
U.S. Industrial
11
cushmanwakefield.com | 1 U.S. Industrial Q2 2019 MARKETBEAT U.S. INDUSTRIAL Overall Vacancy Net Absorption/Rent NNN 4-QTR TRAILING AVERAGE Market Indicators Q2 18 Q2 19 12-Month Forecast Overall Vacancy 4.9% 4.9% Net Absorption 78.3M 52.0M Under Construction 272.1M 327.5M Weighted Asking Rent (NNN) $6.34 $6.47 Rent Growth (Yr/Yr % Chg.) 9.7% 2.7% Employment Indicators Q2 18 Q2 19 12-Month Forecast Total Nonfarm Employment 148.7M 151.1M Industrial Employment 32.5M 33.2M Unemployment 3.9% 3.6% $4.00 $4.50 $5.00 $5.50 $6.00 $6.50 $7.00 0 10 20 30 40 50 60 70 80 90 2015 2016 2017 2018 2019 Net Absorption, MSF Weighted Asking Rent, $ PSF Forecast 0.0% 2.0% 4.0% 6.0% 8.0% 2015 2016 2017 2018 2019 5-Year Historical Average = 5.8% Forecast Demand Picks Up After Slow Start to the Year, Supply Still Constrained U.S. industrial markets absorbed 52.0 million square feet (msf) in the second quarter of 2019, bringing absorption for the first half of the year to 88.6 msf. Note that throughout the current economic expansion, quarterly net absorption has averaged 48.8 msf, albeit often with sizeable quarter-to-quarter swings. New leasing activity for the second quarter totaled 132.7 msf—virtually unchanged from a year ago—and for the first half of the year was 256.6 msf. Seasonality continued to play a role in the second quarter of 2019. Weather conditions delayed delivery of some projects and slowed development starts, although not as aggressively as they did in the first quarter. Consequently, some tenants postponed their occupancy of leases inked in 2018 and early 2019, keeping net absorption slightly lower than in the past few years. In addition to slow production and delays, a serious lack of quality vacant space—especially in secondary and tertiary industrial markets—also restricted net occupancy growth. Net absorption in the first half of this year was relatively low compared to the first half of the past five years (average absorption was 127.3 msf), but all other market fundamentals showed strength. More than 54% of markets report leasing activity increased quarter-over-quarter, vacancy remained near historic lows and average asking rents for all industrial product reached a new nominal high of $6.47 per square foot (psf). Tight conditions push rents upward: Despite the delivery of 126.8 msf of new industrial product during the first half of the year, vacancy was anchored at 4.9% at the close of the second quarter of 2019—90 basis points (bps) below the five-year historical average of 5.8% for all product types. Vacancy rates declined or held steady over the previous 12 months in more than half of the 79 markets tracked by Cushman & Wakefield, with rates holding steady or declining further in 53 markets quarter-over-quarter. The tightest U.S. markets include Savannah, Los Angeles, Orange County and Central New Jersey, all of which have headline vacancy rates under 2.5%. Echoing the tight conditions of the overall market, logistics-related vacancy declined 10 bps over the quarter. With a 5.2% vacancy rate, warehouse/ distribution space continues to be a hot commodity among occupiers. The tightening vacancy powered rent growth during the second quarter of the year. U.S. industrial rents increased 2.7% from the second quarter of 2018 to the second quarter of 2019 year-over-year (YOY). Notably, warehouse/distribution rents rose 7.0% YOY to $5.81 per square foot (psf) in the second quarter of 2019. The West and Midwest recorded the strongest YOY rent gains at 8.0% and 1.7%, respectively. Among the U.S. markets, rents rose in 48 markets with 13 markets registering double-digit gains YOY. Source: Cushman & Wakefield Research Source: BLS
-
Upload
khangminh22 -
Category
Documents
-
view
6 -
download
0
Transcript of U.S. Industrial
cushmanwakefield.com | 1
U.S. IndustrialQ2 2019
MARKETBEAT
U.S. INDUSTRIAL
Overall Vacancy
Net Absorption/Rent NNN 4-QTR TRAILING AVERAGE
Market Indicators
Q2 18 Q2 19 12-Month Forecast
Overall Vacancy 4.9% 4.9%
Net Absorption 78.3M 52.0M
Under Construction 272.1M 327.5M
Weighted Asking Rent (NNN) $6.34 $6.47
Rent Growth (Yr/Yr % Chg.) 9.7% 2.7%
Employment IndicatorsQ2 18 Q2 19 12-Month
Forecast
Total Nonfarm Employment 148.7M 151.1M
Industrial Employment 32.5M 33.2M
Unemployment 3.9% 3.6%
$4.00
$4.50
$5.00
$5.50
$6.00
$6.50
$7.00
0
10
20
30
40
50
60
70
80
90
2015 2016 2017 2018 2019Net Absorption, MSF Weighted Asking Rent, $ PSF
Forecast
0.0%
2.0%
4.0%
6.0%
8.0%
2015 2016 2017 2018 2019
5-Year Historical Average = 5.8%
Forecast
Demand Picks Up After Slow Start to the Year, Supply Still Constrained
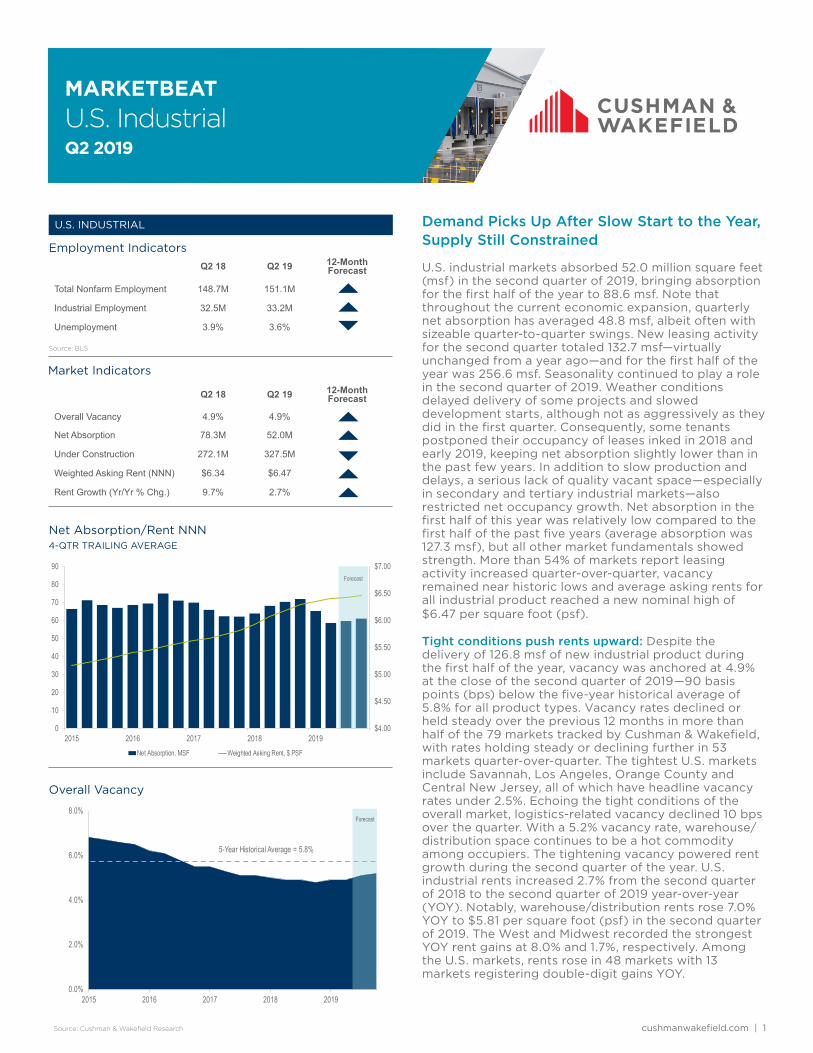
U.S. industrial markets absorbed 52.0 million square feet (msf) in the second quarter of 2019, bringing absorption for the first half of the year to 88.6 msf. Note that throughout the current economic expansion, quarterly net absorption has averaged 48.8 msf, albeit often with sizeable quarter-to-quarter swings. New leasing activity for the second quarter totaled 132.7 msf—virtually unchanged from a year ago—and for the first half of the year was 256.6 msf. Seasonality continued to play a role in the second quarter of 2019. Weather conditions delayed delivery of some projects and slowed development starts, although not as aggressively as they did in the first quarter. Consequently, some tenants postponed their occupancy of leases inked in 2018 and early 2019, keeping net absorption slightly lower than in the past few years. In addition to slow production and delays, a serious lack of quality vacant space—especially in secondary and tertiary industrial markets—also restricted net occupancy growth. Net absorption in the first half of this year was relatively low compared to the first half of the past five years (average absorption was 127.3 msf), but all other market fundamentals showed strength. More than 54% of markets report leasing activity increased quarter-over-quarter, vacancy remained near historic lows and average asking rents for all industrial product reached a new nominal high of $6.47 per square foot (psf).
Tight conditions push rents upward: Despite the delivery of 126.8 msf of new industrial product during the first half of the year, vacancy was anchored at 4.9% at the close of the second quarter of 2019—90 basis points (bps) below the five-year historical average of 5.8% for all product types. Vacancy rates declined or held steady over the previous 12 months in more than half of the 79 markets tracked by Cushman & Wakefield, with rates holding steady or declining further in 53 markets quarter-over-quarter. The tightest U.S. markets include Savannah, Los Angeles, Orange County and Central New Jersey, all of which have headline vacancy rates under 2.5%. Echoing the tight conditions of the overall market, logistics-related vacancy declined 10 bps over the quarter. With a 5.2% vacancy rate, warehouse/distribution space continues to be a hot commodity among occupiers. The tightening vacancy powered rent growth during the second quarter of the year. U.S. industrial rents increased 2.7% from the second quarter of 2018 to the second quarter of 2019 year-over-year (YOY). Notably, warehouse/distribution rents rose 7.0% YOY to $5.81 per square foot (psf) in the second quarter of 2019. The West and Midwest recorded the strongest YOY rent gains at 8.0% and 1.7%, respectively. Among the U.S. markets, rents rose in 48 markets with 13 markets registering double-digit gains YOY.
Source: Cushman & Wakefield Research
Source: BLS

cushmanwakefield.com | 2
U.S. IndustrialQ2 2019
MARKETBEAT
Supply Is Growing, Build-to-Suit Remains SteadyQ2 2019 UNDER CONSTRUCTION BY TYPE
Vacancy Anchored Near Historic Lows LIMITED AVENUES FOR GROWTH IN MANY MARKETS
Outlook• Net absorption is forecasted to surpass 200 msf in 2019 for
a sixth consecutive year, with demand in all regions and all product types growing.
• Increased speculative supply will place upward pressure on vacancy. Cushman & Wakefield forecasts average annual vacancy to rise 20-to-30 bps to between 5.0% and 5.1% by year-end 2019
• Rental rate appreciation will continue, although rent growth will slowly decelerate. We expect year-over-year growth in asking rents of 4.8% in 2019 and 3.6% in 2020 for all types and classes of industrial product.
• The construction pipeline will remain robust as developers strive to get quality space into the market and alleviate the continued pressure on vacancy rates.
Source: Cushman & Wakefield Research
Source: Cushman & Wakefield Research
Source: Cushman & Wakefield Research
Development pipeline expands: Construction starts in the second quarter of 2019 increased 20.3% YOY, with 36 markets experiencing an uptick. The increasingly specialized nature of fulfillment center design and the scarcity of modern, functional space in some markets are prompting more new development. There is currently 327.5 msf of industrial product under construction of which 224.9 msf (68.7%) is speculative and 102.6 msf (31.3%) is build-to-suit. The industrial pipeline is at a record high with 36.8% more space under construction than the three-year average of 239.4 msf. The largest growth in overall construction activity was in the Midwest where the development pipeline increased 38.2% YOY. In the South, construction activity rose 31.1% YOY. Eight markets have more than 10 msf in their respective pipelines. Inland Empire, Dallas/Fort Worth, the Pennsylvania I-81 & I-78 Distribution Corridor, Houston, Atlanta, Chicago, Greenville and Indianapolis combined account for nearly half (49%) of the current development pipeline. Although construction is at its highest volume on record, there are still no major signs of overbuilding in the U.S. industrial market. Until this year, supply and demand have remained in check, proof that despite the high volumes markets are showing restraint. U.S. economy powering through volatility: Despite a decline in consumer confidence in June, slowing growth in major global economies, ongoing trade disputes, uncertainty surrounding the imposition of U.S. trade tariffs on imports from China, effects of USMCA, mixed messages from the Fed on monetary policy, and a volatile equity market—just to name a few factors—the U.S. economy continues to expand at a healthy rate. Real GDP growth in the first quarter of 2019 was 3.1%, 90 bps higher than the 2.2% growth rate in the fourth quarter of 2018. For 2019 Cushman & Wakefield forecasts real GDP growth in the mid-2% range—a moderation from the 2.9% annual growth rate in 2018, but still a healthy backdrop for commercial real estate—with recent economic indicators suggesting risks to the upside.
0
5
10
15
20
25
30
35
Build-to-Suit Under Construction (MSF) Speculative Under Construction (MSF)
0%
2%
4%
6%
4.4%
4.6%
4.8%
5.0%
5.2%
5.4%
5.6%
5.8%
6.0%
0
50
100
150
200
250
300
2016 2017 2018 2019F 2020F
Net Absorption (msf) Completions (msf) Vacancy
Moderating But Solid Growth AheadU.S. INDUSTRIAL SECTOR FUNDAMENTALS

MarketBeat U.S. Q2 2019 cushmanwakefield.com | 3
Net Absorption Leasing Activity
Demand Indicators (Overall) Q2 2018 Q3 2018 Q4 2018 Q1 2019 Q2 2019p Q2 2019p
United States 78,319,382 75,926,699 70,050,871 36,597,960 51,955,123 132,673,529
Northeast 8,386,743 9,872,241 5,937,597 4,353,893 9,861,905 21,085,624
Midwest 19,047,424 11,747,971 18,140,817 11,480,318 13,613,921 26,711,019
South 33,640,911 30,805,975 30,566,874 13,798,038 15,007,346 41,050,459
West 17,244,304 23,500,512 15,405,583 6,965,711 13,471,951 43,826,427
U.S. Industrial Markets Q2 2018 Q3 2018 Q4 2018 Q1 2019 Q2 2019p Q2 2019p
Atlanta, GA 3,914,585 7,111,993 5,495,251 242,525 3,202,627 6,582,580
Austin, TX -7,271 33,372 222,275 -378,143 -185,327 1,158,458
Baltimore, MD 1,503,676 1,207,521 143,512 225,419 755,647 3,130,711
Binghamton, NY -104,450 -137,442 205,987 31,000 205,362 93,900
Birmingham, AL -139,480 296,795 215,434 21,430 188,696 272,487
Boston, MA -322,686 -286,481 425,794 -388,097 944,253 2,396,075
Buffalo, NY -416,072 361,972 -616,508 -242,919 -441,427 256,281
Central Valley, CA 643,298 2,677,005 -1,702,973 2,230,345 251,459 730,909
Charleston, SC 3,374,054 1,298,366 910,071 823,264 -399,307 797,821
Charlotte, NC 1,862,756 936,141 682,510 -212,775 -509,195 1,878,122
Chicago, IL 6,345,261 3,018,145 3,958,387 3,478,365 2,800,099 6,298,652
Cincinnati, OH 1,997,518 1,756,119 1,289,395 -117,193 180,374 969,842
Cleveland, OH -876,635 -682,362 908,040 1,659,071 47,475 1,366,883
Colorado Springs, CO 307,062 351,356 225,427 323,573 -41,576 125,102
Columbus, OH 2,011,600 739,775 2,604,046 2,109,294 2,419,991 3,341,210
Dallas/Ft. Worth, TX 8,095,382 4,758,858 7,012,973 5,307,574 5,745,741 4,517,986
Denver, CO 690,454 1,421,289 3,104,987 388,169 785,821 2,218,994
Detroit, MI 1,767,446 561,905 3,750,620 439,219 -1,317,330 2,551,234
El Paso, TX 1,917,812 2,022,370 1,637,420 -744,694 367,352 530,699
Fort Myers/Naples, FL -48,970 -368,600 301,776 133,738 67,478 365,057
Fredericksburg, VA 16,616 5,401 13,894 172,699 -102,297 24,485
Ft. Lauderdale, FL -125,218 740,788 -296,756 194,302 -18,802 652,307
Greenville, SC 1,069,748 1,868,143 465,341 2,073,719 -746,512 536,654
Hampton Roads, VA -22,701 -338,584 75,511 -388,112 219,304 386,297
Hartford, CT -77,021 -1,363,863 2,338,553 100,699 468,515 920,949
Houston, TX 1,550,170 1,905,652 1,365,054 -122,315 901,007 3,093,573
Indianapolis, IN 2,093,580 4,440,828 1,593,727 968,915 2,305,118 4,533,177
Inland Empire CA 8,232,436 8,996,418 5,869,250 1,730,703 6,757,519 13,890,574
Jacksonville, FL -107,214 4,171 695,185 38,190 98,446 1,679,391
Kansas City, MO 1,895,096 805,447 2,272,848 1,105,262 3,049,358 3,831,483
Lakeland, FL 612,978 240,843 534,577 -55,790 160,500 223,070
Las Vegas, NV 1,329,445 547,358 1,313,471 2,161,756 289,119 1,506,906
Long Island, NY 251,912 -462,724 -706,718 -6,244 -266,188 979,516
Los Angeles, CA 204,722 1,860,620 -511,297 -914,954 -406,891 8,103,714
Louisville, KY 3,238,055 2,034,662 2,627,307 1,392,888 738,103 879,580
Memphis, TN -275,401 1,341,348 1,970,332 1,279,795 2,343,677 2,426,582
Miami, FL 1,418,650 1,093,873 233,183 899,800 740,191 1,409,649
Milwaukee, WI 712,238 79,061 -147,195 1,158,275 1,385,190 476,686
Minneapolis, MN 895,305 560,618 673,576 549,778 890,684 1,495,576
Nashville, TN 1,897,965 1,238,630 726,010 1,901,099 288,229 3,153,074
Demand Indicators

MarketBeat U.S. Q2 2019 cushmanwakefield.com | 4
Net Absorption Leasing Activity
Demand Indicators (Overall) Q2 2018 Q3 2018 Q4 2018 Q1 2019 Q2 2019p Q2 2019p
New Haven, CT -43,970 208,046 327,445 -73,539 34,631 375,106
New Jersey - Central 3,458,058 5,446,125 387,392 460,242 4,735,919 5,885,471
New Jersey - Northern 879,837 370,317 44,971 1,945,548 -1,506,089 1,648,308
Northern VA 511,809 335,388 92,223 251,144 379,803 446,867
NY Outer Boroughs 307,057 648,312 977,500 -526,822 -201,144 624,329
Oakland/East Bay, CA -1,538,437 -99,908 685,184 -783,592 -342,752 2,406,413
Omaha, NE 92,488 -53,388 141,772 -139,085 -200,241 314,715
Orange County, CA 350,319 382,274 309,866 -1,282,691 147,084 2,435,961
Orlando, FL 1,318,618 453,619 819,109 141,766 -506,184 1,028,296
Palm Beach County, FL 138,107 34,941 -23,294 -154,561 22,500 532,352
PA I-81/I-78 Distribution Corridor 5,222,614 3,996,542 1,492,731 845,598 4,027,294 5,402,294
Philadelphia, PA -174,504 344,141 391,994 1,818,431 1,216,620 1,743,022
Phoenix, AZ 2,794,541 2,212,260 1,069,587 1,953,754 2,877,820 2,682,882
Pittsburgh, PA -1,162,742 3,488 168,921 102,306 -80,187 177,319
Portland, OR 1,315,894 2,385,618 254,394 -747,880 -691,681 1,350,067
Providence, RI 142,176 61,684 53,000 115,887 51,793 51,793
Puget Sound - Eastside 214,628 391,358 226,472 101,442 1,033,943 377,086
Raleigh/Durham, NC 184,041 129,296 250,515 -310,477 424,653 178,499
Reno, NV 125,814 254,757 807,700 1,414,748 217,130 1,029,714
Richmond, VA 6,515 1,143,214 444,632 87,124 110,377 176,955
Roanoke, VA 472,350 54,719 486,982 227,024 32,696 100,752
Rochester, NY 34,455 981,275 547,631 226,986 326,122 116,195
Sacramento, CA 827,755 376,574 32,449 282,228 -86,221 688,997
Salt Lake City, UT -136,573 715,280 2,265,732 116,375 -40,221 1,343,044
San Antonio, TX -26,959 79,690 647,238 160,732 0 0
San Diego, CA 903,332 513,371 336,139 165,130 777,177 682,710
San Francisco North Bay, CA 149,437 72,405 -322,978 170,697 -29,851 193,596
San Francisco Peninsula, CA -219,691 -134,821 84,934 -117,642 -445,509 271,261
San Jose (Silicon Valley), CA 72,970 -255,099 150,692 -359,843 247,388 746,915
Savannah, GA 920,868 0 2,144,943 -363,750 -66,066 3,384,304
Seattle, WA 658,361 577,153 1,200,974 170,919 1,832,075 2,850,506
Southern New Hampshire 135,192 -194,820 -129,135 -7,035 90,808 255,710
St. Louis, MO 2,113,527 521,823 1,095,601 268,417 2,053,203 1,531,561
St. Petersburg/Clearwater, FL 115,924 -226,116 135,751 298,378 -415,288 68,183
Suburban MD 173,822 388,158 306,144 154,166 -37,130 390,921
Syracuse, NY 256,887 -104,331 28,039 -48,148 255,623 159,356
Tampa, FL -34,919 911,499 265,156 96,443 839,159 601,232
Tucson, AZ 318,537 255,244 5,573 -37,526 340,118 191,076
Tulsa, OK 114,543 69,824 -33,385 405,436 367,268 443,515
Demand Indicators
p = preliminary
MarketBeat U.S. Q2 2019 cushmanwakefield.com | 5
Vacancy Rates
Overall Vacancy Rate Q2 2018 Q3 2018 Q4 2018 Q1 2019 Q2 2019p
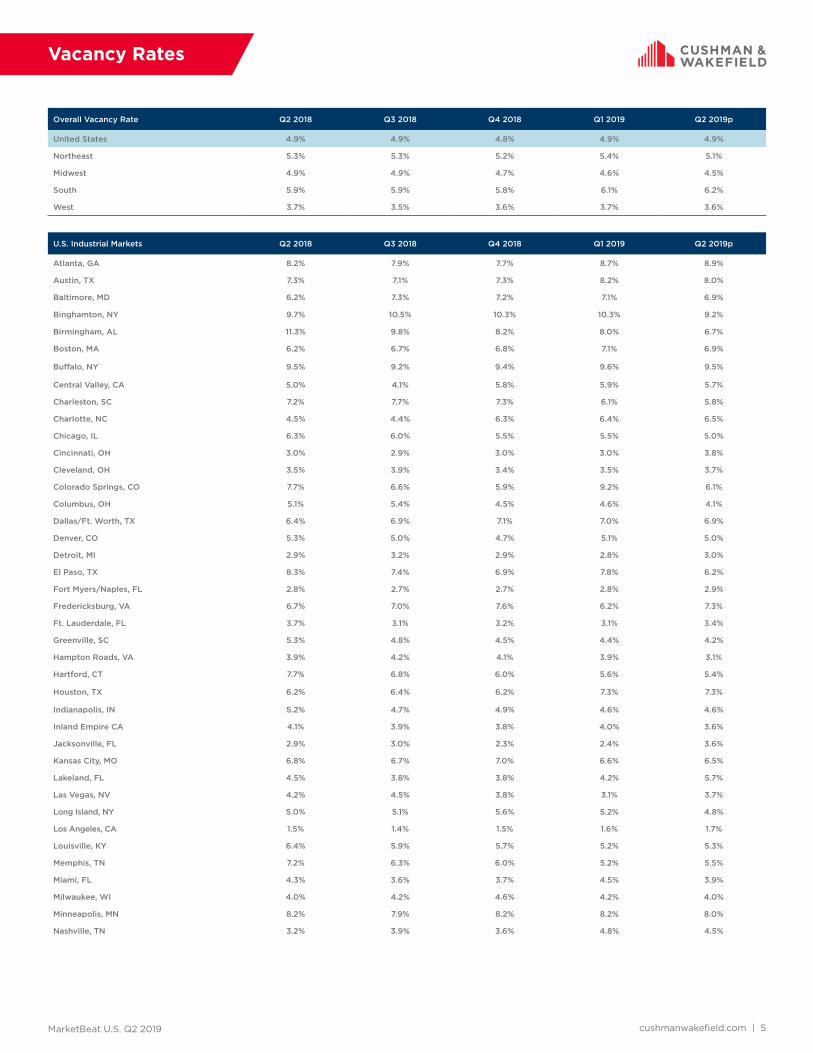
United States 4.9% 4.9% 4.8% 4.9% 4.9%
Northeast 5.3% 5.3% 5.2% 5.4% 5.1%
Midwest 4.9% 4.9% 4.7% 4.6% 4.5%
South 5.9% 5.9% 5.8% 6.1% 6.2%
West 3.7% 3.5% 3.6% 3.7% 3.6%
U.S. Industrial Markets Q2 2018 Q3 2018 Q4 2018 Q1 2019 Q2 2019p
Atlanta, GA 8.2% 7.9% 7.7% 8.7% 8.9%
Austin, TX 7.3% 7.1% 7.3% 8.2% 8.0%
Baltimore, MD 6.2% 7.3% 7.2% 7.1% 6.9%
Binghamton, NY 9.7% 10.5% 10.3% 10.3% 9.2%
Birmingham, AL 11.3% 9.8% 8.2% 8.0% 6.7%
Boston, MA 6.2% 6.7% 6.8% 7.1% 6.9%
Buffalo, NY 9.5% 9.2% 9.4% 9.6% 9.5%
Central Valley, CA 5.0% 4.1% 5.8% 5.9% 5.7%
Charleston, SC 7.2% 7.7% 7.3% 6.1% 5.8%
Charlotte, NC 4.5% 4.4% 6.3% 6.4% 6.5%
Chicago, IL 6.3% 6.0% 5.5% 5.5% 5.0%
Cincinnati, OH 3.0% 2.9% 3.0% 3.0% 3.8%
Cleveland, OH 3.5% 3.9% 3.4% 3.5% 3.7%
Colorado Springs, CO 7.7% 6.6% 5.9% 9.2% 6.1%
Columbus, OH 5.1% 5.4% 4.5% 4.6% 4.1%
Dallas/Ft. Worth, TX 6.4% 6.9% 7.1% 7.0% 6.9%
Denver, CO 5.3% 5.0% 4.7% 5.1% 5.0%
Detroit, MI 2.9% 3.2% 2.9% 2.8% 3.0%
El Paso, TX 8.3% 7.4% 6.9% 7.8% 6.2%
Fort Myers/Naples, FL 2.8% 2.7% 2.7% 2.8% 2.9%
Fredericksburg, VA 6.7% 7.0% 7.6% 6.2% 7.3%
Ft. Lauderdale, FL 3.7% 3.1% 3.2% 3.1% 3.4%
Greenville, SC 5.3% 4.8% 4.5% 4.4% 4.2%
Hampton Roads, VA 3.9% 4.2% 4.1% 3.9% 3.1%
Hartford, CT 7.7% 6.8% 6.0% 5.6% 5.4%
Houston, TX 6.2% 6.4% 6.2% 7.3% 7.3%
Indianapolis, IN 5.2% 4.7% 4.9% 4.6% 4.6%
Inland Empire CA 4.1% 3.9% 3.8% 4.0% 3.6%
Jacksonville, FL 2.9% 3.0% 2.3% 2.4% 3.6%
Kansas City, MO 6.8% 6.7% 7.0% 6.6% 6.5%
Lakeland, FL 4.5% 3.8% 3.8% 4.2% 5.7%
Las Vegas, NV 4.2% 4.5% 3.8% 3.1% 3.7%
Long Island, NY 5.0% 5.1% 5.6% 5.2% 4.8%
Los Angeles, CA 1.5% 1.4% 1.5% 1.6% 1.7%
Louisville, KY 6.4% 5.9% 5.7% 5.2% 5.3%
Memphis, TN 7.2% 6.3% 6.0% 5.2% 5.5%
Miami, FL 4.3% 3.6% 3.7% 4.5% 3.9%
Milwaukee, WI 4.0% 4.2% 4.6% 4.2% 4.0%
Minneapolis, MN 8.2% 7.9% 8.2% 8.2% 8.0%
Nashville, TN 3.2% 3.9% 3.6% 4.8% 4.5%

MarketBeat U.S. Q2 2019 cushmanwakefield.com | 6
Vacancy Rates
Overall Vacancy Rate Q2 2018 Q3 2018 Q4 2018 Q1 2019 Q2 2019p
New Haven, CT 9.3% 6.9% 4.9% 4.6% 4.5%
New Jersey - Central 2.6% 2.8% 2.6% 3.1% 2.4%
New Jersey - Northern 4.1% 4.1% 4.0% 4.0% 4.5%
Northern VA 9.3% 8.6% 8.6% 7.8% 7.5%
NY Outer Boroughs 5.6% 5.8% 5.0% 5.5% 5.9%
Oakland/East Bay, CA 3.7% 4.1% 4.2% 4.5% 5.0%
Omaha, NE 2.5% 2.8% 2.7% 2.9% 3.1%
Orange County, CA 1.9% 1.7% 1.8% 2.4% 2.3%
Orlando, FL 4.8% 5.2% 4.7% 4.9% 6.6%
Palm Beach County, FL 3.1% 2.8% 3.3% 3.5% 3.4%
PA I-81/I-78 Distribution Corridor 5.5% 6.3% 6.5% 7.6% 6.7%
Philadelphia, PA 3.2% 3.1% 4.4% 3.6% 2.7%
Phoenix, AZ 7.1% 7.3% 7.4% 7.0% 6.7%
Pittsburgh, PA 6.1% 6.5% 5.5% 6.3% 6.1%
Portland, OR 3.9% 3.4% 3.0% 3.5% 3.5%
Providence, RI 0.4% 0.4% 0.3% 0.1% 0.1%
Puget Sound - Eastside 4.2% 3.9% 3.6% 3.4% 2.3%
Raleigh/Durham, NC 5.5% 4.8% 4.4% 4.8% 4.1%
Reno, NV 6.5% 6.0% 6.0% 5.5% 5.2%
Richmond, VA 3.5% 4.2% 4.2% 3.4% 2.7%
Roanoke, VA 6.6% 6.6% 5.8% 5.5% 5.6%
Rochester, NY 9.6% 8.3% 7.6% 7.3% 6.9%
Sacramento, CA 5.0% 4.8% 4.5% 3.8% 4.1%
Salt Lake City, UT 5.1% 2.3% 2.8% 3.0% 3.3%
San Antonio, TX 8.6% 9.0% 7.9% 7.3% 7.3%
San Diego, CA 4.9% 5.0% 5.4% 5.4% 5.3%
San Francisco North Bay, CA 2.7% 2.5% 4.3% 4.0% 4.1%
San Francisco Peninsula, CA 2.3% 2.6% 2.4% 2.0% 2.8%
San Jose (Silicon Valley), CA 2.7% 2.8% 2.6% 3.0% 2.9%
Savannah, GA 0.6% 0.6% 0.5% 1.1% 1.1%
Seattle, WA 3.9% 4.0% 4.2% 4.3% 4.0%
Southern New Hampshire 9.2% 8.2% 8.0% 7.9% 7.6%
St. Louis, MO 5.7% 6.1% 5.6% 5.9% 5.8%
St. Petersburg/Clearwater, FL 3.7% 4.0% 3.5% 4.6% 5.6%
Suburban MD 9.3% 8.2% 7.8% 7.8% 7.8%
Syracuse, NY 7.8% 8.0% 7.6% 7.6% 6.9%
Tampa, FL 6.2% 5.5% 5.3% 6.0% 6.9%
Tucson, AZ 6.0% 5.7% 5.7% 5.8% 5.1%
Tulsa, OK 3.0% 2.7% 2.9% 3.9% 3.3%
p = preliminary

MarketBeat U.S. Q2 2019 cushmanwakefield.com | 7
Asking Rents
Overall (All Property Types) W/D MFG
Weighted Average Asking Rent Q2 2018 Q3 2018 Q4 2018 Q1 2019 Q2 2019p Q2 2019p
United States $6.30 $6.36 $6.36 $6.41 $6.47 $5.81 $6.64
Northeast $7.84 $8.09 $7.93 $7.51 $7.73 $7.73 $5.34
Midwest $4.87 $4.88 $4.86 $4.93 $4.96 $4.53 $5.02
South $5.62 $5.58 $5.50 $5.52 $5.56 $4.91 $5.10
West $8.16 $8.48 $8.61 $8.89 $9.02 $8.05 $10.31
U.S. Industrial Markets Q2 2018 Q3 2018 Q4 2018 Q1 2019 Q2 2019p Q2 2019p
Atlanta, GA $4.96 $5.04 $4.47 $4.60 $4.61 $4.08 $7.96
Austin, TX $9.94 $10.37 $10.43 $10.03 $10.16 $7.84 $8.81
Baltimore, MD $5.77 $5.54 $5.63 $5.51 $5.93 $5.40 n/a
Binghamton, NY $4.57 $4.55 $4.25 $4.25 $4.32 $4.22 $4.13
Birmingham, AL $4.06 $4.26 $4.30 $4.35 $4.53 $4.00 n/a
Boston, MA $7.30 $8.22 $8.32 $9.28 $9.46 $8.59 $8.37
Buffalo, NY $4.13 $4.13 $4.13 $4.13 $4.13 $4.25 $3.95
Central Valley, CA $5.05 $5.21 $5.74 $5.65 $5.13 $3.98 $9.31
Charleston, SC $5.52 $5.46 $5.56 $5.67 $5.69 $5.64 $5.27
Charlotte, NC $5.18 $5.30 $5.52 $5.44 $5.47 $5.05 $4.39
Chicago, IL $5.29 $5.34 $5.37 $5.48 $5.44 $4.97 $5.11
Cincinnati, OH $4.40 $4.27 $4.26 $4.38 $4.42 $4.30 $3.40
Cleveland, OH $4.44 $4.12 $4.09 $4.28 $4.36 $4.04 $9.75
Colorado Springs, CO $8.13 $8.57 $8.56 $9.28 $9.51 $9.51 $7.56
Columbus, OH $3.59 $3.60 $3.67 $3.71 $3.74 $3.74 n/a
Dallas/Ft. Worth, TX $5.50 $5.12 $5.04 $5.19 $5.18 $4.34 $3.96
Denver, CO $7.92 $8.02 $8.34 $8.71 $8.61 $7.17 $8.68
Detroit, MI $5.96 $6.09 $6.08 $6.04 $6.20 $5.74 $5.33
El Paso, TX $4.10 $4.25 $4.50 $4.01 $3.84 $3.72 $4.25
Fort Myers/Naples, FL $7.75 $7.99 $8.19 $8.59 $8.78 $8.11 $9.34
Fredericksburg, VA $5.97 $5.69 $5.42 $5.59 $5.70 $5.88 $4.84
Ft. Lauderdale, FL $9.36 $8.73 $9.75 $10.10 $10.01 $9.62 $10.34
Greenville, SC $3.45 $3.63 $3.67 $3.71 $3.70 $3.70 $3.65
Hampton Roads, VA $5.52 $5.67 $5.61 $5.50 $5.55 $5.44 $5.45
Hartford, CT $4.55 $4.88 $5.18 $5.23 $5.35 $5.38 $5.11
Houston, TX $6.13 $6.22 $6.25 $6.15 $6.23 $6.00 $6.40
Indianapolis, IN $4.09 $3.99 $3.95 $3.96 $4.23 $3.94 $4.00
Inland Empire CA $7.76 $7.92 $8.07 $8.20 $8.45 $8.12 $8.81
Jacksonville, FL $5.67 $5.21 $5.10 $5.40 $5.11 $4.61 $4.96
Kansas City, MO $4.29 $4.38 $4.26 $4.28 $4.33 $3.94 $5.42
Lakeland, FL $5.64 $5.68 $5.38 $5.30 $5.17 $5.07 $10.00
Las Vegas, NV $6.96 $6.96 $7.32 $7.56 $8.04 $7.44 $5.76
Long Island, NY $10.90 $10.81 $10.99 $11.05 $10.21 $9.72 $12.00
Los Angeles, CA $10.02 $10.05 $10.43 $10.70 $10.80 $10.27 $10.39
Louisville, KY $3.88 $3.94 $4.06 $4.18 $4.22 $4.07 $3.76
Memphis, TN $3.15 $3.22 $3.08 $3.21 $3.22 $3.09 $3.39
Miami, FL $7.49 $7.55 $7.57 $7.86 $7.93 $7.51 $9.20
Milwaukee, WI $4.60 $4.63 $4.60 $4.57 $4.53 $4.40 $4.29
Minneapolis, MN $4.90 $4.94 $4.97 $5.02 $5.02 $4.73 n/a
Nashville, TN $4.76 $4.80 $4.32 $4.40 $4.67 $4.64 $2.70

MarketBeat U.S. Q2 2019 cushmanwakefield.com | 8
Asking Rents
p = preliminary
Overall (All Property Types) W/D MFG
Weighted Average Asking Rent Q2 2018 Q3 2018 Q4 2018 Q1 2019 Q2 2019p Q2 2019p
New Haven, CT $5.43 $5.31 $6.04 $6.11 $6.15 $4.93 $6.08
New Jersey - Central $8.30 $8.87 $8.24 $8.48 $9.66 $8.40 $7.03
New Jersey - Northern $8.61 $8.67 $8.65 $9.13 $9.06 $8.94 $8.65
Northern VA $11.57 $11.80 $11.94 $11.91 $11.54 $9.17 n/a
NY Outer Boroughs $18.89 $18.64 $19.12 $18.81 $18.44 $18.18 n/a
Oakland/East Bay, CA $11.33 $11.50 $11.43 $11.45 $11.57 $10.65 $12.55
Omaha, NE $5.54 $5.72 $5.79 $5.41 $5.41 $5.25 $3.73
Orange County, CA $11.34 $11.94 $11.06 $11.01 $10.99 $10.37 $11.67
Orlando, FL $6.60 $6.88 $7.02 $7.00 $6.92 $6.01 $7.26
Palm Beach County, FL $10.01 $10.12 $10.57 $10.01 $10.27 $9.23 $10.40
PA I-81/I-78 Distribution Corridor $4.86 $4.88 $4.85 $4.82 $4.81 $4.82 $4.50
Philadelphia, PA $4.79 $4.96 $5.37 $5.28 $5.39 $5.30 $5.43
Phoenix, AZ $7.31 $6.83 $6.45 $6.90 $6.89 $5.46 $8.42
Pittsburgh, PA $8.77 $8.88 $8.96 $7.21 $7.57 $5.31 $3.34
Portland, OR $8.59 $8.67 $8.64 $8.48 $8.71 $7.68 $8.68
Providence, RI $4.85 $4.85 $4.85 $4.85 $4.85 $4.70 $0.00
Puget Sound - Eastside $11.53 $11.14 $11.68 $12.49 $11.53 $10.47 $6.76
Raleigh/Durham, NC $8.66 $8.64 $8.57 $7.96 $7.65 $5.67 $6.30
Reno, NV $4.80 $4.80 $4.56 $4.68 $4.68 $4.44 $4.68
Richmond, VA $5.16 $4.89 $4.71 $4.72 $4.81 $4.85 $4.34
Roanoke, VA $5.16 $5.18 $5.51 $5.00 $5.11 $4.73 $6.66
Rochester, NY $5.40 $5.40 $5.40 $5.40 $5.40 $4.00 $4.75
Sacramento, CA $5.73 $6.07 $6.96 $7.89 $8.01 $7.80 $9.96
Salt Lake City, UT $5.37 $5.64 $5.76 $5.76 $6.21 $5.82 $5.23
San Antonio, TX $6.14 $6.14 $6.04 $6.09 $6.09 $4.88 $11.80
San Diego, CA $12.72 $12.84 $13.32 $13.20 $13.56 $11.76 $12.48
San Francisco North Bay, CA $12.93 $12.93 $12.47 $12.48 $12.55 $12.11 $12.90
San Francisco Peninsula, CA $16.41 $16.49 $16.44 $17.90 $18.13 $17.16 $21.48
San Jose (Silicon Valley), CA $12.84 $12.96 $13.56 $13.56 $14.04 $11.88 $16.44
Savannah, GA $4.91 $4.91 $4.98 $4.72 $4.83 $4.58 n/a
Seattle, WA $8.79 $8.90 $9.48 $9.19 $9.25 $9.16 $8.51
Southern New Hampshire $5.64 $5.78 $5.57 $5.58 $5.59 $4.81 $5.37
St. Louis, MO $4.86 $4.96 $4.88 $4.95 $5.00 $4.58 $6.31
St. Petersburg/Clearwater, FL $7.67 $8.05 $8.61 $8.15 $8.00 $6.63 $5.60
Suburban MD $10.12 $9.66 $9.57 $9.34 $9.52 $7.99 n/a
Syracuse, NY $3.89 $3.88 $4.13 $4.19 $4.54 $4.89 $4.20
Tampa, FL $5.98 $6.24 $6.63 $6.49 $6.48 $5.32 $5.35
Tucson, AZ $6.08 $6.14 $5.95 $6.06 $6.22 $6.21 $5.51
Tulsa, OK $4.69 $4.77 $4.77 $4.83 $4.99 $5.53 $4.24

MarketBeat U.S. Q2 2019 cushmanwakefield.com | 9
Inventory
Inventory Inventory Deliveries YTD 2019 Under Construction as of Q2 2019p
United States 14,883,796,361 126,790,322 327,459,592
Northeast 2,198,373,341 13,857,451 33,925,883
Midwest 3,957,630,530 30,820,306 66,001,667
South 4,559,989,587 55,424,393 145,932,506
West 4,167,802,903 26,688,172 81,599,536
U.S. Industrial Markets Inventory Deliveries YTD 2019 Under Construction as of Q2 2019p
Atlanta, GA 617,006,787 10,151,021 16,950,641
Austin, TX 42,837,433 1,530,310 1,239,612
Baltimore, MD 210,808,509 234,130 5,723,570
Binghamton, NY 17,492,659 0 0
Birmingham, AL 14,570,638 780,000 2,750,000
Boston, MA 175,925,959 856,952 1,013,000
Buffalo, NY 109,070,990 0 437,122
Central Valley, CA 134,837,573 1,835,857 6,475,455
Charleston, SC 75,168,494 1,067,617 3,437,779
Charlotte, NC 194,183,004 733,548 4,676,316
Chicago, IL 1,218,648,540 7,546,037 16,425,726
Cincinnati, OH 290,825,619 3,196,414 9,699,362
Cleveland, OH 505,134,437 2,202,718 2,621,351
Colorado Springs, CO 33,735,128 112,000 106,000
Columbus, OH 258,074,381 4,547,941 5,772,549
Dallas/Ft. Worth, TX 760,695,784 9,778,305 30,294,387
Denver, CO 244,855,974 1,829,007 4,530,170
Detroit, MI 533,979,464 791,749 4,076,819
El Paso, TX 53,868,923 26,100 512,587
Fort Myers/Naples, FL 47,115,042 518,035 463,468
Fredericksburg, VA 13,969,207 0 65,000
Ft. Lauderdale, FL 90,997,958 479,679 1,984,012
Greenville, SC 205,574,271 2,281,501 13,033,563
Hampton Roads, VA 99,097,226 0 869,958
Hartford, CT 94,084,062 0 0
Houston, TX 444,977,360 7,068,904 18,053,313
Indianapolis, IN 268,435,899 2,713,767 12,046,419
Inland Empire CA 556,277,071 8,110,596 31,430,063
Jacksonville, FL 108,237,634 1,583,048 5,469,258
Kansas City, MO 225,866,116 3,629,073 3,273,489
Lakeland, FL 32,458,406 491,920 1,654,434
Las Vegas, NV 120,960,433 3,116,346 975,948
Long Island, NY 130,459,265 64,360 731,455
Los Angeles, CA 1,069,315,898 977,437 7,045,767
Louisville, KY 165,292,579 1,489,082 1,895,919
Memphis, TN 248,613,396 0 8,812,472
Miami, FL 159,685,686 560,601 1,996,798
Milwaukee, WI 203,476,865 1,510,874 4,672,240
Minneapolis, MN 114,919,646 1,578,561 1,796,086
Nashville, TN 215,008,998 4,294,737 5,123,555

MarketBeat U.S. Q2 2019 cushmanwakefield.com | 10
Inventory
Inventory Inventory Deliveries YTD 2019 Under Construction as of Q2 2019p
New Haven, CT 47,649,569 0 855,000
New Jersey - Central 351,848,202 3,886,965 1,667,673
New Jersey - Northern 286,206,641 800,845 1,909,259
Northern VA 62,442,439 216,835 139,000
NY Outer Boroughs 135,275,477 450,000 611,800
Oakland/East Bay, CA 207,874,174 868,316 4,173,330
Omaha, NE 89,713,441 207,600 1,310,274
Orange County, CA 276,751,297 232,354 572,900
Orlando, FL 122,778,754 2,144,685 1,905,383
Palm Beach County, FL 42,133,954 134,030 510,253
PA I-81/I-78 Distribution Corridor 289,742,118 5,856,397 20,816,410
Philadelphia, PA 149,573,229 1,615,092 5,031,951
Phoenix, AZ 321,148,957 2,250,630 7,641,200
Pittsburgh, PA 169,071,891 326,840 529,713
Portland, OR 202,370,886 727,999 2,316,941
Providence, RI 77,727,305 0 0
Puget Sound - Eastside 61,515,060 204,498 526,026
Raleigh/Durham, NC 51,858,026 120,000 150,000
Reno, NV 92,050,913 1,446,431 7,307,205
Richmond, VA 92,002,490 0 4,403,150
Roanoke, VA 51,702,692 0 0
Rochester, NY 73,551,473 0 0
Sacramento, CA 142,078,329 473,016 775,871
Salt Lake City, UT 141,691,188 1,346,097 2,919,645
San Antonio, TX 40,356,673 967,327 3,997,692
San Diego, CA 165,173,785 986,558 1,426,787
San Francisco North Bay, CA 31,255,667 246,200 70,312
San Francisco Peninsula, CA 41,461,167 0 0
San Jose (Silicon Valley), CA 85,520,062 190,000 661,590
Savannah, GA 65,797,801 6,954,315 7,103,510
Seattle, WA 196,184,624 1,685,330 1,328,192
Southern New Hampshire 47,859,057 0 0
St. Louis, MO 248,556,122 2,895,572 4,307,352
St. Petersburg/Clearwater, FL 43,283,778 64,675 0
Suburban MD 50,142,810 46,168 0
Syracuse, NY 42,835,444 0 322,500
Tampa, FL 78,767,670 1,707,820 1,851,876
Tucson, AZ 42,744,717 49,500 1,316,134
Tulsa, OK 58,555,165 0 865,000
p = preliminary

Methodology
Cushman & Wakefield’s quarterly estimates are derived from a variety of data sources, including its own proprietary database, and historical data from third party data sources. The market statistics are calculated from a base building inventory made up of industrial properties deemed to be competitive in the local industrial markets. Generally, owner-occupied and federally-owned buildings are not included. Older buildings unfit for occupancy or ones that require substantial renovation before tenancy are generally not included in the competitive inventory. The inventory is subject to revisions due to resampling. Vacant space is defined as space that is available immediately or imminently after the end of the quarter. Sublet space still occupied by the tenant is not counted as available space. The figures provided for the current quarter are preliminary, and all information contained in the report is subject to correction of errors and revisions based on additional data received.
Regional Map
WestMidwestSouthNortheast
Jason Tolliver Head of Logistics & Industrial Research Americas Tel: +1 317.639.0549 cushmanwakefield.com
Explanation of Terms
Total Inventory: The total amount of industrial space (in buildings of a
predetermined size by market) that can be rented by a third party.
Overall Vacancy Rate: The amount of unoccupied space (new, relet, and
sublet) expressed as a percentage of total inventory.
Absorption: The net change in occupied space between two points in time.
(Total occupied space in the present quarter minus total occupied space from
the previous quarter, quoted on a net, not gross, basis.)
Leasing Activity: The sum of all leases over a period of time. This includes
pre-leasing activity as well as expansions. It does not include renewals.
Overall Weighted Asking Rents: NNN average asking rents weighted by the
amount of available direct and sublease space in industrial properties.
W/D: Warehouse and or distribution properties.
MFG: Manufacturing properties.
About Cushman & Wakefield
Cushman & Wakefield (NYSE: CWK) is a leading global real estate services firm that delivers exceptional value for real estate occupiers and owners. Cushman & Wakefield is among the largest real estate services firms with approximately 51,000 employees in 400 offices and 70 countries. In 2018, the firm had revenue of $8.2 billion across core services of property, facilities and project management, leasing, capital markets, valuation and other services. To learn more, visit www.cushmanwakefield.com or follow @CushWake on Twitter.
©2019 Cushman & Wakefield. All rights reserved. The information contained within this report is gathered from multiple sources believed to be reliable. The information may contain errors or omissions and is presented without any warranty or representations as to its accuracy.
Carolyn Salzer Associate Director, Logistics & Industrial Research Americas Tel: +1 847.518.3212 cushmanwakefield.com
Revathi Greenwood Head of Research Americas Tel: +1 202.463.2100 cushmanwakefield.com