
U.S. GEOLOGICAL SURVEY
73
Interaction between Ground Water and Surface Water in Taylor Slough and Vicinity, Everglades National Park, South Florida: Study Methods and Appendixes By Judson W. Harvey, Jonah M. Jackson, Robert H. Mooney, and Jungyill Choi U.S. GEOLOGICAL SURVEY Open-File Report 00-483 Prepared in cooperation with EVERGLADES NATIONAL PARK Reston, Virginia 2000
-
Upload
khangminh22 -
Category
Documents
-
view
3 -
download
0
Transcript of U.S. GEOLOGICAL SURVEY

Interaction between Ground Water and Surface Water in Taylor
Slough and Vicinity, Everglades National Park, South Florida:
Study Methods and Appendixes
By Judson W. Harvey, Jonah M. Jackson, Robert H. Mooney, and Jungyill Choi
U.S. GEOLOGICAL SURVEY
Open-File Report 00-483
Prepared in cooperation with
EVERGLADES NATIONAL PARK
Reston, Virginia
2000
U. S. DEPARTMENT OF THE INTERIOR BRUCE BABBITT, SECRETARY
U. S. GEOLOGICAL SURVEY Charles G. Groat, Director
The use of firm, trade, and brand names in this report is for identification purposes only and does not constitute endorsement by the U.S. government
Note here that this document will eventually be available on compact disc and via the WWW through links from the USGS SOFIA site (http://sofia.usgs.gov/index.html). Contact the project chief listed below for more information.
For additional information write to:
Judson HarveyU.S. Geological Survey430 National CenterReston, VA20192Email: [email protected]
Copies of this report can be purchased from:
U.S. Geological Survey Branch of Information Services Box 25286 Federal Center Denver, CO 80225
II
CONTENTS
ABSTRACT........................................................................................................................!
INTRODUCTION...............................................................................................................!
Purpose and Scope of Report.................................................................................. 3
Acknowledgments..................................................................................................^
SITE DESCRIPTION AND RESEARCH APPROACH.................................................... 3
STUDY METHODS........................................................................................................... 6
Horizontal Location Surveys................................................................................... 6
Vertical Elevation Surveys......................................................................................6
Hydrologic Measurements...................................................................................... 6
Water Levels and Peat Depths..................................................................... 6
Hydraulic Gradients and Hydraulic Conductivity in Peat........................... 6
Water-Quality Sampling .........................................................................................7
Collection of Ground Water and Surface Water Samples........................... 7
Sample Collection, Treatment, and Handling............................................. 7
REFERENCES CITED.......................................................................................................8
APPENDIXES.................................................................................................................. 10
APPENDIX I: Site Locations and Hydrologic Characteristics of Peat................. 11
APPENDIX II: Data Collected between September 22-October 2, 1997............. 19
APPENDIX III: Data Collected on November 10, 1997 ...................................... 24
APPENDIX IV: Data Collected between November 18 and 20, 1997.................29
APPENDIX V: Data Collected between December 11 and 17, 1997................... 35
APPENDIX VI: Data Collected between June 3 and 6, 1998............................... 40
III

APPENDIX VII: Data Collected between July 20 and 23, 1998.......................... 46
APPENDIX VIII: Data Collected between September 20 and October 5, 1999.. 53
APPENDIX IX: Data Collected between October 25-28, 1999 ........................... 59
IV
FIGURES
1-2. Maps showing:
1. General location of study area in South Florida........................................................ 2
2. Data collection sites and selected features, Taylor Slough and vicinity .................. 5
The following maps are in the Appendixes
1-1. Peat Depth............................................................................................................. 17
I-4. Hydraulic Conductivity in Taylor Slough based on November 10-18, 1997 data 18
II-1. Surface-water monitoring sites: September 22-October 2, 1997.......................... 22
II-2. Ground-water monitoring sites: September 22-October 2, 1997.......................... 23
III-l. Surface-water monitoring sites: November 10, 1997 ...........................................27
III-2. Ground-water monitoring sites: November 10, 1997 ...........................................28
IV-1. Surface-water monitoring sites: November 18-20, 1997...................................... 33
IV-2. Ground-water monitoring sites: November 18-20, 1997...................................... 34
V-l. Surface-water monitoring sites: December 11-17, 1997....................................... 38
V-2. Ground-water monitoring sites: December 11-17, 1997....................................... 39
VI-1. Surface-water monitoring sites: June 3-6, 1998 ...................................................44
VI-2. Ground-water monitoring sites: June 3-6, 1998................................................... 45
VII-1. Surface-water monitoring sites: July 20-23, 1998................................................ 51
VII-2. Ground-water monitoring sites: July 20-23, 1998................................................ 52
VIII-1. Surface-water monitoring sites: September 20-October 5, 1999......................... 57
VIII-2. Ground-water monitoring sites: September 20-October 5, 1999......................... 58
IX-1. Surface-water monitoring sites: October 25-28, 1999........................................... 61
V
TABLES
The following tables are in the Appendixes, and report locations of monitoring sites or
measurements from Taylor Slough on indicated dates.
I-1. Site location and associated peat depth and hydraulic conductivity.......................... 12
II-1. Chemical analyses for samples collected September 22-October 2, 1997................ 20
II-2. Water levels and hydraulic gradients: September 22, 1997...................................... 21
III-l. Chemical analyses for samples collected November 10, 1997................................25
III-2. Water levels and hydraulic gradients: November 10, 1997.....................................26
IV-1. Chemical analyses for samples collected November 19-20, 1997 ......................... 30
IV-2. Water levels and hydraulic gradients: November 18, 1997.................................... 31
V-l. Chemical analyses for samples collected December 11-17, 1997.......................... 36
V-2. Water levels and hydraulic gradients: December 16, 1997..................................... 37
VI-1. Chemical analyses for samples collected June 3-6, 1998.......................................41
VI-2. Water levels and hydraulic gradients: June 3-4, 1998............................................43
VII-1. Chemical analyses for samples collected July 20-23, 1998 ...................................47
VII-2. Water levels and hydraulic gradients: July 20, 1998.............................................. 49
VIII-1. Chemical analyses for samples collected September 20-October 5, 1999............ 54
VIII-2. Water levels and hydraulic gradients: September 20-23, 1999............................. 56
IX-1. Chemical analyses for samples collected October 25-28, 1999.............................. 60
VI
Interaction between Ground Water and Surface Water in Taylor
Slough and Vicinity, Everglades National Park, South Florida: Study
Methods and AppendixesBy Judson W. Harvey, Jonah M. Jackson, Robert H. Mooney, and Jungyill Choi
ABSTRACTThe data presented in this report are products of an investigation that quantified interactions between ground water and surface water in Taylor Slough in Everglades National Park. Determining the extent of hydrologic interactions between wetland surface water and ground water in Taylor Slough is important because the balance of freshwater flow in the lower part of the Slough is uncertain. Although freshwater flows through Taylor Slough are quite small in comparison to Shark Slough (the larger of the two major sloughs in Everglades National Park), flows through Taylor Slough are especially important to the ecology of estuarine mangrove embayments of northeastern Florida Bay. Also, wetland and ground- water interactions must be quantified if their role in affecting water quality is to be determined.
In order to define basic hydrologic characteristics of the wetland, depth of wetland peat was mapped, and hydraulic conductivity and vertical hydraulic gradients in peat were determined. During specific time periods representing both wet and dry conditions in the area, the distribution of major ions, nutrients, and water stable isotopes throughout the slough were determined. The purpose of chemical measurements was to identify an environmental tracer could be used to quantify ground-water discharge.
INTRODUCTION
Management of the wetlands of the Florida Everglades for flood control and water supply is causing significant changes in their hydrology and ecology. Concern has been growing for many years in South Florida over the long- term decreases in surface flow through the Everglades that actually reaches Everglades National Park, and the effects of diminishing flows and changes in the timing of water level fluctuations on bird populations and wildlife of the Park. Simultaneously, there has been increasing awareness of the deteriorating chemical quality of surface water in Water Conservation Areas and the resulting effects on vegetation, including the invasion of cattails and the disappearance of tree islands. In the past ten years, these concerns have fueled wide-ranging debate on how to improve water management in the Everglades in a way that would restore a more equitable balance between natural ecosystem function and human use.
A plan for restoration of the Everglades developed by Federal and State interests is now underway. The overall goal of the twenty-year plan is to restore pre- development conditions of surface water flow, including volume and depth of flow, and the duration of standing water (McPherson and Halley, 1996; Gerould and Higer, 1996).
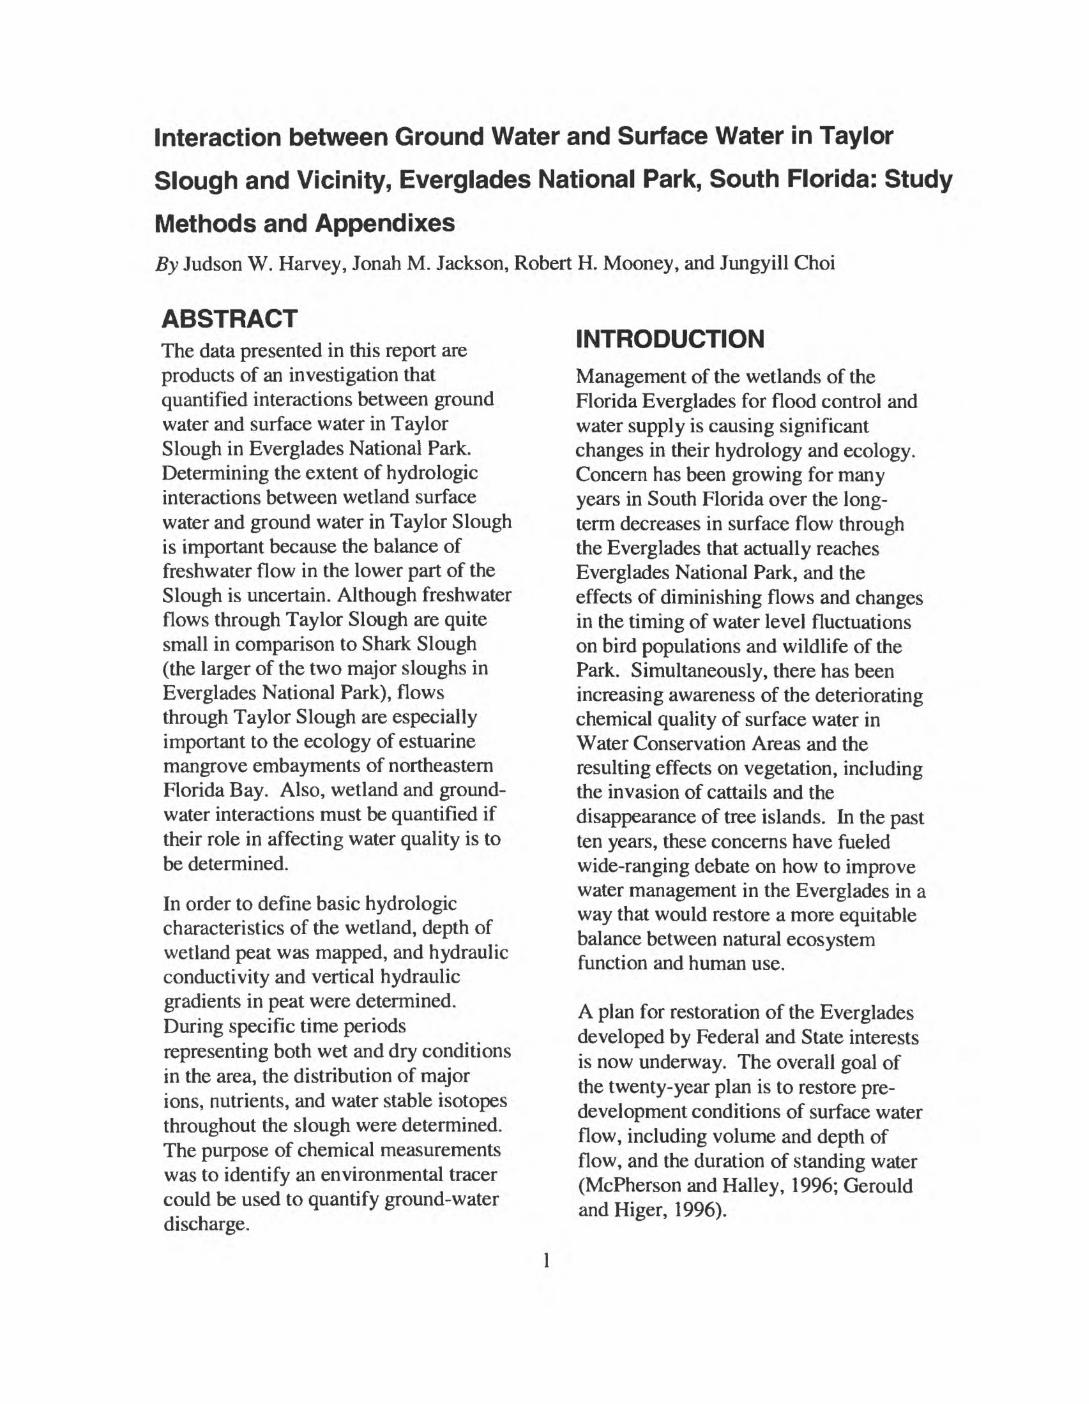
Gulf of Mexico
Figure 1. General location of study area in South Florida.
A key measure of success in restoring the Everglades is the restoration of more favorable surface-flow patterns and improvement or protection of water quality. Evaluating the success of the restoration efforts depends on reliable hydrologic and water-quality information collected prior to re- engineering. For example, information is needed about interactions between ground water and surface water to improve our understanding about how those interactions affect water budgets and water quality under restoration. In cooperation with National Park Service, the U.S. Geological Survey (USGS) has undertaken an investigation about interactions between surface water and ground water in Everglades National Park, as part of a larger effort to better understand surface-flow patterns and ecology of the park wetlands. The investigation was made possible by funding from the Department of Interior administered through the National Park Service (CESI Program), and the U.S. Geological Survey (Place-Based Studies Program).
The goals of this investigation were;
(1) to quantify hydrologic fluxes between surface water and ground water in Taylor Slough, and
(2) take an initial step towarddetermining the relative importance of geologic, anthropogenic, and climatic factors that control interactions between ground water and surface water in the Taylor Slough area.
Purpose and Scope of ReportThe purpose of this report is to compile under one cover all of the data that were
collected about interactions between ground water and surface water in the Taylor Slough area of Everglades National Park during the period between September 1997 and September 1999. In addition, the report contains a detailed description of the study sites, the methods used, and the basic results from hydraulic and geochemical sampling. Data interpretations are the subject of companion publications.
AcknowledgmentsThe assistance of several scientists from the USGS, University of Miami, and the South Florida Water Management District is gratefully acknowledged. Eugene Shinn and his project personnel at USGS in St. Petersburg Florida provided invaluable assistance by emplacing new ground water wells in the wetland interior of Taylor Slough that benefited this project. Rene' Price of the University of Miami shared her knowledge of the ground water system in Everglades National Park and helped us sample some of the ground water wells in the area. Steven Krupa and Cynthia Gefvert of SFWMD assisted us by loaning certain field equipment, such as GPS units and water quality sensors. Gefvert also provided valuable field assistance on several of the trips while she was employed by USGS. William Orem and his project personnel at USGS in Reston Virginia contributed his measurements of peat depth and also collaborated by analyzing all of the nutrient samples collected by this investigation. Mark Zucker and Clint Hittle and other project personnel at USGS in Miami collected the chemical samples from the coastal embayments for this investigation. Gordon Shupe and his project personnel at USGS in Reston accommodated our need for

precisely determined elevations of ground-water wells.
SITE DESCRIPTION AND RESEARCH APPROACH
The two major flow-ways for surface flow through wetlands in Everglades National Park are Shark Slough and Taylor Slough (Figure 1). Taylor Slough is separated from Shark Slough by a series of low-lying coastal ridges surrounded by relatively high-elevation wetlands referred to as the Rocky Glades (Figure 2). Historically, Taylor Slough received water from precipitation, surface overflow from Shark Slough, and possibly ground-water discharge from the coastal ridge systems. Presently, Taylor Slough receives much of its water from the L31-W canal at the S332 pumping structure (at what is effectively the northern terminus of Taylor Slough), and from outflow at the southern end of the L31-W canal.
Taylor Slough is underlain by organic wetland peat that varies in depth (0.2 - 2 m) and in the content of calcitic mud. Under the peat is a highly permeable sand and limestone aquifer (Biscayne aquifer). Hydrogeologic properties of the Biscayne aquifer are described by Fish and Stewart (1991). Merritt (1996) also summarized hydrogeologic properties of the Biscayne aquifer, but he did so within the context of understanding how interactions with surface water might affect seasonal patterns in surface and ground water levels in Everglades National Park. Merritt's report also contains the most recent comprehensive hydrogeologic modeling of ground water flow in Everglades National Park. A previous summary of water budgets and hydrologic modeling in Everglades
National Park is given in Fennema and others (1994) and Parker and others (1955). There are also a number of detailed studies at specific locations within the study area. For example, Genereux and Guardiario (1998) used data from a drawdown experiment in the L31 -W canal to determine hydraulic properties of different layers within the Biscayne aquifer, as well as the conductance of fine sediments controlling seepage from the aquifer to the canal. Recently, Nuttle and others (2000) quantified net discharge of freshwater to Florida Bay using salinity data in Florida Bay and estimates of precipitation and evapotranspiration. Their estimates indicate the possiblity of freshwater inputs to Taylor Slough south of Taylor Slough bridge. However, none of the previous studies explicitly quantified discharge or recharge in Taylor Slough.

530,000 535,000 540.000 545,000 550,000
+ Surface-water measurement site Recording water-level gage O Precipitation/Evapotranspiration
measurement station
A Water-release structures Monitoring wells a Drivepoints in peat
"" « major canals
Figure 2. Data collection sites and selected features, Taylor Slough and vicinity.
STUDY METHODS
Horizontal Location SurveysAll wells and horizontal measuring points were surveyed by global positioning (GPS). The locations of measuring points are reported with reference to the North American Datum of 1927 (NAD 1927). That datum is a reference system that describes horizontal positions with reference to the size and shape of the earth. Using the Army Corps of Engineers program Corpscon, horizontal coordinates were transformed to Northings and Eastings in the Universal Transverse Mercator (UTM) coordinate system.
Horizontal positions were gathered using either a Trimble PRO XR GPS unit (model number 16787-10), a Rockwell PLGR unit (model HNV-560C), or a Garmin unit (various models). In all cases accuracy is expected to be better that plus or minus 100 feet, which was judged to be sufficient for our purposes.
Vertical Elevation Surveys
Vertical control points near or on wells were surveyed using GPS techniques by USGS/NMD personnel in October 1998. Elevations in the NADS 8 datum were derived from the observed NAD83(97) ellipsoid heights and the NGS GEOED96 model. The estimated accuracy of derived elevations is ± 0.07 m. Further questions about surveying techniques should be directed to Gordon Shupe, USGS, Reston.
The elevations for vertical control points near wells were transferred to well top control points by Rene' Price, U. of Miami. At the suggestion of Robert Zepp, National Park Service, an offset of +0.45 m was applied to those elevations in order to
convert the elevations to NGVD 1929 datum, which is considered appropriate for the Taylor Slough area.
Hydrologic Measurements
Water Levels, Water Depths, and Peat Depths
Surface water levels were recorded manually from existing staff gages that are located along the main north-south airboat trail in Taylor Slough. Water depths were either measured directly or they were calculated on the basis of staff-gage readings and water depths measured simultaneously on previous visits. Water levels in wells and drivepoint piezometers were also measured manually during those visits using an electric water level tape (Solinst model 15225 or similar equipment). Peat depths were determined by pushing a 3/8" rod downward through the peat to refusal.
Hydraulic Gradients and Hydraulic Conductivity in PeatVertical flow through the peat was characterized by measuring vertical hydraulic gradients and hydraulic conductivity in the peat. Hydraulic gradients were measured using drivepoint piezometers installed in the peat. The difference in water elevation within and outside the piezometer was determined, and that quantity was divided by the vertical distance between the center of the piezometer screen and the surface of the peat. Vertical hydraulic gradients were determined similarly using data from wells emplaced in the Biscayne aquifer. In a few cases the well screens were open to locations in the aquifer with much higher salinity compared with the surface water in Taylor Slough. In those cases no simple calculation of vertical hydraulic gradient was possible (Reilly, 1993).
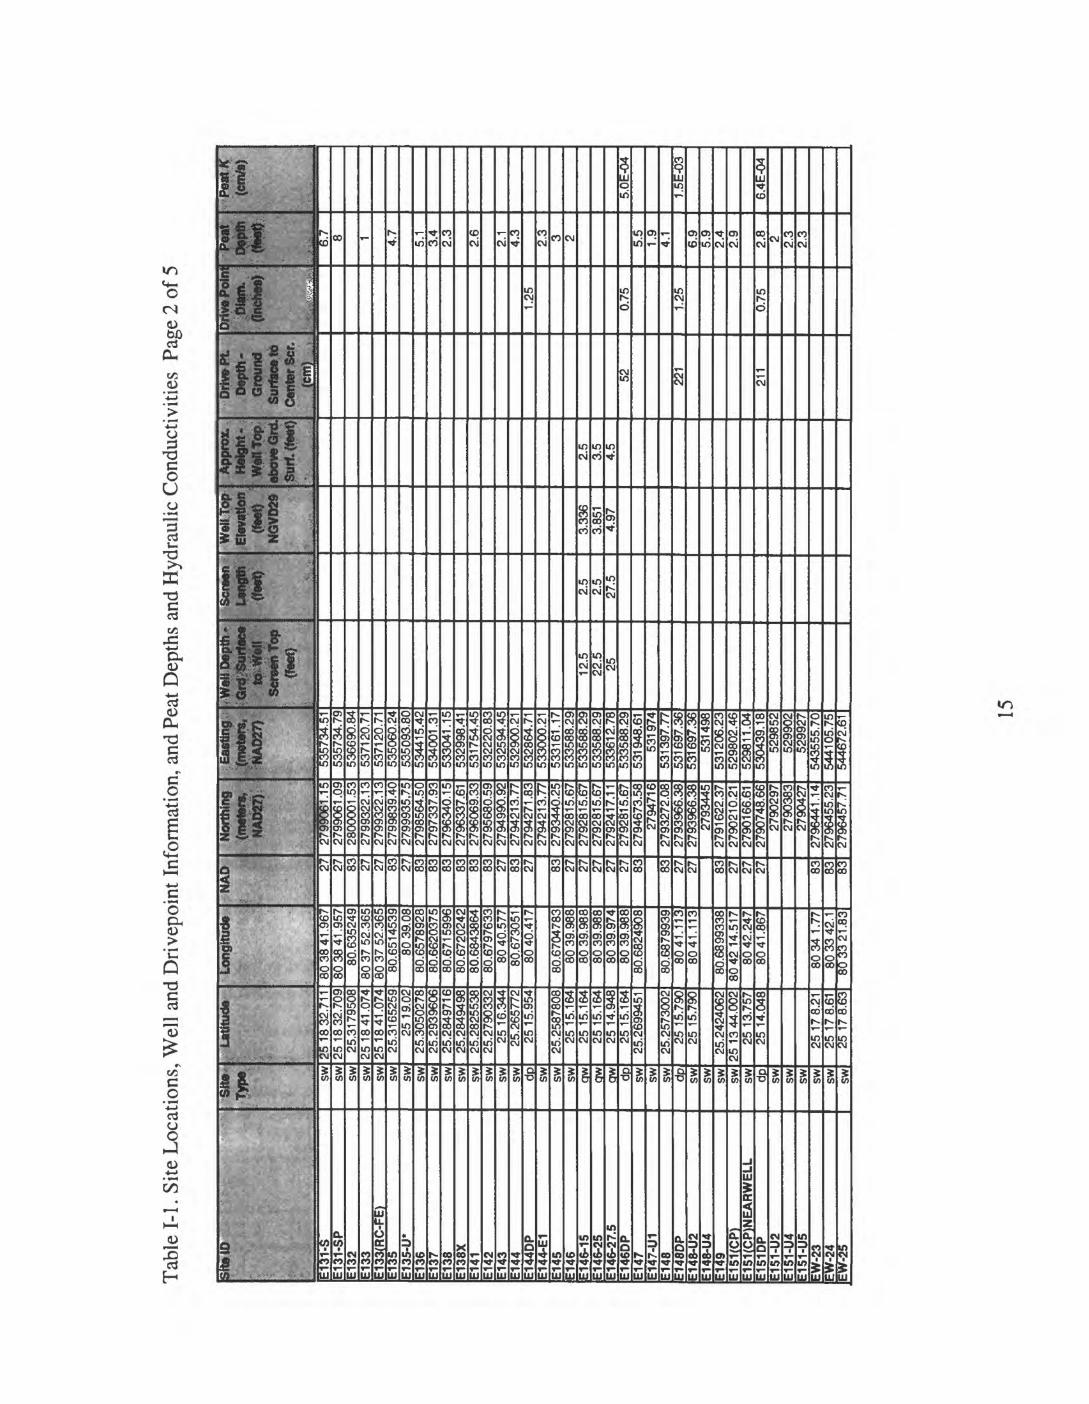
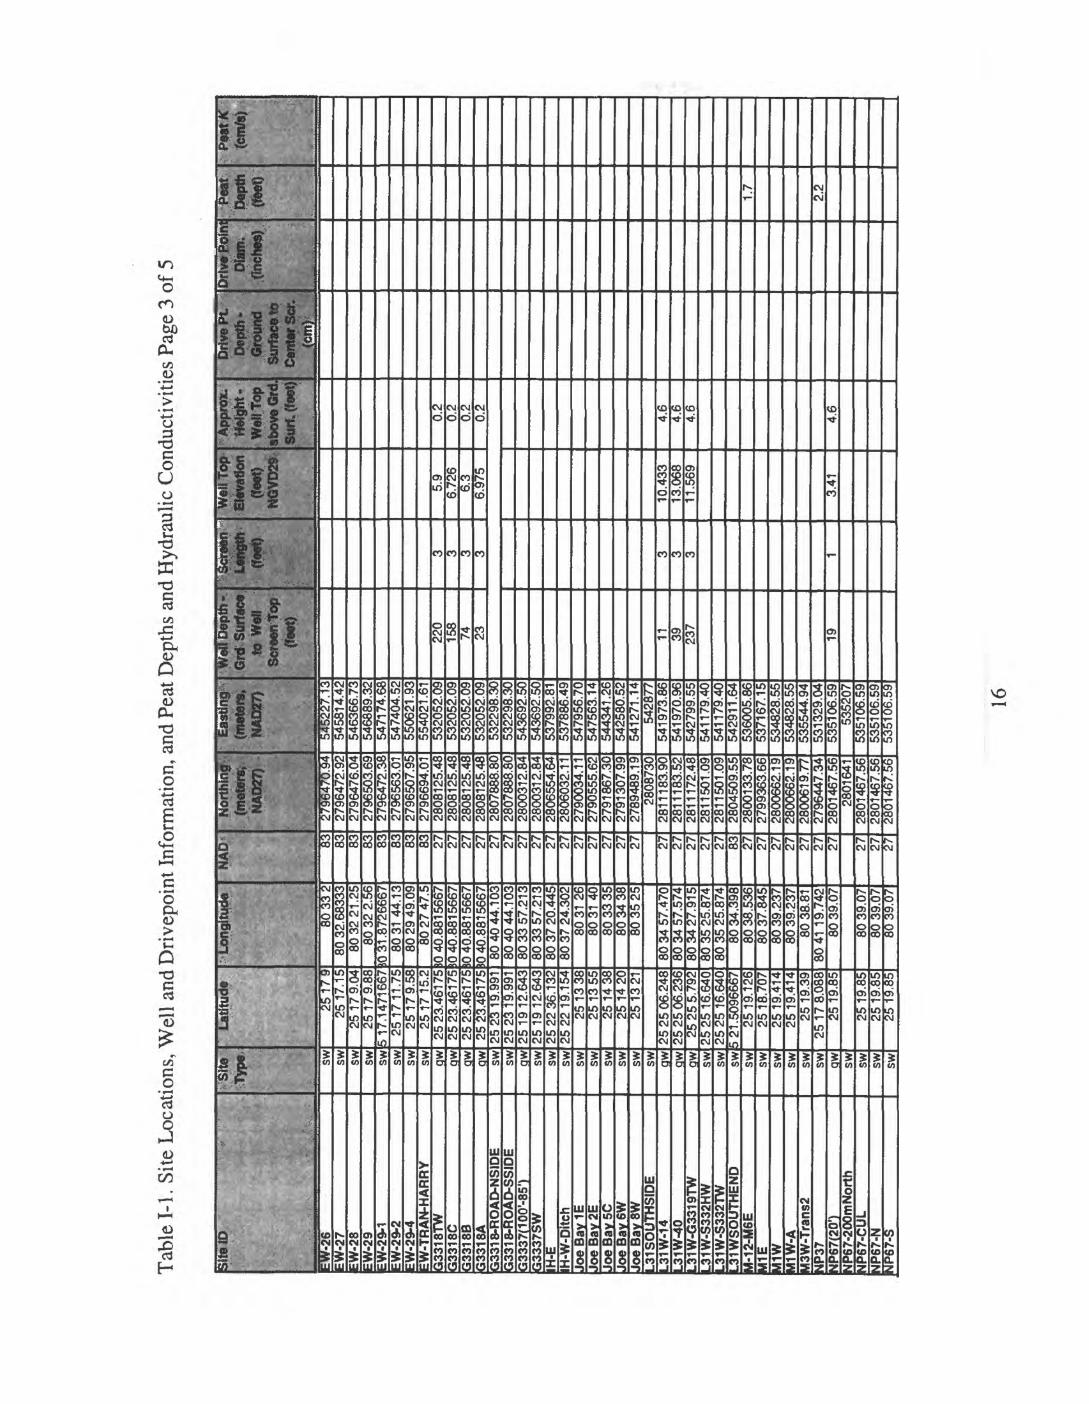
Drivepoint piezometers were constructed of PVC (ranging from % -inch to 1 14 -inch OD), with screens near the tip ranging in length between 1 cm and 12.5 cm. Drivepoints were installed by pushing them into the sediment to various depths ranging between 1 foot and 3 feet below the peat surface. Piezometer screens were kept clear of sediment during emplacement by covering screens with a narrow sleeve that was lifted far enough to expose the screen after piezometer installation. Piezometers were revisited at a later time to measure equilibrium water levels and to perform bail tests.
Hydraulic conductivity of the wetland peat, K, was estimated from bail tests (also referred to as drawdown tests) in the drivepoint piezometers. Bail tests required a measurement of the equilibrium water level in the piezomter, after which water was pumped out of the piezometer and the rate of water-level recovery toward equilibrium measured. Hydraulic conductivity was calculated from water-level recovery data using the method presented by Luthin and Kirkham (1949). It must be noted that in a sediment with alternating layers of low and high K, that a bail test would be more likely to characterize horizontal K. The importance of layering in Taylor Slough peat on hydraulic properties is unknown, although experience in the northern Everglades suggests that bail-test estimates of vertical K compare favorably with estimates based on seepage-meter measurements (Harvey et al., 2000).
Water-Quality SamplingSpatial and seasonal variation of water chemistry is often informative about interactions between surface water and ground water. For this study, sampling was conducted during seven primary measurement periods between September
1997 and September 1999. Field water- quality parameters that were measured included temperature, pH, specific conductivity, oxidation-reduction potential, and dissolved oxygen. In additon to samples for major-ion analysis, samples were collected for analysis of ammonium, phosphate, and the water stable isotopes deuterium (2H) and oxygen-18.
Collection of Ground Water and Surface Water Samples
Prior to sampling wells the wells were purged by pumping with a centrifigal pump until three borehole volumes of water had been evacuated. For drivepoints, the water within the casing was purged completely and the drivepoint was allowed to refill slowly before the sample water was pumped.
Field measurements of basic water quality parameters were obtained in surface water by direct measurement with YSI sensors (models 610 DM or 610D handheld units attached to 600XL sondes). Ground-water samples were pumped through an enclosed flow cell with installed YSI sensors.
All water samples for chemical analysis were obtained using a peristaltic pump loaded with a single piece of tubing (25' of Norprene Masterflex Size 15). For subsurface sampling the tubing was inserted to near the bottom of drivepoints or to the maximum depth possible (approximately 15 feet) in wells. For surface water sampling the placement of the sample tubing was approximately half the depth of the water. Care was taken to keep the tubing inlet suspended in the surface-water column above flocculent sediments. This was accomplished by inserting the tubing inside a PVC pipe with 0.01" slots at the tip, and
positioning the pipe so that the slots were at mid depth in the water column.
Sample Collection, Treatment, and HandlingPrior to fieldwork all equipment that could contact the water to be sampled was cleaned by scrubbing with Liquinox , and rinsing with tap water. Sample bottles were precleaned as necessary by the vendor or by USGS personnel to meet USGS standards. For example, cation and nutrient bottles were precleaned with 10% dilute acid (HCL), rinsed with Milli-Q water, and dried before use. Both filtered and unfiltered samples were obtained at each site in the following order:
Unfiltered samples, requiring nopreservation (sample for 18O and 2H and raw sample for laboratory determination of specific conductivity),
Filtered samples, requiring no preservation (anions),
Filtered samples, requiring preservation (cations and nutrients),
New gloves were used and sample bottles rinsed before a sample was collected at a new surface water site or well. All sample bottles except for water stable isotopes were rinsed with sample water three times before filling. After collecting the unfiltered samples, a new 0.45 [im inline filter was placed on the outlet of the sampling tube before filling the remaining bottles. Cation samples were then preserved with 50% HNO3 to a pH level less than 2.0. After preservation, all samples were stored in a cooler half to three-quarters filled with shaved ice. All nutrient samples were immediately placed in a freezer upon return from the field. Other samples were stored at room temperature until analysis.
Samples to be analyzed for major ions were delivered to the USGS Quality Water Service Unit (QWSU) in Ocala Florida after sampling was completed. Nutrient samples were shipped overnight to USGS in Reston Virginia on ice after sampling was completed. The Geologic Division's Biogeochemistry Laboratory (William Orem-chief) performed the analysis.
Major ions were analyzed by inductively coupled plasma optical emission spectroscopy (cations) and by ion chromatography (anions). More information about the analysis may be obtained directly from the USGS QWSU laboratory in Ocala Florida. Oxygen and hydrogen isotopic results are reported in per mill (°/oo) relative to VSMOW (Vienna Standard Mean Ocean Water) and normalized relative to SLAP (Standard Light Antarctic Precipitation). The 2-G uncertainty of oxygen and hydrogen results is 0.2 %o and 2 °/oo, respectively. Results are based on actvities, not concentrations, which requires that corrections be made for brines. No corrections were made for the present samples. The Chief of the Isotope Fractionation Project at U.S. Geological Survey in Reston, VA should be consulted for more details of the stable isotope analyses. Ammonium and phosphate were analyzed by standard colorimetric analyses. The Chief of the Biogeochemistry Project in Geologic Division in Reston should be contacted for further information about nutrient analyses.
REFERENCES CITED
Fennema, R.J., Neidrauer, C.J., Johnson, R.A., Mac Vicar, T.K, and Perkins, W.A., 1994, A computer model to simulate natural Everglades hydrology: p. 249-289 in Everglades: The Ecosystem and its Restoration,

Davis, S. M. and Ogden, J.C. (eds.), St. Lucie Press, Boca Raton.
Fish, I.E., and Stewart, Mark, 1991,Hydrogeology of the surficial aquifer system, Dade County, Florida: U.S. Geological Survey Water-Resources Investigations Report 90-4108, 50 p.
Genereux, D. and Guardiario, J., 1998, A canal drawdown experiment for determination of aquifer parameters: Journal of Hydrologic Engineering, v. 3, n. 4, 294-302.
Gerould, Sarah, and Higer, Aaron, 1995,South Florida ecosystem program of the U.S. Geological Survey: U.S. Geological Survey Fact Sheet FS- 134-95. 2p.
Gleason, P.J., and Stone, Peter, 1994, Age, origin, and landscape evolution of the Everglades peatland: In Davis, S.M., and Ogden, J.C., eds., Everglades the ecosystem and its restoration: St. Lucie Press, p. 149- 198.
Harvey, J.W., Krupa, S.L., Gefvert, C.J., Choi, J., Mooney, R.H., and Giddings, J.B., 2000, Interaction between Ground Water and Surface Water in the Northern Everglades and Relation to Water Budgets and Mercury Cycling: Study Methods and Appendixes: U.S. Geological Survey Open-File Report 00-168. 411 p.
Luthin, J.N. and Kirkham, D., 1949, Apiezometer method for measuring permeability of soil in-situ below a water table: Soil Science, V68: 349- 358p.
McPherson, B.F., and Halley, R., 1996, The South Florida environment a region under stress: U.S. Geological Survey Circular 1134, 61 p.
Merritt, M.L., 1996, Simulation of thewater-table altitude in the Biscayne aquifer, Southern Dade County, Florida, water years 1945-89. U.S. Geological Survey Water-Supply
Nuttle, W.K., Fourqurean, J.W., Cosby, B.J., Zieman, J.C., and Roblee, M.B., 2000, Influence of net freshwater supply on salinity in Florida Bay, Water Resources Research, v. 36, n. 7, 1805-1822.
Parker, G.G., Ferguson, G.E., Love, S.K.,and others, 1955, Water resources of south Florida with special reference to the geology and ground water of the Miami area: Water Supply Paper 1255, U.S. Geological Survey, Washington D.C.
Reilly, T.E., 1993, Analysis of Ground- water systems in freshwater- saltwater environments: in Regional Ground-water Quality (W.M. Alley, ed.), Van Nostrand Reinhold, New York, 634 p.

10

APPENDIXES
ll

12

APPENDIX I
Data Collection Sites and Hydrologic Characteristics of Peat: Taylor Slough and Vicinity, South Florida
13

Tab
le 1
-1. S
ite L
ocat
ions
, Wel
l an
d D
rive
poin
t In
form
atio
n, a
nd P
eat D
epth
s an
d H
ydra
ulic
Con
duct
iviti
es P
age
1 of
5
Site
ID
* -"
- -
---.
AE
RO
JET
CA
NA
L21
11-1
C11
1-2
D11
1-3
3111
-431
11-5
3111
-6C
111-
WS
111-
S18
C3Y
P2(
10')
3YP
2(10
0'1
2YP
2-S
W-N
CY
P2-
SW
-S3Y
P2-
W1-
N3Y
P2-
W1-
S3Y
P2-
W2-
N3Y
P2-
W2-
S=1
21=1
22E
123
E12
3-F
WE
123-
NN
E12
3-N
W=1
24E
124-
D2
E12
4-T
1CE
124-
T1E
C-U
1EE
124-
T1W
C-U
WO
E12
4-T
1WF
-U4W
E12
5=1
26E
127
E12
7DP
E12
8E
128D
P=1
29E
129D
P=1
30=1
30-1
0=1
30-5
2E
130D
P=1
31E
131D
P
Sita
Ty
pe sw sw sw sw sw sw sw sw sw qw qw sw sw sw sw sw sw sw sw sw sw sw sw sw sw sw sw sw sw sw sw sw dp sw dp sw dp sw aw qw dp sw dp
Latit
ude
2519
.141
2516
.891
25 1
5.02
S25
19.
1 OS
25 1
6.77
2515.2
6
25
19
3C
25
19
44
.33
22
51
94
4.2
09
25 1
9 4
4.33
225
1 9
44.
332
25
19
44
.28
6251944.2
86
251944.2
58
251944.2
58
25.3
7518
6725
.365
7515
2521
.91
25 2
2 8.
866
25 2
1 54
.946
25
22
4.1
03
25.3
6621
35
2521.9
06
25 2
1 .9
542
52
1.9
20
2521.9
14
25.3
6615
5325
.365
7669
25.3
5283
852
52
1.1
46
25.3
4043
8825
.340
4388
25.3
3129
5325
.331
2953
25.3
2774
492519.6
49
2519.6
49
25 1
9.6
4025
.321
9812
25.3
2198
12
Long
itude
8031
.556
80 3
2.50
780
33.
065
, 80
33.
929
80 3
5.28
80 3
5.05
80 3
2 OG
80 4
0 47
.067
80
40
59
.31
580
40
47.0
6780
40
47 0
6780
41
28.0
8980
41
28.0
89804221.1
11
80
42
21
.11
180
.600
6875
80.6
1043
5980
36.
3980
36
59.5
6980
36
27.8
7680
36
47.3
7680
.600
8205
80 3
6.05
080
35.
488
8037.1
39
80 3
6.84
280
.591
9384
80.5
8397
6880
.606
5348
80 3
6.28
780
.620
0736
80.6
2007
3680
.631
6625
80.6
3166
2580
.644
9907
80 3
8.57
780
36.
577
80 3
8.71
180
.641
832
780
.641
8327
NA
D* 27 27 27 27 27 27 27 27 27 27 27 27 27 27 27 83 83 27 27 27 27 83 27 27 27 27 83 83 83 27 83 83 83 83 83 27 27 27 83 83
Nor
thin
g :
(met
ers,
'
: 'Nf
tD»K
'
2804
810.
0028
0019
7.80
2796
039.
8627
9260
0.38
2800
125.
2527
9560
1.47
2793
015.
9628
0908
0.00
2800
857.
4428
01 2
55.2
828
01 2
50.6
828
01 2
55.2
828
0125
5.28
2801
251.
1728
0125
1.17
2801
246.
9728
0124
6.97
2806
349.
4528
0530
1 .7
528
0528
1.77
2805
717.
6328
0529
2.04
2805
572.
1128
0535
5.76
2805
176.
0728
0527
6.07
2805
367.
5028
0529
6.59
2805
286.
9428
0535
2.02
2805
311.
4828
0387
2.98
2803
872.
3028
0249
5.97
2802
495.
9728
0148
0.21
2801
480.
2128
0108
3.43
2801
098.
7928
0109
8.79
2801
081
5828
0044
6.04
2800
446.
04
- Ea
stin
g (m
eter
s,
NAD
27)
6436
36.0
054
771
1 .51
5461
33.7
354
5208
.87
5437
34.2
954
1481
.22
5418
75.8
054
4407
.00
5468
83.8
653
2231
.35
5318
88.9
653
2231
.35
5322
31 .3
553
1084
.54
5310
84.5
452
9602
.25
5296
02.2
554
0150
.49
5391
72.8
353
9590
.71
5385
78.6
053
9465
.58
5389
1 9.
7854
0140
.08
5401
60.8
754
0160
.87
541
1 03.
0053
8334
.67
5388
32.7
454
1033
.73
5418
34.8
853
9569
.53
5397
67.5
953
8211
.16
5382
11.1
653
7047
.75
5370
47.7
553
5707
.47
5359
34.5
153
5934
.51
5357
09.7
853
6027
.00
5360
27.0
0
Wet
l Dep
th*
Grtf
Sur
face
to
Wel
l
Scre
en T
op;
(teeS
;
5 80 7.5
47.5
.-Scw
en(
'j«!i»
«^u
L
.LO
Tgin
f*S
$;:
5 20 2.5 5
Wel
l Top
E
leva
tion
(toet
> N
GV
D29
5.85
5.57
1
App
rox.
H
eigh
* -
Wal
lTop
ab
ove
Grd
. Su
rf, (f
eet)
2.5
2.5
Ctrl
veP
t"D
epth
,-"
Gro
und
Surfa
ce to
C
ente
r Scr
.
103
142
214
Driv
epoi
nt,0
W|fe
(In
ches
)
1.25
1.25
1.25
1.25
1.25
f?«a
t -
Dept
h (fe
et)
2 2.5 3 1 1.5
2.5
1.9
2.9
3.2
2.9
4.5
2.6
8.1
3.5
6.2
5.4
Psa
tK
{crii
fcj
9.9E
-05
2.2E
-04
2.7E
-04
14
Tab
le 1
-1. S
ite L
ocat
ions
, Wel
l an
d D
rive
poin
t In
form
atio
n, a
nd P
eat D
epth
s an
d H
ydra
ulic
Con
duct
iviti
es P
age
2 of
5
Site
ID
' '"
kj|y
E13
1-S
PE
132
E13
3E
133(
RC
-FE
)E
135
E13
5-U
*E
136
E13
7E
138
E13
8XE1
41E
142
E14
3E
144
E14
4DP
E14
4-E
1E
145
E14
6E
146-
15=1
46-
25=1
46-2
7.5
E14
6DP
=147
E14
7-U
1=1
48E
148D
PE
148-
U2
E14
8-U
4E1
49E
15K
CP
)E
151(
CP
)NE
AR
WE
LL=1
51 D
PE
151-
U2
E15
1-U
4E
151-
U5
EW-2
3:W
-24
EW
-25
Sit*'
T*» sw sw sw sw sw sw sw sw sw sw sw sw sw sw sw do sw sw sw O
W
OW
OW do sw sw sw dp sw sw sw sw sw dp sw sw sw sw sw sw
Latit
ude
251832.7
09
25.3
1795
0825
1 8
41
.071
25 1
8 4
1 .0
7125
.316
5255
25 1
9.0
225
.305
027E
25.2
9396
0625
.284
9716
25.2
8494
9£25
.282
553E
25.2
7903
3225
16.3
4125
.265
772
2515
.954
25.2
5878
0E25
15.
164
25 1
5.16
425
15.1
6425
14.
948
2515
.164
25.2
6994
51
25.2
5730
0225
15.
790
25 1
5.79
0
25.2
4240
62251344.0
02
25 1
3.75
725
14.
048
25 1
78.2
125
178
.61
25 1
7 8.
63
Long
itude
80 3
8 41
.967
80 3
8 41
.957
80.6
3524
980
37
52.3
6580
37
52.3
6580
.651
4539
80 3
9.0E
80.6
5789
2880
.662
0375
80.6
7159
9680
.672
0242
80.6
8438
6480
.679
7633
80 4
0.57
780
.673
051
8040
.417
80.6
7047
8380
39.
988
80 3
9.98
880
39.
988
80 3
9.97
480
39.
988
80.6
8249
08
80.6
8799
3980
41.1
1380
41.1
13
80.6
8993
38804214.5
17
80 4
2.24
780
41.8
67
80 3
4 1 .
778
03
34
2.1
803321.8
3
NA
DI
27 27 83 27 27 83 27 83 83 83 83 83 83 27 83 27 83 27 27 27 27 27 83 83 27 27 83 27 27 27 83 83 83
Nor
thin
g (m
eter
s,
JNAD
27J
2/aH
ii.ib
2799
061
.09
2800
001
.53
2799
322.
1327
9932
2.13
2799
839.
4027
9993
5.75
2798
564.
5027
9733
7.93
2796
340.
1527
9633
7.61
2796
069.
3327
9568
0.59
2794
990.
9227
9421
3.77
2794
271
.83
2794
213.
7727
9344
0.25
2792
815.
6727
9281
5.67
2792
815.
6727
9241
7.11
2792
81 5
.67
2794
673.
5827
9471
627
9327
2.08
2793
966.
3827
9396
6.38
2793
445
2791
622.
3727
9021
0.21
2790
166.
6127
9074
8.66
2790
297
2790
383
2790
427
2796
441.
1427
9645
5.23
2796
457.
71
-..Ea
stin
g;
{met
ers,
:N
AD27
>
5357
34.5
153
5734
.79
5366
90.8
453
7120
.71
5371
20.7
153
5060
.21
5350
93.8
053
4415
.42
5340
01 .3
153
3041
.15
5329
98.4
153
1754
.45
5322
20.8
353
2594
.45
5329
00.2
153
2864
.71
5330
00.2
153
3161
.17
5335
88.2
E53
3588
.2S
5335
88.2
553
3612
.78
5335
88.2
953
1948
.61
531
974
5316
97.3
653
1 69
7.36
5314
9853
1 20
6.23
5298
02.4
652
9811
.04
5304
39.1
852
9852
5299
0252
9927
5435
55.7
054
4105
.75
5446
72.6
1
: Wel
l Dep
th -
Grd
: Sur
face
to
Wal
l '
Scr
een
Top
= <**
*> ":"
:
12.5
22.5
25
Scre
en
Leng
th
<to«
Q
2.5
2.5
27.5
Wel
l Top
. E
leva
tion
(feet
) N
GVD
29
3.33
63.
851
4.97
App
ro*.
tW
ght-
;W
ofl T
op
abov
e G
rd.
Sur
f, (fe
et)
2.5
3.5
4.5
Driv
e P
t D
epth
- G
roun
d S
urfa
ce to
C
ente
r Scr
. \c
m)
...',
52 221
211
Driv
e Po
in:
'.ifl
lain
./
(Inch
es)
'' "
' I \y
«f '
tf*. : .
1.25
0.75
1.25
0.75
Peat
D
epth
8 1 4.7
5.1
3.4
2.3
2.6
2.1
4.3
2.3 3 2 5.5
1.9
4.1
6.9
5.9
2.4
2.9
2.8 2 2.3
2.3
Pea
tK
(cm
fc)
5.0E
-04
1 .5E
-03
6.4E
-04
15
Tab
le 1
-1. S
ite L
ocat
ions
, Wel
l an
d D
rive
poin
t Inf
orm
atio
n, a
nd P
eat D
epth
s an
d H
ydra
ulic
Con
duct
iviti
es P
age
3 of
5
site
ID
(
IW-2
6W
-27
W-2
8W
-29
W-2
9-1
W-2
9-2
W-2
9-4
EW
-TR
AN
-HA
RR
YS
3318
TW
S33
18C
G33
18B
G33
18A
3331
8-R
OA
D-N
SID
ES
3318
-RO
AD
-SS
IDE
3333
7(10
0'-8
5')
G33
37S
WH
-EH
-W-D
itch
Joe
Bay
1E
Joe
Bay
2E
Joe
Bay
SC
Joe
Bay
6W
Joe
Bay
8W
.31S
OU
TH
SID
E-3
1W-1
4.3
1W
-40
.31W
-G33
19T
W-3
1W-S
332H
W.3
1W-S
332T
W.3
1WS
OU
TH
EN
DI/I
-12-
M6E
ME
U1W
1/11 W
-Ay<
3W-T
rans
2Y
>37
M >6
7(20
')4P
67-2
00m
Nor
th J
P67
-CU
L J
P67
-N<J
P67-
S
'Site
iTyp
,
sw sw sw sw sw sw sw sw qw aw aw aw sw sw aw sw sw sw sw sw sw sw sw sw aw aw aw sw sw sw sw sw sw sw sw sw aw sw sw sw sw
Latit
ude
2^1
79
2517.1
525179.0
42
51
79
.8£
51
7.1
47
16
67
251711.7
525179.5
E2
51
71
5.2
25
23
.46
17
525
23.
4617
52523.4
6175
25 2
3.46
175
25
23
19
.99
12
52
31
9.9
91
25
19
12
.64
325
19
12.6
4!2
52
23
6.1
32
25
22
19.
154
25
13
38
25 1
3 55
25 1
4 38
25 1
4 20
25
13
21
25 2
5 06
.248
25 2
5 06
.236
25 2
5 5.
792
25
25
16
.64
025
25
16.6
40521.5
096667
25
19
.12
62518.7
07
25
19
.41
42
51
9.4
14
25 1
9.39
25 1
78.0
88
25 1
9.85
2519.8
52519.8
52519.8
5
Long
itude
80
33
280
32.
6833
3803221.2
580
32
2.56
031.8
726667
80
31
44
.1!
80 2
9 49
.09
80 2
7 47
.50
40
.88
15
66
70
40
.88
15
66
7040.8
815667
040.8
815667
80
40
44
.10
38
04
04
4.1
03
80
33
57
.21
38
03
35
7.2
13
80 3
7 20
.445
80 3
7 24
.302
80 3
1 26
80
31
40
80 3
3 35
80 3
4 38
80 3
5 25
80 3
4 57
.470
80 3
4 57
.574
80
34
27
.91
580
35
25.8
7480
35
25.8
7480
34.
398
80
38
.53
680
37.
845
80 3
9.23
78
03
9.2
37
80 3
8.81
80
41
19.
742
80 3
9.07
80 3
9.07
80 3
9.07
80 3
9.07
- N
AD
/
. . r«
&-*
Y s; 83 s: 83 8!
8!
8!
8! 27 27 27 27 27 27 27 27 27 27 27 27 27 27 27 27 27 27 27 27 83 27 27 27 27 27 27 27 27 27 27
Nor
thin
g ,
(met
ers,
; 'N
AD
27):
:
wu 27
9647
0.94
2796
472.
9227
9647
6.04
2796
503.
6927
9647
2.38
2796
563.
0127
9650
7.95
2796
694.
0128
0812
5.48
2808
125.
4828
081
25.4
E28
0812
5.48
2807
888.
8028
0788
8.80
2800
312.
8428
0031
2.8
428
0655
4.64
2806
032.
1127
9003
4.11
2790
555.
6227
9186
7.30
2791
307.
9927
8948
9.19
2808
730
2811
183.
9028
1118
3.52
2811
172.
4828
1150
1.09
2811
501.
0928
0450
9.55
2800
133.
7827
9936
3.66
2800
662.
1928
0066
2.19
2800
619.
7727
9644
7.34
2801
467.
5628
0164
128
0146
7.56
2801
467.
5628
0146
7.56
" Ea
stin
g' '.
(met
ersi
... '
NAD
27)
.^. .
x»«»
'54
5227
.13
5458
14.4
254
6366
.73
5468
89.3
254
7174
.68
5474
04.5
255
0621
.93
5540
21.6
153
2052
.09
5320
52.0
953
2052
.09
5320
52.0
953
2298
.30
5322
98.3
054
3692
.50
5436
92.5
053
7992
.81
5378
86.4
954
7956
.70
5475
63.1
454
4341
.26
5425
80.5
254
1271
.14
5428
7754
1973
.86
5419
70.9
654
2799
.55
5411
79.4
054
1179
.40
5429
11.6
453
6005
.86
5371
67.1
553
4828
.55
5348
28.5
553
5544
.94
5313
29.0
453
5106
.59
5352
0753
5106
.59
5351
06.5
953
5106
.59
Wel
l Dep
th -
Grd
Sur
face
to
Wel
l S
cram
fop
'<M
t
220
158
74 23 11 39 237
19
;.'*S
«re»
n:"i
Cet
igth
) W
JB9
3 3 3 3 3 3 3 1
Wet
i Top
El
evat
ion
(feet
) NQ
VD29
5.9
6.72
66.
36.
975
10.4
3313
.068
1 1 .
569
3.41
^App
roiL
' H
eigh
t -
J^'IT
op
sbov
eGrd
S
urf,
(feet
]
0.2
0.2
0.2
0.2
4.6
4.6
4.6
4.6
Uriy
ePt
- D
epth
- G
roun
d Su
rface
to
Cen
ter S
cr.
(tW?
Driv
e Po
int
DJam
. (W
che$
) - ;
-ffe
at
Dep
th
Cfee
fl ;
1.7
2.2
vPO
TtJC
'
(onf
cj
16

Tab
le 1
-1. S
ite L
ocat
ions
, Wel
l an
d D
rive
poin
t Inf
orm
atio
n, a
nd P
eat D
epth
s an
d H
ydra
ulic
Con
duct
iviti
es P
age
4 of
5
Site
ID
NS-
1M
S-1
0N
S-1
1N
S-1
2N
S-1
3M
S-1
4N
S-1
4BA
CK
UP
MS
-15
MS
-16
MS
-17
MS
-18
MS
-19
MS-
1 B
AC
KU
PM
S-2
MS
-20
MS-
21M
S-2
2M
S-3
MS-
4M
S-S
MS-
6M
S-7
MS-
8M
S-9
>JW
OFE
130N
P67
3LT
-C3L
TC
DP
-U2
3LT
C-U
2O
LT-E
DLT
-FE
DLT
-Mid
Eas
t3L
T-M
W3L
T-M
W2
DLT
-Nea
rEas
tD
LT-N
W>i
neR
MP
3O
1st
Ma
rkP
ast
RC
-3rd
Mar
kPas
tR
C-D
P3
OE
ast
En
d3C
-nea
rEi3
0
Site
fw» sw sw sw sw sw sw sw sw sw sw sw sw sw sw sw sw sw sw sw sw sw sw sw sw sw sw dp sw sw sw sw sw sw sw sw sw sw sw do sw sw
Latit
ude
5 21
.509
6667
519.
6146
667
25 1
927.
1225
ig
iS.S
'!25
1 9
6.9
22
51
91
.37
5 1 9
.022
8333
25
18
48
.87
25
18
39
.43
518.
3778
33J
25 1
814.
142
51
75
6.6
95
21 .5
0966
6725
21 1
525
1739
.12
51
72
3.9
751
7.13
1833
325
21 1
.84
25 2
0 43
.23
5 20
.537
333;
25 2
0 21
.02
25 2
0 9.
4525
195
6.68
25 1
946.
91
25 1
449.
768
25 1
520.
136
25
15
20
.13
625
134
4.86
725
15
18.5
8425
15.5
4025
14.8
6925
1 4
40.
503
2514
.811
25 1
4.84
25
22
53
.13
25 1
9.42
25 1
858.
2625
19.
360
Long
itude
80 3
4.39
8iO
34.
4233
333
80 3
4 25
.39
80 3
4 25
.31
80 3
4 25
.46
8034
25.1
J03
4.41
8833
380
34
25.2
80 3
4 24
.97
034.
4176
667
80 3
4 24
.980
3425
.180
34.
398
80 3
4 25
.22
80 3
4 25
.46
80 3
4 24
.95
IO 3
4.38
5666
780
34
25.7
180
34
25.3
480
34.
4280
34
25.2
280
34
25.2
580
34
25.3
780
34
25.0
1
8041
16.
782
8041
20.
185
8041
20.
185
8042
13.3
6180
3019
.647
80 3
8.83
280
43.
294
80 4
1 47
.408
80 4
0.43
780
41
.82
8036
10.9
86
80 3
8.75
80 3
7 58
.532
80 3
8.77
9
NA
D. 83 83 83 83 83 8J 83 83 83 8J 83 83 83 83 83 83 83 83 83 83 83 83 83 83 27 27 27 27 27 27 27 27 27 27 27 27 27 27
Nor
thin
g.
^fie
ferS
f;
NA
D27
J
< !
.
.. ,-
rJL...
rt
2804
509.
5528
0101
2.04
2800
71 1
.83
2800
395.
6328
0009
0.48
2799
91 9
.7E
2799
91 9
.79
2799
535.
2527
9924
4.94
2798
729.
4C27
9846
7.04
2797
930.
2728
0450
9.55
2804
030.
1927
9738
9.1
827
9692
3.83
2796
429.
9928
0362
5.35
2803
052.
9528
0271
4.9
128
0236
9.79
2802
013.
8928
0162
1.08
2801
320.
5E28
01 4
67.5
627
9219
3.09
2793
126.
9327
9312
6.93
2790
193.
2927
931
34.6
127
9351
4.5
327
9225
8.62
2791
906
.1 5
2792
162.
3727
9221
0.45
2807
083.
0928
0047
828
0030
528
0067
5.40
2799
850.
2728
0056
4.54
. Eas
ting
(foet
eps^
NA
D27
)
,-^t.
5429
1 1 .
6454
2880
.31
5428
81.5
554
2884
.79
5428
81.5
754
2891
.34
5428
91.3
454
2890
.61
5428
97.9
654
2897
.09
5429
02.4
054
2898
.52
5429
11.6
454
2875
.72
5428
90.1
754
2905
.92
5429
58.1
154
2863
.32
5428
75.4
854
2880
.47
5428
81 .0
254
2881
.31
5428
79.2
154
2890
.23
5351
06.5
953
1421
.71
5313
24.3
553
1324
.35
5298
43.3
254
9801
.86
5355
26.7
252
8040
.57
5305
65.6
053
2836
.26
5305
1 4.
7853
9932
.31
5355
4753
5447
5356
45.4
453
6946
.83
5355
97.0
8
WeJ
tDep
m-
Grd
Sur
face
to
Wel
l S
cree
n To
p fle
eO
Scr
een
Leng
th(fe
at)
-Wel
t Top
E
leva
tion
(feet
) N
GVD
29
App
rox.
' L
lj*T
jrf*
>'
Het
gnt-
W
eliT
op
abov
e G
rd.
Sur
t.(fe
ef)
Drive
Jt
' Dep
th '*
' G
roun
d S
urfa
ce to
C
ente
r Scr
. i,.
..,.(e
rti>
.,
135
Driv
e Po
int
0K
tR)t
(Inch
es)
1.25
1.25
peat
De
plii1
fliet
)
1.5
4.3
2.5
2.3
4.3
5.5
5.2 6 5.1
Peat
X"
(cm
/8)
-i
3.9E
-04
17
Tab
le 1
. Site
Loc
atio
ns, W
ell
and
Dri
vepo
int I
nfor
mat
ion,
and
Pea
t Dep
ths
and
Hyd
raul
ic C
ondu
ctiv
ities
Pag
e 5
of 5
Site
jo
" ""'
"
"
RC
-nea
rE13
0-TO
PS-
175
Stil
lwat
er C
reek
rC1A
TC2
res
Trou
t Cre
ekTS
1rs
iors
itrs
i2rs
isrs
i4rs
isrs
iers
i7rs
2rs
ars
4rs
srs
ers
?rs
TWrs
ers
sErs
ewrs
9rs
Bfis
')fS
B(3
4')
rSB
(57'
)-S
B-2
ndP
ioeC
ulE
"SB
-3rd
Pip
eCul
E'S
B-E
BC
(Box
Cul
vert
)-S
B-S
"SB
-UE
"SB
-UM
'SB
-UW
SB
-WB
C(B
oxC
ulve
rt)Ip
stre
am T
aylo
r R
iver
Ves
t Hig
hway
Cre
ek
' S
itei
iyp« sv sw sw sw sw sw sw sw sw sw sw sw sw sw sw sw sw sw sw sw sw sw sw sw sw sw sw sw QW aw aw sw sw sw sw sw sw sw sw sw sw
: La
titud
e
'"-., ,
,, '*<
&,(*'
. ..
25
19.
36C
25 1
9.3
6C25
25
2.59
(2
51
34
'25
1 1
.86'
25
12
.70
!2512.7
22
25125!
25 2
5.0'
2513.9
'2
51
4.8
9!
25
15
.34
72513.7
26
25
12
.77
!25
12.1
1125
1 1
.722
2513
.191
25
24
.30
625
22.
785
25 2
0.31
25 2
0.0;
25
18
.71
;25
17.2
312
51
7.4
1 £
2516.8
225
16.8
E25
16.
8225
14.
232524.1
22524.1
22524.1
2
2524.1
22524.1
22524.1
22524.1
2
25
12
41
25 1
43
3
Um
gttu
tte
80 3
8.7
7!
80 3
8.7
7!
80 3
4 26
.205
802912
80 3
8.59
580
38.
88!
80 3
8.87
780
32
0'80
35.
68!
80 4
1 .2
9780
39.
006
80 3
7.80
!80
37.
04^
80
44
.18
'80
41
227
80 3
9.84
280
36.
27!
80 3
6.37
780
36.
0S80
38.
6780
37.
0^80
38.
7180
38.7
E80
40.
496
80 3
9.81
80 3
8.54
80 4
0.4C
80 4
0.93
680
36.
4580
36.
4580
36.
45
80 3
6.45
80 3
6.45
80 3
6.45
80 3
6.45
803853
802650
NA
D 27 27 27 27 27 27 27 27 27 27 27 27 27 27 27 27 27 27 27 27 27 27 27 27 27 27 27 27 27 27 27 27 27 27 27 27
' Nor
thin
g (in
etaw
r. N
AD27
)
2800
564.
5'28
1107
4.1'
27
90
14
01
927
8672
9.77
2788
289.
7427
8831
3 7
£27
8864
6.56
2811
006.
4C279049617
2792
328.
9727
9316
3.00
2790
175.
0127
8839
6.7J
2787
176.
4527
8646
4.17
2789
191.
4228
0970
3.70
2806
898.
0828
0231
8.2
528
0180
9.05
2799
370.
8127
9663
5.48
2796
975.
1527
9587
2.41
2796
007.
2327
9587
0.09
2791
088.
1428
0936
0.07
2809
360.
0728
0936
0.07
2809
360.
0728
0936
0.07
2809
360.
0728
0936
0.07
2809
360.
0728
0936
0.07
2809
360.
0728
0936
0.07
2788
242.
3927
9175
5.38
East
ing
(met
ers,
NA
D27)
5355
97.0
854
2847
.6<
5517
05.6
553
5942
.5(
5354
44.7
453
5464
.82
5469
82.2
154
0750
.5!
5313
96.6
153
5237
.78
5372
54.7
153
8537
.1;
5265
54.2
953
1521
.65
5338
49.2
253
9824
.28
5395
99.4
854
0088
.96
5357
75.2
753
8510
.66
5357
1 5.
9953
5605
.77
5327
25.5
853
3829
.05
5360
10.1
653
2889
.35
5320
01.2
353
9478
.12
5394
78.1
253
9478
.12
5395
78.1
253
9628
.12
5398
78.1
253
9478
.12
5394
78.1
253
9478
.12
5394
78.1
253
9078
.12
5354
54.3
855
5672
.20
.wen
Dep
th
Grd
Sur
face
to
Wel
l Sc
reen
Top
&
*
12 29 52
y. scr
een
" ;-
M*g
$:(
««}
3 5 5
wel
l Top
H
ewB
on
,<fe
et>
NGVD
29
5.77
15.
814
5.89
6
App
rox,
H
eigh
t- W
ell T
op
abov
e G
rd.
Surf,
(fee
t)
0 0 0
Driv
e P
t' "
Dep
th
. G
roun
d Su
rface
to
: Cen
ter S
cr.
-.. :#w
lc:D
rive
Poin
t "%
«»;'
'
«JC
»M»>
Peat
D
epth
(fe
et)
4.3 4 3.3
1.5
2.8
2.5
3.5
4.5
3.5 4 4.8
3.5 1 2.3 2 4.7
6.3 7 2.3 4 5 2.5
2.8
1 Pe
atK"
* (c
m/s)
' Ele
vatio
ns o
f wel
ls a
t TSB
, L3
1 W
, E1
46, a
nd G
3337
site
s w
ere
deriv
ed b
y G
PS m
etho
ds b
y U
SGS
pers
onne
l usi
ng th
e G
EO
ID96
mod
el.
Thos
e re
sults
wer
e or
igin
ally
repo
rted
by
Gor
don
Shup
e, U
SGS
in th
e N
AV
D 8
8 da
tum
but
are
rep
orte
d he
re i
n th
e N
GVD
29
datu
m th
roua
h an
app
roxi
mat
e co
nver
sion
(ad
ditio
n of
0.4
5 m
) pr
ovid
ed b
y R
ober
t Zep
p, E
NP.
18
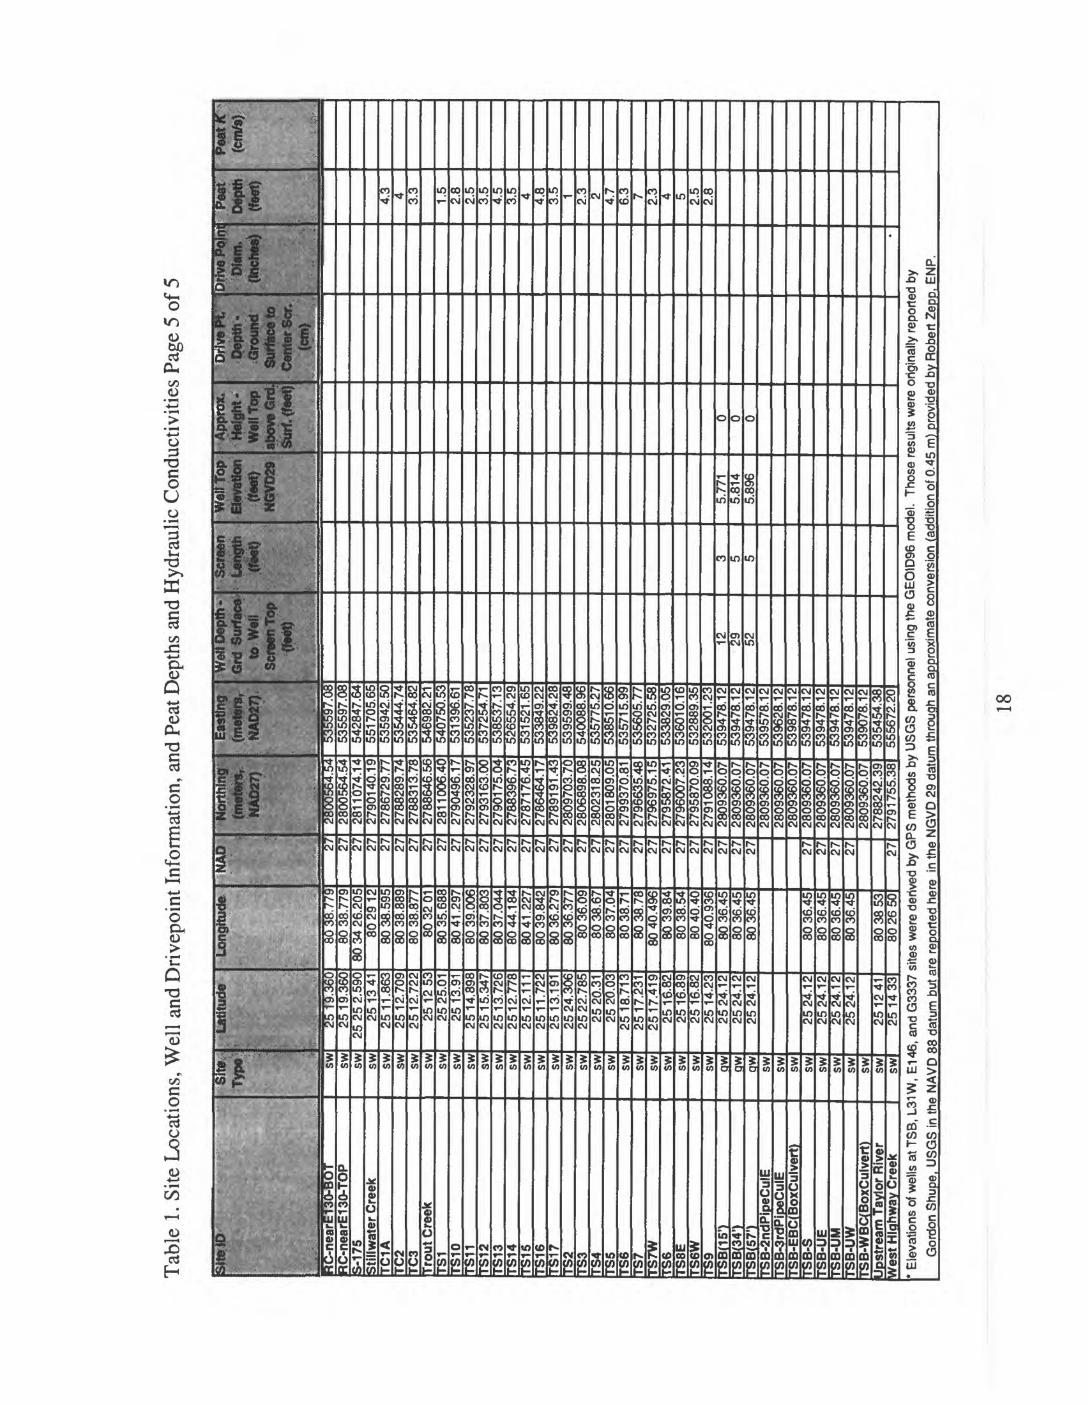
550,000
Figure I-l. Peat depth (feet) in Taylor Slough and vicinity.
19
9.9E-005 2.2E-004 + 3.S
1.5E-003
5.0E-004
6.4E-004
UTM NAD27 Metric Grid
_______I______ I I Ico 530,000 CM"
535,000 540,000 545,000
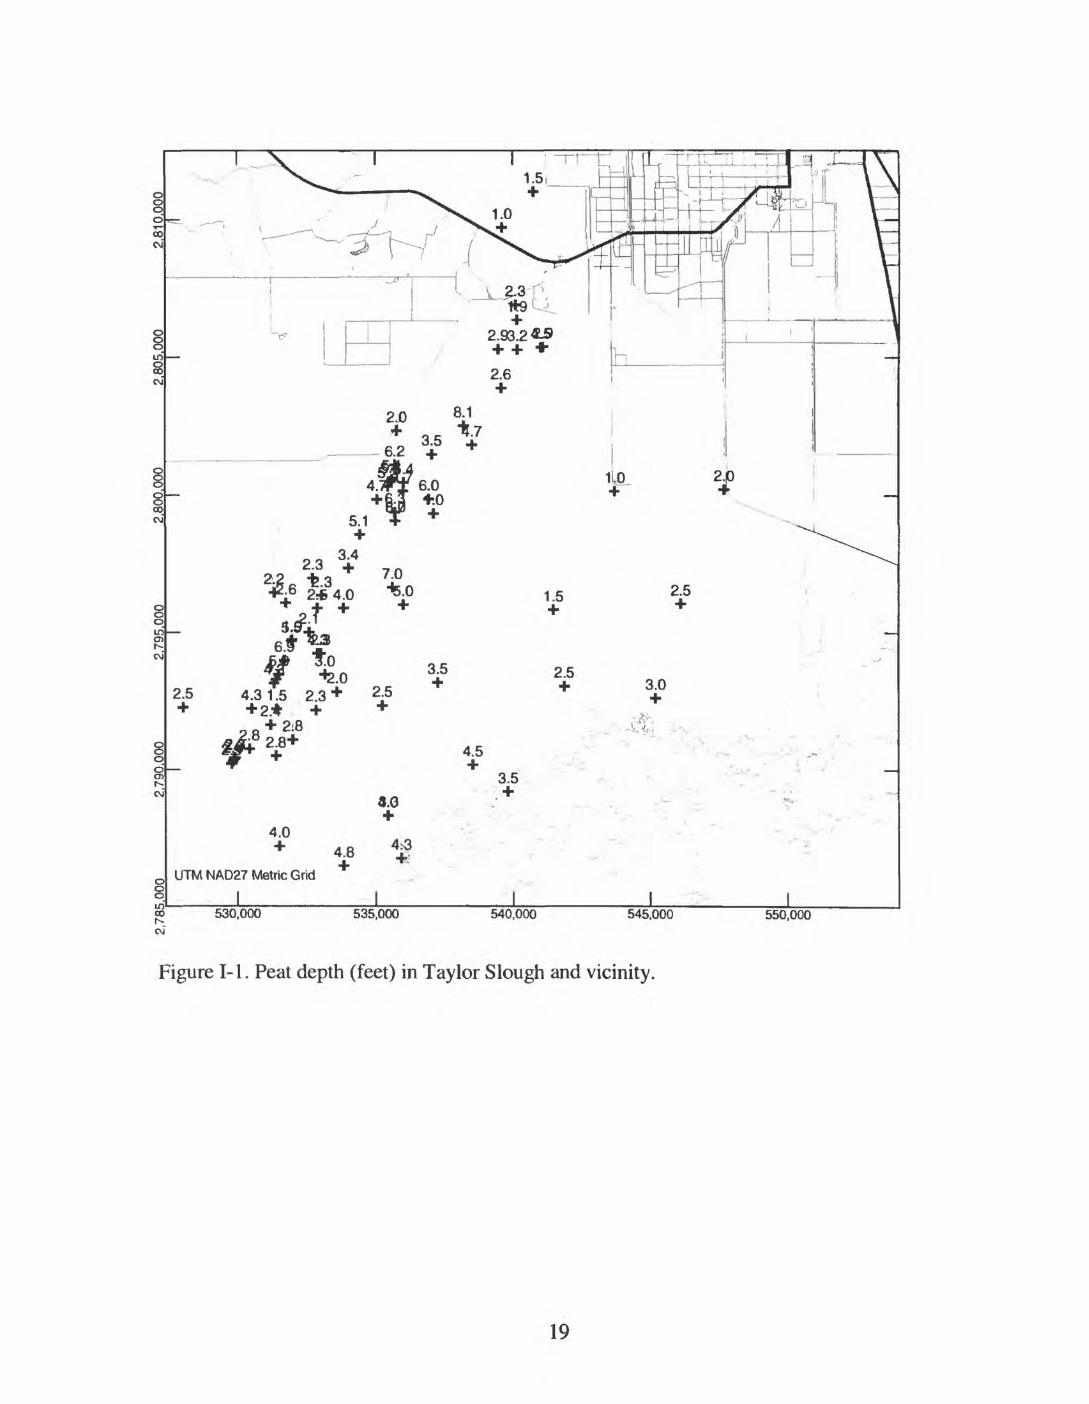
Figure 1-2. Hydraulic conductivity of peat (centimeter/second) in Taylor Slough. Computations were made using head data collected in November 1997.
20

APPENDIX II
Data Collected in Taylor Slough and Vicinity between
September 22 and October 2,1997
21

Tab
le I
I-1.
Che
mic
al A
naly
ses
From
Res
earc
h Si
te L
ocat
ions
: Se
ptem
ber
22-O
ctob
er 2
, 19
97
' S
8oK
> "
'
CYP
2CIO
');Y
P2-s
w-s
124
-TIC
131
135
-U'
;i36
E137
=138
142
15K
CP
)33
337<
!00'
-851
i?6H
Xn
3LT-
NW
!C-n
oa
r£!3
0fS
B-U
E S
B-U
MSB
-UW
' S
te^1
\irw
» gw sw sw sw sw sw sw sw sw sw gw gw sw sw sw sw sw
" D
ate
" "
V
9/25
/97
1 2:4
49/
25/9
7 0:
009/
22/9
7 17
-11
9/22
/97
16:0
89/
22/9
7 0:
009/
22/9
7 13
:55
9/22
/97
0:00
9/22
/971
3:41
9/22
/97
13.3
49/
22/9
710.
2110
/2/9
711:
019/
25/9
7 13
:50
9/22
/97
12:3
09/
22/9
7 14
:30
9/22
/971
8:45
9/22
/97
18.5
59/
26/9
7 18
:50
Tom
p. 31.
29.5
29.5
29.0
30.0
31.3
31.3
32.0
32.2
31.5
28.9
25.1
29.0
28.9
31.0
32.5
32.0
32.2
' >
»
pH
7.44
7.65
7.36 7.
57.
267.
75 7.7
7.9
7.58
7.99
7.58
7.39
7.13
7.82
8.01
7.88 7.
8
otdP
aion
v
°9(m
gro
0.15
5.65 5.6
554
7.25 7.
67.
56.
72 8.7
0.2
0.5
5.74
6.59
7.47
8.14
7.83
BtW
». ow
<m
V)Sp
oc.
Cood
. »«
«» 258
184
386
270
265
264
272
259
302
200
491
401
279
272
388
396
388
labS
p«c
MJS
S.
296
384
206
559
446
111
267
416
" "Co
tor,
(H/c
bv"
qj.
;
0.02 50 51 23 64 89 37 42 56
;NO (mg/
D Oil
7.2 20 12 36 8.7 12 8.6 22
;**»>
-fl»
*4>
, 0.
001 2 5 3 5 3 3 2 5
SO2
onaW
,
Ji
tfft
: '
Jw
i3.
0
44
3.5 17 3.8
3.5
4.1
4.9
a
:(m
o/1)
... &4 13 32 23 87 15 24 14 35
.A
feqt
CoC
OS
(mo/
0
,, ,
, t
$04
crna/o
;
. .
ftZ
0.2
2.4
0.2
5.4
0.2
0.2
0.2
4.8
fit<m
g/t)
-.. -
IDC
OS
0.05
0.05
0.05
0.31
0.08
0.05
0.05
0.05
i-Crt
tod/
^£
.*tln
n
'
Bot
ance
*
: <P
L
M -
" .->
''
nifif
ftofiR
j;*
'**&
;
(US
16.6
0.49
0.95
8
36.9
0.67
71.
240.
552
Pho
sphc
fo
fljM
)
OX
B
0.06
3
0.05
0.05
0.16
20.
050.
050.
05
8ta<
Vi>
;
-3.6 7.9
-7.8
-8.5 3.5
-1.C
-1.1
Si'0
<X>
TH
H-0
.631
1.6C
-1.8
C-1
.76
0.62
-0.1
4-0
.43
Bla
nk c
ells
ind
icat
e no
sam
ple,
no
mea
sure
men
t, no
ana
lysi
s or
that
the
mea
sure
men
t was
not
app
licab
le a
t tha
t site
. O
utlin
ed c
ells
indi
cate
the
resu
lt w
as f
lagg
ed (
e.g.
val
ue e
xces
sive
ly lo
w o
r hi
gh, n
ot in
kee
ping
with
his
tory
, etc
.) an
d is
susp
ect.
Cat
ion/
anio
n ba
lanc
e is
calc
ulat
ed u
sing
mill
iequ
ival
ents
as
(cat
ions
-ani
ons)
/(cat
ions
+ani
ons)
*100
. R
esul
ts b
elow
the
min
imum
det
ectio
n lim
it (M
.D.L
.) ar
e lis
ted
as th
e M
.D.L
.
22
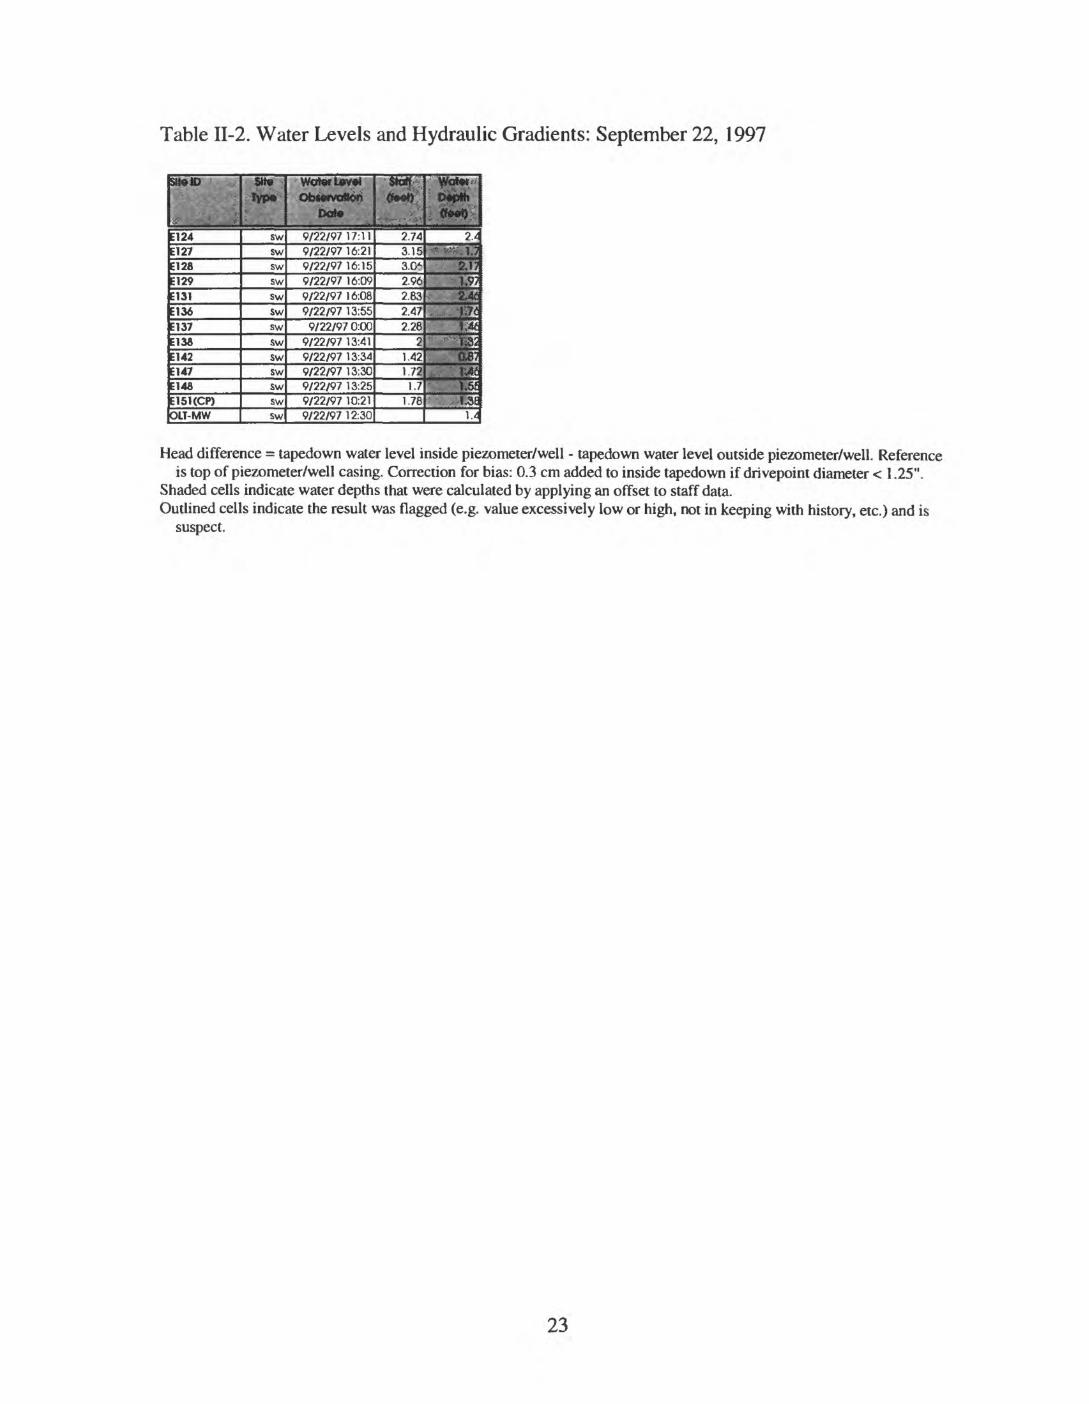
Table II-2. Water Levels and Hydraulic Gradients: September 22, 1997
BttelO
Head difference = tapedown water level inside piezometer/well - tapedown water level outside piezometer/well. Reference is top of piezometer/well casing. Correction for bias: 0.3 cm added to inside tapedown if dri vepoint diameter < 1.25".
Shaded cells indicate water depths that were calculated by applying an offset to staff data.Outlined cells indicate the result was flagged (e.g. value excessively low or high, not in keeping with history, etc.) and is
suspect.
23
E127
E128
CYP2-SW-SE129
E135-U*
E136+
E137
E138
E142
E147
E148+
OLT-NW
E151(CP)
UTM NAD27 Metric Grid
_______I______ Ico 530,000 535,000 540,000 545,000
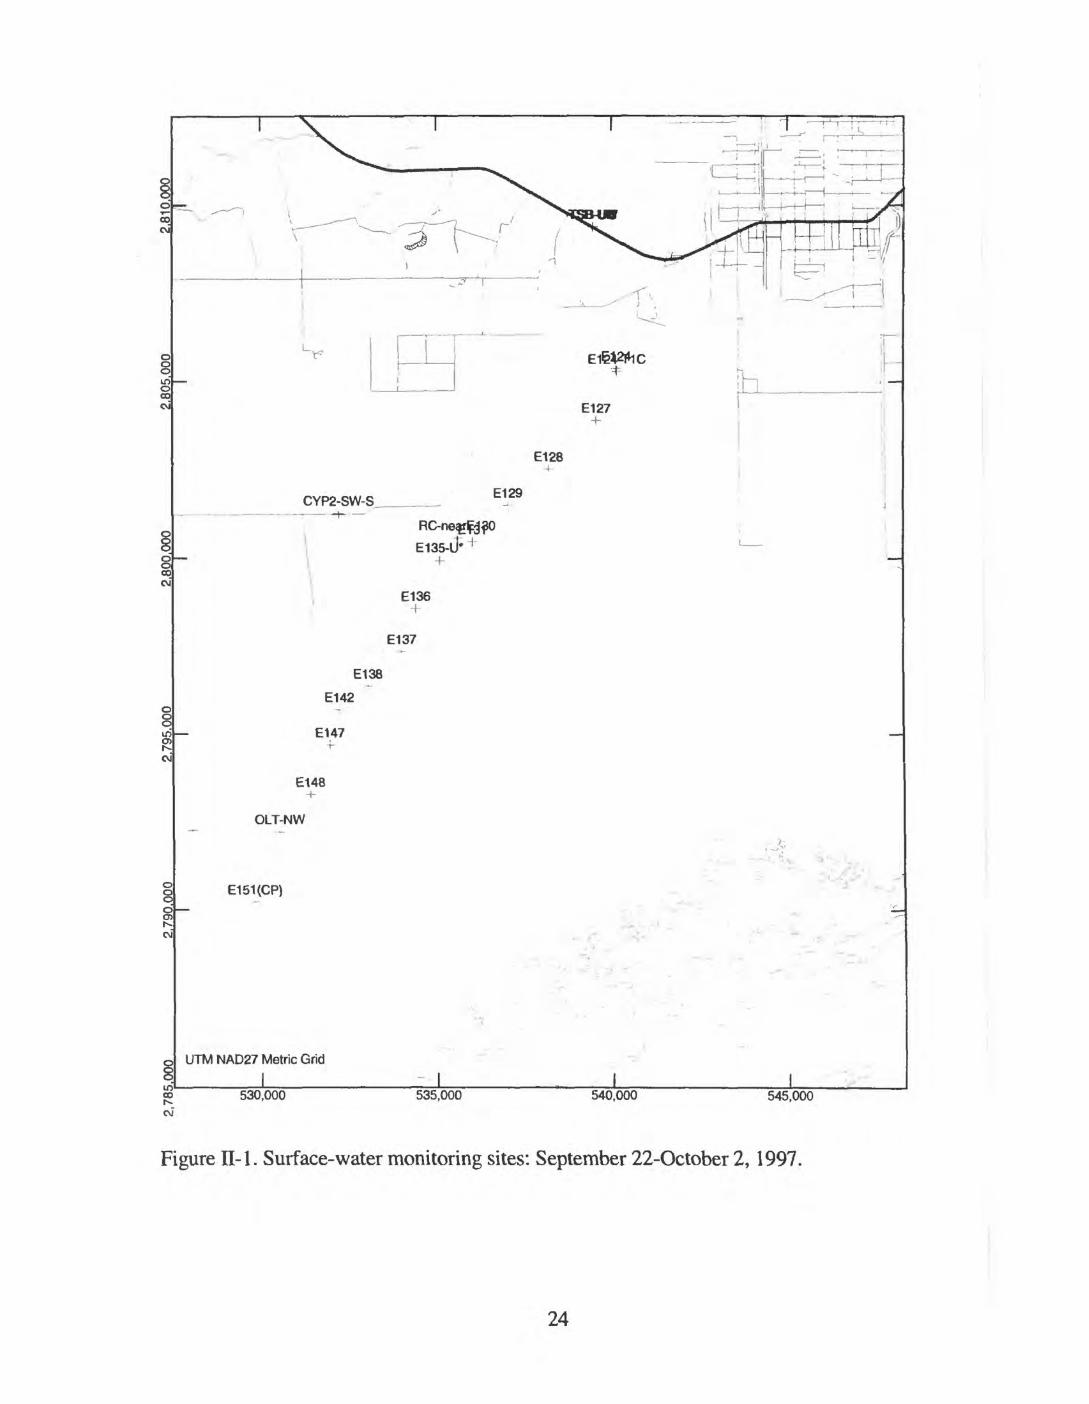
Figure II-1. Surface-water monitoring sites: September 22-October 2, 1997.
24
8
CYP2(10')
UTM NAD27 Metric Grid
_______I______
NP67(20')
J_ I
G3337nOO'-85')
',. '"" - _.."> i
I530,000 535,000 540,000 545,000
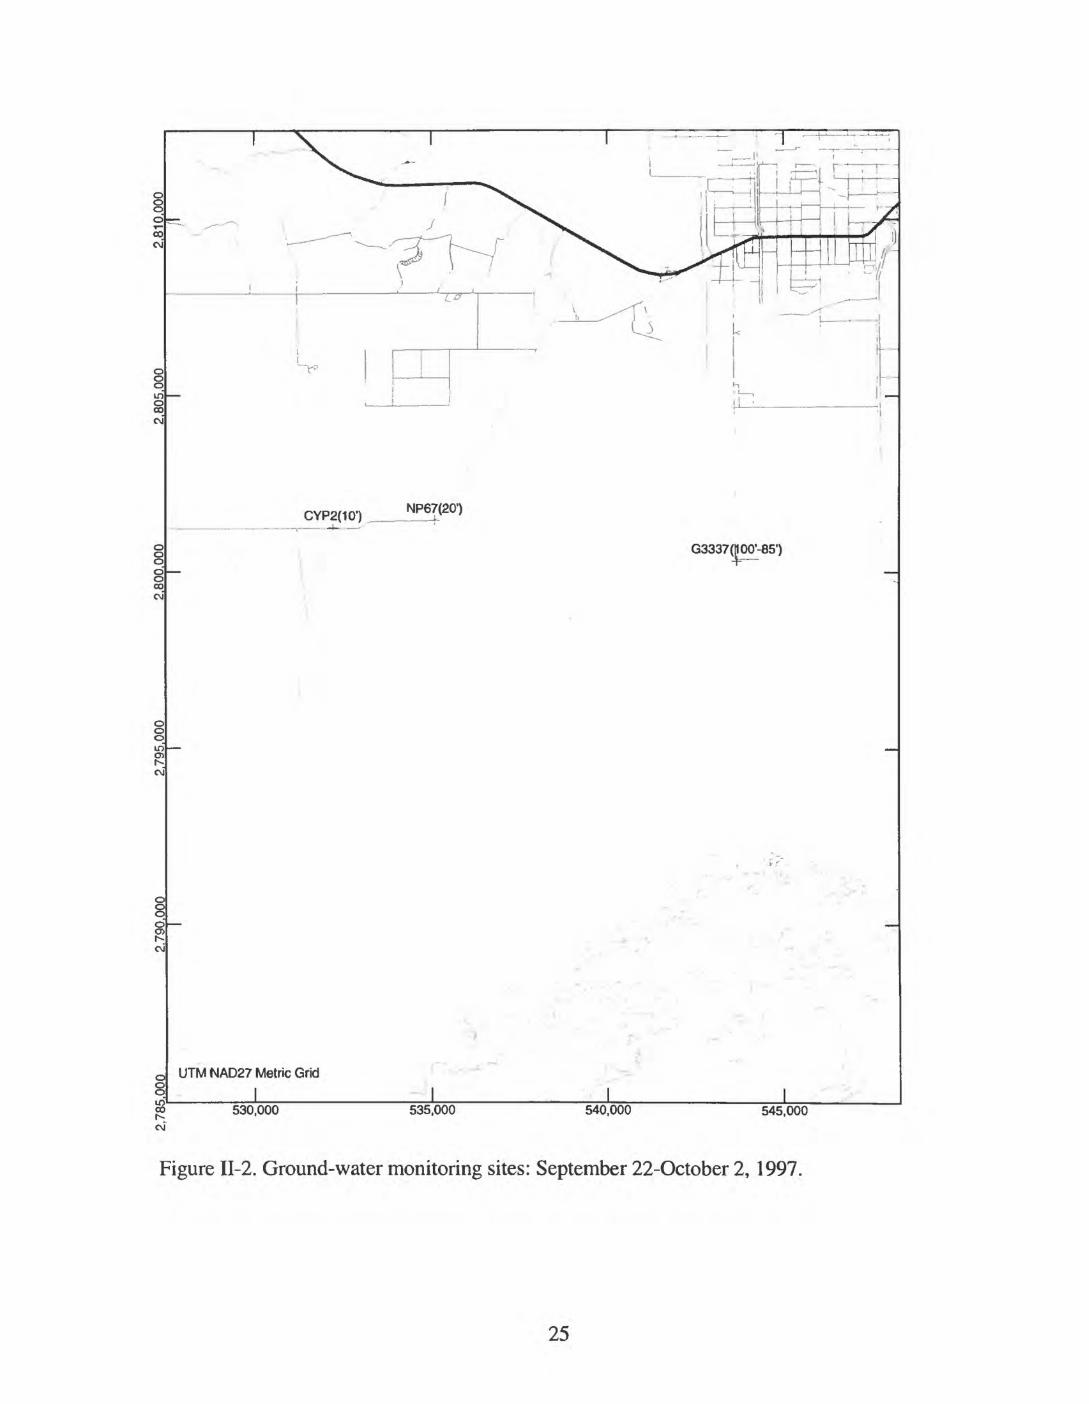
Figure II-2. Ground-water monitoring sites: September 22-October 2, 1997.
25

vo<N
APPENDIX III
Data Collected in Taylor Slough and Vicinity on
November 10,1997
27
Tab
le I
II-l
. C
hem
ical
Ana
lyse
s Fr
om R
esea
rch
Site
Loc
atio
ns:
Nov
embe
r 10
, 19
97
.,,.
"»»
»"'
""
t '
E129
= 130
(101
M31
EI3
5M
36M
37M
SBM
38X
M42 :i44
;i46
;i47
M48
M48
-U2
M49
II5K
CP
)II5
1-U
4II5I-
U5
5LTC
-U2
(C-n
oai£
130-
TO
P
Stt»
iw». sw gw sw sw sw sw sw sw sw sw sw sw sw sw sw sw sw sw sw sw
Dat
e
;11
/10/
979:
3311
/10/
97 1
5:53
11/1
0/97
9:43
11/1
0/97
10:
1111
/10/
97 1
0:21
11/1
0/97
10:
2911
/10/
97 1
0:38
11/1
0/97
10:
441 1
/20/
97 1
0:5
211
/10/
97 1
3: M
11/1
0/97
14:
5611
/10/
97 1
0:57
11/1
0/97
11:
0211
/10/
97 1
2:01
11/1
0/97
11:
4511
/10/
97 1
1.15
11/1
0/97
0:00
11/1
0/97
11:
4211
/10/
97 1
1:59
11/1
0/97
10:
00
' "
""
floW
Par
amet
wt
Tam
p.:N°
e>..
19.9
23.4
20.0
20.0
21.6
21.6
22.4
21.8
21.2
25.5
24.9
21.2
22.2
24.0
22.2
21.1
21.9
22.7
24.0
19.6
PH
DO
<msf
ljx
"<m
<"**
*;Sp
ec.
Con
d.
.<nS> 30
030
030
028
028
030
031
033
034
029
036
031
031
030
033
023
028
032
030
029
0
tot.
"Spe
c.
Cond
.<$
: '
M.D
.I.
^Cot
or
<?»#
»}
" C
o":
<w»/o
No
-<n>
0/t)
' i''
O.J
MO
\jQ
ogfti
:
JMO
J
~~
90t"
-
«*#
r
,(,> .
-BUJ
1
CH
mgt
t)
. .1
-5-O
.J
"Wtio
t;^»
'<m
grt)
$ -,:
' 1
SO
4<m
g/l>
""
'ft2
Br.<
mof
l,>
' ao
s
Cot
ton/
A
nkm
B«ai
w»*
;:
'*»
'
Am
mor
t um
<nM
)
W5
Phm
pte
,&fc
M>
MS
S'HK*
/*)S
«0
#»>
Bla
nk c
ells
indi
cate
no
sam
ple,
no
mea
sure
men
t, no
ana
lysi
s or
that
the
mea
sure
men
t was
not
app
licab
le a
t tha
t site
. O
utlin
ed c
ells
ind
icat
e th
e re
sult
was
fla
gged
(e.
g. v
alue
exc
essi
vely
low
or
high
, not
in k
eepi
ng w
ith h
isto
ry, e
tc.)
and
is su
spec
t. C
atio
n/an
ion
bala
nce
is ca
lcul
ated
usi
ng m
illie
quiv
alen
ts a
s (c
atio
ns-a
nion
s)/(c
atio
ns+a
nion
s)*1
00.
Res
ults
bel
ow th
e m
inim
um d
etec
tion
limit
(M.D
.L.)
are
liste
d as
the
M.D
.L.
28
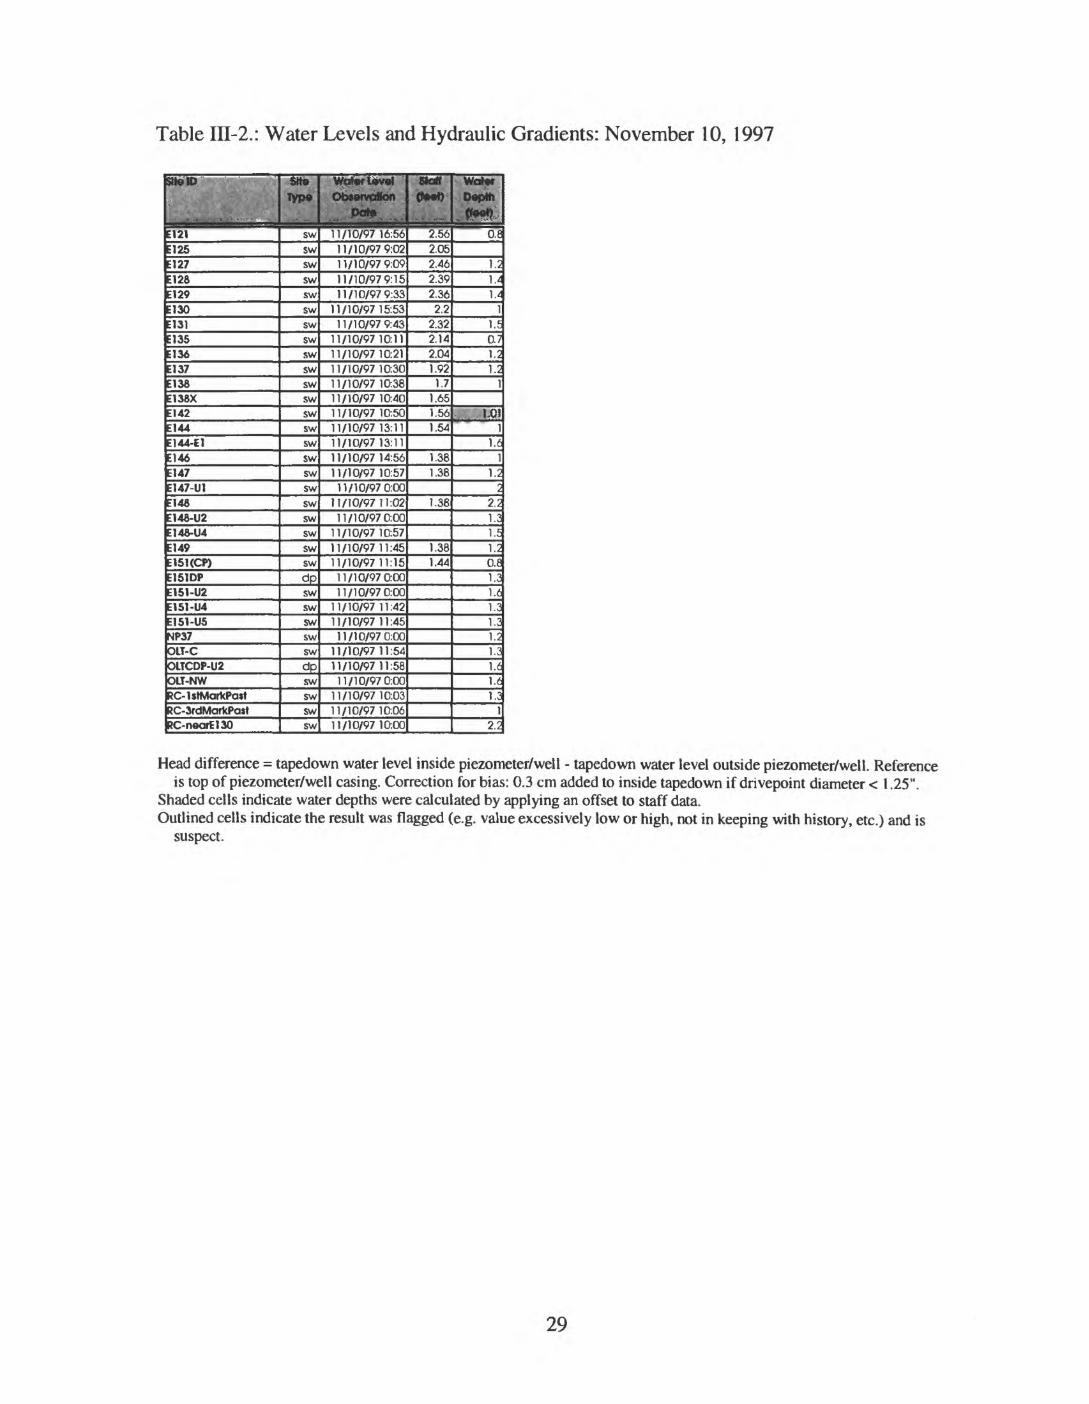
Table III-2.: Water Levels and Hydraulic Gradients: November 10, 1997
stern ;
;i2iE125=127=128
E129 130
E131E135E136El 37E138E138XEI42E144E144-E1E146E147E147-U1E148E148-U2E148-U4E149E1SKCP)E1S1DPE151-U2E151-U4E151-USW37OLT-COLTCDP-U2OLT-NWiC-lslMarkPcut?C-3rdMarkPa»lRC-neaiE130
,«« iyp«
swswswswswswswswswswswswswswswswswswswswswswswdpswswswswswdpswswswsw
Wafer t»v«I ' ObwvaSon
.LJfstk^ill/VO/97 16:5611/10/979:0211/10/979:0911/10/979:1511/10/979:33
11/10/9715:5311/10/979:43
11/10/97 mil11/10/9710:2111/10/97103011/10/97 10:3811/10/97 10:4011/10/97 10:5011/10/9713:1111/10/97 13:1111/10/97 14:5611/10/9710:5711/10/970:00
11/10/9711:0211/10/970:00
11/10/9710:5711/10/9711:4511/10/9711:1511/10/970:0011/'0/97C'00
11/10/97 11:4211/10/97 11:4511/10/970:00
11/10/97 11:5411/10/9711:5811/10/970:00
11/10/9710:0311/10/9710:0611/10/97 10:00
Stall (to*0
2.562.052.462.392.36
2.22.322.142.041.92
1.71.651.561.54
1.381.38
1.38
1.381.44
!; WCU9f
Dopth','»»&
O.f
1.1.1.
1.0.1.1.
Ml
1.
1.
2.
0.
2.
Head difference = tapedown water level inside piezometer/well - tapedown water level outside piezometer/well. Reference is top of piezometer/well casing. Correction for bias: 0.3 cm added to inside tapedown if drivepoint diameter < 1.25".
Shaded cells indicate water depths were calculated by applying an offset to staff data.Outlined cells indicate the result was flagged (e.g. value excessively low or high, not in keeping with history, etc.) and is
suspect.
29
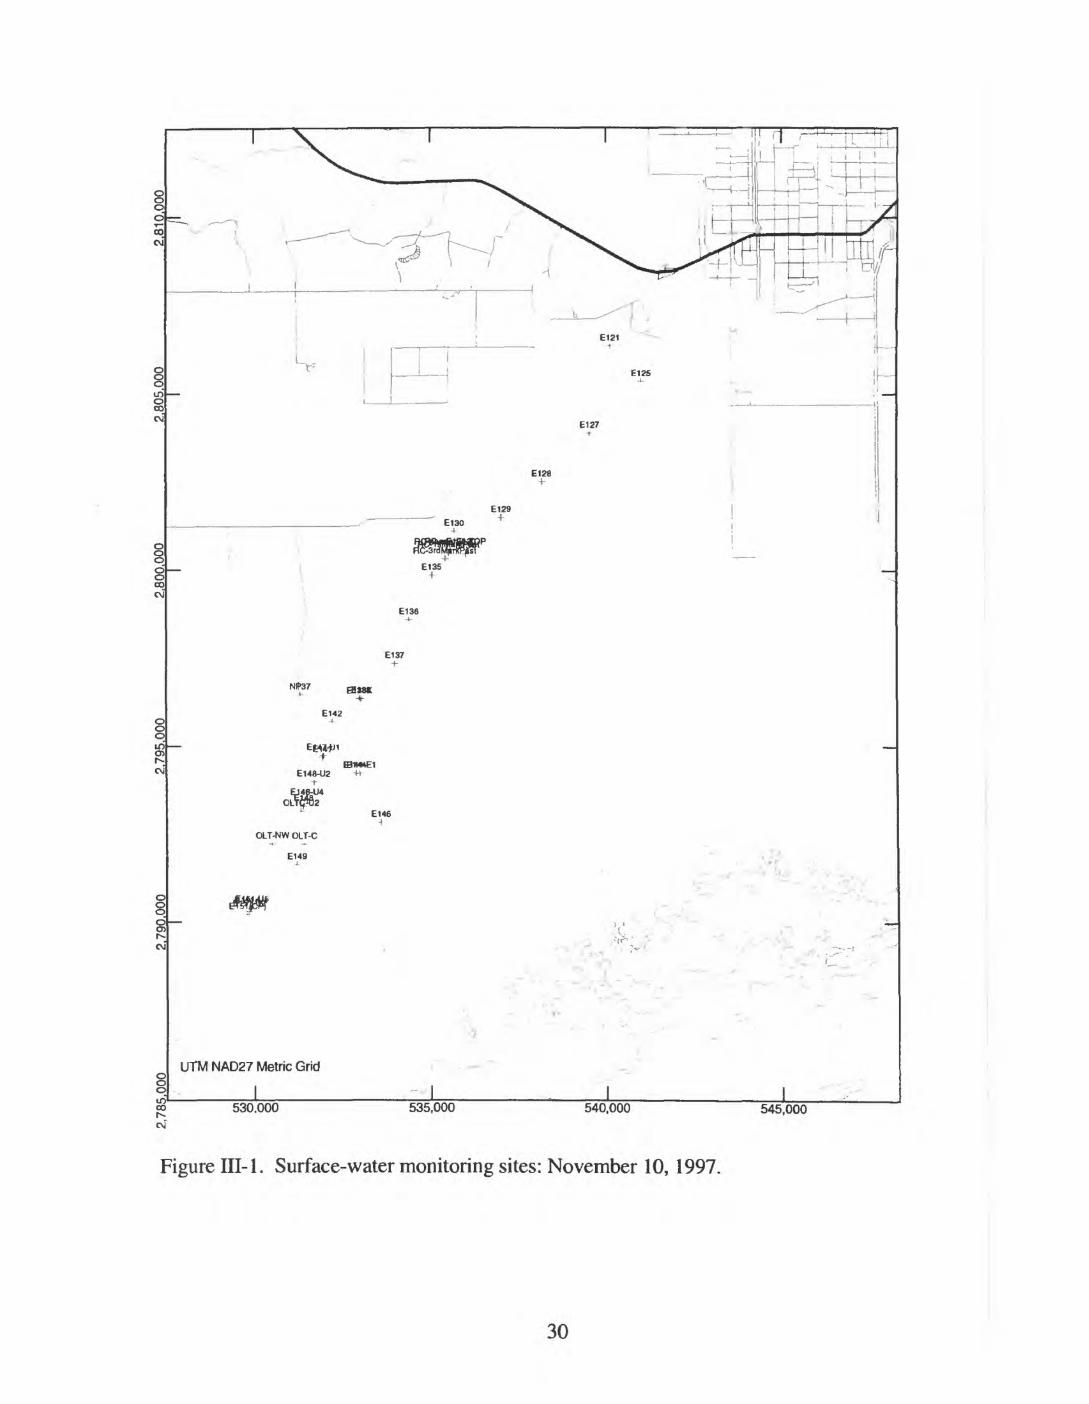
E135+
BMHE1 E14S-U2 -H-
OLT-NW OLT-C
UTM NAD27 Metric Grid
_L J_530.000 535,000 540,000 545,000
Figure III-l. Surface-water monitoring sites: November 10, 1997.
30

OLTCDP-U2
E151DP
UTM NAD27 Metric Grid
_______I______
E130(10')
I I I530,000 535,000 540,000 545,000
Figure III-2. Ground-water monitoring sites: November 10, 1997.
31

32

APPENDIX IV
Data Collected in Taylor Slough and Vicinity between
November 18 and 20,1997
33
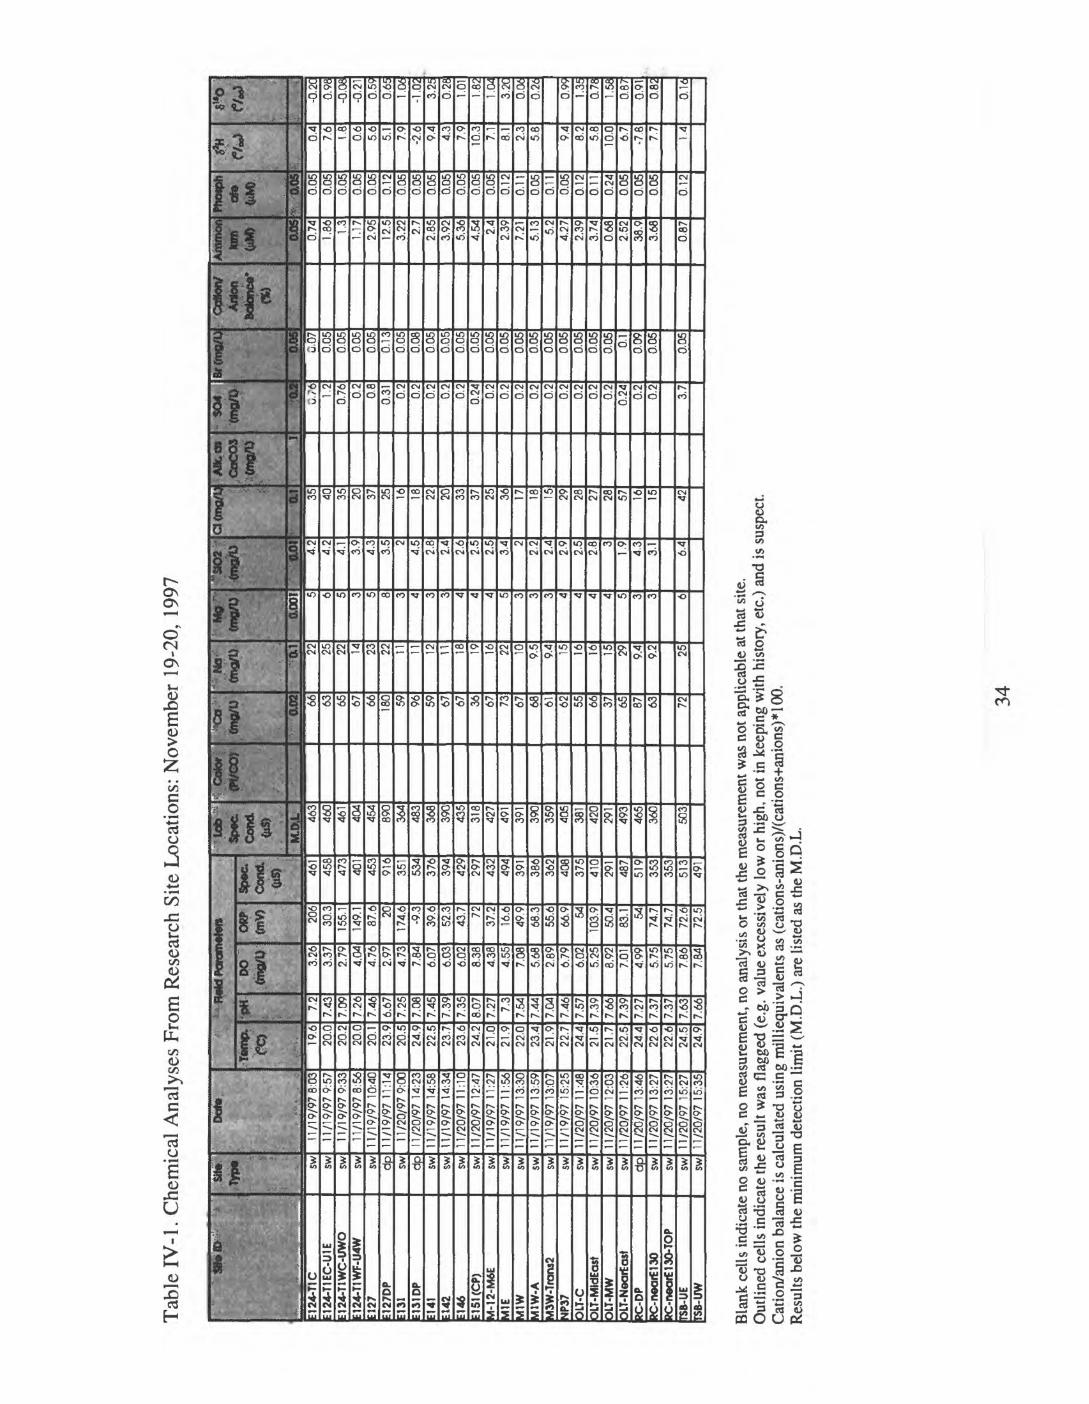
Tab
le I
V-1
. C
hem
ical
Ana
lyse
s Fr
om R
esea
rch
Site
Loc
atio
ns:
Nov
embe
r 19
-20,
199
7
" "
SB
****
- " <
' -
M24
-T1C
M24
-T1E
C-U
1EM
24-T
1WC
-UW
OM
24-T
1WF
-U4W
127
M27
DP
M31
M31
DP
M41
[142
M46
151
(C
P)
1-1
2-M
6EvI
lEtflW
iHlW
-A*3
W-T
ranj2
4P37
3LT
-CX
T-M
ldE
ost
3LT
-MW
XT
-Nearf
ost
iC-D
P!C
-nea
r£13
0!C
-nea
r£13
0-TO
PSB
-UE
SB-U
W
S«e sw sw sw sw sw dp sw dp sw sw sw SW SW SW SW SW SW SW SW SW SW sw d
p sw sw sw sw
Do
te
11
/19
/97
8:0
31
1/1
9/9
79
:57
11/1
9/9
79:3
311/1
9/9
7856
11/1
9/9
710:4
01
1/1
9/9
7 1
1.14
11/2
0/97
9:O
C11
/20/
97 1
4:23
11
/19
/97
14:
5811/1
9/9
714:3
41
1/2
0/9
7 1
1:10
11/2
0/9
712:4
71
1/1
9/9
7 1
1:27
11/1
9/9
711:5
611/1
9/9
713:3
01
1/1
9/9
7 1
3:59
11/1
9/9
713:0
71
1/1
9/9
7 1
5:25
11/2
0/9
711:4
811/2
0/9
710:3
61
1/2
0/9
7 1
2:03
11/2
0/9
711:2
61 1
/2
0/9
7 1
3:4
611/2
0/9
713:2
71
1/2
0/9
7 1
3:27
11
/20
/97
15:
2711/2
0/9
715:3
5
< '*H
eldP
aram
eten
Tem
p.
19.6
20.C
20.2
20.0
20.1
23.9
20.5
24.9
22.5
23.7
23.6
24.2
21.0
21.9
22.0
23.4
21.9
22.7
24.4
21.5
21.7
22.5
24.4
22.6
22.6
24.5
24.9
'« *
'
7.2
7.43
7.09
7.26
7.46
6.67
7.25
7.06
7.45
7.39
7.35
8.07
7.27 7.
37.
547.
447.
047.
467.
577.
397.
667.
39727
737
7.37
7.63
7.66
DO 3.
263.
372.
794.
0^
4.76
2.97
4.73
7.84
6.07
6.03
6.02
8.38
4.38
4.55
7.08
5.68
2.89
6.79
6.02
5.25
8.92
7.01
4.99
5.75
5.75
7.86
7.84
Z 206
so.;
155.
114
9.1
87.6 20
174.
6-9
.3
39.6
52.3
43.7 72
37.2
16.6
49.9
68.3
55.6
66.9 54
103.
950
.483
.1 5474
.774
.772
.672
.5
Spec
. C
wxt
(M
S) 461
458
473
401
453
916
351
534
376
394
429
297
432
494
391
386
362
408
375
410
291
487
519
353
353
513
491
"""*£
*CO
M(M
S)
M.O
.L 463
460
461
404
454
890
364
483
368
390
435
318
427
491
391
390
359
405
381
420
291
493
465
360
503
^Cof
or;
, stca
*:l:
' ftO
Z 66 63 65 67 66 180 59 96 59 67 67 36 67 73 67 68 61 62 55 66 37 65 87 63 72
**
>
"'0
.1 22 25 22 14 23 22 11 11 12 11 18 19 16 22 10 9.5
9.4 15 16 16 15 29 9.4
9.2 25
ftnflf
l)
' -0
.001 5 6 e 3 5 8 3 4 3 3 4 4 4 5 3 3 3 4 4 4 4 5 3 3 6
"SO
2;:
0.01 4.
24.
24.
13.
94.
33.
5 24.
52.
82.
42.
62.
52.
53.
4 22.
22.
42.
92.
52.
8 31.
94.
33.
1
6.4
a<m
g/D at 35 40 35 20 37 25 16 18 22 20 33 37 25 36 17 18 15 29 28 27 28 57 16 15 42
A*.
CO
C
aC
OS
.
" J
- so
*/ "0.2
u.;6 1.2
0.76 0.2
0.8
0.31 0.
20.
20.
20.
20.
20.
24 0.2
0.2
0.2
0.2
0.2
0.2
0.2
0.2
0.2
0.24 0.
20.
2
3.7
Bf(
mg/U
- Li
O.8
5u.
070.
050.
050.
050.
050.
130.
050.
080.
050.
050.
050.
050.
050.
050.
050.
050.
050.
050.
050.
050.
05 0.1
0.09
0.05
0.05
Alto
n 'B
cton
ca'
Amm
an
tarn
'<&*» 0.
050.
741.
86 1.3
1.17
2.95
12.5
3.22 2.
72.
853.
925.
364.
54 2.4
2.39
7.21
5.13 5.
24.
272.
393.
740.
682.
5238
.93.
68
0.87
Phos
ph
ah»
^.'b
.bs
0.05
0.05
0.05
0.05
0.05
0.12
0.05
0.05
0.05
0.05
0.05
0.05
0.05
0.12
0.11
0.05
0.11
0.05
0.12
0.11
0.24
0.05
0.05
0.05
0.12
<v 0.4
7.6
1.8
0.6
5.6
5.1
7.9
-2.6 9.4
4.3
7.9
10.3 7.1
8.1
2.3
5.8
9.4
8.2
5.8
10.0 6.7
-7.8 7.7
1.4
w;
.;.
, <
-0.2
C0.
98-0
.08
-0.2
10.
590.
651.
06-1
.02
3.25
0.28 1.01
1.82
1.04
3.2C
0.06
0.26
0.99
1.35
0.78
1.58
0.87
0.91
0.82
0.16
Bla
nk c
ells
indi
cate
no
sam
ple,
no
mea
sure
men
t, no
ana
lysi
s or
that
the
mea
sure
men
t was
not
app
licab
le a
t tha
t site
. O
utlin
ed c
ells
indi
cate
the
resu
lt w
as f
lagg
ed (
e.g.
val
ue e
xces
sive
ly lo
w o
r hi
gh, n
ot in
kee
ping
with
his
tory
, etc
.) an
d is
sus
pect
. C
atio
n/an
ion
bala
nce
is ca
lcul
ated
usi
ng m
illie
quiv
alen
ts a
s (c
atio
ns-a
nion
s)/(c
atio
ns+a
nion
s)*1
00.
Res
ults
bel
ow th
e m
inim
um d
etec
tion
limit
(M.D
.L.)
are
liste
d as
the
M.D
.L.
34
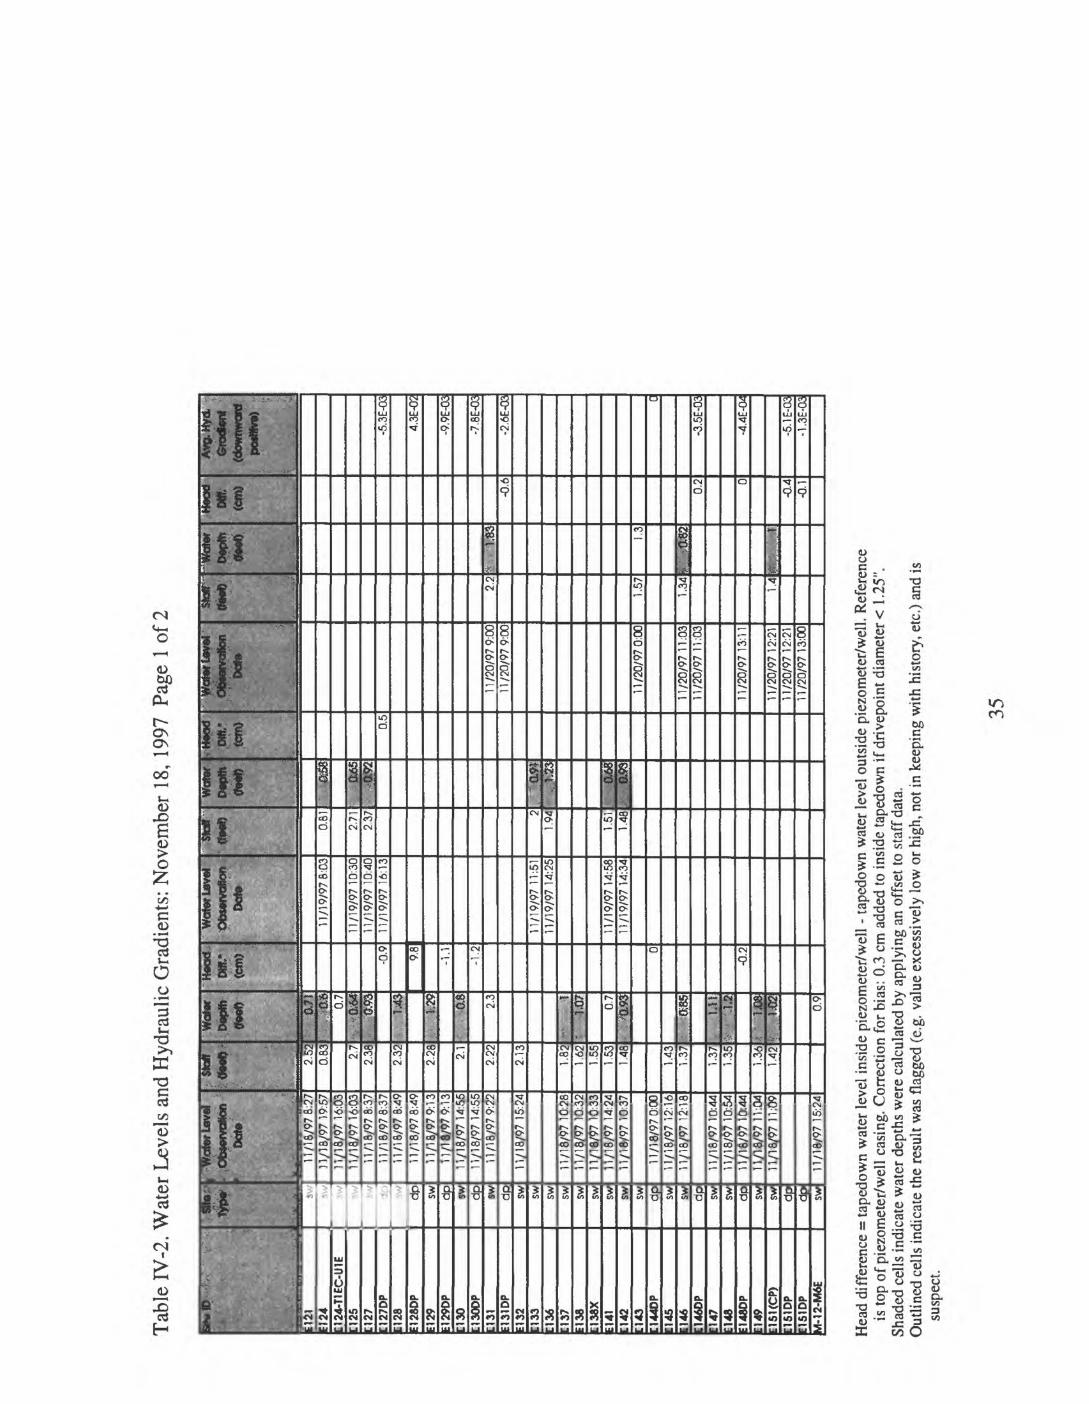
Tab
le I
V-2
. Wat
er L
evel
s an
d H
ydra
ulic
Gra
dien
ts:
Nov
embe
r 18
, 19
97 P
age
1 of
2
»» »
«>
<
" * :
:>.
' -
s
= 121
El 2
4:1
24-T
1EC
-U1E
[125
[127
[I27D
P[1
28 I2
8DP
129
I29D
P[1
30[1
30D
P:i3
i=1
31 D
P 1
32
[133
[136
[137
=138
[I3
8X
=141
:142
1143
M44
DP
1145
:i4*
:146
0P:i4
7:i4
8 I4
8DP
:i49
:isi(C
P)
:isiD
p:i5
iop
ri-l2
-M4E
* ' S
}0 *
<
'.%* dp sw dp sw dp sw dp sw sw sw sw sw sw sw sw sw dp sw sw dp sw sw dp sw sw dp
dp sw
, -W
ater
lovd
: O
tjwtv
aSon
:'
' '
''Bat
e'
11/1
8/97
8:27
11/1
8/97
19:
5711
/18/
97 1
6:03
11/1
8/97
16:0
311
/18/
978:
3711
/18/
978:
3711
/18/
978:
4911
/18/
978:
4911
/18/
979:
1311
/18/
979:
1311
/18/
9714
:55
11/1
8/97
14:5
511
/18/
979:
22
11/1
8/97
15:
24
11/1
8/97
10:
2811
/18/
9710
:32
11/1
8/97
107
3311
/18/
9714
:24
11/1
8/97
10:3
7
11/1
8/97
0:00
11/1
8/97
12:1
611
/18/
97 1
2:18
11/1
8/97
10:4
411
/18/
9710
:54
11/1
8/97
10:4
411
/18/
9711
:04
11/1
8/97
11:
09
11/1
8/97
15:
24
; S
tart
i«w
*^ 2.52
0.83 2.
72.
38
2.32
2.28 2.1
2.22
2.13
1.82
1.62
1.55
1.53
1.48
1.43
1.37
1.37
1.35
1.36
1.42
u/n
bw
Dop
ttlfle
et)
fjjfl
0.7
BR
14
3
V.29 as 2.3 1
- i.0
7
0.7
,^
.9S
tNI»
l.H
i- '"-1
,2
jj --
; {J
J8
':'.
.JK
i
0.9
ftoa
d..
m.':
<«
») -0.9 9.8
-1.1
-1.2 0
-0.2
Waf
er la
ve!"
Otu
srvt
Son
txa»
"""
11/1
9/97
8:03
11/1
9/97
10:3
011
/19/
97 1
0:40
11/1
9/97
16:
13
11/1
9/97
11:
5111
/19/
9714
:25
11/1
9/97
14:5
811
/19/
9714
:34
~<«w
r<t
e« 0.81
2.71
237 i.
1.94
1.51
1.48
Wat
erDe
pth
<fee
t)
, ^6
: ^0
^
-.--
9S2
. "" a
?*1
.. i!is 0.68
. as
s
>/He
<x)j
;,p«-'
i ,&
*» 0.5
Waf
er If
lvel
.Otto
vcA
on .
.""'"b
ite"
.
1 1 /2
0/97
9:0
011
/20/
979:
00
11/2
0/97
0:00
11/2
0/97
11:0
311
/20/
97 1
1:03
11/2
0/97
13:1
1
11/2
0/97
12:2
111
/20/
9712
:21
11/2
0/97
13:0
0
sioir*
"(to
ot) 2.2
1.57
1.34 1.4
""'W
flNH
f
J*P
H»
' '*-
&*)
,
;./:;M
:_/:_
i'.s'
lfes 1.3
* ita
e
t- :..:
.*
Hea
dM
ff.
<«»} -0
.6 0.2 0
-0.4
-0.1
Avo
-Hyd
-;
Gra
dtor
t J
(OO
WIIW
CBu
. ;
pOlff
iVB
)
; ^
;; i
-5.3
E-0
3
4.3E
-02
-9.9
E-0
3
-7.8
E-0
;
-2.6
E-0
3 C
-3.5
E-0
3
4.4
E-CU
-5. I
E-0
3-1
.3E
-03
Hea
d di
ffer
ence
= ta
pedo
wn
wat
er le
vel i
nsid
e pi
ezom
eter
/wel
l - t
aped
own
wat
er le
vel o
utsi
de p
iezo
met
er/w
ell.
Ref
eren
ce
is to
p of
pie
zom
eter
/wel
l ca
sing
. Cor
rect
ion
for b
ias:
0.3
cm
add
ed to
insi
de ta
pedo
wn
if d
rivep
oint
dia
met
er <
1.2
5".
Shad
ed c
ells
indi
cate
wat
er d
epth
s w
ere
calc
ulat
ed b
y ap
plyi
ng a
n of
fset
to s
taff
dat
a.O
utlin
ed c
ells
indi
cate
the
resu
lt w
as f
lagg
ed (e
.g.
valu
e ex
cess
ivel
y lo
w o
r hig
h, n
ot in
kee
ping
with
his
tory
, etc
.) an
d is
susp
ect.
35
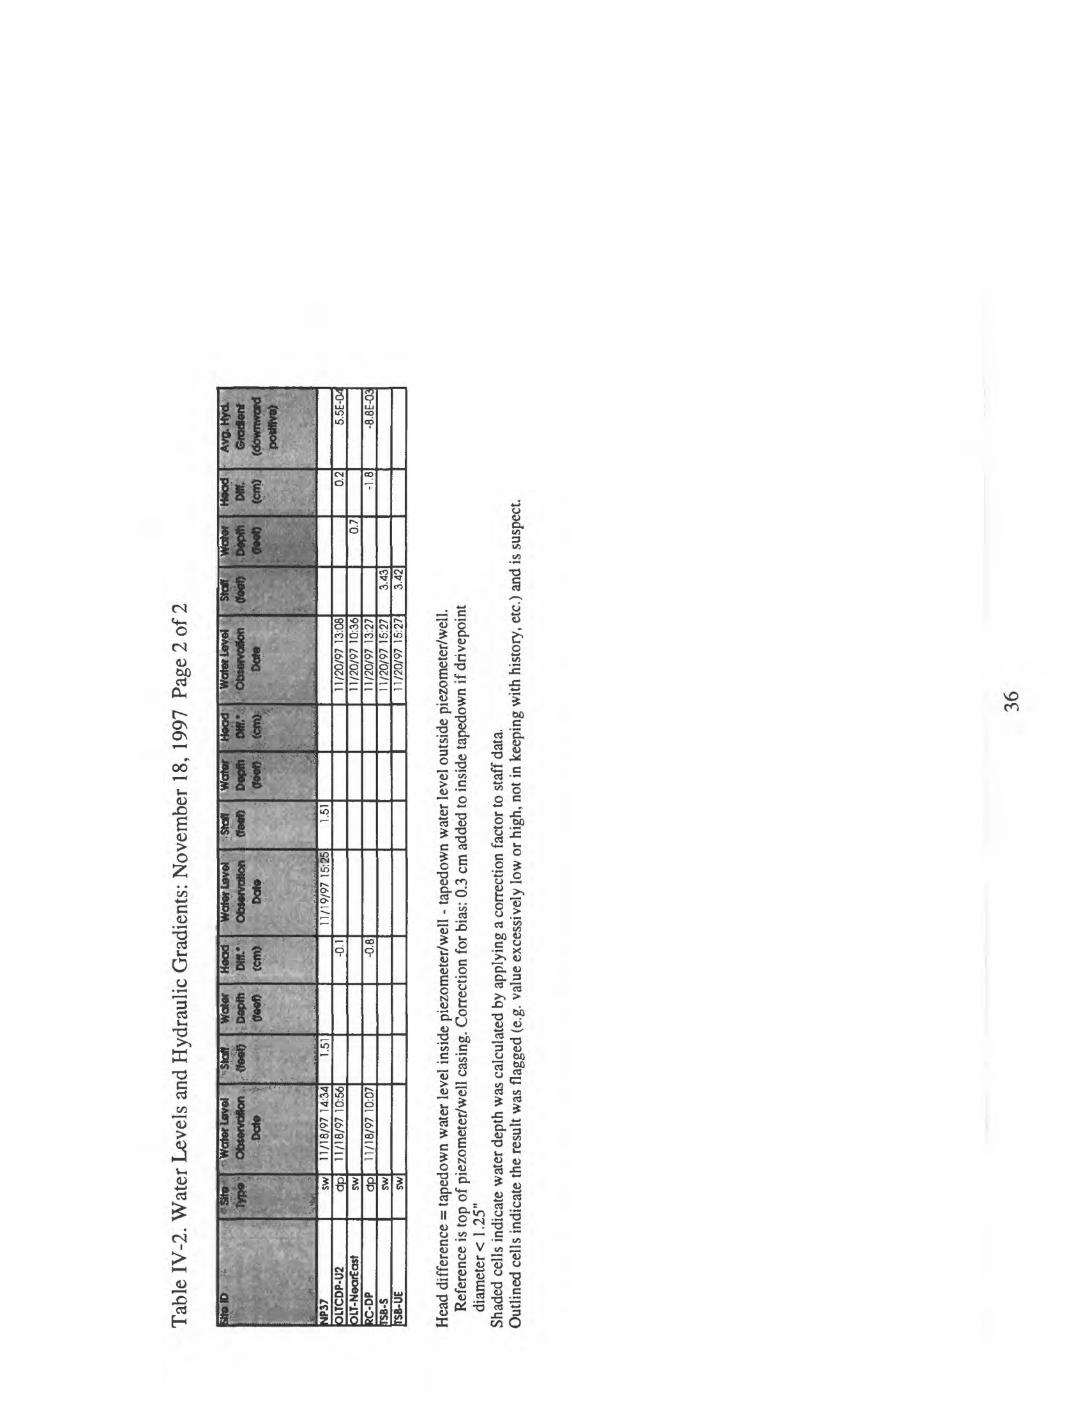
Tab
le I
V-2
. Wat
er L
evel
s an
d H
ydra
ulic
Gra
dien
ts:
Nov
embe
r 18
, 19
97 P
age
2 of
2
8t»H
>
JP37
OLT
CD
P-U
2X
T-N
earE
ost
iC-D
PrS
B-S
FSB-
UE
*
sw dp sw dp sw sw
Wat
er L
Bvel
O
bser
vatio
n D
ate
t '
11/1
8/97
14:
3411
/18/
97 1
0:56
11/1
8/97
10:
07
;"^
°4-
1.51
Wat
erH
0QG
-'-
tern
) -0.1
-0.8
Wat
er le
vel
ObM
rvot
loR
Date
11/1
9/97
15:
25
Stal
l (t
ort) 1.51
Wat
er
twp»
<
(toa
d ,
OUi
.' ' '.,
Wat
er la
vet
O
bs«i
va5o
n Da
te
11/2
0/97
13:
0811
/20/
97 1
0:36
11/2
0/97
13:
2711
/20/
97 1
5:27
11/2
0/97
15:
27
StaR
(te
oJ)
3.43
3.42
Wat
er
Dep
fli
OM
t)
-
0.7
Hea
d'W
rr
<aW 0.
2
-1.8
Avo
.Hya
.; G
radt
ert
(tJOw
nwar
dJX
W«W
>
5.5E
-W
-8.8
E-03
Hea
d di
ffer
ence
= ta
pedo
wn
wat
er le
vel i
nsid
e pi
ezom
eter
/wel
l - t
aped
own
wat
er le
vel o
utsi
de p
iezo
met
er/w
ell.
Ref
eren
ce is
top
of p
iezo
met
er/w
ell
casi
ng. C
orre
ctio
n fo
r bia
s: 0
.3 c
m a
dded
to in
side
tape
dow
n if
driv
epoi
ntdi
amet
er <
1.2
5"Sh
aded
cel
ls in
dica
te w
ater
dep
th w
as c
alcu
late
d by
app
lyin
g a
corr
ectio
n fa
ctor
to s
taff
dat
a.
Out
lined
cel
ls in
dica
te th
e re
sult
was
fla
gged
(e.g
. va
lue
exce
ssiv
ely
low
or
high
, not
in k
eepi
ng w
ith h
isto
ry, e
tc.)
and
is su
spec
t.
36
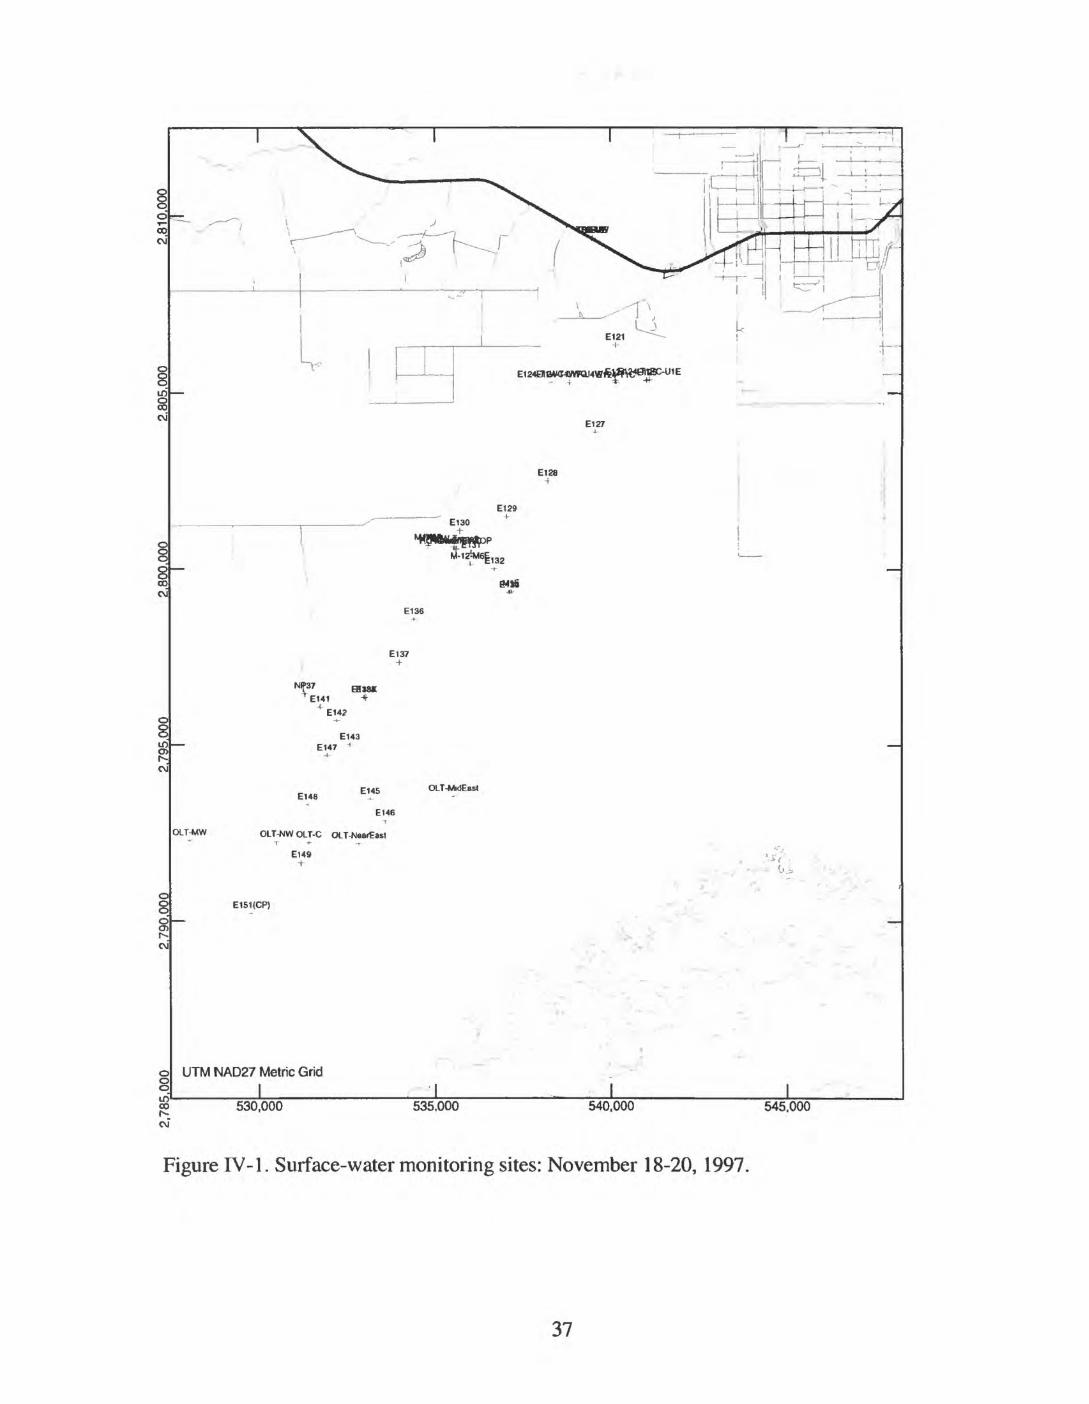
o
If r- cJ
E130
\ °EI32
r E141
+ E142
£148E145
E146
OLT-NW OLT-C OLT-Nea^ast~T + -?-
£149
E15I CP)
UTM NAD27 Metric Grid
_______I______ _l I I530,000 535.000 540.000 545.000
Figure IV-1. Surface-water monitoring sites: November 18-20, 1997.
37
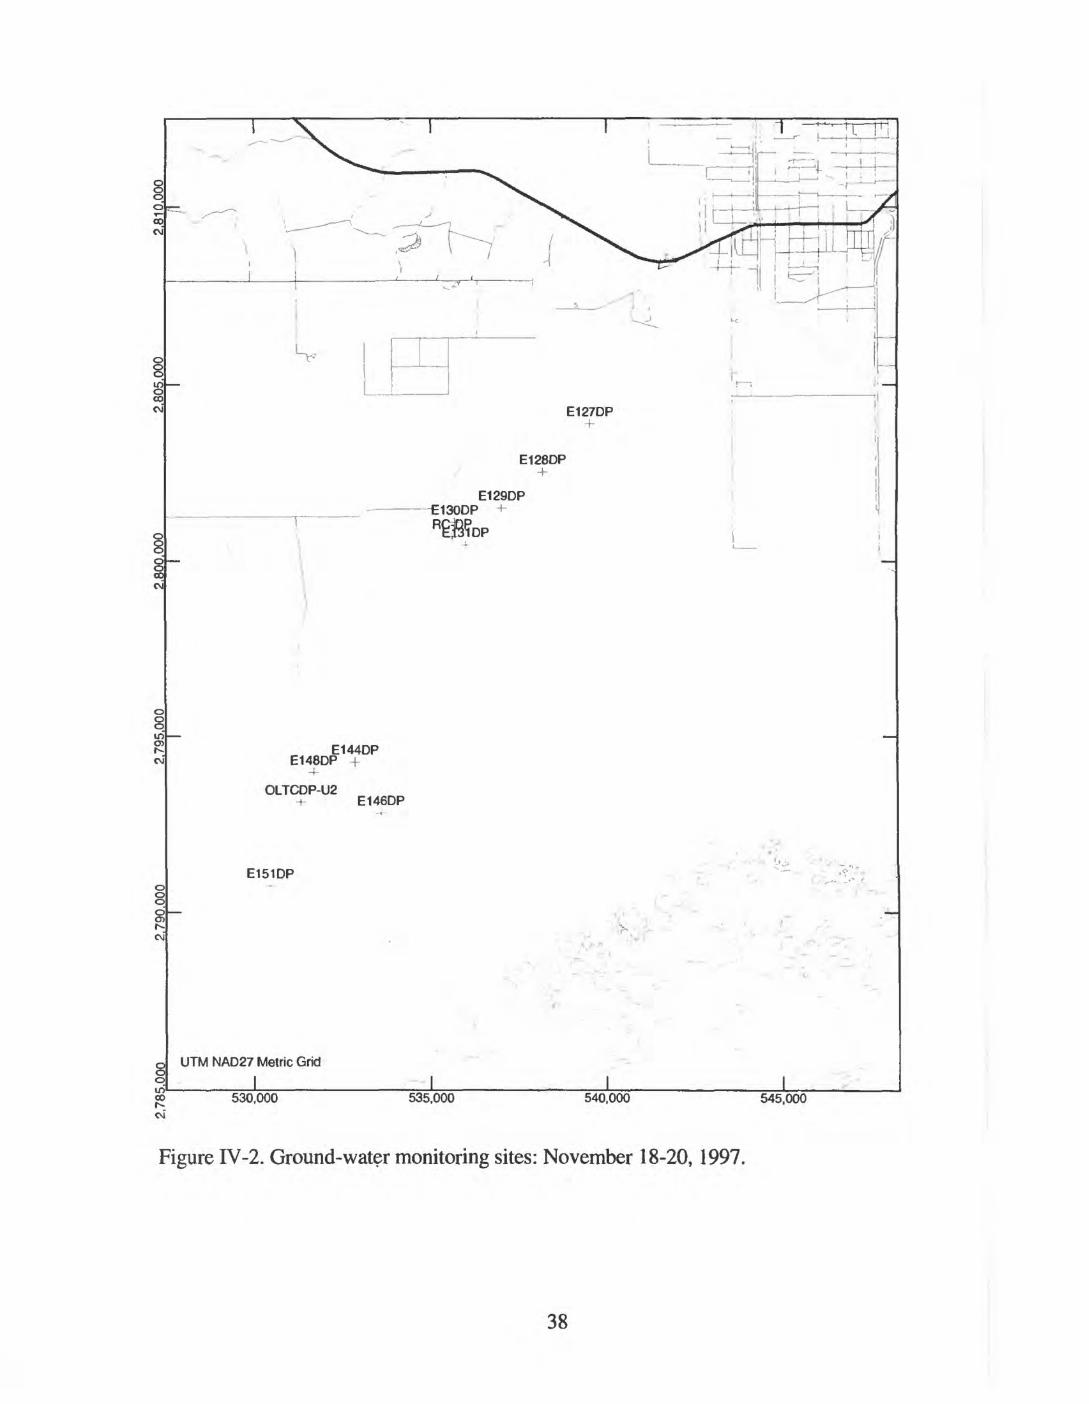
8-00
E128DP+
E129DP^130DP
E144DP E148DP 4-
4-
OLTCDP-U2
E151DP
E146DP
UTM NAD27 Metric Grid
_______I______ I
OJ
530,000 535,000 540,000 545,000
Figure IV-2. Ground-water monitoring sites: November 18-20, 1997.
38

APPENDIX V
Data Collected in Taylor Slough and Vicinity between
December 11 and 17,1997
39

Tab
le V
-l.
Che
mic
al A
naly
ses
From
Res
earc
h Si
te L
ocat
ions
: D
ecem
ber
11-1
7, 1
997
\r;"
SB»ID
»,. .
:YP
2(IO
O')
M30
M30
IW
lff)
1 30
(52'
)M
41M
46M
46; 1
46(1
51
1 144
(25'
)! 1
46(2
7.5'
)33
337(
1 O
O'-S
S1)
J1W
-G33
19(1
41')
J1W
-S33
1 96
(40'
)31
W-S
332T
WD
LT-C
!C-n
earE
130-
TOP
i-175
SB
dS
l15
8(34
')rS
B(5
7')
PSB-
UEFS
B-UE
SB
-UW
Ste
ivo
e
r ' S
w sw SW
gw gw sw sw sw gw
gw gw gw gw gw SW sw sw sw gw gw gw sw sw sw
'ft
ste
' ' '
12/1
6/97
0:00
12/1
6/97
10:
2012
/11/
970:
0012
/11/
970:
0012
/16/
97 1
2:00
12/1
6/97
14:
1812
/16/
970:
0012
/16/
9712
:00
12/1
6/97
0:00
12/1
6/97
0:00
12/1
6/97
12:
0012
/16/
970:
0012
/17/
97 1
2:00
12/1
7/97
12:
0012
/17/
97 1
2:00
12/1
6/97
13;
3012
/16/
97 1
2:24
12/1
7/97
12:
0012
/11/
970:
0012
/11/
970:
0012
/11/
970:
0012
/11/
970:
0012
/16/
970:
0012
/16/
970:
00
Tem
p-
<"$
J.
19.3
20.9
21.1
26.0
21.2
18.0
26.1
25,5
25,1
19,5
18.4
17.5
27.0
25.9
24.1
27,8
19,3
19,5
" "
fl«
pH .'
/
7,95
7.85
7.83 7.
8
7.9
7.7
6.68
6.61 6.
77.
93
7.78
7.39
7.07 7,
57,
097.
597.
957.
93
WP
arar
tH
CO
tmgfli
.n
11,0
9
10.4
5
10.2
8
9,48
8,63 11
10.2
8
(tw
s ORf>
3>m
' v,,
.
14.3
11.9
-4,5
11.7
16.8
Sp
«&
G
oo
dr^
»" 454
362
320
439
319
280
1358
018
500
430
307
367
460
440
430
430
454
430
.-M*T
Sp
ec.
*^<
*k»
..
Cond
.;**
>M
.DX; 37
439
449
148
132
931
8
1520
020
300
2640
0
471
532
495
308
248
519
486
480
480
465
. JCU
&. ;
:,.frW
., \
. '
*"
- r
>rca
" ;s«
art»?
i^ *! ,;"f
i<tt 66 71 87 83 53 53 480
540
550 71 79 73 48 35 83 74 71 70 72
Na
:*"W
p:
- -.
:-. ft
j
7.3
71 8.1
9.2
9.5 11
2500
3500
4700 19 23 19 10 21 18 21 22 22 20
MjJ
ftn
a/D
" T
'.. ttH
H 3 4 4 4 3 3
260
370
540 5 5 5 3 2 5 5 5 5 5
,*£
9B
#
<«»O
W
"v:;i
uw
3 33.
94.
12.
21.
3
8.4
8.3
8.3
5.9
5.4
4.9
1.9
7.1
4.7
4,9
5.2
5.4
5.5
' a '
.,<
Mfl/
P
5><fi
'pr'j£
l 12 13 16 17 18 17
4900
6700
9200 30 37 32 19 32 30 32 32 36 34
** <
»' "
(mam
,,4
"Sp
* '
(noo
flJ "ia 0.2
0.2
0.2
0.34 0.
20.
2
560
810
1200 3.1
4,7
4.7
0.2 12
0.57 0.
20.
26 4.1
23
Bf(
mo/
0
. O
.OS
0.05
0.05
0.09
0.09
0.05
0.05 11 16 20
0.09
0.09
0.08
0.05
0.09
0.09
0.09
0.09
0.05
0.05
CO
Son
/ A
rton
Wance
''
;H&$
A""
^
(ton*
(HM
)
0.0S
1.24
1.36
18.4
15.8 1.8
1.94
2.42
74.3
73.3 74
4.97 7.
97.
853.
22
3.82
1.34
Phdptl
ate
ftiM
}
.; &O
S
0.05
0.05
0.12
30.
123
0.05
0.12
30.
050.
110.
241
0.50
3
0.12
30,
110.
241
0.12
3
0.05
0.05
. tfH
fU
',
-5.5
-3.0 2,8
0.9
s'tj
f 4*
.. -1
.6C
-l.O
J
-0.1
7
-0.2
2
Bla
nk c
ells
indi
cate
no
sam
ple,
no
mea
sure
men
t, no
ana
lysi
s or
that
the
mea
sure
men
t was
not
app
licab
le a
t tha
t site
. O
utlin
ed c
ells
indi
cate
the
resu
lt w
as f
lagg
ed (
e.g.
val
ue e
xces
sive
ly lo
w o
r hig
h, n
ot in
kee
ping
with
his
tory
, etc
.) an
d is
susp
ect.
Cat
ion/
anio
n ba
lanc
e is
calc
ulat
ed u
sing
mill
iequ
ival
ents
as
(cat
ions
-ani
ons)
/(cat
ions
+ani
ons)
*100
. R
esul
ts b
elow
the
min
imum
det
ectio
n lim
it (M
.D.L
.) ar
e lis
ted
as th
e M
.D.L
.
40
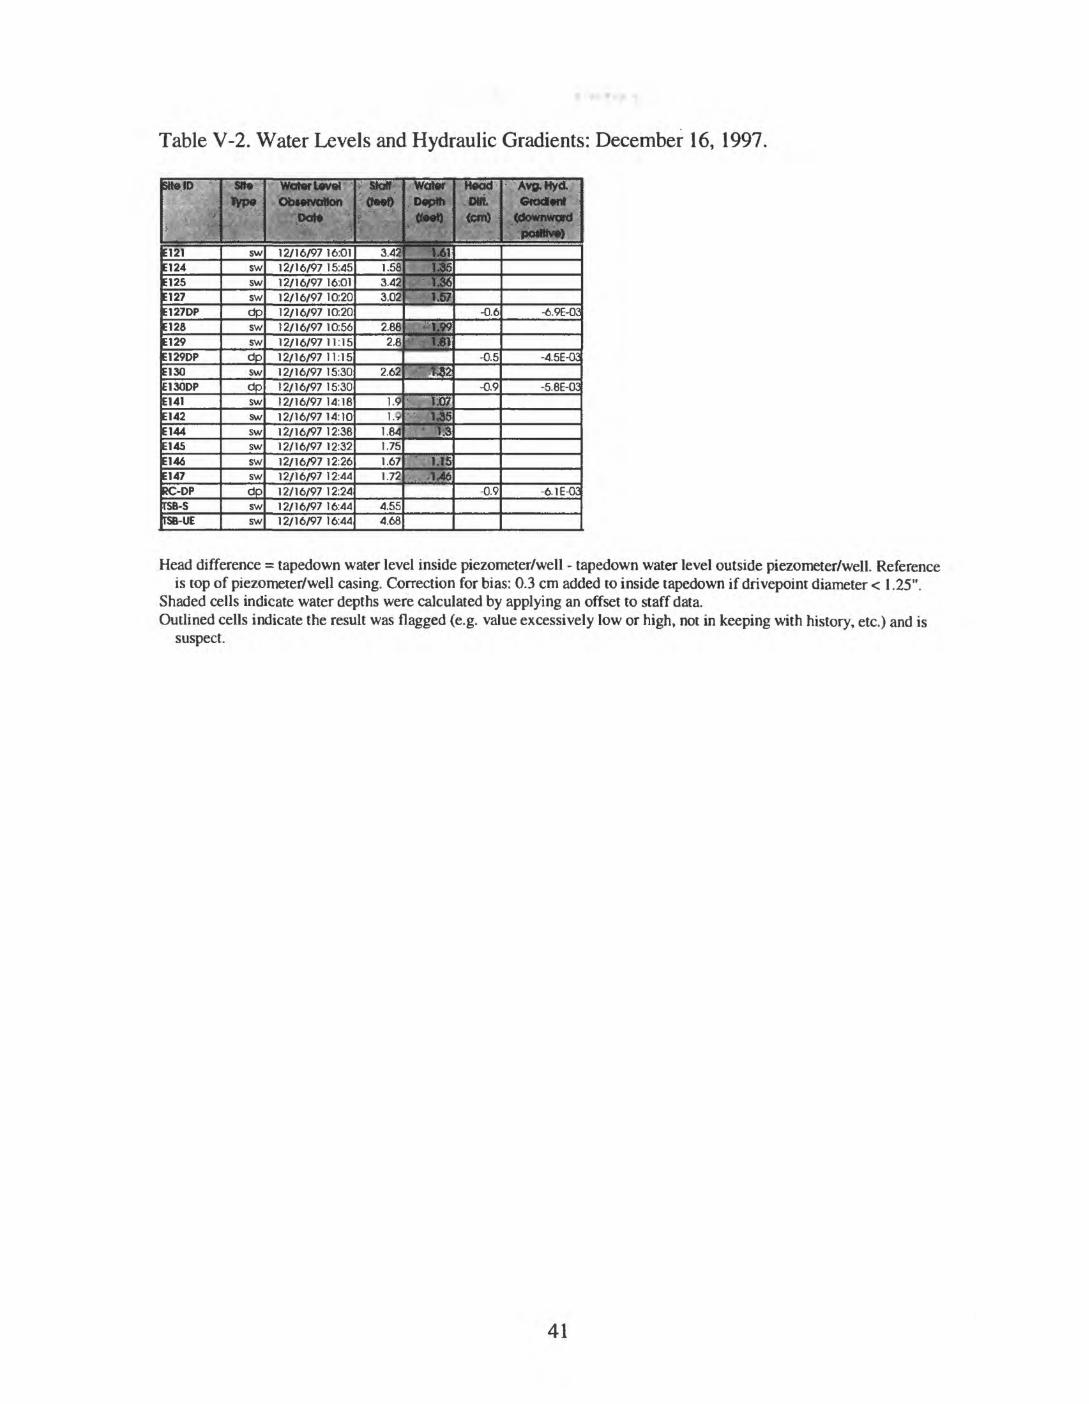
Table V-2. Water Levels and Hydraulic Gradients: December 16, 1997.
HtolD
t
E121El 24E125E127E127DPE128El 29E129DP=130
E130DPE141E142E144E145=144
E147RC-DPfSB-SFSB-UE
SB« lyp«
swswswswdpswswdpswdpswswswswswswdpswsw
Wotftf I^Mw "
Obwvotton*** ;
12/16/9716:0112/16/97 15:4512/16/97 16:0112/16/97 10:2012/16/97 10:2012/16/97 10:5612/16/9711:1512/16/97 11:1512/16/97 15:3012/16/97 15:3012/16/97 14:1812/16/9714:1012/16/97 12:3812/16/97 12:3212/16/97 12:2612/16/97 12:4412/16/97 12:2412/16/97 16:4412/16/97 16:44
* staff; **$js
3.421.583.423.02
2.882.8
2.62
1.9l.y
1.841.751.671.72
4.554.68
Water EWpth<te»0
t61 1.36"i ' 1.36
1,57
"1.99i;«l
:."«2 ,. liS? 14S
- 1.3
l.fS...-1^6
Head DHt tend
-0.6
-0.5
-0.9
-0.9
AvB-Hyd, GfodM
(tfownwofd po««lw«
-6.9E-03
-4.5E-OJ
-5.8E-02
-6. IE-03
Head difference = tapedown water level inside piezometer/well - tapedown water level outside piezometer/well. Reference is top of piezometer/well casing. Correction for bias: 0.3 cm added to inside tapedown if drivepoint diameter < 1.25".
Shaded cells indicate water depths were calculated by applying an offset to staff data.Outlined cells indicate the result was flagged (e.g. value excessively low or high, not in keeping with history, etc.) and is
suspect.
41
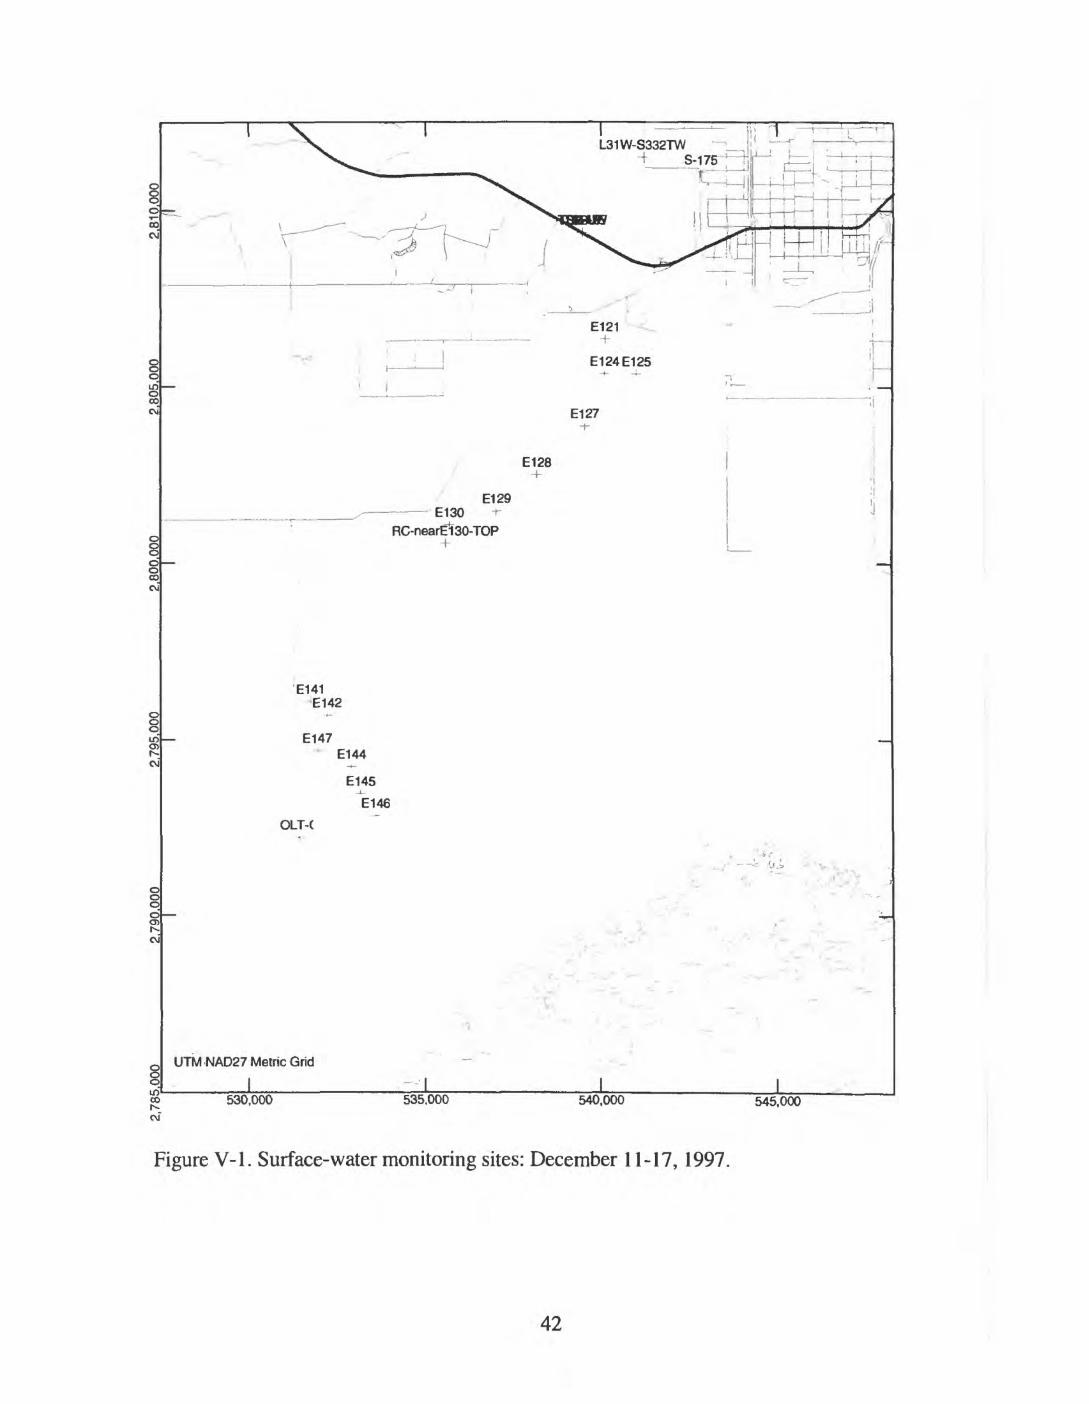
E127
E128
E129E130
RC-nearElSG-TOP+
E141 E142
E147E144
E145
E146
OLT-C
UTM NAD27 Metric Grid
co 530,00000
535.000 540,000 545,000
Figure V-1. Surface-water monitoring sites: December 11-17, 1997.
42

o00
r- c\
§ 1-
CYP2(100')E129DP
RCMDP
E146(25') £146(27.5')
UTM NAD27 Metric Grid
_______I______ I
E127DP
G3337(|K>ff-85')
I I530,000 535,000 540.000 545,000
Figure V-2. Ground-water monitoring sites: December 11-17,1997.
43

44
APPENDIX VI
Data Collected in Taylor Slough and Vicinity between
June 3 and 6,1998
45

Tab
le V
l-1.
Che
mic
al A
naly
ses
From
Res
earc
h Si
te L
ocat
ions
: Ju
ne 3
-6,
1998
Pag
e 1
of 2
p
!*;*
...
SB
*»
~*
;
$> is rYP
ZdO
1):Y
P2-s
w-s
M24
-D2
M24
-T1C
!127
!128 ;i29
M30
!130
1130
(101
;130
(521
;i3i
;U7
:i44
:146
il^dS
l11
46(2
5')
! 1 46
(27.
51;M
7;is
i(CP)
5J31
8r??
m)
>331
8(23
m)
5331
8(41
m)
5331
8(9m
)JlW
-G3
31
9(U
n31
W-G
3319
B(4
0')
31W
-G33
19TW
31W
-S33
2TW
/I1W
IP67
(20'
)JP
67-S
JLT-
CD
LTC
-U2
tC-n
eai£
130-
TO
Pi-1
75rS
BdS
l
";1P»
- |n
» . i gw sw sw sw sw sw sw sw sw gw
gw sw sw sw sw gw
gw gw sw sw gw gw gw gw gw gw gw sw sw gw sw sw sw sw sw gw
«?D
e*e
6/3/
98 0
:OC
6/3/
98 0
:00
6/6/
98 1
8:00
6/6/
98 1
2:00
6/6/
98 1
7:43
6/6/
9817
:32
6/6/
9817
:20
6/4/
98 0
:OC
6/6/
9815
:54
6/4/
98 0
:OC
6/4/
98 0
:OC
6/6/
9817
:15
6/6/
98 1
5:18
6/6/
98 1
4:55
6/4/
98 1
2.0C
6/4/
98 0
:OC
6/4/
98 0
:00
6/4/
98 0
:00
6/6/
98 1
4:5C
6/6/
98 1
2:15
6/3/
98 0
:00
6/3/
98 0
:00
6/3/
98 0
:00
6/3/
98 0
:00
6/3/
9812
:00
6/3/
98 1
2:00
6/3/
98 0
:00
6/3/
98 1
2:00
6/6/
9815
:38
6/3/
98 0
:00
6/3/
98 0
:00
6/6/
98 1
2:45
6/6/
98 1
4:20
6/6/
9815
:47
6/3/
98 1
2:00
6/3/
98 0
:00
' "
'*'
' '
"" M
jiljl ttj'j
iL'iu
LLatn
j*
' '
"
.r
une
i*um
n«pC
T>i<
Tem
p.
CO 26
.634
.^
40.0
38.8
37.1
38.6
27V
25.6
37.^
39.8
38X
31.:
27.2
26.5
26.3
38.7
34.6
25.3
24.9
25.1
25.3
26.9
25.6
25.3
29.0
39.8
26.6
28.7
34.3
35
636
.230
.526
.3
1* 6.<k
7.21 5.
4
7.99
7.92
7.68
7.41
7.94
6.75
6.81
8.18
7.96
8.32
7.01
6.57
6.46
6.53
8.08
7.38
7.41
7.32
7.38
7.04
7.04
7.29
8.69
7.13
7.96
6.84
7.57
7.41
7.67
7.14
6.57
DO
tm
g/D 0.
51
10.0
510
.12
7.84
10.1
3
11.1
9.32
12.3
3
11.2
56.
91
10.0
9
6.6
7.12
7.13
OR
P «n
V>
-32.
9
56.2
66.9
66.3
71.9
57.3 M
62.8
71.7
87.9
63.5
72.1
75.2
72.2
Spo
ie-
Co
ni
te» 41
940
275
4
606
64'
602
402
505
526
506
621
504
469
663
1798
022
00C
2840
C48
914
8928
2C23
1C30
8C 427
58C
465
357
634
453
490
594
935
600
539
634
611
" .la
b"'
<nbr*
Con
d.;-,
y8"
M.D
L 386
340
470
323
480
472
549
1605
020
160
2623
0
930
2680
2200
2960 403
534
434
453
479
572
562
560
."'Co
toi"
V
W&
&,
.e
n"'
«p# tW
K 74 58 70 54 89 86 7350
055
056
0 61 120
140
150 77 71 61 85 93 62 69 89
;' H
a W
OK
,
0.1
8.5
77 22 11 8.8
9.1 34
2800
3600
5000 10
035
026
040
08.
3 32 21 8.6
8.9 44 33 24
Mfl
CmO/
U
0.00
12.
52.
2
5.4
2.9
3.9
3.7
5.4
270
380
550 12 45 27 33 2.1
7.3 5
3.2
3.2
6.9
9.8
5.1
: SO
2 %
jrtJ
T
2.9
4.8 11 3
3.9 4
4.8
7.7
7.7
7.2 11 16 14 18 3.4
6.4
9.5
3.4
3.8 10 7
4.6
" a:
tmo/
U » '
.....,,.
, £
j 16 17 3.6 17 17 17 67
5400
7000
9400 210
770
620
840 15 52 38 16 17 86 58 41
A1K.
OC
caco
s«n
tfl«i&
.,
1
so*
onof
t) OJ
0.9 11 2.5
3.6
0.2
0.2
0.2
650
870
1200 0.2 73 33 79 0.2
2.5
3.1
0.2
0.6
0.2
6.5
0.2
Bf(
mg
/L
0.05
0.05
0.05
0.09
0.05 0.1
0.1
0.2 17 23 3C 0.3
2.5 2
2.6
0.07 0.
10.
09
0.09
0.06 0.2
0.1
0.1
Qutsh
r".An
ton
Bata
nco*
<%
)
.,
tmm
on
tarn
*
<jiM
>
>O05
Phoi
pft
ate
fcM
)
! aa
s
m f>«)
jfO
" <°
Mk i;i
Bla
nk c
ells
indi
cate
no
sam
ple,
no
mea
sure
men
t, no
ana
lysi
s or
that
the
mea
sure
men
t was
not
app
licab
le a
t tha
t site
. O
utlin
ed c
ells
ind
icat
e th
e re
sult
was
fla
gged
(e.
g. v
alue
exc
essi
vely
low
or h
igh,
not
in k
eepi
ng w
ith h
isto
ry, e
tc.)
and
is su
spec
t. C
atio
n/an
ion
bala
nce
is ca
lcul
ated
usi
ng m
illie
quiv
alen
ts a
s (c
atio
ns-a
nion
s)/(c
atio
ns+a
nion
s)*1
00.
Res
ults
bel
ow th
e m
inim
um d
etec
tion
limit
(M.D
.L.)
are
liste
d as
the
M.D
.L.
46

Tab
le V
l-1.
Che
mic
al A
naly
ses
From
Res
earc
h Si
te L
ocat
ions
: Ju
ne 3
-6,
1998
Pag
e 2
of 2
** «
« *»
., j^
Hj.v,,
rSB(
34-)
rSB<
57-)
rSB
-EB
C(B
oxC
ulve
rt)
rSB-
UE
rSB-
UE
rsB-
uwrS
B-W
BC
(Box
Cul
vert
)
site
fy
p« gw gw sw sw sw sw sw
Dot
e
6/3/
98 0
:00
6/3/
98 0
:00
6/6/
98 2
0.05
6/3/
98 0
:00
6/6/
98 1
9:49
6/6/
98 1
9:55
6/6/
98 2
0:00
flekJ
Por
amet
en
T«m
p.'I®
.-
24.9
24.6
31.6
31.2
32.8
32.1
33.1
PH
6.75
6.75
7.78
7.14
7.36 73
7.79
DO
<mg/
U
588
2.65
2.06
6.41
OW
;(m
V)
57.5
53.9
55.7
52.7
:. **-;
.C
ond.
(ttS
) 521
486
770
602
905
843
636
lob
Spw
V;
Con
dit®
^M
.DJ^ 49
545
8
552
-Cot
ar
(JVC
OJ
»;.. >
. vco
- (m
grt)
ito 76 72 67
iV'M
o '
;'^tt
-
'«'.;}
.. 0.1 22 20 36
MO -
ftnsft
: 0.
001
5.1 5 10
,aor
-"r(
n^.
cit
4.9
6.8
8.4
r a
6«
»«
-,, -,.
ai 36 31 59
ABC
OS
CaC
OS
" *N^
^, i""so!*
;- «r
vaw ka 0.
20.
3
4.4
*&
#$
- i
*.0
5 0.1
0.09
0.09
^?y
Aht
on
Ett
ow
e'
«)
Affi
ftion
"* ;
m .£
aos
.".<*»
6iM
)
,,,.,,<
MB
e?H
fU
S"»0
S '&
£
Bla
nk c
ells
ind
icat
e no
sam
ple,
no
mea
sure
men
t, no
ana
lysi
s or
that
the
mea
sure
men
t was
not
app
licab
le a
t tha
t site
. O
utlin
ed c
ells
ind
icat
e th
e re
sult
was
fla
gged
(e.
g. v
alue
exc
essi
vely
low
or h
igh,
not
in k
eepi
ng w
ith h
isto
ry, e
tc.)
and
is su
spec
t. C
atio
n/an
ion
bala
nce
is ca
lcul
ated
usi
ng m
illie
quiv
alen
ts a
s (c
atio
ns-a
nion
s)/(c
atio
ns+a
nion
s)*1
00.
Res
ults
bel
ow th
e m
inim
um d
etec
tion
limit
(M.D
.L.)
are
liste
d as
the
M.D
.L.
47
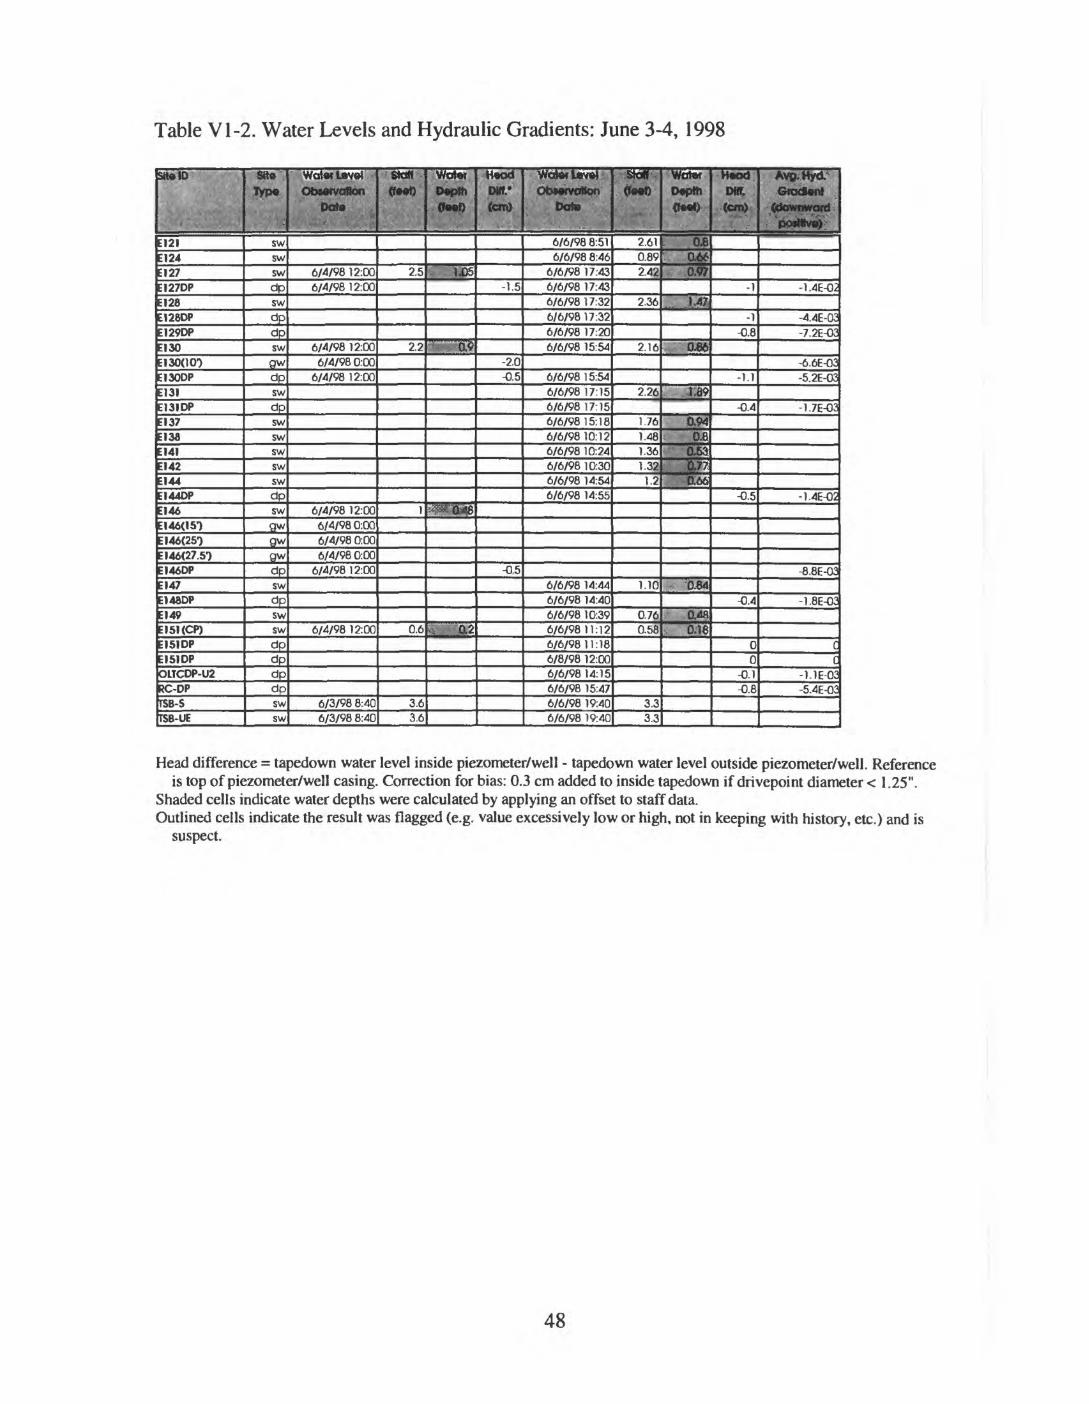
Table VI-2. Water Levels and Hydraulic Gradients: June 3-4, 1998
Site ID
i
:i2i=124;i2?II27DP=128
II28DPII29DP=IM;i30<to")M30DP;uiII3IDP;i37lisa:i4i;i42;i44II44OP:i4«;|46(I51:I46(25>);i46(27.51II46DP;i47M48DP=149
=151 <CP);i5iop=ISIDPOLTCDP-U2JC-DPrsB-srSB-UE
SHe
jyp^
swswswdpswdpdpswgwdpswdpswswswswswdpswgwgwgwdpswdpswswdpdpdpdpswsw
wotwUvei Otawvoflon
Dote
6/4/98 12:006/4/9812:00
6/4/98 12:006/4/980:00
6/4/98 12:00
6/4/98 12:006/4/98 0:006/4/98 0:006/4/98 0:00
6/4/9812:00
6/4/98 12:00
6/3/98 8:406/3/98 8:40
Sta«', ffwO
2.5
2.2
1
0.6
3.63.6
- Wont 0«p9i (fwf)
. 1.05
I , W
sprj£ij8
s 6.2
H«a<lD»rtew)
-1.5
-2.0-0.5
-05
Wato<Uv»l Otxwvatton
; ' Date
6/6/98 8:516/6/98 8:46
6/6/98 17:436/6/98 17:436/6/9817:326/6/9817:326/6/98 17:206/6/98 15:54
6/6/9815:546/6/9817:156/6/98 17:156/6/9815:186/6/98 10:126/6/98 10:246/6/98 10:306/6/98 14:546/6/98 14:55
6/6/98 14:446/6/98 14:406/6/98 10:396/6/9811:126/6/9811:186/8/98 12:006/6/98 14:156/6/98 15:476/6/98 19:406/6/98 19:40
:Sdff--
(( «)
2.610.892.42
2.36
2.16
2.26
1.761.481.361.32
1.2
1.10
0.760.58
3.33.3
Wcrtw
D»pttl
<»« »>:
. 0,8&dt
-O.W
JW?
, O86
,119
O.W_aag»2 p
084
.6*8s cse
H«CKt
D« ; ;{cm>.
-1
-1-0.8
-1.1
-0.4
-0.5
-0.4
00
-0.1-0.8
Avt»,Hyd GrcxSent
C&iwowQfcI*. -'pJcwWv^
-1.4E-0;
-4.4E-00-7.2E-OJ
-6.6E-02-5.2E-K
-1.7E-02
-1.4E-02
-8.8E-0;
-I.SE-O;
Ct
-i IE-O;-5.4E 00
Head difference = tapedown water level inside piezometer/well - tapedown water level outside piezometer/well. Reference is top of piezometer/well casing. Correction for bias: 0.3 cm added to inside tapedown if drivepoint diameter < 1.25".
Shaded cells indicate water depths were calculated by applying an offset to staff data.Outlined cells indicate the result was flagged (e.g. value excessively low or high, not in keeping with history, etc.) and is
suspect.
48

NP67-S E129L: i.
r E130
E91W E141 -*
OLT-CJ-
E149
E151(CP)
-\ '>--K ^
UTM NAD27 Metric Grid
I I Ico 530,000 c\T
535,000 540,000 545,000
Figure VI-1. Surface-water monitoring sites: June3-6, 1998.
49
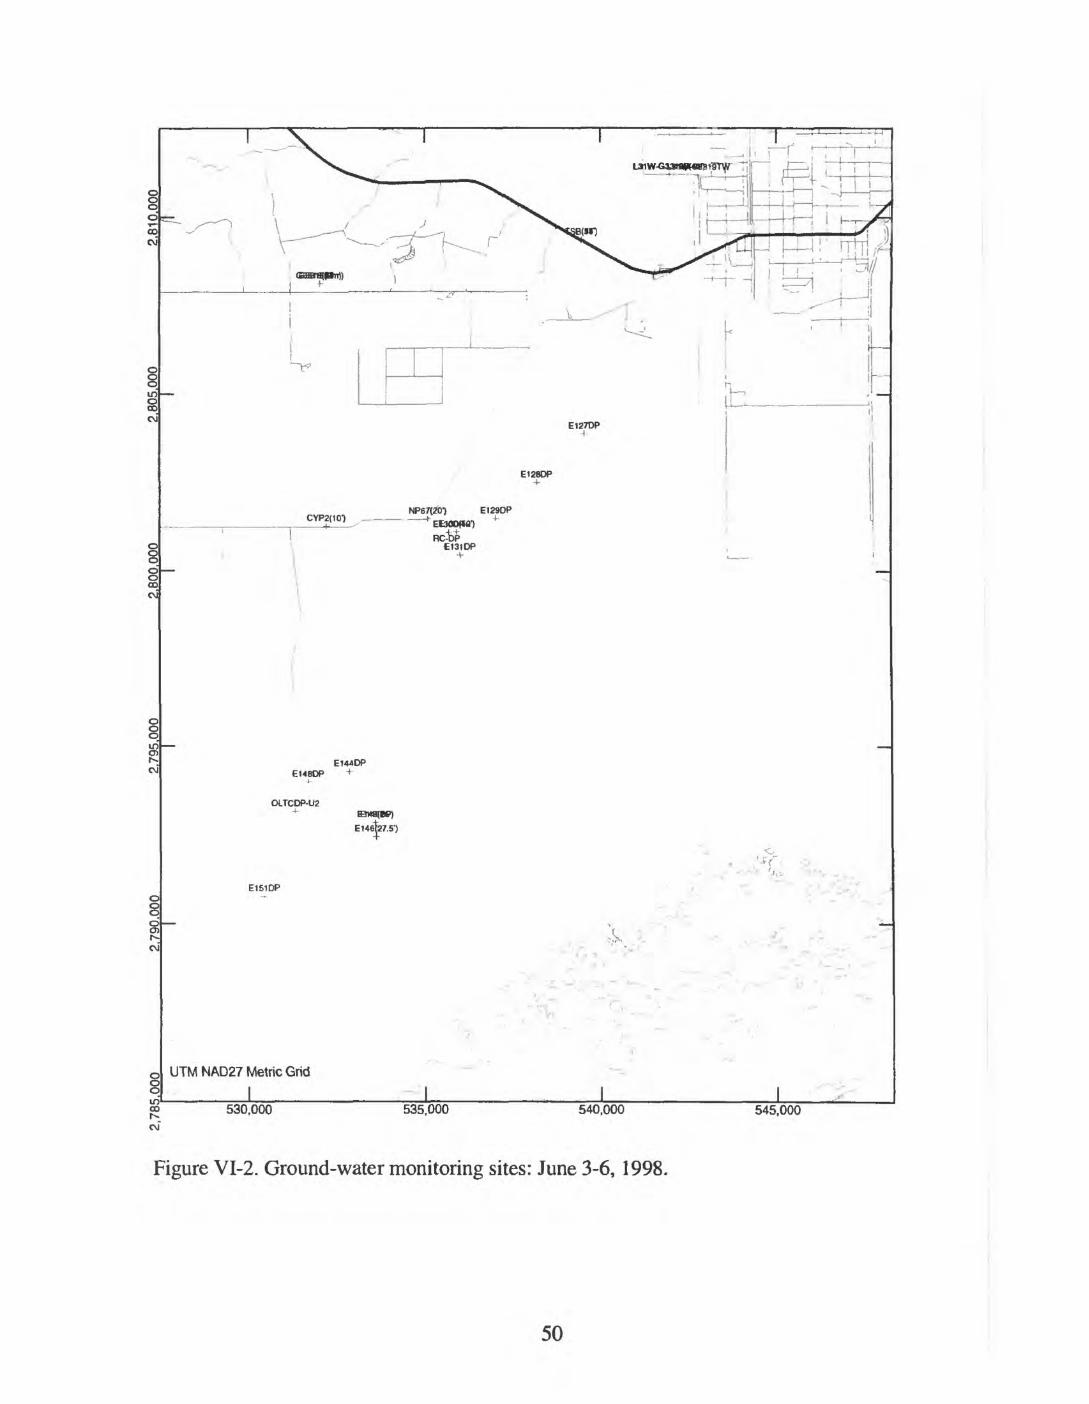
EI48DP
OLTCDP-U2
146J27.5')
UTM NAD27 Metric Grid
I530,000 535,000 540,000 545,000
Figure VI-2. Ground-water monitoring sites: June 3-6, 1998.
50
APPENDIX VII
Data Collected in Taylor Slough and Vicinity between
July 20 and 23,1998
51
Tab
le V
IM.
Che
mic
al A
naly
ses
From
Res
earc
h Si
te L
ocat
ions
: Ju
ly 2
0-23
, 19
98 P
age
1 of
2
>
»»*
'fe<fc
3 -
"-S
-i
:YP
2-S
W-N
:YP2
-sw-
sIY
P2-
W1-
N:v
p2-w
i-s:Y
P2-
W2-
N:Y
P2-
W2-
S 1
21
1123
E123
-FW
M23
-NN
E123
-NW
M24
-D2
M24
-T1C
M25
M27
1127
M26
M29
!130
il 30
(521
:i3i
1131
-SII3
1-S
P:i3
211
33!I3
3(R
C-F
E)
1136
;137 13
814
214
414
514
615
KC
P)
;331
8(7?
m)
5331
8(9
m)
9te
;iyp«
' . > sw sw sw sw sw sw sw sw sw sw sw sw sw sw sw sw sw sw sw gw sw sw sw sw sw sw sw sw sw sw sw sw sw sw gw gw
Oqt
e'n:
.-
; 7/23
/981
2:20
7/23
/981
2:20
7/23
/981
3:10
7/23
/981
3:10
7/23
/98
13:2
27/
23/9
813:
227/
22/9
813:
017/
22/9
8 12
:30
7/22
/98
12'. 1
77/
21/9
8 15
:39
7/21
/981
5:39
7/21
/98
15'lf
7/22
/981
1:11
7/21
/981
5:39
7/21
/98
15:1
87/
22/9
812:
4-1
7/21
/98
15:1
87/
21/9
815:
097/
21/9
810:
4C7/
21/9
8 10
:13
7/21
/98
14:1
47/
21/9
812:
507/
21/9
812:
507/
21/9
811:
327/
21/9
812:
097/
21/9
811:
557/
21 '
98 1
4:35
7/21
/981
4:35
7/21
/98
14:4
87/
20/9
816:
277/
20/9
8 15
:22
7/20
/98
15:2
27/
20/9
8 14
:33
7/20
/98
13:5
87/
23/9
810:
157/
23/9
89:3
5
Tom
p.
<*C) 30
.429
.230
.026
.;29
.729
.229
.2
28.9
33.7
30V
31.7
27.8
33.6
33.8
21.3
31.5
30.8
30.2
25.6
30.0
31.2
28.4
29.3
29.1
29.8
31.3
35.4
37.7
34.6
36.7
34.8
34.5
: ':'
' .S
*
"0H
- 7.4
6.93
7.34
6.87
7.32
7.17
7.52
7.61
8.25
7.2E
7.25
7.16
8.16
8.08
6.92
7.56
7.24
7.65
6.65
7,33
6.64 6.
67.
667.
47
6.85
7.57
7.98
8.44
7.88
7.76
7.39 8.
2
tfP
OH
QR
H/
-
DO
"(
mg/
D 5.39
1.73
4.69
1.65
4.59
4.36
8.29
9.71
11.4
27.
234.
117.
298.
239.
425.
336.
49 1C7.
630.
814.
333.
210.
69 66.
63
1.21
6.44
10.5
89.
818.
946.
24 1.4
7.54
*OT O
RP
ftlV
)
226.
491
.627
6.1
130.
633
8.9
382.
639
8.5
409.
638
940
C39
240
f38
7.6
39C
103.
538
1.9
377.
541
5-2
2.3
29E
24.5
-24.
935
9.8
388.
3
-0.6
275
306.
940
131
8 44-1
10
409.
6
Spec
. C
ond.
fos>=
. »
381
584
376
671
367
37i
389
322
3& 331
39E 42;
34C
29E
385
344
363
296
42E
326
390
412
398
360
325
277
273
288
307
337
463
542
743
4800
lob
Con
d.
¥>
:'M.D
.ti 364
302
40;
34E
32E
475
380
442
391
422
279
270
377
540
406
2.6
Cof
erw
a»
- '
:.'
<Jf^
'<
~:co
{mo/
U
p£&
Si
47 53 53 44 58 89 56 67 55 62 46 48 51 45 79 120
- N
o 6n
g/0
. . -
S.i
22 7.7 24 22 7.7
7.9 20 21 22 21 9.7
9.4 23 50 7.9
370
MO(m
B/U
.*
iu»!
5.6
2.2
5.7
4.7
3.2
3.8
4.2
5.3
3.9
5.2
2.5
2.8
3.9
7.4
2.1 43
''SO?
'-::-
frnfl/
i)
; JL
_*W 6.
34,
4
6.9
7.3
2.6
3.8 11 10 9.5
9.7 2
7.6 8
6.4
3.4 16
a
(mgm
->-L.-
.-!it!i 34 14 39 36 14 16 33 36 39 37 18 17 43 98 15
730
Aft.
m
COCO
3<m
aft>
: ';
' 1
SO
4;<m
aw
l'
"
fife
1.3
0.2
1.5
1.3
0.2
0.2
0.3
0.4
0.2
0.3
0.2
0.2
0.2
0.2
0.2 70
8r(m
g/U
.0.6!
0.05
0.05
0.05
0.05
0.05 0.1
0.05
0.05
0.05
0.05
0.05
0.05
0.08 0.
20.
08 2.4
] C
aHon
/ .
Ant
ohB
aian
es*
' &
>f
. , . ,.
.. . *
Am
man
ta
rn<M
Mi
' <M
»
PtK
Sph
r-J
n '
OlM
)
" ttio
s
. '*»
,i, "
«o*-
.-?
9.5
1.4
6.7
12.0
4.1
11.0
10.5
11.5
12.1 8.3
7.6
15.5
15.1
-8.7
-11.
8
S«
0
."V
w
v;
0.98
-O.d
*
0.7?
1.3;
0.02
1.9? 1.71
1.7J
1.8?
1.11
1.41
3.07
3.1C
-1.9
2-2
.47
Bla
nk c
ells
indi
cate
no
sam
ple,
no
mea
sure
men
t, no
ana
lysi
s or
that
the
mea
sure
men
t was
not
app
licab
le a
t tha
t site
. O
utlin
ed c
ells
indi
cate
the
resu
lt w
as f
lagg
ed (
e.g.
val
ue e
xces
sive
ly lo
w o
r hi
gh, n
ot in
kee
ping
with
his
tory
, etc
.) an
d is
susp
ect.
Cat
ion/
anio
n ba
lanc
e is
calc
ulat
ed u
sing
mill
iequ
ival
ents
as
(cat
ions
-ani
ons)
/(cat
ions
+ani
ons)
*100
. R
esul
ts b
elow
the
min
imum
det
ectio
n lim
it (M
.D.L
.) ar
e lis
ted
as th
e M
.D.L
.
52

Tab
le V
II-1
. C
hem
ical
Ana
lyse
s Fr
om R
esea
rch
Site
Loc
atio
ns:
July
20-
23,
1998
Pag
e 2
of 2
; gf
e":^^
B
^.
..,S
3318
-RO
AD
-NS
IDE
3331
8- R
OA
D-S
SID
E33
337S
WH
-E H-W
-Wtc
hJ1
W-G
3319
B(4
0-)
.31W
-G33
19TW
J1W
-S33
21W
J1W
SO
UTH
EN
D1P
37M
P67
-200
mN
orttl
YP
67-C
UL
YP
67-N
1P67
-SD
LT-C
3LT-
EX
T-FE
3LT-
MW
2In
oRM
PtC
-Eos
tEnd
(C-n
eorE
130-
BO
T(C
-nso
rElS
O-B
OT
KM
war
E13
0-B
OT
!C-n
earE
130-
TO
PtC
-nea
rE13
0-T
OP
rsB
(34I
)rS
B-2
ndP
lpeC
ulE
rSB
-3rd
Plp
eCul
EfS
B-U
EfS
B-U
MB
B-U
WS
B-W
BC
CB
oxC
ulvo
rt)
SB
9 sw sw sw sw sw gw gw sw sw sw sw sw sw sw sw sw sw sw sw sw sw sw sw sw sw gw sw sw sw sw sw sw
"- D
an
""
7/23
/98
10:5
87/
23/9
8 10
:58
7/22
/98
17:5
37/
23/9
8 11
:16
7/23
/98
11:1
67/
22/9
8 16
:26
7/22
/98
15:5
97/
22/9
8 16
:26
7/23
/98
16:5
37/
20/9
8 16
:13
7/23
/981
4:00
7/23
/981
2:15
7/23
/98
14:0
07/
23/9
8 14
:00
7/20
/98
13:2
17/
20/9
813:
417/
20/9
8 15
:22
7/20
/98
13:4
17/
22/9
813:
177/
21/9
8 12
:02
7/21
/981
4:14
7/22
/98
9:20
7/22
/98
10:3
37/
21/9
814:
147/
22/9
8 9:
527/
20/9
8 19
:08
7/20
/981
9:26
7/20
/981
9:30
7/20
/981
8:29
7/20
/98
18:2
97/
20/9
8 18
-29
7/20
/98
19:3
0
- '
" R
ofcf
Par
amet
er
-"*""
'
;m 30.2
527
.44
26.4
628
.928
.628
.130
.136
.936
.429
.76
28.6
29.6
33.8
36.2
36.6
36.2
27.8
28.7
30.4
29.2
27.5
31.3
27.4
24.3
33.6
33.8
35.4
33.6
34.6
34.3
6.99
37
36.
7* 6.8
6.93
6.95
6.87
7.16
7.75
7.19
6.77
7.29
8.07
8.53 7.
28.
547.
287.
476.
676.
49 7.2
7.77
7.15
7.69
8.92
8.95
8.59
8.26
8.61
8.83
A
6.8
2.32
0.52
5.88
6.36
9.22
0.59
8.86
3.98 2.
9 54.
526.
91 2.2
12.3
36.
33.
310.
850.
270.
397.
652.
240.
719.
651 O
.Ofl
11.3
18.
349.
7910
.25
(mv>
:
4821
348.
735
7.6
-23.
730
7.4
410
422.
5-5
0.3
333.
739
8.1
210.
328
6.7
397.
634
0-5
8
393
373
263
44.6
-40.
930
131
813
4.1
-30.
425
232
9.2
417
437.
243
0.4
342
Con
d. 415
713
456
791
622
554
537
519
907
316
787
389
862
416
347
387
534
355
360
380
433
491
295
251
276
488
354
320
433
424
359
357
V*?
.Col
Sl
toS
M.D
.L 425
517
501
486
278
424
210
315
259
260
494
431
VCot
or'"'
',, . .
.
(mg/
t)
' : 0
.02 65 70 70 74 36 81 36 42 42 44 78 57
"" He
* -
0.1 19 29 27 24 16 9.5
5.9 16 8.1
7.8 22 26
-«-S
r 0401
4.9
7.6
6.6 6
3.3
3.2
1.6
3.9
2.5
2.6
5.3
6.3
*** tun 3.7
6.5
6.2 5
2.8
4.4
2.7
6.4
2.4
2.4 5
6.8
!- a.
,
ai 32 47 44 39 31 19 11 31 14 14 36 41
'Cac
6S;
- 1
SO
4
(mgr
t) as 1.2
2.2
2.5
9.9
0.2
0.4
0.7
0.2
0.2
0.2
0.2
1.7
0.05
0.06 0.1
0.1
0.1
0.07
0.05
0.05
0.05
0.05
0.05
O.O
fl
0.06
Alto
n B
atan
ctt*
Am
mon
to
n aos
ato 0.
05
*, 3.
6
8.2
6.4 1.6
11.3 2.0
0.2
14.2 8.0
8.9
!&U 0.1'
1.03
0.79
-0.0
8LS
I-0
.29
-0.4
7
2.77
0.6£
0.65
Bla
nk c
ells
indi
cate
no
sam
ple,
no
mea
sure
men
t, no
ana
lysi
s or
that
the
mea
sure
men
t was
not
app
licab
le a
t tha
t site
. O
utlin
ed c
ells
indi
cate
the
resu
lt w
as f
lagg
ed (
e.g.
val
ue e
xces
sive
ly lo
w o
r hi
gh, n
ot in
kee
ping
with
his
tory
, etc
.) an
d is
susp
ect.
Cat
ion/
anio
n ba
lanc
e is
cal
cula
ted
usin
g m
illie
guiv
alen
ts a
s (c
atio
ns-a
nion
s)/(c
atio
ns+a
nion
s)*1
00.
Res
ults
bel
ow th
e m
inim
um d
etec
tion
limit
(M.D
.L.)
are
liste
d as
the
M.D
.L.
53
Tab
le V
II-2
. Wat
er L
evel
s an
d H
ydra
ulic
Gra
dien
ts:
July
20,
199
8 Pa
ge 1
of
2
a*»a
>
*? ;i2i
M23
-FW
E12
3-N
NM
23-N
WE1
24 1
24-D
2 1
25=1
27
127
DP
M28
E128
DP
M29
M29
DP
M30
ElS
OdO
1)= 1
30(5
21E1
300P
E131
E131
DP
E132
M33
MM
1137
E138
M41
!M2
[144
M44
0P11
45;i4
6:i4
6(!
5r)
;i46(
25r)
1146
(27.
51I1
460P
147
148
1480
P
W
otw
lavo
t O
bMiv
uHof
t;
bate
'
7/20
/989
:50
7/20
/98
9:55
7/20
/981
0:00
7/20
/98
10:0
07/
20/9
8 10
:07
7/20
/98
10:0
77/
20/9
8 10
:13
7/20
/98
10:1
37/
20/9
8 10
.18
7/20
/98
10:1
87/
20/9
810:
187/
20/9
8 10
:18
7/20
/98
10:1
87/
20/9
8 10
:42
7/20
/98
10:4
27/
20/9
8 10
:42
7/20
/98
15:2
27/
20/9
8 15
:22
7/20
/98
15:2
27/
20/9
8 14
:33
7/20
/98
14:3
37/
20/9
814:
337/
20/9
8 14
:33
7/20
/981
4:33
7/20
/98
10:4
27/
20/9
8 1 0
:42
7/20
/98
10:4
2
Sta
ff; «
»<>'' 2.88
1.09
2.58
2.48 2,
4
2.25
2.34 2.
81.
511.
42 1.4
1.27
1.22 1.1
1.17
1.12
' Wat
er*
Dep
tti
<te«
t> 1.07
...r-
OS
*
US
-.' 1
39
*4J
: ,
O.<K
" \J
Sff
" -
. 4,«
OK
,'. -t
oas
s&
7J ass
*"
'6,91
0*7
HOCK
),'tifr
':
(an) -0
.6
-0.4
-0.7
-0.8
-0.7 0
-0.2
-0.6
Wat
er ls
v«l
fW
imtLfijpA
nM
' *J
OT
WV
CH
lOfi
Dot
e
7/21
/981
5:39
7/21
/98
15:3
9
7/21
/981
5:18
7/21
/981
5:39
7/21
/981
5.18
7/21
/981
5:18
7/21
/981
5:18
7/21
/981
5:18
7/21
/981
5:09
7/21
/981
5:09
7/21
/989
:43
7/21
/989
:43
7/21
/98
14:1
47/
21/9
814:
147/
21/9
811:
327/
21/9
8 12
:09
7/21
/981
4:35
7/21
/98
14:3
57/
21/9
814:
4£
..Sfa
»*
(to
ri)
2.98
2.61
2.47
2.42
2.38
2.26
2.09 1
1.84
1.53
Wat
er:
Dop
tti
<te«
rj 0.88
0.83
1.13
0.92
1.17
1.73
1.52
cwe
a; i1.
421.
171.
17
,H0O
Q :
;:,OW
.*'"
'' '<«
«.
-0.9
0.6
-0.5
-2.4 '<
. 0
Wat
er lo
vel:
OtM
MH
VQlf6
f(.;
.Dat
e '
7/22
/98
13:0
17/
22/9
8 ^2
:17
7/22
/98
1 2:0
7
7/22
/98
1 1 :0
47/
22/9
8 11
:04
7/22
/98
10:5
97/
22/9
810:
597/
22/9
810:
517/
22/9
8 10
:51
7/22
/98
10:4
57/
22/9
810:
45
"<SM
t>-
; «*# 1.
16
2.64
2.54
2.48
2.47
Wat
er ji^
*>'
dteo
Q 1.42 1 1
;
us*
^ ii'-
.we
;' lU
tt
!k._
L23
H0G
K3
D«t
:{cm
)Ill'
llmml
mm.^
-0.5
-0.3
-0.7 0.3
Avg
.Hyd
:
JBM
jiftfe
'g
(dB
r:
-7.6
E-0
;
-1.9
E-0
;
-5.7
E-0
;
-7.9
E-0
3-1
.9E-
00-5
.2E-
00
-5.8
E-CU
C
-3.5
E-0
3
-2.7
E-0
3
Hea
d di
ffer
ence
= ta
pedo
wn
wat
er le
vel i
nsid
e pi
ezom
eter
/wel
l - t
aped
own
wat
er le
vel o
utsi
de p
iezo
met
er/w
ell.
Ref
eren
ce
is to
p of
pie
zom
eter
/wel
l ca
sing
. C
orre
ctio
n fo
r bia
s: 0
.3 c
m a
dded
to in
side
tape
dow
n if
driv
epoi
nt d
iam
eter
< 1
.25"
.Sh
aded
cel
ls in
dica
te w
ater
dep
ths
wer
e ca
lcul
ated
by
appl
ying
an
offs
et to
sta
ff d
ata.
Out
lined
cel
ls in
dica
te th
e re
sult
was
fla
gged
(e.
g. v
alue
exc
essi
vely
low
or h
igh,
not
in k
eepi
ng w
ith h
isto
ry, e
tc.)
and
is su
spec
t.
54
Tab
le V
II-2
. W
ater
Lev
els
and
Hyd
raul
ic G
radi
ents
: Ju
ly 2
0-22
, 19
98 P
age
2 of
2
JHfr
B>-
;p
,"
'*'< 1
21E1
23-F
WE1
23-N
NE1
23-N
W 1
24
Wat
er le
vel
4P»
0ivQ
itofi
Dot
e
7/20
/98
9:50
7/20
/98
9:55
staf
f0000 2.88 1.09
wat
erDe
pth
<to«
f>
' ' -
1-.0
7
\, , a
s6
HOO
dO
K*
fcftt
f
Wat
er L
evel
Obt
dfvo
ikM
tD
d»
7/21
/98
15:3
97/
21/9
815:
39
Sfc
«ww
oW
otor
oept
hfl«
*e:
0.88
0.83
Hea
d, e
m,--
, (c
m)
Wat
er Le
vel
fO
t»M
vcAo
n
Date
,722
/981
3:01
7/22
/981
2:17
7/22
/98
1 2:0
7
man
fleet
)£
1.16
" iw
CtfO
f
Dep
mCo
«f) 1.J2 1 1
Hoo
d-M
BC(c
m)
AW'W
lW.
:>O
Wd
lOfJ
-:::
(dO
WTV
Wtf
ftl
potiB
vo)
Hea
d di
ffer
ence
= ta
pedo
wn
wat
er le
vel i
nsid
e pi
ezom
eter
/wel
l - t
aped
own
wat
er le
vel o
utsi
de p
iezo
met
er/w
ell.
Ref
eren
ce
is to
p of
pie
zom
eter
/wel
l cas
ing.
Cor
rect
ion
for b
ias:
0.3
cm
add
ed to
insi
de ta
pedo
wn
if d
rivep
oint
dia
met
er <
1.2
5".
Shad
ed c
ells
ind
icat
e w
ater
dep
ths
wer
e ca
lcul
ated
by
appl
ying
an
offs
et to
sta
ff d
ata.
Out
lined
cel
ls i
ndic
ate
the
resu
lt w
as f
lagg
ed (
e.g.
val
ue e
xces
sive
ly lo
w o
r hig
h, n
ot in
kee
ping
with
his
tory
, etc
.) an
d is
susp
ect.
55
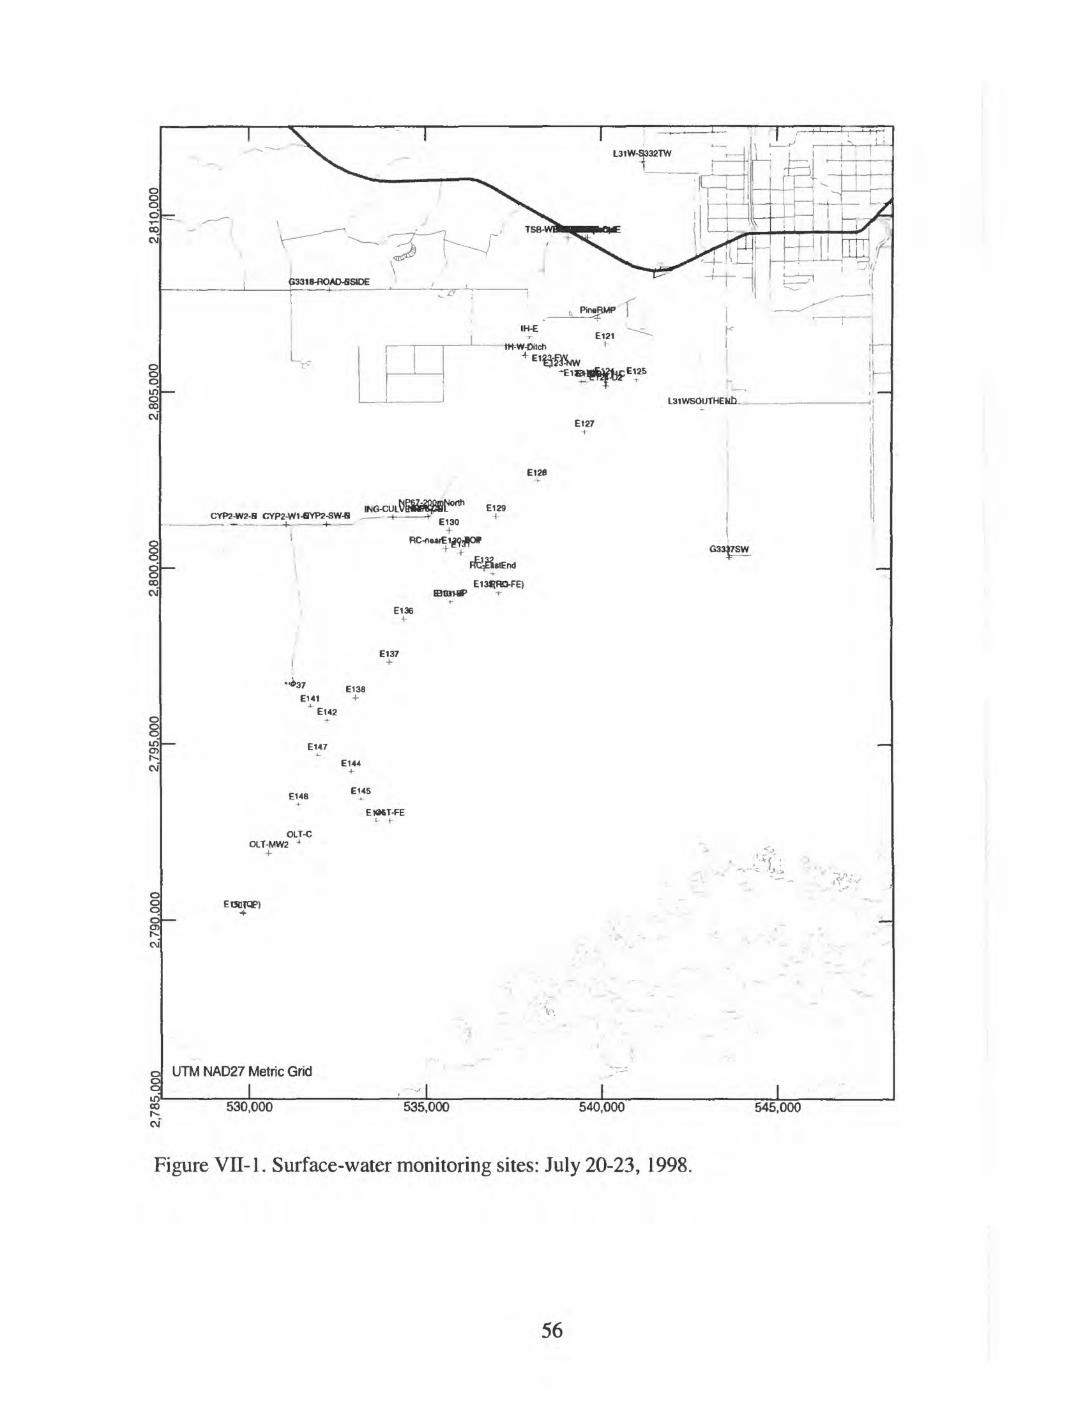
G33J7SW
*37
EM1
J E142
E147
E145
EW6T-FE
EODTOP)
UTM NAD27 Metric Grid
______I_____ I530,000 535,000 540,000 545,000
Figure VII-1. Surface-water monitoring sites: July 20-23, 1998.
56
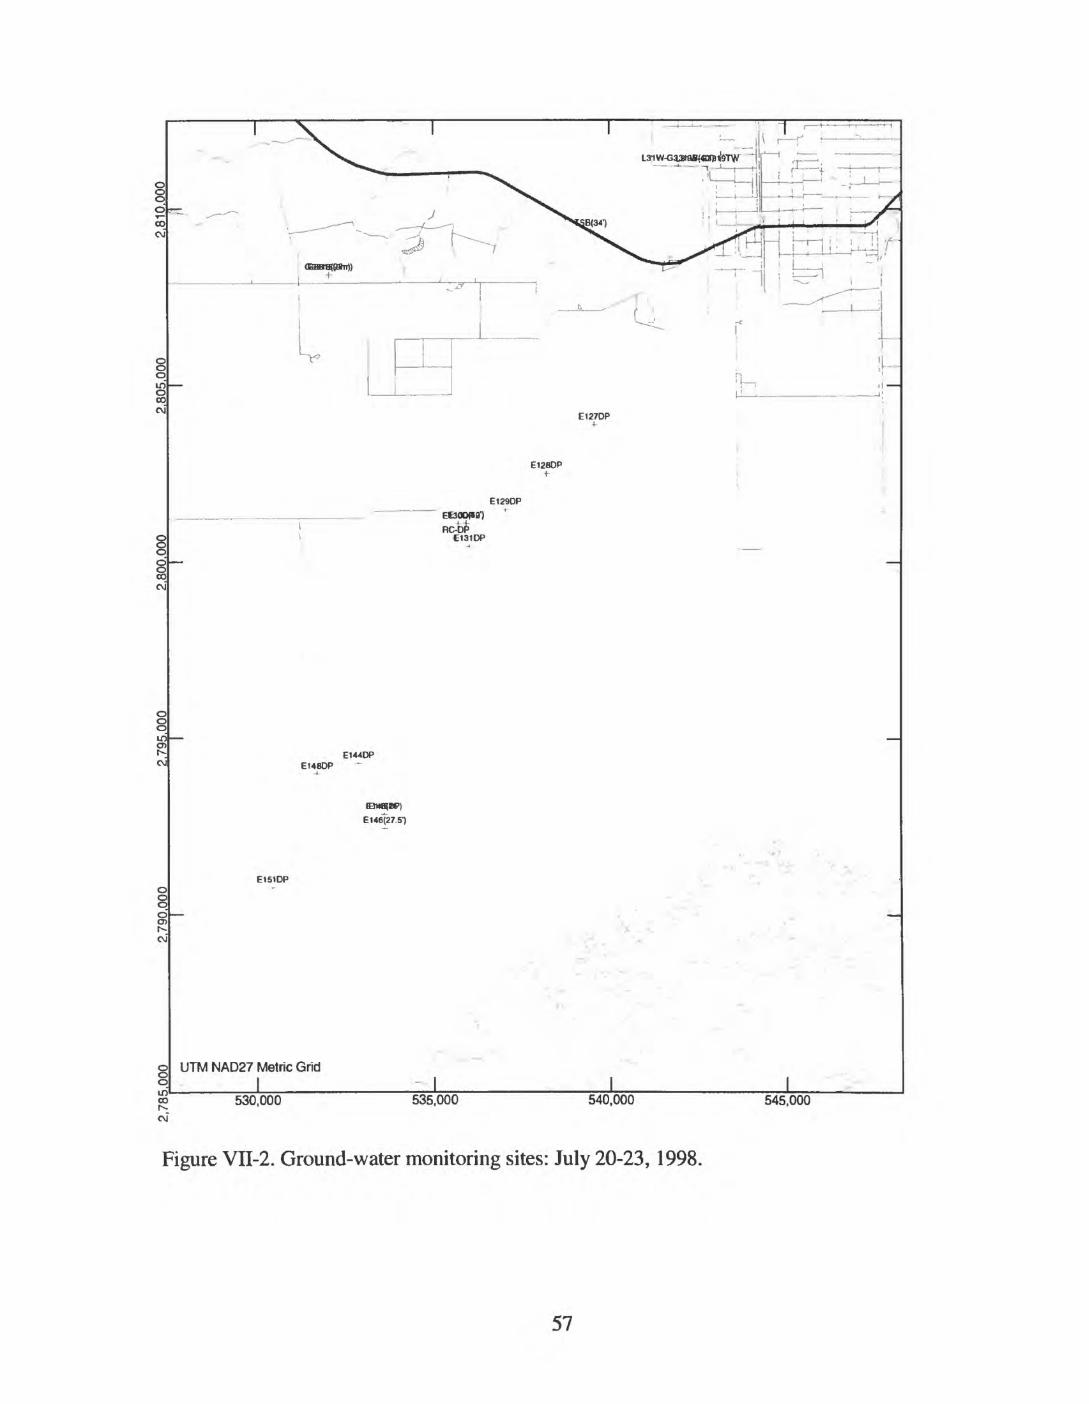
L31W-G33taS<«JB1l9W "Vf~I JrZ
E146t27.5')
UTM NAD27 Metric Grid
_______I______
Et30CX»fl')
M* C131DP
I I530.000 535,000 540,000 545,000
Figure VII-2. Ground-water monitoring sites: July 20-23, 1998.
57

oo

APPENDIX VIII
Data Collected in Taylor Slough and Vicinity between
September 20 and October 5,1999
59

Tab
le V
III-
1. C
hem
ical
Ana
lyse
s Fr
om R
esea
rch
Site
Loc
atio
ns:
Sept
embe
r 20
-Oct
ober
5,
1999
Pag
e 1
of 2
' -
->~
» »
"-""
"
AE
RO
JETC
AN
AL
:ni-w
:iii-sis
cE1
21E1
24E1
27E1
28M
29 ;iao
M31 E135
E136
=137
MM
E142
M46 ;i47
E148
:i49
;isi(C
P)M
S1(
CP
)NE
AR
WE
LLrw
-23
rw-2
4rw
-25
W-2
6W
-27
W-2
8W
-29
W-2
9-1
W-2
9-2
W-2
9-4
W-T
RA
N-H
AR
RY
osB
oy I
Eo
eB
oy2
Eo
eB
nyS
CoeB
oyA
W
SH
»aW
»' sw sw sw sw sw sw sw sw sw sw sw sw sw sw sw sw sw sw sw sw sw sw sw sw sw sw sw sw sw sw sw sw sw sw sw sw
" .D
ote-
'"
9/2
2/9
9 0
:OC
9/2
2/9
9 0
:00
9/22
/99
7:55
9/23
/99
8:39
9/23
/99
8:49
9/23
/99
8:59
9/2
3/9
99:1
09/
23/9
9 9:
2!9/
23/9
9 9:
459/
23/9
9 9:
3£9/2
3/9
910:2
59/2
3/9
910:3
59/2
3/9
910:4
59
/23
/99
10:
5C9
/23
/99
1 1
:OC
9/2
3/9
9 1
3: 1C
9/23
/991
1:22
9/2
3/9
912:0
59/2
3/9
912.1
59
/23
/99
12:
4C9/
23/9
9 0:
OC9/
20/9
9 0:
OC9
/20
/99
0:0
09/
20/9
9 0:
009
/20
/99
0:0
09
/20
/99
0:0
09/
20/9
9 0:
009
/20
/99
0:0
09/
20/9
9 0:
009
/20
/99
0:0
09/
20/9
9 0:
009
/22
/99
0:0
010
/5/9
911:
5010
/5/9
911:
1510
/5/9
910:
0010
/5/9
96:3
0
Ftet
d Pa
ranr
wrfo
n
Tam
p.
fCJ 27
.'27
.527
.727
.628
.627
./27
.627
.E28
.128
.228
.f28
.129
.928
.729
.C29
.128
.9
31.1
31.2
30.7
31.7
29.3
31.2
31.3
29.6
30.0
P» 7.11
7.59
7.3!
7.59
7.62
7.62
7.65
7.5f
7.17
779
7.67
77^
76
765
7.8
7.73
7.74
8.22 8
8.02
7.69
8.18
7.57
7.96
7.85
7.51 7.
67.
66
7.99
8.03
7.93
7.98
DO
(m
oO)
ORP
<n»V
JSp
«e.
Con
d.
<pS> 33
629
724
(21
921
021
520
118
520
922
123
926
925
224
222
724
518
5
298
312
317
326
341
331
341
469
440
450
lob
ttfn^ft
Con
d.
(MS)
M.O
.L 302
505
524
316
229
229
22c
195
25£
250
197
331
459
452
2420 686
545
513
Cot
of "
WC
W
.- '
"'"'<
< 20 20 10 10
"""C
o"
(mart
)
',¥.«
ftt» 45 73
82.3 47 39 38 43 34 45 45 25 45 49 69 49 45 36 37
>.NO;
'On
g/O
-". -?.
&» 15 24
21.7 19 8
6.4
3.5
4.4
9.2
6.1 12 19 36 20 370 84 56 49
-.»*»
(mo/
0
aoot 2.
95.
75.
22 4.1
2.2
1.8
1.8
1.6
24 1,9
2.5
3.5
5.7
4.9 43 12 8.5
8.1
90
2><
mOrt>
.
ii
II II
11 ill V
"' ~
;.tt
O>
3.4 5 c
4.6
3.1
2.5 3
4.5
2.7
2.6
4.2
3.7
4.7
4.5
4.9
3.5 4
-'< »
'"
;<m
gtrti
*- a
i 22 3632
.4 30 11 9.5
6.2
6.5 13 11 20 30 68 31 660
120 99 89
Aft.
oi
COCO
3 :<
maW
;
:- "
' 1
122
203
202.
312
8
103
105
110 92 117
115 67 125
128
186
140
145
110
111
* S0
4«*
girn
" '." 0
2 18.
9
0.8
0.2
0.2
0.2
0.2
0.2
0.2
0.2
0.2
1.4
7.5 83 12 7.8
7.7
BfXt
rntfP
(MB
0.05 0.1
0,05
0.05
0.05
0.05
0.05
0.05
0.05
0.05
0.05 0.1
0.05 2.1
0.3
0.2
0.2
Caf
fon/
An
tort
;,**
»»?»
«?
V .40.
20
1.43
2,16
-0.9
71.
48
-0.1
0
2.46
1.08
1.81
0.21
-0.0
8
0.77
0.14
3.90
-1,1
6-1
.49
Aran
fofi
fern
';w>
«T
O.C
6
Pho
jph
ate
fcM
; 0.0
;
S*H
<V«>
w <%»>
' ,
* ?.,
, ,
K
Bla
nk c
ells
indi
cate
no
sam
ple,
no
mea
sure
men
t, no
ana
lysi
s or
that
the
mea
sure
men
t was
not
app
licab
le a
t tha
t site
. O
utlin
ed c
ells
indi
cate
the
resu
lt w
as f
lagg
ed (
e.g.
val
ue e
xces
sive
ly lo
w o
r hig
h, n
ot in
kee
ping
with
his
tory
, etc
.) an
d is
susp
ect.
Cat
ion/
anio
n ba
lanc
e is
cal
cula
ted
usin
g m
illie
quiv
alen
ts a
s (c
atio
ns-a
nion
s)/(c
atio
ns+a
nion
s)*1
00.
Res
ults
bel
ow th
e m
inim
um d
etec
tion
limit
(M.D
.L.)
are
liste
d as
the
M.D
.L.
60

Tab
le V
III-
1. C
hem
ical
Ana
lyse
s Fr
om R
esea
rch
Site
Loc
atio
ns:
Sept
embe
r 20
-Oct
ober
5,
1999
Pag
e 2
of 2
. *: -.
- *s
«»,»
toe
Ba
yaW
L31S
OU
THSI
DE
L31W
-S33
2HW
MP3
7M
P67-
NM
P67-
SM
S-1
MS-
10M
S-11
MS-
12
MS-
13M
S- 1
4M
S-14
BAC
KUP
MS-
15
MS- 1
6MS
- 17
MS-
18M
S-19
MS- 1
BA
CK
UP
MS-
2
MS-
20M
S-21
MS-
22M
S-3
MS-
4M
S-5
MS-
6M
S-7
MS-
8M
S-9
MW
OFE
130N
P67
i-175
itiliW
Cito
r Cro
okR
B-U
EJp
stre
am T
ayto
r Riv
erVe
st H
ighw
ay C
reek
SB*
1;
&*
»*.
v"-V
,-\ sw sw sw sw sw sw sw sw sw sw sw sw sw sw sw sw sw sw sw sw sw sw sw sw sw sw sw sw sw sw sw sw sw sw sw sw
oo»
:
10/5
/998
:30
9/22
/99
0:00
9/22
/99
0:00
9/27
/99
14:4
09/
22/9
9 0:
009/
22/9
9 0:
009/
20/9
9 0:
009/
20/9
9 0:
009/
20/9
9 0:
009/
20/9
9 0:
009/
20/9
9 0:
009/
20/9
9 0:
009/
22/9
9 0:
009/
20/9
9 0:
009/
20/9
9 0:
009/
20/9
9 0:
009/
20/9
9 0:
009/
20/9
9 0:
009/
22/9
9 0:
009/
20/9
9 0:
009/
20/9
9 0:
009/
20/9
9 0:
009/
20/9
9 0:
009/
20/9
9 0:
009/
20/9
9 0:
009/
20/9
9 0:
009/
20/9
9 0:
009/
20/9
9 0:
009/
20/9
9 0:
009/
20/9
90:0
09/
23/9
9 0:
009/
29/9
9 9:
2510
/5/9
9 13
:00
9/22
/99
0:00
10/5
/999
:45
10/5
/991
3:30
ftetd
Para
mflt
oB
Tem
p..<
«?'
27.2
27.5
27.4
27.7
28.0
28.7
28.3
29.0
29.4
30.2
30.2
30.3
30.7
26.9
26.8
26.9
27.3
27.4
27.4
27.5
.'PR
;
8.02 8.
4
7.37
7.93
7.95
8.01
8.04
8.12
7.94
8.08
7.96
8.02
8.12
7.37
7.82
8.15
8.12
7.53
7.74 7.
77.
827.
787.
947.
89
7.23 8.1
7,72 8.2
.i DO
;(r
nafl>
QRP
<»V)
***;
Con
d,:
«U
» 471
321
297
287
266
256
276
267
291
303
290
408
300
282
289
408
387
380
369
362
344
333
«tot
r*
.:spi
& Co
nd.
<MS>
M.D
.1.
/u4
481
475
203
190
167
460
315
214
284
466
284
375
1410 500
4010 24
465
787
4
' «
WC
OJ:
*!
01 10 9 20 50 20
'-' C
o
<mo/
U
OJ3
2 42 75 7330
.8 35 29 69 40 29 38 71 37 50 2579
.8 58 45 35 54
* N
o »;
<mg/
U ft! 89 22 21 6.4 2
2.8 22 19 12 16 23 17 22 2.7
22.3
640 15 71 96
,w WO
W
aooi 12 4.
84.
81.
93 1.3
1.2
4.9 4
2.8
3.4
5.1
3.3
4.6
1.2
4.7 71 3.3 11 15
S02
:«*« 0
£]
4.9
5.2
5.3
2.1 2
4.7
3.6
2.6
3.3
5.7
4.1
3.9
2.2
4.6 6
3.2
4.7
,: *'C
f
«*8
flJ
."**
...
> .;
"
-.9
X
130 34 33
11.4 5.3
5.2 35 29 17 24 34 26 34 4.7
33.1
1200 22 12
016
0
Aft.
<M
CaC
O3
«"
~
:-
, t
134
200
200
83.9 90 78 190
117 84 109
195
105
140 66
200.
415
512
411
416
7
SO
*
;«w»fl
j ta 12 2.1 ^
0.3
0.2 3
1.5
0.3
0.2
2.3
0.2
1.6
0.2
140
0.6 10 22
IPw
w
' |0
.05
0.3
0.05
0.05
0.05
0.05
0.05
0.05
0.05
0.05
0.05
0.05
0.05
0.05
0.05
0.05 0.
30.
4
Car
ton/
? «
*".
Bala
nce-
;, Jf
»..v
:.
,, .,.
3.91
1.23
0.09
0.85
-1.1
8-0
.02
-0.2
4
0.89
0.26
0.92
0.42
0.82
0.35
-1.8
01.
060.
030.
60
Am
nion
lu
rri
. @a> -iibs
Prr
apft
. at
e .,
<HM
)
'Ki:.
$K&
5%;<
°V
,*.'V
' -3
.8
-1.6
-2.6
:s'M'
; fe ,.
'..' >
.-0
.7
-0.2
6
-0.6
8
Bla
nk c
ells
indi
cate
no
sam
ple,
no
mea
sure
men
t, no
ana
lysi
s or
that
the
mea
sure
men
t was
not
app
licab
le a
t tha
t site
. O
utlin
ed c
ells
indi
cate
the
resu
lt w
as f
lagg
ed (
e.g.
val
ue e
xces
sive
ly lo
w o
r hi
gh, n
ot in
kee
ping
with
his
tory
, etc
.) an
d is
susp
ect.
Cat
ion/
anio
n ba
lanc
e is
cal
cula
ted
usin
g m
illie
quiv
alen
ts a
s (c
atio
ns-a
nion
s)/(c
atio
ns+a
nion
s)*1
00.
Res
ults
bel
ow th
e m
inim
um d
etec
tion
limit
(M.D
.L.)
are
liste
d as
the
M.D
.L.
61

Table VIII-2. Water Levels and Hydraulic Gradients: September 20-23, 1999
soofo ~-
121
;i241127;i28;!280P1129;!29DP=!M;!30(!0-)!!30(521)II30DP;i3i;!3!DP;i35:i36;i37;IM;i42;i46;!46DP
:i47:i4a:i49;i5!(CP)IW-23IW-24IW-25;w-26IW-27;w-28:w-2»:w-29-i«-!
4S-IO<IS-I!>IS-!2>IS-!3
MS-14IS- IS«-!«
4S-I8 JS-19MS-2
MS-20MS-21MS-22MS-3MS-4MS-6MS-7MS-8MS-9
SH*
^^jyp*;
swswswswdpswdpsw
QW
gwdpswdpswswswswswswdpswswswswswswswswswswswswswswswswswswswswswswswswswswswswswswswsw
Water Uvd ; ObwvaJkm
Date' v .".
9/23/99 8:399/23/99 8:499/23/99 8:599/23/999:109/23/999:109/23/99 9:239/23/99 9:239/23/99 9:459/23/99 9:459/23/99 9:459/23/99 9:459/23/99 9:369/23/99 9:36
9/23/99 10:259/23/99 10:359/23/99 10:459/23/99 10:509/23/99 1 1 .009/23/99 13:10
9/23/99 13:10
9/23/9911:229/23/99 12:059/23/9912:159/23/9912:409/20/99 0:009/20/99 0:009/20/990:009/20/99 0:009/20/99 0:009/20/99 0:009/20/99 0:009/20/990:009/20/990:009/20/990:009/20/990:009/20/99 0:009/20/99 0:009/20/990:009/20/990:009/20/99 0:009/20/99 0:009/20/99 0:009/20/990:009/20/99 0:009/20/99 0:009/20/990:009/20/99 0:009/20/99 0:009/20/99 0:009/20/99 0:009/20/99 0:009/20/99 0:00
Sk*
((MO
3.681.833.293.16
3.08
2.94
2.782.632.5
2.372.382.28
2.252.28
2.32.37
Wot« Deptha**o
1.831.711.632.21
1.96
1.54
2.75
1.581.921.421.381.831.63
1.922.131.922.210.83
10.790.670.92
10.58
11.5
0.920.670.830.71
0.50.460.380.42
0.51.5
0.710.670.751.17
1.10.250.420.33
1
Head , DM.
ftwrfl
-0.25
0
-3-2.5
0
0
4.3
; Hy46w*wl(tiOWflWOIXf :.
pOlfltV0y;: . --.-v
-1.12E-03
C
-9.84E-03-1.58E-03
C
C
7.58E-02
Head difference = tapedown water level inside piezometer/well - tapedown water level outside piezometer/well. Reference is top of piezometer/well casing. Correction for bias: 0.3 cm added to inside tapedown if drivepoint diameter < 1.25".
Shaded cells indicate water depths were calculated by applying an offset to staff data.Outlined cells indicate the result was flagged (e.g. value excessively low or high, not in keeping with history, etc.) and is
suspect.
62

WaaHigt roy Creek
f° 530,000 535,000 540,000 545,000 550,000 555,000
Figure VIII-1. Surface-water monitoring sites: September 20-October 5, 1999.
63

8-
E128DP
E129DP
E146DP
, ' i 1 ii ,' ' -'1 r ".
< ! i
"*:'-* i. ~-Vj-''
-i *
UTM NAD27 Metric Grid
Ioo 530,000 ol
535,000 540,000 545,000 550.000 555,000
Figure VIII-2. Ground-water monitoring sites: September 20-October 5, 1999.
64

APPENDIX IX
Data Collected in Taylor Slough and Vicinity between
October 25 and 28,1999
65
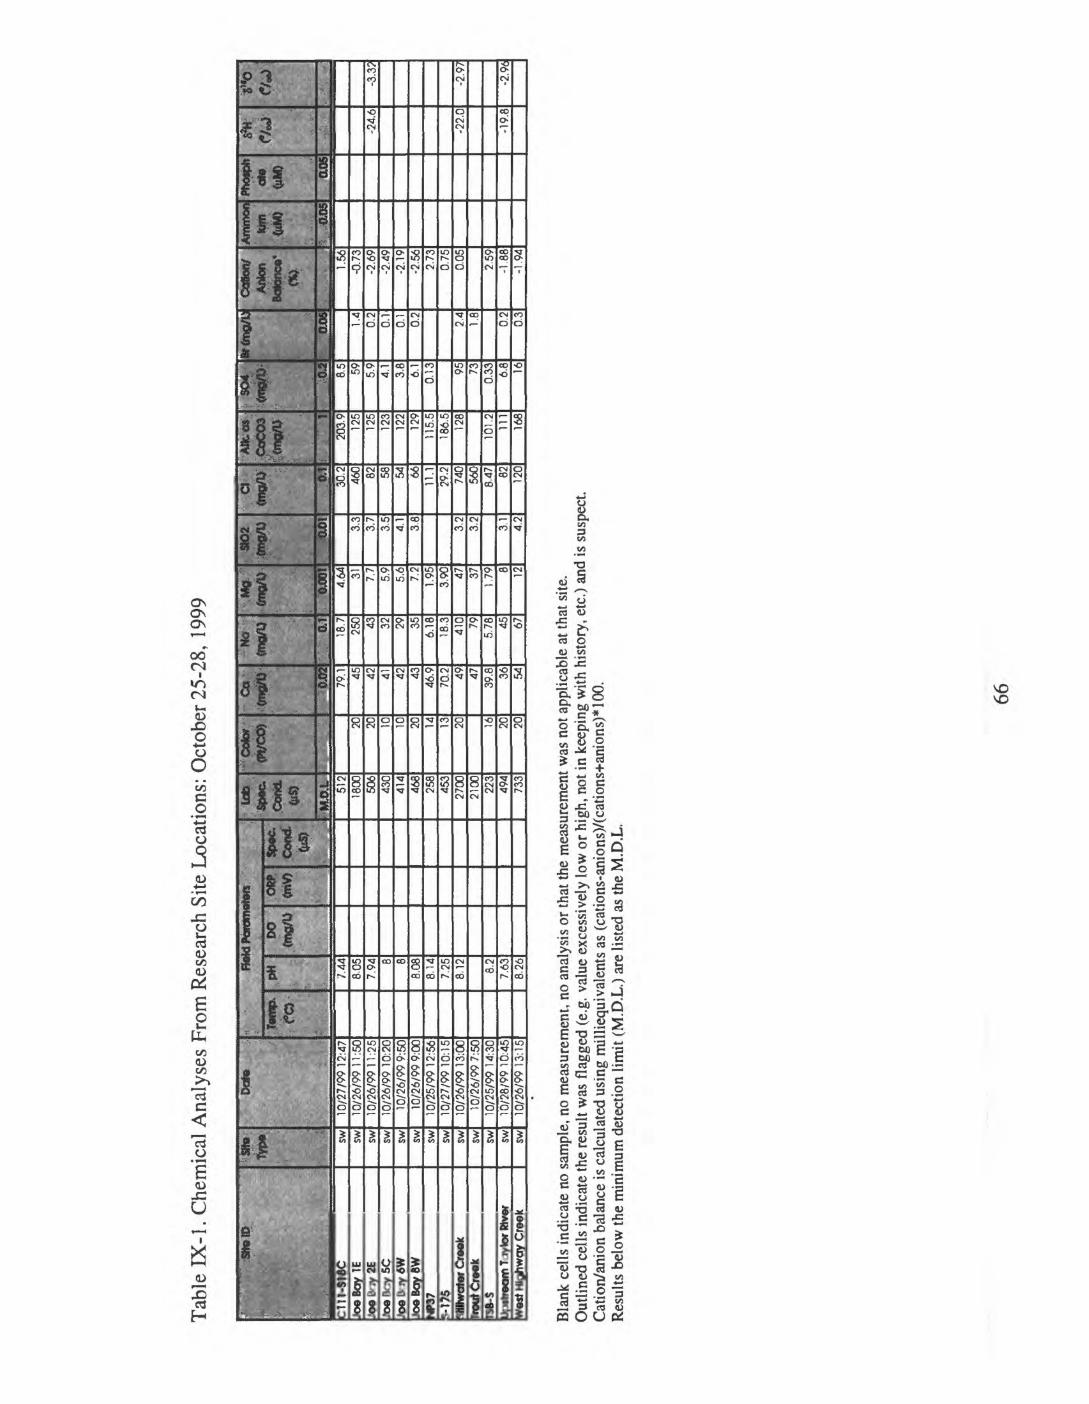
Tab
le D
C-1.
Che
mic
al A
naly
ses
From
Res
earc
h Si
te L
ocat
ions
: O
ctob
er 2
5-28
, 19
99
* "
" :.S
t».S
»i
:in-s
i8C
foe
Boy
IE
:oe
i v
2E!o
e r
ry 5
C o
e L
!v 6
Wto
e B
oy 6
W*3
7*-
l?5
ttUlw
oter
Cre
ekire
ui C
reek
fSB-
SJf
atre
arn
T ly
tor
Riv
erw
est H
ighw
ay C
reek
ijSte
; sw sw sw sw sw sw sw sw sw sw sw sw sw
Dat
e
10/2
7/99
12:4
710
/26/
9911
:50
10/2
6/99
11:2
510
/26/
99 1
0:20
10/2
6/99
9:50
10/2
6/99
9:00
10/2
5/99
12:5
610
/27/
9910
:15
10/2
6/99
13:0
010
/26/
997:
5010
/25/
99 1
4:30
10/2
8/99
10:4
510
/26/
9913
:15
-.
HoW
Par
amet
ers
Jem
p,'.. m
pK /4
48.
057.
94 8 88.
088.
147.
258.
12 8.2
7.63
8.26
DO
a?
<niv>
SfW
C.
Cor
xt
?*
*?
:
CO
M.
M.D
.L 512
1800 506
430
414
468
258
453
2700
2100 223
494
733
**»
20 20 10 10 20 14 13 20 16 20 20
***; OJ
3279
.1 45 42 41 42 4346
.970
.2 49 4739
.8 36 54
**
" ".;
&i 18.7
250 43 32 29 35
6.18
18.3
410 79
5.78 45 67
tmslO <M
»14.
64 31 7.7
5.9
5.6
7.2
1.95
3.90 47 37
1.79 8 12
rjS
02 0.
01 3.3
37 3.5
4.1
3.8
3.2
3.2
3.1
4.2
''.". a
:' .0;?
30.2
460 82 58 54 66
11.1
29.2
740
560
8.47 82 12
0
Altt
-ai
:' .
. "
1
203.
912
512
512
312
212
911
5.5
186.
512
8
101.
211
116
8
i **
,
Mt 8.5 59 5.9
4.1 3.8
6.1
0.13 95 73
0.33 6.
8 16
BK
mg/
U
aos
1.4
0.2
0.1
0.1
0.2
2.4
1.8
0.2
0.3
Cot
ton/
A
nton
B
alan
ce*
..,.-,
. . 1.56
-0.7
3-2
.69
-2.4
9-2
.19
-2.5
62.
730.
750.
05
2.59
-1.8
8-1
.94
Am
rnor
)tur
n. ;
', «#»
.
}.,
:,<
«»
PtXM
phat
e, aos
^ ,,,,. ;.:
-24.
6
-22.
0
-19.
8
r«
. '
. !
-3.3
?
-2.9
7
-2.9
i:
Bla
nk c
ells
indi
cate
no
sam
ple,
no
mea
sure
men
t, no
ana
lysi
s or
that
the
mea
sure
men
t was
not
app
licab
le a
t tha
t site
. O
utlin
ed c
ells
indi
cate
the
resu
lt w
as f
lagg
ed (
e.g.
val
ue e
xces
sive
ly lo
w o
r hig
h, n
ot in
kee
ping
with
his
tory
, etc
.) an
d is
susp
ect.
Cat
ion/
anio
n ba
lanc
e is
calc
ulat
ed u
sing
mill
iequ
ival
ents
as
(cat
ions
-ani
ons)
/(cat
ions
+ani
ons)
*100
. R
esul
ts b
elow
the
min
imum
det
ectio
n lim
it (M
.D.L
.) ar
e lis
ted
as th
e M
.D.L
.
66
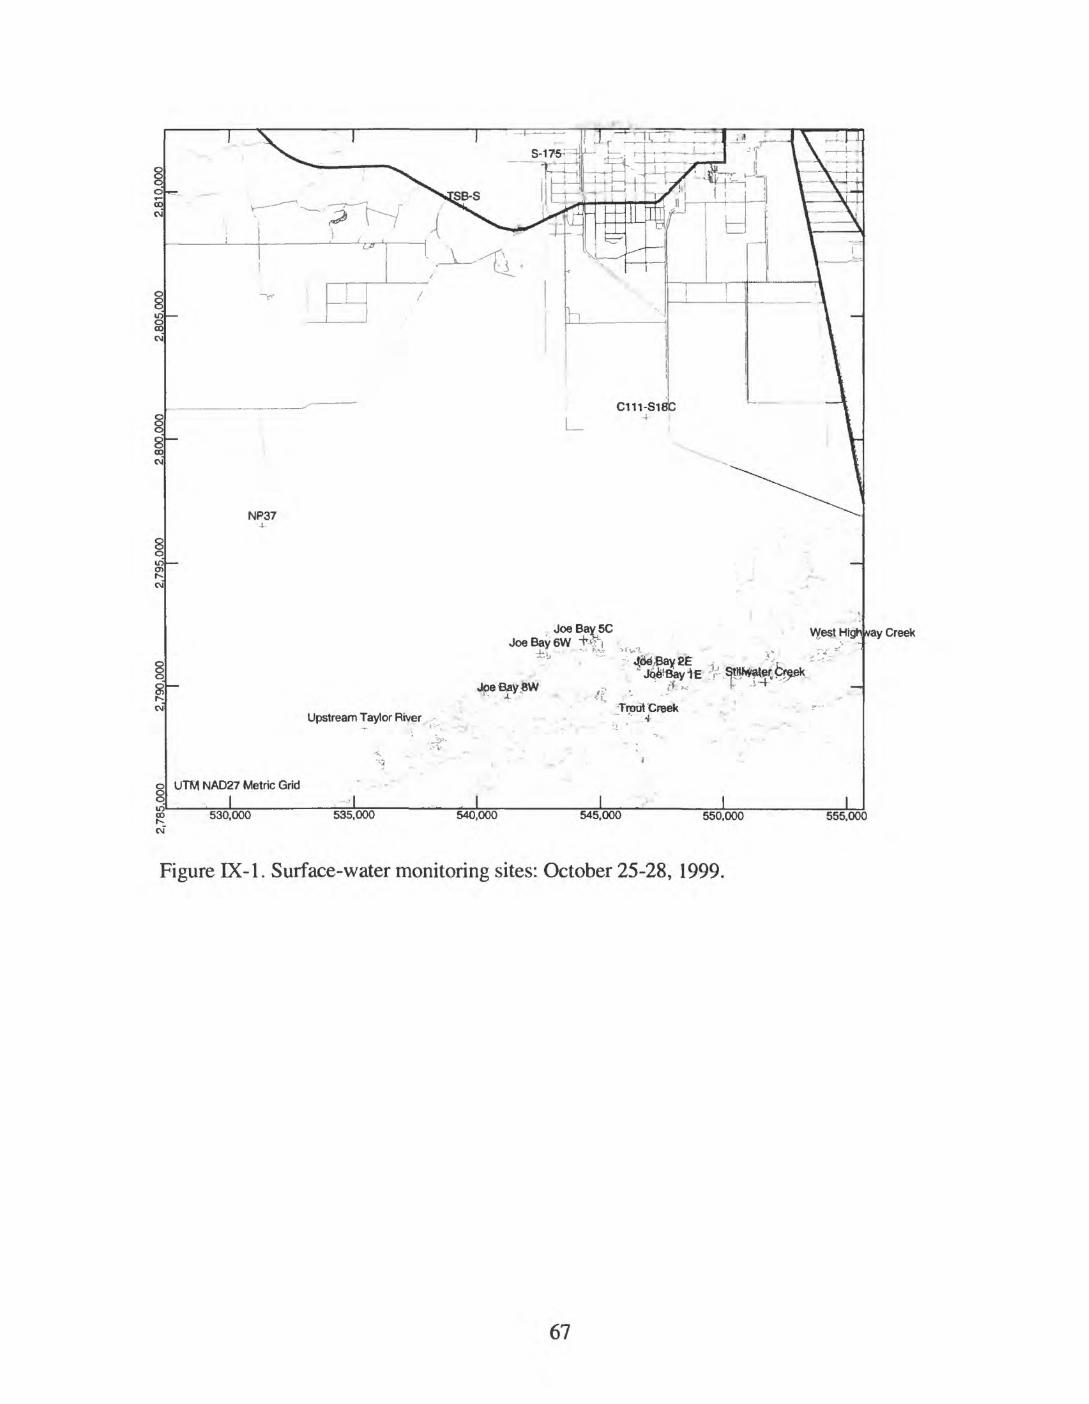
NP37
Joe Bay 5C Joe Bay 6W +#j
Joe Bay CW
West HtgH vay Creek
. - Upstream Taylor River . : * ''
Tradt Creek " .-.-' ~ ' 4 T
UTM NAD27 Metric Grid
______I________ Ioo 530,000 535,000 540,000 545,000 550,000 555,000
Figure EX-1. Surface-water monitoring sites: October 25-28, 1999.
67