U.S. Geological Survey Science for the Wyoming Landscape Conservation Initiative—2012 annual...
83
U.S. Geological Survey Science for the Wyoming Landscape Conservation Initiative—2012 Annual Report Open-File Report 2014–1093 U.S. Department of the Interior U.S. Geological Survey
Transcript of U.S. Geological Survey Science for the Wyoming Landscape Conservation Initiative—2012 annual...
U.S. Geological Survey Science for the Wyoming Landscape Conservation Initiative—2012 Annual Report
Open-File Report 2014–1093
U.S. Department of the Interior U.S. Geological Survey

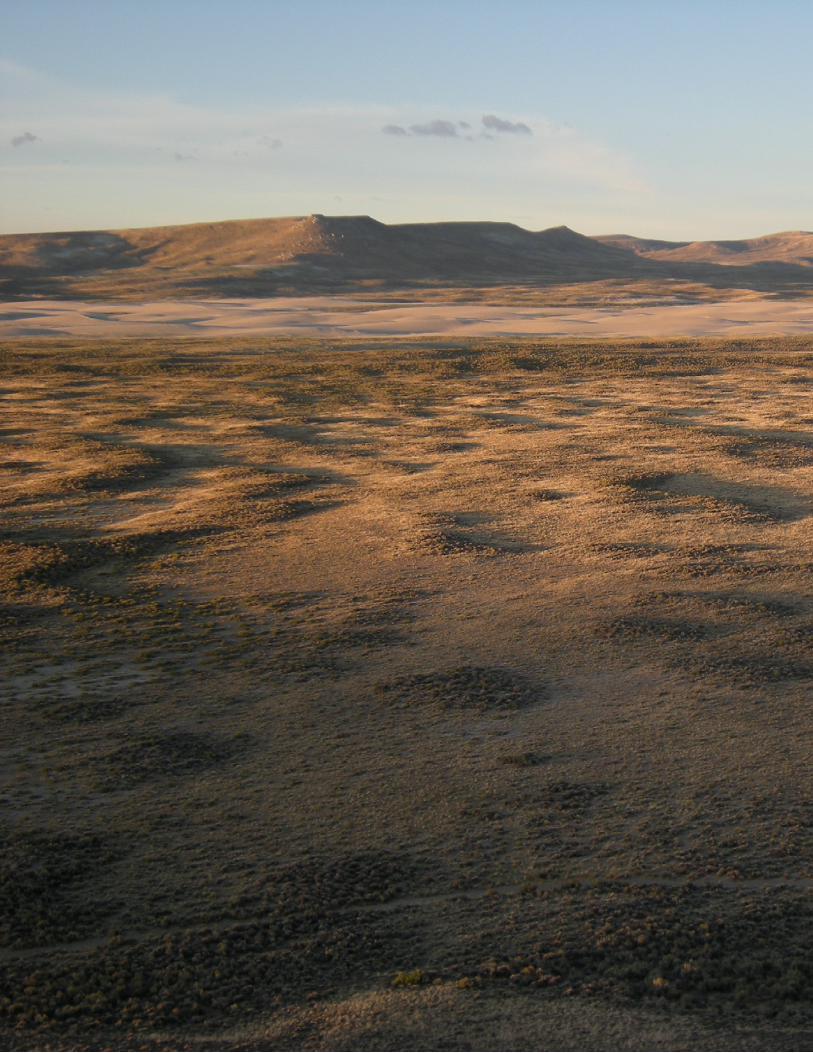
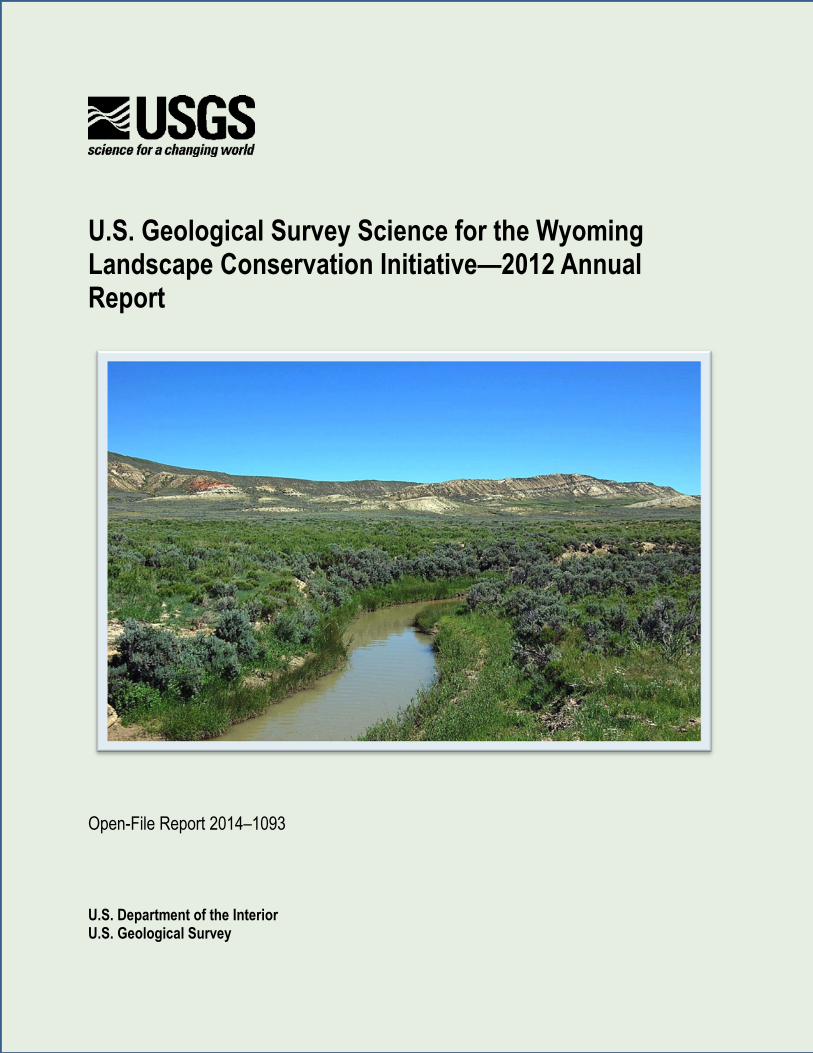
Front and back cover photographs: (Front) Muddy Creek, Wyoming. Aquatic and riparian habitats have been a significant focal point of recent U.S. Geological Survey science efforts in the Wyoming Landscape Conservation Initiative study area. Photo by Robert McDougal, U.S. Geological Survey. (Back) The Sand Dunes Wilderness Study Area, located southeast of Farson, Wyoming, is one of the many locations evaluated by the U.S. Geological Survey’s pygmy rabbit research team. The team has been conducting on-the-ground pygmy rabbit occupancy surveys to assess and improve the accuracy of an existing pygmy rabbit habitat model, and lidar imagery is being evaluated for its usefulness as a tool for identifying and mapping potential pygmy rabbit habitat across the species’ range. Photo by Spencer Schell, U.S. Geological Survey.
U.S. Geological Survey Science for the Wyoming Landscape Conservation Initiative— 2012 Annual Report
By Zachary H. Bowen, Cameron L. Aldridge, Patrick J. Anderson, Timothy J. Assal, Carleton R. Bern, Laura R.H. Biewick, Gregry K. Boughton, Natasha B. Carr, Anna D. Chalfoun, Geneva W. Chong, Melanie L. Clark, Bradley C. Fedy, Katharine Foster, Steven L. Garman, Stephen Germaine, Matthew G. Hethcoat, Collin Homer, Matthew J. Kauffman, Douglas Keinath, Natalie Latysh, Daniel Manier, Robert R. McDougal, Cynthia P. Melcher, Kirk A. Miller, Jessica Montag, Christopher J. Potter, Spencer Schell, Sarah L. Shafer, David B. Smith, Michael J. Sweat, and Anna B. Wilson
Open-File Report 2014–1093
U.S. Department of the Interior U.S. Geological Survey
ii
U.S. Department of the Interior SALLY JEWELL, Secretary
U.S. Geological Survey Suzette M. Kimball, Acting Director
U.S. Geological Survey, Reston, Virginia 2014
For product and ordering information: World Wide Web: http://www.usgs.gov/pubprod Telephone: 1-888-ASK-USGS
For more information on the USGS—the Federal source for science about the Earth, its natural and living resources, natural hazards, and the environment: World Wide Web: http://www.usgs.gov Telephone: 1-888-ASK-USGS
Suggested citation: Bowen, Z.H., Aldridge, C.L., Anderson, P.J., Assal, T.J., Bern, C.R., Biewick, L.R.H., Boughton, G.K., Carr, N.B., Chalfoun, A.D., Chong, G.W., Clark, M.L., Fedy, B.C., Foster, Katharine, Garman, S.L., Germaine, Stephen, Hethcoat, M.G., Homer, Collin, Kauffman, M.J., Keinath, Douglas, Latysh, Natalie, Manier, Daniel, McDougal, R.R., Melcher, C.P., Miller, K.A., Montag, Jessica, Potter, C.J., Schell, Spencer, Shafer, S.L., Smith, D.B., Sweat, M.J., and Wilson, A.B., 2014, U.S. Geological Survey science for the Wyoming Landscape Conservation Initiative—2012 annual report: U.S. Geological Survey Open-File Report 2014–1093, 71 p., http://dx.doi.org/10.3133/ofr20141093.
ISSN 2331-1258 (online)
Any use of trade, product, or firm names is for descriptive purposes only and does not imply endorsement by the U.S. Government.
Although this report is in the public domain, permission must be secured from the individual copyright owners to reproduce any copyrighted material contained within this report.

iii
Contents Introduction and Highlights of 2012 Accomplishments .................................................................................................. 1
Background of the Wyoming Landscape Conservation Initiative ................................................................................ 1 The USGS FY2012 WLCI Annual Report: What’s New? ........................................................................................... 3 Identifying and Prioritizing USGS Science and Technical Assistance Activities for the Wyoming Landscape Conservation Initiative ................................................................................................................................................ 4
Partner Management Needs .................................................................................................................................. 4 U.S. Geological Survey Framework for WLCI Science and Technical Assistance ................................................. 4 WLCI Committee Guidance .................................................................................................................................. 10
Highlights of USGS FY2012 Accomplishments ........................................................................................................ 11 Baseline Synthesis ............................................................................................................................................... 11 Targeted Monitoring and Research ...................................................................................................................... 13 Data and Information Management ...................................................................................................................... 17
Baseline Synthesis Activities ....................................................................................................................................... 18 Application of Comprehensive Assessment to Support Decision-making and Conservation Actions ....................... 18 Modeling Land Use/Cover Change .......................................................................................................................... 19 Assessing Energy Resources .................................................................................................................................. 21 Developing Remote Sensing Applications for Geological, Vegetation, and Soil Investigations: Mapping Invasive Plants ....................................................................................................................................................................... 22 Assessing Mineral Resources .................................................................................................................................. 23 Assessing Energy Exploration/Development Impacts on Biogeochemical Cycling in the Muddy Creek Watershed 25 Western Energy Citation Clearinghouse .................................................................................................................. 26 Assessing Wildlife Vulnerability to Energy Development ......................................................................................... 27 Climate Change and Simulating Potential Future Vegetation................................................................................... 29 Developing Regional Curves Relating Bankfull-Channel Geometry and Discharge to Drainage Area for the Rocky Mountain Hydrologic Region in Wyoming ................................................................................................................ 30
Targeted Research and Monitoring: Long-Term Monitoring Activities ......................................................................... 31 Framework and Indicators for Long-Term Monitoring .............................................................................................. 31 Remote Sensing and Vegetation Inventory and Monitoring ..................................................................................... 33 Long-Term Monitoring of Soil Geochemistry ............................................................................................................ 34 Long-Term Monitoring of Surface Water and Groundwater Hydrology .................................................................... 36 Wyoming Groundwater-Quality Monitoring Network ................................................................................................ 38 New Fork River Periphyton and Bed Sediment Analysis .......................................................................................... 39 Muddy Creek Synoptic Study: Current Status of Aquatic Ecology ........................................................................... 40 Analyzing Salinity Patterns in Muddy Creek, Carbon County, Wyoming .................................................................. 42 A Retrospective Assessment of Groundwater Occurrence in the Normally Pressured Lance Formation and a Field Reconnaissance of Existing Water Wells in the Study Area ............................................................................ 43
Objectives ............................................................................................................................................................. 43 Study Area and Methods ...................................................................................................................................... 43
Targeted Research and Monitoring: Effectiveness Monitoring Activities...................................................................... 46 Applying Greenness Indices to Evaluate Sagebrush Treatments in the WLCI Region ............................................ 46 Mapping Mixed Mountain Shrub Communities to Support WLCI Conservation Planning and Effectiveness Monitoring of Habitat Treatments ............................................................................................................................. 48
Objectives ............................................................................................................................................................. 49 Study Area and Methods ...................................................................................................................................... 49
Greater Sage-Grouse Use of Vegetation Treatments .............................................................................................. 50
iv
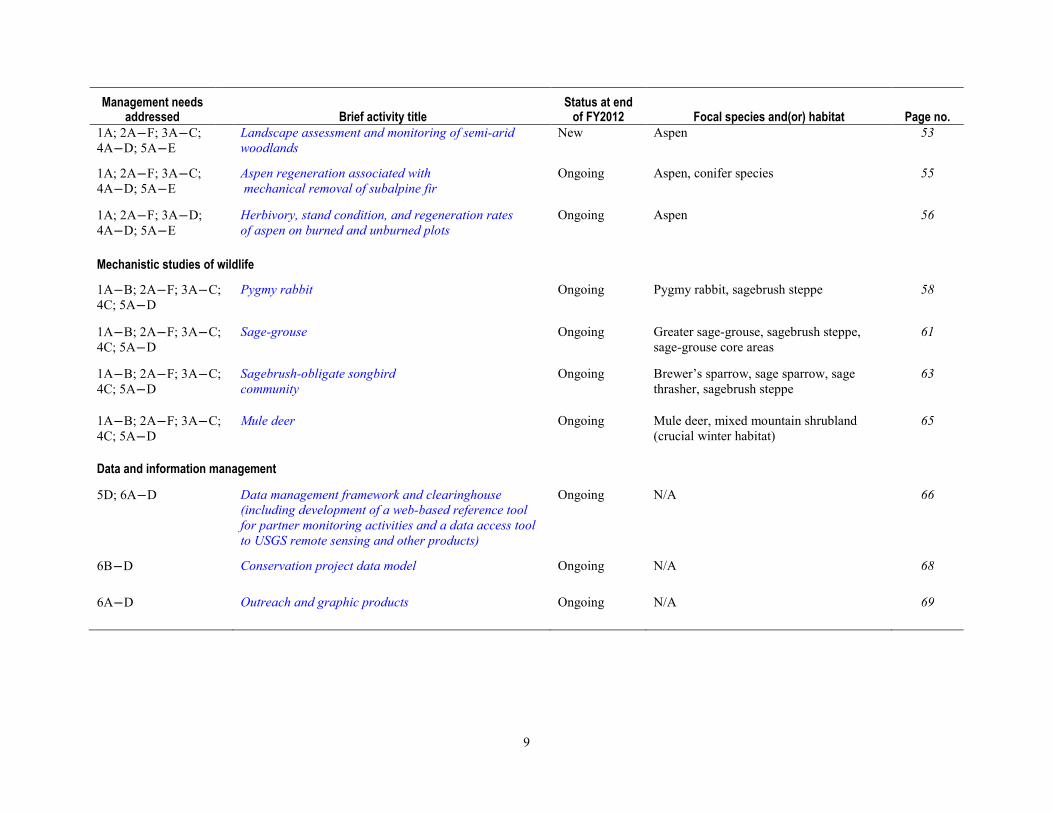
Occurrence of Cheatgrass Associated with Habitat Projects in the Little Mountain Ecosystem ............................... 52 Landscape Assessment and Monitoring of Semi-Arid Woodlands in the Little Mountain Ecosystem ....................... 53
Objectives ............................................................................................................................................................. 53 Study Area and Methods ...................................................................................................................................... 54
Aspen Regeneration Associated with Mechanical Removal of Subalpine Fir ........................................................... 55 Herbivory, Stand Condition, and Regeneration Rates of Aspen on Burned and Unburned Plots in the Little Mountain Ecosystem ................................................................................................................................................ 56
Targeted Research and Monitoring: Mechanistic Research of Wildlife ........................................................................ 58 Pygmy Rabbit ........................................................................................................................................................... 58 Sage-Grouse ............................................................................................................................................................ 61 Mechanistic Understanding of Energy Development Effects on Songbirds .............................................................. 63 Mule Deer: Identifying Threshold Levels of Development that Impede Wyoming Ungulate Migrations .................... 65
Data and Information Management Activities .............................................................................................................. 66 Data Management Framework and Clearinghouse .................................................................................................. 66 Science and Conservation Projects Database ......................................................................................................... 68 Outreach and Graphic Products ............................................................................................................................... 69
References Cited ......................................................................................................................................................... 70
Figures 1. The Wyoming Landscape Conservation Initiative region, with county boundaries, major drainages, roads,
and cities/towns shown.. ............................................................................................................................... 2 2. The U.S. Geological Survey’s approach to researching and monitoring ecosystem components. ............. 10 3. Example of simulated energy development from 2010 to 2026. ................................................................. 20 4. Locations of U.S. Geological Survey’s fiscal year 2012 field-based study areas associated with Baseline
Synthesis projects in the Wyoming Landscape Conservation Initiative study area. .................................... 24 5. Exposure index plotted against the uncertainty index for Wyoming’s Species of Greatest Conservation
Need………. ............................................................................................................................................... 28 6. Example of change in percent bare ground at QuickBird site 1. ................................................................. 33 7. Soil sample locations in the Wyoming Landscape Conservation Initiative study area ................................ 35 8. The probability of exceeding the Environmental Protection Agency’s ecological soil screening level of zinc
for birds in the Wyoming Landscape Conservation Initiative study area ..................................................... 35 9. Locations of U.S. Geological Survey’s fiscal year 2012 field-based study areas associated with Long-term
Monitoring projects in the Wyoming Landscape Conservation Initiative study area. ................................... 37 10. Relationships between stream discharge and total dissolved solids for different years at the stream gage
on Muddy Creek just above Baggs, Wyo.. .................................................................................................. 42 11. Locations of U.S. Geological Survey’s fiscal year 2012 field-based study areas associated with
Effectiveness Monitoring projects in the Wyoming Landscape Conservation Initiative study area. ............ 47 12. Annual mean precipitation in the Little Mountain Ecosystem, 1895–2011. ................................................. 54 13. Aspen regeneration at study sites on Little Mountain. Additional study site locations within the Little
Mountain Ecosystem include Aspen Mountain and Pine Mountain ............................................................. 57 14. Locations of U.S. Geological Survey’s fiscal year 2012 study areas associated with Mechanistic Research
of Wildlife activities for the Wyoming Landscape Conservation Initiative. ................................................... 59 15. Pygmy rabbit site occupancy diminished with increasing density of gas well pads. .................................... 60 16. Raster images showing digitized well pads, road networks, pipelines, and sagebrush habitat as distinct
patches. ...................................................................................................................................................... 64

v
17. Movement rates of mule deer ..................................................................................................................... 65
Tables 1. Major management needs, objectives, and short- and long-term activities identified by partners of the
Wyoming Landscape Conservation Initiative during workshops and meetings in 2006 and 2007. ............... 5 2. Summary of management needs addressed by activities conducted by the U.S. Geological Survey’s
Wyoming Landscape Conservation Initiative Science Team in Fiscal Year 2012 ......................................... 7 3. Number of wells visited, preliminary aquifer assignment, and results of the field visit to determine which
wells meet the Bureau of Land Management’s “credible and suitable” criteria and the U.S. Geological Survey’s criteria for monitor wells to be used in the Normally Pressured Lance project area ..................... 45
vi
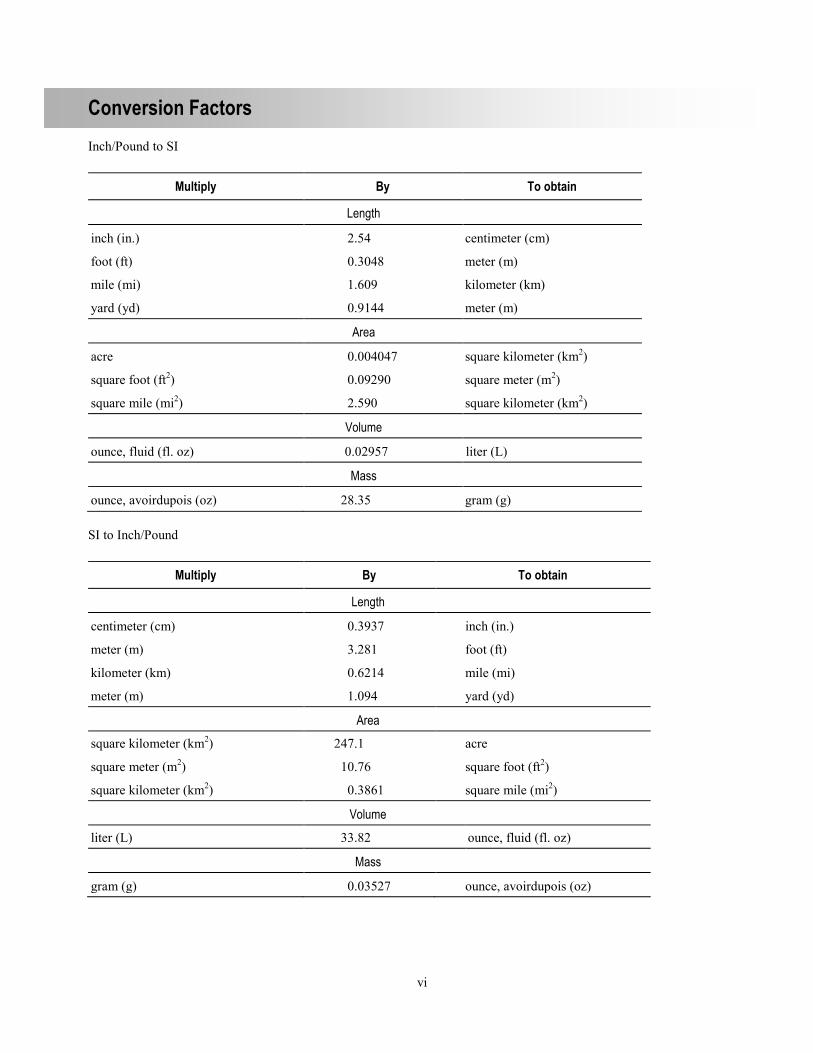
Conversion Factors Inch/Pound to SI
Multiply By To obtain
Length
inch (in.) 2.54 centimeter (cm)
foot (ft) 0.3048 meter (m)
mile (mi) 1.609 kilometer (km)
yard (yd) 0.9144 meter (m)
Area
acre 0.004047 square kilometer (km2)
square foot (ft2) 0.09290 square meter (m2)
square mile (mi2) 2.590 square kilometer (km2)
Volume
ounce, fluid (fl. oz) 0.02957 liter (L)
Mass
ounce, avoirdupois (oz) 28.35 gram (g) SI to Inch/Pound
Multiply By To obtain
Length
centimeter (cm) 0.3937 inch (in.)
meter (m) 3.281 foot (ft)
kilometer (km) 0.6214 mile (mi)
meter (m) 1.094 yard (yd)
Area square kilometer (km2) 247.1 acre
square meter (m2) 10.76 square foot (ft2)
square kilometer (km2) 0.3861 square mile (mi2)
Volume
liter (L) 33.82 ounce, fluid (fl. oz)
Mass
gram (g) 0.03527 ounce, avoirdupois (oz)
vii
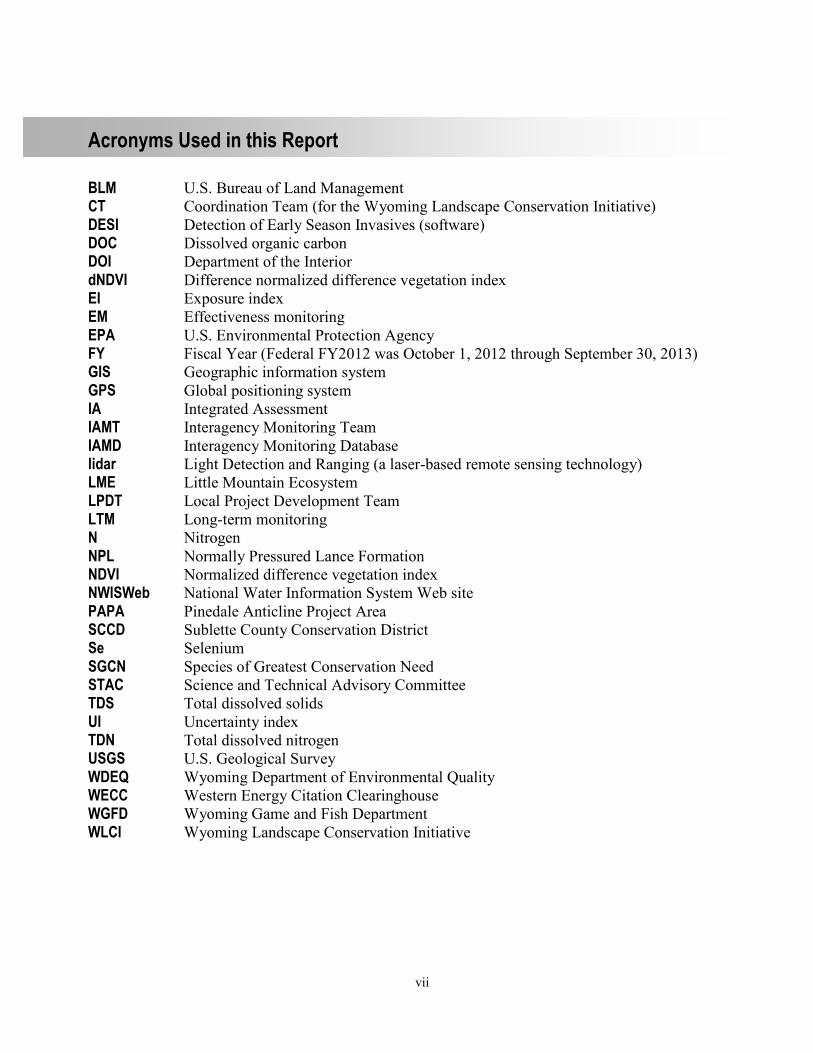
Acronyms Used in this Report
BLM U.S. Bureau of Land Management CT Coordination Team (for the Wyoming Landscape Conservation Initiative) DESI Detection of Early Season Invasives (software) DOC Dissolved organic carbon DOI Department of the Interior dNDVI Difference normalized difference vegetation index EI Exposure index EM Effectiveness monitoring EPA U.S. Environmental Protection Agency FY Fiscal Year (Federal FY2012 was October 1, 2012 through September 30, 2013) GIS Geographic information system GPS Global positioning system IA Integrated Assessment IAMT Interagency Monitoring Team IAMD Interagency Monitoring Database lidar Light Detection and Ranging (a laser-based remote sensing technology) LME Little Mountain Ecosystem LPDT Local Project Development Team LTM Long-term monitoring N Nitrogen NPL Normally Pressured Lance Formation NDVI Normalized difference vegetation index NWISWeb National Water Information System Web site PAPA Pinedale Anticline Project Area SCCD Sublette County Conservation District Se Selenium SGCN Species of Greatest Conservation Need STAC Science and Technical Advisory Committee TDS Total dissolved solids UI Uncertainty index TDN Total dissolved nitrogen USGS U.S. Geological Survey WDEQ Wyoming Department of Environmental Quality WECC Western Energy Citation Clearinghouse WGFD Wyoming Game and Fish Department WLCI Wyoming Landscape Conservation Initiative
viii
Acknowledgments The authors thank the Wyoming Landscape Conservation Initiative’s (WLCI) Science and
Technical Advisory Committee (STAC) and the Coordination Team for their ideas and advice regarding this report, and the authors acknowledge the Wyoming Game and Fish Department and the U.S. Bureau of Land Management for supporting the U.S. Geological Survey’s WLCI efforts by providing data and other information. The authors also wish to thank Mark Drummond (U.S. Geological Survey) and Jason Ransom (National Park Service) for their thorough reviews.
1
U.S. Geological Survey Science for the Wyoming Landscape Conservation Initiative—2012 Annual Report
By Zachary H. Bowen,1 Cameron L. Aldridge,2 Patrick J. Anderson,1 Timothy J. Assal,1 Carleton R. Bern,3 Laura R.H. Biewick,4 Gregory K. Boughton,5 Natasha B. Carr,1 Anna D. Chalfoun,6 Geneva W. Chong,7 Melanie L. Clark,5 Bradley C. Fedy,2 Katharine Foster,5 Steven L. Garman,8 Stephen Germaine,1 Matthew G. Hethcoat,6 Collin Homer,9 Matthew J. Kauffman,6 Douglas Keinath,10 Natalie Latysh,11 Daniel Manier,12 Robert R. McDougal,3 Cynthia P. Melcher,1 Kirk A. Miller,5 Jessica Montag,1 Christopher J. Potter,4 Spencer Schell,1 Sarah L. Shafer,8 David B. Smith,13 Micahel J. Sweat,5 Anna B. Wilson13
Introduction and Highlights of 2012 Accomplishments Background of the Wyoming Landscape Conservation Initiative
Southwest Wyoming contains abundant energy resources, wildlife, habitat, open spaces, and outdoor recreational opportunities. Although energy exploration and development have been taking place in the region since the late 1800s, the pace of development for fossil fuels and renewable energy increased significantly in the early 2000s. This and the associated urban and exurban development are leading to landscape-level environmental and socioeconomic changes that have the potential to diminish wildlife habitat and other natural resources, and the quality of human lives, in Southwest Wyoming. The potential for negative effects of these changes prompted Federal, State, and local agencies to undertake the Wyoming Landscape Conservation Initiative (WLCI) for Southwest Wyoming (fig. 1).
1 U.S. Geological Survey, Fort Collins Science Center, Fort Collins, Colo. 2 Colorado State University, Natural Resource Ecology Laboratory, Fort Collins, Colo., in cooperation with U.S. Geological Survey, Fort Collins Science Center, Fort Collins, Colo. 3 U.S. Geological Survey, Crustal Imaging and Characterization Science Center, Denver, Colo. 4 U.S. Geological Survey, Central Energy Resources Science Center, Denver, Colo. 5 U.S. Geological Survey, Wyoming Water Science Center, Cheyenne, Wyo. 6 U.S. Geological Survey, Wyoming Cooperative Fish and Wildlife Research Unit, Dept. of Zoology and Physiology, Univ.
of Wyoming, Laramie, Wyo. 7 U.S. Geological Survey, Northern Rocky Mountain Science Center, Jackson, Wyo. 8 U.S. Geological Survey, Geosciences and Environmental Change Science Center, Denver, Colo 9 U.S. Geological Survey, Earth Resources Observation and Science Center, Sioux Falls, S. Dak. 10 Wyoming Natural Diversity Database, Univ. of Wyoming, Laramie, Wyo. 11 U.S. Geological Survey, Core Science Systems, Denver, Colo. 12 Cherokee Services Group, contracted to Department of Interior, U.S. Geological Survey, Fort Collins Science Center, Fort Collins, Colo. 13 U.S. Geological Survey, Central Mineral and Environmental Resources Science Center, Denver, Colo.
2
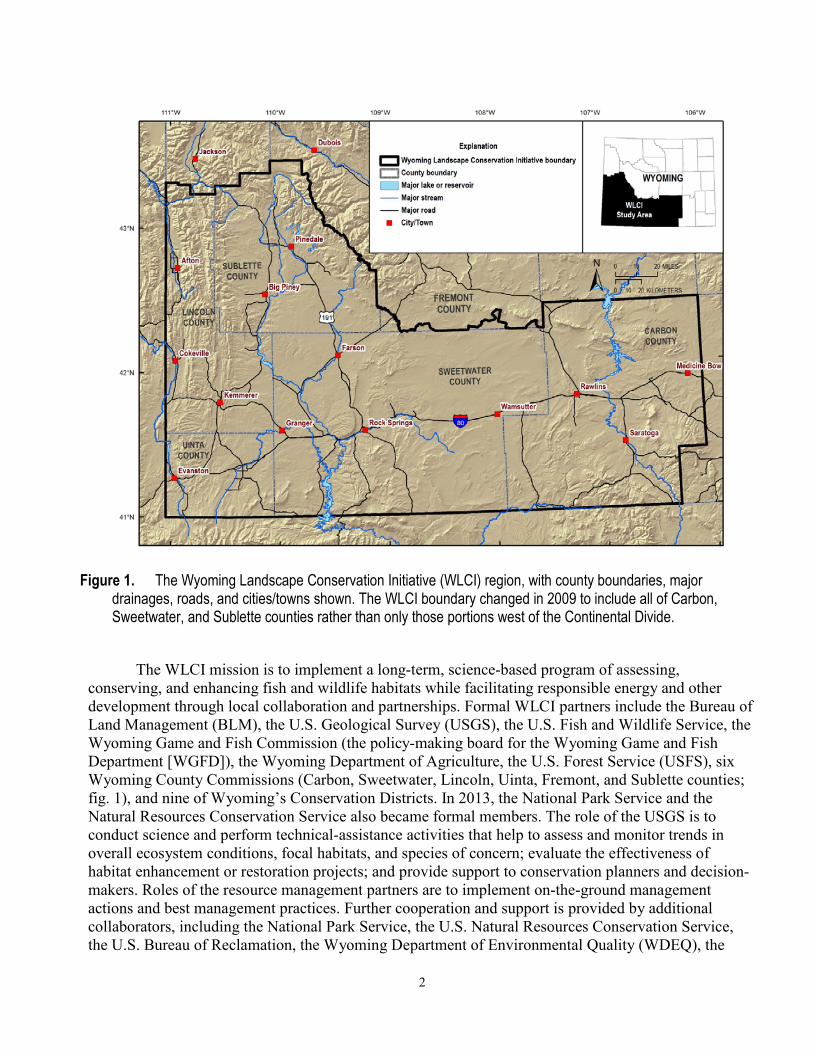
Figure 1. The Wyoming Landscape Conservation Initiative (WLCI) region, with county boundaries, major drainages, roads, and cities/towns shown. The WLCI boundary changed in 2009 to include all of Carbon, Sweetwater, and Sublette counties rather than only those portions west of the Continental Divide.
The WLCI mission is to implement a long-term, science-based program of assessing,
conserving, and enhancing fish and wildlife habitats while facilitating responsible energy and other development through local collaboration and partnerships. Formal WLCI partners include the Bureau of Land Management (BLM), the U.S. Geological Survey (USGS), the U.S. Fish and Wildlife Service, the Wyoming Game and Fish Commission (the policy-making board for the Wyoming Game and Fish Department [WGFD]), the Wyoming Department of Agriculture, the U.S. Forest Service (USFS), six Wyoming County Commissions (Carbon, Sweetwater, Lincoln, Uinta, Fremont, and Sublette counties; fig. 1), and nine of Wyoming’s Conservation Districts. In 2013, the National Park Service and the Natural Resources Conservation Service also became formal members. The role of the USGS is to conduct science and perform technical-assistance activities that help to assess and monitor trends in overall ecosystem conditions, focal habitats, and species of concern; evaluate the effectiveness of habitat enhancement or restoration projects; and provide support to conservation planners and decision-makers. Roles of the resource management partners are to implement on-the-ground management actions and best management practices. Further cooperation and support is provided by additional collaborators, including the National Park Service, the U.S. Natural Resources Conservation Service, the U.S. Bureau of Reclamation, the Wyoming Department of Environmental Quality (WDEQ), the
3
Wyoming State Land Board, the Pinedale Anticline Project Office, and the Jonah Interagency Mitigation and Reclamation Office, non-profit entities (The Nature Conservancy, Trout Unlimited), county weed and pest agencies, industry (primarily Encana), and landowners.
Since the inception of the WLCI, the USGS WLCI Science Team has included more than 50 individuals from at least seven disciplines, including biology, geology, geography, hydrology, sociology, remote sensing/geographic information systems (GIS), and data and information management. The USGS also provides a full-time liaison to the WLCI Coordination Team (CT) to facilitate the coordination of WLCI activities and to integrate our science with habitat projects, decision-making, and planning activities conducted by WLCI partners. The liaison helps to (1) inform the development of adaptive management strategies, best management practices, and prioritization of habitat projects on the basis of USGS science results; (2) integrate existing data with new knowledge and technologies; and (3) disseminate the outcomes of USGS science to partners and other stakeholders.
The USGS FY2012 WLCI Annual Report: What’s New? The USGS has produced a comprehensive annual report on its WLCI science accomplishments
for each year (2008–2011) of the WLCI (at http://pubs.usgs.gov/of/2009/1201/, http://pubs.usgs.gov/of/2010/1231/, http://pubs.usgs.gov/of/2011/1219/, and http://pubs.usgs.gov/of/2013/1033/, respectively). This is the fifth annual report, and details USGS science and technical assistance activities for FY2012. The FY2012 work accomplished, as it relates to the WLCI management needs (table 1) and other WLCI activities, is summarized in table 2. The individual activity reports follow.
To help partners focus on accomplishments, products, and take-home messages of USGS work, we have streamlined this report by providing only three major components: (1) the Introduction and Highlights; (2) shortened project activity reports for ongoing and completed projects; and (3) a list of references cited. The individual activity reports were streamlined by eliminating details of methods and results for all activities except those representing new projects initiated in FY2012; however, details of all projects, including background information and purpose, maps and descriptions of study areas, methods, and results, remain available on the WLCI Web site (www.wlci.gov).
Unlike past annual reports, this one does not include descriptions of work planned for the subsequent year (FY2013). Rather, this information has been collated in a separate document, and will be made available on the WLCI Web site under each ongoing project. In past years, we also reported on the WLCI Coordination, Science Integration, Decision-making, and Evaluation work, but because this work is so similar from year-to-year, it was determined that this information does not add significant value to the annual reports; thus, it was not included this year. However, significant work accomplished as part of these ongoing activities continues to be presented in myriad WLCI meetings and documents, important outcomes of which are generally made available on the WLCI Web site. All WLCI products are listed on the WLCI Web site at http://www.wlci.gov/. The primary contacts for WLCI Coordination, Science Integration, Decision-making, and Evaluation work continue to be Patrick Anderson (970-226-9488; [email protected]), Zachary Bowen (970-226-9218; [email protected]), and Frank D’Erchia (303-236-1460; [email protected]).
4
Identifying and Prioritizing USGS Science and Technical Assistance Activities for the Wyoming Landscape Conservation Initiative
Partner Management Needs The science and technical-assistance activities conducted by the USGS WLCI Science Team are
designed specifically to address the six major Management Needs (table 1) that were identified by WLCI partners in a series of workshops held during 2006–2007 and were subsequently outlined in the USGS WLCI Science Strategy (Bowen, Aldridge, Anderson, Chong, and others, 2009). Workshop participants included not only representatives of the WLCI partners and cooperators but also the WLCI Executive Committee (a group of government executives and elected officials who provide guidance and decision-making authority for the WLCI) and the WLCI CT (composed of interagency personnel responsible for managing daily, field-level WLCI operations and maintaining communications with WLCI partners and collaborators). Major themes of the Management Needs are to (1) identify and assess the cumulative environmental effects (current and future) associated with development activities and other major drivers of landscape change, (2) develop efficient and effective methods for monitoring ecosystem conditions across a vast and heterogeneous landscape, (3) evaluate the effectiveness of habitat enhancement and restoration projects, and (4) develop the tools for housing, displaying, and disseminating data and other information to support planning and decision-making for conserving ecosystem function and integrity in Southwest Wyoming. For each Management Need, WLCI partners also identified a series of objectives and collaborated with the USGS to identify short-term and long-term science and technical-assistance activities designed to meet the Management Need objectives (table 1). In addition to identifying Management Needs, WLCI partners also identified five priority habitats on which WLCI research, monitoring, and conservation activities are to focus: sagebrush steppe, mixed mountain shrubland, aspen (Populus tremuloides), riparian, and aquatic (table 2). It was determined that Wyoming’s wildlife Species of Greatest Conservation Need (SGCN) also should be central to USGS WLCI science and related activities.
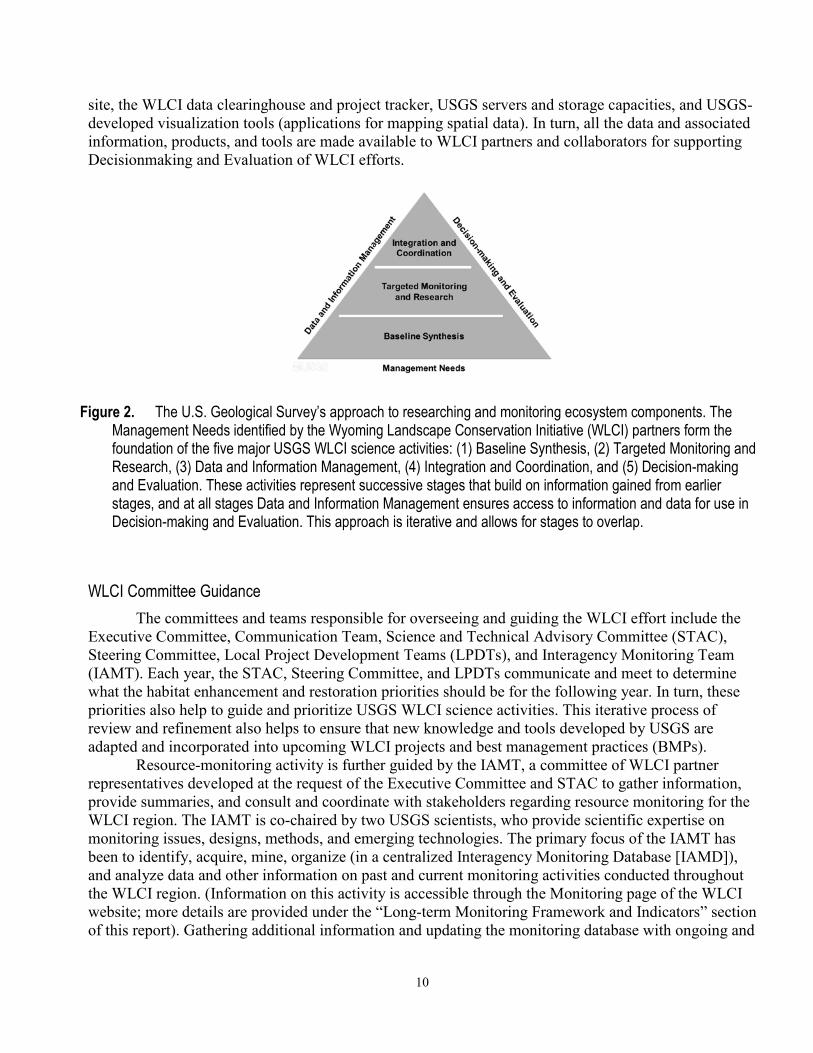
U.S. Geological Survey Framework for WLCI Science and Technical Assistance In its WLCI Science Strategy, the USGS provided a framework for organizing and guiding the
processes associated with WLCI science and technical assistance activities. As shown in figure 2, the framework is founded on the six major WLCI partner Management Needs, and comprises three overall categories of science and technical assistance activities—Baseline Synthesis, Targeted Monitoring and Research (including Long-Term and Effectiveness Monitoring, and Mechanistic Studies of Wildlife), and Integration and Coordination. The Baseline Synthesis entails acquiring, compiling, quality-checking, integrating, and archiving existing and incoming new data and methods used to describe and assess landscape condition and trends. The Targeted Monitoring and Research work entails developing new protocols and methods based on emerging technologies and needs for conducting local-to-landscape-scale inventory and long-term monitoring of focal habitats and SGCN, and testing them through implementation of long-term and effectiveness monitoring and research projects. The top tier of the framework, Integration and Coordination, entails integrating WLCI USGS science results and techniques with existing and proposed projects, including WLCI partner projects and USGS science activities. These three tiers are iterative and interactive in that the USGS continuously builds new information into existing information, and it integrates the knowledge acquired with its science activities as well as partner habitat projects and planning activities. Ultimately, the outcomes (results, products, tools) of USGS science are enfolded by and made accessible through Data and Information Management activities. These activities include developing, maintaining, and enhancing the WLCI Web
5
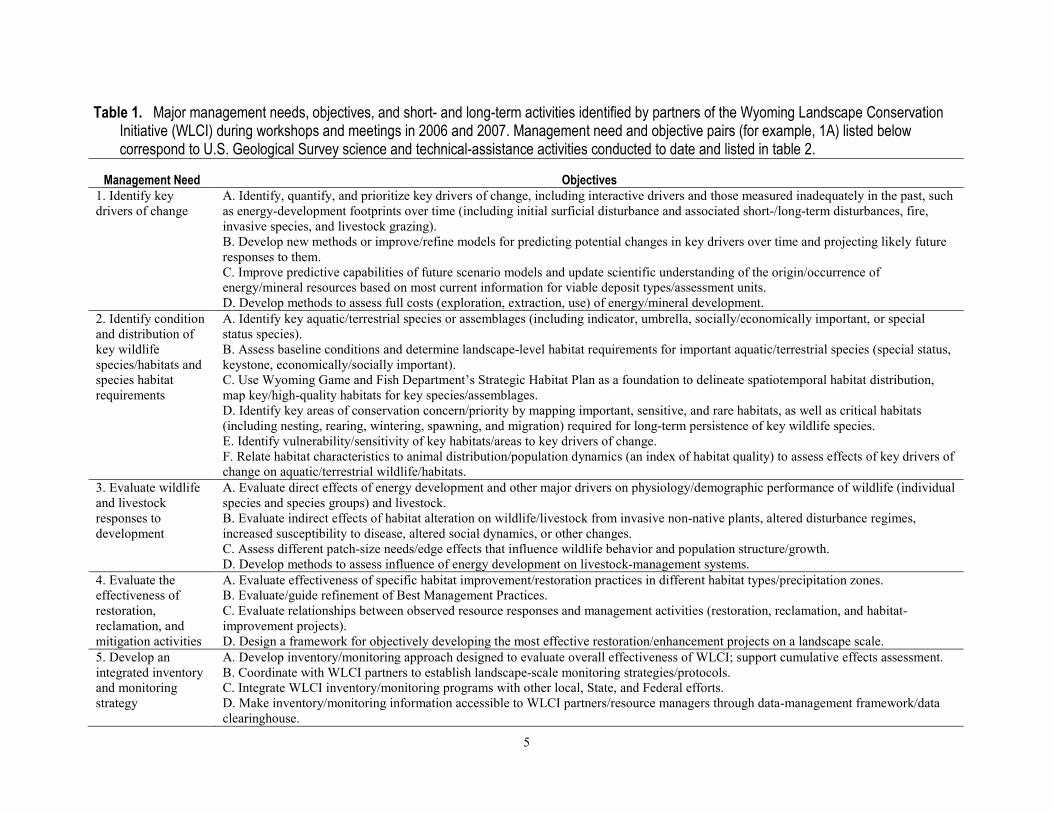
Table 1. Major management needs, objectives, and short- and long-term activities identified by partners of the Wyoming Landscape Conservation Initiative (WLCI) during workshops and meetings in 2006 and 2007. Management need and objective pairs (for example, 1A) listed below correspond to U.S. Geological Survey science and technical-assistance activities conducted to date and listed in table 2.
Management Need Objectives 1. Identify key drivers of change
A. Identify, quantify, and prioritize key drivers of change, including interactive drivers and those measured inadequately in the past, such as energy-development footprints over time (including initial surficial disturbance and associated short-/long-term disturbances, fire, invasive species, and livestock grazing). B. Develop new methods or improve/refine models for predicting potential changes in key drivers over time and projecting likely future responses to them. C. Improve predictive capabilities of future scenario models and update scientific understanding of the origin/occurrence of energy/mineral resources based on most current information for viable deposit types/assessment units. D. Develop methods to assess full costs (exploration, extraction, use) of energy/mineral development.
2. Identify condition and distribution of key wildlife species/habitats and species habitat requirements
A. Identify key aquatic/terrestrial species or assemblages (including indicator, umbrella, socially/economically important, or special status species). B. Assess baseline conditions and determine landscape-level habitat requirements for important aquatic/terrestrial species (special status, keystone, economically/socially important). C. Use Wyoming Game and Fish Department’s Strategic Habitat Plan as a foundation to delineate spatiotemporal habitat distribution, map key/high-quality habitats for key species/assemblages. D. Identify key areas of conservation concern/priority by mapping important, sensitive, and rare habitats, as well as critical habitats (including nesting, rearing, wintering, spawning, and migration) required for long-term persistence of key wildlife species. E. Identify vulnerability/sensitivity of key habitats/areas to key drivers of change. F. Relate habitat characteristics to animal distribution/population dynamics (an index of habitat quality) to assess effects of key drivers of change on aquatic/terrestrial wildlife/habitats.
3. Evaluate wildlife and livestock responses to development
A. Evaluate direct effects of energy development and other major drivers on physiology/demographic performance of wildlife (individual species and species groups) and livestock. B. Evaluate indirect effects of habitat alteration on wildlife/livestock from invasive non-native plants, altered disturbance regimes, increased susceptibility to disease, altered social dynamics, or other changes. C. Assess different patch-size needs/edge effects that influence wildlife behavior and population structure/growth. D. Develop methods to assess influence of energy development on livestock-management systems.
4. Evaluate the effectiveness of restoration, reclamation, and mitigation activities
A. Evaluate effectiveness of specific habitat improvement/restoration practices in different habitat types/precipitation zones. B. Evaluate/guide refinement of Best Management Practices. C. Evaluate relationships between observed resource responses and management activities (restoration, reclamation, and habitat-improvement projects). D. Design a framework for objectively developing the most effective restoration/enhancement projects on a landscape scale.
5. Develop an integrated inventory and monitoring strategy
A. Develop inventory/monitoring approach designed to evaluate overall effectiveness of WLCI; support cumulative effects assessment. B. Coordinate with WLCI partners to establish landscape-scale monitoring strategies/protocols. C. Integrate WLCI inventory/monitoring programs with other local, State, and Federal efforts. D. Make inventory/monitoring information accessible to WLCI partners/resource managers through data-management framework/data clearinghouse.

6
Management Need Objectives E. Integrate inventory/monitoring efforts into an adaptive management framework.
6. Develop a data clearinghouse and information management framework
A. Develop a Web-based WLCI information clearinghouse that can protect confidential, sensitive, and(or) proprietary information. B. Develop/implement a project tracking/database system to provide summaries of habitat projects and associated spatial data. C. Provide data-management, visualization (mapping), and decision-support tools for WLCI. D. Provide public information/outreach on WLCI habitat improvement/science activities.
7
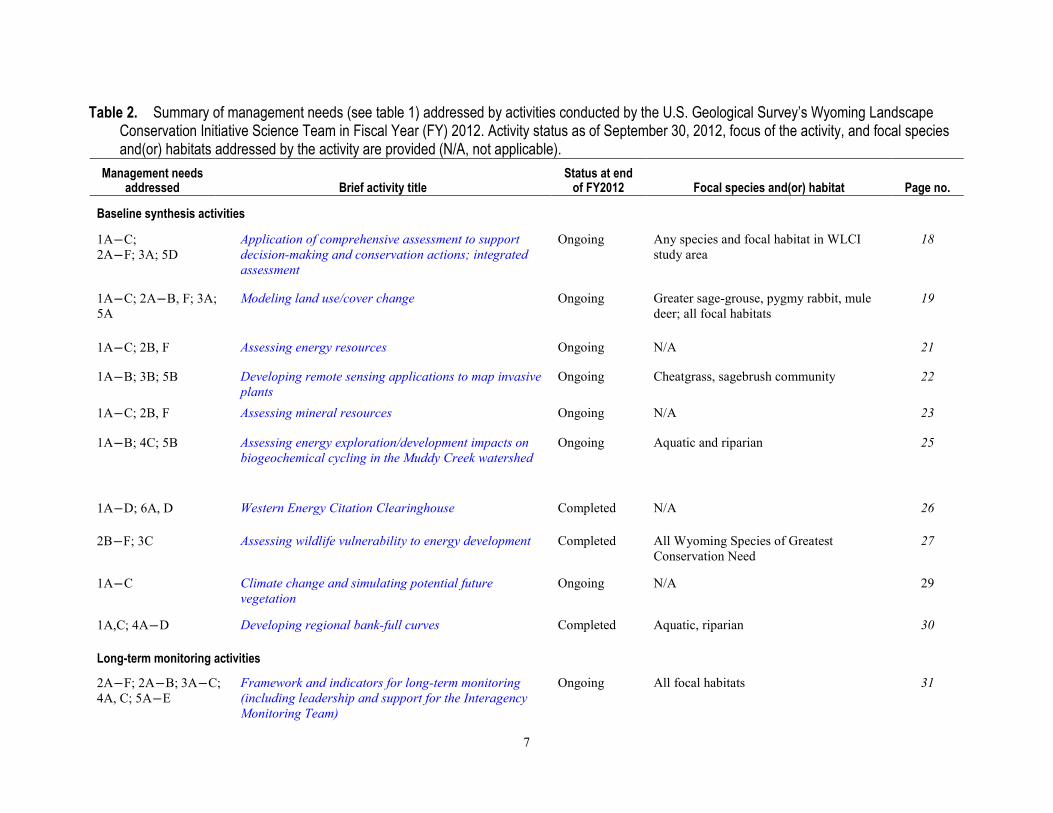
Table 2. Summary of management needs (see table 1) addressed by activities conducted by the U.S. Geological Survey’s Wyoming Landscape Conservation Initiative Science Team in Fiscal Year (FY) 2012. Activity status as of September 30, 2012, focus of the activity, and focal species and(or) habitats addressed by the activity are provided (N/A, not applicable).
Management needs addressed Brief activity title
Status at end of FY2012
Focal species and(or) habitat Page no.
Baseline synthesis activities
1A―C; 2A―F; 3A; 5D
Application of comprehensive assessment to support decision-making and conservation actions; integrated assessment
Ongoing Any species and focal habitat in WLCI study area
18
1A―C; 2A―B, F; 3A; 5A
Modeling land use/cover change Ongoing Greater sage-grouse, pygmy rabbit, mule deer; all focal habitats
19
1A―C; 2B, F Assessing energy resources Ongoing N/A 21
1A―B; 3B; 5B Developing remote sensing applications to map invasive plants
Ongoing Cheatgrass, sagebrush community 22
1A―C; 2B, F Assessing mineral resources Ongoing N/A 23
1A―B; 4C; 5B Assessing energy exploration/development impacts on biogeochemical cycling in the Muddy Creek watershed
Ongoing Aquatic and riparian 25
1A―D; 6A, D Western Energy Citation Clearinghouse Completed N/A 26
2B―F; 3C Assessing wildlife vulnerability to energy development Completed All Wyoming Species of Greatest Conservation Need
27
1A―C Climate change and simulating potential future vegetation
Ongoing N/A 29
1A,C; 4A―D Developing regional bank-full curves Completed Aquatic, riparian 30
Long-term monitoring activities
2A―F; 2A―B; 3A―C; 4A, C; 5A―E
Framework and indicators for long-term monitoring (including leadership and support for the Interagency Monitoring Team)
Ongoing All focal habitats 31
8
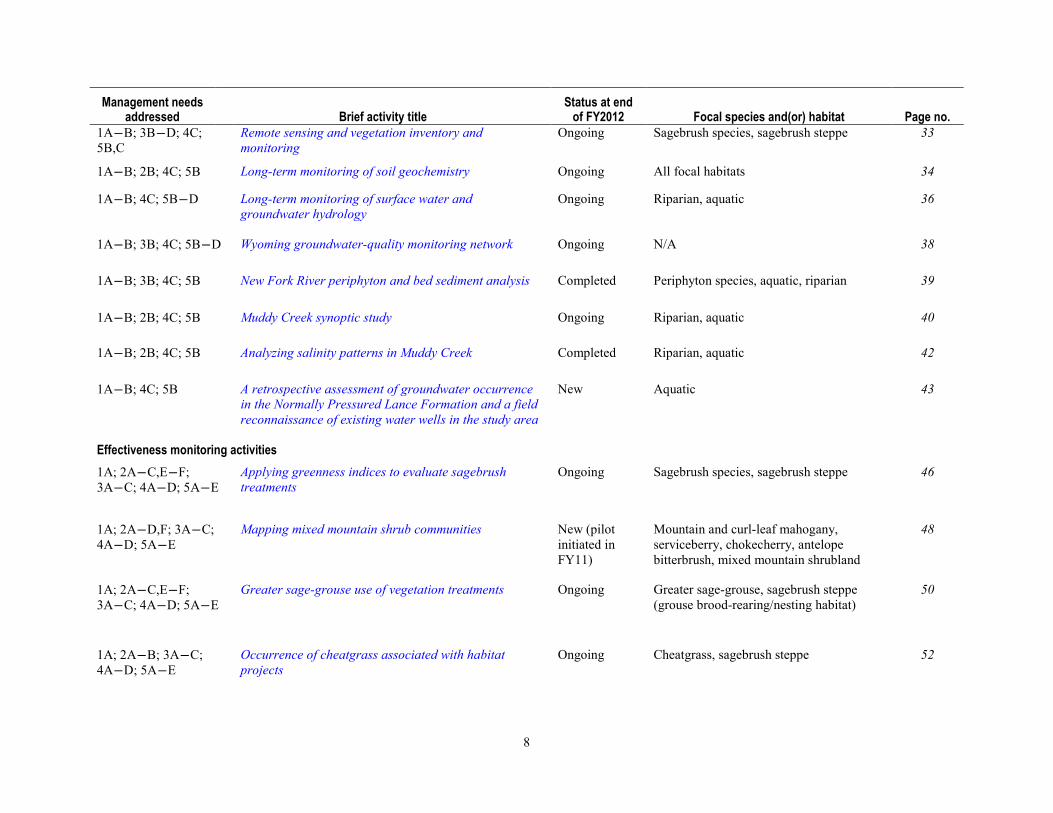
Management needs addressed Brief activity title
Status at end of FY2012
Focal species and(or) habitat Page no.
1A―B; 3B―D; 4C; 5B,C
Remote sensing and vegetation inventory and monitoring
Ongoing Sagebrush species, sagebrush steppe 33
1A―B; 2B; 4C; 5B Long-term monitoring of soil geochemistry Ongoing All focal habitats 34
1A―B; 4C; 5B―D Long-term monitoring of surface water and groundwater hydrology
Ongoing Riparian, aquatic 36
1A―B; 3B; 4C; 5B―D Wyoming groundwater-quality monitoring network Ongoing N/A 38
1A―B; 3B; 4C; 5B New Fork River periphyton and bed sediment analysis Completed Periphyton species, aquatic, riparian 39
1A―B; 2B; 4C; 5B Muddy Creek synoptic study Ongoing Riparian, aquatic 40
1A―B; 2B; 4C; 5B Analyzing salinity patterns in Muddy Creek Completed Riparian, aquatic 42
1A―B; 4C; 5B A retrospective assessment of groundwater occurrence in the Normally Pressured Lance Formation and a field reconnaissance of existing water wells in the study area
New Aquatic 43
Effectiveness monitoring activities
1A; 2A―C,E―F; 3A―C; 4A―D; 5A―E
Applying greenness indices to evaluate sagebrush treatments
Ongoing Sagebrush species, sagebrush steppe 46
1A; 2A―D,F; 3A―C; 4A―D; 5A―E
Mapping mixed mountain shrub communities New (pilot initiated in FY11)
Mountain and curl-leaf mahogany, serviceberry, chokecherry, antelope bitterbrush, mixed mountain shrubland
48
1A; 2A―C,E―F; 3A―C; 4A―D; 5A―E
Greater sage-grouse use of vegetation treatments Ongoing Greater sage-grouse, sagebrush steppe (grouse brood-rearing/nesting habitat)
50
1A; 2A―B; 3A―C; 4A―D; 5A―E
Occurrence of cheatgrass associated with habitat projects
Ongoing Cheatgrass, sagebrush steppe 52
9
Management needs addressed Brief activity title
Status at end of FY2012
Focal species and(or) habitat Page no.
1A; 2A―F; 3A―C; 4A―D; 5A―E
Landscape assessment and monitoring of semi-arid woodlands
New Aspen 53
1A; 2A―F; 3A―C; 4A―D; 5A―E
Aspen regeneration associated with mechanical removal of subalpine fir
Ongoing Aspen, conifer species 55
1A; 2A―F; 3A―D; 4A―D; 5A―E
Herbivory, stand condition, and regeneration rates of aspen on burned and unburned plots
Ongoing Aspen 56
Mechanistic studies of wildlife
1A―B; 2A―F; 3A―C; 4C; 5A―D
Pygmy rabbit Ongoing Pygmy rabbit, sagebrush steppe 58
1A―B; 2A―F; 3A―C; 4C; 5A―D
Sage-grouse Ongoing Greater sage-grouse, sagebrush steppe, sage-grouse core areas
61
1A―B; 2A―F; 3A―C; 4C; 5A―D
Sagebrush-obligate songbird community
Ongoing Brewer’s sparrow, sage sparrow, sage thrasher, sagebrush steppe
63
1A―B; 2A―F; 3A―C; 4C; 5A―D
Mule deer Ongoing Mule deer, mixed mountain shrubland (crucial winter habitat)
65
Data and information management
5D; 6A―D Data management framework and clearinghouse (including development of a web-based reference tool for partner monitoring activities and a data access tool to USGS remote sensing and other products)
Ongoing N/A 66
6B―D Conservation project data model Ongoing N/A 68
6A―D Outreach and graphic products Ongoing N/A 69
10
site, the WLCI data clearinghouse and project tracker, USGS servers and storage capacities, and USGS-developed visualization tools (applications for mapping spatial data). In turn, all the data and associated information, products, and tools are made available to WLCI partners and collaborators for supporting Decisionmaking and Evaluation of WLCI efforts.
Figure 2. The U.S. Geological Survey’s approach to researching and monitoring ecosystem components. The Management Needs identified by the Wyoming Landscape Conservation Initiative (WLCI) partners form the foundation of the five major USGS WLCI science activities: (1) Baseline Synthesis, (2) Targeted Monitoring and Research, (3) Data and Information Management, (4) Integration and Coordination, and (5) Decision-making and Evaluation. These activities represent successive stages that build on information gained from earlier stages, and at all stages Data and Information Management ensures access to information and data for use in Decision-making and Evaluation. This approach is iterative and allows for stages to overlap.
WLCI Committee Guidance The committees and teams responsible for overseeing and guiding the WLCI effort include the
Executive Committee, Communication Team, Science and Technical Advisory Committee (STAC), Steering Committee, Local Project Development Teams (LPDTs), and Interagency Monitoring Team (IAMT). Each year, the STAC, Steering Committee, and LPDTs communicate and meet to determine what the habitat enhancement and restoration priorities should be for the following year. In turn, these priorities also help to guide and prioritize USGS WLCI science activities. This iterative process of review and refinement also helps to ensure that new knowledge and tools developed by USGS are adapted and incorporated into upcoming WLCI projects and best management practices (BMPs).
Resource-monitoring activity is further guided by the IAMT, a committee of WLCI partner representatives developed at the request of the Executive Committee and STAC to gather information, provide summaries, and consult and coordinate with stakeholders regarding resource monitoring for the WLCI region. The IAMT is co-chaired by two USGS scientists, who provide scientific expertise on monitoring issues, designs, methods, and emerging technologies. The primary focus of the IAMT has been to identify, acquire, mine, organize (in a centralized Interagency Monitoring Database [IAMD]), and analyze data and other information on past and current monitoring activities conducted throughout the WLCI region. (Information on this activity is accessible through the Monitoring page of the WLCI website; more details are provided under the “Long-term Monitoring Framework and Indicators” section of this report). Gathering additional information and updating the monitoring database with ongoing and
11
new monitoring activities is a continuous IAMT task. IAMT members are expected to be familiar with monitoring efforts within their agency and participate in conference calls and meetings that afford opportunities for team members to guide the format and content of the IAMD, provide updates on monitoring activities within their agencies, and contribute to the IAMT’s utility and success.
Highlights of USGS FY2012 Accomplishments In FY2012, 33 separate USGS WLCI science and technical assistance activities were initiated,
continued, or completed. All activities focus on addressing the management needs identified by WLCI partners (tables 1 and 2) and providing technical assistance to WLCI partners. Our work continues to address questions and issues at multiple spatial scales, from individual habitat-treatment sites to the entire WLCI landscape and beyond. What follows are the highlights of FY2012 USGS accomplishments, summaries of new and completed projects and links to associated products, and indications of how our work relates to management needs and other USGS WLCI science activities.
Baseline Synthesis In FY2012, the USGS continued work on 10 Baseline Synthesis activities designed for meeting
management needs 1 and 2: (1) Identify key drivers of change, and (2) Identify the condition and distribution of key wildlife species and habitats, and species’ habitat requirements (table 1). The goal of our Baseline Synthesis work is to provide a solid data foundation in ScienceBase, the USGS system for storing and serving myriad research resources, such as databases, maps, and other products (see the “Data and Information Management” section of this report). From the data foundation, trends may be detected and future conditions may be projected. Achieving this goal entails gathering existing data on resource conditions from myriad partners and collaborators, compiling those data and implementing metadata standards for them, and making it all accessible to partners through a centralized online “platform” or storage and server system, ScienceBase. Meeting our goal also requires developing (1) interactive online tools for assessing landscape condition and (2) models for visualizing (mapping) geospatial data and projecting future conditions. In the first five years of the WLCI, we compiled, updated, mapped, and(or) analyzed geospatial and other data that pertain to • surface disturbance (historical and current) associated with energy (fossil fuels, uranium, and renewable
sources) and mineral (including aggregates) development; • locations and characteristics of energy resources and mineral deposits previously developed and crustal and
subsurface characteristics that provide insight into potential energy and mineral development; • SGCN exposure to risk from energy development; • distribution of cheatgrass (Bromus tectorum); • biogeochemical cycling in streams; • climate (precipitation and temperature); • discharge curves (graphical representations of stream discharge rates) for WLCI streams; • perceptions among ranchers about energy development; and • literature review of oil and gas development effects in the WLCI region. Baseline Synthesis products should prove useful for assessing resources, and for projecting change, planning, and making decisions associated with conserving resources and maintaining or enhancing ecosystem conditions.
Our Comprehensive Assessment continues to involve acquiring or updating and developing new data resources, publications, and other products that can serve as a baseline for assessing future effects of energy and mineral development, climate change, and other land-use changes in Southwest Wyoming. This work is supported by our Data and Information Management activities to develop Web
12
services for archiving, cataloging, downloading, and visualizing data that pertain to resource condition (accessed at https://www.sciencebase.gov/catalog/?community=Wyoming+Landscape+Conservation+Initiative). In FY2012, data and information provided by LPDTs and collected as part of the Comprehensive Assessment activity were used to prioritize WLCI habitat projects proposed for FY2013.
Our WLCI Integrated Assessment (IA) was rolled out in FY2012. The IA is founded on geospatial models developed as part of the Modeling Land Use/Cover Change activity. The models use data on existing land cover, resources, and drivers of ecosystem change to score the current or future condition of watershed units. The IA’s interactive Web site environment allows users to assess future conditions under different development scenarios and to decompose the composite scores for evaluating individual resources and incorporating local knowledge into finer-scale assessments. Overall, the IA will be useful to LPDTs and land management agencies for identifying potential management needs and prioritizing or maximizing the conservation value of habitat projects. In FY2012, the IA was introduced to the WLCI community at the 2012 WLCI Science Workshop, and plans were made to provide IA demonstrations and workshops during FY2013. Version 1 of the IA was published as a USGS Data Series 700 with complete metadata, and the Web page for accessing and using the IA was completed. The Web site is publically accessible at http://www.wlci.gov/integrated-assessment, and the data series report is publicly accessible at http://pubs.usgs.gov/ds/700/). Once fully vetted, climate change and other land-use data can be incorporated into the IA.
In FY2012, 3 of the 10 Baseline Synthesis activities were completed: the Assessment of Wildlife Vulnerability to Energy Development (AWVED), the Western Energy Citation Clearinghouse (WECC), and Developing Regional Curves Relating Bankfull-Channel Geometry and Discharge to Drainage Area for the Rocky Mountain Hydrologic Region in Wyoming (Bankfull). More detail follows about these three completed Baseline Synthesis activities.
AWVED—The AWVED goal was to ascertain which of Wyoming’s SGCN are most at risk from energy development and(or) uncertainty due to data gaps. AWVED products are designed to help planners and resource managers prioritize actions for protecting and managing at-risk species before they become imperiled. For each SGCN, USGS scientists and cooperators have developed geospatial distribution models and range maps, conducted sensitivity analyses to estimate the exposure risk of SGCN to energy development, and developed an uncertainty index to represent the confidence in species’ exposure estimates. Highly exposed, sensitive species are likely to benefit from rapid conservation actions, followed by targeted monitoring and research. Species for which the uncertainty index is high would benefit from research and monitoring, particularly if the species are highly exposed. The LPDTs and others may use these AWVED products and tools to guide planning efforts, management actions, and research for evaluating mitigation effectiveness. In FY2012, results of this work were presented to various land-management agencies and conservation groups. The products and tools associated with this work are publically available at http://www.wyocoopunit.org/index.php/kauffman-group/search/assessment-of-wildlife-vulnerability-to-energy-development/.
WECC—In FY2012, the WECC Web site was developed to provide public access to the WECC database that USGS developed in FY2011. This database compiles online databases and other resources about energy development and its associated effects on ecosystems and socioeconomics. As a “living” resource, the WECC database will be updated continuously to provide the most current resources and information. Search and query functions built into the Web site provide USGS scientists, collaborators, and other users an efficient means of locating and accessing pertinent information about energy development and related issues. Combined, the WECC database and Web site represent a foundational,
13
multi-thematic, and up-to-date source of reference materials and resources for informing and supporting the WLCI and similar efforts. The WECC is publically accessible at http://www.wlci.gov/wecc/.
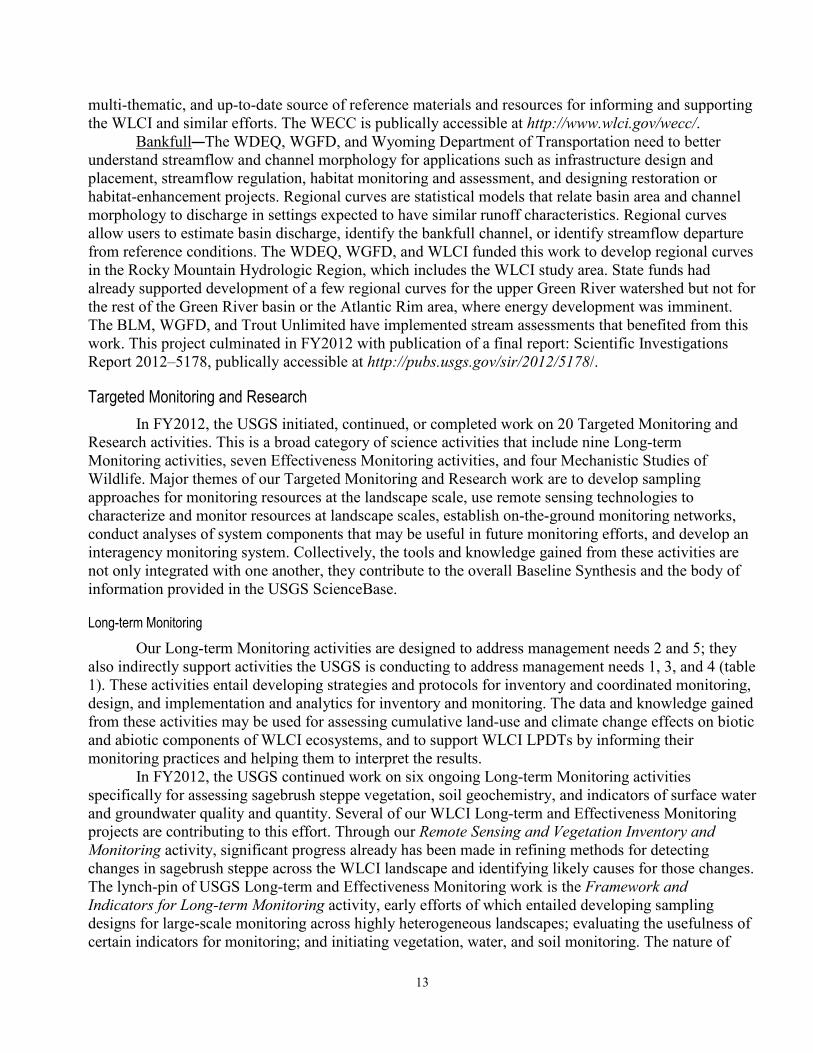
Bankfull—The WDEQ, WGFD, and Wyoming Department of Transportation need to better understand streamflow and channel morphology for applications such as infrastructure design and placement, streamflow regulation, habitat monitoring and assessment, and designing restoration or habitat-enhancement projects. Regional curves are statistical models that relate basin area and channel morphology to discharge in settings expected to have similar runoff characteristics. Regional curves allow users to estimate basin discharge, identify the bankfull channel, or identify streamflow departure from reference conditions. The WDEQ, WGFD, and WLCI funded this work to develop regional curves in the Rocky Mountain Hydrologic Region, which includes the WLCI study area. State funds had already supported development of a few regional curves for the upper Green River watershed but not for the rest of the Green River basin or the Atlantic Rim area, where energy development was imminent. The BLM, WGFD, and Trout Unlimited have implemented stream assessments that benefited from this work. This project culminated in FY2012 with publication of a final report: Scientific Investigations Report 2012–5178, publically accessible at http://pubs.usgs.gov/sir/2012/5178/.
Targeted Monitoring and Research In FY2012, the USGS initiated, continued, or completed work on 20 Targeted Monitoring and
Research activities. This is a broad category of science activities that include nine Long-term Monitoring activities, seven Effectiveness Monitoring activities, and four Mechanistic Studies of Wildlife. Major themes of our Targeted Monitoring and Research work are to develop sampling approaches for monitoring resources at the landscape scale, use remote sensing technologies to characterize and monitor resources at landscape scales, establish on-the-ground monitoring networks, conduct analyses of system components that may be useful in future monitoring efforts, and develop an interagency monitoring system. Collectively, the tools and knowledge gained from these activities are not only integrated with one another, they contribute to the overall Baseline Synthesis and the body of information provided in the USGS ScienceBase.
Long-term Monitoring
Our Long-term Monitoring activities are designed to address management needs 2 and 5; they also indirectly support activities the USGS is conducting to address management needs 1, 3, and 4 (table 1). These activities entail developing strategies and protocols for inventory and coordinated monitoring, design, and implementation and analytics for inventory and monitoring. The data and knowledge gained from these activities may be used for assessing cumulative land-use and climate change effects on biotic and abiotic components of WLCI ecosystems, and to support WLCI LPDTs by informing their monitoring practices and helping them to interpret the results.
In FY2012, the USGS continued work on six ongoing Long-term Monitoring activities specifically for assessing sagebrush steppe vegetation, soil geochemistry, and indicators of surface water and groundwater quality and quantity. Several of our WLCI Long-term and Effectiveness Monitoring projects are contributing to this effort. Through our Remote Sensing and Vegetation Inventory and Monitoring activity, significant progress already has been made in refining methods for detecting changes in sagebrush steppe across the WLCI landscape and identifying likely causes for those changes. The lynch-pin of USGS Long-term and Effectiveness Monitoring work is the Framework and Indicators for Long-term Monitoring activity, early efforts of which entailed developing sampling designs for large-scale monitoring across highly heterogeneous landscapes; evaluating the usefulness of certain indicators for monitoring; and initiating vegetation, water, and soil monitoring. The nature of
14
these efforts, however, has been shifting as WLCI directives and partner needs evolve, and as communication and coordination improve throughout the WLCI community. As a result, we anticipate a renewed effort for compiling and analyzing monitoring data for the Interagency Monitoring Database (IAMD), the objective of which is to identify and eventually integrate resource data from across the WLCI region, support coordinated data analyses, and help to coordinate and support future monitoring efforts.
In FY2012, we initiated a new study: A Retrospective Assessment of Groundwater Occurrence in the Normally Pressured Lance Formation and a Field Reconnaissance of Existing Water Wells in the Study Area (NPL). We also completed two studies: the New Fork Periphyton and Bed Sediment Analysis (New Fork), and the Analysis of Salinity Patterns in Muddy Creek (Salinity). More detail follows about these new and completed Long-term Monitoring activities.
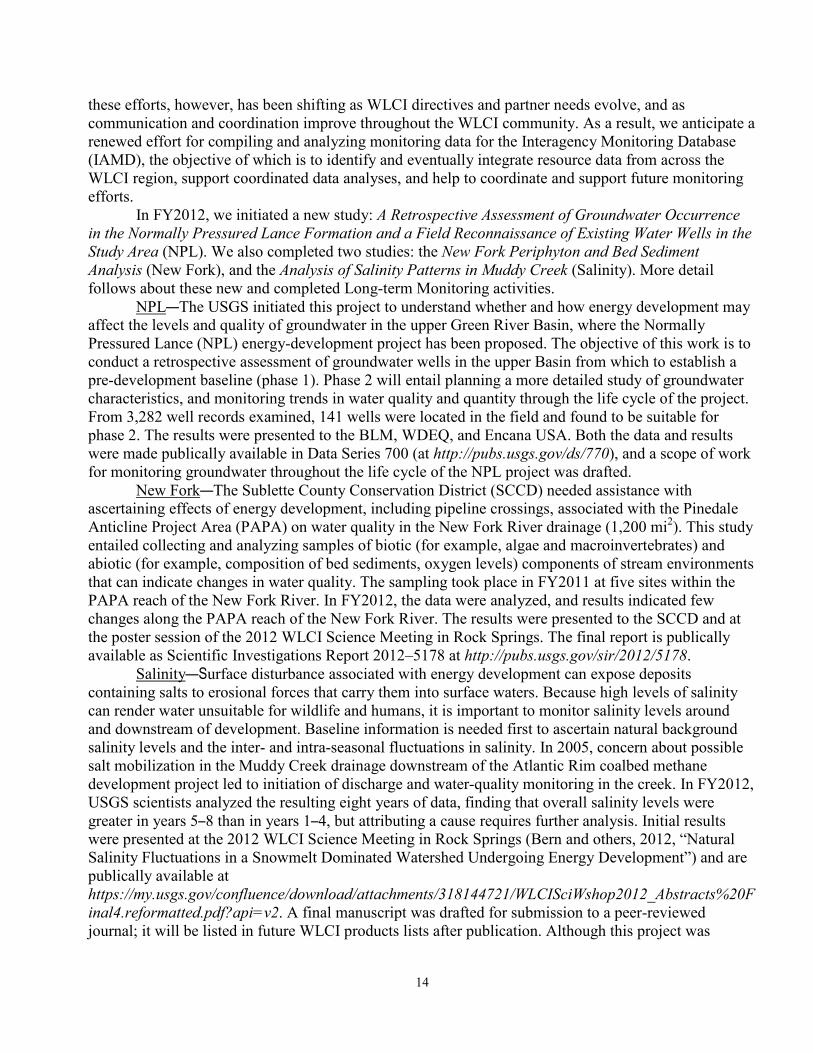
NPL—The USGS initiated this project to understand whether and how energy development may affect the levels and quality of groundwater in the upper Green River Basin, where the Normally Pressured Lance (NPL) energy-development project has been proposed. The objective of this work is to conduct a retrospective assessment of groundwater wells in the upper Basin from which to establish a pre-development baseline (phase 1). Phase 2 will entail planning a more detailed study of groundwater characteristics, and monitoring trends in water quality and quantity through the life cycle of the project. From 3,282 well records examined, 141 wells were located in the field and found to be suitable for phase 2. The results were presented to the BLM, WDEQ, and Encana USA. Both the data and results were made publically available in Data Series 700 (at http://pubs.usgs.gov/ds/770), and a scope of work for monitoring groundwater throughout the life cycle of the NPL project was drafted.
New Fork—The Sublette County Conservation District (SCCD) needed assistance with ascertaining effects of energy development, including pipeline crossings, associated with the Pinedale Anticline Project Area (PAPA) on water quality in the New Fork River drainage (1,200 mi2). This study entailed collecting and analyzing samples of biotic (for example, algae and macroinvertebrates) and abiotic (for example, composition of bed sediments, oxygen levels) components of stream environments that can indicate changes in water quality. The sampling took place in FY2011 at five sites within the PAPA reach of the New Fork River. In FY2012, the data were analyzed, and results indicated few changes along the PAPA reach of the New Fork River. The results were presented to the SCCD and at the poster session of the 2012 WLCI Science Meeting in Rock Springs. The final report is publically available as Scientific Investigations Report 2012–5178 at http://pubs.usgs.gov/sir/2012/5178.
Salinity—Surface disturbance associated with energy development can expose deposits containing salts to erosional forces that carry them into surface waters. Because high levels of salinity can render water unsuitable for wildlife and humans, it is important to monitor salinity levels around and downstream of development. Baseline information is needed first to ascertain natural background salinity levels and the inter- and intra-seasonal fluctuations in salinity. In 2005, concern about possible salt mobilization in the Muddy Creek drainage downstream of the Atlantic Rim coalbed methane development project led to initiation of discharge and water-quality monitoring in the creek. In FY2012, USGS scientists analyzed the resulting eight years of data, finding that overall salinity levels were greater in years 5–8 than in years 1–4, but attributing a cause requires further analysis. Initial results were presented at the 2012 WLCI Science Meeting in Rock Springs (Bern and others, 2012, “Natural Salinity Fluctuations in a Snowmelt Dominated Watershed Undergoing Energy Development”) and are publically available at https://my.usgs.gov/confluence/download/attachments/318144721/WLCISciWshop2012_Abstracts%20Final4.reformatted.pdf?api=v2. A final manuscript was drafted for submission to a peer-reviewed journal; it will be listed in future WLCI products lists after publication. Although this project was
15
completed in FY2012, a final set of analyses are planned to better understand what may have driven the observed changes in salinity levels.
Effectiveness Monitoring Our Effectiveness Monitoring activities are designed to address management need 4: Evaluate
the effectiveness of restoration, reclamation, and mitigation activities. Treatments being monitored and evaluated include applications of herbicides, mechanical removals, mowing, and burning in (1) sagebrush steppe to enhance foraging habitat for greater sage-grouse (Centrocercus urophasianus) broods and pronghorn (Antilocapra americana), and in (2) mixed forest stands to remove conifers and promote regeneration of Southwest Wyoming’s declining aspen stands. A crucial part of this ongoing work includes measuring vegetation responses, such as rates of aspen regeneration and growth, interactive effects of burning and herbivory, and invasions of exotics (cheatgrass in particular) at treatment sites. Sage-grouse use of treatment sites also is being monitored.
As with our Baseline Synthesis and Long-term Monitoring activities, Effectiveness Monitoring activities also entail developing or refining protocols for assessments and monitoring, including the use of near-surface sensors for monitoring plant green-up and senescence and applications of remotely sensed imagery and GIS analyses for monitoring aspen. When completed, the near-surface detection work will be useful to wildlife and livestock managers for determining wild forage availability and detecting or monitoring invasions of exotic plant species, such as cheatgrass.
In FY2012, we initiated two new Effectiveness Monitoring activities: Mapping Mixed Mountain Shrub Communities (Mountain Shrubs) and Landscape Assessment and Monitoring of Semi-Arid Woodlands (Woodlands). More detail follows about these new Effectiveness Monitoring activities.
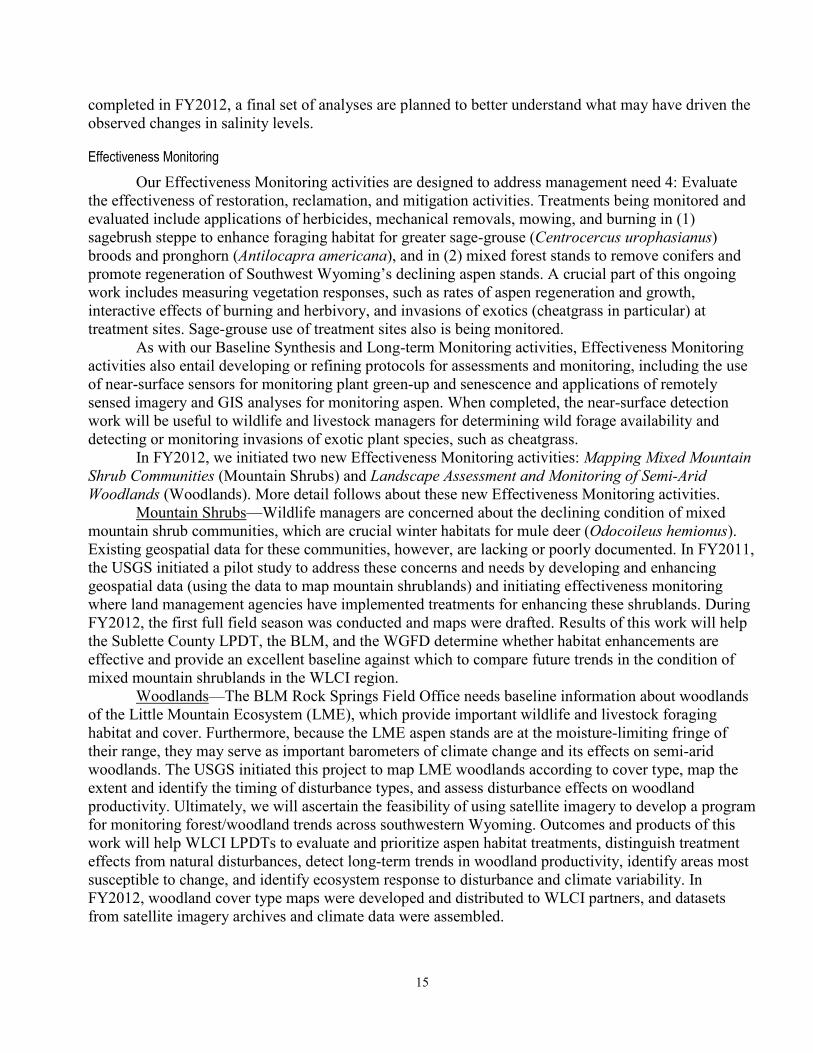
Mountain Shrubs—Wildlife managers are concerned about the declining condition of mixed mountain shrub communities, which are crucial winter habitats for mule deer (Odocoileus hemionus). Existing geospatial data for these communities, however, are lacking or poorly documented. In FY2011, the USGS initiated a pilot study to address these concerns and needs by developing and enhancing geospatial data (using the data to map mountain shrublands) and initiating effectiveness monitoring where land management agencies have implemented treatments for enhancing these shrublands. During FY2012, the first full field season was conducted and maps were drafted. Results of this work will help the Sublette County LPDT, the BLM, and the WGFD determine whether habitat enhancements are effective and provide an excellent baseline against which to compare future trends in the condition of mixed mountain shrublands in the WLCI region.
Woodlands—The BLM Rock Springs Field Office needs baseline information about woodlands of the Little Mountain Ecosystem (LME), which provide important wildlife and livestock foraging habitat and cover. Furthermore, because the LME aspen stands are at the moisture-limiting fringe of their range, they may serve as important barometers of climate change and its effects on semi-arid woodlands. The USGS initiated this project to map LME woodlands according to cover type, map the extent and identify the timing of disturbance types, and assess disturbance effects on woodland productivity. Ultimately, we will ascertain the feasibility of using satellite imagery to develop a program for monitoring forest/woodland trends across southwestern Wyoming. Outcomes and products of this work will help WLCI LPDTs to evaluate and prioritize aspen habitat treatments, distinguish treatment effects from natural disturbances, detect long-term trends in woodland productivity, identify areas most susceptible to change, and identify ecosystem response to disturbance and climate variability. In FY2012, woodland cover type maps were developed and distributed to WLCI partners, and datasets from satellite imagery archives and climate data were assembled.
16
Mechanistic Studies of Wildlife Our Mechanistic Studies of Wildlife are designed to address management need 3: Evaluate
wildlife and livestock responses to development (table 1). They also help to address management needs 1, 2, and 5. These activities entail in-depth research of six species of immediate conservation concern: the pygmy rabbit (Brachylagus idahoensis), greater sage-grouse, mule deer, and a suite of three sagebrush-obligate songbird species. The goals of these activities are to better understand (1) how species respond to direct and indirect effects of energy development and climate change, particularly their distribution, habitat use, demographics, and population dynamics, and (2) the mechanisms that underlie species’ responses. Our approaches include conducting on-the-ground surveys of wildlife populations, site occupancy, habitat use, movements, nest success, and(or) habitat characteristics, including vegetation, soils, anthropogenic features, and other important biotic and abiotic factors.
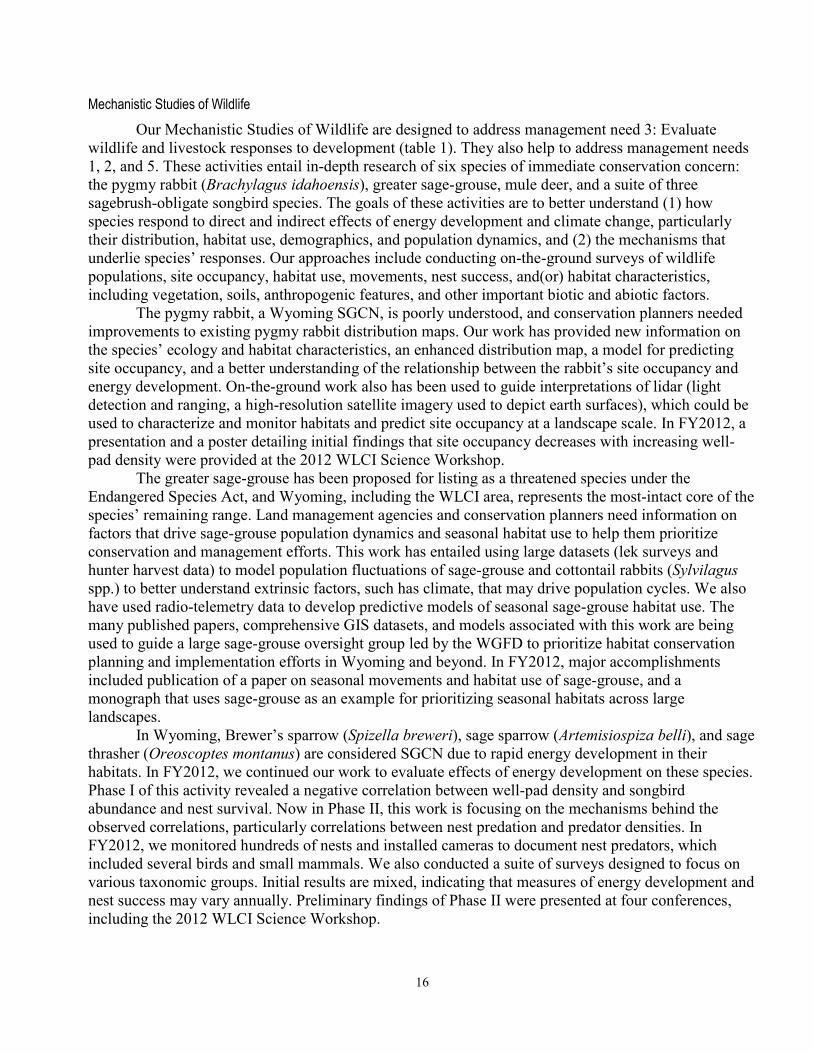
The pygmy rabbit, a Wyoming SGCN, is poorly understood, and conservation planners needed improvements to existing pygmy rabbit distribution maps. Our work has provided new information on the species’ ecology and habitat characteristics, an enhanced distribution map, a model for predicting site occupancy, and a better understanding of the relationship between the rabbit’s site occupancy and energy development. On-the-ground work also has been used to guide interpretations of lidar (light detection and ranging, a high-resolution satellite imagery used to depict earth surfaces), which could be used to characterize and monitor habitats and predict site occupancy at a landscape scale. In FY2012, a presentation and a poster detailing initial findings that site occupancy decreases with increasing well-pad density were provided at the 2012 WLCI Science Workshop.
The greater sage-grouse has been proposed for listing as a threatened species under the Endangered Species Act, and Wyoming, including the WLCI area, represents the most-intact core of the species’ remaining range. Land management agencies and conservation planners need information on factors that drive sage-grouse population dynamics and seasonal habitat use to help them prioritize conservation and management efforts. This work has entailed using large datasets (lek surveys and hunter harvest data) to model population fluctuations of sage-grouse and cottontail rabbits (Sylvilagus spp.) to better understand extrinsic factors, such has climate, that may drive population cycles. We also have used radio-telemetry data to develop predictive models of seasonal sage-grouse habitat use. The many published papers, comprehensive GIS datasets, and models associated with this work are being used to guide a large sage-grouse oversight group led by the WGFD to prioritize habitat conservation planning and implementation efforts in Wyoming and beyond. In FY2012, major accomplishments included publication of a paper on seasonal movements and habitat use of sage-grouse, and a monograph that uses sage-grouse as an example for prioritizing seasonal habitats across large landscapes.
In Wyoming, Brewer’s sparrow (Spizella breweri), sage sparrow (Artemisiospiza belli), and sage thrasher (Oreoscoptes montanus) are considered SGCN due to rapid energy development in their habitats. In FY2012, we continued our work to evaluate effects of energy development on these species. Phase I of this activity revealed a negative correlation between well-pad density and songbird abundance and nest survival. Now in Phase II, this work is focusing on the mechanisms behind the observed correlations, particularly correlations between nest predation and predator densities. In FY2012, we monitored hundreds of nests and installed cameras to document nest predators, which included several birds and small mammals. We also conducted a suite of surveys designed to focus on various taxonomic groups. Initial results are mixed, indicating that measures of energy development and nest success may vary annually. Preliminary findings of Phase II were presented at four conferences, including the 2012 WLCI Science Workshop.
17
The mule deer work was developed to improve the understanding of mule deer migrations and how energy development affects them. Phase I focused on developing a framework for estimating mule deer migration routes, identifying which portions of the routes are used for foraging, resting, and movement; and which routes are most important based on proportion of the population using them. Phase I also ascertained the relationship between mule deer migration movements and vegetation phenology, or green-up. This work is now in Phase II, which entails identifying levels of energy development that represent permeable or impermeable barriers to migrating mule deer and the effects of barriers on their behavior. In FY2012, results indicated that moderate levels of energy development are relatively permeable, with little effect on behavior of migrating mule deer. More intensive development, however, forced the animals to detour from established routes, increase their rates of movement, and spend less time foraging. Results of Phase I were published in a peer-reviewed journal, and in FY213 this work will culminate with establishing development thresholds for allowing mule deer migrations to continue relatively unaffected along established routes. Land managers and planners will be able to use this information to help prioritize management and habitat conservation efforts.
Data and Information Management For a large initiative like the WLCI, there is a need for efficient communication among many
partner agencies and individuals, including data and document sharing, and tools are needed for conducting assessments of resource conditions, displaying geospatial data, tracking projects, and organizing, data, products, people, and events. Collectively, these needs are captured by management need 6: Develop a data clearinghouse and information management framework (table 1). Our Data and Information Management activities address this need by developing and enhancing the functionality of, access to, items cataloged in the USGS ScienceBase system, which stores and serves myriad WLCI resources; a crucial part of this task is to develop and maintain consistent metadata standards for items in ScienceBase. We also developed a Web site for sharing information and products associated with WLCI efforts, interactive online tools for visualizing geospatial data, and a system for tracking and prioritizing habitat conservation projects.
In FY2012, we continued to enhance the online database in ScienceBase by adding new databases and products and developing new search functions and adding “tags” or keywords to projects to make it easier for USGS scientists and WLCI partners to find specific data resources and products, and information pertaining to individual studies and habitat projects. To support development of the new Interagency Monitoring Database, we began to acquire and catalog information about existing monitoring efforts in the WLCI region. We also revamped, enhanced, and re-released the WLCI Web site to address requests made by WLCI partners, and we enhanced the USGS EventManager software to use for registration, abstract uploading, and other organizational activities for the 2012 WLCI Science Workshop. Ultimately, these activities will continue through the life of the WLCI to ensure that all partners and others realize the full value of WLCI activities and products for prioritizing habitat projects, planning conservation actions, and guiding management decisions.

18
Baseline Synthesis Activities Application of Comprehensive Assessment to Support Decision-making and Conservation Actions
The comprehensive assessment is a collaborative, two-part effort to compile and analyze resource data to support WLCI needs and efforts. The first part of the assessment is to direct data synthesis and assessment activities so they will inform and support LPDT and WLCI CT in their conservation-planning efforts. These efforts include developing conservation priorities and strategies, identifying priority areas for future conservation actions, supporting the evaluation and ranking of conservation projects, and evaluating spatial and ecological relationships between proposed habitat projects and WLCI priorities. In FY2012, data and information provided by LPDTs and collected as part of the comprehensive assessment were used to prioritize WLCI habitat projects proposed for FY2013.
The second part of the assessment is designed to support decision-making at the WLCI programmatic level and conservation planning at landscape scales with a multi-disciplinary Integrated Assessment (IA) of factors affecting successful conservation and management across the WLCI region. The IA may be used to identify areas of high conservation and restoration value and those with high development potential, based on the current landscape. It also may be used to consider scenarios of potential future development, which, in turn, may be used for evaluating the conservation and restoration potential of a given area. Finally, the IA provides WLCI partners or other entities a framework for conducting future reassessments and evaluations of change. In FY2012, the IA was finalized and published as a USGS Data Series report with complete metadata. It addresses priority resources in the WLCI region and their condition, agents of change, and potential future condition associated with development and climate change. The IA framework is transparent and hierarchical in that it allows users to decompose the summary scores and evaluate individual resources. A variety of logical assumptions based on current knowledge and data availability are inherent to the initial assessments. The IA does not preclude users from incorporating local knowledge into finer-scale assessments to inform local management projects for land-uses and resource values not considered in this initial effort. Additional development of the IA Web site was completed to enhance its interactive environment.
Products Completed in FY2012 • Assal, T.J., Garman, S.L., Bowen, Z.H., Anderson, P.J., Manier, D., and McDougal, R.R., 2012, Data
resources for the Wyoming Landscape Conservation Initiative integrated assessment: U.S. Geological Survey Data Series 700, at http://www.fort.usgs.gov/Products/Publications/pub_abstract.asp?PubID=23486.
• Bowen, Z.H., Anderson, P.J., Assal, T., Garman, S., Germaine, S., Manier, D., and McDougal, R.R., 2012, Energy and ecosystems—An integrated assessment for southwestern Wyoming, in Wyoming Landscape Conservation Initiative Science Workshop, May 14−17, 2012, Rock Springs, Wyo., p. 31, at https://my.usgs.gov/confluence/download/attachments/318144721/WLCISciWshop2012_Abstracts%20Final4.reformatted.pdf?api=v2.
• Continued development of the WLCI IA web application, at http://www.wlci.gov/integrated-assessment.
Contacts: Zack Bowen, 970.225.9218, [email protected]; Patrick Anderson, 970-226-9488, [email protected]; Tim Assal, 970-226-9134, [email protected]; Steve Garman, 303-202-4118, [email protected]
19
Modeling Land Use/Cover Change Estimates of future patterns in energy development can help inform decisions regarding resource
management and conservation. Identifying areas with a high potential for development, areas likely to remain undisturbed, and overall landscape patterns can help guide the location and types of future habitat-management projects. Although the future cannot be predicted, with reasonable assumptions future plausible outcomes can be illustrated. The goal of this project is to provide a simulation model for assessing different assumptions about future energy development and the resulting effects on wildlife habitat. Commonalities among these outcomes can indicate the propensity for areas to be consistently critical to wildlife persistence and habitat connectivity over a suite of possible futures.
The simulation model has been developed and enhanced to accommodate a range of experimental forecasts. The model uses geospatial data representing existing land cover, well pads, roads, sage-grouse leks, and sage-grouse core areas, along with areas classified according to future energy development potential (high, medium, low). Historical rates of well-pad development and well-pad spacing constraints may be used to estimate the locations of future well pads and the associated road infrastructure (fig. 3). Direct and indirect effects of energy development on wildlife habitat are assessed using known effects of disturbance for individual species and the amount and pattern of surface disturbance resulting from energy development. We added enhancements to the model that allow opportunities to experiment with changes in well efficiency (number of wells per pad), well spacing, and restoration efficiency (reclamation rates of expired pads), thus providing a range of potential future scenarios. A scenario of special interest to WLCI partners is the spatial pattern in development that maintains or enhances the amount and connectivity of native habitat. In an experimental context, different rates and spacing of development may be simulated until connectivity of native habitat for key species is consistently maintained on the landscape over time.
For a given forecast of energy development, key outcomes of the model simulations are identification of areas likely to be dominated by energy development and of areas where habitat projects may enhance the condition and connectivity of surrounding wildlife habitat. These results will be useful to LPDTs in their efforts to prioritize habitat projects, and they will be made available to the BLM and other land management agencies to illustrate potential management needs. A related effort, to produce (digitize) a geospatial data layer of oil/gas pads scars (circa 2009) in southwest Wyoming from aerial imagery, was initiated to provide baseline information for the simulation forecasts. In 2012, about 70 percent of the oil/gas pads were digitized. Aerial imagery and the spectral properties of unpaved roads were used to estimate the amount of bare ground for each well pad. Well-permit data acquired from the Wyoming Oil and Gas Conservation Commission were used to determine the year a pad scar was created and its last year of operation, and from that information, estimates of surface disturbance were derived for well pads in Southwest Wyoming.
Products Completed in FY2012 • Garman, S. L., and Manier, D., 2012, Simulating future effects of energy development on natural resources,
in Wyoming Landscape Conservation Initiative Science Workshop, May 14–17, 2012, Rock Springs, Wyo., p. 33 at https://my.usgs.gov/confluence/download/attachments/318144721/WLCISciWshop2012_Abstracts%20Final4.reformatted.pdf?api=v2.
Contact: Steven L. Garman, 303-236-1353, [email protected]
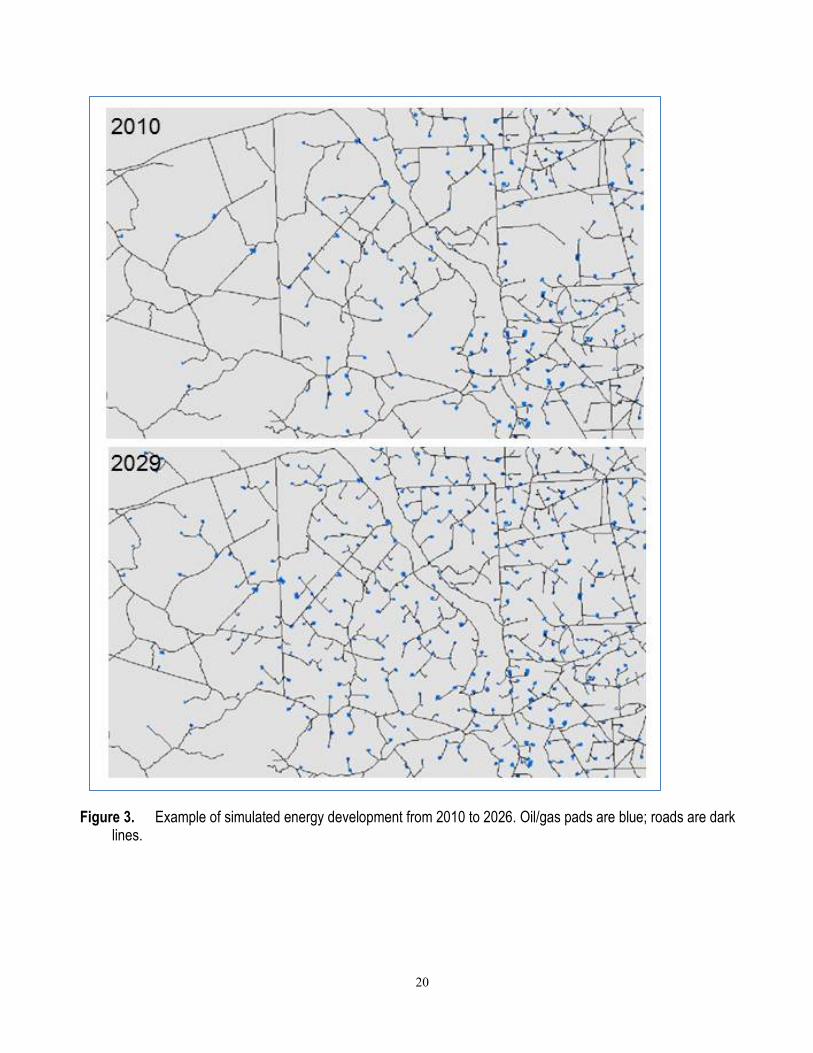
20
Figure 3. Example of simulated energy development from 2010 to 2026. Oil/gas pads are blue; roads are dark lines.
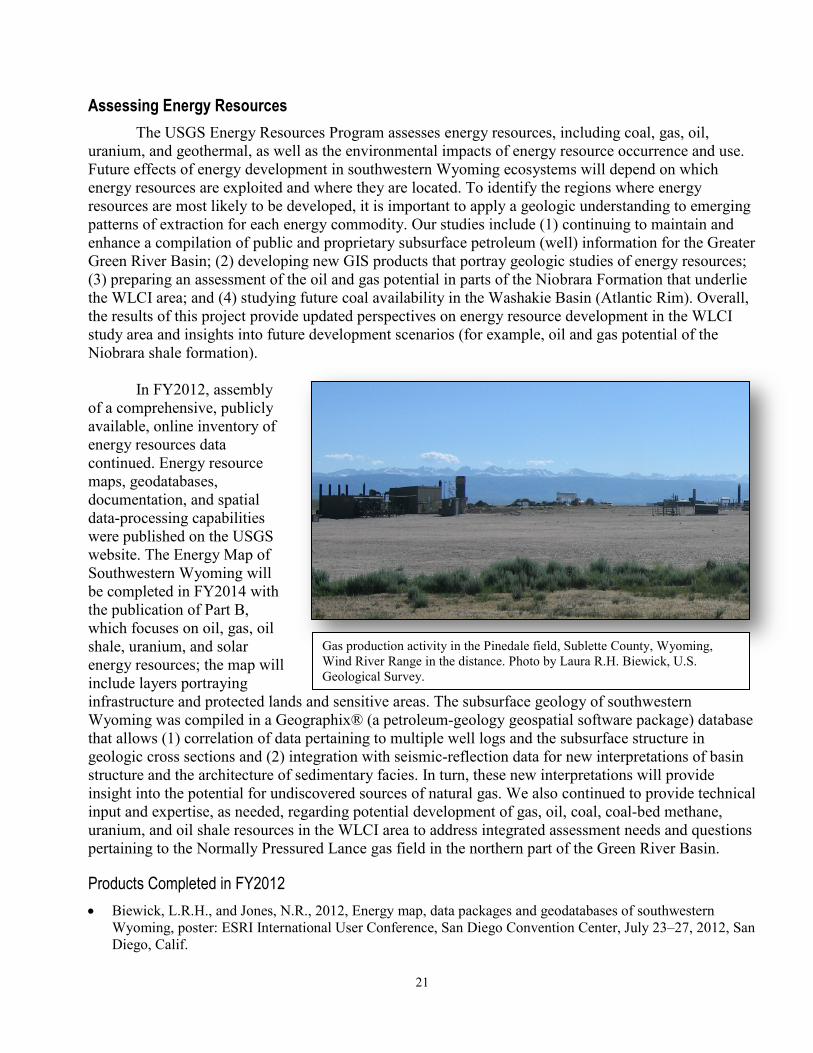
21
Gas production activity in the Pinedale field, Sublette County, Wyoming, Wind River Range in the distance. Photo by Laura R.H. Biewick, U.S. Geological Survey.
Assessing Energy Resources The USGS Energy Resources Program assesses energy resources, including coal, gas, oil,
uranium, and geothermal, as well as the environmental impacts of energy resource occurrence and use. Future effects of energy development in southwestern Wyoming ecosystems will depend on which energy resources are exploited and where they are located. To identify the regions where energy resources are most likely to be developed, it is important to apply a geologic understanding to emerging patterns of extraction for each energy commodity. Our studies include (1) continuing to maintain and enhance a compilation of public and proprietary subsurface petroleum (well) information for the Greater Green River Basin; (2) developing new GIS products that portray geologic studies of energy resources; (3) preparing an assessment of the oil and gas potential in parts of the Niobrara Formation that underlie the WLCI area; and (4) studying future coal availability in the Washakie Basin (Atlantic Rim). Overall, the results of this project provide updated perspectives on energy resource development in the WLCI study area and insights into future development scenarios (for example, oil and gas potential of the Niobrara shale formation).
In FY2012, assembly
of a comprehensive, publicly available, online inventory of energy resources data continued. Energy resource maps, geodatabases, documentation, and spatial data-processing capabilities were published on the USGS website. The Energy Map of Southwestern Wyoming will be completed in FY2014 with the publication of Part B, which focuses on oil, gas, oil shale, uranium, and solar energy resources; the map will include layers portraying infrastructure and protected lands and sensitive areas. The subsurface geology of southwestern Wyoming was compiled in a Geographix® (a petroleum-geology geospatial software package) database that allows (1) correlation of data pertaining to multiple well logs and the subsurface structure in geologic cross sections and (2) integration with seismic-reflection data for new interpretations of basin structure and the architecture of sedimentary facies. In turn, these new interpretations will provide insight into the potential for undiscovered sources of natural gas. We also continued to provide technical input and expertise, as needed, regarding potential development of gas, oil, coal, coal-bed methane, uranium, and oil shale resources in the WLCI area to address integrated assessment needs and questions pertaining to the Normally Pressured Lance gas field in the northern part of the Green River Basin.
Products Completed in FY2012 • Biewick, L.R.H., and Jones, N.R., 2012, Energy map, data packages and geodatabases of southwestern
Wyoming, poster: ESRI International User Conference, San Diego Convention Center, July 23–27, 2012, San Diego, Calif.
22
• Biewick, L.R.H., and Jones, N.R., 2012, Energy map of southwestern Wyoming, Part A—Coal and wind: U.S. Geological Survey Data Series 683, 18 p. pamphlet, 5 plates, online at http://pubs.usgs.gov/ds/683/.
• Biewick, L.R.H., Jones, N.R., and Wilson, A.B., 2013, Energy Map of Southwestern Wyoming—Energy data archived, organized, integrated and accessible: U.S. Geological Survey General Information Product 145, 21 slides. Online at http://pubs.usgs.gov/gip/145/. (Also presented at the Wyoming Landscape Conservation Initiative Science and Management Workshop, May 14–17, 2012, Rock Springs, Wyo.)
• Biewick, L.R.H., and Wilson, A.B., 2013, Energy map of southwestern Wyoming, Part B— Oil, gas, oil shale, uranium and solar: U.S. Geological Survey Data Series, in review.
• Kirschbaum, M.A., and Mercier, T.J., 2013, Controls on the deposition and preservation of the Cretaceous Mowry Shale and Frontier Formation and equivalents, Rocky Mountain Region, Colorado, Utah, and Wyoming: American Association of Petroleum Geologists Bulletin, v. 97, p. 877–898. Online at http://archives.datapages.com/data/bulletns/aop/20130218/images/aapgbltn12090aop.pdf.
Contacts: Laura R.H. Biewick, 303-236-7773, [email protected]; Christopher J. Potter, 303-236-1735, [email protected]
Developing Remote Sensing Applications for Geological, Vegetation, and Soil Investigations: Mapping Invasive Plants
Regional-scale studies, such as those being conducted for the WLCI, are well suited for the use of remote-sensing techniques. Derivative products from remote-sensing instruments, such as Landsat, have been used successfully for decades in studies of geology, vegetation, environmental change, and many other types of scientific research. The continuous coverage of Landsat data since 1972 makes it possible to establish baseline conditions in areas affected by renewable and nonrenewable energy development. In this study, various Landsat datasets are being used to map current and pre-development conditions in the WLCI study area for a selected set of scientific interests.
Landsat scenes have been mosaicked to produce a composite map of minerals, including clays, carbonates, sulfates, micas, ferric and ferrous iron minerals, bare rock, and soil. Landsat imagery from April and June of 2009 was obtained to produce normalized difference vegetation index (NDVI) and difference normalized difference vegetation index (dNDVI) maps. One scene was selected to demonstrate the effectiveness of USGS software DESI (Detection of Early Season Invasives; Kokaly, 2011) for mapping cheatgrass. The DESI software comprises programs, written in Interactive Data Language (IDL), that run within the image-processing system ENvironment for Visualizing Images (ENVI) (ITT Visual Information Solutions, 2009). In FY2012, final products, including mineral and invasive species maps, were drafted and will be completed in FY2013.
Contact: Robert McDougal; 303-236-1854; [email protected]
23
Assessing Mineral Resources Numerous mineral deposits (excluding coal and other energy minerals, with the exception of
uranium) are located within the WLCI area, mostly within 16 mineralized areas (fig. 4). Understanding the extent of mineralization and historic mining activity allows us to predict the likelihood of continued or future mining development and the impacts thereof. The mineral-extraction industry is yet another development factor in Southwest Wyoming. Although Wyoming has a rich mining history, the current state of the industry is, with a few notable exceptions, mostly dormant in the WLCI study area. While there are hundreds of open claims and leases, there are only a few exploration projects, and even fewer active mining operations. Increased demand for uranium by in-situ recovery, however, has placed new demands on the landscape.
Field work conducted in prior years throughout the WLCI region revealed that metals mining (base and precious metals, both underground and placer) appears to be non-existent, unless it occurs on a small scale on private lands. No phosphate mines were found to be operating within the WLCI region, although some phosphate mining is taking place just west of the WLCI area in Idaho. (The largest former phosphate mines in Southwest Wyoming, at Leefe and South Mountain, have been reclaimed.) Uranium companies are exploring and developing some areas in the WLCI region, especially south of the Crooks Gap/Green Mountain area in the Great Divide Basin where traditional surface (open-pit) mining of uranium has given way to in-situ recovery projects. Although no uranium mining is occurring in the study area, several mines are proposed for the northern and eastern parts of the Great Divide Basin, and another is proposed for the Ketchum Buttes area (Gregory and others, 2010). As of early 2013, the only producing operation of any note was mining of trona in the center of the Green River Basin where the Basin is underlain by the Wilkins Peak member of the Eocene-age Green River Formation. West of Green River, several large companies are mining trona underground and processing it to make soda ash. Finally, demand for sand, gravel, and aggregate resources is increasing as gas development proceeds in the northwestern part of the study area.
In FY2012, a uranium assessment was completed and submitted for review as two separate papers. The base and precious metals assessment was presented at the May 2012 WLCI Science Workshop. Final reports summarizing the remaining mineral resources are in preparation and expected to be completed in FY2013. The assessments will help inform resource managers as to which areas are most likely to be impacted by future mining development and where reclamation of past extraction activities is most likely to occur.
Products Completed in FY2012 • Wilson, A.B., Uranium in the WLCI study area, SW Wyoming: U.S. Geological Survey Open-File Report (in
review). • Wilson, A.B., 2012, Mineral resources of WLCI—Past, present, and future, poster and oral presentation at the
Wyoming Landscape Conservation Initiative 2012 Science Workshop, May 14–17, 2012, Rock Springs, Wyo., at https://my.usgs.gov/confluence/download/attachments/318144721/WLCISciWshop2012_Abstracts%20Final4.reformatted.pdf?api=v2.
• Corrections and updates to more than 500 records for each of the mine sites have been made in the active USGS Mineral Resources Database System; countless duplicate records have been consolidated and deleted. For easy retrieval, all current WLCI records have the group code “WLCI.” http://mrds.cr.usgs.gov:7777/mrds/f?p=130: or http://tin.er.usgs.gov/mrds/.
• Wilson, A.B., and Biewick, L.R.H., Uranium resources map: U.S. Geological Survey (in review). • Mineral resources of WLCI Fact Sheet (draft stage).
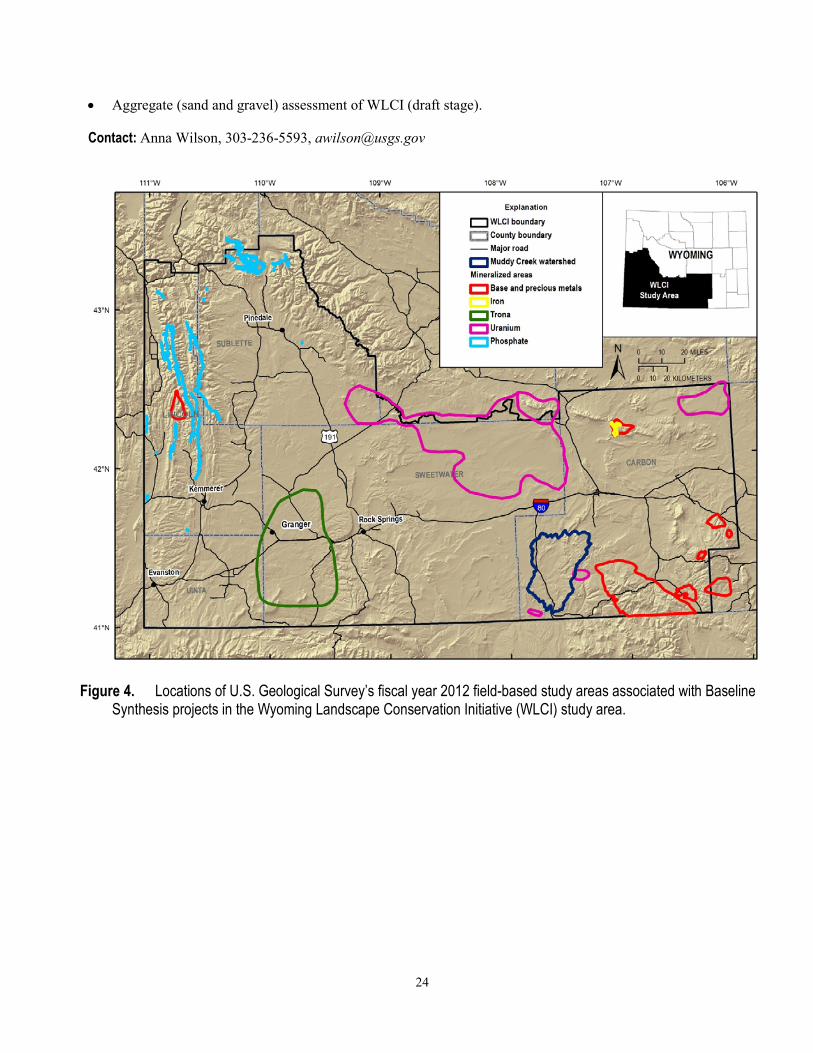
24
• Aggregate (sand and gravel) assessment of WLCI (draft stage).
Contact: Anna Wilson, 303-236-5593, [email protected]
Figure 4. Locations of U.S. Geological Survey’s fiscal year 2012 field-based study areas associated with Baseline Synthesis projects in the Wyoming Landscape Conservation Initiative (WLCI) study area.
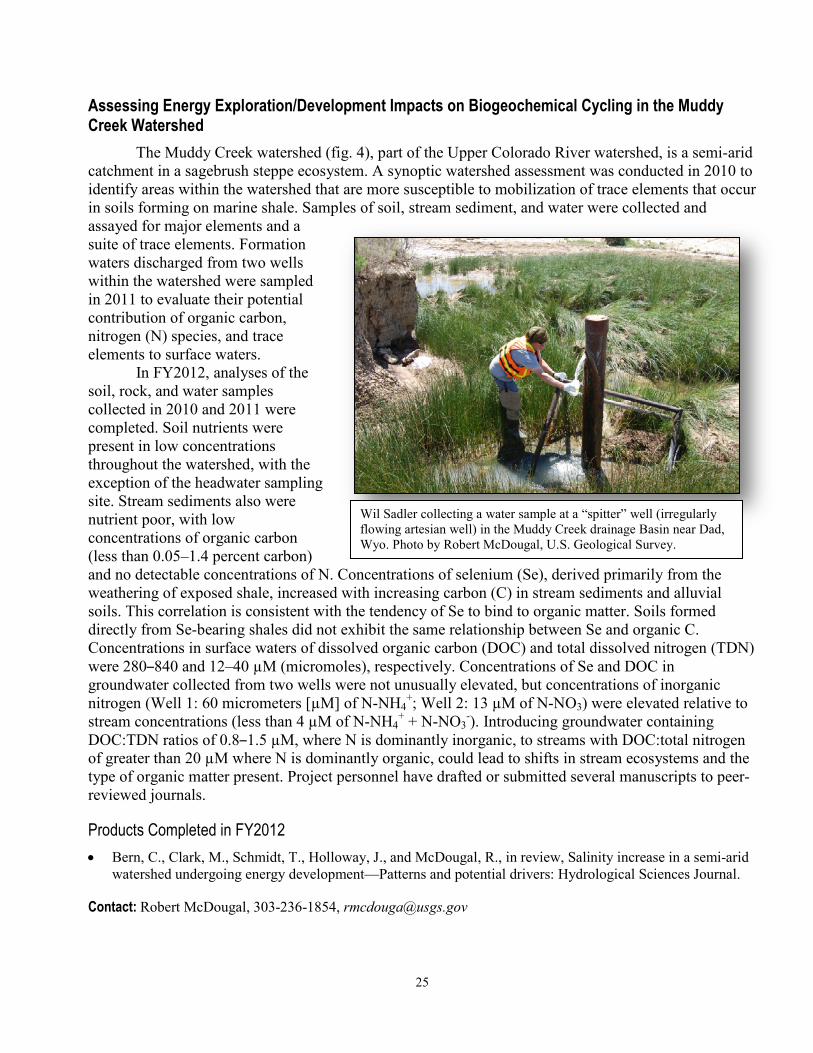
25
Wil Sadler collecting a water sample at a “spitter” well (irregularly flowing artesian well) in the Muddy Creek drainage Basin near Dad, Wyo. Photo by Robert McDougal, U.S. Geological Survey.
Assessing Energy Exploration/Development Impacts on Biogeochemical Cycling in the Muddy Creek Watershed
The Muddy Creek watershed (fig. 4), part of the Upper Colorado River watershed, is a semi-arid catchment in a sagebrush steppe ecosystem. A synoptic watershed assessment was conducted in 2010 to identify areas within the watershed that are more susceptible to mobilization of trace elements that occur in soils forming on marine shale. Samples of soil, stream sediment, and water were collected and assayed for major elements and a suite of trace elements. Formation waters discharged from two wells within the watershed were sampled in 2011 to evaluate their potential contribution of organic carbon, nitrogen (N) species, and trace elements to surface waters.
In FY2012, analyses of the soil, rock, and water samples collected in 2010 and 2011 were completed. Soil nutrients were present in low concentrations throughout the watershed, with the exception of the headwater sampling site. Stream sediments also were nutrient poor, with low concentrations of organic carbon (less than 0.05–1.4 percent carbon) and no detectable concentrations of N. Concentrations of selenium (Se), derived primarily from the weathering of exposed shale, increased with increasing carbon (C) in stream sediments and alluvial soils. This correlation is consistent with the tendency of Se to bind to organic matter. Soils formed directly from Se-bearing shales did not exhibit the same relationship between Se and organic C. Concentrations in surface waters of dissolved organic carbon (DOC) and total dissolved nitrogen (TDN) were 280–840 and 12–40 µM (micromoles), respectively. Concentrations of Se and DOC in groundwater collected from two wells were not unusually elevated, but concentrations of inorganic nitrogen (Well 1: 60 micrometers [µM] of N-NH4
+; Well 2: 13 µM of N-NO3) were elevated relative to stream concentrations (less than 4 µM of N-NH4
+ + N-NO3-). Introducing groundwater containing
DOC:TDN ratios of 0.8–1.5 µM, where N is dominantly inorganic, to streams with DOC:total nitrogen of greater than 20 µM where N is dominantly organic, could lead to shifts in stream ecosystems and the type of organic matter present. Project personnel have drafted or submitted several manuscripts to peer-reviewed journals.
Products Completed in FY2012 • Bern, C., Clark, M., Schmidt, T., Holloway, J., and McDougal, R., in review, Salinity increase in a semi-arid
watershed undergoing energy development—Patterns and potential drivers: Hydrological Sciences Journal.
Contact: Robert McDougal, 303-236-1854, [email protected]
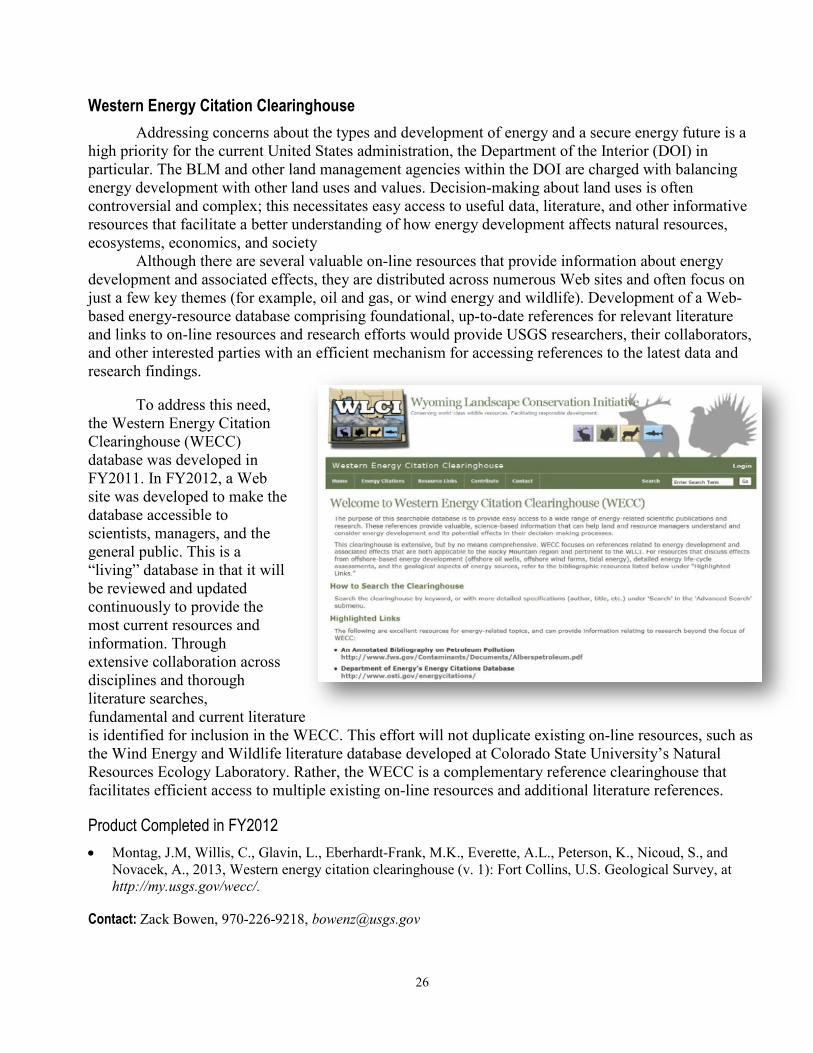
26
Western Energy Citation Clearinghouse Addressing concerns about the types and development of energy and a secure energy future is a
high priority for the current United States administration, the Department of the Interior (DOI) in particular. The BLM and other land management agencies within the DOI are charged with balancing energy development with other land uses and values. Decision-making about land uses is often controversial and complex; this necessitates easy access to useful data, literature, and other informative resources that facilitate a better understanding of how energy development affects natural resources, ecosystems, economics, and society
Although there are several valuable on-line resources that provide information about energy development and associated effects, they are distributed across numerous Web sites and often focus on just a few key themes (for example, oil and gas, or wind energy and wildlife). Development of a Web-based energy-resource database comprising foundational, up-to-date references for relevant literature and links to on-line resources and research efforts would provide USGS researchers, their collaborators, and other interested parties with an efficient mechanism for accessing references to the latest data and research findings.
To address this need,
the Western Energy Citation Clearinghouse (WECC) database was developed in FY2011. In FY2012, a Web site was developed to make the database accessible to scientists, managers, and the general public. This is a “living” database in that it will be reviewed and updated continuously to provide the most current resources and information. Through extensive collaboration across disciplines and thorough literature searches, fundamental and current literature is identified for inclusion in the WECC. This effort will not duplicate existing on-line resources, such as the Wind Energy and Wildlife literature database developed at Colorado State University’s Natural Resources Ecology Laboratory. Rather, the WECC is a complementary reference clearinghouse that facilitates efficient access to multiple existing on-line resources and additional literature references.
Product Completed in FY2012 • Montag, J.M, Willis, C., Glavin, L., Eberhardt-Frank, M.K., Everette, A.L., Peterson, K., Nicoud, S., and
Novacek, A., 2013, Western energy citation clearinghouse (v. 1): Fort Collins, U.S. Geological Survey, at http://my.usgs.gov/wecc/.
Contact: Zack Bowen, 970-226-9218, [email protected]
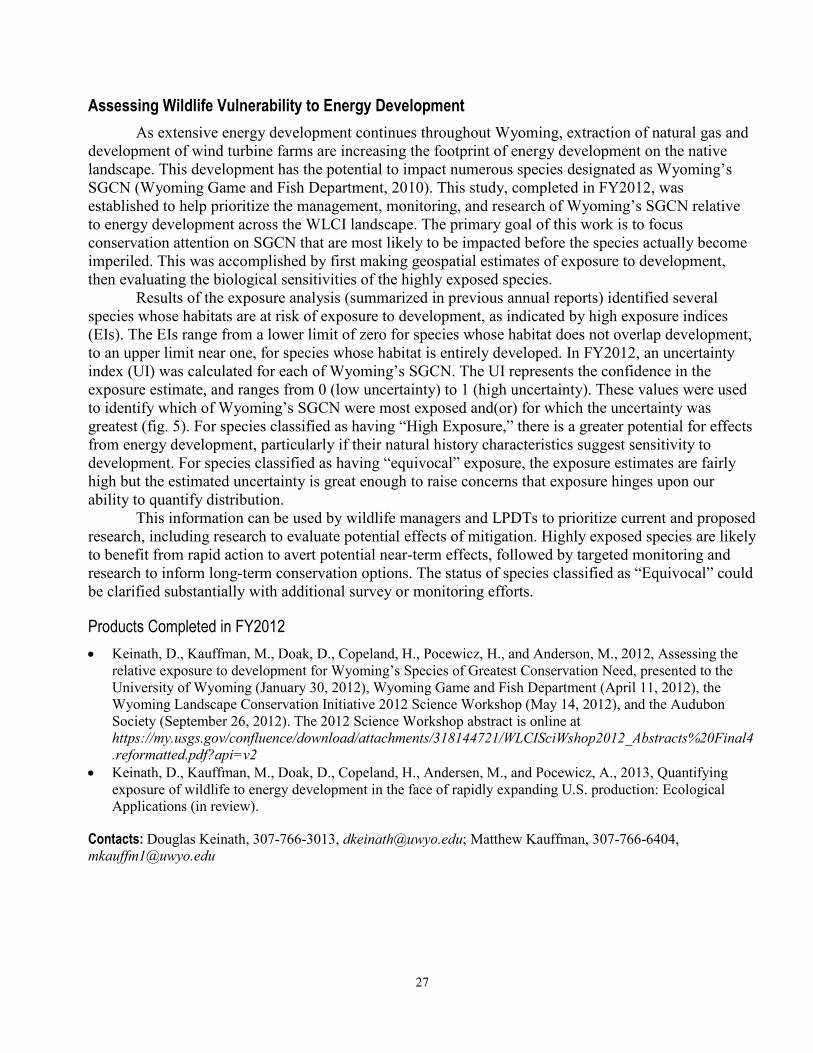
27
Assessing Wildlife Vulnerability to Energy Development As extensive energy development continues throughout Wyoming, extraction of natural gas and
development of wind turbine farms are increasing the footprint of energy development on the native landscape. This development has the potential to impact numerous species designated as Wyoming’s SGCN (Wyoming Game and Fish Department, 2010). This study, completed in FY2012, was established to help prioritize the management, monitoring, and research of Wyoming’s SGCN relative to energy development across the WLCI landscape. The primary goal of this work is to focus conservation attention on SGCN that are most likely to be impacted before the species actually become imperiled. This was accomplished by first making geospatial estimates of exposure to development, then evaluating the biological sensitivities of the highly exposed species.
Results of the exposure analysis (summarized in previous annual reports) identified several species whose habitats are at risk of exposure to development, as indicated by high exposure indices (EIs). The EIs range from a lower limit of zero for species whose habitat does not overlap development, to an upper limit near one, for species whose habitat is entirely developed. In FY2012, an uncertainty index (UI) was calculated for each of Wyoming’s SGCN. The UI represents the confidence in the exposure estimate, and ranges from 0 (low uncertainty) to 1 (high uncertainty). These values were used to identify which of Wyoming’s SGCN were most exposed and(or) for which the uncertainty was greatest (fig. 5). For species classified as having “High Exposure,” there is a greater potential for effects from energy development, particularly if their natural history characteristics suggest sensitivity to development. For species classified as having “equivocal” exposure, the exposure estimates are fairly high but the estimated uncertainty is great enough to raise concerns that exposure hinges upon our ability to quantify distribution.
This information can be used by wildlife managers and LPDTs to prioritize current and proposed research, including research to evaluate potential effects of mitigation. Highly exposed species are likely to benefit from rapid action to avert potential near-term effects, followed by targeted monitoring and research to inform long-term conservation options. The status of species classified as “Equivocal” could be clarified substantially with additional survey or monitoring efforts.
Products Completed in FY2012 • Keinath, D., Kauffman, M., Doak, D., Copeland, H., Pocewicz, H., and Anderson, M., 2012, Assessing the
relative exposure to development for Wyoming’s Species of Greatest Conservation Need, presented to the University of Wyoming (January 30, 2012), Wyoming Game and Fish Department (April 11, 2012), the Wyoming Landscape Conservation Initiative 2012 Science Workshop (May 14, 2012), and the Audubon Society (September 26, 2012). The 2012 Science Workshop abstract is online at https://my.usgs.gov/confluence/download/attachments/318144721/WLCISciWshop2012_Abstracts%20Final4.reformatted.pdf?api=v2
• Keinath, D., Kauffman, M., Doak, D., Copeland, H., Andersen, M., and Pocewicz, A., 2013, Quantifying exposure of wildlife to energy development in the face of rapidly expanding U.S. production: Ecological Applications (in review).
Contacts: Douglas Keinath, 307-766-3013, [email protected]; Matthew Kauffman, 307-766-6404, [email protected]
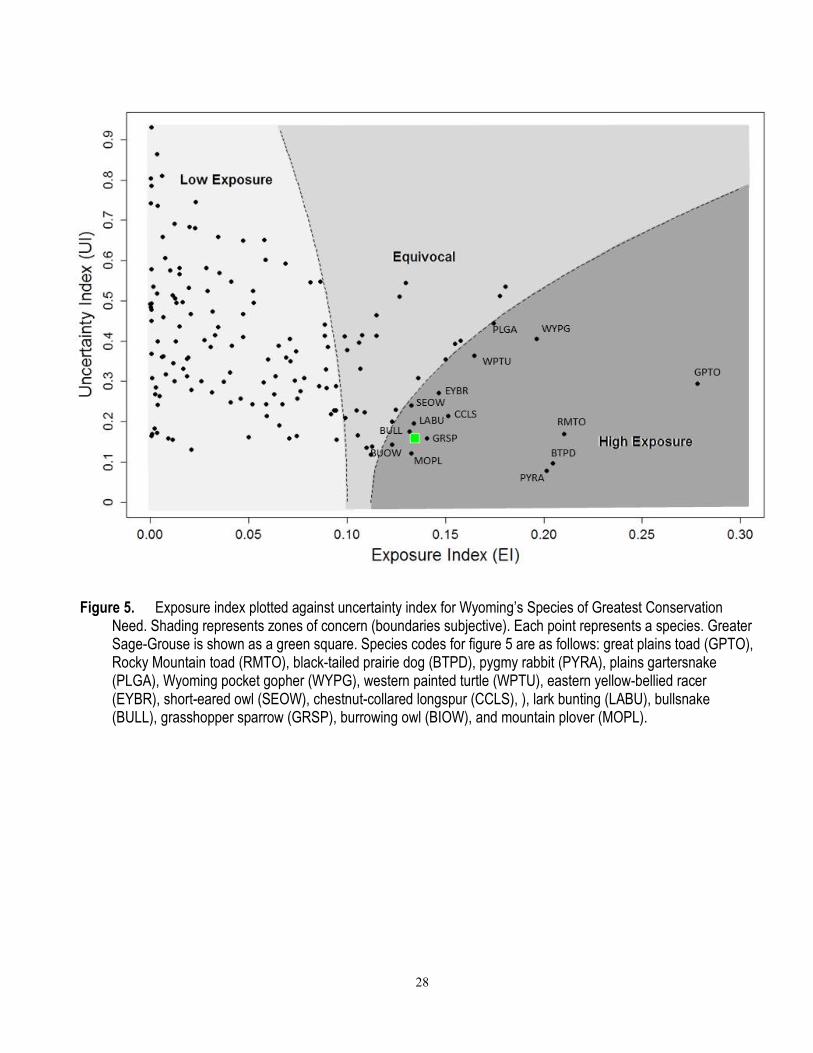
28
Figure 5. Exposure index plotted against uncertainty index for Wyoming’s Species of Greatest Conservation Need. Shading represents zones of concern (boundaries subjective). Each point represents a species. Greater Sage-Grouse is shown as a green square. Species codes for figure 5 are as follows: great plains toad (GPTO), Rocky Mountain toad (RMTO), black-tailed prairie dog (BTPD), pygmy rabbit (PYRA), plains gartersnake (PLGA), Wyoming pocket gopher (WYPG), western painted turtle (WPTU), eastern yellow-bellied racer (EYBR), short-eared owl (SEOW), chestnut-collared longspur (CCLS), ), lark bunting (LABU), bullsnake (BULL), grasshopper sparrow (GRSP), burrowing owl (BIOW), and mountain plover (MOPL).
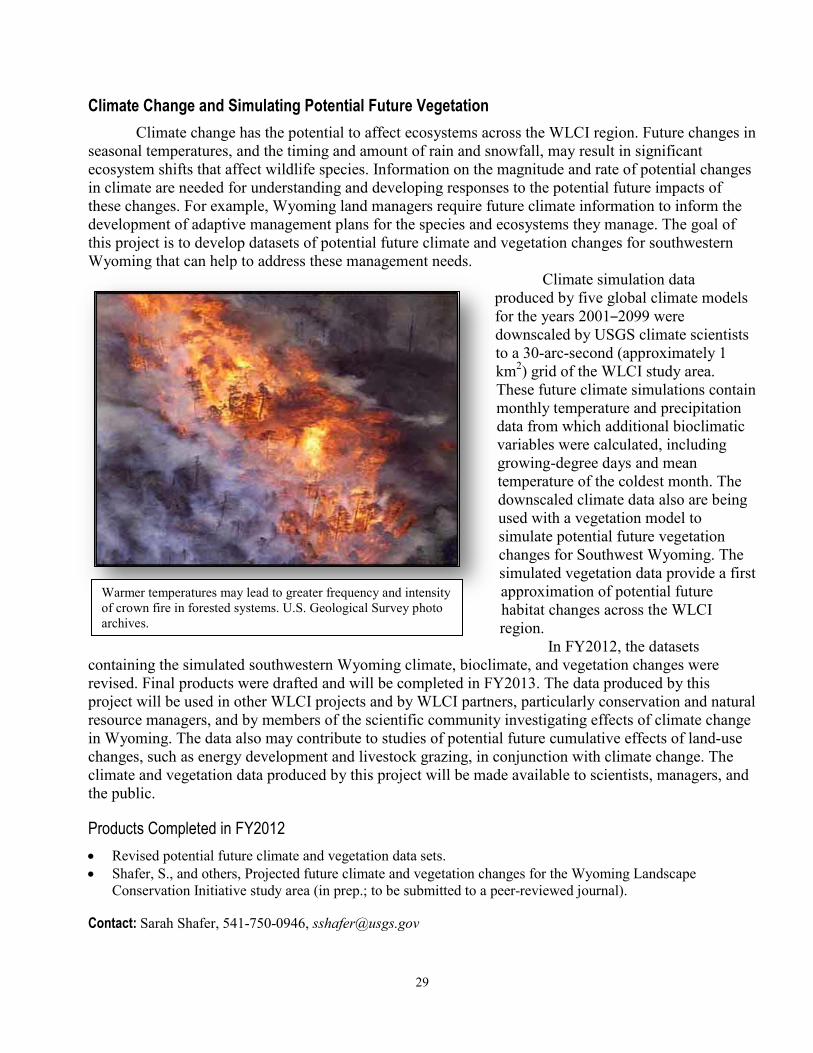
29
Warmer temperatures may lead to greater frequency and intensity of crown fire in forested systems. U.S. Geological Survey photo archives.
Climate Change and Simulating Potential Future Vegetation Climate change has the potential to affect ecosystems across the WLCI region. Future changes in
seasonal temperatures, and the timing and amount of rain and snowfall, may result in significant ecosystem shifts that affect wildlife species. Information on the magnitude and rate of potential changes in climate are needed for understanding and developing responses to the potential future impacts of these changes. For example, Wyoming land managers require future climate information to inform the development of adaptive management plans for the species and ecosystems they manage. The goal of this project is to develop datasets of potential future climate and vegetation changes for southwestern Wyoming that can help to address these management needs.
Climate simulation data produced by five global climate models for the years 2001–2099 were downscaled by USGS climate scientists to a 30-arc-second (approximately 1 km2) grid of the WLCI study area. These future climate simulations contain monthly temperature and precipitation data from which additional bioclimatic variables were calculated, including growing-degree days and mean temperature of the coldest month. The downscaled climate data also are being used with a vegetation model to simulate potential future vegetation changes for Southwest Wyoming. The simulated vegetation data provide a first approximation of potential future habitat changes across the WLCI region.
In FY2012, the datasets containing the simulated southwestern Wyoming climate, bioclimate, and vegetation changes were revised. Final products were drafted and will be completed in FY2013. The data produced by this project will be used in other WLCI projects and by WLCI partners, particularly conservation and natural resource managers, and by members of the scientific community investigating effects of climate change in Wyoming. The data also may contribute to studies of potential future cumulative effects of land-use changes, such as energy development and livestock grazing, in conjunction with climate change. The climate and vegetation data produced by this project will be made available to scientists, managers, and the public.
Products Completed in FY2012 • Revised potential future climate and vegetation data sets. • Shafer, S., and others, Projected future climate and vegetation changes for the Wyoming Landscape
Conservation Initiative study area (in prep.; to be submitted to a peer-reviewed journal).
Contact: Sarah Shafer, 541-750-0946, [email protected]
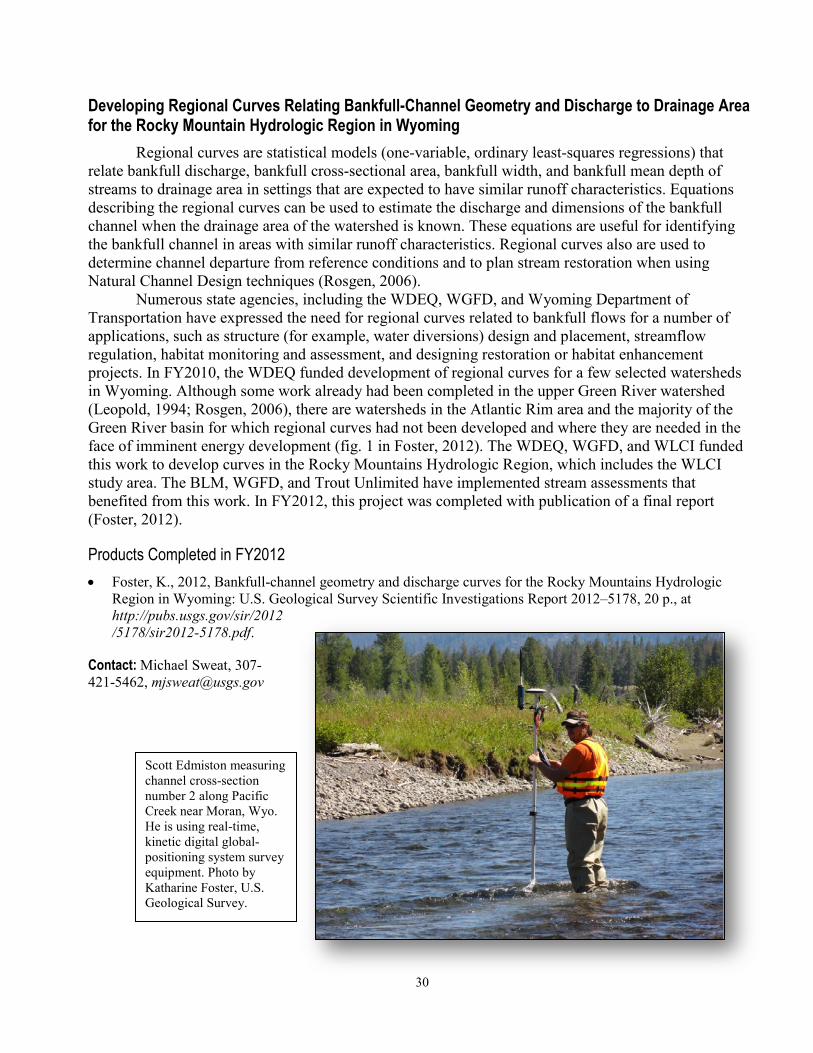
30
Developing Regional Curves Relating Bankfull-Channel Geometry and Discharge to Drainage Area for the Rocky Mountain Hydrologic Region in Wyoming
Regional curves are statistical models (one-variable, ordinary least-squares regressions) that relate bankfull discharge, bankfull cross-sectional area, bankfull width, and bankfull mean depth of streams to drainage area in settings that are expected to have similar runoff characteristics. Equations describing the regional curves can be used to estimate the discharge and dimensions of the bankfull channel when the drainage area of the watershed is known. These equations are useful for identifying the bankfull channel in areas with similar runoff characteristics. Regional curves also are used to determine channel departure from reference conditions and to plan stream restoration when using Natural Channel Design techniques (Rosgen, 2006).
Numerous state agencies, including the WDEQ, WGFD, and Wyoming Department of Transportation have expressed the need for regional curves related to bankfull flows for a number of applications, such as structure (for example, water diversions) design and placement, streamflow regulation, habitat monitoring and assessment, and designing restoration or habitat enhancement projects. In FY2010, the WDEQ funded development of regional curves for a few selected watersheds in Wyoming. Although some work already had been completed in the upper Green River watershed (Leopold, 1994; Rosgen, 2006), there are watersheds in the Atlantic Rim area and the majority of the Green River basin for which regional curves had not been developed and where they are needed in the face of imminent energy development (fig. 1 in Foster, 2012). The WDEQ, WGFD, and WLCI funded this work to develop curves in the Rocky Mountains Hydrologic Region, which includes the WLCI study area. The BLM, WGFD, and Trout Unlimited have implemented stream assessments that benefited from this work. In FY2012, this project was completed with publication of a final report (Foster, 2012).
Products Completed in FY2012 • Foster, K., 2012, Bankfull-channel geometry and discharge curves for the Rocky Mountains Hydrologic
Region in Wyoming: U.S. Geological Survey Scientific Investigations Report 2012–5178, 20 p., at http://pubs.usgs.gov/sir/2012/5178/sir2012-5178.pdf.
Contact: Michael Sweat, 307-421-5462, [email protected]
Scott Edmiston measuring channel cross-section number 2 along Pacific Creek near Moran, Wyo. He is using real-time, kinetic digital global-positioning system survey equipment. Photo by Katharine Foster, U.S. Geological Survey.
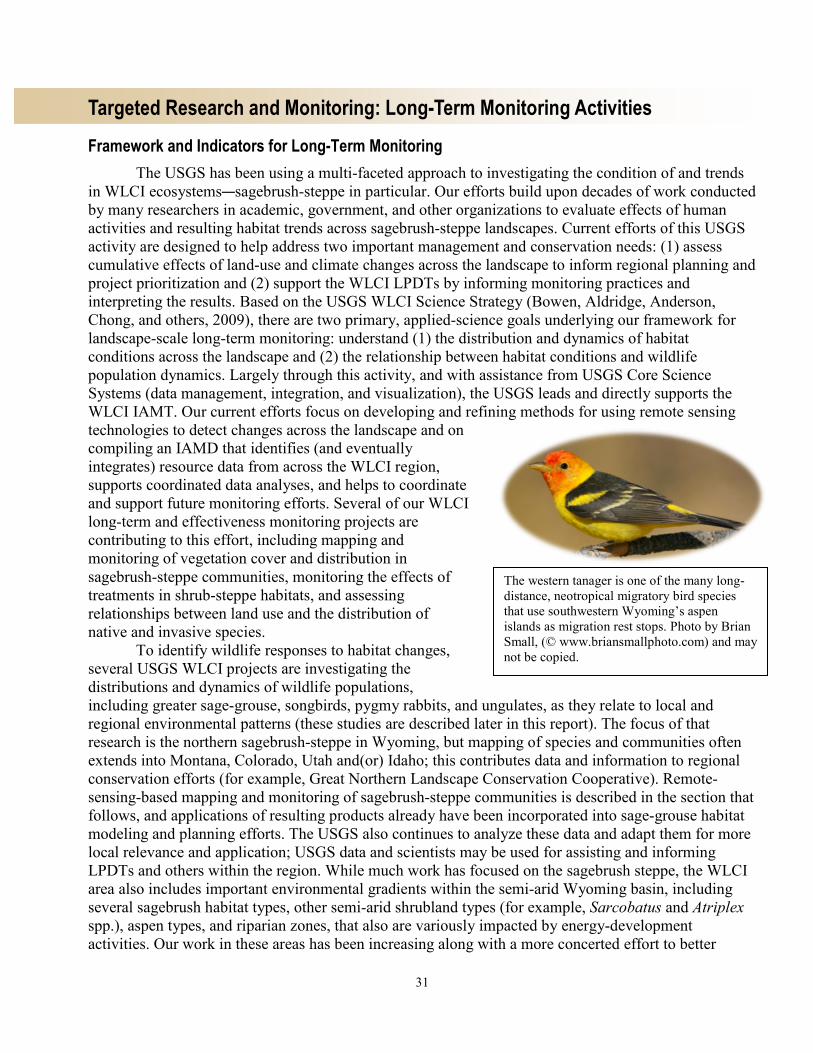
31
The western tanager is one of the many long-distance, neotropical migratory bird species that use southwestern Wyoming’s aspen islands as migration rest stops. Photo by Brian Small, (© www.briansmallphoto.com) and may not be copied.
Targeted Research and Monitoring: Long-Term Monitoring Activities Framework and Indicators for Long-Term Monitoring
The USGS has been using a multi-faceted approach to investigating the condition of and trends in WLCI ecosystems—sagebrush-steppe in particular. Our efforts build upon decades of work conducted by many researchers in academic, government, and other organizations to evaluate effects of human activities and resulting habitat trends across sagebrush-steppe landscapes. Current efforts of this USGS activity are designed to help address two important management and conservation needs: (1) assess cumulative effects of land-use and climate changes across the landscape to inform regional planning and project prioritization and (2) support the WLCI LPDTs by informing monitoring practices and interpreting the results. Based on the USGS WLCI Science Strategy (Bowen, Aldridge, Anderson, Chong, and others, 2009), there are two primary, applied-science goals underlying our framework for landscape-scale long-term monitoring: understand (1) the distribution and dynamics of habitat conditions across the landscape and (2) the relationship between habitat conditions and wildlife population dynamics. Largely through this activity, and with assistance from USGS Core Science Systems (data management, integration, and visualization), the USGS leads and directly supports the WLCI IAMT. Our current efforts focus on developing and refining methods for using remote sensing technologies to detect changes across the landscape and on compiling an IAMD that identifies (and eventually integrates) resource data from across the WLCI region, supports coordinated data analyses, and helps to coordinate and support future monitoring efforts. Several of our WLCI long-term and effectiveness monitoring projects are contributing to this effort, including mapping and monitoring of vegetation cover and distribution in sagebrush-steppe communities, monitoring the effects of treatments in shrub-steppe habitats, and assessing relationships between land use and the distribution of native and invasive species.
To identify wildlife responses to habitat changes, several USGS WLCI projects are investigating the distributions and dynamics of wildlife populations, including greater sage-grouse, songbirds, pygmy rabbits, and ungulates, as they relate to local and regional environmental patterns (these studies are described later in this report). The focus of that research is the northern sagebrush-steppe in Wyoming, but mapping of species and communities often extends into Montana, Colorado, Utah and(or) Idaho; this contributes data and information to regional conservation efforts (for example, Great Northern Landscape Conservation Cooperative). Remote-sensing-based mapping and monitoring of sagebrush-steppe communities is described in the section that follows, and applications of resulting products already have been incorporated into sage-grouse habitat modeling and planning efforts. The USGS also continues to analyze these data and adapt them for more local relevance and application; USGS data and scientists may be used for assisting and informing LPDTs and others within the region. While much work has focused on the sagebrush steppe, the WLCI area also includes important environmental gradients within the semi-arid Wyoming basin, including several sagebrush habitat types, other semi-arid shrubland types (for example, Sarcobatus and Atriplex spp.), aspen types, and riparian zones, that also are variously impacted by energy-development activities. Our work in these areas has been increasing along with a more concerted effort to better
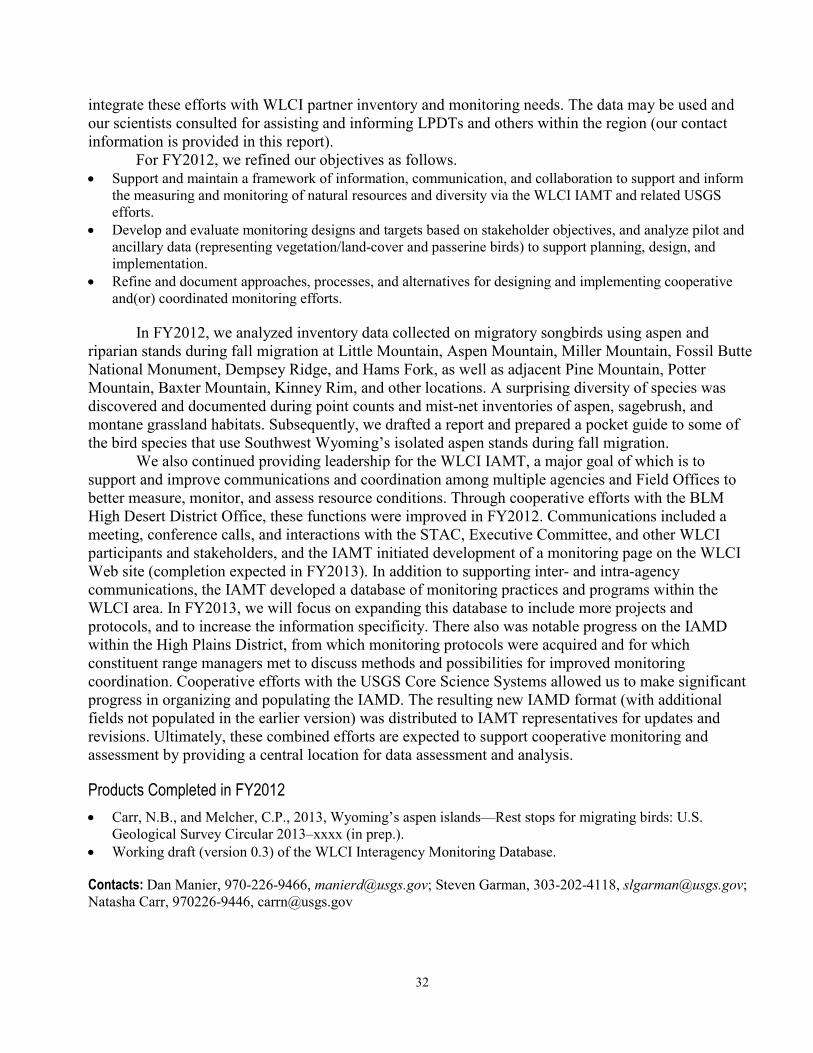
32
integrate these efforts with WLCI partner inventory and monitoring needs. The data may be used and our scientists consulted for assisting and informing LPDTs and others within the region (our contact information is provided in this report).
For FY2012, we refined our objectives as follows. • Support and maintain a framework of information, communication, and collaboration to support and inform
the measuring and monitoring of natural resources and diversity via the WLCI IAMT and related USGS efforts.
• Develop and evaluate monitoring designs and targets based on stakeholder objectives, and analyze pilot and ancillary data (representing vegetation/land-cover and passerine birds) to support planning, design, and implementation.
• Refine and document approaches, processes, and alternatives for designing and implementing cooperative and(or) coordinated monitoring efforts.
In FY2012, we analyzed inventory data collected on migratory songbirds using aspen and riparian stands during fall migration at Little Mountain, Aspen Mountain, Miller Mountain, Fossil Butte National Monument, Dempsey Ridge, and Hams Fork, as well as adjacent Pine Mountain, Potter Mountain, Baxter Mountain, Kinney Rim, and other locations. A surprising diversity of species was discovered and documented during point counts and mist-net inventories of aspen, sagebrush, and montane grassland habitats. Subsequently, we drafted a report and prepared a pocket guide to some of the bird species that use Southwest Wyoming’s isolated aspen stands during fall migration.
We also continued providing leadership for the WLCI IAMT, a major goal of which is to support and improve communications and coordination among multiple agencies and Field Offices to better measure, monitor, and assess resource conditions. Through cooperative efforts with the BLM High Desert District Office, these functions were improved in FY2012. Communications included a meeting, conference calls, and interactions with the STAC, Executive Committee, and other WLCI participants and stakeholders, and the IAMT initiated development of a monitoring page on the WLCI Web site (completion expected in FY2013). In addition to supporting inter- and intra-agency communications, the IAMT developed a database of monitoring practices and programs within the WLCI area. In FY2013, we will focus on expanding this database to include more projects and protocols, and to increase the information specificity. There also was notable progress on the IAMD within the High Plains District, from which monitoring protocols were acquired and for which constituent range managers met to discuss methods and possibilities for improved monitoring coordination. Cooperative efforts with the USGS Core Science Systems allowed us to make significant progress in organizing and populating the IAMD. The resulting new IAMD format (with additional fields not populated in the earlier version) was distributed to IAMT representatives for updates and revisions. Ultimately, these combined efforts are expected to support cooperative monitoring and assessment by providing a central location for data assessment and analysis.
Products Completed in FY2012 • Carr, N.B., and Melcher, C.P., 2013, Wyoming’s aspen islands—Rest stops for migrating birds: U.S.
Geological Survey Circular 2013–xxxx (in prep.). • Working draft (version 0.3) of the WLCI Interagency Monitoring Database.
Contacts: Dan Manier, 970-226-9466, [email protected]; Steven Garman, 303-202-4118, [email protected]; Natasha Carr, 970226-9446, [email protected]
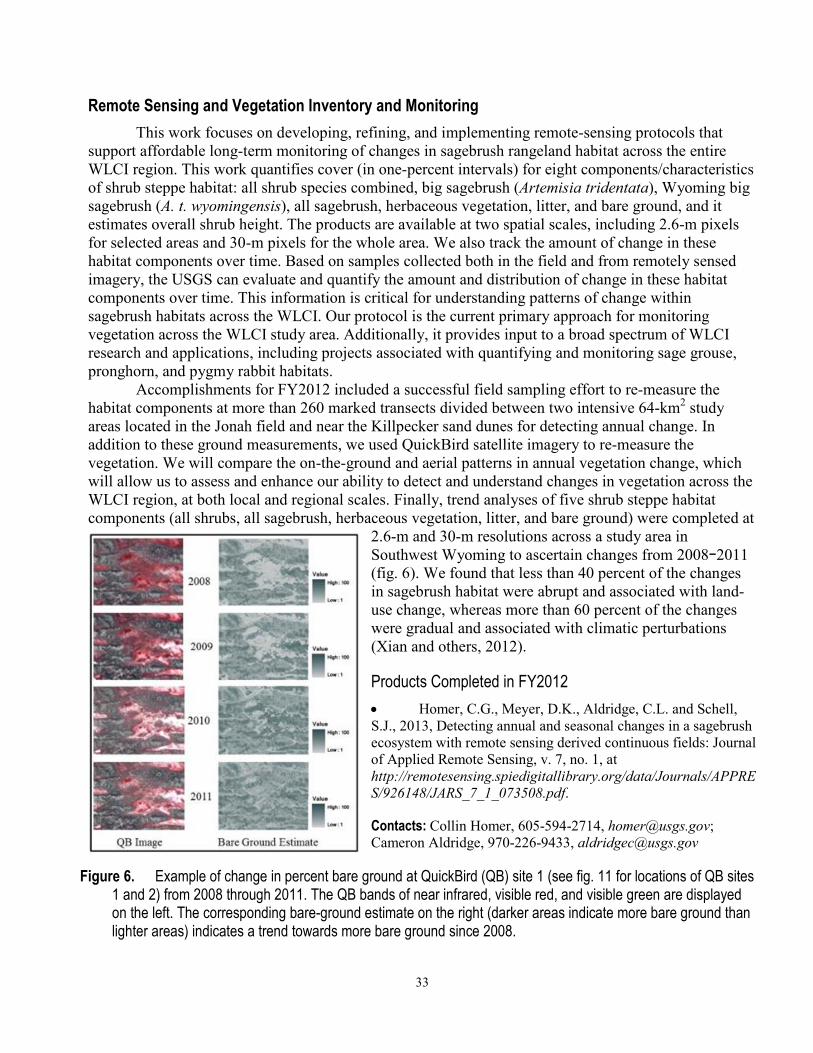
33
Remote Sensing and Vegetation Inventory and Monitoring This work focuses on developing, refining, and implementing remote-sensing protocols that
support affordable long-term monitoring of changes in sagebrush rangeland habitat across the entire WLCI region. This work quantifies cover (in one-percent intervals) for eight components/characteristics of shrub steppe habitat: all shrub species combined, big sagebrush (Artemisia tridentata), Wyoming big sagebrush (A. t. wyomingensis), all sagebrush, herbaceous vegetation, litter, and bare ground, and it estimates overall shrub height. The products are available at two spatial scales, including 2.6-m pixels for selected areas and 30-m pixels for the whole area. We also track the amount of change in these habitat components over time. Based on samples collected both in the field and from remotely sensed imagery, the USGS can evaluate and quantify the amount and distribution of change in these habitat components over time. This information is critical for understanding patterns of change within sagebrush habitats across the WLCI. Our protocol is the current primary approach for monitoring vegetation across the WLCI study area. Additionally, it provides input to a broad spectrum of WLCI research and applications, including projects associated with quantifying and monitoring sage grouse, pronghorn, and pygmy rabbit habitats.
Accomplishments for FY2012 included a successful field sampling effort to re-measure the habitat components at more than 260 marked transects divided between two intensive 64-km2 study areas located in the Jonah field and near the Killpecker sand dunes for detecting annual change. In addition to these ground measurements, we used QuickBird satellite imagery to re-measure the vegetation. We will compare the on-the-ground and aerial patterns in annual vegetation change, which will allow us to assess and enhance our ability to detect and understand changes in vegetation across the WLCI region, at both local and regional scales. Finally, trend analyses of five shrub steppe habitat components (all shrubs, all sagebrush, herbaceous vegetation, litter, and bare ground) were completed at
2.6-m and 30-m resolutions across a study area in Southwest Wyoming to ascertain changes from 2008−2011 (fig. 6). We found that less than 40 percent of the changes in sagebrush habitat were abrupt and associated with land-use change, whereas more than 60 percent of the changes were gradual and associated with climatic perturbations (Xian and others, 2012).
Products Completed in FY2012 • Homer, C.G., Meyer, D.K., Aldridge, C.L. and Schell, S.J., 2013, Detecting annual and seasonal changes in a sagebrush ecosystem with remote sensing derived continuous fields: Journal of Applied Remote Sensing, v. 7, no. 1, at http://remotesensing.spiedigitallibrary.org/data/Journals/APPRES/926148/JARS_7_1_073508.pdf.
Contacts: Collin Homer, 605-594-2714, [email protected]; Cameron Aldridge, 970-226-9433, [email protected]
Figure 6. Example of change in percent bare ground at QuickBird (QB) site 1 (see fig. 11 for locations of QB sites 1 and 2) from 2008 through 2011. The QB bands of near infrared, visible red, and visible green are displayed on the left. The corresponding bare-ground estimate on the right (darker areas indicate more bare ground than lighter areas) indicates a trend towards more bare ground since 2008.
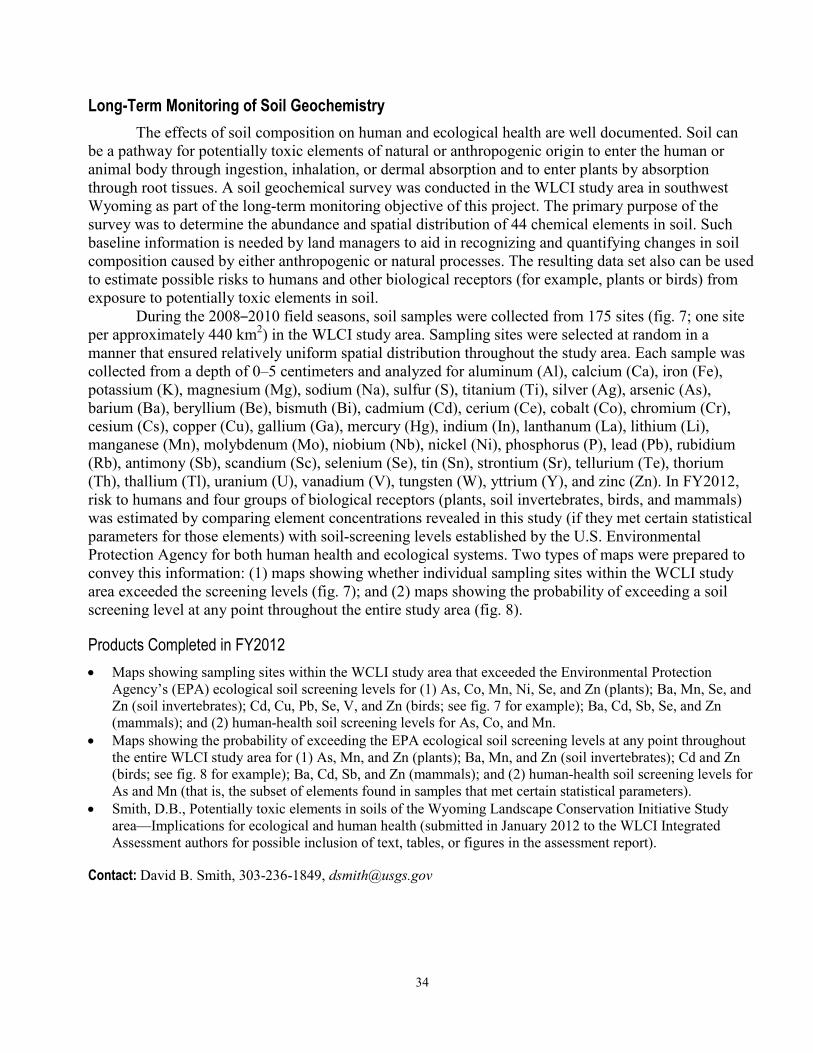
34
Long-Term Monitoring of Soil Geochemistry The effects of soil composition on human and ecological health are well documented. Soil can
be a pathway for potentially toxic elements of natural or anthropogenic origin to enter the human or animal body through ingestion, inhalation, or dermal absorption and to enter plants by absorption through root tissues. A soil geochemical survey was conducted in the WLCI study area in southwest Wyoming as part of the long-term monitoring objective of this project. The primary purpose of the survey was to determine the abundance and spatial distribution of 44 chemical elements in soil. Such baseline information is needed by land managers to aid in recognizing and quantifying changes in soil composition caused by either anthropogenic or natural processes. The resulting data set also can be used to estimate possible risks to humans and other biological receptors (for example, plants or birds) from exposure to potentially toxic elements in soil.
During the 2008–2010 field seasons, soil samples were collected from 175 sites (fig. 7; one site per approximately 440 km2) in the WLCI study area. Sampling sites were selected at random in a manner that ensured relatively uniform spatial distribution throughout the study area. Each sample was collected from a depth of 0–5 centimeters and analyzed for aluminum (Al), calcium (Ca), iron (Fe), potassium (K), magnesium (Mg), sodium (Na), sulfur (S), titanium (Ti), silver (Ag), arsenic (As), barium (Ba), beryllium (Be), bismuth (Bi), cadmium (Cd), cerium (Ce), cobalt (Co), chromium (Cr), cesium (Cs), copper (Cu), gallium (Ga), mercury (Hg), indium (In), lanthanum (La), lithium (Li), manganese (Mn), molybdenum (Mo), niobium (Nb), nickel (Ni), phosphorus (P), lead (Pb), rubidium (Rb), antimony (Sb), scandium (Sc), selenium (Se), tin (Sn), strontium (Sr), tellurium (Te), thorium (Th), thallium (Tl), uranium (U), vanadium (V), tungsten (W), yttrium (Y), and zinc (Zn). In FY2012, risk to humans and four groups of biological receptors (plants, soil invertebrates, birds, and mammals) was estimated by comparing element concentrations revealed in this study (if they met certain statistical parameters for those elements) with soil-screening levels established by the U.S. Environmental Protection Agency for both human health and ecological systems. Two types of maps were prepared to convey this information: (1) maps showing whether individual sampling sites within the WCLI study area exceeded the screening levels (fig. 7); and (2) maps showing the probability of exceeding a soil screening level at any point throughout the entire study area (fig. 8).
Products Completed in FY2012 • Maps showing sampling sites within the WCLI study area that exceeded the Environmental Protection
Agency’s (EPA) ecological soil screening levels for (1) As, Co, Mn, Ni, Se, and Zn (plants); Ba, Mn, Se, and Zn (soil invertebrates); Cd, Cu, Pb, Se, V, and Zn (birds; see fig. 7 for example); Ba, Cd, Sb, Se, and Zn (mammals); and (2) human-health soil screening levels for As, Co, and Mn.
• Maps showing the probability of exceeding the EPA ecological soil screening levels at any point throughout the entire WLCI study area for (1) As, Mn, and Zn (plants); Ba, Mn, and Zn (soil invertebrates); Cd and Zn (birds; see fig. 8 for example); Ba, Cd, Sb, and Zn (mammals); and (2) human-health soil screening levels for As and Mn (that is, the subset of elements found in samples that met certain statistical parameters).
• Smith, D.B., Potentially toxic elements in soils of the Wyoming Landscape Conservation Initiative Study area—Implications for ecological and human health (submitted in January 2012 to the WLCI Integrated Assessment authors for possible inclusion of text, tables, or figures in the assessment report).
Contact: David B. Smith, 303-236-1849, [email protected]
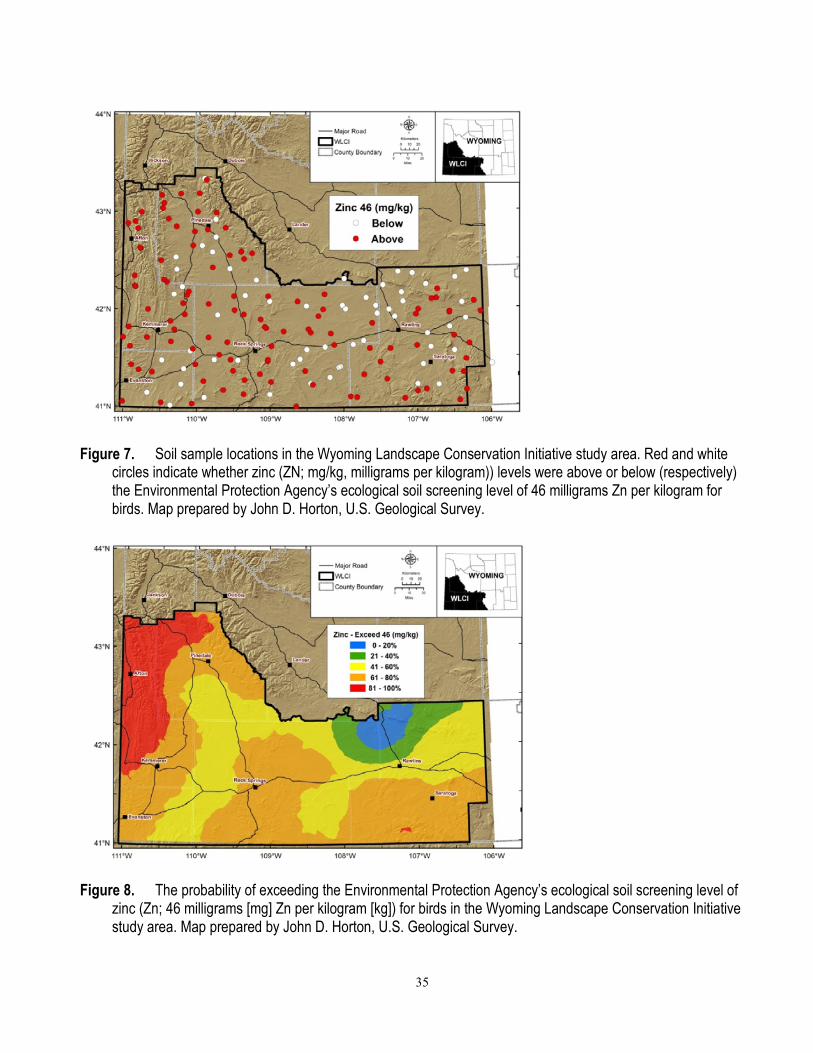
35
Figure 7. Soil sample locations in the Wyoming Landscape Conservation Initiative study area. Red and white circles indicate whether zinc (ZN; mg/kg, milligrams per kilogram)) levels were above or below (respectively) the Environmental Protection Agency’s ecological soil screening level of 46 milligrams Zn per kilogram for birds. Map prepared by John D. Horton, U.S. Geological Survey.
Figure 8. The probability of exceeding the Environmental Protection Agency’s ecological soil screening level of zinc (Zn; 46 milligrams [mg] Zn per kilogram [kg]) for birds in the Wyoming Landscape Conservation Initiative study area. Map prepared by John D. Horton, U.S. Geological Survey.
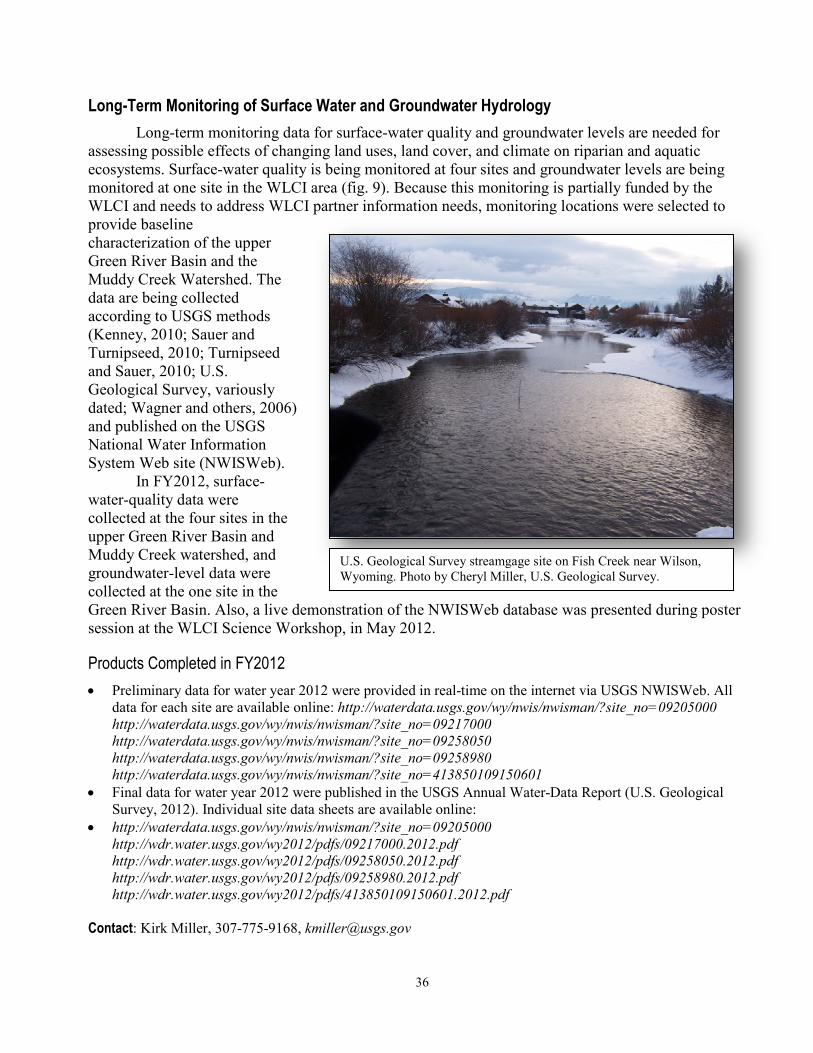
36
U.S. Geological Survey streamgage site on Fish Creek near Wilson, Wyoming. Photo by Cheryl Miller, U.S. Geological Survey.
Long-Term Monitoring of Surface Water and Groundwater Hydrology Long-term monitoring data for surface-water quality and groundwater levels are needed for
assessing possible effects of changing land uses, land cover, and climate on riparian and aquatic ecosystems. Surface-water quality is being monitored at four sites and groundwater levels are being monitored at one site in the WLCI area (fig. 9). Because this monitoring is partially funded by the WLCI and needs to address WLCI partner information needs, monitoring locations were selected to provide baseline characterization of the upper Green River Basin and the Muddy Creek Watershed. The data are being collected according to USGS methods (Kenney, 2010; Sauer and Turnipseed, 2010; Turnipseed and Sauer, 2010; U.S. Geological Survey, variously dated; Wagner and others, 2006) and published on the USGS National Water Information System Web site (NWISWeb).
In FY2012, surface-water-quality data were collected at the four sites in the upper Green River Basin and Muddy Creek watershed, and groundwater-level data were collected at the one site in the Green River Basin. Also, a live demonstration of the NWISWeb database was presented during poster session at the WLCI Science Workshop, in May 2012.
Products Completed in FY2012 • Preliminary data for water year 2012 were provided in real-time on the internet via USGS NWISWeb. All
data for each site are available online: http://waterdata.usgs.gov/wy/nwis/nwisman/?site_no=09205000 http://waterdata.usgs.gov/wy/nwis/nwisman/?site_no=09217000 http://waterdata.usgs.gov/wy/nwis/nwisman/?site_no=09258050 http://waterdata.usgs.gov/wy/nwis/nwisman/?site_no=09258980 http://waterdata.usgs.gov/wy/nwis/nwisman/?site_no=413850109150601
• Final data for water year 2012 were published in the USGS Annual Water-Data Report (U.S. Geological Survey, 2012). Individual site data sheets are available online:
• http://waterdata.usgs.gov/wy/nwis/nwisman/?site_no=09205000 http://wdr.water.usgs.gov/wy2012/pdfs/09217000.2012.pdf http://wdr.water.usgs.gov/wy2012/pdfs/09258050.2012.pdf http://wdr.water.usgs.gov/wy2012/pdfs/09258980.2012.pdf http://wdr.water.usgs.gov/wy2012/pdfs/413850109150601.2012.pdf
Contact: Kirk Miller, 307-775-9168, [email protected]
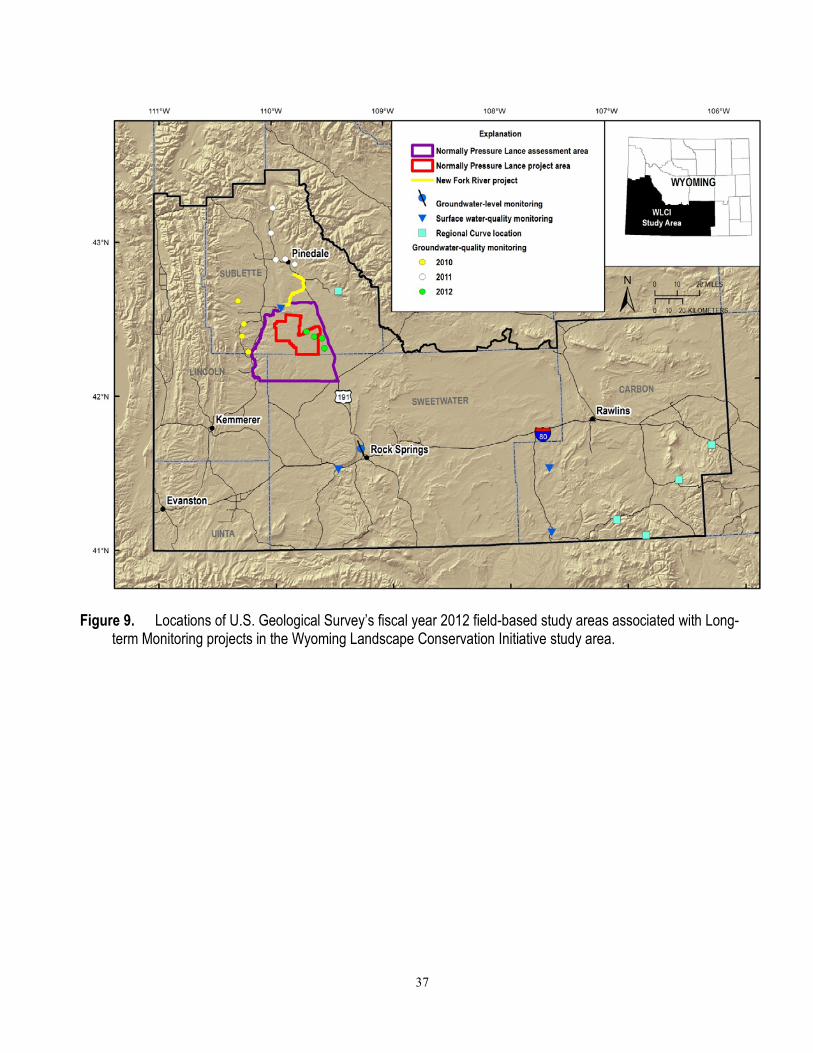
37
Figure 9. Locations of U.S. Geological Survey’s fiscal year 2012 field-based study areas associated with Long-term Monitoring projects in the Wyoming Landscape Conservation Initiative study area.
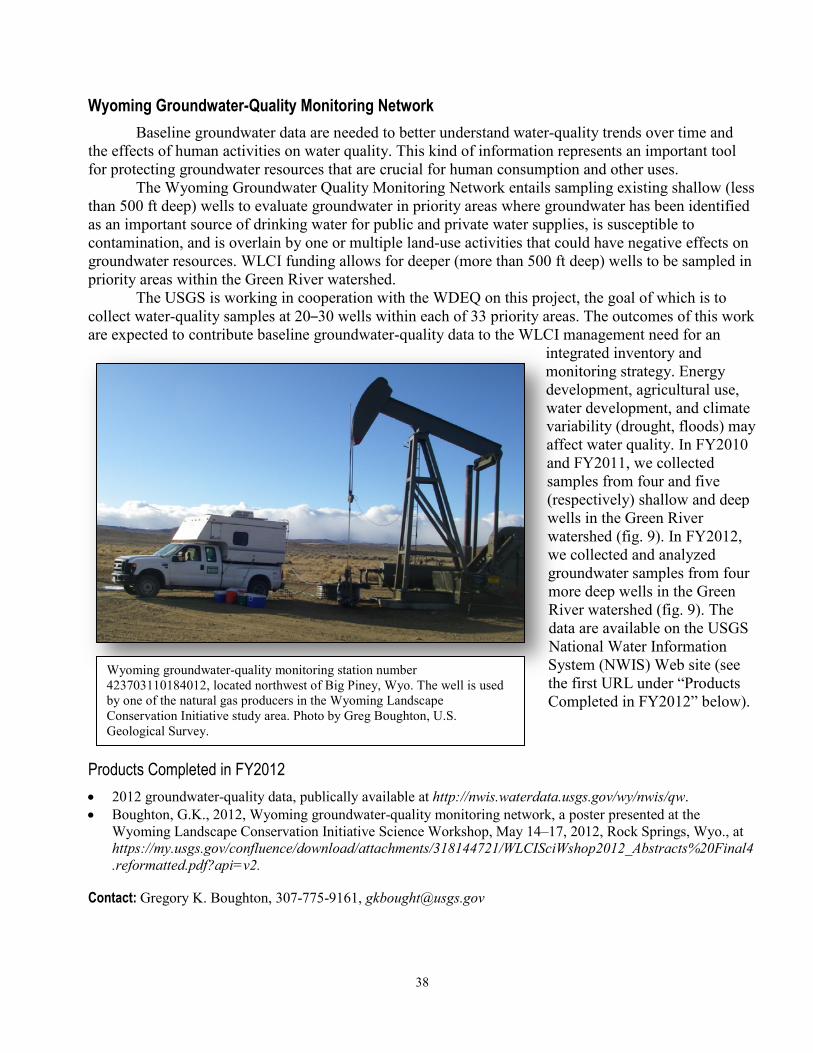
38
Wyoming groundwater-quality monitoring station number 423703110184012, located northwest of Big Piney, Wyo. The well is used by one of the natural gas producers in the Wyoming Landscape Conservation Initiative study area. Photo by Greg Boughton, U.S. Geological Survey.
Wyoming Groundwater-Quality Monitoring Network Baseline groundwater data are needed to better understand water-quality trends over time and
the effects of human activities on water quality. This kind of information represents an important tool for protecting groundwater resources that are crucial for human consumption and other uses.
The Wyoming Groundwater Quality Monitoring Network entails sampling existing shallow (less than 500 ft deep) wells to evaluate groundwater in priority areas where groundwater has been identified as an important source of drinking water for public and private water supplies, is susceptible to contamination, and is overlain by one or multiple land-use activities that could have negative effects on groundwater resources. WLCI funding allows for deeper (more than 500 ft deep) wells to be sampled in priority areas within the Green River watershed.
The USGS is working in cooperation with the WDEQ on this project, the goal of which is to collect water-quality samples at 20–30 wells within each of 33 priority areas. The outcomes of this work are expected to contribute baseline groundwater-quality data to the WLCI management need for an
integrated inventory and monitoring strategy. Energy development, agricultural use, water development, and climate variability (drought, floods) may affect water quality. In FY2010 and FY2011, we collected samples from four and five (respectively) shallow and deep wells in the Green River watershed (fig. 9). In FY2012, we collected and analyzed groundwater samples from four more deep wells in the Green River watershed (fig. 9). The data are available on the USGS National Water Information System (NWIS) Web site (see the first URL under “Products Completed in FY2012” below).
Products Completed in FY2012 • 2012 groundwater-quality data, publically available at http://nwis.waterdata.usgs.gov/wy/nwis/qw. • Boughton, G.K., 2012, Wyoming groundwater-quality monitoring network, a poster presented at the
Wyoming Landscape Conservation Initiative Science Workshop, May 14–17, 2012, Rock Springs, Wyo., at https://my.usgs.gov/confluence/download/attachments/318144721/WLCISciWshop2012_Abstracts%20Final4.reformatted.pdf?api=v2.
Contact: Gregory K. Boughton, 307-775-9161, [email protected]
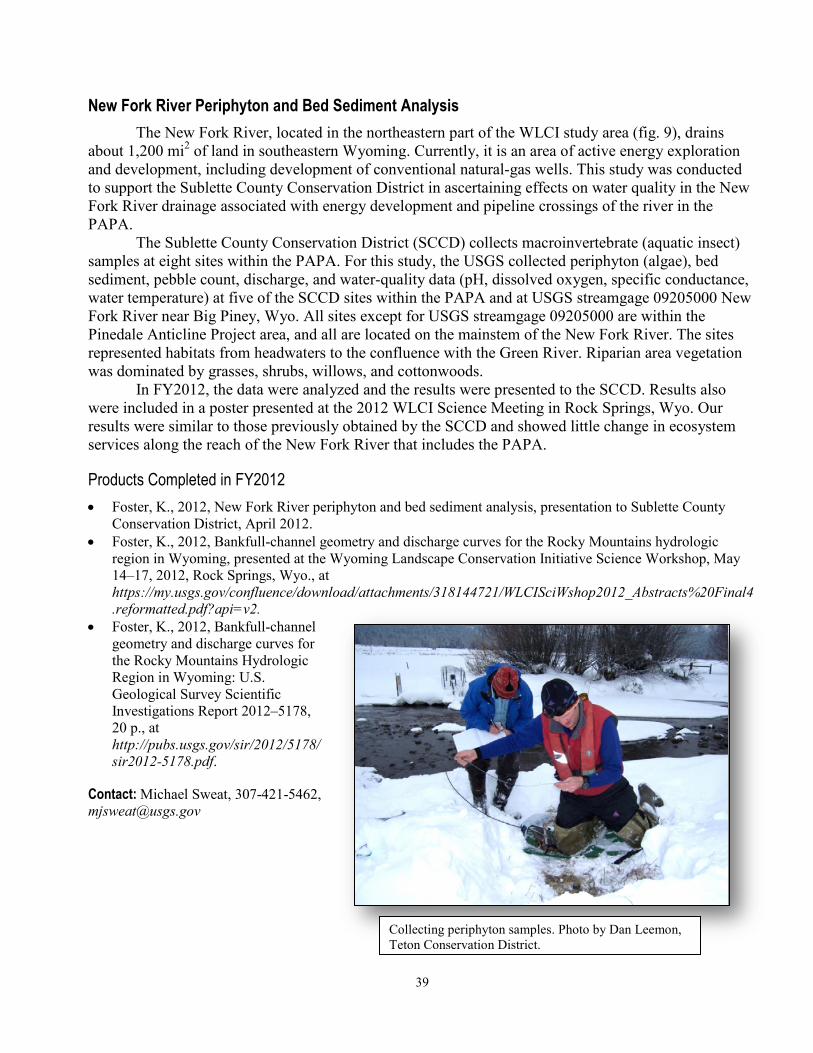
39
New Fork River Periphyton and Bed Sediment Analysis The New Fork River, located in the northeastern part of the WLCI study area (fig. 9), drains
about 1,200 mi2 of land in southeastern Wyoming. Currently, it is an area of active energy exploration and development, including development of conventional natural-gas wells. This study was conducted to support the Sublette County Conservation District in ascertaining effects on water quality in the New Fork River drainage associated with energy development and pipeline crossings of the river in the PAPA.
The Sublette County Conservation District (SCCD) collects macroinvertebrate (aquatic insect) samples at eight sites within the PAPA. For this study, the USGS collected periphyton (algae), bed sediment, pebble count, discharge, and water-quality data (pH, dissolved oxygen, specific conductance, water temperature) at five of the SCCD sites within the PAPA and at USGS streamgage 09205000 New Fork River near Big Piney, Wyo. All sites except for USGS streamgage 09205000 are within the Pinedale Anticline Project area, and all are located on the mainstem of the New Fork River. The sites represented habitats from headwaters to the confluence with the Green River. Riparian area vegetation was dominated by grasses, shrubs, willows, and cottonwoods.
In FY2012, the data were analyzed and the results were presented to the SCCD. Results also were included in a poster presented at the 2012 WLCI Science Meeting in Rock Springs, Wyo. Our results were similar to those previously obtained by the SCCD and showed little change in ecosystem services along the reach of the New Fork River that includes the PAPA.
Products Completed in FY2012 • Foster, K., 2012, New Fork River periphyton and bed sediment analysis, presentation to Sublette County
Conservation District, April 2012. • Foster, K., 2012, Bankfull-channel geometry and discharge curves for the Rocky Mountains hydrologic
region in Wyoming, presented at the Wyoming Landscape Conservation Initiative Science Workshop, May 14–17, 2012, Rock Springs, Wyo., at https://my.usgs.gov/confluence/download/attachments/318144721/WLCISciWshop2012_Abstracts%20Final4.reformatted.pdf?api=v2.
• Foster, K., 2012, Bankfull-channel geometry and discharge curves for the Rocky Mountains Hydrologic Region in Wyoming: U.S. Geological Survey Scientific Investigations Report 2012–5178, 20 p., at http://pubs.usgs.gov/sir/2012/5178/sir2012-5178.pdf.
Contact: Michael Sweat, 307-421-5462, [email protected]
Collecting periphyton samples. Photo by Dan Leemon, Teton Conservation District.
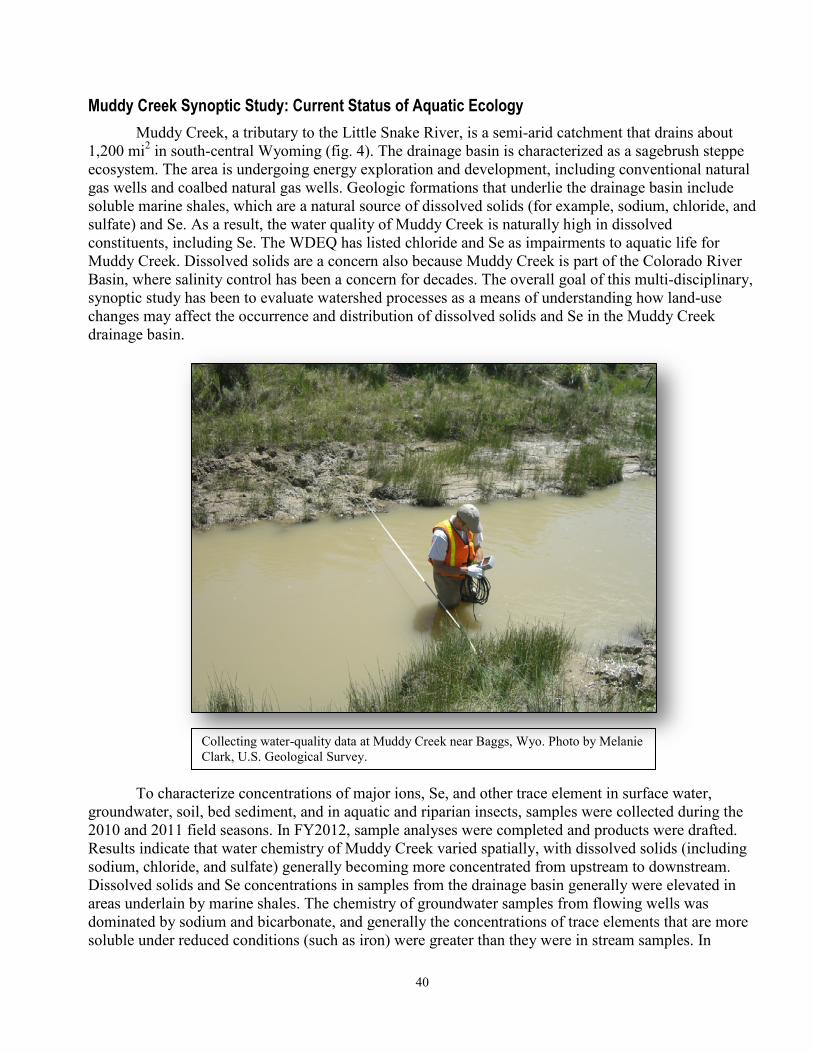
40
Muddy Creek Synoptic Study: Current Status of Aquatic Ecology Muddy Creek, a tributary to the Little Snake River, is a semi-arid catchment that drains about
1,200 mi2 in south-central Wyoming (fig. 4). The drainage basin is characterized as a sagebrush steppe ecosystem. The area is undergoing energy exploration and development, including conventional natural gas wells and coalbed natural gas wells. Geologic formations that underlie the drainage basin include soluble marine shales, which are a natural source of dissolved solids (for example, sodium, chloride, and sulfate) and Se. As a result, the water quality of Muddy Creek is naturally high in dissolved constituents, including Se. The WDEQ has listed chloride and Se as impairments to aquatic life for Muddy Creek. Dissolved solids are a concern also because Muddy Creek is part of the Colorado River Basin, where salinity control has been a concern for decades. The overall goal of this multi-disciplinary, synoptic study has been to evaluate watershed processes as a means of understanding how land-use changes may affect the occurrence and distribution of dissolved solids and Se in the Muddy Creek drainage basin.
To characterize concentrations of major ions, Se, and other trace element in surface water,
groundwater, soil, bed sediment, and in aquatic and riparian insects, samples were collected during the 2010 and 2011 field seasons. In FY2012, sample analyses were completed and products were drafted. Results indicate that water chemistry of Muddy Creek varied spatially, with dissolved solids (including sodium, chloride, and sulfate) generally becoming more concentrated from upstream to downstream. Dissolved solids and Se concentrations in samples from the drainage basin generally were elevated in areas underlain by marine shales. The chemistry of groundwater samples from flowing wells was dominated by sodium and bicarbonate, and generally the concentrations of trace elements that are more soluble under reduced conditions (such as iron) were greater than they were in stream samples. In
Collecting water-quality data at Muddy Creek near Baggs, Wyo. Photo by Melanie Clark, U.S. Geological Survey.
41
contrast, concentrations of other trace elements (such as Se) tended to be greater in stream water than in groundwater samples. Overall, results suggest that the dissolution of mineral salts at or near the surface is an important process controlling the stream chemistry in the Muddy Creek watershed.
Products Completed in FY2012 • Holloway, J.M., Bern, C.R., Schmidt, T.S., and McDougal, R.R., 2012, Major ion and trace element
characteristics of the Muddy Creek watershed, presented at the Wyoming Landscape Conservation Initiative Science Workshop, May 15–17, 2012,Rock Springs, Wyo., at https://my.usgs.gov/confluence/download/attachments/318144721/WLCISciWshop2012_Abstracts%20Final4.reformatted.pdf?api=v2.
• Holloway, J.M., Stricker, C.A., Clark, M.L., and McDougal, R.R, 2012, Muddy Creek biogeochemistry—Sources for nutrients and potential ecosystem impacts, presented at the Wyoming Landscape Conservation Initiative Science Workshop, May 15–17, 2012, Rock Springs, Wyo., at https://my.usgs.gov/confluence/download/attachments/318144721/WLCISciWshop2012_Abstracts%20Final4.reformatted.pdf?api=v2.
• Schmidt, T.S., Wolf, R.E., Strickler, C.A., Holloway, J.M., Bern, C.R., Clark, M.L., and McDougal, R.R., 2012, Development of riparian consumers as indicators of aquatically derived Se in Muddy Creek, Wyo., presented at the Wyoming Landscape Conservation Initiative Science Workshop, May 15―17, 2012, Rock Springs, Wyo., at https://my.usgs.gov/confluence/download/attachments/318144721/WLCISciWshop2012_Abstracts%20Final4.reformatted.pdf?api=v2.
• Bern, C.R., Clark, M.L., Holloway, J.M., McDougal, R.R., and Schmidt, T.S., 2012, Natural salinity fluctuations in a snowmelt dominated watershed undergoing energy development, presented at the Wyoming Landscape Conservation Initiative Science Workshop, May 15–17, 2012, Rock Springs, Wyo., at https://my.usgs.gov/confluence/download/attachments/318144721/WLCISciWshop2012_Abstracts%20Final4.reformatted.pdf?api=v2.
• Holloway, J.M., Bern, C.R., Schmidt, T.S., McDougal, R.R., Clark, M.L., Stricker, C.A., and Wolf, R.E., 2012, Evaluating natural gas development impacts on stream ecosystems in an Upper Colorado River watershed, presented at the Wyoming Landscape Conservation Initiative Science Workshop, May 15–17, 2012, Rock Springs, Wyo.
• Holloway, J.M., Bern, C., Schmidt, T.S., McDougal, R.R., Clark, M.L. Stricker, C.A., Wolf, R.E., December 2011, Evaluating natural gas development impacts on stream ecosystems in an Upper Colorado River watershed: EOS, Transactions of the American Geophysical Union, v. 92, Fall Meeting Supplement, Abstract H31A-1124.
• Schmidt, T.S., Wolf, R.E., Stricker, C.A., Holloway, J.M., Bern, C.R., Clark, M.L, and McDougal, R.R., 2012, Riparian consumers as indicators of aquatic contaminants: Society of Freshwater Science Annual Meeting, Louisville, Ky., May 20–24, 2012, at http://www.sgmeet.com/sfs/sfs2012/viewabstract2.asp?AbstractID=6837.
Contact: Melanie Clark, 307-775-9163, [email protected]
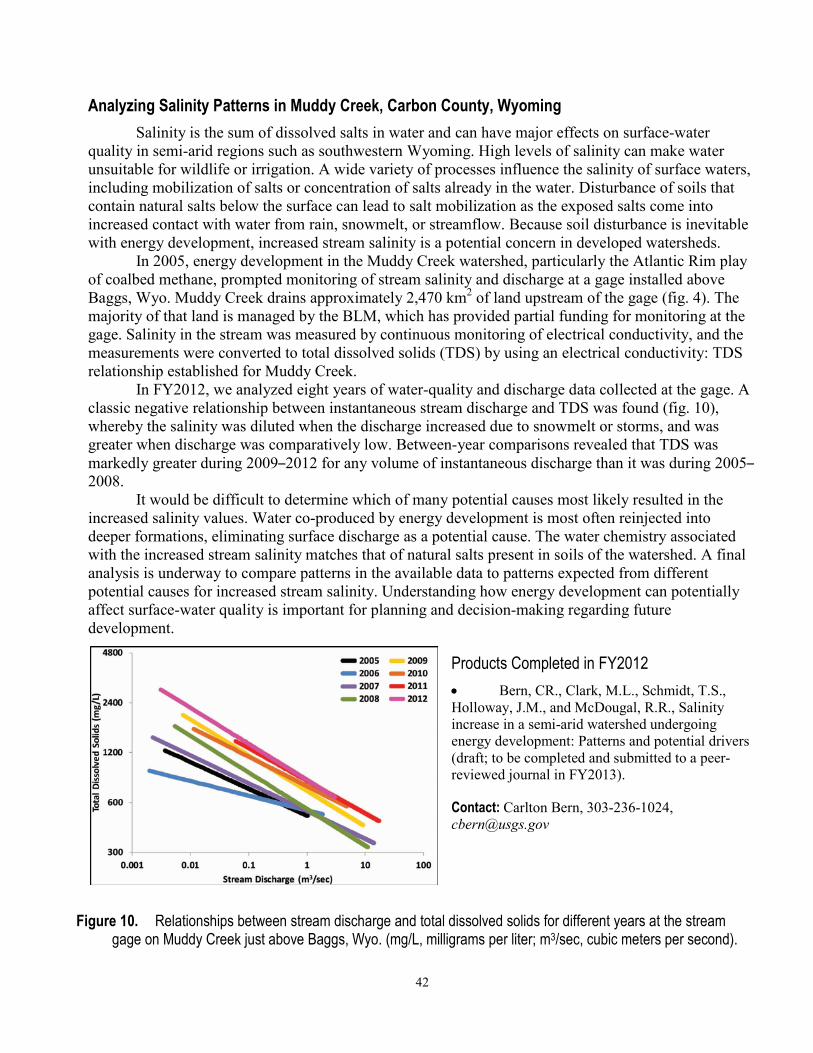
42
Analyzing Salinity Patterns in Muddy Creek, Carbon County, Wyoming Salinity is the sum of dissolved salts in water and can have major effects on surface-water
quality in semi-arid regions such as southwestern Wyoming. High levels of salinity can make water unsuitable for wildlife or irrigation. A wide variety of processes influence the salinity of surface waters, including mobilization of salts or concentration of salts already in the water. Disturbance of soils that contain natural salts below the surface can lead to salt mobilization as the exposed salts come into increased contact with water from rain, snowmelt, or streamflow. Because soil disturbance is inevitable with energy development, increased stream salinity is a potential concern in developed watersheds.
In 2005, energy development in the Muddy Creek watershed, particularly the Atlantic Rim play of coalbed methane, prompted monitoring of stream salinity and discharge at a gage installed above Baggs, Wyo. Muddy Creek drains approximately 2,470 km2 of land upstream of the gage (fig. 4). The majority of that land is managed by the BLM, which has provided partial funding for monitoring at the gage. Salinity in the stream was measured by continuous monitoring of electrical conductivity, and the measurements were converted to total dissolved solids (TDS) by using an electrical conductivity: TDS relationship established for Muddy Creek.
In FY2012, we analyzed eight years of water-quality and discharge data collected at the gage. A classic negative relationship between instantaneous stream discharge and TDS was found (fig. 10), whereby the salinity was diluted when the discharge increased due to snowmelt or storms, and was greater when discharge was comparatively low. Between-year comparisons revealed that TDS was markedly greater during 2009–2012 for any volume of instantaneous discharge than it was during 2005–2008.
It would be difficult to determine which of many potential causes most likely resulted in the increased salinity values. Water co-produced by energy development is most often reinjected into deeper formations, eliminating surface discharge as a potential cause. The water chemistry associated with the increased stream salinity matches that of natural salts present in soils of the watershed. A final analysis is underway to compare patterns in the available data to patterns expected from different potential causes for increased stream salinity. Understanding how energy development can potentially affect surface-water quality is important for planning and decision-making regarding future development.
Products Completed in FY2012 • Bern, CR., Clark, M.L., Schmidt, T.S., Holloway, J.M., and McDougal, R.R., Salinity increase in a semi-arid watershed undergoing energy development: Patterns and potential drivers (draft; to be completed and submitted to a peer-reviewed journal in FY2013).
Contact: Carlton Bern, 303-236-1024, [email protected]
Figure 10. Relationships between stream discharge and total dissolved solids for different years at the stream gage on Muddy Creek just above Baggs, Wyo. (mg/L, milligrams per liter; m3/sec, cubic meters per second).
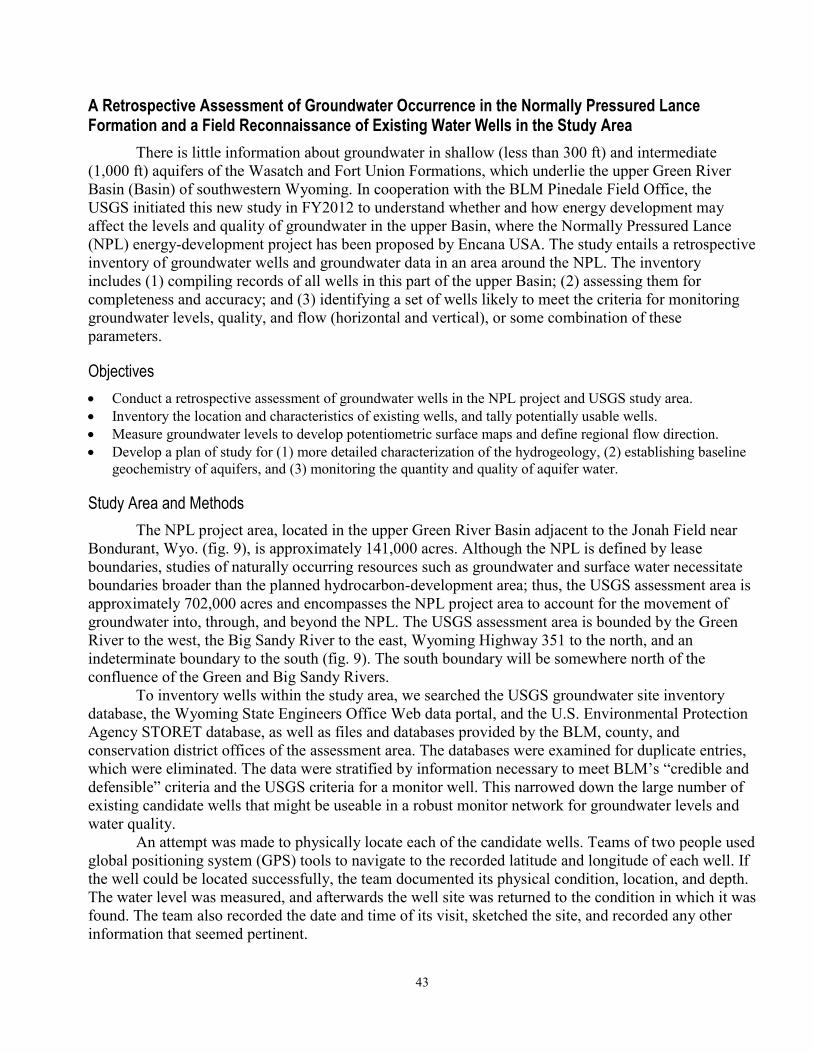
43
A Retrospective Assessment of Groundwater Occurrence in the Normally Pressured Lance Formation and a Field Reconnaissance of Existing Water Wells in the Study Area
There is little information about groundwater in shallow (less than 300 ft) and intermediate (1,000 ft) aquifers of the Wasatch and Fort Union Formations, which underlie the upper Green River Basin (Basin) of southwestern Wyoming. In cooperation with the BLM Pinedale Field Office, the USGS initiated this new study in FY2012 to understand whether and how energy development may affect the levels and quality of groundwater in the upper Basin, where the Normally Pressured Lance (NPL) energy-development project has been proposed by Encana USA. The study entails a retrospective inventory of groundwater wells and groundwater data in an area around the NPL. The inventory includes (1) compiling records of all wells in this part of the upper Basin; (2) assessing them for completeness and accuracy; and (3) identifying a set of wells likely to meet the criteria for monitoring groundwater levels, quality, and flow (horizontal and vertical), or some combination of these parameters.
Objectives • Conduct a retrospective assessment of groundwater wells in the NPL project and USGS study area. • Inventory the location and characteristics of existing wells, and tally potentially usable wells. • Measure groundwater levels to develop potentiometric surface maps and define regional flow direction. • Develop a plan of study for (1) more detailed characterization of the hydrogeology, (2) establishing baseline
geochemistry of aquifers, and (3) monitoring the quantity and quality of aquifer water.
Study Area and Methods The NPL project area, located in the upper Green River Basin adjacent to the Jonah Field near
Bondurant, Wyo. (fig. 9), is approximately 141,000 acres. Although the NPL is defined by lease boundaries, studies of naturally occurring resources such as groundwater and surface water necessitate boundaries broader than the planned hydrocarbon-development area; thus, the USGS assessment area is approximately 702,000 acres and encompasses the NPL project area to account for the movement of groundwater into, through, and beyond the NPL. The USGS assessment area is bounded by the Green River to the west, the Big Sandy River to the east, Wyoming Highway 351 to the north, and an indeterminate boundary to the south (fig. 9). The south boundary will be somewhere north of the confluence of the Green and Big Sandy Rivers.
To inventory wells within the study area, we searched the USGS groundwater site inventory database, the Wyoming State Engineers Office Web data portal, and the U.S. Environmental Protection Agency STORET database, as well as files and databases provided by the BLM, county, and conservation district offices of the assessment area. The databases were examined for duplicate entries, which were eliminated. The data were stratified by information necessary to meet BLM’s “credible and defensible” criteria and the USGS criteria for a monitor well. This narrowed down the large number of existing candidate wells that might be useable in a robust monitor network for groundwater levels and water quality.
An attempt was made to physically locate each of the candidate wells. Teams of two people used global positioning system (GPS) tools to navigate to the recorded latitude and longitude of each well. If the well could be located successfully, the team documented its physical condition, location, and depth. The water level was measured, and afterwards the well site was returned to the condition in which it was found. The team also recorded the date and time of its visit, sketched the site, and recorded any other information that seemed pertinent.
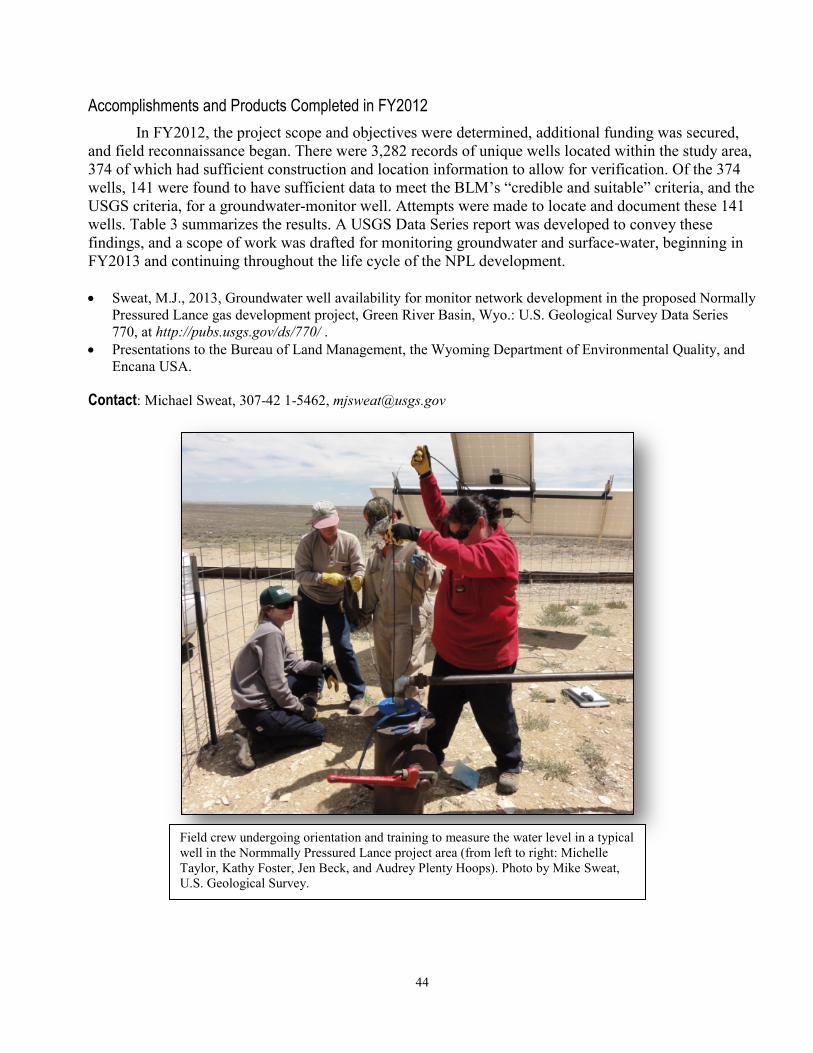
44
Accomplishments and Products Completed in FY2012 In FY2012, the project scope and objectives were determined, additional funding was secured,
and field reconnaissance began. There were 3,282 records of unique wells located within the study area, 374 of which had sufficient construction and location information to allow for verification. Of the 374 wells, 141 were found to have sufficient data to meet the BLM’s “credible and suitable” criteria, and the USGS criteria, for a groundwater-monitor well. Attempts were made to locate and document these 141 wells. Table 3 summarizes the results. A USGS Data Series report was developed to convey these findings, and a scope of work was drafted for monitoring groundwater and surface-water, beginning in FY2013 and continuing throughout the life cycle of the NPL development.
• Sweat, M.J., 2013, Groundwater well availability for monitor network development in the proposed Normally
Pressured Lance gas development project, Green River Basin, Wyo.: U.S. Geological Survey Data Series 770, at http://pubs.usgs.gov/ds/770/ .
• Presentations to the Bureau of Land Management, the Wyoming Department of Environmental Quality, and Encana USA.
Contact: Michael Sweat, 307-42 1-5462, [email protected]
Field crew undergoing orientation and training to measure the water level in a typical well in the Normmally Pressured Lance project area (from left to right: Michelle Taylor, Kathy Foster, Jen Beck, and Audrey Plenty Hoops). Photo by Mike Sweat, U.S. Geological Survey.
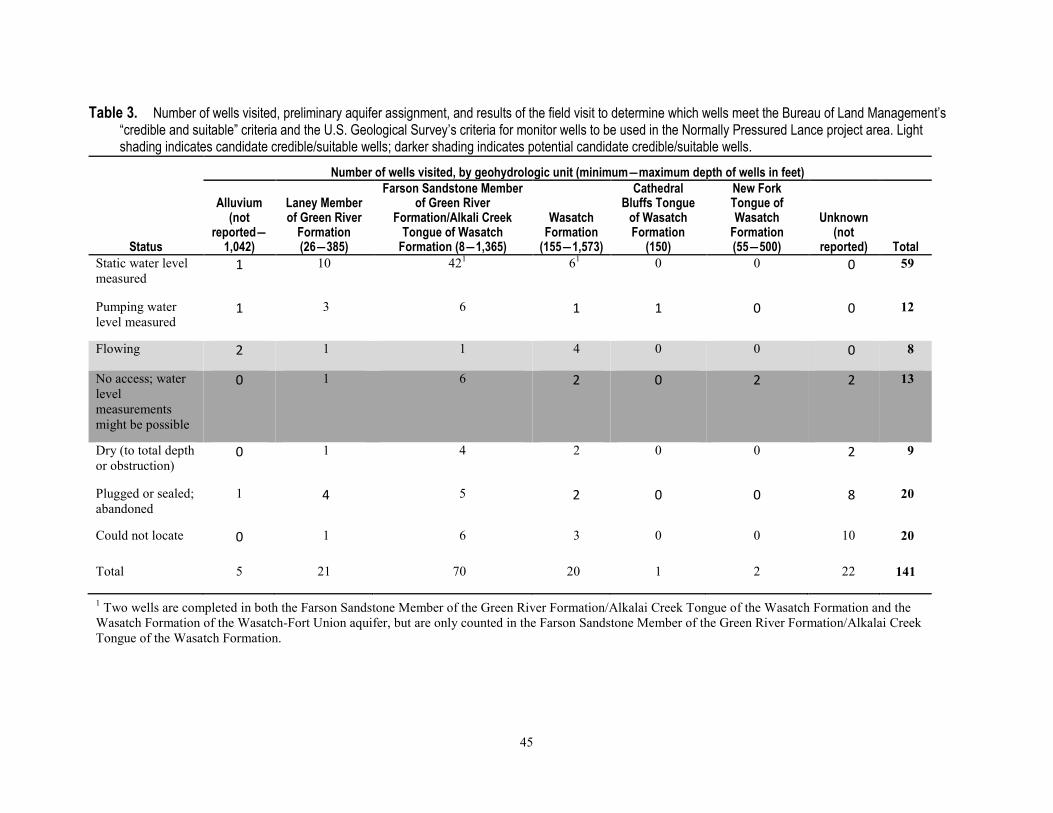
45
Table 3. Number of wells visited, preliminary aquifer assignment, and results of the field visit to determine which wells meet the Bureau of Land Management’s “credible and suitable” criteria and the U.S. Geological Survey’s criteria for monitor wells to be used in the Normally Pressured Lance project area. Light shading indicates candidate credible/suitable wells; darker shading indicates potential candidate credible/suitable wells.
1 Two wells are completed in both the Farson Sandstone Member of the Green River Formation/Alkalai Creek Tongue of the Wasatch Formation and the Wasatch Formation of the Wasatch-Fort Union aquifer, but are only counted in the Farson Sandstone Member of the Green River Formation/Alkalai Creek Tongue of the Wasatch Formation.
Number of wells visited, by geohydrologic unit (minimum―maximum depth of wells in feet)
Status
Alluvium (not
reported―1,042)
Laney Member of Green River
Formation (26―385)
Farson Sandstone Member of Green River
Formation/Alkali Creek Tongue of Wasatch
Formation (8―1,365)
Wasatch Formation
(155―1,573)
Cathedral Bluffs Tongue
of Wasatch Formation
(150)
New Fork Tongue of Wasatch
Formation (55―500)
Unknown (not
reported) Total Static water level measured
1 10 421 61 0 0 0 59
Pumping water level measured
1 3 6 1 1 0 0 12
Flowing 2 1 1 4 0 0 0 8
No access; water level measurements might be possible
0 1 6 2 0 2 2 13
Dry (to total depth or obstruction)
0 1 4 2 0 0 2 9
Plugged or sealed; abandoned
1 4 5 2 0 0 8 20
Could not locate 0 1 6 3 0 0 10 20
Total 5 21 70 20 1 2 22 141
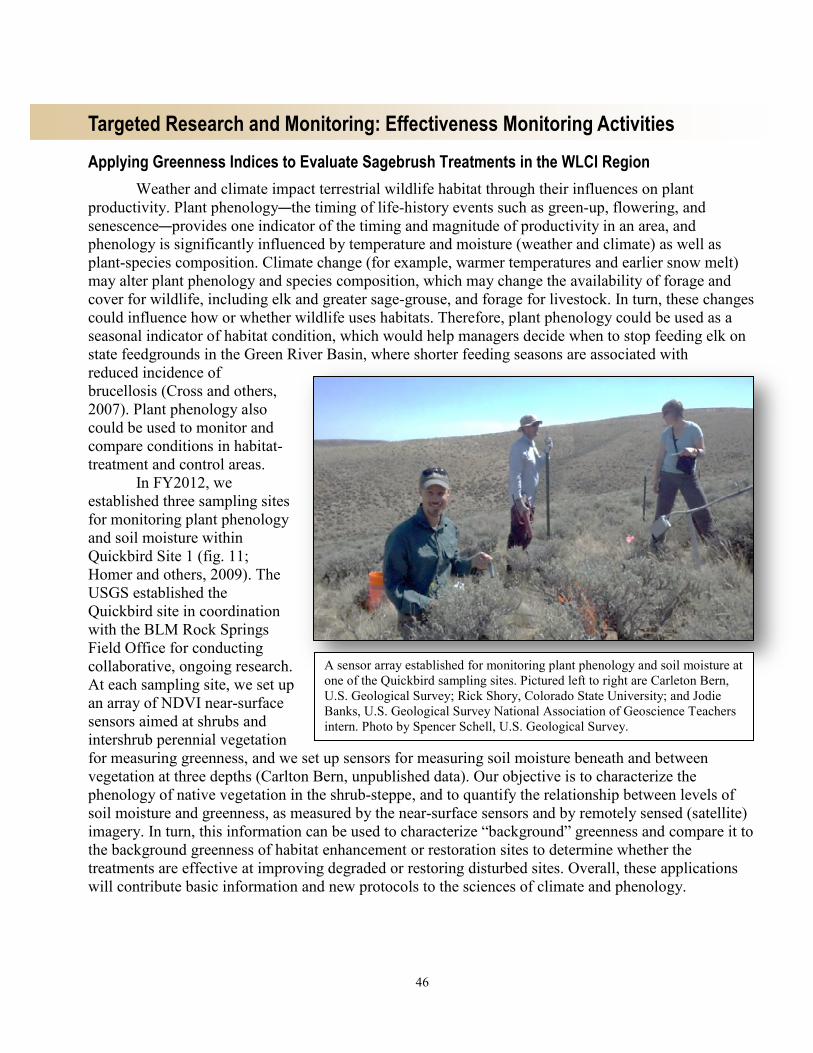
46
Targeted Research and Monitoring: Effectiveness Monitoring Activities Applying Greenness Indices to Evaluate Sagebrush Treatments in the WLCI Region
Weather and climate impact terrestrial wildlife habitat through their influences on plant productivity. Plant phenology—the timing of life-history events such as green-up, flowering, and senescence—provides one indicator of the timing and magnitude of productivity in an area, and phenology is significantly influenced by temperature and moisture (weather and climate) as well as plant-species composition. Climate change (for example, warmer temperatures and earlier snow melt) may alter plant phenology and species composition, which may change the availability of forage and cover for wildlife, including elk and greater sage-grouse, and forage for livestock. In turn, these changes could influence how or whether wildlife uses habitats. Therefore, plant phenology could be used as a seasonal indicator of habitat condition, which would help managers decide when to stop feeding elk on state feedgrounds in the Green River Basin, where shorter feeding seasons are associated with reduced incidence of brucellosis (Cross and others, 2007). Plant phenology also could be used to monitor and compare conditions in habitat-treatment and control areas.
In FY2012, we established three sampling sites for monitoring plant phenology and soil moisture within Quickbird Site 1 (fig. 11; Homer and others, 2009). The USGS established the Quickbird site in coordination with the BLM Rock Springs Field Office for conducting collaborative, ongoing research. At each sampling site, we set up an array of NDVI near-surface sensors aimed at shrubs and intershrub perennial vegetation for measuring greenness, and we set up sensors for measuring soil moisture beneath and between vegetation at three depths (Carlton Bern, unpublished data). Our objective is to characterize the phenology of native vegetation in the shrub-steppe, and to quantify the relationship between levels of soil moisture and greenness, as measured by the near-surface sensors and by remotely sensed (satellite) imagery. In turn, this information can be used to characterize “background” greenness and compare it to the background greenness of habitat enhancement or restoration sites to determine whether the treatments are effective at improving degraded or restoring disturbed sites. Overall, these applications will contribute basic information and new protocols to the sciences of climate and phenology.
A sensor array established for monitoring plant phenology and soil moisture at one of the Quickbird sampling sites. Pictured left to right are Carleton Bern, U.S. Geological Survey; Rick Shory, Colorado State University; and Jodie Banks, U.S. Geological Survey National Association of Geoscience Teachers intern. Photo by Spencer Schell, U.S. Geological Survey.
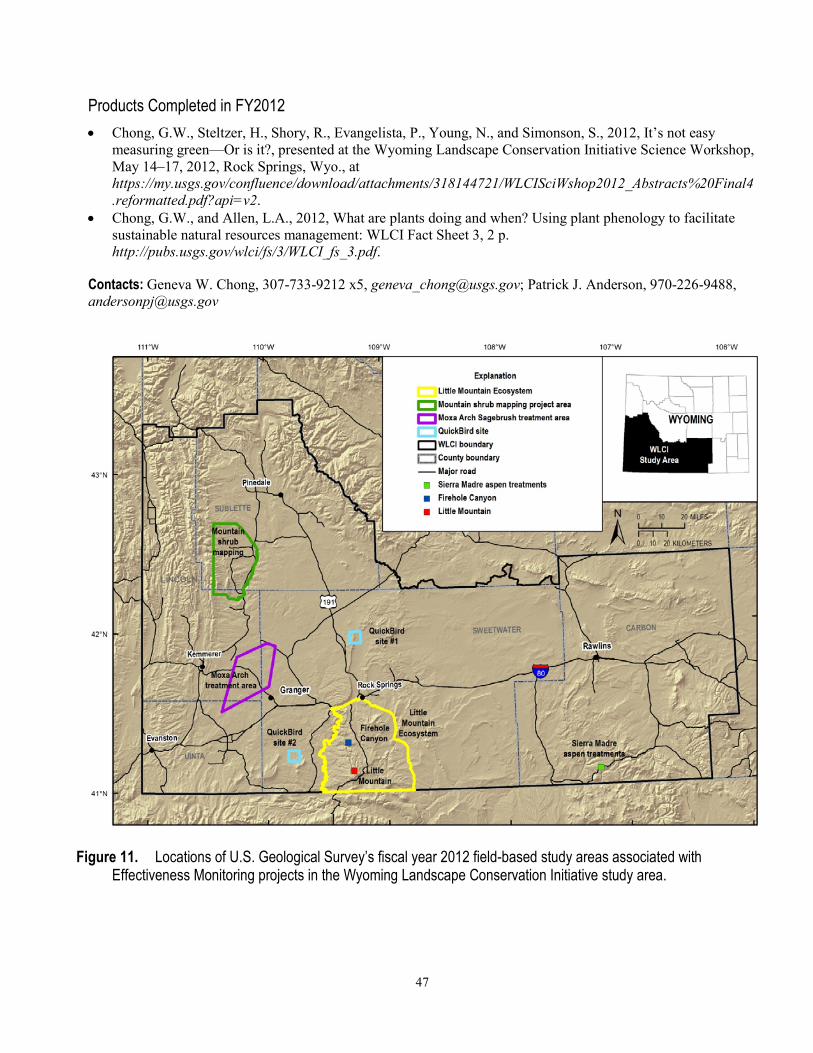
47
Products Completed in FY2012 • Chong, G.W., Steltzer, H., Shory, R., Evangelista, P., Young, N., and Simonson, S., 2012, It’s not easy
measuring green—Or is it?, presented at the Wyoming Landscape Conservation Initiative Science Workshop, May 14–17, 2012, Rock Springs, Wyo., at https://my.usgs.gov/confluence/download/attachments/318144721/WLCISciWshop2012_Abstracts%20Final4.reformatted.pdf?api=v2.
• Chong, G.W., and Allen, L.A., 2012, What are plants doing and when? Using plant phenology to facilitate sustainable natural resources management: WLCI Fact Sheet 3, 2 p. http://pubs.usgs.gov/wlci/fs/3/WLCI_fs_3.pdf.
Contacts: Geneva W. Chong, 307-733-9212 x5, [email protected]; Patrick J. Anderson, 970-226-9488, [email protected]
Figure 11. Locations of U.S. Geological Survey’s fiscal year 2012 field-based study areas associated with Effectiveness Monitoring projects in the Wyoming Landscape Conservation Initiative study area.
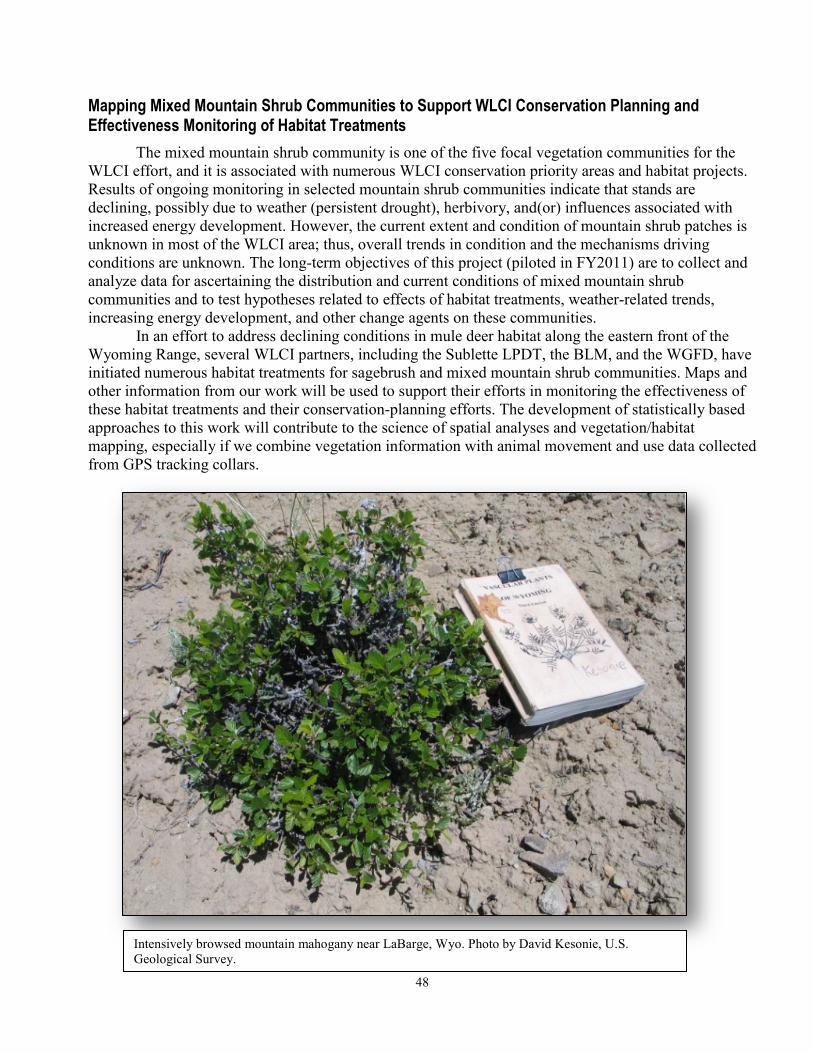
48
Intensively browsed mountain mahogany near LaBarge, Wyo. Photo by David Kesonie, U.S. Geological Survey.
Mapping Mixed Mountain Shrub Communities to Support WLCI Conservation Planning and Effectiveness Monitoring of Habitat Treatments
The mixed mountain shrub community is one of the five focal vegetation communities for the WLCI effort, and it is associated with numerous WLCI conservation priority areas and habitat projects. Results of ongoing monitoring in selected mountain shrub communities indicate that stands are declining, possibly due to weather (persistent drought), herbivory, and(or) influences associated with increased energy development. However, the current extent and condition of mountain shrub patches is unknown in most of the WLCI area; thus, overall trends in condition and the mechanisms driving conditions are unknown. The long-term objectives of this project (piloted in FY2011) are to collect and analyze data for ascertaining the distribution and current conditions of mixed mountain shrub communities and to test hypotheses related to effects of habitat treatments, weather-related trends, increasing energy development, and other change agents on these communities.
In an effort to address declining conditions in mule deer habitat along the eastern front of the Wyoming Range, several WLCI partners, including the Sublette LPDT, the BLM, and the WGFD, have initiated numerous habitat treatments for sagebrush and mixed mountain shrub communities. Maps and other information from our work will be used to support their efforts in monitoring the effectiveness of these habitat treatments and their conservation-planning efforts. The development of statistically based approaches to this work will contribute to the science of spatial analyses and vegetation/habitat mapping, especially if we combine vegetation information with animal movement and use data collected from GPS tracking collars.
49
Objectives • Ground truth existing vegetation within the mixed mountain shrub study area. • Use statistics, digitization, modified knowledge-based classification, and other approaches for mapping
vegetation within the study area. • Present map products to cooperators and provide support for using the maps in their decision-making. • Iteratively ground truth map products to improve them and use them to design a monitoring system.
Study Area and Methods The mixed mountain shrub study area encompasses the Deer Hills area west of Marbleton and
Big Piney (fig. 11, area bounded in green and labeled as “Mountain shrub mapping”). The western boundary is just east of USFS land (Wyoming Range) and the eastern boundary follows the Green River.
During FY2011, a pilot effort was initiated to map mixed mountain shrub communities in the La Barge, Wyo., area, which can serve as a model and base for expanding a similar effort across the WLCI study area and, potentially, throughout the range of the mountain shrub community. Our study sites were co-located with areas where the WGFD has vegetation transects and were described in the Wyoming Range Mule Deer Habitat Assessment (Smith and Younkin, 2010). Data collected included plant species composition and estimates of cover within a given shrub patch. We also recorded sampling locations with GPS units. Using the shrub presence data and environmental variables, we will test our ability to model the probability of species occurrence of mountain shrubs. The distribution and patch-size data also will support long-term monitoring efforts being conducted by the BLM Pinedale Field Office and the WGFD Pinedale Regional Office.
Accomplishments and Products Completed in FY2012 During FY2012, field crews conducted surveys to record the presence of mixed mountain shrub
communities within the Big Piney-La Barge Area identified in the Wyoming Range Mule Deer Habitat Plan (Damm and Randall, 2012). This area was selected to take advantage of existing assessment and monitoring data acquired by WLCI partners. Five shrub species were considered for mountain shrub mapping: mountain mahogany (Cercocarpus montanus), serviceberry (Amelanchier alnifolia), curl-leaf mountain mahogany (Cercocarpus ledifolius), chokecherry (Prunus virginiana), and antelope bitterbrush (Purshia tridentata).
Two methods were used to map mountain shrub patches in the field. Either we walked along patch boundaries while taking GPS readings, thus recording the patch as a polygon, or we drew patches on topographic maps along with an attributed GPS point and photographic documentation. Shrub density and browse intensity were estimated for each shrub patch, and the data collected in FY2011 and FY2012 were prepared for analyses.
• Draft maps from the 2012 field mapping effort. • Datasets of vegetation plots (species composition and cover) and GPS locations from 2011.
Contacts: Geneva W. Chong, 307-733-9212 x5, [email protected]; Patrick J. Anderson, 970-226-9488, [email protected]
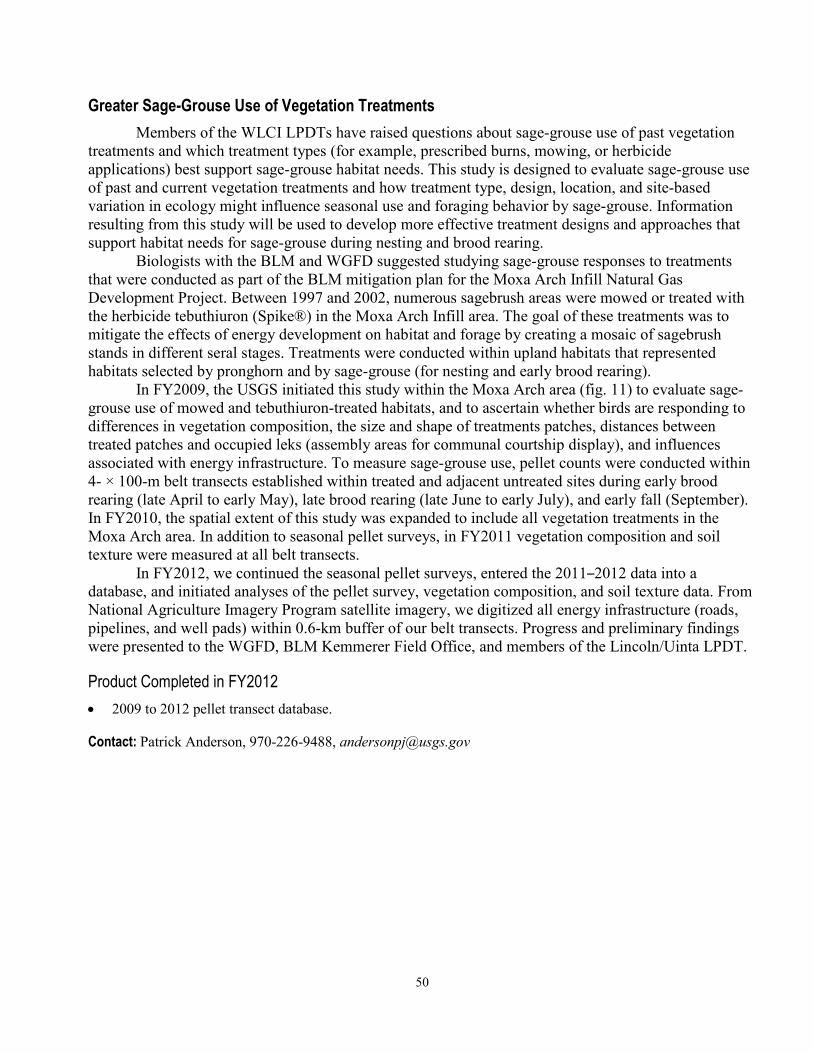
50
Greater Sage-Grouse Use of Vegetation Treatments Members of the WLCI LPDTs have raised questions about sage-grouse use of past vegetation
treatments and which treatment types (for example, prescribed burns, mowing, or herbicide applications) best support sage-grouse habitat needs. This study is designed to evaluate sage-grouse use of past and current vegetation treatments and how treatment type, design, location, and site-based variation in ecology might influence seasonal use and foraging behavior by sage-grouse. Information resulting from this study will be used to develop more effective treatment designs and approaches that support habitat needs for sage-grouse during nesting and brood rearing.
Biologists with the BLM and WGFD suggested studying sage-grouse responses to treatments that were conducted as part of the BLM mitigation plan for the Moxa Arch Infill Natural Gas Development Project. Between 1997 and 2002, numerous sagebrush areas were mowed or treated with the herbicide tebuthiuron (Spike®) in the Moxa Arch Infill area. The goal of these treatments was to mitigate the effects of energy development on habitat and forage by creating a mosaic of sagebrush stands in different seral stages. Treatments were conducted within upland habitats that represented habitats selected by pronghorn and by sage-grouse (for nesting and early brood rearing).
In FY2009, the USGS initiated this study within the Moxa Arch area (fig. 11) to evaluate sage-grouse use of mowed and tebuthiuron-treated habitats, and to ascertain whether birds are responding to differences in vegetation composition, the size and shape of treatments patches, distances between treated patches and occupied leks (assembly areas for communal courtship display), and influences associated with energy infrastructure. To measure sage-grouse use, pellet counts were conducted within 4- × 100-m belt transects established within treated and adjacent untreated sites during early brood rearing (late April to early May), late brood rearing (late June to early July), and early fall (September). In FY2010, the spatial extent of this study was expanded to include all vegetation treatments in the Moxa Arch area. In addition to seasonal pellet surveys, in FY2011 vegetation composition and soil texture were measured at all belt transects.
In FY2012, we continued the seasonal pellet surveys, entered the 2011–2012 data into a database, and initiated analyses of the pellet survey, vegetation composition, and soil texture data. From National Agriculture Imagery Program satellite imagery, we digitized all energy infrastructure (roads, pipelines, and well pads) within 0.6-km buffer of our belt transects. Progress and preliminary findings were presented to the WGFD, BLM Kemmerer Field Office, and members of the Lincoln/Uinta LPDT.
Product Completed in FY2012 • 2009 to 2012 pellet transect database.
Contact: Patrick Anderson, 970-226-9488, [email protected]
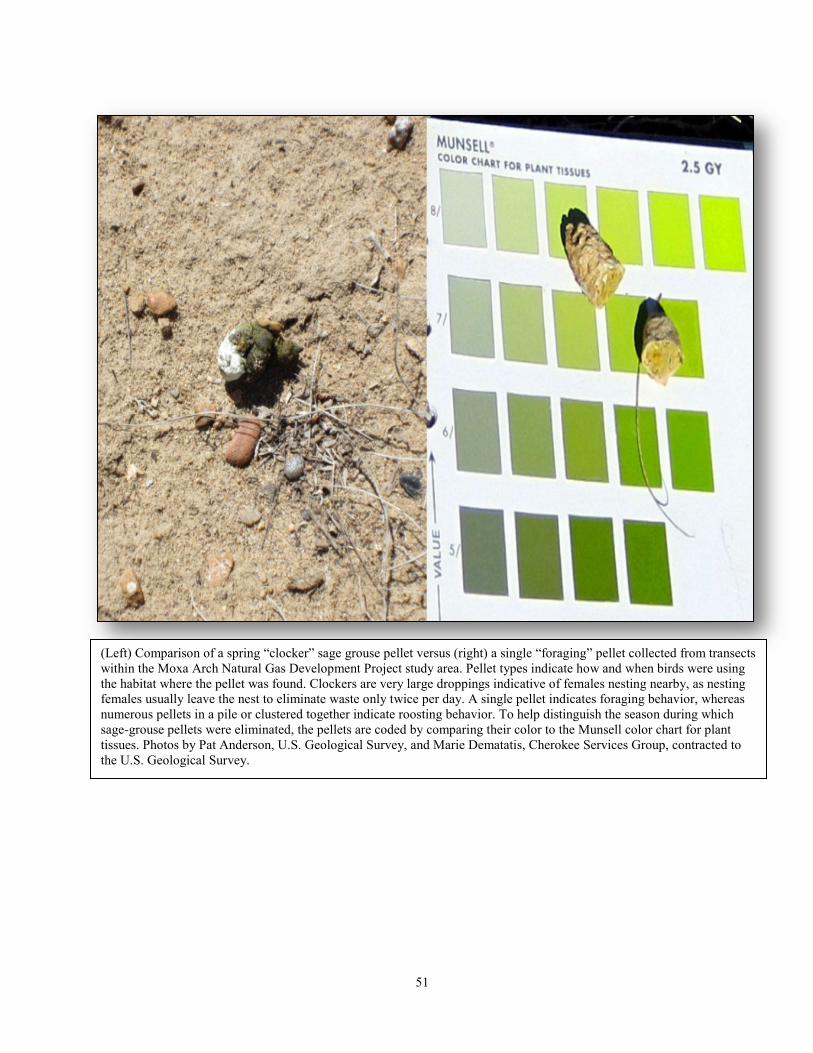
51
(Left) Comparison of a spring “clocker” sage grouse pellet versus (right) a single “foraging” pellet collected from transects within the Moxa Arch Natural Gas Development Project study area. Pellet types indicate how and when birds were using the habitat where the pellet was found. Clockers are very large droppings indicative of females nesting nearby, as nesting females usually leave the nest to eliminate waste only twice per day. A single pellet indicates foraging behavior, whereas numerous pellets in a pile or clustered together indicate roosting behavior. To help distinguish the season during which sage-grouse pellets were eliminated, the pellets are coded by comparing their color to the Munsell color chart for plant tissues. Photos by Pat Anderson, U.S. Geological Survey, and Marie Dematatis, Cherokee Services Group, contracted to the U.S. Geological Survey.
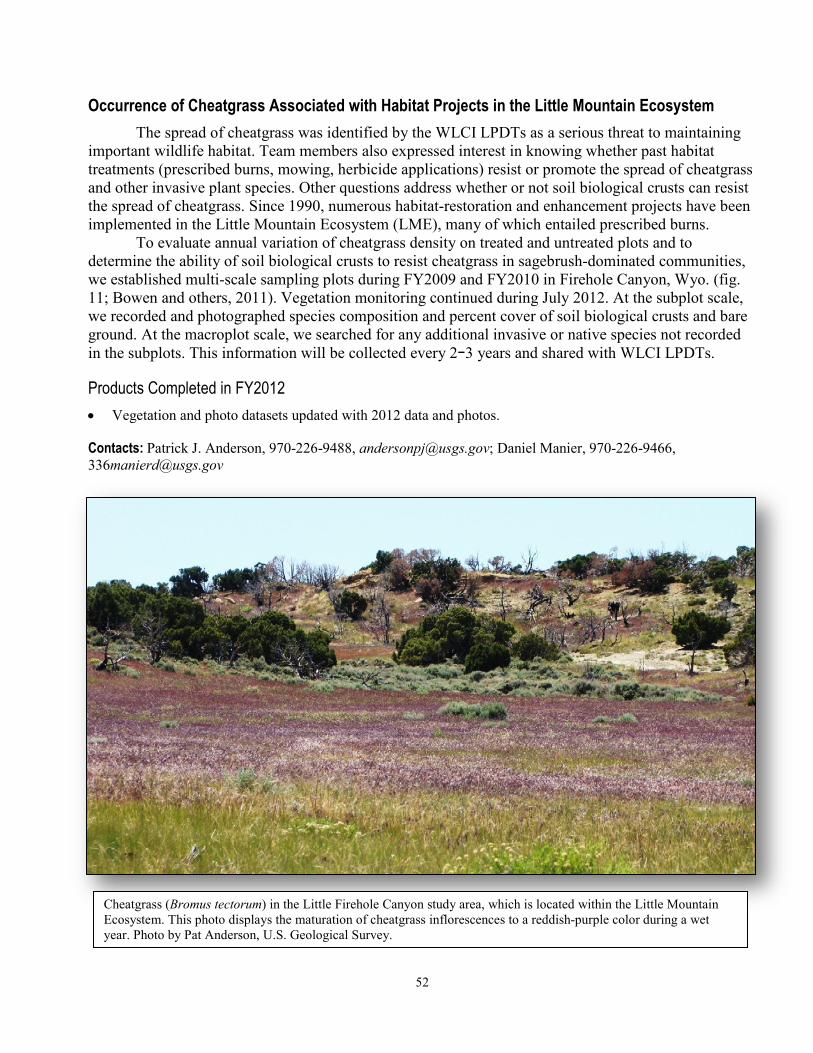
52
Cheatgrass (Bromus tectorum) in the Little Firehole Canyon study area, which is located within the Little Mountain Ecosystem. This photo displays the maturation of cheatgrass inflorescences to a reddish-purple color during a wet year. Photo by Pat Anderson, U.S. Geological Survey.
Occurrence of Cheatgrass Associated with Habitat Projects in the Little Mountain Ecosystem The spread of cheatgrass was identified by the WLCI LPDTs as a serious threat to maintaining
important wildlife habitat. Team members also expressed interest in knowing whether past habitat treatments (prescribed burns, mowing, herbicide applications) resist or promote the spread of cheatgrass and other invasive plant species. Other questions address whether or not soil biological crusts can resist the spread of cheatgrass. Since 1990, numerous habitat-restoration and enhancement projects have been implemented in the Little Mountain Ecosystem (LME), many of which entailed prescribed burns.
To evaluate annual variation of cheatgrass density on treated and untreated plots and to determine the ability of soil biological crusts to resist cheatgrass in sagebrush-dominated communities, we established multi-scale sampling plots during FY2009 and FY2010 in Firehole Canyon, Wyo. (fig. 11; Bowen and others, 2011). Vegetation monitoring continued during July 2012. At the subplot scale, we recorded and photographed species composition and percent cover of soil biological crusts and bare ground. At the macroplot scale, we searched for any additional invasive or native species not recorded in the subplots. This information will be collected every 2−3 years and shared with WLCI LPDTs.
Products Completed in FY2012 • Vegetation and photo datasets updated with 2012 data and photos.
Contacts: Patrick J. Anderson, 970-226-9488, [email protected]; Daniel Manier, 970-226-9466, [email protected]
53
Landscape Assessment and Monitoring of Semi-Arid Woodlands in the Little Mountain Ecosystem The BLM and the WGFD have identified the Little Mountain Ecosystem (LME) in southwestern
Wyoming as a priority area for conservation. This area provides important habitat for many wildlife species, including big game, migratory and resident birds, and Colorado River cutthroat trout, and it is important rangeland for domestic livestock. The mixed woodlands of the LME are particularly important habitats for wildlife. Since the early 1990s, these semi-arid woodlands have been affected by multiple disturbance types. Active management, including prescription burning and mechanical thinning, has sought to rejuvenate decadent aspen stands and reduce conifer encroachment in successional aspen stands. Since the early 2000s, the area also has experienced wildfires and multiple drought years. Such disturbances can contribute to ecological legacies that may have profound effects on ecosystem structure for many years after the event (Turner and Dale, 1998). Moreover, a recent study (Rehfeldt and others, 2009) predicts that the climate profile of the western United States will change between 2009 and the early 2100s, with profound effects on aspen woodlands. Because the two dominant tree species, aspen and subalpine fir (Abies lasiocarpa), in the LME woodlands are already at the fringes of their ecological ranges due to moisture limits, it remains unclear whether they will be able to persist and thrive under predicted conditions. The semi-arid woodlands of the LME are effectively ecotonal habitats at the fringes of their ranges due to moisture limitations; stress, dieback, and mortality are expected to accompany severe drought in this system. Indeed, ecotones are important barometers of climate change (National Ecological Observatory Network, 2000), and studying effects of the drought in the LME woodlands will provide some perspective on potential effects of climate change.
The BLM Rock Springs Field Office requested USGS scientists to develop research that establishes baseline information about the LME woodlands. This project (new in FY2012) will provide information on woodland cover type and the extent and timing of various disturbance types and their effects on woodland productivity. A long-term objective of this research is to determine the feasibility of developing a program to monitor both abrupt and gradual forest/woodland change by using satellite imagery for large areas of southwestern Wyoming. The work is expected to generate multiple datasets, and it will help WLCI LPDTs to evaluate and prioritize aspen habitat treatments. Furthermore, through the use of remote sensing tools, we will distinguish treatment effects from natural disturbances and reveal long-term trends in woodland productivity at a landscape scale. This assessment also will be used to identify areas of the landscape that are most susceptible to change. Finally, a broad aim of this work is to identify ecosystem response to disturbance and climate variability and to contribute to the literature of recent ecosystem change.
Objectives • Map the extent of deciduous and coniferous woodlands on Little Mountain using multi-date (for example,
leaf-on versus leaf-off), fine-scale satellite imagery. • Establish seasonal phenology of deciduous and coniferous woodlands by using coarse-scale satellite imagery. • Calculate the extent and timing of treatments and distinguish them from natural disturbance. • Use newly developed information to refine BLM maps of past habitat treatments.
Aspen canopy on Little Mountain during the drought year of 2012. Aspen woodlands in southwestern Wyoming have undergone stress and mortality. Photo by Tim Assal, U.S. Geological Survey.
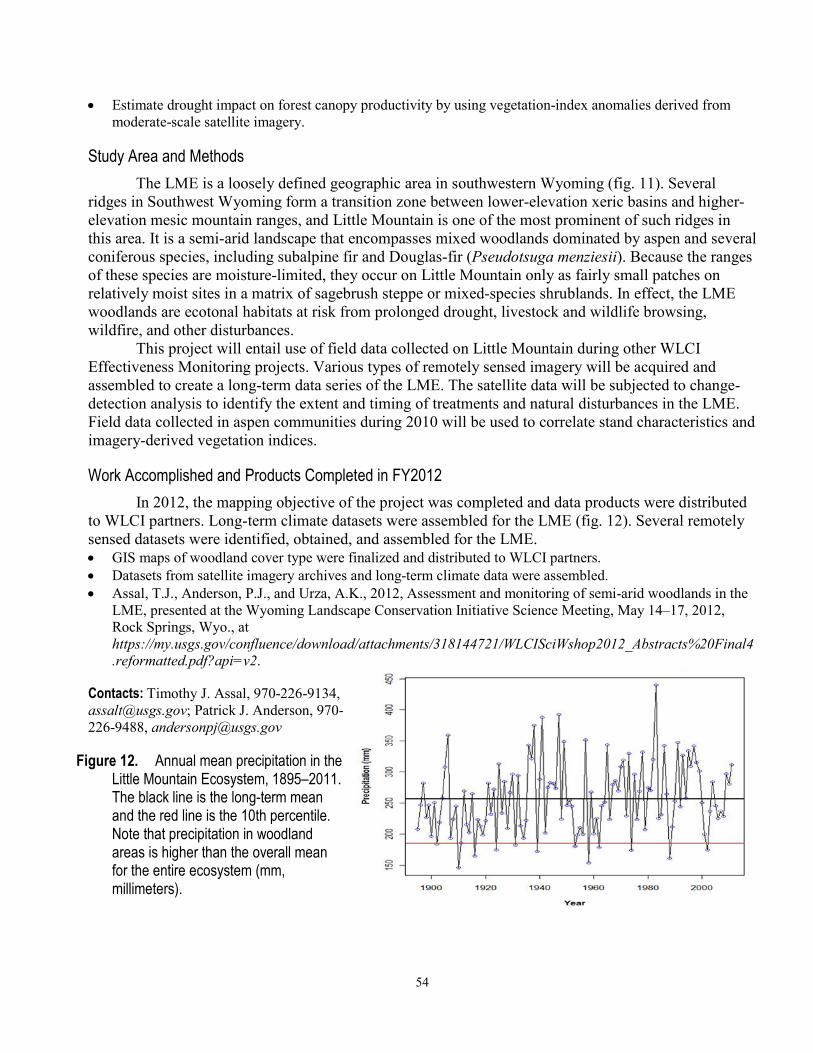
54
• Estimate drought impact on forest canopy productivity by using vegetation-index anomalies derived from moderate-scale satellite imagery.
Study Area and Methods The LME is a loosely defined geographic area in southwestern Wyoming (fig. 11). Several
ridges in Southwest Wyoming form a transition zone between lower-elevation xeric basins and higher-elevation mesic mountain ranges, and Little Mountain is one of the most prominent of such ridges in this area. It is a semi-arid landscape that encompasses mixed woodlands dominated by aspen and several coniferous species, including subalpine fir and Douglas-fir (Pseudotsuga menziesii). Because the ranges of these species are moisture-limited, they occur on Little Mountain only as fairly small patches on relatively moist sites in a matrix of sagebrush steppe or mixed-species shrublands. In effect, the LME woodlands are ecotonal habitats at risk from prolonged drought, livestock and wildlife browsing, wildfire, and other disturbances.
This project will entail use of field data collected on Little Mountain during other WLCI Effectiveness Monitoring projects. Various types of remotely sensed imagery will be acquired and assembled to create a long-term data series of the LME. The satellite data will be subjected to change-detection analysis to identify the extent and timing of treatments and natural disturbances in the LME. Field data collected in aspen communities during 2010 will be used to correlate stand characteristics and imagery-derived vegetation indices.
Work Accomplished and Products Completed in FY2012 In 2012, the mapping objective of the project was completed and data products were distributed
to WLCI partners. Long-term climate datasets were assembled for the LME (fig. 12). Several remotely sensed datasets were identified, obtained, and assembled for the LME. • GIS maps of woodland cover type were finalized and distributed to WLCI partners. • Datasets from satellite imagery archives and long-term climate data were assembled. • Assal, T.J., Anderson, P.J., and Urza, A.K., 2012, Assessment and monitoring of semi-arid woodlands in the
LME, presented at the Wyoming Landscape Conservation Initiative Science Meeting, May 14–17, 2012, Rock Springs, Wyo., at https://my.usgs.gov/confluence/download/attachments/318144721/WLCISciWshop2012_Abstracts%20Final4.reformatted.pdf?api=v2.
Contacts: Timothy J. Assal, 970-226-9134, [email protected]; Patrick J. Anderson, 970-226-9488, [email protected]
Figure 12. Annual mean precipitation in the Little Mountain Ecosystem, 1895–2011. The black line is the long-term mean and the red line is the 10th percentile. Note that precipitation in woodland areas is higher than the overall mean for the entire ecosystem (mm, millimeters).
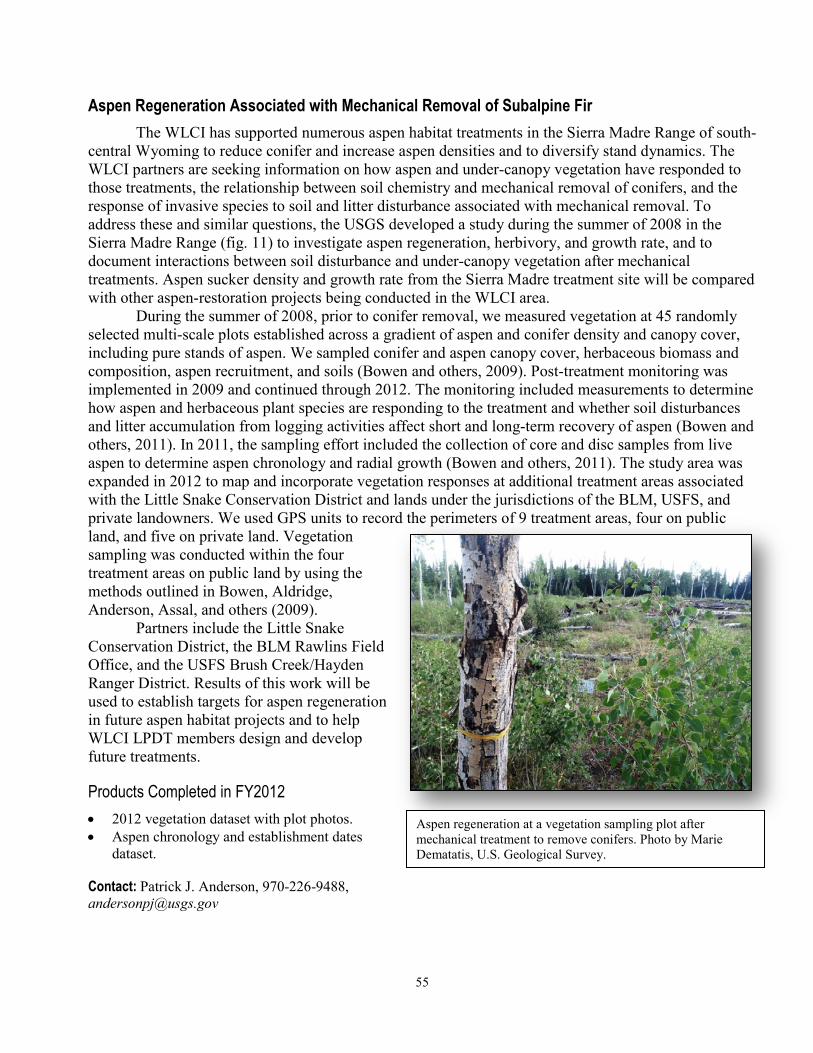
55
Aspen Regeneration Associated with Mechanical Removal of Subalpine Fir The WLCI has supported numerous aspen habitat treatments in the Sierra Madre Range of south-
central Wyoming to reduce conifer and increase aspen densities and to diversify stand dynamics. The WLCI partners are seeking information on how aspen and under-canopy vegetation have responded to those treatments, the relationship between soil chemistry and mechanical removal of conifers, and the response of invasive species to soil and litter disturbance associated with mechanical removal. To address these and similar questions, the USGS developed a study during the summer of 2008 in the Sierra Madre Range (fig. 11) to investigate aspen regeneration, herbivory, and growth rate, and to document interactions between soil disturbance and under-canopy vegetation after mechanical treatments. Aspen sucker density and growth rate from the Sierra Madre treatment site will be compared with other aspen-restoration projects being conducted in the WLCI area.
During the summer of 2008, prior to conifer removal, we measured vegetation at 45 randomly selected multi-scale plots established across a gradient of aspen and conifer density and canopy cover, including pure stands of aspen. We sampled conifer and aspen canopy cover, herbaceous biomass and composition, aspen recruitment, and soils (Bowen and others, 2009). Post-treatment monitoring was implemented in 2009 and continued through 2012. The monitoring included measurements to determine how aspen and herbaceous plant species are responding to the treatment and whether soil disturbances and litter accumulation from logging activities affect short and long-term recovery of aspen (Bowen and others, 2011). In 2011, the sampling effort included the collection of core and disc samples from live aspen to determine aspen chronology and radial growth (Bowen and others, 2011). The study area was expanded in 2012 to map and incorporate vegetation responses at additional treatment areas associated with the Little Snake Conservation District and lands under the jurisdictions of the BLM, USFS, and private landowners. We used GPS units to record the perimeters of 9 treatment areas, four on public land, and five on private land. Vegetation sampling was conducted within the four treatment areas on public land by using the methods outlined in Bowen, Aldridge, Anderson, Assal, and others (2009).
Partners include the Little Snake Conservation District, the BLM Rawlins Field Office, and the USFS Brush Creek/Hayden Ranger District. Results of this work will be used to establish targets for aspen regeneration in future aspen habitat projects and to help WLCI LPDT members design and develop future treatments.
Products Completed in FY2012 • 2012 vegetation dataset with plot photos. • Aspen chronology and establishment dates
dataset.
Contact: Patrick J. Anderson, 970-226-9488, [email protected]
Aspen regeneration at a vegetation sampling plot after mechanical treatment to remove conifers. Photo by Marie Dematatis, U.S. Geological Survey.
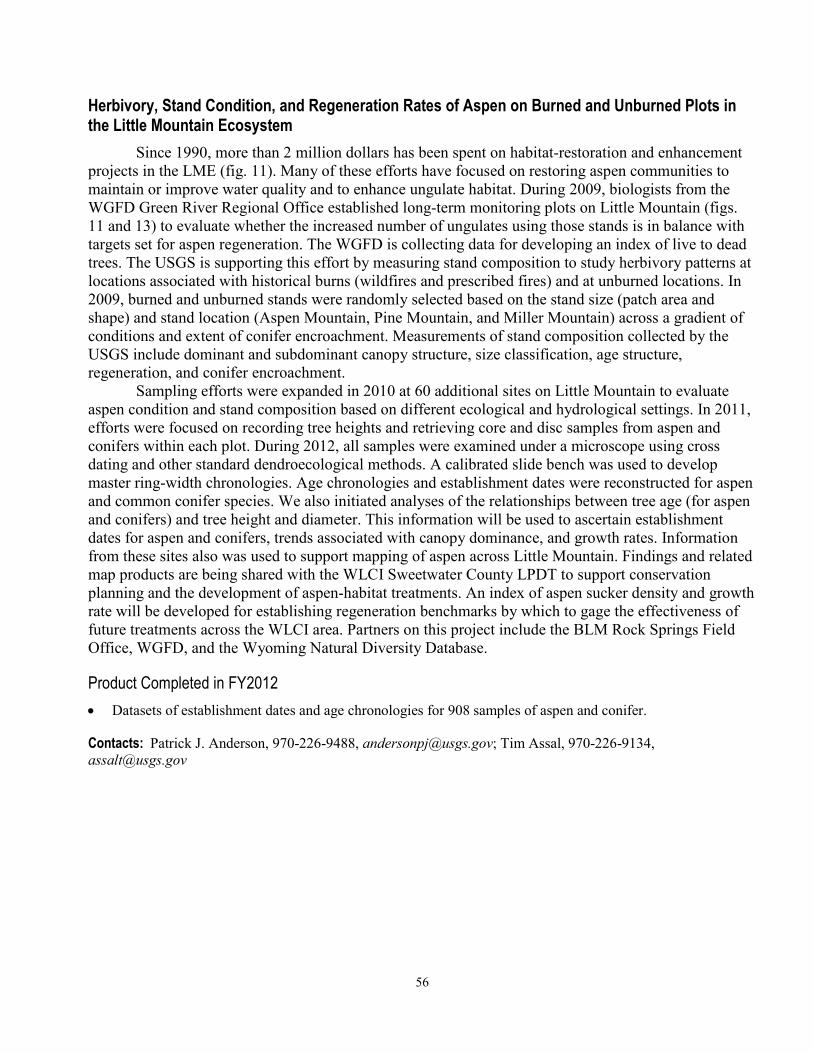
56
Herbivory, Stand Condition, and Regeneration Rates of Aspen on Burned and Unburned Plots in the Little Mountain Ecosystem
Since 1990, more than 2 million dollars has been spent on habitat-restoration and enhancement projects in the LME (fig. 11). Many of these efforts have focused on restoring aspen communities to maintain or improve water quality and to enhance ungulate habitat. During 2009, biologists from the WGFD Green River Regional Office established long-term monitoring plots on Little Mountain (figs. 11 and 13) to evaluate whether the increased number of ungulates using those stands is in balance with targets set for aspen regeneration. The WGFD is collecting data for developing an index of live to dead trees. The USGS is supporting this effort by measuring stand composition to study herbivory patterns at locations associated with historical burns (wildfires and prescribed fires) and at unburned locations. In 2009, burned and unburned stands were randomly selected based on the stand size (patch area and shape) and stand location (Aspen Mountain, Pine Mountain, and Miller Mountain) across a gradient of conditions and extent of conifer encroachment. Measurements of stand composition collected by the USGS include dominant and subdominant canopy structure, size classification, age structure, regeneration, and conifer encroachment.
Sampling efforts were expanded in 2010 at 60 additional sites on Little Mountain to evaluate aspen condition and stand composition based on different ecological and hydrological settings. In 2011, efforts were focused on recording tree heights and retrieving core and disc samples from aspen and conifers within each plot. During 2012, all samples were examined under a microscope using cross dating and other standard dendroecological methods. A calibrated slide bench was used to develop master ring-width chronologies. Age chronologies and establishment dates were reconstructed for aspen and common conifer species. We also initiated analyses of the relationships between tree age (for aspen and conifers) and tree height and diameter. This information will be used to ascertain establishment dates for aspen and conifers, trends associated with canopy dominance, and growth rates. Information from these sites also was used to support mapping of aspen across Little Mountain. Findings and related map products are being shared with the WLCI Sweetwater County LPDT to support conservation planning and the development of aspen-habitat treatments. An index of aspen sucker density and growth rate will be developed for establishing regeneration benchmarks by which to gage the effectiveness of future treatments across the WLCI area. Partners on this project include the BLM Rock Springs Field Office, WGFD, and the Wyoming Natural Diversity Database.
Product Completed in FY2012 • Datasets of establishment dates and age chronologies for 908 samples of aspen and conifer.
Contacts: Patrick J. Anderson, 970-226-9488, [email protected]; Tim Assal, 970-226-9134, [email protected]
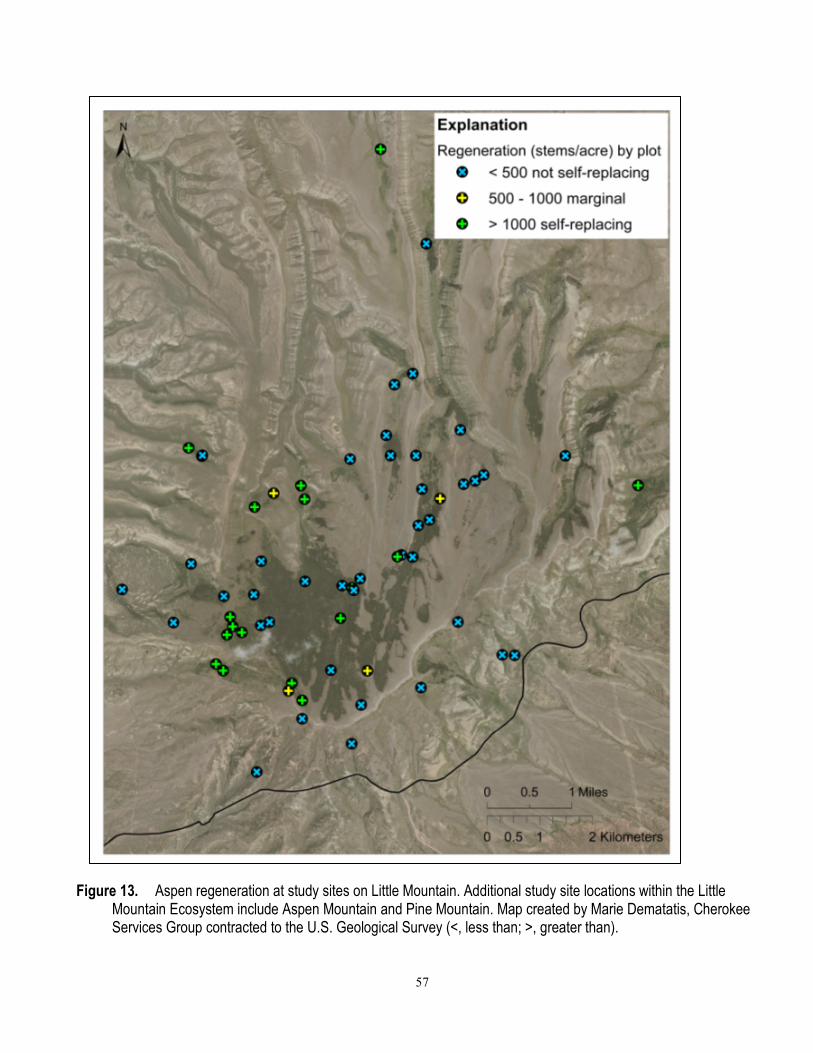
57
Figure 13. Aspen regeneration at study sites on Little Mountain. Additional study site locations within the Little Mountain Ecosystem include Aspen Mountain and Pine Mountain. Map created by Marie Dematatis, Cherokee Services Group contracted to the U.S. Geological Survey (<, less than; >, greater than).
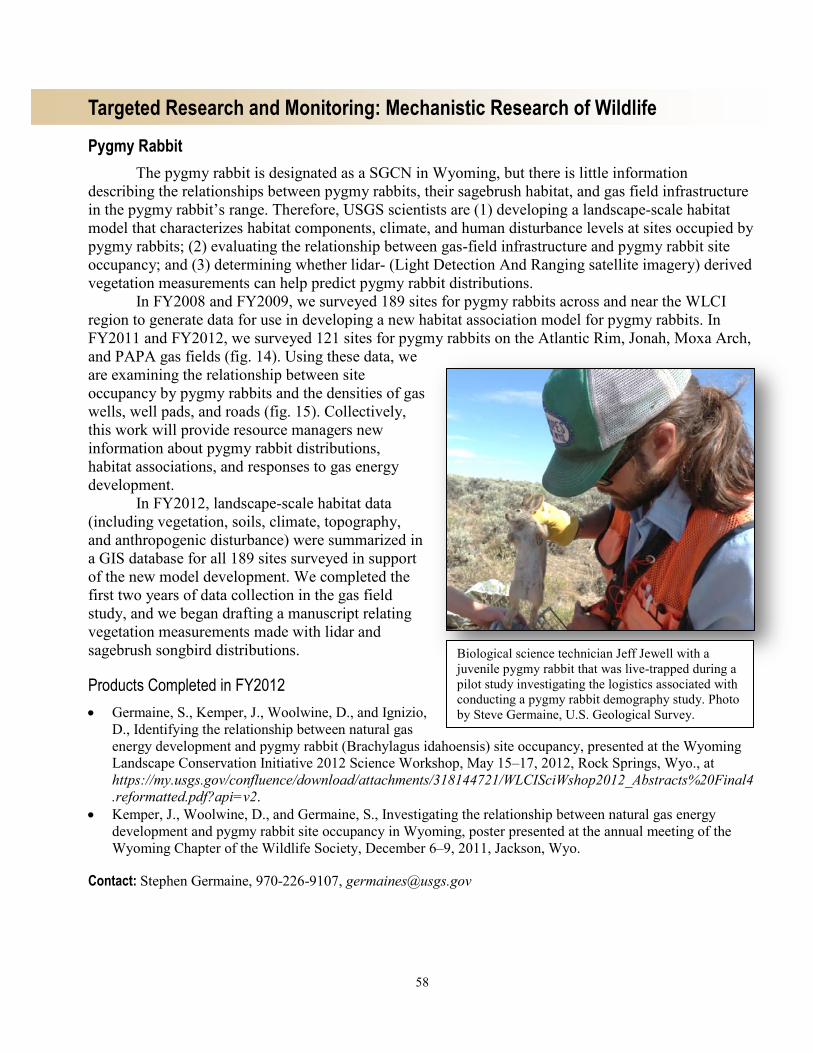
58
Targeted Research and Monitoring: Mechanistic Research of Wildlife Pygmy Rabbit
The pygmy rabbit is designated as a SGCN in Wyoming, but there is little information describing the relationships between pygmy rabbits, their sagebrush habitat, and gas field infrastructure in the pygmy rabbit’s range. Therefore, USGS scientists are (1) developing a landscape-scale habitat model that characterizes habitat components, climate, and human disturbance levels at sites occupied by pygmy rabbits; (2) evaluating the relationship between gas-field infrastructure and pygmy rabbit site occupancy; and (3) determining whether lidar- (Light Detection And Ranging satellite imagery) derived vegetation measurements can help predict pygmy rabbit distributions.
In FY2008 and FY2009, we surveyed 189 sites for pygmy rabbits across and near the WLCI region to generate data for use in developing a new habitat association model for pygmy rabbits. In FY2011 and FY2012, we surveyed 121 sites for pygmy rabbits on the Atlantic Rim, Jonah, Moxa Arch, and PAPA gas fields (fig. 14). Using these data, we are examining the relationship between site occupancy by pygmy rabbits and the densities of gas wells, well pads, and roads (fig. 15). Collectively, this work will provide resource managers new information about pygmy rabbit distributions, habitat associations, and responses to gas energy development.
In FY2012, landscape-scale habitat data (including vegetation, soils, climate, topography, and anthropogenic disturbance) were summarized in a GIS database for all 189 sites surveyed in support of the new model development. We completed the first two years of data collection in the gas field study, and we began drafting a manuscript relating vegetation measurements made with lidar and sagebrush songbird distributions.
Products Completed in FY2012 • Germaine, S., Kemper, J., Woolwine, D., and Ignizio,
D., Identifying the relationship between natural gas energy development and pygmy rabbit (Brachylagus idahoensis) site occupancy, presented at the Wyoming Landscape Conservation Initiative 2012 Science Workshop, May 15–17, 2012, Rock Springs, Wyo., at https://my.usgs.gov/confluence/download/attachments/318144721/WLCISciWshop2012_Abstracts%20Final4.reformatted.pdf?api=v2.
• Kemper, J., Woolwine, D., and Germaine, S., Investigating the relationship between natural gas energy development and pygmy rabbit site occupancy in Wyoming, poster presented at the annual meeting of the Wyoming Chapter of the Wildlife Society, December 6–9, 2011, Jackson, Wyo.
Contact: Stephen Germaine, 970-226-9107, [email protected]
Biological science technician Jeff Jewell with a juvenile pygmy rabbit that was live-trapped during a pilot study investigating the logistics associated with conducting a pygmy rabbit demography study. Photo by Steve Germaine, U.S. Geological Survey.
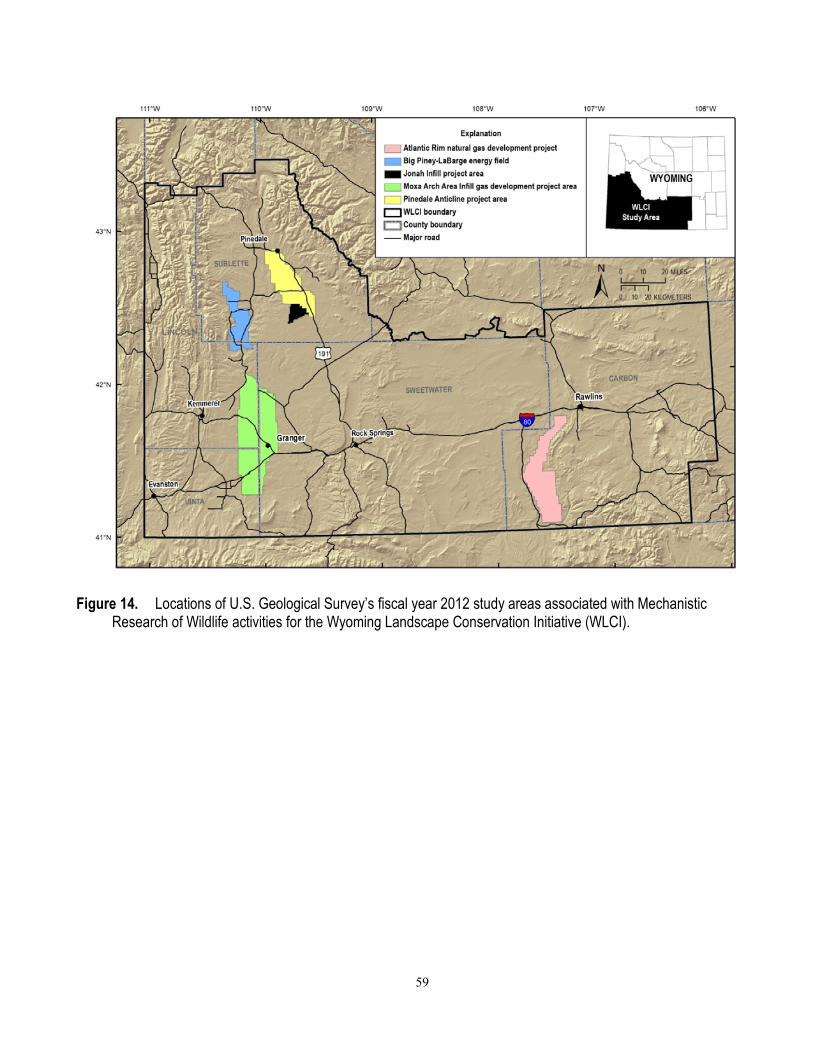
59
Figure 14. Locations of U.S. Geological Survey’s fiscal year 2012 study areas associated with Mechanistic Research of Wildlife activities for the Wyoming Landscape Conservation Initiative (WLCI).
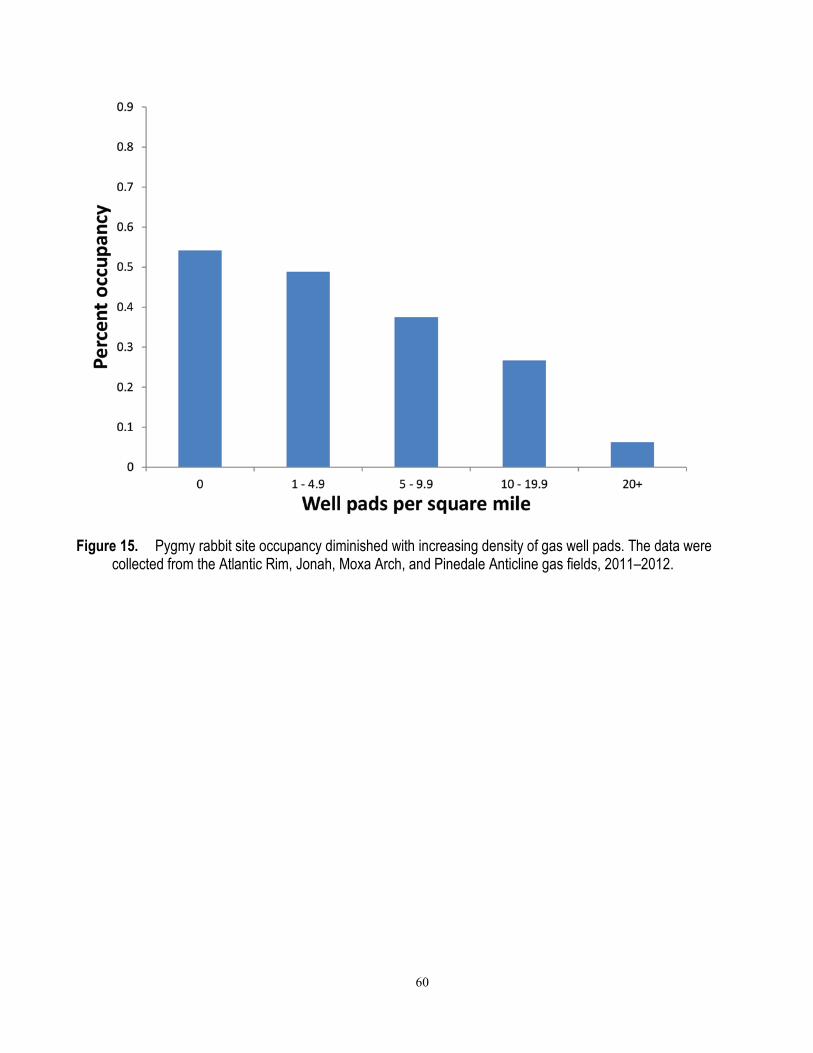
60
Figure 15. Pygmy rabbit site occupancy diminished with increasing density of gas well pads. The data were collected from the Atlantic Rim, Jonah, Moxa Arch, and Pinedale Anticline gas fields, 2011–2012.
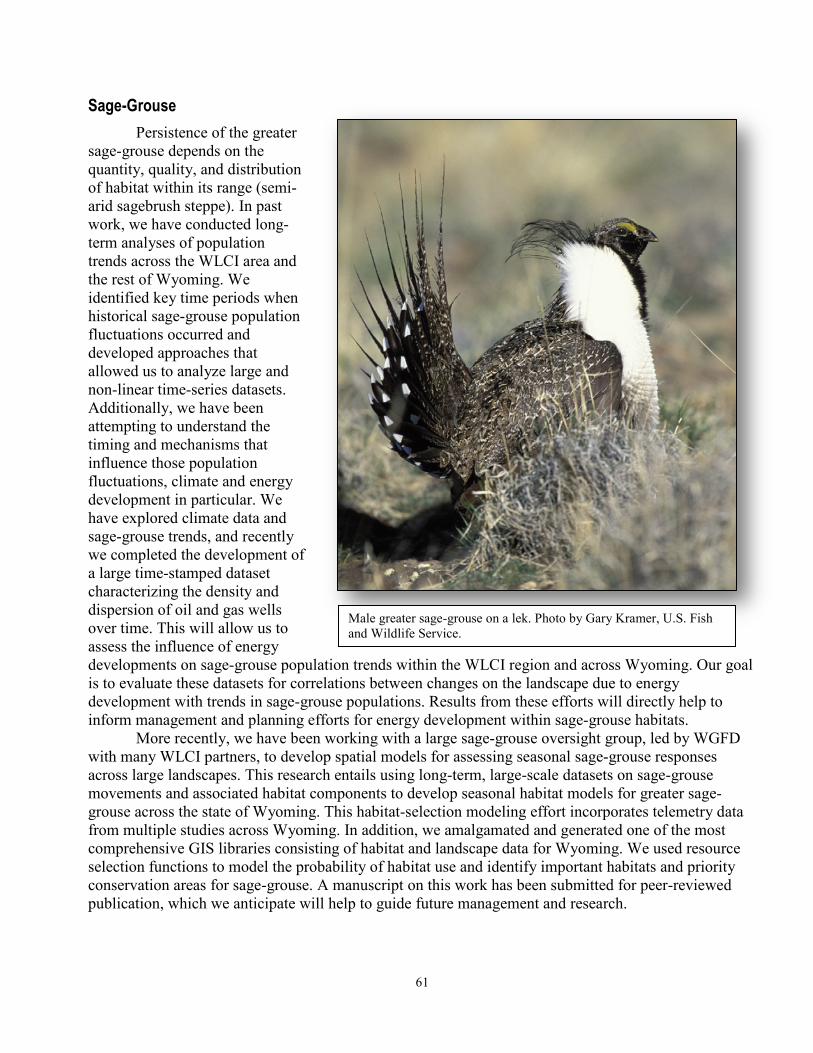
61
Sage-Grouse Persistence of the greater
sage-grouse depends on the quantity, quality, and distribution of habitat within its range (semi-arid sagebrush steppe). In past work, we have conducted long-term analyses of population trends across the WLCI area and the rest of Wyoming. We identified key time periods when historical sage-grouse population fluctuations occurred and developed approaches that allowed us to analyze large and non-linear time-series datasets. Additionally, we have been attempting to understand the timing and mechanisms that influence those population fluctuations, climate and energy development in particular. We have explored climate data and sage-grouse trends, and recently we completed the development of a large time-stamped dataset characterizing the density and dispersion of oil and gas wells over time. This will allow us to assess the influence of energy developments on sage-grouse population trends within the WLCI region and across Wyoming. Our goal is to evaluate these datasets for correlations between changes on the landscape due to energy development with trends in sage-grouse populations. Results from these efforts will directly help to inform management and planning efforts for energy development within sage-grouse habitats.
More recently, we have been working with a large sage-grouse oversight group, led by WGFD with many WLCI partners, to develop spatial models for assessing seasonal sage-grouse responses across large landscapes. This research entails using long-term, large-scale datasets on sage-grouse movements and associated habitat components to develop seasonal habitat models for greater sage-grouse across the state of Wyoming. This habitat-selection modeling effort incorporates telemetry data from multiple studies across Wyoming. In addition, we amalgamated and generated one of the most comprehensive GIS libraries consisting of habitat and landscape data for Wyoming. We used resource selection functions to model the probability of habitat use and identify important habitats and priority conservation areas for sage-grouse. A manuscript on this work has been submitted for peer-reviewed publication, which we anticipate will help to guide future management and research.
Male greater sage-grouse on a lek. Photo by Gary Kramer, U.S. Fish and Wildlife Service.
62
Products Completed in FY2012 • Fedy, B.C., Aldridge, C.L., Doherty, K.E., O’Donnell, M., Beck, J.L., Bedrosian, B., Holloran, M.J.,
Johnson, G.D., Kaczor, N.W., Kirol, C.P., Mandich, C.A., Marshall, D., McKee, G., Olson, C., Swanson, C.C., and Walker, B.L., 2012, Interseasonal movements of greater sage-grouse, migratory behavior, and an assessment of the core regions concept in Wyoming: Journal of Wildlife Management, v. 76, p. 1,062–1,071.
• Fedy, B.C., Doherty, K.E., Aldridge, C.L., O’Donnell, M., Beck, J.L., Bedrosian, B., Gummer, D., Holloran, M.J., Johnson, G.D., Kaczor, N.W., Kirol, C.P., Mandich, C.A., Marshall, D., McKee, G. Olson, C., Swanson, C.C., and Walker, B.L., in review, Habitat prioritization across large landscapes, multiple seasons, and novel areas—An example using greater sage-grouse in Wyoming: Wildlife Monographs.
• Fedy, B.C., Aldridge, C.L., Doherty, K.E., O’Donnell, M., Beck, J.L., Bedrosian, B., Holloran, M.J., Johnson, G.D., Kaczor, N.W., Kirol, C.P., Mandich, C.A., Marshall, D., McKee, G., Olson, C., Swanson, C.C., and Walker, B., 2011, Across space and time—Seasonal and regional variation in habitat selection of greater sage-grouse across large spatial scales, presented at The Wildlife Society Annual Meeting, November 5–10, 2011, Kona, Hawaii.
• Fedy, B.C., Doherty, K.E., and Aldridge, C.L., 2012, Importance of within year repeated lek counts and highly correlated population cycles, in 28th Western Agencies Sage and Columbian Sharp-tailed Grouse Workshop, June 19―22, 2012, Steamboat Springs, Colo., http://wildlife.state.co.us/SiteCollectionDocuments/DOW/Research/Birds/WAFWAGrouseWorkshopAgenda. pdf
• Fedy, B.C., Doherty, K.E., Aldridge, C.L., O’Donnell, M., Beck, J.L., Bedrosian, B., Gummer, D., Holloran, M.J., Johnson, G.D., Kaczor, N.W., Kirol, C.P., Mandich, C.A., Marshall, D., McKee, G. Olson, C., Swanson, C.C., and Walker, B., 2012, Habitat prioritization across large landscapes, multiple seasons, and novel areas: an example using greater sage-grouse in Wyoming, in The 28th Western Agencies Sage and Columbian Sharp-tailed Grouse Workshop, June 19–22, 2012, Steamboat Springs, Colo., at http://wildlife.state.co.us/SiteCollectionDocuments/DOW/Research/Birds/WAFWAGrouseWorkshopAgenda. pdf.
• Fedy, B.C., Doherty, K.E., Aldridge, C.L., O’Donnell, M., Beck, J.L., Bedrosian, B., Gummer, D., Holloran, M.J., Johnson, G.D., Kaczor, N.W., Kirol, C.P., Mandich, C.A., Marshall, D., McKee, G. Olson, C., Swanson, C.C., and Walker, B., 2012, State-wide seasonal habitat selection in Wyoming greater sage-grouse, presented at the Wyoming Landscape Conservation Initiative 2012 Science Workshop, May 15–17, 2012, Rock Springs, Wyo., at https://my.usgs.gov/confluence/download/attachments/318144721/WLCISciWshop2012_Abstracts%20Final4.reformatted.pdf?api=v2.
Contact: Cameron Aldridge, 970-226-9433, [email protected]; Brad Fedy, [email protected]
http://wildlife.state.co.us/SiteCollectionDocuments/DOW/Research/Birds/WAFWAGrouseWorkshopAgenda.pdf
http://wildlife.state.co.us/SiteCollectionDocuments/DOW/Research/Birds/WAFWAGrouseWorkshopAgenda.pdf
http://wildlife.state.co.us/SiteCollectionDocuments/DOW/Research/Birds/WAFWAGrouseWorkshopAgenda.pdf
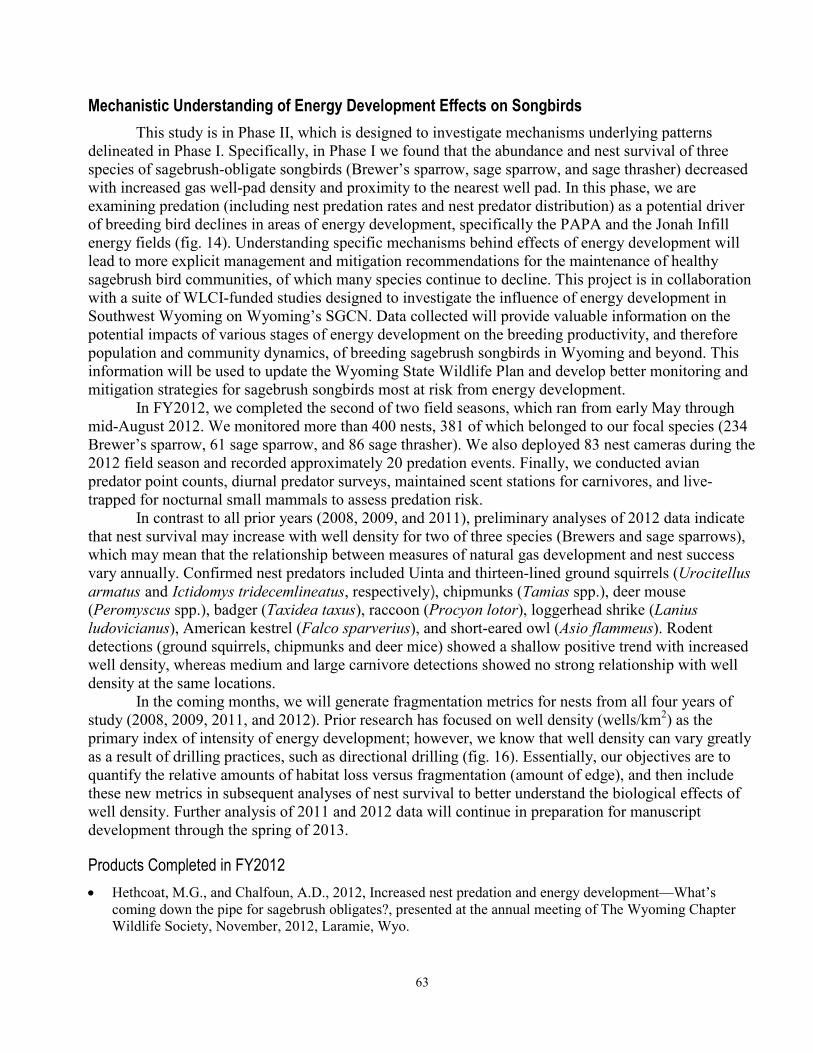
63
Mechanistic Understanding of Energy Development Effects on Songbirds This study is in Phase II, which is designed to investigate mechanisms underlying patterns
delineated in Phase I. Specifically, in Phase I we found that the abundance and nest survival of three species of sagebrush-obligate songbirds (Brewer’s sparrow, sage sparrow, and sage thrasher) decreased with increased gas well-pad density and proximity to the nearest well pad. In this phase, we are examining predation (including nest predation rates and nest predator distribution) as a potential driver of breeding bird declines in areas of energy development, specifically the PAPA and the Jonah Infill energy fields (fig. 14). Understanding specific mechanisms behind effects of energy development will lead to more explicit management and mitigation recommendations for the maintenance of healthy sagebrush bird communities, of which many species continue to decline. This project is in collaboration with a suite of WLCI-funded studies designed to investigate the influence of energy development in Southwest Wyoming on Wyoming’s SGCN. Data collected will provide valuable information on the potential impacts of various stages of energy development on the breeding productivity, and therefore population and community dynamics, of breeding sagebrush songbirds in Wyoming and beyond. This information will be used to update the Wyoming State Wildlife Plan and develop better monitoring and mitigation strategies for sagebrush songbirds most at risk from energy development.
In FY2012, we completed the second of two field seasons, which ran from early May through mid-August 2012. We monitored more than 400 nests, 381 of which belonged to our focal species (234 Brewer’s sparrow, 61 sage sparrow, and 86 sage thrasher). We also deployed 83 nest cameras during the 2012 field season and recorded approximately 20 predation events. Finally, we conducted avian predator point counts, diurnal predator surveys, maintained scent stations for carnivores, and live-trapped for nocturnal small mammals to assess predation risk.
In contrast to all prior years (2008, 2009, and 2011), preliminary analyses of 2012 data indicate that nest survival may increase with well density for two of three species (Brewers and sage sparrows), which may mean that the relationship between measures of natural gas development and nest success vary annually. Confirmed nest predators included Uinta and thirteen-lined ground squirrels (Urocitellus armatus and Ictidomys tridecemlineatus, respectively), chipmunks (Tamias spp.), deer mouse (Peromyscus spp.), badger (Taxidea taxus), raccoon (Procyon lotor), loggerhead shrike (Lanius ludovicianus), American kestrel (Falco sparverius), and short-eared owl (Asio flammeus). Rodent detections (ground squirrels, chipmunks and deer mice) showed a shallow positive trend with increased well density, whereas medium and large carnivore detections showed no strong relationship with well density at the same locations.
In the coming months, we will generate fragmentation metrics for nests from all four years of study (2008, 2009, 2011, and 2012). Prior research has focused on well density (wells/km2) as the primary index of intensity of energy development; however, we know that well density can vary greatly as a result of drilling practices, such as directional drilling (fig. 16). Essentially, our objectives are to quantify the relative amounts of habitat loss versus fragmentation (amount of edge), and then include these new metrics in subsequent analyses of nest survival to better understand the biological effects of well density. Further analysis of 2011 and 2012 data will continue in preparation for manuscript development through the spring of 2013.
Products Completed in FY2012 • Hethcoat, M.G., and Chalfoun, A.D., 2012, Increased nest predation and energy development—What’s
coming down the pipe for sagebrush obligates?, presented at the annual meeting of The Wyoming Chapter Wildlife Society, November, 2012, Laramie, Wyo.
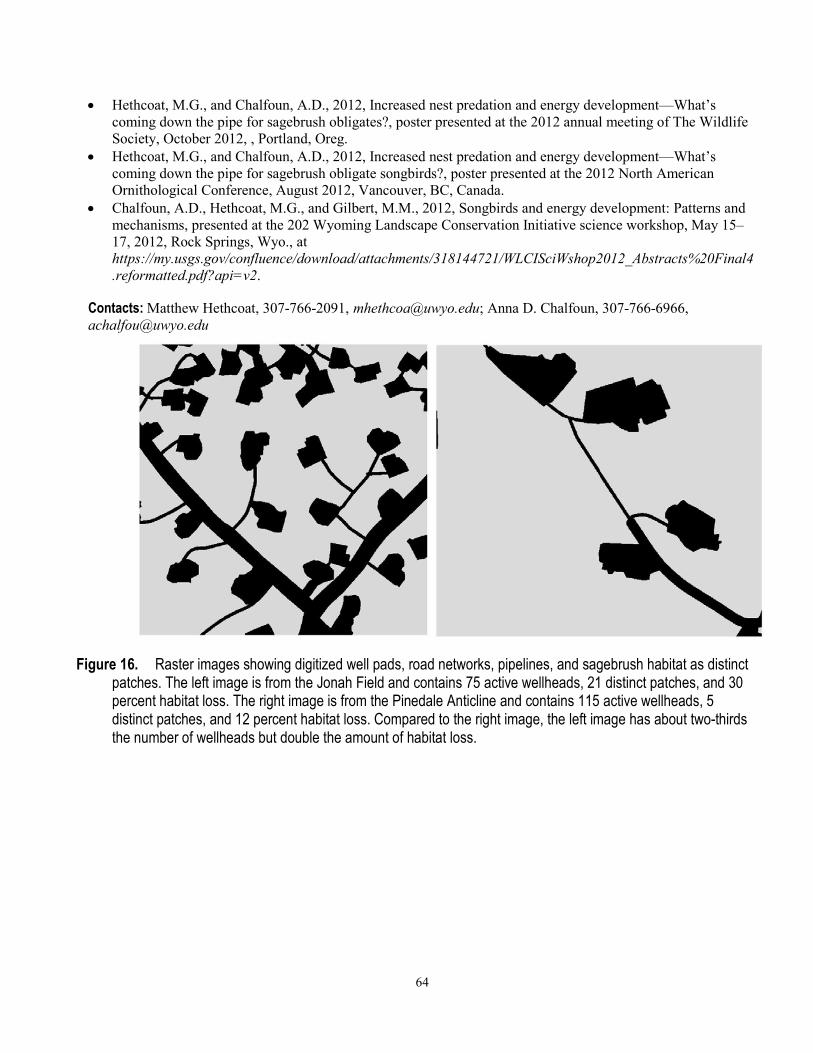
64
• Hethcoat, M.G., and Chalfoun, A.D., 2012, Increased nest predation and energy development—What’s coming down the pipe for sagebrush obligates?, poster presented at the 2012 annual meeting of The Wildlife Society, October 2012, , Portland, Oreg.
• Hethcoat, M.G., and Chalfoun, A.D., 2012, Increased nest predation and energy development—What’s coming down the pipe for sagebrush obligate songbirds?, poster presented at the 2012 North American Ornithological Conference, August 2012, Vancouver, BC, Canada.
• Chalfoun, A.D., Hethcoat, M.G., and Gilbert, M.M., 2012, Songbirds and energy development: Patterns and mechanisms, presented at the 202 Wyoming Landscape Conservation Initiative science workshop, May 15–17, 2012, Rock Springs, Wyo., at https://my.usgs.gov/confluence/download/attachments/318144721/WLCISciWshop2012_Abstracts%20Final4.reformatted.pdf?api=v2.
Contacts: Matthew Hethcoat, 307-766-2091, [email protected]; Anna D. Chalfoun, 307-766-6966, [email protected]
Figure 16. Raster images showing digitized well pads, road networks, pipelines, and sagebrush habitat as distinct patches. The left image is from the Jonah Field and contains 75 active wellheads, 21 distinct patches, and 30 percent habitat loss. The right image is from the Pinedale Anticline and contains 115 active wellheads, 5 distinct patches, and 12 percent habitat loss. Compared to the right image, the left image has about two-thirds the number of wellheads but double the amount of habitat loss.
65
Mule Deer: Identifying Threshold Levels of Development that Impede Wyoming Ungulate Migrations
Impermeable barriers (those that animals will not or cannot cross) can block the migration routes available to migrating animals. For ungulates, however, many forms of development (for example, fences or roads) are semi-permeable, and making informed decisions about their potential impacts to the persistence of migration routes is difficult. This study is evaluating the influence of energy and housing development on the behavior of migrating mule deer. In FY2012, we developed a general framework to understand the influence of barrier effects on ungulate migration. We used global position system data collected from two subpopulations of radio-collared mule deer in the Atlantic Rim Project Area (fig. 14; Dry Cow Creek and Wild Horse Development Areas) to evaluate how different levels of gas development influenced migratory behavior, including movement rates and use of stopover sites (feeding areas). We found migratory behavior to vary with development intensity (Sawyer and others, 2013). More specifically, the data indicate that mule deer can migrate through moderate levels of development without any noticeable effects on migratory behavior; however, in areas with more intensive development, animals often detoured from established routes, increased their rate of movement, and reduced their time spent at stopover sites. This indicates that development can diminish the benefits of migration in these situations (fig. 17). In contrast to impermeable barriers that block animal movements, semi-permeable barriers allow animals to maintain connectivity between their seasonal ranges. Nevertheless, our results indicate that semi-permeable barriers may still affect the functionality of ungulate migration routes. If natural resource managers wish to sustain ungulate migrations, then they would need to consider managing for semi-permeable barriers. Our work in FY2013 will explore the influence of development across a wider range of migratory behaviors and over mule deer migration routes that experience a wider range of development intensity.
Product Completed in FY2012 • Sawyer, H., Kauffman, M.J., Middleton, A.D., Morrison, T.A., Nielson, R.M., and Wyckoff, T.B., 2013, A
framework for understanding semi-permeable barrier effects on migratory ungulates: Journal of Applied Ecology, v. 50, p. 68–78.
Contact: Matthew Kauffman; 307-766-5415; [email protected]
Figure 17. A, Movement rates (mean kilometers per hour (km/hour) ± standard error) of mule deer through the Dry Cow Creek development area during multiple phases of development. Movement rates through the developed area were higher during phases 2a and 2b compared to Phase 1, whereas movement rates through undeveloped habitat decreased. B, Movement rates of mule deer through the Wild Horse Basin development area were similar in both phases.
66
Data and Information Management Activities Data Management Framework and Clearinghouse
Providing access to, managing, analyzing, and using information assembled or generated for the WLCI is essential for supporting WLCI goals. In particular, WLCI users need comprehensive online access to data and other information so they may download data to a local system and view spatial data. An associated Web site to which users may go for data and other information is also required. This project initially entailed developing a Data Management Framework and Clearinghouse that meets these needs by providing a Web-based platform for (1) discovering and using existing data and information, (2) cataloging new data and information, (3) making data and information resources available online to the public and WLCI researchers and decision-makers, and (4) collaborating—promoted by the use of an online utility that fosters partner interaction and allows users to manage knowledge and documents. The USGS Data and Information Management Team (DIMT) must communicate routinely with the USGS Science Team and WLCI partners to identify data needs and determine data availability. Cataloging appropriate data resources for the WLCI community requires identifying the availability, content, scale, and resolution of existing resource data relevant to the WLCI. Ongoing development of the USGS Data Management Framework and Clearinghouse is required to meet increasingly comprehensive user needs and to evolve with fast-paced technological innovations.
The myUSGS system is a powerful collaboration tool made available to the internal WLCI community through the Data Management Framework. This system provides an online platform for document sharing, storage, and management, and it provides a means for organizing content, conducting and recording discussions, and managing community access. Access to the “WLCI community” in myUSGS is restricted to specified WLCI community members, which safeguards sensitive materials and preliminary data and information.
During FY2012, we continued developing the searchable online database to make it easier for users to find and acquire WLCI data and products, such as maps, project locations, key results, and summaries of science or habitat projects. We amalgamated, refined, and managed WLCI data and information by using ScienceBase, a scientific data- and information-management system developed by the USGS for broad application. During FY2012, after updating USGS Web-servicing techniques, we also released a new WLCI website (www.wlci.gov) for using and displaying cataloged data. Items cataloged in the WLCI Data Clearinghouse, including WLCI science and habitat projects and published documents, may be queried and dynamically displayed in the WLCI Web site.
The WLCI Data Clearinghouse references many datasets derived from different sources and in various different formats, which limits the potential to organize, select, display, and use these data. Therefore, in FY2012, we continued to (1) refine and promote the value of these data by completing and enhancing their metadata; (2) develop protocols for assembling and cataloging datasets and serving them from the WLCI Data Clearinghouse to the WLCI Web site; and (3) enable access to these resources online through the use of comprehensive methods for downloading, visualizing, and Web servicing. We also continued to discover and catalog additional data and information useful to researchers, land managers, decision-makers, and the public.
EventManager, an application offered through the myUSGS virtual collaboration system, is an online tool that may be used to plan and coordinate meetings, conferences, workshops, and other large events. EventManager includes functions for tracking and tabulating registrant data, uploading abstracts and presentations, and disseminating logistical information. This application was used to prepare for and manage the 2012 WLCI Science Workshop held during May 2012 in Rock Springs, Wyo.
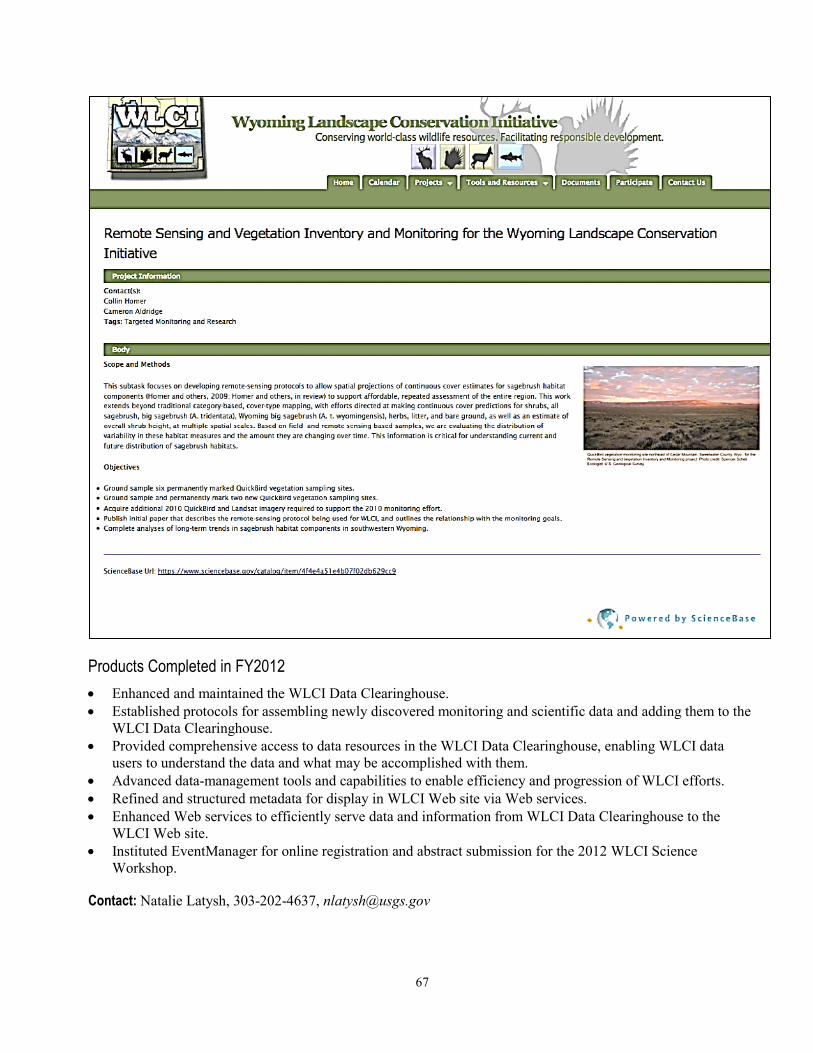
67
Products Completed in FY2012 • Enhanced and maintained the WLCI Data Clearinghouse. • Established protocols for assembling newly discovered monitoring and scientific data and adding them to the
WLCI Data Clearinghouse. • Provided comprehensive access to data resources in the WLCI Data Clearinghouse, enabling WLCI data
users to understand the data and what may be accomplished with them. • Advanced data-management tools and capabilities to enable efficiency and progression of WLCI efforts. • Refined and structured metadata for display in WLCI Web site via Web services. • Enhanced Web services to efficiently serve data and information from WLCI Data Clearinghouse to the
WLCI Web site. • Instituted EventManager for online registration and abstract submission for the 2012 WLCI Science
Workshop.
Contact: Natalie Latysh, 303-202-4637, [email protected]
68
Science and Conservation Projects Database Partners and stakeholders of the WLCI need access to descriptive information about and
locations of (1) “on-the-ground” habitat-conservation projects (hereafter, conservation projects) managed by the WLCI CT, and (2) science projects being conducted by USGS and other science-agency partners. In response to this need, we added WLCI project information to the WLCI Data Clearinghouse and made it available on the WLCI Web site. The WLCI Data Clearinghouse provides an interactive project map that allows users to select geospatially referenced project points to view project information, link to additional resources and data, and use search and filter capabilities to constrain information. For both the WLCI Web site and the WLCI Data Clearinghouse, science- and conservation-project information is routinely updated and communicated to the WLCI CT, the IAMT, and USGS Science Team members to help them identify data management needs for project tracking and management, including the identification and tracking of habitat projects in priority areas.
For storing, organizing, and tracking information on annually proposed and funded WLCI conservation projects, the WLCI CT is using myUSGS, a virtual collaboration site. In myUSGS, project information is organized by year and includes associated project products, such as presentations, proposals, and photographs. The information on funded conservation projects is also cataloged in the WLCI Data Clearinghouse and made available on the WLCI Web Site.
During FY2012, WLCI project descriptions cataloged in the WLCI Data Clearinghouse were updated with regard to their status and progress, and information about new projects was added. For science and habitat projects in the WLCI Data Clearinghouse, we added descriptive tags and keywords for conducting queries and selectively filtering project records in the WLCI Data Clearinghouse and displaying them in the new WLCI website. We also structured project metadata to ensure uniform display and use in the WLCI Web site. Technological advancements in the ScienceBase information-management system (which hosts the WLCI project information) and use of Web services enable users to access dynamic displays of updated, enhanced project information in the new WLCI Web site.
To support scientific monitoring efforts, including the WLCI IAMT, the USGS DIMT began acquiring information about existing monitoring efforts from WLCI partners and developing methods for cataloging the information (see Framework and Indicators for Long-term Monitoring). In addition to monitoring data, the information sought includes details on locations, contacts, goals, analytical methods, monitoring protocols, and data collection. The resulting IAMD is stored on myUSGS and is accessible to the IAMT.
Products Completed in FY2012 • Updated and added to WLCI science and habitat project information in the WLCI Data Clearinghouse. • Advanced Web-servicing capabilities that allow use of cataloged information items, such as project
information and citations, in WLCI Web site. • Enhanced WLCI habitat and science project metadata for transfer to and dynamic display in WLCI website. • Developed cataloging methods for monitoring protocols for potential use by the WLCI Interagency
Monitoring Team.
Contact: Natalie Latysh, 303-202-4637, [email protected]
69
Outreach and Graphic Products A large, multi-partner project such as the WLCI requires excellent intra- and interagency
communications, progress tracking, and dissemination of information and products to interested parties. To meet these needs, the DIMT developed a WLCI Web site (www.wlci.gov) that provides information about ongoing activities and access to additional resources, including workshop information, publications, reports, newsletters, data products, and information about habitat and science projects. With aid from the DIMT, the WLCI CT and Communication Team manage content for the WLCI Web site. In turn, the DIMT routinely communicates with the WLCI CT and Communication Team to identify modifications for the Web site, update project information, and to add photographs, press releases, and meeting notes and agendas. The DIMT attends meetings conducted by the WLCI EC, CT, and others to remain informed about WLCI activities, coordinate with team members to identify outreach needs, and ensure that information about the WLCI is being adequately advertised and promulgated. The DIMT also regularly participates in ad-hoc committees to manage and coordinate information on special events and activities, such as the biannual WLCI science workshops. Finally, the DIMT assists WLCI teams and participants with identifying effective methods for managing and disseminating information. These methods are detailed in articles and other publications and are used for other scientific projects. As information technology and technical infrastructure advance, our methods for managing and delivering WLCI data also advance, and the WLCI website is continuously being improved.
In FY2012, the DIMT released a new WLCI Web site that was developed to differ significantly from the previous WLCI Web site, as requested by WLCI partner agencies and public participants. The new Web site uses the Drupal open-source content-management system, which allows for comprehensive interconnectedness of WLCI information resources by managing information intended for display on the WLCI Web site and integrating with Web services to dynamically display that information, and augmenting the Web site remotely. The new Web site enhances user experience by relating synoptic information, providing aesthetically pleasing photographs and brief explanatory text more prominently, and restricting technical details to supplemental pages of the Web site. To promote dissemination of current and representative information, the WLCI bibliography and project information cataloged in the WLCI Data Clearinghouse was updated and improved for dynamic display on the WLCI website. The new WLCI Web site also was used to disseminate information about the 2012 WLCI Science Workshop, including a regularly updated agenda, information about travel and lodging, and to provide workshop registration through the myUSGS EventManager tool.
Products Completed in FY2012 • Production and release of new WLCI website, using web services to dynamically display cataloged
information in the WLCI Data Clearinghouse. • Improved data and information records cataloged in WLCI Data Clearinghouse for display in WLCI website.
Contact: Natalie Latysh, 303-202-4637, [email protected]
70
References Cited Bowen, Z.H., Aldridge, C.L., Anderson, P.J., Assal, T.J., Baer, L.A., Bristol, S., Carr, N.B., Chong,
G.W., Diffendorfer, J.E., Fedy, B.C., Homer, S.L., Manier, D., Kauffman, M.J., Latysh, N., Melcher, C.P., Miller, K.A., Montag, J., and others, 2009, U.S. Geological Survey science for the Wyoming Landscape Conservation Initiative—2008 annual report: U.S. Geological Survey Open-File Report 2009–1201, 83 p., at http://pubs.usgs.gov/of/2009/1201/.
Bowen, Z.H., Aldridge, C.L., Anderson, P.J., Chong, G.W., Drummond, M.A., Homer, C., Johnson, R.C., Kauffman, M.J., Knick, S.T., Kosovich, J.J., Miller, K.A., Owens, T., Shafer, S., and Sweat, M.J., 2009, U.S. Geological Survey science strategy for the Wyoming Landscape Conservation Initiative: U.S. Geological Survey Scientific Investigations Report 2008–5195, 26 p., at http://pubs.usgs.gov/sir/2008/5195/.
Bowen, Z.H., Aldridge, C.L., Anderson, P.J., Assal, T.J., Biewick, L.R.H., Blecker, S.W., Boughton, G.K., Bristol, S., Carr, N.B., Chalfoun, A.D., Chong, G.W., Clark, M.L., Diffendorfer, J.E., Fedy, B.C., Foster, K., Garman, S.L., Germaine, S., Holloway, J., Homer, C., Kauffman, M.J., Keinath, D., Latysh, N., Manier, D., McDougal, R.R., Melcher, C.P., Miller, K.A., Montag, J., Nutt, C.J., Potter, C.J., Schell, S., Shafer, S.L., Smith, D.B., Stillings, L.L., Tuttle, M., and Wilson, A.B., 2011, U.S. Geological Survey Science for the Wyoming Landscape Conservation Initiative—2010 Annual Report: U.S. Geological Survey Open-File Report 2011–1219, 146 p., at http://pubs.usgs.gov/of/2011/1219/.
Cross, P.C., Edwards, W.H., Scurlock, B., Machaik, E., and Rogerson, J., 2007, Management and climate impacts on brucellosis in elk of the Greater Yellowstone Ecosystem: Ecological Applications, v. 17, no. 4, p. 957–964.
Damm, P., and Randall, J., 2012, Wyoming range mule deer habitat management plan—Big Piney-LaBarge area: Pinedale, Wyo., Wyoming Game and Fish Department, Pinedale Regional Office, 71 p.
Foster, K., 2012, Bankfull-channel geometry and discharge curves for the Rocky Mountains Hydrologic Region in Wyoming: U.S. Geological Survey Scientific Investigations Report 2012–5178, 20 p., at http://pubs.usgs.gov/sir/2012/5178/sir2012-5178.pdf.
Gregory, R.W., Jones, R.W., and Cottingham, K.D., 2010, Uranium map of Wyoming: Wyoming State Geological Survey Map Series 94, scale 1:500,000.
Homer, C.G., Aldridge, C.L., Meyer, D.K., Coan, M.J., and Bowen, Z.H., 2009, Multiscale sagebrush rangeland habitat modeling in Southwest Wyoming: U.S. Geological Survey Open-File Report 2008–1027, 14 p., at http://pubs.usgs.gov/of/2008/1027.
ITT Visual Information Solutions, 2009, ENVI 4.7/ IDL version 7.1 user’s guide: Boulder, Colo., ITT Visual Information Solutions, unpaged.
Kenney, T.A., 2010, Levels at gaging stations: U.S. Geological Survey Techniques and Methods 3-A19, 60 p., at http://pubs.usgs.gov/tm/tm3A19/.
Kokaly, R.F., 2011, Detecting cheatgrass on the Colorado Plateau using Landsat data—A tutorial for the DESI software: U.S. Geological Survey Open-File Report 2011–1327, 88 p., at http://pubs.usgs.gov/of/2010/1327/.
Leopold, L.B., 1994, A view of the river: Cambridge, Mass., Harvard University Press, 298 p. National Ecological Observatory Network, 2000, Report on first workshop on the National Ecological
Observatory Network (NEON), January 10–12, 2000, Archbold Biological Station, Lake Placid, Fla.: Infrastructure for Biology at Regional to Continental Scales, American Institute of Biological Sciences, 17 p., at http://ibrcs.aibs.org/reports/pdf/NEON1_Jan2000.pdf.
71
Rehfeldt, G.E., Ferguson, D.E., and Crookston, N.L., 2009, Aspen, climate, and sudden decline in western USA: Forest Ecology and Management, v. 258, p. 2353–2364.
Rosgen, D.L., 2006, Watershed assessment of river stability and sediment supply (WARSSS): Fort Collins, Colo., Wildland Hydrology, 193 p.
Sauer, V.B., and Turnipseed, D.P., 2010, Stage measurement at gaging stations: U.S. Geological Survey Techniques and Methods, book 3, chap. A7, 45 p., at http://pubs.usgs.gov/tm/tm3-a7/.
Sawyer, H., Kauffman, M.J., Middleton, A.D., Morrison, T.A., Nielson, R.M., and Wyckoff, T.B., 2013, A framework for understanding semi-permeable barrier effects on migratory ungulates: Journal of Applied Ecology, v. 50, p. 68–78.
Smith, M.A., and Younkin, B., 2010, Wyoming range mule deer habitat assessment—Deer Hills, Calpet and Little Colorado Desert study area: Jackson, Wyo., Teton Science Schools.
Turner, M.G., and Dale, V.H., 1998, Comparing large, infrequent disturbances—What have we learned?: Ecosystems, v. 1, p. 493–496.
Turnipseed, D.P., and Sauer, V.B., 2010, Discharge measurements at gaging stations: U.S. Geological Survey Techniques and Methods, book 3, chap. A8, 87 p., at http://pubs.usgs.gov/tm/tm3-a8/.
U.S. Geological Survey, 2012, Water-resources data for the United States, Water Year 2012: U.S. Geological Survey Water-Data Report WDR-US-2012, variously paged, at http://wdr.water.usgs.gov/.
U.S. Geological Survey, variously dated, National field manual for the collection of water-quality data: U.S. Geological Survey Techniques of Water-Resources Investigations, book 9, chaps., A1–A9, unpaged, at http://pubs.water.usgs.gov/twri9A.
Wagner, R.J., Boulger, R.W., Jr., Oblinger, C.J., and Smith, B.A., 2006, Guidelines and standard procedures for continuous water-quality monitors—Station operation, record computation, and data reporting: U.S. Geological Survey Techniques and Methods 1-D3, 51 p. and 8 attachments, at http://pubs.water.usgs.gov/tm1d3.
Wyoming Game and Fish Department, 2010, Wyoming State wildlife action plan: Cheyenne, Wyo., Wyoming Game and Fish Department, unpaged, accessed March 2, 2011 at http://gf.state.wy.us/SWAP2010/Plan/index.asp.
Xian, G., Homer, C.G., and Aldridge, C.L., 2012, Effects of land cover and regional climate variations on long-term spatiotemporal changes in sagebrush ecosystems: GIScience & Remote Sensing, v. 49, no. 3, p. 378–396.
ISSN 2331-1258 (online) http://dx.doi.org/10.3133/ofr20141093

Publishing support provided by: Denver Publishing Service Center For more information concerning this publication, contact: Center Director, USGS Fort Collins Science Center 2150 Centre Ave., Bldg. C Fort Collins, CO 80526-8118 (970)226-9398 Or visit the Fort Collins Science Center Web site at: http://www.fort.usgs.gov/