Geological Survey Research 1962
196
Geological Survey Research 1962 Short Papers in Geology, Hydrology and Topography, Articles 180-239 GEOLOGICAL SURVEY PROFESSIONAL PAPER 450-E
-
Upload
khangminh22 -
Category
Documents
-
view
1 -
download
0
Transcript of Geological Survey Research 1962

Geological Survey
Research 1962Short Papers in Geology, Hydrology and Topography, Articles 180-239
GEOLOGICAL SURVEY PROFESSIONAL PAPER 450-E

Short Papers in Geology
Hydrology, and Topography
Articles 180-239GEOLOGICAL SURVEY RESEARCH 1962
GEOLOGICAL SURVEY PROFESSIONAL PAPER 450-E
Scientific notes and summaries of investigations prepared by members of the Conservation, Geologic, Topographic, and Water Resources Divisions in the fields of geology, hydrology, topography, and related sciences
UNITED STATES GOVERNMENT PRINTING OFFICE, WASHINGTON : 1963
UNITED STATES DEPARTMENT OF THE INTERIOR
STEWART L. UDALL, Secretary
GEOLOGICAL SURVEY
Thomas B. Nolan, Director
For sale by the Superintendent of Documents, U.S. Government Printing OfficeWashington 25, D.C.

FOREWORD
This collection of 60 short papers on subjects in the fields of geology, hydrology, topography, and related sciences is the last of a series released as chapters of Professional Paper 450. The papers in this chapter report on the scientific and economic results of current work by members of the Conservation, Geologic, Topographic, and Water Resources Divisions of the United States Geological Survey. Some of the papers announce new discoveries or present observations on problems of limited scope; other papers draw conclusions from more extensive or continuing investigations that in large part will be discussed in greater detail in reports to be published in the future.
Chapter A of this series presents a synopsis of results from a wide range of work done during the 1962 fiscal year.
/t
THOMAS B. NOLAN,Director.
in


CONTENTS
Page
Foreword. ___-__-_--__-___-_-___________________________________________________-______________--_----------_- Ill
GEOLOGIC STUDIES Economic geology
180. Mineralization associated with a magnetic anomaly in part of the Ely quadrangle, Nevada, by A. L. Brokaw,G. B. Gott, D. R. Mabey, Howard McCarthy, and Uteana Oda_________________________________ El
181. Preliminary report on alkalic intrusive rocks in the northern Wet Mountains, Colorado, by R. L. Parker and F. A.Hildebrand__________________________________________________________________ 8
Engineering geology182. Landslides near Gardiner, Montana, by H. A. Waldrop and H. J. Hyden___________________-__----_-_-------- 11
Structural geology183. The Crooked Creek disturbance, southeast Missouri, by T. H. Kiilsgaard, A. V. Heyl, and M. R. Brock_________ 14184. Origin of the Middlesboro Basin, Kentucky, by K. J. Englund and J. B. Roen____ _____________ _______________ 20185. Thrusting developed after folding in the Valley and Ridge province, southwest Virginia, by L. D. Harris________ 22186. Reversal of throw along a line of low-angle thrust faulting near San Pedro de Atacama, Chile, by R. J. Dingman_ 25187. Gravity and magnetic anomalies in the northern Oquirrh Mountains, Utah, by D. R. Mabey, E. W. Tooker, and
R. J. Roberts_____________________________________________________-___--______-_-_--------_--------- 28Stratigraphy
188. Comparison of Oquirrh Formation sections in the northern and central Oquirrh Mountains, Utah, by E. W. Tookerand R. J. Roberts.________________________________________________________________ 32
189. Windy Gap Volcanic Member of the Middle Park Formation, Middle Park, Colorado, by G. A. Izett, R. B. Taylor,and D. L. Hoover__________________________________________________________-____-_-_-----_---------- 36
190. Shallow halite deposits in the Flowerpot Shale in southwestern Oklahoma, by P. E. Ward______________________ 40191. Crinoidal bioherms in the Fort Payne Chert (Mississippian) along the Caney Fork River, Tennessee, by M. V.
Marcher_________-_______________________________________-____-__---_---_-------_---------------- 43192. Mississippian-Pennsylvanian boundary in northeastern Kentucky, by R. A. Sheppard and Ernest Dobrovolny_ _ _ _ 45193. Correlation of the Parkwood Formation and the lower members of the Pottsville Formation in Alabama, by W. C.
Culbertson_ __ __ _____________________________________________________--_______--_------------------ 47194. Pennsylvanian nomenclature in northwest Georgia, by W. C. Culbertson____________________________--__----- 51195. Pathfinder uplift of Pennsylvanian age in southern Wyoming, by W. W. Mallory___________________,-_----_---- 57196. Unconformity marking the Jurassic-Cretaceous boundary in the La Ligua area, Aconcagua Province, Chile, by
W. D. Carter___________________________________________________________________-_-----------_------ 61197. Relations of the Navajo and Carmel Formations in southwest Utah and adjoining Arizona, by J. C. Wright and
D. D. Dickey_________________________________________________________________-----_ 63Mineralogy, geochemistry, and petrology
198. Bentonite beds of unusual composition in the Carmel Formation, southwest Utah, by L. G. Schultz and J. C. Wright_ 67199. Sampling a zoned galena crystal for lead isotope study, by R. S. Cannon, Jr., K. L. Buck, and A. P. Pierce______ 73200. Epidote and related minerals in two deep geothermal drill holes, Reykjavik and Hveragerdi, Iceland, by G. E.
Sigvaldason_ __ _ ___________________________________________________________________________________ 77201. Epidote in hot-spring systems, and depth of formation of propylitic epidote in epithermal ore deposits, by D. E.
White and G. E. Sigvaldason______________________________________-_______-___------------------------ 80202. Thorium and uranium in some volcanic rocks from the circum-Pacific province, by David Gottfried, Roosevelt Moore,
and Esma CampbelL________________________________________---________----------------------------- 85203. The quartz diorite line in northwestern North America, by J. G. Moore. Arthur Grantz, and M. C. Blake, Jr_____ 89204. Syenite complex older than the Idaho batholith, Big Creek quadrangle, central Idaho, by B. F. Leonard.__ ______ 93205. Trondhjemite in the Riggins quadrangle, western Idaho, by Warren Hamilton.___________________----_------- 98206. X-ray determinative curve for olivines of composition Fogo-95 from stratiform and alpine-type peridotites, by P. E.
Hotz and E. D. Jackson_________________________________________________------------_-------------- 101207. Formation of "salt cups" near San Pedro de Atacama, Chile, by R. J. Dingman____________ ___ ______-------_- 103
Geochronology208. Lead-alpha ages of zircon in quartz monzonite porphyry, Thiel Mountains, Antarctica a preliminary report, by
A. B. Ford, H. A. Hubbard, and T. W. Stern._______________________ .____.--_._-.--__ - - 105209. Evaluation of the Pa231/U- Th230/U method for dating Pleistocene carbonate rocks, by J. N. Rosholt and P. S.
Antal..____________________________________________________________________ ._____-_--.------------- 108

VI CONTENTS
Page Sedimentary petrology
210. Relation of the pore volume of silty sediments to overburden load, particle size, and sorting, by R. H. Meade__ .___ Elll Geomorphology and glacial geology
211. Menan Buttes, cones of glassy basalt tuff in the Snake River Plain, Idaho, by Warren Hamilton and W. B. Myers._ 114212. Comparison of drainage on topograpic maps of the Piedmont province, by E. V. Giusti and W. J. Schneider _._____ 118213. Correlation of some glacial deposits in New Mexico, by G. M. Richmond.___________________________________ 121
Analytical methods214. Ion-exchange separation and spectrophotometric determination of cadmium, by Claude Huffman, Jr____________ 126215. Effect of copper on the precipitation of tellurium with hypophosphorous acid using selenium or gold as a collector,
by H. W. Lakin and C. E. Thompson_____. ___________________________________________ _____________ .. 128216. Spectrophotometric determination of fluorine with thoron, by B. L. Ingram-__________________________________ 130
TOPOGRAPHIC STUDIES Mapping techniques
217. Portable surveying tower, by J. L. Buckmaster and W. D. Murphy------__________________________________ 131218. Airborne control system, by J. L. Buckmaster, H. B. Loving, and T. O. Dando______________________________ 133
HYDROLOGIC STUDIES Engineering hydrology
219. Effects of major water-table changes in Kings and Queens Counties, New York City, by N. M. Perlmutter andJulian Soren___ _______ _________________ ____________________________ _________ ______________ ________ 136
220. Infiltration rates in weathered crystalline rocks at the Georgia Nuclear Laboratory, Dawson County, Georgia, byJ. W. Stewart..--_____________._..______________-__--.__----__-_-______ ._ ___________________________ 140
221. Evapotranspiration and the relation of ground water to surface water in the Pond Creed basin, Oklahoma, by W. E.Clark______________________________________________________________________________________________ 142
222. Estimating the specific capacity of a well, by A. N. Turcan, Jr ____________ __________________________________ 145223. Aerial observation of ice cover to locate areas of ground-water inflow to streams, by S. W. Wiitala and T. G. Newport- _ 148
Ground water224. Permeability of glacial till, by S. E. Norris_____ ____- .___ _______.____ _____.___._____.___ _____________ 150225. Ground water in Cenozoic fill in collapse structures, southeastern Eddy County, New Mexico, by J. B. Cooper-___ 152226. Relation of fresh water to salt water at Centre Island, Nassau County, New York, by John Isbister____ _______ 154227. Highly productive aquifers in the Tacoma area, Washington, by K. L. Walters-_ . ____________________________ 157
Surface water228. Long-term flood frequencies based on extremes of short-term records, by W. J. Conover and M. A. Benson_______ 159229. Flood peaks related to hydrologic factors in the Southwest, by M. A. Benson________________________________ 161
Quality of water230. Dissolved-salt contribution to Great Salt Lake, Utah, by A. M. Diaz _________________________________________ 163
Analytical hydrology231. Orientation of axes for calculating distribution of transmissibility from water-level altitudes, by R. W. Stallman____ 165232. A method of determining the storage-outflow characteristics of nonlinear reservoirs, by John Shen____________ 167233. An analog solution of the turbulent-diffusion equation for open-channel flow, by John Shen____________________ 169234. Measurement of sediment-laden flow by means of a circular orifice, by Nobuhiro Yotsukura_---___- ____________ 172
Experimental hydrology235. Use of a neutron moisture probe to determine the storage coefficient of an unconfined aquifer, by W. R. Meyer_-_- 174236. Centrifuge technique for determining time-drainage relations for a natural sand, by R. C. Prill and A. I. Johnson__ 177237. Behavior of detergents (ABS), bacteria, and dissolved solids in water-saturated soils, by H. G. Page, C. H. Wayman,
and J. B. Robertson_________________________________________________________________________________ 179238. Adsorption of the surfactant ABS35 on kaolinite, by C. H. Wayman, J. B. Robertson, and H. G. Page___ ________ 181239. An application of the Gibbs adsorption equation to detergent solutions, by C. H. Wayman__ ______________ .... 184
INDEXES Subject____-___--_-______-_--.______________________________________________________________ _____________ 187Author.____________ _ _______________________________________________________________________________ _____ 188

GEOLOGICAL SURVEY RESEARCH 1962
SHORT PAPERS IN GEOLOGY, HYDROLOGY, AND TOPOGRAPHY, ARTICLES 180-239
GEOLOGICAL STUDIES
ECONOMIC GEOLOGY
180. MINERALIZATION ASSOCIATED WITH A MAGNETIC ANOMALY IN PART OF THE ELYQUADRANGLE, NEVADA
By ARNOLD L. BKOKAW, GARLAND B. GOTT; DON K. MABEY; HOWARD MCCARTHY, and UTEANA ODA, Denver,Colo. "f Menlo Park, Calif.; Denver, Colo.
Geologic mapping in the Ely quadrangle, Nevada, in 1958-60 revealed structural irregularities and rock alteration suggesting that the Ward Mountain area of the Egan Range contains concealed intrusive rocks and possible accumulations of metals of economic, value. An aeromagnetic survey tested this theory, and a large magnetic anomaly, similar to one near Ruth, Nev., was outlined in the southwest quarter of the quadrangle. Subsequently, a geochemical study tested the possibility that the magnetic anomaly reflects a buried mineralized intrusive body.
The Egan Range is a major north-trending moun tain range in east-central Nevada. The central part of the range, which is the subject of this article, lies south-southwest of Ely between Steptoe Valley on the east and the White River valley on the west (fig. 180.1). The average altitude of the crest of the range in this area is about 10,000 feet above sea level, and the highest peak is 10,933 feet. Near Ruth the alti tude decreases to about 7,000 feet. The floors of the adjoining valleys are about 6,000 to 6,500 feet above sea level.
The Paleozoic sedimentary rocks are a sequence of dolomite, limestone, shale, and sandstone ranging in age from Ordovician to Permian (fig. 180.2). These rocks are overlain in places along the eastern flank of the range by early Tertiary sedimentary rocks and by*somewhat younger volcanic rocks. Gravity data indicate several thousand feet of Cenozoic sedimen tary rocks (valley fill) in Steptoe Valley but gen erally less in the White River valley.
Small quartz monzonite dikes of early Tertiary or Late Cretaceous age intrude the Paleozoic rocks on
the east flank of Ward Mountain, and similar intru sive rocks are exposed near Ruth.
The pre-Tertiary rocks have been complexly folded and displaced by thrust and high-angle faults, whereas the Tertiary rocks have been only slightly folded and tilted.
An aeromagnetic survey of the central part of the Egan Range was flown at an elevation of 11,500 feet along north-south lines spaced about 2 miles apart. The resulting magnetic data are shown by contours on figure 180.1.
A positive magnetic anomaly extends over most of the range from Ruth south to the edge of the map. Two local positive anomalies are superimposed on the more extensive anomaly. The northern anomaly is centered over the south edge of the Robinson mining district, where disseminated copper deposits occur in an east-trending zone of metamorphosed sedimentary rocks and altered monzonite porphyry. The near- surface igneous rocks associated with the copper de posits can account for only part of the measured north ern anomaly, and a major part of it must be caused by a buried igneous body of greater areal extent.
The southern magnetic anomaly is centered over the west edge of the Egan Range where the range is com posed of nonmagnetic Paleozoic sedimentary rocks. The magnetic anomaly is interpreted as due to a large mass of igneous rocks underlying the thickest sedi mentary rocks of the Egan Range and the eastern edge of the White River valley. The zone of high magnetic intensity connecting this anomaly with the anomaly near Ruth suggests that the igneous bodies
El

E2 GEOLOGICAL SURVEY RESEARCH 1962
115°00'
EXPLANATION
^_ 2650 r""^
^___________y
Magnetic contoursHachured where enclosing areas
of lower intensity. Alined dashes are flight lines
Igneous intrusive rocks
39°15'
5 MILESI
39°00'
FIGURE 180.1. Aeromagnetic map of the central Egan Range. Values are total magnetic intensity relative to an arbitrary datum. Contour interval is 10 and 50 gammas. Flight level was 11,500 feet above sea level. Magnetic survey was flown and compiled under the supervision of J. L. Meuschke. Geology is generalized from McJannet (1960).
FIGURE 180.2. Generalized geologic map of the southwest part of the Ely quadrangle, Nevada. Qal, alluvium (Quaternary); TV, volcanic rocks, and Tsp, Sheep Pass Formation of Winfrey (1958) (Tertiary); TKm, monzonite porphyry (Tertiary or Cretaceous); PP, Permian and Pennsylvanian, undifferentiated; Me, Chainman Shale (Mississippian); Mj, Joana Limestone, and Mjj (stipple), Joana jasperoid (Mississippian); D, Devonian, undifferentiated; SO, Silurian and Ordovician, undifferentiated; Oep, Eureka Quartzite and Pogonip Group (Ordovician). Geology by A. L. Brokaw and D. R. Shawe.

ARTICLE 180 E3114°55'
R.62 E. R.63 E.2 MILES
Contact Fault Thrust fault Dashed where approximately located Dashed where approximately located. U, Sawteeth on upper plate
upthrown side, D, downthrown side Area of geochemical anomalies

E4 GEOLOGICAL SURVEY RESEARCH 1962
believed to produce the two local anomalies are con nected at depth.
The geologic features (fig. 180.2) of the general area of the southern magnetic anomaly tend to confirm this interpretation. In gross aspect this part of the Egan Range appears to be a simple tilted fault block similar to many other ranges in Nevada and Utah. In detail, however, the structure is more complex. The sedimentary rocks have been cut by numerous faults that displace the beds from a few tens of feet to several thousand feet and divide the range into several smaller structural blocks.
Overturned folds and thrust faults mapped within and beyond the limits of the area shown in figure 180.2 indicate that thrust faulting was important in the early development of the range. Along Rowe Creek, below the outcrop belt of the Chainman Shale, the beds are overturned and dip to the west on the limb of a recumbent fold that is overturned to the east. The attitude of the fold indicates that a thrust plate moved to the east over the rocks now exposed. The small klippen of Devonian rocks 1 and 3 miles south of Rowe Creek may represent remnants of this plate.
Just north of Rowe Creek and near the center of the southern magnetic anomaly (shown in detail in fig. 180.3), the rocks are cut by the Rowe Creek fault, which displaces the rocks several thousand feet in a left-lateral sense. The fault is terminated on the east by a northwest-trending reverse fault. This reverse fault appears to die out to the southeast in the Chain- man Shale, although its counterpart or continuation may be one of the strong faults that cut the Pennsyl- vanian and Permian rocks to the southeast. Similarly, one of the left-lateral faults that extend across Ward Mountain may be the offset segment of the Rowe Creek fault. Where the Joana Limestone is cut by the reverse fault and related fractures, it is altered to jasperoid, and many of the minor fractures are filled with secondary calcite and iron-oxide minerals. The exposed lower and middle Paleozoic limestones and dolomites also are silicified in the areas of structural deformation.
Some evidence suggests that the rocks near the mag netic anomaly, particularly in the vicinity of the klip- pen, have been differentially elevated, forming a struc tural high that might be due to doming related to a buried intrusive. The 1,500-foot difference in eleva tion between the 2 klippen shown on the map is more than can be accounted for by the known faulting.
The similarity of the two magnetic anomalies, the existence of major ore bodies in the area of the north
ern anomaly and of abandoned small mines on Ward Mountain, the presence of minor intrusive masses in the area of Ward Mountain, and the presence of jas peroid, all suggest that the area of the southern anom aly may also contain significant ore deposits. A geo- chemical study was therefore made.
Semiquantitative spectrographic analyses for 30 ele ments, including Cu, Pb, Mo, Ag, Sn, and W, were made in the field by U. Oda, M. DeValliere, and W. W. Janes, using a truck-mounted spectrograph. As, Sb, and Zn were determined by field-type chemical meth ods of analysis (Ward and others, 1963). Hg analy ses were made spectrographically by Paul Barnett us ing a large sample charge in special electrodes.
The analytical results show that anomalous amounts of Ag, Hg, Cu, Pb, Zn, Mo, Sb, As, W, and Sn are present in jasperoid and iron-rich fracture fillings in the limestones and dolomites along and adjacent to major faults directly over the magnetic anomaly (figs. 180.4 and 180.5). The Rowe Creek fault and the northwest-trending fault that is roughly parallel to the outcrop belt of the Joana Limestone show the highest concentrations of metals and probably were the principal conduits for metal-bearing solutions. Ba, Cr, Fe, Mn, and Ti also are present in abnormally high concentrations in the anomalous area. Unaltered limestones and calcite veins are not appreciably en riched in any of the metals except perhaps Hg and As.
The high concentration of metals along the faults and over the magnetic anomaly may be a leakage halo from metal deposits in and near the postulated con cealed intrusive. The quartz monzonite dikes on the east side of the area are probably connected at depth with this postulated intrusive. The extensive altera tion of limestone to jasperoid suggests that similar dikes are present at depth in the Rowe Creek area, under the geochemical anomalies. The depth to the intrusive rocks is not known; however, the low mobil ity of some of the elements in a limestone environment suggests that the intrusive may be at a relatively shal low depth.
Depth analyses of the geophysical data indicate that the top of the mass causing the major magnetic fea ture (fig. 180.1) is about 3,000 feet above sea level or 3,000 feet below the surface of the White River valley. Details of the magnetic field were not well defined by this survey, but the gradients associated with the southern magnetic high indicate that parts of the mass are nearer the surface than others. Its surface is prob ably irregular and may be at a quite shallow depth in some places.

ARTICLE 180 E5
114°55'
ARE OF GEOCHEMICAL,
R.62E. R.63E.
2 MILES
FIGUKE 180.3. Aeromagnetic map, southwest part of Ely quadrangle. Interval 10 gammas.

E6
R.62 E. R.63 E.
GEOLOGICAL SURVEY RESEARCH 1962
R.62E. R.63 E.
T.14N.
SILVER
>50 10-50 5-10
R.62E. R.63E.
T.14N.
>300
COPPER
30-70 <30
T.14N.
ARSENIC
100-7000 30-100
R.62E. R.63 E.
<30
T.14N.
MOLYBDENUM
>200 100-200 50-100 <50.
2 MILESJ
FIGURE 180.4. General distribution, in parts per million, of Ag, As, Cu, and Mo in jasperoid and in iron oxide in vugs andfractures.

ARTICLE 180 E7
R.62 E. R.63 E. R.62 E. R.63E.
T. 14 N
LEAD AND ZINC
R.62 E. R.63 E.
T. 14 N
>0.5
MERCURY
0.2-0.5 <0.2
T.14N
12
ad*4 !
13
J- 24Rowe..
\ 17
TIN AND TUNGSTEN
R.62 E. R.63 E.
T. 14 N
ANTIMONY
10-100
FIGURE 180.5. General distribution, in parts per million, of Pb, Zn, Sn, W, Hg, and Sb in jasperoid and in iron oxide in vugsand fractures.

E8 GEOLOGICAL SURVEY RESEARCH 1962
REFERENCESMcJannet, George, compiler, 1960, Geologic map of east central
Nevada, in Guidebook to the geology of east-central Ne vada, Intel-mountain Association of Petroleum Geologists, llth Annual Field Conference, 1960, held with Eastern Nevada Geological Society.
Ward, F. N., Lakin, H. W., Oanney, F. C., and others, 1963,
Analytical methods used in geochemical exploration by the U.S. Geological Survey; U.S. Geol. Survey Bull. 1152, 100 p.
Winfrey, W. M., Jr., 1958, Stratigraphy, correlation, and oil potential of the Sheep Pass formation, east-central Ne vada, in Am. Assoc. Petroleum Geologists Rocky Mtn. Section, Geol. Rec., 8th Ann. Mtg., p. 77-82.
181. PRELIMINARY REPORT ON ALKALIC INTRUSIVE ROCKS IN THE NORTHERN WET MOUNTAINS, COLORADO
By RAYMOND L. PARKER and FRED A. HILDEBRAND, Denver, Colo.
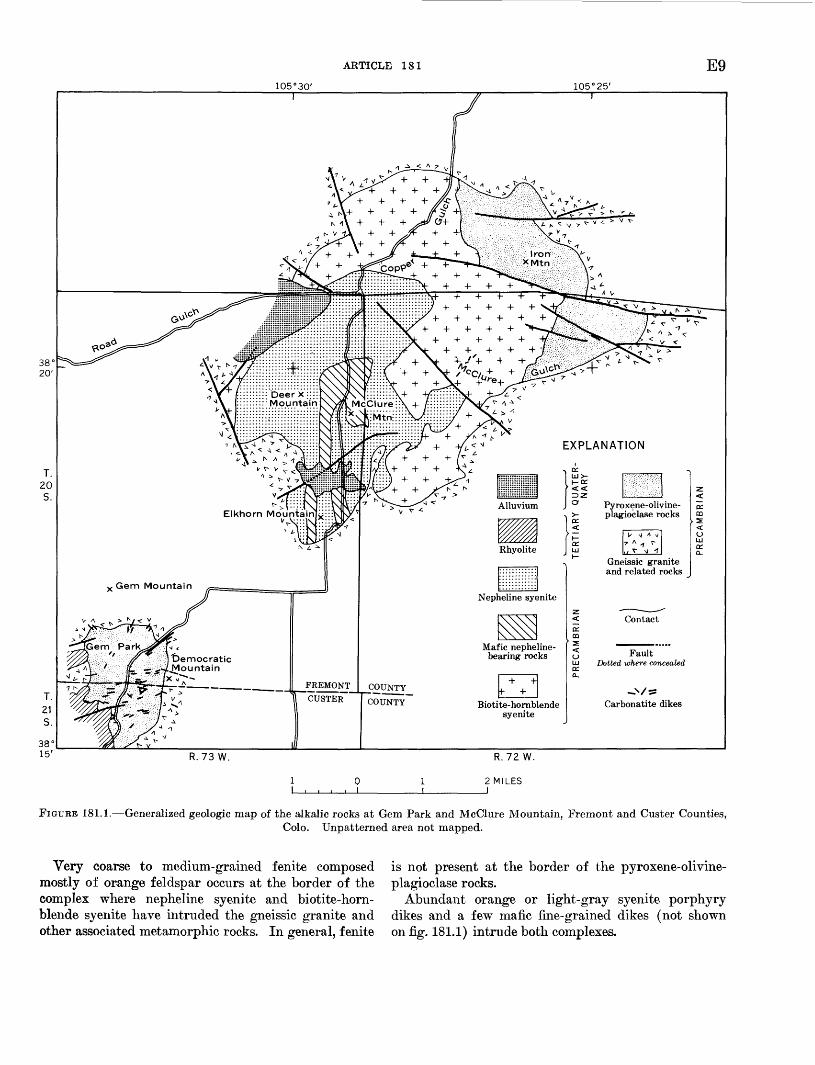
Two genetically related alkalic intrusive complexes in the northern Wet Mountains of south-central Colo rado have been discovered by the U.S. Geological Sur vey (fig. 181.1). The largest complex is centered around McClure Mountain about 13 miles north of Westcliffe, and it occupies an area of about 20 square miles. It is roughly circular in plan, is cut by radiat ing faults, and consists principally of mafic and felsic alkalic rocks that have concentric distribution. A smaller complex at Gem Park, about 5 miles south west of the McClure Mountain complex, is roughly rectangular in plan, is about 2 square miles in area, and consists mainly of mafic alkalic rocks. Both com plexes intrude gneissic granite and other metamorphic rocks of Precambrian age; the Gem Park complex is partly overlain by rhyolite of Tertiary age. Both complexes are cut by carbonatite dikes, some of which contain niobium, rare earths, and thorium. The dis tribution and extent of niobium, thorium, and rare- earth minerals in the McClure Mountain and Gem Park complexes are not yet known, but because of the similarity to other alkalic complexes in the world that contain minable deposits, these two complexes seem worthy of exploration to determine their economic potential.
Principal rocks comprising the McClure Mountain and Gem Park intrusives are: pyroxene-olivine-pla- gioclase rocks, biotite-hornblende syenite, mafic nephe- line-bearing rocks, nepheline syenite, and fenite. The pyroxene-olivine-plagioclase rocks are the oldest and the nepheline-bearing rocks are the youngest although the span in age among the rocks is probably not great. They no doubt are related and belong to the same comagmatic series.
Dark-gray to dark-brown medium-grained to very coarse pyroxene-olivine-plagioclase rocks are promi nent along the eastern border of the McClure Moun tain complex, and form most of the Gem Park intru
sive body. These rocks range from those composed mostly of pyroxene to those composed mostly of pla- gioclase (labradorite). The pyroxene-rich rocks and those with about equal proportions of pyroxene, oli- vine, and plagioclase are the most abundant. Some pyroxene-rich rocks contain concentrations of mag netite, and some contain abundant apatite.
Biotite-hornblende syenite intrudes the pyroxene- olivine-plagioclase rocks on the east side of the Mc Clure Mountain complex. The rock is coarsely crys talline, commonly has a trachytoid texture and is composed mostly of perthite and albite-oligoclase (about 80 percent), and brown biotite and pale-green hornblende, occurring singly or together (10 to 20 per cent) . In places the alinement of biotite and feldspar crystals defines a strong foliation that is attributed to flowage during intrusion.
Nepheline syenite, the most abundant rock type in the McClure Mountain complex, forms the core of the complex and intrudes biotite-hornblende syenite. The rock is medium grained to very coarse and is com posed of sodic orthoclase, highly variable amounts of nepheline, and small to moderate amounts of sodalite and biotite or hornblende. Sphene is abundant in some varieties. The nepheline is clear and has a greasy luster. It weathers readily, leaving recessed light-gray or light-brown grain surfaces between in tersecting white perthite crystals. The nepheline sy enite contains abundant large xenoliths of biotite- hornblende syenite near the contact between the nephe line syenite and the biotite-hornblende syenite.
Mafic nepheline-bearing rocks, which are enclosed and cut by light-gray nepheline syenite, are prominent on McClure and Elkhorn Mountains. These rocks are composed of highly variable amounts of nepheline, orthoclase, amphibole, brown biotite, and sphene. Some of these rocks are amphibole ijolite.
ARTICLE 181 E9105°30' 105°25'
Gneissic granite and related rocks
R. 73 W. R. 72 W.
2 MILES J
FIGURE 181.1. Generalized geologic map of the alkalic rocks at Gem Park and McClure Mountain, Fremont and Ouster Counties,Colo. Unpatterned area not mapped.
Very coarse to medium-grained fenite composed is not present at the border of the pyroxene-olivine-mostly of orange feldspar occurs at the border of the plagioclase rocks.complex where nepheline syenite and biotite-horn- Abundant orange or light-gray syenite porphyryblende syenite have intruded the gneissic granite and dikes and a few mafic fine-grained dikes (not shownother associated metamorphic rocks. In general, fenite on fig. 181.1) intrude both complexes.

E10 GEOLOGICAL SURVEY RESEARCH 1962
Carbonatite dikes occur in the McClure Mountain complex but are more abundant in the Gem Park complex. They are generally light brown to dark reddish brown and range in width from less than 1 foot to more than 10 feet. The larger dikes pinch and swell and branch into smaller dikes along their strikes. Some of the dikes extend beyond the border of the mafic rocks well into the bordering gneissic granite. Preliminary mineralogic examination shows that the carbonatite dikes are composed principally of calcite and dolomite. Some dikes contain rare- earth-bearing apatite, nontitaniferous magnetite, nio- bian (?) ilmenite, ancylite, an unidentified thorium mineral, two unidentified cerium-group minerals (one of which may be bastnaesite), and a light-blue fibrous mineral (possibly riebeckite). Sodium niobate has been reported by the authors from vermiculitic mafic rock near the center of Gem Park (Parker and others, 1962).
The alkalic rocks in the McClure Mountain complex and at Gem Park are probably of late Precambrian age. An albite syenite body, partly mapped by Christ man and others (1959) in the northwestern part of
the McKinley Mountain area only 6 miles southeast of the McClure Mountain complex, was determined by the Larsen zircon method to have an average age of 595 million years. This syenite and the rocks of the McClure Mountain complex all postdate the regional metamorphism of Precambrian age, and are probably about the same age.
The thorium vein deposits and alkalic alteration in the McKinley Mountain area probably are related genetically to the McClure Mountain complex because most of the veins, syenite dikes, and feldspathized zones in that area strike toward the complex; also the rock alteration and the mineral assemblage in the veins are types that commonly accompany alkalic intrusions.
REFERENCES
Christman, R. A., Brock, M. R., Pearson, R. C., and Singewald, Q. D., 1959, Geology and thorium deposits of the Wet Mountains, Colorado, A progress report: U.S. Geol. Sur vey Bull. 1072-H.
Parker, R. L., Adams, J. W., and Hildebrand, F. A., 1962, A rare sodium niobate mineral from Colorado: Art. 61 in U.S. Geol. Survey Prof. Paper 450-C, p. C4-C6.

ARTICLE 182
ENGINEERING GEOLOGY
182. LANDSLIDES NEAR GARDINER, MONTANA
By H. A. WALDROP and H. J. HYDEN, Denver, Colo.
Ell
Glide blocks, slumps, and earthflows of late Pleisto cene and Recent age were noted in tlie course of geo logic mapping in the Gardiner quadrangle in 1960 and 1961. The landslides are in Yellowstone National Park, just southwest of Gardiner, Mont. (fig. 182.1).
The north and east slopes of Sepulchre Mountain are disintegrating into complex intersecting glide blocks and slumps. Large earthflows have begun in this area and have run down over alluvial terraces above the Gardner and Yellowstone Rivers. The land slides form a crudely transitional sequence; they begin as block glides and slumps, then fragment and move as earthflows. Three generations of earthflows were distinguished.
Weed (1893, p. 16) mapped the earthflows as mo raines and ascribed their form to molding under gla cier ice. Despite the advent of aerial photography and increased knowledge of the nature of landslide and glacial deposits, they have been described and mapped as glacial drift ever since. Their manner of origin is evident on aerial photographs (fig. 182.2), which show they have the structure and topographic form typical of earthflows. Moreover, except for scat tered patches of glacial erratics on the oldest flows, the deposits consist entirely of fragments of shale, sandstone, basalt, and volcanic breccia in a plastic bentonitic clay matrix. All these rocks crop out under or upslope from the landslides.
STRATIGRAPHY AND STRUCTURE
Upper Cretaceous shales and conglomeratic sand stones of the Judith River Formation dip northward under the landslide area. Wilson (1934) measured bentonite beds totaling 26 feet in thickness in this sequence.
Sepulchre Mountain is built up of acid and basic andesitic breccias of Tertiary age (Iddings and Weed, 1894) that lie unconformably on the Judith River For mation. The basic breccia overlies the acid breccia and makes up the bulk of the mountain. The acid breccia that crops out at the base of Sepulchre Moun tain includes light-colored quartz-bearing tuffs more acid than andesite. Some of these tuffs are bentonitic. Other exposures in the Gardiner area reveal bentonite on the erosional unconformity at the base of the acid
breccia. This bentonite may have been reworked from the Judith River Formation.
Remnants of highly weathered basalt flows of Ter tiary age lie on Judith River beds under the bentonite at the base of the acid breccia.
BLOCK GLIDE AND SLUMPS
Large straight fissures transect the ridges of Sepul chre Mountain, marking pull-away zones of glide blocks. The largest of these fissures (J., fig. 182.2) is 2,700 feet long, up to 40 feet deep, and 40 to 60 feet wide. Slickensides in basic breccia of the fissure walls indicate that a few feet of downthrow on the north block preceded separation.
Large slump blocks lie transverse to the main ridges. Sag ponds, fissures, and scarplets characterize the slump topography. The original ground surface has been rotated by a slump movement to form steep back- slopes on the blocks. .Contacts between the Judith River, acid breccia, and basic breccia appear haphaz ardly on the faces of slump blocks. Slope wash and forest cover prevent detailed mapping of the intricate glide and slump structures.
EARTHFLOWS
The earthflows consist of a heterogeneous assortment of shale, sandstone, conglomerate, volcanic breccia, and basalt. Fragments range from 10-foot blocks to clay size. Much of the fine matrix in the earthflows weath ers with the puffy "popcorn" texture characteristic of bentonitic shales. Proportions of these constituents vary from one flow to another. In most of the earth- flows the dominant rocks are basic breccia, and shale and sandstone of the Judith River Formation. In the westernmost flow, however (5, fig. 182.2), the coarse fraction is almost entirely acid breccia. This flow is the best preserved and apparently was the most fluid of the postglacial earthflows. It might be termed a mudflow.
Interglacial earthflows probably preceded the last glaciation of the valley. They consist of the same heterogeneous materials as later flows but lack defi nite flow structure and have less hummocky surfaces. Scattered patches of glacial erratics Precambrian
667422 O - 63 - 2

E12 GEOLOGICAL SURVEY RESEARCH 1962
gneiss and schist and Tertiary volcanics appear only on the interglacial flows. The greatest concentration of erratics is on an earthflow that lies just below a remnant of lateral moraine. Clearly the moraine is younger than the earthflow, for it lies between the flow and its source area. The topography of the earthflow was smoothed and the internal structure was
blurred by the glacial action, but in general the plas tic, cohesive nature of the flow deposits inhibited plucking and offered resistance to glacial erosion.
Postglacial earthflows (fig. 182.3) have concave slump-excavated heads, lateral ridges and troughs, and spatulate, convex, pressure-ridged toes typical of large complex earthflows. Their outlines are sharp, and
00'
1MJLE
.CONTOUR INTERVAL 80 FEET DATUM IS MEAN SEA LEVEL
FIGURE 182.1.' Geologic map of Gardiner landslide area. Units of Quaternary age: Qfs, historic earthflows; Qbgs, block glide and slump; Qal, alluvium; Qf2j postglacial earthflows; Qg, lateral moraine; Qfj, interglacial earthflows. Tertiary age: Tp, andesite porphyry sill; Tb, basalt. Late Cretaceous age: Kjr, Judith River Formation. Hachured areas represent block- glide fissures. Long-dashed lines, approximate contacts; short-dashed lines, inferred contacts.

AETICLE 182 E13
their hummocky topography is well preserved. They cut across and incorporate portions of the older inter- glacial flows, and are in turn cut by small historic flows.
Historic flows are recently reactivated parts of older flows. They all bear signs of recent movement: fresh pull-away scarps, sharp new lateral ridges and troughs,
Horberg, 1940) deepened the valley and oversteepened slopes. Retreat of the glacier removed lateral support from materials weakened by frost action. Thawing of permafrost may have reduced stability of slopes and released water for lubrication. Most of the Judith River rocks dip northward toward the valley. Block gliding and slumping probably started along bentonite
FIGURE 182.2. Aerial photograph of Gardiner landslide area. A, block-glide fissure. B, westernmost earthflow. (PhotographGS-JA 1-19.)
fresh transverse and radial cracks, tilted trees, exposed beds in this sequence, and along the unconformity attree roots, and bulging and splitting of turf. Most the base of the acid breccia. Block glide and slumpare in watercourses or below flow-impounded ponds. fissures provided new access for water, which facili-
FACTORS FACILITATING MOVEMENT tated further sliding and led to disruption of glideBentonite beds, dip of rocks, glaciation, and earth- -blocks and slumps into earthflows. Gardiner has been
quakes were contributing causes of the Gardiner land- an active seismic area; earthquakes probably triggeredslides. Advances of Yellowstone Glacier (Weed, 1893; many of the landslides. , , , ..

E14 GEOLOGICAL SURVEY RESEARCH 1962
Sepulchre Mountain
Electric Peak
Mt Everts
FIGURE 182.3. Panorama southwest across the postglacial earthflows. Symbols match those on geologic map.cut in bedrock of the Judith River Formation predate the flows.
Stream terraces
BEFEBENCES
Horberg, Leland, 1940, Geomorphic problems and glacial geol
ogy of the Yellowstone Valley, Park County, Montana: Jour. Geology, v. 48, no. 3, p. 275-303.
Iddings, J. P., and Weed, W. H., 1894, Description of the Liv- ingston quadrangle: U.S. Geol. Survey Geol. Atlas, Folio 1.
Weed, W. H., 1893, The glaciation of the Yellowstone Valley north of the Park: U.S. Geol. Survey Bull. 104, 41 p., 4 pis.
Wilson, C. W., 1934, Section of Paleozoic and Mesozoic rocks measured at Cinnabar Mountain, Park County, Montana and at Mount Everts, Yellowstone National Park, Wyo ming: Am. Assoc. Petroleum Geologists Bull., v. 18, no. 3, p. 368-369.
STRUCTURAL GEOLOGY
183. THE CROOKED CREEK DISTURBANCE, SOUTHEAST MISSOURI
By THOR H. KIILSGAARD, ALLEN V. HEYL, and MAURICE K. BROCK, Washington, B.C., Beltsville, Md.,Denver, Colo.
The Crooked Creek disturbance, in southeast Mis souri, about 7 miles south of Steelville, is one of a number of similar geologic structures in the central part of the United States which have many points in common. These structures are essentially circular areas as much as a few miles in diameter that are peripherally bounded by high-angle faults, within which are highly deformed and brecciated rocks. The central part or core of the deformed area in many structures consists of older rocks that have been up lifted above their original positions. The origin of the structures has been a subject of conjecture, but two concepts have been most commonly advanced: subterranean explosion and meteoritic impact.
^ Rolla
Modified from Geologic Map of Missouri Division of Geological Survey and Water Resources. 1961, and from unpublished structural map of the base of the Rou- bidoux Formation compiled by Mary H. McCracken
10 20 30 MILES
FIGURE 183.1. Major faults in the Crooked Creek and Decatur- ville areas.

ARTICLE 183 E15
The authors visited the Crooked Creek area in No vember 1961, during the course of studies of lead-zinc deposits in the central region of the United States. Previously Heyl and Brock had examined several sim ilar structures, including Serpent Mound, Ohio (Heyl and Brock, 1962); Jeptha Knob, Ky.; the diatreme- like disturbance at the Soward farm, west of Rosi- clare, 111.; and several diatremes in the vicinity of Avon, Mo. Following the visit to Crooked Creek, Heyl and Brock also examined the Decaturville dis turbance, Missouri (fig. 183.1), the Kentland disturb ance, Ind., and the Holloford crater, Ontario.
GEOLOGIC FEATURES OF THE DISTURBANCE
The Crooked Creek area is underlain by sedimen tary rocks of Cambrian and Ordovician age, which dip
a few feet per mile to the northwest. The disturbance is at the west end of the major Palmer fault zone and about 10 miles south of the known south end of the major Cuba fault. It is a complex ovate structure about 3 miles wide and 4 miles long, bounded by a connected series of peripheral normal faults. Within the faulted boundary is an encircling synclinal graben of Roubidoux and Jefferson City Formations, inside of which is a peripherally faulted, uplifted central core of older dolomite and shale (fig. 183.2). Hen- driks (1954, p. 53) notes that these older rocks are about 1,000 feet above their normal stratigraphic po sitions. The central circular core is not a simple up lifted dome but rather a partly collapsed dome of younger rocks encircled by an anticline of older rocks. A north-trending "dog-leg" horst crosses the collapsed
R. 4W. EXPLANATION
I Qal I
Alluvium
| Ojc~]
Jefferson City Dolomite
Roubidoux Formation
| Og~|
Gasconade Dolomite
Ce
Eminence Dolomite
Potosi Dolomite
I Cdd I
Derby-Doe Run Dolomite
[ d [
Davis Formation
I Cb I
Bonneterre Dolomite
Br2 $B» #Brl
Missouri Division of Geological Survey and Water Resources, 1947
1000 0 1000 I
2000 FEET I
Geology by H. E. Hendriks, 1947 with modifications by T. H. Kiilsgaard, A. V. Heyl, and M. R. Brock, 1961
Intrusive brecciaftumber refers to area described in text
Contact D ___
FaultDashed where approximately located,
dotted where concealed; U, upthroum side; D, downthrown side
*~ Folds Anticline Syncline
Strike and dip of beds
Mine or prospect
FIGURE 183.2. Geologic map of the central part of the Crooked Creek disturbance showing intrusive breccias, mines, and prospects.

E16 GEOLOGICAL SURVEY RESEARCH 1962
part of the core, and a number of radial faults extend outward from it. Intricately contorted shale of the Davis Formation crops out along the crest of the anti cline. Alined breccia zones in the core area suggest a more complex fault pattern than is shown on the map.
BRECCIAS
Sedimentary rocks in the central uplifted core of the disturbance are faulted, intensely shattered, and brecciated. Most of the faults are of small displace ment but are marked by alinement of brecciated zones, or by juxtaposition of tilted or contorted rocks of dif ferent lithologies. Two types of breccias are recog nized : shatter and intrusive. The shatter breccias are far more common and may be seen in most of the cen tral area. Some shatter breccias consist of rocks of the same lithology fractured in diverse directions, but without rotation of the multisized undisplaced frag ments. Equally abundant, however, are shatter brec cias in which angular to subangular fragments of the same lithology have been dislodged and rotated so that all trace of bedding is obliterated. The shattered and pulverized fragments are imbedded in a lithified matrix of ground rock and microbi sccia, of uniform lithology.
Intrusive breccias are pipe-like masses of angular to subrounded fragments, imbedded in a pulverized groundmass, that have been injected or intruded into overlying rocks. The intrusive breccia exposed at lo calities 1 and 2 (fig. 183.2) may be a single mass. It consists largely of coarsely crystalline, nondrusy light- to pinkish-gray dolomite fragments intruded into drusy fetid pale-brown Potosi Dolomite, and, in part, into more finely crystalline light-gray dolomite mapped as Derby-Doe Run Formation. The breccia fragments are dolomite characteristic of the Davis and Bonneterre Formations. The groundmass of the breccia, which forms the bulk of the rock, is gray to buff dolomite microbreccia and pulverized argillaceous rock flour. Chert, druse, and quartz crystals so typi cal of the Potosi Dolomite were not seen in the intru sive breccia. At localities 3 and 4 breccia has in truded the Bonneterre and Davis Formations, respectively. In these places it consists of fragments of coarsely crystalline gray dolomite and sandstone in a matrix of cemented sand grains, small angular fragments of dolomite, and pulverized argillaceous rock flour. The sandstone is lithologically similar to the Lamotte Sandstone, which underlies the Bonne terre Dolomite in southeast Missouri, and the frag ments probably came from the Lamotte. In places the dolomite fragments have been leached out, and, at locality 4, barite crystals line some of the dolomite cavities.
SHATTER CONES
Shatter cones occur at several localities in the strongly brecciated central part of the disturbance. They are radially striated blunt pressure cones with large apical angles and range from y% to 4 inches in height. The cones shown in figure 183.3.4 are from the core area and are typical of the larger ones seen, both in size and form. Shatter cones of similar size and appearance (fig. 183.35) were found in the De- caturville disturbance, except that they were sharper and had smaller apical angles than the cones from Crooked Creek.
FIGUKE 183.3A, Shatter cones in Potosi Dolomite, from road cut in Crooked Creek disturbance. Cone A was inclined downward at 60°, cone B inclined upward. Cone A is a rough, blunt conical structure with dimple in center. Apex of partly obscured cone B is at point of arrow. B, Cluster of sharp shatter cones from lead prospect at center of Decaturville disturbance, which are similar in appearance to many of those seen at Crooked Creek.

ARTICLE 183 E17
The shatter cones found by Hendriks (1954) are exposed in a streambed a few hundred feet east of the fork in the road along the west line of sec. 17 (fig. 183.2). Most of the cones in this area point upward, as Hendriks described them. Near the west side of the locality the axes of the cones trend about N. 50° E., and the apexes point upward 10° to 20° above the horizontal. About 100 feet farther to the east the axes trend about N. 15° W. Countless cones were seen in other outcrops in this streambed over a dis tance of about a thousand feet, and the orientation of the cones was found to vary considerably from one locality to the next, with respect both to inclination to the horizontal plane and to the plane of bedding. At most places the more readily apparent cones stand out in relief from the fairly flat bed of the stream, the apexes pointing upward, but close inspection re veals that almost as many cones point downward. Commonly 2 or more cones point in different direc tions within the same hand sample, and in several samples 2 cones were observed base to base, the apexes pointing in opposite directions (fig. 183.3^4.).
Numerous shatter cones were found in highly brec- ciated Potosi Dolomite in fresh roadcuts between the fork of the road on the west line of sec. 17 and the southwest corner of sec. 17. Here most of the cones point downward, but cones having other orientations also are common.
MINERALIZED AREAS
Several places in the central part of the Crooked Creek disturbance are mineralized by galena, sphaler ite, marcasite, barite, and vein quartz. Hendriks (1954, p. 77) states that several thousand tons of barite was mined from residual red clay, thin stringers, and veins and lenses in the Davis Formation in the SE1/4SE1/4NE1/4 sec. 18 (fig. 183.2). Barite crystals line vugs and fill veinlets in sandstone breccia 100 yards northwest of these diggings.
A small tonnage of galena was mined about 100 years ago in the SW^NWi/4 sec. 17 (fig. 183.2) from a cluster of shallow shafts called the Metcalf dig gings (Winslow, 1894, p. 685). The lead was mined from residual clay and dolomite bedrock of the upper Bonneterre Dolomite. Some prospecting, and perhaps some mining also, is shown by the several shallow shafts in the breccia body at the west edge of the Metcalf diggings.
Galena, sphalerite, barite, pyrite, and marcasite are deposited in and along a north-trending breccia zone in the SE corner of the NEi/iSW^, sec. 17 (fig. 183.2). The minerals are associated with and ce
mented by veinlets of milky quartz that cut and re place bleached and brecciated Potosi Dolomite. The sulfides are well crystallized and coarse grained. In dividual crystals and grains of galena, yellow-brown sphalerite, and marcasite range from 1 to 3 cm in maximum dimension; plates of white barite are as much as 6 cm long. In general the mineral charac teristics closely resemble those of minerals in the barite-lead deposits in the area near Palmer, Mo. These deposits are largely in residual clays derived from weathering of the Potosi and Eminence For mations, but they are concentrated near the Palmer fault zone.
None of the sulfides or the barite in any of the mineralized occurrences that were examined were brec ciated or broken by faulting. Their unfractured con dition, plus the fact that at the deposit in the SWi/4 of sec. 17 the sulfides are in quartz that has replaced and cemented brecciated dolomite, clearly demon strates that sulfide mineralization occurred after brec- ciation and fault movement had ceased. Indications are that fractured and brecciated areas provided chan- nelways for the mineralizing solutions as well as fa vorable sites for mineral deposition. The deposits are epigenetic and can be dated as post-Crooked Creek disturbance in age.
ORIGIN OF THE DISTURBANCE
The disturbance was first studied by Hughes (1911, p. 48-52), who described it as an area of sharp folding accompanied by faulting. Hendriks (1954, p. 52-73) mapped it and discusses four ways in which it could have originated: salt-dome intrusion, igneous intru sion, subterranean explosion, and meteoritic impact and explosion. He discards the salt-dome concept be cause salt deposits are unknown in the subsurface of southeast Missouri, and discards the igneous-intrusion possibility because no intrusive igneous rocks have been found in the disturbance, either at the surface or in any of the several holes drilled in the area. He surmises that either a subterranean explosion or mete oritic impact could have formed the disturbance but concludes that orientation of shatter cones and bilat eral symmetry caused by maximum and minimum de pression of the encircling syncline are best explained as having originated by meteoritic impact.
Fox and others (1954, p. 1252-1253) attribute the disturbance to igneous activity connected with renewed movement along the Palmer and Cuba faults. They conjecture that sea water from a covering epicontinen- tal sea descended along the open fractures, was heated by the magma, and caused gaseous explosions that fractured the overlying rocks. Fragments of igneous

E18 GEOLOGICAL SURVEY RESEARCH 1962
rock were prevented from reaching the surface by weight of the sea water and overlying rocks.
The preponderance of evidence reviewed by the au thors favors an origin of the disturbance by subter ranean explosion at the intersection of the Cuba and Palmer faults. The Palmer fault zone has been mapped eastward from the disturbance for about 36 miles, to a point where the fault branches. The north branch continues to the northeast and is believed to merge with the great southeast-trending Ste. Gene- vieve fault system, which, in turn, merges with other fault systems extending east to the Appalachians (Heyl and Brock, 1961, fig. 294.1). The Cuba fault, which has been traced for more than 30 miles, would intersect the disturbance area if it continues on strike from its southernmost exposures (fig. 183.1). Hen- driks did not find the fault immediately north of the disturbance, but most of this area is coArered by deep residuum and dense forest cover. Dake (1930, p. 182) recognized a southward continuation of the Cuba fault and suggested that it might be a continuation of the Palmer fault. Hayes (1962), although not re ferring to the Cuba or the Palmer faults in his map of the configuration of the Precambrian surface, rec ognizes the probability that northwest- and northeast- trending structural lineaments pass through the dis turbance area.
Hendriks (1954, p. 72) suggested that the Palmer fault formed after deformation of the Crooked Creek area, using as evidence the termination of the fault at the disturbance. There is, however, a good pos sibility that the Palmer fault extends west of the disturbance, for south of Holla (fig. 183.1) a fault zone along the projected strike of the Palmer fault could very well be a part of the latter zone. The great known extent of the Palmer fault zone and of other zones with which it is connected indicate a re gional zone of weakness along which fault movement has been intermittently active, possibly since Precam brian time. Precambrian faulting also is suggested by Hayes' (1962) map of the configuration of the Precambrian surface, which shows a pronounced west- trending regional ridge extending more than 40 miles east of the Crooked Creek disturbance and more than 20 miles to the west, whose steeper north side coin cides very closely in location to that of the Palmer fault zone. Near Ironton, Mo., where Precambrian rocks crop out, several alined, elongate ridge fronts are considered to be ancient fault-line scarps, and the same could hold for the buried west-trending escarp ment passing through the Crooked Creek area.
The plausibility of structural control of the Crooked Creek disturbance also is influenced by consideration
of the somewhat similar Decaturville disturbance, about 70 miles to the west. This latter disturbance is an uplifted central core of highly brecciated sedi mentary rocks that is peripherally bounded by high- angle faults. Brecciated dolomite in the core area is mineralized by galena, sphalerite, pyrite, marcasite, and reportedly (H. B. Hart, oral communication,1961) by rare earths, yttrium, niobium, and germa nium. In the central part of the core is a body of granite pergmatite, probably of Precambrian age, surrounded by a mylonitic sericite schist zone. Krish- naswamy and Amstutz (1960) describe the disturbance as resulting from tectonic movement and associated igneous activity. The dome is along or very near the axis of the Proctor anticline (Marbut, 1908, p. 61; Mary McCracken, Missouri Division of Geological Survey and Water Resources, written communication,1962). The Decaturville disturbance also is at or very near the intersection of the anticlinal axis and the southeast projection of a major southeast-trending fault shown a few miles west of Camdenton on the geologic map of Missouri by the Missouri Division of Geological Survey and Water Resources (1962). A remote but nevertheless interesting structural pos sibility is that the dome also is affected by an inter section of the Proctor anticline and the westward continuation of the Palmer fault zone.
The continuity of the narrow "dog-leg" horst (fig. 183.2) extending intact through the collapsed central part of the shattered and brecciated core area of the Crooked Creek disturbance most certainly would have been completely destroyed had the disturbance formed by meteoritic impact. On the other hand, the struc tural pattern displayed in the disturbance has its counterpart in many calderas and fractured domes of undisputed vocanic origin (Wilbur Burbank, oral communication to Heyl and Brock, 1961). The bound ing faults of horsts in these areas can best be ex plained as having formed first as radial tension frac tures which develop during upwelling of the whole structure. With escape of the pent-up gases or molten material, chiefly through the central area of the dome, the central part subsided into the resulting void. Often an unbroken arch of rock is preserved between essentially parallel sets of radial fractures. These blocks are arched upward and they tend to contain rock of older age than the subsided rock on either side. Such is the case of the horst in the Crooked Creek disturbance. Its presence favors origin by ex plosion from below rather than origin from an explo sion resulting from meteoritic impact.
Hendriks (1954, p. 54) observed that cones he had seen in the Crooked Creek disturbance pointed up-

ARTICLE 183 E19
ward, and from this he postulated that explosion oc curred above the level now exposed. He used up ward orientation of the cones to support a meteoritic origin for the disturbance.
Branca and Fraas (1905), in their work on the Steinheim Basin in southern Germany, first recog nized conical features as pressure phenomena formed by explosion. In describing the Wells Creek and Kentland structures, Bucher (1933) reported shatter cones and emphasized their significance as high-pres sure indicators. More recently shatter cones have been found in other peculiar circular structures de scribed by Bucher as cryptovolcanos, including the Serpent Mound, Flynn Creek, and Decaturville dis turbances. Dietz (3961), in his studies on the genesis of shatter cones by impact and explosion, states that apexes of the cones point in the direction of the high- pressure source.
In the Crooked Creek area the sedimentary rocks were at least as flat lying before deformation as they are today. If the structure formed from meteoritic impact it therefore can be assumed that a relatively constant angle should have formed between inclined apexes of the shatter cones and the bedding of the country rock. Such is not the case, however, for the cones are oriented in all directions and display no uniformity with respect to bedding.
Diverse orientation of shatter cones suggests mul tiple centers of impact and explosion within the cen tral part of the Crooked Creek disturbance, rather than pressure from a single source as should result from meteoritic impact. Multiple orientation of cones within relatively small breccia blocks implies that pressure acted on the blocks from more than one direction. The cones apparently are pressure phe nomena, but whether the pressure was generated from above or from below, or both (fig. 183.3J.), is debat able.
Origin of the disturbance from an underlying ex plosion also is indicated by the presence of the in trusive breccia in which the fragments have been forced upward through the overlying rocks. Identical intrusive breccias are to be seen at other diatreme- like disturbances related in origin to tectonic forces and igneous activity. A good example is the breccia at the diatreme on the O. K. Cash farm, southeast of Avon, Mo. This diatreme contains not only intrusive breccia but also intruded igneous rocks, barite, and fluorspar. The oldest of the several types of breccia at the Decaturville disturbance is identical to intrusive breccia at Crooked Creek. At the Soward farm, west
of Rosiclare, 111., a diatreme-like disturbance contains intrusive breccia and brecciated igneous rocks. Simi lar sandstone and dolomite breccias, in many of which the matrix is composed only of ground and relithified sedimentary rocks, occur in the Montreal area, Canada, and are described by Clark (1952, p. 100-105) as diatreme breccias.
In summary, location of the Crooked Creek dis turbance at the intersection of regional faults, pres ence of intrusive breccia identical to intrusive breccia associated with known diatremes, presence of post- breccia sulfide mineralization, and similarity of its structure to that of other diatreme-like disturbances all suggest that the Crooked disturbance originated from a subterranean gaseous explosion.
BEFEBENCES
Branca, W. and Fraas, F., 1905, Das Kryptovulkanische Bechen von Steinheim; K. Preuss. Akad. Wiss. Abb., Berlin, p. 1-64.
Bucher, W. H., 1933, Cryptovolcanic structures in the United States: Internat. Geol. Gong., 16th, London 1933, Kept, of the United States v. 2, p. 1055-1084.
Clark, T. H., 1952, Montreal area, Laval and Lachine areas: Province of Quebec Dept. of Mines, Geol. Surveys Branch, Geol. Kept. 46, 159 p.
Dake, C. L., 1930, Geology of the Potosi and Edgehill quad rangles: Missouri Bureau of Geology and Mines, v. 23, 2d ser., 230 p.
Dietz, R. S., 1961, Astroblemes: Sci. Am. v. 205, no. 2, p. 50-71.Fox, J. H., Alien, V. T., and Heinrich, Ross, 1954, Crooked
Creek "Cryptovolcanic" structure, Steelville, Missouri [abs.] : Geol. Soc. America Bull., v. 65, no. 12, pt. 2, p. 1252-1253.
Hayes, W. C., 1962, Map showing configuration of the Pre- cambrian surface: Missouri Geol. Survey and Water Re sources.
Hendriks, H. E., 1954, The geology of the Steelville quadran gle: Missouri Geol. Survey and Water Resources, v. 36, 2d ser., 82 p.
Heyl, A. V., and Brock, M. R., 1961, Structural framework of the Illinois-Kentucky mining district and its relation to mineral deposits: Art. 294 in U.S. Geol. Survey Prof. Paper 424-D, p. D3-D6.
Heyl, A. V., and Brock, M. R., 1962, Zinc occurrence in the Serpent Mound structure, Ohio: Art. 148 in U.S. Geol. Survey Prof. Paper 450-D, p. D95-D97.
Hughes, V. H., 1911, Reconnaissance work: Missouri Geol. Survey and Mines Bienn. Report for 1909-10.
Krishnaswamy, D. S., and Anistutz, G. C., 1960, Geology of the Decaturville disturbance in Missouri [abs.]: Econ. Geol ogy, v. 55, no. 6, p. 1340.
Marbut, C. F., 1908, The geology of Morgan County: Missouri Bureau of Geology and Mines, v. 7, 2d ser., 94 p.
Missouri Division of Geological Survey and Water Resources, 1962, Geological map of Missouri.
Winslow, Arthur, 1894, Lead and zinc deposits: Missouri Geol. Survey, v. 6-7.

E20 GEOLOGICAL SURVEY RESEARCH 1962
184. ORIGIN OF THE MIDDLESBORO BASIN, KENTUCKY
By KENNETH J. ENGLUND and JOHN B. ROEN, Washington, D.C.
Work done in cooperation with the Kentucky Geological Survey
The Middlesboro Basin is the unique development of a circular, alluviated, topographic depression in a part of the Appalachian Plateaus that is character ized by rugged hillsides, narrow V-shaped valleys, and a minimum of flat bottom land. The relatively broad expanse of the basin with its low, rolling hills contrasts sharply with the fringing mountains which rise 1,000 to 1,900 feet above the valley floor. Nearly all the lowland, about 4 miles in diameter, is occupied by the city of Middlesboro. The conspicuously dif ferent topography and the intense deformation of rocks underlying the basin have attracted geologic interest since the early investigations of Ashley and Glenn (1906) and Eich (1933). They described the physiography of the basin and noted the deformed condition of the underlying rocks. This deformation was attributed by them to collapse or subsidence of an arch following relatively recent movement along faults associated with the Cumberland overthrust sheet in which the basin is situated. Recent geologic mapping does not substantiate their theory of tectonic origin, but indicates that meteoric impact is the probable mode of origin.
The rocks exposed in and adjacent to the Middles boro Basin are the Lee Formation and part of the overlying Breathitt Group, both of Pennsylvanian age. The Lee consists mostly of thick-bedded to massive quartzose sandstone and quartz-pebble con glomerate in contrast to less competent shale, siltstone, sandstone, and coal of the Breathitt Group. Detailed mapping and correlation of thin stratigraphic units show that around the periphery of the basin the Breathitt Group is relatively undisturbed. A shallow syncline surrounds the basin and, locally, low-ampli tude anticlines separate the syncline from the more intensely deformed rocks in the basin. Mining in the Hance and Mason coal beds in the syncline surround ing the basin does not reveal unusual or intense deformation.
The outer edge of the intensely deformed rocks of the Breathitt Group is delineated in most places in the Middlesboro Basin by normal faults with nearly vertical fault planes. Faults are most conspicuous in the northwest part of the basin where brecciated sand stone is abundant in several fault slices. In addition to the faults shown in figures 184.1 and 184.2, de
formation consists of numerous small unmapped faults, fractures in sandstone, and tight folds in shale. Many of these minor structures and the attitude of beds show circular trends around the center of the basin. Toward the center of the basin the strike of the beds becomes more variable and the dip increases to ver tical or overturned.
At the center of the basin, the core of this circular structure consists of conglomeratic sandstone of the Lee Formation which appears to be bounded by steeply inclined normal faults. Deformation is most intense here, with the result that much of the bedding is obscured and individual quartz grains are generally shattered. Fractures are commonly confined to the individual subrounded to rounded quartz grains and do not pass from grain to grain. Parallel arrange ment of fractures in the grains is common, and in some grains different sets of parallel fractures inter sect to form a rhombohedral pattern. Many angular quartz grains, in the silt to very fine sand size, prob ably resulted from the brecciation of larger grains.
Discovery of previously unrecognized Lee Forma tion in the center of the Middlesboro Basin shows that rocks underlying the middle of this depression are structurally high, a significant factor that rules out the earlier interpretations which attributed the structure to an adjustment collapse resulting from movement along the Pine Mountain overthrust fault and Eocky Face fault. A tectonic origin, possibly associated with regional structure, is further ques tionable as shattered quartz grains similar to those in the core 9f the basin have not been found in petrographic examination of intensely deformed Lee sandstone from the principal fault zones of the Cum berland overthrust block.
The character of the rock deformation and the asso ciated structural relations, as disclosed by recent geo logic mapping and as interpreted by the authors, indicates that the Middlesboro Basin may be an an cient meteor impact scar. Several aspects of the basin, such as the nearly circular shape, are particularly more typical of impact structures than structures commonly associated with Appalachian folding and faulting, which tend to be elongate or linear except for fensters which are roughly circular in outline. However, known fensters in nearby areas (Miller and

Q w
to

E22 GEOLOGICAL SURVEY RESEARCH 1962
FIGURE 184.2. Generalized section along line A A' of figure 184.1.
Fuller, 1954) contain exposures of younger rocks framed b}T older rocks of the thrust sheet, a relation not observed in the Middlesboro Basin. The possi bility that the disturbance exhibited in the rocks of the Middlesboro Basin is caused by the proximity of a thrust fault slightly below the basin floor is not substantiated by oil and gas test wells drilled within 4 miles of the basin. These wells show that the Pine Mountain overthrust fault is at a depth of about 2,000 feet below sea level, and they do riot indicate a rising trend in the fault plane. Additional evidence of meteor impact is indicated by the structurally high and intensely shattered core, which may be the result of rebound from an impact explosion. Dimin ishing deformation outward from the center, a mar ginal syncline, and upturned beds on the periphery of the basin are also suggestive of meteor craters. Because the basin is completely breached by drainage,
it can be expected that many of its original physi ographic features have been modified or obliterated by erosion. Silica glass and meteorite fragments are yet to be found, but these could have been eroded from the area or concealed by extensive lowland alluviation. If a meteoric origin, as postulated here, should be firmly established the Middlesboro Basin would serve as a clue to the structure underlying relatively recent depressions of similar origin.
REFERENCES
Ashley, G. H., and Glenn, L. C., 1906, Geology and mineral resources of part of the Cumberland Gap coal field, Ken tucky : U.S. Geol. Survey Prof. Paper 49, 239 p.
Miller, R. L., and Fuller, J. O., 1954, Geology and oil resources of the Rose Hill district the fenster area of the Cumber land overthrust block Lee County, Virginia: Virginia Geol. Survey Bull. 71, 383 p.
Rich, ,T. L., 1933, Physiography and structure at Cumberland Gap: Geol. Soc. America Bull., v. 44, no. 6, p. 1219-1236.
185. THRUSTING DEVELOPED AFTER FOLDING IN THE VALLEY AND RIDGE PROVINCE,SOUTHWEST VIRGINIA
By LEONARD D. HARRIS, Knoxville, Tenn.
Eich (1934) concluded from his study of the Cum berland thrust block of southwest Virginia, south east Kentucky, and north-central Tennessee that major thrust faults developed as bedding-plane thrusts in incompetent zones early in the erogenic cycle, when the rocks were little deformed. These faults tended to remain as bedding-plane thrusts until frictional resistance impeded their growth at depth. They
then crosscut or ramped diagonally upward to higher and younger incompetent zones, where they again be came bedding-plane thrusts. Major folds in the alloch- thonous plates developed as a result of subsequent movement. Thus, lie assumed that the major folds of the area were rootless structures that had no coun terparts below the thrust fault.

ARTICLE 185 E23
About 25 miles northeast of the area Eich discusses, detailed mapping in the Duffield (Harris and Miller, 1958) and Stickleyville quadrangles has confirmed that most of the major faults did develop as bedding- plane thrusts in incompetent zones. However, an analysis of the relation of thrusts to major folds in the area does not support the concept that faults developed early in the erogenic cycle. Rather, thrust ing seems to have been initiated after folding.
Structure in the Duffield and Stickleyville quad rangles is characterized by a series of northeast-trend ing folds and thrust faults. The major structures, from northwest to southeast, are the Cedars syncline, Sandy Eidge anticline, Wallen Valley thrust fault, Powell Mountain anticline, Red Hill thrust fault, Red Hill anticline, Hunter Valley thrust fault, Rye Cove syncline, and Clinchport thrust fault (fig. 185.1). The Wallen Valley, Hunter Valley, and Clinchport faults are regional thrust faults, having displacements on the order of 2 miles or more and continuous traces of 90 miles or more. The Red Hill thrust has a displace ment of about three-quarters of a mile and a trace of about 20 miles.
Over much of the western part of the area the Wallen Valley fault is a bedding-plane thrust dipping about 40° SE. In the north-central part of the area the fault changes from a bedding-plane thrust to one that abruptly crosscuts from Upper Cambrian rocks on the south limb of the Powell Mountain anti cline through the axial region and into the north limb, where it again becomes a bedding-plane thrust in Upper Ordovician rocks. In the area of crosscut the fault dips uniformly 5° SE. (fig. 185.1, section A-A'). This uniform dip seems to rule out the possibility that the Powell Mountain anticline resulted from folding of the thrust plates in later stages of defor mation. Nor does it seem' likely, considering the fact that the fault apparently dies out about 2 miles north east of the Duffield quadrangle, that enough drag oc curred during movement to warp the rocks of the allochthonous plate into a major anticline. The rela tion suggests that the Powell Mountain anticline was largely developed before the Wallen Valley thrust fault and that the fold controlled the position of the developing fault. Subsequent movement along the fault displaced the anticline northwestward from its root structures in the autochthonous plate (section A-A'}.
The Red Hill thrust fault and the doubly plunging Red Hill anticline exhibit on a smaller scale the rela tion -just discussed for the Wallen Valley thrust and the Powell Mountain anticline (section B-B'). How ever, the complex geology of the Red Hill thrust and the Red Hill anticline cannot be conveniently shown at the scale of the map accompanying this article. For a more detailed treatment of this small-scale structure see Harris and Miller (1958).
The development of the Rye Cove syncline before formation of the Hunter Valley thrust fault is strongly suggested by the manner in which the fault conforms to the syncline. The Hunter Valley fault developed in older beds on the south limb of the syncline and crosscut to younger beds as it passed through the downwarped axial region and into the north limb (section A-A'}.
The trace of the Hunter Valley thrust fault in general trends diagonally through the area from southwest to northeast. Near the center of the area, however, the trace swings abruptly southward around a closely spaced series of fault slices in the autochthon ous plate. A longitudinal section (section C-C'} through the area of slices shows that the Hunter Val ley fault must have arched up TOO to 1,000 feet higher in this locality in order to clear the slices. These slices probably were in place early in the development of the Hunter Valley thrust plate, forming an ob struction. Subsequent movement across the obstruc tion warped the Rye Cove syncline enough to cause the eastern and western parts of the syncline to plunge in opposite directions away from the obstruction. An additional effect of the obstruction was to impede movement of the allochthonous plate to the degree that differential movement was initiated. Differential movement resulted in the western part of the syn cline being skewed northward relative to the eastern part. The projected axial trace of the Rye Cove syn cline bends around the obstruction in the autochthon ous plate.
These structural relations suggest that thrust faults developed later in the erogenic cycle than folding. Faults apparently were initiated as bedding-plane thrusts in the oldest incompetent zones, and followed these zones until they encountered preexisting folds, where the beds were downflexed. Downflexing in hibited further development at the same level; how ever, it facilitated crosscutting of the fault to a higher

E24 GEOLOGICAL SURVEY RESEARCH 1962
82° 52'30"
EXPLANATION
Middle Cambrian (lower part) and Lower Cambrian
Contact
FaultU, on upthroum side
Major thrust fault
______ Middle Cambrian
(upper part)
Thrust fault T, on upper plate
AnticlineShowing plunge
t "
Sync lineShburing plunge; dashed where approximately located
HUNTER VALLEY THRUST ,c'lOOO'-P
o'-C
\ " FIGUBE 185.1. Geologic map and structure sections of the Stickleyville and part of the Duffield quadrangle, Virginia. (Geology
of the Duffield quadrangle and section A A' modified from Harris and Miller, 1958.)

ARTICLE 186 E25
level by bringing younger incompetent stratigraphic zones at or near the level of the fault. Under these conditions, faults do not simply ramp upward along steep diagonal shears from older incompetent rocks to younger because of increased frictional resistance; in stead, they change stratigraphic position simply by cutting across preexisting folds.
REFERENCES
Harris, L. D., and Miller, R. L., 1958, Geology of the Duffield quadrangle, Virginia: U.S. Geol. Survey Geol. Quad. Map GQ-111.
Rich, J. L., 1934, Mechanics of low-angle overthrust faulting as illustrated by Cumberland thrust block, Virginia, Ken tucky, and Tennessee : Am. Assoc. Petroleum Geologists Bull., v. 18, p. 1584-1596.
186. REVERSAL OF THROW ALONG A LINE OF LOW-ANGLE THRUST FAULTING NEAR SAN PEDRODE ATACAMA, CHILE
By ROBERT J. DINGMAN, Washington, D.C.
Work done in cooperation with the Instituto de Investigaciones Geoldgicas, Santiago, Chile, and under the auspices of the U.S.Agency for International Development
San Pedro de Atacama is located in the northern part of the Salar de Atacama in eastern Antofagasta Province (fig. 186.1). The Quebrada (canyon) Tarn- bores drains southeastward into the Llano de Pa- ciencia, which is an extension of the Salar between the Cerros de la Sal and the northern part of the Cordillera de Domeyko. This area was mapped geo logically as an adjunct to the mapping of the Tulor quadrangle, most of which is south of the area of this article.
The rocks in the Llano de Paciencia area include the San Pedro and Tambores Formations of early Tertiary age and ash-flow deposits of late Tertiary (Pliocene(?)) age. The San Pedro Formation con sists of beds of poorly lithified shale, siltstone, fine grained sandstone, salt, and gypsum at least 2,100 meters thick which interfinger to the west with con glomerate and sandstone of the Tambores Formation. Both formations are overlain by a series of ash-flow deposits that are intercalated with alluvial sand and gravel. The lower ash-flow deposits are thin, poorly lithified, and irregular in extent, apparently having been extensively eroded before deposition of the upper ash flow, which is 30 to 50 meters thick and in some localities is welded to a dense hard rock. The ash- flow deposits are overlain in and near the borders of the Llano de Paciencia by Quaternary piedmont de posits, largely mud-flow material, and by alluvial de posits of sand, clay, and gravel.
70° 69° 68° 67°
TARAPACA
PROVINCE
BOLIVIA
TULOR Volcan . XT QUADRANGLE_ Licancabur/
Sr-,^\
ANTOFAGASTA
'*' '&'#)] ^e Atacama.1 Salar de^i^ Toconao /Atacama p : ./ /
/Siglia
PROVINCE
25
26ATACAMA
PROVINCE
Tilomonte 7
-¥
0 V
ular
ARGENTINA
100 200 KILOMETERS
FIGURE 186.1. Index map of part of northern Chile.

E26 GEOLOGICAL SURVEY RESEARCH 1962
The sediments of the San Pedro and Tambores Formations were deposited in a basin which adjusted downward under the accumulating lodd of sediments. As a result these formations were gently tilted to ward the center of deposition, and gravitational glid ing occurred in a southeasterly direction from the west side toward the center of the basin. As described by Dingman (1962) the Cerros de la Sal, a few miles south, are a series of domes, anticlines, and synclines produced as a result of this gliding.
The gliding continued even after the Quaternary piedmont deposits were laid down, and it produced strong horizontal compressive stress on the ash-flow beds. The ash-flow deposits in the Tambores area are slightly welded, and they reacted to the com pression as a relatively brittle and easily fractured unit. The fracturing that occurred in the ash flows forms a well-developed system of conjugate joint sets intersecting at an angle of 28° to 30°. The joint sets strike N. 20° E. to N. 30° E. The ash flows in most localities are almost horizontal, and the fracture planes dip from 13° to 15° to the east and to the west.
Low-angle thrust faulting took place along planes parallel to one of the joint sets, generally along the set that dips toward the center of the basin. Major zones of thrust faulting developed along the western border of the Llano de Paciencia and along both the western and eastern slopes of the Cerros de la Sal.
The line of thrust faulting west of the Llano was studied in detail near the mouth of the Quebrada Tambores (fig. 186.2). Along this line most of the displacement occurred on planes dipping 13° to 14° E., but in at least one locality the fracture system dipping 15° W. became the fault plane. The usual displacement with the eastern block upthrown is shown in figure 186.3A. Two kilometers to the northeast along the same line of faulting, the western block is upthrown (fig. 186.35). The eastern block is up- thrown in the next exposure to the north. As shown in the photographs the fault plane is well exposed and the relative displacement is clear. Between the areas of the eastward-dipping fault plane and the area of the west ward-dipping fault plane, the brittle ash flow was probably so crushed that fractures or fault planes were obliterated. This crushed zone may have facilitated erosion to form the broad valleys cut through the ash flow in these areas.
It is not considered likely that the eastward- and westward-dipping faults represent a single twisted or warped fault plane. The faults are probably near- surface features and may curve toward the horizontal to become bedding plane faults at shallow depths.
If the two faults are not a part of the same fault plane, then a near-vertical shear zone oriented normal to the line of faulting must separate the eastward- and westward-dipping faults; however, no evidence of a shear zone was observed.
EXPLANATION
Tt, Tambores Formation Tsp, San Pedro Formation
Steeply dipping faultShowing relative horizontal movement
Low-angle thrust faultShowing dip; dotted where concealed;
barbs on upper plate
ContactDashed where approximately located
Anticline
Overturned anticline
Northern boundary of the Tulor quadrangle
A Locality at which photograph taken
FIGURE 186.2. Geologic sketch map of the Quebrada Tamboresarea.
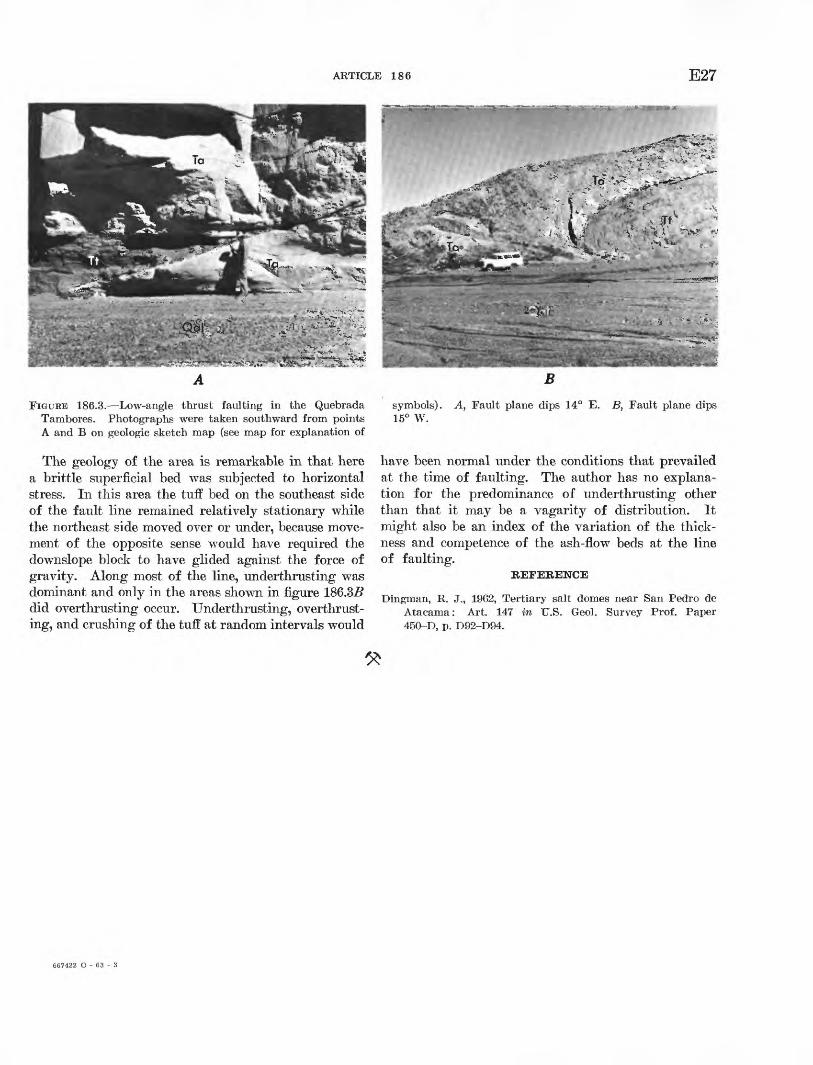
ARTICLE 186 E27
FIGURE 186.3. Low-angle thrust faulting in the Quebrada Tambores. Photographs were taken southward from points A and B on geologic sketch map (see map for explanation of
The geology of the area is remarkable in that here a brittle superficial bed was subjected to horizontal stress. In this area the tuff bed on the southeast side of the fault line remained relatively stationary while the northeast side moved over or under, because move ment of the opposite sense would have required the dowiislope block to have glided against the force of gravity. Along most of the line, underthrusting was dominant and only in the areas shown in figure 186.35 did overthrusting occur. Underthrusting, overthrust- ing, and crushing of the tuff at random intervals would
symbols). A, Fault plane dips 14° E. B, Fault plane dips 15° W.
have been normal under the conditions that prevailed at the time of faulting. The author has no explana tion for the predominance of underthrusting other than that it may be a vagarity of distribution. It might also be an index of the variation of the thick ness and competence of the ash-flow beds at the line of faulting.
REFERENCE
Dingman, R. J., 1962, Tertiary salt domes near San Pedro de Atacama: Art. 147 in U.S. Geol. Survey Prof. Paper 450-D, p. D92-D94.
667422 O - 63 - 3

E28 GEOLOGICAL SURVEY RESEARCH 1962
187. GRAVITY AND MAGNETIC ANOMALIES IN THE NORTHERN OQUIRRH MOUNTAINS, UTAH
By DON E. MABEY, E. W. TOOKEE, and EALPH J. EOBEETS, Menlo Park, Calif.
The northern Oquirrh Mountains (fig. 187.1), about 20 miles west of Salt Lake City, Utah, extend from the vicinity of the Utah Copper mine at Bingham to Great Salt Lake. Several peaks in the northern part of the range reach 9,000 feet above sea level, about 4,500 feet above the surrounding valleys.
10 20 MILES_I
FIGURE 187.1. Index map of part of north-central Utah showing area of gravity map (fig. 187.2). A A', generalized location of gravity and magnetic profiles shown in figure 187.3.
The northern Oquirrh Mountains are composed mostly of sedimentary rocks of Mississippian to Per mian age. Small intrusive bodies cut these rocks near Bingham; sedimentary and volcanic rocks of Tertiary age crop out on the east side of the range.
The rocks at the north end of the range (Tooker and Eoberts, 1961) and their correlatives in the Bing ham area (Welsh and James, 1961) are now recog nized as two different sequences that are juxtaposed along the North Oquirrh thrust fault (Art. 188). The thrust fault dips north and strikes east across the range south of Nelson Peak. The upper plate is com posed of rocks assigned to the Eogers Canyon se
quence, which is about 10,000 feet thick. Eocks in this sequence are folded along northeast-trending axes and are complexly faulted. The plate is broken into two blocks by a major north-trending tear fault, the Gar- field fault. The lower plate of the North Oquirrh thrust is composed of rocks assigned to the Bingham sequence, which is about 21,000 feet thick. These rocks are folded along northwest-trending axes and at Bingham are intruded by granitic stocks. This se quence is correlated with rocks in the upper plate of the Charleston thrust, which is exposed in the Wasatch Eange and assumed to underlie this area.
Antelope Island, about 8 miles north of the Oquirrh Mountains and on the projected trend of the range, is largely composed of metamorphosed Precambrian and Cambrian rocks which Crittenden (1961) believes are autochthonous.
GRAVITY DATA
Only a few measured densities are available for rocks exposed in the Oquirrh Mountains and on Ante lope Island and concealed at depth. The average den sity of nine representative samples of Paleozoic rock in the Oquirrh Mountains is 2.65 g per cm3 No im portant density difference was measured for the two sequences of Mississippian, Pennsylvanian, and Per mian rocks. The average density of the Precambrian rocks cropping out on Antelope Island and in the Wasatch Eange has not been accurately determined but is estimated to be about 2.85 g per cm 3, on the basis of measurements made on 2 of the more abundant rock types and on densities estimated from descrip tions of other units.
A gravity map of the valleys west and north of the Oquirrh Mountains by Cook and Berg (1961), which suggested that a major gravity anomaly exists in the range, has been supplemented by additional gravity stations within the Oquirrh Mountains and in the val ley on the west side of the range. These gravity data are reduced to the Bouguer anomaly assuming the standard density of 2.67 g per cm 3 for the material in the range. Terrain corrections were made through zone N on the Hayford charts. These new data and those of Cook and Berg are compiled in figure 187.2 and contoured at a 5-mgal interval.
The Bouguer anomaly values include corrections for large elevation differences and terrain effects, but uncertainties in these corrections are introduced by possible deviations from the assumed rock density

ARTICLE 187 E29
(2.67 g cm 3 ) used to make elevation corrections and from errors in making terrain correction. A density change of 0.03 g per cm 3 would change the Bouguer anomaly difference between the highest and lowest station by a factor of about 2 mgals. The largest terrain correction is about 45 mgals, but most are much smaller. The maximum error for these correc tions is about 10 percent, thus the maximum error in the Bouguer anomaly values could be about 7 mgals; however, most of the stations are believed ac curate to about 2.5 mgals, or one-half the contour interval on figure 187.2.
Bouguer anomaly values show two features of spe cial interest: (1) a marked increase of values north of the surface trace of the North Oquirrh thrust, and (2) higher values west of the Garfield fault. Values are nearly constant south of the North Oquirrh thrust, varying over a range of 5 mgals. At the north end of the range the values decrease toward a gravity low over Quaternary sediments beneath Great Salt Lake.
40°45
40°30
The anomaly values on the south end of Antelope Island (Cook and Berg, 1961) are about 18 mgals higher than the highest values found in the Oquirrh Mountains (fig. 187.3) and increase northward to the north end of the island. If a correction is made for the Quaternary sediments, the anomaly values con tinue to rise northward over the interval between the Oquirrh Mountains and Antelope Island. The total Bouguer anomaly difference between the Oquirrh Range south of Nelson Peak and the highest values on Antelope Island is about 45 mgals (fig. 187.3). Anomalies of this amplitude over pre-Tertiary rocks in the Basin and Range province are usually asso ciated with regional topographic features and are be lieved to indicate isostatic compensation for regional topography; they generally are not associated with individual ranges as narrow as the Oquirrh Mountains (Mabey, 1960).
A major discontinuity in regional topography oc curs along a west-trending line at the north ends of the Oquirrh and Stansbury Mountains. The eleva-
EXPLANATION
Tertiary sedimentary rocks
Intrusive rocks
Rogers Canyon Bingham sequence sequencePaleozoic sedimentary rocks
Gravity contours112-00'
FIGURE 187.2. Bouguer gravity anomaly map of the northern part of Oquirrh Mountains, Utah; contour interval 5 mgals. Gravity data are partly from Cook and Berg (1961). Geology modified from Cook (1961).

GEOLOGICAL SURVEY RESEARCH 1962
1200
-140
-150
= -160
-170
-180
Bouguer gravity anomaly
FEET , 10,000
SEA LEVEL
-10,000
-20,000
4 P Nelson Peak
Ant£!£PL!?!^d____ GREAT SALT LAKE ^ */^
_ Precambrian basement ***"' "^ ^ / R°eers Ca"y°n sequence / &g
L *- >. ^ -^'^
Oquirrh
Bingham sequence
Basement profile-** ^ / S^ " ' -"'S
**^/ ** *«..- "" / CHARLESTON THRUST
Alternate basement profiles <T^^ (depth and relation to basement unknown)
v X *\?,,,,? MILES ^^ *y^_ ^^Basement profile
Mountains
Intrusive rocks
A
_
-
FIGURE 187.3. Magnetic and gravity profiles from Antelope Island to the central Oquirrh Mountains with diagrammatic sectionshowing generalized topography and inferred structure.
tion of the ranges and adjoining valley floors increases southward, and near the highest parts of the two ranges a small east-trending range nearly connects the two. The result is a west-trending regional topo graphic arch about 40 miles wide close to the westward projection of the axis of the Uinta arch. This re gional topographic arch is superimposed on a more general southward rise in the regional elevations.
A part, but not all, of the gravity difference between the Oquirrh Mountains and Antelope Island undoubt edly reflects isostatic compensation of the regional topography, but the amount of the gravity difference that is attributed to the topography is dependent upon the type of compensation that is assumed. If a major part of the gravity difference is related directly to regional topography, it probably indicates adjustment for mass anomalies in the upper crust. This would require relatively local compensation but would be consistent with the indicated isostatic response to
changes of the water depth in Lake Bonneville as reported by Gilbert (1890, p. 365-392).
The south edge of the gravity high in the Oquirrh Mountains coincides with the trace of the North Oquirrh thrust (fig. 187.3). Because no significant density contrast exists between the rock exposed at the surface along this thrust, the mass anomaly pro ducing the gravity anomaly presumably involves a density interface at depth, such as the surface of the basement rock. The gravity data suggest that the basement rock north of the trace of the North Oquirrh thrust is closer to the surface than it is south of the thrust. The gravity anomaly increases northward to Antelope Island, reflecting a thinning wedge of sedi mentary rocks under the north end of the Oquirrh Mountains and Great Salt Lake.
Alternate basement profiles that are consistent with the available gravity data are illustrated in the dia grammatic section in figure 187.3. One profile (shown

ARTICLE 187 E31
by dashes) assumes that the gravity anomaly in the Nelson Peak area is produced by a displacement of the basement rock on the North Oquirrh thrust. The alternate profile (shown by dots and dashes) assumes that the North Oquirrh thrust does not penetrate base ment rock and is unrelated, or perhaps indirectly re lated, to the gravity anomaly and the inferred relief on the basement rock. If a density contrast of 0.15 g per cm 3 , which is a reasonable estimate, exists between the Precambrian basement rock and the younger sedimentary rocks, the total gravity differ ence between the south end of Antelope Island and the Oquirrh Mountains south of Nelson Peak can be produced by about 25,000 feet of sedimentary rocks overlying the basement south of Nelson Peak.
The Garfield fault, which has been interpreted by Roberts and Tooker (1961, p. 36-45) as a tear fault, is also reflected in the gravity contours. Just north of the North Oquirrh thrust near Nelson Peak the anomaly values are higher on the west side of the fault. This gravity expression decreases northward, and is not apparent at the north end of the range. The gravity difference across the Garfield fault suggests upward displacement of the basement rocks, placing them several thousand feet higher on the west side of the fault. The mechanism of this displacement is not clear, but, if the North Oquirrh thrust penetrates basement rocks in this area, lateral movement on the Garfield tear fault could produce apparent vertical displacement of the basement surface.
MAGNETIC DATA
A magnetic profile (fig. 18Y.3) constructed from a regional aeromagnetic contour map of the region shows
a magnetic anomaly at the south end of the profile produced by some of the post-Paleozoic intrusive rocks in the Bingham area. From this anomaly to the north end of the range the magnetic intensity increases northward at a normal rate. The absence of any magnetic anomaly essentially eliminates the possibil ity that concealed intrusive bodies may account for the gravity anomaly underlying the north end of the range. The magnetic gradient immediately north of the Oquirrh Mountains is probably produced by a contrast in magnetic properties in the basement rock.
REFERENCES
Cook, D. R., ed., 1961, Geology of the Bingham mining district and northern Oquirrh Mountains: Utah Geol. Soc. Guide book to the Geology of Utah, no. 16, pi. 1.
Cook, K. L., and Berg, J. W., Jr., 1961, Regional gravity sur vey along the central and southern Wasatch Front, Utah: U.S. Geol. Survey Prof. Paper 316-E, p. 75-89.
Crittenden, M. D., Jr., 1961, Magnitude of thrust faulting in northern Utah: Art. 335 in U.S. Geol. Survey Prof. Paper 424-D, p. D128-D131.
Gilbert, G. K., 1890, Lake Bonneville: U.S. Geol. Survey Mon. 1, 437 p.
Mabey, D. R., 1960, Regional gravity survey of part of the Basin and Range Province: Art. 130 in U.S. Geol. Survey Prof. Paper 400-B, p. B283-B285.
Roberts, R. J., and Tooker, B. W., 1961, Structural geology of the north end of the Oquirrh Mountains, Utah, in Cook, D. R., ed.: Utah Geol. Soc. Guidebook to the Geology of Utah, no. 16, p. 36-48.
Tooker, B. W., and Roberts, R. J., 1961, Stratigraphy of the north end of the Oquirrh Mountains, Utah, in Cook, D. R., ed.: Utah Geol. Soc. Guidebook to the Geology of Utah, no. 16, p. 17-35.
Welsh, J. B., and James, A. H., 1961, Pennsylvanian and Permian stratigraphy of the central Oquirrh Mountains, Utah, in Cook, D. R., ed.: Utah Geol. Soc. Guidebook to the Geology of Utah, no. 16, p. 1-16.

E32 GEOLOGICAL SURVEY RESEARCH 1962
STRATIGRAPHY
188. COMPARISON OF OQUIRRH FORMATION SECTIONS IN THE NORTHERN AND CENTRAL OQUIRRHMOUNTAINS, UTAH
By E. W. TOOKER and EALPH J. EGBERTS, Menlo Park, Calif.
The Oquirrh Formation is well exposed in the north- trending Oquirrh Mountains in north-central Utah (fig. 188.1), about 20 miles west of Salt Lake City. The rocks exposed in the northern part of the range differ markedly from those of nearly equivalent age span in the central part; these two stratigraphic se quences are separated by the North Oquirrh thrust, a major east-west fault that crosses the range about 9 miles south of Great Salt Lake.
The major characteristics of the rock sequence in the north end of the range have been described by Tooker and Eoberts (1961), and the rocks in the central part by Welsh and James (1961). These features and ad ditional data of the writers for the central part of the range are summarized in tables 188.1 and 188.2 and in figure 188.2. More complete data on the faunas in these sections will be published later.
The stratigraphic sections are referred to as rock sequences, the Eogers Canyon sequence in the north ern part and the Bingham sequence in the central part. The Oquirrh Formation in both sequences is divided into three members on the basis of gross lithology; a lower limestone, a middle cyclical limestone, shale, and quartzite, and an upper quartzite. The members in the two sequences have some differences in age spans, and it is therefore difficult to distinguish them on the basis of age. For the present these general terms are used informally; later, if warranted, the members may be given formal names.
The Oquirrh Formation, which includes the Oquirrh (?) Formation at its base (fig. 188.2), of the Rogers Canyon sequence has an aggregate thickness of about 10,000 feet; its base is placed at the contact of an interbedded shale and limestone and thick overlying limestone. The lower member, 2,800 feet thick, is composed of fossiliferous limestone and sandy, cherty, and shaly limestone. The bottom half of the member contains a brachiopod, coral, and bryozoan assemblage of Late Mississippian age (Helen Duncan and Mac kenzie Gordon, Jr., written communication, 1962). Beds in the top half contain brachiopods and corals of Early Pennsylvanian age. The middle member, 3,500 feet thick, is composed of cyclically repeated sandy, cherty, and shaly limestone, shale, and quartz ite and sandstone beds that contain fusulinids and brachiopods of Atoka and Des Moines (Middle Penn
sylvanian) age (Tooker and Eoberts, 1961). The upper member, 3,700 feet thick, is composed of quartz ite, sandstone, and thin interbedded limestone in the lower part and interbedded dolomite and quartzite in
112° in'
41*
EXPLANATION
Steep fault
Thrust faultBarbs on upper plate
©
Area underlain by thin sequences
Location of sections1. Mount Raymond sequence2. Rogers Canyon sequence3. Bingham sequence4. Timpanogos sequence
FIGURE 188.1. Map of north-central Utah, modified after Crittenden (1959), showing general geographic and geologic features and the location of stratigraphic sections shown on figures 188.2 and 18S.3.

ARTICLE 188
TABLE 188.1. Summary of stratigraphy, Rogers Canyon sequence, northern Oquirrh Mountains, Utah
E33
System
Permian
CARBONIFEROUS \
iPennsylvanian 1
i
|
Provincial Series
Leonard
Wolf camp
Des Moines
Atoka
Morrow
Chester
Formation
Park City Formation
Oquirrh Formation
Oquirrh (?) Formation
Unnamed formation
Member
Grandeur Member
Upper
Middle
Lower
Thickness (feet)
750
3,700
3,500
1,400
1,400
10, 000
300+
Character
Interbedded limestone and shale (42 percent), quartz ite (53 percent), and dolomite (5 percent).
Quartzite (85 percent), limestone (8 percent), and dolomite (7 percent).
Limestone and shale (72 percent), and quartzite (28 percent) .
Limestone (100 percent), includes sandy, cherty, and shaly limestone varieties.
Shale and limestone.
TABLE 188.2. Summary of stratigraphy, Bingham sequence, central Oquirrh Mountains, Utah
System
Permian
CARBONIFEROUS
Pennsylvanian
Missis- sippian
Provincial Series
Wolf camp
Virgil
Missouri
Des Moines
Atoka
Morrow
Chester
Formation
Diamond Creek Sandstone of Welsh and James (1961).
Kirkman Limestone of Welsh and James (1961).
Oquirrh Formation
Manning Canyon Shale
Member
Upper
Middle
Lower
Thickness (feet)
400 ±
1 10, 600
8,700
1,900
21, 200
2 1, 100
Character
Sandstone and quartzite.
Limestone.
Quartzite (90 percent) and lime stone (10 percent).
Limestone (55 percent) and quartzite (45 percent).
Limestone (95 percent) and quartzite (5 percent).
Shale and limestone.
1 Upper half estimated from Welsh and James (1961).
the top part that contain fusulinids and gastropods of Wolf camp (Early Permian) age (Tooker and Eob- erts, 1961). The Oquirrh Formation is capped by a unit assigned to the Grandeur Member of the Park City Formation. This unit, which is 750 feet thick, comprises a fossiliferous basal limestone that con tains brachiopods and gastropods of Leonard (Early Permian) age (Tooker and Roberts, 1961), a medial phosphatic shale, and an upper dolomite.
The Oquirrh Formation of the Bingham sequence aggregates about 21,200 feet in thickness and rests on
2 Gilluly (1932).
the Manning Canyon Shale of Mississippian and Pennsylvanian age (Gilluly, 1932). The lower mem ber, 1,900 feet thick, consists of sandy, shaly, and fine-grained limestone, and some thin interbedded quartzite; it contains brachiopods, corals, and bryo- zoans of Early Pennsylvanian age (Helen Duncan and Mackenzie Gordon, Jr., written communication, 1962). The middle member, 8,700 feet thick, is com posed of cyclical limestone, shale, and quartzite beds that contain fusulinids, brachiopods, corals, and bryo- zoans of Atoka, Des Moines, and Missouri (Middle
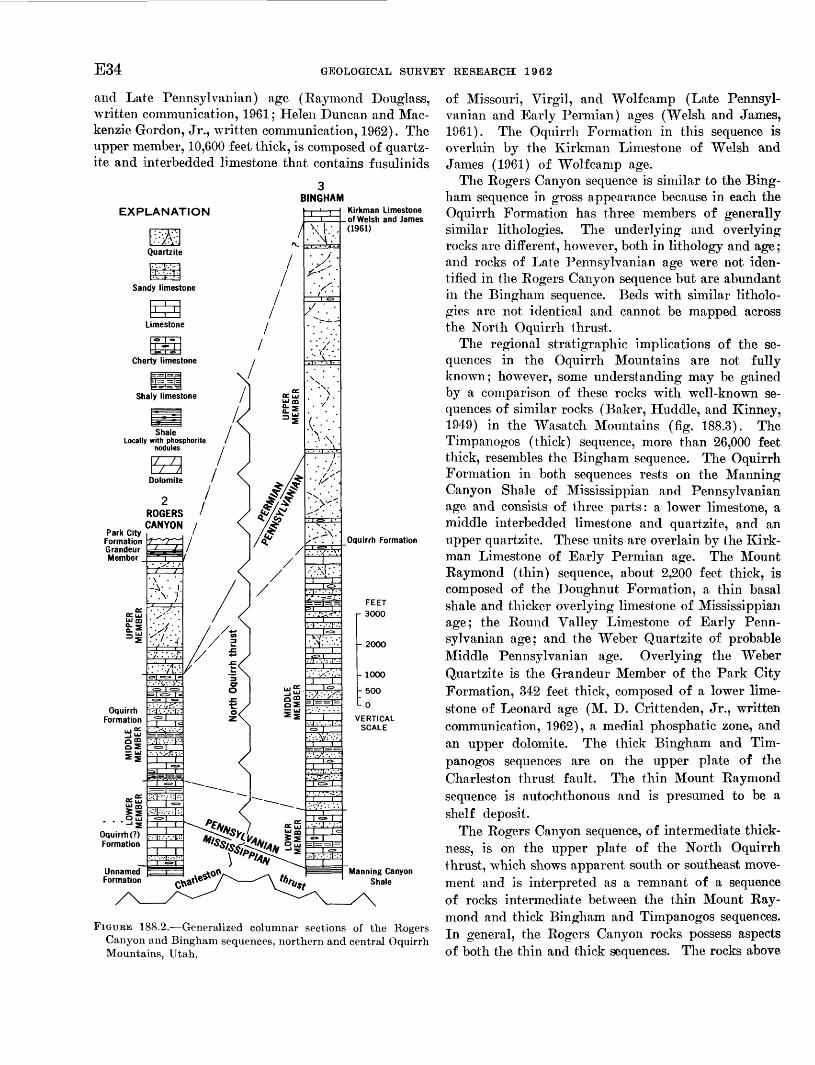
E34 GEOLOGICAL SURVEY RESEARCH 1962
and Late Pennsylvanian) age (Raymond Douglass, written communication, 1961; Helen Duncan and Mac kenzie Gordon, Jr., written communication, 1962). The upper member, 10,600 feet thick, is composed of quartz- ite and interbedded limestone that contains fusulinids
3 BINGHAM
EXPLANATION
\mQuartzite
Kirkman Limestone of Welsh and James (1961)
Oquirrh FormationPark City
Formation Grandeur Member
Manning Canyon Shale
FIGURE 188.2. Generalized columnar sections of the Rogers Canyon and Bingham sequences, northern and central Oquirrh Mountains, Utah.
of Missouri, Virgil, and Wolf camp (Late Pennsyl vanian and Early Permian) ages (Welsh and James, 1961). The Oquirrh Formation in this sequence is overlain by the Kirkman Limestone of Welsh and James (1961) of Wolf camp age.
The Rogers Canyon sequence is similar to the Bing ham sequence in gross appearance because in each the Oquirrh Formation has three members of generally similar lithologies. The underlying and overlying rocks are different, however, both in lithology and age; and rocks of Late Pennsylvanian age were not iden tified in the Rogers Canyon sequence but are abundant in the Bingham sequence. Beds with similar litholo gies are not identical and cannot be mapped across the North Oquirrh thrust.
The regional stratigraphic implications of the se quences in the Oquirrh Mountains are not fully known; however, some understanding may be gained by a comparison of these rocks with well-known se quences of similar rocks (Baker, Huddle, and Kinney, 1949) in the Wasatch Mountains (fig. 188.3). The Timpanogos (thick) sequence, more than 26,000 feet thick, resembles the Bingham sequence. The Oquirrh Formation in both sequences rests on the Manning Canyon Shale of Mississippian and Pennsylvanian age and consists of three parts: a lower limestone, a middle interbedded limestone and quartzite, and an upper quartzite. These units are overlain by the Kirk man Limestone of Early Permian age. The Mount Raymond (thin) sequence, about 2,200 feet thick, is composed of the Doughnut Formation, a thin basal shale and thicker overlying limestone of Mississippian age; the Round Valley Limestone of Early Penn sylvanian age; and the Weber Quartzite of probable Middle Pennsylvanian age. Overlying the Weber Quartzite is the Grandeur Member of the Park City Formation, 342 feet thick, composed of a lower lime stone of Leonard age (M. D. Crittenden, Jr., written communication, 1962), a medial phosphatic zone, and an upper dolomite. The thick Bingham and Tim panogos sequences are on the upper plate of the Charleston thrust fault. The thin Mount Raymond sequence is autochthonous and is presumed to be a shelf deposit.
The Rogers Canyon sequence, of intermediate thick ness, is on the upper plate of the North Oquirrh thrust, which shows apparent south or southeast move ment and is interpreted as a remnant of a sequence of rocks intermediate between the thin Mount Ray mond and thick Bingham and Timpanogos sequences. In general, the Rogers Canyon rocks possess aspects of both the thin and thick sequences. The rocks above

ARTICLE 188 E35
TIMPANOGOS
EXPLANATION
Quartette
Sandstone
Sandy limestone
Limestone
Cherty limestone
Shaly limestone
ShaleLocally with phosphorite
nodules
FEET 6000
- 4000
- 20OO
10OOu 0
VERTICAL SCALE
3 BINGHAM
Kirkman Limestone of Welsh and James (1961)
Dolomite
1MOUNT
RAYMONDPark City FormationN
Grandeur Member
Weber Quartzite Round Valley Limestone
Doughnut Formation/
Park City Formation Grandeur Member
FIGURE 188.3. Generalized columnar sections of the Mount Raymond, Rogers Canyon, Bingham, and Timpanogos sequences and intervening thrust faults. Location of sections shown on figure 188.1.
and below the Oquirrh Formation in Rogers Canyon are comparable with those bounding the Weber Quartzite at Mount Raymond. The lithologic char acter and three-part division of the Oquirrh Forma tion rocks in the Rogers Canyon sequence are com parable with those of the Bingham sequence. The rocks of Late Pennsylvanian and Early Permian age, which are thick in the Bingham sequence, thin and in part pinch out to the north and east in the Rogers Canyon and Mount Raymond sequences. The rocks of Early and Middle Pennsylvanian age also thin shelfward. Finally, the shale facies common to the
thick sequences at the Mississippian and Pennsyl vanian boundary is represented in the thinner se quences by a limestone facies.
In summary, the Mount Raymond sequence is be lieved to have formed on the shelf, the Timpanogos and Bingham sequences in the more rapidly subsid ing part of the basin, and the Rogers Canyon se quence in a region intermediate between shelf and basin. The Rogers Canyon sequence is the only rep resentative of this intermediate facies that has thus far been recognized. Comparable facies may exist in north-central Utah. The rocks of the Rogers Canyon

E36 GEOLOGICAL SURVEY RESEARCH 1962
and Bingham sequences, which were originally de posited under different regimens, were juxtaposed in the Oquirrh Mountains on the North Oquirrh thrust fault.
REFERENCES
Baker, A. A., Huddle, J. W., and Kinney, D. M., 1949, Paleo zoic geology of north and west sides of Uinta Basin, Utah: Arn. Assoc. Petroleum Geologists Bull., v. 33, no. 7, p. 1161- 1197.
Crittenden, M. D., Jr., 1959, Mississippian stratigraphy of the central Wasatch and western Uinta Mountains, Utah, in Williams, N. C., ed., Guidebook to the geology of the Wasatch and Uinta Mountains transition area: Inter-
mountain Assoc. Petroleum Geologists Guidebook 10th Ann. Field Conf., 1959, p. 63-74.
Gillnly, James, 1932, Geology and ore deposits of the Stockton and Fail-field quadrangles, Utah: U.S. Geol. Survey Prof. Paper 173, 171 p.
Tooker, E. W., and Roberts, R. J., 1961, Stratigraphy of the north end of the Oquirrh Mountains, Utah, in Cook, D. R., ed., Geology of the Bingham mining district and northern Oquirrh Mountains: Utah Geol. Soc. Guidebook to the Geology of Utah, no. 16, p. 17-35.
Welsh, J. E., and James, A. H., 1961, Pennsylvanian and Permian stratigraphy of the central Oquirrh Mountains, Utah, in Cook, D. R., ed., Geology of the Bingham mining district and northern Oquirrh Mountains: Utah Geol. Soc. Guidebook to the Geology of Utah, no. 16, p. 1-16.
189. WINDY GAP VOLCANIC MEMBER OF THE MIDDLE PARK FORMATION, MIDDLE PARK, COLORADO
By G. A. IZETT, K. B. TAYLOR, and D. L. HOOVER, Denver, Colo.
A distinctive sequence of andesitic and trachyande- sitic volcaniclastic rocks at or near the base of the Middle Park Formation of Late Cretaceous and Paleo- cene age is here named the Windy Gap Volcanic Member. The type locality is on the north side of U.S. Highway 40, at Windy Gap, 4 miles west of Granby, Colo. The measured type section is given at the end of this article, and the areal extent of the member in central Middle Park, Colo., is shown in figure 189.1.
The lowest volcanic member of the Middle Park Formation has long been recognized as a mappable unit in Middle Park. Marvine (1874) first mapped the volcanic unit and applied the name "doleritic breccia." Later, Cross (1892) recognized the volcanic sequence as the basal unit of a thick complex assem blage of shales, sandstones, grits, conglomerates, and volcanic breccias, to which he applied the name Mid dle Park Formation. He noted that the basal volcanic unit was andesitic rather than dolerite as described by Marvine. Lovering (1930) described and mapped the volcanic unit along the Granby anticline and re ported that the volcanic breccia "'* * * is a valuable key to the geologic section." Tweto (1947; 1 1957) infor mally recognized the unit and described its distribution
HOT SULPHUR SPRINGS QUADRANGLE (IZETT AND HOOVER)
1 Tweto, Ogden, 1947, Precambrian and Laramide geology of the Vasquez Mountains, Colorado : Michigan Univ. thesis, 191 p.
FIGURE 189.1. Index map showing generalized outcrop of the Windy Gap Volcanic Member of the Middle Park Formation, Middle Park, Colo.

ARTICLE 189 E37
and relation to the geologic history of Middle Park. The writers traced the volcanic unit in outcrop in much of central Middle Park and mapped it in detail in the Hot Sulphur Springs and Bottle Pass quad rangles.
Using the nomenclature proposed by Fisher (1961), the Windy Gap Member may be said to consist of complexly intercalated multicolored breccia; lapil- listone; tuff; epiclastic volcanic conglomerate, sand stone, and siltstone; and local thin fluidal flows and a few dike-like bodies. It ranges from 0 to about 1,150 feet in thickness, but averages about 600 feet in thickness in much of the area. Sorting and stratification within the member are variable. The clastic material of the upper part of the unit is gen erally well sorted and ranges from thin to thick bedded; that of the middle and lower parts is very poorly sorted and bedded. The beds are massive, well indurated, and form prominent ridges.
The Windy Gap Member in most areas rests un- conformably on the Pierre Shale of Late Cretaceous age, but locally the unconformity cuts across the Pierre, and the Windy Gap rests on the Niobrara For mation of Late Cretaceous age. The contact between the Windy Gap and the older rocks is sharp and marked by a few feet of reworked shale overlain by poorly sorted volcaniclastic rocks. Fossils collected by the writers from near the top of the Pierre at Windy Gap were identified by W. A. Cobban as Inoceramus cf. /. convexus Hall and Meek, and re ferred to the zone of Baculites scotti, which is cor relative to the upper part of the Hygiene Sandstone Member of the Pierre Shale (Scott and Cobban, 1959). In areas where the Windy Gap Member pinches out into the lower part of the Middle Park Formation, volcanic conglomerates mterfmger with arkosic con glomerates.
The upper contact of the member is gradational. Volcanic breccias and epiclastic volcanic conglomer ates, sandstones, and siltstones grade upward into grits that generally contain a farily high percentage of large Precambrian granitic pebbles plus micro- cline, quartz, and muscovite granules. Olive-gray and yellowish-brown siltstone and claystone as well as thin discontinuous limestone and poor-quality coal beds overlie the member at Windy Gap. Generally the contact was set arbitrarily at the lowest occurrence of large amounts of Precambrian granitic rock and mi- crocline fragments.
Volcanic breccias form a large part of the Windy Gap Volcanic Member, and they are well exposed in the roadcut at Windy Gap. The breccias consist of
variable amounts of angular to subrounded andesite and trachyandesite fragments that range in size from coarse ash to blocks as much as 5 feet in diameter, set in a fine-grained matrix that contains crystals of feldspar, pyroxene, hornblende, and biotite. Figure 189.2 shows a typical sample of the breccia. Rocks other than volcanics are rare, but boulders of Pre cambrian granitic rocks as much as 2 feet in diameter, and some granules and sand-sized grains of micro- cline and quartz, occur near the base of the member at Windy Gap and in areas where the member is thin.
FIGURE 189.2. Typical volcanic breccia of the Windy Gap Volcanic Member.
The volcanic-rock fragments in the Windy Gap are composed of several types of andesite and trachyande site with porphyritic varieties distinguished by differ ences in abundance and mineralogy of phenocrysts. A few fragments have been tentatively identified as porphyritic trachyte. Figure 189.3 shows a photo micrograph of volcanic breccia from near the base of the member. The groundmass of many fragments consists chiefly of zoned plagioclase (An40-50), diop- sidic augite, magnetite, and small amounts of horn blende, biotite, and brown glass. Other fragments also contain considerable amounts of microcrystalline or cryptocrystalline soda-rich alkali feldspar, as identi fied by X-ray methods. The groundmass may be felty or trachytic and ranges from microcrystalline to fine grained. Phenocrysts as much as 5 mm in diameter may form up to a third of the volume of the por phyritic varieties. The phenocrysts are mainly sub-

E38 GEOLOGICAL SURVEY RESEARCH 1962
-i, s*r - _ - fcjf~."i'v-KJ?M^sr.»?.>- - - * . .--r.*- Y^-^^ON* ;; -># JB. - -jfr^v 'i%i<1 ' **- f^-.^.^-.£/>i:^" ^'%l^^' ..^ ^- * %:*,\.«...* --. *^T. ^T --.Vi - Hsr*^t^s^V ^"v*vir': " :f$^^«- ^ -, ^:^^l^rfT^aL.. . * ". * - - .»?'.! J ! * -J - ^ . .«
"» «-*%
FIGURE 189.3. Photomicrograph of volcanic breccia from near base of Windy Gap Member showing clastic trachyte (t), trachyandesite (ta), and andesite (a) fragments in matrix of plagioclase, pyroxene, hornblende, quartz, and magnetite.
hedral to euhedral zoned plagioclase (An40_65 ) and euhedral diopsidic augite (2F 53°-55°); other pheno- crysts seen in a few fragments are oxyhornblende, common hornblende, quartz, alkali feldspar, and bio- tite. Hornblende and orthopyroxene (?) ghosts are common in some fragments. Other minerals in the rock fragments, identified by X-ray methods, include zeolites (analcite, heulandite, thompsonite, stilbite, and phillipsite?), nontronite, celadonite, chlorite, calcite, limonite, quartz, and albite.
Lavas and dikes are rare, but at least one flow and several narrow dikes of trachyandesite are exposed a short distance above the base of the volcanic unit, near the forks of Pole Creek. The flow is about 25 feet thick, has a sharp base, and has a brecciated top consisting of a mixture of coarse debris of the flow in a fine-grained epiclastic matrix. The flow rock is brown altered porphyritic trachyandesite. The groundmass consists of microlites of alkali feldspar, andesine, clinopyroxene, and magnetite, set in a matrix of a brown mineral, perhaps nontronite, that probably formed from glass. The phenocrysts constitute about a fourth of the rock and are augite, strongly zoned andesine-labradorite, and magnetite.
No fossils diagnostic of age were found in the Windy Gap Member; however, pollen identified by E. H. Tschudy, U.S. Geological Survey, from a bed of carbonaceous debris that overlies the member indi cates that the member is of Late Cretaceous age. More collections are needed to confirm this determination.
The Windy Gap Member is locally the basal unit of a thick complex assemblage of shales, sandstones, grits, and conglomerates with subordinate volcaniclas- tic rocks (Middle Park Formation) that were depos ited in the Middle Park Basin in Late Cretaceous and early Tertiary time. The source of the Precambrian detritus was doubtless the bounding Front and Park Ranges. Plugs of andesite and augite syenite near the forks of Ute Bill Creek and at the headwaters of Eightmile Creek may be the source of some of the rocks in the Windy Gap Member. In Late Cretaceous time, the surface expression of the plugs may have
Windy Gap Volcanic Member of the Middle Park Formation, sec. 27, T. 1 N., R. 77 W., Grand County, Colo.
Middle Park Formation: peet8. Mudstone, reddish-brown, structureless; contains
well-rounded andesite granules, pebbles, and cob bles; overlain northward by poor-quality coal beds and thin-bedded limestone ; forms slope _________ 50
Windy Gap Volcanic Member:7. Conglomerate, volcanic; contains well-rounded red
dish-brown, greenish-gray, and grayish-red ande site fragments as much as 2 ft in diameter; matrix is yellowish-brown volcanic sandy mudstone; grades upward into overlying unit; fractures in cobbles are coated with heulandite, forms ridge __ 44
6. Covered; float is reddish-brown soft siltstone; formsslope, _________ _ ________________ _______ 300
5. Sandstone, volcanic, dark-yellowish-brown, con glomeratic; contains rounded andesite fragments as much as 6 inches in diameter; laminated to thick bedded, well bedded; some units lenticular; heulandite in matrix, concentrations of magnetite along laminae; topmost unit is locally chertified and contains abundant carbonaceous debris; forms ridge_ ___________________-_-------_--_- __ _ 124
4. Covered; float is brownish- red soft siltstone; formsslope _ _________________-_----_--_---------_- 75
3. Breccia, volcanic; greenish-gray matrix; varicolored boulders, of angular to subangular trachyte, trachyandesite, and andesite fragments, up to 5 ft in diameter; a few stratification planes outlined by fine-grained volcanic sandstones but generally massive and poorly sorted; highly indurated, fractures are coated with zeolites (stilbite, analcite, thompsonite, and heulandite) and calcite; grades downward into underlying unit; forms massive cliff______ ________ __ ________ _ __ __ _-__ 500
2. Breccia, same as unit 3 except that basal part con tains fragments of granitic rocks, quartz, and microcline as much as 2 ft in diameter; a few lenticular tuff beds; contact with underlying Pierre Shale not well exposed. _ ________________ 100
Total thickness______-__-------_____ ______ 1, 143Pierre Shale:
1. Shale, medium-olive-gray, silty, structureless; inter- bedded with light-gray very fine grained sand stone; forms sIope_________-_-_-_______------- 25

ARTICLE 189 E39
been andesite domes similar to those described by Wil liams (1932). The rapid destruction of these and other domes by running water and debris flow could result in a tabular mass of volcaniclastic rocks that would have characteristics in common with the Windy Gap Member. The Tuscan and Mehrten Formations of California are similar in many respects to the Windy Gap Member, and a similar origin for them has been proposed by Anderson (1933) and Curtis (1954).
REFERENCES
Anderson, C. A., 1933, The Tuscan Formation of northern Cali fornia, with a discussion concerning the origin of volcanic breccias: California Univ. Dept. Geol. Sci. Bull., v. 23, no. 7, p. 215-276.
Cross, Whitman, 1892, The post-Laramie beds of Middle Park, Colorado: Colorado Sci. Soc. Proc., v. 4, p. 192-213.
Curtis, G. H., 1954, Mode of origin of pyroclastic debris in the
Mehrten Formation of the Sierra Nevada: CaliforniaUniv. Pubs. Geol. Sci. Bull., v. 29, no. 9, p. 453-502.
Fisher, R. V., 1961, Proposed classification of the volcaniclas tic sediments and rocks: Geol. Soc. America Bull., v. 72,no. 9, p. 1409-1414.
Levering, T. S., 1930, The Granby anticline, Grand County,Colorado: U.S. Geol. Survey Bull. 822-B, p. 71-76.
Marvine, A. R., 1874, Report of the Middle Park division:U.S. Geol. and Geog. Survey Terr. 7th Ann. Rept (for1873), p. 83-192.
Scott, G. R., and Cobban, W. A., 1959, So-called Hygiene Groupof northeastern Colorado, in Rocky Mtn. Assoc. Geol.Guidebook llth Ann. Field Conf., Washakie-Sandwash-Piceance Basins, Colorado, 1959: p. 124-131.
Tweto, Ogden, 1957, Geologic sketch of southern Middle Park,Colorado, in Rocky Mtn. Assoc. Geol. Guidebook 9th Ann.Field Conf., North and Middle Park Basins, Colorado,1957: p. 18-31.
Williams, Howel, 1932, The history and character of volcanicdomes: California Univ. Dept. Geol. Sci. Bulls., v. 21,no. 5, p. 51-146.
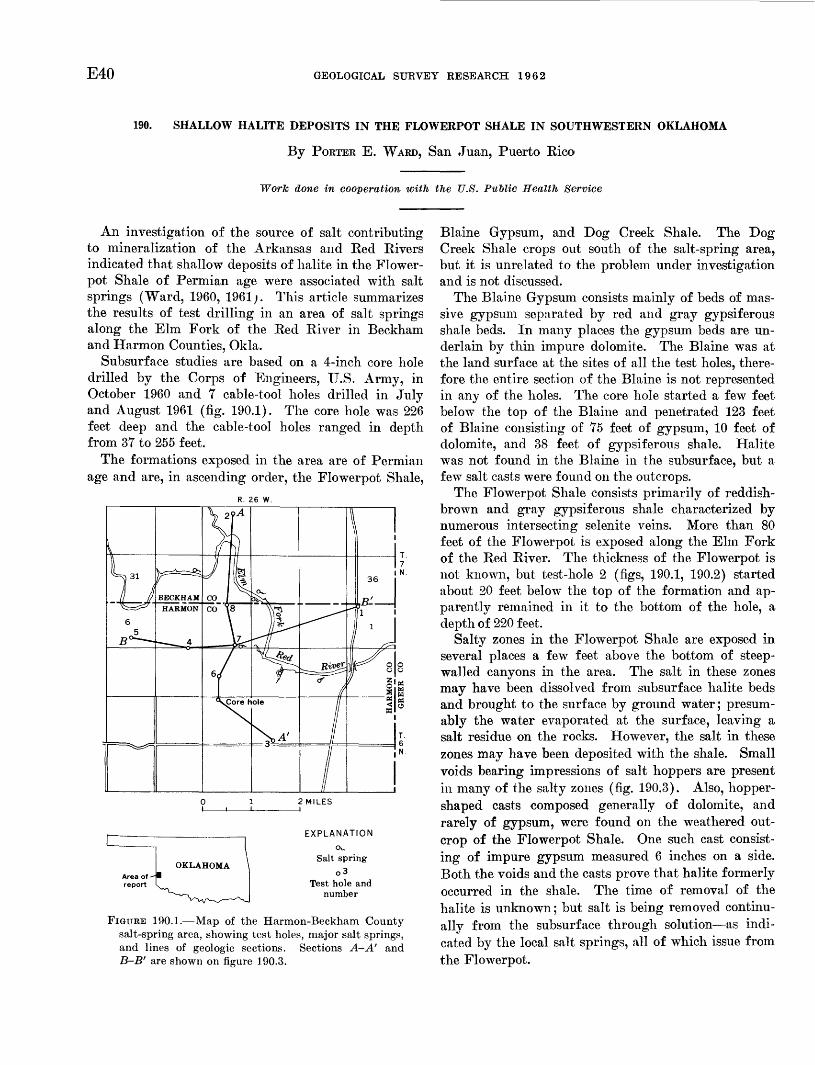
E40 GEOLOGICAL SURVEY RESEARCH 1962
190. SHALLOW HALITE DEPOSITS IN THE FLOWERPOT SHALE IN SOUTHWESTERN OKLAHOMA
By PORTER E. WARD, San Juan, Puerto Rico
Work done in cooperation with the U.S. Public Health Service
An investigation of the source of salt contributing to mineralization of the Arkansas and Red Rivers indicated that shallow deposits of halite in the Flower pot Shale of Permian age were associated with salt springs (Ward, 1960, 1961;. This article summarizes the results of test drilling in an area of salt springs along the Elm Fork of the Red River in Beckham and Harmon Counties, Okla.
Subsurface studies are based on a 4-inch core hole drilled by the Corps of Engineers, U.S. Army, in October 1960 and 7 cable-tool holes drilled in July and August 1961 (fig. 190.1). The core hole was 226 feet deep and the cable-tool holes ranged in depth from 37 to 255 feet.
The formations exposed in the area are of Permian age and are, in ascending order, the Flowerpot Shale,
R. 26 W.
2 MILES
Area of- report
OKLAHOMA
EXPLANATION
CX,
Salt spring0 3
Test hole and number
FIGURE 190.1. Map of the Harmon-Beckham County salt-spring area, showing test holes, major salt springs, and lines of geologic sections. Sections A-A' and B-B' are shown on figure 190.3.
Blaine Gypsum, and Dog Creek Shale. The Dog Creek Shale crops out south of the salt-spring area, but it is unrelated to the problem under investigation and is not discussed.
The Blaine Gypsum consists mainly of beds of mas sive gypsum separated by red and gray gypsiferous shale beds. In many places the gypsum beds are un derlain by thin impure dolomite. The Blaine was at the land surface at the sites of all the test holes, there fore the entire section of the Blaine is not represented in any of the holes. The core hole started a few feet below the top of the Blaine and penetrated 123 feet of Blaine consisting of 75 feet of gypsum, 10 feet of dolomite, and 38 feet of gypsiferous shale. Halite was not found in the Blaine in the subsurface, but a few salt casts were found on the outcrops.
The Flowerpot Shale consists primarily of reddish- brown and gray gypsiferous shale characterized by numerous intersecting selenite veins. More than 80 feet of the Flowerpot is exposed along the Elm Fork of the Red River. The thickness of the Flowerpot is not known, but test-hole 2 (figs, 190.1, 190.2) started about 20 feet below the top of the formation and ap parently remained in it to the bottom of the hole, a depth of 220 feet.
Salty zones in the Flowerpot Shale are exposed in several places a few feet above the bottom of steep- walled canyons in the area. The salt in these zones may have been dissolved from subsurface halite beds and brought to the surface by ground water; presum ably the water evaporated at the surface, leaving a salt residue on the rocks. However, the salt in these zones may have been deposited with the shale. Small voids bearing impressions of salt hoppers are present in many of the salty zones (fig. 190.3). Also, hopper- shaped casts composed generally of dolomite, and rarely of gypsum, were found on the weathered out crop of the Flowerpot Shale. One such cast consist ing of impure gypsum measured 6 inches on a side. Both the voids and the casts prove that halite formerly occurred in the shale. The time of removal of the halite is unknown; but salt is being removed continu ally from the subsurface through solution as indi cated by the local salt springs, all of which issue from the Flowerpot.

ARTICLE 190 E41
A'1950'n
1900'-
1850'-
1800'
1750'-
1700'-
1650'-
1600'-
1950'-i
1900'-
1850'-
1800'
1750'-
1700'-
1650'
EXPLANATION
Shale Dolomite Gypsum Salt(left, bedded; right
disseminated in shale)
1MILE
FIGURE 190.2. Generalized geologic sections of the Harmon-Beckham County salt-spring area. Datum is sealevel.

E42 GEOLOGICAL SURVEY RESEARCH 1962
FIGURE 190.3. Small void in the Flowerpot Shale bearing impressions of hopper-shaped halite crystals.
Halite was found in the Flowerpot Shale in the subsurface both disseminated in the shale and in lentic ular beds. Test-holes 6 and 7 and the core hole pene trated bedded halite, and all the holes penetrated salty shale (fig. 190.2). Bedded halite was reached at depths of 30, 197, and 149 feet below the land surface (fig. 190.2), corresponding to altitudes of 1,720, 1,725, and 1,764 feet, respectively.
The core hole penetrated a zone in the Flowerpot Shale between depths of 197 and 200 feet that con tained salt crystals and solution voids, many of which ranged in diameter from i/2 to 1 inch. The upper few inches of the zone contained cubic-shaped voids, for merly occupied by salt crystals. Several inches lower, many of the voids contained partly dissolved halite crystals. The lower part of the zone contained cubic halite crystals but no voids. Veins of bright-red- orange halite as much as an inch wide, that fill ver tical and near vertical cracks in the shale, were cored at a depth of about 208 feet (fig. 190.4). The color evidently is imparted by small amounts of iron dif fused in the halite.
The test holes were not deep enough to establish the full thickness of the halite-bearing beds. Test-
FIGURE 190.4. Section of a 4-inch core from the Flowerp ot Shale from a depth of about 208 feet in sec. 16, T. 6 N.. R. 26 W. The veins are composed of fibrous reddish-orange halite.
hole 6 penetrated salty shale between depths of 90 and 170 feet, the bottom of the hole. Salty shale was in- terbedded with halite at depths of 148 to 170 feet. Although the areal extent of halite in the Flowerpot Shale has not been determined, subsurface studies show that it is widespread in western Oklahoma and adjacent areas of Kansas and Texas. Individual salt beds or zones apparently pinch out within short dis tances, and sections devoid of halite may be expected in some places. In other places, bedded halite and halite-bearing shale occur within a few feet of the land surface.
REFERENCES
Ward, P. E., I960, Relation of mineral springs to Permian salt deposits [ahs.] : Geol. Soc. America Bull., v. 71, no. 12, pt. 2, p. 1999.
1901, Shallow halite deposits in northern Woodward and southern Woods Counties, Oklahoma: Oklahoma Geo logical Survey, Oklahoma Geology Notes, v. 21, no. 10, p. 275-277.

ARTICLE 191 E43
191. CRINOIDAL BIOHERMS IN THE FORT PAYNE CHERT (MISSISSIPPIAN) ALONG THE CANEY FORKRIVER, TENNESSEE
By MELVIN V. MARCHER, Nashville, Term.
WorJc done in cooperation with the Tennessee Division of Geology
Factors that control the development of permeabil ity and porosity in carbonate rocks are of primary in terest to hydrologists who are concerned with locating and developing ground-water supplies in limestone terranes. The well-developed crinoidal bioherms along the Caney Fork River in east-central Tennessee pro vide excellent examples of both primary and second ary permeability. Only the general features and lith- ologic characteristics of these bioherms are described in this article. Additional study now underway will define, as closely as possible, the role of rock fabric and diagenesis in the development of porosity in the biohermal beds. The results of such a study should be equally applicable to lithologically similar beds not associated with bioherms.
Crinoidal bioherms, which are locally well developed along the Caney Fork River in the reach extending 7 miles downstream from Great Falls Dam, occur at or near the base of the Fort Payne Chert of Early Mis- sissippian age. The base of most bioherms is obscured by talus and vegetation. At least one small bioherm, near Great Falls Dam, is underlain by Fort Payne Chert. Two other bioherms rest directly upon the Chattanooga Shale, which underlies the Fort Payne; at these localities the Chattanooga is bowed slightly downward, presumably from the weight of the bio herms. Where the outlines of the bioherms can be determined, they are oval or elongate moundlike masses. The long axis of most bioherms trends from about N. 30° W. to about N. 30° E. (fig. 191.1). The dimensions of individual bioherms range from tens to hundreds of feet in both width and length and from 20 to nearly 100 feet in thickness. Preliminary study indicates that a completely developed bioherm con sists of three major parts: a core, inner flanking beds, and outer flanking beds (fig. 191.2). In most of the bioherms, the beds making up the core are flat lying whereas the flanking beds drape over the core and dip outward 5° to 20°. In some incompletely developed bioherms, the inner flanking beds are missing and the outer flanking beds are in direct contact \vith the core.
The overlying beds of Fort Payne Chert arch over the bioherms and consist of uniformly bedded very fine grained, calcareous and siliceous siltstone which locally contains scattered crinoidal debris. The litho- logic break between the overlying beds and the MO-
EXPLANATION
TENNESSEE \
Area of biohermal development in the Fort Payne Chert
Trend ofbiohermal
axis
Area of report
FIGURE 191.1. Distribution of bioherms along the Caney ForkRiver.
hermal beds is very distinct, and the contact between them represents a submarine unconformity. At the margins of the bioherms, however, the enclosing beds grade laterally into the biohermal beds. Arching of the beds overlying the bioherms is the result of initial dip and gradually dies out upward.
The strata that make up the cores of the bioherms are thin-bedded greenish-gray argillaceous limestone and greenish- or reddish-gray calcareous shale. Cri- noid columnals as much as 1 inch in diameter are common. In thin sections, it can be seen that the rock consists mainly of crinoidal and algal debris in a fine-grained dolomitic and clayey matrix. Shreds of brown organic(?) material are abundant. Many of the crinoid fragments have corroded edges, suggesting
667422 O - 63 -

E44 GEOLOGICAL SURVEY RESEARCH 1962
EXPLANATION
Enclosing bedsSiltstone, very cherty; contains
scattered crinoidal debris
CoreCrinoidal limestone,fine-grained, very
argillaceous and shaly, dolomitic; contains much algal material
Inner flanking bedsAlgal limestone, fine- to medium-
grained, dolomitic, very irregularly bedded; contains scattered crinoidal debris
Outer flanking bedsCrinoidal and algal limestone, fine- to
very coarse grained, very massive, gypsiferous; contains irregular patches of vuggy dolomite and lime stone rubble
FIGURE 191.2. Sketch section of a completely developedbioherm.
that some recrystallization has occurred, and some are partly or completely silicified. In places the matrix also has been silicified. Algal material forms micro- laminated sheaths on fossil fragments or occurs as small (0.05 mm or less) spherical bodies, many of which are filled with clear crystalline calcite. Parts of the core consist mainly of fine- to medium-grained silty dolomitic limestone that contains only minor amounts of crinoidal and algal debris.
Where present, the inner flanking beds ordinarily are thin and irregularly bedded and consist of pale- yellowish-brown fine- to medium-grained dolomitic limestone that contains various amounts of fossil de bris. Under magnification, the inner flanking beds are seen to contain much algal material in a slightly argillaceous and dolomitic matrix. Most of the cri noid fragments, which are randomly distributed throughout the rock, have irregular edges as a result of dolomitization. Spherical algal bodies are abun dant and some have been filled with calcite. Irregu lar patches in the rock and some of the crinoid frag ments have been replaced by microcrystalline quartz.
The outer flanking beds are massive and lenticular and consist mainly of medium- to coarse-grained dolo mitic limestone that contains much crinoidal and al gal debris. In some thin sections from the outer flank ing beds, it could be seen that practically all the crinoid fragments had been replaced by cryptocrystal- line or crystalline quartz and that part of the matrix
had been irregularly silicified. In at least one thin section, parts of the silicified patches had been re placed by dolomite. Large dolomite crystals, possibly due to replacement of chert by dolomite (Walker, 1962, p. 238), are common in the silicified patches.
Parts of the outer flanking beds are a rubble con sisting of angular fragments and nodules of fine grained slightly argillaceous limestone in a matrix of fine- to medium-grained dolomitic limestone that contains various amounts of crinoidal and algal debris. Many of the large crinoid stems are surrounded by clear crystalline calcite. Most of this calcite is sec ondary in origin, but some appears to be due to recrys tallization of the fine-grained matrix.
Some of the rubble zones in the outer flanking beds contain irregular vugs and seams that are partly filled with powdery gypsum. Some of the smaller vugs and seams are filled with a mixture of crystalline calcite and gypsum, and a few are lined with dolomite rhom- bohedra.
Other parts of the outer flanking beds consist of highly porous and permeable dolomite. Dolomitiza tion has destroyed the outline of most of the fossil fragments, especially the crinoid columnals, but a few spherical algal bodies, some filled with clear crystal line dolomite or calcite, are relatively unaffected. Some of the openings or pores in the rock have been partly filled with carbonate minerals or are lined with dolomite crystals.
The bioherms began to form when the depth of the Fort Payne sea was optimum for establishment of bioherm-f orming crinoid colonies on the sea floor. For a time the growth of the bioherms kept pace with a slowly rising sea level, but at times the crests of the bioherms reached the level where wave action pre vented further growth. At such times the unce- mented debris on the crests of the bioherms would be swept off and accumulate on the flanks. Further rises in sea level submerged the bioherms to a depth such that their crests again afforded optimum conditions for the growth of crinoids. Fluctuations in sea level occasionally allowed waves to sweep debris off the crests onto the flanks of the bioherms. The zones of rubble in the outer flanking beds may have been formed by sliding of material down the sides of the bioherms when the angle of repose was exceeded or when storms swept large amounts of coarse debris from the crests of the bioherms. The angularity of much of the rub ble indicates that the fragments were not transported for a very great distance. Eventually the rate of sea- level rise outpaced the rate of biohermal growth and

ARTICLE 192 E45
created environmental conditions inimicable to the survival of the crinoid colonies.
Preliminary study indicates that the porosity of the outer flanking beds is both primary and secondary in origin. Primary openings appear to have resulted from a failure of fine sediment or cement to be de posited in the original open spaces in the rigid frame work of limestone rubble (Murray, 1960, p. 61). Sea water trapped in such openings may account for the gypsum that lines or fills vugs in the rubble zones. Openings of secondary origin are of two types: rela tively large, irregularly distributed conduits dissolved
by circulating ground water, and small uniformly dis tributed pores developed as a result of dolomitization (Weyl, 1960, p. 85-90).
REFERENCES
Murray, R. C., 1960, Origin of porosity in carbonate rocks: Jour. Sed. Petrology, v. 30, no. 1, p. 59-84.
Walker, T. R., 1962, Reversible nature of chert-carbonate re placement in sedimentary rocks: Geol. Soc. America Bull., v. 73, no. 2, p. 237-242.
Weyl, P. K., 1960, Porosity through dolomitization: Conserva- tion-of-mass requirements: Jour. Sed. Petrology, v. 30, no. 1, p. 85-90.
192. MISSISSIPPIAN-PENNSYLVANIAN BOUNDARY IN NORTHEASTERN KENTUCKY
By EICHAED A. SHEPPAED and ERNEST DOBEOVOLNY, Denver, Colo.
Work done in cooperation with the Kentucky Geological Survey
A. thick sandstone unit forms the walls of Box Can yon, south of Carter Caves State Park near Olive Hill, Ky. (fig. 192.1). The sandstone unit is overlain by shale and limestone assigned to the Pennington (?) Formation of Late Mississippian age, and the Penning ton (?) is overlain by the Lee Formation, which is considered to be of Early Pennsylvanian age. The sandstone, 43 feet thick, is white to light gray, fine to medium grained, quartzose, thick bedded, and conspic uously crossbedded. It is lithologically similar to sandstones in the Lee Formation and unlike other sandstones in the Pennington Formation.
The stratigraphic relations of the sandstone are shown in figure 192.2. A core drilled on the shoulder of Box Canyon in 1961 penetrated the Pencil Cave beds (drillers' term) below the sandstone. The Pen cil Cave beds and a limestone generally found above it are correlated respectively with the Hardinsburg Sandstone and Glen Dean Limestone of western Ken tucky (McFarlan and Walker, 1956, p. 7).
The Pennington (?) Formation consists chiefly of shale, but includes a few thin beds of limestone and sandstone. The shale generally is light green to green ish gray, fossiliferous, and locally silty. Eed shale
FIGURE 192.1. Index map of measured sections and drill hole in vicinity of Carter Caves State Park, Ky.

E46 GEOLOGICAL SURVEY RESEARCH 1962
ARoadcut along State
Highway 182 about 0.6 mile southeast of State Highway 2
cDrill hole on Box
Canyon about 100 feet east of State Highway 182
Top of hole USGS20209-PC/]
EXPLANATION
LEE FORMATION £t^
DRoadcut on hill
south of Tygarts Creek
LEE FORMATION
Shale
Shale with thin limestone lenses
Shale with thin sandstone interbeds
Limestone
Sandstone
USGS 20206-PC Fossil locality
FEET r20
-15
-10
r 5
-0
PENCIL CAVE(DRILLERS'
TERM)
EQUIVALENT OF GLEN DEAN LIMESTONE
PENCIL CAVE(DRILLERS'
TERM)
FIGURE 192.2. Sections of Mississippian and Pennsylvanian rocks in vicinity of Carter Caves State Park, Ky.
was observed in the upper beds in the core at Box Canyon and in nearby outcrops. The most continu ous beds are two limestones, one at or near the base of the formation and another near the top. Both are gray, finely crystalline, argillaceous, and fossiliferous. Weathering along argillaceous laminae causes the lime stone to separate into plates as much as 1 inch thick. Thin, discontinuous yellow-weathering limestones are present in the upper part of the formation; fossils were not found in these. With the exception of the thick sandstone at Box Canyon, the sandstones are light tan to light olive, very fine to fine grained, thin bedded, and quartzose. Green shale chips occur lo cally. The sandstones generally are fossiliferous; they contain abundant spireferoid brachiopods and, locally, fish remains. Perhaps the most diagnostic feature is the abundance of casts of trails on the bottoms of certain beds.
Marine fossils collected from the Pennington (?) Formation in this area (figs. 192.1 and 192.2) were identified by J. T. Dutro, Jr., written communication, 1962) who commented as follows:All the assemblages indicate a Late Mississippian age * * *. There is no indication of an Early Pennsylvanian age for any
of these collections. The occurrence of Diaphragmus cf. D. cestriensis (Worthen) * * * points to a late Chester age. The other invertebrates, especially brachiopods, support this general age assignment.
Diaphragmus cf. D. cestriensis (Worthen) was col lected above the sandstone at locality C.
Fossils collected from localities A and C (figs. 192.1 and 192.2) are:
Locality A:USGS 20204-PC:
Horn coral, indet.Echinoderm debris, indet.; abundantFenestrate bryozoans, indet.; abundantRamose bryozoans, undet.Productoid brachiopod, indet.Spirifer cf. S. leidyi HallComposite, subquadrata (Hall)Eumetria cf. E. vera Hall"Spiriferina" spinosa (Norwood & Pratten)
USGS 20205-PC:Spirifer sp.Pelecypod fragments, indet.; abundantTracks and trails, indet.
USGS 20206-PC:Echinoderm debris, indet.Orthotetes cf. 0. kaskaskiensis (McChesney)

ARTICLE 193 E47
Productoid fragment, indet.Spirifer cf. S. leidyi HallDielasma? sp.Fish tooth, undet.
Locality C:USGS 20207-PC:
Orthotetes cf. 0. kaskaskienses (McChesney)Allorisma sp.; abundant
USGS 20209-PC:Echinoderm debris, indet.; abundantFenestrate bryozoans, indet.Ramose bryozoans, undet.Orthotetes cf. 0. kaskaskiensis (McChesney)Diaphragmus cf. D. cestriensis (Worthen)Ovatia ovata (Hall)Spirifer cf. S. increbescens HallComposita subquadrata (Hall)Aviculopecten sp.Bellerophon sp.Straparollus (Euomphalus) sp.Murchisonia? sp.
Although the sandstone body is shown as a lens in figure 192.2, it may be a tongue of the Lee Formation. Englund and Smith (1960) have demonstrated inter- tonguing of the upper part of the Pennington Forma tion and the lower part of the Lee Formation in southeastern Kentucky. If the sandstone is a tongue of the Lee Formation, the Lee includes beds of Late Mississippian age at this locality. In either case it is clearly indicated that deposition of quartzose sand stones typical of the Lee Formation began during Late Mississippian time.
REFERENCES
Englund, K. J., and Smith, H. L., 1960, Intertonguing and lateral gradation between the Pennington and Lee Forma tions in the tri-state area of Kentucky, Tennessee' and Virginia [abs.] : Geol. Soc. America Bull., v. 71, p. 2015.
McFarlan, A. C., and Walker, F. H., 1956, Some old Chester problems correlations along the eastern belt of outcrop: Kentucky Geol. Survey Bull. 20, 36 p.
193. CORRELATION OF THE PARKWOOD FORMATION AND THE LOWER MEMBERS OF THE POTTSVILLEFORMATION IN ALABAMA
By WILLIAM C. CULBERTSON, Denver, Colo.
In Alabama the Pottsville Formation of Pennsyl- vanian age, the principal coal-bearing formation, con tains one or two resistant conglomeratic quartzose sandstone (orthoquartzite) units at its base that con trast with the less resistant subgraywacke sandstone beds in the rest of Pottsville. In the Cahaba and Coosa coal fields the two quartzose sandstone units are named the Shades Sandstone Member and the Pine Sandstone Member; in the Plateau coal field the two units are the "Lower Conglomerate" and the "Up per Conglomerate" of McCalley (1891), but in the Warrior coal field only one unit has been named, the Boyles Sandstone Member (fig. 193.1). According to the geologic map of Alabama by Butts (1926), the Pottsville is underlain by the Mississippian Parkwood Formation in the Cahaba and Coosa coal fields and on Blount Mountain, but elsewhere it is underlain by the Pennington Formation or the Floyd Shale, both of Mississippian age. It is the purpose of this article to clarify the correlation of lower members of the Potts ville Formation and to redefine the top boundary, and
the extent, of the Parkwood Formation. (See fig. 193.1.)
The correlation of the basal sandstone members of the Pottsville Formation has been hampered by the concept that there is only one quartzose sandstone unit in the Warrior field, compared to two units in each of the other coal fields (for example, Butts, 1910, p. 8, and Shotts, 1961). The Boyles Sandstone Mem ber was named and described by Butts as follows:
The basal part of the Pottsville is everywhere in the Bir mingham quadrangle a sandstone. In this particular field [Warrior] it is called the Boyles sandstone member because it is Avell displayed in Boyles Gap. The sandstone is coarse, thick bedded, quartzose, and in places conglomeratic at the base. Where thickest it changes to a flaggy, finer-grained and perhaps argillaceous rock toward the top * * *. It is 100 feet thick where exposed in Sayreton and Boyles gaps.
Recently the Boyles Sandstone Member was ex posed by the excavation of a railroad cut through the ridge that is formed by this member at a locality about 500 feet north of Boyles Gap. The strata are here overturned, dipping 45° to 60° SE. The ex-
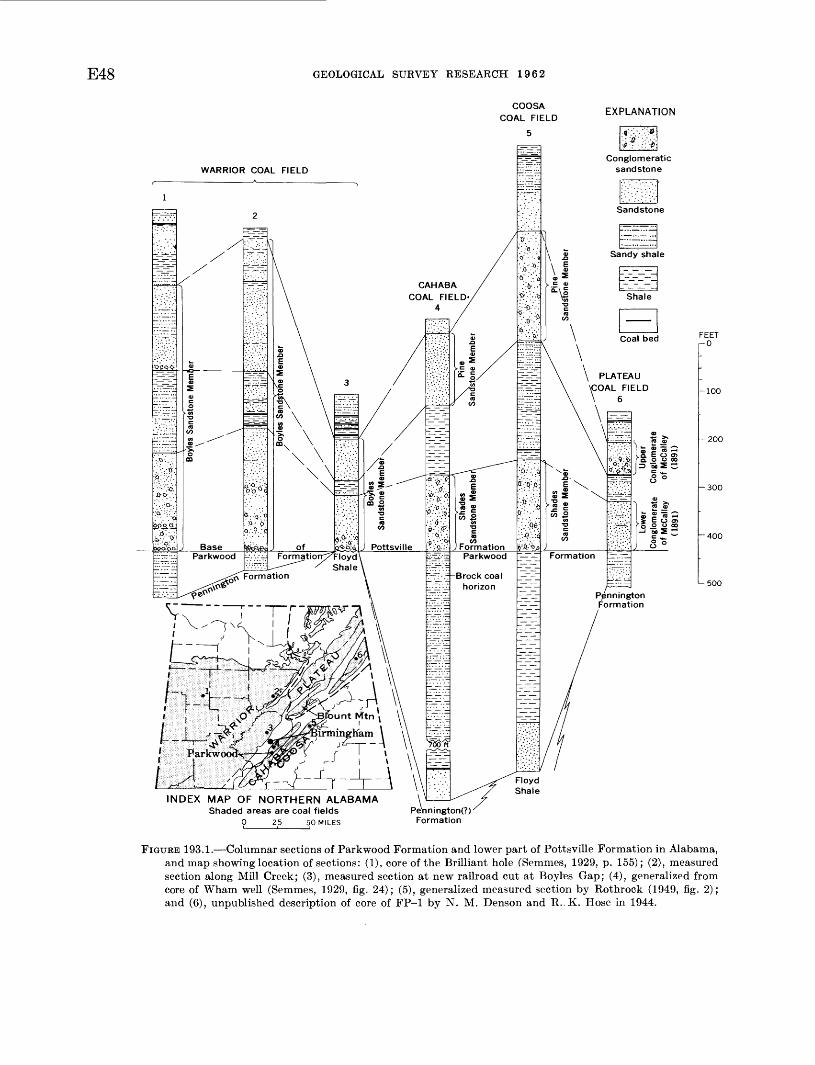
E48 GEOLOGICAL SURVEY RESEARCH 1962
EXPLANATION
FEET r-0
-100
-300
~ - 400
INDEX MAP OF NORTHERN ALABAMA Shaded areas are coal fields
0 25 50 MILES
PenningtorK?)' Formation
FIGURE 193.1. Columnar sections of Parkwood Formation and lower part of Pottsville Formation in Alabama, and map showing location of sections: (1), core of the Brilliant hole (Semmes, 1929, p. 155); (2), measured section along Mill Creek; (3), measured section at new railroad cut at Boyles Gap; (4), generalized from core of Wham well (Semmes, 1929, fig. 24); (5), generalized measured section by Rothrock (1949, fig. 2); and (6), unpublished description of core of FP-1 by N. M. Denson and R..K. Hose in 1944.

ARTICLE 193 E49
posed rocks were measured and described by the au thor as follows:
Section of the Boyles Sandstone Member of the Pottsville Formation in new railroad cut through Sand Mountain, NW1/* sec. 6, T. 17 S., R. 2 W., Jefferson County, Ala.
[Fig. 193.1, col. 3] Pennsylvanian:
Pottsville Formation: Feet Shale, dark-gray; 30 percent of beds medium-dark-
gray carbonaceous very fine to medium-grained sandstone. Lower 50 ft contains 4 coal beds that are 2 to 12 in. thick; sharp basal contact_____.___ 386
Boyles Sandstone Member: Upper sandstone unit:
Sandstone, light-gray, fine- to medium-grained, quartzose, well-indurated, thick-bedded; cross- bedded 30 ft above base. Contains several thin beds of medium-dark-gray sandstone with plant fossils. Abundant flat pebbles of shale and coal in lower 3 to 8 ft. Upper 18 ft is medium-dark- gray medium- to coarse-grained sandstone. Irregular, sharp basal contact ________________ 86
Middle shale unit:Shale, dark-gray, fissile; the lower 4 ft is 30 percent
thin lenticular siltstone and very fine-grained sandstone beds. At 4 ft above base is a bed 8 ft thick of medium-dark-gray very fine- to fine grained sandstone that is interbedded with 10 percent shale. Sharp basal contact,___^______ 33
Lower sandstone unit:Sandstone, light-gray, fine- to medium-grained,
with a few coarse to very coarse grains; quartz ose, well indurated, crossbedded in places; in beds 1 to 5 ft thick. Lower 31 ft is conglomer atic, containing sparse rounded pebbles of quartz as much as % in. in diameter, which in places are concentrated in lenses as much as 1 ft thick. Lowest 3 ft contains abundant quartz and shale pebbles and fragments of coal ________________ 114
Total, Boyles Sandstone Member___________ 233Unconformity. Mississippian:
Floyd Shale:Clay shale, dark-gray, fissile with 5 to 10 percent
beds of buff-weathering fine-grained sandstone.
A comparison of the exposure at the old railroad cut at Boyles Gap with that at the new railroad cut described above indicates that Butts (1910, p. 8) was referring only to the lower 114 feet of sandstone when he stated that the Boyles Sandstone Member was a single sandstone bed 100 feet thick. However, the upper unit is also a "coarse, thick-bedded quartzose sandstone," and the upper unit was included by Butts (1910) in the Boyles Sandstone Member in other parts of the Birmingham quadrangle. For example, at Mill Creek (fig. 193.1, col. 2), the Boyles Sandstone Mem ber, as mapped by Butts (1910), consists of an upper
and a lower ridge-forming quartzose sandstone unit separated by a unit 120 feet thick that is mostly shale. This is the typical lithology of the Boyles in most of the Warrior coal field, although locally the middle shale unit is cut out by channeling, or locally the sandstone units contain one or two interbeds of shale.
In order to make the boundaries of the Boyles Sandstone Member consistent throughout the Warrior coal field, the Boyles Sandstone Member is here re defined to include the entire 233-foot section described at the new railroad cut at Boyles Gap, which is here designated as a reference section.
On the basis of the stratigraphic position, unique lithologic sequence, and persistence of these lower units of the Pottsville, the lower sandstone unit of the Boyles Sandstone Member is correlated with the Shades Sandstone Member and the "Lower Conglom erate" of McCalley (1891). The upper sandstone unit is correlated with the Pine Sandstone Member and the "Upper Conglomerate" (fig. 193.1).
The Parkwood Formation was named from expo sures in the vicinity of Parkwood, T. 19 S., E. 3 W., in the Cahaba coal field. Butts (1910, p. 8) defined it as including the 1,500 to 2,000 feet of gray shale and sandstone "lying above the base of the sandstone making Little Shades Mountain and Bald Ridge * * * and below the Brock coal bed * * *." It is underlain in some places by the Pennington Formation, in other places by the Floyd Shale.
The Brock coal bed is 6 to 10 inches thick and lies about 50 feet below the prominent ridge-forming Shades Sandstone Member of the Pottsville Forma tion. Butts selected the Brock coal because, as he stated later (Butts, 1926, p. 206), "* * * the base of the Pennsylvanian of Alabama, as located at the base of the Brock coal bed, seems to lie at a horizon in the lower Pottsville as low as the lowest Pennsylvanian of Virginia, West Virginia, or Pennsylvania * * *." Subsequent paleontological work, however, showed that the base of the Pennsylvanian is an indefinite boundary more than 500 feet below the Brock coal bed (Butts, 1927, p. 13; Moore, 1944, p. 686). In ad dition, the thinness and limited extent of the Brock coal make its base an impractical formation boundary. The top boundary of the Parkwood Formation is here changed to the more widespread and conspicuous lith ologic boundary, the base of the Shades Sandstone Member of the Pottsville Formation (fig. 193.1). This boundary was used in mapping the Coosa coal field by Butts (1940, p. 11) and Rothrock (1949, p. 18).

E50 GEOLOGICAL SURVEY RESEARCH 1962
According to Butts (1910), the Parkwood Forma tion is not present in the Warrior and Plateau coal fields except on Bloimt Mountain where about 300 feet of Parkwood underlies the Boyles Sandstone Member. However, a sequence of sandstone, shale, and one or more coal beds underlies the Boyles Sand stone Member and "Lower Conglomerate," and uncon- formably overlies the Mississippian Pennington For mation in most of the Warrior and Plateau coal fields. This sequence part of McCalley's Lower Measures (1891, p. 20) is 0 to 150 feet thick along much of the outcrop and thickens to more than 600 feet in the subsurface in the western part of the Warrior coal field. Mellen (1947, p. 1813) noted that this sequence should be called Parkwood Formation in western Ala bama, where its fauna has both Mississippian and Pennsylvanian aspects. The author agrees, and re gards the Parkwood as including all rocks in Alabama between the basal conglomeratic sandstone of the Potts- ville Formation and the Pennington Formation or Floyd Shale. The rocks in Tennessee equivalent to the Parkwood Formation constitute the Raccoon Mountain Formation.
The deposition of the Parkwood Formation is in terpreted as beginning in Mississippian time in the geosynclinal trough that included the present Cahaba and Coosa fields, and continuing into Pennsylvanian time. In early Pennsylvanian time, Parkwood sedi ments were spread over northern Alabama, but a few islands existed where no Parkwood was deposited, such as Boyles Gap. Subsequently, the basal con glomeratic members of the Pottsville Formation were deposited on the Parkwood, filling channels in places
but elsewhere being deposited conformably on the Parkwood Formation. The land surface at Boyles Gap rose slowly during the deposition of the Boyles Sandstone Member, resulting in a much thinner basal unit of the Pottsville than elsewhere in Alabama.
REFERENCES
Butts, Charles, 1910, Description of the Birmingham quadran gle, Alabama: U.S. Geol. Survey Geol. Atlas, Folio 175.
1926, The Paleozoic rocks, in Adams, G. I., Butts, Charles, Stephenson, L. W., and Cooke, C. W., Geology of Alabama: Alabama Geol. Survey Spec. Rept. 14, p. 40- 230.
1927, Description of the Bessemer and Vandiver quad rangles, Alabama: U.S. Geol. Survey Geol. Atlas, Folio 221.
1940, Description of the Montevallo and Columbianaquadrangles, Alabama: U.S. Geol. Survey Geol. Atlas, Folio 226.
McCalley, Henry, 1891, Report of the Coal Measures of the Plateau region of Alabama, including a report on the Coal Measures of Blount County by A. M. Gibson: Ala bama Geol. Survey Spec. -Rept. 3, 238 p.
Mellen, F. F., 1947, Black Warrior basin, Alabama and Mis sissippi : Am. Assoc. Petroleum Geologists Bull., v. 31, no. 10, p. 1801-1816.
Moore, R. C., Chairman, 1944, Correlation of Pennsylvanian formations of North America: Geol. Soc. America Bull., v. 55, p. 657-706.
Rothrock, H. E., 1949, Geology and coal resources of the north east part of the Coosa coal field, St. Clair County, Ala bama : Alabama Geol. Survey Bull. 61, 163 p.
Semmes, D. R., 1929, Oil and gas in Alabama: Alabama Geol. Survey Spec. Rept. 15, 400 p.
Shotts, R. Q., 1961, Correlations in the "Coal Measures" of the Southeast: Alabama State Mine Expt. Sta. Tech. Rept. 23, p. 427-446.

ARTICLE 194
194. PENNSYLVANIAN NOMENCLATURE IN NORTHWEST GEORGIA
By WILLIAM C. CTJLBERTSON, Denver, Colo.
E51
Published reports give four different nomenclatures for the rocks of Early Pennsylvania!! age in north west Georgia. The purpose of this article is to re name the rock units of Georgia according to their correlation with the rock units of Tennessee, and to show their correlation with the equivalent rocks in the adjacent part of Alabama.
In northwest Georgia, rocks of Early Pennsylva- nian age are about 1,000 feet thick and are the cap ping rocks on synclinal Sand, Lookout, and Pigeon Mountains, and on several small hills (fig. 194.1). The youngest Pennsylvanian rocks are preserved in Lookout Mountain near Durham. The rocks consist of resistant thick massive sandstone beds, at least one of which is conglomeratic, interbedded with weak se quences consisting of beds of shale, fine-grained sand stone, and locally a few beds of coal. The rock units vary in thickness from place to place, and locally sandstone beds fill channels in underlying rocks.
The Pennsylvanian nomenclature of northwest Georgia has been strongly influenced by nomenclatures published for adjacent Tennessee (see table). The first was that of Safford, who in 1869 divided the Coal Measures at the Aetna mines in Tennessee (fig.194.1. loc. 1), 2 miles from Georgia, into Lower and Upper Coal Measures separated by a Lower Conglom erate and an Upper Conglomerate. The Upper Con glomerate is only a sandstone at its type locality (fig.194.2. col. Ib), but it is equivalent to the bed that Safford called the Conglomerate in the rest of Ten nessee, and that he later called Sewanee Conglomerate (Safford, 1893, p. 89-98).
The first nomenclature applied directly to north west Georgia was that of Hayes (1892, p. 49), who divided the Coal Measures into two formations, the Lookout Sandstone below and Walden Sandstone above. The contact was placed at the top of "a bed of conglomerate 10 to YO feet in thickness which is a constant feature throughout the greater part of the field." Nowhere in this report on northeast Alabama, northwest Georgia, and southernmost Tennessee, nor in later reports on this same area, did he mention a second conglomerate or indicate how his units corre lated with those of Safford. A few years later, McCallie in a report on the coal deposits of northwest Georgia said that Hayes' Lookout Sandstone corre sponded to Safford's Lower Coal Measures "including
EXPLANATION
Core hole Measured section
Composite sectionGeneral locality
R.8E. R.10E.
10 MILES
FIGURE 194.1. Index map showing areas of outcropping Penn sylvanian rocks (shaded area) and location of stratigraphic sections.

E52 GEOLOGICAL SURVEY RESEARCH 1962
History of vtratigraphic nomenclature of Pennsylvanian rocks in northwest Georgia and South Tennessee
1 CARBONIFEROUS
55 <!M
552 J CO
W PM
55ds£j03 03
03 03 Wa
Aetna (Etna) mines, Tenn. (SafEord, 1869,
p. 383-384; 1893)
(Unit missing)
Upper Coal Measures
Upper Conglomer ate (Sewanee
conglomerate)
Unnamed unit
Lower Conglomerate (Cliff Rock)
Lower Coal Measures
Mountain limestone
Northwest Georgia,
northeast Alabama, and
south Tennessee
(Hayes, 1892, p. 49)
(Unit missing)
Walden sandstone
Lookout sandstone
Bangor limestone
South Tennessee <Nelson, 1925,
p. 39)
Lee group
Rockcastle conglomerate
Vandever shale
Newton sandstone
Eastland shale lentil i
Herbert conglomerate >
Whitwell shale
Sewanee conglomerate
Unnamed member
a.2 U 9 Warren 3 Point 12 sandstoneS O Unnamed
member
Pennington formation
Bangor limestone
Geologic map of Georgia (Georgia Div. of Mines,
Mining, and Geology, 1939)
(Unit missing)
Potts ville formation
Pennington shale
Bangor limestone
Northwest Georgia, Chart 6 of
Pennsylvanian Subcommittee (Moore, 1944)
(Unit missing)
Walden formation
Upper conglomerate
g ~| Unnamed g member
** g Lower § conglomerate
Unnamed member
Pennington formation
Not shown
Northwest Georgia (Johnson, 1946)
(Unit missing)
Rockcastle sandstone
Vandever shale
Bonair sandstone
Whitwell Shale
a Sewanee 12 member
1
g Gizzard ^ member
3
Pennington shale
Bangor limestone
South Tennessee (Wilson and others,
1956, p. 1)
Crab Orchard Mountains group
a o
a
5
Rockcastle conglomerate
Vandever formation
Newton sandstone
Whitwell shale
Sewanee conglomerate
Signal Point shale
Warren Point sandstone
Raccoon Mountain formation
Pennington formation
Not shown
Northwest Georgia (this article)
(Unit missing)
Crab Orchard Mountains Formation
Gizzard Formation
Vandever Member
Newton Sandstone Member
Whitwell Shale
Member
Sewanee Member
Signal Point Shale Member
Warren Point Member
Raccoon Mountain Member
Pennington Shale
Bangor Limestone
1 According to Wilson and others (1956, p. 4) the Eastland Shale Lentil and Herbert Conglomerate of Nelson are equivalent to the Whitwell Shale and Newton Sandstone of Nelson, so the names Eastland and Herbert are discarded.
the Lower Conglomerate and underlying rocks" (MoCallie, 1904, p. 19, 99).
Nelson (1925) published a new detailed nomencla ture for southern Tennessee in which he recognized the Mississippian Pennington Formation in rocks pre viously included in the Lower Coal Measures of Saf- ford (1869). In the second change in Georgia nomen clature, the Georgia Division of Mines, Mining, and Geology (1939) recognized the Pennington Shale in Georgia, but placed all beds above the Pennington Shale into an undivided Pottsville Formation. This
usage was followed by Sullivan (1942, p. 32). In a third change in the nomenclature for Georgia, the Pennsylvanian Subcommittee of the National Research Council Committee on Stratigraphy (Moore, 1944, chart 6) divided the rocks into the Lookout Forma tion and Walden Formation, as did Hayes (1892), but they included an Upper Conglomerate and a Lower Conglomerate within the Lookout Formation. Two years later, Wanless (1946, p. 8), in a compre hensive study of the Southern Appalachian coal field, used essentially the same nomenclature and also cor-
ARTICLE 194 E53
related the rock units with the named units of Nelson in Tennessee.
The fourth nomenclature for northwest Georgia was published by Johnson (1946) as a result of a geologic investigation of Sand and Lookout Mountains, Ga., in connection with a core-drilling program by the U.S. Bureau of Mines. His names are derived from Nelson's (1925) nomenclature for Tennessee, but also include the Lookout Sandstone of Hayes.
It is my conclusion that (1) the Lookout Formation as defined by the Pennsylvanian Subcommittee is a different unit than that defined by Hayes at the type locality, and (2) Johnson's nomenclature is based on a miscorrelation with the rock units of Tennessee. In the type area (Lookout Mountain, Ga.) the top bed of the Lookout Sandstone is the Lower Conglomerate, not the Upper Conglomerate as shown by the Penn sylvanian Subcommittee; and the top bed correlates with the Warren Point Sandstone, not the Sewanee Conglomerate as implied by Johnson's use of the name Sewanee Member of the Lookout Sandstone.
These conclusions were reached during a reconnais sance trip into Lookout, Sand, and Raccoon Moun tains, using Johnson's geologic map (Johnson, 1946), his annotated air photographs, and other published reports. On Lookout Mountain, the bed Johnson calls Sewanee Member of the Lookout Sandstone is the "conglomerate and heavy sandstone" at the top of Hayes' Lookout Sandstone at Johnson Crook, and is the same bed that Wanless (1946, p. 24) calls Warren Point Sandstone Member of the Lookout Sandstone (fig. 194.2, cols. 2, 3, and 4). On Sand Mountain at Cole City, Ga., the Sewanee Member of Johnson is the top bed of the Lookout Sandstone of'Hayes (1894), the Lower Conglomerate of McCallie (1904, p. 98) and McCalley (1891, p. 44), and the Warren Point Sandstone Member of Wanless (1946, pi. 21, col. 2). Johnson's map also adjoins the type locality (fig. 194.1, loc. 8) of the Raccoon Mountain Formation of Wilson and others (1956, p. 19), where the Sewanee Member of Johnson directly overlies the Raccoon Mountain Formation and is thus the same unit as their Warren Point Sandstone (see table). At Aetna Mines on Raccoon Mountain, a comparison of the meas ured sections of Hayes, Safford, and Nelson (fig. 194.2, cols, la, Ib, and 1) also confirms the identity of the top bed of the Lookout Sandstone with the Lower Conglomerate, a fact that was noted in 1904 by J. J. Stevenson (p. 125), and with the Warren Point Sand stone Lentil of Nelson (1925).
Many authors have stated that the Lookout Sand stone includes the Sewanee at its top, but this is true only in Tennessee, exclusive of the southernmost part,
where the Sewanee is largely conglomeratic and the older Warren Point is only a sandstone. In the type area described above and in southernmost Tennessee, Hayes placed the top of the Lookout at the top of the conglomeratic Warren Point Member or its equi valent, and included the generally nonconglomeratic Sewanee Member in the Walden Sandstone. Although Johnson placed the top of the Lookout Sandstone at the same horizon as Hayes, the result of his miscor relation of the top bed is that his named units do not correlate with the units of the same name in Tennessee; for example, the Vandever Shale in Geor gia is a lower bed than the Vandever Shale of Tennessee.
Johnson (1946) has demonstrated that rocks of Pennsylvanian age in northwest Georgia contain many recognizable units which deserve formal recognition. A new nomenclature is here defined for northwest Georgia that consists of 2 formations and 7 members. The names correspond generally to the names of the equivalent rock units in adjacent Tennessee as de scribed in the recent study of Pennsylvanian rocks by Wilson and others (1956) or by Nelson (1925).
The table and figure 194.2 (cols. 5, 6, and 7) show the new nomenclature and its correlation with the generalized sections of Johnson for northwest Georgia, a composite section of Lookout Mountain, Ala., and a composite section in Tennessee that was adapted from Wilson and others (1956), using their description of the units on Walden Ridge and Lookout Mountain wherever possible. The section on Lookout Mountain, Ala., and a description of the rocks were furnished by N. M. Denson and R. K. Hose, who, in 1944, made a geologic investigation of coal-bearing rocks on Look out Mountain near Fort Payne. The only published result of this investigation is a chapter entitled "De scription of deposits" by N. M. Denson in a U.S. Bureau of Mines report (Coulter, 1947, p. 4-5).
The new members in northwest Georgia are de scribed in detail below, primarily on the basis of the descriptions of Johnson (1946), supplemented by the measured section of Wanless (1946, p. 24 and 32) and by personal observation. The thicknesses of the units are derived from Johnson (1946) because most of his data are based on both core drilling and fieldwork. Measurement of the rocks in northwest Georgia has always been hampered by poor exposures, with the result that different authors have reported widely varying thickness for the same interval. Published reports are in essential agreement as to the thickness of the upper 400 to 500 feet of the Pennsylvanian section, but the thickness of the interval between the base of Lower Conglomerate (Castle Rock coal zone)

E54FEET r 0
-100
-200
-300
-400
L 500
GEOLOGICAL SURVEY RESEARCH 1962
EXPLANATION
Conglomeratic sandstone or conglomerate
Sandstone Shale Sandy shale, siltstone, or shaly sandstone
Coal bed Covered
AETNA (ETNA) MINES, TENNESSEE
la(Hayes, 1894)
lbSafford (1869,
p. 383-384)
1CNelson (1925, p. 149, p. 44)
Correlation lineDashed where uncertain; queried where unknown
LOOKOUT MOUNTAIN, GEORGIA
3Core hole
DH-1 (Johnson, 1946)
Walden sandstone
Lookout sandstone
"'-.T.- ~
'-~r. -.^v-----
=zzz.-~---^
-li^i-
z- z'--
6 .' '. ' 9' :'£ :&
d. '&':".
^': :°-_ __
"yr- -7~
^T71
Aetna
Sewanee
Soddy
""Castle Rock
? -
Ifl0}
3
is1o
ia
=3
i
Us= c a>
Lower Conglomerate
Measures
8o <u
!
^----
_ _z^-z-z
IS
E-:;4'd
..--I..
m: '. £> :' & '.ft'.-: :. "CS..C- '-b
4: n'-f.'.L!'.T..', . T
-===-^-7.
"-^r1
^-"
Walker
Slate
-^Kelly
--
Etna
o 5I-sz i
_a> « 6
^ 5 j=
KMSv
ll
*f
8
d formation Warren Point
sandstone
8 i3
_ _ _
MM
"T. ' *
z-z--
3':H-'.T
'.' «(" ;. .;' :; ».' '.'.' '!<* .'
_-_ _
_ _
Sewanee
Kelly
Etna
Dade
Red Ash
Pennington formation
^
4West Brink
(Wanless, 1946, p. 24)
Bangor limestone
Bangor limestone
FIGURE 194.2. Columnar sections of Pennsylvania strata. See figure 194.1 for locations. Formation names of each author shown on left side of column, coal bed names on right except where labeled otherwise. Wanless' correlation of the

CO r §. era'
^ a 1 1 OS 2. ^
CD
shown
in
part 5. cf
CO ?f * ew nomenclature fi p o | S CD O i.
names Warre
p <? 1C 1 Sewanee
to
the
sec o' p p | M r^ B
a 1 o. cr
*< CO =_
fl» 3 ro S
cr
* i <D
W at 3 o. $ 9 w Ul
g I * i the
350
feet
measured
> a M 5 > is
about
300
feet, which
m » 5 a O
e I S a. 3; S
*» S: o M § 0
00 <n y 0^
0 1
- o IB o" 3
O IB
3 m i
Giz
zard
gro
up
Rac
coon
Mou
ntai
n fo
rmat
ion
mm
mm
X^
m ?
o»
War
ren
Poi
nt
sand
ston
e
& ;&
*? $
'.:'$
' ' ' '?
':' ::
''
Looko
ut
san
dst
on
e
Giz
zard
mem
ber
$ i
IS! 2S?
££ (B
[Sig
nal
Poi
n ^\ s
hale
W!
1 :' :
' . ::
'.:: 9 c
Sew
anee
mem
ber [
^
';! :
1 /^ \
Ihitw
ell
shal
e
^ /
^i^
^^W
1
Rac
coon
Mounta
in
[War
ren
Poi
nt rS
iina
TP
oin
t M
embe
r 1^
M
embe
r |S
Me_
Mem
ber
Giz
zard
For
mat
ion
s^S
/^^
P|i|i.:i
.
6-«-
;o:v
':;
! '
'
l|
'l
Cra
b O
rcha
rd M
ount
ains
gro
up
*
en'
JSS
KK
te
Whi
twel
l sha
le
s^^i'^
r'V
&*£&
&\
ltilt*
/
/35
00
/
/fi.
5"
/
/
<
»
IBona
ir sa
ndst
one
iSH
^I
Sew
anee
Mem
ber
'ill '
1
'
I'll
1!0
yr I
Vand
ever
sha
le
; : '"
1 ,'!
',i ' '
I;!
!:,
|l:l
rii
'rn'l:
'
p f
<jt &
Whi
twel
l Sh
ale
Mem
ber
New
ton
sand
ston
e
£':=
:;£:
MV^..
-;.;\
Van
deve
r fo
rmat
ion
m S
? »
?
iii'i-'ii
ii!
\m
^m iP
i.. i
1 '
I'M
-1 LU
^S
H^O
I z
s«ia
H
Sis
s »
m
sgs|
i=
» 8
z=
en
to
Roc
kcas
tle s
ands
tone
«
?
m2-0°
JTI
«
J_ c
0
, , ,
-
. »
'?.=
*'
(D
New
ton
San
dsto
m
Mem
ber
p!ii;
:i=
*3" fiD 3
e Va
ndev
er M
a
Cra
b O
rcha
rd M
ount
ains
For
mat
ion
NTill!
g> y
.g1
2Jlf
|f
%f
I fi
\
/S n:
,
.. .
-«-^
.-'.
; 1
ViV-
'-Ji-;.
': -.'I
.-o-'-
'.^a'-'
. -.1
o9--.-
o9«r;
-. .-.'
im
c
=
w
_i
I 1^8^
1 |
g
1
Sa
l?
*~
* ~
* B
3
z
z
ys
ro
»
"*<»
sis
3°-S
;:.li'
i1:^
: V
l ' .
' '
::l'i
lO
a »
oi * =
V
11 =
t«s
S^-
'S
§S
l
7Lookou
t Mounta
in Alabam
a, compos
ite
'ii
; .
15- 3
M c
m
v-'-i^
£§3 .
To
g
^.-'iv
i S
^o^
tna.
3S8g
» >
°
O^t
Q
3
= S
' =
>~
z o
Tibe
r
0 I
m
>
en >
|
>
CD >
S >

E56 GEOLOGICAL SURVEY RESEARCH 1962
and the No. 4 or Tatum coal bed on Lookout Mountain has been variously reported to be 420 feet (Johnson, 1946), 675 feet (Hayes, 1894), 780 feet (Wanless, 1946, pi. 25, col. 9), and 1,200 feet (Sullivan, 1942, p. 45). As Johnson's measurement is derived from a core hole it should be accurate. The larger thick nesses probably were the result of miscalculating the thickness of rocks underlying the weathered plateau surface of Lookout Mountain.
GIZZARD FORMATION
The Gizzard Formation was named from its ex posures on Little Fiery Gizzard Creek in Marion County, Tenn., 2 miles south of Tracy City in Grundy County (Safford, 1869; Nelson, 1925). In northwest Georgia the Gizzard Formation contains three mem bers: the Raccoon Mountain, the Warren Point, and the Signal Point Shale.
Raccoon Mountain Member. In northwest Georgia the Raccoon Mountain Member is the sequence of gray shale, fine-grained sandstone, and lenticular coal beds that lie unconformably above the Mississippian Pennington Shale and below the cliff-forming con glomeratic sandstone called Warren Point Member. Wilson and others (1956) named the Raccoon Moun tain Formation from its exposure at locality 8 (fig. 194.1), about 0.4 mile northwest of Whiteside, Tenn. It varies considerably in thickness, ranging from 353 feet at locality 8 to about 70 feet on the west side of Lookout Mountain, Ga. On Lookout Mountain, Ala., the equivalent beds average about 50 feet in thickness and do not exceed 150 feet. The coal bed that occurs at or near the top of this unit is widely known as the Etna, Cliff, or Castle Rock coal bed.
Warren Point Member. The Warren Point Mem ber is the massive quartzose (orthoquartzite) sand stone containing scattered to abundant small pebbles of quartz or quartzite that forms the main cliff face on Lookout and Sand Mountains. Its type locality in Tennessee is at Warren Point, i/2 mile north of Mont- eagle, Grundy County, Tenn. It ranges from about 50 to 200 feet in thickness. The equivalent bed in the Walden Ridge area of Tennessee is reported by Wilson and others (1956, p. 4) to be 200 feet thick. A comparison of this thickness with the 100-foot thick ness shown by Nelson (fig. 194.2, col Ic) indicates that the top of the Warren Point is placed at a higher horizon by Wilson and others. Using their definition, the bed equivalent to the Warren Point Member in Lookout Mountain, Ala., is 100 to 150 feet thick in most places, ranging up to as much as 250 feet thick,
and contains shale partings in the upper part. The Underwood coal bed and associated shale (fig. 194.2, col 7) are present only locally.
/Signal Point Shale Member. The Signal Point Shale Member in northwest Georgia is 6 to 50 feet thick and consists of gray shale with locally a thin coal bed and a thin bed of sandstone. The type lo cality of the Signal Point Shale Formation, as named by Wilson and others (1956), is on Tennessee State Highway 8 at locality 9 (fig. 194.1). It crops out around the margin of Lookout Mountain, Ga. The equivalent sequence in Lookout Mountain, Ala., con sists of 15 to 50 feet of shale and fine-grained sand stone and 2 coal beds that have been mined inter mittently (fig. 194.2, col. 7).
CRAB ORCHARD MOUNTAINS FORMATION
Wilson and others (1956) named the Crab Orchard Mountains Group from its exposures in the Crab Orchard Mountains, Cumberland County, Tenn. In northwest Georgia the Crab Orchard Mountains For mation consists of four members: the Sewanee, Whit- well Shale, Newton Sandstone, and Vandever.
Sewanee Member. The Sewanee Member (John son's Bonair Sandstone) is, according to Johnson, a sandstone 150 to 200 feet thick, that is similar in lithology to the Warren Point Member described above except that it does not contain pebbles, and is less resistant to weathering. According to Wanless (1946, p. 24), it contains a few pebbles on the west brink of Lookout Mountain, and according to Denson (oral communication, 1962) it contains pebbles on Pigeon Mountain. Its type locality is at Sewanee, Franklin County, Tenn., about 21 miles west of lo cality 10 (fig. 194.1). It ranges from 150 to 200 feet in thickness in Georgia and is the surface rock on most of Look-out Mountain, Ga. On Lookout Moun tain, Ala., it is a coarse-grained sandstone as much as 150 feet thick with a conglomeratic basal part that averages 60 feet in thickness.
Whitwell Shale Member. The Whitwell Shale Member is a shale and sandy shale sequence, 150 to 200 feet thick, that underlies about 10 square miles in the center of Lookout Mountain, Ga. Its type lo cality is at Whitwell, Tenn. (fig. 194.1, loc. 10). It contains the No. 4 or Tatum coal bed that has been mined at several places on Lookout Mountain. On Lookout Mountain, Ala., the sequence above the Upper Conglomerate includes the thin Sewanee and Tatum coals, and is probably equivalent to the Whitwell Shale Member.

ARTICLE 195 E57
Newton Sandstone Member. On Lookout Mountain, Ga., the coarse crossbedded bench-forming sandstone, about 110 feet thick, that underlies the prominent Dur ham coal bed is named the Newton Sandstone Mem ber. Its type locality is at Newton in southwest Cumberland County, Tenn.
Vand&ver Member. The upper 300+ feet of shale and sandstone exposed on Lookout Mountain is named the Vandever Member from its correlation with the Vandever Shale, whose type locality is at Vandever, Cumberland County, Tenn. It contains the exten sively mined thick Durham coal bed at its base.
REFERENCES
Coulter, D. M., 1947, Coking coal deposits on Lookout Moun tain, DeKalb and Cherokee Counties, Alabama: U.S. Bur. Mines, Kept. Inv. 4030, 89 p.
Georgia Division of Mines, Mining, and Geology, 1939, Geo logic Map of Georgia : scale 1:500,000.
Hayes, C. W., 1892, Report on the geology of northeastern Alabama and adjacent portions of Georgia and Tennessee: Alabama Geol. Survey Bull. 4, 86 p.
1894, Ringgold atlas sheet, Georgia and Tennessee: U.S. Geol. Survey Geol. Atlas, Folio 2.
Johnson, V. H., 1946, Coal deposits on Sand and Lookout
Mountains, Dade and Walker Counties, Georgia: U.S. Geol. Survey Prelim. Map.
McCalley, Henry, 1891, Report on the Coal Measures of the plateau region of Alabama: Alabama Geol. Survey Spec. Rept. 3, 238 p.
McCallie, S. W., 1904, A preliminary report on the coal de posits of Georgia: Georgia Geol. Survey Bull. 12, 121 p.
Moore, R. C., ch., 1944, Correlation of Pennsylvanian forma tions of North America: Geol. Soc. America Bull., v. 55, no. 6, p. 657-706.
Nelson, W. A., 1925, The Southern Tennessee coal field: Ten nessee Div. Geol., Bull. 33-A, 239 p.
Safford, J. M., 1869, Geology of Tennessee : Nashville, Tennessee, 550 p.
1893, The topography, geology, and water supply of Sewanee, Franklin County, Tennessee: Tennessee State Board of Health Bull., v. 8, no. 6,, p. 89-98.
Stevenson, J. J., 1904, Carboniferous of the Appalachian Basin: Geol. Soc. America Bull., v. 15, p. 37-210.
Sullivan, J. W., 1942, The geology of the Sand-Lookout Moun tain area, northwest Georgia: Georgia Div. Mines, Mining and Geology Inf. Circ. 15, 68 p.
Wanless, H. R., 1946, Pennsylvania!! geology of a part of the Southe'rn Appalachian coal field: Geol. Soc. America Mem. 13, 162 p.
Wilson, C. W., Jr., Jewell, J. W., and Luther, E. T., 1956, Pennsylvanian geology of the Cumberland Plateau: Ten nessee Div. Geol. Folio (Nashville), 21 p.
195. PATHFINDER UPLIFT OF PENNSYLVANIAN AGE IN SOUTHERN WYOMING
By WILLIAM W. MALLORY, Denver, Colo.
The Uncompahgre, Front Range, and Zuni-Defiance uplifts have long been recognized as the principal tec tonic elements of the ancestral Rocky Mountains dur ing the Pennsylvanian Period in Colorado and adja cent states. Recent compilation and synthesis of Penn sylvanian stratigraphy in Wyoming for the Penn sylvanian folio (in preparation) of the U.S. Geological Survey paleotectonic map series indicates that a fourth uplift of moderate size in southern Wyoming is re lated tectonically to the other three. It had its great est extent and most pronounced topographic expression in Atoka (Middle Pennsylvanian) time when it ex tended from Laramie northward to Casper and west ward into the southeast corner of Fremont County
(fig. 195.1). The name Pathfinder uplift,1 hereby proposed for this ancient land, is taken from Path finder Mountain in T. 29 N., R. 84 W., south-central Natrona County, Wyo., which is centrally located on the site of the uplift.
The interpretation of the Pathfinder uplift is based largely on a series of measured sections and careful paleontologic determinations by Love and others
i The name Pathfinder uplift was applied in 1932 by T. S. Levering to the structural element in central Wyoming now called the Sweet- water uplift (U.S. Geol. Survey and Amer. Assoc. Petroleum Geolo gists, 1961) or Granite Mountains uplift (Bndlich, 1879). This tec tonic feature is largely a Laramide rejuvenation of the western segment of the uplift of Pennsylvanian age described here. Therefore, both Levering and the author consider that redefinition here of the name Pathfinder uplift is permissible.

E58 GEOLOGICAL SURVEY RESEARCH 1962
108° 107° 106" 105°
20 40 MILES_J_____I
FIGURE 195.1. Index map showing major features and localities. Pathfinder uplift and extreme northern end of Front Range uplift of ancestral Rocky Moun tains of Atoka time, solid-line pattern; Sweetwater (or Granite Mountains) uplift of Laramide age, broken-line pattern; outcrop area of Precambrian rocks in present ranges of the Rocky Mountains, stipple; Laramie Range occupies area between Laramie and Casper.
(1953), Thomas and others (1953), and Love (1954) in the vicinity of the Laramie Range and the Sweet- water uplift. Additional evidence is provided by sample logs of wells in the area, most of which were prepared by the American Stratigraphic Co. of Den ver. Several other recently published reports give information on the fossil content and correlation of Pennsylvania!! rocks in southern Wyoming or nearby areas (Agatston, 1954; Henbest, 1954, 1956; Mallory, 1960; and Maughan and Wilson, 1960). The history of the uplift from its inception in Morrow (Early Pennsylvanian) time to its disappearance in Virgil (Late Pennsylvanian) time is traced in the Pennsyl vanian folio; only its status in Atoka time is de scribed in this article.
The Amsden Formation of Mississippian and Penn sylvanian age extends throughout much of Wyoming, where it is divided into an upper unit 0 to 200 feet thick, and a lower red clastic unit 0 to 150 feet thick.
Except for local lenses of clastic sedimentary rock, the upper part of the Amsden Formation in Wyoming is a carbonate unit. Its age is essentially Atoka al though locally it may include strata a little older or younger. Its average thickness is about 150 feet. The unit is present throughout most of Wyoming except on the Pathfinder uplift, an area of approximately
7,300 square miles in the southern part of the State, where rocks of Atoka age are absent. Three lines of evidence, namely the thickness and the lithology of the upper part of the Amsden and the overlap of younger beds, support the concept that the Pathfinder uplift area was emergent and tectonically positive in Atoka time. At 30 wells and surface sections on the site of the uplift, rocks of Atoka age are lacking. An additional 35 control points in the surrounding area show that the upper part of the Amsden Forma tion thickens uniformly away from the uplift nearly everywhere at a rate of 10 feet per mile; locally in southern Albany County the rate of thickening is much greater, and is 65 feet per mile just south of Laramie (fig. 195.2). If the uplift were post-Atoka in age, isopachs of Atoka strata would be expected to have a pattern discordant at least to some degree with the outline of the uplift.
Four distinct divisions of the Pathfinder uplift can be designated on the basis of areal geology at the end of Atoka time (fig. 195.2): (1) a northeastern seg ment where Madison Limestone of Mississippian age was exposed, (2) a central belt where sandstone and shale largely of Morrow age (the lower part of the Amsden Formation) were exposed, (3) a southern extension where igneous and metamorphic rocks of Precambrian age were exposed, and (4) a western extension where the Madison Limestone (Mississip pian) probably formed all or much of the surface. Tertiary rocks lie on Precambrian rocks over much or all of the area of the Sweetwater uplift, a Laramide tectonic feature comprising most of the western ex tension of the Pathfinder uplift. On the margins of the Sweetwater uplift, however, Pennsylvanian strata rest on the Madison Limestone of Mississippian age. Hence the Madison probably extended partly or en tirely over this part of the Pathfinder uplift at the close of Atoka time. Strong Laramide upward move ment of the Sweetwater uplift caused removal of all or most rocks younger than Precambrian and older than Tertiary; therefore, documentable interpretation of the paleogeology of the western extension at the close of Atoka time is not possible. Figure 195.2 shows Madison Limestone on the western extension of the Pathfinder uplift, but local inliers of older Paleo zoic and basement rocks may have been present.
The lithology of the upper part of the Amsden Formation surrounding the uplift is directly related to the rocks exposed on the uplift in Atoka time and to the tectonic activity in each of the four divisions designated on figure 195.2. The western extension is fringed with local aprons of sandy and shaly strata that grade away from the uplift into the regional

ARTICLE 195 E59
108° 107° 106° 105°
EXPLANATION
AREAL GEOLOGY OF PATHFINDER UPLIFT
/ \ x ^ / ' \ V > I - ',- - -: / H \Z C/o.«~ <f* >< >«.^irii^^^^^S^^i'-SM'-' 1^.^^-;^^^A^^?:Y
Red shale and sandstone of Morrow age (lower part of Amsden Formation)
Y////AMadison Limestone of Mississippian age
Precambrian granitic and metamorphic rocksLITHOLOGY OF UPPER PART OF AMSDEN
FORMATION
Arkosic conglomerate, sandstone, andsiltstone 41
SandstoneApproximate contact
Shaly sandstone
Calcareous sandstonei _ _ |
Shale
Carbonate rock
IsopachShowing thickness, in feet, of rocks of Atoka
age. Interval is 50 feet
0125 A 180Well Surface section
Control pointsNumber is thickness of upper part of Amsden For
mation. P, paleontologic data are available from Pennsylvania^ rocks to aid in correlation
10 I
20 MILES
FIGURE 195.2. Paleogeologic map showing areal geology of Pathfinder uplift at end of Atoka time and thickness and lithology of strata of Atoka age (upper part of Amsden Formation) in area surrounding the uplift.
667422 O - 63 -

E60 GEOLOGICAL SURVEY RESEARCH 1962
carbonate facies. The southern extension, where ig neous and metamorphic rocks were exposed, is sur rounded by arkose of Atoka age. The northeastern segment, where the Madison Limestone was exposed, also is fringed with sandy and shaly strata which grade outward into the regional carbonate facies. Along the northern and southern shores of the central belt, where Morrow strata (sandstone and shale of the lower part of the Amsden) were exposed, the regional carbonate facies of the upper part of the Amsden flanks the uplift.
The aprons of sand and shale that were deposited locally on the fringes of the western extension of the Pathfinder uplift indicate that only moderate up lift occurred in that area. Shale and sandstone of the lower part of the Amsden Formation, and perhaps locally some Paleozoic strata older than Morrow, were stripped off and redeposited in the Atoka sea.
The southern extension of the Pathfinder uplift in Albany County was strongly uplifted, allowing igneous and metamorphic rocks of Precambrian age to be actively weathered, eroded, and deposited on the south ern shores of the uplift as arkose, which attains a thickness of 300 feet south of Laramie. The north eastern segment was moderately uplifted, allowing shale and sandstone of the lower part of the Amsden to be removed and redeposited in the Atoka sea. The Madison was then exposed to some degree of sub- aerial wasting, but uplift was not great enough to result in stripping away this formation. The central belt must have been a lowland nearly awash in marine waters, because clastic strata of the lower part of the Amsden were not removed and adjacent clear marine waters accordingly were not contaminated with mud and sand.
The Pathfinder uplift was progressively submerged during Des Moines, Missouri, and Virgil time, when
its influence was limited to controlling the direction of longshore currents and patterns of local sand depo sition in the Tensleep, Casper, and Minnelusa Forma tions.
REFERENCES
Agatston, R. S., 1954, Pennsylvanian and Lower Permian of northern and eastern Wyoming: Amer. Assoc. Petroleum Geologists Bull., v. 38, no. 4.
Endlich, F. M., 1879, Report on the geology of the Sweetwater district: U.S. Geol. Geog. Survey Terr. (Hayden) llth Ann. Rept, p. 3-158.
Henbest, L. G., 1954, Pennsylvanian foraminifera in Amsden Formation and Tensleep Sandstone, Montana and Wyo ming, in Billings Geol. Soc., Guidebook 5th Ann. Field Conf.: p. 50-53.
1956, Foraminifera and correlation of the Tensleep Sandstone of Pennsylvanian age in Wyoming, in Wyoming Geol. Assoc. Guidebook llth Ann. Field Conf.: p. 58-63.
Love, J. D., 1954, Tentative diagrammatic correlation of Ten- sleep, Amsden, Casper, and Hartville Formations in Wyo ming, in Wyoming Geol. Assoc. Guidebook 9th Ann. Field Conf.: chart (in pocket).
Love, J. D., Henbest, L. G., and Denson, N. M., 1953, Stratig raphy and paleontology of Paleozoic rocks, Hartville area, eastern Wyoming: U.S. Geol. Survey Oil and Gas Inv. Chart OC-44.
Levering, T. S., 1932, Field evidence to distinguish overthrust- ing from underthrusting: Jour. Geology, v. 15, no. 7, p. 656-658.
Mallory, W. W., 1960, Outline of Pennsylvanian stratigraphy of Colorado, in Guide to the geology of Colorado: Geol. Soc. America, Rocky Mtn. Assoc. Geologists, and Colorado Sci. Soc., p. 23-33.
Maughan, E. K., and Wilson, R. F., 1960, Pennsylvanian and Permian strata in southern Wyoming and northern Colo rado, in Guide to the geology of Colorado: Geol. Soc. America, Rocky Mtn. Assoc. Geologists, and Colorado Sci. Soc., p. 34-42.
Thomas, H. D., Thompson, M. L., and Harrison, J. W., 1953, Stratigraphy of the Casper Formation, in Fusulinids of the Casper Formation of Wyoming: Wyoming Geol. Sur vey Bull. 46, pt. 1, p. 5-14.
U.S. Geological Survey and American Association of Petroleum Geologists, 1961, Tectonic map of the United States.
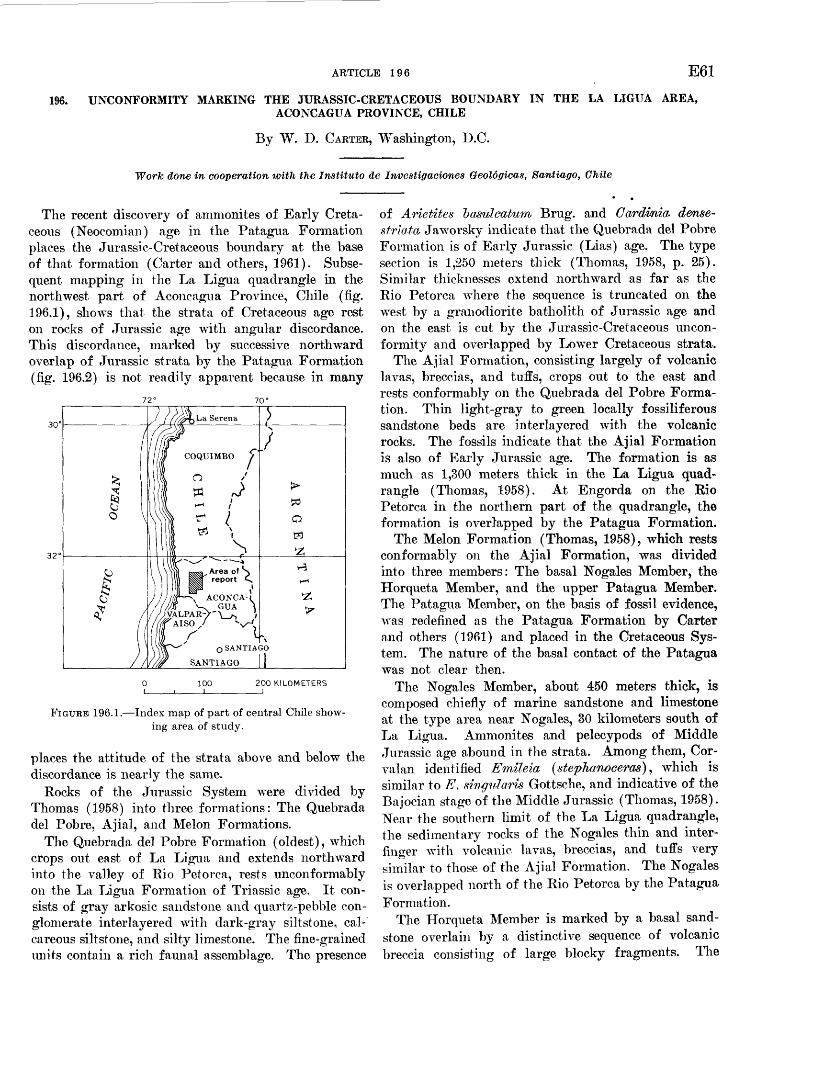
ARTICLE 196 E61
196. UNCONFORMITY MARKING THE JURASSIC-CRETACEOUS BOUNDARY IN THE LA LIGUA AREA,ACONCAGUA PROVINCE, CHILE
By W. D. CARTER, Washington, B.C.
Work done in cooperation with the Institute de Investiffaciones Geoldfficas, Santiago, Chile
The recent discovery of ammonites of Early Creta ceous (Neocomian) age in the Patagua Formation places the Jurassic-Cretaceous boundary at the base of that formation (Carter and others, 1961). Subse quent mapping in the La Ligua quadrangle in the northwest part of Aconcagua Province, Chile (fig. 196.1), shows that the strata of Cretaceous age rest on rocks of Jurassic age with angular discordance. This discordance, marked by successive northward overlap of Jurassic strata by the Patagua Formation (fig. 196.2) is not readily apparent because in many
70°
100 200 KILOMETERS
FIGURE 196.1. Index map of part of central Chile show ing area of study.
places the attitude of the strata above and below the discordance is nearly the same.
Rocks of the Jurassic System were divided by Thomas (1958) into three formations: The Quebrada del Pobre, Ajial, and Melon Formations.
The Quebrada del Pobre Formation (oldest), which crops out east of La Ligua and extends northward into the valley of Eio Petorca, rests unconformably on the La Ligua Formation of Triassic age. It con sists of gray arkosic sandstone and quartz-pebble con glomerate interlayered with dark-gray siltstone, cal careous siltstone, and silty limestone. The fine-grained units contain a rich faunal assemblage. The presence
of Arietites 'basulcatum, Brug. and Cardinia d&nse- striata, Jaworsky indicate that the Quebrada del Pobre Formation is of Early Jurassic (Lias) age. The type section is 1,250 meters thick (Thomas, 1958, p. 25). Similar thicknesses extend northward as far as the Rio Petorca where the sequence is truncated on the west by a granodiorite batholith of Jurassic age and on the east is cut by the Jurassic-Cretaceous uncon formity and overlapped by Lower Cretaceous strata.
The Ajial Formation, consisting largely of volcanic lavas, breccias, and tuffs, crops out to the east and rests conformably on the Quebrada del Pobre Forma tion. Thin light-gray to green locally fossiliferous sandstone beds are interlayered with the volcanic rocks. The fossils indicate that the Ajial Formation is also of Early Jurassic age. The formation is as much as 1,300 meters thick in the La Ligua quad rangle (Thomas, 1958). At Engorda on the Rio Petorca in the northern part of the quadrangle, the formation is overlapped by the Patagua Formation.
The Melon Formation (Thomas, 1958), which rests conformably on the Ajial Formation, was divided into three members: The basal Nbgales Member, the Horqueta Member, and the upper Patagua Member. The Patagua Member, on the basis of fossil evidence, was redefined as the Patagua Formation by Carter and others (1961) and placed in the Cretaceous Sys tem. The nature of the basal contact of the Patagua was not clear then.
The Nogales Member, about 450 meters thick, is composed chiefly of marine sandstone and limestone at the type area near Nogales, 30 kilometers south of La Ligua. Ammonites and pelecypods of Middle Jurassic age abound in the strata. Among them, Cor- valan identified Emileia (stephanoceras] , which is similar to E. singularis Gottsche, and indicative of the Bajocian stage of the Middle Jurassic (Thomas, 1958). Near the southern limit of the La Ligua quadrangle, the sedimentary rocks of the Nogales thin and inter- finger with volcanic lavas, breccias, and tuffs very similar to those of the Ajial Formation. The Nogales is overlapped north of the Rio Petorca by the Patagua Formation.
The Horqueta Member is marked by a basal sand stone overlain by a distinctive sequence of volcanic breccia consisting of large blocky fragments. The

E62 GEOLOGICAL SURVEY RESEARCH 1962
EXPLANATION
:F- }-.. > 4- + -fv>« A If \. ' ' ' ' V^'SSvSl
XaLiguaX +Jgd -"i ^ v < "I-'.' ." '.". &81It\+O-K + 4, f +J 7 ^ * f.- ./ tis&m+ + * i<fVs,i±±? < ^ < v v/."-.\>//-'K«:i^
* * t^y^r/^ V".- ; ->mtti^* + "* />/ v?>^. > ,- N AX-'-' '^^ Vi^PSy
Granodiorite
32°30'+ ^ + + ""MlLON QUADRANGLEl.V^iiHC/. 71°00' La Ligua Formation
ContactApproximately located
Strike and dip of beds
10KILOMETERS
FIGURE 196.2. Generalized geologic map showing the unconformable relation between Jurassic and Cretaceous strata in theLa Ligua quadrangle and vicinity, Aconcagua Province, Chile.
member crops out as a narrow band of prominent cliffs. It is thickest, 1,700 meters (Thomas, 1958, p. 36), at the type section on Cerro Horqueta, about 18 kilometers southeast of La Ligua. Although Thomas shows the Horqueta extending at least 30 kilometers north of Cerro Horqueta, recent mapping (fig. 196.2) indicates that it is overlapped by Cretaceous strata near Cerro Iglesia, only about 8 kilometers to the north.
The oldest Cretaceous unit is the Patagua Forma tion, a thick series of marine limestone that rests un- conformably on Jurassic rocks. The discovery of Thurmanniceras, and other index fossils of Valan- ginian age in Argentina and Chile, resulted in rede
fining Thomas' (1958) Patagua Member of the Melon Formation of Jurassic age as the Patagua Formation of Early Cretaceous age (Carter and others, 1961). At Cerro Iglesia the base of the Patagua Formation is marked by coarse-pebble to cobble conglomerate overlain by and, in places, interfingered with thin layers of compressed coquina composed largely of poorly preserved ammonites and pelecypods. Where exposed, both north and south of this locality, the base of the formation is usually marked by lenticular yellowish-brown medium- to fine-grained sandstone, siltstone-pebble conglomerate, and gray tuffaceous sandstone. These basal units are overlain by a series of thin-bedded limestones, siltstones, and fine-grained

ARTICLE 197 E63
sandstones intercalated with tuff, mainly in the upper part of the sequence. The total average thickness of the formation is about 1,100 meters (Carter and others, 1961, p. 1895).
Conglomerate lenses that mark the base of the Patagua Formation confirm that the contact with the underlying strata was an erosional surface, that is an unconformity. The strata above and below the con tact show agreement of strike and dip in the southern half of the La Ligua quadrangle and southward through the adjacent Melon quadrangle (fig. 196.2). In these places the average strike is due north with dips of 25° to 35° E.
North of the Rio Petorca, however, the strike of the Cretaceous strata swings westward; the strata of Jurassic age are sharply truncated and show minor angular unconformability in dip. This suggests that the basal Cretaceous contact is a regional disconform- ity with local minor angular unconformity. Such
angular unconformity may be the result of orogeny associated with the intrusion of granitic masses of Jurassic age that crop out in the Coastal Cordillera of Chile. Part of one such mass is exposed at La Ligua and west of the Cretaceous contact. On the other hand, Ruiz and others (1961, p. 1558) have suggested that there may have been epeirogenic uplift through out central Chile during Late Jurassic time.
REFERENCES
Carter, W. D., Perez, E., and Aliste, N., 1961, Definition and age of the Patagua formation, Province of Aconcagua, Chile: Am. Assoc. Petrol. Geol. Bull., v. 45, p. 1892-1896.
Ruiz, C., Aguirre, L., Corvalan, J., Rose, H. J., Jr., Segerstrom, K., and Stern, T. W., 1961, Ages of batholithic intrusions of northern and central Chile: Geol. Soc. America Bull., v. 72, p. 1551-1560.
Thomas, H., 1958, Geologia de la Cordillera de la Costa entre el valle de La Ligua y la Cuesta de Barriga: Inst. de Invest. Geologicas, Bull. 2, Santiago, Chile.
197. RELATIONS OF THE NAVAJO AND CARMEL FORMATIONS IN SOUTHWEST UTAH AND ADJOINING ARIZONA
By J. C. WEIGHT and D. D. DICKEY, Beltsville, Md., and Denver, Colo.
Work done in cooperation with the U.S. Atomic Energy Commission
The Navajo Sandstone of Late Triassic(?) and Jurassic age is overlain by the Carmel Formation of Middle and Late Jurassic age throughout most of Utah and northern Arizona. The Navajo is a cross- bedded eolian sandstone and the Carmel an evenly bedded marine limestone, shale, and siltstone unit. The contact between the two formations is distinct because of the markedly contrasting lithologies. In much of central Utah the contact is a smooth plane, which truncates the crossbeds of the Navajo and rep resents a hiatus of unknown duration. But in south western Utah the two formations intertongue exten sively (fig. 197.1, cross section). The largest tongue of Navajo appears to be a marginal marine, rather than eolian, deposit reworked from an older part of the Navajo Sandstone.
Several thin metabentonites near the base of the
Carmel provide a reliable datum which aids in de tailed correlation of the formation.
Location of measured stratigraphic sections shown on figure 197.1
1?,345fi789
1011
Locality
PinturaCave Canyon _ _Mount Carmel Junction J _ .Kanab Creek _ _Lick Wash. __ __ _ _Hackberry CanvonJudd Hollow 12 L_-_---_-____Wahweap Creek __ _ _
Block Mesa 1 .
Section
322
298
25419
314
12
Township
40 S.41 S.39 S.41 S.41 S.41 S.40 S.41 S.43 S.44 S.
43 S.
Range
17 W.15 W.13 W.9 W.8 W.6 W.4 W.1 W.1 E.4 E.
8 W.
1 Discussed by Schultz and Wright (Art. 198).2 Described by Phoenix (1963). » Lat 36°33'30" N., long 111°03' W.

EX
PL
AN
AT
ION
Ou
tcro
p o
f b
ase
of
Car
mel
Fo
rmat
ion
Mea
sure
d s
trat
igra
ph
ic s
ecti
on
Tes
t w
ell
reac
hin
g b
ase
of
Car
mel
Fo
rmat
ion
XQ
!*\/
3 ^
X2
Lin
e o
f se
ctio
n
IRO
N
^A
nti
mo
ny
Can
yon
Car
mel
sid
e o
f co
nta
ct
GA
RF
IEL
D
.__I
Ced
ar C
ity
c£ f-s
<
0
O
r-l
Bry
ce C
anyo
n r
f j
Nat
iona
l P
ark
^J
p-
WA
SH
ING
TO
N
0 St
Geo
rge
MO
HA
VE
AR
IZO
NA
5 6
FEE
T 1
-30
00
-20
00 C
arm
el
Fo
rmat
ion
-1000 N
avaj
o
San
dst
on
e60
MIL
ES
VE
RTI
CA
L E
XA
GG
ER
ATI
ON
X
13
2
EX
PL
AN
AT
ION
Cro
ssb
edd
ed s
and
sto
ne
Red
silt
sto
ne
wit
h s
om
e sa
nd
sto
ne
Red
cla
ysto
ne
wit
h s
om
e si
ltst
on
e
Gra
y ca
lcar
eou
s sh
ale
Gra
y lim
esto
ne
and
do
lom
ite
Gyp
sum
Ben
ton
ite
Cir
cle
srio
ws
sam
ple
posi
tion
Reg
ion
al a
ng
ula
r u
nco
nfo
rmit
y
H
.
__
_
_
CO
CO
NIN
OP
aria
P
I
FIG
UR
E 197.1
. M
ap a
nd s
ecti
on s
how
ing
cont
act
of t
he C
arm
el F
orm
atio
n an
d N
avaj
o S
ands
tone
in
sout
hwes
tern
Uta
h an
d ad
join
ing
Ari
zona
. "E
rode
d ar
ea"
deno
tes
anti
clin
e in
Nav
ajo,
ref
erre
d to
in
text
, th
at w
as b
evel
ed d
urin
g de
posi
tion
of
Tho
usan
d P
ocke
ts T
ongu
e of
Nav
ajo.

ARTICLE 197 E65
NAVAJO SANDSTONE
The Navajo Sandstone extends over most of the Colorado Plateau, and in Zion National Park the white and red cliffs reach spectacular heights of more than 2,000 feet. The sandstone is composed almost entirely of quartzose well sorted fine- to medium- grained sand, and contains wedge sets 30 to 50 feet thick of high-angle, sweeping, gently arcuate cross- beds. The character of the sandstone is uniform through its whole thickness and extent, and it has been consistently interpreted as an eolian deposit.
The Navajo thickens westward across both Utah and northern Arizona, from 800 feet southeast of Kai- bito to about 2,300 feet in Zion National Park (fig. 197.1, cross section). In southwestern Utah the for mation intertongues along both its lower and upper contacts. The Lamb Point Tongue at the base has been described by Wilson (Averitt and others, 1955, p. 2521).
TEMPLE CAP MEMBER
The Temple Cap Member (Gregory, 1950, p. 89) of the Navajo Sandstone is a tonguelike unit about 150 feet thick which forms a prominent cap on East Tem ple, West Temple, and many other buttes at the en trance to Zion Canyon. The member consists chiefly of sandstone nearly identical in lithology and char acter of bedding to the rest of the Navajo, but sepa rated from it by a bed of siltstone, 5 to 25 feet thick. The bed weathers to form a red tree-covered bench or recess at the base of the member. The Temple Cap Member cannot be distinguished from the rest of the Navajo much farther east than Mount Carmel Junc tion because the basal siltstone pinches out. The western limit is in the gap in outcrops between Zion National Park and the Pine Valley Mountains.
THOUSAND POCKETS TONGUE
The Thousand Pockets Tongue (Phoenix, 1963) of the Navajo Sandstone intertongues with the Carmel throughout the Paria Plateau and Paria Valley. The tongue was recognized independently at about the same time by D. A. Phoenix in geologic mapping, by Kathleen MacQueen (1957) in photogeologic mapping of the Paria Plateau, and by the authors of this arti cle in stratigraphic studies at the north end of the Paria Valley. The Thousand Pockets Tongue has since been traced along the outcrop throughout central Kane County. Probable correlatives, to which the name cannot yet be confidently applied, are found in eastern Kane County and in central Garfield County.
From the area of the Glen Canyon Dam, where the tongue is about 200 feet thick, it extends north and northwestward more than 50 miles to where it pinches
out. The tongue is composed of well-sorted quartzose sandstone, lithologically similar to the Navajo Sand stone but deposited in even beds as well as in cross- beds. A few interbeds of reddish flat-bedded silty sandstone extend for thousands of feet within the tongue. Slumped and contorted crossbeds occur throughout the tongue. Toward the southeast, where it joins with the Navajo, large-scale sweeping cross beds very similar to those in the Navajo are common. Toward the distal limits of the tongue, tabular sets of even strata and smaller crossbeds predominate. The tabular sets are truncated at the top along exten sive smooth bedding planes.
The Thousand Pockets Tongue cannot be distin guished easily from the rest of the Navajo southeast of the pinchout of the underlying Judd Hollow Tongue of the Carmel Formation. However, an unusually persistent horizontal truncation plane, underlain by a foot or two of sandstone impregnated with black iron oxide, extends eastward a few miles from the pinch- out on the Paria Plateau. The strata above the black band have tabular sets, even beds, and slump struc tures similar to those described in the Thousand Pockets Tongue. Similar features indicate less cer tainly that the uppermost part of the Navajo Sand stone, along the southeast and eastern fronts of the Kaiparowits Plateau, is probably equivalent to the Thousand Pockets Tongue. In central Garfield County near Escalante and Boulder, prominent inter- beds of sandstone similar to beds of the Thousand Pockets Tongue are present both on outcrop and in test wells which penetrate the lower part of the Carmel Formation; these sandstone beds also prob ably correlate with the Thousand Pockets Tongue.
SOURCE OF THE THOUSAND POCKETS TONGUE
South of the Glen Canyon Dam, local erosion of the Navajo over a buried anticline prior to deposition of the Carmel Formation has been described by Mc- Clymonds (1961). The area from which a minimum of 25 feet of sand was eroded, was estimated from McClymond's isopach map of the Navajo Sandstone and plotted on figure 197.1. Probably more than 300 feet of sand was eroded from the thickest, or north- central, part of this area. It is inferred that the sand eroded from this anticline was redeposited to form the Thousand Pockets Tongue.
This interpretation implies that the material of the Thousand Pockets Tongue was transported northward for distances as great as 70 miles. The thinning of the tongue to the northwestward and the overall relation of the predominantly continental Navajo Sandstone to the marine Carmel Formation fit this concept. The

E66 GEOLOGICAL SURVEY RESEARCH 1962
flat bedding, the numerous smooth truncation planes, and the intertonguing of the Thousand Pockets Ton gue with the marine Carmel are criteria that the tongue is an aqueous deposit (Baars, 1961, p. 187-189). Flame structures (Kelling and Walton, 1947, p. 484- 485), observed in the tongue near Adairville, are con sistently overturned and dragged to the north. This northward overturning is also consistent with the presumed northward slope of the surface at the time of deposition. All the observed features thus indicate northward transport of material in the Thousand Pockets Tongue, even though the southward dip of crossbeds nearly everywhere in the main mass of the Navajo indicates eolian transport in that direction (Poole, 1962; Wells, 1960, p. 126; Phoenix, oral com munication, 1962).
CARMEL FORMATION
The Carmel Formation along the Hurricane Cliffs contains a thin lower sequence of gypsiferous red beds, a thick middle sequence of gray limestone and shale, and an upper sequence of gypsiferous red siltstone and sandstone. The lower red beds are stratigraphi- cally equivalent to the Temple Cap Member of the Navajo Sandstone (Cook, 1957, p. 34). These red beds are only known in Washington County and southeastern Iron County.
Thin bentonite clay beds, altered from volcanic-ash falls, are widely distributed near the base of the Carmel Formation. They are dark purple or light yellowish green, and contrast conspicuously with the white or reddish-brown enclosing strata. The clay is in layers about half an inch to 2 inches thick at most outcrops, but locally is as much as several feet thick. The thicker pods presumably represent ash washed into shallow hollows soon after it fell. Near Gunlock and in the Pine Valley Mountains one bentonite is near the middle of the several-hundred-foot thickness of red beds in the basal part of the Carmel. Several slightly later bentonites, extending from Gunlock to Judd Hollow, are at the base of the limestone in the Carmel, enclosed in 6 inches to 5 feet of clastic strata probably reworked from the underlying Navajo. The mineralogy and petrology of these bentonites are dis cussed by L. G. Schultz and J. C. Wright (Art. 198).
The gray limestone and shale in the middle of the Carmel, and the gypsiferous red beds at the top, form an extensive twofold division of the formation (Gil- luly and Reeside, 1928, p. 73-74). The red beds ex tend beyond the limey beds to the east and southeast.
In southwestern Utah, the Carmel and younger Jurassic formations are truncated by a regional angu
lar unconformity and are overlain by Upper Creta ceous strata. Although this unconformity successively truncates the Morrison, Summerville, Entrada, and Carmel Formations, its angularity is only half a de gree or less. It has been clearly recognized only near the Glen Canyon Dam.
JUDD HOLLOW TONGUE
The limestone of the lower part of the Carmel Formation passes southeastward beneath the Thou sand Pockets Tongue of the Navajo to form the Judd Hollow Tongue of the Carmel (Phoenix, 1963). On the west side of the Paria Valley, the tongue is about 100 to 200 feet thick; on the east side of the valley, about 50 to 100 feet; and near the head of Judd Hol low on the Paria Plateau, it pinches out. From west to east the limestone thins, grades from relatively pure carbonate to argillaceous limestone, and from gray to reddish gray. Interbedded red siltstone and sandstone increase eastward. The uppermost bed of limestone in the Judd Hollow Tongue, which is ripple marked and oolitic near the East Kaibab monocline, grades to ripple-marked limey siltstone that may be traced a little east of Judd Hollow. Fossils have been found in the tongue at the northwest end of the Paria Valley. Calcareous strata north of Escalaiite prob ably grade to very silty beds south of the town.
AGE RELATIONS
In southwest Utah, the limestone of the Carmel con tains assemblages of fossil pelycopods and gastropods. The Carmel in central Utah, and equivalent units of the Twin Creek Limestone in northern Utah, contain these same assemblages, as well as critical ammonites, thus establishing their Bajocian or early Middle Juras sic age (R. W. Imlay and N. F. Sohl, oral communi cation, 1961). The main mass of the Navajo Sand stone is considered Late Triassic (?) on the basis of scanty paleontologic evidence (Lewis and others, 1961, p. 1439). However, the Temple Cap Member, which immediately underlies the bentonite at Mount Carmel Junction, and the Thousand Pockets Tongue are Juras sic because they intertongue with the Carmel Forma tion of definite Jurassic age.
REFERENCES
Averitt, Paul, Dettermann, J. S., Harshbarger, J. W., Repen- ning, C. A., and Wilson, R. F., 1955, Revisions in corre lation and nomenclature of Triassic and Jurassic Forma tions in southwestern Utah and northern Arizona: Am. Assoc. Petroleum Geologists Bull., v. 39, p. 2515-2524.
Baars, D. L., 1961, Permian blanket sandstones of Colorado Plateau, in Geometry of sandstone bodies: Am. Assoc. Petroleum Geologists, p. 179-207.
ARTICLE 198 E67Cook, E. F., 1957, Geology of the Pine Valley Mountains, Utah:
Utah Geol. and Mineralog. Survey Bull. 58, 111 p.Gilluly, James, and Reeside, J. B., Jr., 1928, Sedimentary rocks
of the San Rafael Swell and some adjacent areas in east ern Utah: U.S. Geol. Survey Prof. Paper 150-D, 110 p.
Gregory, H. E., 1950, Geology and geography of the Zion Park region, Utah and Arizona: U.S. Geol. Survey Prof. Paper 220, 200 p.
Kelling, G., and Walton, E. K., 1957, Load-cast structures: their relationship to upper-surface structures and their mode of origin: Geol. Mag., v. 94, p. 481-490.
Lewis, G. E., Irwin, J. H., and Wilson, R. F., 1961, Age of the Glen Canyon Group on the Colorado Plateau: Geol. Soc. America Bull., v. 72, no. 9, p. 1437-1440.
McClymonds, N. E., 1961, Effects of a buried anticline on
ground water in Navajo Sandstone in the Copper Mine- Preston Mesa area, Coconino County, Arizona: Art. 321 in U.S. Geol. Survey Prof. Paper 424-D, p. D79-D82.
McQueen, Kathleen, 1957, Photogeologic map of Lees Ferry NW, Coconino County, Arizona: U.S. Geol. Survey Misc. Geol. Inv. Map 1-196.
Phoenix, D. A., 1963, Geology of the Lees Ferry area, Coconino County, Arizona: U.S. Geol. Survey Bull. 1137. [In press.]
Poole, F. G., 1962, Wind directions in late Paleozoic to middle Mesozoic time on the Colorado Plateau: Art. 163 in U.S. Geol. Survey Prof. Paper 450-D, p. D147-D151.
Wells, J. D., 1960, Stratigraphy and structure of the House Rock Valley area, Coconino County, Arizona: U.S. Geol. Survey Bull. 1081-D, p. 117-158.
MINERALOGY, GEOCHEMISTRY, AND PETROLOGY
198. BENTONITE BEDS OF UNUSUAL COMPOSITION IN THE CARMEL FORMATION, SOUTHWEST UTAH
By L. G. SCHULTZ and J. C. WEIGHT, Denver, Colo., and Beltsville, Md.
Persistent thin beds of bentonite of Jurassic age occur at or near the base of the Carmel Formation in southwest Utah. Their stratigraphic position and geographic distribution are described by Wright and Dickey (Art. 197). The bentonites consist of dark- purple or pale-green claystone beds generally an inch or two in thickness that appear conspicuously differ ent from the enclosing red beds. Field criteria that they are bentonites include their lack of ordinary detrital silt and sand, the conspicuous pseudohexag- onal books of black lustrous biotite which decrease in size and abundance from the bottom to the top of the clay bed, and the broad lateral extent of the thin beds.
Thin-section study shows that the bentonites are composed of about 1 to 10 percent relatively large crystals of feldspar, quartz, and biotite in a very fine clay groundmass. Some thin sections show faint rem nant structures interpreted as fine-grained shards. A few angular fragments apparently of altered vol canic material are outlined because their hematite content differs from that of the surrounding ground- mass. Clay in the groundmass generally is oriented parallel to the bedding, a feature not characteristic of most bentonites; wrapping of this bedding around the larger, presumably volcanic crystals indicates the clay orientation is due at least in part to compaction
during alteration. The larger volcanic crystals appear fresh, except that the biotite in a few samples is altered partly or wholly to clear, slightly birefringent vermiculite. Feldspar phenocrysts are in part eu- hedral and partly broken into very irregular angular particles, indicating aerial rather than stream trans portation.
Samples of both the Carmel bentonites and enclos ing sediments have been separated into coarse (>10/x) and fine fractions. Both size fractions as well as the bulk samples were studied by X-ray dif fraction; mounts of the coarse fraction were studied optically (see table). Note that samples CC-8, MC-T, MC-3u, and MC-31, from bentonite beds shown in their proper stratigraphic sequence within the Carmel Formation in sections at Cottonwood Canyon and Mount Carmel Junction, are repeated at the bottom of the table under "Bentonite beds". The bentonite beds are composed primarily of kaolinite, illite, and mixed-layer clays, and contain little or no montmoril- lonite that is typical of most bentonite beds. Further more, except for the apparent absence of IMd musco- vite polymorph (listed on the table under "Illite") in the bentonites, the clays in the bentonites are similar to those in the adjacent sediments. Thus, the clay minerals themselves do not indicate that the thin clay
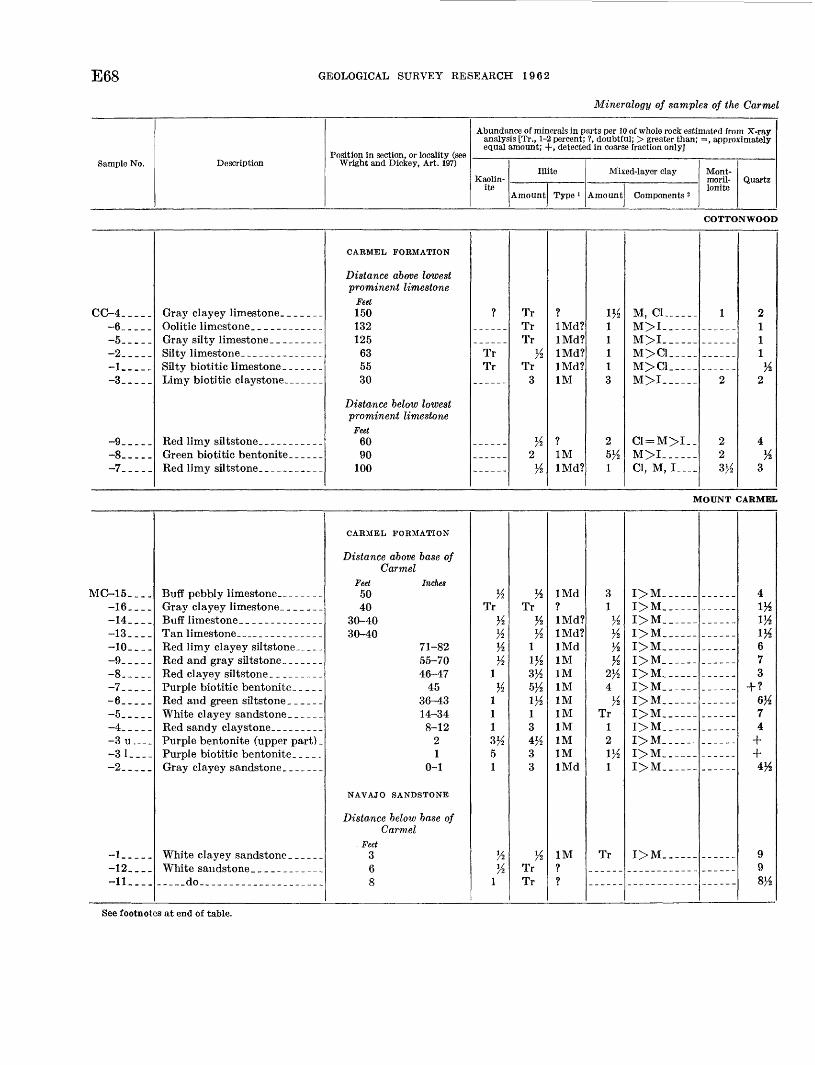
E68 GEOLOGICAL SURVEY RESEARCH 1962
Mineralogy of samples of the Carmel
Sample No. DescriptionPosition in section, or locality (see
Wright and Dickey, Art. 197)
Abundance of minerals in parts per 10 of whole rock estimated from X-ray analysis [Tr., 1-2 percent; ?, doubtful; > greater than; =, approximately equal amount; +, detected in coarse fraction only]
Kaolin- ite
Illite
Amount Type '
Mixed-layer clay
Amount Components 2
Mont- moril- lonite
Quartz
COTTONWOOD
CC-4._...-6-.___
-2. ...._i-3_.._.
9-8.....-7.....
Gray clayey limestone. _ _
Silty biotitic limestone __ _
CARMEL FORMATION
Distance above lowestprominent limestone
Feet150132125
635530
Distance below lowestprominent limestone
Feet6090
100
?
TrTr
TrTrTr
%Tr
3
%2
Vz
?IMd?IMd?IMd?IMd?1M
?1MIMd?
Itf11113
25/2
1
M, CL__-_.M>I..__._M>I.__.__M>C1.____M>C1_____M>I..._._
C1 = M>I__M>I___-._Cl, M, !___.
1
2
223H
2111
%2
4u
3
MOUNT CARMEL
-16....-14....
-10.... Q
-7.....-6.....-5.....-4. ....
-3 1-2
_i-12-11.-..
Gray clayey limestone. _ _Buff limestone _
.-_.. do.. _.-_.____._.__-___.
CARMEL FORMATION
Distance above base of Carmel
Feet Inches 5040
30-4030-40
71-8255-7046-47
4536-4314-348-12
21
0-1
NAVAJO SANDSTONE
Distance below base of Carmel
. Feet 36
u.Tr
Yzi/y
1u
111
51
]/
1
Tr
i/2
1
3/2
5/2
13
33
TrTr
IMd
IMd?IMd?IMd1M1M1M1M1M1M1M1MIMd
1M
?
31
Yz/2
%Yz4
Tr12
1
Tr
I>M__ __I>MT\> jyr
I > 1VII>MI>M1^* 1VI1^* 1VII>MI>MI>MI>M__ .
I^>M__
I>M_._-
4
1^iy>673
6)474
_j_4^
998/2
See footnotes at end of table.
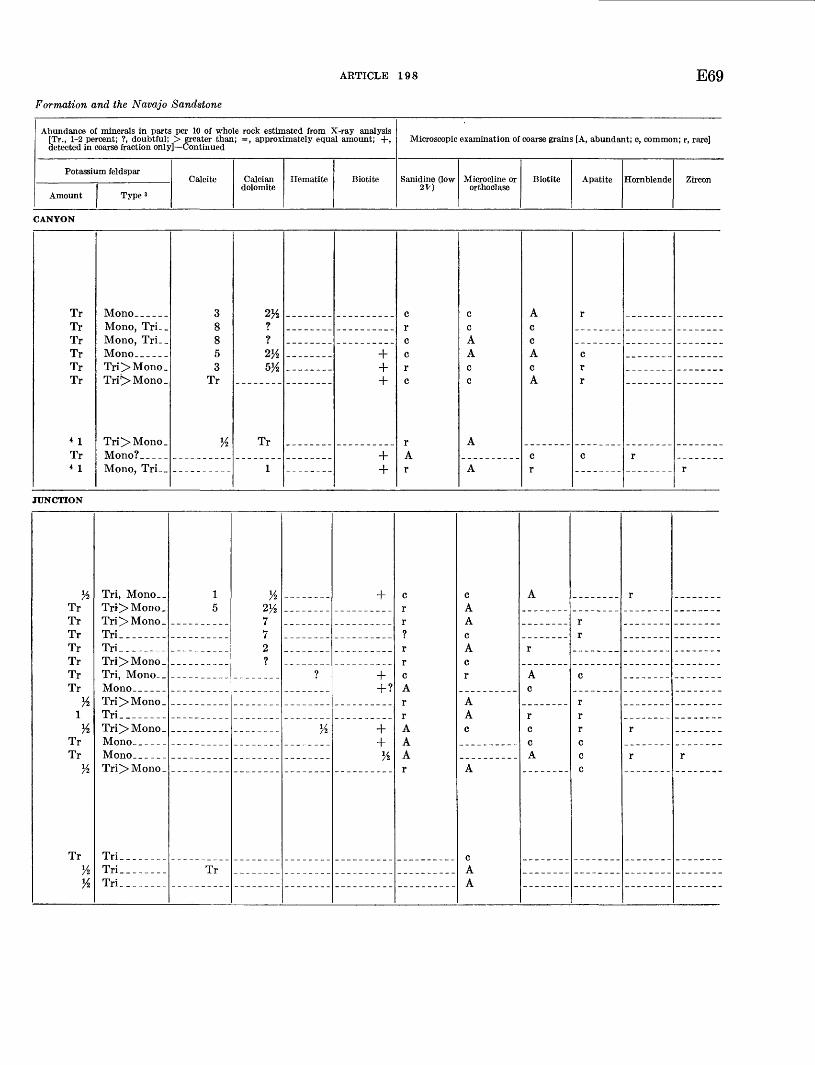
ARTICLE 198 E69
Formation and the Navajo Sandstone
Abundance of minerals in parts per 10 of whole rock estimated from X-ray analysis [Tr., 1-2 percent; ?, doubtful; > greater than; =, approximately equal amount; +, detected in coarse fraction only] Continued
Potassium feldspar
Amount Type 3
Calcite Calcian dolomite
Hematite Biotite
Microscopic examination of coarse grains [A, abundant; c, common; r, rare]
Sanidine (low 2V)
Microcline or orthoclase
Biotite Apatite Hornblende Zircon
CANYON
TrTrTrTrTrTr
* 1
Tr4 1
Mono __Mono, Tri _Mono, Tri _Mono __ __Tri > Mono _Tri>Mono_
Tri > Mono.Mono? _Mono, TrL.
38853
Tr
%
2K??2/2
5%
Tr
1
+++
++
c
c
c
A
ccAAc
A
A
AccAcA
cr
c
JUNCTION
%TrTrTrTrTrTrTr
%1
%TrTr
%
Try-2%
Tri, Mono _Tri> Mono .Tri > Mono.Tri_. ______Tri__._____Tri > Mono.Tri, MonoMono _Tri > Mono.Tri________Tri>Mono_
Mono _Tri > Mono _
Tri. _______Tri_. ______Tri_. ______
15
Tr
1A21A772?
?
%
+
++ ?
++
%
?
cA
AAA
cAA
A
AAc
A
AA
A
Ac
ccA
rr
c
r
cc r
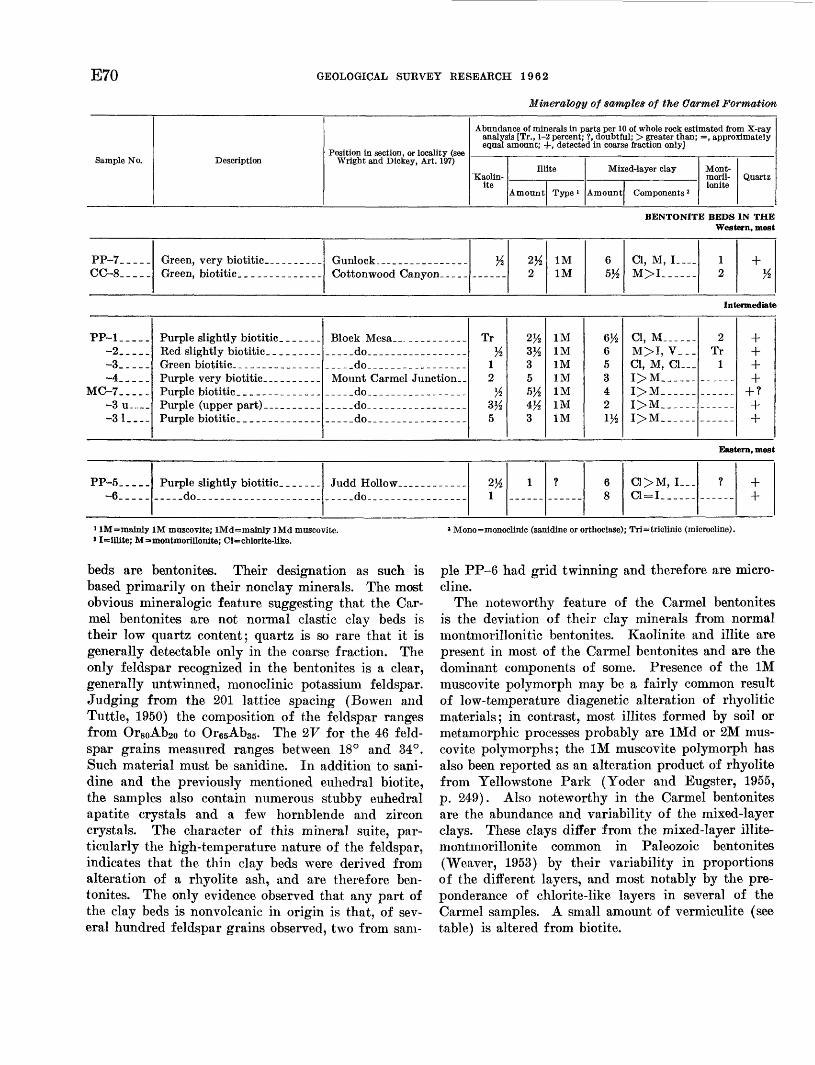
E70 GEOLOGICAL SURVEY RESEARCH 1962
Mineralogy of samples of the Carmel Formation
Sample No. DescriptionPosition in section, or locality (see
Wright and Dickey, Art. 197)
Abundance of minerals in parts per 10 of whole rock estimated from X-ray analysis [Tr., 1-2 percent; ?, doubtful; > greater than; =, approximately equal amount; +, detected in coarse fraction only]
'Kaolin- ite
Illite
Amount Type»
Mixed-layer clay
Amount Components 2
Mont- moril- lonite
Quartz
BENTONITE BEDS IN THEWestern, most
PP-7_____CC-8._.__ Green, biotitic _____ ______
% 2*42
1M1M
65/2
Cl, M, !.___M>I______
12
+%
Intermediate
pp-1_o_3 4
MC 7-3 u_. ...-31.---
Purple slightly biotitic- _ _Red slightly biotitic ______Green biotitic ______ _ _Purple very biotitic _ _ _ _
Purple biotitic_ ______ ____ .
do
dododo
Tr
12
3^5
2/2
3/2
355/2
3
1M1M1M1M1M1M1M
6/2
653421/2
Cl, M______M>I, V___Cl, M, Cl-_
I>M__I>M___I>M__
2Tr
1
_[__[__l_
+ ?_[__j_
Eastern, most
PP-5_____-6_._._ _____do-_-_---_-_----____.__
Judd Hollow _______ _ __-_-_do-_-_---__.-----_-
9J/
1
1 ? 68
C1>M, I__.C1 = I______
? ++
1 lM=mainly 1M museovite; lMd=mainly IMd muscovite. ' I=illite; M=-montmorillonite; Cl=chlorite-like.
beds are bentonites. Their designation as such is based primarily on their nonclay minerals. The most obvious mineralogic feature suggesting that the Car mel bentonites are not normal clastic clay beds is their low quartz content; quartz is so rare that it is generally detectable only in the coarse fraction. The only feldspar recognized in the bentonites is a clear, generally untwinned, monoclinic potassium feldspar. Judging from the 201 lattice spacing (Bowen and Tuttle, 1950) the composition of the feldspar ranges from Or80Ab2o to Or65Ab35. The 2F for the 46 feld spar grains measured ranges between 18° and 34°. Such material must be sanidine. In addition to sani- dine and the previously mentioned euhedral biotite, the samples also contain numerous stubby euhedral apatite crystals and a few hornblende and zircon crystals. The character of this mineral suite, par ticularly the high-temperature nature of the feldspar, indicates that the thin clay beds were derived from alteration of a rhyolite ash, and are therefore ben tonites. The only evidence observed that any part of the clay beds is nonvolcanic in origin is that, of sev eral hundred feldspar grains observed, two from sam-
3 Mono=monoclinic (sanidine or orthoclase); Tri=triclinic (microeline).
pie PP-6 had grid twinning and therefore are micro- dine.
The noteworthy feature of the Carmel bentonites is the deviation of their clay minerals from normal montmorillonitic bentonites. Kaolinite and illite are present in most of the Carmel bentonites and are the dominant components of some. Presence of the 1M muscovite polymorph may be a fairly common result of low-temperature diagenetic alteration of rhyolitic materials; in contrast, most illites formed by soil or metamorphic processes probably are IMd or 2M mus covite polymorphs; the 1M muscovite polymorph has also been reported as an alteration product of rhyolite from Yellowstone Park (Yoder and Eugster, 1955, p. 249). Also noteworthy in the Carmel bentonites are the abundance and variability of the mixed-layer clays. These clays differ from the mixed-layer illite- montmorillonite common in Paleozoic bentonites (Weaver, 1953) by their variability in proportions of the different layers, and most notably by the pre ponderance of chlorite-like layers in several of the Carmel samples. A small amount of vermiculite (see table) is altered from biotite.

ARTICLE 198 E71
and the Navajo Sandstone Continued
Abundance of minerals in parts per 10 of whole rock estimated from X-ray analysis [Tr., 1-2 percent; ?, doubtful; > greater than; =, approximately equal amount; +, detected in coarse fraction only] Continued
Potassium feldspar
Amount Type'
Calcite Calcian dolomite
Hematite Biotite
Microscopic examination of coarse grains [A, abundant; c, common; r, rare]
Sanidine flow 2P)
Microcline or orthoclase
Biotite Apatite Hornblende Zircon
CARMEL FORMATION seaward localities
TrTr
Mono __Mono?_ _ _
Tr Tr 5 Tr
+AA
A cc
r? r
localities
TrTr+TrTrTrTr
Mono.__ _Mono _ _Mono__ - _Mono _Mono__Mono___-__Mono.____
??
5 Tr
Tr+ ?+
%
AAAAAAA
cAAc
Acc
landward localities
+Tr
Mono__ -__Mono___ __
/2
1
+
+
AA
Ac
r
«About half plagloclase. Biotite partly altered to vermiculite.
Clays in the Carmel sediments above and below the bentonites are similar to the clays in the bentonites (see table) and therefore presumably also may be de rived at least in part from rhyolitic tuff. Other evi dence of volcanic components in the sediments are some sanidine, biotite, apatite, and rarely hornblende and zircon similar to that in the bentonites. How ever, the enclosing sediments differ from the benton ites by also containing a preponderance of nonsanidine feldspar (microcline), the IMd muscovite polymorph, and much more quartz; these are probably nonvol- canic detrital constituents. The inferred volcanic ori gin of much of the clay and the noiivolcanic origin of most of the coarser elastics are consistent if much of the clay is derived by devitrification of larger tuff particles originally deposited with the sediments.
Because 1M muscovite in the Carmel Formation is interpreted as being of volcanic origin, and because none of the Navajo samples contain other evidence of volcanic components, the presence of 1M muscovite in sample MC-1 (table) at the top of the Navajo Sand stone seems anomalous. The friable, weathered ap pearance of sample MC-1, and its location just below
a Carmel bentonite bed, suggest that the clay may have infiltrated downward from the overlying ben tonite bed.
No textural criteria were recognized to indicate the sequence of development of the clay minerals in the Carmel bentonites; thus, we can only speculate. The presence of sanidine, biotite, and small amounts of quartz in all the Carmel bentonites indicates that they were altered from a rhyolite tuff of fairly uniform composition. Thus, the original composition of the ash apparently did not control the course of alteration to the variety of clay minerals presently found. Be cause the phenocrysts generally are unaltered, altera tion of the ash was probably no more intensive than devitrification of the glass; thus, the kaolinitic ben tonites probably are not the products of strong leach ing. Experiments with formation of synthetic clays (Julian Hemley, oral communication, 1962) indicate that a single poorly organized montmorillonoid phase forms from a glass much more rapidly than better organized phases like the Carmel illite or kaolinite. We therefore hypothesize that the rhyolite ash first altered to such a poorly organized mass, which, with

E72 GEOLOGICAL SURVEY RESEARCH 1962
time, tended to separate into better organized, more stable phases such as the illite. During formation of the initial montmorillonoid phase from the ash, con siderable SiO2 must have been removed; variable amounts of other elements probably also could be leached with relative ease from such a poorly crystal line material, thereby explaining, for example, how most of the potassium could be leached from some samples without alteration of the relatively stable feldspar. If little of the potassium originally in the rhyolite ash (K2O/A12O3 about ys or 1/4) were re moved, the potassium-rich montmorillonoid would convert largely to illite (K2O/A12O3 about 1/4); if much potassium were removed, abundant mixed-layer clay or montmorillonite would result. If alumina in excess of that needed for the three-layer clays remains, some kaolinite would form. Thus, the highly variable composition of the Carmel bentonites would result from differential leaching of the chemical components of the original ash.
Several factors may have caused variable conditions of leaching of the rhyolite tuff. One such factor is differential oxidation due to relative degree of marine or nonmarine conditions. The Carmel bentonite beds probably were deposited on a tidal flat at about the time the Carmel sea encroached from the west. Most of the samples from intermediate and eastern areas farthest from the encroaching sea (see table) are red or purple due to included hematite, presumably pro duced by oxidation during repeated exposure to wet ting and drying. Several of these bentonites have
relatively high kaolinite contents. In contrast, ben tonite samples from the two more seaward localities are green, indicating that they were more continually submerged and were exposed to relatively little wet ting, drying, and the accompanying oxidation and leaching; these samples contain very little kaolinite. Physical conditions during deposition, however, seem ingly cannot explain all the observed mineralogical variations, such as the highly illitic bentonites at Mt. Carmel Junction, which contrast with highly chloritic mixed-layer bentonites from localities both landward and seaward of Mt. Carmel Junction. Also, at Cot- tonwood Canyon, samples throughout a stratigraphic interval of 250 feet contain fairly montmorillonitic clays, whereas clays at Mt. Carmel Junction are all illitic. The strand line and environment of deposition did not remain static during deposition of all these rocks. Therefore, the course of alteration of the rhyolitic debris in the Carmel must also have been influenced by some such factor as the chemistry of connate water, which could circulate and uniformly affect a considerable thickness of rocks after burial of the sediments.
REFERENCES
Bowen, N. L., and Tuttle, O. F., 1950, The system NaAlSi3O8-KAlSi3O8-H2O: Jour. Geology, v. 58, no. 5, p. 489-511.
Weaver, C. B., 1953, Mineralogy and petrology of some Ordo-vician K-bentonites and related limestones [Pa.]: Geol.Soc. America Bull., v. 64, no. 8, p. 921-943.
Yoder, H. S., and Bugster, H. P., 1955, Synthetic and naturalmuscovites: Geochim. et Cosmochim. Acta, v. 8, nos. 5/6,p. 225-280.

ARTICLE 199
199. SAMPLING A ZONED GALENA CRYSTAL FOR LEAD ISOTOPE STUDY
By KALPH S. CANNON, JR., KATHARINE L. BUCK, and ARTHUR P. PIERCE, Denver, Colo.
E73
Work done in cooperation with Division of Research, U.S. Atomic Energy Commission
Nier (1938; Nier and others, 1941) was the first to show that the isotopic composition of lead in lead minerals of ore deposits varies significantly from one deposit or locality to another, and that ore-lead in deposits of younger geologic age tends to contain higher proportions of the radiogenic isotopes Pb206, Pb207 , and Pb208 from decay of uranium and thorium. He learned further that lead from Joplin, Mo., com pared with lead from other regions, was variable and anomalous in isotopic composition. His discoveries prompted further investigations in many laboratories, including a long-term study of the isotopic variations of lead and their geologic significance by the U.S. Geological Survey.
The initial goal of the Survey program was to learn how to carry out geologic sampling procedures so that lead isotope findings would be meaningful. In sam pling ore deposits one needs to know what kinds of lead isotope variations are expectable within individ ual mineral grains or crystals, within a hand specimen, within a single vein, ore shoot, or deposit, or within the broader scope of an entire district, metallogenic province, or class of ore deposit. Thus forearmed, one can design logical lead isotope experiments to solve specific problems in the geology of ore deposits.
A first step is to learn how uniform the isotopic composition of lead may be throughout single mineral grains or crystals. The first such test was made on galena from the Tri-State mining district (Missouri- Kansas-Oklahoma) because Nier's analyses of three different galena samples from "Joplin, Mo." showed measurable variations in lead isotope ratios. A large crystal was chosen to facilitate selective internal sam pling. Individual growth zones of the crystal were sampled to test whether the isotopic composition of ore-lead was constant as the crystal grew. Isotope analyses of lead from these successive growth zones are not identical. Instead, they show variations greater than analytical error. These variations seem ingly are systematic, with radiogenic isotopes pro gressively more abundant in outer growth layers, ex cepting the outermost skin of the crystal (sample A). These variations appear analogous to those found by Nier in ore deposits of different ages; that is, radio genic isotopes appear to be more abundant in samples of younger age. They suggest a possibility that this
crystal, may have grown during a very long span of geologic time.
These empirical observations seemed of such funda mental importance to research on the isotope geology of lead that only the general nature of the results was reported (Cannon, 1951, 1952, 1953; Cannon and oth ers, 1961) while attempts to elucidate details were continued. Our sampling procedures, together with lead isotope analyses made in 1951 and 1952 (accom panying table), are reported here in detail for the first time. These will help in evaluating other studies
Lead isotope ratios of samples cut from zoned galena crystal TSO-MK
Calculated
Sample No.
A. B_ ....B_ ....C- ....D.. ...E..... ...F-.-____H __I... -
Analysis No.
GS/54GS/55GS/60GS/118GS/56GS/119GS/57GS/58GS/59
7/3/51..--7/11-12/51..7/24-26/51..1/23/52...-.7/12-13/51..1/24/52 _ ..7/18-20/51..7/16-18/51..7/20-24/51..
Instru-
2B2B2B62A62B2A2A
MKH/JWR. -MKH/JEP---DW/JWR..--DW/JWR__-MKH/JWR..DW/JWR....MKH/JWR- -MKH/JWR--MKH/JWR__
Pbaoe
Pb204
91 73
22.1822.2022.4221.8121.7521.3621.2821.29
pb207
Pb'M
15.3815.6815.6215.9415.7815.7915.6315.5815.55
Pbzos
Pb204
40.04
41.43
40.6940.1740.0239.70
Measured :
Lab. No.
GS/54.....
GS/55....------
GS/60 -------- -
GS/118-. --
GS/56.. ---------
G8/119....-..-.-
GS/57 - ----------
G8/58 ..... ... .
GS/59. _ ------
pb204
pb206
0. 0461±. 0002
.0452±.0004
.0450±.0006
.0446±. 0003
.0459±. 0002
.0460±.0002
.0469±.0003
.0469±.0007
.0470±.0006
Pb204
pb207
0.0650±.0001
.0640±. 0005
.0640±.0008
.0627±.0003
.0635±.0002
.0634±.0002
.0639±. 0010
.0642±. 0010
.0645±. 0010
pb204
Pb208
0. 0250±.0001
.0244±.0002
.0245±.0004
.0242±.0001
.0248±. 0002
.0246±.0002
.0249±.0009
.0250±.0005
.0252±.0005
Pb207
pb206
0. 7076±.0017
.7065±. 0012
.7040±.0009
.7110±. 0019
.7233±.0011
.7264±.0019
.7319±.0045
.7325±. 0016
.7303±.0026
pb206
pb208
0. 5427±.0008
. 5434±. 0012
.5439±.0010
.5412±. 0009
.5414±.0007
.5345±. 0011
.5316±.0045
.5319±.0045
.5363±. 0024
Pb207
Pb20B
0.3841±. 0003
.3832±. 0002
.3324±.0019
.3851±.0009
.3913±.0006
.3886±. 0005
.3887±. 0029
.3897±.0005
.3913±.0016
1 Initials of the assayer, M. K. Hill or Dora Whaley, followed by initials of the super visor, J. W. Redniond or J. E. Parham, of the Mass Assay Laboratory, Y-12 Plant, Carbide and Carbon Chemicals Co., Oak Ridge, Tenn.
2 "The errors quoted are an expression of the precision of this measurement only. The accuracy is estimated at less than 1 percent from known sources of systematic errors." (Statement of laboratory.)

E74 GEOLOGICAL SURVEY RESEARCH 1962
of variations within galena crystals which were sam pled by other methods (Kulp and others, 1953, p. 8; Austin and Slawson, 1961), as well as more general studies in Mississippi Valley mining districts (Far- quhar and Gumming, 1954; Eckelmann and Kulp, 1959). The uncertainty of the mass-spectrometric measurements tends to be large, however, as compared with the natural variations. Therefore we are con tinuing to try to make new measurements of the pre cision needed. We hope to interpret these phenomena quantitatively as soon as analyses of appropriate qual ity are at hand.
Our galena crystal is from the Netta mine in the Picher-Miami area of the Tri-State mining district. This mine is in Ottawa County, Okla., one-third mile west of Picher, and about 20 miles south-southwest of Joplin, Mo. The specimen (Field No. TSO-MK) was collected on October 17, 1949, by Mr. Boodle Lane of Galena, Kans., and was obtained from him the same day. Information given by Mr. Lane implies that the crystal was collected in abandoned workings at a depth of about 250 feet, from a mine pillar 400 feet north and 600 feet east of the southwest corner of the Netta tract. This pillar, according to geologic mapping by Carl Addison (McKnight and others, 1944), contains high-grade ore in "M" bed, the most important ore horizon of the district.
The specimen was an imperfect crystal measuring about 7.0 by 7.5 by 9.0 cm and weighing about 2.5 kg. It was attached along one cube-edge to jasperoid, and its external form implies that it grew from this wall of jasperoid into an open space. Growth and lineage structures seen in cross section (fig. 199.1) likewise indicate that the crystal grew asymmetrically outward from the jasperoid wall. Internal discontinuities im ply that crystal growth was periodic, possibly inter rupted at times by partial solution. At some stages of growth the crystal evidently had fairly regular cube faces, but the present crystal faces are made up of a complex and extremely uneven assemblage of cubic and octahedral forms. A few younger, small crystals of dolomite, sphalerite, and marcasite have grown on these rough surfaces. In the last major epi sode of growth history the two cube faces farthest from the wall enlarged by outward growth and ac quired a sprinkling of marcasite crystals, whereas a face adjacent to the wall was etched to depths of a centimeter or more and then dusted with sphalerite crystals.
The crystal was sawed in half, nearly parallel to one cubic cleavage and normal to the wall and the longer axis of the crystal. The sawed faces were polished and then the various etch methods and re
agents recommended by Ramdohr (1955, p. 496) and by Frondel and others (1942) for revealing internal growth structures of galena were tried, without suc cess. After many failures a modification of the hot HC1 etch of cleavage surfaces described by Becke (1884) successfully revealed the growth structures in this crystal. The sawed surfaces were rough ground to develop a matte or pitted surface that is essentially a mosaic of minute cleavage faces. On this matte surface a radial pattern of lineage structures was well exhibited, and the center of this pattern was taken as the nucleus of crystal growth for this particular cross section (fig. 199.15, sample I). This surface was first etched by immersion in cold 1:7 (v/v) HNO3 for sev eral minutes until it began to darken or show irides cent tarnish, and then by immersion in hot fuming 1:2 (v/v) HC1 until light and dark growth structures appeared and developed maximum contrast.
The etched surface is predominantly gray, marked by alternating lighter and darker lines indicating the concentric growth layers, and by relatively large white triangular octahedral-face loci (fig. 199.1). The galena can be expected to contain different concentrations of Ag atoms under the lighter and darker areas (Fron del and others, 1942), and the patterns, therefore, sug gest fluctuations in the ratio of Ag and Pb atoms available to the growing crystal. Several of these fluctuations evidently reflect sudden variation, others more gradual change, in the Ag/Pb ratio. Certain growth zones are marked by inclusions of other sul- fide and carbonate minerals which originated as over growths on former exterior faces of the crystal similar to those on present exterior faces. The principal zones of inclusions seem to coincide with discontinuities within the crystal that are revealed by etch ^patterns. These several lines of evidence taken together indicate that the crystal's growth was interrupted a number of times. Such evidence that galena has had a complex history of repetitive deposition and dissolution has been observed throughout the Miami-Picher area (E. T. McKnight, written communication, 1961).
Samples weighing approximately 50 mg were cut from successive layers on this etched surface (fig. 199.15). Sample I was drilled from the focus of radiating lineages, believed to represent the nearest approach to the growth nucleus in this cross section. Samples F, G, and H were sawed from slots 1 mm wide on three sides of the innermost recognizable growth layer: F was cut at one cube-face position, G at an adjacent cube-face position, and H at an octahedron- face position. Samples E, D, C, and B were similarly cut at cube-face positions from successively younger growth layers outside of sample-position G. Finally,

ARTICLE 199 E75
3cm
r
FIGUEE 199.1. A, Photograph of Tri-State galena crystal TSO-MK as sectioned, etched, and sampled. B, Photograph retouched to emphasize light and dark etch patterns, growth zones, arid crystallographic spacing of samples A through I (described in text).
667422 O - 63 - 6

E76 GEOLOGICAL SURVEY RESEARCH 1962
sample A was scraped from the gray oxidized surface of the exterior cube face adjacent to sample B.
The samples of lead sulfide were converted to lead iodide by R. G. Milkey, U.S. Geological Survey Wash ington laboratory. Lead isotope analyses of the io dide samples were made on several 6-inch Nier-type 60° mass spectrometers in the Mass Assay Laboratory, Y-12 Plant, Carbide and Carbon Chemicals Co., Oak Ridge, Tenn., under the general supervision of Roger F. Hibbs. In July 1951, samples A, B, D ,F, H, and I were analyzed on instruments 2A and 2B; sample B lead iodide was split and submitted as two independ ent samples. To check the systematic variations indi cated by these analyses, intermediate samples C and E were analyzed in January 1952 on instrument 6. The last 2 analyses are imperfectly consistent with the first 7: ratios among Pb206 , Pb207, and Pb208 are consistent, but the reported abundance of Pb204 tends to be lower than in the earlier analyses and is more nearly in accord with Nier's analyses of Joplin samples. How ever, each batch of analyses is judged to be internal^ consistent. The duplicate analyses of sample B are well within experimental error, and anatyses of sam ples F and H from the same growth layer are prac tically identical. Precision of each batch of anatyses is judged to be about 1 percent for ratios involving Pb204, and 0.2 percent for ratios involving only the major isotopes.
For each sample the ratios actually measured, and their calculated log errors, are reported in the second part of the table. For each analysis there is about a 90-percent probability that, under the same operating conditions, the given instrument would find ratios within these limits. The ratios to Pb204 given in the first part of the table, however, are calculated values obtained by adjusting the six measured ratios. Fig
ure 199.2 is a graphic plot of reciprocals of the Pb207/ Pb206 ratios, the most orderly of the measured ratios.
The general nature of the results is evident. Within the visibly zoned part of the crystal, between inner growth z'one F-H and outer growth zone B, the data suggest systematic outward increases in the Pb206/ Pb207 ratio and in total radiogenic lead. As referred to the number of atoms of Pb204, Pb206 increases out ward by about 4 percent, Pb208 by about 2 percent, and Pb207 increases very slightty or remains nearty constant. Only the largest of these variations exceed the uncertainty of the measurements, yet the variations seem to be systematic and consistent except for inner most sample I and outermost sample A. The incon gruous decrease in radiogenic isotopes in outermost sample A .seems to be a "skin effect," similarly noted in galena crystals from Hansonburg, N. Mex., by Austin and Slawson (1961).
Interpreting the data at face value, this galena crys tal had a growth history whose details are recorded by individual growth laj^ers and by the isotopic variations from layer to layer. The lead deposited from ore- forming solutions was progressively enriched in radio genic isotopes as the crystal grew. These radiogenic increments appear to account for about 1 percent of the atoms in the entire crystal. One interpretation of the recorded variations would suggest that the crystal grew for a hundred million years or more, but that the episode of crystal growth had ended before the crystal was collected. Because of the analytical uncertainty of the data, new lead isotope analyses of greater preci sion are now being made, to permit better interpreta tion of the complex history of this crystal and its bearing on the genesis of Mississippi Valley ores.
H-58 1-59 F-57r~r E-119 I
D-56 I
SAMPLES ANALYZED c_ 118B-55 B_6Q A_54
1.42
1.41
§ 1.40
f 1.39s x o 1.38
CL
1.37
1.36200
i300
i400
I500
I600
HYPOTHETICAL VOLUME OF GROWING CRYSTAL, IN CUBIC CENTIMETERS
FIGURE 199.2. Variations in the isotope ratio Pb206/Pb207, based on analyses of samples cut from zoned galena crystal TSO-MK.Hypothetical volume=(2 X linear distance) 3 .

ARTICLE 200 E77
REFERENCES
Austin, C. F., and Slawson, W. F., 1961, Isotopic analyses of single galena crystals: A clue to history of deposition: Am. Mineralogist, v. 46, p. 1132-1140.
Becke, Friedrich, 1884, Aetzversuche am Bleiglanz: Tscher- maks mineralog. petrog. Mitt., v. 6, p. 237-280.
Cannon, R. S., Jr., 1951, Isotope geology of lead, in Rabbitt, J. C., Summary of the research work of the Trace Ele ments Section, Geochemistry and Petrology Branch, for the period Oct. 1-Dec. 31, 1951: U.S. Geol. Survey TEI- 218, p. 25-27, issued by U.S. Atomic Energy Comm. Tech. Inf. Service, Oak Ridge, Tenn.
1952, Geological Survey's work on isotope geology of uranium, thorium, and their decay products: U.S. Geol. Survey TEI-209, 12 p., issued by U.S. Atomic Energy Comm. Tech. Inf. Service, Oak Ridge, Tenn.
1953, Isotope geology of lead, in Trace Elements research Quarterly progress report, Jan. 1-March 31, 1953: U.S. Geol. Survey TEI-270, p. 54-56, issued by U.S. Atomic Energy Comm. Tech. Inf. Service, Oak Ridge, Tenn.
Cannon, R. S., Jr., Pierce, A. P., Antweiler, J. C., and Buck, K. L., 1961, The data of lead isotope geology related to problems of ore genesis: Econ. Geology, v. 56, p. 1-38.
Eckelmann, F. D., and Kulp, J. L., 1959, Lead isotopes and ore deposition in the Southeast Missouri lead district [abs.]: Geol. Soc. America Bull., v. 70, p. 1595.
Farquhar, R. M., and Cumming, G. L., 1954, Isotopic analyses of anomalous lead ores: Royal Soc. Canada Trans., v. 48, ser. 3, p. 9-16.
Frondel, Clifford, Newhouse, W. H., and Jarrell, R. F., 1942, Spatial distribution of minor elements in single-crystals: Am. Mineralogist, v. 27, p. 726-745.
Kulp, J. L., Owen, H. R., Eckelmann, W. R., and Bate, G. L., 1953, Isotopic composition of some samples of common lead: U.S. Atomic Energy Comm., NYO-6197, 13 p., issued by U.S. Atomic Energy Comm. Tech. Inf. Service, Oak Ridge, Tenn.
McKnight, E. T., Fischer, R. P., and others, 1944, Zinc-lead deposits in part of the Picher field, Ottawa County, Okla., and Cherokee County, Kans.: U.S. Geol. Survey Mineral Inv. Prelim. Map, 6 sheets.
Nier, A. O., 1938, Variations in the relative abundances of the
isotopes of common lead from various sources: Am. Chem. Soc. Jour., v. 60, p. 1571-1576.
Nier, A. O., Thompson, R. W., and Murphey, B. F., 1941, The isotopic constitution of lead and the measurement of geo logical time. Ill: Phys. Rev., 2d ser., v. 60, p. 112-116.
Ramdohr, Paul, 1955, Die Erzmineralien und ihre Verwachs- ungen : Berlin, Akademie-Verlag, p. 496.
200. EPIDOTE AND RELATED MINERALS IN TWO DEEP GEOTHERMAL DRILL HOLES, REYKJAVIK ANDHVERAGERDI, ICELAND
By GUDMUNDTJR E. SlGVALDASON i
An extensive review of the volcanic geology and thermal activity of Iceland is given by Barth (1950). More recent work on surface alteration by hydro- thermal solutions has been done by Sigvaldason (1959) and on subsurface temperature relations by Bod- varsson and Palmason (1962). The present article contains results of a preliminary study of hydro- thermal alteration at depth in two Icelandic thermal areas, with special emphasis on the distribution of epidote and related minerals.
Thermal activity in Iceland has been classified into two main categories: high-temperature areas more or less confined to centers of postglacial volcanic ac tivity, and low-temperature areas with no direct rela tion to Pleistocene or Recent volcanism. The city of Reykjavik lies within one of the low-temperature areas. Surface indications of thermal activity are 2 small hot springs with temperatures of 88°C. The area is covered by as much as 100 m of olivine dolerite of Pleistocene age. Below the lavas is a thin series (10 to 20 m) of interglacial deposits, which in turn overlies Tertiary plateau basalts. The thickness of
1 Present address, University Research Institute, Reykjavik, Iceland.
the Tertiary basalts in this area has been estimated at 2,000 m by seismic studies (Tryggvason and Bath, 1961), but the character of the underlying rocks is unknown except that higher densities are indicated.
Drilling for hot water for domestic heating has been carried out over a period of 3 decades. Most of the drill holes range in depth from 100 to 600 m, but recently several holes have been put down to 1,000 m and 1 hole is 2,200 m deep. The deep holes were drilled with a large rotary drill, which delivers rock fragments as cuttings with an average size of 0.1 to 0.5 cm.
Samples were marked as being from the depth of the drill at the time of sampling. For the present report no correction has been made for the error involved, as it is believed to be of minor importance, especially in the upper parts of the hole. More serious errors could be introduced by mixing of rock fragments from different depths by abrasive action of the drilling rods and mud on bore walls. This can result in mis interpretation of the downward extension of a par ticular mineral phase, but correct information is ob tained on the first appearance of a mineral.

E78 GEOLOGICAL SURVEY RESEARCH 1962
The original composition of the Tertiary lavas can only be discussed on a broad basis. Walker (1959, 1960) describes sections 5,000 and 10,000 m thick in the Tertiary plateau of eastern Iceland, OH vine basalts make up about 23 percent of the section, and 48 percent are lavas of the tholeiitic type. No regu larity in the sequence of different lava types was detected. Similar compositions can be expected of lavas in the Reykjavik area, but definite data on this point were not obtained because of the hydrothermal alteration. Most of the minerals of the basalt have undergone complete alteration, but some less altered fragments reveal the general basic character of the original rock. A single sample of cuttings often contains fragments with rather different crystal sizes, presumably resulting from mixing of grains from the marginal fine-grained parts of lava flows and the more coarsely crystallized central parts. As a rule the fine grained material is more altered because of higher susceptibility to hydrothermal solutions and closer contact to flow channels.
The olivine dolerite that mantles the Reykjavik area is generally quite fresh. Below this cover, tem peratures increase at the rate of 0.5°C per meter (fig. 200.1) ; alteration begins with montmorillonite, which extends a few tens of meters down into the Tertiary lavas. Montmorillonite is accompanied by abundant calcite and zeolites. Mordenite has been identified from depths of 176 and 185 m. Other zeolites not yet identified with certainty occur at shallower depths.
TEMPERATURE, IN DEGREES CENTIGRADE
80 100 120 140
FIGURE 200.1. Temperature-depth relations in a drill hole at Reykjavik, Iceland, with data on mineral distribution.
Chlorite is the most characteristic alteration prod uct below the zone of montmorillonite and down to the bottom of the hole. The chlorite is usually pres ent as a replacement mineral, but it occurs also as cavity linings and amygdule fillings. X-ray diffrac tion patterns of the material show that the second order of the basal reflection is consistently stronger than the first order, indicating an iron-rich type. Minerals associated with chlorite and occurring more or less continuously from below the montmorillonite zone down to the bottom of the hole are albite, quartz, calcite, and laumontite. Albite replaces plagioclase more or less completely, especially in strongly altered fragments. Partial albitization of plagioclase is found in coarser grained fragments. Quartz has not been found as a groimdmass constituent, but well-developed quartz prisms are commonly found in the cuttings, indicating deposition in amygdules. Calcite is spor adic throughout the section as amygdule fillings and replacement of other minerals. Laumontite first ap pears at 160 m and is by far the commonest zeolite at greater depths. Nontronite is found between 820 and 1,650 m as brown-colored fine-grained aggregates dispersed in the groundmass. Coarser grained crystals were observed at 1,000 m. Pumpellyite was found just below the olivine dolerite in the sedimentary section and continues in the Tertiary basalts down to a depth of 200 m. The index of refraction (n^, = 1.70) in dicates an iron-rich variety (Seki, 1961). Clinozoisite is present as a minor constituent between 200 and 660 m, with indices of refraction na, = 1.710 and ny, = 1.715. This mineral has anomalous interfer ence colors but no pleochroism. The optical sign is positive, which distinguishes it from epidote. Epi dote was first noted as needles in a vesicle filling with calcite at 900 m. From here down to the bottom of the hole epidote is found in increasing amount. In the upper part of this section epidote appears to be confined to veins and vesicles, where it occurs with calcite and zeolite. At greater depths epidote replaces the groimdmass as well, and crystals up to a consid erable size' (1-2 mm) are developed.
The high-temperature thermal area near Hveragerdi, 50 km east of Reykjavik, has been described by Earth (1950), Einarsson (1951), and Bodvarsson (1961). The area lies within the zone of Recent volcanism, with the last eruption in this general area occurring in A.D. 1000. The rocks consist of basaltic tuffs and lavas with minor intrusive rhyolite. Several holes ranging in depth from 300 to 1,200 m have been drilled in this area. Rocks penetrated at depth are Tertiary basaltic lavas. Depth to the contact is un-

ARTICLE 200 E79
certain but is very probably not deeper than 100 to 200 m.
Temperatures in the drill holes show distinct maxi- mums, indicating horizontal stratification of thermal water with a source of heat outside the drilled area.
After discovery of epidote at and below 900 m in the Reykjavik drill hole just described, a specific search for epidote and related minerals was made in cuttings from a drill hole 655 m deep at Hveragerdi. Pumpellyite, clinozoisite and epidote were found in this hole at much shallower depths than at Reykjavik and at higher temperatures. Figure 200.2 shows the distribution of these minerals. The sequence of altera tion products with depth in Hveragerdi is not yet known in detail, but the distribution of a few minerals is indicated in figure 200.2. In a thin zone near the surface, acid solutions have converted the rock into kaolinitic alteration products. Montmorillonite is the dominant alteration product from depths of a few meters to about 100 m, where chlorite becomes domi nant. Abundant calcite and zeolites are found through out the drilled section below the acid zone. In the upper part zeolites are abundant but their identities are still uncertain. Laumontite first appears at 225 m and is the dominant zeolite below about 250 m.
Qualitatively, alteration follows similar paths in the two areas, the main differences being more complete replacement by hydrothermal minerals in the high- temperature area and appearance of particular min erals or assemblages at different depths, commonly shallower at Hveragerdi.
In order to interpret these differences, especially in regard to the occurrence of epidote, two possibilities are presented below.
The epidote and perhaps some of the zeolite minerals are not related to present thermal activity but are relict from an earlier regional metamorphism. Toward the end of the Tertiary both areas consisted of a pile of basalt flows, considerably thicker than at the pres ent time. Metamorphism took place at depth, similar to that described in eastern Iceland by Walker (1959, 1960); temperatures were consistent with a normal geothermal gradient. Glacial erosion during the Pleistocene resulted in the present relief, and the epi dote should be considered as a relict, metastable phase in the present hot-spring systems.
The second and favored possibility is the forma tion of epidote, and perhaps the zeolites, essentially under present conditions. Factors influencing differ ences in mineralogy between the two thermal areas are pressure, temperature, and activity of dissolved components in hydrothermal solutions. Occurrence of
TEMPERATURE, IN DEGREES CENTIGRADE
160 180 200 220
£ <D ID £ 2 O
I *1I iff I240 S to J3 OO5 5
200
400
600
FIGURE 200.2. Temperature-depth relations in a drill hole at Hveragerdi, Iceland, with data on mineral distribution.
epidote at considerably greater depth in the low-tem perature area favors this latter possibility. In addi tion, epidote is very rare in the regional zeolitic meta morphism of basaltic lavas of Iceland (Walker, 1960, p. 516) but is commonly associated with zeolites in the propylitic type of hydrothermal alteration of basaltic and andesitic lavas, as reviewed in the follow ing paper (Art. 201).
REFERENCES
Barth, Tom F. W., 1950, Volcanic geology, hot springs and geysers of Iceland: Carnegie Inst. Washington Pub. 587, 174 p.
Bodvarsson, Guunar, 1961, Physical characteristic of natural heat resources in Iceland: United Nations Conference on New Sources of Energy, preprint. Rome. 1961.
Bodvarsson, Gunnar, and Palniason, G., 1961, Exploration of subsurface temperatures in Iceland: United Nations Con ference on Xew Sources of Energy, preprint, Rome, 1961.
Einarsson, Trausti, 1951, Geology of the Hengill area: Verk- fraedingafelag Islands, Timarit v. 36, p. 49-82 (in Ice landic with English summary).
Seki, Y., 1961, Pumpellyite in low grade metamorphism: Jour. Petrology, v. 2, p. 407-423.
Sigvaldason, Gudmundur E., 1959, Mineralogische Untersu- chungen uber Gesteinszersetzung durch postvulkanische AktivitJit in Island; Beitrage zur Mineralogie mid Petro- graphie, v. 6, p. 405-426.
Tryggvason, Eysteinn, and Bath, M., 1961, Upper crustal struc ture of Iceland: Jour. Geophys. Research, v. 66, p. 1913- 1925.
Walker, George P. L., 1959, The geology of the Reydarfjordur area, eastern Iceland: Geol. Soc. London Quart. Jour., v. 114, p. 367-393.
19(50, Zeolite zones and dike distribution in relation to the structure of the basalts of eastern Iceland: Jour. Geology, v. 58, p. 515-528.

E80 GEOLOGICAL SURVEY RESEARCH 1962
201. EPIDOTE IN HOT-SPRING SYSTEMS, AND DEPTH OF FORMATION OF PROPYLITIC EPIDOTE INEPITHERMAL ORE DEPOSITS
By DONALD E. WHITE and GTJDMUNDUR E. SIGVALDASON/ Menlo Park, Calif.
Before 1961, epidote was one of the very few altera tion or gangue minerals of epithermal ore deposits that had not been identified in hot-spring systems. Within a period of 1 year, however, epidote was found at considerable depth in 4 different hot-spring systems. Naboko and Piip (1961) first noted epidote in drill core from Pauzhetsk Hot Springs, Kamchatka, where a few crystals were found near 750 m in depth. Steiner (1963, and written communication, 1961) then found epidote at Wairakei, New Zealand, near and below 425 m in depth. Sigvaldason, without knowledge of the previous discoveries, made a specific search for and found epidote in cuttings from a deep drill hole in Reykjavik, Iceland, and later from a Hveragerdi drill hole, as described in the preceding article (Art. 200).
EPIDOTE IN METAMORPHIC ENVIRONMENTS
Much interest has recently been focused on epidote in the relatively low grade green schist and zeolitic facies of metamorphic rocks. Epidote is a common constituent of rocks of the green-schist facies (Fyfe, Turner, and Verhoogen, 1958, p. 166-167), which typically contains quartz, albite, epidote, chlorite (espe cially the iron-rich varieties), muscovite, paragonite, talc, actinolite, pumpellyite, calcite, and dolomite.
A zeolite facies and several subfacies have been proposed (Coombs, 1954, 1960; Fyfe and others, 1958; Coombs and others, 1959) for rocks that bridge the gap between diagenesis and metamorphism. In south ern New Zealand, tuffs and volcanic graywackes have been converted in part to rocks that include, in ap proximate order of appearance downward, heulandite (and the high-sodium variety clinoptilolite), anal- cime, celadonite; laumontite, albite, adularia, chlorite, calcite; and pumpellyite, prehnite, epidote, actinolite, muscovite, and stilpnomelane. The section is now 28,000 feet thick and may have had as much as 10,000 feet of cover removed by erosion. A little epidote occurs in the middle and upper parts of the section and is probably clastic in origin (Coombs and Fyfe, oral communication, 1962). The part of the section with unquestioned epigenetic epidote was buried to depths on the order of 25,000 to 30,000 feet; load pressures were at least 2,500 bars and temperatures were prob ably near 250°C.
1 Present address, University Research Institute, Reykjavik, Iceland.
Zen (1961) has suggested that the zeolite facies can form when the chemical potential of CO2 is low relative to H2 O, but it does not develop in many sedi mentary environments characterized by calcite, quartz, and kaolinite or pyrophyllite. Eeactive components such as volcanic glass, unstable minerals of inter mediate and basaltic volcanic rocks, and a low organic- matter content all favor a low chemical potential of CO2 relative to H2O in sediments after burial. Order- disorder relations may influence formation of epidote from plagioclase (Christie, 1962; Eutland, 1962), and possibly also from zeolites.
EXPERIMENTAL SYNTHESIS OF EPIDOTE
Numerous attempts have been made to synthesize epidote and its related minerals clinozoisite and zoisite. Efforts at less than 5,000 bars of water pressure and 500°C have not been successful (Coombs and others, 1959, p. 90; Fyfe and others, 1958, p. 169). Clino zoisite has been observed at 600°C and about 12,000 bars of pressure (Fyfe and others, 1958, p. 170). Merrin (1960) has reported synthesis of epidote at 525°C and 3,000 bars of pressure; the slope of the boundary of the epidote field is positive, and passes through 650°C and 4,000 bars of pressure. Pistorius and others (1962) have reported zoisite and clinozoisite at temperatures of 400°C to 800°C and pressures of 10 to 15 kilobars; starting materials influence the phases found, and equilibrium may not have been attained in many of the experiments. Pellizer (1957) induced alteration of a diabase to epidote-albite-cal- cite-quartz-sericite-clay by watei; and CC>2; conditions ranged from 375°C to 540°C, about 220 to 340 bars of water pressure, and pH of 3.8 to 9. Finally, Fyfe (1960) has synthesized epidote from its components, but seeded with epidote, at 2,000 bars water pressure and 465°C to 630°C. Zeolites are believed to be the stable phases below 300°C.
EPIDOTE IN PROPYLITIC ALTERATION
In many thick piles of volcanic rocks, hydrothermal alteration has partly or completely changed the origi nal rocks to varied assemblages of minerals that in clude chlorite, albite, and epidote, as well as adularia, various zeolites, celadonite, actinolite, pumpellyite, prehnite, sericite, pyrite, calcite and other carbonates, quartz, and some other minerals. There is not com plete agreement in defining the term "propylitic"
ARTICLE 201 E81
alteration, in specifying which of the above minerals are essential, or in designating the kinds of rocks in volved (Lindgren, 1933, p. 457-458; Coats, 1940; Calkins, 1944; Nakovnik, 1954; Wilshire, 1957; and G. A. Thompson and White, written communication). The rocks are usually andesites or basalts, and the altered assemblages are green; chemical analyses typi cally show significant gains in water, CC>2, and com monly sulfur, but proportions of other components are nearly unchanged. Epidote-bearing rocks are associated in some localities with green zeolitic rocks containing little or no epidote; the latter have com monly been considered as a separate zeolitic alteration, distinct from propylitic alteration. In at least some localities, but perhaps not everywhere, epidote-bearing rocks grade upward into zeolitic rocks containing little or no epidote.
The propylitic and zeolitized rocks commonly occur near centers of volcanic activity; epithermal gold and silver deposits are very common in the vicinity, but generally the ore deposits are more intimately associ ated with different hydrothermal alterations that in volve marked chemical changes such as notable addi tions of quartz, sericite, K-feldspar, alunite, or other minerals (Nolan, 1933). The depth of formation of the propylitic and zeolitic alterations has seldom if ever been determined with confidence, but erosion is commonly considered to have removed a few hundreds to several thousands of feet of cover. Original depths of formation are very unlikely to have been as great as the 20 to 30 km estimated for the epidote-rich zeo litic facies, as previously mentioned, in spite of the strikingly similar mineralogy of the two assemblages, one hydrothermal and the other metamorphic. Schist ose mineral orientation, for example, is typically lack ing in the hydrothermal environment, and is thus con- sit ent with a much shallower depth.
EPIDOTE IN HOT-SPRING SYSTEMS
The depths and corresponding temperatures of the epidote found in hot-spring systems are shown in figure 201.1, with some data on temperatures elsewhere in the drill holes.
The Wairakei thermal system is perhaps the most intensively explored and studied hot-spring system in the world (Steiner, 1953; Grange, 1955; Ban well and others, 1957; Coombs and others, 1959, p. 70-72). Steiner (1963; written communication, 1961) has re cently found epidote at depths as shallow as 420 in, although it is more abundant at deeper levels.
Naboko and Piip (1961) have described alteration assemblages at Pauzhetsk, Kamchatka. Dacitic and andesitic tuffs and tuff-breccias, stratified nearly hori
zontally, occur to 800 m, the greatest drilled depth; andesite is abundant or dominant from 263 to 383 m and below 570 m. The rocks are considered to be Quaternary in age to 668 m and Tertiary at greater depths. Three major alteration zones are recognized:(a) Kaolinite (perhaps with montmorillonite) 0 to 5 m depth; formed by near-surface attack by sulfuric acid.(b) Zeolites and feldspar, 30 to 240 m; andularia and laumontite are abundant in the upper part, and lau- montite and an unidentified but similar zeolite in the lower part with minor adularia, calcite, chlorite, or pyrite. (c) Propylitized green rocks from 250 to 800 m, with chlorite, calcite, and pyrite as the char acteristic minerals, and locally with hydrous mica, gypsum, anhydrite, an unidentified zeolite, and adu laria; in the lowest of 4 propylitic subzones, epidote in individual grains with chlorite and zeolite was identified near 750 m, and albitized plagioclase near 670m.
Temperatures attain a maximum of 180° C in the interval 125 to 400 m; below 400 m, temperatures de crease somewhat (Naboko and Piip, 1961, p. 110). Elsewhere, Piip and others (1961, p. 4) report that ". . . in the central part of the thermal field tapped by the deep rotary well (west of the main heat libera tion zone), a rise of temperature to 180 to 185°C is noted only down to depth 400 m. Still farther down, the temperature declines to 130 to 140° C."
Sigvaldason (Art. 200) described briefly the hydro- thermal alterations at Hveragerdi and Reykjavik, Iceland, with emphasis on the distribution of epidote (see fig. 201.1, this article).
In each of these four hot-spring areas, epidote oc curs in volcanic rocks of Tertiary or early Quaternary age. Conceivably each could have been buried deeply and altered, with the present distribution of minerals at least in part unrelated to the present hydrothermal environment. Except for Pauzhetsk, which has been drilled less than 50 m below the recognized epidote, this mineral becomes increasingly abundant at greater depth. This suggests that it is either forming now in the lower parts of the system, or that former epidote has been destroyed in the upper parts but is stable or metastable below.
Chemical analyses of the waters of the four spring systems are shown in the accompanying table. Of ma jor significance is the fact that all 4 are from 8 to 9.4 in pH. At such a moderately high pH, all or most avail able CO2 is combined as carbonate and bicarbonate, and CO2 activity is low relative to H2O. These are pre cisely the conditions that favor formation of zeolites according to Zen (1961), and this is especially true where reactive volcanic rocks are available.

E82
100
GEOLOGICAL SURVEY RESEARCH 1962
TEMPERATURE, IN DEGREES CENTIGRADE
150 200 250
200
400
600
800
Boiling-point curve; upper limit of temperature in water-saturated environment in fractured, compe tent rocks
EXPLANATION
Pauzhetsk, I Kamchatka |
Shallowest occurrence of epidote in each drill hole
Temperature near 140 C(?) (see text)
To 2,200 meters and 146°C (nearly constant) below about 1,300 meters
FIGURE 201.1. Temperature-depth relations in drill holes containing epidote in four geothermal areas. Dashed curve for Wairakei is generalized for many drillholes. Dashed and queried curve for Pauzhetsk is inferred from published reports.
Some negative evidence is provided by the fact that epidote is absent or extremely rare at shallow depths in all studied hot-spring systems (White, 1955, p. 103-122, and unpublished data). Possibly favorable altered andesitic rocks at Steamboat Springs, Nev. (Sigvaldason and White, 1961, 1962), and lathe in the Upper Basin of Yellowstone Park have been spe cifically searched for epidote, but it is virtually absent at depths ranging up to 685 feet. At Steamboat Springs a few probable grains of clastic epidote were identified from 11 feet in depth in drill hole GS-5 (temperature 50°C), along with fresh clastic grains of hornblende.
The common occurrence of epidote in the propylitic altered rocks of epithermal ore deposits at depths that could originally have been a few thousands of feet, but almost certainly were not as deep as the green schist or the deeper part of the zeolite facies of meta- morphism, is additional supporting evidence that the epidote of the four hot-spring systems is forming now, either stably or met ast ably.
Coombs and others (1959, p. 81-83) have carefully distinguished between load pressure and water pres sure. Most hydrothermal syntheses are carried on under conditions of PH2o = Ptotai. The reaction

ARTICLE 201
Chemical analyses, in parts per million, of waters from the hot spring systems known to contain epidote at depth
E83
Temperature (degrees C.) __ __pH__ ___-_ _______________
SiO2 ________________Al_. _________________ _______Fe._ Ca ___. -_____-_______-_-_.Mg-- Na _ ___ ___ ___ _ _____K____. ______________________Li___ _ ____________________NH4 _ _______________________As HCOa----.----------.---.-CO3 -___-----_---___-__-_SO4 d. _-F __ _______________________Br _ _______________________I______________.____________PO4-_-__--_--_ _________B __________________H2S___--__--__ ___ _CO2.... .....................
Total..-. ________
Pauzhetsk, Kamchatka
Spring »
100.6 8.4
190 None found None found
64 10
1,010 88
1. 1 37
9 83
1,680 .8
3.2 None found
31
3,207
Deep well ' (120-132 m)
8.1
106
53 4.9
| 977
.7
18 24 55
1,540
0
2,779
Deep well 2 (300-400 m)
2(9?)
131
119 7.0
940
. 7
12 71
164 1,400
2,845
Deep well 2 (300-800 m)
2(8?)
113
158 4.6
833
.7
13 20
363 1,280
2,785
Walrakel, New Zealand
Well 4 3
>100 8.6
386
26 <. 1
f 1, 130 \ 146
12 .9
35
35 1,930
6.2
26 1. 1
11
3,745
Hveragerdi, Iceland
Well*
100 9.4
283 .37 . 12
2.8 .0
174 10
. 1
. 1
.08 24 57 72
152 2.1 .5 .0 .08 .85
5.2
784
Reykjavik, Iceland
Well «
100 9.2
172 .18 .00
2. 1 .4
59 2.3 .0 .0 .00
0 35 20 36 1.2
. 1
. 1
. 14
.04
.2
333
»Ivanov (1958, p. 202-207).' Naboko and Piip (1961, p. Ill); no pH given for deep samples from the drill hole
containing epidote but proportions of COs to HCOs suggest 8 to 9.' Well in eastern part of field, typical NaCl type according to Wilson (in Grange,
1955, p. 37).
analcite + quartz >- albite + H2O, for example, occurs at about 280°C and 1,000 bars (Pn2o = P total}- This is probably similar to conditions of metamor- phism of fine-grained water-saturated sedimentary rocks, where compaction and escape of water is still occurring but residual interstitial water and water released from hydrous phases cannot escape rapidly. The situation is very different, however, in the hot- spring and probably the epithermal ore-deposit en vironments, where most or possibly all of the water is meteoric in origin (Craig and others, 1956; White, 1955). White (1957) has suggested that meteoric wa ter commonly circulates in fractured and permeable rocks to depths of as much as 10,000 feet. In systems involving downward penetration of meteoric water, pressure on the water cannot normally exceed hydro static pressure, so that PSi0 «=* Vs PIOOA] Coombs and his associates (1959, p. 81-82) believe that in such cir cumstances, and considering a series of related miner als of differing degrees of hydration, equilibrium will
t Collected 8/31/58 by Q. Bodvarsson, analysis by C. E. Roberson, U.S. Qeol- Survey; also determined Mn, Cu, Pb, Zn, NOs, and NOs, 0.00 ppm.
s Eeykjavik II, Pvottalaugar; collected 10/2/58 by Q. Bodvarsson, analysis by H. C. Whitehead, U.S. Qeol. Survey; also determined Mn, Cu, Pb, Zn, NOs, NOs, 0.00 ppm; OH, 4 ppm.
favor a lower stage of hydration than where Ps2o Plead* In the analcite-albite reaction considered above, for example, calculations suggest that albite stability will be lowered from about 280° C where /V2o = P total = 1,000 bars to only 100° C at PH20 = Vs P total = 1,000 bars. The calculated curve, incidentally, has a flat negative slope similar to that of the upper limit of recognized epidote (fig. 201.1). The same reason ing applied to the series heulandite-pumpellyite-preh- nite-epidote-anorthite suggests that epidote (and each hydrous mineral) is stable at much lower temperatures and H2O pressures in hot-spring-epithermal environ ments than in normal metamorphic environments.
If epidote is actually stable only below the line in dicated on figure 201.1, we should still expect to find relict metastable epidote in the high parts of some spring systems, as in the cited occurrence at Steam boat Springs. [Relatively unstable minerals such as pyroxene and hornblende are commonly preserved metastably in the upper hundred feet or so even in

E84 GEOLOGICAL SURVEY RESEARCH 1962
the hottest of spring systems. Epidote antedating the activity may also be preserved metastably at shallow depths but be decomposed at intermediate depths where reaction rates are higher.
SIGNIFICANCE OF EPIDOTE, IN THE EPITHEKMAL ENVIRONMENT
If the flatly inclined line of figure 201.1 does mark an upper limit for formation of epidote in hydrother- mal environments, it will be useful in defining limits for depth of original cover in areas of altered volcanic rocks and epithermal ore deposits. If epidote occurs at the present land surface, for example, erosion of at least 400 m (1,300 ft) of cover is indicated. Some of the zeolites may likewise prove useful when their distribution in hot-springs systems is better under stood.
E,EFEREN"CES
Banwell, C. J., Cooper, B. R., Thompson, G. E. K., and McCree, K. J., 1957, Physics of the New Zealand Thermal Area: New Zealand Dept. Sci. Indus. Research Bull. 123, 109 p.
Calkins, F. C., 1944, Outline of the geology of the Comstock Lode district, Nevada: U.S. Geol. Survey Prelim. Rept., 35 p.
Christie, O. H. S., 1962, Feldspar structure and the equilibrium between plagioclase and epidote: Am. Jour. Sci., v. 260, p. 149-152.
Coats, R. R., 1940, Propylitization and related types of altera tion and the Comstock Lode: Econ. Geology, v. 35, p. 1-16.
Coombs, D. S., 1954, The nature and alteration of some Trias- sic sediments from Southland, New Zealand: Roy. Soc. New Zealand Trans., v. 82, p. 65-109.
1960, Lower grade mineral facies in New Zealand: Internat. Geol. Cong., 21st, Copenhagen 1960, Proc., pt. 13, p. 339-351.
Coombs, D. S., Ellis, A. J., Fyfe, W. S., and Taylor, A. M., 1959, The zeolite facies, with comments on the interpre tation of hydrothermal syntheses: Geochim. et Cosmo- chim. Acta, v. 17, p. 53-107.
Craig, H., Boato, G., and White, D. B., 1956, The isotopic geo chemistry of thermal waters: Nuclear Sci. Ser., Rept. 19, Nuclear processes in geologic settings, p. 29-44.
Fyfe, W. S., 1960, Stability of epidote minerals: Nature, v. 187, p. 497-498.
Fyfe, W. S., Turner, F. J., and Verhoogen, J., 1958, Metamor- phic reactions and metamorphic facies: Geol. Soc. Amer ica Mem. 73, 259 p.
Grange, L. L., eel., 1955, Geothermal steam for power in New Zealand: New Zealand Dept. Sci. Indus. Research Bull. 117, 102 p.
Ivanov, V. V., 1958, The principal regularities of the formation and distribution of the thermal waters of Kamchatka:
Akad. Nauk SSSR., Trudy Lab. Vulkanol., v. 13, p. 186- 211. (In Russian)
Lindgren, Waldemar, 1933, Mineral deposits, 4th ed.: New York, McGraw-Hill Book Co., Inc., 930 p.
Merrin, Seymour, 1960, Synthesis of epidote and its apparent P-T stability curve [abs.]: Geol. Soc. America Bull., v. 71, p. 1929.
Naboko, S. I., and Piip, B. I., 1961, Recent metamorphism of volcanic rocks in the region of the Pauzhetsk Hot Springs (Kamchatka) : Akad. Nauk SSSR, Trudy Lab. Vulkanol., v. 19, p. 99-114. (In Russian)
Nakovnik, N. I., 1954, Mineral facies, genesis, and practical importance of propylitized rocks: Zapiskl Vsessoyuz, mineralog. Obslichestra., v. 83, p. 85-94. (In Russian)
Nolan, T. B., 1933, Epithermal precious-metal deposits, in Ore deposits of the Western States: Am. Inst. Min. Bng., Lindgren vol., p. 623-640.
Pellizer, R., 1957, Transformazioni spirimentali alle condizione pneumatolitiche e idrotermali di rocce oflolitiche Appen- niniche: Rendiconti Soc. Mineral. Ital., v. 13, p. 294-324. (In Italian)
Piip, B. I., Ivanov, U. V., and Averyev, V. V., 1961, The hydro- thermal waters of Pauzhetsk, Kamchatka, as a source of geothermal energy: United Nations Conference on New Sources of Energy, preprint, p. 1-12.
Pistorius, C. W. F. T., Kennedy, G. C., and Sourirajan, S., 1962, Some relation between the phases anorthite, zoisite, and lawsonite at high temperatures and pressures: Am. Jour. Sci., v. 260, p. 44-56.
Rutland, R. W. R., 1962, Feldspar structure and the equi librium between plagioclase and epidote: A reply: Am. Jour. Sci., v. 260, p. 153-157.
Sigvaldason, G. E., and White, D. E., 1961, Hydrothermal alteration of rocks in two drill holes at Steamboat Springs, Washoe County, Nevada: Art. 331 in U.S. Geol. Survey Prof. Paper 424-D, p. D116-D122.
1962, Hydrothermal alteration in drill holes GS-5 and GS-7, Steamboat Springs, Nevada: Art. 153 in U.S. Geol. Survey Prof. Paper 450-D, p. D113-D117.
Steiner, Alfred, 1953, Hydrothermal rock alteration at Waira- kei, New Zealand: Econ. Geology, v. 48, p. 1-13.
1963, Hydrothermal epidote: Mineralog. Mag. [In press]
White, D. E., 1955, Thermal springs and epithermal ore de posits, in Pt. 1 of Bateman, A. M., ed., Economic geology, 50th anniversary volume, 1905-55: Urbana, 111., Econ. Geology Pub. Co., p. 99-154.
1957, Thermal waters of volcanic origin: Geol. Soc.America Bull., v. 68, p. 1637-1658.
Wilshire, H. G., 1957, Propylitization of Tertiary volcanicrocks near Ebbetts Pass, Alpine Co., Calif.: Calif. Univ.Pub. in Geological Sciences, v. 32, p. 243-272.
Zen, E-an, 1961, The zeolite facies: An interpretation: Am.Jour. Sci., v. 259, p. 401-409.

202.
ARTICLE 202 E85
THORIUM AND URANIUM IN SOME VOLCANIC ROCKS FROM THE CIRCUM-PACIFIC PROVINCE
By DAVID GOTTFRIED, EOOSEVELT MOORE, and ESMA CAMPBELL, Washington, D.C.
New data are available on the thorium and uranium contents of suites of volcanic rocks from the Mariana Islands in the western Pacific Ocean, eastern Oregon, and southwestern British Columbia. The suites are fairly representative of petrographic provinces of calcic-magma types that are found in the circum- Pacific province, peripheral to the margins of the Pacific Basin. The relatively narrow zone between the circum-Pacific province and the Pacific Basin prov ince, the andesite line, is significant to problems bear ing on the petrogenetic evolution of contrasting magma types and has been discussed by Schmidt (1957) with regard to the origin of the volcanic rocks of the Mari ana Islands. In brief, the characteristic volcanic suites in the circum-Pacific province consist of basalt, andesite, dacite, and rhyolite. Their origin and com position are believed to be related to orogeny and to the presence of a sialic layer. Within the Pacific Basin, characterized by crustal stability and the ab sence of a sialic layer, the volcanic rocks are pre dominantly tholeiitic olivine basalts with relatively insignificant amounts of andesites and late alkalic differentiates.
The precision and accuracy of the methods for the determination of thorium and uranium have been dis cussed by Larsen and Gottfried (1960).
MARIANA ISLANDS
The volcanic rocks of Saipan consist mainly of hy- persthene andesites of late Eocene to late Oligocene age and dacites of late Eocene age (Cloud and others, 1956; Schmidt, 1957). Chemically the rocks are char acterized by high SiOg, Al2Os, and CaO contents and a very low K2 O content as compared with ordinary calc-alkalic suites. On the basis of Peacock's (1931) classification of igneous-rock series, the volcanic suite of Saipan is highly calcic with an alkali-lime index of approximately 65.
Basaltic rocks are abundant on Guam according to Schmidt (1957), and corresponding rock types on Guam are similar to those of Saipan. The volcanic rocks from the northern Mariana Islands (Pagan, Agrihan, and Alamagan) were derived from Quat
ernary volcanoes and are chiefly basaltic and ande- sitic flows. The andesites are similar to those of Saipan and to those of the Izu Peninsula region of Japan.
The thorium and uranium contents of 26 samples of chemically analyzed rocks that were supplied by E. G. Schmidt, J. I. Tracey, Jr., and Gilbert Corwin of the Geological Survey were determined. These data and the Th/U ratios are listed in table 202.1, and those of Saipan, Pagan, and Guam are plotted on Larsen type (1938) variation diagrams on figure 202.1. Hence these data can be compared directly with suites from other localities (Larsen and Gootfried, 1960, Gottfried and others, 1962).
The dacites of Saipan are the most siliceous rocks in the Mariana Islands that were analyzed for thorium and uranium. They average only a little over 1 ppm (part per million) of thorium and uranium. The andesites average 0.7 ppm of uranium and 1.1 ppm of thorium. Except for one sample with a Th/U ratio of 2.9, the Th/U ratios of the rocks of Saipan fall between 0.4 and 1.8, and average 1.2.
The basalts and andesites of Pagan average about 0.5 and 0.7 ppm of uranium and 0.9 and 1.2 ppm of thorium respectively. The Th/U ratios of the rocks average 2.1 for the basalts and 2.2 for the andesites.
o
The two basalts from Agrihan and Alamagan contain about 1 ppm each of thorium and uranium.
The basaltic rocks of Guam average about 0.4 ppm of uranium and in this respect are similar to those of Pagan. However their average thorium content 1.4 ppm is greater, and hence the basalts of Guam have a larger Th/U ratio. The Th/U ratios have a wide scatter; omitting 1 sample which has a Th/U ratio of 14, the average Th/U ratio is 2.9. One sam ple 'of andesite from Guam contains 0.35 ppm of ura nium and 0.72 ppm t)f thorium.
Five samples of andesite and 1 sample of gabbro from the Palau islands were analyzed for uranium only; the andesites average 0.26 ppm and the gabbro 0.14 ppm. These data indicate that these andesites have a lower uranium content than those of the Mari ana Islands.

E86 GEOLOGICAL SURVEY RESEARCH 1962
TABLE 202.1. Thorium and uranium contents and Th/U ratios of volcanic rocks from Saipan, Pagan, Guam, Alamagan, and Agrihan, Mariana Islands
Sample No.
S 135_____.
S 636 A__._S 107-.. _.
S 15_______S 67 A_____S 139____ __
S 448-_____S 317_-_-_-
PC-67_____P-8-______
P-5________P-6________PC-75.. ...PC-55_. __.PC-89... _.PC-61_____
Go 7-ld__._Ee 4-2c. ...Go 7-lc_ Dh 6-lb____Dh6-lc_...Fd2-lb____G-S48-85A.MSS 37..
AG-4______
AL-7__.___
Rock types
Saipan
Augite-hyperstheneandesite.
Augite andesite _ Augite-hypersthene
andesite. do- _ - . _do. __._._
Hornblende-bearing dacite vitro- phyre.
Pagan
Augite basalt ______
augite basalt. _ _do_ _. __do _ . _Andesite
Basalt. ___ _ _
Guam
Basalt. _________ __ _do_. _do._ _ __ _do_ _ __ ....
_do_ _-__ _do-_ __ ...
Augite basaltAndesite _ _ _ __
Agrihan
Augite basalt ______
Alamaga
augite basalt.
Position % SiO 2 +K20 CaO-
FeO-MgO
-1. 9
-.9+ 1.2
+ 2.3+ 5.5
+ 24.4
+ 26. 0+ 26.7
-11.9-11.0
-9.3-8.7-4.7-4. 5-1. 1+ 8.5
-12.0-8. 5-7. 6
C Q
-4.8-3.5+ 3.2+ 4.8
-9.9
n
-6.7
Thori um
(ppm)
1. 2
1.2 . 4
1.4.6
1.6
1. 1.88
0.81.79
. 53
. 771. 1.72
1.41.9
2.41. 1
. 61.52.01.3.81. 72
1.0
0. 98
Urani um
(ppm)
0.70
1. 1 .90
.48
.531. 5
.821. 1
0. 21.48
.44
. 53
. 54
.23
.581.3
0. 17.41.28.41.43.41. 90.35
1. 1
0. 95
Th/U
1.7
1.8 .4
2.91. 11. 1
1.3.8
3.91.7
1.21. 52.03. 12.41. 5
14. 12.72.23.74.73 2
. 92. 1
1.0
1.0
MOUNT GARIBALDI AREA. SOUTHWESTERN BRITISH COLUMBIA
The volcanic rocks from southwestern British Co lumbia are Quaternary in age and range in composi tion from basalt to rhyodacite. A report on the petrology of the suite of rocks has been published by Mathews (1957), who furnished the samples for this study. Chemically the rock series is characterized by relatively large amounts of A12C>3 and CaO and low K2O. The suite is strongly calcic as indicated by the Peacock (1931) alkali-lime index of 64.0 and is simi lar in many respects to the volcanic rocks of the High Cascades (Mathews, 1957). Analyses for thorium and uranium have been made on 13 samples (table 202.2 and figure 202.2). Thorium and uranium are present
TABLE 202.2. Thorium and uranium contents and Th/U ratios of volcanic rocks from the Mount Garibaldi area, southwestern British Columbia
Sample No.
526-._-_381_-___532__-__451_____554_____522_____511___-_527_.__.420__-_-547_--_-421_____535____.469_____
Rock type
Gabbro. _______ __Basalt. _______ ____
doAndesite breccia ___
_____do-__------
_____do __.___do ______.do _-
do ______do ___ _________do__---_-___--_
Position M SiOz-f- K2O- CaO- FeO- MgO
-18.0 -11.3 -9.3 + 2.0+ 4.4 + 6.6 + 7.0
+ 12.0 + 12. 5 + 13. 0 + 15. 0 + 19.0 + 24. 1
Thorium (ppm)
1.4 1. 1 1. 1 1.6 1.3 1.0
. 99 2.0 2.6 3. 1 2. 5 2.7 4.0
Uranium (ppm)
1. 2
1. 1
.47 1. 1 .90 . 90
1. 1 1. 1 1.6 1. 2 1.3 1.9 1. 6
Th/U
1. 2 1.0 2.31. 5 1.4 1. 1
. 9 1.8 1.6 2. 6 1.9 1.4 2. 5
in only slightly greater amounts in the dacitic rocks than in the mafic rocks. The increase is less than twofold. The average Th/U ratio of the mafic rocks and the dacites is about 1.5. The one sample of rhyodacite has a Th/TJ ratio of 2.5. The suite as a whole has a Th/U ratio similar to that of the ande- sites and dacites of Saipan.
STRAWBERRY MOUNTAIN, EASTERN OREGON
The upper sequence of volcanic rocks of Strawberry Mountain ranges from basalt to rhyolite but consists chiefly or basaltic and hypersthene andesites. The

ARTICLE 202 E87
I
-iuz50-0
"* 5 nZ> 0
LJ
,3.9 -14.1
-10
POSITION10 " -10
POSITION10
SAIPAN PAGAN GUAM
FIGURE 202.1. Variation diagrams showing the distribution of thorium, uranium, and Th/U ratios in volcanic rocks from SaipanPagan, and Guam.
structural and petrologic relations of these volcanic rocks of Miocene age to those of the Columbia Eiver Plateau has been discussed by Thayer (1957), who points out that these rocks are remarkably similar to the lavas of the High Cascades. Chemical analyses of these rocks were made by S. M. Berthold, E. A. Nygaard and E. N. Eccher of the U.S. Geological Survey. The alkali-lime index of these volcanic rocks is about 62, thereby placing the suite in the calcic series.
The thorium and uranium contents of eight samples are listed in table 202.3 and plotted on figure 202.3.
tnt- 4(T
o^o
D (T 2
I- 1
TABLE 202.3. Thorium and uranium contents and Th/U ratios of volcanic rocks of Strawberry Mountain, Oreg.
< Z0-0
Sample No.
TPT 47-60. . TPT 48-125.TPT 48-122-TPT 48-21 __ TPT 48-23..TPT 48-132_TPT 48-131_ TPT 48-133.
Eock types
Olivine basalt _Basaltic andesite__Andesite (plug)____Pyroxene andesite.
-__-_do-_-_-___--_Pyroxene dacite___Hornblende dacite_ Rhyolite
Position }iS1O2+K2O- CaO- FeO- MgO
-7.6 -1.0
+ 4. 5+ 9. 0 + 8. 9
+ 19. 2+ 20. 2 + 22. 6
Thorium (ppm)
1. 3 1. 52. 23. 2 2. 8 5. 55. 8 6. 4
Uranium (ppm)
0. 46 . 61.75
1. 1 1. 1 2. 22. 2 2. 5
Th/U
2. 8 2. 42. 92. 9 2. 5 2. 52. 6 2.6
-20 -10 0 10 20
POSITION y3 SiO2 + K2O-CaO-FeO-MgO
30
r . , , n ,, , -. . ,, There is approximately a fivefold increase in thethorium and uranium contents of the most siliceous
FIGURE 202.2. Variation diagram showing the distribution of thoriunl) uranium, and Th/U ratios in volcanic rocks from theMount Garibaldi area, southwestern British Columbia.
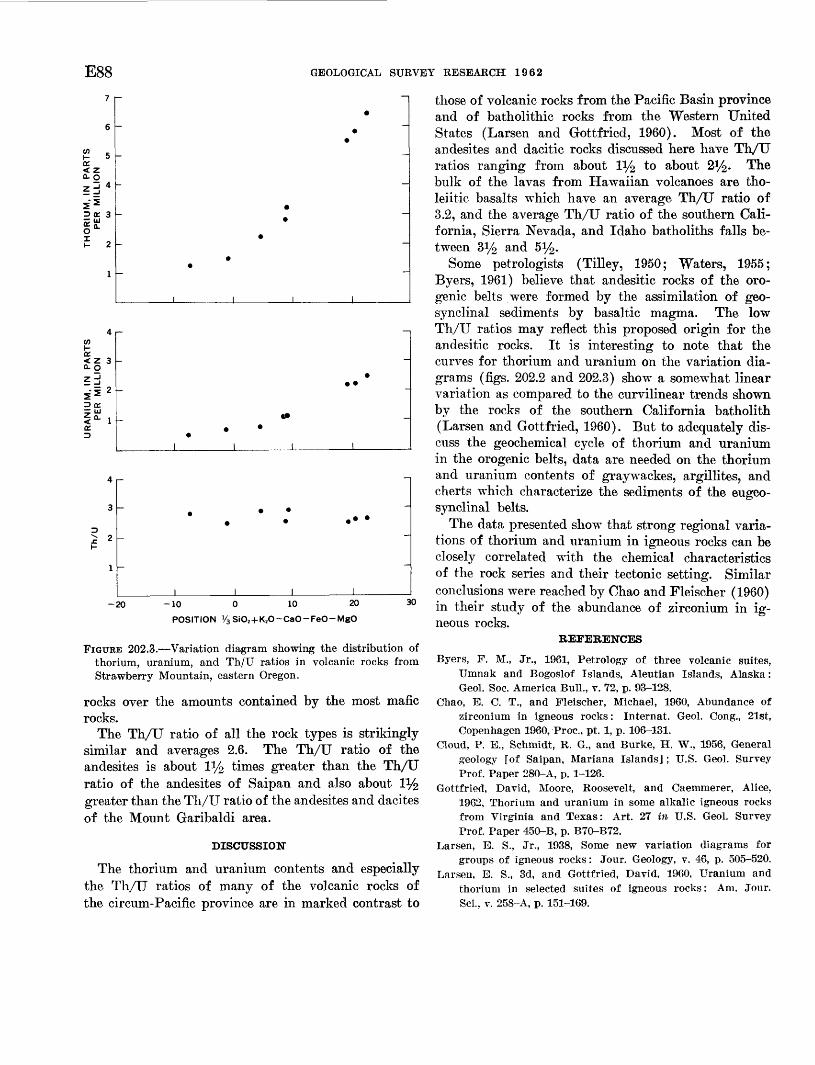
E88 GEOLOGICAL SURVEY RESEARCH 1962
7 r
oe < zQ-
DOC 3
f 2
oe<z 3 Q-O
-20 -10 0 10 20
POSITION V^SiOj + KzO-CaO-FeO-MgO
30
FIGURE 202.3. Variation diagram showing the distribution of thorium, uranium, and Th/U ratios in volcanic rocks from Strawberry Mountain, eastern Oregon.
rocks over the amounts contained by the most mafic rocks.
The Th/U ratio of all the rock types is strikingly similar and averages 2.6. The Th/U ratio of the andesites is about V/2 times greater than the Th/U ratio of the andesites of Saipan and also about 1% greater than the Th/U ratio of the andesites and dacites of the Mount Garibaldi area.
DISCUSSION
The thorium and uranium contents and especially the Th/U ratios of many of the volcanic rocks of the circum-Pacific province are in marked contrast to
those of volcanic rocks from the Pacific Basin province and of batholithic rocks from the Western United States (Larsen and Gottfried, 1960). Most of the andesites and dacitic rocks discussed here have Th/U ratios ranging from about 1% to about 2^. The bulk of the lavas from Hawaiian volcanoes are tho- leiitic basalts which have an average Th/U ratio of 3.2, and the average Th/U ratio of the southern Cali fornia, Sierra Nevada, and Idaho batholiths falls be tween 3i/£ and 5y2.
Some petrologists (Tilley, 1950; Waters, 1955; Byers, 1961) believe that andesitic rocks of the oro- genic belts were formed by the assimilation of geo- synclinal sediments by basaltic magma. The low Th/U ratios may reflect this proposed origin for the andesitic rocks. It is interesting to note that the curves for thorium and uranium on the variation dia grams (figs. 202.2 and 202.3) show a somewhat linear variation as compared to the curvilinear trends shown by the rocks of the southern California batholith (Larsen and Gottfried, 1960). But to adequately dis cuss the geochemical cycle of thorium and uranium in the erogenic belts, data are needed on the thorium and uranium contents of graywackes, argillites, and cherts which characterize the sediments of the eugeo- synclinal belts.
The data presented show that strong regional varia tions of thorium and uranium in igneous rocks can be closely correlated with the chemical characteristics of the rock series and their tectonic setting. Similar conclusions were reached by Chao and Fleischer (1960) in their study of the abundance of zirconium in ig neous rocks.
REFERENCES
Byers, F. M., Jr., 1961, Petrology of three volcanic suites,Umnak and Bogoslof Islands, Aleutian Islands, Alaska:Geol. Soc. America Bull., v. 72, p. 93-128.
Chao, E. C. T., and Fleischer, Michael, 1960, Abundance ofzirconium in igneous rocks: Internat. Geol. Gong., 21st,Copenhagen 1960, Proc., pt. 1, p. 106-131.
Cloud, P. E., Schmidt, R. G., and Burke, H. W., 1956, Generalgeology [of Saipan, Mariana Islands]; U.S. Geol. SurveyProf. Paper 280-A, p. 1-126.
Gottfried, David, Moore, Roosevelt, and Caemmerer, Alice,1962, Thorium and uranium in some alkalic igneous rocksfrom Virginia and Texas: Art. 27 in U.S. Geol. SurveyProf. Paper 450-B, p. B70-B72.
Larsen, E. S., Jr., 1938, Some new variation diagrams forgroups of igneous rocks: Jour. Geology, v. 46, p. 505-520.
Larsen, E. S., 3d, and Gottfried, David, I960, Uranium andthorium in selected suites of igneous rocks: Am. Jour.Sci., v. 258-A, p. 151-169.

ARTICLE 203 E89Mathews, W. H., 1957, Petrology of Quaternary volcanics of
the Mount Garibaldi map-area, southwestern British Co lumbia: Am. Jour. Sci., v. 255, p. 400-415.
Peacock, M. A., 1931, Classification of igneous rock series: Jour. Geol., v. 39, p. 54-67.
Schmidt, R. G., 1957, Petrology of the volcanic rocks [of Saipan, Mariana Islands]: U.S. Geol. Survey Prof. Paper 280-B, p. 127-175.
Thayer, T. P., 1957, Some relations of later Tertiary volcanol-ogy and structure in eastern Oregon: Internat. Geol.Cong., 20th, Mexico City 1956, Section 1 Cenozoic vol-canology, v. 1, p. 231-245.
Tilley, C. E., 1950, Some aspects of magmatic evolution-: Geol.Soc. London Quart. Jour., v. 106, pt. 1, p. 37-61.
Waters, A. C., 1955, Volcanic rocks and the tectonic cycle:Geol. Soc. America Spec. Paper 62, p. 703-722.
203. THE QUARTZ DIORITE LINE IN NORTHWESTERN NORTH AMERICA 1
By JAMES G. MOORE, ARTHUR GRANTZ, and M. C. BLAKE, JR., Menlo Park, Calif.
Buddington (1927) demonstrated that the granitic rocks of southeastern Alaska show a regional zonation in composition: they pass progressively from quartz diorite on the west, through granodiorite, to quartz monzonite on the east. A similar relation has been described in the western conterminous United States (Moore, 1959) where it is possible to delineate a line (called the quartz diorite line) roughly parallel to the Pacific Coast, which separates a western zone in which quartz diorite is the dominant granitic rock from an eastern zone in which granodiorite or quartz monzonite is the dominant granitic rock. The granitic rocks considered are chiefly of Jurassic and Cretaceous age, but they include some Tertiary intrusives and pos sibly some Paleozoic intrusives. In the present paper the quartz diorite line is extended across Alaska and the significance of the regional chemical differences that it helps to outline is explored.
Data regarding the dominant granitic rock type in each of approximately 100 mapped areas in Alaska and Canada (British Columbia and Yukon) are shown on figure 203.1. In order to compare the data, the same system is used in classifying the granitic rocks of all the mapped areas, even if the author of a pub lished report used a different system. The classifica tion system is the same system used in the earlier compilation of data on granitic rocks of the western conterminous United States (Moore, 1959). On figure 203.1 symbols are used for three main groups of granitic rocks: (a) quartz diorite, (b) granodiorite, and (c) quartz monzonite or granite.
iThis article -was first printed as Art. 183 in U.S. Geol. Survey Prof. Paper 424-C. It is reprinted here to include the list of refer ences on fig. 203.1 that -was inadvertently omitted from the first printing.
The granitic rocks of Alaska show an increase in the proportion of K-feldspar relative to plagioclase inland from the southern continental margin; this change is very similar to that found in the granitic rocks of California, Oregon, and Washington. In each area the granitic rocks become progressively richer in K and Si, and poorer in Na, Fe, and Mg inward from the continental margin.
The quartz diorite line drawn across Alaska (fig. 203.1) separates a zone adjacent to the southern coast in which quartz diorite is the dominant granitic rock from a zone to the north where granodiorite, quartz monzonite, or granite is the dominant granitic rock. The quartz diorite line does not mark an abrupt change in composition, and its position is dependent on the classification system employed.
From the latitude of Ketchikan to that of Skagway, the line is close to the international boundary between Alaska and Canada. It trends northwestward from Skagway on the north side of the St. Elias and Wrangell Mountains. The line reaches its farthest north point about 70 miles south of Fairbanks from where it curves to the southwest and ultimately passes out to sea at Bristol Bay. The line remains north of the Aleutian Islands, many of which are underlain by quartz diorite, but is probably south of the Pribilof Islands. The line is subparallel to the arcuate pattern of the regional structural elements of southern Alaska.
By combining all the data on^ie-positfon of the quartz diorite line in northwestern North America, the line can be traced for more than 3,500 miles from the Gulf of California to Bristol Bay in the Bering Sea (fig. 203.2). The quartz diorite line is approxi mately parallel to the west coast of North America,
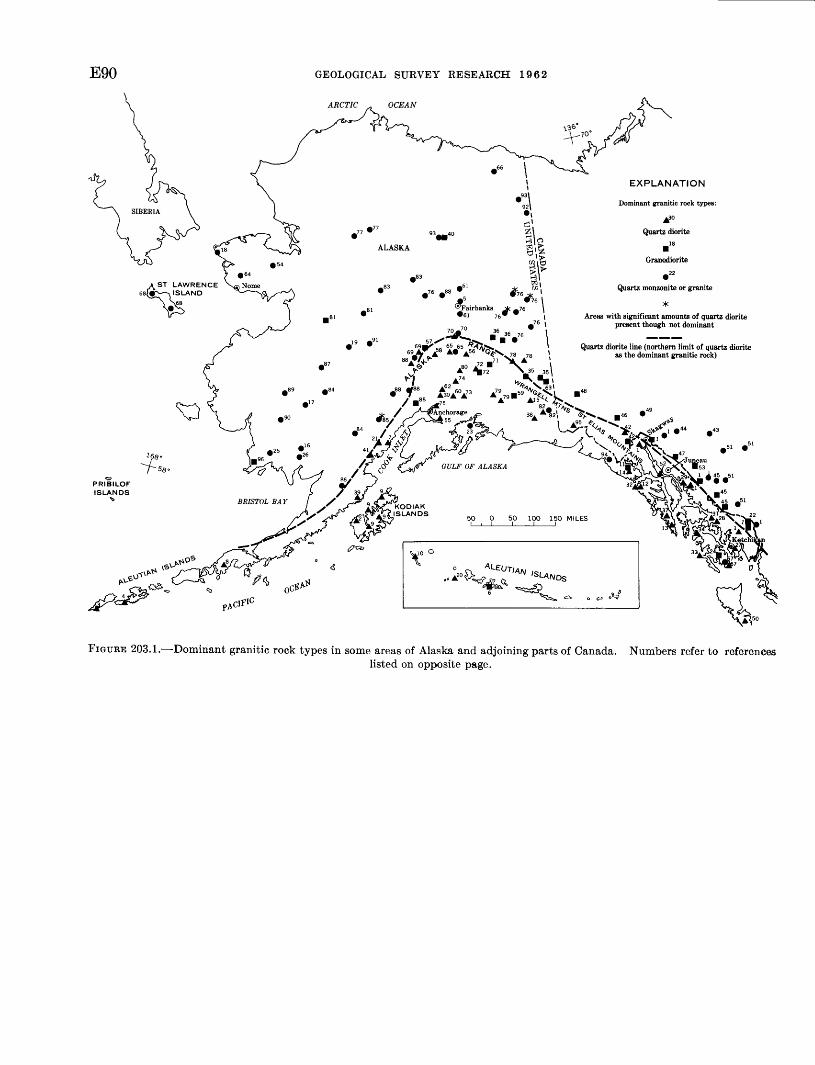
E90 GEOLOGICAL SURVEY RESEARCH 1962
.«.»- *.^^Tairbanks ik 76 I 61 76 * * (
*"1
" 1"& *'" *",;T^' \-i ./*" Xv
EXPLANATION
Dominant granitic rock types:
A30
Quartz diorite 18
Granodiorite
22
Quartz monzonite or granite
Areas with significant amounts of quartz diorite present though not dominant
Quartz diorite line (northern limit of quartz diorite as the dominant granitic rock)
c^11
pA.CIFIC
SL, o \^i" "u^ "r /U./IOA/I v., 4l>> * / ? ^N£«/ r/ 3ZA!/ 3Sf tt~L.
'^IfhkrK ,^\y^4|5>
tffCb
4
JDIAK
"ANDS 50 0 50 100 150 MILESi i 1 1 1 1
WO °
->^TM" *** *" *-^.» .»*
FIGURE 203.1. Dominant granitic rock types in some areas of Alaska and adjoining parts of Canada. Numbers refer to referenceslisted on opposite page.

ARTICLE 203
REFERENCES USED IN COMPILING FIG. 203.1
E91
8.
9.
10.
11.
12.13.
14.
15.16.17.
18.19.20.
21.
22.23.
24.
25.27.
28.
29.
30.
31.
32.
33.
35.
36.37.
38.
39.
40.
41.
42.
43.
44.45.
Buddington, A. F., 1927, Jour. Geology, v. 35, p. 224. Becker, G. F., 1898, U.S. Geol. Survey 18th Ann. Kept.,
Pt. Ill-a, p. 1-86. Byers, F. M., Jr., 1959, U.S. Geol. Survey Bull. 1028-L,
p. 267-369. Becker, G. F., 1898, U.S. Geol. Survey 18th Ann. Kept.,
Pt. Ill-a, p. 1-86; and Byers, F. M., Jr., 1959, U.S.Geol. Survey Bull. 1028-L, p. 267-369.
Byers, F. M., Jr., 1957, U.S. Geol. Survey Bull. 1024-1,p. 179-213.
Fraser, G. D., and Snyder, G. L., 1959, U.S. Geol. SurveyBull. 1028-M, p. 371-408.
Grantz, Arthur, 1956, U.S. Geol. Survey Bull. 1024-D,p. 95-106.
Kennedy, G. C., and Waldron, H. H., 1955, U. S. Geol.Survey Bull. 1028-A, p. 1-18.
Capps, S. R., 1937, U.S. Geol. Survey Bull. 880-C, p. 111-184.
Powers, H. A., Coats, R. R., and Nelson, W. H., 1960, U.S.Geol. Survey Bull. 1028-P, p. 521-554.
Rossman, D. L., 1959, U.S. Geol. Survey Bull. 1058-B,p. 33-59.
1959, U.S. Geol. Survey Bull. 1058-E, p. 139-216. Sainsbury, C. L., 1957, U.S. Geol. Survey Bull. 1024-G,
p. 141-161. Seitz, James, 1959, U.S. Geol. Survey Bull. 1058-C, p. 61-
120.Moffit, F. H., 1938, U.S. Geol. Survey Bull. 894, 137 p. Mertie, J. B., Jr., 1938, U.S. Geol. Survey Bull. 903, 96 p. Cady, W. M., Wallace, B. E., Hoare, J. M., and Webber,
E. J., 1955, U.S. Geol. Survey Prof. Paper 268, 132 p. Sainsbury, C. L., written communication, 1960. Mertie, J. B., Jr., 1938, U.S. Geol. Survey Bull. 903, 96 p. Coats, R. R., 1956, U.S. Geol. Survey Bull. 1028-E, p. 83-
100. Juhle, Werner, 1955, U.S. Geol. Survey open-file report,
74 p.Buddington, A. F., 1929, U.S. Geol. Survey Bull. 807, 124 p. Grant, U. S., and Higgins, D. F., 1910, U.S. Geol. Survey
Bull. 443, 89 p. Kennedy, G. C., 1953, U.S. Geol. Survey Prof. Paper 251,
46 p.26. Hoare, J. M., written communication, 1960. Robinson, G. D., and Twenhofel, W. S., 1953, U.S. Geol.
Survey Bull. 998-C, p. 59-84. Gault, H. R., Rossman, D. L., and Flint, G. M., Jr., 1953,
U.S. Geol. Survey Bull. 998-D, p. 15-58. Gault, H. R., and Fellows, R. E., 1953, U.S. Geol. Survey
Bull. 998-A, p. 1-13. Ray, R. G., 1954, U.S. Geol. Survey Bull. 1004, 86 p.; and
Ray, J. C., 1933, U.S. Geol. Survey Bull. 849-C, p. 165-228.
Bressler, C. T., 1951, U.S. Geol. Survey Bull. 963-C,p. 81-92.
Kennedy, G. C., and Walton, M. S., Jr., 1947, U.S. Geol.Survey Bull., 947-C, p. 39-64.
34. Twenhofel, W. S., Robinson, G. D., and Gault, H. R.,1947, U.S. Geol. Survey Bull. 947-B, p. 7-38.
Moffit, F. H., 1943, U.S. Geol. Survey Bull. 933-B, p. 103-174.
1954, U.S. Geol. Survey Bull. 989-D, p. 65-218.Guild, P. W., and Balsley, J. R., Jr., 1942, U.S. Geol. Sur
vey Bull. 936-G, p. 171-187.Brabb, E. E., and Miller, D. J., 1960, U.S. Geol. Survey
open-file report, 29 p.Keller, A. S., and Reiser, H. N., 1959, U.S. Geol. Survey
Bull. 1058-G, p. 261-298.Mertie, J. B., Jr., 1925, U.S. Geol. Survey Bull. 773, p. 215-
267.Martin, G. C., and Katz, F. J., 1912, U.S. Geol. Survey
Bull. 485, 138 p.Watson, K. DeP., 1948, British Columbia Dept. Mines
Bull., 25, 74 p.Watson, K. DeP. and Mathews, W. H., 1944, British Co
lumbia Dept. Mines Bull. 19, 52 p.Aitken, J. D., 1959, Canada Geol. Survey Mem. 307, 89 p.Kerr, F. A., 1948, Canada Geol. Survey Mem. 246, 94 p.
46. Kindle, E. D., 1952, Canada Geol. Survey Mem. 268, 68 p.47. Kerr, F. A., 1948, Canada Geol. Survey Mem. 248, 84 p.48. Muller, J. E., 1958, Canada Geol. Survey Prof. Paper 58-9,
9 p.49. Cockfield, W. E., and Bell, A. H., 1926, Canada Geol. Sur
vey Mem. 150, 63 p.50. Brown, A. S., and Jeffery, W. G., 1960, British Columbia
Dept. Mines Prelim. Map (Southern Queen Charlotte Island).
51. Canada Geological Survey, 1957, Canada Geol. Survey Prelim. Ser. Map 9 1957.
52. Barker, Fred, 1957, U.S. Geol. Survey Geol. Quad. Map GQ-100.
53. Canada Geological Survey, 1957, Canada Geol. Survey Prelim. Ser., Map 9 1957.
54. Hopkins, D. M., written communication, 1960.55. Park, C. F., Jr., 1933, U.S. Geol. Survey Bull. 849-G, p. 381-
424.56. Ross, C. P., 1933, U.S. Geol. Survey Bull. 849-H, p. 425-
468.57. Reed, J. C., 1933, U.S. Geol. Survey Bull. 849-D, p. 231-
287.58. Ross, C. P., 1933, U.S. Geol. Survey Bull. 849-E, p. 289-
33359. Moffit, F. H., and Mertie, J. B., Jr., 1923, U.S. Geol. Survey
Bull. 745, 149 p.60. Capps, S. R., 1927, U.S. Geol. Survey Bull. 791, 92 p.;
Waring, G. A., 1936, U.S. Geol. Survey Bull. 861, 57 p.; and this report.
61. Prindle, L. M., 1913, U.S. Geol. Survey Bull. 525, 220 p.62. Paige, Sidney, and Knopf, Adolph, 1907, U.S. Geol. Survey
Bull. 327, 71 p.63. Capps, S. R., 1916, U.S. Geol. Survey Bull. 630, 130 p.64. Hummel, C. L., written communication, 1961.65. Wahrhaftig, Clyde, 1958, U.S. Geol. Survey Prof. Paper
293-A, p. 1-68; and Moffit, F. H., 1915, U.S. Geol. Survey Bull. 608, 80 p.
66. Sable, E. G., written communication, 1961.67. MacKevett, E. M., written communication, 1961.68. Muller, E. H., and Alien, H. B., written communication,
1959.69. Reed, John C., Jr., written communication, 1961.70. Wahrhaftig, C., written communication, 1961; and this
report. 71-75. This report.76. Mertie, J. B., Jr., 1937, U.S. Geol. Survey Bull. 872,
276 p.77. Tailleur, I. L., oral communication, 1961; and Smith, P. S.,
and Mertie, J. B., Jr., 1930, US. Geol. Survey Bull. 815, 351 p.
78. Moffit, F. H., 1938, U.S. Geol. Survey Bull. 904, 54 p.79. 1935, U.S. Geol. Survey Bull. 886, 38 p.80. Chapin, Theodore, 1918, U.S. Geol. Survey Bull. 668, 67 p.81. Mertie, J. B., Jr., 1937, U.S. Geol. Survey Bull. 868-D,
p. 145-178.82. Moffit, F. H., 1918, U.S. Geol. Survey Bull. 675, 82 p.83. Eakin, H. M., 1916, U.S. Geol. Survey Bull. 631, 88 p.84. Smith, P. S., 1917, U.S. Geol. Survey Bull. 655, 162 p.85. Capps, S. R., 1935, U.S. Geol. Survey Bull. 862, 101 p.86. Spurr, J. E., 1899, U.S. Geol. Survey 20th Ann. Rept.,
Pt. 7-B, p. 31-264.87. Matzko, J. J., Jaffe, H. W., and Waring, C. L., 1958, Am.
Jour. Sci., v. 256, p. 529-539.88. Brooks, A. H., 1911, U.S. Geol Survey Prof. Paper 70,
234 p.89. Hoare, J. M., and Coonrad, W. L., 1959, U.S. Geol. Survey
Misc. Geol. Inv. Map 1-292.90. 1959, U.S. Geol. Survey Misc. Geol. Inv. Map 1-285.91. Brown, J. S., 1926, U.S. Geol. Survey Bull. 783-D, p. 97-
150.92. White, M. G., 1952, U.S. Geol. Survey Circ. 185, 13 p.93. Brosge", W. P., written communication, 1961.94. Miller, D. J., oral communication, 1961.95. Sharp, R. P., and Rigsby, G. P., 1956, Am. Jour. Sci.,
v. 254, p. 110-122.96. Mertie, J. B., Jr., 1940, U.S. Geol. Survey Bull. 918, 97 p.
667422 O - 63 - 7

E92 GEOLOGICAL SURVEY RESEARCH 1962
Greatest extent of early Tertiary marine transgression
Continental slope Dashed line outer edge continental shelf
FIGURE 203.2. The position of the quartz diorite line in northwestern North America and its relation to other features of the continental margin.
and especially to the inner edge of the continental slope. On the average, it is about 150 miles inland from the inner edge of the continental slope.
Two prominent landward embayments are present in the trend of the quartz diorite line. In Alaska the line curves northward 300 miles from the continental slope, and in Oregon and Washington, the line curves eastward more than 400 miles. Both embayments are reflected in more subdued landward curves in the trend of the edge of the continental shelf.
Although the embayment in Oregon and Washing ton is only faintly reflected by the configuration of the coast line or of the inner edge of the continental slope, it is paralleled more closely by coast lines of the geo logic past. The line representing the greatest trans gression of seas of early Tertiary age (dotted line, fig. 203.2) is deflected markedly into the embayment in Washington and Oregon. Moreover, some evidence suggests that the continental slope within this embay ment may have been father east than at present dur ing early Tertiary time. Eocene rocks of the Olympic Peninsula in northwestern Washington are marine throughout: chiefly pillow basalt, thin-bedded gray- wacke, argillite, and red foraminiferal limestone with associated manganese deposits. Such an assemblage of rocks, and the absence of shallow-water sedimen tary structures in them, suggest deposition in deep water, possibly on or beyond the continental slope.
The quartz diorite line is approximately parallel to major Mesozoic and Cenozoic tectonic elements, such as elongation of granitic intrusives, foliation of meta- morphic rocks, axes of folds, and strike of large faults. Major Quaternary volcanoes are alined paral lel to and slightly on the seaward side of the line (see fig. 203.2).
It is evident from the relations described above and shown on figure 203.2 that the quartz diorite line is a fundamental feature of the western continental mar gin of North America. It trends approximately par allel to the edge of the continent as indicated today by its relation to the shore line and to the continental slope, and as indicated in the past by its relation to early Tertiary shore lines. The difference in chemical composition of granitic rocks on each side of the line is presumably inherited from chemical differences in the crust, which existed before the granitic rocks were emplaced (Moore, 1959). A possible explanation of this difference is that west of the quartz diorite line the crust was thinner than in the area east of it and composed of a larger percentage of eugeosynclinal sediments and volcanic rocks that are relatively rich in sodium. The character of the Precambrian rocks west of the line is little known because exposures are

ARTICLE 204 E93
extremely rare. However, the authors believe that Precambrian granitic rocks are practically nonexistent west of the line. If this is true, then the Mesozoic and Cenozoic granitic rocks there are largely in their first cycle, that is, they were emplaced in a basement containing no older granitic rock.
East of the quartz diorite line, before emplacement of the Mesozoic granitic rocks, the crust was probably thicker and was composed of a larger percentage of platform-type sediments as well as great volumes of granitic rock. Thus, east of the line the crust was relatively rich in potassium relative to sodium. The Mesozoic and Cenozoic granitic rocks generated in this crust therefore contain a larger proportion of potassium feldspar relative to sodium-calcium feld spar than the granitic rocks of the continental border.
Quartz diorite appears to be the dominant granitic rock encircling the entire Pacific basin. A detailed search has not been made of the literature to establish the position of the line in the southern or western
Pacific. However, evidence at hand suggests that the line passes west of Kamchatka and between Japan and Korea. A similar change in composition of gra nitic rocks seems to occur slightly north of New Guinea, and in northern New Zealand. The quartz diorite line probably lies from 200 to 600 miles on the outside (landward side) of the andesite line (Mar shall, 1911, and Macdonald, 1949), and consequently the island arcs of the Pacific border are between the andesite line and the quartz diorite line.
REFERENCES
Buddington, A. F., 1927, Coast Range intrusives of south eastern Alaska: Jour. Geology, v. 35, p. 224.
Macdonald, G. A., 1949, Hawaiian petrographic province: Geol. Soc. America Bull., v. 60, p. 1541-1596.
Marshall, Patrick, 1911, Oceania: Handb. der Regionalen Geologie, v. 7, no. 2, 36 p.
Moore, J. G., 1959, The quartz diorite boundary line in the western United States: Jour. Geology, v. 67, no. 2, p. 198-210.
204. SYENITE COMPLEX OLDER THAN THE IDAHO BATHOLITH, BIG CREEK QUADRANGLE, CENTRAL IDAHO
By B. F. LEONARD, Denver, Colo.
An arcuate complex of syenite and quartz syenite involved with amphibolite is exposed in the Ramey Ridge area, northeast corner of the Big Creek quad rangle, Idaho and Valley Counties, Idaho. (See fig. 204.1.) The name Ramey Ridge Complex is here given to the units of syenitic rock shown on that figure. The syenitic rocks of the Ramey Ridge Complex are the only outcropping felsic plutonic rocks demon- strably older than the Idaho batholith that have been reported from this region. These rocks were earlier interpreted as slightly older facies of the Idaho batho lith itself (Leonard in Larsen and others, 1958, p. 51; Ross m Shenon and Ross, 1936, fig. 2 and p. 8-9). The complex has not been conclusively dated, but the evidence from geologic relations and lead-alpha de terminations on zircon suggests a Paleozoic age.
The chief components of the complex are alkali syenites. They lack feldspathoids and sodic pyriboles, usually contain a little quartz, and are very slightly enriched in cerium and niobium.
The syenite complex, interpreted as an assemblage of slightly to highly contaminated magmatic rocks, was emplaced mostly within old metavolcanic rocks correlated with those recently described from an area 5 miles to the southwest (Leonard, 1962). A narrow belt of the old metavolcanics is preserved along Beaver Creek as the footwall of the syenite complex, and as a septum separating the syenite complex from younger intrusive rocks to the west. The exposed metavol canics comprise dark-green amphibole-rich hornfels and amphibolite; green, fine-grained, biotite-rich horn fels; gray to green, very fine grained, micaceous "metasiltstone"; and some mylonitized felsic rocks. White quartzite on Ramey Ridge and near the county line is interpreted as a remnant of the hanging wall of the syenite complex.
The syenite complex is divisible into a highly con taminated outer part and a less contaminated inner part. In each part, the main components are syenite and quartz syenite of two distinct facies, A and B.
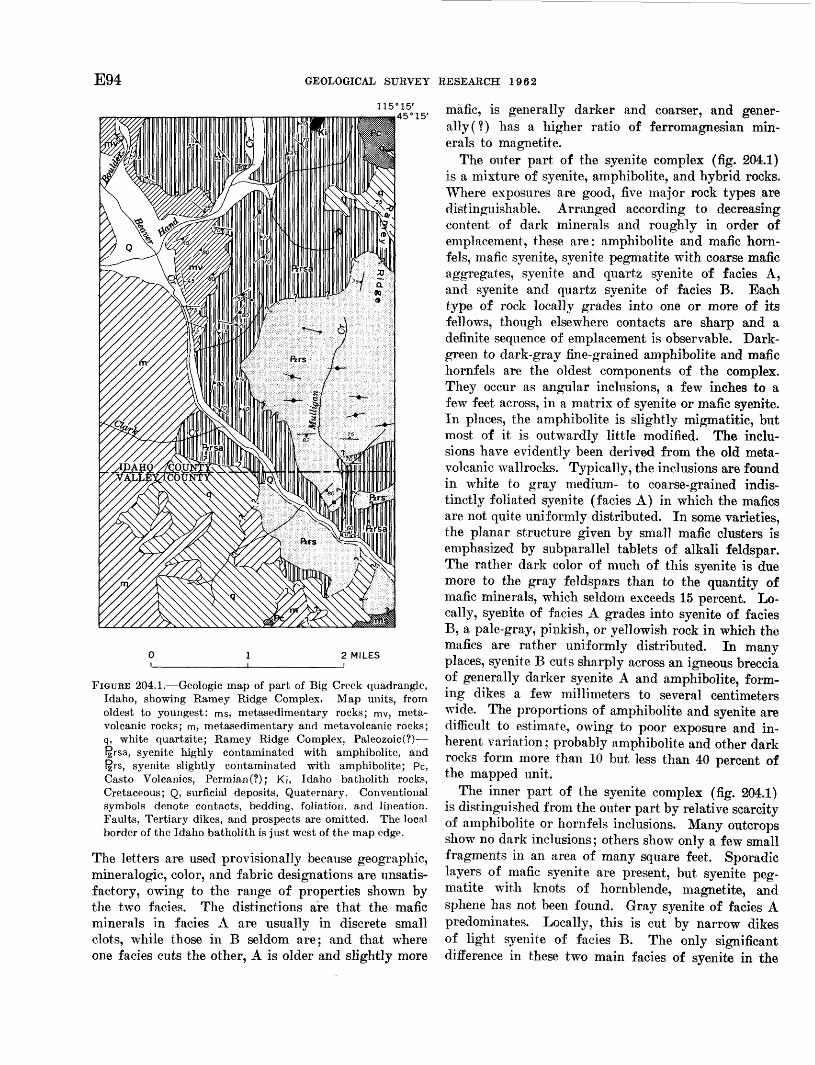
E94 GEOLOGICAL SURVEY RESEARCH 1962
2 MILES
FIGURE 204.1. Geologic map of part of Big Creek quadrangle, Idaho, showing Ramey Ridge Complex. Map units, from oldest to youngest: ms, metasedimentary rocks; mv, meta- volcanic rocks; m, metasedimentary and metavolcanic rocks; q, white quartzite; Ramey Ridge Complex, Paleozoic(?) l^rsa, syenite highly contaminated with amphibolite, and I^rs, syenite slightly contaminated with amphibolite; PC, Casto Volcanics, Permian(?); Ki, Idaho batholith rocks, Cretaceous; Q, surficial deposits, Quaternary. Conventional symbols denote contacts, bedding, foliation, and lineation. Faults, Tertiary dikes, and prospects are omitted. The local border of the Idaho batholith is just west of the map edge.
The letters are used provisionally because geographic, mineralogic, color, and fabric designations are unsatis factory, owing to the range of properties shown by the two facies. The distinctions are that the mafic minerals in facies A are usually in discrete small clots, while those in B seldom are; and that where one facies cuts the other, A is older and slightly more
mafic, is generally darker and coarser, and gener ally (?) has a higher ratio of ferromagnesian min erals to magnetite.
The outer part of the syenite complex (fig. 204.1) is a mixture of syenite, amphibolite, and hybrid rocks. Where exposures are good, five major rock types are distinguishable. Arranged according to decreasing content of dark minerals and roughly in order of emplacement, these are: amphibolite and mafic horn- fels, mafic syenite, syenite pegmatite with coarse mafic aggregates, syenite and quartz syenite of facies A, and syenite and quartz syenite of facies B. Each type of rock locally grades into one or more of its fellows, though elsewhere contacts are sharp and a definite sequence of emplacement is observable. Dark- green to dark-gray fine-grained amphibolite and mafic hornfels are the oldest components of the complex. They occur as angular inclusions, a few inches to a few feet across, in a matrix of syenite or mafic syenite. In places, the amphibolite is slightly migmatitic, but most of it is outwardly little modified. The inclu sions have evidently been derived from the old meta volcanic wallrocks. Typically, the inclusions are found in white to gray medium- to coarse-grained indis tinctly foliated syenite (facies A) in which the mafics are not quite uniformly distributed. In some varieties, the planar structure given by small mafic clusters is emphasized by subparallel tablets of alkali feldspar. The rather dark color of much of this syenite is due more to the gray feldspars than to the quantity of mafic minerals, which seldom exceeds 15 percent. Lo cally, syenite of facies A grades into syenite of facies B, a pale-gray, pinkish, or yellowish rock in which the mafics are rather uniformly distributed. In many places, syenite B cuts sharply across an igneous breccia of generally darker syenite A and amphibolite, form ing dikes a few millimeters to several centimeters wide. The proportions of amphibolite and syenite are difficult to estimate, owing to poor exposure and in herent variation; probably amphibolite and other dark rocks form more than 10 but less than 40 percent of the mapped unit.
The inner part of the syenite complex (fig. 204.1) is distinguished from the outer part by relative scarcity of amphibolite or hornfels inclusions. Many outcrops show no dark inclusions; others show only a few small fragments in an area of many square feet. Sporadic layers of mafic syenite are present, but syenite peg matite with knots of hornblende, magnetite, and sphene has not been found. Gray syenite of facies A predominates. Locally, this is cut by narrow dikes of light syenite of facies B. The only significant difference in these two main facies of syenite in the

ARTICLE 204 E95
inner and outer units (fig. 204.1) is that hornblende as a varietal mafic is effectively restricted to the outer unit, the one in which amphibolite inclusions are rela tively abundant. In the outer unit, hornblende is present locally in syenites of both facies A and B, whereas hornblende is absent from nearly all syenites of both facies in the inner unit. This distribution strongly suggests that hornblende in the outer unit is largely or wholly xenocrystic, or is derived from the reconstitution of mafic xenoliths.
In mineral composition, the two main facies (A and B) are simple. Essential minerals are alkali feld spar, magnetite, and biotite or hornblende. Mafic min erals seldom exceed 15 percent. Quartz is a varietal mineral: a few syenites have none, many have 1 to 3 percent, and the quartz syenites have about 10 percent. Feldspathoids have not been found. Most of the rocks conform to the definition of part of the classic nordmarkites, and the photomicrograph figured by Johannsen (1937, p. 6) would be illustrative of many specimens from the Ramey Ridge Complex. Micro- antiperthite, generally carlsbad twinned, is the pre dominant feldspar. However, some microperthite is present locally. The determination of the host feld spar is so difficult in many of the intergrowths that the term "perthite" will be used in this report. Patch- twinned albite is the principal feldspar in a few spe cimens. Cryptoperthite, anorthoclase, and other alkali feldspars may be present; they have not yet been studied. Biotite is more common than hornblende, though both may be present. The biotite is dark green; the hornblende is blue green. Magnetite is commonly clustered with the ferromagnesian mineral. The fine-grained, more felsic rocks (generally quartz syenites) commonly have 2 or 3 percent magnetite and less biotite or hornblende. Apatite and zircon are ubiquitous. The zircons range from minute to rela tively large (2 or 3 mm). Some of the large ones are pink, even in thin section, and are commonly the coarsest mineral present, except for the perthite. Sphene, either discrete or as rims on magnetite, is present in nearly half of the 36 specimens examined. Small granules of fluorite are found in more than half the specimens. Allanite is present in a few. Chevkinite, a complex Ce-Ti silicate, has been posi tively identified in one sample and is suspected in others. Some chevkinite is rimmed by very fine grained allanite(?), according to X-ray identification by Fred A. Hildebrand. Pyrite is rare, but pseudo- morphs of reddish goethite after accessory pyrite are rather common, and many syenites show crack filling and local replacement by iron oxides, hisingerite (?), and nontronite( ?). Two-thirds of the specimens show
slight alteration to epidote, pumpellyite, chlorite, and leucoxene.
The fabric of facies A and B ranges from unde- formed to cataclastic and granoblastic. Undeformed varieties (represented by less than a third of the specimens) have medium to coarse feldspars, generally carlsbad twinned, either crudely equigranular or dis tinctly elongate. The mafic minerals are usually much finer, occurring as patches between the feldspars. Quartz, if present, is also interstitial to the feldspars. Contacts between adjacent perthites are straight sided, interlocking, or implicated. Alternation of equant and elongate feldspars gives a thin-layered appearance to some otherwise homogeneous, undeformed syenites. Incipient deformation of the primary fabric has caused peripheral granulation of a few perthites, yielding a little mortar of sodic plagioclase. With increasing deformation, more plagioclase mortar has formed. Advanced deformation has caused granulation of part or all of the body of the perthites, yielding a mixture of fine sodic plagioclase and microcline but preserv ing a few perthite porphyroclasts. Some syenite has new biotite growing athwart feldspar contacts, or nar row veinlets of very fine hornblende cutting across primary planar structures. The distribution of cata clastic and granoblastic fabrics has no evident rela tion to contacts or primary flowage features. The changes in fabric and proportions of feldspars are very similar to those in some rocks from the Adirondack Mountains described by Buddington (1939, p. 251- 303). Changes in the syenites in Idaho are likewise taken as evidence of dynamothermal metamorphism.
Chemically analyzed rocks of the two main syenite facies have 62.6 to 67.3 percent SiC>2. Data for a syenite of intermediate SiC>2 content are given in the table below. This syenite belongs to facies B. Judged from many thin sections, the bulk composition of the complex is slightly less silicic.
The presence of 0.3 percent chevkinite was unex pected. This strongly absorbing, dark-brown to opaque accessory mineral was identified by X-ray by Fred A. Hildebrand (film no. D-6260). Young and Powers (1960) described chevkinite as minute crystals and primary inclusions in rhyolitic ash from the Cenozoic of Idaho and other Western States. Dwight L. Schmidt (oral communication, 1962) states that he has not found or heard of chevkinite in any of the major placer deposits of central and south-central Idaho. So far as I know, the mineral has not previ ously been identified in plutonic rocks of the region. Chevkinite accounts for the Ce and some of the Ti in the syenites. The source of the Nb has not yet been determined. The presence of Ce, other rare-

E96 GEOLOGICAL SURVEY RESEARCH 1962
Chemical and modal data for a syenite from the Ramey RidgeComplex
[Field No. L/54/1051; lab. No. B-232. Collected from talus, west side of Hand Creek trail, 2,200 feet northeast of Joe Creek (not shown on map) or about 1 mile upstream frommouth of Hand Creek, northeast ninth, Big Creek quadrangle, Idaho County, Idaho.
Fine-grained, subporphj ritie; faint planar structure given by crude laminae of elongate subparallel feldspars alternating with those of stubby, randomly oriented feldspars. Cataclasis moderate: peripheral granulation common; discontinuous lenticles of crushed material sparse. Represents the youngest faeies of rock form ing the syenite complex]
CHEMICAL ANALYSIS
[Lois Trumbull, analyst, 1955]
Si0 2 ... ... ...TiO2... ... ... ....AljOj. ...............FeaOa-- ~FeOMgO.._ _ .CaO._. .......... ....NajO--..... ......KjO.... ._ ......HjO+_ H20-_-_ PjOj...... ...........MnO. ...............
Weight percent
............ 64.95_- . .46
. .. 16.52.- - 3.37 1.60-. .- .21
.83... . 6.30..... . 5.02. .- .14
04 .-. .09. - -- .19
BaO_-_- .... ... .... C02 - --Cl-.... ...... ... ... ... .F__... ...................S-.--. ..............
Total.......... ........
Total (corrected) ___ .
Spgr... .
Weight percent
........ 0.03
........ .02
..... .03
........ .16
........ .00
........ 99.96
........ .08
....-.- 99.88
........ 12.71
MODE 2
Perthite... ----- ___
Chevkinite- _____
Volume percent
............ 4.9
. _- 3 1.6
............ 76.1
....... ___ - 411.5
1.1 1.0 2.7 .3
Fluorite. __ ..... ___ .
Total..----.-.........
Volume percent
........ 0.22
........ .2
........ .2
....... Tr.
--- 100.0
CIPW NORM
Q
ab.... ... ... ... ....an ...... .........hi-.... ...............
Weight percent
............ 8.05 ... 29.67 53.06. _ . 2.12............ .10._ _- . .52. ______ . 4.43
11 .-- ..............
fr _-_ - .-- . .
Total. ...... ...........
Weight percent
........ 0.30 - .88._ .20..... .18....... .05
.... . 99.56
SPECTROCHEMICAL ANALYSIS (SEMIQUANTITATIVE)
[Paul R. Barnett, analyst, 1955]
Ba.... ................. O.OXBe-........ . . .OOOX-Ce_.......... - .OXOr-......................... .OOOX-Cu......... ............ . .OOOXGa.......................... .OOXLa.............. .OX-
Nb ....................... O.OX-Nd- ..................... .OX-Sc-. .OOOXSr .- - ---. .OOX+Y........................... .OOX+Yb.. . - - .OOOX+ZT........................... .OX-
Looked for but not detected: Ag, As, Au, B, Bi, Cd, Co, Dy, Er, Qd, Qe, Hf, Hg, In, Ir, Li, Mo, Ni, Os, Pb, Pd, Pt, Re, Rh, Ru, Sb, Sm, Sn, Ta, Te, Th, Tl, U, V, W, Zn.
1 Determined by M. Balazs.2 Average of 3 thin sections; 4,441 points counted.3 May include some cryptoperthite and anorthoclase.4 Sodic oligoclase, recrystallized. Some albite, only slightly perthitic, is also
present.
earth elements, and Nb in slightly greater amounts in the syenite complex than in other rocks of the ]8ig Creek area may offer a clue to concentrations of such elements in the bedrock or placers of the area.
The gross structure of the syenite complex is still to be determined. Geologic mapping has not been ex tended north and east of the area shown on figure 204.1, so that an interpretation based on only part of the complex is given here. For this part, the key structure is the Hand Creek syncline, whose nose lies between Boulder and Hand Creeks. Here, the rem nant of old metavolcanics outlines the southwest limb and part of the nose of the southeast-plunging syn cline whose northeast limb is outlined by inclusions and foliation in the syenite complex. This sector of the complex is grossly concordant with the old meta volcanics, though syenite dikes cross the contact locally. The syncline is flanked on the southwest by an anti cline of metavolcanics, but the syenite complex cuts across the limb and nose of this structure along an irregular, steeply-dipping surface that is exposed in cliffs along Beaver Creek. Whether the patch of white quartzite on Ramey Ridge originally lay in the Hand Creek syncline or in a subparallel syncline cannot be determined, owing to the scarcity of out crops in the critical area.
The highly contaminated outer unit of the syenite complex is separated from the cylindrical (?), slightly contaminated central mass along a surface or narrow zone that, where well exposed, is highly irregular. In places, the southwest contact of the inner unit is crudely conformable to the structure of the old coun try rock, but mostly it is markedly discordant. On figure 204.1, this discordance is shown only by the perpendicular relation between the internal structure of the inner unit and the contact between the two units. On a topographic base, the discordant rela tions are more obvious, and the field evidence indi cates that some syenites of the inner unit intrude those of the outer unit.
The northwest contact of the inner unit cannot be accurately determined, owing to disintegration of rocks in the adjoining units.
Some linear magmatic flow in the complex is sug gested by the subparallel, elongate perthites in unde- forined syenite, as well as by scarce elliptical clots of amphibolite.
Superimposed on the earlier tectonic and flow struc tures are patches and zones of mylonite. The largest of these strikes north-northeast, roughly parallel to Hand Creek and 0.3-0.7 mile east of the creek. The mylonite zone is a few hundred to a thousand feet wide. Dikes of Tertiary age, mostly granophyric,

ARTICLE 204 E97
have been intruded here and there along the zone but are not restricted to it. Elsewhere in the Big Creek quadrangle, a few mylonite zones cut the Casto Vol- canics and the rocks of the Idaho batholith. There fore, it is reasonable to suppose that some of the mylonite zones in the syenite complex are younger than the batholith. However, the presence of mortar fabric and granoblastic patches in syenite pebbles taken from conglomerate in hornfelsed, only slightly sheared, prebatholith volcanics (Casto) clearly indi cates that considerable deformation of the syenite oc curred before the Idaho batholith was emplaced. Since some specimens of bedrock from the syenite complex show mylonite veins cutting mortar gneiss and grano blastic syenite, parts of the complex must have been deformed at least twice. It is reasonable to interpret one episode of deformation as prebatholith and one as postbatholith, though in any one specimen or out crop it would be rash indeed to attempt assignment of a mylonite to a particular episode of deformation. If the syenite complex was appreciably deformed during emplacement of the Idaho batholith, evidence of that effect has not yet been recognized.
In spite of some uncertainty in interpreting the gross structure and evolution of the syenite, these points are established: (1) the syenite complex was emplaced after major deformation of the old meta- volcanics had developed a system of rather tight folds that now plunge gently to moderately southeast; (2) syenite intrudes the white quartzite exposed on Ramey Ridge; (3) the white quartzite is unconformably over lain by Casto Volcanics; (4) aplites and alaskites of the Idaho batholith intrude the syenite complex and the Casto Volcanics; (5) only a mile southwest of the syenite complex, rounded pebbles and cobbles of syenite are found in greenstone conglomerate referred to the Casto Volcanics. Until syenite is found cut ting across a tight fold in the white quartzite, the relation between syenite and the principal folding of the quartzite remains indeterminate. However, all the evidence from other areas in the quadrangle indicates that old metavolcanics and overlying white quartzite have undergone the same major episodes of folding.
Thus it is reasonable to assume that the syenite is probably younger than the major folding of the white quartzite. The white quartzite may be late Precambrian, Cambrian, or Ordovician (Leonard, 1962). The Geological Survey's official age assign ment of the Casto is Permian(?). So long as the question mark, instead of the name Permian, is borne in mind, the assignment is appropriate enough for this nonfossiliferous formation. An age of Triassic or even Jurassic is as reasonable as Permian, since the volcanics and associated sedimentary rocks in all three systems are rather similar in the Cordilleran region. (See, for example, Bostwick and Koch, 1962; Nolf and Taubeneck, 1962).
The broadest time span into which the syenite complex can be fitted is therefore late Precambrian to perhaps Cretaceous; the narrowest is perhaps Ordo vician to Permian. Provisionally, the complex is re garded as Paleozoic. A closer approximation of its age awaits the results of isotopic studies of the com ponent rocks and minerals.
REFERENCES
Bostwick, D. A., and Koch, G. S., Jr., 1962, Permian andTriassic rocks of northeastern Oregon: Geol. Soc. AmericaBull., v. 73, p. 419-422.
Buddington, A. F., 1939, Adirondack igneous rocks and theirmetamorphism: Geol. Soc. America Mem. 7, 354 p.
Johannsen, Albert, 1937, A descriptive petrography of theigneous rocks, v. 3, The intermediate rocks: Chicago,Univ. Chicago Press, 360 p.
Larsen, E. S., Jr., Gottfried, David, Jaffe, H. W., and Waring,C. L., 1958, Lead-alpha ages of the Mesozoic batholiths ofwestern North America: U.S. Geol. Survey Bull. 1070-B,27 p.
Leonard, B. F., 1962, Old metavolcanic rocks of the Big Creekarea, central Idaho: Art. 5 in U.S. Geol. Survey Prof.Paper 450-B, p. B11-B15.
Nolf, Bruce, and Taubeneck, W. H., 1962, Permo-Triassicstratigraphic revisions, Wallowa Mountains, northeasternOregon [abs.] : Geol. Soc. America Rocky Mountain Sec tion, Provo Mtg. Program, p. 30-31.
Shenon, P. J., and Ross, C. P., 1936, Geology and ore depositsnear Edwardsburg and Thunder Mountain, Idaho: IdahoBur. Mines and Geology Pamph. 44, 45 p.
Young, E. J., and Powers, H. A., 1960, Chevkinite in volcanicash: Am. Mineralogist, v. 45, p. 875-881.

E98 GEOLOGICAL SURVEY RESEARCH 1962
205. TRONDHJEMITE IN THE RIGGINS QUADRANGLE, WESTERN IDAHO
By WARREN HAMILTON, Denver, Colo.
Trondhjemite is widespread in the 30-minute Rig- gins quadrangle of west-central Idaho, forming two large plutons and several smaller ones as well as abundant dikes and sheets in gneissic complexes. The name "trondhjemite" was introduced by Goldschmidt (1916, p. 77) for light-colored granitic rocks contain ing essential oligoclase and quartz but having little or no K-feldspar, and having biotite as the dominant mafic mineral. Such rocks are strikingly different from common quartz diorite on the one hand and granite on the other, and the distinguishing name "trondhjemite" is desirable to emphasize the unusual composition.
The interior of the Idaho batholith, which is prob ably of middle Cretaceous age (Jaffe and others, 1959), consists largely of massive uniform quartz mon- zonite and granodiorite. West of this is a gneissic and schistose border zone about 30 miles wide within which the proportion of intercalated granitic material and the grade of regional metamorphism decrease westward (Hamilton, 1960). The trondhjemite occurs largely in the western half of the gneissic part of this border zone.
A pluton of trondhjemite crops out beneath Colum bia River Basalt and surficial deposits in the south west part of the Riggins quadrangle and has an area probably greater than 50 square miles. The trondhje mite is white and is flaked by plane-parallel aggregates of large biotite crystals which enclose granular green epidote. Texture is xenomorphic granular and faintly gneissic. Plagioclase is anhedral calcic oligoclase that typically shows slight normal-oscillatory zoning; la mellar acline or pericline twinning is common and many grains are finely grid twinned. Orthoclase is lacking or rare. Quartz anhedra are elongate parallel to the foliation. Biotite forms 5 to 10 percent of the rock and where most abundant is accompanied by a little hornblende. A little muscovite in the more silicic phases is mostly in large extremely irregular crystals of replacement origin.
Epidote is present in practically all of this trondhje mite pluton in amounts up to 2 percent. The epidote is green and hence conspicuous in hand specimen, but it is only weakly pleochroic in thin section. Much of it is in euhedral crystals within or against aggre gates of biotite but some is extremely poikilitic, en closing chiefly biotite. Both types are of replacement origin: single thin sections contain grains of epidote showing all degrees of replacement of biotite, from
highly irregular and poikilitic epidote to compact eu hedral crystals. Oscillatory zoning of the plagioclase shows that the rock crystallized from magma, and the epidote is regarded as a late-magniatic reaction product.
The pluton was intruded semiconcordantly into older gneisses to the east and north, and produced contact miffmatites in a zone as wide as two-thirds of a mile.~
Along Little Salmon River to the north of the pluton varied quartz dioritic gneisses are cut intricately by large and small dikes of relatively dark trondhjemite that is gneissic parallel to the walls of the dikes. These dikes are cut in turn by massive, uniform, light- colored trondhjemite, and these are cut by sodic peg matites. The various dikes bulk larger than does the host gneiss near the pluton. Locally phyllonitized quartz diorite is cut by uncrushed dikes of trondheje- mite. Near Sixmile Creek east of the main trondheje- mite pluton, broadly uniform mafic quartz diorite gneiss is cut by an intricate network of aplitic trond hjemite, partly as discrete dikes, both concordant and discordant, but largely as a pervasive matrix enclosing blocks of quartz diorite. Contacts are extremely ir regular and crosscutting in detail (fig. 205.1A).
Smaller plutons stocks and semiconcordant sheets of trondhjemite similar to that of the plutoa de scribed are present in the center of the quadrangle. One such pluton is broken by a west-directed thrust fault (Hamilton, 1960) and is sheared to phyllonite near the fault.
Trondhjemite gneiss forms abundant intercalations in granodioritic and quartz monzonitic gneisses in the southeastern part of the quadrangle. Some of these layered complexes are much sheared.
A long pluton of trondhjemite gneiss crops out over an area about 5 miles long and several miles wide within the north-central part of the Riggins quad rangle, and is exposed for an additional 10 miles of length north of the quadrangle. The northern part of the west contact dips eastward, and is a semicon cordant intrusive contact in which the trondhjemite lies above marble and metavolcanic rocks; the marble is contact metamorphosed and metasomatized. The metamorphic rocks are the footwall of the same thrust fault that displaces the small pluton of trondhjemite noted above. The southern part of the west contact of the trondhjemite gneiss dips westward beneath hanging-wall metamorphic rocks. The gneiss is inter preted to have been intruded as a thick wedge along

ARTICLE 205 E99
FIGUBE 205.1. A, Trondhjemite-quartz diorite migmatite. The dark gneissio quartz diorite is injected intricately by white trondhjemite, and both are cut by a dike of sodic pegmatite. B, Shear-folded trondhjemite layer in mafic gneiss. Both trondhjemite and host gneiss are foliated and lineated cataclastically. Scale is 6 inches long.

E100
the thrust fault and to have been folded subsequently. The southern and eastern contact of the trondhjemite gneiss pluton is a zone several miles wide of trondhje mite intercalated in varied gneisses. Tight to open t fold shapes defined by foliation in the trondhjemite and by distribution of gneiss layers in the contact zone appear to be folds imposed on the trondhjemite rather than products of its intrusion into a pre-exist ing fold system, or folds produced by quasimagmatic flow. Figure 205.15 shows shear-folded gneiss in the eastern border zone of the pluton.
The trondhjemite gneiss is streaked by discontinu ous folia and trains of biotite, and has a distinctive sugary appearance. Plagioclase is near An2o in most specimens and is as sodic as An1B in some; zoning is evenly gradational without discontinuities, and is normal in some places but reverse in others. Most spe cimens carry a few percent of untwinned potassic feldspar. Mafic minerals total 5 to 12 percent, locally more. Intergrown with the biotite of most specimens is conspicuous green epidote and generally a little hornblende, but many specimens have muscovite in stead accompanying the biotite. Tiny crystals of pink garnet are present locally. Quartz is abundant and in much of the pluton is markedly elongate, with the long dimension and the c crystallographic direction subparallel to foliation. This orientation, the crystal- loblastic fabric of all minerals including orthoclase, and the presence of poikilitic and reverse-zoned oli- goclase indicate metamorphic recrystallization of the rock at high grade high enough to recrystallize or thoclase. The gneiss is monotonously uniform over large areas, and layered rock is uncommon within it.
The trondhjemite and allied rocks are highly dis tinctive mineralogically because of their low content of mafic minerals and their sodic plagioclase. They are comparably distinctive chemically, differing from common types of granitic rocks of similar SiOz con tent in all major oxides (fig. 205.2). Relative to gra nitic rocks of the normal types, in which the proportion of potassic feldspar increases and that of plagioclase decreases with increasing silica content, the trondhje mites contain 2 percent more A12OS , 1 to 2 percent more Na2O, and a little more CaO, but only about % as much iron and MgO, and ys as much K2O.
FIGUEE 205.2. Silica-variation diagram of chemical analyses of trondhjemites and allied dike rocks of Riggins quadrangle, shown by points. Curves show general trends of variations in rocks of the common series quartz diorite-granodiorite- quartz monzonite-granite in the Idaho, Sierra Nevada, and southern California batholiths.
20
15
,10
Ort O
rt fc
60 65 70 75
SiO2 , IN WEIGHT PERCENT
80
ARTICLE 206 E101
The trondhjemite and allied rocks of the Riggins quadrangle also have relatively high ratios of ferric to ferrous iron. This is expressed mineralogically by the almost ubiquitous epidote. Were there less ferric iron, then presumably the calcium which entered the epidote would instead have crystallized in plagio- clase, and the plagioclase would be slightly more calcic than it is.
The trondhjemite of the Riggins quadrangle varies widely in occurrence. One trondhjemite pluton is broken by a thrust fault which is intruded by another pluton, and the later of these plutons is itself highly deformed and metamorphosed. The large pluton of the southwest part of the quadrangle is unmetamor- phosed, and dikes from it cut phyllonite perhaps formed at the time of thrusting. Trondhjemite east of this pluton is sheared cataclastically and reconsti tuted at low grade. As all of the trondhjemite is in the western border zone of the Idaho batholith, within which the proportion of granitoid material decreases systematically westward, it is considered to be re lated genetically to the batholith and to have formed,
despite its complex relations, within a part of Cre taceous time before the emplacement of the massive interior of the batholith. Thrusting, metamorphism, and intrusion within the border zone are viewed as related phases of continuing activity.
Although the metamorphism is of "regional" type, the heat for it was probably partly introduced by granitic magmas and partly generated by extreme de formation of the rocks, and was largely unrelated to geothermal gradients controlled by depth of burial.
REFERENCES
Goldschmidt, M., 1916, Ubersicht der Eruptivgesteine Im kaledonischen Gebirge zwischen Stavanger und Trondh- jem: Kristiania Videnskaps. Skr., I. Math.-Naturv. Klasse, no. 2, 140 p.
Hamilton, Warren, 1960, Metamorphism and thrust faulting in the Riggins quadrangle, Idaho: Art. 103 in U.S. Geol. Survey Prof. Paper 400-B, p. B230-B231.
Jaffe, H. W., Gottfried, David, Waring, C. L., and Worthing, H. W., 1959, Lead-alpha age determinations of accessory minerals of igneous rocks (1953-1957) : U.S. Geol. Sur vey Bull. 1097-B, p. 65-148.
206. X-RAY DETERMINATIVE CURVE FOR OLIVINES OF COMPOSITIONALPINE-TYPE PERIDOTITES
FROM STRATIFORM AND
By PRESTON E. HOTZ and EVERETT D. JACKSON, Menlo Park, Calif.
The X-ray determinative method developed by Jack son (1960), using five natural olivines in the range Fogo-go from the Peridotite member of the Stillwater Complex, Montana, was applied to five chemically ana lyzed olivines from alpine- type peridotites from northwestern California and southwestern Oregon. The alpine-type olivines ranged in composition from Fooo-95 and appeared to fall on the extrapolation of the curve for stratiform types. The data for olivines from both provinces was therefore combined to con struct a curve for the range Fo80_95.
Following the procedures used by Jackson (1960),
olivine concentrates of five specimens of enstatite peri- dotite and dunite from alpine-type peridotites at four localities in northwestern California and southwestern Oregon were prepared and split to obtain samples for chemical analysis and X-ray measurements. The Fo content was calculated from the chemical analyses as the atomic ratio of Mg to total octahedral cations. X-ray measurements were made of the difference in degrees 20 (CuK«i) between the olivine (062J peak, and the lithium fluoride (220) peak for subsamples of the analyzed olivines, again following Jackson's method.

E102 GEOLOGICAL SURVEY RESEARCH 1962
The pertinent data for both the stratiform and alpine-type olivines are summarized in the table below.
Fo content and X-ray measurements of olivine samples
Field No. Foi
Mean of 12readings 2 20062(olivine) -26220(LiF) (degrees)
Standarddeviationof 12 read
ings (degrees)
Stillwater Complex 3
52MV-9-______ _55MV-29____..____55BE-37 4 _ _______55MV-26_______55BE-44 «______. ___________55MV-40- _______________55MV-49___-._____ _________
80. 584. 084. 784. 985. 885. 889. 7
3. 0192. 9582. 9452. 9472. 9282. 9262. 857
0. 001 £. 001 £. 00 K. 002£. 0012. 001C. 0014
California and Oregon
H45-57_______.____________NM1-61_________. _________D9-61___ __________________KN2-61 «.______C7-58._ ________-__NM4-61_______ _
90. 390. 991. 291. 291. 494. 2
2. 8422. 8342. 8302. 8302. 8332. 769
. 0017
. 0021
. 0014
. 0014
. 0021
. 0032
1 Atomic ratio of Mg to total octahedral cations.2 CuKai.s From Jackson (1960, table 197.1). * Hidden duplicate of 55MV-26. «Hidden duplicate of 55MV-40. » Hidden duplicate of D9-61.
A regression analysis of the data in the table was made, considering each of the 13 measured sets to be individual determinations, and taking the Fo value computed from the chemical analysis as the inde pendent variable. The equation for the straight-line curve (fig. 206.1) is: 20062 (olivine) -20220 (LiF) = 4.4722-0.018015 Fo. The regression constant for the combined data differs less than 0.4 percent and the regression coefficient differs less than 1.0 percent from the equation computed for the Stillwater olivines alone (Jackson, 1960, p. B433). The 95 percent con fidence intervals for the combined regression equa tion are ±0.008° 20 at 88 mol percent Fo and ±0.009° 20 at 80 and 95 mol percent Fo. These limits correspond to an uncertainty of approximately ±0.44 mol percent Fo at Fo88 , and ±0.49 mol percent Fo at Fo80 and Fo95 .
We conclude that the relation between the (062) spacing and the Fo content is the same for olivines from both Stillwater and California-Oregon perido- tites, and that the determinative curve (fig. 206.1) is
3.02 -
3.00
O Olivines from the Stillwater Complex /
Olivines from northwestern California/// and southwestern Oregon '
At Fooo the 95 percent confidence
interval is ±0.008
2.80 -
2.78
2.7695 94 93 92 91 90 89 88 87 86 85 84 83 82 81 80
Fo (ATOMIC RATIO Mg/TOTAL OCTAHEDRAL CATIONS)
FIGURE 200.1. X-ray determinative curve for stratiform and alpine-type olivines of composition Foso-95-
probably valid for olivines from both stratiform and alpine-type environments. Preliminary data for oli vines from the Hawaiian volcanic province (K. J. Murata, oral communication, 1962) indicate, however, that use of the determinative curve leads to errors of greater than 2 mol percent Fo, suggesting that the curve is not applicable to olivines from such volcanic rocks.
REFERENCE
Jackson, E; D., 1960, X-ray determinative curve for natural olivine of composition Fo8(M)0 : Art. 197 in U.S. Geol. Survey Prof. Paper 400-B, p. B432-B434.

ARTICLE 207
207. FORMATION OF "SALT CUPS" NEAR SAN PEDRO DE ATACAMA, CHILE
By ROBERT J. DINGMAN, Washington, D.C.
E103
Work done in cooperation icith the Institute de Geologicas Investigaciones, Santiago Chile, and under the auspices of theAgency for International Development
During the geologic mapping of the Tulor quad rangle near San Pedro de Atacama, Chile (fig. 207.1), fragile pure-white structures having the approximate size and shape of an inverted tea cup (fig. 207.2) were observed on outcrops of salt beds in the San Pedro Formation. The occurrence of these "salt cups," as the author proposes to call them, is restricted to smooth horizontal surfaces in the Cerros de la Sal, in the southeast corner of the Tulor quadrangle. The cups are composed of almost pure sodium chloride as are the underlying salt beds of the San Pedro Forma tion, which are 97+percent NaCl. In horizontal sec tion the salt cups are almost perfectly round and are 2 to 4 inches in diameter at the land surface. In ver tical section they are smoothly rounded domes of which the ratio of the base to the altitude is approxi-
20'
21°
22'
23'
24'
25'
26'
71° 70 c 69° 68° 67 C
TARAPACA
PROVINCE
c
BOLIVIA
TULOR i Volcan QUADRANGLE_ Licancabuiv
I A^_..-^%Pedro
SolarAtacama )':";:':':/.,/ '::' ' '. ''
ANTOFAGASTA
PROVINCE
ATACAMA
PROVINCE
/.f.-'. : >: (-, i de Atacama.1
Toconao j i
I I
Tilomonte S
< ;
w V-!__X
Pular
ARGENTINA
100 200 KILOMETERS
FIGURE 207.1. Index map of part of northern Chile showing location of the Tulor quadrangle.
mately 2:1. The thickness of the wall is ys to %6 inch at the base and decreases upward to approximately y16 inch at the top of the cup. The salt cups may be open or completely closed at the top. They are open at the top during the youthful stage, closed in the mature stage (fig. 207.3), and open again during the olcl-age stage (fig. 207.4). Beneath the salt cup a round tubular passage extends downward into the salt. The irregularity of the passage prevents determina tion of its depth, although one tube was probed to a depth of 32 inches.
The cups are formed as a result of solution and re- deposition of salt from the underlying salt beds. The tubular passages under the cups probably extend downward into either an intersecting system of frac tures or a cave or tunnel that forms part of the in ternal drainage system of the salt domes. Under changing atmospheric conditions, the flow of air through such a connection would be similar to that through a sucking and blowing well. The upward moving air during the blowing stage would be moist and would carry a certain amount of salt in solution. Deposition by crystallization would occur at the land surface owing to the lower vapor pressure of the dry outside air. Because fog or periods of high humidity are, very uncommon in this area, the air drawn into
FIGTJKE 207.2. Salt cup in late stage of construction almost closed.
Vent is

E104 GEOLOGICAL SURVEY RESEARCH 1962
the cups is dry and so does not take the salt back into solution. The gradual sealing of the vent at the top
FIGURE 207.3. Mature salt cup. Vent is completely closed.
f ~ - - » ; - -
of a cup indicates that the cup was formed by a very gentle current of air. Actual movement of air out of or into the cups could not be observed because the wind blows continuously in this area.
As shown in figure 207.5, hairlike growths of crystals extend inward from the inner surface of the cups. Except for these growths, the inner surface of the cups is very smooth, whereas the outer surface is relatively rough. Because the wall of a cup is very light in weight and highly porous, air movement through the wall probably occurs even after the vent has been sealed. If the wall were not porous, a closed cup would rupture during changes of air pres sure.
The cups are extremely delicate structures and prob ably are destroyed by raindrops. In the San Pedro area, however, the average rainfall is less than 4 inches per year and several years may pass without any precipitation. The occasional moderate to heavy rains probably provide the moisture that eventually results in the formation of new cups. Like desert flowers, it is likely that salt cups "bloom" after a rain.
FIGURE 207.4. Salt cups in the old-age stage. Erosion results from abrasion by windblown sand or from solution by rain drops. The large size of the mound indicates that many gen erations of salt cups have formed at this site. FIGURE 207.5. Salt cup broken open to show internal structure.

ARTICLE 208 El05
GEOCHRONOLOGY
208. LEAD-ALPHA AGES OF ZIRCON IN QUARTZ MONZONITE PORPHYRY, THIEL MOUNTAINS, ANTARCTICA A PRELIMINARY REPORT
By A. B. FORD, H. A. HTJBBARD, and T. W. STERN, Washington, D.C.
Work supported ~by the National Science Foundation
The Thiel Mountains in the interior of West Ant arctica (fig. 208.1) consist mainly of cordierite-bear- ing hypersthene-quartz monzonite porphyry that has been intruded by plutons of coarse-grained biotite granite (Ford and Aaron, 1962). The porphyry is one of the oldest rock units in the area, but its geologic
age is unknown because of the absence of fossiliferous rocks.
Little is known regarding the geologic age of plu- tonic rocks in West Antarctica. Quartz monzonite basement rocks in the Horlick Mountains, approxi mately 150 miles west of the Thiel Mountains, are
93°W. 92 °W 90°W. 89°W.
NSample 2
Aaron Glacier
-Sample 1
McMurdo Sound I (f>
Ross
90 °E.
5 MILES
85°
GO'S.
85° 15'S
FIGURE 208.1. Index and geologic sketch maps, Thiel Mountains, Antarctica. Hypersthene-quartz monzonite porphyry isshown by small "v"s, younger intrusive granitic rocks by " + "s.
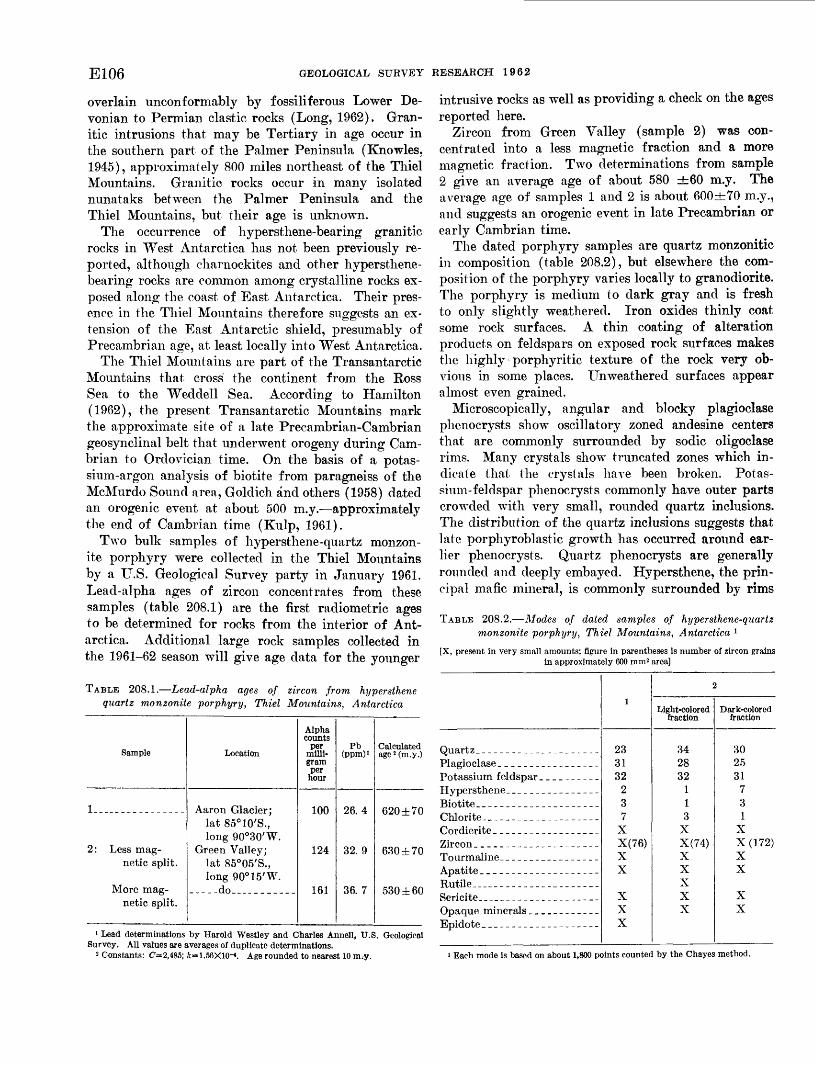
E106 GEOLOGICAL SURVEY RESEARCH 1962
overlain unconformably by fossiliferous Lower De vonian to Permian clastic rocks (Long, 1962). Gran itic intrusions that may be Tertiary in age occur in the southern part of the Palmer Peninsula (Knowles. 1945), approximately 800 miles northeast of the Thiel Mountains. Granitic rocks occur in many isolated nunataks between the Palmer Peninsula and the Thiel Mountains, but their age is unknown.
The occurrence of hypersthene-bearing granitic rocks in West Antarctica has not been previously re ported, although charnockites and other hypersthene- bearing rocks are common among crystalline rocks ex posed along the coast of East Antarctica. Their pres ence in the Thiel Mountains therefore suggests an ex tension of the East Antarctic shield, presumably of Precambrian age, at least locally into West Antarctica.
The Thiel Mountains are part of the Transantarctic Mountains that cross the continent from the Ross Sea to the Weddell Sea. According to Hamilton (1962), the present Transantarctic Mountains mark the approximate site of a late Precambrian-Cambrian geosynclinal belt that underwent orogeny during Cam brian to Ordovician time. On the basis of a potas sium-argon analysis of biotite from paragneiss of the McMurdo Sound area, Goldich and others (1958) dated an orogenic event at about 500 m.y. approximately the end of Cambrian time (Kulp, 1961).
Two bulk samples of hypersthene-quartz monzon- ite porphyry were collected in the Thiel Mountains by a U.S. Geological Survey party in January 1961. Lead-alpha ages of zircon concentrates from these samples (table 208.1) are the first radiometric ages to be determined for rocks from the interior of Ant arctica. Additional large rock samples collected in the 1961-62 season will give age data for the younger
TABLE 208.1. Lead-alpha ages of zircon from hypersthene quartz monzonite porphyry, Thiel Mountains, Antarctica
Sample
1_
2: Less mag netic split.
More magnetic split.
Location
lat 85°10'S., long 90°30'W.
Green Valley; lat 85°05'S., long 90°15'W.
..-.-do ...._.._
Alpha counts
per milli gram per
hour
100
124
161
Pb (ppm)i
26.4
32. 9
36. 7
Calculated age 2 (m.y.)
con i *7n
630 ±70
530 ± 60
intrusive rocks as well as providing a check on the ages reported here.
Zircon from Green Valley (sample 2) was con centrated into a less magnetic fraction and a more magnetic fraction. Two determinations from sample 2 give an average age of about 580 ±60 m.y. The average age of samples 1 and 2 is about 600±70 m.y., and suggests an orogenic event in late Precambrian or early Cambrian time.
The dated porphyry samples are quartz monzonitic in composition (table 208.2), but elsewhere the com position of the porphyry varies locally to granodiorite. The porphyry is medium to dark gray and is fresh to only slightly weathered. Iron oxides thinly coat some rock surfaces. A thin coating of alteration products on feldspars on exposed rock surfaces makes the highly porphyritic texture of the rock very ob vious in some places. Unweathered surfaces appear almost even grained.
Microscopically, angular and blocky plagioclase phenocrysts show oscillatory zoned andesine centers that are commonly surrounded by sodic oligoclase rims. Many crystals show truncated zones which in dicate that the crystals have been broken. Potas sium-feldspar phenocrysts commonly have outer parts crowded with very small, rounded quartz inclusions. The distribution of the quartz inclusions suggests that late porphyroblastic growth has occurred around ear lier phenocrysts. Quartz phenocrysts are generally rounded and deeply embayed. Hypersthene, the prin cipal mafic mineral, is commonly surrounded by rims
TABLE 208.2. Modes of dated samples of hypersthene-quartz monzonite porphyry, Thiel Mountains, Antarctica l
[X, present in very small amounts; figure in parentheses is number of zircon grains in approximately 600 mm2 area]
1 Lead determinations by Harold Westley and Charles Annell, U.S. Geological Survey. All values are averages of duplicate determinations.
2 Constants: C=2,485; ft=1.56X10-«. Age rounded to nearest 10 m.-y.
Chlorite- _ _-.-________-_-__-
Rutile . .____....._.____.__._Sericite ______ -..
i
233132
237
XX(76)XX
XXX
(
Light-colored fraction
342832
113
XX(74)XXXXX
2
Dark-colored fraction
302531
731
XX(172)XX
XX
Each mode is based on about 1,800 points counted by the Chayes method.

ARTICLE 208 E107
of brown and green biotite and locally of chlorite. Biotite is almost entirely associated with hypersthene, from which it appears to be an alteration product. Biotite in porphyry samples from near contacts with the younger granite plutons is porphyroblastic and highly sieve textured. Cordierite occurs both as large euhedral phenocrysts and as anhedral crystals asso ciated with plagioclase and potassium feldspar. Cor dierite is commonly altered to pale-green chlorite and sericite.
Most zircon occurs as separate grains in a dense xenomorphic-granular groundmass of quartz and po tassium feldspar. Dark-brown pleochroic halos are common around very small zircon grains in biotite, and yellow pleochroic halos around zircon in cor- dierite. Small zircon grains are also associated with opaque minerals and with hypersthene. Most zircon is clear and colorless. The grains range in diameter from less than 0.01 to 0.45 mm and average about 0.05 mm.
Quartz and feldspar phenocrysts range from 1 to 5 mm in diameter. Groundmass crystals average 0.05 mm. The groundmass is coarser near contacts with the younger intrusions. The porphyry appears ho mogeneous in most outcrops, as at sample 1 locality, but locally, as at sample 2 locality, poorly defined layered and lens-shaped bodies of very-dark-gray por phyry are present. The darker color of the layers and lenses is apparently due to the greater amount of dense groundmass. Groundmass constitutes 60 per
cent of the very-dark-gray porphyry in contrast to 45 percent of the medium-gray porphyry.
Several features indicate that the porphyry has been recrystallized. These are (1) a hornfelsic or granu- litic groundmass texture, (2) cordierite that appears to have replaced feldspar, (3) poikiloblastic rims on potassium-feldspar phenocrysts, (4) poikiloblastic bio tite crystals, and (5) alteration rims of biotite and chlorite around hypersthene grains. Because these features are much more common in the vicinity of con tacts with the biotite granite, they are probably ef fects of thermal metamorphism related to the intru sions. Therefore, zircon ages reported here may reflect the age of the younger intrusions rather than crystal lization of the porphyry.
REFERENCES
Ford, A. B., and Aaron, J. M., 1962, Bedrock geology of theThiel Mountains, Antarctica: Science, v. 137, no. 3532,p. 751-752.
Goldich, S. S., Nier, A. O., and Washburn, A. L., 1958, A<H)/K40age of gneiss from McMurdo Sound, Antarctica: Am.Geophys. Union Trans., v. 39, no. 5, p. 956-958.
Hamilton, Warren, 1962, Petrochemistry of probable Paleozoicgranitic rocks from the Ross Sea region, Antarctica:Art. 225 in U.S. Geol. Survey Prof. Paper 424-C, p. 0209-C212.
Knowles, P. H., 1945, Geology of southern Palmer Peninsula,Antarctica: Am. Philos. Soc. Proc., v. 89, no. 1, p. 132-145.
Kulp, J. L., 1961, Geologic time scale: Science, v. 133, no. 3459,p. 1105-1114.
Long, W. E., 1962, Sedimentary rocks of the Buckeye Range,Horlick Mountains, Antarctica : Science, v. 136, no. 3513,p. 319-321.

El08 GEOLOGICAL SURVEY RESEARCH 1962
209. EVALUATION OF THE Pa231/U-Th230/U METHOD FOR DATING PLEISTOCENE CARBONATE ROCKS 1
By J. N. ROSHOLT and P. S. ANTAL, Denver, Colo., and The Marine Laboratory, Miami, Fla.
Work done in cooperation ivith The Marine Laboratory, University of Miami
One of the potential radioactive-dating methods is that of measuring the Th230/U and the Pa2ai/U ratios in stratigraphically controlled samples. The Th230/U ratio provides the most direct approach for determin ing age in the time range of 40,000 to 250,000 years, whereas the use of both ratios provides a more strin gent test of the validity of age determinations.
A small amount of previous work has been done on variations of this uranium-decay method. Barnes and others (1956), in their study of coral-limestone cuttings from a drill core taken on a Pacific Ocean atoll, were the first to obtain data on the Th230/!! ratio in Pleistocene rocks. Sackett 2 made more ex tensive analyses on this type of material and estimated ages from the Th230/U ratio in Pleistocene rocks. Tatsumoto and Goldberg (1959) extended the study of the ionium-uranium dating technique to other car bonates of the marine environment, primarily oolites and coral from Atlantic Ocean islands. An evalua tion of this dating method, using Pa231 and Th230, on archeologically correlated bone specimens has been given by Rosholt (1958, p. 235).
If the calculated age is to represent the true age of the material analyzed, three assumptions must be valid: (1) the uranium was introduced into the ma terial over a short interval compared to the age of the daughter products; (2) no measurable amounts of daughter products were introduced directly from the surroundings; (3) measurable quantities of ura nium or daughter products were not subsequently leached from the sample. In most naturally occurring material there is bound to be some deviation from all three of these assumptions. The purpose of this in vestigation is to evaluate the overall effect of the de viations in carbonate-rock material for which good Pleistocene stratigraphic correlations are available. The carbonates include marine limestones, calcareous tufa, and cave stalagmites.
RESULTS
Uranium was determined by the polarographic method (Antal, 1961) and it is expressed as parts per
1 Contribution No. 418, The Marine Laboratory, University of Miami. Research was supported in part by USABC Contract at 40-1
' (2411) and NSF Grant G-15744 to the Marine Laboratory.2 Sackett, W. M., 1958, Ionium-uranium ratios in marine deposited
calcium carbonates and related materials: Washington Univ., St. Louis, Ph.D. thesis.
million of uranium. Radiochemical methods (Ros holt, 1957; Rosholt and Dooley, 1960) were used for the determination of all the radioactive daughter products, which are expressed as equivalents to the parent nu- clides in terms of equivalent parts per million. The description of the type of material, location, and method of Pleistocene stratigraphic correlation for marine limestones and terrestrial carbonate rocks are listed in tables 209.1 and 209.3, respectively. The analytical data, isotope ratios used for calculation, apparent ages obtained from these ratios, and esti mated ages based on Pleistocene correlation, where available, are shown in tables 209.2 and 209.4, re spectively.
TABLE 209.1. Description of marine limestones
[Collected by J. Hoflmeister]
Sample Description and Location Hoff-G___-__ Miami Oolite, calcarenite just below crust.
Overlies contact between oolite and Key Largo Limestone, Big Pine Key, Fla.
-F______ Breccia containing considerable organic matterfrom hole in Key Largo Limestone.
-C___-__ Key Largo Limestone. Calcarenite under top crust, Grassy Key, Fla., 30 miles from Big Pine Key.
-A______ Key Largo Limestone. Coral rock just undercrust, top sample of core 2, Grassy Key, Fla.
-B_ _____ Key Largo Limestone. Coral rock and weatheredcrust at 16-20 foot depth in core 2.
-D______ Key Largo Limestone. Coral rock at 106-113foot depth in core 2.
-E______ Key Largo Limestone. Coral rock in form oflarge pebbles at 156-165 foot depth in core 2, just above quartz sand in underlying deposit.
The suite of Florida marine limestones (samples Hoff-A to Hoff-G) was collected in 1960 by J. E. Hoffmeister, of the University of Rochester. The samples contain a mixture of aragonite and calcite. The uranium content in all the samples is lower than the equivalent Pa231 or Th230, therefore no direct ra tio of daughter product to uranium can be calculated. To provide a comparison between samples where no direct daughter to parent ratio is applicable, appar ent minimum and maximum ages are calculated as described by Rosholt .(1961, p. 1396). If the assump tions made to obtain the apparent minimum and maximum ages approach validity, the actual age of

ARTICLE 209
TABLE 209.2. Analytical data and apparent ages of marine limestones
E109
Sample
Hoff-G___.__ -....__..-F. __________ _-C_______________-A.________....._-B___.___________-D_____. _________-E___-__..____.__
Eesidue (percent)
0. 16 1. 1 .58 . 59 .40 .41 . 31
u
Ppm
1. 02 .20 .35 .46 .50 .29 . 61
Pa23i Th23» Ra2M Thzss
Equivalent ppm
1. 3 . 54
2. 9 1. 5 4. 4 4. 3 4.2
1. 2. 33
1. 5 .86
4. 1 3. 5 3. 7
1. 2 .32
2.0 1.0 3.7 2.8 3.2
0.05 . 16 .06 .05
.04
Th23«/Pa«i
0. 92 .61 . 52 . 56 . 93 . 81 .88
Apparent age (years)
Minimum
150, 000 45, 000 23, 000 33, 000 95, 000 77, 000 88, 000
Maximum
>250, 000 70, 000 40, 000 50, 000
>250, 000 180, 000 230, 000
the sample should be between the two apparent age values.
Samples Hoff-A, -B, -D, and -E were selected from drill core 2, on Grassy Key, Fla. The core ex tended to approximately 170 feet, through the Key
Largo Limestone of Sanford (1909, p. 215). Sample Hoff-B contained a large amount of oolite (G. Rus- nak, oral communication, June 1961) intermixed with a weathered crust. A similarity in apparent ages is evident between sample Hoff-B and Miami Oolite
TABLE 209.3. Description of terrestrial carbonate rocks
Sample Carbonate type Location Stratigraphic description
61 ER-11.
60 ER-5_.
-7-
-11.
61 ER-10.
-I..
-7.
-6.
-4.
-9.
60 ER-16.
-1.
Limestone sinter.
Calcareous tufa_
Lake marl.
Calcareous tufa.
.do-
Stalagmite, calcite___
.do.
.do-
La Vache Cave near Tarascon (Aliege),French Pyrenees. Collected by L. Zotz.
Thoming, 4 miles south of Buxton, SouthAfrica. Collected by K. P. Oakley andF. G. Orffer, 1953.
Exposed at gravel quarry near Zeifen, Kreis-laufen on Salzach River, southeastBavaria, 427 meters above sea level.Submitted by H. Gross.
Hungarian site Tata. Collected by L.Vertes.
Ehringsdorf, Germany. Collected by G.Behm-Blanke, Weimar.
Grotte-abri Lachaud Terrasson, Dordogne,France, 1942. Submitted by MadameLeroi-Gourhan.
"Neanderthal Footprint Cave," Tana dellaBASUA, Toirano, Liguria, North Italy.Collected by Andrea Nersi and K. P.Oakley, March 1961.
.._..do _________.____..-__.-._-._-_.-..
.do. .do.
.do.
Stalagmite calcite prisms.
Stalagmite, porous___
Stalagmite, calcite and aragonite.
Grotto Romanelli, south Italy, from Blanc collection. Submitted by K. P. Oakley.
Santa Croce Bisceglie, Italy. Collected by L. Cordini, submitted by K. P. Oakley.
Grottedel'Hygene, Arcy-sur-Cure (Yonne). Collected by Madame Leroi-Gourham.
Swartkrans, Transvaal, South Africa. lected by K. P. Oakley, 1953.
Col-
Overlies rich Magdalenian deposit of culturedated at 9700 ±200 years by C14 .
Lower Gamblian age.
Interstadial lake. Bed of 1-meter thickness intercalated in Lower Wurm gravel, below Main Wurm ground moraine at depth of 8 meters.
Age is probably greater than 50,000 years.
Eemian age.
Stalagmite fragment containing considerable noncalcareous matter. Proto-Magdalen ian I and proto-Madgalenian II.
Outermost stalagmite blocking entrance to cave. Contains traces of charcoal. Late Wiirm age probable and Main Wiirm age possible.
Upper stalagmite forming inner part of mass blocking entrance to cave. Main or Late Wiirm age probable.
Lower stalagmite blocking entrance to cave. Probable age is Main or Late Wiirm.
Stalagmite layer NIV.X (-H). Age is prob able Early Wurm.
Stalagmite containing small calcite prisms intermixed with charcoal underlying mid dle Mousterian. Age is probable Early Wiirm.
Small conical stalagmite reworked by early Mousterians and placed by them on early Mousterian soil.
Underlying breccia with Paranthropus.
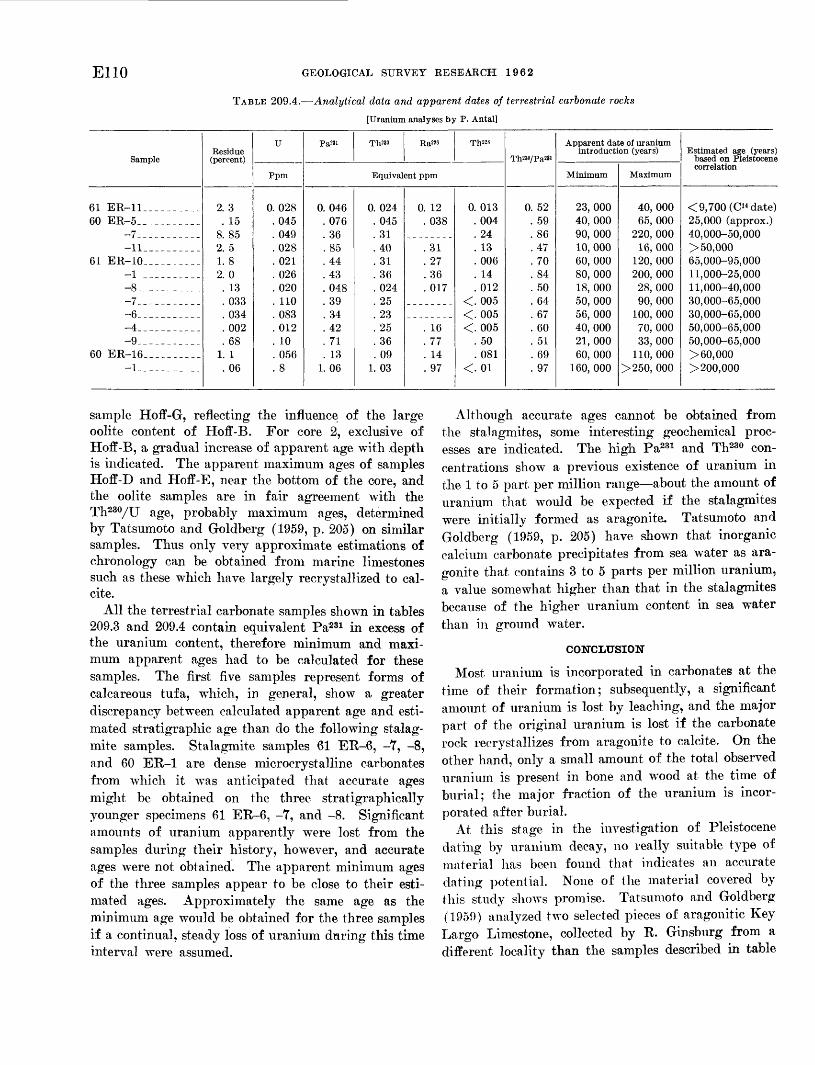
E110 GEOLOGICAL SURVEY RESEARCH 1962
TABLE 209.4. Analytical data and apparent dates of terrestrial carbonate rocks
[Uranium analyses by P. Antal]
Sample
61 ER-11__________60 ER-5-___-______
-7__---_-_----11_. -._-____
61 ER-10-----------1 ______ ___-8__--_______ 7-6__--_-__-__-4-_______-_--9____-_-____
60 ER-16_____-____-1
Residue (percent)
2.3 . 15
8. 85 2. 5 1. 8 2.0
. 13
. 033
. 034
. 002
. 68 1. 1
. 06
u
Ppm
0.028 . 045 . 049 .028 . 021 . 026 . 020 . 110 . 083 . 012 . 10 . 056 . 8
pa231 Th230 Ra226 Th228
Equivalent ppm
0. 046 . 076 . 36 . 85 . 44 . 43 . 048 . 39 . 34 . 42 . 71 . 13
1. 06
0. 024 . 045 . 31 . 40 . 31 . 36 . 024 . 25 .23 . 25 .36 . 09
1. 03
0. 12 . 038
.31
. 27
.36
. 017
. 16
. 77
. 14
. 97
0. 013 . 004 . 24 . 13 . 006 . 14 . 012
<. 005 <.005 <. 005
. 50
. 081 <. 01
Th23o/pa23i
0. 52 . 59 . 86 . 47 . 70 .84 . 50 . 64 . 67 . 60 . 51 . 69 . 97
Apparent date of uranium introduction (years)
Minimum
23, 000 40, 000 90, 000 10, 000 60, 000 80, 000 18, 000 50, 000 56, 000 40, 000 21, 000 60, 000
160, 000
Maximum
40, 000 65, 000
220, 000 16, 000
120, 000 200, 000
28, 000 90, 000
100, 000 70, 000 33, 000
110,000 >250, 000
Estimated age (years) based on Pleistocene correlation
< 9, 700 (O date) 25,000 (approx.) 40,000-50,000 > 50, 000 65,000-95,000 11,000-25,000 11,000-40,000 30,000-65,000 30,000-65,000 50,000-65,000 50,000-65,000 > 60, 000 > 200,000
sample Hoff-G, reflecting the influence of the large oolite content of Hoff-B. For core 2, exclusive of Hoff-B, a gradual increase of apparent age with depth is indicated. The apparent maximum ages of samples Hoff-D and Hoff-E, near the bottom of the core, and the oolite samples are in fair agreement with the Th230/U age, probably maximum ages, determined by Tatsumoto and Goldberg (1959, p. 205) on similar samples. Thus only very approximate estimations of chronology can be obtained from marine limestones such as these which have largely recrystallized to cal- cite.
All the terrestrial carbonate samples shown in tables 209.3 and 209.4 contain equivalent Pa231 in excess of the uranium content, therefore minimum and maxi mum apparent ages had to be calculated for these samples. The first five samples represent forms of calcareous tufa, which, in general, show a greater discrepancy between calculated apparent age and esti mated stratigraphic age than do the following stalag mite samples. Stalagmite samples 61 ER-6, -7, -8, and 60 ER-1 are dense microcrystalline carbonates from which it was anticipated that accurate ages might be obtained on the three stratigraphically younger specimens 61 ER-6, -7, and -8. Significant amounts of uranium apparently were lost from the samples during their history, however, and accurate ages were not obtained. The apparent minimum ages of the three samples appear to be close to their esti mated ages. Approximately the same age as the minimum age would be obtained for the three samples if a continual, steady loss of uranium during this time interval were assumed.
Although accurate ages cannot be obtained from the stalagmites, some interesting geochemical proc esses are indicated. The high Pa231 and Th230 con centrations show a previous existence of uranium in the 1 to 5 part per million range about the amount of uranium that would be expected if the stalagmites were initially formed as aragonita. Tatsumoto and Goldberg (1959, p. 205) have shown that inorganic calcium carbonate precipitates from sea water as ara- gonite that contains 3 to 5 parts per million uranium, a value somewhat higher than that in the stalagmites because of the higher uranium content in sea water
than in ground water.
CONCLUSION
Most uranium is incorporated in carbonates at the time of their formation; subsequently, a significant amount of uranium is lost by leaching, and the major part of the original uranium is lost if the carbonate rock recrystallizes from aragonite to calcite. On the other hand, only a small amount of the total observed uranium is present in bone and wood at the time of burial; the major fraction of the uranium is incor
porated after burial.At this stage in the investigation of Pleistocene
dating by uranium decay, no really suitable type of material has been found that indicates an accurate dating potential. None of the material covered by this study shows promise. Tatsumoto and Goldberg (1959) analyzed two selected pieces of aragonitic Key Largo Limestone, collected by R. Ginsburg from a different locality than the samples described in table

ARTICLE 210 Elll
209.1. The large difference in ThE30/U ages, 130,000 and 230,000 years, of the two aragonitic limestones, which should be approximately the same age (R. Gins- burg, oral communication, Aug. 1961), does not indi cate reliable age determinations.
It is doubtful that calcitic samples will be found that can be analyzed readily for Pa231 in addition to Th230, and that have good dating potential. Primary calcite may have dating potential, but because of the very low uranium content the Pas31 content is con siderably below the present limits of detection. No aragonitic stalagmites or stalactites have been ana lyzed for uranium and daughter products, although Murray (1954, p. 486) has found that nearly pure aragonitic calcium carbonate exists in some caves. Fur ther investigation of this type of material should be made to determine its dating potential.
REFERENCES
Antal, P., 1961, Fehlerquellen bei der polarographischen Bes- timmung von Mikrogramraengen Uran (nach der Anreich- erung aus festen Proben und Wassern) : Mikrochimica Acta, v. 1961, p. 235-244.
Barnes, J. W., Lang, E. J., and Potratz, H. A., 1956, Ratio of ionium to' uranium in coral limestone: Sci., v. 124, p. 175-176.
Murray, J. W., 1954, The deposition of calcite and aragonite in caves: Jour. Geology, v. 62, p. 481-492.
Rosholt, J. N., Jr., 1957, Quantitative radiochemical methods for the determination of the sources of natural radioac tivity: Anal. Chemistry, v. 29, p. 1398-1408.
1958, Radioactive disequilibrium studies as an aid in understanding the natural migration of uranium and its decay products: United Nations Internat. Conf. on the Peaceful Uses of Atomic Energy, 2d, Geneva, 1958, v. 2, p. 230-236.
1961, Uranium migration and geochemistry of uraniumdeposits in sandstone above, at, and below the water table, Part I. Calculation of apparent dates of uranium migra tion in deposits above and at the water table: Econ. Geology, v. 56, p. 1392-1403.
Rosholt, J. N., Jr., and Dooley, J. R., Jr., 1960, Automatic measurements and computations for radiochemical analy ses : Anal. Chemistry, v. 32, p. 1093-1098.
Sanford, Samuel, 1909, The topography and geology of South ern Florida: Florida Geol. Survey, 2d Ann. Rept, p. 177- 231.
Tatsumoto, M., and Goldberg, E. D., 1959, Some aspects of the marine geochemistry of uranium: Geochim. et Cosmochim. Acta, v. 17, p. 201-208.
SEDIMENTARY PETROLOGY
210. RELATION OF THE PORE VOLUME OF SILTY SEDIMENTS TO OVERBURDEN LOAD, PARTICLE SIZE,AND SORTING
By ROBERT H. MEADE, Menlo Park, Calif.
Studies of saturated unconsolidated to semiconsoli- dated silty sediments in western Fresno County, Calif., show that a progressive reduction in pore volume re sults from an increasing overburden load. The inter- granular processes involved in the compaction of some of these sediments were discussed in an earlier paper (Meade, 1961), to which the reader is referred for information on the geographic location and a short descriptive introduction to the studies. This article summarizes some of the pore-volume relations observed in the sediments. The results reported here supersede the porosity-depth relations shown in figure 324.2 of the earlier article. In the earlier study, the use of depth as a variable was misleading because pumping had reduced the artesian pressures in the deeper sedi
ments far below their natural levels, thereby increas ing the effective overburden (grain-to-grain) load in these zones and causing the relation between depth and effective load to become irregular. In this article, therefore, pore volume is plotted against effective load. Furthermore, the samples for the present study were selected more carefully and given more thorough sta tistical treatment.
Samples for this study were taken from flood-plain and alluvial-fan deposits cored in three holes in west ern Fresno County: 14/13-11, 16/15-34, and 19/17-22 (locations shown in Meade, 1961, fig. 324.1). The numerical data were taken mainly from porosity and particle-size measurements that were made in the Geo logical Survey Hydrologic Laboratory (Johnson and
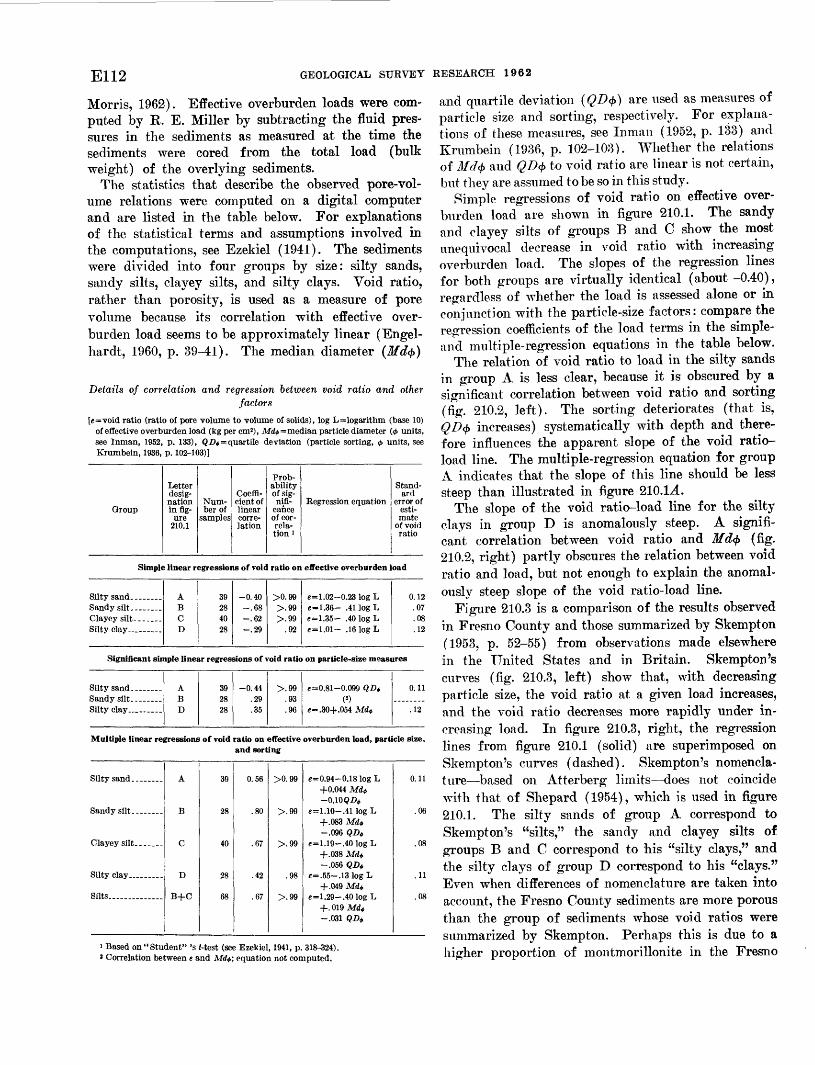
E112 GEOLOGICAL SURVEY RESEARCH 1962
Morris, 1962). Effective overburden loads were com puted by E. E. Miller by subtracting the fluid pres sures in the sediments as measured at the time the sediments were cored from the total load (bulk weight) of the overlying sediments.
The statistics that describe the observed pore-vol ume relations were computed on a digital computer and are listed in the table below. For explanations of the statistical terms and assumptions involved in the computations, see Ezekiel (1941). The sediments were divided into four groups by size: silty sands, sandy silts, clayey silts, and silty clays. Void ratio, rather than porosity, is used as a measure of pore volume because its correlation with effective over burden load seems to be approximately linear (Engel- hardt, 1960, p. 39^1). The median diameter (Md<f>)
Details of correlation and regression between void ratio and otherfactors
[e=void ratio (ratio of pore volume to volume of solids), log L=logarithm (base 10) of effective overburden load (kg per cm2), Md«=median particle diameter (<t> units, see Inman, 1952, p. 133), QZ>$ = quartile deviation (particle sorting, <t> units, see Krumbein, 1936, p. 102-103)]
Group
Letterdesignationin fig
ure210.1
Number of
samples
Coefficient oflinearcorrelation
Probabilityof signifi
canceof correlation'
Regression equation
Standard
error ofestimate
of voidratio
Simple linear regressions of void ratio on effective overburden load
Clayey silt-.. __Silty clay
ABCD
39284028
-0.40-.68-.62-.29
>0.99>> 00
>.99.92
e=1.02-0.23 log Le-1.36- .41 log Le=1.35- .40 log Le=1.01- .16 log L
0.12.07.08.12
Significant simple linear regressions of void ratio on particle-size measures
Silty clay.... _ ..
ABD
392828
-0.44.29.35
.93
.96
e-0.81-0.099 QD«(2)
e=.30+.054 Afd*
0.11
.12
Multiple linear regressions of void ratio on effective overburden load, particle size,and sorting
Silty sand.. _ ...
Sandy silt. .......
Clayey silt... ....
Silty clay-. .......
Silts..............
A
B
C
D
B+C
39
28
40
98
68
0.56
.80
.67
do
.67
>0.99
>.99
>.99
]> 99
C=0.94-0.181ogL+0.044 Md« -0.10Q.D0
e-l.10-.41 log L+.083 Md* -.096 QD*
«=1.19-.401ogL+.038 Md* -.056 QD«
+.049 Md* «-1.29-.401ogL
+. 019 Mdt -.031 QD*
0.11
.06
.08
.11
.08
i Based on "Student" 's J-test (see Ezekiel, 1941, p. 318-324). * Correlation between e and Mrf«; equation not computed.
and quartile deviation (QD<f>] are used as measures of particle size and sorting, respectively. For explana tions of these measures, see Inman (1952, p. 133) and Krumbein (1936, p. 102-103). Whether the relations of Mdcf) and QD<f> to void ratio are linear is not certain, but they are assumed to be so in this study.
Simple regressions of void ratio on effective over burden load are shown in figure 210.1. The sandy and clayey silts of groups B and C show the most unequivocal decrease in void ratio with increasing overburden load. The slopes of the regression lines for both groups are virtually identical (about -0.40), regardless of whether the load is assessed alone or in conjunction with the particle-size factors: compare the regression coefficients of the load terms in the simple- and multiple-regression equations in the table below.
The relation of void ratio to load in the silty sands in group A is less clear, because it is obscured by a significant correlation between void ratio and sorting (fig. 210.2, left). The sorting deteriorates (that is, QD<f) increases) systematically with depth and there fore influences the apparent slope of the void ratio- load line. The multiple-regression equation for group A indicates that the slope of this line should be less steep than illustrated in figure 210.1 A
The slope of the void ratio-load line for the silty clays in group D is anomalously steep. A signifi cant correlation between void ratio and Md$ (fig. 210.2, right) partly obscures the relation between void ratio and load, but not enough to explain the anomal ously steep slope of the void ratio-load line.
Figure 210.3 is a comparison of the results observed in Fresno County and those summarized by Skempton (1953, p. 52-55) from observations made elsewhere in the United States and in Britain. Skempton's curves (fig. 210.3, left) show that, with decreasing particle size, the void ratio at a given load increases, and the void ratio decreases more rapidly under in creasing load. In figure 210.3, right, the regression lines from figure 210.1 (solid) are superimposed on Skempton's curves (dashed). Skempton's nomencla ture based on Atterberg limits does not coincide with that of Shepard (1954), which is used in figure 210.1. The silty sands of group A correspond to Skempton's "silts," the sandy and clayey silts of groups B and C correspond to his "silty clays," and the silty clays of group D correspond to his "clays." Even when differences of nomenclature are taken into account, the Fresno County sediments are more porous than the group of sediments whose void ratios were summarized by Skempton. Perhaps this is due to a higher proportion of montmorillonite in the Fresno

to K
O-
|gi
o g>
' B
ilO
a o
, o
< g-
02
<o S
o
3- r° S
» £
^ &
^§*
§ I
^"
.o
o e-
0
<r> o
3 oo
sr tw
e*-
i
5*
'
-OP
^
B
>-»
so&
0
p
C
B
*J HH
°" 2
. §
en
21
W3
n H
M
k-
nT o
' p
<K
p
CO
§ H
CR
<
O^
CD'
fp
* §
s,to
§
**
i-l
ft!
S5
f '"
"'
en
5'
8 ^
h^ I I
o s
P
fDO
- P
EFF
EC
TIV
E
OV
ER
BU
RD
EN
LO
AD
,
IN
KIL
OG
RA
MS
P
ER
SQ
UA
RE
CE
NT
IME
TE
R
f o.
EFF
EC
TIV
E
OV
ER
BU
RD
EN
LO
AD
,
IN
KIL
OG
RA
MS
P
ER
SQ
UA
RE
CE
NT
IME
TE
R

E114 GEOLOGICAL SURVEY RESEARCH 1962
County sediments (Meade, 1961, p. D89), but this sup position would have to be checked against the clay- mineral compositions of the other sediments.
Whereas the slopes of the regression lines for groups A, B, and C nearly correspond to the appro priate slopes of Skempton's curves for "silts" and "silty clays," the regression line for group D is anoma lous. Were the analogy with Skempton's curves car ried through, line D would be well to the right of line B-C and would have a less steep slope. Physical explanations for this anomaly do not come to mind readily. As mentioned above, it is not explained by variations in median size. If the cause of the anomaly were elastic rebound of the clays between the time of coring and the time the pore volumes were measured, rgression line D would appear well to the right of the other lines. Perhaps the anomaly is due to varia tions in some other factor or factors that were not assessed statistically (sorting or fabric, for example). Or perhaps and I favor this explanation the errors inherent in sampling ("errors" in the statistical sense, that is) were so great that they obscured the true relation. In any case, the results of the statistical study of pore volume in the silty clays of group D are inconclusive.
The above evidence indicates that, under effective overburden loads in the range from 10 to 70 kg per cm 2, the rate of change of void ratio with effective overburden load (expressed as Iog10 kg per cm2 ) in the sandy and clayey silts seems to be about -0.40, and that the rate of change in the silty sands may be near -0.20.
REFERENCES
Engelhardt, Wolf von, 1960, Der Porenraum der Sedimente: Berlin, Springer, 207 p.
Ezekiel, Mordecai, 1941, Methods of correlation analysis (2d ed.) : New York, John Wiley & Sons, 531 p.
Inman, D. L., 1952, Measures for describing the size distribu tion of sediments: Jour. Sed. Petrology, v. 22, p. 125-145.
Johnson, A. I., and Morris, D. A., 1962, Physical' and hydro- logic properties of water-bearing deposits in the Los Ban- tos-Kettleman City area, California: U.S. Geol. Survey open-file rept., 179 p.
Krumbein, W. C., 1936, The use of quartile measures in de scribing and comparing sediments: Am. Jour. Sci., v. 32, p. 98-111.
Meade, R. H., 1961, Compaction of montmorillonite-rich sedi ments in western Fresno County, California: Art. 324 in U.S. Geol. Survey Prof. Paper 424-D, p. D89-D92.
Shepard, F. P., 1954, Nomenclature based on sand-silt-clay ratios: Jour. Sed. Petrology, v. 24, p. 151-158.
Skempton, A. W., 1953, Soil mechanics in relation to geology: Yorkshire Geol. Soc. Proc., v. 29, p. 33-62.
GEOMORPHOLOGY AND GLACIAL GEOLOGY
211. MENAN BUTTES, CONES OF GLASSY BASALT TUFF IN THE SNAKE RIVER PLAIN, IDAHO
By WAEREN HAMILTON and W. BRADLEY MYERS, Denver, Colo.
The Menan Buttes are two well-preserved cones of glassy olivine-basalt tuff that rise from the Snake River Plain about 20 miles north of Idaho Falls in southeastern Idaho. The cones were erupted through the water-saturated flood plain of the Snake River, and to this is due their very unusual character. Each cone is about 2 miles long in a northeast direction (fig. 211.1), but only about two-thirds as wide, and each has a comparably oblate, large summit crater about 1/2 mile long and 200 to 400 feet deep. The crater rim of the northern cone stands as high as 800 feet above the surrounding plain (fig. 211.2), and the southern one 550 feet.
The northeast-trending Snake River Plain is about 50 miles wide at the longitude of Menan Buttes. It has a broad medial upland surface underlain largely by basalt flows of late Quaternary age, and broad marginal alluvial lowlands within which flow most of the streams. The Menan Buttes are at the northwest edge of the southern lowland. The edge of the medial upland is here the river-eroded front of an aa flow of olivine basalt (fig. 211.1). The flow surface is ragged and nearly free of loess; thus, the flow is prob ably of Recent age, although it probably is older than the Menan Buttes. Henrys Fork of the Snake River was diverted southward from its general southwest

43
°47
'
U.S
. Geo
logi
cal
Sur
vey
phot
ogra
phs
Coo
rdin
ates
are
app
roxi
mat
e1
MIL
E
FIG
URE
211
.1. V
erti
cal
aeri
al p
hoto
grap
hs o
f th
e M
enan
But
tes,
Ida
ho,
mou
nted
as
a st
ereo
trip
let.

E116 GEOLOGICAL SURVEY RESEARCH 1962
Prevailing wind >
SOUTHWEST6000' -|
50OO' -
4000'
NORTHEAST
1 MILE
FIGURE 211.2. Section of North Menan Butte.
course by the building of the buttes and joins the main fork of the Snake at the east edge of the south cone. Most of the basalt vents of the Snake River Plain are marked by broad, low lava domes. Cinder cones are uncommon, and tuff cones like the Menan Buttes are rare.
The asymmetry of the Menan Buttes cones and their craters clearly demonstrates northeastward drift of pyroclastic ejecta parallel to the prevailing winds. The cones are markedly asymmetric elongate northeast ward and their craters lie toward the southwest ends of their midlines. The craters are similarly asym metric, their northeast walls being the gentlest and the farthest from the vents and standing 100 to 200 feet higher than the rest of the rims.
The cones were built by small fragments of solid glass that were erupted explosively within the craters and then fell to form the inner walls of the craters as well as the outer slopes of the cones. Tuff beds of the outer slopes steepen gradually upward and are near the angle of repose (35°) only in places near the rim. The crater walls are dip slopes on beds dip ping inward at about the angle of repose, and many beds roll over sharply at the rim to dip outward at angles of 20° to 35° on the upper slopes of the cones. Layering is concordant to the gentle slopes around the base of the cones. This is the general case on the steep upper slopes also, where there are however many aberrant dips, both inward and outward, indicating a complex history of overlapping falls. A number of irregular bedding features in the cones can be seen by stereoscopic study of figure 211.1. No fluidal lava fea tures were found on the cones.
Conspicuous layering throughout the tuff is marked by irregular variation in size of glass fragments. In dividual layers are a fraction of an inch to several feet thick and are generally thickest high on the cones. The tuff is firmly coherent but porous, and most is soft enough so that it thuds and crumbles when struck by a hammer. The tuff is uniform drab, dark olive
gray. It consists largely of sand-size to granule-size fragments of clear, unaltered basaltic glass that is dark in hand specimen but light brown in thin sec tion. There is much pore space, and tiny fragments of similar glass only partly fill the interstices. Palag- onite and other amorphous and cryptocrystalline ma terial discontinuously coat most fragments and give them a dull, drab appearance in hand specimen.
Glass fragments were solid and too cold to flow when they were erupted. Fragments are subround to angular, are undeformed, and consist of equant gran ules rather than shards or droplets. Many fragments are microvesicular; a few vesicles are filled, mostly by calcite. Elongate vesicles are common within gran ules but orientation is random, and neither welding nor secondary flowage was recognized.
The glass is of olivine-basalt composition that is probably typical of the region despite the unusual oc currence. The refractive index of the glass in one specimen ranges from 1.610 to 1.616 for yellow light,1 indicating a silica content of about 4T percent accord ing to the curves presented by Williams and others (1954, fig. 7). The glass contains scattered euhedral crystals of forsteritic olivine ( 2F = 85°-90°) and euhedral laths of labradorite, and sparse octahedra of magnetite. No pyroxene or ilmenite was seen. The Quaternary basalt of the Snake River Plain is olivine bearing and slightly alkaline, typically contains 45 to 48 percent SiO2, and has late-crystallizing augite and ilmenite (Howard A. Powers, written communication, 1961) and is thus like the Menan Buttes material in sofar as they can be compared.
The cones were erupted upon the flood plain of the Snake River and contain abundant xenolithic cobbles, pebbles, and sand grains from the river alluvium. Xenoliths are largest and most numerous near the crater rims on both inner and outer sides, but are plentiful in many places about the lower slopes also.
1 The fast, accurate focal-masking method of Cherkasov (1957), as improved by Ray E. Wilcox (oral communication, 1962), was used.

ARTICLE 211 E117
Rounded river cobbles have a common maximum di ameter of 6 inches and some are as large as 1 foot. Cobbles and pebbles consist partly of locally derived basalt and rhyolite, and partly of aplite, granite, quartzite, and other resistant rocks from more distant sources. Sand grains of quartz and of rhyolite ob sidian and welded tuff, all also derived from river alluvium, are conspicuous throughout the tuff of the buttes. Xenolithic material totals perhaps 1 or 2 percent of the volume of the tuff.
The unusual character of the eruptions that formed the Menan Buttes was obviously due to the presence of water-saturated flood-plain deposits immediately be neath the vents. The cones were erupted across the courses of the Snake River and Henrys Fork in the wettest part of the flood plain. Upon contact with abundant water at very shallow depth, the lava was chilled, slightly palagonitized, and erupted explo sively. Glass fragments were solid when they hit the ground and probably were chilled to solidity during extrusion. We picture the eruption as a steam-charged spray of solid fragments.
Interbedded with the underlying gravels are basalt flows, for angular blocks of basaltic lava also form abundant inclusions in the tuff. Basalt blocks as large as 3 to 5 feet in diameter are numerous near the crater rims and attest to the explosive power of the eruptions, but blocks are smaller and fewer on the lower slopes of the cones.
North and South Menan Buttes are of similar very late Pleistocene or, more probably, early Recent age. Both show comparably small amounts of dissection by shallow radial gullies, the deepest gullies draining the long lee slopes of the cones. Both cones could have formed within as short a period as a few months. Before eruption of the cones, Henrys Fork flowed where North Butte now stands and had a course from upper left to lower right of the left picture of figure 211.1; building of the buttes diverted the river south ward, and it now joins the Snake River at the east edge of South Menan Butte. The rivers have cut bluffs along the eastern and southern sides of the southern butte, but the cones must have been erupted upon the flood plain at virtually its present level.
Between North and South Menan Buttes is a low, arcuate ridge forming a part of the rim of a third tuff cone (fig. 211.1). This cone has been breached by erosion along its southwest edge, and overlapped by South Menan Butte along its southeast edge. Three small narrow ridges trending northeastward from the north side may represent fissure eruptions. The crater is longer and wider than the craters forming the buttes, but its rim stands only 200 feet above the
plain and its slopes are gentler than those of the main cones. The base of the middle cone is buried by flood-plain alluvium and the cone remnants are more dissected than are comparable parts of the main cones.
The Menan Buttes and intervening cone remnant were apparently erupted along a north-northwest- trending fissure zone of recurrent basalt eruptions. A small, much eroded remnant of an old cone lies on the same trend !/2 mile south of the southeast corner of figure 211.1 (Stearns and others, 1938, pi. 4), and another small cone lies just beyond the northwest corner of figure 211.1.
Tuff cones similar to the Menan Buttes probably have similar origins in eruptions through water-satu rated materials. (Basalt eruptions in the far more common relatively dry environments produce flows, domes, fountains, and cinder cones.) The several tuff cones which Howard A. Powers (oral communication, 1962) has seen in other parts of the Snake River Plain were erupted, like the Menan Buttes, through water- saturated surficial material. Tuff cones in the Ha waiian Islands occur only near the coast or as offshore islets, thus also in areas where abundant water was encountered by the erupting basalt (Wentworth and Macdonald, 1953, p. 68). A number of cratefed tuff cones in the Pinacate volcanic field of northwestern Sonora (Jahns, 1959) are similar to the Menan Buttes, and at least one (Cerro Colorado) appears identical in most respects. Although Jahns considered the craters to have formed by collapse, the marked elon gation of the Cerro Colorado cone and crater parallel to the prevailing wind, and the downwind asymmetry of the crater, indicate that crater at least to have formed by explosive rather than collapse processes.
The Menan Buttes are shown with a 10-foot con tour interval on the 1:24,000-scale Menan Buttes topo graphic quadrangle map of the Geological Survey. The shaded-relief edition of this map is included in the Survey's sets of 25 and 100 topographic maps intended for use in the teaching of physiography and map interpretation (Upton, 1955; the buttes were termed cinder cones by Upton). The three vertical aerial photographs of the buttes (fig. 211.1) have an original scale of about 1:27,600, and are available from the Map Information Office, U.S. Geological Survey, Washington 25, B.C. (photographs 2-25, 2-26, 2-27, project GS-LV, Oct. 8, 1950).
REFERENCES
Cherkasov, Yu. A., 1957, O primenenii "fokalnogo ekraniro- vaniya" pri izmereniyakh pokazateley prelomleniya im- mersionnym metodom [Application of "focal screening" to measurement of indices of refraction by the immersion

E118 GEOLOGICAL SURVEY RESEARCH 1962
method], in Sovremennye metody ruineralogicheskogo, issle- dovaniya gornykh porod, rud, i mineralov : Gosudar. Nauch.-tekh. Izdat. Lit. Geol. Okh., Moscow, p. 184-207. (English translation in Internat. Geol. Rev., 1960, v. 2, p. 218-235)
Jahns, R. H., 1959, Collapse depressions of the Pinacate vol canic field, Sonora, Mexico, in Heindl, L. A., ed., South ern Arizona Guidebook II: Ariz. Geol. Soc., p. 165-184.
Stearns, H. T., Crandall, Lynn, and Seward, W. G., 1938, Geology and ground-water resources of the Snake River
Plain in southeastern Idaho: U.S. Geol. Survey Water- Supply Paper 774, 268 p.
Upton, W. B., Jr., assembler, 1955, A set of one hundred topographic maps illustrating specific physiographic fea tures [index map]: U.S. Geological Survey.
Wentworth, C. K., and Macdonald, G. A., 1953, Structures and forms of basaltic rocks in Hawaii: U.S. Geol. Survey Bull. 994, 98 p.
Williams, Howel, Turner, F. J., and Gilbert, C. M., 1954, Petrography: San Francisco, Freeman & Co., 406 p.
212. COMPARISON OF DRAINAGE ON TOPOGRAPHIC MAPS OF THE PIEDMONT PROVINCE
By ENNIO V. GIUSTI and WILLIAM J. SCHNEIDER, Washington, D.C.
Because topographic maps portray only a selected part of the total drainage of an area, they may be inadequate for certain detailed hydrologic studies. Actual differences in drainage between basins are due to differences in geology, topography, and climate. However, the proportions of the streams shown on topographic maps differ also because of differences in map scale, date of publication, and publishing organi zation; these differences are analyzed in this article for maps of the Piedmont province.
For the purposes of this study, the Piedmont prov ince may be considered reasonably homogeneous in geology, topography, and climate. Thus, a random selection of maps of the Piedmont from Virginia southward into Alabama practically eliminates differ ences between maps that are attributable to real varia tions in the number of streams per unit area.
The variables used in this study are drainage area (A), stream order (^), and number of streams of a given order (Nu). Indices A and u are based on a stream classification proposed by Horton (1945) and modified by Strahler (195Y). Although stream fre quency and drainage density are related, stream fre quency was chosen as a variable for this study be cause it is probably a more reliable measure of the morphogenesis of the area. Use of the number of streams rather than stream length eliminates the addi tional variability inherent in current map-making pro cedures caused by the process of editing stream lengths. The three variables were measured on 108 topographic maps compiled by various organizations at various map scales, as shown in table 212.1. Maps of the
Geological Survey were subdivided into two groups according to year of publication because a major change in standards for drainage portrayal was made in 1954.
TABLE 212.1. Stream frequency portrayed in various map series
GroupNo.
123----.
567--__-
Number of maps
13101815126
1519
Publishing agency '
AMS, SCS-USGS .-USGS .__USGS _-USGS __
USGS .
Period of publication
1943-57---.Before 1954_Afterl954__Before 1 954_After 1954_ _1943-57_-_-1891-1907- _1952-57. __.
Scale
1 : 24, 0001:24,0001:24,0001:62, 5001 : 62, 5001:62, 500
1:125,0001 : 250, 000
Number of first- order
streams
per square mile
3. 23. 21. 41. 25
. 431. 92. 1
. 14
i AMS, Army Map Service; SCS, Soil Conservation Service; USGS, Geological Survey.
Iii addition to the 108 topographic maps analysed, the complete drainage network for the Yellow River basin in Georgia was studied photogrammetrically from aerial photographs taken at 7,200 feet. The relation between the number of first-order streams and drainage area for subareas of the Yellow River basin is shown in figure 212.1. The relation is of the form
Nuj. = k A b.In this relation for the Yellow River basin, as well as for those for the standard topographic maps, the exponent b did not differ statistically from unity at

ARTICLE 212 E119
500 -
DRAINAGE AREA (A), IN SQUARE MILES
FIGURE 212.1. Relation between number of first-order streams and drainage areas for subareas of the Yellow River basin,Georgia.
the 95-percent confidence level. Accordingly, the basic equation was modified to
Nui = k A,in which the constant k is an index of the number of first-order streams per unit area. This relation is shown in figure 212.2 for each of the map groups listed in table 212.1. Table 212.1 also lists the num ber of streams per square mile for each map group.
The ratio of these quantities as listed in table 212.2, can be used to convert counts of first-order streams determined for any map group to a comparable value
for a different map group. Thus roughly comparable measures of stream frequency can be computed from maps of different types.
BEFEBENCES
Horton, R. E., 1945, Erosional development of streams and their drainage basins hydrophysical approach to quanti tative morphology: Geol. Soc. Arner. Bull., v. 56, no. 3, p. 275-370.
Strahler, A. N., 1957, Quantitative analysis of watershed geo- morphology; Am. Geophys. Union Trans., v. 38, no. 6, p. 913-920.

GEOLOGICAL SURVEY RESEARCH 1962
EXPLANATION
1:250,000 scalex 1:125,000 scale
1:62,500 scale* 1:24,000 scale
0.05 0.1 0.5 5 10 50 100
DRAINAGE AREA^J.IN SQUARE MILES
500 1000 5000
FIGURE 212.2. Relation between number of streams and area for maps of different scale.
TABLE 212.2. Factors to convert stream frequency from a map at a given scale to the comparable number on another type of map.Multiply if entering from the side; divide if entering from the top.
[Publishing organizations abbreviated as in Table 212.1]
Type of map
Infrared photogram-metry
1:24,000AMS, SCS
1 : 24,000USGSBefore 1954
1:24,000USGSAfter 1954
1 : 62,500AMS
1:62,500USGSBefore 1954
1:62,500USGSAfter 1954
1:125,000USGS
1 : 250,000AMS
Infrared photogram-
metry
1
22
22
51
37
57
165
34
507
1:24,000 AMS, SCS
0.045
1
1
2.3
1.7
2. 6
7.5
1. 5
23
1:24,000 USGS before
1954
0. 045
1
1
2. 3
1. 7
2. 6
7. 5
1. 5
23
1:24,000 USGS after
1954
0.02
. 44
.44
1
.74
1. 12
3.25
.67
10
1:62,600AMS
0.027
.59
.59
1. 35
1
1. 52
4. 4
.90
13. 5
1:62,500 USGS before
1954
0.018
. 39
. 39
.90
. 66
1
2.9
.60
8.90
1:62,500 USGS after
1954
0.006
. 135
. 135
. 31
.23
. 34
1
. 20
3.07
1:125,000 USGS
0.03
. 66
.66
1. 5
1. 1
1. 68
4. 90
1
15
1:250,000 AMS
0.002
.044
.044
. 10
.074
. 112
.325
.067
1
ARTICLE 213 E121
213. CORRELATION OF SOME GLACIAL DEPOSITS IN NEW MEXICO
By GERALD M. EICHMOND, Denver, Colo.
Clear evidence of Pleistocene glaciation in New Mexico is mostly confined to the higher parts of the Sangre de Cristo Mountains, and to the Sierra Blanca in the south-central part of the State (see index map, fig. 213.1). An ancient till, correlated with the Cerro Till of the San Juan Mountains, has also been re ported from the Canjillon Divide area in the north- central part of the State, west of the Eio Grande (Ellis, 1935; Smith, 1936).
Glaciation in the Sangre de Cristo Mountains has been reported by Salisbury (1901) and Stone (1901), and subsequently by Ellis (1931). Eay (1940) was the first to recognize multiple glaciation in the region. He described moraines of five "substages" of the Wis consin "glacial stage" in the vicinity of Wheeler Peak, northeast of Taos, in the valleys draining Jica- rita Peak, southeast of Taos, and in the vicinity of Lake Peak, northeast of Santa Fe. He also showed that deposits described as moraines in the Moreno Valley (Ellis, 1931), are not of glacial origin. Smith and Eay (1941) further reported a complex of Wis consin moraines on the northeast side of Sierra Blanca Peak below a cirque mentioned briefly by Antevs (1935).
In order to correlate Eay's "substages" with the glaciations of the Wind Eiver Mountains of Wyoming (Blackwelder, 1915; Eichmond, 1948, 1957a, 1962; Moss, 1951b; Holmes and Moss, 1955), the writer briefly re-examined the succession of glacial deposits along Eio Hondo on the slopes of Wheeler Peak (fig. 213.1), along Eio Nambe on the slopes of Lake Peak (fig. 213.2) and on Sierra Blanca Peak (fig. 213.3). New topographic maps in two of these areas have made possible a more accurate means of plotting end moraines and of determining their altitudes than was available to Eay. Deposits of glaciations recognized by the writer are correlated with those described by Eay (1940) as shown in the table on page E122.
CRITERIA OF CORRELATION
Deposits of three glaciations from oldest to young est, the Buffalo, Bull Lake, and Pinedale were de scribed in the Wind Eiver Mountains of Wyoming by Blackwelder in 1915. Subsequent work has demon strated 3 pre-Bull Lake glaciations (Cedar Eidge, Sacagawea Eidge, and Dinwoody Lake) (Eichmond, 1962) included in deposits formerly called Buffalo, 2
stades of Bnll Lake Glaciation (Eichmond, 1948; Moss, 1951a; Holmes and Moss, 1955), 3 stades of Pinedale Glaciation (Eichmond, 1948, 1962), and 2 stades (Temple Lake and Gannett Peak) of Neoglacia- tion (Hack, 1943; Moss 1951a, 1951b; Eichmond, 1957b). Criteria for recognition of these glaciations and their subdivisions in the Wind Eiver Mountains and elsewhere have been described in many papers (Blackwelder, 1915, 1931; Fryxell, 1951; Moss, 1951a; Holmes and Moss, 1955; Eichmond, 195Ya, 1962; Nel son, 1954).
The following characteristics of the deposits in the Wind Eiver Mountains were used as the basis for correlation with the deposits in New Mexico de scribed here.
Cedar Ridge and Sacagatwea Ridge Glaciation. deeply weathered; red clayey soils; lack glacial to pography; confined to interstream divides.
Dinwoody Lake Glaciation. Weathering as above, but forming poorly preserved broad, mature moraines on canyon walls or floors.
.Locally deposits of all three glaciations are super posed and separated by thick red clayey soils.
Bull Lake Glaciation. Commonly two broad, ma ture moraines (early and late stades) in canyons; dis sected by axial and tributary streams; mature zonal soils 3 to 4 feet thick. The two tills grade into sep arate outwash deposits, which, where superposed, are separated and overlain by mature zonal soils similar to those on the moraine deposits.
Pinedale Glaciation. Commonly 3 well-preserved rough, bouldery moraines (early, middle, and late stades) in canyons upstream from moraines of the Bull Lake Glaciation. Immature zonal soils 1 to 2 feet thick. Outwash gravels underlie separate ter races or form compound fills. Locally thin azonal soil or dark alluvial silty-clay layer separates outwash of early and middle stades.
Neoglaciation. Temple Lake Stade small moraines or rock glaciers in cirques. Thin azonal soil, tundra or scrub spruce vegetation. Gannett Peak Stade fresh moraines or rock glaciers above those of Temple Lake Stade; no soil; commonly barren, but locally with lichen on boulders and sparse pioneer vegetation; moraines lie in front of existing glaciers or in re cently evacuated cirques.

£ g*
CD
hj
<< 3
S CD ?° c.
£t
i-1
pr
CDCD
*^
c"
) .
K'
CD
TO
<
§
;§
CD
TO
o i: ^^ ! -
P"*"
. CO
t '
CDga
o
n-
p-.
c-t-
O
P^P
ST
po IE.
M
Ct-
M.
p-
P
CD
/TS
character
J
and
that
p.
O
ct-
H
>
1 TO CD H"
Lcomplete
preservation o H> 3 o hS £2.
3* £L
co P If co'
H>
S co P"
^
go h- '
CD o- 3 3 P rt;
h i
P.-T
S
O§
§ ^
P- S
- P-
CD -
rtC
O
M
0 &
|H
»TO
jo
1^?
.
P ^
P«
IF
&cr
w
fphj
2"
. co
2 «
o *
^£
O ^
3
S
r»^
£w
2
a-,
£^_
, H
jH
q ef
- O
3^ 5
CO
P
^ p
^5
§,
r*^- ' -
Ut
UP
wgo
p
^
^.t
o"S
0
O ^
CO
e-f-
_S"
°
85 ^?
^
o-
hj
O
B?
cF1 ^
?= 5T
^ *
0
a,
^
3
co
gh+
9
Hj
cl
S.
^
S£
SsJ
^PT
p
as
MP
,
§ 3
g |
l'3
0
(Tl
H»
W
ga
o^ 3
i s
cl- os
l~d
UJ
O
S &-
0
NS
- o
c
' '
CD
t-"
02
O
CO
ef-
3|
p5
CD
3 o H
>
S
^°
H-"3
tr°
PS
h+»
CO
CD
CDpo
^~
co s~ >
-<8
<"
^
s- II S-^E CD
fF'
H>
£
3 ^
S-& O
TO
T
H| ?i o a-
g:^
^
n-
S cT
s g.
& £ co
3 ~
|
§ '
P'C
TQ®
sr^ 2
^gL
i' o
0
2.
P cr?
CO
H
i-3'
?"
hH 0
>
H>
CO
wg
^
°
co
®
hj
g |
r- &
,
P" Q_
P'
h- '
<<T
co
O h I
CD o. JS &- h+»
P
O
CD r^-
CD Ir £i
n p- g CO °
SJ S
*CD
CD
JO
c*
-
CO
'
CD
th
8- T
Oo
' S
^?
H
1 p_ p'
cr? S § & !-+
-
o a terminal
point at
a 13.
1). Thou
gh loca
lly of
the
morain
es are st
i
h^ 0
^ t-"
sl^F
n altitude
H,
i i
PS rt-
CD hj
P h '
3 oraines
o p r+ r <!
P h '
h '
^
^ EL h '
co
go n-
1 ^
O
h+»
hH
^J
P
tr'
^^-
®
tr-
CD
CD
CD^
^
^ ^
^ »"
g ^
^ 0 h+
»
^
bdl" S
T
18*
I1
hJ
j^«w
o
h-l
^*
C«
o^ p
%*
<*
$ %
e-f-
®
^
P ortheast
si
segments
O
PJ
H»
CD
<j sIQ
h
H ^
^ ^
3
P ?
K> 5
T 2 3
^2.
O
3-;
S
CD
H
rt
O
J-3
P
_
P
.P-
P
CL Q
p«
' 2
. ^
SrT
Oa 5
" 1
1 5
P
hH i-i
3
ga ^
§
hH O
p
S
t.
H
I p ^ 5
' § |
!-<s i*
I
CD
P
p
p" CD
^^s-
=e
£
2.
h-i '
<rt-
tT_
. ..
o- P
^P
. ..
CD
CD
^
&- H
^ I
^ o^S
CD
^
rri
S tf
"*
§ S.
®
2 P-
§
tr g
- g
o TO
CO
P
CD
i-j
oj
H,
CD
MID
DL
E
PL
EIS
TO
CE
NE
Dim
woo
dy L
ake
Gla
ciat
ion
1-1 "o 8
LA
TE
P
LE
IST
OC
EN
E
Bul
l L
ake
Gla
ciat
ion
H^o
i?
o g
.
CD
tr1 p ^o
s*-
<!
9 g-
CD SB
ull
Lak
e G
laci
atio
n
H
§£
§00
p" P
) .
CD h-l
h-l
rSs
rO
» oo 8I CD
Bul
l L
ake
Gla
ciat
ion
H"b
o ^
C71
^5
oo p g- CD
tr1
p_p
CD"
§00 c*~ tt CD
Pin
edal
e G
laci
atio
n
H0^
Sg. a CD
g
sg 00 S
O
i C"
O
oo P CD
tr1
h->
CD^5
oo
8^
0 a CD
h-l
I 1
h-
l ^
h-l
^<
Pin
edal
e G
laci
atio
n
H
5^ O,
oo
°P
p) .
CD h-l
h-l
h-l
glit
51
o *
O
en P CD
sl
rf^
00O
^ CD h-
l
Pin
edal
e G
laci
atio
n
H p^ ^
*C71 O
oo° p
"P
) .
CD
g £?o g
^*C
O ^
O 9
O
en P CD
tr1
£D
S r
o"C
O
Mo £
°l CD
B ^
oo
S'
og
g o
8§
oo.
^o>
5
X
RE
CE
NT
Neo
glac
iati
on
H
~<x *
QO
» CD
'£?
J»
S *
rin
^-O
CO p"
CD ^
O
Kg
"o a
>
^~s
' 0§
Sop
or
^
CO p" 8-
Neo
glac
iati
on
S|
o C
D"
M F CD CO p" CD
ff & ! P e. tf S 5 S" II o' I P1 tf w' s sr CD IS » i i P1 & P e^. 5* 5* 1
' ^ tf
£§ ^td P v;
| tPf 8 S CD - S' w g e. o 1 » P o 1 § W o' 03 CD"
2 P W te* I hd (0 p
to
to
? a*
^
-SS
co
§ I-
g p-
11^
B co
I S I Q
w CO ft)
o M

ARTICLE 213 E123
105°25'
3 MILESJ
FIGURE 213.1. Moraines in the valley of Rio Hondo, Wheeler Peak, Sangre de Cristo Mountains, N. Mex. Be and Bl, early and late stades of Bull Lake Glaciation; Pe, Pm, and P I early, middle, and late stades of Pinedale Glaciation; T and G, Temple Lake Stade and Gannett Peak Stade of Neoglaciation. Index map: 1, Wheeler Peak; 2, Lake Peak; 3, Sierra Blanca.
are extremely blocky, in part owing to removal of the interstitial fine material by melt water. The blocky material extends along the lower southwest slopes of the basin, where it was mapped as Wisconsin IV "sub- stage" by Eay. The soil on both the outer and inner moraines has an immature Brown Podzolic profile like that on the end moraine at 10,200 feet. Because of the hummocky surface, the abundance of boulders, and the immature but zonal character of the soil profile, these moraines are correlated with the early, middle, and late stades of the Pinedale Glaciation.
Within and overlapping the lips of the 11 small cirques that encircle the main basin are small blocky moraines and rock glaciers that were referred by Eay
to his Wisconsin V "substage." Their average alti tude is 11,850 feet, though one extends down across the uppermost Pinedale moraine. The blocks are cov ered by lichen and, where fine material is exposed at the surface, the moraine bears a thin azonal soil. These features are characteristic of the Temple Lake Stade of Neoglaciation.
Four of the cirques contain one or two still younger moraines or rock glaciers that have no soil and only a few sparse plants. These deposits are fresh, but do not appear active. They are correlated with the Gannett Peak Stade of Neoglaciation.
LAKE PEAK
Along the Eio Nambe, on the northeast slope of Lake Peak (altitude 12,409 ft) broad, evenly sloping lateral moraines, 60 to 80 feet high, lie on rock shoul ders within the relatively open canyon at altitudes of between 10,000 and 10,600 feet near the confluence of the north and south forks and about 100 feet above the stream (fig. 213.2) The end moraine was probably
R.10E 11 E.
3 MILESJ
FIGURE 213.2. Moraines in the valley of Rio Nambe on Lake Peak, Sangre de Cristo Mountains, N. Mex. Pre-B, pre-Bull Lake glaciation; Be and Bl, early and late stades of Bull Lake Glaciation; Pe, Pm, PI, early, middle, and late stades of Pinedale Glaciation; T, Temple Lake Stade of Neoglaciation.
667422 O - 63 - 9

E124 GEOLOGICAL SURVEY RESEARCH 1962
at an altitude of just below 10,000 feet and a little over 2 miles from the cirque heads. The surface of the moraines is very smooth, and very few boulders are ex posed. The till contains many deeply disintegrated stones, mostly of granite, gneiss, and schist, but some are fresh and a few preserve soled and striated surfaces. The material is mantled by a compact reddish (7.5T7?) clayey sandy soil more than 6 feet thick. The thick ness, color, and clay content of the soil suggest that the till is of pre-Bull Lake age. The location of the deposits within the canyon and the preservation of morainal topography suggest correlation with the Din- woody Lake Glaciation (Richmond, 1962) the youngest of the three pre-Bull Lake glaciations, in the Wind River Mountains.
Higher in the canyon of the South Fork of the Rio Nambe, at 10,100 and 10,500 feet altitude, are two other broad moraines on the surface of which boulders are fairly numerous. The till contains disintegrated and fresh stones in roughly equivalent proportions and bears a mature Brown Podzolic soil 3 to 4 feet thick. A typical soil profile consists of 6 inches of dark-brown (1.5YR 4/2) loose micaceous silty sand, 14 inches of dark-brown (7.517? 4/4) slightly plastic micaceous stony silty sand, and 20 inches of strong-brown (7.5 TR 5/6) compact plastic micaceous silty sand having a fine angular blocky structure, beneath which is light- brown (7.5J7? 6/3), compact stony sandy till. The lower moraine is the Wisconsin II of Ray (1940). The outer slopes of the upper moraine extend over a rock lip, but the inner slopes are clearly of deposi- tional origin. Along the north fork, a pair of large lateral moraines of similar character on the north side of the valley indicate glacial termini at about 10,400 and 10,500 feet, and at a distance of about iy2 miles from the cirque heads. The mature topography, abundance of surface boulders, and soil profile on these two lateral moraines, and the fact that their terminal portions have been removed by erosion, sug gest their correlation with the early and late stades of Bull Lake Glaciation.
Along the South Fork of the Rio Nambe, at alti tudes of 10,750 and 11,100 feet, and on the north fork at 10,600 and 10,850 feet, are broad, high, steep- fronted bouldery, hummocky end moraines that are but little dissected. The deposits are forested and have an immature Brown Podzolic soil that consists of 1 inch of black humus, iy2 inches of gray silty sand (A2 horizon), and 20 inches of brown (10T7? 4/3), stony silty sand (B horizon), underlain by fresh pale-gray-brown till. The outer moraine on the south fork impounds a peat bog; the inner overlies a rock lip that retains a tarn. The surface character,
soil, and relative position of these deposits suggest their correlation with the early and middle stades of Pinedale Glaciation. The ice at the maximum of these advances extended about 1 mile from the cirque heads.
A single low forested moraine with an immature Brown Podzolic soil lies on the lip of the cirque basin of the North Fork of the Rio Nambe at an altitude of 11,250 feet. Within the cirque of the south fork at 11,400 feet is a forested, blocky deposit that has a similar soil and is probably a rock glacier. The character of these deposits suggests that they represent the late stade of Pinedale Glaciation.
The rock-glacierlike deposit on the south fork is overlapped by a distinctly younger lobate, blocky rock glacier at an altitude of 11,500 feet. The front of the deposit is 100 feet high, and covered with spruce. It has a dark-brown (IOTR 4/3) silty sandy azonal soil about 8 inches thick, and probably repre sents the Temple Lake Stade of Neoglaciation. Fresh talus presumably of Gannett Peak age lies at the foot of the cirque headwall. Along the northwest-facing sector of the cirque on the north fork, a well-developed protalus rampart that has a soil and vegetation char acteristic of the Temple Lake Stade lies at the foot of active talus.
SIERRA BLANCA
From the shallow cirque on the northeast side of Sierra Blanca Peak (altitude 12,003 feet), a bouldery lateral moraine extends along the north side of the canyon of the North Fork of the Rio Ruidoso to a terminal moraine 50 feet high at an altitude of 9,850 feet about a mile from the cirque headwall (fig. 213.3). The deposit is trenched about 30 to 40 feet by the creek, and bears a mature Brown Podzolic soil about 3 feet thick. The B horizon of the soil is strong-brown (7.5T7i? 5/6) and contains noticeable illuviated clay, though it is not plastic. The boulders are mostly of granite porphyry, and many, both on and in the till, are deeply disintegrated. A second broad terminal moraine of similar character lies at an altitude of 10,400 feet. It also is about 50 feet high and is lit tered with boulders, some 10 to 12 feet in diameter. These two moraines are believed to represent the early and late stades of Bull Lake Glaciation. A small lake basin back of the upper moraine is filled with arkosic sand and gravel which extends upslope as an outwash plain into still another bouldery morainal ridge, about 30 feet high, which forms an arcuate loop on the steep slope leading into the cirque at an alti tude of 10,500 feet. The moraine is grass covered
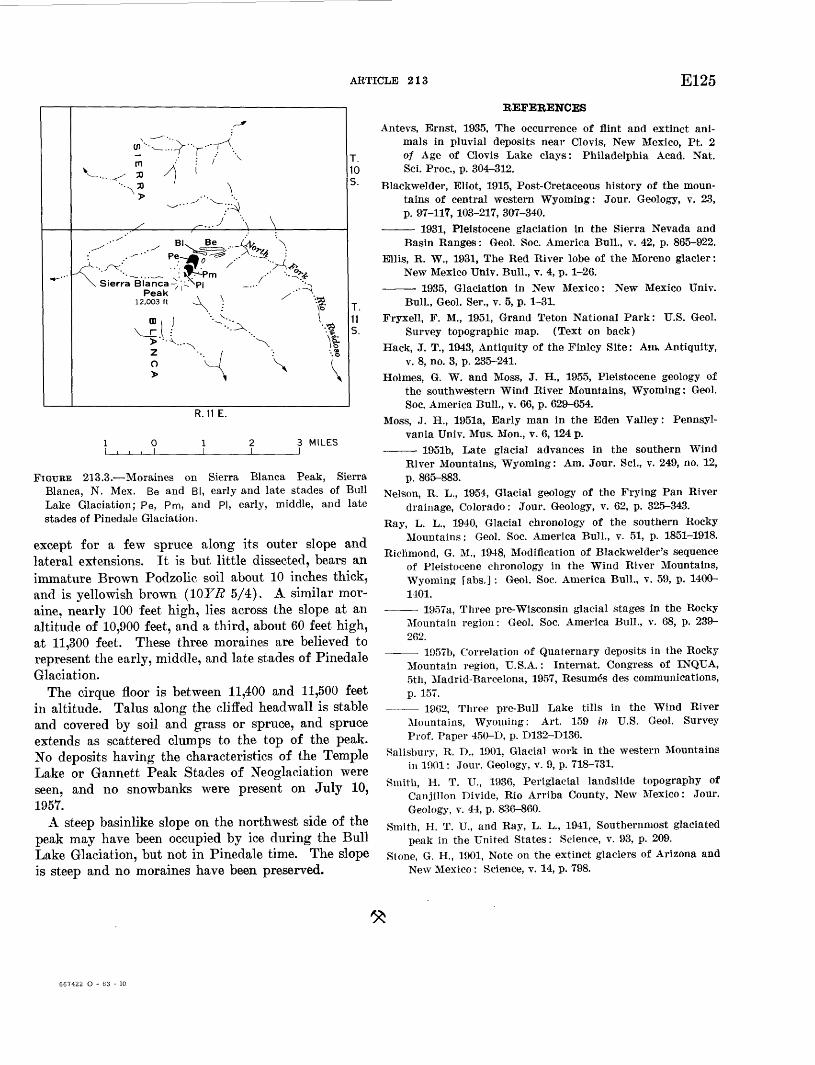
ARTICLE 213 E125
. Sierra Blanca
Peak12,003 ft
03 )
VT. f> -Z
' -. '
-
R. 11 E.
3 MILESJ
FIGURE 213.3. Moraines on Sierra Blanca Peak, Sierra Blanca, N. Mex. Be and Bl, early and late stades of Bull Lake Glaciation; Pe, Pm, and PI, early, middle, and late stades of Pinedale Glaciation.
except for a few spruce along its outer slope and lateral extensions. It is but little dissected, bears an immature Brown Podzolic soil about 10 inches thick, and is yellowish brown (10T7? 5/4). A similar mor aine, nearly 100 feet high, lies across the slope at an altitude of 10,900 feet, and a third, about 60 feet high, at 11,300 feet. These three moraines are believed to represent the early, middle, and late stades of Pinedale Glaciation.
The cirque floor is between 11,400 and 11,500 feet in altitude. Talus along the cliffed headwall is stable and covered by soil and grass or spruce, and spruce extends as scattered clumps to the top of the peak. No deposits having the characteristics of the Temple Lake or Gannett Peak Stades of Neoglaciation were seen, and no snowbanks were present on July 10, 195T.
A steep basinlike slope on the northwest side of the peak may have been occupied by ice during the Bull Lake Glaciation, but not in Pinedale time. The slope is steep and no moraines have been preserved.
REFERENCES
Antevs, Ernst, 1935, The occurrence of flint and extinct ani mals in pluvial deposits near Clovis, New Mexico, Pt. 2 of Age of Clovis Lake clays: Philadelphia Acad. Nat. Sci. Proc., p. 304-312.
Blackwelder, Eliot, 1915, Post-Cretaceous history of the moun tains of central western Wyoming: Jour. Geology, v. 23, p. 97-117, 103-217, 307-340.
1931, Pleistocene glaciation in the Sierra Nevada and Basin Ranges: Geol. Soc. America Bull., v. 42, p. 865-922.
Ellis, R. W., 1931, The Red River lobe of the Moreno glacier: New Mexico Univ. Bull., v. 4, p. 1-26.
- 1935, Glaciation in New Mexico: New Mexico Univ. Bull., Geol. Ser., v. 5, p. 1-31.
Fryxell, F. M., 1951, Grand Teton National Park: U.S. Geol. Survey topographic map. (Text on back)
Hack, J. T., 1943, Antiquity of the Finley Site: Am. Antiquity, v. 8, no. 3, p. 235-241.
Holmes, G. W. and Moss, J. H., 1955, Pleistocene geology of the southwestern Wind River Mountains, Wyoming: Geol. Soc. America Bull., v. 66, p. 629-654.
Moss, J. H., 1951a, Early man in the Eden Valley: Pennsyl vania Univ. Mus. Mon., v. 6, 124 p.
1951b, Late glacial advances in the southern WindRiver Mountains, Wyoming: Am. Jour. Sci., v. 249, no. 12,p. 865-883.
Nelson, R. L., 1954, Glacial geology of the Frying Pan Riverdrainage, Colorado: Jour. Geology, v. 62, p. 325-343.
Ray, L. L., 1940, Glacial chronology of the southern RockyMountains: Geol. Soc. America Bull., v. 51, p. 1851-1918.
Richmond, G. M., 1948, Modification of Blackwelder's sequenceof Pleistocene chronology in the Wind River Mountains,Wyoming [abs.] : Geol. Soc. America Bull., v. 59, p. 1400-1401.
1957a, Three pre-Wisconsin glacial stages in the Rocky Mountain region: Geol. Soc. America Bull., v. 68, p. 239- 262.
1957b, Correlation of Quaternary deposits in the Rocky Mountain region, U.S.A.: Internat. Congress of INQUA, 5th, Madrid-Barcelona, 1957, Resumes des communications, p. 157.
1962, Three pre-Bull Lake tills in the Wind RiverMountains, Wyoming: Art. 159 in U.S. Geol. SurveyProf. Paper 450-D, p. D132-D136.
Salisbury, R- D-, 1901, Glacial work in the western Mountainsin 1901: Jour. Geology, v. 9, p. 718-731.
Smith, H. T. U., 1936, Periglacial landslide topography ofCanjillon Divide, Rio Arriba County, New Mexico: Jour.Geology, v. 44, p. 836-860.
Smith, H. T. U., and Ray, L. L., 1941, Southernmost glaciatedpeak in the United States: Science, v. 93, p. 209.
Stone, G. H., 1901, Note on the extinct glaciers of Arizona andNew Mexico : Science, v. 14, p. 798.
667422 O - 63 - 10

E126 GEOLOGICAL SURVEY RESEARCH 1962
ANALYTICAL METHODS
214. ION-EXCHANGE SEPARATION AND SPECTROPHOTOMETRIC DETERMINATION OF CADMIUM
By CLAUDE HUFFMAN, JR., Denver, Colo.
An anion-exchange resin procedure has been adapted for the separation of microgram amounts of cadmium from milligram amounts of zinc, lead, thallium, co balt, nickel, bismuth, copper, ferric iron, and man ganese before its spectrophotometric determination with dithizone. This separation is based in part on the anion-exchange resin work of Kraus and Nelson (1955) describing the absorption behavior of many metal chlorocomplexes, and also on the zinc procedure of Huffman, Lipp, and Rader (1963). Cadmium and zinc are absorbed on an anion-exchange resin (Dowex 1, X-8, chloride form) from 1.2M hydrochloric acid. Zinc is eluted with O.OLfl/ hydrochloric acid while cadmium remains on the resin. In this investigation, it was determined that cadmium is quantitatively eluted with l.OM nitric acid. The cadmium content is then determined by processing an aliquot of the eluate through the last dithizone-extraction step de scribed by Saltzman (1953).
The method is applied to the determination of a few tenths of a part per million or more of cadmium in mineralized silicate rock samples. Cadmium analy ses are shown for a National Bureau of Standards standard zinc ore sample no. 113, standard diabase W-l, standard granite G-l and a rock sample con taining sphalerite (S-4-A).
APPARATUS AND REAGENTS
Resin column. Column is 24 cm long, with an inside diameter of 0.8 cm. Prepare the resin column for use by adding a water slurry of anion-exchange resin (Dowex 1, X-8, 50- to 100-mesh, chloride form) until the slurry is 10 cm in depth. Condition the resin before use by passing hy drochloric acid through the column as described in "Pro cedure." Regenerate the used resin by passing 100 ml water through the column, followed by 50 ml l.OM hydro chloric acid.
Hydrochloric acid, 1.2M and 0.01M.Nitric acid, l.OJf.Hydroxylamine hydrochloride, 20 g in 100 ml water.Sodium hydroxide, 40-percent, potassium cyanide, 0.05-percent,
400 g and 0.5 g respectively in 1 liter water.Dithizone solution. 10 mg dithizone in 1 liter redistilled
chloroform. Keep in refrigerator.Tartaric acid, 20 g in 100 ml water.Standard cadmium solution, 2 jig Cd per ml in 0.1M hydro
chloric acid. To obtain this solution, dilute a stronger stock solution prepared from cadmium metal.
Spectrophotometer and paired 1-cm cells.
PROCEDURE
Transfer a 1.0-g sample to a platinum dish. Proc ess a reagent blank with the samples. Add 10 ml de- mineralized water, 10 ml nitric acid, 10 ml hydro fluoric acid, and let stand overnight. Add 10 ml perchloric acid, and 5 ml sulfuric acid. Place dish on a hotplate and fume off the acids until about 3 ml remains. Cool. Wash down the sides of the dish with water, add 5 ml perchloric acid and repeat the fuming until all the acid is evaporated. Do not bake the salts. Cool. Add 10 ml hydrochloric acid and 25 ml water to the dish, cover, and digest on a steam bath for 30 minutes. Transfer the solution to a 100-ml volumetric flask, cool, dilute to volume with water, and mix.
Condition the resin column for use by passing 20 ml 0.01J/ hydrochloric acid through it, followed by 20 ml 1.2M hydrochloric acid. Kepeat this operation two or three times and leave the 1.2J/ hydrochloric acid in the column with about 2 ml of solution above the resin.
Quantitatively transfer an aliquot of the sample solution containing less than 50 ^g Cd to the resin column after diluting the aliquot volume to 50 ml with 1.2J/ hydrochloric acid. Regulate the flow rate of the solution through the column to about 1 ml per minute by adjusting the stopcock at the bottom of the column. When the flow stops, discard the solution that has passed through, wash the column with 50 ml 1.2J/ hydrochloric acid, and discard the wash solu tion. Elute the zinc by passing 65 ml 0.01J/" hydro chloric acid through the resin at a flow rate of about 1 ml per minute. Save this solution only if zinc anal ysis is required. Wash the resin with 10 ml water, then place a clean 100-ml volumetric flask under the resin column and elute the cadmium by passing 60 ml l.QM nitric acid through the column at a flow rate of 1-ml per minute. Add 2 g tartaric acid to the flask and dilute to volume with water.
Transfer a 25-ml portion of the eluate solution con taining less than 14 fig Cd to a 125-ml separatory fun nel. Add 0.50 ml hydroxylamine hydrochloride solution, 5 ml sodium hydroxide-potassium cyanide solution, and 15 ml dithizone solution to the separatory funnel and immediately shake for 1 minute. Allow

ARTICLE 214 E127
the phases to separate and drain the chloroform into a 1-cm cell. Measure the absorbance at 518 nut, using the reagent blank as a reference solution.
To establish the standard spectrophotometric curve, add 2, 4, 8, and 12 /^g Cd to 25 ml 2-percent w/v tartaric acid solution and proceed, starting with the dithizone extraction step described in the preceding paragraph.
REMARKS
The amount of 1M nitric acid required to elute 50 /Ag Cd from the resin column was determined. Elu- tion tests with 15, 30, 45, and 60 ml 1M nitric acid showed recoveries of 48, 90, 99, and 99 percent, respec tively. A plot of these data shows that cadmium is quantitatively eluted with about 43 ml of acid. Elu- tion tests with equivalent amounts of 0.001 M hydro chloric acid gave poor recoveries.
Possible interference in the procedure by other metals that react with dithizone was investigated by processing milligram amounts of zinc, lead, thallium, cobalt, bismuth, copper, ferric iron, and manganese through the procedure. With the exception of zinc, these data (table 214.1) show little or no interference from the metals listed. The test with zinc, equivalent to 0.8 /Ag Cd, was found by X-ray fluorescence meas urements to be due to cadmium impurity in the zinc sulfate salt used in the test. Analysis of NBS stand ard sample 113 (Tri-State concentrate zinc ore) con-
TABLE 214.1. Interference of milligram amounts of diverse metals on the cadmium determination after separation by union exchange. (No cadmium added in each test)
Metal added
Amount of inter- Milligrams of ference as micro- metal added grams of cadmium
Fe(III).
3524545
1505
»0. 8< 1
. 2< 1< 1
. 1
. 3< 1< 1
taining 61.1 percent zinc was straightforward; no in terference with the method was noted.
This method is compared in table 214.2 with other methods for the determination of cadmium in 2 zinc sulfide samples and 2 standard silicate rock samples, W-l and G-l. The agreement between methods is good for the zinc sulfide samples. Eecent values re ported by Fleischer and Stevens (1962) for W-l and G-l are in good agreement with those obtained by this method. Earlier values cited by Ahrens and Fleischer (1960) for W-l and G-l are clearly in error. The cadmium values for W-l and G-l were obtained by processing duplicate 2.0-g portions, one spiked with 20 /Ag Cd, through the procedure. The recovery of cadmium added to W-l and G-l was found to be better than 97 percent.
TABLE 214.2. Comparison of cadmium values determined by the method described and by other methods
Sample Rock typeCadmium in percent
Method described Other methods
1 This interference was determined to be cadmium impurity in the zinc sulfate salt solution used in the test.
NBS 113_ Zincore____- 0.410.400.440.40 1 0. 41S-4-A--__ Sphalerite,._ .16 .14 .16 .15 2. 14W-l__-_- Diabase.-.__ <. 00003 3. 00003G-l------ Granite-__-_ <. 00003 3. 000006
1 X-ray fluorescence, oral communication from J. J. Tregoning.2 Controlled-potential electroanalysis, Charles Kinser, analyst. ' Recommended magnitude values cited by Fleischer and Stevens (1962) based
on polarographic, colorimetric, neutron-activation, and spectrogi aphic analysis.
REFERENCES
Ahrens, L. H., and Fleischer, M., 1960, Report on trace con stituents in granite G-l and diabase W-l, in, Stevens, R. E., and others. Second report on a cooperative investi gation of the composition of two silicate rocks: U.S. Geol. Survey Bull. 1113, p. 83-111.
Fleischer, Michael, and Stevens, R. E., 1962, Summary of new data on rock samples G-l and W-l: Geochimica et Cos- mochimica Acta, v. 26, p. 525-543.
Huffman, C., Lipp, H. H., and Rader, L. F., 1963, Spectro photometric determination of micro quantities of zinc in rocks: Geochimica et Cosmochimica Acta. (In press)
Kraus, K. A., and Nelson, F., 1955, Anion exchange studies of the fission products, in International Conference on the Peaceful Uses of Atomic Energy, v. 7, A conf. 8/P/837, U.S.A., 23 June. [In English]
Saltzman, B. E., 1953, Colorimetric microdetermination of cad mium with dithizone: Anal. Chem., v. 25, p. 493.

E128
215.
GEOLOGICAL SURVEY RESEARCH 1962
EFFECT OF COPPER ON THE PRECIPITATION OF TELLURIUM WITH HYPOPHOSPHORUS ACID USINGSELENIUM OR GOLD AS A COLLECTOR
By H. W. LAKIN and C. E. THOMPSON, Denver, Colo.
As a part of a more comprehensive study of analyti cal methods for the determination of traces of tel lurium, tests were made of the completeness of reduc tion and precipitation of tellurium with hyphophos- phorous acid from very dilute solutions of tellurium (IV) using selenium or gold as a collector.
A number of shale samples were digested with oxi dizing acids and hydrofluoric acid; the solutions evap orated to dryness and the residues dissolved in 4N or 6N hydrochloric acid. Tellurium-129 was added to these solutions together with selenium or gold. These solutions were reduced with either stannous chloride, sulfur dioxide, or hypophosphorous acid to determine the effectiveness of the reducing agents. Large ex cesses of the reductants failed in some cases to give any precipitate and in others gave incomplete precipi tation of the tellurium and gold or selenium. Stan nous chloride was the most satisfactory, but the pre cipitate was contaminated with much tin. In solutions of chalcopyrite, however, tellurium and gold or sele nium were quite readily reduced to the element by hypophosphorous acid. In QN hydrochloric acid, fer ric iron is not readily reduced to ferrous iron by sul fur dioxide or hypophosphorous acid. Gold (III) is not reduced to the element by hypophosphorous acid in &N hydrochloric acid containing ferric chloride; tellurium and selenium are incompletely reduced. However, cupric chloride is rapidly reduced by hypo- phosphorous acid in 4N to QN hydrochloric acid, and the cuprous ion readily reduces ferric iron to the fer rous state.
These observations led to the series of experiments outlined below to test the effectiveness of hypophos phorous acid as a reductant and selenium and gold as carriers for tellurium with and without added copper.
To 400 ml of QN hydrochloric acid were added the amounts of tellurium-129, copper as cupric chloride, and selenium noted in table 215.1; 20 ml of 50-percent hypophosphorous acid was added, the solutions were heated on the steam bath for 1 hour, and allowed to stand overnight. The solutions were filtered with suction through very fine sintered-glass filters. The filtrate was evaporated to near dryness and trans ferred to test tubes. The radioactivity of these solu tions was measured in a scintillation counter using as a detector a well-type 1.5-inch thallium-activated so dium iodide crystal. Similar data are given for the
TABLE 215.1 Effect of copper on the precipitation of elemental tellurium from 6N hydrochloric acid using selenium as a carrier
Te129added
(MB)
0. 5. 5
1.01.0
Activity 1 of added Te 129 insame volume
as filtrate(counts per
10 min)
2,6522,5005,3045,000
Se added(mg)
2424
Activity of filtrate (counts per 10 min)
NoCuadded
2, 135870
4,7473,276
2mg Cuadded
381110680
2 0
Te precipitated G*g)
NoCuadded
0. 10.32. 10.65
2mg Cuadded
0.45.48.87
1.00
i Background of 3,576 counts subtracted from all values given in the table. 1 Counts less than average background.
precipitation of tellurium from 47V hydrochloric acid in table 215.2.
TABLE 215.2 Effect of copper on the precipitation of elemental tellurium from 4N hydrochloric acid using selenium as a carrier
Tei»added
(Mg)
0. 5. 5. 5
1.01.0-1. 0
Activity ' ofadded Te12* insame volume
as filtrate(counts per
10 min)
2,4732,2082,2084,9464,4164,416
Se added(mg)
410104
1010
Activity of filtrate(counts per 10 min)
NoCuadded
502
943
2mg Cuadded
90109
71225173207
Te precipitated G*g)
NoCuadded
0.4
.81
2mg Cuadded
0.49.47.49.96
Q8.98
i Background of 3,576 counts subtracted from all values given in the table.
The data in tables 215.1 and 215.2 show that 90 to 100 percent of the tellurium is precipitated from 4A7 and 67V hydrochloric acid solutions containing only 1.2 to 2.5 parts per billion (109 ) of tellurium. Both the concentration of selenium and the presence of copper in the solution affect the recovery of tellurium.
The effect of foreign ions on the precipitation of tellurium from a IN hydrochloric acid solution con taining 25 ppb tellurium is illustrated in table 215.3. These data indicate that about 95 percent of the tel lurium in complex solutions can be precipitated with selenium as a carrier in the presence of copper. In a similar series using 67V hydrochloric acid, the recov ery ranged from 95.6 to 100 percent; the average loss in 13 experiments was 2.1 percent. In the absence of copper, no tellurium was precipitated from a 67V hy drochloric acid solution containing aluminum, iron, potassium, calcium, magnesium, and sodium.

ARTICLE 215 E129
TABLE 215.3. Completeness of precipitation of tellurium in the presence of foreign ions using selenium as a carrier
[Base solution: Each 400 ml of 4AT HC1 contains 0.7 g Al, 1 g K, 0.9 g Fe, 0.3 g Mg, 0.7 g Ca, 0.4 g Na, 10 mg Se, 10 mg Cu, 10 Mg Te 129]
Elements added
Base solution+0.8 g Fe, 0.7 g Pb, 0.4 g Mn. ___________
Base solution + 0.4 g Cu, 0.2 g Zn
Base solution + 0.2 g Ni, 0.5 g Co_______________________
Base solution +0.7 g Hg, 0.4 g Sb,0.3g As_----_---------
Base solution +1 mg Au___
Activity ' of 10 Mg Te128 in
same volume as filtrate (counts
per 10 min)
14, 763
14, 763
18, 453
14, 763
12, 30318, 453
Activity of filtrate (counts per 10 min)
639
679
6Q4
643
958928
Te pre cipitated
(«)
9.57
9. 54
9. 62
9. 57
9.219. 50
i Background of 3,587 counts substracted from all values given in the table.
By reduction with hypophosphorous acid, 99.6 per cent of the tellurium was removed from solution by 2 precipitations with 2 mg of gold from 300 ml of either 2/V or 4A" hydrochloric acid, each solution con taining 1 g of iron, 0.4 g of copper and 5 //,g of tel lurium-129. One precipitation removed 99.7 percent of the tellurium from QN hydrochloric acid.
TABLE 215.4. Precipitation of tellurium from 0N hydrochloric acid using gold as a carrier
Te'»added
fog)
0.5.5
1.01.05.0
Activity ' ofadded Te»« hisame volume
as filtrate(counts per
10 min)
2,6522,5005,3045,000
26, 519
Au added(mg)
28282
Activity of filtrate(counts per 10 min.)
NoCuadded
440128738122
7,525
2mg Cuadded
2512 0
7432 0
652
Te precipitated (Mg)
NoCuadded
0.42.48.82. 98
3.6
2mgCuadded
0.45.50. 82
1.004.9
The data in table 215.4 show the efficiency of gold as a carrier for tellurium. The tellurium-129 and gold were precipitated from 400 ml of 6A" hydrochloric acid by addition of 20 ml of 50-percent hypophos- phorous acid*and heating at 80°-90°C. for 1 hour. The filtration was made the following day. The fil trates were evaporated to a small volume and the radioactivity of the tracer tellurium-129 remaining in the filtrate was compared to reference solutions of known concentration.
Precipitation of tellurium was incomplete from so lutions containing 5 parts per million of gold (2 mg gold dissolved in 400 ml solution) but was complete for those containing 20 ppm of gold. Even in these solutions to which no iron was added, copper appears to enhance the precipitation of tellurium.
The effect of foreign ions on this precipitation is illustrated by the data in table 215.5. These data in dicate that gold is a somewhat better carrier for tel lurium than selenium is.
TABLE 215.5. Completeness of precipitation of tellurium in the presence of foreign ions using gold as a carrier
[Base solution: Each 400 ml of 6ATHC1 contains 0.7 g Al, 1 g K, 0.9 g Fe, 0.3 g Mg, 0.7 g Ca, 0.4 g Na, 8 mg Au, 10 mg Cu, 10 Mg Te 126]
Elements added
Base solution + 1 g Fe+1 g Pb+1 g Mn. _____________
Base solution+ 1 g Cu+ 1 g Zn_ Base solution-!- 1 g Ni+ 1 g Co_ Base solution + 1 g Sb+1.6 g
Bi-_-__________ __________Base solution +1 g Hg + 0.9 g
As --------------------
Activity » of 10 ME Te'29 in
same volume as filtrate (counts
per 10 min)
14, 880
6,20012, 400 12, 400
12, 400
10, 630
Activity of filtrate (counts per 10 min)
196
2 00
241 138
248
192
Te pre cipitated
G«)
9.87
10.009.81 9. 89
9.80
9. 82
1 Background of 3,687 counts subtracted from all values given in the table. * The activity in counts per 10 min was less than the average background.
' Background of 3,368 counts subtracted from all values given in the table. 2 The activity in counts per 10 min was less than the average background.

E130 GEOLOGICAL SURVEY RESEARCH 1962
216. SPECTROPHOTOMETRIC DETERMINATION OF FLUORINE WITH THORON
By BLANCHE L. INGRAM, Washington, D.C.
The method of Grimaldi and others (1955) for the spectrophotometric determination of fluorine with thoron has been modified to permit absorbance meas urements with 5-cm cells, giving increased reliability in the 0-20 jug range. Also discussed is a problem which may arise with blank determinations in the use of unacidified thorium nitrate reagent.'
REAGENTS AND APPARATUS
Standard fluoride solution. 1 ml contains 1 fig fluoride. Pre pare from pure sodium fluoride.
Thorium nitrate solution. 1 ml contains the equivalent of 25 fig thorium dioxide and 0.1 ml perchloric acid.
Thoron solution. o-(2-Hydroxy-3,6-disulfo-l-naphthyazo) ben- zenearsonic acid disodium salt, a 0.10 percent aqueous solution.
Perchloric acid, 70 percent.Sodium hydroxide solution, 2 percent aqueous solution.Phenolphthalein, 0.1 percent alcoholic solution.Spectrophotometer, Beckman DU, supplied with 5-cm cells.
PROCEDURE
Prepare a distillate of the sample as directed in Grimaldi and others (1955). Transfer a 15-20 ml aliquot of the distillate to a 25-ml volumetric flask. Pipet 1-, 3-, 5-, 10-, and 20-ml aliquots of the fluoride standard into 25-ml volumetric flasks. Designate a 25-ml flask as 0 /xg F and another as a reference solu tion. Add sufficient distilled water to all flasks to give a volume of about 15 to 20 ml. Add 1 drop of phe- nolphthalein to each and then sodium hydroxide drop- wise until the indicator changes to pink. Then add, by means of pipets or burets, to all flasks except the reference, 1 ml hydroxylamine hydrochloride, 2.00 ml thorium nitrate, and 1.00 ml thoron reagent. To the reference flask, add 0.2 ml HCKX, 1 ml hydroxyl amine hydrochloride, and 1.00 ml thoron. Adjust all volumes to 25 ml with distilled water and mix. Meas ure the absorbance of the solutions at 545 niju, after 15 minutes using a Beckman DU spectrophotometer and 5-cm cells. A straight-line relation should be obtained between absorbance and fluoride concentration. One microgram of fluoride decreases the absorbance of the thorium-thoron color by about 0.008.
PROBLEM WITH BLANK DETERMINATIONS
The spectrophotometric method of Grimaldi and others gave absorbance readings for 0 /*g standards which were often too low. Zero standards and blank
distillates seemed to contain fluorine that could not be explained. These difficulties were traced to the use of old thorium nitrate reagent. For best results, the reagent referred to as "thorium nitrate solution for spectrophotometry, 1 ml contains 50 jug of thorium dioxide," should be prepared fresh when required. Alternatively, it can be prepared containing 0.1 ml HCICX per milliliter, in which case the addition of 0.2 ml HCKX is omitted in the procedure. The acidi fied solution is stable. Absorbance readings at several fluorine concentrations, using thorium nitrate reagent of varied age with and without acid are given in the table below.
Accurate pipetting can not be overemphasized in this method. Poor pipetting techniques can be a source of error that is very apparent in blank deter minations. As examples, tests using 5-cm cells showed that the absorbance of a 0 jug standard with 0.05 ml thorium nitrate reagent in excess was 0.015 higher, and one with 0.05 ml thoron in excess was 0.019 higher than one without excess of either reagent. Pipetting errors may be kept to a minimum by mix ing the reagents in appropriate ratios just before ad dition and adding all as one reagent with one pipet ting operation.
Absorbance readings using thorium nitrate reagent with and withoutacid 1
F in 25 ml G*g)
0.. ............20.. .. .........40.. .......... .60-- 80. 100.... - Blank distil-
Thorium nitrate reagent without acid
Fresh
0.475 .440 .403 .364 .326
.475
1 week old
0.463 .437 .393 .354 .314 .278
.465
2 weeks
old
0.462 .437 .398 .357 .311 .281
.464
4 weeks
old
0.462 .435 .398 .358 .318 .284
.468
1 year old a
0.383 .416 .382 .346 .307
.418
Thorium nitrate reagent containing 0.1 ml HClOi per ml
Fresh
0.479 .447 .406 .362 .326 .289
.479
1week old
0.479 .443 .404 .364 .325 .291
.478
2weeks
old
0.479 .445 .407 .364 .324 .289
.479
4 weeks
old
0.479 .444 .408 .366 .326 .288
.479
i2-cm cells used for all measurements. 2 Not same Th(NOs)4 reagent.
REFERENCE
Grimaldi, F. S., Ingram, B. L., and Cuttitta, Frank, 1955, Determination of small and large amounts of fluorine in rocks: Anal. Chemistry, v. 27, p. 918-921.

ARTICLE 217
TOPOGRAPHIC STUDIES
E131
MAPPING TECHNIQUES
217. PORTABLE SURVEYING TOWER
By JAMES L. BUCKMASTER and WILBTJRN D. MTJRPHY, Washington, D.C.
With the introduction of electronic distance-meas uring instruments into control surveys in 1956, water bodies, vegetation, and rough terrain were no longer a handicap to accurate distance measurements pro vided stations were intervisible. Older reconnaissance methods such as observing the terrain from the top of a truck, from fire towers, or by climbing trees, were unsatisfactory. Commercial platforms that operated hydraulically were available, but these were costly and could serve only for reconnaissance. Standard tri- angulation towers were heavy, cumbersome, and re quired a trained crew to transport and erect them. In order to plan a control project and select suitable station sites, a portable tower was needed that could be erected quickly.
A lightweight aluminum tower designed by the U.S. Geological Survey combines the qualities of portability and stability, and it can be easily and quickly erected (fig. 217.1). The number of parts in the tower is kept to a minimum by welding each hori zontal triangular brace assembly into a one-piece unit, and by making the tower sections similar. A flared base section is used for better stability at heights greater than 40 feet.
The triangular brace assemblies are vertically spaced 6 feet apart while the corner tubes are either 6 or 12 feet long, permitting separate assembly of 6- and 12-foot tower sections. Each 6-foot section or panel of the outer tower, defined by two corner tubes and two horizontal members, is diagonally crossbraced by %-inch aircraft cable, giving a maximum strength- weight ratio. An aluminum ladder leads to a work ing platform which has a waist-high railing and a nylon netting between the railing and the floor.
For reconnaissance work, only the outer tower is used. For measuring distances and angles, however, an inner tower is used to provide greater stability and rigidity. The construction of the inner tower is simi lar to that of the outer tower, except that each 6-foot section is braced with a diagonal tube that serves as both a tension and a compression member.
For transporting the tower, a special trailer unit, witji accessory box, can be easily attached between any two adjacent horizontal brace members (fig.
217.1). The trailer-mounted tower can be towed by field truck or station wagon. For most ground trans portation, tower height is limited to 50 feet. It is ex pected that a helicopter can transport a fully assem bled tower, in heights to 75 feet, where stations are inaccessible to ground vehicles.
A 50-foot tower can be erected by two experienced men in about 2 hours, using a hand winch and raising boom. Normally it is raised, lowered, and transported fully assembled. In the raising operation, the tower pivots about two lower feet. An imaginary line pass ing through these two points is called the hinge axis. Two lateral cables are attached to the top of the tower and fastened to anchors on opposite sides of the tower along the hinge axis. The raising boom is posi tioned vertically over the base of the tower. The boom is guyed to the same two anchors that hold the tower in lateral position, to restrain the tower and boom from side movement, but allow them to rotate about the hinge axis. The raising cable is attached to the top of the tower and passed over the raising boom to a winch anchored approximately 50 feet be yond the tower base. As the cable is winched in, the tower rises in an arc about its hinge axis. The proc ess is reversed in lowering the tower.
When in position over a station, the tower is leveled with adjustable foot screws which rest on foot plates. The outer structure is guyed with aircraft cables fas tened to screw-in type earth anchors or natural objects such as trees. The inner unit is held to the ground with earth anchors and a cable sling.
A tower may be mounted on a truck for reconnais sance (fig. 217.2). A 50-foot section of tower rests horizontally above the cab and bed and is erected at the rear of the truck by a hand winch and cable sys tem. Lateral outriggers are extended to stabilize the truck and tower before erection. With this system, one man can erect the tower in 15 minutes. Height is limited more by the truck's ability to traverse woods roads than by strength of the tower. Because of the ease and rapidity with which it can be erected, truck- mounted towers are being designed to be erected in heights up to 70 feet.

E132 GEOLOGICAL SURVEY RESEARCH 1962
FIGUEE 217.2. Fifty-foot tower mounted on a truck.
FIGTJEE 217.1. Assembled tower, showing inner and outer tower; trailer unit is attached.
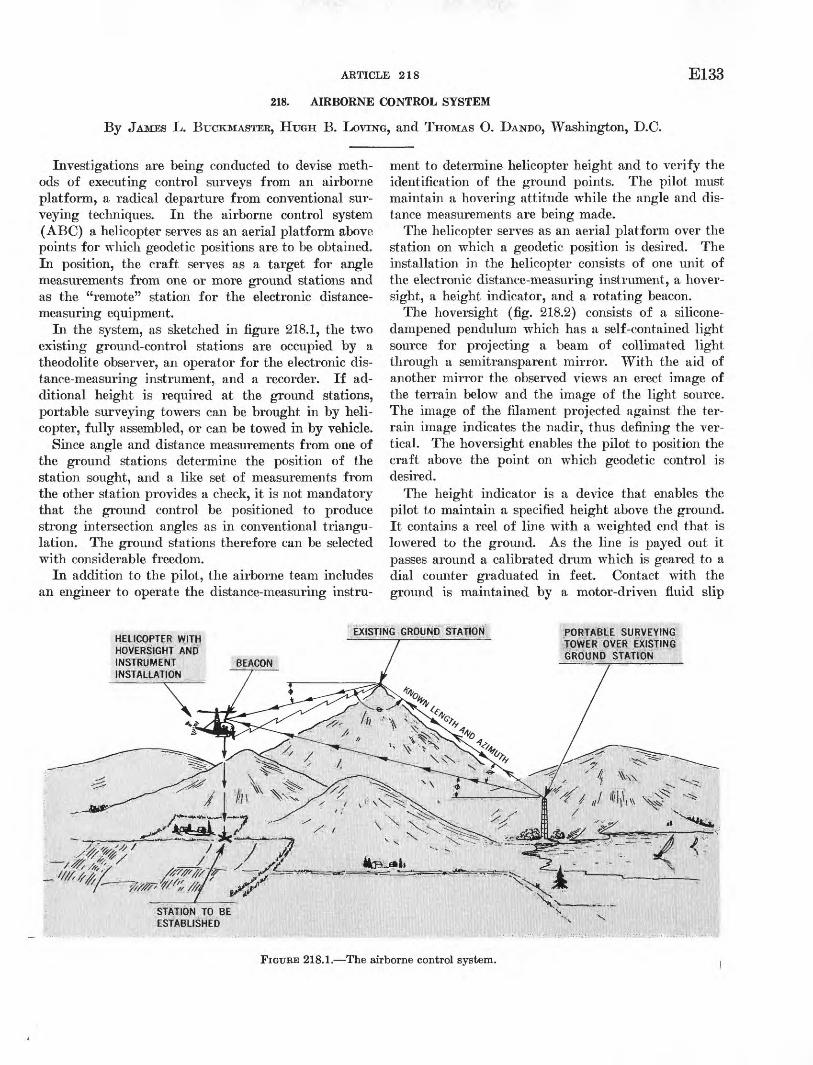
ARTICLE 218
218. AIRBORNE CONTROL SYSTEM
By JAMES L. BUCKMASTER, HUGH B. LOVING, and THOMAS O. DANDO, Washington, D.C.
E133
Investigations are being conducted to devise meth ods of executing control surveys from an airborne platform, a radical departure from conventional sur veying techniques. In the airborne control system (ABC) a helicopter serves as an aerial platform above points for which geodetic positions are to be obtained. In position, the craft serves as a target for angle measurements from one or more ground stations and as the "remote" station for the electronic distance- measuring equipment.
In the system, as sketched in figure 218.1, the two existing ground-control stations are occupied by a theodolite observer, an operator for the electronic dis tance-measuring instrument, and a recorder. If ad ditional height is required at the ground stations, portable surveying towers can be brought in by heli copter, fully assembled, or can be towed in by vehicle.
Since angle and distance measurements from one of the ground stations determine the position of the station sought, and a like set of measurements from the other station provides a check, it is not mandatory that the ground control be positioned to produce strong intersection angles as in conventional triangu- lation. The ground stations therefore can be selected with considerable freedom.
In addition to the pilot, the airborne team includes an engineer to operate the distance-measuring instru
ment to determine helicopter height and to verify the identification of the ground points. The pilot must maintain a hovering attitude while the angle and dis tance measurements are being made.
The helicopter serves as an aerial platform over the station on which a geodetic position is desired. The installation in the helicopter consists of one unit of the electronic distance-measuring instrument, a hover- sight, a height indicator, and a rotating beacon.
The hoversight (fig. 218.2) consists of a silicone- dampened pendulum which has a self-contained light source for projecting a beam of collimated light through a semitransparent mirror. With the aid of another mirror the observed views an erect image of the terrain below and the image of the light source. The image of the filament projected against the ter rain image indicates the nadir, thus defining the ver tical. The hoversight enables the pilot to position the craft above the point on which geodetic control is desired.
The height indicator is a device that enables the pilot to maintain a specified height above the ground. It contains a reel of line with a weighted end that is lowered to the ground. As the line is payed out it passes around a calibrated drum which is geared to a dial counter graduated in feet. Contact with the ground is maintained by a motor-driven fluid slip
FIGURE 218.1. The airborne control system.

E134 GEOLOGICAL SURVEY RESEARCH 1962
FRONT-SURFACE MIRROR
TO NADIR
COLLIMATOR
FIGURE 218.2. Diagram of hoversight.
clutch attached to the reel. Static tests show the unit to be accurate within 0.1 foot in 35 feet.
The rotating beacon is mounted on the exterior of the helicopter cabin on the vertical axis of the hover- sight. It is the target on which angles are observed from the ground stations. Theodolites are used at both ground stations for the observation of both ver tical and horizontal angles.
Measurement procedures are started and stopped by the engineer in the helicopter. Gusty winds may cause the craft to wander from the point, making it necessary to disrupt the measurements until the pilot regains his position.
Current practice is to turn 6 direct and 6 reverse horizontal angles, and 1 to 4 sets of vertical angles. Generally, as much time is required for the distance determination as is required for turning angles.
The number of vertical angles required depends on their intended use. If the vertical angles are to be used for slope reductions alone, one set will suffice (no special effort is made to hold the craft at a fixed height) and these can be measured at the same time the horizontal angles are turned. Vertical angles for supplemental control elevations must be more precise; consequently, they are repeated more times and read as an independent function while the craft is being held at a known height.
For each distance determination the operator per forms a full measuring sequence consisting of an initial coarse reading, repeated fine readings, and a final coarse reading. The mean fine readings are used for refining the distance. Meteorological data are taken at the ground and air stations; on the basis of these data a correction for the index of refraction is made, to the distance.
Limitations of the present installation prevent mak ing simultaneous distance determinations to the ground stations; consequently, one ground crew makes both distance and angle determinations while the other measures only angles. Upon completion of this set of measurements, the procedure is reversed.
Different combinations of angles and distances af ford alternate methods of position computations such as triangulation, trilateration, or a combination of the two. The choice of computing methods and the num ber and kinds of observations made depend on the de sired accuracy and the check requirements. Where an unchecked position will suffice, angles and distances need be measured from only one station, and a hovering period of about 6 minutes over the point is ample time to produce results equivalent to those from a spur traverse-line location or a strong intersected point.
Three separate tests have been conducted wherein existing second-order triangulation was repositioned using the ABC system. A comparison of the results of the last ABC measurements with the triangulated control is shown in the table below. As indicated in
Comparison of ABC tests with triangulation
[Tests made Sept. 16-18,1961]
Remote helicopterstation, using
hoversight
Hoverheight(feet)
Triangulated
geodeticdistance(meters)
Uncertainty ofcontrol l(meters)
Geodeticdistancebased on
ABC(meters)
Difference ingeodeticdistance(meters)
Proportionaldifference 2
Ground station Krech
Gibbs
Culvers Gap (RM2)..._
Normanock LOT .
70180
7572
30122 50
9922. 385637.946714. 94
14704. 39
20615. 9323009. 74 27659. 01
±0.50±.28±.34±.74
±1.03±1.15 ±1.38
9922. 635638. 066714. 45
14703. 60
20615. 3223008. 55 27658. 76
+0.25
+ 19
-.49-.79
-.61
-1.19 -.25
1:39,6891:46,9831:13,7041:18,613
1:33,7951:19,336
1:110,636
Ground station Andover eccentric tower
Gibbs
Culvers Gap (RM2). .... .
Normanock LOT...
42625562
7082 50
7705. 5112101. 767048. 45
15212. 96
21048.8722418. 68 25803. 44
±0.38±.60±.35±.76
±1.05±1.12 ±1.29
7705. 3612101. 86.7048. 3115212. 23
21048. 5222417. 82 25801. 72
-0.15+.10-.14-.73
-.35
-.86 -1.72
1:51,3701:121,0171:50,3461:20,840
1:60,1401:26,068 1:15,002
1 Based on 1:20,000 accuracy.2 Based on triangulated geodetic distance.
the last column, only four ABC measurements differ from the triangulated distances by more than 1:20,000. Three of these lines were measured in earlier tests of the ABC system. The distances obtained in the earlier

ARTICLE 218 E135
tests agree with the distances obtained in the last test to at least 1:50,000; accordingly there is no reason to doubt that second-order triangulation is sufficiently accurate to be used as a comparative standard. An additional test is scheduled using a more accurate control net.
In the ABC system, accuracy is largely a function of hover height and the number of observations. Accuracy falls off almost linearly with increasing
hover height. At present, a 200-foot hover height seems to be a practical limit, but tests are being con ducted to develop a device which will greatly increase the practical hover height. The system shows much promise as a practical method of extending basic horizontal and mapping control. In its present state it should be competitive with conventional methods and should afford substantial savings in areas of limited access.

E136 GEOLOGICAL SURVEY RESEARCH 1962
HYDROLOGIC STUDIES
ENGINEERING HYDROLOGY
219. EFFECTS OF MAJOR WATER-TABLE CHANGES IN KINGS AND QUEENS COUNTIES, NEW YORK CITY
By N. M. PERLMUTTER and JULIAN SOREN, Mineola, N.Y.
Work done in cooperation with New York State Water Resources Commission
Kings and Queens Counties, 2 of New York City's 5 political subdivisions, occupy about 189 square miles of western Long Island (fig. 219.1). Consumption of water in 1961 by the 4.5 million residents and by in dustry totalled about 640 mgd (million gallons per day), of which 93 mgd was pumped from local wells (see table) and the remainder was imported from surface reservoirs owned by the city of New York. Public supplies in Kings County and in northern and southern Queens County are entirely imported from surface sources. However, two private companies sup ply ground water to about 740,000 people in central Queens, and about 800 industrial and commercial wells provide water for cooling and air conditioning in both counties.
The ground-water reservoir ranges in thickness from about 50 to 800 feet and consists of a shallow uncon- fined aquifer and two deep confined (artesian) aqui fers. The shallow aquifer is composed of outwasli de posits of Pleistocene age, and the confined aquifers are
Ground-water pumpage, in millions of gallons per day, in 1961 '
County
Kings ______Queens _ ___ _
Total__ __ __________
Public supply
053. 9
53. 9
Industrial and com mercial
22. 516. 9
39.4
Gross
22. 570. 8
93. 3
Nets
9. 161.0
70. 1
1 Data from New York State Water Resources Commission.2 Net pumpage equals gross pumpage minus amount returned through diffusion
(recharge) wells.
partly deposits of Pleistocene age and partly deposits of Late Cretaceous age. Crystalline bedrock of Pre- cambrian (?) age forms the lower boundary of the zone of saturation. The aquifers are separated by leaky and discontinuous beds of silt, sandy clay, and clay; hence, they are poorly to well connected hy- draulically. Salt water, which surrounds the area on
three sides, has invaded all the beds at the shoreline, and in some places has moved inland as much as 3 miles (Lusczynski, 1952, fig. 2; Perlmutter and others, 1959, fig. 4).
This article is concerned with fluctuations of the water table in the unconfined aquifer in the upper 50 to 150 feet of the zone of saturation. Maps of the water table have been published by Veatch and others (1906), Suter (1937), Jacob (3945), Lusczynski and Johnson (1951), and Lusczynski (1952). The latest map (as of 1961) is shown in figure IB.
In 1903, Kings and Queens Counties were supplied with ground water by about a dozen private water companies, numerous wells and ponds owned'by the city of New York, and some domestic and industrial wells. Most of the water used was discharged to tidewater through public sewers, but in less urbanized sections much of the water was returned to the shallow aquifer through cesspools and septic tanks. Figures 219.L4. and C, and D show contours and profiles of the water table in 1903 under conditions which may reflect some pumping but which are as close to natural as can be depicted from early data. The highest altitudes of the water table were about 20 feet in northeastern Kings County and about 60 feet in north eastern Queens County. Most of the ground water discharged north and northwest into the East River and south and southeast into Jamaica Bay and the Atlantic Ocean. The aquifers contained mostly fresh water in 1903, except in some places near the shore where salt water was present naturally or had moved toward wells near the shore.
By 1933, nearly all the ground water used for pub lic supply and a considerable amount of self-supplied industrial pumpage was wasted to sewers; a deep extensive cone of depression had developed on the water table; and some public-supply wells in Flatbush, in central Kings County, had been contaminated by sea-water encroachment. These conditions, and the increasing use of ground water for air-conditioning,

74°
00'
73
"45
'74°
00'
40
° 37
' 3
0"
73
°45
'
Woo
dhav
en
, Lan
d su
rfac
e Ja
mai
ca
^__ 1
903 _
FIG
UR
E 219.1
. C
onto
urs
of
the
wat
er t
able
in
Kin
gs a
nd Q
ueen
s C
ount
ies,
Lon
g Is
land
, N
.Y.,
in
1903
(A
) an
d 19
61
(B),
and
pro
file
s of
the
wat
er t
able
in
Kin
gs
Cou
nty
(C)
and
Que
ens
Cou
nty
(D).
A
ltit
ude
of l
and
surf
ace
and
wat
er l
evel
s in
fee
t re
ferr
ed t
o m
ean
sea
leve
l; c
onto
ur i
nter
vals
1 a
nd 5
fee
t. C
onto
urs
in 1
903
afte
r W
iggi
n in
Sut
er (
1937
).
Sti
pple
d ar
ea i
s sa
lty
wat
er.
CO M

E138 GEOLOGICAL SURVEY RESEARCH 1962
resulted in the passage of legislation that required the approval of the New York State Water Resources Commission for the drilling of all wells, except agri cultural, yielding more than 70 gpm (gallons per minute). Under this legislation and its amendments, the commission generally ruled that water pumped at rates in excess of 70 gpm (45 gpm since 1954) for air-conditioning and cooling must be returned to the source aquifer.
By 1936, despite conservation measures, the water table had declined to a record low and was below sea level in a large cone of depression which included most of Kings County and the adjoining part of southwestern Queens County (Suter, 1937, fig. 26). The deepest point in the cone was about 35 feet below sea level in the Williamsburg section of northern Kings County (fig. 219.W). The depression of the water table in Kings resulted in a decrease in the rate of downward leakage to the deep confined aquifers and in an increase in ground-water underflow from Queens. From computations based on the volume of the cone of depression and an estimated specific yield of 25 percent for the glacial-outwash deposits, it is calcu lated that at least 49 billion gallons of fresh water was removed from storage in the shallow aquifer in Kings County between 1903 and 1936. Probably two or three times that amount had been "mined," as nearly all the fresh water in the shallow aquifer had been replaced or contaminated by sea water. The decline of the water table was due to excessive pumping from both shallow and deep aquifers, to wasting to sewers of all water from public-supply and some industrial wells, and to a substantial decrease in natural recharge owing to extensive paving of streets and building construction.
In June 1947 the wells of a private water company, which had supplied as much as 27 mgd in central Kings County, were shut down as a result of con demnation proceedings by the city of New York, and a sharp rise of the water table began. Between 1947 and 1950, the ground water in storage in the water- table aquifer increased by about 20 billion gallons (Lusczynski, 1952, p. 10). However, a significant part of this increment probably consisted of salt water that continued to move toward the center of the cone of depression after the cessation of pumping. By De cember 1961 the water table in northern Kings County had recovered as much as 40 feet, and it was above sea level in most of the county except for a small area in the northern part (fig. 219.15). It is estimated
that a net gain in storage of about 18 billion gallons was made between 1950 and 1961.
The recovery of the water table created seepage problems in parts of the subway system and in inade quately waterproofed basements in buildings con structed during the period of low water table. Seep age at several subway stations in Flatbush increased from less than 20 gpm in 1947 to as much as 1,000 gpm in 1961, according to records of the New York City Transit Authority. The use of diffusion wells to return used water from air-conditioning systems has been discontinued in some places where local recharge mounds on the rising water table have reached base ment levels. The principal remedy used to date to overcome local seepage problems has been the opera tion of sump pumps that discharge the water into public sewers. Other remedies such as tile fields and rings of dewatering wells generally have been re garded as too costly to install and maintain.
Hydraulic gradients have been reversed in most of Brooklyn from landward to the normal seaward di rection, and a slow flushing of salt water from the aquifers is in progress. However, salty water con taining several hundred to as much as 14,000 ppm (parts per million) of chloride still occupies parts of the unconfined aquifer in shoreline areas, and water containing as much as several thousand parts per million of chloride occurs in the confined aquifers be neath Flatbush despite the 15-year shutdown of the public-supply wells and the increased rate of recharge resulting from the rise of the water table.
In contrast, the water table in most of Queens County declined during the period 1950-61, and the cone of depression noted as early as 1933 was greatly enlarged. In 1961, water levels in the center of the cone in the Woodhaven-Jamaica area were about 15 feet below sea level. Comparison of figures 219.L4 and B suggests that the water table has declined as much as 20 feet since 1903 along the central part of the Queens-Nassau boundary. It is estimated that underflow from Nassau to Queens increased from a negligible amount in 1903 to about 10 to 13 mgd in 1961. Underflow from Queens to Kings was reduced from a substantial amount in 1935 to a negligible quantity in 1961. Some ground water now flows from Kings County toward the Woodhaven area in Queens County (fig. 219.15). Calculations based on the net decline of the water table and a specific yield of 25 percent indicate that about 51 billion gallons of fresh water was removed from storage in the water-table aquifer in Queens County between 1903 and 1961.

ARTICLE 219 E139
A continued slow rise of the water table in Kings County may result in the eventual filling of the small residual cone of depression in the northern part of the county. An increase of about 11 billion gallons of ground water in storage in the shallow aquifer and an additional 2 to 10 feet of recovery would be re quired to restore the water table to its 1903 level. Because of changes in hydrologic conditions, the 1903 level may never be restored, and full restoration would not be desirable in any case.
The original average rate of natural recharge of 1 mgd per square mile probably has been reduced to about 0.25 to 0.5 mgd per square mile because of building construction, paving, and sewering. Ee- charge with fresh water and rising water levels have resulted in some flushing of salt water from the aquifers, but another 30 to 40 years may be required to flush out the remaining salt water that intruded the aquifers. Some deepening of the water-table de pression in Queens County may be anticipated. Sea water will continue to move landward so long as the depression is below sea level.
The aquifers in Kings and Queens Counties consti tute a valuable emergency source of water for civil defense. Probably 20 mgd of fresh water could be pumped in Kings and 60 mgd in Queens for many years. Larger amounts could be pumped temporarily in both counties for periods of several months to a year without serious damage. However, continued
pumping at much higher rates would result in even tual deterioration of the quality of most of the water owing to sea-water encroachment.
The case histories of overdevelopment in Kings and Queens Counties and the cost in terms of declining water levels and deterioration in water quality are lessons that should be heeded in planning large-scale development of water supplies in Nassau and Suffolk Counties on Long Island and in other coastal areas where similar hydrologic conditions prevail.
REFERENCES
Jacob, C. E., 1945, The water table in the western and central parts of Long Island, New York: N.Y. State Water Power and Control Comm. Bull. GW-12.
Lusczynski, N. J., 1952, The recovery of ground-water levels in Brooklyn, New York, from 1947 to 1950: U.S. Geol. Survey Circ. 167.
Lusczynski, N. J., and Johnson, A. H., 1951, The water table in Long Island, N.Y., in January 1951: New York State Water Power and Control Comm. Bull. GW-27.
Perlmutter, N. M., Geraghty, J. J., and Upson, J. E., 1959, The relation between fresh and salty ground water in southern Nassau and southeastern Queens Counties, Long Island, New York: Econ. Geology, v. 54, p. 416-435.
Suter, Russell, 1937, Engineering report on the water supplies of Long Island: New York State Water Power and Con trol Comm. Bull. GW-2.
Veatch, A. C., Slichter, C. S., Bowman, Isaiah, Crosby, W. O., and Horton, R. E., 1906, Underground water resources of Long Island, New York: U.S. Geol. Survey Prof. Paper-44.

E140
220.
GEOLOGICAL SURVEY RESEARCH 1962
INFILTRATION RATES IN WEATHERED CRYSTALLINE ROCKS AT THE GEORGIA NUCLEAR LABORATORY,DAWSON COUNTY, GEORGIA
By J. W. STEWART, Atlanta, Ga.
Work done in cooperation with the U.S. Atomic Energy Commission and the U.S. Air Force
The rate at which water infiltrates the weathered crystalline rocks at the Georgia Nuclear Laboratory was determined at 2 waste-disposal pits by means of 18- and 24-inch single-ring infiltrometers. The rings were driven into the saprolite to a depth of 6 inches, and a constant water depth of 6 inches was maintained in each ring. A total of 8 tests were made at 6 loca tions in the REL (Radiation Effects Laboratory) disposal pit, and a test was made at each of 3 loca tions in REF (Radiation Effects Facility) disposal pit 2. Of the 11 tests, 6 were made with 24-inch rings and 5 were made with 18-inch rings. With the exception of 1 test, the results obtained with the 24- inch ring were consistently higher than those obtained with the 18-inch ring.
Both disposal pits were constructed in saprolite and average about 4 to 5 feet in depth. The pits are trapezoidal in profile and the slope of the sides is 3:5. The bottom dimensions of the REL pit are 60 by 25 feet and those of REF pit 2 are 50 by 15 feet.
The REL pit is near the top of a small ridge in the southeastern corner of the Georgia Nuclear Lab oratory about 1.1 miles southeast of REF pit 2. The altitude of the land surface at the pit is about 1,112 feet above mean sea level. Quartz-mica schist, garnet- biotite schist, and amphibolite schist underlie the pit, and a small pegmatite dike is exposed in the north corner of the pit. The rocks are deeply weathered; in a test well near the edge of the pit the saprolite is about 135 feet thick, or about 2y2 times thicker than that at REF pit 2. The foliation strikes northeast and dips about 73° SE.
REF pit 2 is on the top of the highest hill in the north-central part of the Georgia Nuclear Laboratory. The topographic relief in the vicinity of this pit is about 200 to 300 feet, and the altitude of the land surface at the pit is 1,245 feet, or about 133 feet higher than at the REL pit. REF pit 2 is underlain by quartz-biotite schist, biotite-garnet schist, and gar- net-biotite-plagioclase schist. The saprolite at this pit is about 55 feet thick but thins rapidly in all directions; at distances of 50 feet both northwest and northeast of the pit, it is about 12 to 15 feet thick. The foliation strikes northeast and dips about 68° SE.
In the REL pit the material tested was largely clay and silt, mica-quartz-garnet schist saprolite, and
kaolinized feldspar; in REF pit 2 the material was biotite-garnet schist saprolite and biotite schist sapro lite. (See fig. 220.1.) Although jointing was evident at all but one of the test locations, the joints were filled and apparently did not affect the infiltration rate. The infiltration rate for the 8 tests in the REL pit ranged from 0.06 to 1.24 in. per hr. (inches per hour), and for the 3 tests in REF pit 2 ranged from 0.96 to 1.94 in. per hr. The greatest infiltration rate was ob tained for biotite-garnet schist saprolite in REF pit 2 (location 18-4), and the smallest infiltration rate was obtained for mica-quartz-garnet schist saprolite and kaolinized feldspar in the REL pit (locations 18-1 and 18-2).
Throughout the REL pit the saprolite is mantled by a layer of silt and clay that ranges in thickness from 11/2 to 4 inches. However, the permeability of the silt and clay proved not to be the major factor controlling infiltration into the saprolite inasmuch as the greatest infiltration rate was determined where the layer of silt and clay is thickest. The greatest infiltration rate (1.24 in. per hr.) was obtained at location 24-3. Although the material tested at this location consists partly of mica-quartz-garnet schist saprolite similar to that at the location of all the other tests in the same pit, it also consists partly of granite- gneiss saprolite, a material not present at the other locations. In general, saprolite derived from granite- gneiss contains less clay and is more permeable than saprolite derived from biotite schist or mica-quartz- garnet schist. Wells drilled in granite-gneiss saprolite commonly yield ample supplies of water for domestic and small industrial uses.
In REF pit 2, the greatest infiltration rate (1.94 in. per hr.) was obtained at location 18-4, where the tested material consisted entirely of biotite-ganiet schist saprolite. The saprolite at location 24^t was similar to that at location 18^t except that the sap rolite contains zones of secondary limonite cementa tion, micaceous fracture coatings, and weathered bio tite schist. The weathered biotite schist 'comprises about 15 percent of the total material tested at loca tion 24^t. The infiltration rate there was 1.09 in. per hr., or considerably less than the rate obtained for the biotite-garnet schist saprolite at location 18^L At location 24-5, where about 50 percent of the sap-

ARTICLE 220 E141
18-1
18-2
18-3
24-3
REL DISPOSAL PIT
7//Z
18-4
24-4
24-5
REF DISPOSAL PIT 2
EXPLANATION
Kaolmized feldspar concentration
Dark micaceous fracture coatings
Biotite-garnet schist saprohte Quartz veins
Secondary limonite cementation
Geology by C. W. Sever, Jr., 1958
FIGURE 220.1. Geologic sections in infiltrometer rings, Georgia Nuclear Laboratory.and 6 inches deep.
The rings are 18 and 24 inches in diameter
667422 O - 63 - 11

E142 GEOLOGICAL SURVEY RESEARCH 1962
rolite consists of weathered biotite schist, the infiltra tion rate was 0.96 in. per hr. the smallest rate ob tained in BEF pit 2. It appears, therefore, that the percentage of weathered biotite schist in the saprolite was the principal factor controlling infiltration of water at the different locations.
Four of the eight tests in the EEL pit were made when the soil was dry, no rain having fallen for 4 to 6 days preceding the tests or during the tests. The other 4 tests were made when the soil was wet to moder ately wet owing to rain for a 1- to 11-day period before the tests were begun and also during the tests.
Tests were made under two different conditions of soil moisture at locations 24-2 and 18-2 in the KEL pit. One of the tests at location 24-2 was made when the soil was dry and the weather was hot and humid; the average infiltration rate was 0.49 in. per hr. Dur ing the 23-hour period of the test, the air temperature ranged from 68°F to 90°F and the water temperature ranged from 70°F to 82°F. Although the changes in air and water temperature seemed to produce erratic changes in the infiltration rate, the effect was minor. Evaporation loss was minimized by covering the 24- inch ring with an aluminum plate and canvas. The other test at location 24 2 lasted 59 hours and was made when the saprolite was wet owing to 11 consecu
tive days of rain (total rainfall 7.15 in.) preceding the test. The average infiltration rate was 0.46 in. per hr., or nearly the same as the rate obtained for the earlier test when the saprolite was initially dry. The two tests at location 18-2 were made with an 18-inch ring under conditions similar to- those made at location 24-2. The average infiltration rate was 0.06 in. per hr. during each of the tests at location 18-2.
All the tests in REF pit 2 were made when the saprolite was wet owing to heavy rains before and during the tests. As a result, the effect of rain on the infiltration rate could not be determined.
The widely differing infiltration rates were due largely to the differences in mineral composition of the saprolite, to the condition of the saprolite (dry or saturated) before and during the test periods, and possibly to the use of rings of different size. Other factors which probably affected the infiltration rates to a lesser degree were the presence or absence of quartz veins, differences in the thickness of the clay and silt cover, and changes in the temperature of the air and water.
Because a large volume of material was tested, the results obtained with the 24-inch ring infiltrometer probably are more representative of the actual infil tration rate of the saprolite.
221. EVAPOTRANSPIRATION AND THE RELATION OF GROUND WATER TO SURFACE WATER IN THE PONDCREEK BASIN, OKLAHOMA
By WILLIAM E. CLARK, Gainesville, Fla.
If a water-table aquifer discharges into a stream, the flow of that stream during periods of no overland runoff is related to the stage of the water level in the aquifer. However, the relation between dry-weather streamflow and water-level fluctuations in wells is not direct because variations in the rate of evapotranspira- tion cause differences in the amount of water meas ured as streamflow. To establish the relation between the dry-weather streamflow and ground-water levels in the Pond Creek basin, Oklahoma, an analysis was made of pertinent data for the period 1951-57. A preliminary analysis of hydrologic data for this basin was made by the author (Clark, 1956).
The Pond Creek basin is in west-central Oklahoma. The drainage from an area of 319 square miles is measured at the Geological Survey gaging station on Pond Creek near Fort Cobb, Caddo County. About 500 feet from the creek at a point about 3.5 miles up stream from the gaging station is an observation well, referred to in this article as well 46. The position of the water level in this well is considered to be a reli able index to the general ground-water level in the part of the aquifer adjoining Pond Creek because it varies linearly with the average water-level position in 16 other wells near the creek. To take into ac count the varying effect of evapotranspiration on the

ARTICLE 221 E143
A/\/V V \/\
FIGURE 221.1. Diagram showing the relation of the dry-weather flow of Pond Creek to the weather index and depthto water in well 46.

E144 GEOLOGICAL SURVEY RESEARCH 1962
dry-weather flow of Pond Creek, a weather index was computed for given dates in the period 1951-57. The weather index for each given date was derived by averaging the maximum air temperature, in degrees Fahrenheit above freezing, for that date and the pre ceding 9 days, and multiplying the average thus ob tained by the number of daylight hours on that date. The results of a correlation of the dry-weather flow of Pond Creek with the depth to water in well 46 and the weather index are shown by the diagram in figure 221.1. As would be expected, the relation be tween dry-weather flow and the depth to water is linear when the weather index is constant. From the diagram, the dry-weather flow of Pond Creek can be determined for various combinations of the weather index and the depth to water in well 46.
The weather index indicates chiefly the effects of weather on the evapotranspiration of ground water, but also includes the effects of weather on the evapo ration of water from the surface of the creek.' When the weather index is less than 280 degree-hours, there is little or no decrease in streamflow due to evapotran spiration. A weather index of about 280 ordinarily occurs when the average daily high temperature is about 60°F. When the weather index exceeds about 280, the dry-weather flow, for a constant stage of the ground-water level, decreases with an increase in the
weather index. The tendency of the curve to flatten for larger values of the weather index indicates that there is a maximum rate at which phreatophytes tran spire ground water.
The effect of evapotranspiration on the dry-weather flow of Pond Creek can be derived from the diagram in figure 221.1 as follows: First, determine the dry- weather flow corresponding to the stage of the water level in well 46 and to a weather index of less than 280 degree-hours. Then, determine the dry-weather flow corresponding to the stage of the water level and to the actual weather index. The difference be tween these dry-weather flows is the decrease in streamflow due to evapotranspiration for the particu lar combination of water level and weather.
The amount of the decrease in streamflow due to evapotranspiration varies not only with the weather index but also with the stage of the ground-water level. As may be determined from the diagram, if the weather index is 1,000 degree-hours, the decrease in streamflow due to evapotranspiration of ground water is 20 cfs (cubic feet per second) when the depth to water in well 46 is 13 feet and is 12 cfs when the depth to water is 17 feet. Thus, a 4-foot decline of the water level in well 46 reduces the ef fect of evapotranspiration on the streamflow by about 40 percent.
1000 pr
100
1953 1954
FIGURE 221.2.- -Comparison of measured streamflow of Pond Creek a'nd the dry-weather flow as determined by the weather indexand depth to water in well 46.

ARTICLE 222 E145
Evapotranspiration accounts for a large percentage of the variation in the dry-weather flow of Pond Creek. For example, when the depth to water in well 46 is 15 feet and the weather index is 1,000 degree- hours, the dry-weather flow is about 11 cfs, a reduc tion of about 16 cfs, or 60 percent, due to evapo- transpiration.
The dry-weather flow as determined from the dia gram and the measured streamflow for the 1954 water year are shown graphically in figure 221.2. During periods of no overland runoff, the dry-weather flow as determined from the diagram and the measured streamflow generally agree closely. However, when
the measured streamflow consisted partly of overland runoff, the dry-weather flow as determined from the diagram represents the potential dry-weather flow, or the flow that the stream would have had if there had been no overland runoff. Some periods, such as July and August, when actual streamflow was slightly less than dry-weather flow determined from the diagram, indicate that other factors may at times be significant.
REFERENCE
Clark, W. E., 1956, Forecasting the dry-weather flow of Pond Creek, Oklahoma; a progress report: Am. Geophys. Union Trans., v. 37, no. 4, p. 442-450.
222. ESTIMATING THE SPECIFIC CAPACITY OF A WELL
By A. N. TURCAN, JR., Baton Rouge, La.
Work done in cooperation with Louisiana Department of Public Works and, Department of Conservation,Louisiana Geological Survey
Although equations and theories regarding the hy draulic properties of an aquifer and the water-pro ducing ability of wells have been derived and discussed byTheis (1935), Muskat (1937), Jacob (1945), Ahrens (1958), and Todd (1959), the performance of a well cannot be predicted readily by the direct application of any one formula. The intent of this article is to present some of the equations, together with simple examples, which aid in predicting the specific capac ity of a 100-percent-efficient well that taps an iso- tropic, homogeneous artesian aquifer of large areal extent. Considered, in order, are the computations of the theoretical specific capacity of a well that is screened opposite the full thickness of the aquifer and of a well that is screened opposite only part of the aquifer. Because all aquifers differ in some respects
from the postulated "ideal" conditions and because few, if any, wells are 100-percent efficient, predictions of well performance can, at best, be only approxi mate.
As used in this article, the terms describing hy draulic properties of an aquifer and the performance of a well are defined as follows: The coefficient of transmissibility (T) of an aquifer is the rate of flow of water, in gallons per day, through a vertical strip of the aquifer 1 foot wide extending the full satu rated height of the aquifer under a unit hydraulic gradient. The coefficient of storage (S) of an aquifer is the volume of water released from or taken into storage per unit surface area of the aquifer per unit change in the component of head normal to that sur-

E146 GEOLOGICAL SURVEY RESEARCH 1962
face. The specific capacity of a well is its yield in gallons per minute per foot of drawdown.
If a well is screened opposite the full thickness of an "ideal" aquifer and if, when the well is pumped, the water level inside the well is the same as that immedi ately outside the well, the specific capacity (I7) of this 100-percent efficient well may be expressed in terms of the Theis nonequilibrium formula (Theis, 1935, p. 520), as follows:
O T U 1 (1)
in which
<?=rate of discharge from the well, in gallons perminute ;
Sw=water-level drawdown in the well, in feet; T is as previously defined; and W(u) is known as "the well function of u."
Values of W(u) corresponding to values of u from 10~ 15 to 9.9 may be obtained from a table presented originally by Wenzel (1942, p. 89) and reproduced by Ferris and others (1962, p. 96-97). The value of u is obtained from
u=-Tt
in which
rw =radius of the pumped well, in feet; £=time since pumping began, in days; and S and T are as previously defined.
The relation of the specific capacity of a 100-percent- efficient well to well diameter and to the hydraulic characteristics of the aquifer is shown by a graph that is based on the Theis nonequilibrium formula and was prepared by Hex K. Meyer (Theis and others, 1954, fig. 2). If the coefficients of transmissibility and stor age for an "ideal" aquifer are known, this graph pro vides a quick and easy method for estimating the specific capacity of the well that has been pumped continuously for 1 day.
The following example illustrates the use of the Theis nonequilibrium formula to estimate the specific capacity of a 100-percent-efficient well that is screened opposite the full aquifer thickness.
Example 1. A water user requires 1,000 gpm (gallons per minute) from a well that has a radius (rw) of 0.5 foot and is screened opposite the full thick ness of an artesian aquifer. The aquifer is 100 feet thick, has a coefficient of transmissibility of 100,000 gpd (gallons per day) per foot, and has a coefficient of storage of 0.001. No nearby pumping will affect the water level in the well. The user desires to know what
the theoretical specific capacity of his well will be at the end of 1 day of continuous pumping.
The value for u is determined, as follows, by sub stituting appropriate values for the unknowns in equation 2 :
^1.87(0.5) 20.001^ U~ 100,000X1 ~
The corresponding value of W(u) is 18.6055, and the theoretical specific capacity of the well at the end of 1 day is computed from equation 1, as follows:
Y= 100,000114.6X18.6055
=47 gpm per foot of drawdown.
In most wells the screen is set opposite only part of the full thickness of the aquifer. Thus, even in an "ideal" aquifer, the flow lines to and into the well are modified and the well's theoretical specific capacity is decreased by a certain percentage. The problem of partial penetration (that is, of wells screened opposite only part of the aquifer) is discussed in detail by Mus- kat (1937), Jacob (1945), and Ahrens (1958). To predict the yield of a well that is screened opposite either the upper or the lower part of an "ideal" aquifer, Jacob (1945) presented the following empirical expres sion of a formula derived by Kozeny (1933):
(3)
in which
Q discharge of a well screened opposite only partof the aquifer;
Q0 = discharge of a well screened opposite the fullthickness of the aquifer;
p=ratio of length of screen to full thickness of theaquifer, expressed as a percentage;
rM,=radius of the pumped well, in feet; and ra=thickness of the aquifer, in feet.
Because equation 3 was derived for steady-state conditions, it is not applicable unless the rate of draw down has become so slow that for all practical purposes steady-state conditions can be assumed to exist. Generally, pumping for 1 day produces such conditions. Even if the well is screened opposite the middle part of the aquifer or is screened opposite two or more different intervals, equation 3 provides results that are satisfactory for most general engineering and design purposes.
The specific capacity of a well that is screened op posite only part of an aquifer (YA) can be expressed in terms of the specific capacity of a well that is screened

ARTICLE 228 E147
opposite the full thickness of the same aquifer (F) by dividing both sides of equation 3 by the drawdown (sw), as follows:
cos 2
1+72pm cos V
For ease of discussion, the quantity in brackets in both equation 3 and equation 4 is referred to as the productivity ratio (PR), a term used by Craft and Hawkins (1959, p. 300) in similar calculations to deter mine the production of oil wells. Thus, equation 4 may be expressed
YA=Y[PR]. (5)
A graph presented by Muskat (1937, fig. 84) has been modified by extension of the curves and changes in nomenclature to provide an easy means for determining the productivity ratio for wells screened opposite different percentages of the full thickness of the aqui fer (fig. 222.1). The productivity factor is a dimension- less term which expresses the relative yield of wells that are screened opposite different percentages of aquifer thickness. The curves in figure 222.1 can be both extrapolated and interpolated with considerable accuracy because, for aquifers more than 50 feet thick, the relation of the productivity factor to aquifer thick ness is almost exactly linear (Muskat, 1937, p. 275).
The successive steps in computing the specific ca pacity of a well that has a radius of 0.25 or 0.5 foot and is screened opposite only part of an isotropic and homogeneous aquifer of known thickness are as fol lows:
1. Using figure 222.1, determine the productivity factor for the well whose specific capacity is to be computed.
2. Using the same illustration, determine the pro ductivity factor for a well that has the same radius, that taps an aquifer of the same thickness, but that is screened opposite the full thickness of the aquifer.
3. Divide the productivity factor determined in step 1 by the productivity factor determined in step 2 to obtain the productivity ratio (PR}.
4. Multiply the productivity ratio by the specific capacity (7) of a 100-percent-efficient well that taps the full thickness of the aquifer. (See equation 5.)
The following example illustrates use of the graph (fig. 222.1).
Example 2. A water user requires 1,000 gpm from a well that has a radius of 0.5 foot and that is
p=ratio of length of screen to full thick ness of aquifer, expressed as a percentage
40 80 120 160 200 240 280 320 360 400
THICKNESS OF AQUIFER, IN FEET
FIGURE 222.1. Relation of aquifer thickness and productivity factor to well radius and percent of aquifer screened (after Muskat, 1937, fig. 84).
screened opposite 50 percent of the full thickness of an artesian aquifer. The aquifer is 100 feet thick, has a coefficient of transmissibility of 100,000 gpd per foot, and has a coefficient of storage of 0.001. No nearby pumping will affect the water level in the well. The user desires to know the specific capacity of his well at the end of 1 day of continuous pumping.
From figure 222.1, the productivity factor for a well that has a radius of 0.5 foot and that is screened opposite 50 percent of the full thickness of an aquifer is 0.95. Also from figure 222.1, the productivity fac tor for a well that has a radius of 0.5 foot and that is screened opposite the full thickness of an aquifer is 1.5. Thus, the productivity ratio (0.95 -=- 1.5) is computed to be 0.63. This value, multiplied by 47 gpm per foot of drawdown (the specific capacity of a well screened opposite the full thickness of the same aquifer), gives 30 gpm per foot of drawdown for the specific capacity of the well screened opposite 50 percent of the aquifer thickness.
E148 GEOLOGICAL SURVEY RESEARCH 1962
REFERENCES
Ahrens, T. P., 1958, Water well engineering: Water Well Jour., v. 12, no. 12, p. 18, 19, 28, 30-32.
Craft, B. C., and Hawking, M. F., 1959, Applied petroleum reservoir engineering: Englewood Cliffs, N.J., Prentice- Hall, Inc., 437 p.
Ferris, J. G., Knowles, D. B., Brown, R. H, and Stallman, R. W., 1962, Theory of aquifer tests: U.S. Geol. Survey Water-Supply Paper 1536-E, p. 69-174.
Jacob, C. E., 1945, Partial penetration of pumping well, ad justments for: U.S. Geol. Survey open-file rept, 7 p., 4 figs.
Kozeny, J., 1933, Theorie und Berechnung der Brunnen: Wasserkraft und Wasserwirtschaft, v. 28, p. 101.
Muskat, Morris, 1937, The flow of homogeneous fluids throughporous media: New York, McGraw-Hill Book Co., Inc.,763 p.
Theis, C. V., 1935, The relation between the lowering of thepiezometric surface and rate and duration of dischargeof a well using ground-water storage: Am. Geophys.Union Trans., pt. 2, p. 519-524.
Theis, C. V., and others, 1954, Estimating transmissibilityfrom specific capacity: U.S. Geol. Survey open-file rept.,lip.
Todd, D. K., 1959, Ground water hydrology: New York, JohnWiley & Sons, Inc., 336 p.
Wenzel, L. K., 1942, Methods of determining permeability ofwater-bearing materials, with special reference to dis-charging-well methods: U.S. Geol. Survey Water-SupplyPaper 887, 192 p.
223. AERIAL OBSERVATION OF ICE COVER TO LOCATE AREAS OF GROUND-WATER INFLOW TO STREAMS
By S. W. WHTALA and T. G. NEWPORT, Lansing and Escanaba, Mich.
Correlation of open-water reaches and measurement of the base flow of streams in the Upper Peninsula of Michigan indicate that the inflow of relatively warm ground water is sufficient to prevent many small streams from freezing over in subfreezing weather. Aerial photography and direct aerial observation can thus be used under favorable conditions as a recon naissance method of mapping areas of ground-water discharge.
The possibility of using aerial observations to de termine areas of ground-water seepage to streams was suggested when open reaches of streams were ob served on a flight over the Upper Peninsula of Michi gan in late January 1962. Streams were at base flow following an extended period of relatively cold weather and were completely ice covered in most areas. Some relatively short reaches were open because of the tur bulence induced by rapids and small waterfalls. Open Avater in other reaches, however, could not be explained by turbulence or by the presence of sewage or other wastes in the streams. These observations led to the hypothesis that the open water in some reaches was caused by the discharge of relatively large quantities of warmer (in winter) ground water into the streams.
To test this hypothesis further, investigations were made in an area near Marquette, Mich. Two low-
altitude flights, on February 20 and on March 15, 1962, were made over the area in a light plane fur nished by the Michigan Department of Conservation. On these flights, observed open reaches of streams were marked on maps and were photographed with a 35-mm camera. On March 17, aerial photographs of the area were taken by the Michigan Air National Guard from an altitude of 13,300 feet. By using a stereoscope, the reaches of open water, even on very small streams, could be defined quite easily and accu rately on the aerial photographs. Later, the observa tions and the photographs obtained on the three flights were correlated with streamflow measurements made on selected streams in the area during a period of base flow in August 1962.
A comparison of the ice conditions observed in Feb ruary and March 1962 on Goose Lake Outlet with base flow on August 16, 1962, is presented on figure 223.1. This stream leaves Goose Lake and flows across an outwash plain composed of sand, gravel, and boulders. Scattered knobs of Precambrian rock pro trude through this sheet of unconsolidated material.
All of the ice cover on Goose Lake Outlet was ob served in a reach where the stream is actually losing water. The open water just downstream from Goose Lake can be attributed to the outflow of lake water,

ARTICLE 223 E149
7 -
i 6o oLJ COo: 5LJ Q_
Area of report
- '/"%
MICHIGAN/^ jn
876543210 DISTANCE ABOVE MOUTH, IN MILES
FIGURE 223.1. Ice-cover observations February and March 1962, in relation to discharge, August 16, 1962, during a period of base flow, Goose Lake Outlet.
which in winter would be somewhat warmer than stream water. The open water between the two fro zen reaches may be caused by rapids and perhaps by slight inflow from a small tributary. The discharge graph is dashed between miles 3.8 and 4.95 because it represents an estimate of the inflow from the small tributary at mile 3.85. Downstream from this tribu tary, the flow increases rapidly in a reach that was open at the time of the winter observations. No other tributaries join Goose Lake Outlet in this reach, but many seeps along both banks noted when the stream- flow measurements were made indicate substantial ground-water discharge.
Similar methods were used to investigate several other streams near Marquette. The results, including those for Goose Lake Outlet, are summarized in the table.
The measured base flows of all streams listed in the table were less than 8 cubic feet per second. The results indicate that in these streams the gain in dis-
Stream
Goose Lake Outlet(below mile 3.8) .
Bear Creek. _ _______
River near Humboldt.
Ice conditions
Open__ ____
_____do______________do________-
Lengthof reach (miles)
2.95
3.903.552. 852. 55
Gain in discharge
per mile of channel
(cubic feet per second)
1. 56
1.571.48.49.42
charge in unfrozen reaches as measured the following summer was about three times greater than that for the reaches that were mostly frozen over.
The investigations described suggest that reaches of open water in small streams during prolonged cold periods may indicate substantial ground-water dis charge to the streams. Extraneous factors such as the turbulence due to steep gradient, the presence of sewage and other wastes, the decomposition of vege tal matter, and perhaps others may also prevent the formation of a complete ice cover on streams. In any particular investigation, these factors must be con sidered.
Winter aerial observations appear to provide a quick, simple, and inexpensive means of identifying areas that should be considered for more intensive in vestigation. The method should be particularly useful in remote and inaccessible areas where other data are not available. It is, of course, adaptable only to rela tively small streams in regions where most of the streams are completely ice covered for long periods. The effect of ground-water inflow upon ice conditions would hardly be noticeable on the larger streams where such inflow is small in relation to the volume of water carried in the stream. In applying the method, flights should be carefully scheduled to co incide with periods of cold weather and base flow, and should not be made soon after a heavy snowfall that may bridge over open areas on small streams.

El 50 GEOLOGICAL SURVEY RESEARCH 1962
GROUND WATER
224. PERMEABILITY OF GLACIAL TILL
By STANLEY E. NORRIS, Columbus, Ohio
Work done in cooperation with the Division of Water of the Ohio Department of Natural Resources and with theMiami Conservancy District
Glacial till controls in varying degree the availabil ity of ground water in thousands of square miles in the northern United States. Where it mantles broad areas of upland, till retards the infiltration of precipi tation to underlying aquifers. Also, in valleys where the water table is hydraulically continuous with a river, a layer of till within the zone of saturation may confine the aquifer below it and greatly limit recharge, by induced infiltration of streamflow, to the confined aquifer.
Despite its hydrologic importance, very few data on the permeability of till have been published. One reason for this lack of permeability determinations is that till is a poor aquifer. No doubt another reason is that many hydrogeologists believe that a perme ability value, or even a range of such values, for till at one place would be meaningless if applied to till in other places. The latter idea may stem from a widespread misconception that till is a more or less random accumulation of drift, ranging widely in its physical properties from place to place and lacking continuity in many of the common lithofacies char acteristics upon which correlation of sediments is based. On the contrary, evidence shows that till in widely separated areas actually is reasonably uniform in permeability and, by inference, in other related properties. Most values of the permeability coeffi cient of till in Ohio are similar to those for till in Illinois and South Dakota (fig. 224.1). This is true for determinations made both in the laboratory and by aquifer tests.
Laboratory determinations of permeability of till are reported for 10 samples from Spink and Hand Counties, east-central South Dakota; 3 from Mont gomery County, southwest Ohio; and 13 from Holmes, Wayne, Medina, and Ashland Counties, northeast Ohio. Field computations of till permeability based on aquifer tests are reported for 5 sites in the Mad River valley, Montgomery County, Ohio, and for 7 sites in southern Illinois. The laboratory tests were made in the Hydrologic Laboratory of the Geological Survey.
i.o
o.i
0.001
0.01
0.0001
Montgomery County, Ohio
FIGURE 224.1. Chart showing range of till permeability in Ohio, Illinois, and South Dakota.

ARTICLE 224 E151
The samples from South Dakota were obtained with a diamond core barrel and hydraulic drill, either from surface exposures or at depths ranging from about 18 to 110 feet. Presumably they represent till of Wis consin age, as do also the Ohio samples.
Four samples of surficial till from Montgomery County, Ohio, were collected by driving thin-walled aluminum cylinders 6 inches in diameter and 6 inches in length into the till, thus cutting an "undisturbed" core. The hardest and most resistant till sampled had a coefficient of permeability of 65 gallons per day per square foot. Because this is an excessively high value, the sample is believed to have cracked before it reached the laboratory. Therefore, the value is not shown on figure 224.1.
Sixteen samples of surficial till were collected in northeastern Ohio also by driving cylinders into the till, but, as the cylinders were smaller 2 inches in diameter and about 2 inches in length sampling was much easier and the resulting cores are believed to have been disturbed less than those collected in the larger cylinders. Nevertheless, 3 of the 16 samples had either shrunk or cracked en route to the labora tory and so were not tested for permeability.
The permeability of till of early Wisconsin age in the Mad River valley at Rohrers Island, near Day ton, Montgomery County, Ohio, was determined by analysis of an aquifer test (Norris, 1959). The till ranges in thickness from about 11 to 50 feet and lies between 2 deposits of water-bearing sand and gravel, of which the upper averages about 65 feet in thickness and the lower about 50 feet. The permeability of the till was determined from its effect on water-level fluc tuations in 5 observation wells whose distance from the pumped well ranged from 510 to about 4,200 feet.
Walton (1960) determined the permeability of till at seven sites in southern Illinois from aquifer tests. At 6 of the" sites the till, which ranges in thickness from 7 to 16 feet, is presumed to be of Illinoian age; at the other site the till is 12 feet thick and is of Wis consin age. The permeability of the till at one site was computed to be 1.6 gallons per day per square foot. As this value is nearly three times as great as the maximum value for the till at the other sites, it is thought not to be representative and so is not shown on figure 224.1.
The permeability values determined by analysis of the aquifer test at Rohrers Island compare closely with those determined in the laboratory for surficial tills from elsewhere in Montgomery County, Ohio. Moreover, the permeability values for till in Illinois are in the same range as those for till in Montgomery County, and although the range of permeability values of the samples collected in northeast Ohio and in South Dakota is relatively large, most values are in the same range as that of the till in southwest Ohio and in Illinois.
The close grouping of most of the permeability val ues suggests that, with judgment, they can be extra polated over large distances and applied with reason able confidence in estimating the rate of percolation through glacial till to underlying aquifers.
REFERENCES
Norris, S. B., 1959, Vertical leakage through till as a source of recharge to a buried-valley aquifer at Dayton, Ohio: Ohio Dept. Nat. Resources, Div. of Water Tech. Rept. 2.
Walton, W. C., 1960, Leaky artesian aquifer conditions in Illinois: Illinois State Water Survey, Dept. Registration and Education Rept. Inv. 39.

E152 GEOLOGICAL SURVEY RESEARCH 1962
225. GROUND WATER IN CENOZOIC FILL IN COLLAPSE STRUCTURES, SOUTHEASTERN EDDY COUNTY,NEW MEXICO
By JAMES B. COOPER, Albuquerque, N. Mex.
Work done in cooperation with the U.S. Atomic Energy Commission
Thick Cenozoic deposits filling a deep depression formed by solution of evaporites from rocks of Per mian age yield large quantities of potable water to wells in southeastern Eddy County, N. Mex. The deposits underlie an area of 150 square miles east of the Pecos River in New Mexico and extend southward into the western part of Texas (fig. 225.1).
Maley and Huffington (1953) described three ex tensive accumulations of Cenozoic fill in the Delaware basin of southeastern New Mexico and western Texas
R.29E. R.30E. TEXAS R.31E.
01234 SMILES I I I I I I
EXPLANATION
NEW MEXICO
Area of report.
Triassic rocks
Permian rocks
Water wellNumeral indicates
number of wells at location
FIGURE 225.1. Map showing subsurface extent of Cenozoic fill and older rocks in southeastern Eddy County, N. Mex. Hachures indicate closed depressions at land surface.
and attributed the formation of the depressions that contain the fill to the removal, by surface and ground water, of great amounts of salt and other evaporites from rocks of Permian age. The depressions pre sumably were formed in late Tertiary time when the evaporite rocks were elevated and partly exposed as a result of an eastward tilting of the Delaware basin. The depression in southeastern Eddy County de scribed here is connected by thin deposits of fill with a larger depression to the south in Texas. Nicholson and Clebsch (1961, p. 46-47) describe similar collapse structures in the adjoining part of southern Lea County to the east.
The Cenozoic fill consists of unconsolidated and semiconsolidated clay, silt, and sand. Probably most of the deposits are of Quaternary age, but in part they may be of late Tertiary age. Maley and Huffing ton (1953, pi. 1) indicate that the fill is more than 1,400 feet thick at its center near the New Mexico-Texas State line, but none of the logs of holes drilled in the New Mexico part of the depression show the fill to be more than 1,000 feet thick. As there are no surface indications of the margins of the collapse depression, the extent of the Cenozoic deposits is shown as ap proximate in figure 225.1. Information from drillers' logs of oils tests and water wells and data on the chemical quality of the ground water were used to determine the approximate extent of the fill. The logs were studied and the water samples were ana lyzed during a detailed investigation of the ground- water resources of the Project Gnome area made by Cooper (1962) on behalf of the U.S. Atomic Energy Commission.
The Cenozoic fill is the only material in southeast ern Eddy County from which large quantities of potable water can be obtained. Although its existence had been known as early as 1952, its potential as an aquifer has been recognized only within the past few years. The bedrock of Permian and Triassic age yields little or no potable water.
The maximum thickness of saturated Cenozoic de posits in the New Mexico part of the depression is about 800 feet. Water is yielded to wells by beds of sand, each as much as 50 feet thick and separated by

ARTICLE 225 E153
somewhat thicker beds of silt of clay. For example, water well 1 that supplies the Pecos turbine station of the El Paso Natural Gas Co. taps four different sand zones. The specific capacity of this well, as
FIGURE 225.2. Chemical quality of ground water in south eastern Eddy County, N. Mex. Sum of calcium plus magnesium in equivalents per million times 50 equals hardness as CaCO3 in parts per million.
determined by pumping the well for 20 hours at about 200 gpm (gallons per minute), was 10 gpm per foot of drawdown. The potential yield of the well is esti mated to be more than 1,000 gpm.
At present, 14 wells ranging in depth from about 300 feet to about 800 feet tap the Cenozoic fill in south eastern Eddy County. Two of the wells, in sec. 5, T. 26 S., E. 30 E., are pumped at more than 100 gpm each to supply water to the Pecos turbine station; all the others are for stock or domestic supplies and are pumped at rates of only a few gallons per minute.
Ground water in the area moves generally south- westward. Although some water percolates into the Cenozoic fill from the Triassic rocks on the east and northeast, the primary source of recharge to the fill probably is local precipitation that infiltrates through large sinkholes and other surface depressions in the central part of the northeast quadrant of the fill area (fig. 225.1). Ground water moves out of the fill into rocks of Permian age where its chemical quality rap idly deteriorates owing to contact with gypsum and saline evaporites.
The chemical quality of the water in the Cenozoic fill is far superior for most uses to the highly saline water normally present in the Permian and Triassic rocks. Figure 225.2 presents chemical analyses of water samples from typical wells tapping each of the indicated aquifers.
The large quantity of water of relatively good chemical quality contained in the Cenozoic fill is a valuable natural resource which has not been utilized fully because the economic development of the region is still in an early stage.
REFERENCES
Cooper, J. B., 1962, Ground-water investigations of the Project Gnome area, Eddy and Lea Counties, N. Mex.: U.S. Geol. Survey TEI 802, open-file rept, 67 p.
Maley, V. C., and Huffington, R. M., 1953, Cenozoic fill and evaporite solution in the Delaware Basin, Texas and New Mexico: Geol. Soc. America Bull., v. 64, no. 5, p. 539-545.
Nicholson, Alexander, Jr., and Clebsch, Alfred, Jr., 1961, Geol ogy and ground-water conditions in southern Lea County, N. Mex.: New Mexico Bur. Mines and Mineral Resources Ground-Water Rept. 6.

El54 GEOLOGICAL SURVEY RESEARCH 1962
226. RELATION OF FRESH WATER TO SALT WATER AT CENTRE ISLAND, NASSAU COUNTY, NEW YORK
By JOHN ISBISTER, Mineola, N.Y.
WorJc done in cooperation with the Nassau County Department of Public WorJcs
Although surrounded on all sides by sea water, Centre Island has ample supplies of fresh water owing to a fortunate combination of geologic and hydro- logic features. Wells yield water of ^excellent quality from a shallow unconfined aquifer and from a deeper confined aquifer. The fresh-water lens in the shallow aquifer floats on salt water and is replenished by in filtration of precipitation on the island. The deep aquifer is effectively sealed off from the overlying salt water by thick, extensive clay strata and is replen ished by infiltration on the main body of Long Island.
Centre Island, in northeastern Nassau County, is slightly more than 2 miles long, ranges in width from about 0.2 to 0.8 mile, and comprises an area of about a square mile (fig. 226.1). Except for a narrow spit which connects it to the mainland, Centre Island is completely surrounded by salt water in Oyster Bay Harbor and Long Island Sound. The long axis of the island is formed by a north-trending ridge of hills, which rises to a maximum altitude of about 100 feet in the southern extremity. Centre Island is nearly breached at its greatest width by a low marshy area that is partly inundated by tidal waters. Glacial till containing large boulders covers most of the irregular land surface. Rocky Point at the north end of the island derives its name from the abundance of boul ders and cobbles that litter the beach.
Centre Island is an incorporated village composed almost entirely of homes and large estates; the popu lation in 1960 was 270 persons (Nassau County Plan ning Commission, 1961, p. 9). Each of the 175 homes on the island has its own well, and wastes are dis posed of through cesspools.
Water levels mentioned in this article are referred to mean sea level at Sandy Hook, N.J., datum. The mean tidal range at Oyster Bay Harbor is about 7.3 feet and the normal range of spring tides is as much as 8.6 feet (U.S. Dept. of Commerce, 1962, p. 214).
Well data from nearby parts of Nassau and Suffolk Counties indicate that the bedrock beneath Centre Island is composed of crystalline rocks of Precam- brian to early Paleozoic age. The bedrock surface slopes southeast and ranges from about 450 feet below sea level at Rocky Point at the north end of the island to 550 feet below sea level at Moses Point at the south end (fig. 226.2). Unconsolidated sediments of Late
Cretaceous and Pleistocene age, ranging in thickness from about 450 to 600 feet, lie on the bedrock. The Upper Cretaceous deposits are divided into two for mations, the Raritan and the Magothy(?). The older, the Raritan Formation, is subdivided into the Lloyd Sand Member and an unnamed clay member. The younger beds of Cretaceous age are tentatively as signed to the Magothy (?) Formation. The Creta ceous deposits are mantled by beds of glacial till and outwash of Wisconsin age referred to informally as upper Pleistocene deposits. A deep buried channel just south of Centre Island indicates that the Creta ceous sediments were eroded to a depth of nearly 550 feet below mean sea level (fig. 226.2). Well data from nearby Cove Neck suggest that the channel filling con sists of beds of the Jameco Gravel, a lower Pleistocene outwash deposit; the Gardiiiers Clay, an interglacial marine deposit; and upper Pleistocene deposits. Re cent deposits form narrow beaches along much of the periphery of the island.
The ground-water reservoir consists of two discrete aquifers: a shallow aquifer, which consists partly of beds of the Magothy (?) Formation and partly of Pleistocene deposits, and a deep confined aquifer, which consists mostly of the Lloyd Sand Member of the Raritan Formation and partly of the Jameco Gravel (fig. 226.2).
The shallow aquifer is composed of beds of sand and gravel and lenses of silt and clay having a total thickness of about 100 to 200 feet. The aquifer con tains water under unconfined or semiconfined condi tions. The water table ranges in altitude from about sea level near the shore to about 4 feet above in the southern part of the island. Recharge is by infiltra tion of local precipitation, which averages about 44 inches annually. Recharge probably ranges from 11 inches (0.5 million gallons per day per square mile) to 22 inches (1.0 mgd per square mile). Discharge from the shallow aquifer is chiefly by evapotranspira- tion and by submarine outflow; the net withdrawal from wells is negligible.
The Lloyd Sand Member, which forms most of the deep confined aquifer, is about 200 feet thick. It con tains water under artesian conditions owing to tight confinement by the overlying clay member and the underlying bedrock. Continuity with the deep con-

ARTICLE 226 E155
CENTRE ISLANDSOUND
,OUG
ATLANTIC25 MILES
FIGURE 226.1. Index map showing location of Centre Island.
fined aquifer of Long Island is maintained beneath Oyster Bay Harbor by hydraulic interconnection through deposits of the Jameco Gravel, which are overlain and confined by the Gardiners Clay (fig. 226.2). The deep aquifer at Centre Island is re charged chiefly by underflow from the south. Dis charge is chiefly by submarine outflow to Long Island Sound. A few wells along the shore flow to waste most of the time, and water pumped for domestic use is returned to the shallow aquifer by cesspools. A survey of the flowing wells in the Centre Island area was made between 1944 and 1949 by H. L. Frauenthal of the Nassau County Department of Public Works.
The shallow aquifer contains a relatively thin lens of fresh water underlain by a larger body of salt water. Wells screened in the shallow aquifer are concentrated in the southern part of the island, where the fresh-water lens is thickest. The fresh-water lens thins to the north to the point where it is inadequate for domestic supply.
The normal range of the tide in Oyster Bay Harbor is from about 4 feet above to 4 feet below sea level. Onshore winds and changes in barometric pressure extend the normal range. Unusually high tides dur ing hurricanes may inundate low-lying areas. Fluc tuations of head in the aquifer and of the tide levels in the surrounding bodies of salt water causes inter mittent movement of salt water into and out of the shallow aquifer, resulting in a wide zone of diffusion. Because of scant data, the contact of fresh water and salt water shown in figure 226.2 is approximate. The chloride content of the water in the shallow aquifer ranges from 8 parts per million in the fresh zone to at least 2,196 ppm in the zone of diffusion, whereas the source of the salty water, Long Island Sound, contains about 15,700 ppm. Slightly higher than normal amounts of chloride in wells tapping the fresh ground water may be caused by water drawn from the zone of diffusion, by a small amount of chloride in the precipitation, by contamination from cesspools, or by a combination of the three. Salt water flooding of the marshy areas also accounts for the presence locally of salty water in the shallow aquifer.
The deep confined aquifer yields fresh water con taining about 3 ppm of chloride. A subbottom depth- recorder survey made in Long Island Sound by Beck- mann and others (1959, p. 749-60) suggests that the buried terminus of the Lloyd is about 1 mile north of Eocky Point. The interface of the fresh and salt water in the deep confined aquifer is therefore probably less than a mile north of the shoreline.

E156 GEOLOGICAL SURVEY RESEARCH 1962
SEA LEVEL
Principal movement of ground water
600
FIGURE 226.2. Generalized geologic section of Centre Island, Nassau County, showing source and occurrence of salty groundwater.
Observed water levels in the deep aquifer have not changed appreciably in the past 10 years, so it is reasonable to assume that the position of the interface has not changed significantly during that period. Two observation wells located just west of Centre Island at Oak Neck Beach and Mill Neck are adequate to monitor any future permanent decline in head that might signify landward movement of the interface.
REFERENCES
Beckmann, Walter C., Roberts, A. C., and Luskin, B., 1959,Sub-bottom depth recorder: Geophysics, v. 24, no. 4,Oct. 1959, p. 749-60.
Nassau County Planning Commission, 1961, Population sixty:Mineola, N.Y., Nassau County Planning Conim., 26 p.
U.S. Dept. of Commerce, Coast and Geodetic Survey, 1962,Tide tables, high and low water predictions: Washington,U.S. Govt. Printing Office, 283 p.

ARTICLE 227 E157
227. HIGHLY PRODUCTIVE AQUIFERS IN THE TACOMA AREA, WASHINGTON
By KENNETH L. WALTERS, Tacoma, Wash.
Work done in cooperation with the State of Washington Department of Conservation, Division of Water Resources
The well field of the city of Tacoma (fig. 227.1) is in an area underlain by glacial aquifers whose per meability may be the greatest of any in the Puget Sound lowland. The dominant physiographic feature of the well field is a channel formed by a stream that discharged from a glacial lake during the latest deglaciation of the Puget Sound lowland. This south-
R. 2E. R. 3 E.
FIGURE 227.1. Map of Tacoma area, showing location of city wells. Contours are in feet above mean sea level.
trending channel, in a part of the city known as South Tacoma, is partly filled with gravel; its surface is at an altitude of about 225 to 300 feet above sea level, about 70 feet lower than the till plain on both sides.
The principal aquifers underlying the well field consist of gravel deposits related to glaciations earlier than the one responsible for the channel. Probably the most important effect that the channel has on the productivity of the well field is that it localizes recharge in an area where till is thin or absent. These aquifers probably underlie a large part of the Tacoma area, but they are known to be of unusually high permeability only in an elongate area occupied in part by the Tacoma well field. The cause of the high permeability at this location is not known, but is probably due to the deposition of coarser or better sorted materials there than were being deposited else where.
The city of Tacoma pumped water from a system of comparatively inefficiently constructed wells in the southern part of the present well field from about 1903 until 1933. The selection of this site was influ enced by the presence of a water pipeline through that area.
More intensive development of the well field was started in 1929 with the drilling of a 310-foot well of modern construction. This well, city well 1-A, was tested at a rate of 3,080 gpm (gallons per minute) with a drawdown of 60 feet, indicating a specific capacity of more than 50 gpm per foot of drawdown. Well 1-A was so productive that the city continued to drill more wells along the course of the channel as the demand for ground water increased. By the end of 1961 the city had 13 public-supply wells in operation along a 3-mile reach of the channel. In addition to these public-supply wells, the city drilled two wells in the north part of the channel for the operation of a heat-pump installation at its utilities building. The 13 public-supply wells have a combined short-term capacity of about 64 million gallons per day. Under conditions of continuous pumping, how ever, the combined daily production is about 51 mil lion gallons; at this pumping rate the drawdown is not considered to be excessive.
Data describing the wells and their performance are presented in table 227.1.

E158 GEOLOGICAL SURVEY RESEARCH 1962
TABLE 227.1. Data on city-owned wells in the Tacoma well field
Well No. (USGS)
20/3-19Pl__-____.__-18D1 ___
-18D2 _ _
-30N1_____ _____
-13H1__ _____-19F1 __________
-13Jl-_____ _
-30L5 -___.__
-30C4____ ______
-18D3 . _ _
-30L6_ ____ .__
20/2-13J2____._ __20/3-18C2 _ ___.20/2-13 Al _______
-13A2__ ___ ___
Well No. (city)
1-A ______2-A ______
2-B_ __ _ _
3-A_ ________
4-A___ __ _______5-A____________
6-A ______
7-A____________
8-A _____
9-A ______
10-B ______
11-A_____ _ __ _12-A ________Utilities Bldg_ _ _
_____do_________
Depth(feet)
306172
70
312
204352
179
298
297
113
83
113167260
85
Altitude (feet above mean sea
level)
261243
245
271
246266
267
266
267
280
257
269309246244
Year drilled
19291930
1949
1931
19301930
1939
1939
1939
1Q4Q
1956
1948195719531953
Pumping rate
(gpm) i
3,0801, 150
(2, 025)3,400
(3, 600)3,650
(3, 920)1,4504,500
(6,240)3,770
(3, 200)920
(3,940)3,890
(4, 250)6,0005,5001,000
(930)9,3505,000
6202,500
Drawdown (feet)
60
60
4. 5
6392
6874
67
60
3125
122312.2
Coefficient of transmissibility
(gpd per ft)
2, 900, 000
270, 800
145, 000184, 500
1, 250, 000
58, 000
114, 000
753, 000
Specific capacity
51
34
800
6216
9251
59
71
30875
4120
1,135
Static water level (feet below land-
surface datum)
3936
25
41
3342
27
28
41
59
28
578439
Date
11-6011-60
11-60
11-60
11-6011-60
11-60
11-60
11-60
11-60
11-60
11-6011-606-53
1 Pumping rates in parentheses are for period of testing only.
The relation between specific capacity and coefficient of transmissibility for individual wells varies consid erably. Although most of the wells tap more than one water-bearing zone, the wide range in specific capacity probably is due more to differences in con struction of the individual wells than to variations in aquifer characteristics.
The well field is used to supplement surface-water supplies, and usually is not pumped continuously for long periods of time. The annual pumpage from the well field increased from 158 million gallons (485 acre-feet) in 1930, to 6,754.7 million gallons (20,740 acre-feet) in 1961 (table 227.2). Since 1930, a total of 39,584 million gallons (121,520 acre-feet) has been pumped from the well field.
Even though the withdrawal has been substantial, periodic measurements of static water levels in the field indicate that the depth to water has not changed appreciably in 30 years. For example, the earliest recorded water-level measurement in well 1-A, on February 11, 1930, shows that the depth to water was then about 42 feet below the land surface. On De
cember 21, 1960, the depth to water in this well was about 38 feet.
The records indicate that ground water can serve as a reliable emergency supply to Tacoma in case of failure of the surface supply, and that the aquifers could yield even more than the present production without serious depletion.
TABLE 227.2 Annual pumpage, Tacoma well field
Year 1930 _____1931 ____1932_.______1933 _____1934 _____1935 --1936 ____1937__-_____1938 _____1939 ____1940 ____-1941 _ _1942 _____1943 _____1944 _____1945 _____
Pumpage from well field
{million gallons)_______ 158.0_______ 168.5____ 381.9_______ 606.9_______ 421.0_______ 278.0_______ 258.5_______ 524.0
412.7----___ 428.7_______ 880.9_______ 619.9_______ 611.3_______ 208.3___ __ 822.2.___._. 1.517.2
Year 1946 _____1947 ____1948 _____1949 _____1950 ____1951 -___1952_. ______1953 ____1954__ ______1955 -___1956 _.__1957 --_-_1958 _-__1959 __._I960 _1961 _
Pumpage from well field
(million gallons) _______ 891.6_______ 1,262.6_______ 1,062. 8_______ 1,059. 5___.__. 1,289.0_______ 1, 140.5_______ 826.7_______ 1,391. 1_____-- 992.5____-._ 2, 143. 5_______ 3, 194. 5_______ 1, 141. 8_______ 1,225.7_______ 2,722. 7.___-_. 4,186. 9_______ 6.754.7

ARTICLE 228
SURFACE WATER
E159
228. LONG-TERM FLOOD FREQUENCIES BASED ON EXTREMES OF SHORT-TERM RECORDS
By W. J. CONOVER and M. A. BENSON, Washington, D.C.
The usual length of flood-discharge records does not permit the assignment of a reliable probability to occasional extraordinary floods. For example, we know that 1,000-year or 10,000-year floods may occur at any time, and that such floods are actually being ex perienced, but the period of record is so short that we cannot assess the recurrence interval of these rare events.
A solution to this problem has been planned that consists of three parts. The first part is the reduc tion of all flood peaks to a comparable basis, so that records at all sites may be combined. The second part is a study of the degree of statistical dependence between flood records and the reduction of all records to an equivalent number of independent records. The third part is the combining of all the independent records and the assigning of recurrence intervals or probabilities to events in the combined group.
The first two parts of this solution are believed to be within reach, requiring only a study of several al ternative procedures and a great deal of work in abstracting the hydrologic characteristics of drainage basins. The subject of this article is a solution to the third part of the problem.
The combining of a set of records that are inde pendent, as in the "station-year" method familiar to hydrologists, consists of adding all records end-to-end and considering them as a single record in assigning probabilities. However, continuous records do not exist at all sites where flood data are available, so that a modification of the station-year method is neces sary.
The solution presented here will enable the evalua tion of recurrence intervals for the peak flood events at all sites for which the maximum peak within a common period of time is known. This solution per mits information at long-term gaging stations to be combined with that at ungaged sites or short-term stations where there is no continuous record but where the highest peak is known. The recurrence intervals,
or probabilities, would be defined for the combined period of record. For example, by using only the highest annual discharges in 50 years at 20 sites where the flow at each site is independent of the flow at the other sites, it would be possible to rank the extremes and to determine their probabilities within a 1,000- year period. The recurrence interval of the highest extreme would be close to 1,000 years; the assignment of recurrence intervals to the other ranked extremes is not as obvious. This paper shows how to determine recurrence intervals for all of the ranked extremes of independent records.
Let nk independent values from any continuous distribution be divided at random into n groups of k elements each. Order the elements of each group, starting from the highest to the lowest, and then order the groups according to the value of the highest element of each group. Denote the first element of the ith group by an. Thus a-n is the largest value of all nk values. Also a2 i is greater than &22, but not necessarily greater than «i2 . The generalized form of the array follows:
Elements within each
group
123
A
i
an«12
a\k
2
«21
«2fc
Group
3
032
03Jfc
n
a n\«n2
Cf n3
a n k
i-1
m=0
Now suppose we consider an additional independent value, x, from the same continuous distribution. What is the probability that x will exceed a« (^=1, 2, . . ., n)?
By use of a basic theorem in order statistics, the solution to this problem can be shown to be
n\
667422 O - 63 - 12

E160 GEOLOGICAL SURVEY RESEARCH 1962
where p(att) represents the probability of an additional independent value, x, exceeding an (i=l, 2, . . ., n). This may be called the exceedance probability. By using the above formula, n=20, and k=5Q, the table below was computed. To compare the theoretical probabilities with the results of sampling from known distributions, three trials were made, using an extreme- values distribution for the first trial and the normal distribution for the other two trials. In each trial, a table of random numbers was used in selecting the samples. Twenty groups of 50 random numbers each were used in each trial, and the numbers in the groups were ranked in the manner previously described. Then the actual rank among the 1,000 random numbers was
recorded for each of the numbers that headed a group, and the corresponding exceedance probabilities were plotted in figure 228.1. Theoretical probabilities given by the values shown in the table below were used to define a smooth curve of theoretical values. Figure 228.1 demonstrates the close correspondence between the sampled and the theoretical values.
Probabilities and recurrence intervals of extremes, n=20, k=50
0.001
Exceedance probability
0. 000999. 002050. 003157. 004329. 005573. 006896. 008313. 009835. 01148. 01328
Recurrence interval
P(au)
100148831723117914512010287. 175.3
Exceedance probability
11_._.__ 0.01524 12___.__ .01743 13_.____ .01988
. 02268
. 02592 _ . 02980
. 03463 _ . 04102 _ . 05051 . . 06913
Recurrence interval
T=-
14.
65.657.450.344. 138.633. 628.924.419.814. 5
0.01-
6 8 10 12 14 16
RANK WITHIN GROUP OF EXTREMES
18
FIGURE 228.1. Theoretical curve compared with random trials, for n = 20 and fc = 50. Dots indicate values from trial 1, open circles from trial 2, and triangles from trial 3.
The formula derived for this article has made it possible to base the probabilities of rare floods on only the extreme events experienced at all sites where flood information is available, provided, first, that the flood data are comparable and, second, that they are independent. Although records of peak discharge, in their usual form, are not comparable and are not in dependent, it is expected that future studies will de velop methods of expressing flood records on a com parable basis and of reducing them to an equivalent set of independent records. The formula developed in this paper can then be applied to assign probabili ties to the extreme flood events that have occurred.

229.
ARTICLE 229
FLOOD PEAKS RELATED TO HYDROLOGIC FACTORS IN THE SOUTHWEST
By MANUEL A. BENSON, Washington, D.C.
E161
In a previous investigation, Benson (1962) examined the relations between annual peak discharge and many hydrologic factors in New England, a humid region. A similar investigation has now been completed for the western part of the Gulf of Mexico basin, a re gion comprising most of Texas and New Mexico and small parts of Louisiana and Colorado. This basin is semiarid to arid in its larger part west of Austin, Tex., and humid in its eastern smaller part. Figure 229.1 shows the extent of the region studied.
Both physiography and climate vary widely in the area studied. The altitude ranges from sea level at the gulf to 14,000 feet in the headwaters of the Eio Grande in Colorado. Mean annual rainfall ranges from 58 inches in Louisiana to 8 inches in New Mexico. The part of the mean annual rainfall that appears as stream runoff ranges from 40 percent in Louisiana to 1 percent in western Texas and New Mexico and is less than 5 percent for two-thirds of the region. The annual peak floods (highest momentary peak dis charges each water year) tend to occur in different seasons in different parts of the region. In Louisiana and eastern Texas, annual floods generally are caused by winter and spring rains, in central Texas by spring storms and fall cyclonic storms, in west Texas and
103° 94°
\COLORADO
I ^' \ i"j\i - Southern boundary' / \\ °f snowmelt area i' | ( ^%__^ I I OKLAHOMA
/ ' \ ' T^ Lf NEW MEXICO ) I '-^ ^-^x^ ) / ) ' X ._. ^\_.aC--'-
/ f /i \ v «-T>.. <s' S^«-_ J.
FIGURE 229.1. Extent of western part of the Gulf of Mexico basin studied, and boundary between snowmelt flood and rain flood areas.
most of New Mexico by summer thunderstorms, and in Colorado and northern New Mexico by spring snow- melt.
A field and library search for historical informa tion provided data concerning floods that occurred before the period of record and helped in determining recurrence intervals of the rare floods in recent years. This information, much of which was not previously available for analysis, provided the principal basis for establishing the values of 50- and 100-year floods that were used in the analyses. Similar values for shorter recurrence intervals were based on annual peaks for the period of record.
In the humid-region study in New England, flood peaks of recurrence intervals varying from 1.2 to 300 years were related to 6 statistically significant variables. In order of decreasing importance, the variables are drainage-area size, main-channel slope, an orographic factor, area of lakes and ponds, winter temperature, and rainfall intensity and duration.
In the study of the largely semiarid region, these and many other physiographic and climatic variables were considered in relation to peak discharge. In cluded were basin altitude, length, rise, shape, and orientation; stream-order number; prevailing wind direction; total annual snow depth; water content of snow on April 1st; spring temperature; mean annual precipitation and runoff; runoff-precipitation ratios; average annual number of thunderstorm days; and the percentage of forested area. In addition, an at tempt was made to develop indices based on channel geometry that could represent the effect of channel storage. A hydrologic soil-cover complex developed by the Soil Conservation Service for representing in filtration capacity was used to represent the effect of soils on peak flow.
The study showed that better results could be ob tained by distinguishing the area where annual peaks are caused by snowmelt from the area where annual peaks are caused by rain. The boundary between the small part of the area affected by snowmelt and the larger part, called the rain flood area, is shown in figure 229.1 as a dotted line roughly through 'Santa Fe, N. Mex. By use of multiple-regression tech niques, the relation of peak discharge to hydrologic variables for both the rain flood and snowmelt flood areas was determined. These relations are linear when the logarithms of all quantities are used.

E162 GEOLOGICAL SURVEY RESEARCH 1962
Within the rain flood area, the annual peak dis charge was found to be related to seven statistically significant variables, which are, in approximate order of decreasing importance:
A, drainage-area size, in square miles;/, rainfall intensity, the 10-year 24-hour rainfall, in inches.S, maiii-channel slope, in feet per mile;L, basin length, in miles ;St, area of lakes and ponds, expressed as percentage of the
total drainage area and increased by 1 percent;R, median runoff-precipitation ratio, for months: when an
nual peaks occur; andN, average annual number of thunderstorm days.
The form of the relation is
QT =aA»ScStdLeI'NgRh,
where QT is the T-year annual peak discharge in cubic feet per second and a, b, c, . . .h are the regression co efficients. Values of the coefficients for selected values of T are shown in table 229.1.
TABLE 229.1. Regression coefficients, rain flood area
T (years)
1.2............2.33 _ ........5.... _ .......10.............25. . .-50.............
a
375QQQ
5399fiQ
1823,670
b
1.61.31.11.01.0
c
00 9
.2
.3
.5
.4
d
0 9-1.3-1.5-1.6-1.0-1.1
e
-1.4-1.1 S
-.7-.5-.5
/
0 0
1 1
1.5i a1 91.4
ff
-0.5-.7__ Q
-.7-.7
-1.0
h
0.7.4.3
.3
.3
The results of this study may be compared with those of the study for New England. Importance of the variables is judged by their relative effect in ex plaining the original variation in the size of flood peaks. The size of drainage area is the most impor tant variable, as in New England. Rainfall intensity is second in importance, because of the extreme vari ability in rainfall characteristics in the rain flood area of the Southwest in contrast to New England, where rainfall intensity was the least effective vari able. Slope is next in importance in the Southwest; in New England its effect was second to that of drain age-area size. Basin length is next in importance, whereas it was not an effective variable in New Eng land. Large losses to channel infiltration and reduc tions in peak discharge due to channel storage are common in the Southwest where floods often flow through channels that were initially dry. Thus, in the rain flood area, peak discharge is related inversely to channel length as shown by the negative exponent of L. Storage in lakes and ponds is an important variable in both New England and the Southwest.
Within the snowmelt flood area, peak discharge was found related to six statistically significant factors, which are:
A, drainage-area size, in square miles;S, main-channel slope, in feet per mile;St, area of lakes and ponds, expressed as percentage of the
total drainage area, and increased by 1 percent; P, mean annual precipitation, in inches; E, altitude, in feet; and N, average annual number of thunderstorm days.
Of these, drainage area is by far the most important, and the rest are of smaller but nearly equal importance. The form of the relation is :
Table 229.2 shows the variation of the coefficients for selected values of T.
TABLE 229.2. Regression coefficients, snowmelt flood area
T (years)
1.2. 2.33.. ....... . ...5 10 25
log 10 a
21. 015615.194316. 325818. 218221. 9216
b
0.2.3.4.3.2
c
-0.9-.7-.6-.6-.7
d
-0.9-.9-.8-.9
-1.3
e
5.03.63.33.53.4
/
-4.2-2.8-3.1-3.5-4.5
ff
-4.2-3.1-3.0-3.2-2.5
Within the snowmelt flood area of the Southwest, slope has a negative coefficient, contrary to what was found in the rain flood area and in New England. The negative coefficient can be explained by the snow- melt characteristics within this area. In the humid climate of New England, the normal 3 to 4 inches of rain per month in the spring, coupled with rising temperatures, results in rapid runoff of combined rain and snowmelt water. In the Southwest, where rain is scant in most of area, the melting of snow in the spring is caused mainly by rising temperatures and occurs over a longer period of time. In addition, the melting starts at low altitudes and progresses to higher altitudes. In a basin with a large rise and hence a steep slope, only a small portion of the basin is con tributing melt water at one time. Therefore, other things being equal, a steep slope is associated with a small peak discharge. The negative relation of the rate of snowmelt to slope overbalances the effect of slope in increasing the rate of travel of the water; the net result is a negative relation of peak discharge to slope.
The standard error of estimate is a measure of suc cess in explaining the variability in a dependent vari able, such as peak discharge, by means of statistically significant independent variables, and is also a meas-

ARTICLE 230 E163
ure of the error in predictions made by using the developed relation. In the New England study the standard error of estimate varied with T and ranged from 23 to 37 percent. In the Southwest, the standard error for floods with recurrence intervals of 2.33 years and more ranged from 42 to 62 percent.
The fact that standard errors are larger in the Southwest than in New England is attributed to the following:
1. Lack of efficient quantitative indices for the fac tors of geology and soil influences that are impor tant in this region.
2. Difficulty in defining the higher flood peaks be cause of shifting sand-bottom streams and short dura tion of thunderstorm flood peaks.
3. Lack of adequate definition of the noncontribut- ing parts of some drainage areas.
4. Erratic chance occurrence of storms within a largely semiarid region.
The error attributable to the first three of these items may be reduced as measurement techniques im prove and hydrologic knowledge increases. The er ratic geographic occurrence of storms, typical of semi- arid conditions, is believed to account for a large part, perhaps the major part, of the unexplainable devia tions present after all known physical and climatic factors are taken into account. On this assumption, the average flood experience within the region is a better basis for establishing hydrologic relations than is the average flood experience at any one point. The part of the residual error that is attributable to the variability of storm occurrence cannot be decreased except by a long period of time sampling of runoff experience.
REFERENCE
Benson, M. A., 1962, Factors influencing the occurrence of floods in a humid region of diverse terrain: U.S. Geol. Survey Water-Supply Paper 1580-B. (In press)
QUALITY OF WATER
230. DISSOLVED-SALT CONTRIBUTION TO GREAT SALT LAKE, UTAH
By A. M. DIAZ, Topeka, Kans.
Work done in cooperation with University of Utah
Estimates based on weighted-average dissolved- solids content of surface discharge to Great Salt Lake indicate that the dissolved-mineral contribution to Great Salt Lake by surface streams was about 2 mil lion tons for the 1960 water year. This estimate ex ceeds previous estimates (Eardley and others, 1957) of approximately 1 million tons annually and is based on systematic measurements during the water year. The estimated contribution of 2 million tons was by streams, drains, canals, and springs; it does not in clude mineral matter contributed by ground-water inflow.
Great Salt Lake is underlain by lake deposits of Pleistocene Age that on the east side of the lake ex-
i University of Utah Research Fund and Uniform School Fund.
tend to the foot of the Wasatch Mountains. Large volumes of ground water move toward the lake through these materials and probably contribute a sizeable dissolved-mineral increment directly to the lake each year. However, the extent to which ground- water inflow affects the total salt contribution cannot be determined from available data.
The table below summarizes the computations of dissolved-solids contributions for the 1960 water year. Fifty-seven percent of the estimated tonnage was con tributed by the three major streams in the basin the Bear, Weber, and Jordan Rivers; 25 percent was from drains discharging industrial and municipal wastes; 17 percent was from springs that discharge along the lakeshore; and 1 percent was from small creeks and drains along the east shore between the

E164 GEOLOGICAL SURVEY RESEARCH 1962
Weber and Jordan River basins. All surface dis charge, summarized in the table, enters the lake along its north, east, and south shores. The lake is bordered on the west by the Great Salt Lake Desert and re ceives no significant inflow from that area.
Estimated contribution of dissolved solids to Great Salt Lake, 1960water year
DissolvedSource salts, in tons
Bear River and Blue Springs Creek _______________ 700, 000Weber River and miscellaneous inflow to Ogden Bay_ 140, 000 Jordan River_____________________________ 320, 000Kennecott drain, Garfield drain, Salt Lake City sew
age canal, and sewage contributed by other communities in the east-front area_____________ 510,000
Springs discharging to lake along north and southshores_____________________________ 340, 000
Small streams along the east shore, not includedabove.-____________________________ 24, 000
Total_________________________ 2, 034, 000
Runoff to Great Salt Lake is derived principally from precipitation on the Wasatch and Uinta Moun tains. Although streams draining these mountains are highly regulated, they are the major source of inflow to the lake. Rocks in the drainage areas range in age from Precambrian to Quaternary. The Pre- cambrian and Paleozoic rocks generally crop out in the higher parts of the mountains, whereas Mesozoic and Cenozoic rocks crop out at lower elevations. The water of streams draining the Precambrian and Paleo zoic rocks in the higher parts of the basin is of the calcium bicarbonate type and is of excellent quality, having a dissolved-solids content of less than 100 parts per million. However, the discharge to the lake itself is generally of poorer quality, having dissolved min eral matter from the rocks over and through which it passed in the lower parts of the basin and having been concentrated by addition of domestic sewage and by extensive agricultural and industrial use. Conse- qently, the quality of water at the mouths of the in dividual streams varies considerably. The wide varia tion in chemical quality between the three major streams is shown by the annual weighted-average anal yses shown in figure 230.1.
The environmental differences between each of the major drainage basins is reflected by the predomi nance of sodium and chloride ions in the Bear River, calcium and bicarbonate ions in the Weber River, and sodium and sulfate ions in the Jordan River. The difference in chemical composition of water in the lower Bear and Weber Rivers may be attributed mainly to differences in geologic environment, whereas the chemical composition of water in the lower Jor-
51 :Q 55 10 EQUIVALENTS PER MILHION
Figurelabove; p^ttfern is dissotved^ solids cqntent, in parts per njilHon
FIGURE 230.1. Average chemical composition of water in Great Salt Lake and its major tributaries, 1960 water year.
dan River is affected significantly by intensive agri cultural and industrial use.
The initial phase of this investigation was made during a relatively dry period, during which the an nual runoff was slightly less than 60 percent of nor mal. The greatly reduced inflow to Great Salt Lako was reflected by a decreasing stage of the lake. At the end of the 1960 water year the surface of Great, Salt Lake was 4,193.40 feet above mean sea level, tho lowest stage in 100 years of record. The previous low stage was recorded in 1940 when the lake reached a level of 4,193.75 feet. At the 4,193.40-foot level the lake contains about 10 million acre-feet of brine, and the lake is about 64 miles long and a maximum of 30 miles wide. The average depth of the lake at this stage is less than 10 feet.

ARTICLE 231 E165
During the 1960 water year, 20 samples of brine were obtained from different parts of the lake. Chem ical analyses of the samples indicate that the brine was nearly saturated with sodium chloride, and that the average dissolved-solids content of the lake brine was about 27 percent. At this concentration, 1 acre- foot of brine contains about 450 tons of salt; there
fore the dissolved-salt content of the lake was 4.5 X 10⁹ tons at the end of the 1960 water year.
REFEBENCE
Eardley, A. J., Gvosdetsky, Vasyl, and Marsell, R. E., 1957, Hydrology of Lake Bonneville and sediments and soils of its basin: Geol. Soc. America Bull., v. 08, p. 1141-1202.
ANALYTICAL HYDROLOGY
231. ORIENTATION OF AXES FOR CALCULATING DISTRIBUTION OF TRANSMISSIBILITY FROMWATER-LEVEL ALTITUDES
By R. W. STALLMAN, Denver, Colo.
Subsequent testing by E. A. Sammel (oral communi cation, July 1962) of a procedure described by Stallman (1956), shows that the sensitivity of calculations for defining the coefficient of transmissibility, T, from water-level altitudes is dependent on the orientation of the x and y axes in the field of flow. This article sets forth the conditions under which sensitivity is a function of axis orientation.
Consider the following differential equation for steady ground-water flow in a confined nonhomogene- ous aquifer:
where T is the coefficient of transmissibility of the aquifer and x and y refer to distances in a cartesian coordinate system in the plane of flow in the aquifer. It has been proposed (Stallman, 1956) to substitute finite-difference approximations of the head differentials in equation 1 at two or more points in the field of flow and to solve the resulting set of equations for the rate and direction of change in T within the aquifer. Unfortunately, water-level altitudes applicable to equation 1 are seldom known to a high degree of accuracy at field sites. Therefore errors occur in the estimates of head differentials made from field measure ments, and these errors are reflected in the calculated rates of change in T derived from finite-difference approximations of equation 1.
All the gradients contained in equation 1 and the angular displacement of each from the x axis of a cartesian coordinate system are shown on figure 231.1. Angles to the vectors are taken from a common reference line which is at an angle 7 from the x axis. The- effect
FIGURE 231.1. Sketch showing definitions of vectors in field of ground-water flow.

E166 GEOLOGICAL SURVEY RESEARCH 1962
on the error, E, of rotating the x axis with respect to the position of the vectors is determined by recon structing equation 1 to account for error and differen tiating to find those values of 7 for which dE/dy is zero that is, when E is a minimum.
If the error terms due to inaccuracies in the data are included, equation 1 may be written as follows:
=E, (2)
where E is the total error in equation 2 due to finite- difference estimates of head differentials, H is the gradient of the first derivative of head, f(H) is the error in the estimate of (d2/*,/b?/2 +d2Vd?/2), / is the gradient of head, jx (I) is the error in the estimate of dh/bx, and/j,(7) is the error in the estimate of bhfoy.
In finite-difference methods, <¥h/dx2 and &h/(ty2 gen erally are evaluated separately. Furthermore, the error in each estimate is approximately inversely propor tional to the value of the second differential. If the second differentials are expressed in trigonometric form, it is seen from the definition of H and from figure 1 that
and
_H cos (T+T) where A is a constant.
[_ +H sin
(3)
(4)
Similarly, errors in the estimates of the first dif ferential are approximately inversely proportional to the respective values of the first differentials. Thus the second and third terms in equation 2 can be written as follows:
(a+7)[/cos (0+7)
, CCOS (0+7)] (5)
and
bT p"N» I "1
Lfy+^(/) \=B sin snsin (0+7)], (6)
where B is the gradient of transmissibility and C is a constant.
The total error, E, is given by the sum of all the terms on the right-hand side of equations 3 to 6. The derivative of the total error is found to be
ay(r+7)-sin
TA ["sin3 (T+7)-cos3 (T+T)"| H L sin2 (r+7) cos2 (r+7) J
sin (0-a)/ sin2 (0+7) cos2 (0+7)
1
J(7)
If dEfdy is set equal to zero, inspection of equation 7 shows that the error is minimal when 0 a=0 and T+7=ir/4 radians. In a physical sense this means that E"is least if the slope of the water surface is parallel to the direction of maximum spatial rate of change of T and if the spatial rate of change in the first differen tial of head is greatest along a line which is at an angle of ?r/4 radians from the x axis. However, such an orientation of vectors is found in few regions of natural flow.
Integration of equation 7 yields
(r+7)+COS
TA.(T+7)+csc
. T2T>ri
-2 sin (0-a)[cot 2(0+7)]?i. (8)
If 7i 72 is assumed to be very small, the change in error produced by a small angular rotation of the reference axis of figure 231.1 can be approximated. Then if 2(0+71)=ir/2 or 3?r/2 radians, the last term in equation 8 vanishes. Therefore, if 71 is taken to be zero, the error in the last term can be minimized by orienting the x axis 7r/4 radians from the gradient of head. In regions where T=0+ir/2 or T=0+ 3ir/2 and 0=7r/4, all terms in equation 8 are zero.
Any wide deviation from the ideal angular relations in the flow field which produces zero or negligible error may preclude the application of equation 1 for accurate estimation of the rate of change in T from water-level altitudes. Error cannot be defined accurately from equation 8 in all cases because the constants A and C generally are unknown. In the general flow problem, the investigator should select T and 0, with 7=0, so that all the bracketed terms in equation 8 are small. For most problems such a selection will suffice for pro ducing relatively accurate estimates of the distribution of T.
REFERENCE
Stallman, R. W., 1956, Numerical analysis of regional water levels to define aquifer hydrology : Am. Geophys. Union Trans., v. 37, no. 4, p. 451-460, August.

ARTICLE 232 El67
232. A METHOD OF DETERMINING THE STORAGE-OUTFLOW CHARACTERISTICS OF NONLINEAR RESERVOIRS
By JOHN SHEN, Phoenix, Ariz.
In the analysis of small-basin flood characteristics, it is often desirable to define the storage-outflow rela tions, from certain observed outflow hydrographs. Such storage effects may be those due to manmade reservoirs or those due to natural storage in ponds, channels, or minor depressions.
Whereas a linear storage-outflow relation is gener ally assumed to be applicable to many natural basins, experience by Mitchell (1962) with streams in Illinois indicates that nonlinear storage is a condition that occurs with sufficient frequency to warrant careful consideration.
Methods for determining the linear storage-outflow characteristics from the recession outflow hydrographs have been suggested by Linsley and others (1958, p. 151-155) and Mitchell (1962). A more generalized method which is applicable to nonlinear as well as linear reservoirs is described below.
Fundamentally, the storage-outflow relation of a nonlinear reservoir may be expressed (Mitchell, 1962)
(1)
in which S is the storage, Q is the rate of outflow, K is the storage coefficient, and x is an exponent. Values of K and x may be variable, but for many sites they appear to be nearly constant.
The basic relation for inflow, outflow, and storage is expressed by the equation of continuity:
(2)
where 7 is'the rate of inflow and t is the time.Upon differentiating equation 1 and substituting it
into equation 2, we have
Thus,
I-Q=KxQ*- 1
dQ_ I-Q dt KxQx~ 1 '
dt (3)
(4)
For the recession limb of an outflow hydrograph, the inflow ceases (7=0), hence
dQ_ Q dt~ *- 1 '
ordQdt (5)
The curvature of the recession hydrograph is repre sented by its second derivative
d*Q^ x-2 dt2
or___J^ x-2 dt2 ~K' x r-l (6)
The significance of equation 5 may be realized if we rewrite it in finite-difference form and take the logarithm of both sides. Hence we have
log -=-(*-2) log Q-log (Kx). (7)
It may readily be seen that equation 7 is a linear loga rithmic equation and may thus be represented by a straight line on log-log graph paper. If the value of
¥ is plotted as the ordinate and the value of Q as
the abscissa, then the slope of the line would be repre sented by (x 2) with the point of intercept (log Q=0) at Kx. Hence, the values of K and x may be determined separately.
From the slope of the line, (x 2), the value of x may be derived. Furthermore, at Q=l, log Q=0, and equation 7 becomes
or
A*_
Kx(8)
Hence, the value of Km&y be determined once the value of x is known.
Two special cases arise which are of particular interest:
When x=2, equation 5 becomes
^2__L_. (Q) dt~~ 2K ^ }
Thus, the recession curve is a straight line on a linear
scale having a constant slope of ^-
When x=l, equation 5 becomes
dQ__ Q dt~ K' (10)
and the reservoir is linear. The value of K can, of course, be readily determined from the recession hydro- graph or by any other conventional methods.

El68 GEOLOGICAL SURVEY RESEARCH 1962
For illustration, figure 232.1 shows a typical outflow
10 11 12
FIGURE 232.1. A typical outflow hydrograph of a nonlinear reservoir. K=2, x = %.
hydrograph of a nonlinear reservoir, for which K= 2 time units and x=%. The hydrograph of inflow to the reservoir is assumed to have the form of an isosceles triangle.
Figure 232.2 shows a plotting of versus Q on
log-log scales for the recession limb of the outflow hydro- graph shown in figure 232.1. It may be seen that the plotted points define a straight line having a slope of 1.5, hence x=%. Moreover, the line intercepts the
point (Q=1.0, -T?=I -°)- Tnus > the val^e of K can
be computed from equation 8 as 2.0.The method described above furnishes a simple
means of analyzing the storage-outflow characteristics
1.0
0.8
0.6
0.4
0.3
I0.2
0.10
0.08
0.06
0.04
0.030.1 0.2 0.3 0.4 0.6 0.8 1.0 2
Q
FIGURE 232.2. Plotting of -^ versus Q.
of small drainage basins. Further evaluation of this method as applied to field data is being undertaken in Illinois under the direction of William D. Mitchell.
REFERENCES
Linsley, R. K., Jr., Kohler, M. A., and Paulhus, J. L. H., 1958, Hydrology for engineers: New York, McGraw-Hill Book Co., Inc., 340 p.
Mitchell, W. D., 1962, Effect of reservoir storage on peak flow: U.S. Geol. Survey Water-Supply Paper 1580-G.

ARTICLE 233 E169
233. AN ANALOG SOLUTION OF THE TURBULENT-DIFFUSION EQUATION FOR OPEN-CHANNEL FLOW
By JOHN SHEN, Phoenix, Ariz.
The basic equation for two-dimensional turbulent jvo. , , -, . -, ,TVT i i diffusion in an open channel may be taken (NobuhiroYotsukura, written communication. May 10, 1962) as' ' J ' '
b.D
be b£=_b_ ba; by
bc(1)
where c is the concentration of diffused material, t is the time, x is the distance in downstream direction, y is the vertical distance from the channel bottom, u is the velocity in x direction, and D is the diffusion coeffi cient assumed to be equal to the coefficient of momen tum exchange. Thus, equation 1 represents the turbulent-diffusion process in spatially two-dimensional steady flow, for which u as well as D is a function of y only.
Electrically, equation 1 may be simulated by a two- dimensional resistance-capacitance network. A gen eralized scheme for such a net is shown in figure 233.1. The upper boundary for the net is the water
For a particular node under steady-flow condition, ^
is of constant value. Thus letting -^ =j(y) K and
substituting it into equation 2, we have
(3)by V by/ by2^ by
And, at a node point (/, m) (see fig. 1), we may write equation 3 in finite-difference form as
b /n bC\ 7-, / Ci ,m+l\Cl ,m 1 Cl, m\*y(D Wt.~D~ ( W )
Ci.m-i Ci.
or
^ / ^,\\ /D j£ \ * ~^~' 2Ay /
'
««
- - -1
V
^, (.
' ;i
p. . .., ,c
^ <
, ,» ,:-,,
; i
J, 4»+
) ^,.1
h
1 l
-*. ..
'.
).. ..- '*-.J-f-liV
i
m-
~ -« ~~~3 As
@ 1 andi
equ
byA
Fdevfigu
"»-l^ A2/ A2/
equation 4 may be rewritten as
1 ) (ci. m-i ei, m). (5)2Ay2
From Kirchhoff's law, an analogous equation may be developed for the electric-resistance network shown in figure 233.2. The electrical equation is
i)+ (Em-i Em). (6)
Equation 6 is seen to be analogous to equation 5.FIGURE 233.1. A schematic two-dimensional net for turbulent
diffusion.
surface and the lower boundary is the channel bottom. Thus, iA is equivalent to ^- ( D ^ V and Em+i, Em and The solution to equation 1 is developed term by term ^ ^ ^ in the following discussion. E^ are equivalent to c,, m+,, c,. m and c,. m_! respec
tively. The necessary conditions for the two equations SOLUTION FOB THE TEBM (D to be completely identical are
The term - [D^ ] may be rewritten as TO+1/2 i oy \ by/
and_b /D *c\=D WCtdD be by V by/ by2 "1" by * by
(2) Rm-V2== ~i2Ay2
(7)

E170 GEOLOGICAL SURVEY RESEARCH 1962
FIGURE 233.2. A resistance network for solving the term
*YD fc\Oy\ OyJ
Hence the values of Rm+y2 and Rm-x may be determined once the values of Dm+1 , Dm, and Dm-\ are known.
<VSOLUTION FOB THE TERM u ^L
da;
dcSimilarly, if we write the term u ^ in finite-difference J> da;
form, we have
dc
Udc2teL
(Ci+i, m Cl
\ 2Axor
. ~U
(8)
Again, an electrically analogous network may be developed as shown in figure 233.3. From figure 233.3, we may write the electrical equation,
(9)1+1/2 1-1/2
Comparing equations 8 and 9, we have the following equivalents:
dc
1+1 = C i+i,
and2Ax
(10)
Hence, the values of R t+y2 and Ri-y2 may be determined from the known value of um. It is seen that in order
FIGURE 233.3. A resistance network for solving the term u
to achieve the complete analogy, Ri+y2 must be a nega tive resistor; that is, the current flows in the opposite direction with respect to the voltage potential.
Whereas a negative resistor can be manipulated by means of operational amplifiers, an alternate approach would be considerably simpler.
If we rewrite equation 8 as
u dc ox
Urn'2Ax (U)
we may accomplish its electrical counterpart by means of one operational amplifier at each node. Figure 233.4
FIGURE 233.4. An operational amplifier circuit for solving the
dcterm u^- .
da;
shows such a circuit, in which the operational amplifier is used as an adder-subtractor.
From the circuit in figure 233.4 we may derive the following relation:
IB=- (12)
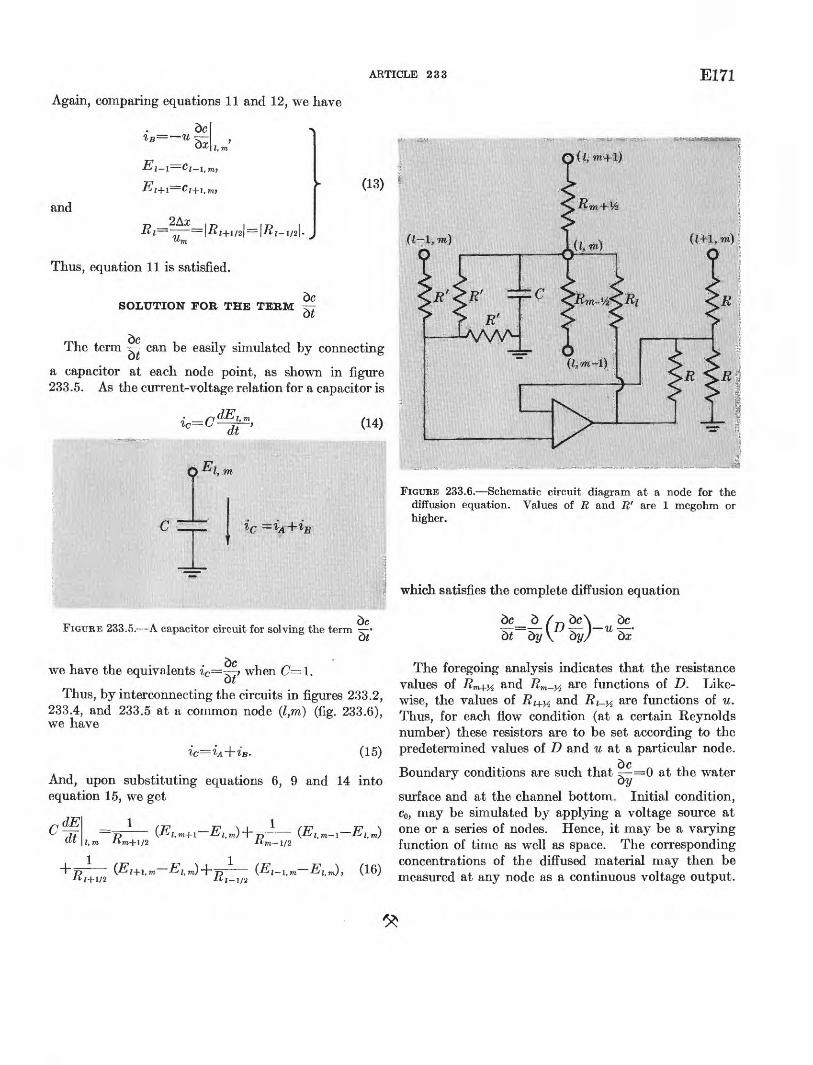
Again, comparing equations 11 and 12, we have
ARTICLE 233 E171
iB= u dcI, m
and2Ax
(13)
Thus, equation 11 is satisfied.
SOLUTION FOB THE TERMdc
The term ^ can be easily simulated by connecting
a capacitor at each node point, as shown in figure 233.5. As the current-voltage relation for a capacitor is
(14)
dc FIGURE 233.5. A capacitor circuit for solving the term j-'
dc we have the equivalents ic ?r> when C l.
Thus, by interconnecting the circuits in figures 233.2,233.4, and 233.5 at a common node (l,m) (fig. 233.6), we have
^e *A + £B- (15)
And, upon substituting equations 6, 9 and 14 into equation 15, we get
(16)
FIGURE 233.6. Schematic circuit diagram at a node for the diffusion equation. Values of R and R' are 1 megohm or higher.
which satisfies the complete diffusion equation
dc d /^ dc\ dc 3-7=5 ( D ^ I u ^-'di d?/\ dy/ dx
The foregoing analysis indicates that the resistance values of Rm+y2 and Rm-y2 are functions of D. Like wise, the values of Ri+y2 and Ri-y2 are functions of u. Thus, for each flow condition (at a certain Reynolds number) these resistors are to be set according to the predetermined values of D and u at a particular node.
dc Boundary conditions are such that ^-=0 at the water
surface and at the channel bottom. Initial condition, c0, may be simulated by applying a voltage source at one or a series of nodes. Hence, it may be a varying function of time as well as space. The corresponding concentrations of the diffused material may then be measured at any node as a continuous voltage output.
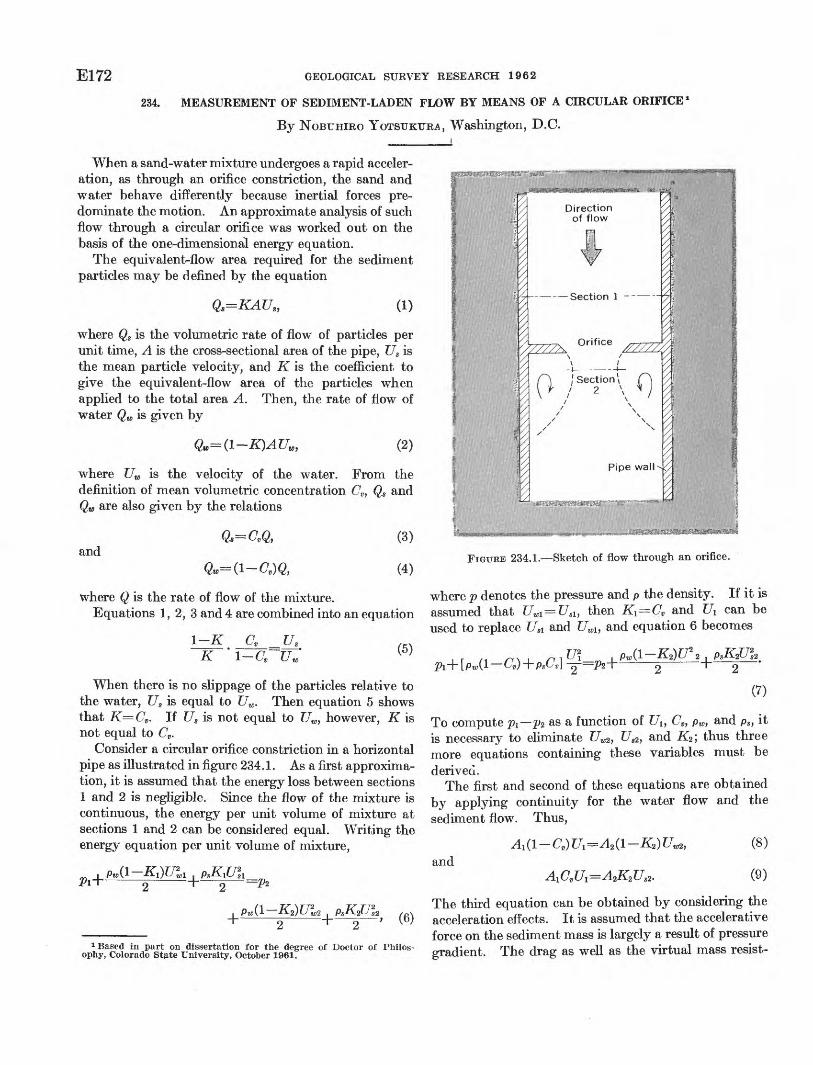
E172 GEOLOGICAL SURVEY RESEARCH 1962
234. MEASUREMENT OF SEDIMENT-LADEN FLOW BY MEANS OF A CIRCULAR ORIFICE *
By NOBUHIRO YOTSUKURA, Washington, D.C.
When a sand-water mixture undergoes a rapid acceler ation, as through an orifice constriction, the sand and water behave differently because inertial forces pre dominate the motion. An approximate analysis of such flow through a circular orifice was worked out on the basis of the one-dimensional energy equation.
The equivalent-flow area required for the sediment particles may be defined by the equation
QS=KAUS, (1)
where Qs is the volumetric rate of flow of particles per unit time, A is the cross-sectional area of the pipe, Us is the mean particle velocity, and K is the coefficient to give the equivalent-flow area of the particles when applied to the total area A. Then, the rate of flow of water Qw is given by
where Uu is the velocity of the water. From the definition of mean volumetric concentration Cv, Qs and Qw are also given by the relations
andQs=CvQ, (3)
(4)
where Q is the rate of flow of the mixture.Equations 1, 2, 3 and 4 are combined into an equation
l-K Cv = U K 'l-C, U (5)
When there is no slippage of the particles relative to the water, Us is equal to Uw. Then equation 5 shows that K=CV . If Ug is not equal to Uw, however, K is not equal to Cv .
Consider a circular orifice constriction in a horizontal pipe as illustrated in figure 234 . 1 . As a first approxima tion, it is assumed that the energy loss between sections 1 and 2 is negligible. Since the flow of the mixture is continuous, the energy per unit volume of mixture at sections 1 and 2 can be considered equal. Writing the energy equation per unit volume of mixture,
_, -\
FIGURE 234.1. Sketch of flow through an orifice.
where p denotes the pressure and p the density. If it is assumed that 17^=17,1, then K±=CV and Ui can be used to replace Usi and Uwi , and equation 6 becomes
* .'
(7)
To compute pi pz as a function of Ui, Cv, pw, and ps , it is necessary to eliminate U^, Us2 , and K2 ; thus three more equations containing these variables must be derived.
The first and second of these equations are obtained by applying continuity for the water flow and the sediment flow. Thus,
and(8)
(9)
1 Based in part on dissertation for the degree of Doctor of Philos ophy, Colorado State University, October 1961.
The third equation can be obtained by considering the acceleration effects. It is assumed that the accelerative force on the sediment mass is largely a result of pressure gradient. The drag as well as the virtual mass resist-

ARTICLE 234 El 73
ance are neglected. Applying the momentum principle between sections 1 and 2 separately on the water flow and the sediment flow,
andCvp1A1 K2p2A2 = PsQs (Us2
(lOa)
(10b)
If each side of equation lOa is divided by the corre sponding side of equation lOb, and a term (Cv K2)A2p2 is assumed to be negligibly small compared with both C^Aip^ A2p2 ) and (1 Cv )(Alpl A2p2 ), it can be shown that
i p s
Us2 Ui(11)
where 7 refers to specific weight.Substituting equations 8, 9, and 11 into equation 7,
it is seen that
whereO__ ISo= >
a=w n^l
S-lo "' a-\-aCv ,
andS-\ na= - auv .
i, (12)
(13)
(14)
(15)
(16)
This is the equation of flow through an orifice, and it takes into account the differential acceleration of sediment and water. It should be noticed that A2 is the area of the vena contracta rather than the orifice area; thus, strictly speaking, A2 is not constant.
The comparable equation assuming a homogeneous mixture is given by
(17)
where the mixture density p is given by
p=(l (18)
Equations 12 and 17 are compared numerically below. For simplicity, equation 12 can be written as
U2(12')
By comparing \}/p w and (a2 l)p, or 2 and > the va-CL 1 pit
lidity of the assumption of the homogeneous mixture can be examined. In preparing the following table, S was assumed to be equal to 2.65.
\\ a
c, \(percent) \
5. __ . _ . _10..,. . .15 20 . . .25 30.... . .
*02-1
1.0621.1141.1801.2401.3001.288
1.67
ppw
1.0821.1651.2481.3301.4131.495
Ratio
1.0191.0461.0581.0731.0871.161
*02-1
1.0611.122
1.2501.3141.388
2
PPw
1.0821.1651.2481.3301.4131.495
Ratio
1.0201.0381.0571.0641.075
*02-1
1.0651.1281.1881.2601.3321.410
3
Ppw
1.0821.1651.2481.3301.4131.495
Ratio
1.0161.0331.0511.0561.0601.060
To obtain the mixture velocity corrected for the nonhomogeneous effect, the velocity determined by the assumption of homogeneous mixture is divided by the square root of the ratio in the table. It is seen that, except for a case of C,= 30 percent and a=1.67, the correction is less than 4 percent.
Because of the assumption employed in the analy sis, the result is not applicable if deposition of sedi ment takes place near the orifice. Even though the assumptions of negligible drag and virtual mass re sistance seem reasonable, they certainly will have some effect if more elaborate calculations are made. Also a small energy loss due^to the impact of sediment on the upstream face of the orifice as well as the wall friction loss are to be expected. Since each of these small effects, except that of virtual mass resistance, will lead to a higher value of P\-P<i than that given by equation 12, the true correction is somewhat larger than that given by the approximate theory used in this article.

E174 GEOLOGICAL SURVEY RESEARCH 1962
EXPERIMENTAL HYDROLOGY
235. USE OF A NEUTRON MOISTURE PROBE TO DETERMINE THE STORAGE COEFFICIENT OF ANUNCONFINED AQUIFER
By WALTER R. METER, Garden City, Kans.
WorTc done in cooperation with the State Geological Survey of Kansas, the Kansas State Board of Health, and the KansasState Board of Agriculture
The coefficient of storage of an unconfined aquifer is approximately equal to the specific yield x of the material that is drained when water is pumped from the aquifer. Under field conditions the storage coeffi cient can be determined by several methods. One of these, the aquifer-test method, consists of measuring the rate of water-level decline (or recovery) in one or more observation wells near a well from which water is being pumped (or has been pumped) at a steady rate. Another method makes use of a neutron moisture probe to determine the difference between the moisture content of saturated material and the mois ture content of the same material after it has been drained. These two distinctly different methods were used simultaneously to determine the storage coeffi cient of alluvium in the Arkansas River valley near Garden City, Kans.
In the vicinity of the test site the aquifer is very uniform both vertically and horizontally. Its thick ness is 54 feet and, although it contains a few lenses of clay, the aquifer consists largely of medium to coarse sand and fine to coarse gravel. Well 24 34 Iddb, which was pumped for the test, is 70 feet deep, and has a 16-inch casing perforated from 16 feet be low land surface to the bottom of the well. The hole drilled for the well was 30 inches in diameter; the annular space between the casing and the wall of the hole was packed with gravel before the well was developed. Observation wells and moisture-probe ac cess tubes were installed at distances of 10, 50, 100, 200, and 450 feet from the pumped well. The obser vation wells, each about 40 feet deep, were cased with li/4-inch iron pipe tipped with a 3-foot sand point. The moisture-probe access tubes were cased with
i As applied to a rock or soil; the ratio of (1) the volume of water which, after being saturated, it will yield by gravity to (2) its own volume.
1.625-inch OD (1.555-inch ID) cold-drawn steel tub ing and were plugged at the bottom to prevent en trance of water. The access tube nearest the pumped well was 30 feet deep; the others were 25 feet deep. The water-level measurements and moisture-content determinations presented here are for observation well 1 and access tube 2, both of which were 10 feet from the pumped well.
The moisture probe and sealer unit used in the test were loaned by the Kansas State Agricultural Ex periment Station at Garden City. The probe contains a BF3 (boron trifluoride) slow-neutron detector tube, a 5-millicurie fast-neutron source (radium-266 and finely ground beryllium), and a transistor amplifier circuit. The number of moderately slow or slow neutrons detected per unit of time is a measure of the concentration of hydrogen atoms in the material be ing sampled. The hydrogen content of inorganic ma terials is largely contained in the molecules of free water; hence, the slow-neutron count is a measure of the moisture content of the material. The count is registered visibly on the sealer's five glow-tube decade counters. The moisture-calibration curves supplied by the manufacturer for specific types of access tubing are used to convert counts per minute to percent moisture by volume.
Before the aquifer test was begun, the percent mois ture by volume was determined for each foot of satu rated material at each access tube. When pumping began, the moisture probe was in access tube 2; its center was 1.5 feet below the water table, at a depth of 18.1 feet below the land surface. Although, dur ing the test, most of the determinations of moisture content were made with the center of the moisture probe at that depth, some also were made with the center of the moisture probe at depths of 17.1 and 19.1 feet below land surface. The determinations

ARTICLE 235 E175
made during the test, covering about 25 hours, are given in the table below.
Water-level measurements and moisture-content determinations during aquifer test near Garden City, Kans., November 21-28, 1960
Water-level measurements and moisture-content determinations during aquifer test near Garden City, Kans., November 21 28, 1960 Continued
Time since pumping started
(minutes)
Depth to water below land surface
(feet) .
Moisture content (percent by volume)
Amount of water drained (percent
by volume)
Center of moisture probe 19.1 feet below land surfacepumping started
(minutes)below land surface
(feet)(percent by volume) drained (percent
by volume)72
Center of moisture probe 17.1 feet below land surface 73
08284 94
480 481
1,484
16.6521. 7721. 78 21.8322.82 22. 82 23. 72
29.314. 213.7 13.811.5 11.3 10. 3
y&
15. 1 15815. 6
15' 5 49117- 8 i S! 18-° '49219. 0 L ' 4y2
21. 7221. 7221.84 21. 8722.0922.09 22.8422.84 23. 75 23. 75
31.531.0Jb. 4 23.813. 112. 9 10.910. 7 9.6 9.5
0.5
5. 17.7
18.418. 6 20. 620. 8 21. 9 22.0
Center of moisture probe 18.1 feet below land surface
02468
1015202530434547485159606264666870809092109180182184484485
1,489
16. 6520. 7220. 8720. 9621.0421. 1121. 2021. 2721.3031. 3621. 5021. 5121. 5321. 5421. 5521.6121. 6221. 6421. 6621. 6721. 6921. 7121. 7621. 8121. 8221. 9122. 1822. 1922. 1922. 8322. 8323. 74
30. 530.530. 229. 731. 130. 530. 531. 130. 429. 929.629. 128.028.028. 125.524.223.423. 122.321. 120. 917.415.015. 214. 313. 913.813. 711.311.310. 3
00
. 3
.8
00
. 1
. 6
. 91. 42. 52. 52. 45.06. 37. 17.48. 29. 49. 6
13. 115. 515. 316. 216. 616. 716. 819. 219. 220. 2
Well 24-35-lddb was pumped at a rate of 915 gal lons per minute for 9,080 minutes (6 days, 7 hours, and 20 minutes). Measurement of the depth to water in all the observation wells was made at 1-minute intervals for the first 10 minutes, at 2-minute intervals for the next 10 minutes, at 3-minute intervals for 9 minutes, at 5-minute intervals for the next hour,, at 30-miimte intervals for the next 2% hours, at 6-hour intervals for the next 24 hours, and at approximately 12-hour intervals for the rest of the test. Personnel of the Division of Water Resources of the Kansas State Board of Agriculture assisted in making the water-level measurements. The .depth to water in ob servation well 1 at the times the determinations of percent moisture by volume were made with the mois ture probe also are given in the table.
The Thiem equation (Wenzel, 1942, p. 79-82) and a modified form of the Theis nonequilibrium formula (Cooper and Jacob, 1946) were used in analyzing the drawdown data. As determined by the Thiem equa tion, the coefficient of transmissibility is 127,000 gal lons per day per foot and the coefficient of storage is 0.19; as determined from the Theis nonequilibrium formula, the coefficient of transmissibility is 115,000 gallons per day per foot and the coefficient of storage is 0.21.
Selected measurements of the depth to water and of the amounts of water drained from materials at depths of 17.1, 18.1, and 19.1 feet, as computed from
667422 O - 63 - 13

E176 GEOLOGICAL SURVEY RESEARCH 1962
the determinations of percent moisture by volume, are plotted in figure 235.1 in relation to time since pumping started.
Although the data for a depth of 18.1 feet appear to indicate that drainage began between 25 and 30 minutes after pumping started, it cannot be stated with certainty that drainage began until about 43 minutes after pumping started inasmuch as the error of accuracy of the determinations is about 1 percent moisture by volume. After 1,489 minutes of pumping, the percent moisture by volume was 10.3 and drainage was virtually complete. This value, therefore, ap proximates the specific retention of the material at that depth. Inasmuch as the percent moisture by volume was about 30.5 before drainage commenced, the specific yield of that material is about 20.2 percent by volume. The curve in figure 235.1 for a depth of 18.1 feet shows that once drainage began it pro ceeded rapidly and was about 80 percent complete within 65 minutes after drainage began.
=> 18
tn 22 """/""T"---.^M^ter;
/ , ^^SL^,
vJk^\ I ^\ I I
10 100 1000 TIME SINCE PUMPING STARTED, IN MINUTES
FIGURE 235.1. Depth to water in observation well 1 and amount of water drained at depths of 17.1, 18.1, and 19.1 feet, as determined by neutron moisture probe in access tube 2.
The curve in figure 235.1 for a depth of 19.1 feet below land surface shows that drainage began about 75 minutes after pumping started. At this depth the moisture content of the fully saturated material was about 31.5 percent by volume and the specific retention after 1,492 minutes of pumping was 9.5 percent. If drainage at that time is regarded as complete, the specific yield of the material at that depth is about 22 percent by volume.
As the first determination of the moisture content at 17.1 feet was not made until 82 minutes after the test began, the time that drainage commenced at that depth is not known. Inasmuch as the moisture con tent by volume before the test began was 29.3 and the specific retention was 10.3 percent by volume, the specific yield was about 19.0 percent by volume when drainage approached completion.
Because the storage coefficient of a water-table aqui fer is approximately equal to the specific yield of the aquifer, the storage coefficient at the test site may be regarded as equal to the average of the specific-yield values for the depths of 17.1, 18.1, and 19.1 feet. That average is 0.205, which is between the values of 0.19 and 0.21 determined by analysis of the draw down data. The closeness of the value determined from measurements made with the neutron moisture probe to those determined by the aquifer-test method indicates that the two methods are equally reliable as a means of determining the storage coefficient of ho mogeneous isotropic unconfined aquifers.
REFERENCES
Cooper, H. H., Jr., and Jacob, G. E., 1946, A graphical method of evaluating formation constants and summarizing well- field history: Am. Geophys. Union Trans., v. 27, no. 4, p. 526-534.
Wenzel, L. K., 1942, Methods for determining permeability of water-bearing materials, with special reference to dis charging-well methods: U.S. Geol. Survey Water-Supply Paper 887, 192 p.

236.
ARTICLE 236 El77
CENTRIFUGE TECHNIQUE FOR DETERMINING TIME-DRAINAGE RELATIONS FOR A NATURAL SAND
By K. C. PRILL and A. I. JOHNSON, Denver, Colo.
Work done in cooperation with the California Department of Water Resources
The solution of many ground-water problems is aided by a knowledge not only of specific yield, or the ultimate drainage of sediments, but also of the amount and distribution of moisture in the sediments with respect to time since drainage started. Centrifuging has been proposed as a promising method of estimat ing moisture distribution in sediments after gravity drainage is complete (Meinzer, 1942, p. 352-356; Marx, 1956; Miller and Miller, 1955; Prill, 1961). As one phase of specific-yield research by the Geological Sur vey Hydrologic Laboratory, Denver, Colo., the cen trifuge method of estimating moisture distribution in sediments after various periods of gravity drain age is undergoing evaluation. This method has been found to yield, for medium sand, time-drainage data that agree closely with those obtained by reading tensiometers inserted into a column of the sand that is allowed to drain naturally.
Fresno sand, a natural medium sand (fig. 236.1) obtained at a test site near Fresno, Calif., was packed in duplicate plastic columns about 163 cm (centi meters) long and 2.8 cm in diameter. Tensiometers
100
were located along the columns at 19 positions above the base. The sand was saturated and then allowed to drain by gravity. Readings of moisture tension with in the columns were made at regular intervals. The data thus collected were converted to moisture con tent, in percent of dry weight, by using a calibration curve relating moisture content to moisture tension for Fresno sand. The moisture content of the sand at the different heights above the base of the columns then was plotted for 1.5, 5, 24, and 148 hours after drainage commenced (fig, 236.2). Because some of
160
5 10 15 20
MOISTURE CONTENT, IN PERCENT OF DRY WEIGHTPARTICLE-SIZE DIAMETER, IN MILLIMETERS
FIGURE 236.2. Moisture distribution in columns of Fresno sand FIGURE 236.1. Particle-size distribution of Fresno sand sample. at intervals after the start of drainage by gravity.

E178 GEOLOGICAL SURVEY RESEARCH 1962
the tensiometers were slow in responding during the early periods of drainage, the moisture values ob tained from them are not plotted. The weighted aver age moisture content (based on the moisture content at the tensiometer locations) of 3 different segments of each column as well as for the whole column was determined for each of the 4 periods of drainage. The values are given in the table below.
Moisture content of Fresno sand after drainage by gravity for selected periods and after centrifuging at 36.2 g's for calculated equivalent time
163-cm column drained by gravity
Segment of column
(centimeters above base)
100-163
70-100
0-70
0-163
Length of drainage
period (hours)
1. 55
24148
1. 55
24148
1. 55
24148
1. 55
24148
Moisture ' content
(percent of dry weight)
9. 57.45. 84.3
10. 48.66.94. 8
15. 113. 613.312. 5
12. 110. 4
9. 17. 9
4.5-cm column drained by centrifuging
Segment of column
(centimeters above base)
2. 8-4. 5
1. 9-2. 8
0 -1. 9
0 -4. 5
Calculated drainage period
(seconds)
4. 113. 766
407
4. 113. 766
407
4. 113. 766
407
4. 113. 766
407
Moisture content
(percent of dry weight)
10.27.35. 84. 0
12. 58. 56.84.9
17. 613. 514.013. 8
13. 810.39.48.4
1 Computed from moisture-tension measurements.
Fresno sand then was packed into duplicate columns 4.5 cm long for drainage by centrifuge. The centrifuge acceleration required to equate the small sample in the centrifuge to the column drained by gravity was obtained from the formula
a=T2 9> (i)
in which LI is the length of the drainage column to which the centrifuged sample is being equated, L2 is the length of the centrifuged sample, a is the centrifuge acceleration, and g is the acceleration due to gravity.
From appropriate substitutions in the formula it was determined that 36.2 g's would be required to equate the sample 4.5 cm long to the sample 163 cm long.
The relation between the times for equivalent drainage by the two methods is given by
(2)
in which ti is the time for gravity drainage, t2 is the time for drainage in the centrifuge, and a and g are as defined previously. According to equation 2, drainage periods of 4.1, 13.7, 66, and 407 seconds in the centrifuge under an induced acceleration of gravity of 36.2 g's would be equivalent to 1%, 5, 24, and 148 hours, re spectively, of natural drainage in the column. The actual centrifuge drainage periods were maintained within ± 1 second of the calculated drainage periods.
For this study, 4 pairs of samples were centrifuged for lengths of time equivalent to column-drainage periods of 1.5, 5, 24, and 148 hours. After each sample was centrifuged it was divided into fractions that were proportionally equivalent to the three dif ferent segments of the drainage column, and the mois ture content of each fraction was determined by oven drying. The values thus determined, together with the weighted average of the entire sample, also are given in the accompanying table.
The values for moisture content obtained by the two methods show a striking similarity, thus indi cating the applicability of this centrifuge technique for predicting gravity-drainage relations of sandy ma terials. Present work shows that promising results also may be obtained by this centrifuge technique when applied to a wide range of materials.
REFERENCES
Marx, J. W., 1956, Determining gravity drainage characteris tics on the centrifuge: Am. Inst. Mining Metall. Engineers Trans., v. 207, p. 88-91.
Meinzer, O. E., ed., 1942, Hydrology: New York, McGraw- Hill, Inc., 712 p.
Miller, E. E., and Miller, R. D., 1955, Theory of capillary flow pt. l, Practical implications: Soil Sci. Soc. America Proc., v. 19, no. 3, p. 267-271.
Prill, R. C., 1961, Comparison of drainage data obtained by the centrifuge and column-drainage methods: Art. 434 in U.S. Geol. Survey Prof. Paper 424-D, p. D399-D401.

ARTICLE 237 El79
237. BEHAVIOR OF DETERGENTS (ABS), BACTERIA, AND DISSOLVED SOLIDS IN WATER-SATURATED SOILS
By H. G. PAGE, C. H. WAYMAN, and J. B. EOBERTSON, Denver, Colo.
Work done in cooperation with Federal Housing Administration
Many investigators (including Flynn and others, 1958; Deluty, 1960; and Walton, 1960) have described water pollution by the anionic detergent alkylbenzene- sulfonate (ABS). This most commonly used type of household detergent is characterized by its resistance to biochemical degradation. When septic-tank and sewage-plant effluents containing ABS and bacteria are infiltrated into unsaturated materials, both of these constituents and dissolved solids are potential pollu tants of ground-water supplies. Robeck and others (1962) determined that the ABS content does not significantly influence the rate of growth of coliform bacteria (EscTierichia coli) or their movement through water-saturated sands. In our study, the comparative effectiveness of a coarse-grained, a fine-grained, and a colloid-coated soil in removing ABS, dissolved solids, and bacteria from sewage effluent was determined un der saturated-flow conditions.
Three filtration test columns approximately 4 feet (column 1), 2 feet (column 2), and 1 foot (column 3) long and of 3.75 inches inside diameter were con structed of Lucite. Column 1 was packed with "20-30 mesh Ottawa sand," column 2 with a sandy loam, and column 3 with a colloidal alumina-coated 20-30 mesh Ottawa sand. The material in the columns was packed with a mechanical vibrator (Morris and Kulp, 1961). Flow rates ranged from 2.2 to 3.6 feet per day and were maintained at approximately 2 milli- liters per minute by peristaltic pumps. The sewage effluent was introduced at the base of the columns and filtered upward to minimize the effect of air entrap ment and channeling. The apparatus for one of the columns is shown in figure 237.1.
Selected results of daily analyses of the sewage effluent, before and after nitration through test column 1, are given in figure 237.2. Coliform (Escherichia coli) and total bacteria were affected similarly by nitration, and their concentrations differed only in magnitude before and after filtration. Determination of selected constituents and properties of the sewage effluent (before filtration) indicated the following ranges of concentration: bacteria, 160,000 to 2,150,000 per milliliter; detergent (ABS), 3.3 to 5.5 ppm (parts per million); dissolved solids, 440 to 1,000 ppm; dis solved oxygen, 0.0 to 5.0 ppm; biochemical oxygen demand, 125 to 225 ppm; pH, 7.4 to 8.1; and surface tension, 50 to 55 dynes per centimeter. ABS was
3t75''
(OTygon tubing*
Lucite - cylinder
-Tygon tubing
Tygon tubing
FIGURE 237.1. Sketch showing one column of the filtration test-column apparatus.
determined by the methylene-blue method, which is subject to a variety of limitations (Wayman, 1962). Determinations of coliform and total bacteria were made by the pour-plate technique, using MacConkey and Nutrient agars, respectively, at an incubation temperature of 37°C for 48 hours. Other determina tions were made by standard laboratory methods.
The 20-30 mesh Ottawa sand in column 1 consisted principally of well-sorted rounded frosted quartz and a minor amount of mica. The parameters of this material are listed in the table (p. E180). Column 1 (Ottawa sand) was operated continuously for 71 days. During the first 10 days of operation, bacteria trav eled through the column virtually unaffected. Dur ing the next 61 days, the removal of bacteria by ni tration ranged from 50 to 99.8 percent and averaged about 88 percent. Filtration, however, had little in fluence on the ABS and dissolved-solids contents (fig. 237.2). After 71 days of operation, a 1-percent solu tion of a positively charged colloidal alumina was added to the sewage reservoir. The colloidal alumina

E180 GEOLOGICAL SURVEY RESEARCH 1962
20 30 ^ 70
TIME, IN DAYS
FIGURE 237.2. Typical effects of soil filtering of sewage effluent.
immediately caused flocculation of about 70 percent of the negatively charged ABS and reduced the bacteria count in the reservoir to zero. No additional ABS was removed by percolating this alumina-containing solution through the soil column. Addition of a 0.1- percent alumina solution removed most of the bacteria but was only about half as effective as the 1-percent solution in removing ABS (see fig. 237.2). Although effective, use of an alumina solution to treat sewage effluent on a large scale would be economically prohib itive at the present cost of 16 cents per gallon.
Physical and chemical properties of column material
[N.D., not determined, but probably insignificant]
Median diameter _ _ _/uCoefficient of sortingSurface area (calculated from sieve anal-
Porosity, packed percentTotal soluble salts. _ ____________ppm__ Organic matter _________________ _ppm_ _ CaCOa ___ ppm P2O5 _ _---__ _ ppm _N as NO3 ______________________ _ppm_ _ Available K_ ___________________ _ppm_ _
Column 1, 20-30 mesh
Ottawa sand
7601.02
2839
N.D. N.D. N.D. N.D.N.D. N.D. N.D.
Column 2, sandy loam
50>2. 35
53453
1,400 20, 000 2,000
28012
130 7.3
The sandy loam in column 2 consisted mainly of quartz, illite, feldspar, and mica (see table for addi tional properties). Approximately 57 percent of this material had a diameter of less than 61j«,. Column 2 was operated for 72 days. Chemical analyses of efflu ent sampled during initial operation of the column indicated that the ABS and dissolved-solids contents of the sewage had increased markedly in passing through the column. This increase presumably re sulted from flushing of the high content of organic matter in the soil (see table) and could not be at tributed entirely to the ABS content. (The analytical procedure used was not specific for ABS.) After the first day of operation, the amount of bacteria removed by the sandy loam ranged from 60 to 96 percent and averaged 93 percent. As in the tests of column 1, little ABS or dissolved solids was removed by filtra tion even after 72 days of operation.
The filter medium in column 3 consisted of 20-30 mesh Ottawa sand coated with colloidal alumina and had 34 percent porosity. The column was operated for only 3 days. Initial operation removed 99 per cent of the bacteria from the sewage and 30 percent of the ABS. After only V/2 days of operation, the capacity of the column to remove bacteria and ABS decreased markedly, and the test was terminated quickly.
Bacterial-slime growth, which resulted in pore clog ging, was indicated in all three columns by darkening of the filter media, presumably largely by iron sul- fide (FeS) (Winneberger and others, 1960, p. 32). In coarse sand, pore clogging increases uniformly in the direction of water flow. In fine-grained soil, pore clogging apparently develops in an erratic pattern along the more permeable channels. After 71 days of operation, pore clogging was minor in coarse sand, but after only 15 days it was serious in fine-grained materials. In the fine-grained soil of column 2, clog ging was so severe that the soil column began to break up after 68 days of operation.
In summary, coarse sand and sandy loam removed about 90 percent of the bacteria from sewage within a few feet of travel, but additional travel does not necessarily remove all the remaining bacteria. Dis solved solids and detergent content (ABS) virtually were unaffected by filtration of saturated flow. Be cause bacterial clogging occurs quickly in fine-grained soils, coarser sand is preferred as a pollution filter for the removal of bacteria. The use of colloidal alumina to remove bacteria or ABS seems to be eco nomically unfeasible at the present time.

ARTICLE 238 E181
REFERENCES
Deluty, Jerome, 1960, Synthetic detergents in well water:Public Health Repts., v. 75, p. 75-77.
Flynn, J. M., Andreoli, A., and Guerrera, A. A., 1958, Studyof synthetic detergents in ground water: Am. WaterWorks Assoc. Jour., v. 50, no. 12, p. 1551-1562.
Morris, D. A., and Kulp, W. K., 1961, Mechanical uniformpacking of porous media: Art. 305 in U.S. Geol. SurveyProf. Paper 424-D, p. D31-D32.
Robeck, G. G., Bryant, A. R., and Woodward, R. L., 1962,Influence of ABS on the movement of coliform throughwater-saturated sandy soils: Am. Water Works Assoc.Jour., v. 54, no. 1, p. 75-82.
Walton, Graham, 1960, Effects of pollutants in water supplies ABS contamination: Am. Water Works Assoc. Jour., v. 52, no. 11, p. 1354-1362.
Wayman, C. H., 1962, Limitations of the methylene blue method for ABS determinations: Art. 49 in U.S. Geol. Survey Prof. Paper 450-B, p. B117-B120.
Winneberger, J. H., Francis, L., Klein, S. A., and McGauhey, P. H., 1960, Biological aspects of failure of septic-tank percolation systems final report: Univ. California, Ber keley, College of Eng. and School of Public Health, Sani tary Eng. Research Lab., 125 p.
238. ADSORPTION OF THE SURFACTANT ABS 35 ON KAOLINITE
By C. H. WAYMAN, J. B. EOBERTSON, and H. G. PAGE, Denver, Colo.
Work done in cooperation with Federal Housing Administration
Nondegradable surfactants injected into the ground in household waste water may pollute ground-water supplies. One of the natural means of removing these surfactants from waste water is by their adsorption on soil minerals. Because the clay mineral kaolinite is widely distributed, its ability to adsorb alkylben- zenesulfonate (ABS), an essential nondegradable sur factant in detergents, was studied.
A radiotracer technique employing ABS tagged with S35 was used in the study. The effect of such variables as alkyl chain length, pH, concentration of ABS, the addition of phosphate and carboxymethyl- cellulose, and salt content on adsorption of ABS by kaolinite was observed.
A sample of kaolinite, presized at 100 percent less than 5/x diameter and 96 percent less than 2/x, was obtained from Dry Branch, Ga. Additional sizing reduced the diameter of the kaolinite to the range from 0.2/x to 2.0/x and resulted in a product having a surface area of 20.5 m2 per g (square meters per gram). Surface area was determined by a method described by Emmett (1942, p. 3). A typical chemical analysis of kaolinite (in percent) is: SiO2 , 45; A12O3 , 38; TiO2, 0.5 to 2.0; loss on ignition, 14; and CaO, Na2O, K2O, and MgO, trace amounts. The two forms of S35-tagged ABS, dodecyl ABS (C12 ) and pentadecyl ABS (C15), differed only in the number of carbon atoms in their alkyl
chains; the typical ABS ion can be represented in solution by
where R represents the alkyl chain. The specific activity of either form was 1 millicurie per millimole.
Experiments were designed to study the adsorption of ABS on kaolinite. Sealed sausage casings con taining a suspension of 200 mg of kaolinite in 10 ml of deionized water were placed in several small poly ethylene bottles. A series of solutions of varying con centrations of ABS tagged with S35 were prepared. Additional anions and cations were added to some of these solutions. Then a 10-ml volume of a different ABS solution tagged with 'S35 was added to each of the small polyethylene bottles -containing the sealed sausage casing. The bottles were capped and were placed in a constant-temperature (25°C ± 1°C) agi tated water bath. The sausage casing functioned as a molecular sieve, being permeable to ABS ions but imperable to clay particles. In time, various amounts of ABS equilibrated with the kaolinite surface.
Periodically, duplicate 1-ml samples were removed from the solutions surrounding the sausage casing and were evaporated to dryness on planchets. The dried samples were counted in a conventional beta counter utilizing a shielded end-window Geiger counter and sealer. Then the counting rates of the test samples

E182 GEOLOGICAL SURVEY RESEARCH 1962
were compared to standards containing known amounts of S35-tagged ABS. The total number of counts for both the standards and the test samples was corrected for background, and the amount of ABS adsorbed per gram of kaolinite was calculated by the following equation:
A (Cs-Ct)VKscswk (1)
where
^lfc =micrograms of ABS adsorbed per gram ofkaolinite;
Cs =the counting rate (counts per second) of 1 ml of evaporated ABS35 solution of known starting concentration (Ks), corrected for background;
Ct = the counting rate (counts per second) of 1 ml of evaporated test-sample solution, cor rected for background;
KS =ABS35 concentration (parts per million) at the beginning of an experiment ;
Wk = weight of kaolinite, in grams; and V volume of water used.
Figure 238.1 shows that ABS is more readily ad sorbed at low pH than at high pH, and that the amount of pentadecyl ABS adsorbed is significantly greater than the amount of dodecyl ABS. The ka olinite surface probably contains more positively charged sites at low pH than at high pH; conse quently, anions like ABS are more readily adsorbed at low pH. Other investigators have found that ani- onic adsorption on clay minerals is significantly de pendent on pH (Schofield, 1949; Schofield and Sam-
300
-20012
TIME, IN DAYS
son, 1953; Street, 1956; and Holtzman, 1962). At pH values greater than 4, ABS is concentrated in the so lution for short equilibration periods. This effect, indicated by negative values for adsorption of ABS, can be attributed to adsorption of water by kaolinite, thereby effectively increasing the concentration of ABS beyond that of the original solution. A pseudo- equilibrium adsorption generally was attained in about 1 or 2 days, but equilibrium adsorption was not at tained, even after 12 days.
Figure 238.2 shows that the adsorption capacity of kaolinite for ABS increases as the concentration of ABS increases. Adsorption is greatest at low pH.
The amount of ABS adsorbed by kaolinite seems to increase in the presence of phosphate and carboxy- methylcellulose (fig. 238.3). In a previous study, Header and Fries (1952) found that phosphate ion in ABS solution was not adsorbed on cotton, a highly adsorptive substance for ABS.
The table on page E183 shows the influence of differ ent types of salts on adsorption of ABS by kaolinite. Results are presented for solutions of dodecyl ABS (4 parts per million) containing approximately 0.01 molar concentrations of aluminum, calcium, or sodium chlorides. Monovalent and divalent chloride salts seem to increase ABS adsorption equally well for the pH range from 4 to 10. Trivalent salts (for exam ple, A1C13 ) cause greater ABS adsorption, especially in the pH range from 4 to 7. This greater adsorption might be explained in part by the combined effects of critical micelle concentration (CMC) and the Schulze- Hardy rule. The CMC is the concentration of sur factant (ABS) necessary to promote formation of
300
200
m o: ujO i- w ^ m ? < -i 100
og -100o
-20010 12
TIME. IN DAYS
FIGURE 238.1. Influence of pH, length of alkyl chain, and time FIGURE 238.2. Influence of.pH, ABS concentration, and time on adsorption of ABS by kaolinite. on adsorption of ABS by kaolinite.

ARTICLE 238 E183
Effect of various salts on ABS adsorption on kaolinite
Percentage in crease in A RS
adsorbed
NaCl, 584 ppm
10.
CaCl2 , 952 pprn
A1C13, 1,333 ppm
10.
403050
355060
17520075
1 Adjusted by adding hydrochloric acid or sodium hydroxide.
ionic aggregates (micelles) from single ions. The micelles have a much higher degree of surface activity than do single ions. The CMC can be reduced if salts are in solution (Corrin and Harkins, 1947). For the
200
mce uj OHm ?<-i 100
ce w oS ->o
-200
EXPLANATION
10 ppm dodecyl ABS
10 ppm dodecyl ABS + 10 ppm phosphate
- 10 ppm dodecyl ABS + 10 ppm phosphate+ 1 ppm carboxy- methylcellulose
O pH=4
A pH = 7 -
El pH = 10
6 8
TIME. IN DAYS
10 12
FIGURE 238.3. Influence of phosphate, carboxymethylcellulose, pH, and time on ABS adsorption by kaolinite.
Schulze-Hardy rule, the higher the valency, the less of the cation required to reduce the CMC (Lange, 1951; Powney and Addison, 1937). If the surface activity is increased by the formation of detergent micelles, then solutions containing high concentrations of salt and highly charged ions (for example, A1+3 ) might enhance ABS adsorption on clay minerals.
This study indicates that ABS adsorption on ka olinite is influenced markedly by the length of the alkyl chain of the surfactant (ABS), concentration of ABS, pH of the solution, and the type and amount of salt in solution.
Studies similar to the above are in progress for the clay minerals illite and montmorillonite and' for mixed clay minerals.
REFERENCES
Corrin, M. L., and Harkins, W. D., 1947, The effect of salt on critical concentration for the formation of micelles In colloidal electrolytes: Am. Chem. Soc. Jour., v. 69, p. 683- 688.
Emmett, P. H., 1942, The measurement of the surface areas of finely divided or porous solids by low temperature ad sorption isotherms: Advances in Colloid Sci., v. 1, p. 1-38.
Holtzman, W., 1962, The application of the Verwey and Over- beek theory to the stability of kaolinite-water systems: Colloid Sci. Jour., v. 17, p. 363-382.
Lange, H., 1951, Tiber dem Einfluss gewohnlicher Electrolyte auf die Mizellenbildung in Kolloidelectrolytelosung: Kol- loid-Zeitschrift, v. 121, p. 66-71.
Meader, A. L., and Pries, B. A., 1952, Adsorption In the de tergent process: Indus, and Eng. Chemistry, v. 44, p. 1636- 1648.
Powney, J., and Addison, C. C., 1937, The properties of deter gent solutions. II. The surface and interfacial tensions of aqueous solutions of alkali sodium sulfates: Faraday Soc. Trans., v. 33, p. 1243.
Schofield, R. K., 1949, Effect of pH on electric charges car ried by clay particles: Soil Sci. Jour., v. 1, p. 1-8.
Schofield, R. K., and Samson, H. R., 1953, The deflocculation of kaolinite suspensions and accompanying change-over from positive to negative chloride adsorption: Clay Min erals Bull., v. 2, p. 45-50.
Street, N., 1956, The rheology of kaolinite suspensions: Aus tralian Chemistry Jour., v. 9, p. 467.

E184 GEOLOGICAL SURVEY RESEARCH 1962
239. AN APPLICATION OF THE GIBBS ADSORPTION EQUATION TO DETERGENT SOLUTIONS
By.COOPER H. WAYMAN, Denver, Colo.
Work done in cooperation with Federal Housing Administration
Surfactants (surface-active agents) or detergents cause changes in the surface properties of solutions. Changes in surface properties of detergent solutions at the air-solution interface can be evaluated by meas urement of the solutions' surface tension. The im portance of surface tension to water-pollution studies has been indicated in adsorption studies by Wayman and Eobertson (1962).
In adsorption studies of detergents, the area occu pied by a detergent molecule at the air-solution inter face is essential to the calculation of amounts of de tergents required to form a monomolecular layer on solid mineral surfaces (Wayman, 1962). The discus sion that follows describes how this area can be de termined from an application of surface-tension meas urements to the Gibbs adsorption equation.
The original Gibbs adsorption equation showing the behavior of surfactants at the air-solution inter face with respect to concentration was derived for ideal, dilute solutions (Gibbs, 1928, p. 219). Later workers who have used surface-tension measurements as a mean of studying the behavior of surfactants at air-solution interfaces have disagreed as to the validity of the equation. For nonionic surfactants, the Gibbs adsorption equation seems to be satisfactory (Hutch- inson, 1948). For ionizable compounds, some investi gators found that the surface excess (the amount of surfactant at the air-solution interface compared to the amount in the bulk solution) calculated from sur face-tension measurements amounts to only half the value measured directly (Brady, 1949; Salley and others, 1950). Pethica (1954) showed that the equa tion is valid only in an excess of a neutral salt. Davies (1952) achieved satisfactory results in calculating the surface excess of cetyltrimethylammonium ions at the oil-water interface, and Matuura and others (1958) found that the surface excess of alkyl sulfates could be calculated reasonably well for concentrations below the critical micelle concentration (that concentration at which single ions begin to form into a cluster of ions). To the writer's knowledge, the Gibbs adsorp
tion equation has not been previously applied in stud ies of solutions containing the surfactant alkylbenzene- sulfonate (ABS).
When surfactants are added to water, their ions or molecules tend to concentrate at the surface in prefer ence to the bulk of solution. The surfactant solute can be represented in solution as a hydrophilic (water- attracting) group and a hydrophobic (water-repelling) group. For the widely used anionic surfactant alkyl- benzenesulfonate, the two groups are located as
[M C6H4 Hydrophobic group Hydrophilic group
where M is the length of the alkyl chain.For a dilute solution of sodium alkylbenzenesulfonate
(Na+1X-1), the Gibbs adsorption equation can be ex pressed as
a« R TTx-idlnCx-i
where(1)
dy= change in surface tension, R=gas constant, T= absolute temperature,
rNa+i=adsorption of sodium ion at the surface, IVi=adsorption of the anionic detergent ion at
the surface,rH+i=adsorption of the hydrogen ion at the sur
face, and CNan, Cx-i, CH«=various ionic concentrations.
If the pH is kept constant and sodium ion is not adsorbed at the surface, then rNa«=0 and FH+i^r^-i = rHjr with CNa,+i = Cx-i=CN&x, and equation 1 reduces to
J- "FT !V /^~"A/xrt T~»rrT " 7 T _ /~y " \ /
Hence, the surface excess, THST (adsorption at the sur face), can be calculated from equation 2 if the surface tension is measured at various ionic concentrations.
Figure 239.1 shows the change in surface tension at various concentrations of detergent at five different temperatures ranging from 2°C to 35°C. At tempera-

ARTICLE 239 E185
o.oooiABS CONCENTRATION, IN MOLES PER LITER
0.001 _______0.011 I I I I
70
60
I I
EXPLANATION
n 2°cA io°c
O 20"C
V 27°C
O 35°C
50
30
20. I I I10 100
ABS CONCENTRATION, IN PARTS PER MILLION
1000 4000
FIGURE 239.1. Relation of surface tension to concentration of ABS and to temperature.
tures of more than 2°C, small changes in concentra tion produce large changes in surface tension for ABS concentrations of as much as the critical micelle con centration (approximately 1,000 ppm). At this con centration, the detergent has less tendency to accu mulate in the surface than at lower concentrations. After computing the changes in surface tension from the slopes of figure 239.1, the surface excesses were calculated and then were plotted on figure 239.2. The data indicate that detergent anions tend to accumulate at the surface and to saturate the air-solution inter face at concentrations of about 1,000 ppm, the critical micelle concentration; at greater concentrations, de- sorption seems to occur. Maximum concentration of ABS at the air-solution interface is indicated at the lowest temperature (2°C).
The data from figure 239.2 can be used to calculate the area occupied per detergent molecule at the air-solution interface as follows:
1 (3)S=TN
whereS area occupied per molecule;
7Vr=Avogadro's number=6.02 X10²³ moleculesper mole;
r=surf ace excess, in moles per cm2 .
If the area occupied per molecule is known, monolayer or multilayer adsorption on solid mineral surfaces can be more readily determined. Equation 3 was used to calculate the area occupied (S) per molecule of a deter gent solution containing 50 ppm of sodium alkyl- benzenesulfonate at 20°C. Thus,
S=3.35X10- 10 moles per cm2 X10- 18 cm2 per A2 X6.02X1023 molecules permole
=49 A2 per molecule,

E186 GEOLOGICAL SURVEY RESEARCH 1962
0.001 0.002
ABS CONCENTRATION, IN MOLES PER LITER
0.003 0.004 0.005 0.006 0.007 0.008 0.009
-1
-OEXPLANATION
D 2°C
A 10°C
o 20°C
V 27°C
O 35°C
1000 2000
ABS CONCENTRATION, IN PARTS PER MILLION
FIGURE 239.2. Relation of surface excess to concentration of ABS and to temperature.
3000
where A2 (1 square angstrom unit) is equivalent to 10~16 cm2 . For similar detergent solutions, the location of the hydrophilic group on the hydrocarbon chain has a pronounced influence on S (Meader and Griddle, 1953). These investigators found the following values for S in dilute solutions of detergents: sodium 1-dode- cylbenzenesulfonate ($=38 A2 per molecule), sodium 2-dodecylbenzenesulfonate (49.5), sodium 6-dodecyl- benzenesulfonate (120), and hygroscopic dodecyl- benzenesulfonate (56). These data suggest that the detergent used in our work ($=49 A2 per molecule) consisted mainly of sodium 2-dodecylbenzenesulfonate.
REFERENCES
Brady, A. P., 1949, Surface tension of aqueous solutions of two foam-fractionated detergents: Jour. Phys. and Col loid Chem., v. 53, p. 56-66.
Davies, J. T., 1952, The application of the Gibbs equation to charged monolayers, and their desorption from the oil- water interface: Faraday Soc. Trans., v. 48, p. 1052-1061.
Gibbs, J. W., 1928, Collected works of J. W. Gibbs, v. 1: London, Longmans, p. 219.
Hutchinson, E., 1948, Mixed monolayers. I. Adsorbed films at air-water interfaces: Jour. Colloid Sci., v. 3, p. 413-424.
Matuura, R., Kimizuka, H., Miyamoto, S., and Shimozawa, E., 1958, The study of the adsorption of detergents at a solu tion-air interface by radiotracer method. I. Adsorption isotherm for the solution of sodium alkyl sulfates: Chem. Soc. Japan Bull., v. 31, p. 532-538.
Meader, A. L., and Griddle, D. W., 1953, Force-area curves of surface films of soluble surface-active agents: Jour. Col loid Sci., v. 8, p. 170-178.
Pethica, B. A., 1954, The adsorption of surface-active electro lytes at the air-water interface: Faraday Soc. Trans., v. 50, p. 413-421.
Salley, D. J., Weith, A. J., Argyle, A. A., and Dixon, J. K., 1950, Measurement of the adsorption of surface-active agents at a solution-air interface by a radiotracer method: Royal Soc. London Proc., series A203, p. 42-55.
Wayman, C. H., 1962, Adsorption of anionic detergent on solid mineral surfaces: Art. 117 in U.S. Geol. Survey Prof. Paper 450-C, p. C137-C139.
Wayman, C. H., Robertson, J. B., and Page, H. G., 1962, Surface tension of detergent solutions: Art. 179 in U.S. Geol. Survey Prof. Paper 450-D, p. D190-D192.
SUBJECT INDEX
[For major topic headings such as "Economic geology," "Engineering geology," "Stratigraphy," see under State names or refer to table of contents]
ArticleABS. See Surfactants.Aeromagnetic surveys, Nevada, Egan Range__ 180
Utah, Oquirrh Mountains..__ 187 Airborne control system, description 218 Alabama, stratigraphy, coal fields..__-__ 193 Alaska, quartz diorite line______ 203 Alluvium, storage coefficient_.___ ___- 235 Alteration, hydrothermal, hot springs.. ___ 200
propylitic, hot springs and ore deposits_ 201 Amsden Formation, Wyoming, geologic
history._______________ 195 Antarctica, geochronology, Thiel Mountains.. 208 Aquifers, glacial deposits. - _________ 224,227
unconflned, determination of storagecoefficient__-..._________ 235
Arid land, hydrology.______________ 229 Arizona, stratigraphy, northern_____.__ 197
B
Bacteria, removal from sewage by soils.... _ 237Bentonite beds, composition__________ 198Bioherms, permeability...___________ 191
C
Cadmium, ion-exchange separation and spec-trophotometric determination.... 214
California, engineering geology, FresnoCounty_______________ 210
sedimentary petrology, Fresno County... 210 Canada, quartz diorite line. __________ 203 Carbonate rocks, Pa25i/U-Th"0/U dating
method________________ 209 Carboniferous. See Mississippian, Pennsyl-
vanian. Carmel Formation, Arizona and Utah, relation
to Navajo Formation_______ 197Utah, bentonite beds___________ 198
Centrifuges, in measurement of soil moisture_ 236Cerium, in syenite.._______________ 204Chile, geomorphology, San Pedro de Atacama. 207
stratigraphy, Aconcagua Province.... _ _ 196structural geology, Salar de Atacama-.._. 186
Clay minerals, association with hot springs_ 200Collapse structures, ground water in_.____ 225Colorado, economic geology, Wet Mountains. 181
stratigraphy, Middle Park.....__ ___ 189Compaction, silty sediments.._ ___ _ __ 210Copper, effect on precipitation of tellurium. _ 215Crab Orchard Mountains Formation, Georgia,
definition of new members. _______ 194Craters, volcanic.._______________ 211 Cretaceous, Colorado, stratigraphy.____ 189 Cretaceous-Jurassic boundary, Chile.-..___ 196 Cryptovolcanoes, Missouri, Crooked Creek... 183
D
237Detergents, removal from sewage by soils_____See also Surfactants.
Dissolved solids, removal from sewage bysoils._________.__.____. 237
surface water, source. ___________ 230 Drainage, comparison on topographic maps 212 Drainage basins, characteristics________ 229
EArticle
Epidote, hydrothermal_____________ 201 Evapotranspiration, effect of streamflow___ 221
Faults and faulting, Chile, Salar de Atacama. 186 Floods, frequency based on extremes of short-
term records____________ 228 frequency in the Southwest________ 229
Flowerpot Shale, southwestern Oklahoma,halite deposits..__________ 190
Fluorine, spectrophotometric determinationwith thoron.. ___________ 216
Fort Payne Chert, Tennessee, bioherms___ 191 Fresh water, relation to salt water_____ 219,226 Fluorine, spectrophotometric determination
with thoron..___________ 216
Q
Galena, lead isotope studies. _________ 199 Georgia, engineering hydrology, Georgia Nu
clear Laboratory__________ 220 stratigraphy, northwest- _________ 194
Gibbs adsorption equation, application to de tergent solutions__________ 239
Glacial till, permeability-..__________ 224 Gravity surveys, Utah, Oquirrh Mountains 187 Great Salt Lake, salt content. _________ 230 Ground water, coefficient of storage in uncon-
fined aquifers____________ 235 inflow to streams._____________ 223
H
Halite deposits, relation to salt springs____ 190Hot springs, clay minerals___________ 200
epidote and zeolites___________ 200,201
Ice cover, relation to ground-water inflow tostreams.._______________ 223
Iceland, geochemistry, Hveragerdi and Rey kjavik-____________-. 200, 201
Idaho, geomorphology, Menan Buttes____ 211 metamorphism and petrology, Big Creek
quadrangle.____________ 204Riggins quadrangle_______.__ 205
Idaho batholith, associated older rocks____ 204trondhjemite...___________.___ 205
Illinois, ground water, southern. ______ 224Ion-exchange separations, cadmium_ ___ 214Ionium dating, carbonate rocks________ 209Isotopes, lead, growth-zoned crystal..--___ 199
Jurassic, Arizona and Utah, stratigraphy. __ 197Utah, bentonite beds. ___________ 198
Jurassic-Cretaceous boundary, Chile____. 196
Kaolinite, adsorption of surfactants on___ 238Kentucky, stratigraphy, northeastern____ 192
structural geology, Middlesboro Basin__ 184
Note. Numbers refer to articles
Article
Landslides, causes of..... 182 Lead, isotopes, variation with growth zoning. 199 Lead-alpha age determinations, zircon 208 Lee Formation, Kentucky, northeastern 192
M
M applng, airborne control system. 218portable surveying tower 217
Metamorphism, zeolitic fades... -- 201Meteoritic impact structures, Kentucky 184
Missouri-.. 183Michigan, engineering hydrology, Upper
Peninsula,.-.. 223 Middle Park Formation, Windy Gap Volcanic
Member, Colorado... 189 Mississippian, Alabama, correlations 193
Tennessee, bioherms---- 191 Utah, correlations... 188
Mississippian-Pennsylvanian boundary, Ken tucky... .._.... . - 192
Missouri, structural geology, Crooked Creekarea. 183
Montana, engineering geology, Gardlner 182geomorphology, Gardlner 182
N
Navajo Formation, Arizona and Utah, relationto Carmel Formation 197
Neutron moisture probe, in determination ofaquifer storage coefficient 235
Nevada, economic geology, Egan Range 180geochemistry, Egan Range 180geophysics, Egan Range 180
New Mexico, flood frequency 229glacial geology, Sangre de Cristo Moun
tains and Sierra Blanca... 213ground water, Eddy County.. 225
New York, ground water, Centre Island 226ground water, Kings and Queens Counties. 219
Niobium, Colorado, Wet Mountains 181Idaho, central.......... 204
O
Ohio, ground water, Montgomery County 224 ground water, northeastern 224
Oklahoma, engineering hydrology, Pond Creekbasin. 221
stratigraphy, Beckham and HarmonCounties..___ 190
Olivine, X-ray determinative curve 206 Open-channel flow, turbulent-diffusion equa
tion-.. - 233Oquirrh Formation, Utah, correlations 188 Ore deposits, propylitic alteration.... 201Orifices, circular, measurement of sediment-
laden flow.. 234
Pa23i/U-Th23l)/U dating method, Pleistocenecarbonate rocks__ ._ 209
Pacific province, thorium and uranium 202 Parkwood Formation, Alabama, correlation.. 193
E187

E188 INDEX
ArticlePathfinder uplift, Wyoming, definition and
history.______________ 195 Pennington Formation, Kentucky, northeast
ern.. 192Pennsylvanlan, Georgia, nomenclature..__ 194
Utah, Oquirrh Formation_________ 188Wyoming, Pathfinder uplift_______ 195
Perldotites, olivlne from alpine and stratiformtypes_____--.--._........ 206
Permian, southwestern Oklahoma, halite__ 190Utah, Oquirrh Formation_________ 188
Piedmont province, drainage_________ 212 Pleistocene, New Mexico, correlations..------ 213
Montana, landslides________.___ 182 Pleistocene continental rocks, dating,.__... 209 Pollutants, in water-saturated soil______ 237 Porosity, relation to overburden, particle size,
and sorting...._________. 210 Portable surveying tower, description..__ 217 Pottsville Formation, Alabama, correlation_ 193 Proactlnium dating, carbonate rocks__. __ 209
Q
Quartz dlorite line, northwestern NorthAmerica_______________ 203
Quaternary, Idaho, Snake River Plain... __ 211 See also Pleistocene.
R
Ramey Ridge Complex, Idaho, definition-... 204 Rare earths, Colorado, Wet Mountains_.... 181
See oZso specific name.Recession curves, streamflow._________ 232 Reservoirs, determination of storage-outflow
characteristics__________. 232
Salt, In surface water______________ 230Salt cups, formation of.__---------__... 207Salt springs, source of salt..__________ 190
ArticleSalt-water encroachment, New York, Long
Island . 219Saprollte, water infiltration rates.. 220 Sediments, silty, compaction. __.. ._ 210 Shatter cones, occurrence and mode of forma
tion......... ... .. 183Short-term records, as basis for long-term flood
frequency.. 228 Soils, measurement of moisture content 236
removal of detergents, bacteria, and dis solved solids....__ ......- 237
South Dakota, ground water, east-central . 224Specific capacity, equations for estimating 222Spectrophotometric determinations, cadmium 214
fluorine ....____ . . 216Stalagmites, dating..._....__._ .. 209Storage coefficient, determination for uncon-
flned aquifers_ 235Storage-outflow characteristics, reservoirs ... 232Streamflow, effect of evapotranspiration ... 221
measurement of sediment-laden flow._.. 234relation of accretion to Ice cover . 223
Surfactants, adsorption on kaollnlte.. 238effect on surface properties of solutions... 239
Surveying, airborne control system 218portable towers___._-_ 217
Syenite, cesium and niobium. 204
T
Tellurium, precipitation with hypophos-phorous acid......_ 215
Tennessee, petrography, Caney Fork Riverarea._ 191
stratigraphy, Caney Fork River area. 191Tertiary, Colorado, stratigraphy 189Texas, flood frequency . 229Thorium, clrcum-Paclflc province. 202
Colorado, Wet Mountains 181Thoron, In Spectrophotometric determination
of fluorine...-. -.-._------_ 216Topographic maps, comparison of drainage on. 212
ArticleTransmisslbillty, calculating distribution of 235 Tri-State mining district, lead Isotope studies. 191 Trondhjemite, occurrence in Idaho batholith.. 209 Tuff, glassy basalt. . . _____ 211 Turbulent flow, open-channel... ______ 233
U
Uranium, circum-Paciflc province.______ 202Utah, geophysics, Oquirrh Mountains.____ 187
mineralogy, southwest___________ 198quality of water, Great Salt Lake area_ 230stratigraphy, Oquirrh Mountains____ 188
southwestern__ ___.__ 197structural geology, Oquirrh Mountains_ 187
V
Virginia, structural geology, Valley and Ridgeprovince______..._______ 185
Volcanic rocks, thorium and uranium content. 202 Volcanlsm, cones of glassy basalt tuft_____ 211
W
227Washington, ground water, Tacoma area...- Water infiltration, rate in weathered crystal
line rocks_____ ______ 220 Water stage, analysis.__------ ______ 231Weathering, effect on water infiltration rates 220 Well yield, formula for estimating_______ 222 Wyoming, stratigraphy, southern.. ______ 195
X
X-ray determinations, olivine from perido-tltes .... ... .....___ 206
Zeolites, hydrothermal... __________ 200,201 Zircon, lead-alpha ages______________ 208
AUTHOR INDEX
Antal, P. S-Article
.. 209
Benson, M. A__________________ 228,229 Blake, M. C., Jr.--------------_.. . 203Brock, M. R____________________ 183 Brokaw, A. L. . __. - 180Buck, K. L- 199Buckmaster, J. L_____________.__ 217,218
Campbell, Esma...________...._ 202Cannon, R. S., Jr. 199Carter, W. D ... .... 196Clark, W. E.......... ... ... 221Conover, W. J___________________ 228Cooper, J. B...... . .- .. ._.. 225Culbertson, W. C.......__... - ....... 193,194
Dando, T. O.-...-._............_...... 218Diaz, A. M........_........................ 230Dickey, D. D............................... 197Dlngman, R. J............................. 186,207Dobrovolny, Ernest_______________ 192
Englund, K. J....____.._____......... 184Ford, A. B.... . .... . . 208
Glustl, E. V .. - 212Gott, G. B........................ ..-. .- 180Gottfried, David... - 202Grantz, Arthur. --_. . 203
Hamilton, Warren... 205,211Harris, L. D..... .................... 135Heyl, A. V ......... .... iH3Hildebrand, F. A. 181Hoover, D. L-. 189Hotz, P. E.. .. - 206Hubbard, H. A.. 208Huffman, Claude, Jr_. ... 214Hyden, H. J.... ...... ... .... 182
Ingram, B. L ..._... . ___ 216Isbister, John-....__._ . ......__ 226Izett, G. A -._......_ . 189
Note. Numbers refer to articles.
Jackson, E. D. Johnson, A. I..
206236
Kiilsgaard, T. H. ........... ............ 183
Lakin, H. W .... ............ 215Leonard, B. F ... ... 204Loving, H. B. _.............__._ 218
Mabey, D. H.............................. 180,187McCarthy, Howard. . 180Mallory. W. W_......... ........... __ 195Marcher, M. V .... .... . 191Meade, R. H. 210Meyer, W. R ......... ...._ __ 235Moore, J. G___________.________ 203Moore, Roosevelt.. 202Murphy, W. D.............................. 217Myers, W. B................................. 211
Newport, T. G ... .......... - 223Norris, S. E .............................. 224

INDEX E189
Article Article Article Oda.Uteana. . - 180 Rosholt, J. N _ ___________.___.._____.____ 209 Thompson, C. E. ........... ................. 215
Tooker, E. W.. ............................ 187,188J---------- Turcan, A. N, Jr............................ 222
Page, H. G ......... 237,238 Schultz, L. G__ __________________ 198
i^arKer, K. 1, ........................ isi John................................. 232,233 Waldrop, H. A. _.___. .__._. 182Perlmutter, N. M ________________ 219 ,_ , . , , ,. -^ T _ . . ' Sheppard, E. A._...................... ... 192 Walters, K. L.. . ......^........ .......... 227P 11 1 -R r r ^ Sigvaldason.G.E....... ................... 200,201 Ward, P. E._ .......... ......... ..... 190rrm, ±i.u_._ .-......................._... Zdb Soren, Julian................................. 219 Wayman, C. H. ........... ........... 237,238,239
Stallman, E. W........ ...................... 231 White, D. E__... ..............-..... .. 201Richmond, G. M...... ....................... 213 Stern, T. W.................................. 208 Wiitala, S. W.. ........... ... .. . .. 223Roberts, R. J _________________ 187,188 Stewart, J. W. .............. _ ... __ ... . _ 220 Wright, J. C. _ .... __ ... _____ ...... 197,198Robertson, J. B. __ . _ ....... _ ........ 237,238Roen, J. B. ______ . ________ ... __ 184 Taylor, R. B ________ .' __ . ______ 189 Yotsukura, Nobuhlro... . ___ . 234
Note Numbers refer to articles.
o