GEOLOGICAL SURVEY RESEARCH 1963 - USGS ...
227
Articles 1-59 GEOLOGICAL SURVEY RESEARCH 1963 Short Papers in Geology and Hydrology GEOLOGICAL SURVEY PROFESSIONAL PAPER 475-B
-
Upload
khangminh22 -
Category
Documents
-
view
0 -
download
0
Transcript of GEOLOGICAL SURVEY RESEARCH 1963 - USGS ...
Articles 1-59
GEOLOGICAL SURVEY RESEARCH 1963
Short Papers in Geology
and Hydrology
GEOLOGICAL SURVEY PROFESSIONAL PAPER 475-B

Short Papers in Geology
and Hydrology
Articles 1-59GEOLOGICAL SURVEY RESEARCH 1963
GEOLOGICAL SURVEY PROFESSIONAL PAPER 475-B
Scientific notes and summaries of investigations prepared
by members of the Conservation, Geologic, and Water
Resources Divisions
UNITED STATES GOVERNMENT PRINTING OFFICE, WASHINGTON : 1963
UNITED STATES DEPARTMENT OF THE INTERIOR
STEWART L. UDALL, Secretary
GEOLOGICAL SURVEY
Thomas B. Nolan, Director
For sale by the Superintendent of Documents, U.S. Government Printing OfficeWashington 25, D.C.

FOREWORDThis collection of 59 articles is one of a series to be released in 1963 as chapters of Pro
fessional Paper 475. The articles report on scientific and economic results of current work by members of the Geologic, Water Resources, and Conservation Divisions of the United States Geological Survey. Some of the papers present the results of completed parts of con tinuing investigations; others announce new discoveries or preliminary results of investiga tions that will be discussed in greater detail in reports to be published in the future. Still others are scientific notes of limited scope, and short papers on methods and techniques.
Chapter A of this series will be published later in the year, and will present a synopsis of results of work done during the present fiscal year.
X-THOMAS B. NOLAN,
Director.in

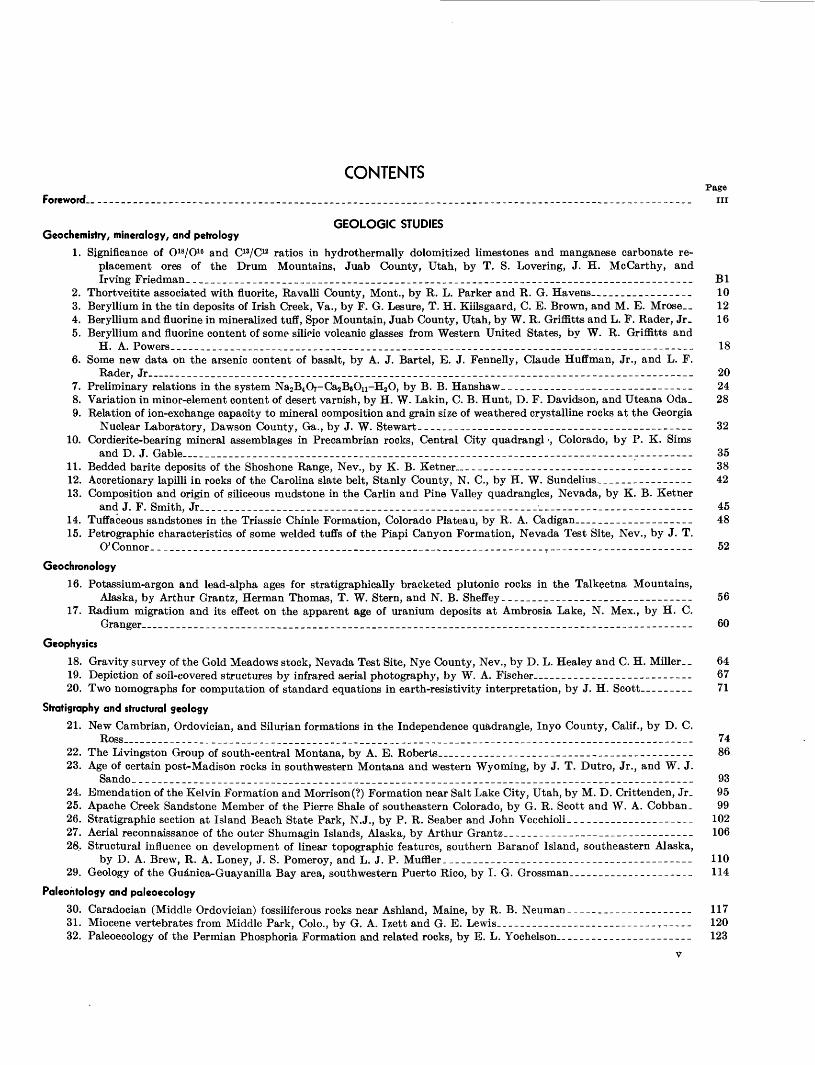
CONTENTSPage
Foreword..----____-__-_-___-_-___--____________________._________________________--_-__------_-_--_-___-_---__ in
GEOLOGIC STUDIES Geochemistry, mineralogy, and petrology
1. Significance of O 18/O16 and C13/C12 ratios in hydrothermally dolomitized limestones and manganese carbonate re placement ores of the Drum Mountains, Juab County, Utah, by T. S. Levering, J. H. McCarthy, and Irving Friedman_____________________________________________________________________________________ Bl
2. Thortveitite associated with fluorite, Ravalli County, Mont., by R. L. Parker and R. G. Havens __-____-__-____ 103. Beryllium in the tin deposits of Irish Creek, Va., by F. G. Lesure, T. H. Kiilsgaard, C. E. Brown, and M. E. Mrose__ 124. Beryllium and fluorine in mineralized tuff, Spor Mountain, Juab County, Utah, by W. R. Griffitts and L. F. Rader, Jr. 165. Beryllium and fluorine content of some silicic volcanic glasses from Western United States, by W. R. Griffitts and
H. A. Powers._________._.__.__.______...___.________._.______._.__-________._. _.___ _ 186. Some new data on the arsenic content of basalt, by A. J. Bartel, E. J. Fennelly, Claude Huffman, Jr., and L. F.
Rader, Jr. ________________...___.__._.___..__._ ______.__._________._______ .._ 207. Preliminary relations in the system Na2B4O7-Ca2B6Ou-H2 O, by B. B. Hanshaw. _______________________________ 248. Variation in minor-element content of desert varnish, by H. W. Lakin, C. B. Hunt, D. F. Davidson, and Uteana Oda_ 289. Relation of ion-exchange capacity to mineral composition and grain size of weathered crystalline rocks at the Georgia
Nuclear Laboratory, Dawson County, Ga., by J. W. Stewart---___-_---_---_----_-------------_----------- 3210. Cordierite-bearing mineral assemblages in Precambrian rocks, Central City quadrangl -, Colorado, by P. K. Sims
and D. J. Gable...._______..___.____..._____.__________.__._._____..__ ____.. _-_ _ 3511. Bedded barite deposits of the Shoshone Range, Nev., by K. B. Ketner _______-___-_-________--_---_-----_--- 3812. Accretionary lapilli in rocks of the Carolina slate belt, Stanly County, N. C., by H. W. Sundelius,______-__-----_ 4213. Composition and origin of siliceous mudstone in the Carlin and Pine Valley quadrangles, Nevada, by K. B. Ketner
and J. F. Smith, Jr___.___________________________________.___ ___________________ 4514. Tuffaceous sandstones in the Triassic Chinle Formation, Colorado Plateau, by R. A. Cadigan _________________ 4815. Petrographic characteristics of some welded tuffs of the Piapi Canyon Formation, Nevada Test Site, Nev., by J. T.
O'Connor.---------______-_----________-----_____-_---_-----__------------- T _----------------------- 52
Geochronology
16. Potassium-argon and lead-alpha ages for stratigraphically bracketed plutonic rocks in the Talkeetna Mountains,Alaska, by Arthur Grantz, Herman Thomas, T. W. Stern, and N. B. Sheffey--_______-_--_-____--___-__----- 56
17. Radium migration and its effect on the apparent age of uranium deposits at Ambrosia Lake, N. Mex., by H. C.Granger _ ___-_-___-______________________________-___--______-_____--_--__---_--_-_--------------- 60
Geophysics
18. Gravity survey of the Gold Meadows stock, Nevada Test Site, Nye County, Nev., by D. L. Healey and C. H. Miller. _ 6419. Depiction of soil-covered structures by infrared aerial photography, by W. A. Fischer __________________--_--- 6720. Two nomographs for computation of standard equations in earth-resistivity interpretation, by J. H. Scott--------- 71
Stratigraphy and structural geology
21. New Cambrian, Ordovician, and Silurian formations in the Independence quadrangle, Inyo County, Calif., by D. C.Ross_____-.________.__._____.__.______________________._____.____-_______ 74
22. The Livingston Group of south-central Montana, by A. E. Roberts__________-________---__-_-___-__-_------ 8623. Age of certain post-Madison rocks in southwestern Montana and western Wyoming, by J. T. Dutro, Jr., and W. J.
Sando_____..____________________________________________ __________________ 9324. Emendation of the Kelvin Formation and Morrison(?) Formation near Salt Lake City, Utah, by M. D. Crittenden, Jr_ 9525. Apache Creek Sandstone Member of the Pierre Shale of southeastern Colorado, by G. R. Scott and W. A. Cobban. 9926. Stratigraphic section at Island Beach State Park, N.J., by P. R. Seaber and John Vecchioli- ______________---_-- 10227. Aerial reconnaissance of the outer Shumagin Islands, Alaska, by Arthur Grantz_________________________------- 10628. Structural influence on development of linear topographic features, southern Baranof Island, southeastern Alaska,
by D. A. Brew, R. A. Loney, J. S. Pomeroy, and L. J. P. Muffler________________________________------_- 11029. Geology of the Gua'nica-Guayanilla Bay area, southwestern Puerto Rico, by I. G. Grossman_______________---_-_ 114
Paleontology and paleoecology
30. Caradocian (Middle Ordovician) fossiliferous rocks near Ashland, Maine, by R. B. Neuman_____________________ 11731. Miocene vertebrates from Middle Park, Colo., by G. A. Izett and G. E. Lewis-------------_---_---------,---_- 12032. Paleoecology of the Permian Phosphoria Formation and related rocks, by E. L. Yochelson_______________________ 123
VI CONTENTS
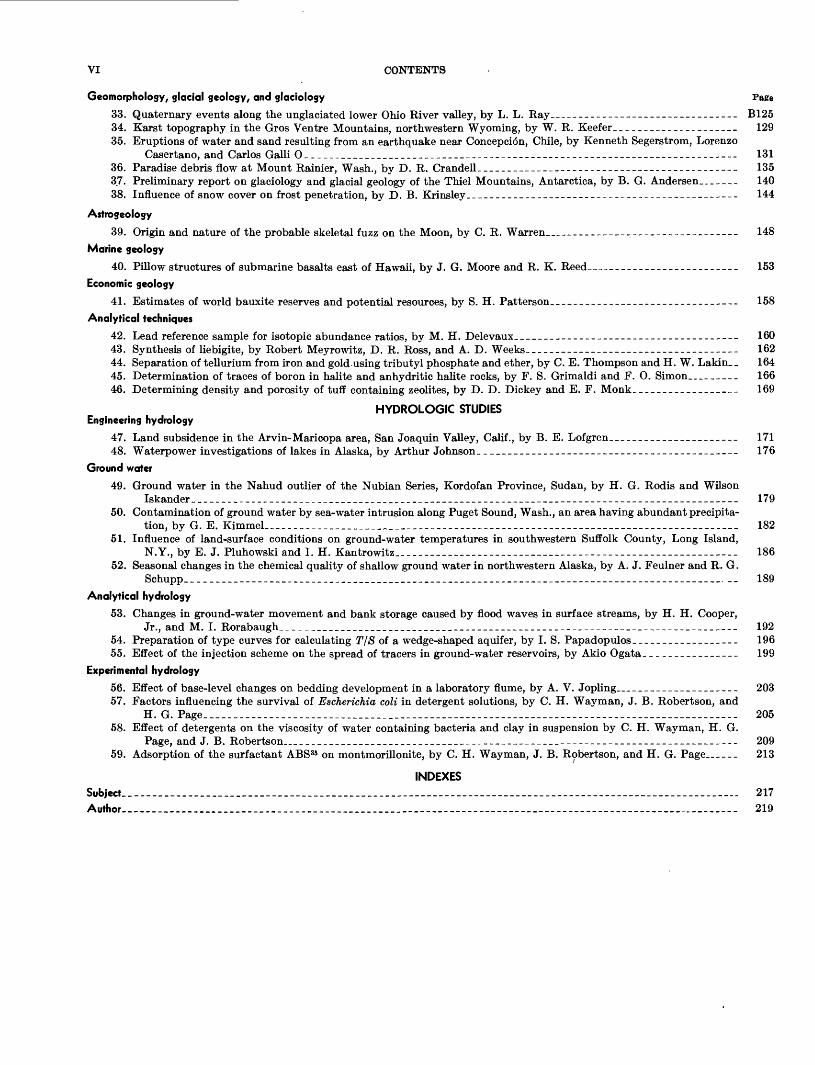
Geomorphology, glacial geology, and glaciology Page
33. Quaternary events along the unglaciated lower Ohio River valley, by L. L. Ray_-------_-_--------------------- B12534. Karst topography in the Gros Ventre Mountains, northwestern Wyoming, by W. R. Keefer__ ___________________ 12935. Eruptions of water and sand resulting from an earthquake near Concepci6n, Chile, by Kenneth Segerstrom, Lorenzo
Casertano, and Carlos Galli O_-__________________-_______------------_-------------------------------- 13136. Paradise debris flow at Mount Rainier, Wash., by D. R. Crandell_____________----------_--_----------------- 13537. Preliminary report on glaciology and glacial geology of the Thiel Mountains, Antarctica, by B. G. Andersen_______ 14038. Influence of snow cover on frost penetration, by D. B. Krinsley________________-___-__--_-___---------_--_--- 144
Astrogeology
39. Origin and nature of the probable skeletal fuzz on the Moon, by C. R. Warren____-______-_-_-_---------_------ 148
Marine geology
40. Pillow structures of submarine basalts east of Hawaii, by J. G. Moore and R. K. Reed__________________________ 153
Economic geology
41. Estimates of world bauxite reserves and potential resources, by S. H. Patterson__-________--_--_--_-________-_- 158
Analytical techniques
42. Lead reference sample for isotopic abundance ratios, by M. H. Delevaux._____________________________________ 16043. Synthesis of liebigite, by Robert Meyrowitz, D. R. Ross, and A. D. Weeks______-----_-___-_-___-________-_-_- 16244. Separation of tellurium from iron and gold using tributyl phosphate and ether, by C. E. Thompson and H. W. Lakin__ 16445. Determination of traces of boron in halite and anhydritic halite rocks, by F. S. Grimaldi and F. O. Simon___-____. 16646. Determining density and porosity of tuff containing zeolites, by D. D. Dickey and E. F. Monk__________________ 169
HYDROLOGIC STUDIES Engineering hydrology
47. Land subsidence in the Arvin-Maricopa area, San Joaquin Valley, Calif., by B. E. Lofgren______________________ 17148. Waterpower investigations of lakes in Alaska, by Arthur Johnson.___________________________________________ 176
Ground water
49. Ground water in the Nahud outlier of the Nubian Series, Kordofan Province, Sudan, by H. G. Rodis and WilsonIskander________________________________________-_________-___-__-__----_-------_-----------___--- 179
50. Contamination of ground water by sea-water intrusion along Puget Sound, Wash., an area having abundant precipita tion, by G. E. Kimmel____-_______________________________________________________ 182
51. Influence of land-surface conditions on ground-water temperatures in southwestern Suffolk County, Long Island,N.Y., by E. J. Pluhowski and I. H. Kantrowitz____________________________________________ 186
52. Seasonal changes in the chemical quality of shallow ground water in northwestern Alaska, by A. J. Feulner and R. G.Schupp__--_________-____.___________________._________________________. _- 189
Analytical hydrology
53. Changes in ground-water movement and bank storage caused by flood waves in surface streams, by H. H. Cooper,Jr., and M. I. Rorabaugh_____________________________________________________________________________ 192
54. Preparation of type curves for calculating T/S of a wedge-shaped aquifer, by I. S. Papadopulos._________________ 19655. Effect of the injection scheme on the spread of tracers in ground-water reservoirs, by Akio Ogata__________--___- 199
Experimental hydrology
56. Effect of base-level changes on bedding development in a laboratory flume, by A. V. Jopling___________________ 20357. Factors influencing the survival of Escherichia coli in detergent solutions, by C. H. Way man, J. B. Robertson, and
H. G. Page______--____________________________________-__-__-______--_----------__-_____________--_- 20558. Effect of detergents on the viscosity of water containing bacteria and clay in suspension by C. H. Wayman, H. G.
Page, and J. B. Robertson___________________________________________________________________________ 20959. Adsorption of the surfactant ABS 35 on montmorillonite, by C. H. Wayman, J. B. Robertson, and H. G. Page____ 213
INDEXES Subject...-._._...___.___._._.______________-_______ . ____-__-__ _-________--_---_--________________- 217Author.._.___._._____---_-.-_.______.--_ __-.______-- -----_.--___-_---_____---_.-_.____..___ 219
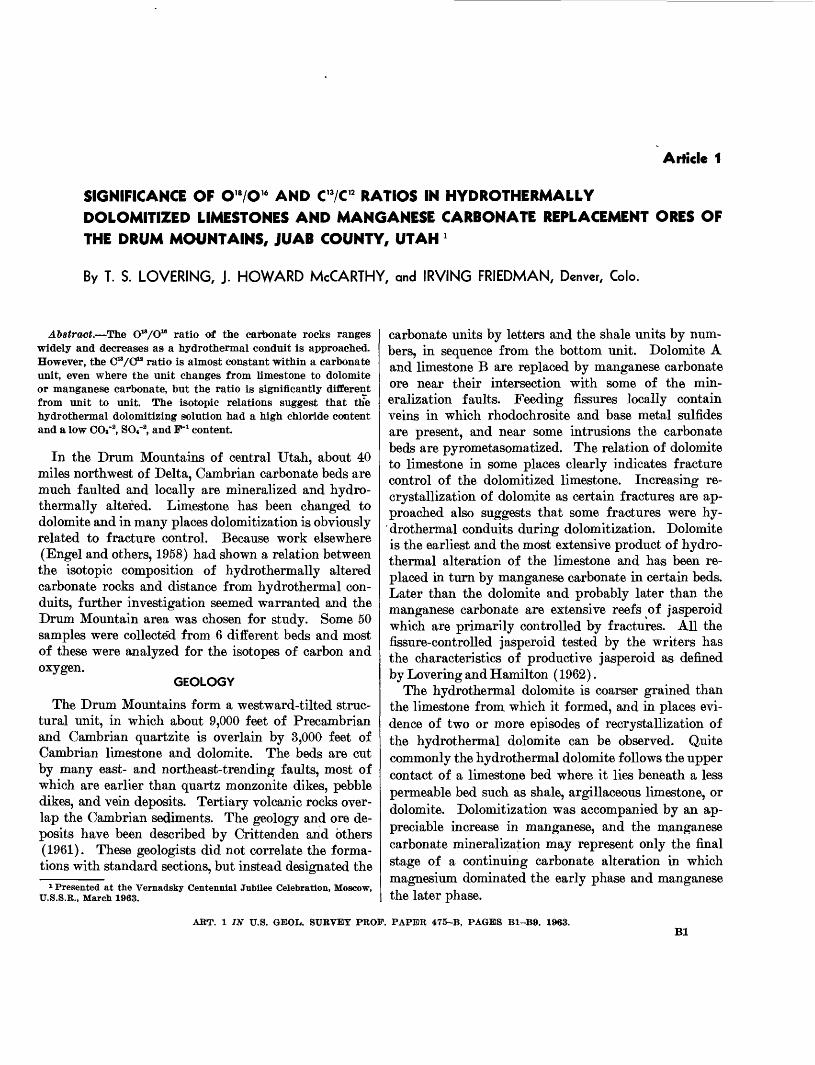
Article 1
SIGNIFICANCE OF O"/O" AND C 13/C" RATIOS IN HYDROTHERMALLYDOLOMITIZED LIMESTONES AND MANGANESE CARBONATE REPLACEMENT ORES OF
THE DRUM MOUNTAINS, JUAB COUNTY, UTAH l
By T. S. LOVERING, J. HOWARD McCARTHY, and IRVING FRIEDMAN, Denver, Colo.
Abstract. The OW/OW ratio of the carbonate rocks ranges widely and decreases as a hydrothermal conduit is approached. However, the C^/O13 ratio is almost constant within a carbonate unit, even where the unit changes from limestone to dolomite or manganese carbonate, but the ratio is significantly different from unit to unit. The isotopic relations suggest that ttie hydrothermal dolomitizing solution had a high chloride content and a low CCV2, SO*"2, and F"1 content.
In the Drum Mountains of central Utah, about 40 miles northwest of Delta, Cambrian carbonate beds are much faulted and locally are mineralized and hydro- thermally altered. Limestone has been changed to dolomite and in many places dolomitization is obviously related to fracture control. Because work elsewhere (Engel and others, 1958) had shown a relation between the isotopic composition of hydrothermally altered carbonate rocks and distance from hydrothermal con duits, further investigation seemed warranted and the Drum Mountain area was chosen for study. Some 50 samples were collecte'd from 6 different beds and most of these were analyzed for the isotopes of carbon and oxygen.
GEOLOGY
The Drum Mountains form a westward-tilted struc tural unit, in which about 9,000 feet of Precambrian and Cambrian quartzite is overlain by 3,000 feet of Cambrian limestone and dolomite. The beds are cut by many east- and northeast-trending faults, most of which are earlier than quartz monzonite dikes, pebble dikes, and vein deposits. Tertiary volcanic rocks over lap the Cambrian sediments. The geology and ore de posits have been described by Crittenden and others (1961). These geologists did not correlate the forma tions with standard sections, but instead designated the
1 Presented at the Vernadsky Centennial Jubilee Celebration, Moscow, U.S.S.R., March 1963.
carbonate units by letters and the shale units by num bers, in sequence from the bottom unit. Dolomite A and limestone B are replaced by manganese carbonate ore near their intersection with some of the min eralization faults. Feeding fissures locally contain veins in which rhodochrosite and base metal sulfides are present, and near some intrusions the carbonate beds are pyrometasomatized. The relation of dolomite to limestone in some places clearly indicates fracture control of the dolomitized limestone. Increasing re- crystallization of dolomite as certain fractures are ap proached also suggests that some fractures were hy drothermal conduits during dolomitization. Dolomite is the earliest and the most extensive product of hydro- thermal alteration of the limestone and has been re placed in turn by manganese carbonate in certain beds. Later than the dolomite and probably later than the manganese carbonate are extensive reefs of jasperoid which are primarily controlled by fractures. All the fissure-controlled jasperoid tested by the writers has the characteristics of productive jasperoid as defined by Levering and Hamilton (1962).
The hydrothermal dolomite is coarser grained than the limestone from, which it formed, and in places evi dence of two or more episodes of recrystallization of the hydrothermal dolomite can be observed. Quite commonly the hydrothermal dolomite follows the upper contact of a limestone bed where, it lies beneath a less permeable bed such as shale, argillaceous limestone, or dolomite. Dolomitization was accompanied by an ap preciable increase in manganese, and the manganese carbonate mineralization may represent only the final stage of a continuing carbonate alteration in which magnesium dominated the early phase and manganese the later phase.
ART. 1 IN U.S. GEOL. SURVEY PROP. PAPER 475-B, PAGES B1-B9. 1963.Bl

B2 GEOCHEMISTRY, MINERALOGY, AND PETROLOGY
VARIATION IN SO18 IN CARBONATE ROCKS AND ORES
Relation to beds
The range of SO18 values 2 within individual beds (tables 1.1 and 1.2, p. B8-B9) tends to be quite similar in given are&s and is clearly related to fracture control rather than to individual beds (figs. 1.1 and 1.2). There is a general rise in the SO18 values in the samples from the higher beds but the upper limit of the SO18 values is very similar in the samples of the least altered part of dolomite A, the lowest carbonate bed, and in dolomites N and L, the highest beds sampled. Figures 1.1 and 1.2 show that all samples having delta values less than 14°/00 are close to a mineralized fracture. The conclusion seems inescapable that the change in delta values of the oxygen is related to hydrothermal altera tion and not to the primary composition of the rocks.
Relation to ore and mineralizing fractures
As shown in figure 1.1, samples 3 taken along the contact of limestone G and dolomite H, between the Staats fault and the Last Chance fault, are instruc tive. The upper part of limestone G has been dolomit- ized near its contact with dolomite H, and the zone of hydrothermal dolomite reaches its maximum thickness near two intersecting east-trending faults about mid way between the Staats fault and the Last 'Chance fault (coordinates D,V, fig. 1.1), reaching deepest into lime stone G at a dolomite breccia vein just north of sample 34. This sample also has the lowest SO18 value of the samples collected in limestone G. Samples collected northward show a progressive increase in SO18 to sample 25, which has the highest delta value of the series, and is about midway between the dolomite brec cia vein near 34 and similar dolomite breccia just south of 20 and 21. Such a change strongly suggests that the east-trending zone followed by the breccia was a con duit through which hydrothermal solutions rose and spread out along the contact of dolomite H and lime-
2 The isotopic composition of an element is commonly reported in "delta units," units that give the per mil (°/00) difference of the O 18/O« or C 13/C 12 ratio from the ratio in a standard; thus SO 18 is given by
o»
oi1 i018
o;«
X 1,000,
where O* is the unknown and O« is the standard.The standard used for O 18/O 16 in this study is "mean ocean water," and for C 13/C 12
is the "standard belemnite" shell originally chosen as a standard by Urey and others (1951).
8 Sample locations are shown on figures 1.1 and 1.2 and are identified by map coordinates (as B.III) in table 1.1 and also in the text where any specific sample is mentioned.
stone G. South of sample 34 the zone of hydrothermal dolomite cuts sharply back towards the contact with dolomite H. The dolomite changes abruptly into lime stone : sample 35 is from the same bed as 34 and only 3 inches to the south, but it is limestone. The delta value for the dolomite, however, is 13.5 °/00 in contrast to 16.9 °/00 for the limestone from which it formed. This latter value is almost the same as that of hydrothermal dolomite sample 25 (16.8°/00), midway between the two dolomite breccia veins. The relation of the hydrother mal dolomite to a specific feeding fissure seems clear here from spatial relations; and the progressive change of the SO18 from 13.5 to 16.8°/00 as the zone of dolomite is followed northward away from the breccia vein is persuasive evidence for low SO18 values in the vicinity of hydrothermal conduits. In harmony with this view we find values of only 14.3 to 14.7°/00 in dolomite sam ples 20 and 21 collected between the jasperoid vein and the dolomite breccia seam a few hundred feet south of the Staats fault (E, V). Similar changes are shown in sample pair 41 and 42 (C,IV; C,III) from north of the Last Chance fault in the upper part of dolomite H, and in samples from dolomite L south of the Last Chance fault (B,III).
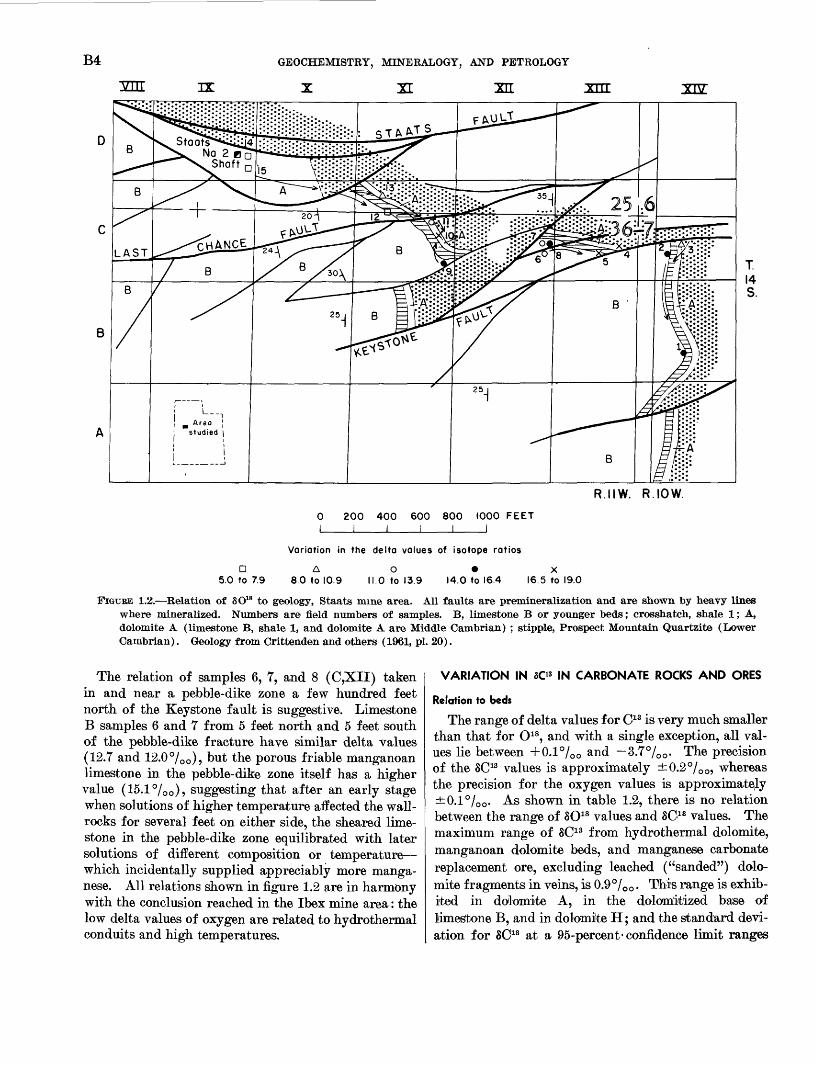
The area shown .in figure 1.1 shows evidence of ore- stage mineralization in few places, whereas the Staats mine area (fig. 1.2), 1,400 feet to the east, has produced a substantial amount of manganese oxide and manga nese carbonate replacement ore from dolomite A and limestone B near the Staats No. 2 shaft. Dolomite A is normally a sandy argillaceous dolomite but changes to a magnetite-rich hydrothermal limestone (sample 13, D,XI) just south of the southerly Staats fault where it is close to shallow intrusive rocks.
The relations of oxygen isotopes to the feeding fis sures so clearly demonstrated in the area of figure 1.1 are also apparent in the more highly mineralized and faulted areas shown in figure 1.2. Samples 14 and 15 (D,IX), of manganoan dolomite (3 to 6 percent Mn) from the Staats No. 2 shaft, show the lowest delta values (6.3 and 5.0°/00 ) of any specimens collected in this study. In general the delta values increased to the south and east away from the strongly mineralized area. The marked difference of the delta values be tween sample pairs 2 and 3 (C,XIV) and 4 and 5 (C,XIII), taken on opposite sides of the Keystone fault, suggests that solutions moved southward from the Keystone fault. The range of delta values for oxygen shown by samples from the dolomitized base of limestone B is almost as great as that for dolomite A and similarly, the lowest values are found in the manganoan dolomite sample 12 (C,XI), which was taken close to the Last Chance fault.

LOVERING, MCCARTHY, AND FRIEDMAN
31 m 12
B3
R.nw.200 400 600 800 1000 FEET
I____I____\____I I
D 5.0 to 7.9
Variation in the delta values of isotope ratios
14.0 to 16.4
A 8.0 to 10.9
O 1.0 to 13.9
X 16.5 to 19.0
FIGTJBE 1.1. Relation of SO18 to geology, Ibex mine area. All faults are premineralization and are shown by heavy lines where mineralized. Numbers are field numbers of samples. Letters indicate carbonate units, from youngest to oldest: dolomite N, limestone M, dolomite L, dolomite K, limestone J, lime stone I (stippled), dolomite H, limestone G. All formations are of Middle Cambrian age. Arrows point in direction of increasing delta values. Geology from Crittenden and others (1961, pi. 20).
B4
vrrr H
GEOCHEMISTRY, MINERALOGY, AND PETROLOGY
I TT "YTT TTTT
R.IIW. R.IOW.
200 400 600I
800 1000 FEET
Variation in the delta values of isotope ratios
a5.0 to 7.9
A 8.0 to 10.9
O II.0 to 13.9 14.0 to 16.4 16.5 to 19.0
FIGURE 1.2. Relation of SO18 to geology, Staats mine area. All faults are premineralization and are shown by heavy lines where mineralized. Numbers are field numbers of samples. B, limestone B or younger beds; crosshatch, shale 1; A, dolomite A (limestone B, shale 1, and dolomite A are Middle Cambrian) ; stipple, Prospect Mountain Quartzite (Lower Cambrian). Geology from Crittenden and others (1961, pi. 20).
The relation of samples 6, 7, and 8 (C,XII) taken in and near a pebble-dike zone a few hundred feet north of the Keystone fault is suggestive. Limestone B samples 6 and 7 from 5 feet north and 5 feet south of the pebble-dike fracture have similar delta values (12.7 and 12.0°/00 ), but the porous friable manganoan limestone in the pebble-dike zone itself has a higher value (15.1 °/00 ), suggesting that after an early stage when solutions of higher temperature affected the wall- rocks for several feet on either side, the sheared lime stone in the pebble-dike zone equilibrated with later solutions of different composition or temperature which incidentally supplied appreciably more manga nese. All relations shown in figure 1.2 are in harmony with the conclusion reached in the Ibex mine area: the low delta values of oxygen are related to hydrothermal conduits and high temperatures.
VARIATION IN SO3 IN CARBONATE ROCKS AND ORES
Relation to beds
The range of delta values for C18 is very much smaller than that for O18, and with a single exception, all val ues lie between +0.1% 0 and 3.7% 0 . The precision of the 8C13 values is approximately ±0.2°/00, whereas the precision for the oxygen values is approximately ±0.1% 0 . As shown in table 1.2, there is no relation between the range of SO18 values and 8C18 values. The maximum range of 8C1S from hydrothermal dolomite, manganoan dolomite beds, and manganese carbonate replacement ore, excluding leached ("sanded") dolo mite fragments in veins, is 0.9°/00 . This range is exhib ited in dolomite A, in the dolomitized base of limestone B, and in dolomite H; and the standard devi ation for SC18 at a 95-percent-confidence limit ranges
LOVERING, MCCARTHY, AND FRIEDMAN B5
from ±0.36°/00 to ±0.306°/00 only slightly more than the precision of the isotopic analysis.
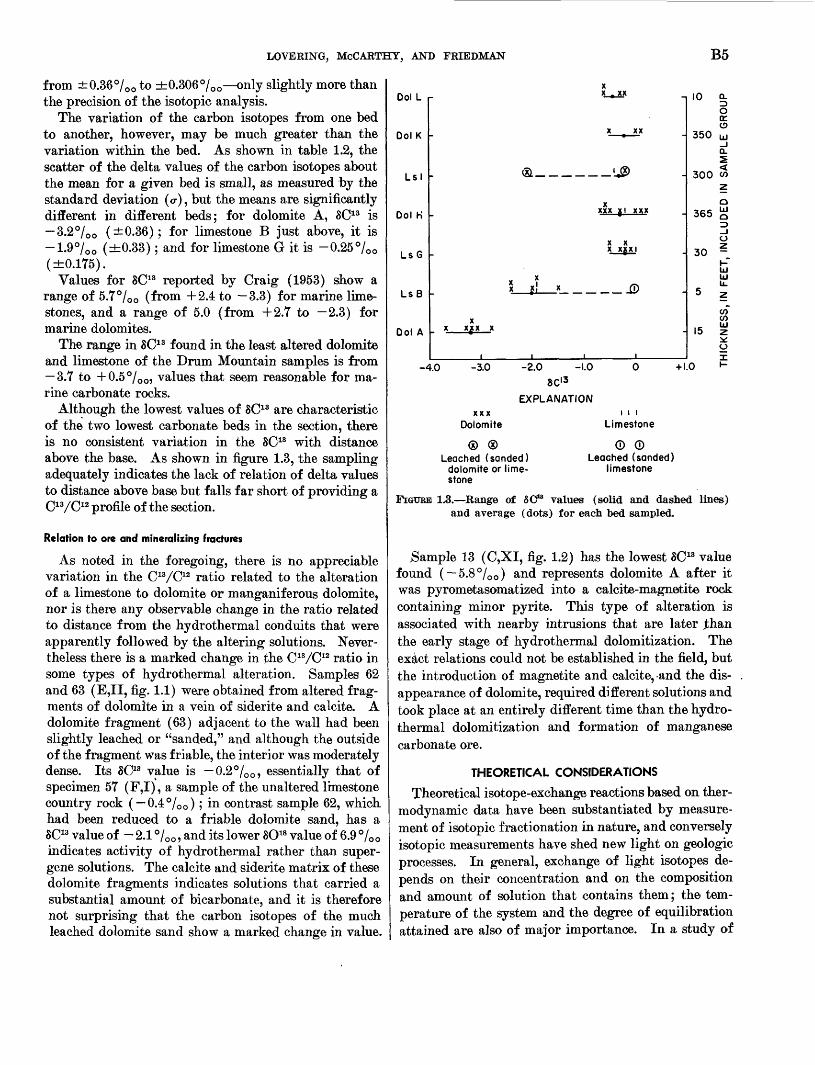
The variation of the carbon isotopes from one bed to another, however, may be much greater than the variation within the bed. As shown in table 1.2, the scatter of the delta values of the carbon isotopes about the mean for a given bed is small, as measured by the standard deviation (<r), but the means are significantly different in different beds; for dolomite A, 8C13 is 3.2°/00 (±0.36); for limestone B just above, it is 1.9°/00 (±0.33); and for limestone G it is -0.25%0 (±0.175).
Values for 8C13 reported by Craig (1953) show a range of 5.7°/00 (from +2.4 to 3.3) for marine lime stones, and a range of 5.0 (from +2.7 to 2.3) for marine dolomites.
The range in 8C13 found in the least altered dolomite and limestone of the Drum Mountain samples is from 3.7 to +0.5°/00, values that seem reasonable for ma rine carbonate rocks.
Although the lowest values of 8C13 are characteristic of the two lowest carbonate beds in the section, there is no consistent variation in the SC13 with distance above the base. As shown in figure 1.3, the sampling adequately indicates the lack of relation of delta values to distance above base but falls far short of providing a Qi3/Qi2 profiie Of the section.
Relation to ore and mineralizing fractures
As noted in the foregoing, there is no appreciable variation in the C13/C12 ratio related to the alteration of a limestone to dolomite or manganiferous dolomite, nor is there any observable change in the ratio related to distance from the hydrothermal conduits that were apparently followed by the altering solutions. Never theless there is a marked change in the C13/C12 ratio in some types of hydrothermal alteration. Samples 62 and 63 (E,II, fig. 1.1) were obtained from altered frag ments of dolomite in a vein of siderite and calcite. A dolomite fragment (63) adjacent to the wall had been slightly leached or "sanded," and although the outside of the fragment was friable, the interior was moderately dense. Its 8C13 value is 0.2°/00 , essentially that of specimen 57 (F,I), a sample of the unaltered limestone country rock ( 0.4°/00 ); in contrast sample 62, which had been reduced to a friable dolomite sand, has a 8C13 value of - 2.1 °/00 , and its lower SO18 value of 6.9 °/00 indicates activity of hydrothermal rather than super- gene solutions. The calcite and siderite matrix of these dolomite fragments indicates solutions that carried a substantial amount of bicarbonate, and it is therefore not surprising that the carbon isotopes of the much leached dolomite sand show a marked change in value.
Ool L
Dol K
LSI
Dol K
LsG
1 f DLS D
Dot A
-4
Xx-»-XX
x t xx
<a us>
JMI-U. .
X X X XgXI
x x! x _£>
X X Xj(X X
1 1 1 1
kO -3.0 -2.0 -kO 0 +1SC 13
EXPLANATION
10 Q-Oo
350 u
0.S
300 wzo
365 g
o30 ~
I-"Ul Ulu.
5 2co" to
15 2
oX
o -
Dolomite
Leached (sanded) dolomite or lime stone
Limestone
© ©Leached (sanded)
limestone
FIGURE 1.3. Range of SO18 values (solid and dashed lines) and average (dots) for each bed sampled.
Sample 13 (C,XI, fig. 1.2) has the lowest 8C13 value found (~5.8°/00 ) and represents dolomite A after it was pyrometasomatized into a calcite-magnetite rock containing minor pyrite. This type of alteration is associated with nearby intrusions that are later jthan the early stage of hydrothermal dolomitization. The exict relations could not be established in the field, but the introduction of magnetite and calcite, and the dis appearance of dolomite, required different solutions and took place at an entirely different time than the hydro- thermal dolomitization and formation of manganese carbonate ore.
THEORETICAL CONSIDERATIONS
Theoretical isotope-exchange reactions based on ther- modynamic data have been substantiated by measure ment of isotopic f ractionation in nature, and conversely isotopic measurements have shed new light on geologic processes. In general, exchange of light isotopes de pends on their concentration and on the composition and amount of solution that contains them; the tem perature of the system and the degree of equilibration attained are also of major importance. In a study of
B6 GEOCHEMISTRY, MINERALOGY, AND PETROLOGY
the Leadville Limestone, Engel and others (1958) dem onstrated the temperature dependence of oxygen-iso tope concentration in carbonates and chert. Assuming from geologic evidence an abundance of hydrothermal solution of fairly constant isotopic composition, they stated, "The highest SO18 values are obtained from bedded calcite, dolomite, and chert which have not been recrystallized by hydrothermal water (unaltered beds). The lowest SO18 values are from the hydrothermal cal cite, dolomite, and quartz closest to ore which therefore seem to have recrystallized at highest temperature." This relation has been further verified by Clayton and Epstein (1958) and checked experimentally by McCrea (1950), who precipitated calcium carbonate in the lab oratory and determined the O18/O16 fractionation fac tor.
The correlation of low SO18 values with hydrothermal conduits in the carbonates of the Drum Mountains thus is consistent with previous observations and known thermodynamic considerations of isotope-exchange reactions.
The isotopes of carbon can be expected to fractionate in roughly the same manner as those of oxygen. Al though carbon-isotope fractionation in nature has been noted chiefly in biological processes, variation in tem perature and isotopic concentration of an inorganic solution will cause isotopic-exchange reactions with ionic carbon compounds as with ionized oxygen com pounds. The amount of C13 found in sedimentary and shell carbonates is in keeping with the calculated frac tionation factors for the system carbonate-bicarbonate- carbon dioxide as worked out by various investigators, including Urey and Grieff (1935), McCrea (1950), and Craig (1953). The fractionation of carbon isotopes characteristic of the metabolic processes of different organisms plays an important role in the isotopic com position of precipitated carbonates. C12 tends to con centrate most in the organic carbon of low forms of plant life. Landergren (1954) states that the carbon isotope ratio is determined by the geochemical condi tions prevailing during precipitation of the carbonate sediments, but so far as carbon is concerned the geo chemical environment is largely the result of biochemi cal reactions.
As noted by Parker (1963) there is a spread in the SC13 between animals of different species of as much as 15% 0 , although there is a spread of only 1°/00 be tween individuals of the same species. A given flora and fauna contributes organic carbon and carbon dioxide to an accumulating sediment, and this sediment should have a characteristic 8C13 value throughout the area in which the ecological conditions are the same. In the area studied by Parker a small bay in the upper
Laguna Madre, Tex. the 8C13 value of the bay water was +6.7%0 , whereas that of the sediment in the bay averaged about -13.3% 0 . The 8C13 values of fish and shellfish in general ranged from about 8 to 18% 0 and the 8C13 values for algae ranged from about 11 to nearly 40% 0 . The different constituents of an or ganism, showed differences in their ability to fractionate the available carbon; in general the fatty acids in an organism were 2 to 5 % 0 less negative than the lipid fractions and both substances were more negative than the total organism. According to Parker (1963), "Fatty acids isolated from some of the organisms were always depleted in C13 relative to the whole organism. Organic matter preserved in the sediments should re flect in its C13/C12 ratio not only the species of the or ganism from which it is derived but the type of molecule preserved." The nearly constant value of the C13/C12 ratio in a given bed is thus consistent with a nearly constant biological and depositional environ ment while the bed was being deposited, and the isotopic variation from bed to bed is caused by changes in the isotopic composition of the carbon available during deposition, changes that in turn ultimately reflect the biochemistry of organic processes.
Weyl (1960), in discussing dolomitization by cir culating brines, points out that most subsurface waters contain large amounts of calcium and magnesium and relatively small amounts of total carbonate, and states that "it is possible to show that dolomitization must take place approximately by the mole-for-mole replace ment of calcite without introduction of external CO2." This process is represented by the equation Mg+2 + 2 aCO3-»CaMg(lCO3 ) 2 +Ca+2 . Such a mechanism of dolomitization is not only suggested by the lack of carbon-isotope fractionation in the Drum Mountain area but would indeed account for that lack.
The marked change in the C13/C12 ratio found in some other types of hydrothermal alteration means conversely that carbon was introduced in the solutions causing such alteration.
COMPOSITION OF HYDROTHERMAL SOLUTIONS
The change from limestone to dolomite is accom panied by a very slight increase in porosity, from about iy2 percent to 4 percent, and by a slight increase in permeability. Although the carbon isotopes of the dolomite and of the limestone from which it formed are indentical, the alteration was accompanied by a marked change in SO18 such as is appropriate to re- crystallization in hydrothermal solutions. There was no significant change in either organic or inorganic carbon; the chief chemical change was, of course, the
LOVERING, MCCARTHY, AND FRIEDMAN B7
substitution of magnesium for about half of the cal cium, but some manganese and iron were also added; these elements, however, rarely make up more than a small fraction of 1 percent of early formed hydro- thermal dolomite. Negative evidence is the lack of fluorite or anhydrite either close to the hydrothermal channels or in the transition zone from hydrothermal dolomite to unaltered limestone, places where such min erals might be expected if the hydrothermal solutions contained appreciable fluorine or sulf ate. The relative constancy of the C13/C12 ratio in different formations where they pass from limestone to dolomite in the Drum Mountains indicates that the magmatic solutions contained little or no carbonate or bicarbonate in solu tion to equilibrate with the carbonate of the dolomite. Similarly the absence of fluorite or anhydrite indicates insufficient F-1 and SO4"2 to saturate the solutions with their calcium salts. It seems safe to assume, therefore, that the solutions were dominantly chloride brines con taining much magnesium and appreciable amounts of iron and manganese. It is worthy of note that one of the earliest experiments in which calcium carbonate was converted to dolomite was carried out by heating calcium carbonate with a solution of magnesium chloride to 200 °C under a pressure of 15 atmospheres (Clark, 1924, p. 566).
Although the late veinlets of manganese carbonate both the black manganoan calcite and rhodochrosite were probably deposited from solutions containing ap preciable bicarbonate, it is probable that the earlier manganoan dolomites containing as much as 6 percent manganese formed from chloride brines similar to those that converted limestone to dolomite but richer in man ganese. It is quite in harmony with the field evidence
to suppose that the dolomitizing solutions became pro gressively richer in manganese chloride with time and that the manganoan replacement of the dolomite repre sents equilibration of the dolomite with later solutions that had a higher ratio of manganese to magnesium than the earlier solutions.
CONCLUSIONS
The evidence presented above seems to warrant the following conclusions:
1. The alteration of limestone to hydrothermal dolo mite in the area studied was accomplished by hot solu tions containing magnesium chloride with little if any bicarbonate, fluoride, or sulf ate ions.
2. The O18/O16 ratios decrease from the outer fringe of dolomitic alteration inward toward the feeding frac tures, reaching their lowest values where there is the greatest evidence of higher temperatures and more in tense mineralization.
3. The C13/C12 ratios remain relatively constant where limestone is dianged to hydrothermal dolomite or manganiferous dolomite but show substantial varia tion in other types of hydrothermal alteration.
4. C13/C12 ratios'should prove useful in correlating carbonate beds, especially where limestone is altered to hydrothermal dolomite in local but unpredictable areas.
5. Alteration by post-dolomite hydrothermal solu tions containing carbon dioxide gave larger negative 8C13 values than those of the original dolomite. This is true both for sanded dolomite in carbonate veins and for magnetite-calcite replacement deposits formed from dolomite.

B8 GEOCHEMISTRY, MINERALOGY, AND PETROLOGY
TABLE 1.1 Delta values of O18 and C13 of some limestones, dolomites, and manganese carbonate ores from the Drum Mountains, Utah
[Delta values determined by Irving Friedman]
Field No.
Map coordinates
,
Rock typeDistance above
Lower Cambrian quartzite (feet)
Distance from
premineralization
fault (feet)
Mn (weight percent)
o
0 0
o
Remarks
Dolomite N
75 A.II Dolomite ... 4,510 10 17.4 -0.4 Basal bed.
Dolomite L
44
47 46
45
BllII
B.III
Average, bas
Dolomite ...
.....do... ... . .do ...
.... .do... ...
4,360
4,360 4,360
4,360
150
25 100
300
<0.02
<.02 <.02
<.02
18.2
18.5 19.0
19.1
-0.3
-.2 -.6
-.6
-.45
Recrystallized, light gray.
Do. Recrystallized,
vuggy. Recrystallized.
Do.lomite K
51
48
A.III
A.III
Average fonr
Dolomite ...
.... .do... ...
3,950
4,300
<50
>200(?)
15.1
18.7
lation ___________________
0.0
.5
.25
Just above Lime stone J.
Black, finely crystalline, syngenetic(?) .
Limestone J
43 B,IV Dolomite. . 3,885 50 17.2 0.1 Fine grained, dark gray.
Limestone I
62
63
57
E.II
Dolomite ...
do.......
Limestone-
2,870
2,870
2,580
0
0
>500
0.30
.75
6.9
11.5
14.6
-2.1
-.2
-.4
"Sand" in siderite- calcite vein.
Sanded, 1 ft from 62.
Midway between jasperoid and Joy fault.
Dolomite H
38
39 21 59
60 37
42
4158
D,V
D,V E.V
D'V
C.IV
Dolomite...
Limestone . Dolomite ... Calcitized
dolomite. Dolomite ... ..do. ..
-do ...
... -do ... - do......
2,255
2,197 2,197 2,525
2,525 2,197
2,545
2,475 2,560
M
50<5
<7.5 »75
>50
>500
Average, formation, dolomite and limestone Average, lower half of formation, dolomite
stone.. -----Average, upper half of formation, d
0.10
.20
.02
.02
.15
......
13.0
14.4 14.7 14.9
15.6 16.4
16.0
17.1 17.1
and lime-
-0.6
-.2 .0
- .5
- .3.2
- .7
.1 - .6
.3
-.15 -.40
Fault, 1-inch throw, between 38 and 39.
3 ft south of 38. 10 ft above 20. About 5 ft from
Staats fault. 2^ ft from 60. About 100 ft
southeast of 39. Close to Last
Chance fault.
15 ft south of mineralized jasperoid.
TABLE 1.1 Delta values of O18 and C33 of some limestones, dolomites, and manganese carbonate ores from the Drum Mountains, Utah Continued
[Delta values determined by Irving Friedman]
Field No.
8
1 §
Rock typeDistance above
Lower Cambrian quartzite (feet)
Distance from
premineralization
fault (feet)
"8
a
!or
6
0
3 O
Remarks
Limestone G
34
20
29
28
27
26
25
35
D,V
E,V
D,V
D,V
D,V
D,V
D,V
D,V
Dolomite ...
.....do .
Limestone.
Dolomite ...
.....do .
.....do
.....do... ...
Limestone.
2,165
2,195
2,195
2,195
2,195
2,195
2,995
2,165
Average, dolomite and limestone (t(
<100
50
80
110
160
240
275
<100
0.10
.20
.2
.10
.10
.10
.10
.05
13.5
14.3
16.1
16.2
16.4
16.5
16.8
16.9
>p30ft) ... ...
-0.5
-.2
.0 -.1
-.3
-.2
.0
-.22
Coarse, recrystal- lized, 3 in. from 35, same bed.
50 ft from metal lized jasperoid.
6 in. below dolomite.
75 percent re- crystallized.
40 percent re- crystallized.
25 percent re- crystallized.
10 percent re- crystallized.
Unaltered lime stone, 3 in. south of hydro- thermal dolo mite 34.
Limestone B
12
7
6
98
1
2
5
C,XI
C.XII
C.XII
C,XI C.XII
B,XIV
c.xrv c,xiv
Manga- noan dolomite.
Dolomite ..
Calcitized dolomite.
Dolomite.. Manga-
noan lime stone.
Dolomite . .
.....do .
... -do... ...
Average, dolomite and llm Average, dolomite (No. 8 o
40
40
45
4045(7)
40
40
40
<5
105
95
50 100
400
100
10
3.0
.2
.6
.4 1.0
.75
.5
.6
6.7
12.0
12.7
14.6 15.1
15.6
16.5
16.7
mitted)...... ....... .......
-1.5
-1.9
-1.9
-2.4 .0
-1.9
-2.0
-2.4
-1.75 -2.0
From manganese prospect pit.
5 ft north of pebble dike.
5 ft south of pebble dike.
Very fresh Sanded manga-
noan limestone from pebble- dike zone.
Coarsely crystal line.
Medium-fine crystalline.
Fine- to medium- fine crystalline.
Dolomite A
15
14
13
3
11
4 10
D.IX
D,IX
C.XI
C,XIV
C,XI
c,xmC,XI
Average, dol Average, dol
Manga- noan dol omite.
Manga- noan cal cite.
Limy dolo mite.
Dolomite ...
..... do .do... ...
smite and lim [>mite only
<20
<20
5
2
2 2
<60
<60
80
20
3
10 40
3.0
5.0
.7
.2
.75
.5 1.4
5.0
6.3
9.5
9.6
13.4
18.2 19.0
-3.2
-2.8
-5.8
-3.1
-3.3
-3.2 -3.7
-3.6 -3.2
Some dark early MnCOs.
White late MnC03 .
Pyrometasomatic.
Altered and porous.
Very fresh.

LOVERING, MCCARTHY, AND FRIEDMAN
TABLE 1.2. Summary of _O18 and _C13 values and variations for samples listed in table 1.1
B9
Unit
Dolomite L____-___ ____ ____Dolomite K__ _ _ _____
Dolomite H______ _ __ _____Limestone G _ -___ ___,_ ___Limestone B 2 __ __ ___ ____
Total number of
samples
4339876
Max
19. 118.714. 617.116.916.719.0
W/oo)
Min
18.215.16.9
13.013.56.75.0
Range
0.93.67.74.03.4
10. 014.0
Max
-0.3.5
-.2.2.0
-1.5-2.8
Min
-0.6.0
-2. 1-.7-.5
-2. 4-3.7
-O
.Range
0.3.5
1.9.9.5.9.9
E<Yoo)
IHO»
0.22.3
1. 12.31. 175. 33.36
Median
-0.45. 1
-.4-.3-.25
-1.9-3.2
Avg
-0.45.2
-.90-.24-.22
-2.00-3.2
i Where a is the standard deviation, computed from range of SC® values and total number of samples, a Sanded manganoan limestone (sample 8) from pebble-dike fissure omitted. » Magnetite-calcite replacement rock (sample 13) omitted.
REFERENCES
Olark, F. W., 1924, Data of geochemistry: U.S. Geol. Survey Bull. 770, p. 566.
Clayton, R. N., and Epstein, S., 1958, The relationship between OM/OM ratios in co-existing quartz, carbonate, and iron oxides from various geological deposits: Jour. Geology, v. 66, p. 352-373.
Oraig, Harmon, 1953, The geochemistry of the stable carbon isotopes: Geochim. et Cosmochim. Acta, v. 3, p. 61, 65.
Crittenden, M. D., Jr., Straczek, J. A., and Roberts, R. J., 1961, Manganese deposits in the Drum Mountains, Juab and Mil- lard Counties, Utah: U.S. Geol. Survey Bull. 1082-H, p. 493-544.
Engel, A. E. J., Clayton, R. N., and Epstein, S., 1958, Variations in isotopic composition of oxygen and carbon in Leadville limestone in its hydrothermal and metamorphic phases: Jour. Geology, v. 66, p. 374-393.
Landergren, Sture, 1954, On the relative abundance of the stable carbon isotopes La marine sediments: Deep-Sea Re search, v. 1, p. 98-120.
Lovering, T. G., and Hamilton, J. C., 1962, Criteria for the rec ognition of jasperoid associated with sulflde ore: Art. 63 in U.S. Geol. Survey Prof. Paper 450-C, p. C9-C11.
McCrea, J. M., 1950, On the isotopic chemistry of carbonates and a paleotemperature scale: Jour. Chem. Physics, v. 18, p. 849-857.
Parker, P. L., 1963, Biogeochemistry of the stable isotopes of carbon in a marine bay [abs.]: Geol. Soc. America Spec. Papers, no. 73, p. 213.
Urey, H. C., and Grieff, L. J., 1935, Isotopic exchange equilibria: Am. Chem. Soc. Jour., v. 57, p. 321-327.
Urey, H. C., Lowenstam, K. A. Epstein, S., and McKiuney, C. R., 1951, Measurement of paleotemperatures and temperatures of the Upper Cretaceous of England, Denmark, and the southeastern United States: Geol. Soc. America Bull., v. 62, no. 4, p. 399-^16.
Weyl, P. K., 1960, Porosity through dolomitization: conserva tion of mass requirements: Jour. Sed. Petrology, v. 30, p. 85-90.
Article 2
THORTVEITITE ASSOCIATED WITH FLUORITE, RAVALLI COUNTY, MONTANA
By RAYMOND L. PARKER and RAYMOND G. HAVENS, Denver, Colo.
Abstract. Thortveitite, (Sc, Y) 2 Si2 C>7, has been found asso ciated with fluorite at the Crystal Mountain fluorite deposit near Darby, Ravalli County, Mont. This is the first occurrence of the mineral to be reported in the Western Hemisphere and is a new mode of occurrence for the mineral, previously found only in granitic pegmatites.
The rare scandium mineral thortveitite, ((Sc, Y) 2 Si2O7 ), has been found in the Crystal Mountain fluorite deposit 26 miles east of Darby, Ravalli County, Mont. This is the first occurrence of the mineral to be reported in the Western Hemisphere.
Thortveitite has been reported from only two other areas: southern Norway, where it is found in several pegmatites in the Iveland-Evje district (Schetelig, 1922; Neumann, 1961); and Madagascar, where it oc curs in the Befanamo pegmatite (Lacroix, 1920) and in the pegmatite district of Berere (Behier, 1960, p. 20).
The Crystal Mountain fluorite deposit has been de scribed by Taber (1952, 1953) and by Weis and others (1958). The deposit consists of tabular bodies of fluorite in coarse-grained biotite granite containing xenoliths of biotite-quartz-plagioclase gneiss, horn- blende-plagioclase gneiss, and pegmatitic granite. The tabular bodies of fluorite, and the foliation in the gneissic xenoliths, strike about north and dip 20°-30° E. Dikes of granite cut the fluorite bodies and the xenoliths.
Thortveitite occurs in the main ore body at Crystal Mountain in dark-purple fluorite that contains con siderable biotite and subordinate sphene, quartz, oligoclase, rare-earth-bearing apatite, and minor green amphibole. Brown vitreous grains of metamict fer- gusonite (Weis and others, 1958) and a green opales cent metamict mineral, probably thorianite, are dis persed in this rock also; both of these minerals are strongly radioactive.
The thortveitite crystals within fluorite are embayed locally by fluorite, and some crystals contain inclusions of fluorite, suggesting that the two minerals were formed nearly contemporaneously.
The thortveitite forms elongate subhedral to euhedral crystals, many as long as 3 mm, which range from color less and clear to smoke colored and translucent. Some of the smoke-colored crystals contain alternating clear and translucent lamellae that appear to be normal to the c-axis. The smoke-colored grains possibly reflect radiation damage caused by nearby crystals of fergu- sonite and thorianite. As seen in thin section, some of the thortveitite crystals are twinned polysynthetically.
X-ray diffraction powder patterns of the Crystal Mountain thortveitite and thortveitite from the Tuf- tane pegmatite, Iveland, Norway, seem identical. The strongest lines (in angstrom units) and estimated in tensities (measured by F. A. Hildebrand, U.S. Geo logical Survey) of the Crystal Mountain mineral are: 3.12 broad (10), 2.93 (7), 1.647 (5), 2.17 (4), 5.10 (3), 2.05 (2),2.60 (2).
A semiquantitative spectrographic analysis of the Crystal Mountain thortveitite is given in the accom panying table. The thortveitite differs principally from that of Norway and Madagascar (Levinson and Borup, 1960) in its lower zirconium content and lack
Semiquantitative spectrographic analysis of thortveitite from Crysta'Mountain, Ravalli County, Mont.
[Analyst: Raymond G. Havens, U.S. Geological Surveyj
Si__.
Sc___
¥____Dy_._Er_._Gd_ _Yb_-Ho Tb_._
Percent______ Major
constituent.______ Major
constituent.----- 3_____ .5_____ .5--_-. .3__-_- .3--_-. .15_._.- .07
Percent 0.07 .05 . 3 . 15 . 15 .03 .015
121515
Percent0. 15
. 15
.07
.03
.02
. 015
.01
.007
.0005
Looked for but not detected: Na, K, P, Ag, As, Au, B, Ba, Bi, Cd, Co, Cu, Ga, Ge, Hf, Hg, In, Li, Ni, Pb, Pd, Pt, Re, Sb, Sr, Ta, Te, Tl, U, W, Zn, Eu. Usual sensitivities for some elements do not apply because of high background and inter ference by rare-earth lines.
BIOART. 2 IN U.S. GEOL. SURVEY PROF. PAPER 475-B, PAGES B10-B11. 1963.
PARKER AND HAVENS Bll
of hafnium. The content of titanium, thorium, calcium, niobium, and possibly small amounts of other elements in the Crystal Mountain thortveitite may be due to minute inclusions of sphene, thorianite, fluorite, and fergusonite, although crystals selected for analysis appeared free of inclusions under the binocular microscope.
The association of thortveitite with fluorite in the deposit at Crystal Mountain represents a new type of occurrence, which contrasts strongly with the oc currences in granitic pegmatites of Norway and Madagascar.
REFERENCES
Behier, Jean, 1960, Contribution a la Mineralogie de Madagas car : Ann. Geol. Madagascar, no. 29, p. 19-20.
Lacroix, Alfred, 1920, Sur I'existence a Madagascar d'un silicate de scandium et d'yttrium, la thortveitite: Acad. Sci. (Paris) Comptes rendus, v. 171, p. 421-423.
Levinson, A. A., and Borup, R. A., 1960, New data on the haf nium, zirconium, and yttrium content of thortveitite: Am. Mineralogist, v. 45, p. 712-715.
Neumann, Henrich, 1961, The scandium content of some Nor wegian minerals and the formation of thortveitite, a recon naissance study: Norsk Geol. Tidsskr., v. 41, p. 197-210.
Schetelig, Jakob, 1922, Thortveitite, a silicate of scandium: Norsk Geol. Tidsskr., v. 6, p. 233-244.
Taber, J. W., 1952, Crystal Mountain fluorite deposits, Ravalli County, Montana: U.S. Bur. Mines Kept. Inv. 4916, 8 p.
1953, Montana's Crystal Mountain fluorite deposit is big and high grade: Mining World, v. 15, no. 7, p. 43-46.
Weis, P. L., Armstrong, F. C., and Rosenblum, Samuel, 1958, Reconnaissance for radioactive minerals in Washington, Idaho, and western Montana, 1952-1955: U.S. Geol. Survey Bull. 1074-B, p. 19-21.
680231 O 63
Article 3
BERYLLIUM IN THE TIN DEPOSITS OF IRISH CREEK, VIRGINIA
By F. G. LESURE, T. H. KIILSGAARD, C. E. BROWN, and MARY E. MROSE,
Washington, D.C.
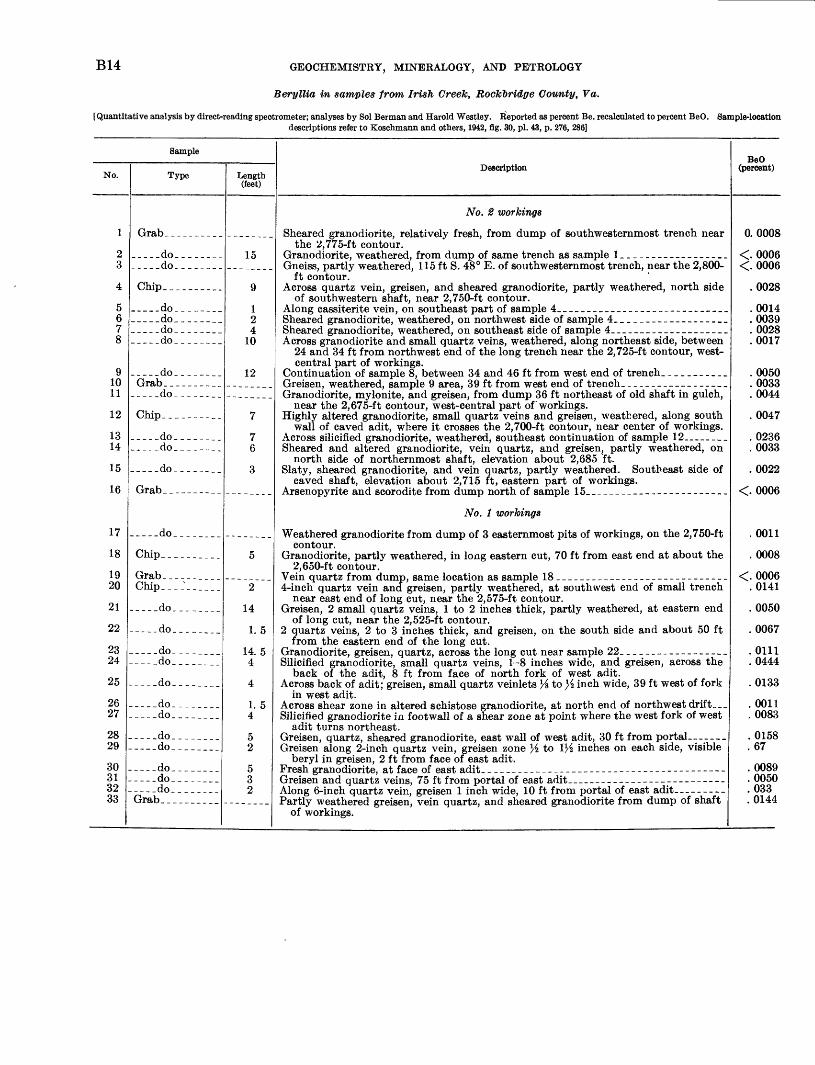
Abstract. Thirty-three chip 'and grajb samples from two adits and several caved cuts of the old Irish Creek tin mine, Bock- bridge County, Va., range in beryllium content from less than 0.0006 to as much as 0.67 percent BeO. Although only a few samples contained visible beryl, nearly all the samples con tained beryllium in amounts greater than average for grano- diorite, the host rock of the deposit. Further prospecting for beryllium-bearing material may be warranted.
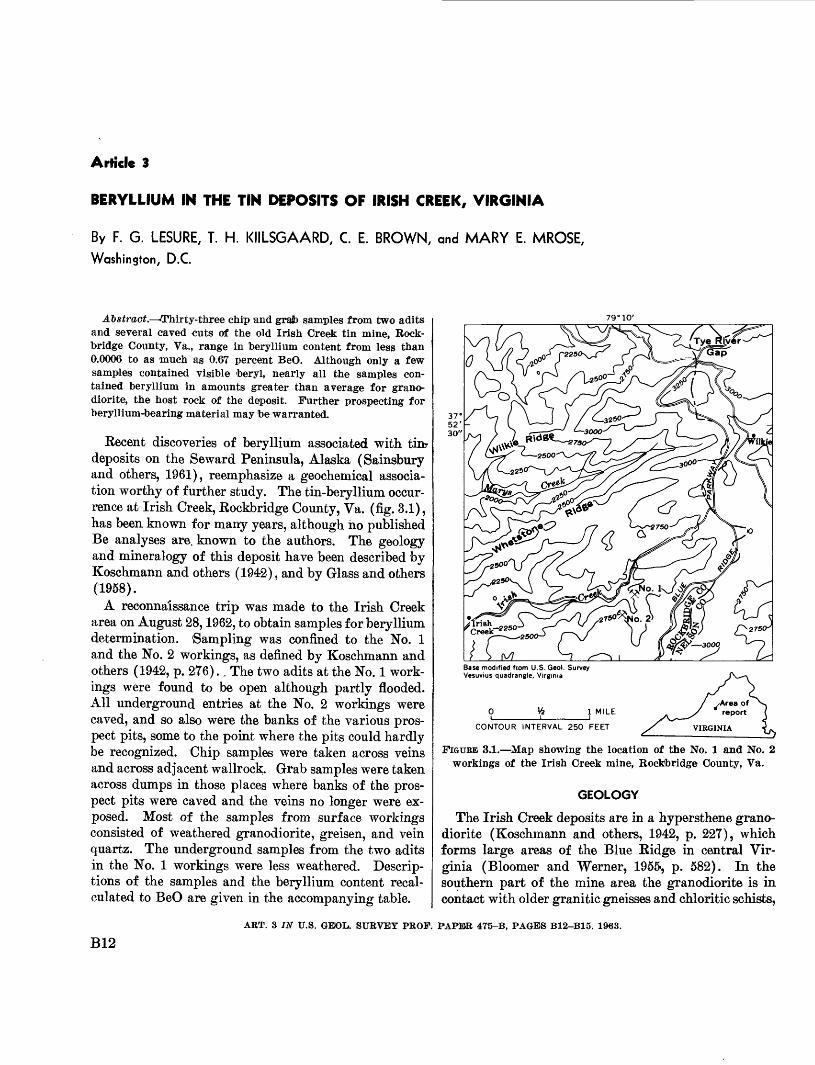
Recent discoveries of beryllium associated with tinr deposits on the Seward Peninsula, Alaska (Sainsbury and others, 1961), reemphasize a geochemical associa tion worthy of further study. The tin-beryllium occur rence at Irish Creek, Rockbridge County, Va. (fig. 3.1), has been known for many years, although ho published Be analyses are. known to the authors. The geology and mineralogy of this deposit have been described by Koschmann and others (1942), and by Glass and others (1958).
A reconnaissance trip was made to the Irish Creek area on August 28,1962, to obtain samples for beryllium determination. 'Sampling was confined to the No. 1 and the No. 2 workings, as denned by Koschmann and others (1942, p. 276).. The two adits at the No. 1 work ings were found to be open although partly flooded. All underground entries at the No. 2 workings were caved, and so also were the banks of the various pros pect pits, some to the point where the pits could hardly be recognized. Chip samples were taken across veins and across adjacent wallrock. Grab samples were taken across dumps in those places where banks of the pros pect pits were caved and the veins no longer were ex posed. Most of the samples from surface workings consisted of weathered granodiorite, greisen, and vein quartz. The underground samples from the two adits in the No. 1 workings were less weathered. Descrip tions of the samples and the beryllium content recal culated to BeO are given in the accompanying table.
79° 10'
37° 52' 30"
LBase modified from U.S. Geol. Survey Vesuvius quadrangle, Virginia
1 MILE
CONTOUR INTERVAL 250 FEET
FIGURE 3.1. Map showing the location of the No. 1 and No. 2 workings of the Irish Creek mine, Rockbridge County, Va.
GEOLOGY
The Irish Creek deposits are in a hypersthene grano diorite (Koschmann and others, 1942, p. 227), which forms large areas of the Blue Ridge in central Vir ginia (Bloomer and Werner, 1955, p. 582). In the southern part of the mine area the granodiorite is in contact with older granitic gneisses and chloritic schists,
ART. 3 IN U.S. GEOL. SURVEY PROF. PAPER 475-B, PAGES B12-B15. 1963.
B12
LESURE, KIILSGAARD, BROWN, AND MROSE B13
and between the No. 1 and No. 2 workings, granodio rite is cut by younger basic dikes and aplite. The tin deposits occur in quartz veins in the granodiorite and in greisen zones that border the veins. The veins are irregular in trend and range in thickness from an inch to several feet. The greisen, which forms a narrow zone 1 inch to several feet thick between the quartz and unaltered granodiorite, consists of muscovite, quartz, and fluorite with smaller amounts of cassiterite, beryl, wolframite, and other minerals (Koschmann and others, 1942, p. 280). Numerous other greisen-bordered quartz veins have been reported in the Irish Creek area by Ferguson (1918, p. 13-14).
BERYLLIUM
Beryllium is present as beryl and phenacite in the quartz veins and associated greisen (Ferguson, 1918, p. 11; Glass and others, 1958, p. 78-79). Beryl, which is the more abundant, is generally at the edge of the quartz veins (Koschmann and others, 1942, p. 281). Minor amounts of phenacite have been found with beryl or cutting chlorite and fluorite (Glass and others, 1958, p. 79). Beryl was the only visible beryllium min eral in the samples that we collected. The mineral is pale green, yellow, or white and forms slender hexag onal prisms that range" from 1 to 10 mm in length and 0.5 to 5 mm across. Longer crystals have been re ported by Ferguson (1918, p. 8) and Koschmann and others (1942, p. 281).
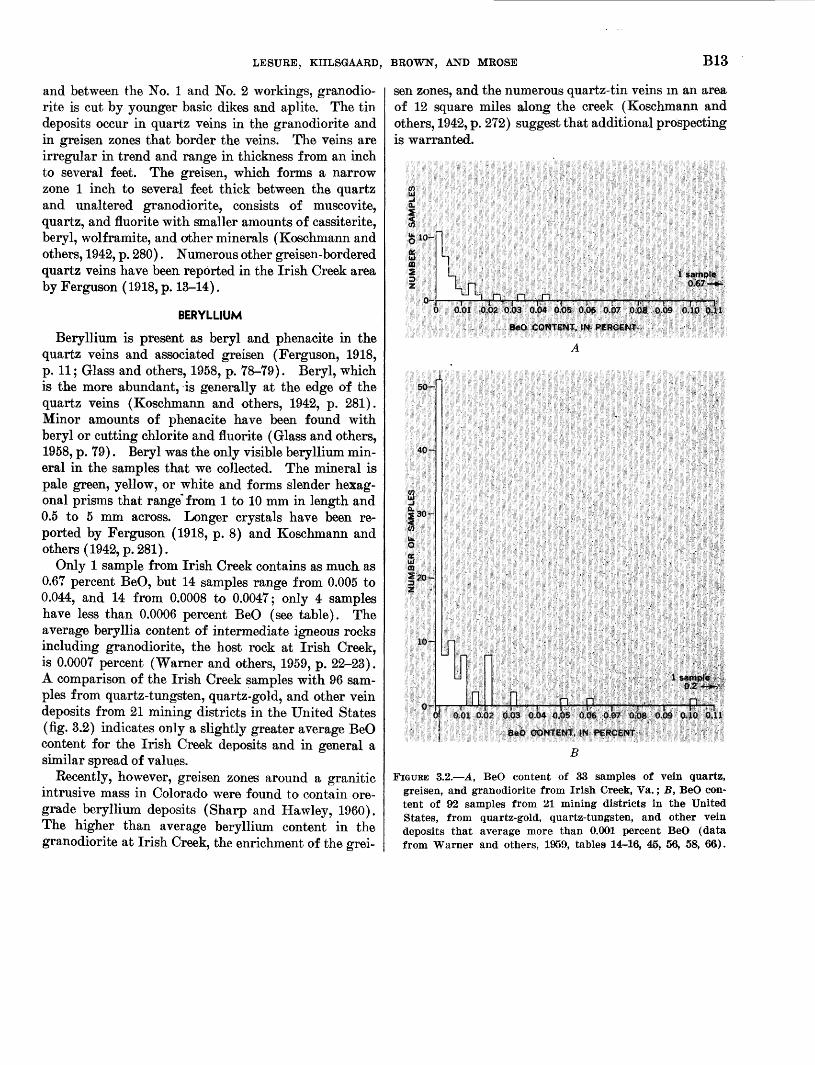
Only 1 sample from Irish Creek contains as much as 0.67 percent BeO, but 14 samples range from 0.005 to 0.044, and 14 from 0.0008 to 0.0047; only 4 samples have less than 0.0006 percent BeO (see table). The average beryllia content of intermediate igneous rocks including granodiorite, the host rock at Irish Creek, is 0.0007 percent (Warner and others, 1959, p. 22-23). A comparison of the Irish Creek samples with 96 sam ples from quartz-tungsten, quartz-gold, and other vein deposits from 21 mining districts in the United States (fig. 3.2) indicates only a slightly greater average BeO content for the Irish Creek deposits and in general a similar spread of values.
Recently, however, greisen zones around a granitic intrusive mass in Colorado were found to contain ore- grade beryllium deposits (Sharp and Hawley, 1960). The higher than average beryllium content in the granodiorite at Irish Creek, the enrichment of the grei
sen zones, and the numerous quartz-tin veins in an area of 12 square miles along the creek (Koschmann and others, 1942, p. 272) suggest that additional prospecting is warranted.
FIGURE 3.2. A, BeO content of 33 samples of vein quartz, greisen, and granodiorite from Irish Creek, Va.; B, BeO con tent of 92 samples from 21 mining districts in the United States, from quartz-gold, quartz-tungsten, and other vein deposits that average more than 0.001 percent BeO (data from Warner and others, 1959, tables 14-16, 45, 56, 58, 66).
B14 GEOCHEMISTRY, MINERALOGY, AND PETROLOGY
Beryllia in samples from Irish Creek, Rockbridge County, Va.
[Quantitative analysis by direct-reading spectrometer; analyses by Sol Herman and Harold Westley. Reported as percent Be, recalculated to percent BeO. Sample-locationdescriptions refer to Koschmann and others, 1942, fig. 30, pi. 43, p. 276, 286]
No.
1
23
4
5678
91011
12
1314
15
16
17
18
1920
21
22
2324
25
2627
2829
30313233
Sample
Type
Grab__---__-_-
_____do--_--__._..._do________
Chip __. _ ___
_____do____-____.__do___-_____.___do-___-________do_____._.
..._.do_. -_-___Grab__---__-__
..__.do_-___-__
Chip_. _.----_.
__--_do-__-_-_.___do___._-_.
-__._do____-__
Grab__-___--
_.-_.do_._.
Chip___.___ _
Grab-._-_-chiP _ __:___
.._-_do____
-_._do_____.
_____do________ __do_____.
-_-.do_____.__
-_...do__..__ -_do__._
_____do____-_-__do__-____
-___do-____.__---.do________ __do______._Grab________
Length (feet)
15
q
1o
410
1 O
7
76
q
5
o
14
1 P;
14 ^
4
4
1 C
4
5o
532
Description
A^o. 2 workings
Sheared granodiorite, relatively fresh, from dump of southwesternmost trench nearthe 2,775-ft contour.
Gneiss, partly weathered, 115 ft S. 48° E. of southwesternmost trench, near the 2,800-ft contour.
of southwestern shaft, near 2,750-ft contour.
Sheared granodiorite, weathered, on southeast side of sample 4_ ______ _ _ _ _ _____
24 and 34 ft from northwest end of the long trench near the 2,725-ft contour, west- central part of workings.
Greisen, weathered, sample 9 area, 39 ft from west end of trench. _ _ _______ __Granodiorite, mylonite, and greisen, from dump 36 ft northeast of old shaft in gulch,
near the 2,675-ft contour, west-central part of "workings. Highly altered granodiorite, small quartz veins and greisen, weathered, along south
wall of caved adit, where it crosses the 2,700-ft contour, near center of workings.
north side of northernmost shaft, elevation about 2,685 ft.
caved shaft, elevation about 2,715 ft, eastern part of workings.
No. 1 workings
Weathered granodiorite from dump of 3 easternmost pits of workings, on the 2,750-ftcontour.
2,650-ft contour.
near east end of long cut, near the 2,575-ft contour. Greisen, 2 small quartz veins, 1 to 2 inches thick, partly weathered, at eastern end
of long cut, near the 2,525-ft contour. 2 quartz veins, 2 to 3 inches thick, and greisen, on the south side and about 50 ft
from the eastern end of the long cut.
back of the adit, 8 ft from face of north fork of west adit. Across back of adit; greisen, small quartz veinlets }i to}£ inch wide, 39 ft west of fork
in west adit.
Silicified granodiorite in f ootwall of a shear zone at point where the west fork of westadit turns northeast.
Greisen along 2-inch quartz vein, greisen zone }£ to 1^ inches on each side, visibleberyl in greisen, 2 ft from face of east adit.
Partly weathered greisen, vein quartz, and sheared granodiorite from dump of shaftof workings.
BeO(percent)
0. 0008
<. 0006<. 0006
.0028
.0014
.0039
.0028
.0017
.0050
. 0033
. 0044
. 0047
. 0236
. 0033
.0022
<. 0006
.0011
.0008
<. 0006.0141
.0050
.0067
.0111
. 0444
.0133
.0011
.0083
.0158
.67
. 0089
.0050
.033
. 0144
LESURE, KIILSGAARD, BROWN, AND MROSE B15
REFERENCES
Bloomer, R. O., and Werner, H. J., 1955, Geology of the Blue Ridge region in central Virginia: Geol. Soc. America Bull., v. 66, no. 5, p. 57&-606.
Ferguson, H. G., 1918, Tin deposits near Irish Creek, Virginia: Virginia Geol. Survey Bull. 15-A, 19 p.
Glass, J. J., Koschmann, A. H., and Vhay, J. S., 1958, Minerals of the cassiterite-bearing veins at Irish Creek, Virginia, and their paragenetic relations: Econ. Geology, v. 53, p. 65-84.
Koschmann, A. H., Glass, J. J., and Vhay, J. S., 1942, Tin de posits of Irish Creek, Virginia: U.S. Geol. Survey Bull. 936-K, p. 271-296.
Sainsbury, C. L., Helz, A. W., Annell, C. S., and Westley, Harold, 1961, Beryllium in stream sediments from the tin-tungsten provinces of the. Seward Peninsula, Alaska: Art. 151 w U.S. Geol. Survey Prof. Paper 424-C, p. C16-C17.
Sharp, W. N., and Hawley, C. C., 1960, Bertrandite-bearing greisen, a new beryllium ore, in the Lake George District, Colorado: Art. 35 in U.S. Geol. Survey Prof. Paper 400-B, p. B73-B74.
Warner, L. A., and others, 1959, Occurrence of nonpegmatite beryllium in the United States: U.S. Geol. Survey Prof. Paper 318, 198 p.
Article 4
BERYLLIUM AND FLUORINE IN MINERALIZED TUFF, SPOR MOUNTAIN, JUAB COUNTY, UTAH
By WALLACE R. GRIFFITTS and L. F. RADER, JR.,
Denver, Colo.
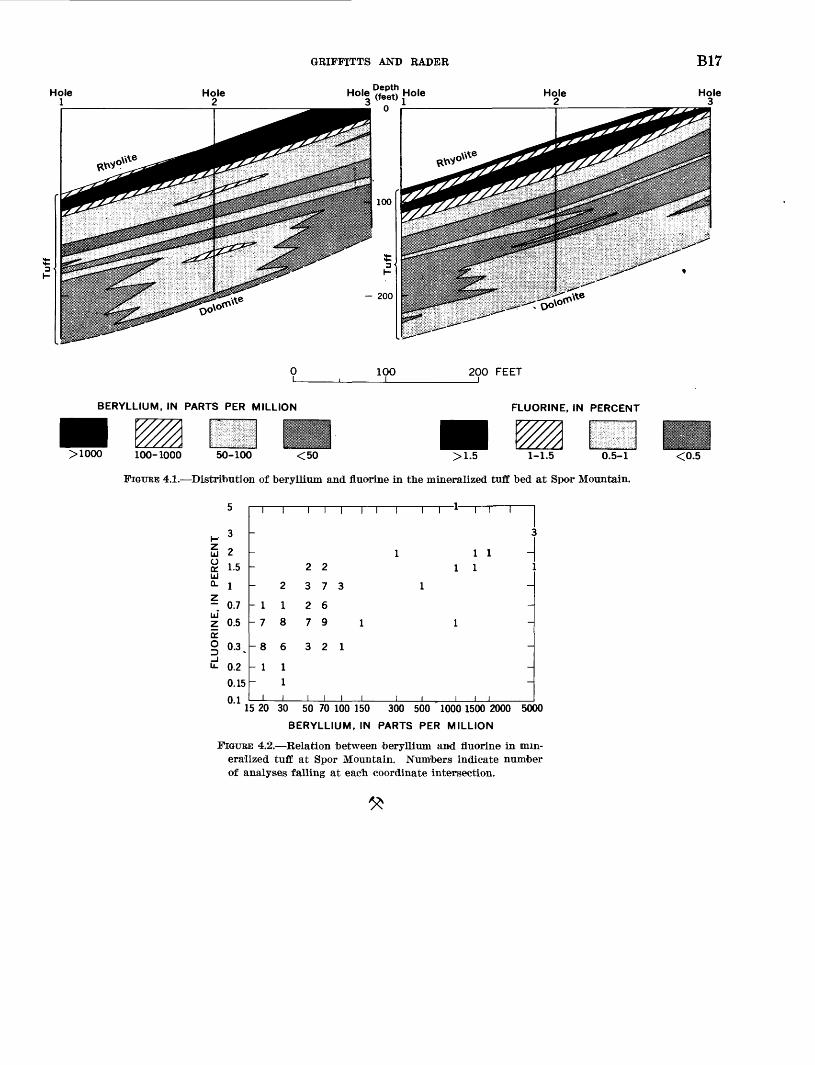
Abstract. The content of beryllium in a mineralized tuff bed varies directly with the fluorine content. Beryllium con centrations show a bimodal distribution with a large mode in the range 20 to 100 ppm and a smaller mode, representing-the ore zone, in the range 1,000 to 10,000 ppm.
Beryllium minerals are associated with minor amounts of fluorite in nonpegmatitic deposits of many districts (Norton and others, 1959). However, no pub lished study of the quantitative relationship between beryllium and fluorine in mineralized rocks has been made. The Spor Mountain, Utah, area was found suit able for such a study because the west side of Spor Mountain has zones of beryllium-rich rhyolitic tuff that also contain fluorite (Staatz and Griffitts, 1961). The Vitro Minerals Co. kindly supplied drill-hole samples to supplement this study; adequate representation of the lower parts of the tuff bed would not have been possible without the samples.
The distribution of beryllium and fluorine in the mineralized tuff bed at Spor Mountain is shown in figure 4.1. The upper part of the tuff bed contains the greatest concentrations not only of beryllium and fluorine but also of iron, manganese, zinc, lead, tin, and rare earths. However, the zones of greatest concen tration of these other elements coincide only approxi mately with the beryllium-rich zones. The abundance of most of the above elements is greater in the lower part of hole 1 than in the lower part of hole 2, the reverse of the trend noted for the abundance of beryl lium and fluorine. The rank-correlation coefficient (Dixon and Massey, 1951, p. 261) calculated for beryl lium and fluorine in 30 samples from each drill hole gives values of 0.636 and 0.656, respectively. The crit ical value for significance at the 1-percent level for 30
samples is listed as 0.432. Thus the correlation between beryllium and fluorine is significant to a very high degree.
The plot of the beryllium concentration against the fluorine content of the samples (fig. 4.2) shows that the concentrations of the two elements vary directly. For convenience the concentrations are grouped into ranges with midpoints in the series 1, 1.5, 2, 3, 5, and 7, and these midpoints are plotted in the diagram. Figure 4.2 shows that most of the samples are grouped in 2 con centration ranges, namely, 1,000 ppm of Be or more, corresponding to the ore zone, and 100 ppm of Be or less, delineating a submarginal mineralization of wide spread extent. The concentration range between 100 and 1,000 ppm of Be contains relatively few samples, indicating a sharp boundary of the ore zone. Similar sharp boundaries between ore and nonore rocks have been observed in other beryllium districts.
The concentrations of the two elements must reach a maximum before either approaches 100 percent. Study of selected specimens suggests that the maximum beryl lium content might be between 7 and 10 percent, as sociated with a fluorine content of about 30 percent.
REFERENCES
Dixon, W. J., and Massey, F. J., Jr., 1951, Introduction to statis- tical analysis: New York, MeGraw-Hill Book Co., Inc., 370 p.
Norton, J. J., Griffitts, W. R., and Wilmarth, V. R., 1959, Geol ogy and resources of beryllium in the United States: United Nations Internat. Oonf. Peaceful Uses Atomic Energy Proc., 2d, Geneva 1955, p. 21-34.
Staatz, M. H., and Griffitts, W. R., 1961, Beryllium-bearing tuff in the Thomas Range, Juab County, Utah: Econ. Geology, v. 56, p. 941-950.
ART. 4 IN U.S. GEOL. SURVEY PROF. PAPER 475-B, PAGES B16-B17. 1963.
B16
GRIFFITTS AND RADER B17
100 200 FEET
BERYLLIUM, IN PARTS PER MILLION FLUORINE, IN PERCENT
>1000 100-1000 50-100 <50 >1.5 1-1.5 0.5-1
FIGUBE 4.1. Distribution of beryllium and fluorine in the mineralized tuff bed at Spor Mountain.
<0.5
1-zUJo£UJ0.
zUJzcrO
u.
3
3
21.5
1
0.7
0.5
0.3,
0.2
0.15n i
i
-
_--- 1- 7
-8
- 1-
i
1
2
1
8
6
11i
1
2
3
2
7
3
i
l 1 1 I 1 1 I A l l i
,, -2 11]
73 1
6
91 1
21
--
iii i i iii15 20 30 50 70 100 150 300 500 1000 1500 2000 5000
BERYLLIUM, IN PARTS PER MILLION
FIGURE 4.2. Relation between 'beryllium and fluorine in min eralized tuff at Spor Mountain. Numbers indicate number of analyses falling at each coordinate intersection.
Article 5
BERYLLIUM AND FLUORINE CONTENT OF SOME SILICIC VOLCANIC GLASSES FROM WESTERN UNITED STATES
By WALLACE R. GRIFFITTS and HOWARD A. POWERS, Denver, Colo.
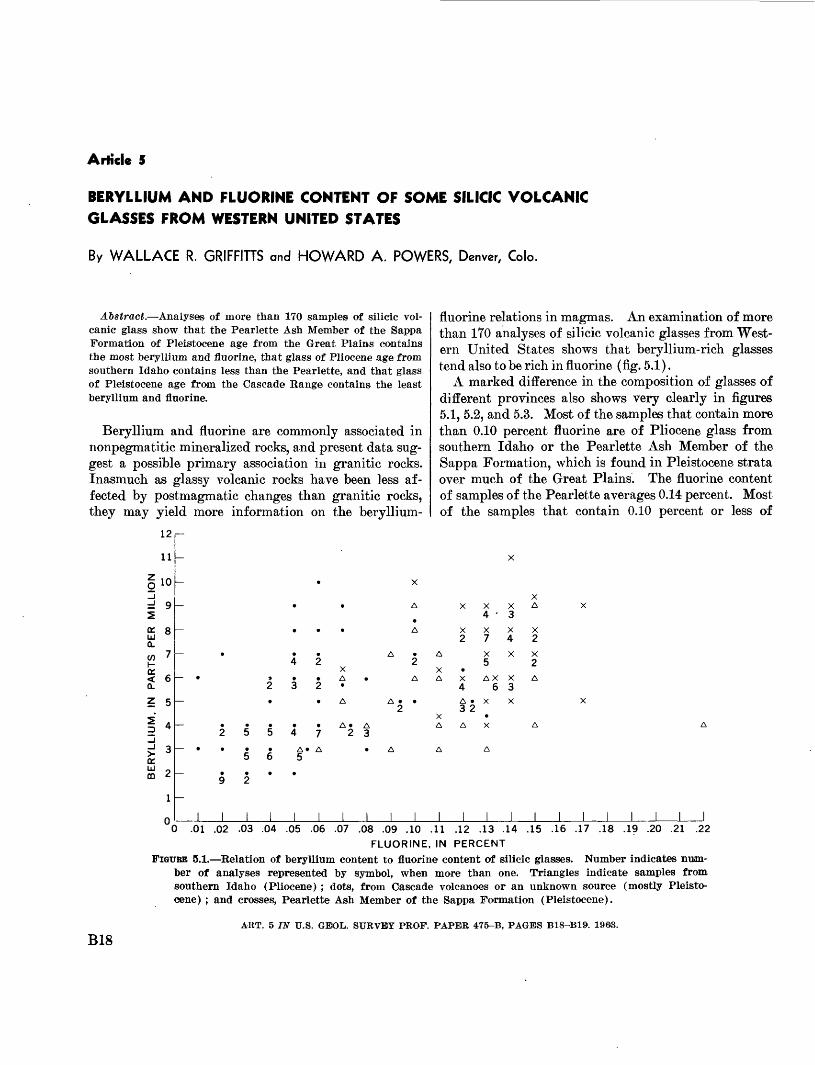
Abstract. Analyses of more than 170 samples of silicic vol canic glass show that the Pearlette Ash Member of the Sappa Formation of Pleistocene age from the Great Plains contains the most beryllium and fluorine, that glass of Pliocene age from southern Idaho contains less than the Pearlette, and that glass of Pleistocene age from the Cascade Range contains the least beryllium and fluorine.
Beryllium and fluorine are commonly associated in nonpegmatitic mineralized rocks, and present data sug gest a possible primary association in granitic rocks. Inasmuch as glassy volcanic rocks have been less af fected by postmagmatic changes than granitic rocks, they may yield more information on the beryllium-
fluorine relations in magmas. An examination of more than 170 analyses of silicic volcanic glasses from West ern United States shows that beryllium-rich glasses tend also to be rich in fluorine (fig. 5.1).
A marked difference in the composition of glasses of different provinces also shows very clearly in figures 5.1, 5.2, and 5.3. Most of the samples that contain more than 0.10 percent fluorine are of Pliocene glass from southern Idaho or the Pearlette Ash Member of the Sappa Formation, which is found in Pleistocene strata over much of the Great Plains. The fluorine content of samples of the Pearlette averages 0.14 percent. Most of the samples that contain 0.10 percent or less of
LZ
11
§10_Jd 95oc 8LUa.w 7oc ,.< 6 a.
? 5
J4
> 3
m 2
1
n
_
x
A X X4 -
A X X2 7
A A X42 2 5
X X » A AAX AX
2 3 2 46 A A A X
2 32x
25547 23
A» A A A A565
92**
-
1 1 1 I 1 1 1 1 1 1 1 1 1
x
xX A X3
X X4 2
X X2
X A3X X
A i
1 1 1 1 1 1 1 1
0 .01 .02 .03 .04 .05 .06 .07 .08 .09 .10 .11 .12 .13 .14 .15 .16 .17 .18 .19 .20 .21 .22FLUORINE, IN PERCENT
FIGURE 5.1. Relation of beryllium content to fluorine content of silicic glasses. Number indicates num ber of analyses represented by symbol, when more than one. Triangles indicate samples from southern Idaho (Pliocene) ; dots, from Cascade volcanoes or an unknown source (mostly Pleisto cene) ; and crosses, Pearlette Ash Member of the Sappa Formation (Pleistocene).
B18ART. 5 IN U.S. GEOL. SURVEY PROF. PAPER 475-B, PAGES B18-B19. 1963.
GRIFFITTS AND POWERS B19
30 V) Ul_l Q.
I 20
"0 .01 .02 .03 .04 .05 .06 .07 .08 .09 .10 .11 .12 .13 .14 .15 .16 .17 .18 .19 .20 .21 .22FLUORINE, IN PERCENT
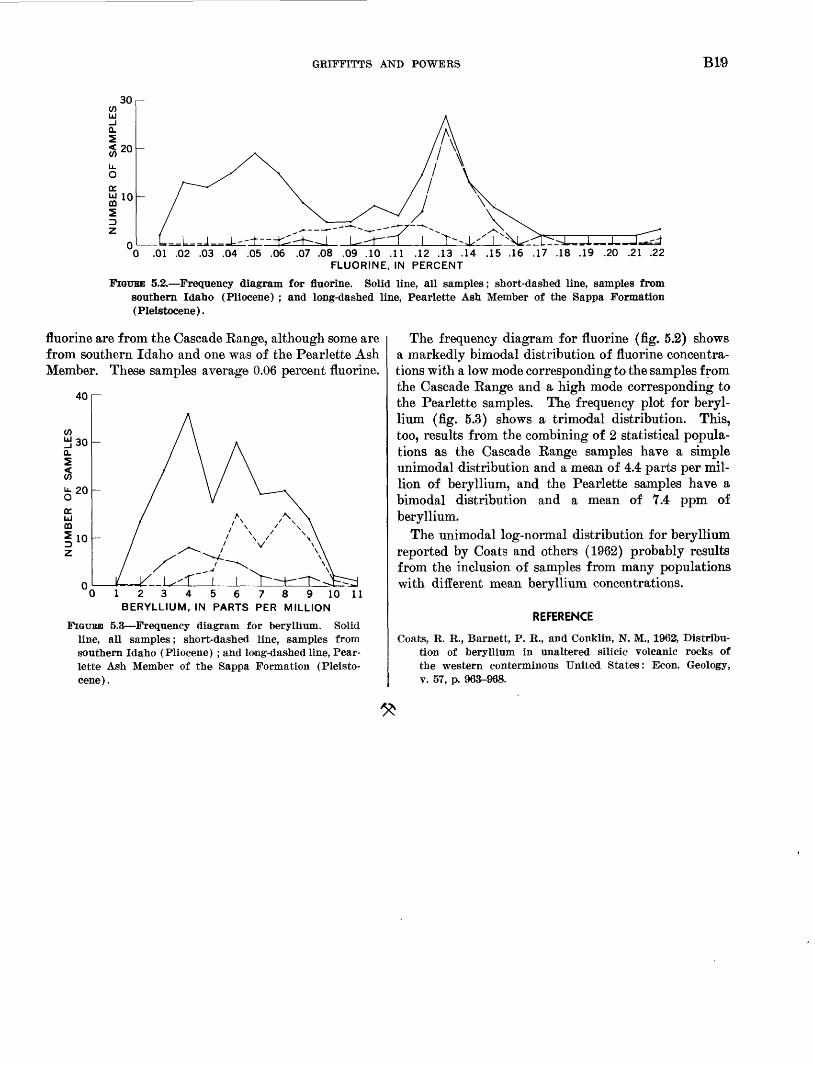
FIGURE 5.2. Frequency diagram for fluorine. Solid line, all samples; short-dashed line, samples from southern Idaho (Pliocene) ; and long-dashed line, Pearlette Ash Member of the Sappa Formation (Pleistocene).
fluorine are from the Cascade Eange, although some are from southern Idaho and one was of the Pearlette Ash Member. These samples average 0.06 percent fluorine.
401
123456789 10 11 BERYLLIUM, IN PARTS PER MILLION
FIGUBB 5.3 Frequency diagram for beryllium. Solid line, all samples; short-dashed line, samples from southern Idaho (Pliocene) ; and long-dashed line, Pear lette Ash Member of the Sappa Formation (Pleisto cene).
The frequency diagram for fluorine (fig. 5.2) shows a markedly bimodal distribution of fluorine concentra tions with a low mode corresponding to the samples from the Cascade Eange and a high mode corresponding to the Pearlette samples. The frequency plot for beryl lium (fig. 5.3) shows a trimodal distribution. This, too, results from the combining of 2 statistical popula tions as the Cascade Range samples have a simple unimodal distribution and a mean of 4.4 parts per mil lion of beryllium, and the Pearlette samples have a bimodal distribution and a mean of 7.4 ppm of beryllium.
The unimodal log-normal distribution for beryllium reported by Coats and others (1962) probably results from the inclusion of samples from many populations with different mean beryllium concentrations.
REFERENCE
Coats, R. R., Barnett, P. R., and Conklin, N. M., 1962, Distribu tion of beryllium in unaltered silicic volcanic rocks of the western conterminous United States: Econ. Geology, v. 57, p. 963-968.
Article 6
SOME NEW DATA ON THE ARSENIC CONTENT OF BASALT
By A. J. BARTEL, E. J. FENNELLY,
CLAUDE HUFFMAN, JR., and L. F. RADER, JR., Denver, Colo.
Abstract. Data are presented on the arsenic content of 48 samples of basalt from 6 different areas. On the basis of this work and 66 determinations previously published by others, a median value of 1 ppm is indicated for the arsenic content of basalt and diabase.
Published data on the arsenic content of rocks are limited. Tremearne and Jacob (1941), in a paper on the arsenic content of phosphates, summarized most of the data published prior to 1940 on arsenic in rocks, minerals, coals, soils, sediments, and waters. More re cently, Onishi and Sandell (1955) reported on the arsenic content of igneous rocks, minerals, chondrites, and shales.
Most common igneous rocks contain only trace amounts of arsenic. Values reported by Onishi and Sandell range from 1.5 ppm for granite to about 3.5 ppm for silicic volcanic rocks, with 2.0 ppm as an average for basalt and diabase.
New data to supplement those available on the arsenic content of basalt have been obtained recently by the analysis of 48 basalts selected as representative of those studied by Eader and others (1963) for zinc content. The* analytical method was described by Eader and Grimaldi (1961) and has been used in this laboratory not only to determine the arsenic content of shales (Tourtelot, 1962) but also of many other samples. The standard deviation of the determinations on 12 basalts from Idaho analyzed by 2 different chemists is 0.35 ppm 'of As for the range 2.0 ppm of As or less. A reagent-blank correction equivalent to 0.5 ppm of As has been made on all determinations.
The arsenic content of basalt based on 48 samples ranges from 0.1 to 6.0 ppm, with a weighted average of 1.0 ppm of As (table 6.1). Only 1 sample was found to contain more than 2 ppm of As. The preponderance of samples from Idaho and Oregon resulted from an effort to determine the range of arsenic in basalts
within a single province as compared to the total range found in basalt.
TABLE 6.1. New data on the arsenic content of basalt
[Analysts, Ardith Bartel, E. J. Fennelly, and C. Huffman, Jr.]
Location
Connecticut, central trap rocks.. ___ _
Idaho, Snake River Plain. __ _______ _New Mexico, Jemez Mountains. ______
Number of
samples
4 4 5
15 4
16
48
Arsenic content (ppm)
Range
0 1-0. 8 8-1.4 1-6.0 3-1.0 3-2.0 1-2.0
. 1-6. 0
Average
0.3 1. 1 1.7 .9
1.0 .8
1 1.0
i Weighted.
Table 6.2 (p. B22) presents complete standard rock analyses and determinations of 14 minor elements on 4 samples from each of the 6 areas. These samples were selected to represent the total range of Variation among the samples within eac'h area in their content of SiO2 , MgO, CaO, K2O, and Na2 O. Despite this careful selec tion based on composition, geologic age, and location, no correlation of arsenic with other elements, either major or minor, has been discovered. The greatest amounts of sulfur and zinc are present in the Idaho samples (table 6.2), and the most copper in the Hawaii samples. However, rank correlations of these elements to arsenic have shown no significance. The spectrographic de terminations (Ga through Sr) have a coefficient of variation ranging from 5.4 percent for nickel to 20.3 percent for strontium (Bastron and others, 1960, p. 180).
The Weighted average value of 1.0 ppm of As in 48 basalts from 6 areas of the United States included in our study differs slightly from that found by Onishi and Sandell (1955, tables 5, 10). Their data in the
B20ART. 6 IN U.S. GBJOL. SURVEY PROF. PAPER 475-B, PAGES B20-D23. 1963.
BARTEL, FENNELLY, HUFFMAN, AND RADER B21
0 5 10 15 20 NUMBER OF SAMPLES
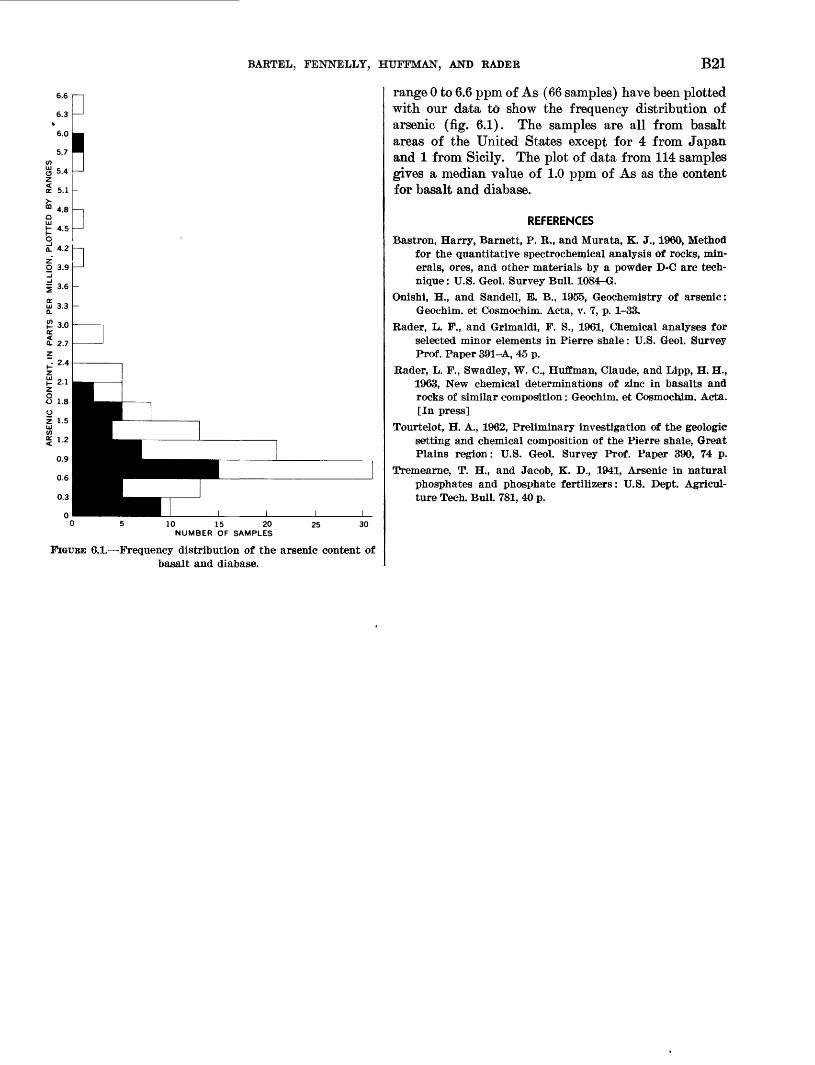
FIGUBE 6.1. Frequency distribution of the arsenic content of basalt and diabase.
range 0 to 6.6 ppm of As (66 samples) have been plotted with our data td show the frequency distribution of arsenic (fig. 6.1). The samples are all from basalt areas of the United States except for 4 from Japan and 1 from Sicily. The plot of data from 114 samples gives a median value of 1.0 ppm of As as the content for basalt and diabase.
REFERENCES
Bastron, Harry, Barnett, P. R., and Murata, K. J., 1960, Method for the quantitative spectrochemical analysis of rocks, min erals, ores, and other materials by a powder D-C arc tech nique: U.S. Geol. Survey Bull. 1084-G.
Onishi, H., and Sandell, E. B., 1955, Geochemistry of arsenic: Geochim. et Cosmochim. Acta, v. 7, p. 1-33.
Rader, L. F., and Grimaldi, F. S., 1961, Chemical analyses for selected minor elements in Pierre shale: U.S. Geol. Survey Prof. Paper 391-A, 45 p.
Rader, L. F., Swadley, W. C., Huffman, Claude, and Lipp, H. H., 1963, New chemical determinations of zinc in basalts and rocks of similar composition: Geochim. et Cosmochim. Acta. [In press]
Tourtelot, H. A., 1962, Preliminary investigation of the geologic setting and chemical composition of the Pierre shale, Great Plains region: U.S. Geol. Survey Prof. Paper 390, 74 p.
Tremearne, T. H., and Jacob, K. D., 1941, Arsenic in natural phosphates and phosphate fertilizers: U.S. Dept. Agricul ture Tech. Bull. 781, 40 p.
B22 GEOCHEMISTRY, MINERALOGY, AND PETROLOGY
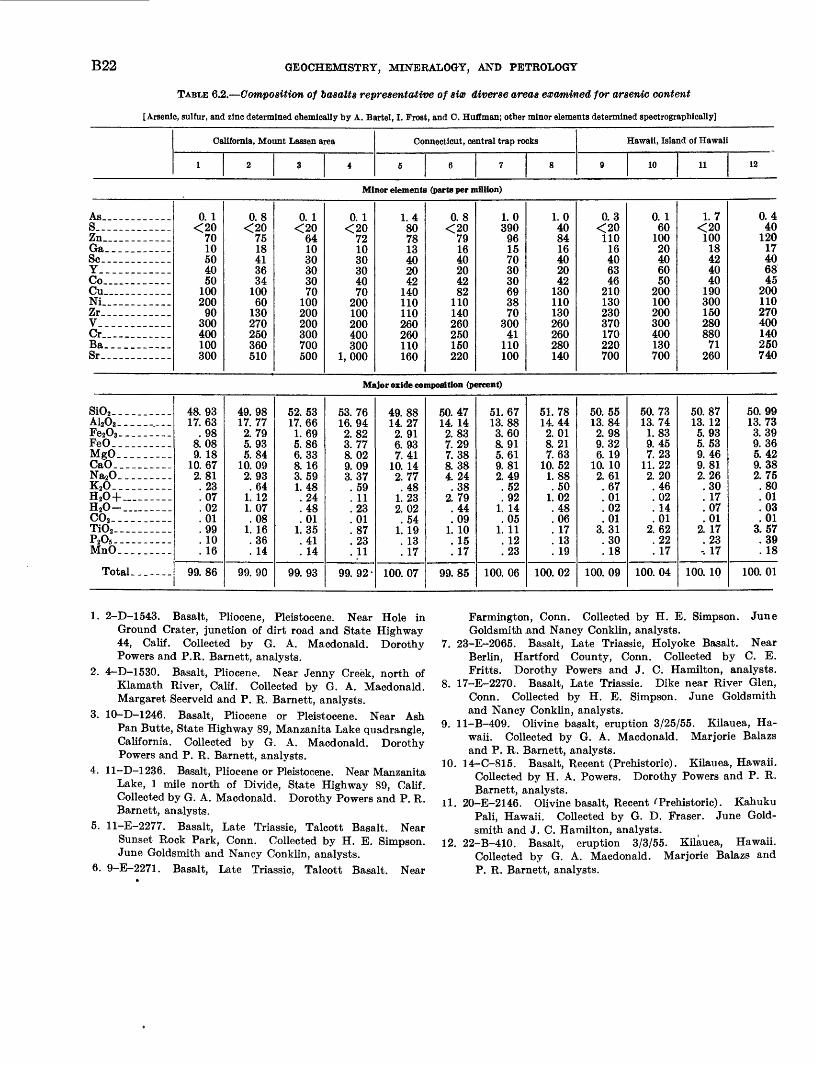
TABLE 6.2. Composition of basalts representative of sfa> diverse areas examined for arsenic content
[Arsenic, sulfur, and zinc determined cbemlcally by A. Bartel, I. Frost, and C. Huflman; other minor elements determined spectrographlcally]
California, Mount Lassen area
1 2 3 4
Connecticut, central trap rocks
6 6 7 8
Hawaii, Island of Hawaii
9 10 11 12
Minor elements (parts per million)
As.. ..._._.___S .Zn__ ..._._.___GaSc---__._---.Y_. ._...__._.Co...... ._-_..Cu...... ......Ni....._......Zr... .........V__ __.__._--.Cr__.__ .......Ba... ........Sr. ...____.__.
0. 1<20701050405010020090300400100300
O Q
^9fj
7518413634inn60i«m
270250360510
0.1/OH
6410onQfJ
3070100200200300700500
0. 1*">n
79
10QfJ
OfJ
4.070
2001002004.00300
1,000
1.48O781 3
409O4.9
140110110260260110160
0 0
/9n7Q
164.O204.989
11014.026025015099O
1.0QQfJ
961 570Of)
3069QO
7030041110100
1.04.O841640204213011013026026028014.0
0.3^f)C\
11016406346
210130230370170220700
0. 16010020406050
200100200300400130700
1.7<201001842404019030015028088071
260
0.44012017406845
200110270400140250740
Major oxide composition (percent)
SiO2 -. _ ...A12O3 . --._-.---Fe2O3 -------_-FeO__ _.._....MgO__ _...._.CaO. ..__...._Na20__ .......K20._......._H20+_________H20-_..._.___C02 ._. .......Ti02 .. ..._....P205 . _ -MnO. ........
Total.......
48.9317.63.988.089. 1810.672.81
. 23
.07
.02
.01
.99
.10
. 16
99.86
49.9817.772.795.935.8410.092.93.64
1. 121.07.08
1. 16.36. 14
on on
52.5317.661 fiQ5 8ft6.338.163 CQ
1 4.894.
.48
.01i 35
. 41
. 14
QQ Q3
53.761fi Q4.2 893 77o f\9
9 no3 07
5Q. 11OQ
.018790
. 11
QQ QO.
4.Q 8814. 97
2 Q1
6 QQ
7.4110.149 77
.481 902 O9
1 1Q 10
.17
100. 07
50.4714. 149 8°.7 on7.388 9.8
424.389 7Q
4.4.
.091. 10.15. 17
99.85
51.6713.883.608 Q1
5.619 819 4.Q
.52
.921. 14.05
1. 1119
.23
100. 06
51.7814 442.018.217.6310.521.88.501.02
4.8
.06
. 1710
. 19
100. 02
50. 5513.842.989.326. 19
10. 102.61.67.01.02.013.31.30.18
100. 09
50.7313. 741. 839.457.2311.222.20.46.02. 14.012.62.22.17
100. 04
50.8713. 125.935. 539.469.812.26.30.17.07.01
2. 17.23
-. 17
100. 10
50.9913.733.399. 365.429.382.75.80.01.03.013.57.39.18
100. 01
1. 2-D-1543. Basalt, Pliocene, Pleistocene. Near Hole in Ground Crater, junction of dirt road and State Highway 44, Calif. Collected by G. A. Macdonald. Dorothy Powers and P.R. Barnett, analysts.
2. 4-D-1530. Basalt, Pliocene. Near Jenny Creek, north of Klamath River, Calif. Collected by G. A. Macdonald. Margaret Seerveld and P. R. Barnett, analysts.
3. 10-D-1246. Basalt, Pliocene or Pleistocene. Near Ash Pan Butte, State Highway 89, Manzanita Lake quadrangle, California. Collected by G. A. Macdonald. Dorothy Powers and P. R. Barnett, analysts.
4. ll-D-1236. Basalt, Pliocene or Pleistocene. Near Manzanita Lake, 1 mile north of Divide, State Highway 89, Calif. Collected by G. A. Macdonald. Dorothy Powers and P. R. Barnett, analysts.
5. ll-E-2277. Basalt, Late Triassic, Talcott Basalt. Near Sunset Rock Park, Conn. Collected by H. E. Simpson. June Goldsmith and Nancy Conklin, analysts.
6. 9-E-2271. Basalt, Late Triassic, Talcott Basalt. Near
Farmington, Conn. Collected by H. E. Simpson. June Goldsmith .and Nancy Conklin, analysts.
7. 23-E-2065. Basalt, Late Triassic, Holyoke Basalt. Near Berlin, Hartford County, Conn. Collected by C. E. Fritts. Dorothy Powers and J. C. Hamilton, analysts.
8. 17-E-2270. Basalt, Late Triassic. Dike near River Glen, Conn. Collected by H. E. Simpson. June Goldsmith and Nancy Conklin, analysts.
9. ll-B-409. Olivine basalt, eruption 3/25/55. Kilauea, Ha waii. Collected by G. A. Macdonald. Marjorie Balazs and P. R. Barnett, analysts.
10. 14-C-815. Basalt, Recent (Prehistoric). Kilauea, Hawaii. Collected by H. A. Powers. Dorothy Powers and P. R. Barnett, analysts.
11. 20-E-2146. Olivine basalt, Recent ''Prehistoric). Kahuku Pali, Hawaii. Collected by G. D. Fraser. June Gold smith and J. C. Hamilton, analysts.
12. 22-B-410. Basalt, eruption 3/3/55. Kilauea, Hawaii. Collected by G. A. Macdonald. Marjorie Balazs and P. R. Barnett, analysts.

BARTEL, FENNELLY, HUFFMAN, AND RADER B23
TABLE 6.2 Composition of basalts representative of six diverse areas examined for arsenic content Continued
Idaho, Snake Biver Plain
13 14 15 16
New Mexico, Jemez Mountains area
17 18 19 20
Oregon, Mount Hood area
21 22 23 24
Minor elements (parts per million)
As ---------S__ .. -----._--Zn._... ...... .Ga.. ...... ...Sc______-.___-¥____---_._--Co..........:.Cu_. .. .......Ni____ ....... .ZT.... ........V. ............Cr_.._ --------Ba__ ----..-Sr
1.05001502040100504090
400250200700500
0.6801201640504353170230240400390160
0.3250130184080396794370300250580300
0.850
140163960376161
230240190460230
0.326082103050604010080200200400500
0.5<208610307040100100200200200400500
1.2<20
6810307040100200200200200
1,0002 000
2.0<201003070405080100200200400800900
0.7<2084165646422287110360260250170
0.4<20110165852412681100360270260190
0. 1<20
711336364246200-150170900220280
0.3<20
70143036285650190200170290310
Major oxide composition (percent)
SiO2AhOaFe203--_.----FeO. .__......MgO _ __----CaO______----Na20_____----K20. ...__.. -H20+______--H20-___-_--C02_ __----Ti02._-______-P205__- ......MnO_-_------
Total. ------
45.3714. 112.9811.986.7410.052.24.47.77.63.02
3. 541. 11.22
100. 23
45.5715. 071.60
12.069.489.502. 57.62. 02. 06.00
2. 63.56. 17
99.91
45. 6714.961.62
12.717.269.492.77.89. 02. 18. 01
3. 23.99.23
100. 03
47.0614. 193. 1811.366.599. 572. 54
. 64
.48
.38. .02
3. 12.60. 21
99.94
46.4816.003.796. 508.638. 172.55
. 652. 992. 16.03
1. 36. 30. 17
99.78
48.4816.373.916.626. 719.593.75.781.06
. 18
.061.84
. 51
. 16
100. 02
49.9816.455.885.226. 069. 523.32.91. 19.22.00
1. 64.37. 17
99.93
51.4016. 337.061. 985.348.283.822.02.57.65.01
1. 52.68. 15
99.81
47.4716.014. 626.266. 6710.302. 53.48
1. 921. 72.061.63.27. 16
100. 10
49.3815. 394. 876.246.49
10. 552. 71.491.48
. 59
.021.44.22
. -18
100. 05
49.9215.272.295.999.818. 593.09.81.861.30.031.45.30. 14
99.85
50.7016.963.774. 216. 168. 643. 52.981.321.41.041.67.36. 14
99.88
13. 9-A-196. Basalt, Pliocene. Tuana Gulch, Idaho. Col- 19. lected by H. A. Powers. Lois Trumbull and P. R. Barnett, analysts.
14. 6-D-1649. Olivine basalt, Recent. Near Wendell, Idaho.Collected by H. A. Powers. Ruth Kittrell and Nancy 20. Conklin, analysts.
15. 8-D-1655. Olivine basalt, late Pleistocene. Near Dietrich, Idaho. Collected by H. A. Powers. Ruth Kittrell and Nancy Conklin, analysts. 21.
16. 23-D-1684. Basalt, middle Pleistocene. Clover Creek, Idaho. Collected by H. E. Malde. Paula Montalto and Nancy Conklin, analysts. 22.
17. 1-53-1758. Basalt, Pliocene. Rio del Oso Wash, Black Mesa quadrangle, New Mexico. Collected by C. S. Ross and R. L. Smith. Lucille Kehl and P. R. Barnett, analysts. 23.
18. 6-54-175. Basalt, Pliocene. Santa Clara Canyon, west of Ranger Station, Santa Clara quadrangle, New Mexico. Collected by C. S. Ross and R. L. Smith. Lois Trumbull 24. and P. R. Barnett, analysts.
8-A-64. Olivine basalt, Pliocene. Near Warm Springs, San Antonio Valley, Jemez Springs quadrangle, New Mexico. Collected by C. S. Ross and R. L. Smith. Jean Theobald and P. R. Barnett, analysts.
2-52-1567. Olivine basalt, Miocene or Pliocene. Near Boyd Ranch, Peralta Canyon, Jemez quadrangle, New Mexico. Collected by C. S. Ross and R. L. Smith. L. C. Peck and R. S. Harner, analysts.
2-D-1781. Basalt, Miocene. Columbia River Basalt, bot tom flow, Johnnycake Mountain, Oreg. Collected by R. E. Wilcox. Ruth Kittrell and P. R. Barnett, analysts.
11-D-1781. Basalt, Miocene. Columbia River Basalt, middle flow, Johnnycake Mountain, Oreg. Collected by R. E. Wilcox. Ruth Kittrell and P. R. Barnett, analysts.
12-D-1776. Olivine basalt, Eocene, Clarno Formation.Bottom flow, Cottonwood Creek, Oreg. Collected by R. E.Wilcox. Ruth Kittrell and P. R. Barnett, analysts.
16-E-1777. Olivine basalt, Eocene, Clarno Formation.Middle flow, Cottonwood Creek, Oreg. Collected by R. E.Wilcox. Ruth Kittrell and P. R. Barnett, analysts.
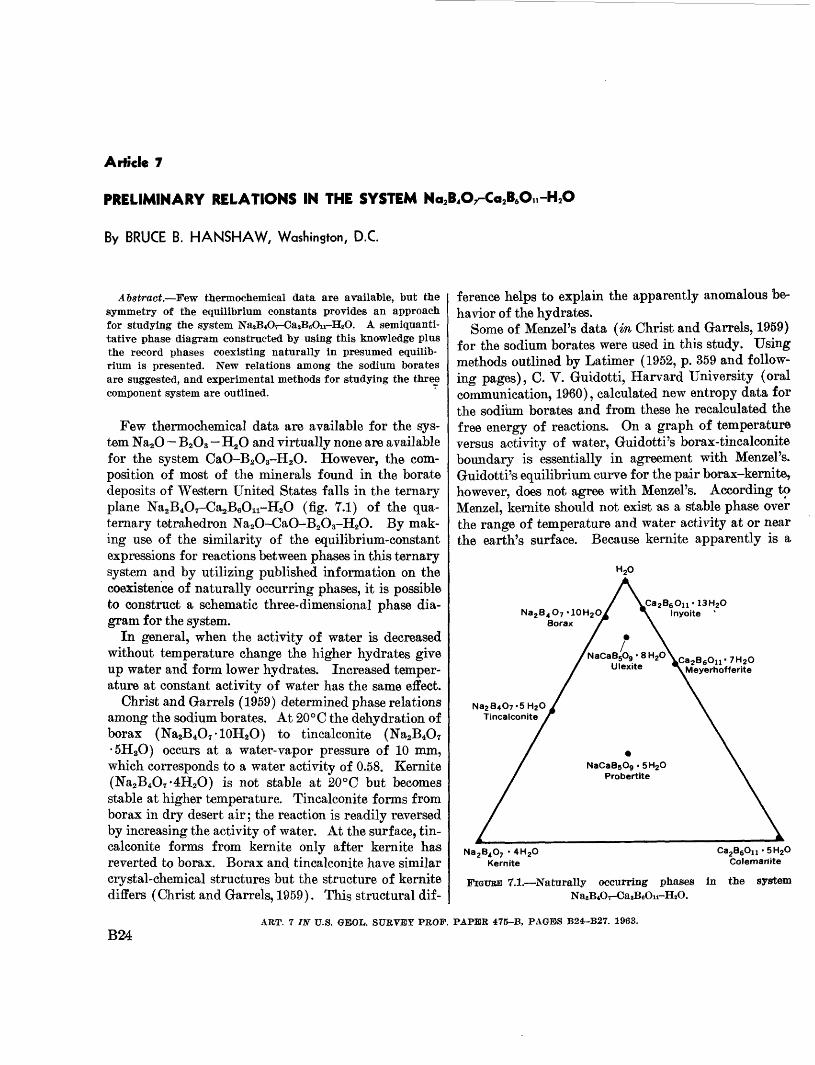
Article 7
PRELIMINARY RELATIONS IN THE SYSTEM Na2B4<VC«2B6On-H2O
By BRUCE B. HANSHAW, Washington, D.C.
Abstract. Few thermochemical data are available, but the symmetry of the equilibrium constants provides an approach for studying the system Na2B4O7-Ca2B8Oii-H2O. A semiquanti- tative phase diagram constructed by using this knowledge plus the record phases coexisting naturally in presumed equilib rium is presented. New relations among the sodium borates are suggested, and experimental methods for studying the three component system are outlined.
Few thermochemical data are available for the sys tem Na2O B2O3 H2O and virtually none are available for the system CaO-B2O3-H2O. However, the com position of most of the minerals found in the borate deposits of Western United States falls in the ternary plane Na2B407-Ca2B6Oii-H2O (fig. 7.1) of the qua ternary tetrahedron Na2O-CaO-B2O3-H2O. By mak ing use of the similarity of the equilibrium-constant expressions for reactions between phases in this ternary system and by utilizing published information on the coexistence of naturally occurring phases, it is possible to construct a schematic three-dimensional phase dia gram for the system.
In general, when the activity of water is decreased without temperature change the higher hydrates give up water and form lower hydrates. Increased temper ature at constant activity of water has the same effect.
Christ and Garrels (1959) determined phase relations among the sodium borates. At 20 °C the dehydration of borax (Na2B4O7 -10H2O) to tincalconite (Na2B4O7 5H2O) occurs at a water-vapor pressure of 10 mm, which corresponds to a water activity of 0.58. Kernite (Na2B4O7 '4H2O) is not stable at 20°C but becomes stable at higher temperature. Tincalconite forms from borax in dry desert air; the reaction is readily reversed by increasing the activity of water. At the surface, tin calconite forms from kernite only after kernite has reverted to borax. Borax and tincalconite have similar crystal-chemical structures but the structure of kernite differs (Christ and Garrets, 1959). This structural dif
ference helps to explain the apparently anomalous be havior of the hydrates.
Some of Menzel's data (in Christ and Garrels, 1959) for the sodium borates were used in this study. Using methods outlined by Latimer (1952, p. 359 and follow ing pages), C. V. Guidotti, Harvard University (oral communication, 1960), calculated new entropy data for the soditim borates and from these he recalculated the free energy of reactions. On a graph of temperature versus activity of water, Guidotti's borax-tincalconite boundary is essentially in agreement with Menzel's. Guidotti's equilibrium curve for the pair borax-kernite, however, does not agree with Menzel's. According to Menzel, kernite should not exist as a stable phase over the range of temperature and water activity at or near the earth's surface. Because kernite apparently is a
H,O
Na 2 B 4 O7 '10H2 Oj Borax
Ca 2 B6 Ou -13H20 Inyoite *
7H 2O Meyerhofferite
Na2 B4O7'5H2 O Tincalconite
Na 2 B4 O7 4H 2O CKernite Colemarfite
FIGUEE 7.1. Naturally occurring phases in the system
ART. 7 IN U.S. GBOL. SURVEY PROP. PAPER 475-B, PAGES B24-B27. 1963.
B24
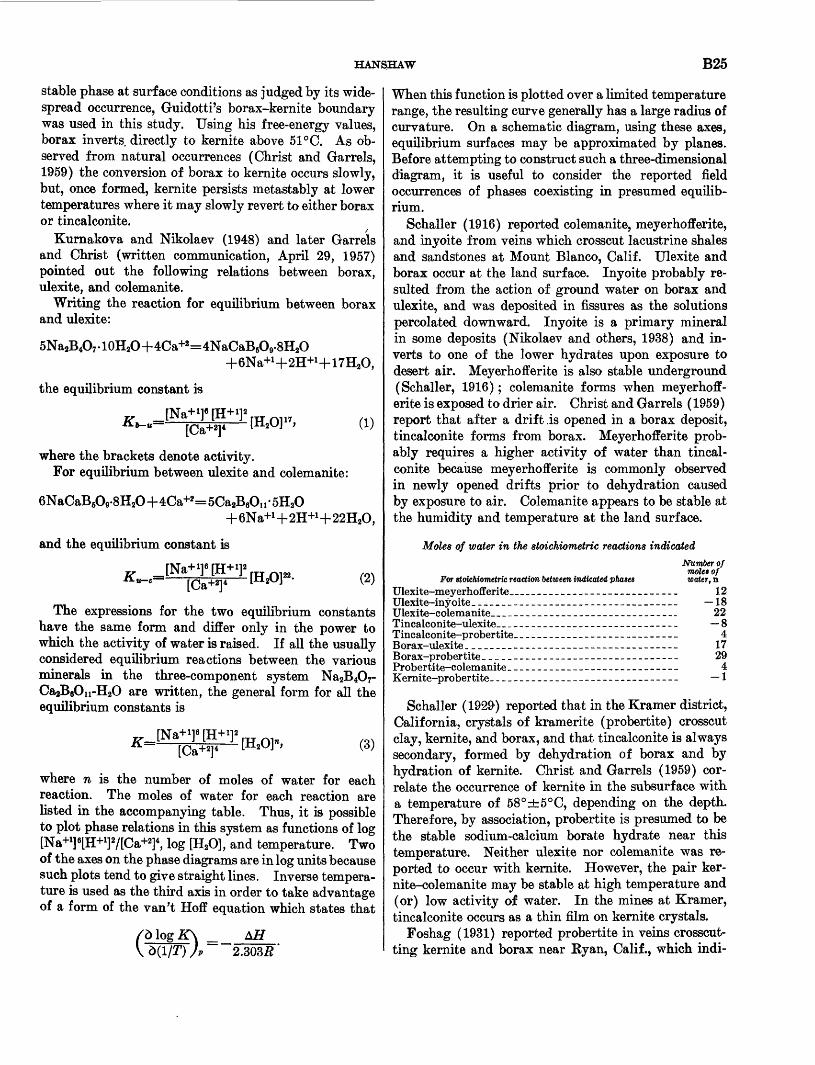
HANSHAW B25
stable phase at surface conditions as judged by its wide spread occurrence, Guidotti's borax-kernite boundary was used in this study. Using his free-energy values, borax inverts, directly to kernite above 51 °C. As ob served from natural occurrences (Christ and Garrels, 1959) the conversion of borax to kernite occurs slowly, but, once formed, kernite persists metastably at lower temperatures where it may slowly revert to either borax or tincalconite.
Kurnakova and Nikolaev (1948) and later Garrels and Christ (written communication, April 29, 1957) pointed out the following relations between borax, ulexite, and colemanite.
Writing the reaction for equilibrium between borax and ulexite:
5Na2B407 .10H20+4Ca+2 =4NaCaB609.8H2O+6Na+1 +2H+1 +17H2O,
the equilibrium constant is
+18+12[Ca+2]4 17 (1)
where the brackets denote activity. For equilibrium between ulexite and colemanite:
6NaCaB6CV8H20+4Ca+2=5Ca_B6011 -5H20+6Na+1 +2H+1 +22H2O,
and the equilibrium constant is
rNa+1l 6 rH+1l2 If _ irNd, j [ji j (2)
The expressions for the two equilibrium constants have the same form and differ only in the power to which the activity of water is raised. If all the usually considered equilibrium reactions between the various minerals in the three-component system Na2B4Or Ca2B6On-H2O are written, the general form for all the equilibrium constants is
[Na+1] 6 [H+1] 2 = [Ca+2] 4 (3)
where n is the number of moles of water for each reaction. The moles of water for each reaction are listed in the accompanying table. Thus, it is possible to plot phase relations in this system as functions of log [Na+1] 6lH+1] 2/[Ca+2]4, log [H2O], and temperature. Two of the axes on the phase diagrams are in log units because such plots tend to give straight lines. Inverse tempera ture is used as the third axis in order to take advantage of a form of the van't Hoff equation which states that
/d log K\ _V d(l/T) }P 2.3035
When this function is plotted over a limited temperature range, the resulting curve generally has a large radius of curvature. On a schematic diagram, using these axes, equilibrium surfaces may be approximated by planes. Before attempting to construct such a three-dimensional diagram, it is useful to consider the reported field occurrences of phases coexisting in presumed equilib rium.
Schaller (1916) reported colemanite, meyerhofferite, and inyoite from veins which crosscut lacustrine shales and sandstones at Mount Blanco, Calif. Ulexite and borax occur at the land surface. Inyoite probably re sulted from the action of ground water on borax and ulexite, and was deposited in fissures as the solutions percolated downward. Inyoite is a primary mineral in some deposits (Nikolaev and others, 1938) and in verts to one of the lower hydrates upon exposure to desert air. Meyerhofferite is also stable underground (Schaller, 1916); colemanite forms when meyerhoff erite is exposed to drier air. Christ and Garrels (1959) report that after a drift is opened in a borax deposit, tincalconite forms from borax. Meyerhofferite prob ably requires a higher activity of water than tincal conite because meyerhofferite is commonly observed in newly opened drifts prior to dehydration caused by exposure to air. Colemanite appears to be stable at the humidity and temperature at the land surface.
Moles of water in the stoichiometric reactions indicated
For stoichiometric reaction between indicated phases Ulexite-meyerhofferite. . _--_-------_--___Ulexite-iny oite _______-_-_-_--_-__-----_-_-Ulexite-colemanite__ _ __-_----------------_-Tincalconite-ulexite__ _ _____________________Tincalconite-probertite- .___-_----_--------_Borax-ulexite. _______--_-____-__-------.---Borax-probertite ___________________ ____-Probertite-colemanite. _ ___--__-__---------_Kernite-probertite. -_____--_____-----------
Number of molet of water, n
12-18
22-8
41729
4-1
Schaller (1929) reported that in the Kramer district, California, crystals of kramerite (probertite) crosscut clay, kernite, and borax, and that tincalconite is always secondary, formed by dehydration of borax and by hydration of kernite. Christ and Garrels (1959) cor relate the occurrence of kernite in the subsurface with a temperature of 58 0 ±:5 0 C, depending on the depth. Therefore, by association, probertite is presumed to be the stable sodium-calcium borate hydrate near this temperature. Neither ulexite nor colemanite was re ported to occur with kernite. However, the pair ker- nite-colemanite may be stable at high temperature and (or) low activity of water. In the mines at Kramer, tincalconite occurs as a thin film on kernite crystals.
Foshag (1931) reported probertite in veins crosscut- ting kernite and borax near Kyan, Calif., which indi-
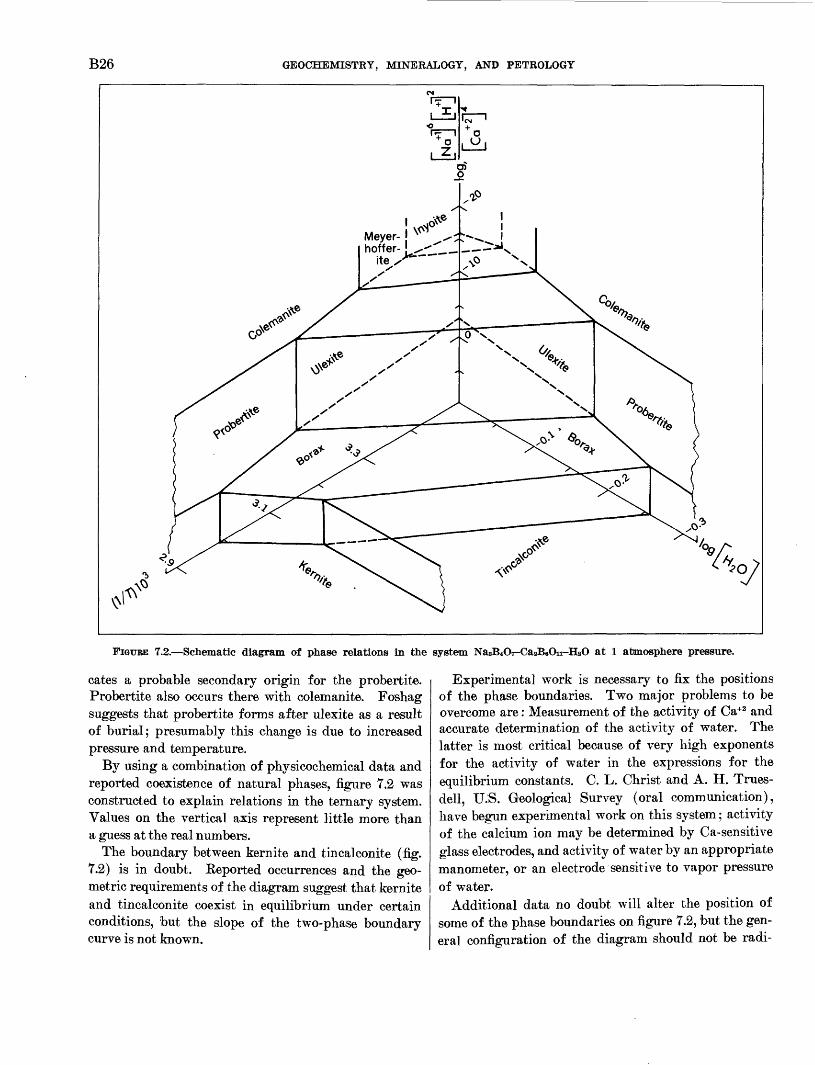
B26 GEOCHEMISTRY, MINERALOGY, AND PETROLOGY
FIGURE 7.2. Schematic diagram of phase relations in the system Na2B4O7-Ca2B6Ou-H2O at 1 atmosphere pressure.
cates a probable secondary origin for the probertite. Probertite also occurs there with colemanite. Foshag suggests that probertite forms after ulexite as a result of burial; presumably this change is due to increased pressure and temperature.
By using a combination of physicochemical data and reported coexistence of natural phases, figure 7.2 was constructed to explain relations in the ternary system. Values on the vertical axis represent little more than a guess at the real numbers.
The boundary between kernite and tincalconite (fig. 7.2) is in doubt. Eeported occurrences and the geo metric requirements of the diagram suggest that kernite and tincalconite coexist in equilibrium under certain conditions, but the slope of the two-phase boundary curve is not known.
Experimental work is necessary to fix the positions of the phase boundaries. Two major problems to be overcome are: Measurement of the activity of Ca+2 and accurate determination of the activity of water. The latter is most critical because of very high exponents for the activity of water in the expressions for the equilibrium constants. C. L. Christ and A. H. Trues- dell, U.S. Geological Survey (oral communication), have begun experimental work on this system; activity of the calcium ion may be determined by Ca-sensitive glass electrodes, and activity of water by an appropriate manometer, or an electrode sensitive to vapor pressure of water.
Additional data no doubt will alter the position of some of the phase boundaries on figure 7.2, but the gen eral configuration of the diagram should not be radi-
HANSHAW B27
cally changed. With additional experimental data, minerals in this system will be unusually useful indicators of conditions in the geologic past.
REFERENCES
Christ, C. L., and Garrels, R. M., 1959, Relations among sodium borate hydrates at the Kramer deposit, Boron, California: Am. Jour. Sci., v. 257, p. 516-528.
Foshag, W. F., 1931, Probertite from Ryan, Inyo County, California: Am. Mineralogist, v. 16, p. 338-341.
Kurnakova, A. G., and Nikolaev, A. V., 1948, Isothermalsolubility of the system Na2O-CaO-B2O3-H2O at 25° C:Akad. Nauk Izv., SSSR, Otdel. Khim. Nauk, no. 4, p.377-382.
Latimer, W. M., 1952, The oxidation states of the elements andtheir potentials in aqueous solutions: Englewood Cliffs,N.J., Prentice-Hall, Inc., 392 p.
Nikolaev, A. V., and others, 1938, The synthesis of inyoite:Doklady Akad. Nauk, U.R.S.S., v. 18, p. 431-432.
Schaller, W. T., 1916 Inyoite and meyerhofferite, two newcalcium borates : U.S. Geol. Survey Bull. 610.
1929, Borate minerals from the Kramer district, MohaveDesert, California: U.S. Geol. Survey Prof. Paper 158-1.
680231

Article 8
VARIATION IN MINOR-ELEMENT CONTENT OF DESERT VARNISH
By H. W. LAKH C. B. HUNT, D. F. DAVIDSON, and UTEANA ODA,
Denver, Colo.
Abstract. The cobalt content of desert varnish from Death Valley and northeastern Nevada shows a close correlation with the manganese content of the desert varnish, and barium, lanthanum, molybdenum, nickel, lead, and yttrium show a gen eral correlation. Thus the content of these elements in desert varnish may not be meaningful as an indicator of mineralized zones. Correlation with ore provinces may be represented by the high boron content of varnish from Death' Valley, Calif., by the high arsenic and antimony content of that from the Edna Mountains, Nev., and by the high copper content of that from the Antler Peak-Copper Basin area, Nevada.
Data on the trace-element content of desert varnish published by Engel and Sharp (1958) aroused interest in the possibility of using desert varnish as a geochem- ical regional-prospecting tool.
Samples from 6 sites in Death Valley, Calif., and from 6 sites in the northeastern quarter of Nevada were used to study the variation of the minor-element con tent of the varnish. Semiquantitative spectrographic analyses were made on three samples from each site: (1) the varnish, (2) the rock chips or pebbles remaining after removal of the varnish, and (3) the soil adjacent to the pebbles. The soil samples are of the 3- to 4-inch- thick light-gray fine-grained very porous surface layer in which the varnished pebbles are embedded.
The varnish was removed from the pebbles by dis solution by the reducing action of a dilute solution of ammonium oxalate and oxalic acid (pH 4.0), activated by ultraviolet light (A. S. DeEndredy, Ghana Soil Survey, oral communication to H. W. Lakin, August 1960). About 1 kilogram of varnished pebbles was placed in a 600-milliliter beaker, covered with the buf fered oxalate solution, and the whole placed under an ultraviolet light for 24 hours. The oxalate solution was filtered, evaporated to dryness, and ignited in a furnace at 500°C. The weight of the oxides thus ob tained ranged from 0.2 to 1.4 grams. Except for wet chemical determination of iron, manganese, and calcium
all other values were obtained by Semiquantitative spectrographic analysis.
In the accompanying table (p. B30-B31), the data are assembled in order of decreasing manganese content in the varnish. Varnish on the pebbles from Death Valley generally has a much higher manganese content than varnish found in northeastern Nevada; the iron content is fairly high in all the samples.
Engel and Sharp (1958, p. 489) in their study of desert varnish in the Mojave Desert and Death Valley state that "Field observations and some chemical data show that varnish is layered. Where the uppermost layer of black material has been removed, the under lying part is brown. Chemical analyses of successive leaches suggest a relative decrease in Mn inward from the surface." The low manganese content of all but one of the samples of varnish from northeastern Nevada may indicate that the high-manganese outer layer of varnish from Death Valley and the Mojave Desert is absent; possibly it was not formed or has been removed.
There is a striking positive correlation between the cobalt content and the manganese content of all the varnish samples. The cobalt content of the varnish ranges from 2,000 ppm in the sample with the highest manganese content to 30 ppm in that with the lowest manganese content; the pebbles and soil have a quite uniformly low cobalt content (<5-20 ppm). The amount of barium, lanthanum, molybdenum, nickel, lead, and yttrium in the varnish also generally de creases with decreasing amounts of manganese. Var nish with a low manganese content is enriched in beryllium. Because the variation in content of these elements appears to be dependent upon the amount of manganese in the varnish, the content of these elements in desert varnish is not likely to be a meaningful indi cator of mineralized zones.
ART. 8 IN U.S. GEOL. SURVEY PROF. PAPER 475-B, PAGES B28-B31. 1963.
B28
LAKIN, HUNT, DAVIDSON, AND ODA B29
Nevertheless, some correlation with ore provinces may be represented by the data. Varnish (N-l, N-2) collected in a region whose rocks are presumed to have a high arsenic, antimony, and vanadium content con tains anomalously large amounts of these elements. But varnish (N-3) collected from pebbles in an alluvial fan 3 miles from a similarly mineralized area does not contain anomalously large amounts of these elements. Varnish from site N-10, west of Eureka, Nev., contains
much silver, lead, zinc, and little copper; the ore mined upstream contains all four metals. Varnish (N-5, N-6) from a copper mining district has a relatively high copper content. The high boron content in the Death Valley varnish .correlates with high boron in the Death Valley area.
REFERENCEEngel, C. G., and Sharp, R. P., 1958, Chemical data on desert
varnish: Geol. Soc. America Bull., v. 69, no. 5, p. 487-518.
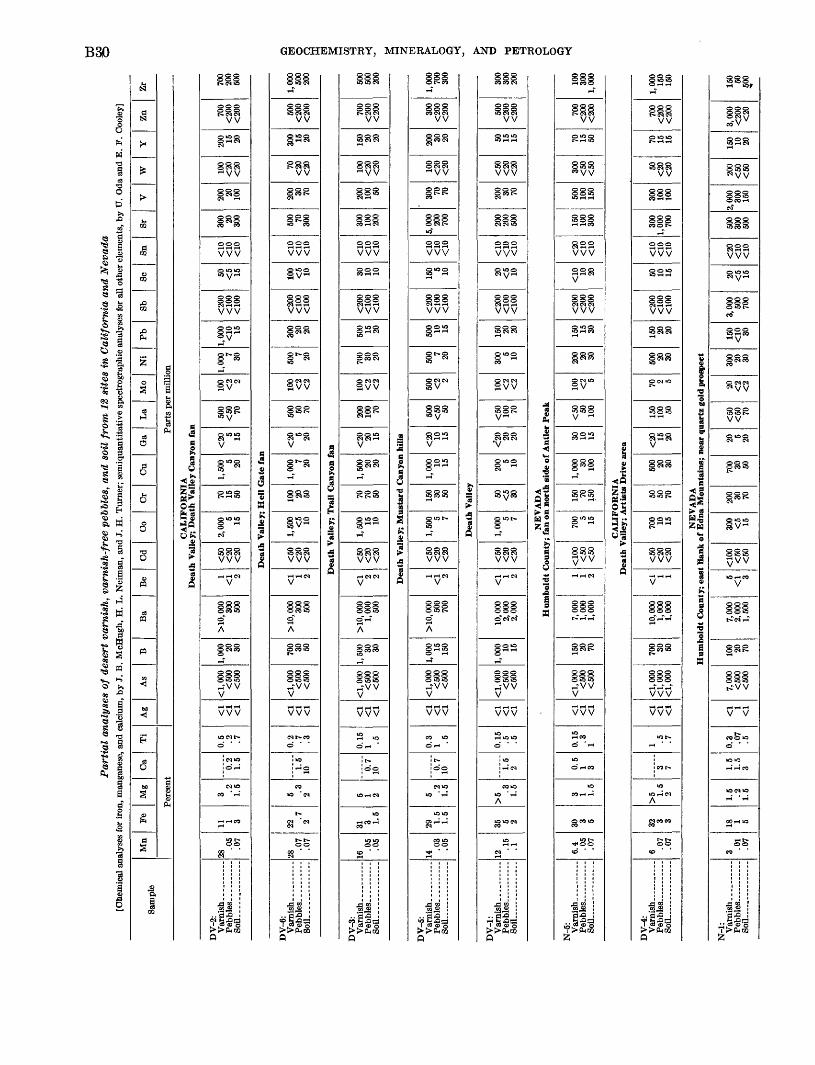
Part
ial
anal
yses
of
dese
rt v
arn
ish
, va
rnis
h-f
ree
pebb
les,
an
d so
il f
rom
12
site
s in
Cal
ifor
nia
an
d N
evad
a [C
hem
ical
ana
lyse
s fo
r iro
n, m
anga
nese
, and
cal
cium
, by
J. B
. McH
ugh,
H. L
. Nei
man
, and
J. H
. Tur
ner;
sem
iqua
ntita
tive
spec
trogr
aphi
c an
alys
es fo
r all
othe
r ele
men
ts, b
y U
. Oda
and
E.
F. C
oole
y]
Sam
ple
Mn
FeM
gC
aT
i
Per
cent
Ag
As
BB
aB
eC
dC
oC
rC
uG
aL
aM
oN
iP
bSb
ScSn
SrV
wY
Zn
Zr
Par
ts p
er m
illio
n
CA
LIF
OR
NIA
D
eath
Val
ley;
Dea
th V
alle
y C
anyo
n fa
n
DV
-2:
So
il....
..
28.0
5.0
7
11 1 3
3 .2 1.5
6.2
1.5
0.5 .2 .7
<1
<1
<1
< 1
,000
<50
0<
500
1,00
0 20 30
> 10
, 000 30
050
0
1<
1 2
<50
<20
<20
2,00
0 5 15
70 15 50
1,50
0 5 20
<20
5 15
500
<50 70
100
<2 2
1,00
0 7 30
1,00
0<
10 15
<20
0<1
00<1
00
50 <5 15
<10
<10
<10
300 20 300
200 20 100
100
<20
<20
200 15 20
700
<200
<200
700
200
500
Dea
th V
alle
y; H
ell
Gat
e fa
n
DV
-6:
Soil
....
..... -
28.0
7.0
7
22.7 2
5 .3 21.
510
0.2 .7 .3
<1
<1
<1
<1,
000
<50
0<5
00
700 30 50
> 10
, 000 300
500
<1 1 2
<50
<20
<20
1,50
0<
5 10
100 20 50
1,00
0 7 20
<20
5 20
500 50 70
100
<2
<2
500 7 20
300 20 20
<200
<100
<100
100
<5 10
<10
<10
<10
500 70 300
200 30 70
70<
20<
20
300 15 20
500
<200
<200
1,00
050
020
0
Dea
th V
alle
y; T
rail
Can
yon
fan
DV
-3:
Soil
-.-.
... ..
..
16.0
5.0
5
31 3 1.5
5 1 20.
710
0.15
1 .5
<1
<1
<1
<1,
000
<50
0<
500
1,50
0 30 30
> 10
, 000
1,00
050
0
<1 2 2
<50
<20 <20
1,50
0 15 10
70 70 50
1,50
0 20 20
<20 20 15
200
100 70
100
<2
<2
700 30 20
500 15 20
<200
<100
<100
30 10 10
<10
<10
<10
300
100
200
200
100 50
100
<20 <20
150 20 20
700
<200
<200
500
500
200
Dea
th V
alle
y; M
usta
rd C
anyo
n h
ills
DV
-5:
So
il.
..... .
.. ..
.
14.0
3.0
5
29 1.5
1.5
5 .2 1.5
0.7
10
0.3
1 .5
<1
<1
<1
<1,
000
<500
<500
1,00
0 15 150
>10
,000 50
070
0
1<
1 2
^fJC
\
<20
<20
1,50
0 5 7
150 30 50
1,00
0 10 15
<20 10 15
Knn
<50 50
500
<2 2
500 7 20
500 10 15
<20
0<
100
<100
150 5 10
<10
<10 <io
5,00
020
070
0
300 70 70
<20
<20
200 w 20
300
<200
<200
1 OO
C7(
X30
f
Dea
th V
alle
y
DV
-1:
So
il . ..
12.1
5.1
35 5 2
>5
.3 1.5
1.5
2
0.15 .5 .5
<1
<1
<1
<1,
000
<500
<500
1,00
0 10 15
10, 0
002,
000
2,00
0
<1 1 2
<50 <20
<20
1,00
0 5 7
50 <5 30
200 5 10
<20 20 20
<50 10
0 70
100
<2
<2
300 5 10
150 20 20
<200
<100
<100
20 <5 10
<10 <io
<10
200
200
500
200 30 70
<50
<20
<20
50 15 15
500
<200
<200
301
301
W
NE
VA
DA
H
um
bol
dt
Cou
nty;
fan
on
nort
h si
de
of
Ant
ler
Pea
k
N-5
:
Soil
. .
...
6.4 .05
.07
30 3 5
3 1 1.5
0.5
1 3
0.15 .3 1
<1
<1
<1
< 1
,000
<500
<500
150 20 70
7,00
01,
000
1,00
0
1 1 2
<100
<50
<50
700 5 15
150 70 150
1,00
0 30 100
30 10 15
<50 50 10
0
100
<2 5
200 20 30
150 15 30
<200
<200
<200
<10 10 20
<20
<10
<10
150
100
300
500
100
150
300
<50
<50
70 15 50
700
<200
<200
100
300
1,00
0
CA
LIF
OR
NIA
D
eath
Val
ley;
Art
ists
Dri
ve a
rea
DV
-4:
Soil
.....
6 .07
.07
32 3 3
>5 1.
52
3 7.5 .7
<1
<1
<1
<1,
000
<1,
000
<1,
000
700 30 50
1,00
01,
000
<1 1
^K
ft
<20 <20
700 10 15
Kfi 50 70
500 20 30
<20 15 20
i in so
70 5
500 20 30
150 20 20
<200
<100
<100
50 10 15
<10
<10
<10
300
1,00
070
0
300
100
100
Cft
<20
<20
70 15 15
700
<200
^"O
AA
1 00
0
150
NE
VA
DA
H
um
bol
dt
Cou
nty;
eas
t fl
ank
of
Edn
a M
ount
ains
; ne
ar q
uart
z go
ld p
rosp
ect
N-l
:
Soil
. ..
... .
-
3 .01
.07
18 1 5
1.5
1.5
1.5
1.5
3
0.3 .07
.5
<1 1
<1
7,00
0<5
00<5
00
100 20 70
7,00
09
fi
fiA
1,50
0
5<
1 3
<100
^ E
A
<50
300
<5 15
200 30 70
700 30 50
20 5 20
<50
<50 70
20 <2
<2
300 20 30
150
<10 30
3,00
050
070
0
20 <5 15
<20
<10
<10
500
300
500
2nn
nO
AA
150
200
j^E
f\
<50
150 10 20
3,00
0<2
00<
20
150
CA
500
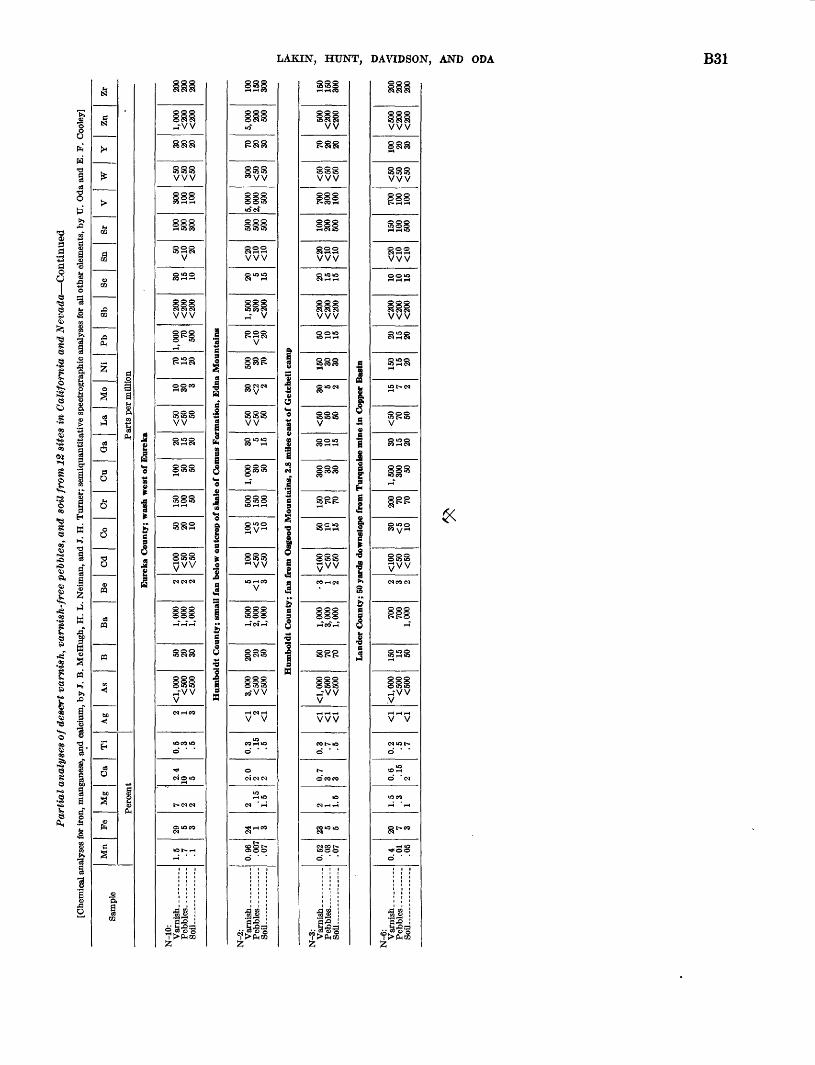
Part
ial
analy
ses
of d
eser
t va
rnis
h,
varn
ish-f
ree
peb
ble
s, a
nd s
oil
fro
m 1
2 si
tes
in C
ali
forn
ia a
nd N
eva
da
Conti
nued
[Che
mic
al a
naly
ses
for i
ron,
man
gane
se, a
nd c
alci
um, b
y J.
B. M
cHug
h, H
. L
. Nei
man
, and
J.
H.
Tur
ner;
sem
iqua
ntita
tive
spec
trog
raph
ic a
naly
ses
for a
ll ot
her
elem
ents
, by
U.
Oda
and
E.
F. C
oole
y]
Sam
ple
Mn
FeM
gC
aT
i
Perc
ent
Ag
As
BB
aB
eC
dC
oO
rC
uG
aL
aM
oN
iP
bSb
ScSn
8rV
wY
ZnZ
r
Par
ts p
er m
illio
n
Eur
eka
Cou
nty;
was
h w
est
of E
urek
a
N-1
0:
Soil
1.5 .7 .1
29 5 3
7 2 2
2.4
10 5
0.5 .3 .5
2 1 3
<1,
000
<50
0<5
00
50 20 30
1,00
01,
000
1,00
0
2 2 2
<100
<50
<50
50 20 10
150
100 50
100 50 50
20 15 20
<50 <50 50
10 30 3
70 15 20
1,00
0 70 500
<20
0<2
00<2
00
30 15 10
50<
10 20
100
500
300
300
100
100
<50
<50
<50
30 20 20
1,00
0<
200
<200
200
200
200
Hum
bold
t C
ount
y; s
mal
l fan
bel
ow o
utcr
op o
f sha
le o
f C
omus
For
mat
ion,
Edn
a M
ount
ains
N-2
:
T*pT
VK
lpQ
Soil
0.96 .007
.07
24 1 3
2 .15
1.5
2.0
2 2
0.3 .15
.5
<1 2
<1
3,00
0<5
00<5
00
200 20 50
1,50
02,
000
1,00
0
5<
1 3
100
<50
<50
100
<5 10
500
150
100
1,00
0 30 50
30 5 15
<50
<50 50
30 <2 2
500 30 70
70<
10 20
1,50
030
0<
200
20 5 15
<20
<10 <10
500
500
500
5,00
02,
000
500
300
<50
<50
70 20 30
5,00
020
050
0
100
150
300
Hum
bold
t C
ount
y; f
an fr
om O
sgoo
d M
ount
ains
, 2.8
mile
s ea
st o
f G
etch
ell c
amp
N-3
:
Soil
.
0.52 .0
3.0
7
23 5 5
2 1 1.5
0.7
3 3
0.3 .7 .5
<1
<1
<1
<1,
000
<50
0<5
00
50 70 70
1,00
03,
000
1,00
0
3 1 2
<100
<50
<50
50 I" 15
150 70 70
300 30 30
30 10 15
<50 50 50
30 5 2
150 30 30
50 10 15
<20
0<
200
<200
20 15 15
<20
<10
<10
100
200
500
700
300
100
<50
<50
<50
70 20 20
500
<20
0<2
00
150
150
300
Lan
der
Cou
nty;
50
yard
s do
wns
lope
from
Tur
quoi
se m
ine
in C
oppe
r B
asin
N-6
:
Soil
0.4 .01
.05
20 7 3
1.5 .3 1
0.6 .15
2
0.2 .5 .7
<1 1
<1
<1,
000
<500
<500
150 15 50
700
700
1,00
0
2 3 2
<100
<50
<50
30 <5 10
200 70 70
1,50
030
0 50
30 15 20
<50 70 50
15 7 2
150 15 20
20 15 20
<20
0<
200
<200
10 10 15
<20
<10
<10
150
100
500
700
100
100
<50
<50
<50
100 W 30
<50
0<
200
<200
200
200
200
w
Article 9
RELATION OF ION-EXCHANGE CAPACITYTO MINERAL COMPOSITION AND GRAIN SIZE OF WEATHERED CRYSTALLINE ROCKSAT THE GEORGIA NUCLEAR LABORATORY, DAWSON COUNTY, GEORGIA
By J. W. STEWART, Lakeland, Fla.
Work done in cooperation with U.S. Atomic Energy Commission and the U.S. Air Force
Abstract. Samples of weathered crystalline rocks at the Georgia Nuclear Laboratory were found to have ion-exchange capacities ranging from 1.0 to 13.7 milliequivalents per 100 grams. In general, the higher ion-exchange capacities charac terized the samples having the higher clay content. The principal minerals were kaolinite, muscovite, quartz, vermicu- lite-biotite, gibbsite, and vermiculite.
The relation of ion-exchange capacity to the mineral composition and grain size of weathered crystalline rocks at the Georgia Nuclear Laboratory was deter mined from samples collected at various depths below land surface from the side of a borrow pit and during the drilling of 33 monitoring wells. The borrow pit and 3 of the wells are near the REL (Radiation Effects Laboratory) waste-disposal pit, and the 30 other wells are near REF (Radiation Effects Facility) waste- disposal pits 1 and 2. The samples from the borrow pit were collected at depths of 1 to 27 feet below land surface and those from the wells at depths of 0 to 18 feet. Laboratory tests of the samples were made by the U.S. Geological Survey, Denver, Colo.
The REL waste-disposal pit is in the southeastern corner of the Georgia Nuclear Laboratory area and is 1.2 miles southeast of REF pit 1. The altitude of the land surface at the REL pit is about 1,112 feet. Quartz-mica schist, garnet-biotite schist, and amphi- bolite schist underlie the pit, and a small pegmatite vein composed largely of quartz and muscovite is exposed in its northern corner. The foliation at the pit strikes northeast and dips about 73° SE.
The saprolite at the REL site is thicker and more deeply weathered than at the REF site, largely because the fine-grained rocks are more intensely sheared than at the REF site. In addition, erosion probably has
removed more saprolite at the REF site where the topo graphic relief is about 200 feet, than it has at the REL site where the topographic relief is about 100 feet. Test drilling near the REL pit revealed that the sapro lite is about 137 feet thick, or about 11 times thicker than that at REF pit 1 and about 2% times thicker than that at REF pit 2. At both the REL and REF sites the schistose structure is preserved in the highly weathered saprolite beneath the soil zone.
The samples of saprolite were dispersed in distilled water with sodium metaphosphate added as a dispersing agent and fractionated by repeated centrifuging and decanting to separate the silt (2-02 microns) and the clay (<2 microns) fractions. The principal minerals in the silt and clay were identified from the X-ray dif fraction patterns of each fraction, and estimates of their relative abundance were expressed as parts in 10.
In order of relative abundance, the principal minerals in the 11 samples of saprolite from the borrow pit were kaolinite, gibbsite, hematite, quartz, muscovite, goethite, and vermiculite. By far the most abundant mineral was kaolinite, which averaged about seven-tenths of the silt fraction and about four-tenths of the clay fraction. Hematite, absent in the silt fraction, was the second most abundant mineral in the clay fraction; it probably resulted from oxidation and hydration of iron-bearing minerals such as muscovite and goethite. Vermiculite was absent in the silt fraction but was present in most of the clay fraction; presumably it resulted from altera tion of some muscovite by hydration and leaching.
The ion-exchange capacity of the samples of saprolite from the borrow pit ranged from 1 to 5 meq per 100 g (milliequivalents per 100 grams). The larger ion- exchange capacities characterized the samples collected
ART. 9 IN U.S. GEOL. SURVEY PROP. PAPER 475-B, PAGES B32-B34. 1963.
B32
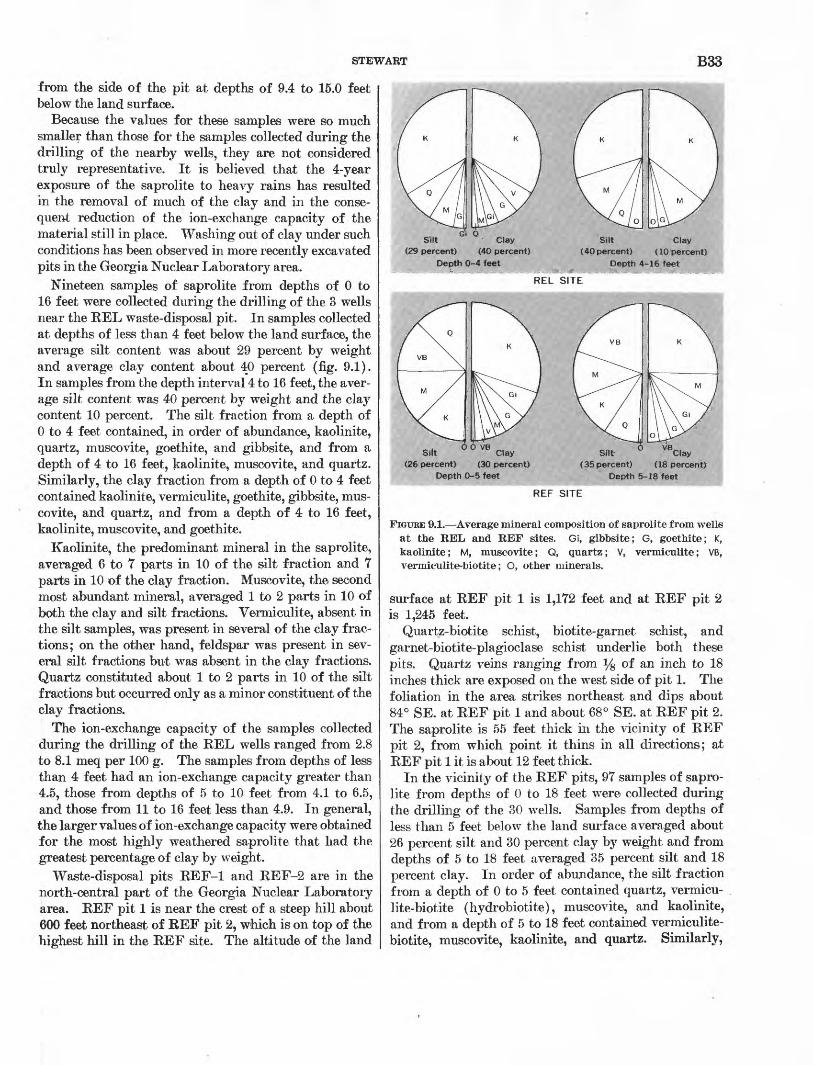
STEWART B33
from the side of the pit at depths of 9.4 to 15.0 feet below the land surface.
Because the values for these samples were so much smaller than those for the samples collected during the drilling of the nearby wells, they are not considered truly representative. It is believed that the 4-year exposure of the saprolite to heavy rains has resulted in the removal of much of the clay and in the conse quent reduction of the ion-exchange capacity of the material still in place. Washing out of clay under such conditions has been observed in more recently excavated pits in the Georgia Nuclear Laboratory area.
Nineteen samples of saprolite from depths of 0 to 16 feet were collected during the drilling of the 8 wells near the EEL waste-disposal pit. In samples collected at depths of less than 4 feet below the land surface, the average silt content was about 29 percent by weight and average clay content about 40 percent (fig. 9.1). In samples from the depth interval 4 to 16 feet, the aver age silt content was 40 percent by weight and the clay content 10 percent. The silt fraction from a depth of 0 to 4 feet contained, in order of abundance, kaolinite, quartz, muscovite, goethite, and gibbsite, and from a depth of 4 to 16 feet, kaolinite, muscovite, and quartz. Similarly, the clay fraction from a depth of 0 to 4 feet contained kaolinite, vermiculite, goethite, gibbsite, mus covite, and quartz, and from a depth of 4 to 16 feet, kaolinite, muscovite, and goethite.
Kaolinite, the predominant mineral in the saprolite, averaged 6 to 7 parts in 10 of the silt fraction and 7 parts in 10 of the clay fraction. Muscovite, the second most abundant mineral, averaged 1 to 2 parts in 10 of both the clay and silt fractions. Vermiculite, absent in the silt samples, was present in several of the clay frac tions; on the other hand, feldspar was present in sev eral silt fractions but was absent in the clay fractions. Quartz constituted about 1 to 2 parts in 10 of the silt fractions but occurred only as a minor constituent of the clay fractions.
The ion-exchange capacity of the samples collected during the drilling of the REL wells ranged from 2.8 to 8.1 meq per 100 g. The samples from depths of less than 4 feet had an ion-exchange capacity greater than 4.5, those from depths of 5 to 10 feet from 4.1 to 6.5, and those from 11 to 16 feet less than 4.9. In general, the larger values of ion-exchange capacity were obtained for the most highly weathered saprolite that had the greatest percentage of clay by weight.
Waste-disposal pits REF-1 and REF-2 are in the north-central part of the Georgia Nuclear Laboratory area. REF pit 1 is near the crest of a steep hill about 600 feet northeast of REF pit 2, which is on top of the highest hill in the REF site. The altitude of the land
Gi 0Silt Clay
(29 percent) (40 percent)Depth 0-4 feet
Silt Clay(40 percent) (10 percent)
Depth 4-16 feetREL SITE "~ ' ~ ~ "
Clay(18 percent)
I8 feet
REF SITE
FIGURE 9.1. Average mineral composition of saprolite from wells at the REL and REF sites. Gi, gibbsite; G, goethite; K, kaolinite ; M, muscovite ; Q, quartz ; V, vermiculite ; VB, vermiculite-biotite ; O, other minerals.
surface at REF pit 1 is 1,172 feet and at REF pit 2 is 1,245 feet.
Quartz-biotite schist, biotite-garnet schist, and garnet-biotite-plagioclase schist underlie both these pits. Quartz veins ranging from y8 of an inch to 18 inches thick are exposed on the west side of pit 1. The foliation in the area strikes northeast and dips about 84° SE. at REF pit 1 and about 68° SE. at REF pit 2. The saprolite is 55 feet thick in the vicinity of REF pit 2, from which point it thins in all directions; at REF pit 1 it is about 12 feet thick.
In the vicinity of the REF pits, 97 samples of sapro lite from depths of 0 to 18 feet were collected during the drilling of the 30 wells. Samples from depths of less than 5 feet below the land surface averaged about 26 percent silt and 30 percent clay by weight and from depths of 5 to 18 feet averaged 35 percent silt and 18 percent clay. In order of abundance, the silt fraction from a depth of 0 to 5 feet contained quartz, vermicu lite-biotite (hydrobiotite), muscovite, and kaolinite, and from a depth of 5 to 18 feet contained vermiculite- biotite, muscovite, kaolinite, and quartz. Similarly,

B34 GEOCHEMISTRY, MINERALOGY, AND PETROLOGY
the clay fraction from a depth of 0 to 5 feet contained kaolinite, gibbsite, goethite, muscovite, vermiculite, and vermiculite-biotite, and from a depth of 5 to 18 feet contained kaolinite, muscovite, gibbsite, goethite, and vermiculite-biotite. (See fig. 9.1.)
Vermiculite-biotite, which was not reported in samples from the BEL site, averaged about 3 parts in 10 of the silt fraction in the samples from the KEF site. Kaolinite, muscovite, and quartz each averaged about 2 parts in 10 of the silt fractions. The average contents of principal minerals in the clay fractions were kaolinite, 6 parts in 10; gibbsite, 1 part in 10; muscovite, 1 part in 10; goethite, 1 part in 10; and vermiculite- biotite, less than 1 part in 10. Gibbsite was present only as a trace hi the silt fractions, and quartz was present only as a trace in the clay fractions. Several of the silt and clay fractions showed traces of chlorite and lepidocrocite.
The ion-exchange capacity of the samples from the REF site ranged from 2.5 to 13.7 meq per 100 g. Most of the ion-exchange values greater than 4.6 were for samples from depths of 5 feet or less. With few excep tions these samples contained the highest percentage of clay by weight, indicating again that the ion-exchange capacity tends to be greater if the average particle size is smaller. The ion-exchange capacity of the samples from depths of 6 to 10 feet ranged from 2.7 to 8.9 meq per 100 g, and from depths of 11 to 18 feet ranged from 2.5 to 8.0 meq per 100 g. In both these depth
ranges, the larger ion-exchange capacities characterized those samples having the greater clay content.
The principal minerals in the samples of saprolite collected during the drilling of all 33 wells consisted of the following, in order of relative abundance: kaolinite, muscovite, quartz, vermiculite-biotite, gibbsite, ver miculite, goethite, and feldspar. At both the REL and KEF sites, kaolinite was the most abundant mineral, constituting as much as 5 to 8 parts in 10 of some samples. The range in ion-exchange capacity at the REL site (2.8* to 8.1 meq per 100 g) was slightly less than that at the REF site (2.5 to 13.7 meq per 100 g), largely because the saprolite at the REF site contained more clay and vermiculite-biotite, vermiculite, and gibbsite. At both sites the largest values of ion- exchange capacity characterized the samples from depths of less than 5 feet. The shallow samples gen erally contained more clay than the samples from greater depths. Although the ion-exchange capacity tended to decrease with depth, the decrease was not uni form nor smoothly progressive.
The generally low ion-exchange capacity of samples from both sites indicates that the saprolite has a rela tively low capacity for base exchange. Nevertheless, the overall efficiency of the saprolite for retention of radionuclides probably is fairly high because tlie sapro lite is thick, the water in the saprolite dilutes the infil trating radioactive wastes, and the rate of lateral movement of water within the saprolite is very slow.
Article 10
CORDIERITE-BEARING MINERAL ASSEMBLAGES IN PRECAMBRIAN ROCKS,
CENTRAL CITY QUADRANGLE, COLORADO
By P. K. SIMS and D. J. GABLE, Minneapolis, Minn., and Denver, Colo.
Abstract. Cordierite occurs with anthophyllite in small lenses within a microcline gneiss unit and in 'biotite-cordierite- garnet-sillimanite gneiss within a biotitic gneiss unit of the Idaho Springs Formation. The cordierite of both occurrences evidently originated by dynamothermal metamorphism of sedi mentary rocks, with little addition of material except possibly magnesium.
Cordierite is common in the Precambrian metamor-" phic rocks of the Idaho Springs Formation in the cen tral part of the Front Range. It occurs with antho phyllite in small bodies within a microcline-bearing paragneiss of granitic composition near Central City, and with sillimanite and garnet in biotite gneiss in ad jacent areas. The rocks are part of the succession of high-grade metasedimentary gneisses that predate the Precambrian intrusive igneous rocks of the Front Range (Moench and others, 1962, p. 37-39; Lovering and Goddard, 1950, p. 19-29).
TABLE 10.1. Representative modes (volume percent) of cordierite-anthophyllite rocks and associated rock types
Biotite.........:..............Garnet. _____ . ___ ......Sillimanite.. _ .... .... ...Apatite.......... .............
Chlorite.. ....__. .............Epidote. __ ..............
Total..
Average grain diameter, in
Cordierite-anthophyllite rocks
1
3.8 90.0
6. i5.4
0.4 0.3
100.0
2
44.4
29.6 2.2
0.7 8.8
13.9Tr.Tr.0.1
0.3
100.0
0.5
3
51.5
27.1 10.4
0.1 8.0
Tr.
2.7
0.2
100.0
0.5
4
.12.7 14.5 29.6 1.3
Tr. 1.9
Tr.
Tr.
Tr.
100.0
Anze
Hornblende- tnd cumming- tonite-bearing
rocks
5
20.9 16.7
47.22.8
1.7
0.1
4.31.25.1
100.0
AJ178-80
0.3
6
8.7 .H.I
30.2
2.0
0.1
0.9
2.60.41.0
100.0
Anei-M
0.3
Cord- icrite- biotite rocks
7
59.4 1.8
21.2
17.1 0.3
0.2
100.0
0.5
Cordierite-anthophyllite rocks occur in scattered lenses within the microcline gneiss. The lenses are a maximum of 300 feet long, elongate in the plane of the foliation, and sharply delineated from the enclosing gneiss. At places they are adjacent to thin layers of amphibolite or a calcic hornblende gneiss. In most bodies the cordierite-anthophyllite rocks are interlay- ered with hornblende and hornblende-cummingtonite rocks, generally on a scale of a few feet. One lens is associated with cordierite-biotite rocks. Cordierite is not found with either hornblende or cummingtonite. Modes that are representative of the rock types, and in dicate their extreme variation in composition, are given in table 10.1. The texture of all the rocks is grano- blastic. Garnet and cordierite tend to form poikilo- blasts in a mosaic of slightly smaller mineral grains.
The cordierite-bearing rocks contain the following mineral assemblages:
Cordierite-anthophyllite rocks
Anthophyllite-biotite-cordierite - magnetite - quartz Anthophyllite-biotite-cordierite-garnet - magnetite-
quartz Anthophyllite-biotite-cordierite-magnetite - plagio-
clase-quartz Anthophyllite-biotite - cordierite - garnet - magnet-
ite-plagioclase-spinel Anthophyllite-biotite-cordierite-magnetite-spinel
Cordierite-biotite rocks
Biotite-cordierite-quartz Biotite-cordierite-garnet-plagioclase-quartz
Green spinel and less commonly corundum are present locally in some thin sections of cordierite-anthophyl lite rock that contain quartz.
The cordierite-bearing biotite gneiss is a distinct unit within the Idaho Springs Formation. It forms dis-
ART. 10 IN U.S. GBOL. SURVEY PROP. PAPER 475-B, PAGES B35-B37. 1963.
B35
B36 GEOCHEMISTRY, MINERALOGY, AND PETROLOGY
continuous layers that conform generally to the gross layering in the biotite gneiss units. One body, a maxi mum of about 1,000 feet thick, can be traced continu ously along strike for 2i£ miles; others are more lenticular. Most bodies lie within larger masses of sil- limanitic biotite-quartz gneiss, and grade sharply into it. Microcline-rich pegmatites are associated with the bodies commonly as lenses or pods lying parallel to the foliation in the gneiss. Lenses of amphibolite, calc- silicate gneiss, granodiorite, and hypersthene-bearing quartz diorite are found near many bodies of cordierite- bearing gneisses.
The cordierite-bearing biotite gneiss consists of the following general mineral assemblages:
Biotite-cordierite-potassic feldspar-sillimaniteBiotite-cordierite-garnetBiotite-cordierite-garnet-sillimaniteBiotite-cordierite-potassic feldspar-garnet-sillima-
niteEach of the assemblages contains magnetite, quartz, and plagioclase; spinel is a local mineral (table 10.2). The rocks have a granoblastic texture and except for the development of porphyroblasts of garnet, cordierite and, rarely, magnetite, the minerals are intergrown in a mosaic pattern. In a few sections, cordierite was ob served to embay garnet and to surround it in well- defined coronas free of sillimanite and biotite. This suggests that the cordierite developed at the expense of garnet, probably by the reaction
garnet+biotite+sillimanite+quartz ^cordierite +magnetite+potassic feldspar+H2O suggested previously by Schreyer and Yoder (1961, p. 150). Magnetite and potassic feldspar developed in this way tend to cluster adjacent to the cordierite. Mineral phases that were not consumed in the reaction were en closed poikilitically in the cordierite.
TABLE 10.2. Representative modes (volume percent) of cordierite-bearing sillimanite-'biotite gneiss
Cordierite __________________Sillimanite ............... ............Garnet. ___________________Biotite ________ .... _ . __ ------
Muscovite- ________________Clinozoisite ________ . __ .... ....Spinel- ______ ....................Chlorite . .............................
Total..... ........ ............
Composition of plagioclase- _ ..........
1
3.92.2
30.426.78.23.9
22.02.7Tr.
100.0
0.7
2
14.22.2
24.519.27.33.6
25.03.9Tr.0.1Tr.Tr.
100.0
0.3
3
Tr.12.127.35.90.1
33.115.26.3Tr.Tr.
Tr.
100.0
0.3
4
7.73.9
26.711.73.2
17.427.71.4Tr.Tr.
0.2
0.1
100.0
5
15.337.231.7
1.5Tr.8.36.0Tr.Tr.
Tr.
100.0
0.3
The cordierite-bearing rocks were produced by dy- namothermal metamorphism, accompanying the plastic deformation of the region (Moench and others, 1962, p. 39-45). The mineral assemblages are characteristic of rocks that span the boundary of the amphibolite- granulite metamorphic facies of Eskola (1952, p. 162- 169).
The assemblages of the cordierite-bearing biotite gneisses developed by recrystallization of original argillaceous sediments, probably with little addition or subtraction of materials. The cordierite apparently marks layers that contained more magnesia that those that yielded the associated sillimanitic biotite-quartz gneiss. Rocks containing similar assemblages are found in many other regions, as noted by Schreyer and Yoder (1961) and Barker (1962).
The origin of the cordierite-anthophyllite and asso ciated rocks is less certain. .These rocks are included within a rock unit of presumed metasedimentary origin, and have a fine-scale lithologic layering that resembles the layering in other metasedimentary rocks of the area. The cordierite-anthophyllite rocks have abnormally high percentages of both ferrous iron and magnesia and abnormally low amounts of lime, soda, and potas sium compared to known sedimentary or igneous rocks. The associated hornblende- and cummingtonite-bearing rocks also have a high content of ferrous iron and mag nesia, but contain substantial lime (6.53 percent CaO in one sample) in contrast to the cordierite-anthophyl lite rocks. Judging from the -modes, the cordierite- anthophyllite gneiss is similar in composition to the cordierite-biotite gneiss except for having less potas sium. Possibly the rocks were derived from original iron-rich sediments by the metasomatic addition of magnesia; primary sediments of this type contain negligible alkalies. A metasomatic origin has been proposed for similar rocks from other regions by Eskola (1914, p. 254), Bugge (1943, p. 103), Tilley (1937), and others.
REFERENCES
Barker, Fred, 1962, Cordierite-garnet gneiss and associatedmicrocline-rich pegmatite at Sturbridge, Massachusetts,and Union, Connecticut: Am. Mineralogist, v. 47, p. 907-918.
Bugge. J. A. W., 1943, Geological and petrological investigationsin the Konggberg-Bamble formation : Norges Geol. Und. no.160, 150 p.
Eskola, Pentti, 1914, On the petrology of the Orijarvi region insouthwestern Finland: Comm. Geol. Finlande Bull., v. 40,277 p.
1952, On the granulites of Lapland : Am Jour. Sci., Bowenvol., p. 133-171.

SIMS AND GABLE B37
Lovering, T. S., and Goddard, E. N., 1950, Geology and ore deposits of the Front Range, Colorado: U.S. Geol. Survey Prof. Paper 223, 319 p.
Moench, R. H., Harrison, J. E., and Sims, P. K., 1962, Pre- cambrian folding in the Idaho Springs-Central City area, Front Range, Colorado: Geol. Soc. America Bull., v. 73, p. 35-58.
Schreyer, W., and Yoder, H. S., Jr., 1961, Tetrographic guides to the experimental petrology of cordierite, in Annual report of the Director of the Geophysical Laboratory, 1960- 1961: Carnegie Inst. Washington Year Book 60, p. 147-152.
Tilley, C. E., 1937, Anthophyllite-cordierite granulites of the Lizard: Geol. Mag., v. 74, p. 300-309.

Article 11
BEDDED BARITE DEPOSITS OF THE SHOSHONE RANGE, NEVADA
By KEITH B. KETNER, Denver, Colo.
Work done in cooperation with the Nevada Bureau of Mines
Abstract. Barite is interbedded with chert and minor amounts of limestone in Paleozoic bedded chert units. Evidence of replacement is widespread. Neighboring sulflde deposits are normal mesothermal deposits in altered wallrocks, are related to intrusive rocks, and are discordant with bedding. Barite de posits are monomineralic, occur in unaltered host rock, are re lated to bedded chert rather than to intrusive rocks, and tend to be concordant. They are probably epigenetic replacements of chert and limestone but are genetically unrelated to neighbor-,, ing sulflde deposits.
In the United States, barite is obtained mainly from three distinct types of deposits: (1) fracture fillings and replacements in carbonate rocks, (2) residual man tles on barite-rich carbonate rocks, and (3) beds in sili ceous sedimentary rocks. Vein and mantle deposits are well known. This study, based on five deposits in the Shoshone Range, Nov., records some of the important features of the less well known bedded deposits. The deposits were briefly described previously by Gianella (1941, p. 294) and Brobst (1958, p. 96).
The Greystone, Bateman Canyon, and Slaven Canyon deposits (fig. 11.1) are in the Slaven Chert of Devonian age. The Mountain Springs deposit is in a chert unit of a formation mapped originally as the Pumpernickel Formation of Carboniferous age (Ferguson and others, 1951); however, recent discoveries of fossils show that the host rocks there are of Devonian age. The Argenta deposit and others farther northeast are in chert forma tions similar to the Slaven in lithology but of unproved age. Small deposits are also found in bedded chert of Ordovician age (James Gilluly, oral communication, 1959).
The host rock consists almost entirely of bedded chert, but includes subordinate limestone and argillite. Shaly laminae at 1- to 3-inch intervals cause the chert to break up into platy fragments. In many beds con centrations of organic matter, clastic particles, or radi- olaria form nonfissile layers about a millimeter thick.
R. 44 E. R. 46 E. R. 47 E.
6 MILES
EXPLANATIONX
Bedded barite deposit Metallic sulfide deposit
FIGTJBE 11.1. Outline of northern part of Shoshone Range showing principal bedded barite deposits and metallic sul fide deposits.
Stylolites nearly parallel to bedding are common. Typically the chert is dark gray to black, less commonly it is greenish gray.
The chert beds are composed largely of quartz and chalcedony with minor amounts of pyrite in various stages of oxidation, carbonaceous matter, illite ( ?), and traces of other minerals too small to be identified. Most
ART. 11 IN U.S. GEOL. SURVEY PROP. PAPER 475-B, PAGES B38-B41. 1963.
B38

KETNER B39
grains of quartz and chalcedony large enough to be seen clearly with the microscope have interpenetrating con tacts. The grain size ranges from about 0.002 to 0.5 mm in diameter. Some of the large grains are clearly clastic particles, distinguishable from the rest by their regular outlines and concentration in beds; others have resulted from secondary growth along fractures. Radiolaria are abundant in many beds.
Limestone lenses in the host rock are poorly bedded. They weather brown but are dark gray on freshly broken surfaces. The limestone is composed almost entirely of calcite but contains minor amounts of quartz and chalcedony. The limestone lenses are much more coarsely crystalline than enclosing chert beds; the grains are commonly 1 to 4 mm in diameter. The coarse grain size seems to be due to recrystallization because many radiolaria replaced by calcite are enclosed within single calcite crystals. Quartz and chalcedony are in the form of remnants of beds bounded by stylo- lites and of small secondary deposits which have re placed calcite. Radiolaria are less abundant in the limestone than in the chert. Brachiopods of the genus Halorella have been found in limestone lenses near the Greystone mine.
No mineralogic, chemical, or textural differences were detected between the host rock closely surrounding and interbedded with barite and the host rock at various distances up to 2 miles from known barite deposits.
Barite deposits consist of interbedded baritev chert, and minor amounts of limestone (fig. 11.2). They range in size from a few feet to about 2,000 feet in long est exposed dimension. Outcrops are generally some what elongate parallel to host-rock bedding. Deposits commonly consist of a large irregular ore body asso ciated with smaller pods at distances of a few hundred feet or less.
Like the host-rock chert, the barite contains thin shaly beds at intervals of one to a few inches and inter nal nonfissile laminae about 1 mm thick. Some sepa rations between laminae resemble stylolites in their jagged cross sections and dark color. The microscopic texture of barite closely resembles that of chert. Barite is commonly dark gray of about the same shade as much of the associated chert and limestone.
An outstanding feature of the barite deposits is their mineralogic simplicity. Minor amounts of quartz and calcite are intimately mixed with barite in some beds. These may be vestigial remains of chert and limestone beds or, possibly epigenetic additions contemporaneous with introduction of the barite. Minute cubes of iron oxide scattered irregularly throughout the barite are apparently altered pyrite. Microscopic veinlets of quartz, calcite, and barite transect some of the barite
FIGURE 11.2. Interbedded barite and chert, Argenta deposit. A white stripe has been painted across all barite beds to distinguish them from the chert beds.
beds. At most, only small amounts of quartz, calcite, and pyrite have been introduced with the barite. The widespread occurrence of these minerals as veinlets in the host rock, distant from any known barite minerali zation, suggests that only barite has been introduced in unusual concentrations.
Microf ossils resembling those present in the host rock are rather common in some barite beds. Brachiopods of the genus Halorella are sparsely distributed in some barite beds of the Greystone and Mountain Springs de posits. All the fossils are baritized and only the gross features are preserved.
The trace-element assemblages of associated barite, limestone, and chert beds are very similar; however, there are certain consistent differences as shown in the accompanying table. In the Slaven Canyon deposit the barite contains less manganese and magnesium than

B40 GEOCHEMISTRY, MINERALOGY, AND PETROLOGY
£
}ft3
i«£000 ST?05 2
8 5N *«* c
6 «1 «00 «s> PH p >»& -055 «
« §e §
ll0 |5£ t*»
«£» c?<a 3eq g-
2
If2* O
O g
^ -4-»^ ' § s 1=2 S
to a S 1* 1
S 50 1l^ CO
1 orȣ ^O fe
2 t £ s 1.si S
*l*r S g1 Sia f-$ Z
Q
^ 1
1 «
IIs a
oo"<to
"e
1*§
^* 44
ha*
£
t
{x
>
p
IH CQ
S
XIPk
S
<S
fc
O
S
d§
. bJ3
§
M
5
-« fe
3 O
0
6
«
M <
^
<S
«
03O
ro
aiiCO
1B]§1^ Eo 1K *nH S > £ < »j -o <B «
£
^'S^8
o
oo
00
t~IO
§8e> '
&8e>
00
oo
oo
IOIO
88e5 '
§se> ' V
oo
sio
_>200
o
oo
oo
»-S e> '
owt~
o
oo
P5t~
88o '
o£
t^co o'
s§o '
sso '
cq--< «>0 Tf *
b-'co
mm
.
I
ie£ '£
1u
iS
>o
88o '
oo
oo
U9U3
88o
IO
sge> '
IOIO
88o
oo
oo
r^S 88 o
§ ta 0
0v
oo
§ >o o
e> '
sso
oo
oo
coco o '
e>
o '
oo
o
oo
t~t-o
*co o
Sco o '
CONr'f
88
s
12 S1IS 1imestone
J
H'H"
oo
oo
ss88o
sso' "
sso
oo
oo
oo
S IO 0
0 V
oo
Sco o
§so
oo
oo
sso"
cot-
o' '
^ bEH EH
oo
oo
oo
>a
8So
t» coo o
00-*
coco coco
i-«O5
cq'cq
5S
5
1
oo
oo
oo
£o
So-d '
s§o
00
oo
oo
o-S
o
oo
ss88e> '
o . V
oo
oo
sso
t-lffl
§8c>£'£
oo
00
00
BSo
coo
BS
ss0
t~00
eJ-J
S^
8
llS 3
U E
5*w 3 ^ gBATEM Ided cher
£
§ie>
o "
>a»o
88o
e>
S3o
Sco88o
oo
00
r^co
o
§&o V
0^'
88o '
S§o '
t-t-C5
E^
o
t-co o '
o "
^s88d
oo
o
0^"
>ot~
00
o-<
cot- d
*PO
3%
ON
.
s
1eA 'f
1u
is
IO
88o '
oo
00
>oco
o '
t-S00
o
o '
oo
IO
880
o '
§§ 0V
oo
Iso '
IOCO
o '
ml~-
to
00
Sco o' '
>o
C5
o
o
1OCO
C5 '
*0
O«5
co-i
t-lO
Oi-<
sso
coco
5S
Olio'
51
oo
oo
oo
t^
o
§oo
s&o
oo
oo
&o
ss°'v
oo
s'io
88 °'v
oo
oo
o
IO
0
E^o
oo
oo
oo
tosso '
tocq
ss1OIO
ooo
00
o~
CD 00 S
.«i* 2§ iH Bg .S
M OS * M +*
GRE Ided cher
S
IO1O
88o '
oo
oo
0
r r 88o
t~>o
o
o
oo
£"lo
SBo ' V
oo
o
cor-ooo
t-0
b EH
o
"3 »^ CO
d '
Sr,88e>
r~>o
is0 '
oo
t-mssC5 '
OO
r-mo »-5
U300
1-fCO
>ot-»-<oo '
O-*
33
co>o
5«
E^o
oo
oo
jfS^8o
'-s88d
IOIO
o "
o
oo
oo
So1
o
oo
K'S^8
o
0
oo
oo
t-lOO »-(
o
o
o
oo
oo
oo
SJ3 o '
OCT>
g^
SBe>
oco ci*o
f-J^I
dt£ >EHfl1
EH
EH.a" EHfl1
1
A&GO
pfaa
s!e*
£PL|
P4
O ofc
fca3 5 a"
SeTW tj W
waTO 0O
awB
£0o> 0 a 0
SaT«
4 <t found:
!I*lLooked foi » Wet
KETNEE B41
the limestone. Generally the barite contains less mag nesium and boron but more strontium than the chert.
Replacement of both chert and limestone are indi cated by the following somewhat ambiguous evidence. Although individual barite beds tend to be remark ably persistent, mapping of entire deposits indicates some discordance between the barite and host-rock bed ding trends that are not easily explained by faults or unconformities. Baritized radiolaria and brachiopods prove replacement, at least locally. Because brachio pods do not occur in chert, replacement of limestone is specifically indicated. Microscopic textural evidence such as bedding textures of chert invaded discordantly by blades of barite also indicate local replacement. The similarity of texture and bedding in chert and barite indicates possible replacement, but the dissimi larity between texture and bedding of limestone lenses and barite indicates that no replacement took place. Perhaps original limestone textures have been altered except where they have been preserved by baritization.
Bedded barite deposits differ from neighboring me tallic sulfide deposits in several important respects. Whereas the sulfide deposits are associated with a north west-trending band of intrusive rocks, the barite de posits apparently are unrelated to concentrations of intrusives but rather are associated with bedded chert, especially Devonian chert. Metallic sufide deposits are controlled by shear zones and are clearly discordant with bedding, whereas the barite deposits are controlled to a large extent by bedding and tend to be concordant. The sulfide deposits contain the common mesothermal
mineral assemblage of pyrite, arsenopyrite, chalcopy- rite, galena, sphalerite, and tetrahedrite, whereas few, if any, minerals but barite have been introduced to form the barite deposits. The sulfide deposits are commonly associated with recrystallized, bleached, and sericitized rock but barite deposits are remarkably free from host rock alteration.
In spite of these contrasts with the obviously epigen- etic metallic sulfide deposits, the extensive textural evidence of replacement, great stratigraphic thickness of all deposits in relation to lateral extent, and the abrupt discordance revealed in some places by mapping and unexplained by visible faults or unconformities, indicate an epigenetic origin for barite too. It seems likely that the bedded barite deposits are replacements of both chert and limestone but are not obviously re lated to igneous intrusives or to other epigenetic de posits of the area.
The invariable association of bedded barite deposits with bedded chert formations and the apparent associa tion with Devonian chert can be used in prospecting. Deposits under shallow cover might be discovered by detailed gravity surveys of areas underlain by bedded chert.
REFERENCES
Brobst, D. A., 1958, Barite resources of the United States:U.S. Geol. Survey Bull. 1072-B.
Ferguson, H. G., Muller, S. W., and Roberts, R. J., 1951, Geologyof the Mount Moses quadrangle, Nevada: U.S. Geol. SurveyGeol. Quad. Map GQ-12.
Gianella, V. P., 1941, Barite deposits of northern Nevada:Am. Inst. Mining Metall. Engineers Trans., v. 144, p. 294-299.
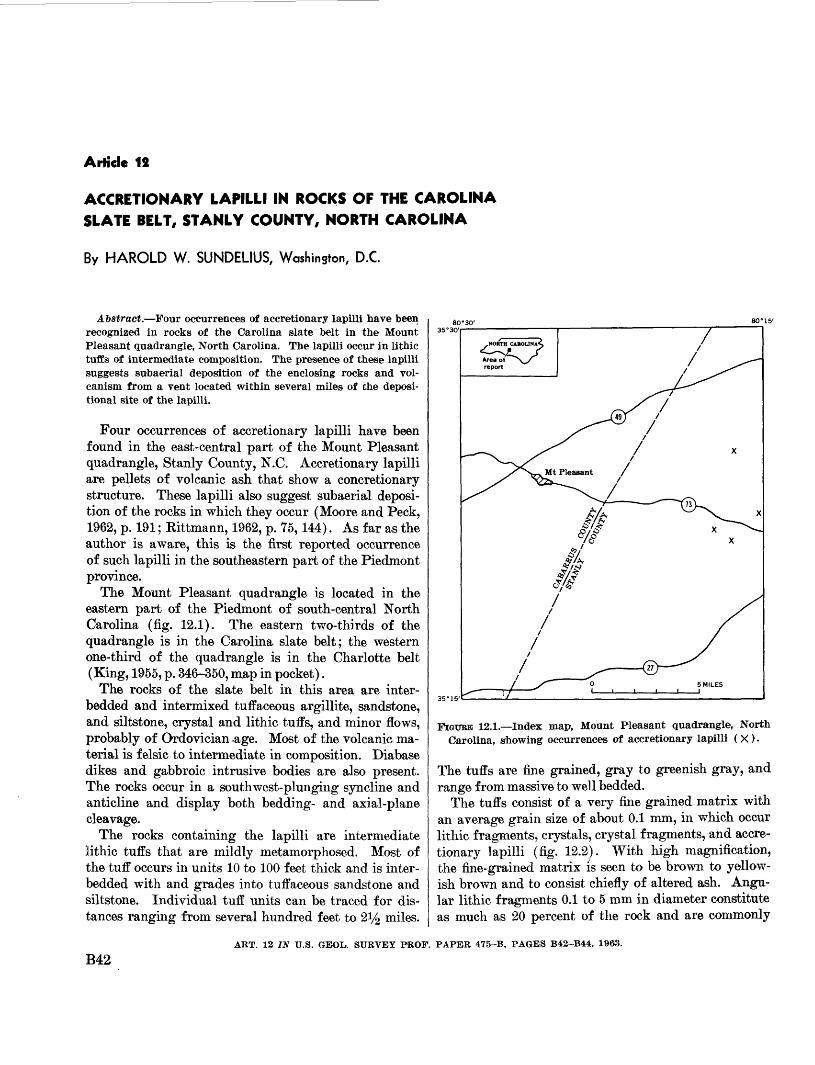
Article 12
ACCRETIONARY LAPILLI IN ROCKS OF THE CAROLINA SLATE BELT, STANLY COUNTY, NORTH CAROLINA
By HAROLD W. SUNDELIUS, Washington, D.C.
Abstract. Four occurrences of accretionary lapilli have been recognized in rocks of the Carolina slate belt in the Mount Pleasant quadrangle, North Carolina. The lapilli occur in lithic tuffs of intermediate composition. The presence of these lapilli suggests subaerial deposition of the enclosing rocks and vol- canism from a vent located within several miles of the deposi- tional site of the lapilli.
Four occurrences of accretionary lapilli have been found in the east-central part of the Mount Pleasant quadrangle, Stanly County, N.C. Accretionary lapilli are pellets of volcanic ash that show a concretionary structure. These lapilli also suggest subaerial deposi tion of the rocks in which they occur (Moore and Peck, 1962, p. 191; Kittmann, 1962, p. 75,144). As far as the author is aware, this is the first reported occurrence of such lapilli in the southeastern part of the Piedmont province.
The Mount Pleasant quadrangle is located in the eastern part of the Piedmont of south-central North Carolina (fig. 12.1). The eastern two-thirds of the quadrangle is in the Carolina slate belt; the western one-third of the quadrangle is in the Charlotte belt (King, 1955, p. 346-350, map in pocket).
The rocks of the slate belt in this area are inter- bedded and intermixed tuffaceous argillite, sandstone, and siltstone, crystal and lithic tuffs, and minor flows, probably of Ordovician -age. Most of the volcanic ma terial is felsic to intermediate in composition. Diabase dikes and gabbroic intrusive bodies are also present. The rocks occur in a southwest-plunging syncline and anticline and display both bedding- and axial-plane cleavage.
The rocks containing the lapilli are intermediate lithic tuffs that are mildly metamorphosed. Most of the tuff occurs in units 10 to 100 feet thick and is inter- bedded with and grades into tuffaceous sandstone and siltstone. Individual tuff units can be traced for dis tances ranging from several hundred feet to 2y2 miles.
FIGTTRE 12.1. Index map, Mount Pleasant quadrangle, North Carolina, showing occurrences of accretionary lapilli (X)
The tuffs are fine grained, gray to greenish gray, and range from massive to well bedded.
The tuffs consist of a very fine grained matrix with an average grain size of about 0.1 mm, in which occur lithic fragments, crystals, crystal fragments, and accre tionary lapilli (fig. 12.2). With high magnification, the fine-grained matrix is seen to be brown to yellow ish brown and to consist chiefly of altered ash. Angu lar lithic fragments 0.1 to 5 mm in diameter constitute as much as 20 percent of the rock and are commonly
ART. 12 IN U.S. GEOL. SURVEY PROF. PAPER 475-B, PAGES B42-B44. 1963.
B42
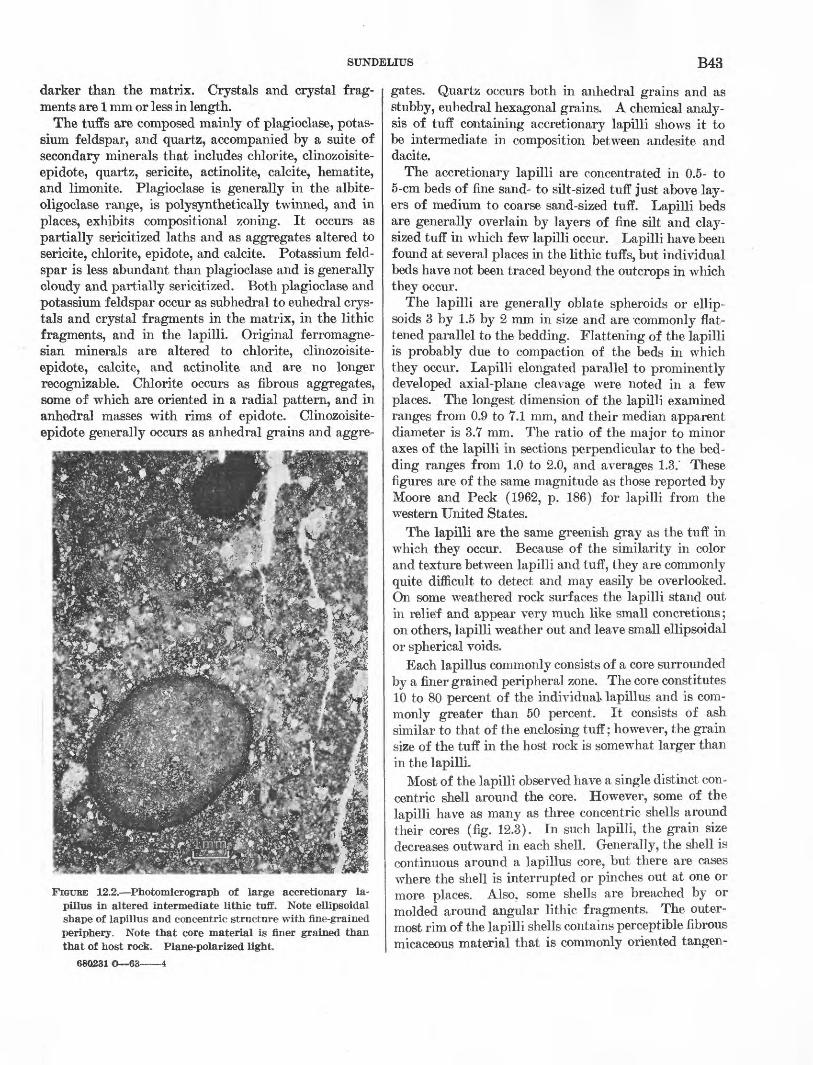
SUNDELIUS B43
darker than the matrix. Crystals and crystal frag ments are 1 mm or less in length.
The tuffs are composed mainly of plagioclase, potas sium feldspar, and quartz, accompanied by a suite of secondary minerals that includes chlorite, clinozoisite- epidote, quartz, sericite, actinolite, calcite, hematite, and limonite. Plagioclase is generally in the albite- oligoclase range, is polysynthetically twinned, and in places, exhibits compositional zoning. It occurs as partially sericitized laths and as aggregates altered to sericite, chlorite, epidote, and calcite. Potassium feld spar is less abundant than plagioclase and is generally cloudy and partially sericitized. Both plagioclase and potassium feldspar occur as subhedral to euhedral crys tals and crystal fragments in the matrix, in the lithic fragments, and in the lapilli. Original ferromagne- sian minerals are altered to chlorite, clinozoisite- epidote, calcite, and actinolite and are no longer recognizable. Chlorite occurs as fibrous aggregates, some of which are oriented in a radial pattern, and in anhedral masses with rims of epidote. Clinozoisite- epidote generally occurs as anhedral grains and aggre-
FIGTJRE 12.2. Photomicrograph of large accretionary la- pillus in altered intermediate lithic tuff. Note ellipsoidal shape of lapillus and concentric structure with fine-grained periphery. Note that core material is finer grained than that of host rock. Plane-polarized light.
680231 O 63 4
gates. Quartz occurs both in anhedral grains and as stubby, euhedral hexagonal grains. A chemical analy sis of tuff containing accretionary lapilli shows it to be intermediate in composition between andesite and dacite.
The accretionary lapilli are concentrated in 0.5- to 5-cm beds of fine sand- to silt-sized tuff just above lay ers of medium to coarse sand-sized tuff. Lapilli beds are generally overlain by layers of fine silt and clay- sized tuff in which few lapilli occur. Lapilli have been found at several places in the lithic tuffs, but individual beds have not been traced beyond the outcrops in which they occur.
The lapilli are generally oblate spheroids or ellip soids 3 by 1.5 by 2 mm in size and are -commonly flat tened parallel to the bedding. Flattening of the lapilli is probably due to compaction of the beds in which they occur. Lapilli elongated parallel to prominently developed axial-plane cleavage were noted in a few places. The longest dimension of the lapilli examined ranges from 0.9 to 7.1 mm, and their median apparent diameter is 3.7 mm. The ratio of the major to minor axes of the lapilli in sections perpendicular to the bed ding ranges from 1.0 to 2.0, and averages 1.3.' These figures are of the same magnitude as those reported by Moore and Peck (1962, p. 186) for lapilli from the western United States.
The lapilli are the same greenish gray as the tuff in which they occur. Because of the similarity in color and texture between lapilli and tuff, they are commonly quite difficult to detect and may easily be overlooked. On some weathered rock surfaces the lapilli stand out in relief and appear very much like small concretions; on others, lapilli weather out and leave small ellipsoidal or spherical voids.
Each lapillus commonly consists of a core surrounded by a finer grained peripheral zone. The core constitutes 10 to 80 percent of the individual, lapillus and is com monly greater than 50 percent. It consists of ash similar to that of the enclosing tuff; however, the grain size of the tuff in the host rock is somewhat larger than in the lapilli.
Most of the lapilli observed have a single distinct con centric shell around the core. However, some of the lapilli have as many as three concentric shells around their cores (fig. 12.3). In such lapilli, the grain size decreases outward in each shell. Generally, the shell is continuous around a lapillus core, but there are cases where the shell is interrupted or pinches out at one or more places. Also, some shells are breached by or molded around angular lithic fragments. The outer most rim of the lapilli shells contains perceptible fibrous micaceous material that is commonly oriented tangen-
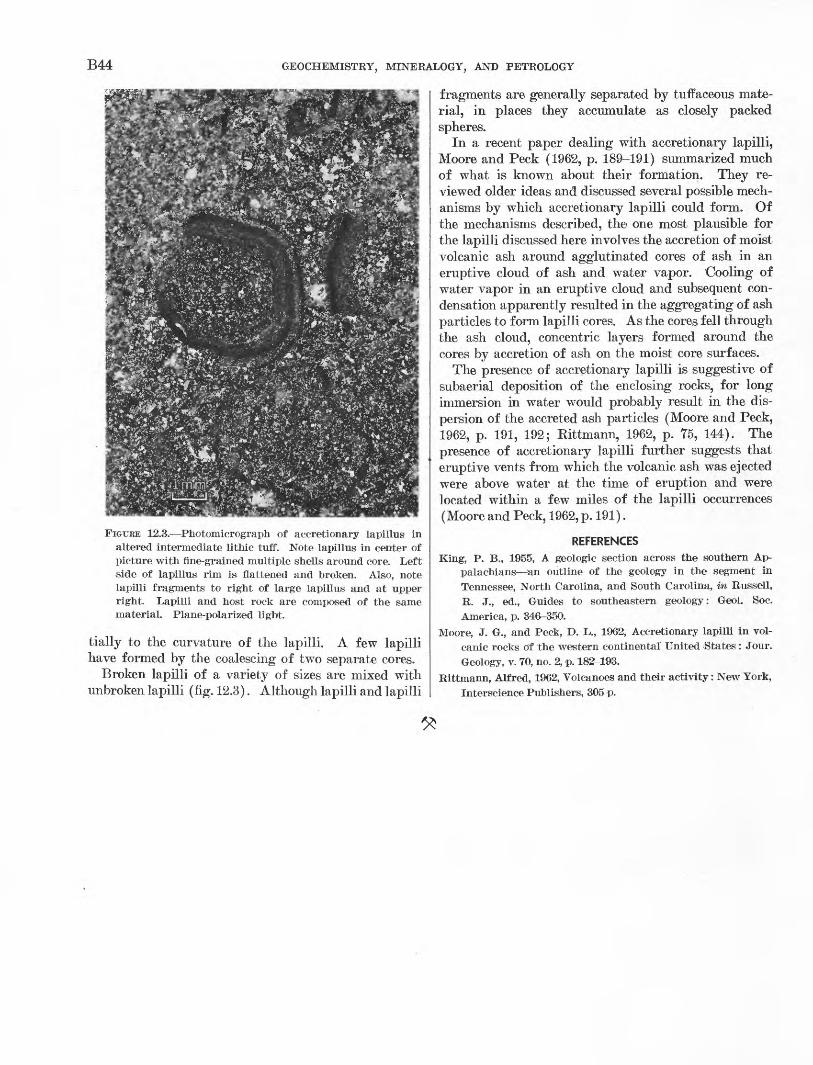
B44 GEOCHEMISTRY, MINERALOGY, AND PETROLOGY
FIGTJKE 12.3. Photomicrograph of accretionary lapillus in altered intermediate lithic tuff. Note lapillus in center of picture with fine-grained multiple shells around core. Left side of lapillus rim is flattened and broken. Also, note lapilli fragments to right of large lapillus and at upper right. Lapilli and host rock are composed of the same material. Plane-polarized light.
tially to the curvature of the lapilli. A few lapilli have formed by the coalescing of two separate cores.
Broken lapilli of a variety of sizes are mixed with unbroken lapilli (fig. 12.3). Although lapilli and lapilli
fragments are generally separated by tuffaceous mate rial, in places they accumulate as closely packed spheres.
In a recent paper dealing with accretionary lapilli, Moore and Peck (1962, p. 189-191) summarized much of what is known about their formation. They re viewed older ideas and discussed several possible mech anisms by which accretionary lapilli could form. Of the mechanisms described, the one most plausible for the lapilli discussed here involves the accretion of moist volcanic ash around agglutinated cores of ash in an eruptive cloud of ash and water vapor. Cooling of water vapor in an eruptive cloud and subsequent con densation apparently resulted in the aggregating of ash particles to form lapilli cores. As the cores fell through the ash cloud, concentric layers formed around the cores by accretion of ash on the moist core surfaces.
The presence of accretionary lapilli is suggestive of subaerial deposition of the enclosing rocks, for long immersion in water would probably result in the dis persion of the accreted ash particles (Moore and Peck, 1962, p. 191, 192; Rittmann, 1962, p. 75, 144). The presence of accretionary lapilli further suggests that eruptive vents from which the volcanic ash was ejected were above water at the time of eruption and were located within a few miles of the lapilli occurrences (Moore and Peck, 1962, p. 191).
REFERENCESKing, P. B., 1955, A geologic section across the southern Ap
palachians :an outline of the geology in the segment in Tennessee, North Carolina, and South Carolina, in Russell, R. J., ed., Guides to southeastern geology: Geol. Soc. America, p. 346-350.
Moore, J. G., and Peck, D. L., 1962, Accretionary lapilli in vol canic rocks of the western continental United States: Jour. Geology, v. 70, no. 2, p. 182-193.
Rittmann, Alfred, 1962, Volcanoes and their activity: New York, Interscience Publishers, 305 p.
Article 13
COMPOSITION AND ORIGIN OF SILICEOUS MUDSTONESOF THE CARLIN AND PINE VALLEY QUADRANGLES, NEVADA
By KEITH B. KETNER and J. FRED SMITH, JR., Denver, Colo.
Work done in cooperation with the Nevada Bureau of Mines
Abstract. Ordovician, Silurian, and Devonian rocks in the upper plate of the Roberts Mountains thrust fault and post- thrust Lower Mississippian rocks are largely siliceous mud- stones. Analyzed representative samples contain 63 to 94 per cent SiO2 and 1 to 13 percent A12O3 . Minerals are mainly quartz, chalcedony, illite, and dolomite. Grains are clastic quartz silt, clastic dolomite silt, fossil tests, and illite all in a mosaic matrix of apparently nonclastic quartz. The matrix quartz seems to be a chemical precipitate unrelated to local vulcanism.
In northeast Nevada, rocks of Ordovician through Devonian age include eastern (carbonatic), western (siliceous), and transitional (mixed) rock assemblages telescoped by the Roberts Mountains thrust of latest Devonian or earliest Mississippian age (Roberts and others, 1958). Mississippian through Permian rocks, which overlap the thrust fault, include limestone and a variety of clastic rocks whose siliceous particles were derived from uplifted western and transitional assem blages. The dominant rock types in the western, tran sitional, and basal-overlap assemblages can be described by the term "siliceous mudstone." As used here the term embraces all siliceous sedimentary rocks made up of grains of silt size and smaller (less than 0.06 mm). Included are such rocks as chert, siliceous shale, sili ceous argillite, cherty siltstone, and intermediate types difficult to classify.
Detailed stratigraphy of western- and transitional- assemblage rocks is unknown owing to poor exposures, complex structure, and scarcity of fossils. Data are necessarily derived from studies of isolated and widely scattered exposures. The samples sectioned and ana lyzed in this investigation, however, are firmly dated by fossils as to system. Ordovician rocks of the west ern and transitional rock assemblages in the Carlin and Pine Valley quadrangles consist mostly of siliceous mudstone aggregating hundreds of feet in thickness,
and lesser amounts of limestone, quartzite, and green stone. Fossils found include graptolites, chitinous brachiopods, hystrichospheres (?), sparse radio- laria (?), and unidentified spheroids about 5 microns in diameter. Silurian rocks of the western assemblage are represented by a single dated sample. However, we believe it to be representative of the several hundred feet of siliceous mudstone beds that we assign to the Silurian western asemblage. Graptolites were the only fossils found. Devonian rocks of the western and tran sitional facies include siliceous mudstone strata aggre gating several hundred feet in thickness, and less abun dant limestone and impure clastic dolomite. Fossils found include eurypterids (appendages only), cono- donts, goniatites, and abundant radiolaria (?).
The stratigraphy of the overlap assemblage is better known; Mississippian rocks of this assemblage include basal units consisting partly of siliceous mudstone lithi- cally similar to some rocks of the western and transi tional assemblages. These basal units are divided into a very siliceous lower unit A of Kinderhook age and an overlying more argillaceous unit B of Kinderhook to Osage age (see table). The lower unit bears certain lithic similarities to the Pilot Shale but as dated it is somewhat younger. Fossils found in it include cono- donts, spicules, and radiolaria. The upper unit is sim ilar in many respects to the Chainman Shale. Fossils found include goniatites, brachipods, and corals. The Joana Limestone is not present.
The siliceous mudstones have certain features in com mon regardless of age. They are generally dark brown or dark gray to black when fresh but commonly weather light gray. On many weathered surfaces, beds an inch to a few inches thick are visible. Microscopic examination reveals internal nonfissile laminations a
ART. 13 IN U.S. GEOL. SURVEY PROF. PAPER 475-B, PAGES B45-B47. 1963.
B45

B46 GEOCHEMISTRY, MINERALOGY, AND PETROLOGY
fraction of a millimeter thick in most specimens. Microfossils are sparse. Thin section, X-ray, and chemical analyses indicate that quartz, including chal cedony, is the dominant mineral; silica composes 63 to 94 percent of the analyzed samples as shown in the accompanying table. Angular detrital quartz grains 0.01 to 0.03 mm in diameter compose on the average less than 10 percent of the rock; the groundmass mate rial is composed mainly of interlocking grains of quartz and chalcedony, which range widely in size but aver age about 0.005 mm in diameter. Aluminous minerals including illite, potash feldspar, and kaolinite com pose an estimated 3 to 20 percent of most samples. X-ray diffraction patterns indicate that illite is the dominant aluminous mineral. The few grains of pot ash feldspar seen in thin section are angular and appear to have grown in place. It is not known whether the illite and kaolinitp are detrital or are alteration prod
ucts of other detrital minerals. Dolomite is a common apparently clastic component in some samples, for ex ample 553-C and 553-E, and small amounts of brown organic debris, amorphous carbon, iron oxides, and water are present in most specimens. Pyrite, marca- site, barite, jarosite, alunite, and gypsum are present in some. The sulfides (pyrite, marcasite) have re placed quartz, whereas the sulf ates tend to occur in vein- lets. Aluminous sulfates may have formed during weathering by reaction of sulfuric acid, derived from oxidation of iron sulfides, with aluminous silicates. For many samples, the carbon content indicated in the table may be abnormally low because weathered mate rial was analyzed. The mineralogic occurrence of many of the elements listed is unknown. The quanti ties of iron, sodium, potassium, titanium, magnesium (in excess of magnesium in dolomite), and zirconium, however, correlate well enough with aluminum to sug-
Analyses of samples of Paleozoic siliceous mudstone, Carlin and Pine Valley quadrangles, Nevada
[Chemical analyses by Paul Elmore, Samuel Botts, Gillison Chloe, and I. C. Frost, 1962; spectrographic analyses by Nancy Conklin, 1962]Chemical analyses (weight percent)
Age and unit
Mississippian: Unit B. ...
Unit A. __ .
Silurian.. ..........
Sample No. 1
580... .......SR-132 ...
161 218 872 823-B.
577-.--.--..822-B .822 A.......
825-.-- ..
818 ..
508- 553-D.......553-C 553-E. ......
SiO 2
71.767.6
89.489.386.484.284.0
QA K
84.480.4
CO 0
QA A
QO 9
87.879 777.863.0
A12 0 3
9 Q10 ft
4 Q
3.24.86.64.0
1.11.55.7
c A
4.2
6.1e 0
5.1
Fe2 O 3
2 A
4.1
.1689
.367900
.4199
1 S
1.5
1 C
.36
.631.0
sn1.0
FeO
2 0
1.4
9fi07
99
.15
.56
19oo
.40
.17
9fi
.11
.14
.27
.86
MgO
1 Q1 Q
.35
.47
.40
.43
.74
no.15
°.Q
3949
1.13.6
CaO
1 9CO
.109Q
.02
.04
.67
.14
.14
.12
.17
97
.10
.12
.471 ft
5.6
Na2 O
0.247°.
.12
.12
.12
.14
.12
.06
.07
.10
.08
.06
.11
.13
.08
.08
.08
K2 O
9 fi
3 9
1.3.63
1.21.6
8Q
1 Q
.261 ft
2 0
2.0
1.11.31.11 91.4
TiO 2
0.69.82
.23
.16
.29
.33
.22
.04
.06
.32
.34
°.n
.06
.22
.25
.28
.25
.24
P 2 05
0.27.30
.10
.17
.08
.12
.13
.061.2.16.12
.08
.10
.07
.081 9
2.0
MnO
0.04.02
.02
.02
.00
.00
.01
.01
.01
.02
.00
.01
.01
.00
.00
.01
.02
.04
Loss on
ignition
5.46.1
1.71.73.54.77.0
2.03.33.87.1
2.0
1.92.23.18.28.1
14.9
Total C
0.73.51
.39
.70
.43
.163.64
.691.37.36
1.81
.20
.73
.15
.232.463.425.12
CO 2
0.92.07
<.05.06
<.05<.05
.06
<.05<.05<.05<.05
<.05
<.05.06
<.05<.051.87.6
Acid insol uble'
;
2.12.7
2.4
Semiquantitative spectrographic analyses (weight percent)
Age and unit
Mississippian: Unit B...
Unit A.--
Devonian
Silurian... .....
Ordoviciai).--
Sample No. 1
" 80SR-132
161 218 872823-B 525
577 822-B . 822-A 506
825
818 564 508 553-D- 553-C, .553-E. ......
B
.007
.015
.005
.01
.01
.007
.003
.003
.015
.01
ftfl^
.002
.007
.007
.007
.007
.005
Ba
0.2.15
.31.51 ^
.3
.2
.15
.15
.3
.2
.07
.07
.1
.15
1.
Cr
0.01.01
.005
.005ftfl^
ftO^
nn°..0015.007.005
003
.0015
.01
.007
.007
Cu
0.007.007
ft A 3.01.003
fifteL
ftfW
ftfW
.01
001
ftft7on*;
.007rwi7
.015
Ga
O ftO9
.003
.0005nnn?
.00150
00.001.0015
001
0.0007.0007.0015.001.0015
La
0.005
00000
00.005.005
0
000000
Mo
.001
00
0.0015
0.001.015.003
0
.000700.0007
0.0005
Ni
.007
.001
.003
.005
.001
.007
.002
.003
.007
.0015
.002
.0007
.0007
.003
.005
.005
Pb
.0015
.00150000
00.0015.0015
.0015
000
. 00150.0015
Sc
0.0015.002
.0007
.001
.001
.00150
00.001.001
0
0.0005.0005
00
.001
Sr
0.015.015
.005
.007
.015
.015
.005
.003
.01
.02
.015
.003
.002
.005
.005
.05
.05
.05
V
0.02.02
.015
.015
.015
.015
.07
.005
.015
.07
.007
.015
.02
.01
.015
.02
.015
.02
Y
0.003.003
.0015
.0015
.001
.00150
0.001.002.001
.0015
.0015
.001
.002
.001
.002
.003
Yb
0. 0003.0003
.0002
. 00015
. 00015
.000150
0.0001.0003.0001
.0002
. 00015
.00015
.0002
.00015
.0002
.0003
Zr
0.02.015
.007
.003
.007
.01
.002
00.007.007
.02
.001
.005
.005
.005
.015
.007
Samples arranged in order of silica content within stratigraphic units. 2 Chiefly barite.
KETNER AND SMITH B47
gest that these elements occur mainly in illite and the other aluminous minerals. The phosphorous content seems to correlate with the quantity of chitinous (?) debris observed in thin section.
The siliceous mudstones appear to be little-altered primary deposits, rather than replacements of pre existing beds of another lithic type such as volcanic ash or limestone. Relict volcanic and carbonatic tex tures are not visible in thin section, and the good pres ervation of some delicate organic structures and fine bedding precludes the possibility that volcanic or other rocks have been replaced with complete loss of original texture.
Although siliceous tests compose as much as 40 per cent of a few beds, particularly those of Devonian age, on the whole they cannot account for more than a small fraction of the free silica present. Recognizably clastic quartz composes only a small fraction of the free silica.
The remaining silica of uncertain origin forms a mosaic of grains a few microns in diameter. The silica, must be either recrystallized very fine detrital or or
ganic silica, or else a chemical precipitate. Because the mosaic or interlocking texture of the fine-grained groundmass could hardly have formed by recrystalli- zation of original detrital or organic silica without obliterating observed radiolaria, we tentatively con clude that the groundmass is a chemical precipitate.
Whether the groundmass quartz was chemically pre cipitated or organically derived, it would seem to neces sitate unusually high concentrations of dissolved silica. Marine vulcanism, which is commonly thought to sup ply such high concentrations, prevailed both locally and regionally in Ordovician time, but local exposures of Devonian, Silurian, and Mississippian rocks contain no volcanic deposits. Apparently local contemporane ous vulcanism was not required for the formation of siliceous mudstone.
REFERENCE
Roberts, R. J., Hotz, P. E., Gilluly, James, and Ferguson, H. G.. 1958, Paleozoic rocks of north-central Nevada: Am. Assoc. Petroleum Geologists Bull., v. 42, no. 12.
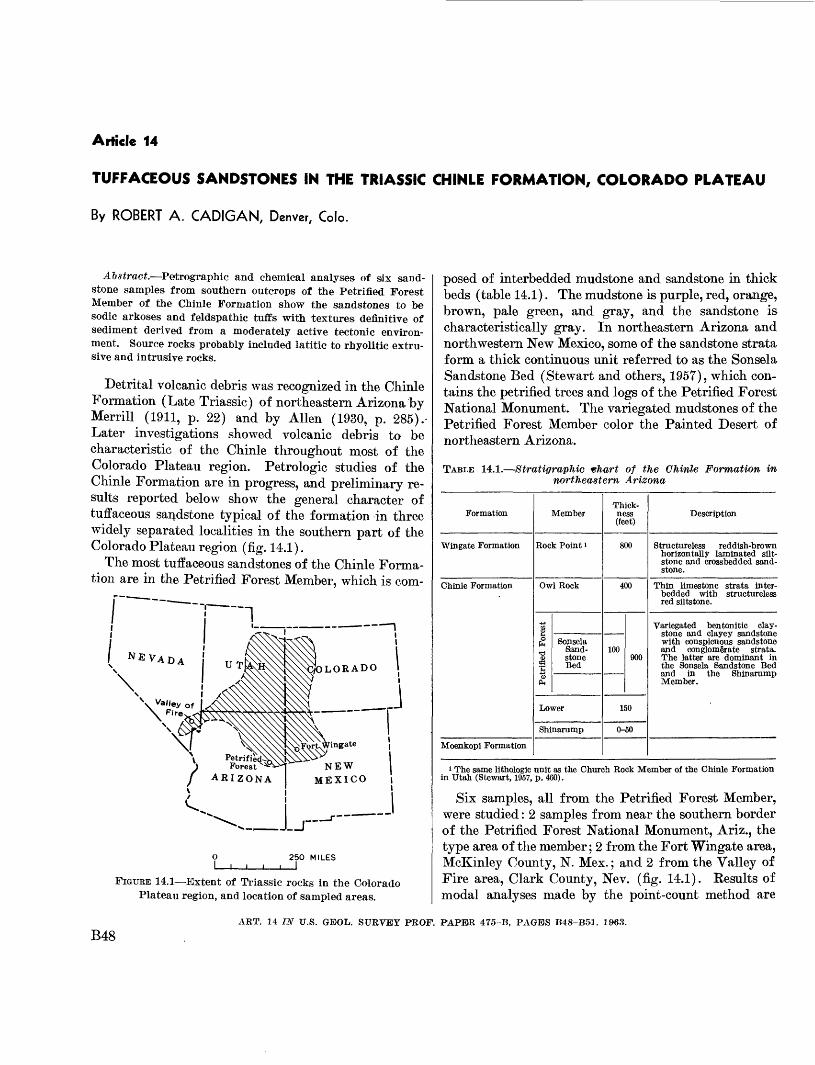
Article 14
TUFFACEOUS SANDSTONES IN THE TRIASSIC CHINLE FORMATION, COLORADO PLATEAU
By ROBERT A. CADIGAN, Denver, Colo.
Abstract. Petrographic and chemical analyses of six sand stone samples from southern outcrops of the Petrified Forest Member of the Chinle Formation show the sandstones to be sodic arkoses and feldspathic tuffs with textures definitive of sediment derived from a moderately active tectonic environ ment. Source rocks probably included latitic to rhyolitic extru sive and intrusive rocks.
Detrital volcanic debris was recognized in the Chinle Formation (Late Triassic) of northeastern Arizona by Merrill (1911, p. 22) and by Alien (1930, p. 285).- Later investigations showed volcanic debris to be characteristic of the Chinle throughout most of the Colorado Plateau region. Petrologic studies of the Chinle Formation are in progress, and preliminary re sults reported below show the general character of tuffaceous sandstone typical of the formation in three widely separated localities in the southern part of the Colorado Plateau region (fig. 14.1).
The most tuffaceous sandstones of the Chinle Forma tion are in the Petrified Forest Member, which is com-
LORADO
ingate
NEW MEXICO i
250 MILES
FIGURE 14.1 Extent of Triassic rocks in the Colorado Plateau region, and location of sampled areas.
posed of interbedded mudstone and sandstone in thick beds (table 14.1). The mudstone is purple, red, orange, brown, pale green, and gray, and the sandstone is characteristically gray. In northeastern Arizona and northwestern New Mexico, some of the sandstone strata form a thick continuous unit referred to as the Sonsela Sandstone Bed (Stewart and others, 1957), which con tains the petrified trees and logs of the Petrified Forest National Monument. The variegated mudstones of the Petrified Forest Member color the Painted Desert of northeastern Arizona.
TABLE 14.1. Stratigraphic vhart of the Chinle Formation in northeastern Arizona
Formation
Wingate Formation
Chinle Formation
Moenkopi Formation
Member
Rock Point i
Owl Rock
Petrified ForestSonsela
Sand stone Bed
Lower
Sbinarump
Thick ness (feet)
800
400
100900
150
0-60
Description
Structureless reddish-brown horizontally laminated silt- stone and crossbedded sand stone.
Thin limestone strata inter- bedded with structureless red siltstone.
Variegated bentonitic clay- stone and clayey sandstone with conspicuous sandstone and conglomerate strata. The latter are dominant in the Sonsela Sandstone Bed and in the Shinarump Member.
i The same lithologic unit as the Church Rock Member of the Chinle Formation in Utah (Stewart, 1957, p. 460).
Six samples, all from the Petrified Forest Member, were studied: 2 samples from near the southern border of the Petrified Forest National Monument, Ariz., the type area of the member; 2 from the Fort Wingate area, McKinley County, N. Mex.; and 2 from the Valley of Fire area, Clark County, Nev. (fig. 14.1). Results of modal analyses made by the point-count method are
B48ART. 14 IN U.S. GEOL. SURVEY PROF. PAPER 475-B, PAGES B48-B51. 1963.
CADIGAN B49
given in table 14.2. The samples from the Petrified Forest National Monument and the Fort Wingate area are impure tuffs, technically feldspathic (sedimentary) tuffs, and those from the Valley of Fire are arkoses with a minor tuff content.
Mineral components were generally identified by their optical properties. Indeterminate clay mixtures, which present.an anomalous optical appearance compared to the better crystallized, relatively pure clay minerals, were identified by X-ray analysis. "Corrensite" was
TABLE 14.2. Modes of sandstone from the Petrified Forest Member of the Chinle Formation
[In percent by volume]
Mineral components
Petrified Forest
National Monument l
2L2067 «L2069
FortWingate '
2 L 2366 L2367
Valley of Fire'
L2356 L2358
Mean modal com posi tion, by vol ume
I. Cementing components (except silica)
a. Carbonates and sulfates (calcite) ______ .....
b. Red interstitial iron oxides
Total
0.8
.8
0.2
.2
.4
0.6
.6
2.0
.2
2.2
0.2
13.2
13.4
2.4
2.4
0.6
2.7
3.3
II. Siliceous components
a. Quartz grains and over-
b. Quartzite fragments ........c. Chert, detrital- -- ..........d. Chert, authigenic _____
Total--.. _ ... ...
29.0
1.8.2
31.0
32.8
.8
33.6
44.0 .2 .2
44.4
40.0 1.4 1.6
43.0
24.2 .8 .2
25.2
41.6 3.0
44.6
35.3 .9.7
36.9
III. Feldspathic components
a. Potassic feldspar. - .........
c. Kaolinitic clays (alteration products). .................
Total .
4.412.0
16.4
3.812.4
16.2
17.0
17.0
12.0
12.0
0.2 46.6
5.2
52.0
12.4 328.8
.8
42.0
3.5 21.5
1.0
26.0
IV. Dark-mineral and mica components
a. Mica flakes and books (bio- tite, chlorite) ................
b. Chlorite and mica clays ....c. Micaceous and mafic rock
d. Heavy minerals (sp gr 2.90+)
e. Miscellaneous (opaque and unidentified grains) ........
Total
0.4 .4
0.8
0.4 .6
*.6
1.6
1.0 7.0
1.4
1.4
10.8
0.2
.4
.2
1.8
2.6
0.2 .8
.2
«.6
.6
2.4
0.2 .8
.2
1.2
0.4 1.6
.3
.3
.6
3.2
V. Volcanic components
a. Tuff and felsite fragments (silicified)
b. Montmorillonitic clays (al teration products) ...........
c. Altered ash (chiefly shards,
Total
Grand total _ _ -. .....
37.2
13.8
51.0
100
34.2
14.0
48.2
100
16.6
10.6
27.2
100
12.2
1.226.8
40.2
100 .
6.8
.2
7.0
100
9.8
9.8
100
19.5
.2 10.9
30.6
100
1 See table 14.3 for identification of samples.2 From the Sonsela Sandstone Bed. * Plagioclase partly altered to chlorite. 4 Includes a little glauconite. 6 Includes authigenic epidote.
identified (sample L2367) by J. C. Hathaway (1959, written communication). Aluminous montmorillonite mixed with chlorite was identified in samples L2358, L206T, and L2069 by L. G. Schultz (1962, oral com munication) . X-ray and optical data suggest that the clays in all the samples are generally high-magnesium, low-iron, and high-aluminum varieties of chlorite and montmorillonite.
Cementing components of the sandstones (table 14.2) are chiefly interstitial calcite and nearly opaque iron oxide-impregnated clay. Siliceous components consist of quartz grains and minor overgrowths, quartzite frag ments, and detrital chert. Feldspathic components are primarily orthoclase and albite; minor interstitial kaolinite present in some samples is included with the feldspathic components because it is presumed to be an alteration product of them. Dark-mineral and mica components are principally chlorite, altered biotite, and finely crystalline mixtures of chlorite and mica clays. Nonopaque heavy minerals included with this group are principally apatite, authigenic epidote, glauconite, and zircon; opaque heavy minerals are leucoxene, mag netite, and ilmenite. The volcanic components consist of devitrified, silicified, and chloritized fragments of the following: volcanic glass or vitrophyre; vitric, crystal, and lithic tuff; and felsite. Montmorillonitic clays are included in this group because they are inter- grown with chlorite and amorphous and microcrystal- line silica in interstitial aggregates that probably repre sent devitrified hydrolyzed volcanic ash.
Tuff and vitrophyre fragments include both sodic and potassic varieties. The sodic variety predominates and in some samples is the only one observed. Some sodic tuff contains albite in euhedral phenocrysts or in poorly crystallized anhedral forms. Potassic frag ments were identified by the yellow stain produced by sodium cobaltinitrite after etching with hydrofluoric acid. All original glass fragments are divitrified and show contorted flow or perlitic structures. The altered glass which forms the matrix of the crystal tuff frag ments has a birefringence of 0.001 or less, but has indices of refraction approximately the same as quartz, which suggests that it has been altered to a poorly crystallized form of quartz.
The chemical composition of the six samples as deter mined by standard rock analysis is shown in table 14.3, which also includes, for comparison, average composi tion of some common clastic sedimentary rocks. With certain exceptions, the samples in general resemble average arkose. The sodium oxide content is near that of average graywacke, but the potassium oxide content is lower than in any of the compared rocks. Magnesia is comparable to that of average sandstone.
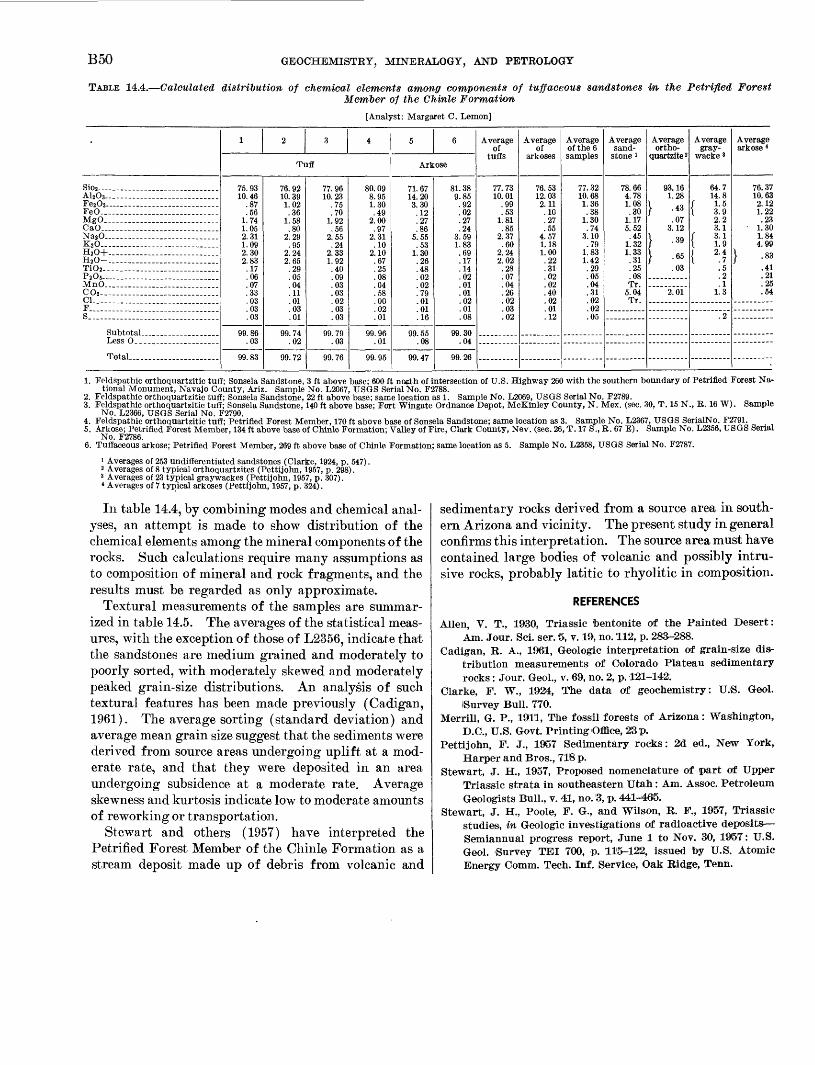
B50 GEOCHEMISTRY, MINERALOGY, AND PETROLOGY
TABLE 14.4. Calculated distribution of chemical elements among components of tuffaceous sandstones in the Petrified ForestMember of the Chinle Formation
[Analyst: Margaret C. Lemon]
Sioj . _______ ____ ......A1 203... .......................Fe2 O3- _ ........... _ ......FeO... ..MgO.... .........................CaO. ..__ ._____.NajO..... ........................K20........ ......................HjO+... .........................HaO-._. ..................TiOj.. .......................P»0 8...... ................ ........MnO.. - ..CO3 .. ........ .Cl........... ...... ....F. ...S_. ....
Total.... ...................
1 2 3 4
Tuff
75.93 10.46
.87
.56 1.74 1.05 2.31 1.09 2.30 2.83 .17 .06 .07 .33 .03 .03 .03
99.86 .03
99.83
76.92 10.39 1.02 .36
1.58 .80
2.29 .95
2.24 2.65 .29 .05 .04 .11 .01 .03 .01
99.74 .02
99.72
77.96 10.23
.75
.70 1.92 .56
2.55 .24
2.33 1.92 .40 .09 .03 .03 .02 .03 .03
99.79 .03
99.76
80.09 8.95 1.30 .49
2.00 .97
2.31 .10
2.10 .67 .25 .08 .04 .58 .00 .02 .01
99.96 .01
99.95
5 6
Arkose
71.67 14.20 3.30 .12 .27 .86
5.55 .53
1.30 .26 .48 .02 .02 .79 .01 .01 .16
99.55 .08
99.47
81.38 9-85 .92 .02 .27 .24
3.59 1.83 .69 .17 .14 .02 .01 .01 .02 .01 .08
99.30 .04
99.26
Average of
tuffs
77.73 10.01
.99
.53 1.81 .85
2.37 .60
2.24 2.02 .28 .07 .04 .26 .02 .03 .02
Average of
arkoses
76.53 12.03 2.11 .10 .27 .55
4.57 1.18 1.00 .22 .31 .02 .02 .40 .02 .01 .12
Average of the 6 samples
77.32 10.68 1.36 .38
1.30 .74
3.10 .79
1.83 1.42 .29 .05 .04 .31 .02 .02 .05
Average sand
stone i
78.66 4.78 1.08 .30
1.17 5.52 .45
1.32 1.33 .31 .25 .08 Tr.
5.04 Tr.
Average ortho-
quartzite 2
93.16 1.28
} «.07
3.12} .39
} .65 .03
2.01
Average gray-
wacke 3
64.7 14.8
f 1.5 I 3.9
2.2 3.1
f 3.1 \ 1.9 I 2.4 I -7
.5
.2
.1 1.3
.2
Average arkose 4
76.37 10.63 2.12 1.22 .23
1.30 1.84 4.99
} .83.41 .21 .25.54
1. Feldspathie orthoquartzitie tuff; Sonsela Sandstone, 3 ft above base; 600 ft notth of intersection of U.S. Highway 260 with the southern boundary of Petrified Forest Na tional Monument, Navajo County, Ariz. Sample No. L2067, USQS Serial No. F2788.
2. Feldspathie orthoquartzitie tuff; Sonsela Sandstone, 22 ft above base; same location as 1. Sample No. L2069, USQS Serial No. F2789.3. Feldspathie orthoquartzitie tuff; Sonsela Sandstone, 140 ft above base; Fort Wingate Ordnance Depot, MeKinley County, N. Mex. (see. 30, T. 15 N., E. 16 W). Sample
No. L2366, USOS Serial No. F2790.4. Feldspathie orthoquartzitie tuff; Petrified Forest Member, 170 ft above base of Sonsela Sandstone; same location as 3. Sample No. L2367, USQS SerialNo. F2791. - krkose; Petrified Forest Member, 134 ft above base of Chinle Formation; Valley of Fire, Clark County, Nev. (sec. 26, T. 17 S.,~ " *" " ' " - T
No. F2786.5. Arkose; Petrified Forest Member, 134 ft above base of Chime Formation; Valley of Fire, Clark County, Nev. (sec. 26, T. 17 S., R. 67 E). Sample No. L2356, USQS Serial
No. F2786.6. Tuffaeeous arkose; Petrified Forest Member, 269 ft above base of Chinle Formation; same location as 5. Sample No. L2358, USQS Serial No. F2787.
1 Averages of 253 undifferentiated sandstones (Clarke, 1924, p. 547).2 Averages of 8 typical orthoquartzites (Pettijohn, 1957, p. 298).3 Averages of 23 typical graywackes (Pettijohn, 1957, p. 307).4 Averages of 7 typical arkoses (Pettijohn, 1957, p. 324).
In table 14.4, by combining modes and chemical anal yses, an attempt is made to show distribution of the chemical elements among the mineral components of the rocks. Such calculations require many assumptions as to composition of mineral and rock fragments, and the results must be regarded as only approximate.
Textural measurements of the samples are summar ized in table 14.5. The averages of the statistical meas ures, with the exception of those of L2356, indicate that the sandstones are medium grained and moderately to poorly sorted, with moderately skewed and moderately peaked grain-size distributions. An analysis of such textural features has been made previously (Cadigan, 1961). The average sorting (standard deviation) and average mean grain size suggest that the sediments were derived from source areas undergoing uplift at a mod erate rate, and that they were deposited in an area undergoing subsidence at a moderate rate. Average skewness and kurtosis indicate low to moderate amounts of reworking or transportation.
Stewart and others (1957) have interpreted the Petrified Forest Member of the Chinle Formation as a stream deposit made up of debris from volcanic and
sedimentary rocks derived from a source area in south ern Arizona and vicinity. The present study in general confirms this interpretation. The source area must have contained large bodies of volcanic and possibly intru sive rocks, probably latitic to rhyolitic in composition.
REFERENCES
Alien, V. T., 1930, Triassic bentonite of the Painted Desert: Am. Jour. Sci. ser. 5, v. 19, no. 112, p. 283-288.
Cadigan, B. A., 1961, Geologic interpretation of grain-size dis tribution measurements of Colorado Plateau sedimentary rocks: Jour. Geol., v. 69, no. 2, p. 121-142.
Clarke, F. W., 1924, The data of geochemistry: TJ.'S. Geol. (Survey Bull. 770.
Merrill, G. P., 1911, The fossil forests of Arizona: Washington, B.C., U.S. Govt. Printing Office, 23 p.
Pettijohn, F. J., 1957 Sedimentary rocks: 2d ed., New York, Harper and Bros., 718 p.
Stewart, J. H., 1957, Proposed nomenclature of part of Upper Triassic strata in southeastern Utah: Am. Assoc. Petroleum Geologists Bull., v. 41, no. '3, p. 441-465.
Stewart, J. H., Poole, F. 'G., and Wilson, R. F., 1957, Triassic studies, in Geologic investigations of radioactive deposits, Semiannual progress report, June 1 to Nov. 30, 1957: U.S. Geol. 'Survey TEI 700, p. 115-122, issued by U.S. Atomic Energy Comm. Tech. Inf. Service, Oak Ridge, Tenn.
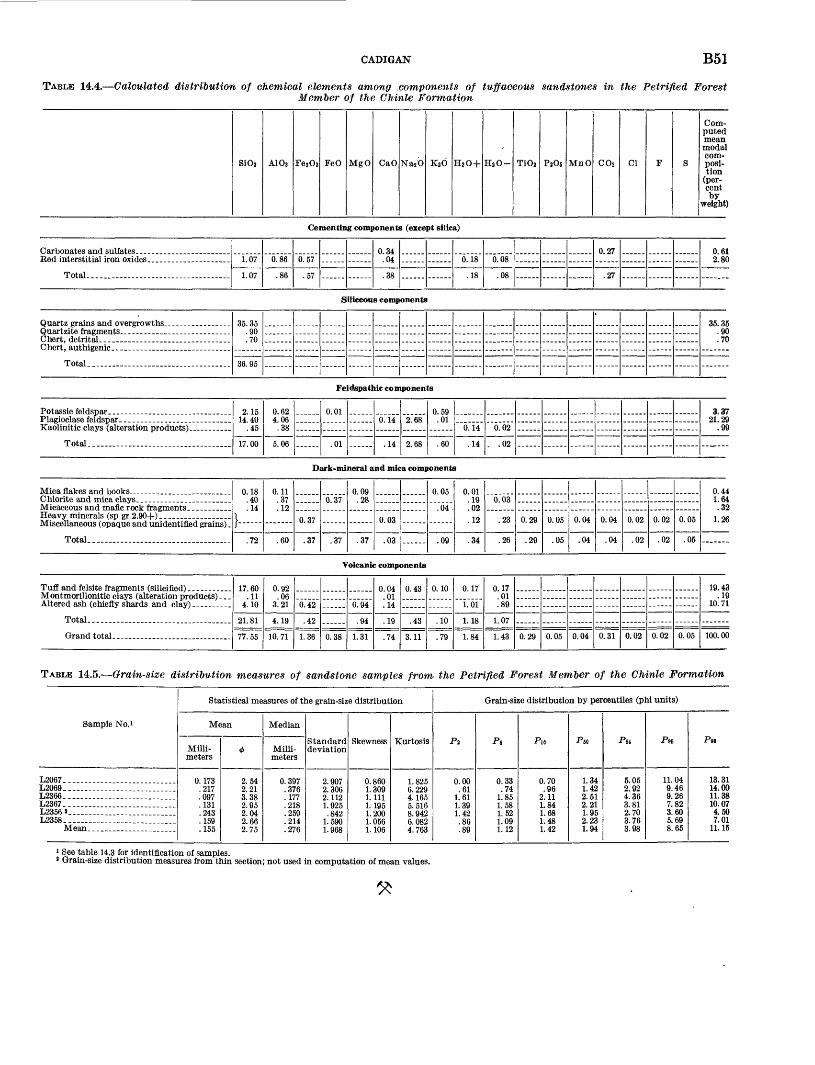
CADIGAN
TABLE 14.4. Calculated distribution of chemical elements among .components of tuffaceous sandstones inMember of the Chinle Formation
B51
the Petrified Forest
SiOj A1O3 ~ FeO MgO CaO Najb KaO H,0+ HZ O- TiOs PjOs MnO CO2 Cl F S
Com puted mean modal com posi tion
(per cent by
weight)
Cementing components (except silica)
Total-... -
1.07
1.07
0.86
.86
0.57
.57
0.34.04
.38
0.18
.18
0.08
.08
0.27
.27
0.61 2.80
Siliceous components
hert, detritaL- _____ ____________Chert, authigenic.. -. ... . ...
Total-.
35.35.90.70
36.95
35.35 .90 .70
Feldspathic components
Potassie feldspar.. ... _____ ... _ ..........
Total... ..............................
2.1514.40
.45
17.00
0.624.06
.38
5.06 ......
0.01
.01 ......
0.14
.14
2.68
2.68
0.59.01
.60
0.14
.14
0.02
. .02 ...... ...... ......= ...... ..... . ......
3.3721.29
.99
Dark-mineral and mica components
Mica flakes and books _______ ............
Heavy minerals (sp gr2.90+)__ ................
0.18 .40.14
\
0.11 .37.12
.
0.37
~6.~37~ 0.09 .28
0.03
0.05
.04
0.01 .19.02.12
"O.'OJT
.23
0.29
......
0.05 0.04
-...--
0.04 0.02 0.02 0.05
0.44 1.64 .32
1.26
Volcanic components
Tuft and felsite fragments (silieified) . . _____ Montmorillonitie clays (alteration products) . . .Altered ash (chiefly shards and clay) ..........
Total.. ..................................
Grand total- ______ . _____ _ _.
17.60 .11
4.10
21.81
77.55
0.92 .06
3.21
4.19
10.71
0.42
.42
1.36
..-
0.38
0.94
.94
1.31
0.04 .01.14
.19
.74
0.43
------
.43
3.11
0.10
------
.10
7Q
0.17
1.01
1.18
1.84
0.17 .01.89
1.07
1.43
......
------
0.29
......
------
0.05
...
......
0.04
......
......
0.31
......
......
......
0.02
.... ..
......
0.02
......
......
0.05
19.43 .19
10.71
.......
100. 00
TABLE 14.5. Grain-size distribution measures of sandstone samples from the Petrified Forest Member of the Chinle Formation
Sample No.i
L2067---.L2069.-- _L2366- ........... .. ..L2367. ................ -.L2356 ».-_--L2358. ............ ..............
Statistical measures of the grain-size distribution
Mean
Milli meters
0.173 .217 .097 .131 .243 .159 .155
*
2.54 2.21 3.38 2.95 2.04 2.66 2.75
Median
Milli meters
0.397 .376 .177 .218 .259 .214 .276
Standard deviation
2.907 2.306 2.112 1.925 .842
1.590 1.968
Skewness
0.860 1.309 1.111 1.195 1.200 1.056 1.106
Kurtosis
1.825 6.229 4.165 5.516 8.942 6.082 4.763
Grain-size distribution by percentiles (phi units)
Pa
0.00 .61
1.61 1.39 1.42 .86 .89
P^
0.33 .74
1.85 1.58 1.52 1.09 1.12
Pie
0.70 .96
2.11 1.84 1.68 1.48 1.42
Pso
1.34 1.42 2.51 2.21 1.95 2.23 1.94
Pw
5.05 2.92 4.36 3.81 2.70 3.76 3.98
P«5
11.04 9.46 9.26 7.82 3.60 5.69 8.65
P98
13.31 14.00 11.38 10.07 4.50 7.01
11.16
i See table 14.3 for identification of samples.8 Grain-size distribution measures from thin section; not used in computation of mean values.
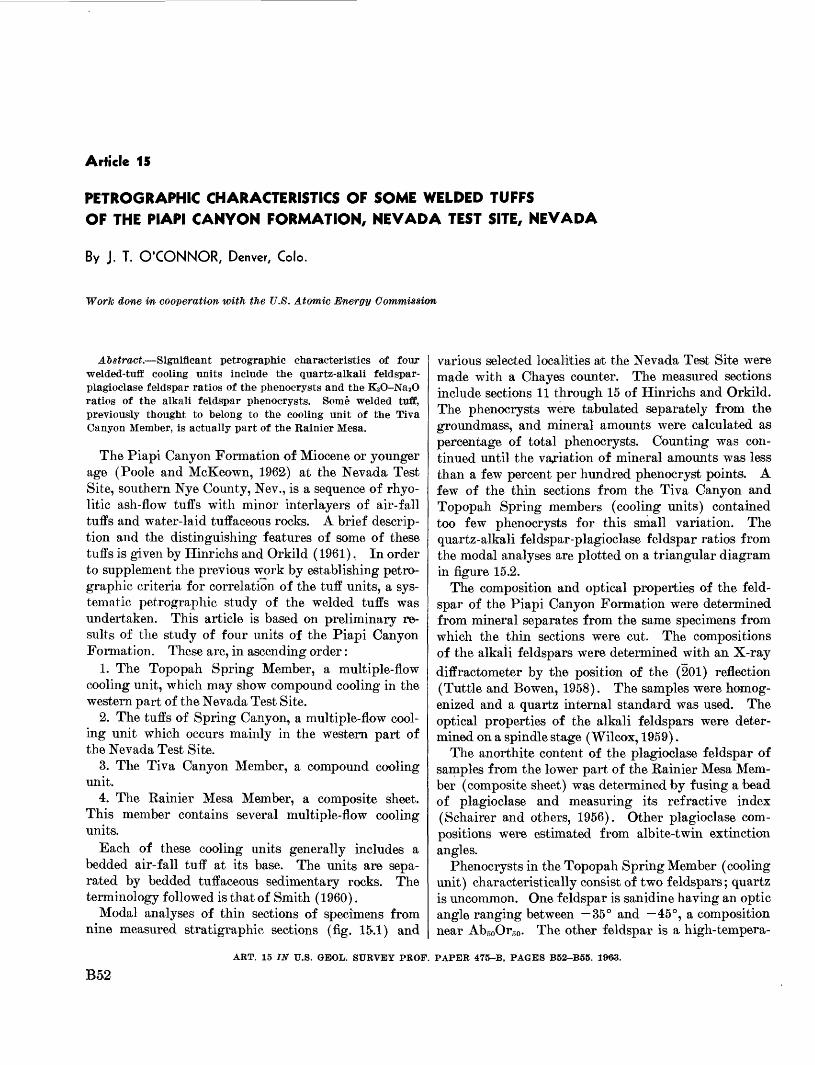
Article 15
PETROGRAPHIC CHARACTERISTICS OF SOME WELDED TUFFSOF THE PIAPI CANYON FORMATION, NEVADA TEST SITE, NEVADA
By J. T. O'CONNOR, Denver, Colo.
Work done in cooperation with the U.S. Atomic Energy Commission
Abstract. Significant petrographic characteristics of four welded-tuff cooling units include the quartz-alkali feldspar- plagioclase feldspar ratios of the phenocrysts and the K2O-Na2O ratios of the alkali feldspar phenocrysts. Some welded tuff, previously thought to belong to the cooling unit of the Tiva Canyon Member, is actually part of the Rainier Mesa.
The Piapi Canyon Formation of Miocene or younger age (Poole and McKeown, 1962) at the Nevada Test Site, southern Nye County, Nev., is a sequence of rhyo- litic ash-flow tuffs with minor interlayers of air-fall tuffs and water-laid tuffaceous rocks. A brief descrip tion and the distinguishing features of some of these tuffs is given by Hinrichs and Orkild (1961). In order to supplement the previous work by establishing petro graphic criteria for correlation of the tuff units, a sys tematic petrographic study of the welded tuffs was undertaken. This article is based on preliminary re sults of the study of four units of the Piapi Canyon Formation. These are, in ascending order:
1. The Topopah Spring Member, a multiple-flow cooling unit, which may show compound cooling in the western part of the Nevada Test Site.
2. The tuffs of Spring Canyon, a multiple-flow cool ing unit which occurs mainly in the western part of the Nevada Test Site.
3. The Tiva Canyon Member, a compound cooling unit.
4. The Rainier Mesa Member, a composite sheet. This member contains several multiple-flow cooling units.
Each of these cooling units generally includes a bedded air-fall tuff at its base. The units are sepa rated by bedded tuffaceous sedimentary rocks. The terminology followed is that of Smith (1960).
Modal analyses of thin sections of specimens from nine measured stratigraphic sections (fig. 15.1) and
various selected localities at the Nevada Test Site were made with a Chayes counter. The measured sections include sections 11 through 15 of Hinrichs and Orkild. The phenocrysts were tabulated separately from the groundmass, and mineral amounts were calculated as percentage of total phenocrysts. Counting was con tinued until the variation of mineral amounts was less than a few percent per hundred phenocryst points. A few of the thin sections from the Tiva Canyon and Topopah Spring members (cooling units) contained too few phenocrysts for this small variation. The quartz-alkali feldspar-plagioclase feldspar ratios from the modal analyses are plotted on a triangular diagram in figure 15.2.
The composition and optical properties of the feld spar of the Piapi Canyon Formation were determined from mineral separates from the same specimens from which the thin sections were cut. The compositions of the alkali feldspars were determined with an X-ray diffractometer by the position of the (201) reflection (Tuttle and Bowen, 1958). The samples were homog enized and a quartz internal standard was used. The optical properties of the alkali feldspars were deter mined on a spindle stage (Wilcox, 1959).
The anorthite content of the plagioclase feldspar of samples from the lower part of the Rainier Mesa Mem ber (composite sheet) was determined by fusing a bead of plagioclase and measuring its refractive index (Schairer and others, 1956). Other plagioclase com positions were estimated from albite-twin extinction angles.
Phenocrysts in the Topopah Spring Member (cooling unit) characteristically consist of two feldspars; quartz is uncommon. One feldspar is sanidine having an optic angle ranging between 35° and 45°, a composition near Ab5oOr5o. The other feldspar is a high-tempera-
ART. 15 IN U.S. GBOL. SURVEY PROF. PAPER 475-B, PAGES B52-B55. 1963.
B52
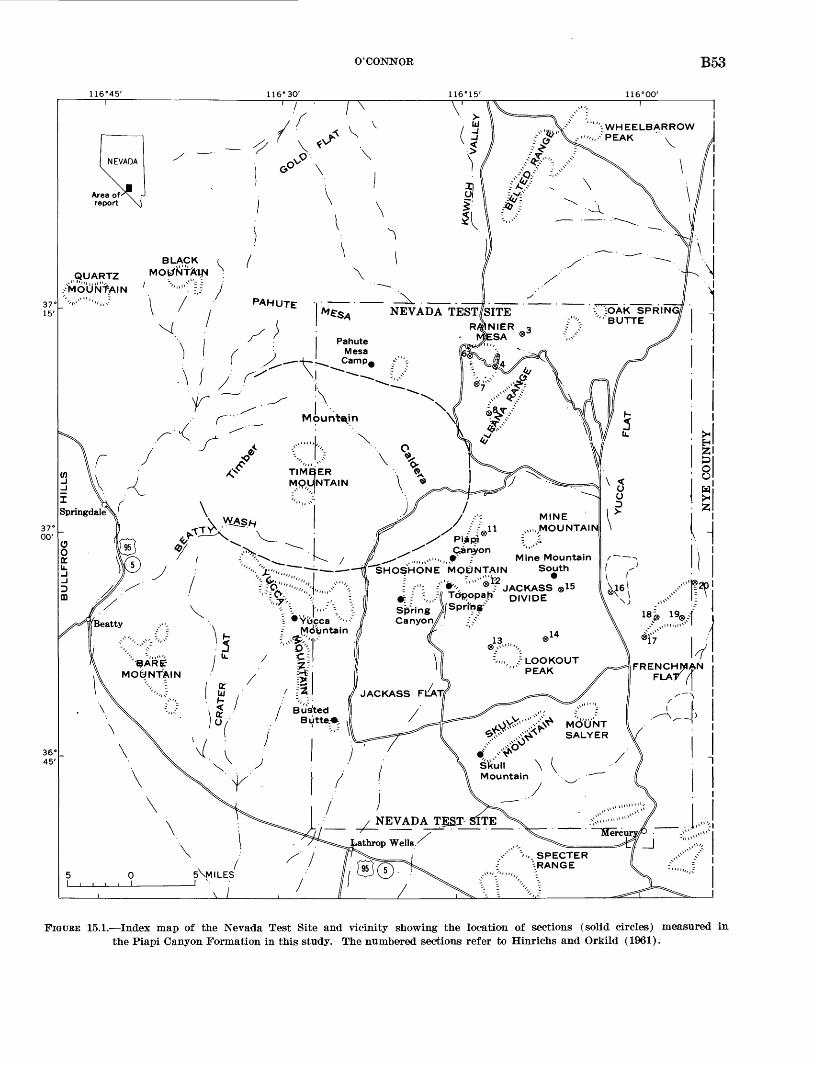
0'CONNOR B53
116°45' 116-30' 116°00'
Mine Mountain SHOSHONE MOUNTAIN South
E f": ;"*% "" ® : JACKASS ®15 Tdt>opaf> DIVIDE
Spring *'° '
FIGURE 15.1. Index map of the Nevada Test Site and vicinity showing the location of sections (solid circles) measured in the Piapi Canyon Formation in this study. The numbered sections refer to Hinrichs and Orkild (1961).
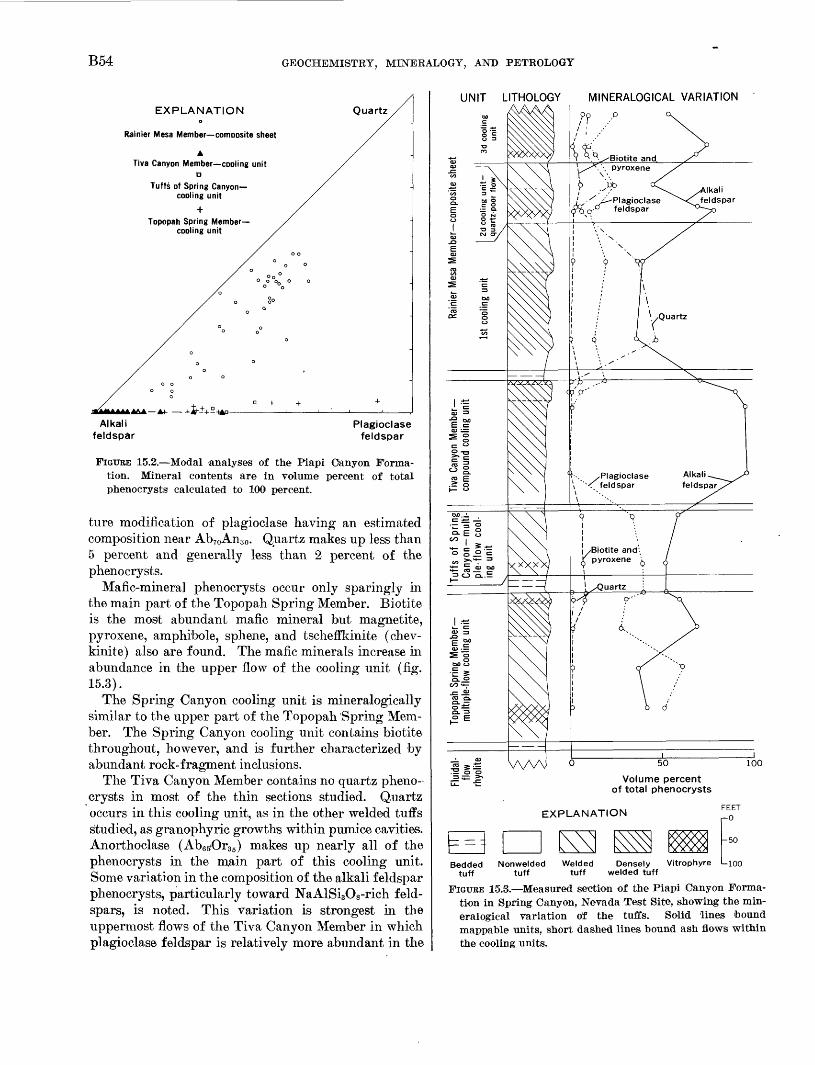
B54 GEOCHEMISTRY, MINERALOGY, AND PETROLOGY
EXPLANATION
Rainier Mesa Member composite sheet
Tiva Canyon Member cooling unit a
Tuffs of Spring Canyon- cooling unit
Topopah Spring Member- cooling unit
Quartz
Alkali feldspar
Plagioclase feldspar
FIGTTRE 15.2. Modal analyses of the Piapi Canyon Forma tion. Mineral contents are in volume percent of total phenocrysts calculated to 100 percent.
ture modification of plagioclase having an estimated composition near Ab7oAn3 o. Quartz makes up less than 5 percent and generally less than 2 percent of the phenocrysts.
Mafic-minera] phenocrysts occur only sparingly in the main part of the Topopah Spring Member. Biotite is the most abundant mafic mineral but magnetite, pyroxene, amphibole, sphene, and tscheffkinite (chev- kinite) also are found. The mafic minerals increase in abundance in the upper flow of the cooling unit (fig. 15.3).
The Spring Canyon cooling unit is mineralogically similar to the upper part of the Topopah Spring Mem ber. The Spring Canyon cooling unit contains biotite throughout, however, and is further characterized by abundant rock-fragment inclusions.
The Tiva Canyon Member contains no quartz pheno crysts in most of the thin sections studied. Quartz occurs in this cooling unit, as in the other welded tuffs studied, as granophyric growths within pumice cavities. Anorthoclase (Ab65Or35 ) makes up nearly all of the phenocrysts in the main part of this cooling unit. Some variation in the composition of the alkali feldspar phenocrysts, particularly toward NaAlSi3O8-rich feld spars, is noted. This variation is strongest in the uppermost flows of the Tiva Canyon Member in which plagioclase feldspar is relatively more abundant in the
UNIT LITHOLOGY MINERALOGICAL VARIATION
^ «^ ¥= o Q..E
CD p"
; . ^Plagioclase \ ' < feldspar
/Biotite and\ pyroxene L
^Quartz
50
Volume percent of total phenocrysts
100
EXPLANATIONFEET -0
Densely Vitrophyre welded tuff
FIGURE 15:3. Measured section of the Piapi Canyon Forma tion in Spring Canyon, Nevada Test 'Site, showing the min- eralogical variation of the tuffs. Solid lines bound mappable units, short dashed lines bound ash flows within the cooling units.

0'CONNOR B55
modal analyses. The optic angle of the alkali feldspar in the Tiva Canyon Member is generally near 45°. The plagioclase feldspar phenocrysts are strongly re- sorbed and replaced by anorthoclase. Eeplacement phenomena are not as abundant in the plagioclase phenocrysts of the Topopah Spring Member and tuffs of Spring Canyon.
The Eainier Mesa Member has the most variable mineralogy of the tuffs of the Piapi Canyon Formation. This composite sheet generally contains abundant quartz, alkali feldspar, and plagioclase feldspar pheno crysts. However, near the margin of the Timber Moun tain caldera, thin quartz-poor densely welded ash flows occur within the Eainier Mesa (fig. 15.3).
The lowest cooling unit of the Rainier Mesa Member has the largest percentage of quartz phenocrysts (35 to 50 percent of the total phenocrysts). The alkali feldspars from this cooling unit have a small optic angle (2F*=28°) and a relatively high KAlSi3O8 content (Or61Ab39 ). Alkali feldspars from younger cooling units in this member have larger optic angles =(as large as 45°) and lower KAlSi3O8 contents. The quartz-poor ash flows of this member contain an alkali feldspar with a composition near Ab61Or39 . Plagioclase in specimens of welded tuff from the lower part of the Eainier Mesa Member have a composition between Ab78An22 and Ab85An15 . The KAlSi3O8 content of the plagioclase was ignored in determining these values. Mantling and replacement of plagioclase by alkali feldspar occur in the welded tuffs of the Eainier Mesa, particularly the quartz-poor flows.
Mafic minerals are concentrated in at least two of the upper cooling units of the Eainier Mesa Member (fig. 15.3).
CONCLUSIONS
The quartz-alkali feldspar-plagioclase feldspar ra tios of the phenocrysts are the most useful petro- graphic characteristics found for correlating the units in the welded tuffs of the Piapi Canyon Formation. The precise mineral percentages are more characteristic of individual ash flows than of the entire cooling units, but a general correlation can usually be observed within the cooling units.
The percentage of the rock consisting of phenocrysts varies widely with the degree of welding and with the ash flow involved. For this reason the modal analyses are plotted as percentage of total phenocrysts rather than percentage of total rock.
The percentage of mafic-mineral phenocrysts in the tuffs varies widely within the cooling units. Generally there is an increase in abundance of mafic minerals in the upper part of the cooling units.
Petrographic examination reveals that Hinrichs' and Orkild's (1961) identification of the Tiva Canyon Member at Jackass Divide (loc. 13, fig. 15.1), Four Corners Butte (14), Yucca Pass (16), Massachusetts Mountain (17, 18), French Peak (19), and Scarp Can yon (20) was in error. Specimens of this unit contain abundant quartz, sanidine, and plagioclase phenocrysts. The sanidine has a small optic angle (2Fa.=28°) and a relatively high KAlSi3O8 content (Or6iAb39 ). These features are characteristic of the lowest cooling unit of the Eainier Mesa Member, not the Tiva Canyon Mem ber. The Tiva Canyon Member is now known to extend approximately 4 miles east and 1 mile south of the Jack ass Divide area; it was not recognized in earlier work in this area because of complex faulting.
REFERENCES
Hinrichs, E. N., and Orkild, P. P., 1961, Eight members of the Oak Springs formation, Nevada Test Site and vicinity, Nye County, Nevada: Art. 327 in U.S. Geol. Survey Prof. Paper 424-D, p. D96-D103.
Poole, F. G., and McKeown, F. A., 1962, Oak Spring Group of the Nevada Test Site and vicinity, Nevada: Art 80 in U.'S. Geol. Survey Prof. Paper 450-C, p. C60-C62.
Schairer, J. F., Smith, R. L., and Chayes, Felix, 1956, Refrac tive indices of plagioclase glasses : Carnegie Inst. Washing ton Year Book 55, p. 195-197.
Smith, R. L., 1960, Zones and zonal variations in welded ash flows: U.S. Geol. 'Survey Prof. Paper 354-F, p. 149-159.
Tuttle, O. F., and Bowen, N. L., 1958, Origin of granite in the light of experimental istudies in the system NaAlSiaOg- KAlSisOs-SiOa-HsO: Geol. Soc. America Mem. 74, p. 153,
Wilcox, R. E., 1959, Use of spindle stage for determining re fractive indices of crystal fragments: Am. Mineralogist, v. 44, p. 1272-1293.
Williams, P. L., 1960, A stained, slice method for rapid deter mination of phenocryst composition of volcanic rocks: Am. Jour. ScL, v. 258, p. 148-152.

Article 16
POTASSIUM-ARGON AND LEAD-ALPHA AGESFOR STRATIGRAPHICALLY BRACKETED PLUTONIC ROCKSIN THE TALKEETNA MOUNTAINS, ALASKA
By ARTHUR GRANTZ; HERMAN THOMAS, T. W. STERN, and NOLA B. SHEFFEY,
Menlo Park, Calif./ Washington, D.C.
Abstract. A tie between radioactivity and stratigraphic time scales resulted from dating the Kosina 'batholith. Two radiogenic methods indicate the batholith is 160-165 million years old; geologic mapping suggests emplacement between Toarcian (Early) and Oxfordian (Late Jurassic) time, and perhaps close to the Early-Middle Jurassic boundary.
Six potassium-argon ages of biotite and four lead- alpha ages of zircon, determined for a stratigraphi- cally bracketed pluton in the eastern Talkeetna Mountains of south-central Alaska, indicate that the pluton is about 160-165 million years old. The plu ton intrudes rocks of Sinemurian to Toarcian (Early Jurassic) age and was the source of many boulders in conglomerate of Oxfordian (Late Jurassic) age. The geologic record further indicates that emplacement may have begun very early in Middle Jurassic time. The data thus suggest a tie between the Toarcian-Oxfordian interval (and perhaps the Early-Middle Jurassic boundary) on the stratigraphic time scale and about 160-165 million years on the radioactivity time scale.
GEOLOGIC ENVIRONMENT
The dated rocks are from the Oshetna Kiver drain age of the eastern Talkeetna Mountains. Half of them are from the plutonic rocks shown in the northwest part of figure 16.1 rocks which occupy a large area in the drainage of Kosina Creek to the north of the area of figure 16.1 and for convenience are called the Kosina batholith. The other half are from boulders in the Naknek Formation near the Little Oshetna Kiver (see table 16.1 and fig. 16.1).
The Talkeetna Formation, which is intruded by the Kosina batholith, is widespread in the southern Tal keetna Mountains and consists of a thickness of perhaps 2 miles or more of predominantly marine sedi
mentary and volcanic rocks. It contains ammonites (identified by K. W. Imlay, written communications, 1961 and 1962) which are representative of parts of the Sinemurian, Pliensbachian, and Toarcian (includ ing upper Toarcian) Stages of the Early Jurassic. Pectens of the genus Weyla from the Talkeetna (iden tified by S. W. Muller, oral communications, 1961 and 1962) belong to species which range through these same stages. Three of the fossil localities are between 1 and 2 miles from the batholith (fig. 16.1). Locality A (USGS Mes. loc. 28659), in hornfelsed beds intruded by an apophysis of the batholith, contains Weyla and is therefore of Early Jurassic age; locality B (USGS Mes. Iocs. 25938, 28660, 28661, 28662, and 28663), in beds within three-quarters of a mile of another apophy sis, contains the ammonites CrucUobiceras (two spe cies), Acanthopleuroceras, and Radstockiceras, and the pecten Weyla dufrenoyi d'Orbigny an association which is of early Pliensbachian age; locality C (USGS Mes. loc. 26722) contains Crucilobiceras of late Sine murian to earliest Pliensbachian age.
The Naknek Formation, deposited in the Matanuska geosyncline from early Oxfordian to late Kimmeridg- ian or early Portlandian time, contains abundant fresh-appearing plutonic clasts which we think orig inated in the Kosina batholith. These clasts occur in conglomerate beds at the base of the formation and at several higher levels. The beds contain cobbles and boulders, and some attain a thickness of 1,000 to 1,500 feet; yet, within a few miles south of their northern most outcrops, they lens out into siltstone and shale. The boulders of plutonic rock that were dated came from about 400 feet above the base of such a conglom erate at the bottom of the Naknek Formation (fig. 16.1). This conglomerate lenses out southward into
ART. 16 IN U.S. GEOL. SURVEY PROF. PAPER 475-B, PAGES B56-B59. 1968.
B56
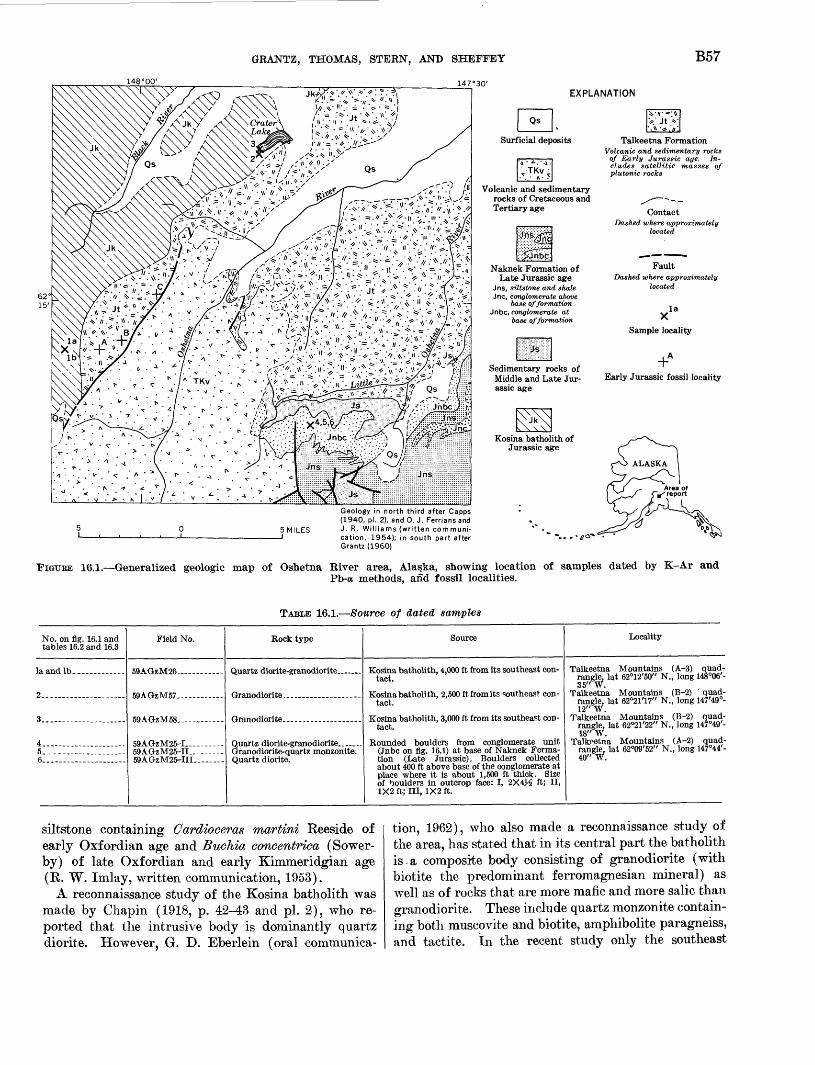
GRANTZ, THOMAS, STERN, AND SHEFFEY B57148°00' 147°30'
EXPLANATION
5 MILES
Geology in north third after Capps (1940, pi. 2), and 0. J. Ferrians and J. R. Williams (written communi cation, 1954); in south part after Grantz (1960)
Naknek Formation of Late Jurassic age
Jns, siltstone and shale Jnc, conglomerate above
base of formation Jnbc, conglomerate at
base of formation
Kosina batholith of Jurassic age
Talkeetna FormationVolcanic and sedimentary rocks
of Early Jurassic age. In cludes satellitic masses of plutonic rocks
ContactDashed where approximately
located
FaultDashed where approximately
located
la X
Sample locality
Early Jurassic fossil locality
FIGURE 16.1. Generalized geologic map of Oshetna River area, Alaska, showing location of samples dated by K-Ar andPb-a methods, and fossil localities.
TABLE 16.1. Source of dated samples
No. on fig. 16.1 and tables 16.2 and 16.3
2.. ...................
S.. ...................
i. ..-.-...-...__..-.56...
Field No.
59AGzM26
TO A fl<7~M"iV7
TO A n<7~M~'yi
59AGzM25-I -59AGzM25-II -----59AGzM25-III. --
Rock type Source
Kosina batholith, 4,000 ft from its southeast contact.
Kosina batholith, 2,500 ft from its southeast contact.
Kosina batholith, 3,000 ft from its southeast contact.
Rounded boulders from conglomerate unit(Jnbc on fig. 16.1) at base of Naknek Formation (Late Jurassic). Boulders collectedabout 400 ft above base of the conglomerate at place where it is about 1,500 ft thick. Size of boulders in outcrop face: I, 2X4}^ ft; II, 1X2 ft; III, 1X2 ft.
Locality
Talkeetna Mountains (A-3) quadrangle, lat 62°12'50" N., long 148°06'- 35" W.
Talkeetna Mountains (B-2) quadrangle, lat 62°21'17" N., long 147'49°- 12" W.
Talkeetna Mountains (B-2) quadrangle, lat 62°21'22" N., long 147°49'- 18" W.
Talkpetna Mountains (A-2) quadrangle, lat 62°09'52" N., long 147°44'-40" W.
siltstone containing Cardioceras martini Reeside of early Oxfordian age and Buchia concentrica (Sower- by) of late Oxfordian and early Kimmeridgian age (K. W. Imlay, written communication, 1953).
A reconnaissance study of the Kosina batholith was made by Chapin (1918, p. 42-43 and pi. 2), who re ported that the intrusive body is dominantly quartz diorite. However, G. D. Eberlein (oral communica
tion, 1962), who also made a reconnaissance study of the area, has stated that in its central part the batholith is.a composite body consisting of granodiorite (with biotite the predominant ferromagnesian mineral) as well as of rocks that are more mafic and more salic than granodiorite. These include quartz monzonite contain ing both muscovite and biotite, amphibolite paragneiss, and tactite. In the recent study only the southeast
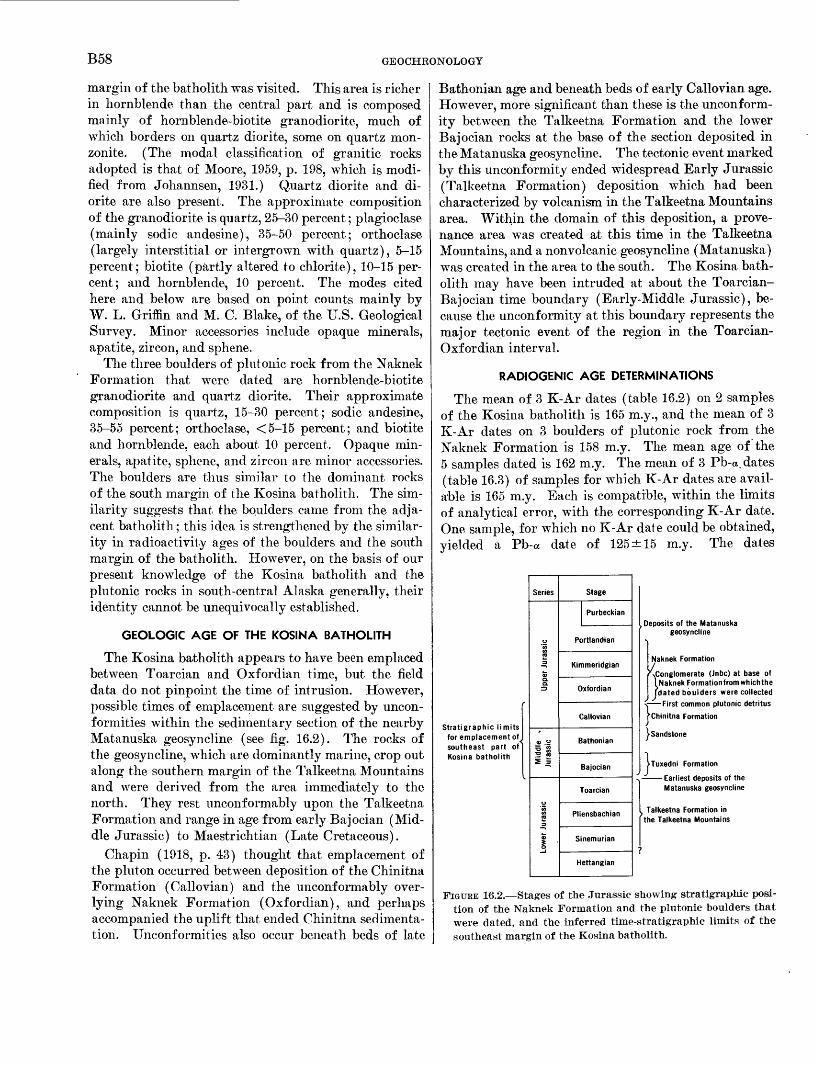
B58 GEOCHRONOLOGY
margin of the batholith was visited. This area is richer in hornblende than the central part and is composed mainly of hornblende-biotite granodiorite, much of which borders on quartz diorite, some on quartz mon- zonite. (The modal classification of granitic rocks adopted is that of Moore, 1959, p. 198, which is modi fied from Johannsen, 1931.) Quartz diorite and di orite are also present. The approximate composition of the granodiorite is quartz, 25-30 percent; plagioclase (mainly sodic andesine), 35-50 percent; orthoclase (largely interstitial or intergrown with quartz), 5-15 percent; biotite (partly altered to chlorite), 10-15 per cent; and hornblende, 10 percent. The modes cited here and below are based on point counts mainly by W. L. Griffin and M. C. Blake, of the U.S. Geological Survey. Minor accessories include opaque minerals, apatite, zircon, and sphene.
The three boulders of plutonic rock from the Naknek Formation that were dated are hornblende-biotite granodiorite and quartz diorite. Their approximate composition is quartz, 15-30 percent; sodic andesine, 35-55 percent; orthoclase, <5-15 percent; and biotite and hornblende, each about 10 percent. Opaque min erals, apatite, sphene, and zircon are minor accessories. The boulders are thus similar to the dominant rocks of the south margin of the Kosina batholith. The sim ilarity suggests that the boulders came from the adja cent batholith; this idea is strengthened by the similar ity in radioactivity ages of the boulders and the south margin of the batholith. However, on the basis of our present knowledge of the Kosina batholith and the plutonic rocks in south-central Alaska generally, their identity cannot be unequivocally established.
GEOLOGIC AGE OF THE KOSINA BATHOLITH
The Kosina batholith appears to have been emplaced between Toarcian and Oxfordian time, but the field data do not pinpoint the time of intrusion. However, possible times of emplacement are suggested by uncon formities within the sedimentary section of the nearby Matanuska geosyncline (see fig. 16.2). The rocks of the geosyncline, which are dominantly marine, crop out along the southern margin of the Talkeetna Mountains and were derived from the area immediately to the north. They rest imconformably upon the Talkeetna Formation and range in age from early Bajocian (Mid dle Jurassic) to Maestrichtian (Late Cretaceous).
Chapin (1918, p. 43) thought that emplacement of the pint on occurred between deposition of the Chinitna Formation (Callovian) and the imconformably over lying Naknek Formation (Oxfordian), and perhaps accompanied the uplift that ended Chinitna sedimenta tion. Unconformities also occur beneath beds of late
Bathonian age and beneath beds of early Callovian age. However, more significant than these is the unconform ity between the Talkeetna Formation and the lower Bajocian rocks at the base of the section deposited in the Matanuska geosyncline. The tectonic event marked by this unconformity ended widespread Early Jurassic (Talkeetna Formation) deposition which had been characterized by volcanism in the Talkeetna Mountains area. Within the domain of this deposition, a prove nance area was created at this time in the Talkeetna Mountains, and a nonvolcanic geosyncline (Matanuska) was created in the area to the south. The Kosina bath olith may have been intruded at about the Toarcian- Bajocian time boundary (Early-Middle Jurassic), be cause the unconformity at this boundary represents the major tectonic event of the region in the Toarcian- Oxfordian interval.
RADIOGENIC AGE DETERMINATIONS
The mean of 3 K-Ar dates (table 16.2) on 2 samples of the Kosina batholith is 165 m.y., and the mean of 3 K-Ar dates on 3 boulders of plutonic rock from the Naknek Formation is 158 m.y. The mean age of the 5 samples dated is 162 m.y. The mean of 3 Pb-a. dates (table 16.3) of samples for which K-Ar dates are avail able is 165 m.y. Each is compatible, within the limits of analytical error, with the corresponding K-Ar date. One sample, for which no K-Ar date could be obtained, yielded a Pb-a date of 125 ±15 m.y. The dates
Stratigraphic limits for emplacement of southeast part of Kosina batholith
Series
a
1a n
T3 $
5 _5
Lower Jurassic
Stage
Purbeckian
Portlandian
Kimmeridgian
Oxfordian
Callovian
Bathonian
Bajocian
Toarcian
Pliensbachian
Sinemurian
Hettangian
.Deposits of the Matanuska geosyncline
Naknek Formation
/..Conglomerate (Jnbc) at base of 1 Naknek Formationfrom which the
1 Jdated boulders were collected < First common plutonic detritus
f Chinitna Formation
1 Sandstone
>Tuxedni Formation
Matanuska geosyncline
> Talkeetna Formation in the Talkeetna Mountains
'
FIGURE 16.2. Stages of the Jurassic showing stratigraphic posi tion of the Naknek Formation and the plutonic boulders that were dated, and the inferred time-stratigraphic limits of the southeast margin of the Kosina batholith.
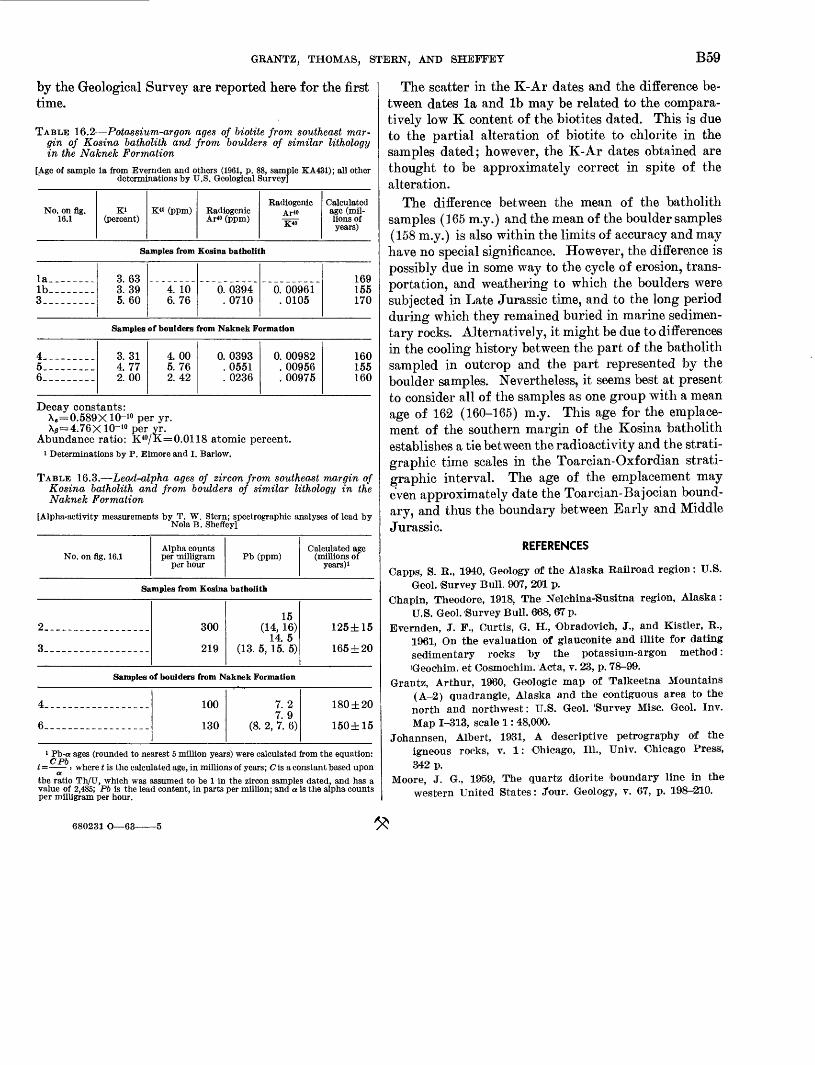
GRANTZ, THOMAS, STERN, AND SHEFFEY B59
by the Geological Survey are reported here for the first time.
TABLE 16.2 Potassium-argon ages of Motile from southeast mar gin of Kosina batholith and from boulders of similar lithology in the Naknek Formation
[Age of sample la from Evernden and others (1961, p. 88, sample KA.431); all other determinations by U.S. Geological Survey]
No. on fig. 16.1
KI(percent)
K« (ppm) Radiogenic Ar<° (ppm)
RadiogenicAr" K*»
Calculated age (mil lions of years)
Samples from Kosina batholith
la_-----._lb_-----_-3. --------
3.633.39 5.60
4. 10 6. 76
0. 0394 . 0710
0. 00961 .0105
169 155 170
Samples of boulders from Naknek Formation
4___ -----5---.--.__6... ------
3.314. 77 2. 00
4. 00 5.76 2. 42
0. 0393 . 0551 . 0236
0. 00982 . 00956 . 00975
160 155 160
Decay constants:A e = 0.589XlO- 10 per yr.X/S =4.76X10⁻¹⁰ per yr.
Abundance ratio: K40/K=0.0118 atomic percent.i Determinations by P. Elmore and I. Barlow.
TABLE 16.3. Lead-alpha ages of zircon from southeast margin of Kosina batholith and from boulders of similar lithology in the Naknek Formation
[Alpha-activity measurements by T. W. Stern; spectrographic analyses of lead by NolaB. Sheffey]
No. on fig. 16.1Alpha counts per milligram
per hourPb (ppm)
Calculated age (millions of
years)i
Samples from Kosina batholith
2... ____...__...-__
3.--. ---_-___-_-__-
300
219
15 (14, 16)
14. 5 (13. 5, 15. 5)
125±15
165 ±20
Samples of boulders from Naknek Formation
4-.____. _...______.
6__--___-.-__-__-__
100
130
7.2 7.9
(8. 2, 7. 6)
180 ±20
150±15
i Pb-« ages (rounded to nearest 5 million years) were calculated from the equation: fi pi.t = > where i is the calculated age, in millions of years; C is a constant based upon athe ratio Th/U, which was assumed to be 1 in the zircon samples dated, and has a value of 2,485; Pb is the lead content, in parts per million; and a is the alpha counts per milligram per hour.
The scatter in the K-Ar dates and the difference be tween dates la and Ib may be related to the compara tively low K content of the biotites dated. This is due to the partial alteration of biotite to chlorite in the samples dated; however, the K-Ar dates obtained are thought to be approximately correct in spite of the alteration.
The difference between the mean of the batholith samples (165 m.y.) and the mean of the boulder samples (158 m.y.) is also within the limits of accuracy and may have no special significance. However, the difference is possibly due in some way to the cycle of erosion, trans portation, and weathering to which the boulders were subjected in Late Jurassic time, and to the long period during which they remained buried in marine sedimen tary rocks. Alternatively, it might be due to differences in the cooling history between the part of the batholith sampled in outcrop and the part represented by the boulder samples. Nevertheless, it seems best at present to consider all of the samples as one group with a mean age of 162 (160-165) m.y. This age for the emplace ment of the southern margin of the Kosina batholith establishes a tie between the radioactivity and the strati- graphic time scales in the Toarcian-Oxfordian strati- graphic interval. The age of the emplacement may even approximately date the Toarcian-Bajocian bound ary, and thus the boundary between Early and Middle Jurassic.
REFERENCES
Capps, S. R., 1940, Geology of the Alaska Railroad region: U.S.Geol. 'Survey Bull. 907, 201 p.
Chapin, Theodore, 1918, The Nelchina-'Susitna region, Alaska:U.S. Geol. 'Survey Bull. 068, 67 p.
Evernden, J. F., Curtis, G. H., Obradovich, J., and Kistler, R.,1961, On the evaluation of glauconite and illite for datingsedimentary rocks "by the potassium-argon method:iGeochim. et Cosmochim. Acta, v. 23, p. 78-99.
Grantz, Arthur, I960, Geologic map of Talkeetna Mountains(A-2) quadrangle, Alaska and the contiguous area to thenorth and northwest: U.S. Geol. 'Survey Misc. Geol. Inv.Map 1-313, scale 1: 48,000.
Johannsen, Albert, 1931, A descriptive petrography of theigneous rocks, v. 1: Chicago, 111., Univ. Chicago Press,342 p.
Moore, J. G., 1959, The quartz diorite 'boundary line in thewestern United States: Jour. Geology, v. 67, p. 198-210.
680231 O 68
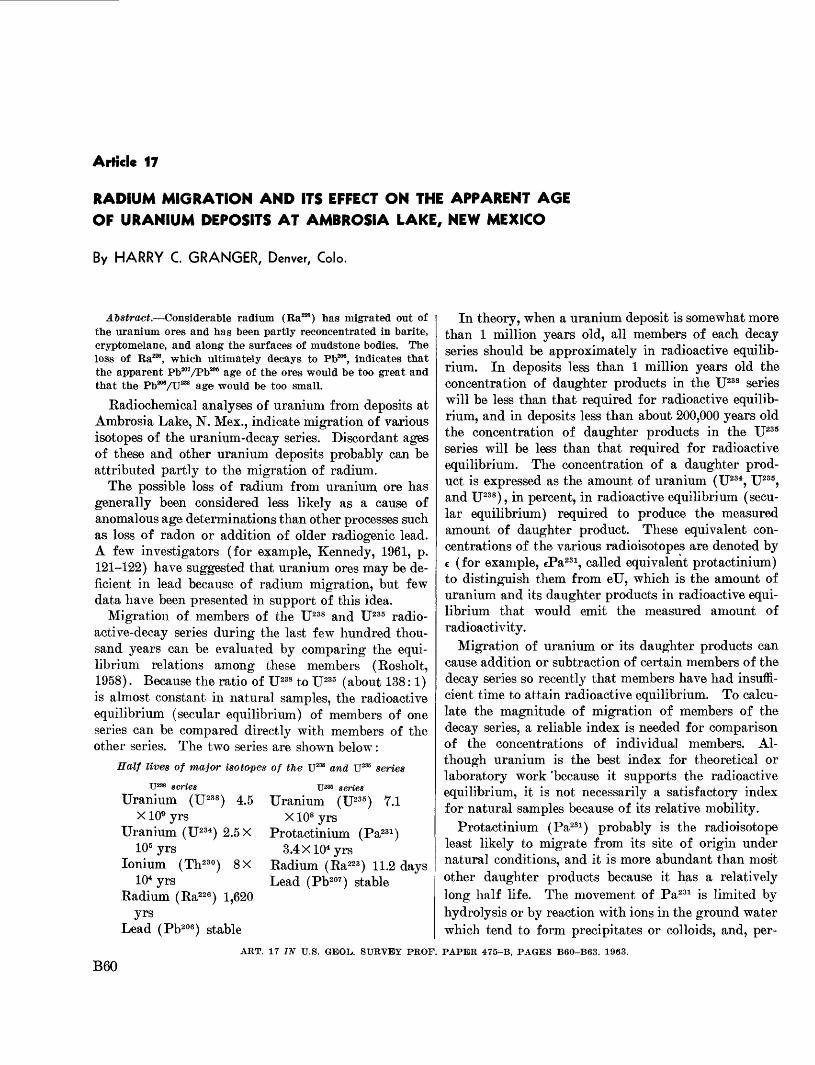
Article 17
RADIUM MIGRATION AND ITS EFFECT ON THE APPARENT AGE OF URANIUM DEPOSITS AT AMBROSIA LAKE, NEW MEXICO
By HARRY C. GRANGER, Denver, Colo.
Abstract. Considerable radium (Ra226 ) has migrated out of the uranium ores and has been partly reconcentrated in barite, cryptomelane, and along the surfaces of mudstone bodies. The loss of Ra226 , which ultimately decays to Pb208, indicates that the apparent Pb^/Pb208 age of the ores would be too great and that the Pb^/U288 age would be too small.
Radiochemical analyses of uranium from deposits at Ambrosia Lake, N. Mex., indicate migration of various isotopes of the uranium-decay series. Discordant ages of these and other uranium deposits probably can be attributed partly to the migration of radium.
The possible loss of radium from uranium, ore has generally been considered less likely as a cause of anomalous age determinations than other processes such as loss of radon or addition of older radiogenic lead. A few investigators (for example, Kennedy, 1961, p. 121-122) have suggested that uranium ores may be de ficient in lead because of radium migration, but few data have been presented in support of this idea.
Migration of members of the U238 and U235 radio active-decay series during the last few hundred thou sand years can be evaluated by comparing the equi librium relations among these members (Rosholt, 1958). Because the ratio of U238 to U235 (about 138:1) is almost constant in natural samples, the radioactive equilibrium (secular equilibrium) of members of one series can be compared directly with members of the other series. The two series are shown below:
Half lives of major isotopes of the U238 and U235 series
U238 series U236 series
Uranium (U238 ) 4.5 Uranium (U235 ) 7.1X109 yrs X108 yrs
Uranium (U234 ) 2.5 X Protactinium (Pa231 )105 yrs 3.4X10⁴ yrs
Ionium (Th230 ) 8X Radium (Ra223 ) 11.2 days104 yrs Lead (Pb207 ) stable
Radium (Ra226 ) 1,620yrs
Lead (Pb206 ) stable
In theory, when a uranium deposit is somewhat more than 1 million years old, all members of each decay series should be approximately in radioactive equilib rium. In deposits less than 1 million years old the concentration of daughter products in the U238 series will be less than that required for radioactive equilib rium, and in deposits less than about 200,000 years old the concentration of daughter products in the U235 series will be less than that required for radioactive equilibrium. The concentration of a daughter prod uct is expressed as the amount of uranium (U234, U235, and U238 ), in percent, in radioactive equilibrium (secu lar equilibrium) required to produce the measured amount of daughter product. These equivalent con centrations of the various radioisotopes are denoted by e (for example, ePa231, called equivalent protactinium) to distinguish them from eU, which is the amount of uranium and its daughter products in radioactive equi librium that would emit the measured amount of radioactivity.
Migration of uranium or its daughter products can cause addition or subtraction of certain members of the decay series so recently that members have had insuffi cient time to attain radioactive equilibrium. To calcu late the magnitude of migration of members of the decay series, a reliable index is needed for comparison of the concentrations of individual members. Al though uranium is the best index for theoretical or laboratory work 'because it supports the radioactive equilibrium, it is not necessarily a satisfactory index for natural samples because of its relative mobility.
Protactinium (Pa231 ) probably is the radioisotope least likely to migrate from its site of origin under natural conditions, and it is more abundant than most other daughter products because it has a relatively long half life. The movement of Pa231 is limited by hydrolysis or by reaction with ions in the ground water which tend to form precipitates or colloids, and, per-
ART. 17 IN U.S. GEOL. SURVEY PROF. PAPER 475-B, PAGES B60-B63. 1963.
B60
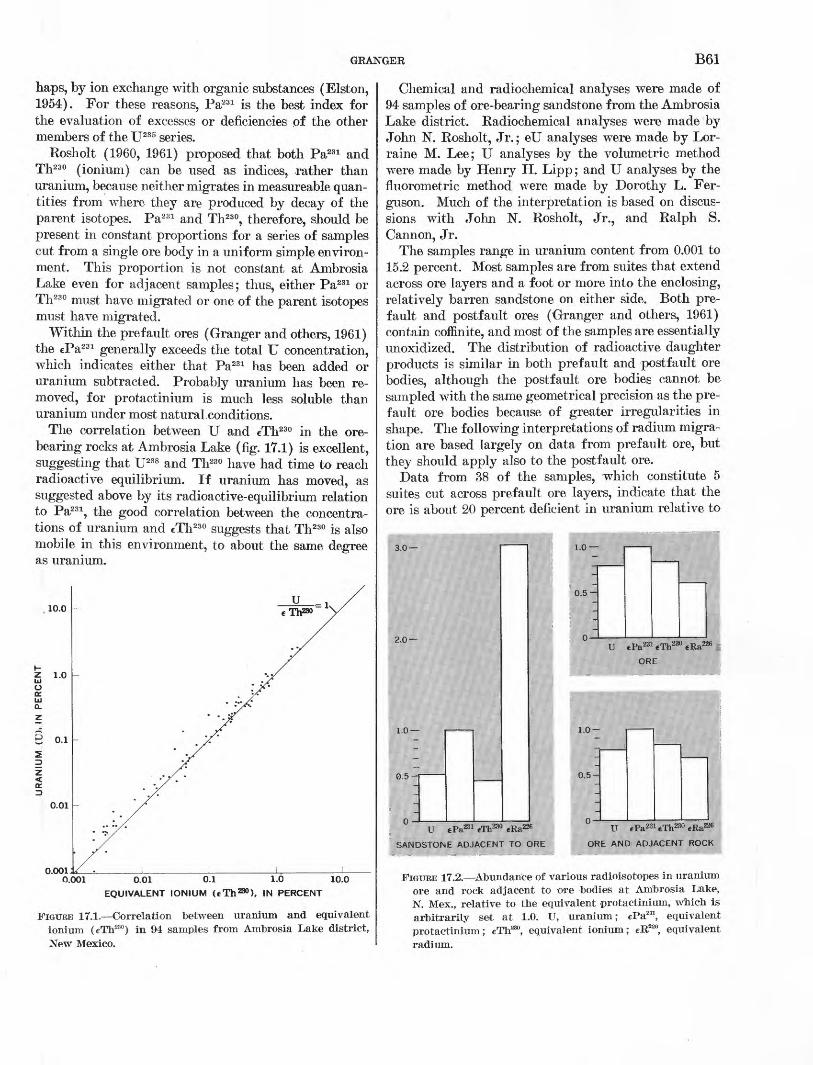
GRANGER B61
haps, by ion exchange with organic substances (Elston, 1954). For these reasons, Pa231 is the best index for the evaluation of excesses or deficiencies of the other members of the U235 series.
Eosholt (1960, 1961) proposed that both Pa231 and Th230 (ionium) can be used as indices, rather than uranium, because neither migrates in measureable quan tities from where they are produced by decay of the parent isotopes. Pa231 and Th230, therefore, should be present in constant proportions for a series of samples cut from a single ore body in a uniform simple environ ment, This proportion is not constant at Ambrosia Lake even for adjacent samples; thus, either Pa231 or Th230 must have migrated or one of the parent isotopes must have migrated.
Within the prefault ores (Granger and others, 1961) the ePa231 generally exceeds the total U concentration, which indicates either that Pa231 has been added or uranium subtracted. Probably uranium has been re moved, for protactinium is much less soluble than uranium under most natural conditions.
The correlation between U and eTh230 in the ore- bearing rocks at Ambrosia Lake (fig. 17.1) is excellent, suggesting that U238 and Th230 have had time to reach radioactive equilibrium. If uranium has moved, as suggested above by its radioactive-equilibrium relation to Pa231 , the good correlation between the concentra tions of uranium and eTh230 suggests that Th230 is also mobile in this environment, to about the same degree as uranium.
10.0
i.o
o.i
o.oi
o.ooi
U
0.001 0.01 0.1 1.0 10.0
EQUIVALENT IONIUM (eTh 230 ), IN PERCENT
FIGURE 17.1. Correlation between uranium and equivalent ionium (eTh230 ) in M samples from Ambrosia Lake district, New Mexico.
Chemical and radiochemical analyses were made of 94 samples of ore-bearing sandstone from the Ambrosia Lake district. Eadiochemical analyses were made by John N. Eosholt, Jr.; elJ analyses were made by Lor raine M. Lee; U analyses by the volumetric method were made by Henry H. Lipp; and U analyses by the fluorometric method were made by Dorothy L. Fer- guson. Much of the interpretation is based on discus sions with John N. Eosholt, Jr., and Ealph S. Cannon, Jr.
The samples range in uranium content from 0.001 to 15.2 percent, Most samples are from suites that extend across ore layers and a foot or more into the enclosing, relatively barren sandstone on either side. Both pre fault and postfault ores (Granger and others, 1961) contain coffinite, and most of the samples are essentially unoxidized. The distribution of radioactive daughter products is similar in both prefault and postfault ore bodies, although the postfault ore bodies cannot be sampled with the same geometrical precision as the pre fault ore bodies because of greater irregularities in shape. The following interpretations of radium migra tion are based largely on data from prefault ore, but they should apply also to the postfault ore.
Data from 38 of the samples, which constitute 5 suites cut across prefault ore layers, indicate that the ore is about 20 percent deficient in uranium relative to
3.0
2.0
1.0
0.5-1
0.5-
ORE
1.0-
0.5-
UTJ ePa^tTh2
SANDSTONE ADJACENT TO ORE
FIGURE 17.2. Abundance of various radioisotopes in uranium ore and rock adjacent to ore bodies at Airibrosia Lake, N. Mex., relative to the equivalent protactinium, which is arbitrarily set at 1.0. U, uranium; ePa231, equivalent protactinium; eTh230, equivalent ionium; eR226, equivalent radium.
B62 GEOCHRONOLOGY
Pa231 (fig. 17.2). The first few feet of relatively barren sandstone on either side of the ore is about 47 percent deficient in uranium. The ore and adjacent rock taken together are about 21 percent deficient in uranium.
In the same group of samples, Ra226 is nearly 41 per cent deficient in the ore and is about 220 percent in excess relative to Pa231 (fig. 17.2) in the sandstone adja cent to the ore. The deficiency in the ore represents a much greater amount of Ra226, because of the high uranium content of the ore, than the excess in the rela tively barren sandstone adjacent to the ore; the average deficiency of Ra226 in the ore and adjacent rock is about 32 percent.
Some of the Ra226 lost from the ores probably can be traced to samples that have an anomalously high radioactivity or radium or lead content. For example, Granger and others (1961) describe high concentrations of Ra226 in radioactive barite in and near some of the bodies. The presence of such concentrations of Ra226, not associated with parent isotopes, is strong evidence of relatively recent migration of radium. The most likely sources of the anomalous radium in radioactive barite are the nearby or enclosing ore bodies.
In like manner, strongly to weakly radioactive cryp- tomelane that partly replaces mudstone galls has been found in several mines. Because of its low uranium content and high barium content, the radioactivity probably is attributable largely to radium substituting chemically for barium. Furthermore, the strongly radioactive cryptomelane is relatively enriched in lead, suggesting that the lead is mostly radiogenic and is de rived from radioactive decay of part of the radium.
Most of the radium concentrated outside the ore bodies is probably contained in mudstone. Gamma- ray logs of drill holes throughout the Ambrosia Lake area show anomalous radioactivity associated with both the upper and lower surfaces of most mudstone lenses. Analyses of the outer 1 or 2 inches of mudstone layers near ore commonly disclose anomalously high radio activity coupled with an abnormally high lead content. Within mudstone layers, however, the radioactivity is essentially in balance with the uranium content, and the lead content is low.
Migration of uranium or daughter products, whether modern, sporadic, or continuous throughout the history of a rock, can affect significantly the apparent age of individual rock samples as determined by uranium- and lead-isotope ratios. If the relative deficiency of uranium in the Ambrosia Lake ores is due entirely to modern loss, and not due to continuous or sporadic loss since the original deposition, the apparent Pb206/U238 and Pb *oyU885 ages should be too great. The Pb207/
Pb206 ratio, however, should represent a reasonably ac curate absolute age if the decay series maintained radio active equilibrium until the time of uranium loss.
Loss of radium does not affect the relative uranium content of the ore but does cause an eventual deficiency of lead. Because of its much longer half life, Ra226 is more likely to escape from the ore and migrate for some distance than Ra223 ; thus, proportionately less Pb206 than Pb207 will be produced in the ore body. Ac cordingly, the Pb206/U238 age will appear to be too small and the Pb207/Pb206 age too great, but the Pb207/!!235 age should be reasonably accurate.
The Pb206 deficiency in Ambrosia Lake ores resulting from long-continued loss of Ra226 is, by inference, rela tively greater than the uranium deficiency resulting from modern loss. Therefore, within the ore, Pb207/ Pb206 ages should appear to be much too great, Pb207/ U235 ages somewhat too great, and Pb206/U238 ages too small.
In the rock adjacent to the ore, however, uranium ap parently has been lost, but the excess of Ra226 predicts an excess of Pb206. Hence, the Pb206/U238 age should appear to be much too great and the Pb207/U235 age somewhat too great, but the Pb^/Pb206 age should ap pear to be much too small.
Until the relative migration of uranium and its daughter products can be better evaluated, isotope age determinations on samples from the Ambrosia Lake district cannot be considered accurate. Because of the apparent paucity of nonradiogenic lead,1 a simple ratio between total lead and total uranium may indicate the true age of mineralization just as accurately as the apparent isotope age. The Pb/U ratio computed from semiquantitative spectrographic analyses for lead and chemical analyses for uranium of 27 high-grade (> 1.0 percent U) prefault ore samples from various mines at Ambrosia Lake suggests an age of about 55 million years.
Somewhat greater ages are indicated if low-grade ore and rock adjacent to ore bodies are included in the age calculations. The total lead and uranium contents of 75 samples in 9 suites extending across prefault ore lay ers and the adjacent wallrocks suggest an average age of about 100 million years. Even this apparent age, however, probably is less than the true age as only a part of the radiogenic lead lost from the ore because of radium migration is contained in the adjacent rock.
iMore than 100 rock samples analyzed by semiquantitative spectro graphic methods contained too little lead to report «0.0007 percent Pb). Many of these were postfault ore samples containing up to 4.86 percent uranium, indicating that postfault ore is of very recent age and that the host rock was essentially devoid of lead before postfault ore deposition.
GRANGER B63
REFERENCES
Elston, R. E., 1954, The chemistry of protactinium, in Seaborg,G. T., and Katz, J. J., eds., Actinide elements: New York,McGraw-Hill Book Co., p. 117.
Granger, H. O., Santos, E. S., Dean, B. G., and Moore, F. B.,1961, Sandstone-type uranium deposits at Ambrosia Lake,New Mexico an interim report: Econ. Geology, v. 56, no. 7,p. 1179-1209.
Kennedy, V. C., 1961, Geochemical studies of mineral depositsin the Lisbon Valley area, San Juan County, Utah: U.S.Geol. Survey open-file rept., 150 p.
Bosholt, J. N., Jr., 1958, Radioactive disequilibrium studies as an aid in understanding the natural migration of uranium and its decay products, in United Nations Internat. Conf. Peaceful Uses Atomic Energy, 2d, Geneva, 1955, Proc., p. 230.
1960, -A study of uranium migration in sandstone-type ore deposits: Art. 21 in U.S. Geol. Survey Prof. Paper 400-B, p. B41-B42.
1961, Uranium migration and geochemistry of uranium deposits in sandstone above, at, and below the water table, pt. 1, Calculation of apparent dates of uranium migration in deposits above and at the water table: Econ. Geology, v. 56, no. 8, p. 1392-1403.
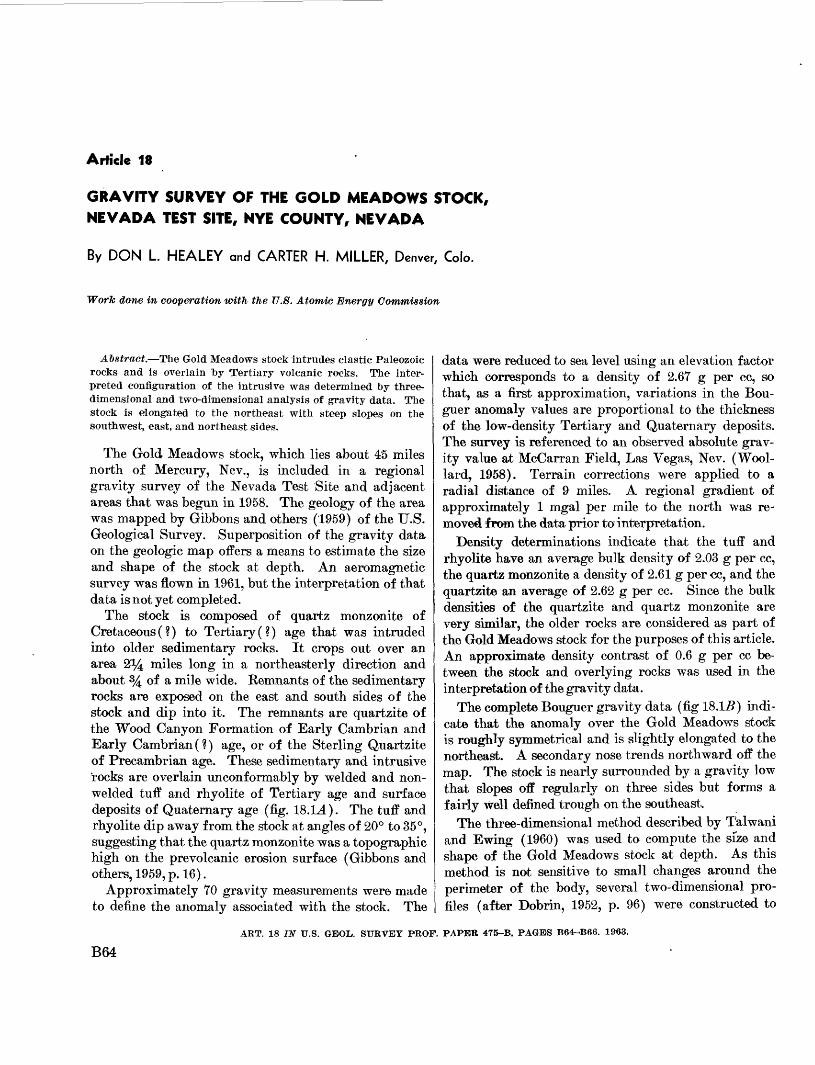
Article 18
GRAVITY SURVEY OF THE GOLD MEADOWS STOCK, NEVADA TEST SITE, NYE COUNTY, NEVADA
By DON L. HEALEY and CARTER H. MILLER, Denver, Colo.
Work done in cooperation with the U.S. Atomic Energy Commission
Abstract. The Gold Meadows stock intrudes clastic Paleozoic rocks and is overlain by Tertiary volcanic rocks. The inter preted configuration of the intrusive was determined by three- dimensional and two-dimensional analysis of gravity data. The stock is elongated to the northeast with steep slopes on the southwest, east, and northeast sides.
The Gold Meadows stock, which lies about 45 miles north of Mercury, Nev., is included in a regional gravity survey of the Nevada Test Site and adjacent areas that was begun in 1958. The geology of the area was mapped by Gibbons and others (1959) of the U.S. Geological Survey. Superposition of the gravity data on the geologic map offers a means to estimate the size and shape of the stock at depth. An aeromagnetic survey was flown in 1961, but the interpretation of that data is not yet completed.
The stock is composed of quartz monzonite of Cretaceous (?) to Tertiary (?) age that was intruded into older sedimentary rocks. It crops out over an area 2*4 miles long in a northeasterly direction and about % of a mile wide. Remnants of the sedimentary rocks are exposed on the east and south sides of the stock and dip into it. The remnants are quartzite of the Wood Canyon Formation of Early Cambrian and Early Cambrian (?) age, or of the Sterling Quartzite of Precambrian age. These sedimentary and intrusive rocks are overlain unconformably by welded and non- welded tuff and rhyolite of Tertiary age and surface deposits of Quaternary age (fig. 18.1A). The tuff and rhyolite dip away from the stock at angles of 20° to 35°, suggesting that the quartz monzonite was a topographic high on the prevolcanic erosion surface (Gibbons and others, 1959, p. 16).
Approximately 70 gravity measurements were made to define the anomaly associated with the stock. The
data were reduced to sea level using an elevation factor which corresponds to a density of 2.67 g per cc, so that, as a first approximation, variations in the Bou- guer anomaly values are proportional to the thickness of the low-density Tertiary and Quaternary deposits. The survey is referenced to an observed absolute grav ity value at McCarran Field, Las Vegas, Nev. (Wool- lard, 1958). Terrain corrections were applied to a radial distance of 9 miles. A regional gradient of approximately 1 mgal per mile to the north was re moved from the data prior to interpretation.
Density determinations indicate that the tuff and rhyolite have an average bulk density of 2.03 g per cc, the quartz monzonite a density of 2.61 g per -cc, and the quartzite an average of 2.62 g per cc. Since the bulk densities of the quartzite and quartz monzonite are very similar, the older rocks are considered as part of the Gold Meadows stock for the purposes of this article. An approximate density contrast of 0.6 g per cc be tween the stock and overlying rocks was used in the interpretation of the gravity data.
The complete Bouguer gravity data (fig 18.1 B] indi cate that the anomaly over the Gold Meadows stock is roughly symmetrical and is slightly elongated to the northeast. A secondary nose trends northward off the map. The stock is nearly surrounded by a gravity low that slopes off regularly on three sides but forms a fairly well defined trough on the southeast.
The three-dimensional method described by Talwani and Ewing (1960) was used to compute the size and shape of the Gold Meadows stock at depth. As this method is not sensitive to small changes around the perimeter of the body, several two-dimensional pro files (after Dobrin, 1952, p. 96) were constructed to
ART. 18 IN U.S. GEOL.. SURVEY PROF. PAPER 475-B, PAGES B64-B66. 1963.
B64
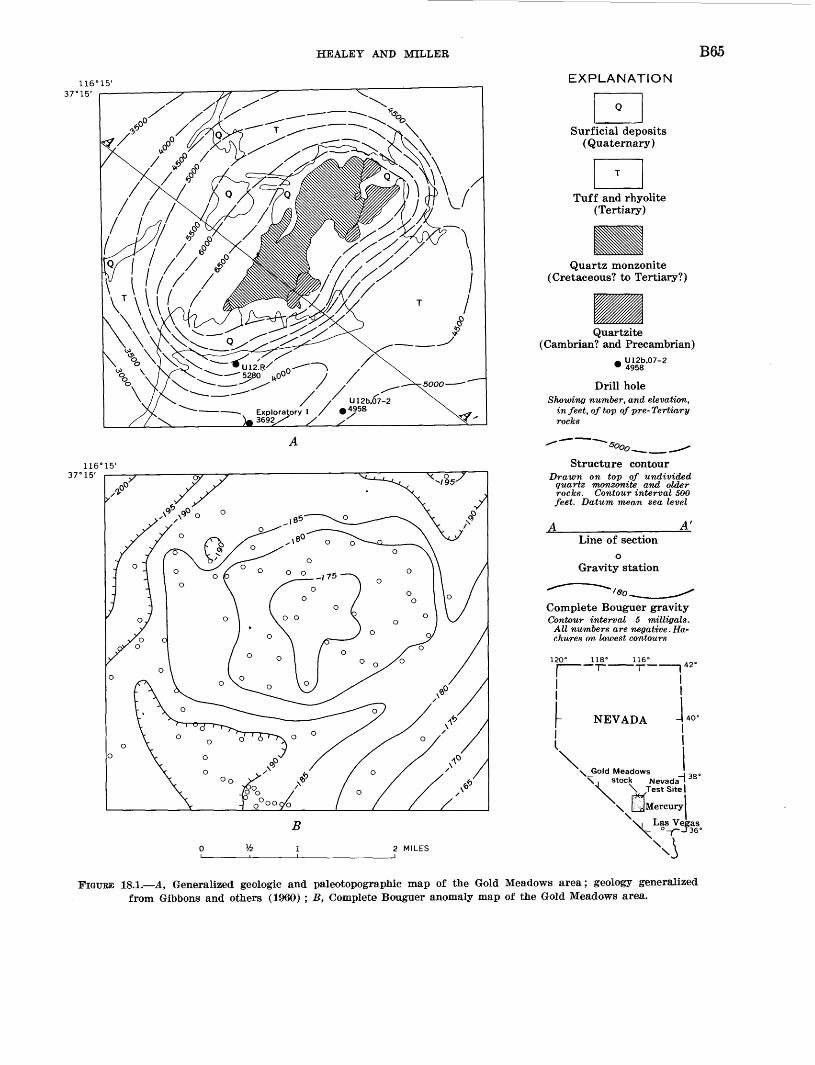
HEALEY AND MILLER B65
EXPLANATION
(Cretaceous? to Tertiary?)
Quartzite (Cambrian? and Precambrian)
U12b.07-2 4958
Drill holeShowing number, and elevation,
in feet, of top of pre- Tertiary rocks
B
i
Structure contourDrawn on top of undivided
quartz monzonite and older rocks. Contour interval 500 feet. Datum mean sea level
A _____________ A' Line of section
Gravity station
Complete Bouguer gravity Contour interval 5 milligals. All numbers are negative. Ha- chures on lowest co-ntours
NEVADA
\_Gold Meadows _.\ . stock Nevada '\ \ Test Site I
\ I JMercury\
2 MILES
Las Vegas°-Y~J36°
\
\\
FIGURE 18.1. A, Generalized geologic and paleotopographic map of the Gold Meadows area; geology generalized from Gibbons and others (1960) ; B, Complete Bouguer anomaly map of the Gold Meadows area.
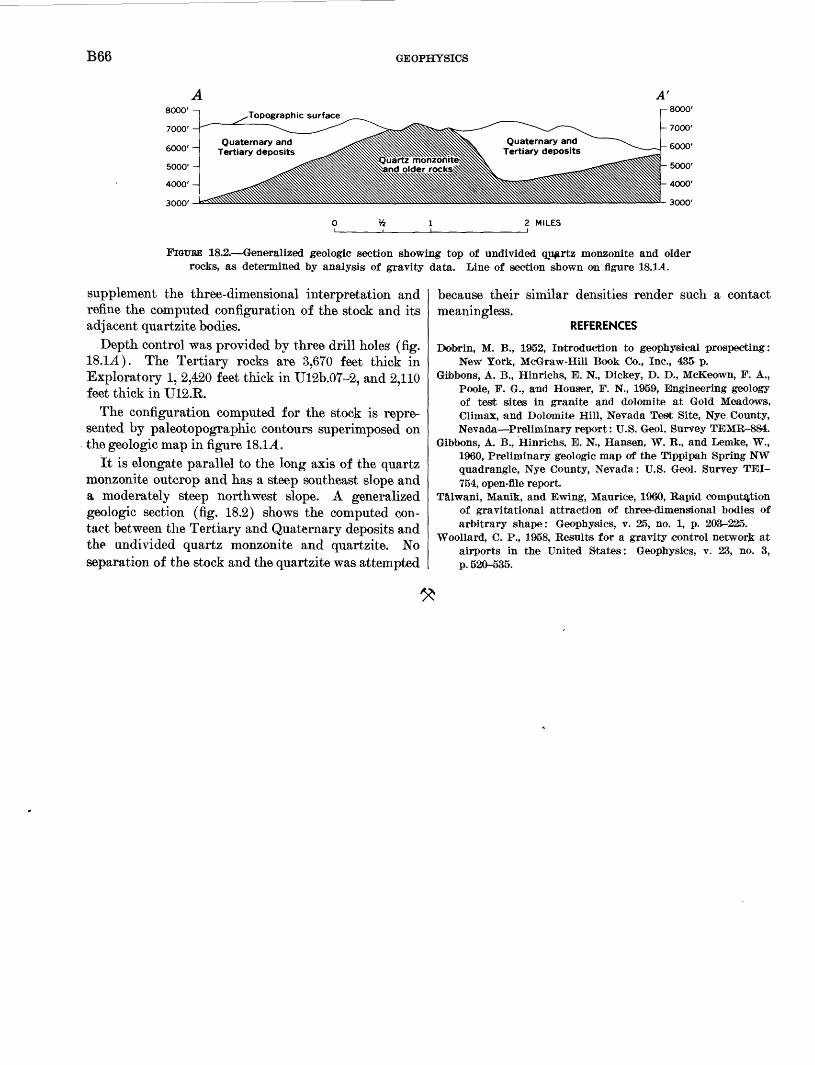
B66 GEOPHYSICS
Quaternary and Tertiary deposits
Quaternary and Tertiary deposits
2 MILES
FIGURE 18.2. Generalized geologic section showing top of undivided quartz monzonite and older rocks, as determined by analysis of gravity data. Line of section shown on figure 18.14.
supplement the three-dimensional interpretation and refine the computed configuration of the stock and its adjacent quartzite bodies.
Depth control was provided by three drill holes (fig. 18.L4). The Tertiary rocks are 3,670 feet thick in Exploratory 1, 2,420 feet thick in Ul2b.07-2, and 2,110 feet thick in U12.E.
The configuration computed for the stock is repre sented by paleotopographic contours superimposed on the geologic map in figure 18.1 A.
It is elongate parallel to the long axis of the quartz monzonite outcrop and has a steep southeast slope and a moderately steep northwest slope. A generalized geologic section (fig. 18.2) shows the computed con tact between the Tertiary and Quaternary deposits and the undivided quartz monzonite and quartzite. No separation of the stock and the quartzite was attempted
because their similar densities render such a contact meaningless.
REFERENCES
Dobrin, M. B., 1952, Introduction to geophysical prospecting: New York, McGraw-Hill Book Co., Inc., 435 p.
Gibbons, A. B., Hinrichs, E. N., Dickey, D. D., McKeown, F. A., Poole, F. G., and Houser, F. N., 1959, Engineering geology of test sites in granite and dolomite at Gold Meadows, Climax, and Dolomite Hill, Nevada Test Site, Nye County, Nevada Preliminary report: U.S. Geol. Survey TEMR-884.
Gibbons, A. B., Hinrichs, E. N., Hansen, W. R., and Lemke, W., 1960, Preliminary geologic map of the Tippipah Spring NW quadrangle, Nye County, Nevada: U.S. Geol. Survey TEI- 754, open-file report.
Talwani, Manik, and Ewing, Maurice, 1960, Rapid computation of gravitational attraction of three-dimensional bodies of arbitrary shape: Geophysics, v. 25, no. 1, p. 203-225.
Woollard, C. P., 1958, Results for a gravity control network at airports in the United States: Geophysics, v. 23, no. 3, p. 520-535.
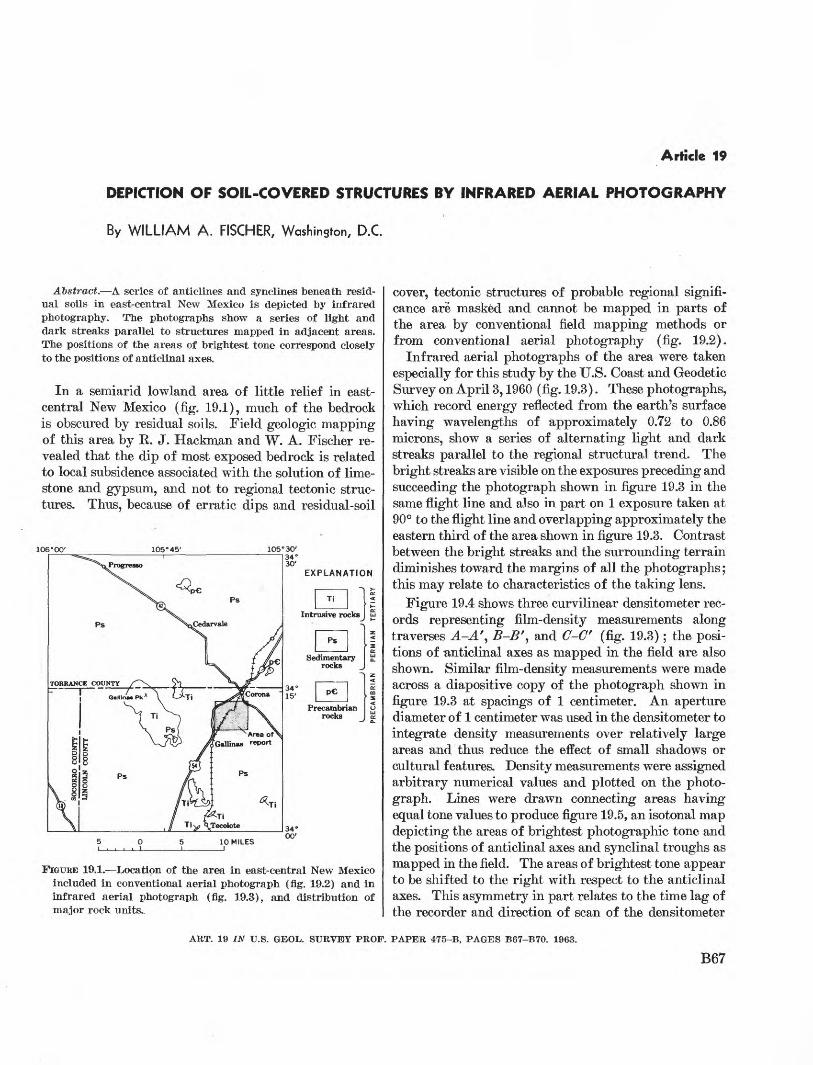
Article 19
DEPICTION OF SOIL-COVERED STRUCTURES BY INFRARED AERIAL PHOTOGRAPHY
By WILLIAM A. FISCHER, Washington, D.C.
Abstract. A series of anticlines and synclines beneath resid ual soils in east-central New Mexico is depicted by infrared photography. The photographs show a series of light and dark streaks parallel to structures mapped in adjacent areas. The positions of the areas of brightest tone correspond closely to the positions of anticlinal axes.
In a semiarid lowland area of little relief in east- central New Mexico (fig. 19.1), much of the bedrock is obscured by residual soils. Field geologic mapping of this area by K. J. Hackman and W. A. Fischer re vealed that the dip of most exposed bedrock is related to local subsidence associated with the solution of lime stone and gypsum, and not to regional tectonic struc tures. Thus, because of erratic dips and residual-soil
FIGURE 19.1. Location of the area in east-central New Mexico included in conventional aerial photograph (fig. 19.2) and in infrared aerial photograph (fig. 19.3), and distribution of major rock units..
cover, tectonic structures of probable regional signifi cance are masked and cannot be mapped in parts of the area by conventional field mapping methods or from conventional aerial photography (fig. 19.2).
Infrared aerial photographs of the area were taken especially for this study by the U.S. Coast and Geodetic Survey on April 3,1960 (fig. 19.3). These photographs, which record energy reflected from the earth's surface having wavelengths of approximately 0.72 to 0.86 microns, show a series of alternating light and dark streaks parallel to the regional structural trend. The bright streaks are visible on the exposures preceding and succeeding the photograph shown in figure 19.3 in the same flight line and also in part on 1 exposure taken at 90° to the flight line and overlapping approximately the eastern third of the area shown in figure 19.3. Contrast between the bright streaks and the surrounding terrain diminishes toward the margins of all the photographs; this may relate to characteristics of the taking lens.
Figure 19.4 shows three curvilinear densitometer rec ords representing film-density measurements along traverses A-A'9 B-B', and C-C' (fig. 19.3); the posi tions of -anticlinal axes as mapped in the field are also shown. Similar film-density measurements were made across a diapositive copy of the photograph shown in figure 19.3 at spacings of 1 centimeter. An aperture diameter of 1 centimeter was used in the densitometer to integrate density measurements over relatively large areas and thus reduce the effect of small shadows or cultural features. Density measurements were assigned arbitrary numerical values and plotted on the photo graph. Lines were drawn connecting areas having equal tone values to produce figure 19.5, an isotonal map depicting the areas of brightest photographic tone and the positions of anticlinal axes and synclinal troughs as mapped in the field. The areas of brightest tone appear to be shifted to the right with respect to the anticlinal axes. This asymmetry in part relates to the time lag of the recorder and direction of scan of the densitometer
ART. 19 IN U.S. GEOL. SURVEY PROF. PAPER 475-B, PAGES B67-B70. 1963.
B67

B68 GEOPHYSICS
FIGURE 19.2. Conventional aerial photograph of the area. Re sidual soils obscure the bedrock in the lower left part of the area. Approximate scale 1:51,000. (Photograph by U.S. Department of Agriculture.)
FIGUEE 19.3. Infrared aerial photograph of approximately the same area shown in figure 19.2. A-A', B-B', and C-C' indi cate location of densitometer traverses shown in figure 19.4. Approximate scale 1:77,000. (Photograph by U.S. Coast and Geodetic Survey.)
EXPLANATION
Axis of known anticline
FIGURE 19.4. Curvilinear densitometer records showing relative light transmission through a positive-film copy of photograph shown in figure 19.3. Location of densitometer traverses shown in figure 19.3. Positions of anticlinal axes plotted from field structural measurements.
Areas of brightest photographic tone
EXPLANATION
Axis of anticline
A'
B'
C'
Axis of syncline
FIGURE 19.5. Map showing areas of brightest tone on figure 19.3, and positions of anticlinal and synclinal axes as mapped in the field.

FISCHER B69
(from left to right). The areas of brightest photo graphic tone, however, are elongate in a direction paral lel to the regional structural trend and appear to corre spond to anticlinal axes.
Interpretation of conventional aerial photographs suggests that in this area soils are thinner over the axes of anticlines than over the troughs of synclines. Lim ited field observation of soil thickness by Fischer and Hackman supports this interpretation and suggests that soils near the crests of anticlines are commonly less than 3 inches thick. The distribution of areas believed over lain by thin soils corresponds closely with the brighter images on the infrared photography.
Measurements of the infrared reflectance of soils and grass from the test area are not available. How ever, samples of the limestone which underlies much of the area and relatively dry grasses collected from other localities were illuminated with a strong tungsten source and observed with a 'Snooperscope (Model M-2). A Snooperscope is an image-converting device that pre sents a visible image of infrared radiation of approxi mately the same wavelengths as those recorded on the infrared aerial photographs. Figure 19.6 is a photo graph taken through the Snooperscope of two clumps of grass set in white paper sample boxes and a sample of the limestone oriented so that a weathered surface faces the camera. This photograph shows that the limestone reflects more infrared radiation of these wavelengths than the grass. This observation leads the author to believe that the relatively bright images ap pearing on the infrared aerial photographs relate to a relative sparsity of grass cover (greater percentage of soil and rock fragments exposed to vertical view) as contrasted to a relatively denser cover of grass in areas having thicker soils. Measurements by Krinov (1947, reflectance curves 62, 97, and 100) of similar terrain in Russia also show that some dry soils and rocks have a higher infrared reflectivity than some grasses.
Figure 19.7 is a photograph recording visible light reflected from the same objects shown in figure 19.6. The limestone reflects more visible light than the grass, but the contrast is not as great as that shown on the infrared photograph (fig. 19.6). This difference in contrast can best be seen by comparing the brightness of the limestone sample to that of the white sample boxes.
Variations in growth stage or moisture content of vegetation are probably not responsible for the varia tions in infrared radiation recorded on the infrared photographs. Measurements by Krinov (1947, reflect ance curve 64) and observations by Ives (1939, p. 434) show that mature vegetation in lush growth reflects more infrared light than dry vegetation. Thus, if vari-
FIGTJKE 19.6. Photograph taken through Snooperscope show ing infrared radiation from a, semidry grass, and 6, lime stone. Size of s~ample trays 6 inches by 6 inches.
FIGURE 19.7. Conventional photograph ©f objects shown in figure 1&.6.
ations in plant moisture or development were a signifi cant cause of the observed tone differences, the tone distribution on the infrared photography of this area would probably have been reversed. That is, vegetation * covering areas underlain by the thinner soils would likely have been drier and (or) growth retarded and have reflected less infrared radiation (photographed with a darker tone) than vegetation growing on areas underlain by relatively thicker soils.
Field investigations by Fischer and Hackman reveal that the composition of the surface of the lowlands area shown in figure 19.3 is relatively uniform, and consists largely of residual soils derived from, under lying limestone. Fragments of sandstone and mon- zonite are present locally in the alluvium, and beds of caliche, and fragments of sandstone are present locally on the surface. The distribution of these materials,
B70 GEOPHYSICS
however, does not correspond to the distribution of tones on the infrared photographs and it is unlikely that tone distribution relates to composition of surface materials.
It is also unlikely that differences in moisture con tent of soils at the surface are a significant cause of the tone differences, because according to records of pre cipitation (U.S. Weather Bureau, 1960) the area was quite dry at the time of photography (April 3, 1960). No measurable precipitation was recorded at any of the 5 most proximate weather stations for the 8 days pre ceding the time of photography. These same stations recorded totals of less than 0.2 inch of precipitation for the entire month of March (U.S. Weather Bureau, 1960).
Study of these infrared photographs suggests that infrared photography may have application in struc
tural studies of some semiarid areas. It will be neces sary, however, to take additional infrared photographs of the area to ascertain whether any of the special con ditions that prevailed at the time these photographs were taken (for example, dry surface, time of year, overexposure) are significant to the postulated relation between tone on infrared aerial photographs and structural features.
REFERENCES
Ives, R. L., 1939, Infrared photography as an aid in ecologicalsurveys: Ecology, v. 20, no. 3, p. 433-^39.
Krinov, E. L., 1947, Spectral reflectance of natural formations,chap. 2: Laboratoriia Aerometodov, Akad. Nauk SSSR,Moscow, 271 p. [Natl. Research Council of Canada Tech.Translation TT 439, translated by E. Belkov, 1953].
U.S. Weather Bureau, 1960, Climatological data New Mexico:v. 66, no. 4, April 1960, p. 56-67, 70.
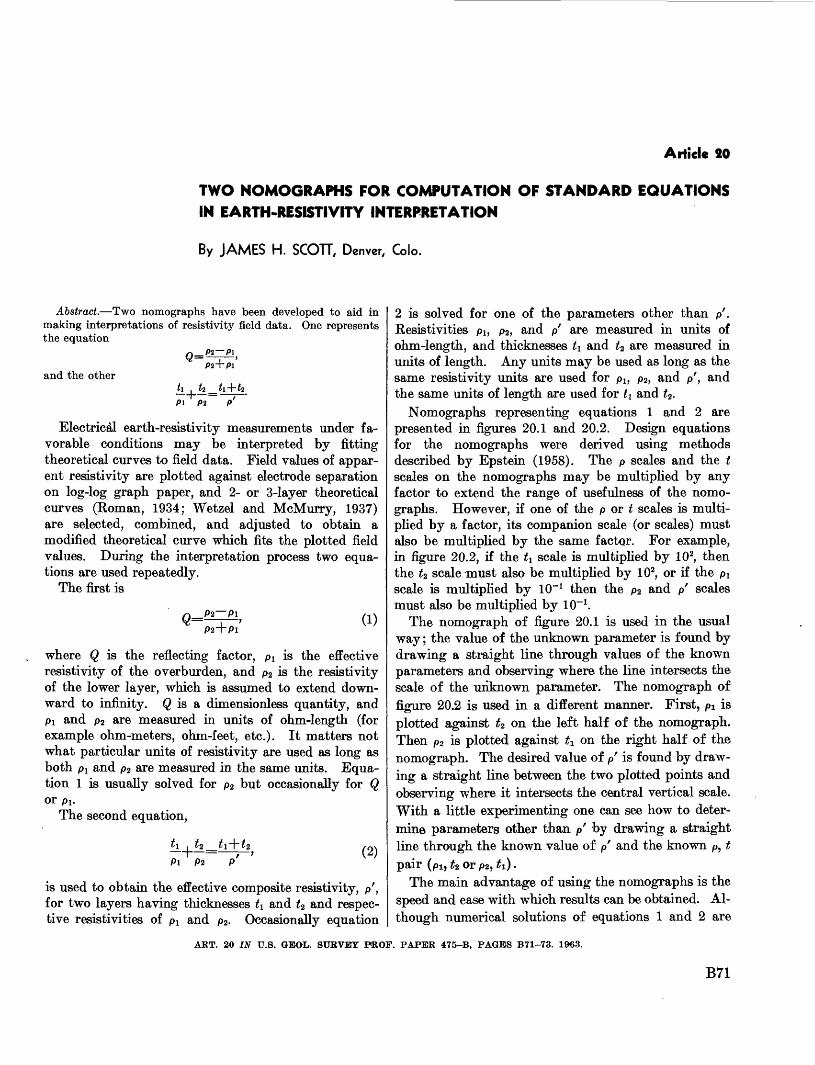
Article 20
TWO NOMOGRAPHS FOR COMPUTATION OF STANDARD EQUATIONS IN EARTH-RESISTIVITY INTERPRETATION
By JAMES H. SCOTT, Denver, Colo.
Abstract. Two nomographs have been developed to aid in making interpretations of resistivity field data. One represents the equation
P2 P1Q=and the other
P2 + P1
\ . % __Pi P2
Electrical earth-resistivity measurements under fa vorable conditions may be interpreted by fitting theoretical curves to field data. Field values of appar ent resistivity are plotted against electrode separation on log-log graph paper, and 2- or 3-layer theoretical curves (Roman, 1934; Wetzel and McMurry, 1937) are selected, combined, and adjusted to obtain a modified theoretical curve which fits the plotted field values. During the interpretation process two equa tions are used repeatedly.
The first is
P2~P1 i 'P2 + P1
(1)
where Q is the reflecting factor, pi is the effective resistivity of the overburden, and p2 is the resistivity of the lower layer, which is assumed to extend down ward to infinity. Q is a dimensionless quantity, and Pi and p2 are measured in units of ohm-length (for example ohm-meters, ohm-feet, etc.). It matters not what particular units of resistivity are used as long as both pl and p2 are measured in the same units. Equa tion 1 is usually solved for p2 but occasionally for Q or Pl .
The second equation,
*1 . C2 ti~T~t 2 I = >
Pl P2 P(2)
is used to obtain the effective composite resistivity, p', for two layers having thicknesses t\ and tz and respec tive resistivities of pi and p2 . Occasionally equation
2 is solved for one of the parameters other than p'. Resistivities pi, p2 , and p' are measured in units of ohm-length, and thicknesses ti and t2 are measured in units of length. Any units may be used as long as the same resistivity units are used for pb p2, and p', and the same units of length are used for t\ and t2 .
Nomographs representing equations 1 and 2 are presented in figures 20.1 and 20.2. Design equations for the nomographs were derived using methods described by Epstein (1958). The p scales and the t scales on the nomographs may be multiplied by any factor to extend the range of usefulness of the nomo graphs. However, if one of the p or t scales is multi plied by a factor, its companion scale (or scales) must also be multiplied by the same factor. For example, in figure 20.2, if the ti scale is multiplied by 102, then the tz scale must also be multiplied by 102, or if the pi scale is multiplied by 10" 1 then the p2 and p' scales must also be multiplied by 10"1 .
The nomograph of figure 20.1 is used in the usual way; the value of the unknown parameter is found by drawing a straight line through values of the known parameters and observing where the line intersects the scale of the unknown parameter. The nomograph of figure 20.2 is used in a different manner. First, pi is plotted against tz on the left half of the nomograph. Then p2 is plotted against £1 on the right half of the nomograph. The desired value of p' is found by draw ing a straight line between the two plotted points and observing where it intersects the central vertical scale. With a little experimenting one can see how to deter mine parameters other than p' by drawing a straight line through the known value of p' and the known p, t pair (pi, tz or p2, £1).
The main advantage of using the nomographs is the speed and ease with which results can be obtained. Al though numerical solutions of equations 1 and 2 are
ART. 20 IN U.S. GEOL. SURVEY PROF. PAPER 475-B, PAGES B71-73. 1963.
B71
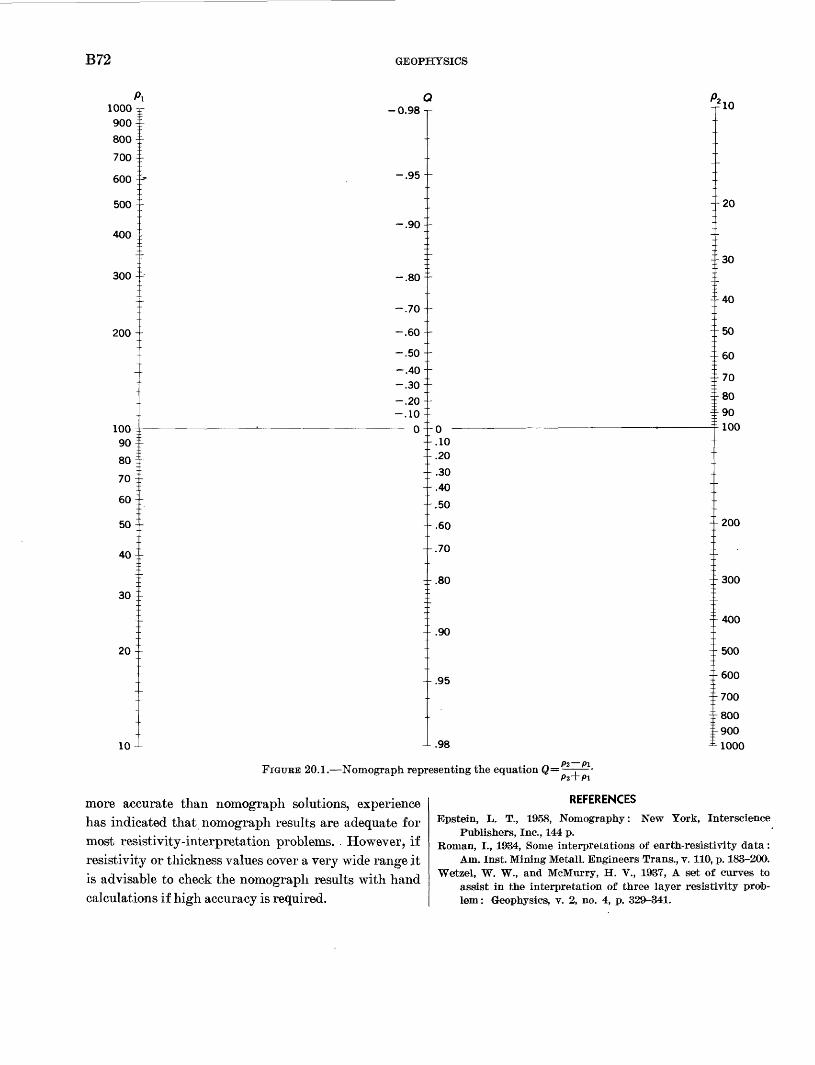
B72 GEOPHYSICS
/c1000900-
800-
700-
600 -
500 -
400:
300 :
200 :
100. 90^
80 i
70 {
60:
50:
40^
30 -_
20-
10-
'i C r - 0.98 n
L- -.95
; -.90 :
: -.80 :
: -.70
- -.60-
" -.50-
'- -.40--.30 :
-.20--.10 :
o .\j
3 /
LQ :
-.10-.20
-.30
-.40 ;-.50 :-.60 ;
-.70 :
7. BO :
-.90 :
-.95 :
.98 ^
P2 piFIGURE 20.1. Nomograph representing the equation Q= .
P2~rpi
ho
: 20
:30
^40
:50
:60
^70
-80
r9QL 100
-200
-300
-400
-500
-600
-700
800-900
1000
more accurate than nomograph solutions, experience has indicated that nomograph results are adequate for most resistivity-interpretation problems. However, if resistivity or thickness values cover a very wide range it is advisable to check the nomograph results with hand calculations if high accuracy is required.
REFERENCES
Epstein, L. T., 1958, Nomography: New York, Interscienee Publishers, Inc., 144 p.
Roman, I., 1934, Some interpretations of earth-resistivity data: Am. Inst. Mining Metall. Engineers Trans., v. 110, p. 183-200.
Wetzel, W. W., and McMurry, H. V., 1937, A set of curves to assist in the interpretation of three layer resistivity prob lem : Geophysics, v. 2, no. 4, p. 329*-341.
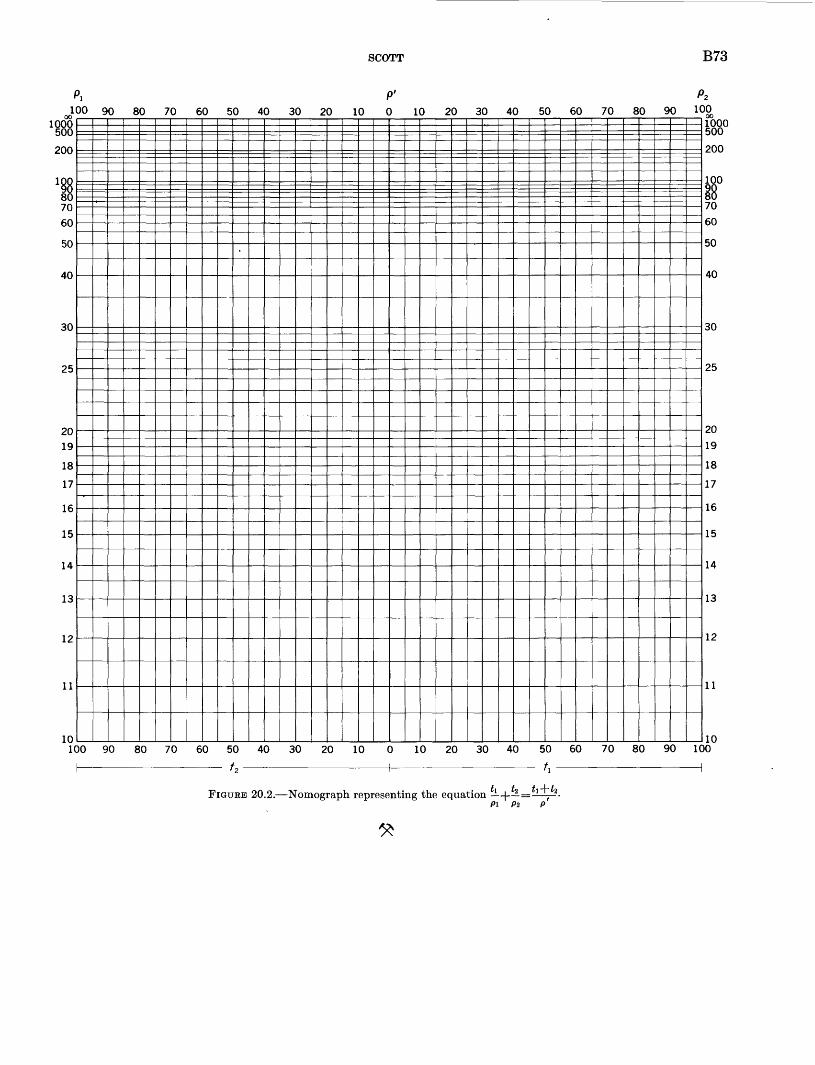
SCOTT B73
I 1
001000 500
200
, m70 60
50
40
30
25
20 19
18
17
16
15
14
13
12
11
10
\ P' L 00 90 80 70 60 50 40 30 20 10 0 10 20 30 40 50 60 70 80 90 1<
"*
2
DO001000 500
200
70 60
50
40
30
25
20 19
18
17
16
15
14
13
12
11
10100 90 80 70 60 50 40 30 20 10 0 10 20 30 40 50 60 70 80 90 100
FIGURE 20.2. Nomograph representing the equation + = , * Pl P2 P

Article 21
NEW CAMBRIAN, ORDOVICIAN, AND SILURIAN FORMATIONSIN THE INDEPENDENCE QUADRANGLE, INYO COUNTY, CALIFORNIA
By DONALD C. ROSS, Menlo Park, Calif.
Work done in cooperation with the California Division of Mines and Geology
Abstract. The Bonanza King Formation is conformably over lain by limestone and siltstone of the Lead Gulch Formation (Upper Cambrian), and by gray dolomite of the Tamarack Canyon Dolomite (Upper Cambrian). The overlying Mazourka Group consists of two formations: siltstone and limestone of the Al Rose Formation (Lower Ordovician), and fossiliferous sdlty blue-gray limestone, siltstone, and chert of the Badger Flat Limestone (Middle Ordovician). A conformable sequence con tinues through the Middle and Upper Ordovician, and is capped by argillaceous, bioclastic limestone rich in coral debris of the Vaughn Gulch Limestone (Silurian), which grades laterally northward to graptolite-bearing calcareous shale, siltstone, and argillaceous limestone of the Sunday Canyon Formation (Silurian).
Six new formations are named in a conformable se quence of Cambrian, Ordovician, and Silurian strata in the Independence quadrangle (fig. 21.1), to call atten tion to lithologic contrasts of these units with their stratigraphic equivalents in nearby areas, particularly to the south and east.
CAMBRIAN FORMATIONS
Conformably overlying the Bonanza King Forma tion of Middle and Late Cambrian age is the Lead Gulch Formation, which comprises about 300 feet of thin-bedded limestone, siltstone, dolomite, chert, and shale. It is in turn conformably overlain by about 900 feet of thin- to thick-bedded gray dolomite with some chert that is named the Tamarack Canyon Dolomite. Details of distribution of the Lead Gulch Formation and the Tamarack Canyon Dolomite can be obtained from a preliminary geologic map of the Independence quadrangle, a black and white map at a scale of 1:48,000 (Boss, 1962). On this map the term Nopah Formation (Upper Cambrian), which included both formations, was used. The two formations were differentiated in the field, however, and both will be shown in color on
a subsequent geologic map. Late Cambrian trilobites in the Lead Gulch Formation and the gross lithology of the two formations suggest affinities with the Nopah Formation and the Dunderberg Shale. Local names are proposed for use in the Inyo Mountains, however, to point up lithologic variations from the type Nopah and Dunderberg, and to express some degree of doubt as to exact correlation with These units at this time.
Lead Gulch Formation
The Lead Gulch Formation is here named for ex posures in Lead Gulch, a short tributary of Mazourka Canyon (fig. 21.1). The formation extends as a thin, relatively continuous, though faulted and folded, 'belt from about the latitude of Independence north to the edge of the quadrangle. The belt of outcrop continues north into the adjoining Waucoba Mountain quadrangle for about 1 mile, where it is cut out by Mesozoic grani tic rocks-and overlapped by Cenozoic basalt. To the south, rocks similar to the Lead Gulch Formation were seen at several points along the front of the Inyo Moun tains east of Lone Pine (15 miles south of Independence on U.S. Highways 6 and 395).
The type section of the formation is here designated as being on a spur along the east wall of Mazourka Can yon, 7,500 feet S. 85° E. from the SE. cor. sec. 36, T. 11 S., K. 35 E. Many other good exposures of at least par tial sections are found along the belt of outcrop, but one of the most striking and easily accessible is along the ridge about 750 feet northeast of the Whiteside mine east of the Mazourka Canyon road.
The thickness of the Lead Gulch Formation at the type section is 280 feet, but structural complications at almost all outcrops of this relatively incompetent unit preclude accurate measured sections. Probably a maxi mum of 300 feet would be a fair estimate for the thick-
ART. 21 IN U.S. GEOL. SURVEY PROF. PAPER 475-B, PAGES B74-B85. 1963.
B74
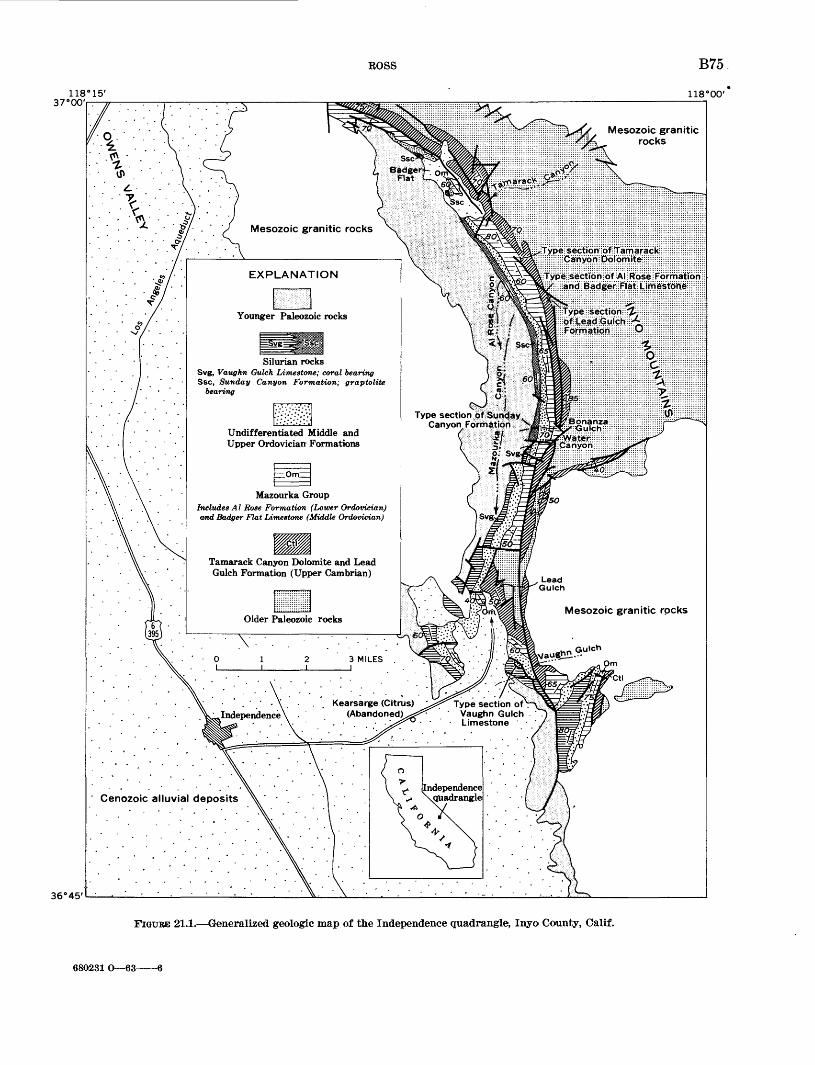
ROSS B75
118°00'
Mesozoic granitic rocks
Mesozoic granitic rocks
;Ty >e;seci ori iif Tarriarac Canyon E'pjom t&
EXPLANATION Type;;sectioniof A
Younger Paleozoic rocks
Silurian rocksSvg, Vaughn Gulch Limestone; coral bearing Ssc, Sunday Canyon Formation; graptolite
bearing
Type section of SundayCanyon Formation
Undirrerentiated Middle andUpper Ordovician- Formations
Mazourka GroupIncludes Al Rose Formation (Lower Ordovician)and Badger Flat Limestone (Middle Ordovician)
Tamarack Canyon Dolomite and LeadGulch Formation (Upper Cambrian)
Mesozoic granitic rpcksOlder Paleozoic rocks
Kearsarge (Citrus) (Abandoned)
Type section of Vaughn Gulch Limestone
Independence quadrangleCenozoic alluvial deposits
36°45
FIGUKE 21.1. Generalized geologic map of the Independence quadrangle, Inyo County, Calif.
680231 O 65
B76 STRATIGRAPHY AND STRUCTURAL GEOLOGY
ness of the formation. At a great many places it is thinned considerably or is entirely squeezed out between the bounding thick dolomites.
The contact with the underlying Bonanza King For- mation is probably conformable judging by the simi larity of attitudes near the contact, though the actual contact is almost invariably structurally disturbed. The contact with the overlying Tamarack Canyon Dolo mite is definitely conformable, and can be seen best at the type locality.
The Lead Gulch Formation comprises limestone, silt- stone, dolomite, chert, and shale interlayered in a regu lar-bedded sequence in which beds are most commonly 1/2 to 2 inches thick, but locally as thick as 5 inches. Thinly laminated siltstone that weathers out in relief in bright orange and red tints, and blue-gray to medium- gray limestone are the dominant lithologies. A dis tinctive fissile olive-brown to dark-green shale, or its metamorphic equivalent, occupies as much as 20 feet at the very base of some sections. This unit, though not noted at the type section, was probably originally pres ent but has been squeezed out. Much of the unit, and particularly the silty and marly material of the orange- weathering beds, has undergone thermal metamor- phism. Minerals, such as diopside, wollastonite, tremo- lite, scapolite, biotite, and antigorite are present in vary ing amounts.
The physical appearance of outcrops of the Lead Gulch Formation is the most striking of any unit in the Inyo Mountains. The interlayered regular-bedded se quence of bluish-gray-weathering limestone and orange- weathering siltstone, which is particularly evident where the section has been metamorphosed, is an excel lent stratigraphic and structural marker. The basal dark-green shale beds are particularly susceptible to structural squeezing and were not noted in many out crops. They serve locally to indicate the base of the formation, particularly north of Lead Gulch where overturning of the formation could be deduced despite the metamorphism of the usually distinctive bounding units to coarse buff massive indistinguishable dolomites.
Superficially, outcrops of the Lead Gulch Formation might be confused with parts of the overlying Al Rose Formation. In most outcrops where a reasonable thickness is exposed, however, it becomes apparent that the Lead Gulch Formation is characterized by regular thin interbedding of the silty and limy units in rela tively equal proportions, whereas the Al Rose Forma tion typically has irregular bedding and wide varia tions in the relative proportions of limy and silty material. Commonly silty material greatly exceeds limy material, which occurs in less resistant lenses or
"eyes." The limestone "eyes," so typical in the Al Rose, are rare in Lead Gulch outcrops.
The type section (see below) has perhaps a greater proportion of thin-bedded dolomite than most other outcrops, but interbedded units of thin-bedded dolomite and thin-bedded limestone are common, particularly near the top of the formation. The top of the forma tion is the uppermost thin-bedded limestone. The base of the formation is sharp and is the lowest fine-grained clastic rock or limestone that overlies the dolomite of the Bonanza King Formation.
Type section of the Lead Gulch Formation in the Independence 15-minute quadrangle, Inyo County, Calif.
[location of section by California grid, zone 4 : 2,273,300 ; 586,400]
Tamarack Canyon Dolomite. Conformable contact. Lead Gulch Formation (280 ft) :
Limestone, medium-dark-gray ; interbedded with orange-weathering silty layers in very thin beds ^ to 1 inch thick _______________ 52
Covered _ 15 Dolomite, medium-dark-gray; very thin bedded in ir
regular layers __ 44Covered _____ 35Dolomite, medium- to dark-gray ; thin platy layers 5Covered (scattered platy dolomite float; fragments of
Lingula) 50Limestone, medium-bluish-gray ; laminated to very thin
bedded. Interlayered with regular layers of siltstone to y2 inch thick, which weathers grayish to orange. Some black chert in nodular beds to 4 inches thick. Lingula present. Beds folded near base and contact contorted- 79
Covered contact, presumably fault cutting out originallyconformable shale.
Bonanza King Formation.
Careful search for fossils yielded only acrotretid brachiopods (black chitinous shells) and fragments possibly of trilobites, until the third field season when Fred K. Miller found a fossiliferous bed on the first spur south of the type section of the Tamarack Canyon Dolomite that yielded small agnostid trilobites, acro tretid brachiopods, and echinoderm parts. This col lection was identified and studied by A. R. Palmer, who reports (written communication, 1961) :
The dominant identifiable trilobites are agnostids represent ing the genera Homagnostus and Pseudagnostus. Homagnos- tus is a characteristic agnostid in the lower Nopah faunas * * *. It is certainly from1 beds no older than the Late Cambrian Aphe- laspis zone of Dresbach age. This is just about the westernmost dated Upper Cambrian locality in the U.S. (exclusive of Alaska) .
The finding of this fossil locality lead to the discovery of other trilobites about 21/4 miles farther south, which were identified and reported on by A. R. Palmer as fol lows (written communication, 1962) :
ROSS B77
The specimens all represent a species of what is presently be ing called Loganellus, and this sort of trilobite characterizes the beds just above the Dunderberg interval over much of Nevada.
The age of the Lead Gulch Formation is therefore considered to be Late Cambrian.
Beds lithologically similar to the Lead Gulch Forma tion and in the correct stratigraphic position to be cor relative are also found along the south edge of the Waucoba Mountain quadrangle, in the Waucoba Wash quadrangle on the west side of Saline Valley, and in the New York Butte quadrangle east of Lone Pine. These areas respectively north, east, and south of the Independence area indicate that the Lead Gulch lithology is a persistent mappable feature through much of the Inyo Mountains. A similar lithology in the Quartz Spring area, which contains fossils indicating a Late Cambrian age, constitutes the lower 250 feet of unit 1 of the Nopah Formation (McAllister, 1952, p. 9). Another occurrence of this same lithology, shown to me by H. G. Stephens, is at the base of the Nopah Formation along the west front of the Panamint Eange north of California Highway 190. The Lead Gulch Formation is considered to be approximately equivalent to the unnamed basal unit of the Nopah Formation in Hazzard's (1937, p. 320) type area.
The term Dunderberg might be applied to these beds, as it has been used informally for the beds lithologi cally similar to the Lead Gulch at Quartz Spring and in the Panamints. However, the lithology and fauna of the Catlin Member of the Windfall Formation (Upper Cambrian) at the Nevada Test Site (Barnes and Byers, 1961) also appear to be similar to the Lead Gulch Formation. It thus appears that the Lead Gulch Formation probably includes the Dunderberg interval plus some of the Windfall interval.
Tamarack Canyon Dolomite
The Tamarack Canyon Dolomite is here named for exposures near the mouth of Tamarack Canyon (fig. 21.1). The type section is here designated to be along the bottom of a subsidiary canyon of Mazourka Canyon about 5,700 feet N. 59° E. of the SE. cor. sec, 36, T. 11 S., E. 35 E. Its distribution parallels that of the Lead Gulch Formation. It is a relatively competent unit and is generally well exposed throughout the belt of outcrop.
At the type section the formation is 910 feet thick. Where variations in thickness exist they are thought to be the result chiefly of faulting and folding. Probably 900 feet, is a reasonable average thickness for this unit. Both the overlying and underlying contacts are con formable.
The formation (see section below) is dominantly laminated to thick-bedded very-light-gray to medium-
gray dolomite that weathers normally to a monotonous dull-gray surface. Commonly outcrops that look grossly thick bedded to massive prove to be thin bedded on close observation; the bedding is shown chiefly by a fluted weathered surface that accentuates minor dif ferences in the thin dolomite layers. Black chert forms nodules and nodular beds as much as a few inches thick. It is scattered to abundant in the dolomite, but though widespread, it is absent in many outcrops. Chert nodules are particularly abundant near the mouth of Lead Gulch and to the west across the Mazourka Can yon road. Hints of crossbedding in some outcrops sug gest clastic dolomite, but'most dolomite is sufficiently recrystallized to mask any original clastic texture. Near granitic contacts, particularly in the Lead Gulch area, the dolomite becomes quite coarse grained and dazzling white on fresh surfaces.
Type section of the Tamarack Canyon Dolomite in the In dependence 15^mimtte quadrangle, Inyo County, C'a-lif.
[Location of section by California grid, zone 4: Base of section, 2,271,500; 590,000; top of section, 2,270,500; 590,0001
Al Rose Formation. FeetConformable contact.Tamarack Canyon Dolomite (910ft) :
Dolomite, medium-dark-gray; weathers medium light gray; generally massive, but in part very thin bedded. Rilled weathered surface accentuates the thin bedding_______ ___ 272
Dolomite, medium- to dark-gray; weathers medium light gray to light gray. Very thin bedded to laminated with rilled weathered surfaces in part. Flaggy to slabby parting. Minor black chert near the base. 123
Dolomite, same as overlying unit, but black chert nodules and lenses as thick as 4 inches and as long as 2 ft are more abundant-_ 515
Conformable contact.Lead Gulch Formation.
The base of the formation is taken as the base of the dolomite above the highest limestone in the under lying Lead Gulch Formation. It is quite probable that the contact between these two formations is an inter- fingering one and that different horizons are taken as the contact in different areas. The top of the formation is marked by the highest dolomite overlain by the limestone, siltstone, and shale of the Al Eose Forma tion. Both the upper and lower contacts are pronounced color breaks; the gray dolomite contrasts strongly with the brown weathering bounding forma tions.
No fossils have been found in this unit, but on the basis of the fossil content of the bounding formations, it could be Late Cambrian or Early Ordovician or both. A Late Cambrian age is tentatively assigned to the Tamarack Canyon because the absence of clastic quartz and silty interlayers in this unit suggests affinity with
B78 STRATIGRAPHY AND STRUCTURAL GEOLOGY
the Nopah Formation (Upper Cambrian) rather than with the lower part of the Pogoni^ Group (Lower and Middle Ordovician), in which clastic material is wide spread. The lithologic break between the Al Rose Formation with its abundant clastic material and the essentially clastic-free Tamarack Canyon Dolomite is thus tentatively equated with the contact between the Pogonip Group and the Nopah Formation and the boundary between the Ordovician and the Cambrian.
Though both the Nopah and Tamarack Canyon Formations are predominantly dolomite, a possibly significant difference exists. The Nopah in its type area in the Nopah Range (Hazzard, 1937, p. 320), in the Quartz Spring area (McAllister, 1952, p. 9), and at many other localities including the west flank of the Last Chance Range only 25 miles northeast of the Inde pendence quadrangle, has characteristic banding in a wide range of shades of gray. This banding, similar to that which is so diagnostic of the Bonanza King Forma tion, is absent in the Tamarack Canyon Dolomite. The seemingly attractive hypothesis that Tamarack Canyon is Nopah that has lost its banding from incipient metamorphism is not valid because the underlying Bonanza King Formation, with the same opportunity for metamorphism, preserves its diagnostic banding quite well. The lack of this diagnostic and very wide spread color banding of the Nopah is the chief reason for proposing a local name for presumably correlative rocks in the Inyos.
The Tamarack Canyon Dolomite is tentatively corre lated with the Nopah Formation of the Quartz Spring area (McAllister, 1952, p. 9) minus its lowest member, which may be correlative with the Lead Gulch Forma tion. The possibility of correlation of the Tamarack Canyon with, lower Pogonip alone or combined with some part of the Nopah cannot be excluded at this time. This dolomite immediately below the Mazourka For mation of Phleger (1933) is regarded by Langenheim and others (1956, p. 2088, fig. 3) as Pogonip. Dull-gray dolomites in the correct stratigraphic position to be cor relative with the Tamarack Canyon were seen in the Inyo Mountains east of Lone Pine, and possibly unit "a" of the Pogonip Group of the Darwin area (Hall and MacKevitt, 1962, p. 8) is also a correlative of the upper part of the Tamarack Canyon Dolomite.
ORDOVICIAN FORMATIONS
New data for the rocks immediately overlying the Upper Cambrian beds suggest the need to modify the nomenclature of that part of the Ordovician section named the Mazourka Formation by Phleger (1933, p. 2-3). He briefly described "a succession of argillaceous shales and limestones of lower Middle Ordovician age,
675 feet in thickness," in which he recognized 2 mem bers, a lower calcareous shale 125 feet thick and an upper argillaceous limestone 550 feet thick. Somewhat earlier Kirk (in Knopf, 1918, p. 35), in the first descrip tion of Ordovician rocks from this area, referred to about 500 feet of argillaceous limestone containing Chazyan fossils, which is almost certainly the same in terval as the upper member of Phleger's Mazourka Formation. Langenheim and others (1956, p. 2085, 2091) augmented previous fossil collections and meas ured stratigraphic sections that included Phleger's Ma zourka Formation.
Detailed study of the Independence quadrangle has confirmed Phleger's Mazourka Formation as a map- pable unit. I propose that the Mazourka Formation be raised to group status and that the two members Phleger described be given formational rank. The newly proposed Mazourka Group thus contains the Al Rose Formation (Lower Ordovician), comprising 400(?) feet of brown-weathering, in part graptolite- bearing siltstone and limestone, which is overlain by the Badger Flat Limestone (Middle Ordovician), com prising 600 feet of fossiliferous silty blue-gray lime stone, siltstone, and chert. The continuity and distinc tive nature of these 2 formations along a strike length of about 15 miles plus the recognition of similar lithol- ogies north and southeast of the Independence quad rangle make them comparable to the other mapped for mations in the area. In addition, group status for the Mazourka would give it a somewhat parallel position with the Pogonip Group, with which it is correlative, certainly in part, and possibly in its entirety.
The name Pogonip Group is not used in the Inde pendence area because of differing opinions as to how much of the Inyo Mountains section is equivalent to the Pogonip. Langenheim and others (1956, p. 2087, 2091) considered the Mazourka Formation of Phleger the uppermost formation of the Pogonip Group. The un derlying dolomite, which I consider to be Upper Cam brian and correlative with part of the Nopah Forma tion, is part of the Pogonip Group by their usage. Farther south in the Inyo Mountains, in the New York Butte quadrangle, C. W. Merriam (written communica tion, 1959) also includes units in the Pogonip Group that are probably correlative with rocks referred to the Upper Cambrian in the Independence quadrangle. These differences of opinion as to what constitutes Pogonip in the Inyos make it advisable to retain the local term Mazourka in the Independence area for the present.
The type sections of the Al Rose Formation and the Badger Flat Limestone, which together make up the Mazourka Group (see stratigraphic section), are
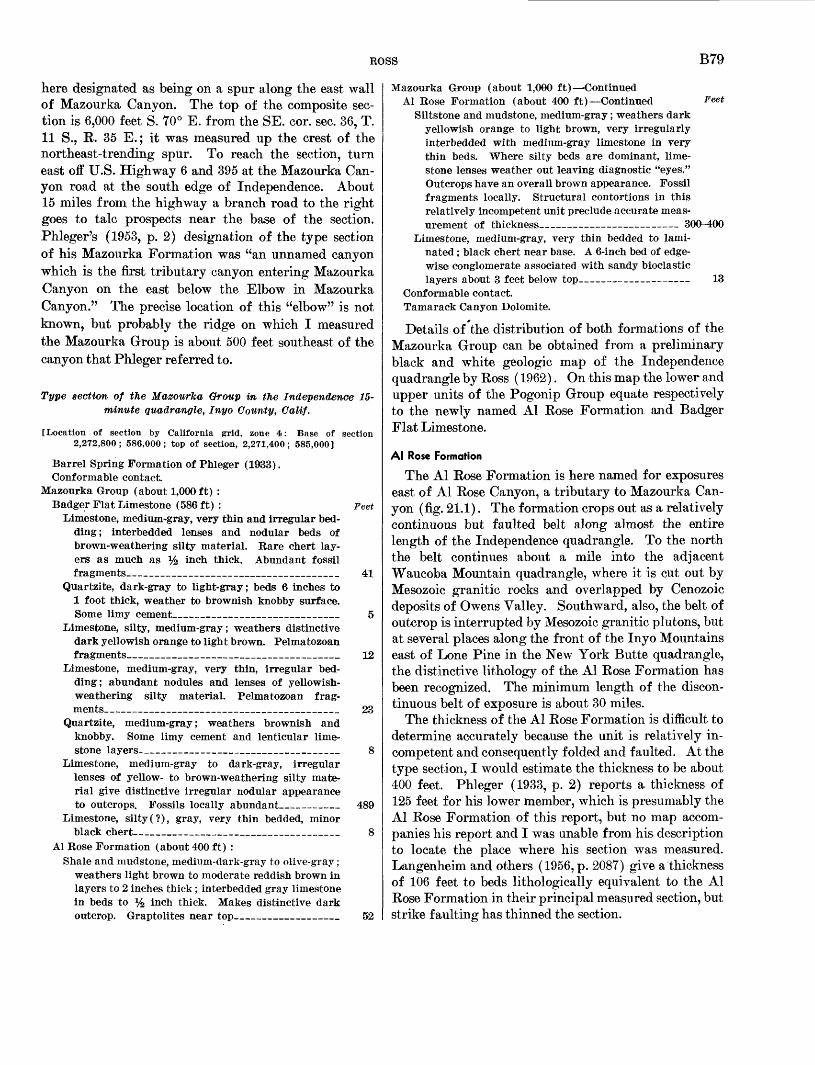
ROSS B79
here designated as being on a spur along the east wall of Mazourka Canyon. The top of the composite sec tion is 6,000 feet S. 70° E. from the SE. cor. sec. 36, T. 11 S., R. 35 E.; it was measured up the crest of the northeast-trending spur. To reach the section, turn east off U.S. Highway 6 and 395 at the Mazourka Can yon road at the south edge of Independence. About 15 miles from, the highway a branch road to the right goes to talc prospects near the base of the section. Phleger's (1953, p. 2) designation of the type section of his Mazourka Formation was "an unnamed canyon which is the first tributary canyon entering Mazourka Canyon on the east below the Elbow in Mazourka Canyon." The precise location of this "elbow" is not known, but probably the ridge on which I measured the Mazourka Group is about 500 feet southeast of the canyon that Phleger referred to.
Type section, of the Mazourka Group in the Independence 15- minute quadrangle, Inyo County, Calif.
[Location of section by California grid, zone 4>: Base of section 2,272,800; 586,000; top of section, 2,271,400; 585,000]
Barrel Spring Formation of Phleger (1933). Conformable contact.
Mazourka Group (about 1,000ft) :Badger Flat Limestone (586ft) : Feet
Limestone, medium-gray, very thin and irregular bed ding; interbedded lenses and nodular beds of brown-weathering silty material. Rare chert lay ers as much as % inch thick. Abundant fossil fragments__________________________ 41
Quartzite, dark-gray to light-gray; beds 6 inches to 1 foot thick, weather to brownish knobby surface. Some limy cement____________________ 5
Limestone, silty, medium-gray; weathers distinctive dark yellowish orange to light brown. Pelmatozoan fragments__________________________ 12
Limestone, medium-gray, very thin, irregular bed ding; abundant nodules and lenses of yellowish- weathering silty material. Pelmatozoan frag ments____________________________ 23
Quartzite, medium-gray; weathers brownish and knobby. Some limy cement and lenticular lime stone layers-_______________________ 8
Limestone, medium-gray to dark-gray, irregular lenses of yellow- to brown-weathering silty mate rial give distinctive irregular nodular appearance to outcrops. Fossils locally abundant_______ 489
Limestone, silty(?), gray, very thin bedded, minorblack chert_________________________ 8
Al Rose Formation (about 400 ft) :Shale and mudgtone, medium-d'ark-gray to olive-gray;
weathers light brown to moderate reddish brown in layers to 2 inches thick ; interbedded gray limestone in beds to % inch thick. Makes distinctive dark outcrop. Graptolites near top____________ 52
Mazourka Group (about 1,000 ft) ContinuedAl Rose Formation (about 400 ft) Continued feet
Siltstone and mudstone, medium-gray ; weathers dark yellowish orange to light brown, very irregularly interbedded with medium-gray limestone in very thin beds. Where silty beds are dominant, lime stone lenses weather out leaving diagnostic "eyes." Outcrops have an overall brown appearance. Fossil fragments locally. Structural contortions in this relatively incompetent unit preclude accurate meas urement of thickness________ ___ 300-400
Limestone, medium-gray, very thin bedded to lami nated ; black chert near base. A 6-inch bed of edge wise conglomerate associated with sandy bioclastic layers about 3 feet below top 13
Conformable contact.Tamarack Canyon Dolomite.
Details of the distribution of both formations of the Mazourka Group can be obtained from a preliminary black and white geologic map of the Independence quadrangle by Ross (1962). On this map the lower and upper units of the Pogonip Group equate respectively to the newly named Al Rose Formation and Badger Flat Limestone.
Al Rose Formation
The Al Rose Formation is here named for exposures east of Al Rose Canyon, a tributary to Mazourka Can yon (fig. 21.1). The formation crops out as a relatively continuous but faulted belt along almost the entire length of the Independence quadrangle. To the north the belt continues about a mile into the adjacent Waucoba Mountain quadrangle, where it is cut out by Mesozoic granitic rocks and overlapped by Cenozoic deposits of Owens Valley. Southward, also, the belt of outcrop is interrupted by Mesozoic granitic plutons, but at several places along the front of the Inyo Mountains east of Lone Pine in the New York Butte quadrangle, the distinctive lithology of the Al Rose Formation has been recognized. The minimum length of the discon tinuous belt of exposure is about 30 miles.
The thickness of the Al Rose Formation is difficult to determine accurately because the unit is relatively in competent and consequently folded and faulted. At the type section, I would estimate the thickness to be about 400 feet. Phleger (1933, p. 2) reports a thickness of 125 feet for his lower member, which is presumably the Al Rose Formation of this report, but no map accom panies his report and I was unable from his description to locate the place where his section was measured. Langenheim and others (1956, p. 2087) give a thickness of 106 feet to beds lithologically equivalent to the Al Rose Formation in their principal measured section, but strike faulting has thinned the section.
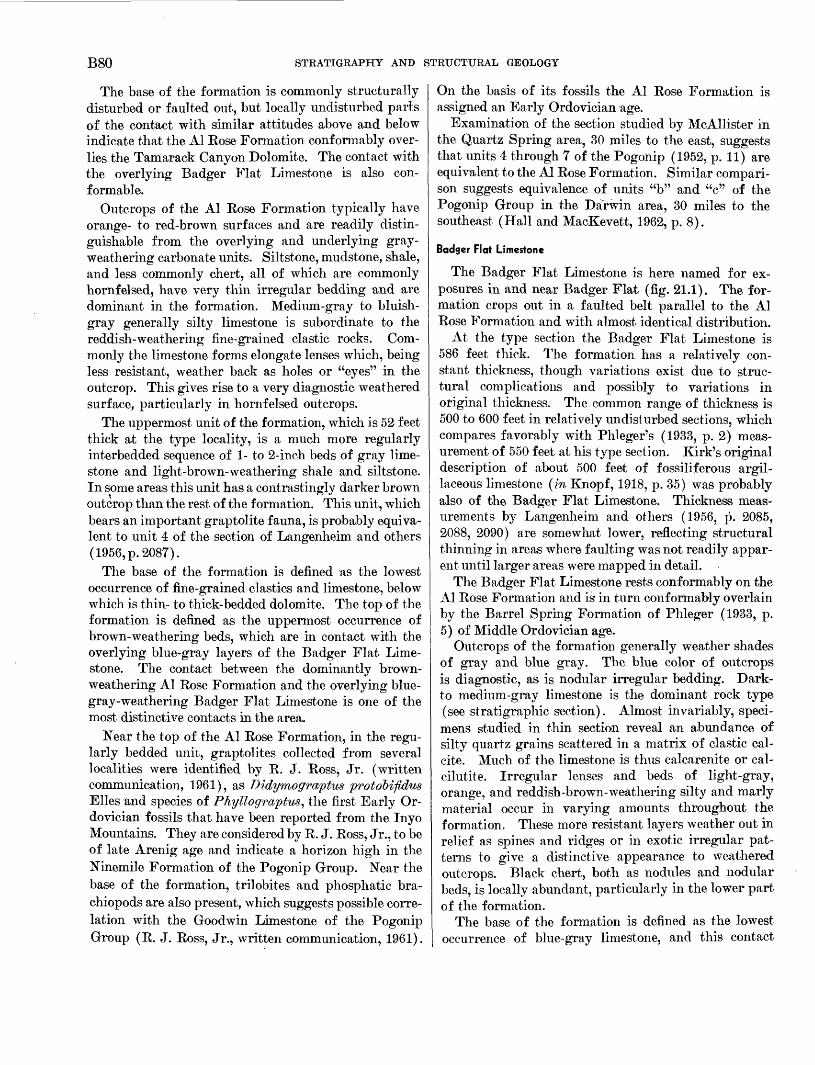
B80 STRATIGRAPHY AND STRUCTURAL GEOLOGY
The base of the formation is commonly structurally disturbed or faulted out, but locally undisturbed parts of the contact with similar attitudes above and below indicate that the Al Rose Formation conformably over lies the Tamarack Canyon Dolomite. The contact with the overlying Badger Flat Limestone is also con formable.
Outcrops of the Al Rose Formation typically have orange- to red-brown surfaces and are readily distin guishable from the overlying and underlying gray- weathering carbonate units. Siltstone, mudstone, shale, and less commonly chert, all of which are commonly hornfelsed, have very thin irregular bedding and are dominant in the formation. Medium-gray to bluish- gray generally silty limestone is subordinate to the reddish-weathering fine-grained clastic rocks. Com monly the limestone forms elongate lenses which, being less resistant, weather back as holes or "eyes" in the outcrop. This gives rise to a very diagnostic weathered surface, particularly in hornfelsed outcrops.
The uppermost unit of the formation, which is 52 feet thick at the type locality, is a much more regularly interbedded sequence of 1- to 2-inch beds of gray lime stone and light-brown-weathering shale and siltstone. In some areas this unit has a contrastingly darker brown outcrop than the rest of the formation. This unit, which bears an important graptolite fauna, is probably equiva lent to unit 4 of the section of Langenheim and others (1956, p.2087).
The base of the formation is defined as the lowest occurrence of fine-grained elastics and limestone, below which is thin- to thick-bedded dolomite. The top of the formation is defined as the uppermost occurrence of brown-weathering beds, which are in contact with the overlying blue-gray layers of the Badger Flat Lime stone. The contact between the dominantly brown- weathering Al Rose Formation and the overlying blue- gray-weathering Badger Flat Limestone is one of the most distinctive contacts in the area.
Near the top of the Al Rose Formation, in the regu larly bedded unit, graptolites collected from several localities were identified by R. J. Ross, Jr. (written communication, 1961), as Didymograptus protobifidus Elles and species of Phyllograptus, the first Early Or- dovician fossils that have been reported from the Inyo Mountains. They are considered by R. J. Ross, Jr., to be of late Arenig age and indicate a horizon high in the Ninemile Formation of the Pogonip Group. Near the base of the formation, trilobites and phosphatic bra- chiopods are also present, which suggests possible corre lation with the Goodwin Limestone of the Pogonip Group (R. J. Ross, Jr., written communication, 1961).
On the basis of its fossils the Al Rose Formation is assigned an Early Ordovician age.
Examination of the section studied by McAllister in the Quartz Spring area, 30 miles to the east, suggests that units 4 through 7 of the Pogonip (1952, p. 11) are equivalent to the Al Rose Formation. Similar compari son suggests equivalence of units "b" and "c" of the Pogonip Group in the Darwin area, 30 miles to the southeast (Hall and MacKevett, 1962, p. 8).
Badger Flat Limestone
The Badger Flat Limestone is here named for ex posures in and near Badger Flat (fig. 21.1). The for mation crops out in a faulted belt parallel to the Al Rose Formation and with almost identical distribution.
At the type section the Badger Flat Limestone is 586 feet thick. The formation has a relatively con stant thickness, though variations exist due to struc tural complications and possibly to variations in original thickness. The common range of thickness is 500 to 600 feet in relatively undisturbed sections, which compares favorably with Phleger's (1933, p. 2) meas urement of 550 feet at his type section. Kirk's original description of about 500 feet of fossiliferous argil laceous limestone (in Knopf, 1918, p. 35) was probably also of the Badger Flat Limestone. Thickness meas urements by Langenheim and others (1956, p. 2085, 2088, 2090) are somewhat lower, reflecting structural thinning in areas where faulting was not readily appar ent until larger areas were mapped in detail.
The Badger Flat Limestone rests conformably on the Al Rose Formation and is in turn conformably overlain by the Barrel Spring Formation of Phleger (1933, p. 5) of Middle Ordovician age.
Outcrops of the formation generally weather shades of gray and blue gray. The blue color of outcrops is diagnostic, as is nodular irregular bedding. Dark- to medium-gray limestone is the dominant rock type (see stratigraphic section). Almost invariably, speci mens studied in thin section reveal an abundance of silty quartz grains scattered in a matrix of clastic cal- cite. Much of the limestone is thus calcarenite or cal- cilutite. Irregular lenses and beds of light-gray, orange, and reddish-brown-weathering silty and marly material occur in varying amounts throughout the formation. These more resistant layers weather out in relief as spines and ridges or in exotic irregular pat terns to give a distinctive appearance to weathered outcrops. Black chert, both as nodules and nodular beds, is locally abundant, particularly in the lower part of the formation.
The base of the formation is defined as the lowest occurrence of blue-gray limestone, and this contact
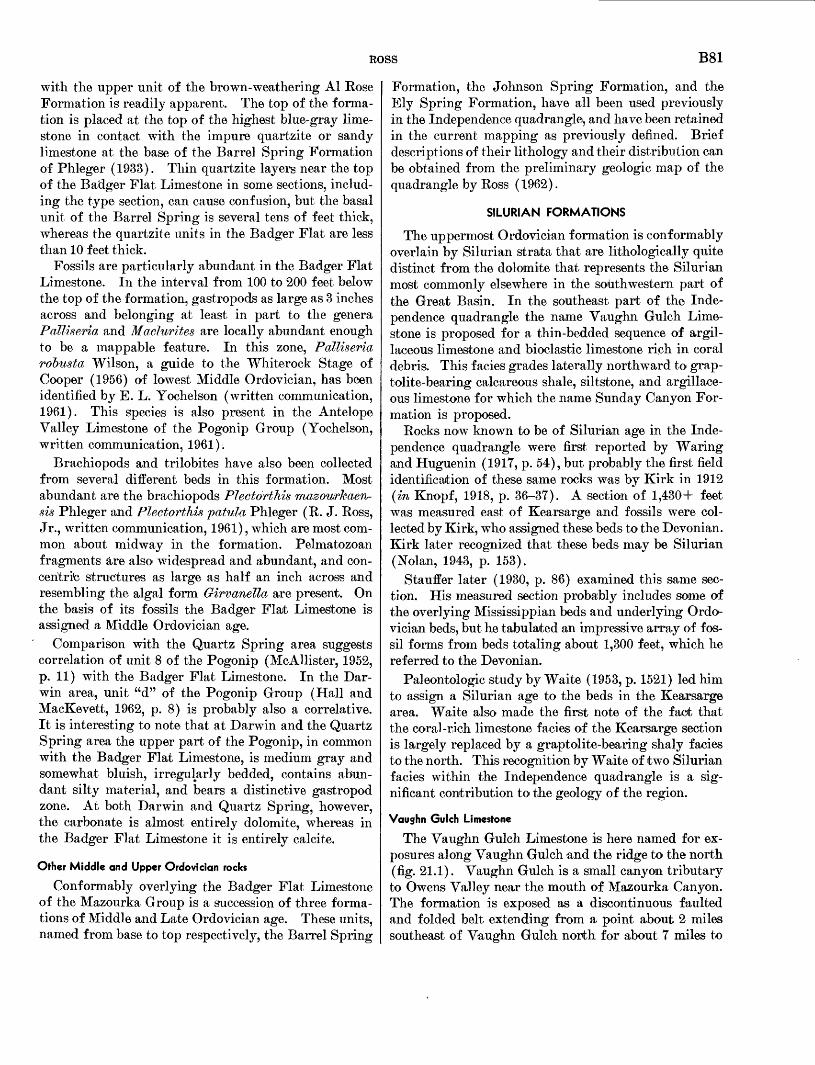
ROSS B81
with the upper unit of the brown-weathering Al Rose Formation is readily apparent. The top of the forma tion is placed at the top of the highest blue-gray lime stone in contact with the impure quartzite or sandy limestone at the base of the Barrel Spring Formation of Phleger (1933). Thin quartzite layers near the top of the Badger Flat Limestone in some sections, includ ing the type section, can cause confusion, but the basal unit of the Barrel Spring is several tens of feet thick, whereas the quartzite units in the Badger Flat are less than 10 feet thick.
Fossils are particularly abundant in the Badger Flat Limestone. In the interval from 100 to 200 feet below the top of the formation, gastropods as large as 3 inches across and belonging at least in part to the genera Palliseria and Maclurites are locally abundant enough to be a mappable feature. In this zone, Palliseria robusta Wilson, a guide to the Whiterock Stage of Cooper (1956) of lowest Middle Ordovician, has been identified by E. L. Yochelson (written communication, 1961). This species is also present in the Antelope Valley Limestone of the Pogonip Group (Yochelson, written communication, 1961).
Brachiopods and trilobites have also been collected from several different beds in this formation. Most abundant are the brachiopods Plectorthis mazourkaen- sis Phleger and Plectarthis patula, Phleger (R. J. Ross, Jr., written communication, 1961), which are most com mon about midway in the formation. Pelmatozoan fragments are also widespread and abundant, and con- ceritric structures as large as half an inch across and resembling the algal form G-irvanella are present. On the basis of its fossils the Badger Flat Limestone is assigned a Middle Ordovician age.
Comparison with the Quartz Spring area suggests correlation of unit 8 of the Pogonip (McAllister, 1952, p. 11) with the Badger Flat Limestone. In the Dar win area, unit "d" of the Pogonip Group (Hall and MacKevett, 1962, p. 8) is probably also a correlative. It is interesting to note that at Darwin and the Quartz Spring area the upper part of the Pogonip, in common with the Badger Flat Limestone, is medium gray and somewhat bluish, irregularly bedded, contains abun dant silty material, and bears a distinctive gastropod zone. At both Darwin and Quartz Spring, however, the carbonate is almost entirely dolomite, whereas in the Badger Flat Limestone it is entirely calcite.
Other Middle and Upper Ordovician rocks
Conformably overlying the Badger Flat Limestone of the Mazourka Group is a succession of three forma tions of Middle and Late Ordovician age. These units, named from base to top respectively, the Barrel Spring
Formation, the Johnson Spring Formation, and the Ely Spring Formation, have all been used previously in the Independence quadrangle, and have been retained in the current mapping as previously defined. Brief descriptions of their lithology and their distribution can be obtained from the preliminary geologic map of the quadrangle by Ross (1962).
SILURIAN FORMATIONS
The uppermost Ordovician formation is conformably overlain by Silurian strata that are lithologically quite distinct from the dolomite that represents the Silurian most commonly elsewhere in the southwestern part of the Great Basin. In the southeast part of the Inde pendence quadrangle the name Vaughn Gulch Lime stone is proposed for a thin-bedded sequence of argil laceous limestone and bioclastic limestone rich in coral debris. This f acies grades laterally northward to grap- tolite-bearing calcareous shale, siltstone, and argillace ous limestone for which the name Sunday Canyon For mation is proposed.
Rocks now known to be of Silurian age in the Inde pendence quadrangle were first reported by Waring and Huguenin (1917, p. 54), but probably the first field identification of these same rocks was by Kirk in 1912 (in Knopf, 1918, p. 36-37). A section of 1,430+ feet was measured east of Kearsarge and fossils were col lected by Kirk, who assigned these beds to the Devonian. Kirk later recognized that these beds may be Silurian (Nolan, 1943, p. 153).
Stauffer later (1930, p. 86) examined this same sec tion. His measured section probably includes some of the overlying Mississippian beds and underlying Ordo vician beds, but he tabulated an impressive array of fos sil forms from beds totaling about 1,300 feet, which he referred to the Devonian.
Paleontologic study by Waite (1953, p. 1521) led him to assign a Silurian age to the beds in the Kearsarge area. Waite also made the first note of the fact that the coral-rich limestone facies of the Kearsarge section is largely replaced by a graptolite-bearing shaly facies to the north. This recognition by Waite of two Silurian facies within the Independence quadrangle is a sig nificant contribution to the geology of the region.
Vaughn Gulch Limestone
The Vaughn Gulch Limestone is here named for ex posures along Vaughn Gulch and the ridge to the north (fig. 21.1). Vaughn Gulch is a small canyon tributary to Owens Valley near the mouth of Mazourka Canyon. The formation is exposed as a discontinuous faulted and folded belt extending from a point about 2 miles southeast of Vaughn Gulch north for about 7 miles to
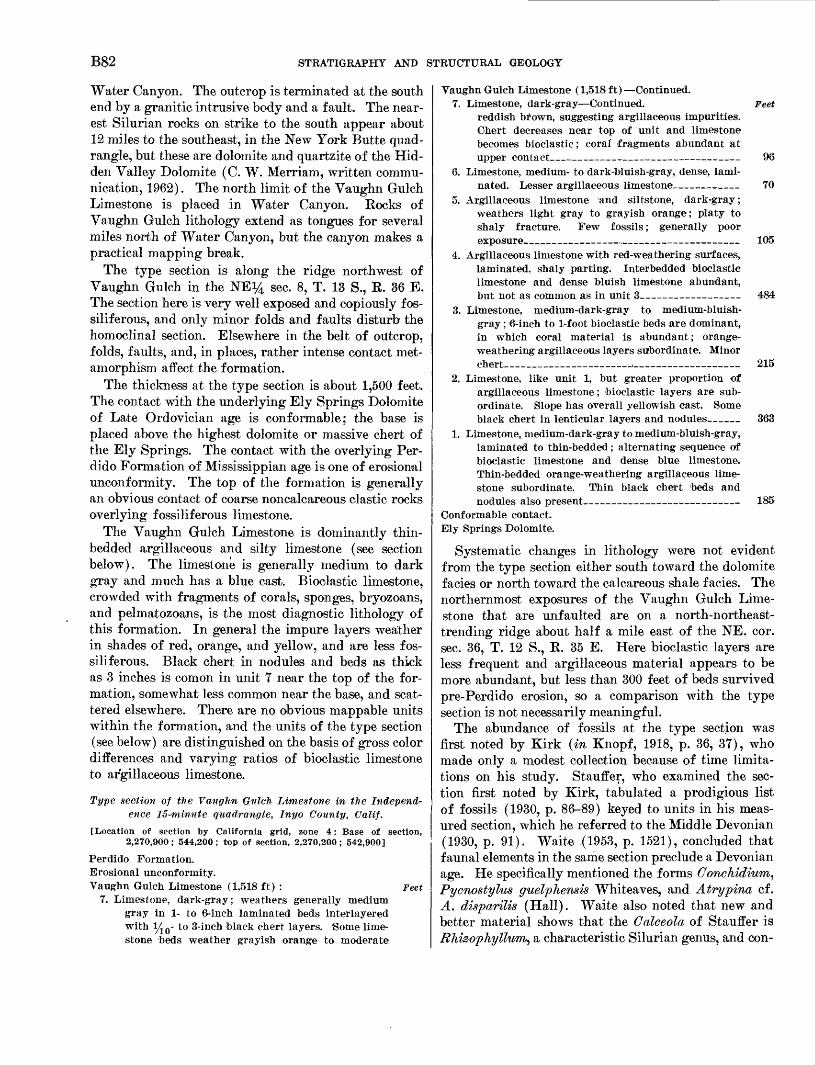
B82 STRATIGRAPHY AND STRUCTURAL GEOLOGY
Water Canyon. The outcrop is terminated at the south end by a granitic intrusive body and a fault. The near est Silurian rocks on strike to the south appear about 12 miles to the southeast, in the New York Butte quad rangle, but these are dolomite and quartzite of the Hid den Valley Dolomite (C. W. Merriam, written commu nication, 1962). The north limit of the Vaughn Gulch Limestone is placed in Water Canyon. Kocks of Vaughn Gulch lithology extend as tongues for several miles north of Water Canyon, but the canyon makes a practical mapping break.
The type section is along the ridge northwest of Vaughn Gulch in the NE^4 sec. 8, T. 13 S., R. 36 E. The section here is very well exposed and copiously f os- siliferous, and only minor folds and faults disturb the homoclinal section. Elsewhere in the belt of outcrop, folds, faults, and, in places, rather intense contact met- amorphism affect the formation.
The thickness at the type section is about 1,500 feet. The contact with the underlying Ely Springs Dolomite of Late Ordovician age is conformable; the base is placed above the highest dolomite or massive chert of the Ely Springs. The contact with the overlying Per- dido Formation of Mississippian age is one of erosional unconformity. The top of the formation is generally an obvious contact of coarse noncalcareous clastic rocks overlying fossiliferous limestone.
The Vaughn Gulch Limestone is dominantly thin- bedded argillaceous and silty limestone (see section below). The limestone is generally medium to dark gray and much has a blue cast. Bioclastic limestone, crowded with fragments of corals, sponges, bryozoans, and pelmatozoans, is the most diagnostic lithology of this formation. In general the impure layers weather in shades of red, orange, and yellow, and are less fos siliferous. Black chert in nodules and beds as thick as 3 inches is comon in unit 7 near the top of the for mation, somewhat less common near the base, and scat tered elsewhere. There are no obvious mappable units within the formation, and the units of the type section (see below) are distinguished on the basis of gross color differences and varying ratios of bioclastic limestone to argillaceous limestone.
Type section of the Vaughn Gulch Limestone in the Independ ence 15-minute Quadrangle, Inyo County, Calif.
[Location of section by California grid, zone 4: Base of section, 2,270,900; 544,200; top of section, 2,270,200; 542,900]
Perdido Formation.Erosional unconformity.Vaughn Gulch Limestone (1,518 ft) : Feet
7. Limestone, dark-gray; weathers generally medium gray in 1- to 6-ineh laminated beds interlayered with l^ 0 - to 3-inch black chert layers. 'Some lime stone 'beds weather grayish orange to moderate
Vaughn Gulch Limestone (1,518 ft) Continued.7. Limestone, dark-gray Continued. Feet
reddish brown, suggesting argillaceous impurities. Chert decreases near top of unit and limestone becomes 'bioclastic; coral fragments abundant 'at upper contact____ __ 96
6. Limestone, medium- to dark-bluish-gray, dense, lami nated. Lesser argillaceous limestone _ 70
5. Argillaceous limestone and siltstone, dark-gray; weathers light gray to grayish orange; platy to shaly fracture. Few fossils; generally poor exposure.______ ..____ 105
4. Argillaceous limestone with red-weathering surfaces, laminated, shaly parting. Interbedded bioclastic limestone and dense bluish limestone abundant, but not as common as in unit 3 484
3. Limestone, medium-dark-gray to medium-bluish- gray ; 6-inch to 1-foot bioclastic beds are dominant, in which coral material is abundant; orange- weathering argillaceous layers subordinate. Minor chert_______________,_____________ 215
2. Limestone, like unit 1, but greater proportion of argillaceous limestone; bioclastic layers are sub ordinate. Slope has overall yellowish cast. Some black chert in lenticular layers and nodules______ 363
1. Limestone, medium-dark-gray to medium-bluish-gray, laminated to thin-bedded; alternating sequence of bioclastic limestone and dense blue limestone. Thin-bedded orange-weathering argillaceous lime stone subordinate. Thin black chert 'beds and nodules also present 185
Conformable contact. Ely Springs Dolomite.
Systematic changes in lithology were not evident from the type section either south toward the dolomite f acies or north toward the calcareous shale f acies. The northernmost exposures of the Vaughn Gulch Lime stone that are unfaulted are on a north-northeast- trending ridge about half a mile east of the NE. cor. sec. 36, T. 12 S., K. 35 E. Here bioclastic layers are less frequent and argillaceous material appears to be more abundant, but less than 300 feet of beds survived pre-Perdido erosion, so a comparison with the type section is not necessarily meaningful.
The abundance of fossils at the type section was first noted by Kirk (in Knopf, 1918, p. 36, 37), who made only a modest collection because of time limita tions on his study. Stauffer, who examined the sec tion first noted by Kirk, tabulated a prodigious list of fossils (1930, p. 86-89) keyed to units in his meas ured section, which he referred to the Middle Devonian (1930, p. 91). Waite .(1953, p. 1521), concluded that f aunal elements in the same section preclude a Devonian age. He specifically mentioned the forms Conchidium, Pycnostylus guelphensis Whiteaves, and Atrypina cf. A. disparilis (Hall). Waite also noted that new and better material shows that the Calceola of Stauffer is Rhizophyllwri) a characteristic Silurian genus, and con-
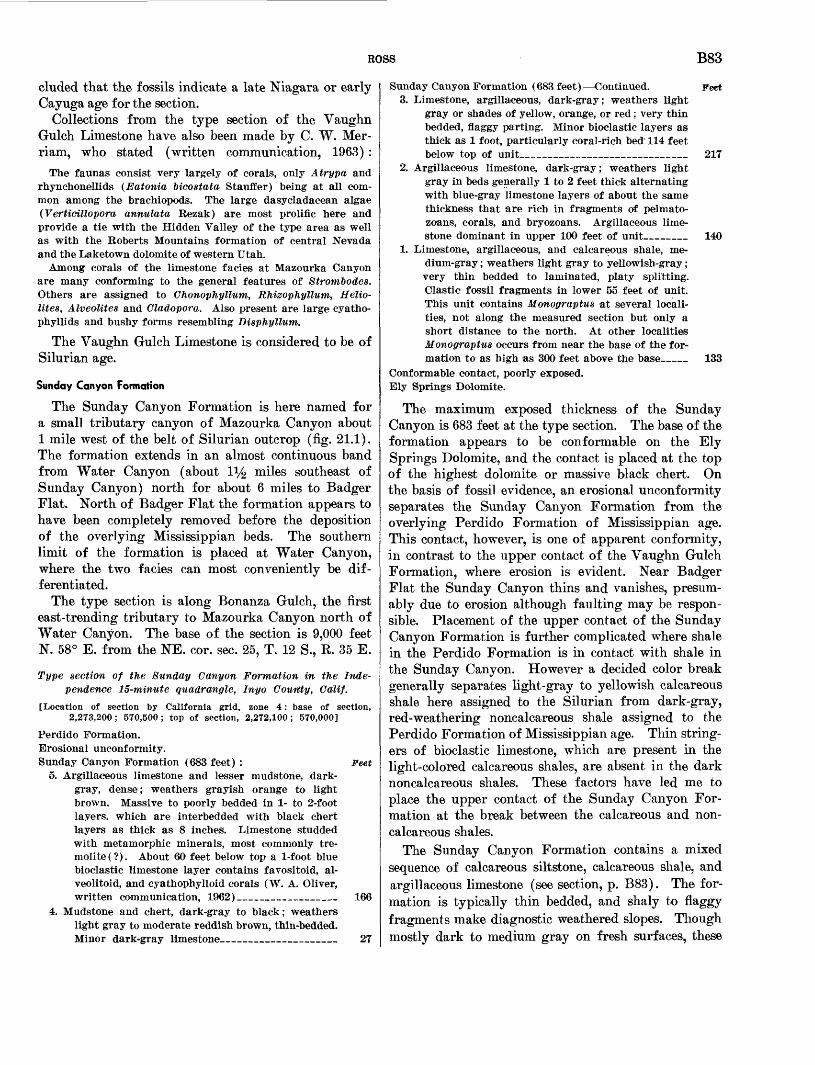
ROSS B83
eluded that the fossils indicate a late Niagara or early Cayuga age for the section.
Collections from the type section of the Vaughn Gulch Limestone have also been made by C. W. Mer- riam, who stated (written communication, 1963) :
The faunas consist very largely of corals, only Atrypa and rhynchonellids (Eatonia Mcostata Stauffer) being at all com mon among the brachiopods. The large dasycladacean algae (Verticillopora annulata Rezak) are most prolific here and provide a tie with the Hidden Valley of the type area as well as with the Roberts Mountains formation of central Nevada and the Laketown dolomite of western Utah.
Among corals of the limestone facies at Mazourka Canyon are many conforming to the general features of Strombodcs. Others are assigned to Chonophyllum, Rhizophyllum, Helio- lites, Alveolites and Clad-opora. Also present are large cyatho- phyllids and bushy forms resembling Disphyllum.
The Vaughn Gulch Limestone is considered to be of Silurian age.
Sunday Canyon Formation
The Sunday Canyon Formation is here named for a small tributary canyon of Mazourka Canyon about 1 mile west of the belt of Silurian outcrop (fig. 21.1). The formation extends in an almost continuous band from Water Canyon (about iy2 miles southeast of Sunday Canyon) north for about 6 miles to Badger Flat. North of Badger Flat the formation appears to have been completely removed before the deposition of the overlying Mississippian beds. The southern limit of the formation is placed at Water Canyon, where the two facies can most conveniently be dif ferentiated.
The type section is along Bonanza Gulch, the first east-trending tributary to Mazourka Canyon north of Water Canyon. The base of the section is 9,000 feet N. 58° E. from the NE. cor. sec. 25, T. 12 S., E. 35 E.
Type section of the Sunday Canyon Formation in the Inde pendence 15-minute quadrangle, Inyo Courity, Calif.
[Location of section by California grid, zone 4: base of section, 2,273,200; 570,500; top of section, 2,272,100; 570,000]
Perdido Formation.Erosional unconformity.Sunday Canyon Formation (683 feet) : Feet
5. Argillaceous limestone and lesser mudstone, dark- gray, dense; weathers grayish orange to light brown. Massive to poorly bedded in 1- to 2-foot layers, which are interbedded with black chert layers as thick as 8 inches. Limestone studded with metamorphic minerals, most commonly tre- molite(?). About 60 feet below top a 1-foot blue bioclastic limestone layer contains favositoid, al- veolitoid, and cyathophylloid corals (W. A. Oliver, written communication, 1962)____________ 166
4. Mudstone and chert, dark-gray to black; weathers light gray to moderate reddish brown, thin-bedded. Minor dark-gray limestone______________ 27
Sunday Canyon Formation (683 feet) Continued. Feet 3. Limestone, argillaceous, dark-gray; weathers light
gray or shades of yellow, orange, or red; very thin bedded, flaggy parting. Minor bioclastic layers as thick as 1 foot, particularly coral-rich bed 114 feet below top of unit____________________ 217
2. Argillaceous limestone, dark-gray; weathers light gray in beds generally 1 to 2 feet thick alternating with blue-gray limestone layers of about the same thickness that are rich in fragments of pelmato- zoans, corals, and bryozoans. Argillaceous lime stone dominant in upper 100 feet of unit_____ 140
1. Limestone, argillaceous, and calcareous shale, me dium-gray ; weathers light gray to yellowish-gray ; very thin bedded to laminated, platy splitting. Clastic fossil fragments in lower 55 feet of unit. This unit contains Honograptus at several locali ties, not along the measured section but only a short distance to the north. At other localities Monograptus occurs from near the base of the for mation to as high as 300 feet above the base___ 133
Conformable contact, poorly exposed. Ely Springs Dolomite.
The maximum exposed thickness of the Sunday Canyon is 683 feet at the type section. The base of the formation appears to be conformable on the Ely Springs Dolomite, and the contact is placed at the top of the highest dolomite or massive black chert. On the basis of fossil evidence, an erosional unconformity separates the Sunday Canyon Formation from the overlying Perdido Formation of Mississippian age. This contact, however, is one of apparent conformity, in contrast to the upper contact of the Vaughn Gulch Formation, where erosion is evident. Near Badger Flat the Sunday Canyon thins and vanishes, presum ably due to erosion although faulting may be respon sible. Placement of the upper contact of the Sunday Canyon Formation is further complicated where shale in the Perdido Formation is in contact with shale in the Sunday Canyon. However a decided color break generally separates light-gray to yellowish calcareous shale here assigned to the Silurian from dark-gray, red-weathering noncalcareous shale assigned to the Perdido Formation of Mississippian age. Thin string ers of bioclastic limestone, which are present in the light-colored calcareous shales, are absent in the dark noncalcareous shales. These factors have led me to place the upper contact of the Sunday Canyon For mation at the break between the calcareous and non- calcareous shales.
The Sunday Canyon Formation contains a mixed sequence of calcareous siltstone, calcareous shale, and argillaceous limestone (see section, p. B83). The for mation is typically thin bedded, and shaly to flaggy fragments make diagnostic weathered slopes. Though mostly dark to medium gray on fresh surfaces, these

B84 STRATIGRAPHY AND STRUCTURAL GEOLOGY
rocks weather to distinctive light gray, commonly with yellow and orange tints. Bioclastic blue-gray lime stone beds and lenses (tongues of the Vaughn Gulch facies) are more common near Water Canyon, but some can be traced almost to Badger Flat. Black chert beds and nodules, and subordinate lenses of quartzite and calcareous quartz sandstone, are associated with some bioclastic layers, particularly in the central part of the formation.
Graptolites have been collected in the shaly to flaggy argillaceous limestone, calcareous shale, and siltstone, generally near the base of the formation, from at least 10 localities from Water Canyon to the south edge of Badger Flat. The graptolites have been identified by E. J. Eoss, Jr., who reports the following forms (writ ten communications, 1960, 1961) :
Monograptus vulgaris WoodMonograptus vomerinus NicholsonMonograptus aff. M. twnescens Wood
These forms are considered by him to indicate a late Wenlock or early Ludlow (mid-Silurian) age.
The bioclastic limestone tongues of the Vaughn Gulch facies in the Sunday Canyon Formation have yielded corals which are generally poorly preserved and com monly fragmented. The following coral forms have been identified by W. A. Oliver, Jr. (written communi cations, 1960,1962) :
Alveolites sp.Favosites sp.Thamnopora sp."Cystiphyllum" sp.cladoporoid coralcerioid rugose coralcyathophylloid(?) coralcylindrical rugose coral
Oliver indicates that the age assignment based on these forms can be no closer than Silurian or Devonian.
Tentaculites cf. T. bellulus Hall has been identified by E. J. Eoss, Jr. (written communication, 1961), from a locality about 300 feet above the base of the formation 11/2 miles north of the type section, where it occurs along with Monograptus. Ostracodes, sponge spicules, and brachiopods that are probably rhynchonellids have also been collected from the formation. The Sunday Canyon Formation is considered to be of Silurian age.
Facies relations
Throughout a large area of southeastern California and parts of southern Nevada the Silurian is repre sented primarily by cherty dolomite, to which the name Hidden Valley Dolomite is generally applied. In the Quartz Spring area, where it was originally defined (McAllister, 1952, p. 15), this formation is largely
Silurian, although fossils of Early Devonian age are found near the top.
The widespread Hidden Valley Dolomite is sepa rated from the Vaughn Gulch Limestone by a several- mile span of granitic rocks, but a paleontologic tie be tween the two formations is furnished by the large dasycladacean algae Verticittopora annulata Eezak, which occurs in the Vaughn Gulch Limestone as well as in the Hidden Valley Dolomite in the southern part of the Inyo Mountains (C. W. Merriam, written communi cation, 1962). The contact of the Vaughn Gulch with the underlying Ely Springs has been placed at an obvious mappable point the top of the uppermost dolo mite but fossils are found only in the lower part of the Ely Springs and it is possible that the upper part of the Ely Springs in the Independence quadrangle could be equivalent to part of the Hidden Valley. Just below the type section of the Vaughn Gulch Limestone in the upper Ely Springs, dark-gray limestone and bedded chert are present. This unique occurrence of limestone in the Ely Springs in the quadrangle could represent an intertonguing of the Hidden Valley dolo mite facies and the Vaughn Gulch coral-limestone facies in the upper part of what has been mapped as Ely Springs.
As already discussed, the Vaughn Gulch coral-lime stone facies grades northward into the Sunday Canyon graptolite facies, which is terminated by erosion or faulting north of Badger Flat. Graptolites at the south edge of Badger Flat mark the northwesternmost oc currence of fossiliferous Silurian rocks in the Great Basin and, in fact, fossiliferous Silurian rocks do not reappear to the north or west for several hundred miles. The thick stratigraphic section in the Mount Morrison roof pendant in the Sierra Nevada, however, may well include Silurian rocks in the several thousand feet of unfossiliferous beds that conformably overlie grapto- lite-bearing Ordovician rocks (Einehart and others, 1959).
REFERENCES
Barnes, Harley, and Byers, F. M., Jr., 1961, Windfall forma tion (Upper Cambrian) of Nevada Test site, and vicinity, Nevada:' Art. 188 in U.S. Geol. Survey Prof. Paper 424-C, p. C103-C106.
Cooper, G. A., 1956, Chazyan and related brachiopods: Smith- sonian Misc. Colln., v. 127, pt. 1, p. 1025-1245.
Hall, W. E., and MacKevett, E. M., Jr., 1962, Geology and ore deposits of the Darwin quadrangle, Inyo County, Cali fornia : V.S. Geol. Survey Prof. Paper 368, 87 p.
Hazzard, J. C., 1937, Paleozoic section in the Nopah and Rest ing Springs Mountains, Inyo County California: Cali fornia Jour. Mines and Geology, Rept. 33, State Mineralo gist, p. 273-339.
ROSS B85
Knopf, Adolph, 1918, A geologic reconnaissance of the Inyo Range and the eastern slope of the southern Sierra Nevada, California, with a, section on Stratigraphy of the Inyo Range, by Edwin Kirk: U.S. Geol. Survey Prof. Paper 110, p. 19-^8.
Langenheim, R. L., Jr., and others, 1956, Middle and Upper (?) Ordovician rocks of Independence quadrangle, California: Am. Assoc. Petroleum Geologists Bull., v. 40, no. 9, p. 2081-2097.
McAllister, J. F., 1952, Rocks and structure of the Quartz Spring area, northern Panamint Range, California: Cali fornia Div. Mines Spec. Rept. 25, p. 1-38.
Nolan, T. B., 1943, The Basin and Range province in Utah, Nevada, and California: U.S. Geol. Survey Prof. Paper 197-D, p. 141-196.
Phleger, F. B., Jr., 1933, Notes on certain Ordovician faunas of the Inyo Mountains, California: Southern California Acad. Sci. Bull., v. 32, pt. 1, p. 1-21.
Rinehart, C. D., Ross, D. C., and Huber, N. K., 1959, Paleozoic and Mesozoic fossils in a thick stratigraphic section in the eastern Sierra Nevada, California : Geol. Soc. America Bull., v. 70, p. 941-946.
Ross, D. C., 1962, Preliminary geologic map of the Independence quadrangle, Inyo County, California: U.S. Geol. Survey Mineral Inv. Map MF-254.
Stauffer, C. R., 1930, The Devonian of California: California Univ. Publications, Geol. Sci., v. 19, no. 4, 81-118.
Waite, R. H., 1953, Age of the "Devonian" of the Kearsarge area, California [abs.] : Geol. Soc. America Bull., v. 64, no. 12, pt. 2, p. 1521.
Waring, C. A., and Huguenin, Emile, 1917, Inyo County, Fif teenth report of the State Mineralogist, California State Mining Bureau, p. 29-134.

Article 22
THE LIVINGSTON GROUP OF SOUTH-CENTRAL MONTANA
By ALBERT E. ROBERTS, Denver, Colo.
Abstract. The western part of the Crazy Mountains basin in south-central Montana contains more than 13,000 feet of continental deposits of latest Cretaceous and Paleooene age, customarily assigned to the Livingston Formation. In the type area, the lower half of this sequence is redefined as the Living ston Group, and,is divided into four new units: the Cokedale, Miner Creek, Dillman Greek, and Hoppers Formations; the upper half is assigned to the Fort Union Formation.
INTRODUCTION
Epeirogenic arching in the vicinity of the Elkhorn Mountains, Mont., began late in the Santonian Stage of Late Cretaceous time with truncation of the Eagle Sandstone and Colorado Shale along parts of the east side of the uplift. This uplift and erosion was accom panied by the volcanism which created the thick Elk- horn Mountains Volcanics (Klepper and others, 1957). Following withdrawal of the Upper Cretaceous Eagle seas in western Montana, the area east of the Bridger Range and north of the Beartooth Range gradually subsided to form the Crazy Mountains basin. This basin, elongated northwest, is 40 to 70 miles wide and 130 miles long (fig. 22.1). Subsidence and deposition were greater in the western part of the basin and were accelerated in late Campanian and Maestrichtian time. The stratigraphic sequence there indicates continuous deposition during latest Cretaceous and Paleocene time. More than 13,000 feet of sediments, derived predom inantly from volcanic rock, was deposited. These rocks have been generally assigned to the Livingston Forma tion. In this article the Livingston is restricted to in clude only the lower half of the continental sequence, and is raised to group rank and subdivided into four new formations.
The thick sequence of sedimentary rocks, consisting chiefly of debris of andesitic lava and other volcanic rocks "typically developed in the vicinity of Living ston, Mont.," was named the Livingston Formation by Weed (1893, p. 21). He divided it into three units: the leaf beds (lowest), the volcanic agglomerates, and the
110° 109° 108°
FIGURE 22.1. Index map of Montana showing localities relative to area discussed. Hachured line shows ap proximate limits of Crazy Mountains basin.
conglomerates. The volcanic agglomerate unit occurs only locally 35 miles east of Livingston, and its strati- graphic position is uncertain. Peale (1896) extended the name Livingston westward to include predomi nantly pyroclastic deposits in Jefferson Canyon, south west of Three Forks, Mont.; near Sphinx Mountain in the Madison Range; and in the Maudlow area at the north end of the Bridger Range (Peale, in Weed, 1893, p. 21). Iddings and Weed (1894) and Weed (1899) assigned the strata younger than the Eagle Sandstone in most of the Crazy Mountains basin to the Livingston Formation. Coal-bearing rocks in the northern part of the basin were first correlated with the Eagle Sand stone by Stone (1908, p. 78-79); however, he placed the Livingston in the Tertiary. Two years later Stone and Calvert (1910, p. 551) demonstrated that the Living ston Formation grades laterally northeastward into marine and nonmarine beds of the Claggett, Judith River, Bearpaw, Lennep, and Lance (Hell Creek) For mations of Late Cretaceous age and the Lebo Member
ART. 22 IN U.S. GBOL. SURVEY PROF. PAPER 475-B, PAGES B86-B92. 1963
BS6

ROBERTS B87
of the Fort Union Formation of Paleocene age. No further stratigraphic studies of the Livingston were made in the southwestern part of the basin until Mc- Mannis (1955, p. 1407) and Richards (1957, p. 420) di vided the formation into five generalized lithologic units including the Fort Union Formation.
The writer is deeply indebted to James R. Gill, Wil liam A. Cobban, and William J. McMannis for geologic information and discussions of stratigraphic problems.
STRATIGRAPHY
The stratigaphic sequence overlying the Eagle Sand stone at Cokedale, Mont., is a thick alternating series of coarse- and fine-grained continental deposits of the Liv ingston Group and Fort Union Formation. The coarse grained units in the lower part of the Livingston Group (Cokedale and Miner Creek Formations) are more con tinuous and sheetlike than the typical stream-channel and piedmont alluvial deposits that are common in the upper part of the Livingston (Billman Creek and Hop pers Formations) and in the overlying Fort Union Formation. Many of the coarse-grained units are conglomeratic.
The Livingston Group thins progressively eastward; the sequence is 6,445 feet thick at Cokedale but is repre sented by only 2,700 feet of marine and nonmarine beds at Columbus, Mont. It also thins northward to Lennep, Mont., where it is represented by 4,260 feet of marine and nonmarine beds. The overlying Fort Union For mation likewise thins markedly to the east and north. In both these directions, rocks of the Livingston and Fort Union become finer grained, better sorted, thin ner bedded, lighter in color, and less andesitic in compo sition owing to an increase in the proportions of quartz and orthoclase. Interfingering of the nonmarine Liv ingston with marine units likewise increases to the east and north.
The petrology of the volcanic material in the Liv ingston Group and Fort Union Formation indicates that it was derived principally from the Elkhorn Mountains, although several other source areas near the southern, western, and northwestern margins of the Crazy Mountains basin have been suggested. A local source near Flathead Pass in the Bridger Range was suggested by Weed (1893, p. 29) and another near the
jDastle Mountains was suggested by Tanner.1 Another local source south of Big Timber, Mont., was first de scribed by Weed (1893, p. 26-29) for his "volcanic agglomerates" unit and later by Parsons (1942, p. 1177) for the "Livingston igneous series." Billingsley (1916, p. 35) stated that the andesite conglomerate at Maudlow
1 Tanner, J. J., 1949, Geology of the Caatle Mountain area, Montana: Prlnceton Univ. Ph.D. thesis. [Available on microfilm from TJniv. Microfilms, Inc., Ann Arbor, Mich. ]
(equivalent to part of the Livingston) could have no other source than the lavas of the Elkhorn Mountains. McMannis (1955, p. 1412) and Klepper and others (1957, p. 40) also concluded that the thick deposits of volcanic material in the Elkhorn Mountains were most likely the source of much of the Livingston Formation.
An eastward increase in abundance of quartz and other minerals of nonvolcanic origin and a decrease in grain size across the Crazy Mountains basin, and the presence of volcanic rock known only from the Elk- horn Mountains Volcanics in conglomerate beds of the Livingston Group, corroborates the conclusion of Bill ingsley, McMannis, and Klepper that the predominant source was to the west and northwest of the basin.
The volcanic material in the Livingston Group in cludes fragments of several types and textures of ande sitic and possibly some latitic rocks as well as beds of bentonite and andesitic ash. Also present in smaller amounts are lithic fragments of welded tuff, spherulitic and devitrified rocks that may be dacitic in composition, crystal fragments of volcanic and nonvolcanic origin, and clay minerals. Plagioclase is the most abundant mineral of volcanic origin, followed by pyroxene, amphibole, biotite, and magnetite. The plagioclase ranges from oligoclase to labradorite; the most common composition is andesine (An40 ). Some of the finer grained clayey rocks contain approximately 45 per cent montmorillonite and 55 percent mixed-layer mpntmorillonite-illite-vermiculite; some also have small amounts of illite and chlorite (L. G. Schultz, oral com munication, 1962). Quartz, probably derived from granitic, metamorphic, and sedimentary rocks, is the principal nonvolcanic constituent. The ratio of quartz to plagioclase in the Livingston is approximately 2 to 1. Orthoclase occurs locally, generally in very small quantities, and ranges from a trace in the lower part of the Livingston Group to as much as 15 percent in the upper part.
Zeolite minerals are common in interstices. Reddish- brown heulandite is the most conspicuous zeolite and is present throughout the Livingston, but is most abun dant in the Miner Creek Formation. Analcite is present in some units as cement, producing a mottled texture owing to crystallization of the analcite in clusters. Traces of laumontite and clinoptilolite are also present in some units. Other cementing agents are silica and calcite.
The Livingston Group includes the following forma tions, in ascending order: Cokedale, Miner Creek, Bill man Creek, and Hoppers. The general correlation and stratigraphic relations of the type Livingston Group near Livingston, Mont., with other areas in Montana and Wyoming are shown in figure 22.2. The Cokedale Formation is the westward nonmarine equivalent of the
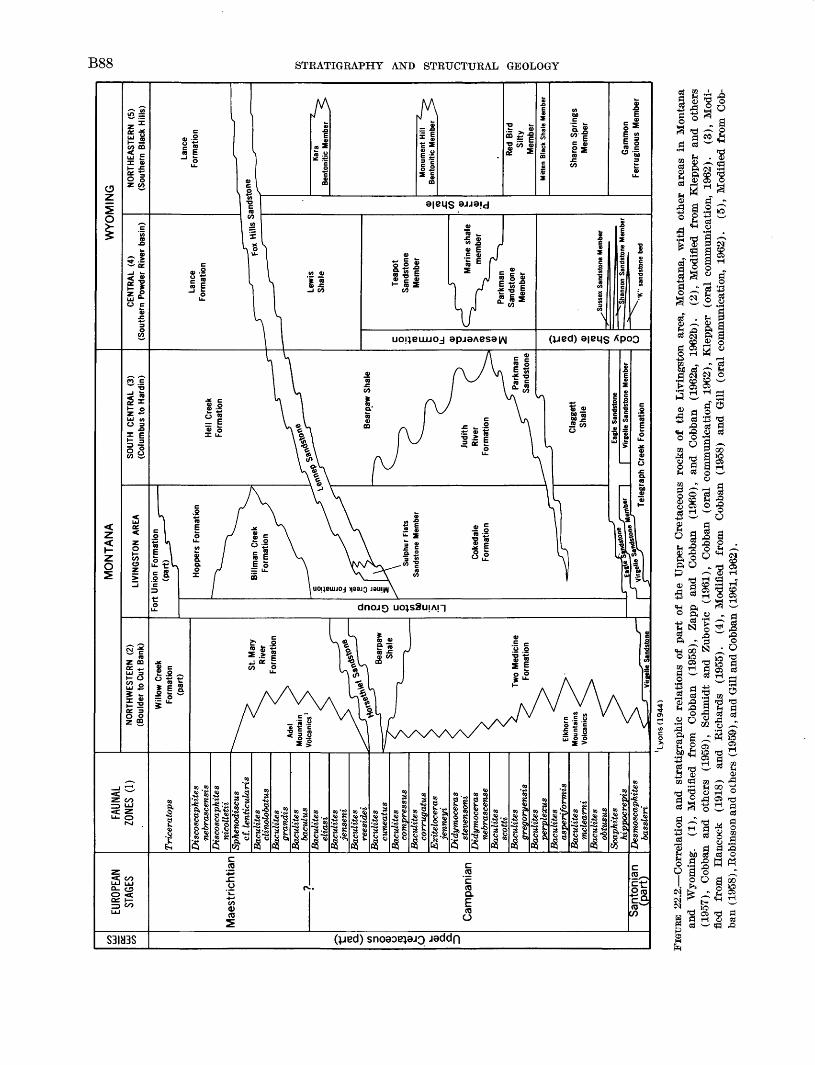
Tvaruonai-s QJSEV AHdva)Dii,vai,s889
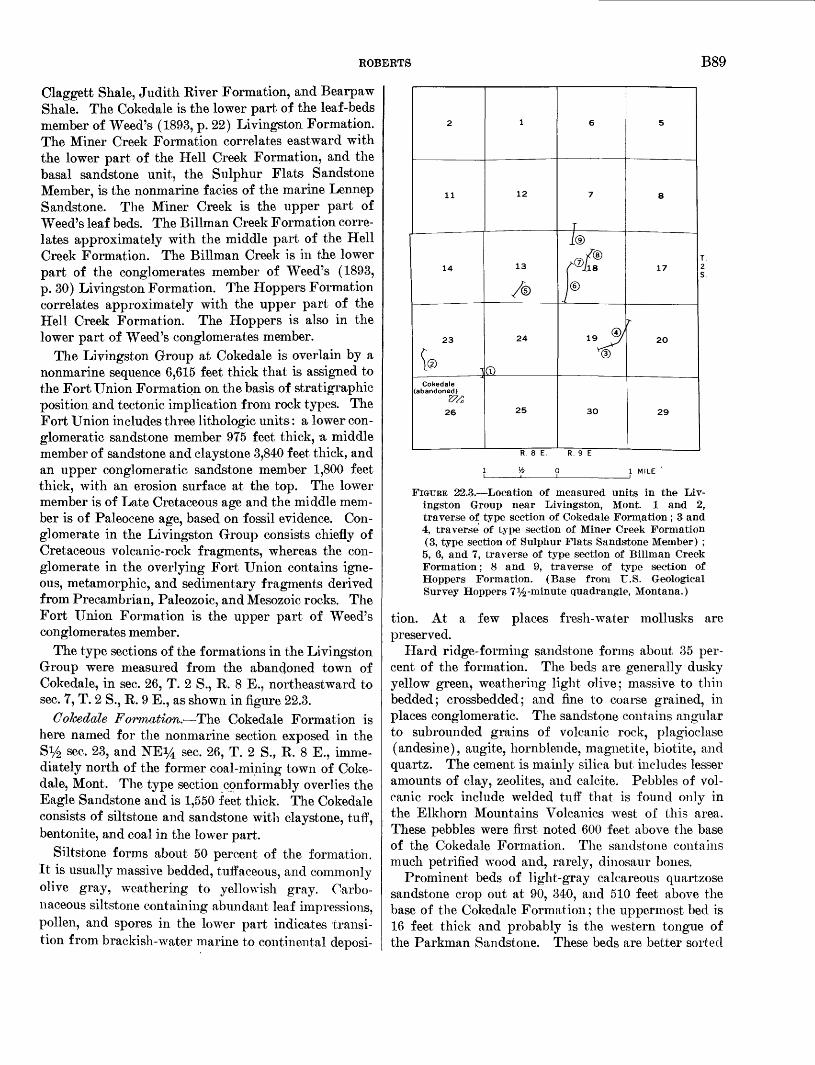
ROBERTS B89
Claggett Shale, Judith River Formation, and Bearpaw Shale. The Cokedale is the lower part of the leaf-beds member of Weed's (1893, p. 22) Livingston Formation. The Miner Creek Formation correlates eastward with the lower part of the Hell Creek Formation, and the basal sandstone unit, the Sulphur Flats Sandstone Member, is the nonmarine f acies of the marine Lennep Sandstone. The Miner Creek is the upper part of Weed's leaf beds. The Billman Creek Formation corre lates approximately with the middle part of the Hell Creek Formation. The Billman Creek is in the lower part of the conglomerates member of Weed's (1893, p. 30) Livingston Formation. The Hoppers Formation correlates approximately with the upper part of the Hell Creek Formation. The Hoppers is also in the lower part of Weed's conglomerates member.
The Livingston Group at Cokedale is overlain by a nonmarine sequence 6,615 feet thick that is assigned to the Fort Union Formation on the basis of stratigraphic position and tectonic implication from rock types. The Fort Union includes three lithologic units: a lower con glomeratic sandstone member 975 feet thick, a middle member of sandstone and claystone 3,840 feet thick, and an upper conglomeratic sandstone member 1,800 feet thick, with an erosion surface at the top. The lower member is of Late Cretaceous age and the middle mem ber is of Paleocene age, based on fossil evidence. Con glomerate in the Livingston Group consists chiefly of Cretaceous volcanic-rock fragments, whereas the con glomerate in the overlying Fort Union contains igne ous, metamorphic, and sedimentary fragments derived from Precambrian, Paleozoic, and Mesozoic rocks. The Fort Union Formation is the upper part of Weed's conglomerates member.
The type sections of the formations in the Livingston Group were measured from the abandoned town of Cokedale, in sec. 26, T. 2 S., R. 8 E., northeastward to sec. 7, T. 2 S., R. 9 E., as shown in figure 22.3.
Cokedale Formation. The Cokedale Formation is here named for the nonmarine section exposed in the Sy2 sec. 23, and NEi/i sec. 26, T. 2 S., R. 8 E., imme diately north of the former coal-mining town of Coke- dale, Mont. The type section conformably overlies the Eagle Sandstone and is 1,550 feet thick. The Cokedale consists of siltstone and sandstone with claystone, tuff, bentonite, and coal in the lower part.
Siltstone forms about 50 percent of the formation. It is usually massive bedded, tuffaceous, and commonly olive gray, weathering to yellowish gray. Carbo naceous siltstone containing abundant leaf impressions, pollen, and spores in the lower part indicates transi tion from brackish-water marine to continental deposi-
11
Cokedale (abandoned)
26
12
13
24
0)
25 3O
R. 8 E.
17
2O
29
FIGURE 22.3. Location of measured units in the Liv ingston Group near Livingston, Mont. 1 and 2, traverse of type section of Cokedale Formation ; 3 and4. traverse of type section of Miner Creek Formation (3, type section of Sulphur Flats Sandstone Member) ;
5. 6, and 7, traverse of type section of Billman Creek Formation; 8 and 9, traverse of type section of Hoppers Formation. (Base from U.S. Geological Survey Hoppers 7^-minute quadrangle, Montana.)
tion. At a few places fresh-water mollusks are preserved.
Hard ridge-forming sandstone forms about 35 per cent of the formation. The beds are generally dusky yellow green, weathering light olive; massive to thin bedded; crossbedded; and fine to coarse grained, in places conglomeratic. The sandstone contains angular to subrounded grains of volcanic rock, plagioclase (andesine), augite, hornblende, magnetite, biotite, and quartz. The cement is mainly silica but includes lesser amounts of clay, zeolites, and calcite. Pebbles of vol canic rock include welded tuff that is found only in the Elkhorn Mountains Volcamcs west of this area. These pebbles were first noted 600 feet above the base of the Cokedale Formation. The sandstone contains much petrified wood and, rarely, dinosaur bones.
Prominent beds of light-gray calcareous quartzose sandstone crop out at 90, 340, and 510 feet above the base of the Cokedale Formation; the uppermost bed is 16 feet thick and probably is the western tongue of the Parkman Sandstone. These beds are better sorted
B90 STRATIGRAPHY AND STRUCTURAL GEOLOGY
than other sandstone in the Cokedale and contain a distinctive heavy-mineral suite similar to that in the Eagle Sandstone at Cokedale (Roberts, 1957, p. 42-45). The heavy minerals, in order of decreasing abundance, are magnetite, zircon, tourmaline, corundum, garnet, hornblende, staurolite, rutile, apatite, hematite, li- monite, and leucoxene (R.F. Gantnier, written com munication, 1962).
Claystone and sandstone from 660 to 680 feet above the base of the Cokedale Formation in the SWl/4 sec. 23, T. 3 S., R. 8 E., contain an abundant pollen and spore flora that according to R. H. Tschudy (written communication, 1962) is definitely older than the flora in the Mitten Black Shale Member of the Pierre Shale and most nearly resembles the flora from the Blair Formation of the Rock Springs region, Wyoming. Fragments of \Monoclonius sp. that commonly occur in the Judith River Formation in Montana and in the "Pale Beds" at the top of the Belly River Forma tion in Alberta were identified by G. E. Lewis (written communication, 1963) from a sandstone 710 feet above the base of the Cokedale.
The basal contact of the Cokedale Formation and the Livingston Group is not distinct. Weed (1893, p. 11) distinguished the volcanic sediments of the Liv ingston Formation from the underlying nonvolcanic coal-bearing formation (Eagle Sandstone) on the basis of lithology and believed the two were separated by an unconformity. Stone and Calvert (1910, p. 761) cor rectly described the Livingston Formation as conform ably overlying the coal measures. Roberts (1957, p. 47) arbitrarily designated the top of the arkosic sand stone that overlies the uppermost minable coal bed (Cokedale No. 5) as the contact between the Livingston and the underlying Eagle Sandstone, and this is taken as the base of the Cokedale. There is some andesitic sandstone in the upper part of the Eagle Sandstone and there is some arkosic sandstone and coal in the lower part of the Cokedale Formation; nevertheless, the boundary used is the best mappable contact in the Livingston area. The difference between physical and chemical properties of the coals in the upper part of the Eagle (bituminous-coking) and the lower part of the Cokedale (lignite-noncoking) also supports this boundary assignment. The thin black chert-pebble conglomerate that marks the top of the Eagle or base of the Claggett throughout much of Montana was not found in the section at Cokedale.
Miner Greek Formation, The Miner Creek Forma tion is here named for the nonmarine section exposed along Miner Creek in the E^ sec. 19 and NW% sec. 20, T. 2 S., R. 9 E. (fig. 22.3)". The type section con formably overlies the Cokedale Formation and is 1,350
feet thick. The Miner Creek consists largely of alter nating beds of siltstone and sandstone. At the base is a prominent ridge-forming sandstone and tuff unit, 160 feet thick, that is here named the Sulphur Flats Sand stone Member for the section exposed along Miner Creek near Sulphur Flats in the SEi/4 sec. 19, T. 2 S., R. 9 E.
Massive-bedded tuffaceous siltstone forms 75 percent of the Miner Creek Formation. The siltstone in the upper part of the formation is olive gray and weathers light olive gray. In the middle of the formation it is dusky yellow green, weathering grayish yellow green, and in the lower part it is generally grayish olive green, weathering grayish yellow green. Red specks and vein- lets of heulandite characterize the formation. Analcite and laumontite are present in traces.
Sandstone forms about 20 percent of the formation. It is generally well bedded and fine grained except for that in the Sulphur Flats Sandstone Member, which is massive, crossbedded, and poorly sorted. The sand stone is grayish green, weathering light olive gray, and is composed of andesitic volcanic-rock fragments, plagioclase (andesine), augite, hornblende, and mag netite; the Sulphur Flats Sandstone Member in addi tion contains much biotite and diopside. A distinctive fine-grained calcareous mottled yellowish-gray quartz- ose sandstone, 6 to 20 feet thick, forms an excellent marker bed at the base of the Sulphur Flats Sandstone Member. In the lower part of the formation, particu larly in the Sulphur Flats Sandstone Member, tuff and bentonite are interbedded with the sandstone. Most of these fine-grained pyroclastic rocks have been altered to indurated siliceous claystone. Petrified wood, pollen, spores, and fragments of dinosaur bones are present in the Sulphur Flats Sandstone Member.
Stanton (in Stone and Calvert, 1910, p. 655) identi fied a marine fauna from the Livingston Formation near Wilsall, Mont., in the NEi/4 sec. 25, T. 4 N., R. 8 E., as Late Cretaceous, probably occupying a position near the top of the Bearpaw Shale. James R. Gill and the writer visited this locality and obtained fossils iden tified by W. A. Cobban (written communication, 1961) as representing the Baculites compressus zone or possi bly the slightly younger Baculites cuneatus zone in the upper Campanian of Late Cretaceous age (fig. 22.2). The marine rocks from which these fossils were obtained can be traced from Wilsall northward into the type sec tion of the Lennep Sandstone at the north end of the Crazy Mountains (J. R. Gill, oral communications, 1962). To the south, in the Livingston area, these beds are represented by the nonmarine Sulphur Flats Sand stone Member of the Miner Creek Formation.
A carbonaceous claystone 420 feet above the base of the Miner Creek Formation in sec. 19, T. 2 S., R. 9 E.,
ROBERTS B91
and a similar clay stone 1,330 feet above the base of the Miner Creek in sec. 20, T. 2 S., R. 9 E., contain a diag nostic pollen and spore flora, according to E. B. Leopold (written communication, 1962). Of these samples the genus of greatest stratigraphic interest is Aqmlapol- lenites, of which five species occur. The pollen assem blage is closely similar to that of a zone rich in Aquila- pollenites in the upper part of the Pierre Shale.
Billman Creek Formation. The Billman Creek For mation is here named for the nonmarine section exposed near Billman Creek in the Sy2 sec. 13, T. 2 S., R. 8 E., and the Wy2 sec. 18, T. 2 S., R. 9 E. (fig. 22.3). The type section conformably overlies the Miner Creek Formation and is 2,590 feet thick. The Billman Creek is mostly claystone but includes lesser amounts of sand stone, siltstone, and conglomerate. It is less resistant to weathering than adjacent formations and generally forms valleys. Claystone comprises about 65 percent of the formation and is usually massive bedded. Three samples average 40 percent montmorillonite, 50 percent mixed-layer montmorillonite-illite-venmculite, 5 per cent illite, and 5 percent chlorite (L. G. Schultz, oral communication, 1962). In the upper part of the forma tion the claystone is olive black to olive gray, weather ing light olive gray; in the middle part it is mostly grayish brown, weathering pale yellowish brown; and in the lower part it is mainly dusky red, weathering grayish red, but partly grayish green, weathering gray ish yellow green.
Channel-fill sandstone and conglomerate form about 25 percent of the formation. They are generally dusky yellow green, weathering grayish yellow green, and are composed of volcanic-rock fragments, plagioclase (andesine), augite, diopside, hornblende, magnetite, biotite, quartz, and orthoclase cemented by silica, cal- cite, clay, or zeolites. A 20-foot continuous sandstone unit 96 feet above the base of the Billman Creek For mation contains abundant spherical calcareous sand stone concretions and is an excellent marker bed.
Dinosaur bones of Lance age were described from several localities in the upper part of the Billman Creek Formation 13 miles east of Bozeman, Mont. (Mc- Mannis, 1955, p. 1408). Fresh-water mollusks were collected from the middle part of the Billman Creek and identified by D. W. Taylor (written communica tion, 1962). The species are known from much of the Cretaceous and could not be precisely dated, but were in accord with the age assigned on the basis of fossil vertebrates.
Hoppers Formation. The Hoppers Formation is here named for the nonmarine section exposed near Hoppers Siding on the Northern Pacific Railway in the SW% sec. 7 and NW% sec. 18, T. 2 S., R. 9 E. (fig.
680231 O 63 7
22.3). The type section conformably overlies the Bill man Creek Formation and is 965 feet thick. The Hoppers consists largely of sandstone with inter- bedded claystone and siltstone.
Ridge-forming sandstone makes up 60 percent of the Hoppers Formation and is generally massive to thin bedded, crossbedded, and poorly sorted. It is dusky yellow green and generally weathers olive gray; how ever, the basal 140 feet weathers a conspicuous yellow ish gray in massive spheroidal shapes. The sandstone consists of angular to subrounded grains of volcanic rock, plagioclase (andesine), augite, hornblende, mag netite, biotite, quartz, and orthoclase. Silica and calcite are the common cement. Many of the sandstone layers are channel-fill deposits containing pebbles of clay and volcanic rock, and fragments of wood and other plants. The basal sandstone beds of the Hoppers are a cliff- forming unit composed of massive, crossbedded, cal careous, generally conglomeratic sandstone with inter- bedded claystone and siltstone. These sandstone beds are generally banded by layers of ferromagnesian min erals, particularly magnetite.
About 25 percent of the formation is massive-bedded claystone. Iti s olive gray, weathering light olive gray. A few beds contain calcareous claystone concretions and at least one contains fresh-water mollusks.
Siltstone, forming about 15 percent of the formation, is generally gradational with sandstone and similar in color and mineral composition.
REFERENCESBillingsley, Paul, 1916, The Boulder batholith of Montana: Am.
Inst. Mining Engineers Trans, v. 51, p. 31-57. Cobban, W. A., 1958, Late Cretaceous fossil zones of the Powder
River basin, Wyoming and Montana, in Wyoming Geol.Assoc. Guidebook 13th Ann. Field Conf., Powder Riverbasin: p. 114-119.
1962a, New Baculites from the Bearpaw Shale and equivalent rocks of the western interior: Jour. Paleontol ogy, v. 36, no. 1, p. 126-135.
1962b, Baculites from the lower part of the Pierre Shaleand equivalent rocks in the western interior: Jour. Paleon tology, v. 36. no. 4, p. 704-718.
Cobban, W. A., Erdmann, C. E., Lemke, R. W., and Maughan, E. K., 1959, Revision of Colorado Group on Sweetgrass Arch, Montana: Am. Assoc. Petroleum Geologists Bull., v. 43, no. 12, p. 2786-2796.
Gill, J. R., and Cobban, W. A., 1961, Stratigraphy of- lower and middle parts of the Pierre Shale, northern Great Plains: Art. 352 in U.S. -Geol. Survey Prof. Paper 424-D, p. D185- D191.
1962, Red Bird Silty Member of the Pierre Shale, a new stratigraphic unit: Art. 8 in U.S. Geol. Survey Prof. Paper 450-B, p. B21-B24.
Hancock, E. T., 1918, Geology and oil and gas prospects of the Lake Basin field, Montana: U.S. Geol. Survey Bull. 691-D, p. 101-147.
B92 STRATIGRAPHY AND STRUCTURAL GEOLOGY
Iddings, J. P., and Weed, W. H., 1894, Description of the Liv- inston sheet [Montana] : U.S. Geol. Survey Geol. Atlas, Folio 1, 5 p., 4 maps.
Klepper, M. R., Weeks, R. A., and Ruppel, B. T., 1957, Geol ogy of the southern Blkhorn Mountains, Jefferson and Broadwater Counties, Montana: U.S. Geol. Survey Prof. Paper 292, p. 82.
Lyons, J. B., 1944, Igneous rocks of the northern Big Belt Range, Mont.: Geol. Soc. America Bull., v. 55, no. 4, p. 445-472.
McMannis, W. J., 1955, Geology of the Bridger Range, Montana : Geol. Soc. America Bull., v. 66, no. 11, p. 1385-1430.
Parsons, W. H., 1942, Origin and structure of the Livingston igneous rocks, Montana: Geol. Soc. America Bull., v. 53, no. 8, p. 1175-1186.
Peale, A. C., 1896, Description of the Three Forks sheet [Mon tana] : U.S. Geol. Survey Geol. Atlas, Folio 24, 7 p., 4 maps.
Richards, P. W., 1955, Geology of the Bighorn Canyon-Hardin area, Montana and Wyoming: U.S. Geol. Survey Bull. 1026, 93 p.
1957, Geology of the area east and southeast of Liv ingston, Park County, Montana: U.S. Geol. Survey Bull. 1021-L, p. 385-438.
Roberts, A. E., 1957, Coal-bearing rocks and mines at Cokedale, Park County, Mont., in Billings Geol. Soc. Guidebook 8th Ann. Field Conf., Crazy Mountain Basin, Montana, 1957: p. 39-47.
Robinson, C. S., Mapel, W. J., and Cobban, W. A., 1959, Pierre shale along western and northern flanks of Black Hills, Wyoming and Montana: Am. Assoc. Petroleum Geologists Bull., v. 43, no. 1, p. 101-123.
Schmidt, R. G., and Zubovic, Peter, 1961, Cobern Mountain over- thrust, Lewis and Clark County, Montana: Art. 211 in U.S. Geol. Survey Prof. Paper 424-C, p. C175-C177.
Stone, R. W., 1908, Coal near the Crazy Mountains, Montana, in coal fields of North* Dakota and Montana: U.S. Geol. Stirvey Bull. 341-A, 120 p.
Stone, R. W., and Calvert, W. R., 1910, Stratigraphic relations of the Livingston Formation of Montana: Bcon. Geology, v. 5, no. 6, p. 551-557; no. 7, p. 652-669; and no. 8, p. 741-764.
Weed, W. H., 1893, The Laramie and the overlying Livingston Formation in Montana: U.S. Geol. Survey Bull. 105, 68 p.
1899, Description of the Little Belt Mountains quad rangle [Montana] : U.S. Geol. Survey Geol. Atlas, Folio 56, 11 p., 4 maps.
Zapp, A. D., and Cobban, W. A., 1960, Some Late Cretaceous strand lines in northwestern Colorado and northeastern Utah: Art. 112 in U.S. Geol. Survey Prof. Paper 400-B, p. B246-B249.
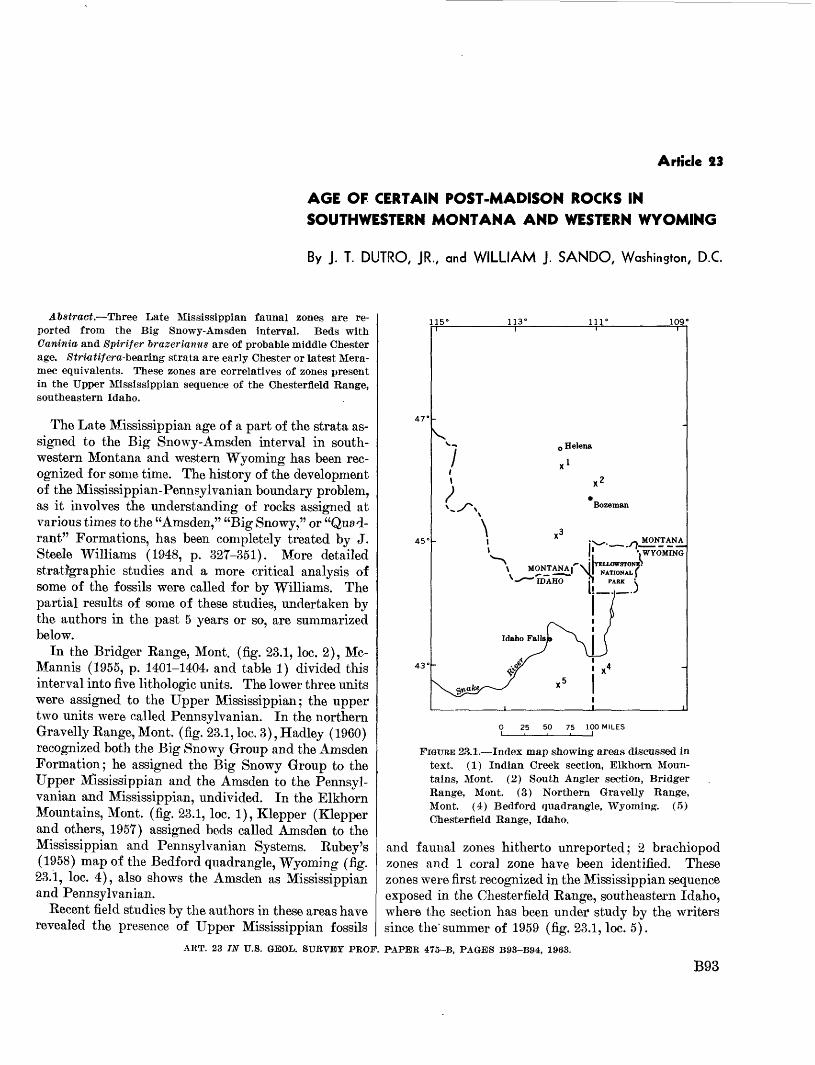
Article 23
AGE OF CERTAIN POST-MADISON ROCKS IN SOUTHWESTERN MONTANA AND WESTERN WYOMING
By J. T. DUTRO, JR., and WILLIAM J. SANDO, Washinston, D.C.
Abstract. Three Late Mississippian faunal zones are re ported from the Big Snowy-Amsden interval. Beds with Caninia and Spirifer braseriamis are of probable middle Chester age. Striatif era-bearing strata are early Chester or latest Mera- mec equivalents. These zones are correlatives of zones present in the Upper Mississippian sequence of the Chesterfield Range, southeastern Idaho.
The Late Mississippian age of a part of the strata as signed to the Big Snowy-Amsden interval in south western Montana and western Wyoming has been rec ognized for some time. The history of the development of the Mississippian-Pennsylvanian boundary problem, as it involves the understanding of rocks assigned at various times to the "Amsden," "Big Snowy," or "Quad rant" Formations, has been completely treated by J. Steele Williams (1948, p. 327-351). More detailed stratJgraphic studies and a more critical analysis of some of the fossils were called for by Williams. The partial results of some of these studies, undertaken by the authors in the past 5 years or so, are summarized below.
In the Bridger Range, Mont. (fig. 23.1, loc. 2), Mc- Mannis (1955, p. 1401-1404, and table 1) divided this interval into five lithologic units. The lower three units were assigned to the Upper Mississippian; the upper two units were called Pennsylvanian. In the northern Gravelly Range, Mont. (fig. 23.1, loc. 3), Hadley (1960) recognized both the Big Snowy Group and the Amsden Formation; he assigned the Big Snowy Group to the Upper Mississippian and the Amsden to the Pennsyl vanian and Mississippian, undivided. In the Elkhorn Mountains, Mont. (fig. 23.1, loc. 1), Klepper (Klepper and others, 1957) assigned beds called Amsden to the Mississippian and Pennsylvanian Systems. Rubey's (1958) map of the Bedford quadrangle, Wyoming (fig. 23.1, loc. 4), also shows the Amsden as Mississippian and Pennsylvanian.
Recent field studies by the authors in these areas have revealed the presence of Upper Mississippian fossils
115° 113°
47'
45'
43°
, Helena
>., ._ MONTANA l ' 'I - '1 '.WYOVnWfi
25 50 75 100 MILES
FIGURE 23.1. Index map showing areas discussed in text. (1) Indian Creek section, Elkhorn Moun tains, Mont. (2) South Angler section, Bridger Range, Mont. (3) Northern Gravelly Range, Mont. (4) Bedford quadrangle, Wyoming. (5) Chesterfield Range, Idaho.
and faunal zones hitherto unreported; 2 brachiopod zones and 1 coral zone have been identified. These zones were first recognized in the Mississippian sequence exposed in the Chesterfield Range, southeastern Idaho, where the section has been under study by the writers since the'summer of 1959 (fig. 23.1, loc. 5).
ART. 23 IN U.S. GEOL. SURVEY PROF. PAPER 475-B, PAGES B93-B94, 1963.
B93
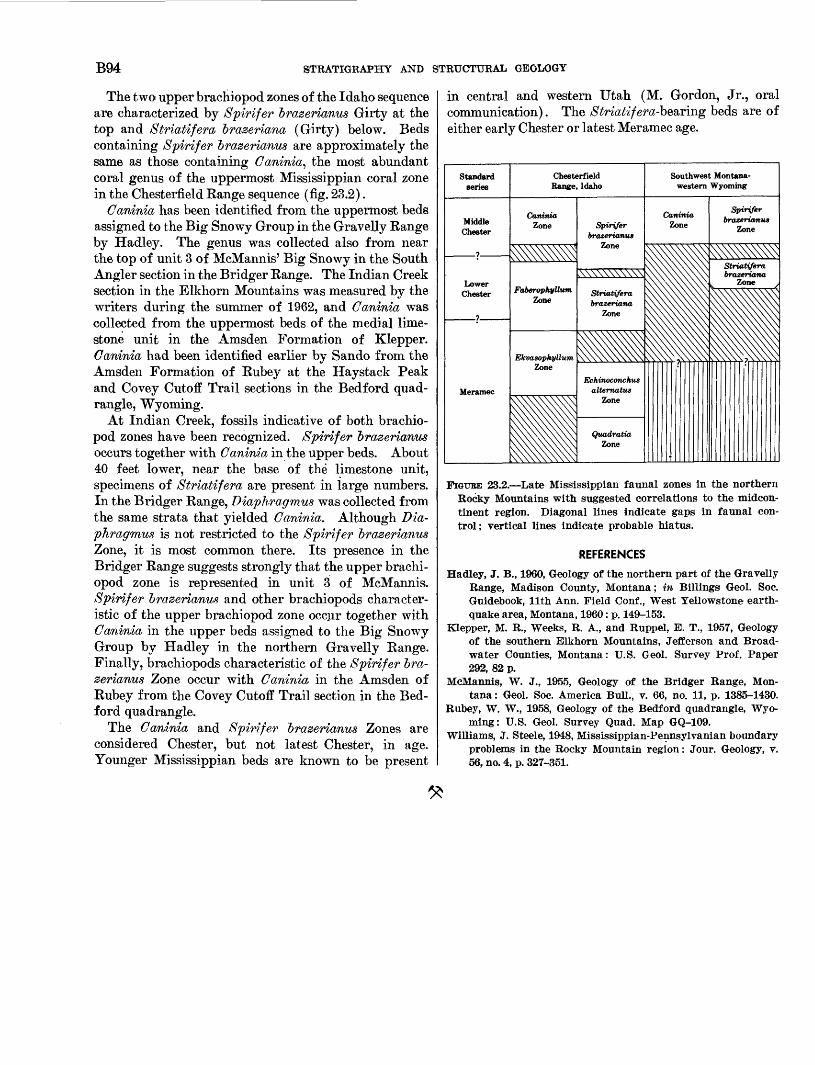
B94 STRATIGRAPHY AND STRUCTURAL GEOLOGY
The two upper brachiopod zones of the Idaho sequence are characterized by Spirifer brazerianus Girty at the top and Striatifera brazeriana (Girty) below. Beds containing Spirifer brazerianus are approximately the same as those containing Caninia, the most abundant coral genus of the uppermost Mississippian coral zone in the Chesterfield Eange sequence (fig. 23.2).
Caninia has been identified from the uppermost beds assigned to the Big Snowy Group in the Gravelly Eange by Hadley. The genus was collected also from near the top of unit 3 of McMannis' Big Snowy in the South Angler section in the Bridger Range. The Indian Creek section in the Elkhorn Mountains was measured by the writers during the summer of 1962, and Caninia was collected from the uppermost beds of the medial lime stone unit in the Amsden Formation of Klepper. Caninia had been identified earlier by Sando from the Amsden Formation of Rubey at the Haystack Peak and Covey Cutoff Trail sections in the Bedford quad rangle, Wyoming.
At Indian Creek, fossils indicative of both brachio pod zones have been recognized. Spirifer brazerianus occurs together with Caninia in the upper beds. About 40 feet lower, near the base of the limestone unit, specimens of Striatifera are present in large numbers. In the Bridger Range, Diapfiragmus was collected from the same strata that yielded Caninia. Although Dia- phragmus is not restricted to the Spirifer brazerianus Zone, it is most common there. Its presence in the Bridger Range suggests strongly that the upper brachi opod zone is represented in unit 3 of McMannis. Spi.rifer brazerianus and other brachiopods character istic of the upper brachiopod zone occur together with Caninia in the upper beds assigned to the Big Snowy Group by Hadley in the northern Gravelly Range. Finally, brachiopods characteristic of the Spirifer bra zerianus Zone occur with Caninia in the Amsden of Rubey from the Covey Cutoff Trail section in the Bed ford quadrangle.
The Caninia and Spirifer brazerianus Zones are considered Chester, but not latest Chester, in age. Younger Mississippian beds are known to be present
in central and western Utah (M. Gordon, Jr., oral communication). The Striatifera-bz&ring beds are of either early Chester or latest Meramec age.
FIGURE 23.2. Late Mississippian faunal zones in the northern Rocky Mountains with suggested correlations to the midcon- tinent region. Diagonal lines indicate gaps in faunal con trol; vertical lines indicate probable hiatus.
REFERENCES
Hadley, J. B., 1960, Geology of the northern part of the Gravelly Range, Madison County, Montana; in Billings Geol. Soc. Guidebook, llth Ann. Field Conf., West Yellowstone earth quake area, Montana, 1960: p. 149-153.
Klepper, M. R., Weeks, R. A., and Ruppel, E. T., 1957, Geology of the southern Elkhorn Mountains, Jefferson and Broad- water Counties, Montana: U.S. Geol. Survey Prof. Paper 292, 82 p.
McMannis, W. J., 1955, Geology of the Bridger Range, Mon tana : Geol. Soc. America Bull., v. 66, no. 11, p. 1385-1430.
Rubey, W. W., 1958, Geology of the Bedford quadrangle, Wyo ming: U.S. Geol. Survey Quad. Map GQ-109.
Williams, J. Steele, 1948, Mississippian-Pennsylvanian boundary problems in the Rocky Mountain region: Jour. Geology, v. mr no. 4, p. 327-351.
Article 24
EMENDATION OF THE KELVIN FORMATION AND MORRISON(?) FORMATION NEAR SALT LAKE CITY, UTAH
By MAX D. CRITTENDEN, JR., Menlo Park, Calif.
Abstract. The Kelvin Formation (Kelvin Conglomerate of Mathews, 1931, Cretaceous) is emended to include (a) the Parleys Member (new name), characterized by white modular limestone and called Morrison(?) Formation by Granger and Sharp (1952), and (b) an upper member consisting of con glomerate and siltstone. The Kelvin is correlated with the Cedar Mountain Formation.
Stratigraphic units previously assigned a Late Juras sic and Early Cretaceous age in the area immediately east of Salt Lake City, Utah, include (a) a thin white unit tentatively designated Morrison(?) by Granger and Sharp (1952, p. 14) and presumed to be Jurassic, and (b) a thick overlying unit consisting of reddish- brown conglomerate that they called the Kelvin Forma tion and assigned to the Cretaceous. Study of these units over a larger area indicates that both are prob ably Cretaceous. As a result, they are assigned to the Kelvin Formation, which is here emended to include two members.
KELVIN FORMATION
Name and history. The name Kelvin conglomerate was first used by Mathews (1931, p. 48) in describing the area of Parleys and Emigration Canyons.
The Kelvin conglomerate is named after Kelvin's Grove, a rather prominent and well established locality in Emigration Canyon. The formation is composed of very coarse, well rounded, well polished boulders cemented with a rather resistant cement. The boulders are from a few inches to two feet in diameter, the average ranging about 6 to 8 inches. The forma tion is somewhat variable in color, locally red, a reddish gray, and in some localities a pure gray. The formation is roughly stratified indicating a still water origin. The thickness of the formation appears to be somewhat variable.
Mathews did not include either a map or a measured section, and thus it is impossible now to be sure exactly what rocks he was talking about. The location of the original Kelvins Grove resort is uncertain, and the site determined by Granger on the basis of local in quiry (written communication, 1962) is in the unit now
designated as the Preuss Sandstone. Moreover, except for the reference to conglomerates described as "pure gray," there is nothing in Mathews' description to indi cate that he saw the white nodular limestones that characterize the unit called the Morrison (?) Formation by Granger.
The term Kelvin (?) Formation was applied by Eard- ley (1944, p. 838) to a section near Peoa on the Weber Eiver that is equivalent to the Kelvin in the type area but is less conglomeratic.
The term Kelvin Formation was later applied by Granger and Sharp (1952, p. 15) and by Granger (1953, p. 4) in the type area to about 1,500 feet of pale-red siltstone, sandstone, and conglomerate that occupies the interval between the top of the white marker bed con taining nodular limestone, and the base of the predomi nantly tan or yellowish sandstones designated the Frontier Formation. A measured section of this unit was publishe'd by Granger (1953, p. 11-12), but the formation was not formally redefined.
The name Morrison Formation was also used by Mathews in this area (1931, p. 47), but was applied to the beds immediately above the Twin Creek Limestone that are designated here and by Granger (1953, p. 4) as the Preuss Sandstone. The first use of the term Morrison (?) for the thin white marker beds was ap parently by Granger and Sharp (1952, p. 14), though this use was attributed partly to unpublished work of Stokes and others. More recently, Stokes (1959, p. 113) has suggested that this unit may be Cretaceous.
Definition. The Kelvin Formation as here defined consists of two members: a lower one, given the new name the Parleys Member, consisting of the distinctive light-colored unit called the Morrison(?) by Granger, and an upper member, unnamed, comprising the rocks to which the name Kelvin Formation was applied by Granger. The type section of the Parleys Member is in readouts on Highway 40 in the N%SWM sec. 8, T.
ART. 24 IN U.S. GEOL. SURVEY PROF. PAPER 475-B, PAGES B95-B98. 1963.
B95
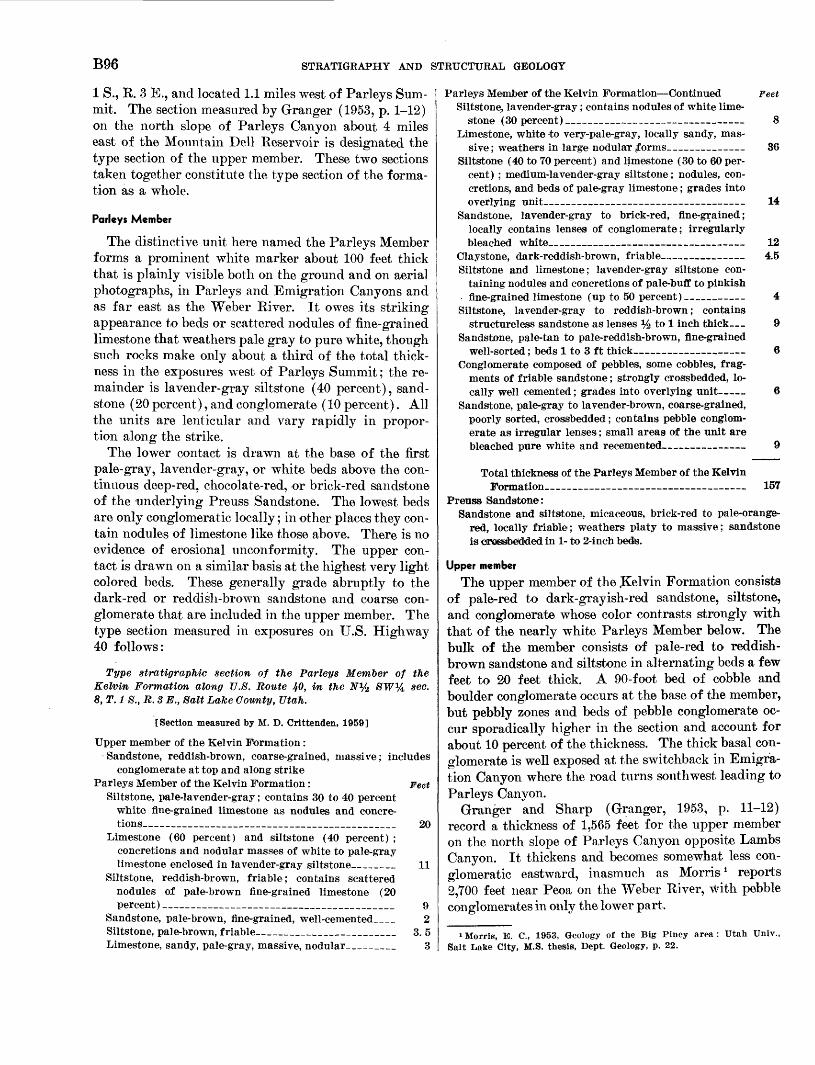
B96 STRATIGRAPHY AND STRUCTURAL GEOLOGY
1 S., R. 3 E., and located 1.1 miles west of Parleys Sum mit. The section measured by Granger (1953, p. 1-12) on the north slope of Parleys Canyon about 4 miles east of the Mountain Dell Reservoir is designated the type section of the upper member. These two sections taken together constitute the type section of the forma tion as a whole.
Parleys Member
The distinctive unit here named the Parleys Member forms a prominent white marker about 100 feet thick that is plainly visible both on the ground and on aerial photographs, in Parleys and Emigration Canyons and as far east as the Weber River. It owes its striking appearance to beds or scattered nodules of fine-grained limestone that weathers pale gray to pure white, though such rocks make only about a third of the total thick ness in the exposures west of Parleys Summit; the re mainder is lavender-gray siltstone (40 percent), sand stone (20 percent), and conglomerate (10 percent). All the units are lenticular and vary rapidly in propor tion along the strike.
The lower contact is drawn at the base of the first pale-gray, lavender-gray, or white beds above the con tinuous deep-red, chocolate-red, or brick-red sandstone of the 'underlying Preuss Sandstone. The lowest beds are only conglomeratic locally; in other places they con tain nodules of limestone like those above. There is no evidence of erosional unconformity. The upper con tact is drawn on a similar basis at the highest very light colored beds. These generally grade abruptly to the dark-red or reddish-brown sandstone and coarse con glomerate that are included in the upper member. The type section measured in exposures on U.S. Highway 40 follows:
Type stratigraphic section of the Parleys Member of the Kelvin Formation along U.S. Route 40, in the Ny2 SWV^ sec. 8, T. 1 8., R. 8 E., Salt Lake County, Utah.
[Section measured by M. D. Crittenden, 1959]
Upper member of the Kelvin Formation:Sandstone, reddish-brown, coarse-grained, massive; includes
conglomerate at top and along strike Parleys Member of the Kelvin Formation: Feet
Siltstone, pale-lavender-gray; contains 30 to 40 percent white fine-grained limestone as nodules and concre tions_______________________________ 20
Limestone (60 percent) and siltstone (40 percent) ; concretions and nodular masses of white to pale-gray limestone enclosed in lavender-gray siltstone_____ 11
Siltstone, reddish-brown, friable; contains scattered nodules of pale-brown fine-grained limestone (20 percent) ____________________________ 9
Sandstone, pale-brown, fine-grained, well-cemented__ 2Siltstone, pale-brown, friable_________________ 3. 5Limestone, sandy, pale-gray, massive, nodular______ 3
Parleys Member of the Kelvin Formation Continued FeetSiltstone, lavender-gray; contains nodules of white lime
stone (30 percent)____________ _ _ 8Limestone, white -to very-pale-gray, locally sandy, mas
sive; weathers in large nodular forms_________ 36Siltstone (40 to 70 percent) and limestone (30 to 60 per
cent) ; medium-lavender-gray siltstone; nodules, con cretions, and beds of pale-gray limestone; grades into overlying unit_________ 14
Sandstone, lavender-gray to brick-red, fine-grained; locally contains lenses of conglomerate; irregularly bleached white. _ 12
Claystone, dark-reddish-brown, friable _ 4.5Siltstone and limestone; lavender-gray siltstone con
taining nodules and concretions of pale-buff to pinkish fine-grained limestone (up to 50 percent) 4
Siltstone, lavender-gray to reddish-brown; contains structureless sandstone as lenses % to 1 inch thick 9
Sandstone, pale-tan to pale-reddish-brown, fine-grained well-sorted; beds 1 to 3 ft thick _____ 6
Conglomerate composed of pebbles, some cobbles, frag ments of friable sandstone; strongly crossbedded, lo cally well cemented; grades into overlying unit 6
Sandstone, pale-gray to lavender-brown, coarse-grained, poorly sorted, crossbedded; contains pebble conglom erate as irregular lenses; small areas of the unit are bleached pure white and recemented 9
Total thickness of the Parleys Member of the KelvinFormation 157
Preuss Sandstone:Sandstone and siltstone, micaceous, brick-red to pale-orange-
red, locally friable; weathers platy to massive; sandstone is ePQissbeidded in 1- to 2-inch beds.
Upper member
The upper member of the ^Kelvin Formation consists of pale-red to dark-grayish-red sandstone, siltstone, and conglomerate whose color contrasts strongly with that of the nearly white Parleys Member below. The bulk of the member consists of pale-red to reddish- brown sandstone and siltstone in alternating beds a few feet to 20 feet thick. A 90-foot bed of cobble and boulder conglomerate occurs at the base of the member, but pebbly zones and beds of pebble conglomerate oc cur sporadically higher in the section and account for about 10 percent of the thickness. The thick basal con glomerate is well exposed at the switchback in Emigra tion Canyon where the road turns southwest leading to Parleys Canyon.
Granger and Sharp (Granger, 1953, p. 11-12) record a thickness of 1,565 feet for the upper member on the north slope of Parleys Canyon opposite Lambs Canyon. It thickens and becomes somewhat less con glomeratic eastward, inasmuch as Morris 1 reports 2,700 feet near Peoa on the Weber River, with pebble conglomerates in only the lower part.
» Morris, E. C., 1953, Geology of the Big Piney area : Utah Univ., Salt Lake City, M.S. thesis, Dept. Geology, p. 22.
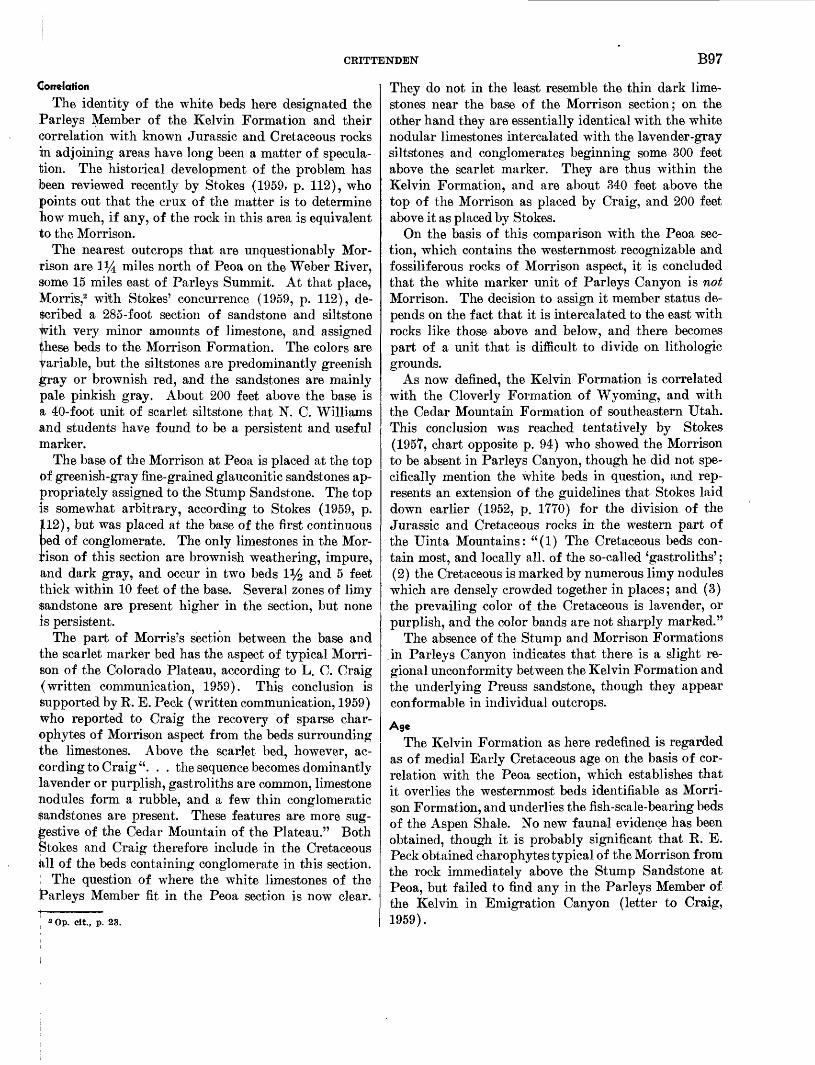
CRITTENDEN B97
Correlation
The identity of the white beds here designated the Parleys Member of the Kelvin Formation and their Correlation with known Jurassic and Cretaceous rocks in adjoining areas have long been a matter of specula tion. The historical development of the problem has been reviewed recently by Stokes (1959, p. 112), who points out that the crux of the matter is to determine how much, if any, of the rock in this area is equivalent to the Morrison.
The nearest outcrops that are unquestionably Mor rison are li/4 miles north of Peoa on the Weber River, Some 15 miles east of Parleys Summit. At that place, Morris,2 with Stokes' concurrence (1959, p. 112), de- $cribed a 285-foot section of sandstone and siltstone ^ith very minor amounts of limestone, and assigned these beds to the Morrison Formation. The colors are variable, but the siltstones are predominantly greenish j^ray or brownish red, and the sandstones are mainly pale pinkish gray. About 200 feet above the base is a 40-foot unit of scarlet siltstone that N. C. Williams and students have found to be a persistent and useful marker.
The base of the Morrison at Peoa is placed at the top Of greenish-gray fine-grained glauconitic sandstones ap propriately assigned to the Stump Sandstone. The top is somewhat arbitrary, according to Stokes (1959, p. 112), but was placed at the base of the first continuous >ed of conglomerate. The only limestones in the Mor rison of this section are brownish weathering, impure, and dark gray, and occur in two beds 1% and 5 feet thick within 10 feet of the base. Several zones of limy Sandstone are present higher in the section, but none is persistent.
The part of Morris's section between the base and the scarlet marker bed has the aspect of typical Morri- $on of the Colorado Plateau, according to L. C. Craig (written communication, 1959). This conclusion is Supported by R. E. Peck (written communication, 1959) jwho reported to Craig the recovery of sparse char- bphytes of Morrison aspect from the beds surrounding phe limestones. Above the scarlet bed, however, ac cording to Craig". . . the sequence becomes dominantly lavender or purplish, gastroliths are common, limestone nodules form a rubble, and a few thin conglomeratic Sandstones are present. These features are more sug gestive of the Cedar Mountain of the Plateau." Both ptokes and Craig therefore include in the Cretaceous till of the beds containing conglomerate in this section.
! The question of where the white limestones of the Parleys Member fit in the Peoa section is now clear.
a Op. cit., p. 23.
They do not in the least resemble the thin dark lime stones near the base of the Morrison section; on the other hand they are essentially identical with the white nodular limestones intercalated with the lavender-gray siltstones and conglomerates beginning some 300 feet above the scarlet marker. They are thus within the Kelvin Formation, and are about 340 feet above the top of the Morrison as placed by Craig, and 200 feet above it as placed by Stokes.
On the basis of this comparison with the Peoa sec tion, which contains the westernmost recognizable and fossiliferous rocks of Morrison aspect, it is concluded that the white marker unit of Parleys Canyon is not Morrison. The decision to assign it member status de pends on the fact that it is intercalated to the east with rocks like those above and below, and there becomes part of a unit that is difficult to divide on lithologic grounds.
As now defined, the Kelvin Formation is correlated with the Cloverly Formation of Wyoming, and with the Cedar Mountain Formation of southeastern Utah. This conclusion was reached tentatively by Stokes (1957, chart opposite p. 94) who showed the Morrison to be absent in Parleys Canyon, though he did not spe cifically mention the white beds in question, and rep resents an extension of the guidelines that Stokes laid down earlier (1952, p. 1770) for the division of the Jurassic and Cretaceous rocks in the western part of the Uinta Mountains: "(1) The Cretaceous beds con tain most, and locally all, of the so-called 'gastroliths'; (2) the Cretaceous is marked by numerous limy nodules which are densely crowded together in places; and (3) the prevailing color of the Cretaceous is lavender, or purplish, and the color bands are not sharply marked."
The absence of the Stump and Morrison Formations .in Parleys Canyon indicates that there is a slight re gional unconformity between the Kelvin Formation and the underlying Preuss sandstone, though they appear conformable in individual outcrops.
Age
The Kelvin Formation as here redefined is regarded as of medial Early Cretaceous age on the basis of cor relation with the Peoa section, which establishes that it overlies the westernmost beds identifiable as Morri son Formation, and underlies the fish-scale-bearing beds of the Aspen Shale. No new faunal evidence has been obtained, though it is probably significant that R. E. Peck obtained charophytes typical of the Morrison from the rock immediately above the Stump Sandstone at Peoa, but failed to find any in the Parleys Member of the Kelvin in Emigration Canyon (letter to Craig, 1959).
B98 STRATIGRAPHY AND STRUCTURAL GEOLOGY
REFERENCESEardley, A. J., 1944, Geology of the north-central Wasatch Moun
tains, Utah: Geol. Soc. America Bull., v. 55, p. 819-894.Granger, A. E., 1953, Stratigraphy of the Wasatch Range near
Salt Lake City, Utah: U.S. Geol. Survey Circ. 296, 14, p.Granger, A. E., and Sharp, B. J., 1952, Geology of the Wasatch
Mountains east of Salt Lake City, City Creek to Parleys Canyon: Utah Geol. Soc. Guidebook, no. 8, p. 1-37.
Mathews, A. A. L., 1931, Mesozoic stratigraphy of the Central Wasatch Mountains: Oberlin College Lab. Bull., new. ser., no. 1, 50 p.
Stokes, W. L., 1952, Lower Cretaceous in Colorado Plateau:
Am. Assoc. Petroleum Geologists Bull., v. 36, No. 9, p.
1766-1776.
1957, Jurassic system of the southern flank of the Uinta Mountains, in Intermountain Assoc. Petroleum Geologists
Guidebook, 8th Ann. Field Conf.: p. 92-96.
1959 Jurassic Rocks of the Wasatch Range and vicinity,
in Intermountain Assoc. Petroleum Geologists Guidebook,
10th Ann. Field Conf.: p. 109-114.
Article 25
APACHE CREEK SANDSTONE MEMBER OF THE PIERRE SHALE OF SOUTHEASTERN COLORADO
By GLENN R. SCOTT and WILLIAM A. COBBAN, Denver, Colo.
Abstract. An 82-foot-thick sandstone bed that crops out on North Apache Creek, Huerf ano County, Colo., is here adopted as the Apache Creek Sandstone Member of the Pierre Shale. The member, shaly in the lower part and sandy above, overlies the transition member and underlies the Sharon Springs Member of the Pierre Shale.
The lower part of the Pierre Shale between Pueblo ,and the Huerfano River contains a persistent sandy unit whose upper part was originally called the "Apache sandstone," later the Apache Creek Sandstone Member of the Pierre Shale. The original description jof the Apache Creek Sandstone Member did not desig nate a type locality or type section. The purpose of this [article is to redefine the member, establish its strati- graphic, boundaries, designate a reference locality, de scribe the reference section, and discuss its fossils, age, and correlation.
The first published reference to the Apache Creek was by Lavington (1933, p. 399) who stated, "In the Walsenburg district this zone [the barren zone] con tains a 20-foot sandstone member which H.W.C. Prom- mel in an unpublished report has called the Apache sandstone." Later, in a catalog of stratigraphic names used in the Raton basin and vicinity, Mitchell and others (1956, p. 131) referred to this unit as the Apache Creek Sandstone Member of the Pierre Shale. John son and Stephens (1954) reported a 10-foot bed of sand stone approximately 500 feet above the base of the Pierre Shale on the western flank of the Greenhorn anticline about a mile south of the Huerfano River, and stated that this sandstone may be what Prommel called the "Apache sandstone." However, Johnson (1958, p. 563) stated that this sandstone does not crop out in the Walsenburg area.
The reference locality of the Apache Creek Sand stone Member is designated as the west-facing valley wall on the east side of a valley tributary to North Apache Creek in the SE}4 sec. 30, T. 25 S., R. 67 W.,
Huerfano County, Colo. At the reference locality the member overlies nonsandy shale of the transition mem ber of the Pierre Shale and is overlain by hard carbo naceous siltstone or silty shale here assigned to the Sharon Springs Member of the Pierre Shale. Both the Apache Creek Sandstone and the Sharon Springs Members are completely exposed.
At its reference locality the member as here redefined is 82 feet thick. A lower sandy shale is 27 feet thick and contains small ironstone concretions; a middle con cretionary sandstone is 25 feet thick and contains sand stone concretions more than 15 feet in diameter; an upper 30-foot-thick sandstone ("Apache sandstone" of Prommel?) forms a prominent cliff. The following stratigraphic section was measured at the reference section.
Reference section measured north of North Apache Creek on west face of Mil in SEy^ sec. 30, T. 25 8., R. 67 W., Huerfano County, Colo., at reference locality of Apache Creek Sand stone Member of Pierre Shale
[Measured with Jacob staff],
Pierre Shale (part) :Sharon Springs Member (part) : Ft in
Shale, olive-gray, sandy in lower 2 ft, silty in upper9 ft 6 in__________ 11 6
Apache Creek Sandstone Member: 19. Sandstone, yellowish-gray, massive; forms
cliffs; contains 1-ft gray shaly bed in middle _____ 15 0
18. Sandstone, yellowish-gray, platy; softer thanbed 19; locally forms cliff _ 15 0
17. Sandstone concretion, yellowish-gray to yellow ish-orange, 15-ft diameter; separated later ally from similar concretions by soft shaly sandstone; contains large smooth baculites 7 0
16. Sandstone, gray, shaly 1 8 15. Sandstone, dark-yellowish-orange, concretion
ary 8 14. Shale, gray, sandy 14 0 13. Sandstone, yellowish-gray 2 0
ART. 25 IN U.S. GEOL.. SURVEY PROF. PAPER 475-B, PAGES B99-B101. 1963.
B99
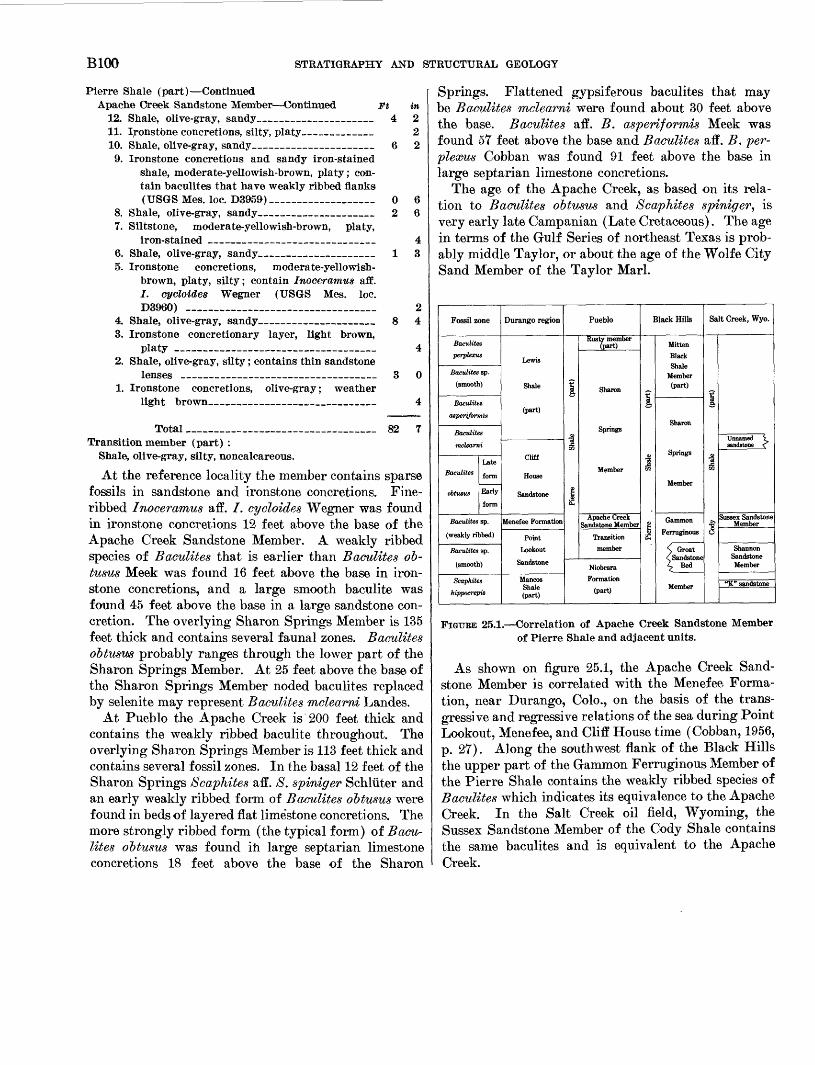
B100 STRATIGRAPHY AND STRUCTURAL GEOLOGY
Pierre Shale (part) ContinuedApache Creek Sandstone Member Continued Ft in
12. Shale, olive-gray, sandy______________ 4 2 11. Ironstone concretions, silty, platy________ 2 10. Shale, olive-gray, sandy___ __________ 6 2
9. Ironstone concretions and sandy iron-stained shale, moderate-yellowish-brown, platy; con tain baculites that have weakly ribbed flanks (USGS Mes. loc. D3959) ____________ 0 6
8. Shale, olive-gray, sandy______________ 2 6 7. Siltstone, moderate-yellowish-brown, platy,
iron-stained ___________________ 4 6. Shale, olive-gray, sandy_____________ 1 3 5. Ironstone concretions, moderate-yellowish-
brown, platy, silty; contain Inoceramus aff. I. cycloides Wegner (USGS Mes. loc. D3960) _______________________ 2
4. Shale, olive-gray, sandy_____________ 8 4 3. Ironstone concretionary layer, light brown,
platy __ _________________________ 42. Shale, olive-gray, silty; contains thin sandstone
lenses _____________________ 3 01. Ironstone concretions, olive-gray; weather
light brown____________________ 4
Total ______________________ 82 7 Transition member (part) :
Shale, olive-gray, silty, noncalcareous.
At the reference locality the member contains sparse fossils in sandstone and ironstone concretions. Fine- ribbed Inoceramus aff. /. cycloides Wegner was found in ironstone concretions 12 feet above the base of the Apache Creek Sandstone Member. A weakly ribbed species of Baculites that is earlier than Baculites ob- tusus Meek was found 16 feet above the base in iron stone concretions, and a large smooth baculite was found 45 feet above the base in a large sandstone con cretion. The overlying Sharon Springs Member is 135 feet thick and contains several faunal zones. Baculites obtusus probably ranges through the lower part of the Sharon Springs Member. At 25 feet above the base of the Sharon Springs Member noded baculites replaced by selenite may represent Baculites mcleami Landes.
At Pueblo the Apache Creek is 200 feet thick and contains the weakly ribbed baculite throughout. The overlying Sharon Springs Member is 113 feet thick and contains several fossil zones. In the basal 12 feet of the Sharon Springs Scaphites aff. S. spiniger Schliiter and an early weakly ribbed form of Baculites obtusus were found in beds of layered flat lime'stone concretions. The more strongly ribbed form (the typical form) of Bacu lites obtusus was found in large septarian limestone concretions 18 feet above the base of the Sharon
Springs. Flattened gypsiferous baculites that may be Baculites mclearni were found about 30 feet above the base. Baculites aff. B. asperiformis Meek was found 57 feet above the base and Baculites aff. B. per- plexus Cobban was found 91 feet above the base in large septarian limestone concretions.
The age of the Apache Creek, as based on its rela tion to Baculites obtusus and Scaphites spiniger, is very early late Campanian (Late Cretaceous). The age in terms of the Gulf Series of northeast Texas is prob ably middle Taylor, or about the age of the Wolf e City Sand Member of the Taylor Marl.
Fossil zone
Baculites
perpleacus
Baculites sp.
(smooth)
Baculites
asperiformts
Baculites
mclearni
Baculites
obtusus
Baculites
Late
form
Early
form
sp.
(weakly ribbed)
Baculites sp.
(smooth)
Scaphites
hippocrepii
Durango region
Lewis
Shale
(part)
Cliff
House
Sandstone
Menefee Formation
Point
Lookout
Sandstone
Mancos Shale (part)
Pueblo
1
£
Rusty member (part)
Sharon
Springs
Member
Apache Creek Sandstone Member
Transition
member
Niobrara
Formation
(part)
Black Hills
£
Mitten
Black Shale
Member (part)
Sharon
Springs
Member
Gammon
Ferruginous
< Groat <f Sandstone £. Bed
Member
Salt Creek, Wyo.
3£
>,3
Unnamed ? sandstone C
Sussex Sandstone Member
Shannon Sandstone Member
"K" sandstone
FIGUBE 25.1. Correlation of Apache Creek Sandstone Member of Pierre Shale and adjacent units.
As shown on figure 25.1, the Apache Creek Sand stone Member is correlated with the Menefee Forma tion, near Durango, Colo., on the basis of the trans- gressive and regressive relations of the sea during Point Lookout, Menefee, and Cliff House time (Cobban, 1956, p. 27). Along the southwest flank of the Black Hills the upper part of the Gammon Ferruginous Member of the Pierre Shale contains the weakly ribbed species of Baculites which indicates its equivalence to the Apache Creek. In the Salt Creek oil field, Wyoming, the Sussex Sandstone Member of the Cody Shale contains the same baculites and is equivalent to the Apache Creek.
SCOTT AND COBBAN B101
REFERENCES
Cobban, W. A., 1956, The Pierre shale and older Cretaceous rocks in southeastern Colorado, in Rocky Mtn. Assoc. Geologists Guidebook, Geology of the Raton basin, Colorado 1956: p. 25-27.
Johnson, R. B., 1958, Geology and coal resources of the Walsen- burg area, Huerfano County, Colorado: U.S. Geol. Survey Bull. 1042-O, p. 557-583.
Johnson, R. B., and Stephens, J. G., 1954, Geology of the La Areta area, Huerfano County, Colorado: U.S. Geol. Survey Oil and Gas Inv. Map OM-146.
Lavington, C. S., 1933, Montana group in eastern Colorado: Ani. Assoc. Petroleum Geologists Bull., v. 17, no. 4, p. 397-410.
Mitchell, J. G., Greene, John, and Gould, D. B., 1956, Catalog of stratigraphic names used in Raton basin and vicinity [Colo.- N. Mex.], in Rocky Mtn. Assoc. Geologists Guidebook, Geol ogy of the Raton basin, Colorado, 1956: p. 131-135.
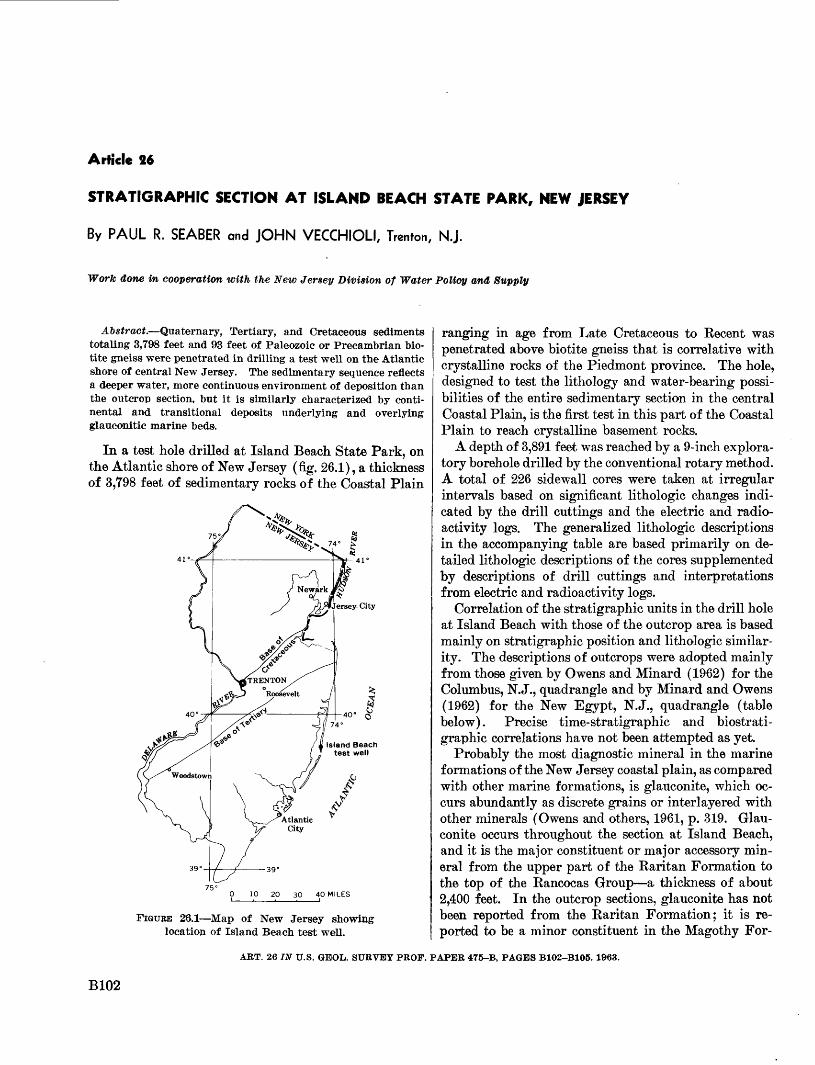
Article 26
STRATIGRAPHIC SECTION AT ISLAND BEACH STATE PARK, NEW JERSEY
By PAUL R. SEABER and JOHN VECCHIOLI, Trenton, NJ.
Work done in cooperation with the New Jersey Division of Water Policy and Supply
Abstract. Quaternary, Tertiary, and Cretaceous sediments totaling 3,798 feet and 93 feet of Paleozoic or Precambrian bio- tite gneiss were penetrated in drilling a test well on the Atlantic shore of central New Jersey. The sedimentary sequence reflects a deeper water, more continuous environment of deposition than the outcrop section, but it is similarly characterized by conti nental and transitional deposits underlying and overlying glauconitic marine beds.
In a test hole drilled at Island Beach State Park, on the Atlantic shore of New Jersey (fig. 26.1), a thickness of 3,798 feet of sedimentary rocks of the Coastal Plain
FIGURE 26.1 Map of New Jersey showing location of Island Beach test well.
ranging in age from Late Cretaceous to Eecent was penetrated above biotite gneiss that is correlative with crystalline rocks of the Piedmont province. The hole, designed to test the lithology and water-bearing possi bilities of the entire sedimentary section in the central Coastal Plain, is the first test in this part of the Coastal Plain to reach crystalline basement rocks.
A depth of 3,891 feet was reached by a 9-inch explora tory borehole drilled by the conventional rotary method. A total of 226 sidewall cores were taken at irregular intervals based on significant lithologic changes indi cated by the drill cuttings and the electric and radio activity logs. The generalized lithologic descriptions in the accompanying table are based primarily on de tailed lithologic descriptions of the cores supplemented by descriptions of drill cuttings and interpretations from electric and radioactivity logs.
Correlation of the stratigraphic units in the drill hole at Island Beach with those of the outcrop area is based mainly on stratigraphic position and lithologic similar ity. The descriptions of outcrops were adopted mainly from those given by Owens and Minard (1962) for the Columbus, N.J., quadrangle and by Minard and Owens (1962) for the New Egypt, N.J., quadrangle (table below). Precise time-stratigraphic and biostrati- graphic correlations have not been attempted as yet.
Probably the most diagnostic mineral in the marine formations of the New Jersey coastal plain, as compared with other marine formations, is glauconite, which oc curs abundantly as discrete grains or interlayered with other minerals (Owens and others, 1961, p. 319. Glau conite occurs throughout the section at Island Beach, and it is the major constituent or major accessory min eral from the upper part of the Raritan Formation to the top of the Eancocas Group a thickness of about 2,400 feet. In the outcrop sections, glauconite has not been reported from the Karitan Formation; it is re ported to be a minor constituent in the Magothy For-
ART. 26 IN U.S. GEOL. SURVEY PROF. PAPER 475-B, PAGES B102-B105. 1963.
B102

SEABER AND VECCHIOLI BIOS
and thickness of formations exposed from Roosevelt Jo Woodstown on the New Jersey coastal plain
[Modified after Minard and Owens, 1960]
Age
Quaternary
"Tertiary
i
Cretaceous
Series
Pleistocene
Pliocene (?) and Miocene (?)
Miocene
Eocene
Paleocene
Late Cretaceous
Group
Rancocas
Monmouth
Matawan
Formation
Cape May
Cohansey Sand
Kirkwood
Manasquan
Vin cento wn Hornergtown Sand
Red Bank Sand Navesink Mount Laurel Sand
Wenonah Marshalltown Englishtown Woodbury Clay Merchantville
Magothy Raritan
Ex posed thick ness (feet)
(?)
0-160
30-90
0-50
0-60 5-30
0-80 5-30
20-70
20-60 10-22 40-70 0-55
50-70
20-50 0-150
mation; and it is the major constituent or a major accessory from the base of the Matawan Group to the top of the Kancocas Group.
Although a general similarity exists between the rocks at Island Beach and their outcrop equivalents, several striking differences, other than the occurrence of glauconite, are readily apparent.
The basement complex of Paleozoic or Precambrian iage, which underlies the entire sedimentary sequence, is represented by pegmatitic biotite gneiss at a depth of 3,798 feet. The upper 64 feet is highly weathered and has the appearance of saprolite. The gneiss is prob ably a correlative of rocks of the Piedmont province that crop out west of the Fall Line (base of the Creta ceous, fig. 26.1). The Raritan Formation of Late Cre- itaceous age, which overlies the basement complex, ! extends from 2,070 to 3,798 feet and is similar only in jits lower 1,004 feet to the continental Raritan exposed !in outcrop. The upper 724 feet appears to have been deposited in a transitional or marine environment and to have no exposed lithologic equivalent. The overlying Magothy Formation has a deeper water aspect than the Magothy in outcrop, the former being thicker, finer grained, and more glauconitic and fossiliferous.
The Matawan and Monmouth Groups, which were penetrated between 1,162 and 1,810 feet, also reflect a deeper water environment of deposition. These de posits are thicker, less quartzose, and more glauconitic, calcareous, and fossiliferous than their outcrop equiva lents. At Island Beach, the dominantly quartzose sand
beds that are present in the outcrop of the Matawan and Monmouth Groups are either finer grained, such as the Red Bank Sand and Wenonah Formation, thin ner, such as the Mount Laurel Sand, or entirely absent, such as the Englishtown Formation (see accompany ing log). The Englishtown Formation is considered to be absent because no lithologic units comparable to those in the outcrop section were found in the appropriate stratigraphic interval. The Navesink and Marshall- town Formations are lithologically similar to their outcrop equivalents, although the Marshalltown is considerably thicker at Island Beach. Lithologic units similar to the Merchantville Formation and Woodbury Clay occur between 1,598 and 1,810 feet but as alternat ing interbedded layers rather than distinct adjacent formations as in the outcrop.
The overlying Rancocas Group is divided into three formations* in the outcrop but could not be subdivided at Island Beach. The unit occurs between 400 and 1,162 feet and grades from a basal glauconitic silt and clay unit not present in the outcrop to a glauconite and quartz sand at the top. The overlying Kirkwood For mation is similar to its occurrence elsewhere in the Coastal Plain. The Cohansey Sand is represented here only by a clay unit similar to clays comprising a small part of the formation elsewhere in the Coastal Plain. The Cape May Formation (46 feet thick) and the Beach complex (74 feet) at the top of the section are similar to units described elsewhere along the coast.
The thickening of the entire section between the out crop and Island Beach is the result of thickening of individual beds and the addition of lithologic units not present in the outcrop section. In the Island Beach well, the thickest additional lithologic units occur where distinct unconformities are present in the outcrop. These units are the marine or transitional deposits (724 feet thick) at the top of the Raritan and the glauconitic clay and silt (370 feet) at the base of the Rancocas Group. The presence of these units in the Island Beach well indicates that the shoreline lay between Island Beach and the outcrop near Trenton during their deposi tion. The thicker section and additional units also sug gest more continuous deposition at Island Beach throughout the Cretaceous and Tertiary than at the outcrop section.
In summary, the sedimentary sequence penetrated in the drilling of the test well at Island Beach reflects deeper water and more continuous deposition than does the outcrop section, but the sequence in both places is characterized by continental and transitional deposits underlying and overlying glauconitic marine beds.
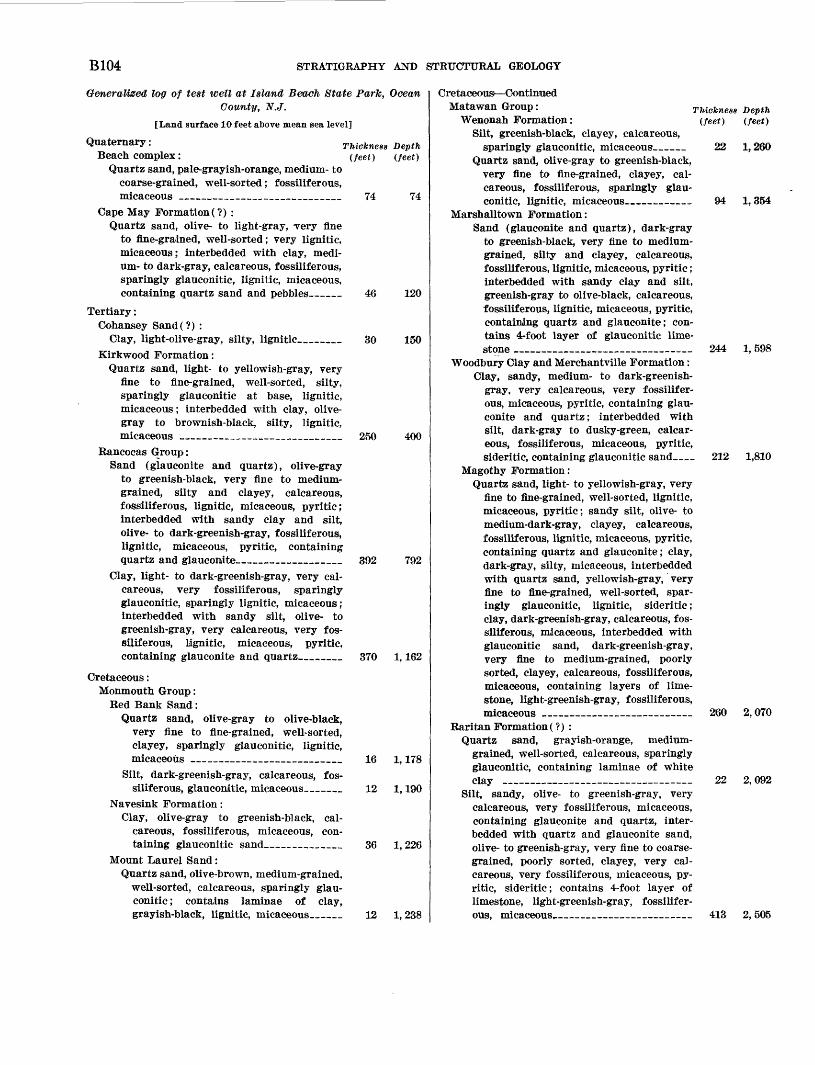
B104 STRATIGRAPHY AND STRUCTURAL GEOLOGY
Generalised log of test well at Island Beach State Park, Ocean County, N.J.
[Land surface 10 feet above mean sea level]
Quaternary: Beach complex:
Quartz sand, pale-grayish-orange, medium- to coarse-grained, well-sorted; fossiliferous, micaceous _____________________________
Cape May Formation( ?) :Quartz sand, olive- to light-gray, very fine
to fine-grained, well-sorted; very lignitic, micaceous; interbedded with clay, medi um- to dark-gray, calcareous, fossiliferous, sparingly glauconitic, lignitic, micaceous, containing quartz sand and pebbles______
Thickness Depth (feet) (feet)
74 74
46 120
Tertiary:Cohansey Sand(?) :
Clay, light-olive-gray, silty, lignitic_____ 30 150Kirkwood Formation:
Quartz sand, light- to yellowish-gray, very fine to fine-grained, well-sorted, silty, sparingly glauconitic at base, lignitic, micaceous; interbedded with clay, olive- gray to brownish-black, silty, lignitic, micaceous __________________ 250 400
Rancocas Group:Sand (glauconite and quartz), olive-gray
to greenish-black, very fine to medium- grained, silty and clayey, calcareous, fossiliferous, lignitic, micaceous, pyritic; interbedded with sandy clay and silt, olive- to dark-greenish-gray, fossiliferous, lignitic, micaceous, pyritic, containing quartz and glauconite____________ 392 792
Clay, light- to dark-greenish-gray, very cal careous, very fossiliferous, sparingly glauconitic, sparingly lignitic, micaceous; interbedded with sandy silt, olive- to greenish-gray, very calcareous, very fos siliferous, lignitic, micaceous, pyritic, containing glauconite and quartz_____ 370 1,162
Cretaceous: Monmouth Group:
Red Bank Sand:Quartz sand, olive-gray to olive-black,
very fine to fine-grained, well-sorted, clayey, sparingly glauconitic, lignitic, micaceous _________________ 16 1,178
Silt, dark-greenish-gray, calcareous, fos siliferous, glauconitic, micaceous____ 12 1,190
Navesink Formation: Clay, olive-gray to greenish-black, cal
careous, fossiliferous, micaceous, con taining glauconitic sand_________ 36 1,226
Mount Laurel Sand:Quartz sand, olive-brown, medium-grained,
well-sorted, calcareous, sparingly glau conitic; contains laminae of clay, grayish-black, lignitic, micaceous____ 12 1, 238
Depth (feet)
Cretaceous ContinuedMatawan Group: Thickness
Wenonah Formation: (feet) Silt, greenish-black, clayey, calcareous,
sparingly glauconitic, micaceous _ 22 1,260 Quartz sand, olive-gray to greenish-black,
very fine to fine-grained, clayey, cal careous, fossiliferous, sparingly glau conitic, lignitic, micaceous_______ 94 1,354
Marshalltown Formation:Sand (glauconite and quartz), dark-gray
to greenish-black, very fine to medium- grained, silty and clayey, calcareous, fossiliferous, lignitic, micaceous, pyritic; interbedded with sandy clay and silt, greenish-gray to olive-black, calcareous, fossiliferous, lignitic, micaceous, pyritic, containing quartz and glauconite; con tains 4-foot layer of glauconitic lime stone _____________________ 244 1,598
Woodbury Clay and Merchantville Formation : Clay, sandy, medium- to dark-greenish-
gray, very calcareous, very fossilifer ous, micaceous, pyritic, containing glau conite and quartz; interbedded with silt, dark-gray to dusky-green, calcar eous, fossiliferous, micaceous, pyritic, sideritic, containing glauconitic sand 212 1,810
Magothy Formation:Quartz sand, light- to yellowish-gray, very
fine to fine-grained, well-sorted, lignitic, micaceous, pyritic; sandy silt, olive- to medium-dark-gray, clayey, calcareous, fossiliferous, lignitic, micaceous, pyritic, containing quartz and glauconite; clay, dark-gray, silty, micaceous, interbedded with quartz sand, yellowish-gray, very fine to fine-grained, well-sorted, spar ingly glauconitic, lignitic, sideritic; clay, dark-greenish-gray, calcareous, fos siliferous, micaceous, interbedded with glauconitic sand, dark-greenish-gray, very fine to medium-grained, poorly sorted, clayey, calcareous, fossiliferous, micaceous, containing layers of lime stone, light-greenish-gray, fossiliferous, micaceous ___________-__ 260 2,070
Raritan Formation (?) : Quartz sand, grayish-orange, medium-
grained, well-sorted, calcareous, sparingly glaueonitic, containing laminae of white clay ______________________ 22 2,092
Silt, sandy, olive- to greenish-gray, very calcareous, very fossiliferous, micaceous, containing glauconite and quartz, inter bedded with quartz and glauconite sand, olive- to greenish-gray, very fine to coarse grained, poorly sorted, clayey, very cal careous, very fossiliferous, micaceous, py ritic, sideritic; contains 4-foot layer of limestone, light-greenish-gray, fossilifer ous, micaceous,.-____ ____ _ 413 2, 505
SEABER AND VECCHIOLI B105
Cretaceous Continued Thickness Depth Raritan Formation (?) Continued (feet) (feet)
Clay, light- to greenish-gray, calcareous, fos- siliferous, glauconitic, micaceous; inter- bedded with quartz sand, light- to yellow ish-gray, fine- to coarse-grained, lignitic, sparingly micaceous, pyritic, sideritic__ 289 2, 794
Quartz sand, light- to yellowish-gray, very fine to coarse-grained, lignitic, micaceous, sideritic; interbedded with clay, light- to dark-gray and red, lignitic, limonitic, micaceous, pyritic; contains two 3-foot layers of shale, black, carbonaceous, mica ceous, pyritic__________________ 1,004 3,798
Paleozoic or Precambrian:Gneiss, biotite, weathered (saprolite?) ____ 64 3,862 Gneiss, biotite, with pegmatite veins______ 29 3, 891
REFERENCES
Minard, J. P., and Owens, J. P., 1960, Differential subsidence of the southern part of the New Jersey coastal plain since early Late Cretaceous time: Art. 82 in U. S. Geol. Survey Prof. Paper 400-B, p. B184-B186.
1962, Pre-Quaternary geology of the New Egypt quad rangle, New Jersey: U.S. Geol. Survey Geol. Quad. Map GQ-161.
Owens, J. P., and Minard, J. P., 1962, Pre-Quaternary geology of the Columbus quadrangle, New Jersey: U.S. Geol. Sur vey Geol. Quad. Map GQ-160.
Owens, J. P., Minard, J. P., and Blackmon, P. D., 1961, Distri bution of clay-sized sediments in the coastal plain forma tions near Trenton, New Jersey: Art. 263 in U.S. Geol. Survey Prof. Paper 424-C, p. C317-C319.
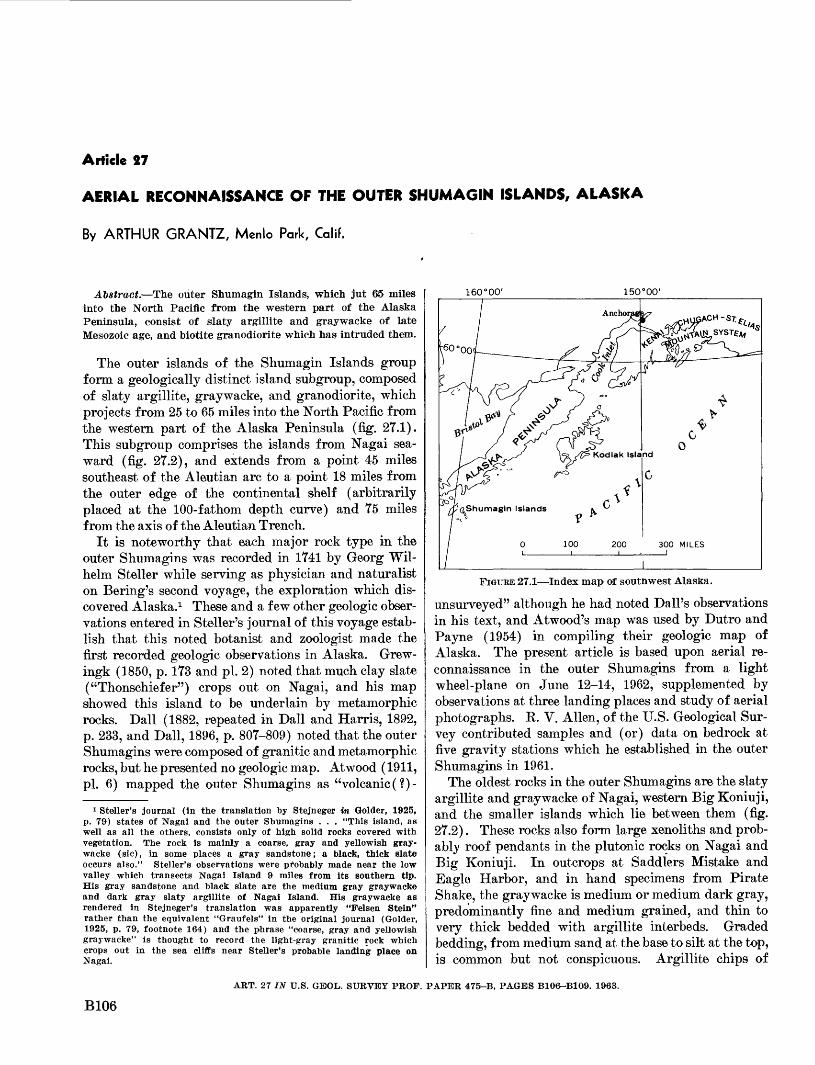
Article 27
AERIAL RECONNAISSANCE OF THE OUTER SHUMAGIN ISLANDS, ALASKA
By ARTHUR GRANTZ, Menlo Park, Calif.
Abstract. The outer Shumagin Islands, which jut 65 miles into the North Pacific from the western part of the Alaska Peninsula, consist of slaty argillite and graywacke of late Mesozoic age, and biotite granodiorite which has intruded them.
The outer islands of the Shumagin Islands group form a geologically distinct island subgroup, composed of slaty argillite, graywacke, and granodiorite, which projects from 25 to 65 miles into the North Pacific from the western part of the Alaska Peninsula (fig. 27.1). This subgroup comprises the islands from Nagai sea ward (fig. 27.2), and extends from a point 45 miles southeast of the Aleutian arc to a point 18 miles from the outer edge of the continental shelf (arbitrarily placed at the 100-fathom depth curve) and 75 miles from the axis of the Aleutian Trench.
It is noteworthy that each major rock type in the outer Shumagins was recorded in 1741 by Georg Wil- helm Steller while serving as physician and naturalist on Bering's second voyage, the exploration which dis covered Alaska.1 These and a few other geologic obser vations entered in Steller's journal of this voyage estab lish that this noted botanist and zoologist made the first recorded geologic observations in Alaska. Grew- ingk (1850, p. 173 and pi. 2) noted that much clay slate ("Thonschiefer") crops out on Nagai, and his map showed this island to be underlain by metamorphic rocks. Dall (1882, repeated in Dall and Harris, 1892, p. 233, and Dall, 1896, p. 807-809) noted that the outer Shumagins were composed of granitic and metamorphic rocks, but he presented no geologic map. Atwood (1911, pi. 6) mapped the outer Shumagins as "volcanic(?)-
1 Steller's journal (in the translation by Stejneger in Colder, 1925, p. 79) states of Nagai and the outer Shumagins . . . "This island, as well as all the others, consists only of high solid rocks covered with vegetation. The rock is mainly a coarse, gray and yellowish gray wacke (sic), in some places a gray sandstone; a black, thick slate occurs also." Steller's observations were probably made near the low valley which transects Nagai Island 9 miles from its southern tip. His gray sandstone and black slate are the medium gray graywacke and dark gray slaty argillite of Nagai Island. His graywacke as rendered in Stejneger's translation was apparently "Felsen Stein" rather than the equivalent "Graufels" in the original journal (Golder, 1925, p. 79, footnote 164) and the phrase "coarse, gray and yellowish graywacke" is thought to record the light-gray granitic rock which crops out in the sea cliffs near Steller's probable landing place on Nagai.
160° 00'
FIGURE 27.1 Index map of soutnwest Alaska.
unsurveyed" although he had noted Ball's observations in his text, and Atwood's map was used by Dutro and Payne (1954) in compiling their geologic map of Alaska. The present article is based upon aerial re connaissance in the outer Shumagins from a light wheel-plane on June 12-14, 1962, supplemented by observations at three landing places and study of aerial photographs. E. V. Alien, of the U.S. Geological Sur vey contributed samples and (or) data on bedrock at five gravity stations which he established in the outer Shumagins in 1961.
The oldest rocks in the outer Shumagins are the slaty argillite and graywacke of Nagai, western Big Koniuji, and the smaller islands which lie between them (fig. 27.2). These rocks also form large xenoliths and prob ably roof pendants in the plutonic rocks on Nagai and Big Koniuji. In outcrops at Saddlers Mistake and Eagle Harbor, and in hand specimens from Pirate Shake, the graywacke is medium or medium dark gray, predominantly fine and medium grained, and thin to very thick bedded with argillite interbeds. Graded bedding, from medium sand at the base to silt at the top, is common but not conspicuous. Argillite chips of
ART. 27 IN U.S. GEOL. SURVEY PROF. PAPER 475-B, PAGES B1O6-B10Q. 1963.
B106
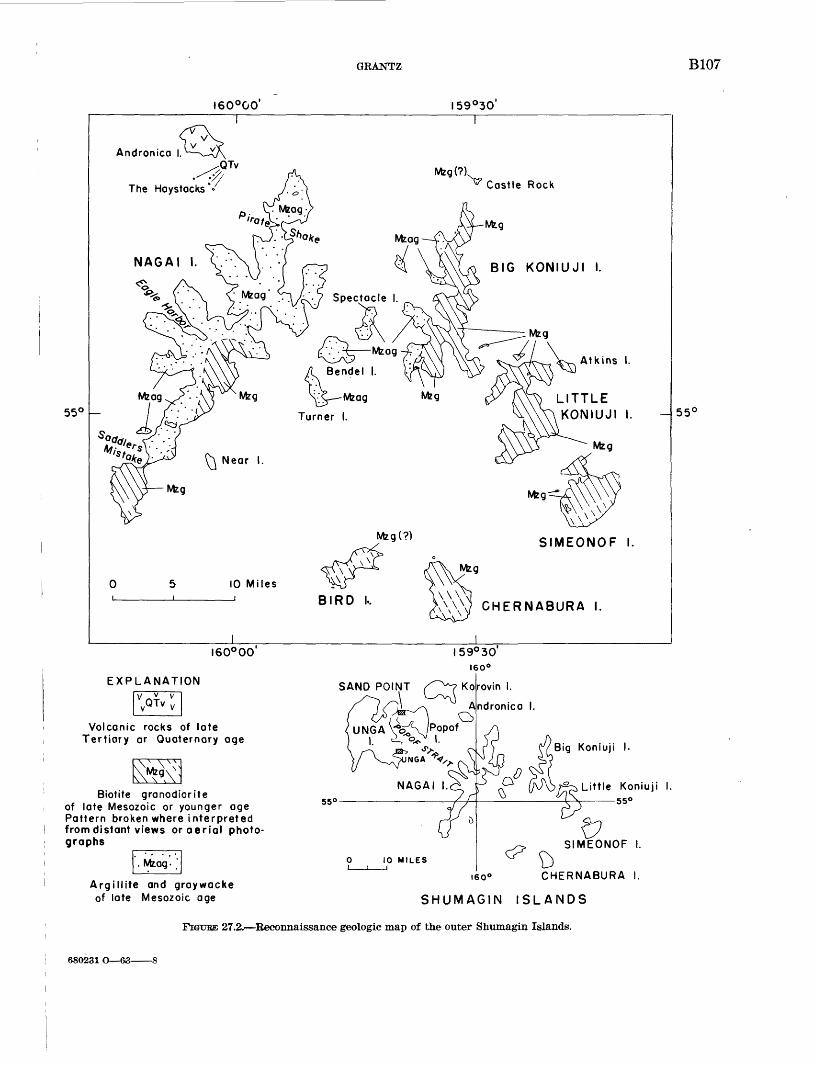
GRANTZ B107
I60°00'
55 C
I59°30'
I
Mzg(?)
Spectacle I.
Mzag
/^ Bendel I.
Mzag Mzg
Turner I.
T&.Y-:Near I.
Mzg(?)
10 Miles
BIRD I..
SIMEONOF I.
K\\\J CHERNABURA I.
55 (
I60°00'
EXPLANATION
Volcanic rocks of lateTertiary or Quaternary age
Biotite granodionteof late Mesozoic or younger agePattern broken where interpretedfrom distant views or aerial photo-
SAND POINT
Big Koniuji I.
Argillite and graywacke of late Mesozoic age
Little Koniuji I.55°
SIMEONOF I.
160° CHERNABURA I.
SHUMAGIN ISLANDS
27.2. Reconnaissance geologic map of the outer Shumagin Islands.
680231 O 6i3 8
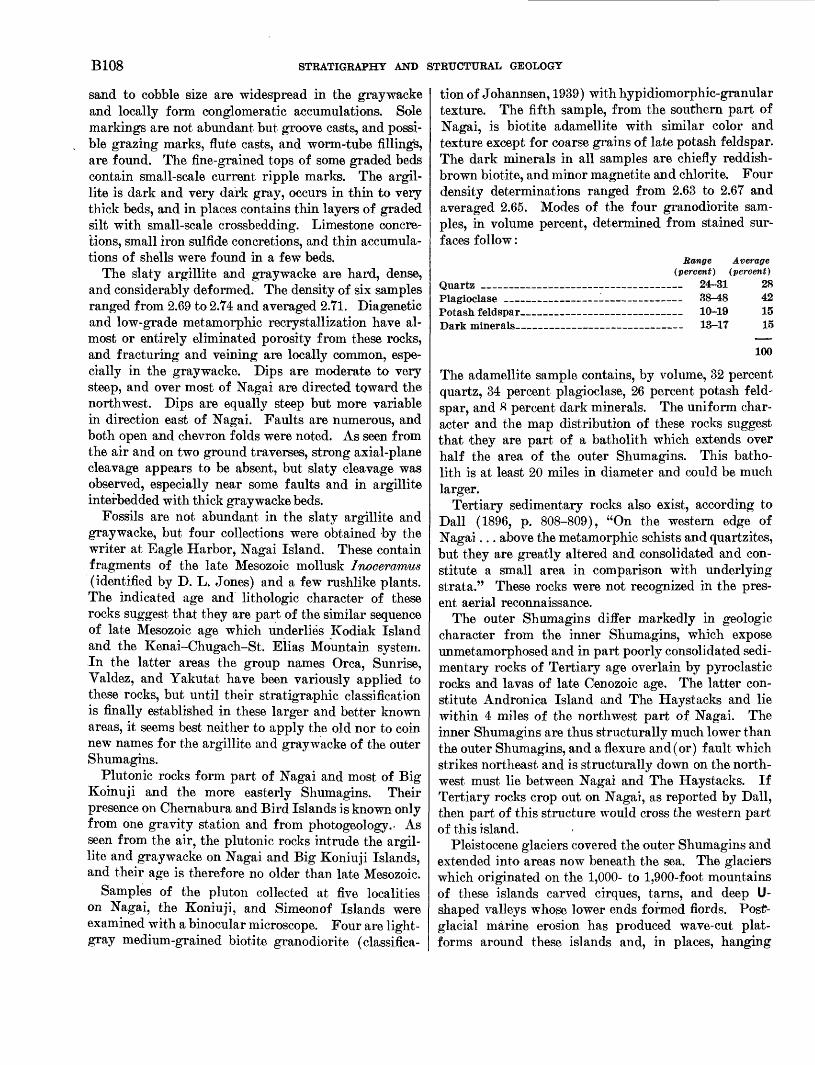
BIOS STRATIGRAPHY AND STRUCTURAL GEOLOGY
sand to cobble size are widespread in the graywacke and locally form conglomeratic accumulations. Sole markings are not abundant but groove casts, and possi ble grazing marks, flute casts, and worm-tube fillings, are found. The fine-grained tops of some graded beds contain small-scale current ripple marks. The argil- lite is dark and very dark gray, occurs in thin to very thick beds, and in places contains thin layers of graded silt with small-scale crossbedding. Limestone concre tions, small iron sulfide concretions, and thin accumula tions of shells were found in a few beds.
The slaty argillite and graywacke are hard, dense, and considerably deformed. The density of six samples ranged from 2.69 to 2.74 and averaged 2.71. Diagenetic and low-grade metamorphic recrystallization have al most or entirely eliminated porosity from these rocks, and fracturing and veining are locally common, espe cially in the graywacke. Dips are moderate to very steep, and over most of Nagai are directed toward the northwest. Dips are equally steep but more variable in direction east of Nagai. Faults are numerous, and both open and chevron folds were noted. As seen from the air and on two ground traverses, strong axial-plane cleavage appears to be absent, but slaty cleavage was observed, especially near some faults and in argillite interbedded with thick graywacke beds.
Fossils are not abundant in the slaty argillite and graywacke, but four collections were obtained by the writer at Eagle Harbor, Nagai Island. These contain fragments of the late Mesozoic mollusk Inoceramus (identified by D. L. Jones) and a few rushlike plants. The indicated age and lithologic character of these rocks suggest that they are part of the similar sequence of late Mesozoic age which underlies Kodiak Island and the Kenai-Chugach-St. Elias Mountain system. In the latter areas the group names Orca, Sunrise, Valdez, and Yakutat have been variously applied to these rocks, but until their stratigraphic classification is finally established in these larger and better known areas, it seems best neither to apply the old nor to coin new names for the argillite and graywacke of the outer Shumagins.
Plutonic rocks form part of Nagai and most of Big Koinuji and the more easterly Shumagins. Their presence on Chernabura and Bird Islands is known only from one gravity station and from photogeology.- As seen from the air, the plutonic rocks intrude the argil lite and graywacke on Nagai and Big Koniuji Islands, and their age is therefore no older than late Mesozoic.
Samples of the pluton collected at five localities on Nagai, the Koniuji, and Simeonof Islands were examined with a binocular microscope. Four are light- gray medium-grained biotite granodiorite (classifica
tion of Johannsen, 1939) with hypidiomorphic-granular texture. The fifth sample, from the southern part of Nagai, is biotite adamellite with similar color and texture except for coarse grains of late potash feldspar. The dark minerals in all samples are chiefly reddish- brown biotite, and minor magnetite and chlorite. Four density determinations ranged from 2.63 to 2.67 and averaged 2.65. Modes of the four granodiorite sam ples, in volume percent, determined from stained sur faces follow:
Average (percent) (percent)
Quartz _______________________ 24-31 28 Plagioclase ___ _ 38-18 42 Potash feldspar_______ __ 10-19 15 Dark minerals________ 13-17 15
100
The adamellite sample contains, by volume, 32 percent quartz, 34 percent plagioclase, 26 percent potash feld spar, and 8 percent dark minerals. The uniform char acter and the map distribution of these rocks suggest that they are part of a batholith which extends over half the area of the outer Shumagins. This batho lith is at least 20 miles in diameter and could be much larger.
Tertiary sedimentary rocks also exist, according to Dall (1896, p. 808-809), "On the western edge of Nagai... above the metamorphic schists and quartzites, but they are greatly altered and consolidated and con stitute a small area in comparison with underlying strata." These rocks were not recognized in the pres ent aerial reconnaissance.
The outer Shumagins differ markedly in geologic character from the inner SHumagins, which expose unmetamorphosed and in part poorly consolidated sedi mentary rocks of Tertiary age overlain by pyroclastic rocks and lavas of late Cenozoic age. The latter con stitute Andronica Island and The Haystacks and lie within 4 miles of the northwest part of Nagai. The inner Shumagins are thus structurally much lower than the outer Shumagins, and a flexure and (or) fault which strikes northeast and is structurally down on the north west must lie between Nagai and The Haystacks. If Tertiary rocks crop out on Nagai, as reported by Dall, then part of this structure would cross the western part of this island.
Pleistocene glaciers covered the outer Shumagins and extended into areas now beneath the sea. The glaciers which originated on the 1,000- to 1,900-foot mountains of these islands carved cirques, tarns, and deep U- shaped valleys whose lower ends formed fiords. Post glacial marine erosion has produced wave-cut plat forms around these islands and, in places, hanging
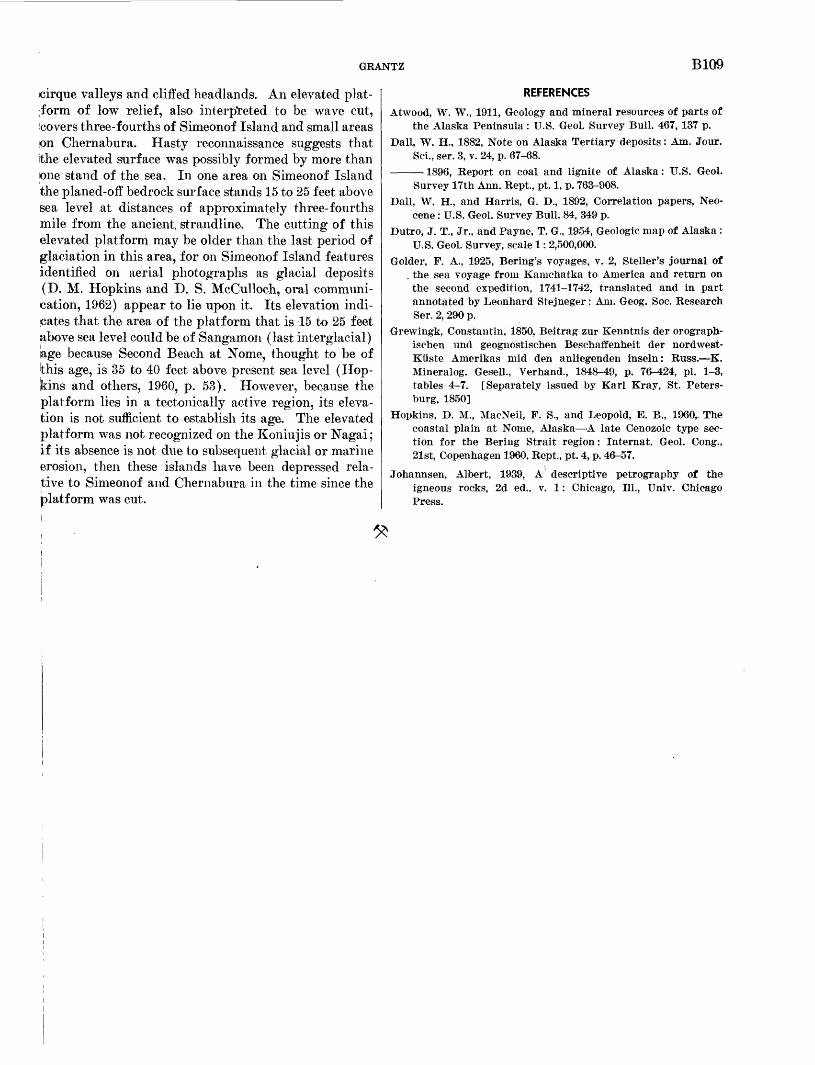
GRANTZ B109
cirque valleys and cliffed headlands. An elevated plat- ;form of low relief, also interpreted to be wave cut, icovers three-fourths of Simeonof Island and small areas on Chernabura. Hasty reconnaissance suggests that ithe elevated surface was possibly formed by more than one stand of the sea. In one area on Simeonof Island Ithe planed-off bedrock surface stands 15 to 25 feet above Sea level at distances of approximately three-fourths mile from the ancient strandline. The cutting of this elevated platform may be older than the last period of glaciation in this area, for on Simeonof Island features identified on aerial photographs as glacial deposits (D. M. Hopkins and D. S. McCulloch, oral communi cation, 1962) appear to lie upon it. Its elevation indi cates that the area of the platform that is 15 to 25 feet above sea level could be of Sangamon (last interglacial) kge because Second Beach at Nome, thought to be of this age, is 35 to 40 feet above present sea level (Hop- Ikins and others, 1960, p. 53). However, because the platform lies in a tectonically active region, its eleva tion is not sufficient to establish its age. The elevated [platform was not recognized on the Koniujis or Nagai; if its absence is not due to subsequent glacial or marine erosion, then these islands have been depressed rela- |tive to Simeonof and Chernabura in the time since the platform was cut.
REFERENCES
Atwood, W. W., 1911, Geology and mineral resources of parts of the Alaska Peninsula : U.S. Geol. Survey Bull. 467, 137 p.
Ball, W. H., 1882, Note on Alaska Tertiary deposits: Am. Jour. Sci., ser. 3, v. 24, p. 67-68.
1896, Report on coal and lignite of Alaska: U.S. Geol. Survey 17th Ann. Rept, pt. 1, p. 763-908.
Ball, W. H., and Harris, G. B., 1892, Correlation papers, Neo cene : U.S. Geol. Survey Bull. 84, 349 p.
Butro, J. T., Jr., and Payne, T. G., 1954, Geologic map of Alaska : U.S. Geol. Survey, scale 1: 2,500,000.
Golder, F. A., 1925, Bering's voyages, v. 2, Steller's journal of. the sea voyage from Kamchatka to America and return onthe second expedition, 1741-1742, translated and in partannotated by Leonhard Stejneger: Am. Geog. Soc. ResearchSer. 2, 290 p.
Grewingk, Constantin, 1850, Beitrag zur Kenntnis der orograph- ischen und geognostischen Beschaffenheit der nordwest- Kiiste Amerikas mid den anliegenden inseln: Russ. K. Mineralog. Gesell., Verhand., 1848-49, p. 76-424, pi. 1-3, tables 4-7. [Separately issued by Karl Kray, St. Peters burg, 1850]
Hopkins, B. M., MacNeil, F. S., and Leopold, E. B., I960, The coastal plain at Nome, Alaska A late Cenozoic type sec tion for the Bering Strait region: Internat. Geol. Cong., 21st, Copenhagen 1960, Rcpt, pt. 4, p. 46-57.
Johannsen, Albert, 1939, A descriptive petrography of the igneous rocks, 2d ed., v. 1: Chicago, 111., Univ. Chicago Press.
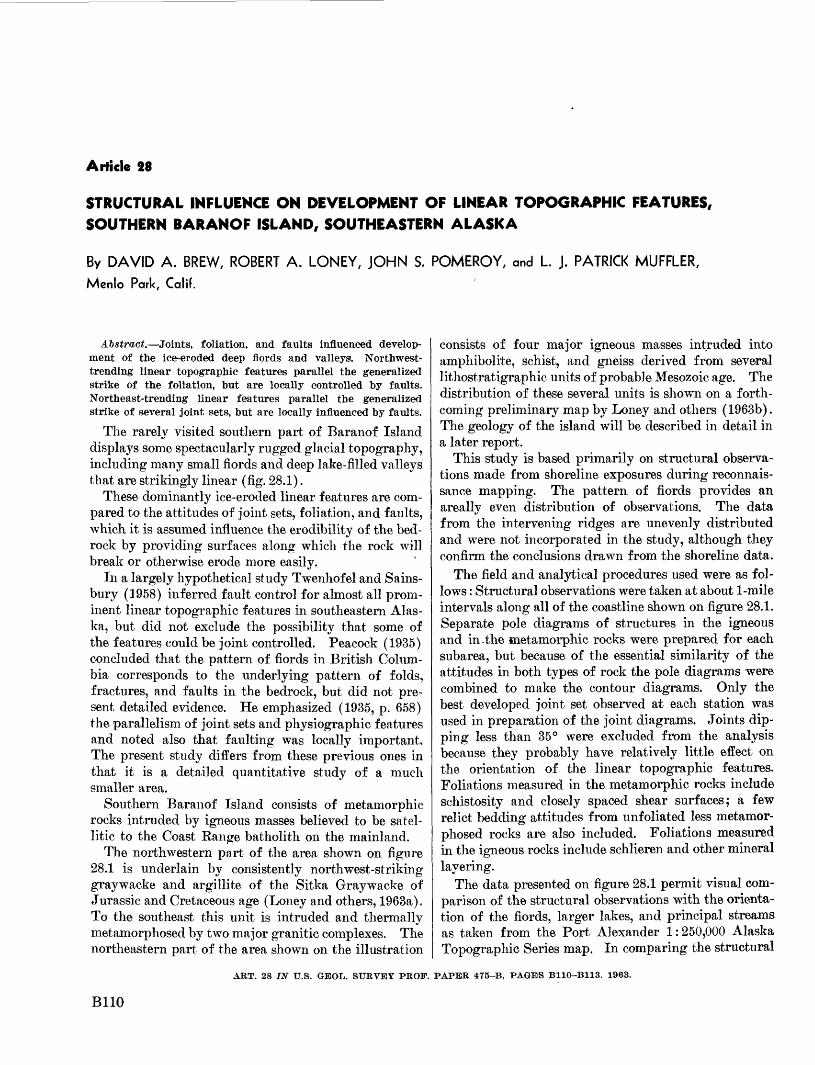
Article 28
STRUCTURAL INFLUENCE ON DEVELOPMENT OF LINEAR TOPOGRAPHIC FEATURES, SOUTHERN BARANOF ISLAND, SOUTHEASTERN ALASKA
By DAVID A. BREW, ROBERT A. LONEY, JOHN S. POMEROY, and L. J. PATRICK MUFFLER,
Mcnlo Park, Calif.
Abstract. Joints, foliation, and faults influenced develop ment of the ice-eroded deep fiords and valleys. Northwest- trending linear topographic features parallel the generalized strike of the foliation, but are locally controlled by faults. Northeast-trending linear features parallel the generalized strike of several joint sets, but are locally influenced by faults.
The rarely visited southern part of Baranof Island displays some spectacularly rugged glacial topography, including many small fiords and deep lake-filled valleys that are strikingly linear (fig. 28.1).
These dominantly ice-eroded linear features are com pared to the attitudes of joint sets, foliation, and faults, which it is assumed influence the erodibility of the bed rock by providing surfaces along which the rock will break or otherwise erode more easily.
In a largely hypothetical study Twenhofel and Sains- bury (1958) inferred fault control for almost all prom inent linear topographic features in southeastern Alas ka, but did not exclude the possibility that some of the features could be joint controlled. Peacock (1935) concluded that the pattern of fiords in British Colum bia corresponds to the underlying pattern of folds, fractures, and faults in the bedrock, but did not pre sent detailed evidence. He emphasized (1935, p. 658) the parallelism of joint sets and physiographic features and noted also that faulting was locally important. The present study differs from these previous ones in that it is a detailed quantitative study of a much smaller area.
Southern Baranof Island consists of metamorphic rocks intruded by igneous masses believed to be satel- litic to the Coast Range batholith on the mainland.
The northwestern part of the area shown on figure 28.1 is underlain by consistently northwest-striking graywacke and argillite of the Sitka Graywacke of Jurassic and Cretaceous age (Loney and others, 1963a). To the southeast this unit is intruded and thermally metamorphosed by two major granitic complexes. The northeastern part of the area shown on the illustration
consists of four major igneous masses intruded into amphibolite, schist, and gneiss derived from several lithostratigraphic units of probable Mesozoic age. The distribution of these several units is shown on a forth coming preliminary map by Loney and others (1963b). The geology of the island will be described in detail in a later report.
This study is based primarily on structural observa tions made from shoreline exposures during reconnais sance mapping. The pattern of fiords provides an areally even distribution of observations. The data from the intervening ridges are unevenly distributed and were not incorporated in the study, although they confirm the conclusions drawn from the shoreline data.
The field and analytical procedures used were as fol lows : Structural observations were taken at about 1-mile intervals along all of the coastline shown on figure 28.1. Separate pole diagrams of structures in the igneous and in.the metamorphic rocks were prepared for each subarea, but because of the essential similarity of the attitudes in both types of rock the pole diagrams were combined to make the contour diagrams. Only the best developed joint set observed at each station was used in preparation of the joint diagrams. Joints dip ping less than 35° were excluded from the analysis because they probably have relatively little effect on the orientation of the linear topographic features. Foliations measured in the metamorphic rocks include schistosity and closely spaced shear surfaces; a few relict bedding attitudes from unfoliated less metamor phosed rocks are also included. Foliations measured in the igneous rocks include schlieren and other mineral layering.
The data presented on figure 28.1 permit visual com parison of the structural observations with the orienta tion of the fiords, larger lakes, and principal streams as taken from the Port Alexander 1:250,000 Alaska Topographic Series map. In comparing the structural
ART. 28 IN U.S. GEOL. SURVEY PROF. PAPER 475-B, PAGES B110-B113. 1963.
B110

BREW, LONEY, POMEROY, AND MUFFLER Bill
FIGURE 28.1. Map of southern Baranof Island, southeastern Alaska, showing: fiords, lakes, streams, faults (dashed where probable) ; and foliation and joint attitudes for each subarea indicated by Roman numeral. Poles to folia tion (F) and joints (J) shown in lower hemispheric equal-area projection; number of poles in parentheses. Solid contours indicate 5 (omitted in diagrams of 30 poles or less), 10, 20, and 40 percent per 1 percent of area. Dashed contours indicate the limit of the 1-percent circle drawn about single points.
B112 STRATIGRAPHY AND STRUCTURAL GEOLOGY
observations and the topographic orientation, the scat ter of both should be kept in mind. Rose diagrams showing the azimuth and length of fiords and valleys in each subarea were prepared for comparative pur poses but are not included here because of space limita tions ; most of these diagrams show the expected bimodal distribution. Divergencies and apparent inhomogene- ities result from the large size of the individual sub- areas. Although the similarity between the distribu tion of linear topographic features and structural ele ments is only approximate, the essential correspondence is within the limits imposed by the large size of the subareas and the scatter of the topographic and struc tural data.
JOINTSWell-developed and persistent, generally northeast-
striking joint sets in both the igneous and metamorphic rocks appear to exercise the primary influence on the northeast-trending linear topographic features. The influence of these sets is in places augmented or sur passed by near-parallel major faults, but (as shown on fig. 28.1) only a few large northeast-striking fault zones were mapped on southern Baranof Island.
The joint diagrams for subareas I-VIII on the west side and southern tip of the island show a complex sys tem of steep northeast-striking joint sets; a few sets of different strike are important in only 1 or 2 subareas. The more diffuse diagrams generally are from subareas with greater areas of igneous rock and migmatite out crop, in which several prominent joint sets are present and no one set is dominant. The difference in the posi tion of the maximum of subarea VIII as compared with the maximums of the subareas to the north may reflect an areal change in lineation attitudes, as most of the joints are of the ac type (perpendicular to the fold axes).
The diagrams for subareas IX-XIII on the eastern side of the island demonstrate that the joint sets meas ured on the western side of the island extend through to the eastern side as far north as subarea X; but the pattern shown by these diagrams is disrupted to the north in the widespread intrusive and migmatite terrane of subareas XI to XIII.
The general correspondence between the strike of the dominant joint sets and the linear northeast-trending topographic features is shown on figure 28.1. This tendency toward parallelism indicates that the joints have very probably controlled the trend of these linear features. Generally northeast-trending topographic
features which diverge somewhat from the strike of the joints may be caused either by the modifying influ ence of foliation, by faults, by local joint sets, or by combinations with joint sets of lesser development that are not represented in the diagrams.
FOLIATION
The northwest-trending linear topographic features are generally shorter than the northeast-trending fea tures and tend to be parallel to the generalized strike of the steeply dipping foliation which ranges from N. 24° W. to N. 44° W. Foliation in the isoclinally folded Sitka Graywacke and its metamorphosed equiva lents consists in many places of pre-metamorphism shear surfaces that locally form significant shear zones. Because of the isoclinal folding, the foliation and the boundaries of the original lithostratigraphic units are almost everywhere nearly parallel; it therefore is un likely that a topographic feature controlled by an origi nal unit would diverge appreciably from the strike of the foliation.
The diagrams of subareas I, II, and III on the west side of Baranof Island show diffuse maximums repre senting steeply dipping foliation that strikes between N. 65° W. and N. 30° W. The foliation diagram for subarea II is not shown because of extreme scatter, probably due to the rotation of the foliated xenoliths within the igneous mass. Diagrams V to IX show simpler, more marked preferred orientations that are due to the lesser amounts of igneous rock involved and to the more uniform deformation recognized in these subareas. The rocks of subarea VIII are strongly lineated, and the lineation may have influenced the credibility of the bedrock through its modifying effect on the foliation. In the diagrams for subareas X to XIII the northwest- and west-northwest-striking pat tern is continued, but is generally more diffuse because of large areas of igneous and mixed igneous and meta morphic rocks in those subareas.
FAULTS
A few major and several minor faults have been mapped on southern Baranof Island (fig. 28.1). More detailed mapping would undoubtedly reveal many more minor faults and possibly a few more major faults. Almost all of the faults shown on the illustration have associated shear zones that influenced the erodibility of the bedrock locally, in many places extensively enough
BREW, LONEY, POMEROY, AND MUFFLER B113
to be expressed on a topographic map at a scale of 1:63,360 or even smaller. At Big Branch Bay the ex istence of a fault is inferred from the offset of geologic contacts across the bay. This is the only northeast- trending fiord where such offset is present.
The pattern of the demonstrated faults indicates that the number of faults striking in the northeast quadrant ,is about equal to that in the northwest and that the I strike of these structures is reflected topographically in their immediate vicinity. It is apparent, however, that most of the fiords and deep valleys do not occur on the :major faults or their extensions.
REFERENCES
Loney, R. A., Berg, H. C., Pomeroy, J. S., and Brew, D. A., 1963a, Reconnaissance geologic map of Chichagof Island and north western Baranof Island, Alaska: U.S. Geol. Survey Misc. Geol. Inv. Map 1-388. [In press]
Loney, R. A., Pomeroy, J. A., Brew, D. A., and Muffler, L. J. P., 1963b, Reconnaissance geologic map of Baranof and Kruzof Islands, Alaska: U.S. Geol. Survey Misc. Geol. Inv. Map. [In press]
Peacock, M. A., 1935, Fiord-land of British Columbia: Geol. Soc. America Bull., v. 46, p. 633-696.
Twenhofel, W. S., and Sainsbury, C. S., 1958, Fault patterns in southeastern Alaska: Geol. Soc. America Bull., v. 69, p. 1431-1442.
Article 29
GEOLOGY OF THE GUANICA-GUAYANILLA BAY AREA, SOUTHWESTERN PUERTO RICO
By I. G. GROSSMAN, Middletown, Conn.
Work done in cooperation with the Commonwealth of Puerto Rico
Abstract. Previously unmapped serpentinite, chert, and associated basic igneous rocks of Cretaceous age (the Benneja Complex of Mattson, 1958) and overlying clastic rocks of Oligo- cene age (the Juana Diaz Formation) crop out near Central San Francisco (a sugar mill) south of an east-trending fault that is concealed by the alluvium of the Rio Yauco. The south side of the fault has been uplifted relative to the north side.
Puerto Rico, the easternmost and smallest of the Greater Antilles, is about 110 miles long and about 35 to 40 miles wide. A central upland, which extends the full length of the island, is composed largely of igneous, metamorphic, and sedimentary rocks of Cre taceous age and in small part of sedimentary rocks of early Tertiary age. The coastal plains flanking this upland on the north and south are made up largely of sedimentary rocks of early to late Tertiary age, and near the coast these beds are mantled by alluvium and beach deposits of Quaternary age. All the princi pal streams flow seaward from the central upland, but those on the south coast are much shorter than those in the north. (See fig. 29.1) The Rio Yauco, a major stream in the southwestern part of the island, makes a sharp turn near the sea; no other large river on the island exhibits so abrupt a change in direction of flow in the lower, more mature part of its course.
Hydrologic studies in southwestern Puerto Rico in 1962 included the lower part of the drainage basin of the Rio Yauco. Geologic mapping in support of those studies revealed a previously unrecognized inlier that extends about three quarters of a mile along the south wall of the Rio Yauco valley west of Central a San Francisco. Postulation of a concealed fault accounts for not only the inlier but also the atypical drainage pattern in the vicinity of Central San Francisco.
Of the two rock units exposed in the inlier, the older consists of serpentinite, chert, and basic igneous rocks
1 The Puerto Rican term for "sugar mill."
(Kb on map). It is believed that these correlate with similar rocks of the Bermeja Complex of Mattson (1958, 1960) of Late Cretaceous age, the type area of which is in the vicinity of Mayagiiez on the west coast. The Bermeja Complex includes the oldest rocks exposed in Puerto Rico, and the newly discovered serpentinite that here is tentatively assigned to the Bermeja is the southeasternmost known outcrop of this metamor phosed igneous rock.
The younger of the two rock units in the inlier con sists of conglomerate and sandstone (Tj on map), which unconformably overlies the Bermeja Complex. It also crops out east of Guanica for a distance of about iy2 miles along the south side of a northeast-trending valley, where it consists of conglomerate and sandstone overlain by shale. Both exposures of this clastic unit are regarded by the author to correlate with the low est member of the Juana Diaz Formation of Oligo- cene age, as described by Zapp and others (1948). In the inlier west of Central San Francisco, the clastic unit ranges in thickness from less than 100 feet near the east end to more than 250 feet near the west end, and dips 17°-35°S. The beds in the outcrop east of Guanica also dip southward at an.angle of 12° near the east end of the exposure. Fossils found at the latter locality in 1955 by C. Wythe Cooke and subse quently identified by him (written communication, 1956) include Lepidocyclina gigas Cushman, Hetero- stegina sp., Pecten meseticus Maury, Ampullinopsis spenceri (Cooke), and Ostreet, haitensis Sowerby. Both the inlier west of Central San Francisco and the clastic rocks east of Guanica are within the large area mapped by Zapp and others (1948) as the Ponce Lime stone of Oligocene and Miocene age. The conglom erate and shale exposed about % mile southeast of Guanica and the shale exposed 2 miles west-southwest of Central San Francisco (X's, fig. 29.1) have not
ART. 29 IN U.S. GEOL. SURVEY PROF. PAPER 475-B, PAGES B114-B116, 1963.
B114

GROSSMAN B115
£_>' ' (; : ^D^-^'vr^rg ..'. '1 *"^TVf' -^f' »
r-j^&gjfcS' * ~;£SAN ~F R A N cis'co" FA" C
v'.'- .Central Saii n-:*VFrancisco.'
2 MILES
CARIBBEAN EXPLANATION
66 "OO1
.Qd
Surficial deposits
Ponce Limestone
10 20 30 40 MILES
Juana Di'az Formation
Upper Cretaceous rocks (after Slodowski, 1956)
Bermeja Complex ofMattson (1958)
Serpentinite, chert, and as- soqiated basic igneous rocks
Contact
p_____ u
Probable fault
i
Possible fault
Postulated concealed fault
Strike and dip of beds
xExposures of clastic rocks
in the Ponce Limestone (after Zapp and others, 1948)
FIGURE 29.1. Geologic map of the Guanica-Guayanilla Bay area, southwestern Puerto Rico.
t>een examined by the writer. They may be beds within the Ponce Limestone.
Igneous rocks of Cretaceous age (Ku, fig. 29.1), which crop out about 2 miles west of San Francisco, yere mapped by Slodowski (1956) as the andesite mem ber of his so-called Ensenada Formation. This unit has [not been studied in detail by the writer but appears to fbe younger than the rocks he has correlated with the iBermeja Complex and older than those correlated with the Juana Diaz Formation. Evidently the surface on which the Tertiary sediments were deposited was one of considerable topographic relief, and deposition of the Ponce Limestone began before the highest hills of eroded Cretaceous rocks had been completely buried by
elastics of the Juana Diaz.The Ponce Limestone, which conformably overlies
the Juana Diaz in the area, is the youngest bedrock unit of Tertiary age in southern Puerto Rico. Throughout its extent in the Guanica-Guayanilla Bay area, it dips 5°-20°S. It is shown in figure 29.1 to extend farther south than indicated on earlier geologic maps of this area; previously, the rugged coastal area between Guanica and Punta Ventana was thought to consist largely of beach deposits of Quaternary age.
Unconsolidated sediments consisting of alluvium, colluvium, beach sand, dune sand, and marsh deposits mantle the bedrock at low altitudes. In the Guanica- Guayanilla Bay area, these deposits of Quaternary age

B116 STRATIGRAPHY AND STRUCTURAL GEOLOGY
are in direct contact with, and unconformably overlie, the Bermeja Complex, the Juana Diaz Formation, and the Ponce Limestone; the upper surface of the surficial deposits ranges from about 45 feet above sea level to a few feet below sea level.
The serpentinite of the Bermeja Complex northwest of Yauco is overlain successively at Yauco by the Juana Diaz Formation and the Ponce Limestone, both of which crop out in broad east-trending belts. There, as in the Guanica-Guayanilla Bay area, the Tertiary rocks com monly dip southward (Grossman, 1962, p. 63). There fore, a fault is postulated to account for the duplication of the stratigraphic sequence in the inlier. Because the south-dipping beds of the Ponce Limestone north of the inlier would, if projected southward, extend be neath the older Bermeja Complex and Juana Diaz Formation, the fault is assumed to underlie the alluvium of the lower Rio Yauco and of its tributary at the bend. If extended westward, the trace of this concealed fault would connect with the fault mapped by Zapp and others (1948) east of Guanica (Z-Zf , fig. 29.1). No search for evidence of faulting has been made in the mile-long intervening upland (indicated by question marks on figure 29.1) which is outside the area of this study.
The hypothesized east-trending fault would explain the present eastward course of the Rio Yauco down stream from the sharp bend and also the eastward course of the small tributary that enters the Rio Yauco at the bend. That the Rio Yauco formerly followed a more direct course to the Carribbean is indicated by the broad valley that extends from the present valley of the river southeastward past Central San Francisco to the Carib bean Sea just east of Punta Ventana. Blocked at its mouth by a sandbar and surmounting dunes, this "aban doned" valley is drained by an undersized ephemeral stream that flows southeastward to the blocked exit to the sea and then doubles back and empties into Guayanilla Bay.
The postulated fault is here named the San Francisco
fault after the sugar mill through whose land it passes. Because the fault offsets the Ponce Limestone and is masked by deposits of undisturbed alluvium, it post dates consolidation of the Oligocene and Miocene lime stone and antedates deposition of the Quaternary allu vium in the east-trending part of the Rio Yauco valley. If it connects with the fault mapped by Zapp and others (1948) east of Guanica and extends eastward as far as Guayanilla Bay, the fault is at least 6 miles long. Pos sibly it is much longer, extending westward beneath the alluvium in the vicinity of Guanica and eastward across Guayanilla Bay.
As the trace of the San Francisco fault is approxi mately parallel to the strike of the beds on both sides, it is classified as a strike fault. However, some doubtful bedding in the more highly deformed Cretaceous unit of the inlier is not parallel to the regional strike. The serpentinite in the inlier is directly in line with the regional trend of a serpentinite body that extends south eastward from the Mayagiiez area, suggesting that strike slip on the fault, if any, was negligible. The amount of dip slip is at least several hundred feet and could be as much as a few thousand feet. The beds south of the fault obviously have moved upward rela tive to those in the north. Classification of the fault as normal or reverse awaits determination of the direc tion of dip of the fault surface.
REFERENCES
Grossman, I. G:, 1962, Stratigraphy and hydrology of the JuanaDiaz Formation in the Yauco area, Puerto Rico: Art. 137in U.S. Geol. Survey Prof. Paper 450-D, p. D62-D63.
Mattson, P. H., 1958, Geology of the Mayagiiez area, PuertoRico: Dissert. Abs., v. 18, no. 1.
1960, Geology of the Mayagiiez area, Puerto Rico: Geol.Soc. America Bull., v. 71, no. 3, p. 319-361.
Slodowski, T. R., 1956, Geology of the Yauco area, Puerto Rico:Princeton Univ. and Industrial Lab., Puerto Rico Admin.de Fomento, 130 p.
Zapp, A. D., Bergquist, H. R., and Thomas, C. R., 1948, Tertiarygeology of the coastal plains of Puerto Rico: U.S. Geol.Survey Oil and Gas Inv. Prelim. Map 85 (2 sheets).
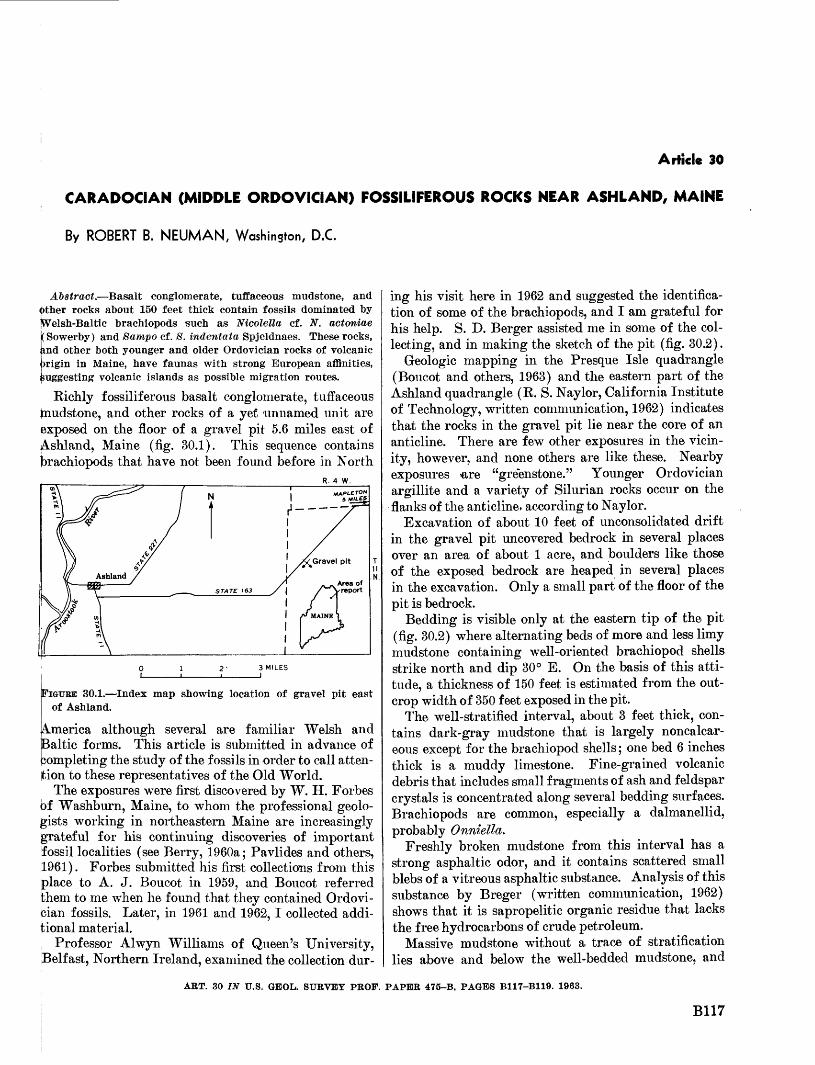
Article 30
CARADOCIAN (MIDDLE ORDOVICIAN) FOSSILIFEROUS ROCKS NEAR ASHLAND, MAINE
By ROBERT B. NEUMAN, Washington, D.C.
Abstract. Basalt conglomerate, tuffaceous mudstone, and Other rocks about 150 feet thick contain fossils dominated by jWelsh-Baltic brachiopods such as Nicolella cf. N. actoniae (Sowerby) and Sampo cf. 8. indentata Spjeldnaes. These rocks, ind other both younger and older Ordovician rocks of volcanic origin in Maine, have faunas with strong European affinities, isuggesting volcanic islands as possible migration routes.
Richly fossiliferous basalt conglomerate, tuffaceous Jnudstone, and other rocks of a yet unnamed unit are exposed on the floor of a gravel pit 5.6 miles east of Ashland, Maine (fig. 30.1). This sequence contains brachiopods that have not been found before in North
R. 4 W.
FIGURE 30.1. Index map showing location of gravel pit east of Ashland.
America although several are familiar Welsh and Baltic forms. This article is submitted in advance of completing the study of the fossils in order to call atten tion to these representatives of the Old World.
The exposures were first discovered by W. H. Forbes of Washburn, Maine, to whom the professional geolo gists working in northeastern Maine are increasingly grateful for his continuing discoveries of important fossil localities (see Berry, 1960a; Pavlides and others, 1961). Forbes submitted his first collections from this place to A. J. Boucot in 1959, and Boucot referred them to me when he found that they contained Ordovi- pian fossils. Later, in 1961 and 1962, I collected addi tional material.
, Professor Alwyn Williams of Queen's University, [Belfast, Northern Ireland, examined the collection dur
ing his visit here in 1962 and suggested the identifica tion of some of the brachiopods, and I am grateful for his help. S. D. Berger assisted me in some of the col lecting, and in making the sketch of the pit (fig. 30.2).
Geologic mapping in the Presque Isle quadrangle (Boucot and others, 1963) and the eastern part of the Ashland quadrangle (E. S. Nay lor, California Institute of Technology, written communication, 1962) indicates that the rocks in the gravel pit lie near the core of an anticline. There are few other exposures in the vicin ity, however, and none others are like these. Nearby exposures -are "greenstone." Younger Ordovician argillite and a variety of Silurian rocks occur on the flanks of the anticline, according to Naylor.
Excavation of about 10 feet of unconsolidated drift in the gravel pit uncovered bedrock in several places over an area of about 1 acre, and boulders like those of the exposed bedrock are heaped in several places in the excavation. Only a small part of the floor of the pit is bedrock.
Bedding is visible only at the eastern tip of the pit (fig. 30.2) where alternating beds of more and less limy mudstone containing well-oriented brachiopod shells strike north and dip 30° E. On the basis of this atti tude, a thickness of 150 feet is estimated from the out crop width of 350 feet exposed in the pit.
The well-stratified interval, about 3 feet thick, con tains dark-gray mudstone that is largely noncalcar- eous except for the brachiopod shells; one bed 6 inches thick is a muddy limestone. Fine-grained volcanic debris that includes small fragments of ash and feldspar crystals is concentrated along several bedding surfaces. Brachiopods are common, especially a dalmanellid, probably Onniella.
Freshly broken mudstone from this interval has a strong asphaltic odor, and it contains scattered small blebs of a vitreous asphaltic substance. Analysis of this substance by Breger (written communication, 1962) shows that it is sapropelitic organic residue that lacks the free hydrocarbons of crude petroleum.
Massive mudstone without a trace of stratification lies above and below the well-bedded mudstone, and
ART. 30 IN U.S. GEOL. SURVEY PROF. PAPER 475-B, PAGES B117-B119. 1963.
B117
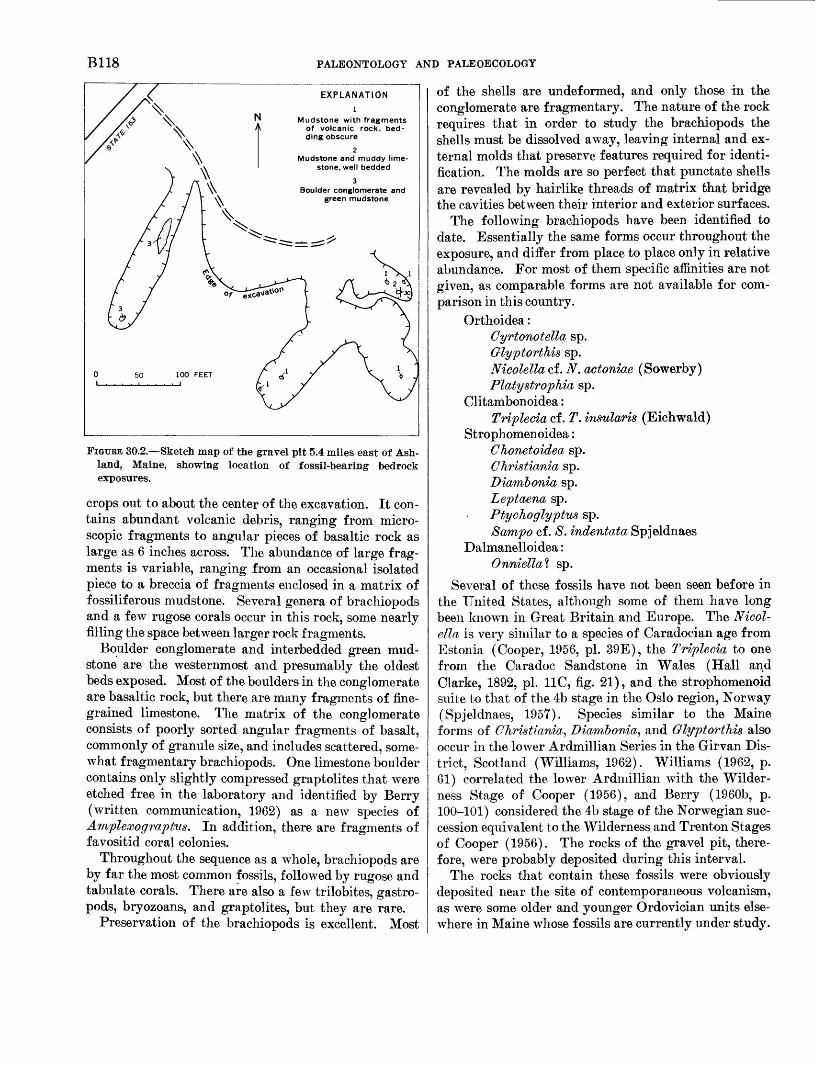
B118 PALEONTOLOGY AND PALEOECOLOGY
Mudstone with fragments of volcanic rock, bed ding obscure
FIGURE 30.2. Sketch map of the gravel pit 5.4 miles east of Ash land, Maine, showing location of fossil-bearing bedrock exposures.
crops out to about the center of the excavation. It con tains abundant volcanic debris, ranging from micro scopic fragments to angular pieces of basaltic rock as large as 6 inches across. The abundance of large frag ments is variable, ranging from an occasional isolated piece to a breccia of fragments enclosed in a matrix of fossiliferous mudstone. Several genera of brachiopods and a few rugose corals occur in this rock, some nearly filling the space between larger rock fragments.
Boulder conglomerate and interbedded green mud- stone are the westernmost and presumably the oldest beds exposed. Most of the boulders in the conglomerate are basaltic rock, but there are many fragments of fine grained limestone. The matrix of the conglomerate consists of poorly sorted angular fragments of basalt, commonly of granule size, and includes scattered, some what fragmentary brachiopods. One limestone boulder contains only slightly compressed graptolites that were etched free in the laboratory and identified by Berry (written communication, 1962) as a new species of Amplexograptus. In addition, there are fragments of favositid coral colonies.
Throughout the sequence as a whole, brachiopods are by far the most common fossils, followed by rugose and tabulate corals. There are also a few trilobites, gastro pods, bryozoans, and graptolites, but they are rare.
Preservation of the brachiopods is excellent. Most
of the shells are undeformed, and only those in the conglomerate are fragmentary. The nature of the rock requires that in order to study the brachiopods the shells must be dissolved away, leaving internal and ex ternal molds that preserve features required for identi fication. The molds are so perfect that punctate shells are revealed by hairlike threads of matrix that bridge the cavities between their interior and exterior surfaces.
The following brachiopods have been identified to date. Essentially the same forms occur throughout the exposure, and differ from place to place only in relative abundance. For most of them specific affinities are not given, as comparable forms are not available for com parison in this country.
Orthoidea:Cyrtonotella sp.Glyptorthis sp.Nicolella cf. N. actoniae (Sowerby)Platystrophia sp.
Clitambonoidea:Triplecia cf. T. insularis (Eichwald)
Strophomenoidea:Chonetoidea sp.Christiania sp.Diambonia sp.Leptaena sp.Ptychoglyptus sp.Sampo cf. S. indentata Spjeldnaes
Dalmanelloidea:Onniettal sp.
Several of these fossils have not been seen before in the United States, although some of them have long been known in Great Britain and Europe. The Nicol ella is very similar to a species of Caradocian age from Estonia (Cooper, 1956, pi. 39E), the Triplecia to one from the Caradoc Sandstone in Wales (Hall and Clarke, 1892, pi. 11C, fig. 21), and the strophomenoid suite to that of the 4b stage in the Oslo region, Norway (Spjeldnaes, 1957). Species similar to the Maine forms of Christiania, Diambonia, and Glyptorthis also occur in the lower Ardmillian Series in the Girvan Dis trict, Scotland (Williams, 1962). Williams (1962, p. 61) correlated the lower Ardmillian with the Wilder ness Stage of Cooper (1956), and Berry (1960b, p. 100-101) considered the 4b stage of the Norwegian suc cession equivalent to the Wilderness and Trenton Stages of Cooper (1956). The rocks of the gravel pit, there fore, were probably deposited during this interval.
The rocks that contain these fossils were obviously deposited near the site of contemporaneous volcanism, as were some older and younger Ordovician units else where in Maine whose fossils are currently under study.
NEUMAN B119
As at Ashland, most of these faunas seem more Euro pean than American. Perhaps these areas of volcanism were in the form of a chain of islands that defined [paths of migration between Europe and North America throughout Ordovician time.
REFERENCES
[Berry, W. B. N., 1960a, Early Ludlow graptolites from the Ash land area, Maine: Jour. Paleontology, v. 34, p. 1158-1163.
1960b, Correlation of Ordovician graptolite-bearing se quences : Internat. Geol. Cong., 21st, Copenhagen 1960, Kept., pt. 7, p. 97-108.
Boucot, A. J., Field, M. T., Fletcher, R. C., Forbes, W. H., Naylor, R. S., and Pavlides, Louis, 1963, Reconnaissance bedrock geology of the Presque Isle quadrangle, Maine: Maine Geol. Survey Bull. [In press]
Cooper, G. A., 1956, Chazyan and related brachiopods: Smith- sonian Misc. Colln., v. 127, pt. 1, 1024 p., pt. 2, 269 pis.
Hall, James, and Clarke, J. M., 1892, An introduction to the study of the genera of Paleozoic Brachiopoda, pt. 1 of Paleontology of New York, v. 8: New York Geol. Survey, 367 p.
Pavlides, Louis, Neuman, R. B., and Berry, W. B. N., 1961, Age of the "ribbon rock" of Aroostook County, Maine: Art. 30 in U.S. Geol. Survey Prof. Paper 424-B, p. B65-B67.
Spjeldnaes, Nils, 1957, The Middle Ordovician of the Oslo re gion, Norway, 8. Brachiopods of the suborder Strophome- nida: Norsk, geol. tidsskr., v. 37, p. 1-214.
Williams, Alwyn, 1962, The Barr and lower Ardmillian series (Caradoc) of the Girvan district, south-west Ayrshire, with descriptions of the Brachiopoda: Geol. Soc. London Mem. 3, 267 p., 25 pis.
Article 31
MIOCENE VERTEBRATES FROM MIDDLE PARK, COLORADO
By GLEN A. IZETT and G. EDWARD LEWIS, Denver, Colo.
Abstract. Fossil vertebrate faunal elements indicate a prob able middle Miocene age for tuffaceous clayey siltstones and conglomerates that are exposed over large areas and mantle older rocks near Kremmling in Middle Park, Colo.
Recent geologic mapping in the Hot Sulphur Springs and Kremmling 15-minute quadrangles, Grand County, Colo., led to the discovery of well-preserved fossil verte brates. Study of the fossil vertebrate faunal elements found by the writers and re-evaluation of the literature concerning these faunal elements indicate that they are probably of middle Miocene age.
The fossils were found in a sequence of soft tuffaceous siltstones and conglomerates that are exposed over large areas near Kremmling, Colo., and that mantle the older rocks in the area. The thickness and the exact strati- graphic relations among the rocks here dated as prob able middle Miocene and adjacent rock units in the area have not been fully determined and await completion of stratigraphic studies now in progress.
The siltstones and conglomerates are shown on the geologic map of Colorado by Burbank and others (1935) as the North Park Formation of Miocene(?) age. These rocks have also been called the Trouble some Formation, by Richards.1 He applied the name to good exposures along Troublesome Creek near Kremmling, Colo., and believed that the rocks might be of Oligocene and Miocene age. Later, Levering and Goddard (1950, p. 41) used the name Troublesome Formation and they suggested that most of the forma tion might be of Oligocene age.
The Troublesome Formation consists of several dis tinct rock types. The most common types are light- grayish-orange, light-greenish-gray, or reddish-brown tuffaceous clayey siltstones. The siltstones are struc tureless and locally limy. Less common rock types that are intercalated with the clayey siltstone are thin beds of ash, impure limestone beds and nodules, mud-pebble conglomerates, chert beds as much as 3 feet thick, and
1 Richards, Arthur, 1941, Geology of the Krernrnling area, Grand County, Colorado : Michigan Univ. Ph. D. thesis. (Available from Uni versity Microfilms, Inc., Ann Arbor, Mich.)
montmorillonitic claystone beds. Pipy concretions or root casts up to 2 inches in diameter are also common in the siltstone. In the lower part of the sequence coarse conglomerates consisting of Precambrian granitic rocks or Tertiary porphyritic volcanic rocks are locally present.
Vertebrate fossils were found at several localities in Middle Park. An incomplete skull and mandible of a horse were found with other bones in limy clayey silt- stones that probably rest unconformably on Precam brian gneiss at locality D526, about 5 miles east of Kremmling, Colo. An incomplete skull and mandible of a rhinoceros were found in grayish-orange limy silt- stone at locality D520, about 4J/2 miles east of Kremm ling, Colo. An incomplete skull of a merycoidodont was found at the base of a road that is cut in grayish- orange limy claystones that rest unconformably on the Niobrara Formation of Late Cretaceous age at locality D522, about 4 miles west of Parshall, Colo. Other fossils collected from the area are not yet identified. The specimens studied were identified as follows:
Merychippus aff. M. sejunctus (Cope); USGS fossil vertebrate locality D526, NW^SE^ sec. 18, T. 1 N., R. 79 W., Grand County, Colo.; incomplete skull and mandible with parts of skeleton.
l.Aphelops megalodus Cope or lAphelops profectus (Matthew); USGS fossil vertebrate locality D520 NW^SEi/4 sec. 24, T. 1 N., R. 80 W., Grand County, Colo.; incomplete skull and mandible.
Merycochoerus aff. M. matthewi Loomis; USGS fos sil vertebrate locality D522, NE^SW% sec. 9, T. 1 N., R. 79 W., Grand County, Colo.; incomplete skull with right and left M2-3.
Cockerell (1908, p. 683) was the first to report middle or upper Miocene rocks from near Kremmling in Mid dle Park, Colo., on the basis of a jaw fragment with two teeth of a horse identified by J. W. Gidley as Parahippus. Levering (1930, p. 74, pi. 6) mapped over 20 square miles of Miocene rocks near Granby in Grand County, Colo., from which he reported the collection of Blastomeryx, a camel comparable to Procamelus, a
ART. 31 IN U.S. GEOL. SURVEY PROF. PAPER 475-B, PAGES B120-B122, 1963.
B120
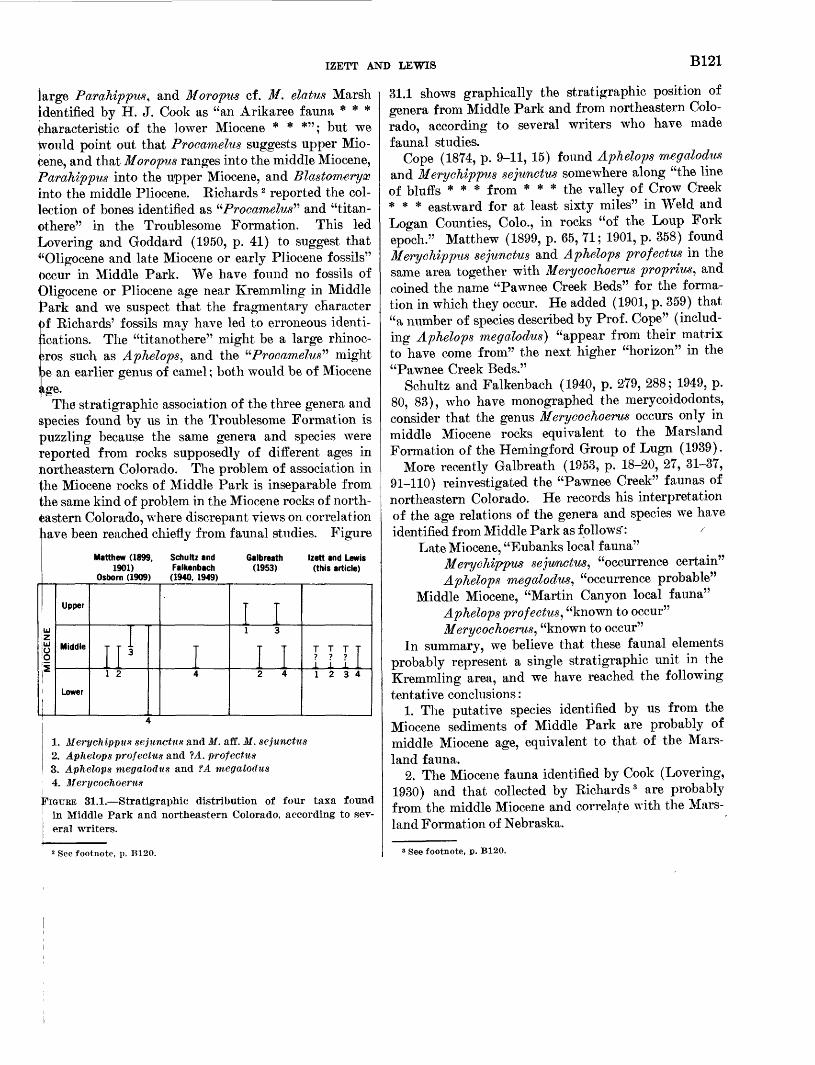
IZETT AND LEWIS B121
large Parahippus< and Moropus cf. M. elatus Marsh identified by H. J. Cook as "an Arikaree fauna * * * Characteristic of the lower Miocene * * *"; but we tvould point out that Procamelus suggests upper Mio cene, and that Moropus ranges into the middle Miocene, ParaMppus into the upper Miocene, and Blastomeryx into the middle Pliocene. Eichards 2 reported the col lection of bones identified as "Procamelus" and "titan- Othere" in the Troublesome Formation. This led Lovering and Goddard (1950, p. 41) to suggest that '''Oligocene and late Miocene or early Pliocene fossils" Occur in Middle Park. We have found no fossils of Oligocene or Pliocene age near Kremmling in Middle Park and we suspect that the fragmentary character of Kichards' fossils may have led to erroneous identi- :ications. The "titanothere" might be a large rhinoc eros such as Aphelops, and the "Procamelus" might >e an earlier genus of camel; both would be of Miocene age.
The stratigraphic association of the three genera and $pecies found by us in the Troublesome Formation is puzzling because the same genera and species were reported from rocks supposedly of different ages in northeastern Colorado. The problem of association in ^he Miocene rocks of Middle Park is inseparable from the same kind of problem in the Miocene rocks of north eastern Colorado, where discrepant views on correlationliave been reached chiefly from f aunal studies. Figure
Matthew (1899, Schultz and Galbreath Izett and Lewis 1901) Falkenbach (1953) (this article)
Osborn (1909) (1940, 1949)
\ MIOCENE
Upper
Middle
Lower
II 11 2
I4
I I1 3
I I2 4
T T T T7 7 7 i i i 11234
1. Merychippus sejunctus and M. aff. M. sejunctus2. Aphelops profectus and ?A. profectus3. Aphelops megalodus and fA megaloflus4. Merycochoerus
FIGURE 31.1. Stratigraphic distribution of four taxa found [ in Middle Park and northeastern Colorado, according to sev
eral writers.
2 See footnote, p. B120.
31.1 shows graphically the stratigraphic position of genera from Middle Park and from northeastern Colo rado, according to several writers who have made f aunal studies.
Cope (1874, p. 9-11, 15) found Aphelops megalodus and Merychippus sejunctus somewhere along "the line of bluffs * * * from * * * the valley of Crow Creek * * * eastward for at least sixty miles" in Weld and Logan Counties, Colo., in rocks "of the Loup Fork epoch." Matthew (1899, p. 65, 71; 1901, p. 358) found Merychippus sejunctus and Aphelops profectus in the same area together with Merycochoerus proprius, and coined the name "Pawnee Creek Beds" for the forma tion in which they occur. He added (1901, p. 359) that "a number of species described by Prof. Cope" (includ ing Aphelops megalodus} "appear from their matrix to have come from" the next higher "horizon" in the "Pawnee Creek Beds."
Schultz and Falkenbach (1940, p. 279, 288; 1949, p. 80, 83), who have monographed the merycoidodonts, consider that the genus Merycochoerus occurs only in middle Miocene rocks equivalent to the Marsland Formation of the Hemingford Group of Lugn (1939).
More recently Galbreath (1953, p. 18-20, 27, 31-37, 91-110) reinvestigated the "Pawnee Creek" faunas of northeastern Colorado. He records his interpretation of the age relations of the genera and species we have identified from Middle Park as follows':
Late Miocene, "Eubanks local fauna"Merychippus sejunctus, "occurrence certain" Aphelops megalodus, "occurrence probable"
Middle Miocene, "Martin Canyon local fauna" Aphelops profectus, "known to occur" Merycochoerus, "known to occur"
In summary, we believe that these fauna! elements probably represent a single stratigraphic unit in the Kremmling area, and we have reached the following tentative conclusions:
1. The putative species identified by us from the Miocene sediments of Middle Park are probably of middle Miocene age, equivalent to that of the Mars- land fauna.
2. The Miocene fauna identified by Cook (Lovering, 1930) and that collected by Kichards 3 are probably from the middle Miocene and correlate with the Mars- land Formation of Nebraska.
3 See footnote, p. B120.
B122 PALEONTOLOGY AND PALEOECOLOGY
REFERENCESBurbank, W. S., and others, 1935, Geologic map of Colorado:
U.S. Geol. Survey. Cockerell, T. D. A., 1908, A new locality for Miocene mammals:
Science, new ser., v. 28, p. 683. Cope, E. D., 1874, Report on the stratigraphy and Pliocene
vertebrate paleontology of northern Colorado: U.S. Geol.and Geog. Survey Terr. Bull. 1, p. 9-28.
Galbreath, E. C., 1953, A contribution to the Tertiary geologyand paleontology of northeastern Colorado: Kansas Univ.Paleont. Contr., art. 4, p. 1-120.
Levering, T. S., 1930, The Granby anticline, Grand County,Colorado: U.S. Geol. Survey Bull. 822-B, p. 71-76.
Levering, T. S., and Goddard, E. N., 1950, Geology and oredeposits of the Front Range, Colorado: U.S. Geol. SurveyProf. Paper 223, 318 p.
Lugn, A. L., 1939, Classification of the Tertiary system in Ne braska : Geol. Soc. America Bull., v. 50, p. 1245-1276.
Matthew, W. D., 1899, A provisional classification of the fresh water Tertiary of the West: Am. Mus. Nat. History Bull., v. 12, p. 19-75.
1901, Fossil mammals of the Tertiary of northeasternColorado: Am. Mus. Nat. History Mem., v. 1, pt. 7, p.355-447.
Osborn, H. F., 1909, Cenozoic mammal horizons of westernNorth America: U.S. Geol. Survey Bull. 361, p. 1-90.
Schultz, C. B., and Falkenbach, C. H., 1940, Merycochoerinae, anew subfamily of oreodonts: Am. Mus. Nat. History Bull.,v. 77, p. 213-306.
1949, Promerycochoerinae, a new subfamily of oreodonts : Am. Mus. Nat. History Bull., v. 93, p. 69-198.

Article 32
PALEOECOLOGY OF THE PERMIAN PHOSPHORIA FORMATION AND RELATED ROCKS
By ELLIS L. YOCHELSON, Washington, D.C.
Abstract. Various associations of fossils suggest that plausi- ^)le paleoecological interpretations are: Park City Formation, limestones deposited in shelf areas and mudflats; Shedhorn Sandstone, sandstones on or near beaches; and Phosphoria For- jnation, black shale and chert in basins. Each environment has its characteristic fauna.
Between 1945 and 1955 slightly more than 1,500 fos sil collections were obtained by Geological Survey parties assigned to investigations of the western phos phate field (McKelvey and others, 1959). The collec tions are from more than 100 measured sections in Idaho, Montana, Utah, and Wyoming, and are from 4 dissimilar rock types. In general, these represent deposition of limestone (Park City Formation) and sandstone (Shedhorn Sandstone) in shelf areas, and black shale and chert (Phosphoria Formation) in basin iareas (McKelvey and others, 1959). Each rock facies lhas its own characteristic fossil assemblage. The nearly complete limitation of each assemblage to a particular facies is striking.
Although more than 150 fossil taxa were identified, only 25 to 30 taxa comprise 95 percent of the fauna. Many fossils are poorly preserved. To insure objec tivity, several degrees of identification reliability were employed for what is probably the same taxon.
Examination of the various combinations of occur rence and relative abundance of the fossils suggested that there might be some consistent associations. Sixty such associations were defined; many, but not all, of these are thought to represent former life assemblages. Each of the 1,500 collections was assigned to one of these associations, though some subjective judgments were required to smooth out variations introduced by quality of preservation and local collecting problems. Some stratigraphic sections, sampled in detail, show a con sistent vertical sequential change in the fossil associa tions. Similar consistent changes with reference to the basin margin also occur.
The most satisfactory interpretations can be made in the shelfward facies, particularly within the middle limestone of the Park City Formation, outcropping be
tween the Wyoming-Idaho State line and the eastern edge of the Wind River Mountains. Sheldon (1963) has interpreted a line of maximum regression within the body of the Franson Member. The first fossils above the line of regression are abundant Orb'iculoidea (Roe- meretta) , a large inarticulate brachiopod. Small nucu- loid pelecypods, thought to have been shallow burrowing forms, are associated locally. Both fossils commonly are found in a light-gray claystone.
The claystone is succeeded by a dense moderately bioclastic limestone with abundant masses of fairly large ramose bryozoan colonies. Slightly higher in the sequence the bryozoans are associated with the brachio- pods Derbyia and Spinferina. Derbyia apparently re quired a hard substrate for cementation; Spiriferina could have been attached to the bryozoan colonies by a pedicle. Eare pectenoids and mytiloids, both nonbur- rowing pelecypods, also occur in this association. Higher in the sequence the two brachiopods are much more abundant while the bryozoan colonies coordinately decrease not only in abundance but also, possibly, in relative size.
The next higher beds are shaly limestones or calcare ous shales characterized by the brachiopods Neospirifer, Sphenosteges, Sphenolosia, and "Liosotella" These four genera are almost mutually exclusive and there is some evidence that they occur in sequence as listed. Neospirifer may have been attached by a pedicle in youth, but probably was free living in later life. The productoids Sphenosteges and Sphenolosia cemented themselves to a hard substrate. "Liosotella" was a small free-living procluctoid supported on the bottom by spines. Mollusks are almost never associated with any of these brachiopods. Nonproductoid brachiopods occur in small numbers, seemingly at random, with each of the genera.
These associations are succeeded in turn by associa tions characterized by EcJiinauris and, finally, by Bathymyonia and (or) Muirwoodia. These three brachiopods are spinose moderately large to large pro-
ART. 32 IN U.S. GEOL. SURVEY PROF. PAPER 475-B, PAGES B123-B124. 1963.
680231 0 63- B123
B124 PALEONTOLOGY AND PALEOECOLOGY
ductoids. Almost all occurrences of these associations are in calcareous shales. The few collections obtained below the line of maximum regression seem to show a similar, but reversed, sequence.
The lithologic sequence of the Franson Member is best considered as an upward change from claystone to limestone and then, gradually, to calcareous shale. Other physical evidence also indicates a transgressing sea. This is interpreted as representing an environ mental change from a harder to a softer bottom. The inferred functional morphology of the fossils indicates a corresponding change from forms requiring a hard substrate to those increasingly able to tolerate and thrive on a softer substrate.
Fossils from the Ervay Carbonate Rock Member or upper limestone member are like those from the Fran son Member and show the same general sequence of occurrence. Slight differences suggest that the Ervay sea may have had less intense wave and current action. Fossils from the Grandeur Member or lower limestone are dissimilar. Too few collections are available to sug gest any valid paleoecologic interpretations.
Eastward and southward, the Ervay and Franson faunas change from bryozoan-brachiopod assemblages to molluscan assemblages. Both burrowing and sur face-dwelling pelecypods occur. Plagioglypta, a scaphopod which seems to have lived partially covered by sediments, is common. In the Uinta Mountains of Utah, the molluscan limestone of the Franson Member is underlain by claystone containing Orbiculoidea (Roemerella) and nuculoid pelecypods. These beds may be interpreted as widespread shallow-water de posits similar to those of modern mudflats.
Northwestward, the bryozoan-brachiopod-bearing shelf limestones and shales are replaced by the Shed- horn Sandstone, which has yielded few fossils. In the main, fossils consist of resistant fish remains, scapho- pods, and large pelecypods, almost exclusively burrow ing forms. The fossils support earlier interpretations of this unit as a beach or near-beach sand. This beach environment is in partial contrast to the mudflat en vironment noted previously in central Wyoming and northeastern Utah.
The two basin facies are more difficult to interpret.
The Rex Chert Member not unexpectedly contains few fossils other than sponge spicules which, however, oc cur in astronomical numbers. While these do not con tribute definitive ecologic information, they are not in compatible with the notion that the chert represents the deepest water facies of the Phosphoria. A few lime stone lenses in the midst of chert sequences are anomal ous. They contain a prolific fauna of bottom-dwelling organisms and have many of the physical characteristics of reef masses. The fauna in each lens is a limited one and differs from that of other nearby lenses. These differences may be explained as fortuitous colonization by pelagic larvae that floated basin ward.
In the Meade Peak Phosphatic Shale Member of the Phosphoria Formation, nine genera of brachiopods and mollusks form the bulk of the fauna. More than 30 associations have been formulated. In contrast to the shelf facies, most of these associations seem to occur at random and no systematic change of the fauna can be demonstrated. Most of the fossils seem to have been surface dwellers rather than members of the infauna; shelled cephalopods and squids, both presumably pela gic carnivores, occur sporadically. The fossils suggest that the bottom sediments may have been somewhat harder than one would judge from their diagenetic product. The profusion of shelled invertebrates im plies a depth range with a maximum depth of several hundred feet for the basin.
The fauna and associations within the younger Retort Phosphortic Shale Member of the Phosphoria Forma tion show some differences from those of the Meade Peak Member. The distinctive features of the Retort may not be significant. Ecologic differences between the two phosphatic shales probably are of the same order of magnitude as the differences between the upper two shelf limestones.
REFERENCESMcKelvey, V. E., Williams, J. Steele, Sheldon, R. P., Cressmann,
E. R., Cheny, T. M., and Swanson, R. W., 1959, The Phosr phoria, Park City, and Shedhorn Formations in the western phosphate field: U.S. Geol. Survey Prof. Paper 313-A, p. 1-47.
Sheldon, R. P., 1963, Physical stratigraphy and mineral resources of Permian rocks in western Wyoming: U.S. Geol. Survey Prof. Paper 313-B. [In press]
Article 33
QUATERNARY EVENTS ALONG THE UNGLACIATED LOWER OHIO RIVER VALLEY
By LOUIS L. RAY, Washington, D.C.
Abstract. The alluvial history of the unglaciated Ohio River valley, below Louisville, Ky., was intimately affected by glaciers invading its drainage basin. Alluviation of a deep bedrock val- lejy and the lower courses of tributary streams is interpreted partly from the stratigraphy of loess deposits genetically related to valley trains.
Below Louisville, Ky., the valley of the Ohio River lies beyond the limits of continental glaciation, yet it has been intimately affected by the waxing and waning of the great Quaternary ice sheets that invaded its drainage basin. Serving as a drainage for debris-laden melt waters during at least 3 glaciations, and possibly 4^ the valley has been deeply alluviated by valley-train deposits. Tributary valleys, except for that of the Wabash River, have been choked in their lower courses by lacustrine, backwater clayey silts to the level of the valley trains of the Ohio that dammed their mouths. The Wabash valley, which also served as a drainageway fij-om the ice sheets to the north, likewise contains val ley-train deposits, so that tributaries to its lower course afe also broadly alluviated by lacustrine, backwater clayey silts. Sand dunes and a stratigraphic succession of loess deposits along the Ohio valley walls and man tling the adjacent countryside are genetically related to tl)ie fluvioglacial deposits within, the valley. Because pre-Wisconsin alluvium in the Ohio valley is buried by Wisconsin and later deposits, the pre-Wisconsin history of Quaternary events is in part interpreted from the l<j)ess deposits.
Well records indicate that the bedrock channel of the Ohio River below Louisville was deeply alluviated dur- i^ig the Quaternary at one point to a depth of 200 ffeet. From Louisville to a point near the confluence of tie ancient Ohio (Cache Valley) with the Mississippi
^iver, the bedrock valley floor descends from an eleva-on of 309 feet (MacCary, 1955) to slightly less than
180 feet (Fisk, 1944). Various ages have been assigned to the cutting of this deeply buried bedrock channel (Wayne, 1952). Regional studies have led to the in ference that the channel cutting was essentially, if not wholly, completed before the advance of the. first glacial i£e sheet, the Nebraskan, and that the channel is, there
fore, of preglacial, presumably pre-Quaternary origin. Significant bedrock incision by the river since the first glacial invasion of its drainage basin is held to be unlikely.
Although events during the Nebraskan Glaciation are obscure, it appears that this first great ice sheet buried and permanently disarranged the ancient Mahomet- Teays river system to the north and east of the pre glacial Ohio River. At that time the drainage basin of the Ohio was vastly enlarged by diversion of the head waters of the Mahomet-Teays drainage into the Ohio. Presumably valley-train deposits were developed along the Ohio, for glacial invasion of a drainage basin re sults in aggradation along the drainageways. Con versely, ice-free interglaciations result in degradation. It appears unlikely that the inferred fluvioglacial de posits were wholly removed by degradation of the Ohio during the Aftonian (post-Nebraskan-pre-Kansan) In- terglaciation or that the river again eroded its bedrock valley bottom. The lack of loess deposits along the Ohio valley that might be genetically related to a Ne braskan valley train is not surprising because of weathering and erosion during the long Aftonian Inter- glaciation. Loess deposits, if formerly present, must have been limited areally and in thickness, for a Ne braskan valley train would have had a restricted surface to serve as source area for deflation of silt sediments. Also the valley train would have been confined within the high protective walls of the deep bedrock valley so that deflation from its surface would have been limited.
Field observations show that ice of the Kansan Gla ciation crossed the Ohio River valley. Tills that are far more deeply weathered than those of the third or Illinoian Glaciation are exposed within the valley of the Ohio and south of the river above Louisville (Ray, 1957; Flint and others, 1959). No outwash debris as signable to a Kansan age has been identified, however, within the Ohio valley below the point where it was crossed by the Kansan glacier, for presumably the out- wash is buried by younger deposits and has not been recognized in well records. The presence of a valley
ART. 33 IN U.S. GEOL. SURVEY PROF. PAPER 475-B, PAGES B125-B128. 1963.
B125
B126 GEOMORPHOLOGY, GLACIAL GEOLOGY, AND GLACIOLOGY
train is indicated, however, by a well-exposed section of loess near Yankeetown, Ind., that has a well-defined stratigraphic succession of four silt deposits. The low est, deeply weathered silt deposit overlies weathered bedrock and is in turn overlain and protected by a com pact colluvium of local rock fragments and silt that is in part cemented by iron oxides. Above the colluvium is the characteristic sequence of three loess deposits re lated to the third (Illmoian) and fourth (Wisconsin) glaciation. The lowest silt, of pre-Illinoian age, is in terpreted as a loess of Kansan age that is composed of eolian sediments swept from the surface of a valley train of Kansan age. It is unlikely that deposits of Kansan loess have been preserved elsewhere unless they have been protected from erosion by fortuitous cir cumstances during the very long post-Kansan, Yar mouth Interglaciation. Normally the younger loesses of Illinoian and Wisconsin age rest directly on bedrock.
During the Yarmouth Interglaciation, earlier loess was subject to deep weathering and erosion, and the Ohio Eiver degraded its valley-train deposits. Fol lowing the Yarmouth, ice sheets of the third glaciation, the Illinoian, advanced across the Ohio valley in a few places above the Louisville area. Again there is no direct evidence of a valley train of Illinoian age, but there is ample evidence of its existence because of the deposits of Loveland Loess along the lower unglaciated valley that were derived from eolian sediments deflated from an Illinoian valley-train surface. The Loveland Loess commonly overlies weathered bedrock; rarely weathered rubble or colluvium (Ray, 1957). Deeply weathered and leached of its original carbonates, the Loveland Loess along the Ohio bears a remarkable simi larity in physical character to, and is in the same strati- graphic position as, those deposits along the Mississippi above and below its confluence with the Ohio (Leighton and Willman, 1950; Horberg, 1956). The distinct well- drained profile of weathering on the Loveland Loess, developed during the following Sangamon Interglacia tion, is characterized by a deep-crimson-red crumbly silty clay at the top that grades downward to a dark- brownish-yellow compact clayey silt. Erosion during the Sangamon Interglaciation completely removed the Loveland Loess in many places, so that the succeeding younger loess deposits of Wisconsin age commonly rest directly on bedrock.
The oldest deposit along the Ohio River valley cor relative with the fourth or Wisconsin Glaciation is the Farmdale Loess (Ray, 1957, I960).1 Lying directly on weathered Loveland Loess or on bedrock, the Farmdale
1 Farmdale Loess at several localities along the Ohio River in north ern Kentucky and southern Indiana recently has been labeled "Rox- ana silt" by Frye and others (1962).
Loess is similar in its distinctive physical character istics and stratigraphic position to loess along the Mis sissippi River valley (Wascher and others, 1948; Leigh- ton and Willman, 1950; Ray, 1963). Although normally compact and leached, its appearance is quite youthful in comparison to the earlier, deeply weathered Loveland Loess. The widespread distribution of Farmdale Loess along the Ohio leads to the conclusion that a valley train of Farmdale age marked the earliest Wisconsin alluvia- tion of the valley, although no valley-train deposits have been identified. A unique exposure, however, of sandy and wood-bearing humic clayey silts at Owens- boro, Ky., has a carbon-14 date of 23,150±500 years B.P. (Rubin and Suess, 1956, sample W-270). These sandy and clayey silt beds underlie 30 feet of fluvio- glacial sand and gravel of the younger valley train of Tazewell age, and are believed to represent alluviation following waning of ice of Farmdale age in the drain-- age basin upstream. Woody materials and pollen from this deposit indicate a local flora similar to that of to day, with some pollen, presumably from afar, indicat ing flora of a cooler climate.
No loess of lowan age has been identified along the Ohio River above the mouth of the Wabash. With the present state of knowledge, it appears that a glacial invasion of the upper Ohio drainage basin did not occur at that time. A thin loess between the Farmdale and the overlying loess of Tazewell age along the lower Wabash valley, and the Ohio valley below the mouth of the Wabash River suggests, however, that a valley train of lowan age, now buried by later outwash of Tazewell age, was its source. The suggested presence of the valley train implies that the Wabash drainage basin as well as that of the Mississippi was invaded by an lowan ice sheet.2
Maximum alluviation of the Ohio River valley oc curred in Tazewell time when ice sheets of Wisconsin age were most widespread in the Ohio drainage basin. The valley was choked by outwash debris that formed a broad valley train whose surface is now the highest terrace within the valley. Notable changes in the course of the river resulted from burial of low bedrock divides by glacial outwash, for example, near Owens- boro, Ky.; also upstream from Paducah, Ky., where a low divide between the lower Cumberland and Ten nessee Rivers was submerged by backwater alluviation of the Cumberland valley, a tributary to the Ohio. Burial of this divide permitted the Ohio to abandon its ancient course through the Cache Valley of southern
2 The lowan Loess, not recognized as such but referred to in places as Peoria (transitional) by Frye and others (1962), has, according to their data, distinctive D.I. (diffraction intensity) ratios, in marked contrast to those of the Farmdale Loess below and the Tazewell Loess above (Roxana silt and Peoria Loess of Frye and others).

RAY B127
Illinois and utilize the lower Cumberland and Tennes- s|ee valleys as a lower route to the head of the Mississippi I£mbayment.
Valley trains along the Ohio and lower Wabash Kivers dammed the mouths of their tributaries and ponded their lower courses to produce shallow basins filled with lacustrine, calcareous backwater clayey silt, in places highly fossiliferous (Thornbury, 1950, and dithers). The resultant lacustrine flats are today prom inent features of the landscape. At one artificial ex posure through a loess-mantled bedrock hill and the adjacent lacustrine sediments that overlap the lower hill slope, the Loveland and Farmdale Loesses on the hjill slope continue beneath the lacustrine sediments, but the thick overlying Tazewell Loess on the hill slope merges imperceptibly with the lacustrine beds. Two carbon-14 dates (Rubin and Alexander, 1960, samples W-520 and W-645) of wood from lacustrine beds along the Ohio indicate a Tazewell age of 18,530±500 and 19,940±300 years B.P. for the deposits. Postdeposi- tional leaching of carbonates of the lacustrine sedi ments averages about 3% inches in depth for each 1,000 years.
All post-Farmdale loess along the Ohio River, be lieved to be largely of Tazewell age above and lowan- Tazewell age below the mouth of the Wabash River, ig called Peorian for convenience. Deposits are thick est nearest the valley-train source areas and grow thin- rier with increasing distance from the source. Where thick and well drained, a characteristic postdepositional profile of weathering has been developed (Ray, 1963). Sand dunes on the Tazewell valley-train surface and on tihe adjacent valley walls are loess mantled; dunes along valley walls may contain intercalated lenses of loess.
The post-Tazewell sequence of events along the un- £;laciated Ohio River valley is complex. Differing ter- lace sequences in various sectors reflect differing sequences of events. Above the mouth of the Tennessee Ipver, remnants of two post-Tazewell terraces are ^ound between the level of the flood plain and the ter- rjace of Tazewell age. The higher of these two terraces is the better represented, and is tentatively assigned a Cary age. The age and origin of the lower terrace,
poorly represented by small scattered remnants, is not certain.
The terrace level assigned a Cary age is believed to be contemporaneous with the surface described in the Wabash River valley by Fidlar (1948) and attributed by him to cutting throughout the course of the Wabash by torrents released from ancient Lake Maumee dur ing retreat of ice of Cary age. Recent field studies, however, indicate that the Wabash eroded only in its upper reaches. In its lower course it was an. aggrading stream, for terrace remnants are underlain by well- bedded deposits of sand and gravel, and the terrace surface is overlain by sand dunes that bank against the valley wall and that are not loess mantled. A deltalike mass of debris that was poured from the Wabash into the Ohio River valley appears to have partly ponded the Ohio and modified its terrace sequence for many miles both upstream and downstream.
Below the mouth of the Cumberland River, the Ohio River, flowing in its new course after abandonment of the Cache Valley, has been largely influenced by events on the Mississippi River. Two low, level terraces above the flood plain are believed to represent backwater al- luviation contemporaneous with periods of aggrada tion along the Mississippi. Of these, the higher, on which the city of Paducah is situated, may be of Man- kato age, and the lower may be contemporaneous with alluviation once assigned a late Mankato age in the Mississippi valley (Leighton and Willman, 1949) and more recently a Valders age (Leighton, 1960). A younger, great alluvial fan in the Mississippi valley, on which the city of Charleston, Mo., is situated, seemingly did not affect the regimen of the Ohio.
The flood plain of the Ohio River represents the last event in its history. WTiere the valley is wide and broadly alluviated, meanders have developed in the al luvial valley fill, and extensive point bars and alluvial islands have formed with surfaces as much as 40 feet above the mean low water level of the river before canalization. All indications suggest that today the artificially canalized river is neither actively aggrading nor degrading. In many places, however, it is shifting laterally so that its course has been somewhat modified in historic time.
B128 GEOMORPHOLOGY, GLACIAL GEOLOGY, AND GLACIOLOGY
REFERENCES
Fidlar, M. M., 1948, Physiography of the lower Wabash Valley [Ind.]: Indiana Dept. Conserv., Div. Geology Bull. 2, 112 p.
Fisk, H. N., 1944, Geological investigation of the alluvial valley of the lower Mississippi River: Vicksburg, Miss., Mississippi River Comm., 78 p.
Flint, R. F., and others, 1959, Glacial map of the United States east of the Rocky Mountains: Geol. Soc. America, 2 sheets, scale 1:1,750,000.
Frye, J. C., Glass, H. D., and Willman, H. B., 1962, Strati graphy and mineralogy of the Wisconsinan loesses of Illi nois : Illinois State Geol. Survey Circ. 334, 55 p.
Horberg, C. L., 1956, Pleistocene deposits along the Mississippi Valley in central-western Illinois: Illinois State Geol. Sur vey Rept. Inv. 192, 39 p.
Leighton, M. M., I960, The classification of the Wisconsin glacial stage of north central United States: Jour. Geology, v. 68, p. 529-552.
Leighton, M. M., and Willman, H. B., 1949, Itinerary of [2nd Pleistocene] field conference: Urbana, 111., auspices of the State Geologists, 86 p.
1950, Loess formations of the Mississippi Valley: Jour. Geology, v. 58, p. 599-623.
MacCary, L. M., compiler, 1955, Map of the Louisville area,Kentucky, showing contours on the bedrock surface: U.S.Geol. Survey Hydrol. Inv. Atlas HA-5.
Ray, L. L., 1957, Two significant new exposures of Pleistocenedeposits along the Ohio River valley in Kentucky: Jour.Geology, v. 65, p. 542-545.
1960, Significance of loess deposits along the Ohio River valley: Art 92 in U.S. Geol. Survey Prof. Paper 400-B, p. B211.
1963, Silt-clay ratios of weathering profiles of Peorianloess along the Ohio valley: Jour. Geology, v. 71, p. 38-47.
Rubin, Meyer, and Alexander, Corrinne, 1960, U.S. GeologicalSurvey radio-carbon dates V: Am. Jour. Sci., RadiocarbonSupp., v. 2, p. 129-185.
Rubin Meyer, and Suess, H. E., 1956, U.S. Geological Surveyradio-carbon dates III: Science, v. 123, p. 442-448.
Thornbury, W. D., 1950, Glacial sluiceways and lacustrine plainsof southern Indiana: Indiana Dept. Conserv., Div. GeologyBull. 4, 21 p.
Waseher, H. L., Humbert, R. P., and Cady, J. G., 1948, Loessin the southern Mississippi Valley; Identification and dis tribution of the loess sheets: Soil Sci. Soc. America Proc.1947, v. 12, p. 389-399.
Wayne, W. J., 1952, Pleistocene evolution of the Ohio andWabash valleys [Ind.]: Jour. Geology, v. 60, p. 575-585.
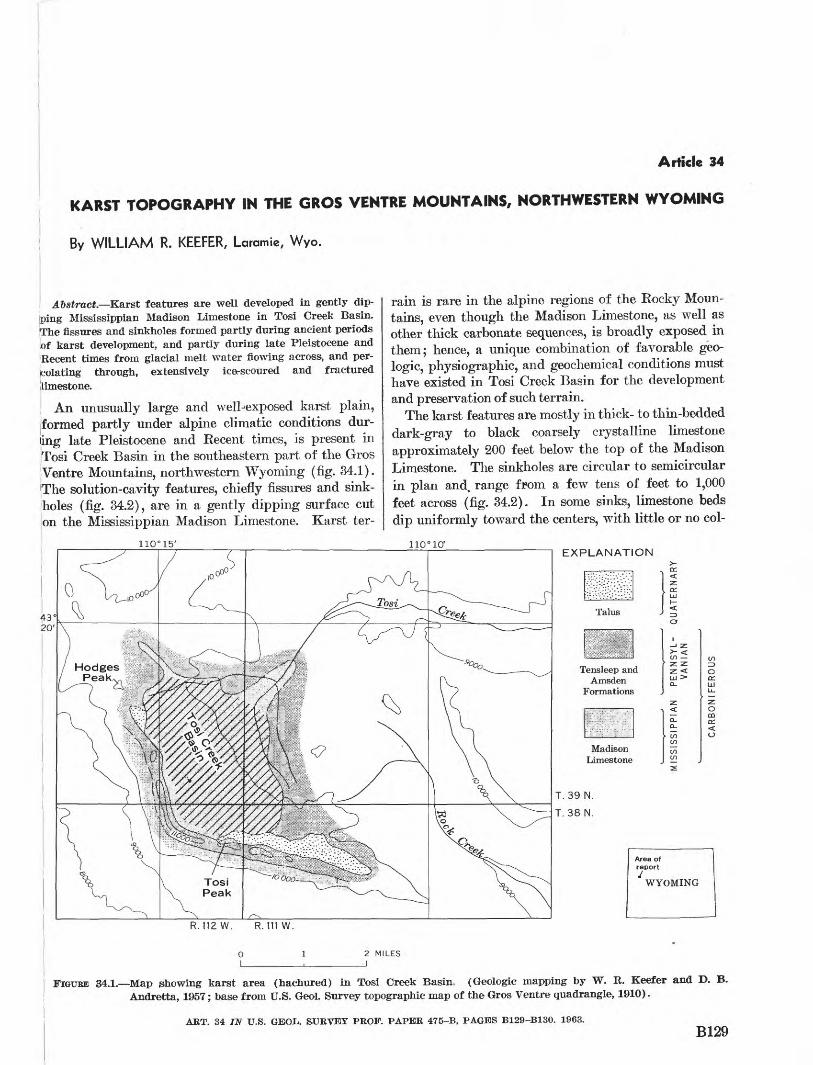
Article 34
KARST TOPOGRAPHY IN THE GROS VENTRE MOUNTAINS, NORTHWESTERN WYOMING
By WILLIAM R. KEEPER, Laramie, Wyo.
Abstract. Karst features are well developed in gently dip ping Mississippian Madison Limestone in Tosi Creek Basin. EThe fissures and sinkholes formed partly during ancient periods .of karst development, and partly during late Pleistocene and (Recent times from glacial melt water flowing across, and per- Icolating through, extensively ice-scoured and fractured [limestone.
, An unusually large and well-^exposed karst plain, iformed partly under alpine climatic conditions dur ing late Pleistocene and Kecent times, is present in Tosi Creek Basin in the southeastern part of the Gros jVentre Mountains, northwestern Wyoming (fig. 34.1). The solution-cavity features, chiefly fissures and sink holes (fig. 34.2), are in a gently dipping surface cut on the Mississippian Madison Limestone. Karst ter
rain is rare in the alpine regions of the Kocky Moun tains, even though the Madison Limestone, as well as other thick carbonate sequences, is broadly exposed in them; hence, a unique combination of favorable geo logic, physiographic, and geochemical conditions must have existed in Tosi Creek Basin for the development and preservation of such terrain.
The karst features are mostly in thick- to thin-bedded dark-gray to black coarsely crystalline limestone approximately 200 feet below the top of the Madison Limestone. The sinkholes are circular to semicircular in plan and, range from a few tens of feet to 1,000 feet across (fig. 34.2). In some sinks, limestone beds dip uniformly toward the centers, with little or no col-
EXPLANATION
R.112W. R. 111 W.
2 MILES
j FIGURE 34.1. Map showing karst area (hachured) in Tosi Creek Basin. (Geologic mapping by W. R. Keefer and D. B. ! Andretta, 1957; base from U.S. Geol. Survey topographic map of the Gros Ventre quadrangle, 1910).
ART. 34 IN U.S. GEOL,. SURVEY PROF. PAPER 475-B, PAGES B129-B130. 1963.B129
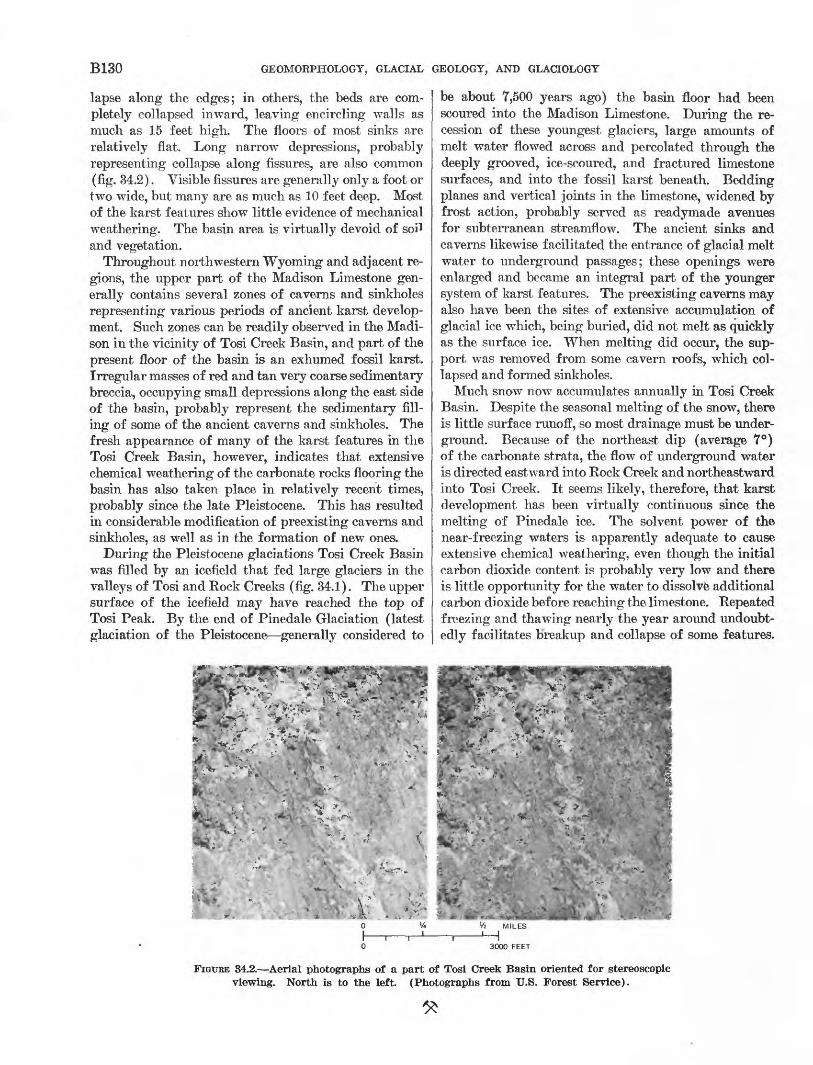
B130 GEOMORPHOLOGY, GLACIAL GEOLOGY, AND GLACIOLOGY
lapse along the edges; in others, the beds are com pletely collapsed inward, leaving encircling walls as much as 15 feet high. The floors of most sinks are relatively flat. Long narrow depressions, probably representing collapse along fissures, are also common (fig. 34.2). Visible fissures are generally only a foot or two wide, but many are as much as 10 feet deep. Most of the karst features show little evidence of mechanical weathering. The basin area is virtually devoid of soil and vegetation.
Throughout northwestern Wyoming and adjacent re gions, the upper part of the Madison Limestone gen erally contains several zones of caverns and sinkholes representing various periods of ancient karst develop ment. Such zones can be readily observed in the Madi son in the vicinity of Tosi Creek Basin, and part of the present floor of the basin is an exhumed fossil karst. Irregular masses of red and tan very coarse sedimentary breccia, occupying small depressions along the east side of the basin, probably represent the sedimentary fill ing of some of the ancient caverns and sinkholes. The fresh appearance of many of the karst features in the Tosi Creek Basin, however, indicates that extensive chemical weathering of the carbonate rocks flooring the basin has also taken place in relatively recent times, probably since the late Pleistocene. This has resulted in considerable modification of preexisting caverns and sinkholes, as well as in the formation of new ones.
During the Pleistocene glaciations Tosi Creek Basin was filled by an icefield that fed large glaciers in the valleys of Tosi and Rock Creeks (fig. 34.1). The upper surface of the icefield may have reached the top of Tosi Peak. By the end of Pinedale Glaciation (latest glaciation of the Pleistocene generally considered to
be about 7,500 years ago) the basin floor had been scoured into the Madison Limestone. During the re cession of these youngest glaciers, large amounts of melt water flowed across and percolated through the deeply grooved, ice-scoured, and fractured limestone surfaces, and into the fossil karst beneath. Bedding planes and vertical joints in the limestone, widened by frost action, probably served as readymade avenues for subterranean streamflow. The ancient sinks and caverns likewise facilitated the entrance of glacial melt water to underground passages; these openings were enlarged and became an integral part of the younger system of karst features. The preexisting caverns may also have been the sites of extensive accumulation of glacial ice which, being buried, did not melt as quickly as the surface ice. When melting did occur, the sup port was removed from some cavern roofs, which col lapsed and formed sinkholes.
Much snow now accumulates annually in Tosi Creek Basin. Despite the seasonal melting of the snow, there is little surface runoff, so most drainage must be under ground. Because of the northeast dip (average 7°) of the carbonate strata, the flow of underground water is directed eastward into Rock Creek and northeastward into Tosi Creek. It seems likely, therefore, that karst development has been virtually continuous since the melting of Pinedale ice. The solvent power of the near-freezing waters is apparently adequate to cause extensive chemical weathering, even though the initial carbon dioxide content is probably very low and there is little opportunity for the water to dissolve additional carbon dioxide before reaching the limestone. Repeated freezing and thawing nearly the year around undoubt edly facilitates breakup and collapse of some features.
FIGURE 34.2. Aerial photographs of a part of Tosi Creek Basin oriented for stereoscopic viewing. North is to the left. (Photographs from U.S. Forest Service).
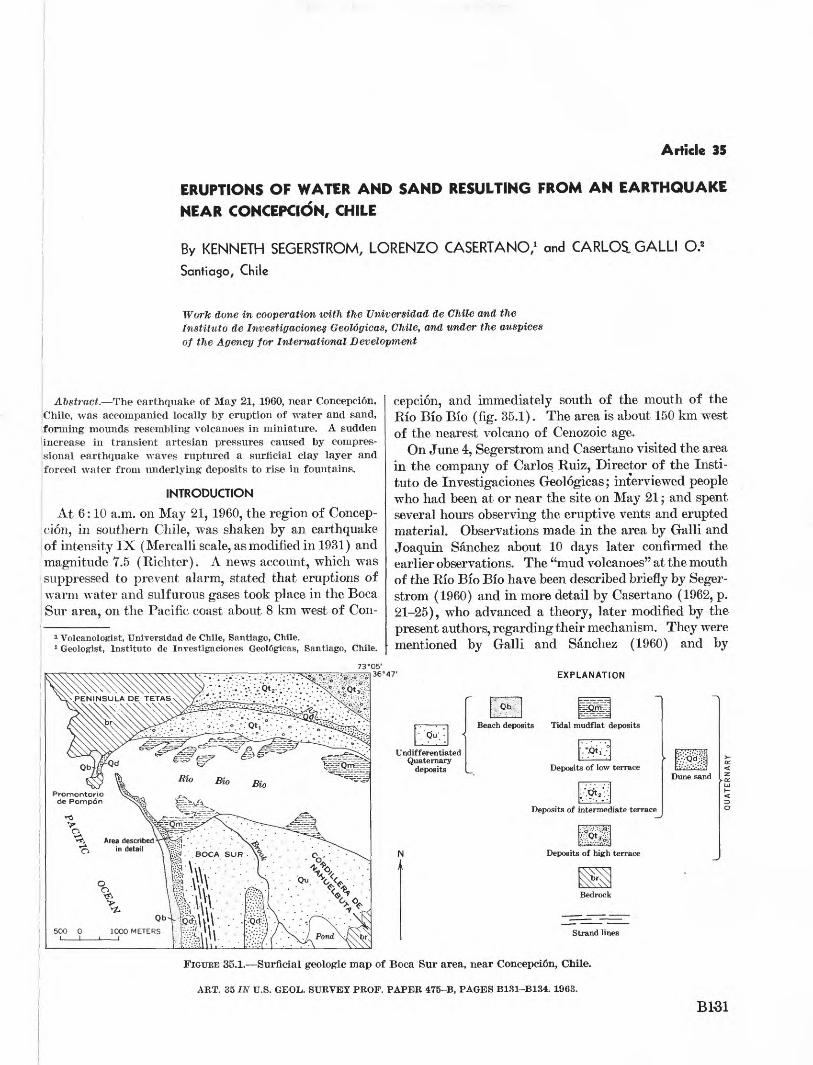
Article 35
ERUPTIONS OF WATER AND SAND RESULTING FROM AN EARTHQUAKE
NEAR CONCEPCION, CHILE
By KENNETH SEGERSTROM, LORENZO CASERTANO,1 and CARLOS. GALLI O.2
Santiago, Chile
Work done in cooperation with the Universidad de Chile and the Institute de Investigaciones Geologicas, Chile, and under the auspices of the Agency for International Development
Abstract. The earthquake of May 21, 1960, near Concepcion, Chile, was accompanied locally by eruption of water and sand,
! forming mounds resembling volcanoes in miniature. A sudden 'increase in transient artesian pressures caused by compres- sioiial earthquake waves ruptured a surficial clay layer and forced water from underlying deposits to rise in fountains.
! INTRODUCTION
At 6:10 a.m. on May 21, 1960, the region of Concep-Icion, in southern Chile, was shaken by an earthquakeof intensity IX (Mercalli scale, as modified in 1931) and
I magnitude 7.5 (Blchter). A news account, which wassuppressed to prevent alarm, stated that eruptions ofwarm water and sulfurous gases took place in the BocaSur area, on the Pacific coast about 8 km west of Con-
1 Volcanologist, Universidad de Chile, Santiago, Chile.2 Geologist, Institute de Investigaciones Geologicas, Santiago, Chile.
cepcion, and immediately south of the mouth of the Rio Bio Bio (fig. 35.1). The area is about 150 km west of the nearest volcano of Cenozoic age.
On June 4, Segerstrom and Casertano visited the area in the company of Carlos Ruiz, Director of the Insti tute de Investigaciones Geologicas; interviewed people who had been at or near the site on May 21; and spent several hours observing the eruptive vents and erupted material. Observations made in the area by Galli and Joaquin Sanchez about 10 days later confirmed the earlier observations. The "mud volcanoes" at the mouth of the Rio Bio Bio have been described briefly by Seger strom (1960) and in more detail by Casertano (1962, p. 21-25), who advanced a theory, later modified by the present authors, regarding their mechanism. They were mentioned by Galli and Sanchez (1960) and by
EXPLANATION
UndifferentiatedQuaternary
deposits
Beach deposits Tidal mudflat deposits
Dune sand
Bedrock
Strand lines
FIGUEE 35.1. Surficial geologic map of Boca Sur area, near Concepci&n, Chile.
ART. 35 IN U.S. GEOL. SURVEY PROF. PAPER 475-B, PAGES B131-B134. 1963.
Bl-31
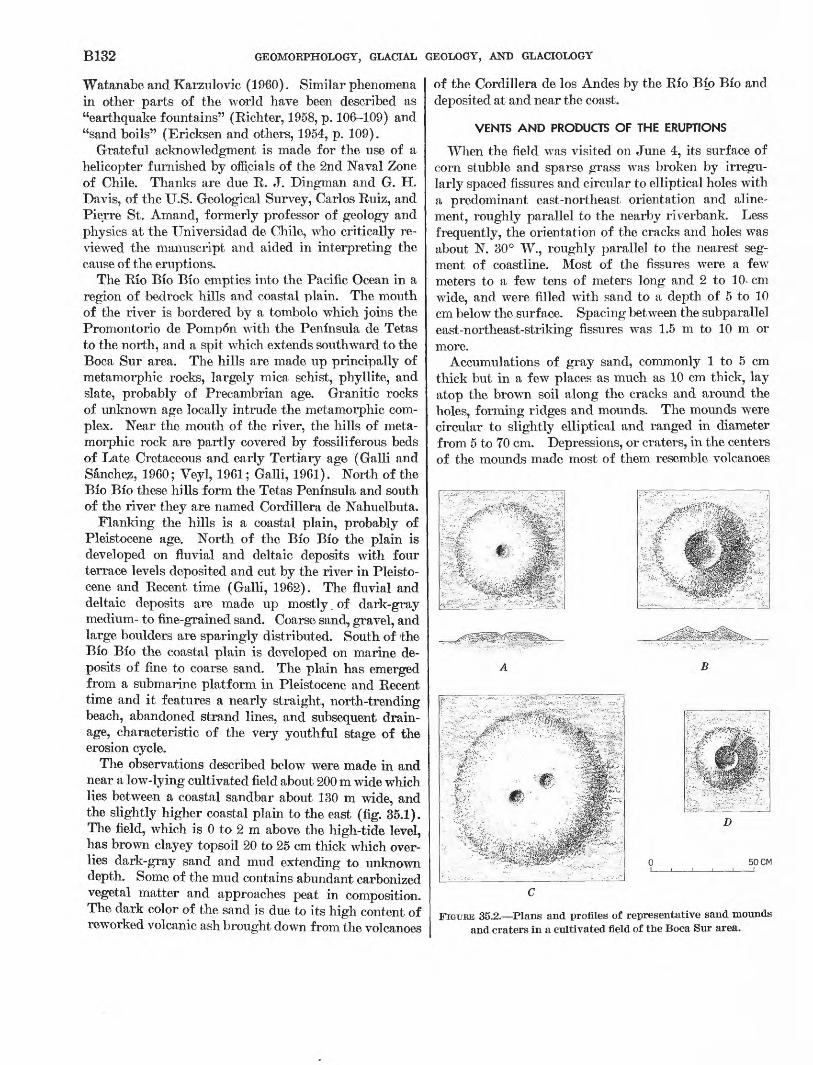
B132 GEOMORPHOLOGY, GLACIAL GEOLOGY, AND GLACIOLOGY
Watanabe and Karzulovic (1960). Similar phenomena in other parts of the world have been described as "earthquake fountains" (Richter, 1958, p. 106-109) and "sand boils" (Ericksen and others, 1954, p. 109).
Grateful acknowledgment is made for the use of a helicopter furnished by officials of the 2nd Naval Zone of Chile. Thanks are due R. J. Dingman and G. H. Davis, of the U.S. Geological Survey, Carlos Ruiz, and Pierre St. Amand, formerly professor of geology and physics at the Universidad de Chile, who critically re viewed the manuscript and aided in interpreting the cause of the eruptions.
The Rio Bio Bio empties into the Pacific Ocean in a region of bedrock hills and coastal plain. The mouth of the river is bordered by a tombolo which joins the Promontorio de Pompon with the Peninsula de Tetas to the north, and a spit which extends southward to the Boca Sur area. The hills are made up principally of metamorphic rocks, largely mica schist, phyllite, and slate, probably of Precambrian age. Granitic rocks of unknown age locally intrude the metamorphic com plex. Near the mouth of the river, the hills of meta morphic rock are partly covered by fossiliferous beds of Late Cretaceous and early Tertiary age (Galli and Sanchez, 1960; Veyl, 1961; Galli, 1961). North of the Bio Bio these hills form the Tetas Peninsula and south of the river they are named Cordillera de Nahuelbuta.
Flanking the hills is a coastal plain, probably of Pleistocene age. North of the Bio Bio the plain is developed on fluvial and deltaic deposits with four terrace levels deposited and cut by the river in Pleisto cene and Recent time (Galli, 1962). The fluvial and deltaic deposits are made up mostly of dark-gray medium- to fine-grained sand. Coarse sand, gravel, and large boulders are sparingly distributed. South of the Bio Bio the coastal plain is developed on marine de posits of fine to coarse sand. The plain has emerged from a submarine platform in Pleistocene and Recent time and it features a nearly straight, north-trending beach, abandoned strand lines, and subsequent drain age, characteristic of the very youthful stage of the erosion cycle.
The observations described below were made in and near a low-lying cultivated field about 200 m wide which lies between a coastal sandbar about 130 m wide, and the slightly higher coastal plain to the east (fig. 35.1). The field, which is 0 to 2 m above the high-tide level, has brown clayey topsoil 20 to 25 cm thick which over lies dark-gray sand and mud extending to unknown depth. Some of the mud contains abundant carbonized vegetal matter and approaches peat in composition. The dark color of the sand is due to its high content of reworked volcanic ash brought down from the volcanoes
of the Cordillera de los Andes by the Rio Bio Bio and deposited at and near the coast.
VENTS AND PRODUCTS OF THE ERUPTIONS
When the field was visited on June 4, its surface of corn stubble and sparse grass was broken by irregu larly spaced fissures and circular to elliptical holes with a predominant east-northeast orientation and aline- ment, roughly parallel to the nearby riverbank. Less frequently, the orientation of the cracks and holes was about N. 30° W., roughly parallel to the nearest seg ment of coastline. Most of the fissures were a few meters to a few tens of meters long and 2 to 10- cm wide, and were filled with sand to a depth of 5 to 10 cm below the surface. Spacing between the subparallel east-northeast-striking fissures was 1.5 m to 10 m or more.
Accumulations of gray sand, commonly 1 to 5 cm thick but in a few places as much as 10 cm thick, lay atop the brown soil along the cracks and around the holes, forming ridges and mounds. The mounds were circular to slightly elliptical and ranged in diameter from 5 to TO cm. Depressions, or craters, in the centers of the mounds made most of them resemble volcanoes
B
50 CM
FIGURE 35.2. Plans and profiles of representative sand mounds and craters in a cultivated field of the Boca Sur area.
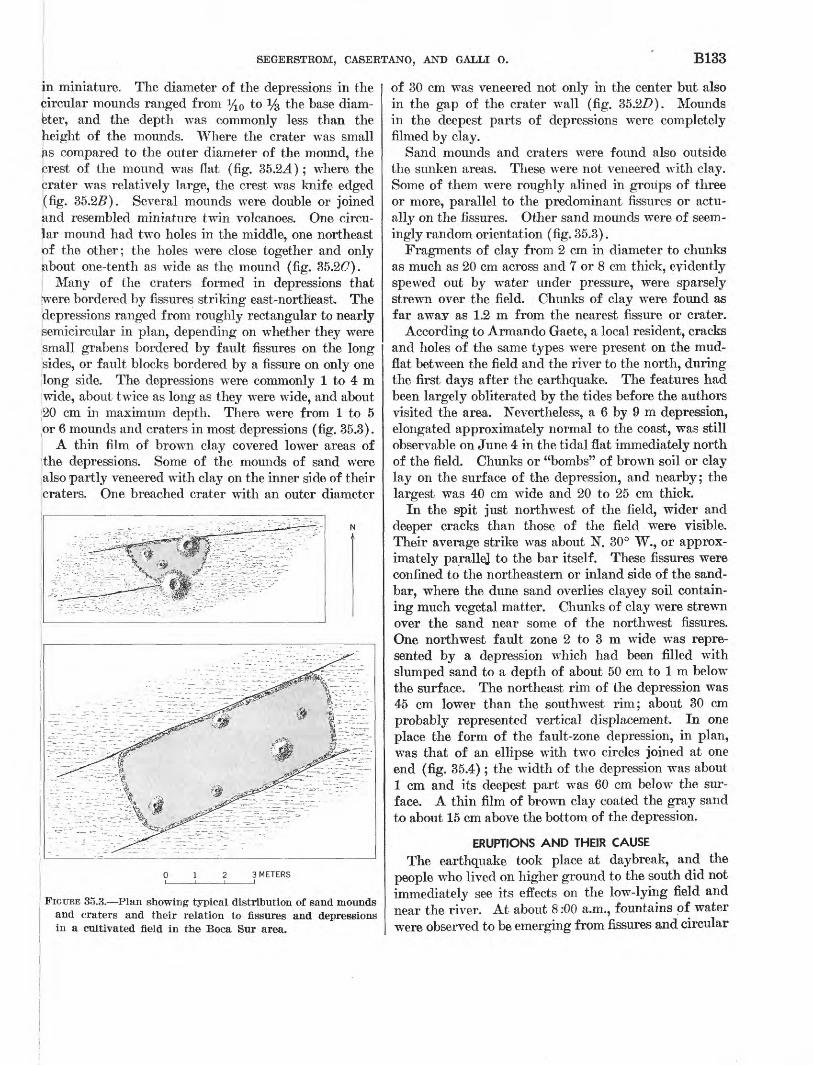
SEGERSTROM, CASERTANO, AND GALLI O. B133
in miniature. The diameter of the depressions in the circular mounds ranged from % 0 to % the base diam eter, and the depth was commonly less than the height of the mounds. Where the crater was small as compared to the outer diameter of the mound, the crest of the mound was flat (fig. 35.2J.); where the crater was relatively large, the crest was knife edged (fig. 35.2Z?). Several mounds were double or joined and resembled miniature twin volcanoes. One circu lar mound had two holes in the middle, one northeast of the other; the holes were close together and only about one-tenth as wide as the mound (fig. 35.2#).
Many of the craters formed in depressions that [were bordered by fissures striking east-northeast. The depressions ranged from roughly rectangular to nearly jsemicircular in plan, depending on whether they were small grabens bordered by fault fissures on the long sides, or fault blocks bordered by a fissure on only one jlong side. The depressions were commonly 1 to 4 m jwide, about twice as long as they were wide, and about |20 cm in maximum depth. There were from 1 to 5 .or 6 mounds and craters in most depressions (fig. 35.3).
A thin film of brown clay covered lower areas of 'the depressions. Some of the mounds of sand were jalso partly veneered with clay on the inner side of their ,craters. One breached crater with an outer diameter
3 METERS
FIGURE 35.3. Plan showing typical distribution of sand mounds and craters and their relation to fissures and depressions in a cultivated field in the Boca Sur area.
of 30 cm was veneered not only in the center but also in the gap of the crater wall (fig. 35.2Z>). Mounds in the deepest parts of depressions were completely filmed by clay.
Sand mounds and craters were found also outside the sunken areas. These were not veneered with clay. Some of them were roughly alined in groups of three or more, parallel to the predominant fissures or actu ally on the fissures. Other sand mounds were of seem ingly random orientation (fig. 35.3).
Fragments of clay from 2 cm in diameter to chunks as much as 20 cm across and 7 or 8 cm thick, evidently spewed out by water under pressure, were sparsely strewn over the field. Chunks of clay were found as far away as 1.2 m from the nearest fissure or crater.
According to Armando Gaete, a local resident, cracks and holes of the same types were present on the mud- flat between the field and the river to the north, during the first days after the earthquake. The features had been largely obliterated by the tides before the authors visited the area. Nevertheless, a 6 by 9 m depression, elongated approximately normal to the coast, was still observable on June 4 in the tidal flat immediately north of the field. Chunks or "bombs" of brown soil or clay lay on the surface of the depression, and nearby; the largest was 40 cm wide and 20 to 25 cm thick.
In the spit just northwest of the field, wider and deeper cracks than those of the field were visible. Their average strike was about N. 30° W., or approx imately parallej to the bar itself. These fissures were confined to the northeastern or inland side of the sand bar, where the dune sand overlies clayey soil contain ing much vegetal matter. Chunks of clay were strewn over the sand near some of the northwest fissures. One northwest fault zone 2 to 3 m wide was repre sented by a depression which had been filled with slumped sand to a depth of about 50 cm to 1 m below the surface. The northeast rim of the depression was 45 cm lower than the southwest rim; about 30 cm probably represented vertical displacement. In one place the form of the fault-zone depression, in plan, was that of an ellipse with two circles joined at one end (fig. 35.4); the width of the depression was about 1 cm and its deepest part was 60 cm below the sur face. A thin film of brown clay coated the gray sand to about 15 cm above the bottom of the depression.
ERUPTIONS AND THEIR CAUSEThe earthquake took place at daybreak, and the
people who lived on higher ground to the south did not immediately see its effects on the low-lying field and near the river. At about 8:00 a.m., fountains of water were observed to be emerging from fissures and circular
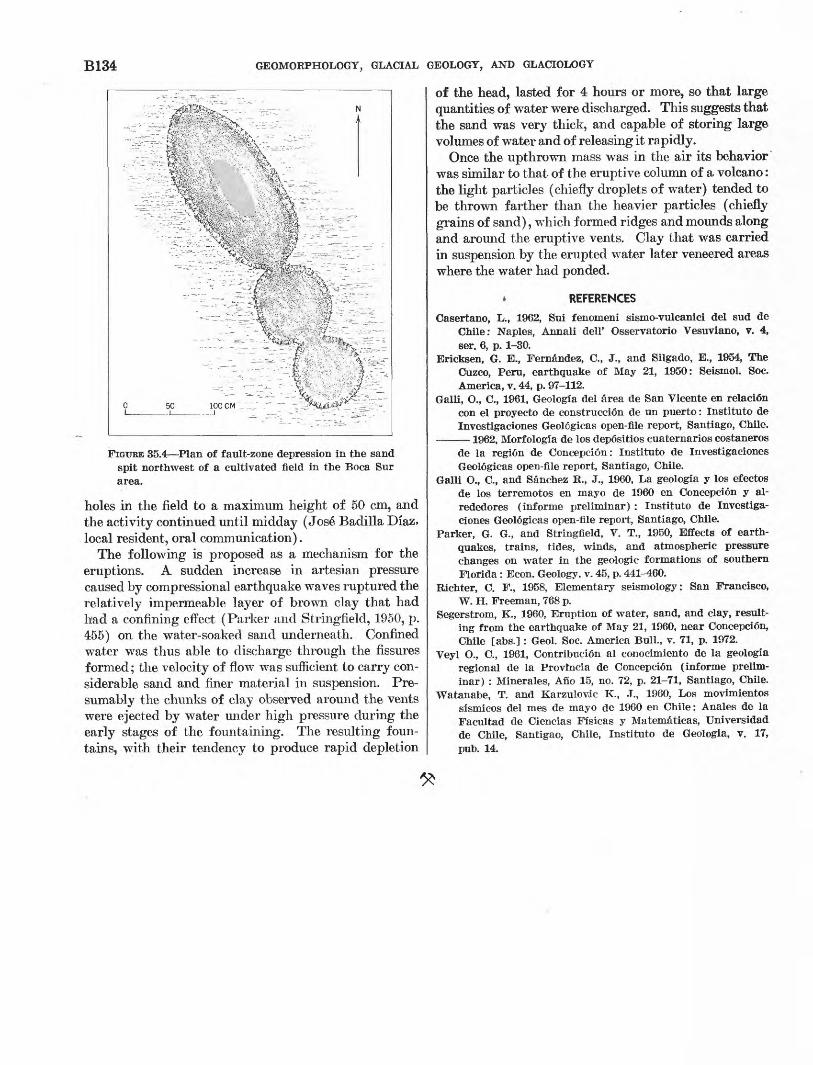
B134 GEOMORPHOLOGY, GLACIAL GEOLOGY, AND GLACIOLOGY
FIGURE 35.4 Plan of fault-zone depression in the sand spit northwest of a cultivated field in the Boca Sur area.
holes in the field to a maximum height of 50 cm, and the activity continued until midday (Jose Badilla Diaz. local resident, oral communication).
The following is proposed as a mechanism for the eruptions. A sudden increase in artesian pressure caused by compressional earthquake waves ruptured the relatively impermeable layer of brown clay that had had a confining effect (Parker and Stringfield, 1950, p. 455) on the water-soaked sand underneath. Confined water was thus able to discharge through the fissures formed; the velocity of flow was sufficient to carry con siderable sand and finer material in suspension. Pre sumably the chunks of clay observed around the vents were ejected by water under high pressure during the early stages of the fountaining. The resulting foun tains, with their tendency to produce rapid depletion
of the head, lasted for 4 hours or more, so that large quantities of water were discharged. This suggests that the sand was very thick, and capable of storing large volumes of water and of releasing it rapidly.
Once the upthrown mass was in the air its behavior" was similar to that of the eruptive column of a volcano: the light particles (chiefly droplets of water) tended to be thrown farther than the heavier particles (chiefly grains of sand), which formed ridges and mounds along and around the eruptive vents. Clay that was carried in suspension by the erupted water later veneered areas where the water had ponded.
* REFERENCES
Casertano, L., 1962, Sui fenomeni sismo-vulcanici del sud de Chile: Naples, Annali dell' Osservatorio Vesuviano, v. 4, ser. 6, p. 1-30.
Ericksen, G. E., Fernandez, C., J., and Silgado, E., 1954, The Cuzco, Peru, earthquake of May 21, 1950: Seismol. Soc. America, v. 44, p. 97-112.
Galli, O., C., 1961, Geologia del area de San Vicente en relacion con el proyecto de construction de un puerto: Institute de Investigaciones Geologicas open-file report, Santiago, Chile.
1962, Morfologia de los depositios cuaternarios costaneros de la region de Concepcion: Institute de Investigaciones Geologicas open-file report, Santiago, Chile.
Galli O., C., and Sanchez R., J., 1960, La geologia y los efectos de los terremotos en mayo de 1960 en Concepcion y al- rededores (informe preliminar) : Institute de Investiga ciones Geologicas open-file report, Santiago, Chile.
Parker, G. G., and Stringfield, V. T., 1950, Effects of earth quakes, trains, tides, winds, and atmospheric pressure changes on water in the geologic formations of southern Florida : Econ. Geology, v. 45, p. 441-460.
Richter, C. F., 1958, Elementary seismology: San Francisco, W. H. Freeman, 768 p.
Segerstrom, K., I960. Eruption of water, sand, and clay, result ing from the earthquake of May 21, 1960, near Concepcion, Chile [abs.] : Geol. Soc. America Bull., v. 71, p. 1972.
Veyl O., C., 1961, Contribution al conocimiento de la geologia regional de la Provtncia de Concepcion (informe prelim inar) : Minerales, Ano 15, no. 72, p. 21-71, Santiago, Chile.
Watanabe, T. and Karzulovic K., J., 1960, Los movimientos sismicos del mes de mayo de 1960 en Chile: Anales de la Facultad de Ciencias Fisicas y Matematicas, Universidad de Chile, Santigao, Chile, Institute de Geologia, v. 17, pub. 14.
Article 36
PARADISE DEBRIS FLOW AT MOUNT RAINIER, WASHINGTON
By DWIGHT R. CRANDELL, Denver, Colo.
i Abstract. The Paradise debris flow blankets the Paradise [Park area on the south flank of Mount Rainier. It is roughly 'correlative in age with the 4,800-year-old Osceola Mudflow on ithe northeast flank of the volcano; both probably originated as [debris avalanches from a former summit of Mount Rainier [volcano.
Studies of surficial deposits in Mount Eainier Na tional Park have revealed an unconsolidated till-like deposit of Eecent age on the south flank of Mount Rain ier volcano. This deposit is inferred to be a debris flow.that originated in an avalanche from the upper slopes|or summit of the volcano. Because it veneers a rather wide area at Paradise Park and Paradise Valley (fig.136.1), it is referred to as the Paradise debris flow.I Description. The debris flow consists of angular andI subangular rock fragments as large as 8 feet in diameter in a purplish-gray matrix of sand, silt, and clay, which oxidizes to yellowish brown. The rock fragments are
| nearly all andesite from Mount Rainier volcano, but a few are of granodiorite that crops out in the upper
i Nisqually River valley. The debris -flow is 1 to 5 feet thick in most outcrops, but a thickness of as much as 15 feet is not uncommon. Owing to its thinness, the debris flow rarely forms constructional topography, but simply veneers ridges, knobs, and depressions in older material (fig. 36.2). At Reflection Lakes, however, the debris flow is thick enough to form a hummocky surface, and the lakes occupy closed depressions in it.
Distribution and volume. The Paradise debris flow forms a blanket that is almost continuous in an area bounded on the north and east by Panorama Point and Mazama Ridge, and on the west by late Recent moraines that extend along the east side of Nisqually Glacier. Southward, the debris flow crops out discontinuously down the Nisqually River valley. It has been recog nized as far downstream as the mouth of Tahoma Creek, about 4 miles down valley from Longmire, and it may be one of several debris flows that occur in the valley as far downstream as National, 13 miles below Longmire.
A large lobe of the debris flow overlies glacial drift of late Wisconsin age in the Reflection Lakes area. The
flow entered the Reflection Lakes depression through a saddle at an altitude of between 5,100 and 5,200 feet in Mazama Ridge that is about 300 feet above the floor of the adjacent Paradise Valley.
The debris flow occurs at a higher altitude at Para dise Park than it does on the opposite side of the Nis qually River valley. Whereas the deposit is at an alti tude of as much as 6,600 feet near Panorama Point, it is not present on a late Wisconsin cirque floor at an altitude of about 5,900 feet on the valley wall directly opposite.
Outcrops along the Entrance Road half a mile east of Ricksecker Point indicate the maximum depth of the debris flow while it was in motion. There, at an altitude of about 4,300 feet, remnants of the Paradise deposit lie about 800 feet above the present floor of the Paradise River valley. The deposit is not found above about 4,250 feet at Ricksecker Point itself. Thus, while the debris flow was moving, its surface sloped westward in the Paradise River valley.
The volume of the debris flow preserved upstream from Longmire probably is not more than about 30 million cubic yards. An estimate of its volume while flowing, based on heights it reached on valley sides and on the probability that the fluid material was draining from one area while the crest was still passing points farther downstream, is 400 to 500 million cubic yards.
Remnants of the deposit that are preserved high on valley sides are not believed to be erosional remnants of a fill that solidified in the valley to that height. Rather, they are interpreted as veneers left after the crest and most of the flow had moved downvalley. The postglacial age of the deposit indicates that its re markable height on valley walls is not the result of the debris flow having moved on the surface of glacial ice in the valley.
Age and origin. At Paradise Park the debris flow is separated from till of late Wisconsin age and older bedrock by colluvial deposits and ash layers that include ash layer O (Crandell and others, 1962), which is
ART. 36 IN U.S. GEOL. SURVEY PROF. PAPER 475-B, PAGES B135-B139. 1963.
B135
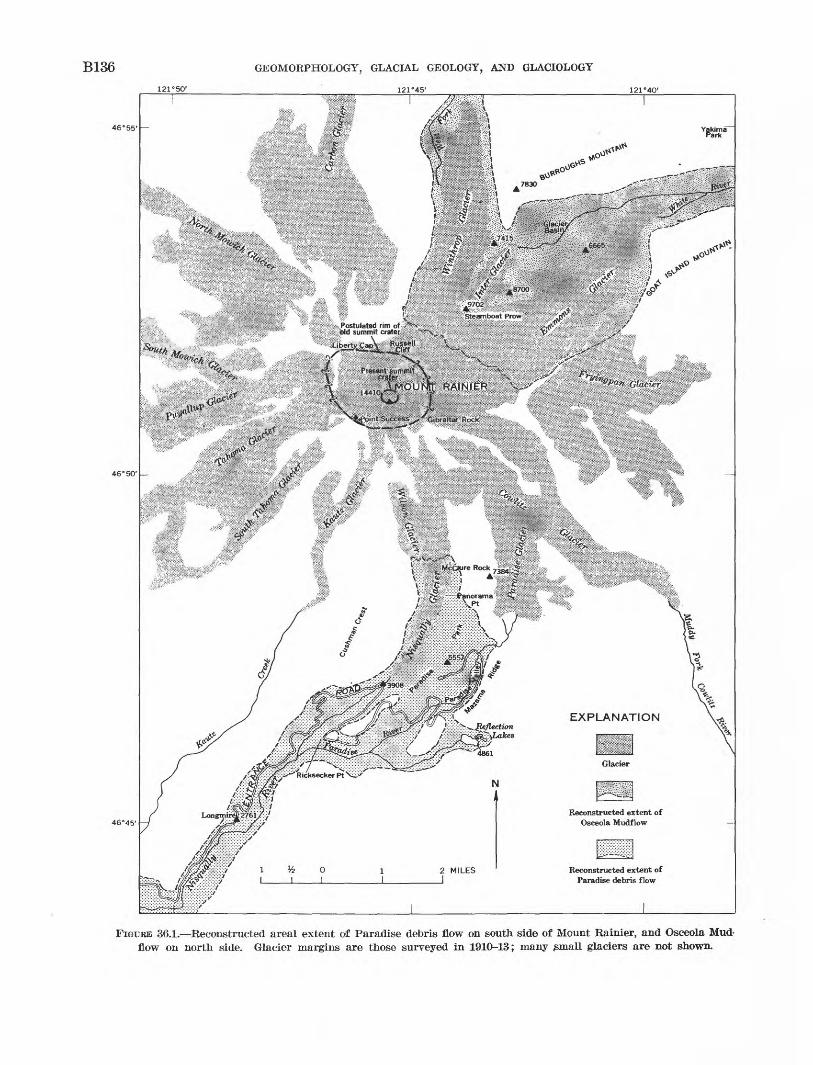
B136 GEOMORPHOLOGY, GLACIAL GEOLOGY, AND GLACIOLOGY
121°45'
46°55'
46-45'
FIGURE 36.1. Reconstructed areal extent of Paradise debris flow on south side of Mount Rainier, and Osceola Mud- flow on north side. Glacier margins are those surveyed in 1910-13; many ^rnall glaciers are not shown.
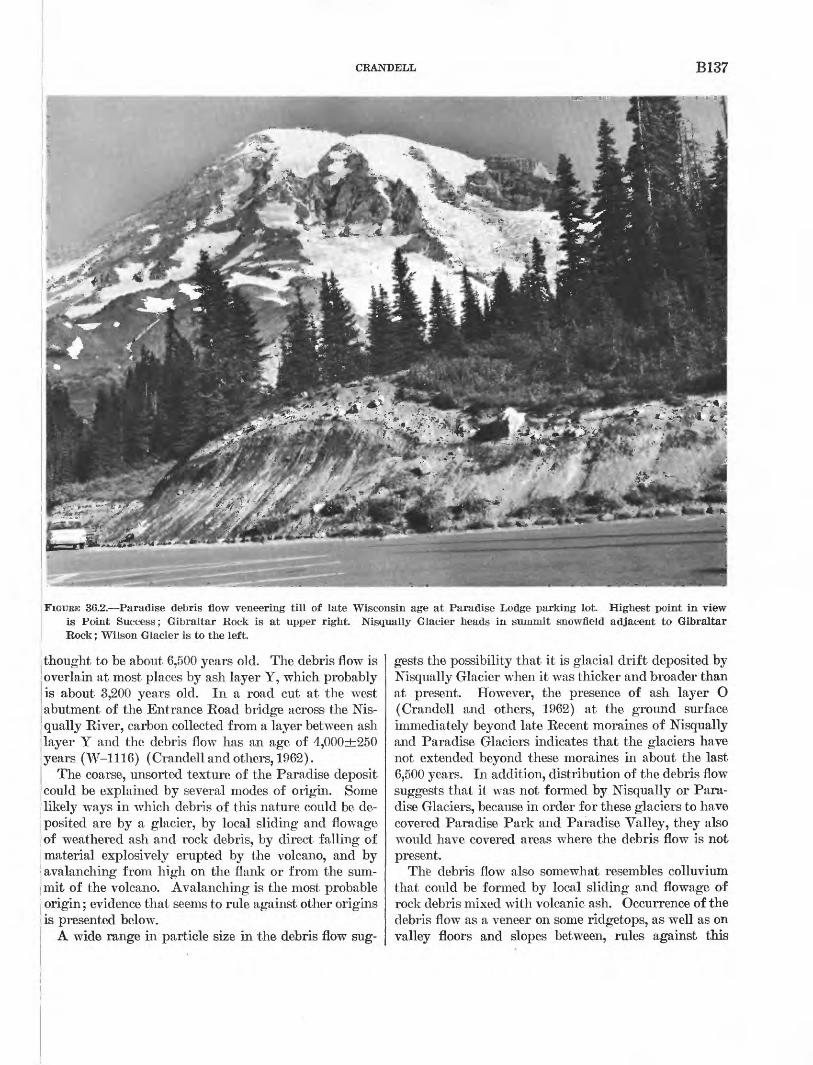
CRANDELL B137
FIGURE 36.2. Paradise debris flow veneering till of late Wisconsin age at Paradise Lodge parking lot. Highest point in view is Point Success; Gibraltar Rock is at upper right. Nisqually Glacier heads in summit snowfield adjacent to Gibraltar
| Rock; Wilson Glacier is to the left.
thought to be about 6,500 years old. The debris flow is overlain at most places by ash layer Y, which probably is about 3,200 years old. In a road cut at the west abutment of the Entrance Road bridge across the Nis qually River, carbon collected from a layer between ash layer Y and the debris flow has an age of 4,000±250 years (W-1116) (Crandell and others, 1962).
The coarse, unsorted texture of the Paradise deposit could be explained by several modes of origin. Some likely ways in which debris of this nature could be de posited are by a glacier, by local sliding and flowage of weathered ash and rock debris, by direct falling of material explosively erupted by the volcano, and by avalanching from high on the flank or from the sum mit of the volcano. Avalanching is the most probable origin; evidence that seems to rule against other origins is presented below.
A wide range in particle size in the debris flow sug
gests the possibility that it is glacial drift deposited by Nisqually Glacier when it was thicker and broader than at present. However, the presence of ash layer O (Crandell and others, 1962) at the ground surface immediately beyond late Recent moraines of Nisqually and Paradise Glaciers indicates that the glaciers have not extended beyond these moraines in about the last 6,500 years. In addition, distribution of the debris flow suggests that it was not formed by Nisqually or Para dise Glaciers, because in order for these glaciers to have covered Paradise Park and Paradise Valley, they also would have covered areas where the debris flow is not present.
Thfe debris flow also somewhat resembles colluvium that could be formed by local sliding and flowage of rock debris mixed with volcanic ash. Occurrence of the debris flow as a veneer on some ridgetops, as well as on valley floors and slopes between, rules against this
B138 GEOMORPHOLOGY, GLACIAL GEOLOGY, AND GLACIOLOGY
origin, as does the restriction of the deposit to the areas immediately adjacent to the Nisqually and Paradise River valleys.
That the Paradise deposit might have resulted from an explosive eruption of Mount Rainier seemingly is denied by its distribution. Ejection of rubble from high on the south side of the volcano in an explosion suffi ciently violent to have covered Paradise Park and Paradise Valley with debris would also have left de posits in the area upslope from Panorama Point.
The absence of any topographic evidence of a source for the deposit near McClure Rock suggests that the debris flow originated high on the volcano in the form of a debris avalanche. Such an avalanche would have accelerated rapidly as it traveled down Nisqually Gla cier. At a point west of McClure Rock, the top of the east valley wall becomes low enough to have permitted a large avalanche to surmount it. Owing to the steep slopes bounding the west sides of Wilson and Nisqually Glaciers, and to the arcuate path of the avalanche, the debris was not deposited very high on the west wall of the Nisqually River valley opposite Paradise Park. Absence of the deposit on Mazama Ridge is best ex plained by lack of either momentum or thickness suffi cient for the avalanche to surmount the ridge.
The avalanche could have been either wet or dry when it covered the Paradise area; in either condition it prob ably would have had sufficient momentum to flow over topographic obstacles. Even if it started dry, it prob ably soon became wet in transit and then formed a debris flow.
Possible correlation and common source of Paradise debris -flow and Osceola Mud-flow. The Paradise debris flow is lithologically similar although less clayey than the 4,800-year-old Osceola Mudflow in the West Fork and White River valleys on the northeast side of Mount Rainier (Crandell and Waldron, 1956). The Osceola moved 45 miles down the White River valley and spread into the Puget Sound lowland in a lobe 20 miles long and as much as 10 miles wide. An investigation of the mudflow in the lowland suggests an average thickness of about 20 feet and a volume of perhaps as much as 1.3 billion cubic yards (Crandell, 1963).
From its distribution at Mount Rainier, Crandell and Waldron (1956) concluded that the Osceola Mudflow had an eruptive source in a vent or vents high on the volcano, but neither an exact source nor mode of origin was proposed. Subsequently, Crandell (1963) sug gested that the mudflow originated in one or more phre- atic explosions that ejected clay-rich debris formed within the volcano by hydrothermal alteration of wall- rock along old conduits and fissures. It was thought
that as this material settled on the flanks of Mount Rainier, it moved on downslope as a mudflow.
The highest outcrop of the Osceola thus far recog nized is at the 9,700-foot summit of Steamboat Prow, but it must have originated somewhere above this point, for it flowed over Steamboat Prow into Glacier Basin, apparently as a debris avalanche.
If the Paradise debris flow and Osceola Mudflow originated as debris avalanches high on the volcano, a source area of large volume is required, and it seems likely that the missing summit of Mount Rainier might in some way be involved.
Russell (1898) first pointed out that the present sum mit of Mount Rainier consists of the higher of two cones built within a large crater, the rim of which is pre served at Point Success and between Liberty Cap and Russell Cliff. High points on this older crater rim indicate that the summit of the volcano was removed above an altitude of about 14,000 feet. The old summit crater had a diameter of about 1.25 miles, measured from Liberty Cap to Point Success. Its formation was attributed both by Russell and by Matthes (1914) to explosive decapitation of the volcano, but Coombs (1936) proposed that the shape of the old summit area resulted from "* * * intermittent explosive activity, probably breaching first one side of the crater and then the other." He also suggested that the old crater sub sequently had been modified by glacial erosion.
Fiske and others (1963) conclude that the missing upper part of Mount Rainier represented the loss of a volume of rock of more than 800 million cubic yards. They point out that if the summit of the volcano had been removed in a violent explosion, explosion breccias should be found around the flanks. As these were not recognized, they conclude that the summit was removed either by vertical subsidence into underlying magma, by outward slumping and flowage of solfatarized and soft ened rock in the central part of the volcano, or by head- ward glacial erosion into a weak core.
The estimated volume of the Osceola and Paradise deposits requires a source area of at least 1.7 billion cubic yards. If it is assumed that the missing summit cone had a basal diameter of 2,200 yards and a height of 500 yards, it would have had a volume of between 600 and 700 million cubic yards. If the cone had a summit crater, as suggested by Coombs (1936), the estimated volume of the summit cone should be reduced accord ingly, perhaps by a fourth or a third. In addition to removal of the volcano above an altitude of about 14,000 feet, it seems likely that the east crater wall also was destroyed, and a huge cirque-shaped depression was formed which opened to the east between Gibraltar
CRANDELL B139
feock and Russell Cliff. The floor of this depression |may have been as much as 1,500 feet below the high [points oh the rim at Liberty Cap and Point Success. ^Although an estimate of the size of this postulated de- ipression is hardly more than a guess, the depression may nave contained as much as a billion cubic yards of ma terial. Fiske and others (1963) point out that the young icone that forms the present summit of the volcano was built on the eastern rim of the old summit crater; thus, fchis cone has largely filled the wide low breach inferred !to have been present in the eastern rim.
I propose that the former summit of Mount Rainier was removed principally by very large avalanches that originated in hydrothermally altered and weakened rocks. The avalanches were probably caused by phre- jatic explosions of the volcano, but could have been caused by earthquakes or even slope failures due to oversteepening by glacial erosion. An avalanche de- iscending the south slope of the volcano was confined by ! the high sides of the Nisqually River valley until it 'reached a point west of McClure Rock, where it flowed 'Over the east valley wall, veneered Paradise Park and jParadise Valley, and extended downvalley as a debris 'flow. The Osceola Mudflow probably originated in a comparable avalanche or several nearly contempora neous avalanches fromlhe summit of the volcano and I moved into the valleys of West Fork and White River.
If parts of the avalanches on the northeast side of the volcano were initially dry, dust rolling up from them may have been deposited on adjacent upland surfaces, accounting for the layer regarded as an air-laid facies of the Osceola Mudflow (Crandell and Waldron, 1956).
A mudflow or debris flow comparable in age to the
Paradise and Osceola deposits has not been seen in the Carbon or Cowlitz River valleys; the .valleys heading in Tahoma, Puyallup, and North and South Mowich Glaciers have not yet been investigated. The absence of such a deposit in the Carbon River valley is consistent with the presence of a high, unbroken rim of the old summit crater between Liberty Cap and Russell Cliff, and its absence in the Cowlitz River valley may have resulted from a predominantly northeastward move ment of avalanches on the east side of the volcano. The valley of Tahoma Creek downstream from South Ta homa Glacier contains a debris flow of large volume that postdates ash layer Y, and thus is less than about 3,200 years old. This debris flow perhaps was formed by an avalanche derived from the western part of the former summit.
REFERENCES
Coombs, H. A., 1936, The geology of Mount Rainier NationalPark: Washington Univ. Pubs, in Geology, v. 3, no. 2, p.131-212.
Crandell, D. R., 1963, Surficial geology and geomorphology of theLake Tapps quadrangle, Washington: U.S. Geol. SurveyProf. Paper 388-A. [In press]
Crandell, D. R., Mullineaux, D. R., Miller, R. D., and Rubin,Meyer, 1962, Pyroclastic deposits of Recent age at MountRainier, Washington: Art. 138 in U.S. Geol. Survey Prof.Paper 450-D, p. D64-D68.
Crandell, D. R., and Waldron, H. II., 1956, A Recent volcanicmudflow of exceptional dimensions from Mount Rainier,Washington: Am. Jour. Sci., v. 254, p. 349-362.
Fiske, R. S., Hopson, C. A., and Waters, A. C., 1963, Geologyof Mount Rainier National Park, Washington: U.S. Geol.Survey Prof. Paper 444. [In press]
Matthes, F. E., 1914, Mount Rainier and its glaciers: Washing ton, U.S. Dept. Interior, 48 p.
Russell, I. C., 1898, Glaciers of Mount Rainier: U.S. Geol. SurveyAnn. Rept. 18, pt. 2, p. 349-115.
680231 O 6S -10
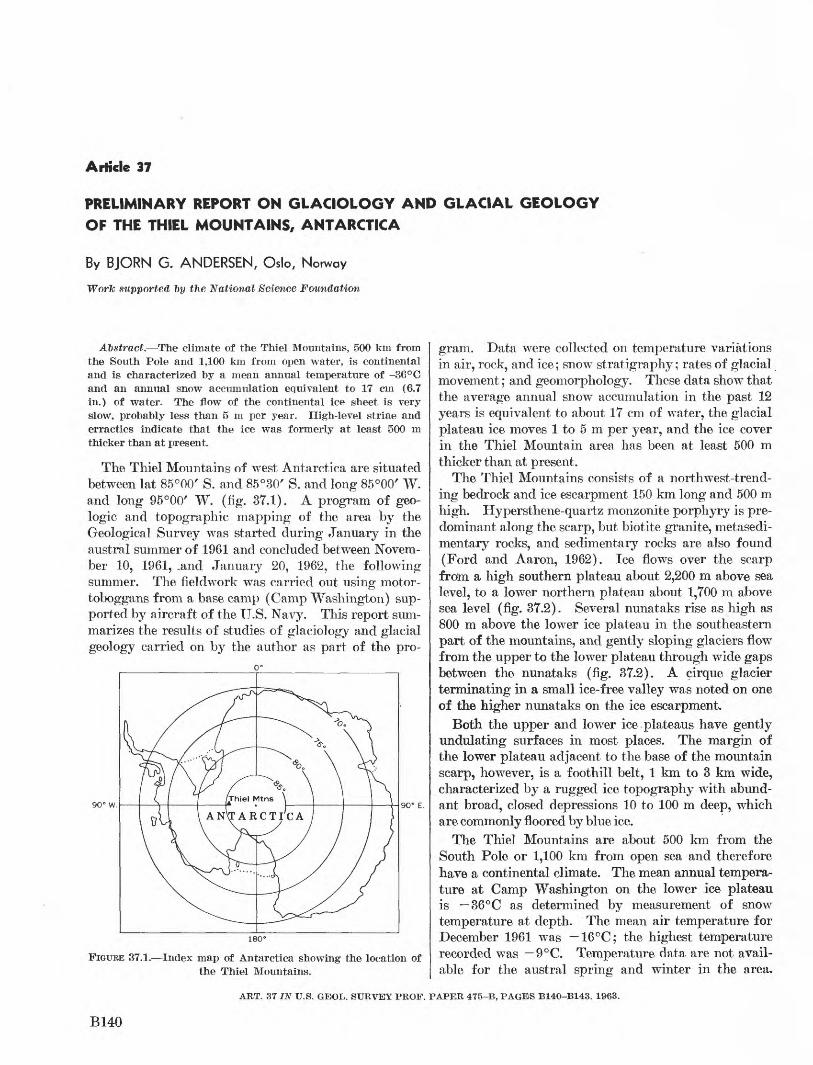
Article 37
PRELIMINARY REPORT ON GLACIOLOGY AND GLACIAL GEOLOGY
OF THE THIEL MOUNTAINS, ANTARCTICA
By BJORN G. ANDERSEN, Oslo, Norway
Work supported ~by the National Science Foundation
Abstract. The climate of the Thiel Mountains, 500 km from the South Pole and 1,100 km from open water, is continental and is characterized by a mean annual temperature of -36 °C and an annual snow accumulation equivalent to 17 cm (6.7 in.) of water. The flow of the continental ice sheet is very slow, probably less than 5 m per year. High-level striae and erractics indicate that the ice was formerly at least 500 m thicker than at present.
The Thiel Mountains of west Antarctica are situated between lat 85°00' S. and 85°30' S. and long 85°00' W. and long 95°00' W. (fig. 37.1). A program of geo logic and topographic mapping of the area by the Geological Survey was started during January in the austral summer of 1961 and concluded between Novem ber 10, 1961, .and January 20, 1962, the following summer. The fieldwork was carried out using motor- toboggans from a base camp (Camp Washington) sup ported by aircraft of the U.S. Navy. This report sum marizes the results of studies of glaciology and glacial geology carried on by the author as part of the pro-
go- E.
FIGURE 37.1. Index map of Antarctica showing the location of the Thiel Mountains.
gram. Data were collected on temperature variations in air, rock, and ice; snow stratigraphy; rates of glacial movement; and geomorphology. These data show that the average annual snow accumulation in the past 12 years is equivalent to about 17 cm of water, the glacial plateau ice moves 1 to 5 m per year, and the ice cover in the Thiel Mountain area has been at least 500 m thicker than at present.
The Thiel Mountains consists of a northwest-trend ing bedrock and ice escarpment 150 km long and 500 m high. Hypersthene-quartz monzonite porphyry is pre dominant along the scarp, but biotite granite, metasedi- mentary rocks, and sedimentary rocks are also found (Ford and Aaron, 1962). Ice flows over the scarp from a high southern plateau about 2,200 m above sea level, to a lower northern plateau about 1,700 m above sea level (fig. 37.2). Several nunataks rise as high as 800 m above the lower ice plateau in the southeastern part of the mountains, and gently sloping glaciers flow from the upper to the lower plateau through wide gaps between the nunataks (fig. 37.2). A cirque glacier terminating in a small ice-free valley was noted on one of the higher nunataks on the ice escarpment.
Both the upper and lower ice plateaus have gently undulating surfaces in most places. The margin of the lower plateau adjacent to the base of the mountain scarp, however, is a foothill belt, 1 km to 3 km wide, characterized by a rugged ice topography with abund ant broad, closed depressions 10 to 100 m deep, which are commonly floored by blue ice.
The Thiel Mountains are about 500 km from the South Pole or 1,100 km from open sea and therefore have a continental climate. The mean annual tempera ture at Camp Washington on the lower ice plateau is 36°C as determined by measurement of snow temperature at depth. The mean air temperature for December 1961 was 16°C; the highest temperature recorded was 9°C. Temperature data are not avail able for the austral spring and winter in the area.
ART. 37 IN U.S. GEOL. SURVEY PROF. PAPER 475-B, PAGES B140-B143. 1963.
B140
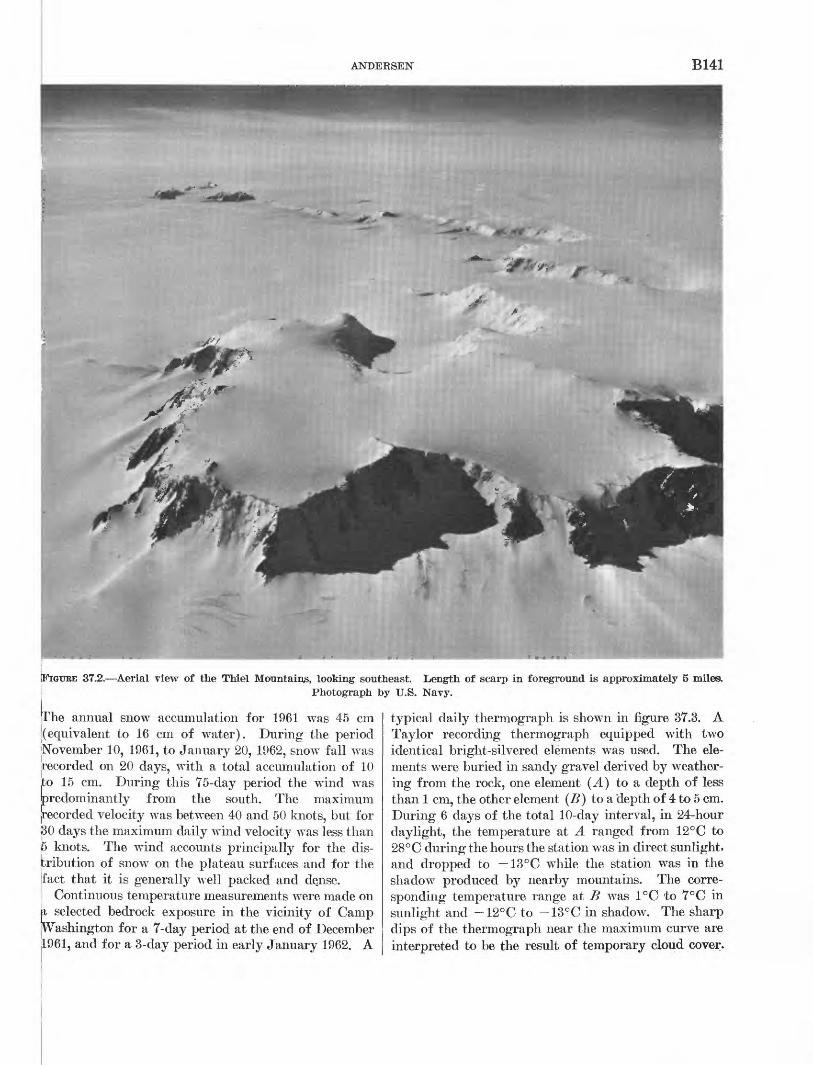
B141
:GTTBE 37.2. Aerial view of the Thiel Mountain^, looking southeast. Length of scarp in foreground is approximately 5 mileaPhotograph by U.S. Navy.
he annual snow accumulation for 1961 was 45 cm .(equivalent to 16 cm of water). During the period 'November 10, 1961, to January 20, 1962, snow fall was recorded on 20 days, with a total accumulation of 10 to 15 cm. During this 75-day period the wind was predominantly from the south. The maximum [recorded velocity was between 40 and 50 knots, but for 30 days the maximum daily wind velocity was less than 5 knots. The wind accounts principally for the dis tribution of snow on the plateau surfaces and for the [fact that it is generally well packed and de.nse, 1 Continuous temperature measurements were made on a selected bedrock exposure in the vicinity of Camp [Washington for a 7-day period at the end of December 1961, and for a 3-day period in early January 1962. A
typical daily thermograph is shown in figure 37.3. A Taylor recording thermograph equipped with two identical bright-silvered elements was used. The ele ments were buried in sandy gravel derived by weather ing from the rock, one element (.4) to a depth of less than 1 cm, the other element (B} to a "depth of 4 to 5 cm. During 6 days of the total 10-day interval, in 24-hour daylight, the temperature at A ranged from 12°C to 28°C during the hours the station was in direct sunlight, and dropped to 13°C while the station was in the shadow produced by nearby mountains. The corre sponding temperature range at B wTas 1°C to 7°C in sunlight and -12°C to -13°C in shadow. The sharp dips of the thermograph near the maximum curve are interpreted to be the result of temporary cloud cover.
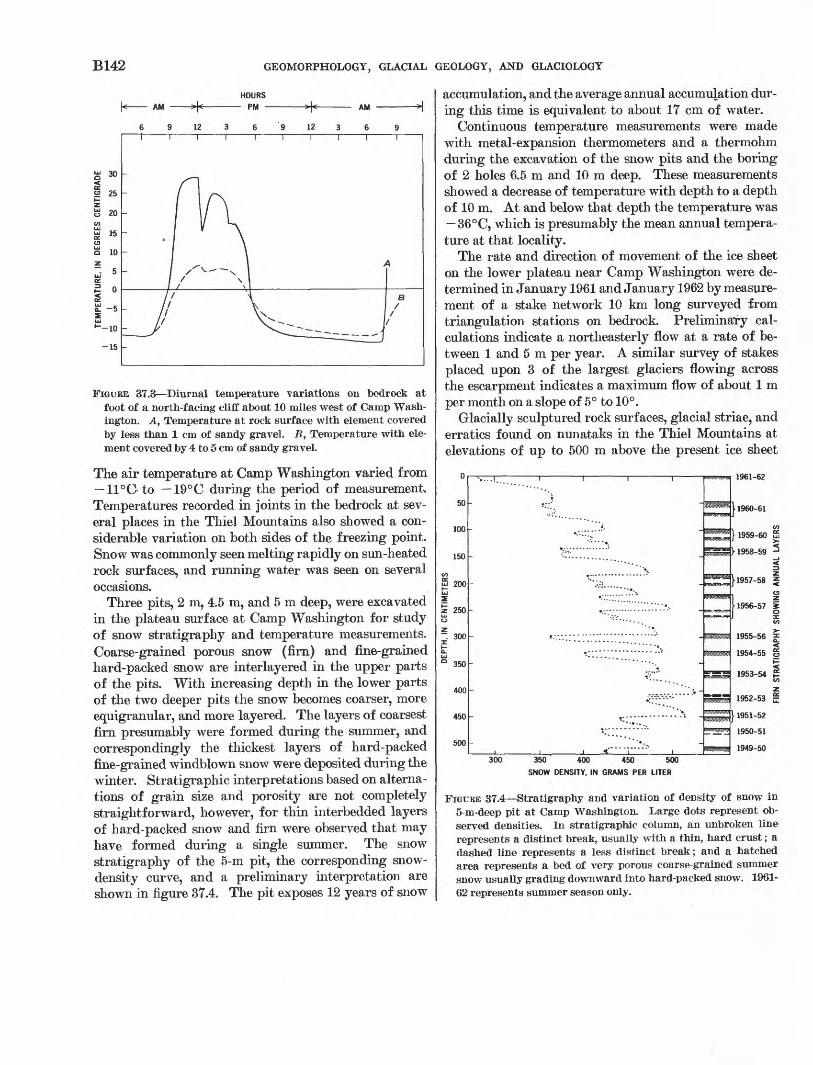
B142 GEOMORPHOLOGY, GLACIAL GEOLOGY, AND GLACIOLOGY
FIGURE 37.3 Diurnal temperature variations on bedrock at foot of a north-facing cliff about 10 miles west of Camp Wash ington. A, Temperature at rock surface with element covered by less than 1 cm of sandy gravel. B, Temperature with ele ment covered by 4 to 5 cm of sandy gravel.
The air temperature at Camp Washington varied from 11°O- to 19°C during the period of measurement. Temperatures recorded in joints in the bedrock at sev eral places in the Thiel Mountains also showed a con siderable variation on both sides of the freezing point. Snow was commonly seen melting rapidly on sun-heated rock surfaces, and running water was seen on several occasions.
Three pits, 2 m, 4.5 m, and 5 m deep, were excavated in the plateau surface at Camp Washington for study of snow stratigraphy and temperature measurements. Coarse-grained porous snow (firn) and fine-grained hard-packed snow are interlayered in the upper parts of the pits. With increasing depth in the lower parts of the two deeper pits the snow becomes coarser, more equigranular, and more layered. The layers of coarsest firn presumably were formed during the summer, and correspondingly the thickest layers of hard-packed fine-grained windblown snow were deposited during the winter. Stratigraphic interpretations based on alterna tions of grain size and porosity are not completely straightforward, however, for thin interbedded layers of hard-packed snow and firn were observed that may have formed during a single summer. The snow stratigraphy of the 5-m pit, the corresponding snow- density curve, and a preliminary interpretation are shown in figure 37.4. The pit exposes 12 years of snow
accumulation, and the average annual accumulation dur ing this time is equivalent to about 17 cm of water.
Continuous temperature measurements were made with metal-expansion thermometers and a thermohm during the excavation of the snow pits and the boring of 2 holes 6.5 m and 10 m deep. These measurements showed a decrease of temperature with depth to a depth of 10 m. At and below that depth the temperature was 36 °C, which is presumably the mean annual tempera ture at that locality.
The rate and direction of movement of the ice sheet on the lower plateau near Camp Washington were de termined in January 1961 and January 1962 by measure ment of a stake network 10 km long surveyed from triangulation stations on bedrock. Preliminary cal culations indicate a northeasterly flow at a rate of be tween 1 and 5 m per year. A similar survey of stakes placed upon 3 of the largest glaciers flowing across the escarpment indicates a maximum flow of about 1 m per month on a slope of 5° to 10°.
Glacially sculptured rock surfaces, glacial striae, and erratics found on nunataks in the Thiel Mountains at elevations of up to 500 m above the present ice sheet
50
100
150
in 2 200UJZ
z 250oz
3C
t
° 350
400
450
500
"~v...!..; " T i i i
"
_:.-..
"f ':.....
"""" --..
....................v
* - . .
,.. ...........: .
""'" .
i i i * i i
WWW
8fc**ffl ffla^SS-s?
mxtm^t
5SR^53S
raSKSBSBSSW
^^fetfe-^-J:
ksMWfe*
~
BOWSER
l»t>l-t><f
} 1960-61
} 1959-60 £j
> 1958-59 *_i< 3
\ 1957-58 z
1 *k956-57 &\ i co
1955-56 j=<
1954-55 ui-
1953-54 £ co
1952-53 §:
\ 1951-52
1950-51
1949-50300 350 400 450 500
SNOW DENSITY, IN GRAMS PER LITER
FIGURE 37.4 Stratigraphy and variation of density of snow in 5-m-deep pit at Camp Washington. Large dots represent ob served densities. In stratigraphic column, an unbroken line represents a distinct break, usually with a thin, hard crust; a dashed line represents a less distinct break; and a hatched area represents a bed of very porous coarse-grained summer snow usually grading downward into hard-packed snow. 1961- 62 represents summer season only.

ANDERSEN B143
indicate that the ice was once 500 m thicker than at present. This observation is significant in estimating former ice thicknesses in the interior parts of Antarc tica, because the Thiel Mountains are close to the center of the continental sheet. Aughenbaugh (1961) reports a thickness 250 m greater than today in the Duf ek Mas sif, and Anderson (1961) reports a thickness that was 200 m greater in the Sentinel Mountains. Similar ob servations in most of the coastal areas of Antarctica are further evidence that the ice sheet was once thicker and more extensive than it has been in recent historic time.
Observations in areas of bedrock indicate that the effects of repeated freezing and thawing are the most important weathering agents, and that frost wedging is a highly significant mode of mechanical weathering iji parts of the Thiel Mountains. Frost wedging is es pecially noticeable where the rock is highly jointed and mountain slopes are covered by angular blocks. Many rock faces in contact with snow surfaces are unusually steep or undercut, probably as a result of intensive frost wedging at the edge of the snow.
Several hill slopes covered by a mantle of brown silty to sandy gravel containing many angular blocks
are characterized by a patterned ground surface con sisting of circles of poorly sorted material surrounding distinctly domed central areas. The circles are closely spaced and range from 1.5 to 5 m in diameter; the domes are 0.3 to 1 m high. Trenches across several of these circles showed that the domes are frozen ground cov ered by a blanket of unfrozen rock debris about 0.3 m thick on the highest part of the domes and about 0.5 m thick in the depressions between the domes. Most of the larger blocks are segregated in the interdomal depressions, but otherwise sorting is poor. This par ticular type of patterned ground is not reported fre quently in the literature; it is, however, probably com mon in high latitudes.
REFERENCES
Anderson, Vernon, 1961, Geographic features observed on the Marie Byrd Land traverse, 1957-1958: International Geo physical Year Glaciological Rept. 4, chap. 6, p. 143-149.
Aughenbaugh, N. B., 1961, Preliminary report on the geology of the Dufek Massif: International Geophysical Year Glacio logical Rept. 4, chap. 8, p. 155-193.
Ford, A. B., and Aaron, J. M., 1962, Bedrock geology of the Thiel Mountains, Antarctica: Science, v. 137, no. 35S2, p. 751-752.
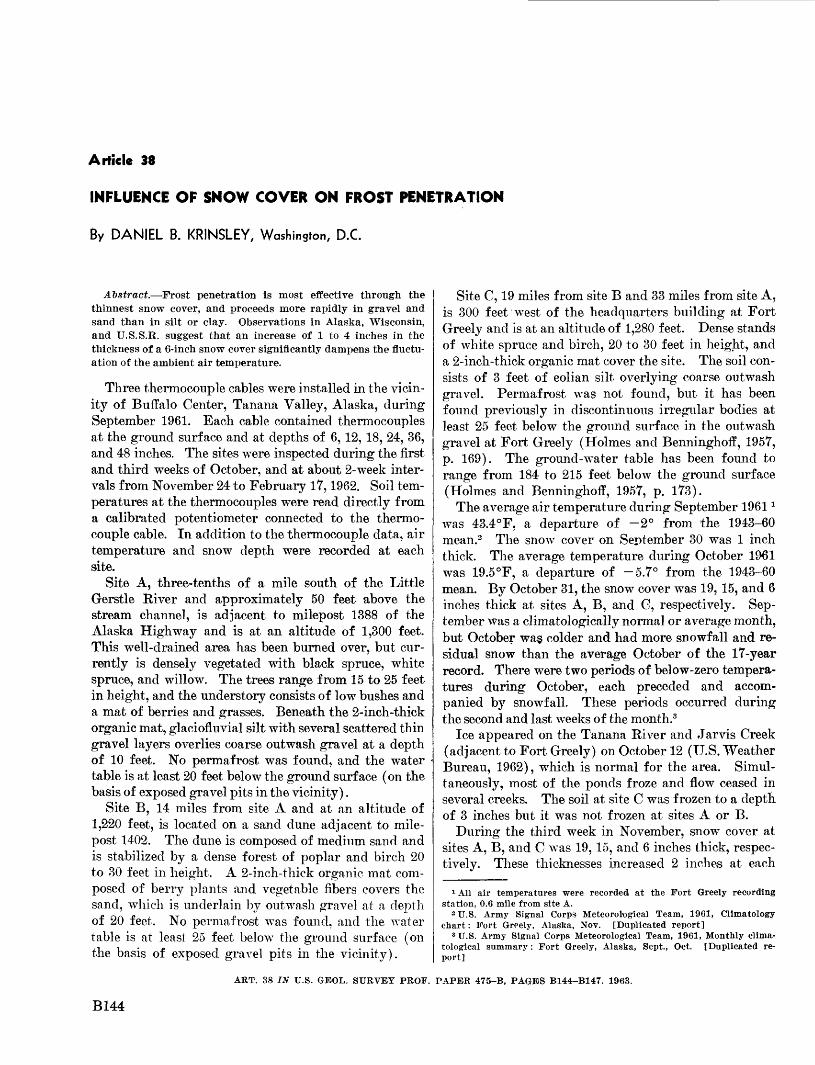
Article 38
INFLUENCE OF SNOW COVER ON FROST PENETRATION
By DANIEL B. KRINSLEY, Washington, D.C.
Abstract. Frost penetration is most effective through the thinnest snow cover, and proceeds more rapidly in gravel and sand than in silt or clay. Observations in Alaska, Wisconsin, and U.S.S.R. suggest that an increase of 1 to 4 inches in the thickness of a 6-inch snow cover significantly dampens the fluctu ation of the ambient air temperature.
Three thermocouple cables were installed in the vicin ity of Buffalo Center, Tanana Valley, Alaska, during September 1961. Each cable contained thermocouples at the ground surface and at depths of 6, 12, 18, 24, 36, and 48 inches. The sites were inspected during the first and third weeks of October, and at about 2-week inter vals from November 24 to February 17,1962. Soil tem peratures at the thermocouples were read directly from a calibrated potentiometer connected to the thermo couple cable. In addition to the thermocouple data, air temperature and snow depth were recorded at each site.
Site A, three-tenths of a mile south of the Little Gerstle River and approximately 50 feet above the stream channel, is adjacent to milepost 1388 of the Alaska Highway and is at an altitude of 1,300 feet. This well-drained area has been burned over, but cur rently is densely vegetated with black spruce, white spruce, and willow. The trees range from 15 to 25 feet in height, and the understory consists of low bushes and a mat of berries and grasses. Beneath the 2-inch-thick organic mat, glaciofluvial silt with several scattered thin gravel layers overlies coarse outwash gravel at a depth of 10 feet. No permafrost was found, and the water table is at least 20 feet below the ground surface (on the basis of exposed gravel pits in the vicinity).
Site B, 14 miles from site A and at an altitude of 1,220 feet, is located on a sand dune adjacent to mile- post 1402. The dune is composed of medium sand and is stabilized by a dense forest of poplar and birch 20 to 30 feet in height. A 2-inch-thick organic mat com posed of berry plants and vegetable fibers covers the sand, which is underlain by outwash gravel at a depth of 20 feet. No permafrost was found, and the water table is at least 25 feet below the ground surface (on the basis of exposed gravel pits in the vicinity).
Site C, 19 miles from site B and 33 miles from site A, is 300 feet west of the headquarters building at Fort Greely and is at an altitude of 1,280 feet. Dense stands of white spruce and birch, 20 to 30 feet in height, and a 2-inch-thick organic mat cover the site. The soil con sists of 3 feet of eolian silt overlying coarse outwash gravel. Permafrost was not found, but it has been found previously in discontinuous irregular bodies at least 25 feet below the ground surface in the outwash gravel at Fort Greely (Holmes and Benninghoff, 1957, p. 169). The ground-water table has been found to range from 184 to 215 feet below the ground surface (Holmes and Benninghoff, 1957, p. 173).
The average air temperature during September 1961 1 was 43.4°F, a departure of -2° from the 1943-60 mean.2 The snow cover on September 30 was 1 inch thick. The average temperature during October 1961 was 19.5°F, a departure of -5.7° from the 1943-60 mean. By October 31, the snow cover was 19, 15, and 6 inches thick at sites A, B, and G, respectively. Sep tember was a climatologically normal or average month, but October wag colder and had more snowfall and re sidual snow than the average October of the 17-year record. There were two periods of below-zero tempera tures during October, each preceded and accom panied by snowfall. These periods occurred during the second and last weeks of the month.3
Ice appeared on the Tanana River and Jarvis Creek (adjacent to Fort Greely) on October 12 (U.S. Weather Bureau, 1962), which is normal for the area. Simul taneously, most of the ponds froze and flow ceased in several creeks. The soil at site C was frozen to a depth of 3 inches but it was not frozen at sites A or B.
During the third week in November, snow cover at sites A, B, and C was 19,15, and 6 inches thick, respec tively. These thicknesses increased 2 inches at each
1 All air temperatures were recorded at the Fort Greely recording station, 0.6 mile from site A.
2 U.S. Army Signal Corps Meteorological Team, 1961, Climatology chart: Fort Greely, Alaska, Nov. [Duplicated report]
3 U.S. Army Signal Corps Meteorological Team, 1961, Monthly clima- tological summary: Fort Greely, Alaska, Sept., Oct. [Duplicated re port]
ART. 38 IN U.S. GEOL. SURVEY PROF. PAPER 475-B, PAGES B144-B147. 1963.
B144
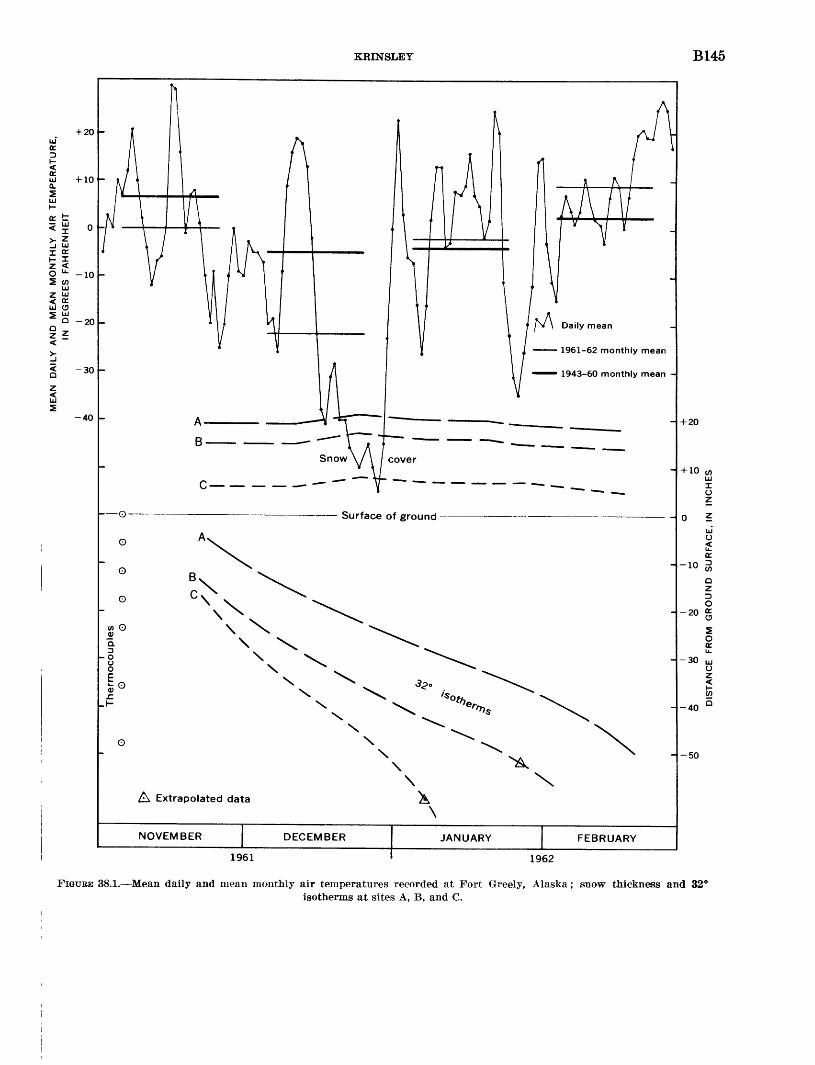
p
PO"
ME
AN
D
AIL
Y
AN
D
ME
AN
M
ON
TH
LY
A
IR
TE
MP
ER
AT
UR
E,
IN
DE
GR
EE
S
FA
HR
EN
HE
IT
I I
I I
+
+ft
W
ho
l-
1 _
!-
(S
3 O
o
O
O
O
o
O
Therm
oco
uple
sO
O
D> m
O
I I
I I
o
+g
8 5
5D
IST
AN
CE
F
RO
M
GR
OU
ND
S
UR
FA
CE
, IN
IN
CH
ES
W
I 1 &
B146 GEOMORPHOLOGY, GLACIAL GEOLOGY, AND GLACIOLOGY
site during the second half of December, and then decreased 3 inches at each site during January and February (fig. 38.1). The snow was light, dry, and free of packing or crusting at all sites. November was 6.3° colder than normal (1943-60 mean); December was 17.2° colder than normal; and both January and February were 2.0° and 6.4°, respectively, warmer than normal.4
The air temperature at site C was generally within 1° of the air temperature at the Fort Greely recording station (fig. 38.1). Above 13°F the air temperature at site C was always 2° to 3° lower than the air temper ature at site A or B (which were generally identical); below 13° F it was always 2° to 3° above the air tem perature at site A or B. All observations at the thermo couple sites were generally made during the hours 0800 to 1200.
The mean temperature at the snow-ground interface for the period November 24 through February 17 was 26.1°, 19.6°, and 1.1°F at sites A, B, and C, respec tively. The mean air temperature during the period November 24 through February 17 was 8.3°F. Ac cording to Lachenbruch (1959, p. 29), "In the Arctic the mean winter temperature of the snow surface is gener ally probably somewhat lower than the corresponding air temperature because of the high emissivity of snow for long wave lengths." If it is assumed that the air- snow interface had a mean temperature (November 24 through February 17) of approximately 9.0°F, then the mean temperature difference between the air-snow and snow-ground interfaces was 35.1°, 28.6°, and 10.1° at sites A, B, and C, respectively.
Frost penetration proceeded most rapidly at site C, which had the thinnest snow cover (fig. 38.1). Curve C steepens considerably after, the 32° isotherm passes through the eolian silt at a depth of 36 inches and enters' coarse outwash gravel. This is in accord with the ob servations made at Dow Field, Bangor, Maine (U.S. Army Corps of Engineers, 1947) and at Portland, Maine (Fuller, 1940) that frost penetration was faster in gravel and sand than in silt and clay. It seems reasonable to assume that curve B would have been closer to curve A if the material at site B had been silt rather than medium sand. Conversely, i f there had been, an identical snow thickness at all sites, curve B would have been below curve C at depths less than 36 inches, but would have crossed curve C somewhere below 36 inches.
Observations at site B indicate that although its snow cover was 2.3 times as thick as that at site C, the insulat ing effect of the snow was 2.9 times as great as that at site C (table 38.1). The snow cover at site A was 2.9
* Idem, Nov. 1961-Feb. 1962.
TABLE 38.1. Summary of ratios of snow thickness, mean tempera ture differences between the air-snow and snow-ground interfaces, and mean frost penetration
Site
A.. ______________________B -C
Ratio of mean snow thickness
(fig. 38.1)
2. 9 2.3 1.0
Ratio of mean temperature
difference between
snow-cround and air-snow
interfaces (insulation)
3.5 2.9 1. 0
Ratio of mean frost
penetration (Nov. 24-
Jan. 7) (&?,. 38.1)
1.0 1.5 2.2
times as thick as that at site C, but the insulating effect of the snow was 3.5 times as great as that at site C. Although visual inspection of the snow at the three sites did not reveal any density differences, layers, or crusts, the existence of these differences cannot be dis counted in the absence of more precise measurements.
Examination of table 38.2 discloses the existence of a significant break in the insulating effect of snow at
TABLE 38.2. Differences in temperature between the air-snow and snow-ground interfaces at site C
Date
Nov. 24 __ ________Dec. 11_. __________Dec. 26-_--_---_-__Jan. 7___ -.__Jan. 20____-_- ___-Jan. 27...- __ ___Feb. 17
Mean temperatureof air-snow inter-
face, and total fluc tuation withinperiod (degrees
Fahrenh
-9.71 18. 3J
-45. 71-26. 7
7.3-26. 7
-. 3
eit)
>28. 0
53.0
Snow- depth
(inches)
6 687 775
Temperature ofsnow-
groundinterface, and total
fluctuationwithinperiod
(degreesFahrenheit)
18J 14-51
0 8 of8
3j4
Differencein tem
peraturebetween air-snow
and snow-ground
interfaces(degrees
Fahrenheit)
13.7.7
40. 726. 7 9.3
29. 74. 3
thicknesses between 6 and 7 inches. This break has been referred to as the "critical thickness" of snow, which may be defined as the amount of snow cover re quired to significantly dampen the fluctuations of the ambient air temperature. The critical thickness of snow has been observed by others (table 38.3).
The insulating quality of snow is an expression of its thermal conductivity. This value is difficult to measure, and it depends on density, structure, texture, and interstitial air flow (Bader, 1962, p. 58). In addi tion, the thermal conductivity of snow is sensitive to the thermal properties of the underlying material (Lachen bruch, 1959, p. 24). In view of all these variables and the widely scattered observations (table 38.3), it is re markable that the critical thickness of snow appears to occupy such a narrow range of values.
KRINSLEY BUT
TABLE 38.3. Critical thickness of snow observed in this and other studies
Source
Krinsley (this report) .
Pruitt (1957). Kabanov
(1937). Atkinson
and Bay (1940).
Location
Buffalo Center, Alaska.
Fairbanks, Alaska _ U.S.S.R___. ______
La Crosse, Wis____
Mean annual temper ature
(degrees F)
25. 7
24. 7
46.3
Minimum tem perature in year of observation
-61 (1961)
-55 (1956)
-38 (1936)
Critical thick ness
(inches)
6-7
6-8 8-10
10
The data summarized in tables 38.1 and 38.2 suggest that the transfer of heat through dry snow is reduced abruptly when a critical thickness is attained. The measurement of the exact rate of reduction at critical thickness and the explanation for this phenomenon are worthy of further study.
REFERENCES
Atkinson, H. B., and Bay, C. E., 1940, Some factors affecting frost penetration: Am. Geophys. Union Trans., v. 21, pt. 3-B, p. 935-951.
Bader, Henri, 1962, The physics and mechanics of snow as a material: U. S. Army Corps Engineers Cold Regions Re search and Engineering Lab., Cold regions science and engineering, pt. 11, sect. B, 79 p.
Fuller, H. U., 1940, Studies of frost penetration: New England Water Works Assoc. Jour., v. 54, no. 3, p. 275-281.
Holmes, G. W., and Benninghoff, W. S., 1957, Terrain study of the Army Test Area, Fort Greely, Alaska: U. S. Geol. Sur vey, Military Geology Branch, v. 1, 287 p.
Kabanov, P. G., 1937, Soil temperature and warming of winter crops [abs.j : Am Meteorological Soc. Bull., v. 18, p. 65-66.
Lachenbruch, A. H., 1959, Periodic heat flow in a stratified me dium with application to permafrost problems: U. S. Geol. Survey Bull. 1083-A, 36 p.
Pruitt, W. O., Jr., 1957, Observations on the bioclimate of some taiga mammals: Arctic, v. 10, no. 3, p. 131-138.
U. S. Army Corps of Engineers, 1947, Report on frost investi gation, 1944-45: Boston, Mass., New England Division, 57 p.
U. S. Weather Bureau, 1961, Climatological data Alaska: v. 47, no. 10, Oct. 1961, p. 156-171.
Article 39
ORIGIN AND NATURE OF THE PROBABLE SKELETAL FUZZ ON THE MOON
By CHARLES R. WARREN, Washington, D.C.
Work done in cooperation with the Office, Chief of Engineers, Department of the Army
Abstract. The most probable origin of skeletal fuzz on the Moon is that it is a residue from vesicular rocks whose sur face is skeletonized by sputtering caused by the solar wind. Such fuzz, blackened by radiation damage, would have most of the known physical properties of the surface material of the Moon.
The surface material of the Moon has the property of strongly retrodirecting light that falls on it; that is, sunlight incident on the lunar surface is back- scattered (reflected back in the direction of the light source, the Sun) much more strongly than it is §cat- tered in other directions. The conclusion that light is retrodirected is based on three otherwise anomalous facts: the extreme steepness of the photometric func tion (the curve showing the change in brightness of the Moon with the phase) ; the shapes of the photo metric-function curves for individual points on the Moon, which have maximums at or near full moon (Diggelen, 1959) instead of at local noon as theory predicts; and the lack of limb darkening on the full Moon.
To give the observed retrodirected light, the surface material of the Moon probably must have an extremely complex structure (Hapke, 1962). Analysis of the requirements for this complex structure (Warren, 1963) shows that the Moon is probably covered, to a depth of several millimeters or centimeters, by a high ly porous, open-textured, skeletal fuzz that consists at least in part of randomly oriented linear units. These linear units either anastomose in a three-dimensional mesh, or branch, as in snowflakes or reindeer moss; in either case they may support nodes as in a Tinker- Toy structure, or may not.
The skeletal fuzz evidently grows or develops at the Moon's surface, for it is present in craters and on their rims, which consist of material thrown out from some depth, yet it is so porous that it must be too fragile to survive a crater-forming explosion, or even to exist at depth, where it would have to support the weight
of a thick overburden. The layered structure of the lunar surface (Gibson, 1961) also shows that the fuzz must be a surface feature.
Three general types of origin may be considered for the lunar surface fuzz. (1) It might form primarily from new material, perhaps burying a prefuzz surface that remains essentially unaltered: new material ar rives on the Moon not only in the form of meteoroids, including meteorites and micrometeorites, but also as individual atoms, which might condense onto the sur face from the solar wind. (2) It might form chiefly from material already present at the Moon's surface, the texture opening out without quantitatively signifi cant gain or loss of matter: the meteoroids that bom bard the lunar surface from time to time must greatly modify it. (3) The fuzz might form by the removal of material, etching out and skeletonizing the surface: the Moon's surface continuously loses material as the protons of the solar wind sputter it away.
The solar wind is a flux of ionized particles moving away from the Sun that has been shown by the recent satellite and space-probe data to be continuously pres ent in interplanetary space. Most of the particles are protons, though a relatively few helium nuclei and even fewer heavier atoms are present. As the protons approach the Moon, they are not deflected into belts comparable to our Van Alien belts because the Moon has essentially no magnetic field (see Markov, 1960, p. 365). Neither are they absorbed by air, because the lunar atmosphere is so tenuous that the mean free path of an atom or molecule in it is much longer than the total thickness of the atmosphere. Thus nearly all the protons strike directly on the Moon's surface. Laboratory experience shows that many of the protons must sputter (eject) an atom from the surface, in most cases with a velocity above the escape velocity from the Moon. Because very few of these atoms are slowed by collisions with atoms of the lunar atmosphere, they
ART. 39 IN U.S. GEOL. SURVEY PROF. PAPER 475-B, PAGES B148-B152. 1963.
B148
WARREN B149
must escape from the Moon and be permanently lost to it.
The long-term average rate of this loss of matter by sputtering is open to question because of uncertainties in the average intensity of the solar wind and the energies of its particles, in the efficiency with which various kinds of particles at various energies sputter various materials, and in the nature of the materials actually present on the Moon. However, the best esti mate appears to be that over a period of time the Moon loses more matter than it gains. Wehner and others (1960) estimate the net loss at 40 meters of rock per eon (109 years), or 1 millimeter every 25,000 years, and the actual rate may be higher than this if the mechanism accounts for the fact that the Moon's surface appears to have been eroded to a depth of more than a kilometer since the oldest recognizable craters were formed (Baldwin, 1949; Gold, 1955).
On this basis, the third possible process of forming the skeletal fuzz on the Moon, by etching and skeletoniz ing the surface, seems more likely than the first, by adding new material. However, the process of open ing out the texture by meteoroid impacts -may be an important contributing factor.
The sputtering process might conceivably produce a skeletal structure by building metal whiskers from the residue of sputtered silicates, but metal whiskers would have a much higher electrical conductivity than the surface material of the Moon, which appears to have electrical characteristics "similar to those of pumice or dust" (Mayer, 1961, p. 454). I therefore suggest that the most probable origin of the skeletal structure is by skeletonizing vesicular rock.
Suppose that a vesicular rock is exposed on the sur face of the Moon. Sputtering by the solar wind slowly etches the substance of the rock. In a few thousand years the thin walls between adjacent pairs of vesicles will be sputtered away entirely, leaving as a rodlike body the thicker material between three adjacent
i vesicles, where three such thin walls converged. If the | vesicles have the close-packed arrangement,1 the corners between four adjacent holes will be left as tetrahedral nodes, where four rods converge. The result will be a type of Tinker-Toy structure, a skeletal mesh of thin rods joining at thicker nodes. As the sputtering con-
, tinues, the rods and nodes will be reduced further, but at the same time the skeletonizing process will penetrate
! farther. By the time all the rods supporting a given
» The three-dimensional distribution of the vesicles in vesicular rocks has not been studied in detail, to my knowledge. The spacing of nu- cleation centers may control this distribution, rather than the mini mum surface-tension energy as in a foam, because the viscosity of a silicate melt is much higher than that of the liquid in a foam.
node are gone, perhaps the node will be the size of a grain of dust rather than of sand. The dust grain will drop into one of the holes in the surface, but presumably such particles are not numerous enough to clog up the texture, and the skeleton can maintain its structure.
The only other reasonable explanation for the ex tremely complex structure of the Moon's surface that I have seen proposed is Hapke's suggestion (1962) that the surface consists of "fairy castles" of dust. However, the dust "castles" that Hapke has produced in the lab oratory are believed to owe their complex structure to electrostatic charges, and would not be likely to remain stable for thousands of years under monthly cycles of ionizing radiation. Moreover, if the particles were only a few microns in diameter, as Hapke's suggestion requires, they probably could not have the opacity necessary to cast dark shadows; dust is normally lighter in color than the rocks from which it is derived, and the low electrical conductivity indicates that the lunar surface material cannot be metallic.
The hypothesis that the skeletal fuzz on the Moon is formed by the sputtering of vesicular rocks requires that the lunar surface rocks be vesicular. Three general classes of vesicular rocks might be expected on the Moon: (1) Vesicular volcanic rocks such as pumice, scoria, or pumiceous tuff may be present. (2) Im- pactite, a vesicular material found around meteorite craters on the Earth, is doubtless present. Sharonov (1960, p. 359) attributes to Madame Sytinskaya the hy pothesis that the entire lunar surface is covered by a "meteor slag" of this origin. (3) Vesicular material from planetesimals that became aggregated to form the Moon in the first place may be present. Comet nuclei and many meteoroids in interplanetary space may have an extremely porous texture produced by sublimation of interstitial ices (including perhaps frozen methane, ammonia, and carbon dioxide as well as water). The fact that meteorites on the Earth do not show such porosity might be because the texture is too insub stantial to survive frictional ablation by passage through the air, or too fragile to survive impact on the ground. On the Moon, however, some porous texture might survive, especially if the interstitial ices were present at impact to provide support, because impact on the Moon would involve essentially no atmospheric friction and might occur at less than one-fourth the velocity of impact on the Earth: the escape velocity from the Moon, and therefore the minimum velocity of infall on the Moon, is 0.213 that on the Earth.
All three of these types of vesicular rock are very probably present on the Moon. If the material flooring the maria is ignimbrite (welded tuff), as suggested by
B150 ASTROGEOLOGY
O'Keefe and Cameron,2 its surface contains much pumice; if it is basalt, as supposed by many earlier writers, its surface consists of scoria or vesicular basalt. The uplands, on the other hand, must have large amounts of impactite and may have much porosity in herited from cometlike planetesimals as well. Isostatic evidence suggests that the terra material may be of low average density compared with the mare material; mapping by the Army Map Service (1962) indicates that the Central and Southern Highlands (Hackman and Mason, 1961) stand an average of 4 to 6 km higher than Mare Imbrium, where the mare material is prob ably thickest.
If their surfaces were skeletonized by the solar wind, any or all of these vesicular rocks would have most of the known physical properties of the lunar surface material. For example, they would retrodirect the sun light; they would have the observed infrared thermal properties, including two anomalous ones; the thermal observations at radio wavelengths would be explained; and the electrical properties of the lunar surface, in cluding the inferred layering, might be expected.
In infrared thermal properties, the skeletonized vesicular rocks can be expected to have the low thermal inertia reported by Sinton (1961, p. 438) because both the density and the thermal conductivity are low. The density is low because most of each cubic centimeter (at least 75 percent, and more likely 90 or 95 percent) consists of vacuum. The thermal conductivity is low because this vacuum is sufficiently subdivided to reduce heat transfer by radiation, and little heat can be trans ferred by conduction along the thin rods.
Three infrared thermal properties of the lunar sur face, two of which are anomalous, can be explained as resulting from the thermal isolation of the individual nodes in skeletal fuzz. First, at full moon, as Pettit observed (1961, p. 415), the infrared radiation tempera ture drops off more slowly from the subsolar point to the limb than is predicted for a smooth, slowly rotating sphere. This is explained as being because most nodes of the skeletal fuzz near the limb that are visible from the Earth are in full sun, and are not much cooled by heat conduction to elements that are not in the sun; they are therefore nearly at the equilibrium temperature for a node in full sun radiating to a hemisphere of space. The temperature measured at the subsolar point is higher chiefly because at that point the bolometer receives radiation not only from nodes at the surface, but also from the deepest nodes to which the Sun's rays penetrate. A node in the interior of the fuzz receives as much solar heat as one near the surface, but its
2 J. A. O'Keefe and W. S. Cameron, paper presented at COSPAR meeting, May, 1962, entitled "Evidence from the Moon's surface features for the production of lunar granites".
efficiency in disposing of this heat by radiation is reduced by the fact that only a small part of the area to which it can radiate is at the cold radiation tempera ture of space. Thus, to reach equilibrium and reradiate heat as fast as a node receives it from the Sun, the deep node must radiate at a higher temperature. The infrared temperature measured is a mean between the high temperatures of the elements (rods and nodes) in the interior and the lower ones of those at the surface.
Second, the fuzz explains the anomaly noted by Pettit (1961, p. 412) that the infrared temperature of the subsolar point depends on the angle of view; the measured temperature is roughly 50 °K lower when the subsolar point is at the limb, at quadrature, than when it is at the center of the apparent disk, at full moon. This is explained because at the limb the bolometer measures radiation only from the cooler surficial fuzz elements, and not from the deeper and hotter elements.
Third, as Strong and Sinton noted (Sinton, 1961, p. 439), during the penumbral stage of a lunar eclipse the limb areas lose a much larger proportion of their heat than the center of the disk, in spite of the fact that they were already cooler before the onset of the eclipse. This is explained as being because the elements seen at the limb are those near the surface, which cool most efficiently by radiation during the penumbral phase.
The observation that the radiation temperature of the subsolar point depends on the wavelength at which it is measured is generally interpreted (for example, Gibson, 1959) to indicate that as the wavelength is in creased the radiation measured comes from increasing depths beneath the surface. This implies that the sur face material is partly transparent to longer waves, though it is opaque to optical and infrared waves. A skeletal fuzz would be expected to have this property.
The known electrical properties of the lunar surface material can also be explained. The low overall elec trical conductivity, similar to that of "pumice or dry sand" (Mayer, 1961), is to be expected for the fuzz be cause it is mostly vacuum and because the surface of such matter as is present is highly broken up, so that path lengths are great and resistance is increased. Gib- son has inferred (1961) that a subsurface layer has a significantly higher electrical conductivity than the 0.5-cm layer at the surface. This inference might be explained by saying that below 0.5 cm only the horizon tal cell walls have been breached, the vertical ones be ing shielded from the protons of the solar wind by fuzz elements above them.3
3 This explanation may be quantitatively inadequate, however, and a further explanation, also based on the sputtering of vesicular rock, will be offered in a report that is in preparation.
WARREN B151
The remaining known physical properties of the lunar surface material are not necessarily inherent in . skeletonized vesicular rock. For example, the Moon is dark colored, about as black as a domino or a rich gar den soilf whereas skeletonized vesicular rock could as easily be light colored. None of the properties appear to be incompatible with the inferred material, however, and some of them are easily explained by slight exten sions of the hypothesis. Thus if the material of the vesicular rocks has the property of darkening slowly on exposure, not only the black color but also the rela tions of the lunar rays would be explained. And if the vesicular rock types present in the maria differ from those in the uplands, their various differences in ob served properties could result.
The Moon is so much blacker than most terrestrial rock materials, including desert soils, that some proc ess of blackening at the surface seems probable. This may be some form of radiation damage, such as by ultra violet or X-radiation or by protons of the solar wind.
Provided this darkening process is slow, the observed relations of the lunar rays are explained by the skele- tonized-vesicular-rock hypothesis. A lunar ray or ray crater is an area where fragments thrown from a crater- forming explosion have either buried the darkened sur face material or plowed "it up and turned it over, expos ing the underlying lighter colored material. If the fresh material is vesicular, it will quickly be skeleton ized and will eventually be darkened, in its turn, so that the ray will disappear into the background, as those formerly radiating from Eratosthenes have done (Shoe maker and Hackman, 1963). However, the darkening will be differential. At an intermediate stage, when the ray is partly darkened, the deeper fuzz elements, shaded from the Sun most of the time, will still be rela tively bright when those near the surface, which are in sunshine all 14 days of the lunar day, have become well blackened. At this intermediate stage, only the black ened surface elements can be seen when the Moon's sur face is illuminated by sunlight at large phase angles. Near full moon, however, one can see the deeper ele ments that the Sun reaches at no other time, and that are therefore little darkened. Moreover, in the fresh rock, where skeletonizing is still proceeding actively, we will see at full moon many vesicles in the interior of the fuzz to which sputtering has only recently broken through, and which have as yet scarcely begun to dark en. These two factors would account for the observed fact, often considered anomalous, that the lunar rays are bright on the full Moon but fade out and may dis appear entirely at large phase angles, near the termina
tor (the twilight line marking the edge of the sunlit por tion of the Moon).
The differences between the maria and the uplands are also reasonable. If different types of vesicular rock are present, the difference in color could reflect a differ ence in susceptibility to the blackening process. The difference in blackenability may apply to the rate as well as to the ultimate degree; lunar rays on terra ma terial are brighter than those across maria. Other dif ferences, such as the generally greater degree of polari zation of light from the maria, could result from differences in chemical composition, in texture, or in scale size of the fuzz.
In summary, the extremely open, porous texture of the skeletal fuzz that probably covers the Moon is more likely to be produced by removal of material by etching out the surface, than by adding to it. It could be pro duced by metal whiskers, but these would lack the ob served low electrical conductivity. The geologically most reasonable explanation of the fuzz appears to be that it is vesicular rock skeletonized by the solar wind. The rock could be volcanic (for example, tuff or scoria) in the maria, and of impactite or planetesimal origin, or both, in the uplands. Such skeletonized vesicular rocks would have most of the known physical proper ties of the lunar surface, and would have no properties that appear to be incompatible with the results of meas urements yet made on the Moon.
REFERENCES
Army Map Service, 1962, Lunar map 1:2,500,000, Mare Nec-taris-Mare Imbrium.
Baldwin, R. W., 1949, The face of the Moon: Chicago, 111., Univ.Chicago Press, 239 p.
Diggelen, J. van, 1959, Photometric properties of lunar craterfloors: Recheches astronomiques de 1'Observatoire d'Ut-recht, v. 14, no. 2,114 p.
Gibson, J. E., 1961, Lunar surface characteristics indicated bythe March 1960, eclipse and other observations: Astrophys.Jour., v. 133, p. 1072-1080.
Gold, Thomas, 1955, The lunar surface: Monthly Notices RoyalAstron. Soc. [London], v. 115, p. 585-604.
Hackman, R. J., and Mason, A. C., 1961, Engineer special studyof the surface of the Moon: U. S. Geol. Survey Misc. Geol.Inv. Map 1-351.
Hapke, B. W., 1962, Second preliminary report on experimentsrelating to the lunar surface: Cornell Univ. Center forRadiophysics and Space Research, CRSR 127, 41 p.
Markov, A. V., ed., 1960, Conclusion, p. 365-378 in Luna: Mos cow, Gosudarstvennoye Izdatel'stvo Fiziko-MatematicheskoyLiteratury.
Mayer, C. H., 1961, Radio emission of the Moon and planets,chap. 12 in Kuiper, G. B., and Middlehurst, B. M., eds.,Planets and satellites, The solar system, v. 3: Chicago, 111.,Univ. Chicago Press, p. 442-472.
B152 ASTROGEOLOGY
Pettit, Edison, 1961, Planetary temperature measurements, chap. 10 in Kuiper, G. B., and Middlehurst, B. M., eds., Planets and satellites, The solar system, v. 3: Chicago, 111., Univ. Chicago Press, p. 400-428.
Sharonov, V. V., 1960, The nature of the lunar surface, chap. 9 In Markov, A. V., ed., Luna: Moscow, Gosudarstvennoye Izdatel'stvo Fiziko-Matematicheskoy Literatury. p. 331-364.
Shoemaker, E. M., and Hackman, R. J., 1963, Stratigraphic 'basis for a lunar time scale, in Kopal, Zden£k, and Mik- hailov, Z. K., eds., The Moon 'Symposium No. 14 of the International Astronomical Union: London and New York, Academic Press, p. 289-300.
Sinton, W. M., 1961, Recent radiometric studies of the planets and the Moon, chap. 11 in Kuiper, G. B., and Middlehurst, B. M., eds., Planets and satellites, The solar system, v. 3: Chicago, 111., Univ. Chicago Press, p. 429-441.
Warren, C. R., 1963, The lunar surface material: Science, v. 140, p. 188-190.
Wehner, G. K., Laegreid, N., and Stuart, R. V., 1960, Study of sputtering of materials: General Mills, Inc., Rept. 2133 for Geophysics Research Directorate, Air Force Cambridge Re search Center, Air Research and Development Command, U.S. Air Force.
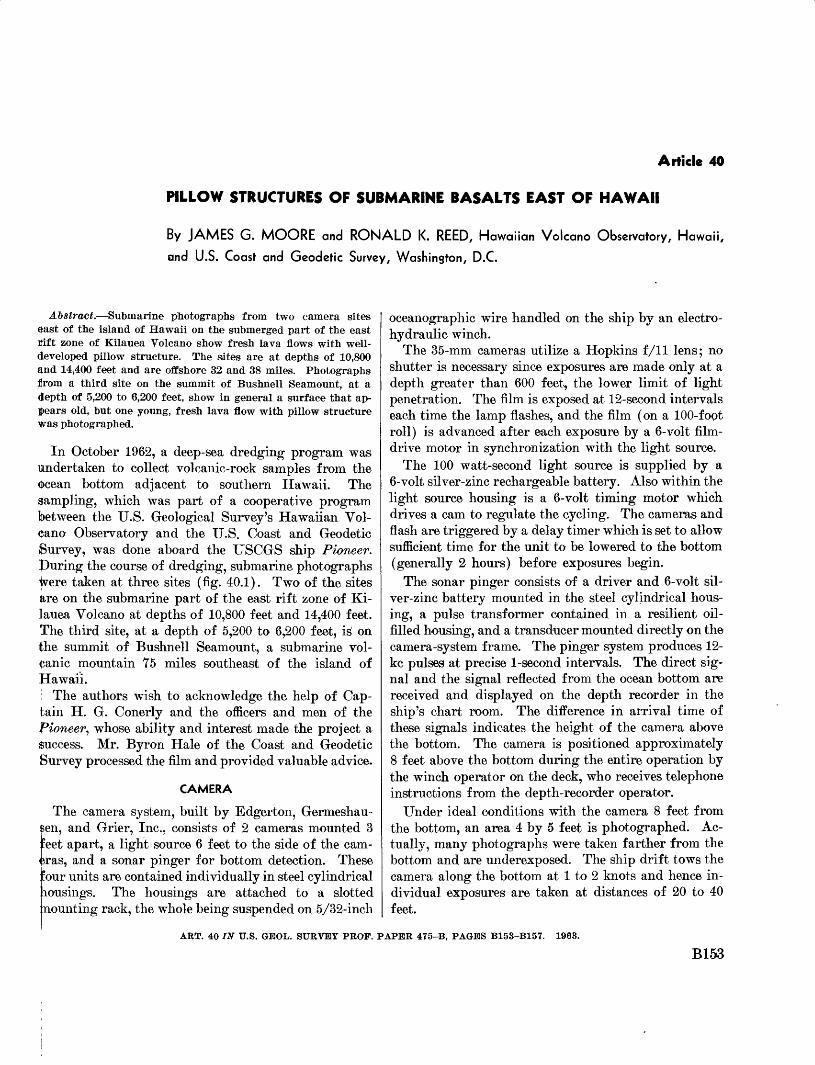
Article 40
PILLOW STRUCTURES OF SUBMARINE BASALTS EAST OF HAWAII
By JAMES G. MOORE and RONALD K. REED, Hawaiian Volcano Observatory, Hawaii,
and U.S. Coast and Geodetic Survey, Washington, D.C.
Abstract. Submarine photographs from two camera sites east of the island of Hawaii on the submerged part of the east rift zone of Kilauea Volcano show fresh lava flows with well- developed pillow structure. The sates are at depths of 10,800 and 14,400 feet and are offshore 32 and 38 miles. Photographs from a third site on the summit of Bushnell Seamount, at a depth of 5,200 to 6,200 feet, show in general a surface that ap pears old, but one young, fresh lava flow with pillow structure was photographed.
In October 1962, a deep-sea dredging program was Undertaken to collect volcanic-rock samples from the Ocean bottom adjacent to southern Hawaii. The sampling, which was part of a cooperative program between the U.S. Geological Survey's Hawaiian Vol cano Observatory and the U.S. Coast and Geodetic Survey, was done aboard the USCGS ship Pioneer. puring the course of dredging, submarine photographs ivere taken at three sites (fig. 40.1). Two of the sites are on the submarine part of the east rift zone of Ki lauea Volcano at depths of 10,800 feet and 14,400 feet. The third site, at a depth of 5,200 to 6,200 feet, ig on the summit of Bushnell Seamount, a submarine vol canic mountain 75 miles southeast of the island of Hawaii.
; The authors wish to acknowledge the help of Cap tain H. G. Conerly and the officers and men of the Pioneer, whose ability and interest made the project a success. Mr. Byron Hale of the Coast and Geodetic Survey processed the film and provided valuable advice.
CAMERA
The camera system, built by Edgerton, Germeshau- Sen, and Grier, Inc., consists of 2 cameras mounted 3 : :eet apart, a light source 6 feet to the side of the cam eras, and a sonar pinger for bottom detection. These : !our units are contained individually in steel cylindrical lousings. The housings are attached to a slotted :nounting rack, the whole being suspended on 5/32-inch
oceanographic wire handled on the ship by an electro- hydraulic winch.
The 35-mm cameras utilize a Hopkins f/11 lens; no shutter is necessary since exposures are made only at a depth greater than 600 feet, the lower limit of light penetration. The film is exposed at 12-second intervals each time the lamp flashes, and the film (on a 100-foot roll) is advanced after each exposure by a 6-volt film- drive motor in synchronization with the light source.
The 100 watt-second light source is supplied by a 6-volt silver-zinc rechargeable battery. Also within the light source housing is a 6-volt timing motor which drives a cam to regulate the cycling. The cameras and flash are triggered by a delay timer which is set to allow sufficient time for the unit to be lowered to the bottom (generally 2 hours) before exposures begin.
The sonar pinger consists of a driver and 6-volt sil ver-zinc battery mounted in the steel cylindrical hous ing, a pulse transformer contained in a resilient oil- filled housing, and a transducer mounted directly on the camera-system frame. The pinger system produces 12- kc pulses at precise 1-second intervals. The direct sig nal and the signal reflected from the ocean bottom are received and displayed on the depth recorder in the ship's chart room. The difference in arrival time of these signals indicates the height of the camera above the bottom. The camera is positioned approximately 8 feet above the bottom during the entire operation by the winch operator on the deck, who receives telephone instructions from the depth-recorder operator.
Under ideal conditions with the camera 8 feet from the bottom, an area 4 by 5 feet is photographed. Ac tually, many photographs were taken farther from the bottom and are underexposed. The ship drift tows the camera along the bottom at 1 to 2 knots and hence in dividual exposures are taken at distances of 20 to 40 feet.
ART. 40 IN U.S. GBOL. SURVEY PROF. PAPER 475-B, PAGES B153-B157. 1963.
B153
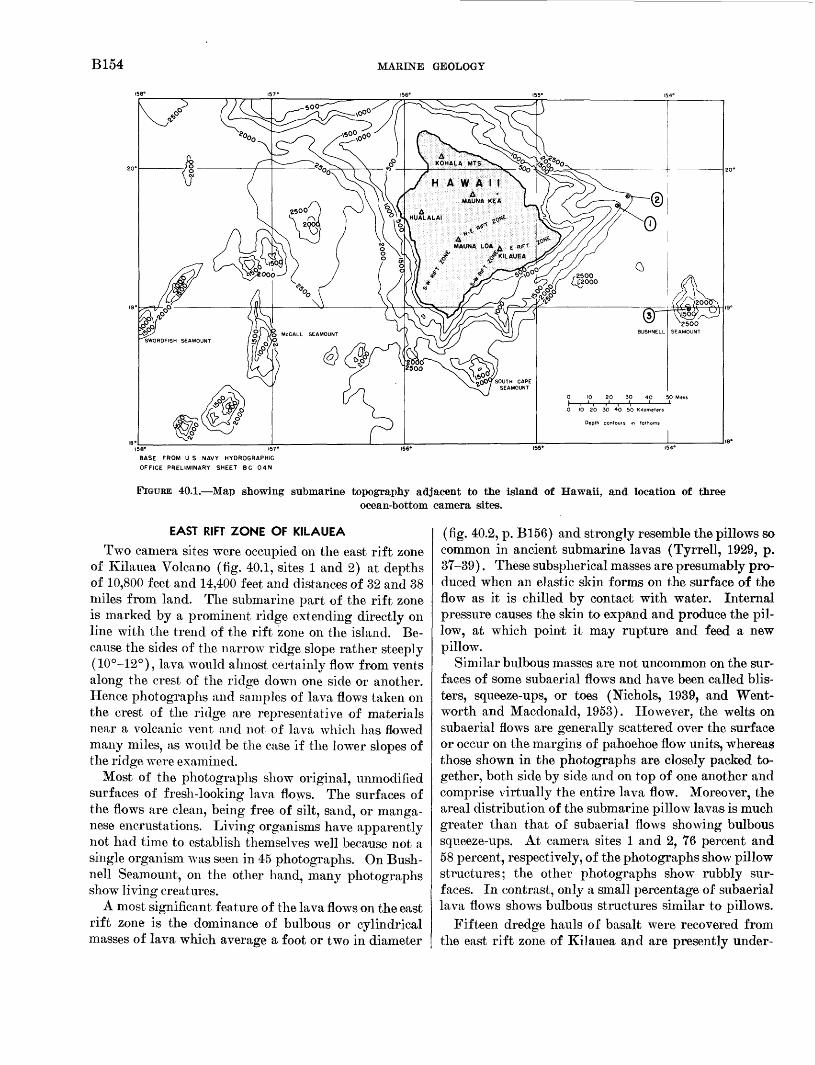
B154 MARINE GEOLOGY
158°
BASE FROM U S NAVY HYDROGRAPHIC
OFFICE PRELIMINARY SHEET BC 04N
FIGURE 40.1. Map showing submarine topography adjacent to the island of Hawaii, and location of threeocean-bottom camera sites.
EAST RIFT ZONE OF KILAUEA
Two camera sites were occupied on the east rift zone of Kilauea Volcano (fig. 40.1, sites 1 and 2) at depths of 10,800 feet and 14,400 feet and distances of 32 and 38 miles from land. The submarine part of the rift zone is marked by a prominent ridge extending directly on line with the trend of the rift zone on the island. Be cause the sides of the narrow ridge slope rather steeply (10°-12°), lava would almost certainly flow from vents along the crest of the ridge down one side or another. Hence photographs and samples of lava flows taken on the crest of the ridge are representative of materials near a volcanic vent and not of lava which has flowed many miles, as would be the case if the lower slopes of the ridge were examined.
Most of the photographs show original, unmodified surfaces of fresh-looking lava flows. The surfaces of the flows are clean, being free of silt, sand, or manga-
t O J 7 O
nese encrustations. Living organisms have apparently not had time to establish themselves well because not a single organism was seen in 45 photographs. On Bush- nell Seamount, on the other hand, many photographs show living creatures.
A most significant feature of the lava flows on the east rift zone is the dominance of bulbous or cylindrical masses of lava which average a foot or two in diameter
(fig. 40.2, p. B156) and strongly resemble the pillows so common in ancient submarine lavas (Tyrrell, 1929, p. 37-39). These subspherical masses are presumably pro duced when an elastic skin forms on the surface of the flow as it is chilled by contact with water. Internal pressure causes the skin to expand and produce the pil low, at which point it may rupture and feed a new pillow.
Similar bulbous masses are not uncommon on the sur faces of some subaerial flows and have been called blis ters, squeeze-ups, or toes (Nichols, 1939, and Went- worth and Macdonald, 1953). However, the welts on subaerial flows are generally scattered over the surface or occur on the margins of pahoehoe flow units, whereas those shown in the photographs are closely packed to gether, both side by side and on top of one another and comprise virtually the entire lava flow. Moreover, the areal distribution of the submarine pillow lavas is much greater than that of subaerial flows showing bulbous squeeze-ups. At camera sites 1 and 2, 76 percent and 58 percent, respectively, of the photographs show pillow structures; the other photographs show rubbly sur faces. In contrast, only a small percentage of subaerial lava flows shows bulbous structures similar to pillows.
Fifteen dredge hauls of basalt were recovered from the east rift zone of Kilauea and are presently under-
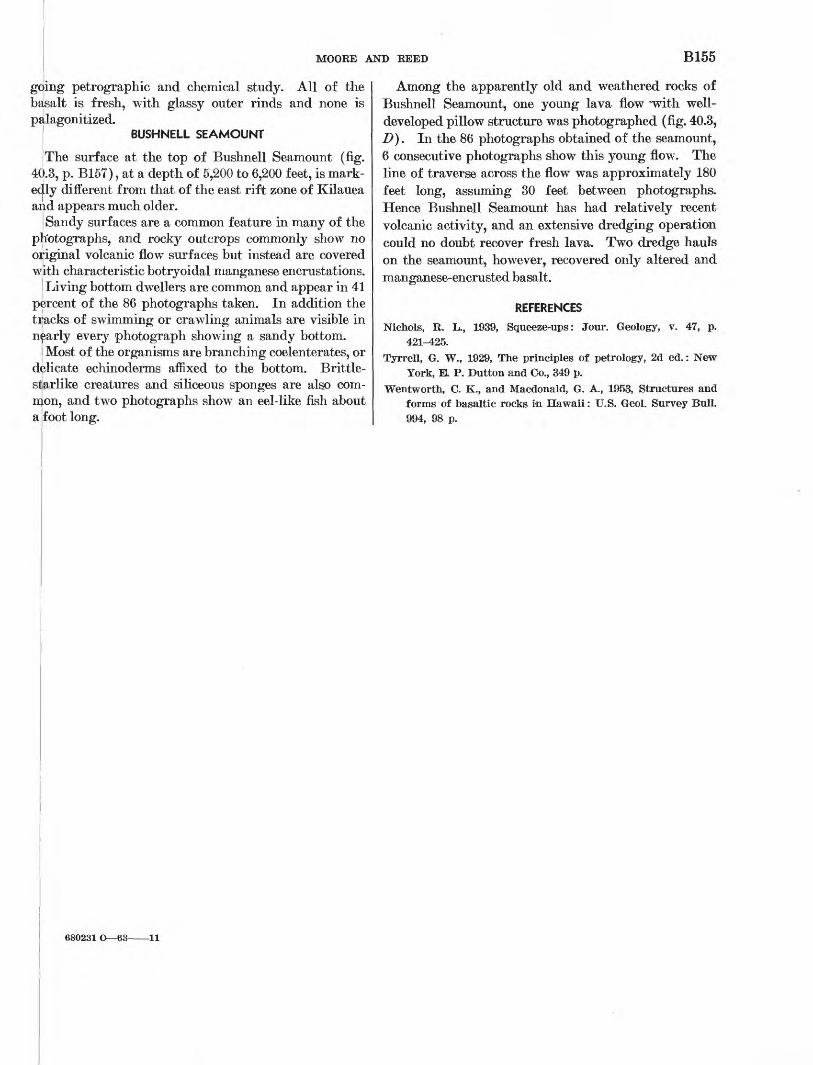
MOORE AND REED B155
going petrographic and chemical study. All of the basalt is fresh, with glassy outer rinds and none is palagonitized.
BUSHNELL SEAMOUNT
The surface at the top of Bushnell Seamount (fig. 40.8, p. B157), at a depth of 5,200 to 6,200 feet, is mark edly different from that of the east rift zone of Kilauea and appears much older.
Sandy surfaces are a common feature in many of the photographs, and rocky outcrops commonly show no original volcanic flow surfaces but instead are covered with characteristic botryoidal manganese encrustations.
! Living bottom dwellers are common and appear in 41 percent of the 86 photographs taken. In addition the tracks of swimming or crawling animals are visible in nearly every photograph showing a sandy bottom.
1 Most of the organisms are branching coelenterates, or delicate echinoderms affixed to the bottom. Brittle- starlike creatures and siliceous sponges are also com mon, and two photographs show an eel-like fish about ajfoot long.
Among the apparently old and weathered rocks of Bushnell Seamount, one young lava flow ~with well- developed pillow structure was photographed (fig. 40.3, D). In the 86 photographs obtained, of the seamount, 6 consecutive photographs show this young flow. The line of traverse across the flow was approximately 180 feet long, assuming 30 feet between photographs. Hence Bushnell Seamount has had relatively recent volcanic activity, and an extensive dredging operation could no doubt recover fresh lava. Two dredge hauls on the seamount, however, recovered only altered and manganese-encrusted basalt.
REFERENCES
Nichols, R. L., 1939, Squeeze-ups: Jour. Geology, v. 47, p.421-425.
Tyrrell, G. W., 1929, The principles of petrology, 2d ed.: NewYork, B. P. Dutton and Co., 349 p.
Wentworth, C. K., and Macdonald, G. A., 1953, Structures andforms of basaltic rocks in Hawaii: U.S. Geol. Survey Bull.994, 98 p.
680231
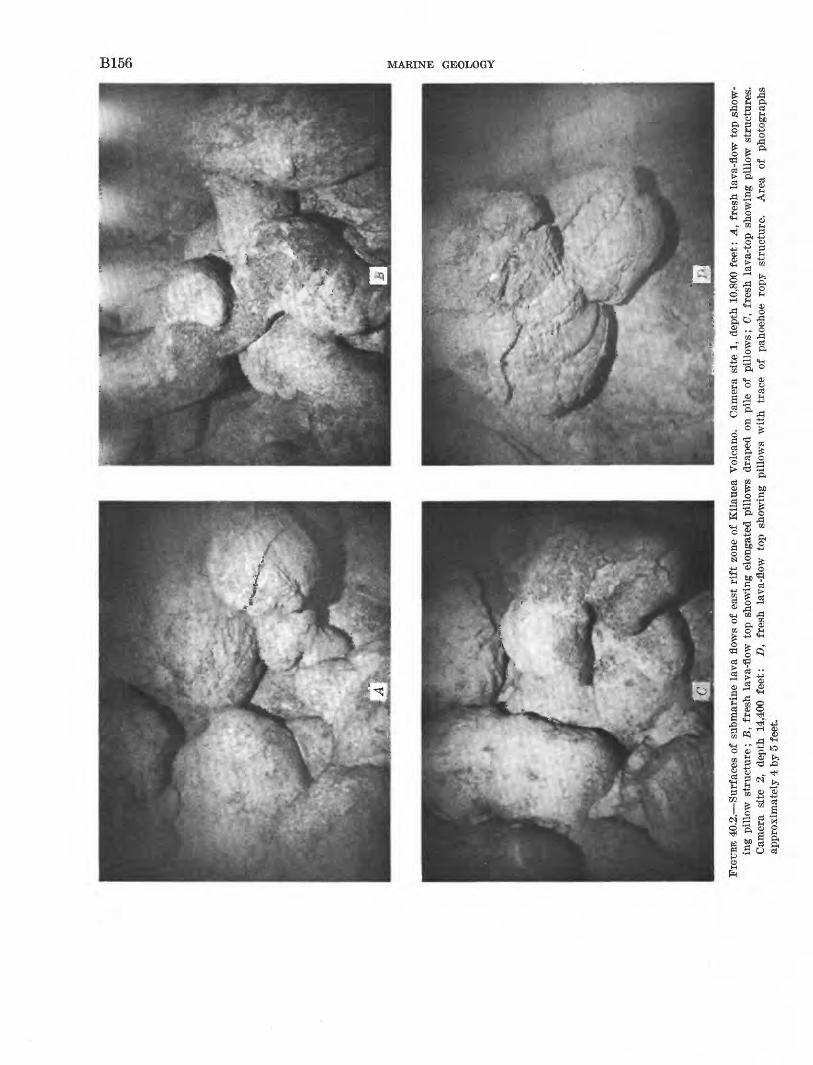
w I * or
os
Lk
^^^^
BH
HH
^HFI
GU
RE 4
0.2.
Sur
face
s of
sub
mar
ine
lava
flo
ws
of e
ast
rift
zon
e of
Kil
auea
Vol
cano
. C
amer
a si
te 1
, de
pth
10,8
00 f
eet:
A,
fres
h la
va-f
low
top
sho
w
ing
pillo
w s
truc
ture
; B
, fr
esh
lava
-flo
w t
op s
how
ing
elon
gate
d pi
llow
s dr
aped
on
pile
of
pill
ows;
0,
fre
sh l
ava-
top
show
ing
pillo
w s
truc
ture
s.
Cam
era
site
2,
de
pth
14,4
00 f
eet:
D
, fr
esh
lava
-flo
w
top
show
ing
pillo
ws
wit
h tr
ace
of
paho
ehoe
ro
py
stru
ctur
e.
Are
a of
ph
otog
raph
s ap
prox
imat
ely
4 by
5 f
eet.
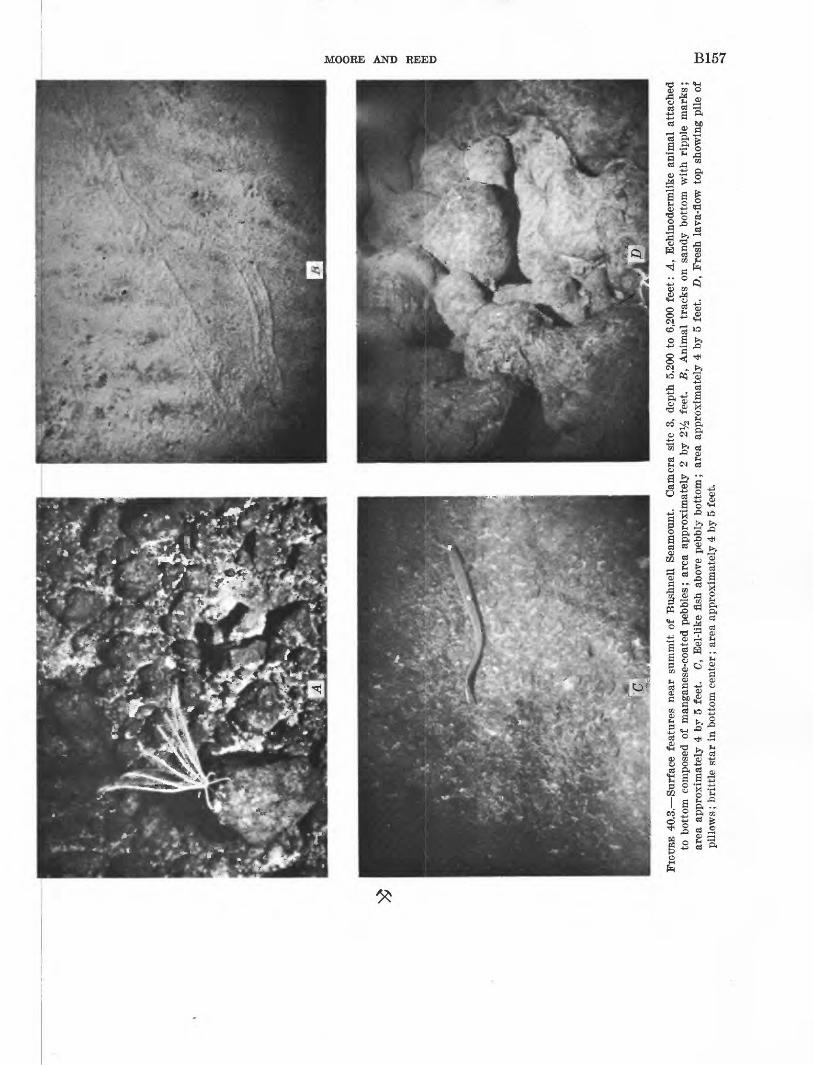
FIG
URE
40.
3. S
urfa
ce f
eatu
res
near
sum
mit
of
Bus
hnel
l Se
amou
nt.
Cam
era
site
3,
dept
h 5,
200
to 6
,200
fee
t: A
, E
chin
oder
mli
ke a
nim
al a
ttac
hed
to b
otto
m c
ompo
sed
of m
anga
nese
-coa
ted
pebb
les;
are
a ap
prox
imat
ely
2 by
2%
fe
et.
B,
Ani
mal
tra
cks
on s
andy
bot
tom
wit
h ri
pple
mar
ks;
area
app
roxi
mat
ely
4 by
5 f
eet.
C, E
el-l
ike
fish
abo
ve p
ebbl
y bo
ttom
; ar
ea a
ppro
xim
atel
y 4
by 5
fee
t. D
, F
resh
lav
a-fl
ow t
op s
how
ing
pile
of
pill
ows;
bri
ttle
sta
r in
bot
tom
cen
ter;
are
a ap
prox
imat
ely
4 by
5 f
eet.
td
Article 41
ESTIMATES OF WORLD BAUXITE RESERVES AND POTENTIAL RESOURCES
By SAM H. PATTERSON, Beltsville, Md.
Abstract. A new review of world bauxite reserves indicates that total world reserves are 5.7 billion tons and that marginal and submarginal resources are 8.7 billion tons.
A new review of world bauxite reserves, listed by country in the accompanying table, indicates that total world reserves are 5.7 billion tons and that marginal and submarginal resources are 8.7 billion tons. The world reserves are more than triple those known a decade ago (Fischer, 1953). The increase is due to vigorous exploration for bauxite, which has resulted in the discovery of several important deposits, includ ing the very large Weipa deposits of the Cape York peninsula, Australia, and the deposits near Boke, Kin- dia, and Fria in the Republic of Guinea.
Approximately 35 percent of the world's bauxite reserves are in Australia, 20 percent in the Republic of Guinea, 10 percent in Jamaica, 5 percent in Hun gary, 5 percent in Yugoslavia, 4.5 percent in Ghana, and 4.5 percent in Surinam. Of the marginal and submarginal resources, 45 percent are in the Republic of Guinea, 13 percent in Australia, 11 percent in British Guiana, 11 percent in Cameroun, and 11 percent in Communist China. Other countries possessing ade quate reserves and other resources to maintain signifi cant bauxite production for several decades include France, Greece, and India.
The United States contains less than 1 percent of the world's bauxite reserves. It is in a somewhat more
favorable position in regard to the size of its sub- marginal resources of bauxite, but these resources can not be used profitably now because they consist chiefly of low-grade bauxite in Hawaii and Oregon and deeply buried, thin deposits in Arkansas and Georgia.
In 1961 domestic consumption of bauxite was 8.6 million tons and world consumption was 29 million tons (Higbie and others, 1962). At this rate of con sumption, domestic reserves of bauxite would last less than 6 years if the foreign sources now supplying most of the United States' requirements were cut off. Known world reserves are adequate to last more than 175 years at the current rate of depletion, and if prices and tech nology adjust to permit mining of the marginal and submarginal resources, they would supply the world's needs for an additional 200 years or more.
The estimates are based on information from more than 200 geological and mining publications, trade journals, and U.S. State Department Foreign Service dispatches. The limitations of this publication do not permit the listing of the sources of information; how ever, a bibliography will be included in a U.S. Geolog ical Survey publication in preparation.
The author is indebted to Miss Mary E. Trought, Mr. Richard D. Wilmot, and Mr. Kenneth B. Higbie, of the U.S. Bureau of Mines, whose suggestions led to obscure reference data for several countries.
ART. 41 IN U.S. GEOL. SURVEY PROF. PAPER 475-B, PAGES B158-B159. 1963.
B158

PATTERSON B159
Estimated total reserves and other resources of bauxite, in millions | of tons l
[L, large; S, small]
Drth America: United States:
Southeastern StatesOregon __ ___ ____ _____Hawaii __ __ _________
Total (rounded) _______________
entral America: Costa Rica___ _ ____ ___ _______Mexico __ ____ _________Panama ____ _ _________ _
Total (rounded) __________
aribbean Islands: Dominican Republic __ _ __ _ ___Haiti_-_--.______ _ __ _ _________Jamaica _ _ _ ___________
Total (rounded) __________ __
outh America: Brazil _____ __ _______
French Guiana __ ______Surinam _ __ _____ ___
Total (rounded)- _ __ _____
Jurope:
France _ _GreeceHungary _ _Italy__--.___ _____________________
Poland. __________________________Rumania _Spain _ __ _ _U.S.S.R- ___-__-_-_---.__________-
Total (rounded) ____ __ _
irica:
Cameroun ___ _ _Congo, - _ _ _Ghana _ _ ______Guinea __ _ __ ____
Eeserves 2
491
50
QfON
S
6025
600
690
40150
250
440
27084
30024
207
3 100290
900
S
2541.100
Marginal and submarginal
resources
652585
125
300
50
25
80
40
400
440
2001,000
70150 mo
1,520
190100
Of)
S
320
10985
L(?)
2.400
Estimated total reserves and other resources of bauxite, in millions of tons 1 Continued
Africa Continued
]VTf»T*f»^pf»
Rhodesia _ ________ _______
Total (rounded) _-__ ___
Asia:
Indonesia ____ _______ _
Malay ____ _ ______ ___
Turkey.--.-------- ----------- _ _Vietnam (North) _ _ __ _
Total (rounded)____--_--------
Oceania: Australia _ - ____ ____
Fiji. __________________ __ --_____
Palau_ _______________-_--_---_--_
Total (rounded) for world- _. __
Reserves 2
S
S
1,350
150. 1
58. 125
710
5. 69.3.3
270
2, 060. 3
3
2,060
5,760
Marginal and submarginal
resources
25L
202. 4
602
3,500
1,000
20010+16409.5
28
65
1,370
1,190.6. 2
20
. 5
1,210
8,740
1 Most figures are in metric or long tons; however, many estimates used in com pilation failed to designate type of tons used.
2 Measured and indicated reserves that in some degree have been inventoried in terms of commercial enterprise and could be used under the economic and tech nologic conditions existing in 1963.
3 Rough estimate based on geologic inferences. Much low-grade bauxite is in cluded that would be classed as marginal and submarginal resources in other countries.
REFERENCES
Fischer, E. C., 1953, Sources and reserves, Chap. 3 in Bauxite: U.S. Bur. Mines Materials Survey 3, 59 p.
Higbie, K. B., Sullivan, A. C., and Trought, M. E., 1962, Bauxite: U.S. Bur. Mines Minerals Yearbook 1961, p. 309-331.
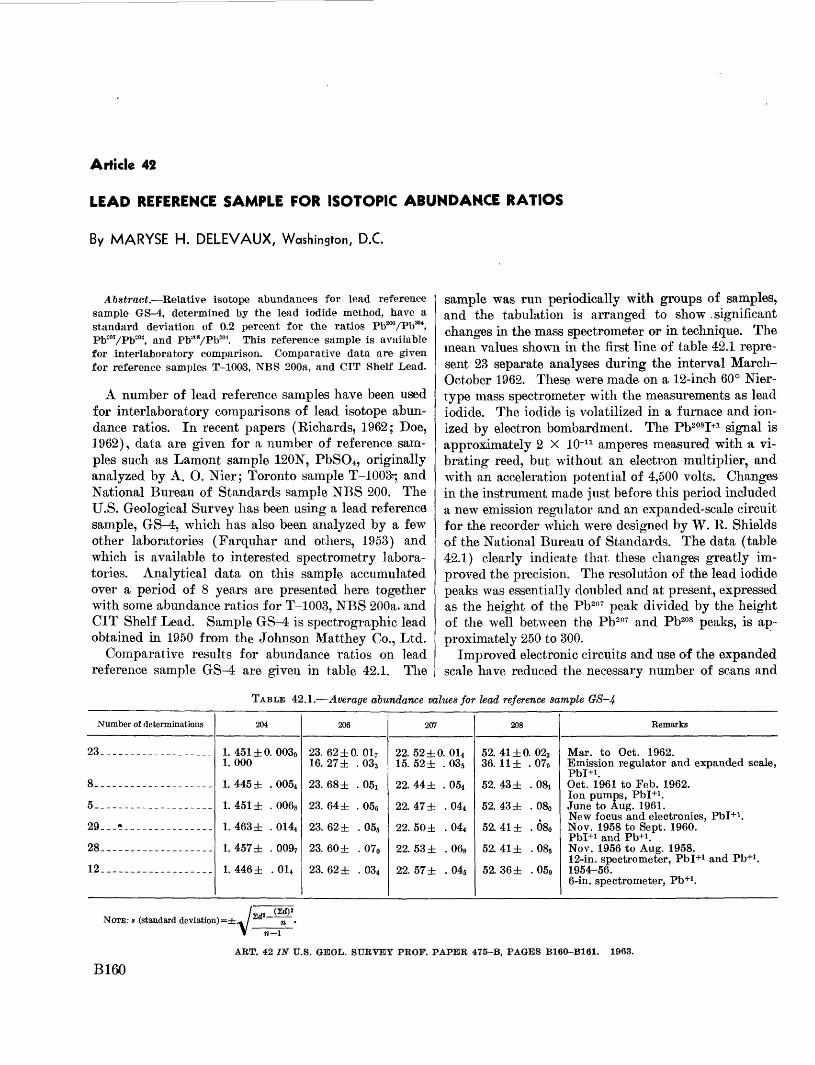
Article 42
LEAD REFERENCE SAMPLE FOR ISOTOPIC ABUNDANCE RATIOS
By MARYSE H. DELEVAUX, Washinston, D.C.
Abstract. Relative isotope abundances for lead reference sample GS-4, determined by the lead iodide method, have a standard deviation of 0.2 percent for the ratios Pb^/Pb20*, Pb^/Pb'04, and Pb^/Pb204. This reference sample is available for interlaboratory comparison. Comparative data are given for reference samples T-1003, NBS 200a, and CIT Shelf Lead.
A number of lead reference samples have been used for interlaboratory comparisons of lead isotope abun dance ratios. In recent papers (Richards, 1962; Doe, 1962), data are given for a number of reference sam ples such as Lament sample 120N, PbSO4, originally analyzed by A. O. Nier; Toronto sample T-1003^ and National Bureau of Standards sample NBS 200. The U.S. Geological Survey has been using a lead reference sample, GS-4, which has also been analyzed by a few other laboratories (Farquhar and others, 1953) and which is available to interested spectrometry labora tories. Analytical data on this sample accumulated over a period of 8 years are presented here together with some abundance ratios for T-1003, NBS 200a, and CIT Shelf Lead. Sample GS-4 is spectrographic lead obtained in 1950 from the Johnson Matthey Co., Ltd.
Comparative results for abundance ratios on lead reference sample GS-4 are given in table 42.1. The
sample was run periodically with groups of samples, and the tabulation is arranged to show .significant changes in the mass spectrometer or in technique. The mean values shown in the first line of table 42.1 repre sent 23 separate analyses during the interval March- October 1962. These were made on a 12-inch 60° Nier- type mass spectrometer with the measurements as lead iodide. The iodide is volatilized in a furnace and ion ized by electron bombardment. The Pb208I+1 signal is approximately 2 X 10~" amperes measured with a vi brating reed, but without an electron multiplier, and with an acceleration potential of 4,500 volts. Changes in the instrument made just before this period included a new emission regulator and an expanded-scale circuit for the recorder which were designed by W. R. Shields of the National Bureau of Standards. The data (table 42.1) clearly indicate that these changes greatly im proved the precision. The resolution of the lead iodide peaks was essentially doubled and at present, expressed as the height of the Pb207 peak divided by the height of the well between the Pb207 and Pb208 peaks, is ap proximately 250 to 300.
Improved electronic circuits and use of the expanded scale have reduced the necessary number of scans and
TABLE 42.1. Average abundance values for lead reference sample GS-4
Number of determinations
23-.--_______________
8__ _____.__.__._ ___.
5_ _..____ __ ..
29-_-»---_-_____-____
28_ _-_-______-__-_
12._--__-_______.___.
204
1. 451 ±0. 00301. 000
1. 445 ± .0054
1. 451 ± .0068
1. 463 ± .0144
1. 457 ± .0097
1. 446 ± . 01 4
206
23. 62 ±0. 01 716. 27 ± . 033
23. 68 ± . 05i
23. 64 ± . 056
23. 62 ± . 055
23. 60 ± . 070
23. 62 ± . 034
207
22. 52 ±0. 01415. 52 ± . 035
22. 44± .054
22. 47 ± .044
22. 50 ± . 044
22. 53 ± . 068
22. 57 ± . 045
208
52. 41 ±0. 02336. 11 ± . 079
52. 43 ± .08i
52. 43 ± .080
52. 41 ± . 08o
52. 41 ± .085
52. 36± .059
Remarks
Mar. to Oct. 1962.Emission regulator and expanded scale, Pbl+i. Oct. 1961 to Feb. 1962.Ion pumps, Pbl+1 . June to Aug. 1961.New focus and electronics, Pbl+1 . Nov. 1958 to Sept. 1960.Pbl+1 and Pb+1 . Nov. 1956 to Aug. 1958.12-in. spectrometer, Pbl+1 and Pb+1 . 1954-56.6-in. spectrometer, Pb+1 .
NOTE: s (standard deviation) =±/»-<«
A/____«_'
ART. 42 IN U.S. GEOL. SURVEY PROF. PAPER 475-B, PAGES B160-B161. 1963.
B160
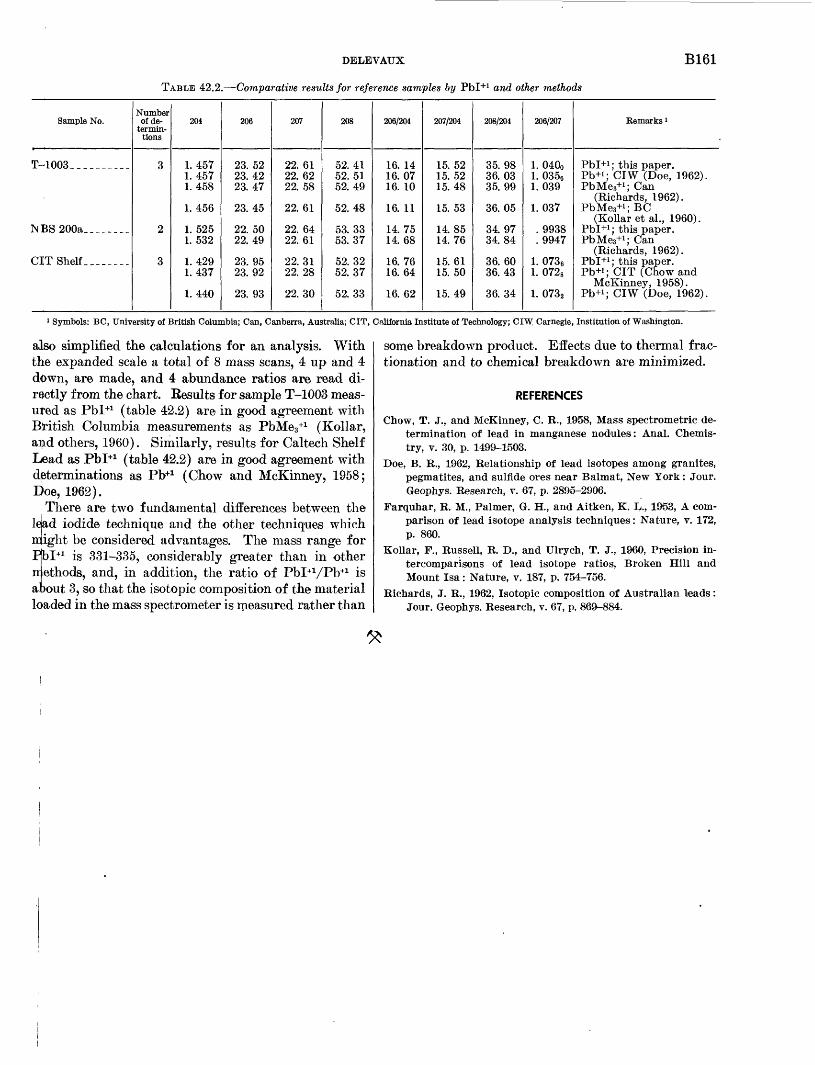
DELEVAUX
TABLE 42.2. Comparative results for reference samples by Pbl+1 and other methods
B161
Sample No.
T~4 003. ---__----
^BS200a_. ______
CITShelf._______
Number of de-
termin- tions
3
2
3
204
1.4571. 457 1.458
1.456
1. 5251. 532
1.4291.437
1.440
206
23. 5223. 42 23. 47
23.45
22. 5022.49
23.9523.92
23. 93
207
22. 6122. 6222. 58
22. 61
22.6422. 61
22. 3122. 28
22.30
208
52.4152. 51 52.49
52. 48
53. 3353. 37
52. 3252. 37
52.33
206/204
16. 1416. 07 16. 10
16. 11
14. 7514. 68
16.7616. 64
16. 62
207/204
15. 5215. 52 15.48
15. 53
14. 8514. 76
15. 6115. 50
15.49
208/204
35.9836. 03 35.99
36. 05
34.9734. 84
36. 6036.43
36. 34
206/207
1. 04001. 0356 1. 039
1. 037
. 9938
.9947
1. 07361. 0728
1. 0732
Remarks l
Pbl+1 ; this paper.Pb+!; CIW (Doe, 1962). PbMe3+1 ; Can
(Richards, 1962). PbMe3+1 ; BC
(Kollar et al., 1960). Pbl+1 ; this paper.PbMe3+1 ; Can
(Richards, 1962). Pbl+1 ; this paper.Pb+1 ; CIT (Chow and
McKinney, 1958). Pb+1 ; CIW (Doe, 1962).
: Symbols: BC, University of British Columbia; Can, Canberra, Australia; CIT, California Institute of Technology; CIW. Carnegie, Institution of Washington.
also simplified the calculations for an analysis. With the expanded scale a total of 8 mass scans, 4 up and 4 down, are made, and 4 abundance ratios are read di rectly from the chart. Results for sample T-1003 meas ured as Pbl+1 (table 42.2) are in good agreement with British Columbia measurements as PbMe3 +1 (Kollar, and others, 1960). Similarly, results for Caltech Shelf Lead as Pbl+1 (table 42.2) are in good agreement with determinations as Pb+1 (Chow and McKinney, 1958; Doe, 1962).
There are two fundamental differences between the lejad iodide technique and the other techniques which might be considered advantages. The mass range for Pbl+1 is 331-335, considerably greater than in other nethods, and, in addition, the ratio of PbI+1/Pb+1 is about 3, so that the isotopic composition of the material loaded in the mass spectrometer is measured rather than
some breakdown product. Effects due to thermal frac- tionation and to chemical breakdown are minimized.
REFERENCES
Chow, T. J., and McKinney, C. R., 1958, Mass spectrometric de termination of lead in manganese nodules: Anal. Chemis try, v. 30, p. 1499-1503.
Doe, B. R., 1962, Relationship of lead isotopes among granites, pegmatites, and sulfide ores near Balmat, New York: Jour. Geophys. Research, v. 67, p. 2895-2906.
Farquhar, R. M., Palmer, G. H., and Aitken, K. L., 1953, A com parison of lead isotope analysis techniques: Nature, v. 172, p. 860.
Kollar, F., Russell, R. D., and Ulrych, T. J., 1960, Precision in- tercomparisons of lead isotope ratios, Broken Hill and Mount Isa: Nature, v. 187, p. 754-756.
Richards, J. R., 1962, Isotopic composition of Australian leads: Jour. Geophys. Research, v. 67, p. 869-884.
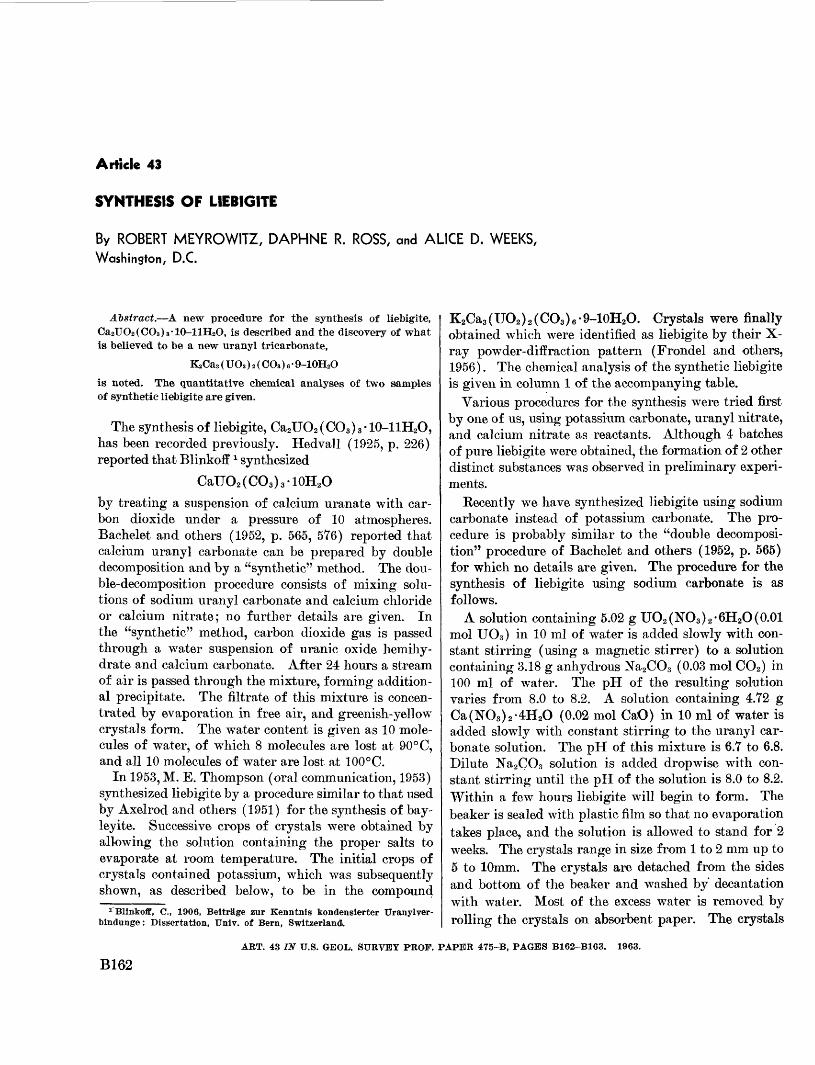
Article 43
SYNTHESIS OF LIEBIGITE
By ROBERT MEYROWITZ, DAPHNE R. ROSS, and ALICE D. WEEKS, Washington, D.C.
Abstract. A new procedure for the synthesis of liebigite, Ca2UO2(CO3)3-10-llH2O, is described and the discovery of what is believed to be a new uranyl tricarbonate,
K2Ca3 ( UO2 ) 2 ( CO3 ) e
is noted. The quantitative chemical analyses of two samples of synthetic liebigite are given.
The synthesis of liebigite, Ca2UO2 (CO3 ) 3 -10-llH2O, has been recorded previously. Hedvall (1925, p. 226) reported that Blinkoff 1 synthesized
CaUO2 (CO3 ) 3 -10H2Oby treating a suspension of calcium uranate with car bon dioxide under a pressure of 10 atmospheres. Bachelet and others (1952, p. 565, 576) reported that calcium uranyl carbonate can be prepared by double decomposition and by a "synthetic" method. The dou ble-decomposition procedure consists of mixing solu tions of sodium uranyl carbonate and calcium chloride or calcium nitrate; no further details are given. In the "synthetic" method, carbon dioxide gas is passed through a water suspension of uranic oxide hemihy- drate and calcium carbonate. After 24 hours a stream of air is passed through the mixture, forming addition al precipitate. The filtrate of this mixture is concen trated by evaporation in free air, and greenish-yellow crystals form. The water content is given as 10 mole cules of water, of which 8 molecules are lost at 90° C, and all 10 molecules of water are lost at 100°C.
In 1953, M. E. Thompson (oral communication, 1953) synthesized liebigite by a procedure similar to that used by Axelrod and others (1951) for the synthesis of bay- leyite. Successive crops of crystals were obtained by allowing the solution containing the proper salts to evaporate at room temperature. The initial crops of crystals contained potassium, which was subsequently shown, as described below, to be in the compound
1 Blinkoff, C., 1906, BeitrSge zur Kenntnls kondensierter Uranylver- bindunge: Dissertation, Univ. of Bern, Switzerland.
K2Ca3 (UO2 ) 2 (CO3 ) e 9-10H2O. Crystals were finally obtained which were identified as liebigite by their X- ray powder-diffraction pattern (Frondel and others, 1956). The chemical analysis of the synthetic liebigite is given in column 1 of the accompanying table.
Various procedures for the synthesis were tried first by one of us, using potassium carbonate, uranyl nitrate, and calcium nitrate as reactants. Although 4 batches of pure liebigite were obtained, the formation of 2 other distinct substances was observed in preliminary experi ments.
Recently we have synthesized liebigite using sodium carbonate instead of potassium carbonate. The pro cedure is probably similar to the "double decomposi tion" procedure of Bachelet and others (1952, p. 565) for which no details are given. The procedure for the synthesis of liebigite using sodium carbonate is as follows.
A solution containing 5.02 g UO2 (NO3 ) 2 -6H2O(0.01 mol UO3 ) in 10 ml of water is added slowly with con stant stirring (using a magnetic stirrer) to a solution containing 3.18 g anhydrous Na2CO3 (0.03 mol CO2 ) in 100 ml of water. The pH of the resulting solution varies from 8.0 to 8.2. A solution containing 4.72 g Ca(NO3 ) 2 -4H2O (0.02 mol CaO) in 10 ml of water is added slowly with constant stirring to the uranyl car bonate solution. The pH of this mixture is 6.7 to 6.8. Dilute Na2CO3 solution is added dropwise with con stant stirring until the pH of the solution is 8.0 to 8.2. Within a few hours liebigite will begin to form. The beaker is sealed with plastic film so that no evaporation takes place, and the solution is allowed to stand for 2 weeks. The crystals range in size from 1 to 2 mm up to 5 to 10mm. The crystals are detached from the sides and bottom of the beaker and washed by decantation with water. Most of the excess water is removed by rolling the crystals on absorbent paper. The crystals
ART. 43 IN U.S. GEOL. SURVEY PROF. PAPER 475-B, PAGES B162-B163. 1963.
B162
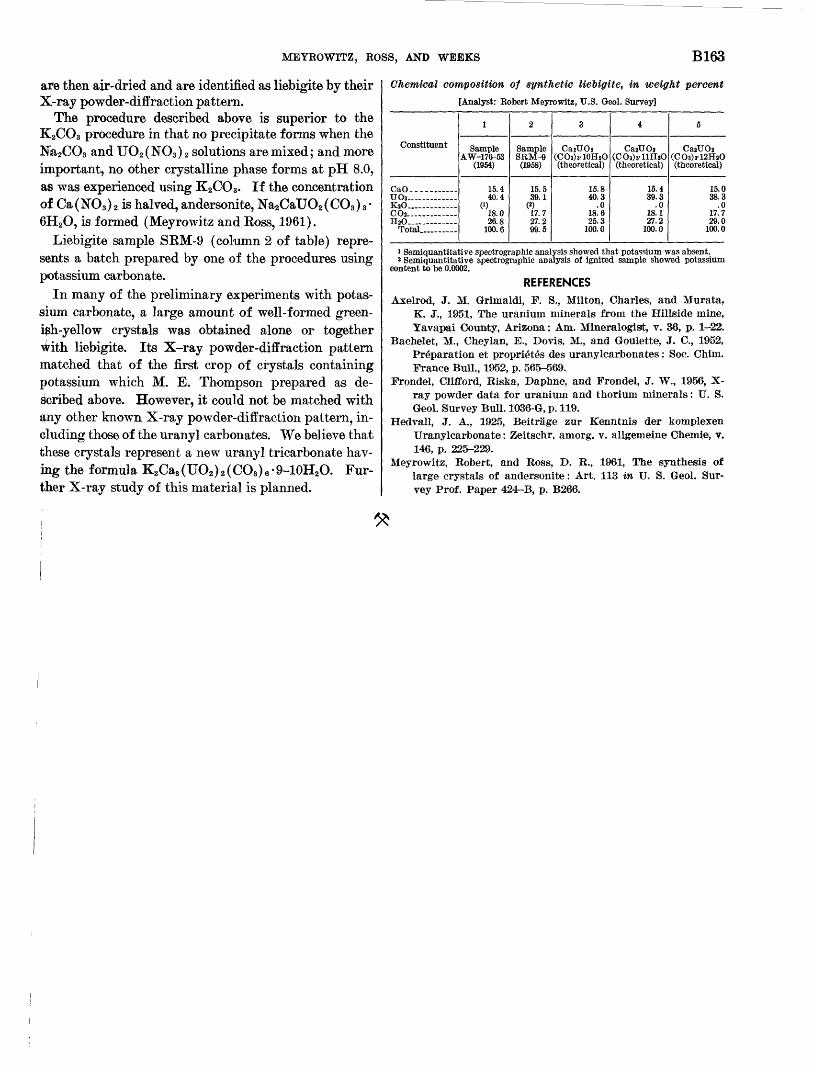
MEYROWITZ, ROSS, AND WEEKS B163
are then air-dried and are identified as liebigite by their X-ray powder-diffraction pattern.
The procedure described above is superior to the K2CO3 procedure in that no precipitate forms when the Na2CO3 and UO2 (NO3 ) 2 solutions are mixed; and more important, no other crystalline phase forms at pH 8.0, as was experienced using K2CO3 . If the concentration of Ca(NO3) 2 is halved, andersonite, Na^aTJOaCCOs)^ 6H2O, is formed (Meyrowitz and Boss, 1961).
Liebigite sample SRM-9 (column 2 of table) repre sents a batch prepared by one of the procedures using potassium carbonate.
In many of the preliminary experiments with potas sium carbonate, a large amount of well-formed green- i$h-yellow crystals was obtained alone or together with liebigite. Its X-ray powder-diffraction pattern matched that of the first crop of crystals containing potassium which M. E. Thompson prepared as de- Scribed above. However, it could not be matched with any other known X-ray powder-diffraction pattern, in cluding those of the uranyl carbonates. We believe that these crystals represent a new uranyl tricarbonate hav ing the formula K2Ca3 (UO2) 2 (CO3) 6 9-10H2O. Fur ther X-ray study of this material is planned.
Chemical composition of synthetic lieUgite, in weight percent
[Analyst: Robert Meyrowitz, U.S. Qeol. Survey]
Constituent
CaO--.--, -UOt KiO. COi HsO . Total. -
1
Sample AW-176-53
(1954)
15.4 40.4
(') 18.0 26.8
100.6
2
Sample SRM-9
(1958)
15.5 39.1
(2) 17.7 27.2 99.5
3
CasUO 2 (CO3)s- lOHzO (theoretical)
15.8 40.3
.0 18.6 25.3
100.0
4
Ca2UOn (COj)»-llHK>(theoretical)
15.4 39.3
.0 18.1 27.2
100.0
5
Ca2UO2 (CO3)3-12HaO (theoretical)
15.0 38.3
.0 17.7 29.0
100.0
i Semiquantitative spectrographic analysis showed that potassium was absent. 8 Semiquantitative spectrographic analysis of ignited sample showed potassium
content to be 0.0002.
REFERENCESAxelrod, J. M. Griinaldi, F. S., Milton, Charles, and Murata,
K. J., 1951, The uranium minerals from the Hillside mine, Yavapai County, Arizona: Am. Mineralogist, v. 36, p. 1-22.
Bachelet, M., Cheylan, E., Dovis, M., and Goulette, J. C., 1952, Preparation et proprietes des uranylcarbonates: Soc. Chirn. France Bull., 1952, p. 565-569.
Frondel, Clifford, Riska, Daphne, and Frondel, J. W., 1956, X- ray powder data for uranium and thorium minerals: U. S. Geol. Survey Bull. 1036-G, p. 119.
Hedvall, J. A., 1925, Beitrage zur Kenntnis der komplexen Uranylcarbonate: Zeitschr. amorg. v. allgerneine Chemie, v. 146, p. 225-229.
Meyrowitz, Robert, and Ross, D. R., 1961, The synthesis of large crystals of andersonite: Art. 113 in U. S. Geol. Sur vey Prof. Paper 424-B, p. B266.
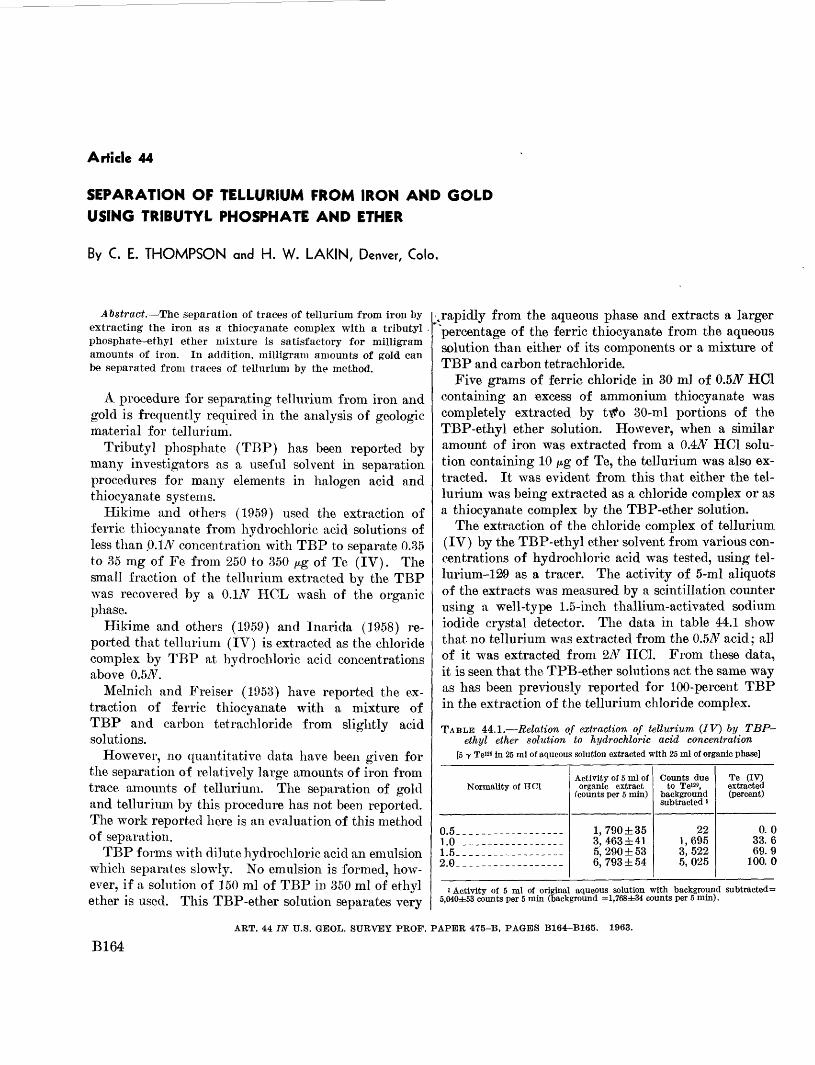
Article 44
SEPARATION OF TELLURIUM FROM IRON AND GOLD USING TRIBUTYL PHOSPHATE AND ETHER
By C. E. THOMPSON and H. W. LAKIN, Denver, Colo.
Abstract. The separation of traces of tellurium from iron by extracting the iron as a thiocyanate complex with a tributyl phosphate-ethyl ether mixture is satisfactory for milligram amounts of iron. In addition, milligram amounts of gold can be separated from traces of tellurium by the method.
A procedure for separating tellurium from iron and gold is frequently required in the analysis of geologic material for tellurium.
Tributyl phosphate (TBP) has been reported by many investigators as a useful solvent in separation procedures for many elements in halogen acid and thiocyanate systems.
Hikime and others (1959) used the extraction of ferric thiocyanate from hydrochloric acid solutions of less than O.l^V concentration with TBP to separate 0.35 to 35 mg of Fe from 250 to 350 Mg of Te (IV). The small fraction of the tellurium extracted by the TBP was recovered by a O.LV HCL wash of the organic phase.
Hikime and others (1959) and Inarida (1958) re ported that tellurium (IV) is extracted as the chloride complex by TBP at hydrochloric acid concentrations above 0.5^V.
Melnich and Freiser (1953) have reported the ex traction of ferric thiocyanate with a mixture of TBP and carbon tetrachloride from slightly acid solutions.
However, no quantitative data have been given for the separation of relatively large amounts of iron from trace amounts of tellurium. The separation of gold and tellurium by this procedure has not been reported. The work reported here is an evaluation of this method of separation.
TBP forms with dilute hydrochloric acid an emulsion which separates slowly. No emulsion is formed, how ever, if a solution of 150 ml of TBP in 350 ml of ethyl ether is used. This TBP-ether solution separates very
.rapidly from the aqueous phase and extracts a larger percentage of the ferric thiocyanate from the aqueous solution than either of its components or a mixture of TBP and carbon tetrachloride.
Five grams of ferric chloride in 30 ml of 0.5^ HC1 containing an excess of ammonium thiocyanate was completely extracted by ttfo 30-ml portions of the TBP-ethyl ether solution. However, when a similar amount of iron was extracted from a 0.47V HC1 solu tion containing 10 /ug of Te, the tellurium was also ex tracted. It was evident from this that either the tel lurium was being extracted as a chloride complex or as a thiocyanate complex by the TBP-ether solution.
The extraction of the chloride complex of tellurium (IV) by the TBP-ethyl ether solvent from various con centrations of hydrochloric acid was tested, using tel- lurium-129 as a tracer. The activity of 5-ml aliquots of the extracts was measured by a scintillation counter using a well-type 1.5-inch thallium-activated sodium iodide crystal detector. The data in table 44.1 show that no tellurium was extracted from the 0.57V acid; all of it was extracted from 2N HC1. From these data, it is seen that the TPB-ether solutions act the same way as has been previously reported for 100-percent TBP in the extraction of the tellurium chloride complex.
TABLE 44.1. Relation of extraction of tellurium (IV) by TBP- ethyl ether solution to hydrochloric acid concentration
[5 y Te129 in 25 ml of aqueous solution extracted with 25 ml of organic phase]
Normality of HC1
0.5------------------1.0_-_. --------------1.5---_~_ --------2.0------------------
Activity of 5 ml of organic extract
(counts per 5 min)
1,790 ±35 3, 463 ±41 5, 290 ±53 6, 793 ±54
Counts due to Tei2»,
background subtracted 1
22 1,695 3,522 5,025
Te (IV) extracted (percent)
0. 0 33. 6 69.9
100.0
i Activity of 5 ml of original aqueous solution with background subtracted = 5,040±53 counts per 5 min (background =1,768±34 counts per 5 min).
ART. 44 IN U.S. GEOL. SURVEY PROF. PAPER 475-B, PAGES B164-B165. 1963.
B164
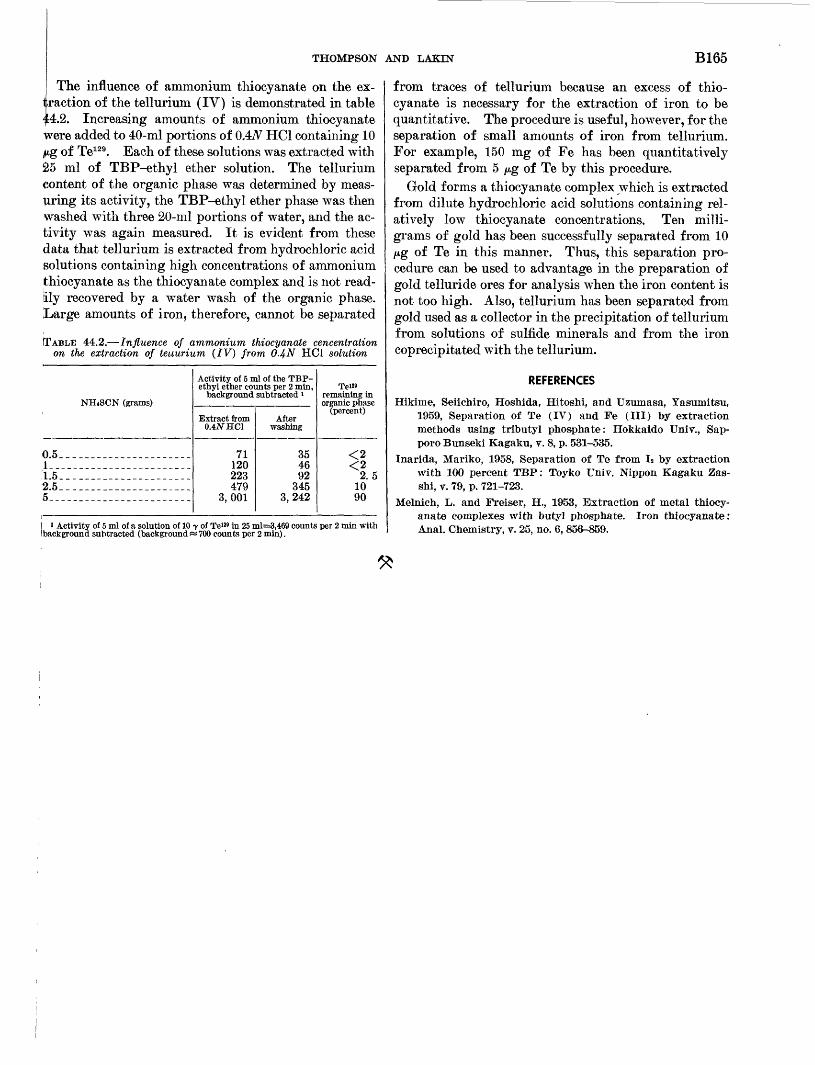
THOMPSON AND LAKIN B165
The influence of ammonium thiocyanate on the ex traction of the tellurium (IV) is demonstrated in table
2. Increasing amounts of ammonium thiocyanate were added to 40-ml portions of 0.4/V HC1 containing 10 /ng of Te129. Each of these solutions was extracted with £5 ml of TBP-ethyl ether solution. The tellurium content of the organic phase was determined by meas uring its activity, the TBP-ethyl ether phase was then washed with three 20-ml portions of water, and the ac tivity was again measured. It is evident from these data that tellurium is extracted from hydrochloric acid solutions containing high concentrations of ammonium thiocyanate as the thiocyanate complex and is not read ily recovered by a water wash of the organic phase. Large amounts of iron, therefore, cannot be separated
TABLE 44.2. Influence of ammonium thiocyanate cencentration on the extraction of teuurium (IV) from 0-4-N HC1 solution
NH4SCN (grams)
0.5______.___ -_____-__--_11.5. __._..__.. ___________2.5__________-__________-5____._ __________________
Activity of 5 ml of the TBP- ethyl ether counts per 2 min,
background subtracted >
Extract from 0.4ZVHC1
71 120 223 479
3,001
After washing
35 46 92
345 3,242
Te«9 remaining in organic phase
(percent)
<2 <2
2.5 10 90
i Activity of 5 ml of a solution of 10 7 of Te»w in 25 ml=3,469 counts per 2 min with background subtracted (background « 700 counts per 2 min) .
from traces of tellurium because an excess of thio cyanate is necessary for the extraction of iron to be quantitative. The procedure is useful, however, for the separation of small amounts of iron from tellurium. For example, 150 mg of Fe has been quantitatively separated from 5 jug of Te by this procedure.
Gold forms a thiocyanate complex which is extracted from dilute hydrochloric acid solutions containing rel atively low thiocyanate concentrations. Ten milli grams of gold has been successfully separated from 10 jug of Te in this manner. Thus, this separation pro cedure can be used to advantage in the preparation of gold telluride ores for analysis when the iron content is not too high. Also, tellurium has been separated from gold used as a collector in the precipitation of tellurium from solutions of sulfide minerals and from the iron coprecipitated with the tellurium.
REFERENCES
Hikime, Seiichiro, Hoshida, Hitoshi, and Uzumasa, Yasumitsu, 1959, Separation of Te (IV) and Fe (III) by extraction methods using tributyl phosphate: Hokkaido Univ., Sap poro Bunseki Kagaku, v. 8, p. 531-535.
Inarida, Mariko, 1958, Separation of Te from L by extraction with 100 percent TBP: Toyko Univ. Nippon Kagaku Zas- shi, v. 79, p. 721-723.
Melnich, L. and Freiser, H., 1953, Extraction of metal thiocy anate complexes with butyl phosphate. Iron thiocyanate: Anal. Chemistry, v. 25, no. 6, 856-859.
Article 45
DETERMINATION OF TRACES OF BORON IN HALITE AND ANHYDRITIC HAUTE ROCKS
By F. S. GRIMALDI and F. O. SIMON, Washinston, D.C.
Abstract. A direct method for the determination of 0.1 ppm or more of boron in halite and anhydritic halite rocks is presented. The sample is dissolved by fuming with sulfuric acid in an open quartz beaker at a sufficiently low temperature to allow reflux action. No boron is lost by volatilization. The determination is completed spectrophotometrically with dian- thrimide. Possible losses of boron through volatilization, sur face adsorption, and polymerization are assessed. When a borate solution is evaporated to dryness in etched quartzware, boron is irreversibly adsorbed on the surface, and low recov eries result.
A number of difficulties are connected with the deter mination of traces of boron. It is common knowledge that boron can be lost by volatilization during the evaporation of aqueous or acidic solutions of boric acid. Wakamatsu (1958) suggests that boron is not volatilized from fuming sulfuric acid solutions, but that it is converted to a form (possibly a pyroborate) that does not react with carminic acid, a generally re liable reagent for the spectrophotometric determination of boron. In a series of carefully executed experi ments, Feldman (1961) reviewed the situation and con cluded that volatilization is slight (<3 percent) from solutions of H3BO3 in H2O, HNO3, H2SO4 , and HC1O4 at about 75 °C unless evaporation is carried to dryness or near dryness; losses from HCI solutions can occur early in the evaporation; and that losses from H2SO4 can occur at above 228 °C but are negligible with sufficient refluxing during the evaporation.
Our laboratory has had to determine very small amounts of boron in almost pure halite rock or mixtures of halite and anhydrite containing up to 10 percent anhydrite. A simple procedure suggested itself con version of NaCl to Na2 SO4 and dissolution of CaSO4 by heating with H2SO4, followed by addition of dian- thrimide for color development provided the dian- thrimide method tolerates appreciable amounts of sodi um salts and that no losses of boron occur during the preparation of the solution for analysis.
During the course of the investigation and in the preparation of standard working curves, a hitherto un observed difficulty arose. When standard aqueous so lutions of sodium tetraborate were evaporated in quartz and color was developed with dianthrimide, variable absorbances were obtained for solutions containing the same concentration of'boron. For some, only about 20 percent of the expected absorbance was found. This difficulty was traced to surface effects and occurred only when etched quartzware was used in the experiments. This article presents evidence for this conclusion and discusses other experiments that form the framework for the method here described.
REAGENTS AND APPARATUS
l,l'-dianthrimide stock solution A: Dissolve 0.4 g in 100 ml of concentrated H2SO4. Mix, transfer solution to a plastic bottle, stopper, and store in refrigerator.
l,l'-dianthrimide working solution B: Dilute 10 ml of stock solution to 100 ml with concentrated H2 SC>4. Store as above.
Standard boron solution, 1 ml equals 50 fig of B2O3 : Dissolve 0.07226 g of anhydrous Na^Or in water and dilute to 1 1 in a volumetric flask. Store in a plastic bottle.
Quartz beakers (General Electric Co., Catalog Q7A) : Beaker No. QBB 25T, 25-cc capacity, 57-mm height; beaker No. QBR 50T, 50-cc capacity, 72-mm height. Both sizes were used. Beakers referred to as etched were those that had been in use in the laboratory for a number of years and had been etched through some past contact with solutions containing fluoride.
Spectrophotometer, Beckman Model DU: 1-cm corex cells were used in the study.
GENERAL PROCEDURE
1. Transfer 1 g of finely pulverized sample to a quartz beaker. Add 0.2 ml of water.
2. Add carefully and in small portions a total of 5 ml of ItSOt. Addition of acid should be slow enough to prevent too vigorous an evolution of HCI gas.
3. When the reaction subsides, grasp the beaker with Blair tongs and heat carefully over a burner until no more HCI fumes are given off, again being careful that too vigorous an evolu tion of HCI does not occur during the heating.
ART. 45 IN U.S. GEOL. SURVEY PROF. PAPER 475-B, PAGES B166-B168. 1963.
B166
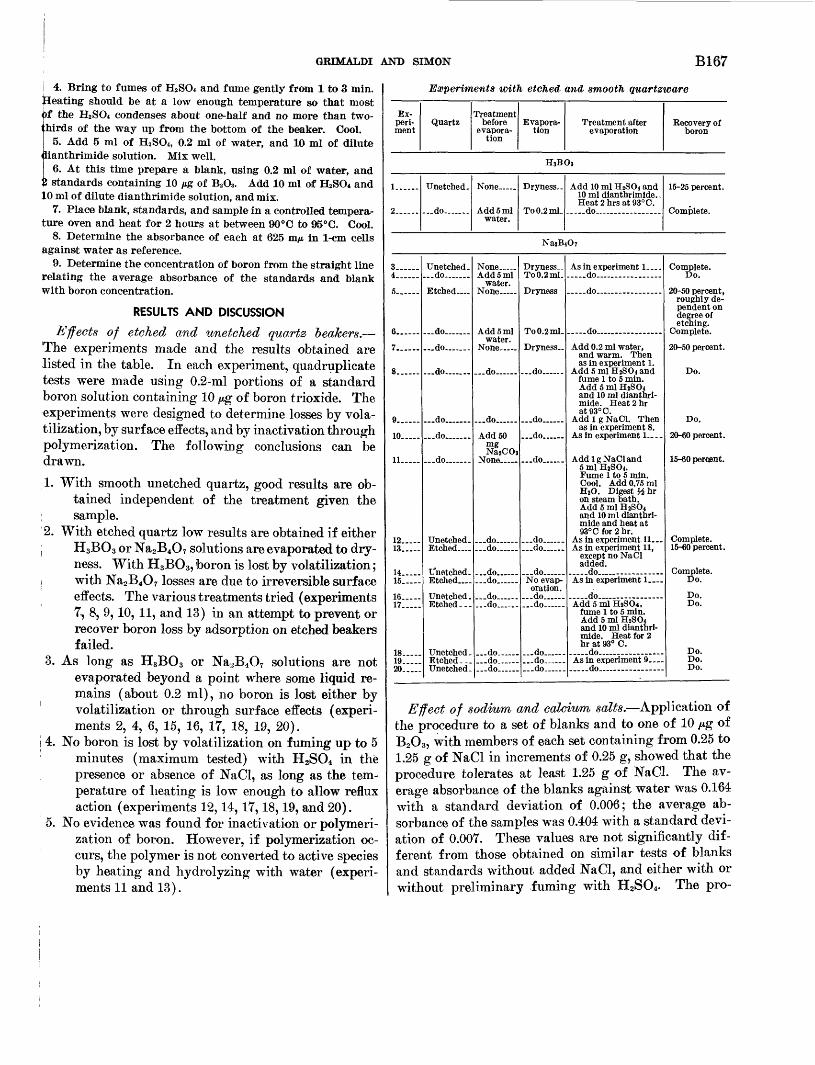
GRIMALDI AND SIMON B167
j 4. Bring to fumes of H2 SO* and fume gently from 1 to 3 min. pleating should be at a low enough temperature so that most of the H2 SO* condenses about one-half and no more than two- thirds of the way up from the bottom of the beaker. Cool.
5. Add 5 ml of H2 SOi, 0.2 ml of water, and 10 ml of dilute (lianthrimide solution. Mix well.
6. At this time prepare a blank, using 0.2 ml of water, and !! standards containing 10 fig of B2 O3. Add 10 ml of H2 SO* and 10 ml of dilute dianthrimide solution, and mix.
7. Place blank, standards, and sample in a controlled tempera ture oven and heat for 2 hours at between 90° C to 95° C. Cool.
8. Determine the absorbance of each at 625 m/t in 1-cm cells against water as reference.
9. Determine the concentration of boron from the straight line relating the average absorbance of the standards and blank with boron concentration.
RESULTS AND DISCUSSION
Effects of etched and unetched quartz beakers. The experiments made and the results obtained are listed in the table. In each experiment, quadruplicate tests were made using 0.2-ml portions of a standard boron solution containing 10 /*g of boron trioxide. The experiments were designed to determine losses by vola tilization, by surface effects, and by inactivation through polymerization. The following conclusions can be drawn.
1. With smooth unetched quartz, good results are ob tained independent of the treatment given the
; sample.2. With etched quartz low results are obtained if either
| H3BO3 or Na2B4O7 solutions are evaporated to dry- ness. With H3BO3 , boron is lost by volatilization;
I with Na2B4O7 losses are due to irreversible surface effects. The various treatments tried (experiments 7, 8, 9,10, 11, and 13) in an attempt to prevent or recover boron loss by adsorption on etched beakers failed.
3. As long as H3BO3 or Na2B4O7 solutions are not evaporated beyond a point where some liquid re mains (about 0.2 ml), no boron is lost either by volatilization or through surface effects (experi ments 2, 4, 6, 15, 16, 17, 18, 19, 20).
! 4. No boron is lost by volatilization on fuming up to 5 minutes (maximum tested) with H2SO4 in the presence or absence of NaCl, as long as the tem perature of heating is low enough to allow reflux action (experiments 12,14,17,18,19, and 20).
5. No evidence was found for inactivation or polymeri-I zation of boron. However, if polymerization oc
curs, the polymer is not converted to active species by heating and hydrolyzing with water (experi ments 11 and 13).
Experiments with etched and smooth quartsware
Experiment
QuartzTreatment
beforeevapora
tion
Evaporation
Treatment afterevaporation
Recovery ofboron
H3BO3
1 .
2 do .... Add 5 mlwater.
Add 10 ml H2SO4 and10 ml dianthrimide.. Heat 2 hrs at 93°C.
-do
3 _ ...4 ...
5 ...
6.
7. .
8 .
9..
10
11.. ...
12 13
14 15
16 17
18 19 20
Unetched -...do ...
... do ....
...do _
do ... .
... do... ....
do
... do
Unetched.
Unetched.
Unetched.
Unetched . Etched. -.Unetched .
None ..Add 5 ml
water.
Add 5 mlwater.
None _
... do
...do-
Add 50mg NaaCOa
None _ .
... do ...
... do
... do
... do... ...
do ... do
... do ...
... do -
... do ...
Dryness-
Dryness..
... do ...
... do
... do
... do.... -
... do
... do... ...
do
oration. do... ... do
do ... do do
As in experiment 1 ....
..... do ..... ...
.do ... .... .... ...
Add 0.2 ml water, and warm. Then as in experiment 1.
Add5mlH 2SO4 andfume 1 to 5 min. Add 5 ml HzSO4 and 10 ml dianthri mide. Heat 2 hr at 93°C.
AddlgNaCl. Thenas in experiment 8.
As In experiment 1 ..
AddlgNaCl and 5 ml H2SO4. Fume 1 to 5 min. Cool. Add 0.75 ml H2O. Digest % hr on steam bath. Add 5 ml H 2SO4 and 10 ml dianthri mide and heat at 93°C for 2 hr.
As in experiment. 11. As in experiment 11,
except no NaCl added.
.do... ... - ... As in experiment 1 ....
.....do...... ........Add 5 ml H2SO4 ,
fume 1 to 5 min. Add 5 ml H2SO4 and 10 ml dianthri mide. Heat for 2 hr at 93° C.
do ... ........ As in experiment 9 __ do __ ._
Do.
roughly de pendent on degree of etching.
20-50 percent.
Do.
Do.
20-60 percent.
15-60 percent.
Complete. 15-60 percent.
Complete. Do.
Do. Do.
Do. Do.Do.
Effect of sodium and calcium salts. Application of the procedure to a set of blanks and to one of 10 /tg of B2O3, with members of each set containing from 0.25 to 1.25 g of NaCl in increments of 0.25 g, showed that the procedure tolerates at least 1.25 g of NaCl. The av erage absorbance of the blanks against water was 0.164 with a standard deviation of 0.006; the average ab sorbance of the samples was 0.404 with a standard devi ation of 0.007. These values are not significantly dif ferent from those obtained on similar tests of blanks and standards without added NaCl, and either with or without preliminary fuming with H2SO4. The pro-
B168 ANALYTICAL TECHNIQUES
cedure was also found to tolerate at least 0.1 g CaSO4 without interference. Other elements were not tested both because the dianthrimide method is almost specific for boron and because such elements that might inter fere are not present in evaporites in sufficient concen trations to cause disturbance.
Boron content of halite and anhydritic-halite rocks. A sample of almost pure halite rock from Tatum salt dome, Lamar County, Miss., was found to contain 0.16
ppm of boron; 3 samples of anhydritic halite from the same locality contained 0.21, 0.29, and 0.34 ppm of boron.
REFERENCES
Feldman, 0., 1961, Evaporation of boron from acid solutions and residues: Anal. Chemistry, v. 33, p. 1916-1920.
Wakamatsu, S., 1958, Loss of boron by volatilization in the de termination of boron: Japan Analyst, v. 7, p. 309-313.
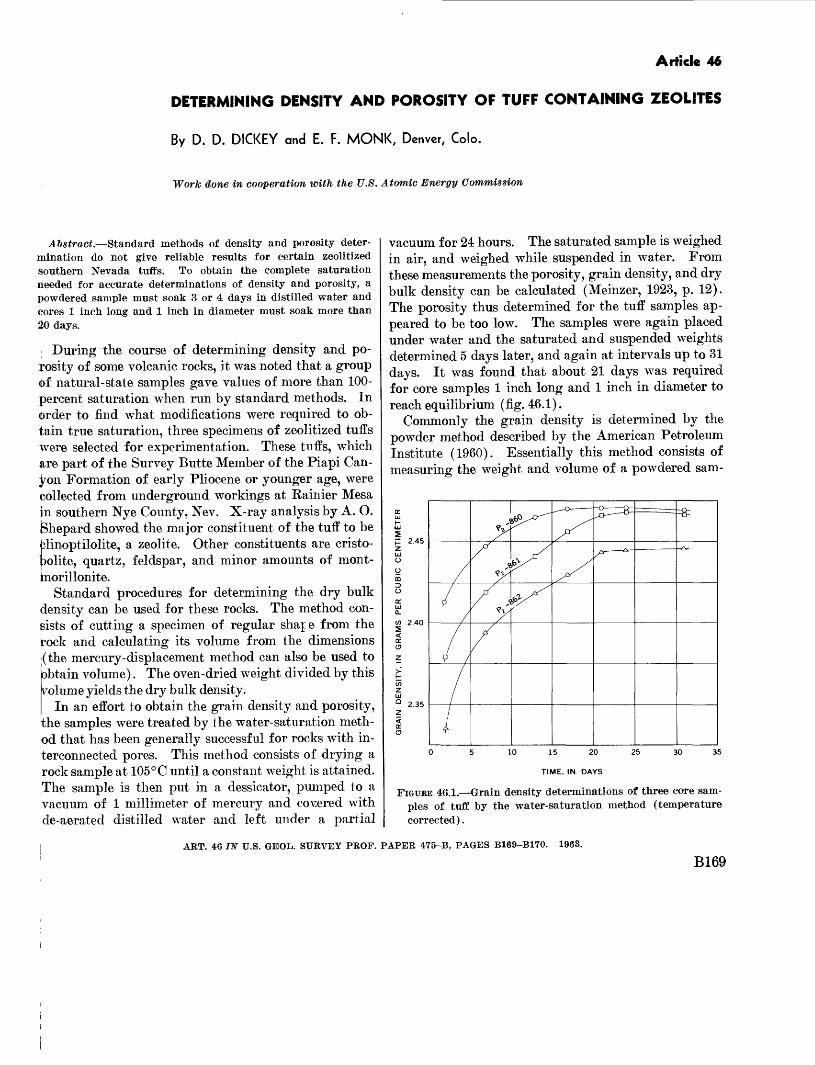
Article 46
DETERMINING DENSITY AND POROSITY OF TUFF CONTAINING ZEOLITES
By D. D. DICKEY and E. F. MONK, Denver, Colo.
Work done in cooperation with the U.S. Atomic Energy Commission
Abstract. Standard methods of density and porosity deter mination do not give reliable results for certain zeolitized Southern Nevada tuffs. To obtain the complete saturation needed for accurate determinations of density and porosity, a powdered sample must soak 3 or 4 days in distilled water and cores 1 inch long and 1 inch in diameter must soak more than 20 days.
During the course of determining density and po rosity of some volcanic rocks, it was noted that a group Of natural-state samples gave values of more than 100- percent saturation when run by standard methods. In Order to find what modifications were required to ob tain true saturation, three specimens of zeolitized tuffs were selected for experimentation. These tuffs, which are part of the Survey Butte Member of the Piapi Can yon Formation of early Pliocene or younger age, were collected from underground workings at Rainier Mesa in southern Nye County, Nev. X-ray analysis by A. O. Shepard showed the major constituent of the tuff to be blinoptilolite, a zeolite. Other constituents are cristo- bolite, quartz, feldspar, and minor amounts of mont- faiorillonite.
Standard procedures for determining the dry bulk density can be used for these rocks. The method con- gists of cutting a specimen of regular shaje from the rock and calculating its volume from the dimensions '(the mercury-displacement method can also be used to obtain volume). The oven-dried weight divided by this volume yields the dry bulk density.
In an effort to obtain the grain density and porosity, the samples were treated by the water-saturation meth od that has been generally successful for rocks with in terconnected pores. This method consists of drying a rock sample at 105°C until a constant weight is attained. The sample is then put in a dessicator, pumped to a vacuum of 1 millimeter of mercury and covered with de-aerated distilled water and left under a partial
vacuum for 24 hours. The saturated sample is weighed in air, and weighed while suspended in water. From these measurements the porosity, grain density, and dry bulk density can be calculated (Meinzer, 1923, p. 12). The porosity thus determined for the tuff samples ap peared to be too low. The samples were again placed under water and the saturated and suspended weights determined 5 days later, and again at intervals up to 31 days. It was found that about 21 days was required for core samples 1 inch long and 1 inch in diameter to reach equilibrium (fig. 46.1).
Commonly the grain density is determined by the powder method described by the American Petroleum Institute (1960). Essentially this method consists of measuring the weight and volume of a powdered sam-
15 20
TIME, IN DAYS
FIGURE 46.1. Grain density determinations of three core sam ples of tuff by the water-saturation method (temperature corrected).
ART. 46 IN U.S. GEOL. SURVEY PROF. PAPER 475-B, PAGES B169-B170. 1963.
B169
B170 ANALYTICAL TECHNIQUES
pie of rock suspended in a liquid. The porosity in per cent is then equal to G-D/G X100, where G is the grain density and D is the dry bulk density. Trouble was immediately encountered using this method. It is usu ally necessary only to add the powdered rock sample to the liquid, wet the grains of powder by swirling the bottle and then place it under a vacuum for a few min utes to remove any air introduced with the sample. Several tests of the zeolitized tuff showed that air bub bles continued to escape from the powdered rock even after the sample had been kept for a few hours in a vacuum. The air bubbles did not entirely disappear until the sample had been soaked for 2 days under a partial vacuum. A grain-density determination was made at this time. The samples were kept under water
and additional grain-density determinations were made periodically for 14 days. These results indicated that 3 to 4 days of soaking in water was necessary to insure complete penetration of the zeolites by water. Experi ments using this method but with fluids other than wa ter yielded data that were peculiar to these particular fluids and that differed appreciably from the porosity and grain densities obtained for water-saturated sam ples.
REFERENCES
American Petroleum Institute, 1960, Recommended practice for core-analysis procedure: Am. Petroleum Institute RP40, sec. 3.59.
Meinzer, O. E., 1923, The occurrence of ground water in the United States: U.S. Geol. Survey Water-Supply Paper 489.
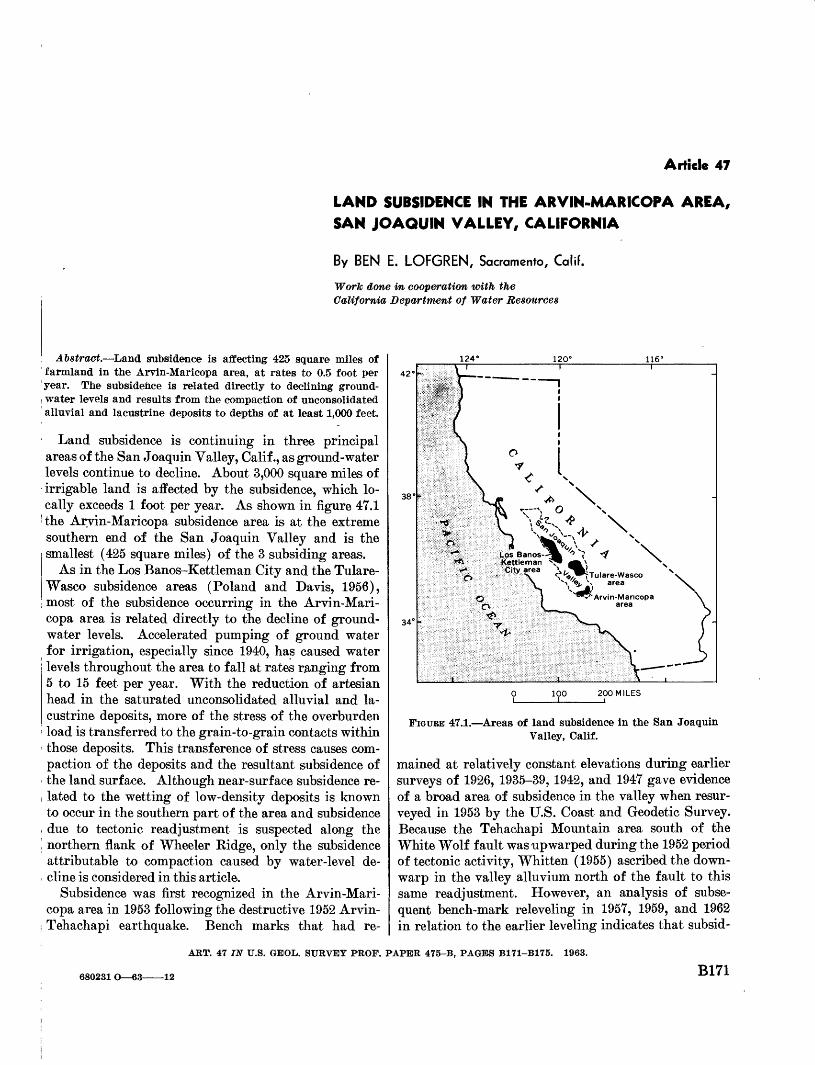
Article 47
LAND SUBSIDENCE IN THE ARVIN-MARICOPA AREA, SAN JOAQUIN VALLEY, CALIFORNIA
By BEN E. LOFGREN, Sacramento, Calif.
Work done in cooperation with the California Department of Water Resources
Abstract. Land subsidence is affecting 425 square miles of farmland in the Arvin-Maricopa area, at rates to 0.5 foot per year. The subsidence is related directly to declining ground- water levels and results from the compaction of unconsolidated alluvial and lacustrine deposits to depths of at least 1,000 feet.
Land subsidence is continuing in three principal areas of the San Joaquin Valley, Calif., as ground-water levels continue to decline. About 3,000 square miles of irrigable land is affected by the subsidence, which lo cally exceeds 1 foot per year. As shown in figure 47.1 the Arvin-Maricopa subsidence area is at the extreme southern end of the San Joaquin Valley and is the smallest (425 square miles) of the 3 subsiding areas.
As in the Los Banos-Kettleman City and the Tulare- Wasco subsidence areas (Poland and Davis, 1956), most of the subsidence occurring in the Arvin-Mari copa area is related directly to the decline of ground- water levels. Accelerated pumping of ground water for irrigation, especially since 1940, has caused water levels throughout the area to fall at rates ranging from 5 to 15 feet per year. With the reduction of artesian head in the saturated unconsolidated alluvial and la custrine deposits, more of the stress of the overburden load is transferred to the grain-to-grain contacts within those deposits. This transference of stress causes com paction of the deposits and the resultant subsidence of the land surface. Although near-surface subsidence re lated to the wetting of low-density deposits is known to occur in the southern part of the area and subsidence due to tectonic readjustment is suspected along the northern flank of Wheeler Ridge, only the subsidence attributable to compaction caused by water-level de cline is considered in this article.
Subsidence was first recognized in the Arvin-Mari copa area in 1953 following the destructive 1952 Arvin- Tehachapi earthquake. Bench marks that had re-
124° 120° 116°
42'
38'
34'
*'. \T--N O
V^V4- \
lettleman
100 200 MILES
FIGTJBE 47.1. Areas of land subsidence in the San Joaquin Valley, Calif.
mained at relatively constant elevations during earlier surveys of 1926, 1935-39, 1942, and 1947 gave evidence of a broad area of subsidence in the valley when resur- veyed in 1953 by the U.S. Coast and Geodetic Survey. Because the Tehachapi Mountain area south of the White Wolf fault was upwarped during the 1952 period of tectonic activity, Whitten (1955) ascribed the down- warp in the valley alluvium north of the fault to this same readjustment. However, an analysis of subse quent bench-mark releveling in 1957, 1959, and 1962 in relation to the earlier leveling indicates that subsid-
ART. 47 IN U.S. GEOL. SURVEY PROF. PAPER 475-B, PAGES B171-B175. 1963.
680231 O 63 12 B171
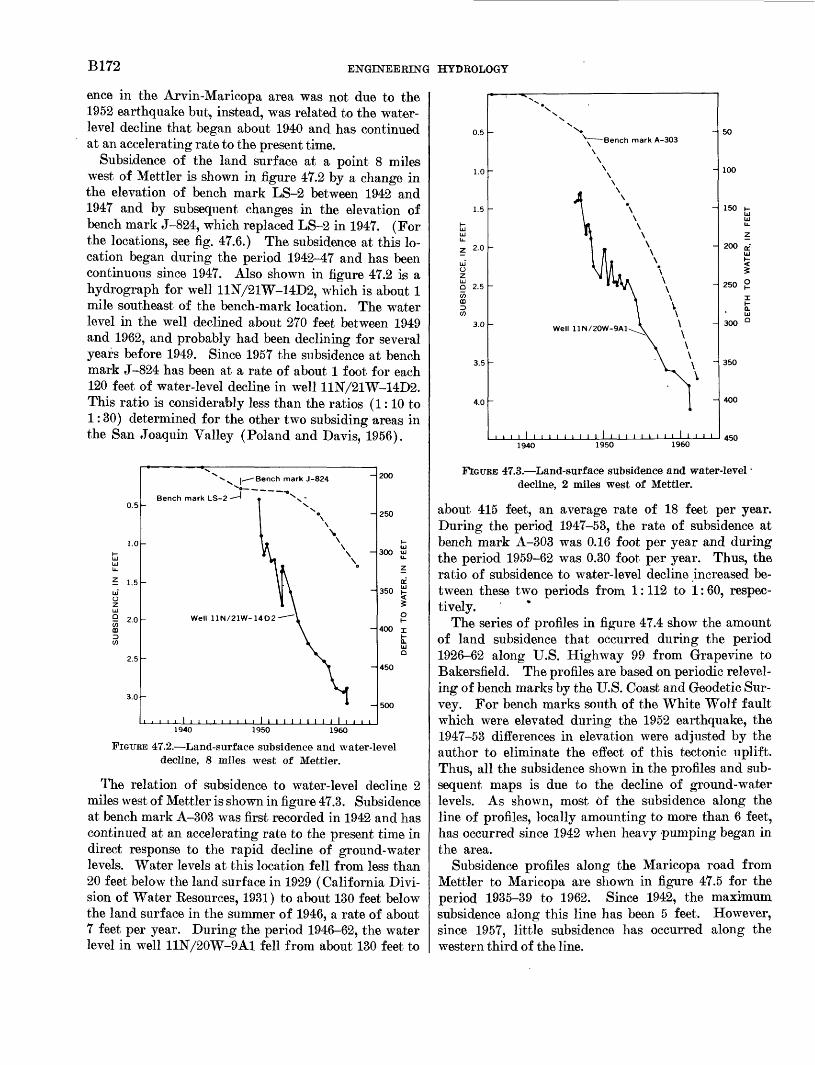
B172 ENGINEERING HYDROLOGY
ence in the Arvin-Maricopa area was not due to the 1952 earthquake but, instead, was related to the water- level decline that began about 1940 and has continued at an accelerating rate to the present time.
Subsidence of the land surface at a point 8 miles west of Mettler is shown in figure 47.2 by a change in the elevation of bench mark LS-2 between 1942 and 1947 and by subsequent changes in the elevation of bench mark J-824, which replaced LS-2 in 1947. (For the locations, see fig. 47.6.) The subsidence at this lo cation began during the period 1942-47 and has been continuous since 1947. Also shown in figure 47.2 is a hydrograph for well 11N/21W-14D2, which is about 1 mile southeast of the bench-mark location. The water level in the well declined about 270 feet between 1949 and 1962, and probably had been declining for several years before 1949. Since 1957 the subsidence at bench mark J-824 has been at a rate of about 1 foot for each 120 feet of water-level decline in well 11N/21W-14D2. This ratio is considerably less than the ratios (1:10 to 1:30) determined for the other two subsiding areas in the San Joaquin Valley (Poland and Davis, 1956).
£ 1.5
Bench mark J-824
ark LS-2 - '
Well 11N/21W-14D2
300
450
1940 1950 1960
FIGURE 47.2. Land-surface subsidence and water-level decline, 8 miles west of Mettler.
The relation of subsidence to water-level decline 2 miles west of Mettler is shown in figure 47.3. Subsidence at bench mark A-303 was first recorded in 1942 and has continued at an accelerating rate to the present time in direct response to the rapid decline of ground-water levels. Water levels at this location fell from less than 20 feet below the land surface in 1929 (California Divi sion of Water Resources, 1931) to about 130 feet below the land surface in the summer of 1946, a rate of about 7 feet per year. During the period 1946-62, the water level in well 11N/20W-9A1 fell from about 130 feet to
Q 2.5
3.5
4.0
Bench mark A-303
Well 11N/20W-9A1
1940 1950 1960
UJui u.Z
200 ££ui$
250 g
t ui
300 Q
350
400
450
FIGURE 47.3. Land-surface subsidence and water-level decline, 2 miles west of Mettler.
about 415 feet, an average rate of 18 feet per year. During the period 1947-53, the rate of subsidence at bench mark A-303 was 0.16 foot per year and during the period 1959-62 was 0.30 foot per year. Thus, the ratio of subsidence to water-level decline increased be tween these two periods from 1:112 to 1: 60, respec tively.
The series of profiles in figure 47.4 show the amount of land subsidence that occurred during the period 1926-62 along U.S. Highway 99 from Grapevine to Bakersfield. The profiles are based on periodic relevel- ing of bench marks by the U.S. Coast and Geodetic Sur vey. For bench marks south of the White Wolf fault which were elevated during the 1952 earthquake, the 1947-53 differences in elevation were adjusted by the author to eliminate the effect of this tectonic uplift. Thus, all the subsidence shown in the profiles and sub sequent maps is due to the decline of ground-water levels. As shown, most of the subsidence along the line of profiles, locally amounting to more than 6 feet, has occurred since 1942 when heavy pumping began in the area.
Subsidence profiles along the Maricopa road from Mettler to Maricopa are shown in figure 47.5 for the period 1935-39 to 1962. Since 1942, the maximum subsidence along this line has been 5 feet. However, since 1957, little subsidence has occurred along the western third of the line.
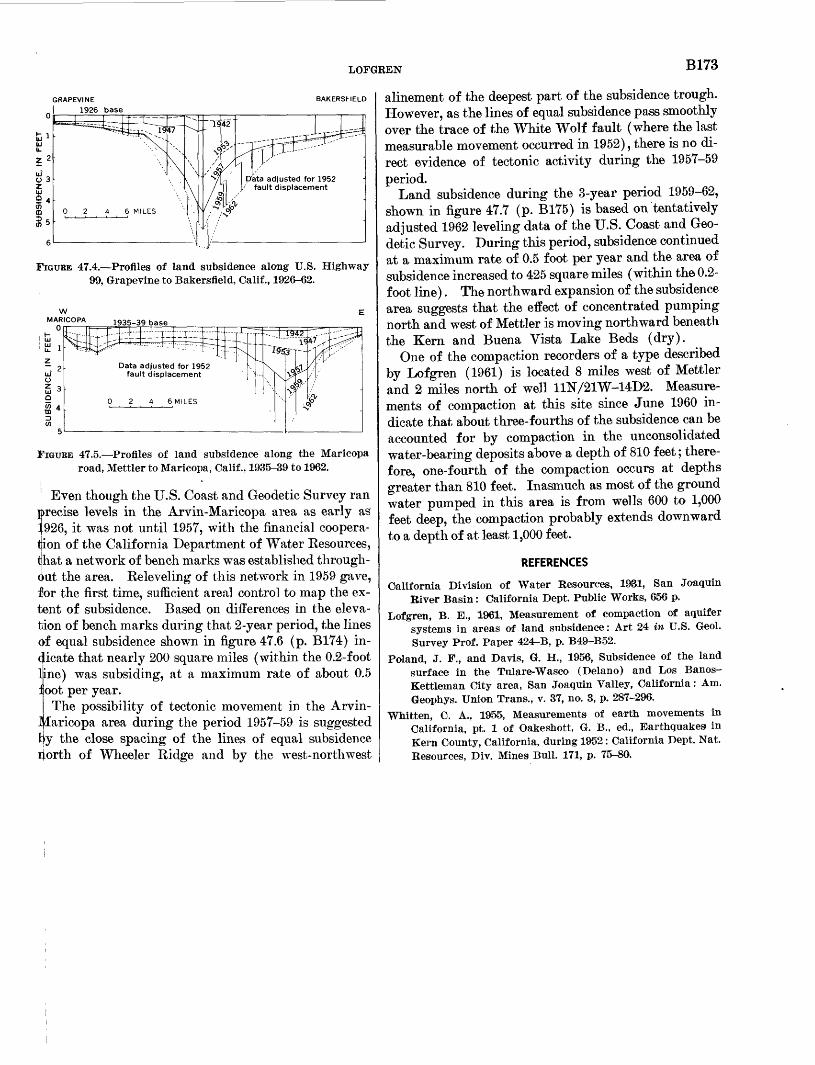
LOFGREN B173
GRAPEVINE
| 1926 baseBAKERSHELD
FIGURE 47.4. Profiles of land subsidence along U.S. Highway 99, Grapevine to Bakersfield, Calif., 1926-62.
FIGUEE 47.5. Profiles of land subsidence along the Maricopa road, Mettler to Maricopa, Calif., 1935-39 to 1962.
Even though the U.S. Coast and Geodetic Survey ran precise levels in the Arvin-Maricopa area as early as }926, it was not until 1957, with the financial coopera- ijion of the California Department of Water Eesources, tjhat a network of bench marks was established through put the area. Eeleveling of this network in 1959 gave, lor the first time, sufficient area! control to map the ex tent of subsidence. Based on differences in the eleva tion of bench marks during that 2-year period, the lines of equal subsidence shown in figure 47.6 (p. B174) in dicate that nearly 200 square miles (within the 0.2-foot line) was subsiding, at a maximum rate of about 0.5 1 oot per year.
The possibility of tectonic movement in the Arvin- Maricopa area during the period 1957-59 is suggested tyy the close spacing of the lines of equal subsidence 4orth of Wheeler Eidge and by the west-northwest
alinement of the deepest part of the subsidence trough. However, as the lines of equal subsidence pass smoothly over the trace of the White Wolf fault (where the last measurable movement occurred in 1952), there is no di rect evidence of tectonic activity during the 1957-59 period.
Land subsidence during the 3-year period 1959-62, shown in figure 47.7 (p. B175) is based on tentatively adjusted 1962 leveling data of the U.S. Coast and Geo detic Survey. During this period, subsidence continued at a maximum rate of 0.5 foot per year and the area of subsidence increased to 425 square miles (within the 0.2- foot line). The northward expansion of the subsidence area suggests that the effect of concentrated pumping north and west of Mettler is moving northward beneath the Kern and Buena Vista Lake Beds (dry).
One of the compaction recorders of a type described by Lofgren (1961) is located 8 miles west of Mettler and 2 miles north of well 11N/21W-14D2. Measure ments of compaction at this site since June 1960 in dicate that about three-fourths of the subsidence can be accounted for by compaction in the unconsolidated water-bearing deposits above a depth of 810 feet; there fore, one-fourth of the compaction occurs at depths greater than 810 feet. Inasmuch as most of the ground water pumped in this area is from wells 600 to 1,000 feet deep, the compaction probably extends downward to a depth of at least 1,000 feet.
REFERENCES
California Division of Water Resources, 1981, San Joaquin River Basin: California Dept. Public Works, 656 p.
Lofgren, B. E., 1961, Measurement of compaction of aquifer systems in areas of land subsidence: Art 24 in U.S. Geol. Survey Prof. Paper 424-B, p. B49-B52.
Poland, J. F., and Davis, G. H., 1956, Subsidence of the land surface in the Tulare-Wasco (Delano) and Los Banos- Kettleman City area, San Joaquin Valley, California: Am. Geophys. Union Trans., v. 37, no. 3, p. 287-296.
Whitten, C. A., 1955, Measurements of earth movements in California, pt. 1 of Oakeshott, G. B., ed., Earthquakes in Kern County, California, during 1952: California Dept. Nat. Resources, Div. Mines Bull. 171, p. 75-80.
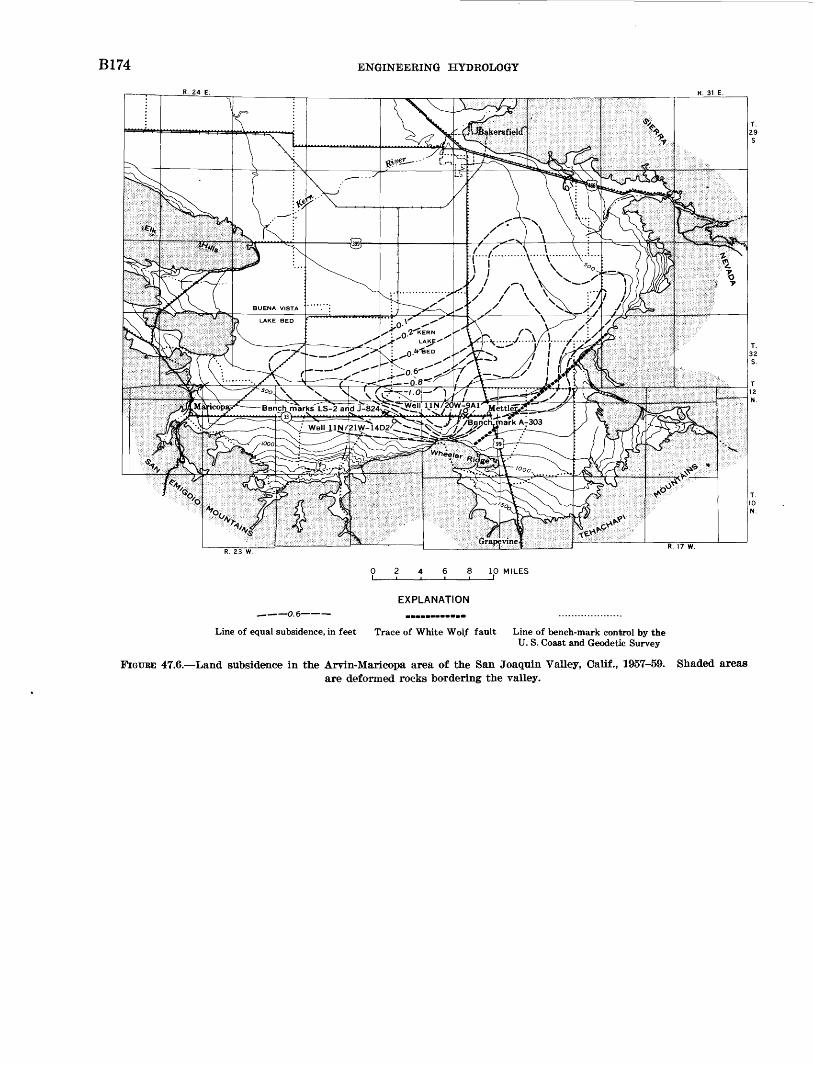
B174 ENGINEERING HYDROLOGY
0246 8 10 MILES
EXPLANATION
Line of equal subsidence, in feet Trace of White Wolf fault Line of bench-mark control by theU. S. Coast and Geodetic Survey
FIGUEE 47.6. Land subsidence in the Arvin-Maricopa area of the San Joaquin Valley, Calif., 1957-69. Shaded areasare deformed rocks bordering the valley.
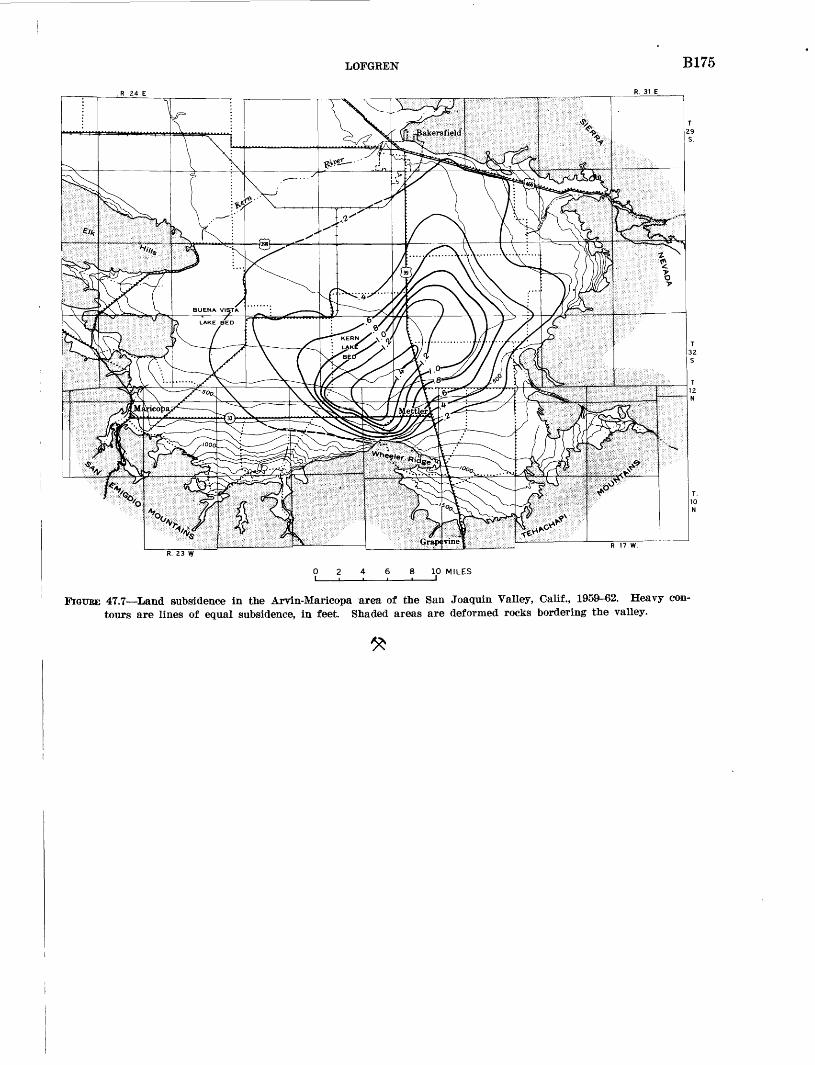
LOFGREN B175
R. 23 W
0 2 4 6 8 10 MILES
FIGURE 47.7 Land subsidence in the Arvin-Maricopa area of the San Joaquin Valley, Calif., 1959-62. Heavy con tours are lines of equal subsidence, in feet. Shaded areas are deformed rocks bordering the valley.
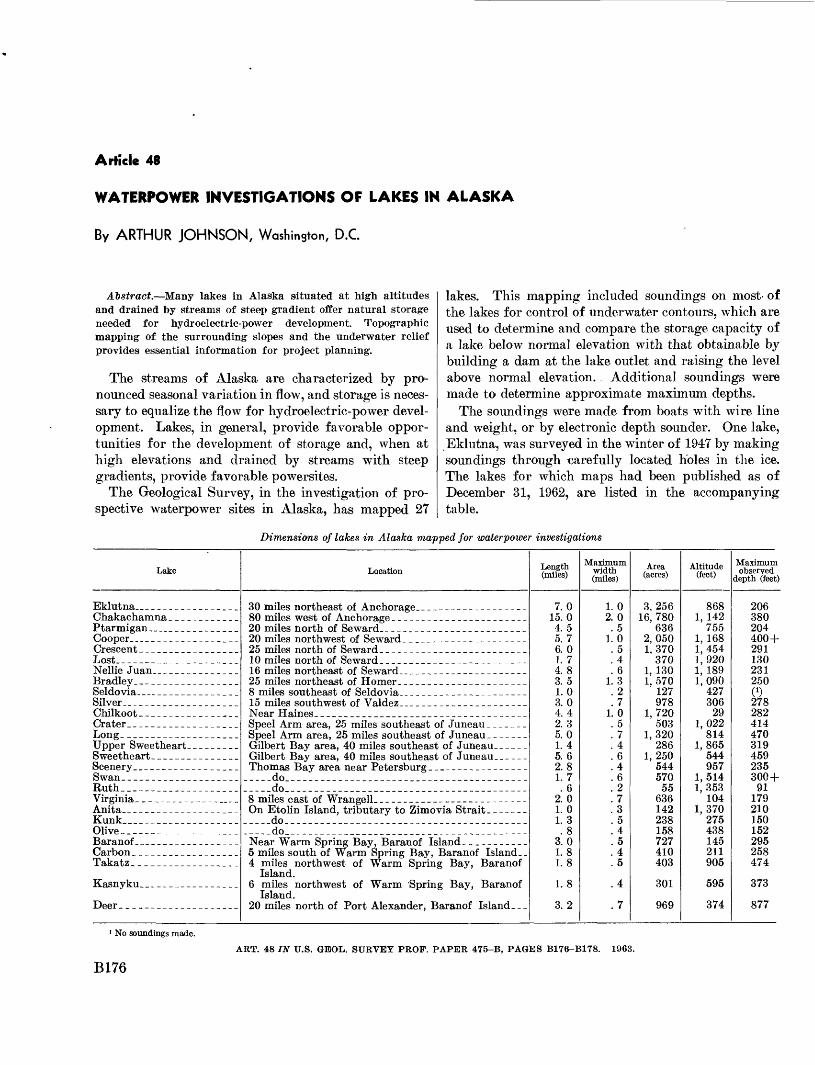
Article 48
WATERPOWER INVESTIGATIONS OF LAKES IN ALASKA
By ARTHUR JOHNSON, Washington, D.C.
Abstract. Many lakes in Alaska situated at high altitudes and drained by streams of steep gradient offer natural storage needed for hydroelectric-power development. Topographic mapping of the surrounding slopes and the underwater relief provides essential information for project planning.
The streams of Alaska are characterized by pro nounced seasonal variation in flow, and storage is neces sary to equalize the flow for hydroelectric-power devel opment. Lakes, in general, provide favorable oppor tunities for the development of storage and, when at high elevations and drained by streams with steep gradients, provide favorable powersites.
The Geological Survey, in the investigation of pro spective waterpower sites in Alaska, has mapped 27
lakes. This mapping included soundings on most- of the lakes for control of underwater contours, which are used to determine and compare the storage capacity of a lake below normal elevation with that obtainable by building a dam at the lake outlet and raising the level above normal elevation. Additional soundings were made to determine approximate maximum depths.
The soundings were made from boats with wire line and weight, or by electronic depth sounder. One lake, Eklutna, was surveyed in the winter of 1947 by making soundings through carefully located holes in the ice. The lakes for which maps had been published as of December 31, 1962, are listed in the accompanying table.
Dimensions of lakes in Alaska mapped for waterpower investigations
Lake
Eklutna.. _ _. _Chakachamna _ - _Ptarmigan. __ ___ __Cooper. .Crescent- . _ __Lost. _ _ __Nellie Juan __ __Bradley __ _ __ _SeldoviaSilver _ _ _Chilkoot___--___ _______CraterLong _ ___ _____
Scenery __ __ ____Swan___ _ _ __Ruth___________________Virginia. _ _ _Anita _ _Kunk__________-______---Olive- _ ________________Baranof-__
Takatz
Kasnyku____ _ _ _
Location
20 miles north of Seward _ _ _ _
25 miles north of Seward__
_-__do_ __ _ ._____._ __ -___. do
_ _do_ ___--_---____._-______ . __ _-__-_do_________ ________________________________
Island.
Island. 20 miles north of Port Alexander, Baranof Island-
Length (miles)
7.015. 04. 55. 76. 01. 74.83.51.03. 04. 42. 35.01. 45. 62. 81.7
. 62. 01. 01. 3
. 83.01. 81.8
1. 8
3. 2
Maximum width (miles)
1 02 0
51 0
546
1 327
1 057464627354545
. 4
.7
Area (acres)
3,25616, 780
6362,0501,370
3701, 1301, 570
127978
1, 720503
1,320286
1,25054457055
636142238158727410403
301
969
Altitude (feet)
8681, 142
7551, 1681,4541,9201, 1891,090
427306
291,022
8141,865
544957
1,5141,353
1041,370
275438145211905
595
374
Maximum observed
depth (feet)
206380204400 +2911302312500)278282414470319459235300 +
91179210150152295258474
373
877
' No soundings made.
B176ART. 48 IN U.S. GBOL,. SURVEY PROF. PAPER 475-B, PAGES B176-B178. 1963.
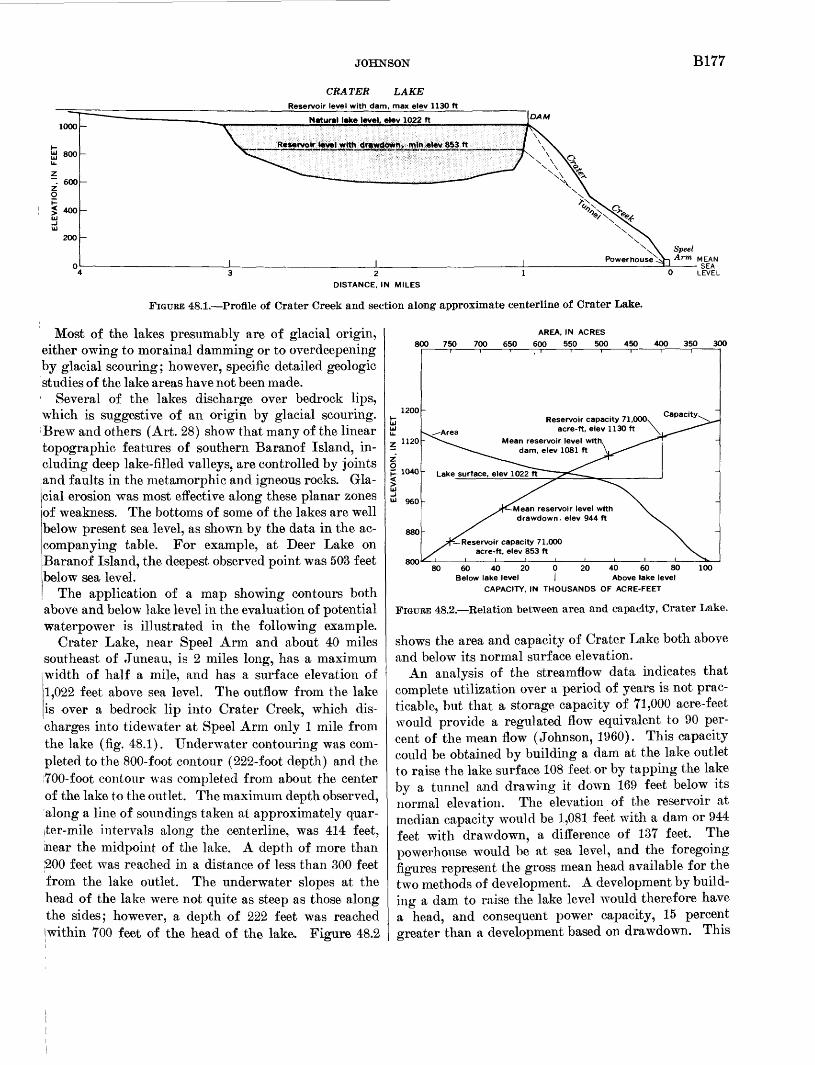
JOHNSON B177
CRATER LAKE
Jteservoir level with dam, max elev 1130Jt
1000
a BOOL_
z - 600
g£ 400uUJ
200
Natural lake level, elev 1022 ft \DAM
.~-JJ!!!*i!S£(2&J^^
x Speel Power house"^-, Arm MEAN
3 2 1 DISTANCE, IN MILES
FIGURE 48.1. Profile of Crater Creek and section along approximate centerline of Crater Lake.
Most of the lakes presumably are of glacial origin, either owing to morainal damming or to overdeepening by glacial scouring; however, specific detailed geologic studies of the lake areas have not been made.
Several of the lakes discharge over bedrock lips, which is suggestive of an origin by glacial scouring. Brew and others (Art. 28) show that many of the linear topographic features of southern Baranof Island, in cluding deep lake-filled valleys, are controlled by joints ;and faults in the metamorphic and igneous rocks. Gla cial erosion was most effective along these planar zones of weakness. The bottoms of some of the lakes are well below present sea level, as shown by the data in the ac companying table. For example, at Deer Lake on Baranof Island, the deepest observed point was 503 feet below sea level.
The application of a map showing contours both above and below lake level in the evaluation of potential waterpower is illustrated in the following example.
Crater Lake, near Speel Arm and about 40 miles southeast of Juneau, is 2 miles long, has a maximum jwidth of half a mile, and has a surface elevation of 1,022 feet above sea level. The outflow from the lake is over a bedrock lip into Crater Creek, which dis charges into tidewater at Speel Arm only 1 mile from the lake (fig. 48.1). Underwater contouring was com pleted to the 800-foot contour (222-foot depth) and the [700-foot contour was completed from about the center of the lake to the outlet. The maximum depth observed, along a line of soundings taken at approximately quar- iter-mile intervals along the centerline, was 414 feet, inear the midpoint of the lake. A depth of more than ;200 feet was reached in a distance of less than 300 feet from the lake outlet. The underwater slopes at the head of the lake were not quite as steep as those along the sides; however, a depth of 222 feet was reached jwithin 700 feet of the head of the lake. Figure 48.2
800 750 700 650
AREA, IN ACRES
600 550 500 450 400 350 300
1200
1120
OJZ 1040
960
880
800
Reservoir capacity 71,000X acre-ft, elev 1130 ft
Capacity^
Lake surface, elev 1022 ft
lean reservoir level with drawdown, elev 944ft
-Reservoir capacity 71,000 acre-ft, elev 853 ft
60 40 20 0 20 40 60 80 100Below lake level I Above lake level
CAPACITY, IN THOUSANDS OF ACRE-FEET
FIGURE 48.2. Relation between area and capacity, Crater Lake.
shows the area and capacity of Crater Lake both above and below its normal surface elevation.
An analysis of the streamflow data indicates that complete utilization over a period of years is not prac ticable, but that a storage capacity of 71,000 acre-feet would provide a regulated flow equivalent to 90 per cent of the mean flow (Johnson, 1960). This capacity could be obtained by building a dam at the lake outlet to raise the lake surface 108 feet or by tapping the lake by a tunnel and drawing it down 169 feet below its normal elevation. The elevation of the reservoir at median capacity would be 1,081 feet with a dam or 944 feet with drawdown, a difference of 137 feet. The powerhouse would be at sea level, and the foregoing figures represent the gross mean head available for the two methods of development. A development by build ing a dam to raise the lake level would therefore have a head, and consequent power capacity, 15 percent greater than a development based on drawdown. This
B178 ENGINEERING HYDROLOGY
information enables project planners to determine whether or not the 15-percent greater capacity would justify the greater cost of building a dam as compared with the cost of a development based on drawdown. Development by a dam would provide a fuller use of a potential resource. Actual development must, how ever, be based on the most favorable economic alterna tive.
At Crater Lake, where the lake surface is at an ele vation of over 1,000 feet, the difference in power be tween the 2 methods of development was shown to be 15 percent. However, for lakes at lower elevations, and with consequently lesser potential heads for power, the percentage difference between the two methods of de velopment would be greater. This difference would in crease as lake elevations decreased, and a point would
be reached where the difference would be so great as to preclude consideration of development by drawdown.
The Eklutna Lake power project, 30 miles northeast of Anchorage, with a rated capacity of 30,000 kilowatts, is an example of a development by drawing a lake below its natural level. The normal elevation of this lake is 868 feet. A tunnel 4^/2 miles long, with an intake ele vation at 800 feet, 68 feet below normal lake level, con veys the water to a powerhouse along the Anchorage- Palmer highway. The turbines are at an elevation of 25 feet, giving a gross head of 843 feet. The tailrace from the powerhouse discharges into Knik Arm.
REFERENCE
Johnson, F. A., 1961, Waterpower resources near Petersburg and Juneau, southeastern Alaska; U.S. Geol. Survey Water- Supply Paper 1529, p. 66.
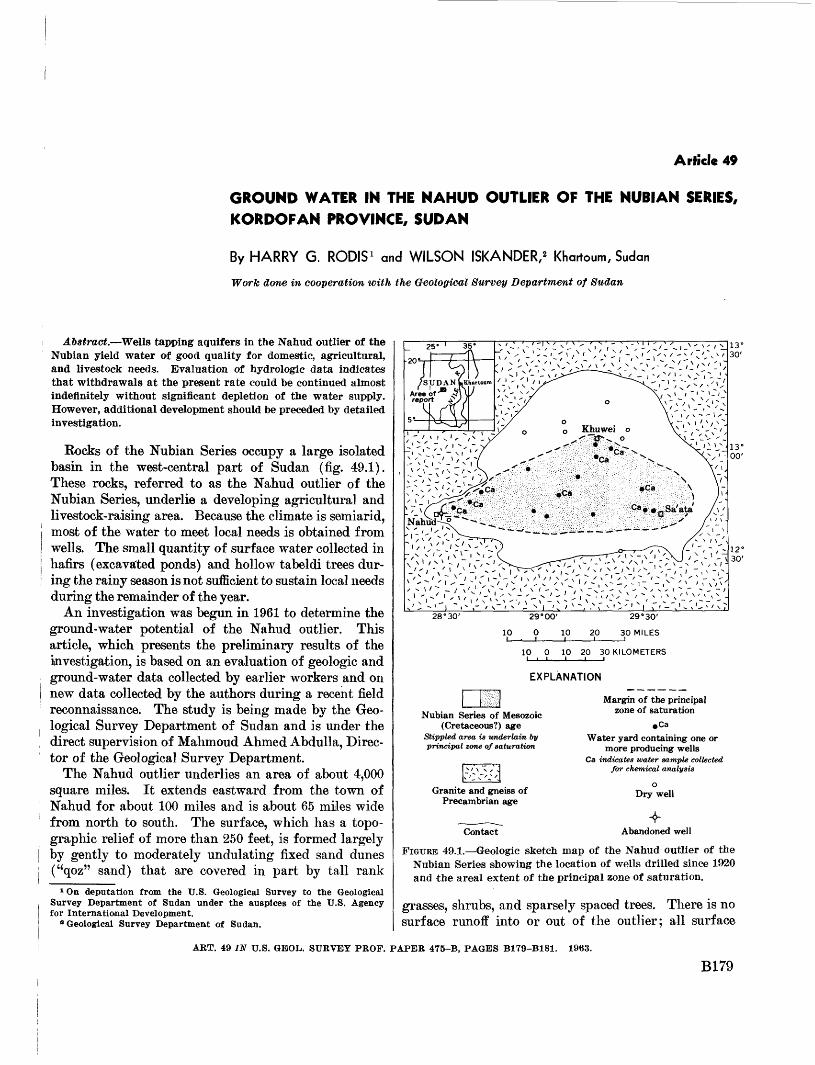
Article 49
GROUND WATER IN THE NAHUD OUTLIER OF THE NUBIAN SERIES,
KORDOFAN PROVINCE, SUDAN
By HARRY G. RODIS 1 and WILSON ISKANDER,2 Khartoum, Sudan
Work done in cooperation with the Geological Survey Department of Sudan
Abstract. Wells tapping aquifers in the Nahud outlier of the Nubian yield water of good quality for domestic, agricultural, and livestock needs. Evaluation of hydrologie data indicates that withdrawals at the present rate could be continued almost indefinitely without significant depletion of the water supply. However, additional development should be preceded by detailed investigation.
Rocks of the Nubian Series occupy a large isolated basin in the west-central part of Sudan (fig. 49.1). These rocks, referred to as the Nahud outlier of the Nubian Series, underlie a developing agricultural and livestock-raising area. Because the climate is semiarid, most of the water to meet local needs is obtained from wells. The small quantity of surface water collected in hafirs (excavated ponds) and hollow tabeldi trees dur ing the rainy season is not sufficient to sustain local needs during the remainder of the year.
An investigation was begun in 1961 to determine the ground-water potential of the Nahud outlier. This article, which presents the preliminary results of the investigation, is based on an evaluation of geologic and ground-water data collected by earlier workers and on new data collected by the authors during a recent field reconnaissance. The study is being made by the Geo logical Survey Department of Sudan and is under the direct supervision of Mahmoud Ahmed Abdulla, Direc tor of the Geological Survey Department.
The Nahud outlier underlies an area of about 4,000 square miles. It extends eastward from the town of Nahud for about 100 miles and is about 65 miles wide from north to south. The surface, which has a topo graphic relief of more than 250 feet, is formed largely by gently to moderately undulating fixed sand dunes ("qoz" sand) that are covered in part by tall rank
1 On deputation from the U.S. Geological Survey to the Geological Survey Department of Sudan under the auspices of the U.S. Agency for International Development.
8 Geological Survey Department of Sudan.
10 0 10 20 30 KILOMETERS
EXPLANATION
Granite and gneiss of Precambrian age
Contact
Margin of the principal zone of saturation
.Ca
Water yard containing one ormore producing wells
Ca indicates water sample collectedfor chemical analysis
o Dry well
Abandoned well
FIGURE 49.1. Geologic sketch map of the Nahud outlier of the Nubian Series showing the location of wells drilled since 1920 and -the areal extent of the principal zone of saturation.
grasses, shrubs, and sparsely spaced trees. There is no surface runoff into or out of the outlier; all surface
ART. 49 IN U.S. GEOL. SURVEY PROF. PAPER 475-B, PAGES B179-B181. 1963.
B179
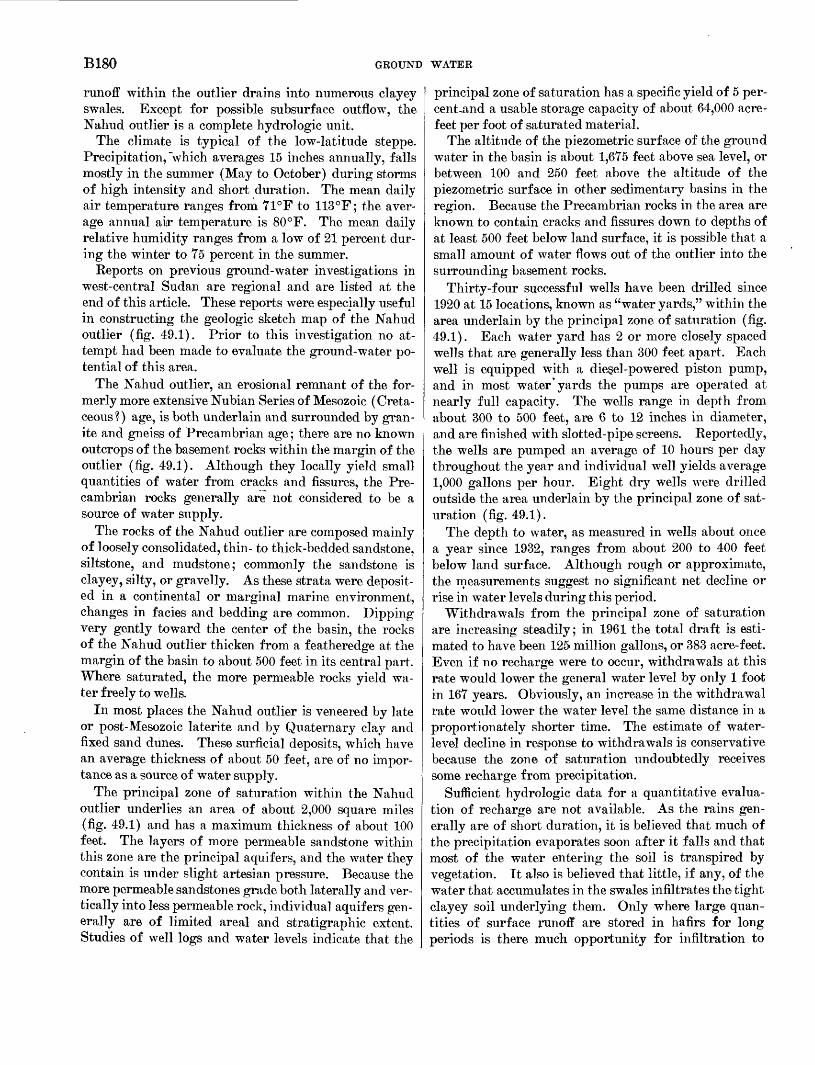
B180 GROUND WATER
runoff within the outlier drains into numerous clayey swales. Except for possible subsurface outflow, the Nahud outlier is a complete hydrologic unit.
The climate is typical of the low-latitude steppe. Precipitation, "which averages 15 inches annually, falls mostly in the summer (May to October) during storms of high intensity and short duration. The mean daily air temperature ranges from 71°F to 113°F; the aver age annual air temperature is 80°F. The mean daily relative humidity ranges from a low of 21 percent dur ing the winter to 75 percent in the summer.
Reports on previous ground-water investigations in west-central Sudan are regional and are listed at the end of this article. These reports were especially useful in constructing the geologic sketch map of the Nahud outlier (fig. 49.1). Prior to this investigation no at tempt had been made to evaluate the ground-water po tential of this area.
The Nahud outlier, an erosional remnant of the for merly more extensive Nubian Series of Mesozoic (Creta ceous ?) age, is both underlain and surrounded by gran ite and gneiss of Precambrian age; there are no known outcrops of the basement rocks within the margin of the outlier (fig. 49.1). Although they locally yield small quantities of water from cracks and fissures, the Pre cambrian rocks generally are not considered to be a source of water supply.
The rocks of the Nahud outlier are composed mainly of loosely consolidated, thin- to thick-bedded sandstone, siltstone, and mudstone; commonly the sandstone is clayey, silty, or gravelly. As these strata were deposit ed in a continental or marginal marine environment, changes in facies and bedding are common. Dipping very gently toward the center of the basin, the rocks of the Nahud outlier thicken from a featheredge at the margin of the basin to about 500 feet in its central part. Where saturated, the more permeable rocks yield wa ter freely to wells.
In most places the Nahud outlier is veneered by late or post-Mesozoic laterite and by Quaternary clay and fixed sand dunes. These surficial deposits, which have an average thickness of about 50 feet, are of no impor tance as a source of water supply.
The principal zone of saturation within the Nahud outlier underlies an area of about 2,000 square miles (fig. 49.1) and has a maximum thickness of about 100 feet. The layers of more permeable sandstone within this zone are the principal aquifers, and the water they contain is under slight artesian pressure. Because the more permeable sandstones grade both laterally and ver tically into less permeable rock, individual aquifers gen erally are of limited areal and stratigraphic extent. Studies of well logs and water levels indicate that the
principal zone of saturation has a specific yield of 5 per- cent^and a usable storage capacity of about 64,000 acre- feet per foot of saturated material.
The altitude of the piezometric surface of the ground water in the basin is about 1,675 feet above sea level, or between 100 and 250 feet above the altitude of the piezometric surface in other sedimentary basins in the region. Because the Precambrian rocks in the area are known to contain cracks and fissures down to depths of at least 500 feet below land surface, it is possible that a small amount of water flows out of the outlier into the surrounding basement rocks.
Thirty-four successful wells have been drilled since 1920 at 15 locations, known as "water yards," within the area underlain by the principal zone of saturation (fig. 49.1). Each water yard has 2 or more closely spaced wells that are generally less than 300 feet apart. Each well is equipped with a diegel-powered piston pump, and in most water'yards the pumps are operated at nearly full capacity. The wells range in depth from about 300 to 500 feet, are 6 to 12 inches in diameter, and are finished with slotted-pipe screens. Reportedly, the wells are pumped an average of 10 hours per day throughout the year and individual well yields average 1,000 gallons per hour. Eight dry wells were drilled outside the area underlain by the principal zone of sat uration (fig. 49.1).
The depth to water, as measured in wells about once a year since 1932, ranges from about 200 to 400 feet below land surface. Although rough or approximate, the measurements suggest no significant net decline or rise in water levels during this period.
Withdrawals from the principal zone of saturation are increasing steadily; in 1961 the total draft is esti mated to have been 125 million gallons, or 383 acre-feet. Even if no recharge were to occur, withdrawals at this rate would lower the general water level by only 1 foot in 167 years. Obviously, an increase in the withdrawal rate would lower the water level the same distance in a proportionately shorter time. The estimate of water- level decline in response to withdrawals is conservative because the zone of saturation undoubtedly receives some recharge from precipitation.
Sufficient hydrologic data for a quantitative evalua tion of recharge are not available. As the rains gen erally are of short duration, it is believed that much of the precipitation evaporates soon after it falls and that most of the water entering the soil is transpired by vegetation. It also is believed that little, if any, of the water that accumulates in the swales infiltrates the tight clayey soil underlying them. Only where large quan tities of surface runoff are stored in hafirs for long periods is there much opportunity for infiltration to
RODIS AND ISKANDER B181
tjhe zone of saturation. However, because the Nahud Outlier has such a large surface area, a very low average annual rate of recharge would result in a significant increment to storage. For example, if no allowance is made for natural discharge from the zone of saturation, a recharge rate of as little as 0.004 inch per year throughout the area underlain by the principal zone of saturation would more than sustain the present rate of withdrawal. Discharge of ground water by evapo- transpiration is nil because of the great depth to the zone of saturation. Therefore, subsurface outflow is the only natural discharge that must be taken into consideration in evaluating the ground-water potential of the Nahud outlier.
The results of chemical analyses of water from eight wells (fig. 49.1) are summarized in the table below. The values shown are believed to be generally repre sentative of the water in the principal zone of satura tion. The low dissolved-solids content of the water in- c.icates that there is little soluble material in rocks of the Nahud outlier and that some subsurface outflow into the Precambrian rocks does occur. The tempera ture of the water sampled for analysis ranged from 91°F to 93°F.
Not included in the table are the results of the chem ical analyses of water from wells in Nahud. There the dissolved-solids content of the water ranged from 1,804 to 1,944 parts per million and the amounts of calcium, sulfate, and chloride were considerably higher than the riaximums given in the table for these constituents. Geologic data, together with the water-quality data, in-
Summary of chemical analyses of water from eight wells tapping the zone of saturation in the Nahud outlier of the Nubian Series
[All analyses made by the Ministry of Health, Republic of Sudan, per million, except as indicated]
Results in parts
Silica (Si02)_. ......-___--_-_-.____
Sodium (Na)_ _ _ _Sulfate (S04)-----'- ----------------Chloride (Cl). .___-______--_-_.___.Fluoride (F)_ ______________________Nitrate (N03) ---------------------
Hardness as CaCOs: - Total __ __-__-___--_-_--___
Specific conductance --micromhos per cm at 20°C--
Range
5-6025 - 8510 - 224-410-100-30.3- 1.0.6- 3. 1
112 -260
60 -2640-20
125 -400
Average
236016189
11.5
1. 1185
18210
293
dicate that the wells in Nahud tap a zone of saturation that is not hydraulically connected with the principal zone of saturation in the outlier.
REFERENCES
Iskander, W., 1963, Geology and hydrology of sheet 54-L:Sudan Geol. Survey, Dept. [In press]
Kleinsorge, H., and Zscheked, J. G., 1958, Geologic-hydrologlcresearch in the arid and semi-arid zone of the westernSudan: Sudan Geol. Survey Dept. open-file report.
Kleinsorge, H., Zscheked, J. G., and Iskander, W., 1963, Geologyof sheets 54-P and 54-O: Sudan Geol. Survey Dept. [Inpress]
Sanford, K. S., 1935, Geological observations on the north-westfrontiers of the Anglo-Egyptian Sudan and the adjoiningpart of the southern Libyan Desert: Geol. Soc. LondonQuart. Jour., v. 91, p. 323-381.
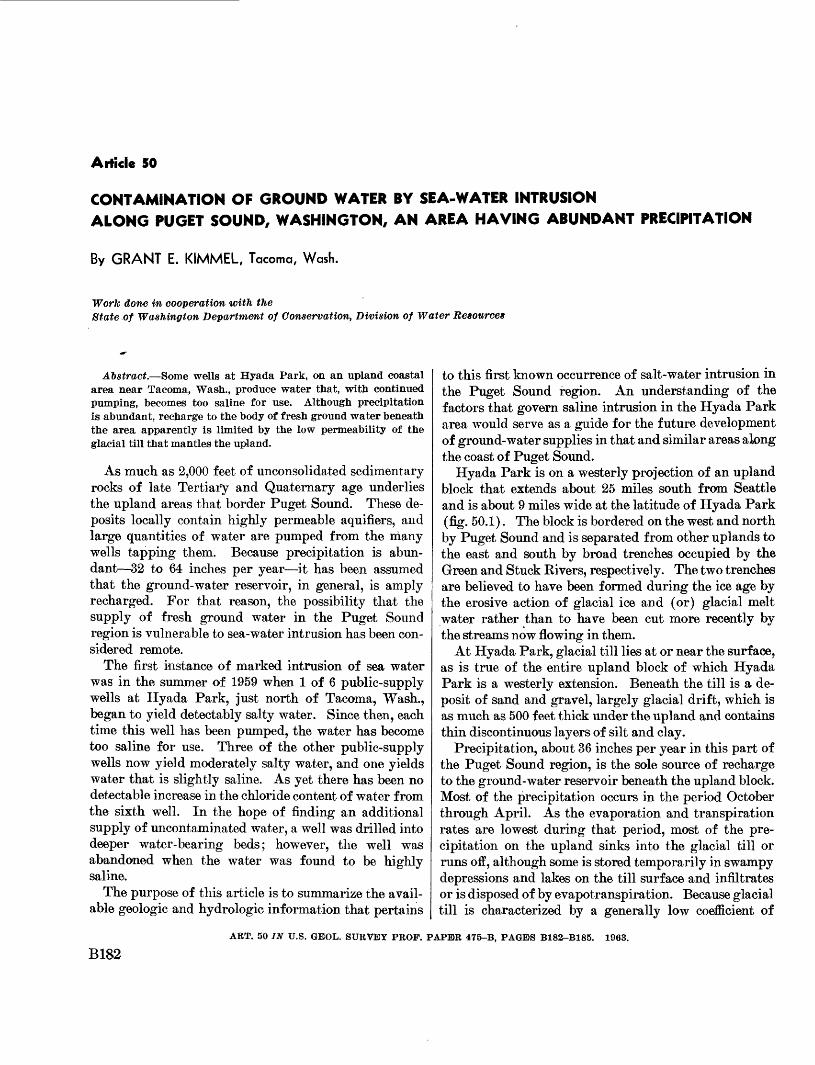
Article 50
CONTAMINATION OF GROUND WATER BY SEA-WATER INTRUSIONALONG PUGET SOUND, WASHINGTON, AN AREA HAVING ABUNDANT PRECIPITATION
By GRANT E. KIMMEL, Tacoma, Wash.
Work done in cooperation with theState of Washington Department of Conservation, Division of Water Resources
Abstract. Some wells at Hyada Park, on an upland coastal area near Tacoma, Wash., produce water that, with continued pumping, becomes too saline for use. Although precipitation is abundant, recharge to the body of fresh ground water beneath the area apparently is limited by the low permeability of the glacial till that mantles the upland.
As much as 2,000 feet of unconsolidated sedimentary rocks of late Tertiary and Quaternary age underlies the upland areas that border Puget Sound. These de posits locally contain highly permeable aquifiers, and large quantities of water are pumped from the many wells tapping them. Because precipitation is abun dant 32 to 64 inches per year it has been assumed that the ground-water reservoir, in general, is amply recharged. For that reason, the possibility that the supply of fresh ground water in the Puget Sound region is vulnerable to sea-water intrusion has been con sidered remote.
The first instance of marked intrusion of sea water was in the summer of 1959 when 1 of 6 public-supply wells at Hyada Park, just north of Tacoma, Wash., began to yield detectably salty water. Since then, each time this well has been pumped, the water has become too saline for use. Three of the other public-supply wells now yield moderately salty water, and one yields water that is slightly saline. As yet there has been no detectable increase in the chloride content of water from the sixth well. In the hope of finding an additional supply of uncontaminated water, a well was drilled into deeper water-bearing beds; however, the well was abandoned when the water was found to be highly saline.
The purpose of this article is to summarize the avail able geologic and hydrologic information that pertains
to this first known occurrence of salt-water intrusion in the Puget Sound region. An understanding of the factors that govern saline intrusion in the Hyada Park area would serve as a guide for the future development of ground-water supplies in that and similar areas along the coast of Puget Sound.
Hyada Park is on a westerly projection of an upland block that extends about 25 miles south from Seattle and is about 9 miles wide at the latitude of Hyada Park (fig. 50.1). The block is bordered on the west and north by Puget Sound and is separated from other uplands to the east and south by broad trenches occupied by the Green and Stuck Rivers, respectively. The two trenches are believed to have been formed during the ice age by the erosive action of glacial ice and (or) glacial melt water rather than to have been cut more recently by the streams now flowing in them.
At Hyada Park, glacial till lies at or near the surface, as is true of the entire upland block of which Hyada Park is a westerly extension. Beneath the till is a de posit of sand and gravel, largely glacial drift, which is as much as 500 feet thick under the upland and contains thin discontinuous layers of silt and clay.
Precipitation, about 36 inches per year in this part of the Puget Sound region, is the sole source of recharge to the ground-water reservoir beneath the upland block. Most of the precipitation occurs in the period October through April. As the evaporation and transpiration rates are lowest during that period, most of the pre cipitation on the upland sinks into the glacial till or runs off, although some is stored temporarily in swampy depressions and lakes on the till surface and infiltrates or is disposed of by evapotranspiration. Because glacial till is characterized by a generally low coefficient of
ART. 50 IN U.S. GEOL. SURVEY PROF. PAPER 475-B, PAGE'S B182-B185. 1963.
B182
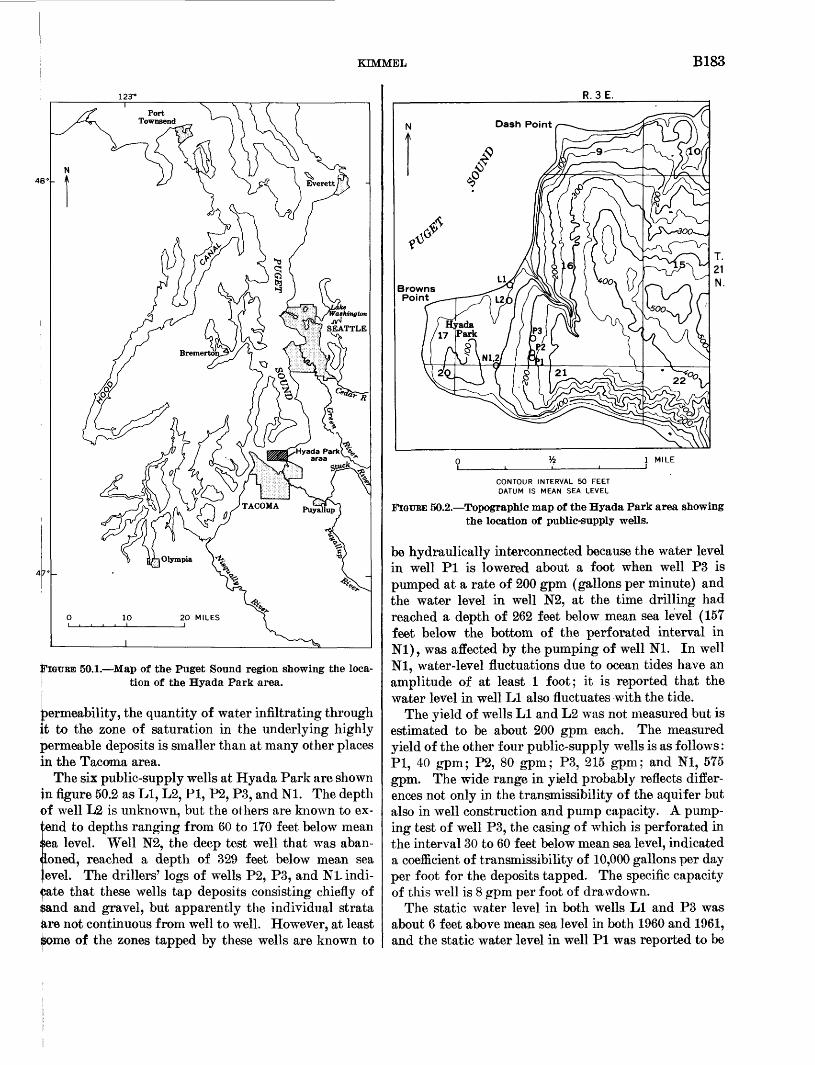
KIMMEL B183
50.1. Map of the Puget Sound region showing the loca- tion of the Hyada Park area.
bermeability, the quantity of water infiltrating through it to the zone of saturation in the underlying highly permeable deposits is smaller than at many other places in the Tacoma area.
The six public-supply wells at Hyada Park are shown in figure 50.2 as LI, L2, PI, P2, P3, and Nl. The depth of well L2 is unknown, but. the others are known to ex-
to depths ranging from 60 to 170 feet below mean level. Well N2, the deep test well that was aban
doned, reached a depth of 329 feet below mean sea evel. The drillers' logs of wells P2, P3, and Nl- indi-
£ate that these wells tap deposits consisting chiefly of $and and gravel, but apparently the individual strata iire not continuous from well to well. However, at least k>me of the zones tapped by these wells are known to
R.3E.
CONTOUR INTERVAL 50 FEET DATUM IS MEAN SEA LEVEL
FIGTJEE 50.2. Topographic map of the Hyada Park area showing the location of public-supply wells.
be hydraulically interconnected because the water level in well PI is lowered about a foot when well P3 is pumped at a rate of 200 gpm (gallons per minute) and the water level in well N2, at the time drilling had reached a depth of 262 feet below mean sea level (157 feet below the bottom of the perforated interval in Nl), was affected by the pumping of well Nl. In well Nl, water-level fluctuations due to ocean tides have an amplitude of at least 1 foot; it is reported that the water level in well LI also fluctuates with the tide.
The yield of wells LI and L2 was not measured but is estimated to be about 200 gpm each. The measured yield of the other four public-supply wells is as follows: PI, 40 gpm; P2, 80 gpm; P3, 215 gpm; and Nl, 575 gpm. The wide range in yield probably reflects differ ences not only in the transmissibility of the aquifer but also in well construction and pump capacity. A pump ing test of well P3, the casing of which is perforated in the interval 30 to 60 feet below mean sea level, indicated a coefficient of transmissibility of 10,000 gallons per day per foot for the deposits tapped. The specific capacity of this well is 8 gpm per foot of drawdown.
The static water level in both wells LI and P3 was about 6 feet above mean sea level in both 1960 and 1961, and the static water level in well PI was reported to be
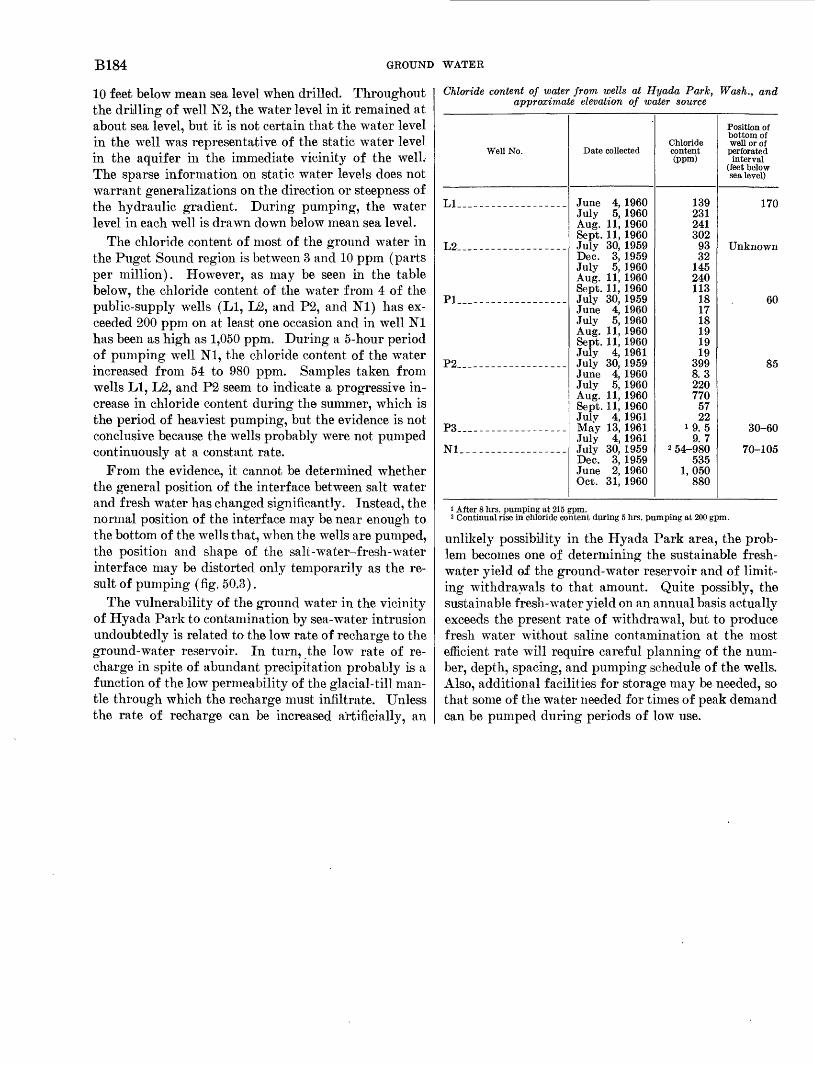
B184 GROUND WATER
10 feet below mean sea level when drilled. Throughout the drilling of well N2, the water level in it remained at about sea level, but it is not certain that the water level in the well was representative of the static water level in the aquifer in the immediate vicinity of the well. The sparse information on static water levels does not warrant generalizations on the direction or steepness of the hydraulic gradient. During pumping, the water level in each well is drawn down below mean sea level.
The chloride content of most of the ground water in the Puget Sound region is between 3 and 10 ppm (parts per million). However, as may be seen in the table below, the chloride content of the water from 4 of the public-supply wells (LI, L2, and P2, and Nl) has ex ceeded 200 ppm on at least one occasion and in well Nl has been as high as 1,050 ppm. During a 5-hour period of pumping well Nl, the chloride content of the water increased from 54 to 980 ppm. Samples taken from wells LI, L2, and P2 seem to indicate a progressive in crease in chloride content during the summer, which is the period of heaviest pumping, but the evidence is not conclusive because the wells probably were not pumped continuously at a constant rate.
From the evidence, it cannot be determined whether the general position of the interface between salt water and fresh water has changed significantly. Instead, the normal position of the interface may be near enough to the bottom of the wells that, when the wells are pumped, the position and shape of the salt-water-fresh-water interface may be distorted only temporarily as the re sult of pumping (fig. 50.3).
The vulnerability of the ground water in the vicinity of Hyada Park to contamination by sea-water intrusion undoubtedly is related to the low rate of recharge to the ground-water reservoir. In turn, the low rate of re charge in spite of abundant precipitation probably is a function of the low permeability of the glacial-till man tle through which the recharge must infiltrate. Unless the rate of recharge can be increased artificially, an
Chloride content of water from wells at Hyada Park, Wash., and approximate elevation of water source
Well No.
LI
Pl.__----------------
P2 ----------------
Nl
Date collected
June 4, 1960July 5, 1960 Aug. 11, 1960 Sept. 11, 1960 July 30, 1959Dec. 3, 1959 July 5, 1960 Aug. 11, 1960 Sept. 11, 1960 July 30, 1959June 4, 1960 July 5, 1960 Aug. 11, 1960 Sept. 11, 1960 July 4, 1961 July 30, 1959June 4, 1960 July 5, 1960 Aug. 11, 1960 Sept. 11, 1960 Julv 4, 1961 May 13, 1961July 4, 1961 July 30, 1959Dec. 3, 1959 June 2, 1960 Oct. 31, 1960
Chloride content (ppm)
139231 241 302
9332
145 240 113
1817 18 19 19 19
3998.3 220 770
57 22
1 9.59.7
2 54-980535
1,050 880
Position of bottom of well or of perforated interval
(feet below sea level)
170
Unknown
60
85
30-60
70-105
1 After 8 hrs. pumping at 215 gpm.2 Continual rise in chloride content during 5 hrs. pumping at 200 gpm.
unlikely possibility in the Hyada Park area, the prob lem becomes one of determining the sustainable fresh water yield of the ground-water reservoir and of limit ing withdrawals to that amount. Quite possibly, the sustainable fresh-water yield on an annual basis actually exceeds the present rate of withdrawal, but to produce fresh water without saline contamination at the most efficient rate will require careful planning of the num ber, depth, spacing, and pumping schedule of the wells. Also, additional facilities for storage may be needed, so that some of the water needed for times of peak demand can be pumped during periods of low use.
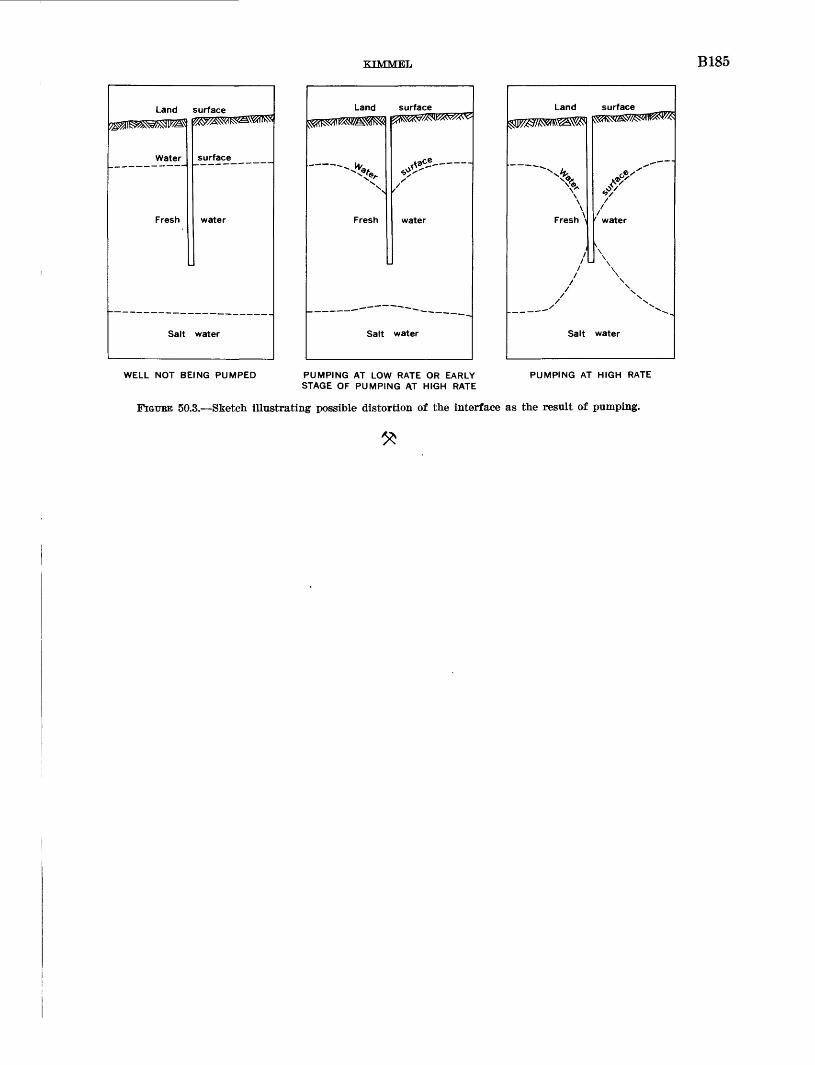
KIMMEL B185
Land surface
Water
Fresh
surface
water
Salt water
WELL NOT BEING PUMPED
Land surface
Fresh water
Salt water
PUMPING AT LOW RATE OR EARLY STAGE OF PUMPING AT HIGH RATE
Land surface
Fresh
*/'
/
' water
Salt water
PUMPING AT HIGH RATE
FIGUEE 50.3. Sketch illustrating possible distortion of the interface as the result of pumping.
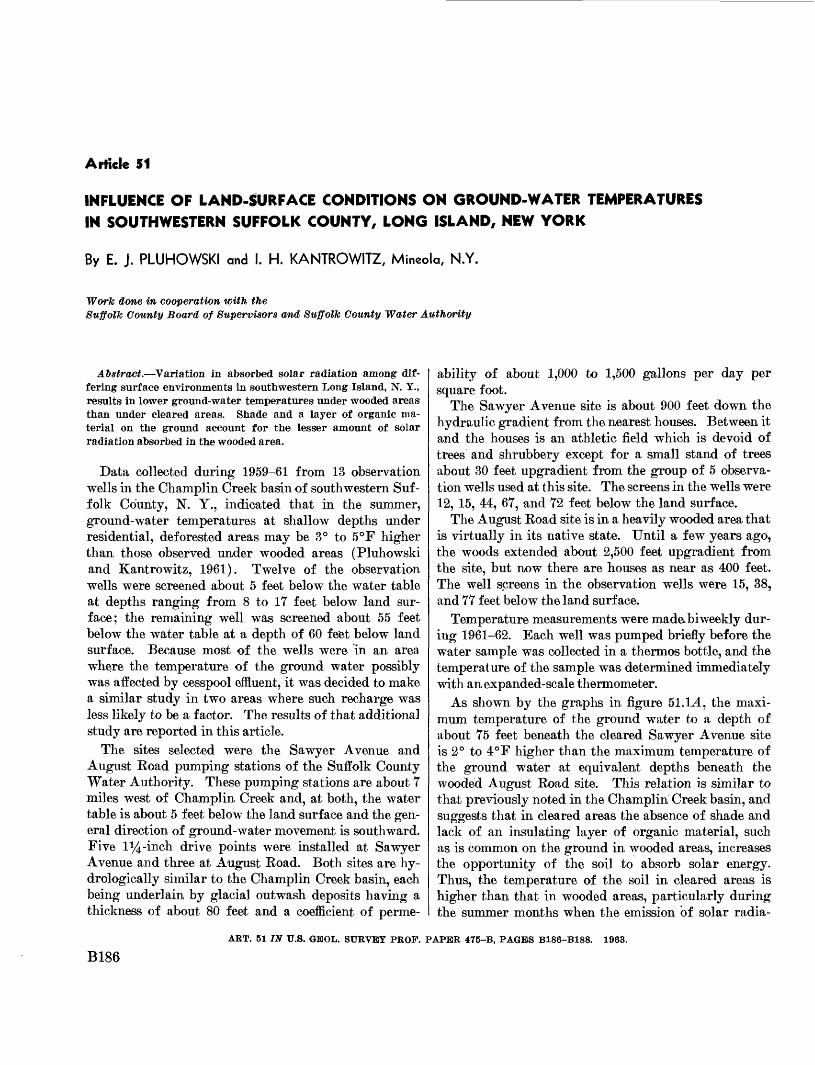
Article 51
INFLUENCE OF LAND-SURFACE CONDITIONS ON GROUND-WATER TEMPERATURES
IN SOUTHWESTERN SUFFOLK COUNTY, LONG ISLAND, NEW YORK
By E. J. PLUHOWSKI and I. H. KANTROWITZ, Mineola, N.Y.
Work done in cooperation with theSuffolk County Board of Supervisors and Suffolk County Water Authority
Abstract. Variation in absorbed solar radiation among dif fering surface environments in southwestern Long Island, N. T., results in lower ground-water temperatures under wooded areas tban under cleared areas. Shade and a layer of organic ma terial on tbe ground account for tbe lesser amount of solar radiation absorbed in tbe wooded area.
Data collected during 1959-61 from 13 observation wells in the Champlin Creek basin of southwestern Suf folk County, N. Y., indicated that in the summer, ground-water temperatures at shallow depths under residential, deforested areas may be 3° to 5°F higher than those observed under wooded areas (Pluhowski and Kantrowitz, 1961). Twelve of the observation wells were screened about 5 feet below the water table at depths ranging from 8 to 17 feet below land sur face; the remaining well was screened about 55 feet below the water table at a depth of 60 feet below land surface. Because most of the wells were in an area where the temperature of the ground water possibly was affected by cesspool effluent, it was decided to make a similar study in two areas where such recharge was less likely to be a factor. The results of that additional study are reported in this article.
The sites selected were the Sawyer Avenue and August Road pumping stations of the Suffolk County Water Authority. These pumping stations are about 7 miles west of Champlin Creek and, at both, the water table is about 5 feet below the land surface and the gen eral direction of ground-water movement is southward. Five l^-inch drive points were installed at Sawyer Avenue and three at August Road. Both sites are hy- drologically similar to the Champlin Creek basin, each being underlain by glacial outwash deposits having a thickness of about 80 feet and a coefficient of perme
ability of about 1,000 to 1,500 gallons per day per square foot.
The Sawyer Avenue site is about 900 feet down the hydraulic gradient from the nearest houses. Between it and the houses is an athletic field which is devoid of trees and shrubbery except for a small stand of trees about 30 feet upgradient from the group of 5 observa tion wells used at this site. The screens in the wells were 12, 15, 44, 67, and 72 feet below the land surface.
The August Road site is in a heavily wooded area that is virtually in its native state. Until a few years ago, the woods extended about 2,500 feet upgradient from the site, but now there are houses as near as 400 feet. The well screens in the observation wells were 15, 38, and 77 feet below the land surface.
Temperature measurements were mada biweekly dur ing 1961-62. Each well was pumped briefly before the water sample was collected in a thermos bottle, and the temperature of the sample was determined immediately with an expanded-scale thermometer.
As shown by the graphs in figure 51.L4, the maxi mum temperature of the ground water to a depth of about 75 feet beneath the cleared Sawyer Avenue site is 2° to 4°F higher than the maximum temperature of the ground water at equivalent depths beneath the wooded August Road site. This relation is similar to that previously noted in the Champlin Creek basin, and suggests that in cleared areas the absence of shade and lack of an insulating layer of organic material, such as is common on the ground in wooded areas, increases the opportunity of the soil to absorb solar energy. Thus, the temperature of the soil in cleared areas is higher than that in wooded areas, particularly during the summer months when the emission of solar radia-
ART. 51 IN U.S. GBOL. SURVEY PROF. PAPER 475-B, PAGEiS B186-B188. 1963.
B186
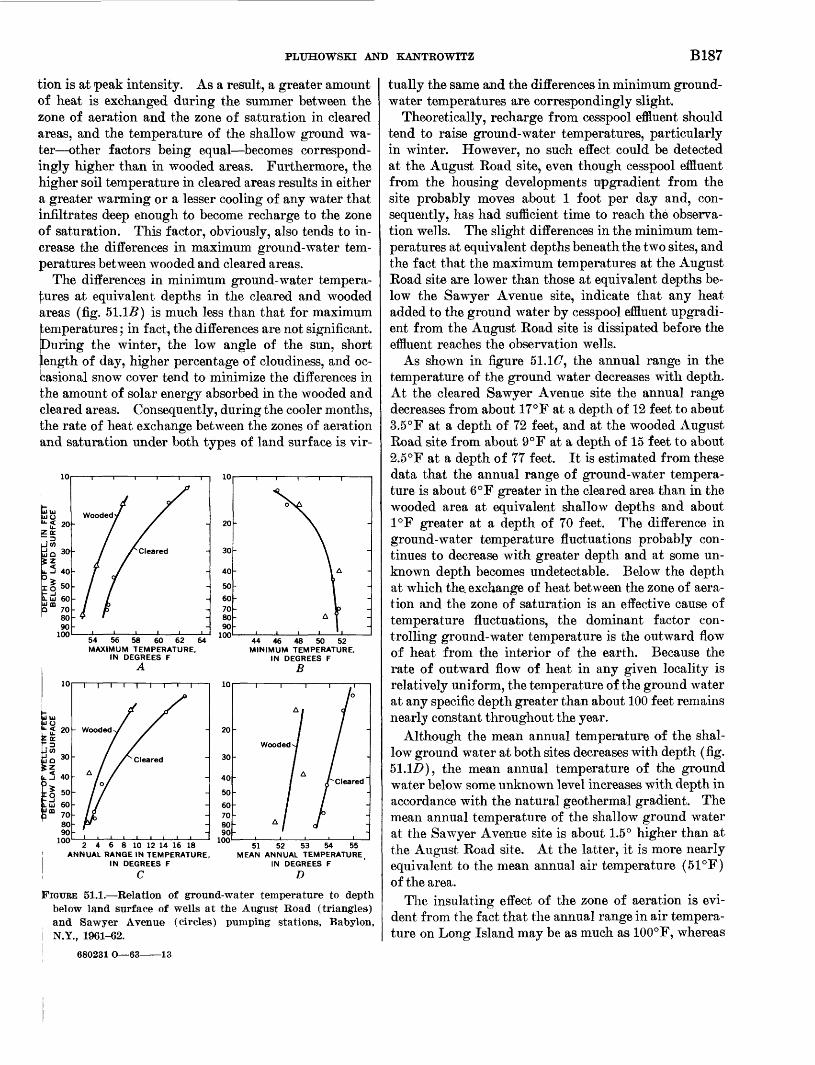
PLUHOWSKI AND KANTROWITZ B187
tion is at peak intensity. As a result, a greater amount of heat is exchanged during the summer between the fcone of aeration and the zone of saturation in cleared areas, and the temperature of the shallow ground wa ter other factors being equal becomes correspond ingly higher than in wooded areas. Furthermore, the higher soil temperature in cleared areas results in either a greater warming or a lesser cooling of any water that infiltrates deep enough to become recharge to the zone of saturation. This factor, obviously, also tends to in crease the differences in maximum ground-water tem peratures between wooded and cleared areas.
The differences in minimum ground-water tempera- ^ures at equivalent depths in the cleared and wooded areas (fig. 51.15) is much less than that for maximum temperatures; in fact, the differences are not significant. JDuring the winter, the low angle of the sun, short ^ength of day, higher percentage of cloudiness, and oc- basional snow cover tend to minimize the differences in j:he amount of solar energy absorbed in the wooded and pleared areas. Consequently, during the cooler months, the rate of heat exchange between the zones of aeration and saturation under both types of land surface is vir-
2 20 <rD
0 30z5 40
jrl 50Js6?
8090
100
10
10 < 20
J Q
LJ 40
l!LUJ 60 ^ ffl 70
80 90
100
Woode
10
54 56 58 60 62 64 MAXIMUM TEMPERATURE,
IN DEGREES F A
44 46 48 50 52MINIMUM TEMPERATURE,
IN DEGREES FB
50
2 4 6 8 10 12 14 16 18ANNUAL RANGE IN TEMPERATURE,
IN DEGREES F
C
40
50
60 70 30 90 100 [
Cleared
51 52 53 54 55 MEAN ANNUAL TEMPERATURE
IN DEGREES F
D
FIGURE 51.1. Relation of ground-water temperature to depth below land surface of wells at the August Road (triangles) and Sawyer Avenue (circles) pumping stations, Babylon,
j N.Y., 1961-62.
680231 0 63 13
tually the same and the differences in minimum ground- water temperatures are correspondingly slight.
Theoretically, recharge from cesspool effluent should tend to raise ground-water temperatures, particularly in winter. However, no such effect could be detected at the August Road site, even though cesspool effluent from the housing developments upgradient from the site probably moves about 1 foot per day and, con sequently, has had sufficient time to reach the observa tion wells. The slight differences in the minimum tem peratures at equivalent depths beneath the two sites, and the fact that the maximum temperatures at the August Road site are lower than those at equivalent depths be low the Sawyer Avenue site, indicate that any heat added to the ground water by cesspool effluent upgradi ent from the August Road site is dissipated before the effluent reaches the observation wells.
As shown in figure 51.1£7, the annual range in the temperature of the ground water decreases with depth. At the cleared Sawyer Avenue site the annual range decreases from about 17°F at a depth of 12 feet to about 3.5°F at a depth of 72 feet, and at the wooded August Road site from about 9°F at a depth of 15 feet to about 2.5°F at a depth of 77 feet. It is estimated from these data that the annual range of ground-water tempera ture is about 6°F greater in the cleared area than in the wooded area at equivalent shallow depths and about 1°F greater at a depth of 70 feet. The difference in ground-water temperature fluctuations probably con tinues to decrease with greater depth and at some un known depth becomes undetectable. Below the depth at which the. exchange of heat between the zone of aera tion and the zone of saturation is an effective cause of temperature fluctuations, the dominant factor con trolling ground-water temperature is the outward flow of heat from the interior of the earth. Because the rate of outward flow of heat in any given locality is relatively uniform, the temperature of the ground water at any specific depth greater than about 100 feet remains nearly constant throughout the year.
Although the mean annual temperature of the shal low ground water at both sites decreases with depth (fig. 51.1Z>), the mean annual temperature of the ground water below some unknown level increases with depth in accordance with the natural geothermal gradient. The mean annual temperature of the shallow ground water at the Sawyer Avenue site is about 1.5° higher than at the August Road site. At the latter, it is more nearly equivalent to the mean annual air temperature (51°F) of the area.
The insulating effect of the zone of aeration is evi dent from the fact that the annual range in air tempera ture on Long Island may be as much as 100°F, whereas

B188 GROUND WATER
ground water at the shallowest depth has an annual temperature range of only 1Y°F. Moreover, it has been demonstrated that the ground-water temperature is unaffected by the alternate passage of warm and cold air masses (Pluhowski and Kantrowitz, 1961, p. 101- 102). By acting as a buffer between the ground-water reservoir and the atmosphere, the zone of aeration also
causes the extremes in ground-water temperature to lag about 2 months behind the extremes of air temperature.
REFERENCE
Pluhowski, E. J., and Kantrowitz, I. H., 1961, Hydrology of the Babylon-Islip area, Suffolk County, Long Island, N. Y.: U.S. Geol. Survey open-file report, p. 99-104.
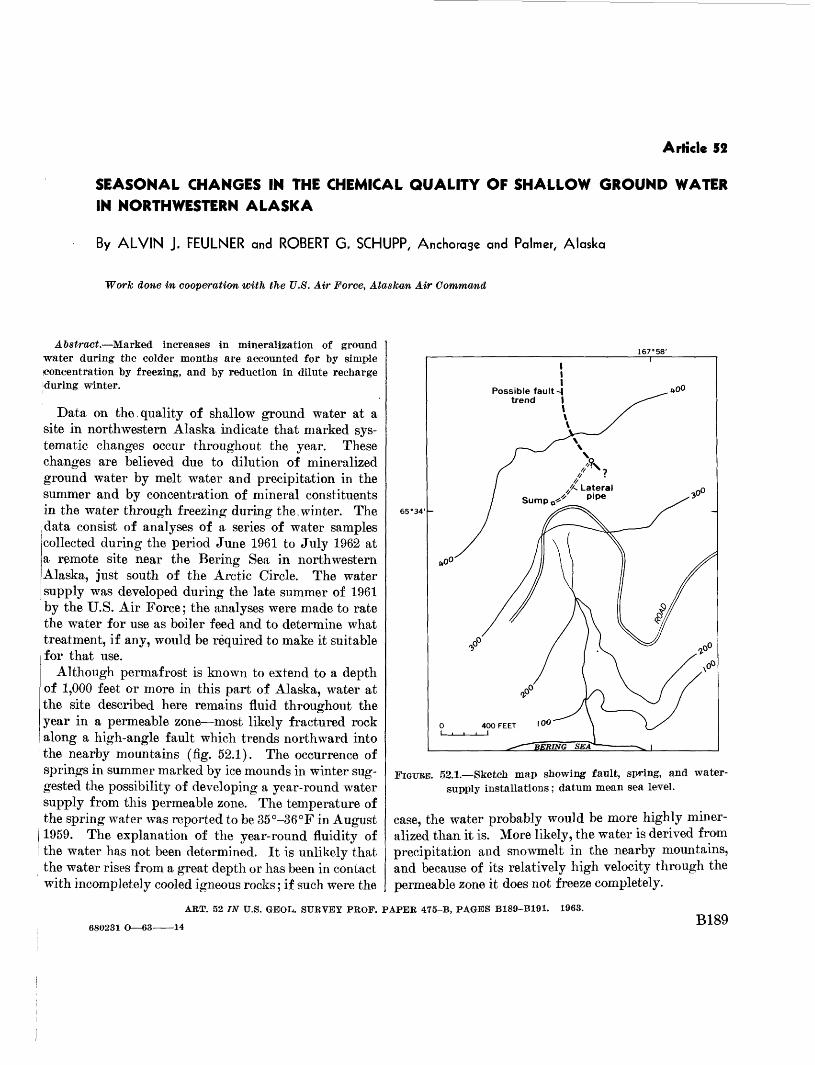
Article 52
SEASONAL CHANGES IN THE CHEMICAL QUALITY OF SHALLOW GROUND WATER IN NORTHWESTERN ALASKA
By ALVIN J. FEULNER and ROBERT G. SCHUPP, Anchorage and Palmer, Alaska
Work done in cooperation with the U.S. Air Force, AlasJcan Air Command
Abstract. Marked increases in mineralization of ground water during the colder months are accounted for by simple concentration by freezing, and by reduction in dilute recharge Curing winter.
Data on the.quality of shallow ground water at a site in northwestern Alaska indicate that marked sys tematic changes occur throughout the year. These changes are believed due to dilution of mineralized ground water by melt water and precipitation in the summer and by concentration of mineral constituents in the water through freezing during the .winter. The ,data consist of analyses of a series of water samples collected during the period June 1961 to July 1962 at a remote site near the Bering Sea in northwestern Alaska, just south of the Arctic Circle. The water supply was developed during the late summer of 1961 by the U.S. Air Force; the analyses were made to rate the water for use as boiler feed and to determine what treatment, if any, would be required to make it suitable for that use.
Although permafrost is known to extend to a depth of 1,000 feet or more in this part of Alaska, water at the site described here remains fluid throughout the year in a permeable zone most likely fractured rock along a high-angle fault which trends northward into the nearby mountains (fig. 52.1). The occurrence of springs in summer marked by ice mounds in winter sug gested the possibility of developing a year-round water supply from this permeable zone. The temperature of the spring water was reported to be 35°-36°F in August 1959. The explanation of the year-round fluidity of the water has not been determined. It is unlikely that the water rises from a great depth or has been in contact with incompletely cooled igneous rocks; if such were the
167° 58'
FIGURE. 52.1. Sketch map showing fault, spring, and water- supply installations; datum mean sea level.
case, the water probably would be more highly miner alized than it is. More likely, the water is derived from precipitation and snowmelt in the nearby mountains, and because of its relatively high velocity through the permeable zone it does not freeze completely.
ART. 52 IN U.S. GEOL. SURVEY PROF. PAPER 475-B, PAGES B189-B191. 1963.
680231 O 63- -14 B189
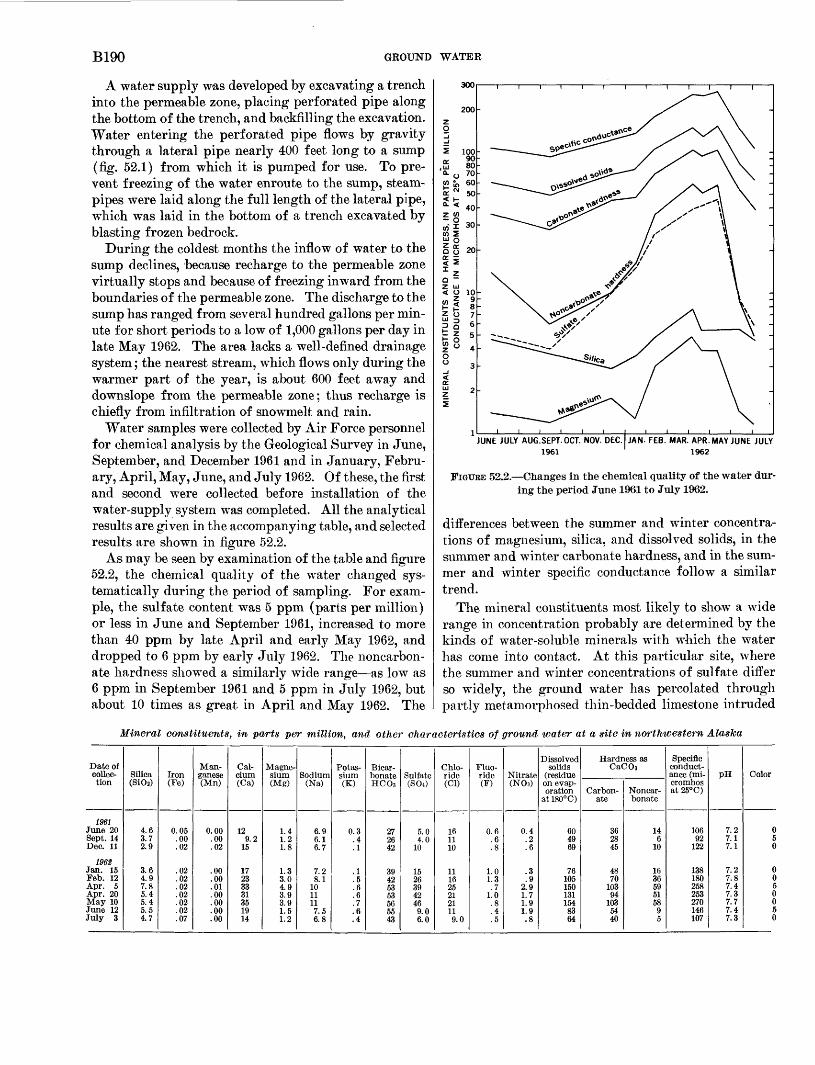
B190 GROUND WATER
A water supply was developed by excavating a trench into the permeable zone, placing perforated pipe along the bottom of the trench, and backfilling the excavation. Water entering the perforated pipe flows by gravity through a lateral pipe nearly 400 feet long to a sump (fig. 52.1) from which it is pumped for use. To pre vent freezing of the water enroute to the sump, steam- pipes were laid along the full length of the lateral pipe, which was laid in the bottom of a trench excavated by blasting frozen bedrock.
During the coldest months the inflow of water to the sump declines, because recharge to the permeable zone virtually stops and because of freezing inward from the boundaries of the permeable zone. The discharge to the sump has ranged from several hundred gallons per min ute for short periods to a low of 1,000 gallons per day in late May 1962. The area lacks a well-defined drainage system; the nearest stream, which flows only during the warmer part of the year, is about 600 feet away and downslope from the permeable zone; thus recharge is chiefly from infiltration of snowmelt and rain.
Water samples were collected by Air Force personnel for chemical analysis by the Geological Survey in June, September, and December 1961 and in January, Febru ary, April, May, June, and July 1962. Of these, the first and second were collected before installation of the water-supply system was completed. All the analytical results are given in the accompanying table, and selected results are shown in figure 52.2.
As may be seen by examination of the table and figure 52.2, the chemical quality of the water changed sys tematically during the period of sampling. For exam ple, the sulfate content was 5 ppm (parts per million) or less in June and September 1961, increased to more than 40 ppm by late April and early May 1962, and dropped to 6 ppm by early July 1962. The noncarbon- ate hardness showed a similarly wide range as low as 6 ppm in September 1961 and 5 ppm in July 1962, but about 10 times as great in April and May 1962. The
JUNE JULY AUG.SEPT.OCT. NOV. DEC. JAN- FEB. MAR. APR. MAY JUNE JULY1961 1962
FIGURE 52.2. Changes in the chemical quality of the water dur ing the period June 1961 to July 1962.
differences between the summer and winter concentra tions of magnesium, silica, and dissolved solids, in the summer and winter carbonate hardness, and in the sum mer and winter specific conductance follow a similar trend.
The mineral constituents most likely to show a wide range in concentration probably are determined by the kinds of water-soluble minerals with which the water has come into contact. At this particular site, where the summer and winter concentrations of sulfate differ so widely, the ground water has percolated through partly metamorphosed thin-bedded limestone intruded
Mineral constituents, in parts per million, and other characteristics of ground water at a site in northwestern Alaska
Date ofcollection
1961June 20Sept. 14Dec. 11
1968Jan. 15Feb. 12Apr. 5Apr. 20May 10June 12July 3
Silica(SiCh)
4.63.72.9
3.64.97.85.45.45.54.7
Iron(Fe)
0.05.00.02
.02
.02
.02
.02
.02
.02
.07
Manganese(Mn)
0.00.00.02
.00
.00
.01
.00
.00
.00
.00
Calcium(Ca)
129.2
15
17233331351914
Magnesium(Mg)
1.41.21.8
1.33.04.93.93.91.51.2
Sodium(Na)
6.96.16.7
7.28.1
1011117.56.8
Potassium(K)
0.3.4.1
.1
.5
.6
.6
.7
.6
.4
BicarbonateHC03
272642
39425353565543
Sulfate(SOO
5.04.0
10
15263942469.06.0
Chloride(01)
161110
1116252121119.0
Fluo-ride(F)
0.6.6.8
1.01.3.7
1.0.8.4.5
Nitrate(NOs)
0.4.2.6
.3
.92.91.71.91.9.8
Dissolvedsolids
(residueon evaporation
at 180°C)
604969
761051501311548364
Hardness asCaCOs
Carbonate
362845
4870
10394
1035440
Noncar-bonate
146
10
163659515895
Specificconductance (mi-cromhosat 25°C)
10692
122
138180258253270146107
PH
7.27.17.1
7.27.87.47.37.77.47.3
Color
050
0050050

FEULNER AND SCHUPP B191
by granite. Pyrite, pyrrhotite, fluorite, and sphalerite are common in the mineralized zones along the contact of the limestone with the granite. Sulfate compounds formed during weathering of these and other sulfide minerals are dissolved readily in the ground water. The relative enrichment of the ground water in calcium and sulfate in the later winter months probably is due to the fact that recharge from precipitation ceases and the discharge from the permeable zone consists almost entirely of ground water that has long been in contact with mineralized rocks. The recharge from precipita tion, which has a relatively high sodium and chloride content owing to proximity to the Bering Sea, is cut off during the winter as soon as the ground freezes. The increases noted in sodium and chloride probably are due to simple concentration by freezing whereas the larger increases in calcium and sulfate are due in part to concentration by freezing but also to the fact that the winter discharge has been in contact with the rock materials longer. Sparse data from another Air Force station in Alaska, where the bedrock consists wholly of limestone, indicate that there the greatest seasonal differences in the chemical quality of the ground water are in the concentrations of calcium and bicarbonate and in the carbonate hardness, and are caused by a combination of the processes similar to those described above. R. M. Waller (U.S. Geological Survey, oral communication, 1962) reported observing similar win-
Ttime increases in mineral content in ground water owing beneath a frozen stream in another part oflaska.As shown by figure 52.2, the mineral content of the
water was lowest during the summer, increased grad ually during the fall, increased relatively rapidly dur ing the winter and early spring, and then declined very rapidly in the late spring to about the same level as that of the previous summer. Concurrent with the more rapid increase in mineralization was a marked decline in the yield of the water-supply system. The decline in yield presumably was caused partly by a freezing inward from the sides and downward from the
top of the aquifer, thus reducing the cross sectional area through which the water could flow. This freezing accentuates the normal seasonal decline in yield, which is due to lack of recharge from precipitation in the winter and to depletion of the water in storage in the aquifer. The increase in mineral content was caused partly by selective concentration of mineral matter in the unfrozen water. The freezing accentuates a normal seasonal increase in mineral content, which is due to a reduction in the diluting effect of recharge from pre cipitation. Thus, in an aquifer 20 feet thick, freezing extending 15 feet into it may result' in a doubling or tripling of the dissolved-solids content in the water that remains unfrozen. The rapid decline in the mineral content of the water in the late spring is related to the thawing of the ice within the aquifer, plus infiltration of surface melt water which recharges the aquifer. The double peaks on several of the curves in figure 52.2 probably indicate that at least one slight thaw preceded the main thaw in the spring of 1962; that the thawing proceeded by stages is confirmed by air- temperature data. As the water level in the sump is reported to have risen markedly on May 28, 1962, it may be reasonable to assume that the maximum mineral concentration of the ground water was reached shortly before that date.
Although documentation is sparse, probably other shallow ground-water supplies in subarctic and artic areas are subject to similar marked seasonal changes in chemical quality. Several factors such as the depth of freezing before the snow cover becomes well estab lished, the total moisture content of the snow cover, and the length of time the ground is snow covered may affect the amount of increase in the concentration of dissolved minerals somewhat. However, it seems unlikely that the extremes would differ more than 10 percent from the values reported here. The observed changes are believed sufficiently representative to pro vide a basis for predicting the type of treatment that boiler-fed water may require at different times during the year.
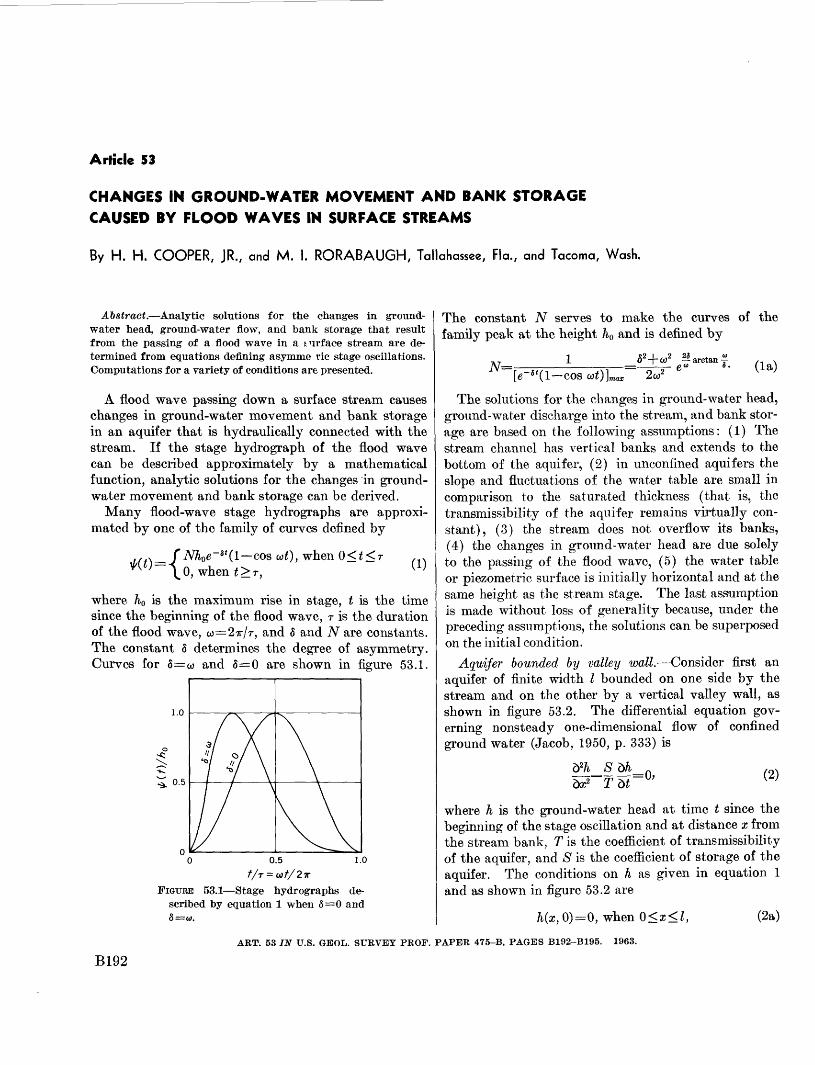
Article 53
CHANGES IN GROUND-WATER MOVEMENT AND BANK STORAGE CAUSED BY FLOOD WAVES IN SURFACE STREAMS
By H. H. COOPER, JR., and M. I. RORABAUGH, Tallahassee, Fla., and Tacoma, Wash,
Abstract. Analytic solutions for the changes in ground- water head, ground-water flow, and bank storage that result from the passing of a flood wave in a surface stream are de termined from equations defining asymme ric stage oscillations. Computations for a variety of conditions are presented.
A flood wave passing down a surface stream causes changes in ground-water movement and bank storage in an aquifer that is hydraulically connected with the stream. If the stage hydrograph of the flood wave can be described approximately by a mathematical function, analytic solutions for the changes in ground- water movement and bank storage can be derived.
Many flood-wave stage hydrographs are approxi mated by one of the family of curves defined by
cos at), when 0<t<r(1)
where h0 is the maximum rise in stage, t is the time since the beginning of the flood wave, r is the duration of the flood wave, w STT/T, and 5 and N are constants. The constant 8 determines the degree of asymmetry. Curves for 5=w and 5=0 are shown in figure 53.1.
FIGUKE 53.1 Stage hydrographs de scribed by equation 1 when 5=0 and
The constant N serves to make the curves of the family peak at the height h0 and is defined by
N=-r 1
The solutions for the changes in ground-water head, ground-water discharge into the stream, and bank stor age are based on the following assumptions: (1) The stream channel has vertical banks and extends to the bottom of the aquifer, (2) in unconfined aquifers the slope and fluctuations of the water table are small in comparison to the saturated thickness (that is, the transmissibility of the aquifer remains virtually con stant), (3) the stream does not overflow its banks, (4) the changes in ground-water head are due solely to the passing of the flood wave, (5) the water table or piezometric surface is initially horizontal and at the same height as the stream stage. The last assumption is made without loss of generality because, under the preceding assumptions, the solutions can be superposed on the initial condition.
Aquifer bounded by valley wall. Consider first an aquifer of finite width / bounded on one side by the stream and on the other by a vertical valley wall, as shown in figure 53.2. The differential equation gov erning nonsteady one-dimensional flow of confined ground water (Jacob, 1950, p. 333) is
_ (2)
where h is the ground-water head at time t since the beginning of the stage oscillation and at distance x from the stream bank, T is the coefficient of transmissibility of the aquifer, and 8 is the coefficient of storage of the aquifer. The conditions on h as given in equation 1 and as shown in figure 53.2 are
h(x,G)=0, when 0<x<l, (2a)
ART. 53 IN U.S. GEOL. SURVEY PROF. PAPER 475-B, PAGES B192-B195. 1963.
B192
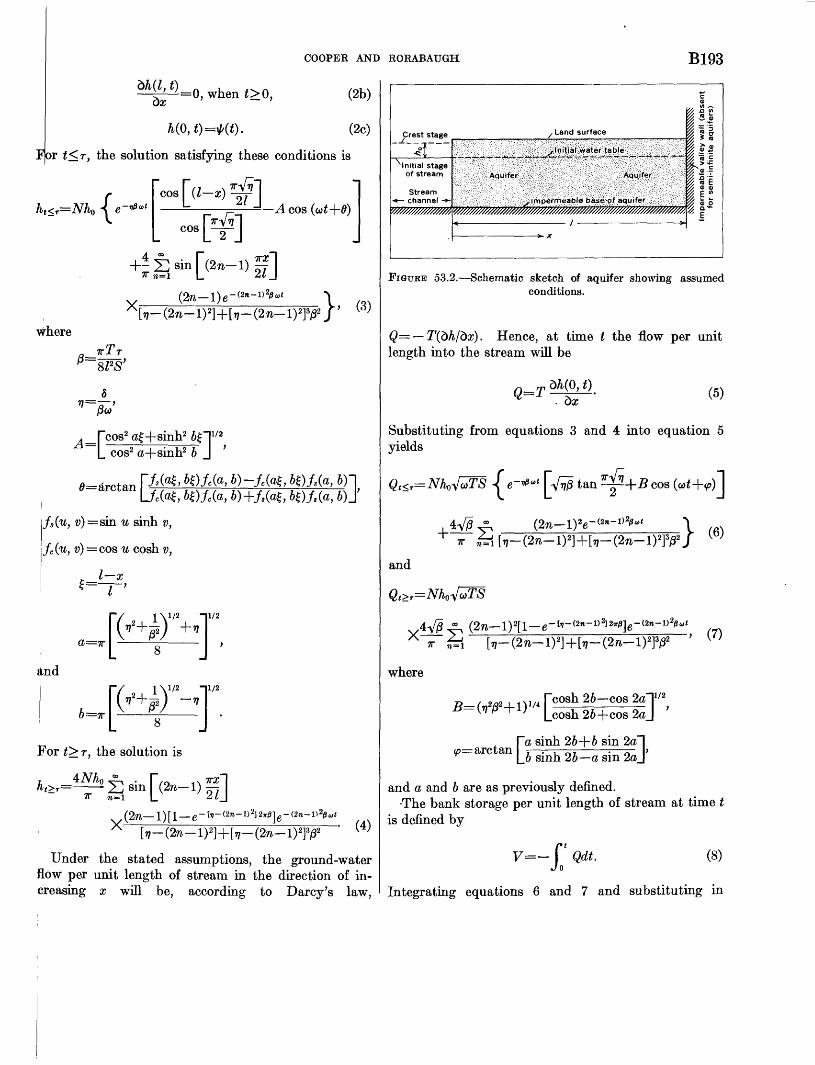
2 t*
OQ
CD*
CO"
- o
to
!-*>
P
5
5
p
co
co
|o ^
P
h"8
g
£
^
&3
gr.
+
TO
B' i
"*
U
II p ci,
O
<!l-
h
^<
*J § «.
IV
oo
* 1
<-C3
xJ"
tol '"
'
+" ^ J
^
C5
COo
e-1
CO
P
Si
Si
8 S-
P-
&JS
J2
p.
e-t- § ES *r
rt
*rrt
<^-*
<^
*
fefe
*fYir
*TifT
r
«rnr
JV
T
1 1
C5
O
CO
w
to
_
+ +
CO
CO
5' 5
'ts
tr >r«v
N*
IA
I- IV O to
1. crcj >-"
P
£'
g
P->
H P
-|c
f^CD
cr p
TO CD
th p
tO Cb
d & crcj r B g:o" CD d o.
(g0
CQ
o & g;
O
>Q e.
!' i
i
t
Y//////////////////////^^^^^
t o/
3 |
S
W
1 k0
£
S W
0)
t-^V
*:;:i
;"''::V
-:'':';-
--Slf/.
?'V-:v
vV
-.-.
-.-.
v:::.
-::::
:W:.-
.-.:v
j..vS
.1----
:- :
=:;
:«
:y:;C
;:r;
j;;J
:j;:
^;.
,:-:;
_ w
'.;':v
;;j .'.
;v::.;
;;.v^
': 5-^
;%
tlififfli
lliilll
S:;
:/;f
eK
^rf
ivS
;Sv
;.-
-i^-
.::-^
-^;S
V::
:;-:..
; W
vW^:
y-;iv
-:>
H:>
^:;:v
^
i 0) a VI c t (D
Ss?
S5
5S
«!^
S^^^
Imperm
eable
valle
y w
all
(abse
nt
for
se
mi-in
fin
ite
aq
uife
rs)
w i i CO
C
O
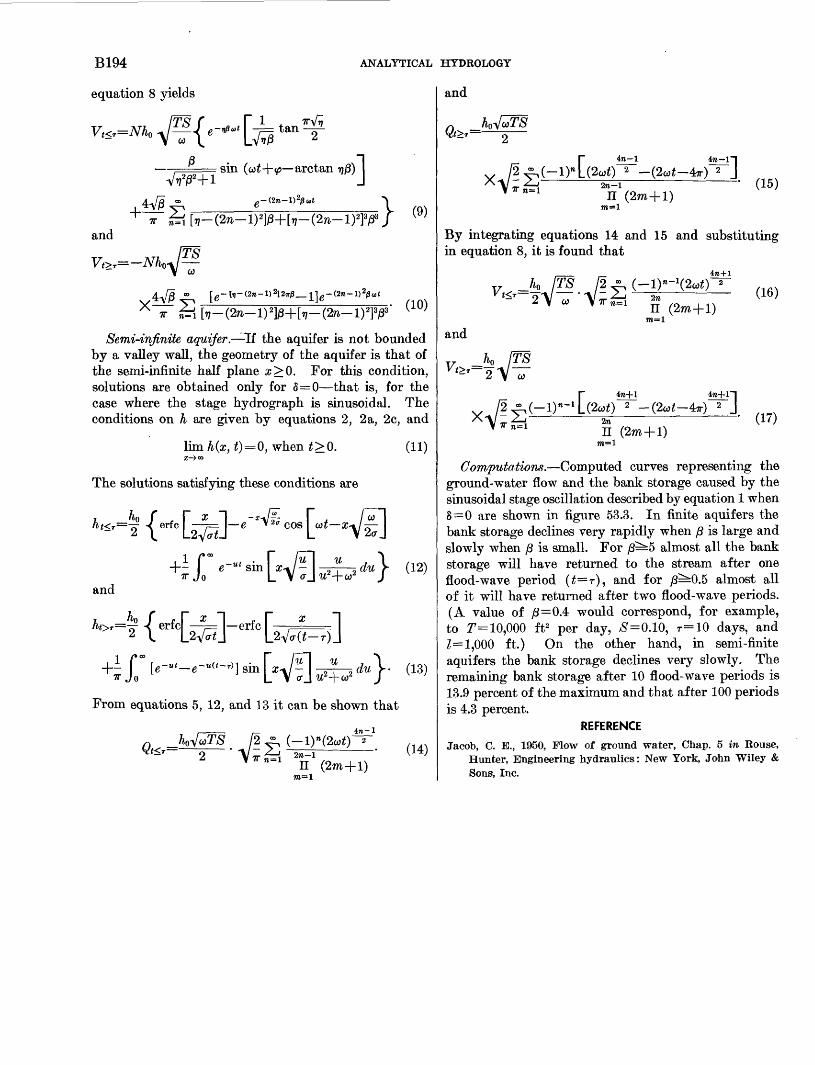
B194
equation 8 yields
ANALYTICAL HYDROLOGY
and
4.
sin (o)t-\-<p arctan
and
X
Semi-infinite aquifer. If the aquifer is not bounded by a valley wall, the geometry of the aquifer is that of the semi-infinite half plane #>0. For this condition, solutions are obtained only for 5=0 that is, for the case where the stage hydrograph is sinusoidal. The conditions on h are given by equations 2, 2a, 2c, and
lim h(x,f)=0, when t > 0.Z->co
The solutions satisfying these conditions are
(11)
* COS .-»
and
+- r e-» f sin far J-~\ -^-2 du \ (12)7T Jo L V ffj W2 + C02 J y
r=^ / erfcfl-erfc 2 \
- r°
7T JO
From equations 5, 12, and 13 it can be shown that
4n-l
Qt<r='7rn~ 1 2 II 1 (2m+l)
(13)V !
(14)
m=l
2
xJ-4n-l"|
a J
II (2ro+l)TO = 1
' (15)
By integrating equations 14 and 15 and substituting in equation 8, it is found that
h04n+l-
nand
4n+l2 _/'0,.,/_
H (2m+1)TO=1
(17)
Computations. Computed curves representing the ground-water flow and the bank storage caused by the sinusoidal stage oscillation described by equation 1 when 8=0 are shown in figure 53.3. In finite aquifers the bank storage declines very rapidly when /? is large and slowly when /? is small. For /?^5 almost all the bank storage will have returned to the stream after one flood-wave period (£=T), and for /?^0.5 almost all of it will have returned after two flood-wave periods. (A value of /3=0.4 would correspond, for example, to T= 10,000 ft2 per day, #=0.10, r=10 days, and Z=1,000 ft.) On the other hand, in semi-finite aquifers the bank storage declines very slowly. The remaining bank storage after 10 flood-wave periods is 13.9 percent of the maximum and that after 100 periods is 4.3 percent.
REFERENCE
Jacob, C. E., 1950, Flow of ground water, Chap. 5 in Rouse, Hunter, Engineering hydraulics: New York, John Wiley & Sons, Inc.
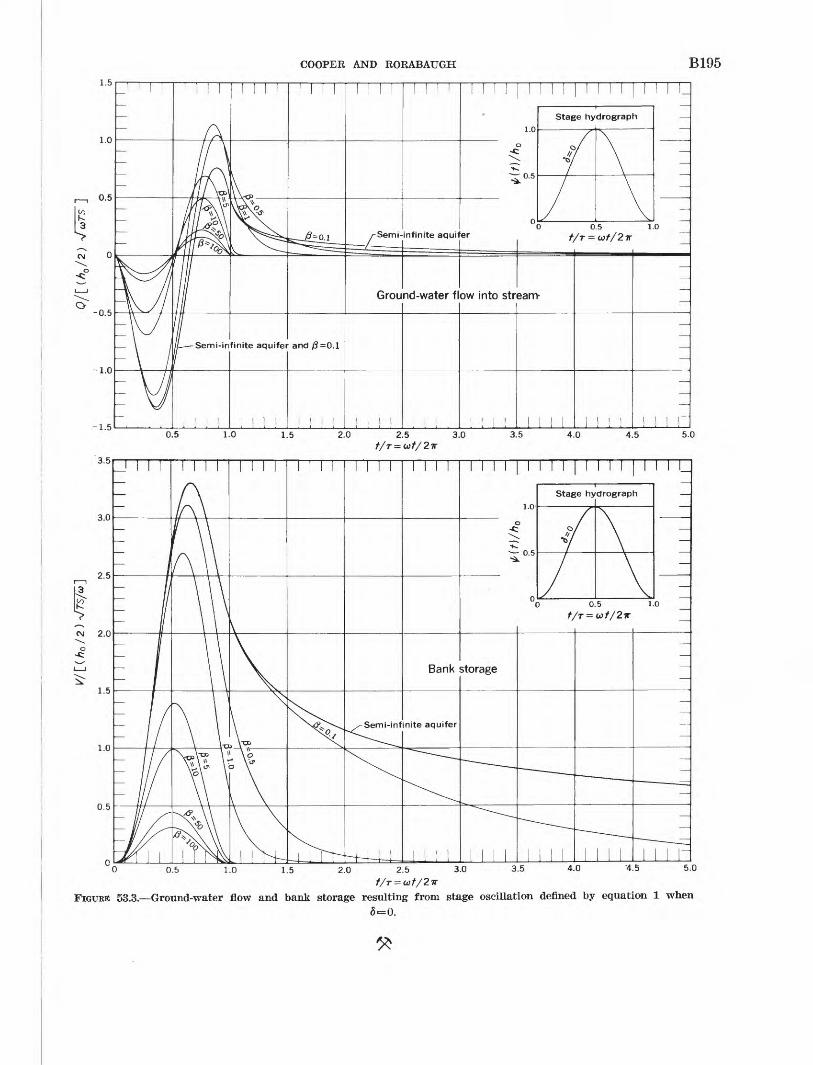
COOPER AND RORABAUGH B195
Ground-water flow into stream
Semi-infinite aquifer and j8=0.1
3.0 3.5 4.0 4.5
FIGURE 53.3. Ground-water flow and bank storage resulting from stage oscillation defined by equation 1 when5-0.
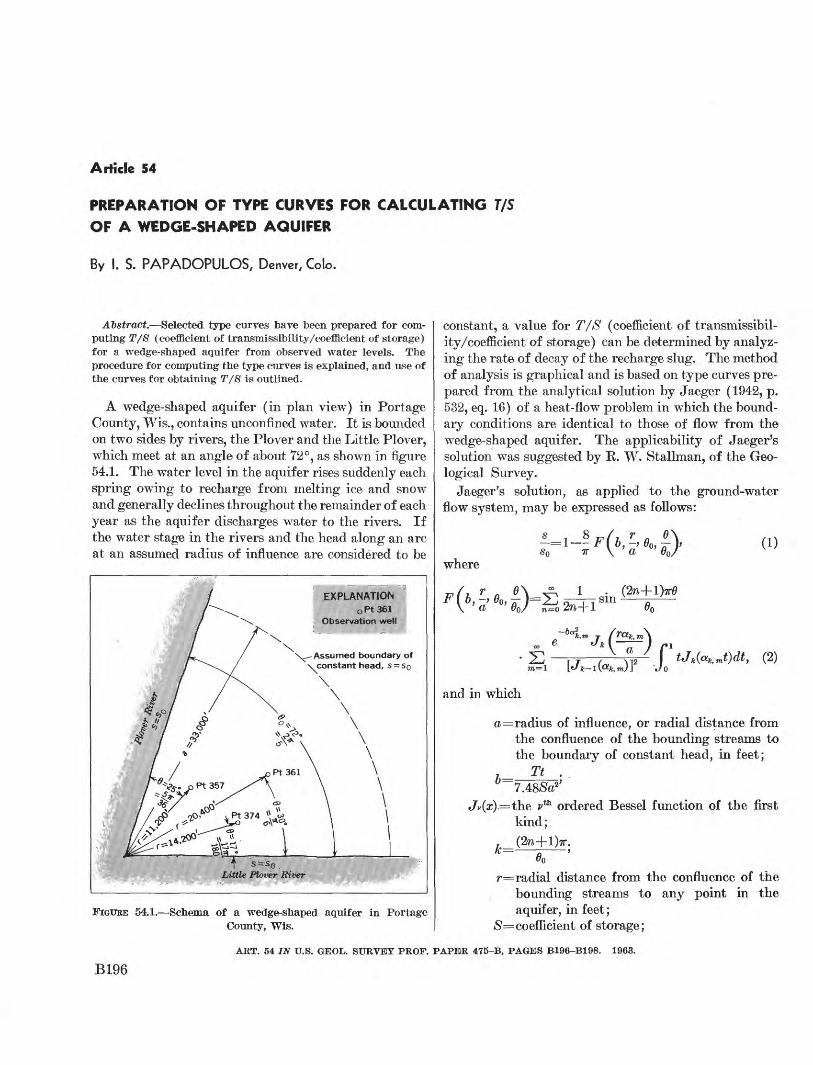
Article 54
PREPARATION OF TYPE CURVES FOR CALCULATING 7/5 OF A WEDGE-SHAPED AQUIFER
By I. S. PAPADOPULOS, Denver, Colo.
Abstract. Selected type curves have been prepared for com puting T/8 (coefficient of transmissibility/coefficient of storage) for a wedge-shaped aquifer from observed water levels. The procedure for computing the type curves is explained, and use of the curves for obtaining T/8 is outlined.
A wedge-shaped aquifer (in plan view) in Portage County, Wis., contains unconfined water. It is bounded on two sides by rivers, the Plover and the Little Plover, which meet at an angle of about 72°, as shown in figure 54.1. The water level in the aquifer rises suddenly each spring owing to recharge from melting ice and snow and generally declines throughout the remainder of each year as the aquifer discharges water to the rivers. If the water stage in the rivers and the head along an arc at an assumed radius of influence are considered to be
FIGURE 54.1. Schema of a wedge-shaped aquifer in Portage County, Wis.
constant, a value for T/8' (coefficient of transmissibil- ity/coefficient of storage) can be determined by analyz ing the rate of decay of the recharge slug. The method of analysis is graphical and is based on type curves pre pared from the analytical solution by Jaeger (1942, p. 532, eq. 16) of a heat-flow problem in which the bound ary conditions are identical to those of flow from the wedge-shaped aquifer. The applicability of Jaeger's solution was suggested by R. W. Stallman, of the Geo logical Survey.
Jaeger's solution, as applied to the ground-water flow system, may be expressed as follows:
where
(1)
(rak, m\\ a ) r
m=ltJt(a*, mt)dt, (2)
and in which
a= radius of influence, or radial distance from the confluence of the bounding streams to the boundary of constant head, in feet;
Ttb=7A8Sa2' '
Jv (x) ihe vth ordered Bessel function of the first kind;
k=-
r= radial distance from the confluence of the bounding streams to any point in the aquifer, in feet;
S coefficient of storage;
ART. 54 IN U.S. GEOL. SURVEY PROF. PAPER 475-B, PAGES B196-B198. 1963.
B196
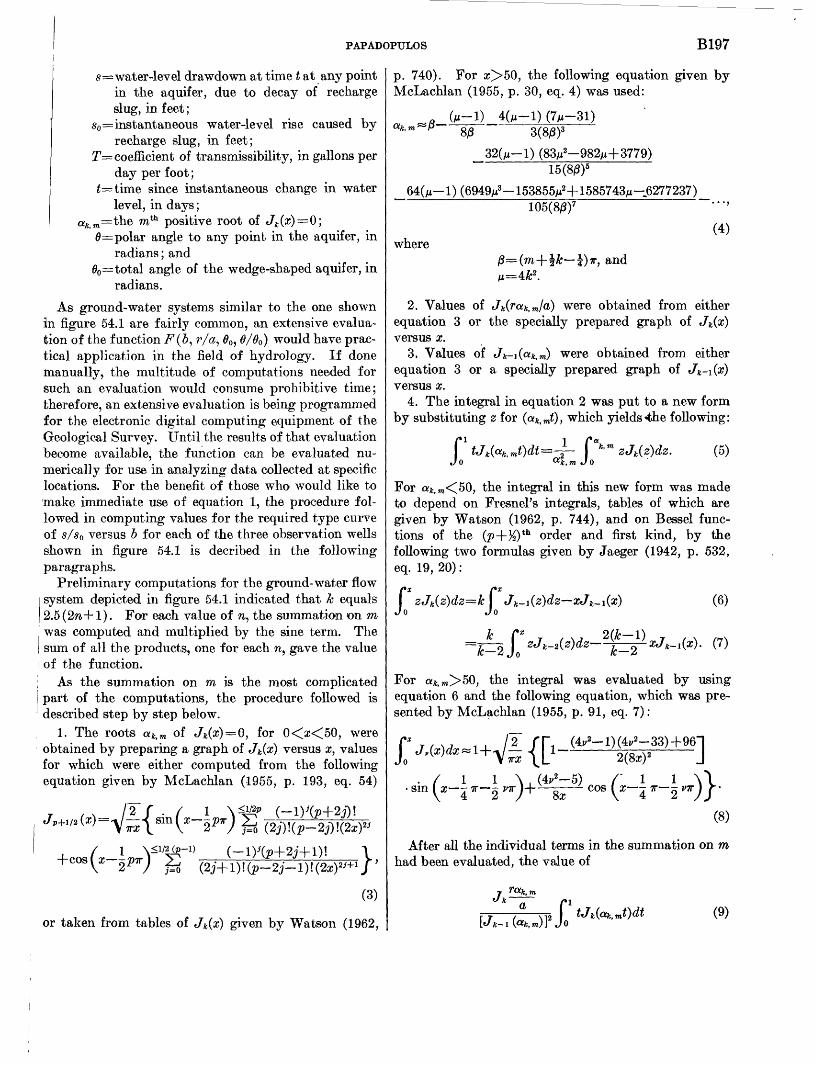
PAPADOPULOS B197
s=water-level drawdown at time t at any pointin the aquifer, due to decay of rechargeslug, in feet;
s0 =instantaneous water-level rise caused byrecharge slug, in feet;
T= coefficient of transmissibility, in gallons perday per foot;
£=time since instantaneous change in waterlevel, in days;
afcTO =the mth positive root of Jfc (z)=0;6=polar angle to any point in the aquifer, in
radians; and 00 := total angle of the wedge-shaped aquifer, in
radians.
As ground-water systems similar to the one shown in figure 54.1 are fairly common, an extensive evalua tion of the function F(l>, r/a, 00 , O/Oo) would have prac tical application in the field of hydrology. If done manually, the multitude of computations needed for such an evaluation would consume prohibitive time; therefore, an extensive evaluation is being programmed for the electronic digital computing equipment of the Geological Survey. Until the results of that evaluation become available, the function can be evaluated nu merically for use in analyzing data collected at specific locations. For the benefit of those who would like to make immediate use of equation 1, the procedure fol lowed in computing values for the required type curve of S/SQ versus l> for each of the three observation wells shown in figure 54.1 is decribed in the following paragraphs.
Preliminary computations for the ground-water flow system depicted in figure 54.1 indicated that k equals 2.5 (2n+1). For each value of n, the summation on m was computed and multiplied by the sine term. The sum of all the products, one for each n, gave the value of the function.
As the summation on m is the most complicated part of the computations, the procedure followed is described step by step below.
1. The roots akim of Jfc(z)=0, for 0<z<50, were obtained by preparing a graph of Jk(x) versus x, values for which were either computed from the following equation given by McLachlan (1955, p. 193, eq. 54)
(3)
or taken from tables of Jk(x) given by Watson (1962,
p. 740). For x>50, the following equation given by McLachlan (1955, p. 30, eq. 4) was used:
(M-l) 4(M-1) (7/J-31) <xk, m ~P gp 3(8/3)3
32(M-1) (83M2-982M +3779) 15(8/3)6
64(M -l)(6949M3 -153855M2+1585743M -.6277237)105(8/3)7
where(4)
|)x, and
2. Values of Jk(raktTn/a) were obtained from either equation 3 or the specially prepared graph of Jk(x) versus x.
3. Values of Jk-i(<xktTn) were obtained from either equation 3 or a specially prepared graph of J^-^x) versus x.
4. The integral in equation 2 was put to a new form by substituting z for (ak>mt), which yields -the following:
r tjk(ak, mt)dt=4- r*'JO ak,m Jo
For afc>OT<50, the integral in this new form was made to depend on Fresnel's integrals, tables of which are given by Watson (1962, p. 744), and on Bessel func tions of the (jo+^) th order and first kind, by the following two formulas given by Jaeger (1942, p. 532, eq. 19, 20) :
/»z /»z
zJk(z)dz=k Jo Jo
(6)
For afc>OT>50, the integral was evaluated by using equation 6 and the following equation, which was pre sented by McLachlan (1955, p. 91, eq. 7) :
r TJo J
sm __ __ 1 1cos x- Tr-
(8)
After all the individual terms in the summation on m had been evaluated, the value of
k-i (<xk, m)], f 1 tjk(ak, mt)dt (9) Jo
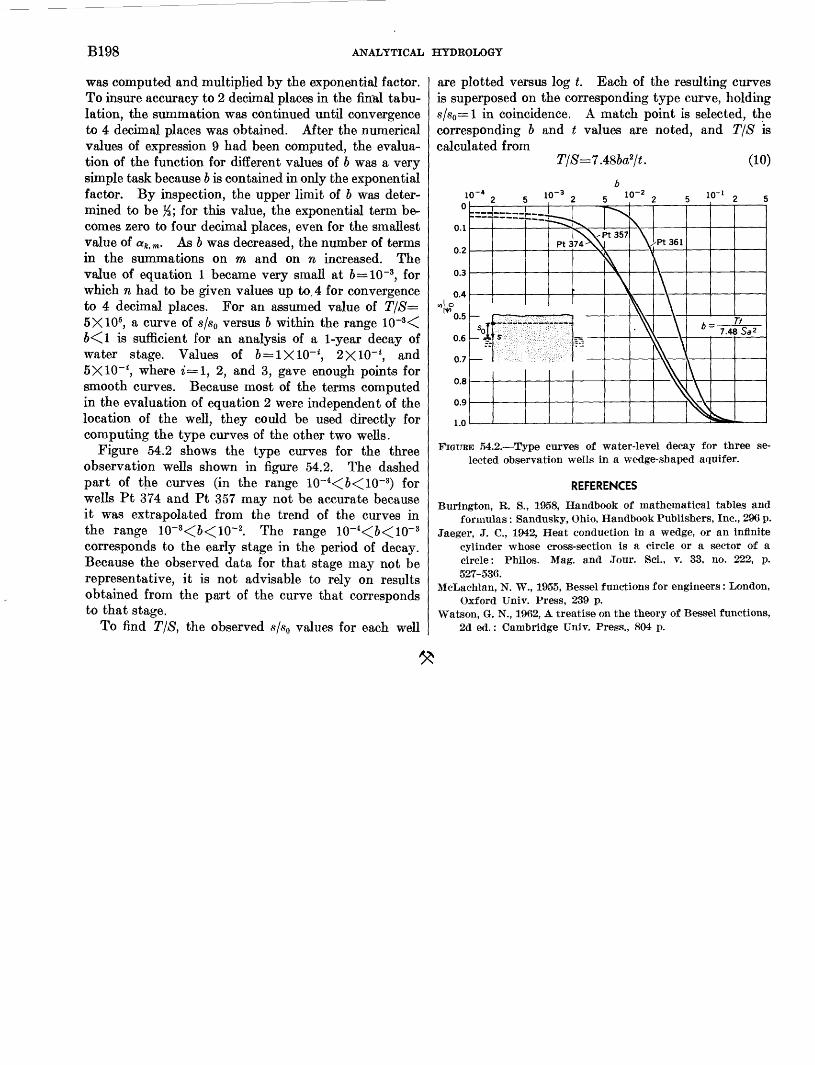
B198 ANALYTICAL HYDROLOGY
was computed and multiplied by the exponential factor. To insure accuracy to 2 decimal places in the final tabu lation, the summation was continued until convergence to 4 decimal places was obtained. After the numerical values of expression 9 had been computed, the evalua tion of the function for different values of 6 was a very simple task because 6 is contained in only the exponential factor. By inspection, the upper limit of 6 was deter mined to be K; for this value, the exponential term be comes zero to four decimal places, even for the smallest value of ak>m . As 6 was decreased, the number of terms in the summations on m and on n increased. The value of equation 1 became very small at 6=10~3, for which n had to be given values up to. 4 for convergence to 4 decimal places. For an assumed value of T/S= 5X10⁵, a curve of s/s0 versus 6 within the range 10~3<C 6<Cl is sufficient for an analysis of a 1-year decay of water stage. Values of 6=1X10-*, 2X10'*, and 5X10"*, where i=l, 2, and 3, gave enough points for smooth curves. Because most of the terms computed in the evaluation of equation 2 were independent of the location of the well, they could be used directly for computing the type curves of the other two wells.
Figure 54.2 shows the type curves for the three observation wells shown in figure 54.2. The dashed part of the curves (in the range 10~4<6<10~3) for wells Pt 374 and Pt 357 may not be accurate because it was extrapolated from the trend of the curves in the range 10-3<6<10~2. The range 10-4<6<10~3 corresponds to the early stage in the period of decay. Because the observed data for that stage may not be representative, it is not advisable to rely on results obtained from the part of the curve that corresponds to that stage.
To find T/S, the observed s/s0 values for each well
are plotted versus log t. Each of the resulting curves is superposed on the corresponding type curve, holding s/s0=l in coincidence. A match point is selected, the corresponding b and t values are noted, and T/S is calculated from
T/S=7A8ba2/t. (10)
10
FIGTJBE 54.2. Type curves of water-level decay for three se lected observation wells in a wedge-shaped aquifer.
REFERENCES
Burington, R. S., 1958, Handbook of mathematical tables and formulas : Sandusky, Ohio, Handbook Publishers, Inc., 296 p.
Jaeger, J. C., 1942, Heat conduction in a wedge, or an infinite cylinder whose cross-section is a circle or a sector of a circle: Philos. Mag. and Jour. Sci., v. 33, no. 222, p. 527-536.
McLachlan, N. W., 1955, Bessel functions for engineers : London, Oxford Univ. Press, 239 p.
Watson, G. N., 1962, A treatise on the theory of Bessel functions, 2d ed.: Cambridge Univ. Press., 804 p.
Article 55
EFFECT OF THE INJECTION SCHEME ON THE SPREAD OF TRACERS IN GROUND-WATER RESERVOIRS
By AKIO OGATA, Honolulu, Hawaii
Abstract. Commonly the dispersion of a tracer or contami nant injected into an isotropic granular medium, in which the regional flow is unidirectional, is attributed primarily to micro scopic velocity variations and ionic diffusion. This is true pro vided the injection scheme neither disturbs nor alters the pre existing flow regime. The effect on the spread of tracers, caused by injection disturbance, is discussed using two examples. The first example concerns injection from an elliptic source-and the second concerns injection from a point source. These examples demonstrate that the spread of tracers caused by these methods of injection may be much larger than the spread due to diffusion.
The spread of tracers or contaminants introduced in to a ground-water system is attributed to dispersion and convection. Dispersion phenomena in isotropic media exist primarily because of microscopic variations in velocity within each capillary tube and what is com monly called molecular diffusion. Some laboratory investigations of dispersion, both transverse and paral lel to the direction of flow, have been examined. In explaining the observed phenomena, no mention is made of the spread of tagged particles that is relatable solely to the potential distribution in the existing flow field. When the analysis concerns one-dimensional dis persion in the direction of flow, consideration need not be given to the natural spread caused by flow from an injection source, or an existing discontinuity in the flow field. However, the effect of the existing injection scheme becomes important in analyzing dispersion transverse to the direction of flow.
In the following discussion it is assumed that the porous medium is isotropic, that conditions are such that two-dimensional analysis is valid, and that the flow of ground-water is unidirectional.
The differential equation describing mass transport from a tracer source into the surrounding ground- water region is analogous to the heat conduction or the diffusion equation with a moving source. One of the boundary conditions commonly postulated is that the head at which the tracer is injected is negligible relative
to the ground-water head near the injection point. -The following discussion attempts to show that the hydro- dynamic conditions governing the flow system near the injection source must be considered before any realistic appraisal can be made of the magnitude of spread due to the diffusive system.
Laboratory analyses (Jacques and Vermeulen, 1957) and statistical analyses (de Josselin de Jong, 1958; Saffman, 1959) show that transverse diffusion is pro portional to the magnitude of the average fluid velocity. This is not surprising since the statistical model assumes existence of a microscopic velocity transverse to the di rection of the head gradient. The prime difficulty is in analyzing the laboratory data from which the angle of spread is determined. In a short laboratory model, alteration of the flow system due to the injection scheme may not have reached an equilibrium state before measurement is made. Under such conditions labora tory data may tend to show a continuous spreading at a given angle, which approximates that of a diffusive process but which may be wholly attributed to hydro- dynamic conditions.
Two examples will serve to illustrate the spreading process. The first example involves a tracer or con taminant source occupying an elliptical region of high permeability within a region of distinctly lower per meability in which the initial areal flow can be de scribed by parallel flow lines. This exemplifies con ditions in a laboratory model, where the cross-sectional area of an injection well may be a relatively large part of the surrounding region. The second example con sists of a point source from which a tracer is injected into a region of parallel flow. This typifies conditions in the field where the wells are essentially points in relation to the overall region.
In the first example it is postulated that parallel areal flow exists at some distance from the elliptic dis continuity. Mathematically, the flow of a tracer from
ART. 55 IN U.S. GEOL. SURVEY PROF. PAPER 475-B, PAGES B199-B202. 1963.
B199
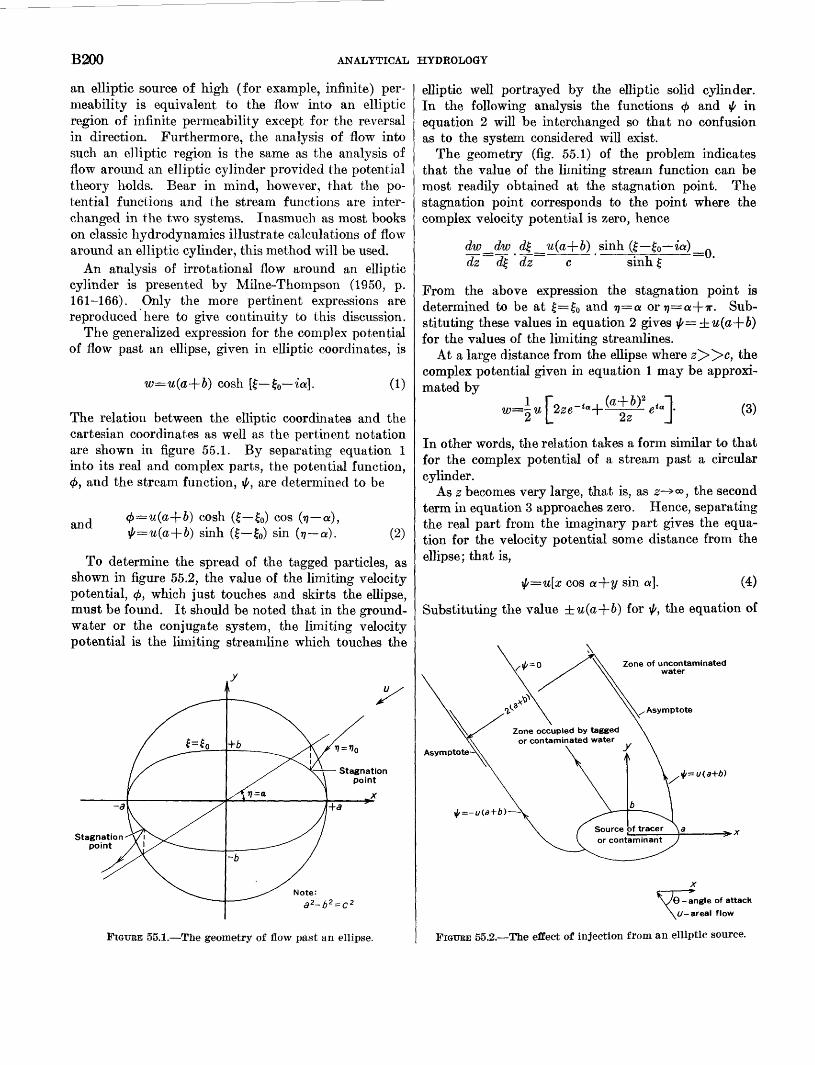
B200 ANALYTICAL HYDROLOGY
an elliptic source of high (for example, infinite) per meability is equivalent to the flow into an elliptic region of infinite permeability except for the reversal in direction. Furthermore, the analysis of flow into such an elliptic region is the same as the analysis of flow around an elliptic cylinder provided the potential theory holds. Bear in mind, however, that the po tential functions and the stream functions are inter changed in the two systems. Inasmuch as most books on classic hydrodynamics illustrate calculations of flow around an elliptic cylinder, this method will be used.
An analysis of irrotational flow around an elliptic cylinder is presented by Milne-Thompson (1950, p. 161-166). Only the more pertinent expressions are reproduced here to give continuity to this discussion.
The generalized expression for the complex potential of flow past an ellipse, given in elliptic coordinates, is
w=u(a-\-b) cosh [£ £0 ia]. (1)
The relation between the elliptic coordinates and the cartesian coordinates as well as the pertinent notation are shown in figure 55.1. By separating equation 1 into its real and complex parts, the potential function, (j>, and the stream function, \f/, are determined to be
and (f>=u(a-\-b) cosh (£ £0) cos (57 0;), $=u(a-\-b} sinh (£ £0) sin (17 a). (2)
To determine the spread of the tagged particles, as shown in figure 55.2, the value of the limiting velocity potential, 0, which just touches and skirts the ellipse, must be found. It should be noted that in the ground- water or the conjugate system, the limiting velocity potential is the limiting streamline which touches the
Stagnation point
FIGURE 55.1. The geometry of flow past an ellipse.
elliptic well portrayed by the elliptic solid cylinder. In the following analysis the functions <£ and ^ in equation 2 will be interchanged so that no confusion as to the system considered will exist.
The geometry (fig. 55.1) of the problem indicates that the value of the limiting stream function can be most readily obtained at the stagnation point. The stagnation point corresponds to the point where the complex velocity potential is zero, hence
dw_dw d% _u(gjrb) sinh (£ £0 io) dz d dz c sinh £
=0.
From the above expression the stagnation point is determined to be at £=£0 and ri=a or ri=ot-\-Tr. Sub stituting these values in equation 2 gives \f/=±u(a-\-b) for the values of the limiting streamlines.
At a large distance from the ellipse where £»c, the complex potential given in equation 1 may be approxi mated by
«?=«'
In other words, the relation takes a form similar to that for the complex potential of a stream past a circular cylinder.
As z becomes very large, that is, as 0 ><» , the second term in equation 3 approaches zero. Hence, separating the real part from the imaginary part gives the equa tion for the velocity potential some distance from the ellipse; that is,
\l/=u[x cos a+2/ sin a]. (4)
Substituting the value ±u(a-\-b) for ^, the equation of
Zone of uncontaminated water
Asymptote
Zone occupied by tagged or contaminated water
/6 - angle of attack
. t/-areal flow
FIGURE 55.2. The effect of injection from an elliptic source.
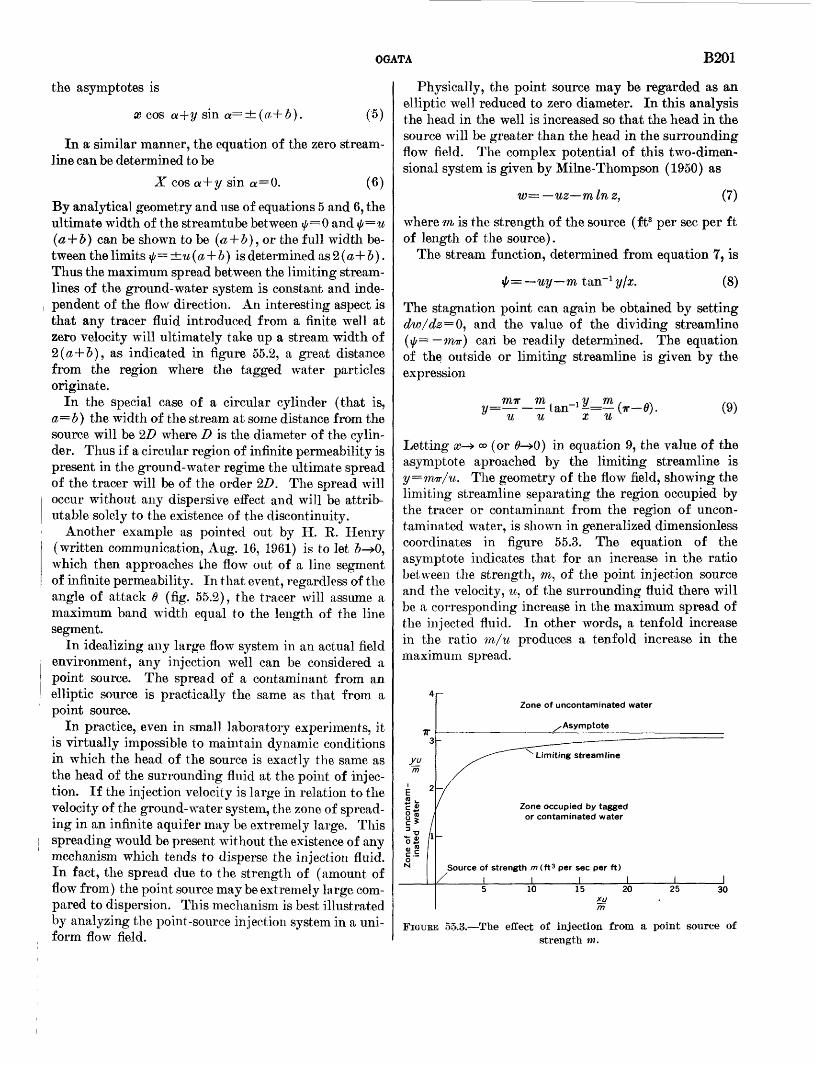
OGATA B201
the asymptotes is
a? cos a+y sin a=±(a+b). (*)
In a similar manner, the equation of the zero stream line can be determined to be
X cos a + y sin a = 0. (6)
By analytical geometry and use of equations 5 and 6, the ultimate width of the streamtube between ^=0 and \]/=u (a + b) can be shown to be (&+ b) , or the full width be tween the limits \]/=±u(a+b) is determined as 2 (a+ b ). Thus the maximum spread between the limiting stream lines of the ground-water system is constant and inde pendent of the flow direction. An interesting aspect is that any tracer fluid introduced from a finite well at zero velocity will ultimately take up a stream width of 2(a+2>), as indicated in figure 55.2, a great distance from the region where the tagged water particles originate.
In the special case of a circular cylinder (that is, a b) the width of the stream at some distance from the source will be 2Z> where D is the diameter of the cylin der. Thus if a circular region of infinite permeability is present in the ground-water regime the ultimate spread of the tracer will be of the order 2Z>. The spread will occur without any dispersive effect and will be attrib utable solely to the existence of the discontinuity.
Another example as pointed out by H. R. Henry (written communication, Aug. 16, 1961) is to let &-»0, which then approaches the flow out of a line segment of infinite permeability. In that event, regardless of the angle of attack 6 (fig. 55.2), the tracer will assume a maximum band width equal to the length of the line segment.
In idealizing any large flow system in an actual field environment, any injection well can be considered a point source. The spread of a contaminant from an elliptic source is practically the same as that from a point source.
In practice, even in small laboratory experiments, it is virtually impossible to maintain dynamic conditions in which the head of the source is exactly the same as the head of the surrounding fluid at the point of injec tion. If the injection velocity is large in relation to the velocity of the ground-water system, the zone of spread ing in an infinite aquifer may be extremely large. This spreading would be present without the existence of any mechanism which tends to disperse the injection fluid. In fact, the spread due to the strength of (amount of flow from) the point source may be extremely large com pared to dispersion. This mechanism is best illustrated by analyzing the point-source injection system in a uni form flow field.
Physically, the point source may be regarded as an elliptic well reduced to zero diameter. In this analysis the head in the well is increased so that the head in the source will be greater than the head in the surrounding flow field. The complex potential of this two-dimen sional system is given by Milne-Thompson (1950) as
w= U2 mlnz, (7)
where m is the strength of the source (ft3 per sec per ft of length of the source).
The stream function, determined from equation 7, is
= uy m tan" 1 y/x. (8)
The stagnation point can again be obtained by setting dw/dz=Q, and the value of the dividing streamline (^= m?r) can be readily determined. The equation of the outside or limiting streamline is given by the expression
TOTT m. _, y m , M y= tan 1 -= (TT 0). u u x u
(9)
Letting a?-» <» (or 0-»0) in equation 9, the value of the asymptote aproached by the limiting streamline is y=mir/u. The geometry of the flow field, showing the limiting streamline separating the region occupied by the tracer or contaminant from the region of uncon- taminated water, is shown in generalized dimensionless coordinates in figure 55.3. The equation of the asymptote indicates that for an increase in the ratio between the strength, m, of the point injection source and the velocity, u, of the surrounding fluid there will be a corresponding increase in the maximum spread of the injected fluid. In other words, a tenfold increase in the ratio in/u produces a tenfold increase in the maximum spread.
Zone of uncontaminated water
___ / Asy m ptote7T
ES >- c «>
Limiting streamline
Zone occupied by tagged or contaminated water
Source of strength m (ft 3 per sec per ft)
10 15 20xu m
25 30
FIGURE 55.3. The effect of injection from a point source of strength m.
B202 ANALYTICAL HYDROLOGY
In conclusion, the injection scheme by which tracers or contaminants are introduced into an aquifer must be considered in order to interpret the results obtained. The neglect of the velocity component in the direction transverse to the regional flow will give reproducible results near the source; however, the description of the mode of mass transport may be erroneous. This is especially true in short laboratory models where the spread caused by the injection source has not reached equilibrium before measurements are taken.
The concentration distribution cannot be obtained from an analysis of the flow system. However, the preceding analysis and discussion points out that the presently calculated mass transfer transverse to the di rection of flow may be due principally to the injection scheme used. Because an equilibrium condition has
not been established near the source, the mass transfer described by the diffusion equation may give a good approximation if the lateral velocity component is in cluded in the dispersion coefficient.
REFERENCES
Jacques, G. L., and Vermeulen, Theodore, 1957, Longitudinaldispersion in solvent-extraction columns Peclet numbersfor ordered and random packings: Calif. Univ. RadiationLab. Kept 8029,152 p.
Josselin de Jong, G. de 1958. Longitudinal and transversediffusion in granular deposits: Am. Geophys. Union Trans.,v. 39, no. 1, p. 67-74.
Milne-Thompson, L. M., 1950, Theoretical hydrodynamics: NewYork, MaeMillan Co., 600 p.
Saffman, P. G., 1959, A theory of dispersion in porous media:Jour. Fluid Mech., v. 6, pt. 3, p. 321-349.
Article 56
EFFECT OF BASE-LEVEL CHANGES ON BEDDING DEVELOPMENT
IN A LABORATORY FLUME
By ALAN V. JOPLING, Cambridge, Mass.
WorJc done in cooperation with Harvard University
Abstract. In a series of flume experiments, the water dis- cjmrge and sediment input were kept constant while the level of the downstream weir was raised at a moderately rapid rate. Ripple and dune bed forms were preserved in the aggrading deposit, and the bedding developed was either irregular, un- dtulose, lenticular, trough shaped, or festoonlike.
The polygenetic development of bedding under dis equilibrium conditions of sediment transport in a labo ratory flume is described qualitatively in this article. Specifically, consideration is given to the effect of a rising base level on the-development of bedding in a rjipple or dune regime. Water discharge and sediment i^iput* are kept constant while base level is raised either continuously or incrementally by an adjustable \jreir at the downstream end of the flume. The genera lized observations recorded here apply to sediment mixes composed mainly of sand sizes, and they relate particularly to the effect of a moderately rapid rise of base level.
\ As an initial postulate, consider that conditions of equilibrium transport prevail before the base level is ifaised. For these conditions there is no net aggradation Or degradation. However, a departure from equilib rium caused by a rise of base level results in a zone of gradually varied flow. This zone may extend to the entrance section of the flume. The transport system then adjusts by aggrading the bed toward a new profile Of equilibrium which is graded to the raised weir level.
For small departures from equilibrium caused by a Slowly rising base level, the mechanics of bedding for- ijnation generally conforms to the description by Ein- ^tein and Chien (1953). The movement of ripples or (jlunes during the process of aggradation results in a
1 Sediment introduced from a dry-feed hopper; the apparatus has been described by the author (1960) in an experimental study on the Mechanics of bedding, Harvard Univ. Ph. D. thesis, 358 p.
deposit characterized by a sequence of regular, undula- tory, or irregular laminae with sporadic "pockets" of ripple or dune cross-lamination. Here the mechanics of deposition is related to the operation of form-drag processes (Jopling, 1963).
In contrast to this mode of deposition, a large depar ture from equilibrium triggered by a rapid and rela tively large rise of base level initiates a new cycle of deposition and culminates in a tabular deposit of ag- gradational ("deltaic") crossbedding. This type of crossbedding is characterized by topset, foreset, and bottomset components, and it has been described in several laboratory studies on delta building, including those of McKee (1957) and Jopling (1962).
For the intermediate case considered in this article, the departure from equilibrium is caused by a moder ately rapid rise of base level of either a steady or incre mental nature. Under such conditions there is a pro gressive increase in water depth concomitant with a decrease in stream velocity. The transport system is in a state of disequilibrium, and aggradation is at a maxi mum in the upstream reach of the channel where the backwater effect is least in evidence.
The configuration of the bed is continually remolded as successive ripples or dunes override and partly as similate their predecessors in the depositional sequence (fig. 56.1). Some ripples or dunes may even be buried intact in this aggrading sequence. For periodic incre mental rises of base level the longitudinal profile of the bed may divide into several segments or reaches, there by imparting a steplike appearance to the profile. Each segment represents the establishment of a rudimentary transport slope more or less commensurate with the local flow conditions in the downstream direction.
In summary, therefore, the superposition of ripples or dunes results in a complex bedding pattern char-
ART. 56 IN U.S. GEOL. SURVEY PROF. PAPER 475-B, PAGES B203-B204. 1963.
B203
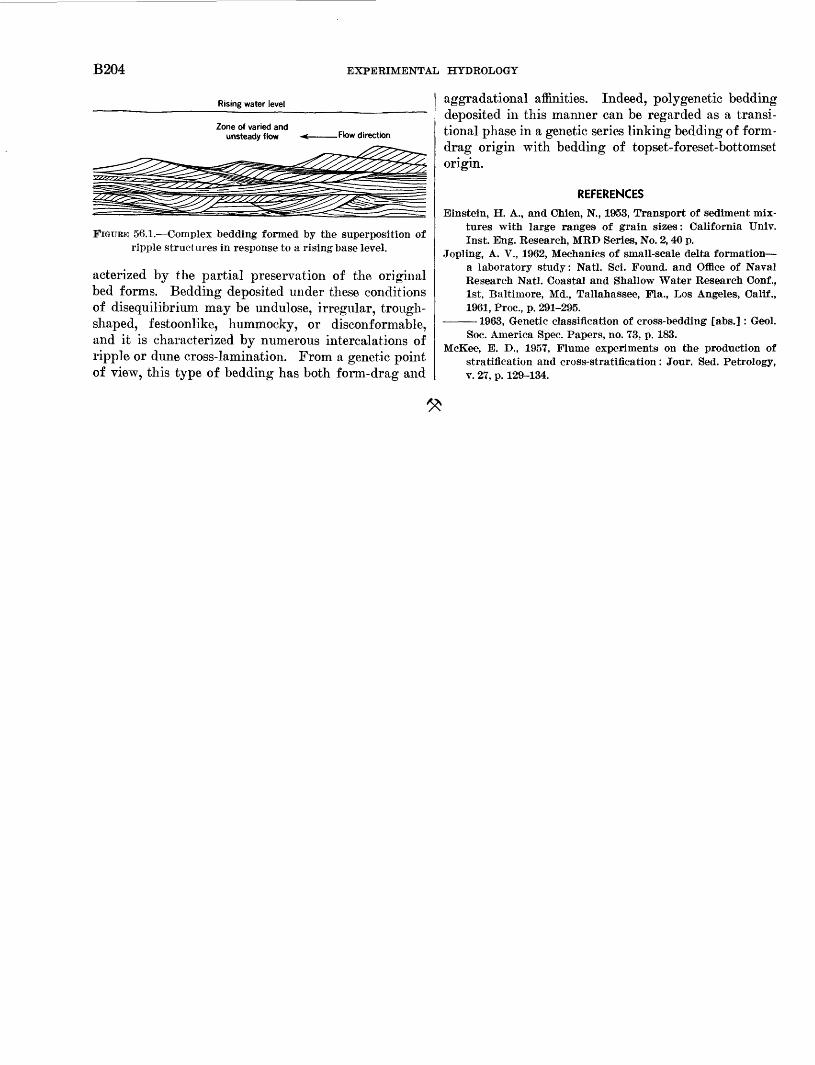
B204 EXPERIMENTAL HYDROLOGY
Rising water level
Zone of varied and unsteady flow Flow direction
FIGURE 56.1. Complex bedding formed by the superposition of ripple structures in response to a rising base level.
acterized by the partial preservation of the original bed forms. Bedding deposited under these conditions of disequilibrium may be undulose, irregular, trough- shaped, festoonlike, hummocky, or disconformable, and it is characterized by numerous intercalations of ripple or dune cross-lamination. From a genetic point of view, this type of bedding has both form-drag and
aggradational affinities. Indeed, polygenetic bedding deposited in this manner can be regarded as a transi tional phase in a genetic series linking bedding of form- drag origin with bedding of topset-foreset-bottomset origin.
REFERENCESEinstein, H. A., and Chien, N, 1953, Transport of sediment mix
tures with large ranges of grain sizes: California Univ. Inst. Eng. Research, MRD Series, No. 2,40 p.
Jopling, A. V., 1962, Mechanics of small-scale delta formation a laboratory study: Natl. Sci. Found, and Office of Naval Research Natl. Coastal and Shallow Water Research Conf., 1st, Baltimore, Md., Tallahassee, Fla., Los Angeles, Calif., 1961, Proc., p. 291-295.
1963, Genetic classification of cross-bedding [abs.]: Geol. Soc. America Spec. Papers, no. 73, p. 183.
McKee, E. D., 1957, Flume experiments on the production of stratification and cross-stratification: Jour. Sed. Petrology, v. 27, p. 129-134.
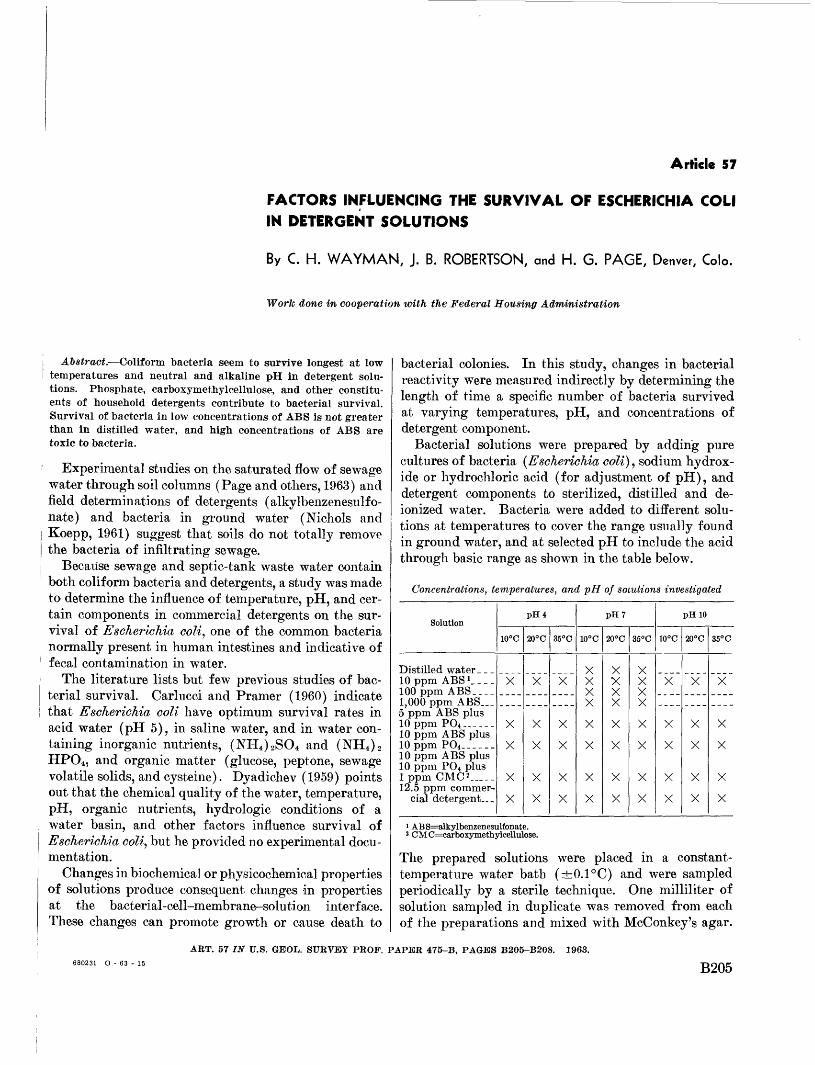
Article 57
FACTORS INFLUENCING THE SURVIVAL OF ESCHERICHIA COLI IN DETERGENT SOLUTIONS
By C. H. WAYMAN, J. B. ROBERTSON, and H. G. PAGE, Denver, Colo.
Work done in cooperation with the Federal Housing Administration
Abstract. Coliform bacteria seem to survive longest at low temperatures and neutral and alkaline pH in detergent solu tions. Phosphate, carboxymethylcellulose, and other constitu ents of household detergents contribute to bacterial survival. Survival of bacteria in low concentrations of ABS is not greater than in distilled water, and high concentrations of ABS are toxic to bacteria.
Experimental studies on the saturated flow of sewage water through soil columns (Page and others, 1963) and field determinations of detergents (alkylbenzenesulfo- nate) and bacteria in ground water (Nichols and Koepp, 1961) suggest that soils do not totally remove the bacteria of infiltrating sewage.
Because sewage and septic-tank waste water contain both coliform bacteria and detergents, a study was made to determine the influence of temperature, pH, and cer tain components in commercial detergents on the sur vival of EscJiericJda coli, one of the common bacteria normally present in human intestines and indicative of fecal contamination in water.
The literature lists but few previous studies of bac terial survival. Carlucci and Pramer (1960) indicate that Escherichia coll have optimum survival rates in acid water (pH 5), in saline water, and in water con taining inorganic nutrients, (NH4 ) 2SO4 and (NH4 ) 2 HPO4 , and organic matter (glucose, peptone, sewage volatile solids, and cysteine). Dyadichev (1959) points out that the chemical quality of the water, temperature, pH, organic nutrients, hydrologic conditions of a water basin, and other factors influence survival of EscJierichia coli, but he provided no experimental docu mentation.
Changes in biochemical or physicochemical properties of solutions produce consequent changes in properties at the bacterial-cell-membrane-solution interface. These changes can promote growth or cause death to
bacterial colonies. In this study, changes in bacterial reactivity were measured indirectly by determining the length of time a specific number of bacteria survived at varying temperatures, pH, and concentrations of detergent component.
Bacterial solutions were prepared by adding pure cultures of bacteria (E schericMa coli) , sodium hydrox ide or hydrochloric acid (for adjustment of pH), and detergent components to sterilized, distilled and de- ionized water. Bacteria were added to different solu tions at temperatures to cover the range usually found in ground water, and at selected pH to include the acid through basic range as shown in the table below.
Concentrations, temperatures, and pH of solutions investigated
Solution
Distilled water _10 ppm ABS i_ - _ -100 ppm ABS____1,000 ppm ABS.._5 ppm ABS plus10 ppm PO4 -_-10 ppm ABS plus10 ppm PO4 ----_-10 ppm ABS plus10 ppm PO4 plus1 ppm CMC *.._.-12.5 ppm commer
cial detergent.. _
10°C
X
X
X
X
X
pH4
20°C
X
X
X
X
X
35°0
X
X
X
X
X
10°C
XXXX
X
X
X
X
pH7
20°C
XXXX
X
X
X
X
35°C
XXXX
X
X
X
X
10°C
X
X
X
X
X
pHIO
20°C
X
X
X
X
X
35° C
X
X
X
X
X
1 ABS=alkylbenzenesulfonate.2 CMC=carboxymethylcellulose.
The prepared solutions were placed in a constant- temperature water bath (±0.1°C) and were sampled periodically by a sterile technique. One milliliter of solution sampled in duplicate was removed from each of the preparations and mixed with McConkey's agar.
ART. 57 IN U.S. GEOL. SURVEY PROF. PAPER 475-B, PAGES B205-B208. 1963.680231 O - 63 - 15 B205
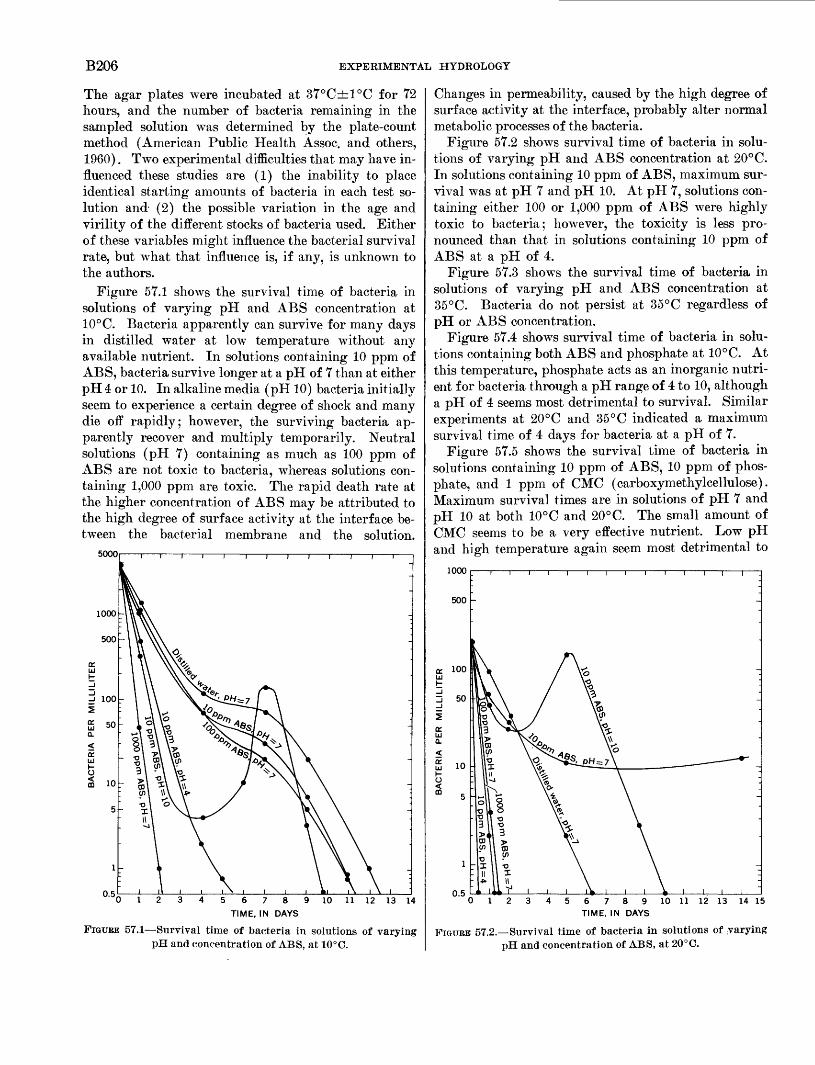
B206 EXPERIMENTAL HYDROLOGY
The agar plates were incubated at 37°C±1°C for 72 hours, and the number of bacteria remaining in the sampled solution was determined by the plate-count method (American Public Health Assoc. and others, 1960). Two experimental difficulties that may have in fluenced these studies are (1) the inability to place identical starting amounts of bacteria in each test so lution and (2) the possible variation in the age and virility of the different stocks of bacteria used. Either of these variables might influence the bacterial survival rate, but what that influence is, if any, is unknown to the authors.
Figure 57.1 shows the survival time of bacteria in solutions of varying pH and ABS concentration at 10°C. Bacteria apparently can survive for many days in distilled water at low temperature without any available nutrient. In solutions containing 10 ppm of ABS, bacteria survive longer at a pH of 7 than at either pH 4 or 10. In alkaline media (pH 10) bacteria initially seem to experience a certain degree of shock and many die off rapidly; however, the surviving bacteria ap parently recover and multiply temporarily. Neutral solutions (pH 7) containing as much as 100 ppm of ABS are not toxic to bacteria, whereas solutions con taining 1,000 ppm are toxic. The rapid death rate at the higher concentration of ABS may be attributed to the high degree of surface activity at the interface be tween the bacterial membrane and the solution.
5000
0 1 2 3 4 5 6 7 8 9 10 11 12 13 14 TIME, IN DAYS
FIGUEE 57.1 Survival time of bacteria in solutions of varying pH and concentration of ABS, at 10°C.
Changes in permeability, caused by the high degree of surface activity at the interface, probably alter normal metabolic processes of the bacteria.
Figure 57.2 shows survival time of bacteria in solu tions of varying pH and ABS concentration at 20°C. In solutions containing 10 ppm of ABS, maximum sur vival was at pH 7 and pH 10. At pH 7, solutions con taining either 100 or 1,000 ppm of ABS were highly toxic to bacteria; however, the toxicity is less pro nounced than that in solutions containing 10 ppm of ABS at a pH of 4.
Figure 57.3 shows the survival time of bacteria in solutions of varying pH and ABS concentration at 35°C. Bacteria do not persist at 35°C regardless of pH or ABS concentration.
Figure 57.4 shows survival time of bacteria in solu tions containing both ABS and phosphate at 10°C. At this temperature, phosphate acts as an inorganic nutri ent for bacteria through a pH range of 4 to 10, although a pH of 4 seems most detrimental to survival. Similar experiments at 20°C and 35°C indicated a maximum survival time of 4 days for bacteria at a pH of 7.
Figure 57.5 shows the survival time of bacteria in solutions containing 10 ppm of ABS, 10 ppm of phos phate, and 1 ppm of CMC (carboxymethylcellulose). Maximum survival times are in solutions of pH 7 and pH 10 at both 10°C and 20°C. The small amount of CMC seems to be a very effective nutrient. Low pH and high temperature again seem most detrimental to
1000
500
100
j 50
0 1 2 3 45 6 7 8 9 10 11 12 13 14 15 TIME, IN DAYS
FIGURE 57.2. Survival time of bacteria in solutions of .varying pH and concentration of ABS, at 20°C.
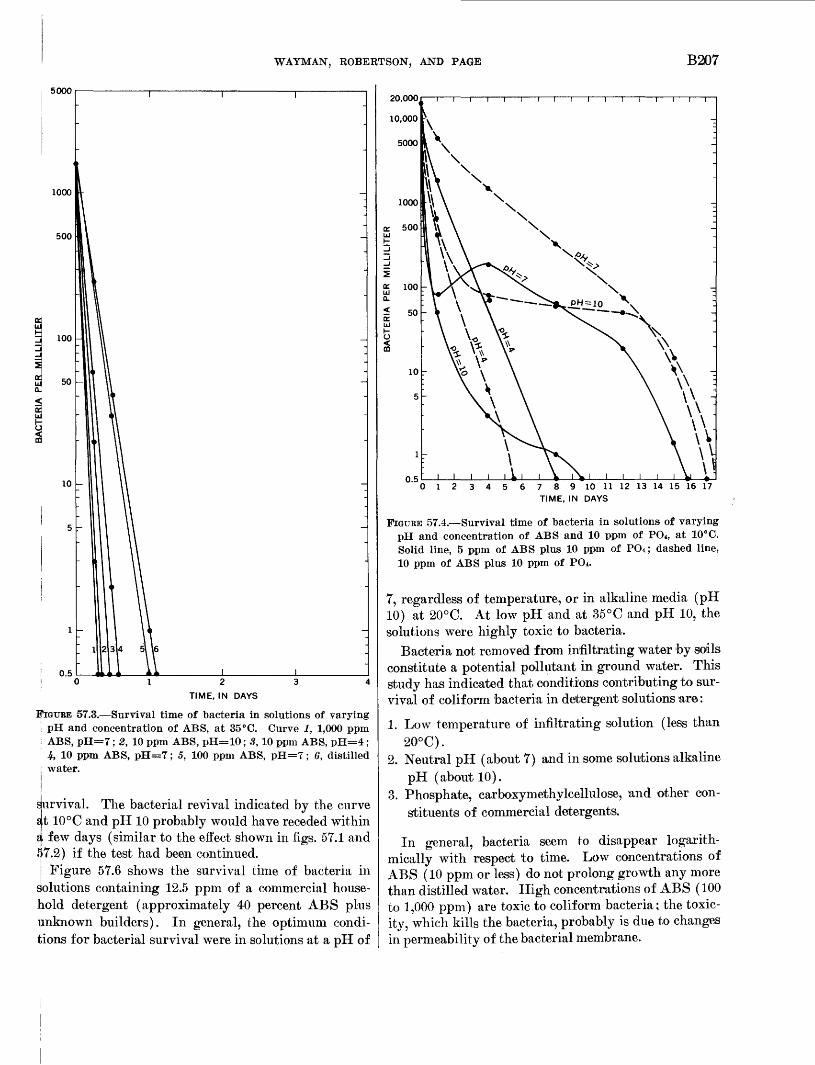
WAYMAN, ROBERTSON, AND PAGE B207
5000
1000
500
100
10
TIME, IN DAYS
FIGURE 57.3. Survival time of bacteria in solutions of varying i pH and concentration of ABS, at 35 °C. Curve 1, 1,000 ppm [ ABS, pH=7; 2, 10 ppm ABS, pH=10; 3, 10 ppm ABS, pH=4;
4, 10 ppm ABS, pH=7; 5, 100 ppm ABS, pH=7; 6, distilledwater.
urvival. The bacterial revival indicated by the curve si 10°C and pH 10 probably would have receded within
, few days (similar to the effect shown in figs. 57.1 and7.2) if the test had been continued. Figure 57.6 shows the survival time of bacteria in
olutions containing 12.5 ppm of a commercial house hold detergent (approximately 40 percent ABS plus ijmknown builders). In general, the optimum condi tions for bacterial survival were in solutions at a pH of
20,000
3 4 7 8 9 10 11 12 13 14 15 16 17 TIME, IN DAYS
FIGURE 57.4. Survival time of bacteria in solutions of varying pH and concentration of ABS and 10 ppm of PO*, at 10°C. Solid line, 5 ppm of ABS plus 10 ppm of PO*; dashed line, 10 ppm of ABS plus 10 ppm of PO*.
7, regardless of temperature, or in alkaline media (pH 10) at 20°C. At low pH and at 35°C and pH 10, the solutions were highly toxic to bacteria.
Bacteria not removed from infiltrating water by soils constitute a potential pollutant in ground water. This study has indicated that conditions contributing to sur vival of coliform bacteria in detergent solutions are:
1. Low temperature of infiltrating solution (less than 20°C).
2. Neutral pH (about 7) and in some solutions alkaline pH (about 10).
3. Phosphate, carboxymethylcellulose, and other con stituents of commercial detergents.
In general, bacteria seem to disappear logarith mically with respect to time. Low concentrations of ABS (10 ppm or less) do not prolong growth any more than distilled water. High concentrations of ABS (100 to 1,000 ppm) are toxic to coliform bacteria; the toxic- ity, which kills the bacteria, probably is due to changes in permeability of the bacterial membrane.
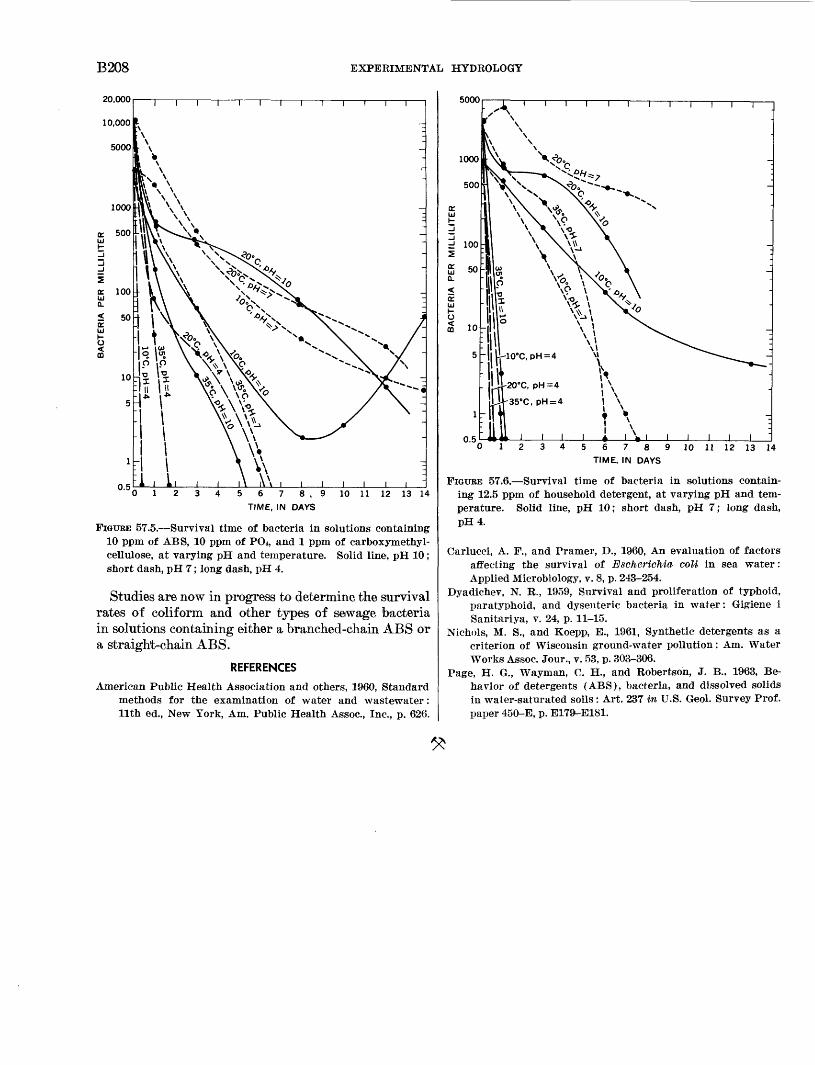
B208 EXPERIMENTAL HYDROLOGY
8,9 10 11 12 13 14
FIGURE 57.5. Survival time of bacteria in solutions containing 10 ppm of ABS, 10 ppm of POi, and 1 ppm of carboxymethyl- cellulose, at varying pH and temperature. Solid line, pH 10; short dash, pH 7; long dash, pH 4.
Studies are now in progress to determine the survival rates of coliform and other types of sewage bacteria in solutions containing either a branched-chain ABS or a straight-chain ABS.
REFERENCES
American Public Health Association and others, 1960, Standard methods for the examination of water and wastewater: llth ed., New York, Am. Public Health Assoc., Inc., p. 626.
5000
56789
TIME, IN DAYS10 11 12 13 14
FIGURE 57.6. Survival time of bacteria in solutions contain ing 12.5 ppm of household detergent, at varying pH and tem perature. Solid line, pH 10; short dash, pH 7; long dash, pH4.
Carlucci, A. F., and Pramer, D., 1960, An evaluation of factors affecting the survival of Escherichia coli in sea water: Applied Microbiology, v. 8, p. 243-254.
Dyadichev, N. R., 1959, Survival and proliferation of typhoid, paratyphoid, and dysenteric bacteria in water: Gigiene i Sanitariya, v. 24, p. 11-15.
Nichols, M. S., and Koepp, E., 1961, Synthetic detergents as a criterion of Wisconsin ground-water pollution: Am. Water Works Assoc. Jour., v. 53, p. 303-306.
Page, H. G., Wayman, C. H., and Robertson, J. B., 1963, Be havior of detergents (ABS), bacteria, and dissolved solids in water-saturated soils : Art. 237 in U.S. Geol. Survey Prof, paper 450-E, p. E179-E181.
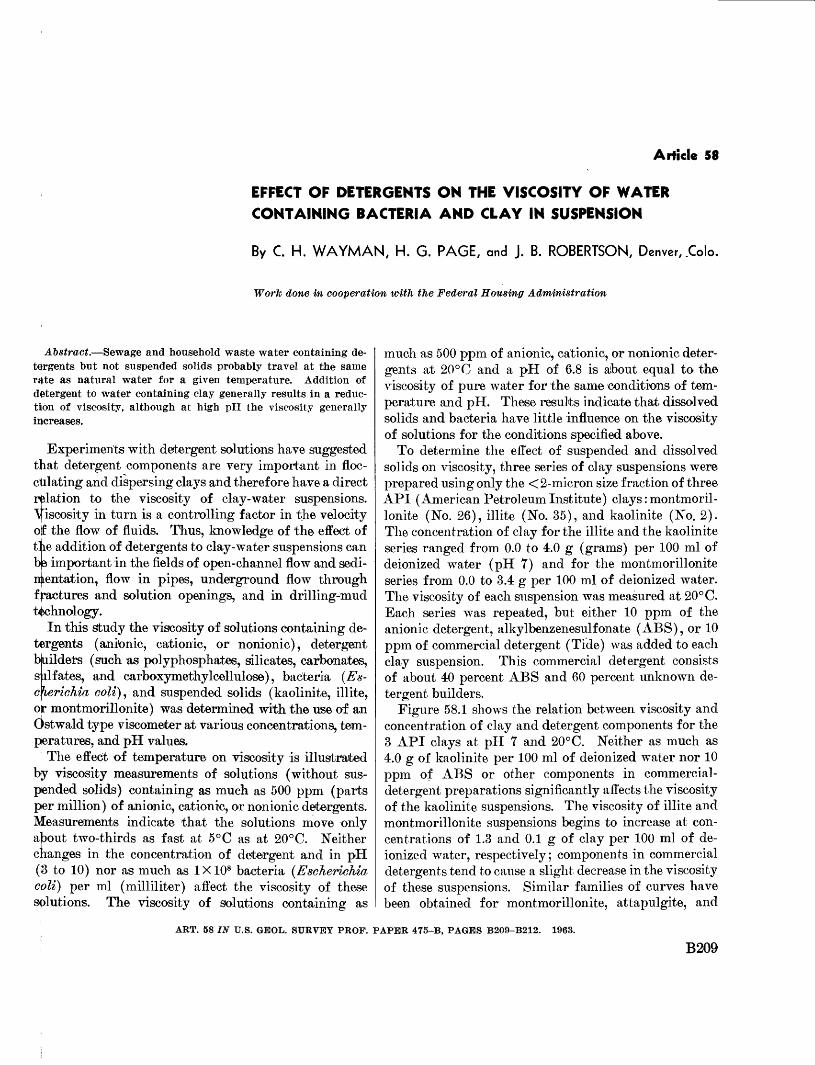
Article 58
EFFECT OF DETERGENTS ON THE VISCOSITY OF WATER CONTAINING BACTERIA AND CLAY IN SUSPENSION
By C. H. WAYMAN, H. G. PAGE, and J. B. ROBERTSON, Denver, .Colo.
Work done in cooperation with the Federal Housing Administration
Abstract. Sewage and household waste water containing de tergents but not suspended solids probably travel at the same rate as natural water for a given temperature. Addition of detergent to water containing clay generally results in a reduc tion of viscosity, although at high pH the viscosity generally increases.
Experiments with detergent solutions have suggested that detergent components are very important in floc culating and dispersing clays and therefore have a direct relation to the viscosity of clay-water suspensions. Viscosity in turn is a controlling factor in the velocity of the flow of fluids. Thus, knowledge of the effect of tl le addition of detergents to clay-water suspensions can ba important in the fields of open-channel flow and sedi mentation, flow in pipes, underground flow through fractures and solution openings, and in drilling-mud technology.
In this study the viscosity of solutions containing de tergents (ankmic, cationic, or nonionic), detergent builders (such as polyphosphates, silicates, carbonates, silfates, and carboxymethylcellulose), bacteria (Es- c^ierichia coli}^ and suspended solids (kaolinite, illite, or montmorillonite) was determined with the use of an Qstwald type viscometer at various concentrations, tem peratures, and pH values.
The effect of temperature on viscosity is illustrated by viscosity measurements of solutions (without sus pended solids) containing as much as 500 ppm (parts per million) of anionic, cationic, or nonionic detergents. IVfeasurements indicate that the solutions move only about two-thirds as fast at 5°C as at 20°C. Neither changes in the concentration of detergent and in pH (3 to 10) nor as much as 1X10⁸ bacteria (EscJierichia. coli] per ml (milliliter) affect the viscosity of these solutions. The viscosity of solutions containing as
much as 500 ppm of anionic, cationic, or nonionic deter gents at 20°0 and a pH of 6.8 is about equal to the viscosity of pure water for the same conditions of tem perature and pH. These results indicate that dissolved solids and bacteria have little influence on the viscosity of solutions for the conditions specified above.
To determine the effect of suspended and dissolved solids on viscosity, three series of clay suspensions were prepared using only the <2-micron size fraction of three API (American Petroleum Institute) clays: montmoril lonite (No. 26), illite (No. 35), and kaolinite (No. 2). The concentration of clay for the illite and the kaolinite series ranged from 0.0 to 4.0 g (grams) per 100 ml of deionized water (pH 7) and for the montmorillonite series from 0.0 to 3.4 g per 100 ml of deionized water. The viscosity of each suspension was measured at 20° C. Each series was repeated, but either 10 ppm of the anionic detergent, alkylbenzenesulfonate (ABS), or 10 ppm of commercial detergent (Tide) was added to each clay suspension. This commercial detergent consists of about 40 percent ABS and 60 percent unknown de tergent builders.
Figure 58.1 shows the relation between viscosity and concentration of clay and detergent components for the 3 API clays at pH 7 and 20°C. Neither as much as 4.0 g of kaolinite per 100 ml of deionized water nor 10 ppm of ABS or other components in commercial- detergent preparations significantly affects the viscosity of the kaolinite suspensions. The viscosity of illite and montmorillonite suspensions begins to increase at con centrations of 1.3 and 0.1 g of clay per 100 ml of de- ionized water, respectively; components in commercial detergents tend to cause a slight decrease in the viscosity of these suspensions. Similar families of curves have been obtained for montmorillonite, attapulgite, and
ART. 58 IN U.S. GBOL. SURVEY PROF. PAPER 475-B, PAGES B209-B212. 1963.
B209
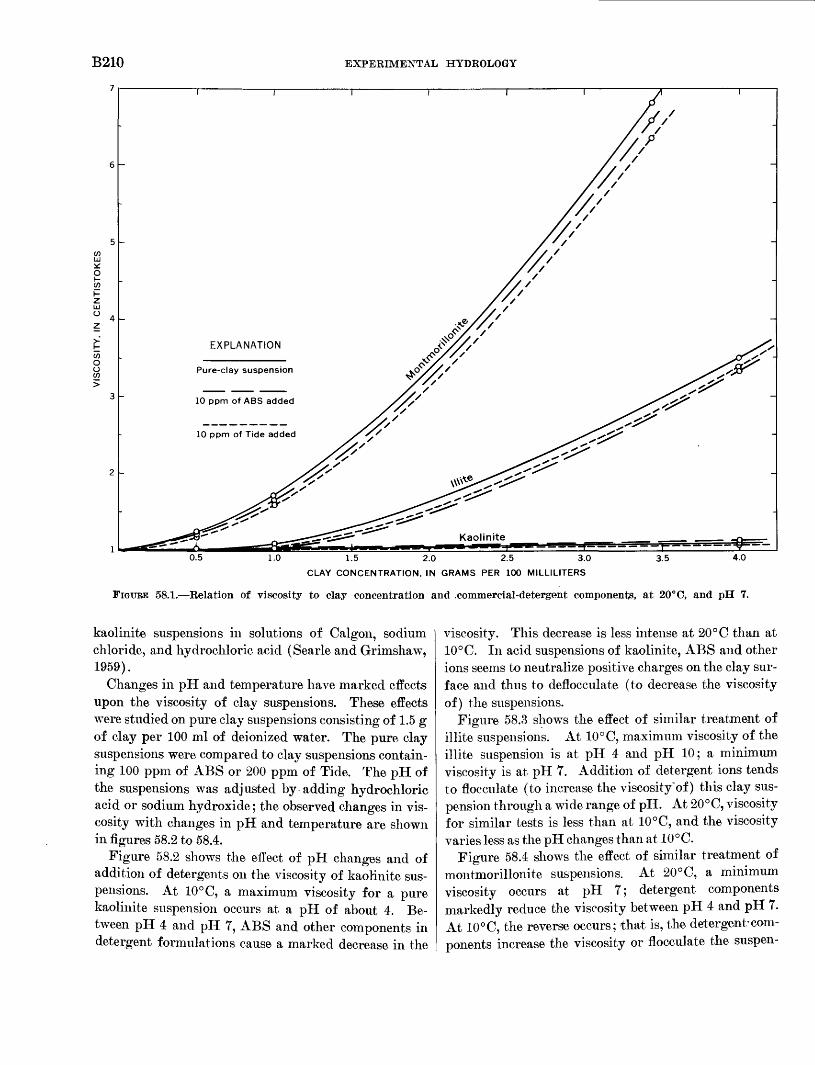
B210 EXPERIMENTAL HYDROLOGY
EXPLANATION
Pure-clay suspension
10 ppm of ABS added
10 ppm of Tide added
0.5 1.0 1.5 2.0 2.5 3.0
CLAY CONCENTRATION, IN GRAMS PER 100 MILLILITERS
3.5
FIGURE 58.1. Relation of viscosity to clay concentration and .commercial-detergent components, at 20°C, and pH 7.
kaolinite suspensions in solutions of Calgon, sodium chloride, and hydrochloric acid (Searle and Grimshaw, 1959).
Changes in pH and temperature have marked effects upon the viscosity of clay suspensions. These effects were studied on pure clay suspensions consisting of 1.5 g of clay per 100 ml of deionized water. The pure clay suspensions were compared to clay suspensions contain ing 100 ppm of ABS or 200 ppm of Tide. The pH of the suspensions was adjusted by adding hydrochloric acid or sodium hydroxide; the observed changes in vis cosity with changes in pH and temperature are shown in figures 58.2 to 58.4.
Figure 58.2 shows the effect of pH changes and of addition of detergents on the viscosity of kaolinite sus pensions. At 10° C, a maximum viscosity for a pure kaolinite suspension occurs at a pH of about 4. Be tween pH 4 and pH 7, ABS and other components in detergent formulations cause a marked decrease in the
viscosity. This decrease is less intense at 20°C than at 10°C. In acid suspensions of kaolinite, ABS and other ions seems to neutralize positive charges on the clay sur face and thus to deflocculate (to decrease the viscosity of) the suspensions.
Figure 58.3 shows the effect of similar treatment of illite suspensions. At 10°C, maximum viscosity of the illite suspension is at pH 4 and pH 10; a minimum viscosity is at pH 7. Addition of detergent ions tends to flocculate (to increase the viscosity'of) this clay sus pension through a wide range of pH. At 20°C, viscosity for similar tests is less than at 10°C, and the viscosity varies less as the pH changes than at 10°C.
Figure 58.4 shows the effect of similar treatment of montmorillonite suspensions. At 20°C, a minimum viscosity occurs at pH 7; detergent components markedly reduce the viscosity between pH 4 and pH 7. At 10°C, the reverse occurs; that is, the detergent-com ponents increase the viscosity or flocculate the suspen-

WAYMAN, PAGE, AND ROBEETSON B211
FIGUBE 58.2. Relation of the viscosity of kaolinite suspensions to pH and commercial-detergent components, at 10°C and 20°C.
FIGUBE 58.3. Relation of viscosity of illite suspensions to pH 1 and commercial-detergent components, at 10°C and 20°C.
Sion. Earlier studies on purified montmorillonite [(Street, 1958) indicated the general trend observed at 10°C, but not at 20°C.
4.40-
4.00 -
3.60 -
g 3.20 r-
t 2.80 -
2.40 -
2.00 -
Montmorillonite + 200 ppm Tide 10°c
(read right scale)
FIGUEE 58.4. Relation of viscosity of montmorillonite sus pensions to pH and commercial-detergent components, at 10°C and 20°C.
The results of the viscosity tests on montmorillonite suspensions are difficult to understand. However, pre vious investigators have indicated that the viscosity of clay suspensions can be explained in terms of electro- kinetic phenomena with use of the Gouy-Freundlich diffuse double-layer concept and van der Waals at tractive forces at the clay particle-solution interface. The concentration of the clay suspension (Coughanour and Norton, 1949), surface area of the clay (Johnson and Lawrence, 1942), and electrolytes in solution (Hau- ser and Hirshon, 1939; Speil, 1940; Johnson and Nor ton, 1941; and Kingery, 1951) influence electrical properties at the clay particle-solution interface and produce changes in the viscosity of clay suspensions. The role played by surface tension alone, neglecting ionic effects, is of dubious importance in the viscosity of clay suspensions. Schwartz (1952) and Kingery and Francl (1954) suggest that wetting agents (detergents and surfactants) decrease the viscosity of clay suspen sions. However, a detailed study of wetting agents in clay suspensions (Ormsby, 1960) indicated that sur face tension seems to have only a minor effect upon the viscosity of clay suspensions. Several variables, some of which could not be considered in this study, influence the viscosity of clay suspensions. Apparently, a greater number of these variables affected the viscosity of mont morillonite suspensions to a greater extent than they affected the viscosity of suspensions of either kaolinite or illite.
B212 EXPERIMENTAL HYDROLOGY
Commercial-detergent components in kaolinite or il- lite clay suspensions slightly decrease and slightly in crease the respective viscosities of these two clay suspensions as compared to the viscosity of water at the same temperature. At 10° C and pH 7, commercial- detergent components in montmorillonite suspensions can increase the viscosity to as much as 25 times that of water. This study has shown that the viscosity of clay suspensions depends on the composition of the clay, pHy temperature, and electrolytes (builders) in detergent formulations.
Because sewage and household waste water contain ing detergents, but no suspended solids, have a viscosity similar to that of pure water, these solutions probably travel at the same rate as water, for a given tempera ture. However, waste water containing clay in sus pension, especially montmorillonite, can be as much as 25 times less mobile than similar water containing no suspended solids, for the conditions mentioned in this article. Thus, the flow of clay-water suspensions can be greatly altered by the presence of detergent com ponents which may have significant influence in many areas of fluid-flow studies.
REFERENCES
Coughanour, L. W., and Norton, F. H., 1949, Influence of particle shape on properties of suspensions, pt. 9 of Funda mental study of clay: Am. Ceramic Soc. Jour., v. 32, p. 129-132.
Hauser, E. A., and Hirshon, S., 1939, Behavior of colloidal sus pensions with electrolytes: Phys. Chemistry Jour., v. 43, p. 1015-1036.
Johnson, A. L., and Lawrence, W. G., 1942, Surface area and its effect on exchange capacity of kaolinite, pt. 4 of Funda mental study of clay: Am. Ceramic Soc. Jour., v. 25, p. 344-346.
Johnson, A. L., and Norton, F. H., 1941, Mechanism of defloc- culation of the clay-water system, pt. 2 of Fundamental study of clay: Am. Ceramic Soc. Jour., v. 24, p. 189-203.
Kingery, W. D., 1951, Note on effect of fluoride ions on a clay suspension, pt. 11 of Fundamental study of clay: Am. Ceramic Soc. Jour., v. 34, p. 242-244.
Kingery, W. D., and Francl, J., 1954, Drying behavior and plastic properties, pt. 13 of Fundamental study of clay: Am. Ceramic Soc. Jour., v. 37, p. 596-602.
Ormsby, W. C., 1960, The role of surface tension in determining certain clay-water properties: Ceramic Bull., v. 39, p. 408-^12.
Schwartz, B., 1952, Note on effect of surface tension of water on plasticity of clay, pt. 12 of Fundamental study of clay: Am. Ceramic Soc. Jour., v. 35, p. 41-43.
Searle, A. B., and Grimshaw, R. W., 1959, The chemistry and physics of clays and other ceramic materials: New York, Interscience Publishers, Inc., p. 458 162.
Speil, S., 1940, Effect of adsorbed electrolytes on properties of monodlsperse clay-water systems: Am. Ceramic Soc. Jour., v. 23, p. 33^38.
Street, N., 1958, Viscosity of clay suspensions : World Oil, v. 147, p. 151-156.

Article 59
ADSORPTION OF THE SURFACTANT ABS35 ON MONTMORILLONITE
By C. H. WAYMAN, J. B. ROBERTSON, and H. G. PAGE, Denver, Colo.
Work done in cooperation with the Federal Housing Administration
Abstract. A radiochemical-tracer technique was used to study the adsorption of ABS (alkylbenzenesulfonate) on montmoril lonite. This adsorption is influenced by length of the alkyl chain, by pH, by phosphate in solution, and by amount and type of ionic salts in solution.
1 Incompletely degradable surfactants injected into the ground in household waste water have in many areas polluted ground-water supplies. One of the nat- tural means by which these surfactants are removed from waste water is by their adsorption on soil miner als. A previous paper (Wayman and others, 1962) de scribed the adsorption of alkylbenzenesulfonate tagged with S35 (ABS35 ), an essential incompletely degradable surfactant in detergents, on kaolinite. A similar study
j in which montmorillonite was substituted for kaolinite 1 is described in this article.
A radiochemical-tracer technique identical to that used in the kaolinite study (Wayman and others, 1962) was used in the montmorillonite study. The effects of such variables as alkyl chain length (Ci 2 and C15 ), pH, phosphate ion, and type and amount of dissolved ionic salts (NaCl, OaCl2 , or A1C13 ) on ABS adsorption by m'ontmorillonite were studied. ABS can be represented in solution as
where K represents the alkyl chain.The preparation of the montmorillonite and the
experimental procedures used were identical to the procedures used in the study of kaolinite. The mont morillonite used was the standard clay mineral (No. 26) of the American Petroleum Institute. The com position of the mineral can be represented by
(Si3 . 91 A10. 09 0. i 6Mgo.33)O10(OH)2 .
Nan on ( -=-
Microscopic examination indicates that it contains about 7.0 percent quartz and feldspar (orthoclase and albite) and 2.0 percent glauconite. Its cation-exchange capacity is 99.0 milliequivalents per 100 grams, and the pH of a suspension of 200 milligrams of the clay in 35 ml (milliliters) of distilled water is about 7.5.
Figure 59.1 shows that both pH and length of the al kyl chain significantly influence the adsorption of ABS from solutions containing 4 ppm (parts per million) of the detergent. The adsorption of dodecyl (C12 ) ABS is insignificant at a pH of 4,7, or 10. Pentadecyl (C15 ) ABS is adsorbed readily at pH 4 and 7 and to a lesser extent at pH 10; however, maximum adsorption at pH 7 seems to occur in about 7 days and desorption occurs therafter. After 14 days, adsorption at pH 7 is only slightly greater than adsorption at pH 10.
The dependence of adsorption on molecular weight, as found in this study, has been observed by others. McAtee (1959) indicated that sodium can be replaced in montmorillonite more easily by large quaternary
200
(/) UJS t 150
§3O -Iggioo
ABS ADSORBED, IN IV
, PER GRAM OF MONTM
8 S o g
.^^_ ^^^_-_-_ o- ,
: f / ^^ ^
: / /^ ^~~
I / ' a _____ - "
X 4ppm of pentadecyl ABS & PH 7
! ' 4ppm of dodecyl ABS Q pM ~ 1U -
D 1 2 3 4 5 6 7 8 9 10 11 12 13 14 15 1
.30 |-
zUJO
20 UJ
1 ' ° K
CO °
0 0
ABS ADSORBED, IN
TIME, IN DAYS
FIGURE 59.1. Influence of pH, length of alkyl chain, and timeon adsorption of ABS by montmorillonite.
ART. 59 IN U.S. GEOL. SURVEY PROF. PAPER 475-B, PAGES B213-B216. 1963.
B213
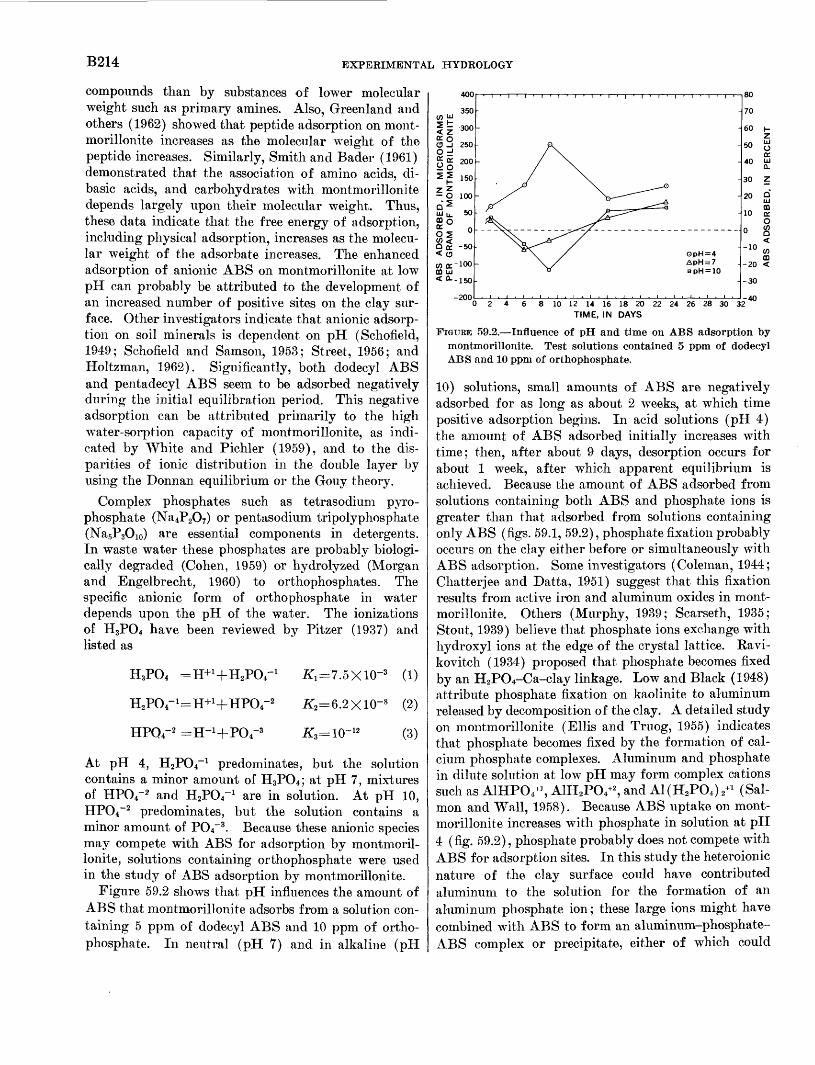
B214 EXPERIMENTAL HYDROLOGY
compounds than by substances of lower molecular weight such as primary amines. Also, Greenland and others (1962) showed that peptide adsorption on mont- morillonite increases as the molecular weight of the peptide increases. Similarly, Smith and Bader (1961) demonstrated that the association of amino acids, di basic acids, and carbohydrates with montmorillonite depends largely upon their molecular weight. Thus, these data indicate that the free energy of adsorption, including physical adsorption, increases as the molecu lar weight of the adsorbate increases. The enhanced adsorption of anionic ABS on montmorillonite at low pH can probably be attributed to the development of an increased number of positive sites on the clay sur face. Other investigators indicate that anionic adsorp tion on soil minerals is dependent on pH (Schofield, 1949; Schofield and Samson, 1953; Street, 1956; and Holtzman, 1962). Significantly, both dodecyl ABS and pentadecyl ABS seem to be adsorbed negatively during the initial equilibration period. This negative adsorption can be attributed primarily to the high water-sorption capacity of montmorillonite, as indi cated by White and Pichler (1959), and to the dis parities of ionic distribution in the double layer by using the Donnan equilibrium or the Gouy theory.
Complex phosphates such as tetrasodium pyro- phosphate (Na4P2O7) or pentasodium tripolyphosphate (Na5P3O10) are essential components in detergents. In waste water these phosphates are probably biologi cally degraded (Cohen, 1959) or hydrolyzed (Morgan and Engelbrecht, 1960) to orthophosphates. The specific anionic form of orthophosphate in water depends upon the pH of the water. The ionizations of H3PO4 have been reviewed by Pitzer (1937) and listed as
H3PO4 =H+1 +H2POr1
HPQ4-2
(1)#2 =6.2X10⁻⁸ (2)
#3 =10- 12 (3)
At pH 4, H2PO4~ 1 predominates, but the solution contains a minor amount of H3PO4 ; at pH 7, mixtures of HPO4~2 and HaPOr1 are in solution. At pH 10, HPO4~2 predominates, but the solution contains a minor amount of PO4~3 . Because these anionic species may compete with ABS for adsorption by montmoril lonite, solutions containing orthophosphate were used in the study of ABS adsorption by montmorillonite.
Figure 59.2 shows that pH influences the amount of ABS that montmorillonite adsorbs from a solution con taining 5 ppm of dodecyl ABS and 10 ppm of ortho- phosphate. In neutral (pH 7) and in alkaline (pH
80
70
60
50
40
30
20
10
0
-10
-20
-30
0 2 8 10 12 14 16 18 20 22 24 26 28 30 32 TIME, IN DAYS
-40
FIGURE 59.2. Influence of pH and time on ABS adsorption by montmorillonite. Test solutions contained 5 ppm of dodecyl ABS and 10 ppm of orthophosphate.
10) solutions, small amounts of ABS are negatively adsorbed for as long as about 2 weeks, at which time positive adsorption begins. In acid solutions (pH 4) the amount of ABS adsorbed initially increases with time; then, after about 9 days, desorption occurs for about 1 week, after which apparent equilibrium is achieved. Because the amount of ABS adsorbed from solutions containing both ABS and phosphate ions is greater than that adsorbed from solutions containing only ABS (figs. 59.1, 59.2), phosphate fixation probably occurs on the clay either before or simultaneously with ABS adsorption. Some investigators (Coleman, 1944; Chatterjee and Datta, 1951) suggest that this fixation results from active iron and aluminum oxides in mont morillonite. Others (Murphy, 1939; Scarseth, 1935; Stout, 1939) believe that phosphate ions exchange with hydroxyl ions at the edge of the crystal lattice. Ravi- kovitch (1934) proposed that phosphate becomes fixed by an H2PO4-Ca-clay linkage. Low and Black (1948) attribute phosphate fixation on kaolinite to aluminum released by decomposition of the clay. A detailed study on montmorillonite (Ellis and Truog, 1955) indicates that phosphate becomes fixed by the formation of cal cium phosphate complexes. Aluminum and phosphate in dilute solution at low pH may form complex cations such as A1HPO/S A1H2PO/2 , and A1(H2P(X) 2+1 (Sal mon and Wall, 1958). Because ABS uptake on mont morillonite increases with phosphate in solution at pH 4 (fig. 59.2), phosphate probably does not compete with ABS for adsorption sites. In this study the heteroionic nature of the clay surface could have contributed aluminum to the solution for the formation of an aluminum phosphate ion; these large ions might have combined with ABS to form an aluminum-phosphate- ABS complex or precipitate, either of which could
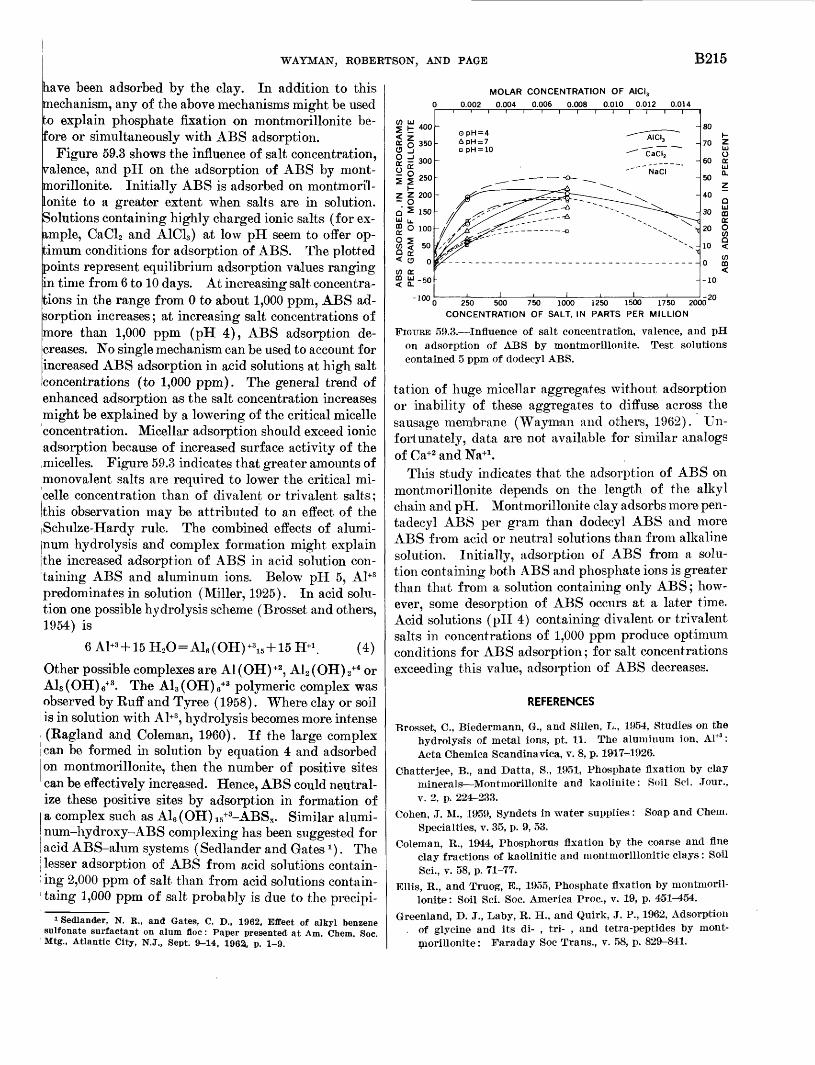
WAYMAN, ROBERTSON, AND PAGE B215
lave been adsorbed by the clay. In addition to this mechanism, any of the above mechanisms might be used ;o explain phosphate fixation on montmorillonite be- :ore or simultaneously with ABS adsorption.
Figure 59.3 shows the influence of salt concentration, valence, and pH on the adsorption of ABS by mont morillonite. Initially ABS is adsorbed on montmoril- Lonite to a greater extent when salts are in solution. Solutions containing highly charged ionic salts (for ex ample, CaCl2 and A1C13 ) at low pH seem to offer op timum conditions for adsorption of ABS. The plotted points represent equilibrium adsorption values ranging in time from 6 to 10 days. At increasing salt concentra tions in the range from 0 to about 1,000 ppm, ABS ad sorption increases ; at increasing salt concentrations of more than 1,000 ppm (pH 4), ABS adsorption de creases. No single mechanism can be used to account for increased ABS adsorption in acid solutions at high salt concentrations (to 1,000 ppm). The general trend of enhanced adsorption as the salt concentration increases might be explained by a lowering of the critical micelle concentration. Micellar adsorption should exceed ionic adsorption because of increased surface activity of the .micelles. Figure 59.3 indicates that greater amounts of monovalent salts are required to lower the critical mi celle concentration than of divalent or trivalent salts; this observation may be attributed to an effect of the Schulze-Hardy rule. The combined effects of alumi num hydrolysis and complex formation might explain the increased adsorption of ABS in acid solution con taining ABS and aluminum ions. Below pH 5, Al+3 predominates in solution (Miller, 1925). In acid solu tion one possible hydrolysis scheme (Brosset and others, 1954) is
6Al+3 + 15H2O=Al6 (OH)+315 + 15H+1 . (4)
Other possible complexes are A1(OH) +2 , A12 (OH) 2 +4 or A13 (OHV 3 . The A13 (OH) 6+3 polymeric complex was observed by Ruff and Tyree (1958) . Where clay or soil is in solution with AH, hydrolysis becomes more intense (Ragland and Coleman, 1960). If the large complex can be formed in solution by equation 4 and adsorbed on montmorillonite, then the number of positive sites can be effectively increased. Hence, ABS could neutral ize these positive sites by adsorption in formation of a complex such as A16 (OH) i5+3-ABSx. Similar alumi- num-hydroxy-ABS complexing has been suggested for acid ABS-alum systems ( Sedlander and Gates x ) . The lesser adsorption of ABS from acid solutions contain-
: ing 2,000 ppm of salt than from acid solutions contain- taing 1,000 ppm of salt probably is due to the precipi-
1 Sedlander, N. R., and Gates, C. D., 1962, Effect of alkyl benzene sulfonate surfactant on alum floe : Paper presented at Am. Chem. Soc. Mtg., Atlantic City, N.J., Sept. 9-14. 1963, p. 1-9.
MOLAR CONCENTRATION OF AICI 3
0.002 0.004 0.006 0.008 0.010 0.012 0.014
-1000 250 500 750 1000 1250 1500 1750 2000'
CONCENTRATION OF SALT, IN PARTS PER MILLION
FIGURE 59.3. Influence of salt concentration, valence, and pH on adsorption of ABS by montmorillonite. Test solutions contained 5 ppm of dodecyl ABS.
tation of huge micellar aggregates without adsorption or inability of these aggregates to diffuse across the sausage membrane (Wayman and others, 1962). Un fortunately, data are not available for similar analogs of Ca+2 and Na+1 .
This study indicates that the adsorption of ABS on montmorillonite depends on the length of the alkyl chain and pH. Montmorillonite clay adsorbs more pen- tadecyl ABS per gram than dodecyl ABS and more ABS from acid or neutral solutions than from alkaline solution. Initially, adsorption of ABS from a solu tion containing both ABS and phosphate ions is greater than that from a solution containing only ABS; how ever, some desorption of ABS occurs at a later time. Acid solutions (pH 4) containing divalent or trivalent salts in concentrations of 1,000 ppm produce optimum conditions for ABS adsorption; for salt concentrations exceeding this value, adsorption of ABS decreases.
REFERENCES
Brosset, C., Biedermann, G., and Sillen, L., 1954, Studies on the hydrolysis of metal ions, pt. 11. The aluminum ion, Al+3 : Acta Chemica Scandinavica, v. 8, p. 1917-1926.
Chatter.iee, B., and Datta, S., 1951, Phosphate fixation by clay minerals Montmorillonite and kaolinite: Soil Sci. Jour., v. 2, p. 224-233.
Cohen, J. M., 1959, Syndets in water supplies: Soap and Chem. Specialties, v. 35, p. 9, 53.
Coleman, R., 1944, Phosphorus fixation by the coarse and fine clay fractions of kaolinitic and montmorillonitic clays: Soil Sci., v. 58, p. 71-77.
Ellis, B., and Truog, E., 1955, Phosphate fixation by montmoril lonite: Soil Sci. Soc. America Proc., v. 19, p. 451^54.
Greenland, D. J., Laby, B. H., and Quirk, J. P., 1962, Adsorption . of glycine and its di- , tri- , and tetra-peptides by mont
morillonite : Faraday Soc Trans., v. 58, p. 829-841.
B216 EXPERIMENTAL HYDROLOGY
Holtzman, W., 1962, The application of the Verwey and Over- beek theory to the stability of kaolinite-water systems: Colloid Sci. Jour., v. 17, p. 363-382.
Low, P. F., and Black, C. A., 1948, Phosphate induced decom position of kaolinite: Soil Sci. Soc. America Proc., v. 12, p. 180-184.
McAtee, J. L., 1959, Inorganic-organic cation exchange on mont- morillonite: Am. Mineralogist, v. 44, p. 1230-1236.
Miller, L. B., 1925, A study of the effects of anions upon the properties of alum floe: U.S. Public Health Repts., v. 40, pt. 1, p. 351.
Morgan, J. J., and Engelbrecht, R. S., 1960, Survey of phos phates and ABS concentration in Illinois streams: Am. Water AVorks Assoc. Jour., v. 52, p. 471-482.
Murphy, H. F., 1939, The role of kaolinite in phosphorus fixa tion : Hilgardia, v. 12, p. 343-382.
Pitzer, K. S., 1937, The heats of ionization of water, ammonium hydroxide, carbonic, phosphoric, and sulphuric acids The variation of ionization constants with temperature and entropy change with ionization: Am. Chem. Soc. Jour., v. 59, p. 2365-2371.
Ragland, J. L., and Coleman, N. T., 1960, The hydrolysis of aluminum salts in clay and soil systems: Soil Sci. Soc. America Proc., v. 24, p. 457-460.
Ravikovitch, S., 1934, Anion exchange; pt. 2, Liberation of the phosphoric acid ion adsorbed by soils: Soil Sci., v. 38, p. 279-290.
Ruff, J. K., and Tyree, S. Y., 1958, Light-scattering studies on aqueous aluminum nitrate solutions: Am. Chem. Soc. Jour., v. 80, p. 1523-1526.
Salmon, J. E., and Wall, J. G. L., 1958, Aluminum phosphates: Chem. Soc. Jour., v. 22, p. 1128-1134.
Scarseth, G. D, 1935, The mechanism of phosphate retention by natural alumino silicate colloids: Am. Soc. Agronomy Jour., v. 27, p. 596-616.
Schofield, R. K., 1949, Effect of pH on electric charges carried by clay particles: Soil Sci. Jour., v. 1. p. 1-8.
Schofield, R. K., and Samson, H. R. 1953, The deflocculation of kaolinite suspensions and accompanying change-over from positive to negative chloride adsorption: Clay Minerals Bull., v. 2, p. 45-50.
Smith, J. B., and Bader, R. G., 1961, Preliminary investigations of the association of organic material and carbon dioxide with sedimentary particles: Texas Agr. and Mech. Coll. Proj. 142, Reference 61-8T, Tech. Rept. 3, p. 1-221.
Stout, P. R., 1939, Alteration in the crystal structure of clay minerals as a result of phosphate fixation: Soil Sci. Soc. America Proc., v. 4, p. 177-182.
Street, N, 1956, The rheology of kaolinite suspensions: Aus tralian Chem. Jour., v. 9, p. 467.
Wayman, C. H., Robertson, J. B., and Page, H. G., 1962, Adsorp tion of the surfactant ABS35 on kaolinite: Art. 238 in U.S. Geol. Survey Prof. Paper 450-E, p. E181-E183.
White, W. A., and Pichler, E., 1959, Water-sorption characteris tics of clay minerals: Illinois Geol. Survey Circ. 266, p. 1-20.
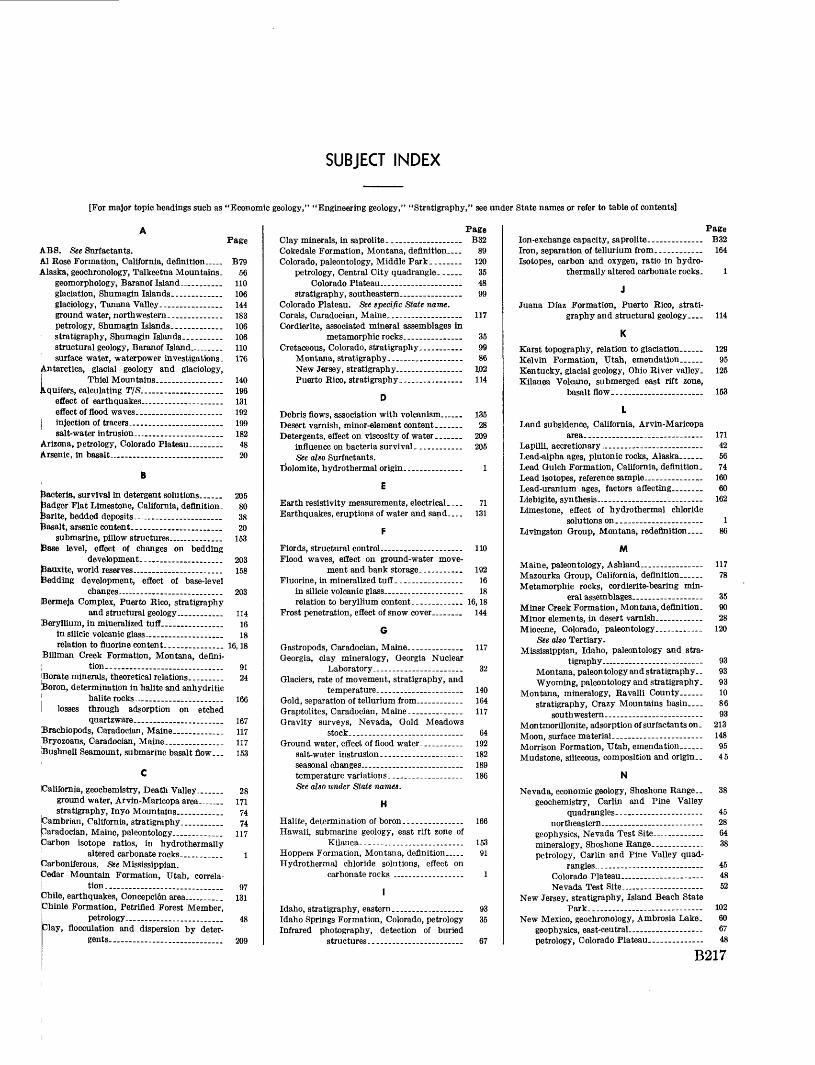
SUBJECT INDEX
[For major topic headings such as "Economic geology," "Engineering geology," "Stratigraphy," see under State names or refer to table of contents]
PageAB8. See Surfactants.Al Rose Formation, California, definition.._ B79Alaska, geochronology, Talkeetna Mountains- 56
geomorphology, Baranof Island-_____ 110glaciation, Shumagin Islands..______ 106glaciology, Tanana Valley.________ 144ground water, northwestern. _______ 183petrology, Shumagin Islands.______ 106stratigraphy, Shumagin Islands_ ____ 106structural geology, Baranof Island....__ 110surface water, waterpower investigations. 176
Antarctica, glacial geology and glaciology,| Thiel Mountains._________ 140Aquifers, calculating T/S....,________ 196
effect of earthquakes..__________ 131effect of flood waves. ___________ 192
} injection of tracers_____________ 199salt-water intrusion_____________ 182
Arizona, petrology, Colorado Plateau..___ 48Arsenic, in basalt._______________ 20
B
Bacteria, survival in detergent solutions___ 205 badger Flat Limestone, California, definition. 80 parite, bedded deposits .___._____. 38 Basalt, arsenic content. ____________ 20
submarine, pillow structures_______ 153 (Base level, effect of changes on bedding
development..__________ 203 (Bauxite, world reserves..___________ 158 Bedding development, effect of base-level
changes .. _____..... 203 Bermeja Complex, Puerto Rico, stratigraphy
and structural geology._____ 114 Beryllium, in mineralized tuft________ 16
in silicic volcanic glass___________ 18 relation to fluorine content.._______ 16,18
Billman Creek Formation, Montana, deflni- ; tion..________________ 91 [Berate minerals, theoretical relations____ 24 Boron, determination in halite and anhydritic ' halite rocks-___________ 166 ! losses through adsorption on etched
quartzware____________ 167 Brachiopods, Caradocian, Maine______ 117 Bryozoans, Caradocian, Maine________ 117 tBushnell Seamount, submarine basalt flow_ 153
California, geochemistry, Death Valley.___ 28 ground water, Arvin-Maricopa area. ... 171 stratigraphy, Inyo Mountains_____.. 74
pambrian, California, stratigraphy_____.. 74 fcaradocian, Maine, paleontology_______ 117 parbon isotope ratios, in hydrothermally
1 altered carbonate rocks. ___ _. i Carboniferous. See Mississippian. pedar Mountain Formation, Utah, correla-
I tion.________________ 97 phile, earthquakes, Conception area_____ 131
hinle Formation, Petrified Forest Member,petrology...... ..___.__ 43
lay, flocculation and dispersion by deter gents. . . ....._____ 209
PageClay minerals, in saprolite.. ____ B32Cokedale Formation, Montana, definition. 89Colorado, paleontology, Middle Park..___ 120
petrology, Central City quadrangle. __ 35Colorado Plateau.. .......... 48
stratigraphy, southeastern________. 99 Colorado Plateau. See specific State name. Corals, Caradocian, Maine.._________ 117 Cordierite, associated mineral assemblages in
metamorphic rocks.________ 35Cretaceous, Colorado, stratigraphy____ 99
Montana, stratigraphy......_ 86New Jersey, stratigraphy__.. 1,02 Puerto Rico, stratigraphy._____.. 114
Debris flows, association with volcanism 135 Desert varnish, minor-element content. .. 28 Detergents, effect on viscosity of water.. 209
influence on bacteria survival.. 205See also Surfactants.
Dolomite, hydrothermal origin.._______ 1
Earth resistivity measurements, electrical-... Earthquakes, eruptions of water and sand....
71131
Fiords, structural control______ _____ 110Flood waves, effect on ground-water move
ment and bank storage.--.---.. 192Fluorine, in mineralized tuff. -..______ 16
in silicic volcanic glass. . 18 relation to beryllium content-..___... 16,18
Frost penetration, effect of snow cover____ 144
Gastropods, Caradocian, Maine..______ 117 Georgia, clay mineralogy, Georgia Nuclear
Laboratory.____________ 32 Glaciers, rate of movement, stratigraphy, and
temperature.___________ 140 Gold, separation of tellurium from__--.-._ 164 Graptolites, Caradocian, Maine-_______ 117 Gravity surveys, Nevada, Gold Meadows
stock_________________ 64 Ground water, effect of flood water. _____ 192
salt-water instrusion.________.__ 182 seasonal changes 189 temperature variations. ________._ 186 See also under State names.
H
Halite, determination of boron......____. 166Hawaii, submarine geology, east rift zone of
Kilauea...................___. 153Hoppers Formation, Montana, definition__ 91 Hydrothermal chloride solutions, effect on
carbonate rocks ___...____ 1
Idaho, stratigraphy, eastern..______... 93 Idaho Springs Formation, Colorado, petrology 35 Infrared photography, detection of buried
structures...____________ 67
PageIon-exchange capacity, saprolite. B32 Iron, separation of tellurium from.....____ 164 Isotopes, carbon and oxygen, ratio in hydro
thermally altered carbonate rocks. 1
Juana Diaz Formation, Puerto Rico, strati graphy and structural geology__ 114
Karst topography, relation to glaciation 129 Kelvin Formation, Utah, emendation___ 95 Kentucky, glacial geology, Ohio River valley. 125 Kilauea Volcano, submerged east rift zone,
basalt flow...___.... 153
Land subsidence, California, Arvin-Maricopaarea.__._ 171
Lapilli, accretionary- 42 Lead-alpha ages, plutonic rocks, Alaska_... 56 Lead Gulch Formation, California, definition. 74 Lead isotopes, reference sample._ 160 Lead-uranium ages, factors affecting 60 Liebigite, synthesis 162Limestone, effect of hydrothermal chloride
solutions on 1 Livingston Group, Montana, redefinition 86
M
Maine, paleontology, Ashland 117 Mazourka Group, California, definition___ 78 Metamorphic rocks, cordierite-bearing min
eral assemblages. 35 Miner Creek Formation, Montana, definition. 90 Minor elements, in desert varnish .. 28 Miocene, Colorado, paleontology 120
See also Tertiary.Mississippian, Idaho, paleontology and stra
tigraphy 93Montana, paleontology and stratigraphy.. 93Wyoming, paleontology and stratigraphy. 93
Montana, mineralogy, Ravalli County 10stratigraphy, Crazy Mountains basin__ 86
southwestern.. 93 Montmorillonite, adsorption of surfactants on. 213 Moon, surface material 148 Morrison Formation, Utah, emendation 95 Mudstone, siliceous, composition and origin.- 45
N
Nevada, economic geology, Shoshone Range.. 38 geochemistry, Carlin and Pine Valley
quadrangles--- 45 northeastern.__ . 28
geophysics, Nevada Test Site --- 64 mineralogy, Shoshone Range.. 38 petrology, Carlin and Pine Valley quad
rangles.-. 45Colorado Plateau--_ 48 Nevada Test Site 52
New Jersey, stratigraphy, Island Beach StatePark...__-__. . 102
New Mexico, geochronology, Ambrosia Lake. 60geophysics, east-ceutral 67petrology, Colorado Plateau 48
B217
B218 SUBJECT INDEX
PageNew York, ground water, Long Island, Suf
folk County... B186Nopah Formation, California, correlations.... 78North Carolina, petrology, Carolina slate belt,
Stanly County... --------_--- 42Nubian Sandstone, Sudan, ground water 179
Oligocene, Puerto Rico, stratigraphy..___. 114See also Tertiary.
Ordovician, California, stratigraphy___ 74Maine, paleontology._______.__ 117
Oxygen isotope ratios, in hydrothermallyaltered carbonate rocks.___ 1
Pacific Ocean, submarine basalt flows, east ofHawaii -...- ... ... - 153
Paleozoic, New Jersey, stratigraphy..____ 102See also system or period names.
Park City Formation, paleoecology.-____ 123 Patterned ground, Antarctica _ _ _ _ ______ 143Permian, Idaho, Montana, Utah, Wyoming,
paleoecology..__________ 123 Phosphoria Formation, paleoecology______ 123 Photogeology, use of infrared photography.... 67Piapi Canyon Formation, Nevada, petrog
raphy.......____-._.-_.__. 52Pierre Shale, Apache Creek Sandstone Mem
ber, Colorado, redefinition-.___ 99 Pillow structures, submarine basalts, at
extreme depths___________ 153 Pleistocene, wave-cut platforms... _ ____ 108
See also Quaternary.Pogonip Group, California, correlations. _ 78 Polygenetic bedding, development-.. ____ 203 Ponce Limestone, Puerto Rico, stratigraphy
and structural features______ 114 Potassium-argon ages, plutonic rocks, Alaska. 56 Precambrian, New Jersey, stratigraphy __.. 102 Puerto Rico, structural geology, Guanica-
Guayanilla Bay area.-- _____ 114
Quality of water, seasonal changes _____ 189
PageQuaternary, Kentucky, glacial geology. B125
New Jersey, stratigraphy__...... 102See also Pleistocene.
Radium, migration of...___.-..__ 60 Rare earths, thortveitite. 10 Resistivity nomographs, in interpretation of
earth resistivity.. 71
Salt-water intrusion, ground water.. 182 Saprolite, ion-exchange capacity.... 32
mineral content._.. 32 Scandium minerals, thortveitite.. 10 Sedimentation, effect of base-level changes 203 Shedhorn Sandstone, paleoecology.. 123 Silurian, California, stratigraphy... 74 Skeletal fuzz, definition and origin._ .- 148 Snow, critical thickness, definition.. 146
effect on frost penetration.. ..-. -. 144 Solar wind, effect on Moon.. - 148 Streams, effect of flood waves on ground-water
movement and bank storage 192 Structural features, depiction by infrared
aerial photography-. 67relation to topography___... 110
Sudan, ground water, Kordofan Province. - 179 Sunday Canyon Formation, California, defini
tion 83Surfactants, adsorption on montmorillonite 213
See also Detergents.
Tamarack Canyon Dolomite, California, defi nition... - 77
Tellurium, separation from iron and gold... 164 Tertiary, New Jersey, stratigraphy_ . - 102
See also Miocene and Oligocene. Thortveitite, first occurrence in Western
Hemisphere.___ .. 10 Tin deposits, associated beryllium .... 12 Topography, relation to structure, 110 Tracers, spread in ground-water reservoirs 199
PageTrilobites, Caradocian, Maine_________ B117Tuff, accretionary lapillL.____ ..__ 42
beryllium and fluorine content - _____ 16determination of density and porosity. 169petrology______________..__ 48welded, petrography___.__... 52
UUranium deposits, age determinations___.. 60Uranium minerals, liebigite, synthesis..... 162Utah, geochemistry, Drum Mountains....-.. 1
geochemistry, Spor Mountain.. .. 16petrology, Colorado Plateau______ 48stratigraphy, Salt Lake City area 95
Vaughn Gulch Limestone, California, defini tion-....--_-_______._-. 81
Vegetation, effect on ground-water tempera ture. 186
Vertebrates, Colorado, Miocene. ______.. 120 Vesicular rock, on Moon______. _ 148 Virginia, economic geology, Irish Creek area.. 12 Volcanic ash, accretionary lapillL. .. ... 42 Volcanic glass, beryllium and fluorine content. 18 Volcanic rocks, determination of density and
porosity___.__._ .__... 169 Volcanism, debris flows.. .. 135
W
Washington, geomorphology, Mount Rainier. 135ground water, Puget Sound area... 182volcanology, Mount Rainier. 135
Waterpower investigations, Alaska 176Wave-cut platforms, Pleistocene 108Weathering, polar environment 140Western States, geochemistry 18
See also under State names. Wyoming, geomorphology, Gros Ventre Moun
tains-. 129glacial geology, Gros Ventre Mountains.. 129 stratigraphy, western 93
Zeolites, eflect on measurements of density andporosity of volcanic rocks 169
AUTHOR INDEX
Andersen, B. G.Page B140
BBartel, A. J..._.-----_._---._._.__._ 20Brew, D. A-_._..._._____........ 110Brown, C. E__________________ 12
Cjadigan, R. A_________________ 48Qasertano, Lorenzo______________ 131Cbbban, W. A......_._.__._.__.. 99Cboper, H. H., Jr____._____._.__ 192C^andell, D. R............................... 135CMttenden, M. D., Jr..........._..._.... 95
Ejavidson, D. F......___._.__........ 28Delevaux, M. H......._.__._.......... 160Dickey, D. D......___....._............ 169D|utro, J. T., Jr.........._._.___...... 93
Fpnnelly, E. J....-...__....._....__.. 20Feulner, A. J___________________ 189FJscher, W. A.....-. ..................... 67Ftledman, Irving...______________ 1
Gible, D. J^...... ._...................... 35Gdli O., Carlos..._._._____.......... 131G-anger, H. C.....__._._._.____.. 60G rantz, Arthur..__.................._.. 56, 106GHffitts, W. R-. .- .............-..... 16, 18Gttmaldi, F. B............................... 166Gfrossman, I. G._________________ 114
Hanshaw, B. B............................_ 24Havens, R. G.......__._____.......... 10Healey, D. L.______....___.......... 64Hjiffman, Claude, Jr..____________ 20H|ant, C. B................................... 28
Islander, Wilson_______________ 179 Iz|Btt, G. A....-... .-... ..-........... 120
PageJohnson, Arthur________________ B176 Jopling, A. V................................. 203
Kantrowitz, I. H.._................_..... 186Keefer, W. R.........._...._.___..._ 129Ketner, K. B........_........_._.__ 38, 45Kiilsgaard, T. H______...._.....__..... 12Kimmel, G. E...._______________ 182Krinsley, D. B.......__....._....._._ 144
L
Lakin, H. W__-.____........._....._ 28, 164Lesure, F. G............_....._____.... 12Lewis, G. E.__........___._.......... 120Lofgren, B. E............._._............ 171Loney, R. A. _...._.-.....-.._...... 110Levering, T. 8.........__................. 1
M
McCarthy, J. H.............................. 1Meyrowitz, Robert_._____________ 162Miller, C. H.... ....- ....... ..... 64Monk, E. F.................................. 169Moore, J. G.................................. 153Mrose, M. E___________________ 12Muffler, L. J. P.....-............ ........ 110
N Neuman, R. B............................... 117
O'Connor, J. T........__........._...... 52Oda, Uteana..._________________ 28Ogata, Akio...___.....__.........._.. 199
Page, H. G........................... 205, 209, 213Papadopulos, I. 8. _______________ 196Parker, R. L.___.____________.._......... 10Patterson, 8. H............................... 158Pluhowski, E. J ........................... 186Pomeroy, J S.......... ...._............... 110Powers, H. A...........___.....___.._ 18
PageRader, L. F., Jr_.___._____.__ B16, 20 Ray, L. L.___..........___.._____ 125Reed, R. K . -. 153Roberts, A. E.........._.___..._.__ 86Robertson, J. B.__...........___ 205, 209, 213Rodis, H. G..... .......................... 179Rorabaugh, M. I_...._.__.... ...._ 192Ross, D. C............................. ... 74Ross, D. E..___.__..._..... .. .. 162
3, W. J..........-..-. ......... 93Schupp, E. G..____._......_ ...... 189Scott, G. R _ . . 99Scott, J. H.. .- .. ...... .. . 71Seaber, P. R...................-. .. 102Segerstrom, Kenneth. . 131Sheffey, N. B........................ ... 56Simon, F. O..___._____.-__--_ 166Sims, P. K.. ................... ' 35Smith, J. F., Jr. .... ..._ - 45Stem, T. W. . - - 56Stewart, J. W................. .. 32Sundelius, H. W................. ..... 42
Thomas, Herman...___.__ _ 56 Thompson, C. E.___________. . 164
Vecchioli, John......................-. 102
W
Warren, C. R..................... ... 148Wayman, C. H...._ . .. . 205, 209, 213Weeks, A. D.................... . ... . 162
Y
Yochelson, E. L.............................. 123
B219
U.S. GOVERNMENT PRINTING OFFICE: 1963 O 68O231