Evaluation of Advanced Airbag Performance ... - VTechWorks
168
Evaluation of Advanced Airbag Performance: Child Injury Exposure Lianne Marie Sandberg Thesis submitted to the faculty of the Virginia Polytechnic Institute and State University in partial fulfillment of the requirement for the degree of Master of Science In Biomedical Engineering Hampton C. Gabler, Chair Stefan M. Duma Richard O. Claus June 2, 2016 Blacksburg, Virginia Keywords: advanced airbag, child injury ©Copyright 2016, Lianne Marie Sandberg
-
Upload
khangminh22 -
Category
Documents
-
view
4 -
download
0
Transcript of Evaluation of Advanced Airbag Performance ... - VTechWorks

Evaluation of Advanced Airbag Performance: Child Injury Exposure
Lianne Marie Sandberg
Thesis submitted to the faculty of the Virginia Polytechnic Institute and State University in partial fulfillment of the requirement for the degree of
Master of Science
In Biomedical Engineering
Hampton C. Gabler, Chair Stefan M. Duma Richard O. Claus
June 2, 2016 Blacksburg, Virginia
Keywords: advanced airbag, child injury
©Copyright 2016, Lianne Marie Sandberg
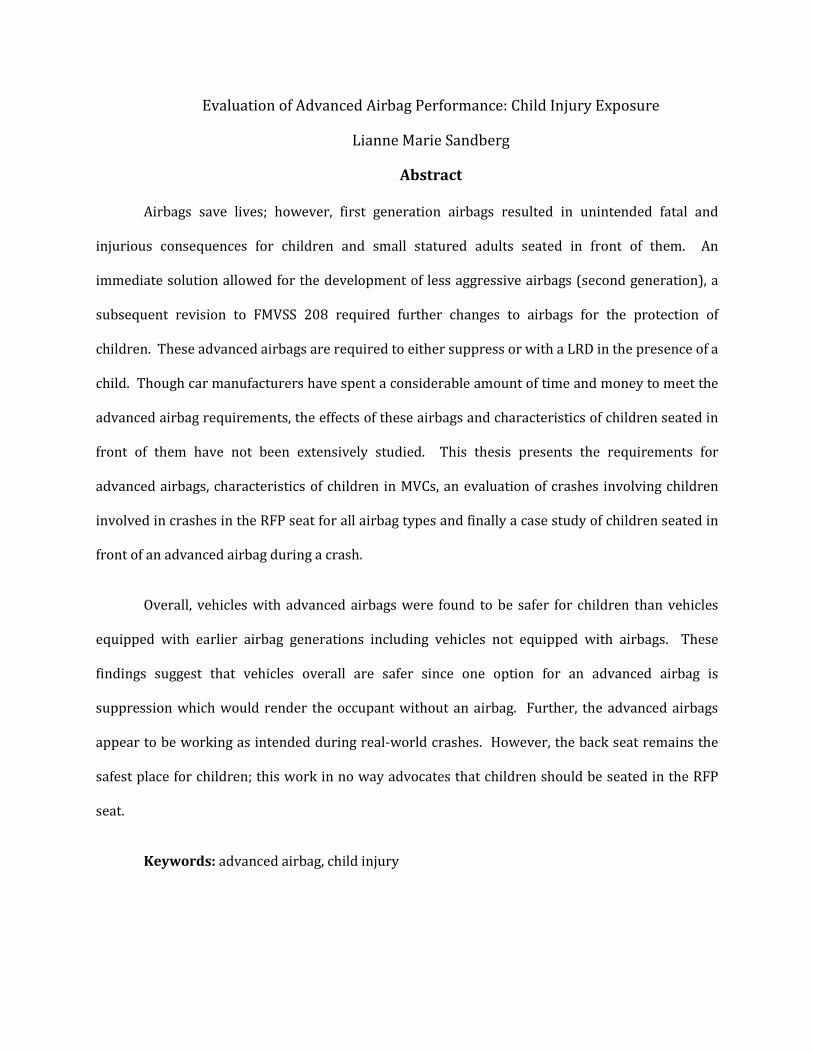
Evaluation of Advanced Airbag Performance: Child Injury Exposure
Lianne Marie Sandberg
Abstract
Airbags save lives; however, first generation airbags resulted in unintended fatal and
injurious consequences for children and small statured adults seated in front of them. An
immediate solution allowed for the development of less aggressive airbags (second generation), a
subsequent revision to FMVSS 208 required further changes to airbags for the protection of
children. These advanced airbags are required to either suppress or with a LRD in the presence of a
child. Though car manufacturers have spent a considerable amount of time and money to meet the
advanced airbag requirements, the effects of these airbags and characteristics of children seated in
front of them have not been extensively studied. This thesis presents the requirements for
advanced airbags, characteristics of children in MVCs, an evaluation of crashes involving children
involved in crashes in the RFP seat for all airbag types and finally a case study of children seated in
front of an advanced airbag during a crash.
Overall, vehicles with advanced airbags were found to be safer for children than vehicles
equipped with earlier airbag generations including vehicles not equipped with airbags. These
findings suggest that vehicles overall are safer since one option for an advanced airbag is
suppression which would render the occupant without an airbag. Further, the advanced airbags
appear to be working as intended during real-world crashes. However, the back seat remains the
safest place for children; this work in no way advocates that children should be seated in the RFP
seat.
Keywords: advanced airbag, child injury
iii
Dedication
To Lynn Nystrom whose passion for life was unparalleled and dedication to her friends,
family, coworkers and advisees was unwavering even in the face of the biggest battle she ever
fought. Lynn, you are truly missed and were such a vital force in many people's lives within the
College of Engineering - we are forever changed for the better because we had you in our lives.
To each of my fellow Hokies who made the ultimate sacrifice on that cold April day in 2007 -
your spirit and dedication to our 'Ut Prosim' motto lives on in all Hokies. May we all live each day in
your honor and may we never forget.
To the man whose name I never knew who to honor his wife whom was fatally injured in an
alcohol related crash, refused to drive or ride in a vehicle again. You did not know it, but your
actions have left an everlasting impression on my mind and inspired my passion for safety.
Last, but not least, to my "Aunt Joannie," who always impressed the importance properly
using/wearing a seat belt.

iv
Acknowledgements
There are so many people and experiences to be grateful for but with regards to this work I
am specifically grateful to my committee members who have supported me in a multitude of ways.
First, I am grateful to my advisor, Dr. Gabler, who agreed to take me on as one of the only part-time
SBES students in the history of the school and has been patient over the past few years while things
like marriage and starting a family have upstaged the effort required to pull the work I have done
together in one place. I am thankful to have had the opportunity to work as an undergraduate
intern under the direction of Dr. Stefan Duma for the Center for Injury Biomechanics, where I met
Dr. Gabler and further grateful to Dr. Duma for serving on my committee. I am also grateful for the
benevolence of Dr. Richard O. Claus who employed me right out of college and supported my dream
of attaining an advanced degree and agreed to serve on my committee.
Mr. Charles Kahane and Mr. Charles Case of the National Highway Traffic Safety
Administration are gratefully acknowledged for providing information regarding passenger airbag
availability and advanced airbag deployment strategies respectively. In addition, Mr. Jeff
Lewandowsky from MGA is gratefully acknowledged for taking the time to answer questions
regarding advanced airbag testing.
I would also like to thank all of my "lab mates" of whom I may have rarely seen in person,
but frequently had contact with and received assistance, guidance and motivation from, specifically:
Dr. Allison Daniello, Dr. Ada Tsoi, Rong "Jackey" Chen, and Dr. Elizabeth Fievisohn. I am thankful as
well for members of the Laboratory for Interdisciplinary Statistical Analysis (LISA), particularly,
Daniel Berry and Matthew Keefe for their assistance with the statistical analyses performed within.
I am so very thankful for all of the help provided to me by Ms. Tess Sentelle and Ms. Amanda Covey
who were both extremely helpful in navigating the graduate school requirements when I had to
take a leave of absence, be re-admitted, register for defending student status, among others.

v
Finally, I would like to thank my parents, husband, son and husband's family, all whom have
been so understanding and supportive through this last stretch. I surely could not have put all of
this together in the short time I allotted if it had not been for their undying love and support.

vi
TABLE OF CONTENTS 1 Introduction ..................................................................................................................................................................... 1
1.1 First Generation Airbags ................................................................................................................................... 4
1.1.1 Injury Patterns & Case Studies Involving First Generation Airbags ...................................... 7
1.2 Second Generation Airbags ............................................................................................................................ 12
1.3 Certified-advanced airbags ............................................................................................................................ 15
1.4 Summary of the Background Between Children & Airbags .............................................................. 16
2 Requirements for Advanced Airbags ................................................................................................................... 18
2.1 Suppression .......................................................................................................................................................... 21
2.2 Low Risk Deployment ...................................................................................................................................... 24
2.3 Injury Criteria ...................................................................................................................................................... 29
2.4 Summary of Advanced Airbag Requirements ........................................................................................ 32
3 Characteristics of Child Fatalities in Motor Vehicle Crashes (MVCs) ..................................................... 34
3.1 Methods ................................................................................................................................................................ .. 34
3.2 Overall Results ..................................................................................................................................................... 37
3.3 All Child Fatalities & Exposures ................................................................................................................... 39
3.4 Child Occupant Fatalities ................................................................................................................................ 43
3.4.1 Fatalities by Crash Mode ....................................................................................................................... 43
3.4.2 Fatalities by Seating Position ............................................................................................................... 50
3.4.3 Fatalities by Age ........................................................................................................................................ 58
3.4.4 Fatalities by Restraint Use & Type .................................................................................................... 60
3.4.5 Fatalities by Vehicle Type ..................................................................................................................... 62
3.5 Conclusions ........................................................................................................................................................... 67
3.5.1 Effect of Crash Mode ................................................................................................................................ 67
3.5.2 Effect of Seating Position ....................................................................................................................... 68
3.5.3 Effect of Age ................................................................................................................................................ 69
3.5.4 Effect of Restraint Use ............................................................................................................................ 71
3.5.5 Effect of Vehicle Type .............................................................................................................................. 71
4 Are Advanced Airbags Safer for Children in the Right Front Seat? ......................................................... 73
4.1 Introduction ......................................................................................................................................................... 73
4.2 Methods .................................................................................................................................................................. 73
4.2.1 Statistical Analysis Methods................................................................................................................. 75
4.2.2 Advanced Airbag Strategies ................................................................................................................. 76
4.2.3 Airbag Generation Classification ........................................................................................................ 77
4.3 Results................................................................................................................................................................ ..... 78
4.3.1 Probability of Moderate Injury ........................................................................................................... 87
vii
4.3.2 Factors Influencing Moderate Injuries ............................................................................................ 90
4.3.3 Injuries by Body Region ......................................................................................................................... 91
4.4 Conclusions ........................................................................................................................................................... 93
5 Case Study of Advanced Airbags in the Field ................................................................................................... 95
5.1 Introduction ......................................................................................................................................................... 95
5.2 Methods ................................................................................................................................................................ .. 95
5.2.1 Weight Classification ............................................................................................................................... 96
5.3 Advanced Airbag Algorithm Analysis ........................................................................................................ 97
5.3.1 Predicted Strategies For Cases Without Strategy Data .......................................................... 102
5.4 A Look at Moderate Injuries in Cases with Advanced Airbags ..................................................... 103
5.4.1 2006 Mazda 6 .......................................................................................................................................... 104
5.4.2 2007 Nissan Sentra ............................................................................................................................... 106
5.4.3 2007 Toyota Highlander ..................................................................................................................... 108
5.4.4 Summary of Moderate Injury Cases ............................................................................................... 110
5.5 Select EDR Cases .............................................................................................................................................. 111
5.5.1 Child Safety Seats & Advanced Airbags ........................................................................................ 111
5.5.2 Unrestrained Children & Advanced Airbags .............................................................................. 115
5.5.3 Advanced Airbag Systems That Detected a Child ..................................................................... 118
5.5.4 Select Advanced Airbags That Suppressed ................................................................................. 120
5.5.5 Select Advanced Airbags That Deployed ..................................................................................... 122
5.6 Conclusions ........................................................................................................................................................ 126
6 Conclusions................................................................................................................................................................ .. 130
6.1 Fatality Risk ....................................................................................................................................................... 130
6.2 Advanced Airbags Present Lower Risk of Injury for Children ...................................................... 130
6.2.1 Injuries by Body Region ...................................................................................................................... 131
6.3 Advanced Airbag Performance Analysis ............................................................................................... 132
6.3.1 Advanced Airbag Cases Involving Moderate Injuries ............................................................. 133
6.3.2 EDRs Indicate Advanced Airbags Are Working In Real World Crashes .......................... 134
6.4 Limitations ......................................................................................................................................................... 135
6.5 Summary ............................................................................................................................................................. 136
7 References .................................................................................................................................................................... 138
8 Appendix....................................................................................................................................................................... 143
viii
List of Figures_____________________________________________________ Figure 1. Illustration of the advanced airbag deployment techniques assuming a crash is severe enough to warrant an airbag deployment showing that for adults advanced airbags employs a two-stage deployment (left), but for children and small statured adults the airbag employs a single stage inflation (middle) or suppresses (right). ...................................................................................................................... 18
Figure 2. Neck Injury Modalities .................................................................................................................................... 31
Figure 3. NHTSA Nij Criterion Limits Established in 2000 ................................................................................. 32
Figure 4. FARS Fatalities over Time for All (grey) and Child (blue) Car & LTV Occupants .................... 39
Figure 5. FARS 1995 – 2013 Child (12 & Under) Fatalities Over Time for All Child Fatalities, Passengers, Pedestrians, Bicyclists and Drivers ....................................................................................................... 40
Figure 6. NASS-GES 1995 – 2013 Estimated Child (12 & Under) Exposures for All Children, Passengers, Pedestrians, Bicyclists and Drivers in 100,000’s............................................................................. 41
Figure 7. FARS 1995 – 2013 Child Fatalities by Vehicle Type for Child Drivers, Passengers, and Unknown Child Occupants in Motor Vehicles During Transport ...................................................................... 42
Figure 8. FARS 1995 – 2013 Fatalities by Crash Mode for Children 12 & Under ....................................... 44
Figure 9. FARS 1995 – 2013 Fatalities by Crash Mode for Children 12 & Under Limited to Model Years 1995 - 2013 ................................................................................................................................................................. 45
Figure 10. NASS-GES 1995 – 2013 Crash Mode Exposure for Children 12 & Under ................................ 46
Figure 11. NASS-GES 1995 – 2013 Crash Mode Exposure for Children 12 & Under Limited to Model Years 1995 - 2013 ................................................................................................................................................................. 46
Figure 12. Relative Risks for Crash Modes with Respect to Frontal Crashes as a Function of Time . 47
Figure 13. Relative Risk for Crash Modes by Calendar Year Generation with Respect Calendar Year Generation 1995 – 1998 ..................................................................................................................................................... 48
Figure 14. FARS 1995 – 2013 Fatalities by Crash Mode for Adults Aged 25 – 65 Years Old ................ 49
Figure 15. NASS – GES 1995 – 2013 Crash Mode Exposure for Adults Aged 25 – 65 .............................. 50
Figure 16. FARS 1995 – 2013 Fatalities by Seating Position for Children 12 & Under ........................... 51
Figure 17. NASS-GES 1995 – 2013 Seat Position Exposure for Children 12 & Under ............................. 52
Figure 18. FARS 1995 – 2013 Fatalities by Seating Position for Children 12 & Under Limited to Model Years 1995 - 2013 ................................................................................................................................................... 52
Figure 19. NASS-GES 1995 – 2013 Seat Position Exposure for Children 12 & Under Limited to Model Years 1995 - 2013 ................................................................................................................................................... 53
ix
Figure 20. Risk per 100,000 Exposure’s for Children 12 & Under Seated in the Front and Back Seats and Relative Fatality Risk Front Seat to Back Seat Over Time ............................................................................ 54
Figure 21. FARS 1995 – 2013 Front Seat Fatalities for Children 12 & Under by Age .............................. 55
Figure 22. NASS-GES Front Seat Exposure for Children 12 & Under by Age ............................................... 56
Figure 23. FARS 1995 – 2013 Back Seat Fatalities for Children 12 & Under by Age ................................ 56
Figure 24. NASS-GES Back Seat Exposure for Children 12 & Under by Age ................................................ 57
Figure 25. Relative Risk for Infants Seated in the Front Seat to the Back Seat Over Time .................... 58
Figure 26. FARS 1995 – 2013 Fatalities by Age for Children 12 & Under ..................................................... 59
Figure 27. NASS-GES 1995 – 2013 Exposure by Age for Children 12 & Under .......................................... 59
Figure 28. FARS 1995 – 2013 Fatalities by Restraint Type for Children 12 & Under .............................. 60
Figure 29. NASS-GES Restraint Type Exposure for Children 12 & Under ..................................................... 61
Figure 30. Relative Risk as a Function of Time for CSS and Unrestrained Children in Crashes with Respect to Children Wearing Seat Belts ....................................................................................................................... 62
Figure 31. FARS 1995 – 2013 Fatalities by Vehicle Type for Children 12 & Under .................................. 63
Figure 32. NASS-GES Vehicle Type Exposure for Children 12 & Under ......................................................... 63
Figure 33. FARS 1995 – 2013 Fatalities by Vehicle Type for Adults Aged 25 – 65 Years Old .............. 64
Figure 34. NASS – GES 1995 – 2013 Vehicle Type Exposure for Adults Aged 25 – 65 Years Old ....... 64
Figure 35. FARS 1995 – 2013 Fatalities by Vehicle Type for Children 12 & Under Limited to Model Years 1995 - 2013 ................................................................................................................................................................. 65
Figure 36. NASS-GES Vehicle Type Exposure for Children 12 & Under Limited to Model Years 1995- 2013 ................................................................................................................................................................ ............................ 66
Figure 37. Risk and Relative Risk as a Function of Time for Vehicle Type, Relative Risk Presented is LTVs with Respect to Cars ................................................................................................................................................. 67
Figure 38. FARS Fatalities by Restraint Use for Infants (Age 0) ....................................................................... 70
Figure 39. FARS Fatalities by Seating Position for Infants (Age 0) .................................................................. 71
Figure 40. Stacked Bar Plot of Weighted MAIS Injuries by Airbag Generation .......................................... 82
Figure 41. Distribution of MAIS by Airbag Generation (Weighted) ................................................................ 83
Figure 42. Distribution of Passenger Airbag Deployments by Airbag Generation (Weighted) ........... 83

x
Figure 43. Passenger & Driver Airbag Deployments by Airbag Generation (Weighted) ........................ 84
Figure 44. Passenger Restraint Use by Airbag Generation (Weighted) ......................................................... 85
Figure 45. Passenger Vehicle Type by Airbag Generation (Weighted) .......................................................... 86
Figure 46. Distribution of Age by Airbag Generation (Weighted) .................................................................... 86
Figure 47. Cumulative Distribution of Weighted Child Occupant RFP Weights ......................................... 87
Figure 48. Probability of moderate injury for restrained children seated in RFP seat of a passenger car with a deployment for all airbag generations as a function of delta-V .................................................... 89
Figure 49. Frequency of any injury sustained by children seated in the RFP during a crash by body region resulting from deployed and non-deployed airbags. ............................................................................... 92
Figure 50. Distribution of Predicted Newborns, 1-, 3- and 6-year olds by Actual Age ............................ 97
Figure 51. Distribution of Known Advanced Airbag Strategies for the NASS-CDS Dataset ................... 98
Figure 52. Distribution of Airbag Responses for Cases with Known Deployment Strategies by Child Occupant Classification .................................................................................................................................................... 100
Figure 53. Deployment Status of Advanced Airbags for Occupants Classified as 12 Year Olds Grouped by Certification Strategy for 6 Year Old Occupants; Surprisingly 3 Airbags Suppressed When Certified to Deploy for the 6 Year Old Occupant Class ........................................................................... 101
Figure 54. Deployment Distribution by Occupant Class ................................................................................... 102
Figure 55. Deployment for Occupants Classified as 12 Year Olds Compared to the Predicted Certification Technique for the 6 Year Old Occupant Class .............................................................................. 103
Figure 56. NASS Case Number 2006-50-135 Scene Diagram Showing the Vehicle Departing the Road and Striking the House ......................................................................................................................................... 105
Figure 57. NASS Case Number 2006-50-135 Vehicle 1, Mazda 6 During Investigation Showing More Damage to the Driver’s Side (left) and the Passenger Airbag (right)............................................................ 106
Figure 58. NASS Case Number 2010-72-027 Scene Diagram Showing the Vehicles Colliding in the Intersection Prior to Striking Inanimate Objects on the Roadside ................................................................ 107
Figure 59. NASS Case Number 2010-72-027 Vehicle 2 Showing the Damage to the Front of the Vehicle (left) and the RFP Seat Fully Forward, No Airbag Deployment (right) ........................................ 108
Figure 60. NASS Case Number 2012-43-102 Scene Diagram Showing the Vehicles Colliding in a Head On Crash ..................................................................................................................................................................... 109
Figure 61. NASS Case Number 2012-43-102 Vehicle 1, Showing Damage to Front of Toyota Highlander (left) and Top-Mounted Passenger Airbag (right) ........................................................................ 110
xi
Figure 62. NASS Case Number 2010-75-160, Chevrolet HHR During Inspection Showing Damage to the Right Front of the Vehicle (left) and Instrument Panel Showing the Airbag Did Not Deploy (right) ................................................................................................................................................................ ...................... 112
Figure 63. Cosco Ambassador Belt Positioning Booster Seat Used in NASS Case Number 2010-75-160 by a 7 year old RFP in Front of an Advanced Airbag that Suppressed ................................................ 113
Figure 64. NASS Case Number 2011-48-111, Ford Escape at the Scene Showing Damage to the Front of the Vehicle (left) and the Instrument Panel for the Suppressed Passenger Airbag (right) 114
Figure 65. NASS Case Number 2009-49-161, Chevrolet C/K-Series Pickup During Investigation Showing More Damage to the Driver’s Side (left) and the Instrument Panel Showing a Suppressed Passenger Airbag (right) ................................................................................................................................................. 116
Figure 66. NASS Case Number 2010-75-081, Hummer H3 The Investigation Occurred After Repairs Began ................................................................................................................................................................ ....................... 117
Figure 67. NASS Case Number 2010-75-081, Hummer H3 Interior Showing Passenger Airbag (left) and Roof Rail Airbags for the Front & Rear Passengers (right) ...................................................................... 117
Figure 68. NASS Case Number 2010-75-081, Hummer H3 Glove Compartment Showing Contact Marks ................................................................................................................................................................ ....................... 118
Figure 69. NASS Case Number 2012-48-80, Ford F-150 Pickup during Investigation which Occurred After Repairs Began (left) and the Passenger Mid-Instrument Panel Mounted Airbag (right) ......... 119
Figure 70. NASS Case Number 2012-4-92, Chevrolet Malibu During Investigation Showing More Damage to the Passenger’s Side (left) and the Instrument Panel Showing a Suppressed Passenger Airbag (right) ................................................................................................................................................................ ....... 120
Figure 71. NASS Case Number 2010-45-166, Chevrolet Impala During Investigation Showing More Damage to the Passenger’s Side (left) and the Instrument Panel Showing a Suppressed Passenger Airbag (right) ................................................................................................................................................................ ....... 122
Figure 72. NASS Case Number 2010-12-78, Chevrolet Uplander During Investigation Showing More Damage to the Driver’s Side (left) and the Instrument Panel Showing a Deployed Passenger Airbag (right) ...................................................................................................................................................................................... 123
Figure 73. NASS Case Number 2011-48-206, GMC Yukon During Investigation Showing Damage to the Front (left) and the Instrument Panel Showing a Deployed Passenger Airbag (right).................. 124
Figure 74. NASS Case Number 2012-43-208, GMC Terrain During Investigation Showing More Damage to the Front Driver’s Side (left) and the Instrument Panel Showing a Deployed Passenger Airbag (right) ....................................................................................................................................................................... 125
xii
List of Tables_____________________________________________________ Table 1. Outline of Airbag Related Injuries by Child Occupant Age and Body Region as Reported by Sato et al. 2002 [22] .............................................................................................................................................................. 10
Table 2. Outline of Positions Required for Suppression Testing per FMVSS 208 for the 3 & 6 Year Old ATDs [9]................................................................................................................................................................ ............. 23
Table 3. Tabulation of the Number of LRD Tests Available via NHTSA's Website by Dummy Size as of January 2016 ...................................................................................................................................................................... 26
Table 4. Tabulation of the Second Stage Deployment Times in Milliseconds for LRD Tests Available via NHTSA's Website by Occupant Class...................................................................................................................... 27
Table 5. History of HIC IARVs for Adult Dummies .................................................................................................. 30
Table 6. Overview of HIC and Nij Injury Assessment Reference Values (IARVs) for Various Dummies ................................................................................................................................................................ ................... 32
Table 7. Tabulation of the Overall FARS Results for All Years and Each Respective Calendar Year Group ................................................................................................................................................................ .......................... 38
Table 8. Abbreviated Injury Scale .................................................................................................................................. 74
Table 9. Distribution of NASS/CDS Cases by Airbag Generation Outlining How Each Designation was Determined ..................................................................................................................................................................... 78
Table 10. Overview of NASS/CDS Cases Showing Unweighted & Weighted Case Counts by Airbag Generation & Varying Demographics ............................................................................................................................ 80
Table 11. Descriptive Demographics of Occupants/Vehicles in the NASS/CDS Dataset (Not Weighted) ................................................................................................................................................................................. 82
Table 12. Variables Initially Included in Logistic Regression for Effects Analysis .................................... 88
Table 13. Statistically Significant Logistic Regression Parameter Estimates .............................................. 88
Table 14. Chi-Square Test Results which Test the Global Null Hypothesis .................................................. 89
Table 15. Odds Ratio of Moderate Injury Adjusted for Longitudinal Delta-V and Airbag Deployment ................................................................................................................................................................ ....................................... 90
Table 16. P-Values Resulting from Model Effects Analysis Examining Factors Influencing Moderate Injuries ................................................................................................................................................................ ....................... 90
Table 17. Weight ranges used to classify a child's age by their weight & the weight of the applicable ATD in kg ................................................................................................................................................................................... 96
Table 18. Actual Responses for All Advanced Airbag Cases by Occupant Classification ........................ 98

xiii
Table 19. Tabulation of advanced airbag deployment strategies by model year, make and model; strategies are listed for 12-month old, 3 year old, and 6 year old respectively ....................................... 143
Table 20. List of vehicles equipped with an advanced airbag during the phase-in period (MY 2003 - 2006); * Indicates Vehicles Identified by NHTSA [52] ........................................................................................ 152

1
1 INTRODUCTION Motor vehicle crashes (MVCs) remain a leading cause of injury and death among children in
the United States (US). During 2013, 943 children aged 15 and younger died as a result of MVCs,
529 (56%) of which were less than 9 years old. Within that same year another 168,000 children
(15 and younger) were injured in MVCs [1]. There is substantial evidence that airbags save lives
[2], [3], [4], [5]. In fact, by 2012 it was estimated that frontal airbags saved approximately 37,000
lives [4]. However, it has been demonstrated that airbags can cause injury; this is especially true
for children seated in close proximity to an airbag [2], [3], [5], [6], [7].
General Motors (GM) and Ford were the first car manufacturers to introduce airbags as
standard equipment in 1972, though the early airbags were included mostly in experimental
vehicles and automobiles sold for government or fleet use. During this time other manufacturer’s
implemented plans to incorporate similar technologies, however, these efforts were short lived.
Starting in model year 1974 GM started offering the early dual airbags as optional (custom order)
safety equipment and then shortly after discontinued the equipment all together [3]. Dual (driver
and passenger) airbags were not included in all automobiles as standard equipment until a
government regulation was established more than 20 years later.
In 1991, the US Congress mandated that the National Highway Traffic Safety Administration
(NHTSA) revise FMVSS 208 (a part of the Code of Federal Regulations) to require that
manufacturers of new passenger vehicles equip vehicles manufactured on or after September 1,
1998 with airbags as supplemental restraints which were intended to be complimentary to seat
belts. This mandate required a phase-in of airbags; therefore airbags were included as standard
equipment in all passenger cars starting in model year 1998 and light trucks and vans (LTVs)
starting in model year 1999. Initially, airbags were implemented on the driver side only; it was not
until later in the phase-in period that passenger-side airbags were made available. These airbags
are referred to as first generation airbags.
2
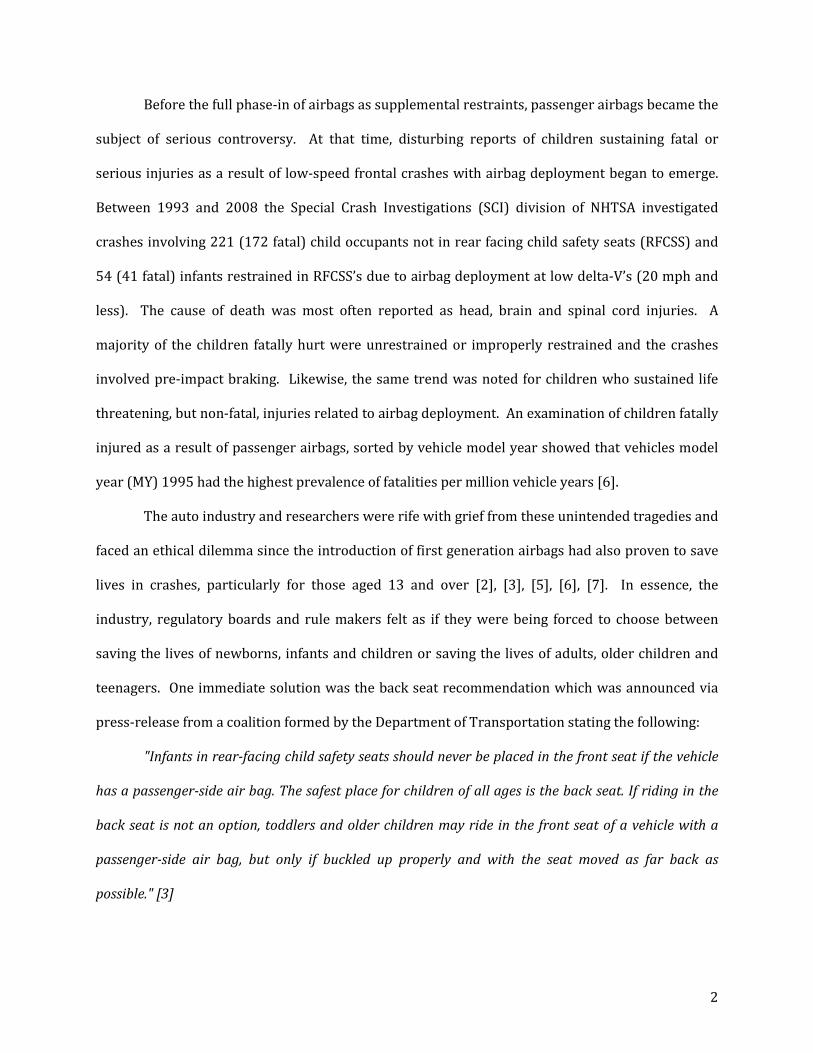
Before the full phase-in of airbags as supplemental restraints, passenger airbags became the
subject of serious controversy. At that time, disturbing reports of children sustaining fatal or
serious injuries as a result of low-speed frontal crashes with airbag deployment began to emerge.
Between 1993 and 2008 the Special Crash Investigations (SCI) division of NHTSA investigated
crashes involving 221 (172 fatal) child occupants not in rear facing child safety seats (RFCSS) and
54 (41 fatal) infants restrained in RFCSS’s due to airbag deployment at low delta-V’s (20 mph and
less). The cause of death was most often reported as head, brain and spinal cord injuries. A
majority of the children fatally hurt were unrestrained or improperly restrained and the crashes
involved pre-impact braking. Likewise, the same trend was noted for children who sustained life
threatening, but non-fatal, injuries related to airbag deployment. An examination of children fatally
injured as a result of passenger airbags, sorted by vehicle model year showed that vehicles model
year (MY) 1995 had the highest prevalence of fatalities per million vehicle years [6].
The auto industry and researchers were rife with grief from these unintended tragedies and
faced an ethical dilemma since the introduction of first generation airbags had also proven to save
lives in crashes, particularly for those aged 13 and over [2], [3], [5], [6], [7]. In essence, the
industry, regulatory boards and rule makers felt as if they were being forced to choose between
saving the lives of newborns, infants and children or saving the lives of adults, older children and
teenagers. One immediate solution was the back seat recommendation which was announced via
press-release from a coalition formed by the Department of Transportation stating the following:
"Infants in rear-facing child safety seats should never be placed in the front seat if the vehicle
has a passenger-side air bag. The safest place for children of all ages is the back seat. If riding in the
back seat is not an option, toddlers and older children may ride in the front seat of a vehicle with a
passenger-side air bag, but only if buckled up properly and with the seat moved as far back as
possible." [3]
3
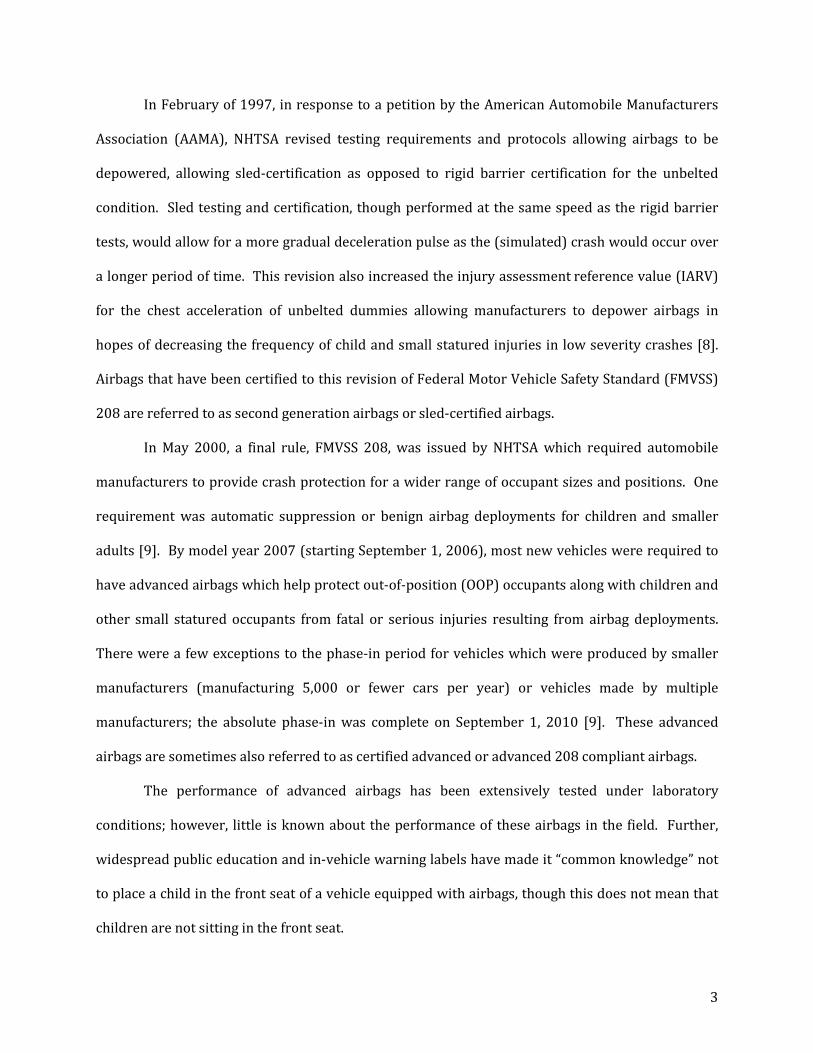
In February of 1997, in response to a petition by the American Automobile Manufacturers
Association (AAMA), NHTSA revised testing requirements and protocols allowing airbags to be
depowered, allowing sled-certification as opposed to rigid barrier certification for the unbelted
condition. Sled testing and certification, though performed at the same speed as the rigid barrier
tests, would allow for a more gradual deceleration pulse as the (simulated) crash would occur over
a longer period of time. This revision also increased the injury assessment reference value (IARV)
for the chest acceleration of unbelted dummies allowing manufacturers to depower airbags in
hopes of decreasing the frequency of child and small statured injuries in low severity crashes [8].
Airbags that have been certified to this revision of Federal Motor Vehicle Safety Standard (FMVSS)
208 are referred to as second generation airbags or sled-certified airbags.
In May 2000, a final rule, FMVSS 208, was issued by NHTSA which required automobile
manufacturers to provide crash protection for a wider range of occupant sizes and positions. One
requirement was automatic suppression or benign airbag deployments for children and smaller
adults [9]. By model year 2007 (starting September 1, 2006), most new vehicles were required to
have advanced airbags which help protect out-of-position (OOP) occupants along with children and
other small statured occupants from fatal or serious injuries resulting from airbag deployments.
There were a few exceptions to the phase-in period for vehicles which were produced by smaller
manufacturers (manufacturing 5,000 or fewer cars per year) or vehicles made by multiple
manufacturers; the absolute phase-in was complete on September 1, 2010 [9]. These advanced
airbags are sometimes also referred to as certified advanced or advanced 208 compliant airbags.
The performance of advanced airbags has been extensively tested under laboratory
conditions; however, little is known about the performance of these airbags in the field. Further,
widespread public education and in-vehicle warning labels have made it “common knowledge” not
to place a child in the front seat of a vehicle equipped with airbags, though this does not mean that
children are not sitting in the front seat.

4
An observational and driver interview survey performed in 1998 revealed that children
(<13 years old) were less likely to be observed riding in a right front passenger (RFP) seat if the car
had a passenger airbag (PAB). Though this study did not control for vehicles like pick-ups or
smaller passenger vehicles without a backseat, the authors reported that roughly 4% of the 503
survey respondents had a vehicle with 2 to 3 seats, while 82% had 4 to 6 seats and the remaining
14% had 7 or more seats. They found that children rode in the right front seat in 30% of the
vehicles surveyed without a PAB, but encouragingly only 17% of the vehicles with a PAB present.
That same study found that driver safety belt use, younger child age, and the presence of an adult
passenger were all associated with children being seated in the rear [10]. Another study published
in 2010 based on data from a phone survey between 2001 and 2003 estimated that more than one
million children (< 13 years old) rode in the front seat of a vehicle in the 30 days prior to the
interview [11]. Further, a retrospective study performed by Arbogast, et al. in 2009 concluded that
even with advanced airbags the results indicated that children were one half to two thirds less
likely to sustain an injury while seated in a rear seat as compared to the front seat, thus
substantiating the current seating recommendation for children - the back seat [12].
1.1 FIRST GENERATION AIRBAGS
A study published by Kahane in 1996 based on the Fatality Analysis Reporting System
(FARS) confirmed the fatality reduction benefit of airbags for all drivers was 30% for purely frontal
crashes and 11% overall for all crash types. This effectiveness level was essentially unchanged
from the 1992 and 1994 analyses performed by NHTSA staff. The positive findings were that driver
airbags saved lives in light trucks and in small cars, passenger airbags saved the lives of RFPs age
13 or older. Further, that driver airbags provided a significant supplemental life-saving benefit for
the driver who buckles up (as well as saving lives of unbelted drivers). On the other hand,
5
preliminary analyses of limited crash data showed a higher fatality risk for child passengers ages 0
to 12 in cars with then-current dual airbags than in cars without a passenger airbag [2].
Braver et al. (1997) assessed the effectiveness of passenger airbags in reducing the risk of
death in frontal crashes for RFPs, using FARS 1992 – 1995 for vehicles with either driver only or
dual airbags, excluding crashes with more than two vehicles. They found that airbags provided an
18% lower risk of fatality among all ages in frontal crashes and 11% overall (all crashes, all ages)
which was consistent with the estimate reported in Kahane’s study. However, they also found that
children (< 10 years old) in the RFP seat were at a 34% increased risk of fatality in frontal crashes
while riding in vehicles equipped with dual airbags, versus children in vehicles equipped only with
driver airbags. The authors noted that there were 3 infants and 11 children fatally injured as a
result of a passenger airbag deployment within the calendar years (1992 - 1995) studied [5].
Grisoni et al. (2000) performed a comparison study between injury risk resulting from
airbag deployment of properly restrained children (<13 years old) and unrestrained children in
RFP seats from patients treated in three regional hospitals in Ohio between January 1995 and
September 1998. The cases were reviewed using the injury severity score (ISS). They concluded
that airbags with or without restraints can lead to mortality or serious morbidity in children.
Injuries in both groups were similar with abdominal injuries exclusive to restrained child
passengers and decapitation exclusive to unrestrained children [13].
Weber (2000) reported that ten properly restrained rear-facing infants and another eight in
unsecured or mis-belted RFCSS’s had been killed in the US by deploying passenger airbags in
otherwise survivable crashes. Among the 28 children ages 6-11 who were killed by a passenger
airbag system through June of 2000, five had the shoulder belt behind their back, one was leaning
forward and another two cases were still under investigation. The other 20 children were
unrestrained [14].
6
Similarly, a retrospective study using a database of State Farm-insured vehicles, limited to
model year 1990 or newer, was performed by Durbin et al. in 2003. The study aimed to estimate
the prevalence of children’s (3-15 y/o) exposure to PAB deployments and determine the relative
risk of injury to restrained children exposed to PABs in frontal impact collisions. They found that
children exposed to PABs were twice as likely to be "seriously" injured (AIS 2+) as those in similar
crashes not exposed to a PAB (cars equipped only with a driver airbag, in crashes with deployment)
[15]. It should be noted that Durbin et al., uses the terminology "serious" injuries, but relates them
on the AIS as having a severity of 2 or greater which corresponds to a description of "moderate" on
the AIS scale.
A retrospective study using the FARS database conducted by Braver et al. in 1998 compared
risk of death among front and rear seated passengers aged 12 and younger who were involved in
fatal crashes. The study looked at restraint use and included vehicles with and without passenger
airbags. They found that restrained children in rear seats had the lowest risk of dying in crashes
involving at least one fatality. However, it was not just restrained children that saw a benefit from
back row seating, they found that both restrained and unrestrained children aged 0–12 were at
lower risk of dying in fatal crashes when seated in rear seats. Rear seats also afforded additional
protection to children aged 5–12 restrained only with lap belts when compared with lap/shoulder
belted children in front seats. Further, they found that seating position in the back seat also
matters; children were about 10–20% less likely to die in rear center than in rear outboard
positions [16], [17].
However, not all children exposed to PAB are seriously injured or killed. A study performed
by Huelke at the University of Michigan Transportation Research Institute (UMTRI) in 1997
examined the positive side of the PAB story. From a review of 7,212 airbag crashes investigated by
UMTRI personnel, there were 117 front seat passengers exposed to PAB deployments. The
majority of these passengers were 16 years of age or older (90 of the 117), with 20 passengers 11

7
years and younger. Two cases, both fatalities, were not described as these crashes were
investigated by NHTSA's SCI Program personnel. In total 18 passengers were examined; 13 were
children who had MAIS-1 (maximum abbreviated injury score) level injuries, two had sustained an
MAIS-2 injury, one child was without injury, and two had MAIS-5 level injuries. There was one
fatality due to intrusion and not attributed to the airbag which was coded as an MAIS of 5. This
child was restrained in the RFP with another child about his age – both with the same seatbelt, the
one closest to the center of the vehicle survived. The other MAIS-5 patient was improperly
restrained; however, most of the children included in the study were properly restrained. Further,
11 of 18 of the vehicles included in this study were Ford, Mercury or Lincoln vehicles [18].
1.1.1 INJURY PATTERNS & CASE STUDIES INVOLVING FIRST GENERATION AIRBAGS
Numerous studies have been published outlining the injury patterns and case studies of
children fatally or seriously injured in crashes involving passenger airbag deployment, this section
will outline the conclusions from these studies.
A review of 29 SCI cases between April 1993 and August 1996 was performed by Winston
and Reed in 1996. They found that seven of the eleven infants and seventeen of the eighteen
children older than one year suffered fatal injuries as a result of an airbag deployment. The eleven
infants all of whom were seated in RFCSS’s ranged in age from one week to nine months. The close
proximity of the rear of the safety seat to the airbag module resulted in rearward displacement of
the safety seat upon contact with either the airbag module flap or the airbag module cover. More
than half of the infant cases involved contact with the cover flap of the airbag and the RFCSS
demonstrated cracks at the site of contact with the airbag module flap cover. The interaction
between the airbag and the RFCSS was thought to involve crush and resulted in skull fractures and
brain injuries. One infant, case CA9516, experienced the most severe crash severity in the series,
suffered from a fatal brain parenchymal fracture in addition to other skull fractures [19].
8
In that same study of SCI cases, fifteen of the seventeen children older than 1 year who were
fatally injured were unrestrained RFP seat occupants and the other two only wore the lap portion
of a lap-shoulder seat belt. The remaining older child in the series was a three year old who was
seated in a belt-positioning booster and restrained, this child was both the only older child in the
series who was properly restrained and the only older child who survived, although his (brain)
injuries were severe. The authors found that the site of the most severe injuries in the older child
group (greater than 1 year old) included: brain, antlanto-occipital ligament, cervical spine, and skull
and neck injuries. Avoidance braking prior to a frontal crash brought the child in close proximity to
the airbag module flap. Due to the child’s forward position, he/she restricted the normal airbag
deployment path allowing for pressure to mount within the airbag module. Upon forceful opening
of the airbag module cover flap, the child was accelerated vertically, often hitting his/her head on
the windshield, followed by a rearward acceleration that resulted in hyperextension of the neck
[19].
Surprised that airbag injuries were observed on a child who was properly restrained in a
state-of-the-art forward facing, five-point harness child seat, Huff et al. published a case review of
the 3 year old boy who presented with facial abrasions and coma secondary to a crash at ~30 miles
per hour where the airbag deployed. The patient had a Glasgow Coma Score (GCS) of 6 and was
transported to a tertiary facility where it was found that he had an increased intracranial pressure
(ICP). The patient was treated with a ventriculostomy and placed in a phenobarbital coma. He was
released to a rehabilitation facility on day 20 [20].
In 1998, Marshall et al. conducted a cohort study to investigate the patterns of injury
occurring in this new mechanism of pediatric trauma via radiological analysis. Patients were
located with the assistance of victim advocacy groups, the media, and institutional networking, in
addition to review of local cases. In total 11 cases were studied. The cause of death or serious
injury in every case was the direct result of neurologic injury. Injury patterns differed according to
9
the child’s age and type of restraint used at the time of collision. Crush injury to the skull (denoted
by the authors as a “nutcracker” force) predominated in infant victims traveling in RFCSS's (3 cases
reviewed). Both cranial and cervical spine trauma occurred in older children traveling restrained
(2 cases), improperly restrained or unrestrained (6 cases) in the vehicle’s RFP seat [21].
A review of 79 studies within the literature was summarized by Sato et al. in 2002 to
examine injuries resulting from airbag deployment. Injuries were identified as ‘airbag-related’ if
the authors concluded that the injuries had been caused by the deployment of the airbag and/or if
other crash dynamics would have not caused the injuries for the occupant. Most injuries were
sustained in low- or moderate-velocity crashes. In one case, an injury was sustained due to
spontaneous deployment of an airbag without a collision. The study did not control for restraint
use as it was intended to serve forensic scientists with a survey of any injury sustained in a crash
involving an airbag deployment. Typically, the child was either unrestrained or improperly
restrained and as a result moved closer to the path of the inflating airbag during the crash.
However, a few injury and fatal cases included in their study were sustained by children who were
properly restrained. Compared to adults who sustained face, upper extremity and chest injuries,
children appeared to have a greater risk for head and neck injuries. The authors reasoned that
head and neck injuries maybe sustained by children because of their small stature, proximity to the
airbag and the upward deployment path of the bag into the child's head and neck. The findings of
this review are summarized in Table 1[22].

10
Table 1. Outline of Airbag Related Injuries by Child Occupant Age and Body Region as Reported by Sato et al. 2002 [22]
Body Region Child (1 - 12 years old) Infant (<1 year old) Head Contusion;
Laceration; Skull fracture; Subgaleal hematoma; Epidural hematoma; Subdural hematoma; Subarachnoid hemorrhage; Cerebral contusion; Diffuse axonal injury; Brainstem contusion; Brainstem laceration
Skull fracture; Subgaleal hematoma; Epidural hematoma; Subdural hematoma; Subarachnoid hemorrhage; Cerebral contusion
Face Abrasion; Contusion; Laceration; Burn; Conjunctival hemorrhage; Eye injury; Fracture of mandible, orbit
Neck Abrasion; Contusion; Laceration; Burn; Ligament disruption of cervical spine; Dislocation or separation of cervical spine; Fracture of cervical spine; Spinal cord injury; Tear of vertebral artery;
Chest Cardiac contusion Abdomen Liver injury;
Splenic injury; Renal injury
Upper Extremities Abrasion; Contusion; Burn; Fracture of radius, ulna; Fracture of humorous
Lower Extremities Burn
In 2002, Okamoto et al. presented a case review of a 4 year old child seated in a forward-
facing child safety seat (FFCSS) who sustained bulbo-C1 spinal cord injuries secondary to airbag
deployment in a “relatively low-velocity car crash” where the vehicle struck trees on side of road at

11
approximately 30 mph without pre-impact braking. The 4 year old child was unconscious and not
breathing after the crash, GCS of 3. His radiographs were normal except for a slight widening of the
interspinous space at C1-2. On Day 3 in the hospital, the child became alert although apneic and
demonstrated complete tetraplegia. There were minimal changes in neurologic functions at 5
months after the incident. The driver and the backseat passenger (10 month old) were not
seriously injured. The child sustained spinal cord injury without radiographic abnormalities and
the physical and MRI findings strongly suggested that either a transient atlanto-occipital dislocation
or subluxation caused the bulbospinal injuries. An atlanto-occipital injury typically results from
extreme hyperextension, lateral flexion, hyperflexion or distraction in the long axis of the body. It
was presumed by the authors that the airbag came into contact with the patient as it was rapidly
inflating and thus providing the forceful impact required to sustain an atlanto-occipital dislocation.
Four other atlanto-occipital dislocation injuries of forward facing children 4 years old and older
were found in the literature by the authors, all were resultant from airbags in crashes ranging from
20 – 25 mph [23].
From a review of national databases in 2006, Quinones-Hinojosa et al. determined the
number and types of fatal and nonfatal injuries to children caused by airbag deployment and child
restraint system use in low-velocity MVCs. The author reviewed 263 reported cases, occurring
between January 1993 and December 2002, in which airbag deployment caused fatal or nonfatal
injuries in children from reports released by NHTSA and the National Pediatric Trauma Registry. Of
the 263 pediatric patients, 159 were fatally injured. The peak incidence was in 1998 (n = 58). Head
injuries were most prevalent (n = 170), followed by spinal injuries (n = 100). For children in “their
first year of life,” head injuries were the sole mechanism of fatality. Of all 263 patients, only six
were properly restrained. Fatal injuries included skull and cervical spine fractures, subdural
hemorrhages, diffuse axonal injuries, cord transections, and decapitations. Only nine fatal and 20
nonfatal injuries did not involve either the head or the spine [24].

12
1.2 SECOND GENERATION AIRBAGS
Several studies in the literature have examined the effects of second generation airbags, also
known as sled certified airbags, on a child's risk of injury this section reviews these studies.
Arbogast et al. used a State Farm Insurance database which linked insurance claims to
telephone surveys and crash investigation data to study children involved exposed to deployed
airbags. The study identified 1,707 cases where restrained children between 3-15 years old were
involved in crashes as part of an ongoing crash surveillance system, Partners for Child Passenger
Safety (PCPS) (1998-2002). Vehicles were limited to 1990 and newer. They found that 3.5% of
children who were exposed to a PAB deployment received an upper extremity fracture, making
them 2.5 times more likely to sustain an upper extremity fracture than children in similar crashes
who were not exposed to a PAB. Examination of the crash investigation cases revealed a
relationship between direction of impact and side of fracture. In the three crashes where the
principal impact was on the right side, the child passengers received left upper extremity fractures.
Similarly, in the crash where the principal impact was on the left side, the child passenger received
a right upper extremity fracture. The authors suggest that this may have been especially
pronounced in children who had poor belt fit resulting from premature graduation to seatbelts. It
was hypothesized that a loose belt would allow for rotation of the contralateral extremity during a
crash which would position the extremity in the path of the airbag during deployment. Further, the
survey data identified no significant difference in the prevalence of upper extremity fractures
between those vehicles assumed to have fully powered airbags (prior to MY 1998) and those
assumed to have depowered airbags (1998 and newer) [25].
Another study by Arbogast et al. also utilized the PCPS to study the effects of second
generation airbags. Data were collected from December 1, 1998 to November 30, 2002 from 15
states in three US regions: east, mid-west, and west; vehicles qualifying for inclusion were State
Farm-insured, model year 1990 or newer, and involved in a crash with at least one child occupant
13
≤15 years of age. The eligible study population consisted of all 430,308 children riding in 288,187
State-Farm-insured vehicles newer than 1990. Results showed that second generation airbags
were beneficial in passenger cars and minivans. The children exposed to second generation airbags
in those vehicles were half as likely to sustain serious injuries. Children in the second generation
category for passenger cars (excluding SUVs and minivans) sustained fewer head injuries, including
concussions and more-serious brain injuries, than children in the first generation category.
However, in SUVs the data suggested no reduction in injury risk with the second generation bags
[26]. The same authors published a paper in 2005 comparing the injury risk to children as a result
of deployments of first and second generation airbags. They concluded that second generation
airbags provided a 41% reduction in the likelihood of a "serious" injury, which they correlated to an
AIS of 2 or greater [27].
A Crash Injury Research and Engineering Network (CIREN) case study which outlined the
success of second generation airbags was performed on cases at the Ryder Trauma Center, a Level I
trauma center, examining the risk of injury resulting from first and second generation airbags. For
second generation airbags, there were no fatalities below 25 mph. In contrast, there were four
fatalities at delta-V’s of less than 20 mph with first generation airbags (two infants in RFCSS’s, two
unbelted children younger than 3, and one unexpected fatality at a moderate crash severity to an
OOP adult). An examination of these cases revealed that among second generation passenger
airbags there were no child fatalities, no fatal neck injuries to small statured (referred to as "close-
in") drivers, and no elderly fatalities below a 30 mph delta-V crash severity. Preliminary data
showed an eight percent higher overall fatality rate with later model (older) airbags. The authors
had no examples of "success stories," defined as a case with a moderate (MAIS ≤ 2) or less severe
injury involving passengers at delta-V’s above 30 mph with first generation airbags [28].
Using a matched cohort design and FARS from 1990 to 2002 to compare first and second
generation airbags, Olson et al. found that among children under 6 years old, first-generation

14
airbags were associated with a statistically significant increased risk of fatality, compared to cases
without an airbag. However, this was not true for second generation airbags (MY 1998 - 2003)
[29].
In 2008, Braver et al., analyzed cases from FARS and the National Automotive Sampling
System - General Estimates System (NASS - GES). They reported that child right-front passengers in
age categories 0–4 and 5–9 within sled-certified vehicles had a statistically significant reduction in
risk of dying in frontal collisions as compared to those with first generation airbags, including a
65% reduced risk among ages 0–4. Further that same study reported that children ages 0–4 who
were fatally killed in a vehicle with a second generation airbag were more likely to be restrained
than children the same age also fatally injured in a vehicle with first generation airbags, specifically
53% and 47% were restrained respectively. Likewise, among those ages 5–9 dying in crashes, the
recorded restraint use rates were 42% in first-generation vehicles and 59% in sled-certified
vehicles. Further, this study provides evidence that depowering airbags reduced the toll of airbag–
related deaths among child RFPs. Whether this was due to changes in airbag designs or concurrent
improvements in vehicle design or other factors is unknown [30].
In 2005 Prasad and Louden in order to investigate whether sled-certified airbags could pass
advanced airbag tests, reviewed the findings of OOP airbag testing involving the 6 year old and 5th
percentile female Hybrid III dummies for six 2001 MY sled-certified vehicles. They found that of
the vehicles studied (Honda Accord, Chevy Impala, Dodge Caravan, Toyota Echo, Ford Escape, Ford
F150) none of the vehicles could pass both the 5th percentile female and the 6 year old OOP
performance requirements. Further, the first stages of the dual stage inflator airbags were
powerful enough to prevent the 6 year old from meeting the OOP requirements. The predominant
failure mode for the 6 year old and the 5th percentile female was neck injury criteria. The 5th
percentile had an additional predominant failure mode of chest deflection [31].
15
1.3 CERTIFIED-ADVANCED AIRBAGS
In a summary of SCI cases published in 2005, there were four cases examined which
involved children in the RFP seat and certified-advanced airbags ages 6, 11, 15 and 16 years old.
These children either presented with no injury or minor injuries (AIS 1) of the face or lower
extremities. There was however, one crash investigated by SCI that was not certified-advanced, but
had advanced features where there was a 4 year old boy belted in the RFP seat that received an AIS
5 head injury [6].
In 2008, the Blue Ribbon Panel for the Evaluation of Advanced Air Bags stated that airbag–
induced fatalities involving children and infants have decreased substantially since they were first
noted in the early 1990s, especially in 1998 and newer vehicles. As of December 2007, the SCI
program had not yet identified an airbag–induced fatality or life-threatening injury to a child or
infant in a low-severity crash of a vehicle certified to the advanced passenger airbag test
requirements that became effective in September 2003 [32]. This still holds true today in April
2016.
To determine whether front airbag changes have affected occupant protection, Braver et al.
(2010) used FARS and the Highway Loss Data Institute (HLDI) database to compare frontal crash
mortality rates of front outboard occupants in vehicles having certified-advanced airbags or sled-
certified airbags with and without advanced features. Unadjusted mortality rates for child right-
front passengers were lower (though the change was not significant) in vehicles having certified-
advanced airbags compared with sled-certified airbags with advanced features and in vehicles
having sled-certified airbags with advanced features relative to sled-certified airbags without
advanced features. The mortality rate was higher, though not at a statistically significant level, for
drivers having certified-advanced airbags compared with sled-certified airbags with advanced
features; the difference was significant for belted drivers [33].
16
The revised FMVSS 208 provides several options to car manufacturers to achieve advanced-
certification. One of those options is to suppress the airbag completely in the presence of an OOP or
child passenger. A study by Menon et al. (2003) examining the benefits of suppression found that
the performance of airbags for children varies widely among vehicle types. Of particular concern
are sport utility vehicles (SUV) and passenger vans. Children in the front seat of these vehicles and
not exposed to an airbag were at a very low risk of injury but children in similar severity crashes in
these vehicles who were exposed to airbags were at a considerable increased risk of injury [34].
1.4 SUMMARY OF THE BACKGROUND BETWEEN CHILDREN & AIRBAGS
In summary, airbags save lives; however, first generation airbags resulted in unintended
fatal and injurious consequences for children and small statured adults seated in front of them.
Fatal injuries sustained by children resulting from an airbag deployment included injuries to the
head, neck and spine. A revision to FMVSS 208 allowed car manufacturers to depower airbags by
allowing sled certification which decreased the test severity by allowing for a more gradual
deceleration. Numerous studies have evaluated the benefit of second generation airbags with
respect to children and have found that these intermediate airbags were effective at reducing the
fatality and injury risk to children involved in crashes.
A subsequent revision to FMVSS 208 required further changes to airbags for the protection
of children and small statured adults, effective for model year 2007 through the foreseeable future,
airbags are required to either suppress or deploy in low risk manner in the presence of a child or
small statured adult. Though car manufacturers have spent a considerable amount of time and
money to meet the advanced airbag requirements, the effects of these airbags and characteristics of
children seated in front of them have not been extensively studied. That may be because there are
no reported cases of an advanced airbag fatally injuring a child. Nonetheless, advanced airbags
warrant an investigation to evaluate their performance. This thesis will present the requirements

17
for advanced airbags, characteristics of children in MVCs, an evaluation of crashes involving
children involved in crashes in the RFP seat for all airbag types and finally present a case study of
children seated in front of an advanced airbag during a crash.

18
2 REQUIREMENTS FOR ADVANCED AIRBAGS Advanced airbags are tested and certified in accordance with Federal Motor Vehicle Safety
Standard (FMVSS) 208. This standard requires that advanced airbags are tested with 50th
percentile male and 5th percentile female Hybrid III dummies in frontal crashes. Further, the 5th
percentile female dummy must be included in one of the front seating positions for purposes of
testing the advanced airbags when testing new vehicles. It also requires testing advanced airbags
with the newborn infant, 12 month-, three and six year-old dummies. Car manufacturers are
allowed to choose to certify their advanced airbags with the small statured child and adult dummies
via the following techniques: suppression, low risk deployment (LRD) or dynamic auto suppression
system (DASS) testing [9]. While the manufacturers are required to pick one technique for
certification purposes, the technique can be different for the different size dummies and different
vehicles (Figure 1).
Figure 1. Illustration of the advanced airbag deployment techniques assuming a crash is severe enough to warrant an airbag deployment showing that for adults advanced airbags employs a two-stage deployment (left), but for children and small statured adults the airbag employs a single stage inflation (middle) or suppresses (right).
The suppression technique uses an occupant classification system (OCS) to identify children
in the right front passenger (RFP) seat and suppresses the airbag to prevent potential injury from
airbag deployment. This system also prevents the airbag from firing when the seat is not occupied,
or if the seat has inanimate objects placed on it. The low risk deployment technique uses the same
2-stage Airbag
Normal Deployment
1-stage Airbag
Low Risk Deployment
Airbag
Suppression
Adult Child Child
19
OCS sensing, but instead of suppressing the airbag allows the airbag to deploy in a low risk manner.
The low risk deployment typically changes the deployment times of the airbags to achieve a low
risk to the passenger in front of the deploying airbag. The DASS test procedure has not yet been
defined in the current version of the rule; however, it is reserved in subpart S28 of the rule [9]. To
the author's knowledge, current advanced airbag systems can only detect certain classes of
occupants, but cannot recognize whether an occupant is in a predetermined zone, such as the
automatic suppression zone (ASZ) which is introduced in the limited verbiage explaining DASS in
the rule.
Occupant classification systems can at a minimum classify a seat as being empty, having an
infant or child placed in it, or having an adult seated in it. In general, there are three methods used
to detect occupant classes within occupant classification systems, they are:
1. Pressure recognition, which uses a fluid filled bladder system to determine weight and
location on the seat, such as the ones described by Delphi [35] [36],
2. Impedance detection, which employs an antenna to measure the impedance of the
occupant, object on the seat or a child safety seat (CSS), such as the systems described
by Delphi [37] and Nidec Elesys [38], and
3. Weight detection, which determines the weight of a person using strain gages, such as
the systems described by Calsonic [39] and Bosch [40].
With the exception of the impedance system, these systems can determine where an
occupant is on the seat based on the movement of the center of gravity (CG) on the seat, but they
are not yet sophisticated enough to determine if the occupant is in a specific zone (e.g. out of
position). A fourth method has been proposed, though the author is unable to find a commercially
available system comprising the idea of pattern recognition, which distinguishes an adult from a
child seat via camera or ultrasonic sensors. Some occupant classification systems also detect the
20
seat track location. Further, the impedance systems could possibly be "fooled" by clothing textiles
with polymeric coatings such as Gore-Tex which have a capacitance similar to plastic car seats.
The certifying technique (suppression or low risk deployment) can be different for each
occupant class (i.e. infant, 3 year old, 6 year old, 5th percentile female). Many of the airbags that use
a low risk deployment certification strategy for one or more occupant classes also use a
suppression strategy for another occupant class. Hence, the manufacturer can decide to suppress
the airbag for one passenger in a crash, but deploy in a low risk manner for a different passenger at
the same location in the same crash. However, FMVSS 208 requires suppression for a newborn
infant [9]. Typically, the suppression technique is also used for the older infant occupant class
which employs the 12 month old CRABI (Child Restraint Airbag Interaction) dummy during testing.
According to Mr. Jeff Lewandowski, a Project Engineer at MGA Research Corporation
responsible for overseeing a majority of the regulatory advanced airbag tests, the choice to certify
advanced airbags with an LRD strategy is made by the manufacturer and can be based on the
demographics, safety and cost for that model and in some part to provide due diligence [41]. Some
car manufacturers have used a single advanced airbag strategy. For instance, several
manufacturers use a suppression strategy for all child and small adult airbag scenarios, while
others like Chrysler employ an LRD strategy for most child and small adult airbag scenarios, as
allowable. Yet, other manufacturers such as BMW and Mercedes employ a LRD strategy for the
three- and six-year-olds and suppression strategy for younger passengers. Yet other manufacturers
may use an overlapping strategy, where the airbags deploy using an LRD strategy for the three- and
six-year-olds in the proper position, but suppress when the three- and six-year-olds are out of
position (OOP). This technique removes the sharp cut-off between suppression and LRD strategies
[41]. Further, most advanced airbags in passenger cars use the windshield of the car to guide the
deployment path of the passenger airbag regardless of where the airbag is mounted (i.e. mid-
mounted, top-mounted, etc.). This is evident in the test reports of several LRD tests where
21
deployment of the airbag alone (in an otherwise stationary vehicle) cracks the windshield upon
deployment.
Many advanced airbags, especially ones that employ a low risk deployment feature, employ
a two-stage deployment technique wherein there are two inflators which either fire into the bag at
the same time or with a delay between the two stages. All LRD airbags deploy both stages of the
two stage bag during low risk deployments. However, in many LRD airbags, the second stage firing
time can be late in the event (i.e. >100 ms) thus discharging the remaining charge in the system
after the crash is over. Airbags are typically fired using pyrotechnics. These explosives present a
potential safety concern for first responders when these explosive charges have not been
completely discharged from the airbags prior to their arrival. Firing the remaining charge late in
the event, after the passenger has been safely restrained from forcefully contacting the windshield
or dashboard, reduces the risk of the airbags spontaneously firing later. However, not all LRD
strategies deploy the second stage of the airbag late in the event, a detailed analysis of the FMVSS
208 compliance test reports available on NHTSA's website revealed that many of these systems do
deploy the second stage in low risk deployment cases around 100 milliseconds or later. As will be
shown later, the deployment time of the second stage can range from 10 to 255 milliseconds after
the first stage deploys.
2.1 SUPPRESSION
Suppression tests are static tests wherein small-statured anthropomorphic test devices
(ATD) or human volunteers are seated in front of the appropriate airbag and the suppression of the
bag is verified. Child volunteers are used when the suppression systems are not activated by
dummies. The volunteers are required to meet age, height and weight requirement and asked to sit
in various positions in the RFP seat. Suppression tests are performed in the right front passenger
22
(RFP) seat with the passenger airbag (PAB). The driver airbag does not have the option to
suppress.
These tests are performed in conjunction with the FMVSS 208-required “telltale” airbag
light on the dash board. The “telltale” light indicates when the passenger airbag is turned off and is
required to be visible to all front seat passengers. “Telltale” requires the light to be yellow and to
use the phrases “Passenger Air Bag Off” or “Pass Air Bag Off.” Because the telltale light indicates
whether the airbag is suppressed, suppression tests are conceivably less expensive and time
consuming than LRD tests which require firing airbags for several scenarios. The suppression test
presents a very low risk to child volunteers as the switches are tested statically where the key is
turned in the ignition to the accessory position, but the vehicle is not running.
The suppression technique is required for newborn babies, but is optional for older
children. To perform the test with the newborn, the dummy is placed in a secured car bed with the
RFP seat in the full-rearward, mid-position and full-forward positions. Tests with the older 12
month-old CRABI dummy, requires that the dummy is placed in several different positions secured
with the RFP seat again in each of the full-rearward, mid-position and full-forward positions for
each of the car seats. Depending on the sensor system employed within the occupant classification
system, the infant and CRABI tests are also to be tested with blankets or sun visors over the car
seat, to ensure that these items will not cause the airbag to deploy or activate [9].
For the three- and six-year-old suppression tests, children or dummies are unbelted and
positioned in numerous positions to ensure the airbag suppresses in all cases, these positions are
outlined in Table 2. The positions vary from lying on the seat to restraint within various child
safety seat (CSS) configurations.
Once the dummy or child is positioned, the key is placed in the ignition and the car ignition
is turned to the position in which the “telltale” light must illuminate. There is a ten second period
between turning on the ignition and reading the “telltale” light which should indicate that the
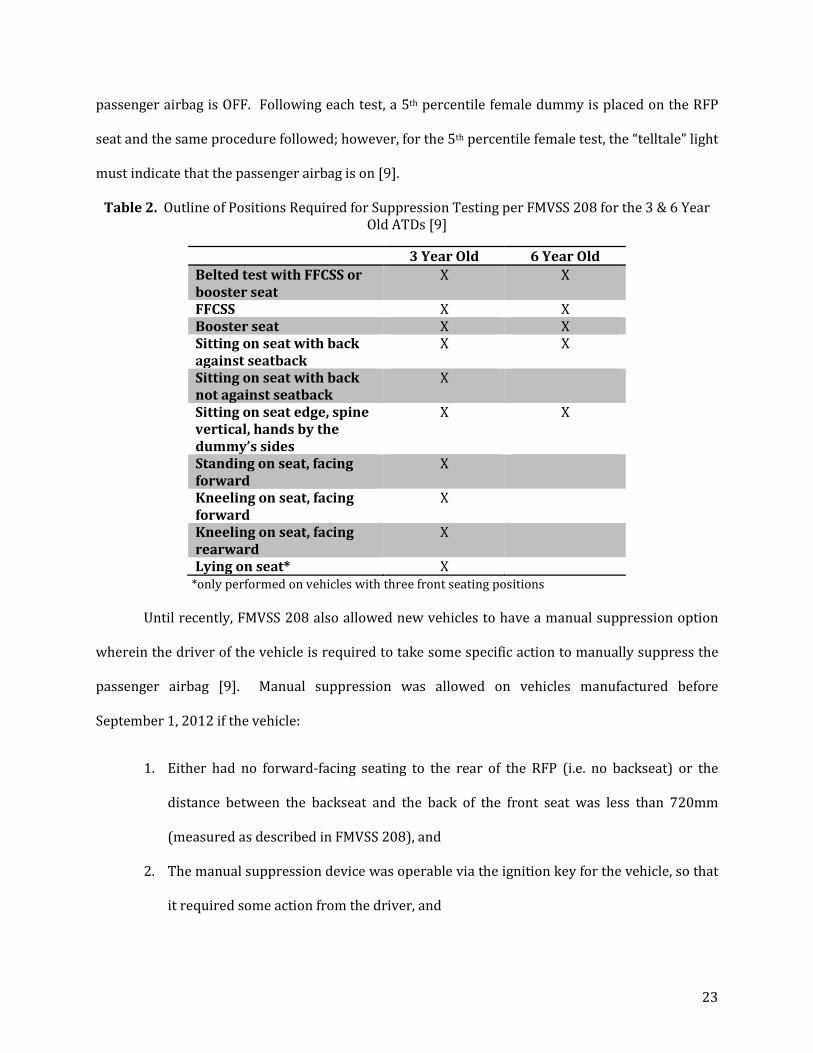
23
passenger airbag is OFF. Following each test, a 5th percentile female dummy is placed on the RFP
seat and the same procedure followed; however, for the 5th percentile female test, the “telltale” light
must indicate that the passenger airbag is on [9].
Table 2. Outline of Positions Required for Suppression Testing per FMVSS 208 for the 3 & 6 Year Old ATDs [9]
3 Year Old 6 Year Old Belted test with FFCSS or booster seat
X X
FFCSS X X Booster seat X X Sitting on seat with back against seatback
X X
Sitting on seat with back not against seatback
X
Sitting on seat edge, spine vertical, hands by the dummy’s sides
X X
Standing on seat, facing forward
X
Kneeling on seat, facing forward
X
Kneeling on seat, facing rearward
X
Lying on seat* X *only performed on vehicles with three front seating positions
Until recently, FMVSS 208 also allowed new vehicles to have a manual suppression option
wherein the driver of the vehicle is required to take some specific action to manually suppress the
passenger airbag [9]. Manual suppression was allowed on vehicles manufactured before
September 1, 2012 if the vehicle:
1. Either had no forward-facing seating to the rear of the RFP (i.e. no backseat) or the
distance between the backseat and the back of the front seat was less than 720mm
(measured as described in FMVSS 208), and
2. The manual suppression device was operable via the ignition key for the vehicle, so that
it required some action from the driver, and
24
3. There was a “telltale” light indicating when the passenger airbag is turned off which was
visible to all front seat passengers. “Telltale” meaning it must be yellow, must use the
words “Passenger Air Bag Off” or “Pass Air Bag Off”, and
4. The vehicle owner’s manual clearly explained the operation of the on/off switch,
conditions under which it was to be used and a warning about the safety risks in using
the switch inappropriately.
2.2 LOW RISK DEPLOYMENT
Low risk deployment (LRD) tests are dynamic tests wherein the airbag is fired while the
vehicle remains stationery; these tests are only performed for vehicles and occupant classes
certified by the automakers to be using a LRD technique. Unlike suppression tests, LRD tests are
performed exclusively with instrumented dummies. The LRD tests were designed to mimic the
“worst-case” scenarios, there is no interest in whether the dummy is classified by the system, the
test assumes that the occupant has been classified as a child and that the bag will deploy in a low
risk manner – a big assumption. The airbag is fired in this low risk fashion with the child dummy
placed in the worst-case locations for the child dummies: in child seats, for the three- and six-year-
old children and with their head or chest directly on the cover of the airbag module.
Since the LRD tests actually deploy the airbag, only one test configuration can be conducted
using the original equipment manufacturer (OEM) airbag installation. The remaining tests use
what the industry has termed "dealer bags," these are airbags that are purchased at a dealership
but are still sold by the OEM. NHTSA decides on a case by case basis which test will used the OEM
airbag. The test performer completes the repair of the airbags for the following 10 – 15 tests using
"dealer bags." According to Mr. Lewandowski, the first LRD takes about one hour to perform, but
re-wiring and re-installing the new "dealer bag" can take a much longer time especially for the
passenger side [41].
25
According to FMVSS 208, the number of stages and their deployment times shall be
determined via a frontal rigid barrier test at a speed up to and including 16 mph. But, the firing
time is not determined from a frontal rigid barrier test, directly by the test performer, rather, these
deployment times are provided by the manufacturer to the test performer prior to testing. The
frontal barrier test may be a threshold test to ensure that advanced airbags will not deploy in low
severity cases. The number of airbag deployment stages and their second-stage deployment times
are then recorded in the test report and that configuration is used for the LRD testing. As noted
above, the deployment of the second stage can range from 10 ms to 255 ms after the first stage
deploys. The manufacturers determine the second stage deployment time as a design metric via
crash tests, sled tests or mathematical models which are performed by the manufacturer during
their airbag development. The manufacturer has to justify these numbers with good engineering
sense and some data; the manufacturer has to show how they came up with the threshold to fire or
not fire the airbag [41].
During LRD testing, the airbags are fired via an input directly connected to the airbag
inflator thereby bypassing any other input to the bag. According to Mr. Lewandowski, the airbag
control units are first divorced from the airbag control system completely. Then, a Diversified
Technical Systems, Inc. (DTS) using a TDAS Pro Timed Output Module (TOM) fires a squib directly
into the airbag inflator via the first and second stage deployment plugs. The plug locations and
stages are defined by the manufacturer prior to testing [41].
LRD tests employing the 12 month-old CRABI ATD are performed in the RFP seat with
various child safety seats. Each type of seat is tested in three seat track positions: full-forward,
middle, full-rearward. There are two positions tested for the three and six year old dummies:
position one with the dummy’s chest on the instrument panel, and position two, with the dummy’s
head on the instrument panel of the PAB. Where the instrument panel is the door opening of the
airbag. Tape with a maximum breaking force of 70 pounds may be used, and frequently is for the
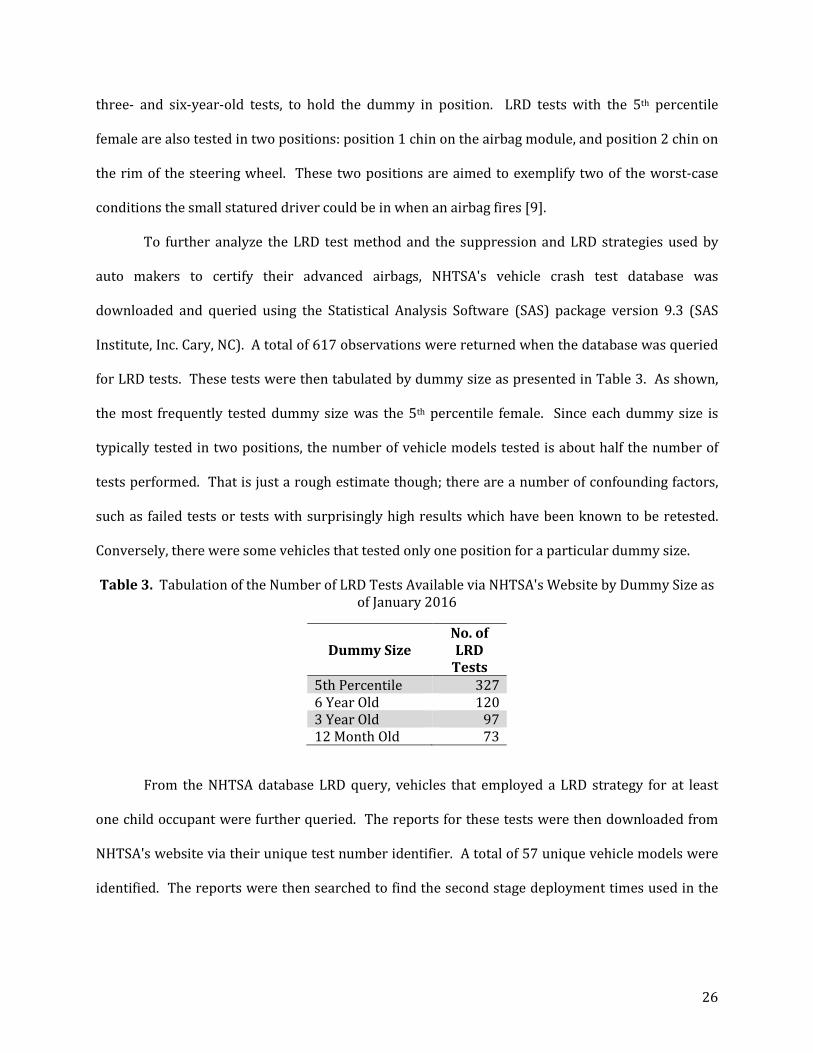
26
three- and six-year-old tests, to hold the dummy in position. LRD tests with the 5th percentile
female are also tested in two positions: position 1 chin on the airbag module, and position 2 chin on
the rim of the steering wheel. These two positions are aimed to exemplify two of the worst-case
conditions the small statured driver could be in when an airbag fires [9].
To further analyze the LRD test method and the suppression and LRD strategies used by
auto makers to certify their advanced airbags, NHTSA's vehicle crash test database was
downloaded and queried using the Statistical Analysis Software (SAS) package version 9.3 (SAS
Institute, Inc. Cary, NC). A total of 617 observations were returned when the database was queried
for LRD tests. These tests were then tabulated by dummy size as presented in Table 3. As shown,
the most frequently tested dummy size was the 5th percentile female. Since each dummy size is
typically tested in two positions, the number of vehicle models tested is about half the number of
tests performed. That is just a rough estimate though; there are a number of confounding factors,
such as failed tests or tests with surprisingly high results which have been known to be retested.
Conversely, there were some vehicles that tested only one position for a particular dummy size.
Table 3. Tabulation of the Number of LRD Tests Available via NHTSA's Website by Dummy Size as of January 2016
Dummy Size No. of LRD
Tests 5th Percentile 327 6 Year Old 120 3 Year Old 97 12 Month Old 73
From the NHTSA database LRD query, vehicles that employed a LRD strategy for at least
one child occupant were further queried. The reports for these tests were then downloaded from
NHTSA's website via their unique test number identifier. A total of 57 unique vehicle models were
identified. The reports were then searched to find the second stage deployment times used in the

27
LRD testing for all occupant sizes, these times are tabulated in Table 4. Where applicable, the
suppression strategy is noted in lieu of a second stage deployment time.
Table 4. Tabulation of the Second Stage Deployment Times in Milliseconds for LRD Tests Available via NHTSA's Website by Occupant Class
Second Stage Deployment Time (ms)
Make Model Year Newborn Infant
12 Month Old -
CRABI
3 yo Hybrid
III
6 yo Hybrid
III
5th% Female Hybrid
III Audi A3 2006 Supp Supp 40 40 40
BMW 128i 2009 Supp Supp 240 240 60 328i 2008 Supp Supp 100 100 60
Cadillac CTS 2010 Supp Supp 30 35 100
Chevrolet
Cobalt 2009 Supp Supp 40 40 100 Equinox 2010 Supp Supp 35 35 100 Impala 2014 Supp Supp 100 100 100 Silverado 2009 Supp Supp 120 120 120 Silverado 1500 2014 Supp Supp 120 120 120 Volt 2011 Supp Supp 120 120 120
Dodge
Avenger 2013 NT 10 40 40 100 Caliber 2008 NT 20 40 40 100 Charger 2007 NT 10 60 60 150 Durango 2004 Supp Supp 130 130 130 Grand Caravan 2008 NT 20 150 150 150 Journey 2009 NT 20 150 150 100 Magnum 2005 Supp Supp 150 150 150
Ram 1500 2006 NT 10 150 150 150 2007 NT 10 NT NT 60
Fiat 500 2012 NT 5 120 120 120 500L 2014 NT 5 120 120 120
Ford Explorer 2011 Supp Supp Supp Supp 150
Honda
Accord 2004 Supp Supp Supp 20 30 2008 Supp Supp Supp 150 150 2013 Supp Supp Supp 150 40
Accord Crosstour 2010 Supp Supp Supp 150 40
Civic 2007 Supp Supp Supp 130 40 Civic Hybrid 2013 Supp Supp Supp 150 40 CRV 2008 Supp Supp Supp 130 40 Fit 2007 Supp Supp Supp 130 30 Insight 2010 Supp Supp Supp 150 40
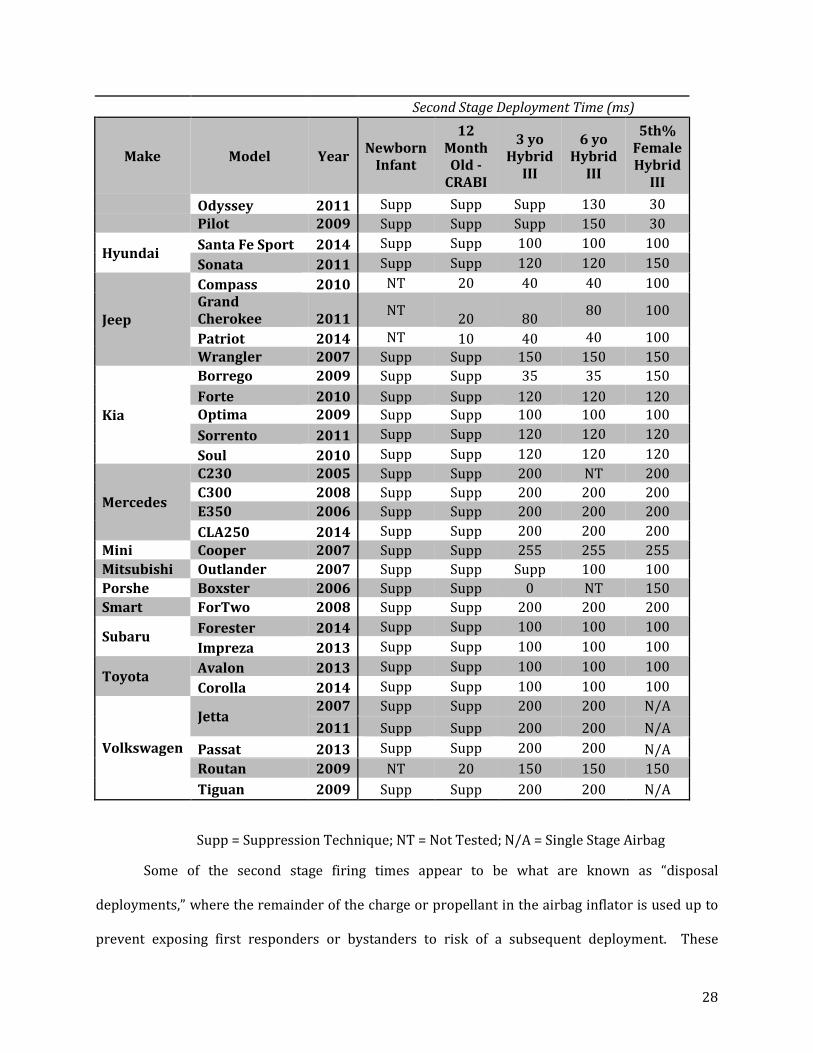
28
Second Stage Deployment Time (ms)
Make Model Year Newborn Infant
12 Month Old -
CRABI
3 yo Hybrid
III
6 yo Hybrid
III
5th% Female Hybrid
III Odyssey 2011 Supp Supp Supp 130 30 Pilot 2009 Supp Supp Supp 150 30
Hyundai Santa Fe Sport 2014 Supp Supp 100 100 100 Sonata 2011 Supp Supp 120 120 150
Jeep
Compass 2010 NT 20 40 40 100 Grand Cherokee 2011 NT 20 80 80 100
Patriot 2014 NT 10 40 40 100 Wrangler 2007 Supp Supp 150 150 150
Kia
Borrego 2009 Supp Supp 35 35 150 Forte 2010 Supp Supp 120 120 120 Optima 2009 Supp Supp 100 100 100 Sorrento 2011 Supp Supp 120 120 120 Soul 2010 Supp Supp 120 120 120
Mercedes
C230 2005 Supp Supp 200 NT 200 C300 2008 Supp Supp 200 200 200 E350 2006 Supp Supp 200 200 200 CLA250 2014 Supp Supp 200 200 200
Mini Cooper 2007 Supp Supp 255 255 255 Mitsubishi Outlander 2007 Supp Supp Supp 100 100 Porshe Boxster 2006 Supp Supp 0 NT 150 Smart ForTwo 2008 Supp Supp 200 200 200
Subaru Forester 2014 Supp Supp 100 100 100 Impreza 2013 Supp Supp 100 100 100
Toyota Avalon 2013 Supp Supp 100 100 100 Corolla 2014 Supp Supp 100 100 100
Volkswagen
Jetta 2007 Supp Supp 200 200 N/A 2011 Supp Supp 200 200 N/A
Passat 2013 Supp Supp 200 200 N/A Routan 2009 NT 20 150 150 150 Tiguan 2009 Supp Supp 200 200 N/A
Supp = Suppression Technique; NT = Not Tested; N/A = Single Stage Airbag
Some of the second stage firing times appear to be what are known as “disposal
deployments,” where the remainder of the charge or propellant in the airbag inflator is used up to
prevent exposing first responders or bystanders to risk of a subsequent deployment. These
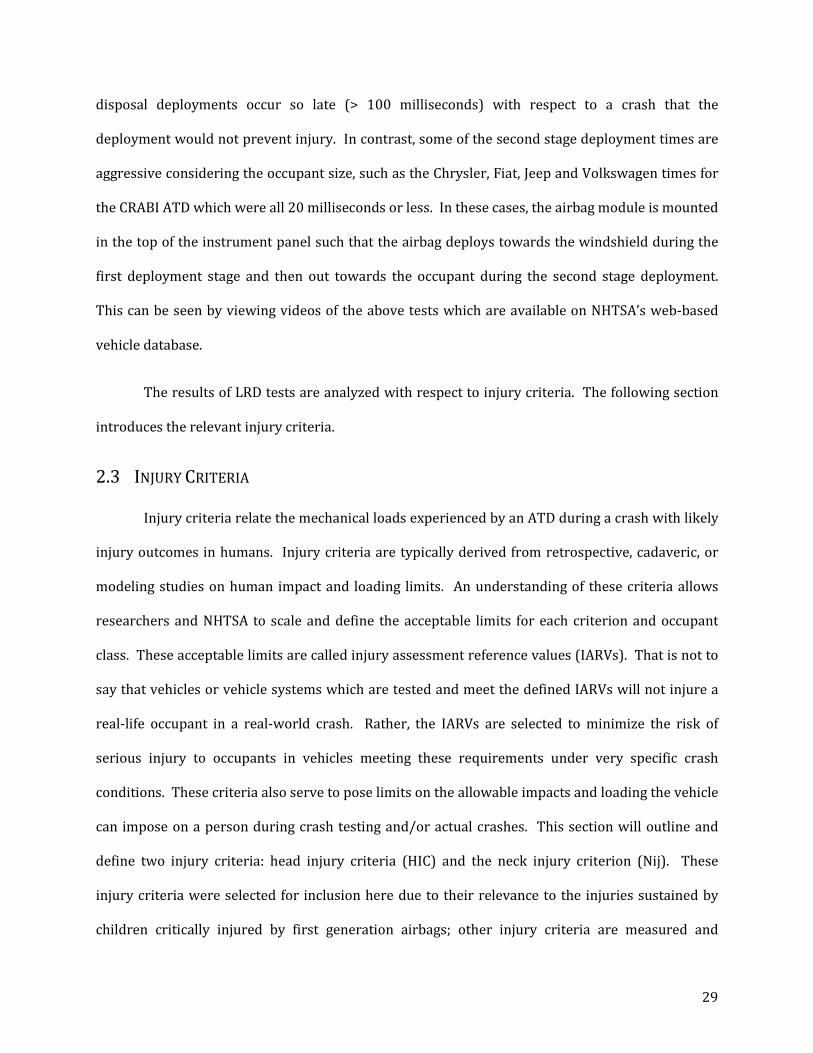
29
disposal deployments occur so late (> 100 milliseconds) with respect to a crash that the
deployment would not prevent injury. In contrast, some of the second stage deployment times are
aggressive considering the occupant size, such as the Chrysler, Fiat, Jeep and Volkswagen times for
the CRABI ATD which were all 20 milliseconds or less. In these cases, the airbag module is mounted
in the top of the instrument panel such that the airbag deploys towards the windshield during the
first deployment stage and then out towards the occupant during the second stage deployment.
This can be seen by viewing videos of the above tests which are available on NHTSA’s web-based
vehicle database.
The results of LRD tests are analyzed with respect to injury criteria. The following section
introduces the relevant injury criteria.
2.3 INJURY CRITERIA
Injury criteria relate the mechanical loads experienced by an ATD during a crash with likely
injury outcomes in humans. Injury criteria are typically derived from retrospective, cadaveric, or
modeling studies on human impact and loading limits. An understanding of these criteria allows
researchers and NHTSA to scale and define the acceptable limits for each criterion and occupant
class. These acceptable limits are called injury assessment reference values (IARVs). That is not to
say that vehicles or vehicle systems which are tested and meet the defined IARVs will not injure a
real-life occupant in a real-world crash. Rather, the IARVs are selected to minimize the risk of
serious injury to occupants in vehicles meeting these requirements under very specific crash
conditions. These criteria also serve to pose limits on the allowable impacts and loading the vehicle
can impose on a person during crash testing and/or actual crashes. This section will outline and
define two injury criteria: head injury criteria (HIC) and the neck injury criterion (Nij). These
injury criteria were selected for inclusion here due to their relevance to the injuries sustained by
children critically injured by first generation airbags; other injury criteria are measured and
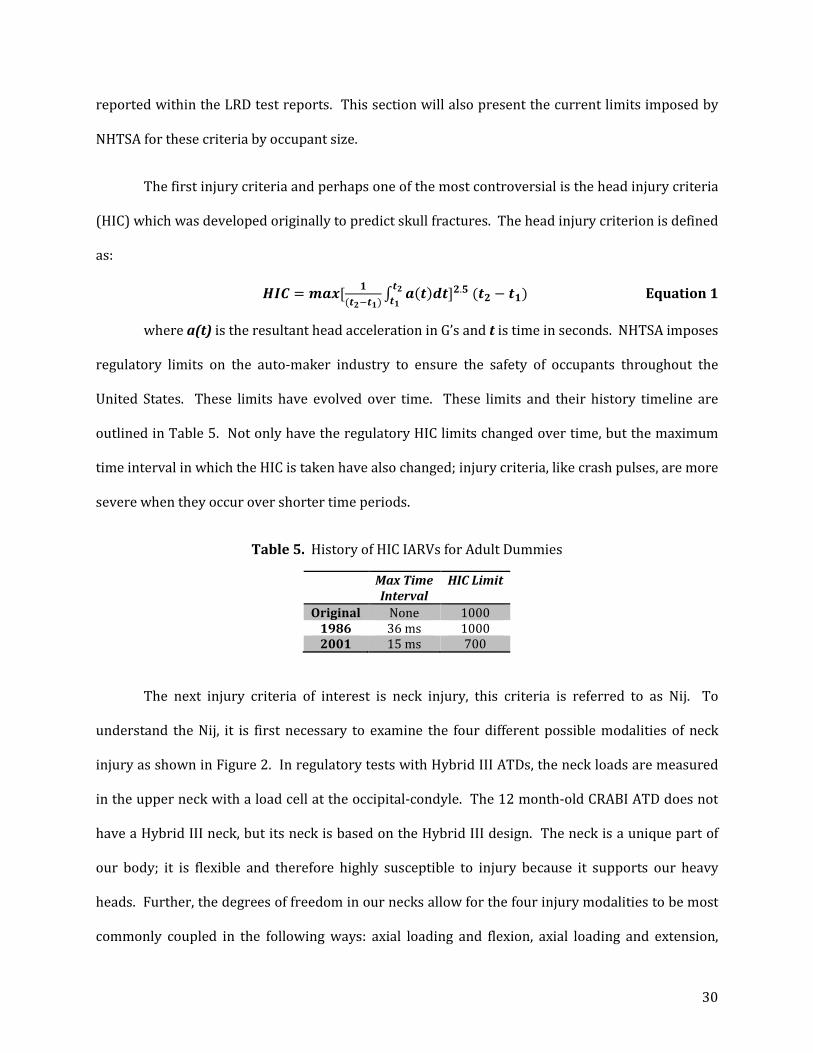
30
reported within the LRD test reports. This section will also present the current limits imposed by
NHTSA for these criteria by occupant size.
The first injury criteria and perhaps one of the most controversial is the head injury criteria
(HIC) which was developed originally to predict skull fractures. The head injury criterion is defined
as:
𝑯𝑯𝑯𝑯𝑯𝑯 = 𝒎𝒎𝒎𝒎𝒎𝒎[ 𝟏𝟏(𝒕𝒕𝟐𝟐−𝒕𝒕𝟏𝟏)∫ 𝒎𝒎(𝒕𝒕)𝒅𝒅𝒕𝒕]𝟐𝟐.𝟓𝟓 (𝒕𝒕𝟐𝟐 − 𝒕𝒕𝟏𝟏) 𝒕𝒕𝟐𝟐
𝒕𝒕𝟏𝟏 Equation 1
where a(t) is the resultant head acceleration in G’s and t is time in seconds. NHTSA imposes
regulatory limits on the auto-maker industry to ensure the safety of occupants throughout the
United States. These limits have evolved over time. These limits and their history timeline are
outlined in Table 5. Not only have the regulatory HIC limits changed over time, but the maximum
time interval in which the HIC is taken have also changed; injury criteria, like crash pulses, are more
severe when they occur over shorter time periods.
Table 5. History of HIC IARVs for Adult Dummies
Max Time Interval
HIC Limit
Original None 1000 1986 36 ms 1000 2001 15 ms 700
The next injury criteria of interest is neck injury, this criteria is referred to as Nij. To
understand the Nij, it is first necessary to examine the four different possible modalities of neck
injury as shown in Figure 2. In regulatory tests with Hybrid III ATDs, the neck loads are measured
in the upper neck with a load cell at the occipital-condyle. The 12 month-old CRABI ATD does not
have a Hybrid III neck, but its neck is based on the Hybrid III design. The neck is a unique part of
our body; it is flexible and therefore highly susceptible to injury because it supports our heavy
heads. Further, the degrees of freedom in our necks allow for the four injury modalities to be most
commonly coupled in the following ways: axial loading and flexion, axial loading and extension,
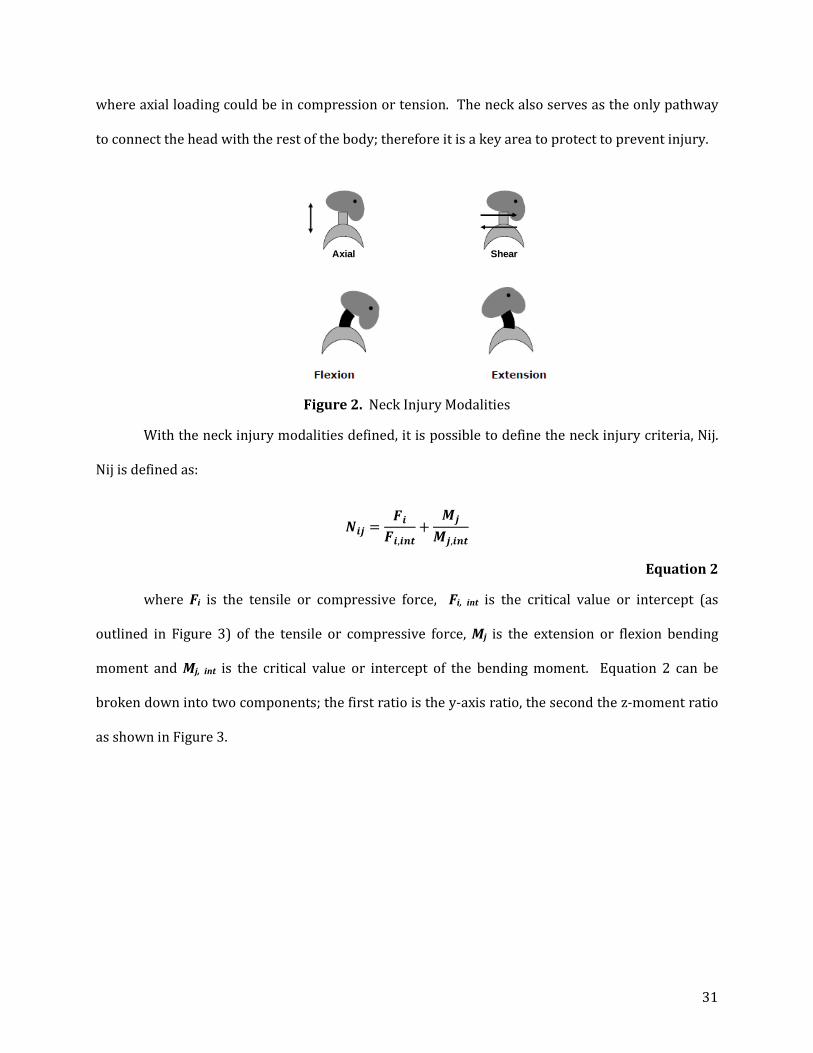
31
where axial loading could be in compression or tension. The neck also serves as the only pathway
to connect the head with the rest of the body; therefore it is a key area to protect to prevent injury.
Figure 2. Neck Injury Modalities
With the neck injury modalities defined, it is possible to define the neck injury criteria, Nij.
Nij is defined as:
𝑵𝑵𝒊𝒊𝒊𝒊 =𝑭𝑭𝒊𝒊𝑭𝑭𝒊𝒊,𝒊𝒊𝒊𝒊𝒕𝒕
+𝑴𝑴𝒊𝒊
𝑴𝑴𝒊𝒊,𝒊𝒊𝒊𝒊𝒕𝒕
Equation 2
where Fi is the tensile or compressive force, Fi, int is the critical value or intercept (as
outlined in Figure 3) of the tensile or compressive force, Mj is the extension or flexion bending
moment and Mj, int is the critical value or intercept of the bending moment. Equation 2 can be
broken down into two components; the first ratio is the y-axis ratio, the second the z-moment ratio
as shown in Figure 3.
Axial Shear

32
Figure 3. NHTSA Nij Criterion Limits Established in 2000
The IARV's for the mid-sized male, small female, six and three year-old children and the 12
month infant are tabulated in Table 6. The newborn infant is not listed because the only option is
suppression for newborns in car beds, so no injury criteria or IARV is needed. Further, FMVSS 208
only requires that these injury criteria be met for the first 100 milliseconds for the three and six
year old child dummies, this may be why several airbags are designed to deploy the second stage
after 100 milliseconds; for 5th percentile females the data is recorded to 125 milliseconds after the
initial deployment stage [9].
Table 6. Overview of HIC and Nij Injury Assessment Reference Values (IARVs) for Various Dummies
Criteria
Mid-Sized Male
(50th %)
Small Female (5th %)
6 yo Child
3 yo Child
12 mo. Infant
HIC15 700 700 700 570 390 Nij 1.0 1.0 1.0 1.0 1.0 Nij Critical Intercept Values: Tension & Compression (N) Flexion (Nm) Extension (Nm)
4500 310 125
3370 155 62
2800
93 37
2120
68 27
1460
43 17
2.4 SUMMARY OF ADVANCED AIRBAG REQUIREMENTS
Under the final advanced airbag ruling, vehicle manufacturers must suppress an advanced
airbag in the presence of an infant (< 1 year old), but can choose whether to suppress or deploy the

33
airbag in a low risk fashion in the presence of three different child occupant classes: 1-, 3- and 6
year olds. FMVSS 208 requires that the suppression or deployment strategy is tested under
laboratory conditions with dummies, or, at the option of the manufacturer, child volunteers (for
suppression tests only). This chapter examined how these extensive tests are performed:
suppression tests use the "telltale" dashboard light to determine whether the airbag is suppressed
or not, while LRD tests are performed by firing several airbags for each occupant class
incorporating an LRD technique. In addition, the NHTSA test database was queried for their results
by occupant class and second stage deployment times commonly exceeded 100 milliseconds which
is after the crash event is over, though some were more aggressive and deployed the second stage
at 5 milliseconds. In addition, relevant injury criteria for the head and the neck were examined
along with their respective IARVs for various dummy sizes. The IARV for the head injury criteria is
the same for a 6 year old as it is for a 5th percentile female and a 50th percentile male; however as
expected the values are lower for the 3 year old and 1 year old. With this understanding of
advanced airbags an analysis of child fatalities in motor vehicle crashes was performed to
investigate the effect advanced airbags has had on child fatalities.

34
3 CHARACTERISTICS OF CHILD FATALITIES IN MOTOR VEHICLE CRASHES (MVCS)
Motor vehicle crashes remain a leading cause of injury and death among children in the
United States (US). While the motor vehicle fatalities among children aged 12 and under have
decreased considerably since 1995, traffic related incidents are responsible for approximately
1,000 children continue to die in the US each year. During the 19 year period between 1995 and
2013 children 12 and younger accounted for an average of 4% of the total Fatality Analysis
Reporting System (FARS) reported fatalities yearly. While this is a small percentage overall, these
fatalities are preventable and child fatalities carry a very large social and economic burden on
society.
This chapter investigates child fatalities as a result of MVCs in the US using FARS for case
years 1995 – 2013 in order to identify specific crash characteristics that lead to child fatalities. The
distribution of child fatalities by crash mode, seating position, age, restraint, and vehicle type may
provide some important insight to MVC injuries and fatalities amongst children. To put the fatality
information from FARS in perspective, the exposure estimates for children during the same years
using National Automotive Sampling System – General Estimate System (NASS-GES) are also
presented for each FARS scenario examined. The chapter first outlines methods used herein, then
reviews fatalities for all children including bicyclists and pedestrians and finally analyzes fatality
and exposure data for child occupants of passenger vehicles (cars and light trucks and vans (LTVs))
with respect to crash mode, seating position, age, restraint use and vehicle type.
3.1 METHODS
The Fatality Analysis Reporting System is a database of all MVCs in the US involving at least
one traffic-related fatality within 30 days following the crash. FARS is a nationwide census which
accounts for all occupants and persons such as bicyclists or pedestrians involved in a crash
35
involving a fatality. The National Automotive Sampling System – General Estimate System is a
database containing a nationally representative sample of police reported MVCs ranging in severity
from minor to fatal crashes. To obtain a nationally representative estimate, NASS-GES provides
weighting factors which estimate the total number of each crash exposure annually within the US.
Crashes included in both FARS and NASS—GES have occurred on public traffic ways.
The fatality and exposure analyses were performed for the 19 year period between 1995
and 2013, including the years 1995 and 2013. This period was selected to capture the peak
incidence of passenger airbag (PAB) related fatalities investigated by the Special Crash
Investigations (SCI) division of the National Highway Traffic Safety Administration (NHTSA)
corresponding to vehicles in the 1995 model year. Starting the analysis in 1995 also provides a
sampling of the child fatalities occurring prior to the introduction of second generation airbags in
model years 1998 and 1999.
The analysis was performed for children 12 and under for consistency with the age range
most commonly used by NHTSA and the Insurance Institute of Highway Safety (IIHS) to classify
children. While 0 – 12 years is a commonly used category for children, other researchers have used
different definitions. At times, such as in their Traffic Safety Facts reports, NHTSA has grouped
children aged 10 to 15 years old together. The Children’s Hospital of Philadelphia typically includes
ages 3 to 15 years when defining children as a group, thus clearly delineating a difference between
infants and children. The Center for Disease Control (CDC) defines children as being between 0 and
14 years old. For reference, the current recommendation is that children less than 16 years old sit
in the back seat [1].
FARS was queried using the Statistical Analysis Software (SAS) version 9.3 (SAS Institute
Inc. Cary, NC) for children 12 and under sustaining fatal injuries during the period investigated. A
total of 29,172 observations were obtained. These FARS-reported fatalities included fatalities for
child: passengers, pedestrians, bicyclists and drivers. Crash modes (i.e. frontal, rear and near or far
36
side impacts) were defined for the FARS data using the FARS impact clock position to define the
general area of damage (GAD). In FARS, 12 o'clock corresponds to the front of the vehicle. The
front seat group included all front seat observations including: right front seat passengers, middle
front seat passengers, driver seat passengers as well as other and unknown front seat locations.
The back seat group includes all observations in the 2nd, 3rd, and 4th row seating locations in the
middle, left and right, positions, as well as other and unknown positions in these rear rows. Vehicle
type was classified using the body type variable in both FARS and GES to place vehicles into classes
such as cars, LTVs, and motorcycles. Observations for the occupant study were limited to cars and
LTVs only. The LTV group included minivans which is particularly relevant to child occupant
studies.
The FARS child fatality dataset included a total of 19,608 children who were occupants of
vehicles. These fatalities were limited to: drivers, passengers and unknown occupants (occupants
with an unknown seating position or role) in a motor vehicle in transit who were travelling in cars
or LTVs only. These child occupants were again between 0 and 12 years of age at the time of the
crash. In the analysis which follows, the 19 year period was broken up into three groups of
calendar years: 1995 – 1998, 1999 – 2006, and 2007 – 2013, these calendar years roughly align
with the airbag generations, though the groups are calendar years, not model years
The FARS data and the NASS-GES data were used to calculate the fatality risk and relative
risk. The fatality risk was calculated via the following equation:
𝐹𝐹𝐹𝐹𝐹𝐹𝐹𝐹𝐹𝐹𝐹𝐹𝐹𝐹𝐹𝐹 𝑅𝑅𝐹𝐹𝑅𝑅𝑅𝑅 =𝑁𝑁𝑁𝑁𝑁𝑁𝑁𝑁𝑁𝑁𝑁𝑁 𝑜𝑜𝑜𝑜 𝐹𝐹𝐹𝐹𝐹𝐹𝐹𝐹𝐹𝐹𝐹𝐹𝐹𝐹𝑁𝑁𝑅𝑅
𝑇𝑇𝑜𝑜𝐹𝐹𝐹𝐹𝐹𝐹 𝐶𝐶𝐹𝐹𝑅𝑅𝑁𝑁𝑅𝑅;
Similarly the relative risk can be calculated using data obtained using the risk values as
follows:
𝑅𝑅𝑁𝑁𝐹𝐹𝐹𝐹𝐹𝐹𝐹𝐹𝑅𝑅𝑁𝑁 𝑅𝑅𝐹𝐹𝑅𝑅𝑅𝑅 = 𝐹𝐹𝐹𝐹𝐹𝐹𝐹𝐹𝐹𝐹𝐹𝐹𝐹𝐹𝐹𝐹 𝑅𝑅𝐹𝐹𝑅𝑅𝑘𝑘𝐴𝐴 𝐹𝐹𝐹𝐹𝐹𝐹𝐹𝐹𝐹𝐹𝐹𝐹𝐹𝐹𝐹𝐹 𝑅𝑅𝐹𝐹𝑅𝑅𝑘𝑘𝐵𝐵
,

37
that is, the ratio of the fatality risk for situation A to the fatality risk for situation B, provides
the relative risk of situation A with respect to situation B. For example, if the relative risk of sitting
in the front seat to sitting in the back seat is more than one, the fatality risk in the front seat exceeds
the fatality risk in the back seat.
3.2 OVERALL RESULTS
A tabulation of the overall child fatalities studied are outlined in Table 7 by calendar year
group, person category, crash mode, occupant location, restraint used and type of vehicle occupied.
Observations for each analysis group were sorted by number of fatalities, since the calendar years
are not divided evenly, percentages for each crash scenario within the calendar year groups. As
implied by the heading rows indicate, the percentages for each calendar year group sum to 100%.
Limiting the study to passengers in cars and LTVs reduces the sample size slightly. However,
limiting the study to these vehicle types also controls for other variables such as children in buses
or as passengers within other vehicles such as motorcycles, mopeds, etc. all which do not have
airbags. The table also highlights how prevalent fatalities are for child passengers as compared to
pedestrian fatalities. The most common crash mode among fatally injured children was frontal
crashes (which passenger airbags are designed to protect against) and rollovers. Though rear seat
fatalities are far more prevalent, exposure data presented within the chapter underscores the
relative risk for children seating in the front seat versus the back seat. It should be also noted that
as a result of knowledge campaigns – the exposure of children seated in the front seat has declined
during the period examined. Notably, roughly twice as many children were fatally injured while
riding unrestrained in a vehicle. Finally, cars are more prevalent in the sample of fatally injured
children; however, for this MVC group, the exposure follows the same trend.
38
Table 7. Tabulation of the Overall FARS Results for All Years and Each Respective Calendar Year Group
All Years
1995-1999
2000-2005
2006-2013
Child Fatalities 29,172 10,524 10,073 8,575
Passengers 20,127 5,451 9,563 5,113 Passengers in Cars & LTVs
19,608 5,351 9,292 4,965
Pedestrians 6,289 2,144 2,693 1,452 Bicyclists 1,797 685 797 315 Drivers 431 100 225 106 Crash Mode 19,608 100% 100% 100%
Front 5,537 34.2% 32.3% 29.6% Rollover 6,110 28.1% 31.5% 33.9% Near Side 2,974 16.3% 15.3% 13.7% Far Side 2,064 11.5% 10.3% 9.9% Back 1,562 6.7% 7.8% 9.6% Other 603 3.3% 2.8% 3.3% Child MVC Fatalities 19,608 100% 100% 100%
Rear Seats 12,266 50.5% 63.1% 74.6% Front Seat 5,537 38.8% 28.0% 17.3% Other Seats 1,805 10.7% 8.9% 8.1% Restraint Use 17,897 100% 100% 100%
None Used 8,569 50.6% 43.8% 36.1% Belt Use 4,921 22.6% 26.5% 25.2% CSS 4,407 15.9% 21.6% 31.3% Vehicle Type 19,608 100% 100% 100%
Car 11,251 65.5% 56.4% 50.4% LTV 8,357 34.5% 43.6% 49.6%
39
3.3 ALL CHILD FATALITIES & EXPOSURES
To put child fatalities among passengers, drivers, pedestrians and bicyclists in perspective,
first an analysis of all traffic related child fatalities was analyzed from 1995 to 2013. Child traffic
fatalities account for roughly 4% of all traffic fatalities in the US (Figure 5). The percentage of
fatally injured children has decreased significantly from 8.8% during the years 1995 to 1999 to
6.1% for the years 2006 through 2013; a positive trend, but there is still a large potential for
improvement since many of these fatalities are preventable. In comparison, the trend for all FARS
persons over this time period has plateaued and even slightly increased with the exception of a
marked decrease which corresponds with the economic downturn in the US as shown in Figure 4.
According to the National Bureau of Economic Research the “Great Recession” was between
December 2007 and June 2009 [42], the only time in the 19 year period exhibiting a significant
reduction in traffic fatalities to less than 40,000 per year. Following the significant decrease the
fatality rate appeared to have plateaued below 35,000.
Figure 4. FARS Fatalities over Time for All (grey) and Child (blue) Car & LTV Occupants
0
5000
10000
15000
20000
25000
30000
35000
40000
45000
50000
1995 1998 2001 2004 2007 2010 2013
Num
ber o
f Fat
aliti
es
Year
All FARS FatalitiesAll Child Fatalities

40
Over the 19 year period, child fatalities in pure numbers exhibit a downward trend as
shown in Figure 5. These fatalities have decreased by 57% overall during the period of analysis.
The number of fatalities for all children 12 and under fell from 2,201 in 1995 to 939 in 2013. While
the latter years of this trend could be explained by a reduction in the vehicle miles traveled due to
an economic downturn, the downward trend is consistent over time.
The fatality trend for child passengers appears to follow the fatality trend for children
overall especially in 2002 and later; child passenger fatalities accounted for 68% of all child traffic
fatalities on average over the 19 year period and this proportion is increasing as shown. Child
pedestrian and child bicyclist fatalities have also followed a similar but less pronounced downward
trend over the period investigated. Child driver fatalities which make up the smallest proportion of
child fatalities, however, do not follow the same general downward trend over investigated time
period; these fatalities appear to stay relatively constant over the 19 year time frame.
Figure 5. FARS 1995 – 2013 Child (12 & Under) Fatalities Over Time for All Child Fatalities, Passengers, Pedestrians, Bicyclists and Drivers
Further perspective may be gained by examining the NASS-GES estimated exposure for
children 12 and under riding in vehicles during the period of interest. The NASS-GES estimates
0
500
1000
1500
2000
2500
1995 1998 2001 2004 2007 2010 2013
Num
ber o
f Fat
aliti
es
Calendar Year
All Child FatalitiesPassengersPedestriansBicyclistsDrivers

41
corresponding to the fatalities presented in Figure 5 are presented in Figure 6. It should be noted
that NASS-GES is biased towards passengers in vehicles as cases are selected from police accident
reports involving a vehicle. Child exposures also trend downward over the period examined; the
estimated exposure for all children decreased by 24% during this time. Since both the FARS fatality
data and the NASS-GES exposure data trend downward, fatality risks were calculated for each of the
19 years examined. The fatality risks exhibited a downward trend as well; the fatality risk for all
children involved in traffic incidents decreased from 188 to 105 per 100,000 exposures over the 19
year period. This decrease was found to be statistically significant when grouping calendar years.
The fatality risk per 100,000 exposures between 1995 and 1999 on average was 180.1, for the
years 2000 to 2005 the average fatality risk was 150.8 and finally for calendar years 2006 through
2013 the average fatality risk was 114.8.
Figure 6. NASS-GES 1995 – 2013 Estimated Child (12 & Under) Exposures for All Children, Passengers, Pedestrians, Bicyclists and Drivers in 100,000’s
To examine the relationship between child drivers and passengers by vehicle types, a pie
chart of child fatalities grouped by type was examined as shown in Figure 7. While some child
0
2
4
6
8
10
12
14
1995 1997 1999 2001 2003 2005 2007 2009 2011 2013
Estim
ated
Exp
osur
e in
100
,000
's
Calendar Year
All ChildrenPassengersDriverPedestrianPedalcyclist
42
drivers indeed drove passenger cars and LTVs, the majority of child drivers drove vehicles in the
other/unknown category. The other/unknown vehicle type includes vehicles such as: limousines,
three wheel automobiles, van motorhomes, recreational vehicles (RVs), all-terrain vehicles (ATVs),
snowmobiles, and farm equipment. Children are most often passengers in cars and LTVs. Since the
goal of this study is to examine airbags and their interaction with children, the remainder of this
fatality analysis, the focus will be cars and LTVs.
While it was not the express interest of this study to examine the incidence of child drivers,
we were surprised to find numerous children coded as drivers in FARS. A total of 431 cases had
drivers between 0 – 12 years of age. To verify that these fatalities were not incorrectly coded in
FARS, a cursory analysis of child drivers was performed. Roughly sixty percent of all child driver
fatalities between 1995 and 2013 occurred in the other/unknown vehicle category. More than half
(65%) of these other/unknown vehicle type driver fatalities occurred on ATVs. Motorcycles are the
second most common vehicle type amongst child driver fatalities. Child drivers were generally
older children aged 9 to 12 years old (mean = 8.5 years, median = 9 years, mode = 11 years).
Figure 7. FARS 1995 – 2013 Child Fatalities by Vehicle Type for Child Drivers, Passengers, and
Unknown Child Occupants in Motor Vehicles During Transport
Car LTV Motorcycles Other / Unknown Vehicle Type
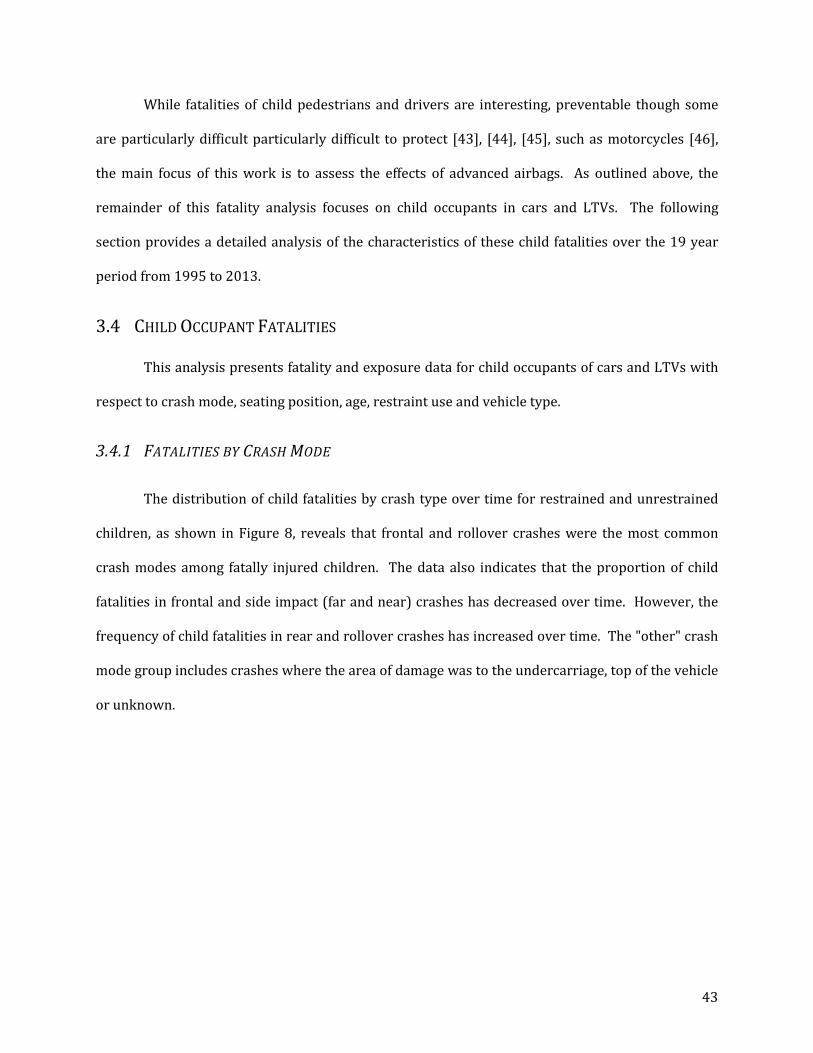
43
While fatalities of child pedestrians and drivers are interesting, preventable though some
are particularly difficult particularly difficult to protect [43], [44], [45], such as motorcycles [46],
the main focus of this work is to assess the effects of advanced airbags. As outlined above, the
remainder of this fatality analysis focuses on child occupants in cars and LTVs. The following
section provides a detailed analysis of the characteristics of these child fatalities over the 19 year
period from 1995 to 2013.
3.4 CHILD OCCUPANT FATALITIES
This analysis presents fatality and exposure data for child occupants of cars and LTVs with
respect to crash mode, seating position, age, restraint use and vehicle type.
3.4.1 FATALITIES BY CRASH MODE
The distribution of child fatalities by crash type over time for restrained and unrestrained
children, as shown in Figure 8, reveals that frontal and rollover crashes were the most common
crash modes among fatally injured children. The data also indicates that the proportion of child
fatalities in frontal and side impact (far and near) crashes has decreased over time. However, the
frequency of child fatalities in rear and rollover crashes has increased over time. The "other" crash
mode group includes crashes where the area of damage was to the undercarriage, top of the vehicle
or unknown.
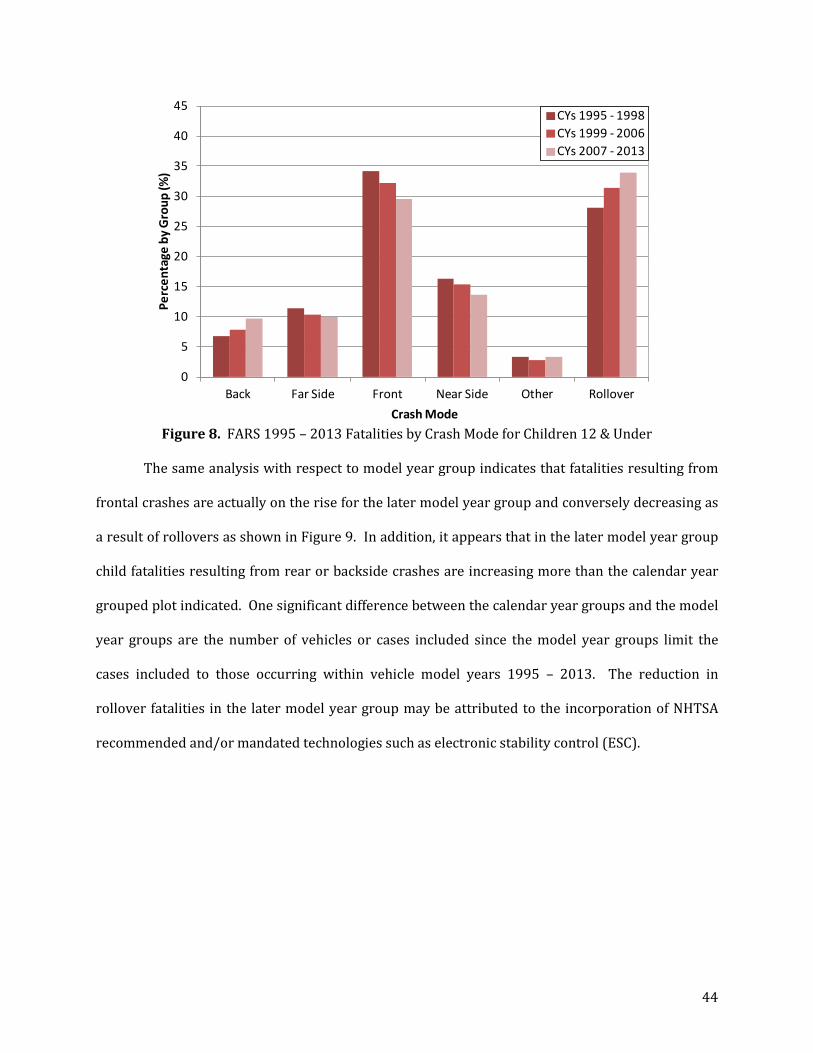
44
Figure 8. FARS 1995 – 2013 Fatalities by Crash Mode for Children 12 & Under
The same analysis with respect to model year group indicates that fatalities resulting from
frontal crashes are actually on the rise for the later model year group and conversely decreasing as
a result of rollovers as shown in Figure 9. In addition, it appears that in the later model year group
child fatalities resulting from rear or backside crashes are increasing more than the calendar year
grouped plot indicated. One significant difference between the calendar year groups and the model
year groups are the number of vehicles or cases included since the model year groups limit the
cases included to those occurring within vehicle model years 1995 – 2013. The reduction in
rollover fatalities in the later model year group may be attributed to the incorporation of NHTSA
recommended and/or mandated technologies such as electronic stability control (ESC).
0
5
10
15
20
25
30
35
40
45
Back Far Side Front Near Side Other Rollover
Perc
enta
ge b
y G
roup
(%)
Crash Mode
CYs 1995 - 1998CYs 1999 - 2006CYs 2007 - 2013

45
Figure 9. FARS 1995 – 2013 Fatalities by Crash Mode for Children 12 & Under Limited to Model
Years 1995 - 2013
Figure 10 examines the exposure of children to these types of crashes using NASS-GES.
Children are most often exposed to crashes involving frontal impact. As might be expected,
children are exposed to rear impact crashes more often than rollover crashes. Moreover, while the
exposure to and fatalities from rear impact crashes are nearly constant at 25%, child fatalities in
rear impact crashes only accounts for roughly 9% of all of the fatalities by crash mode. This
indicates that rear impact crashes present less of a risk for child fatalities than crash modes such as
frontal, and side collisions where the fatality and exposure frequencies are within 10% of each
other. Conversely, rollovers appear to present a very high risk of fatality to child passengers as the
fatality frequency is close to 35% of all crash modes, but the exposure is much less than 5%.
0
5
10
15
20
25
30
35
40
45
Back Far Side Front Near Side Other/Unk Rollover
Perc
enta
ge b
y G
roup
(%)
Crash Mode
MYs 1995 - 1998MYs 1999 - 2006MYs 2007 - 2013
46
Figure 10. NASS-GES 1995 – 2013 Crash Mode Exposure for Children 12 & Under
The same analysis was run with model years as shown in Figure 11. When limited to and
grouped by model years 1995 – 2013, the decrease in exposure to frontal crash modes is similar for
the later model years as the later calendar years, but the exposure to rear or back side crashes is
markedly increased (~33%) in the later model year group as compared to the later calendar year
group (~23%).
Figure 11. NASS-GES 1995 – 2013 Crash Mode Exposure for Children 12 & Under Limited to Model
Years 1995 - 2013
The relative risk for rollovers to frontal crashes between 1995 and 2007 was 16; meaning
rollovers were about 16 times more deadly for children than frontal crashes during that period.
05
1015202530354045
Back Far Side Front Near Side Other/Unk Rollover
Perc
ent b
y CY
Gro
up (%
)
Crash Mode
CYs 1995 - 1998CYs 1999 - 2006CYs 2007 - 2013
05
1015202530354045
Back Far Side Front Near Side Other/Unk Rollover
Perc
ent b
y CY
Gro
up (%
)
Crash Mode
MYs 1995 - 1998MYs 1999 - 2006MYs 2007 - 2013

47
During the period between 2008 and 2013, the relative fatality risk for rollovers to frontal crashes
involving children rose significantly to roughly 140 (Figure 12). Further, the relative risk of near
side crashes with respect to frontal crashes is higher than the relative risk of far side crashes with
respect to frontal crashes as would be expected. Finally, the relative risk for rear or back side
crashes with respect to frontal crashes has increased slightly over time, but their risk has been
nearly equivalent throughout the majority of the period under consideration.
Figure 12. Relative Risks for Crash Modes with Respect to Frontal Crashes as a Function of Time
When the relative risk is compared by calendar year generation of children fatally injured
over the time examined for crash modes, the rise in rollover risk is remarkably evident as expected.
The remaining crash modes have decreased in risk for the latest calendar year generation (2007 –
2013) when the risk for calendar year generation 1995 – 1998 was used as the reference (Figure
13).
0
20
40
60
80
100
120
140
160
0.0
0.5
1.0
1.5
2.0
2.5
3.0
1995 1998 2001 2004 2007 2010 2013
Rela
tive
Risk
Rol
love
r
Rela
tive
Risk
Calendar Year
Near Side:Front Far Side:Front Back:Front Roll:Front
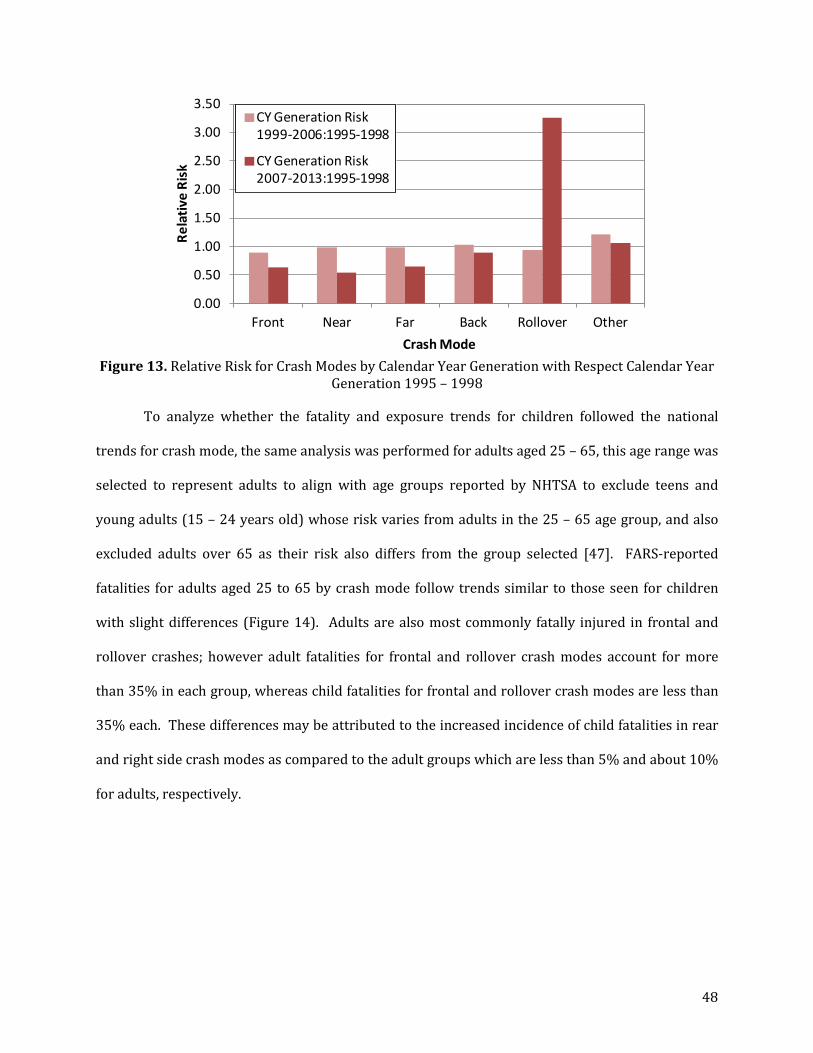
48
Figure 13. Relative Risk for Crash Modes by Calendar Year Generation with Respect Calendar Year
Generation 1995 – 1998
To analyze whether the fatality and exposure trends for children followed the national
trends for crash mode, the same analysis was performed for adults aged 25 – 65, this age range was
selected to represent adults to align with age groups reported by NHTSA to exclude teens and
young adults (15 – 24 years old) whose risk varies from adults in the 25 – 65 age group, and also
excluded adults over 65 as their risk also differs from the group selected [47]. FARS-reported
fatalities for adults aged 25 to 65 by crash mode follow trends similar to those seen for children
with slight differences (Figure 14). Adults are also most commonly fatally injured in frontal and
rollover crashes; however adult fatalities for frontal and rollover crash modes account for more
than 35% in each group, whereas child fatalities for frontal and rollover crash modes are less than
35% each. These differences may be attributed to the increased incidence of child fatalities in rear
and right side crash modes as compared to the adult groups which are less than 5% and about 10%
for adults, respectively.
0.00
0.50
1.00
1.50
2.00
2.50
3.00
3.50
Front Near Far Back Rollover Other
Rela
tive
Risk
Crash Mode
CY Generation Risk 1999-2006:1995-1998
CY Generation Risk 2007-2013:1995-1998

49
Figure 14. FARS 1995 – 2013 Fatalities by Crash Mode for Adults Aged 25 – 65 Years Old
Exposure for adults again indicates that rear impact crashes are more common in terms of
exposure than they are fatal, indicating that the fatality risk in a rear collision is relatively low (32
per 100,000 crashes) (Figure 15). The adult group also exhibits similar exposures for frontal and
side impacts. The fatality risk for rollovers is even higher for adults than for children; the relative
risk for rollovers to frontal crashes for adults between 1995 and 2007 was 32. Adults similarly saw
a significant increase in the relative risk for rollovers to frontal crashes between 2008 and 2013
which rose to 85.
0
10
20
30
40
50
60
70
Back Far Side Front Near Side Other Rollover
Perc
enta
ge b
y G
roup
(%)
Crash Mode
g CYs 1995 - 1998CYs 1999 - 2006CYs 2007 - 2013
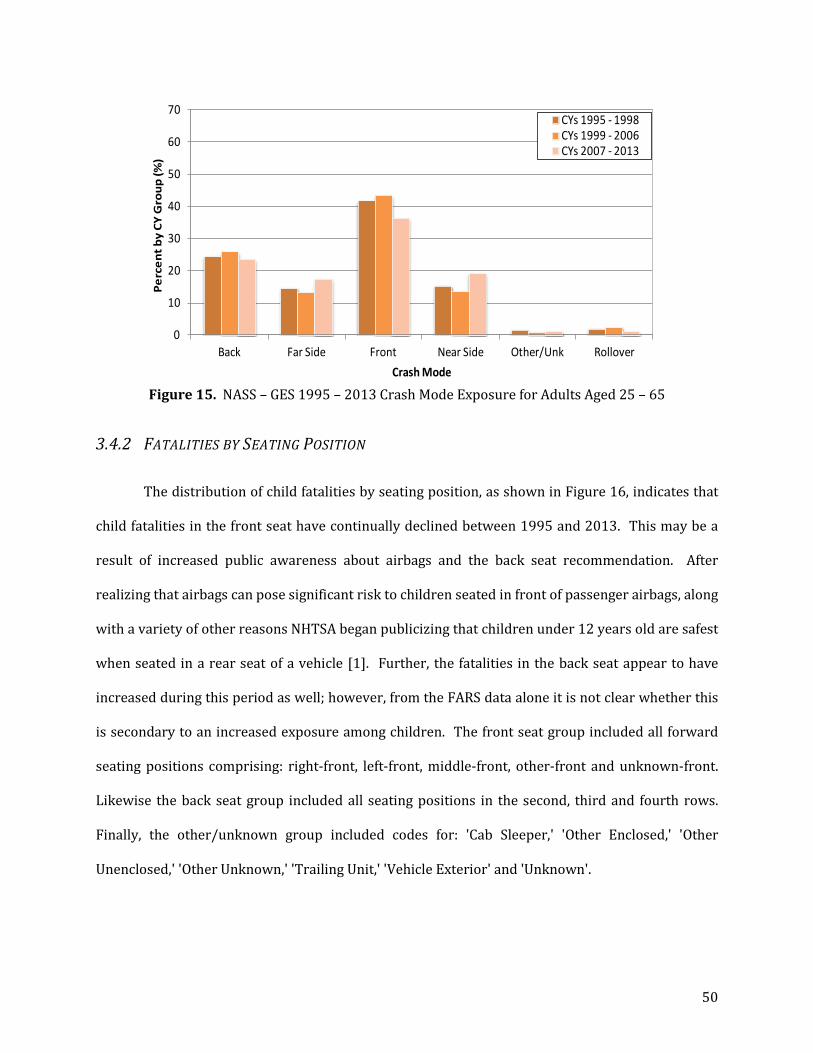
50
Figure 15. NASS – GES 1995 – 2013 Crash Mode Exposure for Adults Aged 25 – 65
3.4.2 FATALITIES BY SEATING POSITION
The distribution of child fatalities by seating position, as shown in Figure 16, indicates that
child fatalities in the front seat have continually declined between 1995 and 2013. This may be a
result of increased public awareness about airbags and the back seat recommendation. After
realizing that airbags can pose significant risk to children seated in front of passenger airbags, along
with a variety of other reasons NHTSA began publicizing that children under 12 years old are safest
when seated in a rear seat of a vehicle [1]. Further, the fatalities in the back seat appear to have
increased during this period as well; however, from the FARS data alone it is not clear whether this
is secondary to an increased exposure among children. The front seat group included all forward
seating positions comprising: right-front, left-front, middle-front, other-front and unknown-front.
Likewise the back seat group included all seating positions in the second, third and fourth rows.
Finally, the other/unknown group included codes for: 'Cab Sleeper,' 'Other Enclosed,' 'Other
Unenclosed,' 'Other Unknown,' 'Trailing Unit,' 'Vehicle Exterior' and 'Unknown'.
0
10
20
30
40
50
60
70
Back Far Side Front Near Side Other/Unk Rollover
Perc
ent b
y CY
Gro
up (%
)
Crash Mode
CYs 1995 - 1998CYs 1999 - 2006CYs 2007 - 2013
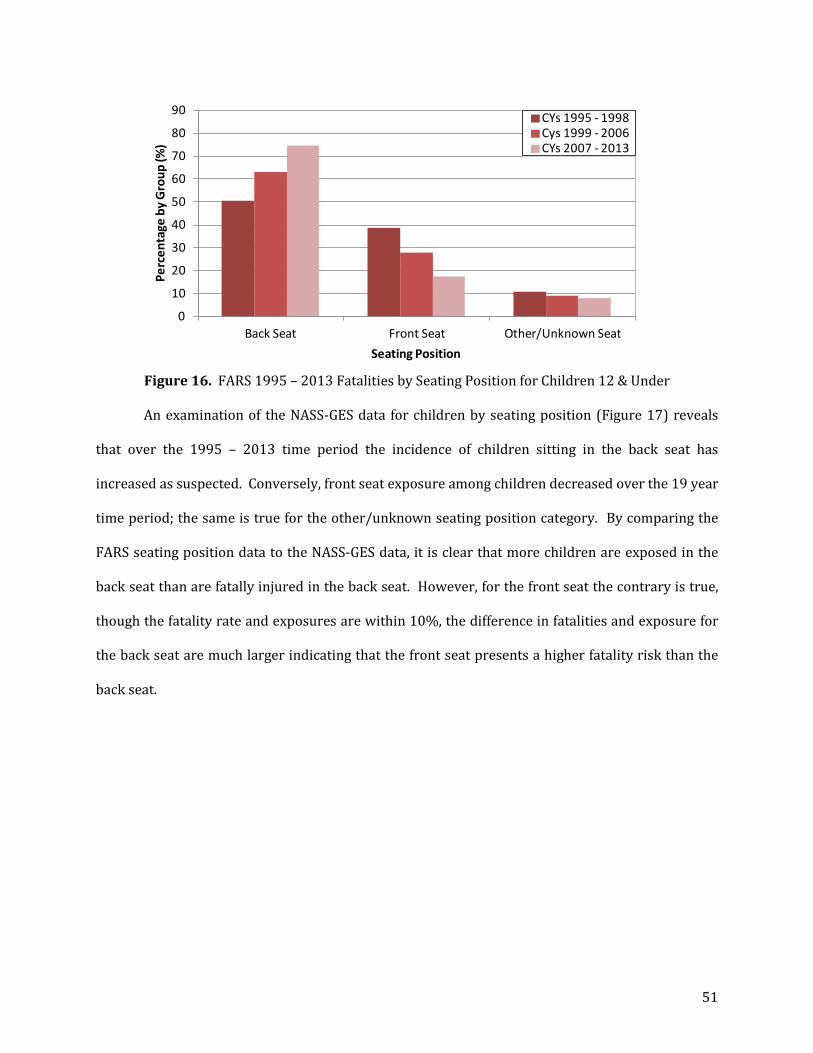
51
Figure 16. FARS 1995 – 2013 Fatalities by Seating Position for Children 12 & Under
An examination of the NASS-GES data for children by seating position (Figure 17) reveals
that over the 1995 – 2013 time period the incidence of children sitting in the back seat has
increased as suspected. Conversely, front seat exposure among children decreased over the 19 year
time period; the same is true for the other/unknown seating position category. By comparing the
FARS seating position data to the NASS-GES data, it is clear that more children are exposed in the
back seat than are fatally injured in the back seat. However, for the front seat the contrary is true,
though the fatality rate and exposures are within 10%, the difference in fatalities and exposure for
the back seat are much larger indicating that the front seat presents a higher fatality risk than the
back seat.
0
10
20
30
40
50
60
70
80
90
Back Seat Front Seat Other/Unknown Seat
Perc
enta
ge b
y G
roup
(%)
Seating Position
CYs 1995 - 1998Cys 1999 - 2006CYs 2007 - 2013

52
Figure 17. NASS-GES 1995 – 2013 Seat Position Exposure for Children 12 & Under
When the seating position of children fatally injured is analyzed by model year instead of
calendar year, it appears that children are fatally injured more frequently in the back seat as model
year increases and conversely less frequently in the front seat (Figure 18). The frequency of
fatalities in the back seat by model year is larger than the calendar year generations indicate and
again conversely lower for the front seat by calendar year generation, though this may again be
explained by exposures.
Figure 18. FARS 1995 – 2013 Fatalities by Seating Position for Children 12 & Under Limited to
Model Years 1995 - 2013
0
10
20
30
40
50
60
70
80
90
Back Front Other/U
Perc
ent b
y CY
Gro
up (%
)
Seating Position
p
CYs 1995 - 1998CYs 1999 - 2006CYs 2007 - 2013
0
10
20
30
40
50
60
70
80
90
Back Seat Front Seat Other/Unknown Seat
Perc
enta
ge b
y G
roup
(%)
Seating Position
MYs 1995 - 1998MYs 1999 - 2006MYs 2007 - 2013

53
As might be expected, when analyzed by model year, the exposure rates indicate that the
increase in fatalities in the backseat amongst children can again be attributed to an increased
exposure (Figure 19). The front seat again appears less benign especially for the earlier model year
generations as the fatalities are by proportion larger than the exposure is for those groups. It
should be noted that some NASS-GES cases included in the calendar year analysis did not have
model year information which led to an excess of 7,000 weighted cases missing model year
information. Since this can significantly affect the relative risk calculations, relative risk was
calculated with respect to calendar year instead of model year.
Figure 19. NASS-GES 1995 – 2013 Seat Position Exposure for Children 12 & Under Limited to
Model Years 1995 - 2013
The fatality risks for the front and back seat were calculated for each year examined in the
19 year time period. From that analysis the relative risk for the front seat to the back seat was
computed over time. If the relative risk is greater than one, the fatality risk in the front seat is
greater than in the back seat. The fatality risk for the front seat and back seat per 100,000
exposures are plotted over time along with the relative risk in Figure 20. While the front seat
fatality risk for children has decreased considerably over the 19 year time period, the relative risk
has consistently remained greater than one. The back seat fatality risk for children has remained
relatively constant over the period examined, with a general downward trend. While this data
0
10
20
30
40
50
60
70
80
90
Back Seat Front Seat Other/Unknown Seat
Perc
ent b
y CY
Gro
up (%
)
Seating Position
MYs 1995 - 1998MYs 1999 - 2006MYs 2007 - 2013

54
represents all children 12 and under, it would be useful to better understand the age distribution of
children fatally injured and exposed to the front and back seats. In 2013, children had roughly a
20% higher risk of being fatally injured if they were seated in a front seat than if they were seated
in a back seat during a crash. For some years this increased risk was greater than 60%.
Figure 20. Risk per 100,000 Exposure’s for Children 12 & Under Seated in the Front and Back
Seats and Relative Fatality Risk Front Seat to Back Seat Over Time
Front seat child fatalities as a function of age are presented in Figure 21. This data
highlights the elevated incidence of infant fatalities in the front seat during the late 90's. More than
10% of the children who died in the front seat in the years between 1995 and 1999 were infants
(age 0); during this time more infants sustained fatal injuries in the front seat than any other age
groups. The data shows that the percent of front seat fatalities for children aged 0 to 3 years old
have decreased over time while front seat fatalities for older children, aged 8 to 12 years old, have
increased over time. To investigate whether this is due to increased exposure the same analysis
was performed using NASS-GES.
0.0
0.2
0.4
0.6
0.8
1.0
1.2
1.4
1.6
1.8
2.0
0
50
100
150
200
250
1995 1998 2001 2004 2007 2010 2013
Rela
tive
Risk
(Fr
ont :
Bac
k)
Risk
per
100
,00
Expo
sure
s
Calendar Year
Front Seat RiskBack Seat RiskRelative Risk
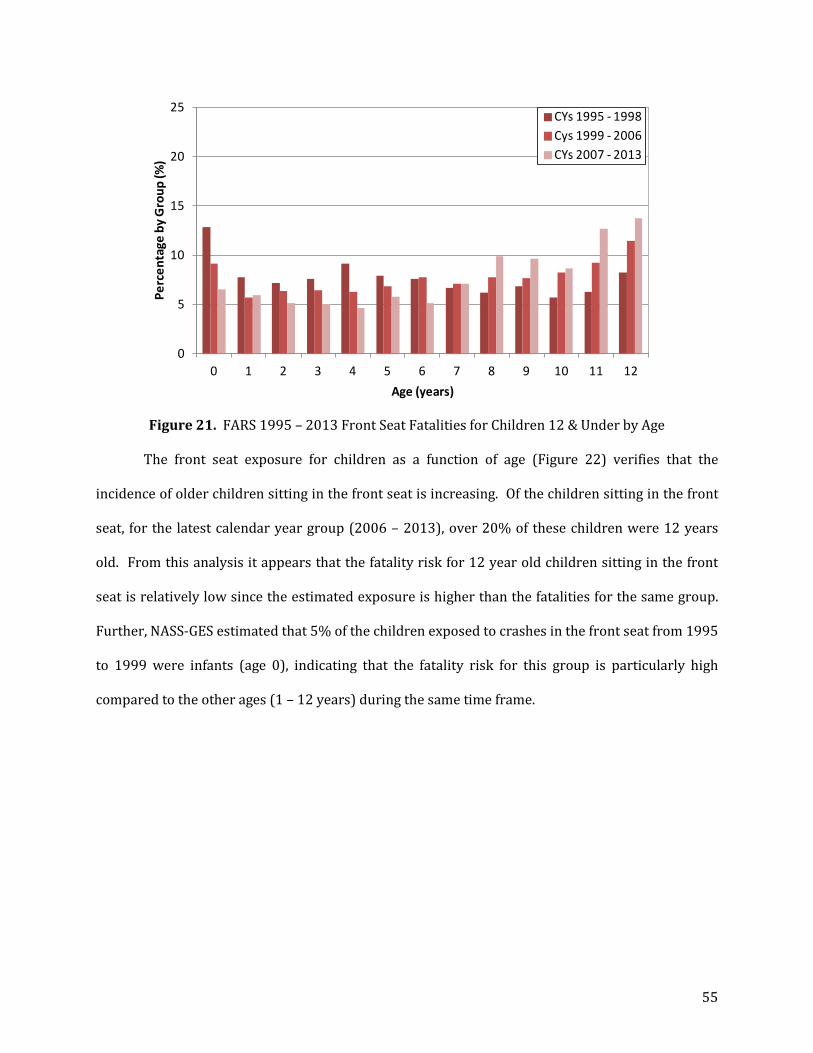
55
Figure 21. FARS 1995 – 2013 Front Seat Fatalities for Children 12 & Under by Age
The front seat exposure for children as a function of age (Figure 22) verifies that the
incidence of older children sitting in the front seat is increasing. Of the children sitting in the front
seat, for the latest calendar year group (2006 – 2013), over 20% of these children were 12 years
old. From this analysis it appears that the fatality risk for 12 year old children sitting in the front
seat is relatively low since the estimated exposure is higher than the fatalities for the same group.
Further, NASS-GES estimated that 5% of the children exposed to crashes in the front seat from 1995
to 1999 were infants (age 0), indicating that the fatality risk for this group is particularly high
compared to the other ages (1 – 12 years) during the same time frame.
0
5
10
15
20
25
0 1 2 3 4 5 6 7 8 9 10 11 12
Perc
enta
ge b
y G
roup
(%)
Age (years)
CYs 1995 - 1998Cys 1999 - 2006CYs 2007 - 2013
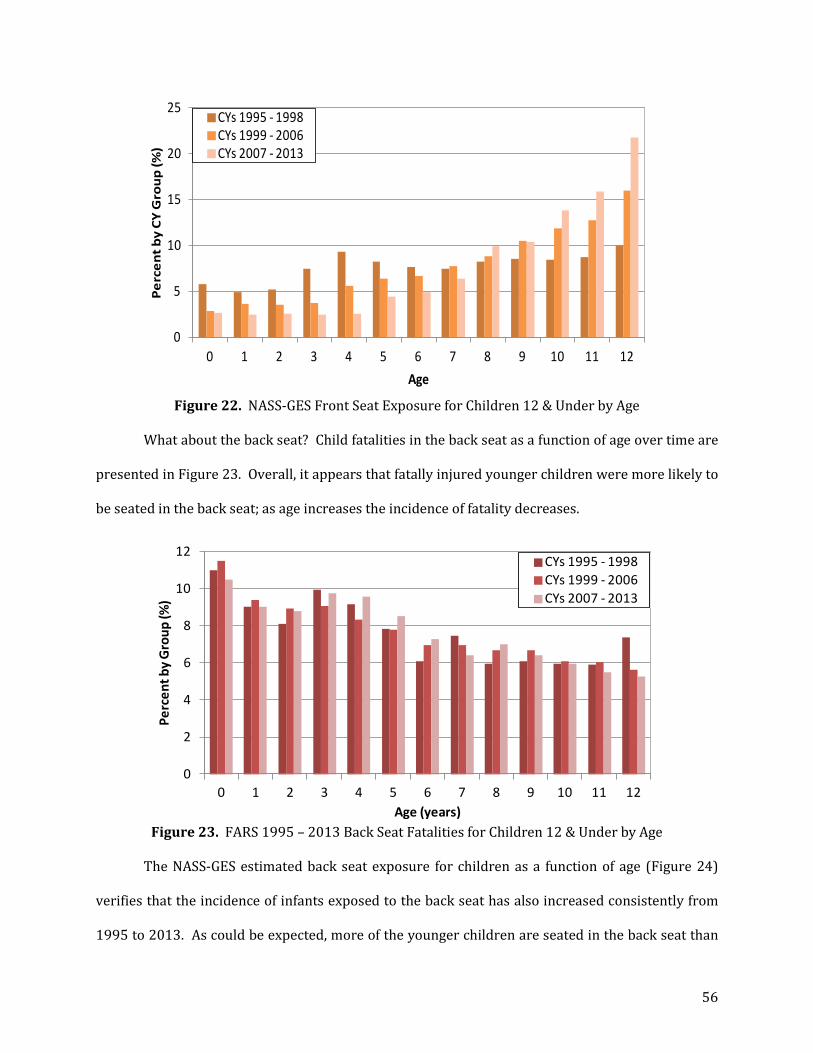
56
Figure 22. NASS-GES Front Seat Exposure for Children 12 & Under by Age
What about the back seat? Child fatalities in the back seat as a function of age over time are
presented in Figure 23. Overall, it appears that fatally injured younger children were more likely to
be seated in the back seat; as age increases the incidence of fatality decreases.
Figure 23. FARS 1995 – 2013 Back Seat Fatalities for Children 12 & Under by Age
The NASS-GES estimated back seat exposure for children as a function of age (Figure 24)
verifies that the incidence of infants exposed to the back seat has also increased consistently from
1995 to 2013. As could be expected, more of the younger children are seated in the back seat than
0
5
10
15
20
25
0 1 2 3 4 5 6 7 8 9 10 11 12
Perc
ent b
y CY
Gro
up (%
)
Age
CYs 1995 - 1998CYs 1999 - 2006CYs 2007 - 2013
0
2
4
6
8
10
12
0 1 2 3 4 5 6 7 8 9 10 11 12
Perc
ent b
y G
roup
(%)
Age (years)
CYs 1995 - 1998CYs 1999 - 2006CYs 2007 - 2013

57
older children. However, it appears that the back seat exposure for infants, while increasing over
time, is particularly low; this would indicate relatively high fatality risk in the back seat for infants
as well. This could be due to any number of things including a lower injury tolerance or improper
installation of, or restraint use within, child safety seats.
Figure 24. NASS-GES Back Seat Exposure for Children 12 & Under by Age
The relative risk for infants sitting in the front seat to the back seat over the 19 year period
analyzed is consistently above unity, indicating that the front seat presents a higher fatality risk
than the back seat. While there is no clear trend for this relative risk over time, as evidenced in
Figure 25, the average relative risk between 1995 and 2013 is 3. Thus, infants were on average 3
times more likely to be fatally injured in the front seat than the back seat.
0
2
4
6
8
10
12
0 1 2 3 4 5 6 7 8 9 10 11 12
Perc
ent b
y CY
Gro
up (%
)
Age
CYs 1995 - 1998CYs 1999 - 2006CYs 2007 - 2013
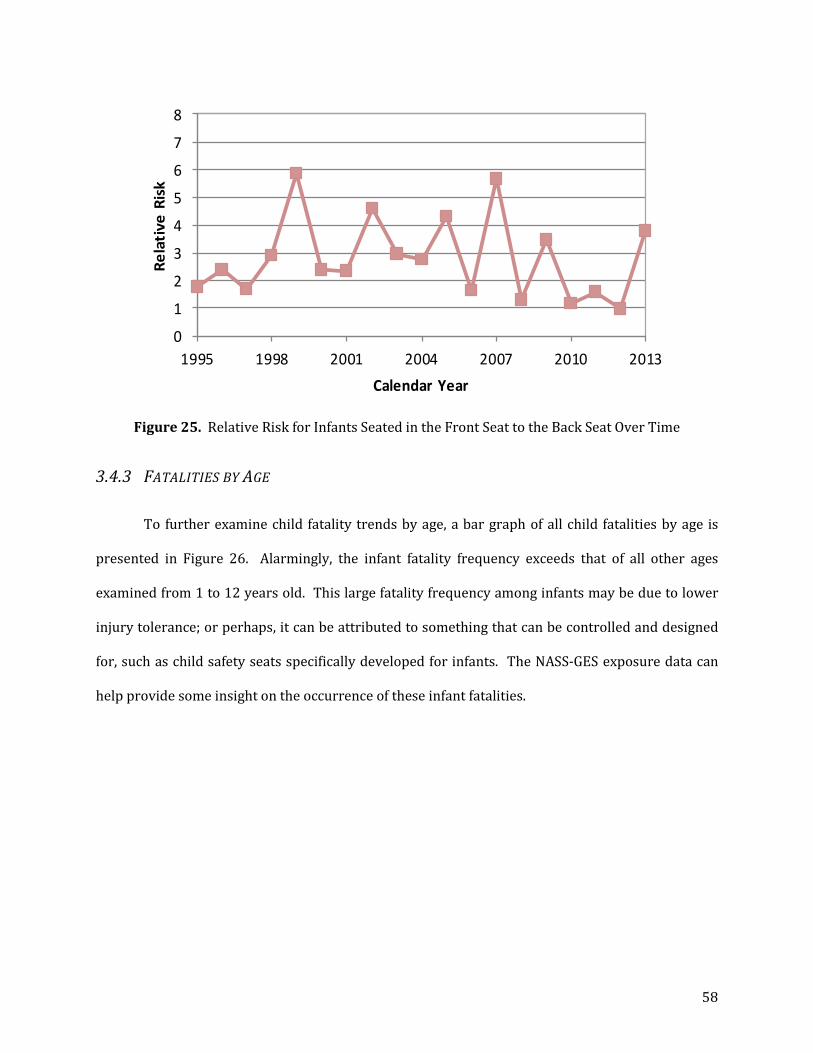
58
Figure 25. Relative Risk for Infants Seated in the Front Seat to the Back Seat Over Time
3.4.3 FATALITIES BY AGE
To further examine child fatality trends by age, a bar graph of all child fatalities by age is
presented in Figure 26. Alarmingly, the infant fatality frequency exceeds that of all other ages
examined from 1 to 12 years old. This large fatality frequency among infants may be due to lower
injury tolerance; or perhaps, it can be attributed to something that can be controlled and designed
for, such as child safety seats specifically developed for infants. The NASS-GES exposure data can
help provide some insight on the occurrence of these infant fatalities.
0
1
2
3
4
5
6
7
8
1995 1998 2001 2004 2007 2010 2013
Rela
tive
Ris
k
Calendar Year
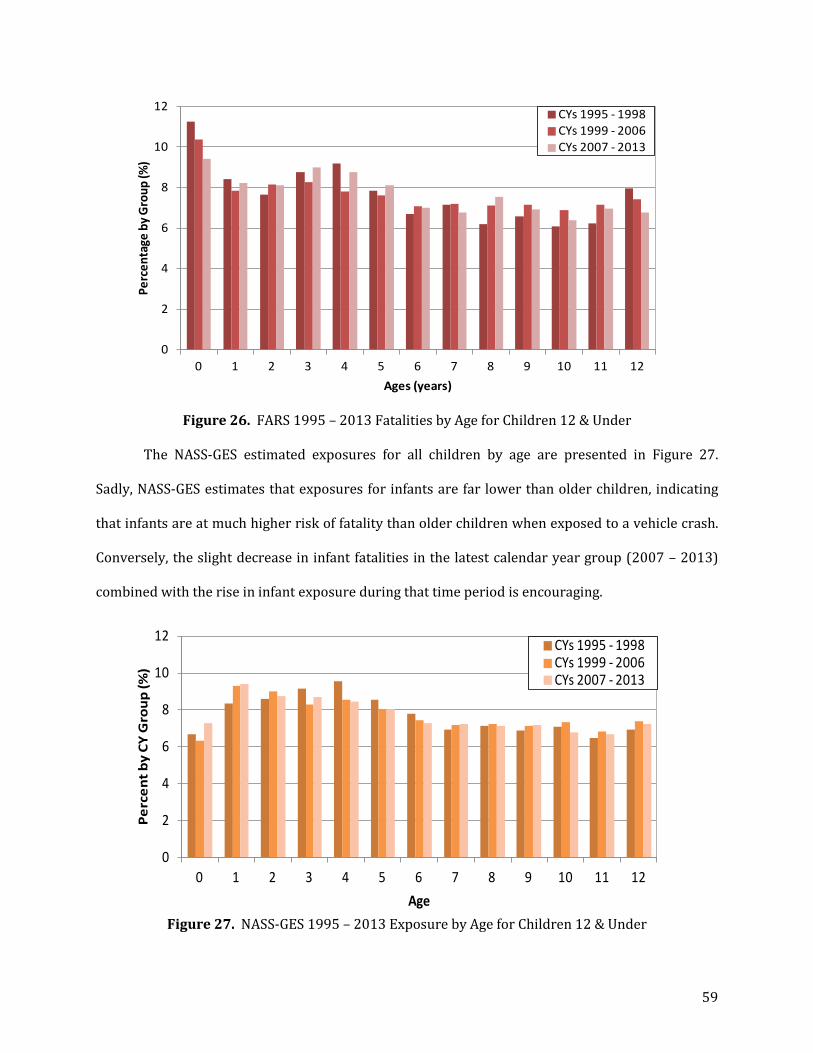
59
Figure 26. FARS 1995 – 2013 Fatalities by Age for Children 12 & Under
The NASS-GES estimated exposures for all children by age are presented in Figure 27.
Sadly, NASS-GES estimates that exposures for infants are far lower than older children, indicating
that infants are at much higher risk of fatality than older children when exposed to a vehicle crash.
Conversely, the slight decrease in infant fatalities in the latest calendar year group (2007 – 2013)
combined with the rise in infant exposure during that time period is encouraging.
Figure 27. NASS-GES 1995 – 2013 Exposure by Age for Children 12 & Under
0
2
4
6
8
10
12
0 1 2 3 4 5 6 7 8 9 10 11 12
Perc
enta
ge b
y Gro
up (%
)
Ages (years)
CYs 1995 - 1998CYs 1999 - 2006CYs 2007 - 2013
0
2
4
6
8
10
12
0 1 2 3 4 5 6 7 8 9 10 11 12
Perc
ent b
y CY
Gro
up (%
)
Age
CYs 1995 - 1998CYs 1999 - 2006CYs 2007 - 2013
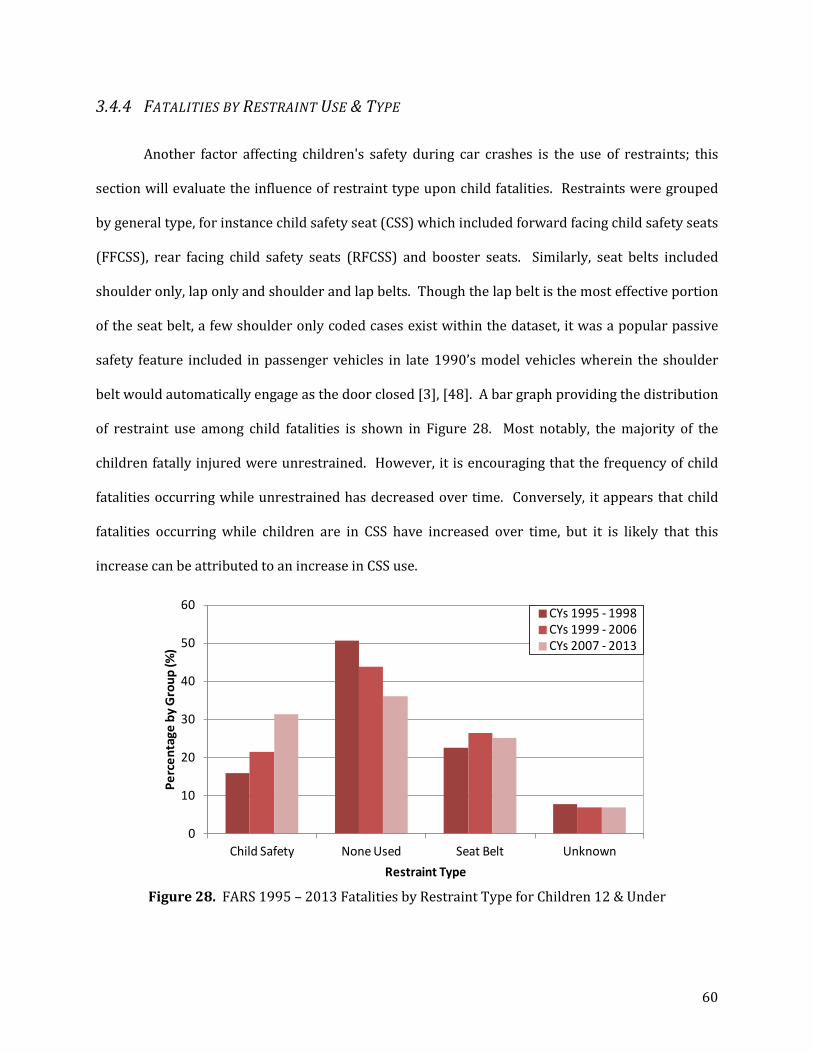
60
3.4.4 FATALITIES BY RESTRAINT USE & TYPE
Another factor affecting children's safety during car crashes is the use of restraints; this
section will evaluate the influence of restraint type upon child fatalities. Restraints were grouped
by general type, for instance child safety seat (CSS) which included forward facing child safety seats
(FFCSS), rear facing child safety seats (RFCSS) and booster seats. Similarly, seat belts included
shoulder only, lap only and shoulder and lap belts. Though the lap belt is the most effective portion
of the seat belt, a few shoulder only coded cases exist within the dataset, it was a popular passive
safety feature included in passenger vehicles in late 1990’s model vehicles wherein the shoulder
belt would automatically engage as the door closed [3], [48]. A bar graph providing the distribution
of restraint use among child fatalities is shown in Figure 28. Most notably, the majority of the
children fatally injured were unrestrained. However, it is encouraging that the frequency of child
fatalities occurring while unrestrained has decreased over time. Conversely, it appears that child
fatalities occurring while children are in CSS have increased over time, but it is likely that this
increase can be attributed to an increase in CSS use.
Figure 28. FARS 1995 – 2013 Fatalities by Restraint Type for Children 12 & Under
0
10
20
30
40
50
60
Child Safety None Used Seat Belt Unknown
Perc
enta
ge b
y G
roup
(%)
Restraint Type
CYs 1995 - 1998CYs 1999 - 2006CYs 2007 - 2013

61
NASS-GES exposure estimates for children by restraint type (Figure 29) indicate that there
are fewer children riding unrestrained – implying that it is considerably more likely that a child will
sustain a fatal injury if travelling unrestrained. Conversely, there are more children riding in CSS
and wearing seat belts than the FARS data would indicate which suggests that safety seats and seat
belts are functioning as intended during crashes. Also the exposure estimates indicate a marked
increase CSS use over time, as was predicted above during the FARS analysis. Children are
estimated more frequently to be wearing seat belts or restrained in CSSs than they are fatally
injured while using these restraint types indicating that the use of these restraints presents little to
no specific fatality risk to children.
Figure 29. NASS-GES Restraint Type Exposure for Children 12 & Under
The relative risk for children unrestrained and restrained in child safety seats with respect
to children wearing seatbelts over time is presented in Figure 30. Children restrained in child
safety seats during the time examined are approximately at the same risk of being fatally injured in
a crash as a child wearing a safety belt, but that is not to say that child safety seats could be replaced
with seat belts. Age appropriate child safety seat use protects younger children whose heads are
proportionally large and neck muscles are not fully developed more so than a seat belt. One reason
that child safety seats may present a higher risk to children than seat belts could possibly be
0
10
20
30
40
50
60
Child Safety Seat None Used Seat Belt Unknown
Perc
ent b
y CY
Gro
up (%
)
Restraint Type
CYs 1995 - 1998CYs 1999 - 2006CYs 2007 - 2013
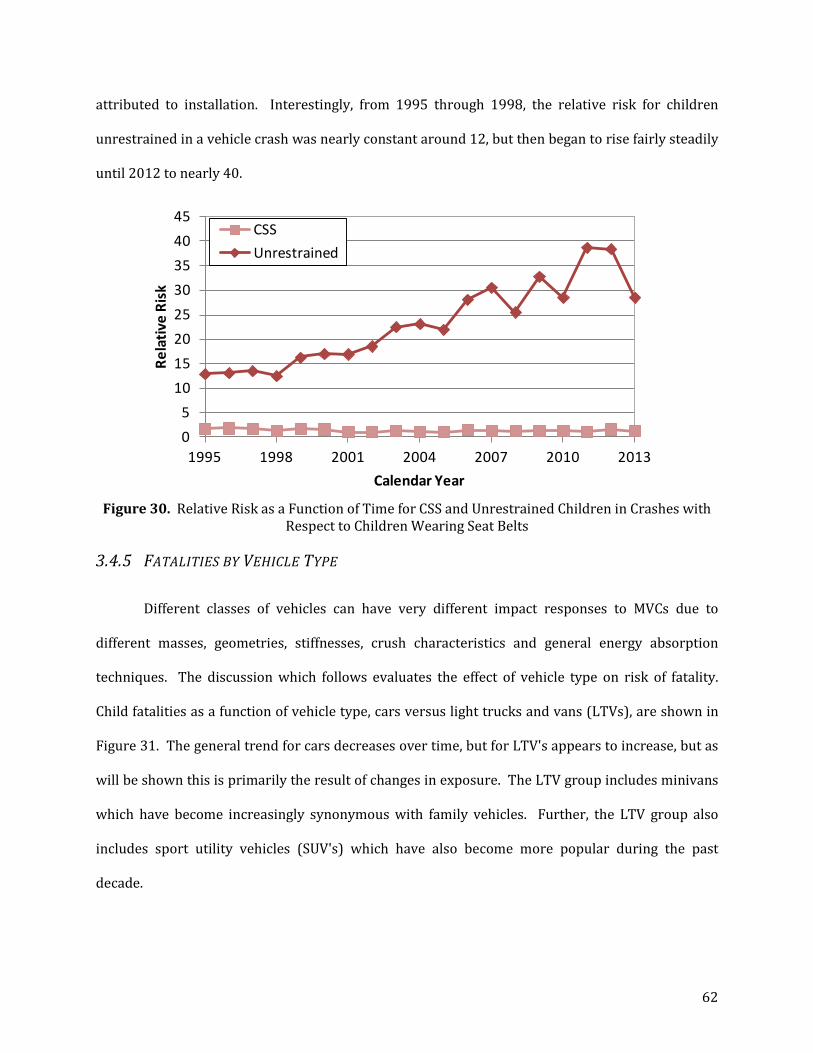
62
attributed to installation. Interestingly, from 1995 through 1998, the relative risk for children
unrestrained in a vehicle crash was nearly constant around 12, but then began to rise fairly steadily
until 2012 to nearly 40.
Figure 30. Relative Risk as a Function of Time for CSS and Unrestrained Children in Crashes with
Respect to Children Wearing Seat Belts
3.4.5 FATALITIES BY VEHICLE TYPE
Different classes of vehicles can have very different impact responses to MVCs due to
different masses, geometries, stiffnesses, crush characteristics and general energy absorption
techniques. The discussion which follows evaluates the effect of vehicle type on risk of fatality.
Child fatalities as a function of vehicle type, cars versus light trucks and vans (LTVs), are shown in
Figure 31. The general trend for cars decreases over time, but for LTV's appears to increase, but as
will be shown this is primarily the result of changes in exposure. The LTV group includes minivans
which have become increasingly synonymous with family vehicles. Further, the LTV group also
includes sport utility vehicles (SUV's) which have also become more popular during the past
decade.
05
1015202530354045
1995 1998 2001 2004 2007 2010 2013
Rela
tive
Risk
Calendar Year
CSSUnrestrained
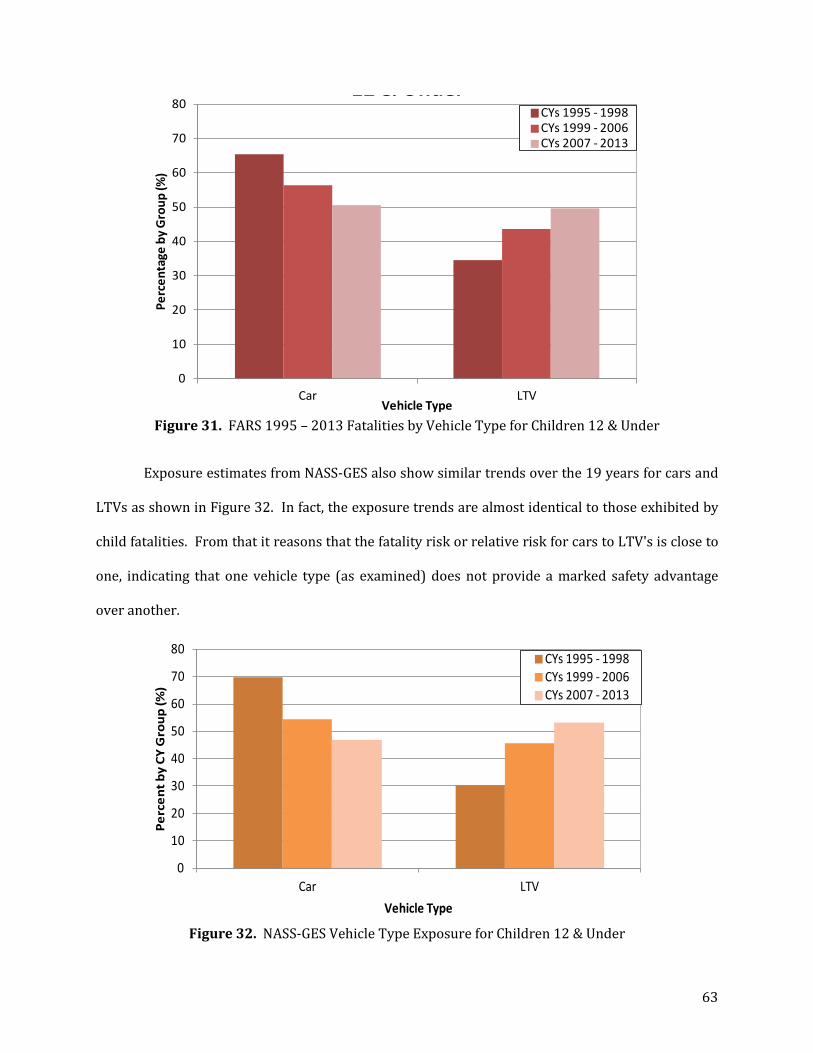
63
Figure 31. FARS 1995 – 2013 Fatalities by Vehicle Type for Children 12 & Under
Exposure estimates from NASS-GES also show similar trends over the 19 years for cars and
LTVs as shown in Figure 32. In fact, the exposure trends are almost identical to those exhibited by
child fatalities. From that it reasons that the fatality risk or relative risk for cars to LTV's is close to
one, indicating that one vehicle type (as examined) does not provide a marked safety advantage
over another.
Figure 32. NASS-GES Vehicle Type Exposure for Children 12 & Under
0
10
20
30
40
50
60
70
80
Car LTV
Perc
enta
ge b
y G
roup
(%)
Vehicle Type
12 & Under
CYs 1995 - 1998CYs 1999 - 2006CYs 2007 - 2013
0
10
20
30
40
50
60
70
80
Car LTV
Perc
ent b
y CY
Gro
up (%
)
Vehicle Type
CYs 1995 - 1998CYs 1999 - 2006CYs 2007 - 2013
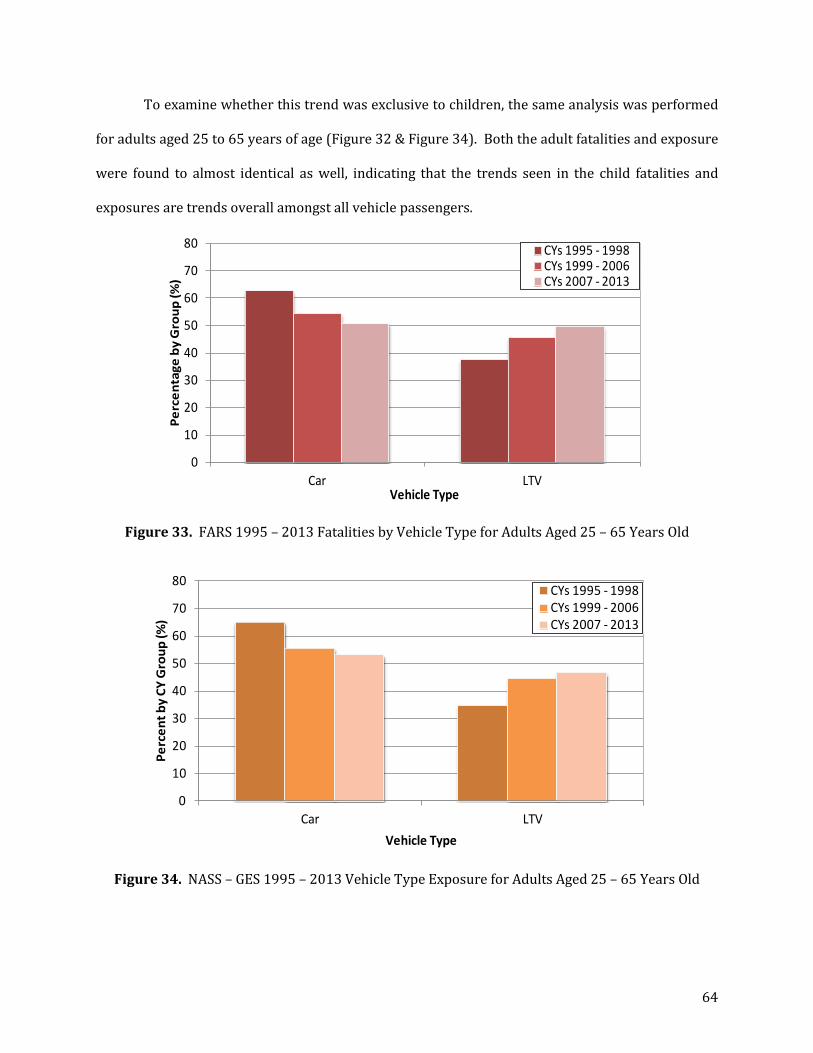
64
To examine whether this trend was exclusive to children, the same analysis was performed
for adults aged 25 to 65 years of age (Figure 32 & Figure 34). Both the adult fatalities and exposure
were found to almost identical as well, indicating that the trends seen in the child fatalities and
exposures are trends overall amongst all vehicle passengers.
Figure 33. FARS 1995 – 2013 Fatalities by Vehicle Type for Adults Aged 25 – 65 Years Old
Figure 34. NASS – GES 1995 – 2013 Vehicle Type Exposure for Adults Aged 25 – 65 Years Old
0
10
20
30
40
50
60
70
80
Car LTV
Perc
enta
ge b
y G
roup
(%)
Vehicle Type
CYs 1995 - 1998CYs 1999 - 2006CYs 2007 - 2013
0
10
20
30
40
50
60
70
80
Car LTV
Perc
ent b
y CY
Gro
up (%
)
Vehicle Type
CYs 1995 - 1998CYs 1999 - 2006CYs 2007 - 2013
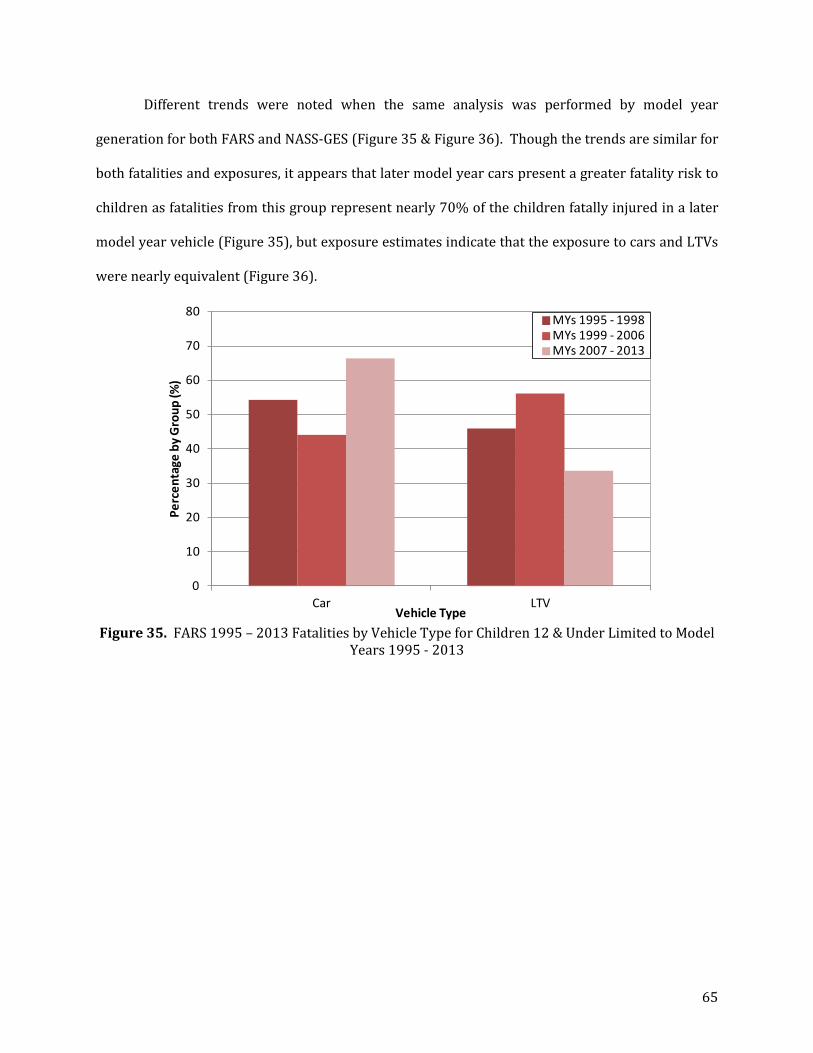
65
Different trends were noted when the same analysis was performed by model year
generation for both FARS and NASS-GES (Figure 35 & Figure 36). Though the trends are similar for
both fatalities and exposures, it appears that later model year cars present a greater fatality risk to
children as fatalities from this group represent nearly 70% of the children fatally injured in a later
model year vehicle (Figure 35), but exposure estimates indicate that the exposure to cars and LTVs
were nearly equivalent (Figure 36).
Figure 35. FARS 1995 – 2013 Fatalities by Vehicle Type for Children 12 & Under Limited to Model
Years 1995 - 2013
0
10
20
30
40
50
60
70
80
Car LTV
Perc
enta
ge b
y G
roup
(%)
Vehicle Type
MYs 1995 - 1998MYs 1999 - 2006MYs 2007 - 2013
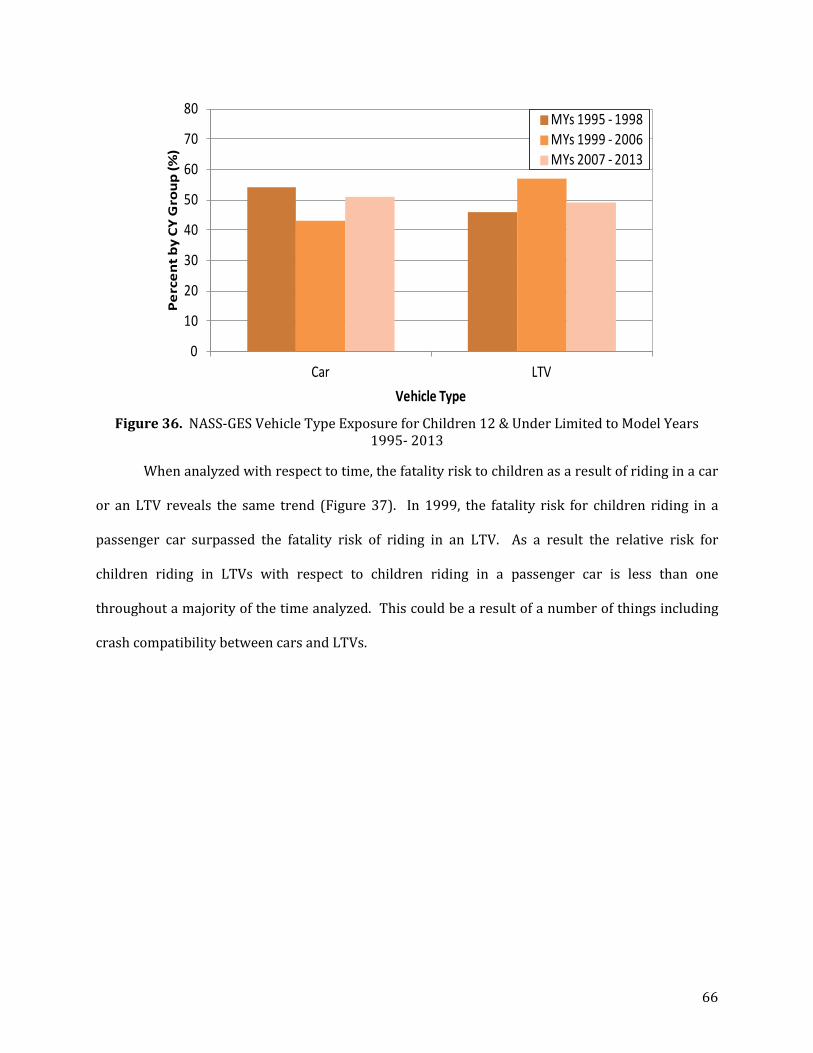
66
Figure 36. NASS-GES Vehicle Type Exposure for Children 12 & Under Limited to Model Years
1995- 2013
When analyzed with respect to time, the fatality risk to children as a result of riding in a car
or an LTV reveals the same trend (Figure 37). In 1999, the fatality risk for children riding in a
passenger car surpassed the fatality risk of riding in an LTV. As a result the relative risk for
children riding in LTVs with respect to children riding in a passenger car is less than one
throughout a majority of the time analyzed. This could be a result of a number of things including
crash compatibility between cars and LTVs.
0
10
20
30
40
50
60
70
80
Car LTV
Pe
rce
nt
by
CY
Gro
up
(%)
Vehicle Type
MYs 1995 - 1998MYs 1999 - 2006MYs 2007 - 2013
67
Figure 37. Risk and Relative Risk as a Function of Time for Vehicle Type, Relative Risk Presented is LTVs with Respect to Cars
3.5 CONCLUSIONS
In the US, child fatalities in traffic crashes decreased during the period from 1995 to 2013.
These fatalities declined by 57% overall during the period of analysis. The number of fatalities for
children 12 and under fell from 2,201 in 1995 to 939 in 2013. The percentage of fatally injured
children decreased significantly from 8.8% during the years 1995 to 1999 to 6.1% for the years
2006 through 2013 – a positive trend. The number of children exposed to traffic crashes also
declined during this period. To compare the fatalities and exposure, fatality risks were calculated
for each of the 19 years examined. The fatality risks exhibited a downward trend as well; the
fatality risk for all children decreased from 188 to 105 per 100,000 exposures over the 19 year
period.
3.5.1 EFFECT OF CRASH MODE
Rollovers appear to present a very high risk of fatality to child passengers as the fatality
frequency is close to 35% of all crash modes, but the exposure is much less than 5%. The relative
risk for rollovers to frontal crashes between 1995 and 2007 was 16; meaning rollovers were about
0.0
0.5
1.0
1.5
2.0
2.5
3.0
3.5
4.0
020406080
100120140160180200
1995 1998 2001 2004 2007 2010 2013
Rela
tive
Risk
Risk
per
100
,000
Exp
osur
es
Calendar Year
Risk LTVRisk CarRelative Risk

68
16 times more deadly than frontal crashes during that period. During the period 2008 to 2013, the
relative fatality risk for children involved in rollovers as compared to frontal crashes was 140, a
significant increase. The crash mode fatality and exposure distributions for adults are nearly the
same as for children. The increased rollover fatality risk due to rollovers is not restricted to
children only; the relative risk for adults between 1995 and 2005 was 32 and it increased to 85 for
the period between 2005 and 2013. This is understandable as there were few, if any, safety
measures designed specifically for rollovers until recently and later model year vehicles were
shown to have a lower fatality proportion as a result of rollover than previous model year groups.
The second most fatal crash mode for children and adults was the frontal crash mode, which is the
crash mode that frontal airbags are designed to provide protection from.
3.5.2 EFFECT OF SEATING POSITION
By comparing the FARS seating position data to the NASS-GES data, it is clear that children
are more frequently fatally injured in the front seat than are exposed to the front seat. However, for
the back seat the contrary is true. This indicates that the front seat presents a higher fatality risk
than the back seat. While the front seat fatality risk for children has decreased considerably over
the 19 year time period, the relative risk has consistently remained greater than one. The back seat
fatality risk for children has remained relatively constant over the period examined, with a general
downward trend.
More than 10% of the children who died in the front seat in the years between 1995 and
1999 were infants (age 0). During this time more infants sustained fatal injuries in the front seat
than any other child age group. NASS-GES estimates show that 5% of the children riding in the
front seat from 1995 to 1999 were infants (age 0). The fatality risk for this group was higher than
all other examined ages (1 – 12 years) during the same time frame. The relative risk for infants
sitting in the front seat to the back seat over the 19 year period analyzed was consistently above
69
unity, indicating that the front seat presents a higher fatality risk than the back seat. While there is
no clear trend for this relative risk over time the average relative risk between 1995 and 2013 is 3 –
infants were 3 times more likely to be fatally injured in the front seat than the back seat.
Overall, it appears that younger children are more frequently fatally injured in the back
seat; as age increases the risk of fatality decreases. But, as could be expected more of the younger
children are seated in the back seat than older children. However, it appears that the back seat
exposure for infants, while increasing over time, is particularly low; this would indicate relatively
high fatality risk in the back seat for infants as well.
3.5.3 EFFECT OF AGE
Alarmingly, regardless of seating position, the infant fatality frequency exceeds that of all
other ages examined from 1 to 12 years old. This could be due to their lower injury tolerance. To
further examine the infant fatalities specifically, Figure 38 shows the restraint use among infants
(age 0) fatally injured during the 19 year period. Infant fatalities resulting while restrained in a CSS
and unrestrained have both decreased over time. Notably at the start of the analysis in 1995,
fatalities among infants restrained in CSS and unrestrained were roughly equal, the unrestrained
group of fatally injured infants decreased fairly consistently over time, this may be due to decreased
exposure resulting from increased awareness following safety campaigns. However, the CSS group
of fatally injured infants appears to have waxed and waned between 1995 and 2005, after which a
general downward trend can be noted, though these are calendar years.
70
Figure 38. FARS Fatalities by Restraint Use for Infants (Age 0)
Yet another analysis performed to examine the FARS data for trends roughly correlated
with the implementation of depowered airbags and advanced airbags looked at fatally injured
infants by seating location (Figure 38). Infants fatally injured in the front seat sharply decreased
after 1996 after which these numbers generally continued declining and have remained at or under
10 per year since 2008 again this is likely due to the decrease in exposure but could also have been
impacted by the introduction of advanced airbags.
0102030405060708090
100
1995 1998 2001 2004 2007 2010 2013
Infa
nt F
atal
ities
Calendar Year
Child SafetyNone UsedUnknown
71
Figure 39. FARS Fatalities by Seating Position for Infants (Age 0)
3.5.4 EFFECT OF RESTRAINT USE
Most children who were fatally injured were unrestrained. However, it is encouraging that
the frequency of child fatalities occurring while unrestrained has decreased over time. NASS-GES
exposure estimates for children by restraint type indicate that there are fewer children riding
unrestrained – implying that it is considerably more likely that a child will sustain a fatal injury if
travelling unrestrained. Conversely, there are more children riding in CSS and wearing seat belts
than in the past which indicates that restraint use is increasing.
3.5.5 EFFECT OF VEHICLE TYPE
Vehicle type does not seem to have a substantial influence on child fatality risk. Exposure
estimates from NASS-GES also show similar trends over the 19 years for cars and LTVs. In fact, the
exposure trends are almost identical to those exhibited by child fatalities. However, when analyzed
with respect to model year generations and calendar year generations it was found that cars
presented a higher risk of fatality than LTVs.
0
10
20
30
40
50
60
70
80
90
100
Infa
nts
Fata
lly In
jure
d
Calendar Year
BackFront
72
In conclusion, rollovers present a very large fatality risk to all occupants not just children,
children riding in the front seat are at increased risk for fatality especially infants, infants
regardless of seating position are at the highest risk of fatality of all children and finally, children
riding unrestrained are at considerable risk of fatality. Overall fatality trends are decreasing among
the child population despite the fact that adult fatalities have remained nearly constant over the 19
year period. This downward trend is encouraging, but the socio-economic burden of child fatalities
as a result of an MVC is still large.
73
4 ARE ADVANCED AIRBAGS SAFER FOR CHILDREN IN THE RIGHT FRONT SEAT?
4.1 INTRODUCTION
This study examines the field crash performance of advanced airbags when children are
seated in the front seat and the resulting injury outcomes.
4.2 METHODS
This study utilized the National Automotive Sampling System - Crashworthiness Data
System (NASS-CDS) from 1995 to 2013 for children in the front seat of an airbag equipped vehicle
involved in a frontal crash. NASS-CDS was used to compare injuries sustained in vehicles equipped
with advanced airbag systems with injuries sustained in vehicles not equipped with advanced
airbag systems.
Started in 1979, NASS-CDS is a stratified sample of crashes in the US wherein at least one
passenger vehicle was towed. NASS-CDS investigates crashes at 24 primary sampling units (PSU)
are located in different geographic regions within the US. Approximately 5,000 cases are selected
each year from crashes involving at least one passenger vehicle wherein a vehicle was towed from
the scene of the crash due to damage to the vehicle. Accidents involving late model year vehicles
(the five most recent model years) are oversampled. NASS-CDS provides a weight for each crash
selected to provide a nationally representative estimate of the number of similar crashes within the
US each year.
Following selection of a case, NASS crash investigators examine the site of the crash for
physical evidence such as skid marks or damage to roadside objects, the vehicle(s) as well as the
occupants involved in the crash. From measurements of the physical damage to the vehicle, NASS
investigators use an algorithm called WinSmash to compute or estimate the vehicle's change in

74
velocity (delta-V) during the crash. Though the accuracy and effectiveness of WinSmash in certain
trajectories have been called into question [49], [50], the estimates have been uniformly calculated
and are sufficient for this analysis. NASS investigators also interview and review medical records
of, the occupants involved in the crash to examine the nature and severity of the injuries sustained.
Injuries are described within NASS-CDS via the Abbreviated Injury Scale (AIS). The AIS is a
method used to rank the threat to life for an injury on a scale from 1 (minor) to 6 (unsurvivable) as
outlined in Table 8 in nine anatomical body regions. The AIS is widely used in trauma registries
and provides standardized vocabulary and numerical methods for injury scoring. For this analysis,
injury severity was classified using the maximum AIS (MAIS) injury score sustained by each
occupant. Further, the MAIS was adjusted so that occupants fatally injured received an MAIS of 6
regardless of the MAIS of their individual injuries. Additionally, injuries were classified by body
region, i.e. head, neck, face, spine, abdomen, upper extremities, and lower extremities.
Table 8. Abbreviated Injury Scale
AIS Level Threat to Life 0 No Injury 1 Minor Injury 2 Moderate Injury 3 Serious Injury 4 Severe Injury 5 Critical Injury 6 Fatal (Unsurvivable) Injury
To examine crashes involving children in the right front passenger (RFP) seat who may be
exposed to a deploying airbag, NASS-CDS cases were selected which met the following conditions:
• Child (Age < 13) passengers in the right front passenger seat, • Passenger car or light trucks/vans, • Frontal crashes, • Excluding rollover crashes, • Known injury severity, • Model year ≥ 1980,
Frontal crashes were selected via the general area of damage (GAD1) variable. Since rollovers are
complex and present a high risk of injury (as evidenced by the high fatality risk associated with

75
rollover accidents noted within the characteristics analysis) cases where a rollover occurred were
excluded. Only cases with known injury severity were included as this was the primary metric of
interest. Further, because the availability of automobile safety equipment varies by model year,
vehicles older than 1980 were excluded from the dataset. Weighting was applied to provide a
nationally representative sample.
4.2.1 STATISTICAL ANALYSIS METHODS
A comparison between airbag generations was based upon the odds of injury, as shown in
Equation 3, where the probability (P) of injury for a given body region was expressed as the
percentage of injured cases in a total number of known cases, as calculated in Equation 4. The odds
ratios were used to compare the odds of injury during a critical event to a reference event, as
shown in Equation 5.
In order to include the effect of several covariates, odds ratios were calculated using a
logistic regression model within SAS called SurveyLogistic which calculated the odds ratios and
their associated confidence limits.
𝑂𝑂𝑂𝑂𝑂𝑂𝑅𝑅 = 𝑃𝑃
1 − 𝑃𝑃 Equation 3
𝑃𝑃 = 𝑁𝑁𝑁𝑁𝑁𝑁𝑁𝑁𝑁𝑁𝑁𝑁 𝑜𝑜𝑜𝑜 𝑐𝑐𝐹𝐹𝑅𝑅𝑁𝑁𝑅𝑅 𝐹𝐹𝐹𝐹 𝐹𝐹 𝑐𝑐𝑁𝑁𝑁𝑁𝐹𝐹𝐹𝐹𝐹𝐹𝑐𝑐 𝑅𝑅𝑁𝑁𝑅𝑅𝑁𝑁𝑁𝑁𝐹𝐹𝐹𝐹𝐹𝐹
𝑇𝑇𝑜𝑜𝐹𝐹𝐹𝐹𝐹𝐹 𝑐𝑐𝑁𝑁𝑁𝑁𝑁𝑁𝑁𝑁𝑁𝑁 𝑜𝑜𝑜𝑜 𝑅𝑅𝑐𝑐𝑜𝑜𝑘𝑘𝑐𝑐 𝑐𝑐𝐹𝐹𝑅𝑅𝑁𝑁𝑅𝑅 Equation 4
𝑂𝑂𝑂𝑂𝑂𝑂𝑅𝑅 𝑅𝑅𝐹𝐹𝐹𝐹𝐹𝐹𝑜𝑜 = 𝑂𝑂𝑂𝑂𝑂𝑂𝑅𝑅 𝑜𝑜𝑜𝑜 𝐼𝐼𝑐𝑐𝐼𝐼𝑁𝑁𝑁𝑁𝐹𝐹 𝑜𝑜𝑜𝑜𝑁𝑁 𝐶𝐶𝑁𝑁𝐹𝐹𝐹𝐹𝐹𝐹𝑐𝑐𝐹𝐹𝐹𝐹 𝐸𝐸𝑅𝑅𝑁𝑁𝑐𝑐𝐹𝐹𝑂𝑂𝑂𝑂𝑂𝑂𝑅𝑅 𝑜𝑜𝑜𝑜 𝐼𝐼𝑐𝑐𝐼𝐼𝑁𝑁𝑁𝑁𝐹𝐹 𝑜𝑜𝑜𝑜𝑁𝑁 𝑅𝑅𝑁𝑁𝑜𝑜𝑁𝑁𝑁𝑁𝑁𝑁𝑐𝑐𝑐𝑐𝑁𝑁 𝐸𝐸𝑅𝑅𝑁𝑁𝑐𝑐𝐹𝐹
Equation 5
The probability of an event occurring can be estimated using a logistic regression model.
Given a dependent variable, a logistic regression predicts the outcome of a categorical variable,
such as injury severity (MAIS 2+ or not), as shown in Equation 6 where βN is the coefficient estimate
which describes the effect of factors, such as passenger restraint use, occupant weight and vehicle
76
delta-V, upon odds of injury. Similar to the calculation of odds, βN is the coefficient estimate which
describes the effect of the relevant covariates.
𝑃𝑃𝑁𝑁𝑜𝑜𝑁𝑁𝐹𝐹𝑁𝑁𝐹𝐹𝐹𝐹𝐹𝐹𝐹𝐹𝐹𝐹 𝑜𝑜𝑜𝑜 𝑂𝑂𝑐𝑐𝑐𝑐𝑁𝑁𝑁𝑁𝑁𝑁𝑐𝑐𝑐𝑐𝑁𝑁 = 1
1 + 𝑁𝑁−(𝛽𝛽0+𝛽𝛽1∗𝐹𝐹𝐹𝐹𝐹𝐹𝐹𝐹𝐹𝐹𝐹𝐹1+...𝛽𝛽𝛽𝛽∗𝐹𝐹𝐹𝐹𝐹𝐹𝐹𝐹𝐹𝐹𝐹𝐹𝛽𝛽) Equation 6
4.2.2 ADVANCED AIRBAG STRATEGIES
With data provided by manufacturers to and made publicly available by NHTSA, the
certified deployment strategies for make and models between model year 2005 and 2012 were
classified using the MAKMOD variable which specifically identifies a vehicles make and model in
NASS-CDS. The strategies for all vehicles included are included in the Appendices in Table 19.
Since the manufacturer’s had to certify a strategy, either suppression or low risk deployment (LRD)
for each of three occupant classes, the 1, 3 and 6 year old, the strategies are described by ‘S’ or ‘L’
for suppression and low risk deployment respectively. The ‘S’ and ‘L’ were then concatenated such
that the first letter represents the strategy for the one year old and the final letter in the string
represents the strategy for the six year old. For example, a vehicle whose deployment strategy is
suppression for all certifying occupant classes, the strategy was noted as SSS. In cases where the
deployment strategy was reported for one model year and not reported for a subsequent year, the
deployment strategy was assumed to be the same as the prior year. In total, strategies were
identified for 357 different make-model combinations. On average each model year included 213
unique vehicles.
Within the 2005 model year, Mercedes Benz employed a technology called “Babysmart,” in
lieu of suppression or low risk deployment, which is denoted with a ‘B.’ The Babysmart technology
consisted of an antenna within the RFP seat that could detect Mercedes Benz Babysmart child
safety seats (CSS). The Mercedes Benz Babysmart CSS also contained electronics within the base
that would indicate to the receiver in the RFP seat that a Babysmart child seat was installed and as a

77
result suppress the airbag. If a non-Babysmart CSS was placed on the RFP seat of a Babysmart
equipped vehicle, the driver could manually switch the airbag off and thus suppress the airbag;
however, a problem with this method is that it is not automatic and is susceptible to human error.
Further, due to the MAKMOD variable not having the resolution to discern between engine
or trim types, cases where the deployment strategy varied by engine or trim level were excluded to
prevent misclassification, these vehicles are listed in the table as having conflicting strategies. In
particular, all model years of the Chevrolet C/K-series (Silverado) and GMC C/K-series (Savanna)
pickup trucks were excluded since their strategy varied by engine type. Also excluded were the
Hyundai Elantra (MYs 2011-2012) and Hyundai Genesis (MYs 2010 - 2012) as their deployment
strategies varied by trim/vehicle configuration. Finally, though several Bentley models reported a
deployment strategy to NHTSA in 2007, the MAKMOD variable did not allow enough resolution
alone to differentiate between the different models and the deployment strategy varied between all
suppression and mixed methods (suppression and LRD). As a result these vehicles were also
considered conflicting in the table for model years 2007 - 2011, when all Bentley models reported
having SLL strategy.
4.2.3 AIRBAG GENERATION CLASSIFICATION
Right front passenger airbags were classified into generations by the model year, make and
model of each vehicle included in the study. The vehicle identification number (VIN) was used to
determine whether a vehicle was equipped with a first generation airbag or not via a VIN decoding
algorithm developed by C. Kahane of NHTSA to determine the restraints in vehicles model year
2006 and earlier. Vehicles were classified as having first generation airbags if they had “dual
airbags,” meaning that they were equipped with both driver and passenger airbags. Since
passenger (frontal) airbags were still being phased-in when FMVSS 208 was revised to include
depowered (second generation) and subsequently advanced airbags, some vehicles in the dataset
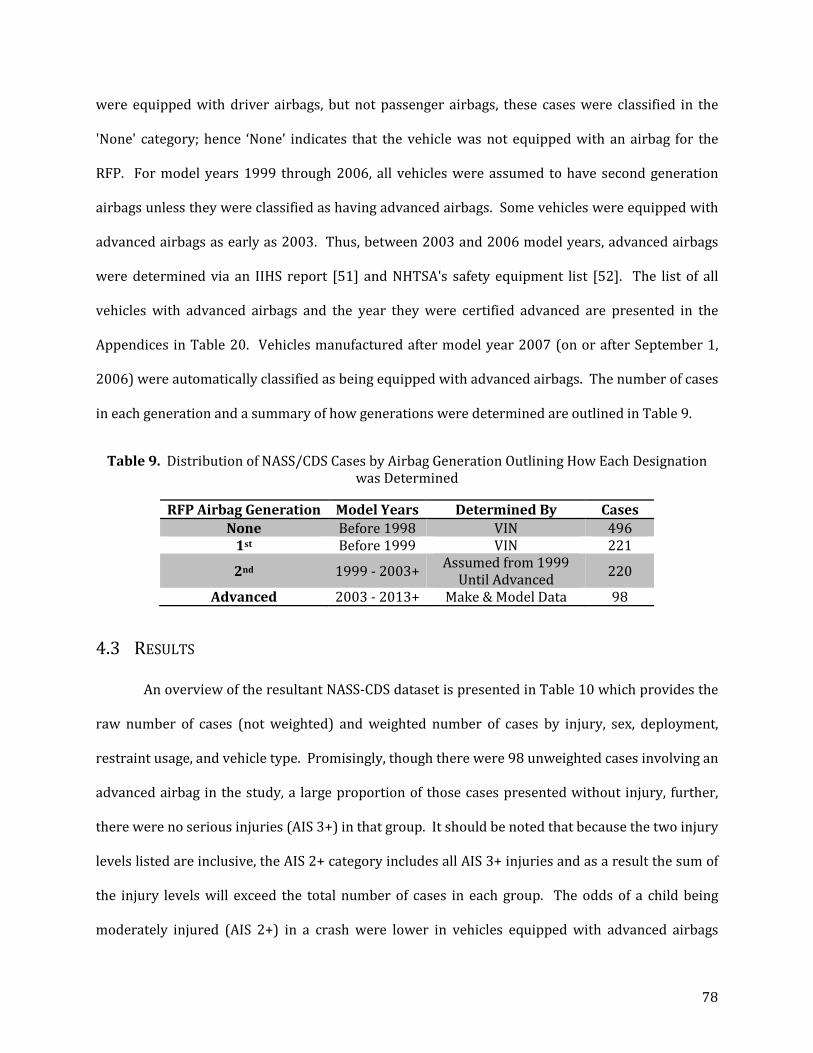
78
were equipped with driver airbags, but not passenger airbags, these cases were classified in the
'None' category; hence ‘None’ indicates that the vehicle was not equipped with an airbag for the
RFP. For model years 1999 through 2006, all vehicles were assumed to have second generation
airbags unless they were classified as having advanced airbags. Some vehicles were equipped with
advanced airbags as early as 2003. Thus, between 2003 and 2006 model years, advanced airbags
were determined via an IIHS report [51] and NHTSA's safety equipment list [52]. The list of all
vehicles with advanced airbags and the year they were certified advanced are presented in the
Appendices in Table 20. Vehicles manufactured after model year 2007 (on or after September 1,
2006) were automatically classified as being equipped with advanced airbags. The number of cases
in each generation and a summary of how generations were determined are outlined in Table 9.
Table 9. Distribution of NASS/CDS Cases by Airbag Generation Outlining How Each Designation was Determined
RFP Airbag Generation Model Years Determined By Cases None Before 1998 VIN 496
1st Before 1999 VIN 221
2nd 1999 - 2003+ Assumed from 1999 Until Advanced 220
Advanced 2003 - 2013+ Make & Model Data 98
4.3 RESULTS
An overview of the resultant NASS-CDS dataset is presented in Table 10 which provides the
raw number of cases (not weighted) and weighted number of cases by injury, sex, deployment,
restraint usage, and vehicle type. Promisingly, though there were 98 unweighted cases involving an
advanced airbag in the study, a large proportion of those cases presented without injury, further,
there were no serious injuries (AIS 3+) in that group. It should be noted that because the two injury
levels listed are inclusive, the AIS 2+ category includes all AIS 3+ injuries and as a result the sum of
the injury levels will exceed the total number of cases in each group. The odds of a child being
moderately injured (AIS 2+) in a crash were lower in vehicles equipped with advanced airbags
79
(0.0165) compared to: second generation (0.0271), first generation (0.0525) and those not
equipped with passenger airbags (0.0410). This does not control for seat belt or child seat use or
deployment and it is likely that increased restraint use, increased safety features in newer vehicles
and the trend for older children being seated in the RFP seat all have an effect on the decrease in
moderate injury odds. For all airbag groups the number of males and females were roughly equal.
Within the first and second generation airbag groups, there were cases where the only the
driver bag deployed, in these cases the airbag was switched off. Interestingly, for the advanced
airbag group, the driver airbag solely deployed in roughly one quarter of the cases and both airbags
deployed in roughly half of the cases. As airbags advanced from one generation to the next, the
number of unrestrained children also decreased, as noted earlier we know that this is likely an
attribute of cultural changes in the US, not an indication of cause and effect on children in crashes.
Finally, for the period of analysis, the proportion of children in cars and LTVs has varied by
airbag generation as shown in Table 11 showing a decline from mostly passenger cars in vehicles
not equipped with passenger airbags to 50/50 for vehicles with advanced airbags. However, as
described earlier in Chapter 3 the exposures (by model year thus aligning with airbag generations)
were nearly 50/50 for cars and LTVs for all generations. This may indicate that cars were more
likely to be involved in tow-away crashes.
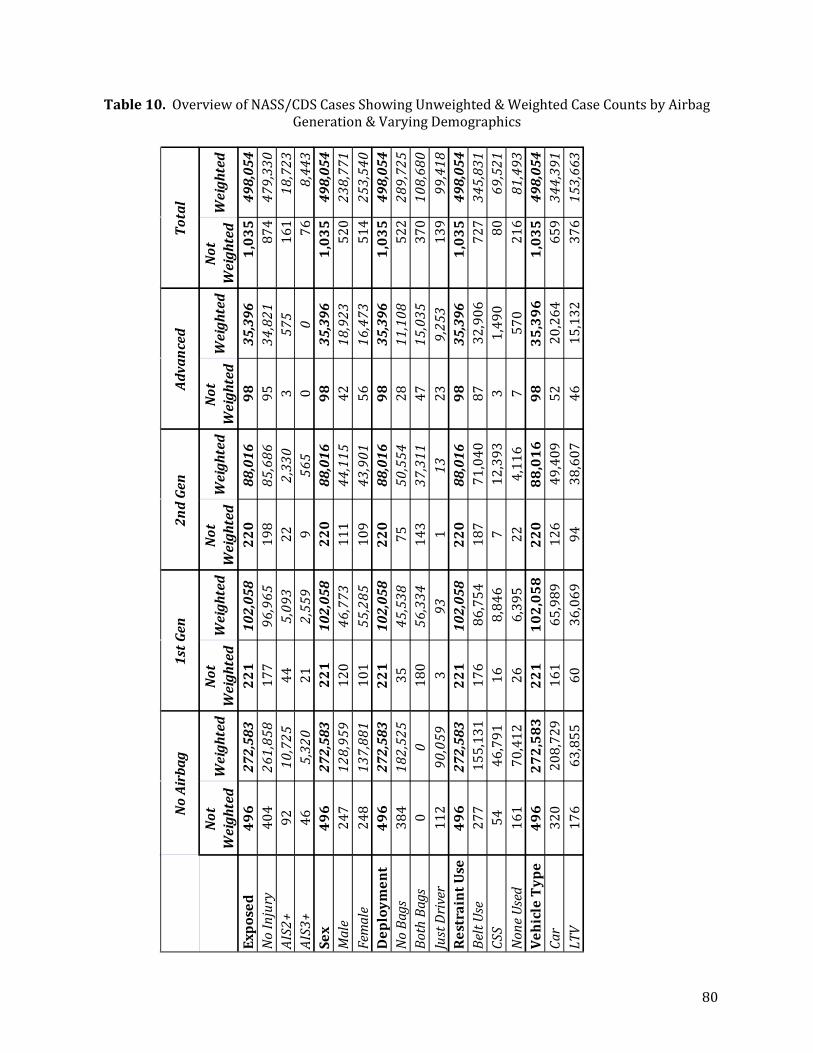
80
Table 10. Overview of NASS/CDS Cases Showing Unweighted & Weighted Case Counts by Airbag Generation & Varying Demographics
Not
Wei
ghte
dW
eigh
ted
Not
Wei
ghte
dW
eigh
ted
Not
Wei
ghte
dW
eigh
ted
Not
Wei
ghte
dW
eigh
ted
Not
Wei
ghte
dW
eigh
ted
Expo
sed
496
272,
583
221
102,
058
220
88,0
1698
35,3
961,
035
498,
054
No
Inju
ry40
426
1,85
817
796
,965
198
85,6
8695
34,8
2187
447
9,33
0AI
S2+
9210
,725
445,
093
222,
330
357
516
118
,723
AIS3
+46
5,32
021
2,55
99
565
00
768,
443
Sex
496
272,
583
221
102,
058
220
88,0
1698
35,3
961,
035
498,
054
Mal
e24
712
8,95
912
046
,773
111
44,1
1542
18,9
2352
023
8,77
1Fe
mal
e24
813
7,88
110
155
,285
109
43,9
0156
16,4
7351
425
3,54
0D
eplo
ymen
t49
627
2,58
322
110
2,05
822
088
,016
9835
,396
1,03
549
8,05
4N
o Ba
gs38
418
2,52
535
45,5
3875
50,5
5428
11,1
0852
228
9,72
5Bo
th B
ags
00
180
56,3
3414
337
,311
4715
,035
370
108,
680
Just
Dri
ver
112
90,0
593
931
1323
9,25
313
999
,418
Rest
rain
t Use
496
272,
583
221
102,
058
220
88,0
1698
35,3
961,
035
498,
054
Belt
Use
277
155,
131
176
86,7
5418
771
,040
8732
,906
727
345,
831
CSS
5446
,791
168,
846
712
,393
31,
490
8069
,521
Non
e Us
ed16
170
,412
266,
395
224,
116
757
021
681
,493
Vehi
cle
Type
496
272,
583
221
102,
058
220
88,0
1698
35,3
961,
035
498,
054
Car
320
208,
729
161
65,9
8912
649
,409
5220
,264
659
344,
391
LTV
176
63,8
5560
36,0
6994
38,6
0746
15,1
3237
615
3,66
3
No A
irba
g1s
t Gen
2nd
Gen
Adva
nced
Tota
l
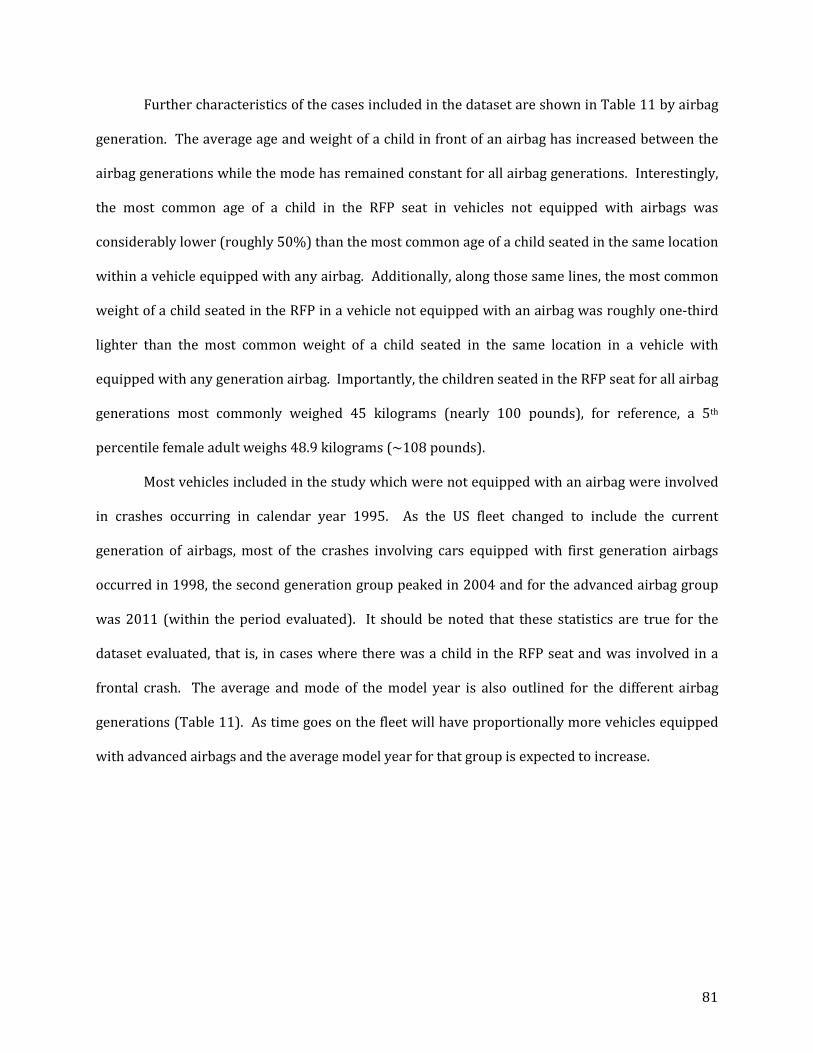
81
Further characteristics of the cases included in the dataset are shown in Table 11 by airbag
generation. The average age and weight of a child in front of an airbag has increased between the
airbag generations while the mode has remained constant for all airbag generations. Interestingly,
the most common age of a child in the RFP seat in vehicles not equipped with airbags was
considerably lower (roughly 50%) than the most common age of a child seated in the same location
within a vehicle equipped with any airbag. Additionally, along those same lines, the most common
weight of a child seated in the RFP in a vehicle not equipped with an airbag was roughly one-third
lighter than the most common weight of a child seated in the same location in a vehicle with
equipped with any generation airbag. Importantly, the children seated in the RFP seat for all airbag
generations most commonly weighed 45 kilograms (nearly 100 pounds), for reference, a 5th
percentile female adult weighs 48.9 kilograms (~108 pounds).
Most vehicles included in the study which were not equipped with an airbag were involved
in crashes occurring in calendar year 1995. As the US fleet changed to include the current
generation of airbags, most of the crashes involving cars equipped with first generation airbags
occurred in 1998, the second generation group peaked in 2004 and for the advanced airbag group
was 2011 (within the period evaluated). It should be noted that these statistics are true for the
dataset evaluated, that is, in cases where there was a child in the RFP seat and was involved in a
frontal crash. The average and mode of the model year is also outlined for the different airbag
generations (Table 11). As time goes on the fleet will have proportionally more vehicles equipped
with advanced airbags and the average model year for that group is expected to increase.
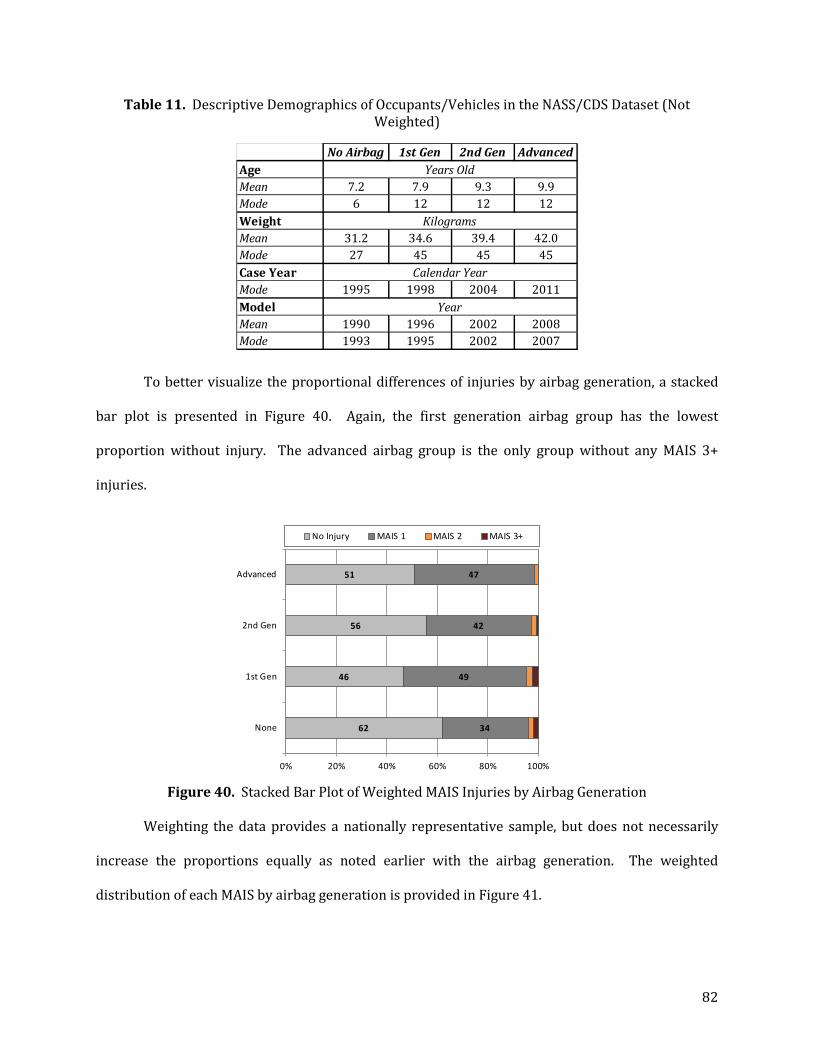
82
Table 11. Descriptive Demographics of Occupants/Vehicles in the NASS/CDS Dataset (Not Weighted)
To better visualize the proportional differences of injuries by airbag generation, a stacked
bar plot is presented in Figure 40. Again, the first generation airbag group has the lowest
proportion without injury. The advanced airbag group is the only group without any MAIS 3+
injuries.
Figure 40. Stacked Bar Plot of Weighted MAIS Injuries by Airbag Generation
Weighting the data provides a nationally representative sample, but does not necessarily
increase the proportions equally as noted earlier with the airbag generation. The weighted
distribution of each MAIS by airbag generation is provided in Figure 41.
No Airbag 1st Gen 2nd Gen AdvancedAgeMean 7.2 7.9 9.3 9.9Mode 6 12 12 12WeightMean 31.2 34.6 39.4 42.0Mode 27 45 45 45Case Year Mode 1995 1998 2004 2011ModelMean 1990 1996 2002 2008Mode 1993 1995 2002 2007
Calendar Year
Year
Years Old
Kilograms
62
46
56
51
34
49
42
47
0% 20% 40% 60% 80% 100%
None
1st Gen
2nd Gen
Advanced
No Injury MAIS 1 MAIS 2 MAIS 3+
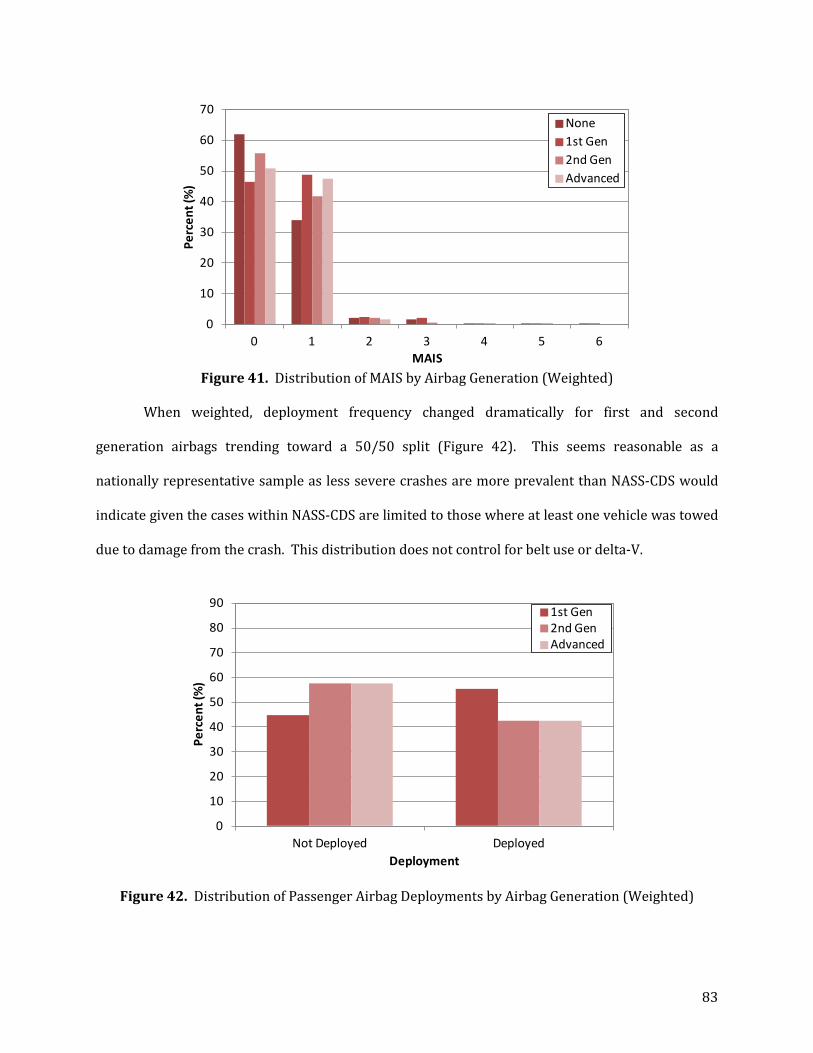
83
Figure 41. Distribution of MAIS by Airbag Generation (Weighted)
When weighted, deployment frequency changed dramatically for first and second
generation airbags trending toward a 50/50 split (Figure 42). This seems reasonable as a
nationally representative sample as less severe crashes are more prevalent than NASS-CDS would
indicate given the cases within NASS-CDS are limited to those where at least one vehicle was towed
due to damage from the crash. This distribution does not control for belt use or delta-V.
Figure 42. Distribution of Passenger Airbag Deployments by Airbag Generation (Weighted)
0
10
20
30
40
50
60
70
0 1 2 3 4 5 6
Perc
ent (
%)
MAIS
None1st Gen2nd GenAdvanced
0
10
20
30
40
50
60
70
80
90
Not Deployed Deployed
Perc
ent (
%)
Deployment
1st Gen2nd GenAdvanced
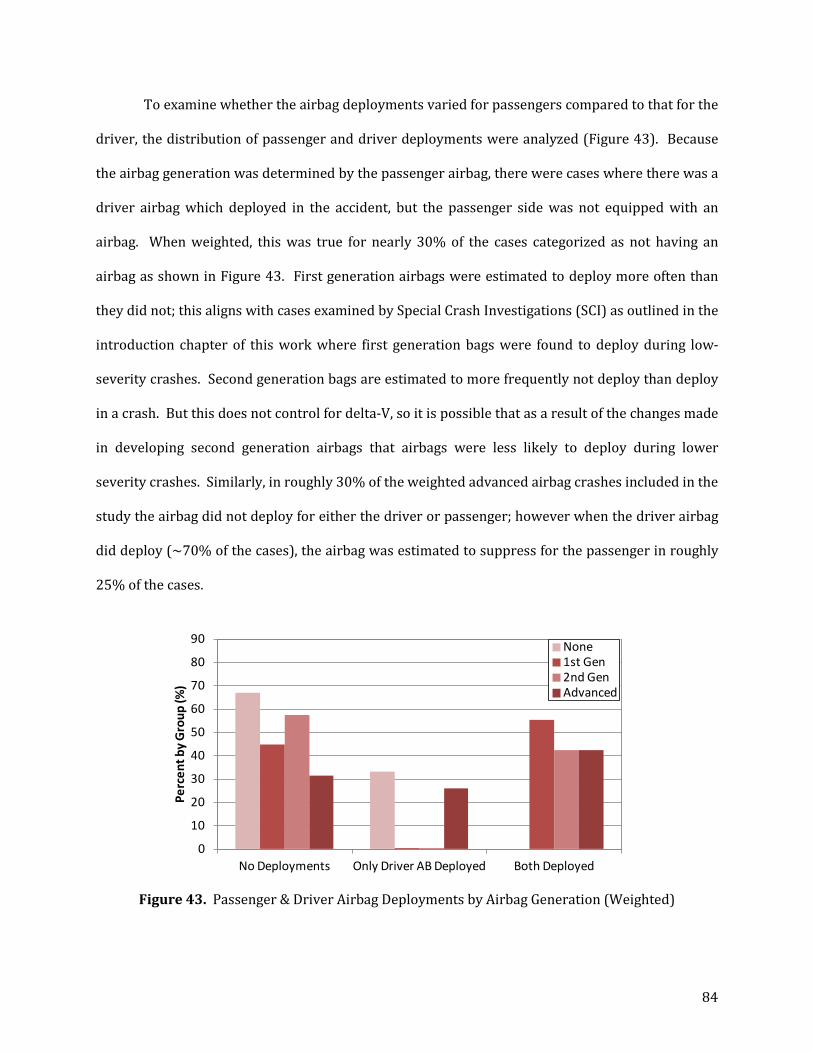
84
To examine whether the airbag deployments varied for passengers compared to that for the
driver, the distribution of passenger and driver deployments were analyzed (Figure 43). Because
the airbag generation was determined by the passenger airbag, there were cases where there was a
driver airbag which deployed in the accident, but the passenger side was not equipped with an
airbag. When weighted, this was true for nearly 30% of the cases categorized as not having an
airbag as shown in Figure 43. First generation airbags were estimated to deploy more often than
they did not; this aligns with cases examined by Special Crash Investigations (SCI) as outlined in the
introduction chapter of this work where first generation bags were found to deploy during low-
severity crashes. Second generation bags are estimated to more frequently not deploy than deploy
in a crash. But this does not control for delta-V, so it is possible that as a result of the changes made
in developing second generation airbags that airbags were less likely to deploy during lower
severity crashes. Similarly, in roughly 30% of the weighted advanced airbag crashes included in the
study the airbag did not deploy for either the driver or passenger; however when the driver airbag
did deploy (~70% of the cases), the airbag was estimated to suppress for the passenger in roughly
25% of the cases.
Figure 43. Passenger & Driver Airbag Deployments by Airbag Generation (Weighted)
0
10
20
30
40
50
60
70
80
90
No Deployments Only Driver AB Deployed Both Deployed
Perc
ent b
y G
roup
(%)
None1st Gen2nd GenAdvanced

85
When weighted and analyzed by airbag generation, it is estimated that children in front of
an advanced airbag during a crash are less likely to be in a CSS or unbelted than other those seated
in front of first or second generation bags (Figure 44). This trend could be part of the reason that
there are fewer injuries in the advanced airbag group.
Figure 44. Passenger Restraint Use by Airbag Generation (Weighted)
The distribution of weighted cases by vehicle type and airbag generation is presented in
Figure 45. When the cases are weighted the no airbag group is estimated to have many more cars
by proportion than the unweighted case distribution would indicate. Conversely, the first
generation and second generation airbag groups are closer to a 60/40 split in favor of cars than
indicated by the unweighted case data. Again, because the exposure data indicates that children are
exposed equally between cars and LTVs, it appears that cars may be more likely than LTVs to be
involved in tow-away crashes. This can likely be attributed to the US fleet composition changing
from mostly cars to an even mix of cars and LTVs over time.
0
10
20
30
40
50
60
70
80
90
100
Belted Child Seat Unbelted
Perc
ent (
%)
Restraint Use
None1st Gen2nd GenAdvanced
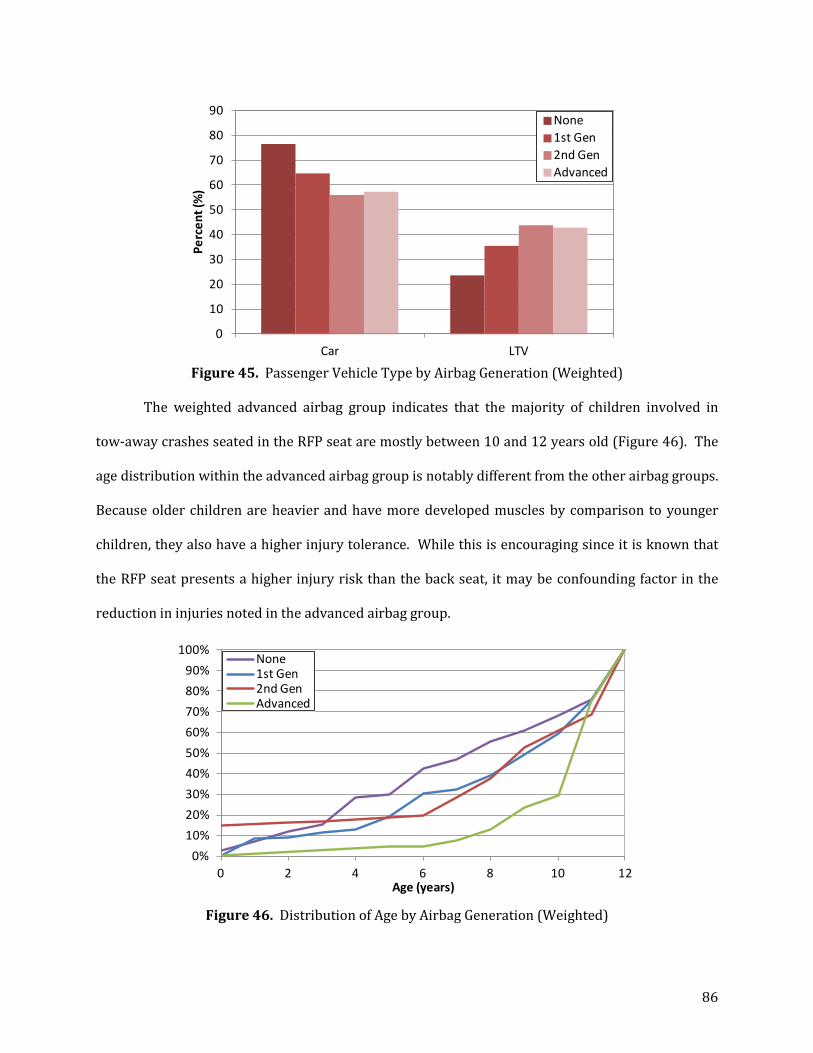
86
Figure 45. Passenger Vehicle Type by Airbag Generation (Weighted)
The weighted advanced airbag group indicates that the majority of children involved in
tow-away crashes seated in the RFP seat are mostly between 10 and 12 years old (Figure 46). The
age distribution within the advanced airbag group is notably different from the other airbag groups.
Because older children are heavier and have more developed muscles by comparison to younger
children, they also have a higher injury tolerance. While this is encouraging since it is known that
the RFP seat presents a higher injury risk than the back seat, it may be confounding factor in the
reduction in injuries noted in the advanced airbag group.
Figure 46. Distribution of Age by Airbag Generation (Weighted)
0
10
20
30
40
50
60
70
80
90
Car LTV
Perc
ent (
%)
l
None1st Gen2nd GenAdvanced
0%10%20%30%40%50%60%70%80%90%
100%
0 2 4 6 8 10 12Age (years)
None1st Gen2nd GenAdvanced
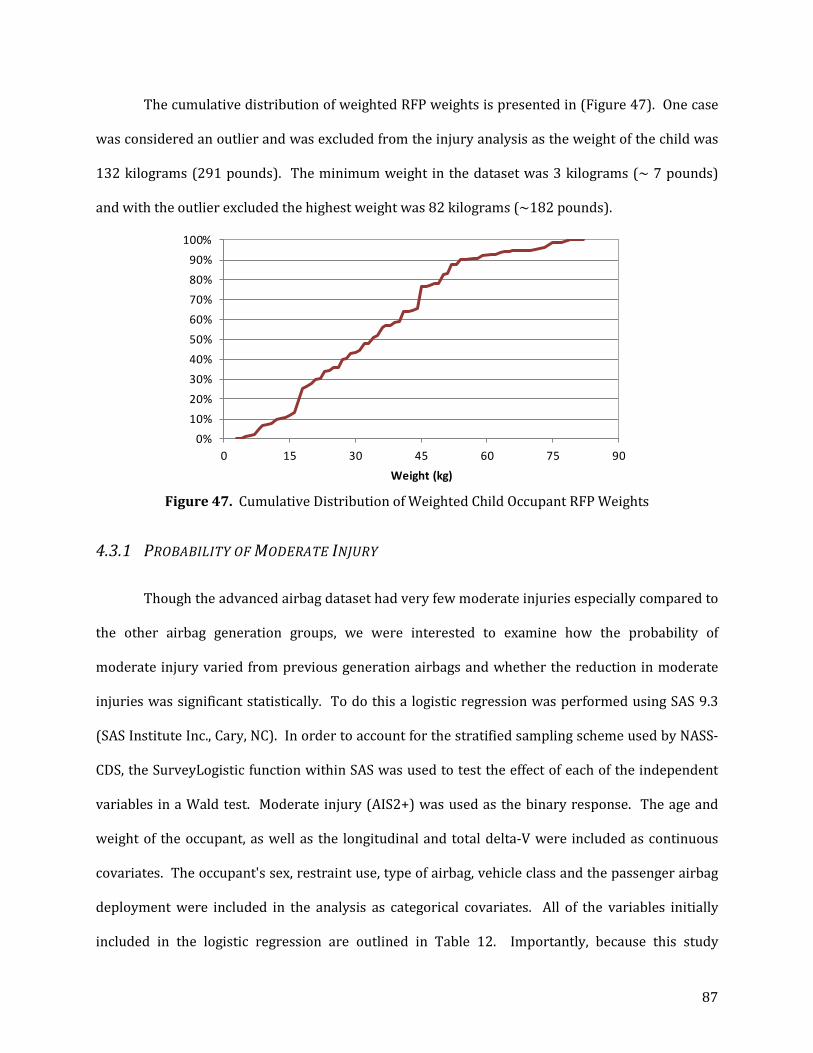
87
The cumulative distribution of weighted RFP weights is presented in (Figure 47). One case
was considered an outlier and was excluded from the injury analysis as the weight of the child was
132 kilograms (291 pounds). The minimum weight in the dataset was 3 kilograms (~ 7 pounds)
and with the outlier excluded the highest weight was 82 kilograms (~182 pounds).
Figure 47. Cumulative Distribution of Weighted Child Occupant RFP Weights
4.3.1 PROBABILITY OF MODERATE INJURY
Though the advanced airbag dataset had very few moderate injuries especially compared to
the other airbag generation groups, we were interested to examine how the probability of
moderate injury varied from previous generation airbags and whether the reduction in moderate
injuries was significant statistically. To do this a logistic regression was performed using SAS 9.3
(SAS Institute Inc., Cary, NC). In order to account for the stratified sampling scheme used by NASS-
CDS, the SurveyLogistic function within SAS was used to test the effect of each of the independent
variables in a Wald test. Moderate injury (AIS2+) was used as the binary response. The age and
weight of the occupant, as well as the longitudinal and total delta-V were included as continuous
covariates. The occupant's sex, restraint use, type of airbag, vehicle class and the passenger airbag
deployment were included in the analysis as categorical covariates. All of the variables initially
included in the logistic regression are outlined in Table 12. Importantly, because this study
0%10%20%30%40%50%60%70%80%90%
100%
0 15 30 45 60 75 90Weight (kg)
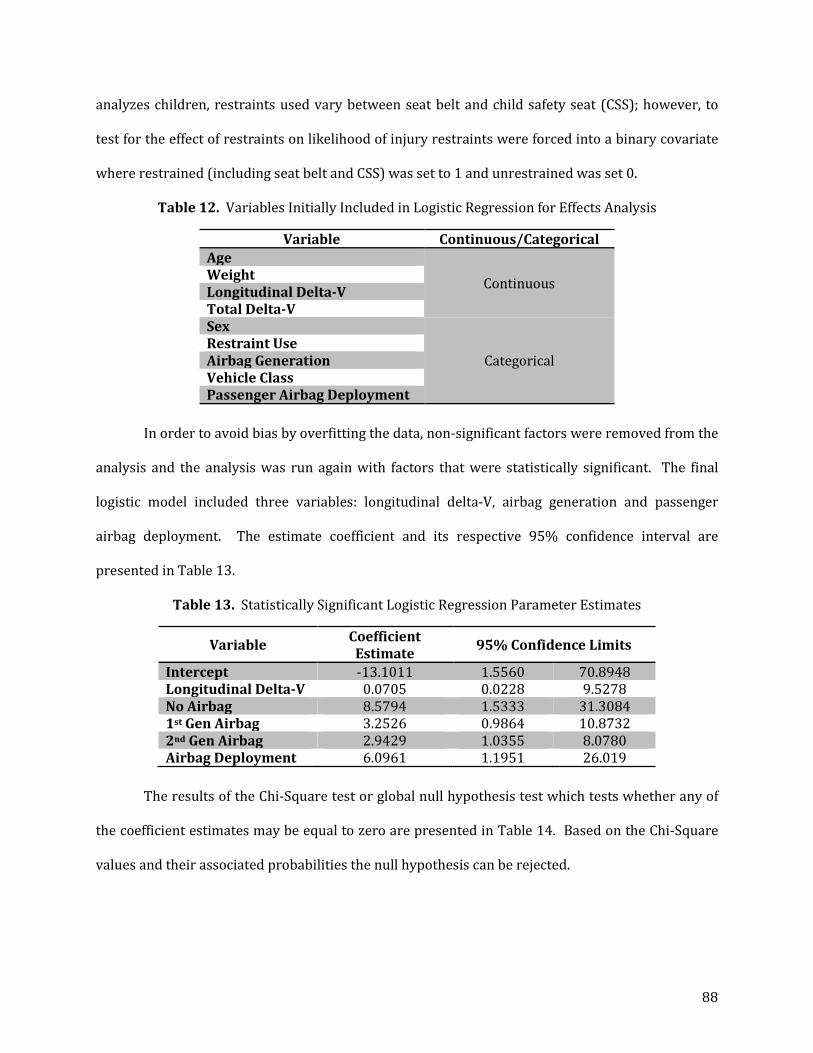
88
analyzes children, restraints used vary between seat belt and child safety seat (CSS); however, to
test for the effect of restraints on likelihood of injury restraints were forced into a binary covariate
where restrained (including seat belt and CSS) was set to 1 and unrestrained was set 0.
Table 12. Variables Initially Included in Logistic Regression for Effects Analysis
Variable Continuous/Categorical Age
Continuous Weight Longitudinal Delta-V Total Delta-V Sex
Categorical Restraint Use Airbag Generation Vehicle Class Passenger Airbag Deployment
In order to avoid bias by overfitting the data, non-significant factors were removed from the
analysis and the analysis was run again with factors that were statistically significant. The final
logistic model included three variables: longitudinal delta-V, airbag generation and passenger
airbag deployment. The estimate coefficient and its respective 95% confidence interval are
presented in Table 13.
Table 13. Statistically Significant Logistic Regression Parameter Estimates
Variable Coefficient Estimate 95% Confidence Limits
Intercept -13.1011 1.5560 70.8948 Longitudinal Delta-V 0.0705 0.0228 9.5278 No Airbag 8.5794 1.5333 31.3084 1st Gen Airbag 3.2526 0.9864 10.8732 2nd Gen Airbag 2.9429 1.0355 8.0780 Airbag Deployment 6.0961 1.1951 26.019
The results of the Chi-Square test or global null hypothesis test which tests whether any of
the coefficient estimates may be equal to zero are presented in Table 14. Based on the Chi-Square
values and their associated probabilities the null hypothesis can be rejected.
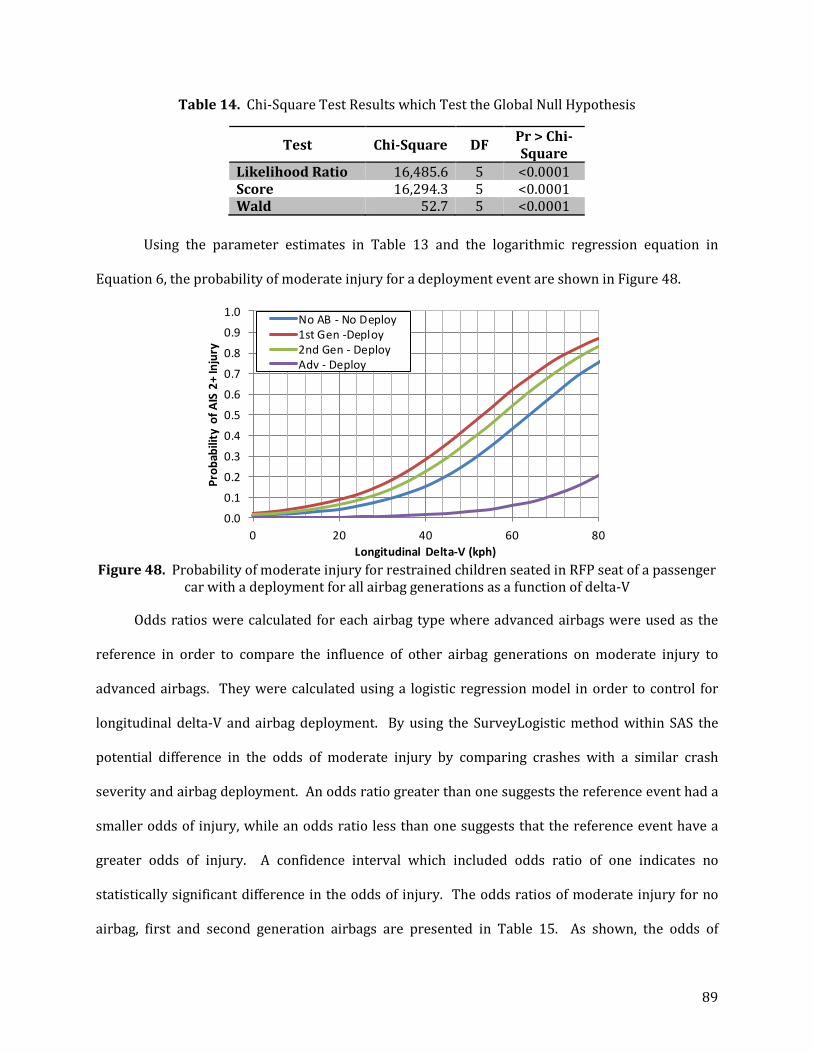
89
Table 14. Chi-Square Test Results which Test the Global Null Hypothesis
Test Chi-Square DF Pr > Chi-Square
Likelihood Ratio 16,485.6 5 <0.0001 Score 16,294.3 5 <0.0001 Wald 52.7 5 <0.0001
Using the parameter estimates in Table 13 and the logarithmic regression equation in
Equation 6, the probability of moderate injury for a deployment event are shown in Figure 48.
Figure 48. Probability of moderate injury for restrained children seated in RFP seat of a passenger
car with a deployment for all airbag generations as a function of delta-V
Odds ratios were calculated for each airbag type where advanced airbags were used as the
reference in order to compare the influence of other airbag generations on moderate injury to
advanced airbags. They were calculated using a logistic regression model in order to control for
longitudinal delta-V and airbag deployment. By using the SurveyLogistic method within SAS the
potential difference in the odds of moderate injury by comparing crashes with a similar crash
severity and airbag deployment. An odds ratio greater than one suggests the reference event had a
smaller odds of injury, while an odds ratio less than one suggests that the reference event have a
greater odds of injury. A confidence interval which included odds ratio of one indicates no
statistically significant difference in the odds of injury. The odds ratios of moderate injury for no
airbag, first and second generation airbags are presented in Table 15. As shown, the odds of
0.0
0.1
0.2
0.3
0.4
0.5
0.6
0.7
0.8
0.9
1.0
0 20 40 60 80
Prob
abili
ty o
f AIS
2+
Inju
ry
Longitudinal Delta-V (kph)
No AB - No Deploy1st Gen -Deploy2nd Gen - DeployAdv - Deploy

90
moderate injury are higher for all airbag types than advanced airbags. Specifically, first generation
airbags are estimated to present roughly 26 times greater odds of moderate injury than advanced
airbags and similarly second generation airbags present 19 times higher odds of moderate injury
for children seated in front of these bags during a crash.
Table 15. Odds Ratio of Moderate Injury Adjusted for Longitudinal Delta-V and Airbag Deployment
Airbag Type Coefficient Estimate
95% Confidence Limits
No Airbag >999.999 263.532 >999.999 1st Gen Airbag 25.857 3.741 178.733 2nd Gen Airbag 18.971 2.493 144.370
Reference: Advanced Airbags
4.3.2 FACTORS INFLUENCING MODERATE INJURIES
As shown in Table 16, factors that are associated with an increase in the probability of a
child in the RFP sustaining a moderate injury include: longitudinal delta-V, airbag generation and
airbag deployment. These factors were all significant at the alpha=0.05 level. However, age,
weight, sex, restraint use and vehicle type did not have a statistically significant effect on
probability of moderate injury and thus were excluded from the model effects analysis. It should be
noted that although for the dataset as a whole, airbag deployment influenced whether a child was
injured or not, there was no such statistical correlation for the advanced airbag group alone.
Table 16. P-Values Resulting from Model Effects Analysis Examining Factors Influencing Moderate Injuries
Variable P-Value Longitudinal Delta-V 0.002 No Airbag <0.0001 1st Gen Airbag 0.001 2nd Gen Airbag 0.0045 Airbag Deployment <0.0001
91
4.3.3 INJURIES BY BODY REGION
In order to evaluate which injuries occur most frequently as a function of airbag generation
and deployment status, the weighted cases where at least one injury was reported were analyzed
by body region (Figure 49). The injuries presented included any injury including minor which
could be a laceration (cut) or hematoma (bruise) and does not control for restraint use. Not
surprisingly, the highest prevalence of head and neck injuries occurred when children were seated
in front of deploying first generation airbags.
In general, the proportions of injuries while seated in front of an advanced airbag regardless
of whether it deployed were lower, with a few exceptions. Children injured in a crash while in front
of an advanced airbag appeared to sustain head injuries as frequently as those seated in front of
second generation airbags. Further, there were proportionally more injured children seated in
front of an advanced airbag that did not deploy who sustained head injuries than those in front of
first or second generation airbags. However, the head injuries in the advanced airbag group ranged
from minor to moderate. Also, though minor (AIS 1) in severity, proportionally more children
sustain neck injuries seated in front of an advanced airbag that did not deploy than those who were
seated in front of advanced airbags that did deploy. Proportionally more children sustained minor
chest injuries when seated in front of an advanced airbag which did not deploy than those in front
of advanced airbags that did deploy. Finally, a large proportion of children injured as a result of a
crash while seated in front of an advanced airbag which did not deploy sustained minor lower
extremity injuries. The majority of the children sustaining lower extremity injuries were
restrained. This injury modality could be the result of poor belt fit resulting in “submarining”
where the child occupant’s hips slide under the belt during the event and make contact with the
instrument panel or could be a result of seat track location.
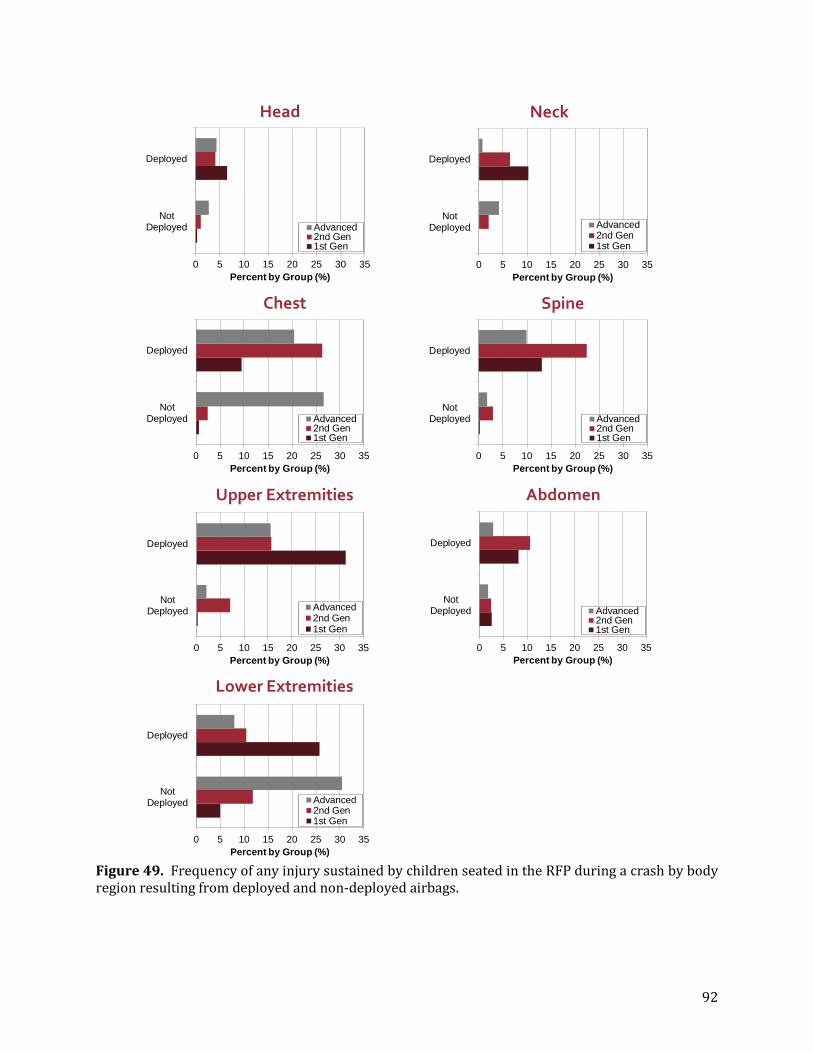
92
Figure 49. Frequency of any injury sustained by children seated in the RFP during a crash by body region resulting from deployed and non-deployed airbags.
Head
0 5 10 15 20 25 30 35
NotDeployed
Deployed
Percent by Group (%)
Advanced2nd Gen1st Gen
Neck
0 5 10 15 20 25 30 35
NotDeployed
Deployed
Percent by Group (%)
Advanced2nd Gen1st Gen
Chest
0 5 10 15 20 25 30 35
NotDeployed
Deployed
Percent by Group (%)
Advanced2nd Gen1st Gen
Spine
0 5 10 15 20 25 30 35
NotDeployed
Deployed
Percent by Group (%)
Advanced2nd Gen1st Gen
Upper Extremities
0 5 10 15 20 25 30 35
NotDeployed
Deployed
Percent by Group (%)
Advanced2nd Gen1st Gen
Abdomen
0 5 10 15 20 25 30 35
NotDeployed
Deployed
Percent by Group (%)
Advanced2nd Gen1st Gen
Lower Extremities
0 5 10 15 20 25 30 35
NotDeployed
Deployed
Percent by Group (%)
Advanced2nd Gen1st Gen
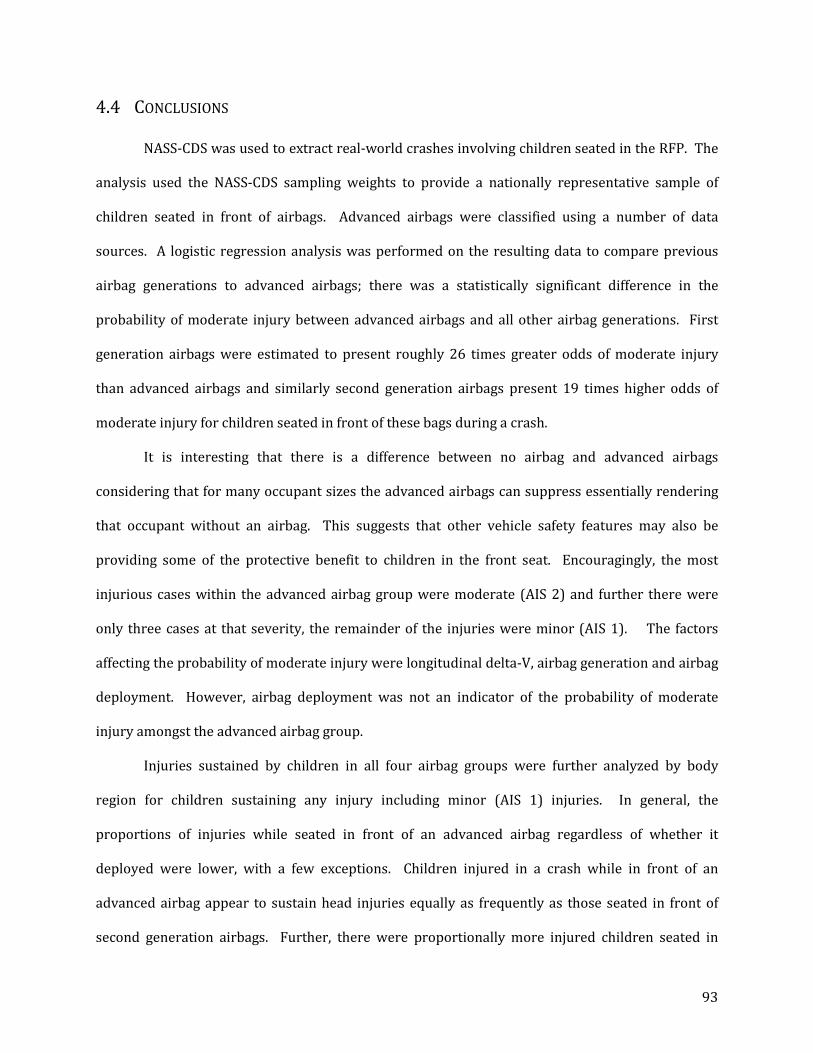
93
4.4 CONCLUSIONS
NASS-CDS was used to extract real-world crashes involving children seated in the RFP. The
analysis used the NASS-CDS sampling weights to provide a nationally representative sample of
children seated in front of airbags. Advanced airbags were classified using a number of data
sources. A logistic regression analysis was performed on the resulting data to compare previous
airbag generations to advanced airbags; there was a statistically significant difference in the
probability of moderate injury between advanced airbags and all other airbag generations. First
generation airbags were estimated to present roughly 26 times greater odds of moderate injury
than advanced airbags and similarly second generation airbags present 19 times higher odds of
moderate injury for children seated in front of these bags during a crash.
It is interesting that there is a difference between no airbag and advanced airbags
considering that for many occupant sizes the advanced airbags can suppress essentially rendering
that occupant without an airbag. This suggests that other vehicle safety features may also be
providing some of the protective benefit to children in the front seat. Encouragingly, the most
injurious cases within the advanced airbag group were moderate (AIS 2) and further there were
only three cases at that severity, the remainder of the injuries were minor (AIS 1). The factors
affecting the probability of moderate injury were longitudinal delta-V, airbag generation and airbag
deployment. However, airbag deployment was not an indicator of the probability of moderate
injury amongst the advanced airbag group.
Injuries sustained by children in all four airbag groups were further analyzed by body
region for children sustaining any injury including minor (AIS 1) injuries. In general, the
proportions of injuries while seated in front of an advanced airbag regardless of whether it
deployed were lower, with a few exceptions. Children injured in a crash while in front of an
advanced airbag appear to sustain head injuries equally as frequently as those seated in front of
second generation airbags. Further, there were proportionally more injured children seated in

94
front of an advanced airbag that did not deploy who sustained head injuries than those in front of
first or second generation airbags. However, the head injuries in the advanced airbag group ranged
from minor to moderate. Also, though minor (AIS 1) in severity, proportionally more children
sustain neck injuries seated in front of an advanced airbag that did not deploy than those who were
seated in front of advanced airbags that did deploy. Proportionally more children sustained minor
chest injuries when seated in front of an advanced airbag which did not deploy than those in front
of advanced airbags that did deploy. Finally, a large proportion of children injured as a result of a
crash while seated in front of an advanced airbag which did not deploy sustained minor lower
extremity injuries.

95
5 CASE STUDY OF ADVANCED AIRBAGS IN THE FIELD
5.1 INTRODUCTION
The performance of advanced airbags has been extensively tested under laboratory
conditions; however, little is known about the field crash performance of these airbags in the
presence of children. This study evaluates the performance of advanced airbags when children are
seated in the front seat in the field.
5.2 METHODS
The first part of this analysis evaluates the behavior of advanced airbags in comparison with
the certified deployment strategy for that particular vehicle make and model. In conjunction with
NASS-CDS the second part of this study employs our event data recorder (EDR) database,
examining cases where children were in the right front passenger seat during a crash. EDRs are the
computer devices that record information about the vehicle and control the airbags in the event of a
crash [55]. EDRs have been validated and ruggedized to survive a multitude of crashes since a
failure of this system can be catastrophic [56]. EDRs have been used previously to evaluate the
performance of advanced airbags for all occupants before [57], [58]. However, this analysis did not
focus on the performance in the presence of children. Since EDRs record the last 5 seconds of
vehicle speed, throttle and braking prior to a crash and/or deployment, they have been used to
analyze crash severity estimates obtained via crash reconstructions and WinSmash algorithms [59],
[60], [61], [62], [63].
The EDR database provides key details about the airbag deployment that NASS-CDS does
not provide such as if a child was detected, when and if the airbag deployed and if deployed the
firing time of the airbag stages. The EDR database provides better insight on the design and
performance of advanced airbags but, does not provide passenger or injury information. By
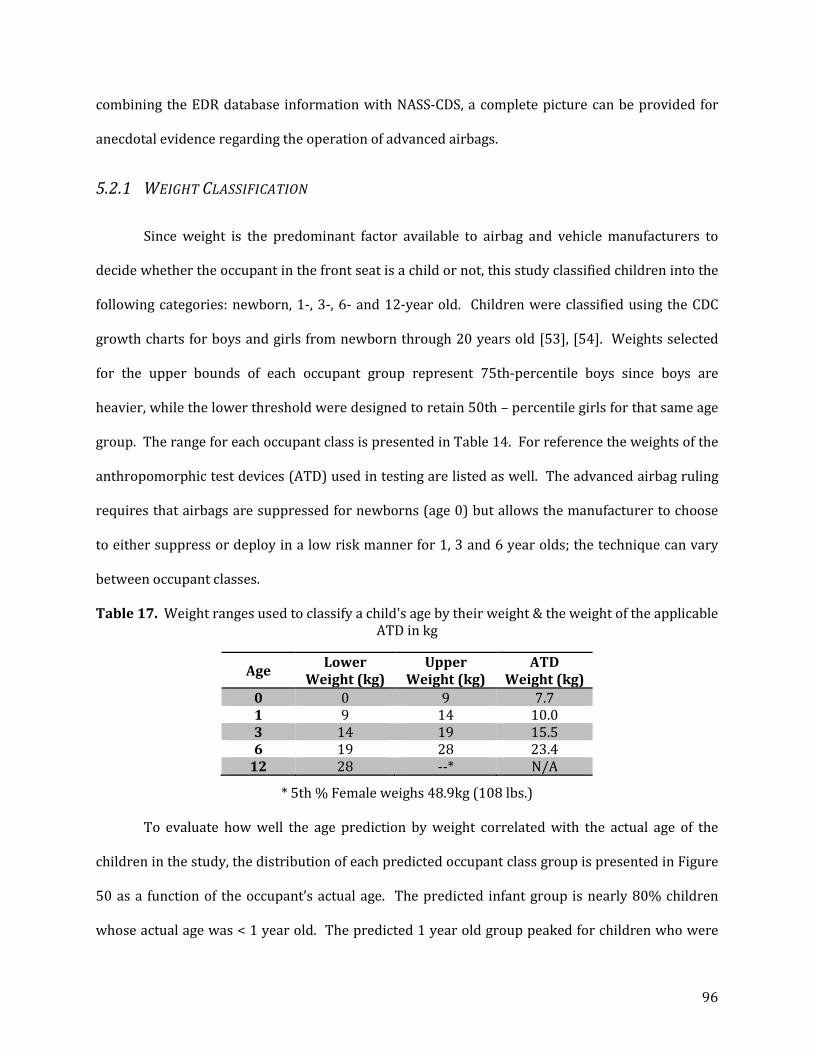
96
combining the EDR database information with NASS-CDS, a complete picture can be provided for
anecdotal evidence regarding the operation of advanced airbags.
5.2.1 WEIGHT CLASSIFICATION
Since weight is the predominant factor available to airbag and vehicle manufacturers to
decide whether the occupant in the front seat is a child or not, this study classified children into the
following categories: newborn, 1-, 3-, 6- and 12-year old. Children were classified using the CDC
growth charts for boys and girls from newborn through 20 years old [53], [54]. Weights selected
for the upper bounds of each occupant group represent 75th-percentile boys since boys are
heavier, while the lower threshold were designed to retain 50th – percentile girls for that same age
group. The range for each occupant class is presented in Table 14. For reference the weights of the
anthropomorphic test devices (ATD) used in testing are listed as well. The advanced airbag ruling
requires that airbags are suppressed for newborns (age 0) but allows the manufacturer to choose
to either suppress or deploy in a low risk manner for 1, 3 and 6 year olds; the technique can vary
between occupant classes.
Table 17. Weight ranges used to classify a child's age by their weight & the weight of the applicable ATD in kg
Age Lower Weight (kg)
Upper Weight (kg)
ATD Weight (kg)
0 0 9 7.7 1 9 14 10.0 3 14 19 15.5 6 19 28 23.4
12 28 --* N/A
* 5th % Female weighs 48.9kg (108 lbs.)
To evaluate how well the age prediction by weight correlated with the actual age of the
children in the study, the distribution of each predicted occupant class group is presented in Figure
50 as a function of the occupant’s actual age. The predicted infant group is nearly 80% children
whose actual age was < 1 year old. The predicted 1 year old group peaked for children who were
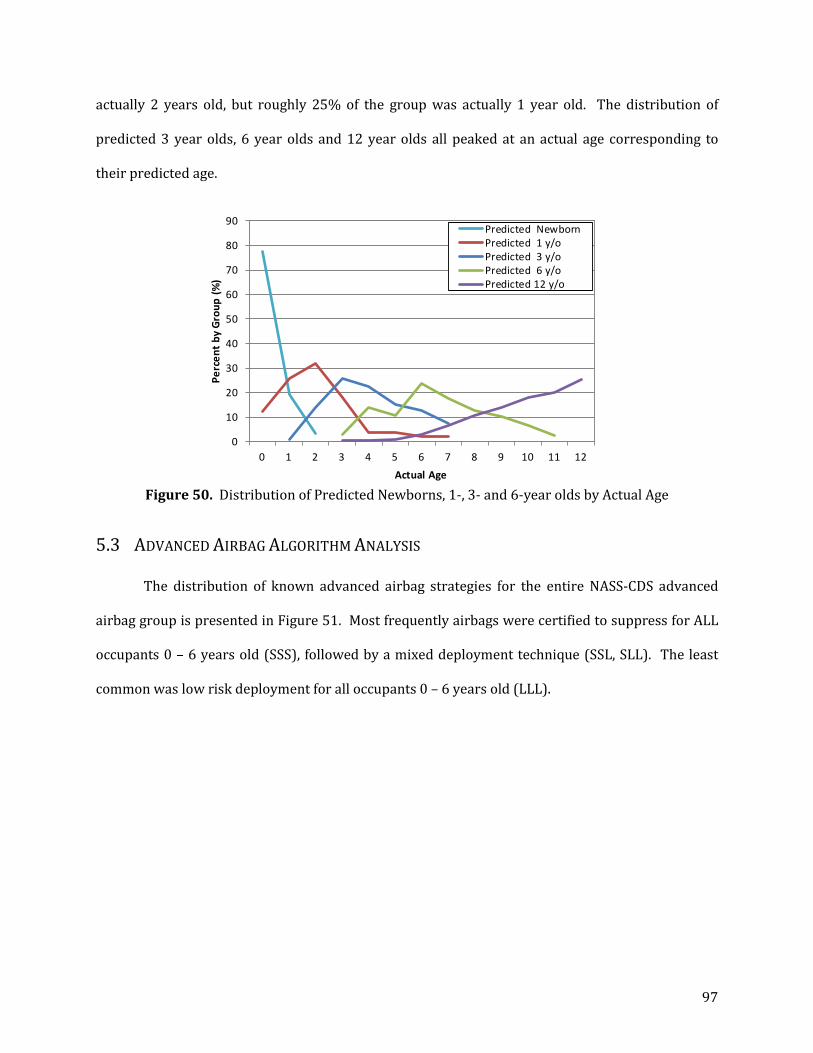
97
actually 2 years old, but roughly 25% of the group was actually 1 year old. The distribution of
predicted 3 year olds, 6 year olds and 12 year olds all peaked at an actual age corresponding to
their predicted age.
Figure 50. Distribution of Predicted Newborns, 1-, 3- and 6-year olds by Actual Age
5.3 ADVANCED AIRBAG ALGORITHM ANALYSIS
The distribution of known advanced airbag strategies for the entire NASS-CDS advanced
airbag group is presented in Figure 51. Most frequently airbags were certified to suppress for ALL
occupants 0 – 6 years old (SSS), followed by a mixed deployment technique (SSL, SLL). The least
common was low risk deployment for all occupants 0 – 6 years old (LLL).
0
10
20
30
40
50
60
70
80
90
0 1 2 3 4 5 6 7 8 9 10 11 12
Perc
ent b
y Gr
oup
(%)
Actual Age
Predicted NewbornPredicted 1 y/oPredicted 3 y/oPredicted 6 y/oPredicted 12 y/o

98
Figure 51. Distribution of Known Advanced Airbag Strategies for the NASS-CDS Dataset
To evaluate whether the airbags were working as designed, the responses in the field (Table
18) were compared with the respective airbag’s certified deployment or suppression strategy.
Since it is impossible to tell if an airbag would have suppressed in an accident where a deployment
for the adult was not warranted, cases where the airbag did not deploy for both the driver and
passenger were categorized as not deployed. However, cases where the driver bag did deploy and
the passenger bag did not were categorized as suppressing. Furthermore, it is not possible to
evaluate whether the airbag behaved as designed for occupants classified as twelve year olds;
however, it is interesting to evaluate whether the airbags in these crashes behaved in accordance
with the certified strategy for the six year old occupant class or not.
Table 18. Actual Responses for All Advanced Airbag Cases by Occupant Classification
Occupant Classification
No Deployment Suppressed Deployed Total
Newborn 0 2 0 2 6 Year Old 3 8 2 13 12 Year Old 26 13 47 86 All 29 23 49 101
Actual airbag responses for cases with known airbag deployment strategies are presented
in Figure 52. In 10 of the cases an advanced airbag suppressed in agreement with the certified
71
13
95
SSS SSL SLL LLL
99
strategy. That is, for children classified by weight as being in a particular occupant class, the airbag
suppressed which aligned with the certified strategy for that vehicle make and model. Two of the
ten cases that suppressed as certified, suppressed for occupants that were classified as newborns.
One of the newborns was an unrestrained riding in a 2008 Suzuki Forenza, wherein an occupant
within the vehicle sustained a serious (MAIS 2) injury. With the exception of that same newborn,
the children in cases where the airbag suppressed as certified were all restrained. In 8 of the 10
cases that were described as suppressing as designed, the occupants were classified as a six year
old occupant, one of which was restrained in a child seat. Their actual ages ranged from 5 to 10
years old, where the average age was 9 years old and children were most frequently 9 years old. Six
of eight six year olds sustained minor injuries (MAIS 1), the remaining two were not injured (MAIS
0). In four of the cases the driver of the vehicle sustained an MAIS 2+ injury. A majority of the cases
where the child was classified as a six year old occurred in cars.
There was one case where an advanced airbag was classified as deploying as certified for an
occupant classified as a six year old. In this case, the vehicle was a 2011 Buick Enclave whose
certified deployment strategy was suppression for the 1 year old occupant class and low risk
deployment for the 3- and 6-year old occupant classes. The child was restrained, the airbag
deployed and the child was not injured during the crash; however, an occupant in the vehicle
sustained a minor injury (MAIS 1). The driver airbag also deployed.
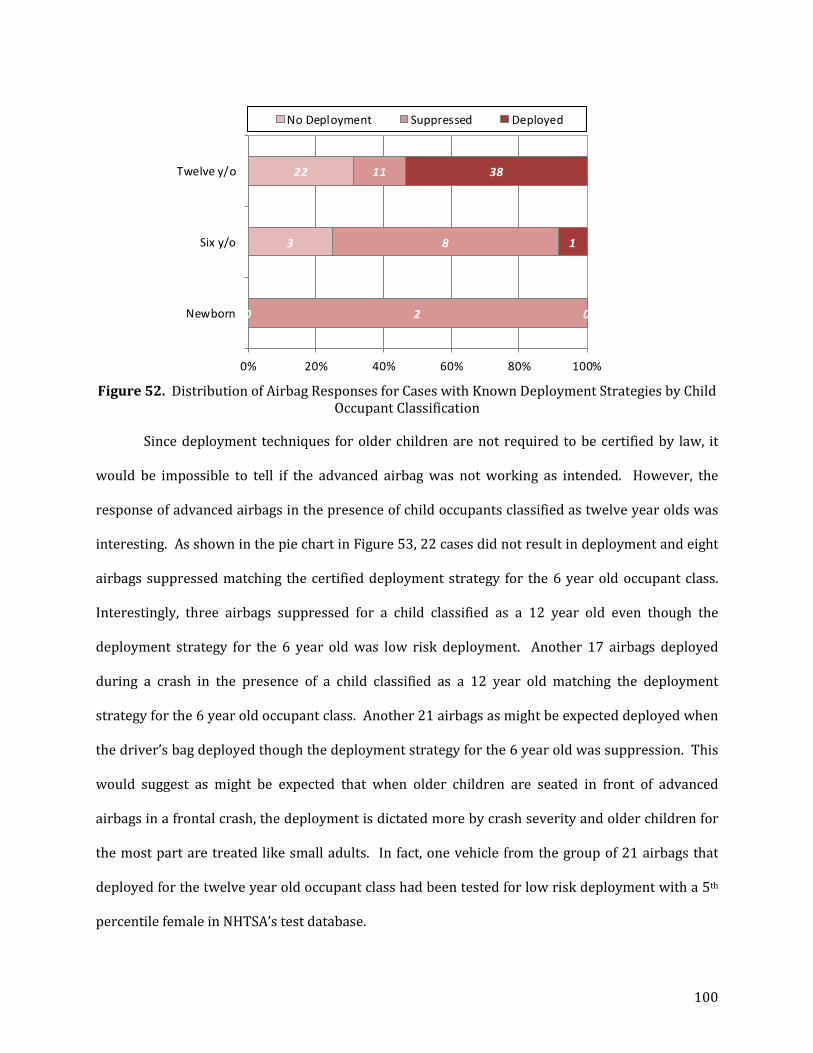
100
Figure 52. Distribution of Airbag Responses for Cases with Known Deployment Strategies by Child
Occupant Classification
Since deployment techniques for older children are not required to be certified by law, it
would be impossible to tell if the advanced airbag was not working as intended. However, the
response of advanced airbags in the presence of child occupants classified as twelve year olds was
interesting. As shown in the pie chart in Figure 53, 22 cases did not result in deployment and eight
airbags suppressed matching the certified deployment strategy for the 6 year old occupant class.
Interestingly, three airbags suppressed for a child classified as a 12 year old even though the
deployment strategy for the 6 year old was low risk deployment. Another 17 airbags deployed
during a crash in the presence of a child classified as a 12 year old matching the deployment
strategy for the 6 year old occupant class. Another 21 airbags as might be expected deployed when
the driver’s bag deployed though the deployment strategy for the 6 year old was suppression. This
would suggest as might be expected that when older children are seated in front of advanced
airbags in a frontal crash, the deployment is dictated more by crash severity and older children for
the most part are treated like small adults. In fact, one vehicle from the group of 21 airbags that
deployed for the twelve year old occupant class had been tested for low risk deployment with a 5th
percentile female in NHTSA’s test database.
0
3
22
2
8
11
0
1
38
0% 20% 40% 60% 80% 100%
Newborn
Six y/o
Twelve y/o
No Deployment Suppressed Deployed

101
Figure 53. Deployment Status of Advanced Airbags for Occupants Classified as 12 Year Olds
Grouped by Certification Strategy for 6 Year Old Occupants; Surprisingly 3 Airbags Suppressed When Certified to Deploy for the 6 Year Old Occupant Class
From the data available it appears that advanced airbags are working as designed during
real-world crashes when children are seated in front of the airbags. There are three interesting
cases where the airbag suppressed for an older child when the airbag was certified to low risk
deployment for a smaller child class. The author has no explanation for this and since there is no
certified strategy for this occupant class it is impossible to know whether this behavior was
intended or not.
22
8
3
17
21 No Deployment
Suppressed - Match 6 y/o
Suppressed - 6 y/o Cert for LRD
Deployed - 6 y/o Certified LRD
Deployed - 6 y/o Cert Supp
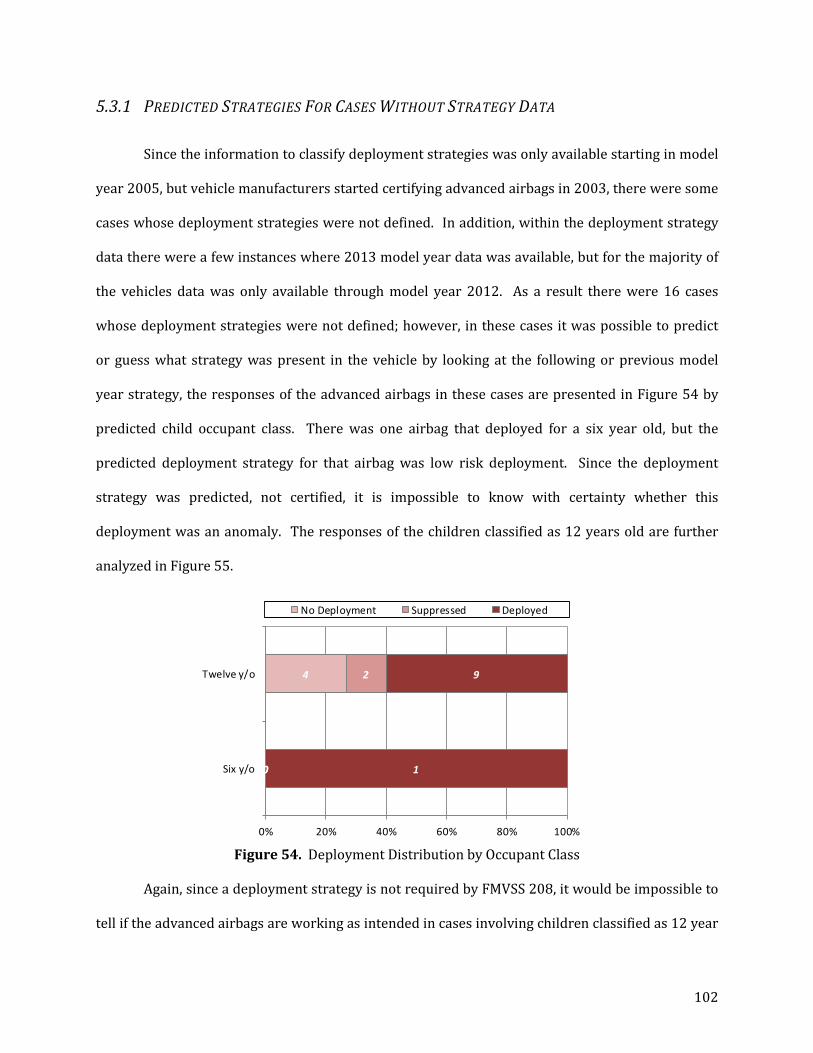
102
5.3.1 PREDICTED STRATEGIES FOR CASES WITHOUT STRATEGY DATA
Since the information to classify deployment strategies was only available starting in model
year 2005, but vehicle manufacturers started certifying advanced airbags in 2003, there were some
cases whose deployment strategies were not defined. In addition, within the deployment strategy
data there were a few instances where 2013 model year data was available, but for the majority of
the vehicles data was only available through model year 2012. As a result there were 16 cases
whose deployment strategies were not defined; however, in these cases it was possible to predict
or guess what strategy was present in the vehicle by looking at the following or previous model
year strategy, the responses of the advanced airbags in these cases are presented in Figure 54 by
predicted child occupant class. There was one airbag that deployed for a six year old, but the
predicted deployment strategy for that airbag was low risk deployment. Since the deployment
strategy was predicted, not certified, it is impossible to know with certainty whether this
deployment was an anomaly. The responses of the children classified as 12 years old are further
analyzed in Figure 55.
Figure 54. Deployment Distribution by Occupant Class
Again, since a deployment strategy is not required by FMVSS 208, it would be impossible to
tell if the advanced airbags are working as intended in cases involving children classified as 12 year
0
4
0
2
1
9
0% 20% 40% 60% 80% 100%
Six y/o
Twelve y/o
No Deployment Suppressed Deployed

103
olds. Regardless, it is interesting to see how the airbags are responding in comparison to their
predicted deployment strategy for the younger occupant class. As shown in the pie chart in Figure
55, in four cases there was no deployment of either the driver or passenger airbag. In two cases the
airbag suppressed which matched the predicted strategy for a 6 year old occupant and similarly in
five cases the airbag deployed again matching the predicted strategy for a 6 year old occupant. In
another 4 cases, the airbag deployed when the predicted strategy for the 6 year old occupant was
suppression. Again, overall this suggests that advanced airbags are treating the older child
occupants like a small adult as would be expected. However, it is surprising that some airbags
would suppress for the older children.
Figure 55. Deployment for Occupants Classified as 12 Year Olds Compared to the Predicted
Certification Technique for the 6 Year Old Occupant Class
5.4 A LOOK AT MODERATE INJURIES IN CASES WITH ADVANCED AIRBAGS
Since there were only three moderate injury cases within the advanced airbag case group,
this section will briefly review the crashes involving advanced airbags and moderate injuries in
children. The three cases involve a Mazda 6, a Nissan Sentra and a Toyota Highlander. Since the
Highlander is in the EDR database, EDR data is also provided for this case.
4
25
4No DeploymentSuppression - Match Predicted 6 y/oDeployed - 6 y/o Predicted LRDDeployed - 6 y/o Predicted Supp

104
5.4.1 2006 MAZDA 6
In November 2006, a 2006 Mazda 6 traveling north on a six lane divided highway departed
the highway, crossed a parking lot and came to a stop after striking a house as shown in the scene
diagram presented in Figure 56 (NASS Case No. 2006-50-135). The vehicle was towed due to
damage. The majority of the damage to the front was on the driver’s side as shown in Figure 57-left.
The driver and RFP were transported and released. The driver suffered from an open fibula
fracture believed to have been caused by the floor pan. The passenger, a 12 year old female
weighing 64 kilograms was belted at the time of the crash and suffered a thoracic spine
(superior/upper T12) fracture without cord involvement and minor disk compression. The injury
was determined to have been caused by direct contact with the seat belt. The top-mounted front
airbag deployed (Figure 57-right) and the seatbelt pre-tensioners fired. However, no other
passenger airbags fired (i.e. seat back or roof rail). The RFP seat was upright and located between
the middle and rear most seat track position at the time of the investigation. The seat was
determined to have been in that position prior to and following the crash. Further, it was
determined that the injuries sustained were not airbag related.
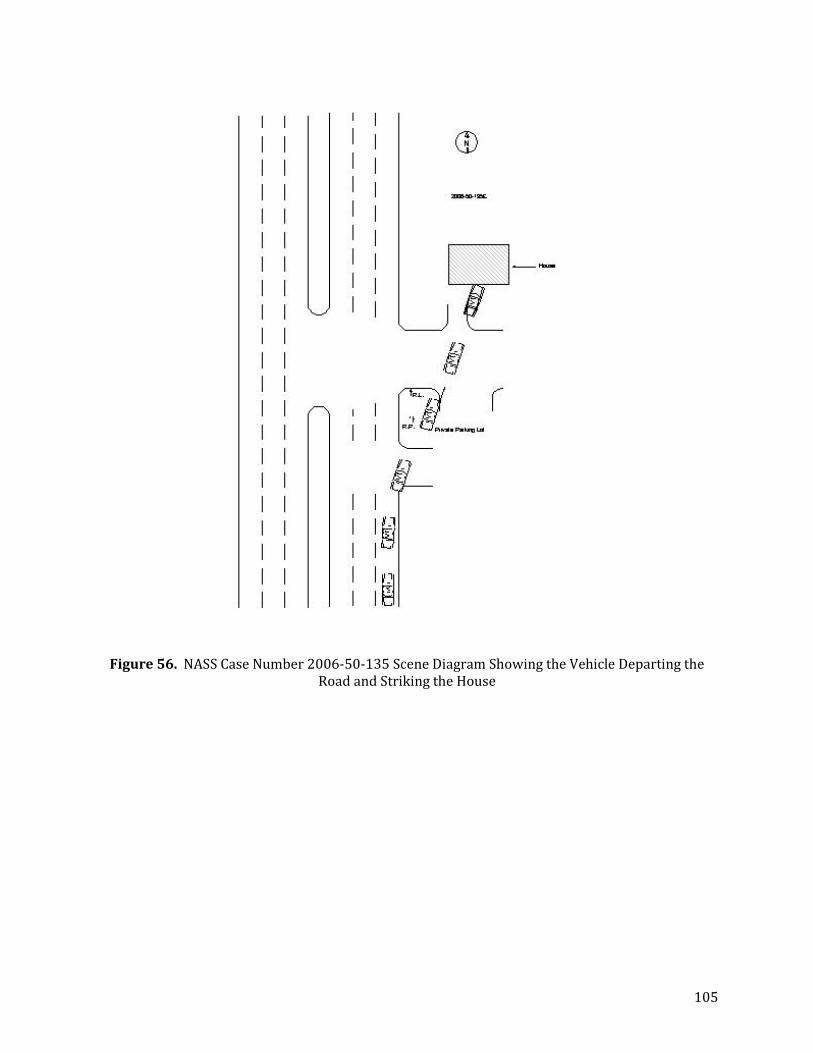
105
Figure 56. NASS Case Number 2006-50-135 Scene Diagram Showing the Vehicle Departing the Road and Striking the House

106
Figure 57. NASS Case Number 2006-50-135 Vehicle 1, Mazda 6 During Investigation Showing More Damage to the Driver’s Side (left) and the Passenger Airbag (right)
5.4.2 2007 NISSAN SENTRA
In March 2010, a 2007 Nissan Sentra (V2) was heading eastbound on an intersecting two-
way undivided roadway (NASS Case No. 2010-72-027). Both the Sentra and a 2008 Honda Accord
(V1) heading southbound entered the intersection in straight paths and the right plane of the
Accord contacted the front plane of the Sentra. After the initial impact, the two vehicles side-
slapped, the left plane of the Sentra impacted the right plane of the Accord as shown in the scene
diagram shown in Figure 58. Both vehicles were towed due to damage; the majority of the damage
sustained by the Nissan was on front of the vehicle as shown in Figure 59-left.
The driver and RFP of the Sentra were treated and released. The driver airbag deployed,
however, the passenger airbag did not (Figure 59-right). The vehicle was equipped with
pretensioners but their firing status was undetermined. The driver was treated for a facial
hematoma determined to be caused by the airbag. The passenger, an 11 year old female weighing
41 kilograms was treated for a cerebral concussion with loss of consciousness for less than 30
minutes and a facial hematoma. The probable cause of both injuries was determined to be the
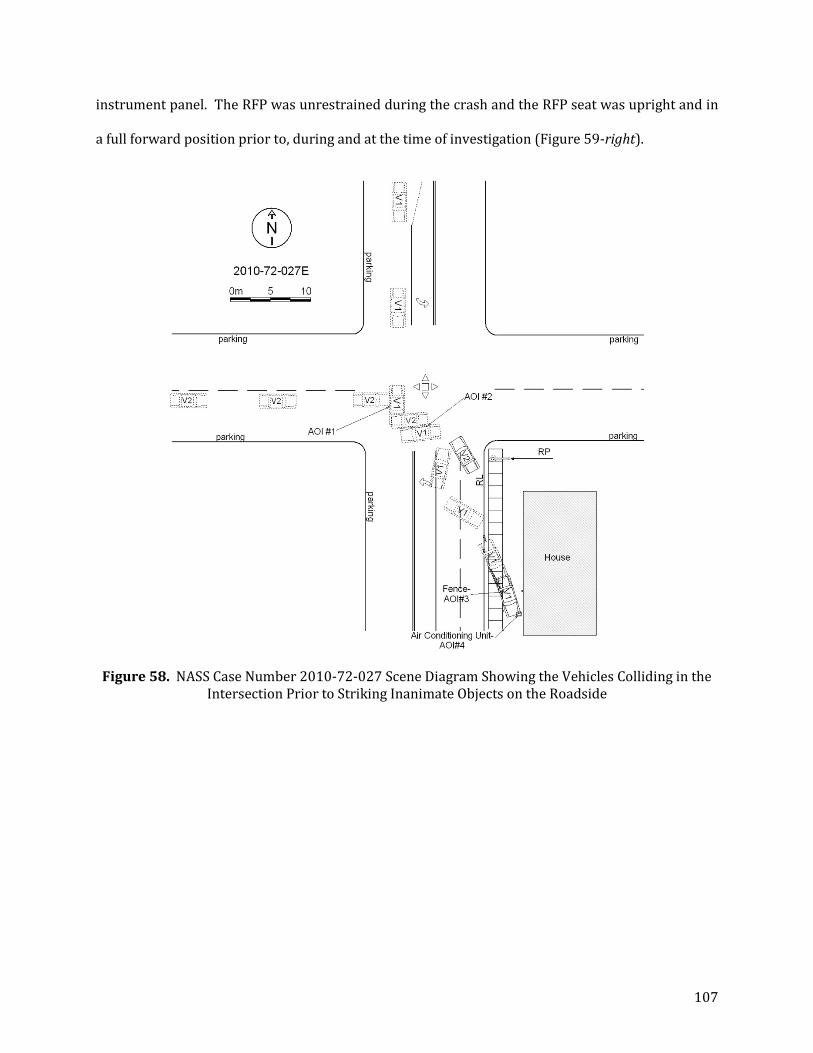
107
instrument panel. The RFP was unrestrained during the crash and the RFP seat was upright and in
a full forward position prior to, during and at the time of investigation (Figure 59-right).
Figure 58. NASS Case Number 2010-72-027 Scene Diagram Showing the Vehicles Colliding in the
Intersection Prior to Striking Inanimate Objects on the Roadside

108
Figure 59. NASS Case Number 2010-72-027 Vehicle 2 Showing the Damage to the Front of the Vehicle (left) and the RFP Seat Fully Forward, No Airbag Deployment (right)
5.4.3 2007 TOYOTA HIGHLANDER
In May 2012, a 2007 Toyota Highlander heading eastbound on a two-lane roadway struck a
1993 Mercury Grand Marquis (travelling westbound) head on as shown in Figure 60. Both vehicles
were towed due to damage; the Highlander sustained damage to the front of the vehicle as shown in
Figure 61-left. Both occupants in the Highlander were restrained. Further, both the driver and the
(top mounted) passenger airbags deployed (Figure 61-right) along with the seat belt pre-tensioners
which fired for both occupants as well.
The driver sustained a multitude of injuries resulting from the seat belt, steering wheel and
airbag and was hospitalized for three days. The 12 year old female, passenger, weighing 50
kilograms was seated in an upright position at the rear-most seat track position. She sustained left
distal radius and ulna fractures which were attributed to the center mounted transmission lever
and a variety of other injuries resulting from the seat belt (e.g. abdominal hematoma, skin
lacerations). The 12 year old passenger was hospitalized for two days; however, none of her
injuries were associated with the deployment of the airbag.
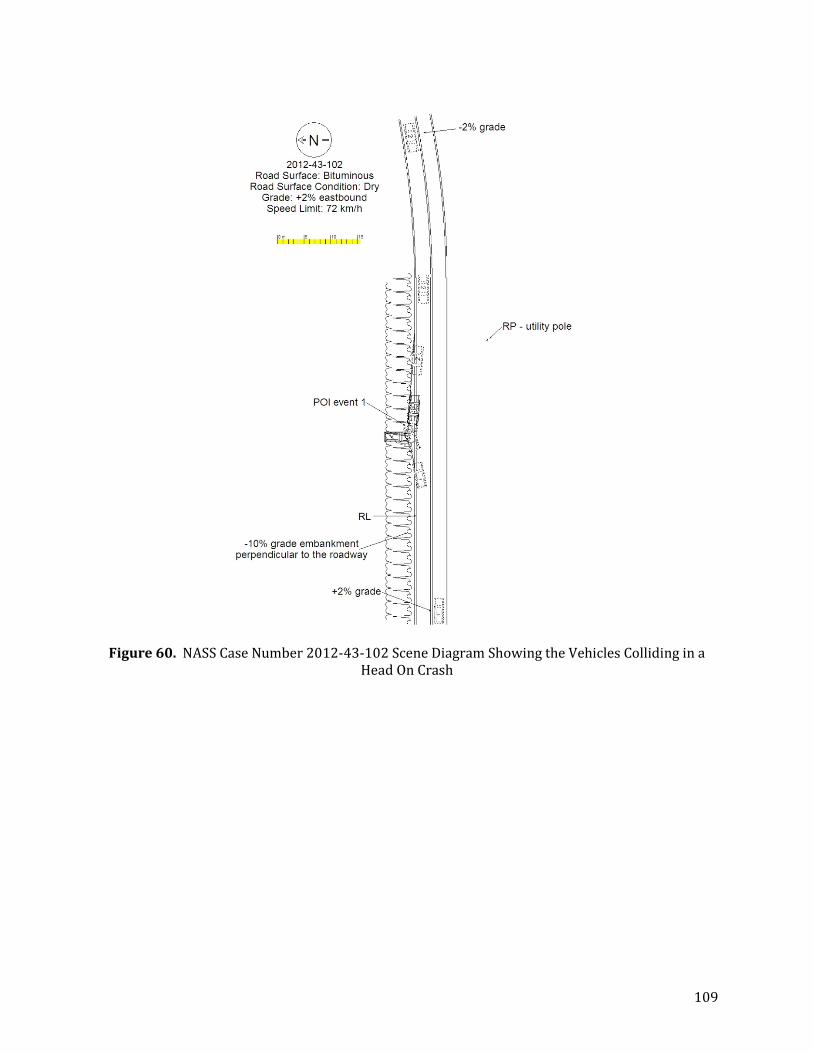
109
Figure 60. NASS Case Number 2012-43-102 Scene Diagram Showing the Vehicles Colliding in a
Head On Crash

110
Figure 61. NASS Case Number 2012-43-102 Vehicle 1, Showing Damage to Front of Toyota
Highlander (left) and Top-Mounted Passenger Airbag (right)
5.4.3.1 EDR Information
The Highlander was one of the vehicles in our EDR database, this subsection will identify
parameters sensed, identified and recorded by the EDR. The EDR expressly sensed the 12 year old
and classified the child as a small statured adult (5th percentile female). The EDR fired the
passenger at 8ms and only fired one stage. The driver’s seat position was sensed as rearward and
the driver’s bag also only deployed one stage. The EDR also indicated that both the driver and
passenger were belted. The airbag warning lamp was not illuminated meaning that the airbag
system was not in error prior to the event/crash. No information was provided regarding the seat
belt pretensioners from the EDR.
5.4.4 SUMMARY OF MODERATE INJURY CASES
Three NASS-CDS cases were presented involving children sustaining moderate (AIS 2)
injuries while seated in front of an advanced airbag. One of the three children required
hospitalization which was likely due to the number of injuries sustained most of which were
identified as being caused by the seat belt. None of the three cases presented injuries were
associated with the airbag. One of the airbags suppressed, the other two deployed. The child
111
seated in front of the airbag that suppressed weighed 48.9 kilograms (classified as a 12 year old by
standards defined herein) was seated in close proximity to the instrument panel this occupant
sustained a cerebral concussion with loss of consciousness for less than 30 minutes and a facial
hematoma. The suspected cause of this injury was the instrument panel which may have been
prevented if the airbag deployed. On the other hand the child could have been more seriously
injured if the airbag had deployed. Additionally, one child was unrestrained, the remaining two
were restrained. All of the airbags included in this section were certified for suppression for the 1,
3 and 6 year old occupants. However, the occupants involved in the crashes examined were all
older (11 and 12 years old).
5.5 SELECT EDR CASES
A total of 30 NASS-CDS cases with children seated in front of advanced airbags were
included in the EDR database, a subset of those cases were selected and presented within this
section to serve as anecdotal evidence that advanced airbags appear to be working as intended
during real world crashes. Specifically, this section will outline advanced airbag cases where: (1)
the child was seated in a child safety seat, (2) the child was unrestrained, (3) the vehicle expressly
classified the passenger as a child, (4) the airbag suppressed, and finally, (5) the airbag deployed.
5.5.1 CHILD SAFETY SEATS & ADVANCED AIRBAGS
This subsection examines two cases within the EDR database where a child was seated in
front of an advanced airbag while restrained in a child safety seat as this was a particular concern
for earlier airbags. The two cases involve a Chevrolet HHR (NASS Case No. 2010-75-160) and a
Ford Escape (NASS Case No. 2011-48-111). In both cases the child safety seat was a belt
positioning booster seat, in one of the cases, pictures of the safety seat were available.
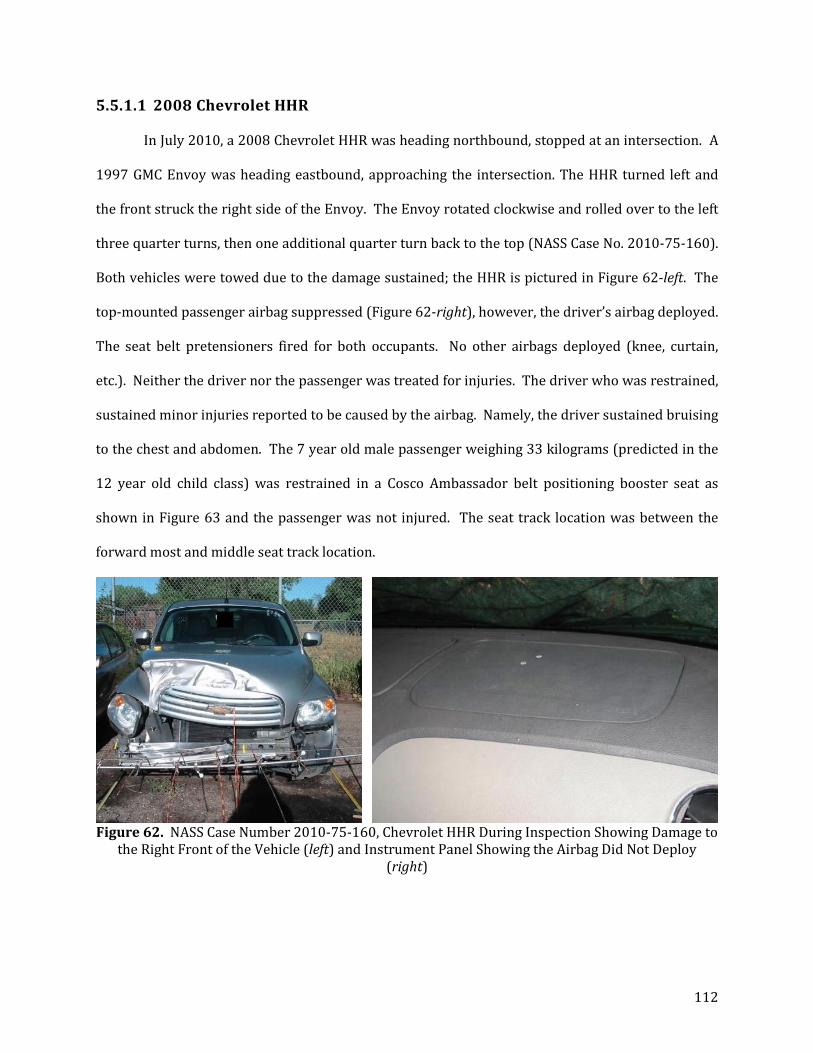
112
5.5.1.1 2008 Chevrolet HHR
In July 2010, a 2008 Chevrolet HHR was heading northbound, stopped at an intersection. A
1997 GMC Envoy was heading eastbound, approaching the intersection. The HHR turned left and
the front struck the right side of the Envoy. The Envoy rotated clockwise and rolled over to the left
three quarter turns, then one additional quarter turn back to the top (NASS Case No. 2010-75-160).
Both vehicles were towed due to the damage sustained; the HHR is pictured in Figure 62-left. The
top-mounted passenger airbag suppressed (Figure 62-right), however, the driver’s airbag deployed.
The seat belt pretensioners fired for both occupants. No other airbags deployed (knee, curtain,
etc.). Neither the driver nor the passenger was treated for injuries. The driver who was restrained,
sustained minor injuries reported to be caused by the airbag. Namely, the driver sustained bruising
to the chest and abdomen. The 7 year old male passenger weighing 33 kilograms (predicted in the
12 year old child class) was restrained in a Cosco Ambassador belt positioning booster seat as
shown in Figure 63 and the passenger was not injured. The seat track location was between the
forward most and middle seat track location.
Figure 62. NASS Case Number 2010-75-160, Chevrolet HHR During Inspection Showing Damage to
the Right Front of the Vehicle (left) and Instrument Panel Showing the Airbag Did Not Deploy (right)

113
Figure 63. Cosco Ambassador Belt Positioning Booster Seat Used in NASS Case Number 2010-75-
160 by a 7 year old RFP in Front of an Advanced Airbag that Suppressed
In this case, the EDR confirmed that both passengers were restrained and that the
pretensioners fired for both the driver and passenger. Further, the EDR reported that only the
driver’s first stage deployed at 40 milliseconds. Finally the SIR warning lamp was off indicating that
the supplemental restraint system was not in error prior to the crash.
5.5.1.2 2011 Ford Escape
In June 2011, a 2011 Ford Escape was traveling west on a two lane road, a medium-heavy
truck, was traveling east on the same road. The Escape crossed the center line and the front
contacted the front plane of the medium-heavy truck. The Escape rotated counter-clockwise and
departed the north road edge. The Escape came to final rest facing east on the grassy roadside. The
truck came to final rest facing east a short distance from the area of impact. Both vehicles were
towed due to disabling damage, the Escape is shown at the scene of the crash in Figure 64-left
(NASS-CDS Case No. 2011-48-111). The driver’s front, roof rail and seatback airbags all deployed.
The passenger’s mid-panel (frontal) airbag suppressed (Figure 64-right), but the roof rail airbag did
deploy for the right front passenger.
The belted driver of the Escape sustained a total of 25 injuries including multiple severe
injuries (MAIS 4). The severe injuries included a diaphragm rupture with herniation, rib fractures
with unilateral flail chest, spleen and liver lacerations. In addition, the driver sustained multiple
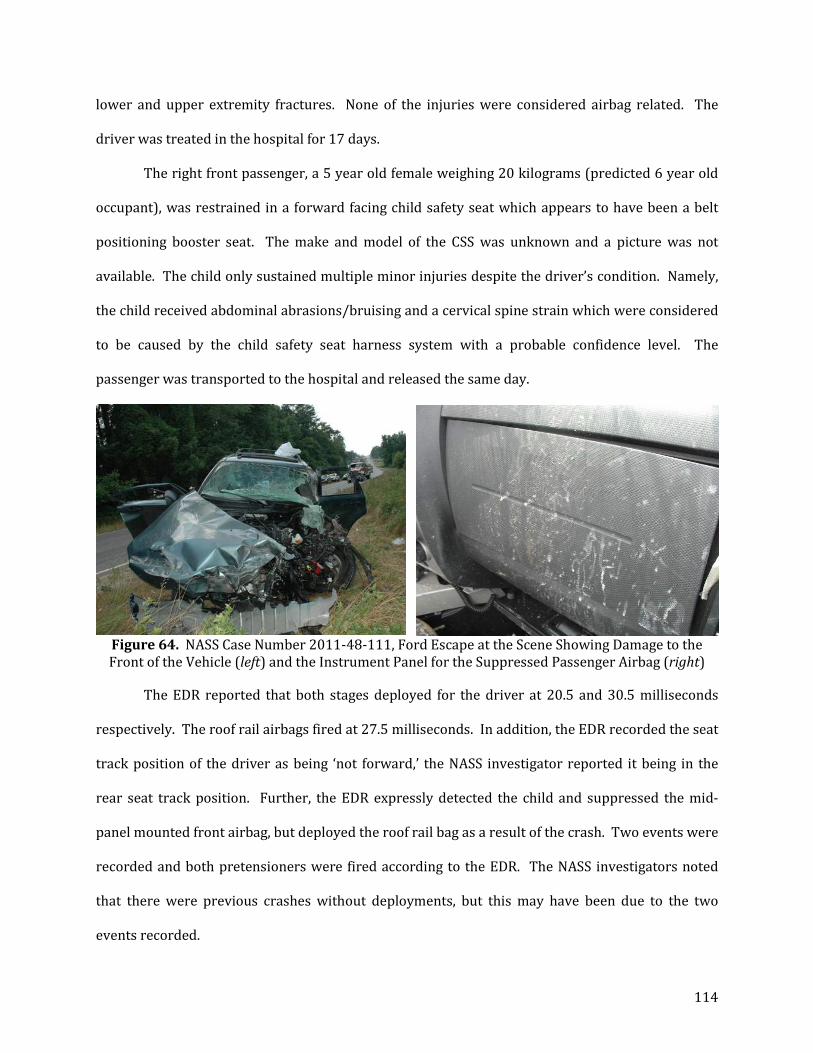
114
lower and upper extremity fractures. None of the injuries were considered airbag related. The
driver was treated in the hospital for 17 days.
The right front passenger, a 5 year old female weighing 20 kilograms (predicted 6 year old
occupant), was restrained in a forward facing child safety seat which appears to have been a belt
positioning booster seat. The make and model of the CSS was unknown and a picture was not
available. The child only sustained multiple minor injuries despite the driver’s condition. Namely,
the child received abdominal abrasions/bruising and a cervical spine strain which were considered
to be caused by the child safety seat harness system with a probable confidence level. The
passenger was transported to the hospital and released the same day.
Figure 64. NASS Case Number 2011-48-111, Ford Escape at the Scene Showing Damage to the Front of the Vehicle (left) and the Instrument Panel for the Suppressed Passenger Airbag (right)
The EDR reported that both stages deployed for the driver at 20.5 and 30.5 milliseconds
respectively. The roof rail airbags fired at 27.5 milliseconds. In addition, the EDR recorded the seat
track position of the driver as being ‘not forward,’ the NASS investigator reported it being in the
rear seat track position. Further, the EDR expressly detected the child and suppressed the mid-
panel mounted front airbag, but deployed the roof rail bag as a result of the crash. Two events were
recorded and both pretensioners were fired according to the EDR. The NASS investigators noted
that there were previous crashes without deployments, but this may have been due to the two
events recorded.

115
5.5.2 UNRESTRAINED CHILDREN & ADVANCED AIRBAGS
Also of interest were children who were riding in front of an advanced airbag while
unrestrained during a frontal crash. Of the 30 advanced cases in the EDR database, two cases
involved unrestrained children, one in a Chevrolet C/K Series Pickup (NASS Case No. 2009-49-161)
and a Hummer H3 (NASS Case No. 2010-75-081). This subsection will outline these two cases.
5.5.2.1 2006 Chevrolet C/K Series Pickup
A 2006 Chevrolet C/K-series pickup was traveling eastbound and veered to the left. The
vehicle departed the left side of the roadway and impacted a metal fence with its front end. The
vehicle then impacted the corner of a house with its front left end. The truck continued eastward
and impacted the house with its left back side. Finally, the vehicle continued eastward and
impacted another metal fence, then the left side of a parked vehicle, with its front end as shown in
Figure 65-left (NASS-CDS Case No. 2009-49-161). The vehicle was towed due to damage. The
airbag deployed for the driver but the mid-instrument panel mounted airbag suppressed for the
passenger (Figure 65-right).
In this case it was found that the driver was driving under the influence of drugs or alcohol
and was unconscious following the final crash for less than one hour. The driver was transported to
the hospital and released. The passenger, a female newborn (4 months old) weighing 6 kilograms
(predicted as a newborn) was not injured, but was transported to the hospital and released
regardless.
During an interview following the crash, during the investigation, the newborn was
reportedly in an Evenflo car seat during the crash. The police reported that restraints use were not
used, but the seatbelt was still buckled upon investigation. It would appear that the car seat, if
used, was either restrained with the belt in such a way that the child safety seat could be removed
without unlatching the seatbelt or another scenario that fits the data would be that the seat belt
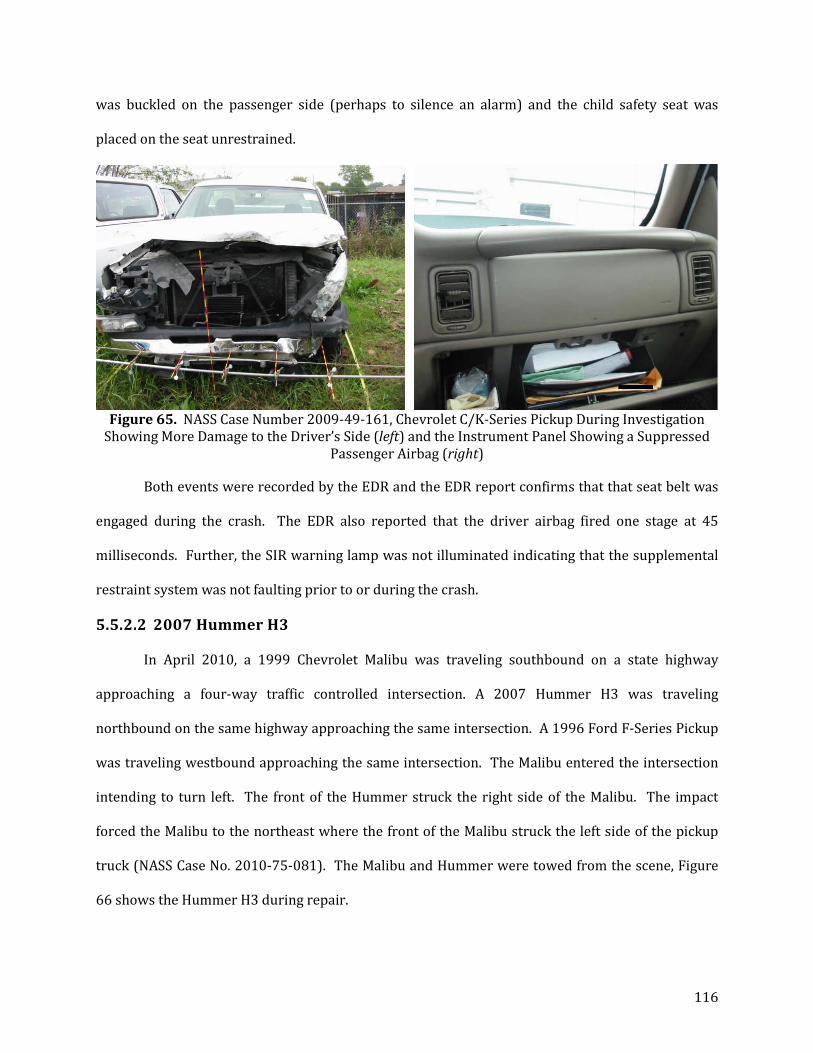
116
was buckled on the passenger side (perhaps to silence an alarm) and the child safety seat was
placed on the seat unrestrained.
Figure 65. NASS Case Number 2009-49-161, Chevrolet C/K-Series Pickup During Investigation
Showing More Damage to the Driver’s Side (left) and the Instrument Panel Showing a Suppressed Passenger Airbag (right)
Both events were recorded by the EDR and the EDR report confirms that that seat belt was
engaged during the crash. The EDR also reported that the driver airbag fired one stage at 45
milliseconds. Further, the SIR warning lamp was not illuminated indicating that the supplemental
restraint system was not faulting prior to or during the crash.
5.5.2.2 2007 Hummer H3
In April 2010, a 1999 Chevrolet Malibu was traveling southbound on a state highway
approaching a four-way traffic controlled intersection. A 2007 Hummer H3 was traveling
northbound on the same highway approaching the same intersection. A 1996 Ford F-Series Pickup
was traveling westbound approaching the same intersection. The Malibu entered the intersection
intending to turn left. The front of the Hummer struck the right side of the Malibu. The impact
forced the Malibu to the northeast where the front of the Malibu struck the left side of the pickup
truck (NASS Case No. 2010-75-081). The Malibu and Hummer were towed from the scene, Figure
66 shows the Hummer H3 during repair.

117
This crash resulted in several airbag deployments, the driver’s steering wheel mounted
airbag and roof rail airbag deployed. In addition, the passenger’s mid-instrument panel mounted
frontal airbag deployed (Figure 67-left). In addition the roof rail airbag deployed for the front and
rear passengers (Figure 67-right).
There were no injuries reported for the driver or the 12 year old female passenger (weight
unknown). Neither were transported to the hospital or treated despite the fact that both were
unrestrained. Impact points were noted on the knee bolster by the investigator on the passenger
side (Figure 68) in addition to toe pan intrusions.
Figure 66. NASS Case Number 2010-75-081, Hummer H3 The Investigation Occurred After
Repairs Began
Figure 67. NASS Case Number 2010-75-081, Hummer H3 Interior Showing Passenger Airbag (left)
and Roof Rail Airbags for the Front & Rear Passengers (right)

118
Figure 68. NASS Case Number 2010-75-081, Hummer H3 Glove Compartment Showing Contact
Marks
Despite all of the airbag deployments during this crash it appears that the EDR perhaps did
not complete recording of the crash; however, no events recorded by EDR. This may be because GM
EDRs can only record a limited number of events. Interestingly, it seems that the pretensioners
may have fired even though NASS reported the occupants were unrestrained, as the NASS
investigator noted that the seat belts were locked in their retracted position.
5.5.3 ADVANCED AIRBAG SYSTEMS THAT DETECTED A CHILD
Since advanced airbags were specifically designed to protect children and small adults, it
was interesting to evaluate cases where a child was expressly detected. There were two cases in
the set that reportedly detected a child in the front seat, one of those cases involved a Ford Escape
(NASS Case No. 2011-48-111) and is detailed in the subsection focusing on child safety seats and
advanced airbags. The other case involves a Ford F Series pickup truck (NASS Case No. 2012-48-
80) and is outlined in the following subsection.
5.5.3.1 2010 Ford F-Series Pickup
A 2004 Toyota Camry was traveling east approaching a “T intersection” controlled by a stop
sign. The 2010 Ford F-150 pickup was traveling south on the intersecting three lane road in lane
one. As the Camry turned left at the intersection, the driver of the F-150 steered left to try to avoid

119
contact but the front of the Camry contacted the front of the F-150. The Camry rotated clockwise to
final rest facing southwest in the intersection. The F-150 came to final rest facing south in the
intersection (NASS Case No. 2012-48-80). The pickup was partially repaired prior to inspection as
shown in Figure 69-left.
Neither the driver’s or passenger’s airbag or pretensioners fired. The driver was
unrestrained during the crash. The passenger’s mid-instrument panel mounted airbag is shown in
Figure 69-right. The 9 year old male weighing 27 kilograms (classified as a 6 year old) was
restrained and not injured or treated.
Figure 69. NASS Case Number 2012-48-80, Ford F-150 Pickup during Investigation which
Occurred After Repairs Began (left) and the Passenger Mid-Instrument Panel Mounted Airbag (right)
The EDR recorded the event and classified the driver’s seat as “not forward.” The EDR
expressly identified the passenger as a child. The certified strategy for the Ford F-Series pickups
was suppression for all of the child occupant classes. Further, the EDR recorded the belt status of
the driver and passenger. The information from this EDR verifies that these systems are working
properly in the field.
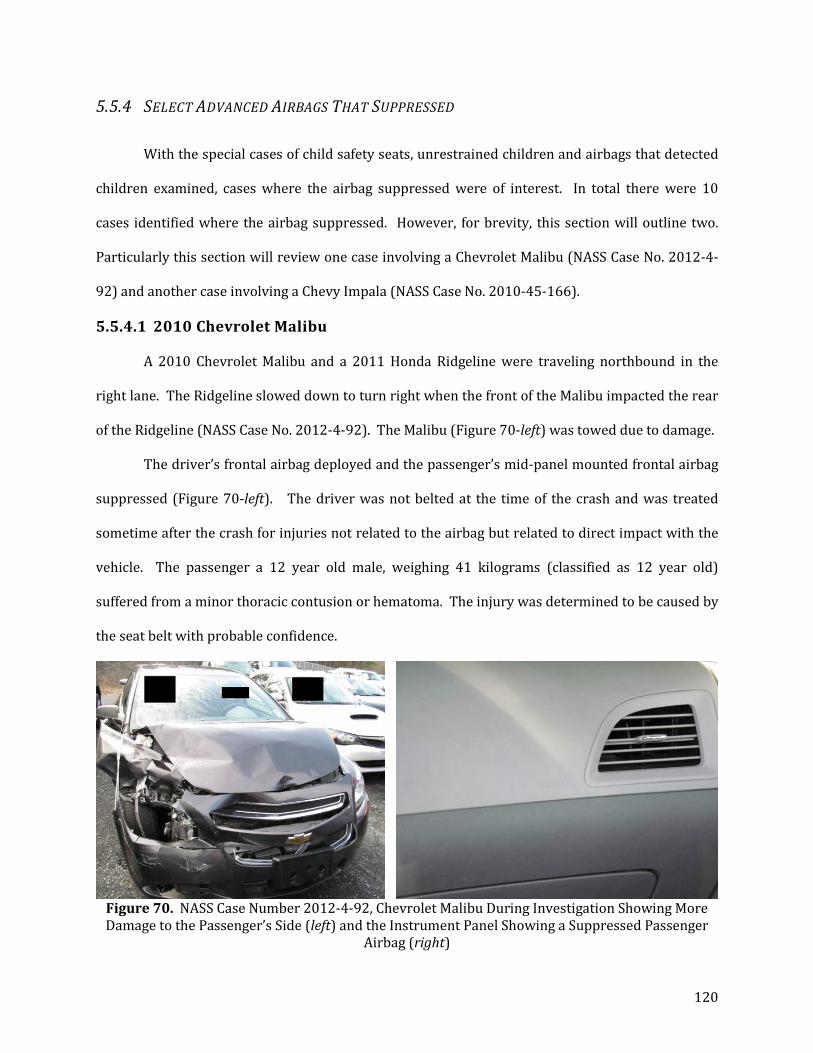
120
5.5.4 SELECT ADVANCED AIRBAGS THAT SUPPRESSED
With the special cases of child safety seats, unrestrained children and airbags that detected
children examined, cases where the airbag suppressed were of interest. In total there were 10
cases identified where the airbag suppressed. However, for brevity, this section will outline two.
Particularly this section will review one case involving a Chevrolet Malibu (NASS Case No. 2012-4-
92) and another case involving a Chevy Impala (NASS Case No. 2010-45-166).
5.5.4.1 2010 Chevrolet Malibu
A 2010 Chevrolet Malibu and a 2011 Honda Ridgeline were traveling northbound in the
right lane. The Ridgeline slowed down to turn right when the front of the Malibu impacted the rear
of the Ridgeline (NASS Case No. 2012-4-92). The Malibu (Figure 70-left) was towed due to damage.
The driver’s frontal airbag deployed and the passenger’s mid-panel mounted frontal airbag
suppressed (Figure 70-left). The driver was not belted at the time of the crash and was treated
sometime after the crash for injuries not related to the airbag but related to direct impact with the
vehicle. The passenger a 12 year old male, weighing 41 kilograms (classified as 12 year old)
suffered from a minor thoracic contusion or hematoma. The injury was determined to be caused by
the seat belt with probable confidence.
Figure 70. NASS Case Number 2012-4-92, Chevrolet Malibu During Investigation Showing More Damage to the Passenger’s Side (left) and the Instrument Panel Showing a Suppressed Passenger
Airbag (right)
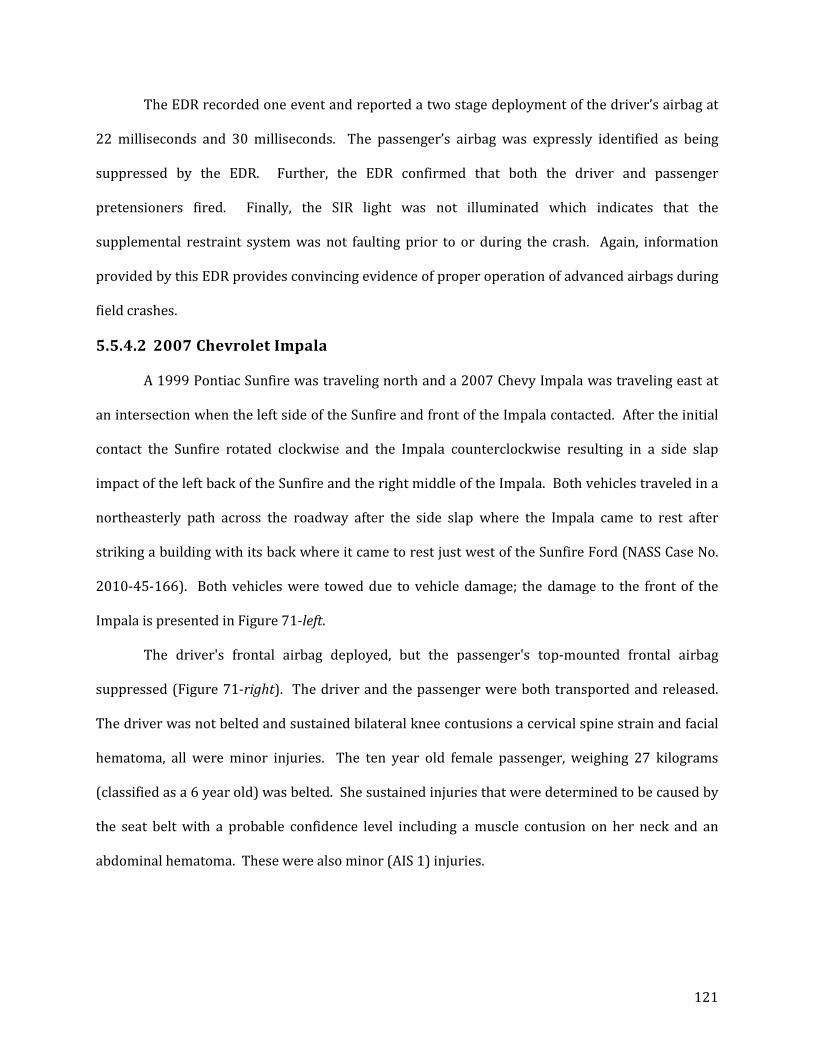
121
The EDR recorded one event and reported a two stage deployment of the driver’s airbag at
22 milliseconds and 30 milliseconds. The passenger’s airbag was expressly identified as being
suppressed by the EDR. Further, the EDR confirmed that both the driver and passenger
pretensioners fired. Finally, the SIR light was not illuminated which indicates that the
supplemental restraint system was not faulting prior to or during the crash. Again, information
provided by this EDR provides convincing evidence of proper operation of advanced airbags during
field crashes.
5.5.4.2 2007 Chevrolet Impala
A 1999 Pontiac Sunfire was traveling north and a 2007 Chevy Impala was traveling east at
an intersection when the left side of the Sunfire and front of the Impala contacted. After the initial
contact the Sunfire rotated clockwise and the Impala counterclockwise resulting in a side slap
impact of the left back of the Sunfire and the right middle of the Impala. Both vehicles traveled in a
northeasterly path across the roadway after the side slap where the Impala came to rest after
striking a building with its back where it came to rest just west of the Sunfire Ford (NASS Case No.
2010-45-166). Both vehicles were towed due to vehicle damage; the damage to the front of the
Impala is presented in Figure 71-left.
The driver's frontal airbag deployed, but the passenger's top-mounted frontal airbag
suppressed (Figure 71-right). The driver and the passenger were both transported and released.
The driver was not belted and sustained bilateral knee contusions a cervical spine strain and facial
hematoma, all were minor injuries. The ten year old female passenger, weighing 27 kilograms
(classified as a 6 year old) was belted. She sustained injuries that were determined to be caused by
the seat belt with a probable confidence level including a muscle contusion on her neck and an
abdominal hematoma. These were also minor (AIS 1) injuries.
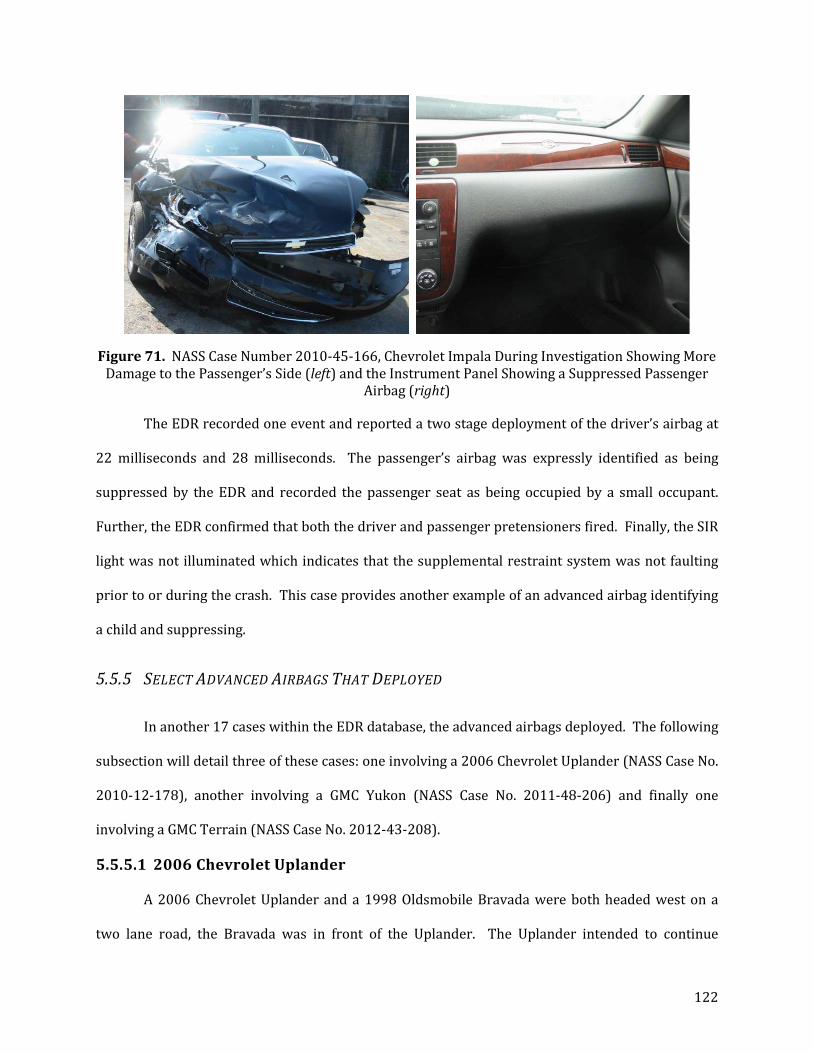
122
Figure 71. NASS Case Number 2010-45-166, Chevrolet Impala During Investigation Showing More Damage to the Passenger’s Side (left) and the Instrument Panel Showing a Suppressed Passenger
Airbag (right)
The EDR recorded one event and reported a two stage deployment of the driver’s airbag at
22 milliseconds and 28 milliseconds. The passenger’s airbag was expressly identified as being
suppressed by the EDR and recorded the passenger seat as being occupied by a small occupant.
Further, the EDR confirmed that both the driver and passenger pretensioners fired. Finally, the SIR
light was not illuminated which indicates that the supplemental restraint system was not faulting
prior to or during the crash. This case provides another example of an advanced airbag identifying
a child and suppressing.
5.5.5 SELECT ADVANCED AIRBAGS THAT DEPLOYED
In another 17 cases within the EDR database, the advanced airbags deployed. The following
subsection will detail three of these cases: one involving a 2006 Chevrolet Uplander (NASS Case No.
2010-12-178), another involving a GMC Yukon (NASS Case No. 2011-48-206) and finally one
involving a GMC Terrain (NASS Case No. 2012-43-208).
5.5.5.1 2006 Chevrolet Uplander
A 2006 Chevrolet Uplander and a 1998 Oldsmobile Bravada were both headed west on a
two lane road, the Bravada was in front of the Uplander. The Uplander intended to continue
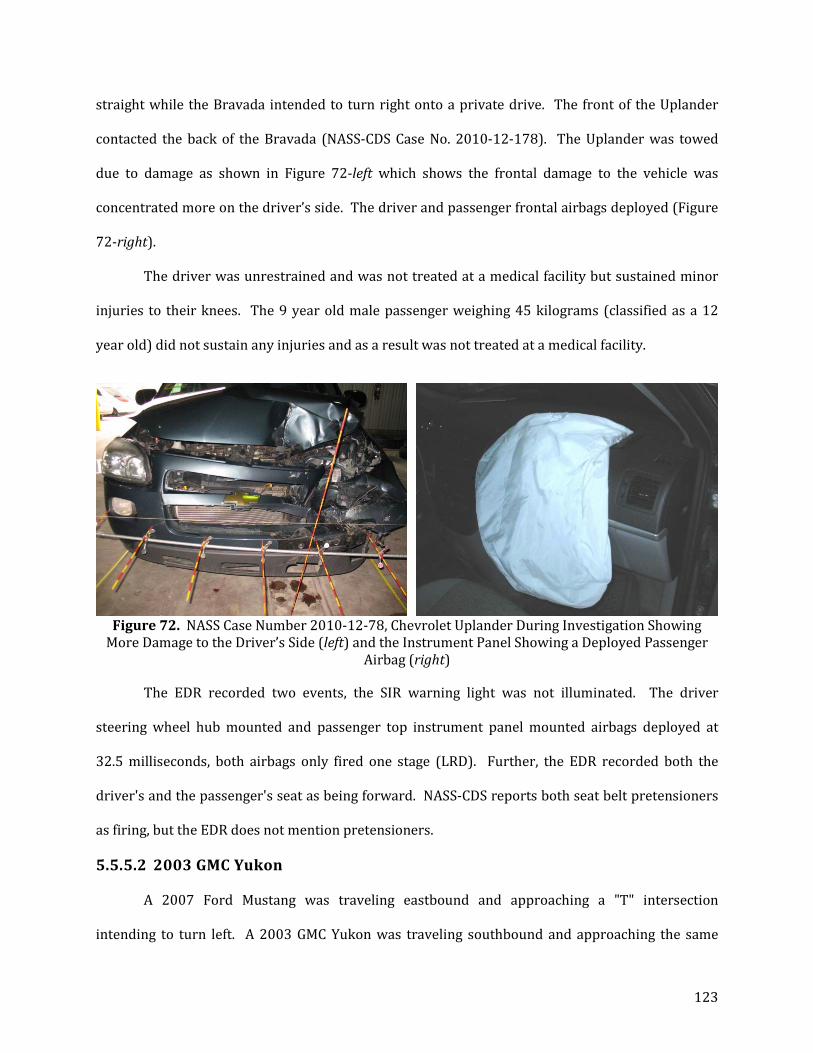
123
straight while the Bravada intended to turn right onto a private drive. The front of the Uplander
contacted the back of the Bravada (NASS-CDS Case No. 2010-12-178). The Uplander was towed
due to damage as shown in Figure 72-left which shows the frontal damage to the vehicle was
concentrated more on the driver’s side. The driver and passenger frontal airbags deployed (Figure
72-right).
The driver was unrestrained and was not treated at a medical facility but sustained minor
injuries to their knees. The 9 year old male passenger weighing 45 kilograms (classified as a 12
year old) did not sustain any injuries and as a result was not treated at a medical facility.
Figure 72. NASS Case Number 2010-12-78, Chevrolet Uplander During Investigation Showing
More Damage to the Driver’s Side (left) and the Instrument Panel Showing a Deployed Passenger Airbag (right)
The EDR recorded two events, the SIR warning light was not illuminated. The driver
steering wheel hub mounted and passenger top instrument panel mounted airbags deployed at
32.5 milliseconds, both airbags only fired one stage (LRD). Further, the EDR recorded both the
driver's and the passenger's seat as being forward. NASS-CDS reports both seat belt pretensioners
as firing, but the EDR does not mention pretensioners.
5.5.5.2 2003 GMC Yukon
A 2007 Ford Mustang was traveling eastbound and approaching a "T" intersection
intending to turn left. A 2003 GMC Yukon was traveling southbound and approaching the same

124
intersection. In the intersection, the front of the Yukon struck the left side of the Mustang. The
Yukon deflected left and departed the road to the left side, where its front struck a signpost (NASS
Case No. 2011-48-206). Both vehicles were towed due to damage; the GMC Yukon is pictured in
Figure 73-left. The driver's and passenger's (Figure 73-right) airbags both deployed.
The restrained driver was not treated but sustained two minor injuries which included
lacerations and bruises on the upper extremity. The passenger, a 9 year old male weighing 54
kilograms (classified as a 12 year old) was also not treated but was reported to have sustained a
contusion or hematoma to the thorax. This injury was believed to have been associated with the
seat belt.
Figure 73. NASS Case Number 2011-48-206, GMC Yukon During Investigation Showing Damage to
the Front (left) and the Instrument Panel Showing a Deployed Passenger Airbag (right)
The EDR recorded one event and reported that the SIR warning light was not illuminated
prior to or during the crash. Both the steering wheel mounted drivers and the mid-instrument
panel mounted passenger's airbag deployed a single stage at 25 milliseconds. The passenger seat
was registered as being in the rearward seat track position. Further, the EDR recorded that the
driver was seat belted at the time of the crash.
5.5.5.3 2012 GMC Terrain
A 2012 GMC Terrain was heading northbound towards an intersection in lane four of a four
lane divided roadway. A Ford F-series pickup truck was heading southbound towards the same

125
intersection in lane two of a four lane divided roadway. Both vehicles entered the intersection, with
the Terrain initiating a left turn. The front of the Terrain impacted the left side of the Ford (NASS
Case No. 2012-43-208). Both vehicles were towed due to vehicle damage; the damage to the front
of the Terrain is presented in Figure 74-left. The driver's and passenger's (Figure 74-right) frontal
airbags deployed.
The driver was restrained and not injured or treated. The passenger an 8 year old male
weighing 34 kilograms (classified as a 12 year old) was also not injured and not treated.
Figure 74. NASS Case Number 2012-43-208, GMC Terrain During Investigation Showing More
Damage to the Front Driver’s Side (left) and the Instrument Panel Showing a Deployed Passenger Airbag (right)
The EDR recorded one event and the SIR warning light was not illuminated prior to or
during the crash. The child was explicitly classified as a small adult and the EDR recorded that both
the driver and passenger were restrained. The driver's steering wheel mounted airbag deployed
both stages at 28 milliseconds and 128 milliseconds respectively; the later deployment is
considered a disposal deployment as outlined in Chapter 2. There was one vehicle, a 2009 Cadillac
Escalade, in the EDR dataset that in lieu of reporting a firing time for the second stage explicitly
referred to the deployment as a disposal. However, the passenger's top instrument panel mounted
airbag deployed both stages at 28 milliseconds and 63 milliseconds respectively. Also noted in
Chapter 2 top-mounted airbags tend to be deployed more aggressively due to the fact that they
126
typically deploy upwards towards the windshield first and then back towards the passenger.
However, these airbag firing times are interesting as the passenger airbag deployment appears
more aggressive than the driver’s deployment. This airbag was explicitly listed as an Autoliv airbag.
5.6 CONCLUSIONS
Using publicly available data a list of advanced airbag deployment strategies for three
different child occupant classes was generated by vehicle model year, make and model. Most
frequently airbags were certified to suppress for ALL occupants 0 – 6 years old, followed by a mixed
deployment technique for the three occupant classes, least common was low risk deployment for
occupants 1– 6 years old. Combined with this information it was possible to analyze whether the
advanced airbags are working as designed or intended. It was not possible to evaluate whether the
airbag behaved as designed for occupants classified as twelve year olds; however, it is interesting to
evaluate whether the airbags in these crashes behaved in accordance with the certified strategy for
the six year old occupant class or not. Since advanced airbags decide whether to deploy or not
based on an occupant's weight, this analysis classified children into different child occupant classes
by weight and evaluated the behavior of advanced airbags in comparison with the vehicle's certified
technique.
In 10 of the cases an advanced airbag suppressed in agreement with the certified strategy.
That is, for children classified by weight as being in a particular occupant class, the airbag
suppressed which aligned with the certified strategy for that vehicle make and model. There was
one case where an advanced airbag was classified as deploying as certified for an occupant
classified as a six year old.
There was no evidence of advanced airbags that performed improperly. However, most of
the cases involved children who were classified as 12 year old occupants for which deployment
strategies are not required as such there is no way to know whether the airbag worked as intended.
127
Despite this, the behavior of the airbags in the presence of occupants classified as 12 year olds was
analyzed. In some cases the airbag still suppressed for the older children. Interestingly, there were
three advanced airbags that suppressed for children classified as 12 year olds when their
deployment strategy for the 6 year old occupant class was suppression. For the vehicles in the
advanced airbag group without certified deployment strategies, their probable strategies were
predicted by using the following or previous model year's certified strategy.
In addition, the only three cases involving a moderately injured child in the right front
passenger seat during a crash were examined. One of the three children required hospitalization,
was likely hospitalized due to the number of injuries sustained. Most of these injuries were
identified as being caused by the seat belt. According to NASS, none of the three moderate injury
cases presented injuries associated with the airbag. One of the airbags suppressed, the other two
deployed. The child seated in front of the airbag that suppressed weighed 48.9 kilograms
(classified as a 12 year old by standards defined herein) was seated in close proximity to the
instrument panel this occupant sustained a cerebral concussion with loss of consciousness for less
than 30 minutes and a facial hematoma. The suspected cause of this injury was the instrument
panel which may have been prevented if the airbag deployed. On the other hand the child could
have been more seriously injured if the airbag had deployed. Additionally, one child was
unrestrained, the remaining two were restrained. All of the advanced airbag cases involving
moderate injuries had airbags which were certified for suppression for ALL occupants 0 – 6 years
old. However, the occupants involved in the crashes examined were all older (11 and 12 years old).
Further, one of the cases involving a moderate injury was also in the EDR database.
The EDR database was used to present cases where the passenger was seated in a child
safety seat, children were unrestrained, the EDR expressly detected a child and finally cases where
the advanced airbags suppressed or deployed respectively. The EDR database provided
information regarding the seat belt status of the occupants, the airbag and pretensioner
128
deployments as well as the number of events, status of the SIR warning lamp and on occasion seat
track positioning for the occupants. None of the injuries sustained by children were identified as
being related to the deployment of the airbag and a number of children were not injured.
There were a total of 30 advanced airbag cases in the database. A total of 10 suppressed, 17
deployed and for the remaining three there was no deployment; most cases involved older children
though there was one newborn. Two cases involved children seated in belt positioning booster
seats, both of those airbags suppressed. There were another two cases that involved unrestrained
children, one was an newborn who appeared to have been riding in an infant seat that may not have
been restrained to the Chevrolet C/K-Series pickup and the other was a 12 year old who was riding
in a Hummer H3. The Chevrolet suppressed the bag and the newborn was not injured; however,
several of the Hummer's airbags deployed, but there were no injuries reported for that occupant.
Another two EDRs expressly detected a child in the RFP seat, both were Ford vehicles. One was an
Escape which was occupied by a 5 year old in a booster seat, the airbag suppressed and the child
sustained minor injuries. However, the driver of the Escape sustained several severe injuries and
was hospitalized for 17 days. The other was an F-150 wherein a 9 year old was restrained in the
RFP seat, neither airbags deployed during in the crash. The occupant was not injured.
In the two cases examined involving an advanced airbag that suppressed, the children
suffered minor injuries resulting from the seat belt. Two of the three cases examined involving
advanced airbags that deployed involved children who were not injured, one suffered minor
injuries resulting from the seat belt. Interestingly, one airbag appeared to have deployed more
aggressively than the driver's airbag as evidenced by the second stage deployment times reported
by the EDR this child was not injured.
An evaluation of EDR data revealed that the advanced airbags could detect children and
suppress the airbag in their presence or deploy in such a way as to prevent serious injury. Further,
the EDR data provided information regarding pre-tensioner and second stage airbag deployment
129
times. A majority of the cases with EDR data revealed that the driver and passenger airbags fired at
similar times, though this could have been due to the fact that older children were seated in front of
advanced airbags.
130
6 CONCLUSIONS The first half of this thesis described the motivation for the development of advanced
airbags and discussed how the advanced airbags are tested and certified. Namely, an advanced
airbag can be designed to deploy or suppress the airbag for child occupants classified as 1-, 3- or 6-
years old. The airbag deployment strategy or technique was defined as the combination of whether
or not the airbag was designed to suppress or deploy in a low risk manner for each occupant class.
In other words, a suppression strategy would indicate that the airbag was designed or certified to
suppress for the 1-, 3- and 6-years old occupants.
6.1 FATALITY RISK
A child fatality analysis was performed using the Fatality Analysis Reporting System (FARS)
1995 -2013 to explore the factors and risks pertaining to children seated in the right front
passenger seat. Frontal and rollover crashes present the highest fatality risk to children (< 13 years
old) amongst all crash modes. The FARS fatality analysis was coupled with an exposure analysis
using NASS-GES. Encouragingly, with time and newer vehicles children were less likely to be seated
in the RFP where a frontal airbag would deploy. When children were seated in the RFP seat they
were older. In addition, children were also more likely to be restrained in recent calendar years
and newer vehicles.
6.2 ADVANCED AIRBAGS PRESENT LOWER RISK OF INJURY FOR CHILDREN
NASS-CDS was used to extract real-world crashes involving children seated in the RFP
location. Young children are less likely to be seated in front of an airbag due to widespread
advertising and information campaigns and as a result the sample size of children seated in front of
advanced airbags in NASS-CDS was relatively small. A logistic regression analysis was performed
on the resulting data to compare previous airbag generations to advanced airbags. Though the

131
sample size was small, the probability of moderate injury for a child seated in front of an advanced
airbag was significantly lower than that for non-advanced (1st and 2nd generation) airbags and
vehicles not equipped with airbags. First generation airbags were estimated to present roughly 26
times greater odds of moderate injury than advanced airbags and similarly second generation
airbags present 19 times higher odds of moderate injury for children seated in front of these bags
during a crash. Even with the risk of moderate injury being lower for children seated in front of an
advanced airbag versus any other airbag type, the safest place for a child is in the back seat of a
vehicle.
It is interesting that there is a difference between no airbag and advanced airbags
considering that for many occupant sizes the advanced airbags are designed to suppress essentially
rendering that occupant without an airbag. This suggests that other vehicle safety features may
also be providing some of the protective benefit to children in the front seat. Encouragingly, the
most injurious cases within the advanced airbag group were moderate (AIS 2) and further there
were only three cases at that severity, the remainder of the injuries were minor (AIS 1). The
factors affecting the probability of moderate injury were longitudinal delta-V, airbag generation and
airbag deployment. However, airbag deployment was not an indicator of the probability of
moderate injury amongst the advanced airbag group.
6.2.1 INJURIES BY BODY REGION
Injuries sustained by children in all four airbag groups were further analyzed by body
region for children sustaining any injury including minor (AIS 1) injuries. In general, the
proportions of injuries while seated in front of an advanced airbag regardless of whether it
deployed were lower than earlier airbag generations, with a few exceptions.
Children injured in a crash while in front of an advanced airbag appear to sustain head
injuries as frequently as those seated in front of second generation airbags. Further, there were

132
proportionally more injured children seated in front of an advanced airbag that did not deploy who
sustained head injuries than those in front of first or second generation airbags. However, the head
injuries in the advanced airbag group ranged from minor to moderate.
Also, though minor (AIS 1) in severity, proportionally more children sustained neck injuries
seated in front of an advanced airbag that did not deploy than those who were seated in front of
advanced airbags that did deploy. Proportionally more children sustained minor chest injuries
when seated in front of an advanced airbag which did not deploy than those in front of advanced
airbags that did deploy. Finally, a large proportion of children injured as a result of a crash, while
seated in front of an advanced airbag which did not deploy, sustained minor lower extremity
injuries.
6.3 ADVANCED AIRBAG PERFORMANCE ANALYSIS
Using publicly available data, a list of advanced airbag deployment strategies for three
different child occupant classes was generated by vehicle model year, make and model. Most
frequently airbags were certified to suppress for ALL occupants 0 – 6 years old, followed by a mixed
deployment technique for the three occupant classes. Least common was low risk deployment for
occupants 1– 6 years old. Combined with this information it was possible to analyze whether the
advanced airbags were working as designed or intended. Because there is not special regulatory
deployment requirement for 12-year olds, it was not possible to evaluate whether the airbag
behaved as designed for occupants classified as twelve year olds; however, it is interesting to
evaluate whether the airbags in these crashes behaved in accordance with the certified strategy for
the six year old occupant class or not. Since advanced airbags decide whether to deploy or not
based on an occupant's weight, this analysis classified children into different child occupant classes
by weight and evaluated the behavior of advanced airbags in comparison with the vehicle's certified
technique.

133
In 10 of the cases an advanced airbag suppressed in agreement with the certified strategy.
That is, for children classified by weight as being in a particular occupant class, the airbag
suppressed which aligned with the certified strategy for that vehicle make and model. There was
one case where an advanced airbag was classified as deploying as certified for an occupant
classified as a six year old. Though there have been no fatalities or serious injuries to children
seated in front of advanced airbags, this research also presents anecdotal evidence using our EDR
database to evaluate how the advanced airbags are working during real-world crashes. The EDR
database provided information regarding the seat belt status of the occupants, the airbag and pre-
tensioner deployments as well as the number of events, status of the SIR warning lamp and on
occasion seat track positioning for the occupants. None of the injuries sustained by children were
identified as being related to the deployment of the airbag and a number of children were not
injured.
There was no evidence of cases in which advanced airbags that performed improperly.
However, most of the cases involved children who were classified as 12-year-old occupants for
which deployment strategies are not required as such there is no way to know whether the airbag
worked as intended. Despite this, the behavior of the airbags in the presence of occupants classified
as 12 year olds was analyzed. In some cases, the airbag still suppressed for the older children.
Interestingly, there were three advanced airbags that suppressed for children classified as 12 year
olds when their deployment strategy for the 6-year-old occupant class was suppression. For the
vehicles in the advanced airbag group without certified deployment strategies, their probable
strategies were predicted by using the following or previous model year's certified strategy.
6.3.1 ADVANCED AIRBAG CASES INVOLVING MODERATE INJURIES
In addition, the only three cases involving a moderately injured child in the right front
passenger seat during a crash were examined. One of the three children required hospitalization,

134
was likely hospitalized due to the number of injuries sustained. Most of these injuries were
identified as being caused by the seat belt. None of the three cases presented injuries associated
with the airbag. One of the airbags suppressed while the other two airbags deployed. All of the
advanced airbag cases involving moderate injuries had airbags which were certified for
suppression for ALL occupants 0 – 6 years old. However, the occupants involved in the crashes
examined were all older (11 and 12 years old). Further, one of the cases involving a moderate
injury was also in the EDR database.
6.3.2 EDRS INDICATE ADVANCED AIRBAGS ARE WORKING IN REAL WORLD CRASHES
The EDR 2006-2013 database was used to identify cases where the passenger was seated in
a child safety seat, children were unrestrained, the EDR expressly detected a child and finally cases
where the advanced airbags suppressed or deployed respectively. The EDR database provided
information regarding the seat belt status of the occupants, the airbag and pretensioner
deployments as well as the number of events, status of the airbag warning lamp and on occasion
seat track positioning for the occupants. None of the injuries sustained by children were identified
as being related to the deployment of the airbag and a number of children were not injured.
There were a total of 30 advanced airbag cases in the EDR database. A total of 10
suppressed, 17 deployed and for the remaining three there was no deployment. Most cases
involved older children though there was one newborn. Two cases involved children seated in belt
positioning booster seats, both of those airbags suppressed. Another two EDRs (both Fords)
expressly detected a child in the RFP seat. One was a Ford Escape which was occupied by a 5 year
old in a booster seat. In this case, the airbag suppressed and the child sustained minor injuries.
However, the driver of the Escape sustained several severe injuries and was hospitalized for 17
days. The other case was a Ford F-150 wherein a 9 year old was restrained in the RFP seat. In this
case, neither airbag deployed during the crash, and the occupant was not injured.

135
In the two cases examined involving an advanced airbag that suppressed, the children
suffered minor injuries resulting from the seat belt. Two of the three cases examined involving
advanced airbags that deployed involved children who were not injured, one suffered minor
injuries resulting from the seat belt. Interestingly, one airbag appeared to have deployed more
aggressively than the driver's airbag as evidenced by the second stage deployment times reported
by the EDR this child was not injured.
6.4 LIMITATIONS
Though this work found a statistically significant difference between the injury risk to
children in front of advanced airbags as compared with a vehicle with any other generation airbag
including those not equipped with airbags, this difference was based on three unweighted cases.
The small sample size, while in some ways indicative of the safety benefits provided by advanced
airbags, may have exaggerated the differences between advanced airbags and prior generation
airbags. The comparison of the certified strategy and the actual response of advanced airbags in a
real-world crash reinforced the results of the safety study. Further, the anecdotal case studies
revealed cases where occupants, mainly drivers, within the same vehicle were more severely
injured than the child. Nonetheless, the small sample size is an inherent limitation within this study
that must be considered while interpreting the results presented herein.
This study also does not address or differentiate between the effect of advanced airbags and
other safety technologies that set vehicles with advanced airbags apart from vehicles from prior
vehicle generations. In the period between model year 1980 and 2013, NHTSA’s regulation and
verification of vehicle safety devices has inspired numerous safety advancements within the auto
industry, including forward collision and lane departure warning systems [64]. Since the dataset
was already limited and separation of these safety advancements is outside the scope of the work, it
is important to consider the conclusions in light of this limitation.
136
Safety features are not the only thing that has changed during the 19-year period studied.
There have been numerous public safety programs aimed at changing the behaviors of drivers in
the US between 1995 and 2013. One of the behavior safety initiatives, noted throughout this work,
has focused on informing parents and caregivers that the safest place for children riding in vehicles
is the backseat. Because the program has been very effective, it has been difficult to analyze the
effects of advanced airbags on children. Some other behavior initiatives that span the period
studied and may affect the results include: (1) seat belt use, (2) proper child safety seat selection
and installation, (3) speed limit changes and enforcement, (4) alcohol- and drug-involved driving,
and (5) fatigue and distracted driving awareness. The effects of behavioral initiatives may have
affected the results reported within this work as well; these effects were not specifically factored
into the analysis of the results, but as exposures to each of the behaviors has increased or
decreased, so has the risk associated with those behaviors.
Finally, economic factors have at times increased or decreased the vehicle miles traveled
(VMT) and as a result the exposure of children riding within vehicles would directly correlate to
those economic changes. Any change in exposure could affect the results obtained since the data
analyzed by and large was derived from a nationally representative sample.
6.5 SUMMARY
The probability of moderate injury for a child seated in front of an advanced airbag is
significantly lower than that for non-advanced (1st and 2nd generation) airbags and vehicles not
equipped with airbags. Some of the injury risk reduction appears to be related to the incorporation
of other safety features within newer vehicles, not just the advanced airbag itself as one option for
an advanced airbag is suppression which would render the occupant without an airbag. Despite
that, children involved in crashes within vehicles equipped with an advanced airbag were still at a
lower risk of injury than a child in a vehicle not equipped with an airbag at the same delta-V.
137
Advanced airbag performance during real-world crashes where a child was seated in the
RFP seat was compared with the manufacturer's certified strategy. There was no evidence of
advanced airbags that performed improperly. An evaluation of EDR data revealed that the
advanced airbags could detect children and suppress the airbag in their presence or deploy in such
a way as to prevent serious injury. Further, the EDR data provided information regarding pre-
tensioner and second stage airbag deployment times. A majority of the cases with EDR data
revealed that the driver and passenger airbags fired at similar times, though this could have been
due to the fact that older children were seated in front of advanced airbags.
Compared to first generation airbags, the outcomes for children involved in crashes while
seated in the front seat are vastly improved. However, the back seat remains the safest place for
children; this work in no way advocates that children should be seated in the RFP seat.

138
7 REFERENCES [1] NHTSA, "Traffic Safety Facts 2013" DOT HS 812 139, 2014 [2] C. J. Kahane, “Fatality Reduction by Air Bags: Analyses of Accident Data Through Early
1996, NHTSA Report Number” DOT HS 808 470, 1996, pp. 1-5. [3] C. J. Kahane, “Lives Saved by the Federal Motor Vehicle Safety Standards and Other
Vehicle Safety Technologies, 1960-2002: Passenger Cars and Light Trucks” DOT HS 809 833, 2004. [4] NHTSA, “Traffic Safety Facts 2012: Occupant Protection” DOT HS 811 892. [5] E.R. Braver, S. A. Ferguson, M. A. Greene, and A. K. Lund, “Reductions in deaths in
frontal crashes among right front passengers in vehicles equipped with passenger air bags.,” JAMA : The Journal of the American Medical Association, vol. 278, Nov. 1997, pp. 1437-9.
[6] NHTSA, “Special Crash Investigations: Counts Of Frontal Air Bag Related Fatalities
and Seriously Injured Persons Crash Investigation Division,” Traffic Safety, 2005. [7] C. J. Kahane, An Evaluation of the 1998-1999 Redesign of Frontal Airbags, NHTSA
Report Number DOT HS 808 685, 2006. [8] NHTSA, “Final Regulatory Evaluation,” 1997,
http://www.nhtsa.gov/CARS/rules/rulings/80g/80g.html, accessed 9/18/11.
[9] Code of Federal Regulations, Title 49. Government Printing Office, Washington, 2005. [10] E. Wittenberg, T. F. Nelson, and J. D. Graham, “The Effect of Passenger Airbags on
Child Seating Behavior in Motor Vehicles,” Pediatrics, vol. 104, no. 6, pp. 1247-1250, 1999. [11] A. I. Greenspan, A. M. Dellinger, and J. Chen, “Restraint use and seating position
among children less than 13 years of age: Is it still a problem?,” Journal of Safety Research, vol. 41, no. 2, pp. 183-5, Apr. 2010.
[12] K. B. Arbogast, M.J. Kallan, and D.R. Durbin, “Front versus rear seat injury risk for
child passengers: evaluation of newer model year vehicles,” Traffic Injury Prevention, vol. 10, Jun. 2009, pp. 297-301.
[13] E. R. Grisoni, S.B. Pillai, T.A. Volsko, K. Mutabagani, V. Garcia, K. Haley, L. Schweer, E.
Marsh, and D. Cooney, “Pediatric Airbag Injuries: The Ohio Experience,” Journal of Pediatric Surgery, vol. 35, Mar. 2000, pp. 160-163.
[14] K. Weber, “Crash Protection for Child Passengers A Review of the Best Practice,”
UMTRI Research Review, vol. 31, 2000, pp. 1-28. [15] D. R. Durbin, M. Kallan, M. Elliott, R. A. Cornejo, K. B. Arbogast, and F. K. Winston,
“Risk of Injury to Restrained Children from Passenger Air Bags,” Traffic Injury Prevention, vol. 4, no. 1, pp. 58-63, 2003.
139
[16] E. R. Braver, R. Whitfield, and S.A. Ferguson, “Risk of Death Among Child Passengers in Front and Rear Seating Positions,” SAE, vol. 973298, 1997, pp. 25-34.
[17] E. R. Braver, R. Whitfield, and S.A. Ferguson, “Seating positions and children’s risk of
dying in motor vehicle crashes,” Injury Prevention, vol. 4, 1998, pp. 181-187. [18] D. F. Huelke, “Children as Front Seat Passengers Exposed to Airbag Deployments,”
SAE, vol. 973295, pp. 1-7, 1997. [19] F. K. Winston and R. Reed, “Air Bags and Children: Results of National Highway
Traffic Safety Administration Special Investigation Into Actual Crashes,” Womens Travel Issues, 1996, pp. 539-547.
[20] G .F. Huff, S. P. Bagwell, and D. Bachman, “Airbag Injuries in Infants and Children: A
Case Report and Review of the Literature,” Pediatrics, vol. 102, Jul. 1998, p. 1-2. [21] K. W. Marshall, B. L. Koch, and J. C. Egelhoff, “Air bag-related deaths and serious
injuries in children: injury patterns and imaging findings,” American Journal of Neuroradiology, vol. 19, Oct. 1998, pp. 1599-607.
[22] Y. Sato, T. Ohshima, and T. Kondo, “Air bag injuries--a literature review in
consideration of demands in forensic autopsies,” Forensic Science International, vol. 128, Aug. 2002, pp. 162-7.
[23] K. Okamoto, M. Takemoto, and Y. Okada, “Airbag-mediated craniocervical injury in a
child restrained with safety device,” The Journal of Trauma, vol. 52, Mar. 2002, pp. 587-90. [24] A. Quinones-Hinojosa, P. Jun, G. Manley, M. Knudson, and N. Gupta, “Airbag
Deployment and Improperly Restrained Children: A Lethal Combination,” Journal of Trauma Injury, Infection & Critical Care, vol. 59, 2004, pp. 729-733.
[25] K. B. Arbogast, M. B. DeNardo, A. M. Xavier, D. R. Durbin, F. K. Winston, and M. J.
Kallan, “Upper Extremity Fractures in Restrained Children Exposed to Passenger Airbags,” SAE, vol. 2003-01-05, 2003, pp. 1-8.
[26] K. B. Arbogast, D. R. Durbin, M. J. Kallan, and F. K. Winston, "Effect Of Vehicle Type
On The Performance Of Second Generation Air Bags For Child Occupants,” 47th Annual Proceedings Association for the Advancement of Automotive Medicine, 2003, pp. 1-15.
[27] K. B. Arbogast, D. R. Durbin, M. J. Kallan, M. R. Elliott, and F. K. Winston, “Injury risk
to restrained children exposed to deployed first- and second-generation air bags in frontal crashes.,” Archives of Pediatrics & Adolescent Medicine, vol. 159, Apr. 2005, pp. 342-6.
[28] J. Augenstein and K. H. Digges, “Performance of Advanced Air Bags Based on Data
William Lehman Injury Research Center and New NASS PSUs,” 47th Annual Proceedings Association for the Advancement of Automotive Medicine, 2003, pp. 1-2.
[29] C. M. Olson, P. Cummings, and F. P. Rivara, “Association of first- and second-
generation air bags with front occupant death in car crashes: a matched cohort study,” American Journal of Epidemiology, vol. 164, Jul. 2006, pp. 161-9.

140
[30] E. R. Braver, M. Scerbo, J. A. Kufera, M. T. Alexander, K. Volpini, and J. P. Lloyd,
“Deaths among drivers and right-front passengers in frontal collisions: redesigned air bags relative to first-generation air bags,” Traffic Injury Prevention, vol. 9, Mar. 2008, pp. 48-58.
[31] A. Prasad and A. Louden, “Injury Risks from Advanced Air Bags in Frontal Static Out-
of-Position Tests; Paper No. 427,” 19th Annual Proceedings of Enhanced Safety of Vehicles, 2005, no. 208, pp. 1-6.
[32] S. A. Ferguson and L. W. Schneider, “An overview of frontal air bag performance with
changes in frontal crash-test requirements: findings of the Blue Ribbon Panel for the evaluation of advanced technology air bags,” Traffic Injury Prevention, vol. 9, no. 5, pp. 421-31, Oct. 2008.
[33] E. R. Braver, M. Shardell, and E.R. Teoh, “How have changes in air bag designs
affected frontal crash mortality?,” Annals of Epidemiology, vol. 20, Jul. 2010, pp. 499-510. [34] R. A. Menon et al., “Differences In Air Bag Performance With Children In Various
Restraint Configurations And Vehicle Types; Paper No. 420,” 18th Annual Proceedings of Enhanced Safety of Vehicles, 2003, pp. 1-15.
[35] Delphi, "Delphi Passive Occupant Detection System-B" brochure
http://www.delphi.com/manufacturers/auto/safety/passive/oc/pods, accessed: 4/11/16
[36] Delphi, "Delphi Passive Occupant Detection System-D" brochure http://www.delphi.com/manufacturers/auto/safety/passive/oc/pods-d, accessed: 4/11/16
[37] Delphi, "Delphi Passive Occupant Detection System-F" brochure
http://www.delphi.com/manufacturers/auto/safety/passive/oc/pods-f, accessed: 4/11/16 [38] Calsonic, "Occupant Detection System"
http://calsonic.com/en/products/electronics/occupant-detection-system, accessed: 4/11/16 [39] Nidec Elesys, "Our Products: Occupant Detection" http://www.elesys-
na.com/occupant-detection accessed: 4/11/16 [40] Robert Bosch GmbH, "Press release: Intelligent bolt: Bosch “iBolt” seat occupancy
sensor system for modified airbag release," June 2004. [41] Lewandowski, J. Personal interview. 16 Apr. 2012. [42] National Bureau of Economic Research, "US Business Cycle Expansions and
Contractions," https://www.nber.org/cycles.html accessed: 4/1/2016 [43] Lefler DE and Gabler HC, “The Fatality and Injury Risk of Light Truck Impacts with
Pedestrians in the United States,” Accident Analysis and Prevention, v.36, pp. 295-304, Elsevier, 2004.
[44] Fildes, B., Gabler HC, Otte, D., Linder, A., L. Sparke, L., “Pedestrian Impact Priorities
Using Real-World Crash Data and Harm” Proceedings of the 2004 International IRCOBI Conference on the Biomechanics of Impact, Graz, Austria, September 2004.

141
[45] Fildes B., Linder, A., Clark, A., Otte, D., Gabler HC, Yang, Y., Fredrikkson, R., Fujita, Y., Cessari, D., Yang, K., Sparke, L., and Smith, S., “Pedestrian Safety: International Collaborative Research Based on Real World Crash Data”, Proceedings of the International Expert Symposium on Accident Research (ESAR), Hannover, Germany, September 2004.
[46] Daniello AL and Gabler HC, “Fatality Risk in Motorcycle Collisions with Roadside
Objects in the United States,” Accident Analysis and Prevention, v.43, pp. 1167–1170, 2011. [47] NHTSA, “Traffic Safety for Older People – 5 Year Plan,” NHTSA Report Number DOT
HS 811 837, 2013. [48] D. Viano, “Effectiveness of safety belts and airbags in preventing fatal injury,” SAE,
no. 910901, 1991. [49] Hampton CE and Gabler HC, “Evaluation of the Accuracy of NASS/CDS Delta-V
Estimates from the Enhanced WinSmash Algorithm”, Annals of Advances in Automotive Medicine, v.54, pp. 241-252, 2010.
[50] Hampton CE and Gabler HC, “NASS/CDS Delta-V Estimates: The Influence of
Enhancements to the WinSmash Crash Reconstruction Code”, Annals of Advances in Automotive Medicine, v.53, pp. 91-102, 2009.
[51] E. Teoh, "How Have Changes in Front Airbag Designs Affected Frontal Crash Death Rates? An Update," Insurance Institute for Highway Safety Report, July 2013.
[52] NHTSA, “Evaluation of the Certified-Advanced Air Bags,” NHTSA Report Number DOT HS 811 834, 2013.
[53] National Center for Health Statistics, "2 to 20 years: Boys Stature-for-age and
Weight-for-age percentiles," CDC, 2000, http://www.cdc.gov/growthcharts [54] National Center for Health Statistics, "2 to 20 years: Girls Stature-for-age and
Weight-for-age percentiles," CDC, 2000, http://www.cdc.gov/growthcharts [55] H.C. Gabler, J. Hinch, and J. Steiner, Event Data Recorders: A Decade of Innovation,
SAE International, Warrendale, PA, 2008 [56] A. Tsoi, J. Hinch, R. Ruth and H.C. Gabler, "Validation of Event Data Recorders in High
Severity Full‑Frontal Crash Tests," SAE International Journal of Transportation Safety 1(1):2013, doi: 10.4271/2013-01-1265, 2013
[57] H.C. Gabler and J. Hinch, “Evaluation of Advanced Air Bag Deployment Algorithm
Performance using Event Data Recorders,” Annals of Advances in Automotive Medicine, v.52, pp. 175-184 , 2008
[58] H.C. Gabler and J. Hinch, “Characterization of Advanced Air Bag Field Performance
using Event Data Recorders”, Proceedings of the Twentieth International Conference on Enhanced Safety of Vehicles, Paper No. 07-0349, Lyons, France, June 2007
142
[59] Gabler HC, Hampton, C.E., and Hinch, J., “Crash Severity: A Comparison of Event Data Recorder Measurements with Accident Reconstruction Estimates”, SAE Paper No. 2004-01-1194, March 2004
[60] Gabler HC, Hampton, C., and Roston, T., “Estimating Crash Severity: Can Event Data
Recorders Replace Crash Reconstruction?” Proceedings of the Eighteenth International Conference on Enhanced Safety of Vehicles, Paper No. 490, Nagoya, Japan. May 2003
[61] Tsoi AH and Gabler HC, “Evaluation of Vehicle-Based Crash Severity Metrics,” Traffic
Injury Prevention, v16:sup2, pp. S132-S139, doi: 10.1080/15389588.2015.1067693, 2015 [62] Gabauer DJ, and Gabler HC, “Comparison of Roadside and Vehicle Crash Test Injury
Criteria in Frontal Crash Tests”, Int. J. Vehicle Safety, Vol. 3, No. 2, pp.135–148, 2008 [63] Kusano KD, Sherony R, and Gabler HC, “Methodology for using Advanced Event Data
Recorders to Reconstruct Vehicle Trajectories for use in Safety Impact Methodologies (SIM)”, Traffic Injury Prevention v.14, Sup1, pp. S77-S86, DOI: 10.1080/15389588.2013.796374, November 2013.
[64] Kusano KD and Gabler HC, “Comparison of Expected Crash and Injury Reduction
from Production Forward Collision and Lane Departure Warning Systems,” Traffic Injury Prevention, v16:sup2, pp. S109-S114, DOI: 10.1080/15389588.2015.1063619, 2015
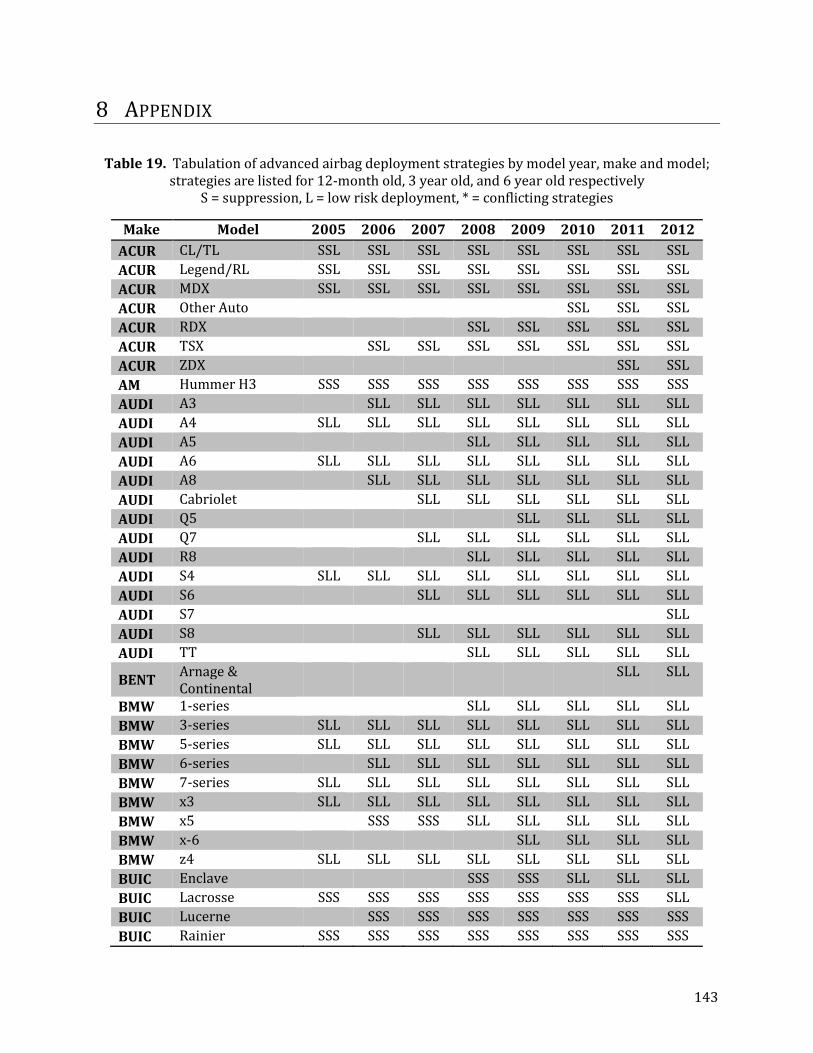
143
8 APPENDIX
Table 19. Tabulation of advanced airbag deployment strategies by model year, make and model; strategies are listed for 12-month old, 3 year old, and 6 year old respectively
S = suppression, L = low risk deployment, * = conflicting strategies
Make Model 2005 2006 2007 2008 2009 2010 2011 2012 ACUR CL/TL SSL SSL SSL SSL SSL SSL SSL SSL ACUR Legend/RL SSL SSL SSL SSL SSL SSL SSL SSL ACUR MDX SSL SSL SSL SSL SSL SSL SSL SSL ACUR Other Auto SSL SSL SSL ACUR RDX SSL SSL SSL SSL SSL ACUR TSX SSL SSL SSL SSL SSL SSL SSL ACUR ZDX SSL SSL AM Hummer H3 SSS SSS SSS SSS SSS SSS SSS SSS AUDI A3 SLL SLL SLL SLL SLL SLL SLL AUDI A4 SLL SLL SLL SLL SLL SLL SLL SLL AUDI A5 SLL SLL SLL SLL SLL AUDI A6 SLL SLL SLL SLL SLL SLL SLL SLL AUDI A8 SLL SLL SLL SLL SLL SLL SLL AUDI Cabriolet SLL SLL SLL SLL SLL SLL AUDI Q5 SLL SLL SLL SLL AUDI Q7 SLL SLL SLL SLL SLL SLL AUDI R8 SLL SLL SLL SLL SLL AUDI S4 SLL SLL SLL SLL SLL SLL SLL SLL AUDI S6 SLL SLL SLL SLL SLL SLL AUDI S7 SLL AUDI S8 SLL SLL SLL SLL SLL SLL AUDI TT SLL SLL SLL SLL SLL
BENT Arnage & Continental
SLL SLL
BMW 1-series SLL SLL SLL SLL SLL BMW 3-series SLL SLL SLL SLL SLL SLL SLL SLL BMW 5-series SLL SLL SLL SLL SLL SLL SLL SLL BMW 6-series SLL SLL SLL SLL SLL SLL SLL BMW 7-series SLL SLL SLL SLL SLL SLL SLL SLL BMW x3 SLL SLL SLL SLL SLL SLL SLL SLL BMW x5 SSS SSS SLL SLL SLL SLL SLL BMW x-6 SLL SLL SLL SLL BMW z4 SLL SLL SLL SLL SLL SLL SLL SLL BUIC Enclave SSS SSS SLL SLL SLL BUIC Lacrosse SSS SSS SSS SSS SSS SSS SSS SLL BUIC Lucerne SSS SSS SSS SSS SSS SSS SSS BUIC Rainier SSS SSS SSS SSS SSS SSS SSS SSS
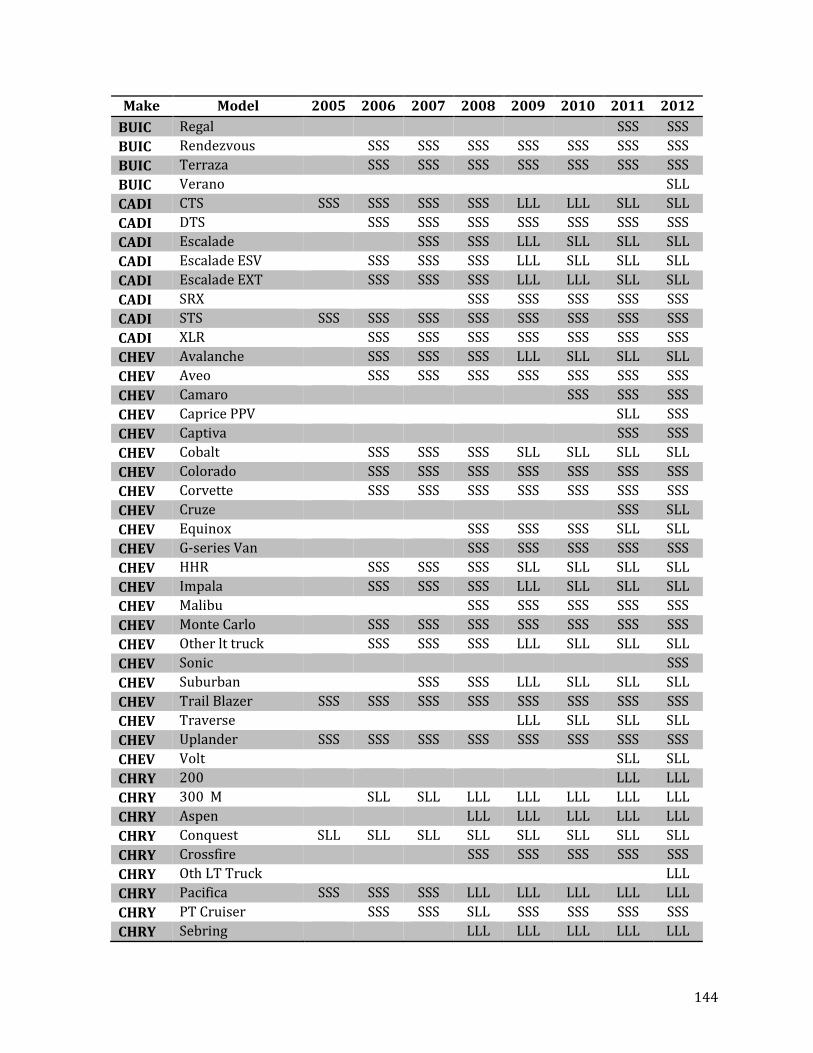
144
Make Model 2005 2006 2007 2008 2009 2010 2011 2012 BUIC Regal SSS SSS BUIC Rendezvous SSS SSS SSS SSS SSS SSS SSS BUIC Terraza SSS SSS SSS SSS SSS SSS SSS BUIC Verano SLL CADI CTS SSS SSS SSS SSS LLL LLL SLL SLL CADI DTS SSS SSS SSS SSS SSS SSS SSS CADI Escalade SSS SSS LLL SLL SLL SLL CADI Escalade ESV SSS SSS SSS LLL SLL SLL SLL CADI Escalade EXT SSS SSS SSS LLL LLL SLL SLL CADI SRX SSS SSS SSS SSS SSS CADI STS SSS SSS SSS SSS SSS SSS SSS SSS CADI XLR SSS SSS SSS SSS SSS SSS SSS CHEV Avalanche SSS SSS SSS LLL SLL SLL SLL CHEV Aveo SSS SSS SSS SSS SSS SSS SSS CHEV Camaro SSS SSS SSS CHEV Caprice PPV SLL SSS CHEV Captiva SSS SSS CHEV Cobalt SSS SSS SSS SLL SLL SLL SLL CHEV Colorado SSS SSS SSS SSS SSS SSS SSS CHEV Corvette SSS SSS SSS SSS SSS SSS SSS CHEV Cruze SSS SLL CHEV Equinox SSS SSS SSS SLL SLL CHEV G-series Van SSS SSS SSS SSS SSS CHEV HHR SSS SSS SSS SLL SLL SLL SLL CHEV Impala SSS SSS SSS LLL SLL SLL SLL CHEV Malibu SSS SSS SSS SSS SSS CHEV Monte Carlo SSS SSS SSS SSS SSS SSS SSS CHEV Other lt truck SSS SSS SSS LLL SLL SLL SLL CHEV Sonic SSS CHEV Suburban SSS SSS LLL SLL SLL SLL CHEV Trail Blazer SSS SSS SSS SSS SSS SSS SSS SSS CHEV Traverse LLL SLL SLL SLL CHEV Uplander SSS SSS SSS SSS SSS SSS SSS SSS CHEV Volt SLL SLL CHRY 200 LLL LLL CHRY 300 M SLL SLL LLL LLL LLL LLL LLL CHRY Aspen LLL LLL LLL LLL LLL CHRY Conquest SLL SLL SLL SLL SLL SLL SLL SLL CHRY Crossfire SSS SSS SSS SSS SSS CHRY Oth LT Truck LLL CHRY Pacifica SSS SSS SSS LLL LLL LLL LLL LLL CHRY PT Cruiser SSS SSS SLL SSS SSS SSS SSS CHRY Sebring LLL LLL LLL LLL LLL
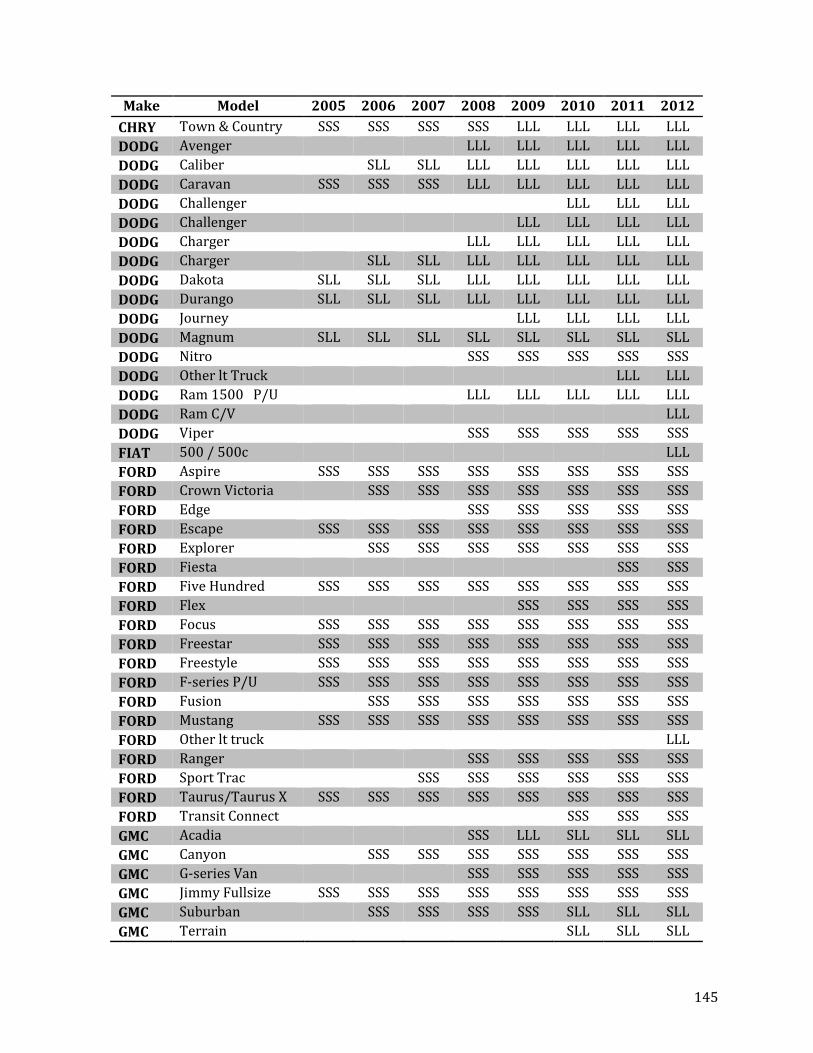
145
Make Model 2005 2006 2007 2008 2009 2010 2011 2012 CHRY Town & Country SSS SSS SSS SSS LLL LLL LLL LLL DODG Avenger LLL LLL LLL LLL LLL DODG Caliber SLL SLL LLL LLL LLL LLL LLL DODG Caravan SSS SSS SSS LLL LLL LLL LLL LLL DODG Challenger LLL LLL LLL DODG Challenger LLL LLL LLL LLL DODG Charger LLL LLL LLL LLL LLL DODG Charger SLL SLL LLL LLL LLL LLL LLL DODG Dakota SLL SLL SLL LLL LLL LLL LLL LLL DODG Durango SLL SLL SLL LLL LLL LLL LLL LLL DODG Journey LLL LLL LLL LLL DODG Magnum SLL SLL SLL SLL SLL SLL SLL SLL DODG Nitro SSS SSS SSS SSS SSS DODG Other lt Truck LLL LLL DODG Ram 1500 P/U LLL LLL LLL LLL LLL DODG Ram C/V LLL DODG Viper SSS SSS SSS SSS SSS FIAT 500 / 500c LLL FORD Aspire SSS SSS SSS SSS SSS SSS SSS SSS FORD Crown Victoria SSS SSS SSS SSS SSS SSS SSS FORD Edge SSS SSS SSS SSS SSS FORD Escape SSS SSS SSS SSS SSS SSS SSS SSS FORD Explorer SSS SSS SSS SSS SSS SSS SSS FORD Fiesta SSS SSS FORD Five Hundred SSS SSS SSS SSS SSS SSS SSS SSS FORD Flex SSS SSS SSS SSS FORD Focus SSS SSS SSS SSS SSS SSS SSS SSS FORD Freestar SSS SSS SSS SSS SSS SSS SSS SSS FORD Freestyle SSS SSS SSS SSS SSS SSS SSS SSS FORD F-series P/U SSS SSS SSS SSS SSS SSS SSS SSS FORD Fusion SSS SSS SSS SSS SSS SSS SSS FORD Mustang SSS SSS SSS SSS SSS SSS SSS SSS FORD Other lt truck LLL FORD Ranger SSS SSS SSS SSS SSS FORD Sport Trac SSS SSS SSS SSS SSS SSS FORD Taurus/Taurus X SSS SSS SSS SSS SSS SSS SSS SSS FORD Transit Connect SSS SSS SSS GMC Acadia SSS LLL SLL SLL SLL GMC Canyon SSS SSS SSS SSS SSS SSS SSS GMC G-series Van SSS SSS SSS SSS SSS GMC Jimmy Fullsize SSS SSS SSS SSS SSS SSS SSS SSS GMC Suburban SSS SSS SSS SSS SLL SLL SLL GMC Terrain SLL SLL SLL
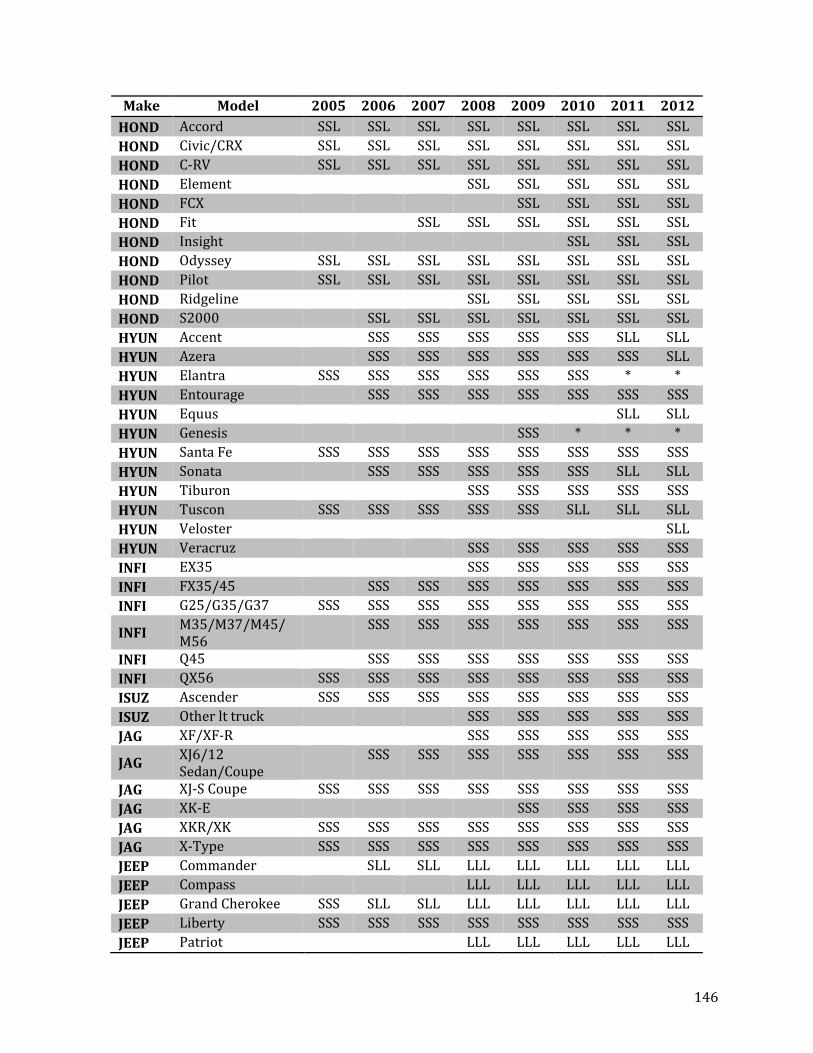
146
Make Model 2005 2006 2007 2008 2009 2010 2011 2012 HOND Accord SSL SSL SSL SSL SSL SSL SSL SSL HOND Civic/CRX SSL SSL SSL SSL SSL SSL SSL SSL HOND C-RV SSL SSL SSL SSL SSL SSL SSL SSL HOND Element SSL SSL SSL SSL SSL HOND FCX SSL SSL SSL SSL HOND Fit SSL SSL SSL SSL SSL SSL HOND Insight SSL SSL SSL HOND Odyssey SSL SSL SSL SSL SSL SSL SSL SSL HOND Pilot SSL SSL SSL SSL SSL SSL SSL SSL HOND Ridgeline SSL SSL SSL SSL SSL HOND S2000 SSL SSL SSL SSL SSL SSL SSL HYUN Accent SSS SSS SSS SSS SSS SLL SLL HYUN Azera SSS SSS SSS SSS SSS SSS SLL HYUN Elantra SSS SSS SSS SSS SSS SSS * * HYUN Entourage SSS SSS SSS SSS SSS SSS SSS HYUN Equus SLL SLL HYUN Genesis SSS * * * HYUN Santa Fe SSS SSS SSS SSS SSS SSS SSS SSS HYUN Sonata SSS SSS SSS SSS SSS SLL SLL HYUN Tiburon SSS SSS SSS SSS SSS HYUN Tuscon SSS SSS SSS SSS SSS SLL SLL SLL HYUN Veloster SLL HYUN Veracruz SSS SSS SSS SSS SSS INFI EX35 SSS SSS SSS SSS SSS INFI FX35/45 SSS SSS SSS SSS SSS SSS SSS INFI G25/G35/G37 SSS SSS SSS SSS SSS SSS SSS SSS
INFI M35/M37/M45/M56
SSS SSS SSS SSS SSS SSS SSS
INFI Q45 SSS SSS SSS SSS SSS SSS SSS INFI QX56 SSS SSS SSS SSS SSS SSS SSS SSS ISUZ Ascender SSS SSS SSS SSS SSS SSS SSS SSS ISUZ Other lt truck SSS SSS SSS SSS SSS JAG XF/XF-R SSS SSS SSS SSS SSS
JAG XJ6/12 Sedan/Coupe
SSS SSS SSS SSS SSS SSS SSS
JAG XJ-S Coupe SSS SSS SSS SSS SSS SSS SSS SSS JAG XK-E SSS SSS SSS SSS JAG XKR/XK SSS SSS SSS SSS SSS SSS SSS SSS JAG X-Type SSS SSS SSS SSS SSS SSS SSS SSS JEEP Commander SLL SLL LLL LLL LLL LLL LLL JEEP Compass LLL LLL LLL LLL LLL JEEP Grand Cherokee SSS SLL SLL LLL LLL LLL LLL LLL JEEP Liberty SSS SSS SSS SSS SSS SSS SSS SSS JEEP Patriot LLL LLL LLL LLL LLL
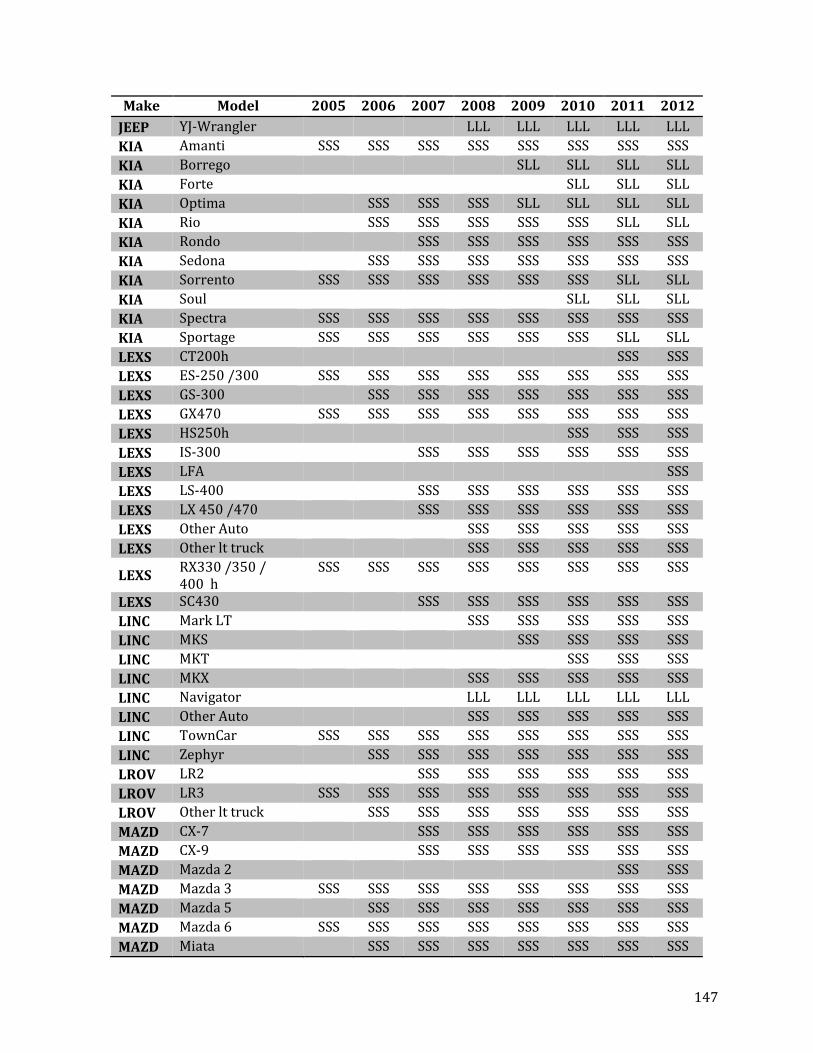
147
Make Model 2005 2006 2007 2008 2009 2010 2011 2012 JEEP YJ-Wrangler LLL LLL LLL LLL LLL KIA Amanti SSS SSS SSS SSS SSS SSS SSS SSS KIA Borrego SLL SLL SLL SLL KIA Forte SLL SLL SLL KIA Optima SSS SSS SSS SLL SLL SLL SLL KIA Rio SSS SSS SSS SSS SSS SLL SLL KIA Rondo SSS SSS SSS SSS SSS SSS KIA Sedona SSS SSS SSS SSS SSS SSS SSS KIA Sorrento SSS SSS SSS SSS SSS SSS SLL SLL KIA Soul SLL SLL SLL KIA Spectra SSS SSS SSS SSS SSS SSS SSS SSS KIA Sportage SSS SSS SSS SSS SSS SSS SLL SLL LEXS CT200h SSS SSS LEXS ES-250 /300 SSS SSS SSS SSS SSS SSS SSS SSS LEXS GS-300 SSS SSS SSS SSS SSS SSS SSS LEXS GX470 SSS SSS SSS SSS SSS SSS SSS SSS LEXS HS250h SSS SSS SSS LEXS IS-300 SSS SSS SSS SSS SSS SSS LEXS LFA SSS LEXS LS-400 SSS SSS SSS SSS SSS SSS LEXS LX 450 /470 SSS SSS SSS SSS SSS SSS LEXS Other Auto SSS SSS SSS SSS SSS LEXS Other lt truck SSS SSS SSS SSS SSS
LEXS RX330 /350 / 400 h
SSS SSS SSS SSS SSS SSS SSS SSS
LEXS SC430 SSS SSS SSS SSS SSS SSS LINC Mark LT SSS SSS SSS SSS SSS LINC MKS SSS SSS SSS SSS LINC MKT SSS SSS SSS LINC MKX SSS SSS SSS SSS SSS LINC Navigator LLL LLL LLL LLL LLL LINC Other Auto SSS SSS SSS SSS SSS LINC TownCar SSS SSS SSS SSS SSS SSS SSS SSS LINC Zephyr SSS SSS SSS SSS SSS SSS SSS LROV LR2 SSS SSS SSS SSS SSS SSS LROV LR3 SSS SSS SSS SSS SSS SSS SSS SSS LROV Other lt truck SSS SSS SSS SSS SSS SSS SSS MAZD CX-7 SSS SSS SSS SSS SSS SSS MAZD CX-9 SSS SSS SSS SSS SSS SSS MAZD Mazda 2 SSS SSS MAZD Mazda 3 SSS SSS SSS SSS SSS SSS SSS SSS MAZD Mazda 5 SSS SSS SSS SSS SSS SSS SSS MAZD Mazda 6 SSS SSS SSS SSS SSS SSS SSS SSS MAZD Miata SSS SSS SSS SSS SSS SSS SSS
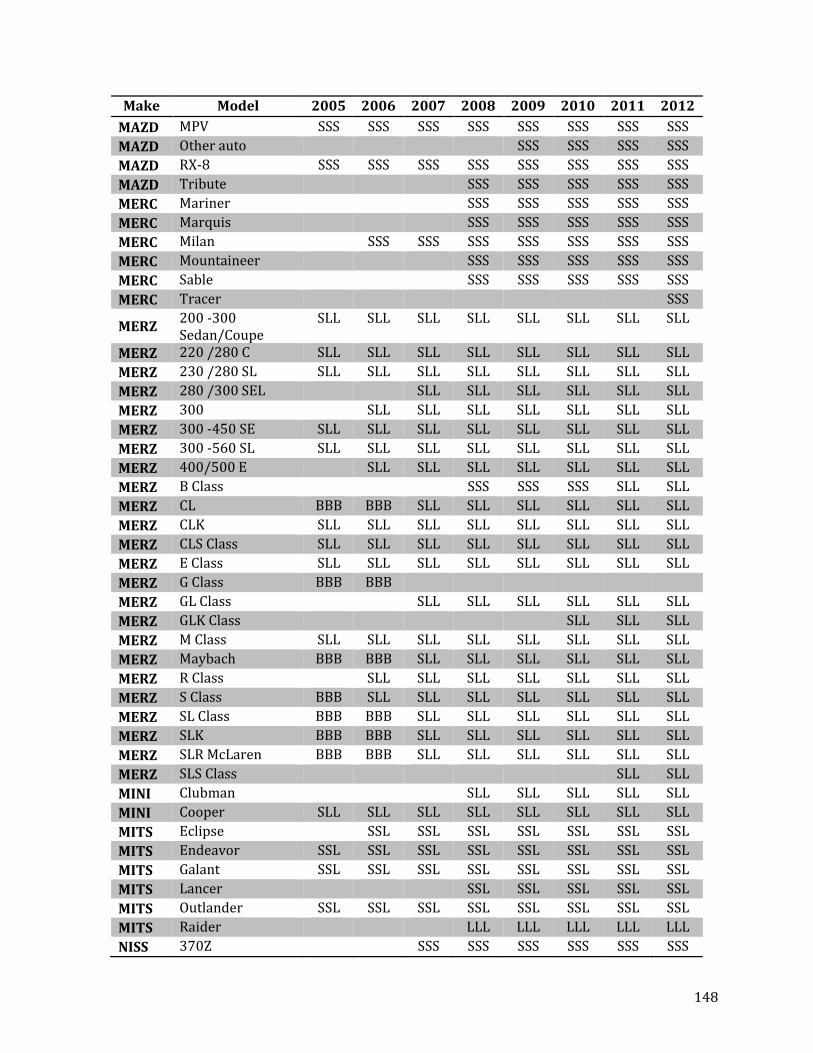
148
Make Model 2005 2006 2007 2008 2009 2010 2011 2012 MAZD MPV SSS SSS SSS SSS SSS SSS SSS SSS MAZD Other auto SSS SSS SSS SSS MAZD RX-8 SSS SSS SSS SSS SSS SSS SSS SSS MAZD Tribute SSS SSS SSS SSS SSS MERC Mariner SSS SSS SSS SSS SSS MERC Marquis SSS SSS SSS SSS SSS MERC Milan SSS SSS SSS SSS SSS SSS SSS MERC Mountaineer SSS SSS SSS SSS SSS MERC Sable SSS SSS SSS SSS SSS MERC Tracer SSS
MERZ 200 -300 Sedan/Coupe
SLL SLL SLL SLL SLL SLL SLL SLL
MERZ 220 /280 C SLL SLL SLL SLL SLL SLL SLL SLL MERZ 230 /280 SL SLL SLL SLL SLL SLL SLL SLL SLL MERZ 280 /300 SEL SLL SLL SLL SLL SLL SLL MERZ 300 SLL SLL SLL SLL SLL SLL SLL MERZ 300 -450 SE SLL SLL SLL SLL SLL SLL SLL SLL MERZ 300 -560 SL SLL SLL SLL SLL SLL SLL SLL SLL MERZ 400/500 E SLL SLL SLL SLL SLL SLL SLL MERZ B Class SSS SSS SSS SLL SLL MERZ CL BBB BBB SLL SLL SLL SLL SLL SLL MERZ CLK SLL SLL SLL SLL SLL SLL SLL SLL MERZ CLS Class SLL SLL SLL SLL SLL SLL SLL SLL MERZ E Class SLL SLL SLL SLL SLL SLL SLL SLL MERZ G Class BBB BBB MERZ GL Class SLL SLL SLL SLL SLL SLL MERZ GLK Class SLL SLL SLL MERZ M Class SLL SLL SLL SLL SLL SLL SLL SLL MERZ Maybach BBB BBB SLL SLL SLL SLL SLL SLL MERZ R Class SLL SLL SLL SLL SLL SLL SLL MERZ S Class BBB SLL SLL SLL SLL SLL SLL SLL MERZ SL Class BBB BBB SLL SLL SLL SLL SLL SLL MERZ SLK BBB BBB SLL SLL SLL SLL SLL SLL MERZ SLR McLaren BBB BBB SLL SLL SLL SLL SLL SLL MERZ SLS Class SLL SLL MINI Clubman SLL SLL SLL SLL SLL MINI Cooper SLL SLL SLL SLL SLL SLL SLL SLL MITS Eclipse SSL SSL SSL SSL SSL SSL SSL MITS Endeavor SSL SSL SSL SSL SSL SSL SSL SSL MITS Galant SSL SSL SSL SSL SSL SSL SSL SSL MITS Lancer SSL SSL SSL SSL SSL MITS Outlander SSL SSL SSL SSL SSL SSL SSL SSL MITS Raider LLL LLL LLL LLL LLL NISS 370Z SSS SSS SSS SSS SSS SSS
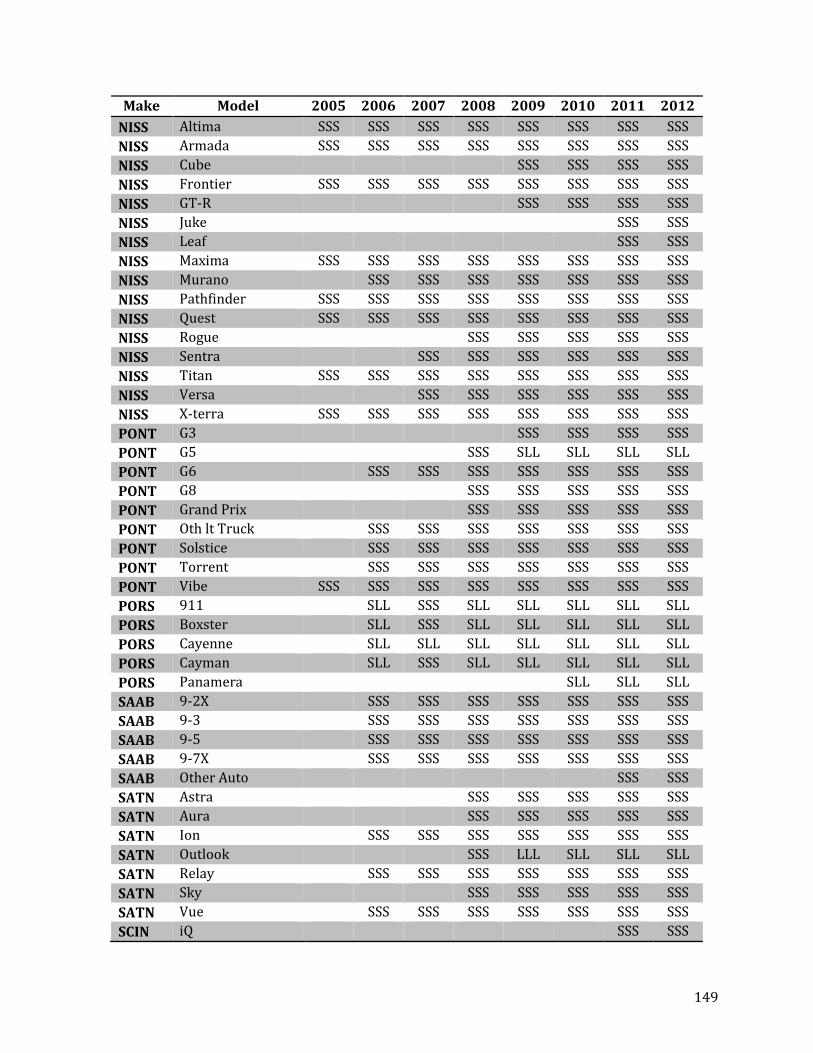
149
Make Model 2005 2006 2007 2008 2009 2010 2011 2012 NISS Altima SSS SSS SSS SSS SSS SSS SSS SSS NISS Armada SSS SSS SSS SSS SSS SSS SSS SSS NISS Cube SSS SSS SSS SSS NISS Frontier SSS SSS SSS SSS SSS SSS SSS SSS NISS GT-R SSS SSS SSS SSS NISS Juke SSS SSS NISS Leaf SSS SSS NISS Maxima SSS SSS SSS SSS SSS SSS SSS SSS NISS Murano SSS SSS SSS SSS SSS SSS SSS NISS Pathfinder SSS SSS SSS SSS SSS SSS SSS SSS NISS Quest SSS SSS SSS SSS SSS SSS SSS SSS NISS Rogue SSS SSS SSS SSS SSS NISS Sentra SSS SSS SSS SSS SSS SSS NISS Titan SSS SSS SSS SSS SSS SSS SSS SSS NISS Versa SSS SSS SSS SSS SSS SSS NISS X-terra SSS SSS SSS SSS SSS SSS SSS SSS PONT G3 SSS SSS SSS SSS PONT G5 SSS SLL SLL SLL SLL PONT G6 SSS SSS SSS SSS SSS SSS SSS PONT G8 SSS SSS SSS SSS SSS PONT Grand Prix SSS SSS SSS SSS SSS PONT Oth lt Truck SSS SSS SSS SSS SSS SSS SSS PONT Solstice SSS SSS SSS SSS SSS SSS SSS PONT Torrent SSS SSS SSS SSS SSS SSS SSS PONT Vibe SSS SSS SSS SSS SSS SSS SSS SSS PORS 911 SLL SSS SLL SLL SLL SLL SLL PORS Boxster SLL SSS SLL SLL SLL SLL SLL PORS Cayenne SLL SLL SLL SLL SLL SLL SLL PORS Cayman SLL SSS SLL SLL SLL SLL SLL PORS Panamera SLL SLL SLL SAAB 9-2X SSS SSS SSS SSS SSS SSS SSS SAAB 9-3 SSS SSS SSS SSS SSS SSS SSS SAAB 9-5 SSS SSS SSS SSS SSS SSS SSS SAAB 9-7X SSS SSS SSS SSS SSS SSS SSS SAAB Other Auto SSS SSS SATN Astra SSS SSS SSS SSS SSS SATN Aura SSS SSS SSS SSS SSS SATN Ion SSS SSS SSS SSS SSS SSS SSS SATN Outlook SSS LLL SLL SLL SLL SATN Relay SSS SSS SSS SSS SSS SSS SSS SATN Sky SSS SSS SSS SSS SSS SATN Vue SSS SSS SSS SSS SSS SSS SSS SCIN iQ SSS SSS
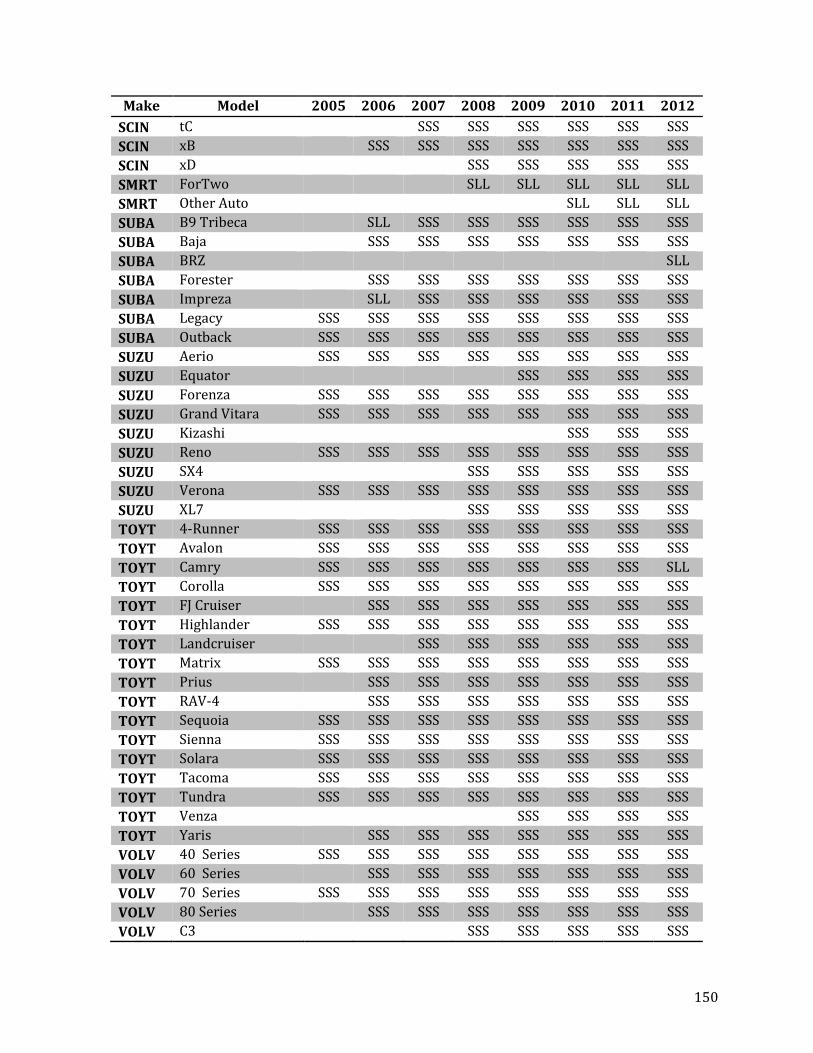
150
Make Model 2005 2006 2007 2008 2009 2010 2011 2012 SCIN tC SSS SSS SSS SSS SSS SSS SCIN xB SSS SSS SSS SSS SSS SSS SSS SCIN xD SSS SSS SSS SSS SSS SMRT ForTwo SLL SLL SLL SLL SLL SMRT Other Auto SLL SLL SLL SUBA B9 Tribeca SLL SSS SSS SSS SSS SSS SSS SUBA Baja SSS SSS SSS SSS SSS SSS SSS SUBA BRZ SLL SUBA Forester SSS SSS SSS SSS SSS SSS SSS SUBA Impreza SLL SSS SSS SSS SSS SSS SSS SUBA Legacy SSS SSS SSS SSS SSS SSS SSS SSS SUBA Outback SSS SSS SSS SSS SSS SSS SSS SSS SUZU Aerio SSS SSS SSS SSS SSS SSS SSS SSS SUZU Equator SSS SSS SSS SSS SUZU Forenza SSS SSS SSS SSS SSS SSS SSS SSS SUZU Grand Vitara SSS SSS SSS SSS SSS SSS SSS SSS SUZU Kizashi SSS SSS SSS SUZU Reno SSS SSS SSS SSS SSS SSS SSS SSS SUZU SX4 SSS SSS SSS SSS SSS SUZU Verona SSS SSS SSS SSS SSS SSS SSS SSS SUZU XL7 SSS SSS SSS SSS SSS TOYT 4-Runner SSS SSS SSS SSS SSS SSS SSS SSS TOYT Avalon SSS SSS SSS SSS SSS SSS SSS SSS TOYT Camry SSS SSS SSS SSS SSS SSS SSS SLL TOYT Corolla SSS SSS SSS SSS SSS SSS SSS SSS TOYT FJ Cruiser SSS SSS SSS SSS SSS SSS SSS TOYT Highlander SSS SSS SSS SSS SSS SSS SSS SSS TOYT Landcruiser SSS SSS SSS SSS SSS SSS TOYT Matrix SSS SSS SSS SSS SSS SSS SSS SSS TOYT Prius SSS SSS SSS SSS SSS SSS SSS TOYT RAV-4 SSS SSS SSS SSS SSS SSS SSS TOYT Sequoia SSS SSS SSS SSS SSS SSS SSS SSS TOYT Sienna SSS SSS SSS SSS SSS SSS SSS SSS TOYT Solara SSS SSS SSS SSS SSS SSS SSS SSS TOYT Tacoma SSS SSS SSS SSS SSS SSS SSS SSS TOYT Tundra SSS SSS SSS SSS SSS SSS SSS SSS TOYT Venza SSS SSS SSS SSS TOYT Yaris SSS SSS SSS SSS SSS SSS SSS VOLV 40 Series SSS SSS SSS SSS SSS SSS SSS SSS VOLV 60 Series SSS SSS SSS SSS SSS SSS SSS VOLV 70 Series SSS SSS SSS SSS SSS SSS SSS SSS VOLV 80 Series SSS SSS SSS SSS SSS SSS SSS VOLV C3 SSS SSS SSS SSS SSS
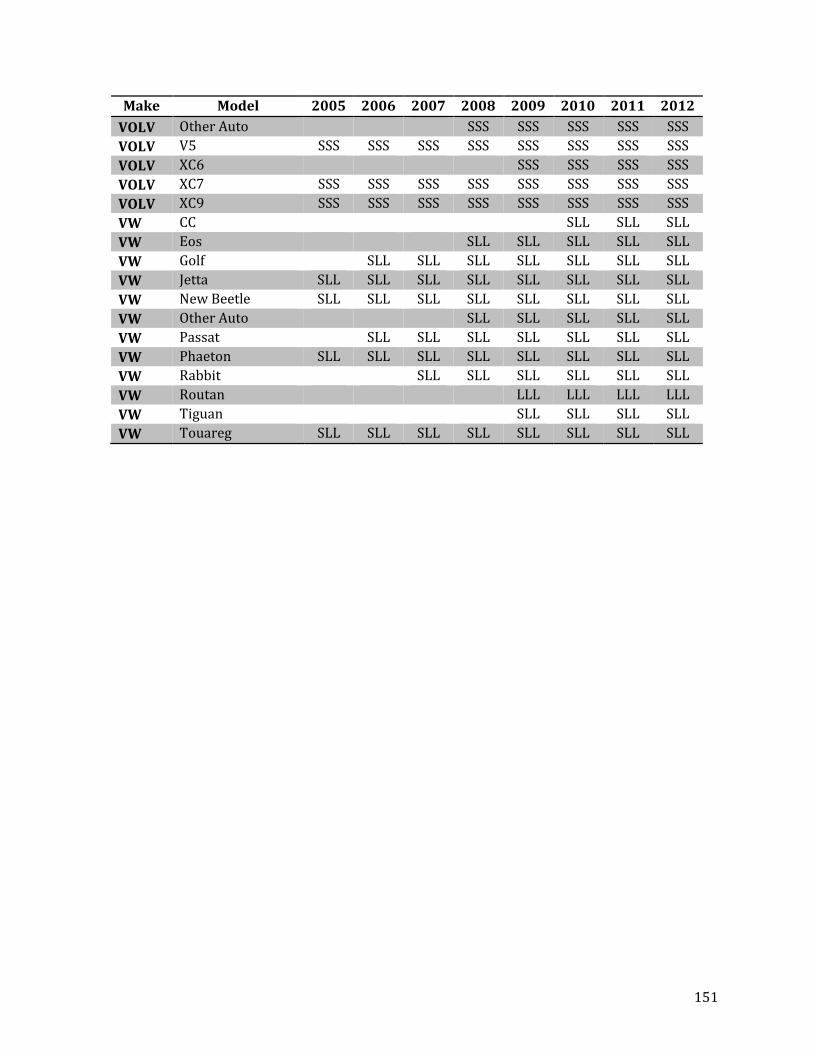
151
Make Model 2005 2006 2007 2008 2009 2010 2011 2012 VOLV Other Auto SSS SSS SSS SSS SSS VOLV V5 SSS SSS SSS SSS SSS SSS SSS SSS VOLV XC6 SSS SSS SSS SSS VOLV XC7 SSS SSS SSS SSS SSS SSS SSS SSS VOLV XC9 SSS SSS SSS SSS SSS SSS SSS SSS VW CC SLL SLL SLL VW Eos SLL SLL SLL SLL SLL VW Golf SLL SLL SLL SLL SLL SLL SLL VW Jetta SLL SLL SLL SLL SLL SLL SLL SLL VW New Beetle SLL SLL SLL SLL SLL SLL SLL SLL VW Other Auto SLL SLL SLL SLL SLL VW Passat SLL SLL SLL SLL SLL SLL SLL VW Phaeton SLL SLL SLL SLL SLL SLL SLL SLL VW Rabbit SLL SLL SLL SLL SLL SLL VW Routan LLL LLL LLL LLL VW Tiguan SLL SLL SLL SLL VW Touareg SLL SLL SLL SLL SLL SLL SLL SLL
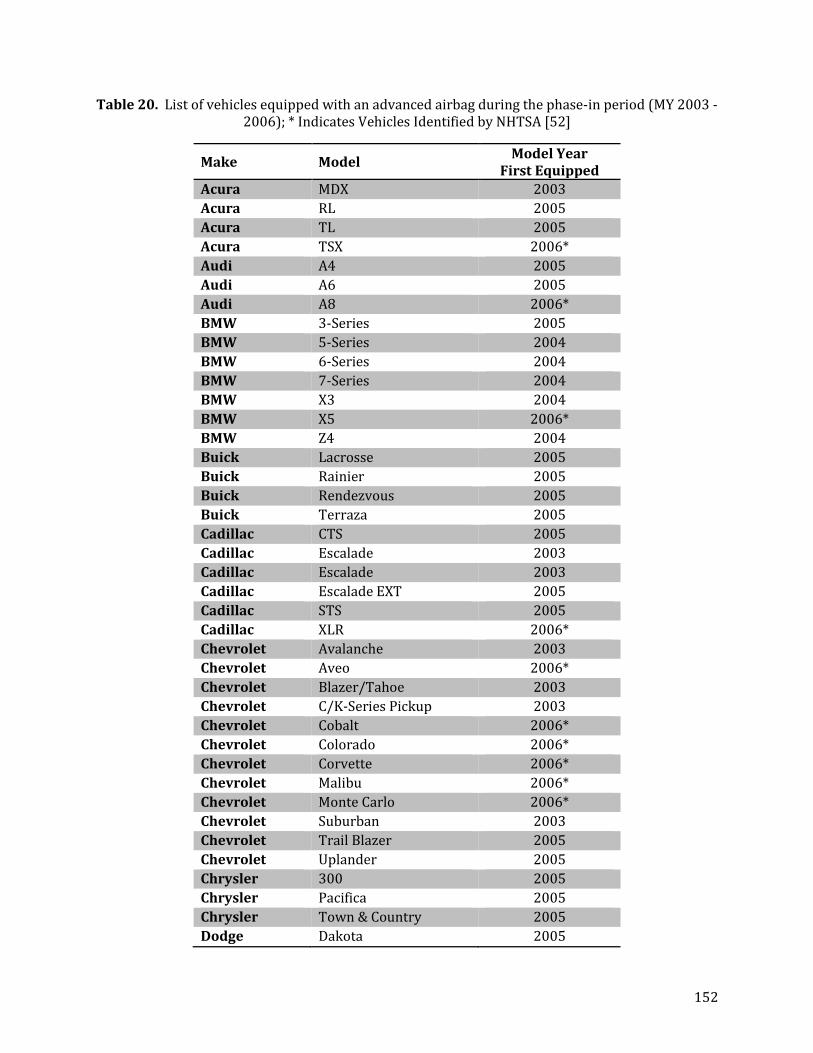
152
Table 20. List of vehicles equipped with an advanced airbag during the phase-in period (MY 2003 - 2006); * Indicates Vehicles Identified by NHTSA [52]
Make Model Model Year First Equipped
Acura MDX 2003 Acura RL 2005 Acura TL 2005 Acura TSX 2006* Audi A4 2005 Audi A6 2005 Audi A8 2006* BMW 3-Series 2005 BMW 5-Series 2004 BMW 6-Series 2004 BMW 7-Series 2004 BMW X3 2004 BMW X5 2006* BMW Z4 2004 Buick Lacrosse 2005 Buick Rainier 2005 Buick Rendezvous 2005 Buick Terraza 2005 Cadillac CTS 2005 Cadillac Escalade 2003 Cadillac Escalade 2003 Cadillac Escalade EXT 2005 Cadillac STS 2005 Cadillac XLR 2006* Chevrolet Avalanche 2003 Chevrolet Aveo 2006* Chevrolet Blazer/Tahoe 2003 Chevrolet C/K-Series Pickup 2003 Chevrolet Cobalt 2006* Chevrolet Colorado 2006* Chevrolet Corvette 2006* Chevrolet Malibu 2006* Chevrolet Monte Carlo 2006* Chevrolet Suburban 2003 Chevrolet Trail Blazer 2005 Chevrolet Uplander 2005 Chrysler 300 2005 Chrysler Pacifica 2005 Chrysler Town & Country 2005 Dodge Dakota 2005

153
Make Model Model Year First Equipped
Dodge Durango 2004 Dodge Caravan & Grand
Caravan 2006*
Dodge Magnum 2005 Ford Crown Victoria 2005 Ford Escape 2005 Ford Five Hundred 2005 Ford Focus 2005 Ford Freestar 2005 Ford Freestyle 2005 Ford Freestyle 2005 Ford F-Series 2004 Ford Mustang 2005 Ford Taurus 2004 GMC C,K,R,V-Series 2003 GMC Canyon 2006* GMC Jimmy 2003 GMC Jimmy/S-15 2005 GMC Sierra 2003 GMC Yukon 2003 Honda Accord 2004 Honda CR-V 2005 Honda Odyssey 2003 Honda Pilot 2005 Hummer H3 2005 Hyundai Elantra 2004 Hyundai Santa Fe 2005 Hyundai Tucson 2005 Infiniti G35 2005 Infiniti FX35 2006* Infiniti M45 2006 Infiniti Q45 2006* Infiniti Qx56 2004 Isuzu Ascender 2005 Jaguar S Type 2005 Jaguar X Type 2005 Jaguar XJ 2005 Jaguar XJ-S Coupe 2005 Jeep Grand Cherokee 2005 Jeep Liberty 2004 Kia Amanti 2005 Kia Sorrento 2005 Kia Spectra 2004

154
Make Model Model Year First Equipped
Kia Sportage 2005 Land LR3 2005 Lexus ES 330 2004 Lexus GX 470 2005 Lexus RX 330 2004 Lexus RX 400H 2005 Lincoln Town Car 2005 Mazda Mazda3 2004 Mazda Mazda6 2005 Mazda MPV 2004 Mazda RX-8 2006* Mazda Tribute 2005 Mercedes C Class 2005 Mercedes CLK Class 2005 Mercedes E Class 2005 Mercury Mariner 2005 Mercury Marquis 2005 Mercury Montego 2005 Mini Cooper S 2005 Mitsubishi Endeavor 2005 Mitsubishi Galant 2004 Mitsubishi Lancer 2006* Mitsubishi Outlander 2005 Nissan Altima 2005 Nissan Armada 2005 Nissan Frontier 2005 Nissan Maxima 2005 Nissan Murano 2006* Nissan Pathfinder 2004 Nissan Quest 2004 Nissan Titan 2004 Nissan Xterra 2005 Pontiac G6 2006* Pontiac GTO 2006* Pontiac Grand Prix 2006* Pontiac Solstice 2006 Pontiac Trans 2005 Pontiac Vibe 2005 Saab 9-2X 2006* Saab 9-3 2006* Saab 9-5 2006* Saab 9-7X 2005 Saturn Relay 2005
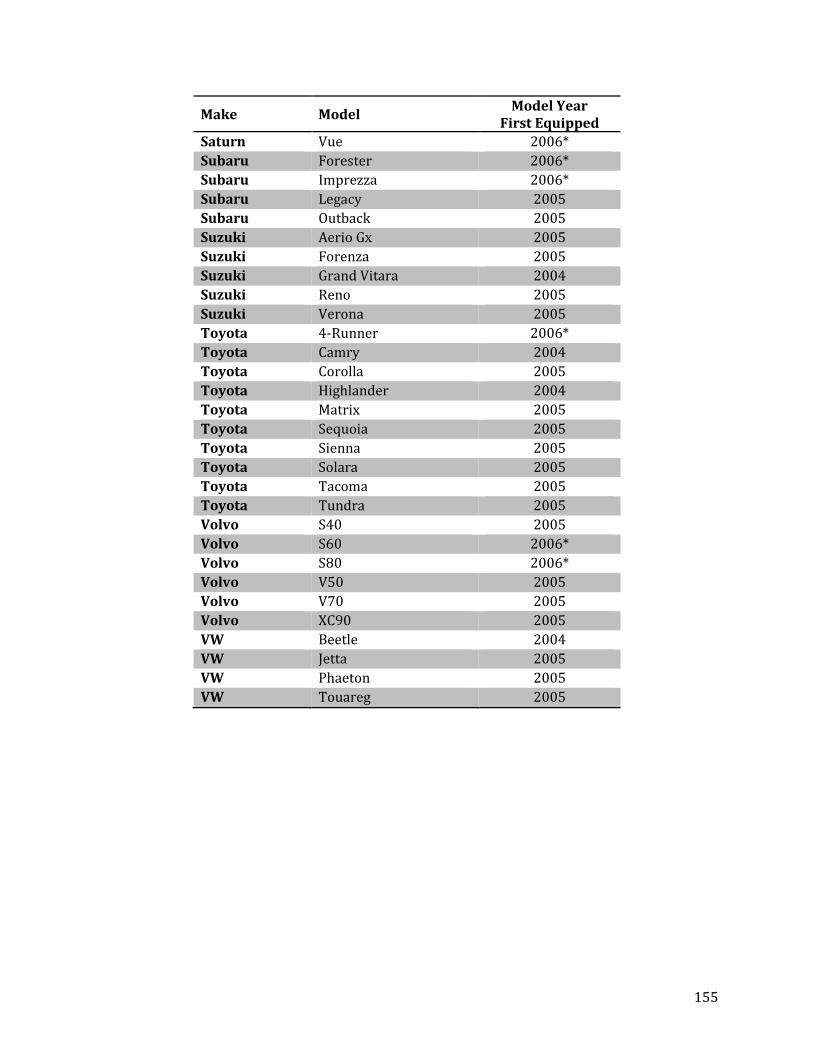
155
Make Model Model Year First Equipped
Saturn Vue 2006* Subaru Forester 2006* Subaru Imprezza 2006* Subaru Legacy 2005 Subaru Outback 2005 Suzuki Aerio Gx 2005 Suzuki Forenza 2005 Suzuki Grand Vitara 2004 Suzuki Reno 2005 Suzuki Verona 2005 Toyota 4-Runner 2006* Toyota Camry 2004 Toyota Corolla 2005 Toyota Highlander 2004 Toyota Matrix 2005 Toyota Sequoia 2005 Toyota Sienna 2005 Toyota Solara 2005 Toyota Tacoma 2005 Toyota Tundra 2005 Volvo S40 2005 Volvo S60 2006* Volvo S80 2006* Volvo V50 2005 Volvo V70 2005 Volvo XC90 2005 VW Beetle 2004 VW Jetta 2005 VW Phaeton 2005 VW Touareg 2005