Environmental & Social Performance Indicators and ...
274
Environmental & Social Performance Indicators and Sustainability Markers in Minerals Development: Reporting Progress towards Improved Ecosystem Health & Human Well-being, Phase III (April 2003 - October 2006) Final Technical Report IDRC Centre File: 101276-001 THE ENERGY AND RESOURCES INSTITUTE (TERI) WESTERN REGIONAL CENTRE GOA, INDIA Research Team Project Leader- Shirin Cooper and P. V. Sridharan Environmental Health specialist - R. Uma Community health specialist - Melba D'Souza Development and Environmental economists: Anand Murugesan, Vikram Dayal, Divya Dutt, Yogita Mehra Biometrician - K. S. Nairy, Meena Sehgal Political sociologist - Saltanat Kazi Biologist - Sangeeta Sonak Environmental scientist - B. Choudri Research assistants - Anuradha Joshi, Jacob George, Satish Padwalkar Consultants and Advisors Political scientist - Dr. Peter R. de Souza, Cardio-respiratory specialist - Dr. S. K. Chabbra Economist - Dr. Sanghamitra Das Artist and social worker - Ms. Milan Khanolkar Submitted: October 2006
-
Upload
khangminh22 -
Category
Documents
-
view
0 -
download
0
Transcript of Environmental & Social Performance Indicators and ...

Environmental & Social Performance Indicators and Sustainability Markers in Minerals Development:
Reporting Progress towards Improved Ecosystem Health & Human Well-being, Phase III
(April 2003 - October 2006)
Final Technical Report
IDRC Centre File: 101276-001
THE ENERGY AND RESOURCES INSTITUTE (TERI) WESTERN REGIONAL CENTRE
GOA, INDIA
Research Team
Project Leader- Shirin Cooper and P. V. Sridharan Environmental Health specialist - R. Uma
Community health specialist - Melba D'Souza Development and Environmental economists: Anand Murugesan, Vikram Dayal, Divya Dutt,
Yogita Mehra Biometrician - K. S. Nairy, Meena Sehgal
Political sociologist - Saltanat Kazi Biologist - Sangeeta Sonak
Environmental scientist - B. Choudri Research assistants - Anuradha Joshi, Jacob George, Satish Padwalkar
Consultants and Advisors
Political scientist - Dr. Peter R. de Souza, Cardio-respiratory specialist - Dr. S. K. Chabbra
Economist - Dr. Sanghamitra Das Artist and social worker - Ms. Milan Khanolkar
Submitted: October 2006
lmantha
Text Box
This report is presented as received by IDRC from project recipient(s). It has not been subjected to peer review or other review processes. This work is used with the permission of The Energy and Resource Institute. © 2006,The Energy and Resource Institute.

© The Energy and Resources Institute 2006
A suggested format fort citing this report is as follows, T E R I. 20o6 Environmental and social performance indicators and sustainability markers in mineral development: Reporting progress towards improved ecosystem health and human well-being (Phase III) Goa: The Energy and Resources Institute - Western Regional Centre. 230 pp.
[T E R I Project Report No. 2002WR41]
For more information about this report, please contact The Energy and Resources Institute (TERI)
Western Regional Centre F - 9, La Marvel colony
Dona Paula - 403 004 Goa, India
Tel: (+91832) 245 6064 / 245 6053 Fax: (+91832) 245 6053 Email: teriwrc (a)sancharnet.in Website: htttr,_t itic tt riin, i tcr% rr
IDRC Centre File: 101276-001 ii
TERI Report no. 2002WR41
Table of contents
Chapter Title Page no.
Acknowledgements ................................................................................................... iv
Glossary of Indian terms .......................................................................................... vi
List of abbreviations ................................................................................................. Vii
Executive summary .................................................................................................. viii
I Introduction ............................................................................................................ 1
2 Valuing environmental-health linkages from air pollution in mining regions..... 6
Air quality monitoring ................................................................................... 12
Health impact analysis .................................................................................. 19
Economic valuation of the cost of ill health .................................................. 34 Health care services ....................................................................................... 39
3 [,and ........................................................................................................................ 50
Impact of mining on agricultural land and employment ............................. 50
Understanding environmental-health linkages: metal uptake in fruit
crops grown on overburden dump ............................................................... 60
4 Governance ............................................................................................................. 72
5 Refinement of tools ................................................................................................ 89
ESPI tool ........................................................................................................ 89
QoL tool .......................................................................................................... 94
Impact adjusted income accounts ................................................................. 96
6 Capacity building and dissemination ..................................................................... 100
Capacity building ............................................................................................ 100
Project outputs and dissemination ................................................................. 107
7 Recommendations, impacts and conclusions ........................................................ 112
Recommendations .......................................................................................... 112
Impacts ........................................................................................................... 120
Conclusions .................................................................................................... 122
References ...................................................................................................... 124
Annexures:
Annexure A ............................................................................................................. 1
Annexure B ............................................................................................................. 24
Annexure C ............................................................................................................. 32
Annexure D ............................................................................................................. 76
IDRC Centre File: 101276-001 iii
TERI Report no. 2002WR41

Acknowledgements
This challenging and innovative study has been possible due to extensive support from various people over the life of the project.
Firstly, we would like to thank IDRC for their continued support over three phases of the project. In addition to the financial support we received support in terms of in depth reviews and feedback, which were extremely valuable for the research. In this regard we would like to specially mention Dr. E. Mota who visited our project provided invaluable feedback regarding the research.
We acknowledge all the members of the Institutional Ethics committee for sharing their time and providing valuable guidance throughout the project, namely Mr. Averthanus D' Souza, Dr. Francisco Couto, Dr. A. Noronha Ferreira, Dr. Uday C Kakodkar, Dr. Sanjyot Pai Vernekar, Dr. Asha Savordekar and Ms. Anuradha Joshi.
We express our sincere gratitude to Dr. S. K. Chabbra, Dr. S. Das and Prof. P.R. de Souza and Ms. Suman Khanolkar for their contributions towards developing and shaping this study, as
consultants to the project.
This study used a participatory approach and over the course of the project, researchers have
met and developed links with various people from industry, government and community. Inputs and feed back from the Goa Mineral Ore Exporters Association (GMOEA), particularly Mr. Sridhar, is acknowledged. Additionally, we would also like to acknowledge the support extended to us by mining companies in carrying out the air quality monitoring exercise and collection of plant samples from overburden dumps, which were crucial to this study. We would like to thank Mr. Mahesh Patil of Sesa Goa for his assistance.
We have had interactions with the various government departments and would like to thank them for their cooperation and for making available secondary data, and sharing with us
their insights and experiences. The Deputy Collector of Bicholim, Mr. Bugde and village Panchayats in the study area requires special mention in this regard. We would also like to acknowledge the support of Dr. Arvind Salelkar, Director, Directorate of Health Services,
Mr. Saxena, Dy. Director, Health Intelligence Bureau, and other staff members from the Directorate of Health Services. Acknowledgement is also due to the health officers and health
care staff attached to the various public health care centers located in the mining regions.
Other government departments that extended support were the State Pollution Control Board, Dept. of Agriculture, the Department of Water Resources, the Public Works Department. Special thanks are due to Mr. Nelson Figueiredo, the Zonal agricultural officer,
and Mr. Parag Rangnekar of the Minerals Foundation who not only provided valuable insights relating to agriculture but also attended several farmers meetings at out request.
From the community, we had extensive interactions with farmers and self help groups,
anganwadi workers, teachers, village level committees and associations. Their participation in our research has been an enriching exercise for us both and would like to thank them for
IDRC Centre File: 101276-001 iv
TERI Report no. 2002WR41

their support and time. We would also like to thank some of the private doctors namely, Dr Surendranath Pokle and Dr Gurudas Naik who without any prejudice extended us time and patient hearing.
We are very thankful to the Field staff, those who canvassed the questionnaires in the field with us, as well as the field technicians who assisted with the health tests and conducted the air quality monitoring exercises. A special thanks is due to some of the field staff, Ms. Milagrina Ferrao, Mr. Suhas Phal Desai, Mr. Prathamesh Tilve, Mr. Sheikh Mubarak and Mr. Surat Alankar who were always willing to assist with fieldwork. We would also like to thank the hospitals that allowed us to carry out the health tests in their premises.
Acknowledgement is due to MYRADA, especially Mr. C. S. Ramesh, Mr. Ramnath and Mr. Venkatesh for their participation in Self-help group training programmes. Additionally, we would like to thank Ms. Swati Kerkar for her inspiring talks as a resource person for women's Gram Sabha programmes.
The research team would like to sincerely thank Dr. Chachadi, Mr. Anibel Ferrus Comelo, Ms. Shilpa Nischal, Dr. R. Tamba and Dr. Varghese Paul for their feedback on the indicator compendium.
Finally, we thank our colleagues Dr. R.K. Pachauri, Ms. Preety Bhandari and Dr. Ligia Noronha and Dr. Sangeeta Sonak, for their guidance and support.
IDRC Centre File: 101276-001 v
TERI Report no. 2002WR41

Glossary of Indian terms
Anganwadi
Gram kruti samiti
Gram Sabha
Mamlatdar
Pancha/Panch
Panchayat
Panchayati Raj
Sarpanch
Shetki committee/ shetkari committee
Zilla Panchayat
Mahila Mandal
Taluka
IDRC Centre File: 101276-001
TERI Report no. 2002WR41
State run village nursery and also the focal point for delivery of services at the community level, to children below six years of age,
pregnant and nursing mothers, and adolescent girls.
Village action committee
Village assembly comprising the adult population of the village
Local magistrate
Elected members of the village Panchayat
The smallest unit of elected local self-government, comprising of a
cluster of villages. Representatives are elected from these villages and constitute the Panchayat.
System of rural elected local government at the village, block and district level
Elected chairman of a village council or Panchayat
Committee or association of farmers in a village
Elected local government body at the district level
An association of women
An administrative unit comprising a number of villages. A number of talukas make up a district.
vi

List of abbreviations
ANM Auxiliary Nurse Midwife AAS Atomic absorption spectrophotometry AQ Air Quality CAO Chronic Airway Obstruction CBHI Central Bureau of Health Intelligence
CIIC Community Healthcare Centre COPD Chronic Obstructive Pulmonary Diseases
DIIS Directorate of Health Services
DTPA Diethylene-triamine-penta-acetic acid
EIA Environmental Impact Assessment
GMC Goa Medical College
RIB Health Intelligence Bureau
IBM Indian Bureau of Mines LHV Lady Health Visitor LR Lower Respiratory MF Minerals Foundation MLA Member of Legislative Assembly
MP Member of Parliament MPHW Multi Purpose Health Worker NGO Non Government Organisation OLS Ordinary Least Squares
PF I' Pulmonary lung Function Test
PHC Primary Healthcare Centre
PM10 Particulate matter smaller than 1o microns PRA Participatory Research Approach PWD Public Works Department RCD Respiratory Communicable Disease
RMD Rural Medical Dispensary RNCD Respiratory Non Communicable Disease
R/P Ratio Reserve to Production ratio RSPM Respirable Suspended Particulate Matter RSQ Respiratory Symptom Questionnaire RTO Road Transport Authority Sc Sub Centre SHG Self Help Group SPCB State Pollution Control Board TB Tuberculosis TEA Total Exposure Assessment
UR Upper Respiratory
IDRC Centre File: 101276-001 vii
TERI Report no. 2002WR41

Executive summary
Executive summary
Background This project was preceded by two earlier phases of research. In Phase I, a conceptual framework for tracking health, well-being and sustainability in mining areas was developed. In Phase II this framework was used to develop a set of three tools to track health and well- being. These tools included a set of Environmental and Social Performance Indicators, a Quality of Life survey tool and Impact Adjusted Income Accounts.
Objectives The main objectives of Phase III of this study are as follows:
Understand environmental health linkages in the context of air pollution in the study area, involving:
o Assessment of exposure to air pollution o Assessment of respiratory health status o Development of an economic model for the valuation of the cost of ill-
health o Assessment of health care services in the region
Assess the impacts of mining on land resources in the region and evaluate the compensation mechanisms in place Assess environmental health linkages in terms of land remediation plans with specific reference to metal uptake in fruit crops To assess the effectiveness of governance in addressing environmental and social impacts of mining Assess how mining affects the well-being of women Develop capacity of stakeholders to better monitor and manage environmental and social problems in the study area. Refinement of the tools developed in Phase II
Approach and methodology This study has followed an Ecohealth approach to explore how the impacts of mining on the environment affect local communities. In keeping with this approach, the project has been participatory, involving people from all three stakeholder groups, namely government, the community and industry through the study. The range of research topics in this project have been addressed through a transdisciplinary team of researchers who have worked together to develop a holistic understanding of factors that affect outcomes in the study area. This project has also paid attention to issues of equity through a focus on gender as a cross cutting issue.
The research methodology has included a mix of qualitative and quantitative techniques including household surveys, seasonal air quality monitoring, health tests, focus group discussions, individual interviews, PRA techniques, laboratory experiments, and observation visits to the field. This combination of methods was crucial in developing an well-rounded understanding of the study area.
IDRC Centre File: 101276-001 viii
TERI Report no. 2002WR41

Executive summary
Results Environmental - health linkages in the context of air pollution The total exposure assessment (TEA) model has been used to study air pollution caused by the transport of ore in the study area. Thus, individual exposure to pollution has been captured rather than ambient air quality. This study has also captured the women's exposure to indoor air pollution generated by the burning of bio-fuels for cooking and included this in the analysis. The studies shows that exposure to air pollution (respirable suspended particulate matter) is high in the mining Clusters and transport Corridors as compared to the control area. Exposure between men and women is similar in the mining and Corridor areas. In the Control, however, women have higher exposure to RSPM. As air pollution from mining is not a significant source of pollution in the control area, high exposure among women in the Control can be attributed to burning of bio fuels in the kitchen. More than go%o of the population in the mining Clusters and Corridor areas are exposed to RSPM levels over 150 pg/m3 which is the threshold level for industrial areas. Similarly, self-reported health assessments and observed health assessments (through chest x-rays and lung function tests) show higher respiratory problems in the mining and corridor areas than in the control group. The table below summarises the patterns emerging in the study area with respect to air pollution and health.
Table I Air pollution and health status results emerging from various data sets'
Reporting of Ambient Average % of people Reported Pulmonary X. ray
air pollution air quality exposure wl exposure lower function (resp
(QOL over 150 respiratory test infections
survey*) illness and TB)
Most stressed Cluster II Corridor Corridor Corridor Corridor Corridor . -Cluster 11
Cluster III Cluster 11 Cluster II Cluster III Cluster II Cluster 11 cluster III
Cluster I Cluster III Cluster III Cluster 11 Cluster III Cluster III Cluster I
Cluster I Cluster I Cluster I Control Cluster I Corridor
Least stressed Control Control Control Control Cluster I Control Control
The QOL survey was conducted in Phase 11. There was no road corridor in the QOL survey.
Table I above shows that the Corridor area is most stressed in terms of air pollution and respiratory health. It also shows that Cluster I, the oldest mining area faces the least stress in terms of respiratory health status and air pollution. This could be a result of a lower intensity of mining as mines approach closure phase, and improved access to health care and education (as explained in Phase II of this study).
In order to value the cost of respiratory ill health in the mining regions an econometric model incorporating total exposure assessment and agricultural model was developed. Data emerging from the health and air pollution component fed into the model to arrive at the cost of ill health in the region.
Results from the RSQ have not been included since the analysis from this data is disaggregated for different symptoms.
IDRC Centre File: 101276-001 ix
TERI Report no. 2002WR41
Executive summary
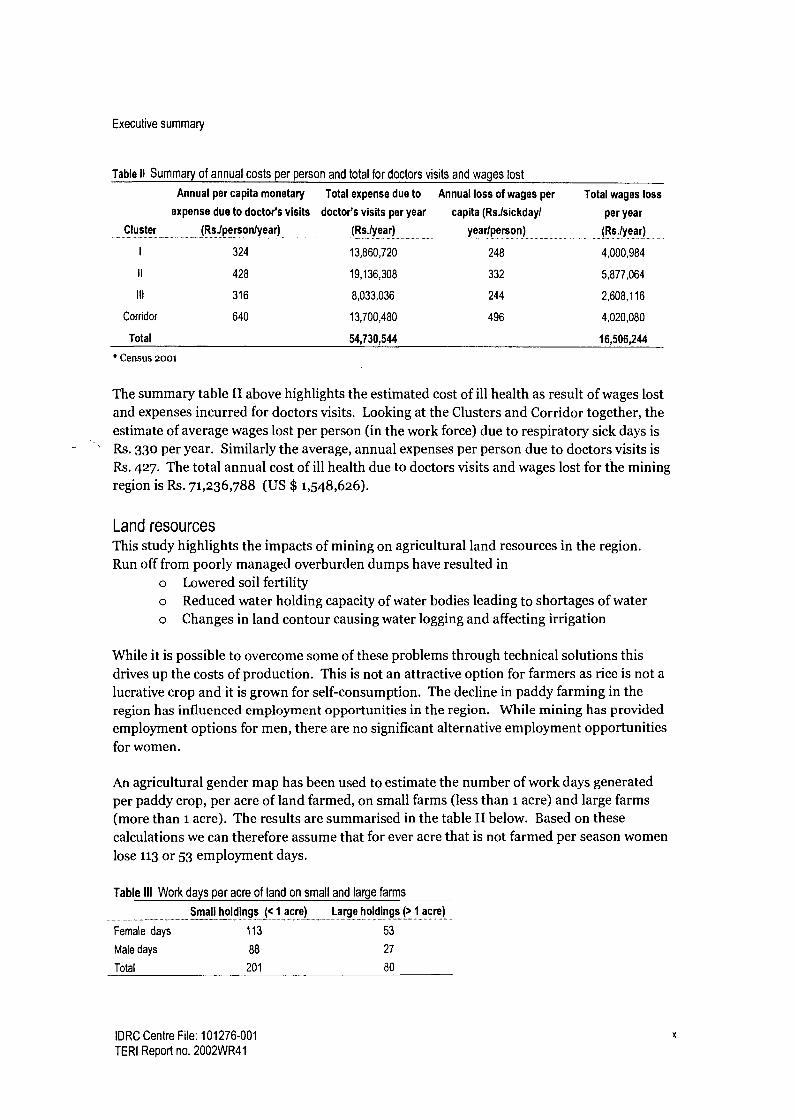
Table II Summary of annual costs per person and total for doctors visits and wages lost
Cluster
Annual per capita monetary
expense due to doctor's visits
(Rs.lperson/year)
Total expense due to
doctor's visits per year
(Rs.lyear)
Annual loss of wages per
capita (Rs.lsickday/
yearlperson)
Total wages loss
per year
(Rs./year)
I 324 13,860,720 248 4,000,984
II 428 19,136,308 332 5,877,064
111 316 8,033,036 244 2,608,116
Corridor 640 13,700,480 496 4,020,080
Total 54,730,544 16,506,244
* Census 2001
The summary table II above highlights the estimated cost of ill health as result of wages lost and expenses incurred for doctors visits. Looking at the Clusters and Corridor together, the estimate of average wages lost per person (in the work force) due to respiratory sick days is Rs. 330 per year. Similarly the average, annual expenses per person due to doctors visits is Rs. 427. The total annual cost of ill health due to doctors visits and wages lost for the mining region is Rs. 71,236,788 (US $ 1,548,626).
Land resources This study highlights the impacts of mining on agricultural land resources in the region. Run off from poorly managed overburden dumps have resulted in
o Lowered soil fertility o Reduced water holding capacity of water bodies leading to shortages of water o Changes in land contour causing water logging and affecting irrigation
While it is possible to overcome some of these problems through technical solutions this drives up the costs of production. This is not an attractive option for farmers as rice is not a
lucrative crop and it is grown for self-consumption. The decline in paddy farming in the region has influenced employment opportunities in the region. While mining has provided employment options for men, there are no significant alternative employment opportunities for women.
An agricultural gender map has been used to estimate the number of work days generated
per paddy crop, per acre of land farmed, on small farms (less than 1 acre) and large farms (more than 1 acre). The results are summarised in the table II below. Based on these
calculations we can therefore assume that for ever acre that is not farmed per season women
lose 113 or 53 employment days.
Table III Work days per acre of land on small and large farms
Small holdings (< 1 acre) Large holdings (> 1 acre) ........ .............. ............. _... _..._............ ........ ...... _._..... ----........ ---..............._....... ................ ..... ......... ....................
Female days 113 53
Male days 88 27
Total 201 80
IDRC Centre File: 101276-001 x
TERI Report no. 2002WR41

Executive summary
Using available data on agricultural land lost to mining over a ten year period the total employment (lays lost per year (including two crops) have been calculated as shown below.
Table IV Total loss of work days per year in agriculture due to mining
Land details Total land in acres Male days Female days Total
Small holdings (< 1 acre) 177
_ ............. _ ......
15576
_....._...... . _ .....
20001
................
35577
Large holdings ( ?1 acre) 863 23301 45739 69040
Total from first crop 1040 38877 65740 104617
Total from second crop 229 8562 14477 23039
Total 1269 47439 80217 127656
Compensation Companies have responded to changes in agriculture by providing compensation to farmers for crop loss. Research reveals, however, that the process of compensation payments is problematic for the following reasons:
Payment of compensation is ad hoc and does not follow a set procedure in terms of setting of rates, recipients entitled, number of payments per year, etc. As a result there is mutual distrust between companies and farmers There is no monitoring of compensation payments by any state agent and no data available on total land area for which payments have been made or number of payments made. The amount of compensation paid is small and therefore does not serve as an incentive towards better dump management by companies.
In addition to companies, there are a range of government departments responsible for regulating mining activities (dump management) and several government departments responsible to manage natural resources (water bodies and agricultural land). However the study shows that their responses have been ineffective in getting companies to comply with regulations and inattentive to farmers needs in the region.
Metal up-take in fruit crops Vegetation of dumps is a crucial part of remediation measures towards stabilising overburden dumps. NGOs, governments and companies have increasingly realised the importance of growing plants/trees that are beneficial to the local community be it in terms of fodder, fuel, or food. While research shows that local communities prefer fruit trees to be grown on dumps it is necessary to study the implications of using mine reject dumps for food crop cultivation. Through laboratory experiments the metal content in biological samples obtained from eight types of fruit trees, and metal content in soil (total and bioavailable) were estimated for five metals (Fe, Mn, Zn, Cr, Ni). Through statistical analysis cashew samples showed significant relationship between metals (iron, manganese, nickel and chromium) in the plant system and that in the biological samples. No such relationship was observed for Zinc. Of the total 55 samples selected, 43 samples showed significant relationship. This indicates that some plants might be accumulating higher quantities of metals, whereas others do not. A major limitation of this study was the absence of enough fruit trees growing on dumps thereby limiting the number of samples available. As a result, further experiments on a trial plot basis are necessary.
IDRC Centre File: 101276-001 xi
TERI Report no. 2002WR41

Executive summary
Governance In terms of governance this study attempted to characterise governance in the study area in terms of responses to air pollution, depleting ground water and deteriorating respiratory health status. The first part of this study involved characterising responses of the three main stakeholders in the study area. Results are summarised in Table V below.
Table V Responses to environmental and social change
Agents
Government
(Panchayats, State
Government Depts.)
Companies
Actions and responses .. .................................. __....................... ..... .. _ ..... ............... .. ................. . ...........
Poor enforcement of legislation, lack of monitoring of envt. and social changes (no data available),
lack of clear policies on how to respond to specific problems, not enough consideration given to
equity in decision making, responses are unsustainable
Poor compliance with the rule of law, offer temporary solutions to problems caused by mining, lack of
transparency in decision making and actions, lack of company policy on various issues leading to ad
hoc responses
Community Ad hoc responses to problems, very few civil society groups at the local level through which to
address issues, willing to compromise on health and well-being for employment, lack of consensus
building and attention to equity
The study, focusing on decision making, attempted to identify the motivations and influences on decisions made in response to environmental and social change. Key factors that emerged from the study are listed below:
Table VI Factors influencing responses of agents
..Agents Factors influencing responses _..._ ......
Government Pressure from political and industrial lobby groups
Lack of coordination / data sharing between departments
Graft
Village politics
Party politics
Companies Lack of commitment to CSR
Profit motive
Size of company
Community Nature and intensity of impact
Lack of unity/village politics
Dependence on mining for employment
Lack of leadership
Lack of information and knowledge
Age of mining
Financial constraints
Findings from this component of the study suggest that all three agents need to respond more effectively to changes in the environment and to impacts on the community. While a
robust legislative framework is necessary to address these problems, it is clearly not enough to tackle the impacts of mining. While companies need to pay more attention to their legal/statutory obligations and corporate social responsibilities, the state needs to play a
more proactive role in monitoring and responding to changes within mining ecosystems by ensuring compliance within industry. The catalyst for this kind of change needs to come from civil society through calls for more information, more transparency and demands for
IDRC Centre File: 101276-001 xii
TERI Report no. 2002WR41

Executive summary
more accountability. The project has attempted to address these lacunae through capacity building programmes for the local community and through the Indicator tool for government and companies (both discussed below).
Refinement of tools Findings flowing from these components of the study were used to refine the three tools developed in Phase II.
The Impact Adjusted Income Accounts taken up in Phase II attempted to value the environmental and social costs of mining and accordingly adjust income obtained from mining to reflect true income. One of the limitations in this project was the assumption in valuing health costs of air pollution that the dose response function for developed countries hold true for the study area. Additionally, there was a lack of sufficient information on cost of treatment and disability due to illness. In Phase III, we have improved on this by developing an econometric model to value the health costs of air pollution (as described above).
Table VII below summarises cost estimates from Phase II and Phase III. Cost estimates through the model developed in this project suggest that costs incurred are much higher than those based on developed country models.
Table VII Comparing annual cost estimates from Phases II and III (Rs. `000)
Cluster Phase U
Lower estimates Higher estimates
Total annual wage Annual medical Total annual
loss expenses wage loss
I 42.4 29.43 42.4
11 2,043.9 1,420.13 2,043.9
III 829.28 576.2 829.28
Corridor - - -
Total 2,915.58 2,026.22 2,915.58
Phase III
Annual medical Total annual wage Annual medical
expenses loss expenses
72.99 4,000.98 1,3860.72
3,521.83 5,877.06 1,9136.31
1428.94 2,608.116 8,033.04
- 4,020.08 13,700.48
5,023.76 16,506.24 54,730.54
The Environmental and Social Performance indicators developed in Phase II were also refined in Phase III. Maintaining the indicator hierarchy used in Phase II, the indicators were revisited with the following in mind:
Feasibility and practicality of data collection Level of data collection and analysis Spatial scale of data Applicability to other metallic mining regions Incorporation of principles of good governance Gender sensitivity
The process of refinement also included the development of a set of guidelines for use by companies and governments.
IDRC Centre File: 101276-001 xiii TERI Report no. 2002WR41

Executive summary
The Quality of Life survey tool was also revisited in Phase III in order to ensure that any issues emerging through the research were covered and in order to improve clarity of questions where needed. At the conceptual level there were no changes made to the QoL tool. Most of the domains and sub-domains that were developed in Phase II have been retained in the final version of the tool. Some sub-domains were eliminated, though the questions were retained and reorganized under relevant sub-domains in order to maintain logical links with the domains. Additionally, a similar reorganization was also carried out within the sub-domains where some questions were regrouped and reorganised into other sub-domains with the same purpose.
A few questions have been added to the Biomedical domain that emerged as important issues through the health component of the project.
Capacity building In addition to research, this project also included a capacity building component. Issues that emerged through the research were addressed in this component of the project. Capacity building focused on empowering local community and local elected representatives to ensure that they have the skills and knowledge required to respond to environmental and social impacts of mining. Specifically, programmes and initiatives focused on the following:
Strengthening local level institutions in the study area ( farmers' groups and women's micro credit groups) Enhancing the skills and knowledge of local level representatives enhancing gender sensitivity Disseminating useful information on health (respiratory problems, nutrition, sanitation) Creating opportunities for discussion and dialogue among stakeholders
Outputs 1. Compendium of Environmental and Social Performance Indicators for metallic
mining regions in India 2. Quality of life survey tool 3. Economic model to value health costs of air pollution 4. Training manual for self-help group trainers
IDRC Centre File: 101276-001 xiv
TERI Report no. 2002WR41

Chapter 1: Introduction
Chapter 1: Introduction
Background Iron ore mining has been an integral part of the Goan economy for the past fifty years. Mining and allied activities have contributed to the state gross domestic product and simultaneously provide employment to a large percentage of the rural population in the mining belt. Goan iron ore also forms the bulk (60%) of iron ore exports from the country.
Yet, as it is commonly known, the benefits of mining are not without their attendant problems. Mining activities have had an impact on the natural environment, namely air, surface and groundwater and the land adjacent to the mine sites. In addition to changes in the biophysical sphere, the presence of mining for several years has altered the socio-political landscape creating new axes of power and dependence. Collectively, these changes have profound impacts (both positive and negative) on the health and well-being of mining communities.
In Phase I of this project contributed a conceptual framework for the development of a set of tools to track health and well-being and sustainability in mining regions. In this phase, issues of concern in the study area were identified and validated through interaction with stakeholders,
In Phase II these issues of concern were used to develop a set of three tools to track sustainability, health and well-being in the region. The three tools included the following:
Environmental and Social Performance Indicators (ESPI): a set of indicators to be used by government and industry to track sustainability and well-being in the region.
Quality of Life survey (QoL): a household questionnaire survey intended to track well-being of mining communities. This survey consists of an objective section to track material conditions and a subjective section that assesses people's satisfaction with their lives and living conditions.
Impact adjusted income accounts: adjustment of income obtained from mining by accounting for social and environmental impacts.
Objectives The final phase of research (Phase III) has focused on further exploring issues that constrain or hinder health and well-being in a mining context and on using these findings to refine the three tools developed in Phase II.
Research in Phase III is guided by the following set of questions: What are the most significant determinants of health and well-being with reference to the following domains: biophysical, social, economical, biomedical and political?
IDRC Centre File: 101276-001
TERI Report no. 2002WR41

Chapter 1: Introduction
What are the reported and observed health conditions of men, women and children in the study villages? How can we improve the assessment of the economic burden of ill - health due to air pollution? What are the institutions of health care in the region? What is the level of access and use of these facilities? Has mining affected the well - being of women differently, and what kind of policy interventions can be put in place? How does mining impact land resources in the region and what is the compensation mechanism in place to address these externalities? How can we improve recommendations for land reclamation with specific reference to metal uptake in fruit crops Who are the actors involved in governance relating to health and well-being issues in the mining region? (Namely air quality, water supply and health-care services) How effective is governance in terms of these issues in a mining context? What are the factors/components that promote or hinder good governance? What measures can be taken to strengthen governance in the mining region
In addition to the research, Phase III has also included a capacity building component that focused on working with stakeholders to improve health and well-being outcomes in the study area.
Project implementation and management The research agenda for Phase III included research related to three broad themes as follows: Land related issues
0
0
Impact of mining on agricultural land Impacts of declining agriculture on employment opportunities for women Compensation mechanisms in place Metal up take in fruit crops used for land remediation
Health related issues Assessment of air pollution in the study area Assessment of respiratory health status in the study area Development of an economic model to value the cost of ill health as a result of air pollution Assessment of health care services in the region
Governance Characterisation of governance in the region with respect to changes in air quality, changes in ground water, and in terms of tracking health status in the region Assessment of factors that influence responses to changing environmental and social systems
IDRC Centre File: 101276-001 2
TERI Report no. 2002WR41
Chapter 1: Introduction
Gender Additionally, gender was explored as a cross-cutting issue in all three themes addressed. In terms of gender, issues that are crucial to women have been specifically probed, such as the
impact of mining on groundwater and the loss of agricultural livelihoods among women.
Within other components of the project, where possible, data has been disaggregated by
gender in order to check whether there are significant differences between men and women
in terms of their health and well-being, in terms of the impacts of mining, and in terms of their agency to affect change.
Methodology The study area as defined in Phase II has been adopted in Phase III and includes 53 villages
in the mining regions of Goa classified into three Clusters based on the age of mining. Cluster I is composed of villages where mining has been present for >40 years, Cluster II >
25 years and Cluster III > 15 years. For the health and air quality components of this study an additional area (Curchorem) that is used extensively for the transport of ore but where there is no active mining was selected as a Road corridor. Additionally, a village which has
no transport routes running through it and no active mining but is in the same geographical region was selected as a Control village (Rivona).
Given the breadth of topics addressed in this research agenda, a variety of qualitative and
quantitative methodologies were used including household surveys, seasonal air quality monitoring, health tests, focus group discussions, individual interviews, PRA techniques, and
observation visits to the field. A detailed description of methods used for each component of the study is presented in the following chapters dedicated to each theme.
Disciplinary orientation A transdisciplinary orientation was necessary for this study given the broad range of issues
addressed. The team consisted of individuals with varied backgrounds including statistics, environmental science, economics, political science, public health, hydrogeology, microbiology, agriculture etc. Each team member has brought with them a unique educational background and work experience that has allowed us to characterise problems in the study area more holistically. The study has been enriched by the variety of perspectives that have emerged from our transdisciplinary team.
Additionally, the project engaged four consultants who are experts in their field and assisted with various components of the research. These included a cardio-respiratory specialist, Dr. S. K. Chabbra, from the Vallabhai Patel Chest Institute, New Delhi, who was involved in the health component of the project. He contributed to the study design, reviewed clinical tests and guided the analysis of health data. Dr S. Das, an economist at Delhi University provided guidance for developing an econometric model to value the cost of ill-health. Dr. P. R. de
Souza, a political scientist at the Centre for the Study of Developing Societies (CSDS), New Delhi, acted as a consultant for the governance component of the project. Ms. Milan Khanolkar, an artist and social worker, worked with the TERI researchers to implement the Training for Self-help group Trainers programme that spanned ten months. She also assisted with documenting the work done and provided illustrations for the manual that has
IDRC Centre File: 101276-001 3
TERI Report no. 2002WR41

Chapter 1: Introduction
been developed. These consultants provided very specific and relevant inputs for the various components in the project.
Involvement of stakeholders Given the stress on participatory techniques, across all three phases this project has, interacted closely with non-researchers: in defining the problem, testing the earlier tools and now addressing the research issues in Phase III. As TERI has been engaged in research and capacity building in the mining areas for several years, we have developed a rapport with people in the community and the mining industry which has been extremely valuable in eliciting participation and cooperation from these stakeholders during the course of the project. Meetings with various stakeholders such as representatives from mining companies, village Panchayats, local hospitals and the community were held from time to time and their inputs were incorporated to improve the study methodology. Focus group meetings and discussions were very central to the research process.
Research ethics Given that this project had a strong health focus and the methodology included health tests, some key steps were taken to ensure that ethical standards were maintained through out the project, including the following:
An Institutional Ethics Committee was constituted based on the Indian Council of Medical Research (ICMR) guidelines and included the following: a medical scientist, clinician, legal expert, social scientist, philosopher, community representative and a
representative from the government. The Committee gave its clearance to the project, and provided valuable feedback and guidance through the life of the research. In all, six meetings were held with the Committee, during which the Committee members were updated about the progress of the study and their views and opinions were sought on various ethic- related issues. Participants in the study were informed of the objectives of the project and informed consent was obtained for involving the participants, including children in the study. Participants were free to withdraw from the study at any time. Follow-up visits were taken up for participants whose health tests indicated health problems. Additionally it was made certain that these participants visited their local health centre or family practitioner.
Scientific management In order to maintain a level of rigour in terms of the research findings, all the components of this project were peer reviewed by colleagues in TERI, New Delhi. Several team members from Goa travelled to Delhi for these meetings and presentations resulted in discussion and several valuable points for further consideration. Additionally, as part of the project team was based in Delhi, this trip presented an opportunity for most of the team members to interact and discuss plans for further integration of findings before October 2006. Additionally, we have had regular visits by various IDRC reviewers, who have provided useful comments and feedback.
IDRC Centre File: 101276-001 4
TERI Report no. 2002WR41

Chapter 1: Introduction
Project administration Given the vast scope of the project, the research agenda was broken down into four sections in order to facilitate efficient management. The team members interacted regularly with each other ensuring that there was a free flow of information and sharing of insights. There has been continuous interaction through face-to-face meetings, short reports, presentations and email communications. In order to improve interaction with team members located in Delhi an audio conferencing facility was set up, which allowed all the members from Delhi to participate in group discussions.
Three months into the project, the Principal Investigator had to relocate to TERI's head
office in Delhi and nine months later the PI went on extended leave from TERI. At this time a new project coordinator was selected from the existing team to lead the project for the rest of the duration.
This project was supposed to end on 15th April 2006. However, in consultation with IDRC a
six-month extension for this project has been sanctioned. We are grateful for this extension since it provided us with the opportunity to continue with some capacity building programmes for Self-help group trainers, to conduct further analysis of data gathered and to integrate the vast findings generated through the various components of this project.
Structure of the report This report has been broken down into 7 chapters and also includes an Annexure volume. Chapter I orients the reader by providing the background to this project, an overview of the research questions, and describes the implementation and management of the project. Chapter II presents findings from the air-pollution and health component of the study. Chapter III addresses the land related topics addressed in this project, namely the impact of mining on agriculture, further impacts on employment, especially for women and an analysis of metal up take in fruit crops grown on overburden dumps. Chapter IV presents a synthesis of three detailed governance case studies taken up in the project on air pollution management, ground water management and health care data management. Details of each case study are included in the Annexure volume. Chapter V includes a summary of work undertaken to refine the three tools developed in Phase II. Chapter VI presents the capacity building work undertaken, dissemination efforts and an overview of project outputs. Chapter VII includes a list of recommendations that have emerged from the project, the teams assessment of the impacts of this project and concluding remarks based on the teams assessment of the project as a whole.
The Annexure volume consists of four parts (A-D) corresponding to Chapters II, III, IV and V and includes material relevant to each of these chapters.
IDRC Centre File: 101276-001 5
TERI Report no. 2002WR41
Chapter 2: Valuing environmental - health linkages
Chapter 2: Valuing environmental-health linkages from air
pollution in mining regions
Introduction Mining and associated activities contribute to environmental degradation that leads to adverse heath impact on the population. Air pollution is one of the major environmental hazards related to mining and associated activities. In the mining regions of Goa, trucks plying through residential areas transport ore from the mine site to loading points along the river where the ore is loaded into barges that move down the river to the sea port. Poor management practices like overloading of trucks, speeding on poor roads and inadequately covered trucks lead to spillage of ore in transit. Continuous movement of trucks along road corridors leads to re-suspension of this ore. Fuel emissions from these trucks also add to the pollution levels. Additionally, ore crushing plants, mine pits and overburden dumps, located in close proximity to residential areas, also contribute to deteriorating air quality. As a result of this, in mining areas, workers and the local community are exposed to high concentration of dust/particulate air pollution.
Fine dust particles less than io microns in aerodynamic diameter (PMio) are in the respirable range and are responsible for health effects. These soluble air particles (PMio) pass into the blood stream after inhalation and deposit in the lung alveoli in the respiratory system. The site of deposition of the inhaled air particles determines the clinical response. (Health Canada 2003)
Long term exposure to ambient air pollution can cause acute and chronic respiratory diseases such as bronchitis, pulmonary tuberculosis, bronchial asthma, emphysema, upper respiratory illness, cor pulmonale, viral infections like pneumonia, pulmonary irritation and heart problems. Exposure to high levels of particulate air pollution can also cause impaired foetal and infant growth and development (UNEP, UNICEF and WHO 2002).
Literature also points to adverse impacts of inhalation of iron ore or oxides of iron. According to Walczak-Drzewiecka, et.al., (2003) PMIO and PM2.5 particles from oxides of iron (ferrite, ferrous) cause dysfunction of the respiratory and immune system. Similarly, inhalation of soluble iron ore particles causes cardiopulmonary toxicity with acute or sub acute ozone-induced pulmonary inflammation (Gurgueira et. al., 2002). Inhalation of iron ore dust can also lead to diffuse micronodular lesions in both lung fields and restrictive ventilatory defect. If deposited within a fibrous nodule it can lead to pulmonary siderosis (Yu et. al. 1993). Inhalation of iron ore (radon daughters) and taconite fibres (type of iron ore) mined near Lake Superior have been seen to cause cancer of the lung, bronchus, and trachea (Hemphill 2003).
In developing countries, families with poor economic status use unprocessed solid biomass fuels for cooking and are consequently exposed to high indoor levels of particles, carbon monoxide and other pollutants. This is cause for further serious respiratory health problems.
IDRC Centre File: 101276-001 6
TERI Report no. 2002WR41

Chapter 2: Valuing environmental - health linkages
An individual's exposure to air pollution is dependent on the location of the home relative to the road, occupation, cooking fuel being used and the duration of time spent in polluted areas. Further respiratory health problems in the mining area depends on exposure levels and a variety of socio-economic factors such education, access to health care, nutritional status etc.
It is clear that many epidemiological studies have linked particulate matter exposure to a series of significant health problems, including aggravated asthma, increase in respiratory problems like painful breathing, chronic bronchitis, decreased lung function and premature death (USEPA 2000, Tetre, et. al. 2002, Burnett, et. al. 2000). However, most of the existing evidence on health impacts of air pollution is primarily based on studies conducted in developed countries. Studies on quantitative assessment of exposure to air pollution and health impacts in developing countries are limited.
This study attempts to identify the extent of respiratory illness in the community as a result of exposure to particulate matter and to value the cost of ill health as a result of air pollution in the mining regions of Goa. By estimating the levels of particulate pollution to which people are exposed rather than simply measuring ambient air pollution this innovative study attempts to analyse the links between air pollution and ill health taking into account exposure to different sources of air pollution, including the burning of bio-fuels.
Specifically, this part of the study includes the following components: Estimation of exposure to air pollution in the study area Assessment of respiratory health status in the study area through subjective (self- reported) and objective (health tests) Development of an economic model using the cost of illness approach to value to the cost of ill health related to air pollution Assessment of health care services in the region
Each of these components is addressed in sections in this chapter.
Methodology Sample selection The study area has been broken into the three mining Clusters (as defined in Phase II), a
Road corridor area and a Control area. The three Clusters are active mining areas that have been classified according to the age of mining. Thus, Cluster I is the oldest mining area, followed by Cluster II, and III. The Road corridor has no active mining, but is an area through which there is heavy movement of trucks involved in the transport of ore. The
Control area is a village that is in the same geographical region but has no active mining.
A sample from the population was identified for administering a household survey, health tests and carrying out air quality monitoring. Using the previous studies conducted by TERI (1997) in the mining area and research conducted under Phase II of this study a sampling list
of villages was prepared. Baseline information such as demographic profile, worker profile, job type, fuel usage, housing characteristics and health data were collected. Additionally,
IDRC Centre File: 101276-001 7
TERI Report no. 2002WR41

Chapter 2: Valuing environmental - health linkages
available secondary information on air pollution levels was considered for sample villages. Based on this a total of 331 households were selected from across three mining Clusters, the Road Corridor and the Control village. Table 2.1, below, provides the list of villages chosen,
the number of households selected in each village and the number of individuals selected to participate in the study.
Table Sample size distribution across villages and clusters
Area Villages Total households Male Female Total Individuals
Cluster I Piligao 37 94 84 178
Cluster II Surla, Pale, Pissurlem 101 233 232 465
Cluster III Sanvordem, Codli-Kiriapal 85 199 202 401
Corridor Curchorem 40 94 86 180
Control Rivona 47 95 93 188
Total 310 620 604 1412
Air pollution exposure assessment Air pollution monitoring Air pollution monitoring in the study involved monitoring of respirable suspended particulate matter (RSPM) levels in important micro-environments where people spend their time, namely:
i. Cooking area during cooking 2. Living room 3. Outdoors 4. Working area (for mining workers and truck drivers)
Ambient and living room micro-environments were monitored for a period of 24 hours. In the cooking micro environment monitoring was carried out during the cooking period (covering 2 or 3 meals cooking in a day) which last about 2 -3 hours in a day. RSPM
monitoring in the working place was carried out for working hours in a day (about 8 hours) with the help of low volume personal air samplers.
Time budget survey A time budget survey (which was a part of the individual survey, discussed below) was conducted among all members of the household on the basis of a 24-h recall. The time budget questionnaire was designed to collect information on time spent by each member in various micro environments and the type of activity they were involved in, in that micro environment on a normal day in the season when the monitoring was carried out. For children, time activity information was collected from their mother.
Time activity patters and concentrations measured in the micro environments were used to reconstruct exposure levels as shown below.
IDRC Centre File: 101276-001 8
TERI Report no. 2002WR41

Chapter 2: Valuing environmental - health linkages
Eij = Ek=, tom = Cijk . tik
Where: Eij = the exposure of the ith individual to the jth type of pollutant, Cijk = the concentration of pollutant type j measured in the kth microenvironment of ith individual tik = the amount of time spend by the ith individual in the kth microenvironment. m = the number of micro-environments
Health assessment Review of secondary data Secondary data on respiratory morbidity available from the Directorate of Health Services (DHS) in Goa was collected and analysed to have a preliminary assessment of respiratory health in the study area.
Questionnaire survey Primary data collection for the health component of the project included a household survey and an individual survey. The first was administered to the head of the household and included general demographic information, nutritional status, household income, education levels, housing characteristics, cooking practices, household health expenditure, etc. The individual survey questionnaire was administered for each member of the household to gather detailed information on personal habits such as smoking, occupation, environmental conditions of the home and work place, mode of transport to work, averting activities followed to reduce the impact of air pollution, awareness about air pollution, costs of treatment etc. The questionnaires was translated into the local language and pilot tested among 3o households. Based on the feed back from pilot test, the final questionnaire was revised and administered to all participants in the study group.
Respiratory symptom questionnaire Health status of all participants was assessed for health ailments with particular reference to respiratory problems. This is a standardized respiratory questionnaire that incorporates questions pertaining to respiratory symptoms and is used by the British Medical Research Council to detect respiratory illnesses in individuals. This questionnaire was administered as part of the individual survey, which was carried out by trained social workers.
Health diaries Each household participating in the study was asked to maintain a health diary in a specified format. The diary included type of illness, day of illness, visits to the doctor, work lost, cost of treatment and days of illness. The household health diaries were given to all subjects during the first survey and with an explanation of how to fill in the data in the local language (konkani/ Marathi). During the re-visits it was observed that very few participants had filled in the health diaries. The local assistants then filled in the required information in the health diaries every six months. The diary was collected twice during the project. As a result of poor compliance among most of the subjects the health diaries data gathered did not serve the full purpose and was not used for analysis.
IDRC Centre File: 101276-001 9
TERI Report no. 2002WR41

Chapter 2: Valuing environmental - health linkages
Recall survey A recall survey was used to ascertain the specific health problems of each individual in each household. Participants could understand the specific symptoms asked in the recall survey and were able to recall the specific illness that occurred in the past 2 weeks. There were no difficulties in gathering the information from subjects.
Health tests Each voluntary subject in the study was administered a chest X-ray and pulmonary function test (PlT). The pulmonary function tests (lung function test) were carried out by trained technicians.
Clinical diagnosis Data gathered through the Respiratory Symptom Questionnaire (RSQ) (part of the health survey) and results from health tests (chest X-rays and lung function tests (LFT) were analysed together for each participant in the study to estimate health status of the study population. This analysis was conducted by Dr. Chhabra, a cardio-respiratory health specialist who is a consultant to this project.
Follow-up All chest X-ray reports were provided to the subjects after the radiologist and the consultant's diagnosis. Additionally abnormal X-rays were given to participants for their perusal and were collected from them after their treatment to refer to them during the sutdy. Subjects whose chest x-rays were found to have deviation from normal or suggested underlying/ potential problems were referred to their local doctors in the area for follow-up and required treatment. The subjects were re-visited with regard to the concerned treatment and follow- up. Subjects who were identified with active tuberculosis (TB) in the study area were motivated and encouraged to seek DOTS (directly observed treatment, short-course) treatment at the respective health centres for follow-up. A few subjects preferred to approach their local private doctors in the area.
Institutional ethics committee An Institutional Ethics Committee consisting of seven members was set up at the beginning of the project in keeping with guidelines of the Indian Council of Medical Research (ICMR). This committee met six times over the course of the project and reviewed the methodology followed and researchers' interaction with the local community in the health component of the study. All recommendations made by the committee have been strictly complied with over the life of the project.
Economic valuation A major limitation of the Phase II study was the assumption, in valuing health costs of air pollution, that the dose response functions for other countries hold true for the study area. To overcome this limitation, an economic model establishing the links between (1) air pollution and health, and (2) health and economic benefits has been developed under the guidance of Dr. S. Das, (Professor of Econometrics at the Indian Statistical Institute) who has worked on this project as a consultant.
IDRC Centre File: 101276-001 10
TERI Report no. 2002WR41

Chapter 2: Valuing environmental - health linkages
The modelling exercise used data generated through air quality monitoring, the health tests and the survey to develop a relationship between exposure and health status. This information was then used to value the cost of illness due to air pollution. The micro- econometric model developed in the study is a combination of the total exposure assessment (TEA) model, from the environmental health sciences, and agricultural household model to arrive at the estimation equations, which explains the relationship between the various variables in the data. These estimation equations were used for further econometric analysis to arrive at how the health end points are affected with a marginal increase in exposure to air pollution. Economic cost of ill health in the region was calculated based on the wages lost and medical expenses due to increased morbidity.
Assessment of health care services Observation visits Over the course of the project several visits were made to the Primary and Community Health Centres, Sub-centres and Rural medical dispensaries and private health clinics/hospitals in all three Clusters and the Road Corridor. These observation visits were made in order to see first-hand the kind of health care facilities available in the study area.
Interviews Interviews and informal discussions were held with doctors and other health care professionals and staff in the study area. Additionally, representatives of the Directorate of Health were interviewed.
Focus group discussions A total of 12 focus group discussions were conducted across the study area in order to understand community perceptions regarding health status, local medical services and risk factors. These FGD were conducted in four separate sessions for men and eight sessions for women across Cluster I (Mayem, Sirigao), Cluster II (Navelim-Amona, Cudnem), Cluster III (Codli, Sanvordem), Corridor (Curchorem) and the Control (Rivona) groups in the study areas. Approximately 10-12 members cutting across different age groups were invited to the meetings.
Survey A survey taken up under the governance component of this project included some questions on utilisation of health care facilities in the study area. (Details about the survey methodology are included in the governance section.)
Review of secondary data Secondary data including reports and documents from the Directorate of Health Services were gathered and analysed.
IDRC Centre File: 101276-001 11
TERI Report no. 2002WR41

Chapter 2: Valuing environmental - health linkages
Results
2A Air quality monitoring As air pollution caused by mining and allied activities has been reported as a major cause of ill health in the study area this component of the study focused on assessing individual exposure to air pollution (respirable suspended particulate matter) within mining communities. Respirable suspended particulate matter (RSPM or PM1o) includes dust particles that are less than uo microns in size and can be easily be absorbed by the lungs.
Rather than look at only ambient air quality, this study has used the Total Exposure Assessment (TEA) approach to studying air pollution in the mining ecosystem. Over a 24- hour period, individuals spend their time in different micro environments (eg. living room, work place, transit to and from work, work place etc.) where particulate matter levels vary. A
time budget survey, which was a part of the individual survey questionnaire, was used to identify the main micro environments in which people spend their time and identify the main sources of air pollution in each. Air quality monitoring was conducted in four micro environments, namely the cooking/kitchen area within the home, the living room within the home, outdoors (outside the house in an open space), and at the workplace (mining and trucking work environments). Air quality monitoring for the workplace focused on mining and allied work because these activities are significant source of air pollution. Using information from the time-budget survey on the number of hours spent in each micro environment and the RSPM levels in each microenvironment, it was possible to construct the 24 exposure to RSPM for each participant in the study.
The tables below show average RSPM concentrations in various micro environments in the study area. Average ambient and indoor concentrations are presented cluster-wise. Table 2A.1 shows that average ambient and living room concentrations were highest in the Road corridor and lowest in the Control area.
Table 2A.1 Average PM,o concentration (pg/m3) in various micro environments
Mining area Average PMio concentration (µg/m3 )
(Ambient and living room micro environments)
Cluster I
Cluster II
Cluster III
Corridor
Control
Ambient (outside the house) Indoor (living room)
224 204
336 302
299 208
436 308
102 114
In the following table (2A.2) average concentration in the kitchen and work place are presented. Average concentrations in the kitchen are classified according to the fuel type being used because levels of pollution vary significantly depending on whether biomass fuels are used. Similarly, average concentrations in the workplace have not been classified by cluster. Rather, concentrations have been classified as:
IDRC Centre File: 101276-001 12
TERI Report no. 2002WR41

Chapter 2: Valuing environmental - health linkages
Indoors (inside the mine office) Outdoors (at various outdoor places within the mine site) Driving (inside the drivers cabin of trucks being used to transport ore)
This classification is adopted because several people living in Cluster I were working in Cluster II or vice-versa. Similarly, people living in Cluster III were working in the Road corridor and vice-versa.
Table 2A.2 Average PM1o concentrations (p.glm3) in kitchen and work micro environments
Kitchen/ cooking micro environment
Fuels Average PMio concentrations Workplace
Work micro environment
Average PMio concentrations
(Kitchen micro envt) (Work micro envt.) ..._.......... .............. _....... ........ _........... ....... ...._.._.._................... ....__............ ._.............. _......_.........__.._.......... ......._.._._._._....__............. ._._._........... .......... .......... ......_.... ............... ................... ....
Biomass 670 Outdoor working 467
Kerosene 325 Inside office 357
LPG 160 Driving 480
Table 2A.2 shows that the levels of RSPM in the cooking area vary significantly (p<o.o5) across the households depending upon the type of fuel used for cooking. The RSPM levels
were found to be highest among the solid biomass fuel users (Figure 2A.2). As expected the
use of LPG resulted in the lowest emission of all fuel categories. A majority of households in the study area (76%) used solid biomass, followed by LPG (16%) and kerosene (8%) for cooking during the monitoring period.
Average concentrations at the workplace were highest inside trucks followed by outdoors at
the mine site. Except for average ambient and living room concentrations in the Control area
and kitchens using LPG, average concentrations in all other microenvironments were well
above the 15ogg/m3 threshold limit for industrial areas.
Figure 2A.1, below, shows cluster-wise variations in outdoor or ambient concentrations in the study area. In addition to showing the mean concentrations, this figure shows that the
range of concentrations recorded in the three mining clusters were high with Cluster II showing the highest range. The Road corridor and the Control do not show a range because
they are smaller areas and we had only one monitoring station in each. The wide range seen
in the mining clusters explains that the spatial nature of air pollution is not uniform and
some areas in each cluster are more stressed in terms of air pollution than others. The wide
range could be due to the location of the village with respect to the mining area as well as
proximity to the main road used for transport of ore.
IDRC Centre File: 101276-001 13
TERI Report no. 2002WR41

Chapter 2: Valuing environmental - health linkages
700
000
100
0
Cluster wise variation in ambient PM,oconcentration
I
N= 235 26 50
4 5
= tl.96'Std. Dev.
[1 31.00'Std. Dev.
Mean
CLUSTER
Figure 2A.1 Cluster wise variation in ambient PMto concentration
Figure 2A.2 below, shows the range of concentrations in kitchens using different types of fuel. Among various micro-environments, PM,,, levels were highest in the cooking micro
RSP concentration in cooking micro environment
El Inter quartile range (IQR) (25%-75%)
0
2
Biomass
3
Kerosene LPG
Fuel
8 I
Median
Range within
1.5* IQR
environment in households where solid biomass fuels are used.
Figure 2A.2 Distribution of RSPM levels in the cooking area during cooking across households using various fuels
Importantly, the percentage of households using bio fuels across the three mining Clusters, the Corridor and the Control were very similar, i.e 78% in Cluster I; 73% in Cluster II; 71% in
IDRC Centre File: 101276-001 14
TERI Report no. 2002WR41

Chapter 2: Valuing environmental - health linkages
Cluster III; 77% in the Corridor and 76% in Control group were using biofuels for cooking during the monitoring period. PM,o levels measured at various micro-environments were further used to estimate the individual exposure levels. Figure 2A.3 shows the cluster wise variation of individuals' 24- hour average PM,o exposure concentration.
Cluster wise variation in 24h average exposure concentration of PM,.
1000
800
600
400
200
0 1 2 3
CLUSTER
4 5
_L Min-Max
-_7 251/1,45%
Median value
Figure 2A.3 Cluster wise variation in estimated exposure levels of individuals for 24 hour PM1o concentration
The above figure reveals that the 24-hour average exposure levels were highest among individuals in Road corridor. Among the 3 mining clusters, little variation is observed in individual exposure to PM,o. Average exposure was lowest in the Control village.
In India, national ambient air quality standards have been set by the Central Pollution Control Board. According to national standards 24 hour exposure should not exceed 150
.ig/m3 in industrial areas'. The RSPM standard for residential areas is set lower, at loopg/m3. Figure 2A.4, below, shows that more than 9o% of the study population in the mining area (Clusters I, II and III) and the Road corridor were recorded with exposure levels
above 15ogg/m3 whereas in the control group 42% of the population were in the category of exposure levels above 150 tg/m3.
The 24-hour average standard should be met 98% of the time in a year. It may exceed 2% of the time, but not on two consecutive days. (National ambient air quality standards, Central Pollution Control Board)
IDRC Centre File: 101276-001 15
TERI Report no. 2002WR41

Chapter 2: Valuing environmental - health linkages
1m
m
40
M
0
Cluster I Cluster II Cluster III Corridor Control
cnstr1
Dk1TDI13bi oYpcpfGrtbr (h6)
1& Iarbls exp 1r calgorks
cnstr2 cnstr3
corrWr coot
Figure 2A.4 Distribution of population in various exposure categories by Cluster
Inter quartile range (IQR)
(25%-75%)
B Median
Range within
1.5' IQR
ex q re caging
-'150mIC,gran000U
-150mkgran000 L1
The study also explored variations in exposure levels among men and women in the study area.
IDRC Centre File: 101276-001 16
TERI Report no. 2002WR41

Chapter 2: Valuing environmental - health linkages
Cluster I Cluster II Cluster III Corridor Control
24-h average exposure concentration among male and female
across various cluster
a.....
71 F7 Femak
im 2ID 3M 5ID
chat r
Figure 2A.5 24-hour average exposure concentration among males and females
Figure 2A.5, above, shows that there is not much variation in 24 hour average exposure levels
between men and women within each Cluster and Corridor. In the control group females
were recorded with higher exposure levels than men. In the Control area, as there is no
significant source of air pollution other than cooking. Since women are mostly in the kitchen their exposure level is greater than that of men.
Additionally, we see that women in the control group have much lower exposure than women in the mining Clusters and Corridor. This is because women in the mining areas and Corridor are exposed to air pollution as a result of mining and related activities in addition to
indoor air pollution from cooking.
The data presented in the tables above show clearly that particulate matter levels are high in
the mining areas (including the road corridor) and are much higher that those recorded in the Control village. Additionally, individual exposure is also higher in the three Clusters and
corridor areas compared to the Control.
IDRC Centre File: 101276-001 17
TERI Report no. 2002WR41

Chapter 2: Valuing environmental - health linkages
Highlights Average ambient RSPM levels are highest in the Corridor followed by Cluster II, III, and I. Average ambient level in the Control area is the lowest. Average ambient RSPM levels in all three mining Clusters and the Road Corridor is higher than the standard of 150 pg /m3 for industrial areas. Average individual exposure in all the mining Clusters and Corridor are above 15opg/m3. This suggests that the population in the mining areas is at risk of developing respiratory illnesses. Average individual exposure is highest in the Corridor followed by Cluster II, Cluster III and then Cluster I. Average exposure is lowest in the Control area. Among those working in mining and allied jobs, truck drivers are exposed to the highest RSPM levels followed by people working outdoors at the mine site. In all the work environments average RSPM levels were more than double the 150 lug /m3 standard for industrial areas. The difference between average male and female 24-hour exposure was marginal in each mining Cluster, and the Corridor. However, it is observed that average exposure among women was higher than men in the Control area. This is because women are more exposed to RSPM from the cooking micro-environment which has emerged the highest compared to other micro environments.
IDRC Centre File: 101276-001 18
TERI Report no. 2002WR41

Chapter 2: Valuing environmental - health linkages
2B Health impact assessment
Secondary data Secondary data from the Directorate of Health Services (DHS) was analysed in order to assess the level of respiratory health problems in Goa as a whole and in the study area.
The study Clusters do no match administrative boundaries and it is not possible to reclassify the data to reflect only the mining Clusters as defined in this project. Therefore data was gathered for the talukas into which the bulk of each Cluster falls.
In each Cluster there is one main health centre serving the population of the Cluster. The health centres serving Cluster I and II are both part of Bicholim taluka2. Thus data from Bicholim taluka is reflective of the study population in Cluster I and II. Cluster III falls into Sanguem taluka. Thus, data for this taluka has been used to reflect Cluster III.
The Road corridor is a town in Quepem taluka. As data for the whole of Quepem taluka would be reflective of a much wider population than just Curchorem town (the Road corridor) we attempted to gather data for Curchorem directly from the Community Health Centre (CHC) located in the town. However, data at the Curchorem CHC was not compiled on a regular monthly basis and no data was available for several months.
The Control village (Rivona) in our study is also located in Quepem taluka. The Primary Health Centre (PHC) in Quepem town is the closest health centre to Rivona village and used by residents of the village. However, this PHC is frequented by people from many villages across the taluka and it is not possible to disaggregate the data by village. Thus, as secondary data for the Control village is not available we attempted to use data for the state of Goa as a comparison or control of sorts when studying the mining region.
Table 2B.1 Secondary data source corresponding to study area
Cluster Town I Taluka I State
Cluster I and II" Bicholim
Cluster III Sanguem
Road Corridor' Curchorem town
Control Goa
Secondary data gathered is classified as respiratory communicable disease (RCD) and respiratory non-communicable diseases (RNCD) and further, it is classified into upper respiratory (UR) and lower respiratory (LR) diseases as explained in Table 2B.2.
2 Several villages in Cluster II are part of Sattari taluka but are served by a Primary Health Centre in Bicholim taluka. Thus, data from Bicholim health centres reflects Cluster II as well
IDRC Centre File: 101276-001 19
TERI Report no. 2002WR41
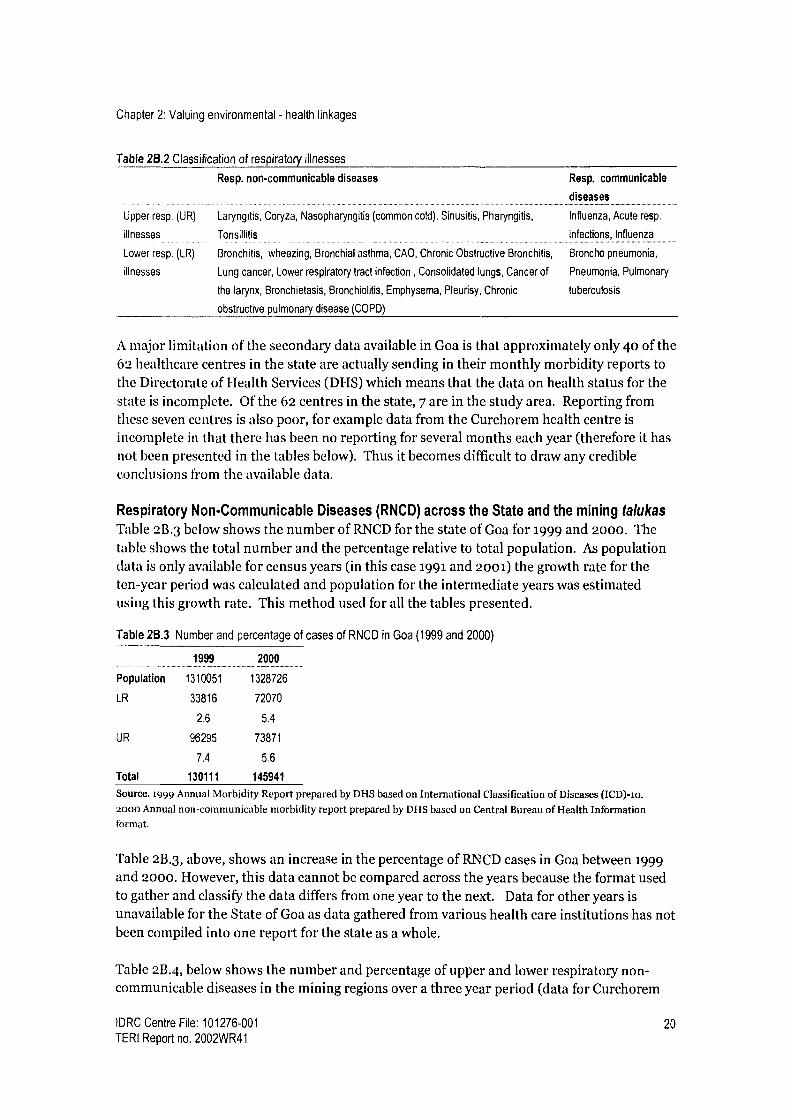
Chapter 2: Valuing environmental - health linkages
Table 2B.2 Classification of respiratory illnesses
Resp. non-communicable diseases
Upper resp. (UR) Laryngitis, Coryza, Nasopharyngitis (common cold), Sinusitis, Pharyngitis,
illnesses Tonsillitis
Lower resp. (LR) Bronchitis, wheezing, Bronchial asthma, CAO, Chronic Obstructive Bronchitis,
illnesses Lung cancer, Lower respiratory tract infection , Consolidated lungs, Cancer of
the larynx, Bronchietasis, Bronchiolitis, Emphysema, Pleurisy, Chronic
obstructive pulmonary disease (COPD)
Resp. communicable
diseases
Influenza, Acute resp.
infections, Influenza
Broncho pneumonia,
Pneumonia, Pulmonary
tuberculosis
A major limitation of the secondary data available in Goa is that approximately only 40 of the 62 healthcare centres in the state are actually sending in their monthly morbidity reports to the Directorate of Health Services (DHS) which means that the data on health status for the state is incomplete. Of the 62 centres in the state, 7 are in the study area. Reporting from these seven centres is also poor, for example data from the Curchorem health centre is incomplete in that there has been no reporting for several months each year (therefore it has
not been presented in the tables below). Thus it becomes difficult to draw any credible conclusions from the available data.
Respiratory Non-Communicable Diseases (RNCD) across the State and the mining talukas Table 2B.3 below shows the number of RNCD for the state of Goa for 1999 and 2000. The table shows the total number and the percentage relative to total population. As population data is only available for census years (in this case 1991 and 2001) the growth rate for the ten-year period was calculated and population for the intermediate years was estimated using this growth rate. This method used for all the tables presented.
Table 2B.3 Number and percentage of cases of RNCD in Goa (1999 and 2000)
....... ........ ...............1999.._......................._..2000._......... .......
Population 1310051 1328726
LR 33816 72070
2.6 5.4
UR 96295 73871
7.4 5.6
Total 130111 145941
Source. 1999 Annual Morbidity Report prepared by DHS based on International Classification of Diseases (ICD)-io. 2000 Annual non-communicable morbidity report prepared by DHS based on Central Bureau of Health Information format.
Table 2B.3, above, shows an increase in the percentage of RNCD cases in Goa between 1999 and 2000. However, this data cannot be compared across the years because the format used to gather and classify the data differs from one year to the next. Data for other years is unavailable for the State of Goa as data gathered from various health care institutions has not been compiled into one report for the state as a whole.
Table 2B.4, below shows the number and percentage of upper and lower respiratory non- communicable diseases in the mining regions over a three year period (data for Curchorem
IDRC Centre File: 101276-001 20 TERI Report no. 2002WR41
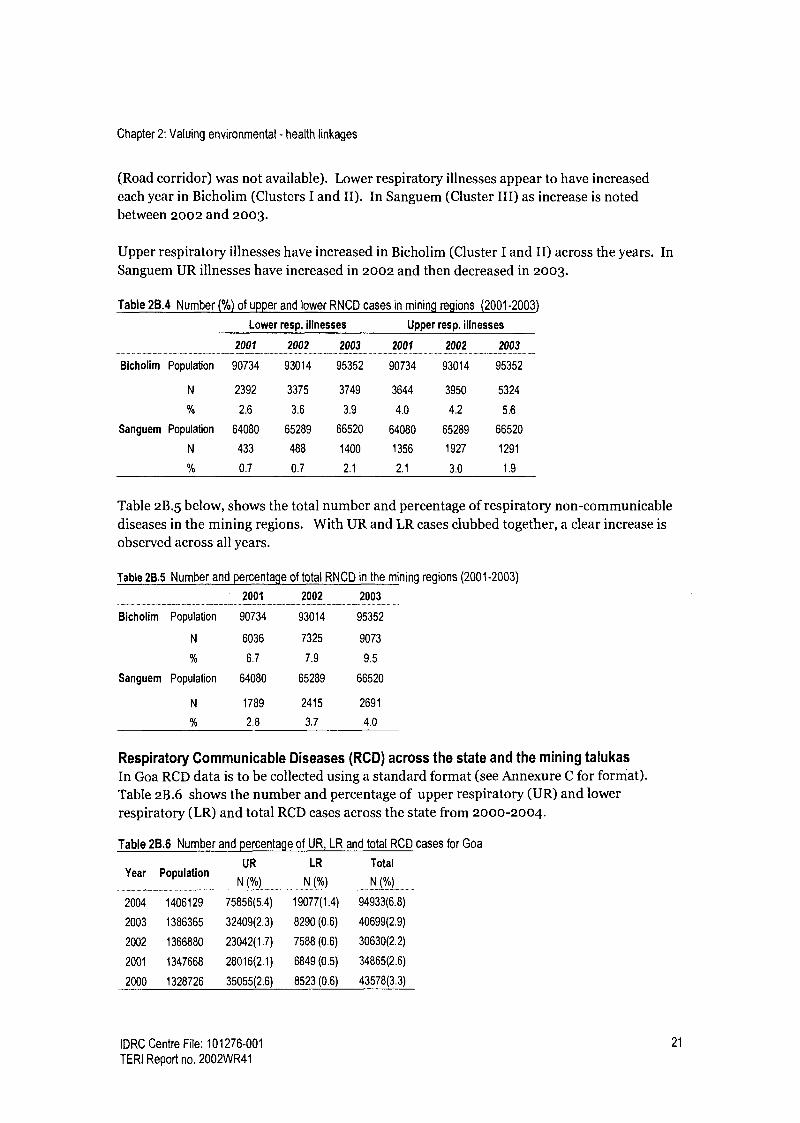
Chapter 2: Valuing environmental - health linkages
(Road corridor) was not available). Lower respiratory illnesses appear to have increased each year in Bicholim (Clusters I and II). In Sanguem (Cluster III) as increase is noted between 2002 and 2003.
Upper respiratory illnesses have increased in Bicholim (Cluster I and II) across the years. In Sanguem UR illnesses have increased in 2002 and then decreased in 2003.
Table 2B.4 Number (%) of upper and lower RNCD cases in mining regions (2001-2003)
Lower resp. illnesses Upper resp. illnesses
2001 2002 2003 2001 2002 2003
Bicholim Population 90734 93014 95352 90734 93014 95352
N 2392 3375 3749 3644 3950 5324
% 2.6 3.6 3.9 4.0 4.2 5.6
Sanguem Population 64080 65289 66520 64080 65289 66520
N 433 488 1400 1356 1927 1291
0% 0.7 0.7 2.1 2.1 3.0 1.9
Table 2B.5 below, shows the total number and percentage of respiratory non-communicable diseases in the mining regions. With UR and LR cases clubbed together, a clear increase is observed across all years.
Table 2B.5 Number and percentage of total RNCD in the mining regions (2001-2003)
2001 2002 2003
Bicholim Population 90734 93014 95352
N 6036 7325 9073
% 6.7 7.9 9.5
Sanguem Population 64080 65289 66520
N 1789 2415 2691
2.8 3.7 4.0
Respiratory Communicable Diseases (RCD) across the state and the mining talukas In Goa RCD data is to be collected using a standard format (see Annexure C for format). Table 2B.6 shows the number and percentage of upper respiratory (UR) and lower respiratory (LR) and total RCD cases across the state from 2000-2004.
Table 28.6 Number and percentage of UR, LR and total RCD cases for Goa
Year Population UR LR Total
N (%) N (%) N (%) .........................
2004 1406129 75856(5.4) 19077(1.4) 94933(6.8)
2003 1386365 32409(2.3) 8290 (0.6) 40699(2.9)
2002 1366880 23042(1.7) 7588 (0.6) 30630(2.2)
2001 1347668 28016(2.1) 6849 (0.5) 34865(2.6)
2000 1328726 35055(2.6) 8523 (0.6) 43578(3.3)
IDRC Centre File: 101276-001 21
TERI Report no. 2002WR41

Chapter 2: Valuing environmental - health linkages
Overall, the percentage share of LR cases is low compared to UR cases. This is because there are very few illnesses classified as lower respiratory communicable diseases. From 2000 to 2003 no clear pattern can be seen. Between 2003 and 2004 a big increase in both UR and IS cases is observed.
Tables 2B.7 and 2B.8 show upper, lower and total respiratory communicable diseases for Bicholim (Clusters I and II), Sanguem (Cluster III) and Goa (Control). Data was only available for 2003 and 2004, and here again data for Curchorem (Road corridor) was not available.
Table 2B.7, below shows that upper and lower respiratory illnesses increased in Bicholim, across the years. However, the extremely low number of LR cases in Bicholim in 2003 suggests that reporting by the health centre in that year may have been very poor. In Sanguem an increase in UR cases and a decrease in LR cases is observed. However, here too the extremely low number of LR cases in 2004 suggest that reporting may have been very poor. The percentage of LR and UR cases in Goa increased over the two year period and were consistently higher than the percentage of cases reported in the study area.
Table 2B.7 Number (percentage) of upper and lower RCD cases in mining regions and Goa (2003-2004)
Upper resp. illnesses Lower resp. illnesses
Bicholim Sanguem Goa Bicholim Sanguem Goa
Population 95352 66520 1386365 95352 66520 1386365
2003 1304 1062 32409 13 100 8290
(1.4) (1.6) (2.3) (0.0) (0.2) (0.6)
Population 97749 67775 1406129 97749 67775 1406129
2004 2435 1312 75856 693 10 19077
(2.5) (1.9) (5.4) (0.7) (0.0) (1.4)
Looking at all respiratory communicable diseases together (Table 2B.8), we see a marked increase between 2003 and 2004 in percentages for Goa state and Bicholim and a slightly less increase in Sanguem.
Table 28.8 Total number (percentage) of RCD cases in mining regions and Goa
Bicholim
Population 95352
2003 1317
(1.4)
Population 97749
2004 3128
(3.2)
Sanguem
66520
1162
(1.7)
67775
1322
(2.0)
1386365
40699
(2.9)
1406129
94933
(6.8)
While increases can be observed in respiratory illnesses over the last few years, because of non-reporting and poor compilation of data no conclusions can be made from the secondary data.
IDRC Centre File: 101276-001 22
TERI Report no. 2002WR41

Chapter 2: Valuing environmental - health linkages
Reported health status Assessment of health status within the community was made through self-reporting of ill health captured through the household and individual survey and through health tests conducted in the study. Here we present findings based on the self-reported health status as captured by the survey.
A survey was administered to 1412 individuals across the study area. A summary of the survey sample is presented in the table below.
Table 2B.9 Sample for the household and individual surveys and air quality monitoring
Area Villages Total Households Male Female Total Individuals
Cluster I Piligao 37 94 84 178
Cluster II Surla, Pale, Pissurlem 101 233 232 465
Cluster Ill Sanvordem, Codli-Kiriapal 85 199 202 401
Corridor Curchorem 40 94 86 180
Control Rivona 47 95 93 188
Total 310 620 604 1412
In the survey participants were asked to state whether they had episodes of specific illnesses. (For a list of illnesses and people's responses across the various Clusters, Control and Corridor see Annexure B).
Across the study area eye, skin and upper respiratory illness emerged as the most reported illnesses. In the Road corridor and Control group in addition to these illnesses throat and cardiovascular illness were highly reported. These illnesses could be related to environmental factors like exposure to high dust and other factors like age, gender, poor immunity, socio-
economic status etc.
Given the focus on respiratory health in this study, illnesses reported in the household survey
were classified into three groups, namely: Upper respiratory (illnesses and symptoms related to the upper respiratory tract that could be linked to air pollution, but not necessarily prolonged exposure) Lower respiratory (chronic illnesses related to the lower respiratory tract that are
likely to occur as a result of prolonged exposure to air pollution) All other illnesses
The bar graph below shows that upper respiratory illnesses were highly reported in all groups and are most commonly reported in Cluster II and the Control group. High upper respiratory illness in the control group was due to high reporting of dry cough. Forty percent
of respondents from the Control reported having a dry cough as compared to 25-36% in the rest of the study area. Non-respiratory illnesses (sensory illnesses, eye and skin problems and heart ailments) were also highly reported and most reported in the Control group, followed by Cluster II, and Cluster III.
Lower respiratory illnesses were least reported in all groups compared to other types of illnesses. Looking at lower respiratory illness reporting across the study areas we see that
IDRC Centre File: 101276-001 23
TERI Report no. 2002WR41
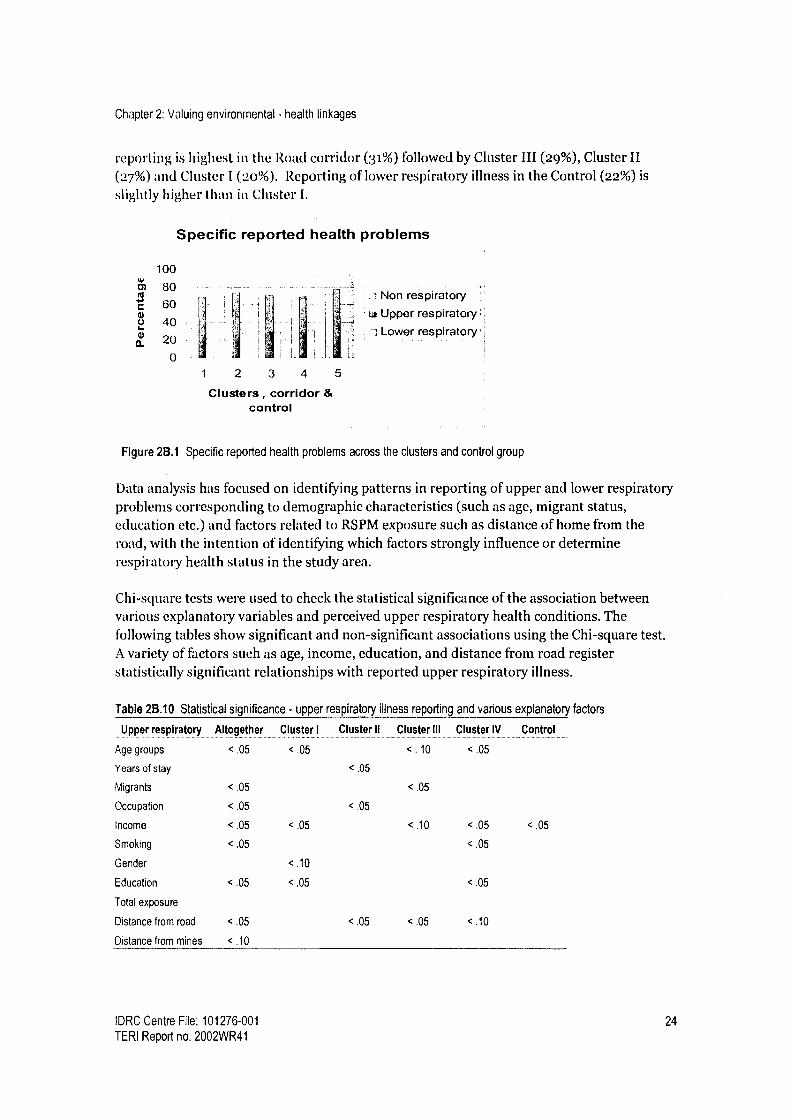
Chapter 2: Valuing environmental - health linkages
reporting is highest in the Road corridor (31%) followed by Cluster III (29%), Cluster II (27%) and Cluster I (2o%). Reporting of lower respiratory illness in the Control (22%) is
slightly higher than in Cluster I.
Specific reported health problems
c
m a.
100
80
60
40
20
0
Non respiratory
Li Upper respiratory'.
i Lower respiratory
Clusters, corridor & control
Figure 2B.1 Specific reported health problems across the clusters and control group
Data analysis has focused on identifying patterns in reporting of upper and lower respiratory problems corresponding to demographic characteristics (such as age, migrant status, education etc.) and factors related to RSPM exposure such as distance of home from the road, with the intention of identifying which factors strongly influence or determine respiratory health status in the study area.
Chi-square tests were used to check the statistical significance of the association between various explanatory variables and perceived upper respiratory health conditions. The following tables show significant and non-significant associations using the Chi-square test. A variety of factors such as age, income, education, and distance from road register statistically significant relationships with reported upper respiratory illness.
Table 2B.10 Statistical significance - upper respiratory illness reporting and various explanatory factors
Upper respiratory Altogether Cluster I Cluster Ii Cluster III Cluster IV Control
Age groups < .05 < .05 <. 10 < .05
Years of stay <.05
Migrants < .05 < .05
Occupation < .05 < .05
Income < .05 <.05 <10 < .05 <.05
Smoking < .05 < .05
Gender <.10
Education < .05 < .05 < .05
Total exposure
Distance from road < .05 <.05 < .05 <10
Distance from mines < .10
IDRC Centre File: 101276-001 24
TERI Report no. 2002WR41

Chapter 2: Valuing environmental - health linkages
Further logistic regression was used check how all these factors together influence the perceived upper respiratory illness. Distance from the road, age groups, education groups, years of stay in the region and smoking emerged as the significant variables on reporting upper respiratory illness.
As this study is primarily concerned with chronic problems that are likely to be related to mining, more focus was given to analysis of reported lower respiratory problems. Table 2B.11 below, shows reporting of lower respiratory illnesses in different age groups across the study area. The table shows that of those who are under 15 in Cluster I, 4.8% reported lower respiratory illness. Similarly, of those who are between 15 and 29 years in Cluster I, 12.2% of have reported lower respiratory illnesses. The table shows that lower respiratory illness is reported more in the mining areas than the control across all age groups except the over-59 age group. Additionally, reporting is highest in the >59 years group across the study area and the control.
In Clusters I and II a clear pattern of increased reporting with age is observed. In the rest of the study area, reporting of lower respiratory problems seemed to start high, dip in the middle age groups and then rise again in the older age groups.
Relatively high reporting of lower respiratory illness among children (< 15 years age group) in parts of the mining areas is noteworthy. The highest reporting was observed in Cluster III (36%), followed by the Road corridor, Cluster II and then the Control. Reporting of illness among children was least in Cluster I.
While the older age groups (> 59) seem more likely to report lower respiratory illnesses
across the study area and the control, age does not display any clear pattern in reporting as
far as lower respiratory illnesses go. Yet high rates of reported lower respiratory illnesses in the <15 years group is of concern since damage to the respiratory system in the early years of life implies increased risk the later years of life.
Table 28.11 Age wise reporting of lower respiratory illness
Cluster < 15 yrs 15-29 yrs 30-44 yrs 45.59 yrs > 59 yrs Total ............................... . ................... .
I Number 1 9 8 12 7 37
Percent (%) 4.8 12.2 25.0 33.3 46.7 20.8
II Number 16 31 27 24 26 124
Percent (%) 20.0 19.9 25.0 35.8 50.0 26.8
III Number 31 31 23 17 16 118
Percent (%) 36.0 24.4 24.0 32.1 41.0 29.4
Corridor Number 10 14 11 8 13 56
Percent (%) 32.3 29.8 24.4 25.0 52.0 31.1
Control Number 7 3 9 7 16 42
Percent (%) 18.4 6.8 20.9 23.3 53.3 22.7
Table 2B.12, below, shows reporting of lower respiratory problems in the study area by
gender. Across the study area (including the Control) reporting of lower respiratory illness
IDRC Centre File: 101276-001 25
TERI Report no. 2002WR41

Chapter 2: Valuing environmental - health linkages
was higher amongst men by between i% and 3%. The exception is Cluster II where a greater percentage of women reported lower respiratory illnesses.
Table 2B.12 Reported lower respiratory symptoms across gender
Clusters Male Female Total
I Number 21 16 37
Percent (%) 22.3 19.0 20.8
II Number 58 66 124
Percent (%) 24.7 28.7 26.7
III Number 60 58 118
Percent (%) 30.3 28.6 29.4
Corridor Number 30 26 56
Percent (%) 31.9 30.2 31.1
Control Number 22 20 42
Percent (%) 23.4 21.3 22.3
Table 2B.13 (below) shows the educational backgrounds of the people reporting lower respiratory health problems in the various clusters. The table below show highest levels of reported lower respiratory health problems among illiterates in the study area and the control. The highest reporting is observed in Cluster II with 45.1% of illiterate population reporting lower respiratory problems. A distinct pattern of decreased reporting with increasing education can be seen in all groups.
Table 2B.13 Reporting of lower respiratory illness by education groups
Cluster Illiterate Upto std.10 Above std.10 Total
Number 17
..........
14 5
.___.....
36
Percent (%) 38.6 19.2 12.5 22.9
II Number 41 48 19 108
Percent (%) 45.1 28.1 15.4 28.1
III Number 19 29 39 87
Percent (%) 33.9 26.6 26.0 27.6
Corridor Number 9 14 23 46
Percent (%) 37.5 36.8 26.4 30.9
Control Number 19 12 4 35
Percent (%) 33.3 24.5 9.1 23.3
Chi-square tests were used to check statistical association between various explanatory variables and perceived lower respiratory health conditions. The following tables show significant and non-significant associations using the Chi-square test.
IDRC Centre File: 101276-001 26
TERI Report no. 2002WR41

Chapter 2: Valuing environmental - health linkages
Table 2B.14 Statistical significance - lower respiratory illness reporting and demographic factors
Lower respiratory Altogether Cluster I Cluster II Cluster III Road Corridor Control
Age groups < .05 < .05 <.05 < .05
Years of stay < .05
Migrants < .05
Occupation < .05 <.05
Income <.10 < .05
Smoking < .05 < .05 < .05 <.05 <.05 < .05
Gender
Education < .05 < .05 < .05 < .05
Total exposure
Distance from road <.05 < .05 < .05
Distance from mines <. 10 < . 10 < .10
Age, smoking, and education and distance from the road showed significant results with lower respiratory illness among individuals in the total study area. Logistic regression is used to check how all these factors together influence the perceived lower respiratory illness. Distance from the road, age groups, education groups and smoking are the significant variables on reporting lower respiratory illness.
The table below shows the relative risk of lower respiratory illness across the mining Clusters and the Corridor area.
Table 2B.15 Relative risk of lower respiratory illness across the study area
Area Relative risk Confidence interval
95% ....___..... . ...................... ....... ............... ................ .... ...... _..... ...._._.... _..............._............
Cluster I 0.93 0.63-1.38
Cluster II 1.19
Cluster III
Mining areas
(Clusters I, II, III)
1.32
1.23
0,88-1.62
0,97-1.79
0,92-1.62
Road Corridor 1.39 0,99-1.96
Control group total sample = 185
Number reporting Lower Resp. Illness = 42
Table 2B.15 shows that based on reporting of lower respiratory sickness, the risk of developing lower respiratory illness relative to the Control is highest in the Road Corridor
(39%) followed by Cluster III (32%) and II (19%). The table also shows that there is no risk of developing lower respiratory illness in Cluster I relative to the Control. As a whole the
people in the mining regions have 23% risk of having LRI compared to the control group.
IDRC Centre File: 101276-001 27
TERI Report no. 2002WR41

Chapter 2: Valuing environmental - health linkages
Highlights (Reported health status) As per the reported health status, eye, skin and upper respiratory illness are major health ailments across all groups. Reported upper respiratory symptoms were highest among the Control group followed by Cluster II, III the Corridor and finally Cluster I. Reporting of lower respiratory symptoms which are more likely to be caused by long- term exposure to air pollution was highest in the Corridor group followed by Cluster III, II, the Control and Cluster I. There is no significant variation between males and females in the study group in reporting respiratory health. Age, education and smoking emerged as statistically significant variables in terms of reporting of lower respiratory illnesses. Distance of the home from the road also emerged as a statistically significant variable. This is important because air pollution in the mining areas is primarily caused by heavy vehicular traffic movement.
IDRC Centre File: 101276-001 28
TERI Report no. 2002WR41

Chapter 2: Valuing environmental - health linkages
Observed health status Results of observed respiratory health status are based on data gathered from the Respiratory Symptom Questionnaire, chest X-rays and pulmonary function tests and a cardio-respiratory specialist's diagnosis.
The respiratory problems were studied for 1411 participants, distributed across the various groups as follows: Cluster I (12%), Cluster II (33%), Cluster III (28%), Road Corridor (13%), and the Control group (13%).
The prevalence of respiratory symptoms across various clusters based on the Respiratory Symptom Questionnaire (RSQ) is presented in the following table.
Table 26.16 Prevalence of respiratory symptoms across the study area based on the RSQ
Symptom Numbers (%) of population reporting respiratory symptoms
Cluster 1 Cluster 11 Cluster Ill Mining area
(Clusters 1-111)
Corridor Control
Cough 9(5) 21(4) 18 (4) 48(4.6) 7 (4) 4 (2)
Phlegm 7(4) 19(4) 8(2) 34(3.3) 4(2) 2(1)
Breathlessness 9 (5) 27 (6) 26 (6) 62 (6.1) 9 (5) 10(5)
Wheezing 5(3) 20(4) 10 (3) 35 (3.4) 7 (4) 11(6)
The above table revels that the prevalence of cough and phlegm were high among people in the mining area and Corridor area when compared to the Control group. However wheezing was higher in the control group.
The relative risk of respiratory symptoms against the control group population was calculated using the EPI Info package and results are presented in the following table. Numbers within parentheses indicate the confidence intervals.
Table 2B.17 Relative risk (and 95% confidence intervals) for respiratory symptoms when compared to control group
Symptom Relative risk (95% Cl)
Cluster 1 Cluster 11 Cluster ill Corridor ----........ - .......... ............... --........... ......... ................ ..._...... -........... ._..........._............................ _........-._ ........._..... ......... _.._.........._...
Cough 2.35 2.24 2.28 2.23
Phlegm
Breathlessness
Wheezing
(0.75-7.42) (0.79-6.38) (0.79-6.58) (0.67-7.39)
2.46 2.70 1.40 1.74
(0.65-9.28) (0.81-8.94) (0.38-5.18) (0.40-7.59)
0.70 0.85 1.30 1.0
(0.24-2.08) (0.37-1.94) (0.59-2.86) (0.36-2.78)
0.45 0.83 0.51 0.86
(0.16-1.26) (0.41-1.67) (0.22-1.16) (0.35-2.13)
The above table reveals that the risk of developing a cough in the mining areas and Road corridor is more than double relative to the control population and relative risk for phlegm ranges from 1.40-2.7 times relative to the control group.
IDRC Centre File: 101276-001 29
TERI Report no. 2002WR41

Chapter 2: Valuing environmental - health linkages
Regression analysis of respiratory symptoms with age, sex and exposure variables shows that elderly people (above 6o years) are more vulnerable to lower respiratory outcomes (p < o.oi). There was no significant difference between men and women with respect to respiratory symptoms.
Consistent and valid spirometry3 (lung function test) results were screened by the cardio- respiratory specialist engaged for this study. Observed Forced expiratory volume in one
second (FEVi) and Forced vital capacity (INC) values were compared with predicted values
obtained from the available literature for normal healthy population of similar ethnic group. The FEV1/FVC ratio was calculated and the results were used to diagnose the respiratory problems. As per the GOLD (Global Initiative for Obstructive Lung Diseases) FEV1 <80% of the predicted value and an FEV1/FEC ratio of <70% confirms the presence of air flow limitation. Summary results are presented in the following table.
Table 2B.18 Diagnosis of lung function test results across the study area
Study area Number (%) of population
Obstructive lung Restrictive lung Normal lung
function function function ............................................. _..................... ...............................
Cluster 1 2(2) 0 99(98)
Cluster II 5(2) 4(2) 203 (96)
Cluster III 6 (3) 4 (2) 196(95)
Mining area (Clusters I-111) 13 (2.5) 8(1.6) 498 (96)
Corridor 1 (3) 6(8) 67(91)
Control 0 1 (1) 102 (99)
The highest percentage of obstructive and restrictive lung function were observed in the Road corridor followed by Cluster III, II and I. Obstructive and restrictive lung function was
lowest in the Control group.
Table 2B.19 Relative risk of reduced lung function across Clusters
Area
Cluster I
Cluster it
Cluster III
Corridor
Mining (Clusters I-III)
Relative risk Confidence interval (95%) .................. .... ............_......... ._......._......_..... ._.... ....._....
2.04
4.37
5.00
9.74
4.17
0.19-22.14
0.56-34.05
0.65-38.53
1.22-77.52
0.57-30.64
Table 2B.19, shows that the relative risk of reduced lung function (obstructive and restrictive lung function) is nine times higher among Corridor group when compared to the Control group population and 2 to 5 times higher in the individual mining Clusters. Looking at the mining Clusters together, relative risk is 4 times higher than the Control. It should be noted that air pollution and exposure levels were also highest among people living in the Road Corridor areas followed by people living in the three Clusters.
3 As some participants were unable to perform the pulmonary function tests correctly, all readings were not valid. Analysis by the cardio-respiratory specialist is based only on the valid readings.
IDRC Centre File: 101276-001 30 TERI Report no. 2002WR41

Chapter 2: Valuing environmental - health linkages
Analysis of X-ray results shows that between 91% -96% of the observed X-rays were normal across all groups in the study. Respiratory problems (TB/ infections) were highest in Cluster II (4.65%) followed by Cluster III (3.75%), Cluster I (3.15%), the Road Corridor (3%) and the Control (2.4%). One percent or less cardiac problems were observed in Cluster II, III and the Control.
Table 2B.20 Clinical diagnosis of X-rays
Cluster I Cluster II Cluster III Road Corridor Control
X Ray N (%) n(%) n(%) n(%) n (%a)
Normal 106 (93) 281 (93) 218 (91) 96 (96) 116(91)
Cardiac problems 0 3(1) 2(.83) 0 1(.8)
Respiratory infection/TB 4(3.15) 14 (4.65) 9 (3.75) 3 (3.00) 3 (2.4)
Humps/lesion 0 0 0 0 2(1.6)
Skeletal problem
(Fracture/kyphoscoliosis) 2(1.75) 3(l) 3(1.25) 0 5 (4)
Not able to diagnose 2(1.75) 0 8(3) 0 0
Total number 114 301 240 100 127
Table 2B.21, below shows the risk of developing respiratory illness in the mining Clusters and Corridor relative to the Control group, as detected through x-rays. The highest relative risk is
observed in Cluster II followed by Cluster III, Cluster I and finally the Road corridor.
Table 2B.21 Relative risk of respiratory illness diagnosed through chest x-rays
Area __............... .... ........_...._.._.....
Cluster I
Cluster II
Cluster III
Road Corridor
Mining (Clusters I- III)
Confidence interval 95% . . . . . . . . . . . . . . ....... ........ ..
0.33-6.30
0.55-6.43
0.43-5.70
0.25-5.82
0.52-5.50
Major respiratory symptoms reported in the respiratory symptom questionnaire (such as
breathlessness, wheezing, cough, and phlegm), pulmonary function test results and X rays were analysed by the cardio-respiratory specialist to identify cases of bronchitis, chronic obstructive pulmonary diseases (COPD), and Asthma.
Table 2B.22 Prevalence respiratory ailments across the study area
Cluster I Cluster II Cluster III Road Corridor Control
Bronchitis
n(%)
5 (2.8)
n(%)
18(3.8)
n (%)
6(1.5)
n (%)
5(2.8)
n (%)
3(1.6)
COPD 2(1.1) 7(1.5) 4(1.0) 4(2.2) 2(1.0)
Asthma 1(0.6) 8(1.7) 4(1.0) 3(1.6) 2(1.0)
Total examined 177 (100) 465 (100) 401 (100) 180 (100) 188 (100)
31 IDRC Centre File: 101276-001
TERI Report no. 2002WR41

Chapter 2: Valuing environmental - health linkages
Among all participants screened for respiratory symptoms, The prevalence of all respiratory ailments together emerges highest in Cluster II (7.10%) followed by the Road Corridor (6.67%), Cluster I (4.52), the Control area (3.72) and Cluster III (3.49%).
The prevalence of Bronchitis (4%) and asthma (1.72) were highest in Cluster II. Prevalence of COPD was highest in the Road corridor (2.22%). Bronchitis emerges as the highest diagnosed illness in all three clusters, the road corridor and the control.
Highlights (Observed health status) Analysis of observed health data (diagnosis based on response to respiratory symptom questionnaire, Lung function test and chest X ray analysis) indicates high prevalence of respiratory morbidity in the Corridor and mining area (Clusters I, II, III) when compared to control group. [It is noteworthy that these groups (Corridor, Clusters II, III and I) had high ambient concentrations of air pollution and high exposure levels compared to the Control group.]
The risk of developing a cough in the Corridor and mining Clusters is double relative to the control group.
Among all participants screened for respiratory symptoms, the prevalence of respiratory ailments was highest in Cluster II (7.10%) followed by the Road Corridor (6.67%), Cluster I (4.52), the Control area (3.72) and Cluster III (3.49%).
In the Road corridor, the risk of developing obstructive/restrictive lung function is nine times higher relative to the control group. In the mining Clusters the risk is between 2 and 5 times higher than the Control group.
There is no statistically significant variation in observed respiratory health problem between males and females in the study population.
Analysis of observed health status data shows that older people (above 6o years) have higher respiratory problems.
The table below presents the patterns emerging with regard to various health and environmental conditions in the study area and helps to identify the most and least stressed groups in terms of each parameter.
IDRC Centre File: 101276-001 32 TERI Report no. 2002WR41

Chapter 2: Valuing environmental - health linkages
Table 2B.23 Air pollution and health status results emerging from various data sets4
Reporting of Ambient Average % of people Reported Pulmonary X- ray
air pollution air quality exposure wl exposure lower function (resp
(QOL over 150 respiratory test infections
survey*) illness and TB)
Most stressed ,_ Cluster ll Corridor .-Corridor Corridor Corridor Corridor Cluster II
Cluster III Cluster 11 Cluster It Cluster III Cluster It Cluster II Cluster III
Cluster I Cluster III Cluster III Cluster II Cluster III Cluster III Cluster I
Cluster I Cluster I Cluster I Control Cluster I Corridor
Least stressed Control Control Control Control Cluster I Control Control
The QOL survey was conducted in Phase it. There was no road corridor in the QOL survey.
Table 2B.23 shows that the Road Corridor is consistently most stressed in terms of air quality (ambient and individual exposure) and most stressed in terms of lower respiratory illness (for self-reported illnesses and those detected through the PFTs). Interestingly, the corridor has not emerged worst off based on the X-rays. It is important to note, however, that X-rays are expected to highlight impacts of long term exposure while PFT measures lung efficiency/ capacity at the time of the test. The road corridor (along with Cluster III) is the youngest area involved with mining/ allied activities. Therefore, even though exposure may be currently the highest, the period of exposure may be the lower than Cluster I and II. This may explain why the Corridor emerges less stressed than other mining Clusters in terms of X-rays.
In the mining region Cluster I emerges the least stressed in terms of air pollution. Current ambient air quality and average exposure are low in Cluster I. Reporting of air pollution in the QOL survey was also lowest in Cluster I. This helps to explain the lower levels of reported and observed respiratory health problems within the population. Other factors that may be influencing relatively better health in Cluster I are better access to health care which emerges in this study and in the QOL survey. Additionally the Phase II QOL survey highlights higher levels of income and consistently higher levels of education in Cluster I which might be having an additional impact on ability to access medical care including private care and on awareness regarding the impacts of air pollution.
Cluster II is second only to the Road Corridor in terms of air pollution levels (ambient and exposure). That Cluster II is worse off compared to III and I also emerges in the QOL survey based on people's own reporting. Looking at respiratory health, both self reported and observed, a clear pattern emerges where Cluster II is consistently worse off or more stressed than Cluster III and Cluster I.
Collectively the results on exposure levels, self-reported and observed health suggest a strong correlation between high levels of exposure to respirable suspended particulate matter and respiratory ill health.
4 Results from the RSQ have not been included since the analysis from this data is disaggregated for different symptoms.
IDRC Centre File: 101276-001 33
TERI Report no. 2002WR41

Chapter 2: Valuing environmental - health linkages
2C Economic valuation of the cost of ill health
Introduction This component of the project has focused on developing an econometric model to value the cost of ill health as a result of increased air pollution in mining areas. Previous sections in this chapter have highlighted air pollution exposure levels and respiratory health problems in the study area. This data has been used to estimate the cost of ill health through the model developed.
The focus of this study is on air pollution generated by mining and allied activities. However, in developing countries, a large percentage of households, especially in rural areas, use solid fuels such as wood, coal, dung and agricultural residues for cooking. This results in extremely high levels of indoor air pollutants with consequent high levels of exposure to air pollution which is a confounding factor. This has not been sufficiently reflected in air pollution valuation studies. Pearce (1996) noted that a major weakness of the literature on air pollution damage in developing countries was the focus on outdoor pollution, and the lack of distinction between ambient concentration and exposure.
In their key paper, Harrington and Portney (1987) have developed a health production model, which showed the role of averting and defensive activities. As Freeman (1993) notes,
one of the key averting activities is staying indoors on high pollution days. We believe that the Harrington and Portney (1987) model needs to be modified if air pollution is to be valued in a developing country context, particularly in rural areas.
Larson and Rosen (2002) have combined the insights from agricultural household models with the Harrington and Portney (1987) type models. In this component, we develop a model drawing on the Harrington and Portney (1987) model, agricultural household models, and `Total exposure assessment' (TEAS). This has an important consequence (Smith 1993) as the significance of small and local sources, especially indoor sources are accounted for.
We develop an analytical model (discussed in detail in Annexure A) to examine the willingness to pay of a rural household in a developing country. Although we make some simplifying assumptions, the model is in several ways more intricate than the Harrington and Portney (1987) model. Having derived analytical expressions for the willingness to pay, we discuss the role of some features which we have not taken into account in the model to keep it analytically tractable-gender roles in the household, exposure with more than two microenvironments, non-market activities of the household, and whether the household accurately perceives the role of air pollution on health. We also discuss the public good nature of outdoor air pollution and the private good nature of indoor air pollution.
TEA is a branch of environmental health sciences. Using exposure rather than ambient concentrations is the basic principle of TEA.
IDRC Centre File: 101276-001 34
TERI Report no. 2002WR41

Chapter 2: Valuing environmental - health linkages
Results of estimation
Table 2C.1 Regression results for dependent variable respiratory sickdays
Tobit xttobit
resp_sickdays _._..._.._....._..... _.....
cum_exp 2.22E-07
(3.73)**
non smok -7.224
(0.98)
male dum -7.210
(0.99)
pc_expend -0.017
(3.27)**
Constant -81.725
(7.73)**
Observations 1170
resp_sickdays ........ ....... ..._......... __......_.
2.22E-07
(3.73)**
-7.224
(0.98)
-7.210
(0.99)
-0.017
(3.27)**
-81.725
(7.73)"
1170
Number of group(comcode) 277
Absolute value oft statistics in parentheses
* significant at 5%; ** significant at 1%
As Table 2C.1 shows, the coefficient of the variable cum_exp (cumulative exposure6) is
statistically very significant, as is per capita expenditure. In other words, we can reject the null hypothesis that the value of the coefficient of cumulative exposure is zero at a 1% level of significance.
Only per capita expenditure and cumulative expenditure are statistically significant. Hence
only the substantial or practical significance of the coefficients of these variables is discussed. The elasticity of respiratory sick-days with respect to cumulative exposure is about 0.35 at the mean of the sample. This implies that a one percent increase in cumulative exposure will lead to a 0.35 percent increase in respiratory sick-days. The elasticity with respect to per capita expenditure is -0.33.
Table 2C.2 Regression results for the dependent variable cumulative exposure
cum_exp
Ambient 84,028.032
(9,31)**
Constant 42050546.030
(12.79)**
Observations 1402
R-squared 0.06
Absolute value oft statistics in parentheses
* significant at 5%; ** significant at 1 %
b Cumulative exposure has been calculated by multiplying level of exposure that individual i faces, with the number of years the individual reported having stayed in the mining area.
IDRC Centre File: 101276-001 35
TERI Report no. 2002WR41

Chapter 2: Valuing environmental - health linkages
Table 2C.3 Regression results for the dependent variable ambient concentration
Cluster Ambient
232.977
(21.44)**
II 309.412
(34.49)**
III 227.267
(24.78)**
Corridor 461.333
(42.63)**
Constant 71
(9.38)**
Observations 1410
R-squared 0.59
Absolute value oft statistics in parentheses
* significant at 5%; ** significant at 1%
As 'f'able 2C.3 shows, the coefficient of ambient concentration is statistically significant relative to cumulative exposure.
Table 2C.3 shows that the cluster dummies are statistically significant explanatory variables for the dependent variable ambient concentration. The ambient concentration varies between clusters, and the value of the coefficient indicates the difference between level of that cluster and the control cluster, which is the base. Corridor for instance, had a level of ambient concentration that was about 461 units higher than the control cluster. The Corridor is the highest followed by Cluster II, I and III.
We can then use the information above to value the effect of air pollution: Value of cumulative exposure due to mining per person =
Loss of wages per person (Rs. per sickday) x marginal effect of cumulative exposure on respiratory sickdays x marginal effect of ambient concentration on cumulative exposure x difference between ambient concentration in mining and control cluster.
Table 2C.4 Monetary loss per person on average assuming a loss in wage of Rs 100/sickday in Rs
Loss of wages per person per 3 Annual loss of wages per capita Total wage loss per
Cluster months (Rs.lsickdayl 3 months) (Rs.lsickdayl yearlperson) Total work force' year (Rs.lyear)
62 248 16,133 4,000,984
II 83 332 17,702 5,877,064
III 61 244 10,689 2,608,116
Corridor 124 496 8,105 4,020,080
Total 16,506,244
* Census 2001
IDRC Centre File: 101276-001 36
TERI Report no. 2002WR41

Chapter 2: Valuing environmental - health linkages
The table above tells us the quarterly per capita loss of wages in each of the three clusters and the road corridor, due to sick-days (as calculated from the model and based on the 3-monthly recall period in the survey). We can then calculate the annual per capita loss of wages due to sick days. Additionally, we multiply the size of the work force in the clusters and the corridor with their respective annual per capita wage loss due to sick-days to get the total wage loss for the mining region.
We see that the annual per capita wage loss is highest in the road corridor (Rs. 496 per capita/year) followed by Cluster II (Rs. 332 per capita/year) and then Clusters I and III with similar levels of loss.
Looking at the total annual wage loss to the mining regions and the road corridor together is
Rs. 16,506,244.
Similarly, we can estimate the economic value of increased doctors' visits due to air pollution arising from mining activities.
Table 2C.5 Regression results for dependent variable doctor visits
Tobit xttobit
Docvisitr docvisitr .......... .... -- 11 ----------- ...... _....------------------ ._...._..._....... _..... _ .... .............................. _......._.._........................-.......... .......
cum_exp 0.000000208 0.000000208
(3.18)** (3.18)"
non_smok 33 33
(4.04)" (4.04)**
male dum -2.6 -2.6
(0.33) (0.33)
pc_expend -0.009 -0.009
(1.99)' (1.99)*
Constant -114 -114
(10.41)" (10.41)"
Observations 1277 1277
Number of group(comcode) 280
Absolute value oft statistics in parentheses
* significant at 5%; ** significant at 1%
Cumulative exposure is a statistically significant explanatory variable for the number of doctor visits. The elasticity of doctor visits with respect to cumulative exposure is 0.24. This means with a one percent increase in cumulative exposure, will lead to a 0.24% increase in
doctor's visits. The elasticity of doctor visits with respect to per capita expenditure is -0.12.
Ideally we would like to have had data on visits to the doctor only on account of respiratory problems. It was difficult for respondents to recall how much they spent for which kind of illness. Therefore we regressed doctor visits on cumulative exposure to air pollution, controlling for other variables, and used the coefficient of cumulative exposure to air pollution. It is reasonable to suppose that this would primarily capture effects of air pollution
IDRC Centre File: 101276-001 37
TERI Report no. 2002WR41

Chapter 2: Valuing environmental - health linkages
on doctor visits. (Please see the step by step equations with the tables of regressions in Annexure A).
Table 2C.6 Average monetary expense per person, assuming expense of Rs. 100 per doctors visit
luster
3-monthly monetary expense
per person, on average, due
to a doctor's visit
(Rs./person/3months)
Annual per capita
monetary expense due
to doctor's visits
(Rs./person/year)
Total
population*
Total expense due to doctor's
visits per year
(Rs.lyear) ..................
I 81 324 42,780 13,860,720
II 107 428 44,711 19,136,308
III 79 316 25,421 8,033,036
Corridor 160 640 21,407 13,700,480
Total 54,730,544
Census 2001
The table above shows the quarterly per capita expense on doctor's visits, (as calculated from the model and based on the 3-monthly recall period in the survey). Using these figures we are
able to arrive at the annual per capita out-of-pocket expense. Multiplying these figures with the total population, we can get estimates of the annual expenses borne by each of the Clusters and the Road corridor in terms of doctors visits.
Once again we see that the annual per capita expense due to doctor's visits is highest in the road corridor at Rs. 640, followed by Cluster II (Rs. 428) and then Clusters I and III.
Looking at the total annual expense to the mining regions and the Road corridor together is
Rs. 54,730,544.
Since the externalities from mining are a public good, we can add up the money values over the population of the cluster to get a sense of aggregate damages via air pollution caused by mining over time. We see that the total annual cost of ill-health due to exposure to air pollution in the mining regions of Goa is Rs. 71,236,788 (USD$ 1,548,625.83).
Highlights Model used incorporates total exposure assessment and agricultural model to estimate cost of ill health. On average (Clusters and Corridor) estimate of wages lost per person (in the work force) due to respiratory sick days is Rs. 330 per year. On average (Clusters and Corridor) annual expenses due to doctors visits is Rs. 427 per person Total annual cost of ill health due to doctors visits and wages lost for the mining region is Rs. 71,236,788 (US $ 1,548,626)
IDRC Centre File: 101276-001 38 TERI Report no. 2002WR41

Chapter 2: Valuing environmental - health linkages
2D Health care services
This component of the study focuses on an assessment of health care services in the study area. As communities in the mining regions face a variety of environmental stressors (especially poor air quality) that have an impact on health, the availability of health care services in the region plays a crucial role in improving health outcomes in the region. This component of the study has the following objectives:
Assess availability of health care services in the Mining Clusters and the Road corridor area in terms of-
- Medical manpower available - General medical facilities available - Specific respiratory health care facilities available
Identify what medical care facilities are provided by mining companies Assess people's perceptions regarding public and private services Assess usage of public and private health care within the community
The state health system is classified into three tiers, namely primary, secondary and tertiary where the level of care becomes more advanced or specialised moving from the primary to the tertiary level. This structure of the health services is uniform throughout the country.
The primary care level is further broken down into three tiers comprising of sub-centres (SC)
at the lowest level (population served 5000), followed by primary health centres (PHC) (population served 30,000) and community health centres (CHC) (population served
120,000). Together these facilities provide basic medical care in rural areas.
The secondary level of care includes more advanced services provided through district hospitals. The tertiary level of care provides the most specialised care and is delivered through the Goa Medical College Hospital located in the capital city. For a detailed map of health care system and services in the state see Annexure A.
At the primary level there is a greater emphasis on preventive care while at the tertiary level the focus is more on curative care. Preventive care at the primary level is delivered through the national health programmes focusing on family planning, antenatal care, child health, immunisation, education outreach regarding sanitation, diarrhoea, worm infestation etc.
Additionally, there is a focus on early detection of communicable diseases such as malaria etc. through mass or family screenings and provision of preventive medicines. Another important aspect of preventive care at the primary level is home, nursery and school visits by multipurpose health workers with a special thrust on family health and child development. In addition to preventive care, the Primary Health Centres (PHCs) and Community Health Centres (CHCs) provide basic curative care. More specialised care is accessed through the referral system.
IDRC Centre File: 101276-001 39
TERI Report no. 2002WR41

Chapter 2: Valuing environmental - health linkages
Health care facilities in the study area The study area consisting of the three Clusters and the Road Corridor includes mostly rural areas and four small towns (one in each Cluster and one in the Road Corridor). Thus, all the government health care facilities present in the study area belong to the primary level of care.
Before presenting the data about the availability of care, however, is it important to understand the spatial nature of the study area. Cluster I and Cluster II are adjacent to each
other and fall mostly into Bicholim taluka with a few villages in Cluster II falling into Sattari taluka. When presenting data on health care services by Cluster we have presented information about the Primary or Community Health Centre in the main town in each
cluster. However as these Clusters are next to each other it is important to remember that people in Cluster I may be visiting the health centre in Cluster II and vice-versa.
The same is true for Cluster III and the Road Corridor. The Road Corridor, Curchorem (in Quepem Taluka), is an urbanised town with a Community Health Centre. Curchorem is
adjacent to Sanguem Taluka (Cluster III). Thus, many people in Sanguem visit the Curchorem health centre. In general, there is good bus connectivity to urban areas across the state and as Goa is a small state even rural communities have relatively easy access to big cities where full-fledged specialised health services are available. Table 2D.1, below provides basic information on population served by each health centre in the study area.
Table 2D.1 Population served by public health centres in the study area
Study area
Health centres
Total population served by health
centres (2001)
Cluster I Bicholim PHC 51292
Cluster II Sanquelim PHC 39115
Cluster III Sanguem PHC 61064
Road corridor Curchorem CHC 51444 Census of Goa 2001 for total population / talukas
The tables below present statistics on the number of government health care facilities and health care workers in the study area relative to the government norms.
Public health centres
Table 2D.2 Number of public health care institutions serving the population
Comm.
Health Cent.
Primary
Health Cent. ................
Sub-centre RMD Population
NORM: 1 CHC: 120000 1 PHC: 30000 1 SC: 5000
Bicholim 1 8 1 51292
Sanquelim 1 7 2 39115
Sanguem 1 11 2 61064
Curchorem 1 8 1 51444
Numbers in bold indicate population served exceeds norms
Source. Health Profile 2005, Health Intelligence Bureau, Directorate of Health Services, Panaji Goa.
IDRC Centre File: 101276-001 40
TERI Report no. 2002WR41

Chapter 2: Valuing environmental - health linkages
Table 2D.2 (above) shows that the population being served per primary health centre in Cluster I (Bicholim) and Cluster III (Sanguem) are higher than the national norms. In cases where the population served is low or within norms, at times the area covered is very vast so accessibility becomes difficult. This was observed mostly in Cluster III (Sanguem) where villages are remote and the transport network is not as well developed. In some cases people find it easier to get to the nearest town for health care than to their nearest sub-centre which may be located in the interiors of another village. Thus, people from the study area are very likely accessing some of the larger hospitals in near by towns (Mapuca, Ponda, Margao etc.). People also use private health care facilities across the region.
Public and private hospitals
Table 2D.3 Public and private hospitals across mining region
No. of hospitals No. of beds Population ..... ------ ..... _............. _......... ._............. ......... _..._._._ ..................._._...................._....._.................................._..........._..............
Bed (Norm: 1:1000)
Bicholim (Clust. I) 7 140 51292
Sanquelim (Clust. II) 2 10 39115
Sanguem (Clust. III) 2 80 61064
Quepem (Curchorem)
(Road Corridor) 7 150 51444
Numbers in bold indicate population served exceeds norms Source. Directory of hospitals in Goa 2005, Health Intelligence Bureau, Directorate of Health Services, Panaji Goa.
Table 2D.3 above shows the number of hospitals and beds relative to population of the study area. It shows that there are fewer beds in Sanquelim relative to other areas. The number of people served per bed is much higher than the norm of 1 bed per loon population in Sanquelim. It is important to note that these figures include beds provided by private health facilities which are not provided free of cost.
Health care manpower During focus group discussions, several people in the study area complained about lack of staff (doctors, health workers, nurses and technicians) in the sub-centres and other facilities in the study area. Additionally, during field visits it was not uncommon to find two sub- centres manned by one health worker because of lack of staff. At some Primary Health Centres (PHCs) diagnostic facilities like X-rays and pulmonary function tests were not available because technicians to run the machines were unavailable. Table 2D.4 (below) provides information on the health care manpower in the government health facilities.
IDRC Centre File: 101276-001 41
TERI Report no. 2002WR41
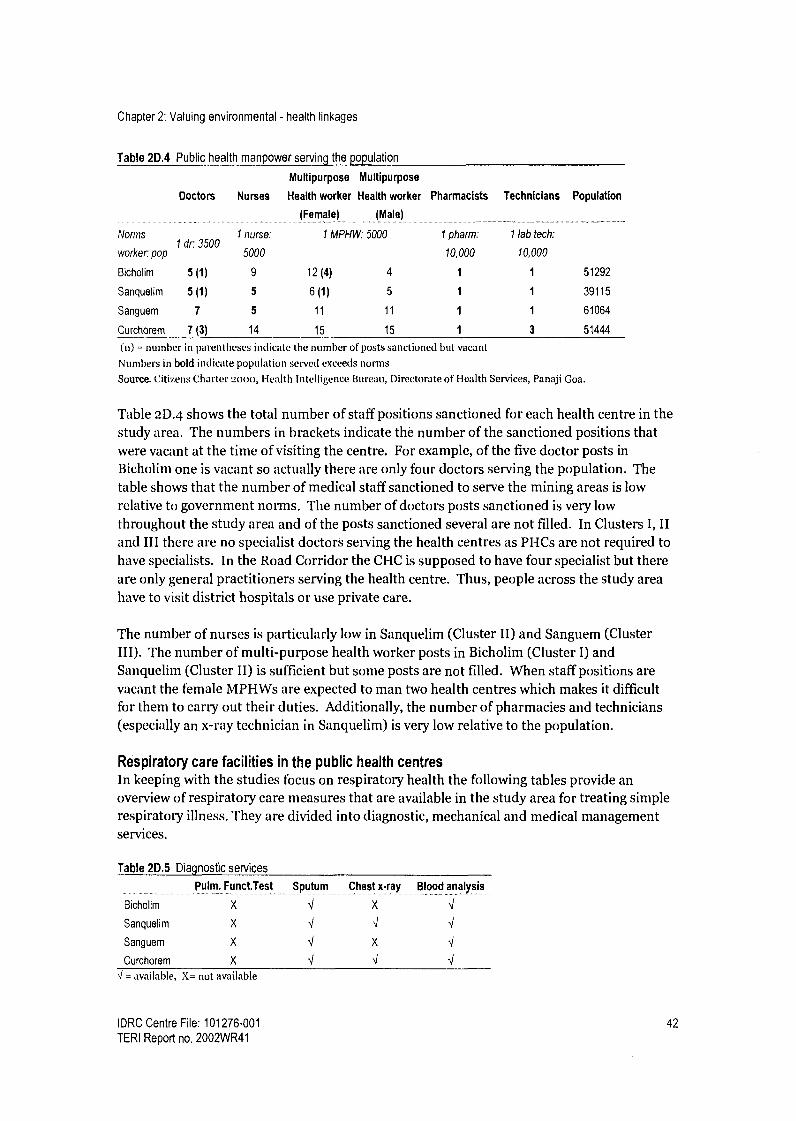
Chapter 2: Valuing environmental - health linkages
Table 2D.4 Public health manpower serving the population
Multipurpose Multipurpose
Doctors Nurses Health worker Health worker Pharmacists Technicians Population
(Female) (Male)
Norms I nurse: 1 MPHW:5000 1 pharm: I lab tech:
k 1 dr: 3500
5000 10 000 10 000 wor er: pop , ,
Bicholim 5(1) 9 12(4) 4 1 1 51292
Sanquelim 5(l) 5 6(1) 5 1 1 39115
Sanguem 7 5 11 11 1 1 61064
Curchorem 7 (3) 14 15 15 1 3 51444
(n) = number in parentheses indicate the number of posts sanctioned but vacant Numbers in bold indicate population served exceeds norms
Source. Citizens Charter 2000, Health Intelligence Bureau, Directorate of Health Services, Panaji Goa.
Table 2D.4 shows the total number of staff positions sanctioned for each health centre in the study area. The numbers in brackets indicate the number of the sanctioned positions that were vacant at the time of visiting the centre. For example, of the five doctor posts in Bicholim one is vacant so actually there are only four doctors serving the population. The table shows that the number of medical staff sanctioned to serve the mining areas is low relative to government norms. The number of doctors posts sanctioned is very low throughout the study area and of the posts sanctioned several are not filled. In Clusters I, II and III there are no specialist doctors serving the health centres as PHCs are not required to have specialists. In the Road Corridor the CHC is supposed to have four specialist but there are only general practitioners serving the health centre. Thus, people across the study area have to visit district hospitals or use private care.
The number of nurses is particularly low in Sanquelim (Cluster II) and Sanguem (Cluster III). The number of multi-purpose health worker posts in Bicholim (Cluster I) and Sanquelim (Cluster II) is sufficient but some posts are not filled. When staff positions are vacant the female MPHWs are expected to man two health centres which makes it difficult for them to carry out their duties. Additionally, the number of pharmacies and technicians (especially an x-ray technician in Sanquelim) is very low relative to the population.
Respiratory care facilities in the public health centres In keeping with the studies focus on respiratory health the following tables provide an overview of respiratory care measures that are available in the study area for treating simple respiratory illness. They are divided into diagnostic, mechanical and medical management services.
Table 2D.5 Diagnostic services
Pulm. Funct.Test Sputum Chest x-ray .. .._... Blood analysis
.
Bicholim X X J
Sanquelim X J J J
Sanguem X X J Curchorem X J J J
J = available, X= not available
IDRC Centre File: 101276-001 42 TERI Report no. 2002WR41

Chapter 2: Valuing environmental - health linkages
Table 2D.5 (above) shows that there is no chest x-ray facility in the Bicholim health centre. The x-ray facility at the Sanquelim Primary Health Centre is available only two days a week. Importantly, there is no radiologist at the Sanquelim centre so all X-rays have to be sent to the district hospital to be analysed. There is no X-ray facility at the Sanguem health centre and there are no facilities for pulmonary function tests in the study area. Simple sputum and blood tests are available in all the centres.
Table 2D.6 Respiratory management measures
Oxygen Nebuliser Suction Medications ................. --........._.....__......._... .................. __..._......... _............_............ ..............._.._.......... .......... ...... _.._.._.............. .._...._......... ............... .
Bicholim J J J J
Sanquelim J J J J
Sanguem J J J
Curchorem J J J J J = available
Basic services like oxygen, steam inhalation, and nebulisation are available throughout the study area as shown in Table 2D.6 (above). Respiratory medicines are available at all health centres in the study area and are provided free of cost. Additionally, simple medications (eg. Cough syrups, decongestants, pain killers, de-worming medication, antacids) are also provided free of cost.
In general, only basic respiratory care facilities are provided in the primary health centres. For other services the people have to access the private health sector, dispensaries run by mining companies (only curative services) in few villages or district centres in the region. For further diagnostic tests, specialized doctors, sophisticated facilities and services they have to follow the referral system and access the state hospitals.
Table 2D.7 (below) provides a summary of hospital care services available in the study area.
Table 2D.7 Other public health care services
Ambulance Hospitalization Out patient Emergency care
-.._........ ._ .....................
Bicholim J
Sanquelim J J
Sanguem J J
Curchorem J J = available
dept. (ambu bag, med...) ......_.............. ........... ._......_..._._............__.....
J J
J J
J J
J J
Basic health care services for hospitalisation and acute/ emergency medical management are available in the public health care system for minor or uncomplicated occupational trauma or injuries (as shown in the table above). For further management (intensive care unit, trauma care, respirator) people or workers are referred to specialized hospitals, which are not in the mining areas. It is worth noting that there is a lack of doctors with specialised training in
respiratory medical care and occupational hazards and safety measures at health centres in the mining regions.
IDRC Centre File: 101276-001 43
TERI Report no. 2002WR41

Chapter 2: Valuing environmental - health linkages
Private health care services In addition to government health care services, there is a range of private facilities in the study area. Table 2D.8 (below) summarises private health care facilities in the study area.
Table 2D.8 Private health care facilities in the mining areas
Area
Allopathic
clinics Indigenous doctors Dentists Hospitals Diagnostic
Pharmacies
Bicholim 35
2 ayurvedic, 4 6
Centres
4 9-10
Sanquelim 15
1 homeopathy
2 ayurvedic 1 1 2 2-3
Sanguem 10 1 homeopathy 0 0 1 1
Curchorem 30 1 homeopathy 2 7 5 5-6
In general there are several private dispensaries in Bicholim and Curchorem probably owing to the fact that these are urban centres. Similarly, the number of hospitals, diagnostic centres and pharmacies in Bicholim and Curchorem are high but very low in Sanquelim and Sanguem.
While private health care providers outweigh the public system in terms of provision of infrastructure, these providers are concentrated mostly in Bicholim town and Curchorem town. There are relatively few private care providers in rural parts of the study area especially the interiors of Sanguem. Importantly, private care is expensive making it inaccessible for people in low income groups.
In addition to allopathic medical care, during focus group discussions people reported preparing and using home remedies for simple ailments as they are cheap and generally do not have side effects. Participants in focus group discussions also reported accessing traditional ayurvedic and homeopathy doctors in the study area for minor and chronic illnesses.
Health care provisions by the mining company This section provides more detailed information on health care services provided through companies. These health care facilities can be classified as provisions for mine workers and provisions for the community.
Provisions for mine workers Mining companies are obliged to provide health care services to mine workers as stipulated by a variety of legislative acts. The Iron Ore Mines, Manganese Ore Mines and Chrome Ore Mines Labour Welfare Cess (Amendment) Act, 1982 mandates that a one rupee cess be collected per tonne of iron ore that is either exported or used for local consumption. The use of this cess fund is stipulated by the Iron Ore Mines, Manganese Ore Mines and Chrome Ore Mines Labour Welfare Fund (Amendment) Act, 1982. These funds are to be used for improvement of public health and sanitation facilities; prevention of disease and improvement of housing; educational, recreational and transportation facilities and social security benefits for Iron ore mine workers. These welfare facilities are extended to both
IDRC Centre File: 101276-001 44 TERI Report no. 2002WR41

Chapter 2: Valuing environmental - health linkages
workers and contracted employees. Mining companies in Goa contribute to this welfare cess and also avail of funds from the cess to provide medical facilities to workers.
Free consultation facility at mine dispensaries: The Mines Safety Act of 1952, mandates that a first aid room stocked with medicines, equipment and medical and nursing staff should be available in case there are more than 150 workers (Section 22, (1-4), Mines Act, 1952). In keeping with this regulation, several companies have set up dispensaries attached to their mine sites and provide free medical consultation to workers. Some companies extend services to workers' family members. Interestingly, several companies have availed of a grant from the welfare cess fund (explained above) to set up these dispensaries.
Emergency facilities: The Mines Act of 1952 (Section, 22, (5)) also mandates that an ambulance facility be available for emergency situations. This facility is also commonly provided by mining companies in Goa and here too companies have availed of a grant in aid from the welfare cess fund to purchase ambulances. There are instances where the ambulance facilities have been extended to the community as well.
Regular health check-ups: Pre-employment and periodic health check up for mines workers is mandated by the Mines Safety Act, 1952. There are guidelines to cover the different parameters that need to be examined and recently spirometry has been included as one of the parameters. Several of the larger companies in Goa are following these guidelines.
Medical reimbursement: Reimbursement of medical costs for workers is made available through the Cess Welfare Fund for mine workers (explained above). Through this provision medical aid is provided to workers for chronic illness such as tuberculosis, heart diseases, kidney transplant and cancer. Medical expenses ranging between Rs. 100,000 to Rs.
200,000 for the above illnesses is covered and in some cases, a subsistence allowance is paid for the attendant of the patient, travel cost and reservation of beds (at government and recognized private hospitals). Additionally, the Workman Compensation Act, 1923, under the labour department and the Mines Safety Act ensures that workers are compensated in case of accidents at the workplace. In Goa mine workers were provided free consultation and hospitalization facilities through a 150 bedded hospital (Central Hospital) and a mobile dispensary. This facility was made available through the welfare cess, however these facilities are currently not available because the hospital has closed down. A proposal for the State government to take over this hospital has been floated and is under consideration.
In addition to insurance provided by the state, some of the larger companies in Goa provide reimbursement through group insurance policies purchased by the company. The terms of coverage vary from one company to another. Some mining companies also pay their workers an annual medical allowance for the family.
IDRC Centre File: 101276-001 45
TERI Report no. 2002WR41

Chapter 2: Valuing environmental - health linkages
Provisions for the community
The Minerals Foundation (MF) of Goa, a trust fund set up by the mining industry in Goa,
provides some community health facilities from time to time7. Health interventions taken up target a wide sector of the local community including women, children and the aged residing in the mining region. The following is a list of MF's initiatives:
i. Health camps: health check-up, blood group testing camps in schools and villages 2. Surgeries for cataract through the project Drushti wherein they have covered iii
patients between 2004-2005. 3. Medical consultation for the aged through a mobile dispensary for the aged in
collaboration with Help Age, India which covers around 8 villages in the mining region (out of approximately 54 mining villages).
4. Distribution of nutritional supplement for TB patients in the mining regions. 5. Weekly medical consultation facility in association with Matruchaya seva at
Savordem and a help desk facility at the GMC. 6. Provision of financial assistance for treatment for illness that is often not covered
through medical insurance such as travel, post-operative care and expenses of the attendant accompanying patients.
People's perceptions of health care services in the study area Through focus group discussions with men and women in the local community people's perceptions of health care services were recorded. The table below summarises people's perceptions of public health services in each of the three mining Clusters and the Road Corridor.
Cluster I Generally happy with government health care services Use government centres for all kinds of illnesses, facilities and hospitalisation
Cluster II Long waiting times are inconvenient At times medical treatment is ineffective For some people access in terms of distance and connectivity is difficult Poor/unfriendly attitude of staff
Cluster III Not enough health centres in the rural areas. Those that exist are very far and inaccessible to many. Waiting times at government health centres are too long Medicines that are supposed to be available free are not available Poor/unfriendly attitude of staff
Road More waiting time on certain days as the centre caters to a large population and Corridor has other facilities
Often lack of working equipment or doctors Acquaintance with the doctor ensures better treatment People prefer going to the government centres for vaccinations and deliveries Ambulance is not always available during emergencies or at night Poor/unfriendly attitude of staff
7 The minerals foundation is the outcome of a corporate social initiative, which came into being in 2000.
IDRC Centre File: 101276-001 46 TERI Report no. 2002WR41

Chapter 2: Valuing environmental - health linkages
Utilisation of health care services During focus group discussion people showed a preference for private health care facilities. The (Governance) survey conducted in this study has reinforced this finding. In all 442 households were surveyed, spread across the study area. Respondent were asked which health care facilities i.e. government /private they had availed.
Usage of Health Facilities at the Lowest Level
Public = 263 (61.59%) Private = 410 (96.02%)
N=427
Figure 2D.1 Usage of privatel public health facilities at the lowest level
When asked this question about usage of private and public facilities at the lowest level of care (sub-centres, rural medical dispensaries, private clinics), of a total 427 respondents who
answered the question, 96 % reported using private health care facilities and 62% reported using public facilities (Figure 2D. 1). The percentage does not sum to hundred percent as 57 percent of the respondents use both facilities. Thirty-eight percent respondents reported using only private facilities and only 4 percent reported using government facilities exclusively. One possible explanation could be that the sub-centres are open for consultation for half a day on a weekly basis and in some cases they are closed due to lack of staff. The rural medical dispensaries on the other hand generally have consultation facility throughout the week however there are few rural medical dispensaries (only 5) in the study area. The consultation timings at these facilities coincide with the working hours as opposed to private facilities, which are open beyond working hours. Additionally, it is possible that respondents underreported use of government facilities as using government health services reflects a
poor economic status.
Figure 2D.2 (below) depicts the usage of health care services at a middle level (Primary/ Community Heath Centres/ private nursing homes/ hospitals). Here too use of private facilities (87%) is much higher than public (68%). When these figures are compared against
those for usage at the lowest level of health care it shows that there is a 9 percent increase in
usage of government health care services. This could be because Primary and Community health centres include hospitalisation facilities, which are free as opposed to the private
centres where hospitalization is expensive. Even though outpatient care is expensive at
private facilities (relative to public which is free) the amount of money involved is probably
IDRC Centre File: 101276-001 47
TERI Report no. 2002WR41

Chapter 2: Valuing environmental - health linkages
affordable for many people in the study area. On the other hand, for hospitalisation or more complex treatments, which involve large sums of money at private facilities, a greater percentage of respondents may prefer to use the government services.
Usage of Health Facilities at the Middle Level
Public = 292 (68.38%)
Figure 2D.2 Usage of private/ public health facilities at a mid-level
N = 430
The data presented in this section suggests that the structure of state health care services and the level of care to be provided at the regional level is adequate. However, all parts of the study area there is a shortage of staff and facilities relative to national norms. Additionally, state health care services have not kept up with population growth in the mining regions. While private facilities make up for the shortfall in public services, their facilities are expensive and therefore not accessible to low income groups. Importantly, private care is
focused on curative services while public health sector provides a range of preventive care facilities as well. For this reason where public facilities are poor/inadequate, private care cannot be seen as an adequate alternative.
Highlights The number of people being served by the Primary Health Centre is high relative to the norms in most parts of the study area The number of staff serving the mining areas is low, specifically doctors Vacant posts for doctors and health workers adds further stress on the system In parts of the study area there are no No X-ray and PFT equipments and no technicians and trained medical staff to interpret the results in the government Primary health centre While a large number of private medical clinics, hospitals, diagnostic centres and dentists and pharmacies exist in urban areas, rural areas are served mostly by the public health system Fair number of mining dispensaries and doctors at and near the mine sites for curative care Local community members are dissatisfied with public health care services in terms of:
Private = 372 (87.12%)
IDRC Centre File: 101276-001 48
TERI Report no. 2002WR41

Chapter 2: Valuing environmental - health linkages
o Waiting time for doctors visits o Attitude of staff o Distance of health care centres from villages o Lack of equipment/ services
Most people in the study area are using a mix of public and private health care facilities. Percentage of people using only public facilities is low (between 4% and 13%). Percentage of people using only private facilities is high (between 32%- 38%)
Conclusions This component of the research highlights the impacts of air pollution on health. The data shows that ambient and exposure levels are high in the mining Clusters and the Corridor compared to the Control area. Importantly, respiratory ill health reported and observed in the study follow a similar pattern. The relative risk of developing health problems in mining Clusters and the Corridor is high relative to the Control area. The study also shows that the per capita cost of ill health based on wages lost and expenses incurred as a result of doctors visits is high in the mining Clusters and highest in the Road corridor area.
As access to health care is an important determinant of health this study has also focused on health care services in the region. Cutting across public and private care, one finds a large number of health care centres available in urban parts of the mining regions but fewer facilities in remote rural areas. While Goa is a small and relatively well-connected state where it is possible to access government health care centres in other areas, this imposes an extra cost on communities in remote areas. Additionally, data shows a lack of medial staff and facilities at government health centres. Thus, even where there are centres care may be inadequate.
These shortcoming have been perceived and reported by community members through focus group discussions. Additionally, the fact that a large percentage of people have reported using private facilities (as opposed to government centres which are free) suggests the cost of externalities of mining have been passed on the local community rather than the state.
Even though medical professionals and staff at the various health centres are aware of the increased respiratory problems in the area, there has been no special attention to chronic respiratory problems or enhancement of respiratory care facilities to cater to the needs of mining communities.
In order to cater to the needs of local communities, in all three mining Clusters and the Road corridor, existing health care facilities need to be enhanced in terms of general care and respiratory health care and in some areas new health centres are required to cater to the growing population.
IDRC Centre File: 101276-001 49
TERI Report no. 2002WR41

Chapter 3: Land
Chapter 3: Land
This chapter, focusing on land resources in the mining regions is divided into two sections.
Section 3A deals with the impacts of mining on agricultural land resources in the region and further on the community. Additionally, it includes an assessment of responses to changes in land and employment from various stakeholders.
Section 3B addresses the issue of metal up-take in fruit crops grown on dumps as part of land remediation measures.
3A Impact of mining on agricultural land and employment
Introduction Mining activities have a profound localised impact on land resources, which in turn impact local communities in the region. These impacts occur in two ways. When new mine leases are issued large tracts of land belonging to individuals and communities are absorbed into the lease. At this time people not only loose the land on which they live but also land which forms the basis of their livelihoods. Once mining operations have begun, land around mines can be affected by mining operations through run-off from overburden dumps which is the focus of this component of the project.
The main objectives of this component of the study are as follows: Identify how mining activities affect land resources in the region Identify how this has affected livelihood opportunities in the region, especially for women Identify responses to land related problems by key agents in the region (including compensation)
Methodology Focus group discussions A total of three focus group discussions (one in each of the mining clusters) were conducted in villages across the study area with men and women farmers.
Cluster I: Soliyem, Sonus 8 women, mixed age groups, mixed land holdings, two agricultural labourers
Cluster II: Cudnem 9 men, mixed land holding sizes, mixed age groups
Cluster III: Codli 15 men, mixed age groups, mixed land holding sizes
The aim of these focus group discussions was to identify; Changes in cropping patterns over the years
How mining had affected agricultural land in the region
IDRC Centre File: 101276-001 50 TERI Report no. 2002WR41
Chapter 3: Land
The availability of compensation The role of farmers groups
Interviews and discussions Interviews and discussions were conducted with the Zonal Agricultral Officers, Deputy Collectors and mining company representatives. These discussions focused on the state of agriculture in the mining regions and procedures for compensation payments. Additionally, discussions with representatives from the Indian Bureau of Mines, the State pollution Control Board, Water Resources Department were taken up regarding their functions and their role in the mining region.
Interaction with farmers In addition to more formal research methods used such as focus group discussions and interviews, the capacity building component for farmers in this project presented ample opportunities to interact with local farmers groups. Through almost continuous interaction with farmers for small programmes, meetings, transect walks etc. researchers have come to know the field intimately and begun to understand with more clarity how exactly agriculture is affected by mining. In addition to group strengthening exercises, interactions with farmers have included helping farmers deal with government officials and company representatives in terms of whom to approach, how to put forth their case etc. This work has helped us to understand the vast network of government bodies that have an impact on agriculture and the gaps in government initiatives be they supportive or regulatory. While we adopted focus group meetings as one of the methodologies to explore issues, the process of interaction over time and simply maintaining notes has rewarded us with a wealth of detailed knowledge on the impacts of mining on the land and on governance and decision making in this context.
Additionally, interaction with women's self-help groups has also provided a lot of information about agriculture as many women in these groups are farmers who belong to agricultural households.
This component of the research has been participatory where a process of mutual learning by researchers and farmers has evolved over time.
Results Impact of mining on land In the iron ore mining areas of Goa the ore to overburden ratio is roughly i:3. Thus, for every ton of ore excavated three tons of overburden material is generated. This material is piled into steep and high dumps. Poor dump management coupled with the heavy monsoons experienced in Goa results in large-scale soil erosion from these dumps. This silt-laden water enters the drainage network and also enters adjacent low-lying paddy fields resulting in the accumulation of silt in fields and water bodies. As mining in Goa is located in rural areas where agriculture is a primary source of income, changes on the land have a profound impact on livelihoods and on human well-being. Men and women in the study area reported changes in cropping patterns over the past several years. This includes a shift from crop rotation to growing only rice and the use of chemical fertilisers. No farmers (men or women) reported using pesticides. Many farmers
IDRC Centre File: 101276-001 51
TERI Report no. 2002WR41

Chapter 3: Land
have stopped growing traditional varieties and have shifted to high yielding hybrids such as
Jyoti and Jaya. Additionally, among the larger farmers it has become common to use a power tiller for land preparation. however, these changes reported by farmers are not limited to the study area but are widespread across Goa. Farmers also reported a variety of changes in the conditions of agricultural land as a result of poorly managed overburden dumps.
According to farmers, the accumulation of silt in water bodies and in fields is the root cause
of problems in the agricultural system. The accumulation of silt over a period of years has
several impacts, namely:
Lowered soil fertility The silt accumulated on the land, which may be as deep as 8o cm on average, has little or no organic matter and has low fertility. Due to low soil fertility, crop yields begin to drop over time. To some extent, this problem can be addressed by increasing the organic matter content in the silt layer and by applying large quantities of chemical fertilisers. However, these measures significantly increase the cost of the crop.
Reduced water-holding capacity of water bodies For paddy crops grown during the monsoon under normal conditions, the fields are flooded in the early part of the monsoon, which is when the seeds germinate. After a period of time the fields are drained by channelling water from the fields back into rivers or streams. Due to heavy silting, the river and stream beds rise, reducing their water-holding capacity and causing an overflow. Thus, the water in the fields cannot be channelled back into the drainage network leaving the fields waterlogged for long periods of time. As a result, the germinated seeds begin to rot and the crop is destroyed.
Change in land contour Land contours play a very important role in drainage and irrigation of fields. In order to properly regulate the amount of water in the fields a network of narrow channels needs to be maintained across a level surface so that water can flow effectively. If the fields are not levelled water logging tends to occur in patches the resulting in the destruction of the crop. Additionally, during the winter crop the traditional irrigation technique of channelling water from the streams into the fields by gravity is not possible due to changes in land contours. While this problem can be overcome by using a pump set it further drives up farmers' expenses.
Maintaining land contours in areas that are silted year upon year requires intensive land preparation to even out the level of the fields. This requires additional labour which is expensive. In some areas farmers have attempted to manually remove some of the silt that has accumulated. This is obviously very labour intensive and the problem of where to dump the silt has not been resolved. Some farmers have used it to strengthen bunds running along the fields or they have created small mounds at intervals and tried to plant trees on them. Given the large volumes of silt that have accumulated over the years, these measures are inadequate and piecemeal. Farmers have expressed irritation, anger and helplessness at the fact that this needs to be done every year because the dumps have not been managed and stabilised.
IDRC Centre File: 101276-001 52 TERI Report no. 2002WR41

Chapter 3: Land
Lack of water Due to silting of water bodies the volume of water flowing through perennial surface water streams has diminished significantly creating a shortage of water in the dry, winter season when irrigation is necessary. In such cases some farmers have stopped growing the winter crop.
Another source of water for irrigation were small ponds or springs that were perennial. As a result of mine pits being very deep (several meters below sea level) the water tables in the area surrounding the mine have dropped and several groundwater sources, including ponds and springs have dried up.
While some of these problems can be overcome by increasing inputs (more intensive application of fertilisers, use of a pump set, more intensive land preparation using a power tiller) these technical fixes also significantly raise the cost of production. However, farmers felt that this was not an attractive option as paddy is not a very lucrative crop and it is usually grown for self-consumption. Under these conditions farmers reported finding it cheaper to buy rice from the market than to grow it.
In several parts of the study area, plots of land are owned/managed by large numbers of farmers. For instance, in one of the villages in Cluster I, one plot of 19 hectares is owned by
70 farmers. Maintenance of the land is normally taken up collectively, eg. building and maintaining of canals for irrigation, maintaining of bunds along the edge of water bodies, sowing, transplanting, harvesting etc.) As more and more farmers stop farming a critical point is reached when those who are left cannot continue farming because they are unable to maintain the land by themselves. Thus, those who wish to continue farming at times have no choice but to give up farming and with time the system begins to collapse.
This domino affect plays out not only within each plot of land but also at a watershed level. As large groups of farmers opt out of the system, the volume of water being carried in the rivers and streams becomes increasingly unpredictable. This begins to have an impact on farmers upstream and downstream. Thus poorly managed dumps in the upstream reaches of the watershed have wide-reaching impact on water-bodies and land through the entire micro-watershed in which they are located. As a result, agriculture has become an unattractive option for the following reasons:
Innovation with more lucrative cash crops is difficult because the basic prerequisites, namely a steady supply of water and good quality soil are lacking. Currently there is
too much uncertainty in the system. Farmers feel frustrated by the fact that several remediation measures have to be taken every year as the flow of silt from the dumps is not contained. Compensation is available. It is often financially a more sensible option and also an easier option than farming. As some peoples' daily needs are met through alternative jobs (mining and others), the need to continue agriculture for sustenance has decreased over time.
IDRC Centre File: 101276-001 53
TERI Report no. 2002WR41

Chapter 3: Land
Agricultural employment '['he impacts of mining on land have undoubtedly had an impact on livelihoods of agricultural households in the study area. As agriculture has gone into decline with increasing numbers of people choosing not to farm or unable to farm, the amount of work available for local men and women has decreased. While mining and allied activities have provided employment opportunities to men in the study area there are almost no women working in mining and allied activities.
An agriculture gender map is used to estimate employment opportunities lost by men and women in the mining region. In order to identify how many days men and women spend on each agricultural task a small questionnaire was canvassed in five villages among 50 farmers who have agricultural land and are still actively cultivating. Of the five villages, two belong to the study area (Sirigao and Codli) and three are adjacent to the study area (Karapur, Sarvona, Kudchire). These adjacent villages were chosen in order to assess the time spent on agricultural tasks in geographically similar regions but where there is no additional stress on agriculture as a result of mining. Those participating in the study were classified into two groups, namely farmers with small land holdings (less than 1 acre) and farmers with large land holdings (one acre and above). The results of this exercise are tabulated below.
Table 3A.1 Employment generation from single paddy crop
Employment generation
Agricultural activities
Land preparation
Ploughing
Seed selection
Sowing
Transplanting
Weeding
Applying organic manure
Preparing green manure
Harvesting
Post-harvest
Threshing
Winnowing
Milling
Boiling/Drying
Market selling
Storage
Bunding/Fencing
Total
Person days per I acre land
(small farmers)
Person days per 1 acre land
(moderate/big farmers)
Male Female Male Female
2 1
15 1 2 1
1 1
4 2 1 1
6 24 2 20
1 30 1 8
3 2 1 1
1 2 0 0
4 18 2 13
4 2 0 0
22 4 7 1
10 5 4 1
3 2 1 1
1 9 0 2
- 3 2
1 1
4 4 2 1
88 113 27 53
Total: 201 days Total: 80 days
IDRC Centre File: 101276-001 54
TERI Report no. 2002WR41
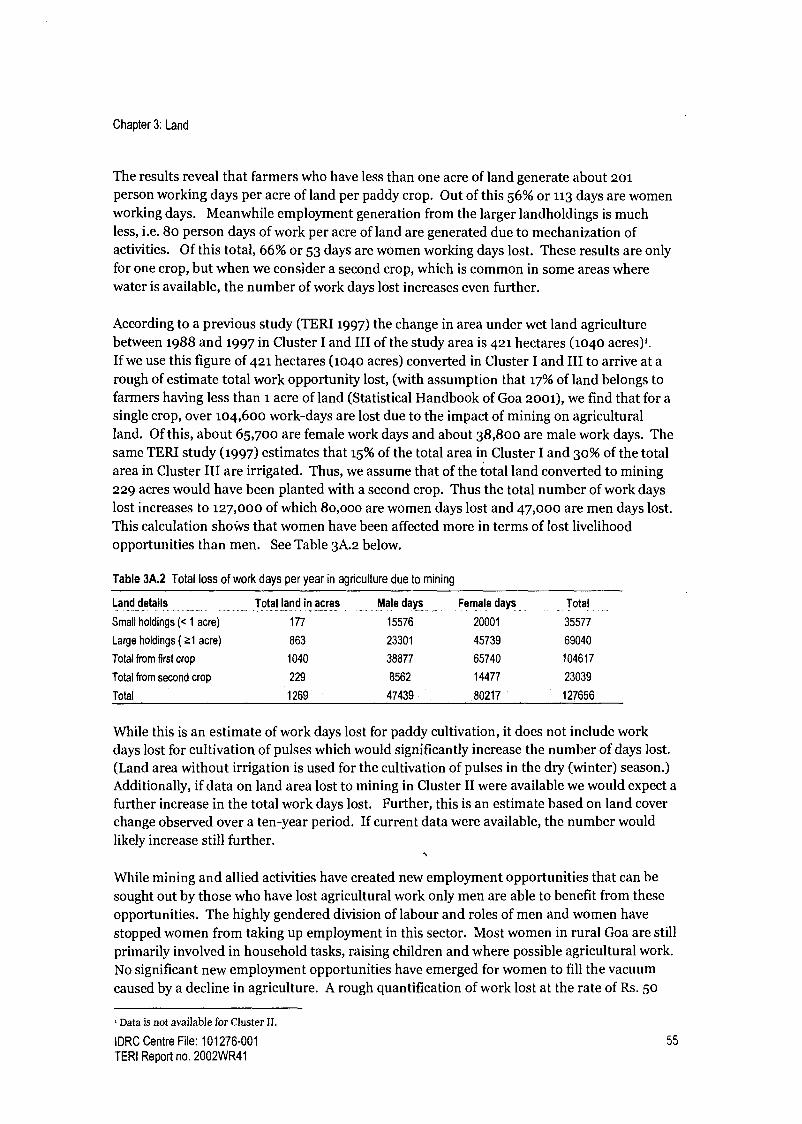
Chapter 3: Land
The results reveal that farmers who have less than one acre of land generate about 201 person working days per acre of land per paddy crop. Out of this 56% or 113 days are women working days. Meanwhile employment generation from the larger landholdings is much less, i.e. 8o person days of work per acre of land are generated due to mechanization of activities. Of this total, 66% or 53 days are women working days lost. These results are only for one crop, but when we consider a second crop, which is common in some areas where water is available, the number of work days lost increases even further.
According to a previous study (TERI 1997) the change in area under wet land agriculture between 1988 and 1997 in Cluster I and III of the study area is 421 hectares (1040 acres),. If we use this figure of 421 hectares (1040 acres) converted in Cluster I and III to arrive at a rough of estimate total work opportunity lost, (with assumption that 17% of land belongs to farmers having less than 1 acre of land (Statistical Handbook of Goa 2001), we find that for a single crop, over 104,600 work-days are lost due to the impact of mining on agricultural land. Of this, about 65,700 are female work days and about 38,800 are male work days. The same TERI study (1997) estimates that 15% of the total area in Cluster I and 30% of the total area in Cluster III are irrigated. Thus, we assume that of the total land converted to mining 229 acres would have been planted with a second crop. Thus the total number of work days lost increases to 127,000 of which 8o,ooo are women days lost and 47,000 are men days lost. This calculation shows that women have been affected more in terms of lost livelihood opportunities than men. See Table 3A.2 below.
Table 3A.2 Total loss of work days per year in agriculture due to mining
Land details ............ ...._..._.... __..._..... _ .............. ....._....... _....... .................
Total land in acres Male days Female days Total ....... ........ __......... ............. ...._.... ......... _...... _..................... ..................._........_._....... .............. ............................... ............. ........................ _..... ............... ......
Small holdings (< 1 acre) 177 15576 20001 35577
Large holdings (21 acre) 863 23301 45739 69040
Total from first crop 1040 38877 65740 104617
Total from second crop 229 8562 14477 23039
Total 1269 47439 80217 127656
While this is an estimate of work days lost for paddy cultivation, it does not include work days lost for cultivation of pulses which would significantly increase the number of days lost. (Land area without irrigation is used for the cultivation of pulses in the dry (winter) season.) Additionally, if data on land area lost to mining in Cluster II were available we would expect a further increase in the total work days lost. Further, this is an estimate based on land cover change observed over a ten-year period. If current data were available, the number would likely increase still further.
While mining and allied activities have created new employment opportunities that can be sought out by those who have lost agricultural work only men are able to benefit from these opportunities. The highly gendered division of labour and roles of men and women have stopped women from taking up employment in this sector. Most women in rural Goa are still primarily involved in household tasks, raising children and where possible agricultural work. No significant new employment opportunities have emerged for women to fill the vacuum caused by a decline in agriculture. A rough quantification of work lost at the rate of Rs. 50
Data is not available for Cluster 11.
IDRC Centre File: 101276-001 55
TERI Report no. 2002WR41
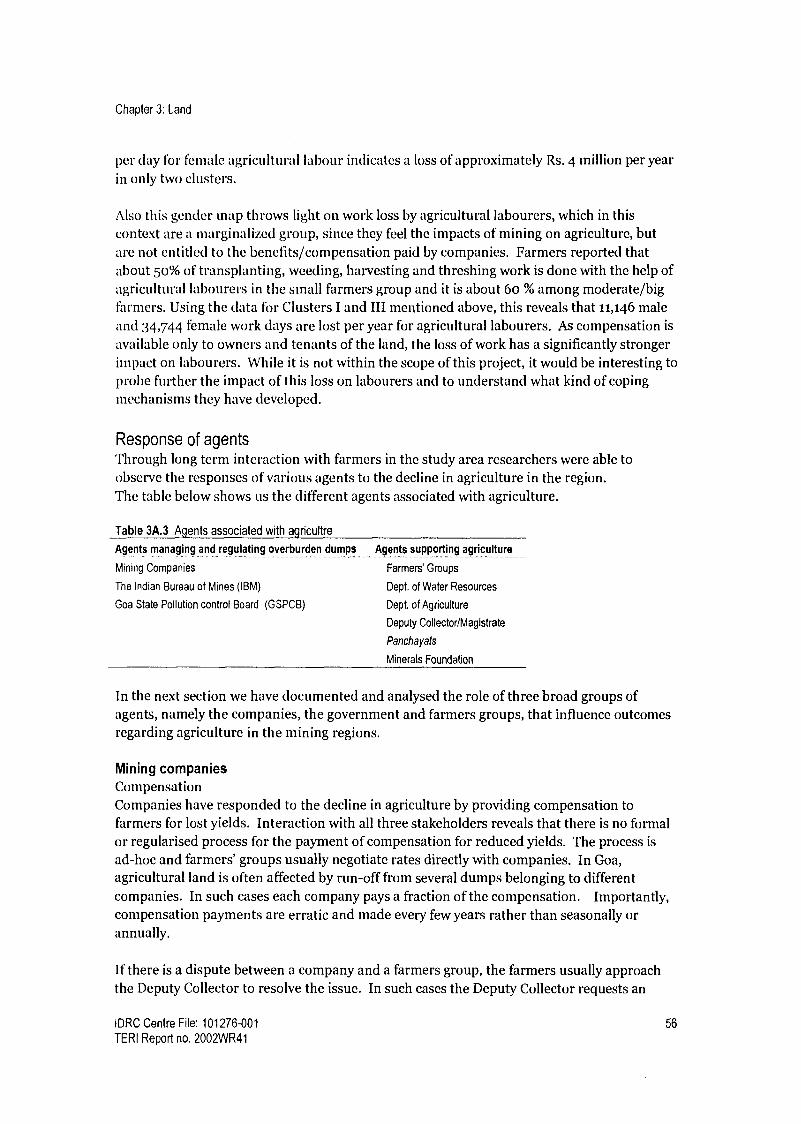
Chapter 3: Land
per day for female agricultural labour indicates a loss of approximately Rs. 4 million per year in only two clusters.
Also this gender map throws light on work loss by agricultural labourers, which in this context are a marginalized group, since they feel the impacts of mining on agriculture, but are not entitled to the benefits/compensation paid by companies. Farmers reported that about 50% of transplanting, weeding, harvesting and threshing work is done with the help of agricultural labourers in the small farmers group and it is about 60 % among moderate/big farmers. Using the data for Clusters I and III mentioned above, this reveals that 11,146 male and 34,744 female work days are lost per year for agricultural labourers. As compensation is
available only to owners and tenants of the land, the loss of work has a significantly stronger impact on labourers. While it is not within the scope of this project, it would be interesting to probe further the impact of this loss on labourers and to understand what kind of coping mechanisms they have developed.
Response of agents 'Through long term interaction with farmers in the study area researchers were able to observe the responses of various agents to the decline in agriculture in the region. The table below shows us the different agents associated with agriculture.
Table 3A.3 Agents associated with agricultre
Agents managing and regulating overburden dumps .._......
Mining Companies
The Indian Bureau of Mines (IBM)
Goa State Pollution control Board (GSPCB)
Agents supporting agriculture ........ ........... __. _
Farmers' Groups
Dept. of Water Resources
Dept. of Agriculture
Deputy Collector/Magistrate
Panchayats
Minerals Foundation
In the next section we have documented and analysed the role of three broad groups of agents, namely the companies, the government and farmers groups, that influence outcomes regarding agriculture in the mining regions.
Mining companies Compensation Companies have responded to the decline in agriculture by providing compensation to farmers for lost yields. Interaction with all three stakeholders reveals that there is no formal or regularised process for the payment of compensation for reduced yields. The process is ad-hoc and farmers' groups usually negotiate rates directly with companies. In Goa, agricultural land is often affected by run-off from several dumps belonging to different companies. In such cases each company pays a fraction of the compensation. Importantly, compensation payments are erratic and made every few years rather than seasonally or annually.
If there is a dispute between a company and a farmers group, the farmers usually approach the Deputy Collector to resolve the issue. In such cases the Deputy Collector requests an
IDRC Centre File: 101276-001 56
TERI Report no. 2002WR41
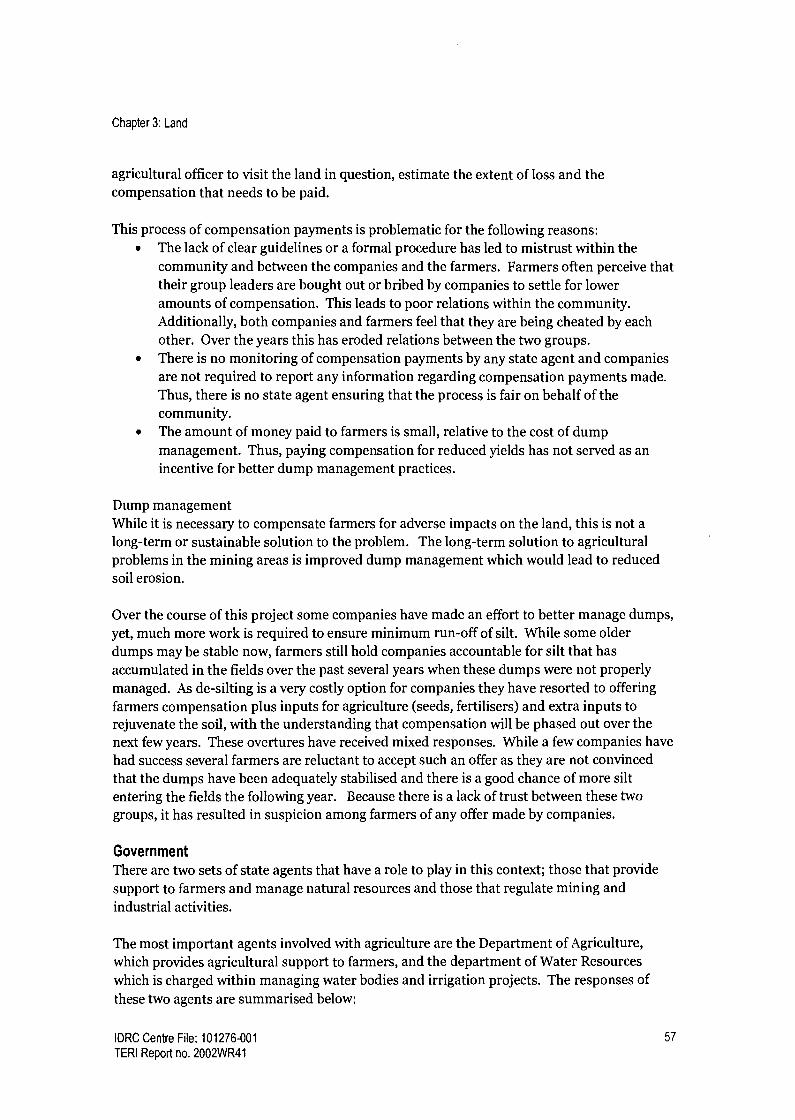
Chapter 3: Land
agricultural officer to visit the land in question, estimate the extent of loss and the compensation that needs to be paid.
This process of compensation payments is problematic for the following reasons: The lack of clear guidelines or a formal procedure has led to mistrust within the community and between the companies and the farmers. Farmers often perceive that their group leaders are bought out or bribed by companies to settle for lower amounts of compensation. This leads to poor relations within the community. Additionally, both companies and farmers feel that they are being cheated by each other. Over the years this has eroded relations between the two groups. There is no monitoring of compensation payments by any state agent and companies are not required to report any information regarding compensation payments made. Thus, there is no state agent ensuring that the process is fair on behalf of the community. The amount of money paid to farmers is small, relative to the cost of dump management. Thus, paying compensation for reduced yields has not served as an incentive for better dump management practices.
Dump management While it is necessary to compensate farmers for adverse impacts on the land, this is not a long-term or sustainable solution to the problem. The long-term solution to agricultural problems in the mining areas is improved dump management which would lead to reduced soil erosion.
Over the course of this project some companies have made an effort to better manage dumps, yet, much more work is required to ensure minimum run-off of silt. While some older dumps may be stable now, farmers still hold companies accountable for silt that has accumulated in the fields over the past several years when these dumps were not properly managed. As de-silting is a very costly option for companies they have resorted to offering farmers compensation plus inputs for agriculture (seeds, fertilisers) and extra inputs to rejuvenate the soil, with the understanding that compensation will be phased out over the next few years. These overtures have received mixed responses. While a few companies have had success several farmers are reluctant to accept such an offer as they are not convinced that the dumps have been adequately stabilised and there is a good chance of more silt entering the fields the following year. Because there is a lack of trust between these two groups, it has resulted in suspicion among farmers of any offer made by companies.
Government There are two sets of state agents that have a role to play in this context; those that provide support to farmers and manage natural resources and those that regulate mining and industrial activities.
The most important agents involved with agriculture are the Department of Agriculture, which provides agricultural support to farmers, and the department of Water Resources which is charged within managing water bodies and irrigation projects. The responses of these two agents are summarised below:
IDRC Centre File: 101276-001 57
TERI Report no. 2002WR41

Chapter 3: Land
Table 3A.4 Government agencies managing agriculture and water resources
Dept. of Agriculture Dept. of Water Resources
Monitoring No attempt to map areas that are silted Monitoring of major water bodies and large
Data on yields not maintained reservoirs/ irrigation projects in the state
No oversight or management of compensation No monitoring of second and third order surface
payments water bodies used for irrigation
Management Agricultural support programmes/schemes available but Desilting of major water bodies only
not suited for the mining areas No special programmes or response to problems in
No targeted programmes to respond to mining areas. the mining region
No networking with other departments (IBM, Water No networking with other departments (Agriculture,
Resources, State Pollution Control Board) State Pollution Control Board, IBM)
Table 3A.4 above shows that despite the presence of mining for several years there is little or no monitoring of impacts and very little support for local communities.
Additionally, the Indian Bureau of Mines and the State Pollution Control Board have a role to play in terms of monitoring and enforcing regulations with respect to mining activities (including dump management) and with respect to prevention of pollution. The responses of these agents are summarised in the table below.
Table 3A.5 Government agencies with authority to enforce rregulations
Indian Bureau of Mines (IBM) State Pollution Control Board .......... ........._........... ..... .............. _....... __......... .................... _...._-..---_ _.._.-_.... ....... _.._........._............_.._._.._----.......... --..._....................... _._........
Monitoring Monitoring of mine sites and activities across No proactive monitoring of water quality in mining areas
the state Generally respond only to complaints
Management Poor enforcement of regulations regarding No networking with other departments (Water Resources,
dump management IBM)
Table 3A.5 reveals that regulatory agents of the state have been lax at enforcing various environmental rules and regulations. As a result, the root cause of the problem has not been addressed.
Farmers groups Farmers groups in the study area have been created in the recent past in order to negotiate compensation with mining companies. These groups generally consist of farmers who own or manage small pieces of land that together to form one large plot. Other than collective bargaining for compensation the farmers' groups have not taken advantage of being in a group in terms of availing of government programmes collectively or planning for regeneration of their land.
Most farmers groups are large and may have as many as 50 to 70 members, but despite this farmers groups are not able to bargain effectively with companies and unable to mobilise help from the relevant government departments for a variety of reasons:
The structure and functioning of the groups are weak, ie. non-democratic, lacking in transparency, ridden by factionalism, lack of leadership etc.
IDRC Centre File: 101276-001 58
TERI Report no. 2002WR41

Chapter 3: Land
Not all farmers are interested in rebuilding or restarting agriculture. Some farmers would prefer to continue receiving compensation in cash. Thus, it is difficult for groups to build consensus and easy for companies to influence group members. A lack of information and knowledge about different erosion control measures and other technical solutions has meant that in some cases when making demands from the companies they have failed to ask for proper dump management in their area. Lack of knowledge and information about various government departments and their jurisdictions. Unsure of whom to approach for various problems.
While these groups have tremendous potential to revive agriculture in the region, the reasons mentioned above have acted as barriers to effective participation in decision making with other stakeholders.
Conclusions The findings presented in this section explain how mining has impacted land in the study area and the resultant decline in agriculture. Under the current conditions the cost of growing paddy has increased to the extent that it has become an unattractive option for farmers. As individual farmers have stopped farming the agricultural system has become unstable at a watershed level.
While both men and women have been affected in terms of work opportunities lost, women have lost more days of work than men per acre of land. Yet, mining and allied activities have not been able to provide alternative employment opportunities for women. Thus, the well- being of women has been disproportionately affected by mining.
Companies have responded to this problem by providing compensation to farmers for reduced yields, however, the methodology used to calculate rates is ad-hoc and the system lacks transparency and oversight.
State agents have an important role to play in monitoring and enforcing standards for overburden dump management and in monitoring and responding to changes in land and water resources. However, this report highlights the fact that these agents have shied away from their roles leaving farmers to tackle companies with little or no support.
IDRC Centre File: 101276-001 59
TERI Report no. 2002WR41

Chapter 3: Land
3B Understanding environmental-health linkages: metal uptake in
fruit crops grown on overburden dumps
Introduction It is well documented that mining activities lead to various environmental and socio- economic problems. In the case of open cast mining, overburden dumps lead to a variety of environmental and land management problems that ought to be addressed. In areas that are densely populated, such as our study area in Goa, inadequate land for dumping mine rejects coupled with a high overburden to ore ratio leads to the formation of steep and high dumps that are eroded during the heavy monsoons in Goa. The runoff from these dumps then affects land resources in the area. A common way to deal with this problem is to vegetate dumps with a variety of grasses and quick-growing trees and plants which results in soil binding and stability and a reduction in the surface area exposed to rainfall. Guidelines for dump management increasingly call for planting of local varieties of trees and plants that can fulfil the needs of local communities. This includes fruit trees from which fruits can be eaten or sold; trees that provide fuel wood, fodder plants, etc. However, would locally grown fruit trees, for example, or any other edible crop grown on the dumps involve metal uptake in
concentrations that can harm human health? It is necessary that before any recommendation for cultivating fruit trees on mining rejects is made, negative impacts on human health of such a recommendation be ruled out.
The uptake of metals by plants grown in soil contaminated with metals has been well documented. For example, accumulation of heavy metals (Zn, Cu, Cd and Pb) in vegetables and weeds grown on industrially polluted fields is higher than that shown to be in the non- polluted soil (Barman and Lal 1994). A study on the accumulation of heavy metals in vegetables, pulse and wheat grown in fly ash amended soil revealed higher metal contents than vegetables grown in the control soil. Parts of edible plants tested indicated that heavy metals such as Cu, Z, Pb concentrations are within the recommended limits whereas Cd, Cr and Ni showed slightly higher concentrations (Barman et. al. 1999). In another study, samples of perennial grass grown extensively in sewage sludge registered high levels of lead, cadmium, chromium, zinc, and nickel (Srikanth et al 1992). Similarly, heavy metal pollution in grass and soil around a cable factory in West Bengal showed a high percentage of extractable and total metal in surface soil than in deeper soils and from soils of relatively unpolluted area about 100 meters away from the factory. The amount of extractable metal in soils and roots showed a high correlation (Dutta and Mookerjee 1980).
Plants adopt several mechanisms to adapt to metaliferous soils. Physiologically, plants develop tolerance to metals through metal exclusion (blocking the movement of metals at the soil-root or root-shoot interface) or accumulation, which is allowing uptake of metals into aerial parts and rendering them non-toxic through chemical binding or intracellular sequestration (Baker 1981, Baker and Walker 1990, Ernst et al 1992, and Pollard et. al. 2002). Hyperaccumulator plants not only grow in soils with high levels of metals, but also accumulate pollutants in high concentrations in their tissues (Ebbs and Kochian, 1998). For instance, hydroponically grown T. caerulescens accumulated about 33,600 mg Zn kg-1, in its shoots (Ebbs et al., 1997). Some hyperaccumulators from Zaire, Ipomoea alpina Rendlek and Haumaniastrum katangense (S. Moore) Duvign. & Plancke could accumulate about 12,300
IDRC Centre File: 101276-001 60
TERI Report no. 2002WR41
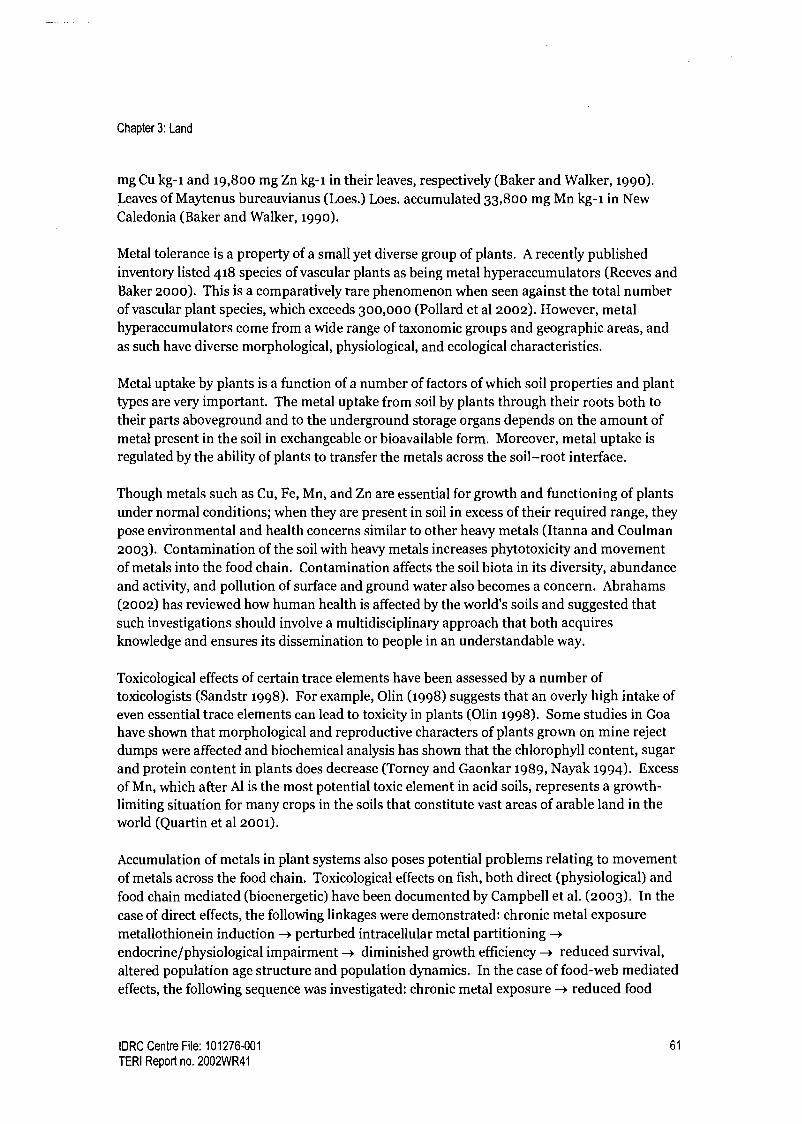
Chapter 3: Land
mg Cu kg-1 and 19,800 mg Zn kg-1 in their leaves, respectively (Baker and Walker, 1990). Leaves of Maytenus bureauvianus (Loes.) Loes. accumulated 33,800 mg Mn kg-1 in New Caledonia (Baker and Walker, 1990).
Metal tolerance is a property of a small yet diverse group of plants. A recently published inventory listed 418 species of vascular plants as being metal hyperaccumulators (Reeves and Baker 2000). This is a comparatively rare phenomenon when seen against the total number of vascular plant species, which exceeds 300,000 (Pollard et al 2002). However, metal hyperaccumulators come from a wide range of taxonomic groups and geographic areas, and as such have diverse morphological, physiological, and ecological characteristics.
Metal uptake by plants is a function of a number of factors of which soil properties and plant types are very important. The metal uptake from soil by plants through their roots both to their parts aboveground and to the underground storage organs depends on the amount of metal present in the soil in exchangeable or bioavailable form. Moreover, metal uptake is regulated by the ability of plants to transfer the metals across the soil-root interface.
Though metals such as Cu, Fe, Mn, and Zn are essential for growth and functioning of plants under normal conditions; when they are present in soil in excess of their required range, they pose environmental and health concerns similar to other heavy metals (Itanna and Coulman 2003). Contamination of the soil with heavy metals increases phytotoxicity and movement of metals into the food chain. Contamination affects the soil biota in its diversity, abundance and activity, and pollution of surface and ground water also becomes a concern. Abrahams (2002) has reviewed how human health is affected by the world's soils and suggested that such investigations should involve a multidisciplinary approach that both acquires knowledge and ensures its dissemination to people in an understandable way.
Toxicological effects of certain trace elements have been assessed by a number of toxicologists (Sandstr 1998). For example, Olin (1998) suggests that an overly high intake of even essential trace elements can lead to toxicity in plants (Olin 1998). Some studies in Goa have shown that morphological and reproductive characters of plants grown on mine reject dumps were affected and biochemical analysis has shown that the chlorophyll content, sugar and protein content in plants does decrease (Torney and Gaonkar 1989, Nayak 1994). Excess of Mn, which after Al is the most potential toxic element in acid soils, represents a growth- limiting situation for many crops in the soils that constitute vast areas of arable land in the world (Quartin et al 2001).
Accumulation of metals in plant systems also poses potential problems relating to movement of metals across the food chain. Toxicological effects on fish, both direct (physiological) and food chain mediated (bioenergetic) have been documented by Campbell et al. (2003). In the case of direct effects, the following linkages were demonstrated: chronic metal exposure metallothionein induction -* perturbed intracellular metal partitioning --*
endocrine/physiological impairment -* diminished growth efficiency -* reduced survival, altered population age structure and population dynamics. In the case of food-web mediated effects, the following sequence was investigated: chronic metal exposure -f reduced food
IDRC Centre File: 101276-001 61
TERI Report no. 2002WR41

Chapter 3: Land
abundance of certain dietary components -* increased energetic costs of feeding --* reduced growth efficiency and ultimately stunting.
Toxicity in humans can be either due to direct consumption or through the food chain. The Iron Disorders Institute, South Carolina, U.S.A. works on exposure to iron. Some of the symptoms that they have reported for acquired iron overload are chronic fatigue, arthritic pain in joints, loss of libido or impotence, amenorrhea (premature cessation of menstrual cycle), changes in skin colour such as jaundice, bronze or grey-olive coloured skin, a tan without being in the sun, redness in the palms of the hands, abdominal pain, weight loss, shortness of breath, chest pain, heart arrhythmia, depression, elevated blood sugar, hypothyroidism and enlargement of spleen and elevated liver enzymes (ALT/AST).
Iron ingestion is one of the most common causes of pediatric poisonings in the United States (Morris 2000). Leung and Bartfay (2002) also report that acute iron poisoning remains a leading cause of morbidity and mortality in pre-school aged children in North America. Acute iron poisoning leads to organ damage, such as respiratory difficulties, cardiac arrhythmias, and possible death (Leung and Bartfay, 2002). Black and Zenel (2003) while reporting a case of paediatric iron poisoning cite various references to discuss the toxicological effects of iron. As discussed by them, iron is directly corrosive to gastric mucosa, and ingestion leads to diarrhoea, nausea, vomiting, and gastrointestinal bleeding. Metabolic acidosis attributable to iron toxicity results from several mechanisms. After absorption in the gut, iron is converted from the ferrous to the ferric state, thus releasing hydrogen ions into the serum. Hepatocyte absorption of iron leads to generation of free radicals, which can uncouple oxidative phosphorylation, causing anaerobic metabolism and the production of lactic acid. Free iron in the serum also has some effect on blood vessels, causing increased capillary permeability and loss of venous tone. Additional fluid losses in the gut, from hemorrhage and diarrhoea, and bradycardia from the cardiac toxicity of free iron accentuate the hypoperfusion, thereby exacerbating the lactic acidosis (Black and Zenel 2003).
Given that most of the mining activity in Goa is connected with iron and manganese ore and given that the soils in Goa have high iron and manganese content, it becomes necessary to study the implications of using mine reject dumps for food crop cultivation. However, there is inadequate research on metal uptake by local fruits grown on iron ore dumps.
With this in mind, the main aim of this component is to understand environment - health linkages in rehabilitation plans. The specific objectives of this component of the project are as follows:
Examine in different mining clusters the distribution of vegetation grown on dumps Identify community preferences of crops grown on dumps through an assessment of end uses and costs and benefits of dominant vegetation Study metal uptake in food crops that are of interest to the local community
IDRC Centre File: 101276-001 62
TERI Report no. 2002WR41

Chapter 3: Land
Methodology Literature review An extensive literature review was carried out on metal up take in plants and on toxicological effects of metals on biota. Available literature suggests that the metal uptake by fruits will depend on the type of the soil and the type of the plant. This creates location specificity for the issue under study i.e. metal uptake. Hence this component assessed metal uptake by local fruit trees grown under local conditions on the mining rejects in Goa.
Vegetation assessment Field surveys were carried out in the study area in order to have first hand knowledge of what trees exist in the mining region, especially on dumps. Three field surveys were carried out across the study area to assess vegetation growing on dumps.
Focus group discussions Focus group discussions were held, with a heterogeneous group of 12 -i6 participants and included both men and women of different ages and educational and occupational backgrounds. Discussions were held to identify the following:
Community perceptions about dump rehabilitation Community preferences regarding fruit crops and the reasons for their choices.
Pair-wise ranking was used to identify crops most preferred by the local communities. Pair wise ranking is an early tool in PRA, which compares pairs of elements such as preference for specific tree species.
The score for each crop was calculated as S = E Pi where i=1ton, n = number of individuals P = score given by each individual for that particular crop type
Matrix ranking exercises were used to get an insight into the reasoning and logic for selecting particular types of crops/ plants/trees. Matrix ranking exercise also served to validate results of focus group discussions and pair-wise ranking.
Costs and benefits identified by participants themselves were categorized and used for reasoning in the matrix ranking exercises.
Interviews with key informants In addition to focus group discussions interviews were conducted with individuals working in
government departments, researchers, local leaders in order to broaden the range of perceptions on preferences for fruit crops.
Assessment of metal uptake in fruit crops A study on metal content in fruit crops was conducted to elucidate the relationship between the metal content of soil and its uptake by plants and accumulation in fruits and other parts.
IDRC Centre File: 101276-001 63
TERI Report no. 2002WR41

Chapter 3: Land
Before conducting the final experiment a pilot experiment was conducted in order to standardize the methodology. For the pilot experiment, samples were initially selected from three mining sites (test) and one non-mining site (control). After the pilot experiment was successful and the methodology was standardized for estimation of metal uptake by fruits from trees grown on mining dumps, the final laboratory experiment was carried out. The concentrations of metals were estimated by total contents and DTPA (diethylene-triamine- penta-acetic acid) extractions.
The methodology used to estimate metal content is delineated below: Sampling design Eight sampling stations were identified. Biological samples collected from these places included fruits and leaves of mainly cashew and mango plants. Fruits and leaves of jackfruit, tamarind and other trees were collected, wherever possible. Soil samples were collected for each biological sample at root zone/sub-surface level.
Pre-processing of samples Biological samples were thoroughly washed with tap water to remove any dust on the surface. This was followed by rinsing with distilled water. The samples, both soil and the biological sample were weighed and dried in a hot oven at 80° for 48 hrs. Dried samples were weighed again and ground to a fine powder. This powder (a known weight) was acid digested. The digestion was accomplished using a microwave oven at 105° for 15 min with to ml of concentrated analytical grade nitric acid.
Metal content analysis with atomic absorption spectrophotometer (AAS) Subsequently the sample was diluted with double deionised water and the sample volume adjusted to a known volume. The extract was analysed using an atomic absorption spectrophotometer (AAS). The metal content was assessed for iron, manganese, nickel, zinc, and chromium, which are expected to be associated with Goan iron ore. Total elemental profile was determined using AAS.
DTPA extraction The bio-available 2 fraction of metals in the soil was estimated using diethylene-triamine- penta-acetic acid (DTPA). DTPA extraction of the metals was carried out by shaking 5g of soil sample with 25 ml of a solution of 0.005 M DTPA and 0.01 M CaCI2 for one hour. The suspension was centrifuged for 30 min at 5700 * g. and used to estimate metal content.
Statistical analysis Relationships between the metal content in the soil system and that in the biological samples was assessed by simple linear regression analysis using Microsoft Excel programme (Sokal and Rohlf,1981; Sonak and Bhosle, 1995). Correlation coefficients for the two parameters were also checked. As a minimum of six observations are necessary for carrying out simple linear regression analysis, the relationship between the two parameters could not be assessed for samples with fewer number of observations.
Bioavailability is the degree to which a contaminant (in this case metals) in environmental media can be assimilated by an organism. Reduced bioavailability means a lower exposure of the chemical (metal) to the ecological receptor. Thus, the less the bioavailability of a metal, the less is its effect on an organism.
IDRC Centre File: 101276-001 64 TERI Report no. 2002WR41

Chapter 3: Land
A major limitation in this study was that only a few fruit bearing trees could be found on dumps or on land affected by mining rejects. This is on account of many factors such as failure of mining companies to re-vegetate/ rehabilitate the dumps, preferred use of acacia or casuarinas to rehabilitate dumps, low tolerance/vigor among plants grown under difficult conditions such as soil with high metal content, and a lack of technical expertise among stakeholders to grow fruit trees.
Results Vegetation assessment The vegetation assessment carried out in the mining areas documented existence of fruit trees such as cashew, mango, jackfruit, banana, tamarind, jujube, sapota etc.
Three field trips were held for vegetation assessment in the study area. Most of the dump sites were found to be vegetated with acacia and casuarinas. Nevertheless, some fruit trees such as Anacarium occidantale (cashew), Mangifera indica (mango), Tamarindus indica (tamarind), jujupus jujube (jackfruit), jujube (boram), sapota, banana, were found growing on dumps at a few places.
Additionally, changes in land uses that have taken place in Goa during the ten-year period from 1988 to 1997 (TERI 1997) show that area under mixed crop has increased in all three clusters (see Table 3B.1 below). This indicates that there is a growing preference for mixed crop cultivation
Table 3B.1 Changes in land use (ha)
1988 1997 Chan
Cluster I
Mixed crop 5404 6127 723
Forest 365 0 -365
Degraded land 489 329 -161
Cluster It
Mixed crop 7105 7408 303
Forest 705 298 -407
Degraded land 1759 1361 -398
Cluster III
Mixed crop 9179 10506 1327
Forest 10918 9836 -1082
Degraded land 1259 825 -434
Source. AEQM report, Table 3.2
Community crop preferences Focus group research in Phase II of this project indicated that local communities would like to grow fruit trees on mine dumps for both self-consumption and for the market. In this component of the project, further focus group discussions and interviews revealed that most of the trees that the community identified to grow on dumps were of the fruit-bearing variety and had a good market value, besides being good for self-consumption. Focus group meetings included discussions regarding cots and benefits of various trees/plants, end uses of vegetation, pair-wise and matrix ranking exercises. Results based
IDRC Centre File: 101276-001 65
TERI Report no. 2002WR41

Chapter 3: Land
on these meetings show that there was very little difference in preferences across the three group discussions. (See Annexure B for results of matrix ranking exercises and summary of discussion on costs and benefits.) The trees that were most favoured are presented in Table :3B.,2 below.
Table 3B.2 Community preferences across clusters based on matrix ranking
Rank Cluster I Cluster 11 Cluster III
1 Teak Cashew
.... _........
Cashew
2 Cashew Teak Mango
3 Mango Mango Jackfruit
4 Kokum Amla Kokum
5 Jackfruit Kokum Amla
6 Amla Medicinal plants Tamarind
7 Sapota Tamarind Teak
8 Tamarind Sapota Sapota
Acacia and casuarinas were the least preferred, though these species currently form a major part of land rehabilitation by mining companies.
Table 3B.3 describes the main reasons for participants selection of various fruit trees.
Table 3B.3 Reasons for preferences
Preferred fruit trees
Cashew
Teak
Mango
Kokum
Jackfruit
Aonla
Tamarind
Sapota
Medicinal plants
Reasons
International market, uses for all parts of the plant, higher financial returns
High demand for furniture, high financial returns
Popular fruit, many local food preparations with high local demand
Self-consumption and local market
Self-consumption, value added products have local market
Medicinal properties of value for self-consumption, demand for fruit from local Ayurvedic hospital
Self-consumption and local market
Self-consumption and local market
Self-consumption, local demand
............. ........ _........ --................ ................ __................ .... _........ ._..._._.... _........_.._.... __......... _.._.__.__.
Looking at these results for the study area as a whole, there is a clear preference for Cashew and Mango trees followed by teak and kokum.
Assessment of metal uptake by fruits In this component metal uptake in trees/plants and grass grown on dumps was assessed. A total of 53 samples from 12 different plant species were tested for the presence of metals.
Acacia Aonla Banana
Cashew Casuarina Grass Jackfruit
IDRC Centre File: 101276-001 66 TERI Report no. 2002WR41
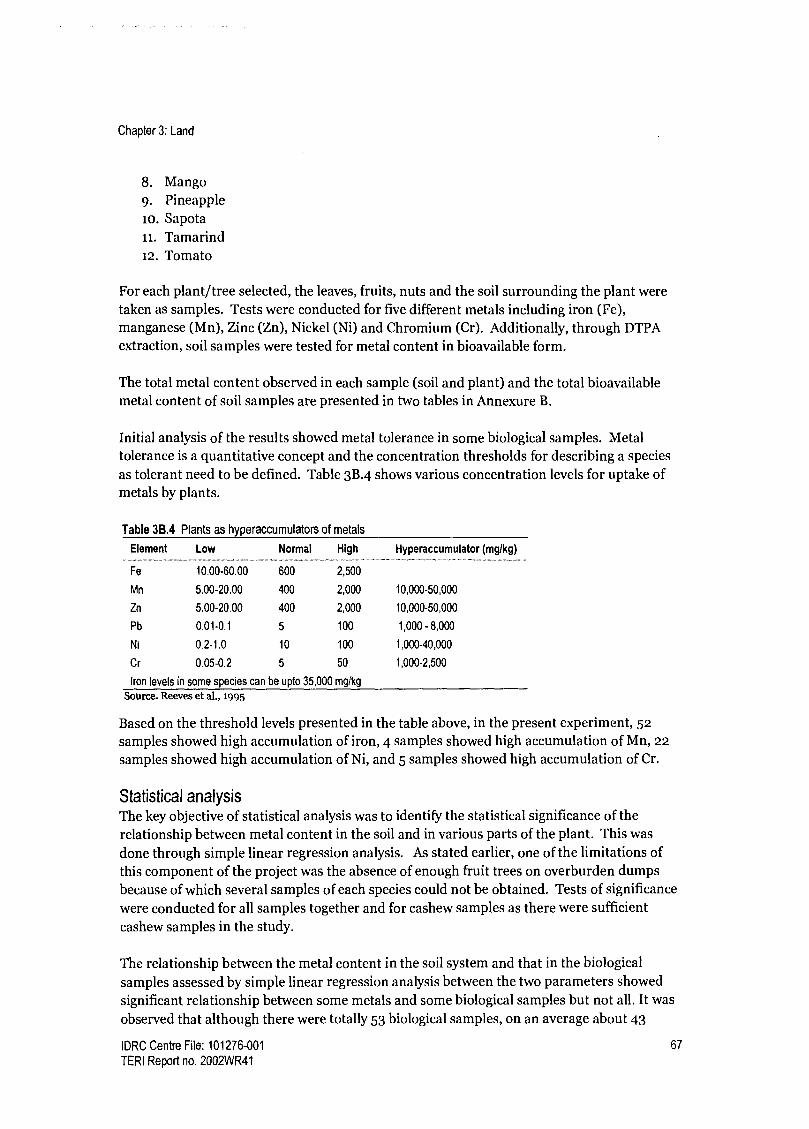
Chapter 3: Land
8. Mango 9. Pineapple io. Sapota 1i. Tamarind 12. Tomato
For each plant/tree selected, the leaves, fruits, nuts and the soil surrounding the plant were taken as samples. Tests were conducted for five different metals including iron (Fe), manganese (Mn), Zinc (Zn), Nickel (Ni) and Chromium (Cr). Additionally, through DTPA extraction, soil samples were tested for metal content in bioavailable form.
The total metal content observed in each sample (soil and plant) and the total bioavailable metal content of soil samples are presented in two tables in Annexure B.
Initial analysis of the results showed metal tolerance in some biological samples. Metal tolerance is a quantitative concept and the concentration thresholds for describing a species as tolerant need to be defined. Table 3B.4 shows various concentration levels for uptake of metals by plants.
Table 3B.4 Plants as hyperaccumulators of metals
Element Low Normal High Hyperaccumulator (mglkg)
Fe 10.00-60.00 600 2,500
Mn 5.00-20.00 400 2,000 10,000-50,000
Zn 5.00-20.00 400 2,000 10,000-50,000
Pb 0.01-0.1 5 100 1,000 - 8,000
Ni 0.2-1.0 10 100 1,000-40,000
Cr 0.05-0.2 5 50 1,000-2,500
Iron levels in some species can be upto 35,000 mg/kg
Source. Reeves et al., 1995
Based on the threshold levels presented in the table above, in the present experiment, 52 samples showed high accumulation of iron, 4 samples showed high accumulation of Mn, 22 samples showed high accumulation of Ni, and 5 samples showed high accumulation of Cr.
Statistical analysis The key objective of statistical analysis was to identify the statistical significance of the relationship between metal content in the soil and in various parts of the plant. This was done through simple linear regression analysis. As stated earlier, one of the limitations of this component of the project was the absence of enough fruit trees on overburden dumps because of which several samples of each species could not be obtained. Tests of significance were conducted for all samples together and for cashew samples as there were sufficient cashew samples in the study.
The relationship between the metal content in the soil system and that in the biological samples assessed by simple linear regression analysis between the two parameters showed significant relationship between some metals and some biological samples but not all. It was
observed that although there were totally 53 biological samples, on an average about 43
IDRC Centre File: 101276-001 67
TERI Report no. 2002WR41

Chapter 3: Land
samples showed significant positive relationship between the different metals in the soil and those in the biological samples. In general, cashew showed significant positive relationship with the content of total Fe, total and bioavailable (DTPA extracted) Mn, total and bioavailable Ni, total and bioavailable Cr, and total and bioavailable Zn. Cashew showed no significant positive relationship with bioavailable Fe.
It was difficult to comment on other plants specifically as a major limitation of the study was absence of sufficient fruit bearing trees or plantation trees on mining rejects.
The results of statistical analysis are presented in different tables for specific relationship between the different metals in the soil system and the different biological samples.
Iron Total 53 biological samples were assessed to check the possibility of iron uptake. Out of 53, only 43 samples showed significant positive relationship. In general, mango samples did not show significant relationship. Other samples, which did not show any relationship, were pineapple, jackfruit and Amla. However, no conclusions can be derived specifically for any particular plant/tree on account of small number of samples for each type of plant/tree. More detailed studies are needed to comment specifically on other plants. Another point that needs attention is that though cashew samples showed significant relationship for total Fe, no relationship was observed after bioavailable extraction of the metals in the soil system.
Table 3B.5 Results of statistical analysis between Fe content (total) in the soil system and in the biological samples
Total Fe and Cashew R N P p level . ..._ Significance level
... .
All samples for Fe 0.136685 53 0.329091 Not significant
All samples for Fe 0.320265 43 0.036284 p<0.05 Significant
Cashew and Fe 0.219264 25 0.292306 Not significant
Cashew and Fe 0.408499 23 0.052962 p<0.1 Significant
R- Regression coefficient, correlation coefficient, N- Number of observations, p-probability
Table 3B.6 Results of statistical analysis between Fe content (bio-available) in the soil system and in the biological
samples
DTPA Fe Significance level .. ....................
All samples for Fe
Cashew and Fe 0.176648 25 0.398282 Not significant
Cashew fruits 0.360694 9 0.340275 Not significant
Cashew nuts 0.025807 9 0.947456 Not significant
Cashew leaves 0.046 7 0.921991 Not significant
R- Regression coefficient, correlation coefficient, N- Number of observations, p-probability
IDRC Centre File: 101276-001 68 TERI Report no. 2002WR41

Chapter 3: Land
Manganese Table 3B.7 shows that all biological samples (58) assessed for the uptake of manganese did not show any relationship between the metal content in the soil system and that in the samples (See Table 3B.7). However, a positive relationship was found between the total Mn content of the cashew samples and that of the soil system. No significant relation was observed between the bioavailable metal content in the soil and all biological samples together. The relationship between bioavailable Mn content in soil and metal content in cashew fruits and the nuts was found to be significant.
Table 3B.7 Results of statistical analysis between Mn content (total and bio-available) in the soil system and in the
biological samples
Total Mn R N P p level Significance
Cashew and Mn 0.47249 28 0.01112 p<0.05 Significant
All samples for Mn 0.074378 58 0.578974 Not significant
DTPA Mn
All samples for Mn 0.189647 59 0.150255 Not significant
Cashew and Mn 0.120843 25 0.565024 Not significant
Cashew fruits 0.7408 9 0.02241 p<0.05 Significant
Cashew nuts 0.74502 6 0.089234 p<0.1 Significant
Cashew leaves 0.387377 7 0.39058 Not significant
R- Regression coefficient, correlation coefficient, N- Number of observations, p-probability
Zinc Biological samples (58) assessed for the uptake of Zn did not show a significant relationship between the metal content in the soil system and that in the samples. Similarly no significant relationship was found between total soil Zn content and Zn content in cashew samples. See Table 3B.8 below.
Table 3B.8 Results of statistical analysis between Zn content (total and bio-available) in the soil system and in the
biological samples
Total Zn R N P Significance
All samples for Zn 0.233448 53 0.170601 Not significant
Cashew and Zn 0.093624 28 0.635594 Not significant
Cashew fruits 0.242708 8 0.562478 Not significant
Cashew nuts
DTPA Zn
All samples for Zn
0.049355
R
10
N
0.892298
P
Not significant
Cashew and Zn 0.196315 25 0.346952 Not significant
Cashew fruits 0.067715 9 0.862578 Not significant
Cashew nuts 0.447162 9 0.227513 Not significant
Cashew leaves 0.019424 7 0.96703 Not significant
R- Regression coefficient, correlation coefficient, N- Number of observations, p-probability
IDRC Centre File: 101276-001 69
TERI Report no. 2002WR41

Chapter 3: Land
Nickel No statistically significant relationship was seen between nickel content in biological samples (55) and the total nickel content in the soil system. However, a positive relationship was found between the total Ni content of the cashew samples and that of the soil system. Similarly no significant relationship was observed between Ni content in the biological samples and DTPA extracted Nickel in the soil, but a significant positive relationship was observed between the metal content in cashew samples and DTPA nickel in the soil.
Table 3B.9 Results of statistical analysis between Ni content (total and bio-available) in the soil system and in the
biological samples
Total Ni R N P p level Significance
All samples for Ni 0.024087 55 0.861427 Not significant
Cashew and Ni 0.437568 23 0.03679 p<0.05 Significant
DTPA Ni
All samples for Ni 0.181821 45 0.231945 Not significant
Cashew and Ni 0.494873 23 0,011904 p<0.05 Significant
R- Regression coefficient, correlation coefficient, N- Number of observations, p-probability
Chromium Table 3B.lo shows that biological samples (58) assessed for the uptake of Chromium showed significant positive relationship between the total Chromium content in the soil system and that in the samples. Similarly a significant positive relationship was found between the total Cr content of the cashew samples and that of the soil system. However, no statistically significant relationship was seen between bioavailable Chromium in the soil and Chromium in the biological samples. A significant positive relationship was observed between the bioavailable Chromium levels in the soil and Chromium content in cashew samples. Results
of relationship between DTPA extracted metals for all samples need further study.
Table 38.10 Results of statistical analysis between Cr content (total and bio-available) in the soil system and in the
biological samples
Total chromium R N P p level Significance
All samples for Cr 0.417163 55 0.001532 p<0.05 Significant
Cashew and Cr 0.633537 26 0.000512 p<0.05 Significant
DTPA Cr
All samples for Cr 0.05434 46 0.719843 Not significant
Cashew and Cr 0.470018 21 0.031554 p<0.05 Significant
R- Regression coefficient, correlation coefficient, N- Number of observations, p-probability
Discussion and conclusion Rehabilitation of overburden dumps is an important part of sustainable mining. Vegetating these dumps is a necessary step towards stabilising the structure and a productive use of the land. As increasing attention is focused on beneficial land uses of reclaimed land, there is a trend towards adopting and advocating vegetation which is useful to the local community, be it for firewood, for grazing or for food. However, in this context, potential metal uptake in
IDRC Centre File: 101276-001 70 TERI Report no. 2002WR41

Chapter 3: Land
fruits needs to be verified as accumulation of metals can have implications to human health through food chain.
Several experiments have been conducted to assess metal uptake which suggest various factors influencing this. For example, in an experiment on mineral analysis that included nitrogen (N), potassium (K), phosphorus (P), calcium (Ca), magnesium (Mg), iron (Fe), zinc (Zn), and Mn of dried plant material, Quartin et al., (2001) concluded that the cultivars Juanilho, Borba, TTE 9201 and BH 1146 (wheat) are more tolerant and that the cultivars Arabian, Beagle, TTE 9101, and TTE 9203 which are more sensitive. They report that the capacity to reduce the Mn uptake and therefore to avoid very high tissue concentrations in the leaf could be a strategy contributing to a higher tolerance in TTE 9201 and wheat BH1146.
Further, different vegetable species accumulate different metals, depending on environmental conditions, and metal types. In general, metals accumulate more in the root region than in other parts of the plants (Eriksson lggo). This metal uptake from the soil system depends on a number of factors, of which, soil type and plant variety are most important.
In our experiments it was found that cashew samples showed significant relationship between metals (iron, manganese, nickel and chromium) in the plant system and that in the biological samples. No such relationship was observed for Zinc. Of the total 55 samples selected, 43 samples showed significant relationship. This indicates that some plants might be accumulating higher quantities of metals, whereas others do not.
Similar results have been reported by others. For example, the concentrations of different forms of heavy metals (Fe, Mn, Zn, Cu, Cr, Ni, Cd and Pb) were determined in mine dump material rich in chalcopyrite by Alvarez et al (2003). The concentrations were compared with those of the natural vegetation colonising the dump. The heavy metal contents in the spontaneously occurring vegetation in the dump ranged between: 150 and goo mg Fe kg-1, 84 and 2069 mg Mn kg-1, 20.5 and 106 mg Cu kg-1 and between 35 and 717 mg Zn kg-1, when considering all the plant samples analysed. Festuca sp. accumulated Fe, Salix atrocinerea accumulated Zn and Mn, and Frangula alnus and Quercus robur accumulated Mn.
A major limitation of the study was the presence of a few types of trees/plants on the dumps or mining rejects. Most of the dumps were either barren or re-vegetated with Acasia, and Casuarina. Only cashew samples were found at the most sampling stations. Hence the study had to compromise with several variables. In general, cashew trees showed significant positive relationship between metals in the soil system and in the plant system. On the other hand, mango samples did not show any relationship between the metals in the soil system and in the plant system. However, since more than 40 plants show significant relationship between metal content in the soil and that in the plant system, there is a need to identify plants/trees that accumulate metals. Detailed studies on plots on a trial basis are required to explore the possibility of metal uptake, if any, by the specific plants from the soil systems.
IDRC Centre File: 101276-001 71
TERI Report no. 2002WR41
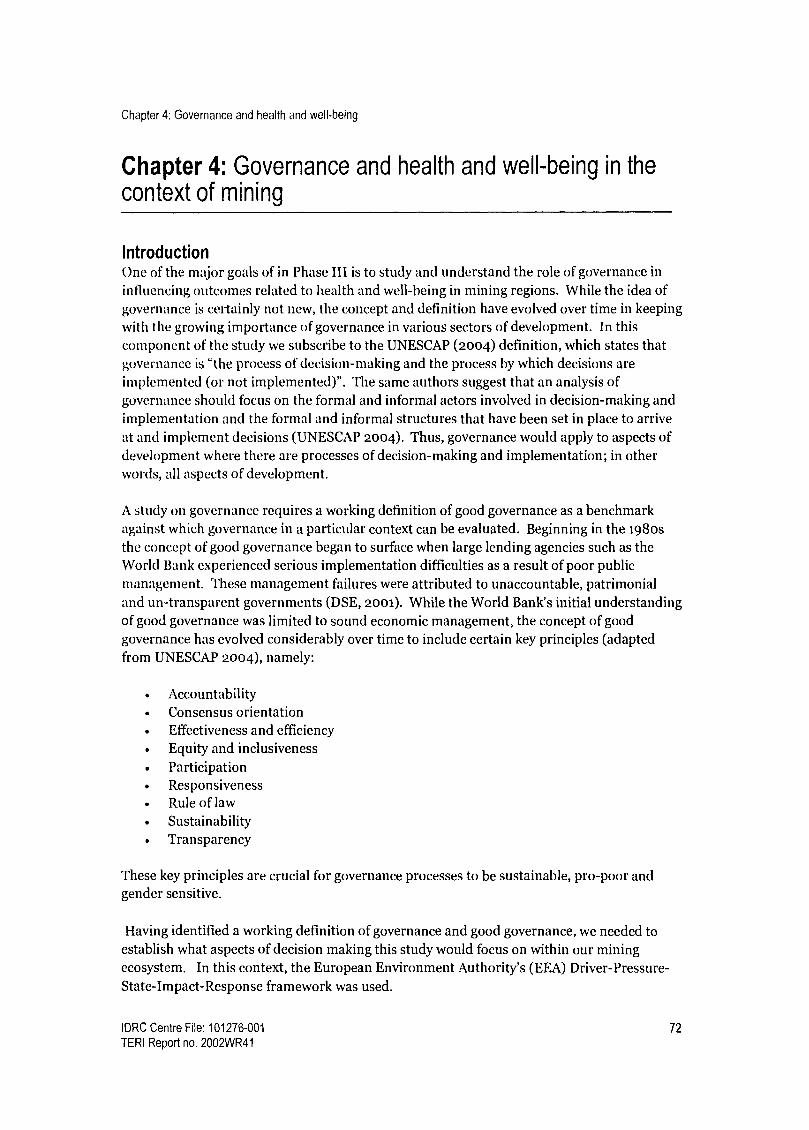
Chapter 4: Governance and health and well-being
Chapter 4: Governance and health and well-being in the context of mining
Introduction One of the major goals of in Phase III is to study and understand the role of governance in influencing outcomes related to health and well-being in mining regions. While the idea of governance is certainly not new, the concept and definition have evolved over time in keeping with the growing importance of governance in various sectors of development. In this component of the study we subscribe to the UNESCAP (2004) definition, which states that governance is "the process of decision-making and the process by which decisions are implemented (or not implemented)". The same authors suggest that an analysis of governance should focus on the formal and informal actors involved in decision-making and implementation and the formal and informal structures that have been set in place to arrive at and implement decisions (UNESCAP 2004). Thus, governance would apply to aspects of development where there are processes of decision-making and implementation; in other words, all aspects of development.
A study on governance requires a working definition of good governance as a benchmark against which governance in a particular context can be evaluated. Beginning in the 198os the concept of good governance began to surface when large lending agencies such as the World Bank experienced serious implementation difficulties as a result of poor public management. These management failures were attributed to unaccountable, patrimonial and un-transparent governments (DSE, 2001). While the World Bank's initial understanding of good governance was limited to sound economic management, the concept of good governance has evolved considerably over time to include certain key principles (adapted from UNESCAP 2004), namely:
Accountability Consensus orientation Effectiveness and efficiency Equity and inclusiveness Participation Responsiveness Rule of law Sustainability Transparency
These key principles are crucial for governance processes to be sustainable, pro-poor and gender sensitive.
Having identified a working definition of governance and good governance, we needed to establish what aspects of decision making this study would focus on within our mining ecosystem. In this context, the European Environment Authority's (EEA) Driver-Pressure- State-Impact-Response framework was used.
IDRC Centre File: 101276-001 72 TERI Report no. 2002WR41
Chapter 4: Governance and health and well-being
D
Price of ore Demand for iron ore
\il ning activities: dewatering o
mine pit, transportation of ore, overburden dumps. disposal of
tailings etc.
1 Monitoring of environmental changes
and social impacts, remediation measures, enhanced public services
etc
Change in soil fertility, watd quality and quantity, air quali
Source: Adapted from EEA 1998 (EU state of the Environment Report, Annex 3)
Figure 4.1 Driver-Pressure-State-Impact-Response framework
Respiratory health problems, loss of agric. livelihoods, water
shortages etc.
I
This framework identifies key Drivers of mining activities within the mining ecosystem, namely the demand for iron ore and the price of ore which. Mining activities, such as transport of ore or dewatering of mine pits in turn put Pressure on the natural environment leading to changes in the State of the environment. These changes have an Impact on various determinants of human health and well-being (livelihoods, health, social networks etc.). Through this framework we also identify the Responses from various agents (state, industry and community) which are a result of the process of decision-making and are integral to the study of governance. Specifically we are looking at responses in terms of the following:
Responses to Pressures - better management practices/ technology Responses to State - monitoring of changes in the environment, enforcement of regulations and standards, remediation measures Responses to Impacts - monitoring of social impacts, enhanced public services, targeted support for local communities
In this study we focus on responses of various agents to changes in natural resources and their impacts on the local community and have attempted to answer a specific set of questions as follows:
IDRC Centre File: 101276-001 73
TERI Report no. 2002WR41

Chapter 4: Governance and health and well-being
Who are the main actors involved in governance in a mining context? I low is governance characterised in the study area?
What factors influence governance in the study area?
I tow can governance be improved in the study area?
As there are several natural resource management problems and human impacts occurring within our mining ecosystem, to further focus this study, three key issues that were of important in a mining context were chosen to be explored, namely
Responses to poor air quality in the region Responses to changes in groundwater and shortages of water for household use
Responses to changing community health status
Each issue net one or more of the criteria delineated below:
The issue emerged as an objective condition that had a statistically significant relationship with subjective satisfaction in the Quality of Life survey conducted in Phase II. This means that the objective condition had a great influence on people's subjective satisfaction across the study area. The issue was emerged repeatedly as a problem during PRA exercises and discussions with local community members suggesting that it was of importance to them. Exploring the issue provided continuity in terms of cross-cutting research themes being explored in the project.
By taking a case-study approach, we delved deeper into each of these topics trying to unpack the processes of governance in each context. Additionally, research on land/agriculture and on-going interaction with farmers during capacity building exercises provided several insights regarding governance in the context of land management (documented in Chapter 2). These insights have been included in this synthesis where relevant.
Methodology For this component of the study, we adopted both quantitative and qualitative methods to explore issues relating to governance. They are described in further detail below.
Survey A household survey including 442 households in the study area was used to explore issues relating to air quality, water supply and the health care system. The survey had the following objectives:
to assess the extent and severity of the water supply problem in the study area to understand the role of civil-society in the governance of issues relating to mining, with a focus on air quality and water supply to verify to what extent people use private health facilities (as this was reported during focus group discussions) to understand why people prefer private medical facilities (where they must pay) when the government provides a comprehensive health care system which is greatly subsidized and in many cases free.
IDRC Centre File: 101276-001 74 TERI Report no. 2002WR41

Chapter 4: Governance and health and well-being
Sample selection The sample included the 17 villages which were selected in Phase II of this study to administer the Quality of Life (QoL) survey in the year 2000 so as to provide some continuity in the analysis. The justification for choosing these villages for the QoL survey was:
Presence of a resource management problem, where it is worth adjusting management or policy to deal with the problem Public recognition of the existence of a resource management problem. Presence of baseline information where there is indication of social and economic impacts, positive and negative. Potential for future stress in the region from mining using the reserve to production (R/P) ratio.
There have been changes in the study area since the QoL survey was undertaken therefore we updated the list of villages based on the health survey conducted in Phase III and interviews with local government officials.
Villages in Goa are made up of between 5-15 wards/hamlets and not all wards within a village have the same degree of air and/or water problems. Therefore we decided to take the ward as the smallest unit and attempted to stratify wards based on the degree of air and/or water supply problems they faced. Air quality problems are defined as a dust problem caused by mining activities and water supply problems are defined based on ground water conditions, as reflected in the level of well water in a ward.
To conduct the stratification we surveyed all village Panchayats in the selected villages regarding their air and water status with the assumption that a Panchayat would have information about each of its wards. Our sample frame included all those wards that experience either some degree of air or water problem. We assumed that air and/or water problems have no effect on the choice of health facilities and therefore no special consideration was made for the health section when deciding the sample frame. Using electoral rolls for the state of Goa we randomly chose households from these wards, ensuring that there was a proportional representation of each stratum as well as each of the three clusters in our sample. One individual in each household was interviewed and efforts were made to ensure that roughly half the respondents were men.
Table 4.1 lists the number of towns and villages included in the survey and Table 4.2 lists the number of households included in the survey.
Table 4.1 Towns and villages included in the survey
Cluster Town Village Total
1 4 5
II 0 6 6
III 0 8 8
Road Corridor 1 0 1
Total 2 18 20
IDRC Centre File: 101276-001 75
TERI Report no. 2002WR41

Chapter 4: Governance and health and well-being
Table 4.2 Number of households in the survey relative to population
Cluster
Population
(no. of households)
Sample
(no. of households) % of pop
1381 70 5.07
II 3195 161 5.04
III 3750 211 5.63
Total 8326 442 5.31
For the purpose of analysing people's responses to air pollution problems we have clubbed Cluster III and the corridor together. The main hypothesis in this context is that people are
less likely to report air pollution problems if they are dependent on mining and allied jobs. In the road corridor a large number of people are dependent on the trucking business as are
people in Cluster IIL Thus, for the purpose of analysis in this case clubbing the two together made sense. Additionally, this does not affect the age of mining theory because the road corridor and Cluster III are adjacent to each other and the Road Corridor is only as old as
Cluster Ill in terms of mining.
When analysing water problems related to tap supply we have removed respondents from Curchorem (the road corridor) and Bicholim Town which is part of Cluster I. This is because
these areas are urban municipal areas that receive 24 hour water supply and this study is
more concerned with rural water supply as the mining region is predominantly rural.
Interviews and guided discussions In addition to data generated through the survey described above, for all three components of the governance section (air, water, health) interviews were conducted with government officers (Water Resources Department, Public Works Department, State Pollution Control Board, Indian Bureau of Mines, Directorate of Health Services, etc.), and civil society agents such as health care workers, truckers associations, bank mangers, tenants associations etc. The data gathered through these interviews has enriched the analysis by capturing precious nuances related to the local community.
Focus group discussion Five focus group discussions were held with elected representative of the Panchayats. The number of participants ranged from 6 to 1o in each meeting. Of these meeting three were held exclusively with women elected representatives. The objective of these discussions was to understand the role played by Panchayats relating to various problems that emerge in a
mining context. Additionally, one focus group discussion was held with state government department representatives at the local level. The aim of this meeting was to assess how these departments interface with the Panchayat.
IDRC Centre File: 101276-001 76 TERI Report no. 2002WR41
Chapter 4: Governance and health and well-being
Results The three key themes that were explored in terms of governance are explained in brief below. (etailed analysis and results for each are presented in Annexure C.)
Air quality In the study area high levels of air pollution (respirable suspended particulate matter) are caused by the handling and transport of iron ore. Over loaded trucks carry ore from within the mines to ports along the river where they transfer the ore to barges waiting there. Poor transport and handling practices (overloading, speeding, not covering trucks) coupled with bad roads results in spillage of ore along the way and continuous truck traffic causes re- suspension of this dust creating poor air quality conditions. As the road corridors pass through settlement areas the air pollution caused has an impact on local communities. While there is extensive legislation to address air quality issues, dust pollution continues to pose a problem in the study area. This study looks at the following:
The political-economy of trucking and its impact on enforcement of regulations The community's role in solving the air quality problem
Water supply Dewatering of mine pits is an integral part of mining operations where excavation is carried out below the watertable. This leads to a lowering of the watertable and impacts the availability of water for households in the vicinity since wells and springs begin going dry. This study looks at the following:
The state's effort to manage groundwater Provision of alternative water supply for household use The community's role as a catalyst for better services
Health care Mining activities exert pressures on the environment that have direct impacts on the health status of local communities. Good governance requires the state to respond to these problems through improved or enhanced health care. However, in order to do so, changes in health status must first be detected and acknowledged. Health data in Goa is poor and does not accurately reflect health status of communities in the study area. This study addresses the following:
Availability of health data for the study area Problems at the local and policy level in monitoring health status
Land and compensation Land and compensation issues have been addressed in Chapter 2. However, as we draw on several findings in this discussion we reiterate the main issues here.
In terms of impacts to land, siltation of agricultural fields and water bodies in the watershed has impacted agriculture by lowering agricultural yields as well as increasing the number of fields that are being left uncultivated. Mining companies compensate farmers for crop loss, but not for deteriorating land quality.
IDRC Centre File: 101276-001 77
TERI Report no. 2002WR41

Chapter 4: Governance and health and well-being
This component looks at the following: Compensation mechanism in place
State's response to the decline in agriculture in terms of dump management and
support to farmers The role of farmers' groups in reviving agriculture in the region
In the section to follow we identify the various actors or agents involved in responding to the problems delineated above, briefly characterise their responses and present a summary of key factors that influence decisions and implementation in response to environmental and social changes.
Who are the actors/ agents? As the impacts of mining are largely felt at the local or village level, we wanted to explore the issues of concern at this level. Thus, studying the role of Panchayati Raj Institutions (PRIs), which form the lowest level of elected government, in dealing with the impacts related to mining was important. Each village has a Panchayat that is responsible for administration within the village, and therefore understanding how officials at this level make decisions became one of the goals of this component of the study.
In 1993 Panchayats received a shot in the arm through that 73rd and 74th amendments to the Constitution of India that sought to strengthen these bodies and give them the necessary powers to play a much bigger role in village development. This decentralisation of power has been hailed as a step forward for village development in India and has sparked intense interest in PRIs and their performance. Preliminary research in the study area showed, however, that while state governments have the mandate to devolve vast powers to PRIs, in Goa and in several states around the country, this has not actually happened. While Panchayats may have more powers than they did before 1993, the bare minimum has been devolved. Various state government departments still play a crucial role in management of natural resources and responding to various socio-economic changes in the region. The table below presents the roles of various agents in the context of air, water and health management in the study area.
Table 4.3 Role of Panchayats and other agents
Jurisdiction of panchayats and other agents
Panchayats Other agents
Air Monitoring and regulation of emissions from Air quality management and emissions within the mine
furnaces (for commercial purposes) in the village. lease area - Indian Bureau of Mines (IBM)
Air quality management within the state, Emissions from
industrial activities - State Pollution Control Board (SPCB)
Emissions from vehicular transport - Regional Transport
Office (RTO)
Contd.
IDRC Centre File: 101276-001 78
TERI Report no. 2002WR41

Chapter 4: Governance and health and well-being
Table 4.3 contd.
Panchayats ........... ..._.. ....... .......
Water Cleaning and maintenance of public wells.
Applications for piped water for the village
(through a Panchayat resolution.)
Verification/ endorsement of individuals'
application for free tap installation.
Request for water tankers during water shortages.
Health Implement preventive health programs such as
maintenance of public wells, implementation of
sanitation schemes
Can devise village specific schemes to
supplement existing state government ones
Liaison with state government departments to
address issues pertaining to health and sanitation
Agriculture Development of (government) waste lands
and Development and maintenance of grazing lands
Compensation (government owned)
(No jurisdiction over privately owned land)
Other agents ....... ... ..... ........
Approval of application for tap water - Public Works Dept.
(PWD)
Daily supply of tap water - Public Works Department
(PWD)
Monitoring/ management of groundwater- Water
Resources Dept.
Monitoring/management of water use within mine sites - Indian Bureau of Mines (IBM)
Primarily responsible for the provision of health care, both
preventive and curative at various levels in the state - Directorate of Health Services (DHS)
Health care for mine employees - Labour Welfare
Commission
Support to farmers - Department of agriculture
Monitoring and management of water bodies,
management of irrigation projects - Water resources
Department
Settle disputes regarding compensation - Deputy Collector
Monitoring of dump management as a preventive
measures- Indian Bureau of Mines (IBM)
Monitoring of water pollution - State Pollution Control
Board (SPCB)
The table above briefly describes the jurisdiction of the Panchayat and other agents, vis-a-vis the various topics. While the Panchayat does have a role to play in terms of air, land, water and health related issues, it plays a limited role and there are a number of other agencies at
higher levels of government that play a more important role in planning, decision-making and implement of these decisions. Thus, to study governance in the context of these issues
we needed to understand the role of other agents in the process of governance as well and
look at Panchayats as one of several agents involved in these issues
Widening the scope of this study allowed us to grapple with decision making among a wide variety of actors some of which play an informal but very significant role. Depending on the
topic at hand, there were different agencies that played an important role in determining outcomes. Broadll, these agents include:
State agents
o Panchayat members o Representative of government departments (Agriculture, Water Resources,
Pollution Control Board, Public Works Department, Health Services etc., Indian Bureau of Mines, Directorate of Health etc.)
IDRC Centre File: 101276-001 79
TERI Report no. 2002WR41

Chapter 4: Governance and health and well-being
Civil society o o o
Village leaders and powerful individuals within the village Entrepreneurs (Truck owners, tanker owners) Civil society groups - (farmers groups, truckers association)
Industry o Mining companies
Characterising governance in the mining area The table below characterises responses by various agents, to the changing state of air, water, land and health in the study area.
Table 4.4 Responses of various agents, to changing state of air, water, land and health in the study area
Air quality Water supply Land and compensation Health status
Government No monitoring of air Poor monitoring and Poor enforcement of laws Poor tracking of health status
quality in road corridor management of groundwater pertaining to scientific No clear policy on health needs
areas resources dump management of populations in areas with
Poor enforcement of air Provision of taps and tankers No monitoring of environmental stress
quality standards as an alternative source of compensation payments No linkage made between
Poor enforcement of water made by companies environment and health
truck loading standards Removal of free public taps No monitoring of changes
in soil, water quality
No targeted support given
Mining Ignoring overloading of Supply of tanker water as an
Companies trucks
Temporary solutions (like
spraying of water on
dusty roads, employing
people to sweep roads
etc) .................
alternative
to farmers
Inadequate dump
management measures
Payment of compensation
for crop loss, but
transparency in
methodology used
Ad hoc health camps
Provision of health care for
mine employees
Local Ad hoc protests/ Protest/complain about water Formation of tenants Demand curative health care
Community/ complaints to
Civil Society responsible agencies
Willingness to trade
health for work
jobs
supply
Demands for water tankers
from companies and PWD/
panchayats
Demand for mining/allied Use civil society groups to
pressure state agents to
respond
At times unable to take
advantage of public services
as a result of infighting
associations to receive
compensation
Discontinuation of
agriculture
Demand/ expect
mining/allied jobs
(health camps from mining
companies)
IDRC Centre File: 101276-001 80 TERI Report no. 2002WR41

Chapter 4: Governance and health and well-being
The summary table above highlights the responses of the three broadly defined agents in the study area. In terms of government agents we observe an unwillingness to respond to various changes in region and an inability to uphold the rule of law (eg. air pollution regulations). Where agents have responded as in the case of water (by providing tap water) effectiveness is low. Similarly, the removal of free public tap water supply suggests that decisions have been made with little attention to the principle of equity.
Companies in the study area show an unwillingness to abide by legal regulations resulting in poor environmental outcomes. While companies have responded to some of these negative outcomes that have emerged as a result of mining (eg. compensation for crop loss, spraying of roads to prevent dust, provision of tanker water) their responses are often unsustainable.
While the local community is responding to changes their responses are often ad hoc and short sighted and thus lead to unsustainable solutions. There is also a lack of consensus building and a lack of attention to equity within the community with the result that responses in terms of protests, complaints often lack the power of collective action movements.
Factors influencing responses Through qualitative and quantative research we have tried to identify factors that influence or motivate decisions by various agents. Below are presented some of the key factors that emerge through the research.
Government State agents responding to various problems respond at a policy level and at the local level in terms of implementation of various policies. Factors influencing decisions at these levels are different and are presented accordingly below.
Strong industrial and political lobby groups Mining companies are a powerful lobby group in Goa and have a strong influence on decisions of various state agents at a policy level. Through'interviews with officers of various government departments it is clear that the pressure brought to bare on them has a strong influence on decisions related to monitoring of environmental impacts and enforcement of standards and regulations. State agents at the local level report that if they attempt to tackle issues such as air pollution or changes in land quality they are likely to get transferred out of the mining areas so that status quo is maintained.
This is one explanation for the lack of policy level decisions within various government departments to gather data or track environmental and social changes (eg. air quality, groundwater status). In all the issues probed, namely air quality, health care, ground water and agriculture, the lack of studies and/or data is probably the most serious lacuna in terms of governance in the mining regions of Goa (e.g. lack of groundwater monitoring studies, no air quality data from road corridors going through settlements, no systematic soil quality studies to detect changes in fertility, no monitoring of compensation etc). In some cases the absence of relevant data is then cited as an excuse by government departments to not enforce laws. In other cases, the magnitude of a particular problem is not recognised, precluding a
targeted response (eg. changes in cropping patterns as a result of siltation). Thus, as
1DRC Centre File: 101276-001 81
TERI Report no. 2002WR41

Chapter 4: Governance and health and well-being
companies are a strong lobby group and wield tremendous power government departments and elected representatives are cautious of how they enforce various laws.
Lack coordination between government departments in terms of data sharing and planning
Even where data does exist, we observe a lack of coordination in planning and data sharing which leads slow or ineffective responses to problems that could be dealt with much more efficiently. For example, the Directorate of Health does not work in tandem with the Pollution Control Board in terms of understanding, mitigating and managing environmental health problems. In the study area there is a general perception among health care workers that respiratory problems are high because of mining related transport. Yet, there has been
no contact with the pollution control board regarding this problem. Additionally, the IBM, which collects quarterly air quality reports from mining companies, does not share this with the pollution control board in order to make enforcement of the law more effective.
Similarly, responding to the decline in agriculture requires the involvement of several government departments such as Water Resources, Agriculture, and Indian Council of Agricultural Research (ICAR) etc., that rarely come together to plan or respond to problems collectively.
Graft While there are several regulations relating to environmental management, enforcement of these laws is generally seen to be poor both at a higher level and at the local level. One of the reasons for this is graft or corruption within the system. While corruption is difficult to prove, community perceptions of corruption levels are high. It is commonly known, for example, that trucks carrying iron ore are overloaded because bribes are paid (and asked for) in order to prevent the enforcement of the loading standards.
Health and well-being and income seen as substitutable Several government servants at the state and local level seem to feel that the impacts of mining on the community are not really very serious. According to them, communities are benefiting from jobs in the region so they shouldn't complain about problems such as
depletion of ground water. This kind of attitude also heavily influences decisions in terms of responding to environmental problems in mining areas. As health and well-being are seen as
unimportant, state agents do not feel the urgency to respond. (See details of water supply study in Annexure Q for details)
Village politics Where the state has responded to problems through public services, such as tap water supply, responses were seen to be uneven across the study area and some areas were seen to be much better off than others. Researchers observed that decision making at the local level was influenced by village politics. This factor was seen to have a heavy influence on decisions at the Panchayat level because Panchayat members are themselves residents of the village and very much a part of the struggle for power at the local level. For example, in one of the villages visited, a landlord has refused to allow water pipes to be laid over his land. While the Panchayat could have taken action against the land lord, the local representative in this case
IDRC Centre File: 101276-001 82 TERI Report no. 2002WR41

Chapter 4: Governance and health and well-being
chose not to because he is a relative of the land lord. Thus, at times Panchayat members seem unable to carry out their roles impartially as they are embroiled in village politics.
Party politics The influence of party affiliations had an influence on decisions of most government departments and Panchayats. For example, if a village Panchayat is affiliated to the ruling party in the state, their applications for a piped network to the PWD tends to be attended to much faster. (See details of water supply study in Annexure Q.
Age of mining As policy level decisions would apply to the whole mining region evenly, the age of mining does not emerge as a factor that influences decisions. Additionally, government department workers at the local level, such as Zonal Agricultural Officers, PWD officers etc. are often transferred to from one region to another. While there is a possibility that Panchayat members would be influenced by the age of mining, this did not emerge clearly through focus group discussions and interviews.
Mining companies Factors that were seen to influence companies' responses to various problems in the mining region are explained below.
Lack of commitment to social responsibility and sustainability A commitment to corporate social responsibility and sustainability at minimum requires adherence to the law and ideally a level of performance that goes beyond legal obligations. Several mining companies in the study region seem to lack this commitment, as is evident form their responses to the various problems faced by the environment and the local community. For example, several companies failed to conduct Environmental Impact Assessments as required by the law. Compliance was only forthcoming after a court of law threatened to close down the mines that had not complied with the rules.
Where companies have taken mitigative steps, these steps are short term and unsustainable indicating that there is a lack commitment to solving the problem and to sustainability. An example is spraying of roads with water in order to keep dust levels down, while overloading of ore carrying trucks (causing dust pollution) goes unchecked. As corporate social responsibilities have not been imbibed into company policy, these responsibilities continue to seem like burdens and are treated as such.
Profit motive It is obvious that for mining companies profit motive would be a key factor influencing their responses to problems in the region. Interestingly, profit motive was seen to be a crucial factor in decisions that led to both sustainable and unsustainable outcomes. For example, while making a choice between desilting of agricultural fields and paying annual compensation to farmers, companies tend to choose the latter because it is cheaper to do so.
To further elucidate this, we cite the example of the Falwada Tenants Association which has a
total of 19 Ha of land. Calculations to rehabilitate and regenerate the fields show that the
IDRC Centre File: 101276-001 83
TERI Report no. 2002WR41
Chapter 4: Governance and health and well-being
total cost would be around Rs. 25,115,617. The cost of annual compensation paid to the association is Rs. 200,000. Even though these costs would be distributed between 7
companies (those located within the watershed and contributing to the siltation of the field), the share of desilting costs would be significantly higher than the share of annual compensation. In some cases companies have offered to pay for inputs such as seeds, fertilisers etc., and resisted any demands for desilting. Farmers say they have been receiving compensation for about 1o years now (irregularly though and the amount received varies each year). Assuming the amount was a constant and regularly paid, over ten years the 7
companies would still have paid out only Rs. 2,000,000 as opposed to Rs. 25,115,617 to clear up the fields.
Table 4.5 Cost estimates for desilting and compensation
Total cost in Rs
(USD$)
Cost/ha in Rs.
(USD$)
25,115,617.50 1 321 874.61 Desilting
(545,991.68)
, ,
(28,736.40)
200,000,00 10,526.32 Annual compensation
(4,347.83) (228.83)
On the other hand, comparisons between annual compensation and costs associated with better dump management practices to reduce run-off indicate that it is more cost effective in the long run to take preventive measures than continuously pay compensation for several years. Consequently we see mining companies taking additionally measures to better manage dumps in order to reduce run-off.
Size of a company The size of the company was also seen as a factor that played a role in they types of decision made. In our study area, mining companies operating are all small family owned enterprises and with the exception of one company having a market capitalisation of approximately Rs.
43.5814 billion or USD$ 947.421 million. Smaller companies not only have limited resources, they also have limited access to information and cutting edge technology. These limitations have a strong influence on decisions and responses to environmental and social outcomes of mining.
Age of mining In the case of mining companies, we did not find the age of mining having any significant influence on their responses. The lessons they learn seem to influence their decisions in all clusters they operate in equally.
Local community I civil society The local community also has a role to play in responding to the various problems that they face in the mining ecosystem. Deteriorated agricultural lands, poor air quality, decreasing groundwater levels, increased risk of respiratory illnesses etc. are some of the impacts from
The activities envisioned include the desilting the fields, an adjacent nallah (water channel), provision of soil amendments to enrich the soil and necessary soil and water conservation measures.
IDRC Centre File: 101276-001 84
TERI Report no. 2002WR41

Chapter 4: Governance and health and well-being
the changing environment that affect the larger community. The key factors influencing their responses to these changes are discussed below:
Nature and intensity of impact The nature of the impact felt by local communities had a significant influence on their decisions to take action or seek solutions to their problems. Some of the impacts of mining affect the basic needs of life and consequently these get more attention from the community than others. Depleting groundwater for example, has affected availability of water for household/daily use, which is basic to life and not possible'to go without water. As a result, the community is more active about complaining or protesting about this problem. Siltation of agricultural fields on the other hand, is a gradual process, the impacts of which have been felt over time. Additionally, as some communities members have shifted away from agriculture to other types of work their dependence on farming has decreased. Thus, the community was seen to respond more quickly to pressures that strongly impacted daily life.
Lack of unity and local politics In the study area the local community is a heterogeneous mix of various groups of people differentiated by caste, level of education, income, land ownership patterns etc. As in any society, these groups vie for power leading to friction within the community. We often found these groups having conflicting perspectives and sometimes refusing to act together to address problems faced collectively. For example, in one of the study villages one group of farmers would not support another group in their efforts to have their irrigation pond desilted even though the desilting would benefit both groups. Through the survey conducted and through personal interactions people themselves identified this as a reason for inadequate responses, but they seem unable to find common ground to address some of their problems collectively.
Involvement in alternate livelihoods/ dependence on mining/ allied jobs Having mining/allied jobs affected the nature of people's responses specifically in the context of air pollution and land degradation. In the case of air pollution caused by transportation and handling of ore, the truck owners who are also residents of the mining villages, are often hostile towards any efforts taken to mitigate the problem or reduce impacts. This is because they perceive a threat to their livelihoods and worry that initiatives to address the problem will result in possible closure of mines. Several instances of intimidation and harassment of those perceived to be opposing mining activities were noted2.
In the context of agriculture those having any other form of employment (mining or other wise) were more willing to trade the health of their agriculture fields for monetary compensation since they were not dependent on agriculture. As a result of this split in the community collective action to solve problems or push for responses by other agents has seen limited success.
2 While conducting survey in an area in the Road corridor TERI researchers and surveyors were approached by an aggressive group of men asking us to record that there was no dust problem in their village and to leave. It was later learnt that the group leader is the sons of one of the main truck contractor involved in transport of iron ore in the area.
IDRC Centre File: 101276-001 85
TERI Report no. 2002WR41

Chapter 4: Governance and health and well-being
Leadership In the study area, we found that in general there were few people who could lead and
motivate larger groups to participate in civil society initiatives. There are examples of people
taking the initiative to lead action to resolve issues, but we found that such instances were often exceptions rather than the rule. The lack of leaders has resulted in ad-hoc responses or protests taln some cases, leaders are 'bought over' by providing them, or members of their families jobs in the industry, or by paying them money, This form of co-option quashes
popular movement that may arise.
Information/ knowledge The lack of information/knowledge was seen to be a crucial factor in the community's response to various problems in the study area. Information or knowledge is necessary for a
community to successfully engage in civil initiatives. Lack of information and knowledge emerged in the following ways:
o Timeliness of information Public hearings that need to be held in the case of new mines or expansions of older ones, are
inadequately publicised and people often hear about it only after it has been held. Thus, they were unable to participate in these meetings.
o Poor understanding of the government machinery Farmers have often not known how to move the system for redress when their fields have been inundated or silted as a result of poor dump management practices. They are unaware of the level at which they need to address the problem, which official to contact etc. In terms of air quality, more than 50% of respondents to the survey stated that they were not aware of the existence of the Goa Pollution Control Board that is responsible enforce air quality standards.
o Language barrier One of the biggest factors influencing community responses was the unavailability of legislation, circulars and other legal information in the local language.
The absence of information has ensured that the communities' responses are ad hoc and ineffective. This has resulted in frustration and a feeling among community members that they there are no solutions.
Financial constraints Financial constraints were seen to be an important factor influencing community member's willingness to be involved in civil initiatives. For example, at the time of strikes, not all truckers can afford to wait-out the strike or lose days of work due to financial constraints and responsibilities. Thus, despite being aware of the impacts of air pollution and the need for higher transportation rates some truckers are willing to make a trade-off between long-term health and well-being and shorter-term and immediate gains because of the existence of needs in the present. Such a predicament often rules out participation in actions where there may be financial costs and a long wait before benefits accrue to people.
IDRC Centre File: 101276-001 86 TERI Report no. 2002WR41

Chapter 4: Governance and health and well-being
Age of mining We attempted to understand whether the age of mining has any influence over the degree of participation or the level of civil society activity within the local community. The table below looks at levels of political activity in the study area (in relation to air quality and water supply problems). We see that in terms of proportions of respondents actively complaining about their problems, in all three clusters a high percentage of people have resorted to complaining. We notice that there is a detectable trend in the first two columns, where we see what proportion of people complained and the average complaints made per complaining person.
Cluster I has the highest proportion of respondents complaining, followed by Cluster II and then Cluster III. We also wanted to see the intensity of this activity amongst those who do complain and we see the same pattern here. Cluster I has a high average of 2.33 complaints per complaining person followed by Clusters II and III. In terms of participation in protest marches, the trend is similar except, there is a higher participation in cluster III than Cluster II. Lastly, we look at those respondents who said they regularly or always attended the Gram Sabha meetings and we find that the highest proportion of respondents attending these meetings were from Cluster I followed by Clusters II and III.
Table 4.6 Political activity across Clusters
Percentage of those having Average
Always/
Regularly
Cluster
problems, actively
complaining
(%)
Complaints/
Complaining
Person
Participation
in protest
marches (%)
attending Gram
Sabha meetings
(%)
1 78.00 2.33 28.00 26.92
1 76.35 1.70 12.84 11.18
III 71.28 1.55 22.56 6.22
Total 74.05 1.71 19.59 10.84
In summary, Cluster I displays the highest level of political activity from among the three Clusters, with Cluster II next, followed by Cluster III, except in the case of participation in protest marches. We can say then, that the age of mining possibly influences the degree of response to impacts, from the local community. Over the years, it is likely that experience,
increased incomes, better education etc, people become more politically active.
Conclusions Through this component we have attempted to study and understand the role of governance in influencing outcomes related to health and well-being in the context of mining. We have characterised the responses of various actors to changes in the mining ecosystem and tried to understand what influences these responses and decisions made by the different actors.
Data presented in these case studies and in this synthesis suggest that all three agents need to respond more effectively to changes in the environment and to impacts on the community. While a robust legislative framework is necessary to address these problems, it is clearly not enough to tackle the impacts of mining. While companies need to pay more attention to
IDRC Centre File: 101276-001 87
TERI Report no. 2002WR41

Chapter 4: Governance and health and well-being
their legal/statutory obligations and corporate social responsibilities, the state needs to play a more proactive role in monitoring and responding to changes within mining ecosystems by ensuring compliance within industry. The catalyst for this kind of change needs to come from civil society through calls for more information, more transparency and demands for more accountability. The ESPI tool (addressed in the following chapter) developed over three phases of research provides a framework for better management of mining ecosystems by companies and government. Simultaneously, capacity building activities undertaken in this project (see Chapter 6) are the starting point of a long process of empowering communities in order to ensure that they can play a more active role in the management of this mining ecosystem.
IDRC Centre File: 101276-001 88 TERI Report no. 2002WR41

Chapter 5: Refinement of tools
Chapter 5: Refinement of tools
The main output of Phase II of this study was a set of three tools to track health, well-being and sustainability in mining regions. These tools included a set of Environmental and Social Performance Indicators (ESPIs), a Quality of Life (QoL) survey and Impact adjusted income accounts for the mining region in Goa.
One of the key objectives of Phase III is to refine these three tools. Further research taken up in Phase III has provided opportunities to revisit and further strengthen these tools in their capacity to track sustainability and health and well-being in mining regions. Refinement work on the three tools is described below.
5A Environmental and Social Performance Indicators (ESPIs)
In Phase II of this project a set of Environmental and Social Performance Indicators were developed for use by companies and government. The development of indicators involved the following steps:
Development of an indicator hierarchy Development of sub-issues for each core issue identified in Phase I Development and pre-pilot testing of tools Evaluation of the indicator set by companies and government departments
Maintaining the indicator hierarchy developed in Phase II, and addressing the same core issues
addressed in Phase II, in this phase we have attempted to refine the indicator tool. Refinement of the tool has included a review of the following aspects or issues:
Practicality of data collection and usefulness of data When reviewing the ESPI tool, the feasibility of data collection and the usefulness of information was reassessed keeping in mind not just Goan conditions but the wider Indian context. This was done with the end objective of having an indicator set that is practically possible to use and that provides useful data in the context of management decisions.
Framework for classification of indicators Indicators in Phase II were classified as response and result indicators. Result indicators were defined as those which highlighted the changes, and the causes and impacts of changes, ie. result indicators corresponded to Pressure and State indicators within the OECDs Pressure- State-Response (PSR) framework. Response indicators were those that highlighted responses to changes and impacts within the ecosystem, corresponding to Response in the PSR framework.
In Phase III the European Environment Agency's DPSIR (Driver-Pressure-State-Impact- Response) framework has been adopted to classify indicators in the tool. While both frameworks acknowledge a cause-effect relationship between social, economic and environmental systems the DPSIR framework has taken the classification a step further by
IDRC Centre File: 101276-001 89 TERI Report no. 2002WR41

Chapter 5: Refinement of tools
distinguishing between Drivers and Pressures and State and Impact and hence allowing for a more refined classification of indicators. The figure below explains how the cause - effect relationship works within a given ecosystem.
('.tuses
Drivers Responses)
PnII' iRS .+ou! r.?tyrls
Impact
Poll iit. tits MAIN ecosvSteells, nr*rOAS
Figure 5A.1 The DPSIR assessment framework
Source. Based on EEA 1998: Guidelines for Data Collection and Processing - EU State of the Environment Report. Annex 3.
In addition to classification as explained above, indicators in this compendium are categorized as Primary or Proxy. Primary indicators are direct measures of the issue in question. Where a direct measure is not possible, proxy indicators provide indirect measures of the issue in question.
Level of data collection and analysis In Phase II village level indicators were meant to be used by Panchayat members or local government representatives at the village level. Phase II also acknowledges that at the local level there was a lack of information, limited capacity to understand the kind of data needed etc. Assuming these hurdles can be overcome through training and exposure, what remains problematic is that a lot of decision making is not done at this level. While Panchayats can and do effectively pressure other departments for better services, decision making powers are still largely vested with State government departments where there is a much greater level of technical expertise.
The studies on governance taken up under this project also originally intended to explore governance issues at the local level with a focus on Panchayats. This orientation was modified during the course of research because a variety of state and central government departments have a crucial role to play in managing and responding to environmental and social changes in a mining context. Thus, in this revised version, indicators for government are meant to be tracked and analysed by the relevant State Governments Departments. While this does not
IDRC Centre File: 101276-001 90
TERI Report no. 2002WR41
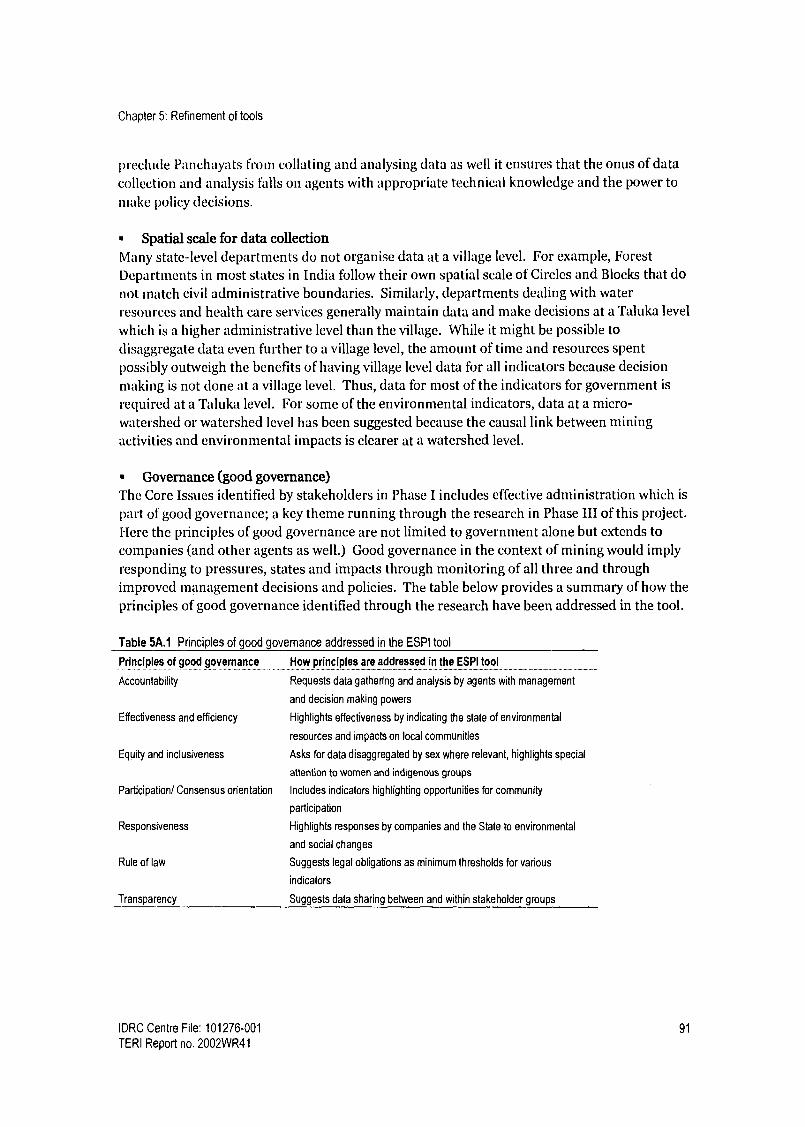
Chapter 5: Refinement of tools
preclude Panchayats from collating and analysing data as well it ensures that the onus of data
collection and analysis falls on agents with appropriate technical knowledge and the power to
make policy decisions.
Spatial scale for data collection Many state-level departments do not organise data at a village level. For example, Forest Departments in most states in India follow their own spatial scale of Circles and Blocks that do not match civil administrative boundaries. Similarly, departments dealing with water resources and health care services generally maintain data and make decisions at a Taluka level which is a higher administrative level than the village. While it might be possible to disaggregate data even further to a village level, the amount of time and resources spent possibly outweigh the benefits of having village level data for all indicators because decision making is not done at a village level. Thus, data for most of the indicators for government is
required at a Taluka level. For some of the environmental indicators, data at a micro- watershed or watershed level has been suggested because the causal link between mining activities and environmental impacts is clearer at a watershed level.
Governance (good governance) The Core Issues identified by stakeholders in Phase I includes effective administration which is
part of good governance; a key theme running through the research in Phase III of this project. Here the principles of good governance are not limited to government alone but extends to companies (and other agents as well.) Good governance in the context of mining would imply responding to pressures, states and impacts through monitoring of all three and through improved management decisions and policies. The table below provides a summary of how the principles of good governance identified through the research have been addressed in the tool.
Table 5A.1 Principles of good governance addressed in the ESPI tool
Principles of good governance How principles are addressed in the ESPI tool ..... ........... _.._.-_- ---_. ..... . .. ......... -.....................
Accountability Requests data gathering and analysis by agents with management
and decision making powers
Effectiveness and efficiency Highlights effectiveness by indicating the state of environmental
resources and impacts on local communities
Equity and inclusiveness Asks for data disaggregated by sex where relevant, highlights special
attention to women and indigenous groups
Participation/ Consensus orientation Includes indicators highlighting opportunities for community
participation
Responsiveness Highlights responses by companies and the State to environmental
and social changes
Rule of law Suggests legal obligations as minimum thresholds for various
indicators
Transparency Suggests data sharing between and within stakeholder groups
IDRC Centre File: 101276-001 91
TERI Report no. 2002WR41

Chapter 5: Refinement of tools
Keeping in mind equity as a key principle of good governance, when refining the indicators attention has been paid to marginalised groups, namely women and indigenous communities.
Gender sensitivity While there are almost no women workers involved in mining in the study area, in other parts of India women form a large part of the mining labour force. Additionally, women in the community are impacted by environmental and social changes related to mining. In order to ensure that the impacts on women are noticed and addressed, where relevant indicators ask for data disaggregated by sex. Additionally, some indicators ask about specific provisions for women/female workers.
Attention to indigenous groups While there are no indigenous groups in the community affected by mining in Goa, other mineral rich states in India have relatively large tribal and indigenous populations that are heavily dependent on natural resources for their livelihoods. As mining changes the state of the environment, these groups often lack the skills necessary to move towards alternative livelihoods. In order to ensure that the welfare of these groups is given special attention, where relevant, indicators regarding indigenous communities have been incorporated.
As good governance is necessary for the management of all domains within an ecosystem indicators that are reflective of the principles of good governance or effective administration are included in each section addressing a core issue. Rather than dedicate a separate section to effective administration or good governance we have incorporated this as a cross cutting issue in all domains.
Applicability to other metallic mining regions in India The indicator tool has been modified to ensure applicability to other metallic mining regions in India. Issues of concern that might emerge in other mining regions, such as the impact on indigenous communities, impacts on community health related to other metals have been addressed. Additionally, the indicators developed have been contextualised within the Indian legal frame work. Thus, mining laws and regulations have been suggested as thresholds for a variety of indicators.
Guidelines for use In order to operationalise the tool, indicators have been organised into a compendium with guidelines for use. Each indicator in the compendium has been explained through a set structure that seeks to highlight the following:
Provide the title of the indicators Explain its placement with the DPSIR framework Identify what constitutes progress in the context of sustainable development Explain the importance of the indicator to sustainable development/ human health and well-being Identify units of measurement Identify the source of data Explain limitations of the data where relevant
IDRC Centre File: 101276-001 92
TERI Report no. 2002WR41

Chapter 5: Refinement of tools
The table below includes the number of indicators finalised under each core issue. For a
detailed list of indicators see Annexure D. Additionally, see enclosed Indicator CD.
Table 5A.2 Indicator tool
Companies Government Total
Background 3 10 13
Environmental quality 4 4
Water quality and quantity 6 4 10
Air quality 3 3 6
Land 5 3 8
Land compensation 3 4 7
Mine closure
Socio-economic issues 5 5 10
Environmental issues 5 3 8
Health
Health status 3 4 7
Health care 2 4 6
Participation
Opportunities for participation 1 1 2
Information availability & access 1 2 3
Labour and employment 5 2 7
Social and community relations 6 6
Investment in the region
Human capital 2 1 3
Physical capital 2 2 4
IDRC Centre File: 101276-001 93
TERI Report no. 2002WR41

Chapter 5: Refinement of tools
5B Quality of Life (QoL) tool
The QoL tool developed in Phase II of this project had three versions (with varying proportion of subjective and objective questions) all of which were piloted. Finally version III, with 75% objective and 25% subjective questions was used to gather data. Results from this version were presented in the final-year Phase II report.
In Phase III the data gathered from Phase II was used for further analysis where Chi-square tests were used to determine the association between objective conditions and subjective satisfaction. Additionally, multiple regression was used to identify those determinants which had a statistically significant relation with subjective satisfaction within each domain.
The main objectives of refinement in Phase III are as follows: update questions based on research in phase III to ensure that any emerging issues were covered improve clarity of questions where needed
Based on these objective, the QOL tool was modified in the following ways:
Reorganization At the conceptual level there were no changes made to the QoL tool. Most of the domains and sub-domains that were developed in Phase II have been retained in the final version of the tool. Some sub-domains were eliminated, though the questions were retained and reorganized under relevant sub-domains. This was done with the intention of maintaining logical links with the domains. Additionally, a similar reorganization was also carried out within the sub- domains where some questions were regrouped and reorganised into other sub-domains with the same purpose. For example, the sub-domain "Fuel used", under the domain "Economic" was removed and instead we created a new sub-domain "Basic amenities" where questions on fuel used, sanitation and water availability were regrouped.
Removal of questions Questions that were either repetitive or did not adequately capture the desired information were deleted. For example, under the sub-domain "Infrastructure" there were two questions that captured telephone usage, so one was dropped. In the same section, a question to capture expense on public transport did not tell us anything about the infrastructure, so it was dropped.
Additions Under some sub-domains, where information could be better captured additional questions were introduced. For example, in the "Biomedical" domain there was no question to capture whether there were any night/emergency facilities that people had access to, so such questions were included.
Figure 5B.1 below provides a summary of the domains and sub-domains within the final version of the tool.
IDRC Centre File: 101276-001 94
TERI Report no. 2002WR41

Chapter 5: Refinement of tools
QOL Tool, Version III (Phase III)
Employment and work conditions Income
Opportunity space
ECONOMIC Nutrition Basic Ammenities Infrastructure Assets
Family and community life Choice regarding marriage and reproduction
SOCIAL Education Social security Conflict resolution
Participation POLTICAL Governance
BIOMEDICAL
Political and legal rights Health facilities Economic ability to maintain health Health status
Air quality Noise and viberations
ENVIRONMENTAL = Water (quality and security) Land Aesthetic environment
SPIRITUAL Spiritual
Figure 5B.1 Domain and sub-domains within the final QOL tool
IDRC Centre File: 101276-001 95
TERI Report no. 2002WR41

Chapter 5: Refinement of tools
5C Impact adjusted income accounts
A major component of the Phase II study included an accounting exercise that attempted to value the environmental and social costs of mining and accordingly adjust income obtained from mining to reflect true income.
The diagram below shows the various components that were included in the calculation of estimates for the purpose of such accounting.
Estimated value added (income) of a mining region
RESOURCE USE/ ENHANCEMENT
r-- IRON ORE
GROUND WATER
I Physical Accounts CS=OS+RA - P
Physical Accounts Gmund water/
Ton used x Total Ore Production
Change in
stocks valued
at user cost
Ground water
Q49fAMIlteniat cost
8.l raction> recharge
r AIR
Emissions
SPM in tonnes/yr.
I Concentration in mining
areas > background mgJn metre
I ntpaets on a t
(death, work days lost
Value in Rupees/$
i
PI.t)S/M IN1/S
WATER
LIRuents e.g. tailing water discharge TDS or SS(mg/L)
CONVERTED
FOREST CROPLAND'
PRODUCTIVITY LOSS I
Area affected
yield/ha
foregone
Area affected (ha.)
Cro yield/ ha. loot
Treatment Costs = w 5,, x per unit treatment costs to arrive at norms
I
Existence value
CVM
Physical loss market prates
Physical loss market prices
Preservation Options value value
t ravel costs
(.FCM
CVM
IMPACT ADJUSTED MRI (I)
Figure 5C.1 Various components that were included in the calculation of estimates
Area lost (to ha.)
Average yield by Forest type
Direct use
I Physical loss value at markel prices & imputed values
As is evident from the above figure, this exercise involved the valuation of several
environmental and social costs including health costs. One of the limitations in this project was the assumption in valuing health costs of air pollution that the dose response function for developed countries hold true for the study area. Additionally, there was a lack of sufficient information on cost of treatment and disability due to illness.
In Phase III, we have attempted to improve on this by developing an econometric model to value the health costs of air pollution.
ENVIRONMENTAL DEGRADATION IMPROVEMENT
Local indirect use
IDRC Centre File: 101276-001 96
TERI Report no. 2002WR41

Chapter 5: Refinement of tools
Specifically, the objectives in Phase III were: To determine the community health status, focusing on the prevalence of respiratory problems among people in the mining area To assess the level of individual exposure to particulate matter of the people in the mining areas To determine the linkage between exposure to air pollution and occurrence of chronic respiratory problems To value the cost of ill-health or morbidity due to air pollution in the mining region using primary data and improving on the 'cost of illness' approach through using a more transdisciplinaty approach to valuation.
Figure 5C.2, below presents a summary of the steps that were taken in Phase III to address these limitations.
Indiv. &
HH Survey
Self-reported
Resp. Symptom
Quest.
Chest X-rays
Observed
PFT Air quality monitoring (micro environments)
Work
Outdoor
Kitchen
living room
Time budget survey
health status health status
Community health status
Development of economic model
Environmental . health linkages
Cost of Ill health
Figure 5C.2 Research components leading to the valuation of health costs
Individual exposure
A detailed report of each of the research components that fed into the valuation are presented in Chapter 2. Below we summarise the results of the valuation exercise and discuss the changes in health costs obtained from this valuation as compared to estimates used in Phase II.
IDRC Centre File: 101276-001 97 TERI Report no. 2002WR41

Chapter 5: Refinement of tools
Table 5C.1 Comparing annual cost estimates from Phases II and III (Rs. `000)
Cluster Phase II Phase III
Lower estimates Higher estimates
Total annual wage Annual medical Total annual
loss expenses wage loss
Annual medical
expenses
Total annual wage
loss
Annual medical
expenses _.......... ..--..... _-......... ................... -.._...............---.._.............-_.._......._-
. _--._................... ............ _............_.. _._-..... -----....................................... _............. .......... .... ..... .... ................ ............. ........ .......... ..........._
1 42.4 29.43 42.4 72.99 4,000.98 1,3860.72
11 2,043.9 1,420.13 2,043.9 3,521.83 5,877.06 1,9136.31
111 829.28 576.2 829.28 1428.94 2,608.116 8,033.04
Corridor - - - - 4,020.08 13,700.48
Total 2,915.58 2,026.22 2,915.58 5,023.76 16,506.24 54,730.54
In Phase II, lower and higher estimates of costs associated with annual wage loss and medical expenses due to respiratory illnesses were provided (Table 5C.1). In Phase III, we have a single estimate as provided above. Based on the new estimates of total annual costs associated with both, wages lost and medical expenses we see a marked increase from those reported in the earlier phase. The Phase II estimates were based on damages, impacts, wages and prices as recorded in 1997 (while using 1991 Census data). The Phase III estimates are based on data from 2005 (and 2001 Census data). There has been an increase in population between the two Census years of 1991 and 2001 and additionally, a new area, the road corridor has been included which was not considered before.
Table 5C.2 Comparing annual per capita costs for Phases II and III (Rs.)
Cluster Phase II Phase III
Lower estimates Higher estimates
Per capita annual Per capita annual Per capita annual Per capita annual Per capita annual Per capita annual
wage loss medical expense wage loss medical expense wage loss medical expense
248 324
II - - - 332 428
III - - - 244 316
Corridor - - - 496 640
Total 121 205 121 335 330 427
In Phase II, lower and higher estimates for annual per capita wage-loss and medical expenses due to respiratory illnesses were presented for the study area as a whole; cluster-wise estimates were not calculated. These estimates were improved upon through the model and we were able to get more refined information at the Cluster/Corridor level. We see that in all the three clusters as well as the road corridor, the annual per capita wage lost due to sickness is greater than the higher estimates form Phase II. Additionally, the Phase III average for the whole study area is also presented and is seen to be grater than Phase II estimates.
In terms of annual per capita medical expense due to respiratory sickness, the Road Corridor and Cluster II show figures greater than the higher estimate of Rs. 335 from Phase II. All Phase III figures under this head were greater than the lower estimates of Phase II.
IDRC Centre File: 101276-001 98
TERI Report no. 2002WR41

Chapter 5: Refinement of tools
Conclusion In ecosystems stressed by minerals development there is a need to better manage and monitor changes in the determinants of health and well-being in order to develop responses that address the negative impacts such changes may bring.The tools developed and refined through the research address this need by helping to ascertain the sustainability of minerals development and to track changes in the state of natural resources, performance of different agents within the and the quality of life of those residing within the mining ecosystem. Even though these tools have been developed in the context of the Goan mining ecosystem, the applicability of these tools is wide and they can be used in the context of minerals development elsewhere. These tools can be especially helpful in the larger Indian minerals context, given the vast expansion expected in minerals development in the country. The methodology adopted to develop these tools can be applied to tailor these tools in order to suit the minerals sector in other countries as well.
IDRC Centre File: 101276-001 99
TERI Report no. 2002WR41

Chapter 6: Capacity building and dissemination
Chapter 6: Capacity building and dissemination
6A Capacity building
Over the course of research undertaken in the project researchers identified a variety of gaps
in community capacity, some of which could be addressed through capacity building programmes. With these insights in mind, a variety of capacity building programmes were
designed for the community. Additionally, some programmes have focused on building capacity with the research team and among NGOs and CBOs working in the study area.
In terms of health, the lack of hygiene and sanitation in some of the poorer areas were observed. By attending health camps (organised by other NGO's and agencies) as observers, researchers also noticed levels of under nourishment among children. Thus, programmes were designed to address these lacuna. Additionally, given the project's focus on respiratory health, and the high incidence of respiratory illness, programmes on early detection of respiratory problems were also chosen as a workshop topic.
Through research on subjects such as governance, gender, agriculture and water, researchers identified problems and shortcomings in skills and capacity within the community which make it difficult for people to respond to the challenges posed by a changing landscape.
Some of these observations are as follows:
Little or no participation of women in village development Very few local level institutions through which people can air their views or address
problems related to mining. Those groups that exist are weak and ineffective due to a
lack of leadership, vision, and clear goals.
A general lack of information/awareness within the community and lack of skills and knowledge required to access various kinds of information among individuals and groups. Weak and ineffective local-level government bodies
Target groups Addressing some of the problems we identified through the research requires social change that generally takes several years and continuous engagement with the community. As the study area for this project covered 53 villages and a relatively large population we needed to prioritise and plan with which groups we would work, in terms of capacity building. With a limited amount of time and resources, we chose to work more intensely with a relatively smaller group of people in order to be able to bring about change in the long run. Additionally, as TERI has been engaged in a variety of capacity building programmes for farmers and women's groups through other projects, we chose to continue working with some of the same groups in order build on those initiatives to see them through to fruition.
IDRC Centre File: 101276-001 100
TERI Report no. 2002WR41

Chapter 6: Capacity building and dissemination
Health related workshops A series of five half-day workshops on sanitation and hygiene conducted in each of the three clusters in the study area. The thrust of these programmes was to provide basic and easy to understand information on hygiene and sanitation and their link to health outcomes. Through the programme, participants were introduced to simple and cost effective ways to improve hygiene in their homes and localities. Additionally programmes on nutrition with a focus on children were conducted with local community women and nursery school workers. Programmes on early detection of respiratory illnesses was aimed at making participants aware of early symptoms and providing information on simple remedies that can be taken up. Table 6A.i below, provides a summary of health related workshops conducted.
Table 6A.1 Health-related awareness workshops
Cluster Village Group Topics covered No. of Date (2005)
participants ..... ....... . ... .......... ............ _
I Sirigao Local community Sanitation and hygiene and early detection 90 July 29th
of respiratory illness, prevention and home
care
II Pale Anganwadi workers Nutrition and balanced diet for the family 25 May 19th
li Advoi- Local women Early detection, care and prevention of 30 June 1st
Pissurlem anaemia and vitamin deficiency
Road Curchorem Local women Sanitation and hygiene and nutrition for 20 June 8th
Corridor under five children
III Sanvordem Local community Sanitation and hygiene and early detection 35 July 27th
of respiratory illnesses and prevention
Strengthening local-level institutions Over the course of the project researchers worked with farmer's and women's self-help groups in the study area with the objective of strengthening group functioning. Well- functioning groups (ie. groups that maintain transparency, elicit participation of all members, have clear goals and annual plans, maintain group discipline, have access to information, have strong leaders etc.) act as systems of support for women or farmers and have tremendous potential to address problems that arise at the local level. With this in mind, a variety of programmes/initiatives were taken up with local level institutions in the study area, as explained below.
Farmers' groups Exposure visit to Van, Mavlinghe village watershed 22 October 2005 No. of participants: 5
A small group of farmers attended this exposure visit to a watershed project area in Goa.
After brief presentations made by the watershed project team, an open discussion ensued between farmers from the mining areas and the watershed farmers focusing on how to resolve problems through a watershed approach.
IDRC Centre File: 101276-001 101
TERI Report no. 2002WR41

Chapter 6: Capacity building and dissemination
Visit to overburden dumps 23 January 2006 - Chowgule and 13andodkar (Pale Mines) 24 January 2oo6 - Dempo and V. M Salgaocar (Dignem Mines) 17 February 2006 -'l'imblo and Quenim (Dignem mine and Cudnem Dump respectively)
The first and most logical step in the process of rebuilding agriculture is control of soil erosion from mine dumps; the root cause of silting of water bodies and land. Unless erosion is controlled, desilting and soil amendments end up being short term and temporary solutions. Understanding the importance of this step for sustainability, the Fal wada Tenants Association had drawn up a plan for rebuilding agriculture in their area. This included erosion control measures that need to be taken up by companies having dumps in the area as the first step, following which they have requested companies to take up desilting of their fields.
With TERI researchers acting as the go-between, these plans were presented to the companies who subsequently agreed to have two or three farmers from the Tenants Association visit each dump in the area (along with TERI staff) to ensure that work on the dumps is satisfactory. Visits were made to seven dumps in the area, following which a report was written with the help of TERI staff, on the adequacy of technical measures observed and on dump areas that need further work. This report has been handed over to the Goa Mineral Ore Exporters Association (GMOEA) to follow up with companies.
These visits have served to build capacity of farmers and company staff in many ways: Leadership building: This has been a good exercise in developing leadership within the farmers group. A few active members from the group have had fruitful interaction with mines managers and other company staff. Levelling: In general companies have always had the upper hand in their relationships with the community. The process of inviting farmers into the mine site to inspect the dumps and showing them around the dumps as guests, is a step towards equalising the relationship between companies and community. Technical knowledge: The dump inspections have led to increased technical knowledge about dump management, including erosion control measures, water harvesting, etc. among farmers. Additionally, farmers were good at identifying potential problem areas based on their own knowledge which they were able to share with company representatives. Communication: This exposure has been invaluable in terms of helping farmers to communicate constructively with companies (rather than fight) both orally during the visits and through the reports written up after each visit.
Water quality sampling with farmers ii August 2006
Along with representatives of the Falwada Tenants Association, researchers collected water samples from streams and rivulets, which are known to originate from overburden dumps, or are fed by run-off from these dumps in order to check silt content in the drainage network. A technician from a government laboratory accompanied us to ensure that the methodology
IDRC Centre File: 101276-001 102
TERI Report no. 2002WR41

Chapter 6: Capacity building and dissemination
adopted was sound. This exercise was completed recently during the monsoon season when run-off from dumps is expected to be high. This exercise was important for farmers because it demonstrated the manner in which water sampling is conducted, along with helping them make contacts with government laboratories so that they can employ similar techniques in the future if needed.
Strengthening farmer's groups: an exposure visit to MYRADA's watershed programme in Chitradurga, Karnataka 19 -23 December 2005 No. of participants: 14 (12 men, 2 women)
Through this exposure visit farmers from the study area were exposed to the work and achievement of successful farmers groups. The workshops and training included in this programme revolved around exploring the structure and functioning of successful farmers groups, vision building and planning and using a watershed approach for land management. As the Department of Agriculture in Goa is an extremely important point of contact for farmers we also invited agricultural officers from the Department for this workshop. The Department's work is often confined to providing technical advice and inputs at subsidised rates. Through this workshop they were able to see the need for and value of collective action and planning among farmers, especially in areas where land is impacted by mining or other industrial activities.
While women are as involved in agriculture as men (as discussed in Chapter 3), they are rarely members of farmers groups and almost never participate in meetings of this nature. Thus, one of the highlights of this programme was the participation of two women in a thoroughly male dominated sphere. Their willingness to participate was especially surprising because this was a six-day trip and they knew they were the only women attending (other than TERI staff). We attribute their willingness to participate to a level of trust and comfort that has been built up with TERI researchers through work with their farmers group since 2004.
Women's groups Training for community organisers In order to ensure that the skills necessary for developing and strengthening local level institutions stay within the community, training for community organisers is imperative. With this in mind, a training programme for community organisers/trainers was conducted through ten modules over a io-month period (December 2005 to September 2006). The
modules covered a variety of topics that are necessary for setting up and strengthening self- help groups or other local level institutions. The trainees, all of who are themselves members of local level institutions, were encouraged to try out these modules with their groups or with new local groups and provide feedback when they attend the following Module. Totally, 8
trainers have undergone all 1o modules of this programme,. Faculty for some of the modules of the programme were engaged from MYRADA, a Bangalore based NGO that has been
' While this programme stated out with 15 participants, over the first few months five participants dropped out (as expected). Two others attended irregularly and have missed several key modules.
IDRC Centre File: 101276-001 103
TERI Report no. 2002WR41

Chapter 6: Capacity building and dissemination
working exclusively on poverty alleviation through local level institution building for over twenty years. A local artist who is also a social worker was engaged to help with these workshops by designing visual aids for training modules, which can later be used by trainers in the future. The work done during these modules has been documented and used to create it manual for trainers. Table 6A.2 lists the training modules conducted between December 2005 and September 2006.
Table 6A.2 List of training modules conducted between December 2005 and April 2006
Module Title Duration ......... .
Module 1 Social analysis of society 1211- 1411 December, 2005
Module 2 The Development Cycle, Concepts of Self Help Affinity Groups 141h -160h January, 2006
Module 3 Structure and functions of successful groups I 11th -13th February 2006
Module 4 Structure and functions of successful groups II 18'" - 20"' March 2006
Module 5 Rules and regulations 15'- - 3rd April 2005
Module 6 The need for participation within groups 17th - 19th July 2006
Module 7 Why do we need SHGs? 25th and 28th July 2006
Module 8 Forming an SHG in the field 7th, 8th and 18th August
Module 9 How to conduct an SHG meeting 14th and 16th September 2006
Module 10 Responsibilities of members and representatives 29th September 2006
Training for members of local government Focus group meetings conducted with members of the Panchayats, highlighted the need for training for these elected representatives in terms of gender awareness and in terms of general functioning. The following programmes were taken up through the project:
Deconstructing gender roles: an exploratory workshop for women Panchas (elected representatives) Two workshops, held in North and South Goa focused on the following issues:
Understanding the difference between sex and gender Gender biases in society and in my life How do Goan women fare relative to the rest of India Exploring the role of women elected representative Why women's attendance at Gram Sabhas (village assembly) is important
Table 6A.3 Details of the exploratory workshops held for women panchas
Study area Dates Number of participants
Cluster I and II 7"' and 8"' July 2005 16
Cluster III 111 and 2nd September 2005 12
IDRC Centre File: 101276-001 104
TERI Report no. 2002WR41

Chapter 6: Capacity building and dissemination
Residential training programme for Local Elected Representatives 18-i9 February 2006 Ponda, Goa No. of participants: Day 1= 15 (12 women, 3 men), Day 2= Cancelled
This workshop was designed to cover a variety of topics based on feed back and information gathered from elected representatives during focus group discussions and based on researchers' insights, namely: preparing village development plans, fund raising, participation, public speaking, leadership qualities, inter-personal skills, availability of information etc. The first day of the workshop went off well and the feedback received from participants was positive. However, despite signing up for the whole workshop most participants refused to stay overnight and decided to go home2. Additionally, many of them were not planning to return the following day.
Women's Gram Sabha The Panchayat (lowest level of elected government) holds a Gram Sabha or village assembly every three months in each village where women's participation is very low. In order to increase awareness about the village assembly and encourage women to participate, a series of women's assembly meetings were held a few days before the village assembly. A variety of issues such as women's legal rights, gender roles, women's health etc. were addressed at each meeting through films, and speakers. These meetings were interactive and always included discussion or experience sharing. The following meetings have been held:
Table 6A.4 List of women's Gram Sabha's meetings
Date of meeting Village Number of participants
20 October 2005 Sirigao 39
20 April 2006 Pissurlem 48
24 April 2006 Mayem 52
26 April 2006 Sirigao 30
26 July 2006 Sirigao 52
28 July 2006 Pissurlem 32
13 October 2006 Molem 25
Although these programmes have been presented according to different themes, in many ways these initiatives have been linked. For example, we have mobilised self-help group women to take up health issues or participate in Gram Sabha meetings. Similarly, we have
used the women's Gram Sabha (discussed above) as a forum to explore issues of health and
hygiene.
When planning this workshop, participants (especially women) were specifically asked whether an over night programme would be suitable to them. The workshop was planned as an overnight event as a result of positive feed back from several Panchas.
IDRC Centre File: 101276-001 105
TERI Report no. 2002WR41

Chapter 6: Capacity building and dissemination
Programmes for the TERI team and NGOs In addition to capacity building programmes for the local community and local elected representatives, a few workshops were also taken up to build capacity within the team and within research/community development teams working in other NGOs. Specific workshops attended by team members include the following:
Social analysis systems This programme was attended by four TERI team members. The other five participants belonged to watershed societies and the Minerals Foundation of Goa. Dona Paula, Goa
15 - i8 April 2005 No. of participants: 9
Workshop on mobilizing women Panchas Pune 2 -4 October 2005 Attended by Ms. Anuradha Joshi (TERI Research Assistant)
Time series analysis using econometric software Goa University, Goa 29 April 20o6 - 3 May 20o6 Attended by Ms. Yogita Mehra (TERI, Research Associate)
IDRC Centre File: 101276-001 106
TERI Report no. 2002WR41

Chapter 6: Capacity building and dissemination
6B Project outputs and dissemination
Project outputs
Tools to track sustainability, health and well-being The three tools developed over Phases I and II of this project have been refined in Phase III. The three tools include
Environmental and social performance indicators for metallic mining regions in India Economic model to value the cost of illhealth Quality of life survey tool
These three tools have been revisited and refined based on the research taken up in Phase III of this project. (For details see Chapter 5)
Self-help Affinity Groups: a Trainer's Manual Experiences and knowledge gained through the Training for Trainers capacity building programme were documented and used to develop a manual for trainers. The manual is in the local language and includes visual aids that can be used by the trainer in their future work. This manual has been developed with participants of the programme by using their experiences and stories to elucidate concepts and ideas. Although this manual discusses the creating and strengthening of self-help groups, many of the concepts can be extended to other community based organizations as well. This output helps ensure that even after the project is over, communities have some reference to continue with their work. Additionally this manual is valuable since there is little or no literature available in the local language.
Papers/Presentations Papers and presentation from the project have been useful in terms of disseminating our research as well as getting valuable feedback from different forums to refine our work.
Dissemination
Workshops Multi-stakeholder workshop 23 June 2003 Dona Paula, Goa
The objective of this meeting was to share with stakeholders the following: The conceptual framework for the development of tools to track health and well-
being in the mining regions The development and testing of environmental and social performance indicators The development of the Quality of Life (QOL) tool. The concept and results of impact accounts for the mineral sector
IDRC Centre File: 101276-001 107
TERI Report no. 2002WR41

Chapter 6: Capacity building and dissemination
Reviving agriculture in the mining areas of Goa: towards an integrated approach 20.January 2006 Ponda, Goa
The objective of this workshop was to disseminate findings on some of the most prevalent hurdles or problems in agriculture in the mining areas and to emphasise the need for a new and more dynamic approach to revive agriculture in the area. In addition to company representatives, the workshop participants included representatives from a range of government departments that play a role in agriculture including the Department of Agriculture, Water Resources, Indian Bureau of Mines, State Pollution Control Board and sub-divisional magistrates who are involved in settling compensation disputes.
Health well-being and sustainability in the mining regions of Goa 17 October 2006 Hotel Nova Goa, Panaji, Goa No. of participants: 43
The objective of this workshop was to disseminate key findings regarding health that have emerged in the course of this study. Representatives from the companies, government, community, doctors from the study area and members of the Institutional Ethics Committee attended this workshop. The dissemination of research findings generated lively discussion on topics including health status of the residents in the mining area, health care services, air pollution, transportation of ore, land remediation and the ESPI tool.
Presentations We have had many external presentations of the project for feedback to various people as listed below:
Noronha L. 2003. Ecosystem approaches to human health and well-being: Illustrations of use in a mining context. Key note presentation at the forum on International Forum on Ecosystem Approaches to Human Health, 18 to 23 May 2003, Montreal, Canada. Dayal V, Datt D, and Murugesan A. 2004. Assessing the impact to health in mining regions: ecosystem and mainstream economic approaches. International Society for Ecological Economics (ISEE) Conference, 11 to 12 July 2004, Montreal, Canada. Cooper S. 2004. Sustainable livelihoods in the mining industry. Presentation made at the Sustainable Livelihoods Workshop, Organized by World Business Council for Sustainable Development (WBCSD) on 20 August 2004, Mumbai, India. D'Souza M. 2004. Women's health in the mining regions of Goa. Presentation made at the International Women's Health Meeting (IWHM), State Level Workshop, on 26 November 2004, Panjim - Goa, India. Cooper S, Mehra Y, and Kazi S. 2004. Beyond curative care: the role of governance as a cross cutting issue determining community health and well-being . Paper presented by Shirin Cooper at parallel sessions on `Transdisciplinary approaches to research for health policy' and as a poster presentation linked to a parallel session on Equity. Global Forum for Health Research, Mexico City, 16 to 18 November 2004.
IDRC Centre File: 101276-001 108
TERI Report no. 2002WR41

Chapter 6: Capacity building and dissemination
Cooper S. 2005. Linking governance and human security: stories from the mining villages of Goa. Presentation made at the National Seminar on Governance and Security Part II, New Delhi, Organized by Delhi Policy Group on 8 June 2005, New Delhi, India. Mehra Y. 2006. Working with stakeholder groups to encourage responsible mining: the TERI experience. Presentation made at the Forum DSDS 2006 - Responsible Mining Side Event, TERI, Habitat Center, New Delhi, Organized by TERI, 2 to 4 February 2006, New Delhi, India. Uma R, Murugesan A, Dayal V, Das S, D'Souza M, Seghal M, Datt D and Mehra Y.
2006. Valuing environmental-health linkages from air pollution in mining regions. Poster presentation made at the Delhi Sustainable Development Summit 2006, Habitat Center, New Delhi, Organized by TERI, 2 to 4 February 2006, New Delhi, India. Cooper S. 2006. An introduction to mining in Goa. Lecture given at the Goa Institute of Management Studies for Goa Civil Services Officers Programme, 5 April 2006, Organized by Goa Institute of Management Studies, Ribandar, Goa, India.
In addition to the presentations detailed above, several presentations have been made for visitors/ reviewers/ stakeholders as follows:
The Ethics Committee Project presentations on a continuous basis for their feedback and comments Dr. Jean Label, Director, Environment and Natural Resource Management (IDRC), June 2003 Project presentations Dr. Rachel Nugent, National Institute of Health, November, 2003 Project presentation followed by field visit Goa Mineral Ore Exporters Association (GMOEA), February 2004 Project presentation IDRC Vice President, Resources, Denys Vermette and Regional Controller, Rana Auditto, December 2004 Project presentations followed by field visit IDRC Board of Governors, March 2005 Project presentations and field visit Dr. Anna Boischio Senior Program Specialist, November 2005 Project presentation followed by field visit Project Peer-Review TERI, New Delhi, February 2006 Presentations on each research component for feed back and comments Dr. Eduardo Mota Professor, Instituto de Saude Coletiva, Universidade Federal da Bahia, May 2006 Project presentation followed by field visits.
IDRC Centre File: 101276-001 109
TERI Report no. 2002WR41

Chapter 6: Capacity building and dissemination
Papers Cooper S, Mehra Y, and Kazi S. 2004. Beyond curative care: The role of governance as a cross cutting issue determining community health and well-being. Paper
presented by Shirin Cooper at parallel sessions on `Transdisciplinary approaches to research for health policy' and as a poster presentation linked to a parallel session on Equity. Global Forum for Health Research, Mexico City, 16 to i8 November 2004. Cooper S. 2005. Linking governance and human security: stories from the mining villages of Goa. Presentation made at the National Seminar on Governance and Security Part 11, New Delhi, 8 June 2005, organized by Delhi Policy Group, New Delhi, India. Ecosystem approaches to human health and well-being: Illustrations of use in a mining context - Ligia Noronha (submitted to Ecohealth) Quality of life in mining regions; reporting from the field- Ligia Noronha and Subrahmanya Nairy (accepted for publication by Economic and Political Weekly (2004)
Abstracts accepted Mehra Y and Cooper S. Trading health for work: A game theoretic model on collective action failure in the mining regions of Goa. Ecological Sustainability and Human Well-Being. Ninth Biennial Conference of the International Society for Ecological Economics (ISEE), 15 - i8 December 20o6, New Delhi, India. Cooper S. (In Preparation). Ecological Sustainability and Human Well-Being. Ninth Biennial Conference of the International Society for Ecological Economics (ISEE), 15 - i8 December 2006, New Delhi, India.
Book chapters Choudri B S and Chachadi A G. 2006. Status of groundwater availability and recharge in the mining watersheds of North Goa; in Multiple Dimensions of Global Environmental Change, pp. 623 - 649, edited by S Sonak, New Delhi, India: TERI Press. 726 pp. Cooper S, Mehra Y, and Joshi A. 2006. Depletion of freshwater in the mining regions of Goa, India: gendered impacts and responses; in Multiple Dimensions of Global Environmental Change, pp. 650 - 673, edited by S Sonak. New Delhi, India: TERI Press. 726 pp.
This project has contributed to building the strength of the research institute as well through tremendous capacity building and experience that has developed within the team. Additionally, through the project a variety of equipment and consumables were purchased as presented below:
IDRC Centre File: 101276-001 110
TERI Report no. 2002WR41

Chapter 6: Capacity building and dissemination
Procurement of equipments and consumables The following equipments and consumables were procured for this study
SKC Make respirable personal air sampler pumps (2 Nos). Model number 224-PCXR 8 SKC make Legand Legacy (air sampler with low and medium flow, suitable for personal and area sampling) - 2 no SKC Make PM1o impactors (4 Nos) Morgan Make Spirometer (1 Nos). Model: 232 pulmonary system Teflon filters 37mm (5oo Nos) 2laptops OHP HP Laser Jet 2300 series Printer Electronic balance Software (LIMDEP) Books and literature relevant to the study
IDRC Centre File: 101276-001 111
TERI Report no. 2002WR41

Chapter 7: Recommendations, impacts and conclusions
Chapter 7: Recommendations, impacts and conclusions
'['his final chapter of the report is organised into three parts. The first section presents a summary of recommendations that have emerged from this study. The second section presents the team's assessment of impacts of the project activities within the mining ecosystem. Finally, the conclusion section presents the teams assessment of the value of the project as a whole.
A Recommendations
This section presents a summary of recommendations that emerge from this study. Recommendations have been organised into three sections. The first deals with management of natural resources and includes recommendations for land, water and air. The second focuses on recommendations that emerge for the health sector and specifically deals with health services and management of data generated through the health service network. The third section includes recommendations regarding capacity building for various stakeholders.
Management of natural resources Land
Agricultural land and farmers Reviving agriculture in the mining belt will require efforts on the part of all three stakeholders, namely companies, government and community. As described earlier, in Chapter 3, agricultural activity occurs within a system that is composed of interlinked components. Over time, these components of agriculture have been impacted by mining activities and have collapsed, making it necessary to simultaneously begin and continue a variety of initiatives to restart agriculture. This task will require a change in the approach being followed currently, as spelled out below:
Reactive approach Proactive approach Various government departments are involved in regulating agriculture as well as the mining industry. In the case of industry regulation, the departments tend to respond only after a problem has emerged. There is no proactive monitoring or support extended to companies to ensure their compliance with the law. Similarly, Agriculture and Water Resources departments tend to respond or intervene only when farmers complain. Despite knowing the impacts of mining, there are few if any, preventive measures taken or proactive assistance offered to farmers. These departments need to move from reacting to issues to responding proactively and taking a lead in planning and working with farmers and companies for better agriculture related outcomes.
IDRC Centre File: 101276-001 112
TERI Report no. 2002WR41
Chapter 7: Recommendations, impacts and conclusions
In a similar vein companies need to take better environmental measures proactively rather than waiting for pressure from the community.
Piecemeal approach Watershed approach One of the most important conclusions from this research is the need for a watershed approach to reviving agriculture. It is clear that the practice of agriculture is a systemic whole composed of many parts that are interrelated and interdependent. In Goa, several overburden dumps are spread across the mining belt. The impact of erosion from these dumps is not limited only to adjacent areas but is felt in the lower reaches of the watersheds in which the dumps are located. Thus, planning for regeneration needs to done at the watershed or micro-watershed level. This would include:
o Intensive dump management of all dumps within the micro-watershed o Desilting of water bodies from the upper reaches to the bottom of the micro-
watershed and treatment of the drainage network to minimise transport of silt (eg. lose boulder check dams)
o Desilting of fields and/or application soil amendments
Independent (top down) planning Participatory (bottom up) planning Government departments and mining companies alike, need to plan watershed activities mentioned above with the local community. Farmers usually have a detailed understanding of the land and water in their areas and can contribute significantly and effectively to any discussion on land management. Importantly, farmers need to have some sense of ownership over initiatives taken in their interest for these initiatives to work and be sustainable.
Individual responses Integrated response Currently, government departments involved in agriculture have little, if any, communication with each other. For example, Agriculture and Water Resource officers are well placed to identify dumps that are poorly maintained, but there is no interaction or feedback mechanism in place between them and regulatory authorities such as the IBM or SPCB. Similarly, there is very little coordination between Agriculture and Water Resources departments, despite the intimate connection between land and water in the context of agriculture. To have better outcomes these departments need to plan for action in coordination with each other.
Compensation for land degradation Currently, small amounts of compensation are paid for crop loss and for de-silting of land to farmers that approach companies. While this system has served as a disincentive to farmers to continue farming, it has not served as an incentive for better dump management. The true cost of poor dump management needs to include not only the losses from decreased agricultural yields but also the cost of land degradation. We recommend compensation for land degradation as necessary because it will capture more accurately the loss born by farmers and it will force companies to spend more on environmental management and deter environmentally damaging practices.
IDRC Centre File: 101276-001 113
TERI Report no. 2002WR41

Chapter 7: Recommendations, impacts and conclusions
Additionally, the Department of Agriculture should play a greater role in monitoring compensation payments since there is no government authority monitoring these compensations unless the amount is disputed.
Metal uptake in fruit crops We have seen that cashew samples in the study showed significant positive relationship between metals in the soil system and in the plant system. On the other hand, mango samples did not show any relationship between the metals in the soil system and in the plant system. One of the main limitations of this study was the lack of sufficient fruit bearing trees growing on dumps because of which a sufficiently large number of samples were not available. As a result no generalisations can be made for the study area. However, since more than 40 plants show a statistically significant relationship between metal content in the soil and that in the plant system, there is a need to identify plants/trees that accumulate metals. Thus, detailed studies on a pilot basis are required to explore the possibility of metal uptake, if any, by the specific plants from the soil systems.
Water Mining activities have had an impact on ground water bodies in the study area. To better address the impacts of mining on ground water resources, the following are recommended:
Ground water management More studies and more data generated on groundwater in the mining areas, both from an anthropocentric and an ecological point of view. Legislation on groundwater provides the authority to restrict groundwater withdrawals in ways that threaten drinking water sources and in watershed considered critical or overexploited. If a mining watershed is deemed critical it is not clear how this legislation will take affect without stoppage of mining activities. This issue needs to be addressed frontally leading to a clear policy. More data sharing regarding ground water and collaboration between departments in order to tackle this issue, specifically the Indian Bureau of Mines and the Department of Water Resources.
Alternative water supply In wards where alternative water supply is very poor or where tankers are the only source of water, more localised solutions need to be sought and invested in, such as rainwater harvesting. Water removed from mine pits could be treated and supplied to local communities. The suitability of abandoned or exhausted pits as water storage sites could be evaluated. More power and funding to Panchayats to address water supply problems at the local level Clear policy on action against landlords that prevent people's access to basic necessities like water
IDRC Centre File: 101276-001 114 TERI Report no. 2002WR41

Chapter 7: Recommendations, impacts and conclusions
Air In addressing air quality issues in the mining areas, we asked why, despite an extensive regulatory structure, air problem continued to persist. One of the major conclusions from this study was that the political-economy around mining and transportation and handling of ore created strong incentives to break existing laws. The deterrents to prevent illegal behaviour though, were weak. To effectively address this problem a holistic approach is required where all agents associated with transportation and handling of ore, namely government agencies, mining companies, financial institutions and truck owners, simultaneously act in order to mitigate the problem. Piece-meal and ad-hoc decisions will be insufficient and eventually ineffective. The following is recommended:
Mining companies A policy to stop overloading of trucks: Since trucks carrying ore are loaded within the mine, and since companies pay truck operators based on the tonnage carried, it is possible for mining companies to monitor the amount of ore loaded onto trucks. Mining companies need to formulate a "no-overloading" policy and ensure that it is adhered to by each of the trucks working for them. Such a proactive approach by companies will help reduce the pressure on air quality. Revision of transportation rates: It is clear from the research that at the current transportation rates paid by mining companies it is possible to break even only by overloading, which is the primary cause of air pollution and a breach of the law. Therefore, mining companies need to keep the ten-tonne limit in mind while calculating transportation rates, ensuring that it is possible to make profits while staying within the legally permissible loading limits.
Government Better enforcement of the law: Government agencies have a role in addressing the problem by better enforcement of the existing laws (related to better transport and handling practices and air quality control, monitoring and mitigation) Reviewing the penalty structure for overloading of trucks: As it exists, the penalty does not act as a strong enough deterrent on two accounts; firstly, the likelihood of being penalised is low and therefore the existence of the penalty is not a deterrent; secondly, the penalty structure is such that it encourages breaking the law with impunity providing incentives for truck operators to factor the penalty into costs and continue breaking the law. If transportation rates are raised but the fine structure remains unchanged, there will be a stronger incentive to break the law. Consequently, the structure of the fine needs to be revisited and revised upwards so as to make it a
strong deterrent to legal violations and compliment other measures taken to regulate air quality. Regular monitoring and compilation of air quality data: While data on air quality within the mine lease exists, it is not in the public domain. Data on air quality outside the lease area, especially in road corridors, has historically not been generated. Only with the existence of regularly collect air quality data is it possible to regulate air pollution. We recommend regular monitoring and compilation of air quality data in mining regions, especially in high stress areas like road corridors, loading-unloading docks along rivers and settlements close to mines.
IDRC Centre File: 101276-001 115
TERI Report no. 2002WR41

Chapter 7: Recommendations, impacts and conclusions
Financial institutions and banks Responsible lending: Lending for purchase of trucks has gained tremendous popularity in the recent past and there is great demand as well as supply for such loans. Financial agencies like banks that evaluate the profitability of the business, need to ensure that their profitability evaluation and terms of the loan provide, do not encourage breaking the law. Thus, while calculating profitability, a ten-tonne load per trip should be taken into account and not more.
Health Health care services
This component of the study focused on an assessment of health care services in the study area. As communities in the mining regions face a variety of environmental stressors (especially poor air quality) that have an impact on health, the availability of health care services in the region play a crucial role in improving health outcomes in the mining areas. The following recommendations are based on the assessment of health care services taken up in the study area.
An increased number of doctors (including specialists where needed) and paramedical staff are required in the mining region. Sub-centres need to be staffed with the prescribed two multipurpose health workers (MPI-IW) so that when one is out making home visits the centre can remain open. Additionally, the MPHWs need to cover a greater number of homes in order to improve preventive care in the region. The number of sub-centres in mining areas (specifically Bicholim /Sanquelim) needs to be increased in order to serve the population adequately. The use of mobile medical vans equipped with basic facilities could be considered in this context. Similarly, mobile vans could also be considered for parts of Cluster III that are remotely located and far from existing facilities. Some of the health care facilities in the mining regions need upgraded medical equipment such as basic operating instruments, X-ray machines, Pulmonary function tests equipment, echo cardiogram equipment, laproscopy etc. Additionally, staff qualified to use this equipment as well as analyse results need to be available. The public health care system could include more public outreach programmes that provide preventive care such as health camps for early detection of illnesses. This can be done in conjunction with local NGOs and private health care facilities. The community should be better informed about services available in the mining regions, including days of the week and timings of specific activities. Information on health care facilities and the services provided through the referral system should be available to users.
IDRC Centre File: 101276-001 116 TERI Report no. 2002WR41

Chapter 7: Recommendations, impacts and conclusions
Data management Research into data management in the health care system highlights the need for robust data on health status in order to track changes in health and respond effectively to health needs. The recommendations regarding health data management are presented below.
Implementation level A variety of measures can be taken to improve functioning of the current system of data collection and management including the following:
Assignment of data recording responsibility on particular staff members who are well trained to do the job Use of a computerised system to facilitate easy compilation and analysis Provision of a feedback based on data analysis to regional health centres in order to ensure that health centres can respond appropriately to health needs of the community. This feed back will also elicit better compliance from staff working at the lower levels because they will know the value of the data. Development of a system to ensure reporting from all health centres each month and to ensure proper data collection and compilation Provisions requiring all private health facilities to provide morbidity data Provision for filling of vacant posts related to data management
Policy level At a policy level there needs to be some introspection on the current structure and function of data management in the state. A variety of issues merit consideration including the following:
The purpose of general morbidity data gathering and the use of data generated through the system The need for more data analysis The need for identification of links between health status and environmental stressors such as mining Working in conjunction with other state government departments, such as the pollution control board to address environmental health issues The need for a state health policy that recognises the impact of environmental stressors on human health and recognises that these areas facing environmental stress may have special health care needs which need to be catered to.
Capacity building This study has highlighted the need for capacity building within the local community and for government.
Local community In order to ensure that local people have enough knowledge and awareness to contribute to decision making in a mining context. We recommend further capacity building for the following three groups of people:
IDRC Centre File: 101276-001 117
TERI Report no. 2002WR41
Chapter 7: Recommendations, impacts and conclusions
Farmers groups There are currently several farmers groups that limit their activities to collecting compensation from mining companies. In order to make these groups more effective and harness their power to bring about change/ revive agriculture these farmers groups need further capacity building that focuses on the following:
Leadership skills Working in groups (group discipline, conflict resolution, group structure and functions etc.) Vision building and planning for agriculture (including experimentation with different crop varieties) Introspection about compensation (current pattern followed) and long-term thinking regarding degradation of a natural asset Developing an understanding of the government support system and linking with these agents Mobilising funds Dealing with mining companies Linking with markets
Micro-credit (Self -help groups) Much like farmers groups, micro-credit groups also need capacity building in the initial stages. While several NGOs have been involved in forming new groups in the study area, very few of them have provided any training to group members following the initial set-up stage. Here we feel that to ensure the sustainability of the micro-credit/ self-help movement in the study area groups need to have ongoing training (group strengthening) and support over the initial two years.
We also recommend that Self-help groups be oriented towards more than just income generating activities and providing credit to members. Self-help groups have tremendous potential to be agents of change and a source of empowerment for women. To actually realise this potential groups need to be oriented towards taking up a variety of activities other than collecting money and giving loans.
Government Local Government (Panchayats) The governance component has highlighted the fact that local communities look to their Panchayats for solutions to a variety of problems that have emerged in the mining areas. On going training and capacity building programmes for elected representatives are recommended in order to ensure that they can perform their jobs more effectively. This would include general training on the following:
Familiarisation with relevant legislation Leadership Participatory development Gender sensitisation
IDRC Centre File: 101276-001 118
TERI Report no. 2002WR41

Chapter 7: Recommendations, impacts and conclusions
Additionally, programmes that are related to tackling specific problems in the mining areas are also recommended.
State Government Department representatives Through interaction with state government representatives the research team has identified some issues that could be taken up for further capacity building:
Further training to use the ESPI indicator tool Further sensitisation to community needs in the area
IDRC Centre File: 101276-001 119
TERI Report no. 2002WR41

Chapter 7: Recommendations, impacts and conclusions
B Impacts of the project
This section highlights the impacts our project has had on the mining ecosystem. Across
three phases of research this project has created opportunities for the research team to interact with all three stakeholders, namely companies, government and local communities. This interaction has taken place through qualitative research methods such as interviews, participatory rural appraisal exercises and group discussions and extensively through capacity building work. Additionally, efforts have been made in each phase of the research to disseminate information about the project and the key findings through multi-stakeholder workshops. Over time this has undoubtedly had an impact on the stakeholders involved. It is important to mention here that we recognize that an ecosystem is a complex system where several factors, agents and incidents influence outcomes and that our effort at creating sustainability in the mining ecosystem is but one such force of change amongst several.
While we cannot claim to be the sole reason for changes in the behaviour of people, attitudes and outcomes, we can confidently say that the project has influenced the direction of change
taking place in the study area.
Importantly, TERI has taken up other projects in the mining areas which helped us build networks between different groups of people. This has played a significant role in extending the reach of this project and helping create sustainable impacts. Through examples we
attempt to discuss the reach and impact our project has had.
Empowerment at the local level Several incidents and events at the local level involving community members we have worked with indicate greater level of empowerment and control. For example, two self-help groups (in the same village) we have engaged with over the course of the project, called a meeting and invited their local elected representatives to the meeting. At this meeting they demanded to know why they had no tap water supply and requested their Pancha to look into the matter.
Similarly, a farmers group we have worked with got together to stop construction of a bridge as they felt it would interfere with the drainage network supplying water to their fields. At one of the Women's Gram Sabha programmes' recently conducted women discussed the lack of health care facilities near their village. By the end of the meeting they had drafted a letter asking their Panchayat to approach higher authorities regarding this matter. Additionally, a few days later, 18 of these women got together, hired a mini-van and went to their village assembly at the Panchayat for the first time.
In terms of empowerment we have specifically noticed the following: Increased confidence among women and farmers regarding their ability to address issues of concern to themselves Better understanding of how to move government machinery for redress More faith in the government mechanism
The main objective of having women's Gram Sabha meetings a few days before the actual village Gram Sabha is to encourage women to attend their village assembly.
IDRC Centre File: 101276-001 120
TERI Report no. 2002WR41

Chapter 7: Recommendations, impacts and conclusions
Awareness about the need for networking and dialogue with government officials and other civil society members with similar experiences
We acknowledge that these are small victories, however, collectively they point to a change in attitude and a sense empowerment at the local level.
Better attitude towards problems in the region and towards other stakeholders Through regular interactions with mining companies we have noticed a change in their attitude towards discussing the impacts of mining. They are more open to acknowledging problems and are much more willing to engage with the community to solve these problems. An example of this is the farmers visit to the mine dumps. Five companies provided a tour of their dumps to a small group of farmers accompanied by TERI researchers. This served as a trust building exercise for both stakeholders.
Discussion and dialogue Various formal and informal meetings and workshops held through this project have provided opportunities for discussion and dialogue. This is especially important for government departments as they usually work in isolation and have very formal interactions with one another. Through our project, we helped create forums where different government departments and officials could interact with another in informal settings where they could freely express their apprehensions and concerns.
Another important contribution of the project in this regard has been to bring community perceptions and perspectives on various topics ranging from agriculture, health, livelihood issues etc to the mining companies. For example, mining companies feel that all farmers are not interested in agriculture and would rather have mining or related jobs. Through our research we have tried to explore this stereotype and determine to what extent this is true. We found that while there were a number of farmers who were not too keen on farming, there were as many who would prefer to continue with agriculture if it were possible. Having understood how poorly managed dumps impact the entire agricultural system and how this makes continuing agriculture in the face of poor dump management practices a losing battle, we have been able to share our insights and community perspectives with companies, who are then in a better position to make decisions regarding supporting agriculture, compensation etc.
Increased exposure to new ideas By including company, government and other NGO representatives in exposure visits and capacity building programmes the project has helped to build knowledge and innovative thinking that is useful to stake holders.
Recognising that the Minerals Foundation (MF - an industry funded foundation) and local government departments will have a continuous presence in the mining areas, we felt it was important to include them in the various components of our project. We ensured they accompanied us for the various exposure visits, both within and outside of Goa. They were also a part of the Social Analysis Systems workshop, where they learnt various social analysis techniques.
IDRC Centre File: 101276-001 121
TERI Report no. 2002WR41

Chapter 7: Recommendations, impacts and conclusions
C Conclusions
In the following concluding remarks we present the teams assessment of this project.
The principles of the Ecohealth approach and the focus on simultaneously exploring the links between several domains within an ecosystem have guided this study through three phases.
This approach has provided the space required to understand the breadth of issues that determine well-being.
Phase III, including components on health, land, gender and governance, has highlighted some of the failures in terms of natural resource management in the study area. This has
emerged very clearly in the context of air quality, land quality and water quantity. Studies
have also shown how the impacts of natural resources have affected health and well-being of the community in terms of bio-medical health, livelihood opportunities and access to basic
needs.
While mining has contributed to economic growth in the region through the creation of employment for a large percentage of the population, it has also led to a loss of employment opportunity in other sectors (agriculture). Left with a degraded natural resource base and without adequate skills to diversify into non-traditional activities, the local community has
been pushed towards a strong dependence on mining for employment. As a result the community is more willing to trade off their health and well-being for work/income. Studies also show that women bear a large proportion of these negative impacts. Their gender roles have confined women to the home and the farmstead making them more dependent on
natural resources and therefore more vulnerable to changes in nature. Simultaneously, their gender roles prevent women from actively participating in civic life, curtailing their ability to respond to changes that profoundly affect their lives.
The governance component of this study has characterised the roles of each of the key stakeholders, namely companies, communities and government, in responding to environmental and social changes in the region. It highlights the need for improved decision making that is based on a better understanding of changes in the region. The lack of information/ data emerging from the region and the community's inability to access what is
available has led to limited and unsustainable responses.
Collectively, these findings have only underlined the need for the tools developed in Phase II to track sustainability and well-being in mining regions. The third phase of research has also focused on refining the three tools, namely Environmental and social performance indicators (ESPI), the Quality of life (QoL) survey and Impact adjusted income accounts. While these tools are meant to support decision making for companies and government, the capacity building programmes undertaken in this project mark the beginning of a process of empowerment within the local community. The capacity building work has focused on helping community members to respond more effectively to changes in their environment and to have more control over their health and well-being.
IDRC Centre File: 101276-001 122
TERI Report no. 2002WR41

Chapter 7: Recommendations, impacts and conclusions
As the demand for metals grows globally to keep pace with expanding economies the mining industry in India is likely to expand over the next decade. In this context, the use of the three tools intended to track health, well-being and sustainability will help temper or balance expectations of high economic growth through a better understanding of well-being. In the Goan context, dissemination of research findings emerging from the study has put valuable information regarding the impacts of mining into the public domain pushing stakeholders to engage with these issues.
This project has generated valuable data on the links between air pollution and respiratory health and on the economic costs of respiratory ill-health in the study area. The research methodology and analysis for these components has taken a bulk of the 3.5 year project period. As these findings have just been disseminated and further dissemination work is required the impact of these findings will emerge over time.
IDRC Centre File: 101276-001 123
TERI Report no. 2002WR41

Chapter 7: Recommendations, impacts and conclusions
References
Abrahams P W. 2002 Soils: their implications to human health The Science of The Total Environment 291 (1-3): 1-32
Alfaro- Moreno E, Martinez L, Gracia- Cuellar C, Bonner J C, Murray C, Rosas I, Rosales S P
L and Osornio- Vargas A R. 2002 Biologic effects induced in vitro by PMI. from three different zones of Mexico city Environmental Health Perspectives 110 (7): 715- 723
Alvarez E, Fernandez Marcos M L, Vaamonde C, and Fernandez-Sanjurjo M J. 2003 Heavy metals in the dump of an abandoned mine in Galicia (NW Spain) and in the spontaneously occurring vegetation The Science of The Total Environment 313 (1-3): 185-197
Anand M.1997 Polluting industries, environment and workers health: a case for intervention Economic Political Weekly 34: L37 - 55
Asthana A. 2003 Decentralisation and supply efficiency: the case of rural water supply in central India The Journal of Development Studies 39 (4): 148 - 159
Baker A J M. 1981
Accumulators and excluders - strategies in the response of plants to heavy metals J. Plant Nutr. 3: 643 - 654
Baker A J M and Walker P L. 199o Ecophysiology of metal uptake by tolerant plants In Heavy Metal Tolerance in Plants: Evolutionary Aspects, pp.155 -177, edited by A J Shaw Boca Raton: CRC Press
Banerjee K, Banerjee R, Sen A, Mukhopadhyay S, Sen A C, Singh D and Mandal B. 2003 Damodar river pollution and health hazards Journal Indian Medical Association 101 (2): 105 - 134
Banerjee P K and Ramgachari G. 1995 A Status Report on Environmental Management in the Iron Ore Mining Sector [Proceedings of the First World Mining Environment Congress, New Delhi, organized by Central Mining Research Institute, New Delhi]
IDRC Centre File: 101276-001 124
TERI Report no. 2002WR41

Chapter 7: Recommendations, impacts and conclusions
Banerjee S P.199o Level of Air Pollution and its Effect on the Health of the Workers and General Population in Lodna- Bagdali- Bararee Fire Area in Jharia Coalfield [Final technical report of ERC project, Dhanbad]
Baranwal A K and Singh S C. 2003 Acute iron poisoning: management guidelines Indian Paediatrics 40: 534 - 556
Barman S C, Kisku G C, and Lal S K. 1994 Accumulation of heavy metals in soil and cultivated vegetables and weeds grown in industrially polluted fields Journal of Environmental Biology 20 (1): 15-18
Barman et al. 1999 Accumulation of heavy metals in vegetables, pulse and wheat grown in fly ash amended soil Journal of Environmental Biology 52: 106-125
Barrett J R. 2000 A sensitive child Environmental Health Perspectives 1o8 (6): 35-59
Batalha J R F, Saldila P H N, Clarke R W, Lawrence J, Murthy G G K, Koutrakis P and Godlesk J I. 2003 Concentrated ambient air particles induce vasoconstriction of small pulmonary artery in rats Environmental Health Perspectives 35 (7): 1191-1207
Bhatia R S. 2001 Diseases of small airways of lung Journal Indian Academy of Clinical Medicine 2 (3): 222 - 254
Black J and Zenel J. 2003 Child abuse by intentional iron poisoning presenting as shock and persistent acidosis Pediatrics 111(1): 197-199
Boy E, Bruce N, and Delgado H. 2002 Birth weight and exposure to kitchen wood smoke during pregnancy in rural Gautemala Environmental Health Perspectives 110 (1): 35-50
Brunnee J and Toope S. 1997 Environmental security and freshwater resources: ecosystem regime building The American Journal of International Law 91 (1): 26-59
IDRC Centre File: 101276-001 125
TERI Report no. 2002WR41

Chapter 7: Recommendations, impacts and conclusions
Campbell P G C, Hontela A, Rasmussen J B, Giguere A, Gravel A, Kraemer L, Kovesces J,
Lacroix A, Levesque H, and Sherwood G. 2003 Differentiating between direct (physiological) and food chain mediated (bioenergetic) effects
on fish in metal-impacted lakes Human and Ecological Risk Assessment 9 (4): 847-866
Churg A and Wright J L. 2002 Airway wall remodeling induced by occupational mineral dusts and air pollutant particles CHEST 122 (6): 3o6S-309S (18 ref) (Suppl)
Churg A, Brauer M, Avila-Casado M D C, Fortoul T I and Wright J L. 2003 Chronic exposure to high levels of particulate air pollution and small airway remodeling Environmental Health Perspectives 111 (5): 678 - 690
Churg A, Brauer M, Carmen M D, Casado A, Fortoul T J and Wright J L. 2003 Chronic exposure to high levels of particulate air pollution and small airway remodeling Environmental Health Perspectives 111 (5): 69-81
Cifuentes E. 2002 Particulate matter - particular concern Environmental Health Perspectives 110 (8): 833-839
Coffey R M, Ball J K, Johantgen M, Elixhauser A, Purcell P, and Andrews R. 1997 The case for national health data standards Health Affairs 16 (5): 58-72
Cohen A J and Pope III C A. 1995 Lung cancer and air pollution Environmental Health Perspectives 130 (8): 213 - 234
Coye M J and Bernstein W S. 2003 Improving America's health care system by investing in information technology Health Affairs 22 (4): 56-58
Department of Environmental Quality. 2003 Air quality: Health and Air Pollution <www.de(istatead.us )oliciesnolicies.htm> [Accessed on 13-10-2003]
de Souza P R. 2002 Decentralisation and local government: The "Second Wind" of democracy in India In India's Living Constitution: Ideas, Practices, Controversies, edited by Z Hasan et. al. New Delhi: Permanent Black.
IDRC Centre File: 101276-001 126 TERI Report no. 2002WR41

Chapter 7: Recommendations, impacts and conclusions
de Souza P R. 2003 The struggle for local government: Indian democracy's new phases
Publius 33 (4): 99-118
Desvousges, William H, Johnson F R, and Banzhaf H S. 1998 Environmental Policy Analysis with Limited Information: Principles and Applications of the Transfer Method. UK: Edward Elgar
DSE. 2001
Governance and health: In depth paper [Online] Deutsche Stiftung fur Internationale Entwicklung Available at: http://www.dse.de/zg/gg/html/english/4 indepthpaper 1.htm Last accessed: 27 August 2004
Dutta IRA and Mookerjee A. 1980 Heavy metal pollution in grass, soil around factory in West Bengal Journal of Environmental Health 22 (03): 220-230
Ebbs S D and Kochian LV. 1998 Phytoextraction of zinc by oat (Avena sativa), barley (Hordeum vulgare), and Indian mustard (Brassicajuncea) Environ. Sci. Technol. 32 (6): 802-806
Ebbs S D, Lasat M M, Brady D J, Cornish J, Gordon R, and Kochian LV. 1997 Phytoextraction of cadmium and zinc from a contaminated soil J. Environ. Qual. 6: 1424-1430
El-Fouly M M, Nofal 0 A, and Mobarak Z M. 2001 Effects of soil treatment with iron, manganese and zinc on growth and micronutrient uptake of sunflower plants grown in high-pH soil J. Agronomy & Crop Science 186: 245 - 251
Eriksson J E. 1990 A field study on factors influencing Cd levels in soils and in grain of oats and winter wheat Journal of Water, Air and Soil Pollution 53: 69-81
Ernst W H 0, Verkleij J A C, and Schat H. 1992 Metal tolerance in plants Acta Bot.Neerl. 41: 229-248
European Environment Agency (EEA). 2003 Europe's environment: the third assessment
Available at: http:/reports.eea.europa.eu environmental assessment report 2003 to/en 'kiev h pt o.pdf
IDRC Centre File: 101276-001 127
TERI Report no. 2002WR41

Chapter 7: Recommendations, impacts and conclusions
Frank R and Tankersley C. 2002 Air pollution and daily mortality: a hypothesis concerning the role of impaired homeostasis Environmental Health Perspectives 110 (1): 62-68
Freeman A M. 1993 The measurement of environmental and resource values: theory and methods. Washington, D C: Resources for the Future
Gardiner R. 2002 Freshwater: A global crisis of water security and basic water provision Environment Series: Towards Earth Summit 2002 Environment Briefing No. 1
[Available at: lit4)1/,/LYAIYe;tUttiStinIMit2OO2.or.L,--/es issues,/ Freshwater/fresliwater.pdt1
Gavett S H, Haykal- Coates N, Highfill J W, Ledbetter A D, Lung Chi Chen, Cohen M D, Harkema J R, Wagner J G and Costa D L. 2002 World trade center fine particulate matter causes respiratory tract hyperresponsiveness in mice Environmental Health Perspectives 77 (7): 56 - 81
Gleick P. 2004 Water Conflict Chronology [Online] [Available at: littp://www.worldwatet,.oi-iz/conflict,liti-n]
Gleick P. 1999
The human right to water Water Policy 1 (5): 87-503 [Available at: http www.pacinst.or re orts/basic water needs/human right to water.pdf]
Government of Goa. 2003 Goa Ground Water Regulation Rules 2003 Goa: Government Printing Press.
Government of Goa. 2002 Goa Ground Water Regulation Act, 2002 Goa: Government Printing Press.
Government of Goa. 2000 Goa Panchayat Raj Act, 1994 (with amendments incorporated till May 2000) Goa: Government Printing Press.
Government of India. 20oia The Air (Prevention and Control of Pollution) Act, 1981, as amended to date In Pollution Control Acts, Rules and Notifications Issued Thereunder, 4th edn, pp. 133 - 170 New Delhi: CPCB.
IDRC Centre File: 101276-001 128 TERI Report no. 2002WR41

Chapter 7: Recommendations, impacts and conclusions
Government of India. 2oo1b Census of India New Delhi
Government of India. 1998
The Motor Vehicle Act [Online] Available from: http://www.geocities.com/bharat x law/mva88.htm [20 September 2004]
Government of India. 1991
District Census Handbook, Census of India-village and town directory New Delhi: Registration of Census
Government of India. 1976 Iron ore mines, Manganese ore mine, Chrome ore mines Labour Welfare Cess (Amendment) Act, 1976
http://labour.nit.in/annrep/annrepo4o.r,/english/Chapter7.pdf Last accessed: October 2006
Government of India. 1952 The Mines Safety Act, 1952 (Act No 35 of 1952, as modified upto 1983) littp://nrcw.nic.in/shared/sublinkima es/172.pdf last accessed: October 2006
Government of India. 1923 Workman Compensation Act, 1923 (Indian Bare Act) http://www.helplinelaw.com/dots/bareact.shtml Last accessed: October 2006
Graeger N. 1996 Environmental security? Journal of Peace Research 33 (1): 109-116.
Greno F. 2000 Mineral development project estimation of physical impacts and monetary valuation for priority impact pathways MERN Research Bulletin and Newsletter 15
UK: Mern
Gurgueira S A, Lawrence J, Coull B, Murthy G G K and Gonzalez- Flecha B. 2002 Rapid increases in the steady-state concentration of reactive oxygen species in the lungs and
heart after particulate air pollution inhalation Environmental Health Perspectives 110 (8): 456 - 478
IDRC Centre File: 101276-001 129
TERI Report no. 2002WR41
Chapter 7: Recommendations, impacts and conclusions
Hall J.1 and Taylor R. 2003 Health for all beyond 2000: the demise of the Alma-Ata Declaration and primary health care
in developing countries Medical Journal of Australia 178: 17-20 http:/Lwww.mja.com.au/`publ c/ ssus/178 of oho o3/ha11o22fm,Qf
I-lamoutene D, Rahimtula A and Payne J. 2000 Iron ore mines leachate potential for oxyradical production Ecotoxicology and Environmental Safety 46 (2): 218-224
I lamra J. 2003 Air pollution: inorganic gases and particulates. Iittp:/;/t icultk taiuuconrne<cc.edu h,unra enviroiincntal toxicologyfevntox ell 1&2.1)I t
[Accessed on 3 Sep. 20031
Harrington W and Portney P R. 1987. Valuing the benefits of health and safety regulation Journal of urban economics 22: 101-112
Ilauser R, Rice T M, Murthy G G K, Wand M P, Lewis D, Bledsoe T and Paulauskis J. 2003 The upper airway response to pollen is enhanced by exposure to combustion particulates: A pilot human experimental challenge study Environmental Health Perspectives 111(4): 473- 486
Health and Welfare Canada. 1992 A Vital Link: Health and the Environment in Canada Ottawa, Ontario: Ministry of Supply and Services
Health Effects Institute (HEI) Perspectives. 2002 Understanding the health effects of components of the particulate matter mix: progress and next steps Boston, USA: Health Effects Institute
Health Intelligence Bureau. 2005 Directory of hospitals in Goa 2005 Goa: Government printing press, Directorate of Health Services, pp24
Health Intelligence Bureau. 2001 Health Profile Goa, 2001 Goa: Government printing press, Directorate of Health Services, pp17
Health Intelligence Bureau. 2000 Citizens Charter for the Directorate of Health Services Goa: Government printing press, Directorate of Health Services, pp31
IDRC Centre File: 101276-001 130
TERI Report no. 2002WR41

Chapter 7: Recommendations, impacts and conclusions
Heedrik D. 1990
Epidemiological studies of the relationship between occupational exposures and chronic non-specific lung disease Neurotoxicology 12 (1): 56 - 89
Hemphill S. 2003 Iron ore mining tied to cancer Environmental Health Perspectives 34 (4): 278 - 300
Itanna F and Coulman B. 2003 Phyto-extraction of copper, iron, manganese, and zinc from environmentally contaminated sites in Ethiopia, with three grass species Communications in Soil Science and Plant Analysis 34 (1 & 2): 111-124
Jenkins W E. 1978 The case of non-decisions In Decision Making: Approaches and Analysis 1985, pp. 318 - 326, edited by A G McGrew and M J Wilson United Kingdom: Manchester University Press.
Jindal S K. 2000 Environment and the lungs In Environmental pollution and health hazards in India, pp.102-118, edited by R Kumar New Delhi: Ashish Publication House. 564 pp.
Jouni J K and Jaakkola K. 2000 It's all in the mix: proving adverse effects of fine and ultrafine PMio Environmental Health Perspectives 61 (5): 591-592
Kumar S and Rao D N. 2001 Valuing benefits of air pollution abatement using health production function: A case study of Panipat thermal power station, India Forth Coming in Environmental & Resource Economics.
Knuiman M W, Divintini M L, Olynk J K, Cullen D J and Bartholomew H C. 2000 Serum ferritin and cardiovascular disease: A 17- year follow- up study in Busselton, Western Australia Environmental Health Perspectives 158 (2): 234 - 267
Label J. 2003 Health: An Ecosystem Approach International Development Research Centre, Ottawa.
Larson B A and Rosen S. 2002. Understanding household demand for indoor air pollution control in developing countries. Social Science and Medicine 55: 571-584
IDRC Centre File: 101276-001 131
TERI Report no. 2002WR41

Chapter 7: Recommendations, impacts and conclusions
Li N, Sioutas C, Clio A, Schmitz D, Misra C, Sempf J, Wang M, Oberley T, Froines J and Nel
A. 2003 Ultrafine particulate pollutants induce oxidative stress and mitochondrial damage
Environmental Health Perspectives 111(4): 65-71
Lippmann M, Frampton M, Schwartz J, Dockery D, Schlesinger R, Koutrakis P, Froines J, Nel A, Finkelstein J, Godleski J, Kaufman J, Koenig J, Larson T, Luchtel D, Sally L J L,
Oberdorster G, Peters A, Sarnat J, Sioutas C, Suh H, Sullivan J, Utell M, Wichmann E and Zelikoff J. 2001 The U.S. Environmental Protection Agency particulate matter health effects research centers
program: a midcourse report of status, progress and plans USA: UNEP/IEPAC TBS Number 2. 63pp.
Lomer M C, Thompson R P and Powell J J. 2002 Fine and ultrafine particles of the diet: influence on the mucosal immune response and association with Crohn's disease
Proceedings of the Nutrition Society 61(1): 123-30
Long C M, Suh H H, Kobzik L, Catalano P J., Yao Yu Ning and Koutrakis P. 2001 A pilot investigation of the relative toxicity of indoor and outcome fine particles: In vitro effects of endotoxin and other particulate properties Environmental Health Perspectives 109 (10)
Magari S R, Hauser R, Schwartz J, Williams P L, Smith T J and Christiani D C.2001 Association of heart rate variability with occupational and environmental exposure to particulate air pollution CIRCULATION 104 (9): 986-991 (14 ref)
Magari S R, Schwartz J, Williams P L, Hauser R, Smith T J and Christiani D C. 2002 The association of particulate air metal concentrations with heart rate variability Environmental Health Perspectives 110 (9): 178 - 210
Mann J K, Tager I B, Lukmann F, Segal M, Quesenbery C P, Lugg M M, Shan J and Eden K V D. 2001 Air pollution and hospital admission for ischemic heart disease in persons with congestive heart failure and arrhythmia Environmental Health Perspectives 45 (7): 1247-1263
Mann J K, Tager I B, Lurmann F, Segal M, Quesenberry C P, Lugg J M M, Shan J and Eeden S K V D. 2002 Air pollution and hospital admissions for ischemia heart disease in persons with congestive heart failure or arrhythmia Environmental Health Perspectives 110 (12): 222-224
IDRC Centre File: 101276-001 132
TERI Report no. 2002WR41

Chapter 7: Recommendations, impacts and conclusions
Ministry of Health and Family Welfare. 2002 Health Policy Website: htt r mohfw.nic.in/np2002.htm Last accessed: 5 December 2005
Mishra V. 1999
Effects of indoor air pollution from biomass combustion and prevalence of asthma in elderly National Family Health Survey of 1998- 9911(5): 71-99
Mitra D K and Dhar B B. 1995 Investigations on respiratory diseases in mining environment [Proceedings of the First World Mining Environment Congress, New Delhi, organized by Central Mining Research Institute, New Delhi]
Morris C C. 2000 Pediatric iron poisonings in the United States South Med J.93: 352-358
Murty M N, Gulati S C, and. Banerjee A. 2003 Hedonic property prices and valuation of benefits from reducing urban air pollution in India Discussion paper no. 61/2003 New Delhi: Institute of Economic Growth
Murty M N, Gulati S C, and. Banerjee A. 2003 Health benefits from urban-air pollution abatement in the Indian subcontinent Discussion paper no. 62/2003 New Delhi: Institute of Economic Growth
Nataro H and Kaper T. 1998 Adding insult to infection: Pollution exacerbates the common cold Environmental Health Perspectives 110 (7): 315-321
Nikula K J, Vallyathan V, Green F H Y and Hahn F F. 2001 Influence of exposure concentration or dose on the distribution of particulate material in rat and human lungs Environmental Health Perspectives 109 (4)
Noronha L. 2000 Environmental Regulation and Enforcement: The Mining Industry in Goa
Unpublished manuscript, TERI, Goa
Nussbaum M and Sen A. 1993 (eds.) The Quality of Life, 2nd edn New Delhi: Oxford University Press
IDRC Centre File: 101276-001 133
TERI Report no. 2002WR41

Chapter 7: Recommendations, impacts and conclusions
OECD. 2005 Health at a Glance: OECD Indicators 2005 ISBN 92-64-01262-1
Olaniya et at. 1998 Heavy metal pollution of agricultural soil and vegetation due to application of Municipal solid waste - a case study Journal of Environmental I[ealth, pp. 22-35
Ong C and Piggott M. 2003 Dust cover ENVIRONMENT: 23 (5): 34 - 56
Ong C and Piggott M. 2003 Sentinel health effects, occupational diagnoses with known environmental exposure as
etiological agents occupationally related unnecessary disease, disability, and untimely death ENVIRONMENT 34 (6): 345 - 367
Ostro B D. 1983 The effects of air pollution on work loss and morbidity ,Journal of Environmental Economics and Management 10: 371-382
Padmath, Srividyas K, Venugopal V, Prasad S and Pandey V L. 2000 Cooking with biofuels: risk factors affecting health impact on rural women Environmental Health Perspectives 100 (2): 156- 178
Park J E and Park K. 1990 Textbook of Preventive and Social Medicine, 12th edn Jabalpur, Madhya Pradesh: Banaridas Bhanot Publishing House. 40- 6oo pp.
Parikh K. and Parikh J. 1997 Accounting and Valuation of Environment (Volumes I and II) Economic and Social Commission for Asia and the Pacific New York: United Nations
Patel S. 2002 Community security versus national security: a case of parallel governance Paper presented at seminar on Environmental Governance and Security: Perspectives from Above and Below Organized by Goa University, TERI-Western Regional Centre, and Konrad Adenauer Foundation, Cidade de Goa, Dona Paula, Goa-India, 7-8 December 2002.
Pearce D. 1996 Economic valuation and health damage from air pollution in the developing world. Energy Policy 24(7): 627-630
IDRC Centre File: 101276-001 134
TERI Report no. 2002WR41

Chapter 7: Recommendations, impacts and conclusions
Pi J. 2002 Proving adverse effects of fine and ultrafine PMio Environmental Health Perspectives 111(7): 1209-1213
Pollard A J, Powell, K D, Harper, F A and Smith J.A C. 2002 The genetic basis of metal hyperaccumulation in plants Critical Reviews in Plant Sciences 21 (6): 539 -566
Pope C A III, Burnett R T, Thun M J, Calle E E, Krewski D, Ito K and Thurston G D. 2002 Lung cancer, cardiopulmonary mortality, and long-term exposure to fine particulate air pollution Journal of Epidemiology and Community Health 287 (9): 1132-1141, (31 ref)
Reeves R D, Baker A J M, and Brooks R R. 1995 Abnormal accumulation of trace metals by plants Mining Environmental Management 3 (3): 4 - 8
Ritz B, Fei Yu, Fruin S, Chapa G, Shaw G M and Harris J A. 2002 Ambient air pollution and risk of birth defects in Southern California American Journal of Epidemiology 155 (1): 17 - 54
Sanders et al. 1987 Zinc, copper and nickel concentrations in soil extracts and crops grown on four soils treated with metal loaded sewage sludges Journal of Environmental Pollution
Saxena S and Dayal V. 1998 Valuing air pollution in India Pacific and Asian journal of Energy 8 (2): 208 Tata Energy Research Institute
Smith K. 2003 Airborne particles of California control valley alter lungs of healthy adult rats Environmental Health Perspectives 111(7): 902-923
Smith K R. 1993 Fuel combustion, air pollution exposure, and health: the situation in developing countries. Annual Review of Energy and Environment 18: 529-566
Sorensen M, Daneshvar B, Hansen M, Dragsted L 0, Hertel 0, Knudsen L and Loft S. 2003 Prenatal PM2.5 exposure and markers of oxidative stress in blood Environmental Health Perspectives 111(2): 26-45
Srikanth R, Kumar C H S, and Khanum A. 1992
Heavy metal content in forage grass grown in urban sewage sludge Journal of Environmental Health 34 (02): 103-107
IDRC Centre File: 101276-001 135
TERI Report no. 2002WR41
Chapter 7: Recommendations, impacts and conclusions
Talib S H, Tayade B 0, Arshad M, Rafeeque A, Mishrikotkar P S and Barjatya P A. 2002 Study of inter-relationship of sinusitis, rhinitis, and bronchial asthma Journal Indian Academy of Clinical Medicine 3 (3): 258- 265
Tertre L A, Medina S, Samoli E, Forsberg B, Michelozzi P, Boumghar A, Vonk J M, Bellini A,
Atkinson R, Ayres J G, Sunyer J, Schwartz J and Katsouyanni K. 2002 Short-term effects of particulate air pollution on cardiovascular diseases in eight European cities Journal of Epidemiology and Community Health 56(10): 773-779 (42 ref)
TERI. 2005 (unpublished) Present status of groundwater recharges and availability in the mining watersheds of North Goa The Energy and Resources Institute, Goa
'I'ERI. 2002 Environmental/social performance indicators (ESPIs) and sustainability markers in minerals development: reporting progress towards improved health and human well-being: Phase II Report submitted to IDRC, Canada.
'I'ERI.199g Environmental/social performance indicators (ESPIs) and sustainability markers in minerals development: reporting progress towards improved health and human well-being: Phase I Report submitted to IDRC, Canada.
TERI 1997 Area wide Environmental Quality Management (AEQM) Plan for the mining belt of Goa State
Goa: Government printing press. 300 pp.
Tiwary R K, Gupta J P, Banerjee N N and Dhar B B. 1995 Impact of coal mining activities on water and human health in the Damodar river basin [Proceedings of the First World Mining Environment Congress, New Delhi, organized by Central Mining Research Institute, New Delhi]
Townsend A and Drakesmith H. 2002 Role of HFE in iron metabolism, hereditary haemochromatosis, anemia of chronic disease, and secondary iron overload The Lancet 359: 145 - 178
IDRC Centre File: 101276-001 136
TERI Report no. 2002WR41
Chapter 7: Recommendations, impacts and conclusions
Tsun- Jen Cheng, Jing- Shiang Hwang, Peng- Yau Wang, Chia- Fang Tsai, Chun-Yen Chen, Sheng- Hsiang Lin and Chang-Chuan Chan. 2003 Effects of concentration ambient particles on heart rate and blood pressure in pulmonary hypertensive rats Environmental Health Perspectives 111(2): 34 - 69
US Environmental Protection Agency. 2000 PM - How Particulate Matter Affects the Way We Live and Breathe
v http://www.gpa.go
UNESCAP. 2004 What is Good Governance? [Online] Available from: http://www.unescap.org/huset/gg/governance.htm [27 August 20041
UNICEF, UNVEP, WHO, 2002 Children in the new millennium: environmental impact of health Geneva: WHO publication ,140 pp. University of Chicago. 2003 Atmosphere <http://tigger.uic.edu/-maqkhan/BIOS448/448 notes 8notes16.html> [Accessed on 7-10-2003]
Vedal S, Brauer M, White R and Pettcao J. 2003 Air pollution and daily mortality in a city with low levels of pollution Environmental Health Perspectives 111(1): 345 - 385
Wellenius G A, Coull B A, Godleski J J, Koutrakis P, Okabe K, Savage S T, Lawrence J E,
Murthy G G K and Verrier R L. 2003 Inhalation of concentrated ambient air particles exacerbates Myocardial Ischemia in conscious dogs Environmental Health Perspectives 111 (4): 17-24
Wennberg J and Gittelson A. 1973 Small area variation in health care delivery: a population-based health information system can guide planning and regulatory decision-making Science 182 (4117): 1102-1108
Weissberg M. 2003 Conceptualizing human security Swords and Ploughshares online 13 (1): 3-11.
[Available at: http://www.american.edu/sis/students/sword/Back Issues/1.pdfJ
World Health Organisation (WHO). 2006 http://,vvww.who.int/whosis/`en/index.html Last accessed on loth October 2006
IORC Centre File: 101276-001 137
TERI Report no. 2002WR41

Chapter 7: Recommendations, impacts and conclusions
World Health Organisation (WHO). 2003 Definition of Health [Online]
ltttta_www w_hc.intalwutlet'nitic>n/end Available from: [28 August 2004]
World Health Organisation (WHO). 1975
Early detection of health impairment in occupational exposure to health hazards Geneva, Switzerland: WHO [Technical Report Series 5711
World Health Organisation (WHO). 1961
Chronic Cor pulomonale: Report of an Expert Committee Geneva, Switzerland: WHO [Technical Report Series, 213]
WHO/UNEP. 1992 Urban Air Pollution in Megacities of the World Oxford: Basil Blackwell, World Health Organization/United Nations Environment Programme, 134PP.
Wolters. 1997
More smoke, less baby: maternal environmental tobacco smoking exposure means low birth weight and preterm delivery Environmental Health Perspectives log (6): 457-461
Yun Chung, Jong Tae Lee, Ho Kim, Eun hee Ha, Schwartz J and Christian D C. 2002 Effects of air pollutants on acute stroke mortality Environmental Health Perspectives 110 (2): 187-204
Zanobetti A, Schwartz J and Gold D. 2000 Are there sensitive subgroups for the effects of airborne particles? Environmental Health Perspectives 108 (9): 841- 863
IDRC Centre File: 101276-001 138 TERI Report no. 2002WR41


Annexures
Annexure A
24-hour PM1o concentration in ambient air ........................................................................2
Reported health problems across clusters ............................................................................3 Structure and functions of public health care services ........................................................4 Economic model of health and air pollution ........................................................................5 Health survey questionnaire
Common household questionnaire .........................................................................10
Specific individual questionnaire ............................................................................15 Recall questionnaire ............................................................................................................22 Health diary .........................................................................................................................23
Annexure B
A Crop preferences through matrix ranking ..............................................................25 B Summary of discussion on costs and benefits ........................................................27 C Metal estimation
Estimation of metal content in soil and biological samples in mg/kg .....28 Estimation of bio-available metals in the soil system in mg/kg ................31
Annexure C
A Governance in the context of air quality in mining areas ......................................33 B Governance case study: Responses to changes in ground water and shortages
of water for household use ......................................................................................47 C Health data management case study ......................................................................66 D Format for communicable diseases ........................................................................73 E Format for non-communicable diseases (general morbidity) data .......................74 F Governance questionnaire ......................................................................................75
Annexure D
Revised QoL tool .................................................................................................................77 Environment and Social Performance Indicators (Companies) ........................................85 Environment and Social Performance Indicators (Government) .....................................89


Annexure A
Annexure A
Contents
24-hour PMI0 concentration in ambient air .............................................................. 2
Reported health problems across clusters .................................................................. 3
Structure and functions of public health care services ............................................... 4
Economic model of health and air pollution ............................................................... 5
Health survey questionnaire
Common household questionnaire .................................................................... 10
Specific individual questionnaire ..................................................................... 15
Recall questionnaire ................................................................................................... 22
Health diary ................................................................................................................. 23
IDRC Centre File: 101276-001 TERI Report no. 2002WR41

Annexure A
24-hour average PM1o concentration in ambient air
Cluster Village PM,o Conc.
I Piligao 205
1 Piligao 256
1 Piligao 184
I Piligao 326
II Pisserlum 144
II Pisserlum 172
II Pisserlum 347
11 Pale 395
II Pale 328
II Surla 534
II Surla 159
III Sanvordem 206
III Sanvordem 362
III Codli 236
Road Corridor Curchorem 436
Control Rivona 71
IDRC Centre File: 101276-001 2
TERI Report no. 2002WR41

Annexure A
Reported health problems across clusters and gender (in percentages)
Cluster I Cluster II Cluster III Corridor Control
Health issues M F T M F T M F T M F T M F T
Headache 35 39 37 39 48 43 31 44 38 20 40 29 29 41 35
Fever 29 30 29 34 28 31 29 34 31 24 29 27 28 35 31
Eye irritation, tears, allergy 24 14 20 24 28 26 25 19 22 18 27 22 18 27 22
Nose irritation, allergy 9 14 11 9 12 10 13 12 12 12 9 11 11 11 11
Cold, sinus 52 62 57 65 63 64 61 60 61 59 56 57 64 66 65
hroat irritation, dry scratchy throat, sore throat 18 18 18 19 24 22 20 23 21 20 19 19 13 26 19
Hoarseness of voice 12 14 13 12 11 12 18 20 19 13 16 14 13 31 22
Skin infection, rashes, boils 7 5 6 6 6 6 13, 8 10 13 , 13 13 17 13 , 15,
Skin irritation, allergy 9 1 5 5 6 6 5 7 6 3 12 7 11 6 9
Respiratory problems 5 1 3 8 10 9 12 8 10 13 16 14 9 9 9
Dust allergy 18 12 15 31 25 28 23 20 21 22 27 24 11 19 15
Dry cough 29 21 25 29 26 27 31 26 29 36 35 36 40 39 40
Cough with phlegm 9 12 10 15 14 15 13 14 13 17 12 14 11 10 10
Shortness of breath 6 5 6 7 9 8 11 10 10 11 12 11 13 12 12
Wheezing 3 4 3 7 10 9 6 8 7 7 10 9 7 10 9
Bronchitis 1 0 1 3 1 2 1 0 0 0 2 1 1 0 1
sthma 0 1 1 3 6 5 2 5 3 1 1 1 4 4 4
B 2 0 1 1 0 0 1 0 0 0 0 0 1 1 1
Heart problems 2 0 1 4 1 3 3 3 3 3 1 2 2 3 3
Chest pain 9 7 8 6 6 6 6 6 6 10 6 8 5 11 8
High blood pressure 2 5 3 7 3 5 7 5 6 9 13 11 4 16 10
Other illness 18, 14 16 22 16 19 21 22 21 21 21 21 27 27 27
M = male, F = female, T = total
IDRC Centre File: 101276-001 3
TERI Report no. 2002WR41
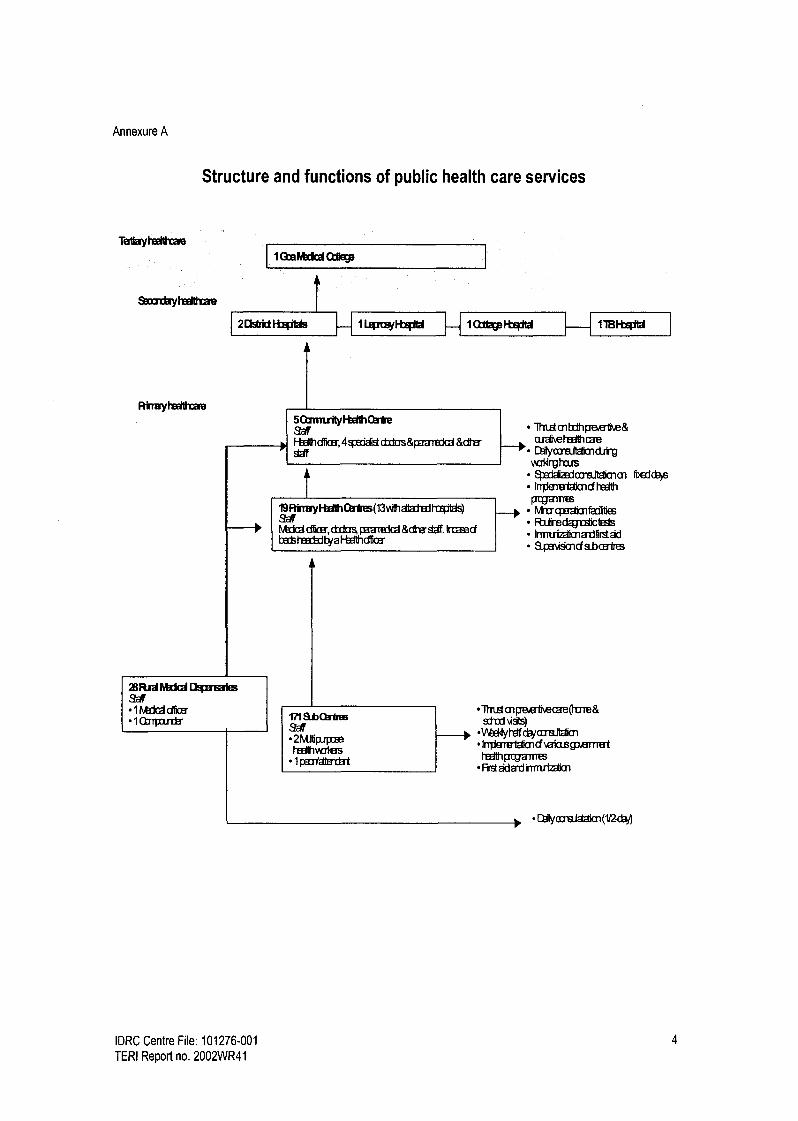
Annexure A
Structure and functions of public health care services
Ta yheel h
st ryheeil m
I (ta Irk QDerp
2DStfldRg3Ws 1 Leowl-bg W 1 Fts? m 11BFt0W
Rkrayhedhae 5QmnrlyF the lm W Fbd hdriaa,4geddistcbos&Wartadd &dha Sw
1
ZRrd Fvkk l UWmaies 9 l htdd dkEr 1 Q7rpatrjjr
Rirr ryFbftO3tm(13vAhatadedhihas)
htdd ddic, d do p3aredd &dhe'sif. Irumd bet ttsscbd by a F-Ih d6oa
171 Sb * aff 2MJtiplpcm hedlhvdas 1 part
1hWcnbdhpee1Ke& ardveheslhrae
r C1alymaltdimd irg vaothaJs
m tcdcts
Irrderetabmdt PajaTffm NtugaAmfa iI P,afrBdagrb1Cte8s Irrmriz3timarifirstad Bpavismcfabaaires
lhnstmMwMcae(hvre& sitd uses)
cbjmBjtahm IrT 1e a1 imdvataspemet
h iMpoganm First adard nM
C>tlyoialam(1f
IDRC Centre File: 101276-001 4
TERI Report no. 2002WR41
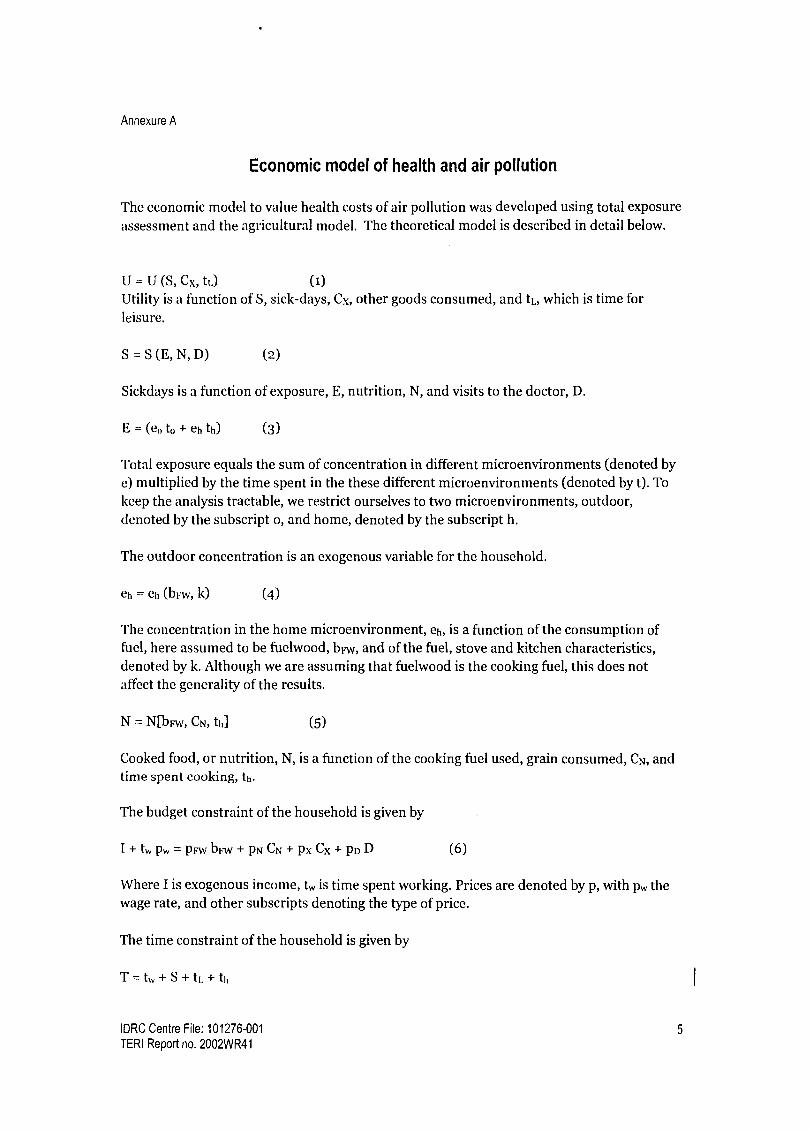
Annexure A
Economic model of health and air pollution
The economic model to value health costs of air pollution was developed using total exposure
assessment and the agricultural model. The theoretical model is described in detail below.
U = U (S, Cx, tL) (1) Utility is a function of S, sick-days, Cx, other goods consumed, and tL, which is time for leisure.
S = S (E, N, D) (2)
Sickdays is a function of exposure, E, nutrition, N, and visits to the doctor, D.
E = (co to + eh th) (3)
Total exposure equals the sum of concentration in different microenvironments (denoted by e) multiplied by the time spent in the these different microenvironments (denoted by t). To keep the analysis tractable, we restrict ourselves to two microenvironments, outdoor, denoted by the subscript o, and home, denoted by the subscript h.
The outdoor concentration is an exogenous variable for the household.
eh = eh (brw, k) (4)
The concentration in the home microenvironment, eh, is a function of the consumption of fuel, here assumed to be fuelwood, bFw, and of the fuel, stove and kitchen characteristics, denoted by k. Although we are assuming that fuelwood is the cooking fuel, this does not affect the generality of the results.
N = N[bFw, CN, th] (5)
Cooked food, or nutrition, N, is a function of the cooking fuel used, grain consumed, CN, and time spent cooking, th.
The budget constraint of the household is given by
I+tWpW=pFwbFW+PNCN+pxCx+pDD (6)
Where I is exogenous income, tW is time spent working. Prices are denoted by p, with pw the wage rate, and other subscripts denoting the type of price.
The time constraint of the household is given by
T=tW+S+tL+th
IDRC Centre File: 101276-001 5
TERI Report no. 2002WR41

Annexure A
Where T denotes total time, tW time working, S is sickdays, L is leisure and h is home. We assume that work is done outdoors, leisure is outdoors, and all time at home is spent cooking. We discuss the implications of relaxing these assumptions after deriving the results using these simplifying assumptions.
After substituting for tW from the time constraint into the budget constraint, we write the Lagrangian as:
J=U[Cx,tL,S(E,N,D)]+X[I+p,,[T-S-tL-th]-pFwbFw-pNCN-pxCx-pDD] (7)
The first order conditions are listed below. aJ _aU+au ase -X pWase°-X.p,t,=0
(8) atL atL as aE ° aE
aJ aU as aU as aN as as ON
= -e +----X pw-e"-. p,,,---kpw=0
at,, as aE h as aN at,, aE aN at"
aJ aU as ae" aU as ON as ae,,
abFW as OE abFw " as ON abFw pw
aE abFw "
as aN P"aNabFw-XPFw=O
aJ aU as aN as ON
aC" as aN aC" P.
aN aC" - P" °
aJ au - =
- X pX =0 (12) acx acX
aJ au as as
a= as a-a Pwa-XP
(9)
In first order condition (8), au
I is the rupee value of utility arising from additional leisure aq
I au as time. ---e is the rupee value of disutility caused by an additional sick day due to an
x as aE °
additional unit of exposure to air pollution. pW is the rupee value of the opportunity cost of
time spent on leisure, time that could be spent working. p,v aE
e° is the opportunity cost of
time due to the additional sickness arising from an additional unit of exposure to outdoor air pollution.
IDRC Centre File: 101276-001 6
TERI Report no. 2002WR41

Annexure A
The indirect utility function can be used to value the health benefits from a reduction in pollution (Harrington and Portney 1987, Freeman 1993). The optimal values for the choice variables tL., ti,, bFw, CN, Cx, D depend on the parameters I, pw, prw, PN, PD, e and k. Thus the indirect utility function can be expressed as V(I, Pw, PFW, PN, P[), e0, k)
The marginal willingness to pay for a reduction in air pollution is:
dt aV/ae,aVlae,, IV
de,, aVla! A. (14)
aV au as aU as
aeo, aS aE tH' + aS of t` - ,V
OE tW - W
0E tL
L -A.PW)(aE) (t,V + t, )
(15)
Our expression for woo differs from that derived by Freeman (1993) only in that it is
multiplied by to (=tW + tL).
The household can adjust its choice variables in such a manner that the marginal gains in terms of benefits from reduced sickness match the marginal costs of adjusting the choice variables. For example, in the case of doctor visits:
(asl3EIty+tL ] (16) -PD (3Sl3D)
we get this expression from equations (13) and (15).
Following Harrington and Portney (1987) and Freeman (1993), we derive an alternative expression for the willingness to pay to avoid outdoor air pollution. To do so, we take the total derivative of the health production function.
dS as aE as aE at* aS aE abFw aS aE ath
de(, aE 3e0 aE 3t 0 3e,, OE abFw aeo aE ath aeo
aS aD * as aN aCN 8S aN abFw as aN at;,
aE 3e0 aN aCN aeo aN abFw aeo ON ath aeo
(17)
In equation (17) we can now move the term aS aE
to one side of the equal sign, and dS/deo 8E aeo
to the other side. Multiplying the equation by the term 1 au
+ p and substituting from X as
W
the first order conditions we get equation (18).
The first order equations can be re-organized as follows. Equation 8b corresponds to the first order condition in equation (8), and so on.
IDRC Centre File: 101276-001 7
TERI Report no. 2002WR41

Annexure A
I
1 au - p,,+(aU/at,)(1/?) (8b) X as +
AV - (aS / aE)e
as +PWl =-P,. aEe"+ ON aN
(9b) x h I'S
I au
)=- aS ae,, aS aN
X aS + P PFw aE abFw t" + aN ab FW
_IaU )=-PN
aS aN
a, as + P v
(aNaCN
x as + PW J
= PN (aD IS) (13b)
(iib)
dS1aUdS aD* atoI au at; W,,°
= P'" deo ? aS de,, + PD ae + P aeo ) ate aeo
abFw at oc ,
+ PI .-W +
ae + PN ae ae
O 0
(18)
Because our health production function has more elements than Harrington and Portney's (1987) or Freeman's (1993), so does the expression for willingness to pay. The top line shows the expressions that are also there in Harrington and Portney (1987), and Freeman (1993)- the lost earnings, direct disutility of sickness, medical expenses, and the averting costs
(which in this model is the costs of adjusting time indoors and outdoors). In addition, there is
the cost of adjusting fuel consumption, and consumption of grain, in the bottom line.
The concentration of air pollution outdoors, e0 is a public good-it is given for a set of households, and they are all affected by outdoor air pollution in the area to which they belong. An improvement in outdoor air quality would lead to total benefits equal to the sum of willingness to pay of individuals in households which live in that area.
Indoor air pollution is a private good-it affects the household alone. Strictly speaking, there is some externality from cooking emissions to neighbouring households, but indoor air pollution is largely a private good. The indoor air exposure is a function of k, which denotes
stove and kitchen design, essentially capturing the conversion of fuel into particulate concentration in the household. We now examine the household's willingness to pay for a
change in k.
Proceeding like we did for outdoor air pollution, we get equation (19).
(lob)
IDRC Centre File: 101276-001 8
TERI Report no. 2002WR41

Annexure A
dS I I)U dS it* 1 III -)t* Wk =/)w-----+/)G +f3 -- n +/)w
(1k X OS A !!
Ok Ok k rtL Ok 7k
+ Pr iv I.`V + PN (l.'N
0k Ok
(19)
Discussion of relaxing some assumptions So far, we have assumed a kind of representative household member. Typically, the household would have adult males and females and children. We can think of a household welfare function with weights on adult male (superscript M), adult female (superscript F),
and children's (superscript C) health (alpha is a weight and S is sickness)
UII -Ull(anlSnfa Fsl ,acsc'tM
L +tL F,
(20)
Typically, the household would behave as though a c > a "' > a F. Since adult females are likely to be doing the cooking, they experience the greater share of exposure to indoor air pollution. So would children. Women would also bear the burden of looking after the sick, a
point we will return to.
We have assumed that the household knows about the effects of air pollution and adjusts its choices accordingly. However, it may underestimate the health effects of indoor air pollution. If decision making is mainly in the hands of men, and women experience the consequences, then the feedback from indoor exposure to decisions about fuel and stoves will be diluted.
We have used a simple function for exposure to keep the analysis tractable. However, we can
think of a more detailed version:
E = toed + tcommecomm + twew + theh + tcookecook (21)
where `comm' stands for commuting and `cook' for cooking. Exposures in the home, eh,
would be influenced by both cooking and by outdoor air pollution. Commuting exposures could be high. So could exposures at the workplace, especially for mining workers.
We have assumed that the household works for a wage, that cooking fuel is bought and that when there is sickness the household would choose to pay for medical expertise. However, the household could carry out production itself, it could gather fuel, and it could use traditional medicine. These actions would have an opportunity cost in terms of time.
IDRC Centre File: 101276-001 9
TERI Report no. 2002WR41

Annexure A
Code: Serial number:
Common Household Questionnaire
Identification information: (to be filled by investigator)
Identification Number: Date: / /
Name of the interviewers:
House Number: Ward:
Village: Taluka:
Time: Start : End:
I. Socio-economic status of the household
i. Are you originally from this village?
(1) Yes -Go to 5 (2) No -Go to 2
2. Which year did you come to this village?
3. Reason for coming to this village:
4. Place of origin:
5a. Religion:
5b. Caste:
6. Type of family (1) Joint (2) Nuclear
7. Size of the household (from the SE table):
8. Number of women in the HH (from the SE table):
9. Total family income per month: Rs
10. Total family expenditure per month: Rs.
II. Housing characteristics
1. Type of house (Observation by the interviewer)
(1) Pucca (2) Semi- pucca (3) Kutcha
2. Floor of residence:
IDRC Centre File: 101276-001 10
TERI Report no. 2002WR41

Annexure A
3a. 'Total number of rooms:
A 'T'otal area of the house: (if they know)
4. Distance from the main road: (meters)
5. Distance from the mine site: (meters)
6. How many windows do you have at your house?
7. Is the house electrified? (1) Yes 0 (2) No
8. What are the other sources of light at home?
(1) Kerosene lamps (2) Gas lights (3) Oil (4) Candles
(5) Others (specify)
9. How do you dispose your solid waste?
(i) Burning (2) Throwing it in open places/river/forests
(3) Manure/compost (4) Open pits panchayat/private
(5) Closed pits (private) (6) Others
to. Do you use coils or incense or any other repellants to ward off insects/ mosquitoes?
(1) Yes 0 (2) No 0
1i. If yes, for how many months in a year do you use it?
III. Kitchen: indoor smoke exposure
i. Who cooks the food in your house?
2. How many meals do you cook in a day?
(1) One (2) Two (3) Three (7
IDRC Centre File: 101276-001 11
TERI Report no. 2002WR41

Annexure A
3. Type of fuel and stove used for cooking and water heating (tick mark in the appropriate column and write the codes for the type of stoves as given below the table)
Type of fuel Purpose Type of stove Cooking Heating Cooking Heating
Wood
Twigs/branches/crop residues Dung cake Kerosene
LPG
Electricity
Biogas (gobar) Any others Types of stoves i.Mud or clay without chimney 2. Mud or clay chula with chimney 3. Three stones 4. Kerosene stove 5. Biogas stove 6. LPG stove 7. Bumba 8.Other (specify)
4. IF LPG/ is in use, since how long are you using this? years
5. How many days does one cylinder last? days
6. Type of kitchen (For indoor cooking/water heating to be observed and tick marked in the appropriate column by the investigator)
Activity Type of kitchen Rainy season Other season
Cooking Separate room inside the house with a door/without a door
Inside the house but not a separate room Separate room/place outside the house
Water heating
Separate room inside the house with a door/without a door
Inside the house but not separate room Separate room lace outside the house
7. How do you cook?
(1) Standing (2) Sitting/bending/kneeling
8. Number of windows in the kitchen:
9. Do you use exhaust fans/chimney in the kitchen?
(1) Yes (2) No
IDRC Centre File: 101276-001 12
TERI Report no. 2002WR41

Annexure A
IV. Health
1. Who pays for your medical expenses?
(t) Employer (2) Self (3) Partly employer
2. If (3) then what is the percentage contribution by the employer?
3. How many members in your family have health insurance?
V. Averting activities
Do you/your HH members avoid walking and disallow children from playing outside due to such pollutants?
(1) Yes (2) No
Has any other activity of the household been changed to avoid dust exposure?
(1) Yes (2) No
3. Do you close the windows or doors of your house to avoid dust?
4.
(t) How many hrs in a day? (2) Which months?
Do you have plants and trees in your garden or compound?
(1) Yes (2) No
5. Any other averting measures used by your HH to avoid dust?
Completely fill in the socio economic table and the specific individual questionnaire for each and every member of the household.
IDRC Centre File: 101276-001 13
TERI Report no. 2002WR41

Annexure A
Socio-economic status of the individuals in the HH.
Ensure that ALL the members of the HH are listed here. Circle the respondent(s) of the common HH questionnaire.
Sl. No
Individual members
Relation to head of HH
Age Sex Marital Status
Education Present occupation
Past occupation (if different from present)
Reason for change in occupation (in case of a change)
Other occupati ons (if any)
If any family members are working abroad, income/month of their remittances
Size of the HH: Number of women/girls in the HH: (count from the
table)
IDRC Centre File: 101276-001 14
TERI Report no. 2002WR41

Annexure A
Code: Serial number:
Specific Individual Questionnaire
Identification information: (to be filled by investigator)
Identification Number: Date:
Name of the Interviewers: House Number: Ward: Village: Taluka: I'inme: Start: End:
Part I:
i. Name of the individual:
2. Number of years staying at this address:
3. Where did you live before this?
4. For how long (years)?
Part II:
1. How often do you travel to school/work/market?
(i) Everyday (2) Alternate day (3) Every week
(4) Once in 15 days (5) Any others
2. How do you usually get to work/school/college? (Tick one or more)
i) 2) 3)
4)
5)
6)
7)
8)
Bus Train
Lorry/truck
Car/Jeep/Van Auto/Tempo Scooter/Motor cycle Bicycle
On foot
3. What are your work/school/college timings?
From to
4. Where is your place of work/study located (address)?
IDRC Centre File: 101276-001 15
TERI Report no. 2002WR41

Annexure A
5. Are you regularly exposed to any kind of irritants such as dust, smoke or fumes at work/study/home?
(1) Yes (2) No
6. Do you work indoors? (1) Yes (2) No
If Yes, where? (Tick the response)
1)
2) 3)
4)
Shop Office Factory (Please specify) Other (Please specify)
7. Do you work outdoors? (1) Yes (2) No
If Yes, where?
8. If you had another job earlier, did you have a similar exposure in your previous job? (Only if applicable) (1) Yes (2) No
9. How much time do you spend in the kitchen?
(1) Actual time cooking hours
(2) Other than cooking hours
10. Do you do exercises? (1) Yes (2) No
11. Smoking status
1) Never smoked 2) Ex-smoker 3) Current smoker
If ex-smoker or current smoker, continue with the following questions
If nonsmoker, go to Part - III
12. What do you or did you smoke? 1) Bidis 2) Cigarettes 3) Hukka 4) Others (please specify)
13. At what age did you start smoking?
14. How many bidis/cigarettes etc do you smoke or used to smoke every day?
Minimum Maximum
15. If ex-smoker, reason for stopping and when stopped:
IDRC Centre File: 101276-001 16
TERI Report no. 2002WR41

Annexure A
Part III: Fill in the clays of sickness for each illness during the past 3 months
Have you suffered from any of the following illnesses?
Yes If Yes, have you suffered from this during the last 3 months
How many days were you sick due to this illness in the last 3 months
t. Headache -v- - 2. Fever
E e irritation, tears, allergy Nose irritation, allergy
5. Cold, sinus 6. 't'hroat irritation,
dry scratchy throat,
sore throat Hoarseness of voice
8. Skin infection, rashes, boils 9. Skin irritation, allergy lo. Respiratory problems ti. Dust /pollen allergy 12. Dry cough t3. Cough with phlegm 14. Shortness of breath j5. Wheezing t6. Bronchitis
17. Asthma
18. 1'13
19. Heart problems 20. Chest pain 21. High blood pressure 22. Any other illness (specify)
Part IV: Questions related to respiratory symptoms
A) Cough
1. Do you frequently get a cough? (Exclude clearing of throat) (1) Yes (2) No
2. Do you usually cough when you get up in the morning? (1) Yes (2) No
3. Do you usually cough at other times during the day or night? (1) Yes (2) No
If "No" to (1,2, or 3), go to "C"
If "Yes" to (1,2 or 3), ask the following questions:
4. Do you cough like this on most days for 3 months or more during the year?
(1) Yes (2) No
IDRC Centre File: 101276-001 17
TERI Report no. 2002WR41

Annexure A
5. In which season do you get cough more often (tick the response):
1) Winter 2) Summer 3) Rains 4) Same in all seasons
B) Phlegm
6. Do you frequently bring up phlegm or sputum from your chest? (1) Yes (2) No
7. Do you usually bring up phlegm or sputum from your chest when you get up in the morning? (1) Yes (2) No
8. Do you usually bring up phlegm or sputum from your chest at other times during the day or night? (1) Yes (2) No
9. Do you usually bring up phlegm or sputum from your chest on most days for as much as 3 months in a year? (1) Yes (2) No
C) Shortness of breath
10. Do you get short of breath when you hurry (walk fast) on level ground or walk up a slight incline? (Distinguish from fatigue) (1) Yes (2) No
11. Do you get short of breath walking with other people of your age on level ground? (1) Yes (2) No
12. Do you have to stop or reduce your pace to catch breath? (1) Yes (2) No If "No" to any of the above, go to "D"
If "Yes" to any of the above, ask the following question:
13. In which season do you get short of breath more often (encircle the response):
1) Winter 2) Summer 3) Rains 4) Same in all seasons 5) Change of seasons
D) Wheezing
14. Do you ever get wheezing of whistling sound in your breathing?
(1) Yes (2) No
If "No" to (14), then go to "E"
If 'es" to (14), please ask the following questions:
IDRC Centre File: 101276-001 18
TERI Report no. 2002WR41

Annexure A
15. Did you ever get wheezing or whistling sound in your breathing?
During the: (tick the response)
i) Last week 2) Last month :3) Last 3 months 4) Last 6 months 5) Last 1 year
16. Does this wheezing or whistling sound occur: (encircle the response)
1) After a "cold"? (1) Yes (2) No
2) After running or severe exercise or intense exertion? (1) Yes (2) No 3) When you are exposed to dust/ smoke/ strong fumes/ smells? (1) Yes (2) No
4) When the weather or season changes? (1) Yes (2) No
17. During the past two years have you had any chest illnesses that have kept you off work, indoors at home or in bed? (1) Yes (2) No
18. Have you ever had or do you currently have any chronic heart or chest disease?
(1) Yes (2) No
(Chronic means disease of long duration)
Part V: Occupational health
t. Does your job involve contact with metals, chemicals, liquids or solvents?
(1) Yes (2) No
2. What are the problems you face at your work place with regard to air, water, noise, humidity, temperature, facilities or any others? (write the kind of problems they face at work, e.g. poor ventilation, unsafe water, loud noise, extreme dryness, heat, cold, poor lighting, poor work space, faulty equipments ect)
3. Are you exposed to allergens like irritants, pollens, mould, droppings, dust mite, pets, wool, cotton? (1) Yes (2) No
4. Do you use safety devices at work like eye goggles, face mask, gas mask, hearing cover, or headgear, if required for your job? (1) Yes (2) No
5. Did you have or are you having any health problems while at work?
If yes, what kind of health problems do you have?
IDRC Centre File: 101276-001 19
TERI Report no. 2002WR41

Annexure A
Part VI: Mitigating activities
1. State individual expenditure incurred towards your medical costs in the last 3 months.
Individual Expenditure Last months 1) Number of visits to the doctor Disease details 2) Expenditure on
a) Doctor's fees b) Pharmacy/medicines c) Diagnostic tests d) Hospitalisation e) Travel f) Any others
Number of days hospitalised Number of days of work lost due to illness Number of days of work lost due to illness of family members
2. Local mitigation measures
2a. Do you undertake any home remedies for respiratory problem?
E.g. herbs, honey, onion juice, dry ginger, tulsi, kashay, gangan, shoonthi, badishee, others
(1) Yes (2) No
3. How much do you spend per month on such measures? Rs.
Part VII: Awareness and averting activities
1. Are you aware that air pollution causes illness? (1) Yes (2) No
2. What are common illnesses that could be caused due to air pollution in your village?
3. Have you/ your family members suffered from any of the above illness during the last one year? (1) Yes (2) No
4. How many dusty months have you experience in your locality in a year? months
5. Do you think air pollution has affected your/ your household members' daily activities? (1) Yes (2) No
6. Do you avoid main roads during peak hours of traffic? (1) Yes (2) No
7. Do avoid exposure to dust have you taken a different route to your work/school/market?
(1) Yes (2) No
IDRC Centre File: 101276-001
TERI Report no. 2002WR41
20

Annexure A
8. Do you use handkerchiefs, duppatta, eye goggles or any protective clothes when you travel though these roads? (t) Yes (2) No
9. Do you stay indoors to avoid such exposure, any loss of workdays due to this?
(t) Yes (2) No
to. What kind of averting measures do you use to avoid dust exposure?
IDRC Centre File: 101276-001 21
TERI Report no. 2002WR41

Recall survey
Household Health Care
1) If you have a health problem where do you go for treatment and why?
1. Private doctor Why?
II. Health centre/ hospital Why?
III. Homeopathy doctor Why?
N. Ayurvedic doctor Why?
V. Others (specify) Why?
2) For which kind of illness do you visit a private doctor/ hospital and why?
3) For which kind of illness do you visit a government health centre/ hospital and why?
4) How do you rate the performance of the health care sector and why? (Refer to rating scale)
Sr. No Sub Centre PHC CHC Dist Hosp GMC Pvt. Doctor
Rating Reason
5) Who is/are your family physicians/ doctors and where is/are the clinics located? i) Name: ii) Place:

Health diary format
Code
House No
Ward
Village
S.n Member Kind of ailment
Date No of days sick
No of work lost
No of visits to doctor
Total medical expense
Additional comments


Annexure B
Annexure B
Contents
A Crop preferences through matrix ranking .............................................................25
B Summary of discussion on costs and benefits .......................................................27
C Metal estimation
Estimation of metal content in soil and biological samples in mg/kg .................28
Estimation of bio-available metals in the soil system in mg/kg ............................31
IDRC Centre File: 101276-001 24 TERI Report no. 2002WR41

Annexure B
A Community crop preferences through matrix ranking
The tables below shows the results of the matrix ranking exercise in each Cluster.
Table B-A.1 Matrix ranking exercise (Cluster I)
Benefit/ha Cashew Man o Sa ota Jackfruit Kokum Tamarind Aonla Teak .---...... _._....... _ ............._--.._.....
g p ....... _............ ---.......... --.._................ ._..__......... _.............. _........ ...... .......... .... .........__.....
Less labour requirement 3 5 5 5 3 3 5 5
Low water requirement 5 5 3 5 5 5 5 5
Higher financial return 5 3 2 4 4 3 5 5
Higher demand for local market 5 4 4 3 4 4 4 5
Higher demand for export market 5 4 1 1 3 2 1 3
Self consumption 5 5 4 4 4 3 2 5
Income tax benefit 1 1 1 1 1 1 1 1
Low occurrence of infestation(disease & pest) 4 4 2 5 5 3 3 5
Total 33 31 22 28 29 21 26 34
Table B-A.2 Matrix ranking exercise (Cluster II)
Benefit/ha Cashew Man o Sa ota Jackfruit Kokum Tamarind Aonla Teak
Traditional
Medicinal
Plants ......__...........- ........... .. ...................._............ ..-
g --..... _..................... _...
p ............ ........._.... _...... __._................... ...._..... ... _............ __........... ........... .................. -............ .........__..........._............. .......... ........_...... .......
Less labour requirement 5 5 3 1 2 3 5 2 5
Low water requirement 4 3 1 5 5 5 5 5 5
Higher financial return 5 4 5 3 3 4 2 5 2
Higher demand for local
market 5 5 5 2 5 3 3 5 3
Higher demand for
export market 5 5 2 2 3 2 2 5 3
Self consumption 2 2 4 5 4 4 4 3 5
Income tax benefit 5 5 5 2 2 2 3 4 1
Low occurrence of
infestation(disease &
pest) 3 3 4 4 5 4 5 5 5
Growth on dump 5 4 2 2 4 4 5 4 3
Total 39 36 31 26 33 31 34 38 32
IDRC Centre File: 101276-001 25
TERI Report no. 2002WR41

Annexure B
Table B-A.3 Matrix ranking exercise (Cluster III)
Benetittha Cashew Mango Sapota Jackfruit Kokum Tamarind Aonla Teak
Less labour requirement 3 5
... ............... _ _ ..............
3 4
.._
4
.....
5
..._.__.._
5
_....
3
Low water requirement 5 5 3 4 5 4 4 4
Higher financial return 5 3 2 3 4 3 5 2
Higher demand for local market 5 4 3 5 3 3 3 2
Higher demand for export market 4 3 1 3 2 1 1 1
Self consumption 5 5 3 5 5 3 4 2
Income tax benefit 5 4 1 1 1 1 1 1
Low occurrence of infestation(disease & pest) 3 3 3 4 4 4 4 4
Growth on Dump 4 4 1 3 4 4 4 3
Total 39 36 20 32 32 28 31 22
IDRC Centre File: 101276-001 26 TERI Report no. 2002WR41
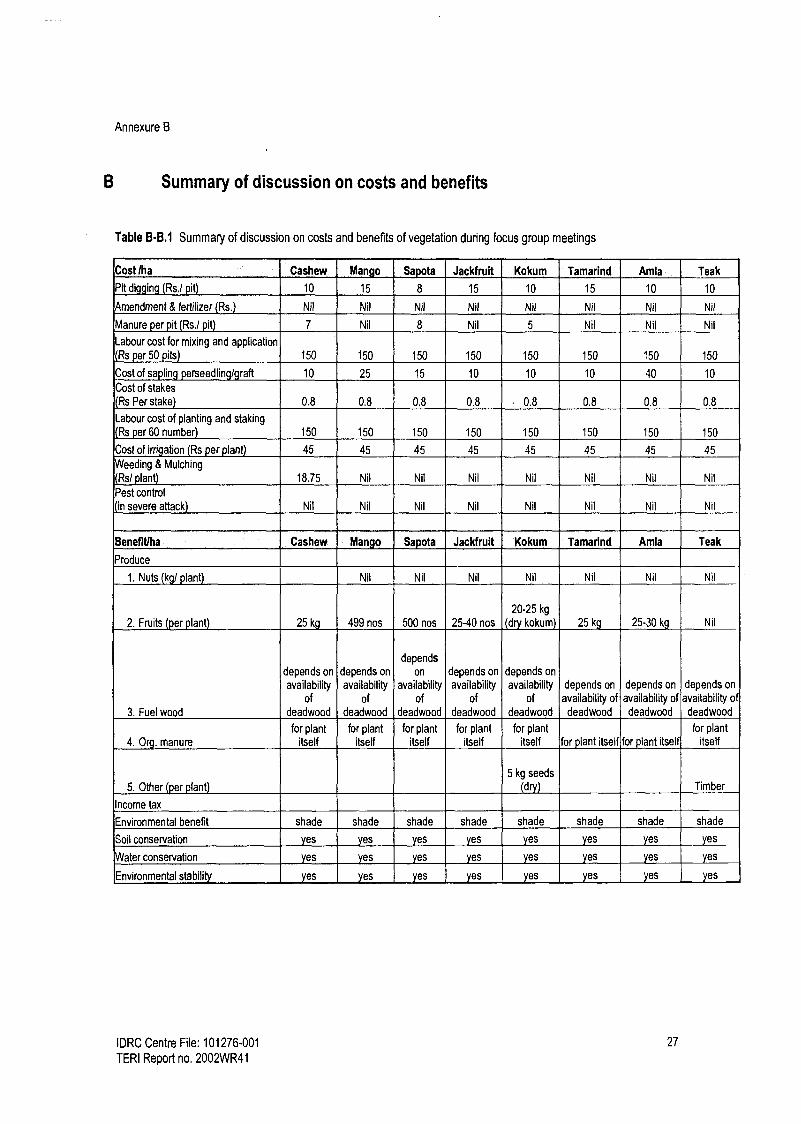
Annexure B
B Summary of discussion on costs and benefits
Table B-B.1 Summary of discussion on costs and benefits of vegetation during focus group meetings
Costlha Cashew Mango Sapota Jackfrult Kokum Tamarind Amla Teak
Pit digging Rs./ pit) 10 15 8 15 10 15 10 10
mendment & fertilizer (Rs.) Nil Nil Nil Nil Nil Nil Nil Nil
Manure per pit Rs./ pit) 7 Nil 8 Nil 5 Nil Nil Nil
Labour cost for mixing and application Rs per 50 its 150 150 150 150 150 150 150 150
Cost of sapling erseedlin I raft 10 25 15 10 10 10 40 10
Cost of stakes
(Rs Per stake) 0.8 0.8 0.8 0.8 0.8 0.8 0.8 0.8
Labour cost of planting and staking
(Rs per 60 number) 150 150 150 150 150 150 150 150
Cost of irrigation (Rs per plant) 45 45 45 45 45 45 45 45
Weeding & Mulching
Rs/ plant) 18.75 Nil Nil Nil Nil Nil Nil Nil
Pest control
(in severe attack) Nil Nil Nil Nil Nil Nil Nil Nil
Benefitlha Cashew Man o Sapota Jackfruit Kokum Tamarind Amla Teak
Produce
1. Nuts (kg/ plant) Nil Nil Nil Nil Nil Nil Nil
2. Fruits (per plant) 25 kg 499 nos 500 nos 25-40 nos
20-25 kg
(dry kokum) 25 kg 25-30 kg Nil
. Fuel wood
depends on
availability of
deadwood
depends on
availability of
deadwood
depends
on
availability of
deadwood
depends on
availability of
deadwood
depends on
availability of
deadwood
depends on
availability of deadwood
depends on
availability of deadwood
depends on
availability of deadwood
4. Or g. manure for plant
itself for plant
itself for plant
itself for plant
itself for plant
itself for plant itself for plant itself for plant
itself
5. Other (per plant) 5 kg seeds
(dry) Timber
Income tax
Environmental benefit shade shade shade shade shade shade shade shade
Soil conservation yes yes yes yes yes yes es yes
Water conservation yes es yes yes yes yes yes yes
Environmental stability yes yes yes yes yes yes yes yes
IDRC Centre File: 101276-001 27
TERI Report no. 2002WR41
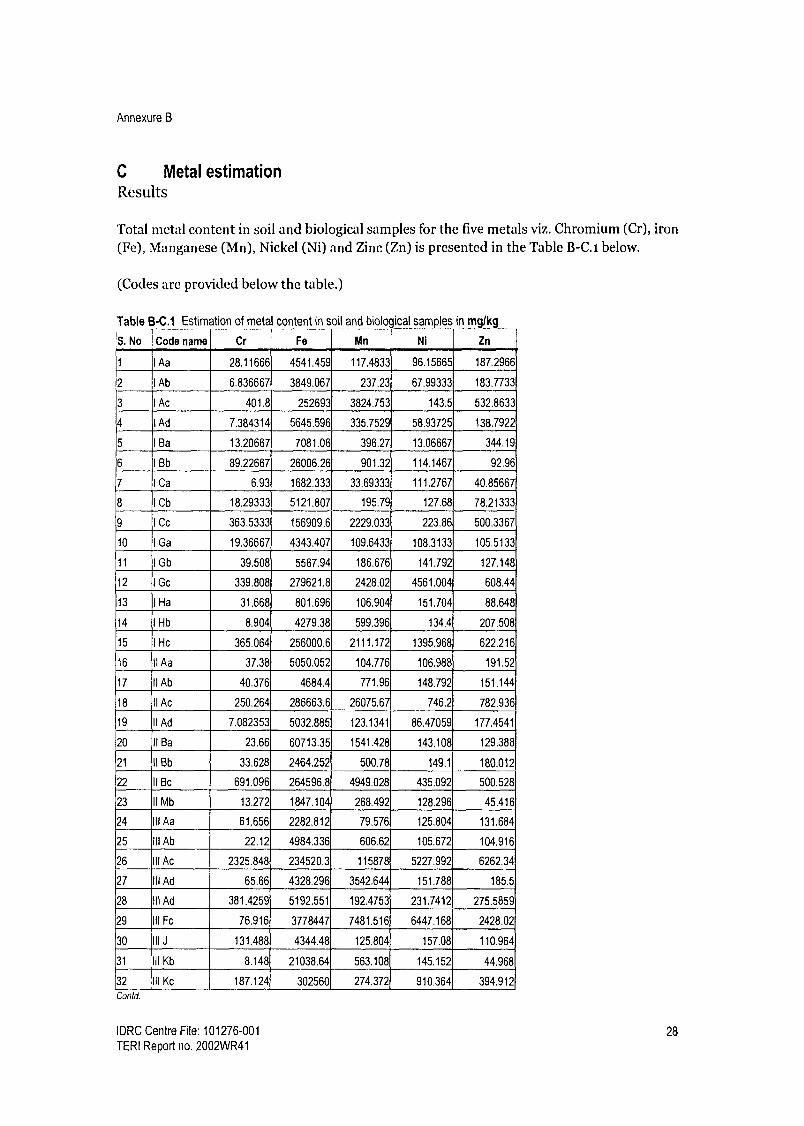
Annexure B
C Metal estimation Results
Total metal content in soil and biological samples for the five metals viz. Chromium (Cr), iron (Fe), Manganese (Mn), Nickel (Ni) and Zinc (Zn) is presented in the Table B-C.i below.
(Codes are provided below the table.)
Table B-C.1 Estimation of metal content in soil and bioloqical samples in mglk
S No Code name Cr Fe Mn Ni Zn
1 I Aa 28.11666 4541.459 117.4833 96.15665 187.2966
2 I Ab 6.836667 3849.067 237.23 67.99333 183.7733
3 I Ac 401.8 252693 3824.753 143.5 532.8633
4 I Ad 7.384314 5645.596 335.7529 58.93725 138.7922
5 1 Ba 13.20667 7081.06 396.27 13.06667 344.19
6 I Bb 89.22667 26006.26 901.32 114.1467 92.96
7 I Ca 6.93 1682.333 33.69333 111.2767 40.85667
8 1 Cb 18.29333 5121.807 195.79 127.68 78.21333
9 I Cc 363.5333 156909.6 2229.033 223.86 500.3367
10 I Ga 19.36667 4343.407 109.6433 108.3133 105.5133
11 I Gb 39.508 5567.94 186.676 141.792 127.148
12 I Gc 339.808 279621.8 2428.02 4561.004 608.44
13 I Ha 31.668 801.696 106.904 151.704 88.648
14 I Hb 8.904 4279.38 599.396 134.4 207.508
15 I He 365.064 256000.6 2111.172 1395.968 622.216
16 It Aa 37.38 5050.052 104.776 106.988 191.52
17 11 Ab 40.376 4684.4 771.96 148.792 151.144
18 11 Ac 250.264 286663.6 26075.67 746.2 782.936
19 11 Ad 7.082353 5032.885 123.1341 86.47059 177.4541
20 11 Ba 23.66 60713.35 1541.428 143.108 129.388
21 II Bb 33.628 2464.252 500.78 149.1 180.012
22 II Bc 691.096 264596.8 4949.028 435.092 500.528
23 11 Mb 13.272 1847.104 268.492 128.296 45.416
24 111 Aa 61.656 2282.812 79.576 125.804 131.684
25 III Ab 22.12 4984.336 606.62 105.672 104.916
26 III Ac 2325.848 234520.3 115878 5227.992 6262.34
27 III Ad 65.66 4328.296 3542.644 151.788 185.5
28 111 Ad 381.4259 5192.551 192.4753 231.7412 275.5859
29 III Fc 76.916 3778447 7481.516 6447.168 2428.02
30 111 1 131.488 4344.48 125.804 157.08 110.964
31 III Kb 8.148 21038.64 563.108 145.152 44.968
32 III Kc 187.124 302560 274.372 910.364 394.912
Contd.
IDRC Centre File: 101276-001 28
TERI Report no. 2002WR41
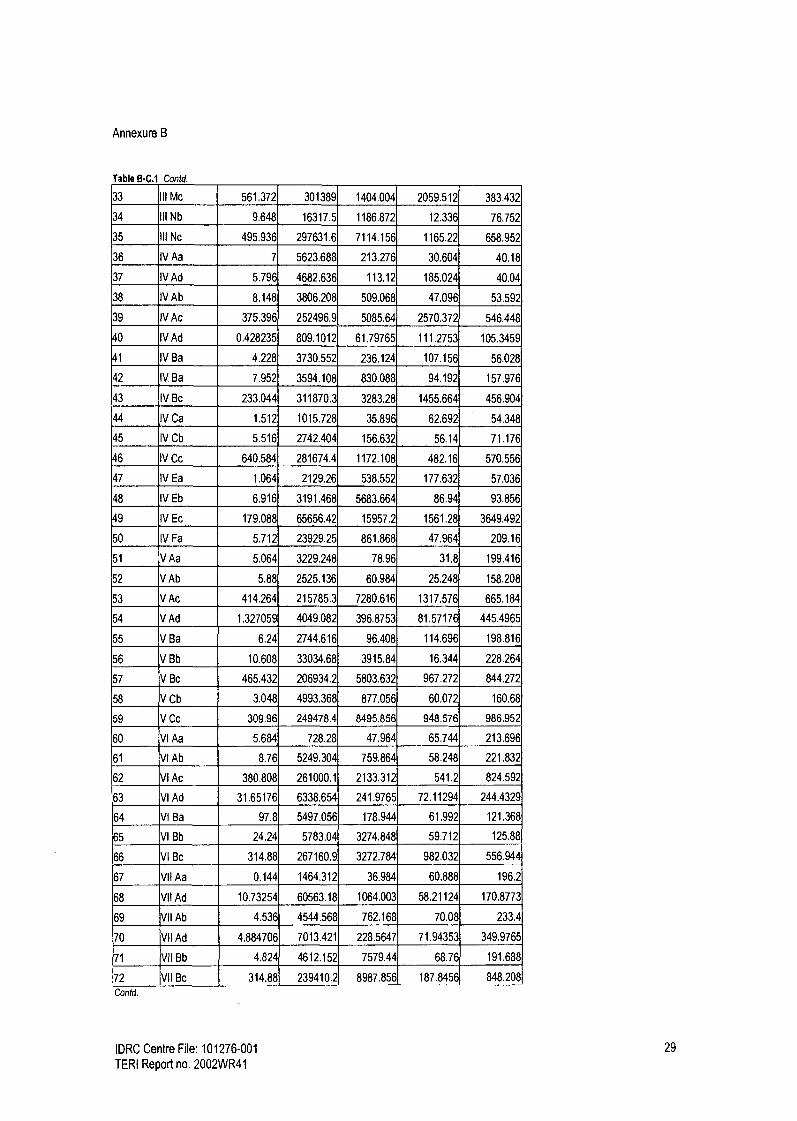
Annexure B
Table B-C.1 Contd.
33 III Mc 561.372 301389 1404.004 2059.512 383.432
34 III Nb 9.648 16317.5 1186.872 12.336 76.752
35 111 Nc 495.936 297631.6 7114.156 1165.22 658.952
36 IV Aa 7 5623.688 213.276 30.604 40.18
37 IV Ad 5.796 4682.636 113.12 185.024 40.04
38 IV Ab 8.148 3806.208 509.068 47.096 53.592
39 IV Ac 375.396 252496.9 5085.64 2570.372 546.448
40 IV Ad 0.428235 809.1012 61.79765 111.2753 105.3459
41 IV Ba 4.228 3730.552 236.124 107.156 56.028
42 IV Ba 7.952 3594.108 830.088 94.192 157.976
43 IV Bc 233.044 311870.3 3283.28 1455.664 456.904
44 IV Ca 1.512 1015.728 35.896 62.692 54.348
45 IV Cb 5.516 2742.404 156.632 56.14 71.176
46 IV Cc 640.584 281674.4 1172.108 482.16 570.556
47 IV Ea 1.064 2129.26 538.552 177.632 57.036
48 IV Eb 6.916 3191.468 5683.664 86.94 93.856
49 IV Ec 179.088 65656.42 15957.2 1561.28 3649.492
50 IV Fa 5.712 23929.25 861.868 47.964 209.16
51 VAa 5.064 3229.248 78.96 31.8 199.416
52 V Ab 5.88 2525.136 60.984 25.248 158.208
53 VAc 414.264 215785.3 7280.616 1317.576 665.184
54 V Ad 1.327059 4049.082 396.8753 81.57176 445.4965
55 V Ba 6.24 2744.616 96.408 114.696 198.816
56 V Bb 10.608 33034.68 3915.84 16.344 228.264
57 V Bc 465.432 206934.2 5803.632 967.272 844.272
58 V Cb 3.048 4993.368 877.056 60.072 160.68
59 V Cc 309.96 249478.4 8495.856 948.576 986.952
60 VI Aa 5.684 728.28 47.964 65.744 213.696
61 VI Ab 8.76 5249.304 759.864 58.248 221.832
62 VI Ac 380.808 261000.1 2133.312 541.2 824.592
63 VI Ad 31.65176 6338.654 241.9765 72.11294 244.4329
64 VI Ba 97.8 5497.056 178.944 61.992 121.368
65 VI Bb 24.24 5783.04 3274.848 59.712 125.88
66 VI Bc 314.88 267160.9 3272.784 982.032 556.944
67 VII Aa 0.144 1464.312 36.984 60.888 196.2
68 VII Ad 10.73254 60563.18 1064.003 58.21124 170.8773
69 VII Ab 4.536 4544.568 762.168 70.08 233.4
70 VII Ad 4.884706 7013.421 228.5647 71.94353 349.9765
71 V11 Bb 4.824 4612.152 7579.44 68.76 191.688
172 VII Bc 314.88 239410.2 8987.856 187.8456 848.208
Contd.
IDRC Centre File: 101276-001 29
TERI Report no. 2002WR41

Annexure B
73 VIII Aa 18.576 1135.656 - - ---- -------- 17.784 -
5.184 115.224
74 VIII Ac 362.112 19807.92 1128.648 615.984 472.32
75 VIIIAd 19.584 3904.248 144.648 10.2 182.568
76 VIII Ba 20.616 1677.456 56.928 11.544 108.624
77 VIII Bb 32.352 16142.11 405.048 14.736 125.736
78 VIII Bc 353.256 20076.55 519.552 3430.224 561.864
79 VIII Cb 52.8 5360.664 194.832 12.624 170.184
30 IX Aa 23.376 2167.08 46.992 7.32 123.072
31 IX Ab 29,304 5209.32 361.08 8.52 175.104
32 IX Ac 218.448 9215.16 989.904 3244.248 606.144
33 IX Ad 28.12235 5738.174 100.9694 20.32941 219.3318
34 IX Ba 33.024 1712.208 72.192 13.08 153.744
35 IX Bb 27.408 4923.264 772.584 14.328 176.16
36 IX Bc 379.824 17442.38 443.784 2862.456 457.56
37 IX Cb 27.36 4015.68 142.08 5.952 114.168
38 IX Cc 1630.488 152407.8 2283.864 461.496 929.88
39 IX Ha 19.92 1688.136 81.648 6.36 154.2
30 IX Hb 4.944 3605.808 51.12 22.848 9.432
31 IX He 6294 648 4363999 73242 07 3628.008 6542.616
I - IX are stations for sample collection; A-N are plants and a-d are the parts of the plants.
A- Cashew, 13- Mango, C-Sapota, D-Chicku, E- Banana, F- Pineapple, G-Tamarind, H-Jackfruit, I- Paddy, J-grass, K-
Amla, L-Tomato, M- Acasia, N-Casuarina a-Fruit, b-Leaves, c-Soil, d- Nuts
IDRC Centre File: 101276-001 30 TERI Report no. 2002WR41

Annexure B
Biologically available metals (Chromium (Cr), iron (Fe), Manganese (Mn), Nickel (Ni) and Zinc (Zn)) in the soil system as estimated using DTPA extraction procedure is given in Table B-C.2, below. (Codes are provided below the table.)
Table B-C.2 Estimation of bio-available metals in the soil system in mglkg
S. No. Code Cr Cu Fe Mn Ni Zn
1 1 Ac 59.25 13.37 202.79 432.88 31.00 37.60
2 I Cc 40.55 10.62 194.01 94.83 3.90 34.24
3 I Gc 21.65 10.21 111.36 169.21 29.81 30.09
4 I He 16.89 5.86 48.79 357.56 15.58 22.22
5 II Ac 36.57 13.00 139.65 462.07 52.97 29.64
6 II Be 20.83 6.64 40.22 47.07 61.21 21.77
7 III Ac 22.14 5.04 56.91 182.74 16.61 16.65
8 III Fc 17.22 6.15 57.20 224.97 23.12 6.27
9 III Kc 16.77 7.87 41.41 40.92 4.18 15.91
10 III Me 25.83 .6.56 63.18 70.60 44.98 7.09
11 III Nc 29.44 5.66 61.05 25.17 53.92 5.66
12 IV Ac 33.01 10.87 143.05 917.01 38.99 16.52
13 IV Be 12.34 14.51 187.41 520.86 34.19 17.30
14 IV Cc 12.59 30.91 157.89 327.96 22.51 47.81
t5 IV Ec 13.90 13.33 87.17 238.09 72.94 20.66
16 V Ac 15.83 16.85 153.55 714.34 27.47 13.24
17 V Be 66.58 14.97 84.99 360.51 34.44 21.77
18 V Cc 48.38 6.77 59.74 203.85 39.32 7.09
19 VI Ac 18.78 7,67 84.01 85.03 51.00 7.75
20 VI Be 20.21 15.13 50.06 145.76 55.39 7.38
21 VII Be 42.11 6.60 43.87 147.52 18.74 5.04
22 VIII Ac 17.84 25.83 635.66 316.56 68.84 46.21
23 VIII Be 24.76 15.58 127.14 179.13 1.23 12.75
24 IX Ac 30.83 13.12 354.81 156.37 59.08 11.07
25 IX Be 52.77 13.04 426.56 434.40 69.17 25.05
26 IX Cc 19.02 18.16 100.12 135.51 9.31 26.57
127 IX He 12.38 21.16 183.07 404.01 24.72 18.61
I - IX are stations for sample collection; A-N are plants. A- Cashew, B- Mango, C-Sapota, D-Chicku, E- Banana, F- Pineapple, G-Tamarind, H-Jackfruit, I- Paddy, J-grass, K- Amla, L-Tomato, M- Acasia, N-Casuarina, c-soil
IDRC Centre File: 101276-001 31
TERI Report no. 2002WR41

Annexure C
Annexure C
Contents
A Governance in the context of air quality in mining areas ..........................................
B Governance case study: Responses to changes in ground water and shortages of
water for household use ..............................................................................................
C Health data management case study ...........................................................................
D Format for communicable diseases .............................................................................
E Format for non-communicable diseases (general morbidity) data ............................
F Governance questionnaire ...........................................................................................
33
47
66
73
74
75
IDRC Centre File: 101276-001 32 TERI Report no. 2002WR41

Annexure C
A Governance in the context of air quality in mining areas
One of the main impacts of mining on air quality is high particulate matter levels, often exceeding the standards laid down by the Central Pollution Control Board (CPCB). (This has been discussed in detail in Chapter 2).
This problem is caused by the overloading of trucks carrying ore from the mine site to barges waiting along the river. Over loaded trucks that are inadequately covered speed down poor roads leading to the spillage of ore. Continuous movement of trucks along road corridors leads to re-suspension of dust and high particulate matter levels. As trucks are generally plying through densely populated areas, air pollution generated has an adverse impact on community health. Mining companies and truck operators have a key role to play in preventing this problem. Companies and truck operators need to ensure that trucks being loaded within the mine site are not overloaded and they are properly covered. While these steps are very easy to follow, both companies and truck operators are unwilling to follow them. There is also a well-developed regulatory framework that empowers various agents to take action. However, this also seems to be ineffective in controlling the problem.
In order to understand how and why the problem of air pollution persists this component presents a brief overview of the legislative framework that deals with air pollution management and goes on to explore:
Political-economy of trucking The community's role in responding to air quality problems
Overview of the legislative framework Agent Empowering Regulatory role Reasons offered for lack of
legislation enforcement of laws
Indian Bureau MMRDA 1957 Regulate mining activities within the lease The air pollution problem is
of Mines (IBM) MCR 1960 areas according to mining plan outside the lease area.
and MCDR 1967 Ensure environmental standards are met Caused by trucking and not
Department of Jurisdiction extends to lease area and buffer mining.
Mines (DoM) zone
Goa State Air (Pollution Regulate industries that are polluting Mining is not an industry- it is a
Pollution Prevention and Control Monitor air pollution primary sector activity.
Control Board Act) 1981 Enforce air pollution standards Cause of the problem is within
(GSPCB) Jurisdiction includes the whole state of Goa the lease area which is not
within their jurisdiction
Cannot monitor air quality
because of lack of staff and
equipment
Road Motor Vehicles Act Ensure road safety rules and regulations No weigh bridges to check
Transport 1988 are followed, including loading of trucks overloading
Office (RTO) within permissible limits Understaffed
Monitor and enforce fuel emissions Over loading of trucks should
standards be monitored at the time of
loading which is inside the
lease area
Panchayats Goa Panchayati Raj Monitor and regulate emissions of smoke -
Act 1998 from commercial furnaces
IDRC Centre File: 101276-001 33
TERI Report no. 2002WR41

Annexure C
Economics of trucking Over the years, the transportation of ore by trucks has been almost completely outsourced by mining companies. Outsourcing of the business of transporting ore has had led to several changes:
New income opportunities have been generated and local residents have developed a stake in the industry Mining companies have been relieved of the liabilities associated with owning, running and maintaining a fleet of trucks Regulation of trucking has become more difficult. From being an activity carried out by a dozen companies, transportation is now done by several thousand truck owners from the local communities. Outsourcing has allowed the Indian Bureau of Mines (the agent responsible for regulating all activities related to mining) to distance itself from this problem because it is technically not caused by mining companies but by truck owners. Simultaneously, the State Pollution Control Board and the Regional Transport Office are now more involved in regulation.
There are over 9000 trucks working directly with mining companies to move ore within the mine as well as transport it outside the mine to jetties where it is unloaded into barges. Most of the trucks operating in the region have been bought with the help of loans taken from local banks'. The terms and conditions for loans stipulated by most banks are similar, with slight differences regarding paper-work or guarantors needed etc. An outline of terms and conditions are presented below:
Loans offered for 80-85% of the cost of a truck with a down payment of 20-15% of the cost A collateral of Rs. 1 lakh as a fixed deposit (waived if the bank is familiar with the individual taking the loan) Guarantors (1 or 2 depending on the bank) Interest rates vary between 11.75% - 15% per annum The loan has to be paid off between 5-7 years while the individual is exempt from making monthly payments to the bank during the monsoon season when mining activities are suspended and transportation of ore is not undertaken
An alternative but less common arrangement to get a loan for a truck is through a mining company. The mining company purchases the truck and gives it to an individual interested in purchasing a truck. The mining company deducts monthly payments towards the truck from the earnings of the individual till the loan is paid off.
IDRC Centre File: 101276-001 34
TERI Report no. 2002WR41

Annexure C
Table C-A.1 shows how the profitability of the business as calculated by banks providing loans. This estimate is based on a 20 km transport route2.
Table C-A.1 Estimates of Costs and Revenue for a long route
REVENUE COSTS*
Head Rs. Head Rs.
Transportation rate (Rs/tonne) 30 Per litre Average (KmIL) 3.5
Average run per trip (kms) 20 Average run per trip (kms) 20
Load per trip (tonnes) Total Km run/month 5000
No. of trips/day 10 Total fuel consumption/month (Litres) 1429
Average no. of days working/month 25 Cost of Fuel (Rs./Litre) 30
Total tonnage transported/month 3500 Total spent on fuel + oil 44,857.14
Revenue/trip 420 Taxes/month 800
Revenue/day 4200 Insurance/month 2,000
REVENUE - Rate Rs,/Tonne/Km 1.50 EMI 16,430
Margin money spread over the term of the loan 2,449
Salary to Driver & Cleaner 8,000
Repairs & Replacement 10,500
Living Expenses 3,000
Total Revenue/Month 105,000.00 Total Costs/Month 88,035.71
Table C-A.1, above shows that truck owners can make a healthy profit of Rs. 16, 964 per month, that is a profitability of about 19% (on costs) using the above calculation. The table also shows, however, that banks calculate this level of profitability using 14 tonnes as the load per trip which exceeds the io ton limit3. This is highly problematic because overloading of trucks is one of the main causes of air pollution in the region.
While the law permits carriage of io tonnes, the economics at io tonnes do not present favourable terms of business and truck owners run into losses. Table C-A.2 (below) presents
marginal costs and revenues for the transport of ore. Based on these calculation we see that at ten tonnes the profitability would be negative with the truck owner making a loss of about
Rs. 13,035 (-14.8%) every month. We see that for every tonne of ore carried in excess of ten tonnes, the marginal cost of transportation decreases, while the marginal remains constant.
Only if a truck owner carried 12 tonnes would he break even. Hence, as long as the economics
are such, truck owners have no incentive to abide the law. Figure C-A.1 graphically represents
the data in the tables, showing the point at which profits become positive and the business is
viable.
2 Transportation rates are calculated based on the distance covered by trucks and is paid per tonne of ore carried. Rates therefore vary depending on the mining company and the distance to be covered. While we have presented only one example, we conducted several such calculations based on rates from different banks, truck operators and members of a truck owners association. All used more than io tonnes for their calculations. 3 All goods carriers, have a "rated capacity" that is determined by the manufacturers. This sets the limit of the load the vehicle can safely carry. According to the Motor Vehicles Act (1988) plying of vehicles that are loaded beyond their rated capacity is a punishable offence and liable to a penalty.
IDRC Centre File: 101276-001 35
TERI Report no. 2002WR41

Annexure C
Table C-A.2 Marginal costs and revenues for transportation of ore
Tonnes carried
Marginal revenue
(Rs./tonne/km)
Marginal cost
(Rs.ltonnelkm)
Profit
(Rs./tonne/km)
Profit
(Rs.lmonth) ......... ._- . .... .................. - --............. .... ....... .__......
10 1.50 1.76 -0.26 -13,035.71
11 1,50 1.60 -0.10 -5,535.71
12 1.50 1.47 0.03 1,964.29
13 1.50 1.35 0.15 9,464.29
14 1.50 1.26 0.24 16,964.29
15 1.50 1.17 0.33 24,464.29
Estimates of Costs £t Revenues in Transportation of Ore - z.oo Longer Route
No. of Tonnes Carried
Figure C-A.1 Estimates of costs and revenues in transportation of ore
We explore further, what options exist for truck operators in order to stay within the ten- tonne limit and continue making profits at the current rate. Truck operators can either decrease costs or increase revenues. Through analysis we find that most of the components of the cost are unchangeable by truck owners, eg. taxes, insurance, interest on the loan, fuel prices, depreciation, maintenance etc.) The only elements of cost that truck operators can alter are the salaries of the drivers and cleaners, where they would be able to make marginal savings.
On the revenue side, they could increase the number of trips they make a day. However, if the tonnage carried were decreased to 1o then each truck would have to nearly double the number of trips to generate the current levels of revenue. This would not be possible on two accounts; firstly there are too many trucks in the business for each one to get twice the amount of work they currently do4; and secondly, in terms of the time available in a day, it is an impossibility.
4 Interviews with truck owners reveal that in certain sectors, due to increasing competition, drivers can do no more than 4
trips a day when they used to do between 10-14 trips a day in the past!
IDRC Centre File: 101276-001 36
TERI Report no. 2002WR41

Annexure C
For trucks to stay within the loading limit, the only option then is to increase the revenue they earn per trip by revisiting the rate paid for transportation. We assume that truck owners are happy with a business as usual scenario, whereby the profits they currently earn (24 paise/tonne/km or a total profits of Rs. 16,964/month) are sufficient for them to continue to operate. If now we reduce the tonnage carried from 14 to 1o tonnes, the transportation rate would have to go up to Rs. 2.10/tonne/km for truck owners to earn the same net profits.
Yet, increasing the rate of transportation is not something truck owners can do unilaterally. They are price takers in a competitive market. Transportation rates are negotiated with each company and settled once every financial year. Unless there is a very sharp change in factor prices, rates are nearly unchangeable. Sometimes truck owner strike work, but these strikes are not very effective because leaders are either bought out, or if a strike drags on for too long, truck owners do not have the staying capacity; they need the work in order to pay back the loans and slowly the strike fails.
In general truck owners we spoke with said that they have very little influence over the rates of transportation; it is the companies who do. Increasing transportation rates increases costs for mining companies and is therefore not in their business interest. While companies may agree to a marginal increase in rates, a 35% - 40% increases would be very difficult if not impossible to get. The easiest adjustment available to the truck owners therefore, is to overload their trucks so as to earn more revenue per trip. Mining companies also prefer this solution since it has a direct bearing on their costs, thus companies overlook overloading of trucks by operators.
Mining companies and government representatives claim that truck owners have unreasonable expectations from the transportation business and even if transportation rates were raised, they would continue to overload since it would mean still more earnings for them. Speaking to truck owners we realise that earlier, when there were fewer trucks, the profit margins were higher. They say that profits were up to 3 times the amount they spent on variable costs like fuel. Now they say the returns have fallen drastically as there is intense competition, and they feel it will only decrease with time. Expectations play a big role in the perception of the profitability of the business. By comparing current profits to those earned before, the perception that the business is not profitable creates the push to earn more. Since overloading is the easy way to do so, truck owners may well break the law even if rates were to increase, unless they are deterred by a heavy fine.
Role of the fine According to the Motor Vehicles Act (1988) if a vehicle is caught carrying weight in excess of the permissible limit, it is charged a fine of Rs. 2000 plus Rs. Ioo0 for every tonne in excess
of the limit. Therefore, if a truck is carrying 12 tonnes it will have to pay a fine of Rs. 3000, or a fine of Rs. 4000 if it is caught carrying 13 tonnes. Under this penalty structure, if a truck owner must overload, he will choose to overload by more than 2 tonnes (see Table C-A.3
below). If a truck is caught with 12 tonnes, the fine is Rs. 3000 while his monthly net profit at that level of tonnage is about Rs. 1200. If he loads 13 tonnes and is caught once that month (the frequency with which the weight of trucks is checked is very low), then even after paying
IDRC Centre File: 101276-001 37
TERI Report no. 2002WR41

Annexure C
the tine, his net profits are more than Rs. 4000 for that month. We see that if the enforcement of the law is weak, then in this case the penalty structure is such that it provides an incentive to violate the law with greater impunity.
Table C-A.3 Profits under the current fine structure (Rslmonth)
Tonnes carried Monthly profits under current rates Monthly profits under revised rates Fines
10 -13,035.71 16,964.29 0.00
11 -5,535.71 24,967.53 2000
12 1,964.29 31,636.90 3000
13 9,464.29 37,280.22 4000
14 16,964.29 42,117.35 5000
15 24,464.29 46,309.52 6000
Further, if transportation rates were raised and the fine structure not revisited, truck operators could continue to load at levels they have been doing, factor penalties into their costs and still earn high profits. Thus, while raising transportation rates it is important to also revisit the penalty structure.
Conclusion This study highlights the vested interests of each party in maintaining the status quo. Given the current power dynamics, truck operators are unable to force companies to raise rates.
Thus, they are left with no choice but to overload. Financial institutions are also profiting from this situation while they support truck operators to break the law. Meanwhile companies save money by keeping transportation rates low and turning a blind eye to overloading. There are also examples of people in positions of power that have vested interests blocking solutions to the air quality problems.
In the study area it is common knowledge that in the mining areas RTO/police officers are bribed to ensure that overloaded trucks are not penalised. While it is very difficult to get any hard facts and figures on who is paid, how much and how and till what level the bribe money collected travels up the official ladder, it is common knowledge that bribes are paid and asked for.
Both truck owner's associations and companies are strong lobby groups and together wield significant power. They are able to use this power to prevent various state agents from enforcing the law. Other powerful agents benefiting from the transportation business also influence decision-making and enforcement of the law and prevent the problem from being addressed. Thus, despite an extensive regulatory framework, air pollution continues to persist.
A state -of-the-art iron ore handling terminal that has been suggested as an alternative to truck transportation has not yet received the green signal after being proposed almost 5 years ago. This project met with roadblocks as the local Member of the Legislative Assembly (MLA) has high stakes in the transportation business and will lose a significant portion of his business if the status quo is disturbed. In this manner, vested interests of people in power block solutions to the problem.
IDRC Centre File: 101276-001 38
TERI Report no. 2002WR41

Annexure C
Role of civil society
Broadly speaking, with the authority to enforce regulations have done little to implement the law regarding air pollution. The role of civil society becomes extremely crucial when government fails to respond to persisting issues. Yet, in the mining areas the role of civil society is constrained by the fact that livelihood opportunities are limited and there is dependence and expectations from mining and allied activities for employment. Through the governance survey carried out in the study area we attempted to study the following:
what factors that influence civic activity and willingness to protest, specifically dependence on mining/trucking for work and age of mining who does the local community approach to address their problem of poor air quality and how do they perceive these agents.
The results from the survey are presented in the tables below.
Table C-A.4 Reporting of air quality problems
Cluster Count/Percentage Yes No Total
I Count 42 27 69
% within cluster 60.90% 39.10% 100.00%
II Count 134 26 160
% within cluster 83.80% 16.30% 100.00%
III Count 154 54 208
% within cluster 74.00% 26.00% 100.00%
Total Count 330 107 437
% within cluster 75.50% 24.50% 100.00%
Table C-A.4 (above) shows the cluster-wise distribution of responses to the question whether respondents felt they had a dust problem in their wards. Nearly 3 out of every 4 people in the entire study area reported that dust pollution was a problem. From those living in Cluster II, almost 84% reported to have a dust related problem, which was the highest from among the three clusters, with clusters III and I coming in second and third place respectively. (Cluster II being most stressed in terms of air pollution also emerges through environmental monitoring conducted in this study.)
Table C-A.5 Who complained about air quality?
Complaining behaviour by cluster
Cluster Count/Percentage No Yes Total
I Count 14 28 42
% within cluster 33.30% 66.70% 100.00%
II Count 62 70 132
% within cluster 47.00% 53.00% 100.00%
III Count 72 80 152
% within cluster 47.40% 52.60% 100.00%
Total Count 148 178 326
% within cluster 45.40% 54.60% 100.00%
IDRC Centre File: 101276-001 39
TERI Report no. 2002WR41

Annexure C
The table above looks at complaining behaviour of those respondents who reported having air quality problems to understand whether people actively take up the issue with different agents. Overall around 55% of those reporting air quality problems complained about it. From those who reported having air quality problems the largest proportion complaining was found in Cluster 1. Clusters II and III have about the same proportions complaining regarding this matter.
One of the hypotheses we wanted to test was that complaining regarding poor air quality is
influenced by the fact that an individual/ family may be dependent on mining or allied occupations. We would expect that those involved in mining or allied occupations (truck transport, garages, working on barges etc...) will be less likely to complain about the poor air quality, since doing so is perceived to threaten their livelihood.
Influence of occupation on complaining behaviour The table below shows the subset of people who reported having poor air quality. For those respondents who were dependent on mining or allied occupations we see that nearly as many reported complaining about the dust problem as did not. For those respondents on who were not dependent on mining or allied jobs, a greater proportion (57.5%) reported having had complained about the problem than not. There is no statistically significant difference in the complaining behaviour (Chi-square = 1.618; df = 1; P-value = 0.203) of those with and without mining jobs, but those without mining jobs are 1.62 times likely to complain as opposed to those who have mining or allied jobs.
Table C-A.6 Kind of occupation and complaining behaviour
Mine related work CountiPercentage No Yes Total
No Count 82 111 193
% within mine related work 42.50% 57.50% 100.00%
Yes Count 66 67 133
% within mine related work 49.60% 50,40% 100.00%
Total Count 148 178 326
% within mine related work 45.40% 54.60% 100.00%
IDRC Centre File: 101276-001 40 TERI Report no. 2002WR41

Annexure C
Table CA.7 Kind of occupation and complaining behaviour - Cluster-wise
Cluster Occupation No/yes Count/Percentage No Yes Total
I Mine related work No Count 9 25 34
% within mine related work 26.50% 73.50% 100,00%
Yes Count 5 3 8
% within mine related work 62.50% 37.50% 100.00%
Total Count 14 28 42
% within mine related work 33.30% 66.70% 100.00%
II Mine related work No Count 35 35 70
% within mine related work 50.00% 50.00% 100.00%
Yes Count 27 35 62
% within mine related work 43.50% 56.50% 100.00%
Total Count 62 70 132
% within mine related work 47.00% 53.00% 100.00%
III Mine related work No Count 38 51 89
% within mine related work 42.70% 57.30% 100.00%
Yes Count 34 29 63
% within mine related work 54.00% 46.00% 100.00%
Total Count 72 80 152
% within mine related work 47.40% 52.60% 100.00%
Data from the previous table has been analysed (above) cluster-wise to see whether there are any patterns emerging within clusters regarding active protests against the dust pollution problem. In Clusters I and III we see that a greater fraction of the respondents without mining or allied jobs complained about the dust problem than with such jobs. Interestingly in Cluster II, we see the opposite where a greater proportion of respondents with mining or allied jobs complained about the dust problem than without. One possible explanation for this could be that since air quality conditions in Cluster II seem to be worse than those in the other two clusters and that the road corridor passes through thickly populated areas, the impact on people in general is high and this prompts people to actively respond to the dust problem, irrespective of whether they do or do not have mining or trucking jobs.
Through the survey we were also able to see the level of political activity (measured as active protest against an issue) of the people residing in the three clusters. Based on the age of mining theory (which claims that increasing years of mining activity in an area positively influence determinants of political activity like income, education, awareness etc...), we
expect that with increasing age of mining, the level of political activity increases. In Table C-
A.8 we find that the average complaints made per household is highest in Cluster I followed by Clusters II and III.
IDRC Centre File: 101276-001 41
TERI Report no. 2002WR41
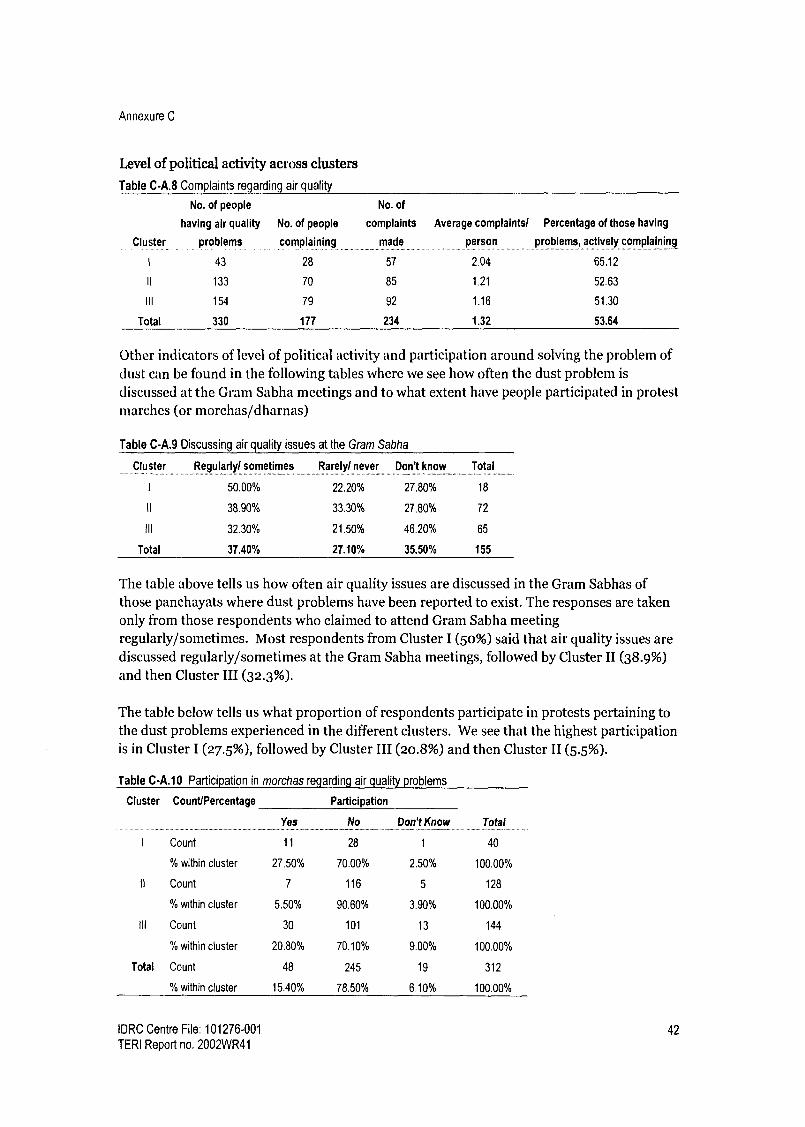
Annexure C
Level of political activity across clusters
Table C-A.8 Complaints regarding air quality
No. of people No. of
Cluster
having air quality
problems
No. of people
complaining
complaints
made
Average complaints/ Percentage of those having
person problems, actively complaining .............. .. .......... _._.
1 43 28 57 2.04 65.12
II 133 70 85 1.21 52.63
III 154 79 92 1.16 51.30
Total 330 177 234 1.32 53.64
Other indicators of level of political activity and participation around solving the problem of dust can be found in the following tables where we see how often the dust problem is
discussed at the Gram Sabha meetings and to what extent have people participated in protest marches (or morchas/dharnas)
Table C-A.9 Discussing air quality issues at the Gram Sabha
Cluster Regularly/ sometimes Rarely/ never Don't know Total
I 50.00% 22.20% 27.80% 18
It 38.90% 33.30% 27.80% 72
Ill 32.30% 21.50% 46.20% 65
Total 37.40% 27.10% 35.50% 155
The table above tells us how often air quality issues are discussed in the Gram Sabhas of those panchayats where dust problems have been reported to exist. The responses are taken only from those respondents who claimed to attend Gram Sabha meeting regularly/sometimes. Most respondents from Cluster I (50%) said that air quality issues are discussed regularly/sometimes at the Gram Sabha meetings, followed by Cluster II (38.9%) and then Cluster III (32.3%).
The table below tells us what proportion of respondents participate in protests pertaining to the dust problems experienced in the different clusters. We see that the highest participation is in Cluster I (27.5%), followed by Cluster III (20.8%) and then Cluster II (5.5%).
Table C-A.10 Participation in morchas regarding air quality problems
Cluster Count/Percentage Participation
I Count
Yes
11
No
28
Don't Know
1
Total
40
% within cluster 27.50% 70.00% 2.50% 100.00%
it Count 7 116 5 128
% within cluster 5.50% 90.60% 3.90% 100.00%
III Count 30 101 13 144
% within cluster 20.80% 70.10% 9.00% 100.00%
Total Count 48 245 19 312
% within cluster 15.40% 78.50% 6.10% 100.00%
IDRC Centre File: 101276-001 42 TERI Report no. 2002WR41

Annexure C
We can conclude that in terms of levels of political activity, we observe that Cluster I is more active than Cluster II which is more active than Cluster III with regards to the level and intensity of complaints and discussion of the issue at the Gram Sabha. As far as protest marches go, Cluster I is still more active, but Cluster III has had more protest marches than Cluster II.
While an active and alert civil society can play the role of a watchdog and influence the enforcement of existing rules, civil society action is seen to be weak or ineffective in the mining areas for a number of reasons. Interviews with community members, village leader etc. reveal that residents who complain about the dust problems are often made stakeholders in the industry by offering them transportation sub-contracts or jobs in the mines. An example of this can be seen in South Goa where in one of the wards severely affected by dust, a popular movement was successfully quashed by sub-contracting the loading and unloading of iron ore to families/houses in the ward. As a result, the opposition to the activity effectively ceased. Ironically, in the mining areas, protest has become a common way to get a job or get money from companies or contractors. In the few cases we came across where members of the community have attempted to take up the issue, they have complained of being harassed and even intimidated by powerful lobby groups.
We now take a look who the community turns to with its problem of dust pollution. Table C- A.11 shows the agents/agencies that respondents approached to register complaints about the dust pollution problems they face.
Table C-A.1 I Who do people complain to regarding air quality? (percentages)
All other agents
Mining
Cluster Panchayat company
1 31.58 33.33
11 38.82 52.94
III 68.48 17.39
Total study
area 48.72 34.19
Gram Kruti Samiti
/other village Member of Total other
groups MLA parliament Mamlatdar Collector Other agents
0 3.51 7.02 12.28 5.26 7.02 35.09
1.18 1.18 2.35 3.53 0 0 8.24
1.09 4.35 0 2.17 1.09 5.43 14.13
0.85 2.99 2.56 5.13 1.71 3.85 17.09
The table above shows that the Panchayats and the mining companies are the two most commonly approached agents regarding air quality problems. In the whole study area looked at together, the panchayat is most likely to be approached, with mining companies as the next option. Looking at this cluster-wise, we see that in Cluster I nearly equal proportions approach the panchayats (31.58%) and mining companies (33.33%) regarding air quality issues. Additionally looking at all other agents together (the last column), we see that almost an equal fraction of those complaining, go to various other agents (35%). This is the highest among the three clusters. In Cluster II, a greater fraction of the complaints are made to mining companies (nearly 53%) than to panchayats (nearly 39%) and only about 8% of the complaints are made to various other agents. In Cluster III clearly the largest fraction of
IDRC Centre File: 101276-001 43
TERI Report no. 2002WR41

Annexure C
complaints are made to the panchayat (68.4%), followed by the mining companies (17%) and about 14% of the complaints are made to various other agents.
To further understand who people choose to approach regarding the dust problem we looked at those people who had approached only one agent (137 out of 178 who took some action to address their air quality problems), and wanted to know which agent was chosen. The first choice for those complaining once differs across clusters. Cluster I had as many respondents approach both the panchayat and the mining companies, while in Cluster II, the mining companies were the first port of call. For Cluster III on the other hand, the panchayat was the most approached agent (Table C-A.12).
Table C-A.12 Who people complain to if they do it only once
Cluster Panchayat Mining company MLA Member of parliament Other N
1 46.15 46.15 0.00 0.00 7.69 13
II 36.36 60.00 0.00 1.82 1.82 55
III 78.26 13.04 2.90 0.00 5.80 69
Total 58.39 35.04 1.46 0.73 4.38 137
Cluster III seems to approach the Panchayat more than Clusters I and II regarding the air pollution problem. Since the Panchayat is the first port of call in a rural context people are
likely to approach it first. It is possible however, that over time and through experience, the local community learns to deal directly with the mining companies as well as higher authorities in the government and we see that in Clusters I and II smaller fractions of people approach the Panchayat and more of them deal either directly with the companies or with other government agents.
Some of the conclusions that can be drawn from the data above is: This survey data suggests that with respect to air quality respondents are more likely to actively protest if they do not have mining/allied jobs. It is possible that the age of mining has influenced political activity and civic engagement, with areas where mining is oldest being most active vis-a-vis the relatively younger areas. Panchayats and mining companies the most approached agents In the older clusters (namely I and II) greater proportions of respondents go to agents other than the panchayat.
We now look at how the respondents perceived the two main agents, the panchayat and the mining companies with respect to the level of concern they showed regarding the dust problem as well as how effective these agents have been in addressing the problem.
IDRC Centre File: 101276-001 44 TERI Report no. 2002WR41

Annexure C
Table C-A.13 Perception of attitudes of various agents towards the dust problem
Cluster Panchayats Mining companies Others
1 2 N 1 2 N I 2 N
33.30 66.70 18 52.60 47.40 19 64.70 35.30 17
II 0.281 71.90 32 31.80 68.20 44 100.00 7
III 15.00 85.00 60 21.40 78.60 14 33.30 66.70 12
Total 21.80 78.20 110 35.10 64.90 77 41.70 58.30 36
t - Poor attitude/ showed no concern (%) 2 - Good attitude/ showed some or a lot of concern (%)
In the table above we focus on the two main agents who are approached by respondents regarding dust problems, i.e. the Panchayats and the mining companies. All other agents have been clubbed together under the heading "other" since the numbers going to any one other agent was not very large.
In the study area we see that a greater proportion of respondents felt that the panchayat showed concern regarding the dust pollution problem as compared to mining companies. As
far as the attitude of the panchayats goes, the highest proportion of respondents from Cluster III (85%) felt that the panchayat showed concern regarding the dust issues followed by Cluster II (71.9%) followed by Cluster I (66.7%). As far as the mining companies go, again the proportion of respondents feeling that the mining companies showed concern was the highest in Cluster III (78.6%) followed by Cluster II (68%) and Cluster I (47.4%).
The table below captures how effective the respondents felt the agents were in actually addressing the problem of dust.
Table C-A.14 Effectiveness of various agents in handling the dust problem as perceived by respondents
Cluster Panchayats Mining companies Others
Not effective Effective Not effective Effective Not effective Effective N
1 55.60 44.40 18 57,90 42.10 19 94.70 5.30 19
II 60.60 39.40 33 45.50 54.50 44 71.40 28.60 7
III 43.50 56.50 62 57.10 42.90 14 69.20 30.80 13
Total 50.40 49.60 113 50,60 49.40 77 82.10 17.90 39
We see that in Cluster I nearly an equal proportion of respondents felt that panchayats and
mining companies were effective in addressing dust problem. In Cluster III a greater proportion of people felt that the panchayat (56.5%) was effective in addressing the dust issue as compared with the mining companies (42.9%). In Cluster II on the other hand, a
greater proportion of respondents felt that the mining companies (54.5%) were effective in addressing dust problems as opposed to the panchayats (39.4%).
While Panchayats have little or no role to play in the regulation of air quality, they are approached by 31%, 38% and 68% of the people in clusters I, II and III respectively.
IDRC Centre File: 101276-001 45
TERI Report no. 2002WR41

Annexure C
From the data presented above, we can conclude that: People have faith in their Panchayats and trust that their representatives will take their complaint forward to the relevant authority. People expect the panchayat top do something about the problem (between 92% -
95% of the respondents in a separate question said that they expected the panchayat to do something to solve the issue) Despite not having any significant legal authority to address the problem, between
39-56.5% of the respondents across the clusters felt that the panchayat was effective in addressing the problem
Conclusions
In the case of air pollution in mining areas of Goa, we see that there is extensive legislation to address the problem, but the enforcement of the law is weak. In the past the GSPCB has shirked its responsibility to `prevent, control and abate' air pollution claiming that mining areas were not under its jurisdiction. Additionally, the GSPCB, the IBM and the RTO have passed the buck of responsibility from one to the other, providing reasons for why the dust pollution is not their problem.
Outsourcing of the transportation business has made regulating this activity difficult since there are thousands of truck owners to monitor. The rapid growth of the transportation industry has been made possible by the irresponsible lending practices of local banks in the mining areas. Because truck owners are unable to act collectively pressure companies to raise transportation rates, they overload their trucks in order make their business viable while companies turn a blind eye to this practice. Those with the authority to enforce the law are bribed to ignore overloaded trucks and vested interests prevent cleaner methods of transportation of ore from being developed.
When markets and governments fail to address problems faced by the people, the role of civil society becomes vital. Yet, we see that dependence on mining or allied activities for a livelihood decreases the likelihood to actively protest against the problem of dust pollution. A common way to quash dissent is to co-opt dissenters by providing them jobs in the mines, giving them transportation or other related contracts, thus creating stakeholders in the community. It is possible that the age of mining has influenced political activity and civic engagement, as we observe that Cluster I is the most active with regards to complaining about the dust problem, discussing the issue at Gram Sabha meetings and participating in protest marches followed by Cluster II and then III.
Panchayats and mining companies are the two most approached agents when it comes to complaining about air quality problems. In the older clusters (namely I and II) a greater proportions of respondents approach agents other than the Panchayat, suggesting that over time, the local community learns to deal directly with the mining companies as well as higher authorities in the government. Despite having no significant legal authority to address the problem, between 31% - 68% of the respondents approached the panchayat and 39-56.5% of the respondents across the clusters felt that the Panchayat was effective in addressing the problem, suggesting that the Panchayat does wield some power when it comes to addressing this issue.
IDRC Centre File: 101276-001 46 TERI Report no. 2002WR41

Annexure C
B Governance case study: Responses to changes in ground water and shortages of water for household use
In this study on governance with regard to ground water management and water supply the following main issues or questions addressed:
How do mining activities affect groundwater resources? How is groundwater managed in the context of mining? Who are the main agents involved in water supply? What are the alternative sources of water in the study area? Characterisation of
alternative water supply How do people perceive the main agents involved in water supply? What are the key factors that influence decision making regarding water supply? What is the community's role in addressing water supply problems?
The problem: Impact of mining on groundwater Communities living in the mining areas of Goa have traditionally relied on well and spring water to meet their daily needs. However, mining has had an impact on the water table and groundwater has become scarce. Dewatering of mine pits is an important part of mining activities where open cast mining pits are working below the watertable. Dewatering is a process by which groundwater that collects in the pit is pumped out with the help of pumps in order to maintain a dry pit floor. This draining out of groundwater can have an impact on the water balance in the local aquifer.
A TERI (2005) study entitled "Present Status of Groundwater Recharges and Availability in the Mining Watersheds of North Goa" provides information on the condition of ten micro watersheds that fall into Cluster I and II in the study area. By capturing groundwater drafts and recharge for all ten micro watersheds, this study shows that groundwater is a highly stressed natural resource. The table below based on this study, shows that three out of ten watersheds are most-critical or critical while another five are sub-critical. Thus, of the io microwatersheds studied, eight are experiencing some level of stress. (TERI 2005)
Table C-B.1 Condition of micro watersheds in North Goa
Water balance classification No. of watersheds ._..._-....__.._......_._............_..._ _.... ..... _.... _.......-- -------. -.-....-------_ -----9-- ---- ......-.....
Most critical (withdrawal
> 100% of recharge) 2
Critical (withdrawal = 75-100% of recharge) 1
Sub-critical (withdrawal = 50-75% of recharge) 5
Non-critical (withdrawal < 50% of recharge) 2
Total 10
Source. TERI 2005
The lowering of the watertable also leads to reduced availability of well water. During focus group meetings, informal discussions and PRA exercises people in all three clusters complained about shortages of well water or drying up of wells. As well water is one of the key sources of water for household use in rural areas, this poses a problem particularly for women who traditionally deal with household activities involving water.
IDRC Centre File: 101276-001 47
TERI Report no. 2002WR41

Annexure C
Results from the governance survey conducted in this project show that the reduced availability of groundwater affects a relatively large percentage of the population and is not limited to a few homes around the mines.
Table C-B.2 Well levels lowered or gone dry
Wells: Levels lowered + gone dry (%)
Summer
Monsoons
Winter
Cluster 1 Cluster 11 Cluster Ill Total
59.62 72.82 71.21 70.3
0.00 7.77 1.52 3.5
21.15 16.50 15.91 17,00
Looking at Table C-B.2 above, it is clear that a very high percentage of people in all clusters have reported well-related problems in the summer. In the summer lowered well levels
cannot be attributed only to mining because there is a natural tendency for water levels to drop in this season. During the monsoon the problem diminishes completely in Cluster I and is considerably low in Cluster II and III. This is probably because mining activities come to a halt during the monsoon. The mine pits fill up with rainwater and the aquifer gets recharged. The percentages recorded for winter tell us more about the impact of mining on well levels because the natural tendency towards dryness observed in summer is absent. The change in well levels just after a heavy monsoon can be attributed to dewatering of the mine pits when operations start up again. In winter Cluster I records the highest level of problems relating to wells followed by Cluster II and then Cluster III.
Survey respondents who reported using wells and reported having a water problem were asked what they perceive to be the cause of changes in well water levels. Table C-B.3 below shows that across the study area 50% of those using wells perceived mining to be the cause of change in well water quantity. The largest proportion of respondents perceiving mining as
the cause was in Cluster II followed by Clusters I and then III.
Table C-B.3 Cause of change in well water levels - community perceptions
Clusters Mining and allied activities % Seasonal % Other % Don't know % N
1 56.00 40.00 8.00 4.00 25
II 63.93 36.07 0.00 1.64 61
III 39.78 45.16 3.23 13.98 93
Total 50.28 41.34 2.79 8.38 179
The survey results presented above show that a sizable proportion of respondents in the study area report groundwater problems across the three clusters and half of them attribute it to mining and allied activities.
Impact of ground water shortages on women In order to understand the impact of well water shortages one group discussions were held with women each Cluster. Additional insights were available through ongoing interaction with self-help groups in the study area.
IDRC Centre File: 101276-001 48 TERI Report no. 2002WR41

Annexure C
Household activities for which water is required as reported by women in the group discussions are listed below:
o Cooking o Drinking o Bathing o Washing clothes o Washing dishes o Cleaning the house o Paving or layering the floors of the house with cow dung o Collecting water o Watering plants and kitchen gardens
With the exception of kitchen gardens where women reported that men are involved in tending the gardens, all the tasks listed above are taken up by women in the household. The difficulties caused by water shortages to women (as reported by the women) in these wards are listed below:
Women's lives have come to revolve around water. They are unable to plan their days or take up any other activities be it income generation, educational, social or political activities, as they are obliged to wait indefinitely for their water supply.
Women are forced to manage all their household tasks with very little water. In the dry months when there isn't enough water for cooking, drinking and washing dishes becomes a priority. As a result children and adults can't bathe and teachers at school complain about the children being dirty and unwashed.
Physical stress increases when conditions are very bad. Women often walk 4 to 5km to the nearest well, stream or spring to wash clothes and bathe. Carrying wet clothes back to their home is tiring and burdensome.
High levels of anxiety and insecurity because of uncertainty in water supply.
Sometimes women have resorted to begging for water on the roads. They try to stop passing water tankers and try to convince the driver to let them fill up a few buckets. (Cluster III only)
In the dry months when water is rationed out from wells or taps fights ensue because of the high levels of stress and anxiety.
The conditions inside the homes are unpleasant and dirty.
Supplementary income from kitchen gardens is not possible as there is no water available for the plants.
As water provided by mining companies is the main alternative source of water in many mining villages, the communities loose a significant amount of leverage with the companies because they depend on companies for basic needs.
IDRC Centre File: 101276-001 49
TERI Report no. 2002WR41

Annexure C
Responses to changes in ground water In an area where traditional sources of water (such as groundwater) are stressed as a result of mining, good governance demands that alternative sources of water be adequately supplied to meet the daily needs of the community.
The following sections look at the responses by the different agents to the water supply problem. First, we look at the legal framework within which groundwater is managed and attempt to characterise groundwater management in the context of mining in Goa. In the face of depleted groundwater resources, we then look at alternative sources of water supply focusing on the agents responsible at different levels in the government. We also characterise the role of civil society in addressing issues related to water and bring out the role of women in dealing with water supply problems.
Groundwater management The Department of Water Resources is responsible for managing groundwater and managing surface water bodies. In terms of ground water, this department is empowered by the Goa Goa Ground Water Regulation Act 2002 (Government of Goa 2002). Some of the main features of this act are as follows:
Clearly prioritizes drinking water supply over other uses of groundwater Provides the authority to restrict groundwater withdrawals in ways that threaten drinking water sources and in critical areas (watersheds) where groundwater is deemed to be overexploited Recognizes the need for limits on the transport of water 6 by surface transport or by pipeline in over exploited areas
While this framework provides considerable powers for the management of groundwater, its enforcement is problematic. For one, enforcement of the Act is dependent on data that identifies watersheds that are critical (where withdrawals exceed recharge). At the moment the Central Ground Water Board monitors only 54 wells across the entire state of Goa (water columns are checked quarterly) which is not enough data to assess the conditions of individual micro-watersheds. According to government representative interviewed, so far, there have been no studies taken up by the state government to assess the impact of mining activities on groundwater and the state government has no plans to do so in the near future. Thus, in the absence of adequate data, the enforcing authorities cannot enforce the Act. According to officials from the Water Resources Department, ground water monitoring and digitisation of this data has begun under a new World Bank funded project. Through this project the State Water Resources Department plans to develop a monitoring network of wells but none of the chosen locations are in the mining areas. The focus seems to be almost exclusively on coastal groundwater.
A potential source of data on the impact of pit dewatering is the Environmental Impact Assessment submitted by each company prior to beginning operations or expansions/ extensions of the mine lease. The Environmental Impact Assessment (EIA) reports
6 The Goa Ground Water Regulation Act, 2002 states, 'No person shall transport groundwater from a source of water in a scheduled area more than 30 000 litres annually, by any means of surface transport or by pipeline without the permission of the Ground Water Officer.'
IDRC Centre File: 101276-001 50
TERI Report no. 2002WR41

Annexure C
submitted by mining companies ought to provide a projection of groundwater use and depletion. According to Department officers, however, these studies, at times, fail to capture the impact on areas within a short radius around the mine pit which is where wells go dry. This may be because the groundwater studies tend to focus on the larger watershed, rather than the micro watershed. Additionally, there is no routine data sharing between the Indian Bureau of Mines, the department overseeing the EIAs, and the Department of Water Resources that is supposed to implement the Groundwater Act.
In general, officers with the Water Resources Department seemed to suggest that impact of mining on groundwater is well know, but is not a big enough problem to merit any attention. It was suggested that since the problem is not wide-spread it is unimportant and not necessary to address. (Yet, in the governance survey conducted for this project, 17 % of respondents across the study area reported that the water level in their wells had lowered or wells had gone completely dry in winter, a season in which lowered levels are more likely to be associated with mining activity than seasonal changes.)
Department officials also expressed the view that mining has created jobs and has benefited the community immensely. Therefore the community has no right to complain about the negative impacts of mining. (While this argument is problematic, to say the least, even by its own logic the numbers do not bear out. In the governance survey conducted, 38.24% of respondents stated that they or their family members are employed in mining and allied activities while 61.31% are not. Thus, a large percentage of people facing water problems may not be benefiting from mining jobs. )
Water Resources Department officers tend to take action only when they receive complaints about groundwater shortages. The department takes a more conciliatory approach where in such cases they ask companies to take up additional water harvesting measures (eg. artificial recharge pits) and request them to provide tanker water to local community members facing water shortages.
Provision of alternative sources of water As mining has had an impact on the water table and groundwater has become scarce, the state and mining companies have responded by providing alternative sources of water. Local
communities have come to depend upon two or three different sources of water. The main agents involved in management household water supply are as follows:
Panchayats: As representatives of the village Panchayats are responsible for making applications to the PWD for tap water supply. They also provide local residents with income certificates to avail of the free tap scheme (explained later) and represent the community / present community opinions or problems to other agents. In terms of groundwater, they are responsible for the maintenance of public wells.
Public works department: This department is responsible for laying and maintaining the pipe network for water supply and for day-to-day provision of tap water.
Mining companies: Provide water by tankers to various local villages that are stressed.
IDRC Centre File: 101276-001 51
TERI Report no. 2002WR41

Annexure C
Ministers of the Legislative Assembly (MLAs): Use their good office to get works sanctioned and implemented speedily.
Landlords: '['hey have no formal role to play but can obstruct the procedure to get taps installed by refusing to allow pipes to pass over their land.
Local communities: Local communities also play a role in creating change by pushing for better practices or more responsiveness from state agents and companies. 'their participation in civic life has an impact on services available in the region.
The two main alternative sources of water in the study area are tap water provided by the Public Works Department (PWD) and water supplied by tankers by mining companies. In this section we characterise alternative water supply in each cluster. The kind of alternative water in each Cluster tells us about the responsiveness of the state to water shortages in the mining areas.
: Tap water The table below shows the percentage of respondents in each Cluster using tap water at home.
Table C-B.4 Percentage of rural population using private taps
Cluster Rural respondents using pvt taps (%) N
I 75.00 52
II 59.01 161
III 56.99 193
Total 60.10 406
From the above table it is clear that a greater percentage of respondents in Cluster I have taps (75%). The percentage of people having taps in Cluster II and III is similar (57% -59%) but about 15% lower than Cluster I. Considering the study area is rural, these numbers suggest that the tap network is quite extensive and show that Panchayats and the PWD have responded to the problem of lowered well water levels. The availability of taps at home show that the Panchayats and the PWD have responded the most in Cluster I as compared to Cluster II and III. In addition to having taps, however, the regularity of supply is also important.
During group meetings, women in the study area had complained about erratic tap water supply which is borne out through the survey. Respondents were asked whether they received tap water daily. The table below shows that in the study area reporting of irregularity is very high (67.6%) summer, drops to 21.7% in the monsoon and rises again to 29.5 % in winter.
IDRC Centre File: 101276-001 52 TERI Report no. 2002WR41

Annexure C
Table C-B.5 Percentage reporting irregular tap water
Cluster Tap water - irregularity 1 no water
Summer Monsoon Winter N -- .......... .................. _...... ..... _....................... .......__...._..._........_... ...... ... _..._..
1 58.97 17.95 15.38 39
II 69.48 31.58 37.89 95
III 69.10 14.55 27.27 110
Total 67.62 21.72 29.51 244
Table C-B.5 above shows that in all seasons the largest percentage of respondents reporting irregularity are in Cluster II. Cluster I is better of than Cluster III, except in the monsoons where a higher percentage of people in Cluster I report irregularity. Interestingly, in Cluster I a higher percentage reported irregularity in the monsoon than in winter, which is contrary to expectations.
Over all it can be seen that Cluster II is the worst off in terms of regular daily water supply followed by Cluster III and then Cluster I.
Regularity in terms of timing
Women in focus group discussions had also complained that they do not receive water at the same time daily. They claimed that they are forced to stay at home all day and they can't take up other activities as a result. In order to verify the extent of this problem we asked whether timings for water supply were regular or not.
Table C-B.6 Percentage reporting irregular timings
Cluster Tap water - irregular timings
Summer Monsoon Winter N _._ ...---...------
46.15 25.64 23.08 39
II 64.21 38.95 43.16 95
III 59.09 17.27 25.45 110
Total 59.02 27.05 31.97 244
Reporting of irregularity was high across the study area (Table C-B.6). A cluster-wise breakdown of results shows that, Cluster II fares worst in term of regularity of timing in all
three seasons. Cluster I fares better than Cluster III, except in the monsoon where 25% of Cluster I reported irregular timings as opposed to 17% in Cluster III.
While tap water is replacing traditional sources, namely well water, it is important to note that tap water supplied by the PWD is not free7 whereas there are no costs associated with well water. In the survey, people were asked whether they felt their monthly bills were reasonable/affordable or expensive. The table below (C-B.7) shows that more than half the respondents in Cluster III found the bills expensive followed by Custer II with just under half the respondents. In Cluster I 36% of respondents found water bills expensive.
The government has a scheme whereby the government pays for the installation of a tap and water meter for families with an income of less than Rs. 25,000 per annum however monthly water bills need to be paid by the family. Families that avail of this scheme save on average Rs. 1500 on the cost of the installation.
IDRC Centre File: 101276-001 53
TERI Report no. 2002WR41

Annexure C
Table C-B.7 Affordability of tap water
Affordability of tap water
Cluster Expensive Affordable .. .... ....._
Don't know/ No response ........ __ ...
I 35.85 60.38 3.77
II 42.55 47.87 9.57
III 53.97 35.71 10.32
Total 46.52 44.69 8.79
While tap water is perceived as expensive by close to half the respondents, the Public Works Department is simultaneously in the process of removing public taps across the state
including mining areas as part of a state policy to stop free supply and enhance revenues.
Public tap water is provided free of cost to the consumer and is an important source of water for people who can't afford private taps. Table C-B.8, below shows the percentage of people who reported using public taps in all three seasons in each Cluster (along with other sources
of water). Approximately 18% of respondents in Cluster III are dependent on public tap supply while in Clusters I and II approximately to% of the study population is using public taps.
Table C-B.8 Public tap usage
Cluster Use public taps
(%i
Don't use because recently
removed (%)
N
1 9.86 27.14 70
II 10.63 22.98 161
II 18.01 18.95 211
Total 15.84 31.07 442
Additionally, the table above tells us that 31% of the respondents don't use public taps because they were recently removed. Interestingly, the highest proportion was in Cluster I followed by Cluster II and then Cluster III. This highlights the state's attention (or lack of attention) to equity in planning and policy.
Tanker water The survey also provided information on tanker supply in each cluster. Table C-B.9, below, shows that Cluster II is highly dependent on tankers (60% -83%) and more so than any other cluster in all seasons. Interestingly, tanker supply is relatively high even during the monsoons in Cluster II.
Table C-B.9 Use of tanker water
Receive tanker water daily or every alternate day (%)
Cluster l Cluster 11 Cluster 111 .............. -................................................................. --__............ _......... ........ .... .---------------
Summer 28.58 83.78 78.82
Monsoon 14.29 60.81 4.71
Winter 14.29 60.81 14.12
The provision of tanker water to large percentages of the population in the study area as a whole suggests that mining companies and Panchayats are making an effort to respond to the
IDRC Centre File: 101276-001 54 TERI Report no. 2002WR41

Annexure C
communities' water problems. One cannot conclude, however, that companies and Panchayats are more responsive in Cluster II because a greater percentage of people get tanker water. Rather the high percentage of tanker supply could be an indication of higher levels of water stress.
While tanker water supply is an effective way to reduce short term water stress, it is not sustainable in the long run and calls into question the relative importance given to issues of sustainability in terms of alternative water supply. In this survey there were 165 respondents who said that they had no water problems. Of those reporting no water problems at all, 16% said they receive water through water tankers suggesting that for sections of the local community being dependent on tanker water is not perceived as a problem and the sustainability of their water source is not a consideration.
From the survey we can conclude that while private taps were found in nearly 60% - 75% of the surveyed households, they were reported as being unreliable in terms of daily supply and supply timings, especially in the summer months, when water stress is highest. Additionally, even though alternatives like tap water exist, they come at a cost as opposed to well or stream water. It is largely felt that private taps are an expensive option, even as the State government, as a policy, is decommissioning pubic taps. Additionally, a large proportion of respondents were dependent on tankers for water supply, which is not a sustainable option in terms of water supply
Community perceptions of agents and community participation In order to identify differences in responsiveness and efficiency of major agents by cluster, and to assess how active the local community is in terms of pushing for change or for better services, residents in the study area were asked who they approach for water problems, what their main complaints were and their opinions about various agents they approached. This was done through the household survey.
From the total sample of 442, 277 respondents claimed to have some water related problem. From these, 267 answered questions relating to whether they approached any agency or not. While 1o people (3.61%) did not respond to the question, 56 respondents (or 20.97%) said that they approached no one, which implies that one out of every five persons is unlikely to complain about water problems that they might face.
Table C-B.1o, below, shows the kinds of problems or issues respondents complained about. Between 80% and 99% of respondents complained about tap water supply, including irregularity, insufficiency of water, broken or leaking pipes etc. Between 15% and 20 % of people complained about lowered wells water level (which is similar to the percentage of people reporting well water problems in winter). A relatively low percentage of respondents complained about tanker water supply.
IDRC Centre File: 101276-001 55
TERI Report no. 2002WR41

Annexure C
Table C-B.10 Problems reported (%)
Cluster Tap related Well related Tanker related
1 99.99 17.65 0 34
II 81.31 20.56 12.15 107
III 96.75 15.45 3.25 123
Total 90.9 17.8 6.44 264
Table C-B.ii below shows that a considerable percentage of respondents in all three clusters
approached their Panchayat for water related problems with Cluster III reporting the highest percentage followed by Cluster II and then I. Despite the Panchayat's role in water supply being limited, the fact that a large percentage of respondents in each Cluster approach them suggests that local communities have faith in their Panchayat's ability to solve their problems and it is an important agent from people's perspectives. The fact that the largest percentage
of respondents approaching the Panchayat were in Cluster III, followed by Cluster II and I suggest, that with age of mining it is possible that people are less inclined to approach their Ianchayat and more inclined to go to approach a greater variety of agents.
In Cluster I the second most approached agent is the PWD followed closely by mining companies. Similarly in Cluster III the second most approached agent is the PWD, however, very few people (only 4.9%) reported approaching mining companies. In Cluster II, mining companies are approached io% more than the PWD.
Table C-B.1 I Agents approached for water problems
Cluster Panchayat PWD Mining Co. Others N
1 47.1 23.5 20.6 8.8 34
II 58.9 12.1 22.4 6.5 107
Ill 68.3 21.1 4.9 5.7 123
Total 61.7 17.8 14.0 6.4 264
In the survey, those who reported approaching a particular agent were asked what kind of response they got from that agent in terms of attitude/concern shown and in terms of whether their problems were solved (effectiveness).
The table below (C-B.12) shows that in the study area in terms of attitude mining companies fared best (86.6%) followed by Panchayats (79%) and finally the PWD (73%).
Table C-B.12 Attitude
Cluster Panchayat PWD Mining companies
Some/ a lot of N Some/ a lot of N Some/ a lot of N
concern (%) concern (%) concern (%)
1 50.0 16 62.5 8 80.0 5
II 69.8 63 41.7 12 91.7 24
III 91.5 82 92.3 26 83.3 6
Total 78.9 161 73.9 46 86.6 35
IDRC Centre File: 101276-001 56
TERI Report no. 2002WR41
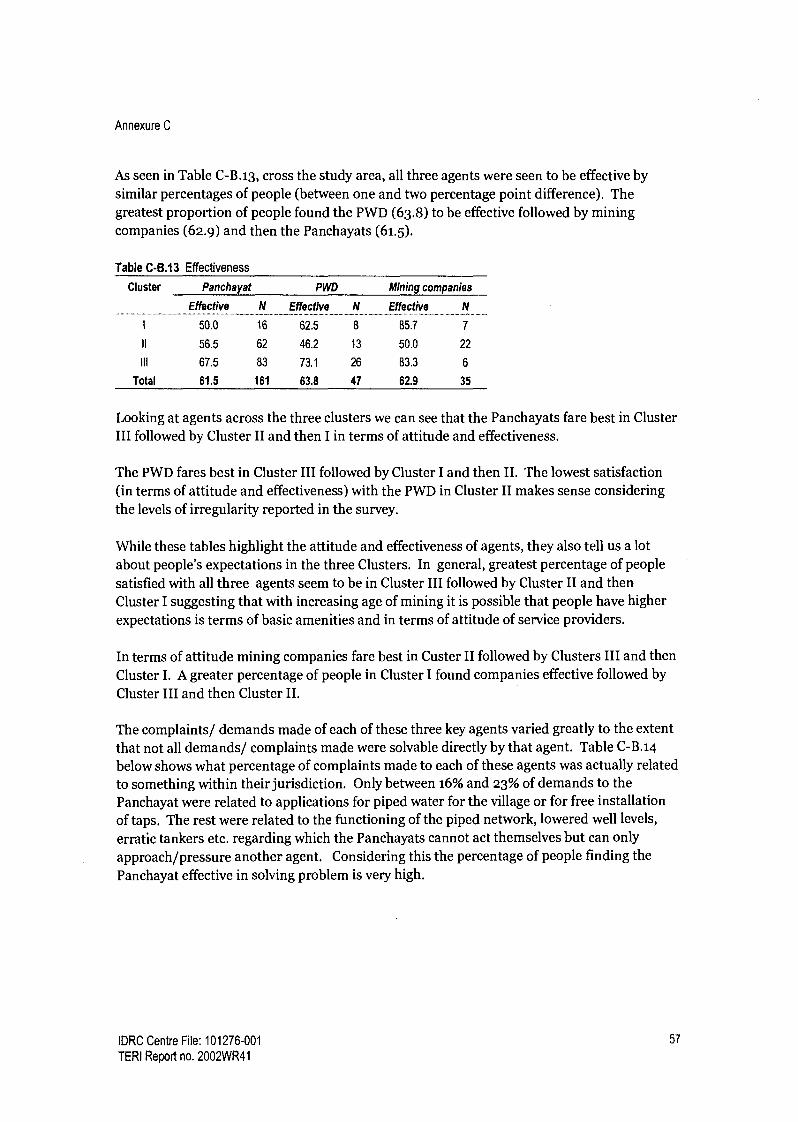
Annexure C
As seen in Table C-B.13, cross the study area, all three agents were seen to be effective by similar percentages of people (between one and two percentage point difference). The greatest proportion of people found the PWD (63.8) to be effective followed by mining companies (62.9) and then the Panchayats (61.5).
Table C-B.13 Effectiveness
Cluster Panchayat PWD Mining companies
Effective N Effective N Effective N
50.0 16 62.5 8 85.7 7
II 56.5 62 46.2 13 50.0 22
III 67.5 83 73.1 26 83.3 6
Total 61.5 161 63.8 47 62.9 35
Looking at agents across the three clusters we can see that the Panchayats fare best in Cluster III followed by Cluster II and then I in terms of attitude and effectiveness.
The PWD fares best in Cluster III followed by Cluster I and then II. The lowest satisfaction (in terms of attitude and effectiveness) with the PWD in Cluster II makes sense considering the levels of irregularity reported in the survey.
While these tables highlight the attitude and effectiveness of agents, they also tell us a lot about people's expectations in the three Clusters. In general, greatest percentage of people
satisfied with all three agents seem to be in Cluster III followed by Cluster II and then Cluster I suggesting that with increasing age of mining it is possible that people have higher expectations is terms of basic amenities and in terms of attitude of service providers.
In terms of attitude mining companies fare best in Custer II followed by Clusters III and then Cluster I. A greater percentage of people in Cluster I found companies effective followed by
Cluster III and then Cluster II.
The complaints/ demands made of each of these three key agents varied greatly to the extent that not all demands/ complaints made were solvable directly by that agent. Table C-B.14
below shows what percentage of complaints made to each of these agents was actually related
to something within their jurisdiction. Only between 16% and 23% of demands to the Panchayat were related to applications for piped water for the village or for free installation of taps. The rest were related to the functioning of the piped network, lowered well levels,
erratic tankers etc. regarding which the Panchayats cannot act themselves but can only approach/pressure another agent. Considering this the percentage of people finding the
Panchayat effective in solving problem is very high.
IDRC Centre File: 101276-001 57
TERI Report no. 2002WR41

Annexure C
Table C-B.14 Percentage of complaints that are within agent's jurisdiction
Cluster Panchayat PWD Mining Co. ........ .....
1 23.81 66.67 75.0
II 23.38 81.25 76.0
III 16.83 81.82 85.7
Total 20.10 79.31 77.5
Factors influencing decision making Having looked at water supply across the three clusters the study attempted to explore the factors that influence decision making among the key agents through qualitative data. Water supply in four hamlets (administrative wards) across the study area was analysed. Here we chose hamlets in each Cluster that were known to have a water problem or know to have very good water supply.
Ward Cluster Characteristics Ward A I Well levels dropping, 24-hour tap supply, public taps phased out Ward B I Well levels dropping, no taps, daily tanker supply Ward C II Wells completely dry and filled up with mud, no taps (public or
private), tankers twice a day Ward E III Wells drying, public taps, very few private taps, no tanker supply
As stated earlier, at the local level there are several agents involved in decision making regarding water supply (Panchayats, PWD, mining companies, MLAs, land lords, community members).
In each ward studied several factors influenced decisions regarding water. Below are the most important factors that emerged across the study area:
Political affiliations of the panchayat While Panchayats and Panchayat members are not supposed to have any political affiliations, in fact many Panchas are often affiliated to major political parties in the state. At one of the wards surveyed the representative found it difficult to get any development taken up in his ward because he was in a minority within the Panchayat. Similarly, PWD staff stated that applications from Panchayats affiliated to the ruling party in the state were treated with more urgency and were more quickly approved. Thus, political affiliations had a strong impact on responsiveness of various agents.
Village disputes/politics In a particular ward surveyed the residents were themselves divided. Thus, the more powerful group ensured that tankers supplying the ward stopped outside their houses. In the same ward, the landlord refused to allow water pipes to be laid over his land thereby preventing the whole ward from having tap water supply despite wells going dry. In such instances the Panchayat does have the power to intervene, but in this case the local representative was related to the landlord which prevented him from taking action against a relative. In this case responsiveness was compromised because of personal affiliations and village politics.
IDRC Centre File: 101276-001 58
TERI Report no. 2002WR41

Annexure C
Using public office for private gain In an interesting case, an elected representative owns a fleet of tankers that are hired out by mining companies to supply water. Company representatives have alleged that there is some level of pressure to hire water tankers from this person as he is powerful and can disrupt the daily working of mines. Some of the wards in this village face serious water stress. It was hinted at by some that the representative may be subtly blocking a long term solution to the problems because it would affect his tanker business. In this example personal monitory gains play a big role in an elected representatives decisions.
State of infrastructure The proximity of a village or hamlet to the main water pipeline or to a reservoir had a big impact on the regularity of water supply. The PWD infrastructure is such that villages closer to the reservoir get better supply. One of the villages surveyed which is adjacent to a reservoir receives close to 24 hours of water throughout the year. Similarly, villages located towards the end of main water pipelines received less water and timings were more irregular.
Political pressure In some cases pressure on the PWD by Ministers of the Legislative Assembly (MLAs) or other influential politicians made a significant difference in terms of how quickly an application for laying of pipes or fixing taps was processed.
Economic interests The PWD started removing all public taps across the state two years ago. They claim that public taps are often leaking and poorly maintained and because the water supplied is free it tends to be wasted. They also stated that free supply of water is a wasted opportunity to earn revenue. Several public taps have been removed across the study area even though not all residents can afford to pay for a private tap connection and monthly water bills. Interestingly, in the ward receiving 24 hour tap water supply, some residents stated that they could not afford the monthly bills and hence have not applied for a private tap. Thus, despite good supply the principle of equity has been ignored.
This study also viewed the local community as an agent involved in change. In the following section the community's participation in addressing water issues is addressed.
The community's role in solving water problems Through the survey was also attempted to understand how and to what extent the community is participating in civic life and through which forums. The survey focused on the following:
Complaining behaviour The Gram Sabha The use of protest Local level institutions
Complaints Data analysis also throws light on the level to which people in each cluster are engaged in
civic life and are willing to move the system for redressal of their problems. Table C-B.15,
below, shows that of those who had water problems, a relatively high percentage (76.17 %) of
IDRC Centre File: 101276-001 59
TERI Report no. 2002WR41
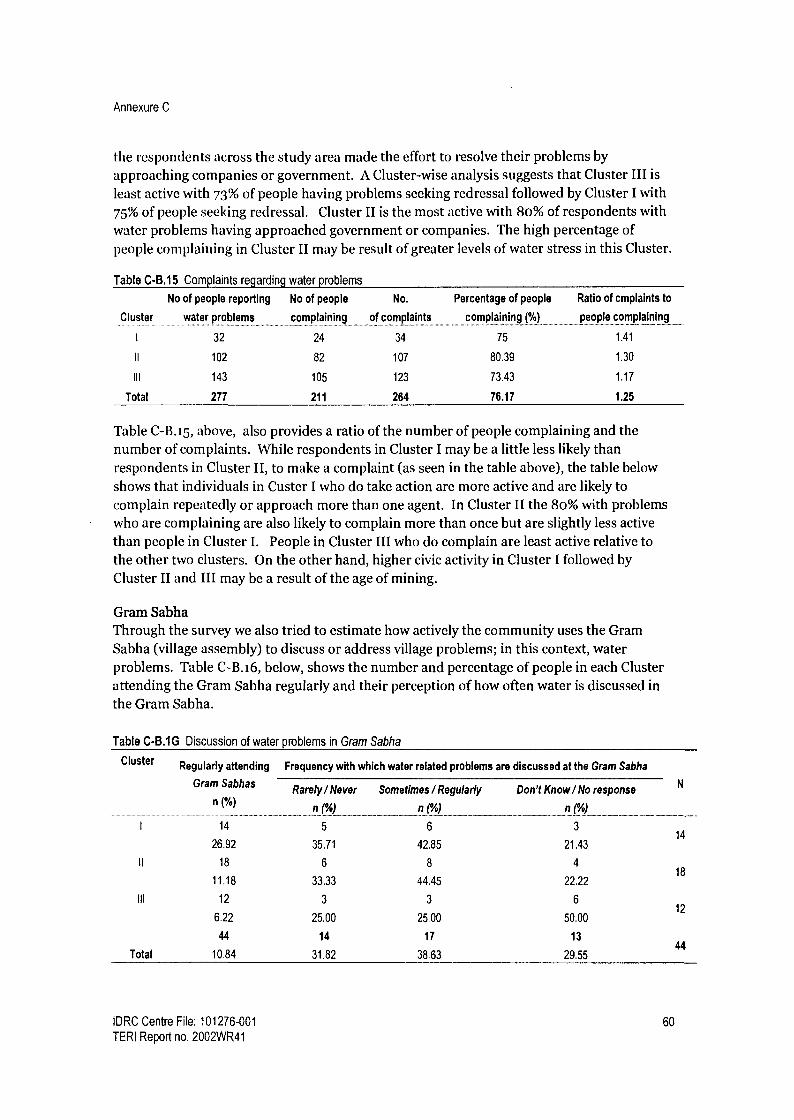
Annexure C
the respondents across the study area made the effort to resolve their problems by approaching companies or government. A Cluster-wise analysis suggests that Cluster III is
least active with 73% of people having problems seeking redressal followed by Cluster I with
75% of people seeking redressal. Cluster II is the most active with 80% of respondents with water problems having approached government or companies. The high percentage of people complaining in Cluster II may be result of greater levels of water stress in this Cluster.
Table C-B.15 Complaints regarding water problems
Cluster
No of people reporting
water problems
No of people
complaining
No.
of complaints
Percentage of people
complaining (%)
Ratio of cmplaints to
people complaining
1 32 24 34 75 1.41
II 102 82 107 80.39 1.30
III 143 105 123 73.43 1.17
Total 277 211 264 76.17 1.25
Table C-B.15, above, also provides a ratio of the number of people complaining and the number of complaints. While respondents in Cluster I may be a little less likely than respondents in Cluster II, to make a complaint (as seen in the table above), the table below shows that individuals in Custer I who do take action are more active and are likely to complain repeatedly or approach more than one agent. In Cluster II the 80% with problems who are complaining are also likely to complain more than once but are slightly less active
than people in Cluster I. People in Cluster III who do complain are least active relative to the other two clusters. On the other hand, higher civic activity in Cluster I followed by Cluster II and III may be a result of the age of mining.
Gram Sabha Through the survey we also tried to estimate how actively the community uses the Gram Sabha (village assembly) to discuss or address village problems; in this context, water problems. Table C-B.i6, below, shows the number and percentage of people in each Cluster attending the Gram Sabha regularly and their perception of how often water is discussed in the Gram Sabha.
Table C-B.IG Discussion of water problems in Gram Sabha
Cluster
I
II
Ill
Regularly attending Frequency with which water related problems are discussed at the Gram Sabha
Gram Sabhas
n(%)
14
26.92
18
11.18
12
6.22
44
Total 10.84
Rarely / Never Sometimes / Regularly Don't Know / No response N
n(%) n(%) n(%)
5 6 3
35.71 42.85 21.43
6 8 4
33.33 44.45 22.22
3 3 6
25.00 25.00 50.00
14 17 13
31.82 38.63 29.55
14
18
12
44
IDRC Centre File: 101276-001 60
TERI Report no. 2002WR41
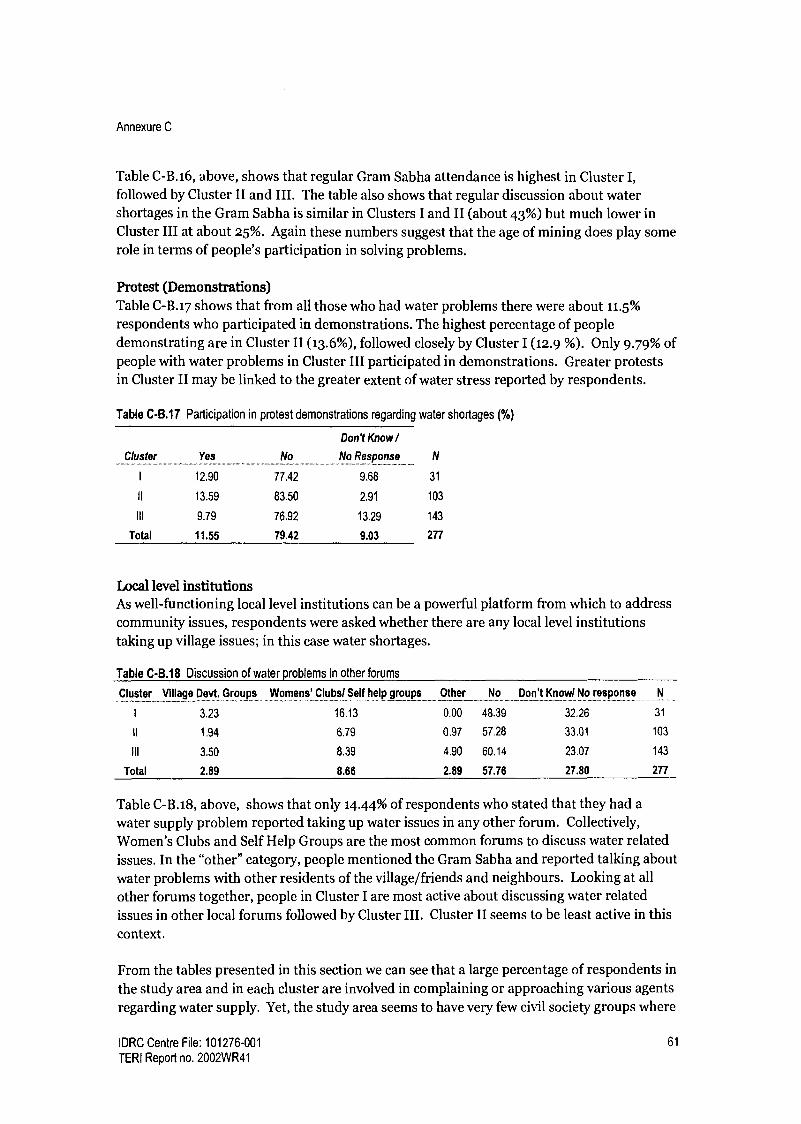
Annexure C
Table C-B.16, above, shows that regular Gram Sabha attendance is highest in Cluster 1,
followed by Cluster II and III. The table also shows that regular discussion about water shortages in the Gram Sabha is similar in Clusters I and II (about 43%) but much lower in Cluster III at about 25%. Again these numbers suggest that the age of mining does play some role in terms of people's participation in solving problems.
Protest (Demonstrations) Table C-B.17 shows that from all those who had water problems there were about 11.5%
respondents who participated in demonstrations. The highest percentage of people demonstrating are in Cluster II (13.6%), followed closely by Cluster I (12.9 %). Only 9.79% of people with water problems in Cluster III participated in demonstrations. Greater protests in Cluster II may be linked to the greater extent of water stress reported by respondents.
Table C-B.17 Participation in protest demonstrations regarding water shortages (%)
Cluster Yes No
Don't Know / No Response
I 12.90 77.42 9.68
II 13.59 83.50 2.91
III 9.79 76.92 13.29
Total 11.55 79.42 9.03
N
31
103
143
277
Local level institutions As well-functioning local level institutions can be a powerful platform from which to address
community issues, respondents were asked whether there are any local level institutions taking up village issues; in this case water shortages.
Table C-8.18 Discussion of water problems in other forums
Cluster Village Devt. Groups Womens' Clubs/ Self help groups Other No Don't Know/ No response
1 3.23 16.13 0.00 48.39 32.26 31
II 1.94 6.79 0.97 57.28 33.01 103
III 3.50 8.39 4.90 60.14 23.07 143
Total 2.89 8.66 2.89 57.76 27.80 277
Table C-B.18, above, shows that only 14.44% of respondents who stated that they had a
water supply problem reported taking up water issues in any other forum. Collectively, Women's Clubs and Self Help Groups are the most common forums to discuss water related
issues. In the "other" category, people mentioned the Gram Sabha and reported talking about
water problems with other residents of the village/friends and neighbours. Looking at all
other forums together, people in Cluster I are most active about discussing water related issues in other local forums followed by Cluster III. Cluster II seems to be least active in this context.
From the tables presented in this section we can see that a large percentage of respondents in
the study area and in each cluster are involved in complaining or approaching various agents
regarding water supply. Yet, the study area seems to have very few civil society groups where
IDRC Centre File: 101276-001 61
TERI Report no. 2002WR41
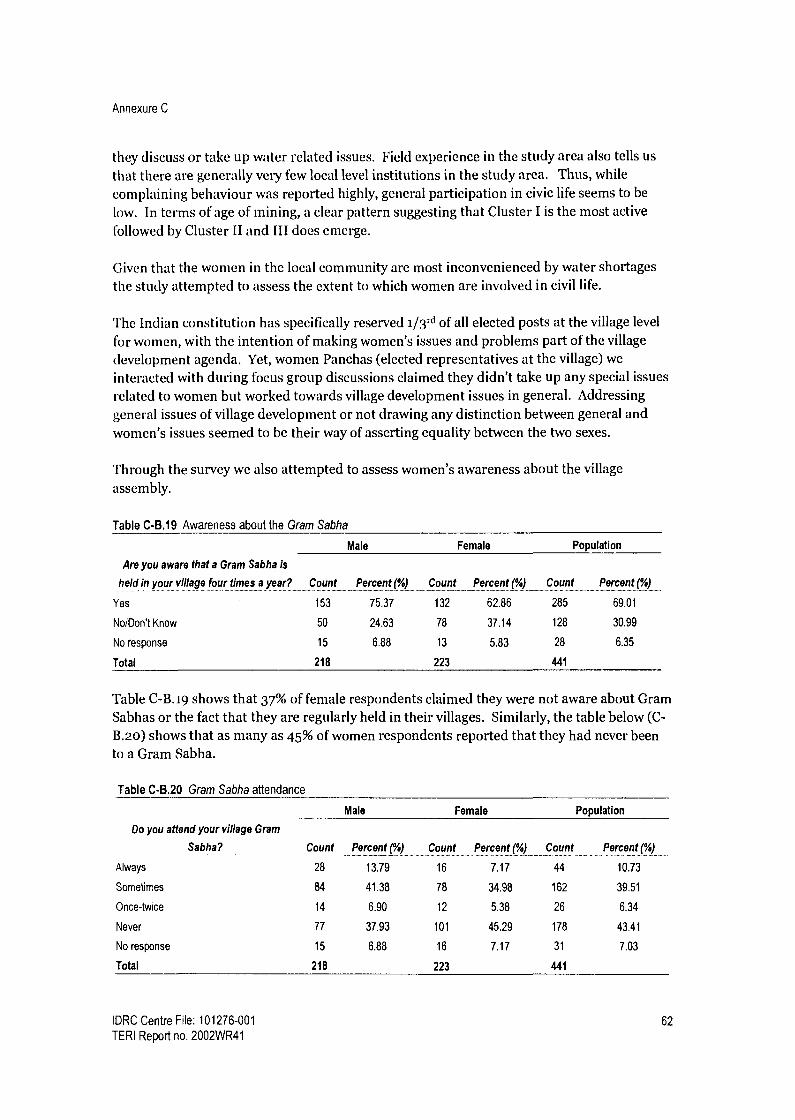
Annexure C
they discuss or take up water related issues. Field experience in the study area also tells us
that there are generally very few local level institutions in the study area. Thus, while complaining behaviour was reported highly, general participation in civic life seems to be low. In terms of age of mining, a clear pattern suggesting that Cluster I is the most active followed by Cluster II and III does emerge.
Given that the women in the local community are most inconvenienced by water shortages the study attempted to assess the extent to which women are involved in civil life.
The Indian constitution has specifically reserved 1/3 rd of all elected posts at the village level
for women, with the intention of making women's issues and problems part of the village development agenda. Yet, women Panchas (elected representatives at the village) we
interacted with during focus group discussions claimed they didn't take up any special issues related to women but worked towards village development issues in general. Addressing general issues of village development or not drawing any distinction between general and women's issues seemed to be their way of asserting equality between the two sexes.
Through the survey we also attempted to assess women's awareness about the village assembly.
Table C-B.19 Awareness about the Gram Sabha
Male Female Population
Are you aware that a Gram Sabha is
held in your village four times a year? Count Percent (%) Count Percent (%) Count Percent (%)
Yes 153 75.37 132 62.86 285 69.01
No/Don't Know 50 24.63 78 37.14 128 30.99
No response 15 6.88 13 5.83 28 6.35
Total 218 223 441
Table C-B.19 shows that 37% of female respondents claimed they were not aware about Gram Sabhas or the fact that they are regularly held in their villages. Similarly, the table below (C- B.2o) shows that as many as 45% of women respondents reported that they had never been to a Gram Sabha.
Table C-B.20 Gram Sabha attendance
Male Female Population
Do you attend your village Gram
Sabha? Count Percent(%) Count Percent(%) Count Percent(%)
Always 28 13.79 16 7.17 44 10.73
Sometimes 84 41.38 78 34.98 162 39.51
Once-twice 14 6.90 12 5.38 26 6.34
Never 77 37.93 101 45.29 178 43.41
No response 15 6.88 16 7.17 31 7.03
Total 218 223 441
IDRC Centre File: 101276-001 62
TERI Report no. 2002WR41

Annexure C
Participants in the survey were asked whether the men or women in the family are involved in making complaints regarding water or air problems. Table C-B.21 shows that only 5% of respondents said that women in their families are involved in complaining and 9% said both men and women complain.
Table CB.21 Do men or women complain?
Who Complains? Count Percentage
Men 153 35.83
Women 22 5.15
Both 40 9.37
Never Complained 144 33.72
Don't know 68 15.93
Similarly, only 4% of respondents reported that women in their families are involved in protests and 6% said that both men and women participate.
Table CB.22 Male/female participation in protest
Participation Count Percentage
Men 55 13.32
Women 16 3.87
Both 27 6.54
Never participated 233 56.42
Don't know 82 19.85
The data presented above suggests that women are not strongly involved in civic life across the study area. While women seem to have very little presence in formal spheres, there is
some evidence that they do influence decisions through informal channels. In one of the water stressed wards visited, women reported that the village development committee had convinced the mining company operating in the area to provide an extra tanker of water daily making women's lives easier and more secure. They also convinced companies to provide a water storage drum to each family in the ward. While there are no women members on this village development committee, women have been successful in getting their demands met. Similarly, women have often mentioned that they don't attend Gram Sabhas or other village meetings because someone else in the family will represent them.
Interestingly, women in micro-credit/ self-help groups in the study area have begun to take action regarding problems faced by them in the village. One of these groups took the initiative to invite their local representative to a meeting and questioned her about her efforts to resolve their water shortage problem. The fact that women are using civil society groups to voice their concerns also stands out in Table C-B.i8 (above). This suggest that given the right exposure and opportunity women are interested in playing a more active role in resolving water problems or other problems that affect their lives.
IDRC Centre File: 101276-001 63
TERI Report no. 2002WR41

Annexure C
Summary Problems with groundwater are relatively widespread across the study area and not limited to just a few homes in the mining areas.
Women are most affected by water shortages as they are responsible for all the household chores requiring water. In the winter season (when the impact of mining is felt most strongly) wells in Cluster I seem to be the most stressed followed by Cluster II and then Cluster III. Cluster II emerges as the most stressed in terms of regularity of tap water supply. The largest percentage of respondents receiving tanker water is in Cluster II While tanker water is necessary in the short run, it is not a sustainable response to the problem of depleting groundwater. The high percentage of people in all Clusters having taps suggests that the Panchayat and PWD have responded to groundwater shortages in the study area. I Iowever, tap water supply is irregular and expensive and has resulted in insecurity and an extra burden on low income groups. In terms of responsiveness, most people found companies showing concern for their water problems followed by the Panchayat and the PWD. In terms of effectiveness a roughly equal percentage of respondents reported the PWD, companies and Panchayats to be effective. Factors that influence behaviour /decision making of various agents responsible for ground water management and water supply were similar in all three Clusters. A high percentage of people are involved in complaining across the study area. In terms of complaining about/ discussing water problems in various forums, Cluster II is slightly more active than Cluster I. (Possibly because of greater stress. Participation in civic life in general (Gram Sabha participation, local level institutions, level of activeness of individuals) is higher in Cluster I than Cluster II. Cluster III is the least active in all ways. Women across the study area are not very active in civic life, especially through formal spheres. Women do have agency and do influence decision making in informal way. Given the right exposure and opportunities women are interested in playing a larger role in decision making.
Conclusions Mining activities have had an impact on ground water bodies in the study area. Looking at the responses of various agents in the study area and their attitude to water shortages, we see that several principles of good governance are absent in terms of decision making and implementation of decisions.
The data presented in this section shows that the state and companies together have been responsive to shortages of water but their attention to effectiveness and equity has been low. While the state is involved in addressing the impacts of mining on ground water, their refusal to acknowledge problems with ground water have precluded any possibility of a response through improved policies or practices towards better management of ground water.
IDRC Centre File: 101276-001 64 TERI Report no. 2002WR41

Annexure C
While the responses of various agents and the factors that influence their behaviour has been similar across the three Clusters, this data shows that the age of mining may have an influence on people's expectations regarding basic needs and regarding responses from various agents in the study area.
According to the cluster (age of mining) hypothesis, people in Cluster I are likely to be more politically active than those in younger clusters because presence of mining over time tends to have a positive effect on a variety of determinants of civic and political participation, such as income, education, infrastructure etc. Cluster I being better off in terms of water supply and in terms of political activity supports the Cluster theory. The slightly higher participation reported in Cluster II may well be related to higher levels of water stress reported by people in this cluster. Cluster III still lags behind Cluster I and II in terms of having a politically active population. This could be attributed to the fact that mining has been present for a shorter time (cluster theory) coupled with the fact that they seem to have slightly less water problems than people in Cluster II.
Recommendations Ground water management
There need to be more studies and more data generated on groundwater in the mining areas, both from an anthropocentric and an ecological point of view. Legislation on groundwater needs to be revisited to see how the impacts of mining can be taken into account without stopping mining activities all together. There needs to be more data sharing and collaboration between departments in order to tackle this issue. There is an urgent need for further awareness and capacity building among government workers about responsible mining and the role of government in supporting companies to comply with regulations or move even beyond the legislative framework.
Alternative water supply In wards where alternative water supply is very poor or where tankers are the only source of water, more localised solutions need to be sought and invested in, such as rainwater harvesting. Water removed from mine pits could be treated and supplied to local communities. The suitability of abandoned or exhausted pits as water storage sites could be evaluated.
Functioning of panchayats More power and funding to Panchayats to address water supply problems at the local
level Capacity building of Panchayat members Clear policy on action against landlords that prevent people's access to basic necessities from being
IDRC Centre File: 101276-001 65
TERI Report no. 2002WR41

Annexure C
C Health data management case study Introduction
Using the Ecohealth approach this project has highlighted some ways in which environmental change in the context of mining has impacted human health, specifically respiratory health. This component of the study is concerned with the state's response to an emerging health problem in the study area. Health outcomes for an individual or community health status are dependent on biological characteristics, behaviour, the presence of environmental stressors and importantly access to good health care. In order to respond to changing health needs of a community through targeted health services and through an improved health policy there is a clear need for robust data that can highlight emerging and potential health problems. The need for sound health data is well recognized in literature (WI 10 2006, OECD 2005, Coffey, et. al. 1997, Coye et. al., 2003) and also recognized in the National Health Policy 2002.
As the health study in this project focuses on respiratory health researchers attempted to gather secondary data on respiratory morbidity from the Directorate of Health Services. However, in most cases data gathered could not be used in the health study because the formats followed were inconsistent or data was missing for several months from some of the health centres in the study area and across the state (Formats are provided at the end of this case study). Given the project's focus on governance, in this component of the project we have attempted to study how data is collected and managed for the study area. Specifically this component has attempts to:
Identify problems with the functioning of the current data management system Comment on the structure and purpose of the system Provide recommendations for change
As the bulk of health care facilities in the study area fall within the primary health care level, this component has focused on health data emerging from the primary level health facilities.
Background The Central Bureau of Health Intelligence (CBHI) (a department under Ministry of Health and Family Welfare) is the national agency responsible for compilation, analysis & evaluation and dissemination of health statistics. The CBHI has developed standardized formats or proforma for data collection to be used by State governments across the country. Additionally, training programmes for medical statistics personnel and technical assistance is provided in each state. This agency also maintains liaisons with research institutions in India and abroad to promote research in statistics. In addition to statistics on general morbidity, the central government compiles data linked to a variety of national health programmes implemented by the states.
The nodal agency in Goa responsible for collecting, compiling, analyzing and disseminating health data is the Health Information Bureau attached to the Directorate of Health Services. This agency is the link between the state and CBHI. The Health Information bureau in Goa gathers health status data on the following:
IDRC Centre File: 101276-001 66
TERI Report no. 2002WR41

Annexure C
Communicable diseases and vaccine preventable diseases (format provided at the end of this case study) Non-communicable diseases (this includes general morbidity data) Cholera and plague
Additionally, data related to a variety of national health programmes that are implemented in the state is also compiled.8 Presented below is a list of national programmes implemented in Goa:
National Family welfare programme National vector borne disease control programme National Filaria control programme National leprosy eradication programme Revised national Tuberculosis control programme National programme for the control of blindness Sexually Transmitted Diseases National Iodine deficiency disorder control programme and Integrated disease surveillance programme (related to both communicable and non communicable diseases)
Within the state data flows from health centres at the lowest level (village level) to the Directorate of Health which is the highest level as shown in the diagram below.
Rural Medical
Dispensary
Sub center Primary Health
?fl
Private Health
Care Services
Center/Community Dir health center Health Service
District Hospitals/ Specialized Hospitals/ Cottage hospital
Figure C-C.1 Data collection and reporting structure
Goa Medical College
Ministry of Health A
Family welfare
There are totally 62 health care institutions across the state of Goa that are supposed to
report morbidity data to the Health Intelligence Bureau (HIB) as presented in Table C-C.1.
8 In Goa the national health programmes are implemented through programme officers These programme officers directly report to the national programme officer in charge of the following schemes.
IDRC Centre File: 101276-001 67
TERI Report no. 2002WR41

Annexure C
Table C-C.1 Health care facilities reporting to the Health Intelligence Bureau
Health Care Facility Number
in Goa
In study
area
Primary Health Centres 19 3
Community Health Centres 5 1
Hospitals 5 -
Urban Health Centres 4 -
Rural Medical Dispensaries 28 3
Sub centres 172 23.
Medical Dispensary 1
Total* 62 7
Note* The total number of health facilities reporting to the Directorate of Health services does not include sub centers as
they do not report directly to the IIIB. Instead they report to Primary or Community Health Centres from where the data
is forwarded to the HIB.
In the study area there are 23 Sub-centres that are supposed to submit data to the Primary Health Centres (PHC)/ Community Health Centre (CHC) to which they are attached.
Analysis of the data collection and management system has focused on the lowest or primary tier of the health care system (PHCs, CHCs, Sub-centres) as all the public health care
facilities in the mining region fall within this category.
Collection and compilation of data At the peripheral level of care the Sub-centers (SC) and Rural Medical Dispensaries (RMDs) located at the village level, gather general morbidity data based on outpatient visits and data pertaining to national programmes implemented at this level (eg. vaccinations, family planning etc.) Multipurpose health workers are supposed to collect data to prepare reports, on the national programmes, a disease report and a health education activity report as part of their regular duty. The Medical Officers (who are doctors) collect general morbidity data at the time of the weekly consultation hours conducted at the Sub-centres. This data is sent to the Primary Health Centre (PHC) or Community Health Care (CHC) to which they are attached. In the absence of the medical officer the Multi purpose health worker (MPHW) may collect this data.
At the PHC/ CHC, records are maintained for all inpatients and for all outpatient visits and for care provided under the national health programmes. This data, along with data received from satellite Sub-centres is compiled and sent to the Directorate of Health Services (DHS). There are approximately 6-8 Sub-centres attached to each PHC or CHC. Additionally, there are 1 or 2 Rural Medical Dispensaries (RMDs) attached to some PHCs/CHCs.
At the secondary and tertiary level of health care, the district hospitals, specialized hospitals and state hospital keep records for all inpatients and outpatients and are required to provide this data to the Directorate of health services (DHS).
At the Directorate of Health Services (DHS) the Health Information Bureau compiles data from all the various health care institutions and sends it to the Central Bureau of Health
IDRC Centre File: 101276-001 68 TERI Report no. 2002WR41

Annexure C
Intelligence. Simultaneously, the programme officers of the different national health programmes send data to the corresponding officers attached at the central government.
Limitations of secondary data for the study area Data missing for particular months/ weeks The table below, used as an example to highlight problems with secondary data, shows data on respiratory communicable diseases from each of the seven health centres in the study area for 20049. Data for some months of the year was absent for all PHCs/CHCc in the study area. The community health centre at Curchorem displays the worst reporting pattern with no data available for 2004.
Table C-C.2 Respiratory communicable disease data for the study area (Inpatient and Outpatient)
Primary & Community Health Centres Rural Medical Dispensaries
Cluster 1 Cluster 2 Cluster 3 Road corridor Cluster 2 Cluster 2 Cluster 3
Bicholim Sanquelim Sanguem Curchorem Surla Pale Dabal .............. ...... .................. ....... ................... .._............. _............_.........
Jan. 8 4 45 * 200 161 63
Feb. 2 5 60 78 * 92
March 68 8 18 * 109 122 160
April * 31 ` 88 102 79
May 5 54 11 90 50 216
June 226 15 * 73 91 162
July 361 15 * 157 119 82
Aug 279 Not available 89 88 148
Sept. 3 33 37 51 113
Not reported
Interestingly, looking at the same table above, in some months we see that rural medical dispensaries which serve a much smaller population (average of five to six thousand) show higher reporting of respiratory communicable diseases compared to PHCs and CHCs, which serve population ranging between 45,000 to 90,000.
The lack of reporting/ data is not limited to only the mining areas or study area but is a common problem across the state. Of the 62 health care institutions (excluding sub-centres) across the state that are supposed to submit data monthly to the DHS, roughly 40 to 45 institutions actually submit data each month. Thus, a significant number of cases both in the study area and across the state remain unaccounted for.
No data from several peripheral health care institutions Satellite sub-centres have weekly consultation hours with a doctor. Often this data is not submitted by the sub-centres to the Primary Health Centres which means that vital grass- roots data is lost.
No reporting from private health centres Private facilities provide data on mortality, TB and Cancer to the Directorate of Health
9 At the time of data collection from the Health Intelligence Bureau data was only available for January to September 2004. During subsequent visits in 2006 the HIB was unable to provide data for the remaining months of 2004.
IDRC Centre File: 101276-001 69
TERI Report no. 2002WR41

Annexure C
(DHS). Additionally, private facilities are expected to provide relevant data for national programmes such as the Integrated Disease Surveillance Programme. However, general morbidity data is not compiled by private institutions and forwarded to the DHS. Given that a large number of people in the study area have reported using private health facilities, the absence of this data means that a large number of cases are going unaccounted.
Disease codes not always recorded Recording general morbidity data requires using disease codes as classified by the World Health Organisation's International Disease Classification 10. Disease codes are not always recorded making compilation and analysis of the data difficult.
Patients place of residence not recorded Data that is gathered does not reflect the patients' address. Thus, patients with complex cases referred to district/state hospitals get recorded as cases from the region in which the hospital is located. As Goa is a small state and bus connectivity is relatively good, people often go to hospitals that are not in their area of residence. Thus, it is not possible so estimate the variation in health status across different regions.
Problems with data management Interviews and discussions with medical officers and other staff at the PHCs and CHCs helped to identify some of the problems that are leading to poor data management.
Lack of staff Until some years ago a compiler/checker attached to the Directorate of Statistics was posted at each Primary Health Centre (PHC) /Community Health Centre (CHC). These compilers have been transferred out of the health services and the posts have remained vacant for several years. None of the 5 PHCs/ CHCs in the study area has a designated person to carry out this task. The DHS has trained multipurpose health workers, lady health workers and doctors for the task of data compiling and management. However, as several posts in the health centres are vacant the staff is overburdened with work and the task of data collection and compilation is passed on to others (pharmacists, lab technicians etc.) who are not trained for the job. This affects the quality of the data that is generated and explains why there is no data from health centres for some months.
Lack of oversight The data that is recorded and compiled needs to be monitor regularly. No person is assigned with the responsibility to check the quality of the data. There seems to be lack of checking or oversight to ensure compliance by health centres.
Focus on national programmes The focus of primary health care services is on preventive health care, which is largely implemented through the various national programmes. As the Directorate of Health is obliged to report progress and targets achieved for the national health programmes to the central government there is a lot of emphasis on recording data pertaining to these programmes. Additionally, communicable diseases are given a high priority (as they should be) but no importance is laid on recording morbidity cases other than these. Hence the
IDRC Centre File: 101276-001 70 TERI Report no, 2002WR41

Annexure C
workers at the primary health care level lay more emphasis on the health programmes and when staff are pressed for time, the compilation of the data for the various national programmes takes precedence.
Additionally, interviews with health officers suggest that at monthly meetings held at each Primary/Community Health Centre and at the Directorate of Health Services10 discussions tend to centre round meeting targets (such as vaccinations, family planning operations etc) for the various national health programmes or the outbreak of communicable diseases or epidemics. These forums are not used to discuss health status within particular regions, trends in morbidity, or to analyse data generated through the system. As there are no health programmes dedicated to respiratory illness other than the tuberculosis control health programme and respiratory track infection in the case of children, general respiratory health has not been given any priority in terms of analysis even in the mining areas where health professionals perceive a particular problem.
Paper based system Although the health policy is geared to have all data computerized by 2005 (National Health Policy 2002) this has not occurred completely. This may be true for some of the national health programmes wherein data is directly uploaded onto the web. In order to facilitate computerization, at the different levels i.e. PHC/CHC and the different secondary level care, computers are provided. However these health centres lack competent staff to work with computers as a result of which they still use a paper based system and much of the burden of computerising data remains at the DHS level. In the absence of digitized data, not much analysis of the data is possible. Further, the use of a paper based system is time consuming and thus resulted in belated analysis which may not serve its purpose.
Lack of a feed back mechanism There is no mechanism whereby comments on the quality of the data (completeness, format etc) or data analysis done at the state level is passed back down to the regional level health care institutions. At the monthly meetings held at the DHS and at the PHCs/CHCs there is some discussion and analysis of data related to national programmes in the presence of medical officers from all the relevant health care institutions. However, doctors and medical officers reported that general morbidity data is not generally discussed.
Issues emerging at a policy level Aside from the deficiencies in the functioning of the data collection system that have emerged through observations and discussions with health care professionals, the system itself merits comment. Perhaps the one of the most serious problems regarding health data is
that state doesn't perceive the need for analysis of morbidity data. The poor condition of state-level data is probably a reflection of the fact that the data generated currently seems to
- At the PHC/CHC level these meetings are attended by all the key health workers attached to the health centre, including multipurpose health workers from the satellite Sub-centres. At the Directorate of Health Services (DHS) these monthly meetings, referred to as the Monthly Conference, are attended by the Health Officers of from each of the PHCs/CHS, District hospitals, Chief Programme Officers of the various national health programmes, the Dy. Directors, Director and Statisticians of the DHS.
IDRC Centre File: 101276-001 71
TERI Report no. 2002WR41

Annexure C
serve no purpose. If, in fact, the data was actually in use, then the problems with the data set would have been addressed.
Another important problem that emerges very starkly in this project is the failure of the state health system to explore the links between environmental stressors and health in the context of mining. Interviews with health workers in the study area reveal that they perceive respiratory illness to be high in the region and they also attribute the problem to high dust pollution related to mining. Yet, in terms of dealing with respiratory health problems in the region the health care system seems to favour curative care rather than a preventive approach which would require acknowledging environmental stressors and attempting to deal with them in conjunction with other government agencies.
Linked to these two problems is the fact that Goa does not have its own state health policy. While the Central Government has drawn up a central health policy to guide health care provision across the country, each state, including Goa, has its own unique health needs and health problems that cannot necessarily be addressed only through the national health programmes. There is a need for the state to respond to existent or emerging health issues and to do this sound data that reflects the health status of the community is necessary.
IDRC Centre File: 101276-001 72 TERI Report no. 2002WR41

Annexure C
D Format for communicable diseases
This format is prescribed by the central Ministry of Health and Family Welfare.
Reported cases and deaths due to communicable diseases
Report on communicable diseases for the month of ..................... Name of the institution .....................................month.....................
Sn. Illness
OPD IPD (patients
treated) Total Deaths (IPD
only)
Male Female Male Female Male Female Male Female
1
Acute diarrheal diseases (including gastroenteritis and cholera)
2 Diphethria
3 Acute oliom leietis
4
Tetanus other than neo- natal
5 Neonatal tetanus
6 Whooping cough
7 Measels
8
Acute respiratory infections including influenza and excluding neumonia
9 Pneumonia
10 Entric fever
11 Viral hepatitis
12 Ja anese encephalitis
13 Meningoccal meningitis
14 Rabies
15 Syphilis
16 Gonoroccoal infection
17 Pulmonary tuberculosis
8
All other diseases treated in the institution excluding the above mentioned diseases TOTAL OPD: Out patient
IPD: In patient
IDRC Centre File: 101276-001 73
TERI Report no. 2002WR41

Annexure C
E Format for non-communicable diseases (general morbidity) data
Please note that no format or guidelines are used when filling, column 2 where disease are noted.
Name of the Urban Health Centre I Primary Health Centre / Community Health Centre / Hospital/ Rural Medical Dispensary ......................................
Morbidity report for the month of ............................. 2006...........
Indoor/Outdoor
Glib nntia Useme Sex f dom NE pem t Qed r?3r[rrk
M F Tdd Hnlz Qti:.iai Mslim aw kI I 1.4 59 1014 1519 2124 2529 a134 3539 40-44 4549 5154 5559 6264 169 70+ ofed IrTpoed
Sere amdbaa
1 2 3 4 5 6 7 8 9 10 11 12 13 14 15 16 17 18 19 20 21 22 23 24 25 28 27 2B 29 30
IDRC Centre File: 101276-001 74 TERI Report no. 2002WR41

Annexure C
F Governance questionnaire
To be filled by the investigator
Name of the interviewer:
Cluster: Taluka: Village: Ward
Date: / / Start Time End Time
House hold number / code
GENERAL QUESTIONS
i. Sex i) Male 2) Female
2. Does anyone in your family work in a mine or do any mine related jobs like have/drive a truck, work on a barge etc...? 1) Technicians, mine electricians, mine operator, mine contractor, mine supervisor, fitter 2) Work in a mine as daily wage labourer 3) Own a truck (mine related) 4) Drive a truck (mine related) 5) Work in a truck repair garage 6) Working on a barge 7) Retired mine worker 8) Other (mine related work - specify) 9) Does not do mine or mine related work
3. Now lets talk about the village you live in. How long have you lived in this village? 1) Less than 2) 1 to 2 year 3) 2 to 5 year 4) 5 to 1o ye 5) 1o years a
a year s s
ars nd more
4.
A. For some hold 4 Gr
years now the Gram Panchayats have been active in Goa. They are required to am Sabhas a year. Are you aware of this?
1) Yes 2) No 3) Don't Know
B. Now let's talk about the Gram Sabha. How often do you attend the Gram Sabha? Regularly, sometimes, once/twice or never?
1) Regularly 2) Sometimes 3) Once or twice (rarely) 4) Never
C. If, never, sometimes, rarely Why don't you attend the GS regularly?
IDRC Centre File: 101276-001 75
TERI Report no. 2002WR41

Annexure C
5.
i) Not interested 2) The Panchayat is too far ;) The timings don't suit me 4) No point in going because I don't think it will make any difference 5) Someone else from the family usually goes 6) 1 don't like the atmosphere at the meetings 7)Women don't usually attend, only men go 8) We are not informed about the date 9) Other
When you have a problem or request or some issue on your mind regarding the village who do you think you should go to?
t) Panchayat member 2) MIA 3) Political Party 4) Social Leader 5) Other (specify)
6. If you have any work at the panchayat, is it easy to meet your Panchayat members, are they generally available? i) Yes, generally available 2) Not always available 3) Difficult to get in touch with 4) Never available 5) I've never had the need to visit them
WATER SUPPLY QUESTIONS 7. We are doing a study on the water situation in the area. I would like to ask you about the water
situation in your home. Do you face any shortage of water for household use during the year? A. No B. Yes - Mar to May (Summer) (1) severe (2) not too bad (3) no problem C. Yes - June to Sept (Monsoons) (1) severe (2) not too bad (3) no problem D. Yes - Oct to Feb (Winter) (1) severe (2) not too bad (3) no problem
8. Now I will ask you about the different sources of water you use for household purposes during different seasons in the year?
(Write 1= for Yes and 2= No in the relevant columns)
Source A
Mar- May (Summer)
B June-Sept
(Monsoons)
C Oct-Feb (Winter)
D Check if used for drinking/cooking
i.Tap at home
2. Public tap
3.Well/tube well
4. Tankers
5. Stream
6. Spring
IDRC Centre File: 101276-001 76
TERI Report no. 2002WR41

Annexure C
WELLS 9. A. Are there wells in your wada?
1) Yes 2) No (If "no" then go to Q11)
B. Are the water levels in the wells okay in the different seasons?
9Bi March-May 1) Yes ok 2) No, level has dropped 3) No, well is 4) Don't know
completely dry 9Bii June-Sept 1) Yes ok 2) No, level has dropped 3) No, well is 4) Don't know
completely dry 9Biii Oct-Feb 1) Yes ok 2) No, level has dropped 3) No, well is 4) Don't know
completely dry
If the answer is "Yes ok" for all three seasons then go to Q1i.
10. A. What is do you think is the cause of the problem?
1) Mining and related activities 2) Seasonal changes 3) Other (specify) 4) Don't know
B. When did they start going dry or how long has it been since the water levels have fallen? 1) Less than 5 years 2) Between 5-10 years 3) More than 1o years
If the respondent has a private tap (refer to Q. 8) then ask the questions in the flowing section
PRIVATE TAP SUPPLY
11. I will ask you about the water supply for private taps in the different seasons. How would you describe your tap water supply? Do you consider it regular (does it come everyday) or irregular? A. March-May (Summer) (1) Regular (2) Irregular (3) No water at all (4) Don't know B. June-Sept (Monsoons) (1) Regular (2) Irregular (3) No water at all (4) Don't know C. Oct-Feb (Winter) (1) Regular (2) Irregular (3) No water at all (4) Don't know
12. Is the timing of the tap water regular? (that means, does it come at the same time daily?) A. Mar-May (Summer) (1) Regular (2) Irregular (3) Don't know B. June-Sept (Monsoons) (1) Regular (2) Irregular (3) Don't know C. Oct-Feb(Winter) (1) Regular (2) Irregular (3) Don't know
13. Approximately what time does the water come? (multiple choices ok) 1) Morning 2) Afternoon 3) Evening 4) Night 5) In the middle of the night 6) No fixed time 7) Don't know
IDRC Centre File: 101276-001 77
TERI Report no. 2002WR41

Annexure C
14. I low many hours a day is the supply? A. Mar - May B. June - Sept C. Oct - Feb
15. Roughly how much are your monthly bills? 1) Less than Rs.50 2) Between Its. 51 to 75 :3) Between Rs. 76 to loo 4) Between Rs.1oo- 150
5) More than Rs. 150
Write the appropriate number in the space provided
1. No water at all 4. 6-12 hr s 2. Less than 2 hours 5. 12-24 hrs 3. 2-5hrsaday
16. What do you feel about the charges? 1) Expensive- it's a strain on our monthly budget 2) Reasonable, I can afford it, but it is high
17. Are mining companies paying your water bills? 1) Yes 2) No
PUBLIC TAPS
18. Are there public taps in your village? 1) Yes 2) No 3) Don't know Go to 0.23
If No/Don't know then go to Q. 23
If `YES' and the respondent uses public taps as a source of water (see Q.11) then continue below.
19. How would you describe your water supply? Do you consider it regular (does it come everyday) or irregular? A. March-May (Summer) (i) Regular (2) Irregular (3) No water at all (4) Don't know B. June-Sept (Monsoons) (1) Regular (2) Irregular (3) No water at all (4) Don't know C. Oct-Feb(Winter) (1) Regular (2) Irregular (3) No water at all (4) Don't know
20. Is the timing regular? A. Mar-May (Summer) (i) Regular (2) Irregular (3) Don't know B. June-Sept (Monsoons) (i) Regular (2) Irregular (3) Don't know C. Oct-Feb (Winter) (i) Regular (2) Irregular (3) Don't know
21. Approximately what time does the water come? (Multiple choices ok) 1) Morning 2) Afternoon 3) Evening 4) Night 5) In the middle of the night 6) No fixed time
IDRC Centre File: 101276-001 TERI Report no. 2002WR41
78

Annexure C
22.
7) Don't know
A. Mar-May B. June - Sept C. Oct - Feb
How many hours a day is the supply?
Go to directly to Q.28
Write the appropriate number in the space provided
1. No water at all 2. Less than 2 hours 3. 2-5 hrs a day 4. 6-12 hr s
5. 12-24hrs
23. If NO, Have there never been public taps in your ward, or have they been recently removed? 1) The taps have been removed recently (Go to Q. 27) 2) There have never been any public taps. 3) Don't know 4) Not applicable
IF PUBLIC TAPS WERE REMOVED
24. Did you use the public taps before? 1) Yes 2) No
25. A. Before removing the taps were you informed?
1) YES 2) NO 3) Don't know 4) Don't remember 5) Not applicable
B. If yes, by whom? 1) Panchayat 2) PWD 3) Don't know 4) Other (specify) 5) Not applicable
C. Was your opinion sought? 1) YES 2) NO 3) Don't know 4) Don't remember 5) Not applicable
Go to Q.31
26. So when the public taps were removed, were you greatly inconvenienced, slightly inconvenienced, or was it no problem at all?
1) Greatly inconvenienced 2) Slightly inconvenienced 3) It didn't make a difference/ no problem at all
IDRC Centre File: 101276-001 79
TERI Report no. 2002WR41

Annexure C
27.
TANKERS
Did you get (or have you applied for) a private tap after the public taps were removed? t) Yes 2) No, did not apply 3) No, had a private tap since before public tap was removed 4) Don't know
28. A.
Do you receive water supplied through tankers? NO (Go to Q. 32)
B. Yes Mar - May (Summer) (1) Daily (2) Alternate days (3) Only when needed (4) No C. Yes .June - Sept (Monsoons) (1) Daily (2) Alternate days (3) Only when needed (4) No D. Yes Oct - Feb (Winter) (1) Daily (2) Alternate days (3) Only when needed (4) No
29. A. Do the tankers come regularly?
1) YES 2) NO 3) Don't know
B. Do the tankers come at the same time everyday? 1)
2) 3)
YES NO Don't know
30. How long ago did you start getting tanker water? 1) Less than 5 years 2) Between 5-10 years 3) More than 1o years
31. Do you know who pays for the tankers? (Multiple choices ok) 1) Panchayat 2) Mining Company 3) PWD 4) Other (specify)... 5) Don't know
32. What do you consider good water supply? (Multiple responses ok)
PEOPLE'S RESPONSES This section is to be answered ONLY by those respondents who have said they have water supply problems.
33. If you have a water supply problem whom do you complain to or contact? 1) Panchayat/ Panchayat member 2) PWD 3) MLA 4) NGO 5) MP 6) Mamlatdar 7) Mining company 8) Others 9) No one
IDRC Centre File: 101276-001 80 TERI Report no. 2002WR41

Annexure C
(Use each of the questions from Q. 34 to Q. 37 to fill in the details for each of the agents the respondent has contacted above)
34. A. Complained or made a request to (write the name of the
appropriate agent and the corresponding no. (1-9) from Q. 33 above)
B. When did you complain/ make a request? 1) Within the last six months 2) Within the last one year 3) Within the last two years 4) Within the last .5 years 5) More than 5 years
C. What was the complaint about? 1) Irregular tap supply (i.e. not every day) 2) Erratic timings for tap water 3) Not enough tap water 4) Demand for taps in the village 5) Public tap leaking 6) Problem with pipes (leaking, broken, clogged etc.) 7) Dropping well water levels/wells going dry 8) Application for a free private tap connection 9) Erratic/irregular tanker supply 10) Other
D. Did the person you contacted show any interest/concern in solving the problem? 1) They showed a lot of interest/concern in solving the problem 2) They seemed moderately interested in solving the problem. 3) They didn't seem to care- showed no interest or concern. 4) Don't know
E. Did the situation improve? 1) YES - Improved slightly 2) YES - but only temporarily 3) YES - improved for good 4) Didn't improve 5) Solution is still being worked on
F. If the situation improved (slightly or temporarily or for good) then in how fast did the situation change/ how soon were your demands met?
1) Within a month 2) Within three months 3) Within six months 4) Within one year 5) More than one year
IDRC Centre File: 101276-001 81
TERI Report no. 2002WR41

Annexure C
35. A. Complained or made a request to (write the name of the
appropriate agent and the corresponding no. (1-9) from Q. 33 above)
S. When did you complain/ make a request? i) Within the last six months 2) Within the last one year ;) Within the last two years
4) Within the last 5 years 5) More than 5 years
C. What was the complaint about? i) Irregular tap supply (i.e. not every day) 2) Erratic timings for tap water 3) Not enough tap water 4) Demand for taps in the village 5) Public tap leaking 6) Problem with pipes (leaking, broken, clogged etc.) 7) Dropping well water levels/wells going dry 8) Application for a free private tap connection 9) Erratic/irregular tanker supply io) Other
D. Did the person you contacted show any interest/concern in solving the problem? i) They showed a lot of interest/concern in solving the problem 2) They seemed moderately interested in solving the problem. 3) They didn't seem to care- showed no interest or concern. 4) Don't know
E. Did the situation improve? i) YES - Improved slightly 2) YES - but only temporarily 3) YES - improved for good 4) Didn't improve 5) Solution is still being worked on
F. If the situation improved (slightly or temporarily or for good) then in how fast did the situation change/ how soon were your demands met?
i) Within a month 2) Within three months 3) Within six months 4) Within one year 5) More than one year
IDRC Centre File: 101276-001 82 TERI Report no. 2002WR41

Annexure C
36. A. Made a request or complained to (write the name of the
appropriate agent and the corresponding no. (1-9) from Q. 33 above)
B. When did you complain/ make a request? i) Within the last six months 2) Within the last one year 3) Within the last two years 4) Within the last 5 years
C. What was the complaint / request about? i) Irregular or erratic tap supply (i.e. not every day, not at the same time) 2) Not enough tap water 3) Demand for taps in the ward 4) Application for a free private tap connection 5) Dropping well water levels/wells going dry 6) Erratic/irregular tanker supply 7) Demand for more tankers 8) Demand for sump, water tank, bore well etc. 9) Request to company to pay tap water bills io) Others (Specify)
D. What was the attitude of the person you contacted? i) They showed a lot of interest in solving the problem. 2) They seemed moderately interested in solving the problem. 3) They didn't seem to care. 4) Don't know
E. Did the situation improve? i) YES-Improved slightly 2) YES - but only temporarily 3) YES - improved for good 4) Didn't improve 5) Solution is still being worked on
F. If the situation improved (slightly or temporarily or for good) then in how long did the situation to change/ how soon were your demands met? 1) Within a month 2) Within three months 3) Within six months 4) Within one year 5) More than one year
IDRC Centre File: 101276-001 83
TERI Report no. 2002WR41

Annexure C
37. A. Made a request or complained to (write the name of the
appropriate agent and the corresponding no. (1-9) from Q. 33 above)
B. When did / make a request? i) Within the last six months 2) Within the last one year 3) Within the last two years 4) Within the last 5 years
C. What was the complaint / request about? i) Irregular or erratic tap supply (i.e. not every day, not at the same time) 2) Not enough tap water 3) Demand for taps in the ward 4) Dropping well water levels/wells going dry 5) Application for a free private tap connection 6) Erratic/irregular tanker supply 7) Demand for more tankers 8) Demand for sump, water tank, bore well etc. 9) Request to company to pay tap water bills io) Others (Specify)
D. What was the attitude of the person? i) They showed a lot of interest in solving the problem. 2) They seemed interested but said they couldn't do anything about it. 3) They seemed moderately interested in solving the problem. 4) They didn't seem to care. 5) Don't know
E. Did the situation improve? 1) YES-Improved slightly 2) YES - but only temporarily 3) YES - improved for good 4) Didn't improve 5) Solution is still being worked on
F. If the situation improved (slightly or temporarily or for good) then in how fast did the situation change/ how soon were your demands met? 1) Within a month 2) Within three months 3) Within six months 4) Within one year 5) More than one year
IDRC Centre File: 101276-001 84
TERI Report no. 2002WR41

Annexure C
OTHER FORUMS
39.
38. Have water problems/ demands been discussed in the gram sabha? i) Never 2) Once or twice 3) Sometimes 4) Regularly 5) Don't know
3) Yes, SHG 4) Yes, Other 5) Don't knowI 6) No
A. Have you or anyone in your family taken up a water issue or discussed the water problem in any other group eg. Gram kriti samite, mahila mandal, SHG...
1) Yes, Gram kriti samitee 2) Yes, Mahila Mandal
Go to Q. No. 40
B. If yes, did the discussion lead to any action? 1) Yes, the group took some action 2) No, the group'didn't take any action 3) I don't know 4) Not applicable
Go to Q. No. 40
C. If action was taken: Did the situation improve/ were demands met? 1) YES-Improved slightly 2) YES - but only temporarily 3) YES - improved for good 4) NO 5) Not applicable
D. Are there any women in this group/samiti? 1) Yes 2) No 3) Don't know
MORCHA/DHARNA
problems? 1) YES 2) NO 3) Don't know 4) Don't remember
A. Have you or anyone in your family participated in a morcha/ dharna about water related
If "No/Don't Know/Don't' remember" then skip section and go to Q. No. 41
B. If yes, to whom did you take the morcha? 1) Panchayat 2) PWD 3) MLA 4) Mining company 5) MP 6) Mamlatdar 7) Other (specify)
IDRC Centre File: 101276-001 85
TERI Report no. 2002WR41

Annexure C
C. What was the morcha about? i) Irregular or erratic tap supply (i.e. not every day, not at the same time) 2) Not enough tap water 3) Demand for taps in the ward 4) Dropping well water levels 5) Dry wells 6) Erratic/ irregular tanker supply 7) Demand for more tankers 8) Demand for sump, water tank, bore well etc. 9) Request to company to pay tap water bills io) Others (Specify)
D. Did the situation improve? i) YES-Improved slightly 2) YES - but only temporarily 3) YES - improved for good 4) Didn't improve 5) Solution is still being worked on
IDRC Centre File: 101276-001 86
TERI Report no. 2002WR41
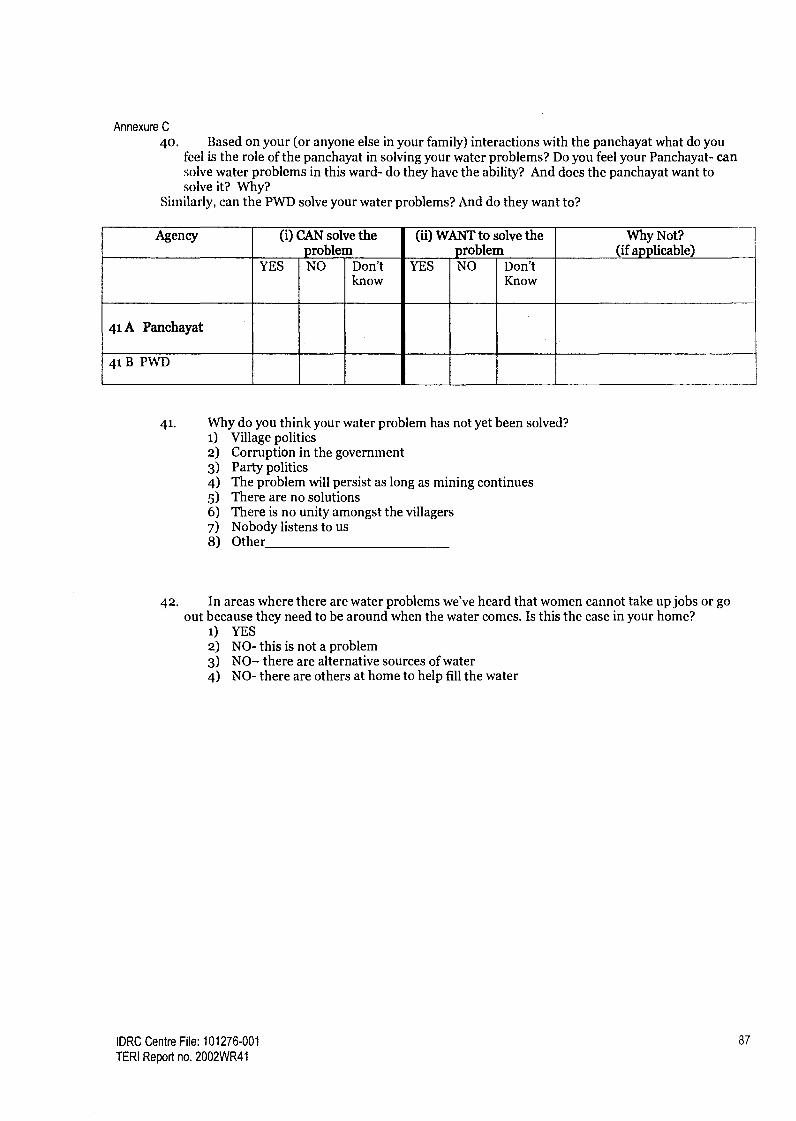
Annexure C
40. Based on your (or anyone else in your family) interactions with the panchayat what do you feel is the role of the panchayat in solving your water problems? Do you feel your Panchayat- can solve water problems in this ward- do they have the ability? And does the panchayat want to solve it? Why?
Similarly, can the PWD solve your water problems? And do they want to?
Agency (i) CAN solve the (ii) WANT to solve the Why Not? problem problem (if applicable)
YES NO Don't YES NO Don't know Know
41 A Panchayat
41BPWD
41. Why do you think your water problem has not yet been solved? 1) Village politics 2) Corruption in the government 3) Party politics 4) The problem will persist as long as mining continues 5) There are no solutions 6) There is no unity amongst the villagers 7) Nobody listens to us 8) Other
42. In areas where there are water problems we've heard that women cannot take up jobs or go out because they need to be around when the water comes. Is this the case in your home?
1) YES 2) NO- this is not a problem 3) NO- there are alternative sources of water 4) NO- there are others at home to help fill the water
IDRC Centre File: 101276-001 87
TERI Report no. 2002WR41

Annexure C
AIR QUALITY QUESTIONS
43-
45.
46.
A. Do you think dust is a problem in your ward? t) Yes (Go to Q. 45) 2) No :3) Unwilling to talk about it
B. In the past was dust a problem for your ward? i) Yes 2) No (Terminate Section) 3) Unwilling to talk about it
44. How much of a problem is (was) the dust - no problem, somewhat of a problem, a major problem...?
t) A problem for others in the ward, but doesn't affect us 2) Somewhat of a problem 3) A major problem 4) Unwilling to talk about it
What is (was) causing the dust? (multiple choices ok) t) Movement of mining trucks through the village 2) Mine pit located close by 3) Screening plant close by 4) Loading/unloading point close by 5) Ore-stored nearby 6) Railway yard close by 7) Other (specify) 8) Don't know
Since how long has the problem existed?/For how long was dust a problem? (no. of years) 1) o to 5 years 2) 5 to to years 3) 10- to 15 years 4) Over 15 years
PEOPLE'S RESPONSES
47. Have you or anyone in your family ever complained about the dust problem to any of the following listed below? (Multiple choices ok)
i) Panchayat(Panch/Sarpanch) 2) Gram Kruti Samiti/other village or ward level forum 3) Mining Co. 4) MLA 5) Minister 6) Mamlatdar 7) Collector 8) Other (specify) 9) No one (Go to Q. 57)
Use each of the questions from Q. 49 to Q. 56 to fill in the details for each of the agents the respondent has contacted above
IDRC Centre File: 101276-001 88
TERI Report no. 2002WR41
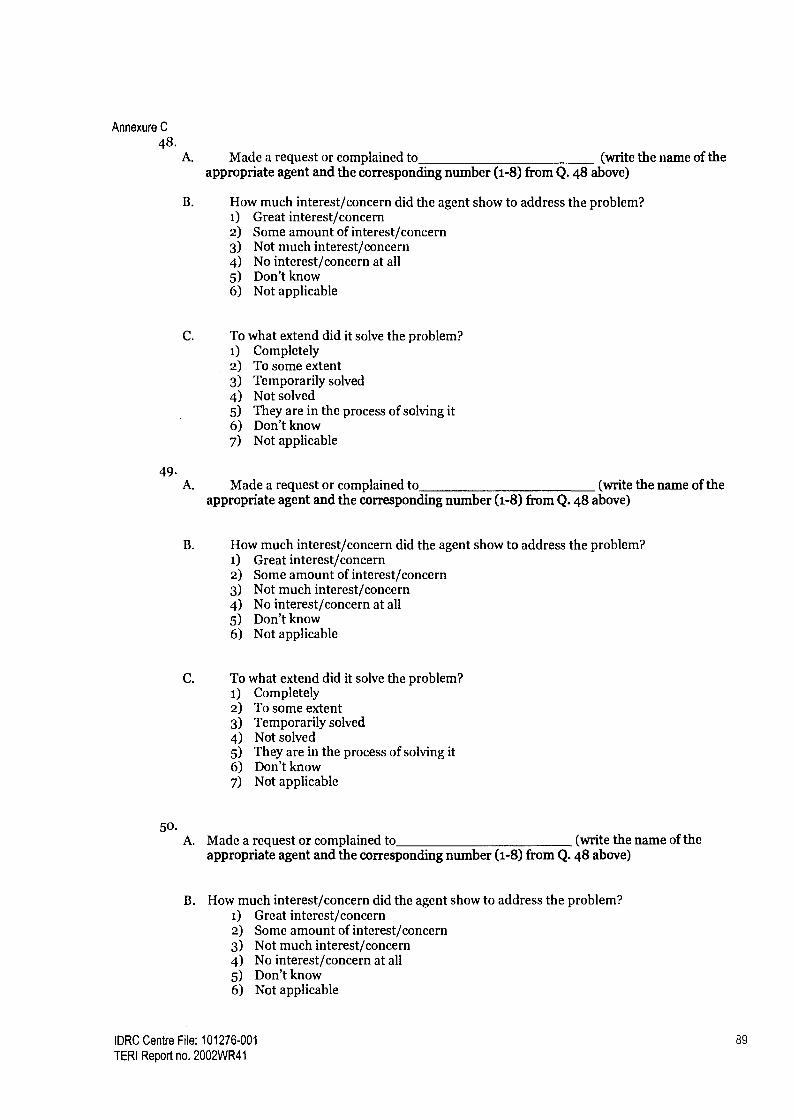
Annexure C
48. A. Made a request or complained to (write the name of the
appropriate agent and the corresponding number (1-8) from Q. 48 above)
B. How much interest/concern did the agent show to address the problem? i) Great interest/concern 2) Some amount of interest/concern 3) Not much interest/concern 4) No interest/concern at all 5) Don't know 6) Not applicable
C. To what extend did it solve the problem? 1) Completely 2) To some extent 3) Temporarily solved 4) Not solved 5) They are in the process of solving it 6) Don't know 7) Not applicable
49. A. Made a request or complained to (write the name of the
appropriate agent and the corresponding number (1-8) from Q. 48 above)
B. How much interest/concern did the agent show to address the problem? i) Great interest/concern 2) Some amount of interest/concern 3) Not much interest/concern 4) No interest/concern at all 5) Don't know 6) Not applicable
C. To what extend did it solve the problem? 1) Completely 2) To some extent 3) Temporarily solved 4) Not solved 5) They are in the process of solving it 6) Don't know 7) Not applicable
50. A. Made a request or complained to (write the name of the
appropriate agent and the corresponding number (1-8) from Q. 48 above)
B. How much interest/concern did the agent show to address the problem? i) Great interest/concern 2) Some amount of interest/concern 3) Not much interest/concern 4) No interest/concern at all 5) Don't know 6) Not applicable
IDRC Centre File: 101276-001 89
TERI Report no. 2002WR41
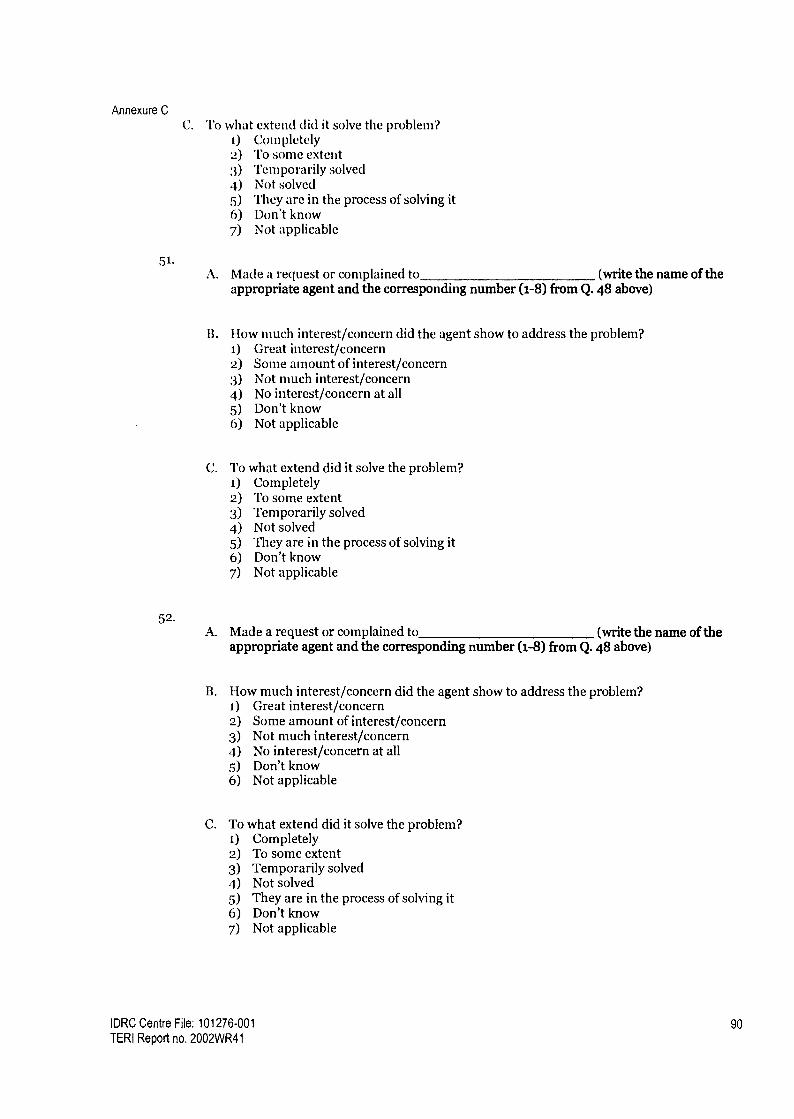
Annexure C
51.
52.
C. To what extend did it solve the problem? t) Completely 2) To some extent 3) Temporarily solved 4) Not solved 5) They are in the process of solving it 6) Don't know 7) Not applicable
A. Made a request or complained to (write the name of the appropriate agent and the corresponding number (1-8) from Q. 48 above)
B. I-Iow much interest/concern did the agent show to address the problem? i) Great interest/concern 2) Some amount of interest/concern 3) Not much interest/concern 4) No interest/concern at all 5) Don't know 6) Not applicable
C. To what extend did it solve the problem? i) Completely 2) To some extent 3) Temporarily solved 4) Not solved 5) They are in the process of solving it 6) Don't know 7) Not applicable
A. Made a request or complained to (write the name of the appropriate agent and the corresponding number (1-8) from Q. 48 above)
B. How much interest/concern did the agent show to address the problem? i) Great interest/concern 2) Some amount of interest/concern 3) Not much interest/concern 4) No interest/concern at all 5) Don't know 6) Not applicable
C. To what extend did it solve the problem? i) Completely 2) To some extent 3) Temporarily solved 4) Not solved 5) They are in the process of solving it 6) Don't know 7) Not applicable
IDRC Centre File: 101276-001 90 TERI Report no. 2002WR41
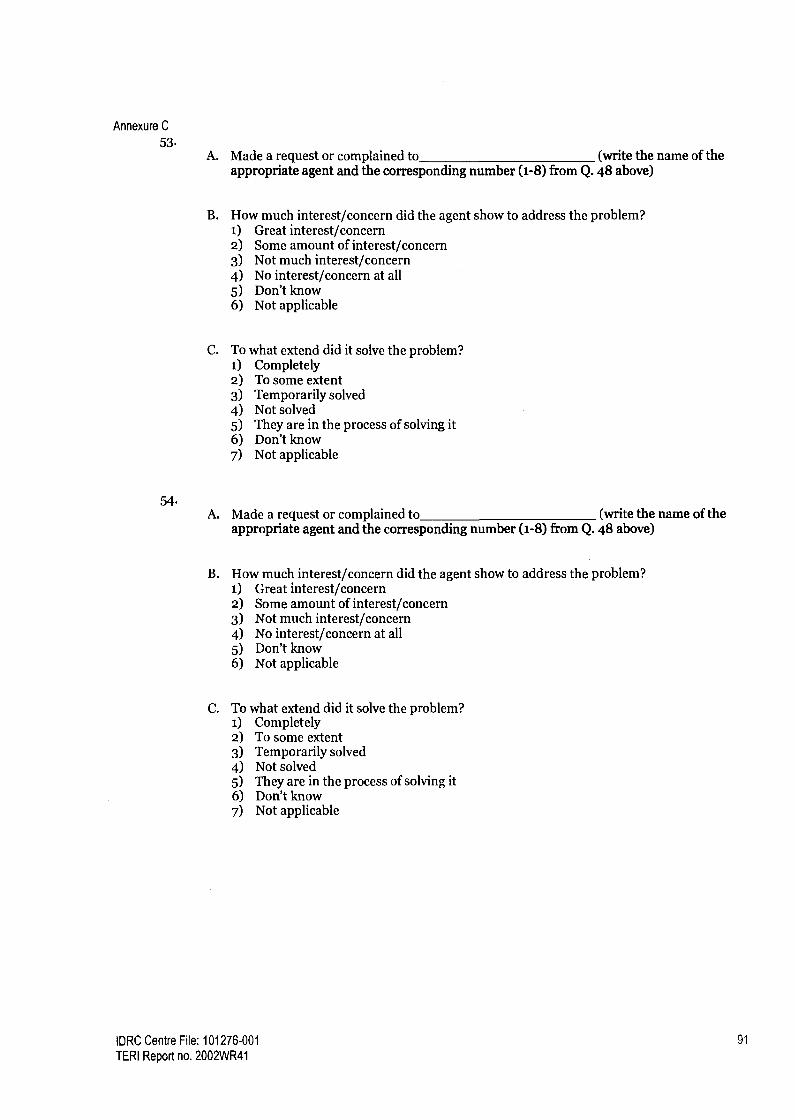
Annexure C
53.
54.
A. Made a request or complained to (write the name of the appropriate agent and the corresponding number (1-8) from Q. 48 above)
B. How much interest/concern did the agent show to address the problem? 1) Great interest/concern 2) Some amount of interest/concern 3) Not much interest/concern 4) No interest/concern at all 5) Don't know 6) Not applicable
C. To what extend did it solve the problem? 1) Completely 2) To some extent 3) Temporarily solved 4) Not solved 5) They are in the process of solving it 6) Don't know 7) Not applicable
IDRC Centre File: 101276-001 91
TERI Report no. 2002WR41

Annexure C
55
56.
57.
A. Made a request or complained to (write the name of the appropriate agent and the corresponding number (1-8) from Q. 48 above)
B. flow much interest/concern did the agent show to address the problem? i) Great interest/concern 2) Some amount of interest/concern 3) Not much interest/concern 4) No interest/concern at all 5) Don't know 6) Not applicable
C. To what extend did it solve the problem? t) Completely 2) To some extent 3) Temporarily solved 4) Not solved 5) They are in the process of solving it 6) Don't know 7) Not applicable
A. Do you think the panchayat should take up the dust problem for the residents? i) YES 2) NO 3) NO OPINION
B. Why should they take / not take it up? i) They are incapable/have no intention of solving it 2) They are corrupt/they are on the side of the mining companies 3) They should as it is their duty/responsibility 4) They are our elected representatives, and therefore they have to 5) Since it concerns people's (health) problems, they have to/must take it up 6) They are the closest (government) agency to us so they should take it up 7) They have the power to force the companies to listen/solve the problem 8) Don't know 9) Other (specify) io) Not applicable
GRAM SABHA
4) Never 5) Don't know
A. How often is the issue of dust pollution discussed at the gram sabha? 1) Regularly 2) Sometimes 3) Once or twice
Go to Q. 59
B. After the issue was brought up at the gram sabha how much interest/ concern did the panchayat take to address the problem? i) Great interest/concern 2) Some amount of interest/concern 3) Not much interest/concern 4) No interest/concern at all
)DRC Centre File: 101276-001 92 TERI Report no. 2002WR41

Annexure C
5) Don't know 6) Not applicable
C. To what extend did it solve the problem? 1) Completely 2) To some extent 3) Temporarily solved 4) Not solved 5) Don't know 6) Not applicable
58. MORCHAS/DHARNAS
the dust problem? 1) YES 2) NO 3) Don't Know
A. Have you or your ward members participated in any morcha/dharna protesting against
if N/DK then Go to Q. No. 6o
B. Who did you take the morcha to? 1) Mining Co. 2) Panchayat 3) MLA 4) Mamlatdar 5) Collector 6) Police 7) Don't know 8) Other (specify)
C. How much interest/ concern did the agent you took the morcha to show to address the problem? 1) Great interest/concern 2) Some amount of interest/concern 3) Not much interest/concern 4) No interest/concern at all 5) Don't know 6) Not applicable
D. To what extend did it solve the problem? 1) Completely 2) To some extent/solved partially 3) Temporarily solved 4) Not solved 5) Don't know 6) Not applicable
E. Why do you think the morcha did not help solve the problem? (Multiple choices ok) 1) Solutions provided were temporary 2) Mining co. paid off the leaders/others in the community 3) The community did not follow-up after the morcha 4) There is no true will to solve the problem 5) The problem will persist as long as mining will continue 6) There are no solutions 7) There is no unity amongst the villagers 8) Nobody listens to us
IDRC Centre Fife: 101276-001 93
TERI Report no. 2002WR41

Annexure C
9) Other (specify) to) Don't know
STOP! CHECK: If respondent has reported currently having dust pollution problems then carry on below with Q. 6o else go to Q. 61
59. Now I will name a few agencies/people to you, can you tell me who in your mind, CAN solve the dust problem and who you think really WANT solve the problem?
Agency (i) CAN solve the problem
(ii) WANT to solve the problem
Why Not? (if applicable)
YES NO Don't know
YES NO Don't know
A. Panchayat
B. MLA
C. Mamlatdar
D. Police/RTO
E. Truck owners/drivers
F. Local citizens/groups like Gram Kruti Samitis G. State Pollution Control Board
H. Mining companies
1. Other (specify)
60. Why do you think there has been no solution to the dust problem yet? Now directly go to Q.63
IDRC Centre File: 101276-001 94 TERI Report no. 2002WR41

Annexure C
ASK Q.62 ONLY IF RESPONDENT SAYS DUST POLLUTION WAS A PROBLEM IN THE PAST.
6i. Who/What do you think had a major role to play in solving the problem or getting it to lessen? (multiple choices are ok)
i) Panchayat 2) Residents of the ward/village, Gram Kruti Samiti etc... 3) Mining-companies 4) Your MLA 5) The Collector 6) The Mamlatdar 7) SPCB 8) Mining has stopped/lessened in the area 9) Other (specify) io) Don't know
62. Do you know that the Pollution Control Board in Goa is responsible to solve air pollution problems?
i) YES 2) NO
63. When you approach the Panchayat for some work are you expected to pay a bribe for the Sarpanch's/ Pancha's/ Panchayat Secretary's help? For example, if you want to have a private tap installed, an NOC or a house number issued, do you need to pay a bribe to the Panchayat members?
i) Never 2) Sometimes, depends on the person 3) Sometimes, depends on the nature of the work 4) Almost always 5) Don't know, never had to approach the Panchayat for work 6) Unwilling to talk about it
64. How do they ask for bribes? i) They don't, it is common knowledge that we have to pay/It is understood that we
have to pay 2) They overtly ask 3) They make some indication and we understand they want us to
IDRC Centre File: 101276-001 95
TERI Report no. 2002WR41

Annexure C
65.
HEALTH SECTION
How regularly you or your family avail the following health care facilities? A. Govt. Sub Centre (1) Regularly (2) Sometimes (3) Rarely (4) Never B. Govt. R M.D (1) Regularly (2) Sometimes (3) Rarely (4) Never C. Private Dispensary / clinic (1) Regularly (2) Sometimes (3) Rarely (4) Never D. Mobile dispensary / Help age (1) Regularly (2) Sometimes (3) Rarely (4) Never
66. If government sub centers or Rural Medical Dispensary are rarely or never visited: Why have you not visited the health Sub centre or RMD regularly? (multiple choices ok)
1) Not close by 2) Not aware that this facility is available 3) Doctor is not available daily 4) These centres are open only during working hours 5) Need to wait for a long time 6) Medication is not available 7) Unsatisfied with the treatment 8) No faith/trust treatment 9) Indifferent or rude attitude of the doctor/staff io) Any other (Specify)
67. If Private dispensaries or clinics are used: Is this dispensary / clinic provided by the mining company?
1) Yes 2) No 3) Don't Know
IDRC Centre File: 101276-001 96
TERI Report no. 2002WR41

Ann
exur
e C
68.
If an
swer
ed "
regu
larl
y" "
som
etim
es"
or "
rare
ly"
to Q
. 69
abo
ve, t
hen:
H
ow w
ould
you
rat
e yo
ur e
xper
ienc
e/ in
tera
ctio
n w
ith th
e ab
ove
heal
th c
are
faci
litie
s in
term
s of
the
follo
win
g cr
iteri
a?
CR
ITE
RIA
(i)
GO
VE
RN
ME
NT
HE
ALT
H S
ER
VIC
ES
-SC
and
RM
Ds
(ii)
PR
IVA
TE
DIS
PE
NS
AR
IES
C
LIN
ICS
R
AT
ING
S
RA
TIN
GS
a)
A
vaila
bilit
y of
1.
2.
3.
Ava
ilabl
e 4.
1.
2.
3
4 do
ctor
/ par
amed
ical
N
ot a
vaila
ble
Som
etim
es
Don
't N
ot a
vaila
ble
Som
etim
es
Ava
ilabl
e D
on't
staf
f av
aila
ble
know
av
aila
ble
know
b)
A
vaila
bilit
y of
1.
2.
3.
4.
- m
edic
ines
N
ot a
vaila
ble
Som
etim
es
Ava
ilabl
e D
on't
><
X
avai
labl
e kn
ow
c)
Cos
t of
trea
tmen
t i.
Exp
ensi
ve/
2.
3.
4.
1. E
xpen
sive
/ 2.
3
4.
not
Rea
sona
ble
Fre
e D
on't
not a
fford
able
R
easo
nabl
e F
ree
Don
't af
ford
able
kn
ow
know
d)
Fa
ith a
nd tr
ust i
n th
e 1.
2
3.
4.
1.
2 3.
4.
tr
eatm
ent
No
faith
S
ome
amou
nt
Gre
at d
eal o
f D
on't
No
faith
S
ome
amou
nt
Gre
at d
eal
Don
't of
faith
fa
ith
know
of
faith
_ of
faith
kn
ow
e)
Atti
tude
of d
octo
r /
1.
2.
3.
4 1.
2.
3
4 pa
ram
edic
al s
taff
Rud
e In
diffe
rent
C
arin
g D
on't
Rud
e In
diffe
rent
C
arin
g D
on't
know
kn
ow
f)
App
oint
men
ts a
nd
1.
2.
3 4
1.
2.
3.
4.
wai
ting
time
Long
wai
ting
Fai
rly
No
wai
ting
Don
't Lo
ng w
aitin
g F
airly
N
o w
aitin
g D
on't
time
reas
onab
le
time
know
tim
e re
ason
able
tim
e kn
ow
wai
ting
time
wai
ting
time
g)
Dis
tanc
e to
hea
lth
1.
2.
3.
4.
1.
2. R
easo
nabl
e 3.
4
care
V
ery
far
Rea
sona
ble
Clo
se b
y D
on't
Ver
y fa
r di
stan
ce
Clo
se b
y D
on't
dist
ance
kn
ow
know
97
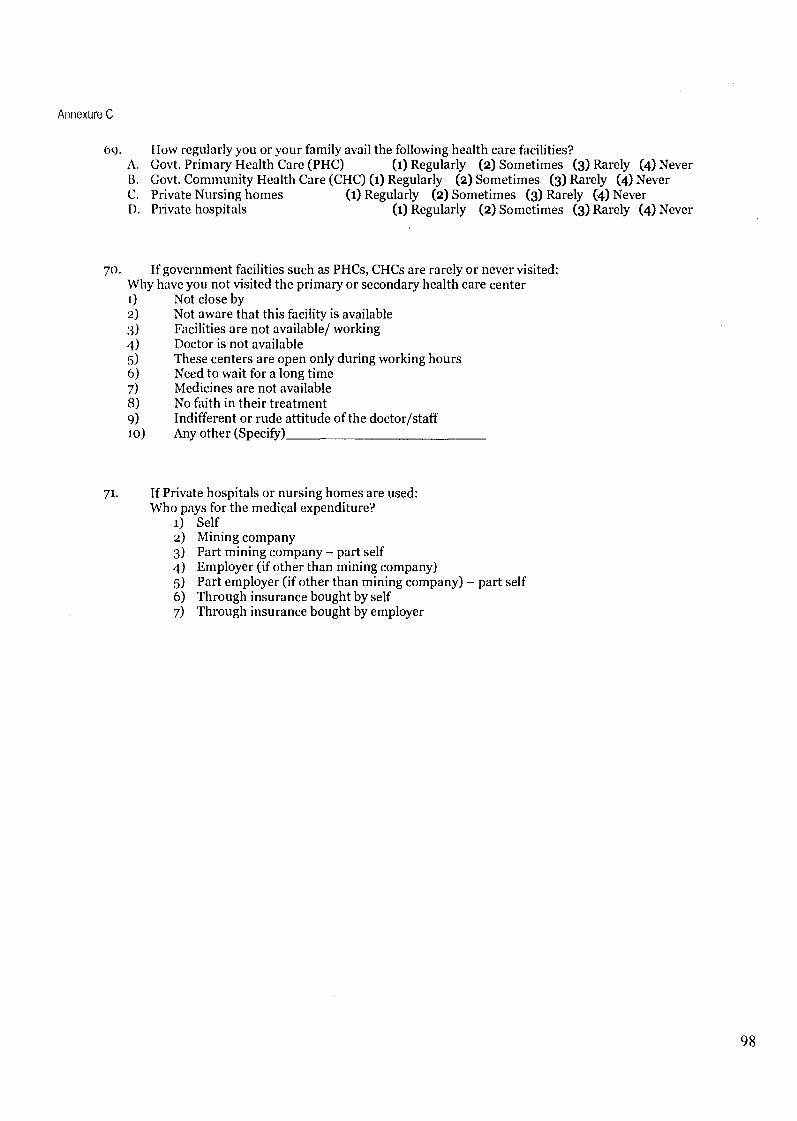
Annexure C
69. Flow regularly you or your family avail the following health care facilities? A. Govt. Primary Health Care (PHC) (1) Regularly (2) Sometimes (3) Rarely (4) Never B. Govt. Community Health Care (CHC) (1) Regularly (2) Sometimes (3) Rarely (4) Never C. Private Nursing homes (1) Regularly (2) Sometimes (3) Rarely (4) Never D. Private hospitals (1) Regularly (2) Sometimes (3) Rarely (4) Never
70. If government facilities such as PHCs, CHCs are rarely or never visited: Why have you not visited the primary or secondary health care center 1) Not close by 2) Not aware that this facility is available :3) Facilities are not available/ working 4) Doctor is not available 5) These centers are open only during working hours 6) Need to wait for a long time 7) Medicines are not available 8) No faith in their treatment 9) Indifferent or rude attitude of the doctor/staff io) Any other (Specify)
71. If Private hospitals or nursing homes are used: Who pays for the medical expenditure?
1) Self 2) Mining company 3) Part mining company - part self 4) Employer (if other than mining company) 5) Part employer (if other than mining company) - part self 6) Through insurance bought by self 7) Through insurance bought by employer
98
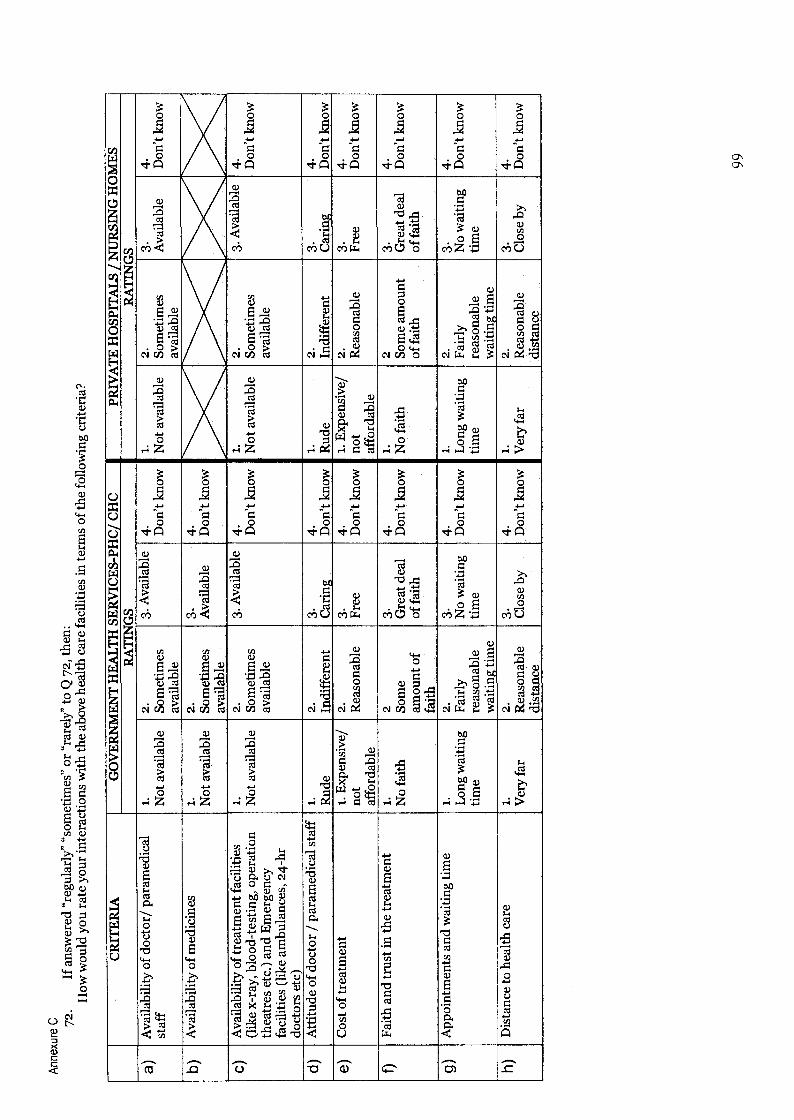
Annexure C
72.
If a
nsw
ered
"re
gula
rly"
"so
met
imes
" or
"rar
ely"
to Q
72,
then
: H
ow w
ould
you
rat
e yo
ur in
tera
ctio
ns w
ith t
he a
bove
hea
lth c
are
faci
litie
s in
term
s of
the
follo
win
g cr
iteri
a?
CR
ITE
RIA
G
OV
ER
NM
EN
T H
EA
LT
H S
ER
VIC
ES
-PH
C/ C
HC
PR
IVA
TE
HO
SPIT
AL
S N
UR
SIN
G H
OM
ES
RA
TIN
GS
R
AT
ING
S
a)
Ava
ilabi
lity
of d
octo
r/ p
aram
edic
al
1.
2.
3. A
vaila
ble
4.
1.
2.
3 4.
st
aff
Not
ava
ilabl
e So
met
imes
D
on't
know
N
ot a
vaila
ble
Som
etim
es
Ava
ilabl
e D
on't
know
av
aila
ble
avai
labl
e
b)
Ava
ilabi
lity
of m
edic
ines
1.
2.
3.
4.
N
ot a
vaila
ble
Som
etim
es
Ava
ilabl
e D
on't
know
av
aila
ble
C)
Ava
ilabi
lity
of tr
eatm
ent f
acili
ties
1.
2.
3. A
vaila
ble
4.
1.
2.
3. A
vaila
ble
4.
(lik
e x-
ray,
blo
od-t
estin
g, o
pera
tion
Not
ava
ilabl
e So
met
imes
D
on't
know
N
ot a
vaila
ble
Som
etim
es
Don
't kn
ow
thea
tres
etc
.) a
nd E
mer
genc
y av
aila
ble
avai
labl
e fa
cilit
ies
(lik
e am
bula
nces
, 24-
hr
doct
ors
etc)
d)
A
ttitu
de o
f doc
tor / p
aram
edic
al s
taff
1.
2.
3.
4.
1.
2.
3.
4
Rud
e In
diffe
rent
C
arin
g D
on't
know
R
ude
Indi
ffere
nt
Car
ing
Don
't kn
ow
e C
ost of
trea
tmen
t i.
Exp
ensi
ve/
2.
3.
4.
1. E
xpen
sive
/ 2.
3
4 no
t R
easo
nabl
e F
ree
Don
't kn
ow
not
Rea
sona
ble
Fre
e D
on't
know
af
ford
able
af
ford
able
f)
F
aith
and
trus
t in
the
trea
tmen
t 1.
2
3 4.
1.
2
3.
4.
No
faith
S
ome
Gre
at d
eal
Don
't kn
ow
No
faith
S
ome
amou
nt
Gre
at d
eal
Don
't kn
ow
amou
nt o
f of
faith
of
faith
of
faith
fa
ith
g)
App
oint
men
ts a
nd w
aitin
g tim
e 1.
2.
3.
4.
1.
2.
3
4 L
ong
wai
ting
Fair
ly
No
wai
ting
Don
't kn
ow
Lon
g w
aitin
g Fa
irly
N
o w
aitin
g D
on't
know
tim
e re
ason
able
tim
e tim
e re
ason
able
tim
e w
aitin
g tim
e w
aitin
g tim
e
h)
Dis
tanc
e to
hea
lth c
are
1.
2.
3.
4.
1.
2.
3.
4 V
ery
far
Rea
sona
ble
Clo
se b
y D
on't
know
V
ery
far
Rea
sona
ble
Clo
se b
y D
on't
know
di
stan
ce
dist
ance
99

Annexure C
Now
I w
ill a
sk y
ou l
ast f
ew q
uest
ions
abo
ut y
ou a
nd y
our
fam
ily:
73
Age
74-
Wha
t is
your
leve
l of
edu
catio
n?
1)
2)
3)
4)
5)
6)
7)
No
scho
olin
g Pr
imar
y (u
p to
4th
ST
D)
Seco
ndar
y (u
p to
lot
h ST
D)
Hig
her s
econ
dary
(up
to 1
2th
STD
) B
ache
lors
deg
ree
(B.A
, B
.Sc.
, B
.Com
, B
.Tec
h et
c...)
M
aste
rs d
egre
e (M
.A, M
.Sc.
, M
.Com
, M
.Tec
h et
c...)
V
ocat
iona
l tra
inin
g (e
lect
rici
an, t
ypin
g, t
ailo
ring
, m
echa
nics
etc
...)
75
App
roxi
mat
ely
wha
t is
your
mon
thly
inco
me?
1)
R
s. lo
oo -
Rs.
2000
2)
R
s. 2
000
- R
s.30
00
3)
Rs.
300
0 -
Rs.
4000
4)
R
s. 4
000 - R
s. 6
000
5)
Rs.
6oo
o - R
s. 8
00o
6)
Rs.
8oo
o - R
s. 1
0,00
0 7)
M
ore
than
Rs.
10,
000
I re
ally
app
reci
ate
your
taki
ng th
e tim
e to
ans
wer
my
ques
tions
, Tha
nk-y
ou v
ery
muc
h.
"Dev
Bor
em K
oru!
"
100


Annexure D
Annexure D
Contents
Revised QoL tool .......................................................................................................... 77
Environment and Social Performance Indicators (Companies) .............................. 85
Environment and Social Performance Indicators (Government) .............................. 89
IDRC Centre File: 101276-001 76
TERI Report no. 2002WR41
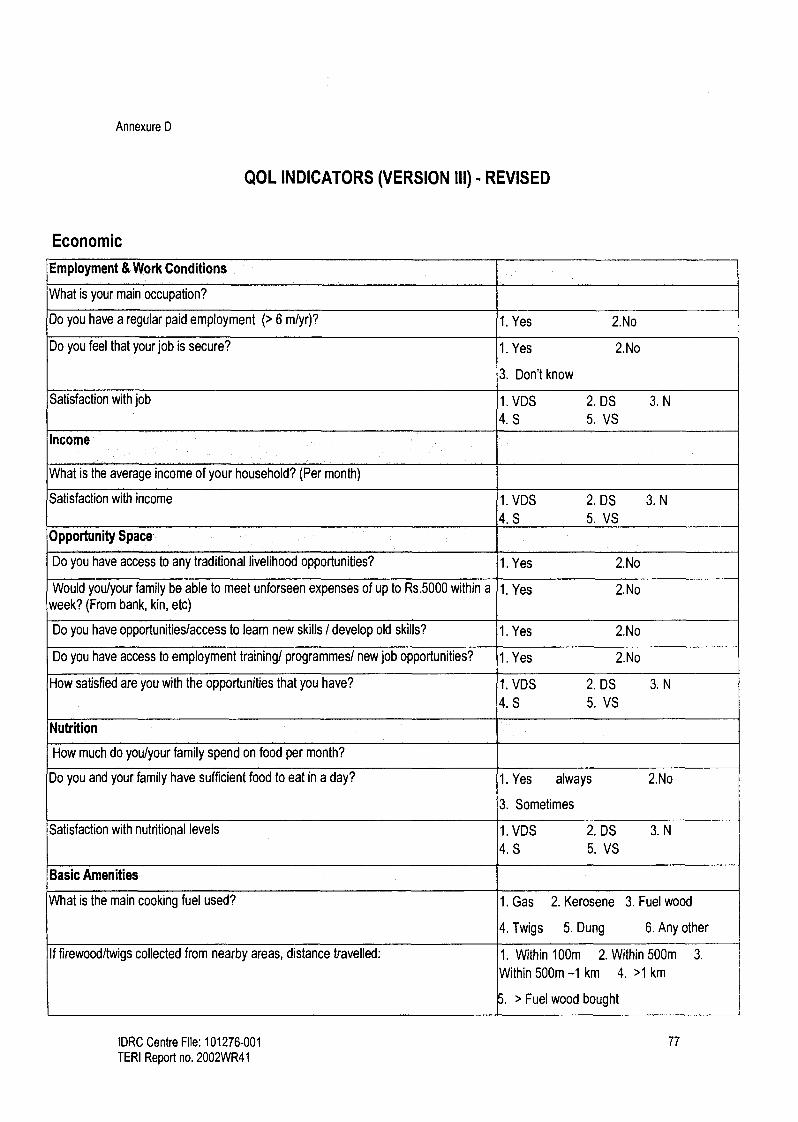
Annexure D
QOL INDICATORS (VERSION III) - REVISED
Economic
Employment & Work Conditions
What is your main occupation?
Do you have a regular paid employment (> 6 m/yr)? 1. Yes 2.No
Do you feel that your job is secure? 1. Yes 2.No
3. Don't know
Satisfaction with job 1. VDS 2. DS
4.S 5.VS 3. N
Income
What is the average income of your household? (Per month)
Satisfaction with income 1. VDS 2. DS
4.S 5, VS
3. N
Opportunity Space
Do you have access to any traditional livelihood opportunities? 1. Yes 2.No
Would you/your family be able to meet unforseen expenses of up to Rs.5000 within a week? (From bank, kin, etc)
1. Yes 2.No
Do you have opportunities/access to learn new skills / develop old skills? 1. Yes 2.No
Do you have access to employment training/ programmes/ new job opportunities? 1. Yes 2.No
How satisfied are you with the opportunities that you have? 1. VDS 2. DS
4.S 5. VS
3. N
Nutrition
How much do you/your family spend on food per month?
Do you and your family have sufficient food to eat in a day? 1. Yes always
3. Sometimes
2.No
Satisfaction with nutritional levels 1. VDS 2. DS
4.S 5. VS
3. N
Basic Amenities
What is the main cooking fuel used? 1. Gas 2. Kerosene 3. Fuel wood
4. Twigs 5. Dung 6. Any other
If firewood/twigs collected from nearby areas, distance travelled: 1. Within 100m 2. Within 500m 3.
Within 500m -1 km 4. >1 km
> Fuel wood bought
IDRC Centre File: 101276-001 77
TERI Report no. 2002WR41

Annexure D
What is the kind of sanitation facility available to you? 1. No toilet 2. Inside home
3. Outside home 4. Public toilet
5. Any other
Do you have easy availability of water for drinking/other domestic purposes? 1. Within house
3. Within 200 m
5. > 1 km
2. Within 100 m
4. Within 1 km
How satisfied are you with availability of these amenities? 1. VDS
4.S 2. DS 3. N
5. VS
Infrastructure
Do you have access to communication services (postal, email, telegraph)? 1. Yes 2.No
Do you have electricity in your home? 1. Yes 2.No
Do you avail of water distributed by public services? 1. Yes 2.No
Do you have a telephone access at home? 1. Yes 2.No
Do you use the public transport system? 1. Yes 2.No
Do you have sufficient places to water and pasture livestock? 1. Yes 2.No
Do you use any of the facilities offered by the government? (Starting new ventures/
subsidies, support, loan) 1. Yes 2.No
How satisfied are you with the above services? 1. VDS
4.S 2. DS 3. N
5. VS
Assets
What is the ownership status of your place of residence/house? 1. Own
3. others
2. Rent
How much land do you own? (in ha)
Do you have any livestock? (number per type) 1. Yes 2.No
Satisfaction with these assets 1. VDS
4.S 2. DS 3. N
5. VS
IDRC Centre File: 101276-001 78 TERI Report no. 2002WR41

Annexure D
Social
Family & Community Life
Do you have the support of the extended family and/or friends? 1. Yes always 2.No
3. Sometimes
Do you have a good family life? 1. Yes most of time 2.No
3. Sometimes
Do you have good relations with relatives? 1. Yes 2.No
3. Sometimes
Satisfaction with family 1. VDS 2. DS 3. N
4.S 5. VS
Do you have a community life? 1. Yes 2.No
3. Sometimes
Are you able to express solidarity with others? 1. Yes 2.No
Satisfaction with community life 1. VDS 2. DS 3. N
4.S 5. VS
Choices regarding marriage and reproduction
Did/Do you have a choice in matters regarding marriage? 1. Yes 2.No
3. Restricted 4. N.A.
Did /Do you have a choice regarding the number and spacing of Children? 1. Yes 2.No
3. Restricted 4. N.A.
How satisfied are you with the degree of freedom? 1. VDS 2. DS 3. N
4.S 5. VS
Education
What educational qualification or level have you achieved? a. Primary level
b. Secondary level
c. Post secondary level
d. Vocational tra ining
How satisfied are you with your level of education attained? 1. VDS 2. DS 3. N
4.S 5. VS
Do your children have the opportunity to go to school /higher education? 1. Yes 2.No
How satisfied are you with the education they have received? 1. VDS 2. DS 3. N
4.S 5. VS
IDRC Centre File: 101276-001 79
TERI Report no. 2002WR41

Annexure D
What kind of access to information do you have? Public- library
Private- Newspaper, Television
Radio
c. Any other
Social Security
Do you have access to social security benefits ?(e.g. free or subsidized medical 1. Yes 2.No support, child support, education support from the State, pension)
3. Do not know
Satisfaction with social security 1. VDS 2. DS 3. N
4.S 5. VS
Do you and/or your family have access to any sports facilities? (Playground, fields 1. Yes 2.No etc)
Do you feel physically safe in the village? (i.e. free from crime or the threat of crime) 1. All the time (l Below)
2. Most of the time
3. Some times
4. Never
Are there any vices such as alcoholism, prostitution, drug abuse etc within your 1. Yes 2.No family? 3. A little
Conflict Resolution
What are the mechanisms you use or support to resolve conflict? (Courts, police,
panchayat)
Do you support the use of traditional ways to prevent & resolve conflict (family, other 1.Yes 2. No informal groups, religious heads)
How satisfied are you with the conflict resolution mechanisms that you have access 1. VDS 2. DS 3. N
to? 4.S 5. VS
Political
Participation
Do you participate in decision making/ planning/ implementing in any or all of the
below? ( below) a. Household level
b. Village/municipal level
Do you participate in local politics? 1. Yes 2.No
Are you involved in monitoring critical issues in your village? 1. Yes 2.No
IDRC Centre File: 101276-001 80 TERI Report no. 2002WR41
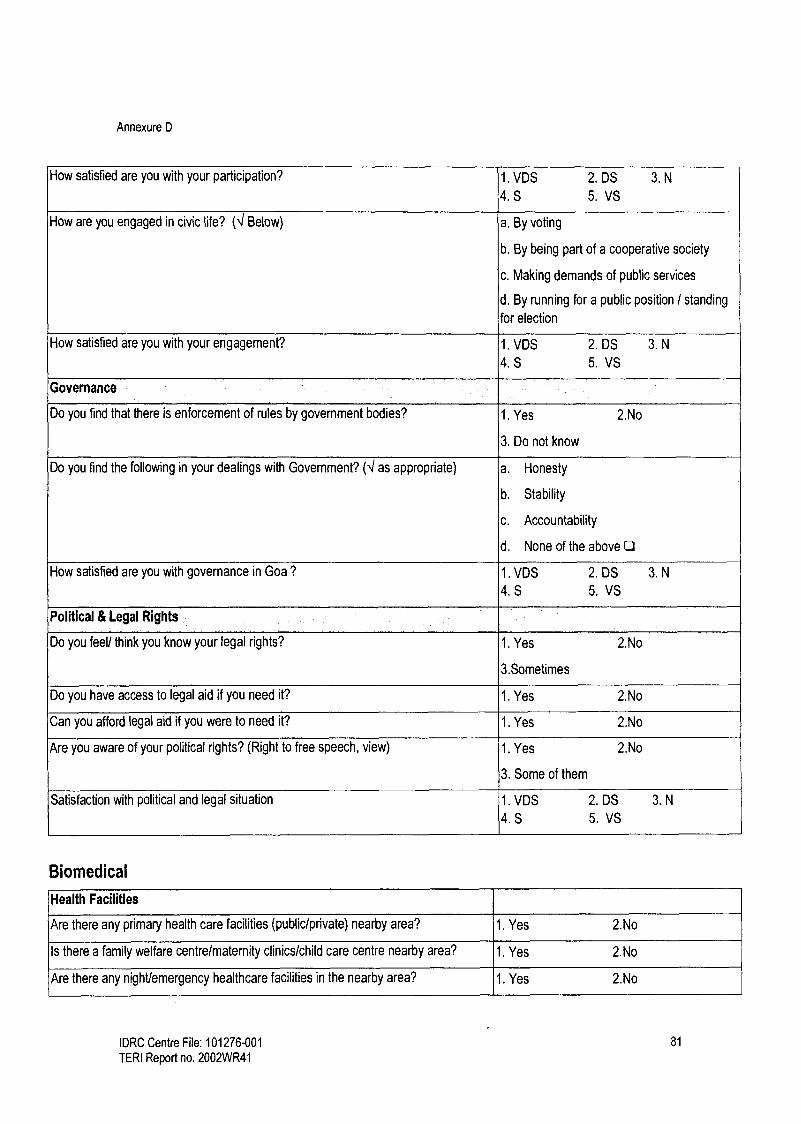
Annexure D
How satisfied are you with your participation? 1. VDS 2. DS 3. N
4.S 5. VS
How are you engaged in civic life? (4 Below) a. By voting
b. By being part of a cooperative society
c. Making demands of public services
d. By running for a public position / standing
for election
How satisfied are you with your engagement? 1. VDS 2. DS 3. N
4.S 5. VS
Governance
Do you find that there is enforcement of rules by government bodies? 1. Yes 2.No
3. Do not know
Do you find the following in your dealings with Government? (I as appropriate) a. Honesty
b. Stability
c. Accountability
d. None of the above
How satisfied are you with governance in Goa ? 1. VDS 2. DS 3. N
4.S 5. VS
Political & Legal Rights
Do you feel/ think you know your legal rights? 1. Yes 2.No
3.Sometimes
Do you have access to legal aid if you need it? 1. Yes 2.No
Can you afford legal aid if you were to need it? 1. Yes 2.No
Are you aware of your political rights? (Right to free speech, view) 1. Yes 2.No
3. Some of them
Satisfaction with political and legal situation 1. VDS 2. DS 3. N
4.S 5. VS
Biomedical
Health Facilities
Are there any primary health care facilities (public/private) nearby area? 1. Yes 2.No
Is there a family welfare centre/maternity clinics/child care centre nearby area? 1. Yes 2.No
Are there any night/emergency healthcare facilities in the nearby area? 1. Yes 2.No
IDRC Centre File: 101276-001 81
TERI Report no. 2002WR41

Annexure D
Are there any dental clinics in the nearby area? 1. Yes 2.No
Is there any alternative or traditional medical system available in the nearby area? 1. Yes 2.No
Do you find western/modern medicines that you need easily available here? 1. Yes 2.No
Do you or your family get the immunisation programmes available easily? 1. Yes
3. NA
2.No
Satisfaction with health facilities available 1. VDS
4.S 2. DS 3. N
5. VS
How would you describe the quality of health care facilities? (e.g. to have facilities
with qualified nurses, regular physician visits, sufficient and clean equipment) 1. V Bad
4. Good
2. Bad 3. Fair
5. V. Good
Economic Ability to Maintain Health
Can you afford any of the medical treatment/immunisation programmes not
supported by the government? 1. Yes
3. NA
2.No
Do you have medical insurance (Public or private ) facility? 1. Yes 2.No
Do you have medical coverage facility? 1. Yes 2.No
Satisfaction with economic ability to maintain health 1. VDS
4.S 2. DS 3. N
5. VS
Health Status
Do you depend on western/modern medicines (in order to be able to undertake your
daily activities?) 1. Yes 2.No
Are you free from physical illness/ mental illness (depression, mental stress, anxiety
etc.)? 1. Yes 2.No
Is your family free from any physical or mental disabilities? 1. Yes 2.No
Is your family free from any chronic illness? 1. Yes 2.No
Do you get enough sleep / rest to have sufficient stamina to carry out your daily activities?
1. Yes 2.No
Do you have good appetite and digestion? 1. Yes 2.No
Do you have good reproductive health / fertility? 1. Yes
3. NA
2.No
Do you have sufficient vigour and stamina to carry out your daily activities? 1. Never 2. Some of the time
3. Most of the time 4. All of the time
Type of frequent or recurring illness in the family
How satisfied are you with your general health status? 1. VDS
4.S 2. DS 3. N
5. VS
Does your work involve health and safety risks? 1. Yes 2.No
IDRC Centre File: 101276-001 82
TERI Report no. 2002WR41

Annexure D
3. NA
How satisfied are you with the health and safety situation you are faced with at your 1. VDS 2. DS 3. N
work place? 4. S 5. VS
Are you able to experience emotional compatibility with those important to you? 1. Yes 2.No
Do you have Self - confidence/ Self respect 1. Yes 2.No
3. Sometimes
How satisfied are you with your emotional life? 1. VDS 2. DS 3. N
4.S 5. VS
Environmental
How would you describe the air quality that you are faced with in your daily life? 1. V Bad 2. Bad 3. Fair
4. Good 5. V. Good
Are you free from noise (loud & constant)? 1. Yes 2.No
Is the place you live in free from man made vibrations? 1. Yes 2.No
Satisfaction with present level of noise and vibrations 1. VDS 2. DS 3. N
4.S 5. VS
How would you describe the water quality for drinking that you are faced with in your 1. V Bad 2. Bad 3. Fair daily life?
4. Good 5. V. Good
How would you describe the water quality for other purposes in your daily life? 1. V Bad 2. Bad 3. Fair
4. Good 5. V. Good
Do you think that water source for drinking/ other domestic purposes available 1. Yes always 2. Sometimes
sufficiently? 3. Uncertain
Satisfaction with water availability 1. VDS 2. DS 3. N
4.S 5. VS
Satisfaction with water quality 1. VDS 2. DS 3. N
4.S 5. VS
How would you describe the changes in the natural landscape around you? 1. No change 2. V Bad 3. Bad
4. Fair 5. Good 6. V. Good
How would you describe the quality of the land you have to cultivate and maintain 1. V Bad 2. Bad 3. Fair animals?
4. Good 5. V. Good
How would you describe the changes in the number or quantity of plants in your area 1. No change 2. Decreasing amount over the last ten years?
3. Increasing amount
How would you describe the changes in the number or quantity of animals in your 1. No change 2. Decreasing amount area over the last ten years?
IDRC Centre File: 101276-001 83
TERI Report no. 2002WR41

Annexure D
3. Increasing amount
Do you feel exposed to the occurrence of calamities like floods, droughts, landslides,
etc? 1. Periodically in monsoons
2. Continuously 3. Rarely
Satisfaction with the overall quality of your physical environment 1. VDS
4.S 2. DS 3. N
5. VS
Is the place (you work/live) clean? 1. Yes 2.No
Is the place (you work/live) accident-free (vehicular)? 1. Yes 2.No
Are there any Open/Green spaces around the place of work? 1. Yes 2.No
Are there any Open/Green spaces around the place you live? 1. Yes 2.No
Satisfaction with the overall appearance of the surrounding landscape 1. VDS
4.S 2. DS 3. N
5. VS
Spiritual
What is the level of spirituality / religion in your life? 1. High 2.Medium 3. Low 4. None
Do you believe in customs and traditions/ rituals? 1. Yes 2.No
3.Somewhat
Are you involved in festivals and religious ceremonies? 1. Yes 2.No
Do you have strong personal beliefs? 1. Yes 2.No 3.Somewhat
Do you believe in a God? 1. Yes 2.No 3.Somewhat
Is there a place of worship close by? 1. Yes 2.No
How important for you to build new/renovate/painting of place of worship? 1. High 2. Medium 3. Low 4. None
How satisfied are you with your spiritual life? 1. VDS
4.S 2. DS 3. N
5. VS
How satisfied are you with the accessibility of places of worship? 1. VDS
4.S 2. DS 3. N
5. VS
IDRC Centre File: 101276-001 84 TERI Report no. 2002WR41
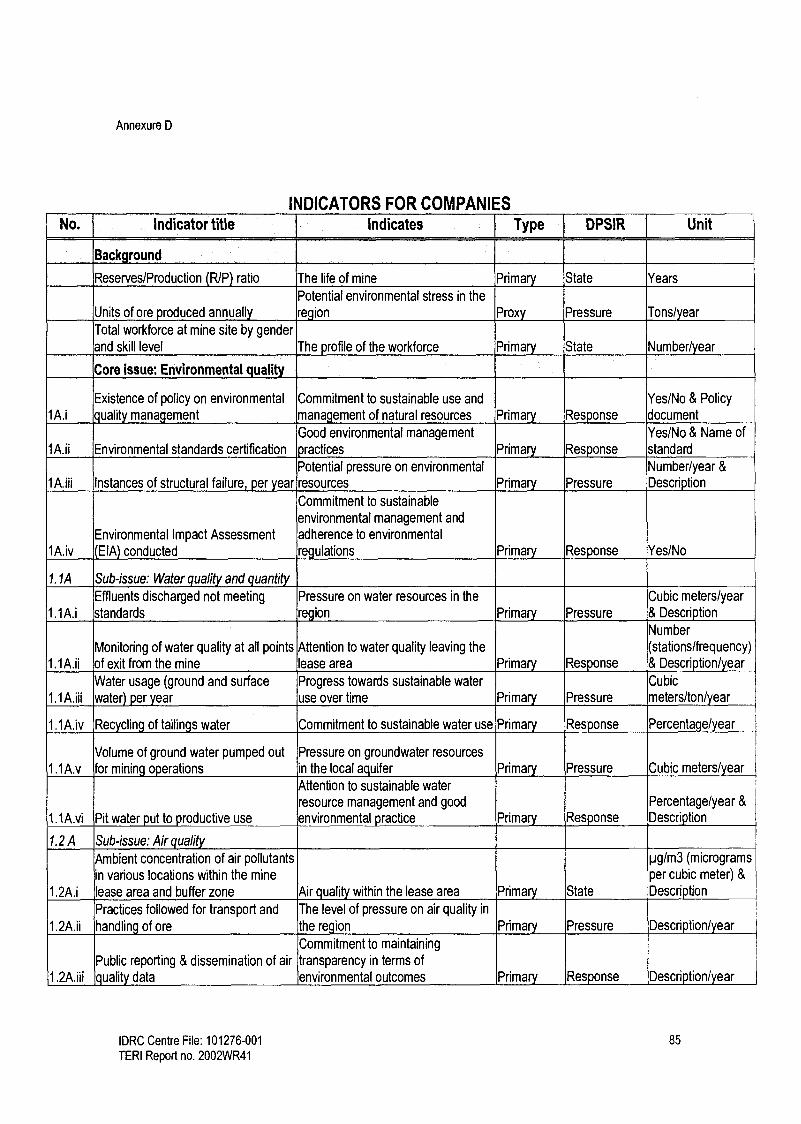
Annexure D
INDICATORS FOR COMPANIES No. Indicator title Indicates Type DPSIR Unit
Back round
Reserves/Production R/P ratio The life of mine Prima State Years
Potential environmental stress in the
Units of ore p roduced annually region Prox Pressure Tons/ ear
Total workforce at mine site by gender and skill level The profile of the workforce Primary State Number/ ear
Core Issue: Environmental quali!y
Existence of policy on environmental Commitment to sustainable use and Yes/No & Policy 1A.i quality management management of natural resources Primary Response document
Good environmental management Yes/No & Name of 1A.ii Environmental standards certification practices Primary Response standard
Potential pressure on environmental Number/year &
1A.iii Instances of structural failure, per year resources Primary Pressure Description
Commitment to sustainable
environmental management and
Environmental Impact Assessment adherence to environmental 1A.iv (EIA) conducted regulations Primary Response Yes/No
1. 1A Sub-issue: Water quality and quantity Effluents discharged not meeting Pressure on water resources in the Cubic meters/year
1.1A.i standards region Primary Pressure & Description
Number
Monitoring of water quality at all points Attention to water quality leaving the (stations/frequency) 1.1A.ii of exit from the mine lease area Primary Response & Description/year
Water usage (ground and surface Progress towards sustainable water Cubic
1.1A.iii water) per year use over time Primary Pressure meters/ton/year
1.1A.iv Recycling of tailings water Commitment to sustainable water use Primary Response Percentage/ye
Volume of ground water pumped out Pressure on groundwater resources
1.1A.v for mining operations in the local aquifer Primary Pressure Cubic meters) ear Attention to sustainable water resource management and good Percentage/year &
1.1A.vi Pit water put to productive use environmental practice Primary Response Description
1.2 A Sub-issue: Air quality
Ambient concentration of air pollutants pg/m3 (micrograms
in various locations within the mine per cubic meter) &
1.2A.i lease area and buffer zone Air quality within the lease area Primary State Description
Practices followed for transport and The level of pressure on air quality in
1.2A.ii handling of ore the region Primary Pressure Description/year
Commitment to maintaining
Public reporting & dissemination of air transparency in terms of 1.2A.iii quality data environmental outcomes Primary Response Description/year
IDRC Centre File: 101276-001 85
TERI Report no. 2002WR41

Annexure D
1.3 A Sub-issue: Land
Annual land use plan for mining lease Efforts towards sustainable land use
1.3A.i area and management Primary Response Plans/ ear
1.3A.ii Ore to overburden ratio Potential pressure on land resources Proxy Pressure Ratio
Management of overburden dumps to Environmental management practices
1.3A.iii ensure physical and chemical stability adopted by the company Primary Response Description
Percentage/year &
1.3A.iv Conservation of topsoil Land management practices followed Primary Response Description
Total agricultural/horticultural land Extent to which land is impacted due
1.3A.v area affected by mining per year to mining Primary Impact Hectares/ ear
Core issue: Land compensation
Compensation for surface rights lost Fairness and adequacy of Rupees/unit land &
2.A.i to lease compensation paid for lost land Primary Response Description
Whether company has taken
responsibility for rehabilitation and
Provision for community rehabilitation resettlement and adequacy of 2.A.ii and resettlement provisions Primary Response Description
Rupees/unit output
Fairness and adequacy of or Rupees/unit land
2.A.iii Compensation for crop loss compensation paid for crop loss Primary Response & Description
Core issue: Mine closure Sub-issue: Socio-economic issues of
3.1A closure
Policy on socio-economic aspects of Commitment to addressing socio- Policy document or 3.1A.i mine closure economic impacts of mine closure Primary Response description
Initiatives towards keeping the
community informed regarding mine Fulfillment of corporate social
3.1A.ii closure responsibility Primary Response Descriptionlyear
Number of jobs terminated by mining The number of people estimated to
3.1A.iii company including outsourced jobs be directly impacted by mine closure Primary Impact Number/ ear
Number &
3.1A.iv Workers receiving compensation Concern for the welfare of workers Primary Response Description
The companies commitment to
Financial support for job search and reducing socio-economic impacts of 3.1A.v relocation for workers mine closure Primary Response Rupees/worker
IDRC Centre File: 101276-001 86
TERI Report no. 2002WR41

Annexure D
Sub-issue: Environmental issues of 3.2A closure
Commitment to address potential Policy on environmental aspects of environmental impacts of mine
3.2A.i mine closure closure Prima Response Policy document
Consideration given to productive use 3.2A.ii Plans for post closure land use of land resources after mine closure Primary Response Description
Commitment to
rehabilitating/reclaiming mine lease
Environmental area and systematic approach to land
3.2A.iii rehabilitation/reclamation plan rehabilitation /reclamation Primary Response Yes/No & Plans
Commitment to implementing the Financial provisions for environmental closure plans.and its commitment to Yes/No &
3.2A.iv management during closure phase sustainability Primary Response Description
Rehabilitation/ reclamation completed per year relative to closure phase Timely fulfillment of rehabilitation/
3.2A.v plans reclamation responsibilities Primary Response Description/year
Core issue: Health
4.1A Sub-issue: Health status
Number of casualties and fatalities at Occupational health impact of mining Number/year &
4.1A.i the mine site on workers Primary Impact Description
Psychological stress within the 4.1A.ii Alcoholism within the workforce workforce Proxy Impact Number/ ear
Illness associated with specific metallic mining detected amongst the Impact of mining on the health of the Number of
4.1A.iii workforce workforce Primary Impact cases/illness/year
4.2A Sub-issue: Health care
Health care benefits provided to Commitment to maintaining a healthy
4.2A.i various categories of worker workforce Prima Response Pescription
Policy on occupational health and Commitment towards occupational 4.2A.ii safety of workers health and safety of workers Primary Response Description
Core issue: Participation Sub-issue: Opportunities for
5.1A participation
Community consultation meetings Company's effort to create Number/year &
5.1A.i held per year opportunities for participation Primary Response Description
Sub-issue: Information availability and 5.2A access
Information regarding the company The availability of information about
and mining projects in the public the company and mining project in
5.2A.i domain the public domain Primary Response Description year
IDRC Centre File: 101276-001 87
TERI Report no. 2002WR41

Annexure D
Core issue: Social and community relations
Existence of a Corporate Social Company's commitment to fulfilling its Yes/No & Policy
6A.i Responsibility CSR policy social responsibility Primary Response document
Existence of a community relations (CR) Importance given to community
6A.ii officer relations and issues Primary Response Yes/No
Number of litigations/legal action initiated
by the community/civil society against the Level of stress in community- 6A.iii company company relations Prox Im act Number/ ear
Research into community perceptions of Concern for the welfare of the local Yes/No &
6A.iv mining project community Prima Response Description
Initiatives to develop and maintain a
relationship with indigenousltribal Concern for the welfare of
6A.v population marginalized groups Prima Res onse Description/year
Core issue: Labour and em to ment Average wages paid to men and women Rupees! category- within various categories of worker Commitment to gender equality and men and Rupees/
7A.i skilled, semi-skilled and unskilled) fairness when setting Wage rates Primary State category-women
Percentage of workers potentially Percentage of jobs outsourced through facing poor working terms and
7A.ii labour contractors conditions Proxy Pressure Percentage
Percentage of workers hired from local Positive impact of mining on local
7A.iii region (taluka) community in terms of employment Primary Impact Percentage/year
Number and description of legal actions against the company by workers/workers' Number &
7A.iv unions Company's relationship with workers Proxy State Description
Concern for labour and companies' commitment to providing a healthy Description or
7A.v Existence of industrial relations policy and positive work environment Primary Res onse olic document
Amount invested on training and capacity Company's commitment to enhancing Rupees/worker/year 7A.vi building skills of their own work force Primary Response & Description
Core issue: Investment in the region
8.1A Sub-issue: Investment in physical capital Investment in physical capital in
8.1A.i Annual investment in roads mining regions Primary Response Rupees/ton/year Annual investment in physical infrastructure (other than roads) in the Investment in physical capital in
8.1A.ii region mining regions Primary Response Rupees/ton/year
8.2A Sub-issue: Investment in human capital Annual investment in
occupational/vocational training and
capacity building / or children's education Investment in human capital in mining Rupees/tonlyear &
8.2A.i within the community regions Primary Response Pescription Investment in human capital in mining Rupees/ton/year &
8.2A.ii Annual investment in community health re ions Primary Response Description
IDRC Centre File: 101276-001 88 TERI Report no. 2002WR41

Annexure D
INDICATORS FOR GOVERNMENT No. Indicator title Indicates Type DPSIR Unit
Background
The population that can be
Total population of mining talukas and watersheds potentially impacted by mining Proxy Impact Number
The socio-economic conditions of the Regional literacy rates population in the mining region Primary State Percentage
Mining contribution to State Domestic Product The relative importance of mining in
SDP the state economy Primary Impact Percentage/year
The benefits of mining to the state Total royalties received per year exchequer Primary Impact Rupees/year
Level or intensity of mining activity in
Total number of active mine sites in the state the state Primary State Number/ ear The intensity at which mining will be
, Quarterly average market price per ton of ore carried out Prima Driver Ru ees/ton) uart
The amount of non-renewable
Total units of ore produced per year resources exhausted annually Primary Pressure Tons/ year
Core issue: Environmental quality
1.1 B Sub-issue: Water quality and quantity
Groundwater quality in the mining Groundwater quality meeting drinking water area and its suitability for drinking
1.1B.i standards ur oses Primary State Yes/No & Results
Monitoring water quality of surface water bodies receiving run-off or into which effluents are Responsible action and concern for Yes/No &
1.1B.ii discharged local ecology and community health Primary Response Description
Groundwater withdrawals as a percentage of The level of criticality of a particular 1.1B.iii recharge in mining micro-watersheds micro-watershed Primary Pressure Percentage
Shortage of water within the community and the need for more
Number of wards dependent on tanker water for sustainable alternative sources of 1.1B.iv household use water Proxy Impact Number
1.2 B Sub-issue: Air uali
Annual ambient concentration of air pollutants Air quality outside the mine lease
1.2B.i outside the mine lease area area Primary State /m3 & Descri tioi
State's commitment to enforcing the Number &
1.2B.ii Enforcement of air quality standards law Primary Response Description
Initiatives to educate the local community State's efforts to inform the
regarding impacts of air pollution and averting community regarding the causes and
1.2B.iii measures impacts of air pollution on health. Primary Response Description
IDRC Centre File: 101276-001 89
TERI Report no. 2002WR41

Annexure D
1.3 B Sub-issue: Land J The pressure on land resources in
1.3B.i New areas brought under mining leases the state Primary Pressure Hectares/ ear
The impact on soil quality due to
.36.ii Soil qualit y in mining watersheds mining Primary Impact Description
Hectares/year &
1.3B.iii Degradation of forests located in mining regions The impact on forest cover Primary Impact Description
Core issue: Land compensation The state's commitment to ensuring
Existence of state policy on resettlement and the welfare of people displaced by Yes/No & Policy B.i rehabilitation development projects Primary Response document
Total number of people displaced by mining
2.B.ii activities Im act of minin on local community Primary Impact Number/ ear
The number of agricultural
Number of households receiving compensation for households impacted by mining B.iii crop loss activities Primary Impact Number/ ear
Instances of disaffection relating to compensation Dissatisfaction with the terms of B.iV payments compensation Proxy Response Number/ ear
Core Issue: Mine closure
1 B l Sub-issue: Socio-economic issues of closure
State's efforts towards planned 1B.i Regional economic development plan development Primary Response Description
The state's foresight, responsibility 1 B.ii Financial plan for maintenance of infrastructure and concern towards the community Primary Response Description
The impact of closure on the 1 B.iii Change in unemployment rate in mining region economy Primary Impact Percentage change
The availability of work in the region Number/thousand and the impact of closure on the local population or
1B.iv Net migration rate in the mining region economy Primary Impact description
The population that is engaged in
1 B.v Worker to population ratio/ work participation rate productive labour market Primary State Percentage
28 Sub-issue: Environmental issues of closure
Yes/No &
B.i Regional land use plan Efforts towards land management Primary Response Description
The state's commitment to ensuring
R Procedures followed for monitoring of mines in sound environmental management of
B.ii final closure phase mine closure Primary Response Description
49 The extent to which the government is prepared to take on long-term
Provisions for long-term monitoring of responsibility of decommissioned 3.2B.iii decommissioned mines mine sites Prima Response Plans
IDRC Centre File: 101276-001 90 TERI Report no. 2002WR41

Annexure D
Core Issue: Health
4.18 Sub-issue: Health status
Hospitalization and doctors visits per thousand Possible health impacts on local Number of AI PL population per year for mining related illness community due to mining Primary Impact cases/ ear
Number of road traffic accidents related to The risk to health and life of the local 4.1 B.ii trucking in the mining regions community in mining regions Proxy Impact Number/ ear
Life expectancy at birth of men and women in the The community health in the mining Years (male &
4.1B.iii mining regions region Proxy State female
Poor health status of the community
Hospitalization and doctors visits for enteric due to poor living conditions and
diseases per thousand population per year in the indicates poor access to basic Number of 4.1B.iv mining regions amenities Primary Impact cases/ ear
4.2B Sub-issue: Health care
Ratio of medical staff to population in the mining Availability of health services in the 4.2B.i region mining region Primary Response Ratio
Ratio of health care centres to population in the Availability of health facilities in the 4.2B.ii mining region mining region Primary Response Ratio
Adequacy of primary health care Primary health care in mining regions meeting services provided by the state in
4.2B.iii national health guidelines mining regions Primary Response Yes/No
Health and safety surveys conducted at the mine Efforts towards upholding health and
4.2B.iv sites safety standards Primary Response Percentage
Core Issue: Participation
5.1 B Sub-issue: Opportunities for patficipation
State's commitment to providing
5.1 B.i Holding of public hearings forums for community participation Proxy Response Number /year
5.2B Sub-issue: Information availabilit and access
State's effort to provide information Number &
5.2B.i Advertisement of public hearings about public hearings Primary Response Description
Name of
Availability of mining related legislation in local State's effort to provide information legislationllocal 5.2B.ii languages related to mining legislation Primary State language
Core Issue: Labour and employment State's commitment to enforcing
7B.i Grievance cases resolved per year labour laws Primary Response Number/year
State's vigilance and concern for 7B.ii Labour inspections conducted per year labour welfare Primary Response Percentage/year
IDRC Centre File: 101276-001 91
TERI Report no. 2002WR41
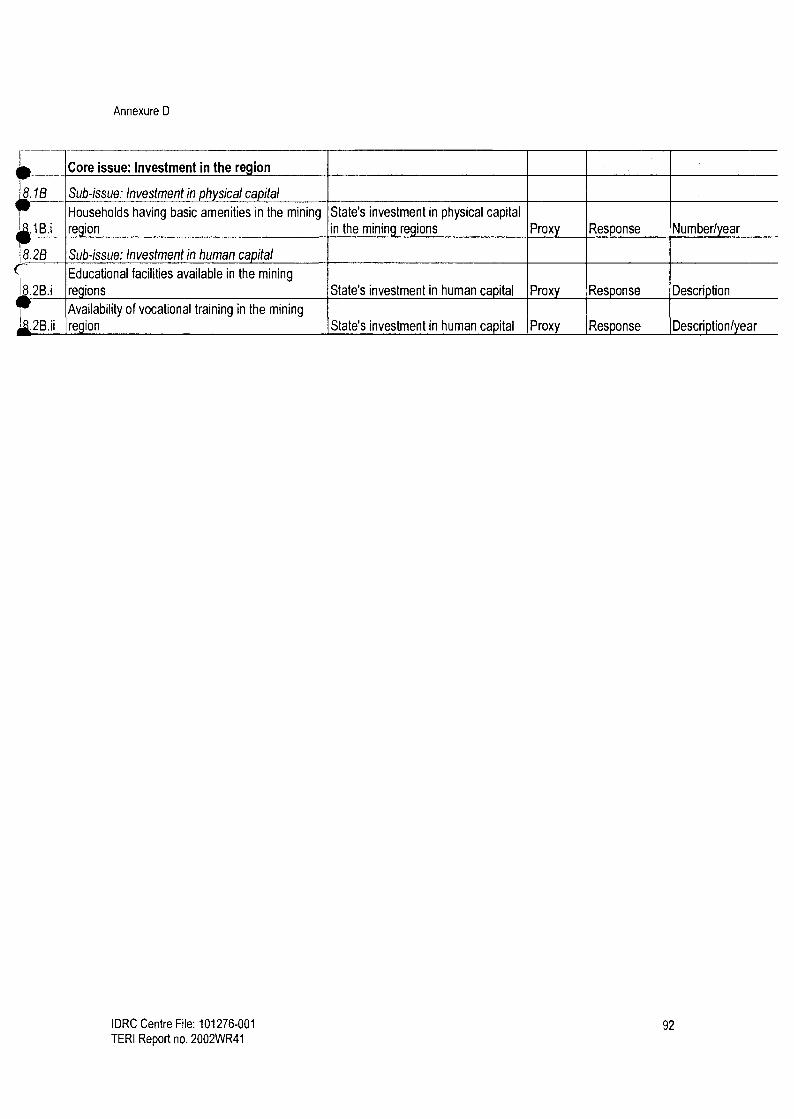
Annexure D
I Core issue: Investment in the region
8.1B Sub-issue: Investment in physical capital
Households having basic amenities in the mining State's investment in physical capital .1 B.i region in the mining regions Proxy Response Number/ ear
8.2B Sub-issue: Investment in human capital
Educational facilities available in the mining
8.2B.i regions State's investment in human capital Proxy Response Description
Availability of vocational training in the mining
region State's investment in human capital Proxy Response Description/year
IDRC Centre File: 101276-001 92 TERI Report no. 2002WR41