Exploring the Use of Key Performance Indicators to Influence ...
377
Exploring the Use of Key Performance Indicators to Influence Nursing and Midwifery Practice. Olivia Mary Elizabeth Gray MSc, BSc (Hons) Ulster University Faculty of Life and Health Sciences Institute of Nursing and Health Research Thesis submitted for the degree of Doctor of Philosophy February 2018 I confirm that the word count of this thesis is less than 100,000 Funded by: Department for Employment and Learning Belfast Health and Social Care Trust
-
Upload
khangminh22 -
Category
Documents
-
view
3 -
download
0
Transcript of Exploring the Use of Key Performance Indicators to Influence ...

Exploring the Use of Key Performance
Indicators to Influence Nursing and
Midwifery Practice.
Olivia Mary Elizabeth Gray
MSc, BSc (Hons)
Ulster University
Faculty of Life and Health Sciences
Institute of Nursing and Health Research
Thesis submitted for the degree of Doctor of Philosophy
February 2018
I confirm that the word count of this thesis is less than 100,000
Funded by: Department for Employment and Learning
Belfast Health and Social Care Trust
i
Contents
Page
Table of contents i
List of tables v
List of figures vi
List of appendices vii
Acknowledgements viii
Summary ix
Abbreviations x
Declaration xii
Chapter One: Introduction to the Study
1.1 Background to the study 1
1.1.1 KPI’s and the policy context 2
1.1.2 Measuring the nursing and midwifery contribution 3
1.1.3 KPI implementation and knowledge translation 4
1.2 Rationale for the study 5
1.3 Purpose of the study 6
1.4 Research question and objectives 6
1.5 Thesis structure 7
1.6 Summary 7
Chapter Two: A Critique of the Literature, Placing the Study in Context
2.1 Search strategy 8
2.2 KPI’S: terminology and definitions 9
2.3 Development of KPI’s in healthcare 13
2.4 The use of KPI’s within nursing and midwifery 16
2.4.1 Identifying KPI’s for use in nursing and midwifery 17
2.4.2 Measurement of service user experience 19
2.4.3 Benefits of using KPI’s 22
2.4.4 Challenges in using KPI’s 24
2.4.5 Performance measurement process 27
2.5 The influence of KPI’s on practice 31
ii
2.5.1 KPI’s and decision-making 32
2.5.2 KPI’s in the context of quality improvement 34
2.6 Summary 40
Chapter Three: Philosophical Worldview
3.1 Knowledge and reality 42
3.2 Research paradigms 44
3.3 Pragmatism as a philosophical paradigm 48
3.4 The pragmatic researcher 51
3.5 Pragmatism as a concept for change 52
3.6 Researcher positioning in relation to the study 54
3.7 Summary 56
Chapter Four: Methodology
4.1 Research question and objectives 57
4.2 Mixed method design 57
4.3 Phase one 64
4.3.1 Data collection method 64
4.3.2 Sampling 67
4.3.3 Data analysis 68
4.3.4 Establishing quantitative rigour 69
4.4 Phase two 71
4.4.1 Data collection method 71
4.4.2 Sampling 72
4.4.3 Data analysis 74
4.4.4 Establishing qualitative rigour 75
4.5 Ethical issues and governance 77
4.6 Ensuring methodological rigour 79
4.7 Summary 83
Chapter Five: Phase One Findings
5.1 Response rate 84
5.2 Organisational profiles 91
5.3 Overview of the listed KPI’s 92
iii
5.4 Operational processes 96
5.4.1 Factors which influenced organisational KPI selection 97
5.4.2 KPI data collection and analysis 97
5.4.3 Systems used for the management of KPI data 100
5.4.4 Reporting of KPI data within organisations 102
5.4.5 Involvement of clinical nurses and midwives in KPI use 103
5.4.6 Mechanisms to support and encourage action on KPI data 104
5.4.7 Examples of when KPI data were used to improve practice 105
5.4.8 KPI’s most valuable for determining the quality of care 107
5.5 Synopsis of findings requiring further exploration 108
5.6 Summary 110
Chapter Six: Phase Two Findings
6.1 Participant profile 111
6.2 The leadership challenge 111
6.2.1 Voiceless in the national conversation 112
6.2.2 Aligning KPI’s within the practice context 117
6.2.3 Listening to those who matter 121
6.3 Taking action 125
6.3.1 Establishing ownership and engaging staff 125
6.3.2 Checks and balances 130
6.3.3 Closing the loop 135
6.4 Summary 138
Chapter Seven: Discussion
7.1 The use of multiple KPI’s and data burden 139
7.2 Measuring what matters 145
7.3 Management of KPI data 152
7.4 Collective leadership 156
7.5 Situating KPI’s within implementation science 162
7.6 Summary 169
Chapter Eight: Concluding Chapter
8.1 Contribution to knowledge 170

iv
8.2 Study limitations 173
8.3 Implications and related recommendations 175
8.3.1 Implications and recommendations for practice and education 175
8.3.2 Implications and recommendations for policy 177
8.3.3 Implications and recommendations for research 178
8.4 Conclusion 179
References 183
Appendices 227

v
List of Tables
Table 2.1: Core characteristics of KPI definitions 10
Table 2.2: Empirical studies with a focus on KPI selection and development 18
Table 2.3: A taxonomy of unintended consequences relevant to the use of KPI’s 26
Table 2.4: Possible reasons for the limited adoption of data management systems 29
Table 3.1: Research paradigms 47
Table 4.1: Integration methods and their applicability to this study 63
Table 4.2: Questionnaire structure 65
Table 4.3: Phase one sample 68
Table 4.4: Thematic framework 75
Table 4.5: Checklist of criteria for assessment of quality and interpretive rigour 82
Table 5.1: Compilation of multiple choice responses 84
Table 5.2 Organisational profile characteristics 91
Table 5.3: Criteria used to define KPI’s 92
Table 5.4: Organisational nursing and midwifery specific and quasi-KPI’s 94
Table 5.5: Clinical nursing and midwifery specific and quasi-KPI’s 94
Table 5.6: Nursing and midwifery field specific and quasi- KPI’s 95
Table 5.7: Patient experience KPI’s specific and quasi-KPI’s 96
Table 5.8: Levels at which KPI data are reported 102
Table 5.9: Practice improvements resulting from use of KPI data 106
vi
List of Figures
Figure 2.1: PRISMA flow model 9
Figure 2.2: PARIHS framework 40
Figure 3.1: Dewey’s model of inquiry 52
Figure 3.2: PDSA model for improvement 53
Figure 4.1: The explanatory sequential design 60
Figure 4.2: The exploratory sequential design 61
Figure 4.3: Overview of the research 63
Figure 5.1: Flowchart of the cleansing and grouping process 93
Figure 5.2: Use of frequently cited organisational KPI’s 98
Figure 5.3: Staff groups collecting organisational KPI’s 99
Figure 5.4: Use of frequently cited clinical KPI’s 99
Figure 5.5: Staff groups who collect data on clinical KPI’s 100
Figure 5.6: Data collection methods for organisational KPI’s 101
Figure 5.7: Data collection methods for clinical KPI’s 101
Figure 5.8: Systems use in KPI management 102
Figure 5.9: KPI processes in which clinical nurses and midwives are involved 103
Figure 5.10: Classification of KPI’s chosen to illustrate improvement 105
Figure 5.11: KPI’s stated to be of value in determining the quality of care 108
Figure 7.1: The PARIHS framework aligned with the study findings 164

vii
List of Appendices
Appendix 1: Literature review search matrix 226
Appendix 2: Literature review data extraction table 232
Appendix 3: KPI's sourced from the literature 252
Appendix 4: KPI Performance Measurement Process Model 278
Appendix 5: Questionnaire 279
Appendix 6: First iteration of the questionnaire 288
Appendix 7: Email to the Directors of Nursing 301
Appendix 8: Phase one letter of invitation 302
Appendix 9: Phase one participant information sheet 303
Appendix 10: Interview guides 305
Appendix 11: Certificate of participation 306
Appendix 12: Phase two participant invitation and formation sheet 308
Appendix 13: Consent form 310
Appendix 14: Descriptive statistics for the quantitative responses 311
Appendix 15: Table of miscellaneous data items 345
Appendix 16: Table of non-nursing and midwifery specific KPI data 346
Appendix 17: Sample of the grouping process for the listed KPI’s 348
Appendix 18: Sample of the content analysis for questionnaire open text data 352
Appendix 19: Examples of practice improvements based on KPI use 355
Appendix 20: Supplementary sub-theme quotations 357

viii
Acknowledgements
As I think back on my journey over the past three years I realise that, although a PhD is
by its unique nature a very solitary pursuit, I have had the pleasure of engaging with some
fantastic people who have all made my efforts so worthwhile.
❖ To my supervisors, Tanya McCance, Donna Brown and Christine Boomer, thank you
for making me reach beyond what I thought I could achieve and for doing so in such
a way that I felt your care and concern. Your patience and guidance have truly
enriched my experience and enhanced this study. Donna, my facilitator and friend on
many voyages of discovery over the years, thank you for the words of encouragement
and always convincing me that I could do this.
❖ My heartfelt thanks to my local collaborators and participants across the UK,
Republic of Ireland and Australia. Without you this endeavour would never have
succeeded. I was made to feel so very welcome by everyone. I hope you can see your
efforts reflected in this thesis.
❖ Thank you to my colleagues in the Belfast Trust who supported my secondment -
Elish MacDougal, you are a star! Moira Kearney, you took a risk and set me on this
path of learning many years ago. Thank you.
❖ A word of thanks must also go to the Royal College of Nursing and the Florence
Nightingale Foundation for their funding awards and practical support.
❖ Fellow PhD students: who knew Northern Ireland was such a hub of international
activity? We have laughed, we have cried, we have shared the highs and the lows.
Long live Percy Pigs and coffee. Too many to name but every one a gem.
❖ To the research teams across each country, thank you for guiding me through the
various processes. Your support and willingness to help kept me sane.
❖ Finally, but most importantly, to my family. Mum, you let me get on with it and never
grumbled about our lack of time together: love always. Barry, Philip, Laura and
Christopher, for putting up with a distracted and sometimes missing wife and mother,
my thank you is simple but written with great love. I am proud of how you have coped
with the disruption to your lives; thanks for supporting me and giving me the space
to get on with it. Barry, proof-reader extraordinaire and my unwavering supporter,
you made me pause and refocus on what is important in life. Thank you, with much
love.

ix
Summary
Internationally, the use of Key Performance Indicators (KPI’s) in nursing and midwifery
is recognised as a reliable and accurate means of measuring and reporting on practice.
The use of KPI’s should lead to safe, high-quality care. However, there is little evidence
of how KPI’s influence decisions throughout organisations, or how they act on the data
collected.
Aim: To scope the KPI’s used in nursing and midwifery and explore how they influence
practice.
Methodology: A two-phased sequential mixed methods approach was chosen. Phase one
involved a questionnaire disseminated across the United Kingdom and Republic of
Ireland. Phase two consisted of interviews conducted at meso and micro levels of nursing
and midwifery in eight organisations.
Results: Quantitative data revealed over 100 nursing and midwifery specific KPI’s being
used in practice. National requirements were a deciding factor in KPI selection, while
clinical involvement was mainly through data collection. Respondents stated that they
used patient experience KPI’s, but only one measure was identified. Thematic analysis
identified two themes: The Leadership Challenge including - ‘voiceless in the national
conversation’, ‘aligning KPI’s within the practice context’ and ‘listening to those who
matter’, while Taking Action includes - ‘establishing ownership and engaging staff’,
‘checks and balances’ and ‘closing the loop’.
Conclusion: Nurses and midwives require enhanced knowledge of the nature and purpose
of KPI’s, as evidence gained from KPI data collection is insufficient to lead to
improvement. A practice context which encourages collective leadership, where multiple
sources of evidence are gathered and everyone is included in KPI evaluation and
subsequent decision-making is key. It is suggested that implementation science, in
general, and the Promoting Action on Research Implementation in Health Services
Framework, offer effective tools for successfully realising KPI’s potential to activate and
sustain improvements in practice.
x
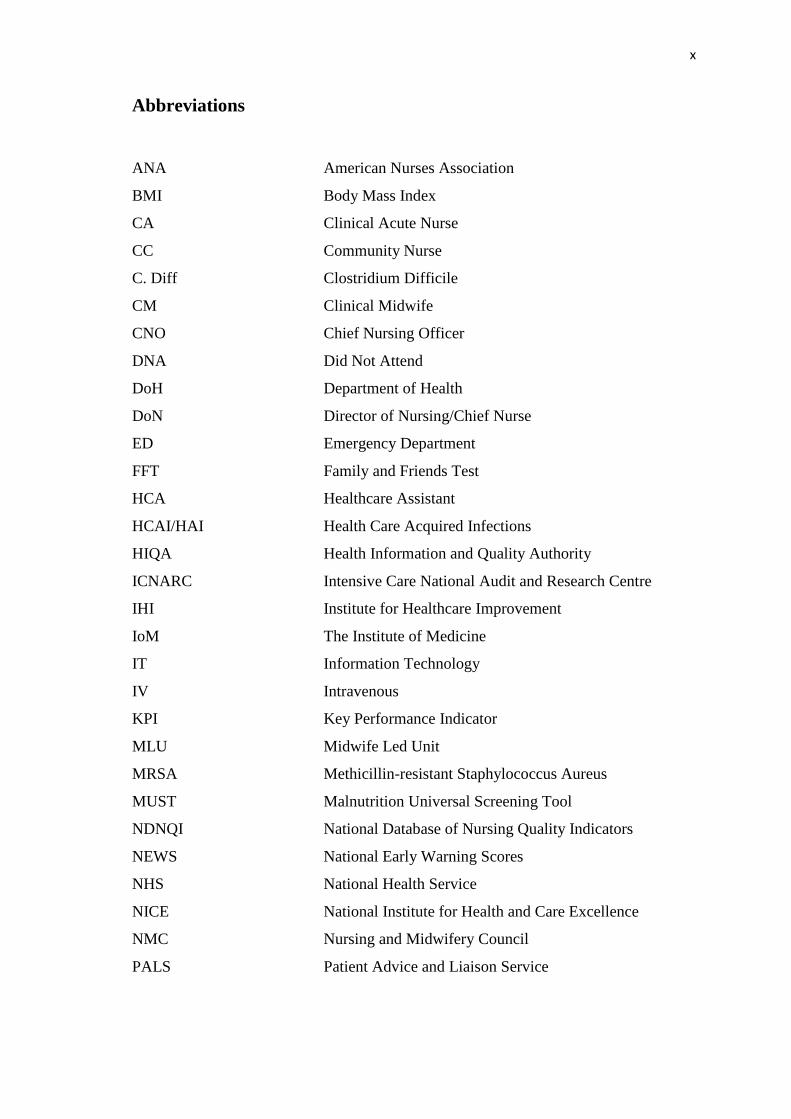
Abbreviations
ANA American Nurses Association
BMI Body Mass Index
CA Clinical Acute Nurse
CC Community Nurse
C. Diff Clostridium Difficile
CM Clinical Midwife
CNO Chief Nursing Officer
DNA Did Not Attend
DoH Department of Health
DoN Director of Nursing/Chief Nurse
ED Emergency Department
FFT Family and Friends Test
HCA Healthcare Assistant
HCAI/HAI Health Care Acquired Infections
HIQA Health Information and Quality Authority
ICNARC Intensive Care National Audit and Research Centre
IHI Institute for Healthcare Improvement
IoM The Institute of Medicine
IT Information Technology
IV Intravenous
KPI Key Performance Indicator
MLU Midwife Led Unit
MRSA Methicillin-resistant Staphylococcus Aureus
MUST Malnutrition Universal Screening Tool
NDNQI National Database of Nursing Quality Indicators
NEWS National Early Warning Scores
NHS National Health Service
NICE National Institute for Health and Care Excellence
NMC Nursing and Midwifery Council
PALS Patient Advice and Liaison Service

xi
PARIHS Promoting Action on Research Implementation in Health
Service
PDSA Plan, Do, Study, Act
PICC Peripherally Inserted Central Catheter
PPH Post-Partum Haemorrhage
QI Quality Improvement
RCA Root Cause Analysis
RCN Royal College of Nursing
RCOG Royal College of Obstetricians and Gynaecologists
ROI Republic of Ireland
RQIA Regulation and Quality Improvement Authority
SAI Serious Adverse Incidents
SM Senior Manager
TrolleyGAR KPI's to monitor patient waiting times on trolleys
UK United Kingdom
VTE Venous Thromboembolism
WHO World Health Organisation
xii
Declaration
“I hereby declare that with effect from the date on which the dissertation is deposited in
Research Student Administration of Ulster University, I permit:
1. the Librarian of the University to allow the thesis to be copied in whole or in
part without reference to me on the understanding that such authority applies to
the provision of single copies made for study purposes or for inclusion within
the stock of another library.
2. the thesis to be made available through the Ulster Institutional Repository
and/or EThOS under the terms of the Ulster eTheses Deposit Agreement which I
have signed.
IT IS A CONDITION OF USE OF THIS THESIS THAT ANYONE WHO
CONSULTS IT MUST RECOGNISE THAT THE COPYRIGHT RESTS WITH THE
AUTHOR AND THAT NO QUOTATION FROM THE THESIS AND NO
INFORMATION DERIVED FROM IT MAY BE PUBLISHED UNLESS THE
SOURCE IS PROPERLY ACKNOWLEDGED”.

xiii
“Knowledge of what is does not open the door directly to
what should be” Albert Einstein.
1
Chapter One: Introduction
An increasing focus on the measurement of performance and a universal drive to improve
healthcare over the past three decades have resulted in the worldwide proliferation of key
performance indicators (KPI’s). This focus on performance and improvement justifiably
extends to nursing and midwifery practice, where most patient care is delivered. It is in
this context that questions have been raised about the application of KPI’s and their
contribution to safe and high quality person-centred care. This chapter will summarise
the background to KPI implementation and explain the context of the study. The rationale
for conducting the study will be presented followed by a statement of the research
question, the study objectives and an overview of the thesis structure.
1.1 BACKGROUND TO THE STUDY
Florence Nightingale is frequently credited as the first nursing professional to begin
recording patient care and outcomes (Montalvo 2007; Magnello 2010). Since then the
nursing role has grown and developed, with nurses and midwives now being pivotal to
the management of patient care. Alongside the professionalisation of nursing and rapid
change within healthcare, there has, in recent years, been a proliferation of research and
policy development aimed at improving healthcare quality and performance. This has led
to an increase in the development and implementation of KPI’s designed to measure the
impact of nursing and midwifery practice. Specifically, ‘nurse-sensitive’ KPI’s measure
nursing care that is:
“based on nurses’ scope and domain of practice, and for which there is empirical
evidence linking nursing inputs and interventions to the outcome” (Doran 2003,
pvii).
KPI’s are widely accepted to have been introduced by the American Nurses Association
(ANA 1995) as a means of monitoring and measuring the impact of staffing on patient
safety and quality of care. They also enable national comparisons of patient outcomes
and promote quality improvement. In addition to their use as tools for national
benchmarking of quality, KPI’s are used by healthcare organisations to identify and
evaluate areas of internal performance that require practice improvement (Montalvo
2007). The emphasis here is on KPI’s capacity to improve understanding of past and

2
current performance and anticipate need, thus facilitating sound management decisions
(Chrusch et al. 2016). However, healthcare organisations are highly complex, with the
provision of care occurring across a wide diversity of services and areas of clinical
practice. This in turn creates many variables which have the potential to impact on care,
and may lead to challenges in selecting the most appropriate KPI’s to be used.
Performance evaluation is further complicated in countries which operate payment
systems, resulting in a heavy burden of related measurement (Martin et al. 2016). In
addition to concerns that this results in a greater focus on finance than quality (Baker et
al. 2010; Mannion et al. 2016), the large volume of measurement involved makes
meaningful evaluation of performance and quality of care difficult, both within and across
organisations. This is a significant limitation given the cost, time and effort that is
invested, not only in the implementation of KPI’s but also in the management of KPI data
(Grimshaw et al. 2012; Mannion et al. 2016). It is also important to act on this data if the
potential of KPI’s is to be fully realised. Efforts have been made to address the associated
workload of KPI implementation through the development of core measures or minimum
data sets. Examples include those within the international Institute of Healthcare
Improvement’s “Triple Aim” project (Berwick et al. 2008; Martin et al. 2016) and the
United Kingdom (UK) Department of Health’s (DoH) NHS Outcomes Framework (DoH
2014a).
1.1.1 KPI’s and the policy context
The development of policy has attempted to address some of the issues highlighted by
the widely publicised failures in healthcare (The Bristol Royal Infirmary Inquiry 2001;
Francis 2013; Keogh 2013). With a focus on improving care, early policy documents
such as ‘A First Class Service’ (DoH 1998) in the UK, and ‘Working for Health and
Well-being’ (DoH and Children 1998) in the Republic of Ireland (ROI), have
subsequently been superseded or replaced as challenges persist. Framework documents
such as ‘Leading Change, Adding Value’ (NHS England 2016) aim to focus attention on
health and wellbeing, care and quality, and funding and efficiency. This is recognised as
a means of addressing the ‘triple aims’ of better outcomes, better experiences for people
and better use of resources (NHS England 2014; World Health Organisation (WHO)
3
2015). Such is the importance placed on safety and quality in healthcare, it is anticipated
that the development of policy will continue.
Charged with the responsibility of implementing policies, various support agencies have
been put in place. These include regulatory bodies, such as The Health Information and
Quality Authority (HIQA) in ROI, and those with a focus on improving public health and
wellbeing - the Public Health Authority in Northern Ireland (NI); Healthcare
Improvement Scotland; and Public Health Wales. These and similar bodies all have a
remit for quality improvement, and avail of KPI’s as a means of measuring the quality
and safety of care provision, as well as using these measurements to evaluate the
effectiveness of their own roles. Nevertheless, the approaches taken by these bodies to
ensure compliance and improvement have been described as dated and directive in nature
(Donaldson et al. 2014). While admitting that this top-down approach has strengths in
providing public assurance, the authors of this national governance review suggest that
the disadvantage is one of local disempowerment and failure to address service user
needs. Instead, they propose a change in leadership style to one which motivates and
embraces innovation for improvement (Donaldson et al. 2014). Conceptualisations such
as this have resulted in research and reports which aim to develop and strengthen
leadership in practical terms from board to clinical practice (West et al. 2014).
1.1.2 Measuring the nursing and midwifery contribution
Against this backdrop, healthcare systems across the world are constrained by economic
funding issues. In the UK and ROI, these economic constraints have resulted in: the
reduction of services; difficulties in the recruitment and retention of staff; and problems
with the timely transfer or discharge of patients, often due to a lack of primary care
services (Health and Social Care Board 2014; Primary Care Workforce Commission
2015). Nevertheless, the imperative to provide a safe, high quality, person-centred service
for people and families in their care is not only a professional requirement, but a
fundamental desire of nurses and midwives (HIQA 2013). There is an obligation on
nurses and midwives to demonstrate improved outcomes and experiences for patients
reflective of safe, effective and compassionate care (DoH 2008). This obligation was later
reinforced by Robert Francis when he advocated a clear set of quality and safety metrics

4
that could be universally applied to support prompt identification of declining
performance (Francis 2013).
Various authors have highlighted a concern that aspects of the care which nurses and
midwives provide are often hidden and not clearly definable, and are thus potentially
difficult to identify and measure (Griffiths et al. 2008; Maben 2008; Dubois et al. 2013).
In part, this is due to the seamless role they play within a multidisciplinary team, not only
carrying out their own role, but also co-ordinating many aspects of care provided by other
professionals. This is especially true regarding their role in providing emotional and
psychosocial support to patients and families. Although it is possible to assess quality
without using KPI’s (Campbell et al. 2002), for example through staff and patient
feedback, measurement plays an important role in providing evidence of improvement
and helping to drive change through accountability and positive motivation to do better
(Griffiths et al. 2008; Hoi 2008; Kinchen 2015). Despite this knowledge, identified
challenges have resulted in few KPI’s being developed to measure the patient experience
(McCance et al. 2016).
1.1.3 KPI implementation and knowledge translation
Nursing and midwifery research produces a constant stream of new or updated evidence.
However, having new evidence is of no value unless it is implemented into practice.
Knowledge translation - also known as knowledge transfer, research utilisation or
knowledge integration - is a process through which research knowledge is created,
circulated and makes an impact on clinical practice (Curtis et al. 2016; Kitson and Harvey
2016). Nevertheless, proponents of knowledge translation agree that the dissemination of
new evidence, such as that in KPI’s, is challenging (Eccles and Mittman 2006; Rycroft-
Malone 2008; Nilsen 2015). Reasons such as resistance to change have been given
(Dixon-Woods et al. 2012). However, mandating KPI’s does not necessarily compel
commitment (Rycroft-Malone 2008; Schein 2010), and poor theoretical underpinning
makes it difficult to understand why (Nilsen 2015). The use of theory is stated to increase
knowledge of the multiple factors which may impact on the implementation process and
guide success (Sandström et al. 2011; Nilsen 2015). Furthermore, it is argued that
reliance on inspection through measurement will not achieve continuous improvement,
but instead set in motion a cycle of fear that then restricts innovation (Deming 1992;

5
Berwick 2015). However, Berwick (2015) also states that when learning is situated within
the complexity of practice, with collaboration and sharing of that learning, improvement
can occur. This is consistent with a proposal made by Greenhalgh et al. (2004) that the
implementation of evidence is an active and planned endeavour for change in
organisations.
1.2 RATIONALE FOR THIS STUDY
The increasing need for good governance has generated huge attention on public
accountability which Bovens (2005) suggests is a difficult concept to argue against as it
evokes only positive images. The resultant growth in KPI’s as a tool for evidencing
compliance, and thus accountability, is contrary to the recommendations for parsimony
laid out in government papers and policies (Francis 2013; DoH 2017). There is little
evidence as to why this might be, although one explanation may be that it is due to
organisations implementing KPI’s for their own internal purposes, in addition to those
that are mandated. Work has previously been commissioned by governments seeking to
assess the scope of KPI’s in use in their countries (NHS Quality Improvement Scotland
(QIS) 2005; Griffiths et al. 2008). However, no evidence has been found of attempts to
clarify the range of KPI’s in use across the UK and ROI1, or the various processes
involved.
The patients experience is one of the most important aspects of quality that should be
measured (McCance et al. 2012; Kinchen 2015), as it is patients and their family who
receive care and thus are in a position to judge. Nevertheless, there are few solid examples
of which aspects of the patient’s experience are measured. ‘Patient satisfaction surveys’
are primarily quoted as measuring patient experience. Arguably however, these are at risk
of becoming a cliché as this is frequently used as a catch-all term within empirical studies
and lists of KPI’s. Notably, few KPI’s have been identified that measure the emotional
and psychosocial care that nurses provide (Griffiths et al. 2008; Dubois et al. 2013) and
yet this is a very important facet of their role.
1 The study covers England, Scotland, Wales, Northern Ireland and the Republic of Ireland, referred to
for the purposes of the thesis as regions.
6
Guidance papers have been produced aimed at providing advice on KPI use (Artley and
Stroh 2001; Health Service Executive 2015). While these describe a process to be
followed, there is little evidence in the empirical literature identifying how the use of
KPI’s has resulted in improvements in quality of care. Additionally, existing reviews
present little evidence on how organisations report and act on their data. This is important
because the principal aim of KPI use is to improve practice (DoH 2008; DoH 2017).
KPI’s and the data that results from their use are simply information. Despite the large
number of KPI’s in use, there is limited evidence of how this information is reported
strategically and translated into useable knowledge. It is also unclear how nurses and
midwives, working in many diverse contextual environments and at various levels in an
organisation, collaborate to use KPI data that produces demonstrable improvement in
care.
1.3 PURPOSE OF THE STUDY
The purpose of this study is to question how the use of KPI’s influences decisions made
about practice both across and within organisations. As Thompson (2001) highlighted the
contribution of nurses will be judged by the decisions they make. It is anticipated that the
findings will add to the knowledge-base and inform the debate on KPI use supporting the
development of indicators that will facilitate the delivery of meaningful care that
improves outcomes for patients and families.
1.4 RESEARCH QUESTION AND OBJECTIVES
The research seeks to answer the following overarching question:
• How does the use of KPI’s influence nursing and midwifery practice?
More specifically the following three objectives were identified:
1. To scope the range of KPI’s used in practice
2. To identify the processes for implementation of KPI’s and mechanisms for
monitoring and reporting
3. To explore the influence of KPI’s on nursing and midwifery practice in an
organisational context, identifying factors to maximise their impact.

7
1.5 THESIS STRUCTURE
This thesis is laid out across eight chapters. This first chapter introduces the research
including the background and justification for the study. Chapter two provides a
comprehensive review of the literature relating to KPI’s, including relevant ‘grey’
material such as policy and white papers. In exploring the context for KPI use in more
depth this chapter also identifies gaps in the knowledge-base and provides justification
of this study. Chapters three and four present the philosophy and methodology upon
which the research is based. Respectively they locate the study within a pragmatic
paradigm and the chosen research approach deemed most appropriate for answering the
research question. Chapter five subsequently reports the quantitative findings from the
first phase of this mixed methods study. While quantitative data illuminate the KPI’s and
detail the processes involved in their use, qualitative data are needed to investigate nurses
and midwives’ perceptions of KPI’s and their influence on practice. Chapter six therefore
reports the qualitative phase two findings. Chapter seven draws together the data sets
from the quantitative and qualitative phases and integrates them in a discussion of
findings. Finally, chapter eight concludes this thesis identifying the limitations of the
study and, importantly, the contribution that it makes to the knowledge-base on KPI use.
1.6 SUMMARY
This chapter has outlined the research objectives within the context of nursing and
midwifery practice at meso and micro levels. The world-wide use of KPI’s for the
measurement of performance has been acknowledged with specific reference to their use
in healthcare. In healthcare, the role of KPI’s is important in measuring the elements of
safety and quality care as evidence of performance. This is especially the case in nursing
and midwifery practice. In the following literature review the use of KPI’s pertinent to
these different perspectives will be explored in more depth, confirming the need for this
research. The subsequent thesis will set out the research approach taken, and report the
resultant findings and their impact on what is currently known about KPI use.
8
Chapter Two: A Critique of the Literature, Placing the Study in Context
Over the past thirty years there has been steady growth in the published literature relating
to healthcare performance, quality of care and the patient experience. This reflects
increased interest in KPI’s and their use. Through a review of the literature, the
development and use of KPI’s across the world generally, and in the UK and ROI in
particular, will be explored. In addition, this chapter will look at the organisational
implementation of KPI’s relevant to nursing and midwifery care, considering: (i) their
use within the context of performance; (ii) how KPI’s are used to demonstrate quality;
and (iii) the role of implementation science in increasing their effectiveness. Clarity about
the meaning of KPI’s and terminology will be discussed, and a working definition will
be provided, which will act as a reference point for this study.
2.1 SEARCH STRATEGY
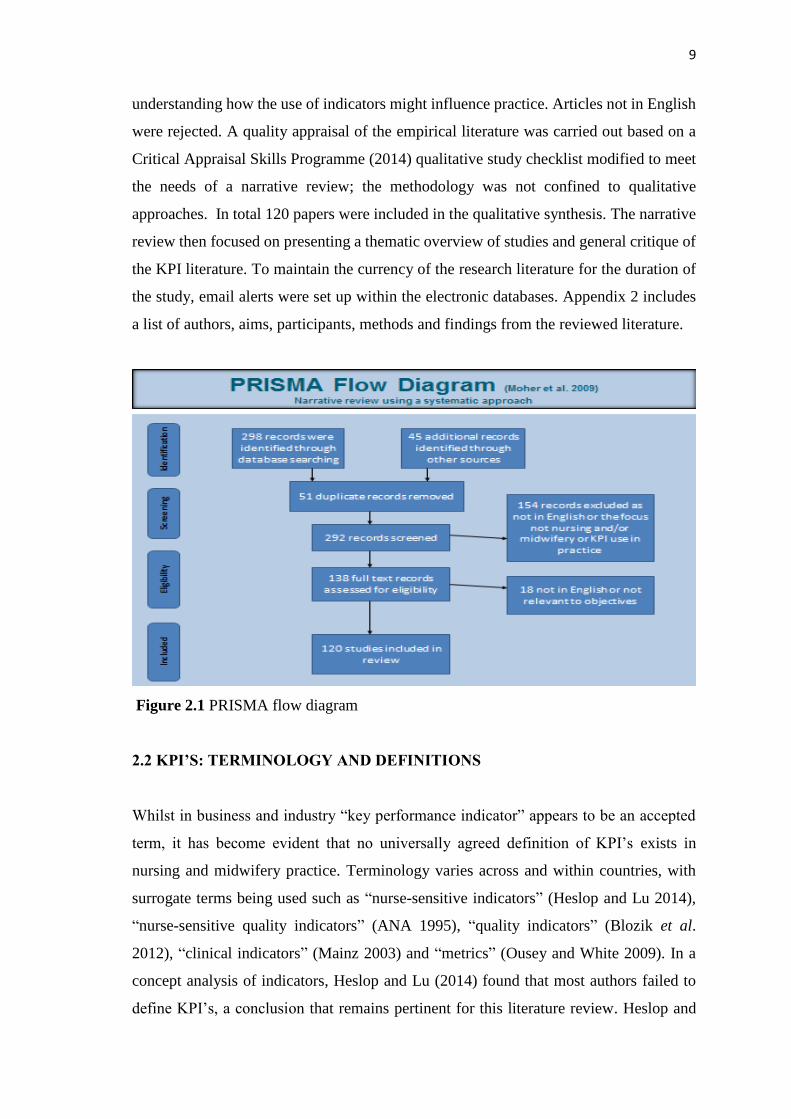
To achieve the objectives identified in chapter one, a narrative review was applied using
a systematic approach based on the PRISMA model (Moher et al. 2009). This advocates
the use of explicit methods to ensure transparency in reporting the quality of the research
literature (Figure 2.1). The search for relevant literature was conducted across four
databases: Cumulative Index to Nursing and Allied Health (CINAHL), Medline, Web of
Science and EMBASE. Scopus and the Cochrane Library were rejected after a
preliminary test identified only a few articles, none of which were relevant. No limits
were set for publication dates. The key search words were: clinical indicators, metrics,
nurs*, midwi*, performance indicators, quality improvement and decision-making
(Appendix 1). The Boolean functions “AND” and “OR” were used to combine or connect
the search words. All database searches were merged and a total of 298 articles were
identified. Grey literature sourced from healthcare web sites revealed 20 relevant reports,
with a further 25 articles identified through reference chaining. The large number of
government and professional body reports highlights the need to explore the strategic
context in which this study will be positioned. Following the removal of duplicates, 292
articles remained. The literature was reviewed by title, abstract, and then full-text for
inclusion based on the following criteria: a) clear focus on nursing and/or midwifery
practice; b) relevance to the study objectives; and c) potential contribution to
9
understanding how the use of indicators might influence practice. Articles not in English
were rejected. A quality appraisal of the empirical literature was carried out based on a
Critical Appraisal Skills Programme (2014) qualitative study checklist modified to meet
the needs of a narrative review; the methodology was not confined to qualitative
approaches. In total 120 papers were included in the qualitative synthesis. The narrative
review then focused on presenting a thematic overview of studies and general critique of
the KPI literature. To maintain the currency of the research literature for the duration of
the study, email alerts were set up within the electronic databases. Appendix 2 includes
a list of authors, aims, participants, methods and findings from the reviewed literature.
Figure 2.1 PRISMA flow diagram
2.2 KPI’S: TERMINOLOGY AND DEFINITIONS
Whilst in business and industry “key performance indicator” appears to be an accepted
term, it has become evident that no universally agreed definition of KPI’s exists in
nursing and midwifery practice. Terminology varies across and within countries, with
surrogate terms being used such as “nurse-sensitive indicators” (Heslop and Lu 2014),
“nurse-sensitive quality indicators” (ANA 1995), “quality indicators” (Blozik et al.
2012), “clinical indicators” (Mainz 2003) and “metrics” (Ousey and White 2009). In a
concept analysis of indicators, Heslop and Lu (2014) found that most authors failed to
define KPI’s, a conclusion that remains pertinent for this literature review. Heslop and

10
Lu (2014) provide no explanation for this, with other authors suggesting that there
appears to be confusion about how KPI’s should be defined (NHS QIS 2005; Dubois et
al. 2013). Developing a succinct definition of ‘KPI’ therefore presents a significant
challenge. To provide some guidance for participants, the broad definition given by
Avinash (2010) was selected for inclusion in the participant information. His definition
was succinct and exemplified the role of KPI’s in promoting the visibility of
organisational performance at a glance:
“high level snapshots of a business or organisation based on specific predefined measures”
Nevertheless, in an effort to provide greater understanding about the characteristics which
define KPI’s, a content analysis of 54 definitions was undertaken. This revealed twelve
characteristics, which are presented in Table 2.1 below in order of prominence.
Table 2.1 Core characteristics of KPI definitions
1) Act as a measure or measurement
2) Highlight improvement
3) Reflect outcomes
4) Indicate performance
5) Allow comparison or identify trends
6) Aid understanding
7) Identify nursing contribution
8) Act as flags or alerts
9) Evidence organisational goals
10) Promote accountability
11) Aid decision-making
12) Are used across levels (in an organisation or business)
The most universal definition of ‘KPI’ is that of a measure or measurement (ANA 1995;
Mortensen 2008). However, KPI’s play an important role that far exceeds that of a mere
number, as can be seen by their prominence in government reports, guidelines and policy
papers. Furthermore, it is argued that a fixation on numerical measures overshadows the
possibility that qualitative KPI data can also provide important information (McCance et
al. 2012). Although acknowledged by the latter as presenting challenges, this supports
Idvall et al’s (1997) argument, based on a review of the literature, that it is necessary to
find a way to make visible those aspects of nursing that are “beyond measurement” (Koch
1992, p.792). In fact Koch (1992), in one of the earlier papers that reviewed quality
assurance, stated that nursing could not be represented by KPI’s due to its complex and
contextual nature. It is also argued that KPI’s are not direct measures of care quality, but

11
indicate deviations from the norm or desired objective which then require further
investigation (Idvall et al. 1997; Campbell et al. 2002). Similarly, a small number of
authors have described KPI’s as flags or alerts (Australian Institute of Health and Welfare
2008; NHS National Services Scotland 2012). While this is part of their role, especially
for sentinel event KPI’s (Joint Commission on Accreditation of Healthcare and
Organisations 1993), it could be argued that focusing on this aspect results in a false sense
of security and a belief that action is only needed if marked deviations appear.
In the business sector the term ‘action’ is used to describe the anticipated end result of
KPI use (Mortensen 2008; Shah 2012), whereas the goal in healthcare is specifically
focused on ‘improvement’, reflecting the link to outcomes, particularly those relating to
patient care (Montalvo 2007; Parlour et al. 2013). It is KPI outcomes that make nurses’
contributions more visible and provide explicit evidence of the difference that nurses and
midwives make to quality of care (Maben et al. 2012; Planas-Campmany et al. 2015).
The concept of performance arises frequently and manifests itself in many different
forms, including: the use of KPI’s to support performance evaluation (Australian Institute
of Health and Welfare 2008; Heslop and Lu 2014); performance accountability; and
performance comparison against other services and organisational goals (Griffiths et al.
2008; HIQA 2013). Separate from, but still closely aligned to, the use of KPI’s to support
performance, is the need to communicate KPI performance data across all levels in an
organisation (NHS QIS 2005; Mortensen 2008). While this appears less often in the
definitions reviewed, it has been highlighted as an important aspect of the role of KPI’s
to ensure awareness of any issues arising (Francis 2013). Finally, KPI’s are described as
providing the means to aid understanding (Griffiths et al. 2008; Royal College of Nursing
(RCN) 2009), which in turn should contribute to more effective decision-making in
practice (HIQA 2013; Parlour et al. 2013).
Clearly, many of these characteristics are interlinked although they fulfill distinct roles
within various definitions. The terms and definitions selected by KPI developers often
appear to be determined by the focus or intended application to practice - for example,
‘clinical outcome indicators’ are KPI’s that focus only on outcomes of clinical care
(Idvall et al. 1997). It may be that, regardless of the name given to them, ‘performance
indicator’ is one of the most over-used yet little understood terms (Petersen 2012).

12
Essentially, the term ‘key performance indicator’ acts as a self-descriptor: it is a key tool
used by a business, team or person to measure and monitor performance against an
important target in order to improve practice. The focus of the KPI should be on driving
and evidencing improvement, not competition; the metric should not overshadow the
indicator function (Marr 2014). KPI’s are not standards, guidelines, benchmarks or
audits, although they may be found in each of these.
Marr (2014) highlights that the terms ‘metric’ and ‘KPI’ are often used interchangeably
but while a KPI is a metric, a metric is not a KPI. By way of explanation, a dictionary
definition of a metric is given as “a standard of measurement” (Merriam-Webster
Incorporated 2015); it is a quantifiable measurement such as a number, percentage or
ratio. KPI’s contain metrics that act as a target to make the indicator meaningful and to
act as a reference point for comparison (Marr 2014). Hatheway (2016) further states that
KPI’s are strategic and metrics are tactical. By this he means that metrics differ from
KPI’s in that they reflect how successful the activities taking place are (tactical) to support
the accomplishment of the KPI. Metrics support KPI’s, which in turn support the overall
business strategic goals and objectives (Hatheway 2016). For the purpose of this study a
KPI is described as a measure that will:
(i) evidence the nursing and midwifery contribution
(ii) define what is to be measured
(iii) have an evidence-based rationale
(iv) contribute to meeting an organisational goal
(v) have a defined target
(vi) be easily understood and provide context
(vii) require information which is straightforward to collect from a legitimate
source
(viii) lead to action, either to maintain consistency or to improve performance.
Additionally, KPI’s may state who is to collect the data and how frequently. Fundamental
to a successful KPI is defining what is to be measured, as this is very important in setting
out its purpose. Thus to be considered a KPI, a measure should be key or core to the
organisation; it should be explicit and unambiguous; and it should be one of a small
number that together will indicate the state of the organisation’s performance. It is for
each organisation to decide which KPI’s are core to its needs (other than those that are
nationally mandated) and to ensure that they are subject to periodic review.

13
2.3 DEVELOPMENT OF KPI’S IN HEALTHCARE
It is difficult to pinpoint the origin of KPI’s, possibly because they are used so widely
across the world and in many different fields of business and industry. However,
references to organisational behaviour can be found as far back as 1960. At that time it
was identified that the use of indicator systems could cause mistrust, create the
development of a blame culture, and hinder the development of learning (Argyris 1960).
Since then, the core underlying principle of KPI’s - that of measurement as a means of
improving performance - has appeared in various works exploring effective learning
organisations (Senge 1990; Schein 2010). In addition, the seminal work of Kaplan and
Norton (1992) on the development of balanced scorecards as performance measurement
systems for the business sector, was a key step in the reporting and management of KPI
data as we know it today. Since the 1990’s, the span of KPI’s has grown remarkably, with
evidence of over 20,000 now in use across nearly every sphere of life (The KPI Institute
2013).
The Joint Commission on Accreditation of Healthcare and Organisations (JCAHO) (Noh
and Lee 2014) and the American Nurses Association (ANA 1995) have influenced the
worldwide evolution of KPI’s in healthcare. These bodies were established to develop
and maintain standards for care following a significant increase in healthcare expenditure
in America and subsequent healthcare reforms (Costello 1995). However, Aiken et al.
(2008), in assessing the impact of implementing the American Magnet2 principles in an
English healthcare organisation, highlight how the experience of similar economic
constraints in healthcare globally, coupled with increasing costs and nursing shortages,
have created challenges for the maintenance of productivity in health services.
Furthermore, in a multi-national study aimed at exploring the relationship between nurse
staffing, education level, and patient mortality, Aiken and her colleagues (Aiken et al.
2014) identified how the resulting need to provide evidence of performance to healthcare
funders has led to rapid growth in KPI development and systems to support their use
across the world.
2 The term ‘Magnet’ originated in America when it was recognised that some hospitals had a high success
rate in recruiting and retaining nurses (Aiken et al. 2008). Magnet status is awarded to hospitals that
satisfy a set of criteria designed to measure the strength and quality of their nursing.
14
In the UK and ROI it is a similar story, with the introduction of various legislation and
government papers highlighting the need for performance accountability. In advance of
the 60th anniversary of the UK National Health Service (NHS) in 2008, Lord Darzi
undertook a comprehensive review of the service, seeking many different viewpoints
nationally and internationally. Aiming to provide a clearer picture of the future direction
of government health policy, his report detailed certain challenges including: the need to
ensure clinical inclusion in service decisions; the integration of primary and secondary
care; and the provision of patient control and choice with more local accountability and
less central direction (DoH 2008). Recommendations were made for developing the
leadership skills of all professionals and for reforms to healthcare regulation aimed at
improving the quality of care.
The King’s Fund (2008), in a briefing paper in advance of Lord Darzi’s review, stated
that these reforms were necessary based on an identified lack of systematic data on care
processes and outcomes for patients, thus making it impossible to benchmark standards
of clinical practice. Furthermore, Lord Darzi’s Review (DoH 2008) prompted the NHS
to focus on identifying quality measures that would reflect the safety, effectiveness and
compassion of nursing care. This resulted in various initiatives including the NHS
Outcomes Framework (NHS Group 2014), a group set up to monitor healthcare outcomes
based on a set of KPI’s developed by the Department of Health in England. Similar in
concept to the American NDQNI (National Database of Nursing Quality Indicators)
regarding transparency and intention to inform practice, there are over 200 indicators that
sit under five domains, although they are mainly process-based and not nurse-specific.
Organisations were also established to support innovation for quality improvement, such
as the NHS Institute for Innovation and Improvement (NHS III) in the UK and the Health
Information and Quality Authority (HIQA) in ROI, both comparable in role to the
Institute for Healthcare Improvement (IHI) in America.
In addition to the need for accountability, there was a call for comprehensive transparency
of performance data, which was reinforced by two main factors: significant failures in
patient care and increasing public expectations (Francis 2013; HIQA 2015). The sub-
optimal care provided by the Mid Staffordshire NHS hospital in England (Francis 2013)
and the HIQA’s (2015) investigation into perinatal deaths in Ireland’s Portlaoise
15
Hospital, are examples of healthcare reviews that have emphasised the role of KPI’s in
monitoring and assessing practice. These failings were partly due to a lack of systematic
data on care, despite this need having been recommended by Lord Darzi (DoH 2008).
With growing concerns about patient care and an increasing volume of complaints,
litigation and unfavourable press coverage, there was a need to defend the safety and
quality of nursing practice (Donaldson et al. 2014; HIQA 2015). The Francis Report
supported the commitment to quality and safety measures that could be universally
applied and also drew attention to the need for:
“unambiguous lines of referral and information flows, so that the performance
manager is not in ignorance of the reality” (Francis 2013, p.1690).
Moreover, some of the performance data now collected is also reported to organisations
that operate in partnership with the health service, such as the National Cancer
Intelligence Network. Arah et al. (2003), in their international review of conceptual
frameworks for performance in health systems, found that the countries, which included
the UK, often had overlapping quality initiatives and reporting or disclosure mechanisms.
However, Ossege (2012) cautions against this rise in public organisational accountability
based on his findings from a factorial survey that explored the effects of accountability
on sixty-five public managers' work behaviour. He suggests that organisational
accountability is aimed at improving governmental performance and can put pressure on
public managers, resulting in positive and not so positive work behaviours.
As regards the indicators that have resulted from these policy recommendations, further
research is required to assess how useful they are at improving care. However, in an
American editorial, Smith (2007, p.43) describes the field of quality measurement and
management as “teaching elephants to dance”. By this she means that those organisations
that did not have a prior commitment to quality measurement have now been forced into
it by policy initiatives, but, despite this, the effective management of processes which
drive improvement is still proving elusive.
2.4 THE USE OF KPI’S WITHIN NURSING AND MIDWIFERY
The monitoring of performance assists organisations in benchmarking against established
quality targets (ANA 1995; HIQA 2013), with the National Institute for Health and Care
Excellence (NICE 2014) advocating the use of KPI’s to evaluate the quality of care

16
delivered. However, many researchers have highlighted the difficulty of measuring
quality of care due to the struggle to define this concept (Mitchell 2008; Department of
Health Social Services and Public Safety (DHSSPS) 2011). The Institute of Medicine
(IoM) (1990, p.21) provided a focused definition specific to healthcare, with the use of
the word “degree” suggesting some form of measurement:
“the degree to which services for individuals and populations increase the
likelihood of desirable outcomes and are consistent with current professional
knowledge”.
In light of this, high quality services should include three key components: patient safety,
clinical effectiveness and patient-centredness/compassion (IoM 2001; DoH 2008), with
the best exhibiting all three (HIQA 2013; DoH 2014b). The Donabedian (1988)
“structure, process, outcome” model was the most frequently cited tool used to articulate
the three key components of healthcare organisation and delivery, and also to evaluate
healthcare quality. Researchers applied this model in various ways, including Montalvo
(2007) who discussed its application as a classification system used in the American
national database (NDQNI). In contrast, Dubois et al. (2013) drew on Donabedian’s
model, among others, to develop a framework to conceptualise nursing care performance.
Although used mainly as a framework to guide the development of indicators for practice
measurement, for example by Pazargadi et al. (2008) who proposed KPI’s for improving
healthcare in Iran, this model was also used by Burston et al. (2013) as a way of
categorising the KPI’s identified in their review. Structural indicators encompass physical
resources; process indicators measure the ways in which work is accomplished; and
outcome indicators evaluate the effects of interventions provided by nurses and midwives
(Doran and Pringle 2011; Dubois et al. 2013). Furthermore, Lee et al. (1999), in their
review, examining how nursing processes affect clinical outcomes, confirmed
Donabedian’s (1988) view that ‘structure’ influences ‘process’ which in turn influences
‘outcome’, and ‘structure’ cannot influence ‘outcome’ except through ‘process’.
Therefore, it is important that information is available on all three when identifying
quality of care issues. Nevertheless, Doran and Pringle (2011), in a book chapter which
explores patient outcomes in relation to accountability, highlight an increasing interest
specifically in the measurement of outcomes, and suggest that this is because they provide
evidence for accountability reviews.
17
2.4.1 Identifying KPI’s for use in nursing and midwifery
Researchers across the world have highlighted that the influence of nursing practice on
patient care has been invisible, partly, but not always, due to the difficulty in measuring
care. In England, Maben (2008), in an editorial debate, suggests that this ‘invisibility’
results in the unmeasured aspects of care which nurses deliver assuming less importance
than the measured aspects. In America, Dubois et al. (2013) accredit ‘invisibility’ to
nursing’s inexperience of the developing area of performance science, which results in
an inability to capture the nursing contribution. Furthermore, in Korea, Noh and Lee
(2014) attribute ‘invisibility’ to the lack of a standardised language, which makes it
difficult to access nursing data. It is worth noting, however, that Doran and Pringle (2011,
p.12) highlight a difficulty in finding support for a “nurse-centric approach” to the study
of outcomes. Instead, they state that more emphasis is being placed on the contribution
of the multi-disciplinary team, arguing that the selection of outcomes to which many
providers can contribute is more efficient and realistic than trying to identify nurse-
specific KPI’s. They further argue that this line of thinking would help to establish trust
across disciplines (Doran and Pringle 2011), although no evidence is presented for this.
In contrast, this review of the literature has found over 100 KPI’s identified as being
nursing or midwifery-specific (Appendix 3). These were identified mainly for the acute
adult sector, but there was also evidence of specific KPI’s for community and midwifery
practice, and in the fields of mental health, intellectual disability and children’s nursing.
It was notable from the analysis of the literature that a substantial number of the papers
focused on the selection and development of KPI’s (Table 2.2). These nineteen papers
utilised consensus group methods, which according to Humphrey-Murto et al. (2017) are
appropriate methods to identify and measure areas where incomplete evidence exists for
decision-making. Most of the consensus methods used comprised Delphi studies,
although other variations included the nominal group technique (Tregunno et al. 2004;
McCance et al. 2012), and the RAND modified technique (Krӧger et al. 2007; Vasse et
al. 2012). Table 2.2 lists the nineteen papers, demonstrating the increasing worldwide
interest in the development of healthcare indicators, and compares service user
involvement in their development with the inclusion of patient experience KPI’s in
subsequent data sets, which will be discussed later.

18
Table 2.2 Empirical studies with a focus on KPI selection and development
Authors Country Service user involvement?
Patient experience KPI’s?
Shield et al. 2003
Zeitlin et al. 2003
McCance et al. 2012
Dancet et al. 2013
Hedges et al. 1999
Ingersoll et al 2000
Clarke et al. 2003
Barnsley et al. 2005
Krӧger et al. 2007
Pazargadi et al. 2008
Tropea et al. 2011
Lodewijckx et al. 2012
Vasse et al. 2012
Talungchit et al. 2013
Van den Heede et al. 2007
Belfroid et al. 2015
Tregunno et al. 2004
Lee and Wang 2014
Flood and Henman 2014
Great Britain
European
Northern Ireland
Holland and Belgium
Australia
America
America and Canada
Canada
Canada
Iran
Australia
15 countries
European
Thailand
10 countries
Netherlands
Canada
Taiwan
Ireland and UK
Yes
Yes
Yes
Yes
No
No
No
No
No
No
No
No
No
No
No
No
No
No
No
Yes
Pat sat
Yes
Yes
No
Yes
Yes
Yes
Pat sat
Pat sat with care
No
Yes
No
No
No
No
Yes
Yes
Pat sat
‘Pat sat’ denotes that the authors included ‘patient satisfaction’ or ‘experience’ but no
specific measurement was given.
As some of these consensus studies concentrated on how the multi-professional team
delivered various aspects of care, sets of indicators were not necessarily considered to be
solely nursing or midwifery focused. Examples of the areas considered included, the
selection of KPI’s to measure the quality of emergency response to infectious disease
outbreaks (Belfroid et al. 2015) and the identification of KPI’s to measure the quality of
infertility care in Holland and Belgium (Dancet et al. 2013). However, there was limited
discussion regarding the number of KPI’s that should be selected either generally or in
the organisational context if this was applicable.
A range of structural KPI’s commonly used at an organisational level were identified,
similar to those listed in Griffiths et al.’s (2008) rapid appraisal of nursing performance
measures in England. Alongside workforce measures (for example ‘the number of staff
vacancies’ and ‘staff skill-mix ratios’) were measurements of staff development and skill,
such as ‘years of experience’ and ‘appraisals’. Commonly included were KPI’s
measuring complaints and incidents specifically related to nursing and midwifery care.
However, ten papers that were reviewed cited more unusual structural indicators seeking

19
to measure staff experience including ‘perceptions of organisational culture and quality
of care’, ‘practitioner autonomy’ and ‘practice control’ (Appendix 3).
The majority of KPI’s identified in this literature review relate to clinical care in the acute
sector, and are most often based on process or outcome. Possibly due to the difficulty in
distinguishing the impact nurses have on patient care from that of other members of the
multi-disciplinary team, certain clinical KPI’s identified as nurse-specific appear to be
focused on repeatedly (Smith 2007; Griffiths et al. 2008). The most frequently quoted
nurse-specific KPI’s identified by this researcher include: incidence of pressure ulcers,
falls, medication errors and hospital-acquired infections. These reflect those listed by
Griffiths et al. (2008) and also by two American researchers: Montalvo (2007), who
describes the role of the National Database of Nursing Quality Indicators (NDNQI); and
Needleman et al. (2007), who reviewed American efforts to identify a set of nursing-
sensitive performance measures. Other clinical KPI’s were reported less often and it
would appear that their use was limited to specialist areas, such as ‘cast care’ and
‘tracheostomy or endotracheal tube care’. Examination of papers revealed that a number
of the clinical KPI’s were difficult to interpret, such as ‘health/functional status’ and
‘patient characteristics’. A small number, not immediately obvious as nursing and
midwifery-specific, related to ‘failure to rescue’ and the need for early warning through
the completion of observations, such as ‘fluid overload’, ‘atelectasis’ and ‘iatrogenic lung
collapse’. Review of the literature would suggest that the exact number of clinical KPI’s
in use may be much greater if a wider definition of the term ‘care’ is used. Furthermore,
if other broad descriptors are adopted - for example, ‘bowel management’ and ‘care of
patients in isolation’ - it would appear that a large number of aspects of care delivery are
being measured.
2.4.2 Measurement of service user experience
With an abundance of aspects of care being measured, it is not unexpected that many of
the commonly cited KPI’s are perceived as negative indicators of quality. In a publication
by the American Agency for Healthcare Research and Quality, Mitchell (2008, p.1) draws
attention to the need for nurse-sensitive positive indicators, such as “achievement of
appropriate self-care”. Researchers have also highlighted the need for KPI’s that can
measure elements of patient experience and the holistic aspects of caring (Griffiths et al.

20
2008; McCance et al. 2012). In addition, the commitment to seek patient feedback has
been clearly identified in policy (DoH 2008; Francis 2013). However, this is not without
its challenges, as reported by Maben (2008) in her editorial and also by Abrahamson et
al. (2015). In the latter’s study, 232 nursing home employees were interviewed in relation
to the use of data within a state programme that was being used to encourage the
implementation of quality improvement projects through financial incentives. One of the
challenges reported by participants was the difficulty in measuring the subtle but
important changes in practice that resulted from the implementation of these projects.
There was a perception that those aspects of nursing which impact on quality of life, such
as compassion, listening and development of patient confidence, were not reflected in the
outcomes measured (Abrahamson et al. 2015). Martin et al. (2015, p.19) describe this
difficult to quantify information as “soft intelligence”. In their qualitative study,
involving interviews with 107 multi-professional staff, participants expressed challenges
both in accessing this softer data and in turning it into a form useful for informing practice
(Martin et al. 2015). Therefore, even though quality improvement initiatives may
positively impact on these more nebulous aspects of care, the ability to capture and
attribute them to nursing is lost due to a lack of relevant measurable KPI’s
Nevertheless, some progress has been made in this area. Although sometimes presented
as statements rather than specific measures, KPI’s designed to capture aspects of the
patient experience have been identified. Examples presented in consensus studies
include: “time spent by nurses and midwives with the patient” (McCance et al. 2012);
“patients are not made to feel they are wasting health professionals’ time” (Shield et al.
2003); and “residents can decide what to wear and how to groom themselves” (Lee and
Wang 2014). As demonstrated in Table 2.2, nine of the consensus studies reviewed
included KPI’s developed to measure patient experience without consulting with service
users. In Lee and Wang’s consensus study, despite the aim being to develop humanistic
indicators to capture the viewpoints of nursing home residents, no service users or carers
were included. Instead, service users’ views of what was important to measure were
assumed based on information gleaned from literature reviews (Lee and Wang 2014).
McCance et al. (2012) and Shield et al. (2003) did include service users in their consensus
studies. McCance et al.’s (2012) study had the specific aim of developing measures
capable of capturing the psychosocial aspects of nursing and midwifery patient
interactions, and detailed the development of a set of patient experience KPI’s which
21
would complement a range of other KPI’s. Initially developed for use in seeking adult
feedback, they have also been tested internationally for use in children’s services
(McCance et al. 2016). Shield et al. (2003) selected KPI’s from existing sources to
measure a range of care in the primary care setting. However, a limitation of Shield et
al.’s (2003) study was that, due to the rating system used, they selected fewer KPI’s that
measured aspects of care of value to patients and carers.
Research, seeking service user and public opinion, both quantitative and qualitative,
concluded that the practice of measuring the patient’s or carer’s perspective through
patient satisfaction surveys also needs to be reviewed (Stricker et al. 2009; Northcott and
Harvey 2012). Patient and staff surveys provide only a broad evaluation of satisfaction
unless they can be broken down and analysed in relation to the individual elements being
measured. While this literature review identified frequent reference to the use of surveys,
there was little indication of which aspects of care were being measured. It is therefore
difficult to identify clearly defined patient experience KPI’s. While highlighting this
distinction, McCance et al. (2012) also found that, despite the inclusion of a range of
participants, including nurses, midwives, commissioners and service users, more
emphasis was placed on the emotional and psychosocial aspects of care than the success
of treatment. This supports previous findings, including those from an experimental study
which indicated that service users and the public placed more value on the opinions of
relatives of nursing home residents over those of regulatory bodies (Van Nie et al. 2010).
Ultimately, in order to assess the quality of care, it is necessary to obtain the views of the
people who experience the journey through the healthcare system (DoH 2008). In this
way a complete picture can be gained of what matters, and what works and does not work,
allowing valuable learning to be captured. While best achieved by asking the patients
themselves, various policy advisors have stated the need to strengthen patient and
organisational collaboration, and highlight that members of patient groups should be
trained for active partnership with healthcare professionals (National Advisory Group on
the Safety of Patients in England 2013; Donaldson et al. 2014). Donaldson et al. (2014)
and Berwick (2015) make this more explicit, and state that patients and families should
be involved in aspects of care ranging from policy making and quality improvement
efforts to the design and evaluation of services.

22
The key point is that the viewpoints and issues of patients and families are incorporated
into active organisational decision-making (Gagliardi et al. 2008). However, despite this
need for involvement being recommended in many white papers, both Kӧtter et al. (2013)
in a systematic review, and Walker and Dewar (2001) in an investigation of carer
involvement, suggest that it is not happening. Possible reasons for this emerged from a
number of papers, including two qualitative studies that specifically aimed to explore
patient participation. Gagliardi et al.’s (2008) study explored beliefs about patient
participation in performance indicator selection, and Gold et al. (2005) explored patient
participation in the planning of supportive care networks. Researchers in these studies,
which both included service users, reported that the limited involvement may be because
there is no advice available for professionals on the best ways to encourage participation.
Of further interest in Gagliardi et al.’s (2008) study was the finding that there was variable
patient interest in collaboration, and that health professionals (physicians, nurses and
managers) would prefer patients to assume a consultative role. Gold et al. (2005), in their
Canadian study, also identified the negative impact of ongoing provincial reforms on
leadership commitment, and the restricted funding for network development. However,
Shield et al. (2003), in a Delphi study, stated that professionals usually outnumber users
and carers in consensus studies, as was the finding in this literature review. Therefore, it
is possible that fewer of the aspects of care that patients value would be included in the
final KPI selection (Shield et al. 2003). Only one consensus study acknowledged these
challenges, stating that support was provided for service users, and planned their
inclusion in the future testing of the KPI’s developed (McCance et al. 2012).
2.4.3 Benefits of using KPI’s
Wilkinson et al. (2000), who explored the reaction of professionals in primary care to
KPI’s, stated that the implementation of measures that meet the needs of both practice
and the organisation not only increases patient safety and quality of care, but also
enhances efficiency and the facilitation of up-to-date practice. Equally, two very different
sources, Kurtzman and Jennings (2008a) in a discussion paper on the reporting of
performance data in America, and Maben et al. (2012), in a mixed methods study
exploring the relationship between patient experience and staff motivation, both highlight
that, by measuring quality of care, nurses and midwives can demonstrate transparency,
23
accountability and a focus on improvement. Kurtzman and Jennings (2008a) also put
forward an argument that nurses should be rewarded for good performance, as opposed
to the organisation, if it is they who are held to account.
Heslop (2014), in an Australian editorial, points out that, as the largest occupational group
accounting for a significant proportion of healthcare operating costs, nursing is
particularly vulnerable to austerity measures. Whilst several authors agree with this,
researchers in a European study examining the relationship between nurse staffing,
education and hospital mortality, also argued that by demonstrating the impact that they
make on patient care, nurses and midwives provide evidence of their worth and increase
their professional value, which in turn reduces the likelihood of workforce challenges
(Aiken et al. 2014). Similarly, in a Spanish study that analysed the contribution of nurses
to the achievement of primary healthcare objectives, Planas-Campmany et al. (2015)
found that nursing and midwifery-specific KPI’s provide evidence of performance and
may support arguments for resources to improve patient care. More importantly, Heslop
(2014) states that nurses and midwives are able to reduce patient risk if they have access
to timely data.
Based on interviews with forty executive board nurses, Jones et al. (2017), noted that
those boards with mature quality improvement governance used all their data for
improvement rather than just assurance. This is in contrast to a similar study conducted
by Mannion et al. (2016), in which boards were found to challenge the validity and
reliability of KPI data, which in turn impacted on the governance of safe care. This is
notable as the authors, who were funded by the National Institute for Health Research,
subsequently recommended training and education of board members in relation to
understanding and interpreting data sets and KPI’s. However, in the organisations
described by Jones et al. (2017) as using their data efficiently, other positive
characteristics were identified. These included the prioritisation of quality improvement;
a balance of short external and long internal goals with related investment; engagement
of staff and patients in quality improvement; and the encouragement of a culture of
continuous improvement (Jones et al. 2017). In a similar vein, it has been stated that
positive KPI data should be reported as a means of disseminating and celebrating
successful initiatives (Phillips et al. 2007; Regulation and Quality Improvement
Authority (RQIA) 2016). While RCN Scotland promotes the national reporting of

24
situations that negatively impact on meeting targets in order to encourage learning and
generate action, they also indicated a need for levels of tolerance to be built into KPI’s to
allow for a degree of latitude in unexpected circumstances (RCN Scotland 2016),
although it was not clear how this would be achieved.
2.4.4 Challenges in using KPI’s
With increasing pressure on healthcare organisations to demonstrate their effectiveness
and efficiency, the KPI’s used can be numerous and have a very broad remit. This reflects
the need to report on the extensive range of services provided, but, as Mattke et al. (2003)
discovered when they implemented a quality reporting system in long-term care, this
creates problems in condensing the information and communicating it meaningfully to
achieve desired improvements in practice. Pearson (2003) suggests that while
manufacturing and service industries have become very selective in identifying
indicators, the healthcare sector lacks clarity about the aspects of performance on which
indicators should focus. Setting a very large number of KPI’s at a strategic level, while
at the same time requiring them to work at the operational level where they are measured,
is very challenging. For this reason researchers indicate a need to focus on a small but
strategically important number of KPI’s (Griffiths et al. 2008; HIQA 2013). Notably, the
interest in KPI’s specific to nursing and midwifery has increased, especially in the past
five years. The researchers of three studies, one which reported an exploration of multi-
national health system performance frameworks (Arah et al. 2003), another which
examined the translation of evidence into practice (Donaldson et al. 2004), and more
recently Burston et al. (2013) in a literature review, all suggest that a multitude of data is
being collected, but not analysed and used to influence practice at a local level. As Snell
(2015, p.15) states, reporting on behalf of the Safe Staffing Alliance in England:
“…although nurses are chasing around collecting lots of data, and dozens of
people are being employed to process it, much of it is meaningless”.
The implication is that it is meaningless, mainly because it is not being acted on. This is
supported by Krugman and Sanders (2016, p.346) who report the challenge of staying
current with multiple data, and state how, in their experience prior to their development
of a visual data display system for nurse managers, only critical data was attended to,
with anything else being “filed and forgotten”. The resultant risk of data burden has been

25
emphasised as an issue in performance measurement (Mattke et al. 2003; Dubois et al.
2013). This is implicit in some empirical papers: Wilkinson et al. (2000) and Tropea et
al. (2011) highlight heavy workloads which limit the time available to assess and improve
practice, while Dubois et al. (2013), in a systematic review, suggest that burden is due to
the requirement on staff to meet an unreasonable number of targets. The risk of data
burden may also be explicit: for example, the onus placed on staff to act through the use
of reporting systems which increase visibility of results (Mattke et al. 2003; RCN 2011b;
Tropea et al. 2011). This area requires further research.
Various barriers to the use of KPI’s were identified in both empirical studies and in the
‘grey’ literature. The onus is on clinical staff to assess and improve the safety and quality
of care, but they may claim that certain barriers prevent this occurring (Donaldson et al.
2014). These barriers may be resource-based or due to contextual issues. In Donaldson
et al.’s (2014) health service review, the authors identify ‘patchy’ leadership as a barrier
to clinicians engaging with quality improvement. In addition, recent reports, which seek
to guide the transformation of healthcare, focus on the development of collective
leadership behaviours. One example is a report presented by West et al. (2014), who were
commissioned to explore collective leadership as a possible key to unlocking cultural
change, following an argument put forward by the King’s Fund for shared leadership
across the NHS. This involves working in partnership, with everyone taking
responsibility for the provision of high quality healthcare (West et al. 2014; DoH 2016).
Other cultural issues were also identified in two case studies. Firstly, Yearwood et al.
(2001), who discussed the implementation of a continuous quality improvement initiative
in a school of nursing, identified that student nurse inclusion in change was minimal
despite being desired, reportedly because there was no history, or culture, of their
participation in governance. Secondly, Gokenbach and Drenkard (2011), who explore the
engagement of nurses in Magnet hospitals, included a culture of top-down decision-
making as a factor which arguably contributes to lack of teamwork and poor
communication. More specifically, Wilkinson et al. (2000) suggest that a lack of staff
knowledge about the importance and relevance of KPI measures may result in a
perception of reduced autonomy and trust. Further universal resource barriers to KPI
implementation were identified in two studies with a specific remit to identify barriers
and facilitators – one in the implementation of shared decision-making in clinical practice

26
(Gravel et al. 2006), and the other in the implementation of outcome measurement
(Dunckley et al. 2005). These barriers include: limited skills to critically appraise the
evidence; lack of time to locate and implement the evidence; insufficient clearly
presented data; limited resources for data analysis; and insufficient training in quality
improvement methods. In contrast, Estabrooks et al. (2005), who report on the theme
‘sources of practice knowledge’ identified from two large ethnographic case studies,
argue that nurses’ reluctance to use research evidence has less to do with these barriers
and more to do with the nature and structure of nurses’ work, which causes a heavy
reliance on contextual knowledge.
Many researchers identified factors to be considered, when planning to use KPI’s, that
could potentially invalidate the data collected or adversely affect care, including Griffiths
et al. (2008), Dixon-Woods et al. (2012) and Powell et al. (2012). However, while
similar, they were not as extensive as those identified by Smith (1995), from which he
developed a taxonomy of eight unintended consequences. Smith’s (1995, p.301)
taxonomy, although designed for the use of KPI’s in the public sector, is still highly
relevant to healthcare as it captures all of the factors identified in this literature review
(Table 2.3). However, little information has been presented on how to prevent, monitor
or manage these adverse events.
Table 2.3 A taxonomy of unintended consequences relevant to the use of KPI’s
1 Tunnel vision –measured elements of care take priority over unmeasured
2 Adverse selection – refers to the possibility of selecting patients who will boost
KPI outcomes over the more vulnerable who may not
3 Misrepresentation – the deliberate manipulation of data so that the reported
behaviour differs from the actual
4 Gaming – manipulation of behaviour to meet targets
5 Myopia – focus on short term goals at the expense of longer term goals
6 Sub-optimisation – pursuit of narrow local goals at the expense of organisational
goals
7 Ossification – inhibition of innovation, possibly due to a rigid organisational
system of measures
8 Measure fixation
Adapted from Smith (1995)

27
Measure fixation, the final unintended consequence listed above, was identified as an
ethical issue by Olsen (2011) in his discussion paper, and refers to the potential for KPI
implementation to adversely affect care, as not all KPI’s will be appropriate to patients’
individual needs. Thus, strict adherence to KPI’s may place nurses under pressure to
make difficult decisions (Olsen 2011). Empirical studies have also raised the issue of
patient harm resulting from an over-zealous desire to achieve the target set by the KPI,
including the finding by Kavanagh et al. (2012) that the measurement of prophylactic
pre-surgery antibiotics promoting unwarranted antibiotic use. Importantly, both
Dwamena et al. (2012) in a systematic review, and Rambur et al. (2013) in a case study
exploring the unintended consequences of performance measurement, highlight that
patients may wish for outcomes other than those stipulated by healthcare professionals or
politicians. As a caveat to the standardisation of care, Donaldson et al. (2014) in a policy
paper, suggested that clinicians should be aware of what is appropriate care and use their
judgement accordingly. Thus, in a concept analysis of evidence-based practice,
Greenhalgh et al. (2014) argue that outcomes should not be subsumed by process, and
that nurses working with patients can make holistic decisions even if these are not what
the evidence suggests (Rambur et al. 2013; Greenhalgh et al. 2014). Furthermore, in their
seminal paper on balanced scorecards Kaplan and Norton (1992) argue that although
measures may be in place to support employees in achieving goals, management cannot
dictate exactly how specific goals will be achieved because the conditions in which the
employees operate is constantly changing. The expectation is that nurses and midwives
will use their autonomy to make decisions based on need and adapt practice accordingly,
further reinforcing the role of collective leadership in practice (West et al. 2014).
2.4.5 Performance measurement process
To support the implementation of government performance measures, a special interest
group established by the America Department of Energy and associate contractors
developed a six-volume compilation of techniques and tools. In volume two, which
focuses on establishing an integrated performance measurement system, Artley and Stroh
(2001) layout a clearly defined sequence of events, illustrated in Appendix 4. This process
includes: identification of need based on strategic goals; selection and development of
KPI’s; implementation with relevant training and establishment of ownership; data
collection, analysis and reporting; and improvement actions and performance evaluation.

28
The process works on a feedback loop across levels in an organisation to influence
ongoing performance development.
A number of professional and government guidance papers state that the selection of
KPI’s is crucial and should be based on those aspects of care that are important to both
the patient and nursing staff (RCN 2011b; HIQA 2013). Flood and Henman (2014) in a
Delphi study, also argue that KPI selection should be dependent on a significant quality
gap that needs to be addressed. In papers discussing the selection of KPI’s, the grade of
nurse involved was not always clear, and because healthcare organisations are now so
large it is likely to be nurse managers, having an overview of the service, who decide
what to measure. Thus clinical nurses and midwives may have no input into these
decisions nor an awareness of the role that KPI’s play in relation to either the service or
their own practice, yet it is they who know best which areas are in need of improvement.
Notably, the National Quality Forum (2003) in America argues that the focus should be
on the areas where the evidence is greatest that measurement can have a positive impact
on healthcare quality. In addition, there is also a risk that organisations measure what
they can, rather than what they should (Griffiths et al. 2008; RCN 2011b).
The collection and reporting of KPI data has developed over recent years. However, in
Australia, Burston et al. (2013), following a review of the literature related to nursing
KPI’s, call into question the nurse-sensitivity of some commonly used indicators. The
inconsistency identified, arose for various reasons including differences in: KPI
definitions, data sources, data collection and analysis methods, and risk adjustment
models. This has implications for data reliability if the evidence derived from KPI’s is to
be used for organisational and national comparison. In addition, Burston et al. (2013)
suggest that to realise the full potential of KPI’s, consideration should be given not only
to the reasons for data collection, but also to how it will be reported so that it is
meaningful to all levels of staff and can be embedded and sustained in practice. Lang
(2008), who argues the case for real-time information reporting systems in a discussion
paper, highlights the huge amounts of data that healthcare organisations generate and
manage. This has led to an increasing interest in electronic data systems as a means of
managing and reporting multiple data (Lang 2008; RCN 2011b). In the literature that has
been influential in strategic terms, there is frequent reference to the importance of such
systems (DoH 2008; Berwick 2015), which enable managers to monitor performance in
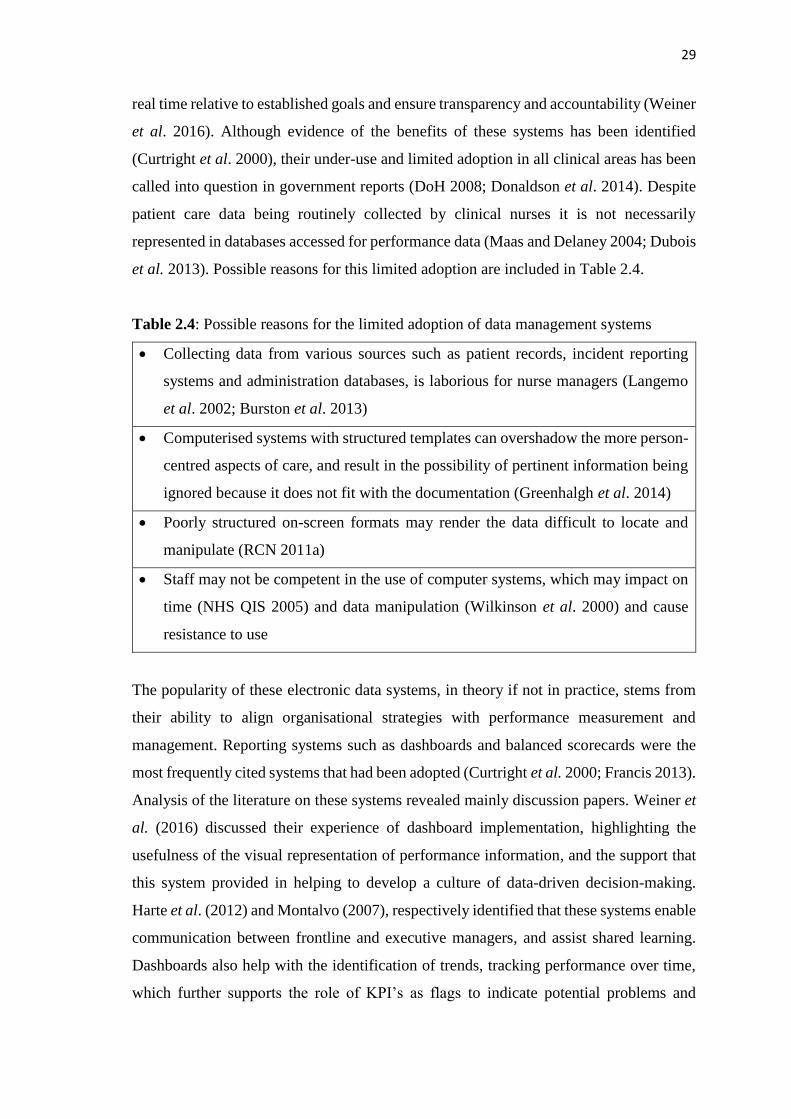
29
real time relative to established goals and ensure transparency and accountability (Weiner
et al. 2016). Although evidence of the benefits of these systems has been identified
(Curtright et al. 2000), their under-use and limited adoption in all clinical areas has been
called into question in government reports (DoH 2008; Donaldson et al. 2014). Despite
patient care data being routinely collected by clinical nurses it is not necessarily
represented in databases accessed for performance data (Maas and Delaney 2004; Dubois
et al. 2013). Possible reasons for this limited adoption are included in Table 2.4.
Table 2.4: Possible reasons for the limited adoption of data management systems
• Collecting data from various sources such as patient records, incident reporting
systems and administration databases, is laborious for nurse managers (Langemo
et al. 2002; Burston et al. 2013)
• Computerised systems with structured templates can overshadow the more person-
centred aspects of care, and result in the possibility of pertinent information being
ignored because it does not fit with the documentation (Greenhalgh et al. 2014)
• Poorly structured on-screen formats may render the data difficult to locate and
manipulate (RCN 2011a)
• Staff may not be competent in the use of computer systems, which may impact on
time (NHS QIS 2005) and data manipulation (Wilkinson et al. 2000) and cause
resistance to use
The popularity of these electronic data systems, in theory if not in practice, stems from
their ability to align organisational strategies with performance measurement and
management. Reporting systems such as dashboards and balanced scorecards were the
most frequently cited systems that had been adopted (Curtright et al. 2000; Francis 2013).
Analysis of the literature on these systems revealed mainly discussion papers. Weiner et
al. (2016) discussed their experience of dashboard implementation, highlighting the
usefulness of the visual representation of performance information, and the support that
this system provided in helping to develop a culture of data-driven decision-making.
Harte et al. (2012) and Montalvo (2007), respectively identified that these systems enable
communication between frontline and executive managers, and assist shared learning.
Dashboards also help with the identification of trends, tracking performance over time,
which further supports the role of KPI’s as flags to indicate potential problems and

30
prompt questions (NHS National Services Scotland 2012). However, while Douglas
(2010) and Drake (2013) discuss how the displaying of data in pictorial form makes it
meaningful and easier to interpret, Cokins (2013) cautions that they do not have the
ability to convey why something matters or what might happen if a decline continues.
Alternatively, balanced scorecards, which are more detailed and include financial
management, are linked to an organisation’s strategic plan, listing all the indicators with
related benchmarks and making it possible to view the environment from different angles
(Kaplan and Norton 1992; Drake 2013).
The final part of the performance measurement process entails the translation of KPI
evidence into improvement in care quality. The procedures involved at the beginning of
the KPI process have been the subject of research ranging from a qualitative study to
explore reactions to the introduction of KPI’s (Wilkinson et al. (2000), to consensus
studies for KPI selection (Talungchit et al. 2013). However, a review of the literature
reveals that there is limited evidence of research on the procedures towards the end of the
process, such as action planning, quality improvement based on KPI data and evaluation.
In light of similar findings, Davies et al. (2015), on behalf of the National Institute for
Health Research, conducted a multimethod study of how knowledge utilisation was
approached in countries outside the UK and in sectors outside healthcare. While
participants acknowledged the importance of evaluation for knowledge utilisation they
found it challenging, which led the authors to state that although the experiences
described were rich in information an opportunity to learn was lost, as formal evaluation
was rare (Davies et al. 2015).
While there is abundant evidence of the implementation of KPI’s and the collection and
reporting of data, this is insufficient per se for ensuring improvements in practice. Thus,
some researchers believe that KPI use remains peripheral to clinical practice and requires
strategies to help nurses and midwives interpret and act on the data obtained (Groff-Paris
and Terhaar 2010; Burston et al. 2013). Groff-Paris and Terhaar (2010) did report and
evaluate their performance improvement project which involved the use of both
qualitative and quantitative data. The quantitative data was collected using a NDNQI
survey and qualitative data obtained from the nurses involved in the implementation of
the project. Despite being an older theoretical framework, Maslow’s (1943) Hierarchy of
Inborn Needs was used to prioritise the performance improvements identified as

31
necessary by the nurses involved. The evaluation identified that the culture, which took
a top-down approach, did provide efficiency and control in the improvement process but
did not engage staff or engender support for the projects (Groff-Paris and Terhaar 2010).
A second study by Aiken et al. (2008) described quality improvement that was based on
the use of nurse-assessed quality of care measures, although they opined that the findings
would need to be confirmed in a larger study. Notably, Aiken et al. (2008) also referred
to culture, and reported that, due to a change in leadership following an externally driven
merger, commitment to the process involved was not shared by the new leaders, and the
organisation concerned withdrew from the project (Aiken et al. 2008).
2.5 THE INFLUENCE OF KPI’S ON PRACTICE
To achieve a high-quality health system requires a combination of “a caring culture,
professional commitment and strong leadership” (DoH 2014b, p.8). This has been
supported by several quantitative studies which identified such factors within the nursing
environment, noting their impact on nurse and/or patient KPI outcomes (Rosati et al.
2009; Houser et al. 2012; Hahtela et al. 2014). However, it has also been suggested that,
despite their contribution to patient care, nurses lack influence in public debate over
quality of care and are under-represented within the policy-making process (Hoi 2008;
Sousa et al. 2015). This supports the findings of Kurtzman and Jennings (2008b) in a
summary of results from a larger mixed methods study that aimed to gain an
understanding of KPI adoption in practice. Their summary, which focuses on the findings
related to leadership, highlights that the successful use of KPI’s and improvement in care
quality requires ‘champion leaders’, specifically those working at nursing executive
level. This was recently confirmed by Jones et al. (2017) in a qualitative study of forty
nurse executives, in which they stated that these nurses were ideally placed to engage
board members with their safety and quality concerns.
Due to the challenges faced by nurses and managers in delivering a high-quality service
in an increasingly demanding environment, a co-ordinated approach is required by
clinicians and managers in order to develop a supportive workplace culture (Tregunno et
al. 2004; Hahtela et al. 2014). As Francis (2013) highlighted, it is difficult to have a
shared culture when not everyone works on the frontline together. Based on their findings
regarding the processes used in Magnet hospitals to engage with nursing staff, Gokenbach

32
and Drenkard (2011) state that managers should be cautious about enforcing their views,
and instead increase contact in order to gain insight into the difficulties and issues
involved in delivering a high quality service. Similarly, they should also engage with
multiple perspectives before embarking on a plan of performance measurement
(Newhouse 2007; Rambur et al. 2013). This would help to address an issue identified by
Mannion et al. (2016) in their research into board governance, whereby poor
communication between clinicians and managers led to confusion over the meaning and
the correct interpretation of performance indicator data.
Researchers from America (St Pierre 2006) and Australia (Sorensen and Iedema 2010)
further argued that nurses at all levels need to acknowledge their different agendas, pool
information and jointly monitor and resolve performance issues. Collaboration in this
form would help to: (i) avoid power struggles and the creation of insular service systems
which serve to undermine organisational goals (Sorensen and Iedema 2010); (ii) support
the smooth flow of information across units (Kontio et al. 2011; Anderson et al. 2012);
and (iii) provide multiple information sources so that managers are fully informed in
relation to decision-making about care requirements (Kontio et al. 2011; Francis 2013).
2.5.1 KPI’s and decision-making
There has been little examination of the influence of KPI’s on decision-making in
practice. However, a few studies have used KPI’s to measure how the decisions made by
nurses impact on quality of care and thus patient outcomes. In a path analysis, Paquet et
al. (2013) used data derived from KPI’s and identified how the quality of care increases
when staff are included in decision-making. Similarly, Houser et al. (2012), in an
American state-wide study, used the measurement of various KPI outcomes to conclude
that shared governance increased staff and patient satisfaction, and reduced the number
of adverse events. However, it has been suggested that the integration of KPI’s into
clinical pathways may blur the relevance of indicators to patient outcomes (Dickerson et
al. 2001). This would indicate a lack of understanding of clinical decision-making tools
and the role of KPI’s in improving care (Fossum et al. 2011). Based on their findings
from a study examining the relationship between nurse involvement in decisions and
nurse-patient outcomes, Houser et al. (2012) propose that it may be possible to ameliorate
this by involving nurses in the evaluation of outcomes and by holding them accountable

33
for the effectiveness of the decisions they make. Supporting Fossum et al.’s (2011)
findings regarding a lack of understanding, Kurtzman and Jennings (2008b) put forward
a different solution, stating that the collection of data is of limited value unless it is
analysed, interpreted and acted on, which they suggest is not happening. In light of this,
they argue for staff education and training in KPI data use and quality improvement.
In commissioned research seeking to understand nurses’ perceptions regarding their
involvement in decision-making, there was a belief that such involvement increased
confidence and ownership, and resulted in nurses who felt that their views were heard
and respected (Graham-Dickerson et al. 2013). The researchers concluded that being
involved in decision-making increased staff satisfaction, which in turn encouraged action
and impacted positively on the patient care that they provided (Graham-Dickerson et al.
2013). This supports previous findings (Nicklin and Barton 2007; Sorensen and Iedema
2010) and, according to Houser et al. (2012), also leads to increased nurse retention. In
Graham-Dickerson et al.’s (2013) study, clinical nurses viewed involvement as a
democratic process and sought more clinical input in decision-making, even at
organisational level. Managers, however, viewed decision-making more as seeking
opinion, and acted unilaterally. Furthermore, clinical nurses believed that they had strong
autonomy in relation to patient care and were involved in the identification of problems,
but felt that they had little say in the development of solutions, or their implementation
and evaluation (Graham-Dickerson et al. 2013). This view is similar to the findings of a
more recent multiple methods study, in which Turner et al. (2017) also state that it was
often unclear who was responsible for making decisions about innovation.
Various mechanisms were presented with the potential to foster decision-making.
Increasing communication and encouraging quality improvement among nursing staff
were means by which general decision-making was enhanced. In relation to KPI’s, the
focus was on nurse involvement in the collection and analysis of data relating to their
areas (Groff-Paris and Terhaar 2010; Foulkes 2011), and the use of dashboards to display
KPI data (Johnson et al. 2006). However, Johnson et al. (2006) also highlight that it was
better reporting systems, combined with staff-driven improvement processes, which
resulted in positive nursing and patient outcomes. Three studies from America, including
one involving Magnet hospitals (Gokenbach and Drenkard 2011) - acclaimed for
motivating staff (Aiken et al. 2008) - found that the participation of nurses in a variety of
34
open discussion groups, such as hospital councils, nursing forums, regular multi-
disciplinary meetings and committees, also facilitated collaboration in decision-making
(Johnson et al. 2006; Graham-Dickerson et al. 2013). In this way, the selection and use
of KPI’s at organisational and clinical levels is based on informed and joint decision-
making. However, in these studies, evidence was unclear regarding the extent to which
such groups were common or inclusive of all levels of staff. Clinical knowledge of KPI’s
and how they may be used to influence decision-making are therefore areas that require
further research, but appear to be linked to aspects of context, culture and the nature of
evidence.
2.5.2 KPI’s in the context of quality improvement
In a review that examined the use of evidence in decision-making about innovation in
practice, Turner et al. (2017) recommend that improvement work should be guided by an
explicit framework because of the diverse range of evidence available (Kitson et al. 1998;
McCormack et al. 2002; Jeffs et al. 2013). Although, as other authors have stated, it is
research evidence which is mostly applied to practice (Rycroft-Malone 2004; Estabrooks
et al. 2005). Consequently, Turner et al. (2017) argue that decision-makers have to be
explicit about which type of evidence influenced the decisions made regarding
innovation. Furthermore, Greenhalgh et al. (2004), in a review examining the
dissemination of service innovation, suggest that implementation methods should be
theory-driven, thus exploring the link between the intervention and the expected outcome
to determine which factors contribute to success or failure. This view is shared by many
researchers including Eccles et al. (2005), Estabrooks et al. (2005) and Rycroft-Malone
et al. (2013). However, in the literature reviewed, evidence of a theoretical underpinning
to quality improvement work was limited. This finding is supported by Arah et al. (2003)
who identified a similar gap in the knowledge-base regarding how performance data are
used to improve care quality. In their review, which aimed to understand the concepts of
some international performance frameworks for healthcare, Arah et al. (2003) also raise
doubts about the ability of performance measurement frameworks to address
effectiveness and quality at both service level and health system level.
In the literature which explores the development and selection of KPI’s, the Donabedian
(1988) model was the most frequently cited global framework, and the reasons for this
35
have been previously discussed (Pazargadi et al. 2008; Burston et al. 2013; Persenius et
al. 2015). Alternatively, in Canada, Dubois et al. (2013) report the development of a
conceptual framework of nursing care performance adapted from Donabedian’s work but
incorporating Parsons’ (1960) social action theory which defines the criteria on which
human services (or society’s) performance must be assessed. This framework
conceptualises performance within the functions: “(1) acquiring, deploying and
maintaining nursing resources; (2) transforming nursing resources into nursing services;
and (3) producing positive changes in patients’ conditions” (Dubois et al. 2013, p.6). The
authors claim that this widens the view of nursing performance beyond acute care and
illustrates the diversity of nursing. In Switzerland, Kleinknecht-Dolf et al. (2014)
designed an instrument based on Perrow’s (1967) theoretical framework which includes
three domains: (1) knowledge of the patient; (2) nursing interventions – decision-making
and planning; and (3) carrying out interventions (Perrow 1967). This framework is also
similar to that of Donabedian, but offers a subjective approach to patient care, as well as
capturing an overall picture of the complexity of each patient’s needs and resulting
nursing care. However, this is an older framework which Benibo (1997) suggests is task
orientated and was originally designed to compare organisations.
The limited application of theory within the KPI literature prompted a search for a greater
understanding of the approaches to quality improvement. This was obtained by studying
implementation science, which is an emerging discipline in the area of quality
improvement and arguably an overarching theory, defined by Eccles and Mittman (2006,
p.1) as the:
“scientific study of methods to promote the systematic uptake of research findings
and other evidence-based practices into routine practice, and, hence, to improve
the quality and effectiveness of health services and care”.
Bauer et al. (2015) describe implementation science as a field of science which shares
the same goal as quality improvement - to improve the quality of healthcare. Researchers
of implementation science draw on theory from a wide range of disciplines, and also
contribute to the development of theory (Eccles and Mittman 2006; Nilsen 2015).
However, several researchers have expressed difficulty in choosing an appropriate theory
due to their quantity and diversity (Mitchell et al. 2010; Rycroft and Bucknall 2010,
Schaffer et al. 2012; Tabak et al. 2012). Indeed, this led to Tabak et al. (2012), among
others, conducting a review of theoretical models in an attempt to help researchers better
36
identify and select models to inform their improvement work. Tabak et al. (2012) divided
the 61 models they identified into five categories on a continuum from models related
mainly to dissemination, to those related mainly to implementation. Nilsen (2015) also
provides a taxonomy of implementation theories, models and frameworks, although it is
less detailed. In comparing the theoretical models identified by these researchers with
those identified in the KPI literature, only one model appeared in all three: the Promoting
Action on Research Implementation in Health Service (PARIHS) framework (Kitson et
al. 1998). In the KPI literature, this framework was used by Botti et al. (2014) to guide
the implementation of a management algorithm for post-operative pain, with KPI’s being
used to evaluate the outcome.
While it was not possible to review all of the theories in depth, Nilsen’s (2015) taxonomy
provided a useful overview of some of those available. Those pertinent to the use of KPI’s
include process models, implementation theories and determinant frameworks. Process
models act as practical guides and include the well-established and extensively used
IOWA model (Iowa Model Collaborative 2017). Originally based on Roger’s (2003)
Diffusion of Innovations theory and designed as a pragmatic guide for the evidence-based
practice process, this model has been recently revised and discusses the use of KPI’s for
monitoring. However, while its developers highlight the need to promote adoption of the
practice change, little guidance is provided as to how this might be achieved (Iowa Model
Collaborative 2017).
Nilsen (2015) classifies Normalisation Process Theory (May and Finch 2009) as an
example of implementation theory, and the PARIHS framework (Kitson et al. 1998) as
an example of a determinant framework. Tabak et al. (2012) place these latter two models
at the high end of their continuum, and are therefore strongly focused on implementation
as opposed to dissemination of evidence-based interventions. Normalisation Process
Theory (May and Finch 2009) is designed to provide better understanding of how changes
in practice are embedded and to address specific aspects of implementation (Nilsen
2015). This theory takes cognisance of the factors involved in the implementation,
embedding and integration of practice and explains the operationalisation of complex
interventions in health care settings, proposing that collective action and context be
considered (May and Finch 2009). However, in relation to KPI’s, it does not take into
account the role of evidence in implementation.
37
Models classified by Nilsen (2015) as ‘determinant frameworks’, include variables that
have been found to influence implementation and which require consideration for
successful outcomes. The PARIHS framework (Kitson et al. 1998), for example,
considers the interlinked variables of: (1) evidence – in the form of research, clinical
expertise and patient choice; (2) context – considering culture, leadership and evaluation;
and (3) facilitation (Figure 2.2). Comparing these variables with the analysis of the
literature, the PARIHS framework (Kitson et al. 1998) potentially offers a useful
theoretical framework to underpin the successful implementation of KPI’s into practice.
Refinement, validation, and clarity of the key elements of the PARIHS framework have
been ongoing since its first publication (McCormack et al. 2002, Rycroft-Malone et al.
2004; Harvey and Kitson 2016). Internationally, researchers have also explored the use
of the framework as a practical and theoretical model to guide their work (for example,
Brown and McCormack 2011, Rycroft-Malone et al. 2013, Botti et al. 2014). An
examination of the theoretical and practical challenges to its implementation in relation
to KPI’s would encourage nurses and midwives to use all forms of evidence, consider the
impact of context (with its sub-elements of culture, leadership and evaluation), and
explore if facilitation would better enhance their understanding of how to translate KPI
evidence into practice.
The use of theory which Greenhalgh et al. (2004) and Nilsen (2015) state is beneficial in
providing a clear explanation of the link between the intervention and the expected
outcome could be useful, as literature suggests a tension exists in the notion of merging
formal research knowledge with the informal or tacit contextual knowledge of
practitioners. Researchers, Greenhalgh et al. (2005) and Titchen (2000), argue that the
successful merging of both forms of knowledge evidence is very much dependent on an
individual’s interpretation of a particular context and negotiation with them on how best
to blend the two. This struggle to merge research evidence with unique contextual
considerations reflects the need for a theoretical position that prioritises some form of
facilitation. Harvey and Kitson (2016, p.6) contend that it is facilitation which activates
“implementation through assessing and responding to characteristics of the innovation
and the recipients (both as individuals and in teams) within their contextual setting”. This
is supported by Ham et al. (2016) in a King’s Fund paper developed to aid action on
quality improvement. These authors further highlight that facilitation would also benefit
the requirement for a sustained commitment of time and resources. Equipped with this
38
knowledge, the factors likely to impact on the implementation of evidence may be
addressed (Greenhalgh et al. 2004). However, this necessitates clarity in relation to what
evidence encompasses in a healthcare setting.
Given their central role in care delivery, it mainly falls on nurses and midwives to
implement KPI evidence into practice (Hoi 2008; Stalpers et al. 2017). However, in order
to increase the likelihood of care being delivered based on evidence of what works, there
must not only be a theoretical grounding, but also knowledge of appropriate
implementation strategies and the numerous quality improvement tools that exist, such
as: Lean; IHI Triple Aim; Root Cause Analysis; Plan Do Study Act (PDSA); Productive
Leader; and Six Sigma (RQIA 2016; Implementation Science 2017). It is argued that
nurses and midwives lack this knowledge and understanding, and thus there is limited
uptake for quality improvement (RQIA 2016). Despite policy recommendations that
clinicians should receive education and training in quality improvement methodology
(DoH 2008; National Advisory Group on the Safety of Patients in England 2013), this
has not happened (Ham et al. 2016). Instead, Ham et al. (2016) state that the toxic effects
of accountability prevail and are hindering the development of a learning culture.
Recognition of these problems has promoted the work of organisations such as NHS
Improvement and IHI, which support research into knowledge utilisation and
implementation science and offer a lens through which to explore these problems.
Additionally, with no single implementation model meeting the needs of all practice
settings, researchers argue that greater understanding of theory, together with evidence-
based practice models and frameworks, would help to break down the complexity of
translating evidence into practice and aid successful change (Rycroft-Malone and
Bucknall 2010; Schaffer et al. 2012).
Challenges of knowledge translation
Globally, there are significant challenges and complexity in ensuring that evidence is
translated into practice for improved patient care (for example, Kirkley et al. 2011;
Parmelli et al. 2011; Curtis et al. 2016). Numerous researchers identify a gap in the
translation of this evidence into practice (Grimshaw et al. 2012; Rycroft Malone et al.
2013). Knowledge translation is the term used to describe:
39
“the process by which knowledge moves from where it was first created and
refined to where it has to get to in order to make an impact on clinical practice
and patient care” (Kitson and Harvey 2016, p.294).
The challenges associated with knowledge transfer are equally applicable to KPI’s, as
they are not only based on research evidence but also provide evidence through their
measurement function (McCormack et al. 2002). As previously outlined, few indicators
currently exist to measure staff and service user experience despite policy calling for their
inclusion (DoH 2008; Francis 2013). In clinical settings prominence has been given to
keeping clinical practice abreast of robust research evidence, meaning that other forms
of evidence such as professional consensus and patient need have been given less
attention. Consequently, there is limited evidence of what is important to these groups,
and there is potentially a missed opportunity to gain a comprehensive picture of practice.
This leads to the question why the nature of evidence on which KPI’s are based appears
to be skewed towards policy and research. The nature of evidence has been defined as a
combination of research, clinical expertise and patient choice (Sackett et al. 1996; Kitson
et al. 1998). The Promoting Action on Research Implementation in Health Service
(PARIHS) framework acknowledges this and offers one knowledge translation model to
support the notion that evidence in all its forms is important for the implementation of
evidence into practice (Kitson et al. 1998). Indeed, Kitson et al. (1998) argue that a
continuum for successful implementation occurs when robust evidence matches
professional consensus and patient opinion (high evidence). Thus research evidence may
range from unsystematic (low evidence) to rigorous (high evidence), and clinical
expertise may be judged to range from high to low level depending on knowledge, skills
and professional consensus. The richness of data obtained from patients’ opinions in
relation to their experiences will naturally vary from high evidence, which includes a
process of systematic feedback and input into decision-making, to superficial feedback
(low evidence) (Kitson et al. 1998; McCance et al. 2012).
The PARIHS framework (Kitson et al. 1998) also articulates the need to consider the
practice context in which the sub-elements of culture, leadership, and evaluation are again
based on a continuum. Originators of the PARIHS framework argue that the context is
receptive to change when sympathetic cultures, effective leadership and appropriate
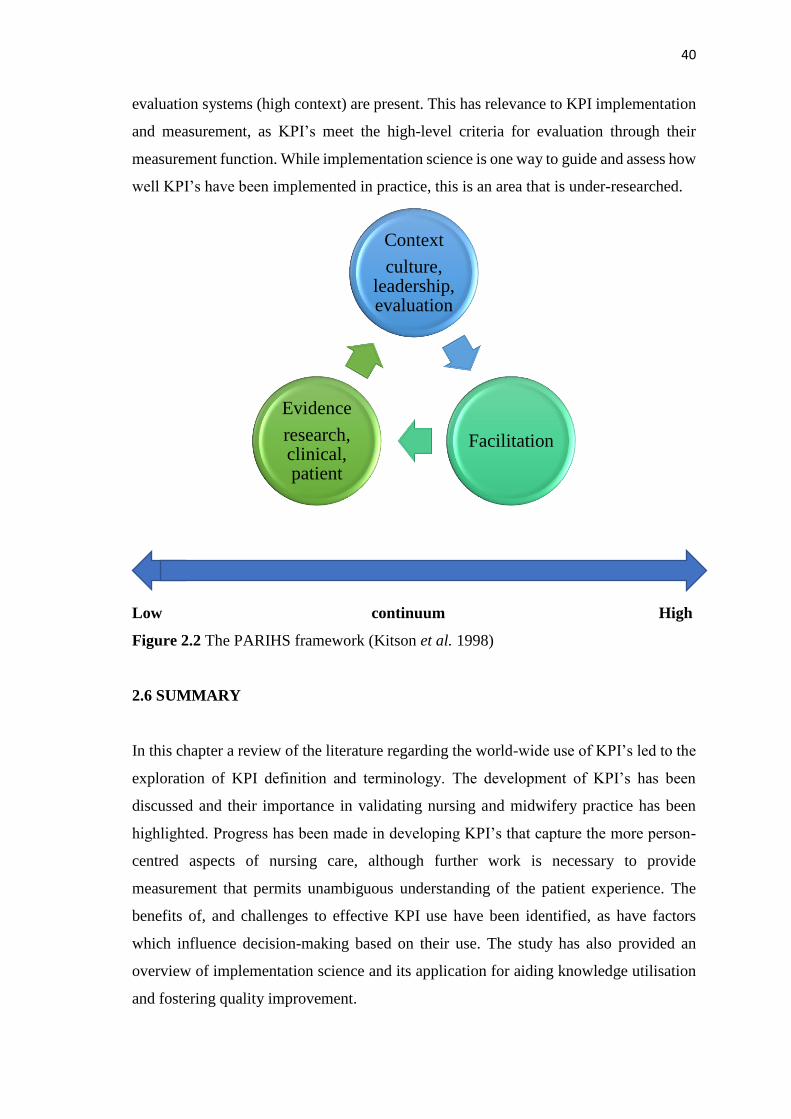
40
evaluation systems (high context) are present. This has relevance to KPI implementation
and measurement, as KPI’s meet the high-level criteria for evaluation through their
measurement function. While implementation science is one way to guide and assess how
well KPI’s have been implemented in practice, this is an area that is under-researched.
Low continuum High
Figure 2.2 The PARIHS framework (Kitson et al. 1998)
2.6 SUMMARY
In this chapter a review of the literature regarding the world-wide use of KPI’s led to the
exploration of KPI definition and terminology. The development of KPI’s has been
discussed and their importance in validating nursing and midwifery practice has been
highlighted. Progress has been made in developing KPI’s that capture the more person-
centred aspects of nursing care, although further work is necessary to provide
measurement that permits unambiguous understanding of the patient experience. The
benefits of, and challenges to effective KPI use have been identified, as have factors
which influence decision-making based on their use. The study has also provided an
overview of implementation science and its application for aiding knowledge utilisation
and fostering quality improvement.
Context
culture, leadership, evaluation
Facilitation
Evidence
research, clinical, patient
41
This chapter has located the use of KPI’s within the many different contexts of the
healthcare system. It is recognised that despite extensive support for KPI’s there is little
evidence of clinical nurses’ and midwives’ knowledge of, or involvement in, decisions
about KPI use. Yet the literature is clear that, as experts in their fields, they should be
involved throughout the process. There is limited knowledge of how KPI data is
communicated within organisations and the effect this has on decisions made at each
level of nursing and midwifery. Indeed, there is very little discussion of the strategic
management of KPI data or the relationship between nursing at the organisational and
clinical levels in respect of performance accountability (Sorensen and Iedema 2010).
Consequently, there is a need to explore this further to identify and understand the factors
which support effective use of KPI’s within an organisation. A mixed methods approach
is therefore considered the most effective means of meeting the objectives of this study
by identifying current KPI use, exploring the relationship between these KPI’s and the
decisions nurses and midwives make, and examining how this relationship influences
their actions in practice.

42
Chapter Three: Philosophical Worldview
Engaging in knowledge creation requires consideration of the source, nature and
development of knowledge. This chapter will therefore discuss the most commonly
considered philosophical paradigms, with a focus on pragmatism, and provide
justification for use of this belief system within the study.
Two major research philosophies have been identified in the Western tradition of science,
namely positivist whose proponents argue that reality can be observed and described
objectively, and constructivist where the contention is that reality is open to subjective
interpretation (Galliers 1991; Johnson and Onwuegbuzie 2004; Polit and Beck 2014).
However, a third option has been advocated; that of pragmatism. Pragmatists recognise
that there are many ways of interpreting the world and undertaking research, and argue
for the mixing of more than one research approach in a study if this will support action
(Creswell 2014; Johnson et al. 2017). Pragmatism offers an opportunity for the use of
both the objective quantitative, and subjective qualitative approaches in a mixed methods
study, and has been selected as a means to fully explore and answer the research questions
and objectives of this study.
3.1 KNOWLEDGE AND REALITY
As a quest for a deep understanding of something, philosophy asks questions about the
nature of understanding and thus of enquiry and knowledge. The answers we create in
response to our philosophical questions represent our views and include what we take to
be our knowledge. In essence, traditional philosophy asks two questions of whatever is
of interest: ‘what is the nature, or reality, of the subject in question?’ and ‘how can we
know this, if at all?’ (Burrell and Morgan 2005). This assumes that there may be a single
reality and truth. However, an alternative viewpoint has been put forward by pragmatic
researchers which centres on the belief that reality is not a fixed entity, cannot be known
and thus challenges these traditional metaphysical assumptions (Morgan 2014). By
learning more and changing what we think in light of this learning we get closer to the
‘truth’, but this truth if it exists, is always subjective and involves an element of
guesswork (Popper 2002a; Magee 2010).
43
Karl Popper, a philosopher of the 20th century, developed a theory of knowledge centred
around his belief that scientific knowledge must always be conjecture, for it will always
be replaced by new knowledge which is closer to the truth. This is not dissimilar to the
view of Socrates - that we can never know the truth, everything is open to question, even
the answers to those same questions. Popper (2002b) realised that, like the natural
sciences, the social sciences too are in a state of perpetual change, and the pace of that
change is increasingly fast. Thus certainty, or truth, is equally as elusive in society and
therefore enforcing a single viewpoint is never warranted. Our reality, what we know and
how we know it, constantly changes. As a result, Peters (2014) argues that we continually
strive to progress and learn through problem-solving, replacing one theory with a better
one as we gain new knowledge.
3.2 RESEARCH PARADIGMS
Philosopher Thomas Kuhn (1962) advanced the idea that research enquiry is
characterised by paradigms or world-views. He described a paradigm as a general concept
that refers to a group of researchers who have a shared education and belief system. Any
knowledge acquired is filtered through whatever paradigm, or belief system, is in play,
which in turn influences how we construct and understand the world. Furthermore,
Bryman (2012) has highlighted that the adoption of a particular research paradigm is
crucial since it influences decisions about the important focus of the study, the way the
study is conducted and the way results are interpreted.
In research, ontological, epistemological, methodological and axiological assumptions
have traditionally collectively defined a research paradigm, which guides the researcher’s
beliefs and underpins the research that is taking place (Denzin and Lincoln 2013;
Creswell 2014).
• Ontology refers to the nature of reality, and in social science research the two
commonly held views of social reality are that of the objectivist and the subjectivist
(Lincoln et al. 2011). Creswell (2014) states that the objectivist (or realist/post-
positivist) ontology assumes a single, concrete reality that would exist regardless of
people’s activities, whereas the subjectivist (or idealist/constructivist) ontology
assumes multiple realities due to each individual’s differing perceptions. As will be
discussed later, it is this aspect of philosophy that causes the most debate among
44
researchers as they try to rationalise pragmatism as a third paradigm, and which in
turn impacts on epistemology.
• Epistemology refers to the nature of knowing in an attempt to understand the concept
of reality (Dewey 1917). It is concerned with understanding the meaning of
knowledge; what does it mean to know something, and how do we know that we
know? When considering the epistemology of a study, Guba (1990) suggests that a
researcher would ask: what is the relationship of the knower to the known (or
knowable)? Is it quantitative-realist or qualitative-idealist?
• The methodology is the strategy which outlines the way in which the research will be
undertaken. It offers the theoretical underpinning required to understand and aid
selection of the method or set of methods required to answer a particular research
need. Whilst distinct from the methodology, Lacey (2015) contends that the methods
of enquiry broadly fall into the paradigms of quantitative or qualitative methods.
• A fourth philosophical concept which is sometimes discussed is axiology which refers
to how people determine the value of different things. Morgan (2007) argues that
values and beliefs are better considered in relation to the philosophy of ethics and
aesthetics than to the philosophy of knowledge. Conversely, the argument is made
here that values and beliefs impact on research priorities and the choices that are
made, as well as influencing the purpose of the study, and should be clarified
(Sandelowski 2000).
Consequently, the views that a researcher holds in relation to these four positions defines
their perspective of the world, and in this study that is one of pragmatism.
The post-positivist paradigm
Positivist and post-positivist assumptions are held to represent the traditional form of
research and are primarily associated with quantitative approaches, such as tests and
questionnaires (Guba and Lincoln, 1982; Crotty, 1998; Mertens 2010). Post-positivism
refers to the scientific thinking that followed after positivism whereby, rather than the
belief that there is an absolute truth, it was recognised that truth cannot be positively
confirmed (Philips and Burbules 2000). Sometimes called the scientific method or
positivist research, knowledge that develops through this lens is objective and based on
observation and measurement (Creswell 2014), therefore “anything that cannot be
verified by experience is meaningless” (Blaikie 2004, p.98). However, constructivist

45
researchers such as Guba and Lincoln (1982) and Gage (1989) object to the use of
scientific methods to study human behaviour based on the premise that human nature is
inconsistent and often contradictory. They attack the objectivity in post-positivist
research believing that there is no ‘linear causal method’ to understand human behaviour
since it is neither stable nor uniform (Guba and Lincoln 1982; Gage, 1989).
The post-positivist tradition originated from the work of August Comte, the founder of
positivism in the 19th century. Advancement of positivism, based on critique by
researchers including Karl Popper and Thomas Kuhn , led to post-positivism. These
researchers subscribed to the perspective that the world exists separate from our
understanding (Crotty 1998). Consequently, meaning is found in objects rather than the
researcher’s consciousness of those objects (Shah and Al-Bargi 2013). According to
Morgan (2014) this then constrains the experiences of post-positivists to that which is
measurable in the natural world resulting in the impartial discovery of absolute truth.
Often described as a deterministic philosophy (Creswell 2014), post-positivist
researchers assert that there are laws or theories that govern the world and thus they aim
to identify the cause of outcomes and the effect on the social world in order to understand
it better. However, critique that post-positivism fails to understand the diversity and
complexity of individuals and society led to the emergence of the constructivist paradigm.
The constructivist paradigm
Constructivism, or interpretivism, is a subjective perspective often characterised by
qualitative approaches (Bryman 2012; Creswell 2014). Emerging from the work of
researchers such as Lincoln and Guba (1985) and Crotty (1998), constructivism aimed to
address the void which post-positivism did not fulfil; to seek an understanding of human
reality in the social world. For Richards (2003, p.38) this is achieved through the eyes of
the “social actor”; people with their own stories “acting in particular circumstances at
particular times”. Constructivist believe that individuals develop subjective meanings
from their experiences, which are many and varied, resulting in complex viewpoints
(Creswell 2014). For them, meaning is constructed by individuals through their
interaction and interpretation within a particular setting or experience (Crotty 1998;
Bryman 2012) and are influenced by cultural norms. Researchers within this paradigm
rely on the participant’s view of the situation being studied to gain a greater
understanding. Creswell (2014) states that rather than starting with a theory, which may
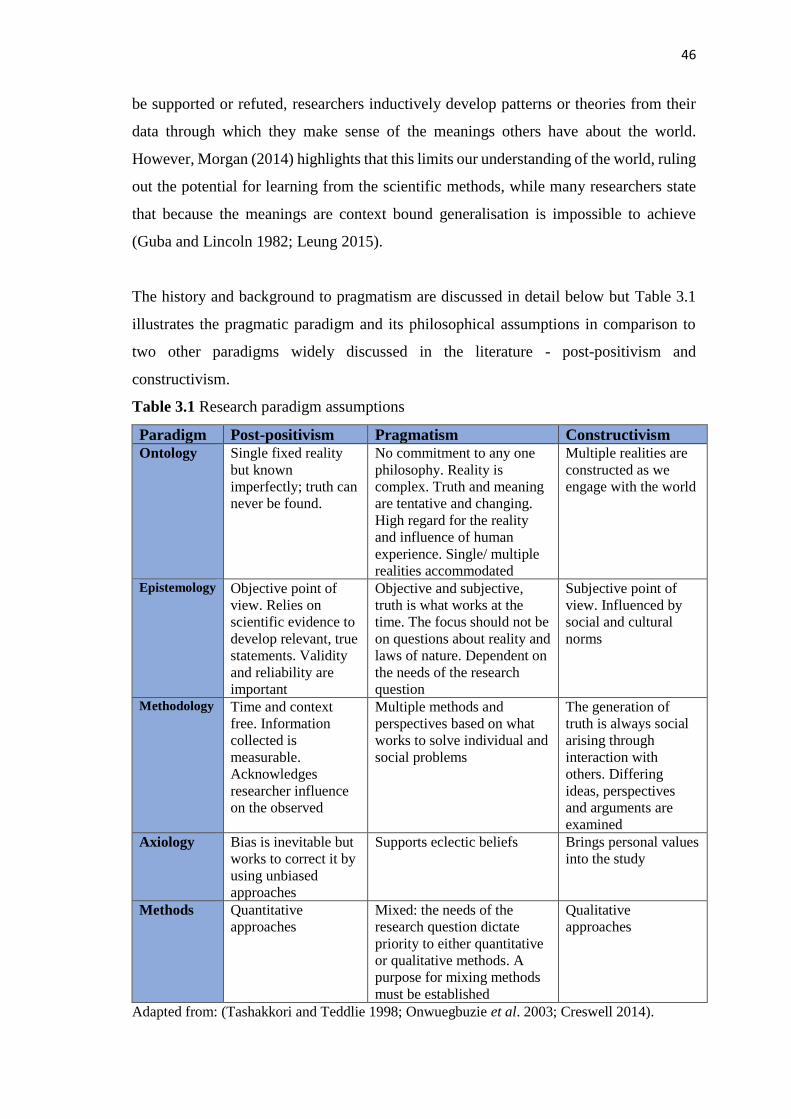
46
be supported or refuted, researchers inductively develop patterns or theories from their
data through which they make sense of the meanings others have about the world.
However, Morgan (2014) highlights that this limits our understanding of the world, ruling
out the potential for learning from the scientific methods, while many researchers state
that because the meanings are context bound generalisation is impossible to achieve
(Guba and Lincoln 1982; Leung 2015).
The history and background to pragmatism are discussed in detail below but Table 3.1
illustrates the pragmatic paradigm and its philosophical assumptions in comparison to
two other paradigms widely discussed in the literature - post-positivism and
constructivism.
Table 3.1 Research paradigm assumptions
Paradigm Post-positivism Pragmatism Constructivism Ontology Single fixed reality
but known
imperfectly; truth can
never be found.
No commitment to any one
philosophy. Reality is
complex. Truth and meaning
are tentative and changing.
High regard for the reality
and influence of human
experience. Single/ multiple
realities accommodated
Multiple realities are
constructed as we
engage with the world
Epistemology Objective point of
view. Relies on
scientific evidence to
develop relevant, true
statements. Validity
and reliability are
important
Objective and subjective,
truth is what works at the
time. The focus should not be
on questions about reality and
laws of nature. Dependent on
the needs of the research
question
Subjective point of
view. Influenced by
social and cultural
norms
Methodology Time and context
free. Information
collected is
measurable.
Acknowledges
researcher influence
on the observed
Multiple methods and
perspectives based on what
works to solve individual and
social problems
The generation of
truth is always social
arising through
interaction with
others. Differing
ideas, perspectives
and arguments are
examined
Axiology Bias is inevitable but
works to correct it by
using unbiased
approaches
Supports eclectic beliefs Brings personal values
into the study
Methods Quantitative
approaches
Mixed: the needs of the
research question dictate
priority to either quantitative
or qualitative methods. A
purpose for mixing methods
must be established
Qualitative
approaches
Adapted from: (Tashakkori and Teddlie 1998; Onwuegbuzie et al. 2003; Creswell 2014).

47
3.3 PRAGMATISM AS A PHILOSOPHICAL PARADIGM
To gain an understanding of pragmatism and the philosophy on which it is grounded, it
is necessary to consider the viewpoints of the recognised founders. Pragmatism came to
prominence in the 19th century through American philosophers such as Charles Sanders
Peirce, William James and John Dewey (Pansiri 2005; Talisse and Aikin 2011). These
early pragmatic philosophers never considered pragmatism as a distinctive paradigm and
were even divided over how it should be defined (Talisse and Aikin 2011). However,
they were all in agreement on the need for a new view of science and knowledge. For
James and Dewey this was based on the belief that nothing is ever certain, which went
very much against the view of the scientific community up until that time (Magee 2010).
Pierce on the other hand, the acknowledged founding father of pragmatism and a scientist,
dismissed ontology and the questions this raised in relation to the nature of reality. As a
scientist, his desire lay in achieving unbiased answers to questions (Johnson et al. 2017).
Therefore, he focused on the development of pragmatism as a theory of meaning, a
“method of ascertaining the meanings of hard words and abstract concepts” (Pierce 1935
cited in Talisse and Aiken 2011, p.1). Pierce believed that as the research progressed the
methods required would emerge (Johnson et al. 2017).
James, on the other hand, drew meaning from the subjective experience believing that
reality was continually shifting (Johnson et al. 2017). He proposed that, rather than
ignoring the ontological concerns, we use pragmatism to uncover the practical
consequences of a situation to identify the nature of its reality at that point in time (James
2000). In this way James was interested in exploring people’s beliefs and the actions that
resulted from those beliefs. He proposed that people are unlikely to adapt if their beliefs
do not correspond with their experience (Johnson et al. 2017).
Like James, Dewey was curious about how people react to their experiences and similar
to his fellow pragmatists, he considered ‘knowing’ to be an active concept rather than
passively gained through observation (Magee 2010; Field 2017). He argued that science
should aim to gain understanding of experiences in order to make practical judgements
about how to deal with problems, and favoured ‘learning by doing’ which combined
taking account of theory with being practical (Powell 2001). In this way Dewey
emphasised the human experience rather than abstract philosophy. For him ontology and
48
epistemology were not as important as understanding the human experience (Dewey
2008a). Despite their various individual viewpoints, the pragmatists viewed knowledge
as an instrument which we, as active participants, use to gain explanations for things that
puzzle us (Pierce 1935 cited in Talisse and Aiken 2011).
Interest in pragmatism dwindled following the Second World War, when the scientific
and logical techniques of analytical philosophy prevailed. Then, in the 1980’s Richard
Rorty sparked renewed interest in the development of pragmatism as a methodological
approach. The ensuing critique against quantitative research led to a period known as the
‘paradigm wars’ (Gage 1989; Hammersley 1992). This resulted in the development of
two separate research cultures, the quantitative approach versus the qualitative, with a
focus on their differences and arguments about which was superior, rather than
identification of their unique strengths and how they could complement each other
(Johnson and Onwuegbuzie 2004). However, the great debate that this ‘war’ encouraged
has resulted in many contemporary researchers (Abbas Tashakkori, Charles Teddlie, John
Creswell, Anthony Onwuegbuzie, Burke Johnson and Donna Mertens among others) now
appreciating the advantages of both cultures and championing pragmatism as an
alternative third paradigm (Johnson and Onwuegbuzie 2004; Morgan 2014).
Purists from both quantitative and qualitative research (Lincoln and Guba 1985; Popper
2002a; Maxwell and Delaney 2004; Denzin 2010) argue that, as it is not possible for a
researcher to hold more than one world-view, equally it is impossible to mix paradigms
in a study. Until recently, contemporary pragmatic researchers did little to refute this,
focusing more on how the practical mixed methodology harmonised with their arguments
rather than demonstrating a philosophical link for mixing methods (Denzin 2010; Morgan
2014; Riazi 2016). However, Morgan (2014) argues that to be taken seriously as an
alternative paradigm, ignoring the underlying philosophy is not an option. In part the
debate over whether it is possible to mix methodologies is intensified because it is usually
taken that epistemological paradigms are tightly bound to specific ways of doing research
(Rolfe 2006; Morgan 2014). While Morgan (2014) would agree with this affinity, he also
points out that there is no predetermined claim that a particular paradigm should be linked
with a particular set of methods, and this includes any preconceived idea that pragmatism
is uniquely linked to mixed methods research. Furthermore, if the terms quantitative and
qualitative are thought of merely as data collection methods, as in Creswell et al.’s (2003)
49
definition whereby quantitative researchers collect numerical data and qualitative
researchers collect textual data, then, Rolfe (2006) argues, mixed methodology research
is feasible. Indeed, Maxwell (2015) cites examples of studies combining the use of
quantitative and qualitative methods that can be found in astronomy both with the ancient
Greeks and later in the 17th century with Galileo, well before the concept of paradigms
became popular. Therefore, Bazeley (2003) and Tashakkori and Teddlie (2010) defend
that mixed methods research has a longer history and is not as newly emerging as has
been argued.
The practical, problem-solving approach that pragmatism affords is however considered
to be an insufficient argument on which to base our understanding of it as a philosophical
system (Denzin 2012; Morgan 2014). Consequently, with the rise in popularity of mixed
methods research, many researchers have been defending pragmatism as a philosophical
paradigm in its own right (Johnson and Onwuegbuzie 2004; Pansiri 2005; Morgan 2014).
Arguments that it is not possible to mix paradigms in a study have been refuted, with
Johnson and Onwuegbuzie (2004) highlighting that it is not possible to be totally
objective or subjective in any research. Johnson and Onwuegbuzie (2004) also highlight
that while post-positivists may claim to be objective they disregard the fact that many
subjective choices need to be made, such as what to study, which approach to take and
methods to use, and which conclusions to draw. Constructivists likewise claim to be
subjective but work within an analysis framework when interpreting data, provide a
rationale for sample selection and need to be objective when reaching conclusions,
especially if an opinion has been obtained that goes against logic or law (Johnson and
Onwuegbuzie 2004).
Consideration needs to be given to the question of whether ontology should be considered
within pragmatism if, as Dewey (2008a) suggests, it is the nature of human experience
rather than the nature of reality that is relevant. As an emerging paradigm it was difficult
to identify discussion on this point. However, Morgan (2014) puts forward an argument
based on Dewey’s work, which is worth noting. Morgan argues that while Dewey
disregards arguments about the nature of reality he does not deny the differences between
post-positivism and constructivism. Instead, for Dewey, ontology encompasses both the
single reality of the post-positivists, and the multiple realities of the constructivists but
he was not concerned with understanding these realities. For him, regardless of which

50
viewpoint a person takes, the claims they make about their experience are equally
important and valid (Morgan 2014). Both contribute to knowledge development, albeit
viewed through different lenses (Morgan 2014, p.4):
“On the one hand, our experiences in the world are necessarily constrained by
the nature of that world; on the other hand, our understanding of the world is
inherently limited to our interpretations of our experience.”
It does not matter whether we believe either in a reality that exists apart from our
understanding, or multiple realities created by our conceptions, because we are all
constrained by our experiences in the world and our interpretations of these, which limits
our understanding (Dewey 2008b).
3.4 THE PRAGMATIC RESEARCHER
Dewey’s belief that it is more useful to understand the nature of human experience than
the nature of reality resulted in a more dynamic form of enquiry than the abstract
metaphysical form (Morgan 2014). Dewey believed that knowledge is based on our
experiences: our beliefs inform our actions which in turn inform our beliefs, and so on,
in a cycle of learning through reflection and action (Morgan 2014; Johnson et al. 2017)
(Figure 3.1). Often we do not question our actions in response to certain experiences:
they are habits (Morgan 2014). Enquiry, on the other hand, is self-conscious decision-
making based on cognition, emotions and social influences, and was supported in this
study through research training, field notes, supervision and discussion with colleagues.
In pragmatic research, enquiry provides information which influences our choices and
the way we carry out our research (Dewey 2008a).
The pragmatic paradigm acknowledges that the researcher will bring into a study their
own view of reality, assumptions and values, which will play a role in interpreting the
results (Johnson and Onwuegbuzie, 2004; Mertens and Hesse-Biber 2013). Regardless of
personal subjectivity, the results of the study must still be substantiated by evidence and
are subject to the judgement of others (Denzin 2010; Morgan 2014). The pragmatic
researcher needs to be challenged about assumptions that may be made: critical debate is
therefore required to increase insight and self-awareness, and to ensure that informed
decisions are made and reflected in the data. This will, in turn, support inter-subjectivity
- the mutual understanding that is required between the researcher and those who read

51
and review the research, which is central to the pragmatic approach (Morgan 2007). How
this was achieved is described in detail in chapter four.
Figure 3.1 Dewey’s model of inquiry (Morgan 2009)
Pragmatism provides an underpinning foundation for this study as it supports the use of
various methods as a means of answering the research question and identifying the truth
of the situation at a particular point in time (Johnson and Onwuegbuzie 2004; Creswell
2014). This is based on Dewey’s transactional realism where he argues that truth is
constantly changing, is dependent on the context and results from the solving of problems
(Dewey 1929; Hickman 2009; Hall 2013). Therefore, as a researcher within a pragmatic
paradigm, the focus is on the practical research experience and on how the researcher’s
beliefs influence the actions they take, such as the choice of methods and what effect one
choice might have over another (Powell 2001; Morgan 2014). Creswell (2014) states that
the pragmatic researcher places the research question at the centre of the study and then
uses whatever methods are available to understand and answer the question.
3.5 PRAGMATISM AS A CONCEPT FOR CHANGE
Attention also needs to be given to the impact of Dewey’s pragmatism beyond the
philosophy and methodology of this research. Powell (2001) suggests that pragmatism
plays an equally significant role in the transfer of knowledge. Morgan (2007) agrees with
this and, when considered broadly within practice communities such as those in nursing
and midwifery, he clarifies that social views, or paradigms, exist that exert a powerful
Reflecting on
actions to choose
beliefs
Reflecting on
beliefs to choose
action Suggested solution
↓
↓
Recognising problem
Considering likely
effects of solution
↓
Taking action
Considering nature
of problem
↓
Suggested solution
↓
Reflecting on beliefs
to choose action Reflecting on actions
to choose beliefs
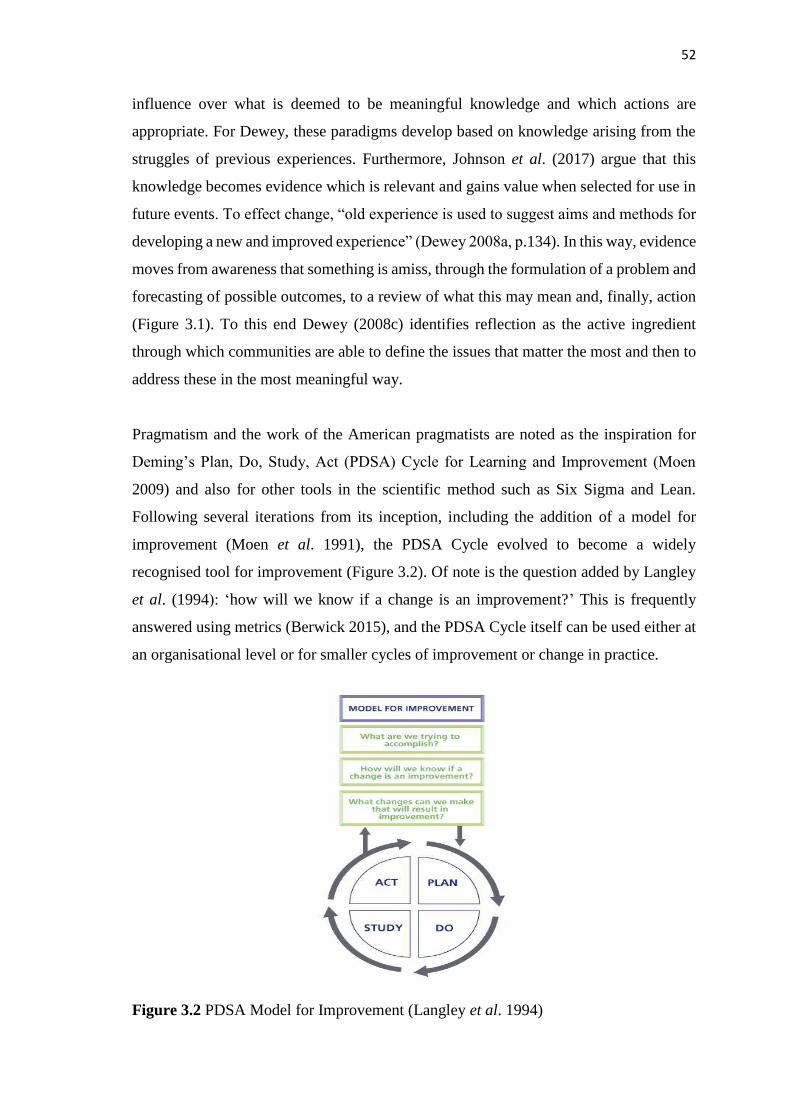
52
influence over what is deemed to be meaningful knowledge and which actions are
appropriate. For Dewey, these paradigms develop based on knowledge arising from the
struggles of previous experiences. Furthermore, Johnson et al. (2017) argue that this
knowledge becomes evidence which is relevant and gains value when selected for use in
future events. To effect change, “old experience is used to suggest aims and methods for
developing a new and improved experience” (Dewey 2008a, p.134). In this way, evidence
moves from awareness that something is amiss, through the formulation of a problem and
forecasting of possible outcomes, to a review of what this may mean and, finally, action
(Figure 3.1). To this end Dewey (2008c) identifies reflection as the active ingredient
through which communities are able to define the issues that matter the most and then to
address these in the most meaningful way.
Pragmatism and the work of the American pragmatists are noted as the inspiration for
Deming’s Plan, Do, Study, Act (PDSA) Cycle for Learning and Improvement (Moen
2009) and also for other tools in the scientific method such as Six Sigma and Lean.
Following several iterations from its inception, including the addition of a model for
improvement (Moen et al. 1991), the PDSA Cycle evolved to become a widely
recognised tool for improvement (Figure 3.2). Of note is the question added by Langley
et al. (1994): ‘how will we know if a change is an improvement?’ This is frequently
answered using metrics (Berwick 2015), and the PDSA Cycle itself can be used either at
an organisational level or for smaller cycles of improvement or change in practice.
Figure 3.2 PDSA Model for Improvement (Langley et al. 1994)
53
Dewey’s philosophical influence, which encourages ‘learning by doing’ and combines
the theoretical with the practical (Magee 2010), was alluded to in the theories of
knowledge transfer in the previous chapter and has been clearly outlined here. It will
continue to weave through this thesis.
3.6 RESEARCHER POSITIONING IN RELATION TO THIS STUDY
There is ongoing debate among mixed methods researchers about whether it is important
to understand and acknowledge how personal philosophical assumptions can influence
study decisions (Bawden 2006; Gorard 2010; Mertens et al. 2016). Nonetheless, personal
values and beliefs will, consciously or not, impact on all decisions made while
undertaking a research study. It is therefore important to clarify for the reader, “thoughts
about the nature of research” (Morgan 2007, p.52) and the world-view which will
underpin this study and guide the research process.
My first introduction to KPI’s was about eight years ago during a presentation in the
hospital in which I worked. Up to that point I had no working knowledge of KPI’s nor I
think, did my colleagues. This was not terminology with which we were familiar.
Following that presentation, which was reporting back on KPI research being carried out
in the Trust, I began to think about my work in relation to indicators. I became more
aware of KPI’s that were reported in the press or in policy papers, although they were not
always labelled as such. It became a game to guess which KPI might have led to the
information being reported. Due to my curiosity about KPI’s I was very interested to hear
that they were to be the focus of a PhD study. I was also in a position in my life where I
was ready for another challenge, and when the opportunity arose to apply for this study I
went for it.
Not having worked in clinical practice for ten years prior to beginning this doctoral study,
I would classify myself as an ‘outsider’; a researcher with little or no engagement with
practice (Reed 2010). However, Corbin Dwyer and Buckle (2009, p.60) suggest that
rarely is a researcher either totally an ‘insider’ or an ‘outsider’, but will inhabit “the space
between”. As an ‘outsider’, this position has certain advantages and disadvantages. In
their guide for doctoral students, Drake and Heath (2011) discuss the advantage of having
no history with participants, thus minimising power plays and the need to balance

54
loyalties and values. In addition, maintaining the rigour of a study is less of a challenge
than for an ‘insider’ (Drake and Heath 2011). Similarly, Kent (2015) contends that it is
easier to maintain distance and rigour when there is little prior knowledge of the topic
and no knowledge of the setting. In this respect I was at an advantage, as I had never used
KPI’s in my clinical career and held no particular beliefs in relation to their use in
practice. On the other hand my lack of experience with KPI’s meant that I needed to ask
more clarifying questions during the interviews. However, this also had the benefit of
encouraging conversation and provided an opportunity to unpick the finer details of the
discussion.
Corbin Dwyer and Buckle (2009) also suggest that my desire to study the particular topic
of KPI’s, which I had been interested in for some time, placed me closer on the continuum
to that of an ‘insider’. I therefore had to remain alert to the possibility of any
preconceptions interfering with my interpretation of the findings. For this reason care was
taken during the analysis to ground the data through accurate presentation, and there was
strict adherence to the principles of rigour. I was also conscious of the requirement to
maintain my own reflexivity as an aid to avoiding bias. As part of my pre-interview
checklist I mentally prepared to remain neutral, actively listen and focus on my role as a
researcher.
My own particular methodological preference is that of qualitative research, mainly based
on my use of this method during my MSc study. I also believe that my background in
facilitation and practice development, with their focus on reflexive practice, have
encouraged my preference for narrative rather than numbers. However, I fully
acknowledge that quantitative research has value, and that the methodology and methods
used should be those that are best suited to answering the research aims and objectives
(Morgan 2007). Over the past decade I have been working in healthcare in educational
roles supporting clinical practitioners in their personal and professional development.
This has provided opportunities to test my learning style (Honey and Mumford 1992).
While my style has fluctuated between that of a reflective learner and a theoretical
learner, possibly due to my own academic development at that time, tests have always
concluded that I maintain a balance as a pragmatic learner. This is consistent with my
personal characteristics of being practical and a problem-solver. I have always had a
straightforward, matter-of-fact approach to life and feel a strong affinity to pragmatism.

55
For these reasons I would strongly identify myself as a natural pragmatist, and by
extension a pragmatic researcher.
3.7 SUMMARY
The philosophical rationale that accommodates mixing of qualitative and quantitative
approaches of research into a single study is pragmatism. It is argued that we can never
know if there is a single reality or multiple realities, therefore there is no logical reason
to take a stand on either view. Following this line of thinking, ontology is removed from
the philosophical decision-making process. Therefore, the constraints that making this
choice imposes - to follow an objective or subjective epistemological and methodological
path - are removed. The researcher is then free to focus on which approach and tools, or
combination thereof, best contribute to understanding the human experience of the given
situation and as a result answer the research question. Although concerns have been
addressed regarding the philosophical incongruity between the post-positivist and
constructivist positions in mixed methods research, there remains the need for a
systematic, rigorous and transparent approach to ensure research quality. This will be
addressed in the ensuing methodology (Teddlie and Tashakkori 2009).
Within paradigms, researchers hold very different beliefs based on their experiences,
which then influence their actions in the research world (Morgan 2014). The exploratory
pragmatic approach taken in this study is the researcher’s attempt to learn and problem-
solve, as discussed throughout this chapter. The practical aspects of pragmatism, while
not claimed to be perfect, are argued to be the most effective for this task.
56
Chapter Four: Methodology
This chapter discusses the overall mixed methods research design which is congruent
with a pragmatic paradigm. The steps taken to answer the research question and
objectives are detailed in this chapter and an overview of the phases of the research are
presented. Challenges in the mixing of quantitative and qualitative research approaches
are identified. Justification for the researcher’s choices within the study design are
presented, including the data collection and analysis methods, participant recruitment and
ethical considerations. Finally, rigour is considered in relation to the methodologies used.
4.1 RESEARCH QUESTION AND OBJECTIVES
As previously identified in the literature review there are many complexities associated
with the effective and efficient use of KPI’s, where the aim is not only to measure
outcomes but to drive improvement and evaluate the impact made by nurses and
midwives. Subsequently, one research question with three objectives guided the study:
Research question: How does the use of KPI’s influence nursing and midwifery
practice?
Research objectives:
1. To scope the range of KPI’s used in practice
2. To identify the processes for implementation of KPI’s and mechanisms for monitoring
and reporting
3. To explore the influence of KPI’s on nursing and midwifery practice in an
organisational context, identifying factors for maximising the impact of KPI’s.
4.2 MIXED METHOD DESIGN
Scientific endeavour requires researchers to select the most appropriate methodology and
methods for a specific investigation (Teddlie and Tashakkori 2009). Having explored the
underpinning philosophy, and accepting that to fully address this research question
required the blending of both qualitative and quantitative approaches, it became apparent

57
that a mixed methodology supported by the pragmatic paradigm was most suited to
exploring and illuminating the phenomenon of KPI use.
While historically, quantitative methodology has been the mainstay of health services
research, in recent years there has been increasing interest in qualitative methods as a
means of unearthing the complexities of healthcare (O’Cathain et al. 2007a; Topping
2015). Used together, in a mixed methodology, many benefits have been acknowledged
including; more comprehensive understanding of organisational structures and processes
and the impact of care delivery; increased confidence in the research findings; and
provision of a voice for social justice and disempowered groups (Mertens 2003;
O’Cathain 2013; Creswell 2014). Acknowledged researchers broadly define mixed
methods thus:
“Research in which the investigator collects and analyses data, integrates the
findings, and draws inferences using both qualitative and quantitative approaches
or methods in a single study or program of inquiry” (Tashakkori and Cresswell
2007, p.4).
Choosing an appropriate research design entailed identifying the approach that was most
suited to addressing the research aims and objectives (Morgan 2014). A mixed
methodology was selected for this research because it permitted the use of different
methods, which together provided a greater depth of understanding of the KPI
phenomenon (Turnbull and Lathlean 2015). It is this that addresses Bryman’s (2007, p.8)
concerns that the end product should be “more than the sum of the individual quantitative
and qualitative parts”. It also provided a means of building on the strengths and reducing
the weaknesses inherent in each approach (Creswell 2014). In addition, an opportunity is
provided to discover anything that would have been missed if only a quantitative or a
qualitative approach had been used.
In this study both methods were required to address distinct research objectives and thus
the overarching research question (O’Cathain et al. 2007b). The quantitative approach of
the first research phase employs many of the elements of post-positivism: objective
collection of data through a measurable questionnaire; elimination of bias in sampling; a
deductive process identifying statistical variables from the data; and presentation in a
formal empirical style. The qualitative phase reflects the constructivist elements: an
active process where reality is socially constructed using data gained through interaction
58
with others; the researcher, as facilitator, to uncover deeper meaning; biased
interpretations; and an inductive approach creating understanding from textual data. The
objective data from the questionnaire and the subjective data from the interviews balance
each other and enhance the findings of the research (Mertens 2003; Teddlie and
Tashakkori 2009). In this way both methods are complementary. Pragmatism, then,
provides the lens through which the post-positivist and constructivist elements are drawn
together, integrating both sets of data to gain more in-depth knowledge and a
comprehensive understanding of the role that KPI’s play in influencing nursing and
midwifery practice.
The advantage of a mixed methods methodology can only be achieved through the
integration of both methods and it is this integration which mixed methods researchers
argue adds value and increases confidence in a study (Bryman 2007; O’Cathain et al.
2010; McKim 2015). It is important to note that it is possible to include more than one
method in a study and not be using a mixed methods approach (Moran-Ellis et al. 2006).
In ‘combined methods’, different approaches may be used to answer different research
questions, or a qualitative approach may follow a quantitative approach or vice versa.
O’Cathain et al. (2007b) state the latter as justification for undertaking a mixed method
study, for example one method guides the sampling of another (Sandelowski 2000).
However; if we follow Moran-Ellis et al.’s (2006) argument, this would be viewed as a
combined method. The distinction between mixed methods and combined methods
occurs in the relationship between the two approaches. For example, in a combined
method, a qualitative approach may be used to enlarge on the quantitative findings but it
is argued that while this may improve the depth of findings, there is unequal contribution
to knowledge of the phenomenon because of the lack of integration (Green et al. 1989;
Moran-Ellis et al. 2006). Therefore, the integration of methods has significant impact on
the quality of a mixed methods study.
There are many different design options for a mixed methods study and to this end
numerous typologies, or classifications, have been created providing a choice of
frameworks to meet the needs of the research (Tashakkori and Teddlie 1998;
Sandelowski 2000; Creswell and Plano Clark 2011). Additionally, there was the option
to take a “dynamic approach” (Creswell and Plano Clark 2011, p.59) and create a bespoke
research process designed around the methods needed to answer the research question

59
(Maxwell and Loomis 2003; Hall and Howard 2008). This was considered as an option
for this study as it did not neatly fall into one of the six major classifications - convergent,
sequential exploratory, sequential explanatory, embedded, transformative or multiphase
designs (Creswell and Plano Clark 2011; Halcomb and Hickman 2015). Reasons for this
related to the ‘priority’ given to the research methods and are discussed below. The
selected framework needed to guide the implementation of the research methods and
increase confidence in the trustworthiness, rigour and high quality of the research design
(Creswell and Plano Clark 2011; Denzin and Lincoln 2011).
To guide the choice of framework design, key decisions were made in relation to timing,
priority and integration (Teddlie and Tashakkori 2009; Creswell and Plano Clark 2011;
Turnbull and Lathlean 2015). To assist with the decision-making and framework
selection process, the work of Creswell and Plano Clark (2011) was reviewed. This
decision was based on their robust work in compiling a comprehensive typology of design
classifications based on the work of 15 authors.
Timing
In a mixed methods design timing, meaning the order or sequence of the phases, which
may be simultaneous or staggered, needs consideration (Sandelowski 2000; Morse and
Niehaus 2009; Teddlie and Tashakkori 2009). In this study the quantitative and
qualitative phases occurred in chronological order (Creswell 2014; Morgan 2014), with
the qualitative data “building upon the initial quantitative results” (Creswell and Plano
Clark 2007, p.71), thus a sequential exploratory design was chosen. Within Creswell and
Plano Clark’s (2011) own classification there are two frameworks available for a
sequential design:
Figure 4.1 The explanatory sequential design
Quantitative Data
Collection and
Analysis
Follow
up with
Qualitative
Data Collection
and Analysis
Interpretation
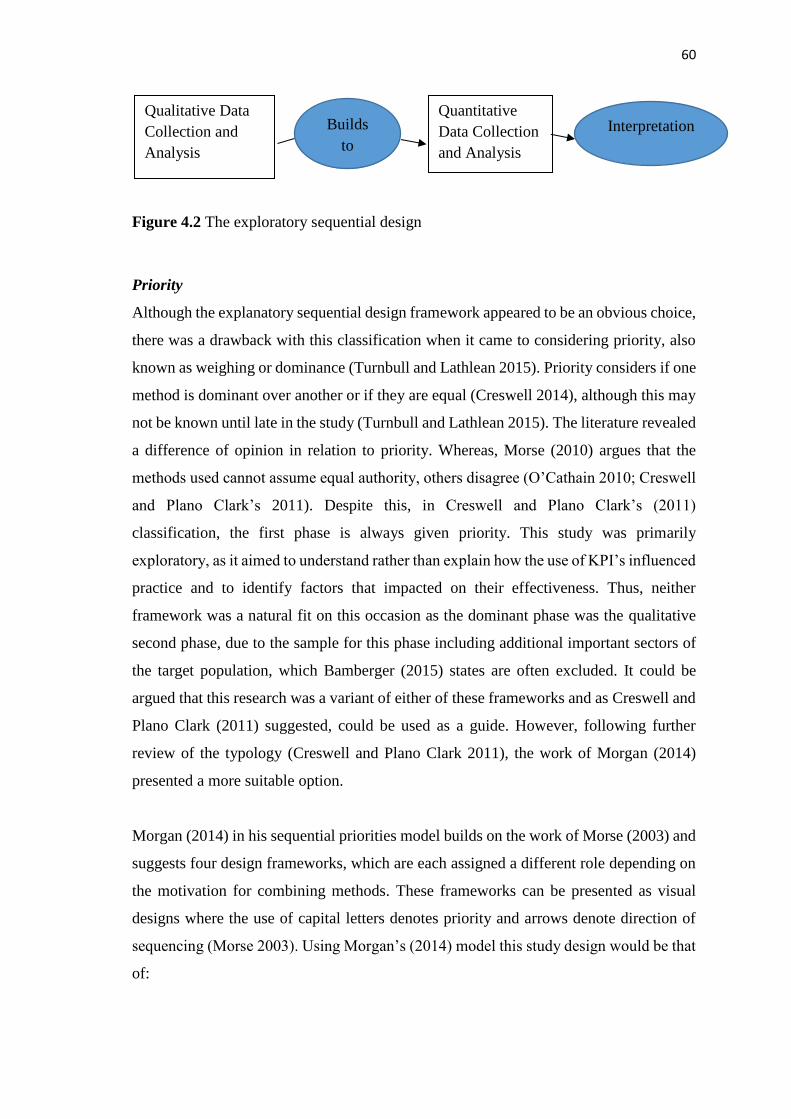
60
Figure 4.2 The exploratory sequential design
Priority
Although the explanatory sequential design framework appeared to be an obvious choice,
there was a drawback with this classification when it came to considering priority, also
known as weighing or dominance (Turnbull and Lathlean 2015). Priority considers if one
method is dominant over another or if they are equal (Creswell 2014), although this may
not be known until late in the study (Turnbull and Lathlean 2015). The literature revealed
a difference of opinion in relation to priority. Whereas, Morse (2010) argues that the
methods used cannot assume equal authority, others disagree (O’Cathain 2010; Creswell
and Plano Clark’s 2011). Despite this, in Creswell and Plano Clark’s (2011)
classification, the first phase is always given priority. This study was primarily
exploratory, as it aimed to understand rather than explain how the use of KPI’s influenced
practice and to identify factors that impacted on their effectiveness. Thus, neither
framework was a natural fit on this occasion as the dominant phase was the qualitative
second phase, due to the sample for this phase including additional important sectors of
the target population, which Bamberger (2015) states are often excluded. It could be
argued that this research was a variant of either of these frameworks and as Creswell and
Plano Clark (2011) suggested, could be used as a guide. However, following further
review of the typology (Creswell and Plano Clark 2011), the work of Morgan (2014)
presented a more suitable option.
Morgan (2014) in his sequential priorities model builds on the work of Morse (2003) and
suggests four design frameworks, which are each assigned a different role depending on
the motivation for combining methods. These frameworks can be presented as visual
designs where the use of capital letters denotes priority and arrows denote direction of
sequencing (Morse 2003). Using Morgan’s (2014) model this study design would be that
of:
Qualitative Data
Collection and
Analysis
Builds
to
Quantitative
Data Collection
and Analysis
Interpretation
61
a preliminary quantitative input to a core qualitative method.
Visually represented by the notation:
quant → QUAL.
Preliminary quantitative methods can be used to identify data sources for a subsequent
stage as well as revealing insights through inductive examination of the data even though
this data is quantitative (Morgan 2014). When applied here, the quantitative phase takes
place first in order to meet objective one through the provision of both deductive and
inductive baseline knowledge of KPI use, across a large number of organisations. This
then contributed to the generation of questions for phase two with the intention of meeting
objectives two and three.
Integration
Finally, consideration is given to the integration of data in mixed methods research. A
mixed methodology involves the collection, analysis and interpretation of data in
numerical forms for quantitative methods and narrative forms of data for qualitative
methods (Parahoo 2014). However, it was important that the data sets were mixed or
integrated and inferences drawn from both research methods (Teddlie and Tashakkori
2009; Creswell and Plano Clarke 2011; Turnbull and Lathlean 2015). The imperative for
integration of data from both methods at any, or multiple points throughout the study was
grounded in the rationale that without this integration, the knowledge gained would be
no greater than if either method had been used independently (Bryman 2007; O’Cathain
et al. 2007b). It is suggested that integration may occur once or on several occasions
during a research inquiry in four possible ways; connecting, building, merging and
embedding (Creswell and Plano Clarke 2011; Fetters et al. 2013). Table 4.1 clarifies
where, and how, integration occurred throughout this study.
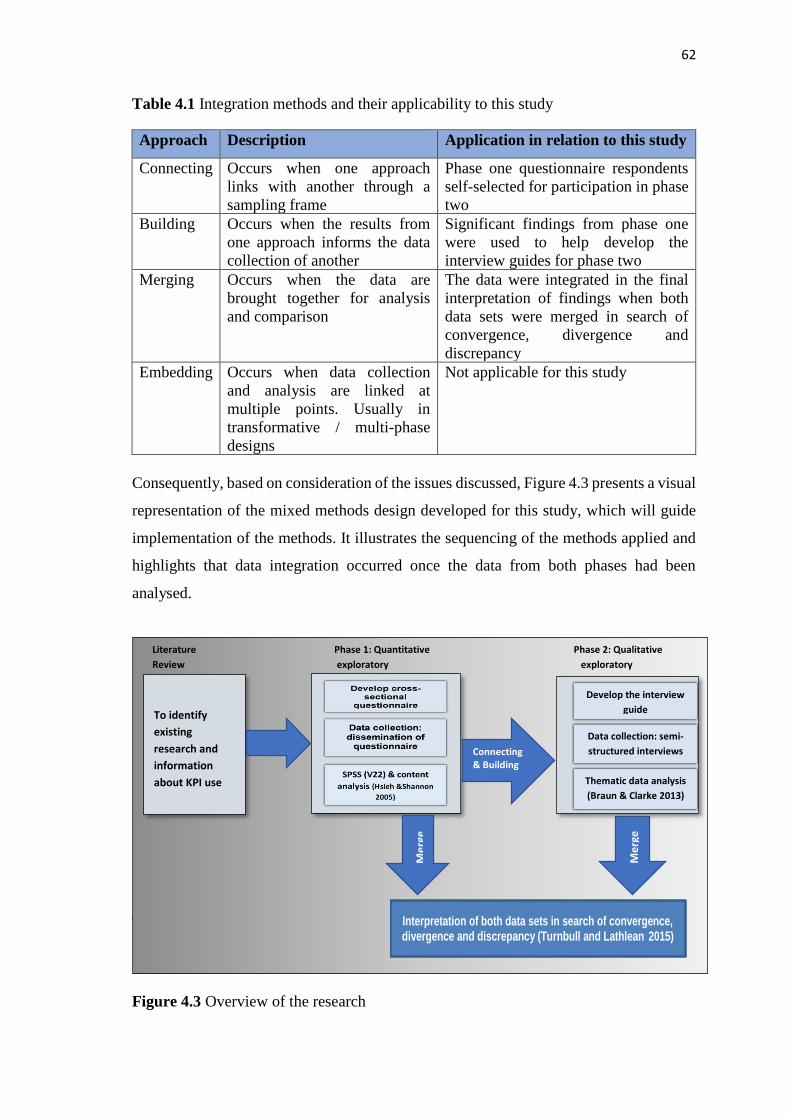
62
Table 4.1 Integration methods and their applicability to this study
Approach Description Application in relation to this study
Connecting Occurs when one approach
links with another through a
sampling frame
Phase one questionnaire respondents
self-selected for participation in phase
two
Building Occurs when the results from
one approach informs the data
collection of another
Significant findings from phase one
were used to help develop the
interview guides for phase two
Merging Occurs when the data are
brought together for analysis
and comparison
The data were integrated in the final
interpretation of findings when both
data sets were merged in search of
convergence, divergence and
discrepancy
Embedding Occurs when data collection
and analysis are linked at
multiple points. Usually in
transformative / multi-phase
designs
Not applicable for this study
Consequently, based on consideration of the issues discussed, Figure 4.3 presents a visual
representation of the mixed methods design developed for this study, which will guide
implementation of the methods. It illustrates the sequencing of the methods applied and
highlights that data integration occurred once the data from both phases had been
analysed.
4.3 PHASE ONE
Figure 4.3 Overview of the research
Develop cross-sectional
questionnaire
Data collection:
dissemination of
questionnaire
Literature Phase 1: Quantitative Phase 2: Qualitative
Review exploratory exploratory
Interpretation of both data sets in search of convergence, divergence and discrepancy (Turnbull and Lathlean 2015)
To identify
existing
research and
information
about KPI use
Me
rge
Me
rge
Connecting & Building
Develop the interview
guide
Data collection: semi-
structured interviews
Thematic data analysis
(Braun & Clarke 2013)
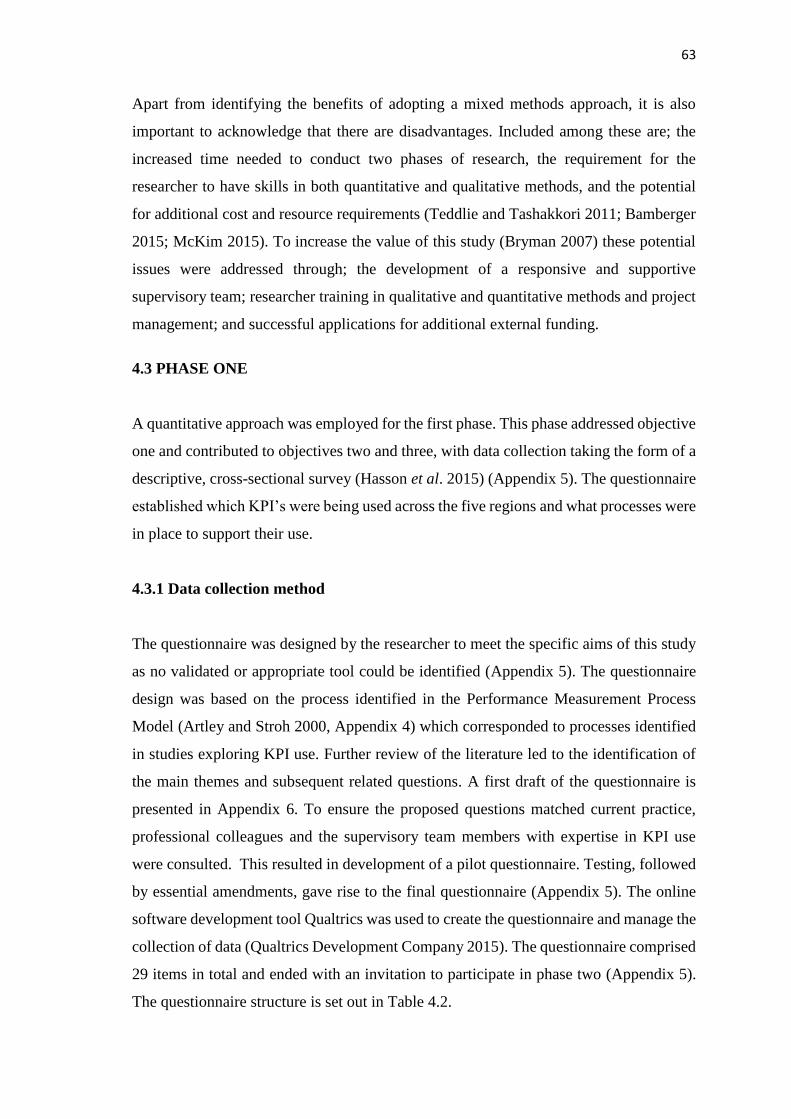
63
Apart from identifying the benefits of adopting a mixed methods approach, it is also
important to acknowledge that there are disadvantages. Included among these are; the
increased time needed to conduct two phases of research, the requirement for the
researcher to have skills in both quantitative and qualitative methods, and the potential
for additional cost and resource requirements (Teddlie and Tashakkori 2011; Bamberger
2015; McKim 2015). To increase the value of this study (Bryman 2007) these potential
issues were addressed through; the development of a responsive and supportive
supervisory team; researcher training in qualitative and quantitative methods and project
management; and successful applications for additional external funding.
4.3 PHASE ONE
A quantitative approach was employed for the first phase. This phase addressed objective
one and contributed to objectives two and three, with data collection taking the form of a
descriptive, cross-sectional survey (Hasson et al. 2015) (Appendix 5). The questionnaire
established which KPI’s were being used across the five regions and what processes were
in place to support their use.
4.3.1 Data collection method
The questionnaire was designed by the researcher to meet the specific aims of this study
as no validated or appropriate tool could be identified (Appendix 5). The questionnaire
design was based on the process identified in the Performance Measurement Process
Model (Artley and Stroh 2000, Appendix 4) which corresponded to processes identified
in studies exploring KPI use. Further review of the literature led to the identification of
the main themes and subsequent related questions. A first draft of the questionnaire is
presented in Appendix 6. To ensure the proposed questions matched current practice,
professional colleagues and the supervisory team members with expertise in KPI use
were consulted. This resulted in development of a pilot questionnaire. Testing, followed
by essential amendments, gave rise to the final questionnaire (Appendix 5). The online
software development tool Qualtrics was used to create the questionnaire and manage the
collection of data (Qualtrics Development Company 2015). The questionnaire comprised
29 items in total and ended with an invitation to participate in phase two (Appendix 5).
The questionnaire structure is set out in Table 4.2.
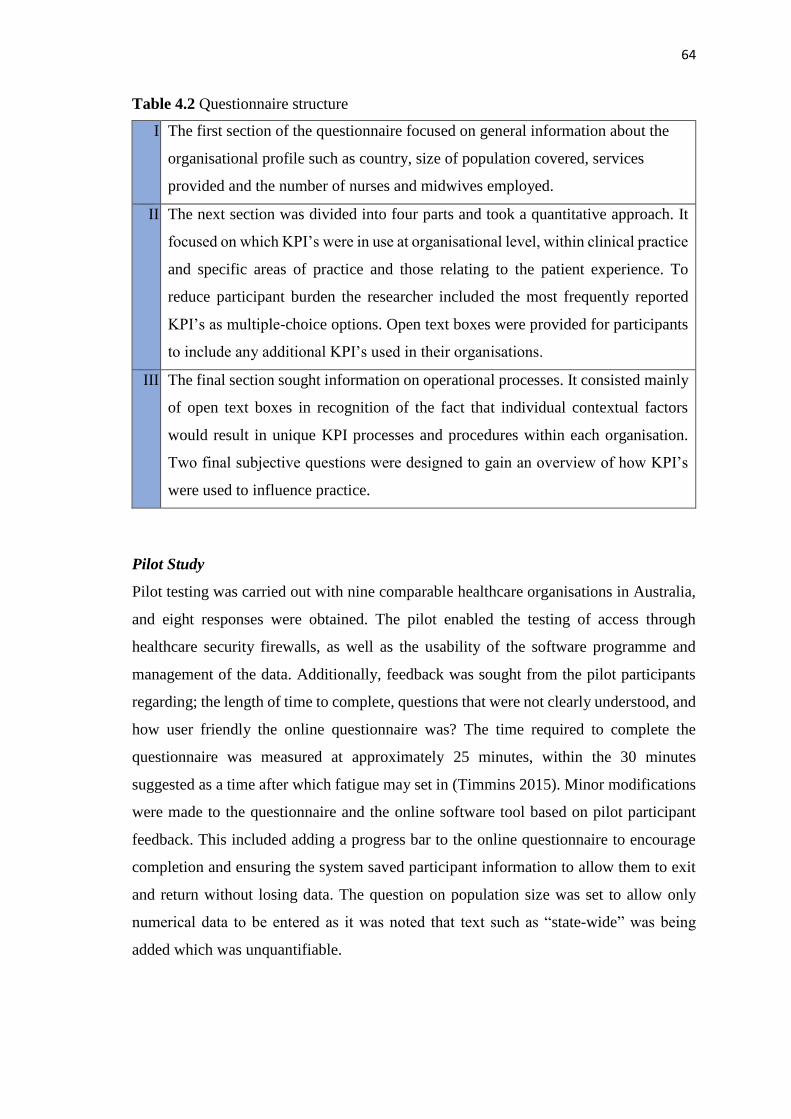
64
Table 4.2 Questionnaire structure
I. The first section of the questionnaire focused on general information about the
organisational profile such as country, size of population covered, services
provided and the number of nurses and midwives employed.
II. The next section was divided into four parts and took a quantitative approach. It
focused on which KPI’s were in use at organisational level, within clinical practice
and specific areas of practice and those relating to the patient experience. To
reduce participant burden the researcher included the most frequently reported
KPI’s as multiple-choice options. Open text boxes were provided for participants
to include any additional KPI’s used in their organisations.
III. The final section sought information on operational processes. It consisted mainly
of open text boxes in recognition of the fact that individual contextual factors
would result in unique KPI processes and procedures within each organisation.
Two final subjective questions were designed to gain an overview of how KPI’s
were used to influence practice.
Pilot Study
Pilot testing was carried out with nine comparable healthcare organisations in Australia,
and eight responses were obtained. The pilot enabled the testing of access through
healthcare security firewalls, as well as the usability of the software programme and
management of the data. Additionally, feedback was sought from the pilot participants
regarding; the length of time to complete, questions that were not clearly understood, and
how user friendly the online questionnaire was? The time required to complete the
questionnaire was measured at approximately 25 minutes, within the 30 minutes
suggested as a time after which fatigue may set in (Timmins 2015). Minor modifications
were made to the questionnaire and the online software tool based on pilot participant
feedback. This included adding a progress bar to the online questionnaire to encourage
completion and ensuring the system saved participant information to allow them to exit
and return without losing data. The question on population size was set to allow only
numerical data to be entered as it was noted that text such as “state-wide” was being
added which was unquantifiable.
65
Process for dissemination
Each country in the UK and ROI has a nursing and midwifery professional lead known
as a chief nursing officer (CNO). The CNO’s had been made aware of the research at the
outset of this study, through communication with the CNO for Northern Ireland, and each
had offered their support to encourage participation. Dissemination of the questionnaire
was initiated through an email sent by the researcher to each CNO. This email included
a request that it be forwarded to the executive directors of nursing (DoN) for each
healthcare organisation in their respective jurisdictions via their email distribution lists.
The email (Appendix 7) took the form of a letter of invitation (Appendix 8), and a
participant information sheet (Appendix 9) to which a Microsoft Word copy of the
questionnaire was attached. This was included to accommodate participant choice and
could be posted or emailed back to the researcher. A hyperlink was also embedded in the
body of the email which provided access to the online questionnaire. This mode of data
collection permitted ease of use, was inexpensive to implement, and reduced the effort of
manual data entry (Guise et al. 2010).
Although the majority of the questions only required a tick response, there were a number
of open questions that required some thought and text entry. It was anticipated that the
use of this ‘eQuestionnaire’ would also encourage a greater response rate as it was
possible to apply logics. These logics ensured that certain questions remained hidden
unless the system identified them as applicable to the participant, thus potentially
reducing completion time. To further encourage response, a strategy suggested by
Dillman (2002) was employed following modification for email delivery. Dillman’s
strategy involved the dissemination of a thank-you email one week after the original had
been sent with a reminder to non-respondents, then two weeks after that another email
was sent to all participants with the original attachments included. The final step in this
strategy involves the resending of the email to non-respondents only, but as the
questionnaire was anonymous this was not possible. In both England and ROI, data
protection regulations prevented the researcher having access to the email lists used for
dissemination. Contacts were established in each of these countries that the researcher
could liaise with and who confirmed that dissemination of the questionnaire and follow-
up reminders had taken place.
66
Participants were initially provided with one month for completion of the questionnaire.
However, due to unanticipated delays in dissemination from the CNO offices in ROI and
England the closure date was extended by three weeks. One week before closure an email
was sent to the CNO’s requesting their support in a final email to all participants.
Participants were informed that a number of partially completed responses were noted in
Qualtrics and they were encouraged to complete and close these for submission within
the following week. This proved effective with a further eight fully completed
questionnaires being returned.
4.3.2 Sampling
The target population for this phase of the study were the DoNs of healthcare
organisations in the UK and ROI. These executive nurses were deemed to be the richest
source of information in relation to the organisational and clinical use of KPI’s specific
to nursing and midwifery, and thus to answer the research question (Hunt and Lathlean
2015; Patton 2015). As such, this group represented a probability sample for this
quantitative phase, which ensured equal opportunity of selection and permitted
generalisation (Hunt and Lathlean 2015). This clearly defined population also reduced
sampling error and potential researcher bias in participant selection. In each country the
participant organisations work within different systems. Some organisations incorporate
both primary and secondary care, while other organisations may focus their care
provision on only one of these services. As policy was focused on integrating hospital
and community care to streamline the service, it was considered important to include both
these areas in the research (NHS 2014). In this way the findings would benefit the future
development and use of KPI’s, in what will be an integrated system. Discussion with the
deputy CNO of ROI highlighted healthcare restructuring in the country at the time of data
collection. The aim of the restructuring was to amalgamate the large number of hospitals
and community organisations into smaller groups which would have a resultant impact
on the DoN positions. As this process was ongoing for the foreseeable future the
recommendation was to include the original 310 Irish organisations. The organisations
included are presented in Table 4.3 below:

67
Table 4.3 Phase one sample
Country Organisation Number
England Foundation and non-Foundation Trusts 165
Republic of Ireland Public and voluntary health care including
primary care
310
Northern Ireland Health and Social Care Trusts 5
Scotland Health Boards 14
Wales Health Boards and Trust 8
This resulted in a total of 502 healthcare organisations being eligible for inclusion. The
exclusion criteria for the UK included; ambulance trusts, public health, general
practitioner practices and private/voluntary healthcare organisations. For ROI, the
terminology of the exclusion criteria was amended to include; ambulance trusts, general
practitioner practices and the private sector. This was due to a slight difference in
terminology whereby public health included community nursing, and some public
hospitals were classed as ‘voluntary public’ due to the governance and funding
arrangements in place. It was anticipated that the DoNs, as the most senior nurses, would
be the best people to complete the questionnaire based on their knowledge of KPI use in
their respective healthcare organisations.
4.3.3 Data analysis
Questionnaires were checked for completion. This highlighted the questionnaires that
held sufficient data to be included in the study. Consequently, questionnaires that
included only organisational profile information were excluded based on the criterion
that this phase aimed to gather information on current KPI use as well as contribute to
answering the research question. All other questionnaires, regardless of whether they had
only completed section two but not section three, were included. In this way, the value of
the data, and participant time and effort was acknowledged.
Qualtrics responses were individually checked for duplicates which might indicate more
than one submission from the same source. No duplicate submissions were identified and
data were anonymised through removal of the IP addresses. The questionnaire data were
then exported from Qualtrics to SPSS (Statistical Package for the Social Sciences)
version 22 for data analysis, and postal and emailed responses were added by the
researcher. The data were manually checked and coded for missing and inapplicable
68
items. Analysis focused on frequency and descriptive statistics for this data. Statistics
including means and percentages, were calculated as appropriate, for all variables. This
allowed development of an initial understanding of the data.
The qualitative data which identified lists of the KPI’s in use, were transferred to a
spreadsheet in Microsoft Excel. The KPI’s were grouped into organisational, clinical,
field specific and patient experience KPI’s (Appendix 17). This provided an overview of
KPI use in the UK and ROI. Finally, the descriptive qualitative data related to
organisational processes were transferred into a second Excel spreadsheet. This acted as
a master document for each participant’s data set. The responses of each participant were
allocated a unique code, which would allow tracing back to the original response if
required. All of the data sets were then broken down and grouped by question. Summative
content analysis was then applied to the data whereby the content of the open text box
responses were colour coded and message elements such as words or phrases were
counted to determine emphasis and themes of various topics, followed by the
interpretation of the underlying context (Hsieh and Shannon 2005). Appendix 18 presents
a sample of the content analysis. The overall findings from the phase one analysis then
focused the information sought, and suggested analytic paths for phase two (Sandelowski
2000).
4.3.4 Establishing quantitative rigour
A questionnaire is a measurement tool composed of questions designed to help answer
an overarching research question and areas of interest (Moule and Goodman 2014). While
they aim for objectivity they are constrained by the honesty of participant’s responses
(Polit and Tatano Beck 2014). Before circulation of a questionnaire, validity and
reliability should be checked, as these can influence the quality of the data obtained
(Pallant 2013; Parahoo 2014).
Validity
There are various types of validity including external and internal validity. External
validity refers to the ability to generalise the findings to a wider population and this has
been addressed in the quantitative sampling already discussed. Internal validity is the
level of confidence that we can place in the cause and effect relationship in a study

69
(Parahoo 2014). Thus, internal validity is only relevant in studies that try to establish a
causal relationship and was not applicable as the questions were mainly designed to
achieve a description of the current situation. The validity of the questionnaire also refers
to the extent to which it measures what it is supposed to measure. The main types of
validity are acknowledged as: content validity - do the questions relate to the topic; face
validity - from the participants perspective are the questions relevant to the topic; criterion
validity - how well one variable predicts an outcome based on information from other
variables; and construct validity - the degree to which it measures what it says it is
measuring, this relates to the ability to be able to generalise the findings to a wider
population (Pallant 2013; Parahoo 2014). The questionnaire design did not lend itself to
criterion or construct validity as it was a new tool and the information sought did not
strongly aim to compare or predict. However, face and content validity were tested using
a pilot study, when the questionnaire was disseminated to DoNs outside the UK. The
questions originated from the literature on the topic (Timmins 2015) and the participants
were deemed to understand what was being asked in the questionnaire by way of their
role as senior nurses responsible for quality and performance entailing extensive use of
KPI’s. While they were not asked to formally rate the relevance of each question to the
topic, an open text box was added to the pilot questionnaire requesting feedback on issues
such as questions that were not clear or easily understood (Timmins 2015).
Reliability
Reliability refers to the extent to which a questionnaire measures what it is supposed to
measure in a reliable way (Jones and Rattray 2015) and for this several statistical tests
are available; the test-retest, inter-rater reliability and internal consistency of reliability
of a scale (Pallant 2013; Jones and Rattray 2015). Test-retest considers if the
questionnaire will provide the results if administered in the same situation over a short
time frame. This was not appropriate for use in phase one for a number of practical
reasons, which included pilot feedback that identified the enormity of documenting all
the KPI’s in use and therefore an anticipated low response rate to re-testing owing to time
pressures on directors of nursing (American Educational Research Association et al.
1985; Kelly et al. 2015). Additionally, the factual nature of the questions with no
requirement to measure attitude or the same construct more than once, ruled out the
possibility of using inter-rater reliability and internal consistency. While conceding that
none of the reliability tests proved feasible, it is argued that there can be validity without

70
reliability, if reliability is considered as consistency among independent measures (Moss
1994). In this way inconsistency in the responses given did not invalidate the
questionnaire, but rather created puzzles to be solved by searching for a more
comprehensive understanding (Moss 1994). This was the role undertaken by the
qualitative second phase.
4.4 PHASE TWO
Building on the key quantitative findings in phase one which used a mainly deductive
approach to explore the use of KPI’s across a large population, phase two employed a
qualitative inductive approach. This phase, which took ‘priority’, focused on addressing
objectives two and three. Digitally recorded semi-structured interviews were utilised as
a method to gain nurses and midwives perceptions of the findings of interest from phase
one. They provided a means of exploring the complex organisational contexts within
which the KPI’s were being used, in greater depth.
4.4.1 Data collection method
Data collection in phase two involved the use of semi-structured interviews which were
undertaken by the researcher who was a skilled facilitator. Data collection took three
months beginning at the end of July 2016 and finishing at the end of October 2016.
Semi-structured interviews
The interview guides developed in this study were derived from the literature and key
findings of the quantitative phase (Appendix 10). Interviews have been identified as the
preferable option when “gathering data from people with expertise dealing with complex
topics” (Hitchcock et al. 2015, p.6) Semi-structured interviews allowed for a range of
topics to be covered while encompassing the flexibility to move from one topic to another
depending on cues from the interviewees (Parahoo 2014; Yin 2014). Additionally, the
use of open ended questions provided the researcher with the opportunity to ask
additional questions, as well as allowing the participants the freedom to express their
views in their own terms (Cohen and Crabtree 2006; Parahoo 2014). There was no
defined order to the questions as participants were encouraged to engage in a

71
conversational narrative and their responses then guided the order (Dearnley 2005). This
permitted greater exploration of identified key findings and sought to gain participants
perceptions of KPI use in the context in which they worked. The semi-structured
interviews were digitally recorded and field notes were made immediately after the
interviews. In addition to points of interest for possible follow up in other interviews, the
researcher’s initial thoughts were detailed. If necessary during the interview the
researcher restated information provided to seek clarity of meaning (Harper and Cole
2012). When the interviews were completed the participants were provided with a
certificate of contribution to research incorporating a reflective account template
(Appendix 11). They then had the opportunity to use this as evidence to contribute
towards their continuing professional development.
Pilot study
The interview questions were tested prior to the commencement of data collection. This
allowed for the questions to be refined and facilitation skills refreshed (Tod 2015). It also
helped to identify practical issues that could be addressed in advance and provided an
opportunity to practise the use of the recording equipment. Two fellow PhD students who
were practising nurses consented to take part in the pilot interviews. They both worked
at managerial level so had some knowledge of KPI use. In addition to confirming the
potential effectiveness of the questions these nurses were asked to comment on their
clarity and the general flow of the interview structure. Following the pilot some small
amendments were made to enhance the wording of the questions to make them more
conversational (Appendix 10).
4.4.2 Sampling
Whilst authors would argue that there is no clear guidance for conducting purposeful
sampling in mixed methods studies (Guetterman 2015; Palinkas et al. 2015), a significant
number of strategies for selecting participants in qualitative research were identified
(Miles and Huberman 1994; Patton 2015). However, Maxwell (2013) would argue that
they are almost all purposive in nature. Purposive selection involves the deliberate
selection of participants who can provide the richest source of information to contribute
to answering the research question (Creswell 2014; Morgan 2014). Morgan (2014)
identifies four strategies for purposive selection all of which essentially rely on specifying

72
appropriate data sources: (i) sources of specific information; (ii) sources which would
help develop theory and applications; (iii) sources suitable for systematic comparisons;
and (iv) defining criteria. Nevertheless, Morgan (2014) states that three of the four are
more complex variations of the principal strategy. Therefore, this principal strategy,
which involved the defining of criteria, was chosen as the most appropriate fit for both
initial selection of organisations and then of their participants.
Organisational selection
Based on points of interest arising from analysis of the first phase, it was determined that
interviews undertaken with nurses and midwives working at executive, senior manager
and clinical level within the selected organisations, would be of the most benefit.
However, it was not deemed feasible to conduct interviews in all thirty-nine of the
organisations that volunteered. Patton (2002) argues for a pragmatic approach to
qualitative sample size, stating that there is no recommended number but rather this is
dependent on the available alternatives when the purpose, resources and time scale are
considered. Additionally, Taylor and colleagues state that “an N of 1 can be just as
illuminating as a large sample” (Taylor et al. 2016, p.106). More recently Patton (2015,
p.313) expressed the view that:
“The validity, meaningfulness and insights gained from qualitative inquiry have
more to do with the information richness of the cases selected and the
observational/analytic capabilities of the researcher than with sample size”.
Criteria were therefore identified for organisational selection: (i) willingness to
participate, (ii) completion of all sections of the questionnaire (to permit informed
selection by the researcher), (iii) use of a range of KPI’s (to enable exploration of KPI
use across as wide a range as possible) and (iv) evidence of KPI use to improve practice.
Ten of the thirty-nine organisations met these criteria and the DoNs were provided with
information on the phase two process. They were asked to confirm if they were still
willing to take part. One organisation withdrew at this point. Subsequently, one further
organisation withdrew just prior to their interviews beginning due to unforeseen
circumstances.
Participant selection
The DoNs of the selected organisations were asked to appoint a local collaborator to liaise
with the researcher for governance processes and to identify potential participants. Based
73
on the large number of maternity KPI’s identified in phase one, and lesser number of
community KPI’s, the local collaborators were asked to include clinical managers
working in these settings if the services were provided. Selection criteria for participants
included willingness to take part and involvement in KPI use. This ensured that the
experiences of the participants would contribute to a deeper understanding of KPI use in
healthcare organisations. Local collaborators were provided with a participant invitation
and information leaflet to disseminate to those nurses and midwives who met the criteria
(Appendix 12). Researcher contact details were included for anyone seeking further
information. Local collaborators were asked to forward contact details of potential
participants to the researcher. This helped to minimise researcher bias in the selection of
participants, whilst collaborator bias was minimised pre-interview, when participants
were contacted by the researcher to confirm willingness to participate. This also provided
an opportunity for the researcher to answer any questions and to arrange a suitable time
and place for the interviews.
4.4.3 Data analysis
The six-step thematic analysis framework devised by Braun and Clarke (2013) (Table
4.4) was used as an inductive approach to analysis, allowing the exploration to stay as
closely linked to the data as possible. This also ensured that the full breadth of participant
perceptions of KPI use was captured. Braun and Clarke (2013) view thematic analysis as
the foundational method of qualitative analysis arguing that it was sufficiently flexible to
be applied across a range of theoretical and epistemological approaches, and provided a
means of identifying, analysing and reporting themes, or patterns, within the data (Braun
and Clarke 2013).
The qualitative data were transcribed verbatim by the researcher which aided the first
step in the thematic framework through immersion into the data. As with most qualitative
research methods, analysis occurred simultaneous to data collection; it was not left until
the end of data collection (Houser 2008; Gerrish and Lacey 2010). This allowed for
continuous comparisons to be made and the identification of themes for further
development. Therefore, steps two and three began straight away to develop the initial
codes and then themes which were recorded in a database. The codes are basic elements
of the raw data upon which broad themes are developed. A theme is the label or name

74
given by the researcher, to an important topic which appears as some form of pattern in
the data and relates to the research question (Braun and Clarke 2013). Furthermore, Braun
and Clarke (2006) argue that it is researcher judgement which determines what a theme
is. To support judgement of the codes and themes, the analytical process was discussed
within the supervisory team. Where differences of opinion were identified in the codes
and themes selected, the researchers worked together to seek resolution. As more data
were analysed, the researcher created broader themes, which were agreed to be an
accurate reflection of the data. Finally, the researcher selected verbatim data extracts for
reporting to vividly illustrate the findings of the analysis (Braun and Clarke 2013).
Table 4.4 Phases of thematic analysis
Phase Description of the process
1. Familiarisation
with your data:
Transcribing data (if necessary), reading and rereading the data,
noting down initial ideas.
2. Generating
initial codes:
Coding interesting features of the data in a systematic fashion
across the entire data set, collating data relevant to each code.
3. Searching for
themes:
Collating codes into potential themes, gathering all data
relevant to each potential theme.
4. Reviewing
themes:
Checking the themes work in relation to the coded extracts
(Level 1) and the entire data set (Level 2), generating a thematic
“map‟ of the analysis.
5. Defining and
naming themes:
Ongoing analysis to refine the specifics of each theme, and the
overall story the analysis tells; generating clear definitions and
names for each theme.
6. Producing the
report:
The final opportunity for analysis. Selection of vivid,
compelling extract examples, final analysis of selected extracts,
relating back of the analysis to the research question and
literature, producing a scholarly report of the analysis.
(Braun and Clarke 2013)
4.4.4 Establishing qualitative rigour
While quantitative research measures effect, and demands control and avoidance of bias
in its subject matter, qualitative research, with its focus on understanding meaning,
75
acknowledges the potential for bias and requires honesty and reliability to address the
validity of the findings (Houser 2008). Hence rigour in qualitative approaches is often
discussed in terms of the trustworthiness of the research, and various strategies or criteria
can be applied to verify this and ensure transparency throughout the research process
(Sandelowski 1993; Morse et al. 2002). Despite Rolfe’s (2006) argument that consensus
on quality criteria for qualitative research was unlikely to be reached due to disagreement
on ideology, many researchers favour Guba’s (1981) assessment criteria (Shenton 2004).
Therefore, these were employed to verify the rigour of the second phase. Guba and
Lincoln (1989) recommended that the criteria of credibility (internal validity),
dependability (reliability), and transferability (external validity) were met to address the
issue of validity in qualitative research. In addition, they stated that confirmability, the
requirement to demonstrate how interpretations were arrived at, would be achieved if
these three criteria were met. It has also been recognised that establishing trustworthiness
in qualitative research is complex and thus these criteria should be closely examined and
addressed (Sandelowski 2000).
Credibility
As a subjective approach, the researcher seeks to analyse inductively, deriving meaning
from the participant data. For this reason it is important to be transparent about the
processes involved in the collection and analysis of the data. Additionally, Lathlean
(2015) states that in nursing research the researcher is often a member of the same
professional group as the participants, and therefore needs to be especially conscious of
the effect this might have on any aspect of the process. This could range from shaping
the direction of the study (Creswell 2014), to influencing interpretation of the data
(Lathlean 2015; Topping 2015). To address this it is essential that the researcher
maintains active self-awareness (Guba and Lincoln 1989). All transcriptions were read
against the recordings to double check the accuracy of the transcribing. Monthly, or more
frequent, recorded supervision sessions were maintained for the duration of the study.
Supportive challenge was provided as required and minutes of the discussion and
decisions that were made were drawn up. The identification of themes was debated with
the supervisory researchers and consensus was reached when differences of opinion
arose. Additionally, for Shenton (2004), credibility also arises from the willingness of
each participant to take part thus the information was freely given.
76
Dependability
Dependability aims to show indications of stability and consistency in the process of
inquiry and is usually evidenced by the documentation of an audit trail (Sandelowski
1986; Riege, 2003; Koch 2006). In addition to the clear evidence trail provided by this
thesis, a thematic analysis framework clarified the interpretation process, coding of the
quotations permitted the data to be tracked back to the source for verification, and an
audit trail of the thematic process was provided.
Transferability
Transferability relates to the similarity between contexts which impacts on the ability to
transfer findings. Thus, it is difficult to establish trustworthiness in this respect within
qualitative research due to the unique nature of the research environments and situations
(Guba and Lincoln 1989). Sandelowski (1986) suggests that these criteria would be met
when the reader can view the research findings as meaningful and applicable in terms of
their own experiences. To achieve this, clear inclusion criteria for the organisational and
participant samples are provided along with the time scale for data collection, and rich
descriptions of the contexts are presented in chapter six. This afforded sufficient evidence
to allow others to judge the transferability of the findings to their own contexts (Guba
and Lincoln 1989).
4.5 ETHICAL ISSUES AND GOVERNANCE
Approval for phase one of this proposal was granted by the Ulster University Research
Governance Filter committee and by the host NHS organisation. In addition to approval
being sought from the university prior to phase two, approval was also sought from the
regional NHS research coordinating bodies. A research passport was obtained in line with
requirements in England. No ethical issues were raised. Following this, approval was
sought and granted from the Research and Development offices of the organisations
involved, following their research governance protocols.
In this study the prominent ethical issues included anonymity, confidentiality, informed
consent and non-maleficence (Parahoo 2014).
• Anonymity – occurs when the participants cannot be linked to their data (Polit and
Tatano Beck 2014). Anonymity of the organisations during phase one was assured in
77
the participant information sheet. The IP address (the link with the participant’s email
address) which was automatically recorded by the software system Qualtrics, was
deleted after data collection and checks for duplicates was completed. In phase two,
anonymity was assured for interviewees through anonymisation of the transcribed
data.
• Confidentiality – relates to the right of participants to privacy. Confidentiality
regarding the content of the completed questionnaires was assured as the
questionnaires were anonymous. However, in qualitative research additional care
needs to be taken to protect participants’ identity due to the in-depth nature of the
data collected (Polit and Tatano Beck 2014). In addition to the transcriptions being
anonymised, interviewees in phase two were assured of confidentiality through
reassurance that no information would be publicly reported in such a way as to
identify them and that the data would only be accessed by the supervisory team (Polit
and Tatano Beck 2014).
• Consent - Informed consent should be fundamental to all research undertaken
(International Council of Nurses 2003). This entails participants having sufficient
information about the study to make an informed choice as to whether they wish to
take part. In phase one, a letter of invitation and participant information leaflet
(Appendix 8 and 9) were emailed to the key informants along with the questionnaire.
It was highlighted in the participant information sheet that participation was entirely
voluntary. Consent to participate was assumed if the questionnaire was returned
(Jones and Rattray 2015). In phase two, all participants were fully informed through
an information leaflet (Appendix 12) sent directly to them prior to the interviews.
This outlined the purpose of the study, the proposed use of digital recording during
the interview, confidentiality, anonymity within the data collected, and the
participant’s right to withdraw from the study at any point. The participant then had
time to consider what was involved and to request further information before agreeing
to participate. On the day of the interview the participant’s understanding of their role
was clarified and written consent sought (Appendix 13). For the telephone interviews
written consent was obtained prior to the telephone interview and followed up with
verbal consent obtained at the beginning of the interview.
• Non-maleficience – relates to the principle of freedom from harm. In theory this may
seem easy to adhere to but in practice it is more difficult, with some risks being less
78
obvious than others (Johnson and Long 2015). Freedom from harm not only refers to
physical harm but also to psychological harm that may occur because of the research
(Parahoo 2014). Within the qualitative phase of this study there was a risk that the
principle of non-maleficence could be breeched. Although the risk was small for the
topic under discussion, generation of interactive dialogue poses a risk that subject
matter will be raised which could not have been anticipated and which has the
potential to cause harm to the participant/s. A debriefing period after the interviews
allowed the participants the freedom to ask questions and discuss anything of concern.
The information sheet also contained the contact details for their occupational health
department. Potential benefits to participants were highlighted, including the
opportunity for the interviewee to discuss their personal situation with a friendly,
objective colleague and the satisfaction of knowing they are contributing to research
that may help others (Polit and Tatano Beck 2014; Johnson and Long 2015). Risk to
the researcher was small but supervisory and local collaborator support was available
if needed.
• Data security - All data were stored on a university computer which was password
protected and in a locked office. Hard copies of data and posted questionnaires were
stored in a locked filing cabinet in the same office. Digital recordings were
downloaded the same day and deleted from the recorder. Storage and archiving of
information following closure of the study was in line with the Ulster University’s
procedures on research data. Only the researcher and supervisory team had access to
the research data.
4.6 ENSURING METHODOLOGICAL RIGOUR
Essentially rigour refers to the quality of the research process. It originated in the
empirical positivistic realm as the concepts of validity and reliability (Curtis and Drennan
2013; Parahoo 2014). Whereas, for those with alternative worldviews, rigour is viewed
in terms of trustworthiness, legitimacy, believability and truth (Sandelowski 1993;
Cutcliffe and McKenna 2002; Denzin and Lincoln 2011). However, the issue of rigour in
mixed method studies has resulted in on-going debate about how best to ensure high
quality research and the criteria which should be applied to assess this (Morse 2003;
O’Cathain 2010; Morgan 2014). It has been suggested that due to the different
epistemological backgrounds in mixed methods, qualitative and quantitative approaches

79
require their own assessment criteria, while others argue that this only serves to cause
confusion (Lincoln and Guba 1985; Sandelowski, 1993; Rolfe 2006). However,
development of an appraisal framework specific to mixed methodology, which is
comprehensive enough to assess the variety of studies conducted without causing
confusion, has proved difficult. O’Cathain’s (2010) critical appraisal framework
contained forty-four criteria (which the author herself stated was too many), and does not
meet the call for a framework that is easy and clear to use (Heyvaert et al. 2013). Rolfe
(2006), on the other hand, queries the relevance of any set criteria and there is
disagreement about whether quality should be assessed during a study or afterwards
(Sandelowski, 1993; Morse 2003).
Of further consideration was the understanding that in mixed methods, the study of the
same phenomenon through multiple methods help corroborate the findings; often referred
to as triangulation (Morse 2003; Creswell 2014). Triangulation is claimed to enhance the
findings of the research (Teddlie and Tashakkori 2009) and provided a means of
balancing the objective data from the questionnaire, with the subjective data from the
interviews (Mertens 2003). In this way both methods complemented each other, building
on the other’s limitations such as, the need to understand the context from which the
factual quantitative data arose, and the use of the quantitative data to substantiate the
perceptions gained from the qualitative findings. Together, the methods used produced
findings that offered a more comprehensive understanding of the research question
(Turnbull and Lathlean 2015). However, while various authors highlighted the appeal of
triangulation (Sandelowski 1995; Morse et al. 2002; Denzin and Lincoln 2011),
Sandelowski (1995) warned it was not a solution for everything and cautioned against its
use as a means of indicating that more than one method was used. Furthermore, although
triangulation may be proposed as a means of increasing rigour and especially validity,
based on the notion that if the findings converge they must be legitimate, problems occur
if the findings diverge or raise discrepancies (Turnbull and Lathlean 2015). As an
acknowledged concern, discrepancies were monitored for, but rather than being seen as
a problem, divergence was viewed as an opportunity for further exploration to increase
understanding. However, in this study more convergence than divergence emerged from
the findings.
80
Due to differing opinions about how the rigour of mixed methods studies should be
assessed, Heyvaert et al. (2013) argue against a single set of criteria for their appraisal.
With no current consensus on the criteria that should be used to evaluate the quality of
mixed methods studies (Heyvaert et al. 2013), this researcher chose to broadly discuss
how rigour is established in: i) quantitative methods (section 4.4.4); and ii) qualitative
methods (section 4.5.4). However, it is also acknowledged that a mixed methods study is
more than the sum of its qualitative and quantitative elements, requiring comprehensive
critical appraisal (O’Cathain 2010; Creswell and Plano Clark 2011). Therefore, the
researcher has also chosen a pragmatic framework to fulfil the need for an appraisal
specific to mixed methods approaches (Table 4.5). Designed by Teddlie and Tashakkori
(2009), this framework was considered to complement the study methodology because it
combines a strong active orientation with a smaller philosophical orientation. Teddlie and
Tashakkori (2003) recommend the terms ‘inference quality’ and ‘inference
transferability’ for assessment of validity in mixed method studies. This is based on an
argument that inferences are made in research regardless of whether the interpretation is
inductive or deductive, thus the concept of ‘inference’ transcends quantitative and
qualitative research (Teddlie and Tashakkori 2003; Onwuegbuzie and Johnson 2006).
Inference quality refers to internal validity and credibility, while inference transferability
refers to the concepts of external validity (quantitative research) and transferability
(qualitative research) (Ihantola and Kihn 2011).

81
Table 4.5 Checklist of criteria for assessment of quality and interpretive rigour in a mixed methods study (Teddlie and Tashakkori 2009)
Aspects of
inference
quality
Research
criterion
Indicator or audit
Location in the study
Design
quality
1.Design
suitability
Are the methods of study appropriate for
answering the research question/s? Does
the design match the research questions?
Justification for using a mixed methods approach is provided in chapter three
and chapter four
2.Design
adequacy/ fidelity
2a. Are the procedures implemented with
quality and rigour?
2b. Are the methods capable of capturing
the meanings, effects, or relationships?
2c. Are the components of the design (e.g.
sampling, data collection procedures, data
analysis procedures) implemented
adequately?
2a. The procedures are detailed in the methodology with accompanying
evidence in the appendices.
2b. Chapter four explains the rationale for selection of the methods and
chapters five and six present the study findings.
2c. Sampling and data collection are reported in chapter four with data
analysis as per Braun and Clarke (2013), Hsieh and Shannon (2005) and
SPSS. The study was supervised by experienced researchers. Progress of the
study has been scrutinised on three occasions internal to the university, and
procedures subjected to examination by the university research office and the
research and development offices of eight healthcare organisations.
3.Within design
consistency
Do the components of the design fit
together in a seamless manner? Is there
“within design consistency” across all
aspects of the study?
The research design is reported in section 4.3 with accompanying rationale.
Methods followed the two-phase sequential exploratory design. Section 1.4
presents the thesis structure of this study.
4.Analytic
adequacy
Are the data analysis procedures/strategies
appropriate and adequate to provide
possible answers to research questions?
Analysis techniques are detailed in chapter four. Data analysis is present in
chapters five and six. Chapters seven and eight present the findings and
conclusions in response to the research question and objectives.
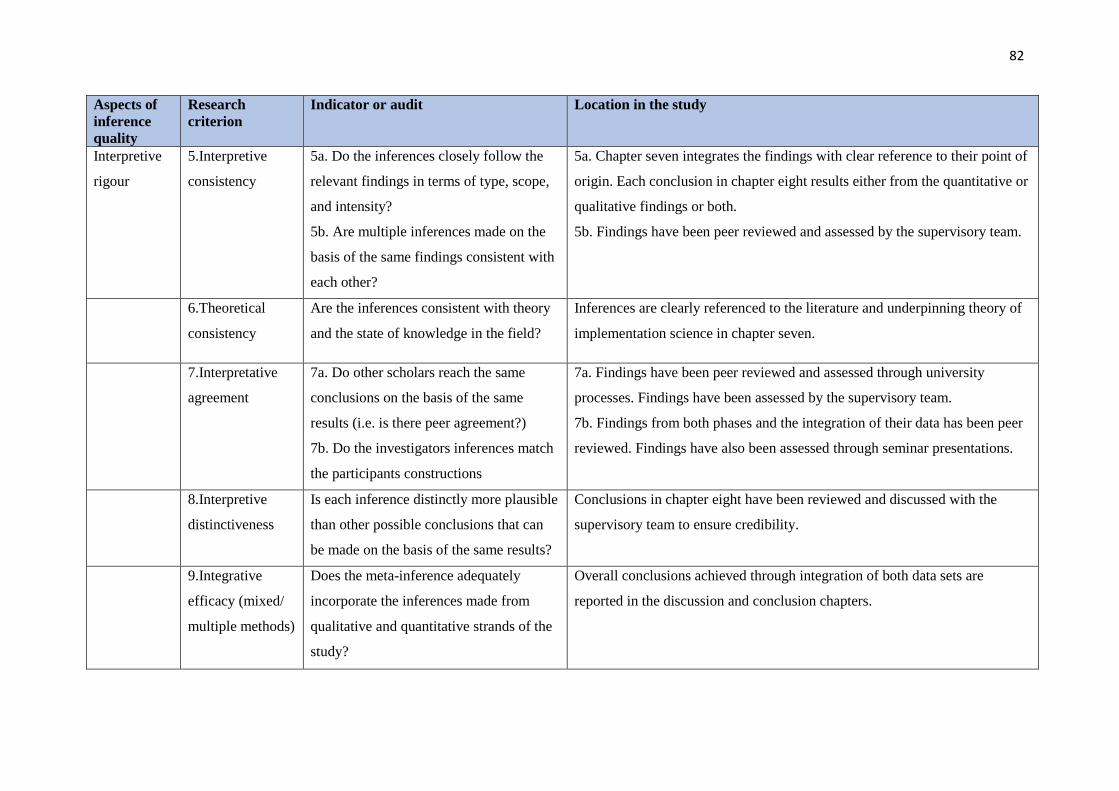
82
Aspects of
inference
quality
Research
criterion
Indicator or audit
Location in the study
Interpretive
rigour
5.Interpretive
consistency
5a. Do the inferences closely follow the
relevant findings in terms of type, scope,
and intensity?
5b. Are multiple inferences made on the
basis of the same findings consistent with
each other?
5a. Chapter seven integrates the findings with clear reference to their point of
origin. Each conclusion in chapter eight results either from the quantitative or
qualitative findings or both.
5b. Findings have been peer reviewed and assessed by the supervisory team.
6.Theoretical
consistency
Are the inferences consistent with theory
and the state of knowledge in the field?
Inferences are clearly referenced to the literature and underpinning theory of
implementation science in chapter seven.
7.Interpretative
agreement
7a. Do other scholars reach the same
conclusions on the basis of the same
results (i.e. is there peer agreement?)
7b. Do the investigators inferences match
the participants constructions
7a. Findings have been peer reviewed and assessed through university
processes. Findings have been assessed by the supervisory team.
7b. Findings from both phases and the integration of their data has been peer
reviewed. Findings have also been assessed through seminar presentations.
8.Interpretive
distinctiveness
Is each inference distinctly more plausible
than other possible conclusions that can
be made on the basis of the same results?
Conclusions in chapter eight have been reviewed and discussed with the
supervisory team to ensure credibility.
9.Integrative
efficacy (mixed/
multiple methods)
Does the meta-inference adequately
incorporate the inferences made from
qualitative and quantitative strands of the
study?
Overall conclusions achieved through integration of both data sets are
reported in the discussion and conclusion chapters.

83
4.7 SUMMARY
The main consideration when planning a research methodology is that the approach
chosen provides the most appropriate means of answering the research question (Creswell
2014; Morgan 2014; Turnbull and Lathlean 2015). This chapter has laid out the research
design considered most effective for this study arguing how the use of mixed methods
can provide a broader approach than other methodologies, and thus take into account the
values and perceptions of the organisational context in which the research is conducted
(Andrew and Halcomb 2009).
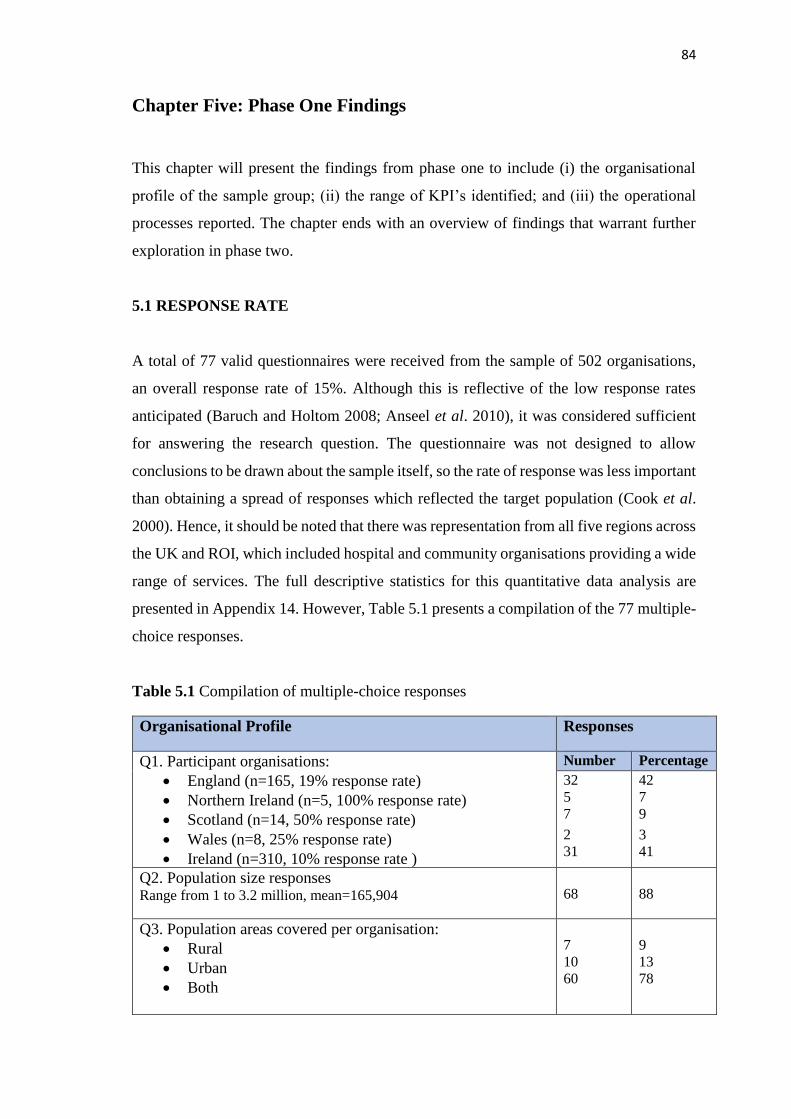
84
Chapter Five: Phase One Findings
This chapter will present the findings from phase one to include (i) the organisational
profile of the sample group; (ii) the range of KPI’s identified; and (iii) the operational
processes reported. The chapter ends with an overview of findings that warrant further
exploration in phase two.
5.1 RESPONSE RATE
A total of 77 valid questionnaires were received from the sample of 502 organisations,
an overall response rate of 15%. Although this is reflective of the low response rates
anticipated (Baruch and Holtom 2008; Anseel et al. 2010), it was considered sufficient
for answering the research question. The questionnaire was not designed to allow
conclusions to be drawn about the sample itself, so the rate of response was less important
than obtaining a spread of responses which reflected the target population (Cook et al.
2000). Hence, it should be noted that there was representation from all five regions across
the UK and ROI, which included hospital and community organisations providing a wide
range of services. The full descriptive statistics for this quantitative data analysis are
presented in Appendix 14. However, Table 5.1 presents a compilation of the 77 multiple-
choice responses.
Table 5.1 Compilation of multiple-choice responses
Organisational Profile Responses
Q1. Participant organisations:
• England (n=165, 19% response rate)
• Northern Ireland (n=5, 100% response rate)
• Scotland (n=14, 50% response rate)
• Wales (n=8, 25% response rate)
• Ireland (n=310, 10% response rate )
Number Percentage
32
5
7
2
31
42
7
9
3
41
Q2. Population size responses Range from 1 to 3.2 million, mean=165,904
68
88
Q3. Population areas covered per organisation:
• Rural
• Urban
• Both
7
10
60
9
13
78

85
Q4. Services provided per organisation:
• Acute
• Community
• Both
15
19
39
21
26
53
Q5. Areas of practice provided per organisation:
• Adult
• Midwifery
• Children’s
• Learning disability
• Community
• Mental health
70
57
60
34
48
31
91
74
78
44
62
40
Q6. Total staff employed per organisation:
• Under 2000
• 2001-5000
• 5001-10000
• 10001-15000
• 15001-20000
• Over 20000
31
14
15
10
2
5
40
18
19
13
3
7
Q7. Approximate number of nurses employed:
• Under 1000
• 1001-3000
• 3001-5000
• 5001-7000
• 7001-9000
• Over 9000
36
21
10
6
0
4
47
27
13
8
0
5
Q8. Approximate number of midwives employed:
• Under 1000
• 1001-3000
• Over 3000
49
5
0
91
9
0
3 Q9, 12, 13, 15, 18, 19, 23, 32 permit multiple responses therefore the aggregate response rates exceed one hundred.
Processes related to the use of ORGANISATIONAL KPI’s Number Percentage3
Q9. Frequently cited organisational KPI’s:
• Agency and nurse bank usage (of 76 applicable)
• Number of nursing vacancies (of 76)
• Number of nursing absences (of 75)
• Incidence of complaints specific to nursing care (of 76)
61
67
65
62
80
88
87
82

86
Processes related to use of ORGANISATIONAL KPI’s (cont) Number Percentage
Q10. Data collection methods used for organisational KPI’s:
• Agency and nurse bank usage - paper
(of 61 applicable) computer
both
• Number of nurse vacancies - paper
(of 67 applicable) computer
both
• Number of nurse absences - paper
(of 64 applicable, additional missing data×1) computer
both
• Incidence of complaints - paper
(of 62 applicable) computer
both
5
34
22
5
36
26
3
40
21
8
27
27
8
56
36
7
54
39
5
62
33
13
43
43
Q11. Frequency of data collection:
• Agency and nurse bank usage - monthly or more often
(of 61 applicable) bi-monthly
quarterly or less often
• Number of nurse vacancies - monthly or more often
(of 67 applicable) bi-monthly
quarterly or less often
• Number of nurse absences - monthly or more often
(of 65 applicable) bi-monthly
quarterly or less often
• Incidence of complaints - monthly or more often
(of 62 applicable) bi-monthly
quarterly or less often
57
0
4
58
2
7
62
0
3
49
1
12
93
0
7
87
3
10
95
0
5
79
2
19
Q12. Collection of organisational KPI’s by:
• Agency and nurse bank usage – clinical staff
(of 60 applicable, additional missing data×1) admin/clerical
managerial
• Number of nurse vacancies - clinical staff
(of 66 applicable, additional missing data×1) admin/clerical
managerial
• Number of nurse absences - clinical staff
(of 64 applicable, additional missing data×1) admin/clerical
managerial
• Incidence of complaints - clinical staff
(of 62 applicable) admin/clerical
managerial
26
38
29
24
33
41
22
37
41
26
33
40
43
63
48
36
50
62
34
58
64
42
53
65
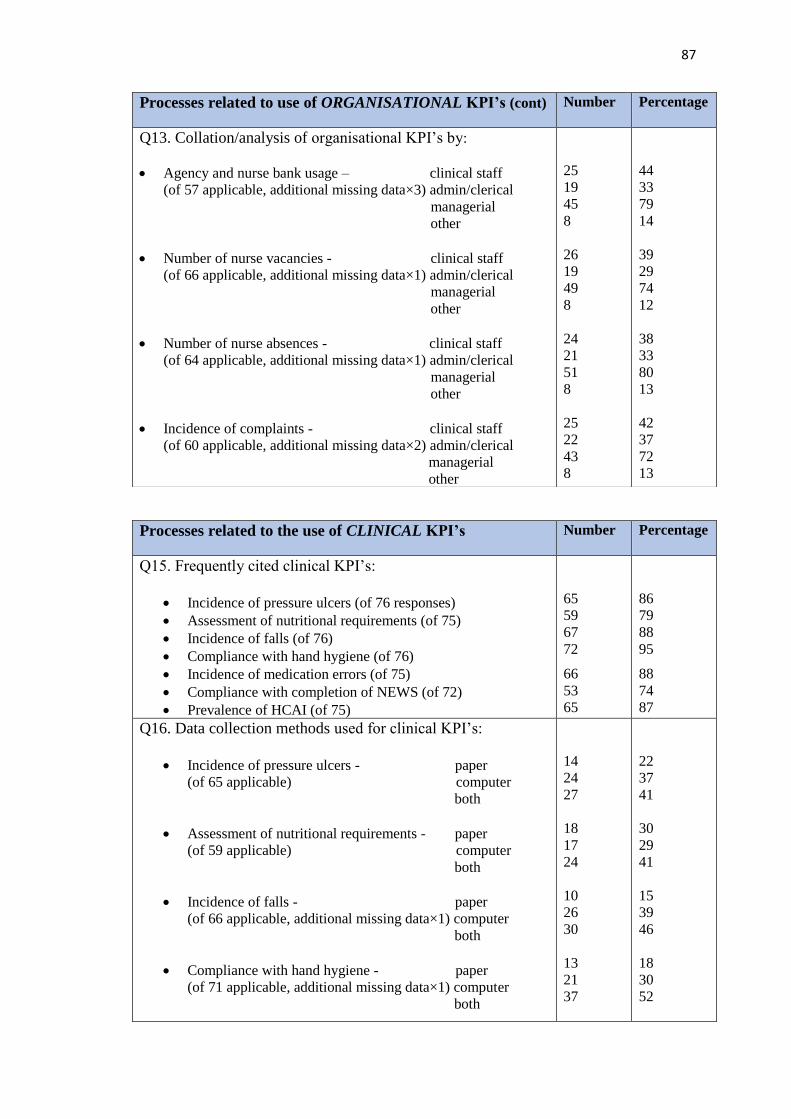
87
Processes related to the use of CLINICAL KPI’s Number Percentage
Q15. Frequently cited clinical KPI’s:
• Incidence of pressure ulcers (of 76 responses)
• Assessment of nutritional requirements (of 75)
• Incidence of falls (of 76)
• Compliance with hand hygiene (of 76)
• Incidence of medication errors (of 75)
• Compliance with completion of NEWS (of 72)
• Prevalence of HCAI (of 75)
65
59
67
72
66
53
65
86
79
88
95
88
74
87
Q16. Data collection methods used for clinical KPI’s:
• Incidence of pressure ulcers - paper
(of 65 applicable) computer
both
• Assessment of nutritional requirements - paper
(of 59 applicable) computer
both
• Incidence of falls - paper
(of 66 applicable, additional missing data×1) computer
both
• Compliance with hand hygiene - paper
(of 71 applicable, additional missing data×1) computer
both
14
24
27
18
17
24
10
26
30
13
21
37
22
37
41
30
29
41
15
39
46
18
30
52
Processes related to use of ORGANISATIONAL KPI’s (cont) Number Percentage
Q13. Collation/analysis of organisational KPI’s by:
• Agency and nurse bank usage – clinical staff
(of 57 applicable, additional missing data×3) admin/clerical
managerial
other
• Number of nurse vacancies - clinical staff
(of 66 applicable, additional missing data×1) admin/clerical
managerial
other
• Number of nurse absences - clinical staff
(of 64 applicable, additional missing data×1) admin/clerical
managerial
other
• Incidence of complaints - clinical staff
(of 60 applicable, additional missing data×2) admin/clerical
managerial
other
25
19
45
8
26
19
49
8
24
21
51
8
25
22
43
8
44
33
79
14
39
29
74
12
38
33
80
13
42
37
72
13
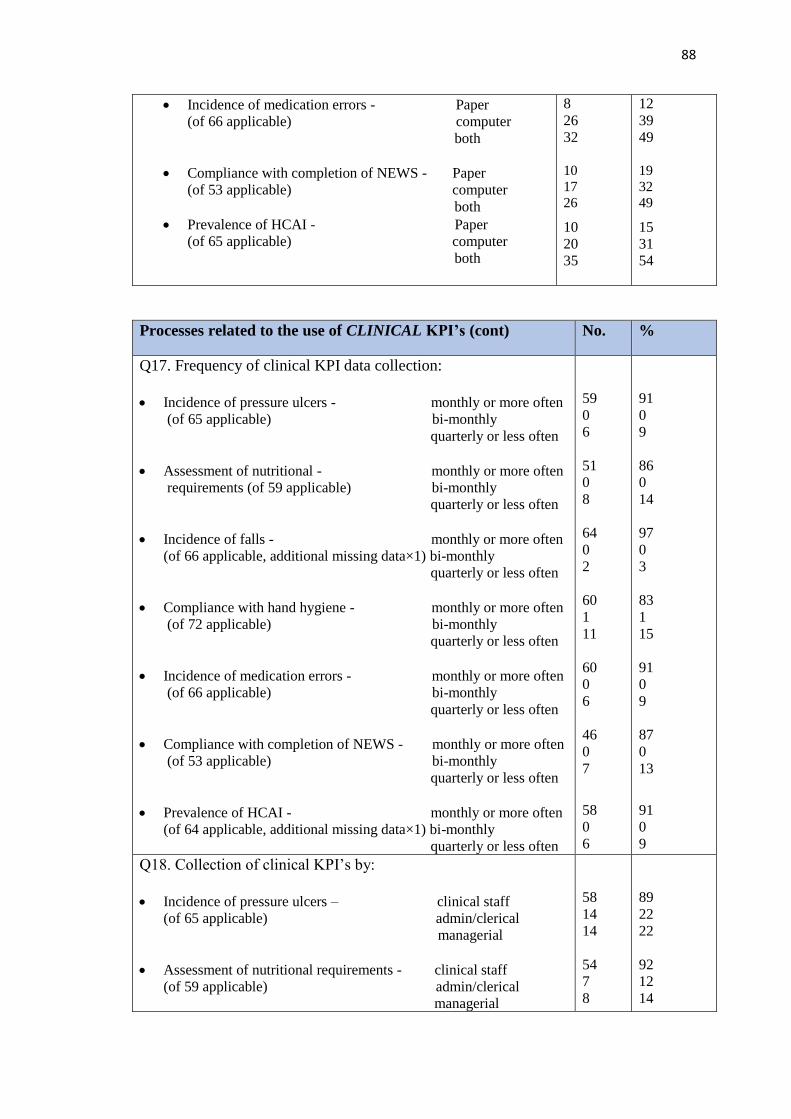
88
• Incidence of medication errors - Paper
(of 66 applicable) computer
both
• Compliance with completion of NEWS - Paper
(of 53 applicable) computer
both
• Prevalence of HCAI - Paper
(of 65 applicable) computer
both
8
26
32
10
17
26
10
20
35
12
39
49
19
32
49
15
31
54
Processes related to the use of CLINICAL KPI’s (cont) No. %
Q17. Frequency of clinical KPI data collection:
• Incidence of pressure ulcers - monthly or more often
(of 65 applicable) bi-monthly
quarterly or less often
• Assessment of nutritional - monthly or more often
requirements (of 59 applicable) bi-monthly
quarterly or less often
• Incidence of falls - monthly or more often
(of 66 applicable, additional missing data×1) bi-monthly
quarterly or less often
• Compliance with hand hygiene - monthly or more often
(of 72 applicable) bi-monthly
quarterly or less often
• Incidence of medication errors - monthly or more often
(of 66 applicable) bi-monthly
quarterly or less often
• Compliance with completion of NEWS - monthly or more often
(of 53 applicable) bi-monthly
quarterly or less often
• Prevalence of HCAI - monthly or more often
(of 64 applicable, additional missing data×1) bi-monthly
quarterly or less often
59
0
6
51
0
8
64
0
2
60
1
11
60
0
6
46
0
7
58
0
6
91
0
9
86
0
14
97
0
3
83
1
15
91
0
9
87
0
13
91
0
9
Q18. Collection of clinical KPI’s by:
• Incidence of pressure ulcers – clinical staff
(of 65 applicable) admin/clerical
managerial
• Assessment of nutritional requirements - clinical staff
(of 59 applicable) admin/clerical
managerial
58
14
14
54
7
8
89
22
22
92
12
14
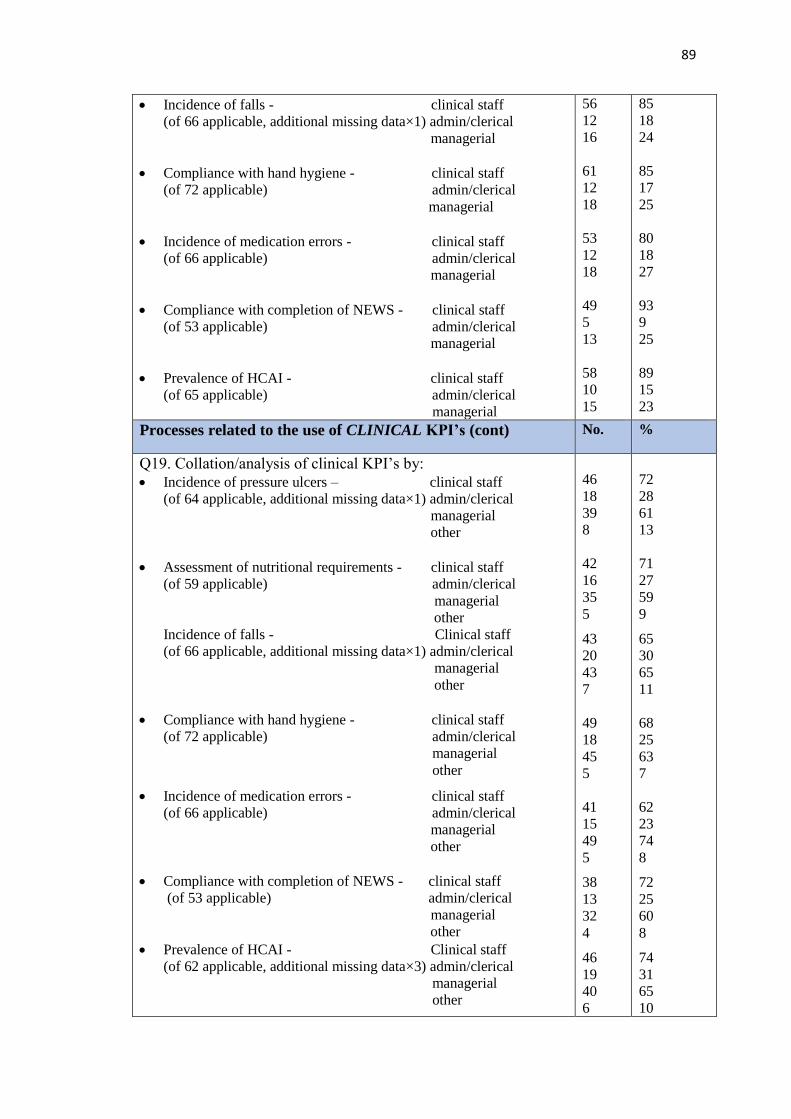
89
• Incidence of falls - clinical staff
(of 66 applicable, additional missing data×1) admin/clerical
managerial
• Compliance with hand hygiene - clinical staff
(of 72 applicable) admin/clerical
managerial
• Incidence of medication errors - clinical staff
(of 66 applicable) admin/clerical
managerial
• Compliance with completion of NEWS - clinical staff
(of 53 applicable) admin/clerical
managerial
• Prevalence of HCAI - clinical staff
(of 65 applicable) admin/clerical
managerial
56
12
16
61
12
18
53
12
18
49
5
13
58
10
15
85
18
24
85
17
25
80
18
27
93
9
25
89
15
23
Processes related to the use of CLINICAL KPI’s (cont) No. %
Q19. Collation/analysis of clinical KPI’s by:
• Incidence of pressure ulcers – clinical staff
(of 64 applicable, additional missing data×1) admin/clerical
managerial
other
• Assessment of nutritional requirements - clinical staff
(of 59 applicable) admin/clerical
managerial
other
Incidence of falls - Clinical staff
(of 66 applicable, additional missing data×1) admin/clerical
managerial
other
• Compliance with hand hygiene - clinical staff
(of 72 applicable) admin/clerical
managerial
other
• Incidence of medication errors - clinical staff
(of 66 applicable) admin/clerical
managerial
other
• Compliance with completion of NEWS - clinical staff
(of 53 applicable) admin/clerical
managerial
other
• Prevalence of HCAI - Clinical staff
(of 62 applicable, additional missing data×3) admin/clerical
managerial
other
46
18
39
8
42
16
35
5
43
20
43
7
49
18
45
5
41
15
49
5
38
13
32
4
46
19
40
6
72
28
61
13
71
27
59
9
65
30
65
11
68
25
63
7
62
23
74
8
72
25
60
8
74
31
65
10

90
Patient experience KPI’s Number Percentage
Q21. Organisations that collect patient experience KPI’s
(of 77 applicable):
60
78
Field specific KPI’s Number Percentage
Q23. Organisations that use KPI’s for specific practice:
• Within mental health (of 56 responses)
• Within learning disability (of 59)
• Within children’s (of 63)
• Within midwifery (of 61)
• Within community (of 58)
• Within other specific areas (of 58)
21
25
40
45
30
37
38
42
64
74
52
64
5.2 ORGANISATIONAL PROFILES
The profiles of the respondents are presented in Table 5.2. Organisational response rates
per country ranged from 100% in Northern Ireland to 10% in Ireland. Fifty-six per cent
(n=43) of respondents served populations of less than 1000, while 33% (n=25) served
populations of over 100,000. Organisations providing solely acute services made up 21%
(n=15) of responses and solely community services - 26% (n=19) of responses, while just
over half provided both (53%, n=39). The majority of organisations provided adult
services (91%, n=70). Seventy-four per cent (n=57) and 78% (n=60) respectively
provided maternity and children’s services. Sixty-two per cent (n=48) of respondents
cited the provision of community services while intellectual disability (44%, n=34) and
mental health services (40%, n=31) were provided by less than half of the respondents.
Systems used in KPI processes Number Percentage
Q32. Systems used to present KPI data (of 65 applicable):
• Manual systems
• Balanced Score Card
• Standard database
• Custom designed IT system
• Other
29
34
37
42
14
45
52
57
65
22
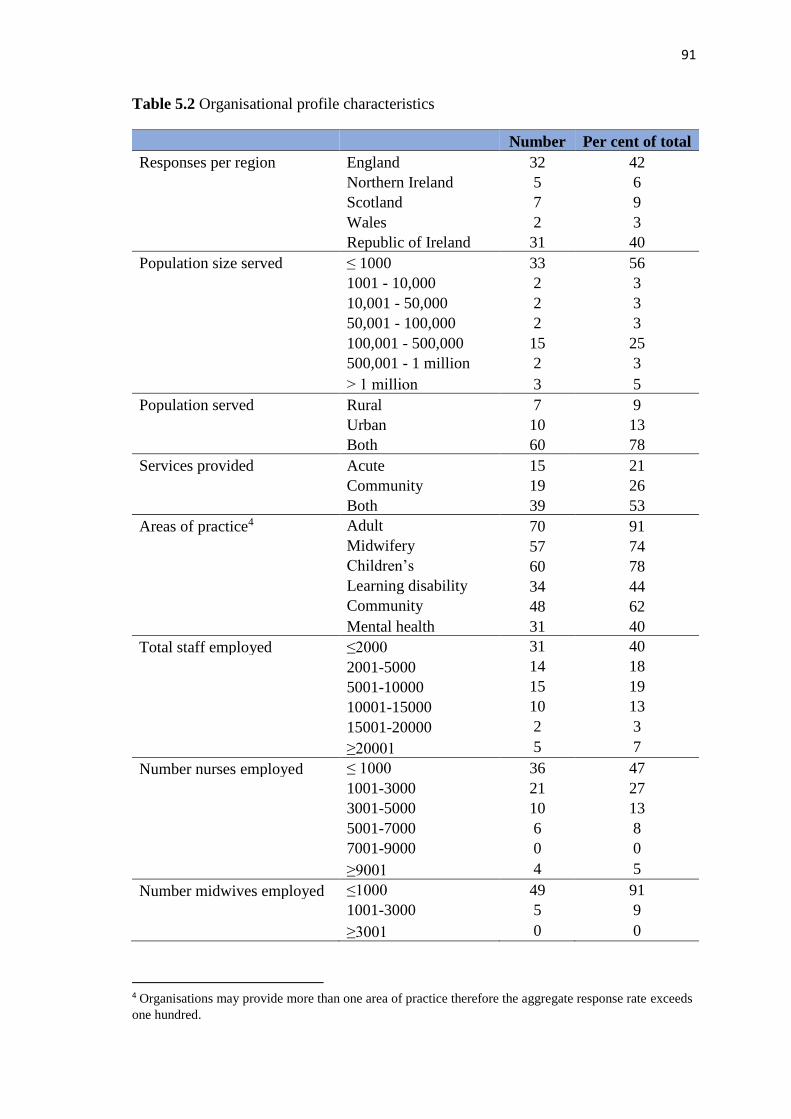
91
Table 5.2 Organisational profile characteristics
Number Per cent of total
Responses per region England 32 42
Northern Ireland 5 6
Scotland 7 9
Wales 2 3
Republic of Ireland 31 40
Population size served ≤ 1000 33 56
1001 - 10,000 2 3
10,001 - 50,000 2 3
50,001 - 100,000 2 3
100,001 - 500,000 15 25
500,001 - 1 million 2 3
˃ 1 million 3 5
Population served Rural 7 9
Urban 10 13
Both 60 78
Services provided Acute 15 21
Community 19 26
Both 39 53
Areas of practice4 Adult 70 91
Midwifery 57 74
Children’s 60 78
Learning disability 34 44
Community 48 62
Mental health 31 40
Total staff employed ≤2000 31 40
2001-5000 14 18
5001-10000 15 19
10001-15000 10 13
15001-20000 2 3
≥20001 5 7
Number nurses employed ≤ 1000 36 47
1001-3000 21 27
3001-5000 10 13
5001-7000 6 8
7001-9000 0 0
≥9001 4 5
Number midwives employed ≤1000 49 91
1001-3000 5 9
≥3001 0 0
4 Organisations may provide more than one area of practice therefore the aggregate response rate exceeds
one hundred.
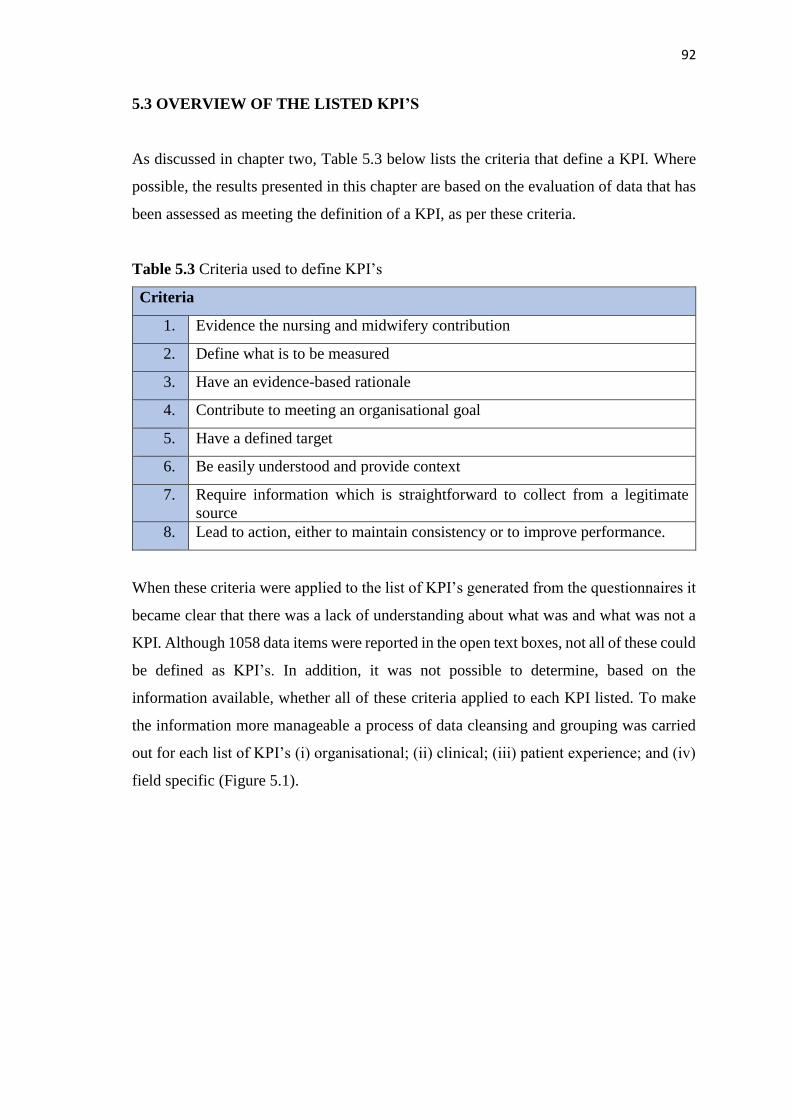
92
5.3 OVERVIEW OF THE LISTED KPI’S
As discussed in chapter two, Table 5.3 below lists the criteria that define a KPI. Where
possible, the results presented in this chapter are based on the evaluation of data that has
been assessed as meeting the definition of a KPI, as per these criteria.
Table 5.3 Criteria used to define KPI’s
Criteria
1. Evidence the nursing and midwifery contribution
2. Define what is to be measured
3. Have an evidence-based rationale
4. Contribute to meeting an organisational goal
5. Have a defined target
6. Be easily understood and provide context
7. Require information which is straightforward to collect from a legitimate
source
8. Lead to action, either to maintain consistency or to improve performance.
When these criteria were applied to the list of KPI’s generated from the questionnaires it
became clear that there was a lack of understanding about what was and what was not a
KPI. Although 1058 data items were reported in the open text boxes, not all of these could
be defined as KPI’s. In addition, it was not possible to determine, based on the
information available, whether all of these criteria applied to each KPI listed. To make
the information more manageable a process of data cleansing and grouping was carried
out for each list of KPI’s (i) organisational; (ii) clinical; (iii) patient experience; and (iv)
field specific (Figure 5.1).
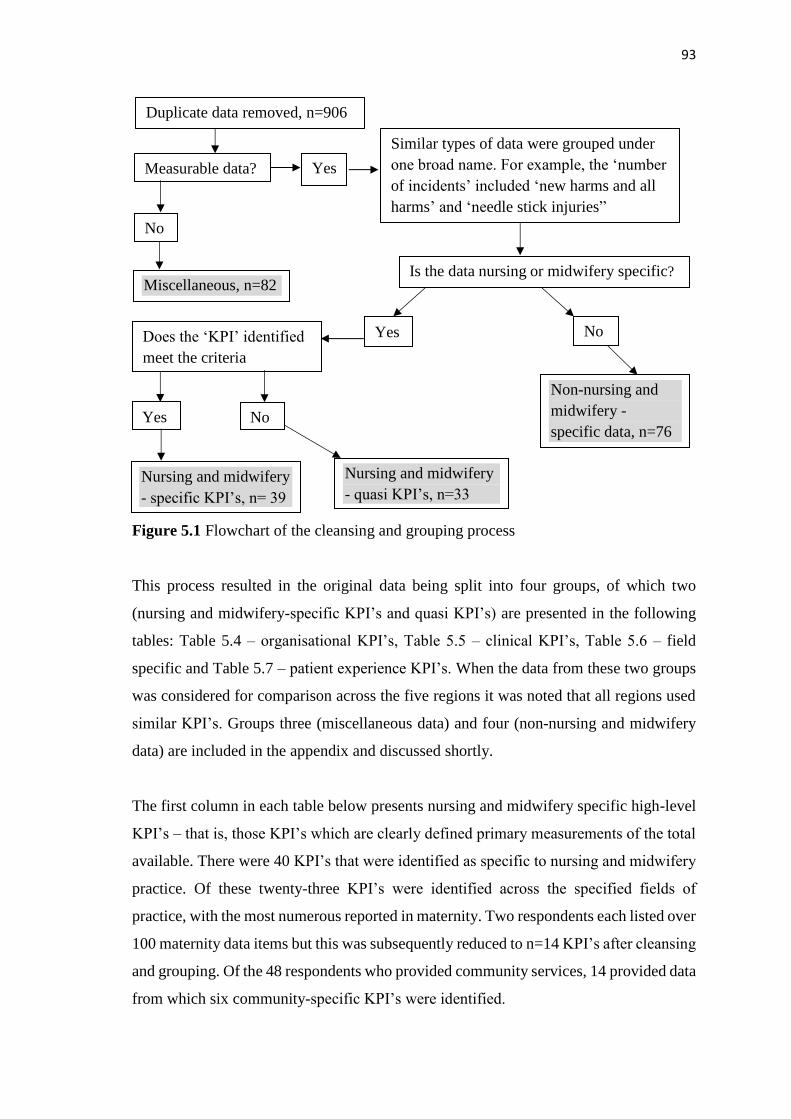
93
Figure 5.1 Flowchart of the cleansing and grouping process
This process resulted in the original data being split into four groups, of which two
(nursing and midwifery-specific KPI’s and quasi KPI’s) are presented in the following
tables: Table 5.4 – organisational KPI’s, Table 5.5 – clinical KPI’s, Table 5.6 – field
specific and Table 5.7 – patient experience KPI’s. When the data from these two groups
was considered for comparison across the five regions it was noted that all regions used
similar KPI’s. Groups three (miscellaneous data) and four (non-nursing and midwifery
data) are included in the appendix and discussed shortly.
The first column in each table below presents nursing and midwifery specific high-level
KPI’s – that is, those KPI’s which are clearly defined primary measurements of the total
available. There were 40 KPI’s that were identified as specific to nursing and midwifery
practice. Of these twenty-three KPI’s were identified across the specified fields of
practice, with the most numerous reported in maternity. Two respondents each listed over
100 maternity data items but this was subsequently reduced to n=14 KPI’s after cleansing
and grouping. Of the 48 respondents who provided community services, 14 provided data
from which six community-specific KPI’s were identified.
Measurable data?
Similar types of data were grouped under
one broad name. For example, the ‘number
of incidents’ included ‘new harms and all
harms’ and ‘needle stick injuries”
Nursing and midwifery
- specific KPI’s, n= 39
Nursing and midwifery
- quasi KPI’s, n=33
Non-nursing and
midwifery -
specific data, n=76
Miscellaneous, n=82
No
Yes
Is the data nursing or midwifery specific?
Yes No Does the ‘KPI’ identified
meet the criteria
Yes No
Duplicate data removed, n=906

94
The second column presents nursing and midwifery specific quasi-KPI’s – ‘quasi’ being
defined as something which is almost but not completely the thing described (McIntosh
2011). Therefore, in this context they are data items which almost, but do not completely
resemble, the study’s specified criteria. These data items, although specific to nursing
and midwifery, were not clearly identifiable as KPI’s due to lack of a defining
measurement or that were not high-level.
Table 5.4: Organisational nursing and midwifery specific and quasi-KPI’s
Nursing and midwifery specific KPI’s Nursing and midwifery quasi
KPI’s
The number of compliments Preceptorship of nursing students
Actual daily staffing percentage achieved against
the planned level of staffing
Special leave. Maternity leave.
Study leave
Number of nursing absences Agency and nurse bank usage
Incidence of complaints specific related to nursing New graduate retention
Validation of RN/RM professional registration
with NMC (Nursing and Midwifery Council)
Nurse/midwife supervision ratios
Number of incidents
The percentage of staff in post up to date with
their mandatory training, by course name
Number of nursing vacancies
Staff turnover rates
The percentage of employees who completed their
pre- Personal Appraisal Development Review and
PADR in the month due
Table 5.5 Clinical nursing and midwifery specific and quasi KPI’s
Nursing and midwifery specific KPI’s Nursing and midwifery quasi KPI’s
Incidence of medication errors Compliance with care bundles
Prevalence of infections/HCAI (any of the
following: urinary catheters, ventilator
pneumonia, central lines, MRSA, C Diff)
Right Patient, Right Blood Competency
Assessment
Incidence of falls Compliance with documentation standards
Number of nurse prescribers who prescribe Compliance with completion of NEWS
Incidence of pressure ulcers Nursing assessment compliance
Assessment of nutritional requirements
Continence screening
Blood transfusion errors
NMC Referrals
Pain scores
Compliance with hand hygiene

95
Table 5.6 Nursing and midwifery field specific and quasi KPI’s
Nursing and midwifery specific KPI’s Nursing and midwifery quasi
KPI’s
Mental health KPI’s Mental health KPI’s
Number of service users and staff who are
participating in WRAP (recovery focussed
initiative)
Mental health advocacy
Number of special observations Therapeutic interventions 1:1
Children's KPI’s Learning/intellectual disability
Workforce establishment holding an accredited
post registration qualification in specialist
neonatal care
Health needs assessment on an
annual basis
Midwifery KPI’s Compliance with our policy around
use of passport
Smoking rate at time of birth Children's KPI’s
Number of bookings for antenatal care Children’s Triage Score
Midwife to births ratio Prevention of over infusion of
intravenous fluids in neonates
PPH rate (post-partum haemorrhage) Midwifery KPI’s
Rate of booking BMI -various classifications Newborn hearing screening
Number and type of perineal tears Health and Social Assessment
Percentage of VTE forms completed on admission
and after 3 days
Electronic fetal monitoring
Number of mothers seen within 72 (or 48hrs)
following discharge from hospital
Normal Births without intervention
(instrumental)
Percentage of women receiving 1:1 care in labour Neonatal bloodspot screening
Percentage of times co-ordinator is supernumerary Community KPI’s
80% of women get access to antenatal checks
before week 12
Child immunisations
Suturing commenced within 1 hour of delivery Other KPI’s
Number of mothers exclusively breast feeding on
discharge from hospital
Compliance with end of life care
plan
Number of mothers not exclusively breast feeding
on discharge from hospital
Community KPI’s
Breast feeding rates at three months
Breast feeding rates at nine months
Percentage of early years health reviews carried
out by health visitors within the timescale
Number of children reaching 10 months who have
had a developmental assessment
Number of mothers not exclusively breast feeding
at 3 months
Neonatal blood spot screening results received by
12 days post sample taken

96
Table 5.7 Patient experience specific and quasi-KPI’s
Nursing and midwifery
specific KPI’s
Nursing and midwifery quasi KPI’s
Call bell response time Were you treated with care and compassion?
Patient satisfaction with: emotional support; comfort;
nutrition and eating experience; communication;
information provided; hand hygiene; respect; pain
control; attitude
Percentage of person-centred plans
The third group included the miscellaneous data (Appendix 15) and illustrates the wide
variety of data reported in the open text boxes assigned for the listing of KPI’s. These
were collectively identified as ‘miscellaneous’ and classified under six broad headings
comprising:
• information pertaining to the point of origin for KPI’s, including many agencies
external to the organisations
• data collection methods
• data reporting methods
• data suggestive of care planning tools
• general statements of opinion
• data which was unclassifiable to any of these.
Comments were also included in seven of the open text boxes requesting the listing of
KPI’s. These related to the number of KPI’s which DoNs were required to collect data
on. For example, “a significant number over a range of areas”, “lots more” and “too many
and even more coming”.
The fourth group comprised the non-nursing and midwifery data items. As it is not in the
remit of this study to determine whether these non-nursing data items are KPI’s or not,
they are presented in their totality in Appendix 16. Appendix 17 provides a sample
illustration of the grouping process.
5.4 OPERATIONAL PROCESSES
To increase understanding of the processes involved in KPI use, the data obtained from
the multiple-choice questions and the open text boxes are presented following the order
laid out in the KPI performance process model (Artley and Stroh 2001). Findings from
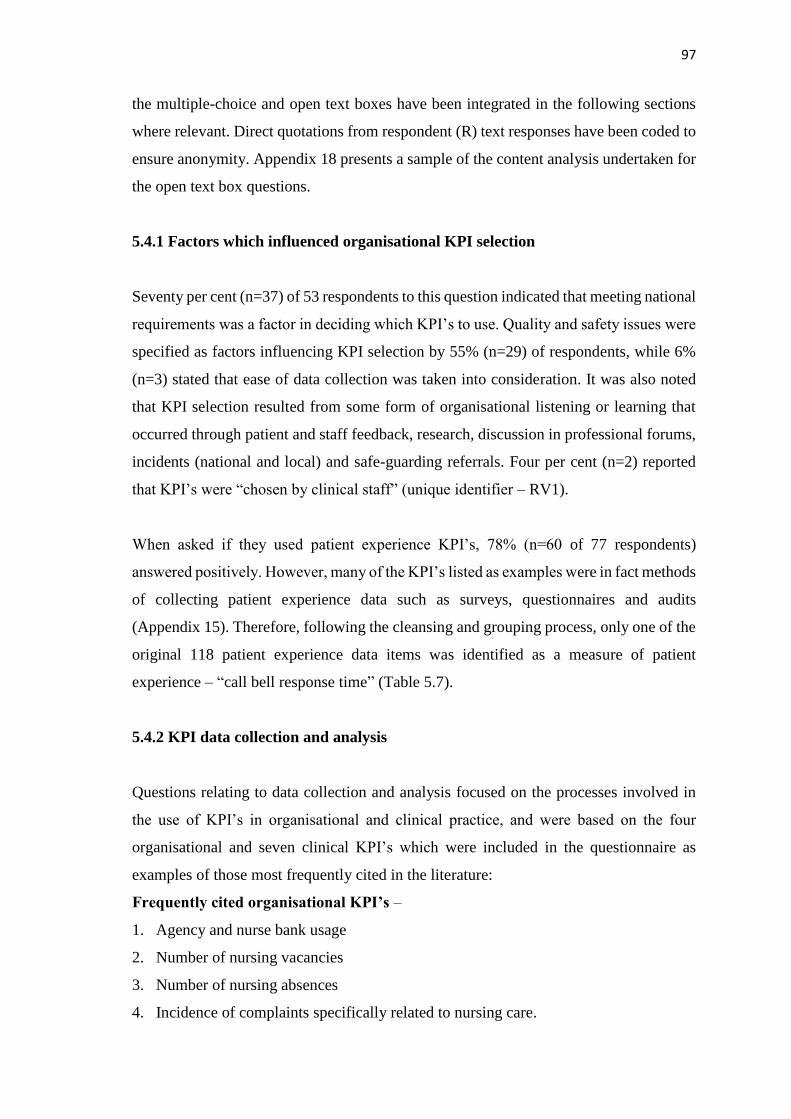
97
the multiple-choice and open text boxes have been integrated in the following sections
where relevant. Direct quotations from respondent (R) text responses have been coded to
ensure anonymity. Appendix 18 presents a sample of the content analysis undertaken for
the open text box questions.
5.4.1 Factors which influenced organisational KPI selection
Seventy per cent (n=37) of 53 respondents to this question indicated that meeting national
requirements was a factor in deciding which KPI’s to use. Quality and safety issues were
specified as factors influencing KPI selection by 55% (n=29) of respondents, while 6%
(n=3) stated that ease of data collection was taken into consideration. It was also noted
that KPI selection resulted from some form of organisational listening or learning that
occurred through patient and staff feedback, research, discussion in professional forums,
incidents (national and local) and safe-guarding referrals. Four per cent (n=2) reported
that KPI’s were “chosen by clinical staff” (unique identifier – RV1).
When asked if they used patient experience KPI’s, 78% (n=60 of 77 respondents)
answered positively. However, many of the KPI’s listed as examples were in fact methods
of collecting patient experience data such as surveys, questionnaires and audits
(Appendix 15). Therefore, following the cleansing and grouping process, only one of the
original 118 patient experience data items was identified as a measure of patient
experience – “call bell response time” (Table 5.7).
5.4.2 KPI data collection and analysis
Questions relating to data collection and analysis focused on the processes involved in
the use of KPI’s in organisational and clinical practice, and were based on the four
organisational and seven clinical KPI’s which were included in the questionnaire as
examples of those most frequently cited in the literature:
Frequently cited organisational KPI’s –
1. Agency and nurse bank usage
2. Number of nursing vacancies
3. Number of nursing absences
4. Incidence of complaints specifically related to nursing care.

98
Frequently cited clinical KPI’s –
1. Incidence of pressure ulcers
2. Assessment of nutritional requirements
3. Incidence of falls
4. Compliance with hand hygiene
5. Incidence of medication errors
6. Compliance with completion of national early warning scores (NEWS)
7. Prevalence of infections/HCAI (any of the following: urinary catheters, ventilator
pneumonia, central lines, MRSA, C Difficile)
Organisational KPI’s
On average, 84% (n=65) of the 77 organisations collected the four organisational KPI’s
which were included in this multiple-choice question (Figure 5.2). A majority (92%,
n=71) collected data on the cited organisational KPI’s on a monthly (or more frequent)
basis. Data collection was mainly carried out by managers, except for data on
agency/bank usage which was more often collected by administration/clerical staff
(Figure 5.3). Nine per cent (n=7) stated that all three groups of staff - clinical, clerical
and managerial - would collect this organisational data. When asked who analysed the
organisational data, 76% (n=59) of respondents identified managers as being responsible,
while clerical staff were least likely to analyse the data. Thirteen per cent (n=10) of these
organisations employed an ‘other’ to analyse KPI data.
Figure 5.2 Percentage of organisations using the frequently cited organisational KPI’s

99
Figure 5.3 Staff groups collecting organisational KPI’s
Clinical KPI’s
On average, 84% (n=65) of the 77 organisations used the seven clinical KPI’s included
in the questionnaire. Figure 5.4 demonstrates that the clinical KPI’s used by respondent
organisations are representative of those most frequently cited in the literature. Collection
of data on National Early Warning Scores (NEWS) was relatively less common (74%,
n=57) which is possibly reflective of the low use of this KPI in the community setting.
Of the 14 responses from community-only organisations, two collected data on NEWS.
Compared to organisational KPI’s where the collection of data is undertaken mainly by
managers (Figure 5.3), clinical KPI data is primarily collected by clinical staff (avg 88%)
(Figure 5.5), and mostly completed monthly or more often (avg 89%). Also, in contrast
to organisational KPI’s, clinical nurses and midwives (69%, n=53) as well as managers
(64%, n=49) were the main analysts of clinical KPI data.
Figure 5.4 Percentage of organisations using the frequently cited clinical KPI’s
Cli
nic
al s
taff
Ad
min
/cle
rica
l
Man
ager
ial
Cli
nic
al s
taff
Ad
min
/cle
rica
l
Man
ager
ial
Cli
nic
al s
taff
Ad
min
/cle
rica
l
Man
ager
ial
Cli
nic
al s
taff
Ad
min
/cle
rica
l
Man
ager
ial
Agency and nurse
bank usage
Number of nurse
vacancies
Number of nurse
absences
Incidence of
complaints
43%
63%48%
36%50%
62%
34%
58% 64%
42%53%
65%
Sta
ff g
rou
p
Organisational KPI's

100
Figure 5.5 Staff groups who collect data on clinical KPI’s
5.4.3 Systems used for the management of KPI data
Computer systems were the most popular method of data collection reported by the 77
respondents for organisational KPI’s (Figure 5.6). However, the collection of clinical KPI
data was most commonly reported to be through a combination of both paper and
computer-based methods (Figure 5.7), with solely paper-based systems the least popular.
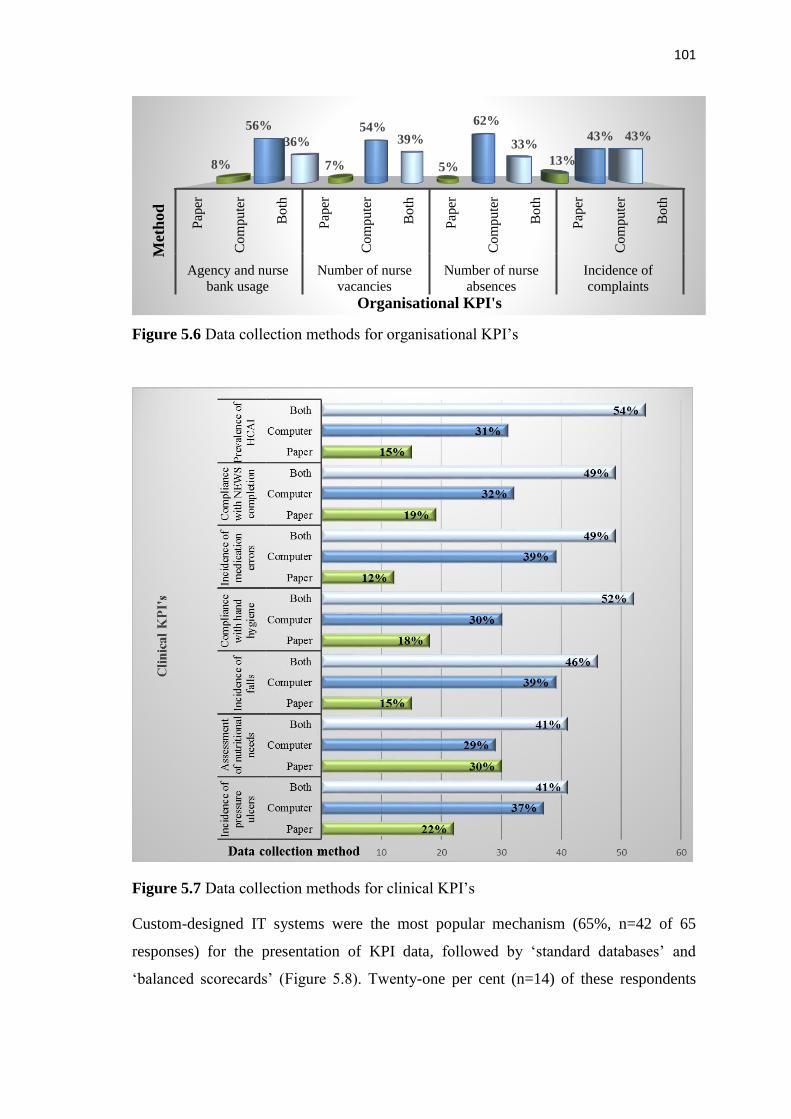
101
Figure 5.6 Data collection methods for organisational KPI’s
Figure 5.7 Data collection methods for clinical KPI’s
Custom-designed IT systems were the most popular mechanism (65%, n=42 of 65
responses) for the presentation of KPI data, followed by ‘standard databases’ and
‘balanced scorecards’ (Figure 5.8). Twenty-one per cent (n=14) of these respondents
Pap
er
Co
mp
ute
r
Bo
th
Pap
er
Co
mp
ute
r
Bo
th
Pap
er
Co
mp
ute
r
Bo
th
Pap
er
Co
mp
ute
r
Bo
th
Agency and nurse
bank usage
Number of nurse
vacancies
Number of nurse
absences
Incidence of
complaints
8%
56%
36%
7%
54%39%
5%
62%
33%
13%
43% 43%
Met
hod
Organisational KPI's
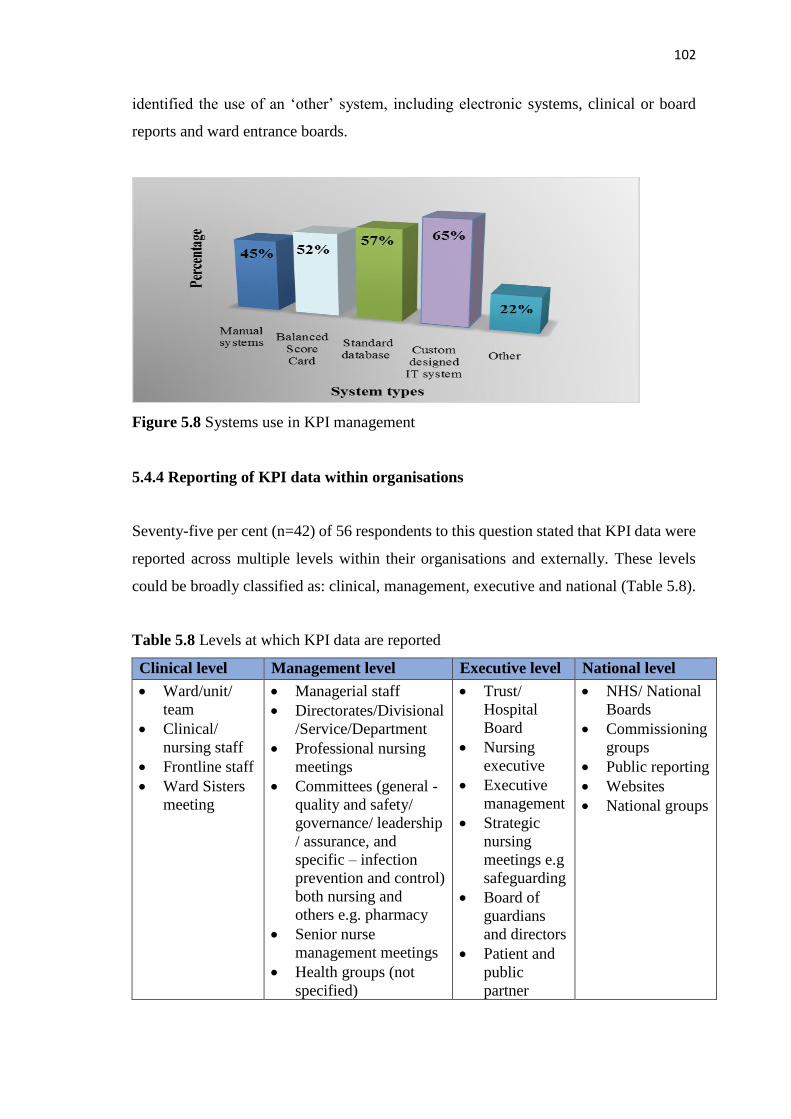
102
identified the use of an ‘other’ system, including electronic systems, clinical or board
reports and ward entrance boards.
Figure 5.8 Systems use in KPI management
5.4.4 Reporting of KPI data within organisations
Seventy-five per cent (n=42) of 56 respondents to this question stated that KPI data were
reported across multiple levels within their organisations and externally. These levels
could be broadly classified as: clinical, management, executive and national (Table 5.8).
Table 5.8 Levels at which KPI data are reported
Clinical level Management level Executive level National level
• Ward/unit/
team
• Clinical/
nursing staff
• Frontline staff
• Ward Sisters
meeting
• Managerial staff
• Directorates/Divisional
/Service/Department
• Professional nursing
meetings
• Committees (general -
quality and safety/
governance/ leadership
/ assurance, and
specific – infection
prevention and control)
both nursing and
others e.g. pharmacy
• Senior nurse
management meetings
• Health groups (not
specified)
• Trust/
Hospital
Board
• Nursing
executive
• Executive
management
• Strategic
nursing
meetings e.g
safeguarding
• Board of
guardians
and directors
• Patient and
public
partner
• NHS/ National
Boards
• Commissioning
groups
• Public reporting
• Websites
• National groups

103
Sixty-one per cent (n=34) of respondents, identified reporting structures where clinical
nurses and midwives had the opportunity to discuss KPI results. Examples included
governance meetings, professional forums, town hall meetings and practice-specific
committees, such as those held by infection prevention and control teams. In contrast
three responses indicated a top down approach to the reporting of KPI data, where
information was “reported to front line staff” [unique identifier - RU16].
5.4.5 Involvement of clinical nurses and midwives in KPI use
Data collection was by far the most frequent way in which clinical nurses and midwives
were involved in KPI use, with 50% of respondents (n=28 of 56) reporting this method
(Figure 5.9). Twenty-one per cent (n=12) identified clinical nurses and midwives as being
involved in acting on KPI data and only 9% (n=5) were stated to be involved in driving
improvement.
Figure 5.9 KPI processes in which clinical nurses and midwives are involved
Where respondents referred to a KPI process, the involvement of nurses throughout this
process was reported by only 4% (n=2): “Completely, from developing, implementing,
owning and driving the improvements” [RX1]; “In all aspects – collection and review for
improvement” [RV3]. In comparison, 5% (n=3) reported that nurses were not involved
0
10
20
30
40
50
50
29 29 2721
11 95
2Per
cen
tage
KPI processes
104
in working with KPI at all. Other respondents indicated that they were indirectly involved
as clinical staff in KPI use:
“The clinical nurses and midwives receive a Ward Quality Report in electronic
format. The staff can access this and compare themselves with other wards”
[RY5].
5.4.6 Mechanisms to support and encourage action on KPI data
The majority of responses (94%, n=53 of 56) identified various communication strategies
as mechanisms to encourage action on KPI data. These included display boards, action
plans and organisational groups such as nurse practice committees, divisional quality
meetings and a range of specialist teams. In contrast, one respondent identified only
“admin and IT resources” as support mechanisms and described these as “inadequate”
[RU8], while another simply stated “nil” [RU23]. When the communication strategies
were analysed in more depth, some form of practice monitoring was reported by 68%
(n=38) of respondents. This took the form of reviews, audits, tracking change and action
plans.
Shared learning and comparing performance were reported as ways in which to
encourage action on KPI implementation, with statements such as, “visible comparative
performance between teams/wards is used to drive improvement in practice” [RY3] and
“Directors of Nursing can use (KPI’s) to benchmark across similar specialities and
hospitals” [RU18]. In addition, 29% (n=16 of 56) of respondents identified some form of
challenge or being held to account as a support mechanism. These were captured in
responses such as “performance management” [RY10, RY4, RX4], “‘Confirm and
Challenge’ meetings” [RY2], and “presentation of action plans for non-compliance”
[RY8].
Twenty per cent (n=11 of 56) stated that practical support measures were available such
as additional funding, reconfiguring of services, specialist services, quality improvement
staff and practice development staff. A further 11% (n=6) identified some form of staff
training to help them understand KPI’s. In addition to formal teaching such as “quality
assurance programmes” [RY31] and “further education” [RU20], this training included
supervision, mentorship and individual guidance. Support mechanisms were identified at
three levels:
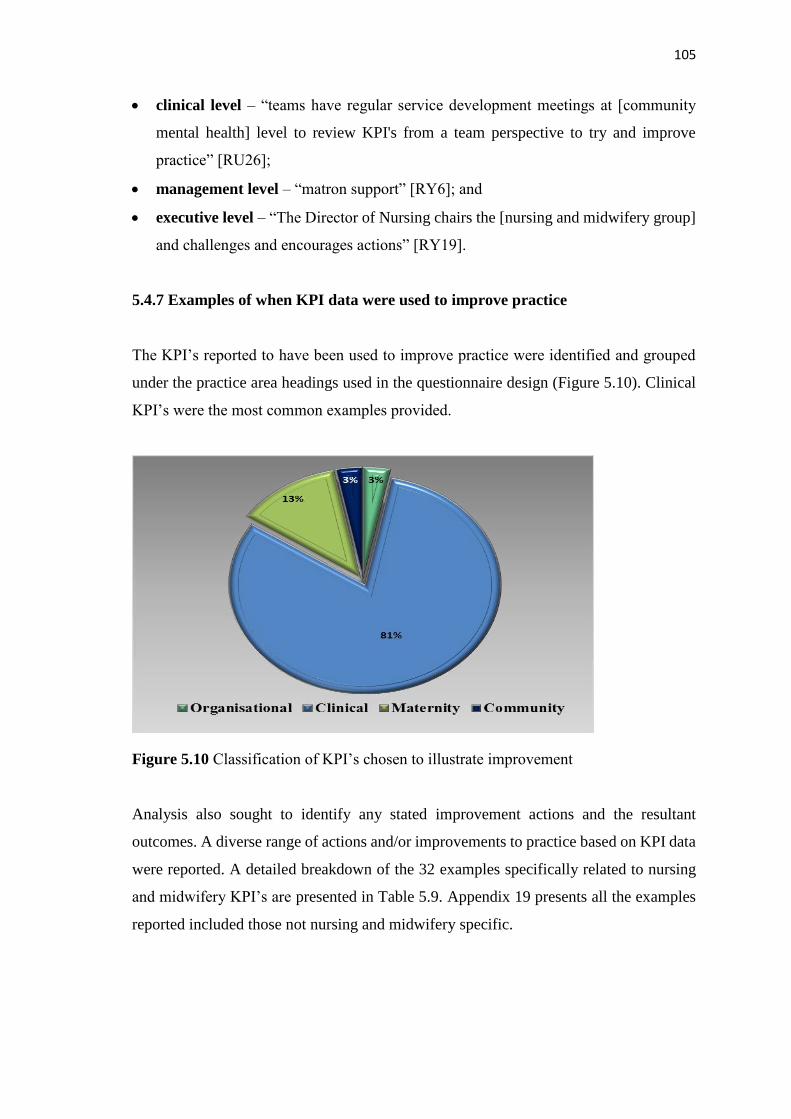
105
• clinical level – “teams have regular service development meetings at [community
mental health] level to review KPI's from a team perspective to try and improve
practice” [RU26];
• management level – “matron support” [RY6]; and
• executive level – “The Director of Nursing chairs the [nursing and midwifery group]
and challenges and encourages actions” [RY19].
5.4.7 Examples of when KPI data were used to improve practice
The KPI’s reported to have been used to improve practice were identified and grouped
under the practice area headings used in the questionnaire design (Figure 5.10). Clinical
KPI’s were the most common examples provided.
Figure 5.10 Classification of KPI’s chosen to illustrate improvement
Analysis also sought to identify any stated improvement actions and the resultant
outcomes. A diverse range of actions and/or improvements to practice based on KPI data
were reported. A detailed breakdown of the 32 examples specifically related to nursing
and midwifery KPI’s are presented in Table 5.9. Appendix 19 presents all the examples
reported included those not nursing and midwifery specific.

106
Table 5.9 Nursing and midwifery specific practice improvements resulting from the use
of KPI data
Aspect of practice
measured and
number of examples
Action taken and/or improvement achieved
Number of
infections
n=5
Time taken to isolate
patient
n=1
• Reduction in bloodstream MRSA
• MRSA reduced through use of the Saving Lives audits
• Increase in infections triggers use of root cause analysis
(RCA)
• Training and education. Extra resources. Equipment.
• RCA used to improve dressings and care of peripheral and
central lines
• Reduction in time to isolate – decreased delays
Number of hospital-
acquired pressure
ulcers
n=10
• Informed use of risk assessments in reporting and
management
• Implementation of new reporting system and staff training
• Implementation of a skin bundle
• Implementation of pressure ulcer collaborative
• Root cause analysis resulted in Trust wide action plan
• Implementation of specific campaign
• Escalation process devised
• Development of tissue viability team and implementation
of ‘300 days without pressure ulcers’ initiative
Number of
prescribed
medications not
administered
n=2
• Strengthened training in relation to diabetes
• Omitted medications-an action plan/learning programme
was put in place leading to a reduction in "blanks" doses
Delay time in
recording
observations
n=1
• Implementation of RCA reduced delay in recording of
cardiovascular observations
Number of falls
n=6 • Prevention – significant improvement
• Reduction due to use of Improvement Methodology
• Reduction following introduction of improvement plan
and review of compliance
• Focused initiatives in identified areas of need
• Escalation process devised
• Strengthened compliance with assessment and
interventions
Compliance with
hand hygiene
n=1
• Multi-disciplinary taskforce established
Number of delayed
notifications of post-
natal discharges
n=2
• New system of e-reporting of discharge notifications
• Late notification of birth – improvement plan between
hospital and community led to reduced incidents and
targets being met

107
Table 5.9 Continued
Aspect of practice
measured and
number of examples
Action taken and/or improvement achieved
Breastfeeding rates
n=1 • Appointment of lactation consultant
Number of pregnant
women taking folic
acid supplements
n=1
• Identified reduction led to appointment of a clinical
midwife specialist
Completion of child
health development
checks
n=1
• Established as a key priority with additional training and
focus on meeting national Standards
Number of
temporary staff
employed to support
1:1 patient care
n=1
• Analysis and costing led to creation of a dedicated team of
nursing assistants. This has improved care and cost
efficiency.
Further analysis involved reviewing the examples given in Table 5.9 in more depth to
identify not only what had been done but also in what way the improvements or actions,
described as resulting from KPI data, had been achieved. Seventy-seven per cent (n=37
of 48 respondents) identified ways in which outcomes had been achieved. These could
be categorised under the headings of:
• Education (including awareness days, storytelling, formal training, presentations
and briefings, campaigns, development of guidance)
• Change of practice (including change in care delivery, implementation of
escalation processes/ standard operating procedures/ improvement plans/ audits)
• Reviews of practice (including root cause analysis and incidents) and policies.
• Promotion of team working (at all levels of nursing and midwifery and across
services, with other members of the multi-disciplinary team, through development
of local champions)
• Extra resources (development of new teams/services, provision of equipment, IT
investment).
5.4.8 KPI’s most valuable for determining the quality of care
Eighty-five per cent (n=39, of 46 respondents) identified at least one KPI which they
believed was valuable to determining care. However, 22% (n=10) highlighted that they
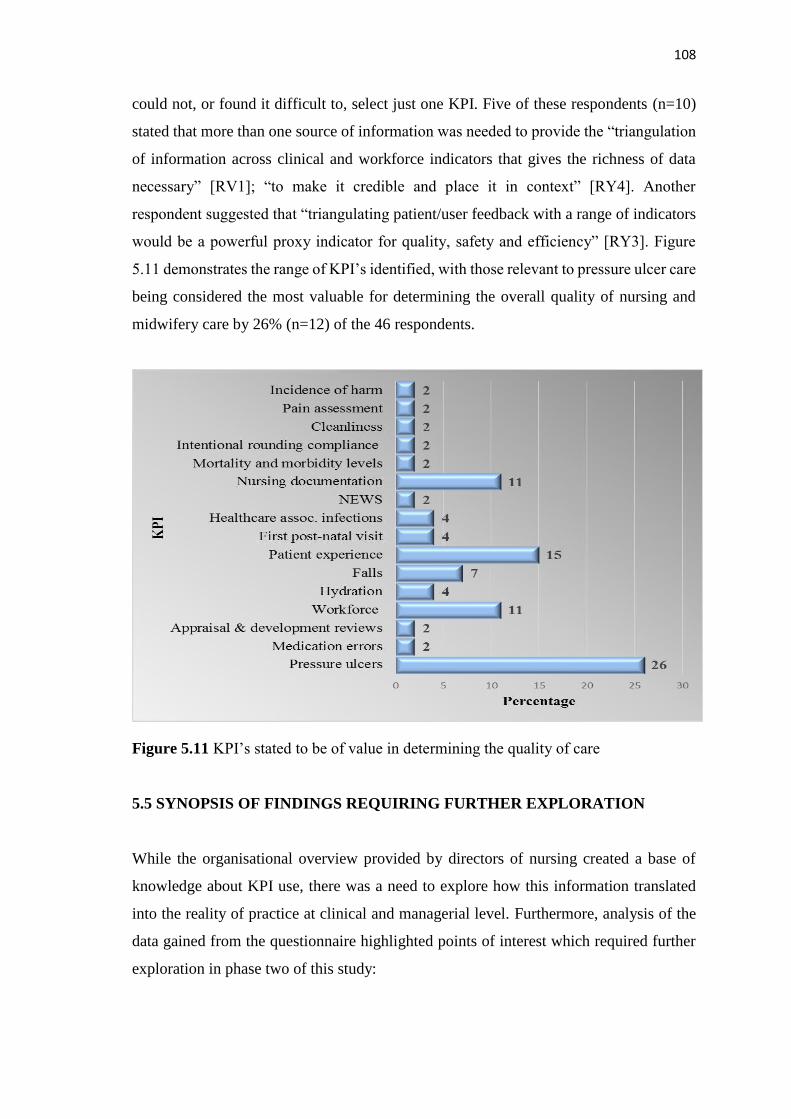
108
could not, or found it difficult to, select just one KPI. Five of these respondents (n=10)
stated that more than one source of information was needed to provide the “triangulation
of information across clinical and workforce indicators that gives the richness of data
necessary” [RV1]; “to make it credible and place it in context” [RY4]. Another
respondent suggested that “triangulating patient/user feedback with a range of indicators
would be a powerful proxy indicator for quality, safety and efficiency” [RY3]. Figure
5.11 demonstrates the range of KPI’s identified, with those relevant to pressure ulcer care
being considered the most valuable for determining the overall quality of nursing and
midwifery care by 26% (n=12) of the 46 respondents.
Figure 5.11 KPI’s stated to be of value in determining the quality of care
5.5 SYNOPSIS OF FINDINGS REQUIRING FURTHER EXPLORATION
While the organisational overview provided by directors of nursing created a base of
knowledge about KPI use, there was a need to explore how this information translated
into the reality of practice at clinical and managerial level. Furthermore, analysis of the
data gained from the questionnaire highlighted points of interest which required further
exploration in phase two of this study:
109
• Findings suggested that a wide range of data were being collected across the five
regions, yet few could be confirmed as KPI’s.
• Over half of the data items listed by directors of nursing were not clearly recognisable
as being specific to nursing or midwifery.
• Nationally mandated requirements were the main reason given for KPI selection,
while few respondents specified that KPI selection involved clinical staff.
• Data on the frequently cited KPI’s were collected by more than one group of staff in
some organisations. Clinical staff were identified as the main collectors of clinical
KPI data, but which clinical staff is not known.
• Responses derived from the open text boxes suggested that few organisations
prepared their clinical staff for KPI use or provided access to formal quality
improvement support.
• The number of respondents indicating the involvement of clinical staff throughout the
KPI process, including action on KPI data, was low. Despite this, the examples
provided of KPI’s that were deemed to be of value in determining quality of care, and
those reported to have improved practice, were mainly those which involved
measurement of clinical practice.
• Insight was gained into the processes used in the collection, analysis and reporting of
KPI data, with custom-designed IT systems being the most commonly reported means
of data management. However, the impact these had on practice was not identified.
• A number of respondents indicated the use of an ‘other’ for data analysis but who or
what this might be was not explained.
• Although a large number of data items were listed as patient experience KPI’s, this
was much reduced following analysis.
• A high number of maternity data items were reported in comparison to nursing,
although many where subsequently identified not to be midwifery specific.
• Only a small number of KPI’s were identified for the community sector despite sixty-
two per cent of the respondent organisations providing this service.
• A variety of different data reporting methods were identified, some of which were
stated to encourage shared learning and competition.
110
5.6 SUMMARY
This chapter has presented the findings from the first phase of the study as reported by
the DoNs. The participants represented a diverse range of healthcare organisations,
serving both large and small populations, and providing an almost equal balance of acute
and community services. Examples of KPI selection, data gathering and implementation
in all four fields of nursing, midwifery and community practice have been included.
These findings provide insight into KPI operational processes from the DoNs
perspectives though this is limited. Also, analysis of the quantitative data based on
comparison between the participant regions has revealed that the regions use similar
processes in relation to: KPI data collection, frequency of collection, staff who collect the
data, data reporting methods and the systems used to present the data.
Objective one of the research study, being to scope the range of KPI’s used in nursing
and midwifery across the UK and ROI has been achieved. Progress was made towards
identifying KPI processes, and potential barriers and enablers to KPI use were identified.
To further enhance understanding of the organisational dynamics which influence KPI
use required the perspectives of nurses and midwives working at senior management and
clinical levels. The findings discussed in this chapter contributed to the design of the
interview guides that directed a more in-depth exploration of the factors influencing KPI
choice, application and implementation. The resultant findings of phase two are discussed
in detail in the following chapter.

111
Chapter Six: Phase Two Findings
This chapter presents the data from phase two and outlines how participants described
their work with KPI’s. Although interview responses were gathered from meso and micro
levels of nursing and midwifery it was noted, as analysis progressed, that there were many
commonalities within their responses. Therefore, their responses will be woven together
to articulate the perspectives of each level as appropriate. Two themes and six sub-themes
emerged: firstly ‘The Leadership Challenge’ which included the sub-themes: (i)
Voiceless in the national conversation, (ii) Aligning KPI’s within the practice context and
(iii) Listening to those who matter; and secondly ‘Taking Action’ which included the sub-
themes: (i) Establishing ownership and engaging staff, (ii) Checks and balances and (iii)
Closing the loop.
6.1 PARTICIPANT PROFILE
Of the 77 questionnaire respondents, 39 (51%) directors of nursing expressed interest in
their organisation participating in the interviews and provided details for follow-up
contact. Following application of the selection criteria (section 4.4.2), the total number
of organisations that participated in this phase of the study was eight. A total of thirty-
five semi-structured interviews took place either face-to-face (n=33) or via the telephone
(n=2). Interviews lasted between thirty-five and eighty-five minutes. Participants
included directors of nursing (n=7), senior managers (n=8) and clinical managers (n=20).
The length of time participants had worked in their current posts ranged from four months
to eighteen years. For those who were registered nurses and midwives, the length of time
registered ranged from two years to thirty-six years, with the mean being twenty-two
years. One senior manager was not a nurse or midwife. Nine participants were midwives
working at either senior manager or clinical level, and six participants were nurses or
midwives working in the community setting.
6.2 THE LEADERSHIP CHALLENGE
Analysis of data suggested that a connection existed between the effective use of KPI’s
and leadership at all levels in healthcare, from those setting strategic KPI direction at
national level through to nurses and midwives working in clinical practice. Where KPI’s

112
were used effectively to improve practice there was evidence of either personal or
managerial leadership. However, numerous challenges were also identified, both internal
and external to practice that prevented or threatened effective KPI use:
“In some environments, they’re really confident, complex conversations around
the priorities and how do we make those improvements. In some areas it’s a case
of we need you to tick all the boxes. It’s incredibly variable depending on… the
leadership” [SM4]5.
This theme illustrates the national and organisational use of KPI’s within three sub-
themes that reflect the challenges and need for leadership at all levels if KPI’s are to be
effective in healthcare.
6.2.1 Voiceless in the national conversation
Participants responses illuminated how powerless they felt in terms of participating in a
national conversation about what was useful to measure and the choice of appropriate
KPI’s. Despite all DoNs agreeing that KPI’s are “a very useful tool for driving up
improvements” [DoN8], the nationally mandated KPI’s, which all organisations were
required to comply with, raised various challenges. While the intention of the national
bodies was generally believed to be “noble” [DoN5] and the KPI’s “there for a reason”
[DoN8], senior nurses and midwives reported these KPI’s did not necessarily evidence
their work and they felt powerless to influence this agenda:
“Some of the national ones are mandated, you have to do it... the local ones with
the commissioners are more open to negotiation” [SM6].
This powerlessness translated as a sense of frustration that their concerns were not being
listened to and heard. DoNs stated that despite raising the lack of feedback on submitted
KPI data with several external bodies, they either received no response, or a response
which resulted in more frustration. DoNs called into question the authenticity of some
KPI’s and identified the collection of KPI data solely for statistical purposes, with
unnecessary duplication of data and impact on cost. The relevance of some national but
non-mandated KPI’s was also called into question, causing frustration with leadership at
board level: “it turned out we’ve had [the KPI’s] written into our contract… but it has no
value” [SM8]:
5Directors of Nursing: [DoN]; Senior managers [SM]; Clinicians are [CA] if the nurse worked in the
acute sector, [CM] midwives, [CC] community nurses.

113
“We are accountable to three [councils]… All of them want different information
at different times and they call them KPI’s. We submit a huge amount of data
each quarter… the work that that creates is an industry… And if we were to cost
that across the NHS it'd be staggering. Some of this is nationally driven in terms
of understanding demographics, the cause of trends… I'm pushing back to say,
‘okay, I'm giving you all of this data… we're being asked to...achieve x, y and z...
How does that translate to improvements?’ Quite often the people that we submit
it to can't answer that question either” [DoN8].
Conversely, in another region there was reported to be more collaboration in national KPI
use, and a sense of being listened to:
“The people who chose the [KPI’s] are the people from the [organisations], and
although the CNO chairs the group, all the [organisations] have a contribution to
make and participate in that meeting” [SM2].
At director level there was a perception that some of the national KPI’s which they were
mandated to use were not measuring what mattered. Waiting time targets in emergency
departments were regarded as “a proxy of care” [DoN2], in that patients should be seen
quickly, but individual’s circumstances also needed to be considered. While DoNs
understood the rationale for KPI’s that could evidence effectiveness in terms of value to
service users and the healthcare system, some held mixed feelings about KPI’s developed
to improve efficiency, believing they did not always measure the right thing at the right
time and place:
“There's probably 20 questions that you have to ask so it's not a triage anymore…
arguably if we don't do it, we've not met a KPI… If we've got [patients] that are…
critically ill, how important is… the public health message... I often question is
this the right place and the right time to be meaningful and add value?” [DoN8].
Additionally, DoNs reported failure at national level to consult on the use of some KPI’s
described as politically motivated, with concerns stated about their evidence-base:
“It was a politician attempting to reduce the amount of time it takes to get to an
operation. However, it was a material shift, it brought the waiting time… down
to weeks instead of years. But there was no evidence behind that, it was an
assertion… why wasn't it reduced further? …zero tolerance against MRSA and
C. Diff - absolutely is a different category of indicator” [DoN5].
Being unable to achieve KPI compliance due to circumstances over which they had no
control resulted in dissatisfaction for all levels of nursing and midwifery. Powerlessness
at board level to influence national KPI use was noted, with resultant impact on clinicians
who had to use KPI’s that were irrelevant for practice improvement:

114
“What are we measuring this for if we can’t do anything about it?... It comes up
at those monthly performance meetings with the [Board]. So, they do know, but
they can’t influence the system either” [DoN1];
“Sometimes… [the KPI] doesn’t fit women having babies… it’s a young, healthy
population... We’ve been open for five years and the birth centre has never had a
case of C. Diff… We fill out slips, trips and falls but they’re not really relevant”
[CM4].
A perceived lack of communication, collaboration and leadership at national level
resulted in failure to provide opportunities for discussion and negotiation between
regional bodies and organisations. Consequently, participants considered that
organisations were ‘set up to fail’, with all levels of nurses and midwives raising concerns
about the negative impact on financial income: “if we don't generate, or we lose money
because we don't reach a KPI, then we're not going to be here” [CC8]:
“Commissioners say, ‘reduce outpatient activity by the end of the financial year’,
which is ludicrous. [The innovation] is based on a 12-month reduction. If we agree
in April we have a process of planning and we implement in quarter two… You're
not going to see the reduction [until quarter two of the following year]. The
negotiation back is, ‘we can't... We can demonstrate a reduction in bookings’.
They say, ‘No’” [DoN5].
The lack of discussion also resulted in nurses and midwives experiencing frustration
when mandated KPI’s competed with organisational KPI’s for limited resources. For
example, when the implementation of KPI’s required staff resources; nurses and
midwives had to decide was it more important to try and meet a mandated KPI in one
service or an organisational KPI in another area of practice. This need to meet national
KPI’s for financial benefit was of concern in most organisations. Furthermore, it was
reported that sometimes the financial imperative was what drove improvement, leading
to issues with sustaining practice especially if a KPI was not seen as relevant:
“The harsh reality sometimes is as soon as that target and that money goes, people
resort back to old practice. That’s the challenge… how do you keep that going
because often it’s been the money and that focus that’s related to the
improvement” [DoN4].
Moreover, failure to include clinicians and patients in the development of national KPI’s
was apparent in reports that patient choice was not taken into consideration. This resulted
in perceived unfairness and conflict between meeting patient choice or meeting KPI’s for
organisational financial gain: “we might be penalised for something that could be

115
mother's choice. ...even if they're steeped in evidence-base” [DoN5]. For example, with
premature babies:
“The mum pumps away… provides them with [breast] milk. Ten weeks down the
line she's struggling. It gets to that last 24 hours… they really want to get home
so they say, ‘I'm going to use a bottle now’. [The KPI’s based] ... on the last feed
before they go home. Ten weeks of really fantastic work and then you wouldn't
get the money” [SM8].
At both national and organisational level, there was a need for those in senior leadership
positions to listen to the “people on the floor… they’ll know what’s gonna make a
difference” [CA1]. This was stated to be essential as “increasingly, senior management
have no clinical credibility” [CM4]. Collaboration on KPI use that was inclusive of all
levels of nursing and midwifery was a prerequisite to ensuring that the reality of practice
was not overlooked:
“Externally mandated ones… I don’t think they have enough people involved
from the ground floor when they’re devising the KPI’s... With all due respect to
the assistant directors they’re not operational. When was the last time they did a
medicine round?” [SM3].
The reality for some nurses and midwives was that decision-making took a top-down
approach: “usually it’s [in] the consultants meeting that decisions are finally made”
[CM7]. There was also a belief that commissioners and board members did not always
understand how nursing systems work or appreciate the impact that one KPI may have
on another. Inclusive KPI decision-making would help ensure that “if you are hitting or
achieving one standard or measure… you’re not being detrimental to other processes of
care” [SM4]. Due to national leaders failing to provide clear KPI definition and guidance
on their use, or following KPI use to provide timely feedback, other participants
considered they were hindered in their ability to move forward with improvements:
“The [KPI] ‘care hours per patient day’ is a new one and we haven't had any
guidance about what we're trying to achieve on that one yet. Although we're
collecting [and submitting] data every month… I’m thinking, ‘what is the care
hour?’” [SM6];
“You may submit your data and then the result comes out six months later… It
makes it very difficult for you to change practice or implement improvements”
[CA8].
The need for leadership at national and organisational level to make key decisions to
reduce this workload was raised by most participants due to the potential for “reducing
the amount of time we have to give care” [CC4].

116
Using the audit process as a means of measurement for KPI’s seemed to be the most
common tactic employed. However, this placed demands on nurses and midwives
through the effort involved. Some organisations were reportedly in the process of
identifying how heavy their audit commitment was with one organisation employing
“over 500 audits” [DoN4]. This also led to confusion as to whether “you’re auditing or
whether this is a performance indicator that we need to be measuring ourselves against”
[DoN1]:
“People are spending inordinate amounts of time writing the biggest load of
rubbish. And then other poor people are spending inordinate amounts of time
auditing the biggest load of rubbish” [DoN3].
For this reason, half of the participant organisations had taken steps to stop or reduce data
collection. However, there appeared to be a lack of strategic consensus or direction at
national level to act on reducing those KPI’s that were mandated, except in one region
were agreement to reduce the frequency of data collection for a national KPI was
reported:
“We've said, ‘you can’t cull the ones that we need to formally report on [but] cull
the ones that you think we never use or we could do every second month, or every
six months’” [DoN4];
“[Chief Nursing Officer] is happy that the ‘tick box’ part of the skin [care] bundle
is not completed every month... Practice is showing that it’s well embedded and
that the care is being given” [SM3].
Being held to account by the regulators was a key consideration when it came to making
a decision about stopping or reducing KPI use. Reluctance to address this was
demonstrated by participants at all levels, despite concerns being expressed about the
growing number of KPI’s and resultant pressure on clinical nurses and midwives and
potential detriment to patient care:
“Everyone wants their own KPI’s, but for a nurse on the frontline they all become
completely accumulative and unmanageable and it’s sometimes unclear why
they’re doing it” [SM4];
“It is frustrating if we are short staffed and I’m having to take somebody off that
I could do with on the floor” [CA2].
The fear of being held to account appeared to increase the reliance on KPI’s as a means
of providing assurance, resulting in their use to improve practice where no problems
existed. The failure of people in positions of leadership to address this resulted in

117
frustration, especially for those who were aware that it is “false reassurance, that because
you’re monitoring everything that it will deliver what you need” [DoN6]:
“[A specific KPI] We’ve never had a single issue... I would have had line
managers in the past… that would say ‘you’re absolutely right: we’ll fight that
corner; we’re not doing it’. But I now have a line manager who would say ‘just
do it and then it’s done’ [CM4].
6.2.2 Aligning KPI’s within the practice context
The need for a balance of KPI’s to supplement those nationally mandated was
highlighted. Various considerations were identified when deciding which nurse-specific
KPI’s an organisation should select for use, such as: “we’ve added some [KPI’s] that we
think give a broader view of a system” [DoN4]. There was a commonly expressed view
that a range of KPI’s were needed to be able to triangulate KPI data and thus “see the
totality of a patient’s journey” [DoN3]. For example, in the ED:
“Unless you’re also measuring the patient experience, you could have been very
efficient in hitting the target about getting them in and out of the department, but
they could have had a dreadful experience” [DoN3].
Sources of information which influenced KPI selection for monitoring or improvement
included: “important indicators from the literature” [DoN1], as well as the use of
benchmarking with other organisations and “international institutions” [DoN1].
Additionally, it was reported that “each year we chose three areas of deep focus” [DoN6],
which was an aspiration expressed by others.
Participants expressed concern that executive boards sometimes rescinded their
responsibilities despite the authority granted to them. This related to a perceived failure
to address internal disagreements on the use of certain national KPI’s, with reports of
some “very senior nurses and doctors becoming complacent” [DoN8] about KPI data.
The lack of leadership at board level in addressing issues was viewed as adversely
affecting the drive to improve practice. For some, complacency was no excuse: “you can’t
always measure things on a like for like basis but that’s no reason not to strive to”
[DoN4]:
“Caesarean section... the national average is about 25 per cent... I would like to
use that as a benchmark for improving our services, but there is no impetus to do
that. They… say, ‘we're not a standard unit, we're a tertiary centre’… When it's
creeping up to 30 per cent I'm getting anxious… The doctors don't put as much

118
emphasis on them. The Board of Directors and the executives don't take a stand”
[SM8].
Another challenge was failure, as a multi-disciplinary team, to take responsibility for, and
address problems relating to, the use of KPI’s. Despite DoNs reporting that medical and
nursing directors worked together as lead professionals to influence practice, there was
evidence that the use of KPI’s was not always a team effort. There were reports of clinical
managers needing the backing of senior management, such as when consultants
threatened hand hygiene compliance: “no, there’s nowhere for me to hang me jacket”
[CA1]. While other participants reported that responsibility for the management and
improvement of non-nurse specific KPI’s was incumbent upon nurses:
“It’s a leadership conversation… many of the KPI’s… they’re [not] uni-
professional and sometimes nurses are held to account for things that are not in
their gift. Antimicrobial prescribing... that’s a difficult conversation to have with
the [medic], saying, ‘you’ve just prescribed this and our policy is…’ and is that
really… fair?” [SM4];
“It can feel that a lot of this is left to nursing, whether it’s nurses’ responsibility
or not… VTE… a big element of it is medical, but if it’s not going as well as it
might be it’s down to nursing to sort. That’s just about working our way through
that” [DoN3].
The selection of KPI’s was influenced by the view that KPI’s are valued where they
“relate back to the frontline. [They] are the ones that… matter and help us to improve”
[DoN1]. The most beneficial KPI’s were those that were reported to be clinically
meaningful, “those which affect patients, staff as well” [CC7]. The desire for KPI’s to be
clinically meaningful resulted in a few organisations encouraging their clinicians to
develop KPI’s relevant to their own practice:
“Part of that [organisational] approach is about staff working at the frontline
saying, ‘what does ‘good’ look like for our service?’ We will work with people
to get bespoke KPI’s” [DoN3].
In some organisations groups were reported to contribute to organisational KPI selection,
but this predominantly involved senior nurses and midwives representing and negotiating
on behalf of clinicians in their service areas:
“We’ve a… governance forum which I chair. A senior nurse... from each of the
directorates sits on that, and their job is to get a consensus within their areas so
that we would have some discussion and agreement about [KPI selection]”
[DoN2].
119
Conversely, some reported organisational disinterest in KPI’s that were considered by
clinicians to be useful and, as with the national KPI’s, there was often a lack of
consideration given to how some KPI’s aligned within the practice context. Where the
KPI’s did not align with practice need, they were tolerated by clinicians but were not the
focus of improvement:
“You tick the boxes on the ones that aren’t [relevant]… and everyone gets off
your back. Then you do the ones that are… the most meaningful” [CM4].
When scoping the KPI’s used by organisations in phase one, there were two areas of
interest that emerged warranting further exploration the first of which was the large
number of midwifery KPI’s. Several explanations emerged in the course of seeking to
understand why so many maternity KPI’s had been identified and how these could all be
actively used to improve practice. The reasons given were that maternity had the “highest
amount of litigation” [DoN3] and that midwives acted as “independent practitioners…
they have a lot of authority over a very risky life event” [DoN5]. Thus there was a belief
that:
“The hospital has produced a very negative, very risk averse, very scary place for
midwives to work… and KPI’s have become a comfort blanket without a real
understanding of whether they are leading to an improvement” [SM4].
There was also a view that, until recently, midwifery regulation has been centralised far
from practice and therefore has been difficult to scrutinise, causing a drive for assurance
which KPI’s were perceived to provide. The large number of maternity KPI’s was also
linked to the notion that data collection in maternity services had become very
streamlined, as a result of which, “obstetrics is something that you can audit quite easily”
[CM2]. Often this data was described as statistical and had more to do with monitoring
performance than improvement:
“The further away you are from the operations, big data is what you need to help
with the scrutiny of quality and safety of a service” [DoN5];
“I asked if they had any statistics from [a recent national investigation]. They had
no statistics, so they had nothing to monitor their activity” [CM3].
The second area of interest that emerged from phase one was the use of only a few KPI’s
in the community setting. Most DoNs stated that, to date, KPI use has been focused on
the acute sector, possibly because:

120
“Significant areas of concern have been flagged up, say in the media or in nursing
literature or [from] serious adverse incidents” [DoN2].
The most frequently reported reason for there being so few KPI’s specifically designed
to measure community activity was lack of role clarity. Despite one region engaging
community nurses in KPI selection for their own practice, choosing relevant KPI’s was
described as, “more challenging, there is no doubt about it” [DoN2], with nurses
themselves “struggling to identify KPI’s” [SM2] that aligned to their practice:
“We are involved in so many different areas that criss-cross with GPs, social
services and other teams. Plus, the complex issues that we deal with... It will be
informal… there's no set pattern to what we do” [CC7].
Contrarily, in other regions district nurses reported a lack of clinical engagement in KPI
selection. This resulted in district nurses in different regions reporting inappropriate use
of the same KPI. Autocratic leadership styles come through in the statements that they
were “told we must get a base-line weight even if somebody [just needs] a one-off
injection” [CC3]. The KPI guidance also detracted from experiential knowledge:
“We were told to do nutritional assessments on every patient whether they were
a young person who walks in or patients in the last few days of life. The one form-
filling exercise and assessment was meant to cover the whole spectrum... It can
take away personal knowledge and experience because you're being guided down
a certain road” [CC7].
However, some success was identified with KPI’s related to completion of MUST
assessments, pressure ulcer reduction and patient experience: “collecting patient stories -
looking at district nurses” [DoN2], as well as the development of a community-specific
KPI which had subsequently been adopted for national use:
“In the commissioning plan there is now a target in relation to carers’ assessments,
which would not have been there before” [DoN3].
Another challenge that impacted on the introduction of KPI’s for use in the community
was the incidence of unreliable data. Reasons given were issues of patient access; failure
to complete documentation by either the support workers or the patient (in the absence of
the nurse); and the support workers or patients not conforming to the KPI guidance, thus
resulting in unreliable data:
“We have patients or clients in the community where the nurses don’t visit very
often. It may be care staff, and the care staff have a very high turnover. There’s
also a lot of issues with working in somebody’s house… they’re not under any
obligation to use your equipment or take your advice” [CC3].
121
6.2.3 Listening to those who matter
Organisations captured the service users’ experience and considered recommendations
for practice in various ways. Nevertheless, specific concerns were raised about listening
effectively to service users and understanding how to manage patient experience data.
Most participants identified the need for measurement that captures the experience of
patient care to complement the numeric data and, whilst not in themselves KPI’s, surveys
were the predominant method used for this. However, there was also a belief that patient
experience was regarded as less important by some professionals:
“…patient stories, patient experience alongside the KPI’s cos the KPI’s can be
crude measures around sickness, absence or spend. They’re one dimension… So,
measuring ‘good’ for me is both quantitative and qualitative” [DoN4];
“We could raise the profile of patient feedback. At Board meetings they have a
patient's story but I'm not 100 per cent certain that it's there with the finance
figures… on a par” [SM7].
Perspectives about the capacity of KPI’s to capture the patient experience of care varied.
For those unused to collecting patient experience data this was viewed as almost
impossible. Other participants reported the regional use of KPI’s to collect data on the
more psychosocial aspects of care such as, “is your nurse’s attitude acceptable?” [CA2]
and “all the nurses had a good understanding of the care I needed” [DoN2]:
“I think KPI’s can only capture… certain activities that nurses undertake,
generally tasks. They won’t capture the patient piece necessarily. It’s like they
won’t capture the nursing art, they capture the science” [SM1].
Additionally, participants confirmed that, apart from the national survey, they did not
collect patient experience data although they all agreed that, “there would be a benefit…
absolutely” [SM1]. The reason given for this suggested there was a lack of collaborative
accountability and working between professional teams:
“We can’t audit medical staff... I don’t know how many times I’ve designed one
and either it hasn’t been allowed [pause]. If the answer is negative… [about
another] discipline… how do you action that as a nurse?” [SM1].
Although most participants viewed surveys favourably in terms of evidencing good care,
a few viewed them as being less informative: “the generic comments at the end maybe
‘had a good experience’, something that you wouldn't get a lot more data out of” [CA8].
122
Difficulties were also noted in obtaining useful information from service users with
limited ability to communicate or a strong desire to remain anonymous:
“[Our] service is quite delicate; people are not happy to say they have been with
us” [CC2];
“…because of cognitive issues or they can’t hold a pen or they’re blind. So,
ironically, it ends up they almost have to ask us to fill it in for them, and that
probably invalidates the results” [CC4].
Furthermore, with the increase in electronic data collection systems, computer literacy
was a problem, although some organisations had taken steps to help address this through
the appointment of a “patient experience manager” [CA3] or teams.
Another challenge was obtaining honest feedback that would be beneficial in identifying
areas for improvement. Participants reported that patients felt nurses and midwives would
not want the truth unless it was favourable, or that there was “fear that if they… said
something bad… it may affect the care they get” [CA2]. Where one-to-one care was
delivered it was also reported that:
“We have given them out before but it’s almost like a personal thing, they don’t
want to get their nurse into trouble. You don’t get the best information back”
[CC3].
Despite the reluctance of service users to provide critical feedback, clinicians appeared
to desire information which they could use for improvement: “if I'm not doing something
okay, tell me, so that I can make a difference for you” [CM6]. The main method suggested
to achieve greater honesty was to have data collected by some-one not directly involved
in caring for the patient: “if it’s somebody outside of the ward who’s doing [the
collecting]” [CA2] such as, “volunteers that give patients the… survey” [CA6]:
“If somebody’s had a bad experience, sometimes it’s just their channel, instead of
making a complaint, to give a lot of negative feedback. But we need that too”
[CA3].
Most clinicians also expressed a preference for real-time feedback, thus allowing them
an opportunity for immediate action. The benefit of electronic systems to support this
was reported and compared to the time delay for national surveys:
“We could have a patient with us for six to eight weeks on IV antibiotics, I would
give it out in the middle of their stay to see if we could improve it for them”
[CA2];
123
“[Locally] it's computerised, that comes straight to us as individual ward
managers… The [national survey] we get back quarterly” [CA6], or “it'll take
about a year for the results to come” [SM8].
Although a few clinicians reported collecting and analysing their own patient feedback,
most stated that the information was collated centrally and sent back to them. However,
there appeared to be a lack of collective agreement and communication in relation to
follow-through, as it was not always clear how this feedback was then utilised by nurses
and midwives: “whether they're interpreted appropriately and whether we use that to
change services or not is a different matter” [SM8]:
“We get patient satisfaction surveys back in pie charts and blocks. They are
displayed. Every month she [displays] how we’ve done or what comments were
said. I know because I’m a [junior manager], I’m not sure whether all the [staff
nurses] know it’s there” [CA7].
Where mechanisms were in place to provide feedback, concerns were raised about the
lack of detail provided and thus the impact this had on ability to act: “it’s anonymous so
you can't ask for more detail” [CA8], as well as not having a means to explain why patient
wishes may not be met. This may have been because of a potential negative impact on
other patients:
“I don’t want to collect data from parents and they arrive in a month later and I
haven’t [been able to do anything] … Parents are gonna be more dissatisfied than
satisfied after going through the effort of filling it out” [CA1].
Most organisations used additional methods to collect patient data as a means of
compensating for the limitations of regional surveys, such as minimal distribution: “[It]
only touches about 2000 people a month, we see 2500 patients in our outpatients alone
in one day” [DoN6]. These methods included the collection of patient experience data
“through [patient stories]” [CM3], which were reported to be used to good effect in half
of the organisations: “…surveys, probably not so good. The patients and their relatives’
[stories], brilliant” [CA6]. One reason given for the possible reluctance to use this
method more widely was reported to be because, although believed to be more
meaningful, it was more time consuming. A slightly different method of collecting patient
stories was also reported though it was not yet known if this would reduce burden:
“We're doing early testing... simple questions about their day... One patient… was
distraught and upset [a fellow patient had died] … He didn't want to speak but he
was happy to write how it affected him. We're looking at using diaries to say:
‘how can we improve services? Or ‘this is how we're doing’” [SM7].
124
Various informal sources for patient experience data included: “comfort rounds, matron
rounds” [DoN8]: “[executive walkabouts] when we… check back with the patients”
[DoN1]; and “our council of governors… send us emails about what people are saying…
and advocacy [services]” [DoN5]. Furthermore, as well as a patient experience app which
some organisations were exploring, social media was becoming a source of information
on patients’ experiences:
“The old traditional thing of filling out a comments card, less and less, but
frequently we would see postings on Facebook, on Twitter and our
[communications] department monitor that” [DoN3].
Another method of listening to the patient or family was through the narrative provided
in complaints and incidents. Although the ‘number of complaints’ and ‘number of
adverse incidents’ are high-level numeric KPI’s, the complaints and incident reports
themselves appeared to act as proxy indicators for experience. Complaints were the main
source of information where surveys were not available. When asked which KPI was of
most value:
“Honestly? Complaints. If somebody tells me something in a complaint, usually
the passion that comes through or the distress that comes through with it I find
quite upsetting and distressing” [SM8].
Listening to those who matter was evident in the efforts made by leaders to engage service
users on various committees: “when we’re developing organisational service strategies”
[DoN4] or to provide “feedback on design of a KPI system for their information” [DoN6].
It was also reported that “patient/client experience work” [DoN2] was being used to
inform the use of KPI’s. Additionally, opportunities existed for staff to contribute to
“designing their own questionnaires or their own methods of gathering patient
experience” [SM2]. Furthermore, when the KPI was nurse-specific, clinicians
demonstrated leadership qualities, showed empathy and acted as advocates for their staff
or patients to over-ride the imperative of meeting the KPI target, even though “there’s
this perception that you can’t be seen to be failing” [CC2]. For example:
“If you start talking about care bundles while they’re running ragged out there…
the respect is lost… so we postponed it” [CA1];
“[The KPI] ‘cannot attend’… two cancellations and one DNA and you’re off…
Somebody… with dementia… staff make the decision whether we send for them
again or not... No KPI target can do the individual patient assessment… if we
breach the target, we breach the target... my contract says that I act in the best
interest of the patient” [CC2].
125
6.3 TAKING ACTION
The findings presented here focus on those elements of practice that enabled nurses and
midwives to act, or not, on their KPI data. Participants described how, if KPI’s were
meaningful to their practice and patients, they would be more likely to own and engage
in their use and act on data. The sub-theme of “Checks and Balances” unearths how action
taken can increase confidence in data collection and reporting because, although KPI’s
were viewed as objective in nature, challenges where identified in ensuring reliability.
‘Closing the loop’ was a term used by participants to illustrate the full cycle of KPI use
from their development through to the identification of practice improvement. Here the
focus is on action that has resulted in improvement to practice and how this has been
achieved.
6.3.1 Establishing ownership and engaging staff
The ownership of KPI’s by nurses and midwives, and their engagement in KPI use,
dominated discussion by the clinical managers. It was suggested that achieving
understanding and the resulting increased motivation would lead to greater compliance
with KPI’s, and thus improved practice:
“Engaging all levels more… not just your [junior managers] and above, but your
healthcare assistants as well… If people understand why, it motivates them more
and it gives them a purpose” [CA8].
Participants highlighted that the level of understanding of KPI’s varied and that
comprehending what a KPI was and was not, presented them with difficulties. This was
especially so for clinicians as they required a skill set that frontline nurses were not
trained in:
“I find a bell curve distribution in my organisation of people who really get KPI’s
- use them pro-actively, get stuck into the wards, get people ingrained in
understanding them. A good group in the middle who get most of them, use them
intuitively to support improvements in their parts of the organisation, and there
are some people who just don’t understand KPI’s full stop” [DoN6].
Thus, most clinicians, when asked to suggest how they would improve KPI use, reported
a need for greater understanding of what exactly they were being asked to do. Suggestions
as to how this could be achieved were either through training or by involvement in KPI

126
use to support the link between the indicators and quality of care: “that they’re for the
benefit of patient care and staff, and not… something that’s scary” [CC2]. The integration
of KPI language into daily practice was reported as helpful for some participants. This
was achieved in the acute sector through short, daily ‘safety briefs’:
“We talk about [KPI’s] within the floor meeting and it's good to say the patient or
the relatives’ comments, cos it makes it real. It's not us telling, it's us sharing,
which makes a difference” [CA6].
Taking action on KPI findings was stated to be the responsibility of the clinical managers,
who were held accountable for their own KPI’s. However, clinicians felt distanced from
‘owning’ their KPI’s when they perceived they had little involvement in organisational
negotiation and decision-making about KPI selection. For example, the desire for
organisational comparison across practice areas resulted in the selection and
implementation of KPI’s, which some clinical managers viewed as no longer relevant for
improvement in their practice areas:
“Let me tell you, you’re under scrutiny. If… this is your ward, you have to be
pretty sure that you’re delivering a high standard of care, and if there’s things that
are not being done well you have to make sure that you’re on top of it” [DoN2];
“We've lots of specialty wards, and just because they're maternity doesn't mean…
their patients [couldn’t] still come to harm... It's rare that they drop below 100 per
cent… They did ask, ‘can we stop doing...?’ We said, ‘no, because your patients
are still at risk of falling, of pressure ulcers.’ Paediatrics ask [the same thing]...
But it's important to have a perspective of all of our wards” [SM6].
The idea of increasing the engagement of nurses and midwives through the collection of
KPI data was commonly agreed. Furthermore, in this phase it was argued that:
“Some people feel: ‘that’s terrible wasting nurses’ time’… But it’s about their
ward, I feel they need to have that level of ownership” [DoN3].
Equally, in an organisation with electronic systems for collecting the data, the only audits
that nurses and midwives could be involved in were a few observational audits. Here it
was reported that, “because the IT team gather the data, we probably don't involve people
as much as we [should]” [CM6]. However, the “time-consuming” [CA2] aspect of data
collection was of concern. For this reason and because “it’s just quicker to do it yourself”
[CA4], some clinical managers reported that data collection was carried out by
themselves, reducing greater nursing and midwifery involvement. It was suggested that
the issue of KPI workload might be resolved by employing efficient electronic systems:
127
most participant organisations used both electronic and paper-based data collection
methods.
The challenge of sustaining interest in KPI’s was reported by all levels of participants,
with it being noted that when people are doing the same thing continually, “it stops
meaning much… You need to refresh it” [DoN3]. This along with a focus on KPI targets
was also reported to cause people to forget the overarching purpose of improving
practice. Methods to ensure sustainability included involving clinicians in the
introduction of KPI’s and the related development of their practice:
“You need something to work towards but you can't lose sight of what it's about.
And maybe sometimes we do, a little bit” [SM6];
“The more that we can generate this kind of activity from the bottom up rather
than top down, the more likelihood there is of ownership and sustainability round
it” [DoN3].
In addition to the need to involve all levels of staff in the local development of KPI’s,
discussed in the previous theme, other methods of sustaining interest in KPI’s were
offered. These were both formal, through quality improvement programmes and
organised “study days... we try to reinvigorate them twice a year” [SM3], and informal,
through the enthusiasm of clinical managers:
“It was amazing… because it was visual and really easy for them to see and
understand, they all… got involved… They thought I had gone a bit crazy too,
‘what is she doing with this counting, and this board?’ But I really enjoyed it
because you could… go, ‘this is what so and so tells us we need to do… come on
let’s do it” [CA1].
However, the most commonly reported method of supporting and sustaining KPI interest
was through the identification of champions, either nurses with a specialist role or local
nurses and midwives. The champions were viewed as having the role of really
understanding KPI’s and consistently helping others to understand outcomes and
consider improvements. As a way of identifying how this would work, one participant
offered their experience which involved formal education, requiring completion of a
quality improvement project. This resulted in applying their learning to embed changes
in practice and developing their own facilitation skills:
“A lot of the time people are delighted to be asked. You’ve kinda brought them
along… a little trick I learnt… Because I had a few different people and the
facilitator as well involved, it didn’t feel like it was just me. The same with other
128
things that we’ve done since. I’d always say to the girls ‘pick a few people’”
[CA1].
The greatest motivator for engaging in and integrating KPI’s into practice was the ability
to relate them to improvement in care for patients:
“Yes, it's a KPI, but it's understanding… that it can make a difference to that mum
and her baby. That's what midwives would latch on to completely because they
want to care for women and give them the best evidence-based care” [CM6].
However, understanding that a KPI can make a difference relies on more than the use of
numeric data alone. Clinicians reported a need to “see the impact of that data,
[otherwise]… it feels like it’s for someone else’s use” [CC4]. If evidence of patient
impact was available, such as hearing a family’s story as a live experience following a
root cause analysis, or wider group discussion following a complaint, then greater
engagement in practice development was reported:
“[A complaint] came through our system recently which highlighted [poor patient
care]… We got the team to come and present their experiences, what they’d
done... Whilst that’s difficult for some people to talk about, it’s part of our
philosophy about being open and transparent so we can learn” [DoN6].
Similarly, with the limited use of KPI’s in the community setting, district nurses reported
that having KPI’s that reflected their specific contribution to patient care would increase
ownership and motivate improvement. Despite the challenges, this was stated to be
achievable if the necessary support was provided:
“We know what we do, but it's very difficult to explain. It would be nice to have
some evidence there: this is what we are doing; how can we move this forward,
instead of just reacting to things all the time? It would help… make you want to
develop further” [CC7].
Performance feedback is an important means of motivating nurses and midwives to take
ownership of and act on KPI data. However, interviewees revealed that while managers
stated that, “they’re not having to collect [KPI data] for it to fall into some sort of
bottomless pit, they get this information back” [DoN3], clinicians reported issues in
receiving or accessing this feedback:
“It’s collected… and then it goes off into the wide blue yonder, we get very little
feedback. We get feedback if it’s not done... you might get a report at the end of
the year... Whether it makes any difference to the patient outcome, I’m not sure”
[CC3].

129
For some, feedback, and the ability to understand it, made a significant difference to
whether they engaged in improvement:
“I understand the dashboard, I think it’s important that we’re reviewing our rates,
that we’re constantly looking at how we can improve our care. But the other bits
that I fill in like hand hygiene, I think it’s just a bit of a paper exercise… I never
see any feedback from that, I’m not sure whether I’m entering the right data for a
start, where it actually goes to, who’s looking at it and what I should be doing to
make that any better” [CM7].
The most popular means of communication reported was the use of display boards. In
some areas, the boards were positioned in public areas, whereas for others they were
placed for staff information only. Within the hospital setting, the use of emails was an
unsuccessful method of communicating KPI data to clinical nurses and midwives.
Priority was given to patient care and staff stated they were too busy to check emails.
The data suggested that team working was required to support the use of KPI’s. This was
most strongly evident with the midwives and nurses in the acute sector. Interviewees
revealed that this ranged from strategic engagement across all nursing levels, to more
local team working either as part of a quality improvement project or in daily practice:
“If we've noticed a trend... we come up with an action plan… staff nurses, HCA,
dependent on what it was. The ward clerk, cleaners, everybody's a team... The
more… the merrier, more ideas... Sometimes… different people walk in and they
see things differently” [CA6].
Opportunities were reported for the sharing of learning which would support KPI use and
practice improvement. These were mainly in the form of meetings or committees,
although discussion with colleagues also featured and was reported to motivate
initiatives. Engaging clinicians in this way helped to overcome the lack of ownership
which resulted “when people feel that it’s being imposed on them” [DoN4]. For example,
some directors reported chairing regular meetings with all levels of nursing and
midwifery:
“It’s for both ward managers and [managers]. We have a very open transparent
approach. All the data around nursing KPI’s is… freely available via the
intranet… We’ll go through individual areas of performance… and highlight
who’s doing what well and who’s doing poorly and identify through the [KPI’s]
where we need support and intervention" [DoN6].

130
Conversely, when asked to articulate how staff nurses were engaged in KPI use responses
suggested there was limited team working, little positive reinforcement and lack of
involvement in decision-making:
“By looking through [documentation] you can tell if they’re… filling them in.
They probably don’t ask how well we’re doing. It’s only if you get negative
feedback, then you will bring it up at safety brief” [CA7].
Other measures to motivate and engage clinicians with KPI’s included the use of
competition through the open reporting of KPI data across organisations, and celebration.
However, while clinicians mainly viewed competition as being positive for motivating
and improving performance: “they want to know ‘where did I lose that five per cent?’”
[SM1], it could also be seen as punitive and have a negative impact: “seeing 100 per cent
drop to 50, somebody’s head will roll, that is the way they feel about it” [SM1]. On the
other hand, failure was also viewed as a motivator for improvement. For example, in an
organisation with a very open approach to the reporting of KPI data:
“When the [new dashboard] come out… we asked for the staff's views on it. What
shocked me was they wanted it in order of where they were in the Trust… We did
ask [what if you are at the bottom?], but they said, ‘we still want it because, do
you know what, you can only go up’ [CA6].
Innovative ways to positively promote engagement with KPI’s, and to encourage nurses
and midwives to act on their data were reported. These included the use of newsletters,
parties and the presentation of certificates of achievement and awards. Additionally,
celebration ranged from reporting patient feedback at safety briefings “if somebody
comments on the great care” [CM7], to being asked to present improvement work:
“There’s a quality indicator day and we’ve been encouraged to try and get a
PowerPoint done and promote what we’ve done” [CC2].
6.3.2 Checks and balances
Providing the organisations’ Executive Boards with assurance that KPI’s were being used
and acted upon was reported as a checking mechanism and increased confidence in KPI
management and the data produced. Participants also reported that nursing management
were responsible for making decisions about what information the Board received, and
that they made similar decisions about information dissemination back down to the
clinical level:
131
“Ward-to-Board reporting is really important so that the Board gets to see all of
those performance metrics. Any… that aren't delivering, there would be
additional scrutiny, there would be holding to account” [DoN8].
Nevertheless, KPI data alone was insufficient to provide assurance at board level, and
additional information was sought: “the [Board] don’t just think about it in terms of
numbers, they will ask for the further breakdown” [DoN1]. While responsibility to
provide assurance at this level mainly lay with management, one organisation encouraged
clinical representation at board as a means of checking the finer detail:
“When [ward managers] go to their monthly performance meetings with the
Board... they need to know what data they've got and why… They would expect
questions on it” [SM5].
Nurses also articulated concern that KPI data may be used as a means to manage peoples’
performance rather than to use them as a mechanism for driving improvement.
Furthermore, findings demonstrated that checks by the regulators or internal personnel
may place undue emphasis on accountability. This was disadvantageous in that it took
the focus off KPI’s for improvement and created a fear of being performance managed:
“at the moment the management have been very hot onto [our clinical manager] because
we have an external auditor coming in” [CA7]. To move forward with data collection
when clinical managers failed to submit their KPI data citing staff shortages, they were
encouraged to pass responsibility to their staff nurses without due consideration of the
underlying problem:
“With staff vacancies and shortages, a lot of staff some months weren’t doing
their KPI’s… Sometimes it’s left very much to the [clinical managers], and the
[staff nurses] don’t really have ownership. So, a lot of the wards are trying to
bring it down a level to help them see how meaningful it is” [CA3].
Conversely, if managed supportively, performance management was reported to be
beneficial:
“We're going through that at the minute and we meet every week… and go
through our performance indicators and say what we're doing to improve our
compliance rates. It's good, you can get information that will help you to move
forward. Any blockers, you've got the backup of the managers” [CM8].
Another consequence of overzealous performance checking and accountability, noted
across participant levels, was a sense of growing dependence on data as a way of assuring
that practice performance and quality were of an acceptable standard. At clinical level

132
this dependence could manifest itself as self-imposed burden. With their varied
efficiency, data management systems either added to, or lessened, the workload:
“Every week I do a MUST audit [of five charts]… Whenever entering the
[monthly] data we would lift another five charts. I suppose we are replicating.
Everybody does it... it’s reassurance... I like to keep everything from the last
couple of months… If the inspection people come they will ask for it... our
managers ask us to have them” [CA2].
Multiple systems were the norm for KPI data collection but few could communicate with
each other, causing frustration in locating and viewing KPI data as a whole: “we use loads
and loads of different excel spreadsheets; how can we bring it together at ward level?”
[SM4], and sometimes contributing to confusion:
“I would not think staff would call this KPI’s, this is just the dashboard… our
figures [number of perineal tears, breastfeeding rates etc] and how they’re
performing. I probably wouldn’t have called that a KPI, it’s a dashboard. To me
the KPI’s are in the computer, these pressure areas, falls” [CM3].
The reliability of the KPI data was also called into question, with reports of confusion in
understanding both KPI’s and the processes involved in their use. Most clinicians
described learning about KPI management through their senior managers. The quality of
this varied, with some clinical managers resorting to the use of online resources and a
few participants also suggesting a lack of KPI understanding by “some senior people. I
don’t know that they know what it is” [SM1]:
“Initially the challenge was ‘what on earth am I supposed to fill in?’… Basically,
they said, ‘whatever’s been filled in before, that’s what you’ve to fill in’… I think
I’m reporting the right things” [CM7].
Confidence varied regarding the ability of KPI data to reliably and objectively measure
nursing activity and effect improvement. Additionally, the elements of data collection
and reporting came under scrutiny with the belief that:
“Unless there’s rigorous and accurate recording of the care processes/ bundle
elements and consistency in application of the audit tool, the results will be
unreliable. Who’s auditing, how have they been trained, what are the checks and
balances that you’ve put in?” [DoN2];
“What I don’t see is the rigour in the production of KPI’s, the testing, the
implementation, and are we confident it will lead to an improvement. What we
do is go ‘bumph’, everyone has to do it” [SM4].

133
Several methods were reported as being designed to increase the reliability of KPI data.
Peer review was the most commonly reported action taken to ensure the reliability of data
collection due to the belief that it removed potential bias. To try and ensure strong inter-
rater reliability when collecting KPI data, all levels of participant discussed the additional
involvement of people designated as independent, this included quality officers, specialist
nurses and independent auditors. The latter were reported to be cost restrictive. However,
this was noted to result in a degree of data collection duplication:
“We do the central lines and PICC lines. But equally the vascular team do it as
well. It's kind of twice… to ensure we're following the process” [CA6];
“If you’re asking your support staff, are they going to give [questionnaires] to a
woman who they know is complaining that she has been waiting four hours for
her discharge?” [CM4].
Given the lack of understanding previously discussed under the sub-theme –
‘Establishing ownership and engaging staff’, there was a need to ensure that all nurses
and midwives involved in data collection were trained to ensure consistency and reduce
personal interpretation. Consistency was also reported as important because the scoring
of some audits was set within ‘all or nothing’ parameters, and misinterpretations could
make a significant difference to the results:
“Making sure that people understand exactly what it is that they’re auditing
because [in] a bundle, you only have to go down on one element and you’re at
zero” [DoN2].
Participants largely did not discuss how the reliability of patient experience data was
assessed, some reported it took the form of executive walkabouts or observations. In one
organisation a set of criteria were reported to be used. Nevertheless, the possibility of
variances occurring with so many people carrying out observations of practice was
reported as a challenge, and no-one discussed preparation for this role:
“There is a lot of critical thinking, and you have to make sure you understand
what you’re seeing” [SM2].
Clinicians reported that reliability was also impacted on by data burden. However, actions
to overcome or manage this were noted, such as rostering time so that nurses and
midwives were not under time pressures which had the potential to result in errors either
in the collecting or entering of the data, or through the use of:

134
“A dedicated IT team who… fill it in, so data quality is good… it's not somebody's
doing it as well as their other job, which we know gives you poor data... Not
everybody… will see the importance of data collection and you get disturbed”
[CM6].
Additionally, human fallibility in reporting when under time pressure was highlighted
and the reliability of information that was recorded on Datix, the incident reporting
system used by most participant organisations and from which some KPI data was
collected, came under scrutiny:
“Incident reporting systems are reliant on staff reporting. Sometimes we cross
reference with other sets of data to see how accurate they are... A third-degree
tear… should come in through the incident system. Not always, if staff are busy.
You cross reference it with the delivery suite log... Sometimes your KPI for third
degree tears... won’t be taken from incident reporting, it would be taken from the
[log] in the first place” [CM2].
Another aspect of reliability checking was monitoring for gaming, where either data or
processes were manipulated to provide positive results. For most, “there was a particular
risk with clock-based and access targets that you get into gaming” [DoN3], as a result of
external pressure to meet public expectation:
“Four-hour trolley waits... it’s a mad rush to get a patient into a bed and maybe
they’re not going to the appropriate ward, but… we have to report that up the
road. You see it in the papers all the time, [journalists] love it: ‘they had 12
breaches last night’” [SM3].
For other participants, the manipulation occurred in the numerical data. This was most
frequently reported to be due to the pressure resulting from the need to meet targets for
financial gain, and was evident in the form of subtle gaming through the aggregation of
figures:
“The midwife-led unit numbers are put into the whole unit’s numbers… Third-
degree tear rate for perineal repair… if you include all the women who’ve had
sections in that, well, they were never going to have a tear, no-one went near their
perineum… If [for] spontaneous vaginal delivery rate you’ve included a birth
centre, then that’s going to falsely increase your rate. … You wonder what it does
to someone else’s data” [CM4].
Finally, it was reported that reliable data was ensured by having clear KPI definitions, a
sound evidence-base and guidance on how data was to be reported, alongside regular
reviews of KPI dashboards and data collection processes. If the standard or care had
changed, negating a need for modification, a case would often be made which was then

135
presented for consideration at board level. However, the soundness of some KPI
evidence-bases to “show that there’s a standard of nursing care available” [DoN2] was
questioned:
“One of the other issues was the robustness of the care bundles themselves… they
don’t meet the criteria of the IHI requirements” [SM2];
“Some organisations that I've worked in, we've reported it as a number and some
have reported it as a percentage... we either all do a number or we all do a
percentage” [SM8].
6.3.3 Closing the loop
Participants in half of the organisations reported the use of formal facilitated support as
a way of converting the raw KPI data into action to enrich practice. For example, working
with the multi-professional team, with management support to release nurses and
midwives and provide resources, resulted in the successful use of quality improvement
[QI] methodology to reduce the postpartum haemorrhage [PPH] rate, and thus distress to
mothers:
“We know there was an improvement by measuring it on the dashboard and
reports from the blood bank… of women requiring a transfusion... It was a PDSA
cycle. We audited all the PPH notes for one month and looked at the drug
management and realised that... the order of drugs… wasn’t in compliance with
the RCOG… We [questioned] medical and nursing staff… There was no
standard... We laminated [flowcharts] for everybody… Had theory drill and a
feedback session. Then asked ten [people] and the figures had improved slightly,
but still weren’t brilliant. We came up with this PPH box... you can reduce blood
loss if you go straight into the right order of drugs” [CM3].
However, while improving practice through QI methodology requires knowledge and
time, and often “staff just don’t have the headroom or the improvement capability to look
at that” [SM4], examples of improvement work without the use of QI methodology were
also reported. When clinical nurses and midwives had managerial support and were
engaged in decision-making, quite extensive changes to practice and the environment
were achieved with measurable evidence of patient benefit:
“A lot of our falls are around patients with dementia forgetting that they’ve broke
their hip and can’t walk... We’ve got a lot of distraction therapies in use now…
we looked at the [physical environment]... We looked at light, noise... We would
have had anywhere between five and ten falls per month. The last three months
we’ve had no falls” [CA2].
136
While most examples of collaborative improvement were reported at organisational level,
a few examples of regional work to improve practice based on KPI use were reported,
such as reducing the rate of “stillbirths as part of a national programme” [SM4], and for
a care bundle as part of a continence-related KPI:
“This is an all-[country] pathway and it's quite cumbersome… we're working with
our continence colleagues to say, ‘how can we make it user-friendly?’” [SM7].
Assistance to support the use of KPI’s for improvement mainly came from quality teams
or specialist nurses. Although responsibility for the improvement of practice may have
lain with clinicians, the provision of physical resources could be problematic especially
if it was financial in nature. Conversely, “as long as we were… going to improve the
service, I could have as many [machines]... as I wanted... As long as it was less than
£5000” [CC2]. Where action to improve practice seemed challenging was in relation to
problems requiring additional staffing:
“We have ongoing issues with… blocked catheters and out of hours calls and…
if we put nurses in to manage the catheters… then things do improve but we don’t
have the staffing” [CC3];
“There's no money in the system... the word ‘support’, as in ‘what can I do to help
you,’ but the actual, real, physical support, there's not a lot” [SM8].
For some participants, closing the loop to ensure action was taken on KPI data results
was sometimes a case of ‘doing whatever it takes’, when, despite trying many different
approaches, changes in practice had continually failed to embed and action was required:
“One of our wards ... was consistently zero [with their KPI dashboard] ... Lots of
complaints… and some safety issues... The morale was quite low and the
leadership on the ward wasn't as it should be...Turnover rate was very high, lots
of agency use. We changed the [nursing and medical] leadership..., personnel...
and structure... Their dashboard [scores went up] and consistently have been
thereafter. They now have the best stability, zero agency use… they top the charts
in all our awards internally, the complaints have just dropped off and the feedback
is consistently high” [DoN5].
Many of the examples of improved practice reflected actions based on service user
feedback, rather than action on specific patient experience KPI’s. Therefore, it was not
possible to evidence measurable improvement based on patient experience data. The need
for change may have been identified either by patients or relatives through comment

137
boxes in questionnaires. Changes to practice ranged from the relatively simple-to-
achieve, to changes that took more effort and involved changes to building contracts:
“The teas were going out before the breakfast. The feedback was that they would
like it together, so we’ve changed practice around that... The cups were small
plastic cups, people were saying, ‘we’d like bigger cups, we’d like them to be
insulated’” [CA4];
“Patients saying, "It's too bright at night, we can't sleep." So we have just... put
some dimmer lights in and it's taken some time because of the contracts” [SM6].
Additionally, action to meet the KPI target for “number of complaints” resulted in
improvements being made based on individual feedback. Action taken on this feedback
at clinical level not only improved practice at this level, but positively impacted on
strategic goals. The information available in complaints was also used to inform
organisational strategy:
“One of the things that’s really important is that we can demonstrate the impact
on the patient. That might be reduced pressure ulcers… on a macro level, but on
a micro level where incidents occur we’ve got a clear feedback loop in terms of
demonstrating actions for an individual patient… That’s why we review our
KPI’s, to make sure that they still align to the Trust’s values and vision and
strategy but also in relation to being relevant to making improvements” [DoN6].
However, responses in relation to how patient feedback was used to improve care was
inconsistent and a small number of participants struggled for an answer. For community
nurses, the responses suggested an ongoing relationship of feedback and negotiation: “It’s
something that we do every day in discussion with the patients” [CC4], while another
nurse stated, “I don’t think there’s anything. I suppose like pressure sores, we have
intentional rounding charts now… they work well” [CA7].
Occasionally, closing the loop was achieved by meeting the individual needs of nurses
and midwives. For one midwife, while KPI’s acted as the flag, further investigation and
person-centred knowledge of her midwives helped identify action to address the problem:
“From [the number of births] you’re able to look at [number] of transfers... If you
have one particular midwife who’s always transferring someone for continuous
monitoring, then... is it genuinely they’ve just had a really bad run… Or is it that
six weeks ago they were involved in a stillbirth and now they’re scared? Do you
need to support them and how can you do that?” [CM4].
138
Again, with KPI’s acting as flags, other examples of practice improvement illustrated a
sense of being curious to explore trends and question what action could be taken to
change these. Examples included actions on KPI’s relating to falls and the removal of
urinary catheters in the community, which involved action based on networking with
colleagues across organisations:
“One of the [wards] had the lowest rate of falls in the hospital and I thought, ‘this
is fantastic for the group of patients they have’, but the other ward had one of the
highest. I thought, ‘you two have got the same bed base, the same type of patients,
what are you doing that's so different?’ Part of it was an [inexperienced] new ward
manager... and there wasn't sharing because they were in different [locations]. It
was like they were poles apart. When I got them working together their falls came
right down” [SM6];
“I’ve had three last week and three the week before... [patients who] failed their
[trial removal of catheter] and they had epidurals. And I’m saying to myself, do
we need to look at the source of anaesthetic? Should we leave those patients [a
while]? ... Is it too early… because their mobility’s not brilliant? We’ve nothing
to compare it to because we had no previous clinic. I have a colleague in [another
Trust] who's going to send me her figures to see if… that would help” [CC2].
6.4 SUMMARY
This chapter has reported the findings from phase two of the study, with particular
emphasis on how KPI data influences decision-making at meso and micro level in
healthcare organisations. Participants with a range of experience in KPI use, working in
very diverse roles, provided a comprehensive overview of KPI management in practice.
Barriers and enablers for maximising the use of KPI’s have also been identified: some
are pertinent to specific roles and others are more general and recognisable by all
participants. Additional quotations that support these findings can be found in Appendix
20. The findings discussed here along with those from phase one are now drawn together
in the following discussion chapter.
139
Chapter Seven: Discussion
In keeping with an exploratory mixed methods design, this chapter focuses on bringing
together the quantitative data provided by DoNs on organisational KPI use and processes,
with the qualitative contextual perceptions of nurses and midwives working at meso and
micro levels. In isolation, each phase provides insight into various aspects of how KPI’s
are used; through integration (Figure 4.3, page 62), the findings present a more complete
and detailed understanding of the factors influencing their use for decision-making in
practice (Morgan 2014). With both phases reinforcing each other, the integrated findings
focus on the challenges associated with KPI use under the following headings: the use of
multiple KPI’s and data burden; measuring what matters; data management; collective
leadership; and situating KPI’s within implementation science. In addition, to answer the
research question, the findings are explored through the lens of quality improvement and
implementation science theory. In this way the importance of transferring knowledge
gained from KPI’s into practice is emphasised.
The findings from this study indicate that participants have a desire to deliver the best
care for their patients, but do not fully understand how KPI’s can contribute to this. For
managers, nurses and midwives to actively engage and take ownership of implementing
KPI’s into practice there is a need for them to have greater involvement in the decision-
making aspects of the KPI process, from selection to evaluation, in order to make the
connection between the use of KPI’s and improvements to practice.
7.1 THE USE OF MULTIPLE KPI’S AND DATA BURDEN
Globally, numerous KPI data sets and frameworks have been established (NQF 2003; the
KPI Institute 2013; NHS Group 2014). Data from both phases of this study nevertheless
show that organisations still struggle to identify clearly which measures to select, and that
tensions exist between ensuring public protection and minimising the workload involved
in data collection. This would indicate little understanding of what KPI’s are and what
their role is, which is a significant finding of this study identified across all levels of
nursing and midwifery. As Dubois et al. (2013), among many others, have stated, KPI’s
can provide a comprehensive and accurate picture of nursing and midwifery services,
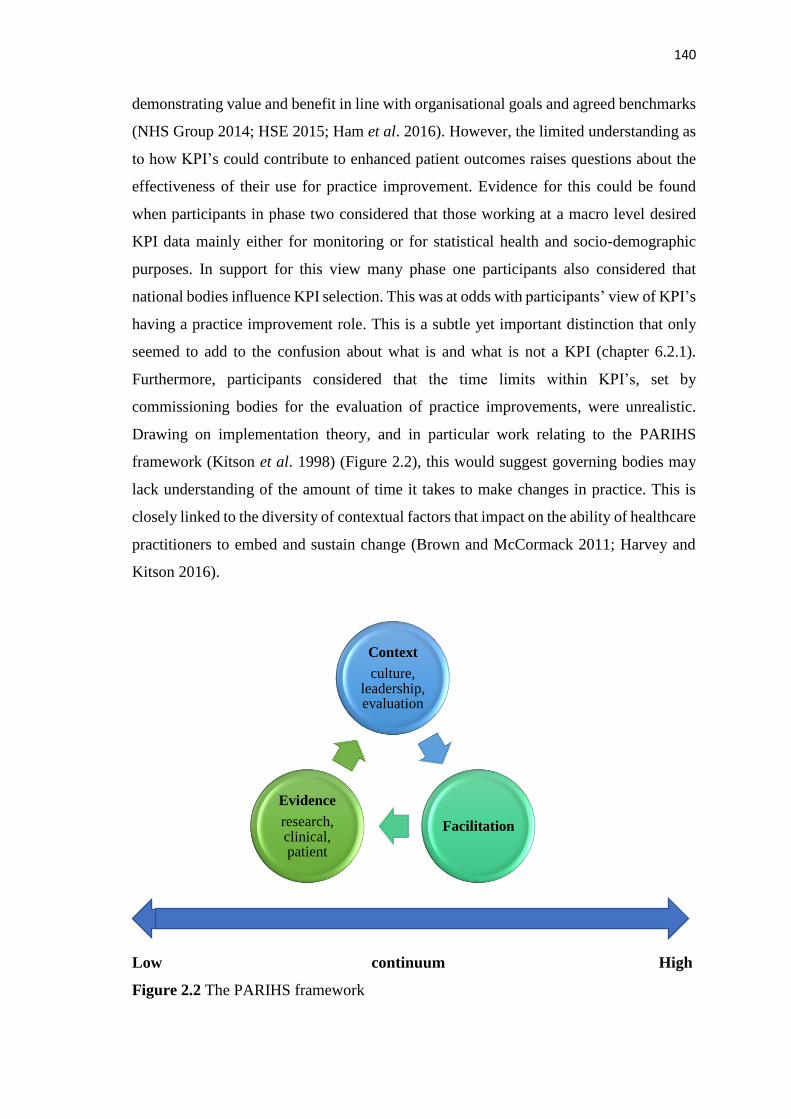
140
demonstrating value and benefit in line with organisational goals and agreed benchmarks
(NHS Group 2014; HSE 2015; Ham et al. 2016). However, the limited understanding as
to how KPI’s could contribute to enhanced patient outcomes raises questions about the
effectiveness of their use for practice improvement. Evidence for this could be found
when participants in phase two considered that those working at a macro level desired
KPI data mainly either for monitoring or for statistical health and socio-demographic
purposes. In support for this view many phase one participants also considered that
national bodies influence KPI selection. This was at odds with participants’ view of KPI’s
having a practice improvement role. This is a subtle yet important distinction that only
seemed to add to the confusion about what is and what is not a KPI (chapter 6.2.1).
Furthermore, participants considered that the time limits within KPI’s, set by
commissioning bodies for the evaluation of practice improvements, were unrealistic.
Drawing on implementation theory, and in particular work relating to the PARIHS
framework (Kitson et al. 1998) (Figure 2.2), this would suggest governing bodies may
lack understanding of the amount of time it takes to make changes in practice. This is
closely linked to the diversity of contextual factors that impact on the ability of healthcare
practitioners to embed and sustain change (Brown and McCormack 2011; Harvey and
Kitson 2016).
Low continuum High
Figure 2.2 The PARIHS framework
Context
culture, leadership, evaluation
Facilitation
Evidence
research, clinical, patient

141
Both phases of this study highlighted that nurses and midwives did not seem to fully
understand KPI’s, as they had limited engagement with the full KPI process. Phase one
findings highlighted that data collection is the main way in which clinical nurses and
midwives are involved in the use of KPI’s. This was verified at interview, has been
confirmed in previous literature reviews (Maas and Delaney 2004; Dubois et al. 2013),
and would indicate that clinical nurses and midwives have little involvement in the full
process of KPI management and implementation as described by Artley and Stroh (2001).
Yet involvement, from the inception of KPI’s to evaluation and implementation of action
to improve practice, could potentially increase nurses’ and midwives’ understanding of
the value and relevance of KPI’s. This is an important issue, as highlighted by Wilkinson
et al. (2000) in their primary care study which found that a lack of understanding may
lead to an indifference to KPI’s, which in turn may limit action on KPI data. Similarly,
the use of KPI’s as management tools may be overlooked (Wilkinson et al. 2000), thus
reducing their effectiveness (for example, in workforce planning and the monitoring of
care). Berwick (2008) points out that it is those people making the changes in healthcare
who know most about the context and the mechanisms that will work to effect change.
With this in mind, the application of Normalisation Process Theory (May and Finch
2009) would be beneficial. Similar to the PARIHS framework (Kitson et al. 1998), it
encourages staff to explore the barriers that may exist in their areas of practice in
anticipation that they will then take ‘collective action’ (the third component of
Normalisation Process Theory) to address these, thus ensuring that implementation
occurs (May and Finch 2009). However, Berwick’s (2008, p.1184) argument, that staff
should be “equipped to study the effects of their efforts, actively and objectively, as part
of daily work”, is reliant on a culture that is supportive of collaboration and collective
leadership. This was not well evidenced in either phase of this study.
A culture of inclusivity is required if clinical staff are to be involved in the decision-
making process. Involvement of this nature would enable staff to offer an opinion on the
selection of essential KPI’s, with the potential to ensure a greater focus on safety and
quality of care. Within the PARIHS framework (Kitson et al. 1998), the involvement of
staff in decision-making requires the establishment of a culture where shared decision-
making is encouraged and supported through robust leadership (Brown and McCormack
2011). This would suggest that a context (an environment or setting in which practice
takes place (McCormack et al. 2002) situated more towards the high end of the continuum

142
is required for successful implementation of KPI’s. DoN’s in phase one listed various
opportunities for nurses and midwives to be involved in the use of KPI’s. However,
participants at all levels in phase two, stated that there was limited shared decision-
making in relation to identifying the pertinent KPI’s, situating context towards the lower
end of the continuum.
This was also apparent through the listing of multiple KPI’s by DoNs, providing evidence
that the recommendation to use only a small number of important KPI’s is not carried
through in practice (DoH 2008; HIQA 2010; DoH 2017). At interview, DoNs explained
that they were also responsible for KPI’s relevant to other disciplines. They did not
distinguish these in their questionnaire responses, which explains the listing of some non-
nursing and midwifery specific KPI’s such as ‘complaint response times’. Qualitative
data also confirmed that most of the KPI’s listed in phase one were nationally mandated,
with limited organisational involvement in KPI selection. Findings indicated that local
councils, departments of statistics, professional bodies and networks, and national
databases all contribute to the weight of data that is requested. With no national or
organisational overview reported, the full extent of the workload in generating and
managing this data is unknown. Nevertheless, it was reported to be having a negative
impact on the efficiency of the system, and the administrative cost incurred was
speculated to be significant. Qualitative findings further show that, nationally, the
mandated data is either not always reported on or is not timely and cannot therefore drive
improvement. This mirrors the observations made by Heslop (2014) who, in an editorial,
raised concerns that data may be used for monitoring purposes rather than the aim of
reducing patient risk.
A contributory reason for the proliferation of KPI’s is the directive for development of
measures that evidence safety, quality and compassion in care arising from national
enquiries into healthcare failings (Francis 2013; Bubb 2014; Heslop et al. 2014).
However, this increase in public organisational accountability, aimed in part at improving
governmental performance, has resulted in negative behaviours (as surmised by Ossege
2012). These developments appear to have given rise to a culture that emphasises
performance monitoring and holding to account, with the qualitative findings of this study
highlighting the resultant anxiety and drive for assurance, as well as gaming, previously
identified by Griffiths and Maben (2009). Due to the centralisation of national monitoring
143
and its distance from the practice setting, there is a misguided sense that having big data
will provide the requisite assurance of performance, as reported in chapter six. This is
then replicated within organisations, with reports of data being collected unnecessarily in
anticipation that it might be requested by regulators. It would appear that the importance
of burden not exceeding benefit, as stipulated in national guidance for nursing and
midwifery KPI’s (DoH 2017), has been outweighed by nurses’ anxiety about
performance management. Alternatively, for nurses who are not engaged in using KPI’s,
these demands for assurance are viewed as of little significance, demonstrated through
the non-submission of KPI data or the submission of data with no further action being
taken (section 6.3.2). This emphasises the view that nurses do not fully understand how
KPI’s could contribute to clinical practice, nor do they actively engage in practice
improvement.
The demand for so much KPI data, as reported in phase one, for what appears to be purely
monitoring purposes at an external level, sets the tone for what then occurs in practice.
With little feedback, qualitative data suggests that the focus shifts away from KPI’s being
used for improvement and instead is directed towards a drive for assurance. This pressure
for data increases incrementally down through the organisations as each level adds more
KPI’s until the end-point is reached in clinical practice. Since nursing is the one constant
in care delivery (Hoi 2008) and interweaves with all other professions, it is not surprising
that nurses and midwives are the key people to approach for patient data. However, the
qualitative findings revealed that DoNs may not be aware of all the data that is collected,
especially if it is not reported through nursing. For example, some interviewees stated
that intensive care and midwifery data was reported through medical channels. Therefore,
this leads one to question if the volume of data collected from the lists of KPI’s provided
by the DoNs in the questionnaires may have been underestimated. Thus, at the lowest
level, nurses and midwives are expected not only to provide the KPI data, but are
delegated the responsibility of acting on it and improving care. This is of additional
concern when considered in light of Goddard and Smith’s (2001) argument that pushing
staff to deliver an unreasonable number of targets may increase stress, lower morale and
ultimately compromise quality and performance.
The recognition by interviewees of the requirement to address the growing problem of
data burden is in keeping with the call for a fifty per cent reduction in KPI’s made by

144
Berwick (2015). There has been little discussion in national policy about how this might
be achieved, although RCN Scotland (2016, p.5) recently highlighted the necessity for an
“exit strategy” to be built into KPI’s, acknowledging the need identified in this study to
consider their ‘retirement’. Principally, though, other than the requirement for regular
KPI review (RCN Scotland 2016; DoH 2017), mechanisms or advice on stopping or
reducing the frequency of data collection are rarely mentioned. Consequently, findings
indicate that effective KPI’s, which are well embedded in practice and achieve consistent
compliance, continue to be collected at regular monthly intervals, years later. Some
organisations had taken steps to review and reduce the internal data they collected but,
although an effort had been made to challenge the need for successful mandated KPI’s,
the overall perception was that this was non-negotiable.
Non-negotiable factors tend to impact negatively upon shared decision-making, which
was borne out by this research. An exploration of the decisions made around KPI’s, based
on interviews, revealed little evidence of organisational leaders being able to influence
decision-making at a macro level. This suggests that the key role of macro leaders, in
terms of transforming cultures and shaping the context to prepare it for change (Rycroft-
Malone 2004), is not being realised to its full potential. When considered from this
perspective and through the lens of the PARIHS framework, context falls to the lower
end of the continuum (Kitson et al. 1998). While mandated KPI data is useful at national
level as a means of monitoring practice, findings demonstrate that the identification of
further aspects of care in need of improvement at an organisational level results in the
implementation of new KPI’s and ever-increasing burden on clinical practice.
Whilst acknowledging that improvement science requires measurement in order to assess
the progress of implementation, for example in the ‘study’ phase of the PDSA cycle
(Deming 1992, chapter three), it is argued that this need could be met by the use of tactical
metrics rather than KPI’s, as discussed in chapter two, which could then be reduced or
stopped as appropriate. While the term ‘tactical metric’ was not mentioned at interview,
a similar concept, which was used to educate staff, was described as: “auditable measures
underneath something like a statutory target on infection control” (DoN 6). However, the
introduction of this concept would require a clear understanding of KPI’s at all levels,
which findings show is lacking.
145
Neither phase of this study uncovered much use of theory for KPI implementation, and
the PDSA cycle, which was mentioned by a few interviewees, was the only
implementation tool identified. This suggests that there is limited knowledge and use of
implementation science and quality improvement methods, which presents a challenge in
practice. Without this knowledge, nurses and midwives remain unaware of the benefits
that can be gained from theoretical understanding in both guiding successful
implementation through the identification of, and action to address, barriers, and also in
supporting the evaluation and sustainment of improvement. Implementation tools such
as PDSA cycles may help to guide a change in practice, but unless theory is applied to
help predict or explain the factors which may disrupt practice improvement, it may not
be embedded and sustained.
7.2 MEASURING WHAT MATTERS
The concept of measuring what matters was clearly important for interviewees and sits
within the evidence construct of the PARIHS framework (Kitson et al. 1998), which
comprises evidence drawn from research, professional consensus and patient opinion.
Researchers argue that these sources are equally important if evidence is to be highly
relevant and effect changes in practice (Sackett et al. 1996; McCormack et al. 2002;
Rycroft-Malone et al. 2004; Turner et al. 2017). However, both the quantitative and
qualitative findings of this study support Pearson’s (2003) view that there continues to be
a lack of clarity about what is important to be measured. In phase two of this study it was
apparent that, where organisational culture recognised the unique perspectives of nurses,
midwives and service users, decision-making for KPI selection was inclusive of all.
Organisations were seen to listen to feedback from a variety of perspectives and through
this engagement to address the need for meaningful indicators. New avenues of
communication were opened, resulting in managers learning what was important for
practice, approving resources, and being willing to retire KPI’s or reduce data collection.
The organisation’s values were matched to actions, existing KPI’s were reviewed and the
development of new KPI’s was aligned to strategic goals (Artley and Stroh 2001; Drake
2013). However, where the organisational culture was not conducive to collaborative and
participative partnership (Boomer and McCormack 2010), the realities of the practice
context were seen to be ignored, resulting in irrelevant or ineffectual KPI’s being
enforced. In such organisations, despite policy calling for healthcare to provide service
146
users with the necessary skills for partnership working, there was little evidence of
collaboration with patients and families (National Advisory Group on the Safety of
Patients in England 2013). Aligning these findings to the PARIHS framework (Kitson et
al. 1998), it is clear that genuine engagement with the collection of multiple sources of
evidence developed a positive culture in which evaluation seemed more meaningful. This
positions evidence and context at the higher success end of the PARIHS framework
(Kitson et al. 1998). Conversely, organisations who dismissed the concept of gaining
evidence collaboratively worked towards the least successful low end of the PARIHS
continuum (Kitson et al. 1998) in terms of evidence and context.
Exploring more fully the evidence from multiple sources, it became apparent that patient
evidence was not particularly well represented. While Donabedian’s (1988) model gives
equal credence to structure, process and outcome measurement, it would appear that
outcome is mainly assessed in relation to physical health as opposed to outcomes of care
delivery as perceived by the patient and family. Examining the lists of KPI’s in the
quantitative findings revealed the collection of only a small number of patient experience
KPI’s. This was of interest, as phase one of the study also revealed that patient experience
KPI’s were the second most frequently quoted as being of value for measuring the quality
of care. The qualitative findings indicated that the use of patient experience KPI’s
remains focused on the acute sector. Community settings reported little gathering of
patient experience data, citing similar challenges to those working in the acute sector,
such as ensuring anonymity and honest responses, which remain to be addressed (Glasper
2016).
Opportunities were also lost for clinical nurses and midwives to act as patient advocates
in decisions made about the selection of patient experience KPI’s, as they too had limited
representation at strategic level despite this being recommended (RCN 2011b; HIQA
2013). This may be because nurses and midwives are considered to lack the necessary
KPI knowledge for effective collaboration, in which case the required development
should be supported, a similar argument to that which Berwick puts forward for patient
and family inclusion and collaboration (National Advisory Group on the Safety of
Patients in England 2013). Joint participation of all management levels and patients or
carers in KPI selection was reported in only one organisation. In most organisations, but
not all, clinical rather than patient opinion was sought. This information was funnelled

147
through senior management to the directors for presentation at executive level. While the
PARIHS framework (Kitson et al. 1998) states that clinical opinion is a valuable and
viable source of evidence, in isolation its relevance to the selection of KPI’s is weak.
Therefore, to address patient issues and concerns, evidence from both patients and
clinicians is required; a finding that was limited in this study.
The argument for engagement of clinical staff and service users in all aspects of KPI
management is further strengthened when the findings from phase one are considered.
The scarcity of indicators in fields of practice, other than maternity and the acute sector,
suggests a disparity in KPI use. Given the drive for primary care delivery in the
community (Primary Care Workforce Commission 2015), the paucity of community-
specific KPI’s identified in the questionnaire responses warranted further exploration,
with phase two confirming a significant gap. Two points emerge from this finding firstly,
that research has yet to demonstrate what best practice is for certain aspects of community
care; and secondly the struggle experienced by district nurses in trying to identify what
should be measured.
In relation to the first point, while the adaptation of KPI’s, such as the prevention of
pressure ulcers and falls, was described by managers as having been successfully
implemented in community residential and nursing homes, it was reported by district
nurses that KPI’s and guidance struggled to address circumstances unique to the care of
patients in their own homes. The international literature corroborates and attempts to
address the KPI gap in community care. In Canada, a shortfall in staff triggered the need
for initiatives to strengthen primary care with subsequent measurement (Barnsley et al.
2005), while in the UK it was geographical variation in the quality of care across primary
mental health services which led to KPI development (Shield et al. 2003). However,
research has to date focused on the development and use of KPI’s in general practice
(Barnsley et al. 2005) and communal community care (Fossum et al. 2011). KPI’s
designed for use in settings such as those providing specific palliative and dementia care
(Vasse et al. 2012) will be very difficult to apply to the delivery of this care in patients’
own homes, hence a tension exists. Viewing this argument in relation to the PARIHS
framework (Kitson et al. 1998), it can be seen that empirical research utilising both
clinical and patient and/or carer evidence would potentially help to identify which aspects
of care it is important to measure in this setting. Until this gap is addressed, qualitative

148
data from this study suggests that the ‘one-size-fits-all’ enforcement of KPI’s, onto areas
of practice for which the evidence-base was not designed, is destined to fail.
In relation to the second point that emerged from the scarcity of community specific
KPI’s - the struggle district nurses experienced in trying to identify what mattered to them
and what they felt should be measured - if the aim is to improve patient care, it is
undoubtedly the patients who should be asked this question. For KPI’s to be meaningful
for patients being cared for in their own homes, their engagement is even more crucial
than that of nurses and midwives. It is nurses with their practice experience, and those in
receipt of community care who live with the problems, who can provide the expert advice
needed to inform the evidence-base and decision-making about what is important to
measure for improvement (McCance et al. 2012). Service user engagement in KPI
development would also contribute to discussion of how patient choice should be
addressed within KPI’s when this is contrary to the evidence-base (Olsen 2011;
Dwamena et al. 2012; Kӧtter et al. 2013). Policies currently state that targets must not
take precedence over the patient’s wishes (DoH 2017): although it was not clear in these
findings if nurses and midwives were aware of this, they reported in discussion that their
priority was to meet the patient’s needs, not the targets. While the arguments above
specifically focus on community KPI’s, they are also highly relevant to all areas of
practice including those with well-established KPI’s.
The impact of recent national policies (NHS Scotland 2015; DoH 2017) calling for all
organisations to collect data specifically to measure their patients’ experiences was
evident in the high number of patient surveys reported in phase one. However, this was
contested at interview. Viewed from a theoretical perspective, opinion about patient
experience as evidence of performance can also be seen to vary. Discussion of evidence
features less in Parson’s theory (1960) and Normalisation Process theory (May and Finch
2009), but does play an important role in the PARIHS framework (Kitson et al. 1998),
the Iowa model (2017), Perrow’s theory (1967) and Donabedian’s framework (1988). An
advantage of the collection of patient experience data, highlighted by Donabedian (2005),
is that it can be obtained close to real-time, whereas outcomes of physical interventions
may take time to manifest. He also states that measurement of only physiological function
will result in a different assessment of performance than if psychosocial function is
included (Donabedian 1988). Although Perrow does not talk about patient experience as

149
evidence per se, he does take a subjective view and discusses ‘technology’, by which he
means cognitive processing. Perrow (1967) uses the term ‘technology’ to distinguish
between the different approaches to problem-solving that can be found, for example in
custodial or socialising institutions and psychiatric agencies. When discussing ‘craft
technology’, Perrow (1967) states that because the nature of thought processing is
sometimes unanalysable, staff must rely on feedback from patients. As an evidence-based
process model, the Iowa model gives credence to various forms of evidence including
regulatory and national initiatives, and philosophies of care (Iowa Model Collaborative
2017). It also requires consideration of the strength of the evidence, and whether the
implementation of a change in practice is appropriate to a particular setting (Iowa Model
Collaborative 2017).
Although all organisations that took part did report their national surveys, for some
interviewees these were not seen to represent patient experience. Essentially this was
because they were simply used to monitor organisational performance at a high level and
lacked the meaningful detail required for improving practice. If supplementary methods
were not employed, then interviewees perceived that no patient experience data was
collected. This is concerning given that the quantitative data reveal that almost a quarter
of participants did not collect patient experience data and therefore have no feedback on
which to base service improvement. Additionally, regardless of whether or not
supplementary patient experience data was collected, it was perceived to be of little
consequence to other professionals at board level. This potentially results in
organisational strategies that do not reflect either what is important to the patient or the
reality of day-to-day practice (Francis 2013). Therefore, as highlighted by the findings of
this study, what is being measured is not necessarily always meaningful and may not have
the desired impact on practice.
A fundamental premise of the PARIHS framework (Kitson et al. 1998) is that while
research is strongly favoured as a source of evidence, all sources, including the views of
the patients and carers, are meaningful and constitute evidence (Helfritch et al. 2010;
Harvey and Kitson 2016). Consequently, the limited, and sometimes neglected focus on
patient opinion and experience which these findings highlight, places this form of
evidence on the lower end of the PARIHS continuum. Indeed, this is also argued to be
the case for ‘culture’ given the perception that not all professionals appreciate the value
150
of seeking patient experience data. Interestingly, attributing less importance to patient
experience data is at odds with the importance placed on addressing patient complaints
and adverse incidents, identified in phase two. The fear of litigation and adverse negative
publicity for an organisation appears to play a role in defining what is important and
requires attention.
Rather than being proactive and seeking to explore the opportunities that patient
engagement might provide, some boards were perceived to seek reassurance in their
numeric data, blind to the limitations imposed by this narrow way of thinking, such as
obstructing the development of person-centred cultures (McCance et al. 2015). The
paternalistic approach of the medical model is apparent in the interviews and is seen to
thwart attempts to listen to what the patient has to say. In part this may be due to the lack
of credibility and inadequacy of methods used to gain and report informative patient data,
or, as Turner et al. (2017) state, it may be because the type of evidence preferred varies
depending on the service or professional group.
Surveys remain the mainstay of data collection but, as has been revealed, these are not
regarded as effective. While both phases of the study confirmed the complexity of
measuring the holistic elements of care to which nursing contributes so much, there was
evidence of some progress in this regard (Griffiths et al. 2008; Dubois et al. 2013;
Abrahamson et al. 2015). Based on the view that person-centred outcomes should be
designed around what the ‘person’ believes is important for further improvement
(McCormack and McCance 2017), McCance et al. (2015) reported positive initial testing
of eight person-centred KPI’s, and elements of these were identified in both phases. Co-
designed by service users, KPI’s such as these would provide measurable data that meet
quantifiable requirements and address the call for KPI’s that contribute to the
psychosocial aspects of nursing practice (Dubois et al. 2013; Noh and Lee 2014). In this
way, ‘co-design’ moves the use of evidence towards the high end of the PARIHS
continuum (Kitson et al. 1998). These KPI’s are therefore relevant for both clinicians and
patients, and there is increased potential for their application across nursing and
midwifery settings, which would also meet the need for comparability.
It is a significant challenge to design KPI’s that are flexible enough to be applied across
the diversity of nursing and midwifery practice. This is especially difficult when
151
considered alongside the need for KPI’s to be comparable (Griffiths et al. 2008; HIQA
2013). Once adapted to suit the distinct needs of practice, a KPI is no longer comparable
at national level unless negotiated for use in similar practice across organisations; this
requires collaboration, which appears to be limited. As reported in chapter six, this
difficulty was taken advantage of by professionals and served only to hinder improved
performance and quality of care. Nationally, the desire for comparability is an assurance
mechanism and is at its roots driven by public and political concerns (Ossege 2012). At
this level the aim is for KPI’s to monitor practice. In theory they should also drive
improvement through a natural competitive desire (Bandura 1977), as identified in both
phases of this study, and through shared learning across organisations (St Pierre 2006),
of which there was evidence in phase one but less so in phase two. However, this is
dependent on the data being reported publicly, which phase two shows did not always
happen or was not timely, and improvement was restricted because the guidance within
the KPI’s limited their application to certain settings. Therefore, it is argued that a
compromise must be found between reliable comparability and flexibility if KPI’s are to
be used effectively for improvement, which is the ultimate and most important aim.
The selection and implementation of KPI’s can arguably contribute to the creation of a
conceptual representation of reality within healthcare, as the focus is on that which is
measured (Hauser and Katz 1998). For this reason, it is important to ensure that
organisations are measuring what matters by engaging with those who matter. This may
mean developing alternative methods to overcome patients’ communication difficulties
that may act as barriers hindering service user involvement. Consistent with the literature,
this study reveals that this is still not always the case (Walker and Dewar 2001; Phillips
et al. 2007; Kӧtter et al. 2013). Qualitative findings also indicate the enforced use of
KPI’s that hold no relevance to the practice setting, which in turn contributes nothing to
improvement because a problem does not exist, and serves only to bolster overall KPI
compliance or creates a negative impression of practice if taken out of context (chapter
6.2.2). Normalisation Process theory (May and Finch 2009) includes four components
that require attention if implementation is to succeed, of which the first two, ‘coherence’
and ‘cognitive participation’, have relevance here. May and Finch (2009) state that
coherence will be achieved if those involved have an understanding of why it is important
to implement an innovation. This then links with the second component of cognitive
participation whereby there is buy-in from the stakeholders. Similar to the PARIHS

152
framework (Kitson et al. 1998), this theory works on a continuum. Thus, if there is low
coherence or cognitive participation, the likelihood of successful implementation is
reduced (May and Finch 2009).
7.3 MANAGEMENT OF KPI DATA
In an initial exploration of the findings related to ownership of KPI data, it was revealed
that, in order to own the data, practitioners really needed to collect it. This was somewhat
surprising given the disadvantages highlighted by nurses and midwives in collecting data,
in terms of the increased workload and cost which outweighed the benefits. Similar to the
literature, all levels of interviewee stated that the primary benefits of data collection were
increased understanding and ownership (Groff-Paris and Terhaar 2010; Foulkes 2011). It
was also clarified at interview that it was the clinical managers who mostly collected the
data, unless practice involved a caseload or one-to-one care where it was the
responsibility of the individual practitioner. While being responsible for data collection
potentially has merit, the data highlighted that a dichotomy existed between the
perception of nurses and midwives that collecting data would translate into greater
understanding and engagement of KPI’s, and the reality of practice (section 6.3.1). This
was particularly evident when exploring the responses of nurses and midwives working
in more IT-efficient organisations. Despite these participants not being responsible for
data collection, they reported just as much understanding and ownership of KPI’s as those
working in organisations where they had to collect the data. Instead, the participants
talked about having regular opportunities to meet and discuss their KPI’s as an
organisational team. Similarly, clinical managers engaged their staff through regular
conversations about quality improvement, and were clear about their accountability. In
addition, they felt they had more autonomy and were supported to negotiate and take
action. This would suggest that linking KPI data collection with improved understanding
and ownership of KPI’s overall is too simplistic an idea. Drawing, once again, on the
PARIHS framework (Kitson et al. 1998) as a way of understanding what was occurring,
it is arguably the organisations fully engaged with KPI’s that displayed the behaviours
most often seen at the high end of the context continuum of the framework. An
environment that was conductive to having regular discussions about KPI’s and being
aware of the accountability of nurses and midwives indicated a culture with strong

153
leadership that valued their contribution to practice improvement (Schein 2010; Brown
and McCormack 2011).
The dichotomy that exists between the espoused and actual value of KPI’s on practice is
also important in terms of assurance. Paradoxically, not only is the manifold use of KPI’s
causing increased workload as evidenced in both study phases, but it may result in false
assurance at national level if the receipt of data, whether ‘good’ or ‘bad’, is assumed to
make practice and the quality of care visible. The reality is that this is impossible to
achieve, especially from purely numeric data (Werner and Asch 2007; Griffiths et al.
2008; Berwick 2015). McCormack et al. (2002) state that in an effective culture - that is,
one on the high end of the PARIHS continuum (Kitson et al. 1998) - there is a need for
both the ‘hard’ outcome data and the ‘soft’ data of user experiences in order to be able to
evaluate practice. In this way, as culture moves towards the high end of the continuum
(Kitson et al. 1998), so too does the sub-element of evaluation. However, the negative
impact on patient care that results from the effort involved in providing the measured data
remains unseen in what is not measured, and consequently managers continue in
ignorance of reality (Francis 2013). Similarly, caution should be exercised regarding
over-reliance on data triangulation, which was popular with managers. This could lead,
for example, to an assumption that finding an anomaly in one KPI is the answer to non-
compliance in another, and could be persuasive enough to stop further, more revealing
investigation. Due to a recognition of the need to augment data assurance with additional
information sources, most executive level directors undertook site visits and scheduled
regular engagement with all staff (chapter 6.2.3 and 6.3.1).
Apart from the community setting, this study did not identify as an issue the under-use
and limited adoption of computer systems referred to in previous reports (DoH 2008;
Donaldson et al. 2014). Exploring the findings from phase one more thoroughly in phase
two interviews, all organisations were noted to employ numerous systems and data
collection methods to obtain KPI data. However, this appeared to cause problems: as
phase one revealed, most patient care data is still collected on paper, with interviewees
complaining that the documentation audits used to provide evidence for KPI’s were the
most burdensome. The required data had to be extracted manually and collated for
reporting through computers. Other data, such as staff rostering, was compiled solely on
computers, while yet more data was collected both manually and on computers, such as

154
incident reporting. These systems in turn acted as reservoirs of information for KPI use.
Phase two subsequently revealed that these systems were rarely capable of ‘talking’ to
each other to pull down and merge the required information into one KPI database. This
complicated data collection and reporting processes causing duplication, confusion and
frustration rather than aiding understanding and decision-making (DoH 2004; Parlour
2013). Nurses and midwives identified a need for data to be succinct and easily accessed
if they were not to be discouraged from engaging with the information, and managers
resented the time spent looking for what they needed. This is consistent with a concern
raised by Berwick (2015) about systems of data management that, if they were not fit for
purpose, technology would only make them work faster, not better. However, Mannion
et al. (2005) report that, when effective systems are matched with supportive technology,
research has shown a positive relationship with high performing organisations. In such
situations priority is placed on the development of cutting-edge information systems to
support the management of performance data (Mannion et al. 2005). Similarly, in this
study, when efficient systems with designated information technology (IT) personnel
were employed, data burden was rarely mentioned and interview conversation focused
on data use. Also, where these personnel were the phase one ‘other’ data reporters, they
provided the benefit of skilled updating of systems following the review, addition or
removal of KPI’s.
Despite the large number of KPI’s identified in phase one, interviewees reported that data
in midwifery was collected efficiently, possibly for the reasons reported in section 6.2.2.
Here, though, interviews revealed further issues with KPI reporting. Firstly, the sheer
volume of data collected, as identified in phase one, posed a simple logistical problem,
as computer screens can only present so much information before legibility becomes an
issue (RCN 2011a). Secondly, the way in which some organisations managed this
difficulty resulted in a two-system approach. One system appeared to take priority and
reported maternity KPI data, while the second system assumed less priority and reported
organisational KPI data. This created confusion as to what a KPI was (Rutherford 2008)
and what was important, and potentially reinforced a ‘them and us’ mind-set. There is a
strong argument to be made across all services for reducing KPI’s to those that are
actively being used for improvement or that are important for monitoring purposes, and
for each service to present a single report of their specific and general organisational data.
Furthermore, in this setting the evaluation of practice through multiple measurements did

155
not seem to result in a complete picture of care being achieved, as might be assumed.
Rather, the midwifery KPI’s identified in the quantitative data appear to rely on a narrow
source of performance information, few of them measure experience, and the evaluation
of performance relies on single rather than multiple methods (McCormack et al. 2002).
Therefore, evaluation in this context would be situated towards the lower end of the
effectiveness continuum in the PARIHS framework (Kitson et al. 1998).
Sixty years ago, March and Simon (1958) proposed that the flow of information in
organisations outstripped managers’ capacity to process it, and that to simplify problems
they relied on managerial cognition to scan, analyse and make decisions regarding action
(Johnson and Hoopes 2003). Since then the information flow has increased significantly,
as demonstrated in phase one by the increasing growth and reporting of KPI’s. The ability
of modern systems to scan data trends was commented on favourably by participants.
Whereas previously a gradual increase in the incidence of a harm, such as the number of
patient falls, might have been subconsciously accepted as a new norm, now nurses can
see the trend as it develops and take action (Phillips et al. 2007). However, while IT
visuals increase managers’ ability to scan data, the analysis and resultant decision-making
are still largely dependent on manageable data volume, contextual understanding and
experience. Qualitative findings suggest that these are issues which need to be improved.
As the qualitative findings demonstrated, human fallibility, gaming due to various
pressures, and changeable contextual issues may all contribute to the provision of
inaccurate data, for which managers need to be vigilant. Additionally, the study revealed
that, although there were occasions when feedback on data failed, overall reporting within
the hospital setting was good. Yet despite all organisations providing some method of
displaying KPI results, nurses and midwives still reported a lack of KPI understanding,
and ignored or failed to see the relevance of the displayed data to their practice. This
supports the finding of Burston et al. (2013) that, despite progress in the collection and
reporting of KPI’s, they remain at the periphery of clinical practice. While this was true
for most of the participant organisations, it was less evident where there was additional
input in the form of ongoing organisationally inclusive discussion and active engagement
in KPI use and decision-making. The extra level of facilitative support provided by a few
organisations, through shared learning and engagement in decision-making regarding the
use of KPI’s, did appear to make a difference, strengthening ownership and helping
156
nurses interpret and act on their data. Mc Cormack et al. (2002) argue that it is the
characteristics of leadership, culture and evaluation in Kitson et al.’s (1998) PARIHS
framework which may best capture and characterise issues of context. In these few
organisations, the descriptions provided by participants of their collaborative and
inclusive experiences provide evidence of strong leadership, culture and evaluation, thus
moving the element of context towards the high end of the continuum in the PARIHS
framework (Kitson et al. 1998).
Although surveys were the main method to gather patient experience data, other
techniques were also employed. However, challenges were identified in the management
of this information. Neither phase revealed a reporting method capable of pulling this
data together to provide a cohesive picture. This often resulted in one overarching patient
experience KPI – such as ‘the number of survey responses’ or ‘number of people
recommending the service’ – being included in dashboards, possibly because this was the
only or easiest option, which Griffiths et al. (2008) advise may not be the most effective
decision for practice improvement. As well as providing little useful information, this
restricted the visibility of survey items and limited the analysis undertaken at board level
unless specifically requested or reported (Greenhalgh et al. 2014). It also meant that when
the more meaningful narrative data was presented, it was separate from the other numeric
data, arguably emphasising differences in the level of importance given to each. Where
less emphasis was placed on patient experience data, nurses and midwives reported
making their own decisions on what action to take, if any, and there was no challenge or
follow up. Thus, contrary to the advice of the National Advisory Group on the Safety of
Patients in England (2013), there is limited incorporation of patients’ views into
organisational practice. IT and social media were noted in phase two as avenues being
explored to facilitate greater inclusiveness in the collection of patient experience data.
However, given the diversity of service user abilities reported at interview, significant
challenges remain to be overcome in providing everyone with an opportunity to be heard.
7.4 COLLECTIVE LEADERSHIP
Organisations have been identified as consisting of many co-existing cultures, and they
all impact on organisational performance (Schein 2010). While the concept of
performance is as complex to understand as culture (Mannion et al. 2005), the central

157
importance of leadership for cultural change and continuing performance improvement
is well documented and was also found in this research, albeit to varying degrees (DoH
1999; Schein 2010; National Advisory Group on the Safety of Patients in England 2013).
Recently, there has been a focus on the need for collective leadership as a means of
developing cultures where responsibility and accountability for performance lies with
staff at all levels (West et al. 2014; NHS Improvement 2016). However, qualitative
findings reveal limited evidence of collective leadership and staff working together to
reinforce the desired organisational cultures or to improve care within and across trusts,
despite the reporting structures listed in phase one. Instead, a more autocratic and top-
down form of leadership was generally identified. Even in one organisation where
participants indicated a culture of collaboration and inclusion, there was evidence of
autonomy being suppressed: for example, although a KPI may have had no relevance to
an area, it was still enforced in order to meet the desire for organisational and national
comparison (chapter 6.3.1).
The literature clearly explains the importance of developing leadership qualities and skills
that will encourage staff to challenge, take calculated risks and learn from experience
(Francis 2013; National Advisory Group on the Safety of Patients in England 2013).
Additionally, Moss Kanter (1999) argues that successful change management comes
about if everyone affected by the change is actively involved and does not feel as if they
are just the tools or subject of the change, which this study has shown is sometimes the
case. May and Finch (2009) affirm this within their Normalisation Process Theory. The
more inclusive and thorough the action taken to achieve implementation, the more likely
it is to succeed. This, then, places the component of ‘collective action’ at the higher end
of the continuum. More can be achieved from a workforce if they are treated as human
beings and involved in decisions regarding their work (Wedderburn Tate 1999; Graham-
Dickerson et al. 2013). They need to be able to contribute and to believe that their
contribution is valued. However, the latter, if it is to be meaningful, should extend beyond
data collection, which findings reveal was the main way in which clinical nurses and
midwives were engaged in KPI management. The Iowa model (Iowa Model
Collaborative 2017) encourages the use of evidence from many sources, and proposes
that clinicians are prepared for change in practice but, as a process model, it is linear and
didactic which may offer limited consideration of culture and leadership.

158
More recently, leadership training for all levels of staff has been recommended, without
which it will be difficult for the culture of the NHS to change and overcome the
challenges of quality improvement (Jasper and Jumaa 2005; Dixon-Woods et al. 2012).
Leadership is important for those who are required to work with the competing demands
of clinical decision-making, staff relationships, organisational systems and authority
(Dopson 2007). Both data sets would suggest that all of these factors are present for those
working with KPI’s. While leadership training was not a focus of this study, it was
identified as important by a number of participants in phase two. For the clinical nurses
and midwives, the knowledge gained was used to establish ownership and engage their
staff to act on KPI data. A strong focus on collective leadership recognises that it is not
only the executives and managers who are expected to be leaders but also individuals at
all levels within the organisation (Mannarelli 2006; West et al. 2014). For
transformational or collective leadership to become apparent it is necessary to develop
cultures where everyone has an opportunity to contribute or lead (West et al. 2014).
Without effective leadership it can be difficult to build and sustain effective working
cultures (Brown and McCormack 2011). Thus, contexts that sit at the low end of the
PARIHS framework (Kitson et al. 1998) are more likely to have autocratic leaders,
whereas those at the higher end will have leaders who are able to work through their staff.
By virtue of their role, DoNs as organisational leaders have a unique advocacy
responsibility for nursing and midwifery, through which they can not only raise concerns
on behalf of staff but can influence change for improvement. Phase two revealed that,
although DoNs were aware of staff concerns relating to KPI use, when it came to
influencing change external to their organisations they felt powerless. Whilst they did
challenge the usefulness of some KPI’s, there was little evidence of constructive
conversation or negotiation with the mandating bodies. Why this occurred is beyond the
remit of this study, but is suggestive of a reluctance to buy into collective leadership at a
national level. Nevertheless, DoNs, as nursing advocates, have a responsibility to take
action and, because of their position, do have an opportunity to address this situation.
Speaking as a collective voice to policy makers can result in managers discovering that
most obstructive rules are within their power to change, “apart from some regulatory
barriers” (Berwick et al. 2017, p.2161). This study has revealed that DoNs are arguably
responding to demands rather than taking risks and making decisions about what they
want and need from KPI’s.

159
The negative impact of external bodies in relation to KPI use is evident in both phases,
although phase two demonstrated that concerns stretch beyond DoN level. There is no
doubt that these bodies have an important role, but they appear not only to limit the ability
of organisations to decide for themselves which KPI’s will be of most benefit, but to
create resentment. For example, a factor influencing KPI selection was reported by a
phase one participant as: ‘Told to by…’ [Y11]. Furthermore, as demonstrated in phase
two, external bodies are curtailing organisational and clinical risk-taking for practice
innovation and improvement, by encouraging instead a culture focused on monitoring for
assurance. This contrasts with the opinion of the National Advisory Group on the Safety
of Patients in England (2013, p.44), as set out in an open letter to the NHS where they
state the need to strike a balance:
“between the hard guardrails that keep things in proper order and the culture of
continual learning that helps everyone to grow”.
Where organisational culture is focused on assurance rather than the successful
implementation of evidence, it reflects a setting in which collective leadership is absent.
Senior leaders are required to create an environment that encourages staff to develop and
make appropriate decisions, while holding them to account (Brown and McCormack
2011). Nevertheless, argue Hodder and Marples (2005), there is a skill required in
knowing when to stand back and when to step in, and ensuring a balance is achieved
between helping staff to feel empowered rather than abandoned. The findings of this
study suggest that the culture in some organisations is one of fear regarding regulation
and inspection rather than one that invites checks as part of partnership working. Whether
this stems from a punitive regulatory or organisational culture, or both, is unclear.
However, action could be taken at executive and managerial level to turn this around so
that nurses and midwives do not feel performance-managed and end up over-collecting
data ‘just in case’. By engaging collectively with nurses and midwives as an
organisational leadership group, more can be achieved because the whole is greater than
the individual parts. This would also demonstrate to clinical managers the importance of
their leadership role in setting the culture, something of which they are often unaware
(Brown and McCormack 2016).
While quantitative data demonstrated various reporting strategies across organisational
levels, qualitative data showed that health professionals at board level were sometimes
perceived not to be working in partnership. As the main stakeholders in health service
160
delivery, doctors and nurses are accountable for the services they provide, and as such
have an obligation to work together to achieve the best outcomes for their patients.
Nevertheless, power plays between nurses and doctors have been well documented
(Mannion et al. 2005; Speed and Luker 2006) and are seen in this study at all levels.
Nurses and midwives perceived that they had limited influence when differences of
opinion arose between themselves and their medical colleagues. For example, it was
stated that doctors at executive level placed less emphasis on meeting KPI targets used
for organisational comparability, while trivial disagreements over where doctors should
hang their coats threatened compliance with infection control KPI’s. In their qualitative
study, Brown and McCormack (2016) identified similar autocratic medical behaviour.
However, while West et al. (2014, p.7) describe collective leadership as the “distribution
of leadership responsibility onto the shoulders of every person in the organisation”,
Brown and McCormack (2016) state that there will be occasions where senior leaders
may be called upon to hold others to account, which arguably would include peer
accountability at senior level. The latter, however, was not evident in this study, which
found that negotiation at board level was more of a struggle and there was no indication
as to where the authority for decision-making lay.
Whilst the complexity of these power and control relationships between doctors and
nurses presents a challenge to boards to provide stronger leadership, it was also seen
between nurses themselves, at national level in professional and departmental bodies,
through to clinical level. Clinical nurses reported subversion of managerial authority by
ticking the appropriate KPI boxes to appease their managers and then focusing the team’s
attention on what they considered to be more meaningful. This reflects a lack of open
communication and collaboration that was reported at all levels, with resultant frustration
of nurses and midwives at their limited involvement in decision-making. Here again the
findings can be linked to the weaker contextual characteristics of the PARIHS framework
(Kitson et al. 1998) demonstrating that potentially useful KPI’s were not being fully
exploited as nurses and midwives were not involved in decision-making processes.
Consequently, management remained unaware either of how meaningless the KPI’s were
to practice or the challenges involved. With collective leadership, the aim is to generate
commitment as a team to address such issues by setting out expected leadership
behaviours in organisational strategy (West et al. 2014). Collective leadership, both inter
and intra-professional, would support collaborative working, with everyone accepting

161
responsibility and accountability within their teams and to the wider organisation and
service users. The subsequent evaluation of leadership would be based on aligning
behaviours to the strategy (West et al. 2014).
In contrast to the “command-and-control” leadership culture described above, there were
also cultures that produced positive findings in relation to KPI use (West et al. 2014,
p.14). In phase two, the organisations where KPI’s appeared to have a strong impact on
driving improvement, there was evidence of a collective leadership culture, with those
interviewed displaying the traits and behaviours of transformational leaders (Kouzes and
Posner 2002; Tappen et al. 2006; West et al. 2014). At all levels, interviewees clearly
articulated the role KPI’s played in their practice, acknowledged their role in leading the
development of high-quality and compassionate care, and demonstrated examples of staff
engagement. Communication relating to KPI use was apparent within and across teams
at all levels. Nurses and midwives reported involvement in decision-making and were
confident in reporting failures as well as successes, knowing that open and honest
discussion was encouraged and used for learning by their colleagues. In this way, while
responsibility lay with nurses and midwives, its purpose was not performance
management. Some clinical managers reported to board level, in line with the
communication structures identified in phase one, but were supported by their managers.
This in turn could potentially help to develop their skills for future career progression.
They were familiar with their data and could relate it to what was happening in practice.
In these organisations, nurses perceived themselves to have autonomy to act in the best
interests of their patients; they could and did challenge authority and adapted practice on
their patients’ behalf even if it deviated from KPI compliance (Rambur et al. 2013;
Greenhalgh et al. 2014).
McCormack et al. (2002) suggest that these positive factors – including, for example,
involvement in decision-making, supportive staff relationships, collective leadership, and
authority to innovate – provide evidence of strong contexts when assessed within the
PARIHS framework (Kitson et al. 1998). In addition, qualitative data in these
organisations demonstrated the use of more than one source of evidence, further
strengthening the likelihood of successful practice improvement. A degree of service user
engagement and/or gathering of patient experience was identified. Similarly, staff survey
data was viewed as important to an organisation because it was acted on promptly:

162
“they’re not wasting any time finding out why staff are not satisfied” [CC2], reinforcing
the value placed on staff and the links between staff and patient satisfaction (Aiken et al.
2014). DoNs were visible to the nurses and midwives and role-modelled respect through
problem-solving with them, inviting challenge and celebrating success.
Collective leadership also requires service users to be leaders (Centre for Patient
Leadership and FPM 2013; National Advisory Group on the Safety of Patients in England
2013; McCormack and McCance 2017). However, with this aspect of collective
leadership often neglected according to both phases of the study, patient experience data
took less priority or was overlooked due to the limitations in collecting detailed feedback
and in presenting and reporting the data. In this respect, and as reported previously in this
chapter, when considered within the PARIHS framework (Kitson et al. 1998), a valuable
source of evidence is overlooked and an opportunity is lost in terms of improving those
aspects of practice which are important to the service users. Interviewees reported that
when collected, the use of narrative data, especially in the form of patient stories, was
particularly successful in securing emotional engagement and initiating action for
improvement. Conversely, none of the practice improvements identified in phase one
were reported to arise from patient engagement. West et al. (2014, p.15) argue that, as
with inter-professional team-working, “collective leadership with patients would require
a redistribution of power and decision-making”, reflecting Perrow’s (1967) theoretical
stance that staff must exercise their discretion and power to seek feedback that will help
to explain that which is difficult to analyse. The findings from both phases certainly
suggest that organisations are working on innovative ways to improve collaboration with
service users. Nevertheless, patient leadership is more than Patient and Public
Involvement, encompassing patients who, with support, can lead and manage their own
health and well-being, and use this to influence others (Center for Patient Leadership and
FPM 2013). To a small extent this was illustrated in phase two but will hopefully be
developed further if clinical nurses and midwives are themselves supported as leaders.
7.5 SITUATING KPI’S WITHIN IMPLEMENTATION SCIENCE
An extensive review of the literature and the findings of this study have highlighted the
limited knowledge of nurses and midwives regarding how to use KPI’s to influence
practice in an effective and consistently meaningful way. It has become apparent that the

163
successful use of KPI’s for quality improvement needs to be underpinned by theory
related to knowledge utilisation (Greenhalgh et al. 2004; Burston et al. 2013), and the
various theories and processes that promote KPI use have been drawn on throughout this
discussion. This may help to explain why getting KPI evidence into practice is not
straightforward (Rycroft-Malone et al. 2002), despite Berwick’s (2008) assertion that to
accelerate improvement a range of methodologies should be embraced, and also despite
research acknowledging the availability of numerous tools. The innovation of practice is
by its nature unique: it requires the design of flexible programmes of action where nurses
and midwives are encouraged to take risks and try new ways of doing things, with
mistakes tolerated and action taken (Berwick 2015). However, as the findings from both
phases show, innovation is not something that nurses and midwives are trained for; in
some organisations, this may be especially challenging given the weight of evidence
demonstrating KPI use for monitoring and assurance purposes rather than quality
improvement. In this study the focus on assurance can be seen to have a negative impact,
confirming that it is ineffective as a driver for improvement and instead may lead to fear,
as suggested by Berwick (2015). It is claimed that improvement will only be achieved if
situated in cultures that support the use of theories and methods in improvement science
and that understand that change takes time (Berwick 2015; Ham et al. 2016). In such
environments, their role for improvement will be better understood and lead to effective
use.
There are many theories within implementation science that would be useful in
supporting the implementation of KPI evidence into practice. This study has identified
components which appear in many of these theories, such as the need for evidence,
leadership, motivation and consideration of context. However, having looked at the
findings in their totality, it was apparent that they particularly aligned to the PARIHS
framework (Kitson et al. 1998). The constructs of the PARIHS framework (Kitson et al.
(1998) can be seen to weave and interlink with many aspects of the study data (Figure
7.1). It acknowledges that multiple evidence sources, context and facilitation are
interlinked components of knowledge transfer that may be essential for the successful
implementation of KPI’s into practice. In exploring the qualitative data there are some
areas where it is clear that organisations value evidence in all of its forms. However, in
others, policy and research evidence were favoured, with the quantitative data
demonstrating that little consideration was given to the benefits that could be achieved
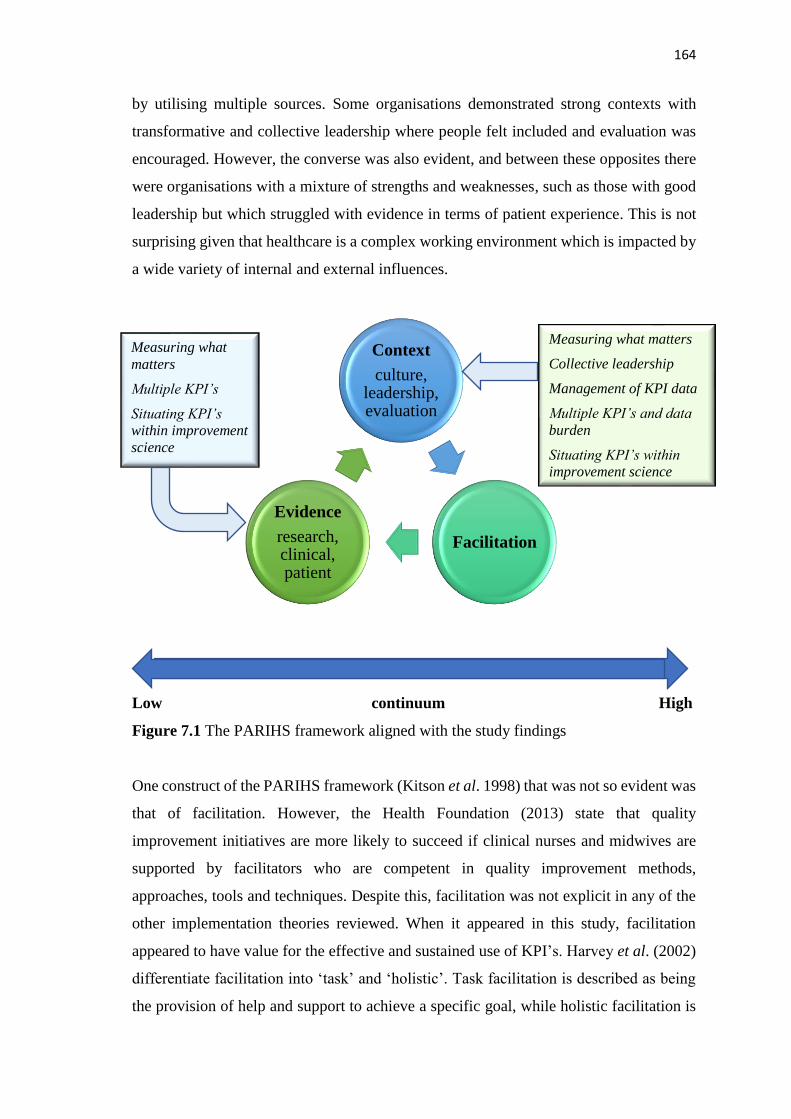
164
by utilising multiple sources. Some organisations demonstrated strong contexts with
transformative and collective leadership where people felt included and evaluation was
encouraged. However, the converse was also evident, and between these opposites there
were organisations with a mixture of strengths and weaknesses, such as those with good
leadership but which struggled with evidence in terms of patient experience. This is not
surprising given that healthcare is a complex working environment which is impacted by
a wide variety of internal and external influences.
Low continuum High
Figure 7.1 The PARIHS framework aligned with the study findings
One construct of the PARIHS framework (Kitson et al. 1998) that was not so evident was
that of facilitation. However, the Health Foundation (2013) state that quality
improvement initiatives are more likely to succeed if clinical nurses and midwives are
supported by facilitators who are competent in quality improvement methods,
approaches, tools and techniques. Despite this, facilitation was not explicit in any of the
other implementation theories reviewed. When it appeared in this study, facilitation
appeared to have value for the effective and sustained use of KPI’s. Harvey et al. (2002)
differentiate facilitation into ‘task’ and ‘holistic’. Task facilitation is described as being
the provision of help and support to achieve a specific goal, while holistic facilitation is
Context
culture, leadership, evaluation
Facilitation
Evidence
research, clinical, patient
Measuring what matters
Collective leadership
Management of KPI data
Multiple KPI’s and data
burden
Situating KPI’s within
improvement science
Measuring what
matters
Multiple KPI’s
Situating KPI’s
within improvement
science

165
that which enables “individuals and teams to analyse, reflect and change their own
attitudes, behaviour and ways of working” (Harvey et al. 2002, p.580). The researchers
state that these terms are not mutually exclusive and, as with the constructs of evidence
and context, exist as extreme points on a continuum (Harvey et al. 2002).
Facilitation is identified by Harvey and Kitson (2015) as the most useful strategy for
achieving the implementation of evidence, while according to Eccles et al. (2005) it also
assuages the complexity of practice through the opportunity for collaborative decision-
making on which improvement approaches will suit individual practice environments. In
the recently revised i-PARIHS framework detailed below, Harvey and Kitson (2016)
argue that it is facilitation which activates the other three components of the framework:
innovation, recipients and context. It is the ability of the facilitator, which does not have
to be a formal role, and the facilitation processes, that enable the recipients to adopt and
apply the innovation, tailoring the intervention to meet their particular context (Harvey
and Kitson 2016). Unlike training, which has been identified as having limited success in
bringing about change (Coomarasamy and Khan 2004; Williams and Smith 2017),
facilitation aims to:
“help individuals and teams think creatively about how their performance could
be improved by utilizing the new knowledge being introduced” (Kitson and
Harvey 2016, p.296).
In both phases, where successful implementation of KPI’s was reported, elements of
facilitation could be identified. This was especially apparent in the second phase when
the implementation of large scale and multi-disciplinary innovations required more in-
depth knowledge of quality improvement tools and facilitation. However, it was also
evident on a smaller scale where clinical managers demonstrated facilitative skills to
encourage their staff to act (Judah 2017): for example, by ensuring inclusion and ongoing
discussion on impending changes or by purposefully offering opportunities to people who
might have been reluctant to become involved. Furthermore, while KPI’s produce data
which can provide hard evidence that improvement is required, nurses and midwives may
lack expertise in interpreting and acting on it (Dixon-Woods et al. 2012; Berwick 2015).
Although clinical managers were ideally placed to facilitate, as they had the required
knowledge of culture and context, they accessed additional support from facilitation or
quality improvement teams such as those listed in the quantitative findings, which
produced more focused approaches to improvement.

166
In the original PARIHS framework (Kitson et al. 1998), the construct of ‘evidence’
included evidence from research, as well as staff and patient experience (Rycroft-Malone
et al. 2002). This continues to apply in the revised framework, but the construct is
broadened and renamed ‘innovation’. This is based on the premise that evidence-based
guidance, such as that on which KPI’s are based, is typically adapted to fit the context
into which it is to be applied (Harvey and Kitson 2016). Whilst KPI use alone may
increase performance and quality of care, qualitative findings showed that this was
difficult to sustain if nurses and midwives did not believe they were meaningful to their
practice and thus did not own and engage in their use. An example of failure to sustain
innovation, which is possibly attributable to a lack of facilitation, was the implementation
of some financially incentivised KPI’s.
Despite a sound evidence-base, if KPI’s were not viewed as relevant, their use stopped
when funding ended. This finding is supported by Mannion et al. (2016) who found that
financial incentives had little impact on safety and quality improvement. Data also
suggests that the evidence produced by KPI’s is not valued by nurses and midwives
because it is not understood, or there is just too much of it, or we are not measuring what
is meaningful. Thus it was reported that nurses walked past and ignored display boards,
viewing them as for someone else’s use. In contrast, successful innovation, as defined in
the i-PARIHS framework (Harvey and Kitson 2016), is evident in findings describing
staff collaboration and inclusion in decision-making, where their opinions are valued as
evidence and where patient feedback is sought and acted on. Where multiple forms of
evidence were collected, interviewees reported successful innovation (section 6.3.3).
Berwick (2015) supports the use of patient experience data, such as that achieved through
survey feedback, as a means of listening to service users, but he goes further to highlight
the need for their inclusion in all healthcare decision-making. Thus there is greater
opportunity to seek the opinion of service users, which in turn provides additional
evidence for action.
The new i-PARIHS ‘recipient’ construct emphasises the importance of considering the
impact on, and made by, those people involved in the implementation, either as
individuals or groups (Harvey and Kitson 2016). This reinforces the previous discussion
that collective leadership is necessary for the successful transfer of evidence into practice.

167
The influence of this recipient construct is especially evident in chapter six, where the
necessity of establishing ownership and engaging staff was highlighted. The lack of
consideration given to the impact on staff is also apparent in both data sets, particularly
in respect of data burden. Equally, the impact of KPI data on practice, when evaluated
under this construct, demonstrates how some nurses struggled to identify any
improvements. This is not necessarily because improvement has not occurred, but that a
lack of KPI understanding and engagement in decision-making regarding practice
improvement results in nurses and midwives who are disinterested or oblivious to KPI
use and their raison-d’être. The facilitator role is therefore to look for barriers such as
these that may exert a negative influence during implementation (Harvey and Kitson
2016). In contrast, participants who were enthusiastic about practice improvement, and
who described in detail the changes made following KPI use, had developed their
knowledge and skill through education in quality improvement and/or by support from
quality teams or dedicated facilitators.
The construct of “context” remains unchanged in i-PARIHS except that, with the
complexity of practice in mind (Eccles et al. 2005), it now encompasses the need to
consider aspects of context from macro to micro levels, as well as external influences
(Harvey and Kitson 2016). In this study, external influences were clearly very influential
in KPI use and created many frustrations. Taking cognisance of the various contexts in
which innovation was planned, success was achieved when leaders facilitated staff
engagement, demonstrated enthusiasm for the change and responded to local concerns.
This creation of joy in work through engagement and celebration is gaining prominence
as a principal element for achieving improvement, and should be encouraged (Berwick
2015). Although practice improvements based on KPI data were identified in phase one,
the level of detail was not sufficient to determine if facilitation had played a role in
successful implementation. However, understanding the importance of culture and
context in the uptake of innovation, interviewees believed that greater staff inclusion in
decision-making for KPI use at the local level would result in sustained support, which
is in keeping with Graham-Dickerson et al.’s (2013) finding. Successful innovations,
such as those described in section 6.3.3, involved facilitation at many different levels
depending on the recipient and context needs. This ranged from organisation-wide
facilitation of PDSA trials by quality improvement teams, to the engagement of local
champions to promote buy-in and sustain the innovation.

168
All organisations in phase two reported providing quality improvement support in some
form. Where nurses and midwives availed of this support, cohesive team-working was
more evident and decisions were made that translated into action. Individual
responsibility and accountability appeared to be reframed not as something to be feared,
but as an opportunity to actively improve patient care. However, only a few examples
were provided of improvement based on such support, and the closest reference to the
application of theory was the use of the PDSA tool. This might be a capacity issue or, as
with KPI’s themselves, it may be that there is limited understanding of what can be
achieved from such facilitative support, and therefore clinical managers do not consider
accessing it:
“They do discuss the [KPI] scores but I don't know how much is a coaching and
improvement conversation. That's where we [the quality improvement team],
would like to get more involved, ‘OK what can we do about it?’" [SM7].
There is a challenge in practice that staff lean on tools such as PDSA rather than
implementation science theory. Both data sets revealed little understanding of either how
implementation science can be of benefit in guiding innovation to ensure than barriers
are identified and addressed, or how implementation science can support the evaluation
and sustainment of change following implementation.
Another approach which is supportive of holistic facilitation is that of practice
development. With a focus on the promotion of person-centred cultures, practice
development also uses facilitation to engage staff, producing greater commitment to and
responsibility for the change or development, and results in ownership and more
successful implementation (Boomer and McCormack, 2008; Manley et al. 2008).
Working in tandem, practice development and quality improvement strategies and tools
would provide a compendium of resources. These would support staff to explore and
make known their local contextual knowledge, which findings have shown impact on
KPI effectiveness, and would aid decision-making about implementation strategies,
interpretation of data and testing cycles of change (Kitson et al. 2008; Marshall 2014;
Abrahamson 2015). Access to quality improvement and practice development knowledge
and skills, when actively encouraged by management as demonstrated in phase two,
would help staff to address the imbalance whereby the focus is on performance
management rather than decision-making for action (St Pierre 2006). It would also

169
prevent improvement being seen as management driven, and demonstrate commitment
to a more transformative way of thinking about practitioner engagement (St Pierre 2006;
Kitson et al. 2008).
It can be seen from this discussion that the most useful lens through which to look at the
use of KPI’s in practice is that of implementation science, and in particular those
frameworks which encompass facilitation. The importance of giving consideration to a
range of forms of evidence and to the elements of context – culture, leadership and
evaluation – has been well reported in implementation science, but the element of
facilitation is often neglected.
7.6 SUMMARY
This discussion chapter has integrated the findings from both phases of the study and
merged them with policy and theoretical literature. In doing so, barriers and enablers that
influence the effective use of KPI’s for decision-making in practice have been
highlighted. Good examples of effective organisational KPI use to improve the safety,
quality and patient experience have been identified. However, analysis suggests that too
much data is being collected, and much of this has no focus on improvement. Ineffective
data management is compounding data burden (Mattke et al. 2003; RCN 2011b) and
negatively impacting on healthcare cost and patient care. Nurses, midwives and service
users, who will know what is important to measure, are not being consulted. Instead there
is over reliance on existing KPI’s to identify problems. Accessing of quality improvement
and facilitative support is limited, therefore opportunities to achieve maximum value
from KPI data is lost. It is argued that only through collective leadership, with
responsibility and decision-making for improving care taken on by all staff, will KPI use
result in positive patient outcomes. If the desire to do what is in the best interest of the
service users can be harnessed then improvement will happen. Harnessing this desire
appears to best be achieved through facilitation which engages the collaboration and
participation of all stakeholders.
170
Chapter Eight: Concluding Chapter
In this final chapter, the conclusions drawn from the study findings are outlined,
providing a summary of the key points of interest. The study’s contribution to the existing
knowledge-base on how KPI’s are used in practice will be presented, and the implications
and recommendations arising from the findings will be detailed. Consideration is also
given to the limitations of the research conducted.
This study has achieved the objectives set out to answer the research question in relation
to how KPI’s are used to influence nursing and midwifery practice. The range of KPI’s
currently in use across the UK and ROI have been identified, as have the processes for
their implementation, monitoring and reporting (objective one). In addition, this study
has advanced understanding about the factors that influence the use of KPI’s by nurses
and midwives (objectives two and three). Previous research on KPI use has focused on
their selection and development as well as data collection and reporting, leaving
healthcare professionals with little information regarding the influence of KPI use on
nursing and midwifery practice. Evidence demonstrates that KPI’s can improve safety
and care quality, but this research has been successful in identifying several factors which
influence KPI use that are of importance to nurses and midwives.
8.1 CONTRIBUTION TO KNOWLEDGE
The expectation that implementation of KPI’s will automatically lead to improvements
in practice is contested. This research highlights that policy makers and healthcare leaders
should take account of the complex interplay of factors that can impact on the
effectiveness of KPI’s, before mandating their introduction. Furthermore, the need for
collective leadership across all levels of nursing and midwifery is offered as having the
potential for enhancing effective KPI use. Collective leadership provides everyone with
the opportunity to take ownership of, and engage with, the collection, analysis,
dissemination and action arising out of KPI data, for practice improvement. However,
this perspective is insufficient without some universal understanding and agreement
around KPI’s, coupled with collaboration and inclusion in decision-making about their
usage. Consequently, prerequisites for the implementation of KPI’s leading to a positive

171
change in practice are: a clear single definition for KPI’s in healthcare; enhanced
understanding of what KPI’s are; and knowledge of implementation science frameworks
to allow healthcare teams to most effectively translate evidence into practice. Using
implementation science frameworks and exploring further the use of facilitation may
offer better outcomes for staff and patients.
This study provides a ‘systems’ view of KPI’s, how they are used in practice and, arising
from that, the identification of factors that influence nursing and midwifery practice.
Most empirical research has focused on the selection and development of KPI’s, as well
as data collection and reporting processes. While previous studies have explored nursing
and midwifery decision-making and the implementation of evidence into practice, there
has been little relating explicitly to KPI use.
The questionnaire used in this study has been successful in identifying many KPI’s
currently in use. Findings indicate a proliferation of national bodies requiring KPI data
with no centralised strategic overview nationally or organisationally. This fragmented
situation has resulted in a failure to address both the growth in KPI’s and the retirement
of those that are no longer relevant or actively used for improvement. Consequently, there
is a negative impact at the clinical level with increasing nursing and midwifery workload
and healthcare cost. Although policy stipulates that the choice of KPI is crucial and
measurement should be based on those aspects of care that are important to nursing staff
and patients (NHS QIS 2005; RCN 2011b; HIQA 2013), the evidence presented in this
thesis indicates that this is not happening.
Principally, this is because, as suggested by the findings, clinical nurses and midwives
have little input into decision-making regarding the KPI’s they use in practice, and
methods for patients’ inclusion in the decision-making process are perceived as being
unsuccessful. Despite their limited inclusion either externally or within their
organisations, nurses and midwives are required to make clinical decisions based on
KPI’s over which they have little control, resulting in frustration and negative behaviours,
such as failure to engage. They are also held to account for KPI’s that are multi-
disciplinary, which is challenging unless cultures of collaboration exist. It is also
perceived that financially incentivised KPI’s, designed to motivate practice
172
improvement, may compromise quality improvement due to the time constraints imposed
by the commissioning cycle.
While ‘big data’ is not necessarily numeric, it is argued that the management of large
volumes of data in the healthcare sector is still in its infancy and thus focused on the
easier-to-analyse numeric data. As well as leading to a drive for numeric assurance rather
than improvement, the collection and analysis of qualitative patient experience data at the
national level has lower priority in most regions and has fallen behind. The foregoing is
also reflected at organisational level although it is this information that nurses and
midwives especially value. The study also found that patient care data continues to be
mainly collected manually. Additionally, whilst there are numerous electronic systems
for the management of data they are not capable of communicating with each other.
Therefore, the onus of collating and reporting clinical KPI data from these multiple
manual and electronic sources remains with nurses and midwives.
Clinical nurses’ and midwives’ understanding of KPI’s has been identified as largely
inadequate, and consequently they struggle to fully engage with their potential for
enhancing practice. Furthermore, the level of understanding at senior manager level also
appears to be limited. To optimise the use of KPI’s for improvement, all staff require a
basic level of understanding of both KPI’s and quality improvement methodology.
According to the participants, while the term ‘KPI’ is unfamiliar to staff, they are able to
identify what is being measured in practice. This is not enough. Participants reported that
where there is comprehensive understanding of KPI’s they become part of the daily
conversation: nurses and midwives begin to think pro-actively, viewing their practice
critically in terms of how it can be improved, and engaging in change. However, training
alone has very limited success in bringing about change, as contextual factors also need
to be addressed (Coomarasamy and Khan 2004; Williams and Smith 2017). Though
facilitation was seldom mentioned, where it was evident and provided locally by skilled
clinical managers or by organisational teams, it was noted to increase KPI understanding
and to result in data being recognised as evidence of care quality. Nurses and midwives
were engaged in decision-making and thus were motivated to act.
The innovative approach of this study in exploring KPI use at meso and micro levels of
nursing and midwifery has highlighted that collective leadership and engagement of all

173
nurses and midwives in the implementation of KPI’s is crucial to improving practice. The
effective use of KPI’s requires that practice moves beyond ‘top down’ leadership to one
where all nurses and midwives, regardless of their level, take responsibility for their
KPI’s and engage in improvement. This is dependent on nurses’ and midwives’
understanding of KPI’s as a mechanism for generating evidence to improve practice, as
well as their involvement in decision-making regarding all aspects of the KPI’s that they
use. Where organisational leaders foster a culture of continuous quality improvement
with visible collaborative and collective leadership across all levels, findings show that
KPI data extends beyond assurance to become a positive influence for improvement.
Finally, there is no support for the expectation that the use of KPI’s will automatically
lead to improvement in practice. Findings demonstrate that there is a need to consider
KPI’s within a framework of quality improvement. Access to improvement science
provides many sources of information which positively influence the translation of
evidence into practice. As the literature and this study have revealed, nurses and
midwives do not make use of either the tools or the knowledge available, whether
theoretical or practical. For KPI’s to be used effectively, consideration needs to be given
to the nature of the evidence; the context in which implementation is to take place; and
the use of facilitation to activate and sustain change, which the findings of this study
suggest is missing. Based on the data from this research it is argued that facilitation could
potentially make the difference between KPI use for the purpose of monitoring and
assurance, and its use for the improvement of care. By working with nurses and
midwives, facilitators, whether internal or external to the practice setting, can help them
identify and overcome barriers to knowledge utilisation which the complexity of culture
and context exerts.
8.2 STUDY LIMITATIONS
There are limitations to this study regarding the questionnaire’s relatively low response
rate of fifteen per cent, which may have been due in part to the effort required to complete
the open text boxes, especially the listing of KPI’s. Whilst KPI numbers were stated by
some to be very large, this is consistent with the findings of the literature review
(Appendix 3). However, a lower response rate was to be anticipated since research
indicates that organisational leaders are the least likely to respond to questionnaires

174
(Weiner and Dalessio 2006; Baruch and Holtom 2008). The principal reasons for non-
completion of questionnaires are that: a) participants are ‘too busy’; b) the topic is not
considered relevant (Fenton-O’Creevy 1996); and c) none of the usual response rate
enhancement techniques are effective at executive level (Cycyota and Harrison 2006).
An additional limitation faced by the researcher was that ROI was undergoing a
significant restructure of its healthcare system, which had implications for the number of
director posts. These posts were being sharply reduced and some of those contacted may
no longer have been in post, thus affecting the response rate. Furthermore, ROI had
undertaken a similar scoping exercise within the previous six months, possibly creating
a degree of response apathy.
The descriptive cross-sectional questionnaire met the conditions for obtaining
information on current KPI use and was not designed to study associations between
variables or provide evidence of cause and effect (Hasson et al. 2015). However, inherent
in the use of any new questionnaire is the question of how valid and reliable it is, and
normative data will not be available as a baseline for comparison of results (Mathers et
al. 2009). Questionnaire completion was based on self-reporting, and the data are
therefore potentially subject to bias. However, in using a mixed methods design, the
findings from the interviews indicated that, if present, bias has had minimal influence on
the results. Similarly, between eighty and ninety per cent of the respondents confirmed
the collection of the KPI’s listed in the questionnaire – which were those most frequently
cited in the literature – indicating a low probability of inappropriate reporting. In addition,
with the researcher’s increased understanding of what a KPI was (and was not), came the
realisation that inclusion of some of these frequently cited KPI’s in the questionnaire was
inappropriate. In hindsight, ‘agency and nurse bank usage’ and ‘assessment of nutrition
requirements’ should not have been included.
A further limitation of the questionnaire was that it used the term ‘clinical staff’ and did
not clarify if clinical managers – that is ward sisters/charge nurses or team leaders – were
to be regarded as managers or clinical staff. The assumption was made that these would
be viewed as members of clinical staff. Similarly, when terms such as ‘senior’ or ‘lead
nurses’ were used in the responses, it was assumed that these were senior clinical nurses
and not nurses working at managerial level. Staff nurses were not included in phase two
of this study: while this would have helped to confirm (or otherwise) the views expressed

175
by participants about staff nurses’ lack of understanding, it remains unknown whether
more insight into KPI use would have been gained.
The use of local collaborators in phase two presented both strengths and limitations.
While their local knowledge of the organisation was beneficial in ensuring full sample
participation, there may have been potential for selection bias. Given that the local
collaborators organised recruitment within each of their organisations, the participants’
viewpoints are potentially unrepresentative of the wider nursing and midwifery
population. Data from both phases were based on the knowledge and experiences of the
participants at a specific point in time. Replication of the research will invariably result
in different outcomes in other settings (Rolfe et al. 2001). It is for the reader to decide if
the findings of this study resonate with their individual experiences and work situations
(Guba and Lincoln 1981; Rolfe et al. 2001).
As with all research carried out for the achievement of an academic award, the analysis
is personal to the researcher. Efforts made to make the analysis and interpretation of data
as transparent as possible have been detailed in chapter four and in the appendices.
8.3 IMPLICATIONS AND RELATED RECOMMENDATIONS
The conclusions drawn from this research have implications for practice, policy and
research that need to be examined in order to improve understanding about the use of
KPI’s in nursing and midwifery. These implications form the basis of the
recommendations and overall conclusion.
8.3.1 Implications and recommendations for practice and education
The factors influencing KPI use have important implications for their effectiveness in
nursing and midwifery practice. The sub-theme of establishing ownership and
engagement indicates that a principal factor in the successful use of KPI’s is an
understanding by nurses and midwives of: a) what constitutes a KPI; and b) the rationale
for their use. Without this, people perceive only the burden of data collection for someone
else’s benefit. As part of the development of an improvement culture, all nurses and

176
midwives, pre-and post-registration, should understand what KPI’s are and how they are
used to improve practice.
The importance of collaborating with nurses and midwives, and including them in
decisions made about their practice, should not be underestimated. If the desire to
improve care for their patients can be harnessed, a major hurdle in KPI use will be
reduced. This will only be achieved and sustained if nurses and midwives are included in
discussions and come to own and engage in practice change. The greater the inclusion
and collaboration across levels in an organisation, the greater the buy-in and focused
attention on improvement. In addition, organisations should select two or three aspects
of practice for focused attention every year based on an identified need for improvement.
Collective leadership is a means of ensuring that all nurses and midwives take
responsibility for their part in the delivery of quality care. However, this also requires
engagement and some form of facilitation, otherwise KPI’s become process-oriented and
do not move beyond being a data collection exercise. With many methodologies and tools
available for the transfer of evidence into practice, there is a need to support clinical
access so that the data collected becomes meaningful and helpful to staff and service
users. Organisations should develop facilitation strategies for practice development and
quality improvement based on KPI use, and should consider the inclusion of facilitation
training in current leadership programmes.
Patient experience data was reported to be a valuable commodity but various challenges
were identified in obtaining this, such as generating honest and critical feedback from
patients including those with physical and cognitive limitations. Yet the latter probably
access services most and can contribute information that is useful for improving practice.
Additionally, methods of reporting patient experience data are inadequate compared to
the reporting of numeric data, resulting in less emphasis being placed on it and reducing
opportunities for learning. Consideration should be given to alternative methods of
measuring and reporting the experiences of service users, with particular focus on those
who require support in communicating.
This study found that a large number of KPI’s are in use. Some participant organisations
have started to review the data they collect – essentially an audit of audits – with the aim
of reducing data collection generally. Unfortunately, organisations do not have the

177
authority to reduce or ‘retire’ mandated KPI’s. Without review and control, the ever-
increasing demand for KPI data from numerous sources results in a cumulative burden
for nurses and midwives. The number of KPI’s needs to be significantly reduced, with
superfluous and duplicate indicators retired and guidance provided on how this should be
done.
Contrary to previous reports that the adoption of data management systems was limited
(DoH 2008; Donaldson et al. 2014), participants stated that this was not a concern.
Instead, frustration was directed at the use of multiple systems which are time-consuming
because of their inability to connect with each other. Furthermore, the systems are not
capable of presenting either the large number of KPI’s or patient experience data in an
easily accessible format. If, as anticipated, the growth of ‘big data’ related to healthcare
continues, systems that are more effective in collating data from different sources will be
required. The cost implications must also be considered, especially if the data is being
provided solely for socio-demographic reasons.
8.3.2 Implications and recommendations for policy
Although this study did not set out to explore KPI use at a macro level, national factors
were identified which impact on the use of KPI’s in practice. An absence of collaborative
working with clinical nurses and midwives resulted in many frustrations when mandated
KPI’s were subsequently applied to clinical practice. This lack of inclusion not only
relates to discussion at Department of Health level but also to local council, regulatory
and commissioning levels. The use of data mainly for monitoring purposes, and the lack
of collaboration and feedback, contributes to the development of a culture focused on
assurance rather than improvement. This in turn drives a focus on what is measured but
does a disservice to that which is not, as was identified in examples of emergency
department care.
Due to the absence of a strategic overview of KPI’s in use there is little knowledge of the
volume of data that is collected by nurses and midwives, and no focused examination and
dissemination of good practice. There is a need for policy makers to agree what a KPI is
in the field of healthcare, based on the criteria identified in this study. Working from an
agreed KPI definition, there needs to be a national review of all the data collected for the

178
purpose of externally reported KPI’s. At a minimum, analysis should distinguish data
collected for statistical purposes, from that which contributes to KPI’s used by nurses and
midwives for improvement purposes. It should also analyse to whom the data is reported,
frequency of reporting, cost incurred, provision of feedback and the usefulness of this for
improvement purposes. Information collected solely for national and international
statistical purposes should be classified as such, and efforts made to streamline and
reduce the burden of data collection and reporting, with more efficient systems employed.
Specifically, there needs to be a reassessment of the use of KPI’s for the provision of
assurance and inter-organisational comparison if this competes with their use to improve
practice. The number of KPI’s used at this level should be limited to the few that are
important and can be designed to meet most practice settings without adaptation,
including person-centred KPI’s. This would allow organisations and services to focus on
the areas identified as requiring improvement, which, along with the flexibility to stop or
reduce KPI use (as appropriate), will result in minimal burden to clinical practice.
Nurses and midwives are disillusioned with KPI’s, even if they do understand them, when
they cannot see their relevance to practice; all they see is the collection of data for its own
sake. Greater inclusion of nurses and midwives in decisions about KPI use is required at
national, regulatory and council level. This should include clinical practitioners as well
as managers. Nursing and midwifery KPI’s should be tested in the areas in which they
are to be used prior to regional and organisational implementation, and local consultation
undertaken. For KPI’s that have been in use for a long time, such as measuring the
incidence of pressure ulcers, the challenge for national bodies and organisations is how
to combine and sustain those used for monitoring with those used to drive improvement,
without creating burden. National conversations are required to agree a small set of KPI’s
that can be used for comparison. Timely feedback and greater openness and transparency
should be provided by all bodies that collect KPI data. Feedback should include shared
learning and examples of what aided and hindered success.
8.3.3 Implications and recommendations for research
This study identifies a deficit of research on the provision of care to people in their own
homes, which has an impact on the development of KPI’s for this area of practice due to
179
the weak evidence-base. Further research is required to inform the development of KPI’s
for this area of practice. The focus of KPI development and selection remains on the acute
sector and consequently the contribution of nurses in other areas of practice remains
unrecognised. Further research is needed to ascertain if the small number of KPI’s
identified in the children’s, mental health and intellectual disability fields of nursing is
deliberate based on the requirement for a small number of important KPI’s, or due to a
lack of focus in these areas. If it is the former, is there any learning that would benefit
KPI use? The research would therefore also need to quantify the extent to which data
collection negatively impacts on care delivery, and explore how this can be improved.
There remain challenges in obtaining the views of service users. Organisations frequently
rely on patient surveys for collecting patient experience data. To increase effectiveness,
a toolkit of measures should be developed to fit the diverse needs of practice and patients
including those thus far excluded from presenting their views. Further work is required
to explore how to utilise the growth in information technology to facilitate greater staff
and service user participation in, and feedback from, quality improvement. Focused
attention is also required on the identification of KPI’s designed to measure the
psychosocial aspects of the patient experience.
Key policy documents have highlighted KPI use as a means of driving improvement.
However, many challenges have been identified in translating the KPI evidence-base into
practice. A deficit has been recognised in the application of theories to implement KPI’s,
and this warrants further exploration. While simple changes to practice can be achieved
with little effort, those requiring more substantial and sustainable change require
theoretical underpinning. The PARIHS framework (Kitson et al. 1998) or revised i-
PARIHS framework (Harvey and Kitson 2016), with their focus on facilitation, have been
presented as a possible means to support the transfer of KPI evidence into practice.
Testing the use of the i-PARIHS framework (Harvey and Kitson 2016), as a means to
support the implementation of KPI’s into practice for quality improvement, is required.
8.4 CONCLUSION
To date, little attention had been given to how KPI’s influence decisions made about
practice within organisations, and the evidence that linked the use of KPI’s with quality
180
improvement was weak. This study addresses these gaps: its results show that nurses and
midwives are motivated to use KPI’s when they are understood and can be seen to be
effective in improving the situation for their patients. Promoting this person-centred
approach to achieve better patient outcomes through the full adoption of KPI’s requires
nurses and midwives to be included in decisions made about their practice in a supportive
culture that values positive inter-professional relationships and fosters practice
improvement (McCormack and McCance 2017). This research suggests that the effective
use of KPI’s by nurses and midwives to improve practice is related to a culture that
demonstrates appreciation of their contribution through uniform inclusion in decision-
making, leading to shared goals and practical support for innovation.
Findings suggest that the participation of clinical nurses and midwives in KPI
implementation is generally limited to data collection. Furthermore, the current process
of KPI reporting is technical, linear and instructive. This limits the ability of nurses and
midwives to understand KPI’s, which in turn hampers their ability to initiate analysis and
trigger actions for improvement. Lack of ownership and engagement further compounds
the problem. When feedback is available it is usually presented on dashboards or display
boards which may be disregarded by busy clinical nurses and midwives.
The evidence presented in this thesis points to the need for leadership at all levels of an
organisation if KPI’s are to be used successfully to drive safety, quality and compassion
in care (DoH 2008). It also points to the need for a shift in the balance of power, giving
more control to the service user (Berwick 2015). Findings suggest that multiple methods
of engagement are required. It is argued that more must be done to ensure a cultural
change from department level through to clinical level. The key to unlocking the required
change potentially lies in collective leadership that is inclusive of all organisations and
bodies that work in partnership within healthcare, including service users (West et al.
2014, p.2) and each nurse and midwife.
A total of 106 users of KPI’s contributed to this study. Despite everyone being asked to
provide examples of how the use of KPI’s influenced their practice, findings demonstrate
that there is little translation of KPI evidence into quality improvement. Perceptions vary
regarding the need for theory when undertaking knowledge transfer. There are arguments
for (Eccles et al. 2005; Estabrooks et al. 2006) and against (Oxman et al. 2005), as well
181
as arguments for a tailored approach based on a continuum according to the practice
context (Rycroft-Malone 2007). The use of a framework which allows for a continuum
of facilitation is considered most appropriate. This is based on the range of practice
improvements identified, from aligning the provision of tea with breakfast delivery to the
(more complex) adoption of a multi-professional approach to reduce post-partum
haemorrhage rates. However, the study has identified both a lack of KPI understanding
by nurses and midwives and a consequent limited improvement in quality. When
considered in relation to the theory of implementation science this demonstrates that,
without some form of active process, the evidence underpinning, and produced by, KPI’s
will remain purely data for data’s sake.
Based on the theories reviewed, it is suggested that facilitation is the most beneficial
method of increasing knowledge and achieving the transfer of evidence into practice. The
i-PARIHS framework (Harvey and Kitson 2016), with its attention to successful
implementation through the facilitation of practice-based innovation, has resonance with
the findings and is proposed as a framework worthy of consideration. Facilitation need
not be formal (Harvey and Kitson 2016), as the findings show that clinical managers who
have been suitably prepared with leadership and facilitation skills are best placed to
support and reinforce KPI use and quality improvement on an ongoing basis.
In conclusion, the core of this study has focused on the use of KPI’s to influence practice
within the confines of nursing and midwifery practice in primary and secondary care. The
KPI process has therefore been examined within the broader national contexts and from
the perspective of the nurses and midwives tasked with the use of KPI’s and engaged in
improving the care they deliver. The findings presented are especially important given
the significant investment that has been made in healthcare – and thus the need to
demonstrate its effectiveness (DoH 2017) – and the focus on measurement and
improvement in government policy and white papers (DoH 2014b; Frankel et al. 2017).
Their importance is also supported by the assertion of Van DeVelde-Coke et al. (2012)
that it is policy makers and the public who are driving the momentum for quality
measurement rather than academic enquiry. Research is therefore important to ensure that
this momentum is guided by a strong evidence-base rather than hearsay and random
opinions.
182
This study has successfully addressed its objectives and answered the research question.
Factors influencing the use of KPI’s in practice have been identified. There is a clear need
for some means of engaging nurses and midwives in the use of KPI’s to improve their
practice, and facilitation is argued to be the active ingredient to achieve this. However, to
support this action, nurses and midwives in national bodies and organisations must work
collectively to refine KPI use beyond that described in the literature. The study also
utilised a mixed method approach to ensure a rigorous and credible process which
pragmatically met the research objectives.
In conclusion, this study has contributed to the knowledge-base on the use of KPI’s, thus
offering the potential to optimise their future effectiveness in practice.
183
References
Abrahamson, K., Miech, E., Wood Davila, H., Mueller, C., Cooke, V. and Arling, G.
(2015) Pay-for-performance policy and data-driven decision making within nursing
homes: a qualitative study. British Medical Journal Quality and Safety, 24(5), 311-317.
Aiken, L.H., Buchan, J., Ball, J. and Rafferty, A.M. (2008) Transformative impact of
Magnet designation: England case. Journal of Clinical Nursing, 17(24), 3330-3337.
Aiken, L.H., Sloane, D.M., Bruyneel, L., Van den Heede, K., Griffiths, P., Busse, R.,
Diomidous, M., Kinnunen, J., Kόzka, M., Lesaffre, E., McHugh, M.D., Moreno-Casbas,
M.T., Rafferty, A.M., Schwendimann, R., Scott, P.A., Tishelman, C., van Achterberg, T.
and Sermeus, W. (2014) Nurse staffing and education and hospital mortality in nine
European countries: a retrospective observational study. The Lancet, 383, 1824-1830.
American Educational Research Association, American Psychological Association, and
National Council on Measurement in Education. (1985) Standards for educational and
psychological testing. Washington: AERA Publications Sales.
American Nurses Association. (1995) Nursing care report card for acute care.
Washington: American Nurses Publishing.
Anderson, R.A., Corazzini, K., Porter, K., Daily, K., McDaniel, R.R. and Colón-Emeric,
C. (2012) CONNECT for quality: protocol of a cluster randomised controlled trail to
improve fall prevention in nursing homes. Implementation Science. Available at:
www.implementationscience.com/content/7/1/11 [Accessed 11 November 2014].
Andrew, S. and Halcomb, E.J. (2009) Mixed methods research for nursing and the health
sciences. Oxford: Blackwell Publishing.
Anseel, F., Lievens, F., Schollaert, E. and Choragwicka, B. (2010) Response rates in
organizational science, 1995–2008: a meta-analytic review and guidelines for survey
researchers. Journal of Business and Psychology, 25, 335-349.
184
Arah, O.A., Klazinga, N.S., Delnoij, D.M., ten Asbroek, A.H. and Custers, T. (2003)
Conceptual frameworks for health systems performance: a quest for effectiveness, quality
and improvement. International Journal of Quality Health Care, 15(5), 377-398.
Argyris, C. (1960) Understanding organisational behaviour. London: Travistock.
Artley, W. and Stroh, S. (2001) The performance-based management handbook Vol 2.
California: Performance-Based Management Special Interest Group.
Attree, M. (2001) A study of the criteria used by healthcare professionals, managers and
patients to represent and evaluate quality care. Journal of Nursing Management, 9, 67-
78.
Australian Institute of Health and Welfare. (2008) A set of performance indicators
across the health and aged care system. Available at:
http://www.aihw.gov.au/WorkArea/DownloadAsset.aspx?id=6442471955 [Accessed
18/11/14].
Avinash, K. (2010) Occam’s razor. Available at: http://www.kaushik.net/avinash/web-
analytics-101-definitions-goals-metrics-kpis-dimensions-targets/ [Accessed 6 July
2015].
Baker, G., Denis, J.L., Pomey, M. and Macintosh-Murray, A. (2010) Effective
governance for quality and patient safety in Canadian healthcare organizations. Ottawa:
Canadian Health Services Research Foundation.
Bamberger, M. (2015) Innovations in the use of mixed methods in real-world evaluation.
Journal of Development Effectiveness, 7(3), 317-326.
Bandura, A. (1977) Self-efficacy: toward a unifying theory of behavioural change.
Psychology Review, 84(2),191-215.
Barnsley, J., Berta, W., Cockerill, R., MacPhail, J. and Vayda, E. (2005) Identifying
performance indicators for family practice. Canadian Family Physician, 51, 700-701.
185
Baruch, Y. and Holtom, B.C. (2008) Survey response rate levels and trends in
organizational research. Human Relations, 61(8), 1139-1160.
Bauer, M.S., Damschroder, L., Hagedorn, H., Smith, J. and Kilbourne, A.M. (2015) An
introduction to implementation science for the non-specialist. BMC Psychology, 3, 32.
Bawden, D. (2006) Users, user studies and human information behaviour: a three decade
perspective on Tom Wilson’s ‘On user studies and information needs’, Journal of
Documentation, 62(6), 671-679.
Bazeley, P. (2003) Teaching mixed methods. Qualitative Research Journal, 3, 117-126.
Belfroid, E., Hautvast, J.L., Hilbink, M., Timen, A. and Hulscher, M.E. (2015) Selection
of key recommendations for quality indicators describing good quality outbreak
response. BMC Infectious Diseases, 15, 166.
Benibo, B.R. (1997) A technology-contingency framework for a productivity-oriented
workforce diversity. SAM Advanced Management Journal, Spring, 62(2).
Berwick, D. (2015) Key note address. London: International Forum on Quality and Safety
in Healthcare. Available at: http://livestream.com/IFQSH/ForumLIVE [Accessed 15
September 2017].
Berwick, D., Loehrer, S. and Gunther-Murphy, C. (2017) Breaking the rules for better
care. American Medical Association, 317(21), 2161-2164.
Berwick, D.M., Nolan, T.W. and Whittington, J. (2008) The Triple Aim: care, health,
and cost. Health Affairs, 27(3), 759-769.
Blaikie, N. (2004) Positivism. In: Lewis-Beck, M., Bryman, A. and Liao, T. eds.
Encyclopedia of social science research methods. Thousand Oaks: Sage Publications,
837-839.
186
Blozik, E., Nothacker, M., Bunk, T., Szecsenyi, J., Ollenschläger, G. and Scherer, M.
(2012) Simultaneous development of guidelines and quality indicators - how do guideline
groups act?: A worldwide survey. International Journal of Health Care Quality
Assurance, 25(8), 712-729.
Boomer, C. and McCormack, B. (2008) Where are we now? A process for evaluating the
context of care in practice development. Practice Development in Health Care. 7(3), 123-
133.
Boomer, C.A. and McCormack, B. (2010) Creating the conditions for growth: a
collaborative practice development programme for clinical nurse leaders. Journal of
Nursing Management, 18, 633-644.
Botti, M., Kent, B., Bucknall, T., Duke, M., Johnstone, M., Considine, J., Redley, B.,
Hunter, S., de Steiger, R., Holcombe, M. Cohen, E. (2014) Development of a
management algorithm for post-operative pain (MAPP) after total knee and total hip
replacement: study rationale and design. Implementation Science, 9, 110.
Bovens, M. (2005) Public accountability. In: Ferlie, E., Lynn, L.E. and Pollitt, C. eds.
The Oxford handbook of public management. Oxford: Oxford University Press, 182-
208.
Braun, V. and Clarke, V. (2006) Using thematic analysis in psychology. Qualitative
Research in Psychology, 3(2), 77-101.
Braun, V. and Clarke, V. (2013) Successful qualitative research. London: SAGE
Publications.
Brown, D. and McCormack, B.G. (2011) Developing the practice context to enable more
effective pain management with older people: an action research approach.
Implementation Science, 6,9.
187
Brown, D. and McCormack, B. (2016) Exploring psychological safety as a component of
facilitation within the Promoting Action on Research Implementation in Health Services
framework. Journal of Clinical Nursing, 25, 2921-2932.
Bryman, A. (2007) Barriers to integrating quantitative and qualitative research. Journal
of Mixed Methods Research, 1(1), 8-22.
Bryman, A. (2012) Social research methods. 4th ed. Oxford: Oxford University Press.
Bubb, S. (2014) Winterbourne View – time for change. London: The Stationery Office.
Burrell, G. and Morgan, G. (2005) Sociological paradigms and organisational analysis.
Burlington: Ashgate Publishing.
Burston, S., Chaboyer, W. and Gillespie, B. (2013) Nurse-sensitive indicators suitable to
reflect nursing care quality: a review and discussion of issues. Journal of Clinical
Nursing, 23, 1785-1795.
Caldwell, D.F. and O’Reilly, C.A. (2003) The determinants of team-based innovation in
organizations. The role of social influence. Small Group Research, 34(4), 497-517.
Campbell, S.M., Braspenning, J., Hutchinson, A. and Marshall, M. (2002) Research
methods used in developing and applying quality indicators in primary care. Quality and
Safety in Health Care, 11, 358-364.
Centre for Patient Leadership and FPM. (2013) Bring it on - 40 ways to support patient
leadership. A paper produced for NHS Midlands and East. Available at:
http://engagementcycle.org/wp-content/uploads/2013/03/Bring-it-on-40-ways-to-
support-Patient-Leadership-FINAL-V-APRIL-2013.pdf. [Accessed 13 July 2017].
Chrusch, C.A., Martin, C.M. and The Quality Improvement in Critical Care Project.
(2016) Quality improvement in critical care: selection and development of quality
indicators. Canadian Respiratory Journal. Available at:
http://dx.doi.org/10.1155/2016/2516765 [Accessed 3 October 2017].

188
Cohen, D, and Crabtree, B. (2006) Semi-structured interviews. Qualitative research
guidelines project. Available at: http://www.qualres.org/HomeSemi-3629.html
[Accessed 25 September 2017].
Cokins, G. (2013) The balanced scorecard, strategy maps and dashboards: why are they
different? Available at: www.cgma.org/magazine/features/pages/20138186.aspx
[Accessed 25 November 2014].
Cook, C., Heath, F. and Thompson, R.L. (2000) A meta-analysis of response rates in
web-or internet-based surveys. Educational and Psychological Measurement, 60, 821-
836.
Coomarasamy, A. and Khan, K.S. (2004) What is the evidence that postgraduate teaching
in evidence based medicine changes anything? A systematic review. British Medical
Journal, 329(7473), 1017.
Corbin Dwyer, S. and Buckle, J.L. (2009) The space between: on being an insider-
outsider in qualitative research. International Journal of Qualitative Methods, 8(1), 54-
63.
Costello, K. (1995) Managed care – the corporatization of healthcare. California Nurse,
91(6), 10-11.
Creswell, J. (2014) Research design: qualitative, quantitative and mixed method
approaches. 4th ed. Thousand Oaks: SAGE.
Creswell, J.W., Clark, V.L., Gutmann, M.L. and Hanson, W.E. (2003) Advanced mixed
methods research designs. In: Tashakkori, A. and Teddlie, C. eds. Handbook of mixed
methods in social & behavioral research. Thousand Oaks: SAGE, 209-239.
Creswell, J. and Plano Clark, V. (2007) Designing and conducting mixed methods
research. Thousand Oakes; SAGE Publications.
189
Creswell, J. and Plano Clark, V. (2011) Designing and conducting mixed methods
research. 2nd ed. Thousand Oaks; SAGE Publications.
Critical Appraisal Skills Programme. (2014) CASP qualitative checklist. Available at:
http://www.casp-uk.net/checklists [Accessed 12 January 2016].
Crotty, M. (1998) The foundations of social research. London: Sage Publications.
Curtis, E. and Drennan, J. (2013) Quantitative health research: issues and methods.
Berkshire: Open University Press.
Curtis, K., Fry, M., Shaban, R.Z. and Cinsidine, J. (2016) Translating research findings
into clinical nursing practice. Journal of Clinical Nursing, 26, 862-872.
Curtright, J., Stolp-Smith, S.C. and Edell, E.S. (2000) Strategic performance
management: development of a performance measurement system at the Mayo Clinic.
Journal of Healthcare Management, 45, 1.
Cutcliffe, J. and McKenna, H. (2002) When do we know what we know? Considering
the truth of research findings and the craft of qualitative research. International Journal
of Nursing Studies, 39, 611-618.
Cycyota, C.S. and Harrison, D.A. (2006) What (not) to expect when surveying
executives. Organizational Research Methods, 9, 133-160.
Dancet, E.A.F., D’Hooghe, T.M., Spiessens, C., Sermeus, W., De Neubourg, D., Karel,
N., Kremer, J.A.M. and Nelen, W.L.D.M. (2013) Quality indicators for all dimensions of
infertility care quality: consensus between professionals and patients. Human
Reproduction, 28(6), 1584-1597.
Davies, H.T.O., Powell, A.E. and Nutley, S.M. (2015) Mobilising knowledge to improve
UK health care: learning from other countries and other sectors - a multimethod mapping
study. Health Services and Delivery Research, 3(27).

190
Dearnley, C. (2005) A reflection on the use of semi-structured interviews. Nurse
Researcher, 13, 19-29.
Deming, E. (1992) Out of the crisis. Cambridge, Massachusetts: Massachusetts Institute
of Technology.
Denzin, N.K. (2010) Moments, mixed methods, and paradigm dialogs. Qualitative
Inquiry, 16(6), 419-427.
Denzin, N.K. (2012) Triangulation 2.0. Journal of Mixed Methods Research, 6, 80-88.
Denzin, N.K. and Lincoln, Y.S. (2011) The SAGE handbook of qualitative research. 4th
ed. Thousand Oaks; SAGE Publications.
Denzin, N.K. and Lincoln, Y.S. (2013) The landscape of qualitative research. 4th ed.
California: SAGE Publications.
Department of Health. (1998) A first class service. Quality in the new NHS. London: Her
Majesty’s Stationery Office.
Department of Health. (1999) Making a difference – strengthening the nursing, midwifery
and health visiting contribution to health and healthcare. London: Her Majesty’s
Stationery Office.
Department of Health. (2004) Quality and outcomes framework. Dublin: An Roinn
Sláinte.
Department of Health. (2008) High quality care for all – NHS next stage review final
report. (CM 7432). London: The Stationery Office.
Department of Health. (2014a) The NHS outcomes framework 2015/16. London: Her
Majesty’s Stationery Office.
191
Department of Health. (2014b) NHS five year forward view. London: Her Majesty’s
Stationery Office.
Department of Health. (2016) Health and wellbeing 2026 – delivering together. Available
at: www.health-ni.gov.uk [Accessed 17 November 2017].
Department of Health. (2017) Framework for national performance indicators for
nursing and midwifery. Dublin: An Roinn Sláinte.
Department of Health and Children. (1998) Working for health and well-being’ strategy
statement 1998 – 2001. Dublin: An Roinn Sláinte.
Department of Health, Social Services and Public Safety. (2011) Quality 2020: a 10 year
strategy to protect and improve quality in health and social care in Northern Ireland.
Belfast: Department of Health Social Services and Public Safety.
Dewey, J. (1917) The need for a recovery of philosophy. In: Talisse, R.B. and Aikin, S.F.
(2011) eds. The pragmatism reader: from Pierce through the present. New Jersey:
Princeton University, 109-140.
Dewey, J. (1929) Experience and nature. London: George Allen and Unwin.
Dewey, J. (2008a) Reconstruction in philosophy. In: Boydston, J. and Ross, R. eds. The
middle works of John Dewey, 1899-1924 (Vol.12). Carbondale: Southern Illinois
University Press, 77-202.
Dewey, J. (2008b) Experience and nature. In: Boydston, J. and Hook, S. eds. The later
works of John Dewey, 1925-1953 (Vol.1). Carbondale: Southern Illinois University
Press, 1-437.
Dewey, J. (2008c) The public and its problems. In: Boydston, J. and Gouinlock, J. eds.
The later works of John Dewey, 1925-1953 (Vol. 2). Carbondale: Southern Illinois
University Press, 235-372.

192
Dickerson, S.S., Sackett, K., Jones, J.M. and Brewer, C. (2001) Guidelines for evaluating
tools for clinical decision making. Nurse Education, 26(5), 215-220.
Dillman, D.A. (2002) Procedures for conducting government-sponsored establishment
surveys: comparisons of the total design method (TDM), a traditional cost compensation
model, and tailored design. Unpublished paper. Pullman: Washington State University.
Dixon-Woods, M., McNicol, S. and Martin, G. (2012) Ten challenges in improving
quality in healthcare: lessons from the Health Foundation’s programme evaluations and
relevant literature. British Medical Journal Quality and Safety, 21, 876-884.
Donabedian, A. (1988) The quality of care: how can it be assessed? Journal of the
American Medical Association, 260, 1743-1748. Reprinted in: Archives of Pathology and
Laboratory Medicine (1997), 121(11).
Donabedian, A. (2005) Evaluating the quality of medical care. The Milbank Quarterly,
83(4), 691-729.
Donaldson, L., Rutter, P. and Henderson, M. (2014). The right time, the right place.
Belfast: Department of Health Social Services and Public Safety. Available at:
http://www.dhsspsni.gov.uk/donaldsonreport270115.pdf [Accessed 5 February 2015].
Donaldson, N.E., Rutledge, D.N, and Ashley, J. (2004) Outcomes of adoption: measuring
evidence uptake by individuals and organizations. Worldviews on Evidence-Based
Nursing, 1(1), 41-51.
Doran, D.M. (2003) Preface. In: Doran, D.M. ed. Nursing outcomes: the state of the
science. Sudbury: Jones and Bartlett, p.vii.
Doran, D.M. and Pringle, D. (2011) Patient outcomes as an accountability. In: Doran,
D.M. ed. Nursing outcomes: the state of the science. Sudbury: Jones and Bartlett, 1-23.
Douglas, K. (2010) Digital dashboard and staffing: a perfect match. American Nurse
Today 5, 52-54.

193
Drake, K. (2013) Finding your way…data to decision. Nursing Management, 44(9), 40-
44.
Drake, P. and Heath, L. (2011) Practitioner researcher at doctoral level. London:
Routledge.
Dubois, C., D’Amour, D., Pomey, M., Girard, F. and Brault, I. (2013) Conceptualizing
performance of nursing care as a prerequisite for better measurement: a systematic and
interpretive review. BioMed Central Nursing, 12:7 Available at:
www.biomedcentral.com/1472-6955/12/7 [Accessed 15 October 2014].
Duclay, E., Hardouin, J.B., Sébille, V., Anthoine, E. and Moret, L. (2015) Exploring the
impact of staff absenteeism on patient satisfaction using routine databases in a university
hospital. Journal of Nursing Management, 23, 833-841.
Dunckley, M., Aspinal, F., Addington-Hall, J.M., Hughes, R. and Higginson, I.J. (2005)
A research study to identify facilitators and barriers to outcome measure implementation.
International Journal of Palliative Nursing, 11(5), 219-225.
Dwamena, F., Holmes-Rovner, M., Gaulden, C.M., Jorgenson, S., Sadigh, G., Sikorskii,
A., Lewin, S., Smith, R.C., Coffey, J., Olomu, A. and Beasley, M. (2012) Interventions
for providers to promote a person-centred approach in clinical consultations (Review).
Cochrane Database of Systematic Reviews. The Cochrane Collaboration: John Wiley and
Sons.
Eccles, M., Grimshaw, J., Walker, A., Johnston, M. and Pitts, N. (2005) Changing the
behaviour of healthcare professionals: the use of theory in promoting the uptake of
research findings. Journal of Clinical Epidemiology, 58, 107-112.
Eccles, M.P. and Mittman, B.S. (2006) Welcome to implementation science.
Implementation Science, 1, 1.
194
Estabrooks, C.A., Rutakumwa, W., O’Leary, K.A., Profetto-McGrath, J., Milner, M.,
Levers, M. J. and Scott-Findlay, S. (2005) Sources of practice knowledge among nurses.
Qualitative Health Research, 15(4), 460-476.
Estabrooks, C.A., Thompson, D.S., Lovely, J.J. and Hofmeyer, A. (2006) A guide to
knowledge translation theory. The Journal of Continuing Education in the Health
Professions, 26(1), 25-36.
Fenton-O’Creevy, M. (1996) Employee involvement and the middle manager.
Unpublished dissertation. London: London Business School.
Fetters, M.D., Curry, L.A. and Creswell, J.W. (2013) Achieving integration in mixed
methods designs – principles and practices. Health Services Research, 48(6), 2134-2156.
Field, R. (2017) John Dewey (1859-1952). The Internet Encyclopaedia of Philosophy,
Available at: http://www.iep.utm.edu/dewey/ [Accessed 9 January 2018].
Flood, B. and Henman, M.C. (2014) Building quality indicators for medication use in
people aging with intellectual disabilities and behavioural disorders. International
Journal of Developmental Disabilities, 0, 1-17.
Fossum, M., Alexander, G.L., Göransson, K.E., Ehnfors, M. and Ehrenberg, A. (2011)
Registered nurses’ thinking strategies on malnutrition and pressure ulcers in nursing
homes: a scenario-based think-aloud study. Journal of Clinical Nursing, 20, 2425-2435.
Foulkes, M. (2011) Nursing metrics: measuring quality in patient care. Nursing Standard,
25(42), 40-45.
Francis, R. (2013) Report of the Mid Staffordshire NHS Foundation Trust public inquiry.
London: Her Majesty’s Stationery Office.
Frankel, A., Haraden, C., Federico, F. and Lenoci-Edwards, J. (2017) A framework for
safe, reliable, and effective care. White Paper. Cambridge, Massachusetts: Institute for
Healthcare Improvement and Safe and Reliable Healthcare. Available at:
195
https://www.medischevervolgopleidingen.nl/sites/default/files/paragraph_files/a_frame
work_for_safe_reliable_and_effective_care.pdf [Accessed 2 February 2018].
Gage, N.L. (1989) The paradigm wars and their aftermath: a "historical" sketch of
research on teaching since 1989. Educational Researcher, 18(7), 4-10.
Gagliardi, A.R., Lemieux-Charles, L., Brown, A.D., Sullivan, T. and Goel, V. (2008)
Barriers to patient involvement in health service planning and evaluation: an exploratory
study. Patient Education and Counseling, 70, 234-241.
Galliers, R.D. (1991) Choosing appropriate information systems research approaches: a
revised taxonomy. In: Nissen, H.E., Klein, H.K. and Hirschheim, R. eds, Information
systems research: contemporary approaches and emergent traditions. North Holland:
Elsevier Science Publishers, 327-345.
Gerrish, K. and Lacey, A. (2010) The research process in nursing. Chichester: Wiley-
Blackwell.
Glasper, A. (2016) Fifteen-minute home visits and the quest to improve care. British
Journal of Nursing, 25(4), 224-225.
Goddard, M. and Smith, P.C. (2001) Performance measurement in the new NHS. Health
Policy Matters, 3, 1-8.
Gokenbach, V. and Drenkard, K. (2011) The outcomes of Magnet environments and
nursing staff engagement: a case study. Nursing Clinics of North America, 46(1), 89-105.
Gold, S.K.T., Abelson, J. and Charles, C.A. (2005) From rhetoric to reality: including
patient voices in supportive cancer care planning. Health Expectations, 8(3), 195-209.
Gorard, S. (2010) Research design, as independent of methods. In: Teddlie, C. and
Tashakkori, A. eds. Handbook of mixed methods. Los Angeles: SAGE Publications, 237-
252.
196
Graham-Dickerson, P., Houser, J., Thomas, E., Casper, C., ErkenBrack, L., Wenzel, M.
and Siegrist, M. (2013) The value of staff nurse involvement in decision making. Journal
of Nursing Administration, 43(5), 286-292.
Gravel, K., Légaré, F. and Graham, I.D. (2006) Barriers and facilitators to implementing
shared decision-making in clinical practice: a systematic review of health professionals’
perceptions. Implementation Science, 1, 16.
Greenhalgh, T., Howick, J. and Maskrey, N. (2014) Evidence based medicine: a
movement in crisis? British Medical Journal, 348, 3725.
Greenhalgh, T., Robert, G., MacFarlane, F., Bate, P. and Kyriakidou, O. (2004) Diffusion
of innovations in service organisations: systematic review and recommendations. The
Millbank Quarterly, 82(4), 581-629.
Greenhalgh, T., Robert, G., MacFarlane, F., Bate, P., Kyriakidou, O. and Peacock, R.
(2005) Storylines of research in diffusion of innovation: a meta-narrative approach to
systematic review. Social Science and Medicine, 61, 417-430.
Griffiths, P., Jones, S., Maben, J. and Murrells, T. (2008) State of the art metrics for
nursing: a rapid appraisal. London: King’s College London.
Griffiths, P. and Maben, J. (2009) The metrics of care. Nursing Standard, 23(20), 62-63.
Grimshaw, J.M., Eccles, M.P., Lavis, J.N., Hill, S.J. and Squires, J.E. (2012) Knowledge
translation of research findings. Implementation Science, 7, 50.
Groff-Paris, L. and Terhaar, M. (2010) Using Maslow’s pyramid and the national
database of nursing quality indicators to attain a healthier work environment. Online
Journal of Issues in Nursing, 16(1), 6.

197
Grol, R. (2001) Improving the quality of medical care. Building bridges among
professional pride, payer profit and patient satisfaction. Journal of American Medical
Association, 286, 2578-2585.
Guba, E.G. (1981) Criteria for assessing the trustworthiness of naturalistic inquiries.
Educational Communication and Technology Journal, 29, 75-91.
Guba, E.G. (1990) The paradigm dialog. California: SAGE Publications.
Guba, E.G. and Lincoln, Y.S. (1981) Effective evaluation: improving the usefulness of
evaluation results through responsive and naturalistic approaches. San Francisco:
Jossey-Bass.
Guba, E.G. and Lincoln, Y.S. (1982). Epistemological and methodological bases of
naturalistic inquiry. Educational Communication and Technology, 30(4), 233-252.
Guba, E.G. and Lincoln, Y.S. (1989) Fourth generation evaluation. Newbury Park:
SAGE Publications.
Guetterman, T.C. (2015) Descriptions of sampling practices within five approaches to
qualitative research in education and the health sciences. Forum: Qualitative Social
Research, 16(2), 25.
Guise, V., Chambers, M., Valimaki, M., and Makkonen, P. (2010) A mixed-mode
approach to data collection: combining web and paper questionnaires to examine nurses'
attitudes to mental illness. Journal of Advanced Nursing, 66(7), 1623-1632.
Hahtela, N., Paavilainen, E., McCormack, B., Slater, P., Helminen, M. and Suominen, T.
(2014) Influence of workplace culture on nursing-sensitive nurse outcomes in municipal
primary health care. Journal of Nursing Management, 23(7), 931-939.
Halcomb, E. and Hickman, L. (2015) Mixed methods research. Nursing Standard,
29(32), 41-47.
198
Hall, B. and Howard, K. (2008) A synergistic approach: conducting mixed methods
research with typological and systemic design considerations. Journal of Mixed Methods
Research, 2(3), 248-269.
Hall, J.N. (2013) Pragmatism, evidence, and mixed methods evaluation. In: Mertens,
D.M. and Hesse-Biber, S.N. eds. Mixed methods and credibility of evidence in
evaluation. New York: Wiley, 15-26.
Ham, C., Berwick, D. and Dixon, J. (2016) Improving quality in the English NHS. A
strategy for action. London: The King’s Fund.
Hammersley, M. (1992) The paradigm wars: reports from the front. British Journal of
Sociology of Education, 13(1), 131-143.
Harper, M. and Cole, P. (2012) Member checking: can benefits be gained similar to group
therapy? The Qualitative Report, 17(2), 510-517.
Harte, B., Hixson, E., Proctor, A., LaRochelle, D. and Auron, M. (2012) Actionable
quality improvement: synergizing the EMR and BI. Journal of Hospital Medicine, 7, 131-
132.
Harvey, G. and Kitson, A. (2015) Implementing evidence-based practice in healthcare.
A facilitation guide. Oxford: Routledge.
Harvey, G. and Kitson, A. (2016) PARIHS revisited: from heuristic to integrated
framework for the successful implementation of knowledge into practice. Implementation
Science, 11, 33.
Harvey, G., Loftus-Hills, A., Rycroft-Malone, J., Titchen, A., Kitson, A., McCormack,
B. and Seers, K. (2002) Getting evidence into practice: the role and function of
facilitation. Journal of Advanced Nursing, 37(6), 577-88.
Hasson, F., McKenna, H. and Keeney, S. (2015) Surveys. In: Gerrish, K. and Lathlean,
J. eds. The research process in nursing. 7th ed. Oxford: Wiley Blackwell, 255-266.

199
Hatheway, R. (2016) The real difference between metrics and KPIs. Linkedin. July 8.
Available at: https://www.linkedin.com/pulse/real-difference-between-metrics-kpis-
richard-hatheway [Accessed 13 October 2017].
Hauser, J. and Katz, G. (1998) Metrics: you are what you measure! European
Management Journal, 16(5), 517-528.
Health and Social Care Board. (2014) Safety and quality of services a priority in financial
plans. Available at: http://www.hscboard.hscni.net/1742/ [Accessed 5 October 2017].
Health Information and Quality Authority. (2010) Guidance on developing key
performance indicators and minimum data sets to monitor healthcare quality. Dublin:
Health Information and Quality Authority.
Health Information and Quality Authority. (2013) Guidance on developing key
performance indicators and minimum data sets to monitor healthcare quality. Version
1.1. Dublin: Health Information and Quality Authority.
Health Information and Quality Authority. (2015) Report of the investigation into the
safety, quality and standards of services provided by the Health Service Executive to
patients in the Midland Regional Hospital, Portlaoise. Dublin: Health Information and
Quality Authority.
Health Service Executive. (2015) Guiding framework for the implementation of nursing
and midwifery quality care-metrics. Dublin: Health Service Executive.
Helfrich, C.D., Damschroder, L.J., Hagedorn, H.J., Daggett, G.S., Sahay, A., Ritchie, M.,
Damush, T., Guihan, M., Ullrich, P.M. and Stetler, C.B. (2010) A critical synthesis of
literature on the promoting action on research implementation in health services
(PARIHS) framework. Implementation Science, 5, 82.
Heslop, L. (2014) Australian direct care nurses can make cost savings and improve
health-care quality if they have access to meaningful data. International Journal of
Nursing Practice, 20, 337-338.
200
Heslop, P., Blair, P.S., Fleming, P., Hoghton, M., Marriott, A. and Russ, L. (2014) The
confidential inquiry into premature deaths of people with intellectual disabilities in the
UK: a population-based study. The Lancet, 383, 889-895.
Heslop, L. and Lu, S. (2014) Nursing-sensitive indicators: a concept analysis. Journal of
Advanced Nursing, 70(11), 2469-2482.
Heyvaert, M., Hannes, K., Maes, B. and Onghena, P. (2013) Critical appraisal of mixed
methods studies. Journal of Mixed Methods Research, 7(4), 302-327.
Hickman, L.A. (2009) John Dewey: his life and work. In: Hickman, L.A., Neubert, S.
and Reich, K. eds. John Dewey between pragmatism and constructivism. New York:
Fordham University Press, 3-18.
Hillen, J.B., Vitry, A. and Caughey, G.E. (2015) Evaluating medication-related quality
of care in residential aged care: a systematic review. SpringerPlus, 4, 220. Available at:
https://doi.org/10.1186/s40064-015-0984-9 [Accessed 3 September 2017].
Hitchcock, J.H., Onwuegbuzie, A.J. and Khoshaim, H.B. (2015) Examining the
consequential validity of standardised examinations via public perceptions: a review of
mixed methods survey design considerations. International Journal of Multiple Research
Approaches, 9(1), 24-39.
Hodder, M. and Marples, S. (2005) Strategic leadership for healthcare management. In:
Jasper, M. and Jumaa, M. eds. Effective healthcare leadership. Oxford: Blackwell
Publishing, 48-57.
Hoi, E. (2008) The importance of being measurable: quantifying nursing quality. Journal
of Student Nursing Research, 1(2), 3.
Available at: http://repository.upenn.edu/josnr/vol1/iss2/3 [Accessed 12 July 2015].
Holmes, B.J., Finegood, D.T., Riley, B.L. and Best, A. (2012) Systems thinking in
dissemination and implementation research. In: Brownson, R.C., Colditz, G.A. and
201
Proctor, E.K. eds. Dissemination and implementation research in health. New York:
Oxford University Press, 192-212.
Honey, P. and Mumford, A. (1992) The manual of learning styles. London: Peter Honey
Associates.
Houser, J. (2008) Nursing research. Reading using and creating evidence. London: Jones
and Bartlett Publishers.
Houser, J., ErkenBrack, L., Handberry, L., Ricker, F. and Stroup, L. (2012) Involving
nurses in decisions: improving both nurse and patient outcomes. Journal of Nursing
Administration, 42(7/8), 375-382.
Hsieh, H. and Shannon, S.E. (2005) Three approaches to qualitative content analysis.
Qualitative Health Research, 15(9), 1277-1288.
Humphrey-Murtoa, S., Varpiob, L., Gonsalvesa, C. and Wooda, T.J. (2017) Using
consensus group methods such as Delphi and Nominal Group in medical education
research. Medical Teacher, 39(1), 14-19.
Hunt, K. and Lathlean, J. (2015) Sampling. In: Gerrish, K. and Lathlean, J. eds. The
research process in nursing. 7th ed. Oxford: Wiley Blackwell, 173-184.
Idvall, E., Rooke, L. and Hamrin, E. (1997) Quality indicators in clinical nursing: a
review of the literature. Journal of Advanced Nursing, 25, 6-17.
Ihantola, E and Kihn, L. (2011) Threats to validity and reliability in mixed methods
accounting research. Qualitative Research in Accounting and Management, 8(1), 39-58.
Institute of Medicine. (1990) Health, health care and quality of care. In: Lohr, K.N. ed.
Medicare: a strategy for quality assurance. 1st ed. Washington: National Academy Press,
21.
202
Implementation Science. (2017) About implementation science. Available at:
https://implementationscience.biomedcentral.com/about [Accessed 24/8/17].
Institute of Medicine. (2001) Closing the quality chasm: a new health system for the
21st century. Washington: National Academies Press. Available at:
http://www.nap.edu/openbook.php?record_id=10027&page=R1 [Accessed 17 February
2015].
International Council of Nurses. (2003) Ethical guidelines for nursing research. Geneva:
International Council of Nurses.
Iowa Model Collaborative. (2017) Iowa model of evidence-based practice: revisions and
validation. Worldviews on Evidence-Based Nursing, 14(3), 175-182.
James, W. (2000) Pragmatism and other writings. London: Penguin Books.
Jasper, M. and Jumaa, M. (2005) Effective healthcare leadership. Oxford: Blackwell
Publishing.
Jeffs, L., Sidani, S., Rose, D., Espin, S., Smith, O., Martin, K., Byer, C., Fu, K. and Ferris,
E. (2013) Using theory and evidence to drive measurement of patient, nurse and
organizational outcomes of professional nursing practice. International Journal of
Nursing Practice, 19, 141-148.
Johnson, D.R. and Hoopes, D.G. (2003) Managerial cognition, sunk costs, and the
evolution of industry structure. Strategic Management Journal, 24, 1057-1068.
Johnson, K., Hallsey, D., Meredith, R.L. and Warden, E. (2006) A nurse-driven system
for improving patient quality outcomes. Journal of Nursing Care Quality, 21(2), 168-
175.
Johnson, M. and Long, T. (2015) Research ethics. In: Gerrish, K. and Lathlean, J. eds.
The research process in nursing. 7th ed. Oxford: Wiley-Blackwell, 31-41.
203
Johnson, R.B. and Onwuegbuzie, A. (2004) Mixed methods research: a research
paradigm whose time has come. Educational Researcher, 33(7), 14-26.
Johnson, R.B., Stefurak, T., de Waal, C. and Hildebrand, D.L. (2017) Understanding the
philosophical positions of classical and neopragmatists for mixed methods research.
Cologne Journal of Sociology and Social Psychology, 69(2), 63-86.
Joint Commission on Accreditation of Healthcare and Organisations. (1993) The
measurement mandate: on the road to performance improvement in healthcare. Illinois:
JCAHO.
Jones, L., Pomeroy, L., Robert, G., Burnett, S., Anderson, J.E. and Fulop, N.J. (2017)
How do hospital boards govern for quality improvement? A mixed methods study of 15
organisations in England. British Medical Journal Quality and Safety, 0, 1-9. Available
at: http://qualitysafety.bmj.com/content/early/2017/07/07/bmjqs-2016-006433
[Accessed 3 September 2017].
Jones, M. and Rattray, J. (2015) Questionnaire design. In: Gerrish, K. and Lathlean, J.
eds. The research process in nursing. 7th ed. Oxford: Wiley Blackwell, 413-425.
Judah, B. (2017) Successful innovation will not arrive through disruption. Available at:
https://www.linkedin.com/pulse/successful-innovation-arrive-through-disruption-ben-
judah?trk=eml-email_feed_ecosystem_digest_01-recommended_articles-7-
Unknown&midToken=AQF2OsfcYr9HXw&fromEmail=fromEmail&ut=1MfYjV6_H7
HDU1 [Accessed 7 September 2017].
Kaplan, R.S. and Norton, D.P. (1992) The balanced scorecard – measures that drive
performance. Harvard Business Review, 70(1), 71-79.
Kavanagh, K.T., Cimiotti, J.P., Abusalem, S. and Coty, M. (2012) Moving healthcare
quality forward with nurse-sensitive value-based purchasing. Journal of Nursing
Scholarship, 44(4), 385-395.
204
Kelly, D., Lankshear, A. and Jones, A. (2015) Resilient leadership in a time of crisis:
experiences of executive directors of nursing in the wake of the Francis Report. Report
to the GNC Trust. Cardiff: Cardiff University.
Kent, B. (2015) Practitioner research. In: Gerrish, K. and Lathlean, J. eds. The research
process in nursing. 7th ed. Oxford: Wiley Blackwell, 319-331.
Keogh, B. (2013) Review into the quality of care and treatment provided by 14 hospital
trusts in England: overview report. Available at: https://www.nhs.uk/nhsengland/bruce-
keogh-review/documents/outcomes/keogh-review-final-report.pdf [Accessed 15
September 2017].
Kinchen, E. (2015) Development of a quantitative measure of holistic nursing care.
Journal of Holistic Nursing American Holistic Nurses Association, 33(3), 238-246.
King’s Fund. (2008) Background to the Next Stage Review. London: The Stationery
Office.
Kirkley, C., Bamford, C., Poole, M., Arksey, H., Hughes, J. and Bond, J. (2011) The
impact of organisational culture on the delivery of person-centred care in services
providing respite care and short breaks for people with dementia. Health & Social Care
in the Community, 19(4), 438-48.
Kitson, A. and Harvey, G. (2016) Methods to succeed in effective knowledge translation
in clinical practice. Journal of Nursing Scholarship, 48(3), 294-302.
Kitson, A., Harvey, G. and McCormack, B. (1998) Enabling the implementation of
evidence-based practice: a conceptual framework. Quality Health Care, 7, 149-158.
Kitson, A., Rycroft-Malone, J., Harvey, G., McCormack, B., Seers, K. and Titchen, A.
(2008) Evaluating the successful implementation of evidence into practice using the
PARIHS framework: theoretical and practical challenges. Implementation Science, 3, 1.

205
Koch, T. (1992) A review of nursing quality assurance. Journal of Advanced Nursing,
17, 785-794.
Koch, T. (2006) Establishing rigour in qualitative research: the decision trail. Journal of
Advanced Nursing, 53(1), 91-103.
Kontio, E., Lundgren-Laine, H., Kontio, J., Korvenranta, H. and Salantera, S. (2011)
Critical incidents and important information in the care processes of patients with cardiac
symptoms. Journal of Nursing Management, 19, 209-217.
Kötter, T., Schaefer, F.A., Scherer, M. and Blozik, E. (2013) Involving patients in quality
indicator development – a systematic review. Patient Preference and Adherence, 7, 259-
268.
Kouzes, J. and Posner, B. (2002) The leadership challenge. 3rd ed. San Francisco: Jossey-
Bass.
Krugman, M.E. and Sanders, C.L. (2016) Implementing a nurse manager profile to
improve unit performance. Journal of Nursing Administration, 46(6), 345-351.
Kuhn, T.S. (1962) The structure of scientific revolutions. Chicago: University of Chicago
Press.
Kuhn, T.S. (1977) The essential tension: selected studies in scientific tradition and
change. Chicago: University of Chicago Press.
Kurtzman, E.T. and Jennings, B.M. (2008a) Trends in transparency: nursing performance
measurement and reporting. Journal of Nursing Administration, 38(7/8), 349-354.
Kurtzman, E.T. and Jennings, B.M. (2008b) Capturing the imagination of nurse
executives in tracking the quality of nursing care. Journal of Nursing Administration,
32(3), 235-246.
206
Lacey, A. (2015) The research process. In: Gerrish, K. and Lathlean, J. eds. The research
process in nursing. 7th ed. Oxford: Wiley Blackwell, 15-29.
Lang, N. (2008) The promise of simultaneous transformation of practice and research
with the use of clinical information systems. Nursing Outlook, 56, 232-236.
Langemo, D.K., Anderson, J. and Volden, C. (2002) Nursing quality outcome indicators,
the North Dakota Study. Journal of Nursing Administration, 32, 98-105.
Langley, G., Nolan, K. and Nolan, T. (1994) The foundation of improvement. Quality
Progress, 27(6), 81-86.
Lathlean, J. (2015) Qualitative analysis. In: Gerrish, K. and Lathlean, J. eds. The research
process in nursing. 7th ed. Oxford: Wiley Blackwell, 471-487.
Lee, I. and Wang, H. (2014) Preliminary development of humanistic care indicators for
residents in nursing homes: a Delphi technique. Asian Nursing Research, 8, 75-81.
Lee, J.L., Chang, B.L., Pearson, M.L., Kahn, K.L. and Rubenstein, L.V. (1999) Does
what nurses do affect clinical outcomes for hospitalised patients? A review of the
literature. Health Service Research, 34(5), 1011-1032.
Leung, L. (2015) Validity, reliability, and generalizability in qualitative research. Journal
of Family Medicine and Primary Care, 4(3), 324-327.
Lincoln, Y.S. and Guba, E.G. (1985) Naturalistic inquiry. Newbury Park: Sage
Publications.
Lincoln, Y.S., Lynham, S.A. and Guba, E.G. (2011) Paradigmatic controversies,
contradictions and emerging confluences. Revisited. In: Denzin, N.K. and Lincoln, Y.S.
4th ed. The SAGE handbook of qualitative research. Thousand Oaks: SAGE Publications.
Maas, M.L. and Delaney, C. (2004) Nursing process outcome linkage research: issues,
current status, and health policy implications. Medical Care, 42(2), 40-48.
207
Maben, J. (2008) The art of caring: invisible and subordinated? A response to Juliet
Corbin: “Is caring a lost art in nursing?” International Journal of Nursing Studies, 45,
335-338.
Maben, J., Morrow, E., Ball, J., Robert, G. and Griffiths, P. (2012) High quality care
metrics for nursing. London: National Nursing Research Unit, King’s College.
Magee, B. (2010) The story of philosophy. London: Dorling Kindersley Limited.
Magnello, M.E. (2010) The passionate statistician. In: Nelson, S. and Rafferty, A.M. eds.
Notes on Nightingale: the influence and legacy of a nursing icon. New York: Cornell
University, 115-129.
Mainz, J. (2003) Defining and classifying clinical indicators for quality improvement.
International Journal of Quality Health Care, 13, 469-474.
Manley, K., McCormack, B. and Wilson, V. (2008) International practice development
in nursing and healthcare. Oxford: Blackwell Publishing.
Mannarelli, T. (2006) Accounting for leadership. Charismatic, transformational
leadership through reflection and self-awareness. Accountancy Ireland, 38(6), 46-48.
Mannion, R., Davies, H. and Marshall, M. (2005) Cultural characteristics of ‘high’ and
‘low’ performing hospitals. Journal of Health Organization and Management, 19(6),
431-439.
Mannion, R., Freeman, T., Millar, R. and Davies, H. (2016) Effective board governance
of safe care: a cross-sectional examination of the breadth and depth of relationships
through local case studies and national surveys. NIHR Health Services and Delivery
Research, 4(4), 1-200.
March, J.G. and Simon, H.A. (1958) Organizations. Oxford: Wiley.
208
Marr, B. (2014) Caution: when KPIs turn to poison. Linkedin. 24 March. Available at:
https://www.linkedin.com/pulse/20140324073422-64875646-caution-when-kpis-turn-
to-poison [Accessed 21 October 2014].
Marshall, M. (2014) Bridging the ivory towers and the swampy lowlands; increasing the
impact of health services research on quality improvement. International Journal for
Quality in Health Care, 26(1), 1-5.
Martin, G.P., McKee, L. and Dixon-Woods, M. (2015) Beyond metrics? Utilizing ‘soft
intelligence’ for healthcare quality and safety. Social Science and Medicine, 142, 19-26.
Martin, L., Nelson, E., Rakover, J. and Chase, A. (2016) Whole system measures 2.0: a
compass for health system leaders. Cambridge, Massachusetts: Institute for Healthcare
Improvement.
Maslow, A.H. (1943) A theory of human motivation. Psychological Review 50, 70-396.
Mathers, N., Fox, N. and Hunn, A. (2009) Surveys and Questionnaires. The National
Institute for Health Research. Available at: https://www.rds-yh.nihr.ac.uk/wp-
content/uploads/2013/05/12_Surveys_and_Questionnaires_Revision_2009.pdf
[Accessed 27 September 2017].
Mattke, S., Reilly, K., Martinez-Vidal, E., McLean, B. and Gifford, D. (2003) Reporting
quality of nursing home care to consumers: the Maryland experience. International
Journal of Quality in Healthcare, 15(2), 169-177.
Maxwell, J.A. (2013) Qualitative research design: an interactive approach. 3rd ed.
London: SAGE Publications.
Maxwell, J.A. (2015) Expanding the history and range of mixed methods research.
Journal of Mixed Methods Research, 10(1), 12-27.
209
Maxwell, J.A. and Loomis, D.M. (2003) Mixed methods design: an alternative approach.
In: Tashakkori, A. and Teddlie, C. eds. Handbook of mixed methods in social and
behavioural research. Thousand Oaks: SAGE Publications, 241-271.
Maxwell, S.E. and Delaney, H.D. (2004) Designing experiments and analysing data. 2nd
ed. New York: Psychology Press.
May, C. and Finch, T. (2009) Implementing, embedding, and integrating practices: an
outline of normalization process theory. Sociology, 43(3), 535-554.
McCance, T., Hastings, J. and Dowler, H. (2015) Evaluating the use of key performance
indicators to evidence the patient experience. Journal of Clinical Nursing, 24, 3084-3094.
McCance, T., Telford, L., Wilson, J., MacLeod, O. and Dowd, A. (2012) Identifying key
performance indicators for nursing and midwifery care using a consensus approach.
Journal of Clinical Nursing, 21, 1145-1154.
McCance, T., Wilson, V. and Kornman, K. (2016) Paediatric international nursing study:
using person-centred key performance indicators to benchmark children’s services.
Journal of Clinical Nursing, 25, 2018-2027.
McCormack, B., Kitson, A., Harvey, G., Rycroft-Malone, J., Titchen, A. and Seers, K.
(2002) Getting evidence into practice: the meaning of 'context'. Journal of Advanced
Nursing, 38(1), 94-104.
McCormack, B. and McCance, T. (2017) Person-centred practice in nursing and health
care- theory and practice. 2nd ed. Oxford: John Wiley and Sons.
McIntosh, C. (2011) Cambridge Essential English Dictionary. 2nd ed. Cambridge:
Cambridge University Press.
McKim, C.A. (2015) The value of mixed methods research: a mixed methods study.
Journal of Mixed Methods Research, 11(2), 202-222.
210
Merriam-Webster Incorporated. (2015) Merriam-Webster Dictionary. Available at:
http://www.merriam-webster.com/dictionary/metric [Accessed 3 November 2015].
Mertens, D.M. (2003) Mixed methods and the politics of human research: the
transformative emancipatory perspective. In: Tashakkori, A. and Teddlie, C. eds.
Handbook of mixed methods in social and behavioural research. Thousand Oaks: SAGE,
135-166.
Mertens, D.M. (2010) Research and evaluation in education and psychology: Integrating
diversity with quantitative, qualitative, and mixed methods. 3rd ed. Thousand Oaks: Sage
Publications.
Mertens, D.M., Bazeley, P., Bowleg, L., Fielding, N., Maxwell, J., Molina-Azorin, J.F.
and Niglas, K. (2016) Expanding thinking through a kaleidoscopic look into the future:
implications of the mixed methods international research association’s task force report
on the future of mixed methods. Journal of Mixed Methods Research, 1-7.
Mertens, D.M. and Hesse-Biber, S. (2013) Mixed methods and credibility of evidence in
evaluation. In: Mertens, D.M. and Hesse-Biber, S. eds. Mixed methods and credibility of
evidence in evaluation: new directions for evaluation, 138, 5-13.
Miles, M. and Huberman, M. (1994) Qualitative data analysis. 2nd ed. London: SAGE
Publications.
Mitchell, P.H. (2008) Defining patient safety and quality care. In: Hughes, R.G. ed.
Patient safety and quality: an evidence-based handbook for nurses Rockville: Agency
for Healthcare Research and Quality, chapter one.
Mitchell, S.A., Fisher, C.A., Hastings, C.E., Silverman, L.B. and Wallen, G.R. (2010) A
thematic analysis of theoretical models for translating science in nursing: mapping the
field. Nursing Outlook, 58, 287-300.

211
Moen, R. (2009) Foundation and history of the PDSA Cycle. Available at:
https://deming.org/uploads/paper/PDSA_History_Ron_Moen.pdf [Accessed 17
September 2017].
Moen, R., Nolan, T., and Provost, L, (1991) Improving quality through planned
experimentation. New York: McGraw-Hill.
Moher, D., Liberati, A., Tetzlaff, J., Altman, D.G. and the PRISMA Group. (2009)
Preferred reporting items for systematic reviews and meta-analyses: the PRISMA
statement. Annals of Internal Medicine, 151(4), 264-269.
Montalvo, I. (2007) The national database of nursing quality indicators. Online Journal
of Issues in Nursing, 12(3). Available at:
http://www.nursingworld.org/MainMenuCategories/ANAMarketplace/ANAPeriodicals/
OJIN/TableofContents/Volume122007/No3Sept07/NursingQualityIndicators.html?css=
print [Accessed 30 December 2014].
Moran-Ellis, J., Alexander, V.D., Cronin, A., Dickinson, M., Fielding, J., Sleney, J. and
Thomas, H. (2006) Triangulation and integration: processes, claims and implications.
Qualitative Research, 6(1), 45-59.
Morgan, D.L. (2007) Paradigms lost and pragmatism regained. Methodological
implications of combining qualitative and quantitative methods. Journal of Mixed
Methods Research, 1(1), 48-76.
Morgan, D.L. (2009) Pragmatism as a paradigm for social research. Qualitative Inquiry,
20(10), 1-9.
Morgan, D.L. (2014) Integrating qualitative and quantitative methods: a pragmatic
approach. London: SAGE Publications.
Morse, J.M. (2003) Principles of mixed methods and multimethod research design. In:
Tashakkori, A. and Teddlie, C. eds. Handbook of mixed methods in social and
behavioural research. London: SAGE, 189-208.
212
Morse, J.M. (2010) Procedures and practice of mixed methods design: maintaining
control, rigor and complexity. In: Tashakkori, A. and Teddlie, C. eds. SAGE handbook
of mixed methods in social and behavioural research. 2nd ed. London: SAGE
Publications, 339-352.
Morse, J.M., Barrett, M., Mayan, M., Olson, K. and Spiers, J. (2002) Verification
strategies for establishing reliability and validity in qualitative research. International
Journal of Qualitative Methods,1(2), 13-22.
Morse, J.M. and Niehaus, L. (2009). Mixed methods design: principles and procedures.
Walnut Creek: Left Coast Press.
Mortensen, D. (2008) The difference between a KPI and a metric. Available at:
http://www.slideshare.net/dennis.mortensen/the-difference-between-a-kpi-and-a-metric
[Accessed 25 June 2015].
Moss, P.A. (1994) Can there be validity without reliability? Educational Researcher, 23,
5-12.
Moss Kanter, R. (1999) The enduring skills of change leaders. Leader to Leader, 13, 15-
22.
Moule, P. and Goodman, M. (2014) Nursing research: an introduction. 2nd ed. London:
Sage Publications.
National Advisory Group on the Safety of Patients in England. (2013) A promise to learn
– a commitment to act: improving the safety of patients in England. London: Department
of Health.
National Health Service. (2014) The forward view into action: planning for 2015/16.
Available at: http://www.england.nhs.uk/wp-content/uploads/2014/12/forward-view-
plning.pdf. [Accessed 5 January 2015].

213
National Health Service England. (2014) Five year forward view. London: Department
of Health.
National Health Service England. (2016) Leading change, adding value. London:
Department of Health.
National Health Service Group. (2014) The NHS outcomes framework 2015/16. London:
The Stationery Office.
National Health Service National Services Scotland. (2012) Quality indicators for
critical care in Scotland Version 2.0. Edinburgh: ISD Scotland Publications.
National Health Service Quality Improvement Scotland. (2005) The impact of nursing
on patient clinical outcomes. Available at:
http://www.healthcareimprovementscotland.org/previous_resources/indicators/clinical_
indicatiors_-_nursing.aspx [Accessed 20 October 2014].
National Health Service Scotland. (2015) NHS Scotland 2015-16 local delivery plan
guidance. Edinburgh: The Scottish Government.
National Institute for Health and Care Excellence. (2014) Indicators process guide.
Manchester: NICE.
National Quality Forum. (2003) A comprehensive framework for hospital care
performance evaluation: a consensus report. Washington: National Quality Forum.
Needleman, J., Kurtzman, E.T. and Kizer, K.W. (2007) Performance measurement
of nursing care: State of the science and the current consensus. Medical Care Research
and Review, 64, 10S- 43S.
Newhouse, R.P. (2007) Accelerating improvement: implications of the IOM report for
nurse executives. Journal of Nursing Administration, 37(6), 264-268.

214
Nicklin, W. and Barton, M. (2007) CCHSA accreditation: a change catalyst toward
healthier work environments. Healthcare Papers, 7, 58-63.
Nilsen, P. (2015) Making sense of implementation theories, models and frameworks.
Implementation Science, 10, 53.
Noh, H.K. and Lee, E. (2014) Relationships among NANDA-1 diagnoses, nursing
outcomes classification, and nursing interventions classification by nursing students for
patients in medical-surgical units in Korea. International Journal of Nursing Knowledge,
26(1), 43-51.
Northcott, H. and Harvey, M. (2012) Public perceptions of key performance indicators
of healthcare in Alberta, Canada. International Journal for Quality in Health Care, 24(3),
214-223.
O’Cathain, A. (2013) Mixed methods involving qualitative research. In: Bourgeault, I.,
Dingwall, R. and De Vries, R. eds. The SAGE handbook of qualitative methods health
research. London: SAGE Publications, 575-589.
O’Cathain, A., Murphy, E. and Nicholl, J. (2007a) Why, and how, mixed methods
research is undertaken in health services research in England: a mixed methods study.
BMC Health Services Research, 7, 85.
O’Cathain, A., Murphy, E. and Nicholl, J. (2007b) Integration and publications as
indicators of ‘‘Yield’’ from mixed methods studies. Journal of Mixed Methods Research,
1(2), 147-163.
O’Cathain, A., Murphy, E. and Nicholl, J. (2010) Three techniques for integrating data
in mixed methods studies. British Medical Journal, 341, 1147-1150.
Olsen, D. (2011) When being good means looking bad. American Journal of Nursing,
111(10), 63-65.
215
Onwuegbuzie, A.J. and Johnson, R.B. (2006) The Validity Issue in Mixed Research.
Research in the Schools, 13(1), 48-63.
Onwuegbuzie, A.J., Johnson, R.B. and Collins, K.M.T. (2003) Call for mixed analysis:
a philosophical framework for combining qualitative and quantitative approaches.
International Journal of Multiple Research Approaches, 3, 114-139.
Ossege, C. (2012) Accountability – are we better off without it? Public Management
Review, 14(5), 585-607.
Ousey, K. and White, R. (2009) Editorial: Tissue viability and the quality accounts
agenda: quality indicators and metrics. British Journal of Nursing, 18, 20.
Oxman, A.D., Fretheim, A. and Flottorp, S. (2005) The OFF theory of research
utilization. Journal of Clinical Epidemiology, 58(2), 113-116.
Palinkas, L.A., Horwitz, S.M., Green, C.A., Wisdom, J.P., Duan, N. and Hoagwood, K.
(2015) Purposeful sampling for qualitative data collection and analysis in mixed method
implementation research. Administration and Policy in Mental Health, 42(5), 533-544.
Pallant, J. (2013) SPSS survival manual. 5th ed. Berkshire: McGraw Hill, Open University
Press.
Pansiri, J. (2005) Pragmatism: a methodological approach to researching strategic
alliances in tourism. Tourism and Hospitality Planning and Development, 2(3), 191-206.
Paquet, M., Courcey, F., Lavoie-Tremblay, M., Gagnon, S. and Maillet, S. (2013)
Psychosocial work environment and predictors of quality of care indicators in one
Canadian health centre. Worldviews on Evidence-Based Nursing, 10(2), 82-94.
Parahoo, K. (2014) Nursing research: principles, process and issues. 3rd ed. Hampshire:
Palgrave Macmillan.
216
Parlour, R. Slater, P. and Breslin, E. (2013) Health Service Executive North West nursing
and midwifery metrics evaluation research report. Dublin: Health Service Executive.
Parmelli, E., Flodgren, G., Beyer, F., Baillie, N., Schaafsma, M.E. and Eccles, M.P.
(2011) The effectiveness of strategies to change organisational culture to improve
healthcare performance: a systematic review. Implementation Science, 6, 33.
Parson, T. (1960) Structure and process in modern societies. New York: Free Press.
Patton, M.Q. (2002) Qualitative evaluation and research methods. 3rd ed. London: SAGE
Publications.
Patton, M.Q. (2015) Qualitative evaluation and research methods. 4th ed. London: SAGE
Publications.
Pazargadi, M., Tafreshi, M.Z., Abedsaeedi, Z., Majd, H.A. and Lankshear, A.J. (2008)
Proposing indicators for the development of nursing care quality in Iran. International
Nursing Review, 55, 399-406.
Pearson, A. (2003) Key performance indicators for nursing. International Journal of
Nursing Practice, 9, 337.
Perrow, C. (1967) A framework for the comparative analysis of organizations. American
Sociological Review, 32(2), 194-208.
Persenius, M., Hall-Lord, M, Wilde-Larsson, B. and Carlsson, E. (2015) Clinical nursing
leaders’ perceptions of nutritional quality indicators in Swedish stroke wards: a national
survey. Journal of Nursing Management, 23, 705-715.
Peters, M.A. (2014) The shapes of theory in education. Educational Philosophy and
Theory, 46(12), 1315-1319.
217
Petersen, R. (2012) 12 Experts define key performance indicators. Available at:
http://barnraisersllc.com/2012/02/experts-define-key-performance-indicators/ [Accessed
5 February 2015].
Philips, D.C. and Burbules, N.C. (2000) Postpoitivism and educational research.
Lanham: Rowman and Littlefield.
Phillips, C.D., Hawes, C., Lieberman, T. and Koren, M.J. (2007) Where should momma
go? Current nursing home performance measurement strategies and a less ambitious
approach. BMC Health Services Research, 7, 93.
Planas-Campmany, C., Quinto´, L., Icart-Isern, M., Calvo, E. and Ordi, J. (2015) Nursing
contribution to the achievement of prioritized objectives in primary health care: a cross-
sectional study. European Journal of Public Health, 26(1), 53-59.
Polanyi, M. (1962) Personal knowledge: towards a post-critical philosophy. Chicago:
University of Chicago Press.
Polit, D.F. and Tatano Beck, C.T. (2014) Essentials of nursing research: appraising
evidence for nursing practice. 8th ed. Philadelphia: Lippincott, Williams and Wilkins.
Popper, K. (2002a) The logic of scientific discovery. London: Routledge Classics.
Popper, K. (2002b) The open society and its enemies: Volume 1: The spell of Plato.
London: Routledge Classics.
Powell, A.A., White, K.M., Partin, M.R., Halek, K., Christianson, J.B., Neil, B., Hysong,
S.J., Zarling, E.J. and Bloomfield, H.E. (2012) Unintended consequences of
implementing a national performance measurement system into local practice. Journal of
General Internal Medicine, 27(4), 405-412.
Powell, T.C. (2001) Competitive advantage: logical and philosophical considerations.
Strategic Management Journal, 22(9), 875-888.

218
Primary Care Workforce Commission. (2015) The future of primary care, creating teams
for tomorrow. London: Health Education England.
Qualtrics Development Company. (2015) Qualtrics. Utah: Qualtrics. Available at:
http://www.qualtrics.com [Accessed 12 June 2016].
Rambur, B., Vallett, C., Cohen, J. and Mattuck Tarule, J. (2013) Metric-driven harm: an
exploration of unintended consequences of performance measurement. Applied Nursing
Research, 26, 269-272.
Reed, J. (2010) Practitioner research. In: Gerrish, K. and Lacey, A. eds. The research
process in nursing. 6th ed. Oxford: Wiley-Blackwell, 271-283.
Regulation and Quality Improvement Authority (2016) Review of quality improvement
systems and processes. Available at: www.rqia.org.uk [Accessed 11/6/17].
Riazi, M.A. (2016) Innovative mixed-methods research: moving beyond design
technicalities to epistemological and methodological realizations. Applied Linguistics,
37(1), 33-49.
Richards, K. (2003) Qualitative inquiry in TESOL. Basingstoke: Palgrave Macmillan.
Riege, A.M. (2003) Validity and reliability tests in case study research: a literature
review with "hands-on" applications for each research phase. Qualitative Market
Research, 6, 75-86.
Rogers, E.M. (2003) Diffusion of Innovations. 5th ed. New York: Free Press.
Rolfe, G. (2006) Validity, trustworthiness and rigour: quality and the idea of qualitative
research. Journal of Advanced Nursing, 53, 304-310.
Rolfe, G., Freshwater, D. and Jasper, M. (2001) Critical reflection for nursing and the
helping professionals: a user’s guide. Hampshire. Palgrave MacMillan.
219
Rosati, R.J., Marrren, J.M., Davin, D.M. and Morgan, C.J. (2009) The linkage between
employee and patient satisfaction in home healthcare. Journal for Healthcare Quality,
31(2), 44-53.
Royal College of Nursing. (2009) Measuring for quality in health and social care. An
RCN position statement. Available at:
https://www.rcn.org.uk/__data/assets/pdf_file/0004/248872/003535.pdf [Accessed 6
January 2015].
Royal College of Nursing. (2011a) Making nursing visible; valuing our contribution to
high quality patient-centred care. Available at: http://www.rcn.org.uk/ehealth.
[Accessed 6 January 2015].
Royal College of Nursing. (2011b) Nursing dashboards – measuring quality. London:
Royal College of Nursing.
Royal College of Nursing Scotland. (2016) Measuring success: principles for a new
approach to improving health and wellbeing in Scotland. Edinburgh: Royal College of
Nursing.
Rutherford, M.A. (2008) Standardized nursing language: what does it mean for nursing
practice? Online Journal of Issues in Nursing, 13, 1.
Rycroft-Malone, J. (2007) Theory and knowledge translation: setting some coordinates.
Nursing Research, 56(4), 78-85.
Rycroft-Malone, J. (2008) Evidence-informed practice: from individual to context.
Journal of Nursing Management, 16(4), 404-408.
Rycroft-Malone, J. and Bucknall, T. (2010) Models and frameworks for implementing
evidence-based practice: linking evidence to action. West Sussex: Wiley-Blackwell.
220
Rycroft-Malone, J., Kitson, A.L., Harvey, G., McCormack, B., Seers, K., Titchen, A. and
Estabrooks, C. (2002) Ingredients for change: revisiting a conceptual framework. Quality
and Safety in Health Care, 11, 174-180.
Rycroft-Malone, J., Seers, K., Chandler, J., Hawkes, C.A., Crichton, N., Allen, C.,
Bullock, I. and Strunin, L. (2013) The role of evidence, context, and facilitation in an
implementation trial: implications for the development of the PARIHS framework.
Implementation Science, 38, 28.
Rycroft-Malone, J., Seers, K., Titchen, A., Harvey, G., Kitson, A.L., and McCormack,
B. (2004) What counts as evidence in evidence-based practice. Journal of Advanced
Nursing, 47(1), 81-90.
Sackett, D.L., Rosenberg, W.M.C., Gray, J.A.M., Haynes, B. and Richardson, W.S.
(1996) Evidence based medicine. What it is and what it isn’t. British Medical Journal,
312, 71-2.
Sandelowski, M. (1986) The problem of rigor in qualitative research. Advances in
Nursing Science, 8, 27.
Sandelowski, M. (1993) Rigor or rigor mortis: the problem of rigor in qualitative research
revisited. Advances in Nursing Sciences, 16(2), 1-8.
Sandelowski, M. (1995) Triangles and crystals: on the geometry of qualitative research.
Research in Nursing and Health, 18, 569-574.
Sandelowski, M. (2000) Combining qualitative and quantitative sampling, data
collection, and analysis techniques in mixed-method studies. Research in Nursing and
Health, 23, 246-255.
Sandström, B., Borglin, G., Nilsson, R. and Willman, A. (2011) Promoting the
implementation of evidence-based practice: a literature review focusing on the role of
nursing leadership. Worldviews on Evidence-Based Nursing, 8(4), 212-223.
221
Schaffer, M.A., Sandau, K.E. and Diedrick, L. (2012) Evidence-based practice models
for organisational change: overview and practical applications. Journal of Advanced
Nursing, 69(5), 1197-1209.
Schein, E.H. (2010) Organizational culture and leadership. 4th ed. San Francisco: Jossey-
Bass.
Senge, P. (1990) The fifth discipline: the art and practice of the learning organisation.
London: Century Business.
Shah, S. (2012) KPI definition and context. In: Peterson, R. 12 Experts define key
performance indicators. Available at:
http://barnraisersllc.com/2012/02/experts-define-key-performance-indicators/
[Accessed 5 February 2015].
Shah, S.R. and Al-Bargi, A. (2013) Research paradigms: researchers’ worldviews,
theoretical frameworks and study designs. Arab World English Journal, 4(4), 252-264.
Shelton, D., Reagan, L., Weiskopf, C., Panosky, D., Nicholson, M. and Diaz, D. (2015)
Baseline indicators and implementation strategies in a statewide correctional nurse
competencies program: mid-year report. Journal of Continuing Education in Nursing,
46(10), 455-461.
Shenton, A.K. (2004) Strategies for ensuring trustworthiness in qualitative research
projects. Education for Information, 22(2), 63-75.
Shield, T., Campbell, S., Rogers, A., Worrall, A., Chew-Graham, C. and Gask, L. (2003)
Quality indicators for primary care mental health services. Quality and Safety in Health
Care, 12, 100-106.
Smith, A.P. (2007) Nurse-sensitive care measures: a platform for value and vision.
Nursing Economics, 25(1), 43-46.
222
Smith, P. (1995) On the unintended consequences of publishing performance data in the
public sector. International Journal of Public Administration, 18(2-3), 277-310.
Snell, J. (2015) Invest in nurses to pull NHS out of crisis, alliance urges MPs. Nursing
Standard, 29(20), 14-15.
Snowden, M. (2015) Use of diaries in research. Nursing Standard, 29(44), 36-41.
Sorensen, R. and Iedelma, R. (2010) Accounting for health-care outcomes: implications
for intensive care unit practice and performance. Health Services Management Research,
23, 97-102.
Sousa, K.H., Weiss, J., Welton, J., Reeder, B. and Ozkaynak, M. (2015) The Colorado
collaborative for nursing research: nurses shaping nursing’s future. Nursing Outlook,
63(2), 204-210.
Speed, S. and Luker, K. (2006) Getting a visit: how district nurses and general
practitioners 'organise' each other in primary care. Sociology of Health and Illness, 28(7),
883-902.
Stalpers, D., De Vos, M., Van Der Linden, D., Kaljouw, M. and Schuurmans, M. (2017)
Barriers and carriers: a multicentre survey of nurses’ barriers and facilitators to
monitoring of nurse-sensitive outcomes in intensive care units. Nursing Open, 4(3), 149-
156.
St Pierre, J. (2006) Staff nurses' use of report card data for quality improvement: first
steps. Journal of Nursing Care Quality, 21(1), 8-14.
Stricker, K.H., Kimberger, O., Schmidlin, K., Zwahlen, M., Mohr, U. and Rothen, H.U.
(2009) Family satisfaction in the intensive care unit: what makes the difference? Intensive
Care Medicine, 35, 2051-2059.
223
Tabak, R.G., Khoong, E.C., Chambers, D.A. and Brownson, R.C. (2012) Bridging
research and practice: models for dissemination and implementation research. American
Journal of Preventative Medicine, 43(3), 337-350.
Talisse, R.B. and Aiken, S.F. (2011) The pragmatism reader: from Pierce through the
present. New Jersey: Princeton University Press.
Talungchit, P., Liabsuetrakul, T. and Lindmark, G. (2013) Development and assessment
of indicators for quality care in severe preeclampsia/eclampsia and postpartum
haemorrhage. Journal for Healthcare Quality, 35(5), 22-34.
Tappen, R.M., Weiss, S.A. and Whitehead, D.K. (2006) Essentials of nursing leadership
and management. 4th ed. Philadelphia: F.A. Davis Company.
Tashakkori, A. and Creswell, J. (2007) The new era of mixed methods. Journal of Mixed
Methods Research, 1(1), 3-7.
Tashakkori, A. and Teddlie, C. (1998) Mixed methodology: combining qualitative and
quantitative approaches. Thousand Oaks: SAGE.
Tashakkori, A. and Teddlie, C. (2010) Handbook of mixed methods in social &
behavioural science. 2nd ed. Thousand Oaks, SAGE Publications.
Taylor, S.J., Bogdan, R., and DeVault, M.L. (2016) Introduction to qualitative research
methods: a guidebook and resource. Hoboken: John Wiley and Sons.
Teddlie, C. and Tashakkori, A. (2009) Foundations of mixed methods research.
Thousand Oaks: Sage Publications.
Teddlie, C., and Tashakkori, A. (2011) Mixed methods research: contemporary issues in
an emerging field. In: Denzin, N. and Lincoln, Y. eds. The Sage handbook of qualitative
research. 4th ed. London: SAGE, 285-299.

224
The Bristol Royal Infirmary Inquiry. (2001) The report of the public inquiry into
children’s heart surgery at the Bristol Royal Infirmary 1984-1995: learning from Bristol.
London: The Stationery Office.
The Health Foundation. (2013) Quality improvement made simple. What everyone should
know about health care quality improvement. London: The Health Foundation.
The KPI Institute. (2013) The KPI compendium. Melbourne: The KPI Institute.
Thompson, C. (2001) JAN forum: clinical decision making in nursing: theoretical
perspectives and their relevance to practice – a response to Jean Harbinson. Journal of
Advance Nursing, 35, 134-137.
Timmins, F. (2015) Surveys and questionnaires in nursing research. Nursing Standard,
29(42), 42-50.
Titchen, A. (2000) Professional craft knowledge in patient-centred nursing and the
facilitation of its development. University of Oxford DPhil thesis. Oxford; Ashdale Press.
Tod, A. (2015) Interviewing. In: Gerrish, K. and Lathlean, J. eds. The research process
in nursing. 7th ed. Oxford: Wiley Blackwell. 388-400.
Topping, A. (2015) The quantitative-qualitative continuum. In: Gerrish, K. and Lathlean,
J. eds. The research process in nursing. 7th ed. Oxford: Wiley-Blackwell, 159-171.
Tregunno, D., Baker, R.G., Barnsley, J. and Murray, M. (2004) Competing values of
emergency department performance: balancing multiple stakeholder perspectives. Health
Service Research, 39, 4, part 1.
Tropea, J., Amatya, B., Brand, C.A. and Expert Advisory Group. (2011) Use of consensus
methods to select clinical indicators to assess activities to minimise functional decline
among older hospitalised patients. Australian Health Review, 35, 404-411.
225
Turnbull, J. and Lathlean, J. (2015) Mixed methods research. In: Gerrish, K. and
Lathlean, J. eds. The research process in nursing. 7th ed. Oxford: Wiley Blackwell, 371-
383.
Turner, S., D’Lima, D., Hudson, E., Morris, S., Sheringham,J., Swart, N. and Fulop, N.J.
(2017) Evidence use in decision-making on introducing innovations: a systematic
scoping review with stakeholder feedback. Implementation Science, 12, 145.
Turpin, R.S., Darcy, L.A., Koss, R., McMahill, C., Meyne, K., Morton, D., Rodriguez,
J., Schmaltz, S., Schyve, P. and Smith, P. (1996) A model to assess the usefulness of
performance indicators. International Journal of Quality in Health Care, 8, 321-329.
VanDeVelde-Coke, S., Doran, D., Grinspun, D., Hayes, L., Sutherland Boal, A., Velji,
K., White, P., Bajnok, I. and Hannah, K. (2012) Measuring outcomes of nursing care,
improving the health of Canadians: NNQR (C), C-HOBIC and NQuiRE. Nursing
Leadership, 25(2), 26-37.
Van Nie, N.C., Hollands, L.M. and Hamers, J.P.H. (2010) Reporting quality of nursing
home care by an internet report card. Patient Education and Counseling, 78, 337-343.
Vasse, E., Moniz-Cook, E., Rikkert, M.O., Cantegreil, I., Charras, K., Dorenlot, P.,
Fumero, G., Franco, M., Woods, B. and Vernooij-Dassen, M. (2012) The development
of quality indicators to improve psychosocial care in dementia. International
Psychogeriatrics, 24(6), 921-930.
Walker, E. and Dewar, B.J. (2001) How do we facilitate carers’ involvement in decision
making? Journal of Advanced Nursing, 34(3), 329-337.
Wedderburn Tate, C. (1999) Leadership in nursing. London: Churchill Livingstone.
Weiner, J., Tanniru, M., Khuntia, J., Bobryk, D., Naik, M. and LePage, K. (2016) Digital
leadership in action in a hospital through a real time dashboard system implementation
and experience. Journal of Hospital Administration, 5(4), 34-43.

226
Weiner, S. P. and Dalessio, A.T. (2006) Oversurveying: causes, consequences, and cures.
In: Kraut, A. ed. Getting action from organizational surveys: new concepts, methods and
applications. San Francisco: Jossey-Bass, 294-311.
Werner, R.M. and Asch, D.A. (2007) Clinical concerns about clinical performance
measurement. Annals of Family Medicine, 5(2), 159-163.
West, M., Eckert, R., Steward, K. and Pasmore, B. (2014) Developing collective
leadership for health care. London: The Kings Fund.
Wilkinson, E.K., McColl, A., Exworthy, M., Roderick, P., Smith, H., Moore, M. and
Gabbay, J. (2000) Reactions to the use of evidence-based performance indicators in
primary care: a qualitative study. Quality in Healthcare, 9, 166-174.
Williams, T.M. and Smith, G.P. (2017) "Does training change practice? A survey of
clinicians and managers one year after training in trauma-informed care". The Journal of
Mental Health Training, Education and Practice, 12(3), 188-198.
World Health Organisation. (2015) Institutional repository for information sharing.
Available at: www.who.int/iris [Accessed 20 January 2015].
Yearwood, E., Singleton, J., Feldman, H.R. and Colombraro, G. (2001) A case study in
implementing CQI in a nursing education programme. Journal of Professional Nursing,
17(6), 297-304.
Yin, R. (2014) Case study research: design and methods. 5th ed. California: SAGE
Publications.

227
APPENDICES
Appendix 1: Literature review search matrix
Search Strategy: used to search Medline.
# Searches Results
1. ((clinical indicators or metrics or performance indicators) and
nurs* and decision-making).af.
30
2. clinical indicators.mp. 1732
3. metrics.mp. 13816
4. quality indicators, health care/ or "standard of care"/ 11803
5. performance indicators.mp. 1775
6. 2 or 3 or 4 or 5 28411
7. exp decision making/ or judgment/ or problem solving/ 155566
8. decision-making.mp. 132795
9. 7 or 8 215659
10. 6 and 9 1157
11. exp Nurses/ 71425
12. nurs*.mp. [mp=title, abstract, original title, name of substance
word, subject heading word, keyword heading word, protocol
supplementary concept word, rare disease supplementary
concept word, unique identifier]
570409
13. 11 or 12 570409
14. 10 and 13 134
15. Midwifery/ 15142
16. Nurse Midwives/ 6059
17. midwi*.mp. 27165
18. 15 or 16 or 17 27165
19. 10 and 18 6
20. 14 and 19 3
21. 13 or 15 or 17 581410
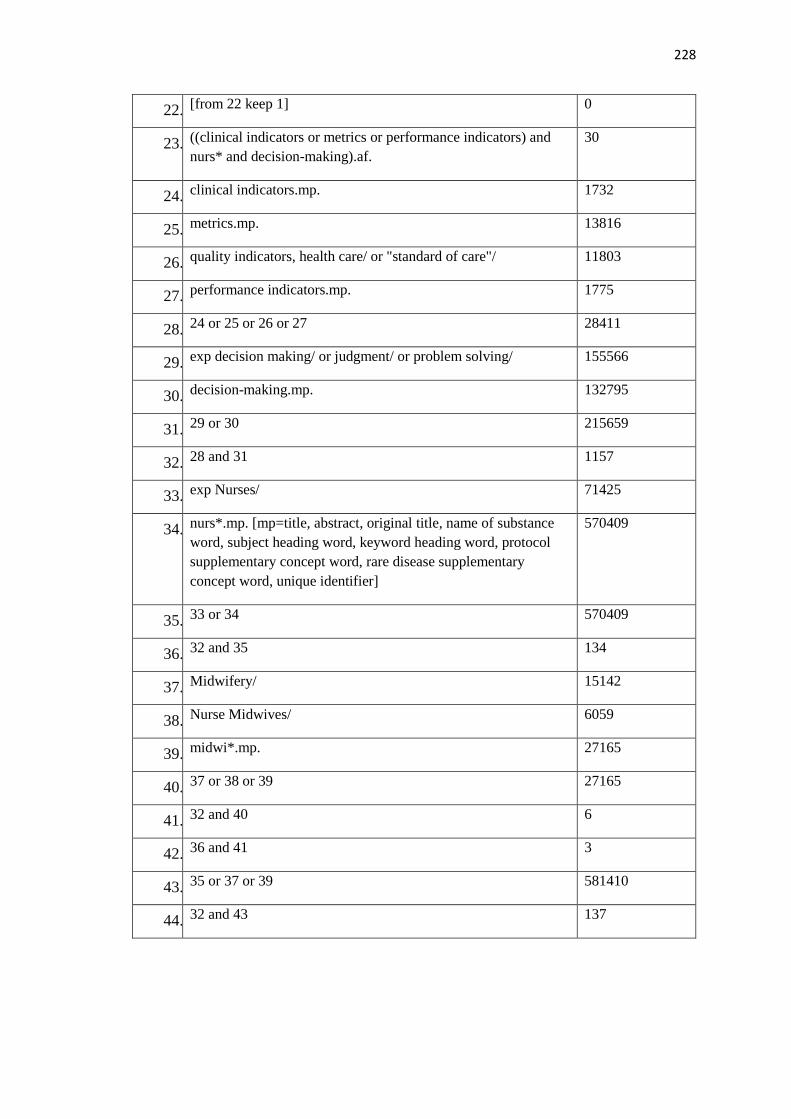
228
22. [from 22 keep 1] 0
23. ((clinical indicators or metrics or performance indicators) and
nurs* and decision-making).af.
30
24. clinical indicators.mp. 1732
25. metrics.mp. 13816
26. quality indicators, health care/ or "standard of care"/ 11803
27. performance indicators.mp. 1775
28. 24 or 25 or 26 or 27 28411
29. exp decision making/ or judgment/ or problem solving/ 155566
30. decision-making.mp. 132795
31. 29 or 30 215659
32. 28 and 31 1157
33. exp Nurses/ 71425
34. nurs*.mp. [mp=title, abstract, original title, name of substance
word, subject heading word, keyword heading word, protocol
supplementary concept word, rare disease supplementary
concept word, unique identifier]
570409
35. 33 or 34 570409
36. 32 and 35 134
37. Midwifery/ 15142
38. Nurse Midwives/ 6059
39. midwi*.mp. 27165
40. 37 or 38 or 39 27165
41. 32 and 40 6
42. 36 and 41 3
43. 35 or 37 or 39 581410
44. 32 and 43 137
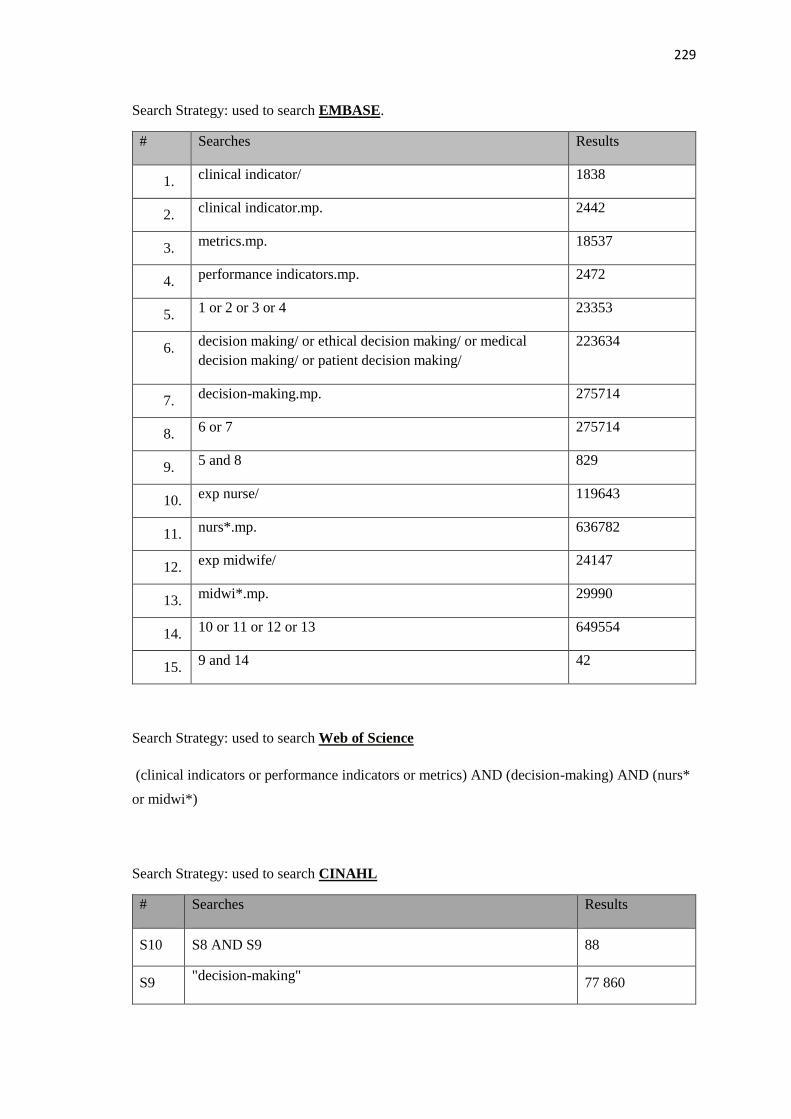
229
Search Strategy: used to search EMBASE.
# Searches Results
1. clinical indicator/ 1838
2. clinical indicator.mp. 2442
3. metrics.mp. 18537
4. performance indicators.mp. 2472
5. 1 or 2 or 3 or 4 23353
6. decision making/ or ethical decision making/ or medical
decision making/ or patient decision making/
223634
7. decision-making.mp. 275714
8. 6 or 7 275714
9. 5 and 8 829
10. exp nurse/ 119643
11. nurs*.mp. 636782
12. exp midwife/ 24147
13. midwi*.mp. 29990
14. 10 or 11 or 12 or 13 649554
15. 9 and 14 42
Search Strategy: used to search Web of Science
(clinical indicators or performance indicators or metrics) AND (decision-making) AND (nurs*
or midwi*)
Search Strategy: used to search CINAHL
# Searches Results
S10 S8 AND S9 88
S9 "decision-making"
77 860
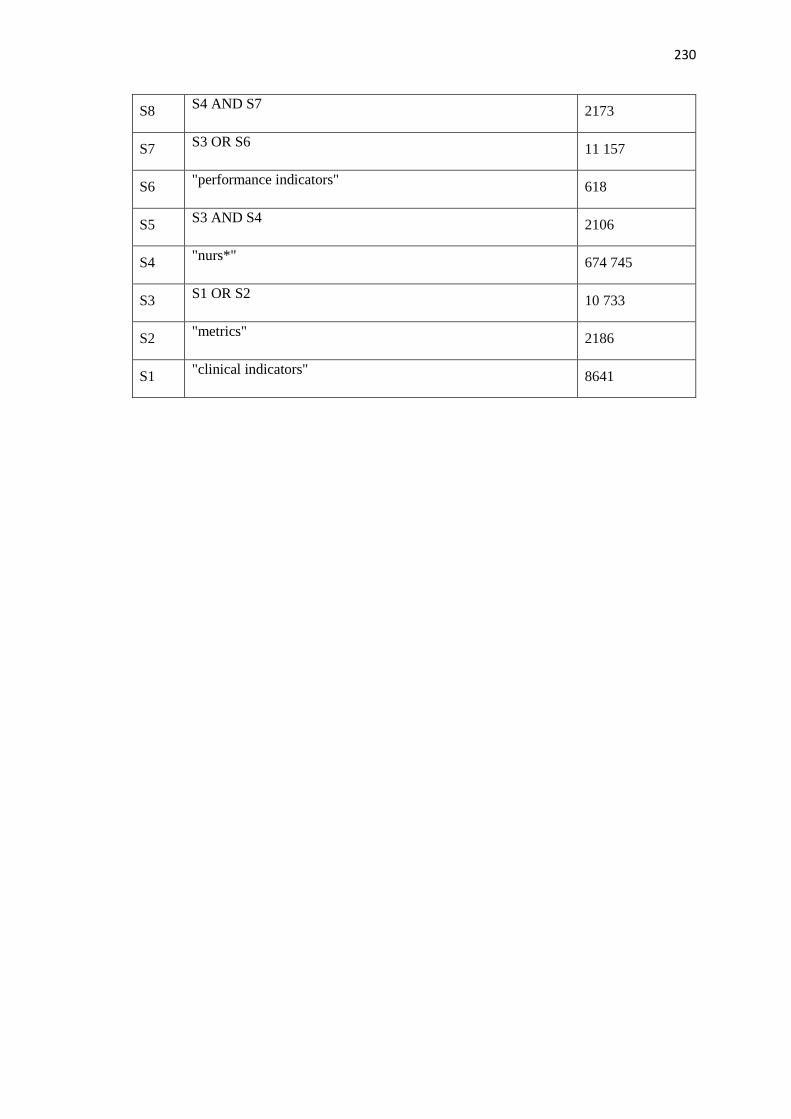
230
S8 S4 AND S7
2173
S7 S3 OR S6
11 157
S6 "performance indicators"
618
S5 S3 AND S4
2106
S4 "nurs*"
674 745
S3 S1 OR S2
10 733
S2 "metrics"
2186
S1 "clinical indicators"
8641

232
Appendix 2: Literature review data extraction table
Authors Aim Participants Method Findings and relevance to the study
Griffiths 2008 Discussion on metrics for nursing Journal Feature Metrics must be sensitive to the unique contribution nurses make to practice.
Can be used to enhance quality care delivery, incentivise nurses and ensure
quality is not neglected in drive to meet targets. Indicator development should
include measures of safety, effectiveness and compassion
Heslop and Lu 2014 To report a concept analysis of
nursing-sensitive indicators
within the acute setting
Concept Analysis Two main attributes identified. Structural, including hours of nursing care per
patient day and staffing and outcome attributes related to patient care including,
prevalence of pressure ulcer, falls, patient/family satisfaction with care.
Discusses the history of indicators in America, the Donabedian framework and
implications for healthcare. Suggests insufficient use and application of nursing
process measures
Burston et al. 2013 To review nurse-sensitive
indicators that may be suitable to
assess nursing care quality
Literature review
(2002-2011)
Commonly used indicators are inconsistent in evidencing nurse-sensitivity.
Issues identified include definitions, data collection and analysis methods. Nurse
managers need to be aware of the factors that can influence use of indicators at
unit level
McCance et al. 2011 To gain consensus on Key
Performance Indicators that are
appropriate and relevant to
nursing and midwifery
Nursing and
midwifery staff in two
Trusts in Northern
Ireland, senior nurses
across the country,
representatives from
education, government
and professional
bodies, and service
users
Consensus approach
using a nominal
group technique
Eight indicators reflecting person-centred aspect of nursing and midwifery care
identified. Measurement of these indicators will provide an opportunity to
evidence the unique impact of nurses/midwives on the patient experience.
Potential challenge as to whether patients will be able to differentiate care
quality in the indicators between nurses and other members of the multi-
disciplinary team
Rambur et al. 2013 To explore potential negative
unintended consequences of
performance metrics
Case study Inconsistent and contradictory evidence on effectiveness and patient benefit
from indicator use. Possible inappropriate clinical care, lack of focus on patient
concerns and concessions in patient independence and education. Challenges to
clinical decision-making. Nurse ideally placed to identify metric driven harm
and moral distress. Data manipulation can improve metrics but decrease quality
of care.
Griffiths et al. 2008 Reviews the status of the
evidence base on nursing metrics
and provides recommendations on
the way forward for nursing
Research paper. Sets metrics within the current healthcare agenda. Discusses need to make
nurses contribution “visible” and also to develop indicators in relation to patient
outcomes and experience. Defines a good indicator. Identifies common
indicators and evidence base for associating between nursing and outcomes
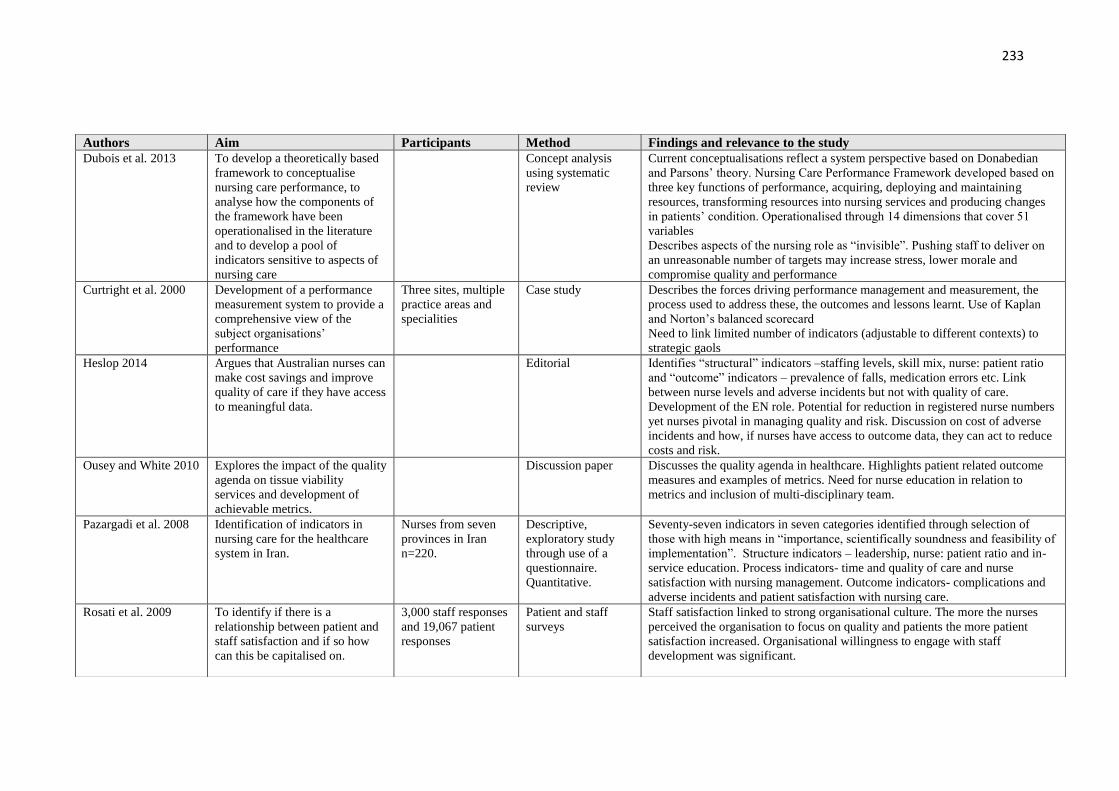
233
Authors Aim Participants Method Findings and relevance to the study
Dubois et al. 2013 To develop a theoretically based
framework to conceptualise
nursing care performance, to
analyse how the components of
the framework have been
operationalised in the literature
and to develop a pool of
indicators sensitive to aspects of
nursing care
Concept analysis
using systematic
review
Current conceptualisations reflect a system perspective based on Donabedian
and Parsons’ theory. Nursing Care Performance Framework developed based on
three key functions of performance, acquiring, deploying and maintaining
resources, transforming resources into nursing services and producing changes
in patients’ condition. Operationalised through 14 dimensions that cover 51
variables
Describes aspects of the nursing role as “invisible”. Pushing staff to deliver on
an unreasonable number of targets may increase stress, lower morale and
compromise quality and performance
Curtright et al. 2000 Development of a performance
measurement system to provide a
comprehensive view of the
subject organisations’
performance
Three sites, multiple
practice areas and
specialities
Case study Describes the forces driving performance management and measurement, the
process used to address these, the outcomes and lessons learnt. Use of Kaplan
and Norton’s balanced scorecard
Need to link limited number of indicators (adjustable to different contexts) to
strategic gaols
Heslop 2014 Argues that Australian nurses can
make cost savings and improve
quality of care if they have access
to meaningful data.
Editorial Identifies “structural” indicators –staffing levels, skill mix, nurse: patient ratio
and “outcome” indicators – prevalence of falls, medication errors etc. Link
between nurse levels and adverse incidents but not with quality of care.
Development of the EN role. Potential for reduction in registered nurse numbers
yet nurses pivotal in managing quality and risk. Discussion on cost of adverse
incidents and how, if nurses have access to outcome data, they can act to reduce
costs and risk.
Ousey and White 2010 Explores the impact of the quality
agenda on tissue viability
services and development of
achievable metrics.
Discussion paper Discusses the quality agenda in healthcare. Highlights patient related outcome
measures and examples of metrics. Need for nurse education in relation to
metrics and inclusion of multi-disciplinary team.
Pazargadi et al. 2008 Identification of indicators in
nursing care for the healthcare
system in Iran.
Nurses from seven
provinces in Iran
n=220.
Descriptive,
exploratory study
through use of a
questionnaire.
Quantitative.
Seventy-seven indicators in seven categories identified through selection of
those with high means in “importance, scientifically soundness and feasibility of
implementation”. Structure indicators – leadership, nurse: patient ratio and in-
service education. Process indicators- time and quality of care and nurse
satisfaction with nursing management. Outcome indicators- complications and
adverse incidents and patient satisfaction with nursing care.
Rosati et al. 2009
To identify if there is a
relationship between patient and
staff satisfaction and if so how
can this be capitalised on.
3,000 staff responses
and 19,067 patient
responses
Patient and staff
surveys
Staff satisfaction linked to strong organisational culture. The more the nurses
perceived the organisation to focus on quality and patients the more patient
satisfaction increased. Organisational willingness to engage with staff
development was significant.

234
Authors Aim Participants Method Findings and relevance to the study
Noh and Lee 2014 To identify what aspects of
nursing care are most frequently
undertaken by student nurses and
determine level of change in the
outcomes through the use of a
computerised system.
Nursing students
from two nursing
schools in South
Korea n=153
Comparative
descriptive.
Quantitative. Student
clinical input data was
extracted from a web-
based nursing
documentation system
Provides 30 nursing diagnosis and outcomes. As for nurses, pain was the most
frequently selected diagnosis suggesting this was considered the most
immediate and important to act on. Also hyperthermia, constipation and skin
integrity. Strong emphasis on education of patients. Possibly due to the fact
that families often contribute to care and thus need preparation for this.
Kleinknecht-Dolf et
al. 2014
To develop an instrument for
measuring the complexity of
nursing care
Pilot study.
Descriptive,
explorative cross-
sectional survey and
qualitative
questionnaire
Perrow’s framework utilised. To estimate the impact and outcomes of nursing
it is necessary to have knowledge of the patient situation.
Discusses the role/goals of nursing and the complexity of decision-making.
Some units assessed the complexity of nursing care as “not or slightly
complex” despite highly complex patient situations and decision-making
requirements. Possibly nurses learn to perform accurately and methodically
even in highly complex situations and come to terms with the complexity.
“Extreme complexity” was rated in areas were certain care needed to be
carried out by nurses with several years’ experience.
Baxter and Rideout
2006
Sought to discover how student
nurses make decisions in the
clinical setting.
Student nurses n=12 Qualitative, intrinsic
case study.
Discusses emotion and knowledge based responses. Student/patient encounters
most complex. Desire to keep the patient happy and avoid conflict. Students
often did what the patient wanted even if they knew it was unsafe. Lack of
confidence, fear of upsetting nurses, respect and recognition of nurses power
left students unable to approach nurses for help.
Ousey and White
2009
Aims to raise the agenda of
accountability in the field of
tissue viability.
Editorial Specifies the quality agenda in the UK. Provide a challenging definition of
metrics. Highlights the need for practitioners in the field of tissue viability to
consider evidencing quality of care delivery.
Idvall et al. 1997 To describe and analyse the
characteristics of clinical
indicators
Literature review Provides a definition of a clinical indicator and discusses structure, process
and outcome. Identifies influences behind the selection and development of
indicators. Uses the word “threshold” to identify the level between what is
considered good or not.
Northcott and
Harvey 2012
To examine the relationship
between public perceptions of
KPI’s assessing various aspects of
the health-care system.
4,000 adults
randomly selected
each year.
Cross-sequential
survey approach using
telephone calls.
Developed from business in the private sector to support the Ministry of
Health Accountability Act. Discussion of reasons for patients excusing
deficiencies in care. Highlights the use of KPI’s to assess patients’ perceptions
of healthcare in general and particularly the role the media plays.
Rutherford 2014 Explain the need for a
standardised nursing language
Discussion paper Explains what a standardised language is and the benefits to nursing. Identifies
some of the nursing languages available and discusses these in-depth.
Pearson 2003 Raising the profile of KPI's Editorial Highlights the importance of KPI’s in the current climate in order to support
higher quality outcomes.

235
Authors Aim Participants Method Findings and relevance to the study
Kontio et al. 2011 Identifies important information
in the care processes of cardiac
patients
Ward sisters and
nursing staff,
physicians and senior
managers - managerial
“experts”.
Qualitative study in
two phases. Phase one
- online questionnaire.
Phase two -interviews
Relates to information flows and how decisions are made. Used the critical
incident technique to analyse incidents to identify what information was
important in care. Focuses on managerial decision-making. Identifies that
single points of action are not enough and that fluent management requires a
comprehensive picture of the care process.
Griffiths and Maben
2009
Explaining the scope of
measuring quality of care through
use of indicators
Short article Addresses briefly the question “can nursing performance be measured?” and
calls for metrics as a means of making the impact of nursing “visible”.
Kurtzman and
Corrigan 2007
A summary of National Quality
Forum’s consensus development
process
The public and NQF
members
Discussion paper States the rules against which indicators were developed. No consensus on
the link between nurse education and quality. Suggests these measures foster
a climate receptive to monitoring and reporting nurses’ influence.
Houser et al. 2012 To determine the relationship
between nurse decision-making
and patient outcomes
Nurses Quantitative causal-
comparative study
Policy should be based on evidence but none available that demonstrated
that nurse involvement in staffing decisions generated positive patient
outcomes. Involving nurse in outcome evaluation was associated with better
patient outcomes. A relationship was identified between job satisfaction,
retention and decision-making. Direct care nurses often make decisions
independent of leadership. Organisation governance includes little direct
care nurse involvement. Nurses expect to be held accountable for their
decisions. Use Weston’s (2008) theory framework
Drake 2013 Discusses the use of dash boards
and balanced scorecards
Discussion paper Identifies how dashboards can be used to aid decision-making in nursing.
Discusses what needs to be considered before setting up an electronic system
and how to use it to best advantage.
Barnsley et al. 2005 To identify indicators for family
practice
Physicians n=11 and
one nurse practitioner
Delphi study Development of indicators for primary care. Challenges in developing a
performance assessment system-inconsistent supporting evidence and lack of
communication in multi-disciplinary team leading to information not being
up-to-date. Activities identified that might be carried out but weren't
recorded; it was suggested that actions that identified problems were more
likely to be recorded.
Greenhalgh et al.
2014
Presents debate on the
development of evidence-based
practice
Discussion paper Argues that although intended to act as a means of strengthening practice,
evidence-based practice has had some negative consequences. It is open to
“gaming”, and person-centredness has the potential to be overtaken by
performance concerns. Volume of evidence has become unmanageable and
evidence-based guidelines may not take into account co-morbidities.
Cokins 2013 Information paper on dashboards
and balanced scorecards.
Web based
information
Explains the differences and uses for dashboards and balanced scorecards.
Discusses how these systems may be of use in organisations.

236
Authors Aim Participants Method Findings and relevance to the study
Groff-Paris and
Terhaar 2010
Presentation of a performance
improvement project
513 nurses in a
hospital and one unit
in a hospital.
Mixed methods. Phase
1- survey Phase 2 –
pilot in one unit of a
service improvement
initiative. Phase 3 -
evaluation
Discusses creation of a tool based on Maslow’s pyramid and NDQNI, to enable
nurses to interpret and analyse their units’ indicator data. Also, the piloting of an
intervention designed to improve nurses’ perceptions of their work environment
and promote safer delivery of patient care. Highlights how nurses previously
were not involved in the collection and analysis of data related to their areas and
therefore nurses did not engage or support the projects.
Hahtela et al. 2014 To explore the influence of
culture on sickness, overtime
and injury in primary care
Healthcare
organisations n=9,
with acute in-patient
units n=21
Cross-sectional survey For managers to improve nursing outcomes they need to understand the
influence of culture on these outcomes. A negative perception of management
will impact on sickness, injury and overtime. Staff shortages will increase.
Happy staff equals happy patients.
Maben 2008 Response paper on the topic
of the value of nursing.
Editorial debate Suggests that nursing work is subordinate to other more visible and accountable
activities. Discusses previous research the author has undertaken where student
nurses encountered barriers meaning their work was undermined and
undervalued. Highlights the challenge of making the role of the nurse more
visible.
Graham-Dickerson
et al. 2013
To explore the perceptions of
nurses regarding their
involvement in decision-
making.
Nurses from 10
hospitals
Qualitative descriptive
study
Discusses the use of shared governance as a process to enable nurses to feel
heard and improve decision-making. Identifies different means by which nurses
can contribute and suggests that this increases job satisfaction. Nurses expressed
a wish to be more involved in the multi-disciplinary team and administration
decision-making. Asking for and trusting nurses judgements was perceived to
increase staff confidence and improve performance. Greater feeling of
ownership in the organisation. Key to this was involvement by unit staff at
hospital council; the necessity of the feedback loop.
Joseph 2007 Presents a conceptual
framework of 6 nursing care
constructs that affect
outcomes
Discussion paper Culture, staffing levels and other variables have no direct effect on outcomes
except through the influence of these on delivery of care. Discusses the
constructs of environment, unit qualities, nursing qualities, patient qualities,
nursing care and outcomes.
Kӧtter et al. 2013 To explore the inclusion of
patients in development of
quality indicators.
A systematic review Patient views on quality improvement and desired outcomes should be included.
Their involvement has an impact on acceptance of the indicators in practice.
However, not all patients want to be involved in decision-making. Identifies 11
articles and 4 web-based documents that identified inclusion of patients’
opinions in indicator development.
Health Information
and Quality
Authority 2013
Guidance on development of
KPI’s
Guidelines Information relevant to development of KPI’s and minimum data sets to monitor
healthcare quality in the Republic of Ireland. Discusses the role of KPI’s,
reasons for use and data reporting
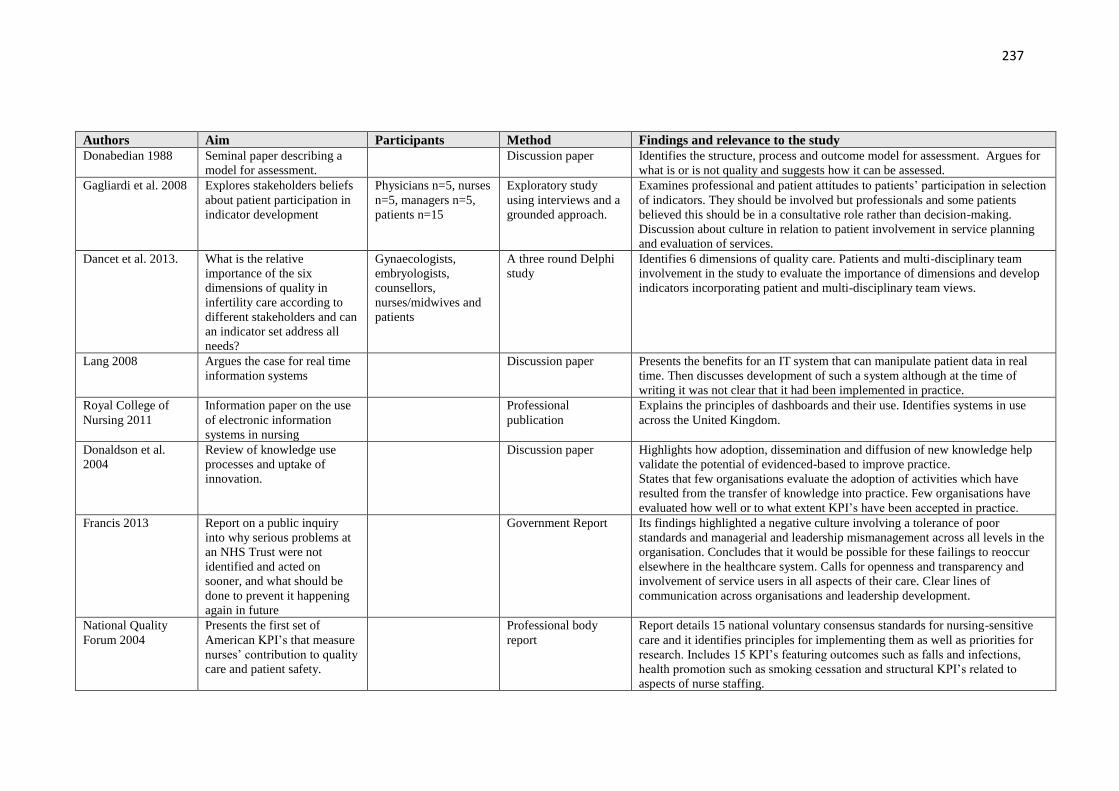
237
Authors Aim Participants Method Findings and relevance to the study
Donabedian 1988 Seminal paper describing a
model for assessment.
Discussion paper Identifies the structure, process and outcome model for assessment. Argues for
what is or is not quality and suggests how it can be assessed.
Gagliardi et al. 2008 Explores stakeholders beliefs
about patient participation in
indicator development
Physicians n=5, nurses
n=5, managers n=5,
patients n=15
Exploratory study
using interviews and a
grounded approach.
Examines professional and patient attitudes to patients’ participation in selection
of indicators. They should be involved but professionals and some patients
believed this should be in a consultative role rather than decision-making.
Discussion about culture in relation to patient involvement in service planning
and evaluation of services.
Dancet et al. 2013. What is the relative
importance of the six
dimensions of quality in
infertility care according to
different stakeholders and can
an indicator set address all
needs?
Gynaecologists,
embryologists,
counsellors,
nurses/midwives and
patients
A three round Delphi
study
Identifies 6 dimensions of quality care. Patients and multi-disciplinary team
involvement in the study to evaluate the importance of dimensions and develop
indicators incorporating patient and multi-disciplinary team views.
Lang 2008 Argues the case for real time
information systems
Discussion paper Presents the benefits for an IT system that can manipulate patient data in real
time. Then discusses development of such a system although at the time of
writing it was not clear that it had been implemented in practice.
Royal College of
Nursing 2011
Information paper on the use
of electronic information
systems in nursing
Professional
publication
Explains the principles of dashboards and their use. Identifies systems in use
across the United Kingdom.
Donaldson et al.
2004
Review of knowledge use
processes and uptake of
innovation.
Discussion paper Highlights how adoption, dissemination and diffusion of new knowledge help
validate the potential of evidenced-based to improve practice.
States that few organisations evaluate the adoption of activities which have
resulted from the transfer of knowledge into practice. Few organisations have
evaluated how well or to what extent KPI’s have been accepted in practice.
Francis 2013 Report on a public inquiry
into why serious problems at
an NHS Trust were not
identified and acted on
sooner, and what should be
done to prevent it happening
again in future
Government Report Its findings highlighted a negative culture involving a tolerance of poor
standards and managerial and leadership mismanagement across all levels in the
organisation. Concludes that it would be possible for these failings to reoccur
elsewhere in the healthcare system. Calls for openness and transparency and
involvement of service users in all aspects of their care. Clear lines of
communication across organisations and leadership development.
National Quality
Forum 2004
Presents the first set of
American KPI’s that measure
nurses’ contribution to quality
care and patient safety.
Professional body
report
Report details 15 national voluntary consensus standards for nursing-sensitive
care and it identifies principles for implementing them as well as priorities for
research. Includes 15 KPI’s featuring outcomes such as falls and infections,
health promotion such as smoking cessation and structural KPI’s related to
aspects of nurse staffing.

238
Authors Aim Participants Method Findings and relevance to the study
Senge 1990 Discusses management
“disciplines” necessary for
learning organisations
Book Focuses on group problem solving using the systems thinking method in order to
convert companies into learning organizations. The five disciplines represent
approaches (theories and methods) for developing three core learning
capabilities: fostering aspiration, developing reflective conversation, and
understanding complexity.
National Quality
Forum 2003
Presents a framework
for constructing a set of
hospital care consensus
standards
Professional body
report
Recommends processes for reporting, implementing, maintaining, evaluating,
and improving the set of KPI’s. This work led onto the development of the first
set of KPI’s detailed in the National Voluntary Consensus Standards.
Lee at al. 1999 To identify studies of nursing
care quality that evaluate the
links between process and
patient outcomes.
Literature review Identifies types of nursing processes described in retrieved articles and compares
against information related to outcomes. Recommendations include further study
to evaluate how nursing problem identification relates to subsequent nurse
performance and patient outcomes
Attree 2001 To explore the perceptions of
healthcare professionals,
patients and relatives concept
of quality care.
Nurses, doctors,
managers n=36,
patients n= 34,
relatives n= 7
Qualitative approach
using grounded theory.
Exploratory,
descriptive study.
Presents the argument that validity and reliability of quality measures is
questionable if as some authors have stated quality is too diverse a concept to be
measured. Discusses the nature of the practitioner under “care processes” –
emotional labour of nursing and how nurses put an emphasis on meeting the
needs of the patient so that outcomes may be met despite poor resources
(structure) and processes.
Harte et al. 2012 Discusses implementation of
an electronic dashboard.
Discussion paper Highlights the real-time benefits of use of dashboards. Communication to
frontline and executive managers, alerts staff pre and when process fails.
Improvement efforts can be focused on area of need and impact can be quickly
identified. Decisions can be made based on current situations. Patients receive
better care.
Sermeus et al. 2008 To develop a measure of the
intensity of nursing care
Acute hospitals n= 115 Quantitative
retrospective analysis
Identified the content of 23 nursing KPI’s not reviewed for 20 years. The San
Joaquin classification system was used to measure intensity of care delivered
over a set retrospective period of time. Both intensity and type of care were
measured. The intensity of care increased but nature of care did not change. May
provide way to examine the relationship between workload/patient acuity and
staffing and patient outcomes.
Hedges et al. 1999 Proposes indicators for
discharge planning based on
findings from a literature
review.
Literature review Highlights the need for stakeholder feedback but identifies limitations due to
lack of research evidence on this topic. Based indicator development on
structure, process, and outcome. Suggest that the indicators are best
implemented through policies and procedures.

239
Authors Aim Participants Method Findings and relevance to the study
Clarke et al. 2003 To develop indicators for end-
of-life care in ICU.
Critical end-of-life
peer work group n=36,
physicians =15, nurses
n=15
Literature review and
consensus
Identified a comprehensive set of quality indicators including patient and
family-centred decision-making however, no patients or family were included in
development of the indicators. Evidence was gathered from literature and ethical
guidelines. Highlight the need for validation before implementation.
Fero et al. 2010 Discusses the concept of
critical thinking.
Discussion paper Examines the use of simulation to measure critical thinking skills in student
nurses.
Argyris 1960 Considers organisational
behaviour
Book Discusses various aspects of individual behaviours such as frustration, tension,
conflict and other defensive behaviours and their impact in organisational
situations. Includes case studies.
Maben et al. 2012 To build the evidence base
and theory on metrics for
future use in the development
of indicators
Research paper Builds on the information provided in a previous research paper on metrics.
Contributes to the establishment of a small set of key indicators of high quality
nursing and design of an infrastructure to enable national consistency and
benchmarking.
Snell 2015 Report on Safe Staffing
Alliance campaign
Journal feature item Report presents campaign to persuade politicians that staffing levels are key to
solving NHS problems. Identifies a manifesto for safe staffing. Highlights issues
with the current reporting of staffing levels.
Mattke et al. 2003 To design and implement a
reporting system for quality
care.
Discussion paper The study does not identify what process was used to select the indicators
stakeholders were include but considering this system was to be launched to the
public no pilot appears to have been run.
Arah et al. 2003 Reviews conceptual
frameworks for performance
Discussion paper Reviews conceptual frameworks in Australia, USA, Canada and UK as well as
WHO and other international bodies. Identifies gap in the knowledge-base for
how performance output data is used to improve quality care.
Royal College of
Nursing 2011
Guidance for nurses on
electronic documentation and
technology
Guidance paper Discusses the current use of electronic management of patient information.
Highlights issues in relation to this.
Fossum et al. 2011 Explores thinking strategies
and clinical reasoning
processes of nurses during
simulations
Registered nurses
n=30 in nursing homes
n=9
Qualitative using think
aloud techniques
Assess findings against Fonteyns 17 thinking strategies. Identifies a tendency to
go straight to planning care without data collection. No systematic risk
assessment done. Numerous decisions made but may be ineffective due to lack
of data collected. No explicit consideration of EB when making choices. This
study would be evidence of benefit of KPI’s as they should be evidenced-based.
Kavanagh et al. 2012 Highlights the need for
healthcare reform.
Discussion paper Discusses patient harm in relation to KPI’s recording infection rates and the
overuse of antibiotics. Transparency of KPI measures allow consumers to chose
care providers. Focuses on structure and outcome measures rather than process.
Despite having the highest spending on healthcare, the USA has some of the
poorest quality care.

240
Authors Aim Participants Method Findings and relevance to the study
Dunton et al. 2004 Estimates the relationship
between three aspects of nurse
staffing and the patient fall
rate for acute care units
One year of data from
1751 hospitals
Retrospective analysis
using a generalized
linear mixed model
Higher fall rates were associated with fewer nursing hours per patient day and a
lower percentage of registered nurses, although the relationship varied by unit
type. Smaller hospitals also had higher fall rates.
Dunckley et al. 2005 Discusses the use of outcome
measures to assess
effectiveness and outcomes of
treatment and interventions.
Patients and staff in a
specialist hospice
inpatient unit and a
nursing home
An action-research
approach discussion
paper
Suggests that use of the same tool in diff contexts has issues as not always
appropriate. A critical and unresolved barrier was top down approach.
Implementation barriers: top-down decision-making; KPI’s perceived as time-
consuming to use; limited resources for data analysis; and a lack of knowledge
of the importance of KPI’s. Enablers: involving all staff in decisions about
implementation; using a measure that can be adapted to organisation needs and
clinical practice
De Casterlé et al
2008
Examines the impact of a
leadership development
programme on the team and
care processes
Nurses n=9, physios
n=3, psychologist n=1,
occ therapist n=1, Dr
n=1, head nurse and
nursing manager
Mixed methods case
study
More transformational and less transactional leadership attributes following the
programme. Increased self and team management, better relationship with the
organisation, communication, autonomous work environment, sense of
responsibility to patients, nurses encouraged to problem solve and resolve team
issues, nurse development, more clarity and structure that enhanced control over
practice (characteristics of Magnet). Supported by interview data only, no hard
evidence.
Leveck and Jones
1996
Examines the effects of key
factors in the nursing practice
environment—management
style, group cohesion, job
stress, organizational job
satisfaction, and professional
job satisfaction—on staff
nurse retention and process
aspects of quality of care
50 nursing units at
four acute care
hospitals
Tested a four-stage
theoretical model
The model, which is modified from Hinshaw and Atwood’s (1985) anticipated
turnover model, explained 49% of the variance in staff nurse retention and 39%
of the variance in process aspects of quality of nursing care. Results substantiate
the belief that aspects of the practice environment affect staff nurse retention,
and the quality of care delivered in hospitals
Duffield et al. 2007 Explored whether nurse
staffing, experience and skill
mix influenced care in
medical-surgical wards
Data from 80
randomly selected
medical-surgical wards
in 19 public hospitals
and nurses (n = 2278)
Retrospective analysis
and nurse surveys
Skill mix, nurse experience, nursing workload and factors in the ward
environment significantly influenced the model of care in use. Wards with a
higher ratio of degree qualified, experienced registered nurses, working on their
'usual' ward were more likely to practice patient allocation while wards with
greater variability in staffing levels and skill mix were more likely to practice
team nursing. Nurses adapt the model of nursing care on a daily or shift basis,
according to patients' needs, skill mix and individual ward environments.

241
Authors Aim Participants Method Findings and relevance to the study
Paquet et al. 2013 Explores the psychosocial
variables that explain
organisational outcomes of
medication errors and length
of stay
Healthcare workers
n=243 from 13
different units
Path analyses Links data between work climate scales, effort/reward, and social support to
absenteeism, turnover and overtime to nurse/patient ration, medication errors
and length of patient stay. Staff active in decision-making are more satisfied
with their work and quality care increases as does staff retention. Employee’s
perception of the work environment is an important indirect predictor of patient
outcomes. Happy staff=happy patients
Shuldham et al. 2009 To explore the relationship
between nurse staffing and
patient outcomes
A NHS Trust
comprising two
hospitals
Case study using
retrospective data
Patient data extracted from hospital records over a one-year period. Patient
outcomes analysed to determine if the outcomes of care was related to various
aspects of nurse staffing. Weak association found and study did not replicate
previous findings.
Mitchell and Soule
2008
Chapter in a book on patient
safety and quality of care
Book Provides some examples of positive rather than negative KPI’s e.g. use of
pressure relieving mattresses to prevent pressure ulcers. Discussion on nurses’
role in safety and most critical contribution being the co-ordination and
integration of quality care within the nursing and MDT and highlights their key
role in communication.
Sorensen and
Iedema 2010
Aims to understand the
environment of health care,
and how clinicians and
managers
respond in terms of
performance accountability
45 participants
including: divisional,
departmental medical
directors, consultants,
manager, clinical
educators and staff
nurses
Qualitative research Specific focus on ICU. Discusses need for MDT working and agreement on
measures of performance. Good patient outcomes require processes whereby all
MDT and family can contribute at key points. Highlights limited studies
available on the relationship between corporate and clinical domains. Need to
pool resources and collaborate to address problems as they arise.
Edelen and Bell
2011
Evaluation of an intervention
designed to develop student
nurses decision-making skills
51 students and 10
lecturers
A quasi-experimental,
non-equivalent group,
post-test-only,
comparison group de-
sign
Supportive feedback on journal entries and direction to evaluate the details and
actions of a clinical decision in relation to past decisions enhanced students’
learning from their experience. Lecturer supported reflective practice enhances
learning as does case study comparison based on students’ personal experiences
and past theoretical or experiential knowledge.
Anderson et al. 2012 Discusses implementation and
sustainability of quality
improvement programme.
Discussion paper Identifies components of complexity science and means of achieving high
quality outcomes. Also, aspects of psychological safety and challenge with
peers.
Kaplan and Norton
1992
Seminal paper on the
development of balanced
scorecards
Discussion paper Describes the development of measures that provide managers with a
comprehensive overview of the performance of their business.
Emphasis is on strategic use of KPI’s to track performance and selection of the
most effective measures and what should be taken into account for this to
happen. The balanced score card identifies goals but assumes that people will
make whatever changes are needed to reach this goal. The focus is not on
control but rather desire to reach an agreed vision.

242
Authors Aim Participants Method Findings and relevance to the study
Zeitlin et al. 2003 Development of a set of
perinatal KPI’s for European
use
Obstetricians,
paediatrics,
epidemiologists/
statistician n=unclear.
Plus a midwife and a
service user. An
additional panel of 15
midwives
subsequently run.
Delphi consensus Suggested KPI’s for inclusion in selection requested from national and
international experts. Time between Delphi rounds allowed for language barriers
to be addressed. Little mention of the patient experience in the suggested KPI’s.
This was highlighted as need to address.
Yearwood et al.
2001
Implementation of a
continuous quality
improvement effort at a
nursing school.
Discussion paper Discusses use of a Report Card to organise and monitor quality improvement.
Presents a sample Report Card and discusses its use in quality assessment.
Examines the process of implementing change and barriers that occurred, initial
scepticism, time to embed change.
Accreditation as a driver for change and use of benchmarking outcomes to
enable comparisons and again drive change.
Stricker et al. 2009 Use of a questionnaire to
gauge next-of-kin satisfaction
in ICU and identify
opportunities for
improvement.
23 ICUs. 996
completed
questionnaires
Quantitative research. Measures to assess satisfaction pre-set within the instrument used. Limited
discussion of these. A few open-ended questions but qualitative analysis not
presented.
Walker and Dewar
2001
To investigate carers’
involvement in decision-
making in an older persons
psychiatric unit
Carers n=20, nurses
and assistant nursing
staff n=17, doctors
n=5, occupational
therapists n=2, social
workers n=2,
community psychiatric
nurses n=3.
Case study Identifies that carer involvement in practice is not happening. Discusses various
factors as to why this may be, placing them into two categories: hospital systems
and processes and the relationship between nurses and carers.
Argues that for involvement to improve staff need to firstly identify the issue
and then challenge the relevant barriers.
Vasse et al. 2012 The development of KPI’s to
improve psychosocial care in
dementia
49/114 questionnaires
returned in round
1.14/49 responses to
second round.25
experts agreed on final
selection of 12 KPI’s
RAND modified
Delphi consensus
No patient or carer involvement in KPI development. No specific KPI related to
satisfaction with care. However, "preference" is noted within two KPI categories
as is the need to "tailor" care to patients and carers thus indicating involvement
of both in decision-making. Care of carers is also included within a specific
category. The use of patient records as the data source to measure the KPI's was
identified as an issue as most records were incomplete leading to under-
reporting of care delivery. Recommends interviews with carers in future studies
to help address this.

243
Authors Aim Participants Method Findings and relevance to the study
Van den Heede et al.
2007
To assess key variables used
in research on nurse staffing
and patient outcomes
24 researchers and 8
nurse administrators
from 10 countries
Delphi consensus
although no panel
meeting occurred
International study to examine which KPI's best measure the relationship
between staffing and patient outcomes. Mortality is the most widely recognised
KPI however a need was recognised for nurse specific care. KPI's mainly
structural and outcome based. Some process based KPI's nominated by experts
included smoking cessation advice, counselling for various conditions and pain
assessment/interventions
Van Nie et al. 2010 Test of an internet report card
to assess if consumers can
interpret the information
provided to gain valued and
reliable opinions on which to
base decisions on choice of
nursing home.
Service users and
relatives from a
consumer group. 42
university students, 70
nursing staff,
managers and quality
coordinators from
nursing homes
Experimental design Netherlands has a national database of KPI data. Participants rated consumer
satisfaction with quality care highest and information on KPI data relatively low.
However, when only consumer satisfaction was available, the report card was
viewed more negatively perhaps due to belief that information was deliberately
being withheld.
Tregunno et al. 2004 Explores what different
stakeholders believe is
important to gauge
performance in an ED.
Hospital: Physicians,
nurses, frontline and
senior managers.
Community: home
care case and senior
managers. Prehospital:
paramedics, clinical
programme directors
and admin staff. Total
n=685 respondents, a
62% response rate.
Nominal group
process to identify
KPI’s for inclusion on
a questionnaire. Then
quantitative analysis of
multiple stakeholder
responses to this
questionnaire.
Different groups have different preferences. Quality improvement relies on
teamwork therefore it is important to identify relevance to practice in order to
enhance change effectiveness. It is suggested that managers’ view of what is
important may supersede that of practice staff and that they need to be aware of
multiple viewpoints and reflect this in improvement initiatives. Use of the
Competing Values Framework of Organisational Effectiveness (adapted from
Quinn and Rohrbaugh 1983) to articulate performance perspectives of the
different stakeholders.
Tropea et al. 2011 To select KPI's to assess
activities to minimise decline
in older hospitalised patients
Medical, nursing and
allied health
professionals, total n=
13. Plus project team.
Number not specified
Delphi consensus No service user or carer involvement. 17 process based KPI's and 2 outcome based.
Literature review and web search of grey material carried out. Rating based on
importance, feasibility and scientific soundness, not usability. Evaluated the process
at the end. Identified a lack of person-centred KPI's in literature as reason for these
not to be included in the final selection. Highlights data burden briefly.
Wilkinson et al.
2000
To explore reaction to the
introduction of KPI's for
stroke and cardio.
GPs n=29, practice
managers n=11,
practice nurses n=12
across 15 primary care
practices
Qualitative study Evaluates introduction of KPI's and identifies barriers and facilitators. MDT KPI’s
mainly, only smoking cessation nurse-sensitive. Benefits: capacity to monitor quality
care, increased efficiency and facilitates up-to-date practice. Barriers: data burden,
decreased autonomy and trust, financial penalties and short-term expectations of
improved care quality. Lack of teamwork; discussion happening within professional
teams rather than across, terminology, time, issues with dissemination of action
plans.
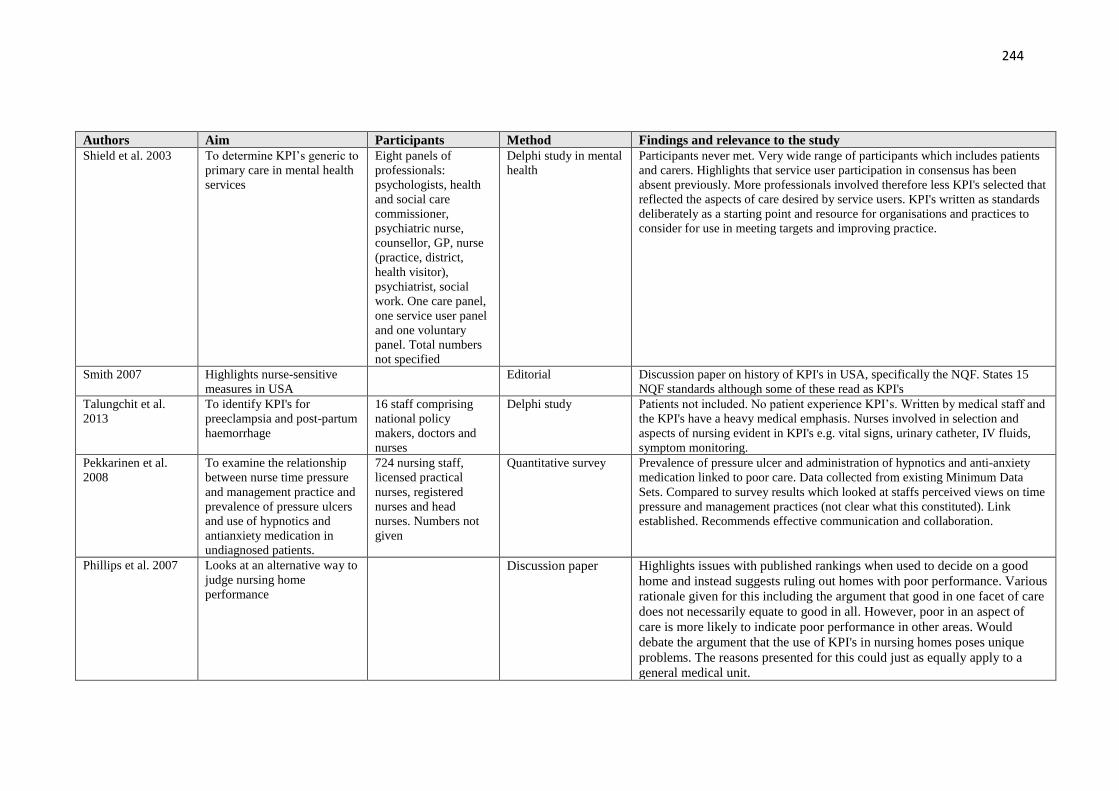
244
Authors Aim Participants Method Findings and relevance to the study
Shield et al. 2003 To determine KPI’s generic to
primary care in mental health
services
Eight panels of
professionals:
psychologists, health
and social care
commissioner,
psychiatric nurse,
counsellor, GP, nurse
(practice, district,
health visitor),
psychiatrist, social
work. One care panel,
one service user panel
and one voluntary
panel. Total numbers
not specified
Delphi study in mental
health
Participants never met. Very wide range of participants which includes patients
and carers. Highlights that service user participation in consensus has been
absent previously. More professionals involved therefore less KPI's selected that
reflected the aspects of care desired by service users. KPI's written as standards
deliberately as a starting point and resource for organisations and practices to
consider for use in meeting targets and improving practice.
Smith 2007 Highlights nurse-sensitive
measures in USA
Editorial Discussion paper on history of KPI's in USA, specifically the NQF. States 15
NQF standards although some of these read as KPI's
Talungchit et al.
2013
To identify KPI's for
preeclampsia and post-partum
haemorrhage
16 staff comprising
national policy
makers, doctors and
nurses
Delphi study Patients not included. No patient experience KPI’s. Written by medical staff and
the KPI's have a heavy medical emphasis. Nurses involved in selection and
aspects of nursing evident in KPI's e.g. vital signs, urinary catheter, IV fluids,
symptom monitoring.
Pekkarinen et al.
2008
To examine the relationship
between nurse time pressure
and management practice and
prevalence of pressure ulcers
and use of hypnotics and
antianxiety medication in
undiagnosed patients.
724 nursing staff,
licensed practical
nurses, registered
nurses and head
nurses. Numbers not
given
Quantitative survey Prevalence of pressure ulcer and administration of hypnotics and anti-anxiety
medication linked to poor care. Data collected from existing Minimum Data
Sets. Compared to survey results which looked at staffs perceived views on time
pressure and management practices (not clear what this constituted). Link
established. Recommends effective communication and collaboration.
Phillips et al. 2007 Looks at an alternative way to
judge nursing home
performance
Discussion paper Highlights issues with published rankings when used to decide on a good
home and instead suggests ruling out homes with poor performance. Various
rationale given for this including the argument that good in one facet of care
does not necessarily equate to good in all. However, poor in an aspect of
care is more likely to indicate poor performance in other areas. Would
debate the argument that the use of KPI's in nursing homes poses unique
problems. The reasons presented for this could just as equally apply to a
general medical unit.

245
Authors Aim Participants Method Findings and relevance to the study
Campbell et al. 2002 Research methods used to
develop and apply KPI’s in
primary care
Discussion paper Provides definitions and examples of KPI, standards, review criteria and
guidelines. Differentiates between performance and quality KPI’s-
performance does not infer quality. Stakeholders will have different values
and rate KPI’s differently in consensus. Patients relate quality more to
attitude, clinical performance and communication skills.
Argues that to improve quality the focus should be on process KPI’s.
Discusses non-systematic and systematic methods of developing KPI’s.
Case studies – non-systematic. Defines Delphi, RAND appropriate, nominal
group technique, guidelines.
Adams et al. 2011 To explore unintended
consequences of performance
measurement systems
4 sites, 59 interviews
with doctors, nurses
and managers
Qualitative study Performance measurement systems well embedded and consistently high
scores achieved. Decision made to try and improve practice by reducing
negative unintended consequences of KPI implementation rather than seek
to further improve already high scores. Study to identify what the negative
consequences are. These include: polypharmacy, patient frustration with
repeated use of KPI’s in part due to systems which do not accept patient
refusal of treatment. Patient education reduced due to time pressure of
meeting other KPI’s.
Dickerson et al.
2001
Development of a learning
strategy which involves use of
guidelines to evaluate clinical
decision-making tools.
Discussion paper Discusses use of pathways and algorithms. Provides guidance for evaluation
of quality indicators. Highlights nurses need to increase knowledge of
decision-making tools to help plan care and evaluate outcomes.
Krӧger et al. 2007 Selection of indicators
suitable for older adults with
cognitive impairment
33 experts from across
10 areas. GP n=6,
geriatricians n= 3,
nurses n=6,
psychologists and
neuropsychologists n=
5, pharmacists n=4,
occ.therapists n=3,
dieticians n=3 S
workers n=3.
Modified RAND
appropriateness
Delphi
No patient or carer involvement in agreement of KI's however, 40 were
involved in a phone pat/sat interview to assess feasibility of agreed KPI's
plus 29 patient notes reviewed. KPI’s accessed through a separate web link
and revealed a mix of multiprofessional KPI’s. Nurse sensitive KPI’s
recorded on the relevant table of indicators.
Lodewijckx et al.
2012
Selection of COPD KPI’s Doctors n= 19, nurses
n=8, physiotherapists
n=8
Delphi study International study. Identified process and outcomes KPI’s for use in follow-up
studies on quality e.g. care pathways. No patient involvement although several
of the KPI’s are patient and family focused. More medical KPI’s identified and
possible reasons given apart from higher percentage of medics involved.
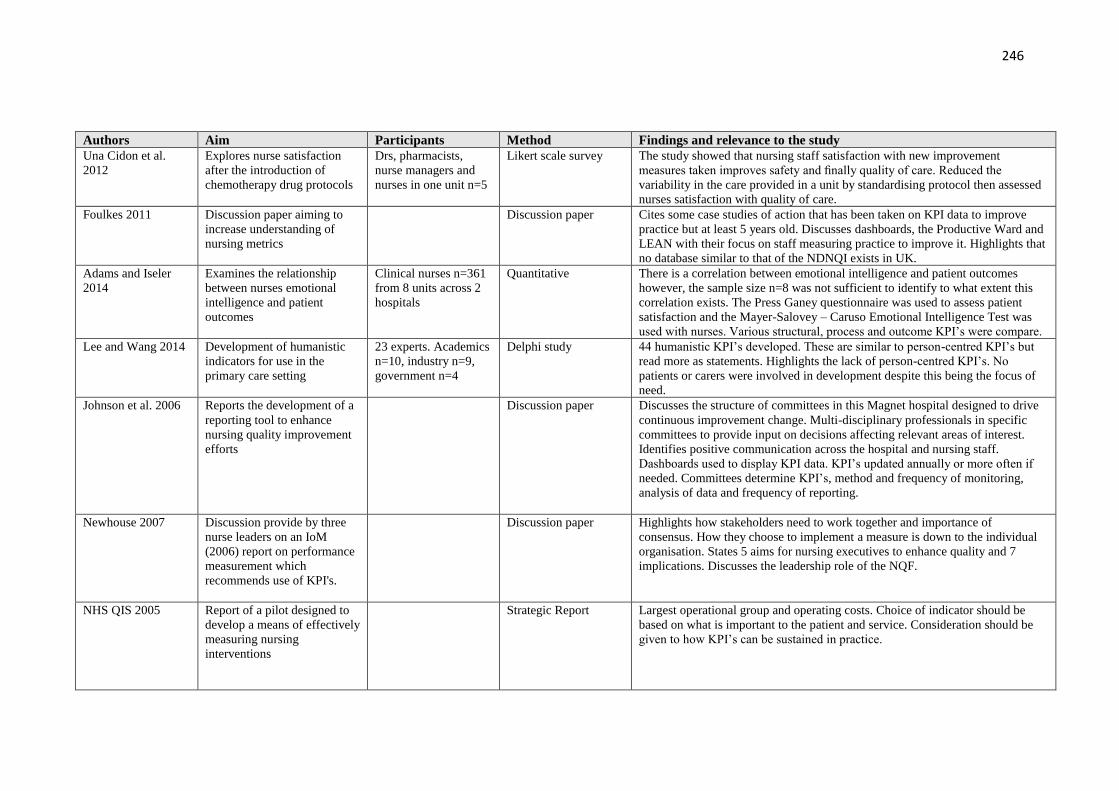
246
Authors Aim Participants Method Findings and relevance to the study
Una Cidon et al.
2012
Explores nurse satisfaction
after the introduction of
chemotherapy drug protocols
Drs, pharmacists,
nurse managers and
nurses in one unit n=5
Likert scale survey The study showed that nursing staff satisfaction with new improvement
measures taken improves safety and finally quality of care. Reduced the
variability in the care provided in a unit by standardising protocol then assessed
nurses satisfaction with quality of care.
Foulkes 2011 Discussion paper aiming to
increase understanding of
nursing metrics
Discussion paper Cites some case studies of action that has been taken on KPI data to improve
practice but at least 5 years old. Discusses dashboards, the Productive Ward and
LEAN with their focus on staff measuring practice to improve it. Highlights that
no database similar to that of the NDNQI exists in UK.
Adams and Iseler
2014
Examines the relationship
between nurses emotional
intelligence and patient
outcomes
Clinical nurses n=361
from 8 units across 2
hospitals
Quantitative There is a correlation between emotional intelligence and patient outcomes
however, the sample size n=8 was not sufficient to identify to what extent this
correlation exists. The Press Ganey questionnaire was used to assess patient
satisfaction and the Mayer-Salovey – Caruso Emotional Intelligence Test was
used with nurses. Various structural, process and outcome KPI’s were compare.
Lee and Wang 2014 Development of humanistic
indicators for use in the
primary care setting
23 experts. Academics
n=10, industry n=9,
government n=4
Delphi study 44 humanistic KPI’s developed. These are similar to person-centred KPI’s but
read more as statements. Highlights the lack of person-centred KPI’s. No
patients or carers were involved in development despite this being the focus of
need.
Johnson et al. 2006 Reports the development of a
reporting tool to enhance
nursing quality improvement
efforts
Discussion paper Discusses the structure of committees in this Magnet hospital designed to drive
continuous improvement change. Multi-disciplinary professionals in specific
committees to provide input on decisions affecting relevant areas of interest.
Identifies positive communication across the hospital and nursing staff.
Dashboards used to display KPI data. KPI’s updated annually or more often if
needed. Committees determine KPI’s, method and frequency of monitoring,
analysis of data and frequency of reporting.
Newhouse 2007 Discussion provide by three
nurse leaders on an IoM
(2006) report on performance
measurement which
recommends use of KPI's.
Discussion paper Highlights how stakeholders need to work together and importance of
consensus. How they choose to implement a measure is down to the individual
organisation. States 5 aims for nursing executives to enhance quality and 7
implications. Discusses the leadership role of the NQF.
NHS QIS 2005 Report of a pilot designed to
develop a means of effectively
measuring nursing
interventions
Strategic Report Largest operational group and operating costs. Choice of indicator should be
based on what is important to the patient and service. Consideration should be
given to how KPI’s can be sustained in practice.

247
Authors Aim Participants Method Findings and relevance to the study
St Pierre 2006 Discusses employment of a
shared decision-making model
to empower bedside nurses.
Discussion paper Suggests nurses are frequently divorced from patient outcomes due to the delay
between practice and consequences, quick turnover, lack of self-belief as seen as
a team dependent. Highlights the benefits to be gained from a structure of
councils designed to engage all levels of nurses and aid communication in
relation to improving quality care. Staff nurses actively chair councils at unit
level and are trained in leadership and facilitation skills as well as practice
improvement methodology, research and evidence-based practice skills. Impacts
identified include nurses directly involved in improving care, nurses sense of
satisfaction, control and compliance and team working increased. Now aware of
gaps in care delivery. Early signs of improved quality of care but too early to
note trends.
Lancaster and King.
1999
Describes the use of spider
diagrams in a report card as a
means of combining
information from KPI to assist
in decision-making.
Discussion paper You cannot see trends from spider diagrams. Need to "drill down" if issues are
identified. Staffing largest cost and is directly related to outcomes. Use data to
argue for resources.
Sinclair 1997 Discusses the use of IT to
maximise quality outcomes
and decision-making. This
was back at the outset of IT
and KPI development
Discussion paper Managers must do more with less. Highlights the need to monitor trends.
Defines care pathways. Detail description of the benefits of IT systems but very
little on the barriers or issues to use. Emphasis is on the managers to be able to
engage with multiple IT programmes as a means of improving productivity,
decision-making and management of care, staff, costs.
Newhouse 2006 Describes the generic process
for selection and development
of KPI's.
Discussion paper Highlights the four criteria for assessing KPI's. Details a referenced process for
selection and development of KPI's. Follows the Donabedian model for KPI
development. Identifies multiple sources of information useful to KPI
development.
Gokenbach et al.
2011
Discusses the new Magnet
model for assessing
organisations for accreditation
Discussion paper Based on the Donabedian model with 5 areas needing evidenced. Highlights the
need for staff engagement as a critical component of patient safety and quality
care. Discusses Kanter and empowerment. Provides a case study of one hospitals
journey to Magnet status.
Highlights avenues of communication developed between executive level and
clinical level nurses.
Olsen 2011 Ethical paper related to KPI’s Ethics discussion Raises some issues related to KPI harm. Presents examples of gaming and
suggests this will occur as a result of KPI's inappropriate to individual patient
needs as nurses try to meet the measure and do what is best for the patient.
Discusses Bok's "justified deception". Highlights the need to include clinical
nurses in KPI development to ensure KPI's fit in with the reality of practice and
avoid gaming.
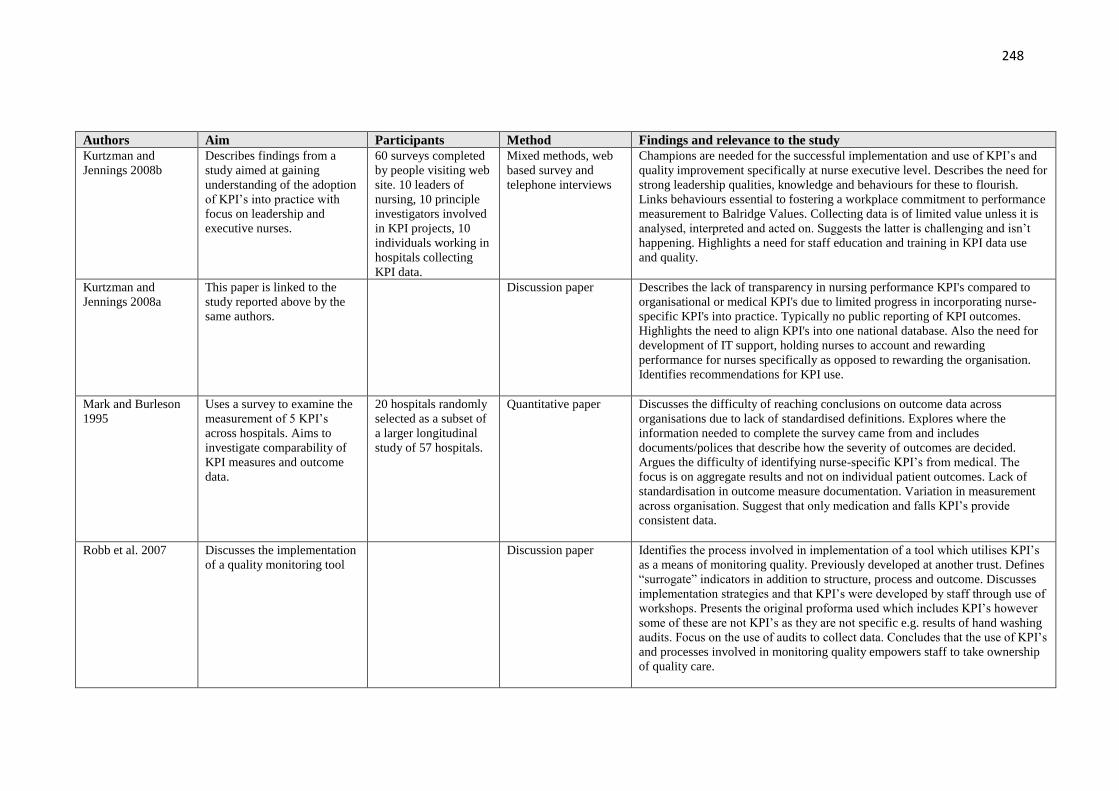
248
Authors Aim Participants Method Findings and relevance to the study
Kurtzman and
Jennings 2008b
Describes findings from a
study aimed at gaining
understanding of the adoption
of KPI’s into practice with
focus on leadership and
executive nurses.
60 surveys completed
by people visiting web
site. 10 leaders of
nursing, 10 principle
investigators involved
in KPI projects, 10
individuals working in
hospitals collecting
KPI data.
Mixed methods, web
based survey and
telephone interviews
Champions are needed for the successful implementation and use of KPI’s and
quality improvement specifically at nurse executive level. Describes the need for
strong leadership qualities, knowledge and behaviours for these to flourish.
Links behaviours essential to fostering a workplace commitment to performance
measurement to Balridge Values. Collecting data is of limited value unless it is
analysed, interpreted and acted on. Suggests the latter is challenging and isn’t
happening. Highlights a need for staff education and training in KPI data use
and quality.
Kurtzman and
Jennings 2008a
This paper is linked to the
study reported above by the
same authors.
Discussion paper Describes the lack of transparency in nursing performance KPI's compared to
organisational or medical KPI's due to limited progress in incorporating nurse-
specific KPI's into practice. Typically no public reporting of KPI outcomes.
Highlights the need to align KPI's into one national database. Also the need for
development of IT support, holding nurses to account and rewarding
performance for nurses specifically as opposed to rewarding the organisation.
Identifies recommendations for KPI use.
Mark and Burleson
1995
Uses a survey to examine the
measurement of 5 KPI’s
across hospitals. Aims to
investigate comparability of
KPI measures and outcome
data.
20 hospitals randomly
selected as a subset of
a larger longitudinal
study of 57 hospitals.
Quantitative paper Discusses the difficulty of reaching conclusions on outcome data across
organisations due to lack of standardised definitions. Explores where the
information needed to complete the survey came from and includes
documents/polices that describe how the severity of outcomes are decided.
Argues the difficulty of identifying nurse-specific KPI’s from medical. The
focus is on aggregate results and not on individual patient outcomes. Lack of
standardisation in outcome measure documentation. Variation in measurement
across organisation. Suggest that only medication and falls KPI’s provide
consistent data.
Robb et al. 2007 Discusses the implementation
of a quality monitoring tool
Discussion paper
Identifies the process involved in implementation of a tool which utilises KPI’s
as a means of monitoring quality. Previously developed at another trust. Defines
“surrogate” indicators in addition to structure, process and outcome. Discusses
implementation strategies and that KPI’s were developed by staff through use of
workshops. Presents the original proforma used which includes KPI’s however
some of these are not KPI’s as they are not specific e.g. results of hand washing
audits. Focus on the use of audits to collect data. Concludes that the use of KPI’s
and processes involved in monitoring quality empowers staff to take ownership
of quality care.

249
Authors Aim Participants Method Findings and relevance to the study
NHS Group 2014 Sets out the indicators that
will be used to hold NHS
England to account for
improvements in outcomes
Web-based policy
paper
Indicates the future direction for indicator development in England.
NHS 2014a Action plan to address the
commitment laid out in the
plan for health service
development in the UK over
next five years
Government Report Includes the empowerment of patients, health of staff, engaging
communities. Discusses external bodies to promote and monitor care
quality.
NHS 2014b Sets out a plan for health
service development in the
UK over the following five
years
Government Report Identifies the need to measure the important aspects of health and calls for
openness regarding the data produced. Emphasises the need for team
working across healthcare disciplines and inclusion of the patient and
family. Integration of hospital and primary care to streamline services.
Development of information systems to aid communication internally,
externally and with the service user e.g. telemedicine and health apps.
JCAHO 1993 To provide information on
performance indicators Book Discusses various aspects of performance indicators, what they are, how
they should be used, difference between rate-based and sentinel event KPI’s
and reasons for measuring care among others.
Gold et al. 2005 To explore the extent of
patient participation in the
planning of care support
networks in Ontario.
Qualitative multi-
case study
Uses semi-structured interviews, document analysis and observations of
strategic meetings to explore patient involvement in provincial care
planning. Highlights the lack of patient participation despite positive intents.
Reasons given include lack of direction for patient involvement, dominance
of established medical centres and competition from other political
priorities.
ANA 1995 Presents the Nursing Care
Report Card for Acute Care
based on the outcome of a
safety and quality initiative in
America.
Report Details 21 measures of performance linked to a conceptual or quantifiable
aspect of nursing practice. Operationally defines 10 KPI’s specific to acute
nursing care. Comprehensive description of each in order to promote
consistency of data collection and analysis.
Department of
Health 2008
Review of the NHS and plan
for its development into the
next century
Government Report Calls for high quality care with the patient and public at the centre. Plan to
develop a strategy for the introduction of a framework of quality KPI’s.
Highlights patient safety, experience and effectiveness of care. The need to
measure and understand what we do. Includes dashboards and publishing
performance results.

250
Authors Aim Participants Method Findings and relevance to the study
NHS National
Services Scotland
2012
Report on the work of an
intensive care society’s
quality improvement
programme
Professional Report Presents the management process for the use of KPI’s. Defines KPI’s as
“flags”. KPI’s presented under the headings structure, process and outcome.
Not nurse-specific, strategic for ICU setting.
Blozik et al. 2012 Examines how official bodies
and healthcare organisations
deal with a lack of guidance
on the simultaneous
development of clinical
practice guidelines and quality
indicators.
90 members of the
Guidelines
International
Network across 34
countries
Survey A variety of methods were used for the simultaneous development but
approx. 50% lacked formal procedures. Development of KPI’s expensive
and time consuming therefore it is sensible to develop KPI’s at the same
time as development of guidance such as that which NICE would produce.
Identifies various methods for KPI development.
National Advisory
Group on the Safety
of Patients in
England 2013
Review of NHS England
following the Francis Report
and others to identify learning
and recommendations for
action
Independent Review Targets may take precedence over patient care. Lines of responsibility need to be
clear with leadership from the frontline to Prime Minister. All levels of staff
should be trained to measure and improve care. Quality care cannot be achieved
solely through regulation based on standards. The focus should be on culture.
Defines quality in terms of control, improvement and planning. Encourages
patient and public involvement with support and training to understand and
actively participate at all stages of quality improvement.
Department of
Health, Social
Services and Public
2011
Presents a ten-year strategy to
improvement quality of care
in health and social care in
Northern Ireland
Government paper Specifics strategic goals and objectives for service improvement. Emphasises
the need to put the service user at the heart of care and health promotion. States
what will be done and how we will know it is achieved for each of the ten
objectives.
Institute of Medicine
1990
Report on a study
commissioned to design a
strategy for quality review and
assurance in Medicare.
Quality Committee
Report
Defines quality, evaluate methods to evaluate quality, also methods to measure,
review and assure quality care. Evaluate methods available to correct or prevent
identified problems with quality of care.
Mainz 2003 Examines definitions, and
classification of KPI’s in
healthcare
Discussion paper Classifies using Donabedian model. Highlights difference between rate-based
and sentinel event KPI’s. Also specifies a difference between generic measures
that are relevant for most patients or disease-specific.
Parlour et al. 2013 Report commissioned to
evaluate the impact of
medication management
metrics upon the delivery of
nursing and midwifery care
Three locations with
38 sites.
Mixed methods study Planned observations of practice/audits, sought the opinion of patients and staff,
and used an assessment framework to assess the context of practice.
Implementation viewed favourably. Needed buy-in from all staff and there is a
need ensure that all action plans generated are completed.
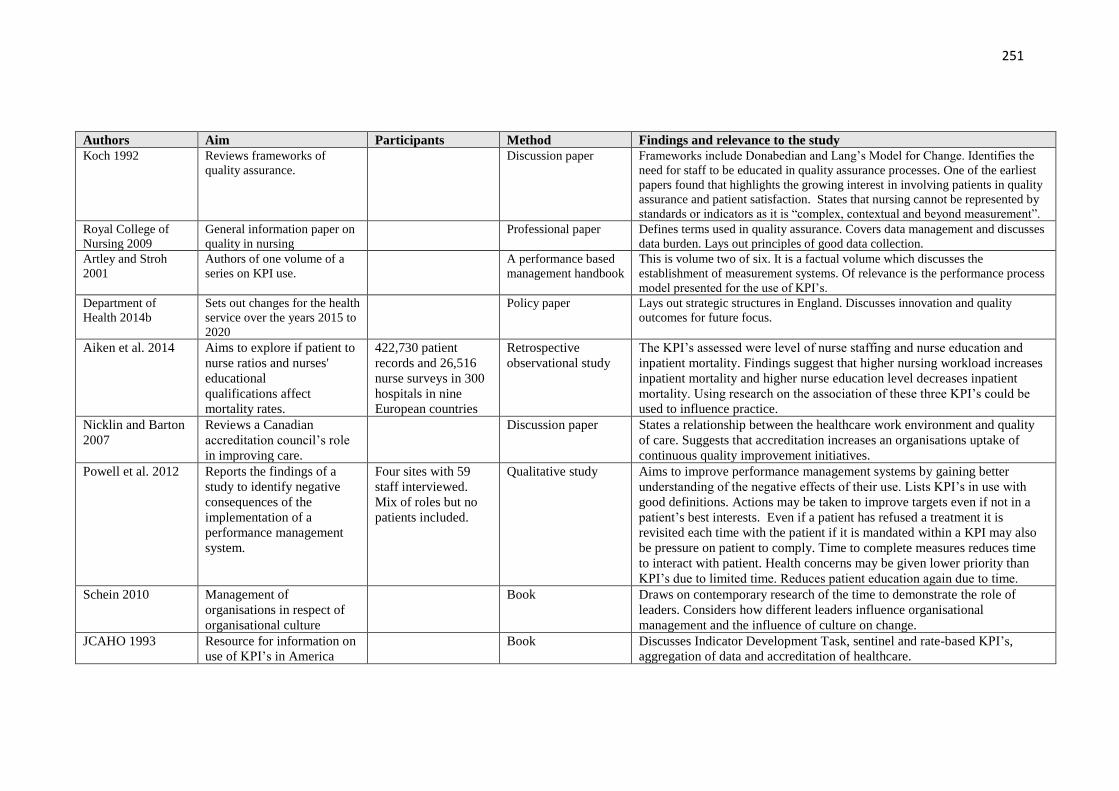
251
Authors Aim Participants Method Findings and relevance to the study
Koch 1992 Reviews frameworks of
quality assurance.
Discussion paper Frameworks include Donabedian and Lang’s Model for Change. Identifies the
need for staff to be educated in quality assurance processes. One of the earliest
papers found that highlights the growing interest in involving patients in quality
assurance and patient satisfaction. States that nursing cannot be represented by
standards or indicators as it is “complex, contextual and beyond measurement”.
Royal College of
Nursing 2009
General information paper on
quality in nursing
Professional paper Defines terms used in quality assurance. Covers data management and discusses
data burden. Lays out principles of good data collection.
Artley and Stroh
2001
Authors of one volume of a
series on KPI use.
A performance based
management handbook
This is volume two of six. It is a factual volume which discusses the
establishment of measurement systems. Of relevance is the performance process
model presented for the use of KPI’s.
Department of
Health 2014b
Sets out changes for the health
service over the years 2015 to
2020
Policy paper Lays out strategic structures in England. Discusses innovation and quality
outcomes for future focus.
Aiken et al. 2014 Aims to explore if patient to
nurse ratios and nurses'
educational
qualifications affect
mortality rates.
422,730 patient
records and 26,516
nurse surveys in 300
hospitals in nine
European countries
Retrospective
observational study
The KPI’s assessed were level of nurse staffing and nurse education and
inpatient mortality. Findings suggest that higher nursing workload increases
inpatient mortality and higher nurse education level decreases inpatient
mortality. Using research on the association of these three KPI’s could be
used to influence practice.
Nicklin and Barton
2007
Reviews a Canadian
accreditation council’s role
in improving care.
Discussion paper States a relationship between the healthcare work environment and quality
of care. Suggests that accreditation increases an organisations uptake of
continuous quality improvement initiatives.
Powell et al. 2012
Reports the findings of a
study to identify negative
consequences of the
implementation of a
performance management
system.
Four sites with 59
staff interviewed.
Mix of roles but no
patients included.
Qualitative study Aims to improve performance management systems by gaining better
understanding of the negative effects of their use. Lists KPI’s in use with
good definitions. Actions may be taken to improve targets even if not in a
patient’s best interests. Even if a patient has refused a treatment it is
revisited each time with the patient if it is mandated within a KPI may also
be pressure on patient to comply. Time to complete measures reduces time
to interact with patient. Health concerns may be given lower priority than
KPI’s due to limited time. Reduces patient education again due to time.
Schein 2010 Management of
organisations in respect of
organisational culture
Book Draws on contemporary research of the time to demonstrate the role of
leaders. Considers how different leaders influence organisational
management and the influence of culture on change.
JCAHO 1993
Resource for information on
use of KPI’s in America
Book Discusses Indicator Development Task, sentinel and rate-based KPI’s,
aggregation of data and accreditation of healthcare.
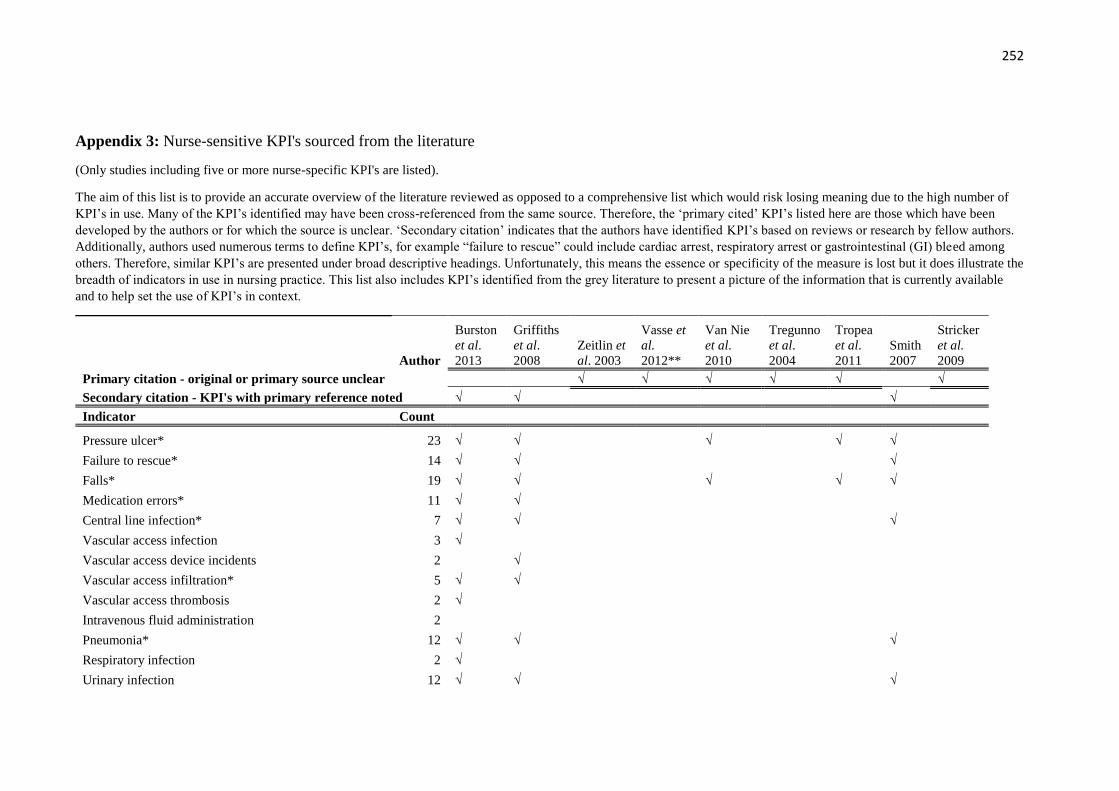
252
Appendix 3: Nurse-sensitive KPI's sourced from the literature
(Only studies including five or more nurse-specific KPI's are listed).
The aim of this list is to provide an accurate overview of the literature reviewed as opposed to a comprehensive list which would risk losing meaning due to the high number of
KPI’s in use. Many of the KPI’s identified may have been cross-referenced from the same source. Therefore, the ‘primary cited’ KPI’s listed here are those which have been
developed by the authors or for which the source is unclear. ‘Secondary citation’ indicates that the authors have identified KPI’s based on reviews or research by fellow authors.
Additionally, authors used numerous terms to define KPI’s, for example “failure to rescue” could include cardiac arrest, respiratory arrest or gastrointestinal (GI) bleed among
others. Therefore, similar KPI’s are presented under broad descriptive headings. Unfortunately, this means the essence or specificity of the measure is lost but it does illustrate the
breadth of indicators in use in nursing practice. This list also includes KPI’s identified from the grey literature to present a picture of the information that is currently available
and to help set the use of KPI’s in context.
Author
Burston
et al.
2013
Griffiths
et al.
2008
Zeitlin et
al. 2003
Vasse et
al.
2012**
Van Nie
et al.
2010
Tregunno
et al.
2004
Tropea
et al.
2011
Smith
2007
Stricker
et al.
2009
Primary citation - original or primary source unclear √ √ √ √ √ √
Secondary citation - KPI's with primary reference noted √ √ √
Indicator Count
Pressure ulcer* 23 √ √ √ √ √
Failure to rescue* 14 √ √ √
Falls* 19 √ √ √ √ √
Medication errors* 11 √ √
Central line infection* 7 √ √ √
Vascular access infection 3 √
Vascular access device incidents 2 √
Vascular access infiltration* 5 √ √
Vascular access thrombosis 2 √
Intravenous fluid administration 2
Pneumonia* 12 √ √ √
Respiratory infection 2 √
Urinary infection 12 √ √ √

253
Urinary catheter/ostomy 5 √
Continence 7 √ √ √
Bowel management/ostomy 2
Deep vein thrombosis 5 √ √
CNS complications 3 √
Vital sign status 8
Metabolic derangement 5 √
Post-operative infection* 5 √ √
Post-operative complications 3 √ √
C. difficile 2 √
MRSA 2 √
Wound care 2
Healthcare acquired infection surveillance system* 8 √
Functional status 8 √ √ √
Sleep/rest 2
Self-care 9 √
Nutritional assessment/screening* 9 √ √
Protected meal times policy implemented 1 √
Patient characteristics* 2
Patient complaints 4 √ √
Patient satisfaction* 15 √ √ √ √
Next-of-kin satisfaction* 3 √
Confidence and trust 4 √
Practice environment/perceived quality 5 √ √
Cleanliness 2 √
Hand hygiene 2
Thrombophlebitis 2 √ √
Fluid overload 1 √

254
Iatrogenic lung collapse 1 √
Pulmonary embolis 3 √
Atelectasis 1 √
Activities of daily living index* 3 √ √ √
Pain scores* 13 √ √ √ √
Health status/quality of life 4 √
Vaccination rates 5 √
Allergies recorded 1 √
Risk assessments 5 √ √
Assessment and management of social situation 4
Accidents/incidents 4 √ √
Symptom manager index* 7 √ √
Symptom resolution 4 √
Physical and mental health change scores 3 √ √
Patient absconding or lost 1 √
Physical/sexual assault 3 √
Restraint* 8 √ √
Psychological well-being 7 √ √
Self-harm risk assessment 2 √
Cognitive screening 3 √
Confusion/delirium 2 √
Staff satisfaction and wellbeing 11 √ √
Nurse to patient ratio 4
Staffing levels/skill mix* 13 √ √ √
Sickness rates 3 √
Smoking cessation advice 7 √ √
Staffing bank/agency/overtime utilisation 7 √
Perception of adequate staffing 2 √
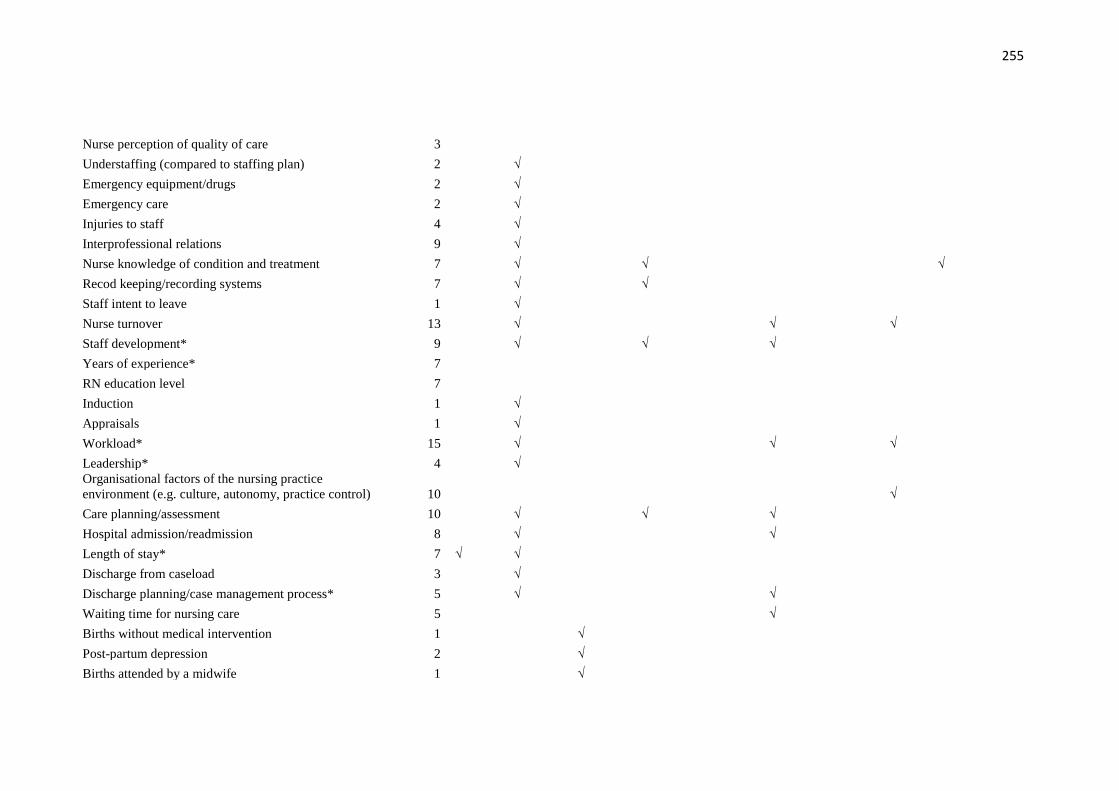
255
Nurse perception of quality of care 3
Understaffing (compared to staffing plan) 2 √
Emergency equipment/drugs 2 √
Emergency care 2 √
Injuries to staff 4 √
Interprofessional relations 9 √
Nurse knowledge of condition and treatment 7 √ √ √
Recod keeping/recording systems 7 √ √
Staff intent to leave 1 √
Nurse turnover 13 √ √ √
Staff development* 9 √ √ √
Years of experience* 7
RN education level 7
Induction 1 √
Appraisals 1 √
Workload* 15 √ √ √
Leadership* 4 √ Organisational factors of the nursing practice
environment (e.g. culture, autonomy, practice control) 10 √
Care planning/assessment 10 √ √ √
Hospital admission/readmission 8 √ √
Length of stay* 7 √ √
Discharge from caseload 3 √
Discharge planning/case management process* 5 √ √
Waiting time for nursing care 5 √
Births without medical intervention 1 √
Post-partum depression 2 √
Births attended by a midwife 1 √

256
Breast feeding 2 √
Carers offered respite or short-care break 1 √
Designated nurse 2 √
Timely blood culture collection in patients with
pneumonia 1 Timely antibiotic administration to patients with
pneumonia 1
Time to triage 2 √
Access to primary care in the community/referrals 4 √
Current medications* 5 √
Cervical screening 3
Oxygen therapy* 1
Nebuliser and inhalers use and administration 1
Unplanned extubation 1
Tracheostomy or endotrachel tube care 1 Consistent delivery of nursing/midwifery care against
identified need, patient's sense of safety whilst under the
care of N/M, Patient’s confidence in the knowledge and
skills of the nurse/midwife 2 Time spent by N/M with the patient, respect from the
N/M for patient's preferences and choice,
Nurse/midwife’s support for patients to care for
themselves, where appropriate 2 N/M understanding of what is important to the patient,
patient's involvement in decisions made about their N/M
care 4 Cast care 1 Venepuncture and/or cannulation 1 Care of patients in isolation 1 Patient education/health promotion 8
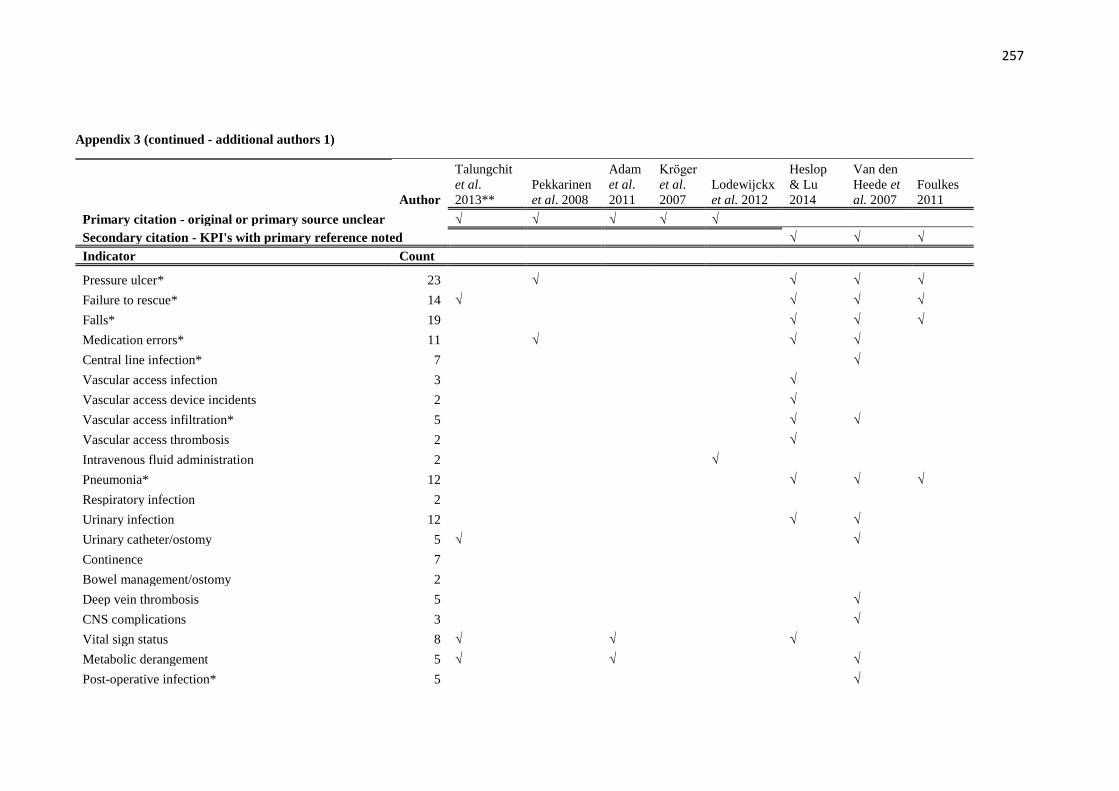
257
Appendix 3 (continued - additional authors 1)
Author
Talungchit
et al.
2013**
Pekkarinen
et al. 2008
Adam
et al.
2011
Krӧger
et al.
2007
Lodewijckx
et al. 2012
Heslop
& Lu
2014
Van den
Heede et
al. 2007
Foulkes
2011
Primary citation - original or primary source unclear √ √ √ √ √
Secondary citation - KPI's with primary reference noted √ √ √
Indicator Count
Pressure ulcer* 23 √ √ √ √
Failure to rescue* 14 √ √ √ √
Falls* 19 √ √ √
Medication errors* 11 √ √ √
Central line infection* 7 √
Vascular access infection 3 √
Vascular access device incidents 2 √
Vascular access infiltration* 5 √ √
Vascular access thrombosis 2 √
Intravenous fluid administration 2 √
Pneumonia* 12 √ √ √
Respiratory infection 2
Urinary infection 12 √ √
Urinary catheter/ostomy 5 √ √
Continence 7
Bowel management/ostomy 2
Deep vein thrombosis 5 √
CNS complications 3 √
Vital sign status 8 √ √ √
Metabolic derangement 5 √ √ √
Post-operative infection* 5 √
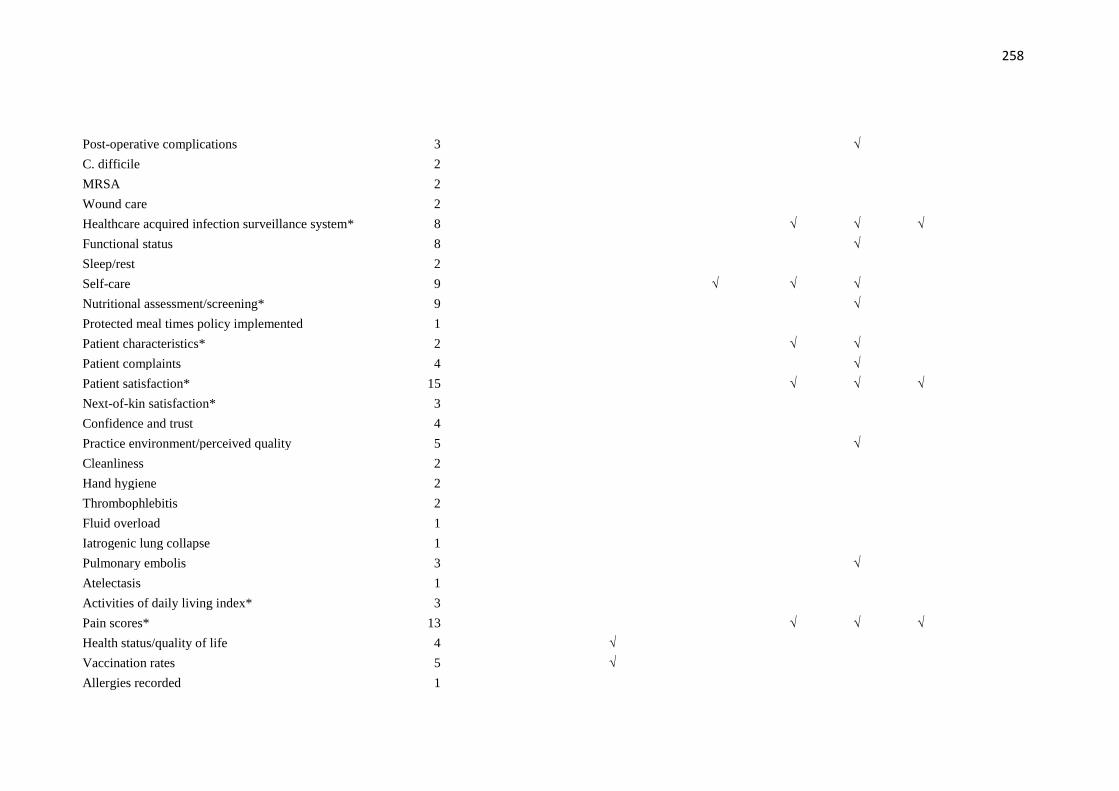
258
Post-operative complications 3 √
C. difficile 2
MRSA 2
Wound care 2
Healthcare acquired infection surveillance system* 8 √ √ √
Functional status 8 √
Sleep/rest 2
Self-care 9 √ √ √
Nutritional assessment/screening* 9 √
Protected meal times policy implemented 1
Patient characteristics* 2 √ √
Patient complaints 4 √
Patient satisfaction* 15 √ √ √
Next-of-kin satisfaction* 3
Confidence and trust 4
Practice environment/perceived quality 5 √
Cleanliness 2
Hand hygiene 2
Thrombophlebitis 2
Fluid overload 1
Iatrogenic lung collapse 1
Pulmonary embolis 3 √
Atelectasis 1
Activities of daily living index* 3
Pain scores* 13 √ √ √
Health status/quality of life 4 √
Vaccination rates 5 √
Allergies recorded 1

259
Risk assessments 5 √
Assessment and management of social situation 4 √
Accidents/incidents 4
Symptom manager index* 7 √ √
Symptom resolution 4 √
Physical and mental health change scores 3 √
Patient absconding or lost 1
Physical/sexual assault 3
Restraint* 8 √ √
Psychological well-being 7 √
Self-harm risk assessment 2 √
Cognitive screening 3
Confusion/delirium 2
Staff satisfaction and wellbeing 11 √ √ √
Nurse to patient ratio 4 √ √
Staffing levels/skill mix* 13 √ √ √
Sickness rates 3 √
Smoking cessation advice 7 √ √ √
Staffing bank/agency/overtime utilisation 7 √
Perception of adequate staffing 2 √
Nurse perception of quality of care 3 √ √
Understaffing (compared to staffing plan) 2 √
Emergency equipment/drugs 2
Emergency care 2 √
Injuries to staff 4 √ √
Interprofessional relations 9 √ √
Nurse knowledge of condition and treatment 7
Recod keeping/recording systems 7 √

260
Staff intent to leave 1
Nurse turnover 13 √ √
Staff development* 9 √ √
Years of experience* 7 √ √
RN education level 7 √ √ √
Induction 1
Appraisals 1
Workload* 15 √ √ √ √
Leadership* 4 √ √ Organisational factors of the nursing practice
environment (e.g. culture, autonomy, practice control) 10 √ √ √ √
Care planning/assessment 10 √
Hospital admission/readmission 8 √ √
Length of stay* 7 √ √
Discharge from caseload 3
Discharge planning/case management process* 5
Waiting time for nursing care 5 √ √
Births without medical intervention 1
Post-partum depression 2
Births attended by a midwife 1
Breast feeding 2
Carers offered respite or short-care break 1
Designated nurse 2 Timely blood culture collection in patients with
pneumonia 1 √ Timely antibiotic administration to patients with
pneumonia 1 √
Time to triage 2 √
Access to primary care in the community/referrals 4

261
Current medications* 5
Cervical screening 3 √
Oxygen therapy* 1 √
Nebuliser and inhalers use and administration 1 √
Unplanned extubation 1 √
Tracheostomy or endotrachel tube care 1 Consistent delivery of nursing/midwifery care against
identified need, patient's sense of safety whilst under the
care of N/M, Patient’s confidence in the knowledge and
skills of the nurse/midwife 2 Time spent by N/M with the patient, respect from the
N/M for patient's preferences and choice,
Nurse/midwife’s support for patients to care for
themselves, where appropriate 2 N/M understanding of what is important to the patient,
patient's involvement in decisions made about their N/M
care 4
Cast care 1
Venepuncture and/or cannulation 1
Care of patients in isolation 1
Patient education/health promotion 8
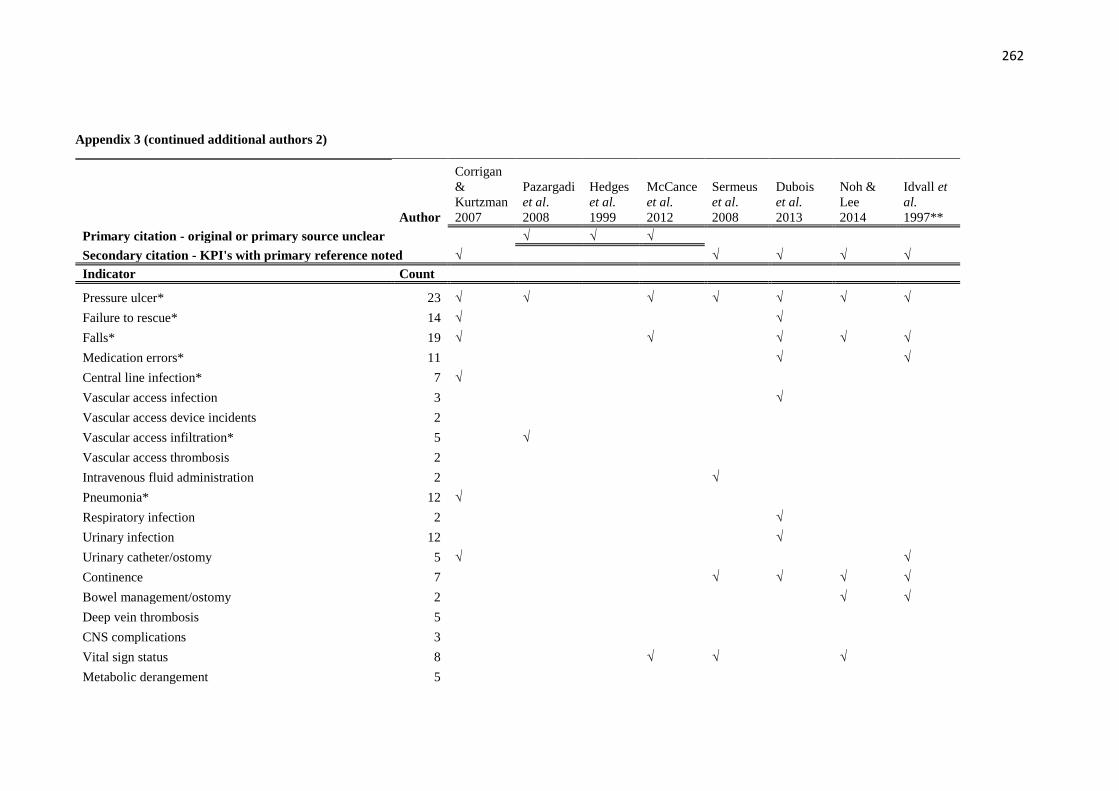
262
Appendix 3 (continued additional authors 2)
Author
Corrigan
&
Kurtzman
2007
Pazargadi
et al.
2008
Hedges
et al.
1999
McCance
et al.
2012
Sermeus
et al.
2008
Dubois
et al.
2013
Noh &
Lee
2014
Idvall et
al.
1997**
Primary citation - original or primary source unclear √ √ √
Secondary citation - KPI's with primary reference noted √ √ √ √ √
Indicator Count
Pressure ulcer* 23 √ √ √ √ √ √ √
Failure to rescue* 14 √ √
Falls* 19 √ √ √ √ √
Medication errors* 11 √ √
Central line infection* 7 √
Vascular access infection 3 √
Vascular access device incidents 2
Vascular access infiltration* 5 √
Vascular access thrombosis 2
Intravenous fluid administration 2 √
Pneumonia* 12 √
Respiratory infection 2 √
Urinary infection 12 √
Urinary catheter/ostomy 5 √ √
Continence 7 √ √ √ √
Bowel management/ostomy 2 √ √
Deep vein thrombosis 5
CNS complications 3
Vital sign status 8 √ √ √
Metabolic derangement 5

263
Post-operative infection* 5
Post-operative complications 3
C. difficile 2
MRSA 2
Wound care 2 √ √
Healthcare acquired infection surveillance system* 8 √ √ √
Functional status 8 √ √ √
Sleep/rest 2 √
Self-care 9 √ √ √
Nutritional assessment/screening* 9 √ √ √ √ √
Protected meal times policy implemented 1
Patient characteristics* 2
Patient complaints 4 √
Patient satisfaction* 15 √ √ √ √ √
Next-of-kin satisfaction* 3 √ √
Confidence and trust 4 √
Practice environment/perceived quality 5 √
Cleanliness 2 √
Hand hygiene 2 √
Thrombophlebitis 2
Fluid overload 1
Iatrogenic lung collapse 1
Pulmonary embolis 3
Atelectasis 1
Activities of daily living index* 3
Pain scores* 13 √ √ √
Health status/quality of life 4 √
Vaccination rates 5

264
Allergies recorded 1
Risk assessments 5 √
Assessment and management of social situation 4 √ √ √
Accidents/incidents 4 √
Symptom manager index* 7 √ √ √
Symptom resolution 4
Physical and mental health change scores 3
Patient absconding or lost 1
Physical/sexual assault 3 √
Restraint* 8 √ √
Psychological well-being 7 √ √
Self-harm risk assessment 2
Cognitive screening 3 √ √
Confusion/delirium 2 √
Staff satisfaction and wellbeing 11 √ √ √
Nurse to patient ratio 4 √ √
Staffing levels/skill mix* 13 √ √
Sickness rates 3 √
Smoking cessation advice 7 √
Staffing bank/agency/overtime utilisation 7 √
Perception of adequate staffing 2
Nurse perception of quality of care 3
Understaffing (compared to staffing plan) 2
Emergency equipment/drugs 2
Emergency care 2
Injuries to staff 4 √
Interprofessional relations 9 √ √
Nurse knowledge of condition and treatment 7 √
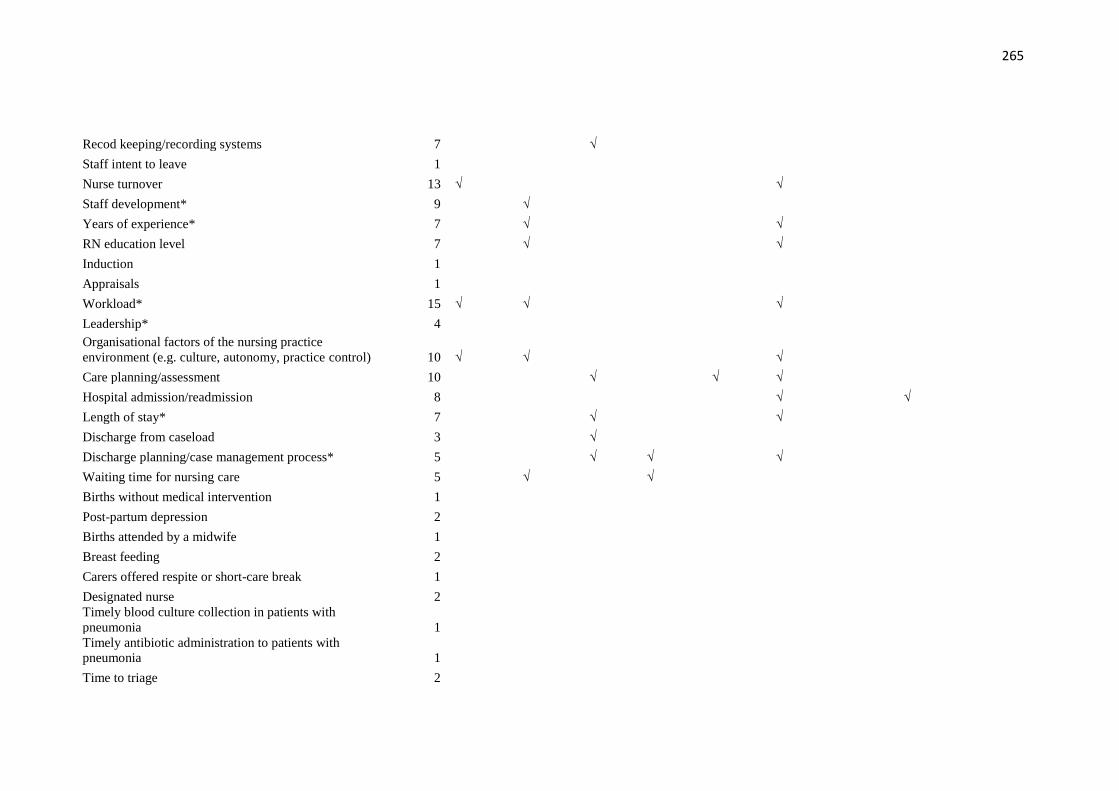
265
Recod keeping/recording systems 7 √
Staff intent to leave 1
Nurse turnover 13 √ √
Staff development* 9 √
Years of experience* 7 √ √
RN education level 7 √ √
Induction 1
Appraisals 1
Workload* 15 √ √ √
Leadership* 4
Organisational factors of the nursing practice
environment (e.g. culture, autonomy, practice control) 10 √ √ √
Care planning/assessment 10 √ √ √
Hospital admission/readmission 8 √ √
Length of stay* 7 √ √
Discharge from caseload 3 √
Discharge planning/case management process* 5 √ √ √
Waiting time for nursing care 5 √ √
Births without medical intervention 1
Post-partum depression 2
Births attended by a midwife 1
Breast feeding 2
Carers offered respite or short-care break 1
Designated nurse 2 Timely blood culture collection in patients with
pneumonia 1 Timely antibiotic administration to patients with
pneumonia 1
Time to triage 2
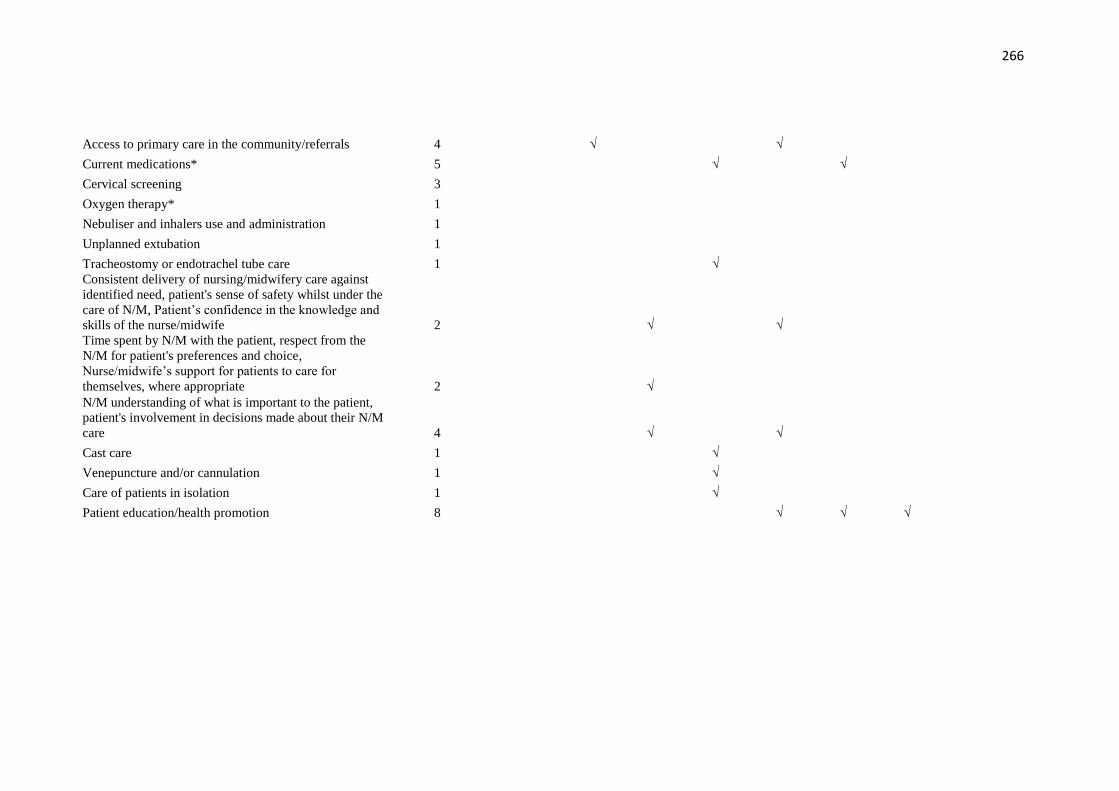
266
Access to primary care in the community/referrals 4 √ √
Current medications* 5 √ √
Cervical screening 3
Oxygen therapy* 1
Nebuliser and inhalers use and administration 1
Unplanned extubation 1
Tracheostomy or endotrachel tube care 1 √ Consistent delivery of nursing/midwifery care against
identified need, patient's sense of safety whilst under the
care of N/M, Patient’s confidence in the knowledge and
skills of the nurse/midwife 2 √ √ Time spent by N/M with the patient, respect from the
N/M for patient's preferences and choice,
Nurse/midwife’s support for patients to care for
themselves, where appropriate 2 √ N/M understanding of what is important to the patient,
patient's involvement in decisions made about their N/M
care 4 √ √
Cast care 1 √
Venepuncture and/or cannulation 1 √
Care of patients in isolation 1 √
Patient education/health promotion 8 √ √ √
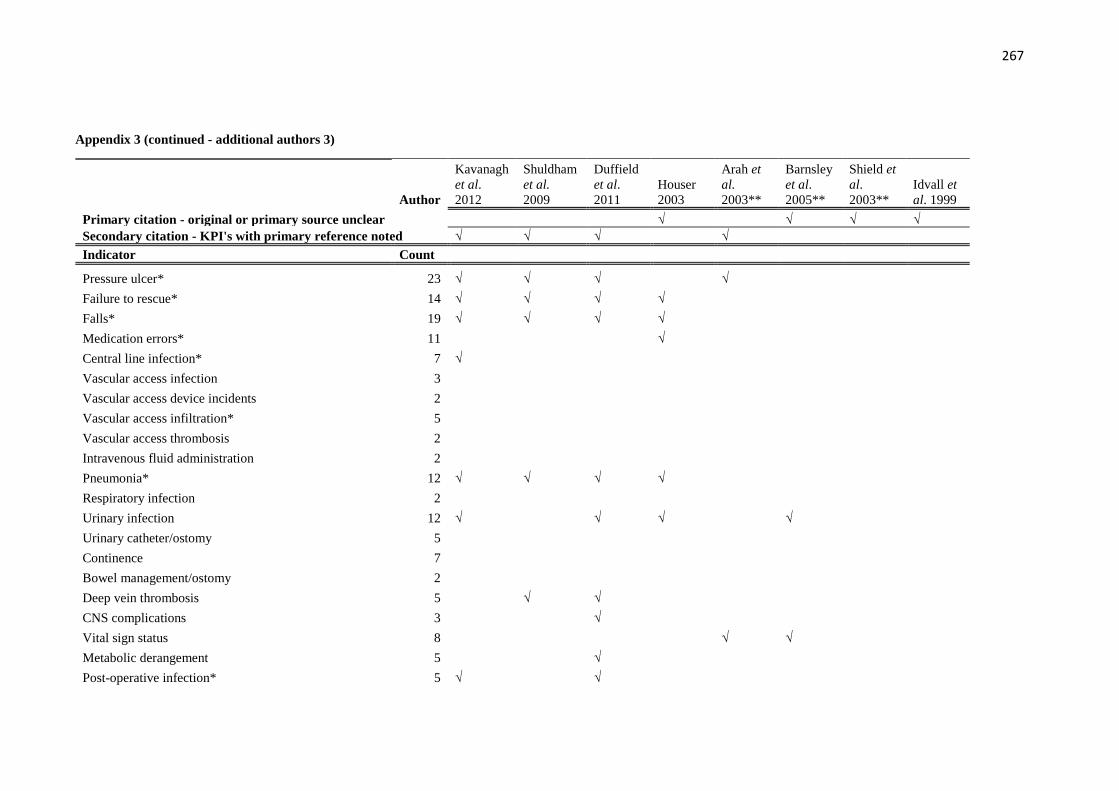
267
Appendix 3 (continued - additional authors 3)
Author
Kavanagh
et al.
2012
Shuldham
et al.
2009
Duffield
et al.
2011
Houser
2003
Arah et
al.
2003**
Barnsley
et al.
2005**
Shield et
al.
2003**
Idvall et
al. 1999
Primary citation - original or primary source unclear √ √ √ √
Secondary citation - KPI's with primary reference noted √ √ √ √
Indicator Count
Pressure ulcer* 23 √ √ √ √
Failure to rescue* 14 √ √ √ √
Falls* 19 √ √ √ √
Medication errors* 11 √
Central line infection* 7 √
Vascular access infection 3
Vascular access device incidents 2
Vascular access infiltration* 5
Vascular access thrombosis 2
Intravenous fluid administration 2
Pneumonia* 12 √ √ √ √
Respiratory infection 2
Urinary infection 12 √ √ √ √
Urinary catheter/ostomy 5
Continence 7
Bowel management/ostomy 2
Deep vein thrombosis 5 √ √
CNS complications 3 √
Vital sign status 8 √ √
Metabolic derangement 5 √
Post-operative infection* 5 √ √
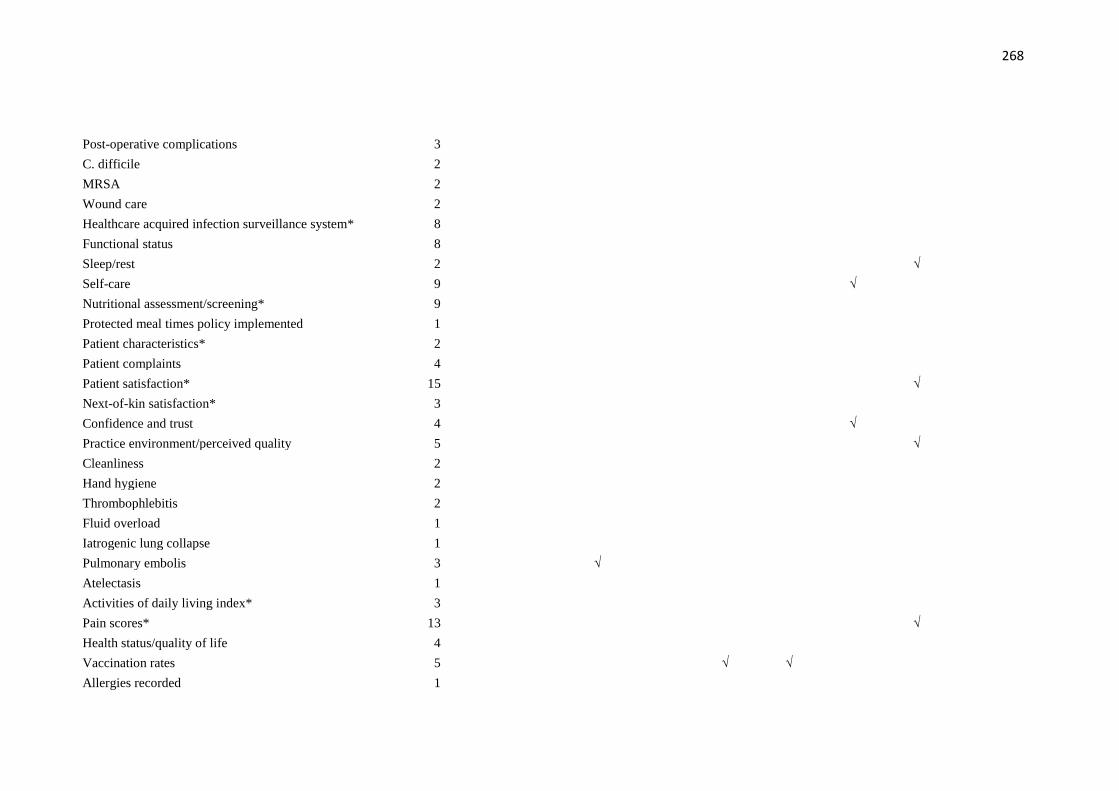
268
Post-operative complications 3
C. difficile 2
MRSA 2
Wound care 2
Healthcare acquired infection surveillance system* 8
Functional status 8
Sleep/rest 2 √
Self-care 9 √
Nutritional assessment/screening* 9
Protected meal times policy implemented 1
Patient characteristics* 2
Patient complaints 4
Patient satisfaction* 15 √
Next-of-kin satisfaction* 3
Confidence and trust 4 √
Practice environment/perceived quality 5 √
Cleanliness 2
Hand hygiene 2
Thrombophlebitis 2
Fluid overload 1
Iatrogenic lung collapse 1
Pulmonary embolis 3 √
Atelectasis 1
Activities of daily living index* 3
Pain scores* 13 √
Health status/quality of life 4
Vaccination rates 5 √ √
Allergies recorded 1
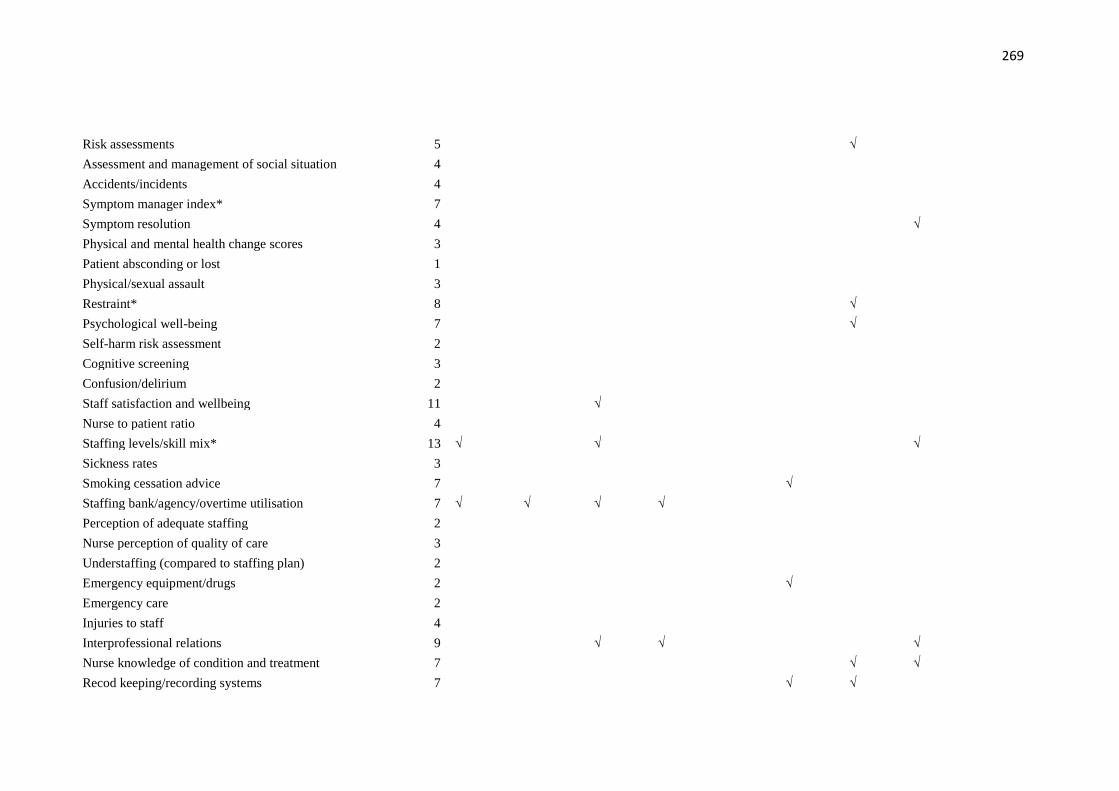
269
Risk assessments 5 √
Assessment and management of social situation 4
Accidents/incidents 4
Symptom manager index* 7
Symptom resolution 4 √
Physical and mental health change scores 3
Patient absconding or lost 1
Physical/sexual assault 3
Restraint* 8 √
Psychological well-being 7 √
Self-harm risk assessment 2
Cognitive screening 3
Confusion/delirium 2
Staff satisfaction and wellbeing 11 √
Nurse to patient ratio 4
Staffing levels/skill mix* 13 √ √ √
Sickness rates 3
Smoking cessation advice 7 √
Staffing bank/agency/overtime utilisation 7 √ √ √ √
Perception of adequate staffing 2
Nurse perception of quality of care 3
Understaffing (compared to staffing plan) 2
Emergency equipment/drugs 2 √
Emergency care 2
Injuries to staff 4
Interprofessional relations 9 √ √ √
Nurse knowledge of condition and treatment 7 √ √
Recod keeping/recording systems 7 √ √

270
Staff intent to leave 1
Nurse turnover 13 √ √ √
Staff development* 9 √ √
Years of experience* 7 √ √
RN education level 7
Induction 1
Appraisals 1
Workload* 15 √ √ √
Leadership* 4 √ Organisational factors of the nursing practice
environment (e.g. culture, autonomy, practice control) 10 √ √
Care planning/assessment 10 √ √
Hospital admission/readmission 8 √
Length of stay* 7 √
Discharge from caseload 3
Discharge planning/case management process* 5
Waiting time for nursing care 5
Births without medical intervention 1
Post-partum depression 2 √
Births attended by a midwife 1
Breast feeding 2 √
Carers offered respite or short-care break 1
Designated nurse 2 √
Timely blood culture collection in patients with
pneumonia 1 Timely antibiotic administration to patients with
pneumonia 1 Time to triage 2
Access to primary care in the community/referrals 4 √
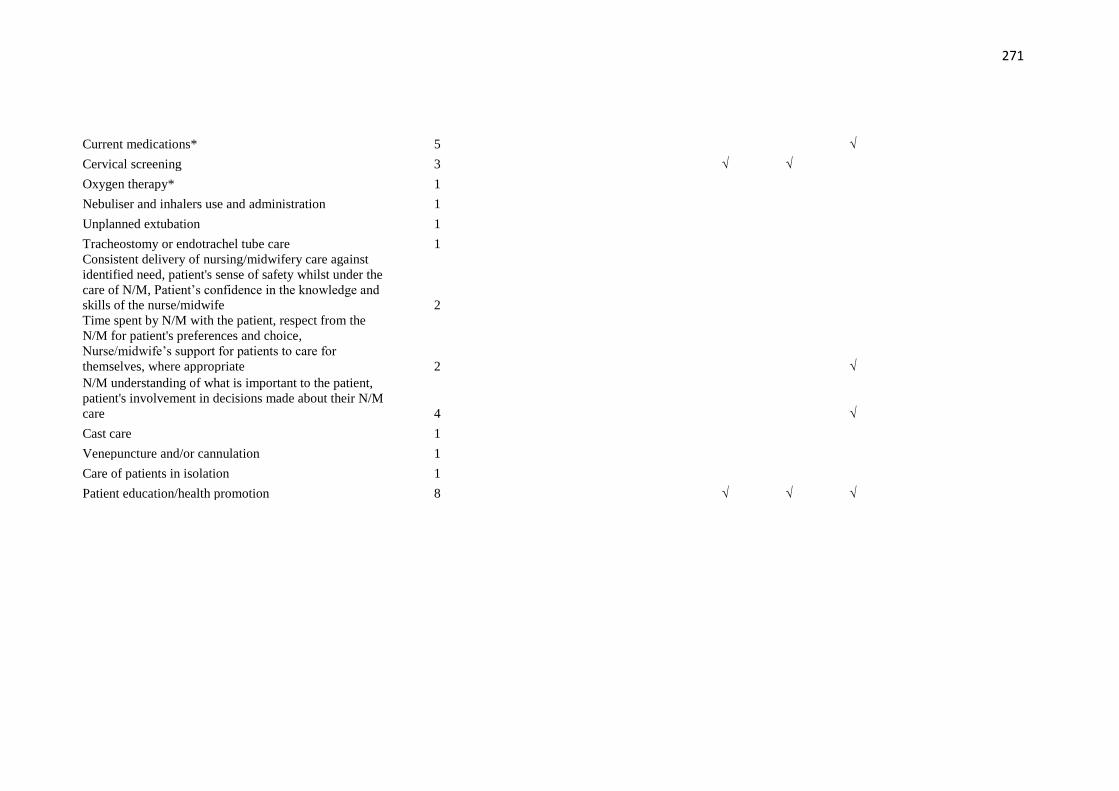
271
Current medications* 5 √
Cervical screening 3 √ √
Oxygen therapy* 1
Nebuliser and inhalers use and administration 1
Unplanned extubation 1
Tracheostomy or endotrachel tube care 1 Consistent delivery of nursing/midwifery care against
identified need, patient's sense of safety whilst under the
care of N/M, Patient’s confidence in the knowledge and
skills of the nurse/midwife 2 Time spent by N/M with the patient, respect from the
N/M for patient's preferences and choice,
Nurse/midwife’s support for patients to care for
themselves, where appropriate 2 √ N/M understanding of what is important to the patient,
patient's involvement in decisions made about their N/M
care 4 √
Cast care 1
Venepuncture and/or cannulation 1
Care of patients in isolation 1
Patient education/health promotion 8 √ √ √
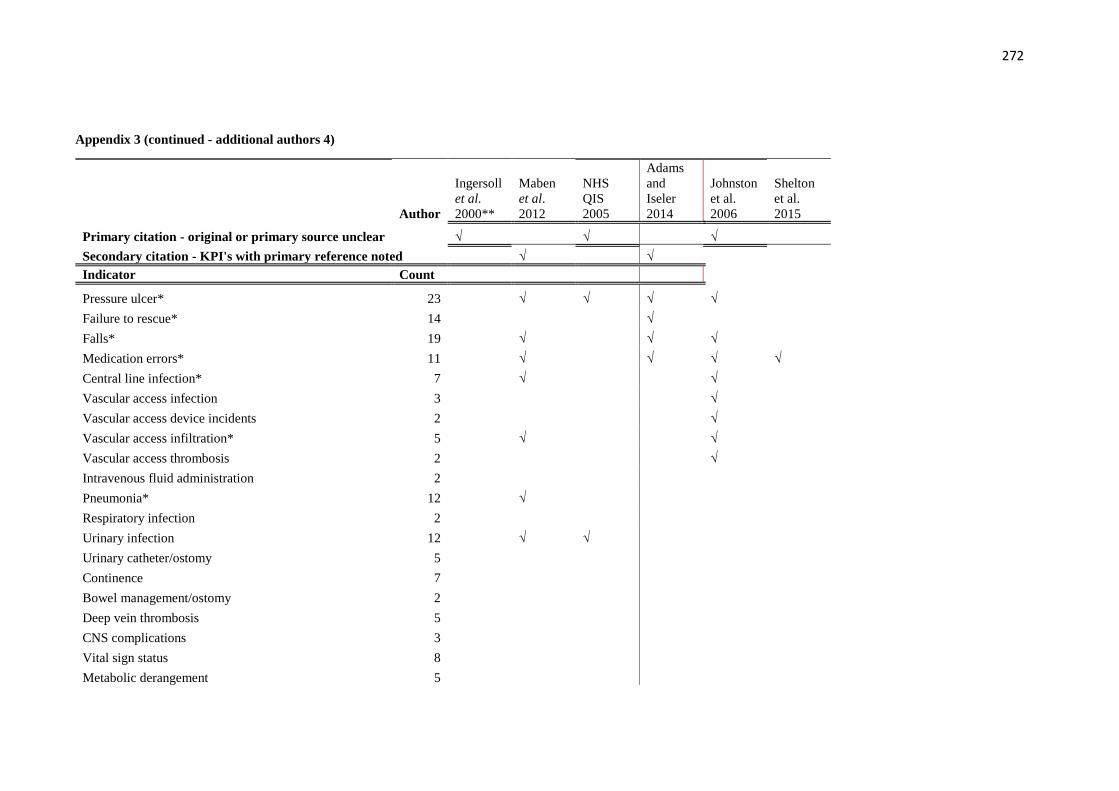
272
Appendix 3 (continued - additional authors 4)
Author
Ingersoll
et al.
2000**
Maben
et al.
2012
NHS
QIS
2005
Adams
and
Iseler
2014
Johnston
et al.
2006
Shelton
et al.
2015
Primary citation - original or primary source unclear √ √ √
Secondary citation - KPI's with primary reference noted √ √
Indicator Count
Pressure ulcer* 23 √ √ √ √
Failure to rescue* 14 √
Falls* 19 √ √ √
Medication errors* 11 √ √ √ √
Central line infection* 7 √ √
Vascular access infection 3 √
Vascular access device incidents 2 √
Vascular access infiltration* 5 √ √
Vascular access thrombosis 2 √
Intravenous fluid administration 2
Pneumonia* 12 √
Respiratory infection 2
Urinary infection 12 √ √
Urinary catheter/ostomy 5
Continence 7
Bowel management/ostomy 2
Deep vein thrombosis 5
CNS complications 3
Vital sign status 8
Metabolic derangement 5
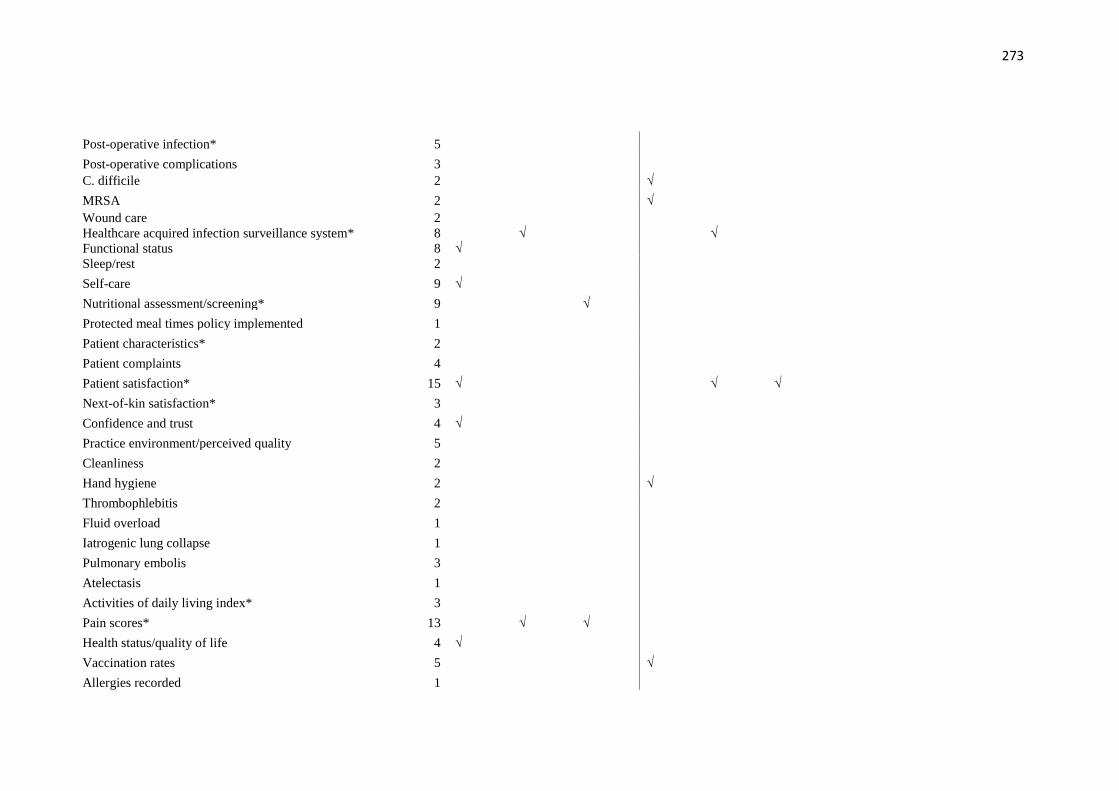
273
Post-operative infection* 5
Post-operative complications 3 C. difficile 2 √
MRSA 2 √ Wound care 2 Healthcare acquired infection surveillance system* 8 √ √ Functional status 8 √ Sleep/rest 2
Self-care 9 √
Nutritional assessment/screening* 9 √
Protected meal times policy implemented 1
Patient characteristics* 2
Patient complaints 4
Patient satisfaction* 15 √ √ √
Next-of-kin satisfaction* 3
Confidence and trust 4 √
Practice environment/perceived quality 5
Cleanliness 2
Hand hygiene 2 √
Thrombophlebitis 2
Fluid overload 1
Iatrogenic lung collapse 1
Pulmonary embolis 3
Atelectasis 1
Activities of daily living index* 3
Pain scores* 13 √ √
Health status/quality of life 4 √
Vaccination rates 5 √
Allergies recorded 1

274
Risk assessments 5
Assessment and management of social situation 4
Accidents/incidents 4 √
Symptom manager index* 7
Symptom resolution 4 √ √
Physical and mental health change scores 3
Patient absconding or lost 1
Physical/sexual assault 3 √
Restraint* 8 √ √
Psychological well-being 7 √
Self-harm risk assessment 2
Cognitive screening 3
Confusion/delirium 2
Staff satisfaction and wellbeing 11 √ √
Nurse to patient ratio 4
Staffing levels/skill mix* 13 √ √
Sickness rates 3
Smoking cessation advice 7
Staffing bank/agency/overtime utilisation 7 √
Perception of adequate staffing 2
Nurse perception of quality of care 3 √
Understaffing (compared to staffing plan) 2
Emergency equipment/drugs 2
Emergency care 2
Injuries to staff 4
Interprofessional relations 9 √
Nurse knowledge of condition and treatment 7 √
Recod keeping/recording systems 7 √ √
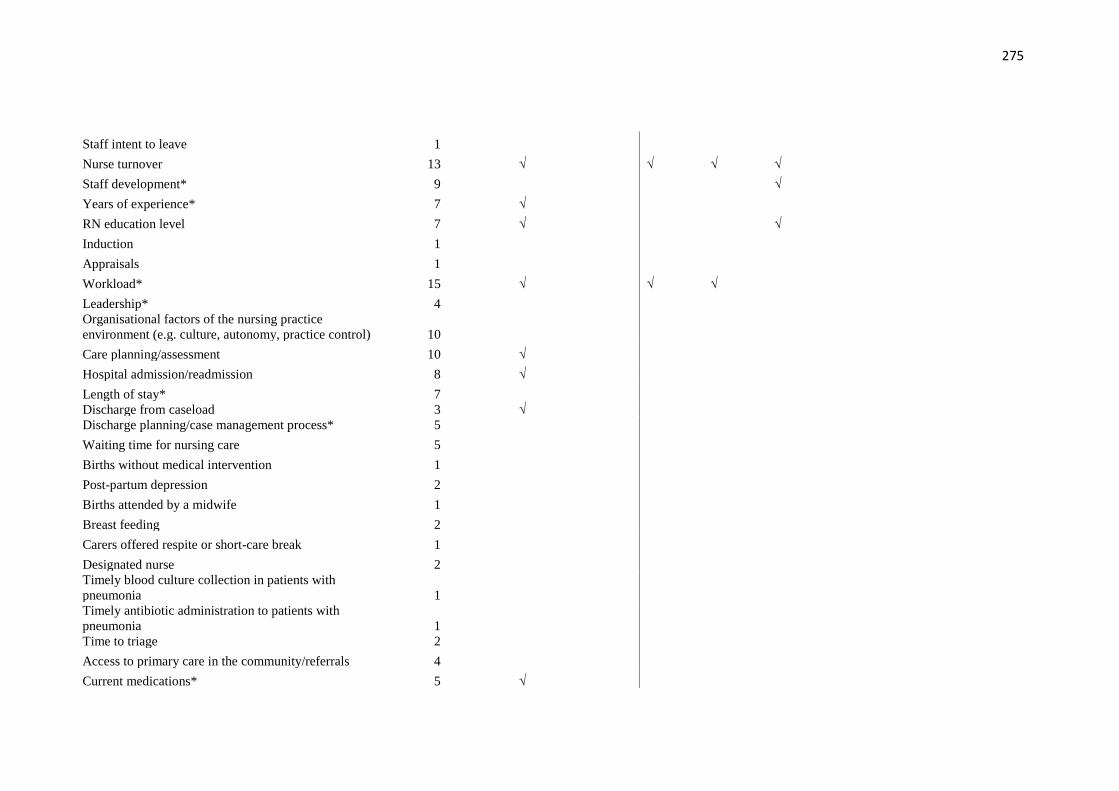
275
Staff intent to leave 1
Nurse turnover 13 √ √ √ √
Staff development* 9 √
Years of experience* 7 √
RN education level 7 √ √
Induction 1
Appraisals 1
Workload* 15 √ √ √
Leadership* 4 Organisational factors of the nursing practice
environment (e.g. culture, autonomy, practice control) 10
Care planning/assessment 10 √
Hospital admission/readmission 8 √
Length of stay* 7 Discharge from caseload 3 √ Discharge planning/case management process* 5
Waiting time for nursing care 5
Births without medical intervention 1
Post-partum depression 2
Births attended by a midwife 1
Breast feeding 2
Carers offered respite or short-care break 1
Designated nurse 2 Timely blood culture collection in patients with
pneumonia 1 Timely antibiotic administration to patients with
pneumonia 1 Time to triage 2
Access to primary care in the community/referrals 4
Current medications* 5 √

276
Cervical screening 3
Oxygen therapy* 1
Nebuliser and inhalers use and administration 1
Unplanned extubation 1
Tracheostomy or endotrachel tube care 1 Consistent delivery of nursing/midwifery care against
identified need, patient's sense of safety whilst under the
care of N/M, Patient’s confidence in the knowledge and
skills of the nurse/midwife 2 Time spent by N/M with the patient, respect from the
N/M for patient's preferences and choice,
Nurse/midwife’s support for patients to care for
themselves, where appropriate 2 N/M understanding of what is important to the patient,
patient's involvement in decisions about their N/M care 4 √
Cast care 1 Venepuncture and/or cannulation 1 Care of patients in isolation 1 Patient education/health promotion 8 √ √
*Failure to rescue also includes: Upper GI bleed, mortality, sepsis, shock, cardiac/respiratory arrest, cardiac/pulmonary failure, deterioration, complications, unplanned
extubation, renal failure
*Falls also includes: falls with injury, prevention behaviour, mobility
*Pneumonia also includes: ventilator acquired, aspiration pneumonia
*Nutritional assessment/screening also includes: malnutrition, dehydration, alimentation or supplements, weight loss
*Restraint also includes: prevalence, restraint application duration, documentation, chemical & physical
*Post-operative infection also includes: surgical wound infection
*Healthcare acquired infection surveillance system also includes: general hospital acquired infections
*Central line infection also includes: bloodstream
*Pain score also includes: pain assessment, pain control and patient satisfaction with control
*Thrombophlebitis also includes: vascular access thrombophlebitis
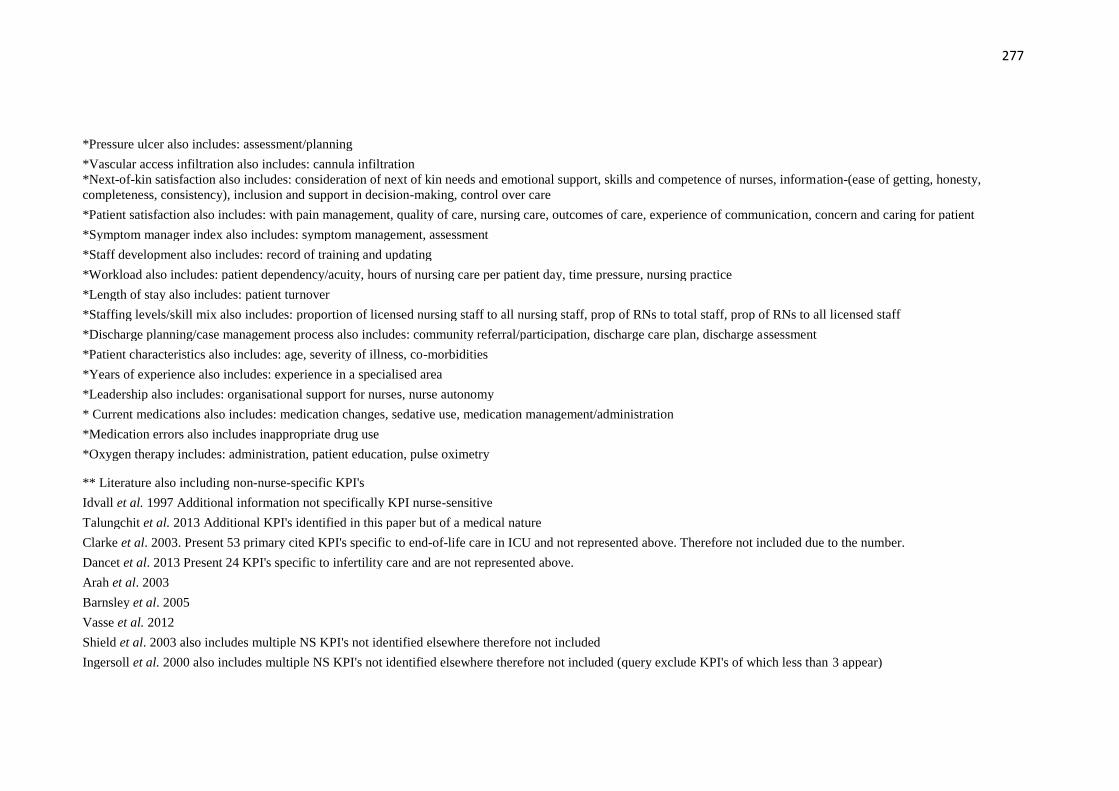
277
*Pressure ulcer also includes: assessment/planning
*Vascular access infiltration also includes: cannula infiltration
*Next-of-kin satisfaction also includes: consideration of next of kin needs and emotional support, skills and competence of nurses, information-(ease of getting, honesty,
completeness, consistency), inclusion and support in decision-making, control over care
*Patient satisfaction also includes: with pain management, quality of care, nursing care, outcomes of care, experience of communication, concern and caring for patient
*Symptom manager index also includes: symptom management, assessment
*Staff development also includes: record of training and updating
*Workload also includes: patient dependency/acuity, hours of nursing care per patient day, time pressure, nursing practice
*Length of stay also includes: patient turnover
*Staffing levels/skill mix also includes: proportion of licensed nursing staff to all nursing staff, prop of RNs to total staff, prop of RNs to all licensed staff
*Discharge planning/case management process also includes: community referral/participation, discharge care plan, discharge assessment
*Patient characteristics also includes: age, severity of illness, co-morbidities
*Years of experience also includes: experience in a specialised area
*Leadership also includes: organisational support for nurses, nurse autonomy
* Current medications also includes: medication changes, sedative use, medication management/administration
*Medication errors also includes inappropriate drug use
*Oxygen therapy includes: administration, patient education, pulse oximetry
** Literature also including non-nurse-specific KPI's
Idvall et al. 1997 Additional information not specifically KPI nurse-sensitive
Talungchit et al. 2013 Additional KPI's identified in this paper but of a medical nature
Clarke et al. 2003. Present 53 primary cited KPI's specific to end-of-life care in ICU and not represented above. Therefore not included due to the number.
Dancet et al. 2013 Present 24 KPI's specific to infertility care and are not represented above.
Arah et al. 2003
Barnsley et al. 2005
Vasse et al. 2012
Shield et al. 2003 also includes multiple NS KPI's not identified elsewhere therefore not included
Ingersoll et al. 2000 also includes multiple NS KPI's not identified elsewhere therefore not included (query exclude KPI's of which less than 3 appear)

278
Appendix 4: Flowchart for the KPI Process Model (adapted from NPR Performance Management Process Model)
Service user and stakeholder input
----------------------------------------------------------
Management priorities and decisions
----------------------------------------------------------
Department of Health priorities and decisions
Measuring
performance
(data collection
and reporting)
Performance
reporting to service
users and
stakeholders
Analysing and
reviewing
performance
data
• Mission is clear and energises employees
• Strategic goals and
objectives have focus and are stretching
• Owners are identified
for goals and objectives
• Strategies are developed
and resources allocated
• Service user needs are addressed
• Outputs and outcomes
are defined (logic models or other tools are used)
• Decision issues and
decision processes are used
Establishing
and updating
performance
measures and
goals
Establishing
accountability
for performance
Evaluating and
utilising
performance
information
Service user
driven strategic
planning
↓
Multi-year goal
setting and
resource
planning
↓
Annual
performance
planning
↓
Resource
allocation
• Management culture is supportive
• Measures flow from
goals, and objectives are developed by
managers working
with - multi-disciplined
teams
- focus groups and
- stakeholders
• Inventory of common measures is explored
• Balanced Scorecard or
similar tools are used • Measures cascade and
align through the
organisation • Performance levels are
reflective of resources
• Ownership of each
measure is formalised
and resources provided
• Responsibilities for
data collection, reporting, analysis and
posting are identified
• Managers use measures to evaluate
performance
• Reward systems are clear and consistent
and are reflective of
level of success
• Data sources are
identified
• Information systems are designed to support data
collection and reporting
• Pilot tests are conducted • Automated or manual
requests are used for
periodic updates • Data entry, tabulation,
summarisation methods
are documented for each measure
• Data definition for
common measures are followed
• Reliability, timeliness,
accuracy, rapid access, and confidentiality are
addressed
• Activity/process owners use
performance information for continuous improvement
• Results are displayed and
shared with service users and stakeholders
• Rewards and recognition
are based on results • Benchmarking and
comparative analysis with
best in class are done
• Management feedback is
provided for updating goals
and measures
• Performance information is
used to identify
opportunities for
reengineering and allocation
of resources
• Data are integrated •
Analytical capabilities
are developed • Results are analysed
and validated
• Management reviews results vs. expectations
and makes mid-course
corrections • Feedback is provided
to activity/process
owners for continuous
improvement
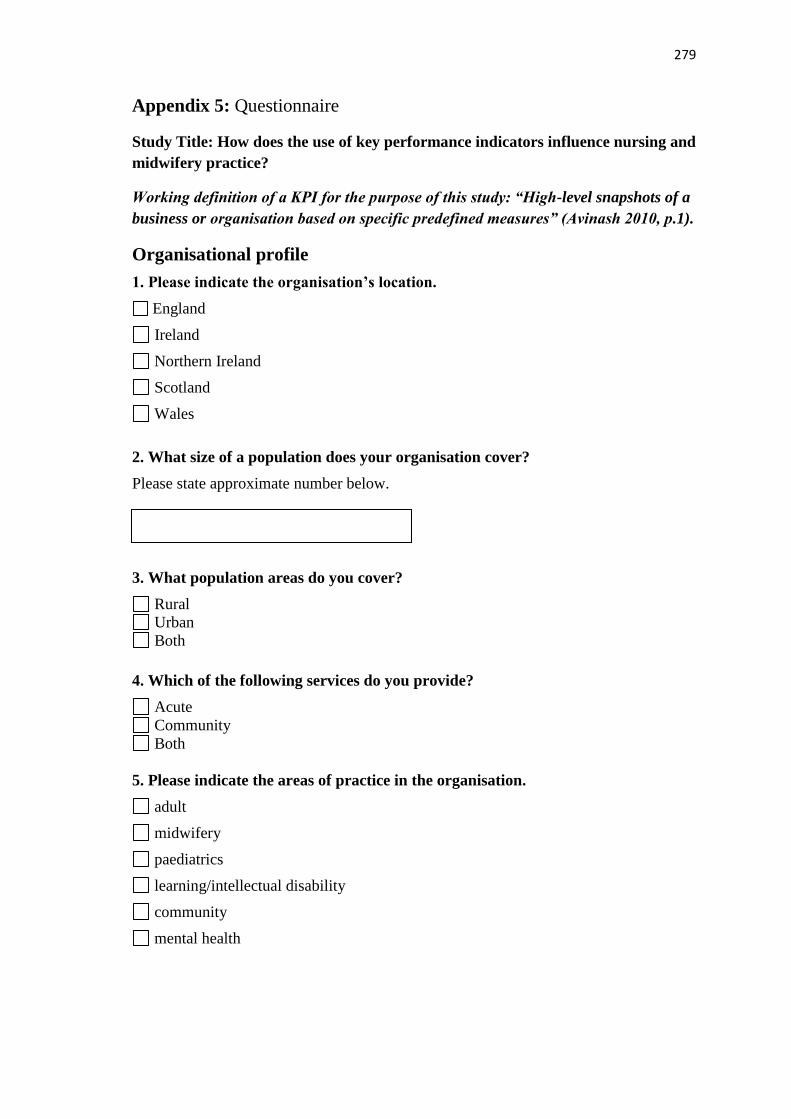
279
Appendix 5: Questionnaire
Study Title: How does the use of key performance indicators influence nursing and
midwifery practice?
Working definition of a KPI for the purpose of this study: “High-level snapshots of a
business or organisation based on specific predefined measures” (Avinash 2010, p.1).
Organisational profile
1. Please indicate the organisation’s location.
England
Ireland
Northern Ireland
Scotland
Wales
2. What size of a population does your organisation cover?
Please state approximate number below.
3. What population areas do you cover?
Rural
Urban
Both
4. Which of the following services do you provide?
Acute
Community
Both
5. Please indicate the areas of practice in the organisation.
adult
midwifery
paediatrics
learning/intellectual disability
community
mental health
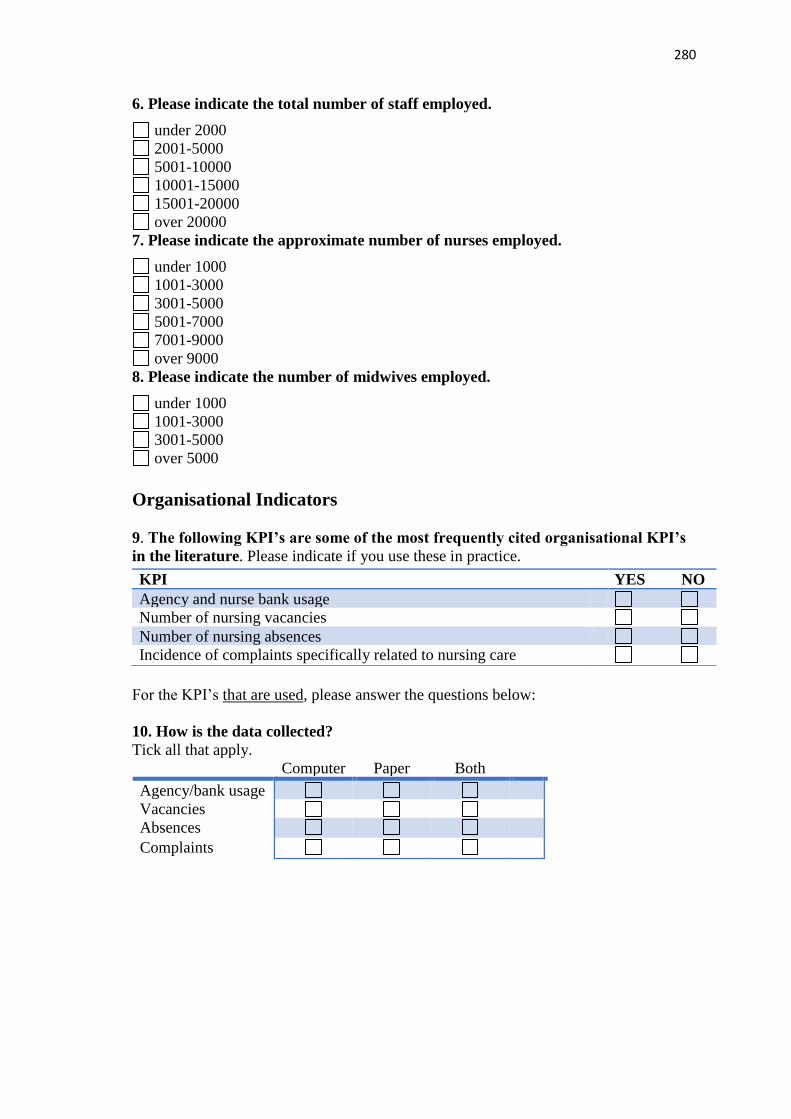
280
6. Please indicate the total number of staff employed.
under 2000
2001-5000
5001-10000
10001-15000
15001-20000
over 20000
7. Please indicate the approximate number of nurses employed.
under 1000
1001-3000
3001-5000
5001-7000
7001-9000
over 9000
8. Please indicate the number of midwives employed.
under 1000
1001-3000
3001-5000
over 5000
Organisational Indicators
9. The following KPI’s are some of the most frequently cited organisational KPI’s
in the literature. Please indicate if you use these in practice.
For the KPI’s that are used, please answer the questions below:
10. How is the data collected?
Tick all that apply.
Computer Paper Both
Agency/bank usage
Vacancies
Absences
Complaints
KPI YES NO
Agency and nurse bank usage
Number of nursing vacancies
Number of nursing absences
Incidence of complaints specifically related to nursing care

281
11. How frequently is the data collected?
Tick all that apply.
Monthly
or more
often
Bi-
monthly
Quarterly
or less
frequently
Agency/bank usage
Vacancies
Absences
Complaints
12. Who collects this data?
Tick all that apply. Clinical
staff
Admin/clerical Managerial
staff
Agency/bank usage
Vacancies
Absences
Complaints
13. Who collates/analyses this data?
Tick all that apply.
Clinical
staff
Admin/clerical Managerial
staff
Other
Agency/bank usage
Vacancies
Absences
Complaints
14. Do you collect data on any other organisational KPI’s?
Please list in the box below.
Clinical Indicators

282
15. The following KPI’s are some of the most frequently cited clinical KPI’s
reported in the literature. Please indicate which are used in your organisation.
For the KPI’s that are used, please answer the questions below:
16. How is the data collected? Tick all that apply. Paper Computer Both
Pressure ulcers
Nutritional assessment
Falls
Hand hygiene
Medication errors
NEWS
HCA infections
17. How frequently is the data collected? Tick all that apply. Monthly or
more often
Bi-
monthly
Quarterly or less
frequently
Pressure ulcers
Nutritional assessment
Falls
Hand hygiene
Medication errors
NEWS
HCA infections
KPI YES NO
Incidence of pressure ulcers
Assessment of nutritional requirements
Incidence of falls
Compliance with hand hygiene
Incidence of medication errors
Compliance with completion of national early warning scores (NEWS)
Prevalence of infections/HCAI (any of the following: urinary catheters,
ventilator pneumonia, central lines, MRSA, C Difficile)
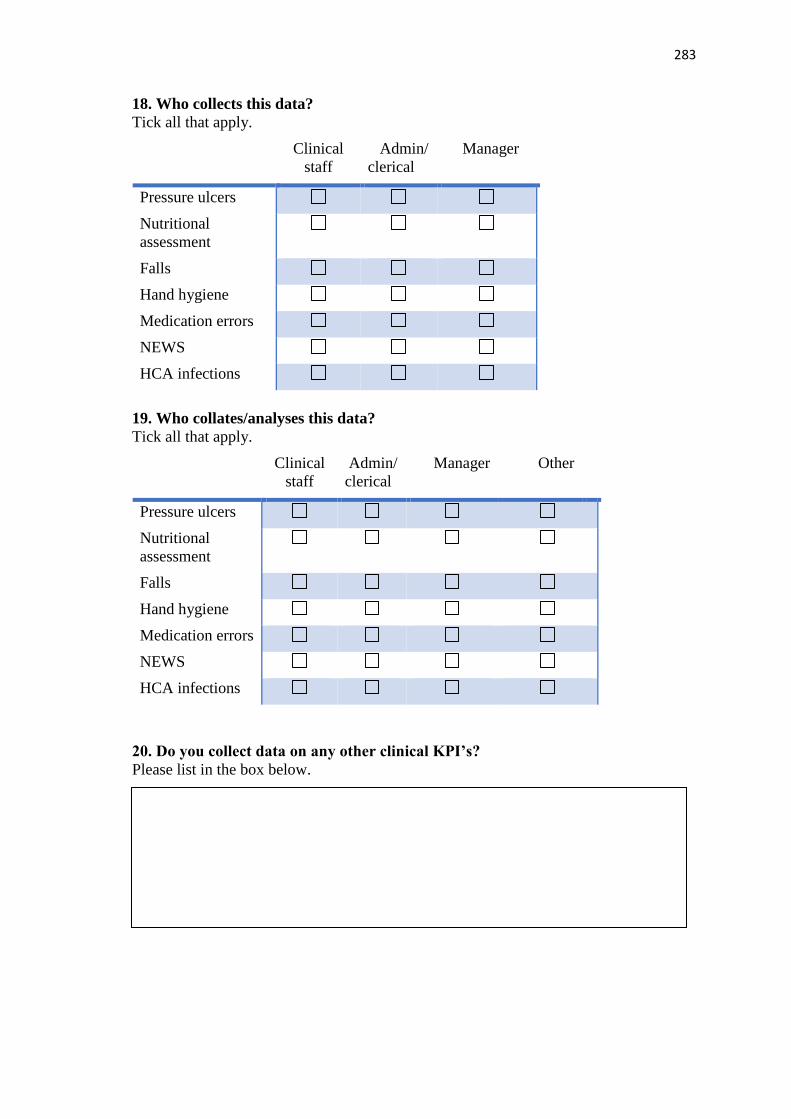
283
18. Who collects this data?
Tick all that apply.
Clinical
staff
Admin/
clerical
Manager
Pressure ulcers
Nutritional
assessment
Falls
Hand hygiene
Medication errors
NEWS
HCA infections
19. Who collates/analyses this data?
Tick all that apply.
Clinical
staff
Admin/
clerical
Manager Other
Pressure ulcers
Nutritional
assessment
Falls
Hand hygiene
Medication errors
NEWS
HCA infections
20. Do you collect data on any other clinical KPI’s?
Please list in the box below.

284
Patient experience indicators
21. Do you use any specific KPI’s that reflect the patient experience?
YES NO
If yes, please include the KPI’s in the box below.
Field specific indicators.
22. Do you collect any KPI’s specific to the following fields of practice?
YES NO
Mental health
Learning/intellectual disability
Children’s
Midwifery
Community
If yes, please indicate what KPI’s you are using?
Mental health
Learning/intellectual disability
Children’s

285
Midwifery
Community
Other (e.g. intensive care specific, palliative care specific)
KPI operational processes
23. What factors influence selection of KPI’s for use within your organisation?
24. How are clinical nurses and midwives involved in KPI’s?
25. What system/s do you use to present your data?
Tick all that apply.
Manual
Balanced scorecard (strategic system aligning organisational vision and goals to
performance; KPI’s sit within this)
Standard databases
Custom designed IT system (for example dashboards)
Other
If other, please describe in the box below.
286
26. How is the KPI data reported within your organisation?
27. What mechanisms are in place to support/encourage action on KPI data to
improve practice?
28. Can you provide one example of when data generated from use of a KPI was used to
improve practice?
29. Which indicator do you feel is the most valuable for determining the quality of
nursing and midwifery care across your organisation and why?

287
30. Would you be interested in participating in phase two of this research?
YES NO
If you would be interested in participation in phase 2 please insert your name and
email address below.
Name:
Email address:
This personal information will only be known to the researcher and supervisory
team and used solely to contact you to discuss participation in phase 2.
Thank you for your participation in this research.
We greatly appreciate your time and effort in completing this
questionnaire.
288
Appendix 6: First iteration of the phase one questionnaire
Questionnaire
This questionnaire is designed to explore the use of high level performance and care
quality indicators that are nurse-sensitive; those indicators that capture care or its
outcomes most affected by nursing care.
These indicators are known by many terms including:
• Key performance indicators
• Quality indicators
• Nurse-sensitive indicators
• Clinical quality indicators
• Metrics
• Health care quality indicators
For the purpose of this questionnaire the term Key Performance Indicators (KPI’s) will
be used. Many definitions specify quantitative measures but this may not be pertinent to
capture some of the more nebulous aspects of nursing care. The definition of a high
level indicator for the purpose of this questionnaire is that they:
Are tools that measure care or its outcomes most affected by nursing practice and
that help decision makers identify progress and set action plans, if necessary, to
meet organisational goals. Their use aims to improve quality of care and the
patient experience.
To ensure clarity of understanding indicators are not audits, care bundles, care
pathways, benchmarks or minimum standards although KPI’s may be found within
these. KPI’s “can only serve as flags or pointers, which summarise and prompt
questions about complex systems of clinical care and they must be understood in that
context” (NHS National Services Scotland 2012 p2)
You will be asked to provide information under four headings:
• Section 1. Demographic information
• Section 2. Frequently cited KPI’s:
➢ How they are collected
➢ Frequency of collection
➢ How they are reported
• Section 3. Field specific (NMC 2010) indicators and areas of specialism.
• Section 4. Your opinions related to performance and care quality indicators.

289
Section 1. Demographic information
This section asks for general information about your organisation and the KPI’s used.
Please indicate the organisation’s location.
England
Northern Ireland
Scotland
Wales
Please indicate the areas of practice in the organisation.
adult
midwifery
paediatrics
learning disability
community
mental health
Please indicate the approximate number of nurses employed.
under 1000
1001-2000
2001-3000
3001-4000
4001-5000
5001-6000
6001-7000
7001-8000
over 8000
Please indicate the number of midwives employed.
under 1000
1001-2000
2001-3000
3001-4000
4001-5000
over 5000
Please indicate the approximate number of staff employed.
under 2000
2001-3000
3001-4000
4001-5000
5001-6000
6001-7000
7001-8000
8001-9000
290
over 9000
What size of population does your organisation provide care for?
Please state below
Please indicate treatment numbers for 14/15 if applicable:
Inpatient
Outpatient
Non-elective
Births
Has your organisation undergone a merger in the past five years?
Yes No
How long has the current Director of Nursing been in post?
Less than five years
Five –ten years
More than ten years
Section 2. Frequently Cited Indicators
The following ten KPI’s are some of the most frequently cited in the literature. Can you
indicate if you apply these to practice and if so answer the related questions.
1. Agency and nurse bank usage?
Yes No
How is this data collected?
Tick all that apply.
Review of nursing documents
Local audits
291
Rostering schedules
How frequently is this data collected?
Tick all that apply.
Weekly
Fortnightly
Monthly
Less frequently than monthly
How is this data reported?
Tick all that apply.
Excel spreadsheets
Dashboards
Balanced scorecards
Custom designed computer system
Ready-made, validated computer measurement tools (e.g. CORE software, Nursing
Minimum Data Sets)
Accountability reviews
Report/score cards
Database
2. Staff skill mix ratios?
Yes No
How is this data collected?
Tick all that apply.
Review of nursing and medical documents
Local audits
Rostering schedules
How frequently is this data collected?
Tick all that apply.
Weekly
Fortnightly
Monthly
Less frequently than monthly
How is this data reported?
Tick all that apply.
Excel spreadsheets
Dashboards
292
Balanced scorecards
Custom designed computer system
Ready-made, validated computer measurement tools (e.g. CORE software, Nursing
Minimum Data Sets)
Accountability reviews
Report/score cards
Database
Part 1.
This first part seeks to identify the performance and care quality indicators used in your
organisation.
Please tick all that are appropriate.
Organisational indicators:
Nursing and midwifery absence rates
Staff skill mix ratios
Nurse vacancy rates
Percentage of nurse supervision
Percentage of midwifery supervision
Percentage of annual appraisals
Percentage of eligible nursing staff who have completed mandatory training in the
last 12 months (various training topics)
Percentage of nursing staff reporting positive job satisfaction
Waiting times for nurse consultations
Number of adverse events related specifically to nursing care
Please include any additional indicators in the box below.
Acute care indicators:
Incidence of pressure ulcers
Percentage of patients assessed for nutritional requirements.
Evidence of action on early warning scores if warranted
Percentage of inpatients who experience a hospital-acquired complication and die
(failure to rescue)
Falls (could include evidence of appropriate assessment/ reporting and rates)
Prevalence of nosocomial infections (associated with: urinary catheters, central
lines, ventilator pneumonia, and cellulitis)
Compliance with hand hygiene

293
Recording of pain scores (could include evidence of accurate recording, action on
and patient satisfaction with pain management)
Incidence of medication errors
Incidence of complaints specific to nursing care
Nurse led discharge rates
Incidence of vascular access complications
Incidence of restraint
Incidence of pulmonary embolism
Incidence of deep venous thrombosis
Number of patients who have received a vulnerable adult risk assessment
Please include any additional indicators in the box below.
Field specific (NMC 2010) indicators and areas of specialism. Some of these
indicators may be used across fields for example, children who require a Looked After
Children’s review may be supported by children’s, mental health or learning disability
services. Please only include additional indicators once.
Mental health specific including community
Percentage of patients who have received a safety/risk assessment
Percentage of completed weekly treatment plans
Evidence of user and career involvement in treatment plans
Patient readmission rates for bipolar illness and schizophrenia
Number of CORE outcome self-assessments completed
Percentage of staff trained in Management of Actual or Potential Aggression
(MAPA)
Percentage of staff trained in Wellness Recovery Action Plans (WRAP)
Percentage of young people and their families engaged in the Choice and
Partnership Approach (CAPA)
Percentage of patients on a caseload who have been screened for alcohol intake as
part of their assessment or personalised care planning
Percentage of patients on a caseload who have been screened for illegal drug as part
of their assessment or personalised care planning
Percentage of patients on a caseload who have been screened for anxiety and
depression
Please include any additional indicators in the box below.
Learning disability specific including community
Percentage of people who have received a safety/risk assessment

294
Number of people CORE-LD outcome self-assessments completed
Percentage of people with an individualised care plan
Evidence of personal participation in care planning
Percentage of people accessing annual health checks (including vaccinations, dental
and cervical/breast screening)
Each person with a learning disability can access a named person who can signpost
them to relevant services
Number of people with completed health action plans (including e.g. weight, fitness,
smoking)
Number of people supported to live in the community
Percentage of people with a learning disability who do not use speech as their main
form of communication who have been supported to establish a functional
communication system
Percentage of parents whose child has a learning disability and complex physical
health needs who have, and can name their, key worker with coordinating responsibility
Percentage of children and young people with complex physical health needs who
have effective transition arrangements in place between hospital and community
Where challenging behaviours present a significant risk to the individual, a
Management Plan has been developed and implemented within 48 hours
Percentage of people with a learning disability and dementia who can access
appropriate dementia services as required
Evidence of specific actions in palliative care service delivery that make reasonable
adjustment for people with a learning disability
Please include any additional indicators in the box below.
Children’s specific including community
Number of children who have received a safeguarding risk assessment
Prevention of hyponatremia
Pain assessment undertaken using an appropriate tool
Use of non-drug methods of pain relief
Evidence of child/young person involvement as appropriate in decision-making
about care
Evidence of effective communication between child/young person and health care
professionals
Evidence of psychosocial support for children with a chronic illness
Parent/carer satisfaction with facilities provided if able/wants to stay with child
Percentage of paediatric and neonatal trained nurses
Provision for age and developmental needs (could include play room, school room,
school teacher)
Percentage of children on a caseload who have a care plan
Number of Looked After Children (LAC) reviews
Percentage of children in reception year who are obese

295
Percentage of children who have had a two-year review by 32 months of age
Percentage of children for whom you are commissioned to provide a service who,
on becoming looked after, have received a health assessment
Please include any additional indicators in the box below.
Maternity specific including community
Percentage of mothers attending a 12 week booking appointment
Number of infants’ breast fed totally or partially at 6-8 weeks
Number of first time mothers attending antenatal classes
Percentage of expectant mothers registered as a smoker when booking a first
midwife appointment who, by the time of delivery, have stopped smoking
Percentage of new mothers with an assessment for postnatal depression
Percentage of home births
Percentage of women who receive 1:1 care during labour
Percentage of mothers with a pre-existing condition offered pre-conception
counselling/care (e.g. cardiac, diabetes, epilepsy)
Percentage of mothers screened for domestic violence
Please include any additional indicators in the box below.
Community specific
Cervical screening rates
Number of vaccinations (of various types)
Number of patients who receive an annual diabetic health check up
Attendance at smoking cessation clinics
Incidence of leg ulcers
Percentage of venous leg ulcer wounds that have healed within 12 to 24 weeks from
start of treatment
Multi-disciplinary referral rates
Percentage of patients from an agreed cohort who have an unplanned admission
where the length of stay was less than two days
Percentage of patients on a caseload achieving improvement as measured using a
validated assessment tool appropriate to the scope of the practice
Percentage of patients on a caseload who have not been admitted to hospital by day
90 following referral (community support has avoided hospital admission)
Percentage of carers who have been assessed for strain using a recognised tool e.g.
Caregiver Strain Index
Percentage of completed referrals for home equipment within seven days
Where care is being delivered in the patient’s home, the percentage of patients
offered a time band for a visit
296
Please include any additional indicators pertinent to community specialist nurses
or teams.
Intensive care/high dependency specific
Designation of a clinical liaison who will communicate with the family daily
Incidence of unplanned extubations
48 hour readmission rates
Percentage of nurses with critical care training
Percentage of patients admitted within a set time parameter
Number of patients with premature discharge
Prevention of ventilator-associated pneumonia
Prevalence of peptic ulcer disease
Percentage of blood transfusion errors
Use of case management approach
Prevalence of open vs closed suction system
Maintenance of predetermined blood glucose levels
Initiation of ventilator weaning following a protocol
Initiation of tracheostomy decannulation following a protocol
Please include any additional indicators in the box below.
Palliative care specific
There is a holistic assessment of palliative care needs of patients and their family
caregivers
Number of patients who have been assigned a palliative/oncology nurse
There is an assessment of pain and other symptoms using a validated instrument
Percentage of patients with moderate to severe pain
Percentage of patients who feel depressed
Percentage of patients with shortness of breath
Percentage of patients with constipation
Percentage of relatives who felt that they were treated well in all respects by the
caregivers
There are facilities for a relative to stay overnight
For a palliative care patient staying at home there is the possibility, if needed, to
provide someone (a volunteer or professional) to stay overnight if needed
Dying patients are able to have a single bedroom if they want to
297
Presence of documentation concerning the desired care and treatment at the end of
life
Percentage of patients who died in the location of their preference
Percentage of relatives who indicate that the patient died peacefully
All relevant team members are informed about patients who have died
Please include any additional indicators in the box below.
Please include any additional indicators which you do not feel are represented
above, but wish to have included, in the box below.
Part 2.
Part 2.
Please indicate how the indicators selected in part 1 were identified.
Tick all that apply.
Clinical guidelines
Policies
Identified by local need and developed at this level or by a quality improvement
person/ group
Identified by service level need and developed at this level or by a quality
improvement person/group
Identified through a management framework (e.g. strategic plan or balanced score
card)
Patient feedback
Regional indicator development bodies or steering groups
Government publications
Professional bodies
National databases
Research findings (including Delphi, RAND, consensus studies)
Evidence-based practice
World Wide Web
Other
If other, please indicate what in the box below.
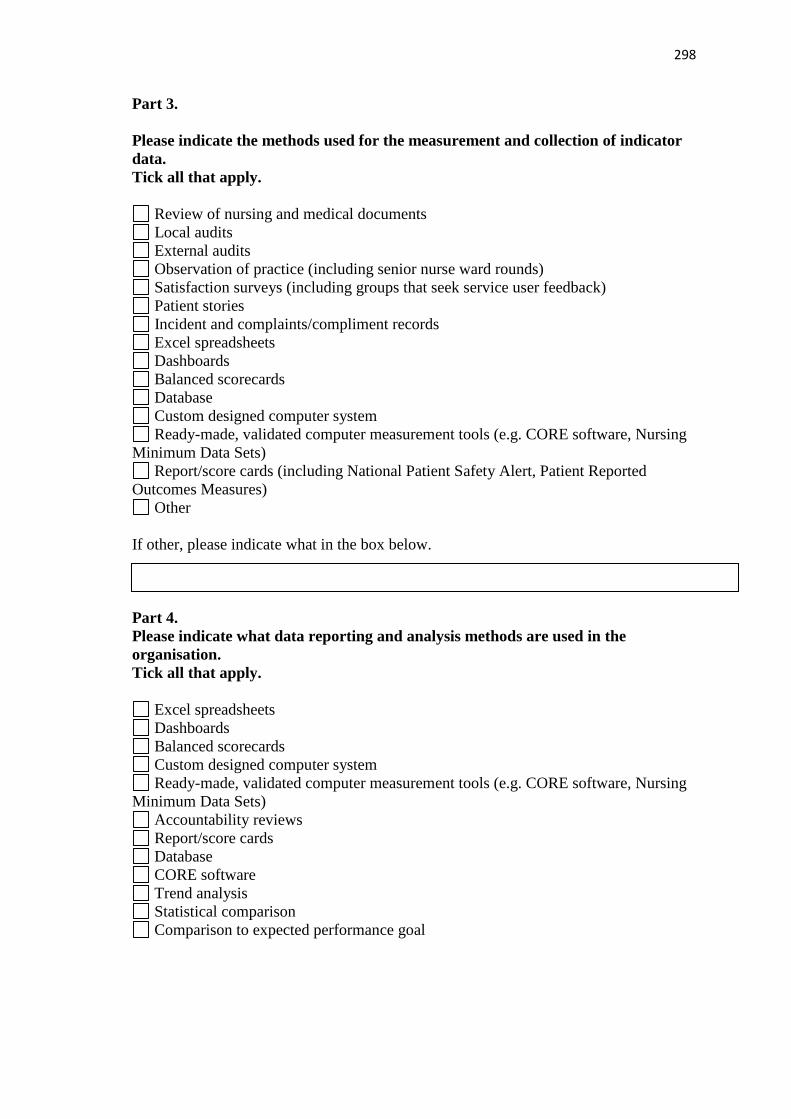
298
Part 3.
Please indicate the methods used for the measurement and collection of indicator
data.
Tick all that apply.
Review of nursing and medical documents
Local audits
External audits
Observation of practice (including senior nurse ward rounds)
Satisfaction surveys (including groups that seek service user feedback)
Patient stories
Incident and complaints/compliment records
Excel spreadsheets
Dashboards
Balanced scorecards
Database
Custom designed computer system
Ready-made, validated computer measurement tools (e.g. CORE software, Nursing
Minimum Data Sets)
Report/score cards (including National Patient Safety Alert, Patient Reported
Outcomes Measures)
Other
If other, please indicate what in the box below.
Part 4.
Please indicate what data reporting and analysis methods are used in the
organisation.
Tick all that apply.
Excel spreadsheets
Dashboards
Balanced scorecards
Custom designed computer system
Ready-made, validated computer measurement tools (e.g. CORE software, Nursing
Minimum Data Sets)
Accountability reviews
Report/score cards
Database
CORE software
Trend analysis
Statistical comparison
Comparison to expected performance goal
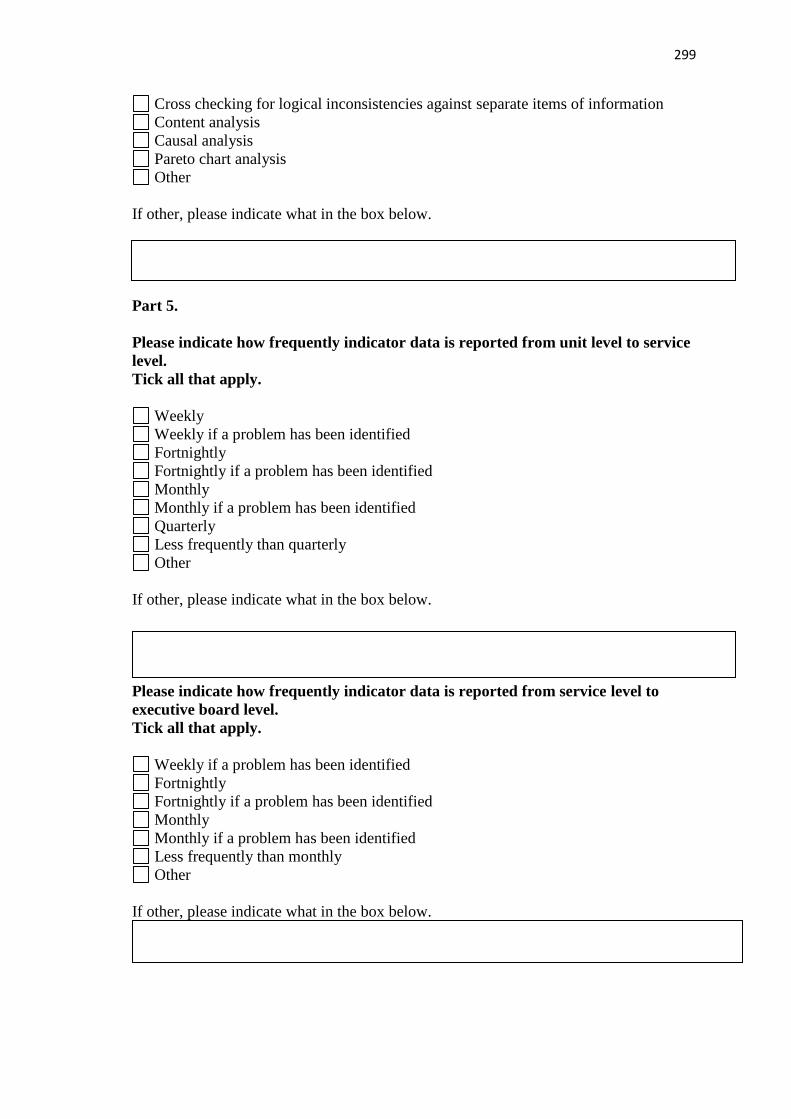
299
Cross checking for logical inconsistencies against separate items of information
Content analysis
Causal analysis
Pareto chart analysis
Other
If other, please indicate what in the box below.
Part 5.
Please indicate how frequently indicator data is reported from unit level to service
level.
Tick all that apply.
Weekly
Weekly if a problem has been identified
Fortnightly
Fortnightly if a problem has been identified
Monthly
Monthly if a problem has been identified
Quarterly
Less frequently than quarterly
Other
If other, please indicate what in the box below.
Please indicate how frequently indicator data is reported from service level to
executive board level.
Tick all that apply.
Weekly if a problem has been identified
Fortnightly
Fortnightly if a problem has been identified
Monthly
Monthly if a problem has been identified
Less frequently than monthly
Other
If other, please indicate what in the box below.

300
Part 6.
Please indicate how the organisation acts on indicator data.
Tick all that apply.
Action plans at local level if problems are identified
Service level action plans if problems are identified
Organisational action plan if problems are identified
Involvement of a quality improvement person/group
Celebration of improvement in practice
Escalation to service level
Escalation of all local level data to the executive board
Action plans tabled for follow up at every service meeting until improvement is
consistently identified
Action plans tabled for follow up at every executive board meeting until
improvement is consistently identified
Presentation of good practice within the organisation
Presentation for discussion at shared learning forums
Other
If other, please indicate what in the box below.
Part 2 alternative
What was the driver for KPI use?
Local unit or service need Yes/No
Organisational need Yes/No
Department of Health policy and guidelines Yes/No
Please indicate from what source/s the indicators selected in part 1 were
developed.
Tick all that apply.
Developed at unit or service level
Quality improvement person/group
Regional indicator development bodies or steering groups
Government publications
Professional bodies
National databases
Research findings (including Delphi, RAND, consensus studies)
Evidence-based practice
World Wide Web
Other
301
Appendix 7: Email to the directors of nursing
How does the use of key performance indicators influence nursing and midwifery practice? Dear colleague,
I am a doctoral student currently undertaking a PhD in the Ulster University. I am writing to ask if you would kindly consider taking part in phase one of a research study. The purpose of the study is to investigate how the use of key performance indicators (KPI’s) impacts on nursing and midwifery practice.
Although there is substantial evidence of the development and application of KPI’s in practice, there is limited research into how the information generated by use of these KPI’s, influences practice to improve patient care. I wish to explore the use of nurse-sensitive KPI’s in healthcare that influence those care outcomes most affected by nursing practice. I am therefore circulating a questionnaire to healthcare organisations across the United Kingdom and Ireland.
Your participation in this survey will contribute to the knowledge-base generated by this research which, it is anticipated, will support the future use of indicators that will facilitate the delivery of meaningful care that improves outcomes for patients and families. It will only take approximately 25 minutes of your time, and your input will be very much appreciated. Two options for completion of the questionnaire are available. Either; complete the online questionnaire by clicking on the following hyperlink: https://ulsterhealth.eu.qualtrics.com/SE/?SID=SV_8HR7rWAlJbdZnbn Please note - if you need to exit and return to the questionnaire later, Qualtrics will save your responses. Or; print off, complete and return the attached questionnaire to myself at the address below.
Further details are included in the attached Participant Information Sheet to which a copy of the questionnaire is included. A leaflet version of the information is also attached. A request for contact details is included at the end of the questionnaire if you would be willing to participate in phase two. If you have any questions about the questionnaire or research study I can be contacted at Insert email address
Completion and return of the questionnaire is requested by the 25th February 2016. I would like to thank you in advance of your contribution and very much appreciate your time and effort,
Olivia
Insert contact details
302
Appendix 8: Phase one letter of invitation
Letter of Invitation
Study Title: How does the use of key performance indicators
influence nursing and midwifery practice?
Dear colleague,
I am a doctoral student currently undertaking a PhD in the Ulster University. I am writing to ask
if you would kindly consider taking part in phase one of a research study. The purpose of the
study is to investigate how the use of key performance indicators (KPI’s) impacts on nursing and
midwifery practice.
Although there is substantial evidence of the development and application of KPI’s in practice,
there is limited research into how the information generated by use of these KPI’s influences
practice to improve patient care. I wish to explore the use of nurse-sensitive KPI’s in healthcare
that influence those care outcomes most affected by nursing practice. I am therefore circulating a
questionnaire to healthcare organisations across the United Kingdom and Ireland.
Your participation in this survey will contribute to the knowledge-base generated by this research
which it is anticipated, will support the future use of indicators that will facilitate the delivery of
meaningful care that improves outcomes for patients and families. It will only take approximately
20 minutes of your time, and your input will be very much appreciated.
Further details are included in the attached Participant Information Sheet to which a copy of the
questionnaire is included. A leaflet version of the information is also attached. A request for
contact details is included at the end of the questionnaire if you would be willing to participate in
phase two. If you have any questions about the questionnaire or research study I can be contacted
Completion and return of the questionnaire is requested by the ………. 2016.
Yours sincerely,
Olivia Gray
PhD student
Insert contact details

303
Appendix 9: Phase one participant information sheet
Participant Information Sheet for Directors of Nursing
Study Title: How does the use of key performance indicators
influence nursing and midwifery practice?
Invitation.
Dear colleague,
You are being invited to complete a questionnaire as phase one of a research study. Before you
decide to take part you need to understand why the research is being done and what it would
involve for you. Please take the time to read this information carefully and feel free to contact
either myself or the chief investigator about the study if this would help.
What is the study about?
The aim of this UK and Ireland study is to explore the impact of KPI’s on nursing and midwifery
practice within an organisational context. These high-level performance and care quality
indicators are nurse-sensitive; those indicators that capture care or its outcomes most affected by
nursing practice.
Why has my organisation been selected?
All healthcare organisations in the United Kingdom and Ireland, except Ambulance trusts, public
health, GP practices and the private/voluntary sector, are being invited to participate. Your Chief
Nursing Officer has been informed of this study.
Do I have to take part?
No - participation is entirely voluntary. It is up to you to decide. If you choose not to take part
this will be respected and will not affect your professional standing in any way. Completion of
this questionnaire does not commit your organisation to participation in phase two.
What will the study involve?
Phase one of the study involves completion of a questionnaire. It should only take approximately
20 minutes of your time. Completion and return of the questionnaire is requested by the:
What is required if I take part?
To make it easier for you, the questionnaire may be completed in the following ways:
• online via Qualtrics by clicking on the hyperlink in the body of the email. The
questionnaire automatically saves completed pages if you need to exit and return to it at
a later time.
• by printing off the questionnaire, and posting to Olivia Gray at the address below.

304
Will my information be kept confidential?
The responses provided in the questionnaire will be anonymous and confidential. Qualtrics will
not collect IP addresses therefore organisations will remain anonymous. All information will be
handled, and stored in accordance with the requirements of the Data Protection Act 1998.
What if there is a problem?
If you have concerns about the questionnaire or any aspect of the study, you can contact me or
the Chief Investigator of the study (see contact details), and we will try to answer your questions.
If you remain unhappy and wish to complain formally, you will be provided with relevant
information that will enable you to do so.
What will happen to the results of the research study?
It is anticipated that the results of this questionnaire will contribute to the body of evidence on
KPI’s in the United Kingdom and Ireland, identify strategies that have been developed for their
effective use and help to maximise the future use of KPI’s to improve care quality and the patient
experience. Once complete the study findings will be sent for publication in a professional and/or
peer reviewed journal and/or may be presented at conferences. You will personally receive a
written summary of the key findings from the study and an opportunity to discuss this with the
research team if you wish.
Some organisations will be invited to participate in phase two of the study. Phase two will involve
interviews (face-to-face or telephone) with nurses and midwives. This will provide a more in-
depth understanding of the influence of KPI’s on nursing and midwifery practice and identify
barriers and enablers for maximising the impact of KPI’s.
Who is organising and funding the research?
This study is being led by the Ulster University, Northern Ireland. Funding has been secured from
the Department of Employment and Learning and the five Health and Social Care Trusts in
Northern Ireland.
Who has reviewed the study?
The study has been reviewed by the Ulster University, School of Nursing Research Ethics
Committee.
Further information and contact details
If you have any queries or would like further information on the study please feel free to contact
a member of the research team. Contact details are provided below.
Yours sincerely,
Olivia
Professor Tanya McCance (Chief Investigator)
Professor of Nursing, Ulster University
Insert contact details
Olivia Gray (PhD Student)
Insert contact details

305
Appendix 10: Table of interview guides
Directors of nursing Senior managers Clinical managers
What is your view on the use of
key performance indicators as a
mechanism to improve quality of
care?
What is your view on the use of
key performance indicators?
What does a key performance
indicator mean to you?
Can you tell me about what
drives KPI selection and use in
this organisation?
Can you tell me about what
drives KPI selection and use in
this organisation?
What is your general view of
KPI’s?
Can you tell me why you think
that only a small number of
KPI’s are identified in the
community setting?
Can you tell me why you think
that only a small number of
KPI’s are identified in the
community setting?
What KPI’s do you use most
frequently in your area?
What KPI’s do you feel are of
most value to service and why?
What KPI’s do you feel are of
most value to service and why?
What KPI’s do you think are
most beneficial?
Can you tell me about any
challenges you have come across
in relation to KPI use?
Can you tell me about any
challenges you have come across
in relation to KPI use?
Can you tell me about any
challenges you have come across
in relation to KPI use?
What are your views on the
value of KPI’s that measure
efficiency with those that
measure quality of care
What are your views on the
value of KPI’s that measure
efficiency with those that
measure quality of care
In what ways are your staff
engaged in KPI use?
How are you assured that the
KPI’s collected in this
organisation benefit patients?
a. How do the systems you
have in place help the
management of KPI data at
clinical level?
b. How do they offer assurance
at organisational level?
What systems do you have in
place for managing your KPI
data?
How do you use the data
collected to inform the
organisational direction for
patient care?
What strategies or structures are
in place within the organisation
to support and encourage action
on KPI’s to improve practice?
Can you tell me about any
support provided within the
organisation for KPI use?
I am interested in exploring what
ways your staff are supported to
improve care based on use of
KPI’s?
How is patients experience
captured and how are you
assured that it is being used to
improve care?
What are your thoughts on the
value of patient surveys to
improve care?
How is patients experience
captured and how are you
assured that it is being used to
improve care?
If you had to make one
suggestion about how to make
the KPI process more effective
at improving patient care, what
would it be?
Can you give me any examples
of KPI’s that you have used to
improve practice?
If you had one suggestion about
how to make the KPI process
more effective at improving
patient care, what would it be?
Can you tell me about an
occasion when you considered
KPI’s were not helpful for
patient care?
If you had to make one
suggestion about how to make
the KPI process more effective
at improving patient care, what
would it be?
306
Appendix 11: Certificate of participation
Reflective account: Participation in a research study.
Study Title:
How does the use of key performance indicators influence nursing and midwifery practice?
Self-assessment/reflection/comment
What was the nature of the CPD activity and/or practice-related feedback and/or
event or experience in your practice?
What did you learn from the CPD activity and/or feedback and/or event or
experience in your practice?
How did you change or improve your practice as a result?
How is this relevant to the Code?
Select a theme: Prioritise people - Practice effectively - Preserve safety - Promote professionalism and trust?

307
_______________________________
Participated in an
INTERVIEW CONTRIBUTING TO A UNITED KINGDOM AND IRELAND
NURSING AND MIDWIFERY RESEARCH STUDY
(Insert time spent: …………….. of participatory CPD)
On
______________________
DATE
_________________________ Research Facilitator
308
Appendix 12: Phase two participant information sheet
LETTER OF INVITATION AND INFORMATION FOR
INTERVIEWEES
Study Title:
How does the use of key performance indicators influence nursing and midwifery practice?
Invitation.
Dear colleague,
I am a nurse and am currently undertaking a research study as part of my PhD, with the Ulster University.
I am writing to invite you to take part in a taped semi-structured interview within phase two of this
research study. Before you decide I would like you to understand why the research is being undertaken
and what it would involve for you. Please take the time to read this information carefully and feel free
to contact either myself or the chief investigator about the study if this would help.
What is the study about?
The aim of this UK and Ireland study is to explore how the use of KPI’s within healthcare organisations
influences nursing and midwifery practice. The performance and quality indicators that are of interest
are those that capture the delivery and outcomes of nursing and midwifery care. The aim of the interview
is to gain a deeper understanding of your experience and views on the use of KPI’s for example, what
benefits and challenges you have encountered in using KPI’s, have you any examples of when they were
used to improve practice? It is anticipated that the results of the study will contribute to the knowledge-
base on KPI's and the processes involved in their management. The study findings may potentially
contribute to the future development of indicators that will be used to deliver meaningful care that
improves outcomes for patients and families, as well as potentially streamlining the KPI process.
Why has my organisation been selected?
All healthcare organisations in the United Kingdom and Ireland (except Ambulance trusts, public health,
GP practices and the private sector) were invited to take part in phase one. At that time your Director of
Nursing expressed willingness to participate in this second phase.
Do I have to take part?
No - your participation is entirely voluntary; you are free to withdraw at any stage and are not obliged
to disclose anything you may feel uncomfortable with.
What is required if I take part?
This phase of the study involves taking part in a semi-structured interview. It will take no more than an
hour of your time and we can meet at a location and time to be agreed between the two of us. With your
permission, the interview will be recorded to ensure your information is captured accurately and you
will also be asked to sign a consent form. There are no right or wrong answers – I am simply interested
in your opinion. The information you provide will then be analysed for themes and information that
contribute to this study.
309
Will my information be kept confidential?
All information collected will be strictly confidential. Your name and details will not be recorded. The
recording will be transcribed verbatim by the researcher or a certified transcriber and your responses
will be anonymised to avoid identification. Direct quotations may be used, however your name will not
be disclosed and it will not be possible to trace personal information back to you. If information is
disclosed that identifies a patient safety or public protection issue then this overrides the need for
confidentiality, and may be shared with other healthcare professionals (NMC 2015). All information
will be handled and stored in accordance with the requirements of the Data Protection Act 1998.
What are the benefits of taking part?
By taking part in this research you will be contributing to the evidence-based of knowledge on KPI use
which has the potential to influence the future use of indicators to improve care for patients. As a
research participant you may choose to use the interview as evidence to contribute to your continuing
professional development for the NMC. A certificate of contribution to research and a reflective
accounts template will be supplied on completion of the interview.
What if there is a problem?
You are free to stop at any time and can leave the room without any explanation being needed. If there
are any issues that arise that you feel you may require support to deal with, counselling can be arranged
through the Occupational Health department of your organisation. If you have concerns about the
interview or any aspect of the study, you can contact me or the Chief Investigator of the study (see
contact details), and we will try to answer your questions. If you remain unhappy and wish to complain
formally, you will be provided with relevant information that will enable you to do so.
What will happen to the results of the research study?
It is anticipated that the results of this study will contribute to the body of evidence on KPI’s in the
United Kingdom and Ireland, identify strategies that have been developed for their effective use and
help to maximise the future use of KPI’s to improve care quality and the patient experience. Once
complete the study findings will be sent for publication in a professional and/or peer reviewed journal
and/or may be presented at conferences. You will personally receive a written summary of the key
findings from the study and an opportunity to discuss this with the research team if you wish.
Who is organising and funding the research?
This study is being led by the Ulster University, Northern Ireland. Funding has been secured from the
Department of Employment and Learning and the five Health and Social Care Trusts in Northern
Ireland. A travel scholarship has been granted by the Florence Nightingale Foundation.
Who has reviewed the study?
The study has been reviewed by the Ulster University, School of Nursing Research Ethics Committee
and by the Research and Development office of your organisation.
Further information and contact details
If you have any queries or would like further information on the study please feel free to contact a
member of the research team. Contact details are provided below.
Please confirm within the next week if you are interested in taking part in an interview. I shall then
contact you to confirm a date and venue.
Thank you for considering this request,
Olivia Gray (PhD Student)
Insert contact details
Professor Tanya McCance (Chief Investigator)
Insert contact details
310
Appendix 13: Consent form
CONSENT FORM FOR INTERVIEW PARTICIPANTS
Study title: How does the use of key performance indicators influence nursing
and midwifery practice?
By ticking the boxes below, I confirm that:
1 I have read and understood the information for the above project. I have had
the opportunity to consider the information, ask questions and have had these
answered satisfactorily.
2 I understand that the interviewer will hold all information and data collected in
a secure and confidential manner.
3 I understand that my participation is voluntary and that I am free to withdraw
at any time, without giving any reason. Any data obtained will be removed if
you chose to withdraw.
4 I understand that the interview will be recorded and that anonymised direct
quotations may be used from this. However, no-one will be able to identify me
through the information presented.
5. I understand that disclosure of unsafe practice will have to be shared with a
designated professional as per my organisation’s protocol.
6. I agree to take part in an interview within this study.
I confirm that I have read and understood the information above:
Name of participant:
Signature:
Date:
Name of facilitator taking consent:
Signature:
Date:

311
Appendix 14: Descriptive statistics of quantitative responses
Q1. Participant organisations per country
Please indicate your organisation's location
Frequency Percent Valid Percent Cumulative %
Valid 1 England 32 41.6 41.6 41.6
2 Northern Ireland 5 6.5 6.5 48.1
3 Scotland 7 9.1 9.1 57.1
4 Wales 2 2.6 2.6 59.7
5 Ireland 31 40.3 40.3 100.0
Total 77 100.0 100.0
Q2. Population size covered by participant organisations
What size of a population does your organisation cover?
Valid 68
Missing 9
Mean 165903.91
Median 525.00
Std. Deviation 443082.914
Range 3199999
Minimum 1
Maximum 3200000
Q3. Frequencies of Population areas covered
What population areas do you cover?
Frequency Percent Valid Percent Cumulative %
Valid 1 Rural 7 9.1 9.1 9.1
2 Urban 10 13.0 13.0 22.1
3 Both 60 77.9 77.9 100.0
Total 77 100.0 100.0
Q4. Services provided by participant organisations
Which of the following services do you provide?
Frequency Percent Valid Percent Cumulative %
Valid 1 Acute 15 19.5 20.5 20.5
2 Community 19 24.7 26.0 46.6
3 Both 39 50.6 53.4 100.0
Total 73 94.8 100.0
Missing 99 missing 4 5.2
Total 77 100.0

312
Q5. Areas of practice within organisations
Area of practice - Adult
Frequency Percent Valid Percent Cumulative %
Valid 0 not chosen 7 9.1 9.1 9.1
1 chosen 70 90.9 90.9 100.0
Total 77 100.0 100.0
Area of practice - Midwifery
Frequency Percent Valid Percent Cumulative %
Valid 0 not chosen 20 26.0 26.0 26.0
1 chosen 57 74.0 74.0 100.0
Total 77 100.0 100.0
Area of practice - Children’s
Frequency Percent Valid Percent Cumulative %
Valid 0 not chosen 17 22.1 22.1 22.1
1 chosen 60 77.9 77.9 100.0
Total 77 100.0 100.0
Area of practice - Learning Disability
Frequency Percent Valid Percent Cumulative %
Valid 0 not chosen 43 55.8 55.8 55.8
1 chosen 34 44.2 44.2 100.0
Total 77 100.0 100.0
Area of practice - Community
Frequency Percent Valid Percent Cumulative %
Valid 0 not chosen 29 37.7 37.7 37.7
1 chosen 48 62.3 62.3 100.0
Total 77 100.0 100.0
Area of practice - Mental Health
Frequency Percent Valid Percent Cumulative %
Valid 0 not chosen 46 59.7 59.7 59.7
1 chosen 31 40.3 40.3 100.0
Total 77 100.0 100.0
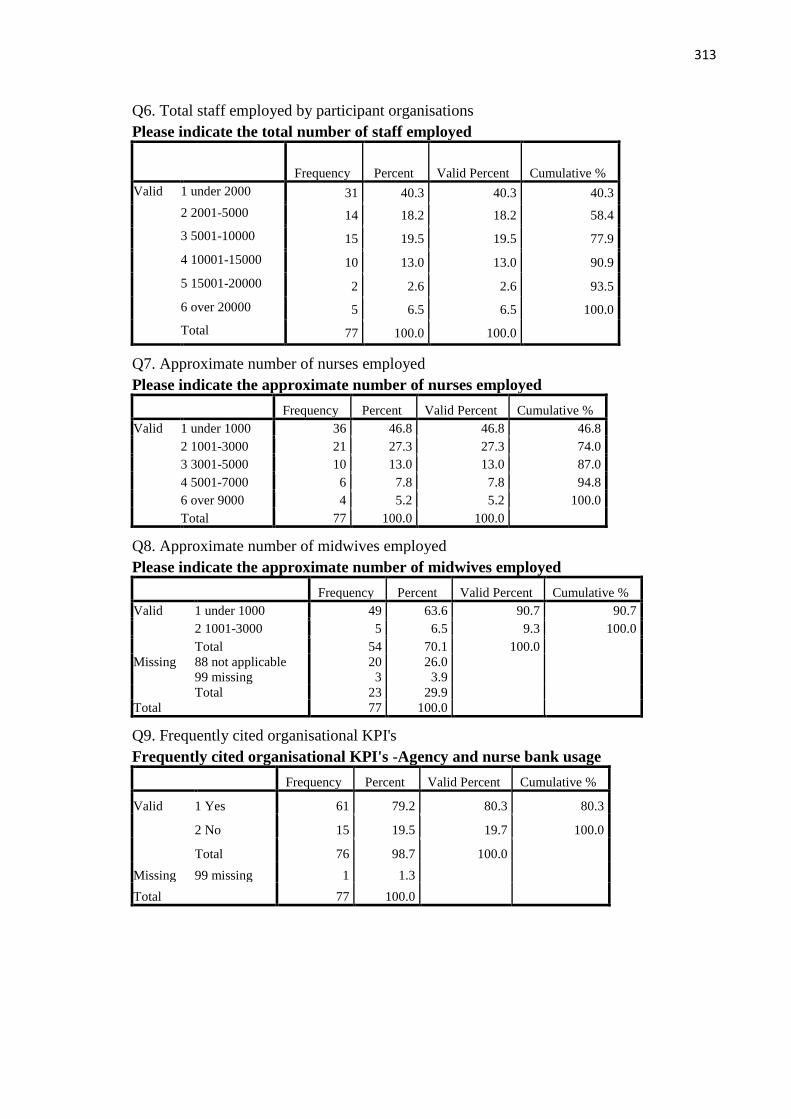
313
Q6. Total staff employed by participant organisations
Please indicate the total number of staff employed
Frequency Percent Valid Percent Cumulative %
Valid 1 under 2000 31 40.3 40.3 40.3
2 2001-5000 14 18.2 18.2 58.4
3 5001-10000 15 19.5 19.5 77.9
4 10001-15000 10 13.0 13.0 90.9
5 15001-20000 2 2.6 2.6 93.5
6 over 20000 5 6.5 6.5 100.0
Total 77 100.0 100.0
Q7. Approximate number of nurses employed
Please indicate the approximate number of nurses employed
Frequency Percent Valid Percent Cumulative %
Valid 1 under 1000 36 46.8 46.8 46.8
2 1001-3000 21 27.3 27.3 74.0
3 3001-5000 10 13.0 13.0 87.0
4 5001-7000 6 7.8 7.8 94.8
6 over 9000 4 5.2 5.2 100.0
Total 77 100.0 100.0
Q8. Approximate number of midwives employed
Please indicate the approximate number of midwives employed
Frequency Percent Valid Percent Cumulative %
Valid 1 under 1000 49 63.6 90.7 90.7
2 1001-3000 5 6.5 9.3 100.0
Total 54 70.1 100.0
Missing 88 not applicable 20 26.0
99 missing 3 3.9
Total 23 29.9
Total 77 100.0
Q9. Frequently cited organisational KPI's
Frequently cited organisational KPI's -Agency and nurse bank usage
Frequency Percent Valid Percent Cumulative %
Valid 1 Yes 61 79.2 80.3 80.3
2 No 15 19.5 19.7 100.0
Total 76 98.7 100.0
Missing 99 missing 1 1.3
Total 77 100.0

314
Frequently cited organisational KPI's - Number of nursing vacancies
Frequency Percent Valid Percent Cumulative %
Valid 1 Yes 66 85.7 86.8 86.8
2 No 10 13.0 13.2 100.0
Total 76 98.7 100.0
Missing 99 missing 1 1.3
Total 77 100.0
Frequently cited organisational KPI's - Number of nursing absences
Frequency Percent Valid Percent Cumulative %
Valid 1 Yes 65 84.4 86.7 86.7
2 No 10 13.0 13.3 100.0
Total 75 97.4 100.0
Missing 99 missing 2 2.6
Total 77 100.0
Frequently cited organisational KPI's - Incidence of complaints
specifically related to nursing care
Frequency Percent Valid Percent Cumulative %
Valid 1 Yes 62 80.5 81.6 81.6
2 No 14 18.2 18.4 100.0
Total 76 98.7 100.0
Missing 99 missing 1 1.3
Total 77 100.0
Q10. Data collection methods for organisational KPI's
How is the data collected for - Agency and nurse bank usage?
Frequency Percent Valid Percent Cumulative %
Valid 1 Paper 5 6.5 8.2 8.2
2 Computer 34 44.2 55.7 63.9
3 Both 22 28.6 36.1 100.0
Total 61 79.2 100.0
Missing 88 not applicable 15 19.5
99 missing 1 1.3
Total 16 20.8
Total 77 100.0
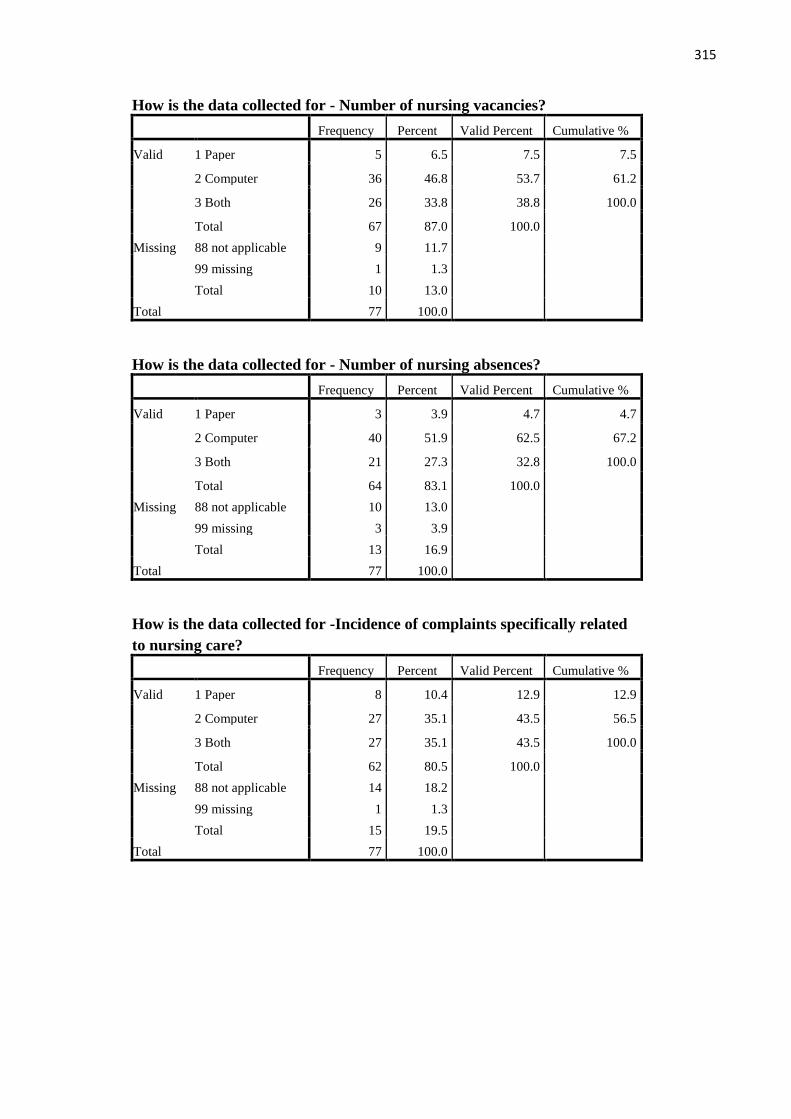
315
How is the data collected for - Number of nursing vacancies?
Frequency Percent Valid Percent Cumulative %
Valid 1 Paper 5 6.5 7.5 7.5
2 Computer 36 46.8 53.7 61.2
3 Both 26 33.8 38.8 100.0
Total 67 87.0 100.0
Missing 88 not applicable 9 11.7
99 missing 1 1.3
Total 10 13.0
Total 77 100.0
How is the data collected for - Number of nursing absences?
Frequency Percent Valid Percent Cumulative %
Valid 1 Paper 3 3.9 4.7 4.7
2 Computer 40 51.9 62.5 67.2
3 Both 21 27.3 32.8 100.0
Total 64 83.1 100.0
Missing 88 not applicable 10 13.0
99 missing 3 3.9
Total 13 16.9
Total 77 100.0
How is the data collected for -Incidence of complaints specifically related
to nursing care?
Frequency Percent Valid Percent Cumulative %
Valid 1 Paper 8 10.4 12.9 12.9
2 Computer 27 35.1 43.5 56.5
3 Both 27 35.1 43.5 100.0
Total 62 80.5 100.0
Missing 88 not applicable 14 18.2
99 missing 1 1.3
Total 15 19.5
Total 77 100.0
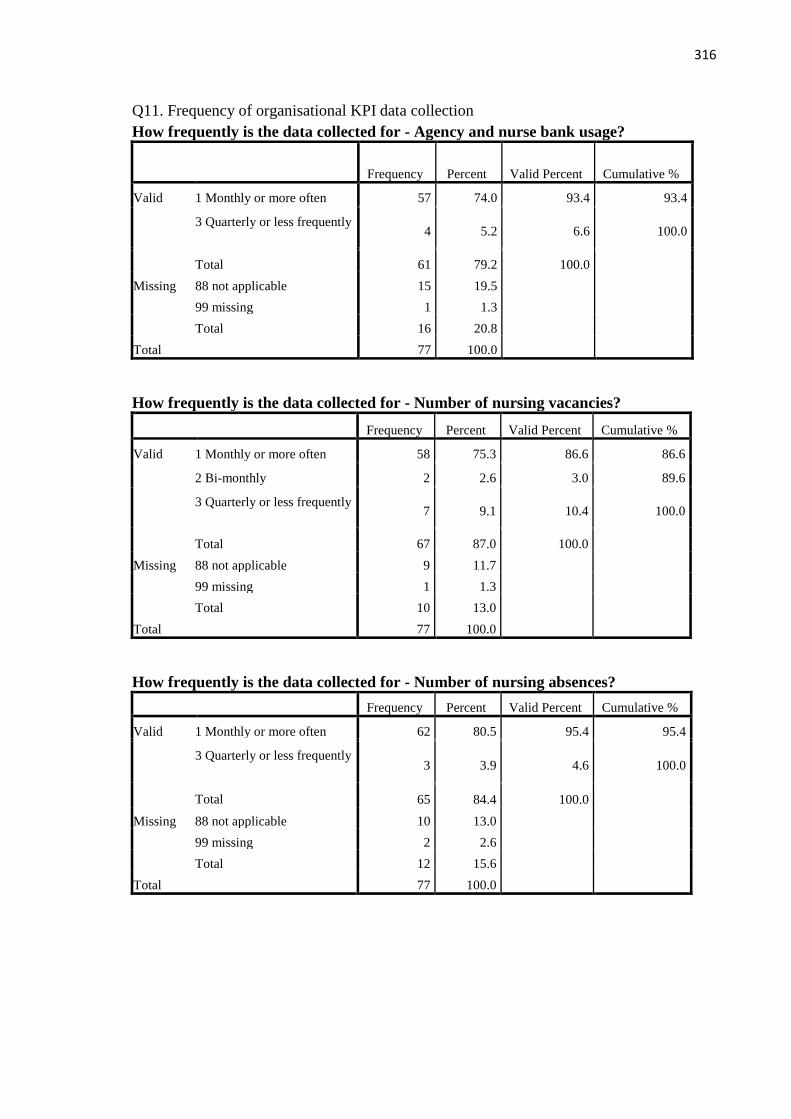
316
Q11. Frequency of organisational KPI data collection
How frequently is the data collected for - Agency and nurse bank usage?
Frequency Percent Valid Percent Cumulative %
Valid 1 Monthly or more often 57 74.0 93.4 93.4
3 Quarterly or less frequently 4 5.2 6.6 100.0
Total 61 79.2 100.0
Missing 88 not applicable 15 19.5
99 missing 1 1.3
Total 16 20.8
Total 77 100.0
How frequently is the data collected for - Number of nursing vacancies?
Frequency Percent Valid Percent Cumulative %
Valid 1 Monthly or more often 58 75.3 86.6 86.6
2 Bi-monthly 2 2.6 3.0 89.6
3 Quarterly or less frequently 7 9.1 10.4 100.0
Total 67 87.0 100.0
Missing 88 not applicable 9 11.7
99 missing 1 1.3
Total 10 13.0
Total 77 100.0
How frequently is the data collected for - Number of nursing absences?
Frequency Percent Valid Percent Cumulative %
Valid 1 Monthly or more often 62 80.5 95.4 95.4
3 Quarterly or less frequently 3 3.9 4.6 100.0
Total 65 84.4 100.0
Missing 88 not applicable 10 13.0
99 missing 2 2.6
Total 12 15.6
Total 77 100.0
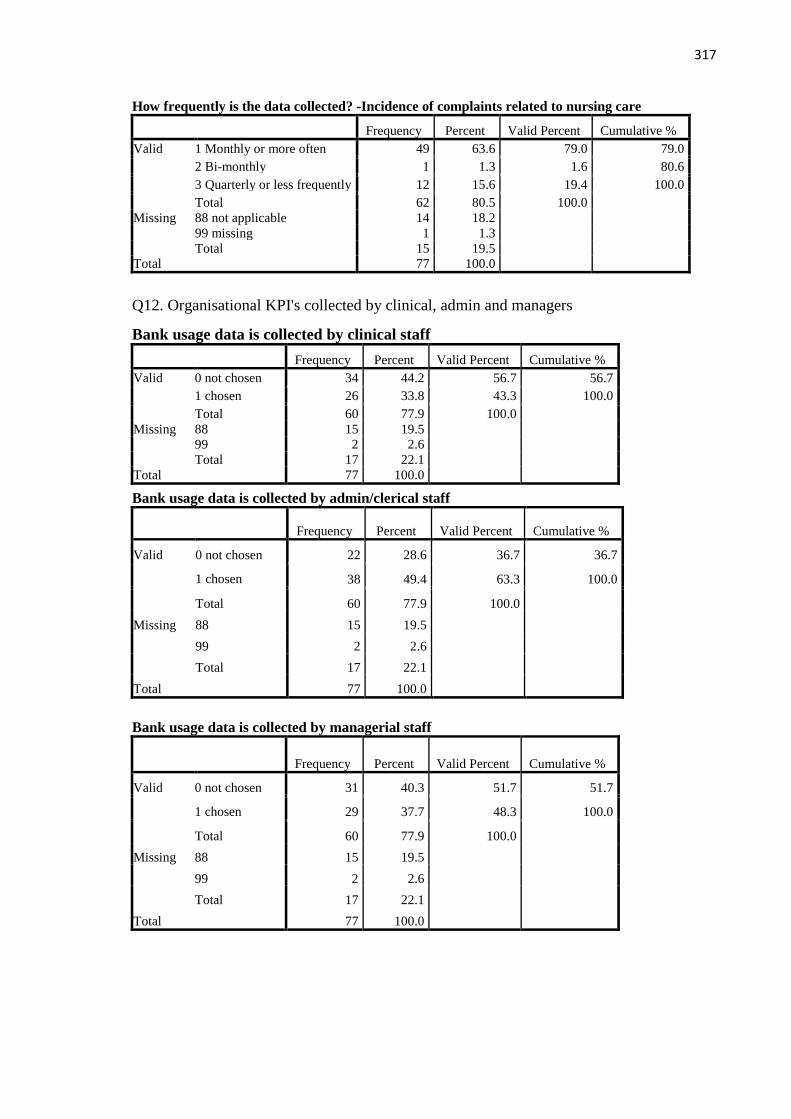
317
How frequently is the data collected? -Incidence of complaints related to nursing care
Frequency Percent Valid Percent Cumulative %
Valid 1 Monthly or more often 49 63.6 79.0 79.0
2 Bi-monthly 1 1.3 1.6 80.6
3 Quarterly or less frequently 12 15.6 19.4 100.0
Total 62 80.5 100.0
Missing 88 not applicable 14 18.2
99 missing 1 1.3
Total 15 19.5
Total 77 100.0
Bank usage data is collected by admin/clerical staff
Frequency Percent Valid Percent Cumulative %
Valid 0 not chosen 22 28.6 36.7 36.7
1 chosen 38 49.4 63.3 100.0
Total 60 77.9 100.0
Missing 88 15 19.5
99 2 2.6
Total 17 22.1
Total 77 100.0
Bank usage data is collected by managerial staff
Frequency Percent Valid Percent Cumulative %
Valid 0 not chosen 31 40.3 51.7 51.7
1 chosen 29 37.7 48.3 100.0
Total 60 77.9 100.0
Missing 88 15 19.5
99 2 2.6
Total 17 22.1
Total 77 100.0
Q12. Organisational KPI's collected by clinical, admin and managers
Bank usage data is collected by clinical staff
Frequency Percent Valid Percent Cumulative %
Valid 0 not chosen 34 44.2 56.7 56.7
1 chosen 26 33.8 43.3 100.0
Total 60 77.9 100.0
Missing 88 15 19.5
99 2 2.6
Total 17 22.1
Total 77 100.0
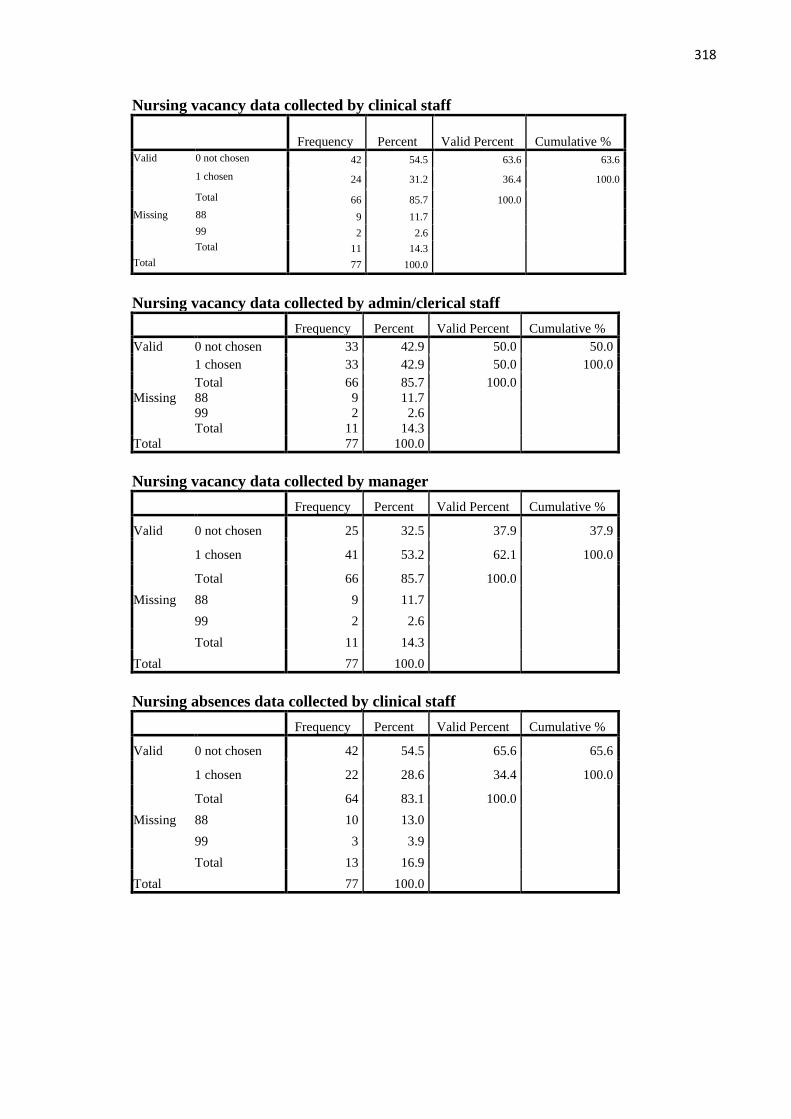
318
Nursing vacancy data collected by clinical staff
Frequency Percent Valid Percent Cumulative %
Valid 0 not chosen 42 54.5 63.6 63.6
1 chosen 24 31.2 36.4 100.0
Total 66 85.7 100.0
Missing 88 9 11.7
99 2 2.6
Total 11 14.3
Total 77 100.0
Nursing vacancy data collected by admin/clerical staff
Frequency Percent Valid Percent Cumulative %
Valid 0 not chosen 33 42.9 50.0 50.0
1 chosen 33 42.9 50.0 100.0
Total 66 85.7 100.0
Missing 88 9 11.7
99 2 2.6
Total 11 14.3
Total 77 100.0
Nursing vacancy data collected by manager
Frequency Percent Valid Percent Cumulative %
Valid 0 not chosen 25 32.5 37.9 37.9
1 chosen 41 53.2 62.1 100.0
Total 66 85.7 100.0
Missing 88 9 11.7
99 2 2.6
Total 11 14.3
Total 77 100.0
Nursing absences data collected by clinical staff
Frequency Percent Valid Percent Cumulative %
Valid 0 not chosen 42 54.5 65.6 65.6
1 chosen 22 28.6 34.4 100.0
Total 64 83.1 100.0
Missing 88 10 13.0
99 3 3.9
Total 13 16.9
Total 77 100.0

319
Nursing absences data collected by admin/clerical staff
Frequency Percent Valid Percent Cumulative %
Valid 0 not chosen 27 35.1 42.2 42.2
1 chosen 37 48.1 57.8 100.0
Total 64 83.1 100.0
Missing 88 10 13.0
99 3 3.9
Total 13 16.9
Total 77 100.0
Nursing absences data collected by managerial staff
Frequency Percent Valid Percent Cumulative %
Valid 0 not chosen 23 29.9 35.9 35.9
1 chosen 41 53.2 64.1 100.0
Total 64 83.1 100.0
Missing 88 10 13.0
99 3 3.9
Total 13 16.9
Total 77 100.0
Nursing complaints data collected by clinical staff
Frequency Percent Valid Percent Cumulative %
Valid 0 not chosen 36 46.8 58.1 58.1
1 chosen 26 33.8 41.9 100.0
Total 62 80.5 100.0
Missing 88 14 18.2
99 1 1.3
Total 15 19.5
Total 77 100.0
Nursing complaints data collected by admin/clerical staff
Frequency Percent Valid Percent Cumulative %
Valid 0 not chosen 29 37.7 46.8 46.8
1 chosen 33 42.9 53.2 100.0
Total 62 80.5 100.0
Missing 88 14 18.2
99 1 1.3
Total 15 19.5
Total 77 100.0
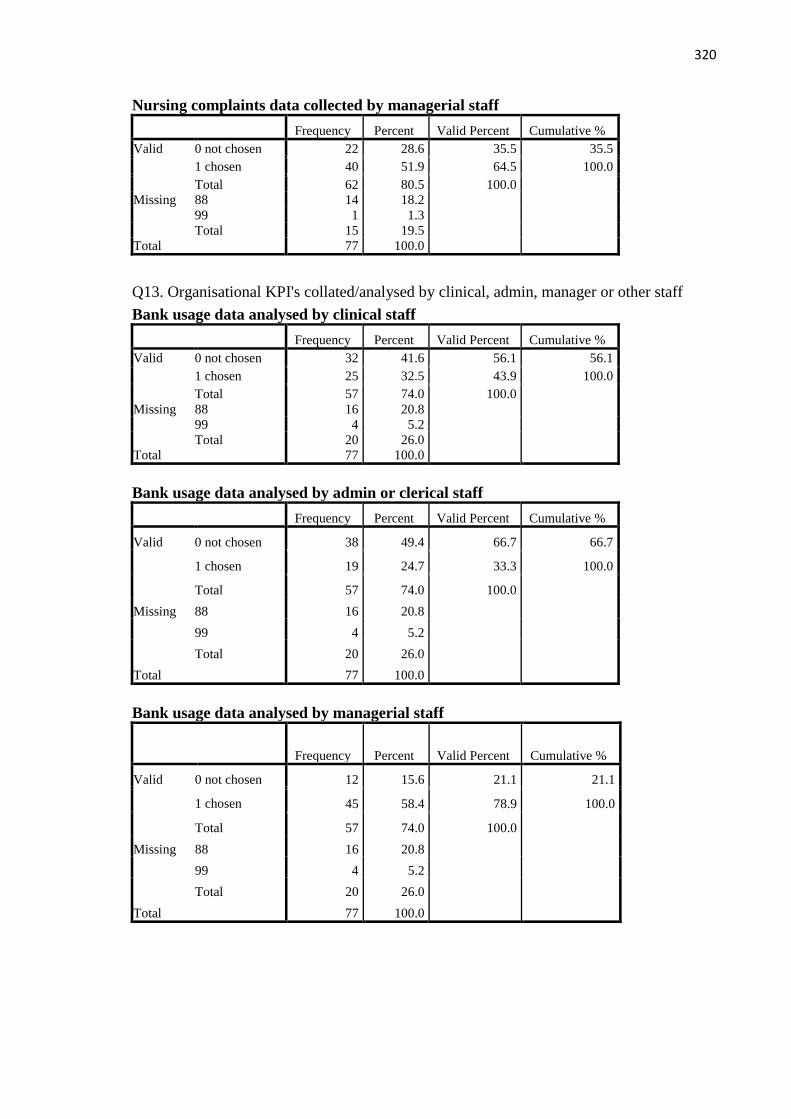
320
Nursing complaints data collected by managerial staff
Frequency Percent Valid Percent Cumulative %
Valid 0 not chosen 22 28.6 35.5 35.5
1 chosen 40 51.9 64.5 100.0
Total 62 80.5 100.0
Missing 88 14 18.2
99 1 1.3
Total 15 19.5
Total 77 100.0
Q13. Organisational KPI's collated/analysed by clinical, admin, manager or other staff
Bank usage data analysed by clinical staff
Frequency Percent Valid Percent Cumulative %
Valid 0 not chosen 32 41.6 56.1 56.1
1 chosen 25 32.5 43.9 100.0
Total 57 74.0 100.0
Missing 88 16 20.8
99 4 5.2
Total 20 26.0
Total 77 100.0
Bank usage data analysed by admin or clerical staff
Frequency Percent Valid Percent Cumulative %
Valid 0 not chosen 38 49.4 66.7 66.7
1 chosen 19 24.7 33.3 100.0
Total 57 74.0 100.0
Missing 88 16 20.8
99 4 5.2
Total 20 26.0
Total 77 100.0
Bank usage data analysed by managerial staff
Frequency Percent Valid Percent Cumulative %
Valid 0 not chosen 12 15.6 21.1 21.1
1 chosen 45 58.4 78.9 100.0
Total 57 74.0 100.0
Missing 88 16 20.8
99 4 5.2
Total 20 26.0
Total 77 100.0
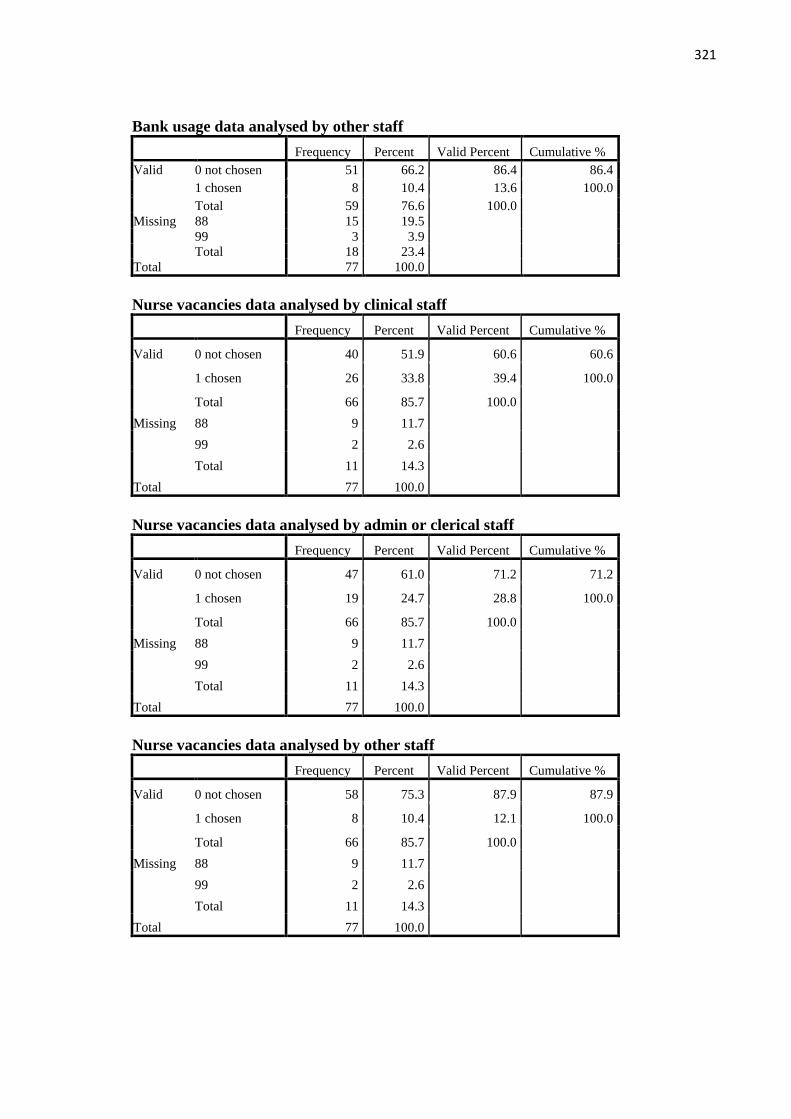
321
Bank usage data analysed by other staff
Frequency Percent Valid Percent Cumulative %
Valid 0 not chosen 51 66.2 86.4 86.4
1 chosen 8 10.4 13.6 100.0
Total 59 76.6 100.0
Missing 88 15 19.5
99 3 3.9
Total 18 23.4
Total 77 100.0
Nurse vacancies data analysed by clinical staff
Frequency Percent Valid Percent Cumulative %
Valid 0 not chosen 40 51.9 60.6 60.6
1 chosen 26 33.8 39.4 100.0
Total 66 85.7 100.0
Missing 88 9 11.7
99 2 2.6
Total 11 14.3
Total 77 100.0
Nurse vacancies data analysed by admin or clerical staff
Frequency Percent Valid Percent Cumulative %
Valid 0 not chosen 47 61.0 71.2 71.2
1 chosen 19 24.7 28.8 100.0
Total 66 85.7 100.0
Missing 88 9 11.7
99 2 2.6
Total 11 14.3
Total 77 100.0
Nurse vacancies data analysed by other staff
Frequency Percent Valid Percent Cumulative %
Valid 0 not chosen 58 75.3 87.9 87.9
1 chosen 8 10.4 12.1 100.0
Total 66 85.7 100.0
Missing 88 9 11.7
99 2 2.6
Total 11 14.3
Total 77 100.0
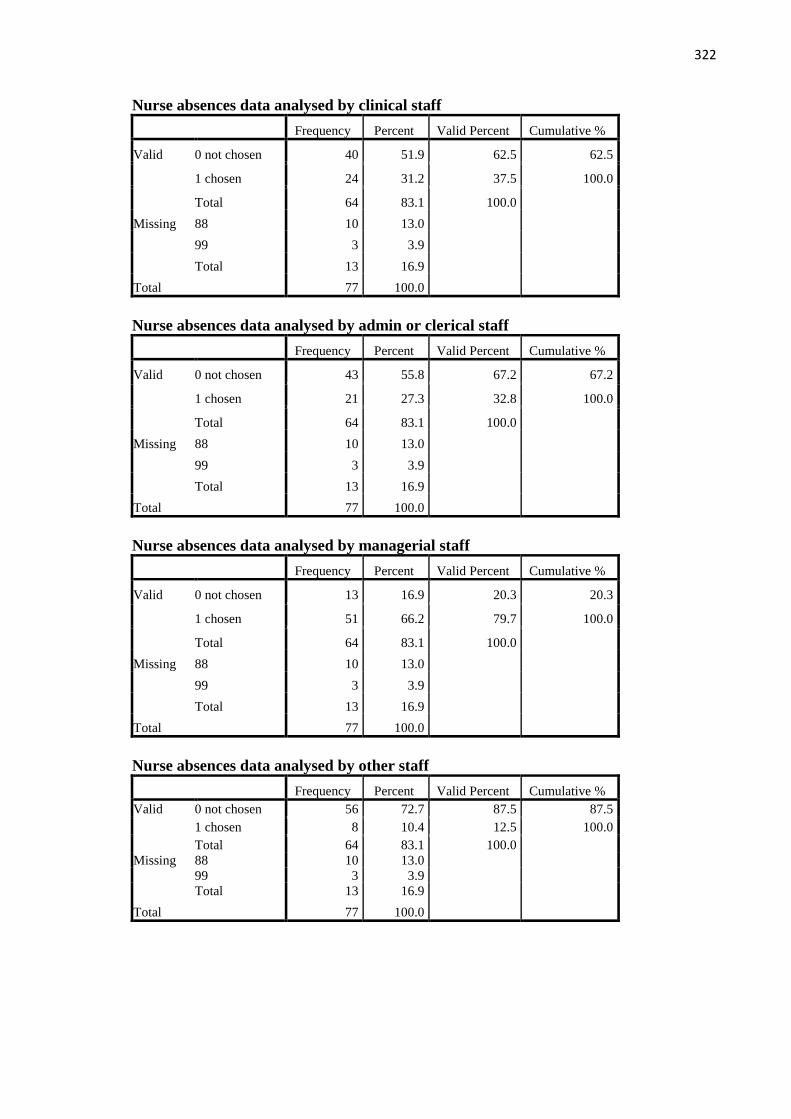
322
Nurse absences data analysed by clinical staff
Frequency Percent Valid Percent Cumulative %
Valid 0 not chosen 40 51.9 62.5 62.5
1 chosen 24 31.2 37.5 100.0
Total 64 83.1 100.0
Missing 88 10 13.0
99 3 3.9
Total 13 16.9
Total 77 100.0
Nurse absences data analysed by admin or clerical staff
Frequency Percent Valid Percent Cumulative %
Valid 0 not chosen 43 55.8 67.2 67.2
1 chosen 21 27.3 32.8 100.0
Total 64 83.1 100.0
Missing 88 10 13.0
99 3 3.9
Total 13 16.9
Total 77 100.0
Nurse absences data analysed by managerial staff
Frequency Percent Valid Percent Cumulative %
Valid 0 not chosen 13 16.9 20.3 20.3
1 chosen 51 66.2 79.7 100.0
Total 64 83.1 100.0
Missing 88 10 13.0
99 3 3.9
Total 13 16.9
Total 77 100.0
Nurse absences data analysed by other staff
Frequency Percent Valid Percent Cumulative %
Valid 0 not chosen 56 72.7 87.5 87.5
1 chosen 8 10.4 12.5 100.0
Total 64 83.1 100.0
Missing 88 10 13.0
99 3 3.9
Total 13 16.9
Total 77 100.0

323
Complaints data analysed by clinical staff
Frequency Percent Valid Percent Cumulative
Valid 0 not chosen 35 45.5 58.3 58.3
1 chosen 25 32.5 41.7 100.0
Total 60 77.9 100.0
Missing 88 14 18.2
99 3 3.9
Total 17 22.1
Total 77 100.0
Complaints data analysed by admin or clerical staff
Frequency Percent Valid Percent Cumulative %
Valid 0 not chosen 38 49.4 63.3 63.3
1 chosen 22 28.6 36.7 100.0
Total 60 77.9 100.0
Missing 88 14 18.2
99 3 3.9
Total 17 22.1
Total 77 100.0
Complaints data analysed by managerial staff
Frequency Percent Valid Percent Cumulative
Valid 0 not chosen 17 22.1 28.3 28.3
1 chosen 43 55.8 71.7 100.0
Total 60 77.9 100.0
Missing 88 14 18.2
99 3 3.9
Total 17 22.1
Total 77 100.0
Complaints data analysed by other staff
Frequency Percent Valid Percent Cumulative %
Valid 0 not chosen 52 67.5 86.7 86.7
1 chosen 8 10.4 13.3 100.0
Total 60 77.9 100.0
Missing 88 14 18.2
99 3 3.9
Total 17 22.1
Total 77 100.0

324
Q15. Frequently cited clinical KPI's
Frequently cited clinical KPI's - Incidence of pressure ulcers
Frequency Percent Valid Percent Cumulative %
Valid 1 Yes 65 84.4 85.5 85.5
2 No 11 14.3 14.5 100.0
Total 76 98.7 100.0
Missing 99 missing 1 1.3
Total 77 100.0
Frequently cited clinical KPI's - Assessment of nutritional
requirements
Frequency Percent Valid Percent Cumulative %
Valid 1 Yes 59 76.6 78.7 78.7
2 No 16 20.8 21.3 100.0
Total 75 97.4 100.0
Missing 99 missing 2 2.6
Total 77 100.0
Frequently cited clinical KPI's - Incidence of falls
Frequency Percent Valid Percent Cumulative %
Valid 1 Yes 67 87.0 89.3 89.3
2 No 8 10.4 10.7 100.0
Total 75 97.4 100.0
Missing 99 missing 2 2.6
Total 77 100.0
Frequently cited clinical KPI's - Compliance with hand hygiene
Frequency Percent Valid Percent Cumulative %
Valid 1 Yes 72 93.5 94.7 94.7
2 No 4 5.2 5.3 100.0
Total 76 98.7 100.0
Missing 99 missing 1 1.3
Total 77 100.0
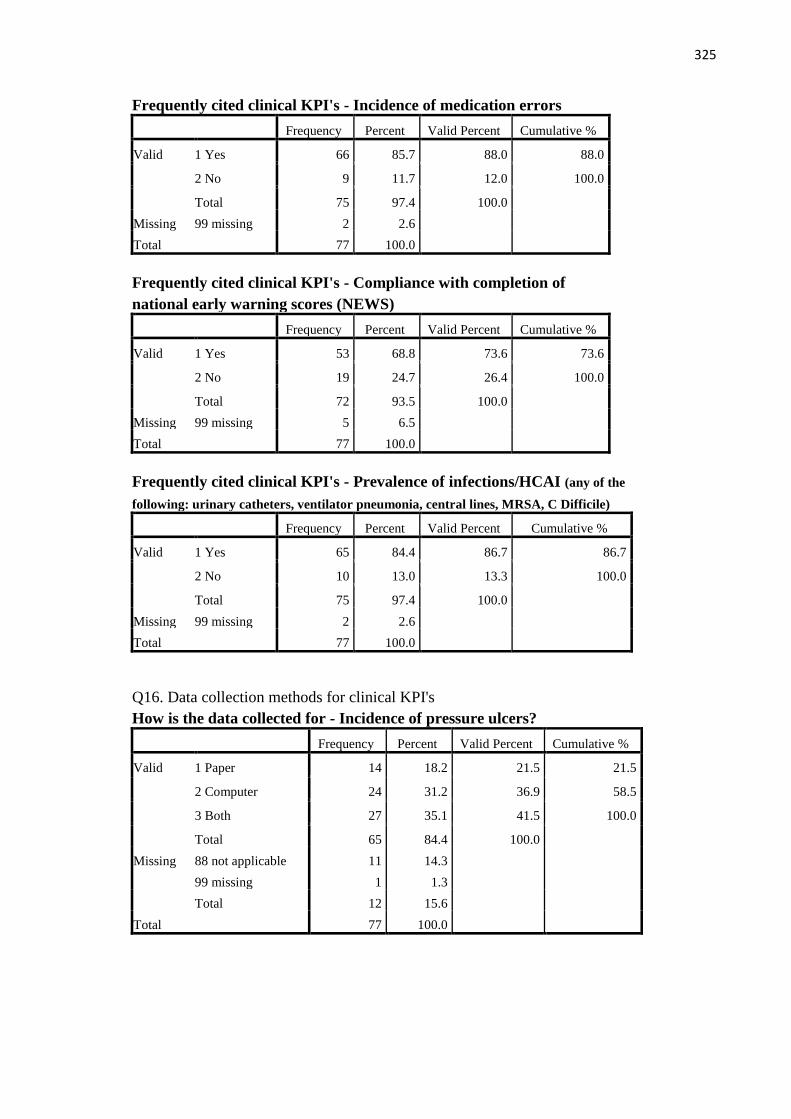
325
Frequently cited clinical KPI's - Incidence of medication errors
Frequency Percent Valid Percent Cumulative %
Valid 1 Yes 66 85.7 88.0 88.0
2 No 9 11.7 12.0 100.0
Total 75 97.4 100.0
Missing 99 missing 2 2.6
Total 77 100.0
Frequently cited clinical KPI's - Compliance with completion of
national early warning scores (NEWS)
Frequency Percent Valid Percent Cumulative %
Valid 1 Yes 53 68.8 73.6 73.6
2 No 19 24.7 26.4 100.0
Total 72 93.5 100.0
Missing 99 missing 5 6.5
Total 77 100.0
Frequently cited clinical KPI's - Prevalence of infections/HCAI (any of the
following: urinary catheters, ventilator pneumonia, central lines, MRSA, C Difficile)
Frequency Percent Valid Percent Cumulative %
Valid 1 Yes 65 84.4 86.7 86.7
2 No 10 13.0 13.3 100.0
Total 75 97.4 100.0
Missing 99 missing 2 2.6
Total 77 100.0
Q16. Data collection methods for clinical KPI's
How is the data collected for - Incidence of pressure ulcers?
Frequency Percent Valid Percent Cumulative %
Valid 1 Paper 14 18.2 21.5 21.5
2 Computer 24 31.2 36.9 58.5
3 Both 27 35.1 41.5 100.0
Total 65 84.4 100.0
Missing 88 not applicable 11 14.3
99 missing 1 1.3
Total 12 15.6
Total 77 100.0
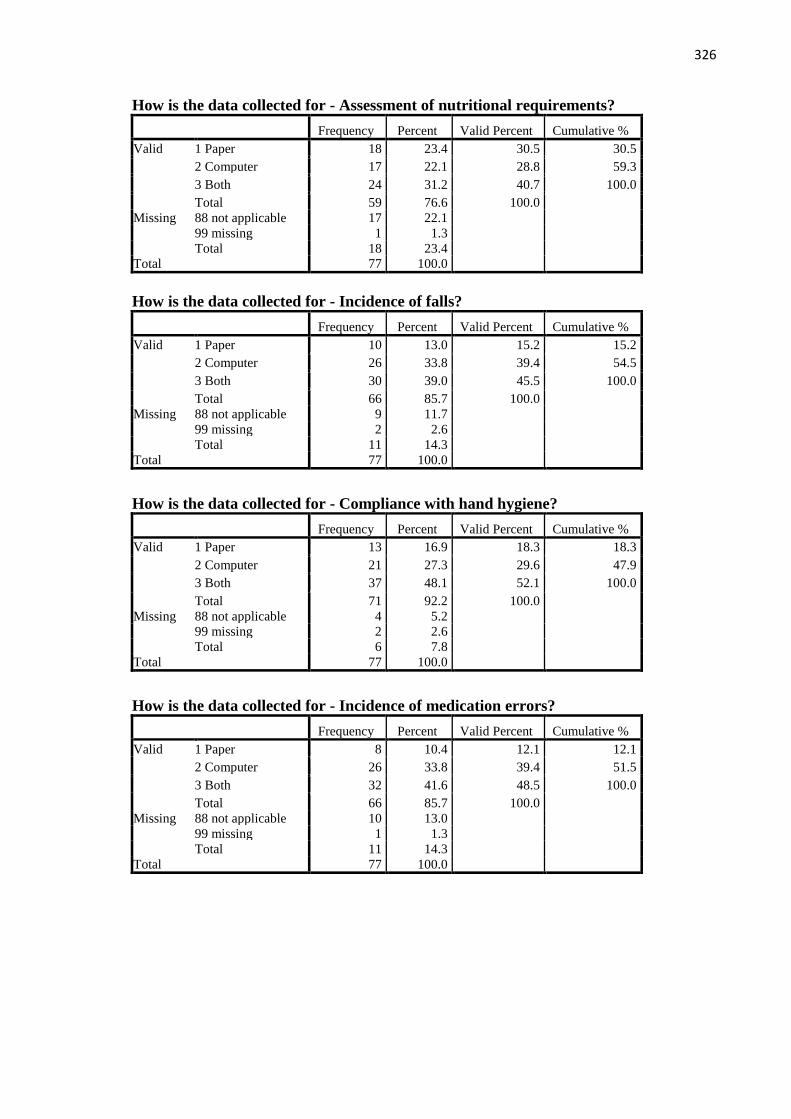
326
How is the data collected for - Assessment of nutritional requirements?
Frequency Percent Valid Percent Cumulative %
Valid 1 Paper 18 23.4 30.5 30.5
2 Computer 17 22.1 28.8 59.3
3 Both 24 31.2 40.7 100.0
Total 59 76.6 100.0
Missing 88 not applicable 17 22.1
99 missing 1 1.3
Total 18 23.4
Total 77 100.0
How is the data collected for - Incidence of falls?
Frequency Percent Valid Percent Cumulative %
Valid 1 Paper 10 13.0 15.2 15.2
2 Computer 26 33.8 39.4 54.5
3 Both 30 39.0 45.5 100.0
Total 66 85.7 100.0
Missing 88 not applicable 9 11.7
99 missing 2 2.6
Total 11 14.3
Total 77 100.0
How is the data collected for - Compliance with hand hygiene?
Frequency Percent Valid Percent Cumulative %
Valid 1 Paper 13 16.9 18.3 18.3
2 Computer 21 27.3 29.6 47.9
3 Both 37 48.1 52.1 100.0
Total 71 92.2 100.0
Missing 88 not applicable 4 5.2
99 missing 2 2.6
Total 6 7.8
Total 77 100.0
How is the data collected for - Incidence of medication errors?
Frequency Percent Valid Percent Cumulative %
Valid 1 Paper 8 10.4 12.1 12.1
2 Computer 26 33.8 39.4 51.5
3 Both 32 41.6 48.5 100.0
Total 66 85.7 100.0
Missing 88 not applicable 10 13.0
99 missing 1 1.3
Total 11 14.3
Total 77 100.0

327
How is the data collected for - Compliance with completion of NEWS?
Frequency Percent Valid Percent Cumulative %
Valid 1 Paper 10 13.0 18.9 18.9
2 Computer 17 22.1 32.1 50.9
3 Both 26 33.8 49.1 100.0
Total 53 68.8 100.0
Missing 88 not applicable 20 26.0
99 missing 4 5.2
Total 24 31.2
Total 77 100.0
How is the data collected for - Prevalence of infections/HCAI ?
Frequency Percent Valid Percent Cumulative %
Valid 1 Paper 10 13.0 15.4 15.4
2 Computer 20 26.0 30.8 46.2
3 Both 35 45.5 53.8 100.0
Total 65 84.4 100.0
Missing 88 not applicable 11 14.3
99 missing 1 1.3
Total 12 15.6
Total 77 100.0
Q17. Frequency of clinical KPI data collection
How frequently is the data collected for - Incidence of pressure ulcers?
Frequency Percent Valid Percent Cumulative %
Valid 1 Monthly or more often 59 76.6 90.8 90.8
3 Quarterly or less frequently 6 7.8 9.2 100.0
Total 65 84.4 100.0
Missing 88 not applicable 11 14.3
99 missing 1 1.3
Total 12 15.6
Total 77 100.0

328
How frequently is the data collected for - Assessment of nutritional
requirements?
Frequency Percent Valid Percent Cumulative %
Valid 1 Monthly or more often 51 66.2 86.4 86.4
3 Quarterly or less frequently 8 10.4 13.6 100.0
Total 59 76.6 100.0
Missing 88 not applicable 17 22.1
99 missing 1 1.3
Total 18 23.4
Total 77 100.0
How frequently is the data collected for - Incidence of falls?
Frequency Percent Valid Percent Cumulative %
Valid 1 Monthly or more often 64 83.1 97.0 97.0
3 Quarterly or less frequently 2 2.6 3.0 100.0
Total 66 85.7 100.0
Missing 88 not applicable 9 11.7
99 missing 2 2.6
Total 11 14.3
Total 77 100.0
How frequently is the data collected for - Compliance with hand hygiene?
Frequency Percent Valid Percent Cumulative %
Valid 1 Monthly or more often 60 77.9 83.3 83.3
2 Bi-monthly 1 1.3 1.4 84.7
3 Quarterly or less frequently 11 14.3 15.3 100.0
Total 72 93.5 100.0
Missing 88 not applicable 4 5.2
99 missing 1 1.3
Total 5 6.5
Total 77 100.0
How frequently is the data collected for - Incidence of medication errors?
Frequency Percent Valid Percent Cumulative %
Valid 1 Monthly or more often 60 77.9 90.9 90.9
3 Quarterly or less frequently 6 7.8 9.1 100.0
Total 66 85.7 100.0
Missing 88 not applicable 10 13.0
99 missing 1 1.3
Total 11 14.3
Total 77 100.0

329
How frequently is the data collected for - Compliance with completion of NEWS?
Frequency Percent Valid Percent Cumulative %
Valid 1 Monthly or more often 46 59.7 86.8 86.8
3 Quarterly or less frequently 7 9.1 13.2 100.0
Total 53 68.8 100.0
Missing 88 not applicable 20 26.0
99 missing 4 5.2
Total 24 31.2
Total 77 100.0
How frequently is the data collected for - Prevalence of infections/HCAI?
Frequency Percent Valid Percent Cumulative %
Valid 1 Monthly or more often 58 75.3 90.6 90.6
3 Quarterly or less frequently 6 7.8 9.4 100.0
Total 64 83.1 100.0
Missing 88 not applicable 11 14.3
99 missing 2 2.6
Total 13 16.9
Total 77 100.0
Q18. Clinical KPI's collected by clinical, admin and managers
Pressure ulcer data collected by clinical staff?
Frequency Percent Valid Percent Cumulative %
Valid 0 not chosen 7 9.1 10.8 10.8
1 chosen 58 75.3 89.2 100.0
Total 65 84.4 100.0
Missing 88 11 14.3
99 1 1.3
Total 12 15.6
Total 77 100.0
Pressure ulcer data collected by admin or clerical staff?
Frequency Percent Valid Percent Cumulative %
Valid 0 not chosen 51 66.2 78.5 78.5
1 chosen 14 18.2 21.5 100.0
Total 65 84.4 100.0
Missing 88 11 14.3
99 1 1.3
Total 12 15.6
Total 77 100.0
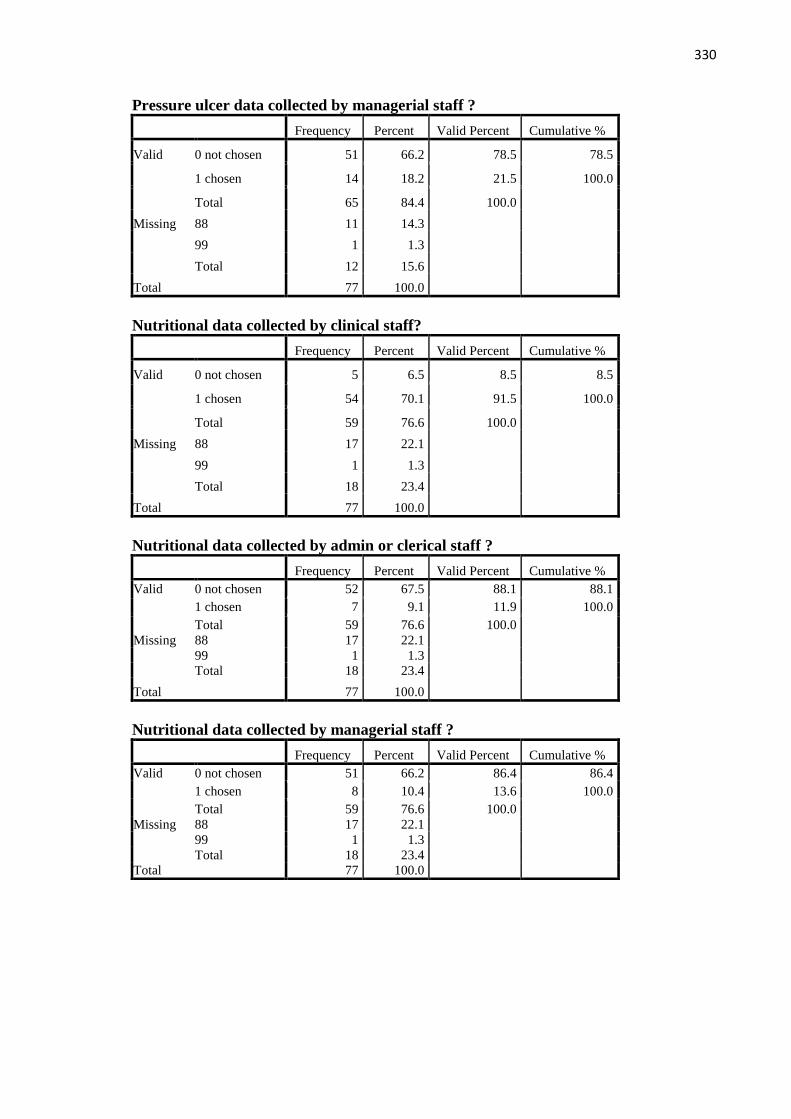
330
Pressure ulcer data collected by managerial staff ?
Frequency Percent Valid Percent Cumulative %
Valid 0 not chosen 51 66.2 78.5 78.5
1 chosen 14 18.2 21.5 100.0
Total 65 84.4 100.0
Missing 88 11 14.3
99 1 1.3
Total 12 15.6
Total 77 100.0
Nutritional data collected by clinical staff?
Frequency Percent Valid Percent Cumulative %
Valid 0 not chosen 5 6.5 8.5 8.5
1 chosen 54 70.1 91.5 100.0
Total 59 76.6 100.0
Missing 88 17 22.1
99 1 1.3
Total 18 23.4
Total 77 100.0
Nutritional data collected by admin or clerical staff ?
Frequency Percent Valid Percent Cumulative %
Valid 0 not chosen 52 67.5 88.1 88.1
1 chosen 7 9.1 11.9 100.0
Total 59 76.6 100.0
Missing 88 17 22.1
99 1 1.3
Total 18 23.4
Total 77 100.0
Nutritional data collected by managerial staff ?
Frequency Percent Valid Percent Cumulative %
Valid 0 not chosen 51 66.2 86.4 86.4
1 chosen 8 10.4 13.6 100.0
Total 59 76.6 100.0
Missing 88 17 22.1
99 1 1.3
Total 18 23.4
Total 77 100.0

331
Falls data collected by clinical staff ?
Frequency Percent Valid Percent Cumulative %
Valid 0 not chosen 10 13.0 15.2 15.2
1 chosen 56 72.7 84.8 100.0
Total 66 85.7 100.0
Missing 88 9 11.7
99 2 2.6
Total 11 14.3
Total 77 100.0
Falls data collected by admin or clerical staff?
Frequency Percent Valid Percent Cumulative %
Valid 0 not chosen 54 70.1 81.8 81.8
1 chosen 12 15.6 18.2 100.0
Total 66 85.7 100.0
Missing 88 9 11.7
99 2 2.6
Total 11 14.3
Total 77 100.0
Falls data collected by managerial staff?
Frequency Percent Valid Percent Cumulative %
Valid 0 not chosen 50 64.9 75.8 75.8
1 chosen 16 20.8 24.2 100.0
Total 66 85.7 100.0
Missing 88 9 11.7
99 2 2.6
Total 11 14.3
Total 77 100.0
Hand hygiene data collected by clinical staff?
Frequency Percent Valid Percent Cumulative %
Valid 0 not chosen 11 14.3 15.3 15.3
1 chosen 61 79.2 84.7 100.0
Total 72 93.5 100.0
Missing 88 4 5.2
99 1 1.3
Total 5 6.5
Total 77 100.0

332
Hand hygiene data collected by admin or clerical staff?
Frequency Percent Valid Percent Cumulative %
Valid 0 not chosen 60 77.9 83.3 83.3
1 chosen 12 15.6 16.7 100.0
Total 72 93.5 100.0
Missing 88 4 5.2
99 1 1.3
Total 5 6.5
Total 77 100.0
Hand hygiene data collected by managerial staff?
Frequency Percent Valid Percent Cumulative %
Valid 0 not chosen 54 70.1 75.0 75.0
1 chosen 18 23.4 25.0 100.0
Total 72 93.5 100.0
Missing 88 4 5.2
99 1 1.3
Total 5 6.5
Total 77 100.0
Medication errors collected by clinical staff?
Frequency Percent Valid Percent Cumulative %
Valid 0 not chosen 13 16.9 19.7 19.7
1 chosen 53 68.8 80.3 100.0
Total 66 85.7 100.0
Missing 88 10 13.0
99 1 1.3
Total 11 14.3
Total 77 100.0
Medication errors collected by admin or clerical staff?
Frequency Percent Valid Percent Cumulative %
Valid 0 not chosen 54 70.1 81.8 81.8
1 chosen 12 15.6 18.2 100.0
Total 66 85.7 100.0
Missing 88 10 13.0
99 1 1.3
Total 11 14.3
Total 77 100.0

333
Medication errors collected by managerial staff?
Frequency Percent Valid Percent Cumulative %
Valid 0 not chosen 48 62.3 72.7 72.7
1 chosen 18 23.4 27.3 100.0
Total 66 85.7 100.0
Missing 88 10 13.0
99 1 1.3
Total 11 14.3
Total 77 100.0
Completion of NEWS collected by clinical staff?
Frequency Percent Valid Percent Cumulative %
Valid 0 not chosen 4 5.2 7.5 7.5
1 chosen 49 63.6 92.5 100.0
Total 53 68.8 100.0
Missing 88 20 26.0
99 4 5.2
Total 24 31.2
Total 77 100.0
Completion of NEWS collected by admin or clerical staff?
Frequency Percent Valid Percent Cumulative %
Valid 0 not chosen 48 62.3 90.6 90.6
1 chosen 5 6.5 9.4 100.0
Total 53 68.8 100.0
Missing 88 20 26.0
99 4 5.2
Total 24 31.2
Total 77 100.0
Completion of NEWS collected by managerial staff?
Frequency Percent Valid Percent Cumulative %
Valid 0 not chosen 40 51.9 75.5 75.5
1 chosen 13 16.9 24.5 100.0
Total 53 68.8 100.0
Missing 88 20 26.0
99 4 5.2
Total 24 31.2
Total 77 100.0

334
Prevalence of HCAI data collected by clinical staff?
Frequency Percent Valid Percent Cumulative %
Valid 0 not chosen 7 9.1 10.8 10.8
1 chosen 58 75.3 89.2 100.0
Total 65 84.4 100.0
Missing 88 11 14.3
99 1 1.3
Total 12 15.6
Total 77 100.0
Prevalence of HCAI data collected by admin or clerical staff?
Frequency Percent Valid Percent Cumulative %
Valid 0 not chosen 55 71.4 84.6 84.6
1 chosen 10 13.0 15.4 100.0
Total 65 84.4 100.0
Missing 88 11 14.3
99 1 1.3
Total 12 15.6
Total 77 100.0
Prevalence of HCAI data collected by managerial staff?
Frequency Percent Valid Percent Cumulative %
Valid 0 not chosen 50 64.9 76.9 76.9
1 chosen 15 19.5 23.1 100.0
Total 65 84.4 100.0
Missing 88 11 14.3
99 1 1.3
Total 12 15.6
Total 77 100.0
Q19. Clinical KPI's collated/analysed by clinical, admin, managers or other staff
Pressure ulcer data analysed by clinical staff?
Frequency Percent Valid Percent Cumulative %
Valid 0 not chosen 18 23.4 28.1 28.1
1 chosen 46 59.7 71.9 100.0
Total 64 83.1 100.0
Missing 88 11 14.3
99 2 2.6
Total 13 16.9
Total 77 100.0

335
Pressure ulcer data analysed by admin or clerical staff?
Frequency Percent Valid Percent Cumulative %
Valid 0 not chosen 46 59.7 71.9 71.9
1 chosen 18 23.4 28.1 100.0
Total 64 83.1 100.0
Missing 88 11 14.3
99 2 2.6
Total 13 16.9
Total 77 100.0
Pressure ulcer data analysed by managerial staff?
Frequency Percent Valid Percent Cumulative %
Valid 0 not chosen 25 32.5 39.1 39.1
1 chosen 39 50.6 60.9 100.0
Total 64 83.1 100.0
Missing 88 11 14.3
99 2 2.6
Total 13 16.9
Total 77 100.0
Pressure ulcer data analysed by other staff?
Frequency Percent Valid Percent Cumulative %
Valid 0 not chosen 56 72.7 87.5 87.5
1 chosen 8 10.4 12.5 100.0
Total 64 83.1 100.0
Missing 88 11 14.3
99 2 2.6
Total 13 16.9
Total 77 100.0
Nutritional data analysed by clinical staff ?
Frequency Percent Valid Percent Cumulative %
Valid 0 not chosen 17 22.1 28.8 28.8
1 chosen 42 54.5 71.2 100.0
Total 59 76.6 100.0
Missing 88 17 22.1
99 1 1.3
Total 18 23.4
Total 77 100.0
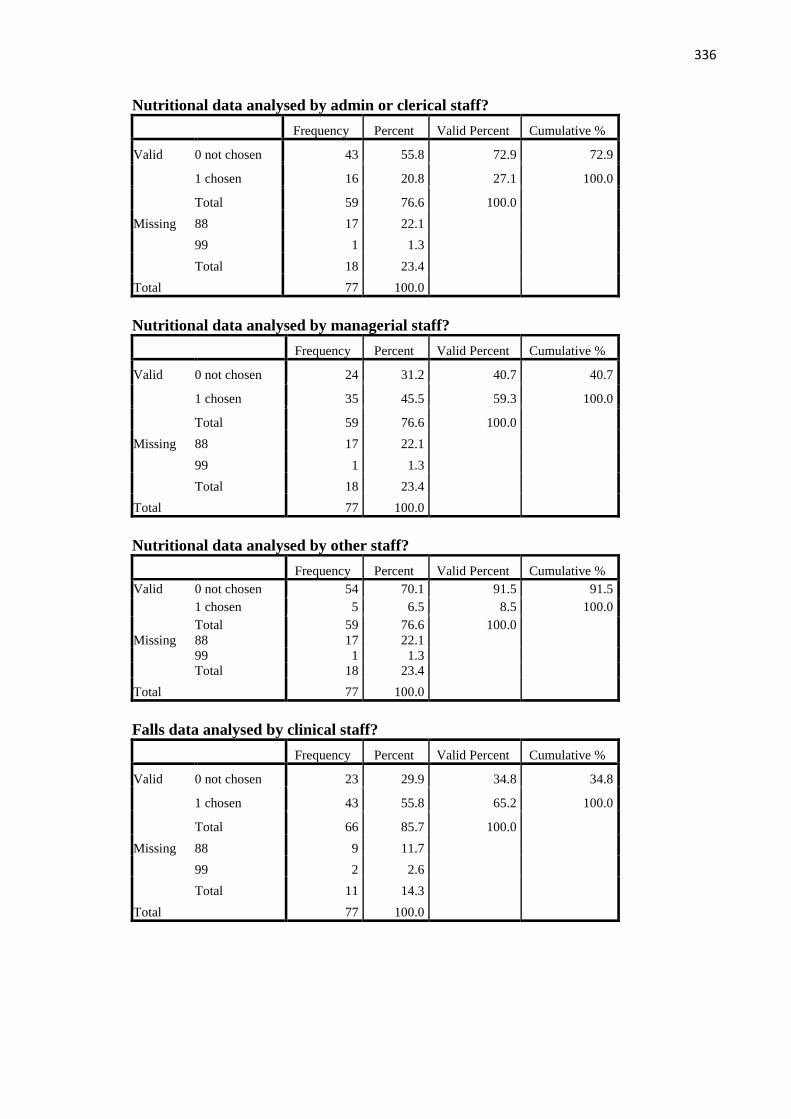
336
Nutritional data analysed by admin or clerical staff?
Frequency Percent Valid Percent Cumulative %
Valid 0 not chosen 43 55.8 72.9 72.9
1 chosen 16 20.8 27.1 100.0
Total 59 76.6 100.0
Missing 88 17 22.1
99 1 1.3
Total 18 23.4
Total 77 100.0
Nutritional data analysed by managerial staff?
Frequency Percent Valid Percent Cumulative %
Valid 0 not chosen 24 31.2 40.7 40.7
1 chosen 35 45.5 59.3 100.0
Total 59 76.6 100.0
Missing 88 17 22.1
99 1 1.3
Total 18 23.4
Total 77 100.0
Nutritional data analysed by other staff?
Frequency Percent Valid Percent Cumulative %
Valid 0 not chosen 54 70.1 91.5 91.5
1 chosen 5 6.5 8.5 100.0
Total 59 76.6 100.0
Missing 88 17 22.1
99 1 1.3
Total 18 23.4
Total 77 100.0
Falls data analysed by clinical staff?
Frequency Percent Valid Percent Cumulative %
Valid 0 not chosen 23 29.9 34.8 34.8
1 chosen 43 55.8 65.2 100.0
Total 66 85.7 100.0
Missing 88 9 11.7
99 2 2.6
Total 11 14.3
Total 77 100.0

337
Falls data analysed by admin or clerical staff?
Frequency Percent Valid Percent Cumulative %
Valid 0 not chosen 46 59.7 69.7 69.7
1 chosen 20 26.0 30.3 100.0
Total 66 85.7 100.0
Missing 88 9 11.7
99 2 2.6
Total 11 14.3
Total 77 100.0
Falls data analysed by managerial staff?
Frequency Percent Valid Percent Cumulative %
Valid 0 not chosen 23 29.9 34.8 34.8
1 chosen 43 55.8 65.2 100.0
Total 66 85.7 100.0
Missing 88 9 11.7
99 2 2.6
Total 11 14.3
Total 77 100.0
Falls data analysed by other staff?
Frequency Percent Valid Percent Cumulative %
Valid 0 not chosen 59 76.6 89.4 89.4
1 chosen 7 9.1 10.6 100.0
Total 66 85.7 100.0
Missing 88 9 11.7
99 2 2.6
Total 11 14.3
Total 77 100.0
Hand hygiene data analysed by clinical staff?
Frequency Percent Valid Percent Cumulative %
Valid 0 not chosen 23 29.9 31.9 31.9
1 chosen 49 63.6 68.1 100.0
Total 72 93.5 100.0
Missing 88 4 5.2
99 1 1.3
Total 5 6.5
Total 77 100.0

338
Hand hygiene data analysed by admin or clerical staff?
Frequency Percent Valid Percent Cumulative %
Valid 0 not chosen 54 70.1 75.0 75.0
1 chosen 18 23.4 25.0 100.0
Total 72 93.5 100.0
Missing 88 4 5.2
99 1 1.3
Total 5 6.5
Total 77 100.0
Hand hygiene data analysed by managerial staff?
Frequency Percent Valid Percent Cumulative %
Valid 0 not chosen 27 35.1 37.5 37.5
1 chosen 45 58.4 62.5 100.0
Total 72 93.5 100.0
Missing 88 4 5.2
99 1 1.3
Total 5 6.5
Total 77 100.0
Hand hygiene data analysed by other staff?
Frequency Percent Valid Percent Cumulative %
Valid 0 not chosen 67 87.0 93.1 93.1
1 chosen 5 6.5 6.9 100.0
Total 72 93.5 100.0
Missing 88 4 5.2
99 1 1.3
Total 5 6.5
Total 77 100.0
Medication error data analysed by clinical staff?
Frequency Percent Valid Percent Cumulative %
Valid 0 not chosen 25 32.5 37.9 37.9
1 chosen 41 53.2 62.1 100.0
Total 66 85.7 100.0
Missing 88 10 13.0
99 1 1.3
Total 11 14.3
Total 77 100.0
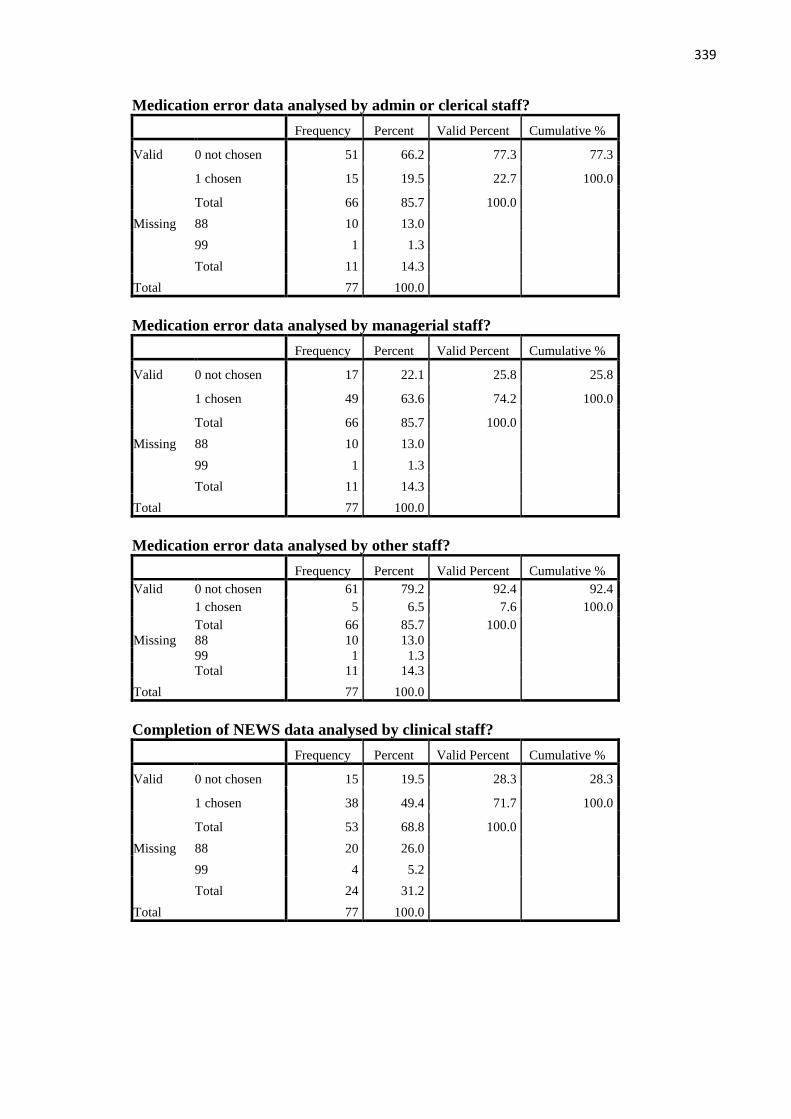
339
Medication error data analysed by admin or clerical staff?
Frequency Percent Valid Percent Cumulative %
Valid 0 not chosen 51 66.2 77.3 77.3
1 chosen 15 19.5 22.7 100.0
Total 66 85.7 100.0
Missing 88 10 13.0
99 1 1.3
Total 11 14.3
Total 77 100.0
Medication error data analysed by managerial staff?
Frequency Percent Valid Percent Cumulative %
Valid 0 not chosen 17 22.1 25.8 25.8
1 chosen 49 63.6 74.2 100.0
Total 66 85.7 100.0
Missing 88 10 13.0
99 1 1.3
Total 11 14.3
Total 77 100.0
Medication error data analysed by other staff?
Frequency Percent Valid Percent Cumulative %
Valid 0 not chosen 61 79.2 92.4 92.4
1 chosen 5 6.5 7.6 100.0
Total 66 85.7 100.0
Missing 88 10 13.0
99 1 1.3
Total 11 14.3
Total 77 100.0
Completion of NEWS data analysed by clinical staff?
Frequency Percent Valid Percent Cumulative %
Valid 0 not chosen 15 19.5 28.3 28.3
1 chosen 38 49.4 71.7 100.0
Total 53 68.8 100.0
Missing 88 20 26.0
99 4 5.2
Total 24 31.2
Total 77 100.0

340
Completion of NEWS data analysed by admin or clerical staff?
Frequency Percent Valid Percent Cumulative %
Valid 0 not chosen 40 51.9 75.5 75.5
1 chosen 13 16.9 24.5 100.0
Total 53 68.8 100.0
Missing 88 20 26.0
99 4 5.2
Total 24 31.2
Total 77 100.0
Completion of NEWS data analysed by managerial staff?
Frequency Percent Valid Percent Cumulative %
Valid 0 not chosen 21 27.3 39.6 39.6
1 chosen 32 41.6 60.4 100.0
Total 53 68.8 100.0
Missing 88 20 26.0
99 4 5.2
Total 24 31.2
Total 77 100.0
Completion of NEWS data analysed by other staff?
Frequency Percent Valid Percent Cumulative %
Valid 0 not chosen 49 63.6 92.5 92.5
1 chosen 4 5.2 7.5 100.0
Total 53 68.8 100.0
Missing 88 20 26.0
99 4 5.2
Total 24 31.2
Total 77 100.0
Prevalence of HCAI data analysed by clinical staff?
Frequency Percent Valid Percent Cumulative %
Valid 0 not chosen 16 20.8 25.8 25.8
1 chosen 46 59.7 74.2 100.0
Total 62 80.5 100.0
Missing 88 11 14.3
99 4 5.2
Total 15 19.5
Total 77 100.0
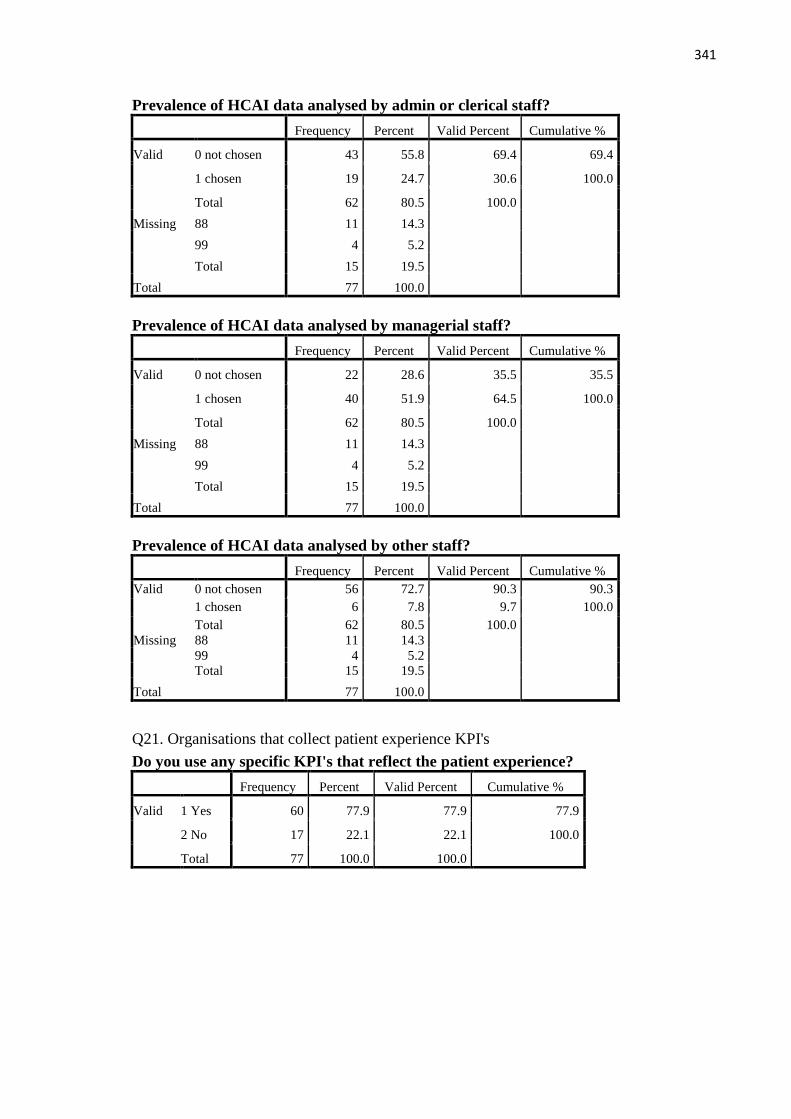
341
Prevalence of HCAI data analysed by admin or clerical staff?
Frequency Percent Valid Percent Cumulative %
Valid 0 not chosen 43 55.8 69.4 69.4
1 chosen 19 24.7 30.6 100.0
Total 62 80.5 100.0
Missing 88 11 14.3
99 4 5.2
Total 15 19.5
Total 77 100.0
Prevalence of HCAI data analysed by managerial staff?
Frequency Percent Valid Percent Cumulative %
Valid 0 not chosen 22 28.6 35.5 35.5
1 chosen 40 51.9 64.5 100.0
Total 62 80.5 100.0
Missing 88 11 14.3
99 4 5.2
Total 15 19.5
Total 77 100.0
Prevalence of HCAI data analysed by other staff?
Frequency Percent Valid Percent Cumulative %
Valid 0 not chosen 56 72.7 90.3 90.3
1 chosen 6 7.8 9.7 100.0
Total 62 80.5 100.0
Missing 88 11 14.3
99 4 5.2
Total 15 19.5
Total 77 100.0
Q21. Organisations that collect patient experience KPI's
Do you use any specific KPI's that reflect the patient experience?
Frequency Percent Valid Percent Cumulative %
Valid 1 Yes 60 77.9 77.9 77.9
2 No 17 22.1 22.1 100.0
Total 77 100.0 100.0

342
Q23. KPI use specific to fields of practice
Do you collect KPI's specific to - Mental health?
Frequency Percent Valid Percent Cumulative %
Valid 1 Yes 21 27.3 37.5 37.5
2 No 35 45.5 62.5 100.0
Total 56 72.7 100.0
Missing 99 missing 21 27.3
Total 77 100.0
Do you collect KPI's specific to - Learning/intellectual disability?
Frequency Percent Valid Percent Cumulative %
Valid 1 Yes 25 32.5 42.4 42.4
2 No 34 44.2 57.6 100.0
Total 59 76.6 100.0
Missing 99 missing 18 23.4
Total 77 100.0
Do you collect KPI's specific to - Children's?
Frequency Percent Valid Percent Cumulative %
Valid 1 Yes 40 51.9 63.5 63.5
2 No 23 29.9 36.5 100.0
Total 63 81.8 100.0
Missing 99 missing 14 18.2
Total 77 100.0
Do you collect KPI's specific to – Midwifery?
Frequency Percent Valid Percent Cumulative %
Valid 1 Yes 45 58.4 73.8 73.8
2 No 16 20.8 26.2 100.0
Total 61 79.2 100.0
Missing 99 missing 15 19.5
System 1 1.3
Total 16 20.8
Total 77 100.0
Do you collect KPI's specific to – Community?
Frequency Percent Valid Percent Cumulative %
Valid 1 Yes 30 39.0 51.7 51.7
2 No 28 36.4 48.3 100.0
Total 58 75.3 100.0
Missing 99 missing 19 24.7
Total 77 100.0
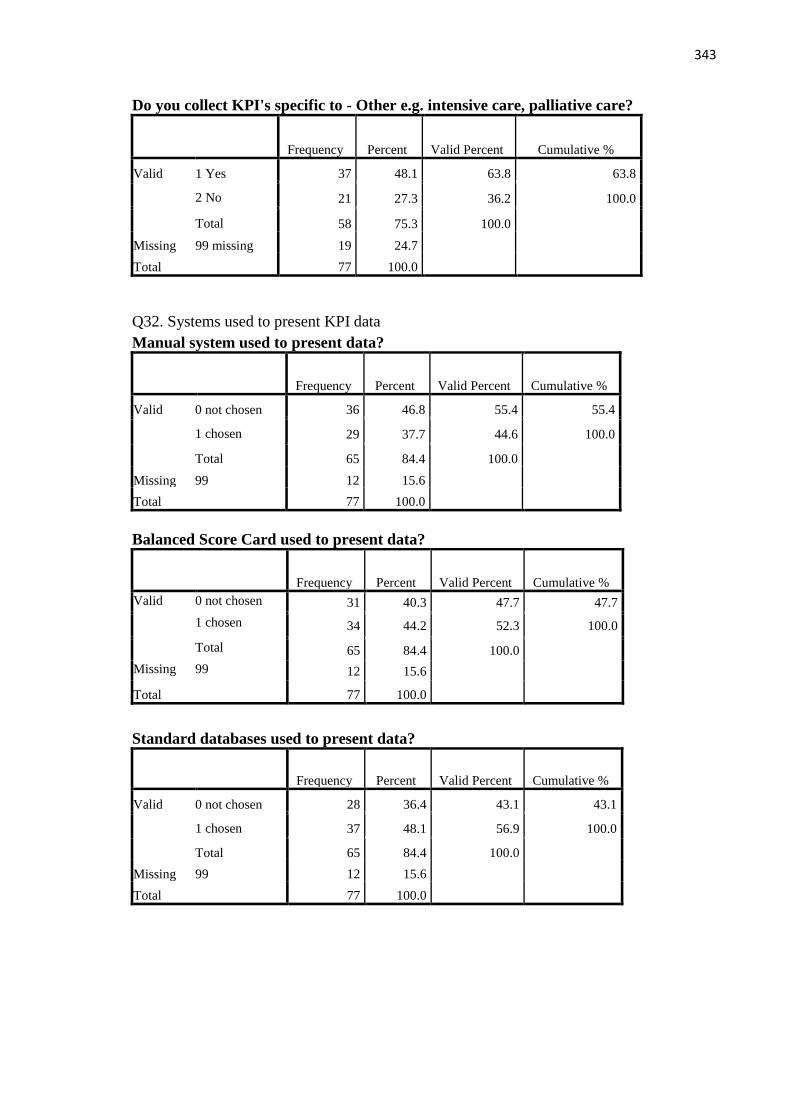
343
Do you collect KPI's specific to - Other e.g. intensive care, palliative care?
Frequency Percent Valid Percent Cumulative %
Valid 1 Yes 37 48.1 63.8 63.8
2 No 21 27.3 36.2 100.0
Total 58 75.3 100.0
Missing 99 missing 19 24.7
Total 77 100.0
Q32. Systems used to present KPI data
Manual system used to present data?
Frequency Percent Valid Percent Cumulative %
Valid 0 not chosen 36 46.8 55.4 55.4
1 chosen 29 37.7 44.6 100.0
Total 65 84.4 100.0
Missing 99 12 15.6
Total 77 100.0
Balanced Score Card used to present data?
Frequency Percent Valid Percent Cumulative %
Valid 0 not chosen 31 40.3 47.7 47.7
1 chosen 34 44.2 52.3 100.0
Total 65 84.4 100.0
Missing 99 12 15.6
Total 77 100.0
Standard databases used to present data?
Frequency Percent Valid Percent Cumulative %
Valid 0 not chosen 28 36.4 43.1 43.1
1 chosen 37 48.1 56.9 100.0
Total 65 84.4 100.0
Missing 99 12 15.6
Total 77 100.0

344
Q2. What size of a population does your organisation cover? Outliers removed
N Valid 59
Missing 18
Mean 191209.56
Median 800.00
Std. Deviation 471024.927
Range 3199900
Minimum 100
Maximum 3200000

345
Appendix 15: Table of miscellaneous data items identified in phase one
Origin of KPI’s Data collection
methods
Reporting
mechanisms
Care planning
tools
Statements Unclassified Unclassified
Commissioning Group Surveys Board of Directors I want great care A plethora Clinical research Patient identification
JAG6 on gastrointestinal
endoscopy
Comparison of feedback
from children & parents
Reports What do you expect
of nursing staff?
Wide range Metrics Dignity and privacy
National Institute
Cardiovascular Outcomes
Output from approved
centres (mental health)
Communication
plans
What would you like
to happen to you?
Too numerous
to mention
IUD (maternity) Theme of cleanliness
All Ireland Project (Dignity
Care Intervention)
Ombudsman cases Attendance at
multiagency
meetings
Care in your own
home: The five must
do with me
Monitoring
standards
work
Numbers (learning
disability)
Involvement
HIQA inspections TrolleyGAR Dashboards Tell us Ten Things Recovery (mental health) Older persons data
All nationally mandated KPI's Audits Balanced score card What matters to you? Mental Capacity Act Normality (maternity)
WHO checklist PALS feedback Databases Autism Puerperal sepsis
HEAT targets Resident forums Quality frameworks Dental Fetal anomaly scan
As per clinical care
programmes for critical and
palliative care
Therapy groups examine
impact of programmes
on mental health
Judgement Support
Framework for
Approved Centres
Ventilator related
pneumonia
Carbon monoxide/
Carbon dioxide testing
(maternity)
Matching Michigan -ICU
safety programme
We are also developing a
Consumer Panel
Patient Transfer
Logistics Plan Brachial Plexus
Injury/Fracture(maternity)
Protected meal times
NHS Choices Questionnaires Domestic abuse Hysterectomy
Minimum dataset for
children’s palliative care
Cancer treatment
helpline
Noise at night from staff
and other patients
Student nurse
experience
NICE staffing red flags Vaccinations Alcohol and drugs
RCOG Skin to skin Thrombophlebitis
PICANET Vulnerable adult data Symptom managemen
ICNARC data Smoking cessation Oxygen therapy
Vitamin D Impressions
6 See List of Abbreviations for further information on contractions in this table.

346
Appendix 16: Non-nursing and midwifery specific data items
Organisational KPI’s Clinical KPI’s
The number of Emergency Department
(ED) staff currently under an employee
relation caseload
% of stroke patients admitted to stroke unit
within 4 hours
The ratio between the actual number of
patients who die following hospitalisation
and the number that would be expected to
die on the basis of average national figures
Failure to rescue
The percentage of harm free care Incidences of behaviour that challenges
Complaint response times
GP access Return to theatre
The percentage of patients who were
discharged, admitted, transferred from, or
died in, the Emergency Department within
four hours of arrival.
VTE compliance
DNA's (Did not attend) Compliance with ward cleaning schedules
Inpatient and outpatient cancellations. Use of psychotropic drugs
Rate of Medio legal claims Restraint rate
Compliance with safety/NPSA alerts. Mental health KPI’s
Percentage of patients first seen within 14
days of receipt of GP urgent suspected
cancer referral
Time taken from referral to mental health
liaison team for assessment
Grievances Incidences of persons self-harming using
ligature points
Lengths of stay (LOS) Compliance with MHA (Mental Health
Act)
Delayed transfers Number of safeguard referrals
Discharges - non-elective and elective Lithium level monitoring
Locum usage Learning/intellectual disability KPI’s
Bed nights for respite Monthly referrals to service
Waiting times Monthly referrals to other services
Proportion of mortality reviews Children's KPI’s
Morbidity. Maternal and neonatal Metabolic screening
Looked after and accommodated children;
27-34 month assessment
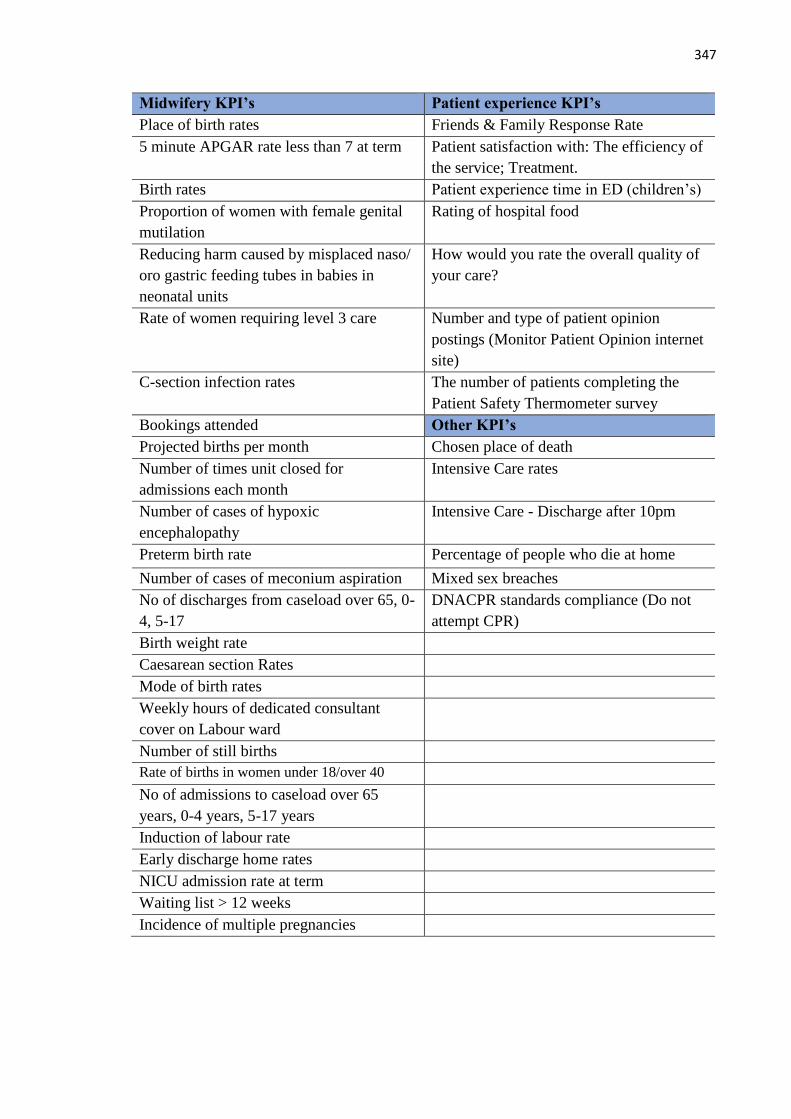
347
Midwifery KPI’s Patient experience KPI’s
Place of birth rates Friends & Family Response Rate
5 minute APGAR rate less than 7 at term Patient satisfaction with: The efficiency of
the service; Treatment.
Birth rates Patient experience time in ED (children’s)
Proportion of women with female genital
mutilation
Rating of hospital food
Reducing harm caused by misplaced naso/
oro gastric feeding tubes in babies in
neonatal units
How would you rate the overall quality of
your care?
Rate of women requiring level 3 care Number and type of patient opinion
postings (Monitor Patient Opinion internet
site)
C-section infection rates The number of patients completing the
Patient Safety Thermometer survey
Bookings attended Other KPI’s
Projected births per month Chosen place of death
Number of times unit closed for
admissions each month
Intensive Care rates
Number of cases of hypoxic
encephalopathy
Intensive Care - Discharge after 10pm
Preterm birth rate Percentage of people who die at home
Number of cases of meconium aspiration Mixed sex breaches
No of discharges from caseload over 65, 0-
4, 5-17
DNACPR standards compliance (Do not
attempt CPR)
Birth weight rate
Caesarean section Rates
Mode of birth rates
Weekly hours of dedicated consultant
cover on Labour ward
Number of still births
Rate of births in women under 18/over 40
No of admissions to caseload over 65
years, 0-4 years, 5-17 years
Induction of labour rate
Early discharge home rates
NICU admission rate at term
Waiting list > 12 weeks
Incidence of multiple pregnancies
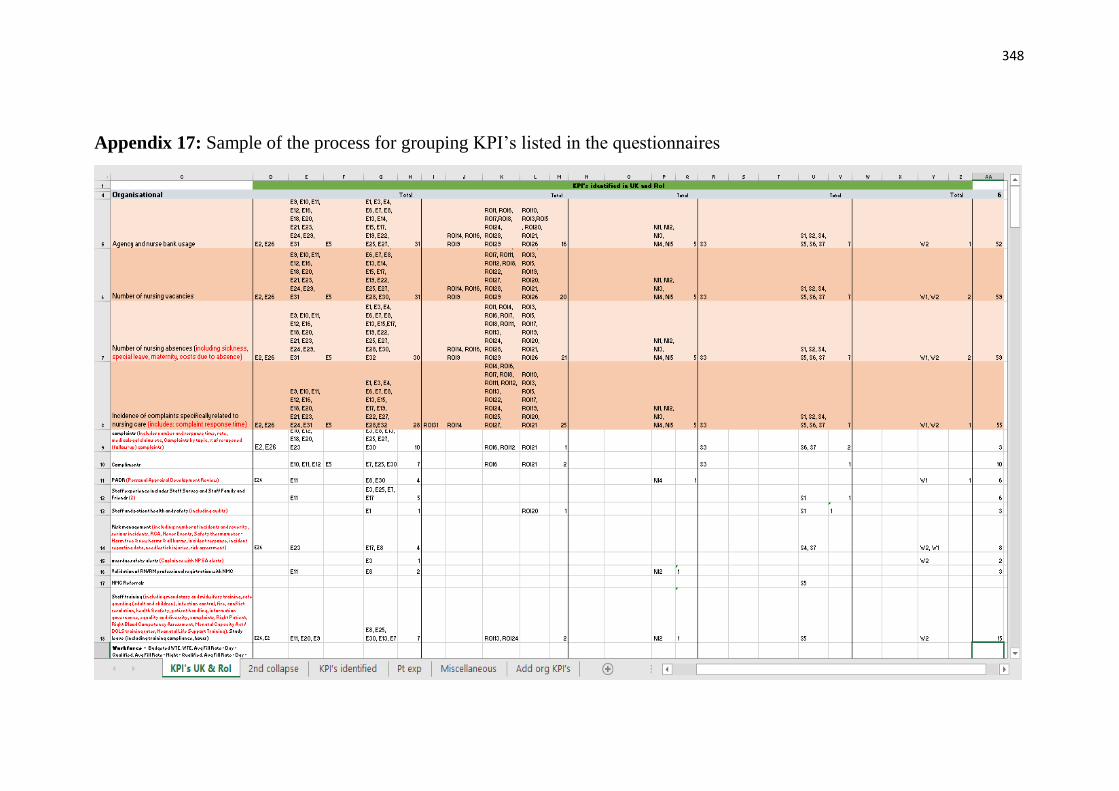
348
Appendix 17: Sample of the process for grouping KPI’s listed in the questionnaires
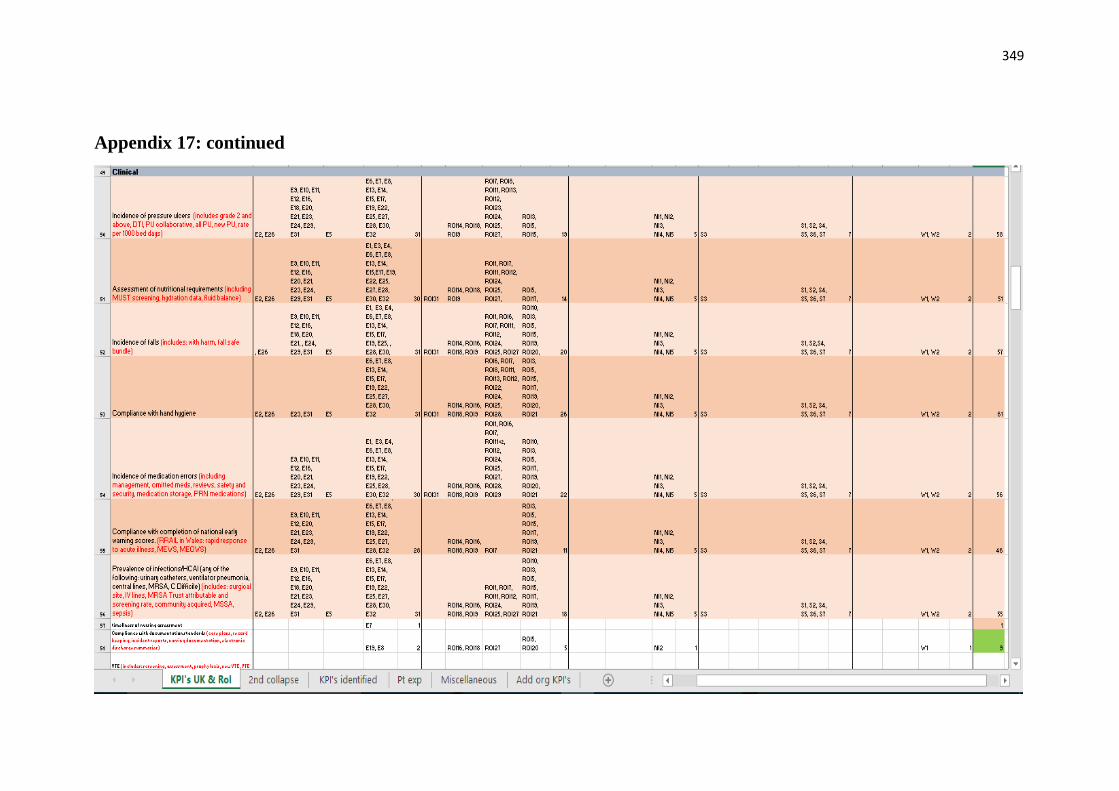
349
Appendix 17: continued
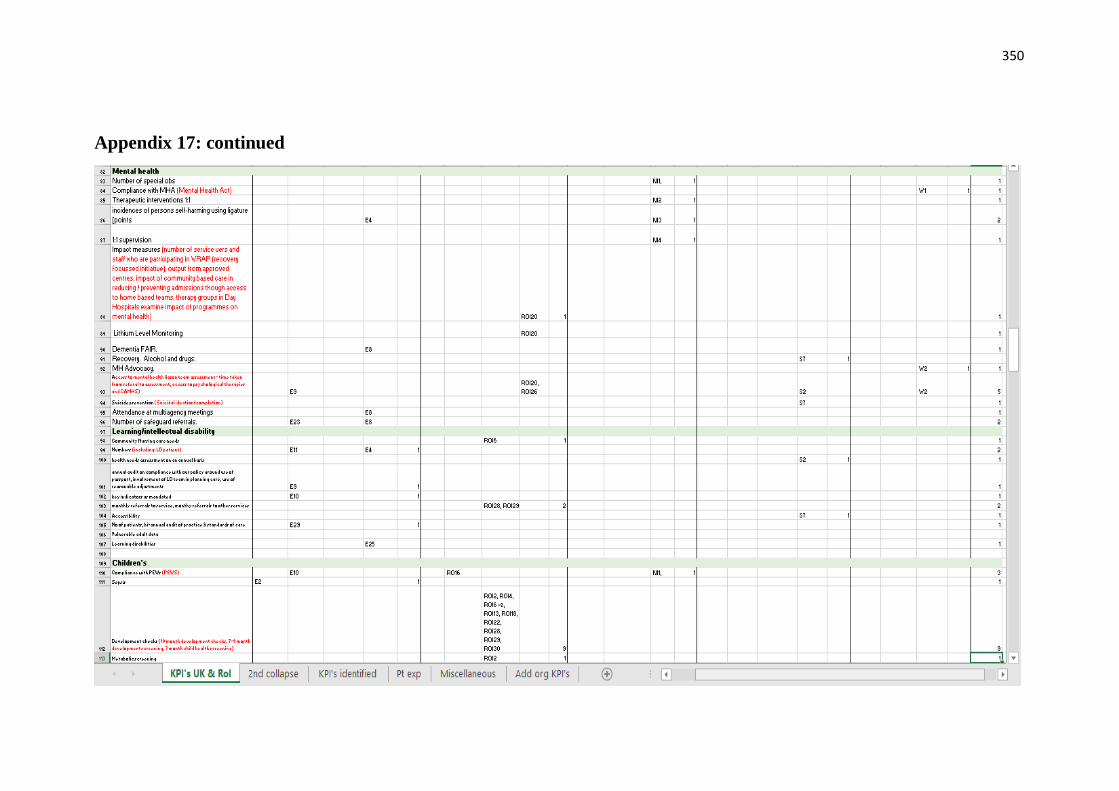
350
Appendix 17: continued

351
Appendix 17: continued
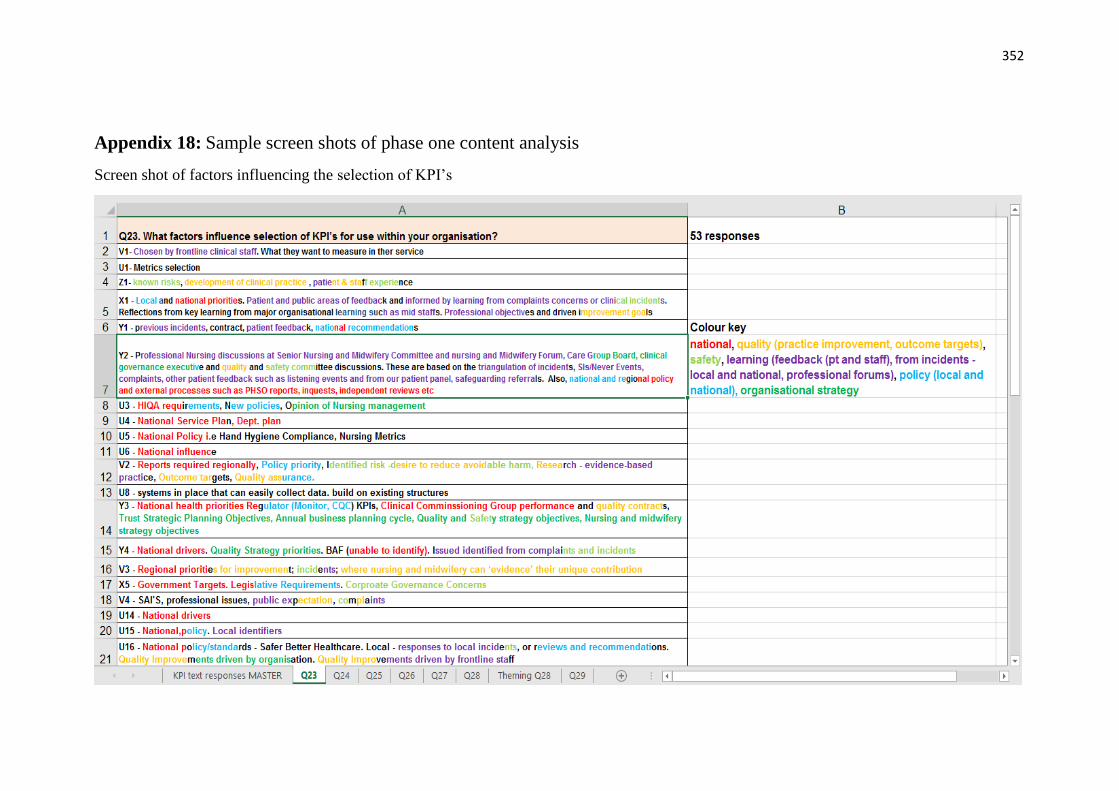
352
Appendix 18: Sample screen shots of phase one content analysis
Screen shot of factors influencing the selection of KPI’s

353
Appendix 18: continued
Screen shot of ways in which nurses and midwives are involved in KPI use

354
Appendix 18: continued
Screen shot of mechanisms used to support/encourage action on KPI’s
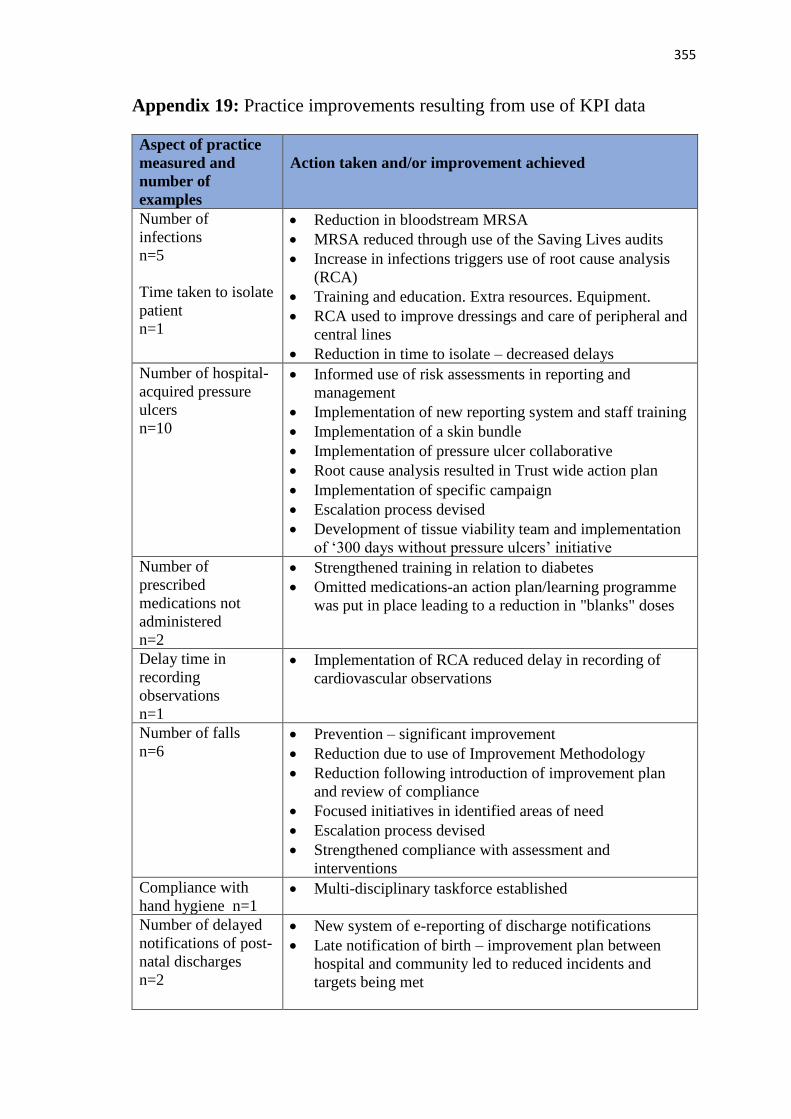
355
Appendix 19: Practice improvements resulting from use of KPI data
Aspect of practice
measured and
number of
examples
Action taken and/or improvement achieved
Number of
infections
n=5
Time taken to isolate
patient
n=1
• Reduction in bloodstream MRSA
• MRSA reduced through use of the Saving Lives audits
• Increase in infections triggers use of root cause analysis
(RCA)
• Training and education. Extra resources. Equipment.
• RCA used to improve dressings and care of peripheral and
central lines
• Reduction in time to isolate – decreased delays
Number of hospital-
acquired pressure
ulcers
n=10
• Informed use of risk assessments in reporting and
management
• Implementation of new reporting system and staff training
• Implementation of a skin bundle
• Implementation of pressure ulcer collaborative
• Root cause analysis resulted in Trust wide action plan
• Implementation of specific campaign
• Escalation process devised
• Development of tissue viability team and implementation
of ‘300 days without pressure ulcers’ initiative
Number of
prescribed
medications not
administered
n=2
• Strengthened training in relation to diabetes
• Omitted medications-an action plan/learning programme
was put in place leading to a reduction in "blanks" doses
Delay time in
recording
observations
n=1
• Implementation of RCA reduced delay in recording of
cardiovascular observations
Number of falls
n=6 • Prevention – significant improvement
• Reduction due to use of Improvement Methodology
• Reduction following introduction of improvement plan
and review of compliance
• Focused initiatives in identified areas of need
• Escalation process devised
• Strengthened compliance with assessment and
interventions
Compliance with
hand hygiene n=1 • Multi-disciplinary taskforce established
Number of delayed
notifications of post-
natal discharges
n=2
• New system of e-reporting of discharge notifications
• Late notification of birth – improvement plan between
hospital and community led to reduced incidents and
targets being met

356
Aspect of practice
measured and
number of
examples
Action taken and/or improvement achieved
Documentation
n=3 • Introduction of audits to improve recording of care
• Use of cycles of ‘Plan, Do, Study and Act’
• Multi-disciplinary team care planning improved following
presentations, audits and the development of a guidance
document
Breastfeeding rates
n=1
Infant nutrition n=1
• Appointment of lactation consultant
• Targeted work by matron
Complaints and
incident reports
n=1
• Improved the quality of responses to complaints.
Additionally, complaints and incident reports have been
used to aid decisions on service investment
Number of Did Not
Attends
n=1
• Review of DNA policy and practice
Care bundle for
children with
mechanical devices
in situ
n=1
• Introduction led to improved care of children with
mechanical devices in situ
Number of pregnant
women taking folic
acid supplements
n=1
• Appointment of a clinical midwife specialist
Completion of child
health development
checks
n=1
• Established as a key priority with additional training and
focus on meeting national Standards
Number of epidural
requests facilitated
n=1
• Provision of epidurals on request improved
Family and Friends
Test feedback n=1 • Reduced night time noise
Number of
temporary staff
employed to support
1:1 patient care
n=1
• Analysis and costing led to creation of a dedicated team to
meet this need
Caesarean section
rates
n=1
• Closer monitoring, on-going audit, increased consultant
involvement, individual C-section cases scrutinised
leading to reduction in C-sections
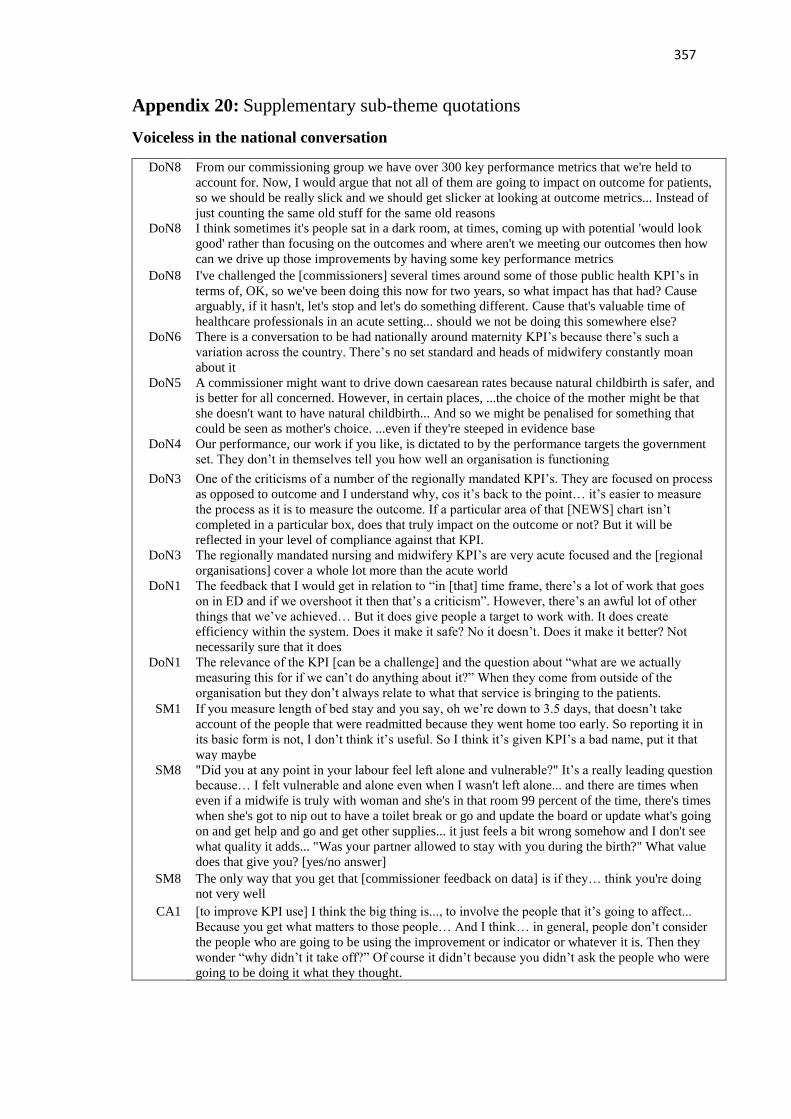
357
Appendix 20: Supplementary sub-theme quotations
Voiceless in the national conversation
DoN8 From our commissioning group we have over 300 key performance metrics that we're held to
account for. Now, I would argue that not all of them are going to impact on outcome for patients,
so we should be really slick and we should get slicker at looking at outcome metrics... Instead of
just counting the same old stuff for the same old reasons
DoN8 I think sometimes it's people sat in a dark room, at times, coming up with potential 'would look
good' rather than focusing on the outcomes and where aren't we meeting our outcomes then how
can we drive up those improvements by having some key performance metrics
DoN8
I've challenged the [commissioners] several times around some of those public health KPI’s in
terms of, OK, so we've been doing this now for two years, so what impact has that had? Cause
arguably, if it hasn't, let's stop and let's do something different. Cause that's valuable time of
healthcare professionals in an acute setting... should we not be doing this somewhere else?
DoN6 There is a conversation to be had nationally around maternity KPI’s because there’s such a
variation across the country. There’s no set standard and heads of midwifery constantly moan
about it
DoN5 A commissioner might want to drive down caesarean rates because natural childbirth is safer, and
is better for all concerned. However, in certain places, ...the choice of the mother might be that
she doesn't want to have natural childbirth... And so we might be penalised for something that
could be seen as mother's choice. ...even if they're steeped in evidence base
DoN4 Our performance, our work if you like, is dictated to by the performance targets the government
set. They don’t in themselves tell you how well an organisation is functioning
DoN3 One of the criticisms of a number of the regionally mandated KPI’s. They are focused on process
as opposed to outcome and I understand why, cos it’s back to the point… it’s easier to measure
the process as it is to measure the outcome. If a particular area of that [NEWS] chart isn’t
completed in a particular box, does that truly impact on the outcome or not? But it will be
reflected in your level of compliance against that KPI.
DoN3 The regionally mandated nursing and midwifery KPI’s are very acute focused and the [regional
organisations] cover a whole lot more than the acute world
DoN1 The feedback that I would get in relation to “in [that] time frame, there’s a lot of work that goes
on in ED and if we overshoot it then that’s a criticism”. However, there’s an awful lot of other
things that we’ve achieved… But it does give people a target to work with. It does create
efficiency within the system. Does it make it safe? No it doesn’t. Does it make it better? Not
necessarily sure that it does
DoN1 The relevance of the KPI [can be a challenge] and the question about “what are we actually
measuring this for if we can’t do anything about it?” When they come from outside of the
organisation but they don’t always relate to what that service is bringing to the patients.
SM1 If you measure length of bed stay and you say, oh we’re down to 3.5 days, that doesn’t take
account of the people that were readmitted because they went home too early. So reporting it in
its basic form is not, I don’t think it’s useful. So I think it’s given KPI’s a bad name, put it that
way maybe
SM8 "Did you at any point in your labour feel left alone and vulnerable?" It’s a really leading question
because… I felt vulnerable and alone even when I wasn't left alone... and there are times when
even if a midwife is truly with woman and she's in that room 99 percent of the time, there's times
when she's got to nip out to have a toilet break or go and update the board or update what's going
on and get help and go and get other supplies... it just feels a bit wrong somehow and I don't see
what quality it adds... "Was your partner allowed to stay with you during the birth?" What value
does that give you? [yes/no answer]
SM8 The only way that you get that [commissioner feedback on data] is if they… think you're doing
not very well
CA1 [to improve KPI use] I think the big thing is..., to involve the people that it’s going to affect...
Because you get what matters to those people… And I think… in general, people don’t consider
the people who are going to be using the improvement or indicator or whatever it is. Then they
wonder “why didn’t it take off?” Of course it didn’t because you didn’t ask the people who were
going to be doing it what they thought.

358
Aligning KPI’s to the organisational context
DoN1 We have a quality group within the hospital. They would identify some [KPI’s]… Our infection
control team are quite active, so if they noticed that we were getting line infections it would be
brought to the corporate management team... [Suggestions for KPI’s] can come from anybody...
DoN2 There has been a whole lot of work done here around trying to engage directly with nurses
themselves around identifying the ones which are important to them. Probably those are the ones
which we’re finding a bit more difficulty in getting to understand at a local level, what is important
to those particular teams, what’s important to their services and their outcomes
DoN5 Myself and the medical director, based on the clinical strategy of the organisation...clinical
divisions..., the external requirements from our commissioners and our regulators - we devise what
are the key indicators we would look at
DoN6 A dialogue with the ward leaders about what’s relevant and what’s important… we do stop certain
KPI’s were we don’t think they are relevant and they’re not adding to quality improvement
DoN8 Some might be imposed, ... If we were non-compliant ... mandatory training for safeguarding, non-
negotiable. That would be, "you're doing it".... in our quality strategy. Each organisation will have
their own internal key performance indicators linked to outcomes or linked to the quality agenda.
So those will be built up through the divisions, so for example, maternity would be asked to go
away and come back and say what are the three things they want to improve in the next year.
SM2 Community is a challenge… the difficulty is collecting tangible evidence from them and records is
not a good start, because they’re in the patients’ homes and you have to get access and that’s
laboursome to get out and do that. But there has to be other ways of collecting information, you can
ask the patient and engage the patient and I think maybe just thinking a wee bit laterally
SM3 The staff have invited us in. There’s a big [safety and quality] culture in this Trust and staff want to
show that they’re improving... So, we go into the areas and we will work with them... All my staff
have been through the [QI] programme… We will then work on those issues as to how we’re going
to improve because we don’t always want to tick the box we want to demonstrate the improvement
SM4 I don’t think everyone knows all the KPI’s that are collected. You’ve cancer ones, which have
nursing ones in it. You have the generic ones which are like documentation and assessment and
swallow screening. If you put them all together you’d probably couldn’t get into this room
SM7 We've been approached by the assistant director for community, they're wanting to look at
measuring what district nurses are doing because of the lack of KPI’s.
CA2 I don’t think there’s any that we need to leave out because it’s all focused on things that we should
avoid happening.
CA3 I think they [clinical staff] probably think they are doing enough measuring of things at the minute
cos sort of when you bring out a new initiative some of them are like, “not another audit” because
things are tight with staffing levels
CA4 The challenges are around the number that we have to do. And so often there can be twenty a
month for different ones and it’s the time-consuming aspect of that
CA7 The ones that we get the most from are pressure ulcers and falls
CA8 Our education ones [KPI’s] come from... Regionally…
CA8 I do feel that sometimes when they are set, perhaps the people on the shop floor don't fully
understand the reason why they're set or see that they're applicable to what they do. And I think lots
of people go with the assumption that there's a financial drive behind it and we've got to collect this
because of that drive. Rather than really understanding some of the quality underneath it… and how
it can influence the care that patients get from it
CM7 I don’t know that we use them all [KPI’s]… It’s been altered in the years that I’ve worked here, the
different data that we do collect. So I assume someone is looking at whether it’s important to
collect this data or not. It seems as if they’ve just added more [laughs], not that they’ve taken
anything away.
CC3 Some of them are better taken on than others. Some of them are very difficult to capture the
information. Recording, the amount of paper work that we have in community is just absolutely
phenomenal and we’re getting buried in its. Then you’re asking nurses to go in and put things onto
the dashboard, record MUST scores, put on these things every month. And…these things are all
recorded somewhere else
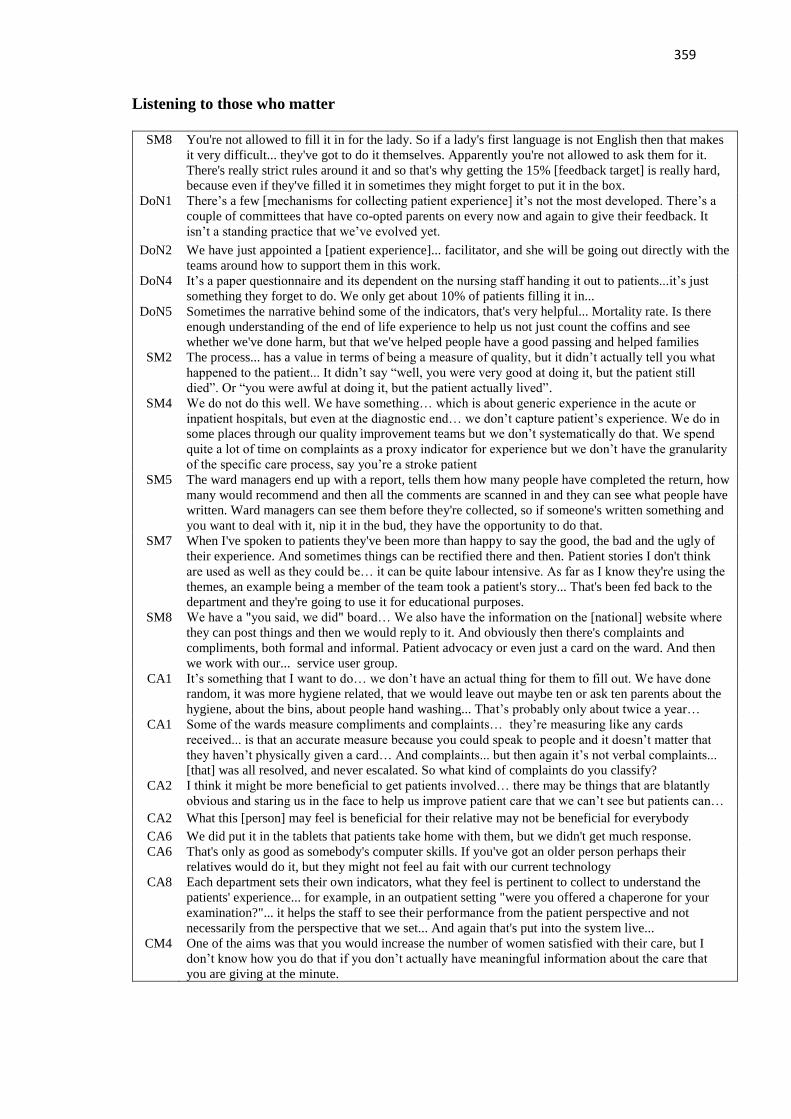
359
Listening to those who matter
SM8 You're not allowed to fill it in for the lady. So if a lady's first language is not English then that makes
it very difficult... they've got to do it themselves. Apparently you're not allowed to ask them for it.
There's really strict rules around it and so that's why getting the 15% [feedback target] is really hard,
because even if they've filled it in sometimes they might forget to put it in the box.
DoN1 There’s a few [mechanisms for collecting patient experience] it’s not the most developed. There’s a
couple of committees that have co-opted parents on every now and again to give their feedback. It
isn’t a standing practice that we’ve evolved yet.
DoN2 We have just appointed a [patient experience]... facilitator, and she will be going out directly with the
teams around how to support them in this work.
DoN4 It’s a paper questionnaire and its dependent on the nursing staff handing it out to patients...it’s just
something they forget to do. We only get about 10% of patients filling it in...
DoN5 Sometimes the narrative behind some of the indicators, that's very helpful... Mortality rate. Is there
enough understanding of the end of life experience to help us not just count the coffins and see
whether we've done harm, but that we've helped people have a good passing and helped families
SM2 The process... has a value in terms of being a measure of quality, but it didn’t actually tell you what
happened to the patient... It didn’t say “well, you were very good at doing it, but the patient still
died”. Or “you were awful at doing it, but the patient actually lived”.
SM4 We do not do this well. We have something… which is about generic experience in the acute or
inpatient hospitals, but even at the diagnostic end… we don’t capture patient’s experience. We do in
some places through our quality improvement teams but we don’t systematically do that. We spend
quite a lot of time on complaints as a proxy indicator for experience but we don’t have the granularity
of the specific care process, say you’re a stroke patient
SM5 The ward managers end up with a report, tells them how many people have completed the return, how
many would recommend and then all the comments are scanned in and they can see what people have
written. Ward managers can see them before they're collected, so if someone's written something and
you want to deal with it, nip it in the bud, they have the opportunity to do that.
SM7 When I've spoken to patients they've been more than happy to say the good, the bad and the ugly of
their experience. And sometimes things can be rectified there and then. Patient stories I don't think
are used as well as they could be… it can be quite labour intensive. As far as I know they're using the
themes, an example being a member of the team took a patient's story... That's been fed back to the
department and they're going to use it for educational purposes.
SM8 We have a "you said, we did" board… We also have the information on the [national] website where
they can post things and then we would reply to it. And obviously then there's complaints and
compliments, both formal and informal. Patient advocacy or even just a card on the ward. And then
we work with our... service user group.
CA1 It’s something that I want to do… we don’t have an actual thing for them to fill out. We have done
random, it was more hygiene related, that we would leave out maybe ten or ask ten parents about the
hygiene, about the bins, about people hand washing... That’s probably only about twice a year…
CA1 Some of the wards measure compliments and complaints… they’re measuring like any cards
received... is that an accurate measure because you could speak to people and it doesn’t matter that
they haven’t physically given a card… And complaints... but then again it’s not verbal complaints...
[that] was all resolved, and never escalated. So what kind of complaints do you classify?
CA2 I think it might be more beneficial to get patients involved… there may be things that are blatantly
obvious and staring us in the face to help us improve patient care that we can’t see but patients can…
CA2 What this [person] may feel is beneficial for their relative may not be beneficial for everybody
CA6 We did put it in the tablets that patients take home with them, but we didn't get much response.
CA6 That's only as good as somebody's computer skills. If you've got an older person perhaps their
relatives would do it, but they might not feel au fait with our current technology
CA8 Each department sets their own indicators, what they feel is pertinent to collect to understand the
patients' experience... for example, in an outpatient setting "were you offered a chaperone for your
examination?"... it helps the staff to see their performance from the patient perspective and not
necessarily from the perspective that we set... And again that's put into the system live...
CM4 One of the aims was that you would increase the number of women satisfied with their care, but I
don’t know how you do that if you don’t actually have meaningful information about the care that
you are giving at the minute.

360
CM6 We collect them antenatally at 36 weeks to get a feedback from them about their community
experience. They do one about labour, they do one about their in-patient post-natal, and then they do
their post-natal as a whole. So we try and capture information four times
CM8 There are some patients that you will never make happy no matter what you do for them, and there
are some where you have to do very little for them and they're so much appreciated. But I think if we
don't get that feedback then we're never going to know if we're not fulfilling the needs of the patients
CC2 I have had to say to the girls “don’t be selective who you give your questionnaire to. You can’t pick
the patient who thinks you’re lovely. I want you to leave the questionnaire for everybody who’s there,
including the families if they chose to fill it in”. You can’t be seen to skew information
CC4 When I have a student, they have to ask a service user [about] the care they have given, or I’m to ask
on their behalf. It’s hard for a lot of the patients to say anything negative cos we’re in there on an
ongoing basis. So, they don’t often feedback after the episode of care because maybe they’ve died.
CC7 [Do you collect your patients' experience?] No we don't, to be quite honest. We may document in the
unified assessment nursing notes that we have a patient's views or... how they've expressed things to
us. But again it doesn't go any further... we collect, which sounds silly, the thank you cards
Establishing ownership and engaging staff
DoN2 We’re trying to get a bit more flexibility in our system to allow ward managers to make more
decisions at a local level because they are scundered around the volume of recording that they have to
do, and I think we can be a bit more flexible around that
CC8 For community midwifery there is five [KPI’s]… [performance team] pull the data from everything
that we document electronically. We don't personally collect any data as the team leaders. We get an
email to say "this needs to be done, that needs to be done, this needs to be looked at".
DoN1 The people who are involved in the direct collection of their information would be the clinical nurse
managers in the ward area
DoN1 We have set up specific… meetings... with the senior assistant directors of nursing... I also meet with
Education, Research, Quality and the Heads of Department. So you’d have all of the clinical nurse
managers… It’s about explaining to them what their responsibility is in achieving these targets. Why
these targets keep our patients safe, why it gives them good quality care and the importance that they
need to take back in their message… It’s about connecting for them that they can see that information
is utilised. I think you can get caught up in the ‘tick box’, and that’s not what you want to do.
DoN2 It’s the lead nurse in the ward who owns this information she’ll have help, there’s lead nurses, there’s
governance co-ordinators [who have a] practice development background
DoN3 If you have an idea and you want to come forward to get some thoughts on how you might do it, then
those [staff] will point you in the right direction.... That will then impact on what you would take
forward in your local KPI’s and how you’ll do it…[They] learn quality improvement methodologies
to help them.
DoN4 People like a KPI if they’re doing well or they’ve created it themselves so there’s a bit of ownership
around it… So engage people early in the process around why are we developing this KPI. It is not a
punitive thing... it’ll tell us something about performance, about patient experience
DoN5 We have QI training internally, we have a programme where people can be coached by QI facilitator,
and we have quite a lot of support for anyone who wants to do a project of improvement.
DoN6 A lot of people were initially quite uncomfortable [reviewing complaints in a professional forum] but
it’s not about exposing people, it’s about making sure that we share all of the data we hold
SM2 It is comprehensive in that it is multi-disciplinary and that’s a challenge for some of the community
mental health nurses to try and identify [KPI’s]. It’s not even that they can’t do it, I think they just
need the space and the time to do it. Nobody’s asked them before [laughs], and they haven’t been
given… the time to kinda tease out the challenge because they’re too busy doing their job.
SM3 We’ll identify key people as champions.
SM3 [Staff nurses] also do the bundles on [computer system] to give them ownership, to get them to
understand the meaning of why we do this, why we get the baseline audits, why are we sending this
information in, why do we have to report this to the [national organisation]. So they can see
improvement. ... Why is it just the responsibility of the [clinical managers]? It’s the [staff nurses] who
are out there implementing the skin bundle for the Sister to go into her office and tick
SM4 I lived through this response in my early years which was “not meeting this KPI what’s your action
plan” [bangs table]. [Instead of] why are we not meeting it… what’s the key things we know or we
theorise or we expect if we do will lead to an improvement around this. Let’s test it on one patient,
five patients. Has it led to an improvement, no, fine. Let’s try something else

361
SM6 Staff ability to use them [a challenge]... not just with KPI’s but we have some ward managers and
matrons who are very good and take notice of them, some of them who are a little bit more blasé and
need more direction in terms of how they use their KPI’s.
SM6 Every month they get updated… we can see trends on graphs, it's very easy to navigate around our
dashboards. I found them incredibly helpful… because some of the graphs that you produce for the
staff it's very easy for them to see where we're going... You don't have to go into immense detail,
some of the more junior nurses don't have that understanding
SM6 There’s a big sort of competition in that they think, "oh gosh, there's another ward that's doing better
than me". And this is what it's sort of brought out, that competitive nature, thinking, "gosh, we're on a
downward spiral here, we've had three months in the red, how can we rectify this?"
SM8 It's the managers who go to the quality meeting and then the managers then hold their team meetings.
They would share that information or not, as the case may be depending on what's going on and what
they think is important. Cause although we know that the start of the process occurs, whether the full
cascade occurs is always subject to interpretation, isn't it?
CA1 I had started talking about [care bundles] with the girls “we’re going to bring these in, the safety of
the lines and the line infection and whatever”. And the reaction was kinda of [makes a sighing noise]
“another piece of paper, like again it’s to tick more boxes, we’re ticking more boxes every day”
CA1 I’d picked out a few people to help, you know promote it, people that are interested in it. Some of the
people… would always complain about whatever. It actually worked because she was delighted to be
involved... she went on afterwards to [something else].
CA3 The only challenges are trying to get ownership and trying to, when resources are low on the ward, to
keep the momentum going and get the staff to do them and understand the importance of it
CA3 If we’ve any new initiative coming out like that we would try and invite the people along to our
monthly sisters meeting so the sisters can ask questions, what they feel is wrong, what’s right and if
it’s any benefit or if there’s an easier way to do it
CA4 [Data collection is done by yourself?] yeah... I think they could be more involved... I don’t think any
of these things should be person specific because if they go off sick then you’re going to have to train
someone else. So maybe it should be rotating around staff and getting more aware of what we’re
collecting and the value of that.
CA5 They are not fully aware of KPI’s but senior member of the staff, whenever I do an audit I explain it
to them. Like my senior staff nurse… so they understand what I am doing, go around looking at
specific things. Because these are things… they could help me prevent.
CA6 We do tend to print them out because a number of staff don't go on the internet or don't always have
the time because they're busy. And equally sometimes if you said to staff, "what's a KPI?" they
perhaps wouldn't tell you, but if you said, "oh, what do you do about your cannulation figures? What
do you do about your C. Diff figures?" they'd then probably give you a ream of information....
CA6 Every month we have a floor meeting. And everything gets discussed between the whole of the
[service]. It's quite good because I'm part of the other wards as well so there's a lot of learning. What
we've taken from our ward we also take it to the floor meetings so everybody can be aware. And
equally it's raised… if there's something that we feel the whole Trust can learn from
CA7 How did I get my knowledge? I suppose they just appear there, the plans to use really [laughs].
Obviously the Trust introduces another [KPI] and then we follow on I suppose
CA7 [When asked about opportunities for shared learning] not that I know of that we share as a ward. I
mean obviously they have matron’s meetings and maybe they talk about these things
CA8 They [staff nurses] understand it when I explain to them… sometimes they need that explanation
beneath it as to why we're measured on it... why is it important that we engage in that… I've people
volunteering to be involved and they become more collaborative when you have the time to explain
CM2 We’ve had a [development programme] that was implemented… It was looking at what systems we
have in place and about stream-lining them, and maybe looking at what way we’re providing care.
How to do away with stuff that we don’t need to be doing. It was about getting the girls that are
working on the floor involved, getting everybody talking around a table to discuss… issues and what
they needed to address to improve care. It was also aimed at improving situations for staff, making
them feel that they had more input into the service that they were providing, trying to retain staff.
CM3 I do think clinical staff need to be involved in it… what they think, how they can measure their
performance... I think a lot of these organisations make decisions without involving clinical staff.
CA6 Thankfully, the information is collated centrally… Everybody gets fed up if you had ten audits to
complete plus a wealth of forms... you could see that it' d soon impact on your workload and then you
wouldn't be able to move on and action plan and think about what you can do to improve, cause
realistically it's the improve, we all want to improve.
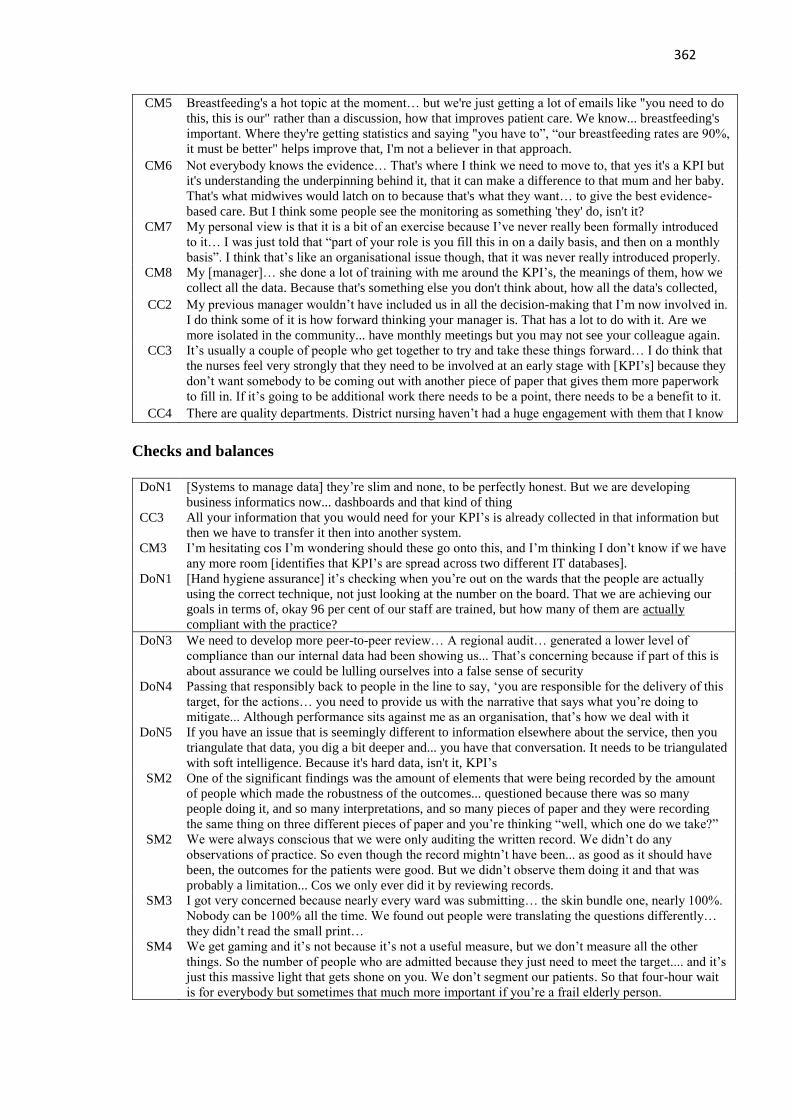
362
CM5 Breastfeeding's a hot topic at the moment… but we're just getting a lot of emails like "you need to do
this, this is our" rather than a discussion, how that improves patient care. We know... breastfeeding's
important. Where they're getting statistics and saying "you have to”, “our breastfeeding rates are 90%,
it must be better" helps improve that, I'm not a believer in that approach.
CM6 Not everybody knows the evidence… That's where I think we need to move to, that yes it's a KPI but
it's understanding the underpinning behind it, that it can make a difference to that mum and her baby.
That's what midwives would latch on to because that's what they want… to give the best evidence-
based care. But I think some people see the monitoring as something 'they' do, isn't it?
CM7 My personal view is that it is a bit of an exercise because I’ve never really been formally introduced
to it… I was just told that “part of your role is you fill this in on a daily basis, and then on a monthly
basis”. I think that’s like an organisational issue though, that it was never really introduced properly.
CM8 My [manager]… she done a lot of training with me around the KPI’s, the meanings of them, how we
collect all the data. Because that's something else you don't think about, how all the data's collected,
CC2 My previous manager wouldn’t have included us in all the decision-making that I’m now involved in.
I do think some of it is how forward thinking your manager is. That has a lot to do with it. Are we
more isolated in the community... have monthly meetings but you may not see your colleague again.
CC3 It’s usually a couple of people who get together to try and take these things forward… I do think that
the nurses feel very strongly that they need to be involved at an early stage with [KPI’s] because they
don’t want somebody to be coming out with another piece of paper that gives them more paperwork
to fill in. If it’s going to be additional work there needs to be a point, there needs to be a benefit to it.
CC4 There are quality departments. District nursing haven’t had a huge engagement with them that I know
Checks and balances
DoN1 [Systems to manage data] they’re slim and none, to be perfectly honest. But we are developing
business informatics now... dashboards and that kind of thing
CC3 All your information that you would need for your KPI’s is already collected in that information but
then we have to transfer it then into another system.
CM3 I’m hesitating cos I’m wondering should these go onto this, and I’m thinking I don’t know if we have
any more room [identifies that KPI’s are spread across two different IT databases].
DoN1 [Hand hygiene assurance] it’s checking when you’re out on the wards that the people are actually
using the correct technique, not just looking at the number on the board. That we are achieving our
goals in terms of, okay 96 per cent of our staff are trained, but how many of them are actually
compliant with the practice?
DoN3 We need to develop more peer-to-peer review… A regional audit… generated a lower level of
compliance than our internal data had been showing us... That’s concerning because if part of this is
about assurance we could be lulling ourselves into a false sense of security
DoN4 Passing that responsibly back to people in the line to say, ‘you are responsible for the delivery of this
target, for the actions… you need to provide us with the narrative that says what you’re doing to
mitigate... Although performance sits against me as an organisation, that’s how we deal with it
DoN5 If you have an issue that is seemingly different to information elsewhere about the service, then you
triangulate that data, you dig a bit deeper and... you have that conversation. It needs to be triangulated
with soft intelligence. Because it's hard data, isn't it, KPI’s
SM2 One of the significant findings was the amount of elements that were being recorded by the amount
of people which made the robustness of the outcomes... questioned because there was so many
people doing it, and so many interpretations, and so many pieces of paper and they were recording
the same thing on three different pieces of paper and you’re thinking “well, which one do we take?”
SM2 We were always conscious that we were only auditing the written record. We didn’t do any
observations of practice. So even though the record mightn’t have been... as good as it should have
been, the outcomes for the patients were good. But we didn’t observe them doing it and that was
probably a limitation... Cos we only ever did it by reviewing records.
SM3 I got very concerned because nearly every ward was submitting… the skin bundle one, nearly 100%.
Nobody can be 100% all the time. We found out people were translating the questions differently…
they didn’t read the small print…
SM4 We get gaming and it’s not because it’s not a useful measure, but we don’t measure all the other
things. So the number of people who are admitted because they just need to meet the target.... and it’s
just this massive light that gets shone on you. We don’t segment our patients. So that four-hour wait
is for everybody but sometimes that much more important if you’re a frail elderly person.

363
SM5 We've got specific people to do it... it's not a different person every time so you don't get, variations.
They're collecting it from systems... from things that IT record, from Datix... I guess it's probably an
advantage because if you get a massive anomaly they would probably go back in to question that.
SM7 I think there's danger of aggregating because would you always see the outliers?
SM8 The organisation is starting to realise, what we've been saying, that one impacts on the other so you
can make one go up but in turn something else will falter, and it's keeping them all in balance. Have
some of them been set too unrealistic? Is 100% one-to-one care in labour the beast of all beasts that
then prevents us being able to do 90% on a 30-minute triage, who says which is most important?
CA3 There’s a girl, a quality officer, would come round and do like a revalidation audit just to make sure
that we’re scoring sort of similar
CA4 You’ve watched how he’s collected that, what we’re doing with it, someone might have explained
the system to you, you know. But I think training would be good, proper training. And as I say
maybe someone who is out with you clinical then doing the data collection for you
CA6 For example, one of our indicators is falls with harm. The very nature of the fact they've fallen,
they'll have a bruise or they may have cut their arm. It's how you perhaps perceive harm because
initially… you tend to think of harm as kind of a fracture, a head injury, but the actual indicator for
that pathway is any harm. I think it'd be good to revisit it… Sometimes with the indicator, you can
see it kind of being so high... it can kind of swallow up the meaning. Because there's a high
percentage of people that do get a bruise... to separate it and say these are severe harms
CC3 We’re only asked to feedback on two clients and I would say people probably feedback on the
positive aspects than the negative ones… the ones that they have actually completed the proper
documentation for rather than the ones that aren’t
Closing the loop
DoN2 One of the things we’re trying to do is ensure that mealtimes are protected... You have to engage with
your multi-disciplinary team around that. You’re going to be... saying to doctors “well I’m sorry, you
can’t come in and do a ward round when there mealtime”, or clergy “sorry, give the patient 15
minutes so they can have peace to eat their meal”.
DoN3 [A ward] were very conscious of the frequency with which patients were being re-cannulated. And
they wanted to do a piece of work around that. So, using the quality improvement methodology,
they... looked at their data in relation to their baseline, looked at PDSA small cycles of change,
looked at what the improvement was as a result of that first change, built on that, and are measuring
their KPI specifically around that aspect, and using that to drive their quality improvement
DoN6 We added a lot of the KPI’s… because we had a number of failure to rescue events that resulted in
either harm or mortality. We had a big conversation in the organisation for [almost a year] about
what they meant, why we were achieving them, what the impact would be, what we were going to
do. Also what we would track to show performance improvement and what I needed from the team
SM4 One of the big issues is we sit KPI’s within a culture that is punitive rather than improvement
focused. It’s binary, you haven’t met it you haven’t met it, it’s either yes or no. Instead of saying
“talk me through that, what does that look like, how does that fit with the other process of care
you’ve got in place”, what happens is we chase the indicator instead of understanding why the
indicator is there, which is about improving care in this context…
SM6 [Staff turnover KPI] in that area their sickness is increasing because the staff are so stressed. We saw
this coming... with the dashboard so that's why... things have been put in place to... risk assessments
to maintain some safety there. ...we haven't rectified it, but we've tried to make it a little bit easier for
the nurses so that we keep the good neuro nurses that are there, they don't completely burn out.
SM6 Nurses and patients were switching lights off in bays because they couldn't sleep. We had a big piece
of work because we thought well that's not safe, we can't have lights off… We did see an increase in
our complaints about patients saying, "It's just too bright at night, we can't sleep"... So we have just...
put some dimmer lights in.... I'm hoping to see a reduction in that now...
CA2 We have a mini staff meeting every week. And we would discuss [incidents] and I also send it out in
a global email to all my staff for learning. If something has happened, if they have missed a
medication, to go through it with them, make sure they realise the importance of it, see what
happened, why and encourage them to reflect on it and use the reflection as learning.

364
CA5 It's screening and saying this patient has got cognitive impairment and what care should be followed
up by the GP, how it will affect care planning, and involvement of the next of kin... We have got a
dementia nurse in post now. We have a dedicated dementia OT. We have alerts in real time... The
'This Is Me' passport is being utilised and there are champions in the ward who will fill them in on
behalf of their relatives. We engage the next of kin, how a particular behaviour of a dementia patient
is manifest and then how can we deal with it
CM6 You say to your ladies, "I get 15 minutes for your appointment. If you don't have any problems and
we don't talk about anything that you're worried about, we'll fill the 15 minutes. If you want as long
as you can have with me, my clinic will over-run. Please bring a book with you and please don't be
cross with me if your appointment slot runs late," and they go, "Yeah, that's fine". Then they [know]
... or they'd ring and say, "Is [midwife] on time?"... They should have longer… screening, smoking,
breastfeeding, if we're not imparting that information to women, how do they know choices…You
can't do that and test someone's urine, do their blood pressure, have a feel of their tummy, listen to
the baby, ask them about their emotional well-being in 15mins