
exploring innovative indicators for the next-generation energy ...
62
EXPLORING INNOVATIVE INDICATORS FOR THE NEXT-GENERATION ENERGY PERFORMANCE CERTIFICATES FEATURES - REAL ENERGY CONSUMPTION THIS PROJECT HAS RECEIVED FUNDING FROM THE EUROPEAN UNION’S HORIZON 2020 RESEARCH AND INNOVATION PROGRAMME UNDER GRANT AGREEMENT NO 845958. MAY 2021
-
Upload
khangminh22 -
Category
Documents
-
view
0 -
download
0
Transcript of exploring innovative indicators for the next-generation energy ...

EXPLORING INNOVATIVE INDICATORSFOR THE NEXT-GENERATION ENERGYPERFORMANCE CERTIFICATESFEATURES -REAL ENERGY CONSUMPTION
T H I S P R O J E C T H A S R E C E I V E D F U N D I N G F R O M T H E E U R O P E A N U N I O N ’ S H O R I Z O N 2 0 2 0 R E S E A R C HA N D I N N O V A T I O N P R O G R A M M E U N D E R G R A N T A G R E E M E N T N O 8 4 5 9 5 8 .
M A Y 2 0 2 1

Exploring innovative indicators for the next-generation EPC features
Project Acronym X-tendo
Project Name eXTENDing the energy performance assessment and certification schemes via a mOdular approach
Project Coordinator Lukas Kranzl
Technische Universität Wien (TU Wien)
Gusshausstraße 25-29/370-3, A-1040 Vienna
Project Duration 2019 - 2022
Website www.X-tendo.eu
Project Acronym X-tendo
Project Name eXTENDing the energy performance assessment and certification schemes via a mOdular approach
Project Coordinator
Project Duration 2019 - 2022
Website
Deliverable no. D3.1
Dissemination level Public
Work package WP3- Innovative EPC indicators and calculation methods
Lead beneficiary Buildings Performance Institute Europe (BPIE)
Contributing beneficiaries VITO, e-think, NAPE, BPIE
Author(s) Sheikh Zuhaib (BPIE)
Co-author(s) Guillermo Borragán Pedraz (VITO), Jan Verheyen (VITO), Jerzy Kwiatkowski (NAPE), Marcus Hummel (e-think), Vivian Dorizas (BPIE)
Reviewed by Kalle Firus (TREA), Maarten De Groote (VITO), Lukas Kranzel (TU WIEN)
Editing: Barney Jeffries & Roberta D’Angiolella (BPIE)
Date 29.05.2020
File name X-tendo_Deliverable 3.1
Deliverable No.
Dissemination Level
Work Package
Lead beneficiary
Contributing beneficiary(ies)
Author(s)
Co-author(s)
Reviewed by
Date

Exploring innovative indicators for the next-generation EPC features
2
Legal notice
The sole responsibility for the content of this publication lies with the authors. It does not necessarily reflect the opinion of the European Union. Neither EASME nor the European Commission is responsible for any use that may be made of the information contained therein
All rights reserved; no part of this publication may be translated, reproduced, stored in a retrieval system, or transmitted in any form or by any means, electronic, mechanical, photocopying, recording or otherwise, without the written permission of the publisher. Many of the designations used by manufacturers and sellers to distinguish their products are claimed as trademarks. The quotation of those designations in whatever way does not imply the conclusion that the use of those designations is legal without the consent of the owner of the trademark.

Exploring innovative indicators for the next-generation EPC features
3
TABLE OF CONTENT TABLE OF CONTENT ........................................................................................................................................................... 3
EXECUTIVE SUMMARY ...................................................................................................................................................... 4
1 EXTENDING THE FUNCTIONALITIES OF EPCS WITH INNOVATIVE INDICATORS: SCOPING AND ANALYSIS ................................................................................................................................................................................ 7
1.1 AIM OF THE X-TENDO PROJECT .................................................................................................................................... 7 1.2 SCOPE AND OBJECTIVE OF THIS REPORT ....................................................................................................................... 9
2 FEATURE 4: REAL ENERGY CONSUMPTION ...................................................................................................... 11
2.1 OVERVIEW OF THE ASSESSMENT METHODS FOR REAL ENERGY CONSUMPTION ...................................................... 11 Approaches used to assess real energy consumption .................................................................... 16
2.2 DESCRIPTION OF APPROACHES USED FOR THE ASSESSMENT OF REAL ENERGY CONSUMPTION ............................ 17 Building-level simple approach ................................................................................................................. 17 Building-level detailed approach ............................................................................................................. 23 Stock-level model development ............................................................................................................... 24
2.3 APPLICATION OF ASSESSMENT METHODS FOR THE INDICATOR ............................................................................... 24 Use of methods for EPCs in different countries ................................................................................. 24 Applicability of methods to different building typologies .............................................................. 25 Presentation of the indicator ..................................................................................................................... 26
2.4 LINKING THE ASSESSMENT METHODS TO ENERGY PERFORMANCE AND EPCS ....................................................... 27 2.5 LEGAL BOUNDARIES OR REQUIREMENTS OF ASSESSMENT METHODS ...................................................................... 27 2.6 RANKING OF METHODS FOR ASSESSING THEIR FEASIBILITY FOR THE FEATURE ...................................................... 28 2.7 SWOT ANALYSIS OF THE ASSESSMENT METHODS .................................................................................................. 28 2.8 PROPOSED PRELIMINARY APPROACH TO DEVELOP THE FEATURE ........................................................................... 29
3 FINDINGS ................................................................................................................................................................... 33
4 CONCLUSIONS .......................................................................................................................................................... 38
GLOSSARY OF TERMS ......................................................................................................................................................40
REFERENCES ...................................................................................................................................................................... 42
ANNEX 1 ............................................................................................................................................................................... 52
Exploring innovative indicators for the next-generation EPC features
4
EXECUTIVE SUMMARY Energy performance certificate (EPC) schemes have not evolved much since their first introduction in the Member States to meet the mandatory requirements of the Energy Performance of Buildings Directive (EPBD). Stakeholders have questioned their reliability but at the same time, they have been useful for the real estate industry. All the Member States have legislation in place and existing infrastructure or systems to run EPC schemes. These schemes require evolution with the changing needs of the built environment and requirements to look beyond the energy consumption of buildings to take in elements such as better indoor comfort, reducing air pollution and others. Public authorities view them as potential instruments to improve the performance of the existing and new building stock. Extending the functionalities of existing systems will create several pathways to update and manage next-generation EPCs.
This report presents the preliminary scoping and analysis of the five technical features related to developing innovative EPC indicators proposed within X-tendo1: (i) smart readiness, (ii) comfort, (iii) outdoor air pollution, (iv) real energy consumption, and (v) district energy. The outcome of this report is an initial mapping and selection of the suitable options of methods for developing indicators for these five features. The follow-up activities in the project will take forward this work to elaborate and provide technical specifications of the methodologies and concepts for the five features.
This report presents an overview of existing assessment approaches and methodologies for each feature that could be adopted in the indicator development for the EPCs. Details are provided of the most suitable existing methods that can be applied in the assessment of five technical indicators when integrated with EPCs. Their suitability and applicability to EPCs is analysed in a broader context, including building typologies and ranking/scoring techniques.
The report also evaluates existing links between these methods and the energy performance of a building/EPCs to determine how these can be integrated in the feature development. Since most of the assessment methods require some type of data related to end-users, therefore, their legal boundaries are also studied. Within the scoping and analysis, a ranking and SWOT analysis of several methods is presented to assess their suitability and feasibility of application in the development of the new features. Finally, a conceptual approach is proposed for the development of each of the five features. Findings are presented, highlighting the barriers, challenges and limitations of the assessment methods for the five features.
1 In addition to these five features, X-tendo will also provide a set of five features dealing with innovative handling of EPC data.

Exploring innovative indicators for the next-generation EPC features
5
Across all features, the following conclusions are made:
Indicators
‘Smart readiness’ approach presents a potential method for assessing the smartness
of buildings with nine domains (e.g. lighting, ventilation, envelope, monitoring and
control etc.)
‘Comfort’ approach incorporates four key indicators – thermal, visual and acoustic
comfort and indoor air quality – to be assessed through checklists, on-site
measurements and surveys
‘Outdoor air pollution’ approach addresses a building’s impact on air by two methods:
an outdoor air pollution contribution index and indoor air purity index
‘Real energy consumption’ approach outlines an assessment method based on
operational ratings, with options for normalisation to allow for better inter-building
comparison
‘District energy’ approach focuses on predicting the potential for future development
for buildings via two methods: expected future performance of district heating and
heat distribution and transfer system
Cross-cutting issues
Technical challenges that constrain the application of existing methods such as
assessment time, accuracy, normalisation process, variable definitions and emission
factors could be overcome by certain modifications in approach
Features should be aligned financially to increase market acceptance and cost-
effective assessments during the development
Legal and governance issues should be addressed by dealing with challenges such as
development of universal methodologies, presence of multiple standards at Member
State level, control of citizen data and privacy, and acceptance of future estimations by
public authorities
From a social perspective, user acceptance and public understating of the features are
key issues and should be considered in feature development
If these indicators are well integrated within EPCs, significant environmental benefits
are anticipated
Future implementation of indicators can be strengthened by addressing lack of
industry readiness, understanding of anticipated benefits and enforcement issues
Exploring innovative indicators for the next-generation EPC features
6
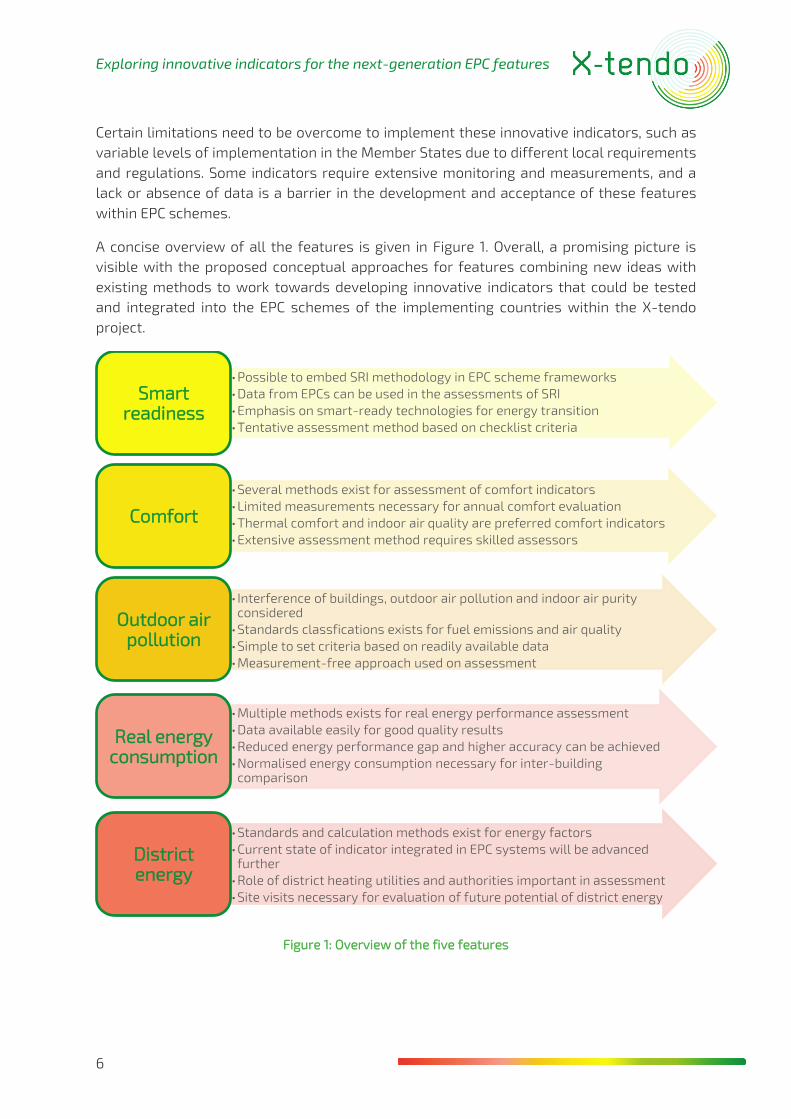
Certain limitations need to be overcome to implement these innovative indicators, such as variable levels of implementation in the Member States due to different local requirements and regulations. Some indicators require extensive monitoring and measurements, and a lack or absence of data is a barrier in the development and acceptance of these features within EPC schemes.
A concise overview of all the features is given in Figure 1. Overall, a promising picture is visible with the proposed conceptual approaches for features combining new ideas with existing methods to work towards developing innovative indicators that could be tested and integrated into the EPC schemes of the implementing countries within the X-tendo project.
Figure 1: Overview of the five features
•Possible to embed SRI methodology in EPC scheme frameworks•Data from EPCs can be used in the assessments of SRI •Emphasis on smart-ready technologies for energy transition•Tentative assessment method based on checklist criteria
Smart readiness
•Several methods exist for assessment of comfort indicators•Limited measurements necessary for annual comfort evaluation•Thermal comfort and indoor air quality are preferred comfort indicators•Extensive assessment method requires skilled assessors
Comfort
• Interference of buildings, outdoor air pollution and indoor air purity considered
•Standards classfications exists for fuel emissions and air quality•Simple to set criteria based on readily available data•Measurement-free approach used on assessment
Outdoor air pollution
•Multiple methods exists for real energy performance assessment•Data available easily for good quality results•Reduced energy performance gap and higher accuracy can be achieved•Normalised energy consumption necessary for inter-building
comparison
Real energy consumption
•Standards and calculation methods exist for energy factors•Current state of indicator integrated in EPC systems will be advanced
further•Role of district heating utilities and authorities important in assessment•Site visits necessary for evaluation of future potential of district energy
District energy

Exploring innovative indicators for the next-generation EPC features
7
1 EXTENDING THE FUNCTIONALITIES OF EPCS WITH INNOVATIVE INDICATORS: SCOPING AND ANALYSIS
Energy performance certificates (EPCs) are the key source of information on the energy performance of the building stock [1]. Their role for the end-user and the real estate sector has mainly been limited to indicating and comparing the energy class of the building, helping to regulate property transaction prices and rents. They have also been attractive for end-users and builders in gaining access to funds and incentives to conduct energy efficiency improvements. EPCs have also been seen as an unreliable source of information by stakeholders in some Member States [2]. Weak enforcement, low public acceptance and awareness, quality of audits, qualifications of the auditors and widely varying certificate costs all influence the role of EPCs and how they can affect the real estate market.
Many Member States stepped up efforts in the last decade to improve their EPC frameworks after the introduction of the requirement of energy performance and assessment systems under the EPBD (2002/91/EC) and EPBD recast (2010/31/EU). The recent amendments in the EPBD (2018/844) further strengthened the existing provisions by setting out that Member States should provide information to owners and tenants on the purpose and objectives of EPCs, energy efficiency measures, and supporting financial instruments through accessible and transparent advisory tools such as direct advice and one-stop-shops.
In the current scenario, EPCs are viewed as instruments that can bring additional benefits to the end-user (e.g. property seller, buyer, or tenant) by being a vehicle for additional information other than energy efficiency.
1.1 Aim of the X-tendo project
The X-tendo project is developing a framework of 10 “next-generation EPC features”, aiming to improve compliance, usability, and reliability of the EPC. The X-tendo partners cover 10 countries or regions – Austria, Belgium (Flanders) Denmark, Estonia, Greece, Italy, Poland, Portugal, Romania, and the UK (Scotland) as displayed in Figure 2.

Exploring innovative indicators for the next-generation EPC features
8
Figure 2: X-tendo consortium and target countries
The X-tendo project approaches next-generation EPCs by exploring 10 new features in addition to their existing functionalities (see Figure 3). The features that will be explored in the project fall into two broad categories:
• New technical features used within EPC assessment processes and enabling the inclusion of new indicators in EPCs 1) Smart readiness 2) Comfort 3) Outdoor air pollution 4) Real energy consumption 5) District energy
• Innovative approaches to handle EPC data and maximise its value for building owners and other end-users. 6) EPC databases 7) Building logbook 8) Tailored recommendations 9) Financing options 10) One-stop-shops

Exploring innovative indicators for the next-generation EPC features
9
Figure 3: The X-tendo toolbox representing both innovative EPC indicators and novel ways of handling EPC data
Existing EPC schemes lack focussed vision. In order to become a catalyst for energy renovations, the next-generation EPC must provide an improved and more reliable service to the end-users. The key output of the project will be the X-tendo toolbox, a freely available online knowledge hub that will be continued beyond the project duration. For each feature, the toolbox would include (i) solution concepts and good practice examples, (ii) descriptions of methodological approaches, (iii) calculation tools, and (iv) implementation guidelines and recommendations.
1.2 Scope and objective of this report
The purpose of this report is to identify suitable methods and approaches to assess the five features (i) smart readiness, (ii) comfort, (iii) outdoor air pollution, (iv) real energy consumption, (v) district energy. Before developing individual methods for their assessment, a detailed review of the existing assessment and calculation methods is presented for developing the indicators for all the five features in this report. Although the goal of the next-generation EPC will be more holistic, the relation with energy performance remains a key boundary condition for the selected approaches presented in this report.
The identification of the suitable methods will consider the objective of the modular toolbox being developed specifically for EPC assessments. The results of the report will be an initial selection of options for methods and indicators for features 1-5. Findings of the scoping and analysis are gathered in this report for these indicators.

Exploring innovative indicators for the next-generation EPC features
10
Table 1 lists the five innovative EPC indicators that could make EPCs more than just an informative tool. It also indicates the feature leads (VITO, BPIE, NAPE and e-think) who will develop the innovative indicators and organisations (EASt, DEA, TREA, CRES, ENEA, NAPE, ADENE, AAECR and EST) from implementing/expert partner countries that would support them in the development and testing of the indicators on several test projects.
Table 1: Innovative EPC indicators
Smart readiness
Comfort
Outdoor air pollution
Real energy consumption
District energy
Feature lead VITO BPIE NAPE VITO e-thinkEASt (Austria/Styria)
Implementer Implementer Implementer
DEA (Denmark)
Implementer Implementer Expert
TREA (Estonia)
Implementer/ Expert
Implementer
CRES (Greece)
Implementer Implementer
ENEA (Italy)
Implementer Implementer
NAPE (Poland)
Implementer/ Expert
Implementer
ADENE (Portugal)
Implementer
AAECR (Romania) Implementer Implementer
Implementer/ Expert
Implementer
EST (UK)
Implementer
The EPCs can become much more useful for the end-users, public authorities and policymakers by providing more detailed information on the existing building stock and its performance. Next-generation EPCs can support the transition to a low-carbon building sector, provided they are revised considering new indicators, with effective mechanisms to ensure compliance and high quality, reliable certifications.
Exploring innovative indicators for the next-generation EPC features
11
2 FEATURE 4: REAL ENERGY CONSUMPTION
2.1 Overview of the assessment methods for real energy consumption
This overview describes state of the art approaches for energy performance evaluation based on measured energy consumption. The scope of the study comprises methods for energy performance evaluation that may use all energy consumed or produced at the location of the building as an input. This includes energy consumption of building-related utilities (such as heating, ventilation, etc.), but also plug loads or electric vehicle charging. The final energy can be delivered by any energy carrier, such as fossil fuels, electricity, thermal energy, or biomass. Submetering may be applied to distinguish between different applications or energy origin (renewable versus non-renewable sources). It may also serve to exclude specific energy consumption or production from the analysis.
The methods described in this overview may include all or only part of the building energy consumption. They can comprise the final energy delivered to the building by all energy carriers or, for instance, be limited to the gross energy for space heating. They will not capture full details of energy usage for different applications, the energy user profile over time or in relation to bidirectional aspects (produced versus consumed energy).
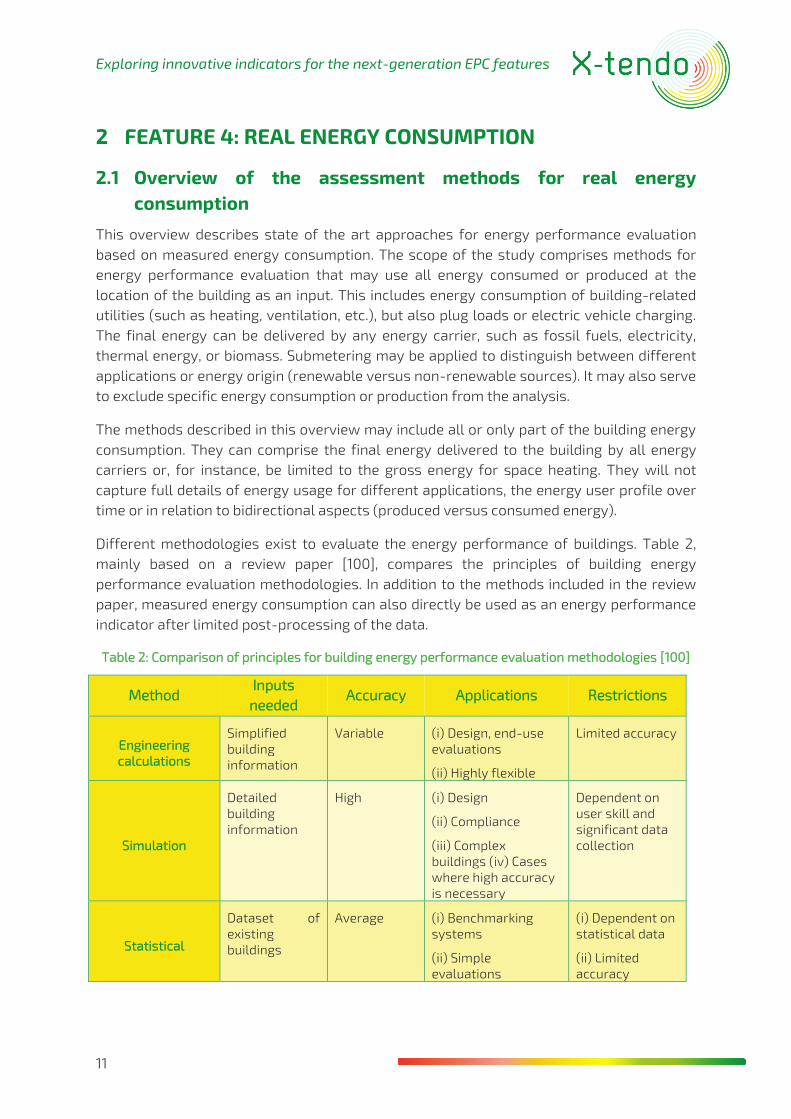
Different methodologies exist to evaluate the energy performance of buildings. Table 2, mainly based on a review paper [100], compares the principles of building energy performance evaluation methodologies. In addition to the methods included in the review paper, measured energy consumption can also directly be used as an energy performance indicator after limited post-processing of the data.
Table 2: Comparison of principles for building energy performance evaluation methodologies [100]
Method Inputs
needed Accuracy Applications Restrictions
Engineering calculations
Simplified building information
Variable (i) Design, end-use evaluations
(ii) Highly flexible
Limited accuracy
Simulation
Detailed building information
High (i) Design
(ii) Compliance
(iii) Complex buildings (iv) Cases where high accuracy is necessary
Dependent on user skill and significant data collection
Statistical
Dataset of existing buildings
Average (i) Benchmarking systems
(ii) Simple evaluations
(i) Dependent on statistical data
(ii) Limited accuracy

Exploring innovative indicators for the next-generation EPC features
12
Machine learning
Large dataset Average to high
(i) Buildings with highly detailed data collection
(ii) Complex problems with many parameters
(i) Model construction is complicated
(ii) Does not consider direct physical characteristics
Limited post-processing
Data of measured energy consumption
Variable (depending on building-only energy performance)
(i) Simple evaluation (ii) Historical benchmark
Includes non-standard influences
These methodologies can be divided in two groups:
Methodologies based on calculated energy consumption Methodologies based on measured energy consumption
These groups can be further divided into subtypes according to EN ISO 52000-1 [101]. These types are adopted in Table 3.
Table 3: EPB assessment types according to EN ISO 52000-1 [101]
Type Subtype Input data
Type of application Use Climate Building
Calculated (asset)
Design Standard Standard Design Building permit, certificate under conditions
As built Standard Standard Actual EPC, regulation
Actual Actual Actual Actual Validation
Tailored Depending on purpose Optimisation, validation, retrofit, planning, energy audit
Measured (operational)
Actuala Actual Actual Actual Monitoring
Climate corrected
Actual Corrected to standard
Actual Monitoring or energy audit
Use corrected
Corrected to standard
Actual Actual Monitoring
Standard Corrected to standard
Corrected to standard
Actual EPC, regulation
a This is not energy performance, because essential corrections are missing.
Various studies and publications [100], [102], [103] have demonstrated a gap between real (measured) energy performance and theoretical (calculated) performance of a building, referred to as the energy performance gap. The energy performance gap of buildings can be significant [104] and often is [105]. Previous research has identified that the actual
Exploring innovative indicators for the next-generation EPC features
13
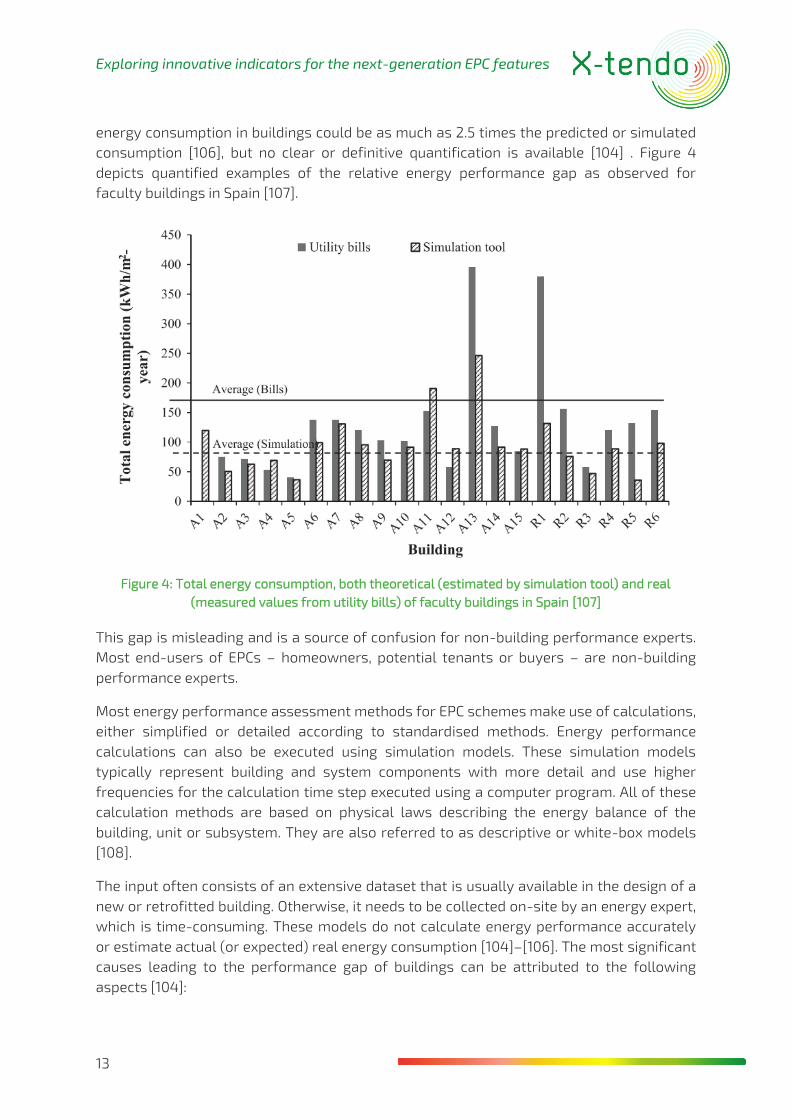
energy consumption in buildings could be as much as 2.5 times the predicted or simulated consumption [106], but no clear or definitive quantification is available [104] . Figure 4 depicts quantified examples of the relative energy performance gap as observed for faculty buildings in Spain [107].
Figure 4: Total energy consumption, both theoretical (estimated by simulation tool) and real (measured values from utility bills) of faculty buildings in Spain [107]
This gap is misleading and is a source of confusion for non-building performance experts. Most end-users of EPCs – homeowners, potential tenants or buyers – are non-building performance experts.
Most energy performance assessment methods for EPC schemes make use of calculations, either simplified or detailed according to standardised methods. Energy performance calculations can also be executed using simulation models. These simulation models typically represent building and system components with more detail and use higher frequencies for the calculation time step executed using a computer program. All of these calculation methods are based on physical laws describing the energy balance of the building, unit or subsystem. They are also referred to as descriptive or white-box models [108].
The input often consists of an extensive dataset that is usually available in the design of a new or retrofitted building. Otherwise, it needs to be collected on-site by an energy expert, which is time-consuming. These models do not calculate energy performance accurately or estimate actual (or expected) real energy consumption [104]–[106]. The most significant causes leading to the performance gap of buildings can be attributed to the following aspects [104]:

Exploring innovative indicators for the next-generation EPC features
14
• Occupant behaviour • Micro-environment • ‘Design versus as-built’ issues
In the context of energy consumption in buildings, occupant behaviour includes occupants’ interactions with and operation of windows, thermostats, lights and blinds, and their movement between spaces [104]. The microenvironment refers to the outdoor climatic conditions of the location of the building for the time period in which the measurements of the actual energy consumption took place, such as air temperature and humidity, solar irradiation and wind speed and direction. Design versus as-built issues concern the difference in technical characteristics used in the calculation versus those observed in the as-built phase. Examples of such influencing parameters for the energy performance gap include the thermal transmittance of the building envelope or the energy efficiency of the heating system. Also, excessive simplification such as the use of default values in energy performance calculation models contributes to the design versus as-built performance difference. These default values are retained in case the required information is not available and cannot be obtained from inspection. The default values are usually defined in a conservative way, resulting in underestimated energy performance of the building. For example, in the Flemish EPC calculation method, if no airtightness measurement test result is available, a default value for v50 – the air leakage at 50 Pa per unit envelope area – of 12 m³/(h.m²) is used.
Additionally, the translation of final energy consumption to primary energy consumption by application of the primary energy conversion factor alters the difference between actual and calculated energy consumption. Consequently, the relative difference of the electrical energy part in the total energy consumption enlarges when expressed in terms of primary energy due to a much larger primary energy conversion factor for electricity compared to other energy vectors. Also, the EPC methodology may use default values set on a European level, while more detailed information on a national level is used for the calculation of the actual primary energy consumption. Most of all, expressing energy performance in terms of primary energy consumption is confusing to end-users as it is unclear how it relates to final energy consumption known from metering and energy bills.
Instead of calculated energy performance, energy performance can be based on measured energy consumption. The most straightforward approach is simply to include the measured energy consumption in the EPC in relation to a reference, usually in this case the historical energy consumption data. Statistical modelling and machine learning techniques could be used, based on data of energy consumption complemented by other data such as outdoor climatic conditions. These methods based on measured data are also referred to as data-driven models. In fact, machine learning can be categorised as a subset of statistical modelling [109]. These data-driven models have the advantage that on-site visits are no longer required for energy performance assessment of the building, reducing the complexity of the simplified calculation methods currently in use or even replacing them. Measured energy consumption, however, incorporates the influence of user behaviour, micro-environmental conditions and energy consumption not included in the

Exploring innovative indicators for the next-generation EPC features
15
EPC. This necessitates post-processing of the data. The non-EPC energy consumption needs to be identified and separated from the energy consumption that is to be included according to the EPC assessment method. For some building services it is less common that these are considered, e.g. energy consumption of appliances (plug loads), cooking, mechanical escalators and elevators. This may also depend on the building or space categories. It is also possible that this energy is only accounted for as a contribution to the internal heat gains and not necessarily in the final energy consumption. In this case, the internal heat gains originating from appliances are considered in a non-standard way. Furthermore, the influence of user-related aspects and climatic conditions (outdoor, but also indoor environmental conditions deviating from comfortable conditions) on the energy consumption needs to be excluded by some form of normalisation to allow for comparison over time and between different buildings. It is also more complicated to disaggregate the energy consumption available for the different energy vectors into their constituents to facilitate tailored renovation advice.
Data-driven models can be further subdivided in two categories:
• Black-box models, in which the model structure and the model parameters are identified from the data only
• Grey-box models or hybrid models that combine a mathematical description of the building’s physical model, for which model parameters are identified by fitting it to the measurements.
Furthermore, the energy performance of a building can be predicted using detailed model calibration [110], in which a detailed building model is combined with measurement data to calibrate the model. Detailed model calibration is time consuming and requires high-quality input data and high-level expertise to develop.
The integration of real (i.e. actual measured) energy consumption data in EPCs could provide added value to the existing energy performance evaluation methods or even serve as the basis for alternative evaluation methods, replacing the existing energy performance evaluation method. Where an energy performance rating method – an evaluation method in which an energy performance indicator is compared to one or more references – is based on measured energy consumption, this is also referred to as operational rating. In theory, a performance-based rating approach should be based (and is in almost all other industries) on “requirement setting” and “compliance” checking by measurements [100]. The actual measured energy consumption can be obtained from energy bills, energy meter readings or building energy monitoring systems in various levels of detail concerning time resolution of the measurement data, subsystem measurement locations and variety of monitoring parameters. Data from smart meters can be complemented by data on other parameters such as geometrical building characteristics and weather data obtained from various sources e.g. online databases or IoT devices. Due to an increasing availability of data from smart meters and on-site measurement devices, improved accuracy is feasible [111] and thus the relevance (and accuracy) of this method will increase.
Exploring innovative indicators for the next-generation EPC features
16
Approaches used to assess real energy consumption
Different approaches for the inclusion of real energy consumption in EPCs can be distinguished and, for this overview, categorised in the following three main groups.
Building-level simple approach
The simple approach consists of simply adopting the total measured energy consumption of the building in the frame of the EPC assessment method. The values of the actual measured energy consumption per energy carrier can be obtained directly from energy meters or derived indirectly from energy bills. This data acquisition and processing should preferably be organised in an automated manner but can also be done manually. The measured energy consumption is aggregated and included as such or normalised to compensate for the influence of external factors such as climatic conditions, size or occupancy, in order to exclusively represent the energy performance related to the building or a part of it. The measured energy consumption can either be displayed:
• In addition to the existing energy performance indicator; or • As a replacement for the existing energy performance indicator.
Examples of Member States that have implemented this approach in EPC assessment schemes for part of the building stock can be found in Sweden, the UK and Flanders (Belgium) (see Section 2.2.1.2).
Building-level detailed approach
In the detailed approach, a part or multiple part of the energy balance of the building is determined, such as the energy consumption for domestic hot water or the heat transfer through the building envelope. This can comprise the direct characterisation of parameters related to the energy performance of the building or components of it that can serve as
• An accurate value of input parameters of (simplified) energy performance calculation methods; or
• An energy performance indicator to complement existing indicators.
The parameters that can be derived include the heat loss coefficient, the global solar aperture coefficient, efficiency of the heating system, airtightness, and the dynamic behaviour of the building. The building-level detailed approach also includes the disaggregation of energy consumption across its constituent parts. Separation between gas use for domestic hot water and for space heating, or quantification of electricity use for appliances, are not typically considered in EPCs but can be done. These parameters can be translated into models as currently in use for energy performance certification. Some of these parameters can also be implemented directly as an energy performance indicator, complementing or substituting existing indicators. An example of this is the heat transfer coefficient of the building envelope – a parameter that represents the amount of heat transferred between indoor and outdoor environment per unit of envelope area and per unit of temperature difference [W/m²K]. This could replace or complement the U-value of the various building envelope components or the overall U-value of the building envelope.

Exploring innovative indicators for the next-generation EPC features
17
Also included in this category of approach is a detailed model calibration in which the various inputs of a fully descriptive law-driven model of a building system are tuned to match the measured data [110]. Such a detailed model calibration approach requires considerable time, effort and expertise for development together with detailed input data regarding building characteristics and usage profiles.
More information on building-level detailed approach is given in Section 2.2.2.
Stock-level model development
Datasets on building stock level allow us to improve and validate existing methods, develop alternative models and set benchmarking levels for evaluation. These concern the overall building energy consumption or performance, but also physical performance characteristics of part of the building or systems enable the development of improved models and benchmarking performance levels. This approach differs from the previous approaches in the level of application. Rather than a single building, large sample datasets of the complete building stock or subsets of it are used to develop methods for use in parallel with existing EPC calculation methods or derive new models to improve parts of existing EPC calculation methods. In relation to individual buildings, the models can be used to determine typical performance of similar buildings that can serve as a baseline for comparison. Alternatively, the models can be used as energy performance determination methods in themselves, applied for certification or complementing existing assessment methods.
Some of these approaches may also use data obtained from on-site experiments, such as co-heating experiments [112]. Although on-site experiments on unoccupied buildings are useful for quality assurance and characterisation of new or renovated buildings, this report focusses on the use of methodologies to characterise and assess the actual energy performance of buildings starting from on-site monitored data of in-use buildings. This may also comprise compliance checking as a means for quality assurance for new or renovated buildings (see for instance the QUALICHeCK project), or energy awareness services providing direct feedback to building users [113][114]. More information on stock-level model development approaches with some examples is included in Section 2.2.3.
2.2 Description of approaches used for the assessment of real energy consumption
Building-level simple approach
The first approach is the most straightforward. It consists of the inclusion of the yearly final measured energy consumption as an indicator in the EPC scheme. The value can be translated to primary energy level or normalised to the size of the building, the number of occupants, the weather or to exclude other influences to allow for correct comparison amongst buildings. A simple inclusion of the yearly total energy consumption as an energy performance indicator can have a purely informative purpose, or it can be coupled to requirements for evaluation of the energy performance. The latter consequently requires a

Exploring innovative indicators for the next-generation EPC features
18
benchmark reference and influences that are not directly building-related (such as user behaviour) need to be excluded from the energy performance indicator. The energy consumption of previous years, from similar buildings or modelled energy consumption can be used as a reference. The EPC assessment methods in Sweden, Flanders (for public buildings only) and the UK (for public buildings only) are examples of the building-level simple approach. More information on these methods is given below with examples.
2.2.1.1 Normalisation
Different options exist for adapting the total actual energy consumption to minimise the influence of various parameters for improved comparison between buildings. These include considering the following aspects:
• Weather • Building size • Building use
- Building function - User-related aspects (occupancy, behaviour, etc.)
• Indoor environmental conditions and quality of service provision • Energy consumption not covered in EPC calculations or atypical energy
consumption • Basis for comparison (final energy, primary energy, CO2 emissions, exergy,
share of energy from renewable sources etc.)
Normalisation to standard weather conditions is usually done by the heating degree days method. This only takes outdoor temperatures into account, generally available from a national weather station. Solar radiation is only indirectly reflected (via its influence on outdoor temperature and by assumptions; the baseline temperature reflects internal and solar heat gains). Methods incorporating solar radiation along with outdoor temperature are also available. In principle, the normalisation should only be executed on the part of the energy consumption that is influenced by weather conditions and the space heating energy consumption. Domestic hot water and other uses are much less influenced by outdoor climatic conditions. The same holds true for space cooling. If this is disregarded, the relative error increases for low energy buildings, because space heating makes up a lower share of total energy consumption compared to less efficient buildings.
Normalisation to size can be based on floor area, volume, building envelope area or another characteristic (e.g. equivalent surface area of a sphere with the same volume as the building unit). Normalisation to occupancy can be based on the number of building users. Additionally, occupancy profiles could be included in the normalisation factor. This is easy if the data source is available. Discounting the effect of user behaviour is much more complicated and not applied in the building-level simple approach. This is the most important downside of this method: the influence of user behaviour makes the building-level simple approach less suitable for comparison between buildings. However, this can also be an advantage, especially when combined with a good benchmark, triggering both building energy performance and user behaviour change.

Exploring innovative indicators for the next-generation EPC features
19
The translation to primary energy consumption can be done if the total energy consumption per energy carrier is available. This is done using the primary energy conversion factors as set on a national level (possibly adopting the values from EU directives). The translation to CO2 emissions can be done in a similar way.
In addition to the aspects briefly described above, the indoor environmental conditions and service provision requiring energy should also be considered when comparing buildings. The energy performance of buildings with different levels of indoor environmental quality (e.g. indoor temperatures, ventilation levels) or with different levels of quality of provision of services should not be compared without some form of compensation (e.g. by use of a weighting factor).
Note that the normalisation can be applied to the total final actual energy consumption for the evaluated building, or to the benchmark value of energy consumption. The first method is the most applied and results in fixed benchmarking levels for various buildings of the same type, allowing comparison between buildings. The second method establishes the best link with the actual energy consumption as can be found on the energy bills, ideally to be renewed annually. An example of the deployment of tailored benchmarks can be found in the UK, developed by CIBSE [115] (TM46/47 [62][116]).
2.2.1.2 Examples
Sweden
In Sweden energy performance certification based on real energy consumption is implemented for both newly constructed and existing buildings that undergo thorough renovation.
The set of evaluation criteria consists of:
• maximum measured energy consumption (specific yearly primary energy consumption [kWhprim/(m².year)])
• maximum average heat transfer coefficient (Umax [W/(m².K)]) • maximum capacity of installed electrical heating [W/m²]
The measurement procedure can be chosen by the building owner but is usually executed according to the EPC procedure in which energy bills are collected by an independent energy expert who reports the measured energy consumption. The procedure requires a measurement period of 12 months within two years after completion of the building. The measured energy consumption is the sum of the yearly energy consumption delivered for heating, comfort cooling, domestic hot water and electricity use for purposes other than heating. The yearly energy consumption for heating is corrected for regional climatic conditions. The total amount is recalculated to primary energy and divided by the heated floor area. The calculation is done using following relation [117]:
𝑃𝐸𝑝𝑒𝑡 =
∑ (𝐸𝑢𝑝𝑝𝑣,𝑖𝐹𝑔𝑒𝑜
+ 𝐸𝑘𝑦𝑙,𝑖 + 𝐸𝑡𝑣𝑣,𝑖 + 𝐸𝑓,𝑖) . 𝑃𝐸𝑖6𝑖=1
𝐴𝑡𝑒𝑚𝑝
Exploring innovative indicators for the next-generation EPC features
20
where
• PEpet primary energy indicator [kWh/m².year] • Euppv delivered energy for heating [kWh] • Fgeo geographical factor to account for climatic variation [-] • Ekyl delivered energy for cooling [kWh] • Etvv energy delivered for domestic hot water [kWh] • Ef electricity delivered for other than heating [kWh] • Atemp heated floor area [m²] • PEi primary energy factor per energy carrier i (electricity, district heating, district
cooling, biofuel, oil and gas) [-]
Measurement of the domestic hot water use is legally required but considered economically not feasible. In practice, a standardised domestic hot water use is considered together with the attribution of solar thermal panels or recovery of waste heat, if any. The electricity consumption for applications other than heating is monitored using smart meters which allow for a segregated measurement of heating and applications other than heating. For the building permit application, the building owner can opt for verification by theoretical calculation or based on measured energy consumption. It is strongly encouraged to already include a calculation of the predicted energy consumption in the construction permission request. The input for this calculation is completed by standardised input for climatic conditions (depending on the geographical location), building use and user behaviour according to the Swedish programme for standardisation and verification of energy performance of buildings (SVEBY).
If the measured use does not comply to the requirements, an external energy expert can be appointed. Only 6% of local governments apply sanctions if energy requirements are not fulfilled.
Some specific aspects in the Swedish approach:
• It is not required that the calculated energy consumption (building permit application) and the measured energy consumption are similar. Both need to comply separately to the threshold of the requirements.
• Smart meters have been deployed on a large scale since 2009, facilitating the monitoring.
• Energy performance calculation uses a commercially developed software tool. For the design of residential buildings, a simple calculation program is allowed. For non-residential buildings dynamic calculation software (according to EU standards) is advised.
• BIM (building information modelling) is applied but currently only for pilot cases.
Flanders (Belgium)
In Flanders (Belgium), existing public buildings need to display the EPC (see Figure 5) on a publicly accessible and visible location in the building. The energy performance indicator is

Exploring innovative indicators for the next-generation EPC features
21
the sum of the measured yearly energy consumption per energy carrier recalculated to primary energy and normalised to the useful floor area and standard climatic conditions [118]. A benchmark is added by means of a coloured bar scale with the indicator value for the maximum of the scale and for an average building of the same type (e.g. post office, library).
Figure 5: Example of an EPC for public buildings used in Flanders [119]
In addition to the indicator, advice is included tailored to the specific building. The advice is based on an on-site building audit (following a questionnaire) to be completed by the energy expert. A database with information gathered in the frame of this mandatory EPC assessment is publicly available.
United Kingdom
In the UK (England and Wales), EPCs (see Figure 6) of public buildings are based on operational rating and referred to as display energy certificates (DECs) [120].
Currently DECs are mandatory for public buildings over 250m², only valid for 10 years and must always be displayed prominently at a location clearly visible to the public. They must be accompanied by an advisory report that contains recommendations for improvement of the energy performance of the building. For buildings with a floor area of 1000m² or more, a DEC is valid for 12 months and the advisory report for seven years. For these buildings, DECs must include operational ratings for the previous two years. For private buildings, a DEC can be commissioned on a voluntary basis.

Exploring innovative indicators for the next-generation EPC features
22
Figure 6: Example of a display energy certificate (DEC)
The operational rating is based on meter readings of the energy consumption during the last 12 months and is compared to a hypothetical building with a typical performance for its type (the benchmark). The operational rating is a numerical indicator shown on a scale from A to G, determined by the government-approved operational rating methodology [121] using approved software and executed by an accredited energy assessor. The various types of energy consumption are brought together on a common basis (actual annual CO2 emissions of the building) so that the performance can be compared between buildings. Typical performance for that type of building would have an operational rating of 100.
Aspects of the UK EPC assessment based on operational ratings include:
• Normalisation for weather is done by heating degree days method using regional values
• Normalisation for occupancy is done in the case of significantly larger periods of occupancy compared to the predefined (category-specific) occupancy period
• (Avoided) CO2 emissions due to the contribution of renewables are included below the zero line of CO2 emissions
• Application of composite benchmarks for mixed-use assessment • Exclusion of separable energy uses (not typical of that building type) facilitated
by separate metering.

Exploring innovative indicators for the next-generation EPC features
23
Netherlands
In the Netherlands, the EPC calculation method is explicitly not intended to estimate the real energy consumption of an individual building. It is, however, intended to closely match the average energy consumption for the whole of the Netherlands, by including an average, representative building use (e.g. internal heat gains, indoor temperature) in the method. In 2016, a study was done to analyse the option of two parallel methods, one based on calculations next to another based on measurements. It was chosen not to introduce this direct coupling for the following reasons [122]:
• The large influence of user behaviour on real energy performance • Policy preference to have uniform requirements (e.g. maximum values) for the
entire country • The anticipated high complexity of such a method.
Building-level detailed approach
Replicable methodologies to characterise and assess the actual energy performance of buildings are being developed embedded in a statistical and building physical framework starting from on-board monitored data of in-use buildings in the frame of IEA EBC annex 71 “Building energy performance assessment based on in-situ measurements”. The work within annex 71 further builds on the work done in the frame of IEA EBC annex 58 “Reliable building energy performance characterization based on full scale dynamic measurements”.
Identification of building behaviour as well as the identification of physical parameters for quality assurance methods are explored within annex 71. The global as-built heat loss coefficient (HLC), based on measured data during normal operating conditions, can be determined using different methods. The most important options are the following methods [123]:
• Average method • Linear regression models • Energy signature model • AR(MA)X models • Grey box models.
This actual heat loss coefficient accounts for the transmission heat (gains and) losses through the building fabric and optionally the infiltration losses. Efforts have been made to further detail the output of data-driven modelling that distinguishes the heat flow paths for different boundary conditions (e.g. outdoor air, ground, non-heated adjacent spaces). These require advanced measurement data as an input. When this data is not available, as is usually and in the case of adoption in EPC schemes most likely the case, it is suggested to limit the complexity of the model and only deduce the overall building thermal properties [124].
More information on the determination methods is given in Annex 1.

Exploring innovative indicators for the next-generation EPC features
24
The aspects concerning normalisation (see Section 2.2.1.1) are also relevant for a building-level detailed approach.
Stock-level model development
The third approach consists of top-down methodologies for the analysis of energy performance of buildings or groups of buildings. These methodologies use statistical techniques to predict or evaluate energy performance based on sufficiently large datasets of multiple buildings. This approach allows us to improve and validate existing methods, develop alternative models, and set benchmarking levels for evaluation. These concern the overall building energy consumption or performance, but also the physical performance characteristics of part of the building or its systems enable the development of improved models and benchmarking performance levels.
More information on the methods used in this approach is included in Annex 1.
The aspects concerning normalisation as described for the building-level simple approach (see Section 2.2.1.1) may also be relevant for this approach.
2.3 Application of assessment methods for the indicator
Use of methods for EPCs in different countries
The following findings are mainly adopted from a BPIE study published in 2014 [2]; in 14 of 28 EU countries, both the actual and calculated energy consumptions are foreseen for EPC assessment schemes, depending mainly on building type or building age:
• For some countries, the actual energy performance methodology applies only for non-residential (e.g. Slovenia) or other specific type of buildings (e.g. Flanders and UK (England and Wales); public buildings with minimum floor area)
• In others (e.g. Estonia, Latvia2) the evaluation of the actual energy consumption is extended to all the existing buildings while, for new buildings, the energy consumption is calculated.
For three Member States, the following additional information was found on the applied methods using measured energy consumption:
• In Sweden, the approach is part of a mandatory EPC assessment scheme, but an alternative to the verification based on measurements of energy consumption is foreseen in the option for verification by theoretical calculation.
• In the UK, energy performance rating of public buildings based on measured energy consumption is mandatory for public buildings and can be commissioned for non-public buildings on a voluntary basis.
2 In Latvia for new buildings a method based on calculation is implemented if measured data is not available.
Exploring innovative indicators for the next-generation EPC features
25
• In Flanders, the procedure based on measured energy consumption is mandatory for existing public buildings. The EPC based on measured energy consumption needs to be displayed on a publicly accessible and visible location in the building since January 2009 for buildings with useful floor area ≥ 1000m²; since January 2013 for buildings with useful floor area ≥ 500m²; since January 2015 for buildings with useful floor area ≥ 250m².
The methods applied in Sweden, the UK and Flanders can be categorised as approach 1: building-level simple approach. Further information is included in Section 2.2.
Applicability of methods to different building typologies
All methods described in Section 2.2 are applicable to both new and existing buildings. In the case of new or renovated buildings, a period after commissioning is required to obtain the necessary measurement data as an input to these methods. Additionally, co-heating or other on-site experiments that need to be performed on unoccupied buildings can be more easily executed for new or renovated buildings prior to occupancy or operation. This allows for more detailed building characteristic determination that can improve the model detail and accuracy. Furthermore, for new and renovated buildings, energy performance indicators based on measurements can serve as a compliance check for quality assurance purposes, also including quality of workmanship. For existing buildings, an additional important value is the incorporation of operational performance. It is also possible to evaluate user behaviour and energy consumption of applications outside the scope of current EPC evaluation methods to trigger improvement. All methods require measurement infrastructure to be installed.
There are no limitations regarding the building typology: the presented approaches can be implemented for all typologies. Some aspects may, however, possibly require additional attention when considering the use of measured energy consumption in EPC methods:
• Privacy legislation needs to be respected by compliance to the GDPR. This may require special considerations, especially measures for buildings with a limited number of occupants, such as individual dwellings. (Measured data can be part of a secure logbook where the building user decides who gets access.)
• In some buildings, energy cost allocation is based on parameters other than energy consumption at sub-metering level. For these buildings, such as older multifamily houses, the disaggregation of total measured energy consumption over common areas and private areas and the allocation of the energy consumption of the common areas to the individual end-users may pose additional difficulties.
• For some large and complex buildings with atypical use (tertiary buildings), a method based on measured energy consumption may be favourable, since the assumptions are less straightforward to make, and it is more difficult to include atypical uses in a general calculation method. On the other hand, for the purpose of comparison, atypical use needs to be excluded or considered separately.
• A method based on measured energy consumption is also more effective for buildings with less frequent user turnover, as the user behaviour is reflected in the measurement results. This is also relevant in the case of buildings being sold or let, as afterwards building characteristics or use (e.g. occupancy profile) may be

Exploring innovative indicators for the next-generation EPC features
26
different, rendering historical energy consumption data less useful as a reference for the specific building.
• For buildings that make use of certain energy sources, such as wood/pellets or heating oil, the use over time is difficult to track. It may even render methods implementing analysis over periods with a smaller time-step using high time resolution impossible.
On the other hand, methods based on measured energy consumption can take the effects of more innovative technologies into account. This is favourable for existing buildings that make use of such innovative technologies, but it will also stimulate innovation in technologies for the improvement of energy performance of buildings.
Presentation of the indicator
The assessment methods for real energy consumption can deliver one or more of the following energy performance (and related) indicators as output:
• Yearly or monthly (primary) (specific) energy consumption [kWh/month] [kWhprim/(m².year)]
• Yearly or monthly (primary) (specific) energy consumption per application [kWh/month] [kWhprim/(m².year)] (e.g. space heating and domestic hot water)
• Share of energy from renewable sources [%] [-] • Yearly or monthly CO2 emission [kg/month] [kg/(m².year)] • Yearly or monthly CO2 emission per application [kg/month] [kg/(m².year)] (e.g.
space heating and domestic hot water) • Avoided CO2 emission by use of energy from renewable sources [kg/month]
[kg/(m².year)] • Heat loss coefficient [W/K] [W/(m².K)] • Global solar aperture coefficient [m²] • Thermal capacity [J/K] [J/K.m³] • Wind induced infiltration [m³/h] [m³/(h.m²)]
These can directly serve as an energy performance indicator for inclusion in EPC assessment or indirectly provide a more accurate input for simplified energy performance calculation methods. Also, disaggregation of energy consumption over its constituents, the quantification of user behaviour effect (splitting building-related energy consumption from occupant’s energy consumption), and the identification of energy from renewable sources can be useful outputs for direct or indirect purposes in EPC assessment methods.
The performance indicator value can be compared to a reference value or reference scale or ranked in categories. The reference quantification (baseline) can be based on historical energy performance, typical performance of similar buildings, simulated (expected) energy performance, potential energy performance (from building-specific audits or reviews) or a performance level determined by regulatory methodology [100]. A noteworthy special case is the notional building approach in which the baseline for energy performance is determined for a building with partly the same and partly reference characteristics by calculation or simulation, which means that it is less relevant for EPC methods based on measured energy consumption (apart from e.g. calibrated simulation).
Exploring innovative indicators for the next-generation EPC features
27
2.4 Linking the assessment methods to energy performance and EPCs
Currently user acceptance of EPCs is hampered by the interpretation of the energy performance indicator. This indicator is expressed as the annual characteristic specific primary energy consumption. The adjective ‘characteristic’ means it is determined at standardised conditions concerning outdoor and indoor environmental conditions and building use. This inherent nature of the indicator and especially the fact that it is expressed in primary energy makes it difficult to comprehend or to link it to energy bill or metering information. Furthermore, the discrepancy between calculated and measured energy performance, the energy performance gap, is detrimental for trust in EPC relevance. Including an indicator expressing energy performance in terms of yearly or monthly actual energy consumption would mitigate both aspects that are currently disadvantageous to successful achievement of energy efficiency and decarbonisation goals in the building sector.
This feature directly reflects the real energy performance of the building. It may enable direct user feedback and would additionally allow for quality assurance in the case of building commissioning (new or renovated buildings) and evaluation of operational energy performance. Furthermore the real energy consumption feature (and the integration of smart metering) interlinks with the development of smart grids and the growing importance of smart buildings in the broader energy system in terms of integrating energy from local renewable sources and better demand-side management and energy storage opportunities [125][126].
These methodologies can provide a valuable feature for EPCs, either in addition to existing energy performance indicators and benchmarks or as standalone replacements. The resulting indicators can be included as information or accompanied by minimum energy performance requirements or benchmarks for evaluating the energy performance of the building or its components. Some of the presented methods also enable determination of input parameters for simplified energy performance calculation methods currently in use in EPC methodologies. This input can automatically be inserted in software tools, reducing costs and risk of errors by on-site inspection and manual data processing. The methods can also increase the accuracy of current EPC models. This in turn will improve monitoring of Member States’ progress toward long-term objectives regarding energy efficiency, the share of renewables and the reduction of greenhouse gas emissions.
2.5 Legal boundaries or requirements of assessment methods
Legislation on privacy needs to be respected. This is part of the EU Clean Energy for All Europeans package [127], which includes compliance with relevant EU data protection and privacy legislation. Adequate measures need to be taken to comply with the GDPR.
Where this feature is used for evaluation purposes, influencing aspects other than those strictly related to the building energy performance need to be excluded to allow objective comparison amongst buildings or in relation to the reference (minimum) performance.
Exploring innovative indicators for the next-generation EPC features
28
Measurement procedures need to be controllable. For manual meter readings in existing buildings not yet equipped with smart meters or on-site monitoring provided by a building energy monitoring system, adequate control measures need to be foreseen in the procedures to minimise fraud. Special considerations need to be made for measurement of energy delivered by bulked properties such as wood.
2.6 Ranking of methods for assessing their feasibility for the feature
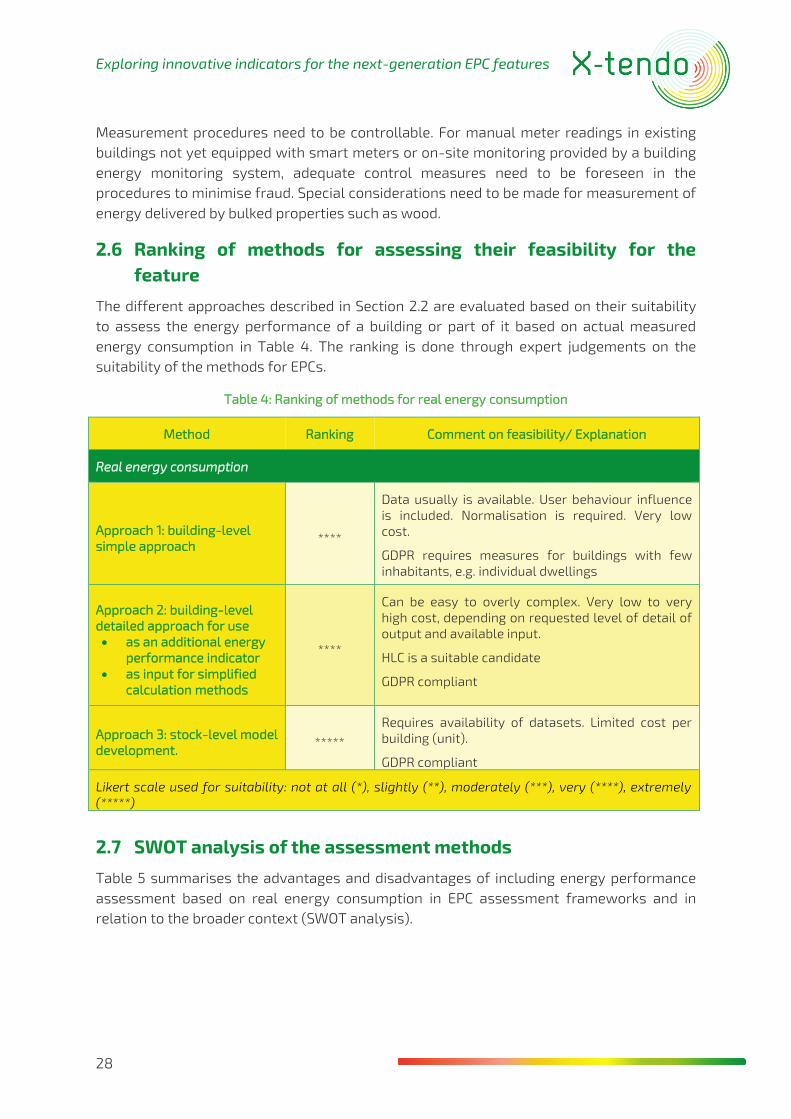
The different approaches described in Section 2.2 are evaluated based on their suitability to assess the energy performance of a building or part of it based on actual measured energy consumption in Table 4. The ranking is done through expert judgements on the suitability of the methods for EPCs.
Table 4: Ranking of methods for real energy consumption
Method Ranking Comment on feasibility/ Explanation
Real energy consumption
Approach 1: building-level simple approach
****
Data usually is available. User behaviour influence is included. Normalisation is required. Very low cost.
GDPR requires measures for buildings with few inhabitants, e.g. individual dwellings
Approach 2: building-level detailed approach for use • as an additional energy
performance indicator • as input for simplified
calculation methods
****
Can be easy to overly complex. Very low to very high cost, depending on requested level of detail of output and available input.
HLC is a suitable candidate
GDPR compliant
Approach 3: stock-level model development.
*****
Requires availability of datasets. Limited cost per building (unit).
GDPR compliant
Likert scale used for suitability: not at all (*), slightly (**), moderately (***), very (****), extremely (*****)
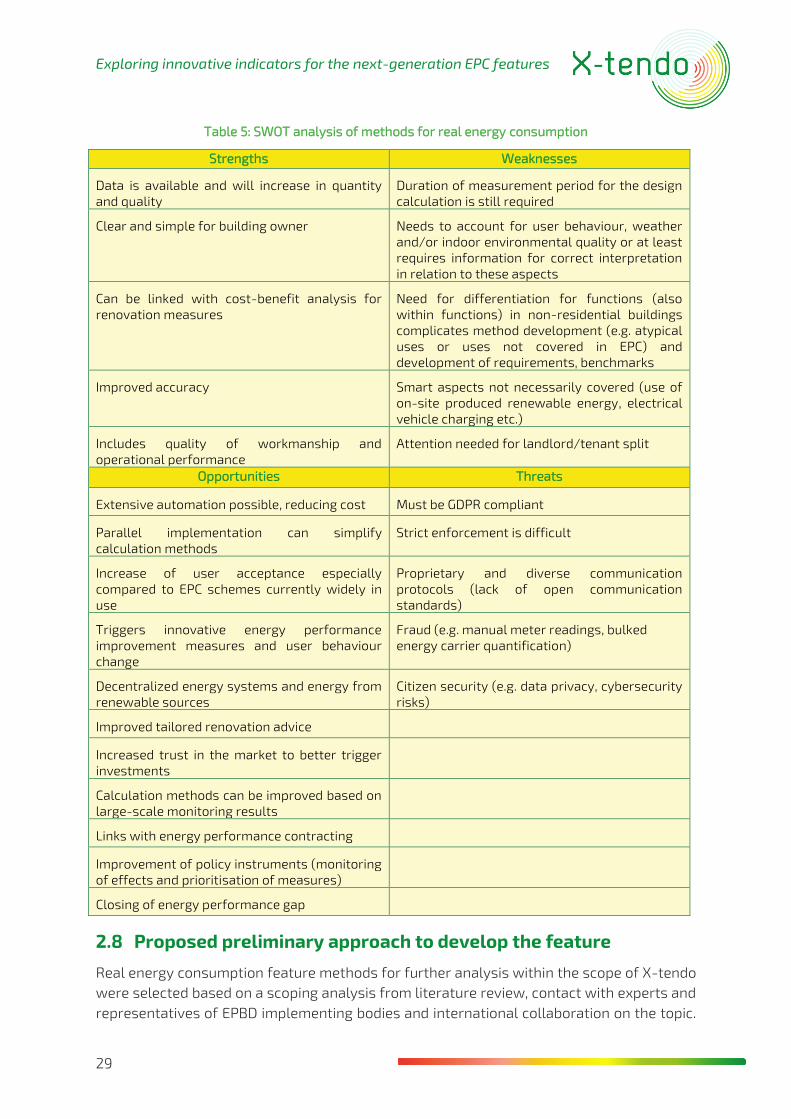
2.7 SWOT analysis of the assessment methods
Table 5 summarises the advantages and disadvantages of including energy performance assessment based on real energy consumption in EPC assessment frameworks and in relation to the broader context (SWOT analysis).
Exploring innovative indicators for the next-generation EPC features
29
Table 5: SWOT analysis of methods for real energy consumption
Strengths Weaknesses
Data is available and will increase in quantity and quality
Duration of measurement period for the design calculation is still required
Clear and simple for building owner Needs to account for user behaviour, weather and/or indoor environmental quality or at least requires information for correct interpretation in relation to these aspects
Can be linked with cost-benefit analysis for renovation measures
Need for differentiation for functions (also within functions) in non-residential buildings complicates method development (e.g. atypical uses or uses not covered in EPC) and development of requirements, benchmarks
Improved accuracy Smart aspects not necessarily covered (use of on-site produced renewable energy, electrical vehicle charging etc.)
Includes quality of workmanship and operational performance
Attention needed for landlord/tenant split
Opportunities Threats
Extensive automation possible, reducing cost Must be GDPR compliant
Parallel implementation can simplify calculation methods
Strict enforcement is difficult
Increase of user acceptance especially compared to EPC schemes currently widely in use
Proprietary and diverse communication protocols (lack of open communication standards)
Triggers innovative energy performance improvement measures and user behaviour change
Fraud (e.g. manual meter readings, bulked energy carrier quantification)
Decentralized energy systems and energy from renewable sources
Citizen security (e.g. data privacy, cybersecurity risks)
Improved tailored renovation advice
Increased trust in the market to better trigger investments
Calculation methods can be improved based on large-scale monitoring results
Links with energy performance contracting
Improvement of policy instruments (monitoring of effects and prioritisation of measures)
Closing of energy performance gap
2.8 Proposed preliminary approach to develop the feature
Real energy consumption feature methods for further analysis within the scope of X-tendo were selected based on a scoping analysis from literature review, contact with experts and representatives of EPBD implementing bodies and international collaboration on the topic.

Exploring innovative indicators for the next-generation EPC features
30
Based on this preliminary scoping analysis, two approaches were identified as candidates most suitable for inclusion in EPC schemes. Within each approach category, one best option method was suggested for further elaboration:
• Building-level simple approach • Building-level detailed approach: whole building heat loss coefficient (HLC)
The third approach, namely stock-level model development, was not retained for further analysis.
More enhanced detailed building- and district-level approaches will become available in the future, but more research is necessary to fine-tune the combinations of measurement set-up and analysis methods in relation to the accuracy requirements and cost and time constraints. The second method (HLC) was also evaluated to be currently not feasible for inclusion in EPC schemes for similar reasons. It is the most promising method of building-level detailed approaches, and with some limited further research (for e.g. automation of procedure) will be ready for cost-effective implementation in EPC schemes in a future context of broad-scale sensor deployment and increasing availability of data. A brief description of the concept of the HLC method is therefore included in Annex 1.
The building-level simple approach method combines features that are included in the initial selection of options for methods and indicators identified as suitable for including real energy consumption in EPCs. A brief description of the method is given below.
Building-level simple approach method for the determination of energy performance based on real energy consumption
• Description
This method is based on the EPC method (operational rating) as implemented in Sweden and extended with optional modules for normalisation or correction to allow for inter-building comparison. These optional modules are based on other methods such as the EPC method (operational rating) implemented in England and Wales. The method requires measurement infrastructure for monitoring of all energy constituents and per energy carrier. Only the domestic hot water use monitoring can be replaced by using a calculation model. In essence, the method can also be applied based on billing information. If only billing energy consumption information is available, normalisation options are limited and in most cases modules for calculated energy consumption are used to complete the missing data, such as for the implementation of the heating degree day method. The output is an energy performance indicator, the “energy use indicator”, representing the yearly specific primary energy consumption of the building.
Normalisation or correction of the indicator to standard consumption or external conditions is included for:
• Size of the building unit (floor area) • External weather conditions (heating and cooling degree days method) • Energy carrier (primary energy factors)
It is optional for:

Exploring innovative indicators for the next-generation EPC features
31
• Indoor thermal comfort level (inclusion in HDD/CDD) • Indoor air quality level • Service provision
The inclusion of an additional optional indicator of share of renewable energy and of additional optional user behaviour benchmarking can be considered. These are not included in the visualisation (see Figure 7).
• Visualisation of the determination method
Figure 7: Energy use indicator calculation process
• Input parameters The input parameters per energy carrier and the optional indoor environmental quality parameters (indoor temperature, ventilation air flow rate, supply and return air temperatures) are obtained from monitoring infrastructure. Only the domestic hot water use monitoring can be replaced by using a calculation model. Per energy carrier I (i: 1…6; electricity, district heating, district cooling, biofuel, oil and gas)*:
• Esh,i Energy delivered for space heating by energy carrier I [kWh] • Edhw,i Energy delivered for domestic hot water by energy carrier I [kWh]** • Ecool,i Energy delivered for space cooling by energy carrier I [kWh] • Eother,i Energy delivered for other purposes (excl. non-EPC) by energy carrier
I [kWh]
All parameters: Net energy inputs for the time period considered (1 year)*** • fprim Primary energy conversion factor for energy carrier I [kWhprim/kWh]
Building info:
• Auseable useable floor area of the building (unit) [m²] Indoor environmental quality (IEQ) parameters (optional):

Exploring innovative indicators for the next-generation EPC features
32
• Ti Indoor air temperature [°C] • V Ventilation air flow rate [m³/h] • Tsupply Temperature of supply air [°C]**** (May be substituted by Te) • Treturn Temperature of return air [°C]**** (May be substituted by Ti) • th,HRU Thermal efficiency of heat recovery unit [-] (1 representative value
for operational efficiency; only in case of heat recovery system) • th,sh Thermal efficiency of space heating system [-] (1 representative
value for operational efficiency, to translate ventilation net energy losses to final energy consumption)
Occupancy info (optional) • noccupants Number of occupants [-]
* Non-EPC related energy consumption needs to be disentangled and excluded from the analysis, e.g. social housing common washing room energy consumption
** Edhw measurement is economically not feasible in EPC framework (Swedish method); alternatively a modelled value is allowed; Edhw=f(noccupants or Vbuilding).
*** 1) Net: referring here to the exclusion of the use of on-site produced and on-site used (or stored within considered period of time) or exported renewable energy. 2) If indicator share of renewable or total on-site renewable energy production is wanted, additional submetering is required.
**** Calculation of ventilation heat loss for implementation of fvent (only to this part of heat losses).

Exploring innovative indicators for the next-generation EPC features
33
3 FINDINGS This section presents a summary of key findings (Table 6) related to the indicators that will be developed for the five innovative features in the X-tendo toolbox. This summary will be a precursor for further work in WP3. The findings have been categorised into key barriers, challenges, limitations, delivery actors, presentation, target audience and link with energy performance.
Table 6: Key findings of the scoping and analysis of all features
Feature 1: smart readiness
Feature 2: comfort
Feature 3: outdoor air pollution
Feature 4: real energy consumption
Feature 5: district energy
Key barriers
Technical/
methodological
Dealing with differences in building services (heating, EV presence, etc.) and characteristics (age, type or geographical location)
Weighted measures and theoretical building maximums need to be developed
Assessment methodology for different building typologies
Proper definition of outdoor air quality
Length of the monitoring duration
Implementation of a certification scheme for calculating future PEF, REF and CEF could be a major barrier for some countries
Financial
/economic
Existence of several schemes (market saturation)
- - Normalisation for user behaviour financially
-
Legislative/
governance
Differences across MS in smart readiness levels
Various standards at MS level
- Enforcement frame
Accounting for bulked quantities
-
Social Novelty of the indicator requires the presence of useful information
Benefits are not well understood by public
- Landlord/tenant split
-

Exploring innovative indicators for the next-generation EPC features
34
for the majority of the public
Environmental ICT technology might have a significant environmental impact
- - Monitoring infrastructure cost in relation to benefits
Additional efforts and committing to values stated in EPCs might be a reason for district heating utilities to oppose these indicators
Industry Potential lack of readiness of the industry to satisfy the demand of new ICT
Application of industry-based solutions in building sector
- Strict enforcement is difficult or even not feasible
Implementation of a certification scheme for calculating future PEF, REF and CEF could be a major barrier for some countries
Key challenges
Technical/
methodological
Quick assessment -> Method A is created to reduce assessment time
Provision of single rank/score
Accuracy of methods with or without measurements
Estimation of filter classification for each county
Proper definition of reference values of emission rates
Scale of indexes and weights for each country
Development of suitable models for missing data (e.g. DHW energy consumption)
Differentiation of method for various functions (especially non-residential)
Normalisation versus maintaining the link with actual measured energy consumption
Normalisation for indoor environmental
Variable definitions of PEF, REF and CEF
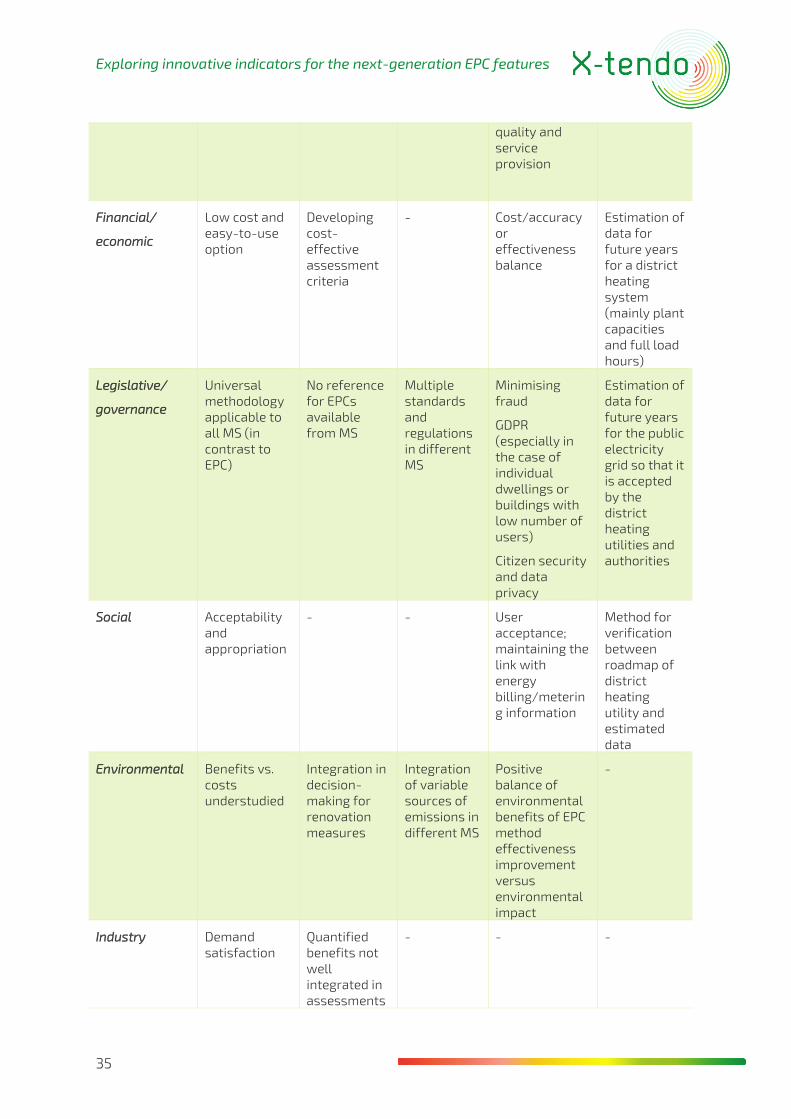
Exploring innovative indicators for the next-generation EPC features
35
quality and service provision
Financial/
economic
Low cost and easy-to-use option
Developing cost-effective assessment criteria
- Cost/accuracy or effectiveness balance
Estimation of data for future years for a district heating system (mainly plant capacities and full load hours)
Legislative/
governance
Universal methodology applicable to all MS (in contrast to EPC)
No reference for EPCs available from MS
Multiple standards and regulations in different MS
Minimising fraud
GDPR (especially in the case of individual dwellings or buildings with low number of users)
Citizen security and data privacy
Estimation of data for future years for the public electricity grid so that it is accepted by the district heating utilities and authorities
Social Acceptability and appropriation
- - User acceptance; maintaining the link with energy billing/metering information
Method for verification between roadmap of district heating utility and estimated data
Environmental Benefits vs. costs understudied
Integration in decision-making for renovation measures
Integration of variable sources of emissions in different MS
Positive balance of environmental benefits of EPC method effectiveness improvement versus environmental impact
-
Industry Demand satisfaction
Quantified benefits not well integrated in assessments
- - -

Exploring innovative indicators for the next-generation EPC features
36
Limitations Might work at the level of some MS but not all
Higher smartness levels should reflect better quality of life for occupants and building performance
Reduction of measurements for cost-effectiveness
Limited complexity to simplify training of experts
AQI data is required
For the design, calculation is still required; duration of measurement period (relevant for new/renovated buildings)
Monitoring infrastructure roll-out may not be supported in all MS
-
Presentation Well-developed presentation approach
Few examples of presentation available
Existing colourful scale exists
As part of EPC, printed, digital, as part of building logbook, complementary to current EPC information or replacing it.
-
Delivery actors EPC assessors, qualified experts but also owners (self-assessment)
EPC assessors, qualified building professionals
EPC assessors, energy auditors
EPC assessors, qualified building professionals/experts
Depending on data availability, potentially fully automated
EPC assessors, district heating utilities
Target audience
Whole building ecosystem: property owners, buyers, renters, tenants, facility managers, public authorities
Property owners, buyers, renters, tenants, facility managers
End-users, owners, occupants
Same as current EPC target audience, although focus is more user-oriented.
Property owners, buyers, renters, tenants, facility managers, research, public authorities responsible for planning heating and cooling
Link with energy performance
Monitoring and operation at the building level and
Thermal comfort and indoor air quality have a
Pollutant emission and indoor air purity
Real energy consumption directly links with energy
All indicators have a strong link to the energy

Exploring innovative indicators for the next-generation EPC features
37
improved interoperability with the grid
strong link with energy performance
have a strong link with building thermal and installation characteristics
performance and additional operational (energy) performance
Potentially contributes to mitigation of energy performance gap
performance of the building
Exploring innovative indicators for the next-generation EPC features
38
4 CONCLUSIONS This report provides useful and crucial insights into working out the indicators for the five features during the X-tendo project. For all features, we have outlined details of the existing assessment/calculation methods in the context of EPCs. Their application domain, legal boundaries, and links with energy consumption and EPCs were also studied and evaluated. A SWOT analysis and ranking of methods were presented highlighting the best fits for each of the indicators. However, further work and adjustments to these methods would be required to make them available for real testing. A proposed approach for the development of each feature based on a preliminary concept for the indicator is also presented. Finally, across all features, key findings have been presented, leading to the following conclusions in two groups:
Indicators
‘Smart readiness’ approach presents a potential method for assessing the smartness
of buildings with nine domains (e.g. lighting, ventilation, envelope, monitoring and
control etc.)
‘Comfort’ approach incorporates four key indicators – thermal, visual and acoustic
comfort and indoor air quality – to be assessed through checklists, on-site
measurements and surveys
‘Outdoor air pollution’ approach addresses a building’s impact on air by two methods:
an outdoor air pollution contribution index and indoor air purity index
‘Real energy consumption’ approach outlines an assessment method based on
operational ratings, with options for normalisation to allow for better inter-building
comparison
‘District energy’ approach focuses on predicting the potential for future development
for buildings via two methods: expected future performance of district heating and
heat distribution and transfer system
Cross-cutting issues
Technical challenges that constrain the application of existing methods such as
assessment time, accuracy, normalisation process, variable definitions and emission
factors could be overcome by certain modifications in approach
Features should be aligned financially to increase market acceptance and cost-
effective assessments during the development
Legal and governance issues should be addressed by dealing with challenges such as
development of universal methodologies, presence of multiple standards at Member

Exploring innovative indicators for the next-generation EPC features
39
State level, control of citizen data and privacy, and acceptance of future estimations by
public authorities
From a social perspective, user acceptance and public understating of the features are
key issues and should be considered in feature development
If these indicators are well integrated within EPCs, significant environmental benefits
are anticipated
Future implementation of indicators can be strengthened by addressing lack of
industry readiness, understanding of anticipated benefits and enforcement issues
Certain limitations need to be overcome to implement these innovative indicators, such as variable levels of implementation in the Member States due to different local requirements and regulations. Some indicators require extensive monitoring and measurements, and a lack or absence of data is a barrier in the development and acceptance of these features within EPC schemes.
A range of delivery actors was identified for all the features, including EPC assessors, qualified experts, building professionals, and auditors. It is especially important to focus on them while developing the features as they will directly affect the outcomes of the assessments. While developing the features, links with energy performance are being explored and studied with reference to interoperability with the grid, energy consumption, and operational energy performance. To successfully develop the indicators and their implementation in the EPC schemes of the Member States, the features should ensure compliance with the requirements of the target audience and the framework principles of the cross-cutting criteria in X-tendo.
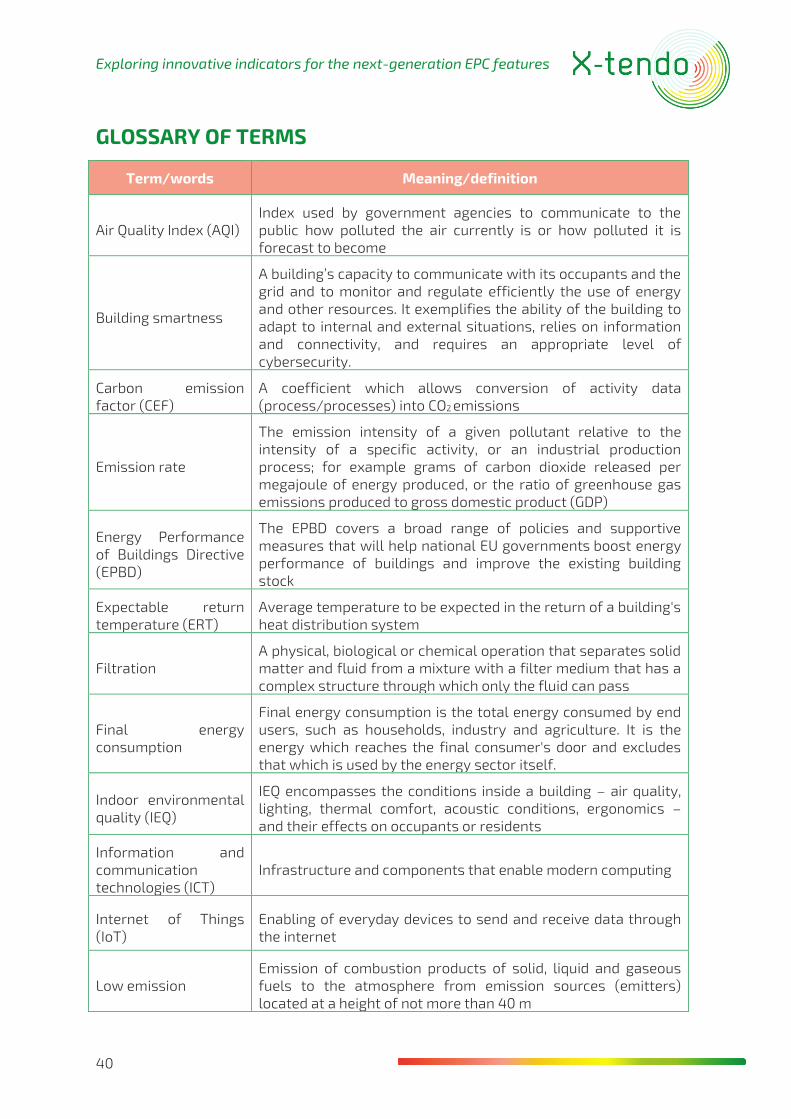
Exploring innovative indicators for the next-generation EPC features
40
GLOSSARY OF TERMS
Term/words Meaning/definition
Air Quality Index (AQI) Index used by government agencies to communicate to the public how polluted the air currently is or how polluted it is forecast to become
Building smartness
A building’s capacity to communicate with its occupants and the grid and to monitor and regulate efficiently the use of energy and other resources. It exemplifies the ability of the building to adapt to internal and external situations, relies on information and connectivity, and requires an appropriate level of cybersecurity.
Carbon emission factor (CEF)
A coefficient which allows conversion of activity data (process/processes) into CO2 emissions
Emission rate
The emission intensity of a given pollutant relative to the intensity of a specific activity, or an industrial production process; for example grams of carbon dioxide released per megajoule of energy produced, or the ratio of greenhouse gas emissions produced to gross domestic product (GDP)
Energy Performance of Buildings Directive (EPBD)
The EPBD covers a broad range of policies and supportive measures that will help national EU governments boost energy performance of buildings and improve the existing building stock
Expectable return temperature (ERT)
Average temperature to be expected in the return of a building's heat distribution system
Filtration A physical, biological or chemical operation that separates solid matter and fluid from a mixture with a filter medium that has a complex structure through which only the fluid can pass
Final energy consumption
Final energy consumption is the total energy consumed by end users, such as households, industry and agriculture. It is the energy which reaches the final consumer's door and excludes that which is used by the energy sector itself.
Indoor environmental quality (IEQ)
IEQ encompasses the conditions inside a building – air quality, lighting, thermal comfort, acoustic conditions, ergonomics – and their effects on occupants or residents
Information and communication technologies (ICT)
Infrastructure and components that enable modern computing
Internet of Things (IoT)
Enabling of everyday devices to send and receive data through the internet
Low emission Emission of combustion products of solid, liquid and gaseous fuels to the atmosphere from emission sources (emitters) located at a height of not more than 40 m
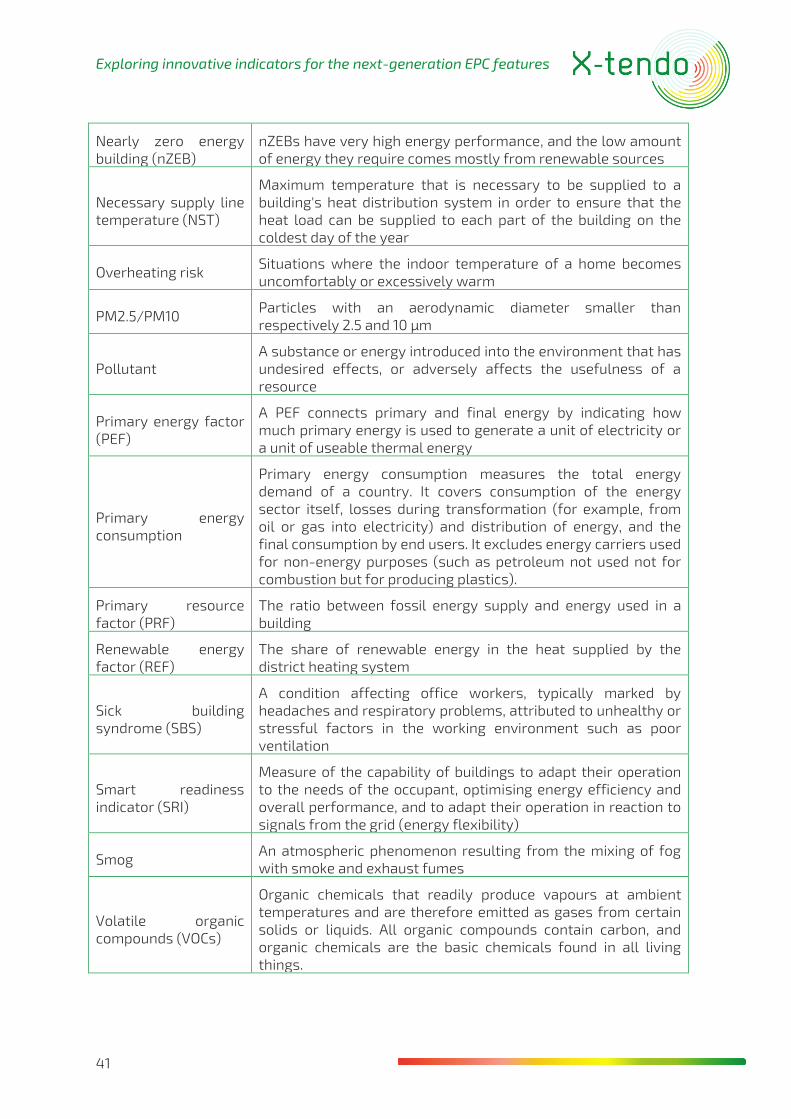
Exploring innovative indicators for the next-generation EPC features
41
Nearly zero energy building (nZEB)
nZEBs have very high energy performance, and the low amount of energy they require comes mostly from renewable sources
Necessary supply line temperature (NST)
Maximum temperature that is necessary to be supplied to a building's heat distribution system in order to ensure that the heat load can be supplied to each part of the building on the coldest day of the year
Overheating risk Situations where the indoor temperature of a home becomes uncomfortably or excessively warm
PM2.5/PM10 Particles with an aerodynamic diameter smaller than respectively 2.5 and 10 µm
Pollutant A substance or energy introduced into the environment that has undesired effects, or adversely affects the usefulness of a resource
Primary energy factor (PEF)
A PEF connects primary and final energy by indicating how much primary energy is used to generate a unit of electricity or a unit of useable thermal energy
Primary energy consumption
Primary energy consumption measures the total energy demand of a country. It covers consumption of the energy sector itself, losses during transformation (for example, from oil or gas into electricity) and distribution of energy, and the final consumption by end users. It excludes energy carriers used for non-energy purposes (such as petroleum not used not for combustion but for producing plastics).
Primary resource factor (PRF)
The ratio between fossil energy supply and energy used in a building
Renewable energy factor (REF)
The share of renewable energy in the heat supplied by the district heating system
Sick building syndrome (SBS)
A condition affecting office workers, typically marked by headaches and respiratory problems, attributed to unhealthy or stressful factors in the working environment such as poor ventilation
Smart readiness indicator (SRI)
Measure of the capability of buildings to adapt their operation to the needs of the occupant, optimising energy efficiency and overall performance, and to adapt their operation in reaction to signals from the grid (energy flexibility)
Smog An atmospheric phenomenon resulting from the mixing of fog with smoke and exhaust fumes
Volatile organic compounds (VOCs)
Organic chemicals that readily produce vapours at ambient temperatures and are therefore emitted as gases from certain solids or liquids. All organic compounds contain carbon, and organic chemicals are the basic chemicals found in all living things.
Exploring innovative indicators for the next-generation EPC features
42
REFERENCES [1] Buildings Performance Institute Europe (BPIE), Europe’s Buildings Under The
Microscope. 2011.
[2] Buildings Performance Institute Europe (BPIE), Energy Performance Certificates Across the EU. A mapping of National Approaches. 2014.
[3] B. L. Risteska Stojkoska and K. V. Trivodaliev, “A review of Internet of Things for smart home: Challenges and solutions,” Journal of Cleaner Production. 2017.
[4] I. Alam, S. Khusro, and M. Naeem, “A review of smart homes: Past, present, and future,” ICOSST 2017 - 2017 Int. Conf. Open Source Syst. Technol. Proc., 2018 (6), pp. 35–41, 2018.
[5] A. H. Buckman, M. Mayfield, and S. B. M. Beck, “What is a smart building?,” Smart Sustain. Built Environ., 3(2), pp. 92–109, 2014.
[6] D. Arditi, G. Mangano, and A. De Marco, “Assessing the smartness of buildings,” Facilities, 33(9–10), pp. 553–572, 2015.
[7] X. Lu, D. Clements-Croome, and M. Viljanen, “Past, present and future mathematical models for buildings,” Intell. Build. Int., 2009.
[8] J. Yang and H. Peng, “Decision support to the application of intelligent building technologies,” Renew. energy, 2001.
[9] A. B. R. González, J. J. V. Díaz, A. J. Caamaño, and M. R. Wilby, “Towards a universal energy efficiency index for buildings,” Energy Build., 2011.
[10] D. Katz and J. Skopek, “The CABA building intelligence quotient programme,” Intell. Build. Int., 1(4), pp. 277–295, 2009.
[11] W. L. Lee and J. Burnett, “Benchmarking energy use assessment of HK-BEAM, BREEAM and LEED,” Build. Environ., 2008.
[12] P. Mathew, D. Sartor, W. Lintner, and P. Wirdzek, “Labs21 Environmental Performance Criteria : Toward ‘ LEED TM for Labs ,’” December, pp. 1–10, 2001.
[13] W. To, L. Lai, K. Lam, and A. Chung, “Perceived Importance of Smart and Sustainable Building Features from the Users’ Perspective,” Smart Cities 1(1), pp. 163–175, 2018.
[14] N. Dodd, M. Cordella, M. Traverso, and S. Donatello, Level(s)-A common EU framework of core sustainability indicators for office and residential buildings Part 3: How to make performance assessments using Level(s) (Draft Beta v1.0), August 2017.
[15] DGNB, “New DGNB ‘Climate Positive’ award for buildings that make an active contribution to climate protection,” 2019. [Online]. Available: www.dgnb.de/de/aktuell/pressemitteilungen/2019/new-dgnb-climate-positive-award.
[16] Y. M. Stijn Verbeke, D. Aerts, G. Rynders, “Interim report July 2019 of the 2th technical support study on the Smart Readiness Indicator for Buildings,” VITO Rep., July, p. 281,
Exploring innovative indicators for the next-generation EPC features
43
2019.
[17] A. Romero, P. De Agustin, and T. Tsitsanis, “Integration of Real-Intelligence in Energy Management Systems to Enable Holistic Demand Response Optimization in Buildings and Districts,” in Proceedings - 2018 IEEE International Conference on Environment and Electrical Engineering and 2018 IEEE Industrial and Commercial Power Systems Europe, EEEIC/I and CPS Europe 2018, 2018, no. 768614.
[18] S. Verbeke, D. Aerts, G. Rynders, and Y. Ma, “3rd Interim report of the 2nd technical support study on the Smart Readiness Indicator for buildings,” Brussels, 2020.
[19] S. Kephalopoulos, O. Geiss, J. Barrero-Moreno, D. D’agostino, and D. Paci, “Promoting healthy and energy efficient buildings in the European Union,” European Commission, Luxembourg, 2016.
[20] Y. Al horr, M. Arif, M. Katafygiotou, A. Mazroei, A. Kaushik, and E. Elsarrag, “Impact of indoor environmental quality on occupant well-being and comfort: A review of the literature,” Int. J. Sustain. Built Environ., 5(1), pp. 1–11, 2016.
[21] R. Antikainen, S. Lappalainen, A. Lönnqvist, K. Maksimainen, K. Reijula, and E. Uusi-Rauva, “Exploring the relationship between indoor air and productivity,” Scand. J. Work. Environ. Heal. Suppl., 4, pp. 79–82, 2008.
[22] C. Dai, L. Lan, and Z. Lian, “Method for the determination of optimal work environment in office buildings considering energy consumption and human performance,” Energy Build., 76, pp. 278–283, 2014.
[23] DOE, “International Performance Measurement & Verification Protocol: Concepts and Practices for Improved Indoor Environmental Quality,” National Renewable Energy Laboratory, Oak Ridge, 2001.
[24] EU, Directive 2010/31/EU of the European Parliament and the Council of 19 May 2010 on the energy perfromance of buildings (recast). 2010, pp. 13–35.
[25] EU, Directive 2012/27/EU of the European Parliament and of the Council of 25 October 2012 on energy efficiency, October. 2012, pp. 1–56.
[26] EC, Energy Efficient Buildings: Multi-annual roadmap for the contractual PPP under Horizon 2020. Publications Office of the European Union, 2013.
[27] E. C. You, D. Dunt, and C. Doyle, “Influences on Case-Managed Community Aged Care Practice.,” Qual. Health Res., 2015.
[28] I. Sarbu and C. Sebarchievici, “Aspects of indoor environmental quality assessment in buildings,” Energy Build. 60, pp. 410–419, 2013.
[29] ASHRAE, “ANSI/ASHRAE 55:2013 Thermal Environmental Conditions for Human Occupancy,” American Society of Heating, Refrigerating and Air-Conditioning Engineers, Atlanta, GA, 2013.
[30] ISO, “ISO 7730 Ergonomics of the Thermal Environment: Analytical Determination and Interpretation of Thermal Comfort Using Calculation of the PMV and PPD Indices and Local Thermal Comfort Criteria,” International Organization for Standardization, 2006.

Exploring innovative indicators for the next-generation EPC features
44
[31] P. Wargocki, D. P. Wyon, J. Sundell, G. Clausen, and P. O. Fanger, “The effects of outdoor air supply rate in an office on perceived air quality, sick building syndrome (SBS) symptoms and productivity.,” Indoor Air, 10( 4), pp. 222–236, 2000.
[32] S. R. Jurado, A. D. P. Bankoff, and A. Sanchez, “Indoor air quality in Brazilian universities,” Int. J. Environ. Res. Public Health, 11(7), pp. 7081–7093, 2014.
[33] M. Di Giulio, R. Grande, E. Di Campli, S. Di Bartolomeo, and L. Cellini, “Indoor air quality in university environments,” Environ. Monit. Assess., 170(1–4), pp. 509–517, 2010.
[34] T. Godish and J. D. Spengler, “Relationships Between Ventilation and Indoor Air Quality: A Review,” Indoor Air, 6(2), pp. 135–145, 1996.
[35] WHO, “WHO guidelines for indoor air quality: Selected Pollutants,” World Health Organisation, Copenhagen, 2010.
[36] CEN, “EN 12665:2011- Light and lighting- Basic terms and criteria for specifying lighting requirements,” European Commitee for Standardization, Brussels, 2012.
[37] D. K. Serghides, C. K. Chatzinikola, and M. C. Katafygiotou, “Comparative studies of the occupants’ behaviour in a university building during winter and summer time,” Int. J. Sustain. Energy, 34(8), pp. 528–551, 2015.
[38] M. Frontczak and P. Wargocki, “Literature survey on how different factors influence human comfort in indoor environments,” Build. Environ. 46(4), pp. 922–937, 2011.
[39] I. A. Sakellaris et al., “Perceived Indoor Environment and Occupants’ Comfort in European ‘Modern’ Office Buildings: The OFFICAIR Study,” Int. J. Environ. Res. Public Health, 13(5), 2016.
[40] S. Kang, D. Ou, and C. M. Mak, “The impact of indoor environmental quality on work productivity in university open-plan research offices,” Build. Environ., 124, pp. 78–89, 2017.
[41] P. Ricciardi and C. Buratti, “Environmental quality of university classrooms: Subjective and objective evaluation of the thermal, acoustic, and lighting comfort conditions,” Build. Environ., 127(August), pp. 23–36, 2018.
[42] K. L. Jensen, E. Arens and L. Zagreus, “Acoustical Quality in Office Workstations, as Assessed By Occupant Surveys,” in Indoor Air: 10th international conference on indoor air quality and climate, 2005, pp. 2401–2405.
[43] ISO, “ISO 16283-1:2014 Acoustics- Field measurments of sound insulation in buildings and of building elements- Part 1: Airborne sound insulation,” International Organization for Standardization, 2014.
[44] BREEAM, “BREEAM International Non-Domestic Refurbishment 2015-Technical Manual SD225 1.4,” 2015.
[45] BREEAM, “BREEAM Refurbishment Domestic Buildings 2015-Technical Manual SD5077 2.2,” 2015.
[46] DGNB, “DGNB- Sociocultural and functional quality- SOC1.1/Thermal Comfort,” 2018.
[47] DGNB, “DGNB- Sociocultural and functional quality- SOC1.2/Indoor Air Quality,” 2018.

Exploring innovative indicators for the next-generation EPC features
45
[48] DGNB, “DGNB- Sociocultural and functional quality- SOC1.3/Acoustic Comfort,” 2018.
[49] DGNB, “DGNB- Sociocultural and functional quality- SOC1.4/Visual Comfort,” 2018.
[50] USGBC, “LEED v4.1 Operations and Maintenance - Getting started guide for beta participants,” 2018.
[51] IGBC, “Home Performance Index,” 2019.
[52] WELL, “The WELL Building Standard v1,” 2019.
[53] P. Fanger, Thermal comfort: analysis and application in environmental engineering. Danish Technical Press, 1970.
[54] N. Djongyang, R. Tchinda and D. Njomo, “Thermal comfort: A review paper,” Renew. Sustain. Energy Rev., 14(9), pp. 2626–2640, 2010.
[55] CEN, EN-15251: Indoor environemntal input parameters for design and assessment of energy performance of buildings adressing indoor air quality, thermal environment, lighting and acoustics, 44(0). 2007.
[56] CEN, EN 16798-1:2019 Energy performance of buildings - Ventilation for buildings - Part 1: Indoor environmental input parameters for design and assessment of energy performance of buildings addressing indoor air quality, thermal environment, lighting and acous. 2019.
[57] L. Yang, H. Yan and J. C. Lam, “Thermal comfort and building energy consumption implications - A review,” Appl. Energy, 115, pp. 164–173, 2014.
[58] M. A. Humphreys, “Outdoor temperatures and comfort indoors,” Batim. Int. Build. Res. Pract., 2(2), 1978.
[59] J. F. Nicol and M. A. Humphreys, “New standards for comfort and energy use in buildings,” Build. Res. Inf., 37(1), pp. 68–73, 2009.
[60] S. Barlow and D. Fiala, “Occupant comfort in UK offices-How adaptive comfort theories might influence future low energy office refurbishment strategies,” Energy Build., 39(7), pp. 837–846, 2007.
[61] A. Wagner, E. Gossauer, C. Moosmann, T. Gropp and R. Leonhart, “Thermal comfort and workplace occupant satisfaction: Results of field studies in German low energy office buildings,” Energy Build., 39(7), pp. 758–769, 2007.
[62] CIBSE, “TM46: energy benchmarks.” CIBSE London, 2008.
[63] CEN, EN 16798-2:2019 Energy performance of buildings - Ventilation for buildings - Part 2: Interpretation of the requirements in EN 16798-1 - Indoor environmental input parameters for design and assessment of energy performance of buildings addressing indoor air. 2019.
[64] S. Kunkel, E. Kontonasiou, A. Arcipowska, F. Mariottini and B. Atanasiu, Indoor Air Quality, Thermal Comfort and Daylight - Analysis of Residential Building Regulations. Brussels, 2015.
[65] J. M. Daisey, W. J. Angell and M. G. Apte, “Indoor air quality, ventilation and health

Exploring innovative indicators for the next-generation EPC features
46
symptoms in schools: an analysis of existing information.,” Indoor Air, 13(1), pp. 53–64, 2003.
[66] A. P. Jones, “Indoor air quality and health,” Atmos. Environ., 33(28), pp. 4535–4564, 1999.
[67] D. J. Clements-Croome, “Work performance, productivity and indoor air,” Scand. J. Work. Environ. Heal. Suppl., 4, pp. 69–78, 2008.
[68] N. Michelot and M. Carrega, “Monitoring indoor air quality in French schools and day-care centres. Results from the first phase of a pilot survey.” In: Healthy Buildings 2012, 10th International Conference, 2014, pp. 1–6.
[69] O. a Seppänen, W. J. Fisk and M. J. Mendell, “Association of ventilation rates and CO2 concentrations with health and other responses in commercial and institutional buildings.,” Indoor Air, 9, pp. 226–252, 1999.
[70] JRC, “Methods for monitoring indoor air quality in schools,” World Health Organization, Bonn, 2011.
[71] J. Atkinson, Y. Chartier, C. L. Pessoa-Silva, P. Jensen, Y. Li and W.-H. Seto, Natural Ventilation for Infection Control in Health-Care Settings. Canberra, 2009.
[72] A. K. Persily, “Evaluating building IAQ and ventilation with indoor carbon dioxide,” ASHRAE Transactions, 103 (2), pp. 193–204, 1997.
[73] ASTM D6245-12, “Standard Guide for Using Indoor Carbon Dioxide Concentrations to Evaluate Indoor Air Quality and Ventilation,” West Conshohocken, PA, 2012.
[74] CEN, “EN 12464-1: 2011- Light and lighting- Lighting of work places- Part 1: Indoor work places,” European Commitee for Standardization, Brussels, 2011.
[75] V. Fabi, R. Andersen and S. Corgnati, “Accounting for the Uncertainty Related to Building Occupants with Regards to Visual Comfort: A Literature Survey on Drivers and Models,” Buildings, 6(1), p. 5, 2016.
[76] A. D. Galasiu and J. A. Veitch, “Occupant preferences and satisfaction with the luminous environment and control systems in daylit offices: a literature review,” Energy Build., 38(7), pp. 728–742, 2006.
[77] CEN, EN 17037:2018 Daylight in buildings. 2018.
[78] C. Reinhart, J. Mardaljevic, Z. Rogers and Leukos, Dynamic Daylight Performance Metrics for Sustainable Building Design. 2006.
[79] R. G. Hopkinson, “Glare from daylighting in buildings,” Appl. Ergon., 3(4), pp. 206–215, Dec. 1972.
[80] Berkowitz, “Improving the Energy Efficiency of Aging Commercial Buildings through Window Retrofits,” BERKOWITZ, Pedricktown, New Jersey, 2014.
[81] N. G. Vardaxis, D. Bard and K. Persson Waye, “Review of acoustic comfort evaluation in dwellings—part I: Associations of acoustic field data to subjective responses from building surveys,” Build. Acoust. 25(2), pp. 151–170, 2018.
Exploring innovative indicators for the next-generation EPC features
47
[82] A. Laouadi and A. Parekh, “Lighting characteristics of complex fenestration systems.” In IBPSA-Canada Esim Conference, 2006, pp. 1–7.
[83] EU, “Special Eurobarometer 468: Attitudes of European citizens towards the environment,” 2017. [Online]. Available: https://data.europa.eu/euodp/en/data/dataset/S2156_88_1_468_ENG.
[84] EUROSAI, “Joint report on air quality,” 2019.
[85] L. Myllyvirta and E. Howard, “Five things we learned from the world’s biggest air pollution database,” 2018. [Online]. Available: https://unearthed.greenpeace.org/2018/05/02/air-pollution-cities-worst-global-data-world-health-organisation.
[86] EEA, “Air quality in Europe — 2019 report — EEA Report No 10/2019,” Luxembourg, 2019.
[87] BRITANNICA, “Smog- Atmosphere,” 2020. [Online]. Available: www.britannica.com/science/smog.
[88] EMEP/EEA, “EMEP/EEA air pollutant emission inventory guidebook 2019,” Denmark, 2019.
[89] EC, DIRECTIVE 2009/125/EC of the European Parliament and of the Council – establishing a framework for the setting of ecodesign requirements for energy-related products (recast). 2009.
[90] ASHRAE, “ASHRAE 62.1-2010: Ventilation for acceptable indoor air quality,” Atlanta, 2010.
[91] CEN, “EN 13779-2007: Ventilation for non-residential buildings – Performance requirements for ventilation and room conditioning systems,” 2007.
[92] BREEAM, “BREEAM International New Construction 2016- Technical Manual,” 2016.
[93] KOBiZE, “Wskaźniki emisji zanieczyszczeń ze spalania paliw – kotły o nominalnej mocy cieplnej do 5 MW,” Warsaw, 2015.
[94] EEA, “European Air Quality Index- GIS Map application,” 2017. [Online]. Available: www.eea.europa.eu/themes/air/air-quality-index#tab-based-on-data.
[95] CEN, “EN 779-2002: Particulate air filters for general ventilation – Determination of the filtration performance,” 2002.
[96] WHO, “The World Health Report 1999,” 1999.
[97] DEA, “Implementing the Energy Performance of Buildings Directive – Country Reports 2018,” 2019.
[98] Wikipedia, “Air Quality Index,” 2020. [Online]. Available: https://en.wikipedia.org/wiki/Air_quality_index.
[99] IEP, “Air Quality Scale in Poland,” The World Air Quality Project, 2015. [Online]. Available: https://aqicn.org/faq/2015-09-03/air-quality-scale-in-poland.
Exploring innovative indicators for the next-generation EPC features
48
[100] E. H. Borgstein, R. Lamberts and J. L. M. Hensen, “Evaluating energy performance in non-domestic buildings: A review,” Energy Build. 128, pp. 734–755, 2016.
[101] CEN, “EN ISO 52000-1:2017: Energy performance of buildings - Overarching EPB assessment - Part 1: General framework and procedures,” Brussels, 2017.
[102] M.-H. Laurent, B. Allibe, T. Oreszczyn, I. Hamilton, C. Tigchelaar and R. Galving, “Back to reality: How domestic efficiency policies in four European countries can be improved by using empirical data instead of normative calculation.” In: ECEEE Summer study, 2013.
[103] D. Majcen, “Predicting energy consumption and savings in the housing stock – A performance gap analysis in the Netherlands .” TU Delft, 2016.
[104] X. Shi et al., “Magnitude, Causes, and Solutions of the Performance Gap of Buildings: A Review,” Sustainability, 11(3), 2019.
[105] M. Rietkerk, J. Mastop and C. Tigchelaar, “Differences in real and theoretical gas consumption in households.” In: ECN, 2015.
[106] P. X. W. Zou, X. X. Xu, J. Sanjayan and J. Y. Wang, “Review of 10 years research on building energy performance gap: Life-cycle and stakeholder perspectives,” Energy Build. 178, pp. 165–181, 2018.
[107] M. Herrando, D. Cambra, M. Navarro, L. de la Cruz, G. Millán and I. Zabalza, “Energy Performance Certification of Faculty Buildings in Spain: The gap between estimated and real energy consumption,” Energy Convers. Manag., 125 (January 2014), pp. 141–153, 2016.
[108] E. Himpe, “Characterisation of residential energy use for heating using smart meter data.” Ghent University, 2017.
[109] S. Seyedzadeh, F. P. Rahimian, I. Glesk and M. Roper, “Machine learning for estimation of building energy consumption and performance: a review,” Vis. Eng. 6(1), 2018.
[110] H. Krstic and M. Teni, “Review of Methods for Buildings Energy Performance Modelling,” World Multidiscip. Civ. Eng. Plan. Symp. - Wmcaus, 245, 2017.
[111] H. Bloem and L. Vandaele, “The building as the cornerstone of our future energy infrastructure - Outcome of the Dynastee Symposium.” 2019.
[112] A. Janssens, “Reliable building energy performance characterization based on full scale dynamic measurements – Report of Subtask 1b: Overview of methods to analyze dynamic data.” KU Leuven, 2016.
[113] B. Karlin, J. F. Zinger and R. Ford, “The Effects of Feedback on Energy Conservation: A Meta-Analysis,” Psychol. Bull., 141(6), pp. 1205–1227, 2015.
[114] S. Darby, “Making it obvious: Designing feedback into energy consumption,” Energy Effic. Househ. Appliances Light., pp. 685–696, 2001.
[115] R. Cohen and B. Bordass, “Mandating transparency about building energy performance in use,” Build. Res. Inf., 43(4), pp. 534–552, 2015.
[116] CIBSE, TM47: Operational Ratings and Display Energy Certificates. 2009.
Exploring innovative indicators for the next-generation EPC features
49
[117] Boverket, “Boverkets byggregler (2011:6) – föreskrifter och allmännaråd, BBR.” Boverket, 2019.
[118] VEA, “Toelichting voor de (kandidaat)-energiedeskundige type C voor de opmaak van het EPC voor publieke gebouwen.” VEA, 2013.
[119] B. Staatsblad, “Belgisch Staatsblad 08.11.2007.” Belgisch Staatsblad, 2007.
[120] DCLG, “Improving the energy efficiency of our buildings – A guide to display energy certificates and advisory reports for public buildings.” DCLG, 2015.
[121] DCLG, “The Government’s methodology for the production of Operational Ratings, Display Energy Certificates and Advisory Reports.” DCLG, 2008.
[122] H. J. J. Valk and A. F. Kruithof, “Beleidskader Energieprestatie - Voorstel voor een beleidskader voor de energieprestatie van gebouwen.” Ministerie van BZK, 2016.
[123] S. Roels, “Building energy performance assessment based on in-situ measurements.” KU Leuven, 2019.
[124] D. Saelens and G. Reynders, “IEA-EBC Annex 58: Reliable building energy performance characterization based on full scale dynamic measurements; Report of subtask 4b: Towards characterization of buildings based on in situ testing and smart meter readings and potential for applications.” KU Leuven, 2016.
[125] D. Kolokotsa et al., “The role of smart grids in the building sector,” Build. Environ., 116, pp. 703–708, 2016.
[126] T. M. Lawrence et al., “Ten questions concerning integrating smart buildings into the smart grid,” Build. Environ., 108, pp. 273–283, 2016.
[127] EC, “Clean energy for all Europeans package,” 2017. [Online]. Available: https://ec.europa.eu/energy/topics/energy-strategy/clean-energy-all-europeans_en.
[128] DEA, “Regulation and planning of district heating in Denmark,” Copenhagen, 2016.
[129] A. Müller, M. Hummel, L. Kranzl, M. Fallahnejad and R. Büchele, “Open source data for gross floor area and heat demand density on the hectare level for EU 28,” Energies,12(24), 2019.
[130] M. Fallahnejad, M. Hartner, L. Kranzl, and S. Fritz, “Impact of distribution and transmission investment costs of district heating systems on district heating potential,” Energy Procedia, 149, pp. 141–150, 2018.
[131] E. Latõšov, A. Volkova, A. Siirde, J. Kurnitski, M. Thalfeldt, “Primary energy factor for district heating networks in European Union member states,” Energy Procedia, 116, pp. 69–77, 2017.
[132] CEN, “EN 15316-4-5: Heating systems in buildings - Method for calculation of systems energy requirements and system efficiencies - Part 4-5: Space heating generation systems, the performance and quality of district heating and large volume systems,” 2017.
[133] M. ENERGII, “DZIENNIK USTAW RZECZYPOSPOLITEJ POLSKIEJ 2017 poz. 1912 -
Exploring innovative indicators for the next-generation EPC features
50
ROZPORZĄDZENIE MINISTRA ENERGII w sprawie szczegółowego zakresu i sposobu sporządzania audytu efektywności energetycznej oraz metod obliczania oszczędności energii,” 2017.
[134] UNI, “UNI/TS 11300-1:2014 - Prestazioni energetiche degli edifici - Parte 1: Determinazione del fabbisogno di energia termica dell’edificio per la climatizzazione estiva ed invernale,” 2014.
[135] UNI, “UNI/TS 11300-4:2016 - Prestazioni energetiche degli edifici - Parte 4: Utilizzo di energie rinnovabili e di altri metodi di generazione per la climatizzazione invernale e per la produzione di acqua calda sanitaria,” 2016.
[136] MED, Ministry of Economic Development. Applying the methods of calculating energy performance and definition of requirements and minimum standards of buildings. Decree 26.06.2015. Italy, 2015.
[137] AGFW, “Arbeitsblatt AGFW FW 309 Teil 1 - Energetische Bewertung von Fernwärme - Bestimmung der spezifischen Primärenergiefaktoren für Fernwärmeversorgungssysteme,” 2014.
[138] AGFW, “AGFW district energy systems,” 2020.
[139] NEN, “NEN 7125:2017 - Energieprestatienorm voor maatregelen op gebiedsnuveau (EMG) - Bepalingsmethode,” 2017.
[140] OIB, “OIB-Richtlinie 6 - Energieeinsparung und Wärmeschutz,” 2019.
[141] I. Uriarte, A. Erkoreka, C. Giraldo-Soto, K. Martin, A. Uriarte and P. Eguia, “Mathematical development of an average method for estimating the reduction of the Heat Loss Coefficient of an energetically retrofitted occupied office building,” Energy Build., 192, pp. 101–122, 2019.
[142] H. Madsen et al., “IEA-EBC Annex 58: Report of subtask 3, part 2: Thermal performance characterization using time series data – Reliable building energy performance characterization based on full scale dynamic measurements statistical guidelines.” KU Leuven, 2016.
[143] C. Ghiaus, “Experimental estimation of building energy performance by robust regression,” Energy Build., 38(6), pp. 582–587, 2006.
[144] T. Bohlin and S. F. Graebe, “Issues in Nonlinear Stochastic Grey Box Identification,” Int. J. Adapt. Control Signal Process., 9(6), pp. 465–490, 1995.
[145] S. Marieline, “Characterisation of the Heat Loss Coefficient of Residential Buildings Based on In-use Monitoring Data,” KU Leuven, 2019.
[146] B. Stein, T. Loga and N. Diefenbach, “Tracking of Energy Performance Indicators in Residential Building Stocks – Different Approaches and Common Results. EPISCOPE Synthesis Report No. 4.” IWU, 2016.
[147] B. Stein, T. Loga and N. Diefenbach, “Monitor Progress Towards Climate Targets in European Housing Stocks - Main Results of the EPISCOPE Project - Final Project Report - (Deliverable D1.2).” IWU, 2016.

Exploring innovative indicators for the next-generation EPC features
51
[148] N. Altmann-Mavaddat, O. Mair am Tinkhof, G. Simader, A. Arcipowska and D. Weatherall, “Report on existing monitoring initiatives and database systems; From databases to retrofit action: How European countries are using energy performance certificate (EPC) database systems - Request2Action Deliverable D2.1.” Austrian Energy Agency, 2015.
[149] J. Rattenbury, V. G. Oñate, R. Fragoso, E. Costanzo, A. Androutsopoulos and D. Weatherall, “Recommendations on building Hubs support – Request2Action Deliverable D4.1.” Energy Saving Trust, 2017.
[150] W. Rivers, M. Mclean, F. Downy and D. Weatherall, “Best Practices and practical advice on home energy efficiency advice tools – Request2Action Deliverable D3.1.” Energy Saving Trust, 2015.
[151] P. Johansson, P. Wahlgren and J.-O. Dalenbäck, “Sweden – Differences between measured and calculated energy use in EPCs versus building permits – New field study 2016 – QUALICHeCK, Status on the ground.” Chalmers University of Technology, 2017.

Exploring innovative indicators for the next-generation EPC features
52
ANNEX 1
Feature 4: Real energy consumption
Building-level detailed approach methods
Method overview
Different detailed methods for determining building energy performance or related parameters for use in evaluation methods based on measured data during normal operating conditions are described in this annex. An example is the determination of the global as-built heat loss coefficient (HLC) [123].
Determination of the in-use HLC by average method does not require a detailed physical model of the building. Only the total area of the windows and scheduled occupancy data are required [141] in addition to the already widespread monitoring data (e.g. indoor temperature, weather conditions, heating system energy inputs and electricity use). The HLC is defined based on the energy balance equations using this input data. However, the accumulation term and the solar gains are hard to estimate accurately. Careful setup of the boundary conditions of the experiment (e.g. the weather conditions of the testing period and the indoor temperature conditions) can remedy this. In simple steady-state models, the parameters are found using classical methods for linear regression [142]. Such steady-state techniques provide sub-optimal use of the information embedded in the data and provide information only about the heat transfer coefficient and gA-values.
Energy signature models are a data-driven models that express heating energy consumption in function of weather variables [112], e.g. heating degree days (HDD).
𝑄 = 𝑐1 + 𝑐2. 𝐻𝐷𝐷 + 𝜀𝑡
where
• Q heating energy consumption • C1 coefficient representing the baseline energy consumption [kWh] • C2 coefficient representing the heating energy consumption per degree
temperature decrease below the base temperature [kWh] • HDD heating degree days [-] • t error term [kWh]
Coefficients c1 and c2 define the energy signature. Coefficient c2 defines the relation between the energy consumption and the heating degree days and is an indicator for the whole building heat loss. Coefficient c1 is an indication of the weather-independent energy consumption (if the base temperature is estimated correctly) [108]. The energy signature can be used to evaluate the overall heat transfer coefficient of the building which is equal to the regression coefficient of the energy consumption – exterior temperature relation, divided by the heat loss area of the building and the base temperature [112]. The base temperature is the temperature above which no heating is needed considering the heat

Exploring innovative indicators for the next-generation EPC features
53
gains. It is mostly used to correct for outdoor climatic conditions to compare energy consumption for different years or to a reference. Classical energy signature models fall short in identifying other constituents than energy consumption for heating (those that are not related to weather conditions)
Energy signatures are the most well-known data-driven energy consumption models and are typically applied when occasional meter readings of the gas or heat use are available (yearly or monthly values). They are only useful if measurements include space heating energy consumption. Energy signature models are static models that do not account for time-dependency of the data. Data should be aggregated to at least one day (although some experts recommend longer time periods). For time intervals shorter than one day, dynamic models are recommended. The assumptions made for application of linear regression are not always satisfied: Annex 58 subtask 1b report [112] describes two approaches to mitigate these issues; namely robust regression of heating load curve based on Q-Q plot as proposed by Ghiaus [143] and linear regression considering dynamic and solar gain effects [143]. Such methods also are referred to as pseudo-dynamic linear regression models in which a dynamic correction is added to the regression (see Figure 8).
Figure 8: Total heat transfer coefficient determined from energy signature (daily data), (a) with and (b) without correction for the dynamic effect [143]
Auto-regressive models with exogenous inputs (ARX-models) provide information about the HTC and gA-values as well as some limited information about the dynamics, usually expressed as time-constants [142]. ARX can be classified as black-box models; they describe the external relations between the inputs and the outputs of the system, although the structure is often also based on the heat-balance equation of a building. Similar methods as used in classical linear regression such as ordinary least squares method is used. In addition to the (weather) input variables (‘exogenous inputs’), time lags of the output variables are added as input variables in the model, so called auto-regressive inputs

Exploring innovative indicators for the next-generation EPC features
54
[108]. These serve to deal with the dynamical properties of the system. ARX is more accurate for estimating energy consumption of a full heating season compared to classical linear regression models. ARX is also applied for real-time forecasting purposes. Dynamics can be captured in ARX models with data at hourly or daily time steps. Also, interior temperature is usually an input in most examples in the literature.
Grey-box modelling is a modelling approach where prior physical knowledge is combined with data-driven statistical modelling techniques [144]. Data with high time-resolution is used representing the dynamics of the building and both linear and non-linear effects can be modelled. In a grey-box model a set of continuous stochastic differential equations (SDEs) describing the thermal dynamics of the building are combined with a set of discrete measurement equations to form a continuous-discrete time state-space model (CTSM). The stochastic differential equations describe the physical model, usually linear R-C networks for building or building components (see Figure 9Error! Reference source not found.).
Figure 9: Examples of electric analogy of R-c network of (a) first order model and (b) fourth order model
The model parameters are directly interpretable as building physical properties (heat transfer coefficients, thermal capacities, solar aperture, wind-induced infiltration). A parameter estimation scheme for CTSM is freely available in the open source R-package CTSM-R3. For a basic setup, measurements are needed for indoor air temperature, heat input, outdoor air temperature, global radiation and wind speed and direction. Indoor air temperature monitoring is usually part of the building energy monitoring system but can alternatively easily be installed as one or more separate sensors. Heat input data is generated by heat sensors, ideally for each application separately (domestic hot water and space heating, etc.), but can also be derived from gas or electricity use monitoring. The other parameters can be obtained from an on-site weather station with air temperature, wind speed and direction sensors and pyranometer. Furthermore, the dynamic response of the building needs to be captured by the measurements, which can ideally be obtained from dedicated heating experiments on the unoccupied building.
3 http://ctsm.info
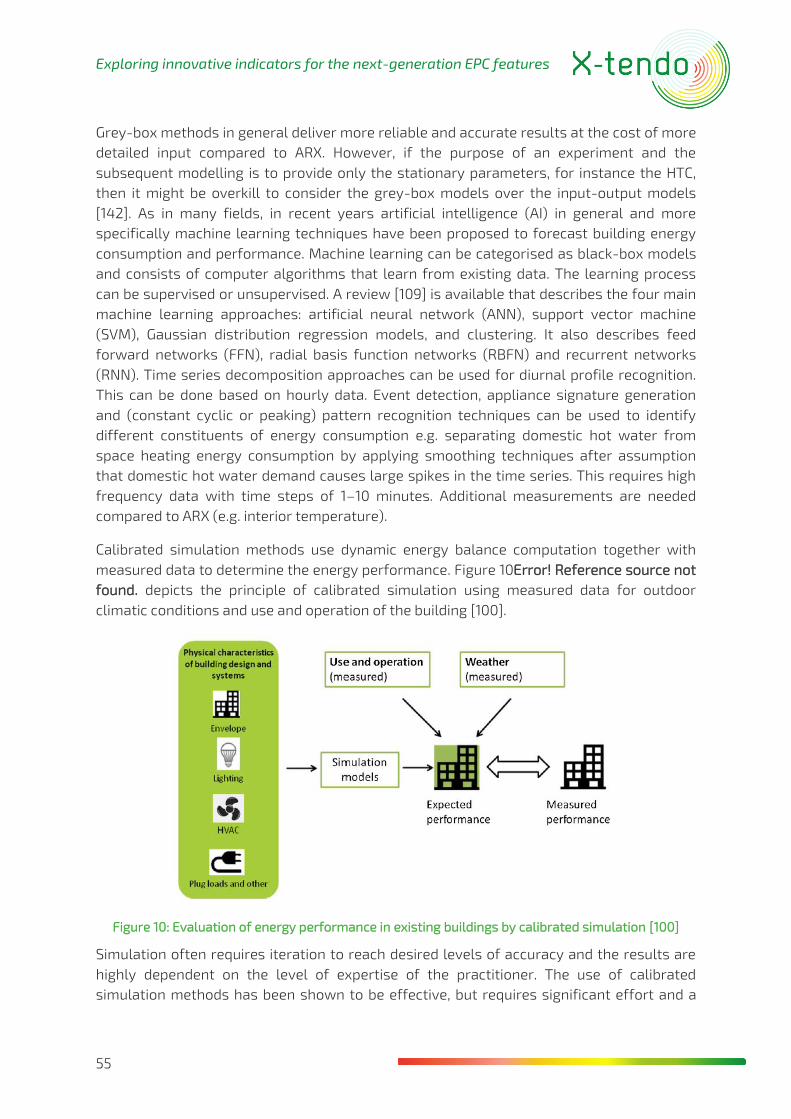
Exploring innovative indicators for the next-generation EPC features
55
Grey-box methods in general deliver more reliable and accurate results at the cost of more detailed input compared to ARX. However, if the purpose of an experiment and the subsequent modelling is to provide only the stationary parameters, for instance the HTC, then it might be overkill to consider the grey-box models over the input-output models [142]. As in many fields, in recent years artificial intelligence (AI) in general and more specifically machine learning techniques have been proposed to forecast building energy consumption and performance. Machine learning can be categorised as black-box models and consists of computer algorithms that learn from existing data. The learning process can be supervised or unsupervised. A review [109] is available that describes the four main machine learning approaches: artificial neural network (ANN), support vector machine (SVM), Gaussian distribution regression models, and clustering. It also describes feed forward networks (FFN), radial basis function networks (RBFN) and recurrent networks (RNN). Time series decomposition approaches can be used for diurnal profile recognition. This can be done based on hourly data. Event detection, appliance signature generation and (constant cyclic or peaking) pattern recognition techniques can be used to identify different constituents of energy consumption e.g. separating domestic hot water from space heating energy consumption by applying smoothing techniques after assumption that domestic hot water demand causes large spikes in the time series. This requires high frequency data with time steps of 1–10 minutes. Additional measurements are needed compared to ARX (e.g. interior temperature).
Calibrated simulation methods use dynamic energy balance computation together with measured data to determine the energy performance. Figure 10Error! Reference source not found. depicts the principle of calibrated simulation using measured data for outdoor climatic conditions and use and operation of the building [100].
Figure 10: Evaluation of energy performance in existing buildings by calibrated simulation [100]
Simulation often requires iteration to reach desired levels of accuracy and the results are highly dependent on the level of expertise of the practitioner. The use of calibrated simulation methods has been shown to be effective, but requires significant effort and a

Exploring innovative indicators for the next-generation EPC features
56
range of problems have been detected concerning standardisation, complexity, accuracy of inputs, uncertainty evaluation and automation [100]. At the current stage, therefore, calibrated simulation is less suitable for integration in EPC frameworks and is to be reserved for complex evaluations involving several interlinking efficiency measures.
Selection of methods suitable for EPC: determination of the heat loss coefficient
This chapter contains a brief description of the concept of the determination method of the whole building heat loss coefficient (HLC). It is considered the most promising building-level detailed approach method for implementation in EPC schemes in a near-future context.
This method is based on the method to determine the whole building HLC as analysed in the frame of IEA EBC Annex 71. The HLC describes the thermal insulation quality (including thermal bridges) and airtightness of a building envelope in a single factor [145]. It also captures the dynamic behaviour of the building to some extent (depending on the analysis method). It can be used as an input in calculation methods to determine the energy performance of the building (unit). The main advantages of inclusion of the HLC based on on-board monitoring are simplification of inspection procedures and increased accuracy. Quantification of user influence on heating demand is also possible. If the accuracy of the HLC can be improved (<10%) implementation of HLC for quality control purposes or direct certification of the energy performance of the building envelope can be considered. The method is described for residential buildings, but can also be applied to non-residential (with optional ventilation measurements).
• Visualisation of the characterisation method
Figure 11: HLC calculation process
• Input parameters
Six main variables are shown to have a large impact on the HLC estimate: the net heat input for space heating, the solar gains, the internal heat gains, the heat losses by intended

Exploring innovative indicators for the next-generation EPC features
57
ventilation, the interior temperature, the exterior temperature. For an accurate estimation of the HLC, each of these variables must be adequately represented by data collected by the sensor setup. With a reduced monitoring setup – the five sensor setup [145] – an accuracy <35% can be reached. This does not require prior knowledge of the envelope performance, geometry or occupants, although limited input of building and occupancy information can contribute to augmented accuracy.
The five-sensor setup is used for monitoring following parameters: • Ti Indoor air temperature [°C]: Living room air temperature
sensor • Te Outdoor air temperature [°C]: Local air temperature sensor • Ihor Global horizontal radiation [W/m²]: Local pyranometer • E Electricity use [W]: Electricity smart meter • Qsh,net Net energy for space heating [Wh/h]: Heat meter
Additional sensors for monitoring of ventilation heat losses (optional): • Qventilation Ventilation heat loss [Wh/h]: �̇�𝑣𝑒𝑛𝑡 , Tsupply and Treturn (and th,HRU
if any)
Building info: • g.A Solar absorption [m²] (1 value to be fitted by analysis model)
Occupancy info: • Act Activity level profile per occupant
Data analysis is done using an ARX model preferably. Grey-box modelling (building physical model (RC) with statistical analysis) can also be considered.
Stock-level model development methods
The stock-level model development approach consists of top-down methodologies that use statistical techniques on datasets of multiple buildings. The purpose of these models can be to improve or validate existing methods, develop alternative models or set benchmarking levels for evaluation. These concern the energy consumption or performance of a building, a part of a building, its systems or building components. This annex contains a description of the most important purposes of stock-level models and the methods to develop such models.
Figure 12Error! Reference source not found. depicts the principle of evaluation of building performance by comparison with statistical benchmarks [100].

Exploring innovative indicators for the next-generation EPC features
58
Figure 12: Evaluation of building performance by comparison with statistical benchmarks [100]
The datasets can also be used for the monitoring of policy measures in view of achieving the long-term objectives related to energy performance of buildings or to quantify and explain the energy performance gap. A review [100] of a variety of statistical techniques that have been used for these purposes contains a brief description of the principal statistical methods for benchmark development and evaluation of building energy performance. A summary of the applications is included in the following Table 7 adopted from this review study.
Table 7: Summary of principal statistical methods for benchmark development and evaluation of building energy performance [100].
Algorithm Applications
Simple and multivariate linear regression
Simple models for building performance based on a few characteristics
Change-point regression Model the non-linear effects of external conditions, e.g. below a certain external temperature, heating systems are switched on
Gaussian process and Gaussian mixture regression
Prediction of dynamic performance, with an understanding of uncertainty. Flexible models, but more complex
Stochastic frontier analysis Effective when there are large numbers of efficient buildings and a few that inefficient. Outliers may make the method ineffectual, as residuals will be large
TOPSIS Can be used to develop effective benchmarks, based on regressions
Data envelopment analysis Evaluates the technical efficiency and improvement potential of buildings. Can only be applied to buildings within the original dataset
Correction factors Relate building performance to physical parameters, useful for benchmarking

Exploring innovative indicators for the next-generation EPC features
59
Machine learning techniques that have been applied to predict and evaluate energy performance in different situations, such as for the development of energy performance benchmarks, are also described, including artificial neural networks and clustering analysis. These techniques are listed in the review paper specifically for application for non-domestic buildings, but the methods can be used for domestic buildings as well. Examples of studies applying these techniques are included and referred to in the review study [100] .
Illustrative examples of benchmark development using linear regression can be found in the US and Canada (Energy Star Rating and portfolio manager building energy performance benchmarking system for commercial buildings, also applied by LEED certification for operation and maintenance of existing buildings), Australia (National Australian Built Environment Rating System (NABERS)) and the UK (TM46 [62]) [115]. In the TABULA and EPISCOPE projects [146], stock models are developed for residential buildings based on synthetical average buildings (theoretically developed archetypical buildings) for building stock relevant subgroups. These can be used for benchmarking to compare distinct, real buildings or be used for basic scenario analysis. To account for the energy performance gap, the calculated energy consumption of the average buildings is calibrated by adaptation factors derived from measured values for energy consumption per energy carrier. In the final EPISCOPE report different sources to obtain this data are mentioned: national/regional energy balances, national registries, data from energy suppliers, EPC data or own field surveys. However, wide information gaps concerning the actual state as well as the trends concerning building thermal insulation and energy supply systems were identified. Recommendations to improve the data situation by applying regular monitoring concepts were compiled [147]. The importance of inclusion and verification of energy consumption data for the calibration of building stock models is emphasised, adding proof to the relevance of monitoring infrastructure and data acquisition in the built environment. The resulting tools can be used for policy guidance and continuous monitoring of energy performance in the building stock in relation to the targets. Furthermore, in the frame of the EPISCOPE project, a pilot study of the municipality of Sønderborg in Denmark examined how the energy savings mentioned in EPCs issued before and after refurbishment activities can be validated against energy consumption measurements [148] .
The concept of hubs specifically on building energy renovation is explored in the frame of the Request2Action project. Real energy consumption can be part of the information gathered by national hubs on building energy renovation or related tools such as home energy check tools linked to databases. This data can be used to formulate refurbishment advice or for the calibration of calculation models to mitigate the energy performance gap. Examples of energy renovation hubs or home energy check tools that include the gathering of real energy consumption of households can be found in Belgium (ZetJeWoningOpDeKaart tool), Italy (Portale4e), the Netherlands (VerbeterUwHuis tool), Portugal (Portal CasA+) [149] and the UK (SMAP tool) [150]. Furthermore, the Zeus database system by the federal states of Salzburg, Styria and Carinthia in Austria, records actual energy consumption for comparison with calculated energy demand [148].

Exploring innovative indicators for the next-generation EPC features
60
In the pilot projects of Request2Action [148], the Netherlands Enterprise Agency has carried out a study [105] comparing the calculated energy demand of the EPC and the real energy consumption (as a base for financing the retrofits), describing deviations and underlying causes. In the EU project EPATEE tools and knowledge are disseminated to EU Member States for a better evaluation of their energy efficiency policies. One of the main topics subject to study in this frame is the difference between the actual and calculated energy consumption and the consequences for the energy savings achieved on the level of the building stock. Examples of these studies include the Netherlands and the UK. In the QUALICHeCK project, EPCs and quality of works compliance frameworks were analysed. In a pilot study in Sweden [151], the difference between measured and calculated energy consumption in EPCs versus building permits was studied.
Exploring innovative indicators for the next-generation EPC features
61
www.x-tendo.eu
#Xtendoproject
This project has received funding from the European Union’s Horizon 2020 research and innovation programme under grant agreement No 845958.