KEY PERFORMANCE INDICATORS - Collinsville, IL
25
ANNUAL REPORT 2019 KEY PERFORMANCE INDICATORS
-
Upload
khangminh22 -
Category
Documents
-
view
0 -
download
0
Transcript of KEY PERFORMANCE INDICATORS - Collinsville, IL
A N N U A L R E P O R T2 0 1 9
KEY PERFORMANCE INDICATORS
PB
Contents03
PAGE 202 Executive
SummaryCity Clerk’s
Office
PA G E 3
10Page 4
04 Community Development
Economic Development
P a g e 1 0
12PAGE 11
11 Finance Development
Fire Department
PA G E 1 2
15PAGE 14
14 Gateway Convention Center
Human Resource Department
PA G E 1 5
17PAGE 16
16 IT Department
Parks & RecDepartment
PA G E 1 7
20PAGE 19
19 Police Department
Public Works Department
PA G E 2 0
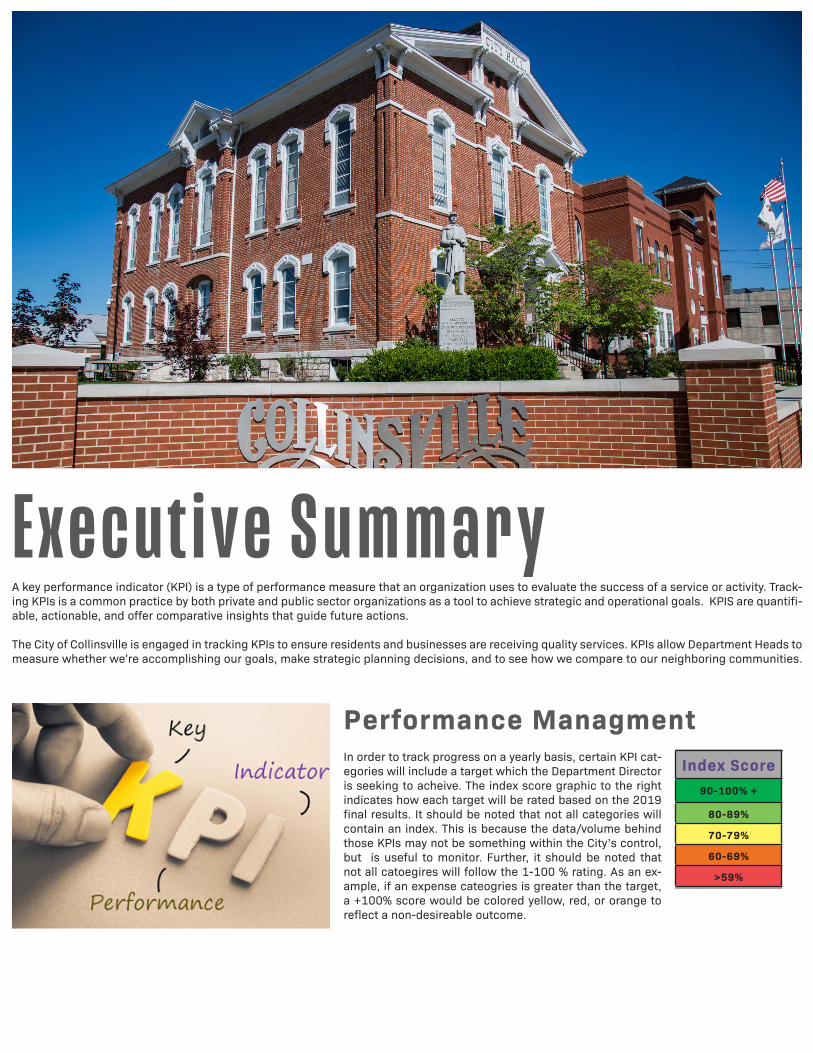
Index Score90-100% +
80-89%
70-79%
60-69%
>59%
PB
Executive SummaryA key performance indicator (KPI) is a type of performance measure that an organization uses to evaluate the success of a service or activity. Track-ing KPIs is a common practice by both private and public sector organizations as a tool to achieve strategic and operational goals. KPIS are quantifi-able, actionable, and offer comparative insights that guide future actions.
The City of Collinsville is engaged in tracking KPIs to ensure residents and businesses are receiving quality services. KPIs allow Department Heads to measure whether we’re accomplishing our goals, make strategic planning decisions, and to see how we compare to our neighboring communities.
In order to track progress on a yearly basis, certain KPI cat-egories will include a target which the Department Director is seeking to acheive. The index score graphic to the right indicates how each target will be rated based on the 2019 final results. It should be noted that not all categories will contain an index. This is because the data/volume behind those KPIs may not be something within the City’s control, but is useful to monitor. Further, it should be noted that not all catoegires will follow the 1-100 % rating. As an ex-ample, if an expense cateogries is greater than the target, a +100% score would be colored yellow, red, or orange to reflect a non-desireable outcome.
Performance Managment
PB
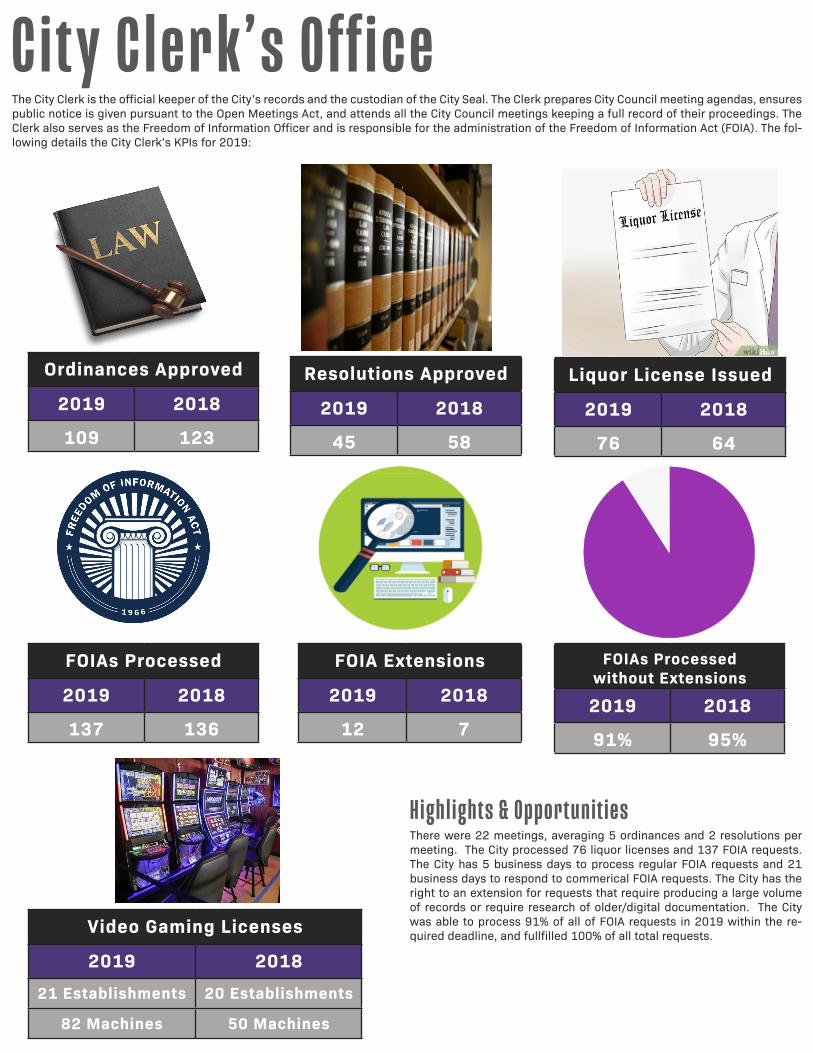
C ity Clerk’s OfficeThe City Clerk is the official keeper of the City’s records and the custodian of the City Seal. The Clerk prepares City Council meeting agendas, ensures public notice is given pursuant to the Open Meetings Act, and attends all the City Council meetings keeping a full record of their proceedings. The Clerk also serves as the Freedom of Information Officer and is responsible for the administration of the Freedom of Information Act (FOIA). The fol-lowing details the City Clerk’s KPIs for 2019:
There were 22 meetings, averaging 5 ordinances and 2 resolutions per meeting. The City processed 76 liquor licenses and 137 FOIA requests. The City has 5 business days to process regular FOIA requests and 21 business days to respond to commerical FOIA requests. The City has the right to an extension for requests that require producing a large volume of records or require research of older/digital documentation. The City was able to process 91% of all of FOIA requests in 2019 within the re-quired deadline, and fullfilled 100% of all total requests.
Hi g hl i g hts & O ppo r tuni ti e s
Ordinances Approved
2019 2018
109 123
Resolutions Approved
2019 2018
45 58
Liquor License Issued
2019 2018
76 64
FOIAs Processed
2019 2018
137 136
FOIA Extensions
2019 2018
12 7
FOIAs Processed without Extensions
2019 2018
91% 95%
Video Gaming Licenses
2019 201821 Establishments 20 Establishments
82 Machines 50 Machines
PB
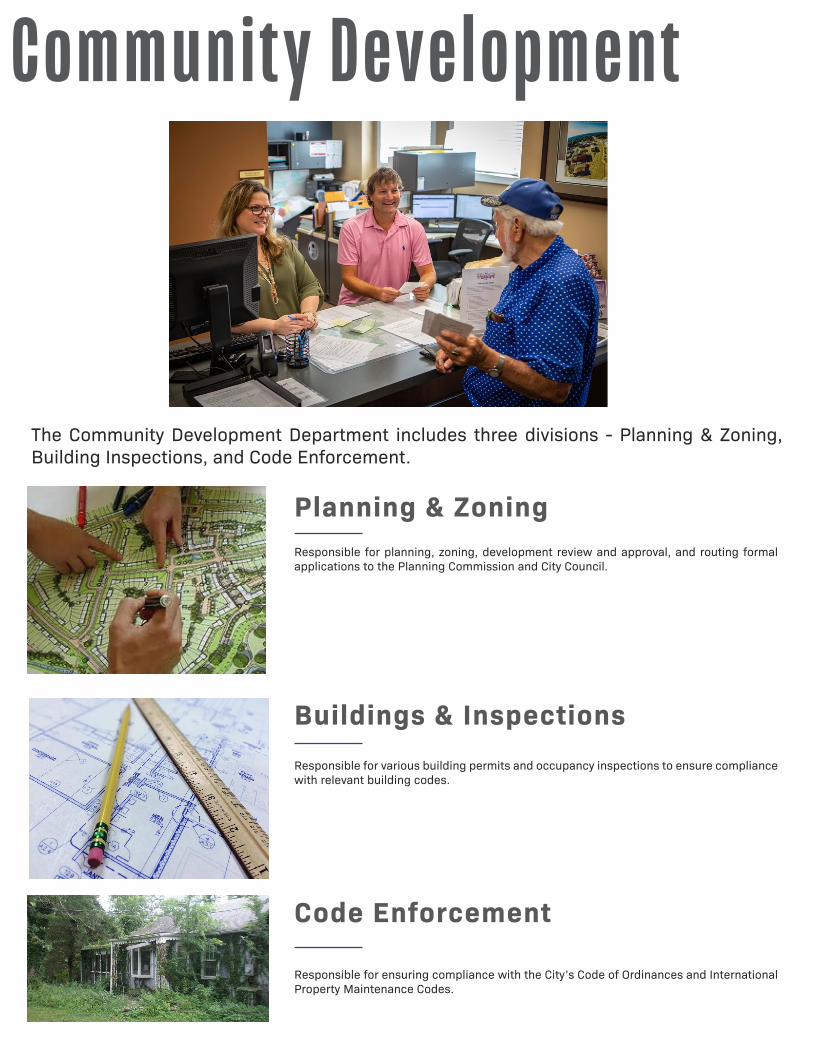
C o mmunity Development
The Community Development Department includes three divisions - Planning & Zoning, Building Inspections, and Code Enforcement.
Planning & Zoning
Buildings & Inspections
Code Enforcement
Responsible for planning, zoning, development review and approval, and routing formal applications to the Planning Commission and City Council.
Responsible for various building permits and occupancy inspections to ensure compliance with relevant building codes.
Responsible for ensuring compliance with the City’s Code of Ordinances and International Property Maintenance Codes.
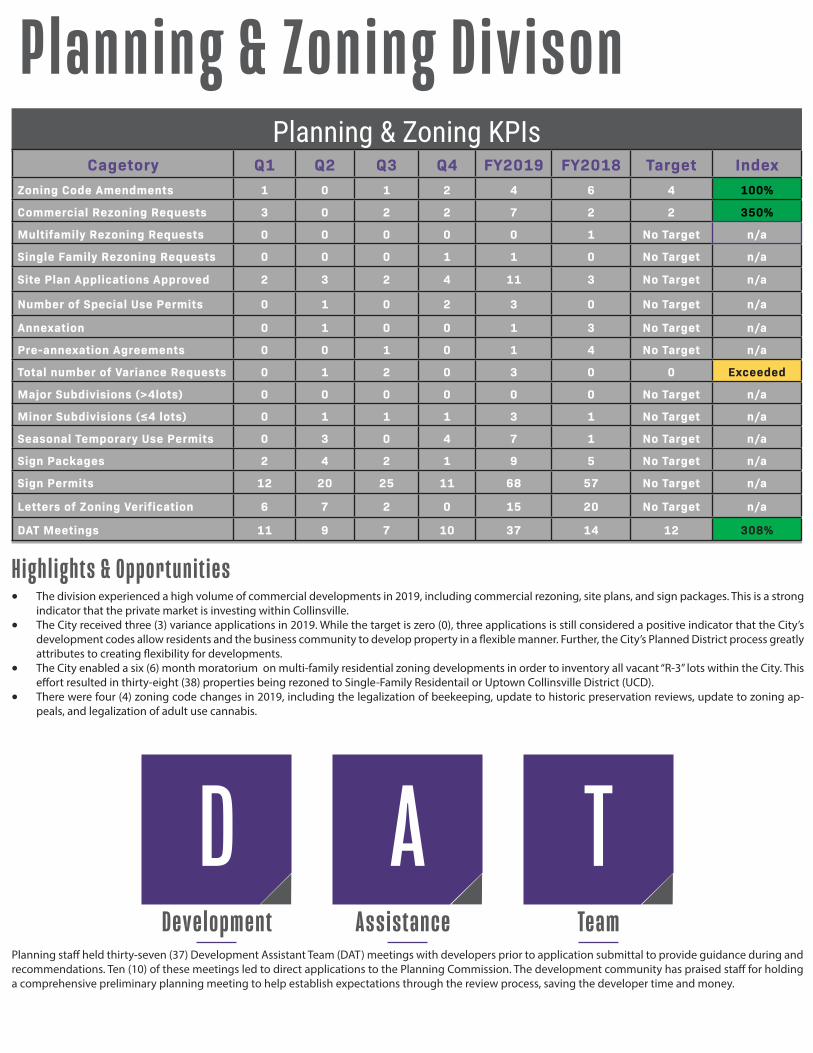
Cagetory Q1 Q2 Q3 Q4 FY2019 FY2018 Target IndexZoning Code Amendments 1 0 1 2 4 6 4 100%
Commercial Rezoning Requests 3 0 2 2 7 2 2 350%
Multifamily Rezoning Requests 0 0 0 0 0 1 No Target n/a
Single Family Rezoning Requests 0 0 0 1 1 0 No Target n/a
Site Plan Applications Approved 2 3 2 4 11 3 No Target n/a
Number of Special Use Permits 0 1 0 2 3 0 No Target n/a
Annexation 0 1 0 0 1 3 No Target n/a
Pre-annexation Agreements 0 0 1 0 1 4 No Target n/a
Total number of Variance Requests 0 1 2 0 3 0 0 Exceeded
Major Subdivisions (>4lots) 0 0 0 0 0 0 No Target n/a
Minor Subdivisions (≤4 lots) 0 1 1 1 3 1 No Target n/a
Seasonal Temporary Use Permits 0 3 0 4 7 1 No Target n/a
Sign Packages 2 4 2 1 9 5 No Target n/a
Sign Permits 12 20 25 11 68 57 No Target n/a
Letters of Zoning Verification 6 7 2 0 15 20 No Target n/a
DAT Meetings 11 9 7 10 37 14 12 308%
Planning & Zoning KPIs
PB
Planning & Zoning Divison
Development Assistance TeamPlanning staff held thirty-seven (37) Development Assistant Team (DAT) meetings with developers prior to application submittal to provide guidance during and recommendations. Ten (10) of these meetings led to direct applications to the Planning Commission. The development community has praised staff for holding a comprehensive preliminary planning meeting to help establish expectations through the review process, saving the developer time and money.
D A T
• The division experienced a high volume of commercial developments in 2019, including commercial rezoning, site plans, and sign packages. This is a strong indicator that the private market is investing within Collinsville.
• The City received three (3) variance applications in 2019. While the target is zero (0), three applications is still considered a positive indicator that the City’s development codes allow residents and the business community to develop property in a flexible manner. Further, the City’s Planned District process greatly attributes to creating flexibility for developments.
• The City enabled a six (6) month moratorium on multi-family residential zoning developments in order to inventory all vacant “R-3” lots within the City. This effort resulted in thirty-eight (38) properties being rezoned to Single-Family Residentail or Uptown Collinsville District (UCD).
• There were four (4) zoning code changes in 2019, including the legalization of beekeeping, update to historic preservation reviews, update to zoning ap-peals, and legalization of adult use cannabis.
H ig hlights & Opportunities
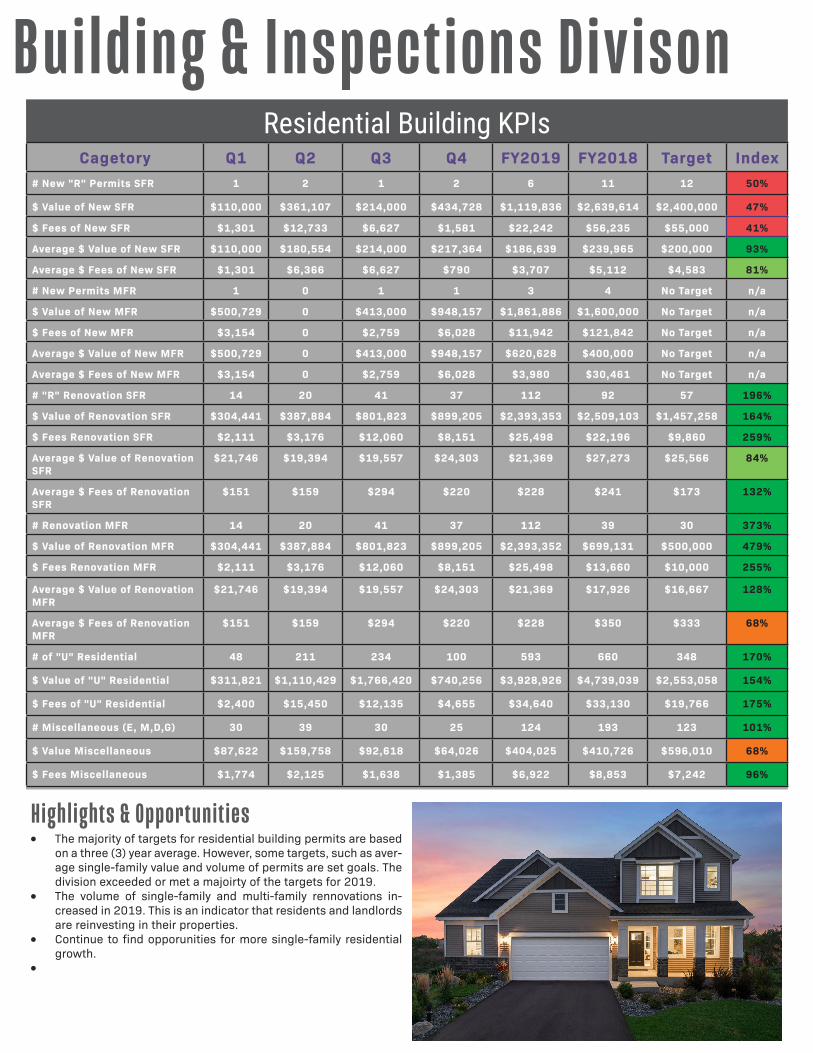
Cagetory Q1 Q2 Q3 Q4 FY2019 FY2018 Target Index# New "R" Permits SFR 1 2 1 2 6 11 12 50%
$ Value of New SFR $110,000 $361,107 $214,000 $434,728 $1,119,836 $2,639,614 $2,400,000 47%
$ Fees of New SFR $1,301 $12,733 $6,627 $1,581 $22,242 $56,235 $55,000 41%
Average $ Value of New SFR $110,000 $180,554 $214,000 $217,364 $186,639 $239,965 $200,000 93%
Average $ Fees of New SFR $1,301 $6,366 $6,627 $790 $3,707 $5,112 $4,583 81%
# New Permits MFR 1 0 1 1 3 4 No Target n/a
$ Value of New MFR $500,729 0 $413,000 $948,157 $1,861,886 $1,600,000 No Target n/a
$ Fees of New MFR $3,154 0 $2,759 $6,028 $11,942 $121,842 No Target n/a
Average $ Value of New MFR $500,729 0 $413,000 $948,157 $620,628 $400,000 No Target n/a
Average $ Fees of New MFR $3,154 0 $2,759 $6,028 $3,980 $30,461 No Target n/a
# "R" Renovation SFR 14 20 41 37 112 92 57 196%
$ Value of Renovation SFR $304,441 $387,884 $801,823 $899,205 $2,393,353 $2,509,103 $1,457,258 164%
$ Fees Renovation SFR $2,111 $3,176 $12,060 $8,151 $25,498 $22,196 $9,860 259%
Average $ Value of Renovation SFR
$21,746 $19,394 $19,557 $24,303 $21,369 $27,273 $25,566 84%
Average $ Fees of Renovation SFR
$151 $159 $294 $220 $228 $241 $173 132%
# Renovation MFR 14 20 41 37 112 39 30 373%
$ Value of Renovation MFR $304,441 $387,884 $801,823 $899,205 $2,393,352 $699,131 $500,000 479%
$ Fees Renovation MFR $2,111 $3,176 $12,060 $8,151 $25,498 $13,660 $10,000 255%
Average $ Value of Renovation MFR
$21,746 $19,394 $19,557 $24,303 $21,369 $17,926 $16,667 128%
Average $ Fees of Renovation MFR
$151 $159 $294 $220 $228 $350 $333 68%
# of "U" Residential 48 211 234 100 593 660 348 170%
$ Value of "U" Residential $311,821 $1,110,429 $1,766,420 $740,256 $3,928,926 $4,739,039 $2,553,058 154%
$ Fees of "U" Residential $2,400 $15,450 $12,135 $4,655 $34,640 $33,130 $19,766 175%
# Miscellaneous (E, M,D,G) 30 39 30 25 124 193 123 101%
$ Value Miscellaneous $87,622 $159,758 $92,618 $64,026 $404,025 $410,726 $596,010 68%
$ Fees Miscellaneous $1,774 $2,125 $1,638 $1,385 $6,922 $8,853 $7,242 96%
Residential Building KPIs
PB
Building & Inspections Divison
• The majority of targets for residential building permits are based on a three (3) year average. However, some targets, such as aver-age single-family value and volume of permits are set goals. The division exceeded or met a majoirty of the targets for 2019.
• The volume of single-family and multi-family rennovations in-creased in 2019. This is an indicator that residents and landlords are reinvesting in their properties.
• Continue to find opporunities for more single-family residential growth.
•
H ig hlights & Opportunities
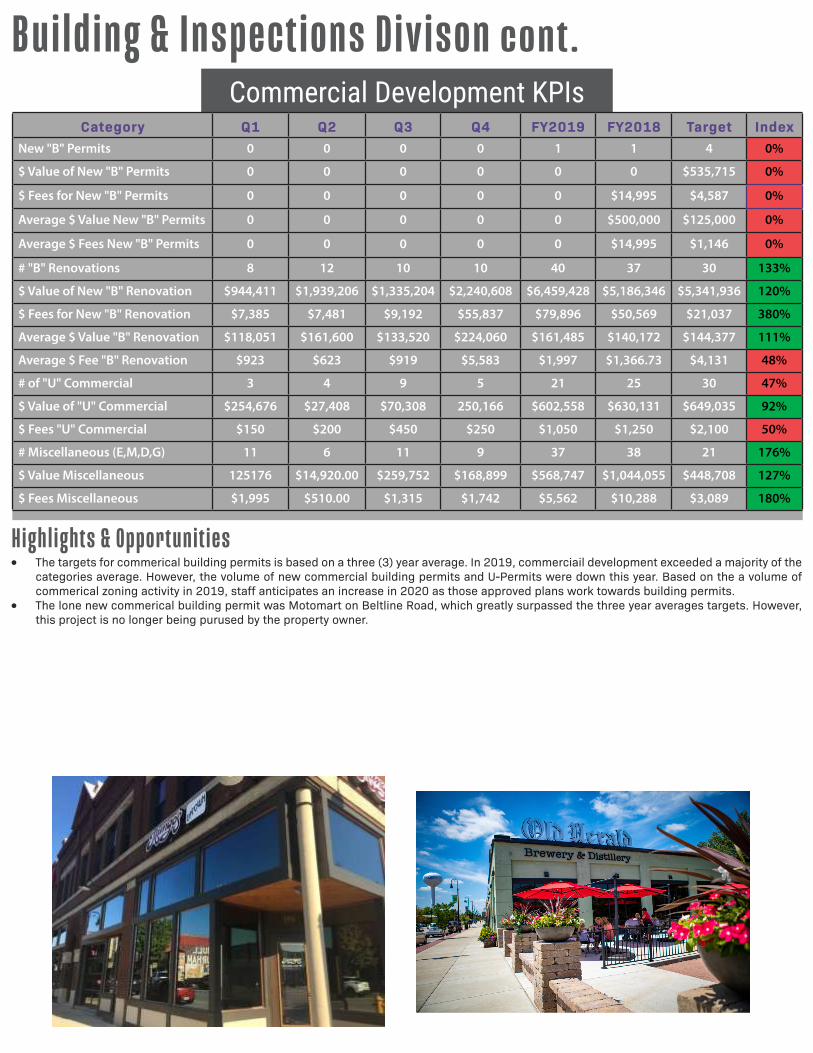
Category Q1 Q2 Q3 Q4 FY2019 FY2018 Target IndexNew "B" Permits 0 0 0 0 1 1 4 0%
$ Value of New "B" Permits 0 0 0 0 0 0 $535,715 0%
$ Fees for New "B" Permits 0 0 0 0 0 $14,995 $4,587 0%
Average $ Value New "B" Permits 0 0 0 0 0 $500,000 $125,000 0%
Average $ Fees New "B" Permits 0 0 0 0 0 $14,995 $1,146 0%
# "B" Renovations 8 12 10 10 40 37 30 133%
$ Value of New "B" Renovation $944,411 $1,939,206 $1,335,204 $2,240,608 $6,459,428 $5,186,346 $5,341,936 120%
$ Fees for New "B" Renovation $7,385 $7,481 $9,192 $55,837 $79,896 $50,569 $21,037 380%
Average $ Value "B" Renovation $118,051 $161,600 $133,520 $224,060 $161,485 $140,172 $144,377 111%
Average $ Fee "B" Renovation $923 $623 $919 $5,583 $1,997 $1,366.73 $4,131 48%
# of "U" Commercial 3 4 9 5 21 25 30 47%
$ Value of "U" Commercial $254,676 $27,408 $70,308 250,166 $602,558 $630,131 $649,035 92%
$ Fees "U" Commercial $150 $200 $450 $250 $1,050 $1,250 $2,100 50%
# Miscellaneous (E,M,D,G) 11 6 11 9 37 38 21 176%
$ Value Miscellaneous 125176 $14,920.00 $259,752 $168,899 $568,747 $1,044,055 $448,708 127%
$ Fees Miscellaneous $1,995 $510.00 $1,315 $1,742 $5,562 $10,288 $3,089 180%
Commercial Development KPIs
PB
Buildin g & Inspections Divison cont.
• The targets for commerical building permits is based on a three (3) year average. In 2019, commerciail development exceeded a majority of the categories average. However, the volume of new commercial building permits and U-Permits were down this year. Based on the a volume of commerical zoning activity in 2019, staff anticipates an increase in 2020 as those approved plans work towards building permits.
• The lone new commerical building permit was Motomart on Beltline Road, which greatly surpassed the three year averages targets. However, this project is no longer being purused by the property owner.
H ig hlights & Opportunities
Cagetory Q1 Q2 Q3 Q4 FY2019 FY2018Commercial Total Demolitions 1 1 2 1 5 6
Total Residential Demolitions 0 4 2 5 11 8
City Demolished Houses 3 0 0 5 8 0
Total Residential Demolitions - Garage/Access 0 1 0 5 6 2
Demolition Data
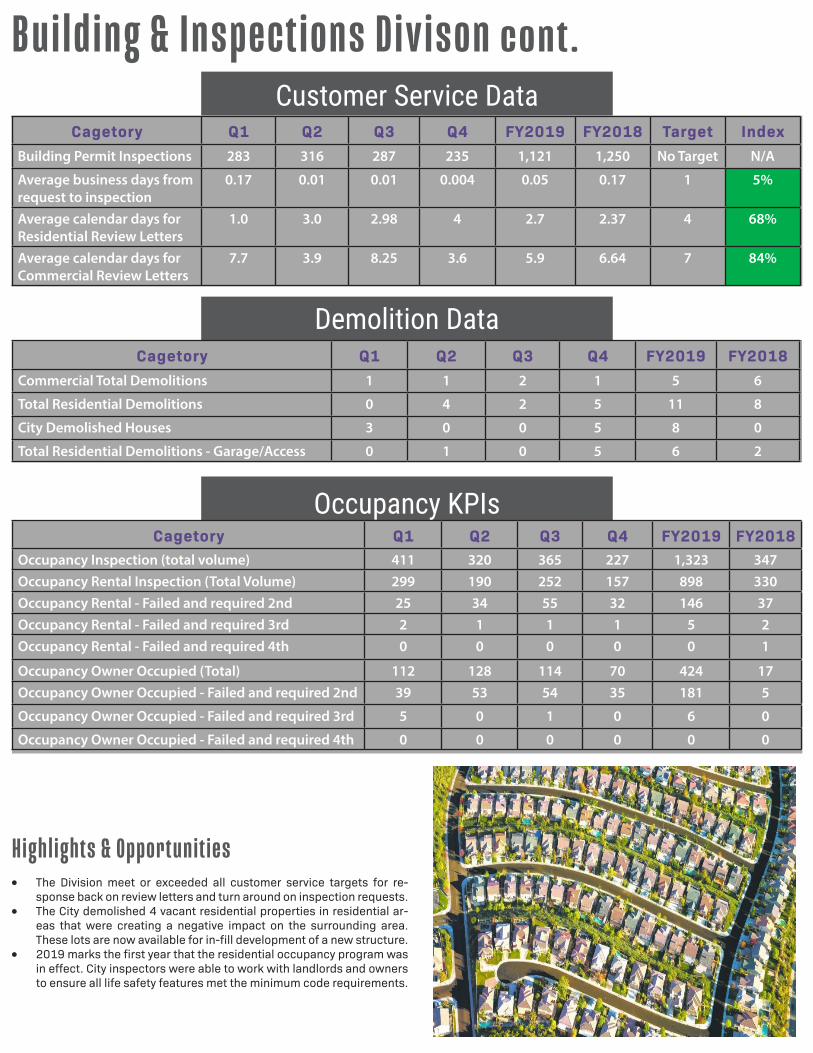
Cagetory Q1 Q2 Q3 Q4 FY2019 FY2018 Target IndexBuilding Permit Inspections 283 316 287 235 1,121 1,250 No Target N/A
Average business days from request to inspection
0.17 0.01 0.01 0.004 0.05 0.17 1 5%
Average calendar days for Residential Review Letters
1.0 3.0 2.98 4 2.7 2.37 4 68%
Average calendar days for Commercial Review Letters
7.7 3.9 8.25 3.6 5.9 6.64 7 84%
Customer Service Data
Cagetory Q1 Q2 Q3 Q4 FY2019 FY2018Occupancy Inspection (total volume) 411 320 365 227 1,323 347Occupancy Rental Inspection (Total Volume) 299 190 252 157 898 330Occupancy Rental - Failed and required 2nd 25 34 55 32 146 37Occupancy Rental - Failed and required 3rd 2 1 1 1 5 2Occupancy Rental - Failed and required 4th 0 0 0 0 0 1
Occupancy Owner Occupied (Total) 112 128 114 70 424 17Occupancy Owner Occupied - Failed and required 2nd 39 53 54 35 181 5
Occupancy Owner Occupied - Failed and required 3rd 5 0 1 0 6 0
Occupancy Owner Occupied - Failed and required 4th 0 0 0 0 0 0
Occupancy KPIs
PB
Buildin g & Inspections Divison cont.
• The Division meet or exceeded all customer service targets for re-sponse back on review letters and turn around on inspection requests.
• The City demolished 4 vacant residential properties in residential ar-eas that were creating a negative impact on the surrounding area. These lots are now available for in-fill development of a new structure.
• 2019 marks the first year that the residential occupancy program was in effect. City inspectors were able to work with landlords and owners to ensure all life safety features met the minimum code requirements.
H ig hlig hts & Opportunities
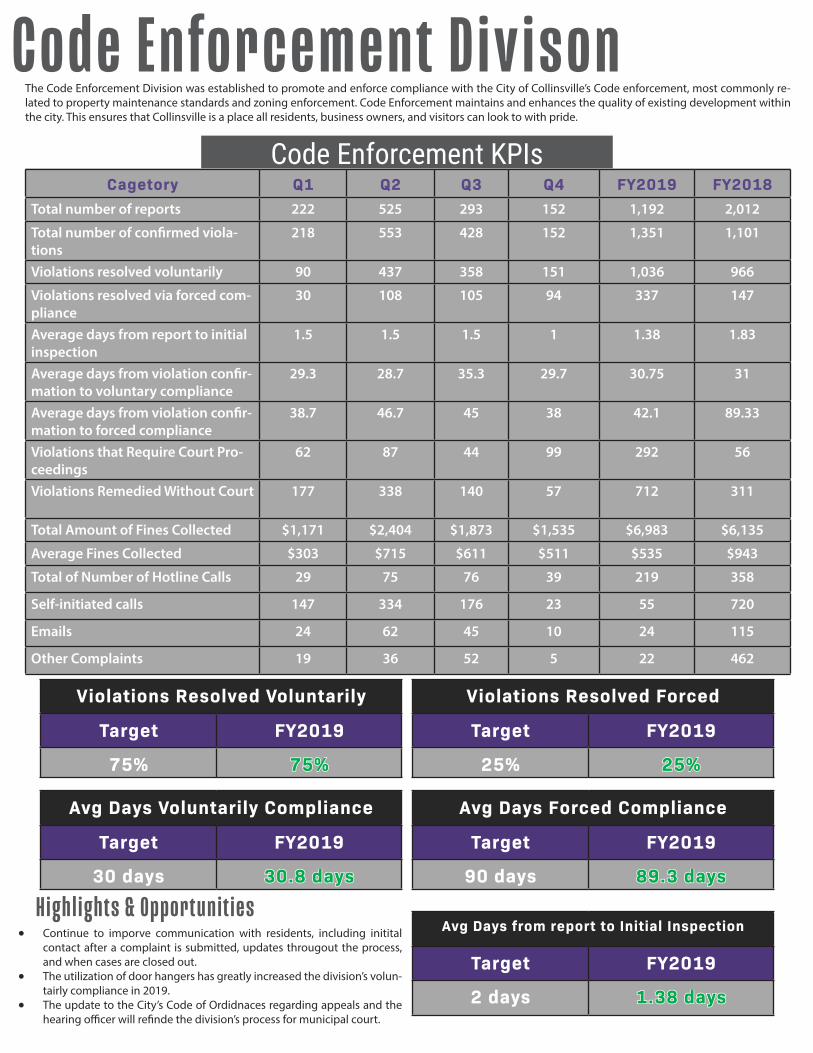
Cagetory Q1 Q2 Q3 Q4 FY2019 FY2018Total number of reports 222 525 293 152 1,192 2,012
Total number of confirmed viola-tions
218 553 428 152 1,351 1,101
Violations resolved voluntarily 90 437 358 151 1,036 966
Violations resolved via forced com-pliance
30 108 105 94 337 147
Average days from report to initial inspection
1.5 1.5 1.5 1 1.38 1.83
Average days from violation confir-mation to voluntary compliance
29.3 28.7 35.3 29.7 30.75 31
Average days from violation confir-mation to forced compliance
38.7 46.7 45 38 42.1 89.33
Violations that Require Court Pro-ceedings
62 87 44 99 292 56
Violations Remedied Without Court 177 338 140 57 712 311
Total Amount of Fines Collected $1,171 $2,404 $1,873 $1,535 $6,983 $6,135
Average Fines Collected $303 $715 $611 $511 $535 $943
Total of Number of Hotline Calls 29 75 76 39 219 358
Self-initiated calls 147 334 176 23 55 720
Emails 24 62 45 10 24 115
Other Complaints 19 36 52 5 22 462
Code Enforcement KPIs
PB
C o de Enforcement DivisonThe Code Enforcement Division was established to promote and enforce compliance with the City of Collinsville’s Code enforcement, most commonly re-lated to property maintenance standards and zoning enforcement. Code Enforcement maintains and enhances the quality of existing development within the city. This ensures that Collinsville is a place all residents, business owners, and visitors can look to with pride.
• Continue to imporve communication with residents, including initital contact after a complaint is submitted, updates througout the process, and when cases are closed out.
• The utilization of door hangers has greatly increased the division’s volun-tairly compliance in 2019.
• The update to the City’s Code of Ordidnaces regarding appeals and the hearing officer will refinde the division’s process for municipal court.
Hig hlights & Opportunities
Violations Resolved Voluntarily
Target FY2019
75% 75%75%
Violations Resolved Forced
Target FY2019
25% 25%25%
Avg Days Voluntarily Compliance
Target FY2019
30 days 30.8 days30.8 days
Avg Days Forced Compliance
Target FY2019
90 days 89.3 days89.3 days
Avg Days from report to Initial Inspection
Target FY2019
2 days 1.38 days1.38 days
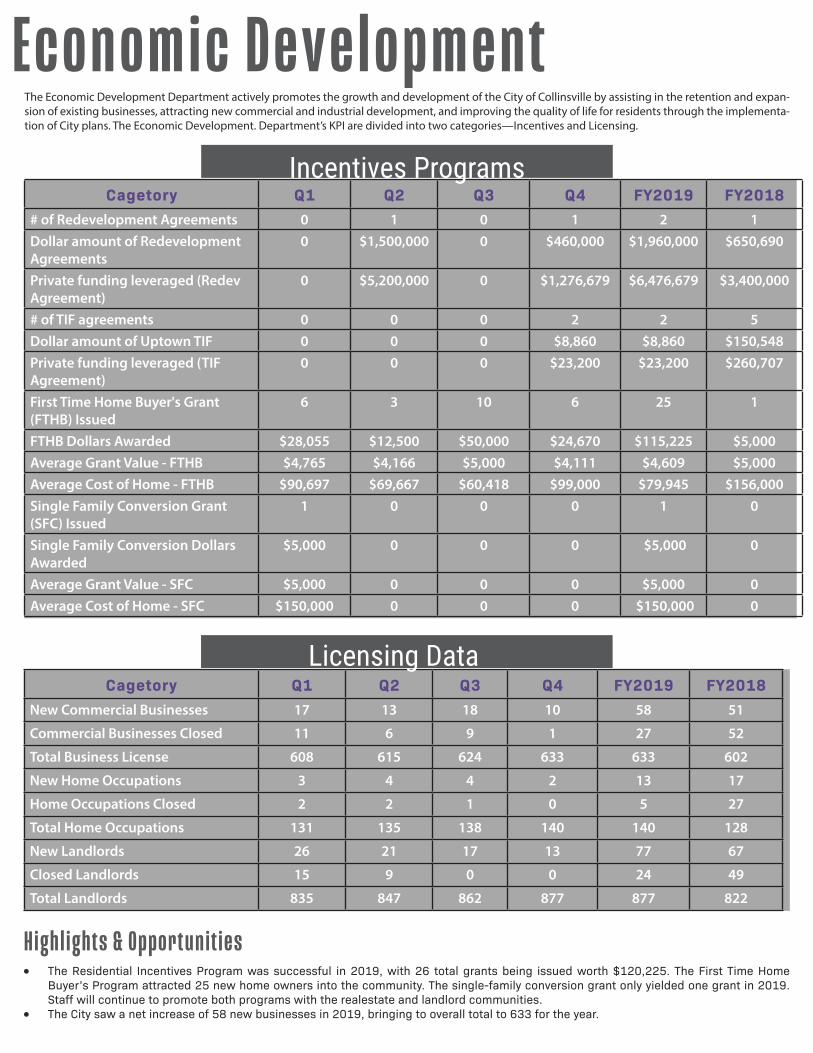
Cagetory Q1 Q2 Q3 Q4 FY2019 FY2018# of Redevelopment Agreements 0 1 0 1 2 1Dollar amount of Redevelopment Agreements
0 $1,500,000 0 $460,000 $1,960,000 $650,690
Private funding leveraged (Redev Agreement)
0 $5,200,000 0 $1,276,679 $6,476,679 $3,400,000
# of TIF agreements 0 0 0 2 2 5Dollar amount of Uptown TIF 0 0 0 $8,860 $8,860 $150,548Private funding leveraged (TIF Agreement)
0 0 0 $23,200 $23,200 $260,707
First Time Home Buyer's Grant (FTHB) Issued
6 3 10 6 25 1
FTHB Dollars Awarded $28,055 $12,500 $50,000 $24,670 $115,225 $5,000Average Grant Value - FTHB $4,765 $4,166 $5,000 $4,111 $4,609 $5,000Average Cost of Home - FTHB $90,697 $69,667 $60,418 $99,000 $79,945 $156,000Single Family Conversion Grant (SFC) Issued
1 0 0 0 1 0
Single Family Conversion Dollars Awarded
$5,000 0 0 0 $5,000 0
Average Grant Value - SFC $5,000 0 0 0 $5,000 0Average Cost of Home - SFC $150,000 0 0 0 $150,000 0
Incentives Programs
Cagetory Q1 Q2 Q3 Q4 FY2019 FY2018New Commercial Businesses 17 13 18 10 58 51
Commercial Businesses Closed 11 6 9 1 27 52
Total Business License 608 615 624 633 633 602
New Home Occupations 3 4 4 2 13 17
Home Occupations Closed 2 2 1 0 5 27
Total Home Occupations 131 135 138 140 140 128
New Landlords 26 21 17 13 77 67
Closed Landlords 15 9 0 0 24 49
Total Landlords 835 847 862 877 877 822
Licensing Data
PB
Ec onomic DevelopmentThe Economic Development Department actively promotes the growth and development of the City of Collinsville by assisting in the retention and expan-sion of existing businesses, attracting new commercial and industrial development, and improving the quality of life for residents through the implementa-tion of City plans. The Economic Development. Department’s KPI are divided into two categories—Incentives and Licensing.
• The Residential Incentives Program was successful in 2019, with 26 total grants being issued worth $120,225. The First Time Home Buyer’s Program attracted 25 new home owners into the community. The single-family conversion grant only yielded one grant in 2019. Staff will continue to promote both programs with the realestate and landlord communities.
• The City saw a net increase of 58 new businesses in 2019, bringing to overall total to 633 for the year.
H ig hlig hts & Opportunities
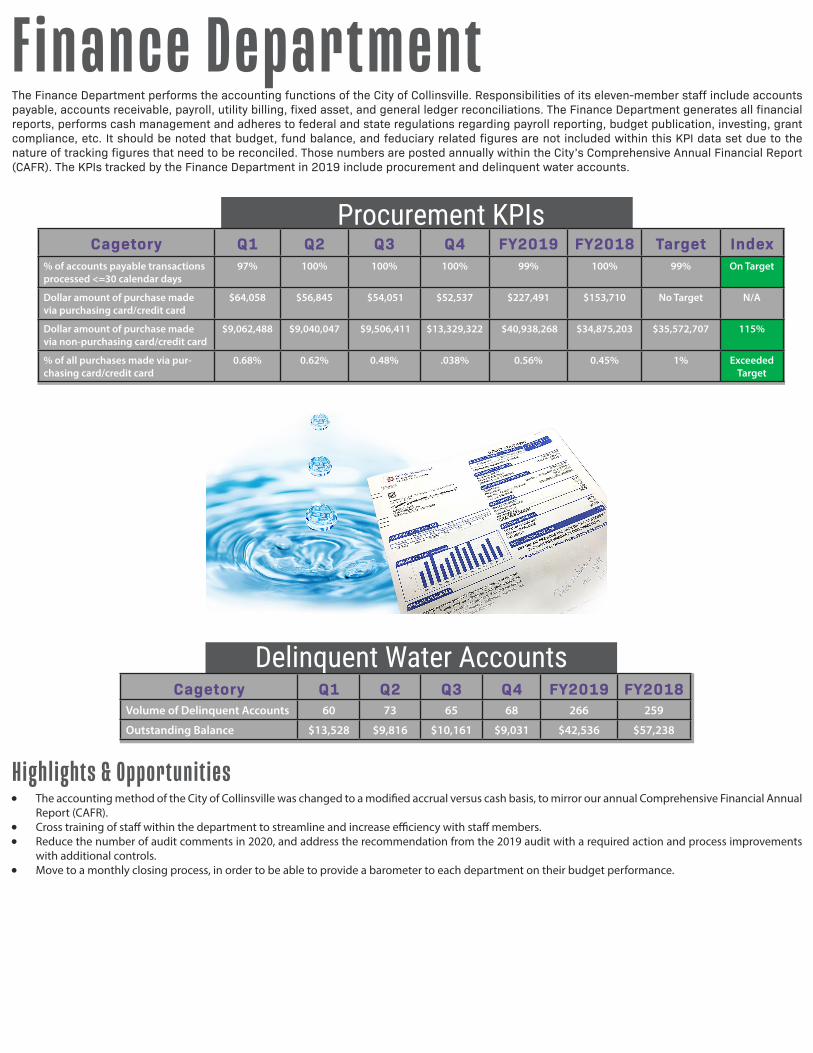
Cagetory Q1 Q2 Q3 Q4 FY2019 FY2018 Target Index% of accounts payable transactions processed <=30 calendar days
97% 100% 100% 100% 99% 100% 99% On Target
Dollar amount of purchase made via purchasing card/credit card
$64,058 $56,845 $54,051 $52,537 $227,491 $153,710 No Target N/A
Dollar amount of purchase made via non-purchasing card/credit card
$9,062,488 $9,040,047 $9,506,411 $13,329,322 $40,938,268 $34,875,203 $35,572,707 115%
% of all purchases made via pur-chasing card/credit card
0.68% 0.62% 0.48% .038% 0.56% 0.45% 1% Exceeded Target
Procurement KPIs
Cagetory Q1 Q2 Q3 Q4 FY2019 FY2018Volume of Delinquent Accounts 60 73 65 68 266 259
Outstanding Balance $13,528 $9,816 $10,161 $9,031 $42,536 $57,238
Delinquent Water Accounts
PB
Finan ce Depar tmentThe Finance Department performs the accounting functions of the City of Collinsville. Responsibilities of its eleven-member staff include accounts payable, accounts receivable, payroll, utility billing, fixed asset, and general ledger reconciliations. The Finance Department generates all financial reports, performs cash management and adheres to federal and state regulations regarding payroll reporting, budget publication, investing, grant compliance, etc. It should be noted that budget, fund balance, and feduciary related figures are not included within this KPI data set due to the nature of tracking figures that need to be reconciled. Those numbers are posted annually within the City’s Comprehensive Annual Financial Report (CAFR). The KPIs tracked by the Finance Department in 2019 include procurement and delinquent water accounts.
• The accounting method of the City of Collinsville was changed to a modified accrual versus cash basis, to mirror our annual Comprehensive Financial Annual Report (CAFR).
• Cross training of staff within the department to streamline and increase efficiency with staff members. • Reduce the number of audit comments in 2020, and address the recommendation from the 2019 audit with a required action and process improvements
with additional controls. • Move to a monthly closing process, in order to be able to provide a barometer to each department on their budget performance.
H ighlights & Opportunities

Cagetory 2019 2018Total Training Hours 1,450 n/a
Average Training Hours per Sworn Officer 38.15 n/a
Total Fires 82 100
% Calls for Fires 2% 2.6%
Total Calls for Structure Fires 28 14
% Calls For Service for Structure Fires 34% 30%
Total Calls for EMS Service 2,799 2,938
% Calls For Service for EMS Service 73% 76%
# of CPR Classes 14 16
Total # of CPR Class Attendees 100 127
Average Attendees per CPR Class 7.14 7.9
# of Community Focused Prevention Presentations 44 27
Total hours spent on community events 66 54
Smoke Detector installations 21 14
Total # of Commercial Inspections 184 114
Business License Inspections 69 40
Construction & Life Safety Inspections 115 49
School Inspection 11 4
Misc. Inspections 27 25
Plan Reviews 58 54
# Hydrants Tested 1,200 1,200
Fire Department KPIs
PB
Fir e De partmentThe Fire Department’s services include fire prevention, public fire safety education, fire suppression, rescue, hazard miti-gation, and advance life support services. Average response time, volume of fires and cardiac arrests, and volume of calls within the City and District are among the Department’s KPI categories.
Calls for Service Sworn EMS/Firefighters
Average Response Time
Total Fires
Cardiac Arrest
3,624 38
8m | 1 9 s
82
27 Cases | 4 Saves
679 per capita
PB
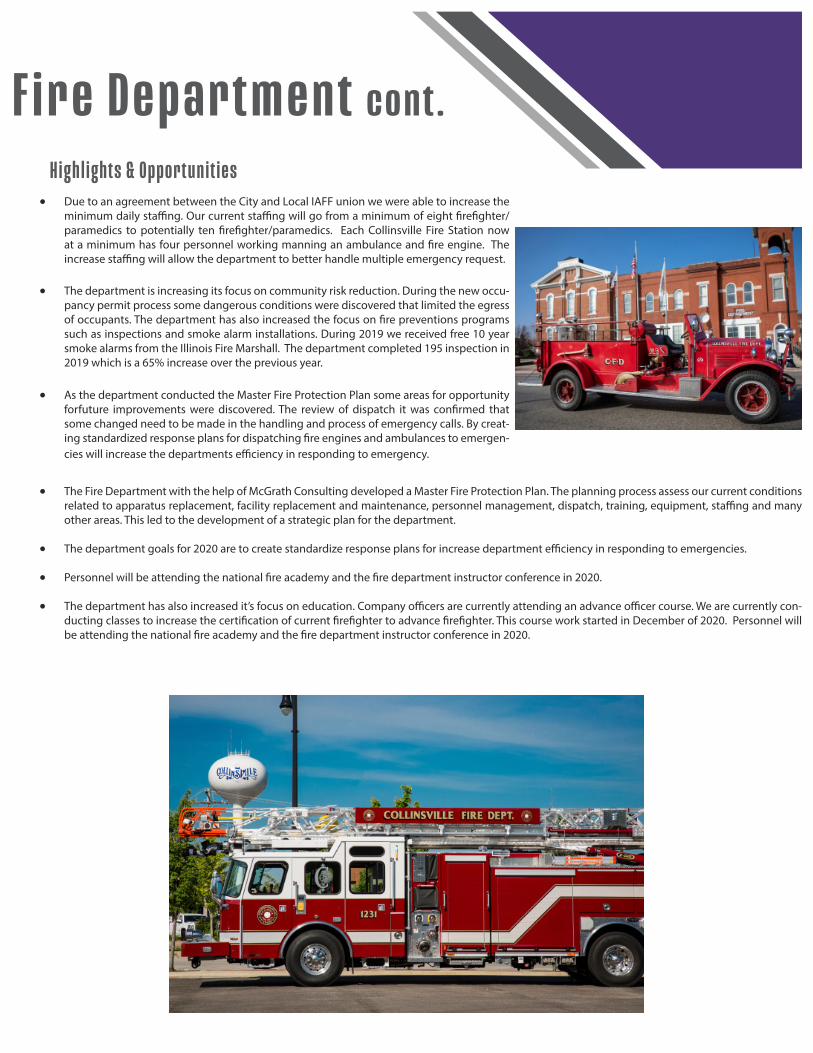
Highlights & Oppo r tu n itie s • Due to an agreement between the City and Local IAFF union we were able to increase the
minimum daily staffing. Our current staffing will go from a minimum of eight firefighter/ paramedics to potentially ten firefighter/paramedics. Each Collinsville Fire Station now at a minimum has four personnel working manning an ambulance and fire engine. The increase staffing will allow the department to better handle multiple emergency request.
• The department is increasing its focus on community risk reduction. During the new occu-pancy permit process some dangerous conditions were discovered that limited the egress of occupants. The department has also increased the focus on fire preventions programs such as inspections and smoke alarm installations. During 2019 we received free 10 year smoke alarms from the Illinois Fire Marshall. The department completed 195 inspection in 2019 which is a 65% increase over the previous year.
• As the department conducted the Master Fire Protection Plan some areas for opportunity forfuture improvements were discovered. The review of dispatch it was confirmed that some changed need to be made in the handling and process of emergency calls. By creat-ing standardized response plans for dispatching fire engines and ambulances to emergen-cies will increase the departments efficiency in responding to emergency.
• The Fire Department with the help of McGrath Consulting developed a Master Fire Protection Plan. The planning process assess our current conditions related to apparatus replacement, facility replacement and maintenance, personnel management, dispatch, training, equipment, staffing and many other areas. This led to the development of a strategic plan for the department.
• The department goals for 2020 are to create standardize response plans for increase department efficiency in responding to emergencies.
• Personnel will be attending the national fire academy and the fire department instructor conference in 2020.
• The department has also increased it’s focus on education. Company officers are currently attending an advance officer course. We are currently con-ducting classes to increase the certification of current firefighter to advance firefighter. This course work started in December of 2020. Personnel will be attending the national fire academy and the fire department instructor conference in 2020.
Fire De partment cont.
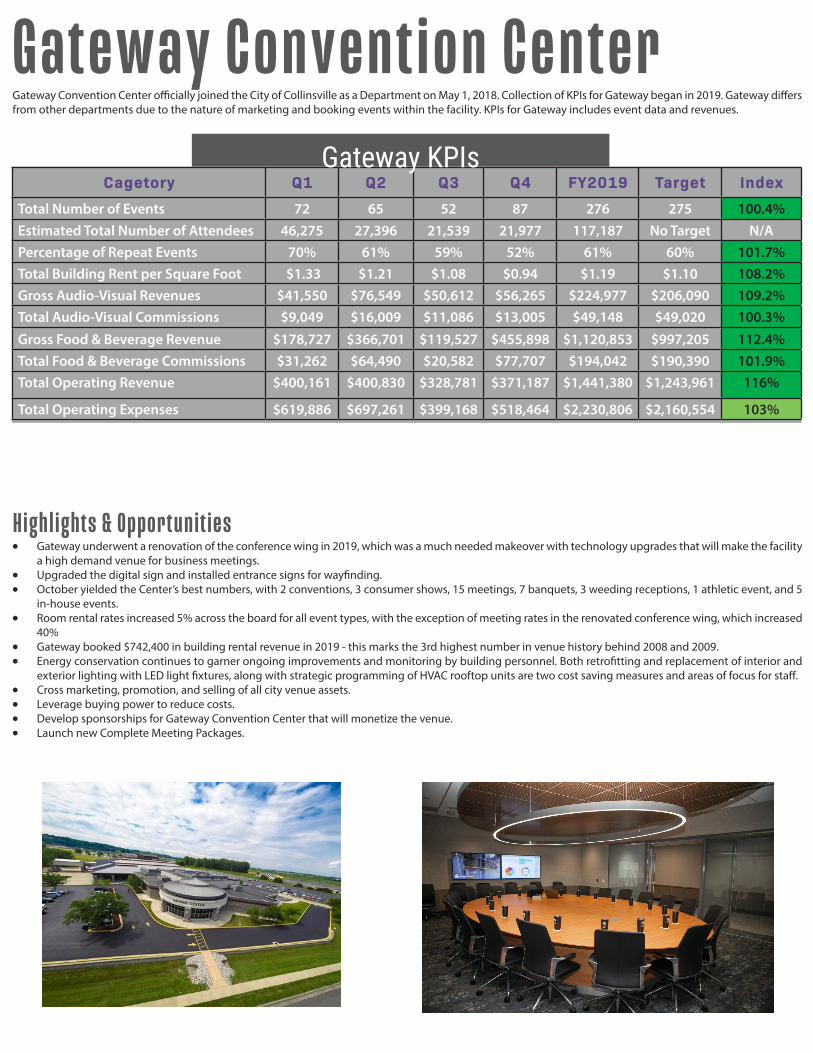
Cagetory Q1 Q2 Q3 Q4 FY2019 Target IndexTotal Number of Events 72 65 52 87 276 275 100.4%Estimated Total Number of Attendees 46,275 27,396 21,539 21,977 117,187 No Target N/APercentage of Repeat Events 70% 61% 59% 52% 61% 60% 101.7%Total Building Rent per Square Foot $1.33 $1.21 $1.08 $0.94 $1.19 $1.10 108.2%Gross Audio-Visual Revenues $41,550 $76,549 $50,612 $56,265 $224,977 $206,090 109.2%Total Audio-Visual Commissions $9,049 $16,009 $11,086 $13,005 $49,148 $49,020 100.3%Gross Food & Beverage Revenue $178,727 $366,701 $119,527 $455,898 $1,120,853 $997,205 112.4%Total Food & Beverage Commissions $31,262 $64,490 $20,582 $77,707 $194,042 $190,390 101.9%Total Operating Revenue $400,161 $400,830 $328,781 $371,187 $1,441,380 $1,243,961 116%
Total Operating Expenses $619,886 $697,261 $399,168 $518,464 $2,230,806 $2,160,554 103%
Gateway KPIs
PB
G a teway Convention Center
• Gateway underwent a renovation of the conference wing in 2019, which was a much needed makeover with technology upgrades that will make the facility a high demand venue for business meetings.
• Upgraded the digital sign and installed entrance signs for wayfinding. • October yielded the Center’s best numbers, with 2 conventions, 3 consumer shows, 15 meetings, 7 banquets, 3 weeding receptions, 1 athletic event, and 5
in-house events. • Room rental rates increased 5% across the board for all event types, with the exception of meeting rates in the renovated conference wing, which increased
40% • Gateway booked $742,400 in building rental revenue in 2019 - this marks the 3rd highest number in venue history behind 2008 and 2009. • Energy conservation continues to garner ongoing improvements and monitoring by building personnel. Both retrofitting and replacement of interior and
exterior lighting with LED light fixtures, along with strategic programming of HVAC rooftop units are two cost saving measures and areas of focus for staff. • Cross marketing, promotion, and selling of all city venue assets. • Leverage buying power to reduce costs. • Develop sponsorships for Gateway Convention Center that will monetize the venue. • Launch new Complete Meeting Packages.
Hig hlights & Opportunities
Gateway Convention Center officially joined the City of Collinsville as a Department on May 1, 2018. Collection of KPIs for Gateway began in 2019. Gateway differs from other departments due to the nature of marketing and booking events within the facility. KPIs for Gateway includes event data and revenues.

Cagetory Target 2019 2018Average Sick Hours Used: All employees 5 days 7.6 days 5 days
Average Sick Hours Used: Sworn Fire/EMS 5 days 9 days 7.4 days
Average Sick Hours Used: Sworn Police 5 days 8.9 days 5 days
Average Employee Time Off - Funeral 0 days 0.33 days 5 days
Average Employee Time Off - Vacation 5 to 10 days 9.92 days 9.5 days
Average Employee Time Off - Personal 1 day 1 day 0.9 days
Workers Comp - Days lost to Injury - All Departments 0 74 685
Workers Comp - Days lost to Injury - Sworn Fire/EMS 0 14 55
Workers Comp - Days lost to Injury - Sworn Police 0 471 191
Workers Comp Claims 0 27 27
Leave & Workers Comp Data
Cagetory 2019 2018Number of Full-Time Employees 207 195
Number of Part-Time Employees 163 114
Number of Sworn Fire/EMS 38 32
Number of Sworn Police 43 37
Total of Salary and Benefits for all Full-Time Employees $16,296,190 $14,683,319
Total Wages for all Part-Time Employees $1,317,280 $685,675
Total of All Salries and Benefits $17,613,470 $15,401,995
Payroll Statistics
PB
H R DepartmentThe Human Resource (HR) Department is responsible for recruitment, employer-employee relations, compensation and benefits, training and development, and labor law compliance. HR is also responsible for procuring insurance, administering general and auto liability claims, the workers’ compensation process and the safety needs of the organization.
• Turnover continues to be low for the City. High turnover rates can lead to inconsistency within an organization, poor productivity, and a lost sense of unity. Likewise, having a low turnover can reverse these negative effects and decrease cost.
H ighlig hts & Opportunities
• Increase use of part-time and seasonal employees provides benefits to the City such as lower payroll costs and a flexible workforce.
• Full-time employees have used approximately two weeks of vacation time in 2019. The City experiences several significant benefits when employees take extended vacation time. it allows an employee to recharge and unwind, preventing burnout and facilitates higher energy levels, creativity and fresh perspective.
• Comprehensive Return to Work Program: When employees experience illness or injury, it often impacts their ability to perform their jobs. Return-to-work strategies and programs have traditionally been used to reduce workers’ compensation costs. Examples of effective return-to-work strategies include offering the opportunity to work part-time, telecommuting, modifying work duties, modifying schedules, and implementing reasonable ac-commodations to provide employees with the tools and resources they need to carry out their responsibilities.
• Sick Leave Monitoring Program: Full-time employees are provided with a generous sick leave accrual program, earning the equivalent of one day of sick leave per month. Sick leave is intended to help prevent loss of wages due to short-term personal injury or illness. In addition, eligible employees can sell-back unused sick leave accruals per CBA provisions and City policy.
PB
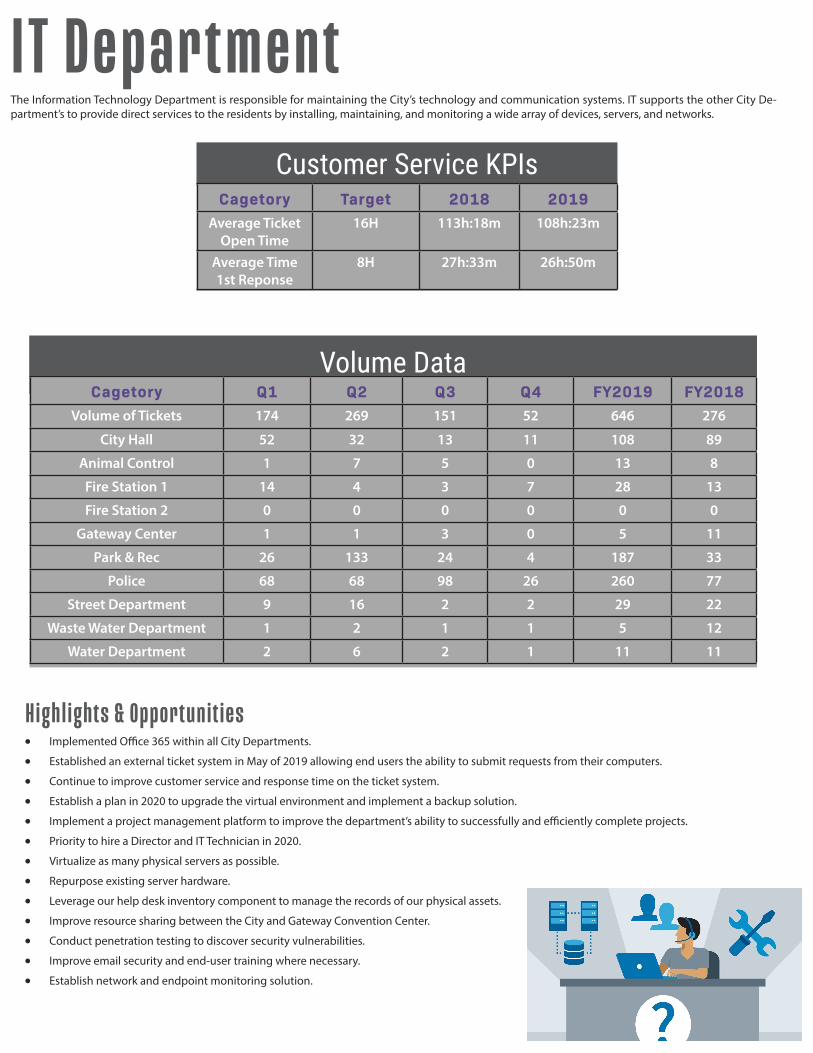
The Information Technology Department is responsible for maintaining the City’s technology and communication systems. IT supports the other City De-partment’s to provide direct services to the residents by installing, maintaining, and monitoring a wide array of devices, servers, and networks.
IT Department
• Implemented Office 365 within all City Departments.
• Established an external ticket system in May of 2019 allowing end users the ability to submit requests from their computers.
• Continue to improve customer service and response time on the ticket system.
• Establish a plan in 2020 to upgrade the virtual environment and implement a backup solution.
• Implement a project management platform to improve the department’s ability to successfully and efficiently complete projects.
• Priority to hire a Director and IT Technician in 2020.
• Virtualize as many physical servers as possible.
• Repurpose existing server hardware.
• Leverage our help desk inventory component to manage the records of our physical assets.
• Improve resource sharing between the City and Gateway Convention Center.
• Conduct penetration testing to discover security vulnerabilities.
• Improve email security and end-user training where necessary.
• Establish network and endpoint monitoring solution.
H ighlig hts & Opportunities
Cagetory Target 2018 2019Average Ticket
Open Time16H 113h:18m 108h:23m
Average Time 1st Reponse
8H 27h:33m 26h:50m
Customer Service KPIs
Cagetory Q1 Q2 Q3 Q4 FY2019 FY2018Volume of Tickets 174 269 151 52 646 276
City Hall 52 32 13 11 108 89
Animal Control 1 7 5 0 13 8
Fire Station 1 14 4 3 7 28 13
Fire Station 2 0 0 0 0 0 0
Gateway Center 1 1 3 0 5 11
Park & Rec 26 133 24 4 187 33
Police 68 68 98 26 260 77
Street Department 9 16 2 2 29 22
Waste Water Department 1 2 1 1 5 12
Water Department 2 6 2 1 11 11
Volume Data
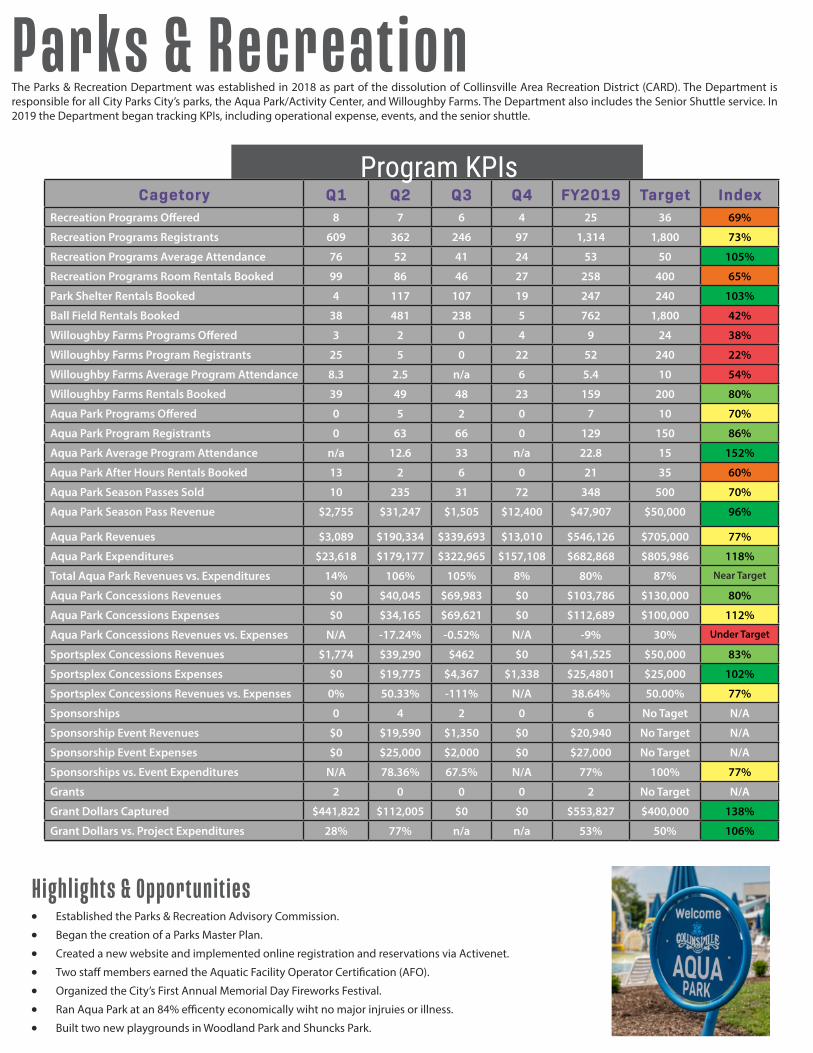
Cagetory Q1 Q2 Q3 Q4 FY2019 Target IndexRecreation Programs Offered 8 7 6 4 25 36 69%
Recreation Programs Registrants 609 362 246 97 1,314 1,800 73%
Recreation Programs Average Attendance 76 52 41 24 53 50 105%
Recreation Programs Room Rentals Booked 99 86 46 27 258 400 65%
Park Shelter Rentals Booked 4 117 107 19 247 240 103%
Ball Field Rentals Booked 38 481 238 5 762 1,800 42%
Willoughby Farms Programs Offered 3 2 0 4 9 24 38%
Willoughby Farms Program Registrants 25 5 0 22 52 240 22%
Willoughby Farms Average Program Attendance 8.3 2.5 n/a 6 5.4 10 54%
Willoughby Farms Rentals Booked 39 49 48 23 159 200 80%
Aqua Park Programs Offered 0 5 2 0 7 10 70%
Aqua Park Program Registrants 0 63 66 0 129 150 86%
Aqua Park Average Program Attendance n/a 12.6 33 n/a 22.8 15 152%
Aqua Park After Hours Rentals Booked 13 2 6 0 21 35 60%
Aqua Park Season Passes Sold 10 235 31 72 348 500 70%
Aqua Park Season Pass Revenue $2,755 $31,247 $1,505 $12,400 $47,907 $50,000 96%
Aqua Park Revenues $3,089 $190,334 $339,693 $13,010 $546,126 $705,000 77%
Aqua Park Expenditures $23,618 $179,177 $322,965 $157,108 $682,868 $805,986 118%
Total Aqua Park Revenues vs. Expenditures 14% 106% 105% 8% 80% 87% Near Target
Aqua Park Concessions Revenues $0 $40,045 $69,983 $0 $103,786 $130,000 80%
Aqua Park Concessions Expenses $0 $34,165 $69,621 $0 $112,689 $100,000 112%
Aqua Park Concessions Revenues vs. Expenses N/A -17.24% -0.52% N/A -9% 30% Under Target
Sportsplex Concessions Revenues $1,774 $39,290 $462 $0 $41,525 $50,000 83%
Sportsplex Concessions Expenses $0 $19,775 $4,367 $1,338 $25,4801 $25,000 102%
Sportsplex Concessions Revenues vs. Expenses 0% 50.33% -111% N/A 38.64% 50.00% 77%
Sponsorships 0 4 2 0 6 No Taget N/A
Sponsorship Event Revenues $0 $19,590 $1,350 $0 $20,940 No Target N/A
Sponsorship Event Expenses $0 $25,000 $2,000 $0 $27,000 No Target N/A
Sponsorships vs. Event Expenditures N/A 78.36% 67.5% N/A 77% 100% 77%
Grants 2 0 0 0 2 No Target N/A
Grant Dollars Captured $441,822 $112,005 $0 $0 $553,827 $400,000 138%
Grant Dollars vs. Project Expenditures 28% 77% n/a n/a 53% 50% 106%
Program KPIs
PB
Pa rks & Recre ationThe Parks & Recreation Department was established in 2018 as part of the dissolution of Collinsville Area Recreation District (CARD). The Department is responsible for all City Parks City’s parks, the Aqua Park/Activity Center, and Willoughby Farms. The Department also includes the Senior Shuttle service. In 2019 the Department began tracking KPIs, including operational expense, events, and the senior shuttle.
• Established the Parks & Recreation Advisory Commission.
• Began the creation of a Parks Master Plan.
• Created a new website and implemented online registration and reservations via Activenet.
• Two staff members earned the Aquatic Facility Operator Certification (AFO).
• Organized the City’s First Annual Memorial Day Fireworks Festival.
• Ran Aqua Park at an 84% efficenty economically wiht no major injruies or illness.
• Built two new playgrounds in Woodland Park and Shuncks Park.
H ig hlights & Opportunities
PB
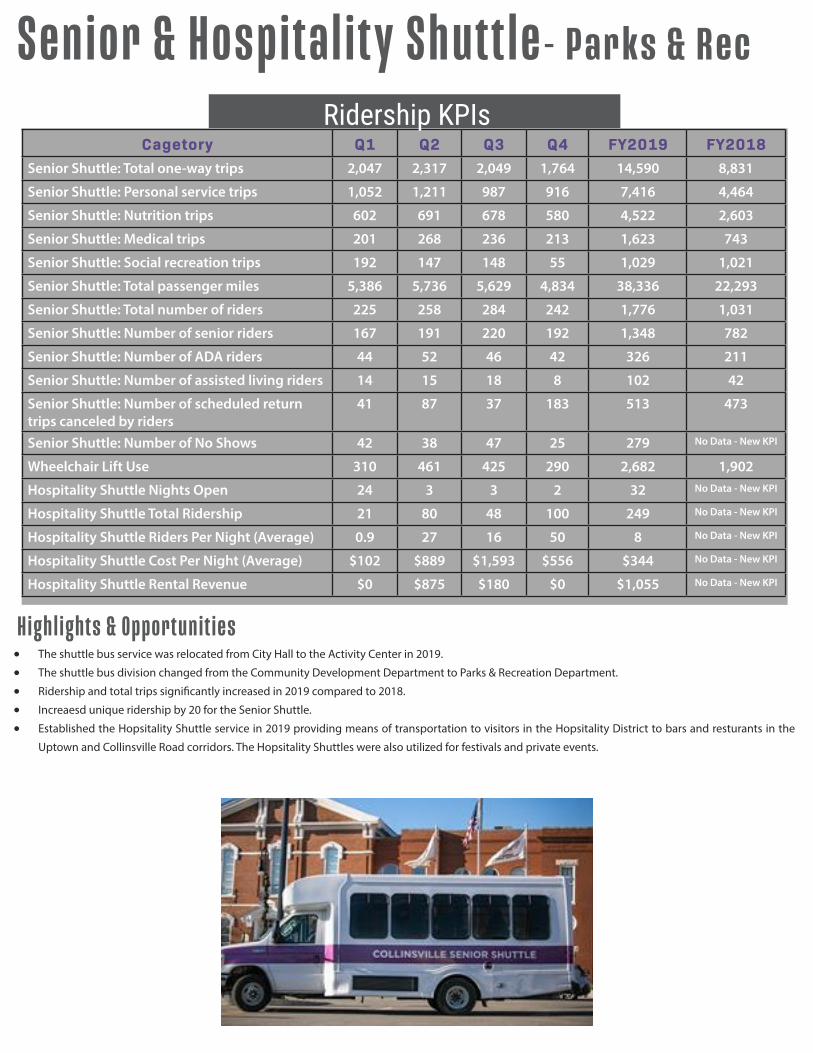
S enior & Ho s pi ta lity Sh u ttle - Parks & R ec
Cagetory Q1 Q2 Q3 Q4 FY2019 FY2018Senior Shuttle: Total one-way trips 2,047 2,317 2,049 1,764 14,590 8,831
Senior Shuttle: Personal service trips 1,052 1,211 987 916 7,416 4,464
Senior Shuttle: Nutrition trips 602 691 678 580 4,522 2,603
Senior Shuttle: Medical trips 201 268 236 213 1,623 743
Senior Shuttle: Social recreation trips 192 147 148 55 1,029 1,021
Senior Shuttle: Total passenger miles 5,386 5,736 5,629 4,834 38,336 22,293
Senior Shuttle: Total number of riders 225 258 284 242 1,776 1,031
Senior Shuttle: Number of senior riders 167 191 220 192 1,348 782
Senior Shuttle: Number of ADA riders 44 52 46 42 326 211
Senior Shuttle: Number of assisted living riders 14 15 18 8 102 42
Senior Shuttle: Number of scheduled return trips canceled by riders
41 87 37 183 513 473
Senior Shuttle: Number of No Shows 42 38 47 25 279 No Data - New KPI
Wheelchair Lift Use 310 461 425 290 2,682 1,902
Hospitality Shuttle Nights Open 24 3 3 2 32 No Data - New KPI
Hospitality Shuttle Total Ridership 21 80 48 100 249 No Data - New KPI
Hospitality Shuttle Riders Per Night (Average) 0.9 27 16 50 8 No Data - New KPI
Hospitality Shuttle Cost Per Night (Average) $102 $889 $1,593 $556 $344 No Data - New KPI
Hospitality Shuttle Rental Revenue $0 $875 $180 $0 $1,055 No Data - New KPI
Ridership KPIs
• The shuttle bus service was relocated from City Hall to the Activity Center in 2019.
• The shuttle bus division changed from the Community Development Department to Parks & Recreation Department.
• Ridership and total trips significantly increased in 2019 compared to 2018.
• Increaesd unique ridership by 20 for the Senior Shuttle.
• Established the Hopsitality Shuttle service in 2019 providing means of transportation to visitors in the Hopsitality District to bars and resturants in the
Uptown and Collinsville Road corridors. The Hopsitality Shuttles were also utilized for festivals and private events.
Highlig hts & Opportunities
Cagetory National Average
2018 Volume
2018 Rate
2019 Volume
2019 Rate
Agg Assault 60% 32 66% 45 63%
Arson 20% 0 N/A 0 N/A
Burglary 20% 85 35% 69 29%
Homicide 60% 1 100% 0 N/A
Human traffic 35% 0 N/A 0 N/A
Rape 25% 15 0% 12 13%
Robbery 50% 8 63% 7 80%
Theft 30% 441 46% 389 51%
Vehicle Theft 15% 23 30% 37 43%
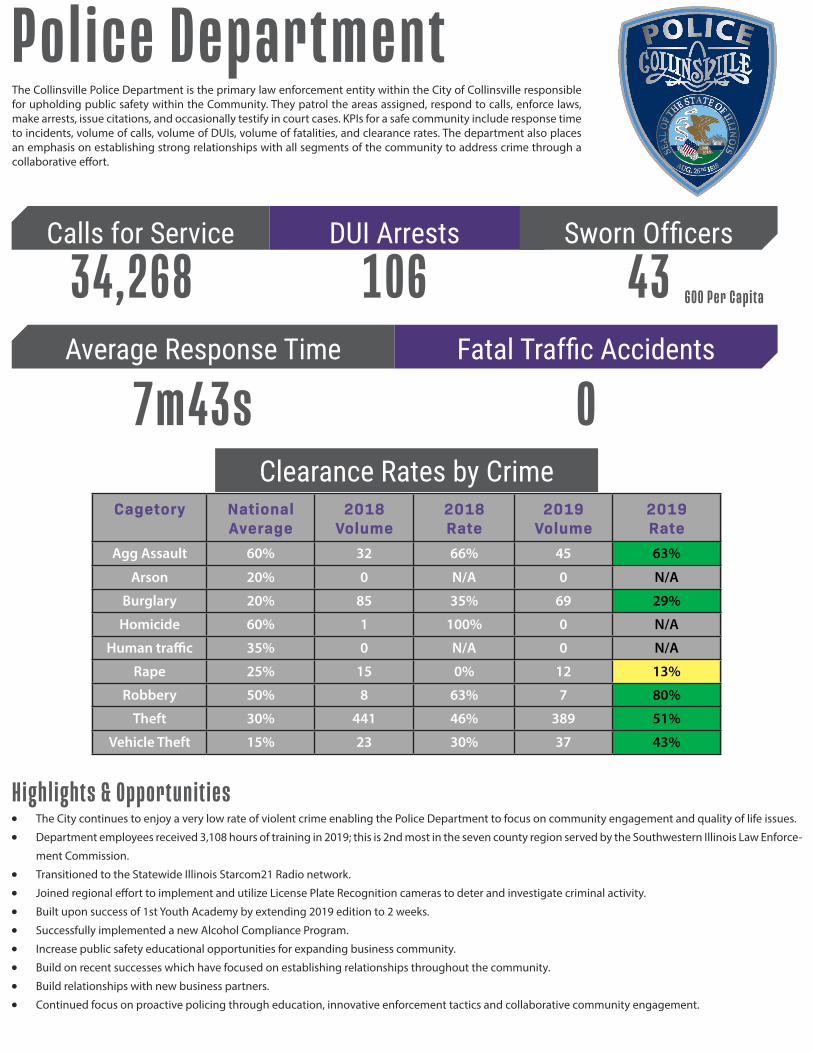
The Collinsville Police Department is the primary law enforcement entity within the City of Collinsville responsible for upholding public safety within the Community. They patrol the areas assigned, respond to calls, enforce laws, make arrests, issue citations, and occasionally testify in court cases. KPIs for a safe community include response time to incidents, volume of calls, volume of DUIs, volume of fatalities, and clearance rates. The department also places an emphasis on establishing strong relationships with all segments of the community to address crime through a collaborative effort.
• The City continues to enjoy a very low rate of violent crime enabling the Police Department to focus on community engagement and quality of life issues.
• Department employees received 3,108 hours of training in 2019; this is 2nd most in the seven county region served by the Southwestern Illinois Law Enforce-
ment Commission.
• Transitioned to the Statewide Illinois Starcom21 Radio network.
• Joined regional effort to implement and utilize License Plate Recognition cameras to deter and investigate criminal activity.
• Built upon success of 1st Youth Academy by extending 2019 edition to 2 weeks.
• Successfully implemented a new Alcohol Compliance Program.
• Increase public safety educational opportunities for expanding business community.
• Build on recent successes which have focused on establishing relationships throughout the community.
• Build relationships with new business partners.
• Continued focus on proactive policing through education, innovative enforcement tactics and collaborative community engagement.
Calls for Service Sworn Officers
Average Response Time
DUI Arrests
Fatal Traffic Accidents
PB
Clearance Rates by Crime
Police Department
34,268 43
7m 4 3 s
106
0
H ig hlig hts & Opportunities
600 Per Capita
PB
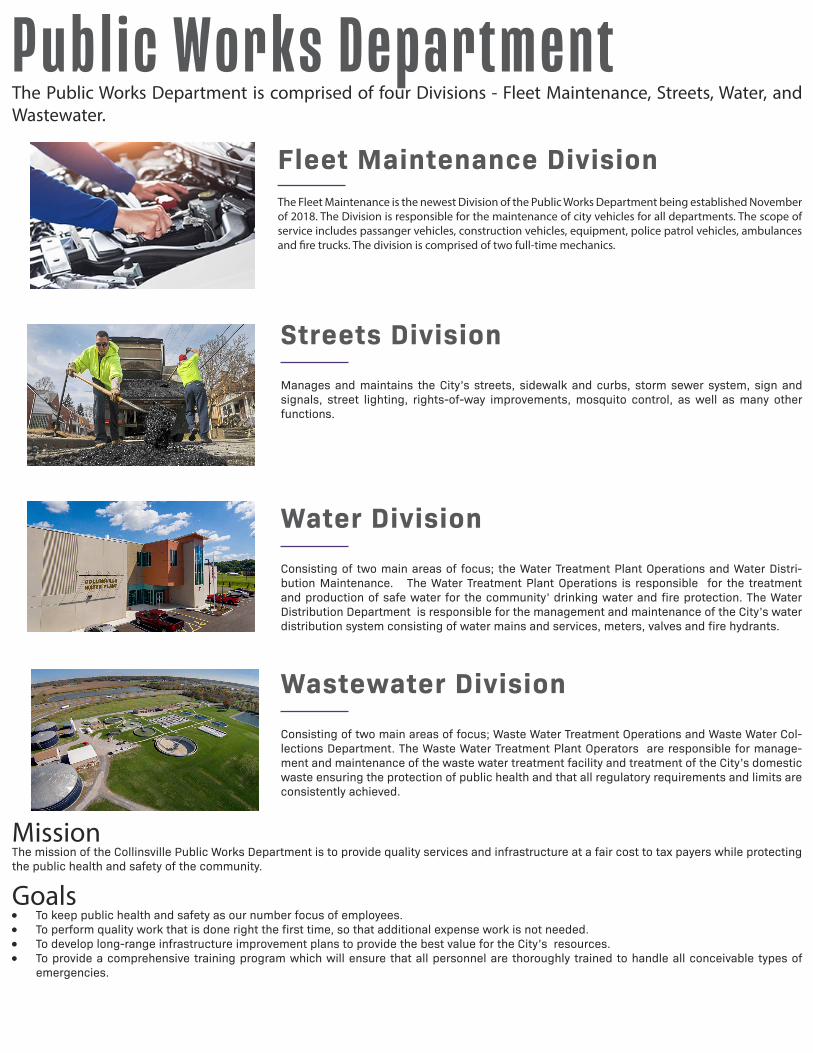
Pu blic W orks DepartmentThe Public Works Department is comprised of four Divisions - Fleet Maintenance, Streets, Water, and Wastewater.
Fleet Maintenance Division
Streets Division
The Fleet Maintenance is the newest Division of the Public Works Department being established November of 2018. The Division is responsible for the maintenance of city vehicles for all departments. The scope of service includes passanger vehicles, construction vehicles, equipment, police patrol vehicles, ambulances and fire trucks. The division is comprised of two full-time mechanics.
Manages and maintains the City’s streets, sidewalk and curbs, storm sewer system, sign and signals, street lighting, rights-of-way improvements, mosquito control, as well as many other functions.
Water DivisionConsisting of two main areas of focus; the Water Treatment Plant Operations and Water Distri-bution Maintenance. The Water Treatment Plant Operations is responsible for the treatment and production of safe water for the community’ drinking water and fire protection. The Water Distribution Department is responsible for the management and maintenance of the City’s water distribution system consisting of water mains and services, meters, valves and fire hydrants.
Wastewater DivisionConsisting of two main areas of focus; Waste Water Treatment Operations and Waste Water Col-lections Department. The Waste Water Treatment Plant Operators are responsible for manage-ment and maintenance of the waste water treatment facility and treatment of the City’s domestic waste ensuring the protection of public health and that all regulatory requirements and limits are consistently achieved.
MissionThe mission of the Collinsville Public Works Department is to provide quality services and infrastructure at a fair cost to tax payers while protecting the public health and safety of the community.
Goals • To keep public health and safety as our number focus of employees. • To perform quality work that is done right the first time, so that additional expense work is not needed. • To develop long-range infrastructure improvement plans to provide the best value for the City’s resources. • To provide a comprehensive training program which will ensure that all personnel are thoroughly trained to handle all conceivable types of
emergencies.
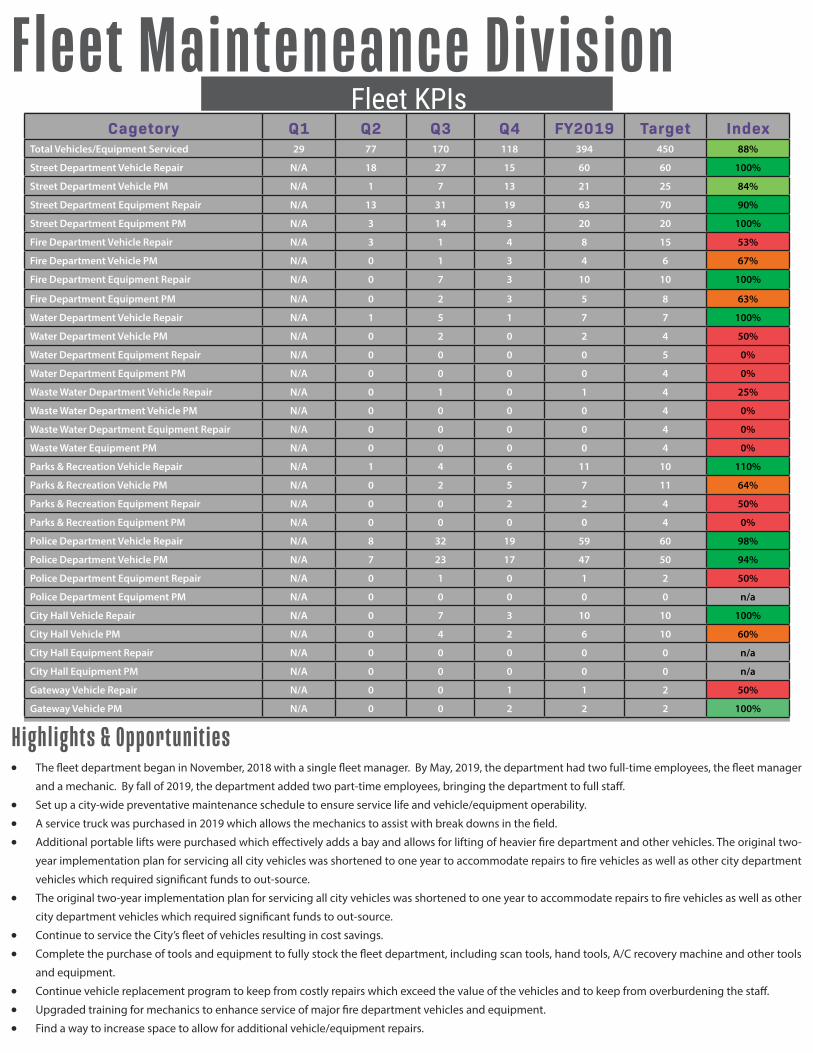
Cagetory Q1 Q2 Q3 Q4 FY2019 Target IndexTotal Vehicles/Equipment Serviced 29 77 170 118 394 450 88%
Street Department Vehicle Repair N/A 18 27 15 60 60 100%
Street Department Vehicle PM N/A 1 7 13 21 25 84%
Street Department Equipment Repair N/A 13 31 19 63 70 90%
Street Department Equipment PM N/A 3 14 3 20 20 100%
Fire Department Vehicle Repair N/A 3 1 4 8 15 53%
Fire Department Vehicle PM N/A 0 1 3 4 6 67%
Fire Department Equipment Repair N/A 0 7 3 10 10 100%
Fire Department Equipment PM N/A 0 2 3 5 8 63%
Water Department Vehicle Repair N/A 1 5 1 7 7 100%
Water Department Vehicle PM N/A 0 2 0 2 4 50%
Water Department Equipment Repair N/A 0 0 0 0 5 0%
Water Department Equipment PM N/A 0 0 0 0 4 0%
Waste Water Department Vehicle Repair N/A 0 1 0 1 4 25%
Waste Water Department Vehicle PM N/A 0 0 0 0 4 0%
Waste Water Department Equipment Repair N/A 0 0 0 0 4 0%
Waste Water Equipment PM N/A 0 0 0 0 4 0%
Parks & Recreation Vehicle Repair N/A 1 4 6 11 10 110%
Parks & Recreation Vehicle PM N/A 0 2 5 7 11 64%
Parks & Recreation Equipment Repair N/A 0 0 2 2 4 50%
Parks & Recreation Equipment PM N/A 0 0 0 0 4 0%
Police Department Vehicle Repair N/A 8 32 19 59 60 98%
Police Department Vehicle PM N/A 7 23 17 47 50 94%
Police Department Equipment Repair N/A 0 1 0 1 2 50%
Police Department Equipment PM N/A 0 0 0 0 0 n/a
City Hall Vehicle Repair N/A 0 7 3 10 10 100%
City Hall Vehicle PM N/A 0 4 2 6 10 60%
City Hall Equipment Repair N/A 0 0 0 0 0 n/a
City Hall Equipment PM N/A 0 0 0 0 0 n/a
Gateway Vehicle Repair N/A 0 0 1 1 2 50%
Gateway Vehicle PM N/A 0 0 2 2 2 100%
Fleet KPIs
PB
Fleet Mainteneance Division
• The fleet department began in November, 2018 with a single fleet manager. By May, 2019, the department had two full-time employees, the fleet manager
and a mechanic. By fall of 2019, the department added two part-time employees, bringing the department to full staff.
• Set up a city-wide preventative maintenance schedule to ensure service life and vehicle/equipment operability.
• A service truck was purchased in 2019 which allows the mechanics to assist with break downs in the field.
• Additional portable lifts were purchased which effectively adds a bay and allows for lifting of heavier fire department and other vehicles. The original two-
year implementation plan for servicing all city vehicles was shortened to one year to accommodate repairs to fire vehicles as well as other city department
vehicles which required significant funds to out-source.
• The original two-year implementation plan for servicing all city vehicles was shortened to one year to accommodate repairs to fire vehicles as well as other
city department vehicles which required significant funds to out-source.
• Continue to service the City’s fleet of vehicles resulting in cost savings.
• Complete the purchase of tools and equipment to fully stock the fleet department, including scan tools, hand tools, A/C recovery machine and other tools
and equipment.
• Continue vehicle replacement program to keep from costly repairs which exceed the value of the vehicles and to keep from overburdening the staff.
• Upgraded training for mechanics to enhance service of major fire department vehicles and equipment.
• Find a way to increase space to allow for additional vehicle/equipment repairs.
H ig hlights & Opportunities
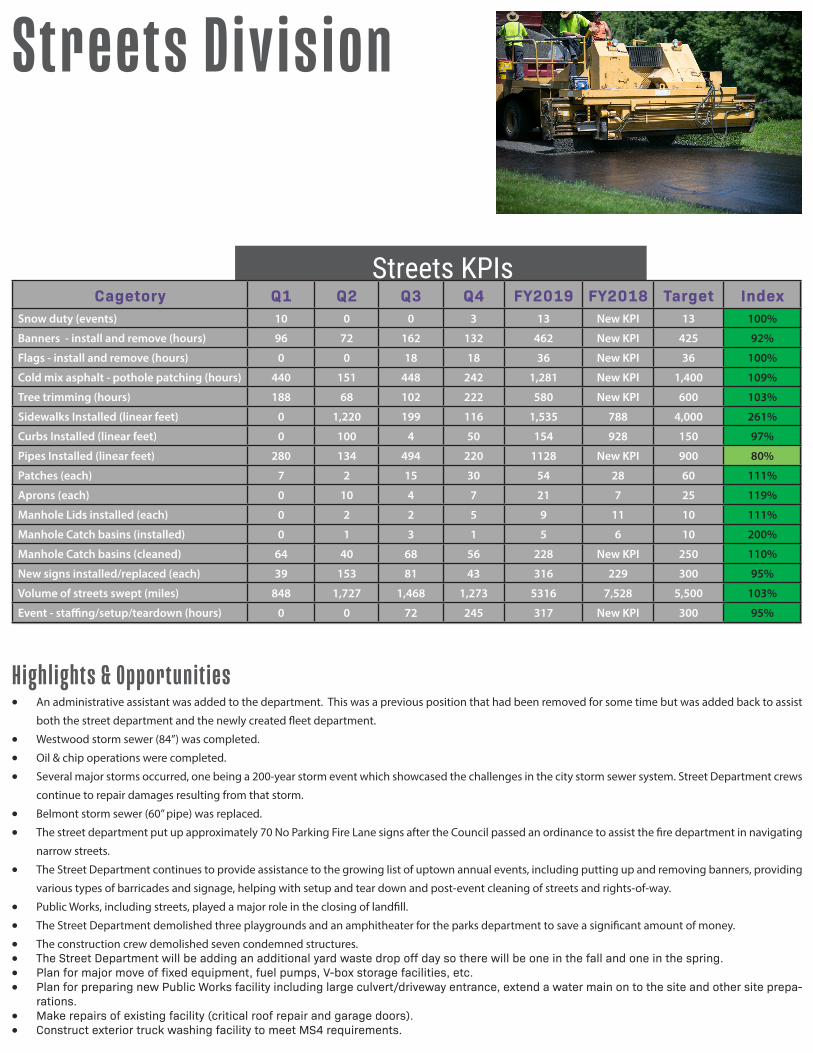
Cagetory Q1 Q2 Q3 Q4 FY2019 FY2018 Target IndexSnow duty (events) 10 0 0 3 13 New KPI 13 100%
Banners - install and remove (hours) 96 72 162 132 462 New KPI 425 92%
Flags - install and remove (hours) 0 0 18 18 36 New KPI 36 100%
Cold mix asphalt - pothole patching (hours) 440 151 448 242 1,281 New KPI 1,400 109%
Tree trimming (hours) 188 68 102 222 580 New KPI 600 103%
Sidewalks Installed (linear feet) 0 1,220 199 116 1,535 788 4,000 261%
Curbs Installed (linear feet) 0 100 4 50 154 928 150 97%
Pipes Installed (linear feet) 280 134 494 220 1128 New KPI 900 80%
Patches (each) 7 2 15 30 54 28 60 111%
Aprons (each) 0 10 4 7 21 7 25 119%
Manhole Lids installed (each) 0 2 2 5 9 11 10 111%
Manhole Catch basins (installed) 0 1 3 1 5 6 10 200%
Manhole Catch basins (cleaned) 64 40 68 56 228 New KPI 250 110%
New signs installed/replaced (each) 39 153 81 43 316 229 300 95%
Volume of streets swept (miles) 848 1,727 1,468 1,273 5316 7,528 5,500 103%
Event - staffing/setup/teardown (hours) 0 0 72 245 317 New KPI 300 95%
Streets KPIs
PB
S treets Division
• An administrative assistant was added to the department. This was a previous position that had been removed for some time but was added back to assist
both the street department and the newly created fleet department.
• Westwood storm sewer (84”) was completed.
• Oil & chip operations were completed.
• Several major storms occurred, one being a 200-year storm event which showcased the challenges in the city storm sewer system. Street Department crews
continue to repair damages resulting from that storm.
• Belmont storm sewer (60” pipe) was replaced.
• The street department put up approximately 70 No Parking Fire Lane signs after the Council passed an ordinance to assist the fire department in navigating
narrow streets.
• The Street Department continues to provide assistance to the growing list of uptown annual events, including putting up and removing banners, providing
various types of barricades and signage, helping with setup and tear down and post-event cleaning of streets and rights-of-way.
• Public Works, including streets, played a major role in the closing of landfill.
• The Street Department demolished three playgrounds and an amphitheater for the parks department to save a significant amount of money.
• The construction crew demolished seven condemned structures. • The Street Department will be adding an additional yard waste drop off day so there will be one in the fall and one in the spring. • Plan for major move of fixed equipment, fuel pumps, V-box storage facilities, etc. • Plan for preparing new Public Works facility including large culvert/driveway entrance, extend a water main on to the site and other site prepa-
rations. • Make repairs of existing facility (critical roof repair and garage doors). • Construct exterior truck washing facility to meet MS4 requirements.
H ig hlig hts & Opportunities
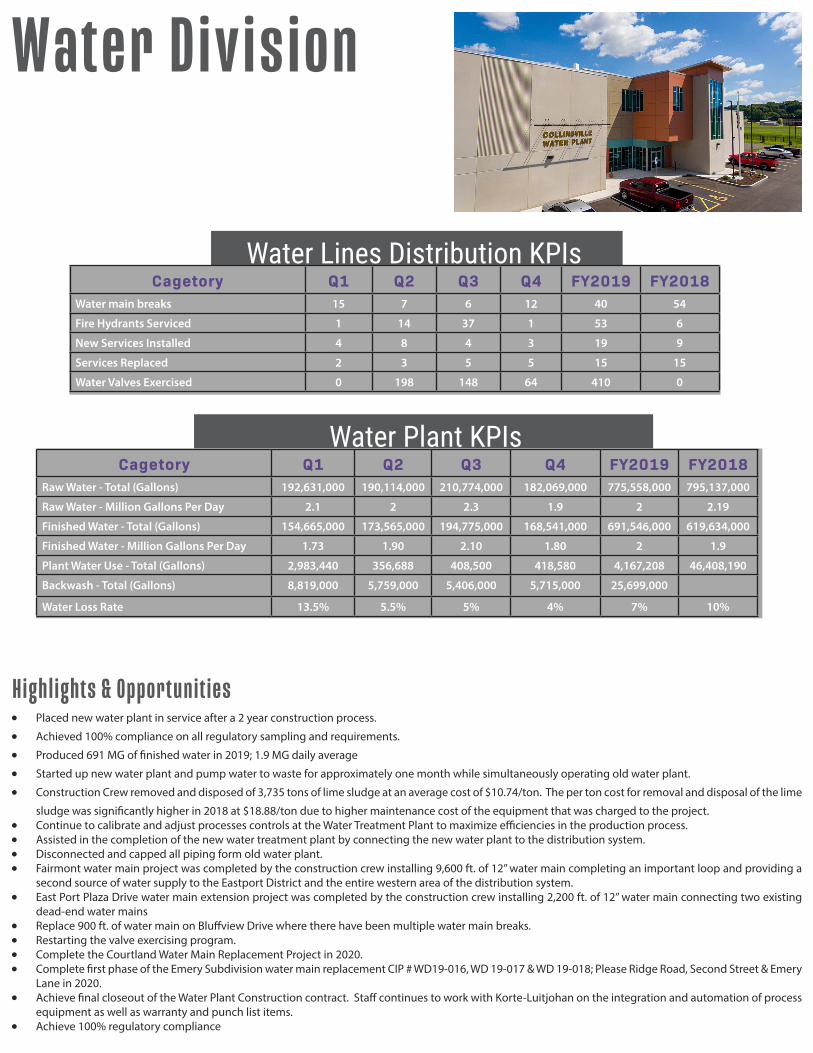
Cagetory Q1 Q2 Q3 Q4 FY2019 FY2018Raw Water - Total (Gallons) 192,631,000 190,114,000 210,774,000 182,069,000 775,558,000 795,137,000
Raw Water - Million Gallons Per Day 2.1 2 2.3 1.9 2 2.19
Finished Water - Total (Gallons) 154,665,000 173,565,000 194,775,000 168,541,000 691,546,000 619,634,000
Finished Water - Million Gallons Per Day 1.73 1.90 2.10 1.80 2 1.9
Plant Water Use - Total (Gallons) 2,983,440 356,688 408,500 418,580 4,167,208 46,408,190
Backwash - Total (Gallons) 8,819,000 5,759,000 5,406,000 5,715,000 25,699,000
Water Loss Rate 13.5% 5.5% 5% 4% 7% 10%
Water Plant KPIs
Cagetory Q1 Q2 Q3 Q4 FY2019 FY2018Water main breaks 15 7 6 12 40 54
Fire Hydrants Serviced 1 14 37 1 53 6
New Services Installed 4 8 4 3 19 9
Services Replaced 2 3 5 5 15 15
Water Valves Exercised 0 198 148 64 410 0
Water Lines Distribution KPIs
PB
Water Division
• Placed new water plant in service after a 2 year construction process.
• Achieved 100% compliance on all regulatory sampling and requirements.
• Produced 691 MG of finished water in 2019; 1.9 MG daily average
• Started up new water plant and pump water to waste for approximately one month while simultaneously operating old water plant.
• Construction Crew removed and disposed of 3,735 tons of lime sludge at an average cost of $10.74/ton. The per ton cost for removal and disposal of the lime
sludge was significantly higher in 2018 at $18.88/ton due to higher maintenance cost of the equipment that was charged to the project. • Continue to calibrate and adjust processes controls at the Water Treatment Plant to maximize efficiencies in the production process. • Assisted in the completion of the new water treatment plant by connecting the new water plant to the distribution system. • Disconnected and capped all piping form old water plant. • Fairmont water main project was completed by the construction crew installing 9,600 ft. of 12” water main completing an important loop and providing a
second source of water supply to the Eastport District and the entire western area of the distribution system. • East Port Plaza Drive water main extension project was completed by the construction crew installing 2,200 ft. of 12” water main connecting two existing
dead-end water mains • Replace 900 ft. of water main on Bluffview Drive where there have been multiple water main breaks. • Restarting the valve exercising program. • Complete the Courtland Water Main Replacement Project in 2020. • Complete first phase of the Emery Subdivision water main replacement CIP # WD19-016, WD 19-017 & WD 19-018; Please Ridge Road, Second Street & Emery
Lane in 2020. • Achieve final closeout of the Water Plant Construction contract. Staff continues to work with Korte-Luitjohan on the integration and automation of process
equipment as well as warranty and punch list items. • Achieve 100% regulatory compliance
H ig hlights & Opportunities
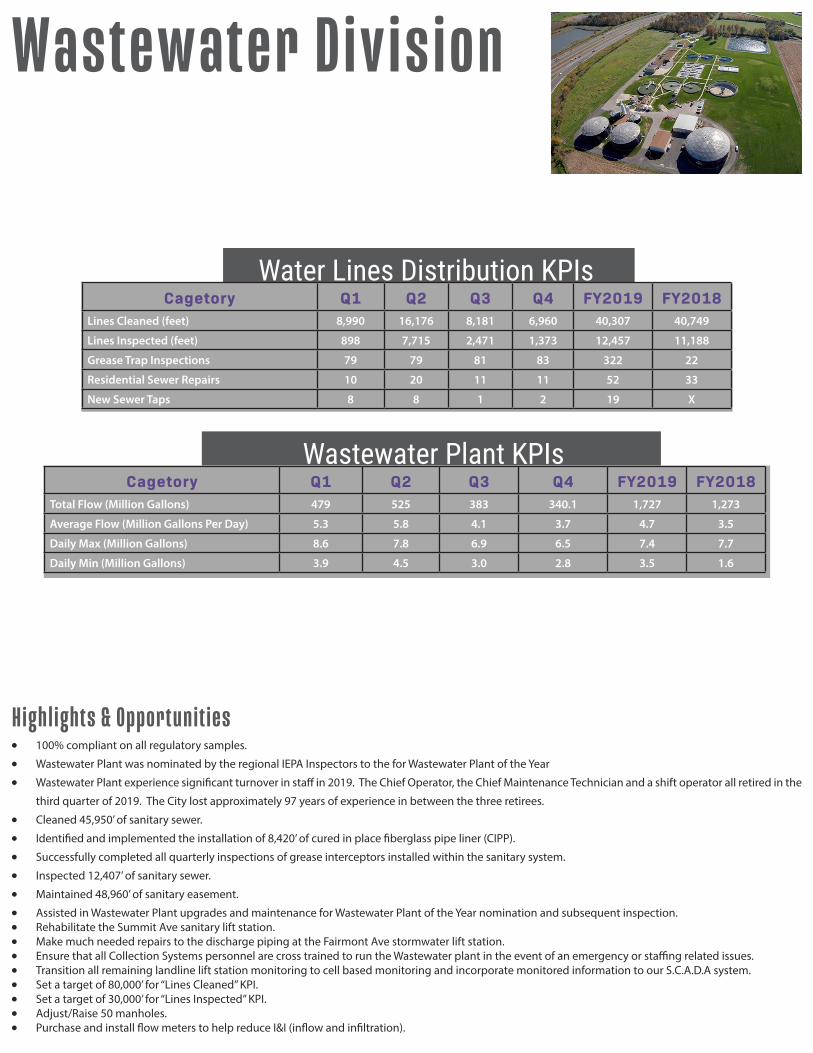
Cagetory Q1 Q2 Q3 Q4 FY2019 FY2018Total Flow (Million Gallons) 479 525 383 340.1 1,727 1,273
Average Flow (Million Gallons Per Day) 5.3 5.8 4.1 3.7 4.7 3.5
Daily Max (Million Gallons) 8.6 7.8 6.9 6.5 7.4 7.7
Daily Min (Million Gallons) 3.9 4.5 3.0 2.8 3.5 1.6
Wastewater Plant KPIs
Cagetory Q1 Q2 Q3 Q4 FY2019 FY2018Lines Cleaned (feet) 8,990 16,176 8,181 6,960 40,307 40,749
Lines Inspected (feet) 898 7,715 2,471 1,373 12,457 11,188
Grease Trap Inspections 79 79 81 83 322 22
Residential Sewer Repairs 10 20 11 11 52 33
New Sewer Taps 8 8 1 2 19 X
Water Lines Distribution KPIs
PB
Wastewater Division
• 100% compliant on all regulatory samples.
• Wastewater Plant was nominated by the regional IEPA Inspectors to the for Wastewater Plant of the Year
• Wastewater Plant experience significant turnover in staff in 2019. The Chief Operator, the Chief Maintenance Technician and a shift operator all retired in the
third quarter of 2019. The City lost approximately 97 years of experience in between the three retirees.
• Cleaned 45,950’ of sanitary sewer.
• Identified and implemented the installation of 8,420’ of cured in place fiberglass pipe liner (CIPP).
• Successfully completed all quarterly inspections of grease interceptors installed within the sanitary system.
• Inspected 12,407’ of sanitary sewer.
• Maintained 48,960’ of sanitary easement.
• Assisted in Wastewater Plant upgrades and maintenance for Wastewater Plant of the Year nomination and subsequent inspection. • Rehabilitate the Summit Ave sanitary lift station. • Make much needed repairs to the discharge piping at the Fairmont Ave stormwater lift station. • Ensure that all Collection Systems personnel are cross trained to run the Wastewater plant in the event of an emergency or staffing related issues. • Transition all remaining landline lift station monitoring to cell based monitoring and incorporate monitored information to our S.C.A.D.A system. • Set a target of 80,000’ for “Lines Cleaned” KPI. • Set a target of 30,000’ for “Lines Inspected” KPI. • Adjust/Raise 50 manholes. • Purchase and install flow meters to help reduce I&I (inflow and infiltration).
H ig hlig hts & Opportunities