
Key performance indicators of sustainable port - EconStor
19
Muangpan, Thanyaphat; Kamonchanok Suthiwartnarueput Article Key performance indicators of sustainable port: Case study of the eastern economic corridor in Thailand Cogent Business & Management Provided in Cooperation with: Taylor & Francis Group Suggested Citation: Muangpan, Thanyaphat; Kamonchanok Suthiwartnarueput (2019) : Key performance indicators of sustainable port: Case study of the eastern economic corridor in Thailand, Cogent Business & Management, ISSN 2331-1975, Taylor & Francis, Abingdon, Vol. 6, pp. 1-18, https://doi.org/10.1080/23311975.2019.1603275 This Version is available at: http://hdl.handle.net/10419/206171 Standard-Nutzungsbedingungen: Die Dokumente auf EconStor dürfen zu eigenen wissenschaftlichen Zwecken und zum Privatgebrauch gespeichert und kopiert werden. Sie dürfen die Dokumente nicht für öffentliche oder kommerzielle Zwecke vervielfältigen, öffentlich ausstellen, öffentlich zugänglich machen, vertreiben oder anderweitig nutzen. Sofern die Verfasser die Dokumente unter Open-Content-Lizenzen (insbesondere CC-Lizenzen) zur Verfügung gestellt haben sollten, gelten abweichend von diesen Nutzungsbedingungen die in der dort genannten Lizenz gewährten Nutzungsrechte. Terms of use: Documents in EconStor may be saved and copied for your personal and scholarly purposes. You are not to copy documents for public or commercial purposes, to exhibit the documents publicly, to make them publicly available on the internet, or to distribute or otherwise use the documents in public. If the documents have been made available under an Open Content Licence (especially Creative Commons Licences), you may exercise further usage rights as specified in the indicated licence. https://creativecommons.org/licenses/by/4.0/
-
Upload
khangminh22 -
Category
Documents
-
view
0 -
download
0
Transcript of Key performance indicators of sustainable port - EconStor

Muangpan Thanyaphat Kamonchanok Suthiwartnarueput
Article
Key performance indicators of sustainable port Casestudy of the eastern economic corridor in Thailand
Cogent Business amp Management
Provided in Cooperation withTaylor amp Francis Group
Suggested Citation Muangpan Thanyaphat Kamonchanok Suthiwartnarueput (2019) Keyperformance indicators of sustainable port Case study of the eastern economic corridor inThailand Cogent Business amp Management ISSN 2331-1975 Taylor amp Francis Abingdon Vol6 pp 1-18httpsdoiorg1010802331197520191603275
This Version is available athttphdlhandlenet10419206171
Standard-Nutzungsbedingungen
Die Dokumente auf EconStor duumlrfen zu eigenen wissenschaftlichenZwecken und zum Privatgebrauch gespeichert und kopiert werden
Sie duumlrfen die Dokumente nicht fuumlr oumlffentliche oder kommerzielleZwecke vervielfaumlltigen oumlffentlich ausstellen oumlffentlich zugaumlnglichmachen vertreiben oder anderweitig nutzen
Sofern die Verfasser die Dokumente unter Open-Content-Lizenzen(insbesondere CC-Lizenzen) zur Verfuumlgung gestellt haben solltengelten abweichend von diesen Nutzungsbedingungen die in der dortgenannten Lizenz gewaumlhrten Nutzungsrechte
Terms of use
Documents in EconStor may be saved and copied for yourpersonal and scholarly purposes
You are not to copy documents for public or commercialpurposes to exhibit the documents publicly to make thempublicly available on the internet or to distribute or otherwiseuse the documents in public
If the documents have been made available under an OpenContent Licence (especially Creative Commons Licences) youmay exercise further usage rights as specified in the indicatedlicence
httpscreativecommonsorglicensesby40
MANAGEMENT | RESEARCH ARTICLE
Key performance indicators of sustainable portCase study of the eastern economic corridor inThailandThanyaphat Muangpan1 and Kamonchanok Suthiwartnarueput1
Abstract Sustainable port KPIs are an important concept to operate in port Thispaper therefore compiles amp attempts to identify the sustainable port KPIs fromacademic and practice aspects and test with Thailand ports in the EasternEconomic Corridor (EEC) Exploratory factor analysis and one-way ANOVA areapplied to group and classify these KPIs The findings show that there are two mainsustainable port KPI groups namely critical and preferable groups KPI group 1 andgroup 2 are considered as the critical ones whereas KPI group 3 and group 4 areclassified as the preferable ones This paper also finds that there are some signifi-cant differences in sustainable port KPIs among types of ports namely containernon-container and multi-purpose port for the preferable group but there is nodifference for the critical group one
Subjects Planning Business Management and Accounting Supply Chain ManagementIndustry amp Industrial Studies
Keywords Key Performance Indicators (KPIs) sustainable port container port non-container port multi-purpose port exploratory factor analysis
Thanyaphat Muangpan
ABOUT THE AUTHORSThanyaphat Muangpan PhD has Bachelorrsquosdegree in International Business Masterrsquos degreein Transport and Logistics Management PhD inLogistics and Supply Chain and PostdoctoralFellowship in sustainable port Her researchexperience is sustainable supply chain manage-ment The areas of special research are sustain-able supply chain management sustainable portlogistics and supply chain management andperformance measurement in supply chainShersquos a full lecturer in Faculty of LogisticsBurapha University Thailand
Kamonchanok Suthiwartnarueput PhD hasBachelorrsquos degree in Management Masterrsquosdegree and PhD in Maritime Studies Universityof Wales UK Shersquos a professor at Faculty ofCommerce and Accountancy ChulalongkornUniversity Thailand Her professionalresearch are in the field of shipping and portmanagement as well as logistics and supplychain management The areas of special researchare shipping and port management logistics andsupply chain management
PUBLIC INTEREST STATEMENTIn performing the port operation environmentaland social problems have been found resulting inport operation focuses on improving port sus-tainability that is to reduce the environmental andsocial impacts around the ports Therefore thisresearch attempts to identify the sustainable portindicators for improving these environmental andsocial problems This paper found two maingroups of sustainable port indicators that are thecritical and preferable groups The critical groupmust be applied to sustainable port manage-ment and the preferable group is supported toport sustainability Three types of ports namelycontainer non-container and multi-purpose portof critical group is similarly practiced in threetypes of ports but the preferable group is indi-cated as being different management The bene-fits of finding are to support the first policy andport practice for developing friendly environmentand social responsibility of ports
Muangpan amp Suthiwartnarueput Cogent Business amp Management (2019) 6 1603275httpsdoiorg1010802331197520191603275
copy 2019 The Author(s) This open access article is distributed under a Creative CommonsAttribution (CC-BY) 40 license
Received 15 February 2019Accepted 31 March 2019First Published 04 Apr 2019
Corresponding author ThanyaphatMuangpan Faculty of Commerce andAccountancy ChulalongkornUniversity Bangkok ThailandE-mail thanyadonutgmailcom
Reviewing editorJingxin Dong UK
Additional information is available atthe end of the article
Page 1 of 18
1 IntroductionInternational shipping is strongly associated with global trade and port management that goes alongwith it have affected the environment and surrounding communities Therefore there is a need todevelop transportation and port sustainability Port operation in Thailand aims to increase its efficiencyand effectiveness of competitiveness particularly on the sustainable aspects of the environment andsocial dimensions (Office of the National Economic and Social Development Board 2017) Sustainablemanagement is an important concept to operate in port operation including of the three main pillars ofsustainable development namely environmental (to reduce the impact on the environment) social(community management) and economic (to help the organization benefit and enhance its economicperformance) These three pillars are intersected and have a relationship among the pillars (UNCTAD2017)
As a result port sustainability is challenging port authorities around the world to find ways ofoperating and managing their ports efficiently and effectively in terms of economic social as wellas environmental development (Chen amp Siu Lee Lam 2018 Roh Thai amp Wong 2016) Thereforesustainability for Thailand port is essential This paper thus aims to determine and analyze thesustainable port KPIs In this study Literature is reviewed to explore the sustainable port KPIs byintegrating academic aspect using academic peer-reviewed journals dated back 15 years togetherwith practical aspect using sustainable port annual reports of 12 ports from 40 of the worldrsquos topports (Review of Maritime Transport 2015 UNCTAD 2016) Exploratory factor analysis is applied tothe analysis in order to identify the sustainable port KPIs and sustainable port KPI groups Threetypes of ports namely container non-container and multi-purpose port are surveyed to see thesimilarity differentiation among port sustainable KPI groups from the three different types of ports
2 Literature review
21 Sustainable port managementSustainable port is the concept of port operation that is managed with triple bottle line These threepillars include the environmental social and economic pillars which intersect among pillars (SsilianJaegler amp Cariou 2016) Sustainable port is used in business strategy and considers the relationship ofthree pillars The aim of this concept is tomeet the stakeholder needs while defending the sustainabilityof social and natural resources (Sakar amp Cetin 2012) This is a challenge to the improved port operationand internal standard (Asgari Hassani Jones amp Nguye 2015) Therefore Sustainable port requires theoperation of three main pillars and depends on practical of the relationship among these pillars Theaims of the sustainable port are to improve the equilibrium of cost efficiency in port the environmentalport and societal port However there is still more pillars of port sustainability that supports the portoperation as well
22 Reviewed literature on sustainable port KPIsSustainable port KPIs are reviewed from sustainable port annual reports on the top 40 ports andacademic peer-reviewed journals related to port sustainability In the first goal of the research theresearcher aims to find all sustainable port KPIs which covers all practical and academic aspectsFirstly after reviewing 12 sustainable port reports from total 40 of the worldrsquos top ports (UNCTAD2016) it is found that there are 8 ports that present sustainable port KPIs in their annual reportsFour ports further have environmental ports annual reports Only annual reports of 8 ports fromtotal 40 ports are available in their websites (Long Beach port 2010 Busan port 2014 Los Anglesport 2014 Rotterdam port 2008 Bremerhaven port 2015 Santos port 2016 Antwerp port 2017Singapore port 2016) The variety of sustainable port KPIs is presented as part of the environmentpillar including consumption of energy water consumption and air emissions etc The social pillarfocuses on the quality of life community development safety management and employeeprofiles etc The economic pillar clarifies by capacity review for cargo financial and non-
Muangpan amp Suthiwartnarueput Cogent Business amp Management (2019) 6 1603275httpsdoiorg1010802331197520191603275
Page 2 of 18
financial performance and strengthens positions etc In addition it found that the organizationalmanagement pillar is an important aspect in improving port sustainability
Furthermore it is found there are annual reports of 4 more ports that are reviewed These 4reports showing in their port websites just present only one pillar namely environmental airquality noise management water quality and waste management (Dubai port 2016 Kaohsiungport 2016 Tanjung Pelepas port 2017 Valencia port 2017)
Secondly the total 163 articles are reviewed from academic peer-reviewed journals published in2003ndash2017 Four keywords are ldquosustainable portrdquo ldquoenvironmental portrdquo ldquosocial portrdquo and ldquoeconomicportrdquo are searched It is found that there are 79 articles in sustainable port 14 articles in environmentalport 4 articles in social port and 66 articles in economic port These academic articles are searched fromfour databases including Science Direct (96 articles) Emerald insight (35 articles) ABI Inform complete(22 articles) and Springer Link (10 articles) The number of articles on the AD year basis can besummarized as shown in Figure 1
During the period of 2003ndash2007 there are not somany articles regarding the keywords Also the 10articles on port sustainability are the fewest among the four keywords (Stojanovic Ormerod Smith ampWooldridge 2006) There are a total of 37 articles during the period of 2008ndash2012 This is a significantincrease in the number of reviewed papers Most articles are about environmental sustainability andfocused on identifying themain factors of port operation (Burskyte Belous amp Stasiskiene 2011 Delai ampTakahashi 2011 Lopes 2012) A larger number of 116 articles are published from 2013 to 1017 andthe concept of port sustainability is applied in practical planning and strategic business Most articleson port sustainability introduced the concept key element and various KPIs (Asgari et al 2015 LaxeBermuacutedez Palmero amp Novo-Corti 2016 Zhang Kim Tee amp Lam 2017) These articles are achieved byliterature review conceptual frameworks and case study (Davarzani Fahimnia Bell amp Sarkis 2016Puig Wooldridge amp Darbra 2014 Xiao amp Lam 2017)
Sustainable port KPIs is analyzed by content analysis that it is found 156 KPIs Three main pillarsare found together with the environmental port social port and economic port pillarsFurthermore organizational management principle is found as one more dimension extendedfrom three main pillars Therewith these sustainable port KPIs of three main pillars and one
0 5 10 15 20 25 30 35
200320042005200620072008200920102011201220132014201520162017
Years
Reviewed Literature (KPIs)
Number of articles
2
1
1
2
4
1
4
21555
15
12
18
22
32
32
Figure 1 The number of articlesin each year
Muangpan amp Suthiwartnarueput Cogent Business amp Management (2019) 6 1603275httpsdoiorg1010802331197520191603275
Page 3 of 18
principle are put into the questionnaires survey in order to classify the sustainable port KPI groupsfrom three types of ports
3 MethodologyThis study analyzes the data using mixed methods of both qualitative and quantitative research toidentify the sustainable port KPIs from the three types of ports in the Eastern Economic Corridor(EEC) of Thailand The research design is divided into two phases Firstly qualitative approachthrough content analysis is applied to find the sustainable port KPIs using academic peer-reviewedjournals published between 2003 and 2017 which are searched database from Emerald insightSpringer Link Science Direct and ABI Inform Together with sustainable port annual reports of 12ports from the 40 top ports (UNCTAD 2016) Secondly a quantitative approach by factor analysis isapplied to classify these KPIs into main group base on sustainable pillars
31 Framework of statistics analysisThis study is analyzed through four steps as shown in Figure 2 Step 1 the literature reviewed found156 sustainable port KPIs by content analysis Step 2 is questionnaires survey Step 3 inferentialstatistics analysis using exploration factor analysis is applied to analysis the sustainable port KPIgroups and sustainable port KPIs These sustainable port KPIs are selected with factor loadings thatare above 07 (70) in general which factor loadings are similar to correlation coefficients in that theycan vary from minus1 to 1 (Gefen Straub amp Boudreau 2000 MacCallum Widaman Preacher amp Hong2001) This factor analysis is to use a data reduction method designed to explain the correlationsbetween observed variables (Lu Shang amp Lin 2016a 2016b Gebauer Putzr Fischer Wang amp Lin2008) Step 4 one-way analysis of variance (ANOVA) using Scheffe testing is employed to test thedifference of the important levels of the KPI group with the three types of ports (Chawla amp Joshi 2010Diaz amp Rodriguez 2016) This ANOVA test is a technique using to compare means of two or moresamples for determiningwhether there are any statistically significant differences between themeansof three or more independent groups (Howell 2002) Finally 91 sustainable port KPIs are selectedforming to the critical KPI and the preferable KPI group
32 Data population collection and questionnaire designThe total populations are 63 managers who directly respond to sustainable port All of managersare to work in EEC of Thailand ports which 21 terminals are including the 18 terminals of LaemChabang port controlled by the Port Authority of Thailand (Laem Chabang port 2017) and another3 private ports in the area Although the number of criteria (156 KPIs) and the number ofrespondents (63 managers) are not to the scale proportion But if we increase the respondent
Survey research
Step 3 Exploratory factor analysis (EFA)
To determine the KPI groups and KPIs
Step 4 One-way analysis of variance (ANOVA)
To test the difference KPI group with the three types of ports
The critical KPI and the preferable KPI group
Step 2 The questionnaires survey were distributed to the total population
Step 1 literature reviewed find to sustainable port KPIs
Content analysis
Figure 2 Framework of statis-tics analysis
Muangpan amp Suthiwartnarueput Cogent Business amp Management (2019) 6 1603275httpsdoiorg1010802331197520191603275
Page 4 of 18
number it may create more error instead of having a better statistical meaning Since the directmanagers who involved with sustainability are very few in each port
The instruments are a questionnaire survey which is filled with face to face interview to indicatethe level of importance of the sustainable port KPIs with a 10-level scale (Amrina amp Vilsi 2015) Theimportance of sustainable port KPIs ranged from strongly disagree (1-low) to strongly agree (10-high)in regards to sustainable port The questionnaire has two sections Section one the demographicinformation relates company and personal information about the company name portterminaloperator ISO certificate PSHE-MS member type of port position responsibility and educationSection two contains two subsections the question of sustainable port KPIs the important levels(from 1 to 10) and other indicators of the respondentrsquos opinion
The questionnaires regarding 156 KPIs are distributed to the total population 63 managers in 21terminals The completed questionnaires are accounted for 57 managers that are 9048 of therespondents Operational manager with 7719 middle manager with 1228 and top manager with1053 Of this total 5614 responded to sustainable development and 3509 responded to portmanagement and 877 are others responsibility More than a half of managers 5263 in Masterdegree Bachelorrsquos degree in 4737 and there is no one graduate in a Doctoral degree Moreover Typeof ports in data collection displayed with 5789 in container port 2105 in non-container port and2105 in multi-purpose port
4 Findings and discussionsThe findings of this study are divided into three parts Firstly the results of the exploration factoranalysis of port sustainable KPI groups and factor loading of sustainable port KPIs Secondary theanalysis of variance (ANOVA) comparing means of the important levels of KPI among three typesof ports Finally discussion of the analysis result
41 Results of exploration factor analysis for sustainable port KPI groupsThe analysis of Pearsonrsquos correlation measures the correlation coefficient by studying the relation-ship between variables The correlation test is significant at the 005 level (2-tailed) It seems to beconcluded that most of the KPI variables are correlated to each other This confirms that factoranalysis can be used with this data (Iddris 2016 Vanichbuncha 2010) The KPIs are analyzed toclassify KPI groups Table 1 displays the results of variance and cumulative percentage each KPIgroups To achieve an acceptable fit it found that there are four KPI groups group 1 and group 2show the high percentages of variance which are 26519 and 24290 respectively Then group3 and group 4 show a variance of 19337 and 19008 respectively
The cumulative percentage is explained by the variance that applies to select an optimal numberof KPI group In this study we choose four KPI groups as the cumulative variance of 89153 thatpresent a high percentage to confirm the number of KPI group
Table 2 presents the factor analysis with principal component method extraction The varimaxrotation is adapted to steps for evaluating the terms of error of indicators that composes the factorsThe results show factor loadings being more than 07 levels indicating that the KPI is highly importantto be represented to the corresponding KPI groups The sustainable port KPIs are of total 91 KPIs from
Table 1 The results of variance and cumulative percentage of KPI groups
KPI group of Variance Cumulative
1 26519 26519
2 24290 50808
3 19337 70145
4 19008 89153
Muangpan amp Suthiwartnarueput Cogent Business amp Management (2019) 6 1603275httpsdoiorg1010802331197520191603275
Page 5 of 18
Table2
Resu
ltsof
explorationfactor
analys
is
KPIs
KPIgrou
p1
KPI
grou
p2
KPIgrou
p3
KPIgrou
p4
G11Dieselp
artic
ulatematter
(DPM
)721
G12Water
quality
759
G13Em
ploy
eeed
ucation
829
G14Ed
ucationon
human
rights
710
G15So
cial
contrib
ution
861
G16Qua
lityCo
mmun
ityof
life
756
G17Occup
ationa
lhea
lthan
dsa
fety
inpo
rt704
G18Listen
ingto
ourem
ploy
ees
andstak
eholde
rs709
G19So
cial
infras
truc
ture
919
G110
Port
safety
policy
964
G111
Cons
tantly
giving
supp
ortfor
employ
eesrsquo
training
758
G112
Percen
tage
ofman
agersan
dsu
pervisorstraine
din
occu
patio
nal
safetyh
ealthan
dinjury
man
agem
entresp
onsibilities
838
G113
Percen
tage
ofworke
rsrepresen
tedin
health
andsa
fety
committee
s
853
G114
Port
prod
uctiv
ity799
G115
Num
berof
thepo
rtca
ll829
G116
Valuedistrib
uted
tosh
areh
olde
rs705
G117
Load
ingan
dun
load
ingco
st916
(Con
tinue
d)
Muangpan amp Suthiwartnarueput Cogent Business amp Management (2019) 6 1603275httpsdoiorg1010802331197520191603275
Page 6 of 18
Table2
(Con
tinu
ed)
KPIs
KPIgrou
p1
KPI
grou
p2
KPIgrou
p3
KPIgrou
p4
G118
Effic
ienc
yof
theus
eof
the
port
area
915
G119
Amou
ntof
cargoha
ndledpe
rreso
urce
usag
e790
G120
Berthoc
cupa
ncyreve
nuepe
rtonof
cargo
978
G121
Cargoha
ndlin
greve
nuepe
rtonof
cargo
859
G122
Reve
nuegrow
thtren
d800
G123
Net
profitgrow
thtren
d800
G124
Net
profitmargintren
d800
G125
Totalliabilitiestren
d947
G126
Owneq
uity
tren
d964
G127
Return
onas
sets
821
G128
Growth
rate
ofop
erating
profit
821
G129
Supp
liers
andpa
rtne
rsrelatio
nship
807
G130
Organ
izationca
pital(OCS
)746
G21Elec
trical
cons
umption
977
G22Natureco
nserva
tion
765
G23En
ergy
cons
umption
706
G24Su
staina
bleen
ergy
791
G25En
ergy
man
agem
ent
869
G26Se
dimen
tmon
itorin
g934
G27Airqu
ality
950
(Con
tinue
d)
Muangpan amp Suthiwartnarueput Cogent Business amp Management (2019) 6 1603275httpsdoiorg1010802331197520191603275
Page 7 of 18
Table2
(Con
tinu
ed)
KPIs
KPIgrou
p1
KPI
grou
p2
KPIgrou
p3
KPIgrou
p4
G28Noise
quality
control
766
G29Green
policies
899
G210
Environm
entalrisk
man
agem
ent
740
G211
Environm
entaltrainingan
daw
aren
ess
894
G212
Was
tewater
trea
tmen
t751
G213
Ave
rage
noiseleve
lofpo
rt738
G214
Prov
idingex
pans
ionplan
projec
tinform
ationto
thepu
blic
765
G215
Percen
tage
ofem
ploy
ees
traine
din
theorga
niza
tionrsquosan
ti-co
rrup
tionpo
liciesan
dproc
edure
950
G216
Port
charge
s747
G217
PortTh
roug
hput
Growth
Rate
(PTG
R)839
G218
Environm
entalleg
islatio
n832
G219
Supp
ortin
gac
tivities
(SA)
788
G220
Inform
ationca
pital(ICS)
883
G221
Inform
ationco
mmun
ication
integration
706
G222
Sustaina
blePo
rtPo
licy
745
G223
Sustaina
blePo
rtStrategy
745
G31Green
hous
ega
sem
ission
s737
G32Was
tedischa
rge
861
G33En
vironm
entalc
omplaints
964
G34Em
ploy
eeturnov
erin
port
947
(Con
tinue
d)
Muangpan amp Suthiwartnarueput Cogent Business amp Management (2019) 6 1603275httpsdoiorg1010802331197520191603275
Page 8 of 18
Table2
(Con
tinu
ed)
KPIs
KPIgrou
p1
KPI
grou
p2
KPIgrou
p3
KPIgrou
p4
G35Num
berof
repo
rtab
leac
cide
ntsin
port
967
G36Num
berof
lost
timeac
cide
nts
inpo
rt971
G37Occup
ationa
ldisea
serate
inpo
rt988
G38Num
berof
fatalitiesin
port
916
G39Co
nstantly
improv
ing
employ
eesrsquo
working
cond
ition
san
dsa
fety
869
G310
Failu
reto
comply
838
G311
Num
berof
port
secu
rity
incide
nts
953
G312
Non
-con
solid
ated
finan
cial
positio
n932
G313
Non
-con
solid
ated
inco
me
statem
ent
951
G314
Freigh
tha
ndlin
g848
G315
Sign
ifica
ntindirect
econ
omic
impa
cts
837
G316
Prov
isionof
facilitiesfor
compa
nies
934
G317
Tonn
ageworke
d971
G318
Mainten
ance
costs
932
G319
Return
oneq
uity
907
G41Noise
pollu
tion
710
G42Fu
elco
nsum
ption
794
(Con
tinue
d)
Muangpan amp Suthiwartnarueput Cogent Business amp Management (2019) 6 1603275httpsdoiorg1010802331197520191603275
Page 9 of 18
Table2
(Con
tinu
ed)
KPIs
KPIgrou
p1
KPI
grou
p2
KPIgrou
p3
KPIgrou
p4
G43En
courag
ingus
ingrecyclab
lematerial
777
G44En
vironm
entalc
ertificates
883
G45Em
ploy
men
ttype
andge
nder
859
G46To
tale
mploy
men
tin
port
765
G47Co
mmun
ityRe
latio
ns723
G48Age
structureof
employ
men
tin
port
705
G49To
taln
umbe
rof
incide
ntsof
discrim
inationin
port
979
G410
Commun
ityinve
stmen
t780
G411
Ave
rage
labo
urco
st949
G412
Ethica
lissue
s876
G413
Returnson
inve
stmen
t863
G414
Port
operations
trade
facilitation
851
G415
Indu
stry
lead
ingpo
sitio
n935
G416
Clea
ren
vironm
ental
performan
ceindica
tors
912
G417
Organ
izationan
dStructure
702
G418
Asset
sustaina
bility
751
G419
Upg
rade
andmainten
ance
offacilities
878
Muangpan amp Suthiwartnarueput Cogent Business amp Management (2019) 6 1603275httpsdoiorg1010802331197520191603275
Page 10 of 18
156 KPIs KPI group 1 determines the highest numbers of sustainable port KPIs with economic portmanner KPI group 2 concludes as having the most sustainable port KPIs with environmental portmanagement KPI group 3 identifies the highest numbers of sustainable port KPIs with impartial portmanagement KPI group 4 indicates most of sustainable port KPIs with social port management
42 The analysis of variance (ANOVA) comparing means of the important level of KPI amongthree types of portsThis part analyzes the differences in the importance level among four KPI groups from the threetypes of ports container ports non-container port and multi-purpose port
Table 3 presents the results of analysis of variance (ANOVA) comparing the important levelswithin the four KPI groups following the three types of ports This table shows the Scheffetesting for alpha 05 of all KPI groups This analysis further found that KPI group 1 and group 2has non-significant differences among the three types of ports KPI groups 1 and 2 arepresented as having a high level of important indicators which show higher than 08 importantlevels KPI group 1 shows the non-container ports (988) multi-purpose ports (869) andcontainer ports (846) KPI group 2 displays the mean levels of importance indicators by non-container ports (982) multi-purpose ports (915) and container ports (817) Thus in the threetypes of ports the important indicators need to operate to port sustainability has nodifferentiation
KPIgroup3andgroup4 indicatea significantdifference in the three typesofports KPI group3 fornon-container ports is shown to have the lowest level of indicators of importance (512) after that is themulti-purpose port (754) and container port (883) KPI group 4 for container ports is given to the lowestlevel of importance indicators (719) while the mean level of importance indicators for multi-purposeports (920) and non-container ports (953) are shown to have the highest level of importance indicatorsTherefore container ports offer an important level of KPI group 3 more than non-container ports alsomulti-purpose ports provide an important level of KPI group of three more than a non-container portHowever container ports andmulti-purpose port are given the important level of KPI group 3 with non-differentiation
43 DiscussionsSustainable port is the greatest challenge in the world of ports (Mora Orejas Subirats Ibanez ampAlvarez 2005 Mori amp Best 2017) Ports in Asia have been implementing various green and sustainableactivities seeking to reduce the environmental and social impacts of shipping and port activities (Rohet al 2016 Hou amp Geerlings 2016) In this paper it is found that KPI groups are divided into twomaingroups including the critical KPI groups and the preferable KPI group KPI group 1 and group 2 are thecritical KPI in which the sustainable port must be operated to port management Additionally KPIgroup 3 and group 4 are the preferable KPI groups that port operation need to apply sustainable portsfollowed by types of ports
Table 3 One-way ANOVA of differences among three types of ports
Sustainableport factors
(1) ContainerPort
(2) Non-Container
Port
(3) Multi-purpose Port
F-ratio Scheffe test
KPI group 1 846 988 869 2391
KPI group 2 817 982 915 2317
KPI group 3 883 512 754 14785 (12) (23)
KPI group 4 719 953 920 8637 (12) (13)
Note p lt 005
Muangpan amp Suthiwartnarueput Cogent Business amp Management (2019) 6 1603275httpsdoiorg1010802331197520191603275
Page 11 of 18
Sustainable port KPIs total 91 KPIs are comprised of the environmental aspect 22 KPIs (2418)social aspect 28 KPIs (3077) economic aspect 27 KPIs (2967) and port organizational manage-ment aspect 14 KPIs (1538) as shown in Figure 3 This paper introduces that modern port shouldapply these sustainable port KPIs in order to improve their sustainable ports performance
The critical KPIs are shown in the highest explanation of sustainable ports in the 30 KPIs of KPIgroup 1 and 23 KPIs of KPI group 2 There are a total of 53 KPIs that must be considered foroperational planning in ports to achieve port practice towards port sustainability The KPIs group 1presents the economic port manner referring to the port management that is achieved byintegrating key cost efficiency and cooperate social responsibility in ports Port operation canachieve KPIs in group 1 with KPIs of G11ndash130 The applied practices of sustainable port planningcan be considered for the factor loading of sustainable port KPIs KPIs of G11ndash12 explain themanagement of environmental costs and G13ndash113 indicates the cost of cooperate social respon-sibility G14ndash130 specifies the economic management which offers the financial and consumptionin port Port operation can achieve KPIs in group 2 with KPIs of G21ndash223 The applied operationsof sustainable port performance are to consider the factor loading of sustainable port KPIs KPIs ofG21ndash213 and G18-23 explain the environmental management in ports and G214ndash117 point tothe environmental efficiency cost and social responsibility However these critical KPIs are pre-sented with non-difference in the level of importance indicators to practice of the three types ofports These ports will be applicable for operation to develop sustainable KPIs for producing thepractical plan and key measurement in port operation
The preferable KPIs are revealed in the exceptional sustainable port KPIs of sustainable portsin the 19 KPIs of KPI group 3 and 19 KPIs of KPI group 4 There are a total of 38 KPIs needed toreflect on operational planning in ports for achieving better performance in port sustainabilityIn the KPIs group 3 presents about the impartial port management referring to the portmanagement that is achieved the superimposed economic and social efficiency in port Portoperation can be achieved with KPIs in group 3 with KPIs of G 31ndash319 The port managementof sustainable planning is to be considered to factor loading of sustainable port KPIs KPIs ofG31ndash33 explain the management of the equitable environment and KPIs of G34ndash119 shownfor operating the social-economic management of a port In the KPIs group 4 it indicated thatthe social port management referring to the port management Port practice can achieve KPIsin group 4 with KPIs of G 41ndash419 The planning of sustainable port operation is to beconsidered with the factor loading of sustainable port KPIs KPIs of G41ndash44 explain theenvironmental management to the community surrounding the port and KPIs of G45ndash411identify the social sustainability in port KPIs of G412ndash419 identify the organization and
Sustainable Port KPIs
IPKlacitir
C
Gro
up 1
(30
KPI
s)
Pref
erab
leK
PI
Gro
up 3
(19
KPI
s)
Cri
tical
KPI
Gro
up 2
(23
KPI
s)
Pref
erab
leK
PI
Gro
up4
(19
KPI
s)
(1538)Port Organization Management
aspects
(2967) Economic
aspects
(2418) Environment
aspects
(3077) Social aspects
Figure 3 Sustainable port KPIs
Muangpan amp Suthiwartnarueput Cogent Business amp Management (2019) 6 1603275httpsdoiorg1010802331197520191603275
Page 12 of 18
community management to port The preferable KPIs recommend as an important indicatorlevel of difference implementation followed by three types of ports that are found in KPIsgroup 3 and group 4 are significant different testings
In addition the performance measurement of KPIs group 3 in container ports and multi-purposeports need to be given a high importance level of practice planningmore than non-container ports Theperformance measurement of KPIs group 4 in non-container ports and multi-purpose ports need tooffer a high important level of operational management more than container ports In light of theresults obtained container ports andmulti-purpose ports require operational integrating financial andsocial efficiency of KPI group 3 to performance measurement in port Furthermore the practice of KPIgroup 3 in non-container port demands the least importance to manage the performance measure-ment in ports For the need of KPI group 4 container ports require operational indication by the leastimportant social and organizational management less than non-container ports and multi-purposeports these two types of ports affect the more natural environment and social surroundings Allinformation support is to direct the development of a sustainable port which explains the sustainableperformance measurement and port management
5 ConclusionsPort operation focuses on improving port sustainability in order to add value to the high profile ofinternational ports and reduce environmental and social impacts Together with this port operationsupports maritime transport and the overall economic system However in performing the portoperation environmental and social problems have been found and are lacking the sustainableport KPIs This paper finds four sustainable port KPI groups using exploratory factor analysis Thefindings also identify that the sustainable port KPIs are formed into groups The four KPI groups areshown with 91 sustainable port KPIs display factor loadings being higher than a 07 level indicationThese KPIs are included in the environmental aspect 22 KPIs social aspect 28 KPIs economic aspect27 KPIs and port organizational management aspect 14 KPIs
KPI group 1 and group 2 are the critical KPI to explain the high importance of port sustainabilityThese critical KPIs must be applied to sustainable port management Whereas the preferable KPI arefound in KPI group 3 and group 4 which are supported to port sustainability Besides three types ofport are tested for the different group using one-way ANOVA with the important levels of thesustainable port KPI groups As a result KPI group 1 and group 2 are presented as having significantnon-differences but KPI group 3 and group 4 are indicated as being significantly different between thethree types of ports Figure 3 introduces the sustainable port KPIs that contemporary port should applythese KPIs for improving their sustainable ports performance
Therefore port management should be considered with these sustainable port KPIs and sustainableport KPI groups to the first policy and practice for developing sustainability reports towards highperformance and creating a good image of environmentally and socially of sustainable ports Futureresearch can consider these findings in comparison to other stakeholders and in other areas or countries
AcknowledgementsThis research is supported by Rachadapisek Sompote Fundfor Postdoctoral Fellowship Graduate School ChulalongkornUniversity
FundingThe authors received no direct funding for this research
Author detailsThanyaphat MuangpanE-mail thanyadonutgmailcom1
Kamonchanok Suthiwartnarueput1
E-mail kamonchanokcbschulaacth1 Faculty of Commerce and Accountancy ChulalongkornUniversity Bangkok Thailand
Citation informationCite this article as Key performance indicators of sus-tainable port Case study of the eastern economic corridorin Thailand Thanyaphat Muangpan amp KamonchanokSuthiwartnarueput Cogent Business amp Management(2019) 6 1603275
ReferencesA Sustainable Port for the Future (2014) 2014 BPA sus-
tainability report Retrieved from httpswwwunglo-balcompactorgsystemattachmentscop_2016290231originalBPA_future_eng01pdf1464943203
Amrina E amp Vilsi A L (2015) Key performance indica-tors for sustainable manufacturing evaluation incement industry Procedia CIRP 26 19ndash23doi101016jprocir201407173
Muangpan amp Suthiwartnarueput Cogent Business amp Management (2019) 6 1603275httpsdoiorg1010802331197520191603275
Page 13 of 18
Asgari N Hassani A Jones D amp Nguye H H (2015)Sustainability ranking of the UK major portsMethodology and case study Transportation ResearchPart E 78 19ndash39 doi101016jtre201501014
Burskyte V Belous O amp Stasiskiene Z (2011) Sustainabledevelopment of deep-water seaport The case ofLithuania Environmental Scienceand Pollution Research18 716ndash726 doi101007s11356-010-0415-y
Chawla D amp Joshi H (2010) Knowledge managementpractices in Indian industries -a comparative studyJournal of Knowledge Management 14 708ndash725doi10110813673271011074854
Chen C amp Siu Lee Lam J (2018) Sustainability andinteractivity between cities and ports A two-stagedata envelopment analysis (DEA) approach MaritimePolicy amp Management 45(7) 944ndash961 doi1010800308883920181450528
Davarzani H Fahimnia B Bell M amp Sarkis J (2016)Greening ports and maritime logistics A reviewTransportation Research Part D 48 473ndash487
Delai I amp Takahashi S (2011) Sustainability measure-ment system A reference model proposal SocialResponsibility Journal 7 438ndash471 doi10110817471111111154563
Diaz M R amp Rodriguez T F E (2016) Determining thesustainability factors and performance of a tourismdestination from the stakeholdersrsquo perspectiveJournal Sustainability 8 doi103390su8090951
Environmental policy Valencia port (2017) Retrievedfrom httpswwwvalenciaportcomen
Gebauer H Putzr F Fischer T Wang C amp Lin J (2008)Exploring maintenance strategies in Chinese productmanufacturing companies Management ResearchNews 31 941ndash950 doi10110801409170810920648
Gefen D Straub D amp Boudreau M (2000) Structuralequation modeling and regression Guidelines forresearch practice Communications of the Association forInformation Systems 4(7) 1ndash78 doi10177051CAIS
Hou L amp Geerlings H (2016) Dynamics in sustainableport and hinterland operations A conceptual frame-work and simulation of sustainability measures andtheir effectivenes s based on an application to thePort of Shanghai Journal of Cleaner Production 135449ndash456 doi101016jjclepro201606134
Howell D (2002) Increasing earnings inequality andunemployment in developed countries Markets insti-tutions and the Unified Theory (SCEPA WorkingPaper Series) Schwartz Center for Economic PolicyAnalysis (SCEPA) The New School
Iddris F (2016) Measurement of innovation capability insupply chain An exploratory study InternationalJournal of Innovation Science 8 331ndash349doi101108IJIS-07-2016-0015
Johor Port authority (2014) Towards sustainable portoperation amp development Green port policy 2014ndash2020 Retrieved from httpswwwptpcommyPTP]14ce0c57-bce4-44b5-bb59-3c49bf46faf0pdf
Laem Chabang port (2017) Environmental and socialRetrieved from httpswwwlaemchabangportnewcom
Laxe F G Bermuacutedez F M Palmero F M amp Novo-Corti I(2016) Assessment of port sustainability throughsynthetic indexes Application to the Spanish caseMarine Pollution Bulletin 119 220ndash225 doi101016jmarpolbul201703064
Leading the Future Sustainability (2016) DP WorldAnnual Report and Accounts 2016 Retrieved fromhttpswwwdpworldcomeninvestorsfinancials-and-Presentationsfinancial-reportsannual-reports
Lopes I T (2012) Seeking a sustainable developmentscoreboard Beyond the agency theory SocialinėstechnologijosSocial Technologies 2(2) 273ndash289
Lu C S Shang K C amp Lin C C (2016a) Examiningsustainability performance at ports Port managersrsquoperspectives on developing sustainable supplychains Maritime Policy amp Management 43(8)909ndash927 doi1010800308883920161199918
Lu C S Shang K C amp Lin C C (2016b) Identifyingcrucial sustainability assessment criteria for con-tainer seaports Maritime Business Review 1 90ndash106doi101108MABR-05-2016-0009
MacCallum R Widaman K Preacher K amp Hong S(2001) Sample size in factor analysis The role ofmodel error Multivariate Behavioral Research 36(4)611ndash637 doi101207S15327906MBR3604_06
Mora E P Orejas J M Subirats A Ibanez S ampAlvarez P (2005) Development of a system of indi-cators for sustainable port management MarinePollution Bulletin 50 1649ndash1660 doi101016jmarpolbul200506048
Mori R Jr amp Best P (2017) GRI G4 content index Does itimprove credibility and change theexpectation-performance gap of GRI-assured sus-tainability reports Sustainability AccountingManagement and Policy Journal 8 571ndash594doi101108SAMPJ-12-2015-0115
Office of the National Economic and Social DevelopmentBoard (2017 August 1) The twelfth national eco-nomic and social development plan (2017ndash2021)Retrieved from httpswwwnesdbgoth
Port of Kaohsiung Environmental Report (2016) TaiwanInternational Ports Corporation Ltd Retrieved fromhttpswwwtwportcomtwUploadARelFileCustomPage2920f244a4ab-5d64-4189-9075-cff288eabc6dpdf
Port of Long Beach Sustainable Design and ConstructionGuidelines (2010)
Port of Los Angeles (2014) Sustainability reportJuly 2013ndashJune 2014
Port of Rotterdam Authority (2008) The sustainable portProject organization Maasvlakte 2
Puig M Wooldridge C amp Darbra R M (2014)Identification and selection of environmental per-formance indicators for sustainable portdevelopment Marine Pollution Bulletin 81 124ndash130doi101016jmarpolbul201402006
Review of Maritime Transport 2015 (2015) Retrievedfrom httpswwwunctadorg
Roh S Thai V V amp Wong Y D (2016) Towards sus-tainable ASEAN port development Challenges andopportunities for Vietnamese Ports The Asian Journalof Shipping and Logistics 32(2) 107ndash118doi101016jajsl201605004
Sakar G D amp Cetin C K (2012) Port sustainability andstakeholder management in supply chainsA Framework On Resource Dependence Theory TheAsian Journal of Shipping and Logistics 28 301ndash320doi101016jajsl201301002
Ssilian L Jaegler A amp Cariou P (2016) A literaturereview on port sustainability and oceanrsquos carriernetwork problem Research in TransportationBusiness amp Management 19 19ndash26 doi101016jrtbm201603005
Stojanovic T A Ormerod Smith H D ampWooldridge C F (2006) The impact of the habitatsdirective on European port operations andmanagement Geo Journal 65 165ndash176doi101007s10708-006-0004-2
Sustainability Report 2015 (2015) Bremen portsSustainability Report 2016 (2016) Annual sustainability
report ndash 2016 Santos BrasilSustainability Report 2017 (2017) Port of Antwerp
Muangpan amp Suthiwartnarueput Cogent Business amp Management (2019) 6 1603275httpsdoiorg1010802331197520191603275
Page 14 of 18
Tanjung Pelepas port (2017) MMC corporation BerhadAnnual Report 2017 Retrieved from httpswwwmmccommyMMC20Annual20Report20201720small20file20sizepdf
The maritime and port authority of Singapore and itssubsidiary (2016) MPA SustainabilityIntegratedReport 2016 Singapore Retrieved from httpswwwdpworldcomeninvestorsfinancials-and-Presentationsfinancial-reportsannual-reports
UNCTAD (2016) Retrieved from httpswwwunctadorgUnited Nations (2017) UN sustainable development
Retrieved from httpswwwunorg
Vanichbuncha K (2010) Statistical package for the socialscience for windows Bangkok ChulaPress
Xiao Z amp Lam J S L (2017) A systems framework forthe sustainable development of a Port City A casestudy of Singaporelsquos policies Research inTransportation Business amp Management 22 255ndash262doi101016jrtbm201610003
Zhang Y Kim C W Tee K F amp Lam J S L (2017)Optimal sustainable life cycle maintenance strate-gies for port infrastructures Journal of CleanerProduction 142 1693ndash1709 doi101016jjclepro201611120
Appendix (Questionnaire example)
Questionnaire (13 pages)
(Key Performance Indicators-KPIs of Sustainable Port Management)
Instructions
Section one The demographic information
For this section please check () and fill in questions to indicate your company and personalinformation about Company name PortTerminal operator ISO certificate PSHE-MS member Typeof port Position Responsibility and Education
Section two The influence of sustainable port KPIs to sustainable port management
For this section please check () in the important levels of sustainable port KPIs to sustainableport management that corresponds to your opinion
The important levels are estimated with 1minus10 levels including
1ndash10 = The levels of importance of sustainable port KPIs from Strongly disagree (1-low) to
Strongly agree (10-high) that affect sustainable port management
Section 1 Please check () and fill in questions to indicate your company and personalinformation
11 Company information
111 Company name helliphelliphelliphelliphelliphelliphelliphelliphelliphelliphelliphelliphelliphelliphelliphelliphelliphelliphelliphelliphelliphelliphelliphellip
112 PortTerminal operator helliphelliphelliphelliphelliphelliphelliphelliphelliphelliphelliphelliphelliphelliphelliphelliphelliphelliphelliphelliphellip
113 ISO certificate
() Yes Specifyhelliphelliphelliphelliphelliphelliphelliphelliphelliphelliphelliphelliphelliphelliphelliphelliphelliphelliphelliphelliphelliphelliphelliphellip
() No
114 PSHE-MS member
() Yes
() No
115 Type of port
() Container port
() Non-container port
() Multi-purpose port
() Other Specifyhelliphelliphelliphelliphelliphelliphelliphelliphelliphelliphelliphelliphelliphelliphelliphelliphelliphelliphelliphelliphelliphelliphellip
Muangpan amp Suthiwartnarueput Cogent Business amp Management (2019) 6 1603275httpsdoiorg1010802331197520191603275
Page 15 of 18
12 Company information
121 Position
() Top manager
() Middle manager
() Operation manager
() Administrator
122 Responsibility
() port management
() Sustainable development
() Other Specifyhelliphelliphelliphelliphelliphelliphelliphelliphelliphelliphelliphelliphelliphelliphelliphelliphelliphelliphelliphelliphelliphelliphellip
123 Education
() Doctorrsquos degree Major inhelliphelliphelliphelliphelliphelliphelliphelliphelliphelliphelliphelliphelliphelliphelliphelliphelliphelliphellip
() Masterrsquos degree Major inhelliphelliphelliphelliphelliphelliphelliphelliphelliphelliphelliphelliphelliphelliphelliphelliphelliphelliphelliphellip
() Bachelorrsquos degree Major inhelliphelliphelliphelliphelliphelliphelliphelliphelliphelliphelliphelliphelliphelliphelliphelliphelliphellip
() Other specifyhelliphelliphelliphelliphelliphelliphelliphelliphelliphelliphelliphelliphelliphelliphelliphelliphelliphelliphelliphelliphelliphelliphellip
Section 2 Please check () in the important levels of 156 sustainable port KPIs to Sustainable Port
Management
Table 21 Environmentalndashsustainable port KPIs (48 KPIs)
Environmentalmdashsustainableport KPIs
Levels of important
1 2 3 4 5 6 7 8 9 101 Electrical consumption
2 Water consumption
3 Greenhouse gas emissions(carbon dioxide CO2)
4 Waste discharge
5 Paper consumption
6 Cleanliness index
7 Dock litter
8 Barge waste
Table 22 Social ndash sustainable port KPIs (45 KPIs)
Socialmdashsustainable port KPIs Levels of important
1 2 3 4 5 6 7 8 9 101 Creating CSR awareness
2 Employment type and gender
3 Employee education and training
4 Prohibition of child labor andforced labor
5 Education on human rights
6 Social contribution (time andexpenses spent on socialcontribution)
(Continued)
Muangpan amp Suthiwartnarueput Cogent Business amp Management (2019) 6 1603275httpsdoiorg1010802331197520191603275
Page 16 of 18
25 Other sustainable port KPIs and the levels of important
helliphelliphelliphelliphelliphelliphelliphelliphelliphelliphelliphelliphelliphelliphelliphelliphelliphelliphelliphelliphelliphelliphelliphelliphelliphelliphelliphelliphelliphelliphelliphelliphelliphelliphelliphelliphelliphelliphelliphelliphelliphelliphelliphelliphelliphelliphelliphelliphelliphelliphelliphelliphelliphelliphelliphelliphelliphelliphelliphelliphelliphellip
helliphelliphelliphelliphelliphelliphelliphelliphelliphelliphelliphelliphelliphelliphelliphelliphelliphelliphelliphelliphelliphelliphelliphelliphelliphelliphelliphelliphelliphelliphelliphelliphelliphelliphelliphelliphelliphelliphelliphelliphelliphelliphelliphelliphelliphelliphelliphelliphelliphelliphelliphelliphelliphelliphelliphelliphelliphelliphelliphelliphelliphellip
helliphelliphelliphelliphelliphelliphelliphelliphelliphelliphelliphelliphelliphelliphelliphelliphelliphelliphelliphelliphelliphelliphelliphelliphelliphelliphelliphelliphelliphelliphelliphelliphelliphelliphelliphelliphelliphelliphelliphelliphelliphelliphelliphelliphelliphelliphelliphelliphelliphelliphelliphelliphelliphelliphelliphelliphelliphelliphelliphelliphelliphellip
helliphelliphelliphelliphelliphelliphelliphelliphelliphelliphelliphelliphelliphelliphelliphelliphelliphelliphelliphelliphelliphelliphelliphelliphelliphelliphelliphelliphelliphelliphelliphelliphelliphelliphelliphelliphelliphelliphelliphelliphelliphelliphelliphelliphelliphelliphelliphelliphelliphelliphelliphelliphelliphelliphelliphelliphelliphelliphelliphelliphelliphellip
helliphelliphelliphelliphelliphelliphelliphelliphelliphelliphelliphelliphelliphelliphelliphelliphelliphelliphelliphelliphelliphelliphelliphelliphelliphelliphelliphelliphelliphelliphelliphelliphelliphelliphelliphelliphelliphelliphelliphelliphelliphelliphelliphelliphelliphelliphelliphelliphelliphelliphelliphelliphelliphelliphelliphelliphelliphelliphelliphelliphelliphellip
Table 23 Economic ndash sustainable port KPIs (43 KPIs)
Economicmdashsustainable portKPIs
Levels of important
1 2 3 4 5 6 7 8 9 101 Port productivity
2 Number of Voyage
3 Offshore Support Vessels
4 Consolidated financial position
5 Consolidated income statement
6 Non-consolidated financialposition
7 Non-consolidated incomestatement
8 Freight handling
Table 24 Organization Management ndash sustainable port KPIs (20 KPIs)
Organization Managementmdashsustainable port KPIs
Levels of important
1 2 3 4 5 6 7 8 9 10
1 Industry leading position
2 Management supportenvironmental supply chain
3 Clear environmental performanceindicators
4 Budget on green performanceincluding promotion campaign
5 Environmental legislation
6 Organization and Structure
7 Risk Management Process
8 Strategically partnering
Socialmdashsustainable port KPIs Levels of important
1 2 3 4 5 6 7 8 9 10
7 Quality Community of life
8 Total employment in port
Muangpan amp Suthiwartnarueput Cogent Business amp Management (2019) 6 1603275httpsdoiorg1010802331197520191603275
Page 17 of 18
copy2019 The Author(s) This open access article is distributed under a Creative Commons Attribution (CC-BY) 40 license
You are free toShare mdash copy and redistribute the material in any medium or formatAdapt mdash remix transform and build upon the material for any purpose even commerciallyThe licensor cannot revoke these freedoms as long as you follow the license terms
Under the following termsAttribution mdash You must give appropriate credit provide a link to the license and indicate if changes were madeYou may do so in any reasonable manner but not in any way that suggests the licensor endorses you or your useNo additional restrictions
Youmay not apply legal terms or technological measures that legally restrict others from doing anything the license permits
Cogent Business amp Management (ISSN 2331-1975) is published by Cogent OA part of Taylor amp Francis Group
Publishing with Cogent OA ensures
bull Immediate universal access to your article on publication
bull High visibility and discoverability via the Cogent OA website as well as Taylor amp Francis Online
bull Download and citation statistics for your article
bull Rapid online publication
bull Input from and dialog with expert editors and editorial boards
bull Retention of full copyright of your article
bull Guaranteed legacy preservation of your article
bull Discounts and waivers for authors in developing regions
Submit your manuscript to a Cogent OA journal at wwwCogentOAcom
Muangpan amp Suthiwartnarueput Cogent Business amp Management (2019) 6 1603275httpsdoiorg1010802331197520191603275
Page 18 of 18

Table2
(Con
tinu
ed)
KPIs
KPIgrou
p1
KPI
grou
p2
KPIgrou
p3
KPIgrou
p4
G28Noise
quality
control
766
G29Green
policies
899
G210
Environm
entalrisk
man
agem
ent
740
G211
Environm
entaltrainingan
daw
aren
ess
894
G212
Was
tewater
trea
tmen
t751
G213
Ave
rage
noiseleve
lofpo
rt738
G214
Prov
idingex
pans
ionplan
projec
tinform
ationto
thepu
blic
765
G215
Percen
tage
ofem
ploy
ees
traine
din
theorga
niza
tionrsquosan
ti-co
rrup
tionpo
liciesan
dproc
edure
950
G216
Port
charge
s747
G217
PortTh
roug
hput
Growth
Rate
(PTG
R)839
G218
Environm
entalleg
islatio
n832
G219
Supp
ortin
gac
tivities
(SA)
788
G220
Inform
ationca
pital(ICS)
883
G221
Inform
ationco
mmun
ication
integration
706
G222
Sustaina
blePo
rtPo
licy
745
G223
Sustaina
blePo
rtStrategy
745
G31Green
hous
ega
sem
ission
s737
G32Was
tedischa
rge
861
G33En
vironm
entalc
omplaints
964
G34Em
ploy
eeturnov
erin
port
947
(Con
tinue
d)
Muangpan amp Suthiwartnarueput Cogent Business amp Management (2019) 6 1603275httpsdoiorg1010802331197520191603275
Page 8 of 18
Table2
(Con
tinu
ed)
KPIs
KPIgrou
p1
KPI
grou
p2
KPIgrou
p3
KPIgrou
p4
G35Num
berof
repo
rtab
leac
cide
ntsin
port
967
G36Num
berof
lost
timeac
cide
nts
inpo
rt971
G37Occup
ationa
ldisea
serate
inpo
rt988
G38Num
berof
fatalitiesin
port
916
G39Co
nstantly
improv
ing
employ
eesrsquo
working
cond
ition
san
dsa
fety
869
G310
Failu
reto
comply
838
G311
Num
berof
port
secu
rity
incide
nts
953
G312
Non
-con
solid
ated
finan
cial
positio
n932
G313
Non
-con
solid
ated
inco
me
statem
ent
951
G314
Freigh
tha
ndlin
g848
G315
Sign
ifica
ntindirect
econ
omic
impa
cts
837
G316
Prov
isionof
facilitiesfor
compa
nies
934
G317
Tonn
ageworke
d971
G318
Mainten
ance
costs
932
G319
Return
oneq
uity
907
G41Noise
pollu
tion
710
G42Fu
elco
nsum
ption
794
(Con
tinue
d)
Muangpan amp Suthiwartnarueput Cogent Business amp Management (2019) 6 1603275httpsdoiorg1010802331197520191603275
Page 9 of 18
Table2
(Con
tinu
ed)
KPIs
KPIgrou
p1
KPI
grou
p2
KPIgrou
p3
KPIgrou
p4
G43En
courag
ingus
ingrecyclab
lematerial
777
G44En
vironm
entalc
ertificates
883
G45Em
ploy
men
ttype
andge
nder
859
G46To
tale
mploy
men
tin
port
765
G47Co
mmun
ityRe
latio
ns723
G48Age
structureof
employ
men
tin
port
705
G49To
taln
umbe
rof
incide
ntsof
discrim
inationin
port
979
G410
Commun
ityinve
stmen
t780
G411
Ave
rage
labo
urco
st949
G412
Ethica
lissue
s876
G413
Returnson
inve
stmen
t863
G414
Port
operations
trade
facilitation
851
G415
Indu
stry
lead
ingpo
sitio
n935
G416
Clea
ren
vironm
ental
performan
ceindica
tors
912
G417
Organ
izationan
dStructure
702
G418
Asset
sustaina
bility
751
G419
Upg
rade
andmainten
ance
offacilities
878
Muangpan amp Suthiwartnarueput Cogent Business amp Management (2019) 6 1603275httpsdoiorg1010802331197520191603275
Page 10 of 18
156 KPIs KPI group 1 determines the highest numbers of sustainable port KPIs with economic portmanner KPI group 2 concludes as having the most sustainable port KPIs with environmental portmanagement KPI group 3 identifies the highest numbers of sustainable port KPIs with impartial portmanagement KPI group 4 indicates most of sustainable port KPIs with social port management
42 The analysis of variance (ANOVA) comparing means of the important level of KPI amongthree types of portsThis part analyzes the differences in the importance level among four KPI groups from the threetypes of ports container ports non-container port and multi-purpose port
Table 3 presents the results of analysis of variance (ANOVA) comparing the important levelswithin the four KPI groups following the three types of ports This table shows the Scheffetesting for alpha 05 of all KPI groups This analysis further found that KPI group 1 and group 2has non-significant differences among the three types of ports KPI groups 1 and 2 arepresented as having a high level of important indicators which show higher than 08 importantlevels KPI group 1 shows the non-container ports (988) multi-purpose ports (869) andcontainer ports (846) KPI group 2 displays the mean levels of importance indicators by non-container ports (982) multi-purpose ports (915) and container ports (817) Thus in the threetypes of ports the important indicators need to operate to port sustainability has nodifferentiation
KPIgroup3andgroup4 indicatea significantdifference in the three typesofports KPI group3 fornon-container ports is shown to have the lowest level of indicators of importance (512) after that is themulti-purpose port (754) and container port (883) KPI group 4 for container ports is given to the lowestlevel of importance indicators (719) while the mean level of importance indicators for multi-purposeports (920) and non-container ports (953) are shown to have the highest level of importance indicatorsTherefore container ports offer an important level of KPI group 3 more than non-container ports alsomulti-purpose ports provide an important level of KPI group of three more than a non-container portHowever container ports andmulti-purpose port are given the important level of KPI group 3 with non-differentiation
43 DiscussionsSustainable port is the greatest challenge in the world of ports (Mora Orejas Subirats Ibanez ampAlvarez 2005 Mori amp Best 2017) Ports in Asia have been implementing various green and sustainableactivities seeking to reduce the environmental and social impacts of shipping and port activities (Rohet al 2016 Hou amp Geerlings 2016) In this paper it is found that KPI groups are divided into twomaingroups including the critical KPI groups and the preferable KPI group KPI group 1 and group 2 are thecritical KPI in which the sustainable port must be operated to port management Additionally KPIgroup 3 and group 4 are the preferable KPI groups that port operation need to apply sustainable portsfollowed by types of ports
Table 3 One-way ANOVA of differences among three types of ports
Sustainableport factors
(1) ContainerPort
(2) Non-Container
Port
(3) Multi-purpose Port
F-ratio Scheffe test
KPI group 1 846 988 869 2391
KPI group 2 817 982 915 2317
KPI group 3 883 512 754 14785 (12) (23)
KPI group 4 719 953 920 8637 (12) (13)
Note p lt 005
Muangpan amp Suthiwartnarueput Cogent Business amp Management (2019) 6 1603275httpsdoiorg1010802331197520191603275
Page 11 of 18
Sustainable port KPIs total 91 KPIs are comprised of the environmental aspect 22 KPIs (2418)social aspect 28 KPIs (3077) economic aspect 27 KPIs (2967) and port organizational manage-ment aspect 14 KPIs (1538) as shown in Figure 3 This paper introduces that modern port shouldapply these sustainable port KPIs in order to improve their sustainable ports performance
The critical KPIs are shown in the highest explanation of sustainable ports in the 30 KPIs of KPIgroup 1 and 23 KPIs of KPI group 2 There are a total of 53 KPIs that must be considered foroperational planning in ports to achieve port practice towards port sustainability The KPIs group 1presents the economic port manner referring to the port management that is achieved byintegrating key cost efficiency and cooperate social responsibility in ports Port operation canachieve KPIs in group 1 with KPIs of G11ndash130 The applied practices of sustainable port planningcan be considered for the factor loading of sustainable port KPIs KPIs of G11ndash12 explain themanagement of environmental costs and G13ndash113 indicates the cost of cooperate social respon-sibility G14ndash130 specifies the economic management which offers the financial and consumptionin port Port operation can achieve KPIs in group 2 with KPIs of G21ndash223 The applied operationsof sustainable port performance are to consider the factor loading of sustainable port KPIs KPIs ofG21ndash213 and G18-23 explain the environmental management in ports and G214ndash117 point tothe environmental efficiency cost and social responsibility However these critical KPIs are pre-sented with non-difference in the level of importance indicators to practice of the three types ofports These ports will be applicable for operation to develop sustainable KPIs for producing thepractical plan and key measurement in port operation
The preferable KPIs are revealed in the exceptional sustainable port KPIs of sustainable portsin the 19 KPIs of KPI group 3 and 19 KPIs of KPI group 4 There are a total of 38 KPIs needed toreflect on operational planning in ports for achieving better performance in port sustainabilityIn the KPIs group 3 presents about the impartial port management referring to the portmanagement that is achieved the superimposed economic and social efficiency in port Portoperation can be achieved with KPIs in group 3 with KPIs of G 31ndash319 The port managementof sustainable planning is to be considered to factor loading of sustainable port KPIs KPIs ofG31ndash33 explain the management of the equitable environment and KPIs of G34ndash119 shownfor operating the social-economic management of a port In the KPIs group 4 it indicated thatthe social port management referring to the port management Port practice can achieve KPIsin group 4 with KPIs of G 41ndash419 The planning of sustainable port operation is to beconsidered with the factor loading of sustainable port KPIs KPIs of G41ndash44 explain theenvironmental management to the community surrounding the port and KPIs of G45ndash411identify the social sustainability in port KPIs of G412ndash419 identify the organization and
Sustainable Port KPIs
IPKlacitir
C
Gro
up 1
(30
KPI
s)
Pref
erab
leK
PI
Gro
up 3
(19
KPI
s)
Cri
tical
KPI
Gro
up 2
(23
KPI
s)
Pref
erab
leK
PI
Gro
up4
(19
KPI
s)
(1538)Port Organization Management
aspects
(2967) Economic
aspects
(2418) Environment
aspects
(3077) Social aspects
Figure 3 Sustainable port KPIs
Muangpan amp Suthiwartnarueput Cogent Business amp Management (2019) 6 1603275httpsdoiorg1010802331197520191603275
Page 12 of 18
community management to port The preferable KPIs recommend as an important indicatorlevel of difference implementation followed by three types of ports that are found in KPIsgroup 3 and group 4 are significant different testings
In addition the performance measurement of KPIs group 3 in container ports and multi-purposeports need to be given a high importance level of practice planningmore than non-container ports Theperformance measurement of KPIs group 4 in non-container ports and multi-purpose ports need tooffer a high important level of operational management more than container ports In light of theresults obtained container ports andmulti-purpose ports require operational integrating financial andsocial efficiency of KPI group 3 to performance measurement in port Furthermore the practice of KPIgroup 3 in non-container port demands the least importance to manage the performance measure-ment in ports For the need of KPI group 4 container ports require operational indication by the leastimportant social and organizational management less than non-container ports and multi-purposeports these two types of ports affect the more natural environment and social surroundings Allinformation support is to direct the development of a sustainable port which explains the sustainableperformance measurement and port management
5 ConclusionsPort operation focuses on improving port sustainability in order to add value to the high profile ofinternational ports and reduce environmental and social impacts Together with this port operationsupports maritime transport and the overall economic system However in performing the portoperation environmental and social problems have been found and are lacking the sustainableport KPIs This paper finds four sustainable port KPI groups using exploratory factor analysis Thefindings also identify that the sustainable port KPIs are formed into groups The four KPI groups areshown with 91 sustainable port KPIs display factor loadings being higher than a 07 level indicationThese KPIs are included in the environmental aspect 22 KPIs social aspect 28 KPIs economic aspect27 KPIs and port organizational management aspect 14 KPIs
KPI group 1 and group 2 are the critical KPI to explain the high importance of port sustainabilityThese critical KPIs must be applied to sustainable port management Whereas the preferable KPI arefound in KPI group 3 and group 4 which are supported to port sustainability Besides three types ofport are tested for the different group using one-way ANOVA with the important levels of thesustainable port KPI groups As a result KPI group 1 and group 2 are presented as having significantnon-differences but KPI group 3 and group 4 are indicated as being significantly different between thethree types of ports Figure 3 introduces the sustainable port KPIs that contemporary port should applythese KPIs for improving their sustainable ports performance
Therefore port management should be considered with these sustainable port KPIs and sustainableport KPI groups to the first policy and practice for developing sustainability reports towards highperformance and creating a good image of environmentally and socially of sustainable ports Futureresearch can consider these findings in comparison to other stakeholders and in other areas or countries
AcknowledgementsThis research is supported by Rachadapisek Sompote Fundfor Postdoctoral Fellowship Graduate School ChulalongkornUniversity
FundingThe authors received no direct funding for this research
Author detailsThanyaphat MuangpanE-mail thanyadonutgmailcom1
Kamonchanok Suthiwartnarueput1
E-mail kamonchanokcbschulaacth1 Faculty of Commerce and Accountancy ChulalongkornUniversity Bangkok Thailand
Citation informationCite this article as Key performance indicators of sus-tainable port Case study of the eastern economic corridorin Thailand Thanyaphat Muangpan amp KamonchanokSuthiwartnarueput Cogent Business amp Management(2019) 6 1603275
ReferencesA Sustainable Port for the Future (2014) 2014 BPA sus-
tainability report Retrieved from httpswwwunglo-balcompactorgsystemattachmentscop_2016290231originalBPA_future_eng01pdf1464943203
Amrina E amp Vilsi A L (2015) Key performance indica-tors for sustainable manufacturing evaluation incement industry Procedia CIRP 26 19ndash23doi101016jprocir201407173
Muangpan amp Suthiwartnarueput Cogent Business amp Management (2019) 6 1603275httpsdoiorg1010802331197520191603275
Page 13 of 18
Asgari N Hassani A Jones D amp Nguye H H (2015)Sustainability ranking of the UK major portsMethodology and case study Transportation ResearchPart E 78 19ndash39 doi101016jtre201501014
Burskyte V Belous O amp Stasiskiene Z (2011) Sustainabledevelopment of deep-water seaport The case ofLithuania Environmental Scienceand Pollution Research18 716ndash726 doi101007s11356-010-0415-y
Chawla D amp Joshi H (2010) Knowledge managementpractices in Indian industries -a comparative studyJournal of Knowledge Management 14 708ndash725doi10110813673271011074854
Chen C amp Siu Lee Lam J (2018) Sustainability andinteractivity between cities and ports A two-stagedata envelopment analysis (DEA) approach MaritimePolicy amp Management 45(7) 944ndash961 doi1010800308883920181450528
Davarzani H Fahimnia B Bell M amp Sarkis J (2016)Greening ports and maritime logistics A reviewTransportation Research Part D 48 473ndash487
Delai I amp Takahashi S (2011) Sustainability measure-ment system A reference model proposal SocialResponsibility Journal 7 438ndash471 doi10110817471111111154563
Diaz M R amp Rodriguez T F E (2016) Determining thesustainability factors and performance of a tourismdestination from the stakeholdersrsquo perspectiveJournal Sustainability 8 doi103390su8090951
Environmental policy Valencia port (2017) Retrievedfrom httpswwwvalenciaportcomen
Gebauer H Putzr F Fischer T Wang C amp Lin J (2008)Exploring maintenance strategies in Chinese productmanufacturing companies Management ResearchNews 31 941ndash950 doi10110801409170810920648
Gefen D Straub D amp Boudreau M (2000) Structuralequation modeling and regression Guidelines forresearch practice Communications of the Association forInformation Systems 4(7) 1ndash78 doi10177051CAIS
Hou L amp Geerlings H (2016) Dynamics in sustainableport and hinterland operations A conceptual frame-work and simulation of sustainability measures andtheir effectivenes s based on an application to thePort of Shanghai Journal of Cleaner Production 135449ndash456 doi101016jjclepro201606134
Howell D (2002) Increasing earnings inequality andunemployment in developed countries Markets insti-tutions and the Unified Theory (SCEPA WorkingPaper Series) Schwartz Center for Economic PolicyAnalysis (SCEPA) The New School
Iddris F (2016) Measurement of innovation capability insupply chain An exploratory study InternationalJournal of Innovation Science 8 331ndash349doi101108IJIS-07-2016-0015
Johor Port authority (2014) Towards sustainable portoperation amp development Green port policy 2014ndash2020 Retrieved from httpswwwptpcommyPTP]14ce0c57-bce4-44b5-bb59-3c49bf46faf0pdf
Laem Chabang port (2017) Environmental and socialRetrieved from httpswwwlaemchabangportnewcom
Laxe F G Bermuacutedez F M Palmero F M amp Novo-Corti I(2016) Assessment of port sustainability throughsynthetic indexes Application to the Spanish caseMarine Pollution Bulletin 119 220ndash225 doi101016jmarpolbul201703064
Leading the Future Sustainability (2016) DP WorldAnnual Report and Accounts 2016 Retrieved fromhttpswwwdpworldcomeninvestorsfinancials-and-Presentationsfinancial-reportsannual-reports
Lopes I T (2012) Seeking a sustainable developmentscoreboard Beyond the agency theory SocialinėstechnologijosSocial Technologies 2(2) 273ndash289
Lu C S Shang K C amp Lin C C (2016a) Examiningsustainability performance at ports Port managersrsquoperspectives on developing sustainable supplychains Maritime Policy amp Management 43(8)909ndash927 doi1010800308883920161199918
Lu C S Shang K C amp Lin C C (2016b) Identifyingcrucial sustainability assessment criteria for con-tainer seaports Maritime Business Review 1 90ndash106doi101108MABR-05-2016-0009
MacCallum R Widaman K Preacher K amp Hong S(2001) Sample size in factor analysis The role ofmodel error Multivariate Behavioral Research 36(4)611ndash637 doi101207S15327906MBR3604_06
Mora E P Orejas J M Subirats A Ibanez S ampAlvarez P (2005) Development of a system of indi-cators for sustainable port management MarinePollution Bulletin 50 1649ndash1660 doi101016jmarpolbul200506048
Mori R Jr amp Best P (2017) GRI G4 content index Does itimprove credibility and change theexpectation-performance gap of GRI-assured sus-tainability reports Sustainability AccountingManagement and Policy Journal 8 571ndash594doi101108SAMPJ-12-2015-0115
Office of the National Economic and Social DevelopmentBoard (2017 August 1) The twelfth national eco-nomic and social development plan (2017ndash2021)Retrieved from httpswwwnesdbgoth
Port of Kaohsiung Environmental Report (2016) TaiwanInternational Ports Corporation Ltd Retrieved fromhttpswwwtwportcomtwUploadARelFileCustomPage2920f244a4ab-5d64-4189-9075-cff288eabc6dpdf
Port of Long Beach Sustainable Design and ConstructionGuidelines (2010)
Port of Los Angeles (2014) Sustainability reportJuly 2013ndashJune 2014
Port of Rotterdam Authority (2008) The sustainable portProject organization Maasvlakte 2
Puig M Wooldridge C amp Darbra R M (2014)Identification and selection of environmental per-formance indicators for sustainable portdevelopment Marine Pollution Bulletin 81 124ndash130doi101016jmarpolbul201402006
Review of Maritime Transport 2015 (2015) Retrievedfrom httpswwwunctadorg
Roh S Thai V V amp Wong Y D (2016) Towards sus-tainable ASEAN port development Challenges andopportunities for Vietnamese Ports The Asian Journalof Shipping and Logistics 32(2) 107ndash118doi101016jajsl201605004
Sakar G D amp Cetin C K (2012) Port sustainability andstakeholder management in supply chainsA Framework On Resource Dependence Theory TheAsian Journal of Shipping and Logistics 28 301ndash320doi101016jajsl201301002
Ssilian L Jaegler A amp Cariou P (2016) A literaturereview on port sustainability and oceanrsquos carriernetwork problem Research in TransportationBusiness amp Management 19 19ndash26 doi101016jrtbm201603005
Stojanovic T A Ormerod Smith H D ampWooldridge C F (2006) The impact of the habitatsdirective on European port operations andmanagement Geo Journal 65 165ndash176doi101007s10708-006-0004-2
Sustainability Report 2015 (2015) Bremen portsSustainability Report 2016 (2016) Annual sustainability
report ndash 2016 Santos BrasilSustainability Report 2017 (2017) Port of Antwerp
Muangpan amp Suthiwartnarueput Cogent Business amp Management (2019) 6 1603275httpsdoiorg1010802331197520191603275
Page 14 of 18
Tanjung Pelepas port (2017) MMC corporation BerhadAnnual Report 2017 Retrieved from httpswwwmmccommyMMC20Annual20Report20201720small20file20sizepdf
The maritime and port authority of Singapore and itssubsidiary (2016) MPA SustainabilityIntegratedReport 2016 Singapore Retrieved from httpswwwdpworldcomeninvestorsfinancials-and-Presentationsfinancial-reportsannual-reports
UNCTAD (2016) Retrieved from httpswwwunctadorgUnited Nations (2017) UN sustainable development
Retrieved from httpswwwunorg
Vanichbuncha K (2010) Statistical package for the socialscience for windows Bangkok ChulaPress
Xiao Z amp Lam J S L (2017) A systems framework forthe sustainable development of a Port City A casestudy of Singaporelsquos policies Research inTransportation Business amp Management 22 255ndash262doi101016jrtbm201610003
Zhang Y Kim C W Tee K F amp Lam J S L (2017)Optimal sustainable life cycle maintenance strate-gies for port infrastructures Journal of CleanerProduction 142 1693ndash1709 doi101016jjclepro201611120
Appendix (Questionnaire example)
Questionnaire (13 pages)
(Key Performance Indicators-KPIs of Sustainable Port Management)
Instructions
Section one The demographic information
For this section please check () and fill in questions to indicate your company and personalinformation about Company name PortTerminal operator ISO certificate PSHE-MS member Typeof port Position Responsibility and Education
Section two The influence of sustainable port KPIs to sustainable port management
For this section please check () in the important levels of sustainable port KPIs to sustainableport management that corresponds to your opinion
The important levels are estimated with 1minus10 levels including
1ndash10 = The levels of importance of sustainable port KPIs from Strongly disagree (1-low) to
Strongly agree (10-high) that affect sustainable port management
Section 1 Please check () and fill in questions to indicate your company and personalinformation
11 Company information
111 Company name helliphelliphelliphelliphelliphelliphelliphelliphelliphelliphelliphelliphelliphelliphelliphelliphelliphelliphelliphelliphelliphelliphelliphellip
112 PortTerminal operator helliphelliphelliphelliphelliphelliphelliphelliphelliphelliphelliphelliphelliphelliphelliphelliphelliphelliphelliphelliphellip
113 ISO certificate
() Yes Specifyhelliphelliphelliphelliphelliphelliphelliphelliphelliphelliphelliphelliphelliphelliphelliphelliphelliphelliphelliphelliphelliphelliphelliphellip
() No
114 PSHE-MS member
() Yes
() No
115 Type of port
() Container port
() Non-container port
() Multi-purpose port
() Other Specifyhelliphelliphelliphelliphelliphelliphelliphelliphelliphelliphelliphelliphelliphelliphelliphelliphelliphelliphelliphelliphelliphelliphellip
Muangpan amp Suthiwartnarueput Cogent Business amp Management (2019) 6 1603275httpsdoiorg1010802331197520191603275
Page 15 of 18
12 Company information
121 Position
() Top manager
() Middle manager
() Operation manager
() Administrator
122 Responsibility
() port management
() Sustainable development
() Other Specifyhelliphelliphelliphelliphelliphelliphelliphelliphelliphelliphelliphelliphelliphelliphelliphelliphelliphelliphelliphelliphelliphelliphellip
123 Education
() Doctorrsquos degree Major inhelliphelliphelliphelliphelliphelliphelliphelliphelliphelliphelliphelliphelliphelliphelliphelliphelliphelliphellip
() Masterrsquos degree Major inhelliphelliphelliphelliphelliphelliphelliphelliphelliphelliphelliphelliphelliphelliphelliphelliphelliphelliphelliphellip
() Bachelorrsquos degree Major inhelliphelliphelliphelliphelliphelliphelliphelliphelliphelliphelliphelliphelliphelliphelliphelliphelliphellip
() Other specifyhelliphelliphelliphelliphelliphelliphelliphelliphelliphelliphelliphelliphelliphelliphelliphelliphelliphelliphelliphelliphelliphelliphellip
Section 2 Please check () in the important levels of 156 sustainable port KPIs to Sustainable Port
Management
Table 21 Environmentalndashsustainable port KPIs (48 KPIs)
Environmentalmdashsustainableport KPIs
Levels of important
1 2 3 4 5 6 7 8 9 101 Electrical consumption
2 Water consumption
3 Greenhouse gas emissions(carbon dioxide CO2)
4 Waste discharge
5 Paper consumption
6 Cleanliness index
7 Dock litter
8 Barge waste
Table 22 Social ndash sustainable port KPIs (45 KPIs)
Socialmdashsustainable port KPIs Levels of important
1 2 3 4 5 6 7 8 9 101 Creating CSR awareness
2 Employment type and gender
3 Employee education and training
4 Prohibition of child labor andforced labor
5 Education on human rights
6 Social contribution (time andexpenses spent on socialcontribution)
(Continued)
Muangpan amp Suthiwartnarueput Cogent Business amp Management (2019) 6 1603275httpsdoiorg1010802331197520191603275
Page 16 of 18
25 Other sustainable port KPIs and the levels of important
helliphelliphelliphelliphelliphelliphelliphelliphelliphelliphelliphelliphelliphelliphelliphelliphelliphelliphelliphelliphelliphelliphelliphelliphelliphelliphelliphelliphelliphelliphelliphelliphelliphelliphelliphelliphelliphelliphelliphelliphelliphelliphelliphelliphelliphelliphelliphelliphelliphelliphelliphelliphelliphelliphelliphelliphelliphelliphelliphelliphelliphellip
helliphelliphelliphelliphelliphelliphelliphelliphelliphelliphelliphelliphelliphelliphelliphelliphelliphelliphelliphelliphelliphelliphelliphelliphelliphelliphelliphelliphelliphelliphelliphelliphelliphelliphelliphelliphelliphelliphelliphelliphelliphelliphelliphelliphelliphelliphelliphelliphelliphelliphelliphelliphelliphelliphelliphelliphelliphelliphelliphelliphelliphellip
helliphelliphelliphelliphelliphelliphelliphelliphelliphelliphelliphelliphelliphelliphelliphelliphelliphelliphelliphelliphelliphelliphelliphelliphelliphelliphelliphelliphelliphelliphelliphelliphelliphelliphelliphelliphelliphelliphelliphelliphelliphelliphelliphelliphelliphelliphelliphelliphelliphelliphelliphelliphelliphelliphelliphelliphelliphelliphelliphelliphelliphellip
helliphelliphelliphelliphelliphelliphelliphelliphelliphelliphelliphelliphelliphelliphelliphelliphelliphelliphelliphelliphelliphelliphelliphelliphelliphelliphelliphelliphelliphelliphelliphelliphelliphelliphelliphelliphelliphelliphelliphelliphelliphelliphelliphelliphelliphelliphelliphelliphelliphelliphelliphelliphelliphelliphelliphelliphelliphelliphelliphelliphelliphellip
helliphelliphelliphelliphelliphelliphelliphelliphelliphelliphelliphelliphelliphelliphelliphelliphelliphelliphelliphelliphelliphelliphelliphelliphelliphelliphelliphelliphelliphelliphelliphelliphelliphelliphelliphelliphelliphelliphelliphelliphelliphelliphelliphelliphelliphelliphelliphelliphelliphelliphelliphelliphelliphelliphelliphelliphelliphelliphelliphelliphelliphellip
Table 23 Economic ndash sustainable port KPIs (43 KPIs)
Economicmdashsustainable portKPIs
Levels of important
1 2 3 4 5 6 7 8 9 101 Port productivity
2 Number of Voyage
3 Offshore Support Vessels
4 Consolidated financial position
5 Consolidated income statement
6 Non-consolidated financialposition
7 Non-consolidated incomestatement
8 Freight handling
Table 24 Organization Management ndash sustainable port KPIs (20 KPIs)
Organization Managementmdashsustainable port KPIs
Levels of important
1 2 3 4 5 6 7 8 9 10
1 Industry leading position
2 Management supportenvironmental supply chain
3 Clear environmental performanceindicators
4 Budget on green performanceincluding promotion campaign
5 Environmental legislation
6 Organization and Structure
7 Risk Management Process
8 Strategically partnering
Socialmdashsustainable port KPIs Levels of important
1 2 3 4 5 6 7 8 9 10
7 Quality Community of life
8 Total employment in port
Muangpan amp Suthiwartnarueput Cogent Business amp Management (2019) 6 1603275httpsdoiorg1010802331197520191603275
Page 17 of 18
copy2019 The Author(s) This open access article is distributed under a Creative Commons Attribution (CC-BY) 40 license
You are free toShare mdash copy and redistribute the material in any medium or formatAdapt mdash remix transform and build upon the material for any purpose even commerciallyThe licensor cannot revoke these freedoms as long as you follow the license terms
Under the following termsAttribution mdash You must give appropriate credit provide a link to the license and indicate if changes were madeYou may do so in any reasonable manner but not in any way that suggests the licensor endorses you or your useNo additional restrictions
Youmay not apply legal terms or technological measures that legally restrict others from doing anything the license permits
Cogent Business amp Management (ISSN 2331-1975) is published by Cogent OA part of Taylor amp Francis Group
Publishing with Cogent OA ensures
bull Immediate universal access to your article on publication
bull High visibility and discoverability via the Cogent OA website as well as Taylor amp Francis Online
bull Download and citation statistics for your article
bull Rapid online publication
bull Input from and dialog with expert editors and editorial boards
bull Retention of full copyright of your article
bull Guaranteed legacy preservation of your article
bull Discounts and waivers for authors in developing regions
Submit your manuscript to a Cogent OA journal at wwwCogentOAcom
Muangpan amp Suthiwartnarueput Cogent Business amp Management (2019) 6 1603275httpsdoiorg1010802331197520191603275
Page 18 of 18
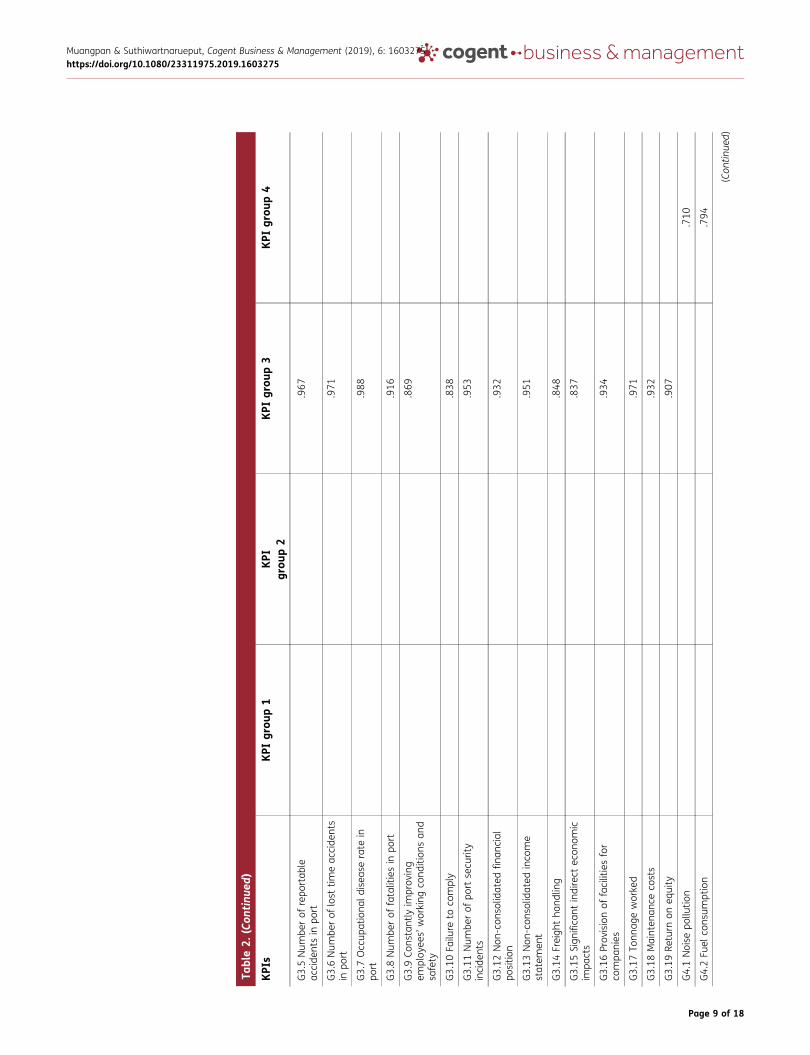
Table2
(Con
tinu
ed)
KPIs
KPIgrou
p1
KPI
grou
p2
KPIgrou
p3
KPIgrou
p4
G43En
courag
ingus
ingrecyclab
lematerial
777
G44En
vironm
entalc
ertificates
883
G45Em
ploy
men
ttype
andge
nder
859
G46To
tale
mploy
men
tin
port
765
G47Co
mmun
ityRe
latio
ns723
G48Age
structureof
employ
men
tin
port
705
G49To
taln
umbe
rof
incide
ntsof
discrim
inationin
port
979
G410
Commun
ityinve
stmen
t780
G411
Ave
rage
labo
urco
st949
G412
Ethica
lissue
s876
G413
Returnson
inve
stmen
t863
G414
Port
operations
trade
facilitation
851
G415
Indu
stry
lead
ingpo
sitio
n935
G416
Clea
ren
vironm
ental
performan
ceindica
tors
912
G417
Organ
izationan
dStructure
702
G418
Asset
sustaina
bility
751
G419
Upg
rade
andmainten
ance
offacilities
878
Muangpan amp Suthiwartnarueput Cogent Business amp Management (2019) 6 1603275httpsdoiorg1010802331197520191603275
Page 10 of 18
156 KPIs KPI group 1 determines the highest numbers of sustainable port KPIs with economic portmanner KPI group 2 concludes as having the most sustainable port KPIs with environmental portmanagement KPI group 3 identifies the highest numbers of sustainable port KPIs with impartial portmanagement KPI group 4 indicates most of sustainable port KPIs with social port management
42 The analysis of variance (ANOVA) comparing means of the important level of KPI amongthree types of portsThis part analyzes the differences in the importance level among four KPI groups from the threetypes of ports container ports non-container port and multi-purpose port
Table 3 presents the results of analysis of variance (ANOVA) comparing the important levelswithin the four KPI groups following the three types of ports This table shows the Scheffetesting for alpha 05 of all KPI groups This analysis further found that KPI group 1 and group 2has non-significant differences among the three types of ports KPI groups 1 and 2 arepresented as having a high level of important indicators which show higher than 08 importantlevels KPI group 1 shows the non-container ports (988) multi-purpose ports (869) andcontainer ports (846) KPI group 2 displays the mean levels of importance indicators by non-container ports (982) multi-purpose ports (915) and container ports (817) Thus in the threetypes of ports the important indicators need to operate to port sustainability has nodifferentiation
KPIgroup3andgroup4 indicatea significantdifference in the three typesofports KPI group3 fornon-container ports is shown to have the lowest level of indicators of importance (512) after that is themulti-purpose port (754) and container port (883) KPI group 4 for container ports is given to the lowestlevel of importance indicators (719) while the mean level of importance indicators for multi-purposeports (920) and non-container ports (953) are shown to have the highest level of importance indicatorsTherefore container ports offer an important level of KPI group 3 more than non-container ports alsomulti-purpose ports provide an important level of KPI group of three more than a non-container portHowever container ports andmulti-purpose port are given the important level of KPI group 3 with non-differentiation
43 DiscussionsSustainable port is the greatest challenge in the world of ports (Mora Orejas Subirats Ibanez ampAlvarez 2005 Mori amp Best 2017) Ports in Asia have been implementing various green and sustainableactivities seeking to reduce the environmental and social impacts of shipping and port activities (Rohet al 2016 Hou amp Geerlings 2016) In this paper it is found that KPI groups are divided into twomaingroups including the critical KPI groups and the preferable KPI group KPI group 1 and group 2 are thecritical KPI in which the sustainable port must be operated to port management Additionally KPIgroup 3 and group 4 are the preferable KPI groups that port operation need to apply sustainable portsfollowed by types of ports
Table 3 One-way ANOVA of differences among three types of ports
Sustainableport factors
(1) ContainerPort
(2) Non-Container
Port
(3) Multi-purpose Port
F-ratio Scheffe test
KPI group 1 846 988 869 2391
KPI group 2 817 982 915 2317
KPI group 3 883 512 754 14785 (12) (23)
KPI group 4 719 953 920 8637 (12) (13)
Note p lt 005
Muangpan amp Suthiwartnarueput Cogent Business amp Management (2019) 6 1603275httpsdoiorg1010802331197520191603275
Page 11 of 18
Sustainable port KPIs total 91 KPIs are comprised of the environmental aspect 22 KPIs (2418)social aspect 28 KPIs (3077) economic aspect 27 KPIs (2967) and port organizational manage-ment aspect 14 KPIs (1538) as shown in Figure 3 This paper introduces that modern port shouldapply these sustainable port KPIs in order to improve their sustainable ports performance
The critical KPIs are shown in the highest explanation of sustainable ports in the 30 KPIs of KPIgroup 1 and 23 KPIs of KPI group 2 There are a total of 53 KPIs that must be considered foroperational planning in ports to achieve port practice towards port sustainability The KPIs group 1presents the economic port manner referring to the port management that is achieved byintegrating key cost efficiency and cooperate social responsibility in ports Port operation canachieve KPIs in group 1 with KPIs of G11ndash130 The applied practices of sustainable port planningcan be considered for the factor loading of sustainable port KPIs KPIs of G11ndash12 explain themanagement of environmental costs and G13ndash113 indicates the cost of cooperate social respon-sibility G14ndash130 specifies the economic management which offers the financial and consumptionin port Port operation can achieve KPIs in group 2 with KPIs of G21ndash223 The applied operationsof sustainable port performance are to consider the factor loading of sustainable port KPIs KPIs ofG21ndash213 and G18-23 explain the environmental management in ports and G214ndash117 point tothe environmental efficiency cost and social responsibility However these critical KPIs are pre-sented with non-difference in the level of importance indicators to practice of the three types ofports These ports will be applicable for operation to develop sustainable KPIs for producing thepractical plan and key measurement in port operation
The preferable KPIs are revealed in the exceptional sustainable port KPIs of sustainable portsin the 19 KPIs of KPI group 3 and 19 KPIs of KPI group 4 There are a total of 38 KPIs needed toreflect on operational planning in ports for achieving better performance in port sustainabilityIn the KPIs group 3 presents about the impartial port management referring to the portmanagement that is achieved the superimposed economic and social efficiency in port Portoperation can be achieved with KPIs in group 3 with KPIs of G 31ndash319 The port managementof sustainable planning is to be considered to factor loading of sustainable port KPIs KPIs ofG31ndash33 explain the management of the equitable environment and KPIs of G34ndash119 shownfor operating the social-economic management of a port In the KPIs group 4 it indicated thatthe social port management referring to the port management Port practice can achieve KPIsin group 4 with KPIs of G 41ndash419 The planning of sustainable port operation is to beconsidered with the factor loading of sustainable port KPIs KPIs of G41ndash44 explain theenvironmental management to the community surrounding the port and KPIs of G45ndash411identify the social sustainability in port KPIs of G412ndash419 identify the organization and
Sustainable Port KPIs
IPKlacitir
C
Gro
up 1
(30
KPI
s)
Pref
erab
leK
PI
Gro
up 3
(19
KPI
s)
Cri
tical
KPI
Gro
up 2
(23
KPI
s)
Pref
erab
leK
PI
Gro
up4
(19
KPI
s)
(1538)Port Organization Management
aspects
(2967) Economic
aspects
(2418) Environment
aspects
(3077) Social aspects
Figure 3 Sustainable port KPIs
Muangpan amp Suthiwartnarueput Cogent Business amp Management (2019) 6 1603275httpsdoiorg1010802331197520191603275
Page 12 of 18
community management to port The preferable KPIs recommend as an important indicatorlevel of difference implementation followed by three types of ports that are found in KPIsgroup 3 and group 4 are significant different testings
In addition the performance measurement of KPIs group 3 in container ports and multi-purposeports need to be given a high importance level of practice planningmore than non-container ports Theperformance measurement of KPIs group 4 in non-container ports and multi-purpose ports need tooffer a high important level of operational management more than container ports In light of theresults obtained container ports andmulti-purpose ports require operational integrating financial andsocial efficiency of KPI group 3 to performance measurement in port Furthermore the practice of KPIgroup 3 in non-container port demands the least importance to manage the performance measure-ment in ports For the need of KPI group 4 container ports require operational indication by the leastimportant social and organizational management less than non-container ports and multi-purposeports these two types of ports affect the more natural environment and social surroundings Allinformation support is to direct the development of a sustainable port which explains the sustainableperformance measurement and port management
5 ConclusionsPort operation focuses on improving port sustainability in order to add value to the high profile ofinternational ports and reduce environmental and social impacts Together with this port operationsupports maritime transport and the overall economic system However in performing the portoperation environmental and social problems have been found and are lacking the sustainableport KPIs This paper finds four sustainable port KPI groups using exploratory factor analysis Thefindings also identify that the sustainable port KPIs are formed into groups The four KPI groups areshown with 91 sustainable port KPIs display factor loadings being higher than a 07 level indicationThese KPIs are included in the environmental aspect 22 KPIs social aspect 28 KPIs economic aspect27 KPIs and port organizational management aspect 14 KPIs
KPI group 1 and group 2 are the critical KPI to explain the high importance of port sustainabilityThese critical KPIs must be applied to sustainable port management Whereas the preferable KPI arefound in KPI group 3 and group 4 which are supported to port sustainability Besides three types ofport are tested for the different group using one-way ANOVA with the important levels of thesustainable port KPI groups As a result KPI group 1 and group 2 are presented as having significantnon-differences but KPI group 3 and group 4 are indicated as being significantly different between thethree types of ports Figure 3 introduces the sustainable port KPIs that contemporary port should applythese KPIs for improving their sustainable ports performance
Therefore port management should be considered with these sustainable port KPIs and sustainableport KPI groups to the first policy and practice for developing sustainability reports towards highperformance and creating a good image of environmentally and socially of sustainable ports Futureresearch can consider these findings in comparison to other stakeholders and in other areas or countries
AcknowledgementsThis research is supported by Rachadapisek Sompote Fundfor Postdoctoral Fellowship Graduate School ChulalongkornUniversity
FundingThe authors received no direct funding for this research
Author detailsThanyaphat MuangpanE-mail thanyadonutgmailcom1
Kamonchanok Suthiwartnarueput1
E-mail kamonchanokcbschulaacth1 Faculty of Commerce and Accountancy ChulalongkornUniversity Bangkok Thailand
Citation informationCite this article as Key performance indicators of sus-tainable port Case study of the eastern economic corridorin Thailand Thanyaphat Muangpan amp KamonchanokSuthiwartnarueput Cogent Business amp Management(2019) 6 1603275
ReferencesA Sustainable Port for the Future (2014) 2014 BPA sus-
tainability report Retrieved from httpswwwunglo-balcompactorgsystemattachmentscop_2016290231originalBPA_future_eng01pdf1464943203
Amrina E amp Vilsi A L (2015) Key performance indica-tors for sustainable manufacturing evaluation incement industry Procedia CIRP 26 19ndash23doi101016jprocir201407173
Muangpan amp Suthiwartnarueput Cogent Business amp Management (2019) 6 1603275httpsdoiorg1010802331197520191603275
Page 13 of 18
Asgari N Hassani A Jones D amp Nguye H H (2015)Sustainability ranking of the UK major portsMethodology and case study Transportation ResearchPart E 78 19ndash39 doi101016jtre201501014
Burskyte V Belous O amp Stasiskiene Z (2011) Sustainabledevelopment of deep-water seaport The case ofLithuania Environmental Scienceand Pollution Research18 716ndash726 doi101007s11356-010-0415-y
Chawla D amp Joshi H (2010) Knowledge managementpractices in Indian industries -a comparative studyJournal of Knowledge Management 14 708ndash725doi10110813673271011074854
Chen C amp Siu Lee Lam J (2018) Sustainability andinteractivity between cities and ports A two-stagedata envelopment analysis (DEA) approach MaritimePolicy amp Management 45(7) 944ndash961 doi1010800308883920181450528
Davarzani H Fahimnia B Bell M amp Sarkis J (2016)Greening ports and maritime logistics A reviewTransportation Research Part D 48 473ndash487
Delai I amp Takahashi S (2011) Sustainability measure-ment system A reference model proposal SocialResponsibility Journal 7 438ndash471 doi10110817471111111154563
Diaz M R amp Rodriguez T F E (2016) Determining thesustainability factors and performance of a tourismdestination from the stakeholdersrsquo perspectiveJournal Sustainability 8 doi103390su8090951
Environmental policy Valencia port (2017) Retrievedfrom httpswwwvalenciaportcomen
Gebauer H Putzr F Fischer T Wang C amp Lin J (2008)Exploring maintenance strategies in Chinese productmanufacturing companies Management ResearchNews 31 941ndash950 doi10110801409170810920648
Gefen D Straub D amp Boudreau M (2000) Structuralequation modeling and regression Guidelines forresearch practice Communications of the Association forInformation Systems 4(7) 1ndash78 doi10177051CAIS
Hou L amp Geerlings H (2016) Dynamics in sustainableport and hinterland operations A conceptual frame-work and simulation of sustainability measures andtheir effectivenes s based on an application to thePort of Shanghai Journal of Cleaner Production 135449ndash456 doi101016jjclepro201606134
Howell D (2002) Increasing earnings inequality andunemployment in developed countries Markets insti-tutions and the Unified Theory (SCEPA WorkingPaper Series) Schwartz Center for Economic PolicyAnalysis (SCEPA) The New School
Iddris F (2016) Measurement of innovation capability insupply chain An exploratory study InternationalJournal of Innovation Science 8 331ndash349doi101108IJIS-07-2016-0015
Johor Port authority (2014) Towards sustainable portoperation amp development Green port policy 2014ndash2020 Retrieved from httpswwwptpcommyPTP]14ce0c57-bce4-44b5-bb59-3c49bf46faf0pdf
Laem Chabang port (2017) Environmental and socialRetrieved from httpswwwlaemchabangportnewcom
Laxe F G Bermuacutedez F M Palmero F M amp Novo-Corti I(2016) Assessment of port sustainability throughsynthetic indexes Application to the Spanish caseMarine Pollution Bulletin 119 220ndash225 doi101016jmarpolbul201703064
Leading the Future Sustainability (2016) DP WorldAnnual Report and Accounts 2016 Retrieved fromhttpswwwdpworldcomeninvestorsfinancials-and-Presentationsfinancial-reportsannual-reports
Lopes I T (2012) Seeking a sustainable developmentscoreboard Beyond the agency theory SocialinėstechnologijosSocial Technologies 2(2) 273ndash289
Lu C S Shang K C amp Lin C C (2016a) Examiningsustainability performance at ports Port managersrsquoperspectives on developing sustainable supplychains Maritime Policy amp Management 43(8)909ndash927 doi1010800308883920161199918
Lu C S Shang K C amp Lin C C (2016b) Identifyingcrucial sustainability assessment criteria for con-tainer seaports Maritime Business Review 1 90ndash106doi101108MABR-05-2016-0009
MacCallum R Widaman K Preacher K amp Hong S(2001) Sample size in factor analysis The role ofmodel error Multivariate Behavioral Research 36(4)611ndash637 doi101207S15327906MBR3604_06
Mora E P Orejas J M Subirats A Ibanez S ampAlvarez P (2005) Development of a system of indi-cators for sustainable port management MarinePollution Bulletin 50 1649ndash1660 doi101016jmarpolbul200506048
Mori R Jr amp Best P (2017) GRI G4 content index Does itimprove credibility and change theexpectation-performance gap of GRI-assured sus-tainability reports Sustainability AccountingManagement and Policy Journal 8 571ndash594doi101108SAMPJ-12-2015-0115
Office of the National Economic and Social DevelopmentBoard (2017 August 1) The twelfth national eco-nomic and social development plan (2017ndash2021)Retrieved from httpswwwnesdbgoth
Port of Kaohsiung Environmental Report (2016) TaiwanInternational Ports Corporation Ltd Retrieved fromhttpswwwtwportcomtwUploadARelFileCustomPage2920f244a4ab-5d64-4189-9075-cff288eabc6dpdf
Port of Long Beach Sustainable Design and ConstructionGuidelines (2010)
Port of Los Angeles (2014) Sustainability reportJuly 2013ndashJune 2014
Port of Rotterdam Authority (2008) The sustainable portProject organization Maasvlakte 2
Puig M Wooldridge C amp Darbra R M (2014)Identification and selection of environmental per-formance indicators for sustainable portdevelopment Marine Pollution Bulletin 81 124ndash130doi101016jmarpolbul201402006
Review of Maritime Transport 2015 (2015) Retrievedfrom httpswwwunctadorg
Roh S Thai V V amp Wong Y D (2016) Towards sus-tainable ASEAN port development Challenges andopportunities for Vietnamese Ports The Asian Journalof Shipping and Logistics 32(2) 107ndash118doi101016jajsl201605004
Sakar G D amp Cetin C K (2012) Port sustainability andstakeholder management in supply chainsA Framework On Resource Dependence Theory TheAsian Journal of Shipping and Logistics 28 301ndash320doi101016jajsl201301002
Ssilian L Jaegler A amp Cariou P (2016) A literaturereview on port sustainability and oceanrsquos carriernetwork problem Research in TransportationBusiness amp Management 19 19ndash26 doi101016jrtbm201603005
Stojanovic T A Ormerod Smith H D ampWooldridge C F (2006) The impact of the habitatsdirective on European port operations andmanagement Geo Journal 65 165ndash176doi101007s10708-006-0004-2
Sustainability Report 2015 (2015) Bremen portsSustainability Report 2016 (2016) Annual sustainability
report ndash 2016 Santos BrasilSustainability Report 2017 (2017) Port of Antwerp
Muangpan amp Suthiwartnarueput Cogent Business amp Management (2019) 6 1603275httpsdoiorg1010802331197520191603275
Page 14 of 18
Tanjung Pelepas port (2017) MMC corporation BerhadAnnual Report 2017 Retrieved from httpswwwmmccommyMMC20Annual20Report20201720small20file20sizepdf
The maritime and port authority of Singapore and itssubsidiary (2016) MPA SustainabilityIntegratedReport 2016 Singapore Retrieved from httpswwwdpworldcomeninvestorsfinancials-and-Presentationsfinancial-reportsannual-reports
UNCTAD (2016) Retrieved from httpswwwunctadorgUnited Nations (2017) UN sustainable development
Retrieved from httpswwwunorg
Vanichbuncha K (2010) Statistical package for the socialscience for windows Bangkok ChulaPress
Xiao Z amp Lam J S L (2017) A systems framework forthe sustainable development of a Port City A casestudy of Singaporelsquos policies Research inTransportation Business amp Management 22 255ndash262doi101016jrtbm201610003
Zhang Y Kim C W Tee K F amp Lam J S L (2017)Optimal sustainable life cycle maintenance strate-gies for port infrastructures Journal of CleanerProduction 142 1693ndash1709 doi101016jjclepro201611120
Appendix (Questionnaire example)
Questionnaire (13 pages)
(Key Performance Indicators-KPIs of Sustainable Port Management)
Instructions
Section one The demographic information
For this section please check () and fill in questions to indicate your company and personalinformation about Company name PortTerminal operator ISO certificate PSHE-MS member Typeof port Position Responsibility and Education
Section two The influence of sustainable port KPIs to sustainable port management
For this section please check () in the important levels of sustainable port KPIs to sustainableport management that corresponds to your opinion
The important levels are estimated with 1minus10 levels including
1ndash10 = The levels of importance of sustainable port KPIs from Strongly disagree (1-low) to
Strongly agree (10-high) that affect sustainable port management
Section 1 Please check () and fill in questions to indicate your company and personalinformation
11 Company information
111 Company name helliphelliphelliphelliphelliphelliphelliphelliphelliphelliphelliphelliphelliphelliphelliphelliphelliphelliphelliphelliphelliphelliphelliphellip
112 PortTerminal operator helliphelliphelliphelliphelliphelliphelliphelliphelliphelliphelliphelliphelliphelliphelliphelliphelliphelliphelliphelliphellip
113 ISO certificate
() Yes Specifyhelliphelliphelliphelliphelliphelliphelliphelliphelliphelliphelliphelliphelliphelliphelliphelliphelliphelliphelliphelliphelliphelliphelliphellip
() No
114 PSHE-MS member
() Yes
() No
115 Type of port
() Container port
() Non-container port
() Multi-purpose port
() Other Specifyhelliphelliphelliphelliphelliphelliphelliphelliphelliphelliphelliphelliphelliphelliphelliphelliphelliphelliphelliphelliphelliphelliphellip
Muangpan amp Suthiwartnarueput Cogent Business amp Management (2019) 6 1603275httpsdoiorg1010802331197520191603275
Page 15 of 18
12 Company information
121 Position
() Top manager
() Middle manager
() Operation manager
() Administrator
122 Responsibility
() port management
() Sustainable development
() Other Specifyhelliphelliphelliphelliphelliphelliphelliphelliphelliphelliphelliphelliphelliphelliphelliphelliphelliphelliphelliphelliphelliphelliphellip
123 Education
() Doctorrsquos degree Major inhelliphelliphelliphelliphelliphelliphelliphelliphelliphelliphelliphelliphelliphelliphelliphelliphelliphelliphellip
() Masterrsquos degree Major inhelliphelliphelliphelliphelliphelliphelliphelliphelliphelliphelliphelliphelliphelliphelliphelliphelliphelliphelliphellip
() Bachelorrsquos degree Major inhelliphelliphelliphelliphelliphelliphelliphelliphelliphelliphelliphelliphelliphelliphelliphelliphelliphellip
() Other specifyhelliphelliphelliphelliphelliphelliphelliphelliphelliphelliphelliphelliphelliphelliphelliphelliphelliphelliphelliphelliphelliphelliphellip
Section 2 Please check () in the important levels of 156 sustainable port KPIs to Sustainable Port
Management
Table 21 Environmentalndashsustainable port KPIs (48 KPIs)
Environmentalmdashsustainableport KPIs
Levels of important
1 2 3 4 5 6 7 8 9 101 Electrical consumption
2 Water consumption
3 Greenhouse gas emissions(carbon dioxide CO2)
4 Waste discharge
5 Paper consumption
6 Cleanliness index
7 Dock litter
8 Barge waste
Table 22 Social ndash sustainable port KPIs (45 KPIs)
Socialmdashsustainable port KPIs Levels of important
1 2 3 4 5 6 7 8 9 101 Creating CSR awareness
2 Employment type and gender
3 Employee education and training
4 Prohibition of child labor andforced labor
5 Education on human rights
6 Social contribution (time andexpenses spent on socialcontribution)
(Continued)
Muangpan amp Suthiwartnarueput Cogent Business amp Management (2019) 6 1603275httpsdoiorg1010802331197520191603275
Page 16 of 18
25 Other sustainable port KPIs and the levels of important
helliphelliphelliphelliphelliphelliphelliphelliphelliphelliphelliphelliphelliphelliphelliphelliphelliphelliphelliphelliphelliphelliphelliphelliphelliphelliphelliphelliphelliphelliphelliphelliphelliphelliphelliphelliphelliphelliphelliphelliphelliphelliphelliphelliphelliphelliphelliphelliphelliphelliphelliphelliphelliphelliphelliphelliphelliphelliphelliphelliphelliphellip
helliphelliphelliphelliphelliphelliphelliphelliphelliphelliphelliphelliphelliphelliphelliphelliphelliphelliphelliphelliphelliphelliphelliphelliphelliphelliphelliphelliphelliphelliphelliphelliphelliphelliphelliphelliphelliphelliphelliphelliphelliphelliphelliphelliphelliphelliphelliphelliphelliphelliphelliphelliphelliphelliphelliphelliphelliphelliphelliphelliphelliphellip
helliphelliphelliphelliphelliphelliphelliphelliphelliphelliphelliphelliphelliphelliphelliphelliphelliphelliphelliphelliphelliphelliphelliphelliphelliphelliphelliphelliphelliphelliphelliphelliphelliphelliphelliphelliphelliphelliphelliphelliphelliphelliphelliphelliphelliphelliphelliphelliphelliphelliphelliphelliphelliphelliphelliphelliphelliphelliphelliphelliphelliphellip
helliphelliphelliphelliphelliphelliphelliphelliphelliphelliphelliphelliphelliphelliphelliphelliphelliphelliphelliphelliphelliphelliphelliphelliphelliphelliphelliphelliphelliphelliphelliphelliphelliphelliphelliphelliphelliphelliphelliphelliphelliphelliphelliphelliphelliphelliphelliphelliphelliphelliphelliphelliphelliphelliphelliphelliphelliphelliphelliphelliphelliphellip
helliphelliphelliphelliphelliphelliphelliphelliphelliphelliphelliphelliphelliphelliphelliphelliphelliphelliphelliphelliphelliphelliphelliphelliphelliphelliphelliphelliphelliphelliphelliphelliphelliphelliphelliphelliphelliphelliphelliphelliphelliphelliphelliphelliphelliphelliphelliphelliphelliphelliphelliphelliphelliphelliphelliphelliphelliphelliphelliphelliphelliphellip
Table 23 Economic ndash sustainable port KPIs (43 KPIs)
Economicmdashsustainable portKPIs
Levels of important
1 2 3 4 5 6 7 8 9 101 Port productivity
2 Number of Voyage
3 Offshore Support Vessels
4 Consolidated financial position
5 Consolidated income statement
6 Non-consolidated financialposition
7 Non-consolidated incomestatement
8 Freight handling
Table 24 Organization Management ndash sustainable port KPIs (20 KPIs)
Organization Managementmdashsustainable port KPIs
Levels of important
1 2 3 4 5 6 7 8 9 10
1 Industry leading position
2 Management supportenvironmental supply chain
3 Clear environmental performanceindicators
4 Budget on green performanceincluding promotion campaign
5 Environmental legislation
6 Organization and Structure
7 Risk Management Process
8 Strategically partnering
Socialmdashsustainable port KPIs Levels of important
1 2 3 4 5 6 7 8 9 10
7 Quality Community of life
8 Total employment in port
Muangpan amp Suthiwartnarueput Cogent Business amp Management (2019) 6 1603275httpsdoiorg1010802331197520191603275
Page 17 of 18
copy2019 The Author(s) This open access article is distributed under a Creative Commons Attribution (CC-BY) 40 license
You are free toShare mdash copy and redistribute the material in any medium or formatAdapt mdash remix transform and build upon the material for any purpose even commerciallyThe licensor cannot revoke these freedoms as long as you follow the license terms
Under the following termsAttribution mdash You must give appropriate credit provide a link to the license and indicate if changes were madeYou may do so in any reasonable manner but not in any way that suggests the licensor endorses you or your useNo additional restrictions
Youmay not apply legal terms or technological measures that legally restrict others from doing anything the license permits
Cogent Business amp Management (ISSN 2331-1975) is published by Cogent OA part of Taylor amp Francis Group
Publishing with Cogent OA ensures
bull Immediate universal access to your article on publication
bull High visibility and discoverability via the Cogent OA website as well as Taylor amp Francis Online
bull Download and citation statistics for your article
bull Rapid online publication
bull Input from and dialog with expert editors and editorial boards
bull Retention of full copyright of your article
bull Guaranteed legacy preservation of your article
bull Discounts and waivers for authors in developing regions
Submit your manuscript to a Cogent OA journal at wwwCogentOAcom
Muangpan amp Suthiwartnarueput Cogent Business amp Management (2019) 6 1603275httpsdoiorg1010802331197520191603275
Page 18 of 18


