C u sto m er F eed b ack Key Performance Indicators Area ...
89
2017 Jul Aug Sep Oct Nov Dec Jan Feb Mar April May June FY 31 31 30 31 30 31 31 28 31 30 31 30 19,801 1,898 1,725 1,737 1,688 1,618 1,791 1,821 1,672 1,737 15,687 Calls 54.2 61.2 55.6 57.9 54.5 53.9 57.8 58.7 59.7 56.0 57.3 Daily Emergency P1 / P2 12,306 1111 1,052 1,050 1,042 989 1,166 1,167 1,100 1,109 9,786 P1 / P2 Scheduled P3 / P4 755 80 51 63 68 50 64 56 50 62 544 P3 / P4 Inter-facility P6 57 4 5 10 7 2 1 0 2 3 34 P6 Out of Town P5 / 15 1,495 141 96 125 95 108 115 103 99 96 978 P5 Behavioral Transfers P25 13 2 1 0 2 3 0 1 1 0 10 P25 Buchanan Co. P51 30 3 2 1 0 1 1 0 0 1 9 BC Aditional Patient Transport AP 107 9 12 6 11 7 8 12 4 9 78 Add Pt Total Patient Transports 14,763 1,350 1,219 1,255 1,225 1,160 1,355 1,339 1,256 1,280 11,439 Transports Per Day 40.4 43.5 39.3 41.8 39.5 38.7 43.7 43.2 44.9 41.3 41.7 Daily DAS 125 11 10 11 15 13 14 17 14 12 117 DAS ALS 93 13 10 14 11 19 17 7 4 10 105 ALS Mutual Aid 30 1 2 2 1 2 2 0 2 1 13 MA 398 39 41 27 26 47 28 35 38 27 308 PS SB 245 37 29 33 28 10 10 7 16 17 187 CS SB C11 113 12 6 9 8 5 7 5 6 5 63 C11 P1 94 94 94 96 97 96 95 93 92 94 95 P1 Avg P2 95 93 93 94 95 95 93 92 94 93 94 P2 Avg Mailings sent 1,622 150 120 137 139 158 136 184 136 138 1,298 Total Mailings returned 412 32 36 32 38 36 33 59 42 32 340 Total Return % 25.4% 21.3% 30.0% 23.4% 27.3% 22.8% 24.3% 32.1% 30.9% 23.2% 26.2% Avg 379 29 34 28 37 35 31 54 40 31 319 Total 92.0% 90.6% 94.4% 87.5% 97.4% 97.2% 93.9% 91.5% 95.2% 96.9% 93.8% Avg 28 2 2 4 1 1 2 5 2 1 20 Total 6.8% 6.3% 5.6% 12.5% 2.6% 2.8% 6.1% 8.5% 4.8% 3.1% 5.9% Avg 5 1 0 0 0 0 0 0 0 0 1 Total 1.2% 3.1% 0.0% 0.0% 0.0% 0.0% 0.0% 0.0% 0.0% 0.0% 0.3% Avg Corporate Training 14 0 1 0 0 0 0 0 0 0 1 Total Community Training 448 13 39 22 0 0 0 0 0 0 74 Total Student Training 660 0 0 0 0 0 352 0 0 0 352 Total Sponsorships & Donations $5,510.00 $0.00 $350.00 $855.00 $500 $1,000.00 $0.00 $0.00 $0.00 $1,000.00 $3,705.00 Total Standby Services (in kind) $88,415.43 $15,324.60 $10,317.85 $15,140.72 $12,053.88 $3,535.47 $3,049.34 $4,669.29 $5,893.87 $7,575.53 $77,560.55 Total $99,016.57 $7,289.06 $9,918.68 $17,207.74 Total Communit y Partnering CPR Donation Financial Assistance Customer Feedback Mail Satisfaction Excellent Adequate Needs Improvement OTHER Misc Public Safety Standby Community Event Standby Service Car Resp Time Cedar Rapids Key Performance Indicators Area Ambulance Service 2017-2018 YTD Calls for Service Total Calls for Service Per Day Patient Calls TRANSPORTS
-
Upload
khangminh22 -
Category
Documents
-
view
0 -
download
0
Transcript of C u sto m er F eed b ack Key Performance Indicators Area ...

2017 Jul Aug Sep Oct Nov Dec Jan Feb Mar April May JuneFY 31 31 30 31 30 31 31 28 31 30 31 30
19,801 1,898 1,725 1,737 1,688 1,618 1,791 1,821 1,672 1,737 15,687 Calls54.2 61.2 55.6 57.9 54.5 53.9 57.8 58.7 59.7 56.0 57.3 Daily
Emergency P1 / P2 12,306 1111 1,052 1,050 1,042 989 1,166 1,167 1,100 1,109 9,786 P1 / P2Scheduled P3 / P4 755 80 51 63 68 50 64 56 50 62 544 P3 / P4Inter-facility P6 57 4 5 10 7 2 1 0 2 3 34 P6Out of Town P5 / 15 1,495 141 96 125 95 108 115 103 99 96 978 P5Behavioral Transfers P25 13 2 1 0 2 3 0 1 1 0 10 P25Buchanan Co. P51 30 3 2 1 0 1 1 0 0 1 9 BCAditional Patient Transport AP 107 9 12 6 11 7 8 12 4 9 78 Add PtTotal Patient Transports 14,763 1,350 1,219 1,255 1,225 1,160 1,355 1,339 1,256 1,280 11,439 TransportsPer Day 40.4 43.5 39.3 41.8 39.5 38.7 43.7 43.2 44.9 41.3 41.7 DailyDAS 125 11 10 11 15 13 14 17 14 12 117 DASALS 93 13 10 14 11 19 17 7 4 10 105 ALSMutual Aid 30 1 2 2 1 2 2 0 2 1 13 MA
398 39 41 27 26 47 28 35 38 27 308 PS SB245 37 29 33 28 10 10 7 16 17 187 CS SB
C11 113 12 6 9 8 5 7 5 6 5 63 C11
P1 94 94 94 96 97 96 95 93 92 94 95 P1 Avg
P2 95 93 93 94 95 95 93 92 94 93 94 P2 Avg
Mailings sent 1,622 150 120 137 139 158 136 184 136 138 1,298 TotalMailings returned 412 32 36 32 38 36 33 59 42 32 340 Total Return % 25.4% 21.3% 30.0% 23.4% 27.3% 22.8% 24.3% 32.1% 30.9% 23.2% 26.2% Avg
379 29 34 28 37 35 31 54 40 31 319 Total92.0% 90.6% 94.4% 87.5% 97.4% 97.2% 93.9% 91.5% 95.2% 96.9% 93.8% Avg
28 2 2 4 1 1 2 5 2 1 20 Total6.8% 6.3% 5.6% 12.5% 2.6% 2.8% 6.1% 8.5% 4.8% 3.1% 5.9% Avg
5 1 0 0 0 0 0 0 0 0 1 Total1.2% 3.1% 0.0% 0.0% 0.0% 0.0% 0.0% 0.0% 0.0% 0.0% 0.3% Avg
Corporate Training 14 0 1 0 0 0 0 0 0 0 1 TotalCommunity Training 448 13 39 22 0 0 0 0 0 0 74 TotalStudent Training 660 0 0 0 0 0 352 0 0 0 352 TotalSponsorships & Donations $5,510.00 $0.00 $350.00 $855.00 $500 $1,000.00 $0.00 $0.00 $0.00 $1,000.00 $3,705.00 TotalStandby Services (in kind) $88,415.43 $15,324.60 $10,317.85 $15,140.72 $12,053.88 $3,535.47 $3,049.34 $4,669.29 $5,893.87 $7,575.53 $77,560.55 Total
$99,016.57 $7,289.06 $9,918.68 $17,207.74 TotalCom
mun
ity
Part
nerin
g
CPR
Don
atio
n
Financial Assistance
Cus
tom
erFe
edba
ck
Mai
lSa
tisfa
ctio
n Excellent
Adequate
Needs Improvement
OTH
ER
Mis
c Public Safety StandbyCommunity Event StandbyService Car
Res
pTi
me
Cedar Rapids
Key Performance IndicatorsArea Ambulance Service 2017-2018
YTD
Cal
ls fo
r Ser
vice
Tota
l Calls for ServicePer Day
Patie
nt C
alls
TRA
NSP
OR
TS

Fire Standbys Date Start End UH Crew Total Hrs $ / Hr. Total $ Paid Standby Events Date Start End UH Crew Total Hrs $ / Hr. Total $1/1 0:10:39 0:29:13 0:18:34 2 0:37:08 $127.17 $39.35 Elite Fight Club 1/20 18:17:49 21:44:36 3:26:47 2 6:53:34 $127.17 $438.281/1 5:24:45 7:28:32 2:03:47 2 4:07:34 $127.17 $262.36 Ice Racing 1/27 19:12:16 22:15:00 3:02:44 2 6:05:28 $127.17 $387.301/1 18:02:50 21:22:30 3:19:40 2 6:39:20 $127.17 $423.19 6:29:31 12:59:02 $825.581/2 7:18:12 7:28:24 0:10:12 2 0:20:24 $127.17 $21.621/2 8:11:07 8:23:48 0:12:41 3 0:38:03 $127.17 $26.881/2 18:18:09 18:26:45 0:08:36 2 0:17:12 $127.17 $18.23 RR Ice Hockey Date Start End UH Crew Total Hrs $ / Hr.1/4 16:27:04 16:40:52 0:13:48 2 0:27:36 $127.17 $29.25 RoughRiders 1/5 18:27:05 22:02:31 1:47:43 1 1:47:43 $127.17 $228.311/5 14:48:08 14:51:45 0:03:37 2 0:07:14 $127.17 $7.67 RoughRiders 1/6 18:11:36 21:45:00 1:46:42 1 1:46:42 $127.17 $226.151/5 18:14:38 19:03:05 0:48:27 2 1:36:54 $127.17 $102.69 RoughRiders 1/13 18:14:47 21:41:20 3:26:33 3 10:19:39 $127.17 $437.781/6 19:01:50 19:21:40 0:19:50 2 0:39:40 $127.17 $42.04 RoughRiders 1/19 18:08:39 21:33:25 1:42:23 1 1:42:23 $127.17 $217.001/7 5:31:33 5:49:46 0:18:13 2 0:36:26 $127.17 $38.61 RoughRiders 1/20 18:34:03 21:30:21 1:28:09 1 1:28:09 $127.17 $186.831/7 15:35:32 15:43:22 0:07:50 2 0:15:40 $127.17 $16.60 Total 5 Standbys 10:11:30 17:04:36 $1,296.071/8 20:55:04 21:05:29 0:10:25 2 0:20:50 $127.17 $22.081/9 13:57:32 16:08:07 2:10:35 2 4:21:10 $127.17 $276.771/9 14:05:24 17:46:49 3:41:25 2 7:22:50 $127.17 $469.291/9 16:53:12 16:59:04 0:05:52 2 0:11:44 $127.17 $12.43
1/12 16:31:25 16:54:58 0:23:33 3 1:10:39 $127.17 $49.911/12 18:43:15 18:51:50 0:08:35 2 0:17:10 $127.17 $18.19
1/14 11:00:30 11:09:11 0:08:41 2 0:17:22 $127.17 $18.40 Total In Kind Dollars1/16 17:00:14 17:03:23 0:03:09 2 0:06:18 $127.17 $6.681/20 13:58:39 14:02:36 0:03:57 2 0:07:54 $127.17 $8.371/20 16:21:22 17:06:18 0:44:56 2 1:29:52 $127.17 $95.241/22 16:02:54 16:26:17 0:23:23 1 0:23:23 $127.17 $49.561/23 20:51:09 21:11:10 0:20:01 2 0:40:02 $127.17 $42.431/24 0:07:22 0:14:00 0:06:38 3 0:19:54 $127.17 $14.061/25 16:05:38 16:12:19 0:06:41 2 0:13:22 $127.17 $14.171/26 9:22:52 9:28:25 0:05:33 2 0:11:06 $127.17 $11.761/27 13:45:40 14:40:02 0:54:22 2 1:48:44 $127.17 $115.231/28 19:42:52 19:49:19 0:06:27 2 0:12:54 $127.17 $13.67
Total 29 Standbys 17:49:28 35:58:25 $2,266.73
Law Enforcement Date Start End UH Crew Total Hrs $ / Hr. Total $Ellis Blvd NW 1/3 3:19:06 6:11:21 2:52:15 2 5:44:30 $127.17 $365.08Hennessey Pkwy 1/10 13:20:34 16:47:34 3:27:00 2 6:54:00 $127.17 $438.74Four Oaks Dr SW 1/11 7:54:15 9:01:26 1:07:11 2 2:14:22 $127.17 $142.4032nd St NE 1/11 20:57:14 21:55:21 0:58:07 2 1:56:14 $127.17 $123.18Total 4 Standbys 8:24:33 16:49:06 $1,069.39
Airport Alert Date Start End UH Crew Total Hrs $ / Hr. Total $Arthur Collins Parkway 1/17 16:48:18 17:04:48 0:16:30 2 0:33:00 $127.17 $34.97Total 1 Standby 0:16:30 0:33:00 $34.97
HazMat Date Start End UH Crew Total Hrs $ / Hr.Ashton Pl NE 1/5 16:44:14 16:45:14 0:01:00 2 0:02:00 $127.17 $2.12Total 1 Standby 0:01:00 0:02:00 $2.12
Special Events SummaryJanuary 2018
$4,669.29
2 Standbys

Fire Standbys Date Start End UH Crew Total Hrs $ / Hr. Total $ Paid Standby Events Date Start End UH Crew Total Hrs $ / Hr. Total $2/1 17:05:44 17:16:47 0:11:03 2 0:22:06 $127.17 $23.42 Rodeo 2/2 18:09:58 21:49:39 3:39:41 2 7:19:22 $127.17 $465.622/3 18:52:51 18:57:48 0:04:57 2 0:09:54 $127.17 $10.49 Rodeo 2/3 17:43:42 21:53:05 4:09:23 2 8:18:46 $127.17 $528.572/3 23:32:57 0:36 1:03:22 2 2:06:44 $127.17 $134.31 Avenged Sevenfold Concert 2/9 17:13:08 23:09:03 5:55:55 2 11:51:50 $127.17 $754.372/4 10:12:50 11:18:38 1:05:48 2 2:11:36 $127.17 $139.46 Chris Young Concert 2/24 17:51:16 22:58:04 5:06:48 2 10:13:36 $127.17 $650.262/4 11:06:21 11:29:46 0:23:25 2 0:46:50 $127.17 $49.63 18:51:47 37:43:34 $2,398.812/4 11:19:41 11:27:57 0:08:16 2 0:16:32 $127.17 $17.522/4 11:53:18 12:01:52 0:08:34 2 0:17:08 $127.17 $18.16 Community Events Date Start End UH Crew Total Hrs $ / Hr. Total $2/6 17:24:48 17:37:25 0:12:37 2 0:25:14 $127.17 $26.74 Alternate Post Freezfest 2/17 10:12:57 10:43:24 0:30:27 2 1:00:54 $127.17 $64.542/6 18:44:22 18:55:22 0:11:00 2 0:22:00 $127.17 $23.31 Total 1 Standby 0:30:27 1:00:54 $64.542/7 22:13:51 22:45:49 0:31:58 2 1:03:56 $127.17 $67.752/9 10:36:30 10:43:15 0:06:45 2 0:13:30 $127.17 $14.31
2/10 3:12:47 3:21:00 0:08:13 2 0:16:26 $127.17 $17.42 RR Ice Hockey Date Start End UH Crew Total Hrs $ / Hr. Total $2/10 14:04:55 14:12:11 0:07:16 2 0:14:32 $127.17 $15.40 RR Game Rockford Rd SW 2/2 18:34:31 21:29:22 1:27:25 1 2:54:51 $127.17 $185.302/10 18:27:34 19:13:06 0:45:32 2 1:31:04 $127.17 $96.51 USHL Tournament 2/16 7:18:09 12:05:07 4:46:58 2 4:46:58 $127.17 $608.232/11 21:17:05 21:33:59 0:16:54 2 0:33:48 $127.17 $35.82 RR Game Rockford Rd SW 2/16 18:09:18 21:33:15 1:41:59 1 3:23:57 $127.17 $216.142/12 8:06:52 8:18:46 0:11:54 2 0:23:48 $127.17 $25.22 USHL Tournament 2/17 8:01:50 13:26:45 5:24:55 2 5:24:55 $127.17 $688.662/12 15:15:30 15:53:17 0:37:47 2 1:15:34 $127.17 $80.08 RR Game Rockford Rd SW 2/17 18:02:45 21:32:08 1:44:41 1 3:29:23 $127.17 $221.892/12 22:30:18 22:40:19 0:10:01 2 0:20:02 $127.17 $21.23 USHL Tournament 2/18 7:20:30 10:51:01 3:30:31 2 3:30:31 $127.17 $446.192/17 9:47:57 10:05:58 0:18:01 2 0:36:02 $127.17 $38.19 RR Game Rockford Rd SW 2/23 18:18:27 0.892569 1:33:25 1 3:06:51 $127.17 $198.012/17 13:01:58 13:47:05 0:45:07 2 1:30:14 $127.17 $95.62 High School Hockey 2/24 12:02:08 16:03:49 2:00:50 1 4:01:41 $127.17 $256.122/17 23:39:38 23:49:23 0:09:45 2 0:19:30 $127.17 $20.67 RR Game Rockford Rd SW 2/24 18:03:01 21:30:31 1:43:45 1 3:27:30 $127.17 $219.902/18 11:31:13 12:35:31 1:04:18 2 2:08:36 $127.17 $136.28 Total 9 Standbys 23:54:30 34:06:37 $3,040.442/18 18:34:17 18:44:14 0:09:57 2 0:19:54 $127.17 $21.092/19 21:01:21 21:12:26 0:11:05 2 0:22:10 $127.17 $23.492/20 15:02:46 15:47:49 0:45:03 2 1:30:06 $127.17 $95.482/21 16:47:05 16:55:08 0:08:03 2 0:16:06 $127.17 $17.062/23 15:53:16 16:17:50 0:24:34 2 0:49:08 $127.17 $52.07 CR Rampage Soccer Date Start End UH Crew Total Hrs $ / Hr. Total $2/24 21:22:01 21:57:19 0:35:18 2 1:10:36 $127.17 $74.82 Rampage Soccer 2/16 18:08:24 22:54:49 2:23:13 1 4:46:25 $127.17 $303.532/26 11:50:14 11:55:56 0:05:42 2 0:11:24 $127.17 $12.08 Rampage Soccer 2/23 18:19:56 22:31:12 2:05:38 1 4:11:16 $127.17 $266.282/26 17:37:04 18:01:19 0:24:15 2 0:48:30 $127.17 $51.40 Total 2 Standby 4:28:51 8:57:41 $569.81
Total 30 Standbys 11:26:30 22:53:00 $1,455.04
Total In Kind Dollars
Law Enforcement Date Start End UH Crew Total Hrs $ / Hr. Total $Mount Vernon Road SE 2/2 5:28:26 6:26:03 0:57:37 2 1:55:14 $127.17 $122.12Kirkwood Blvd SW 2/5 7:53:30 9:08:09 1:14:39 2 2:29:18 $127.17 $158.227th Ave SW 2/6 5:41:04 6:22:15 0:41:11 2 1:22:22 $127.17 $87.29Woodlark Ln NE Waveland D 2/21 6:01:13 6:39:18 0:38:05 2 1:16:10 $127.17 $80.727th Ave SW 2/21 6:03:02 6:37:43 0:34:41 2 1:09:22 $127.17 $73.5118th St SE 2/22 20:47:58 21:51:07 1:03:09 2 2:06:18 $127.17 $133.858th Ave and Parkview Dr 2/26 6:05:26 6:31:01 0:25:35 2 0:51:10 $127.17 $54.22Total 7 Standbys 5:34:57 11:09:54 $709.93
HazMat Date Start End UH Crew Total Hrs $ / Hr. Total $22nd Ave SW 2/17 13:57:21 14:22:53 0:25:32 2 0:51:04 $127.17 $54.12Total 1 Standby 0:25:32 0:51:04 $54.12
Special Events SummaryFebruary 2018
$5,893.87
4 Standbys

Fire Standbys Date Start End UH Crew Total Hrs $ / Hr. Total $3/2 3:19:02 3:25:30 0:06:28 2 0:12:56 $127.17 $13.713/3 20:58:05 21:14:30 0:16:25 2 0:32:50 $127.17 $34.80 Paid Standby Events Date Start End UH Crew Total Hrs $ / Hr. Total $3/4 0:55:24 2:28:17 1:32:53 2 3:05:46 $127.17 $196.87 WWE 3/4 14:58:16 20:15:00 5:16:44 2 10:33:28 $127.17 $671.323/5 15:02:34 16:20:05 1:17:31 2 2:35:02 $127.17 $164.30 Little Big Town Concert 3/23 18:31:20 23:34:54 5:03:34 2 10:07:08 $127.17 $643.413/8 3:16:17 3:42:14 0:25:57 2 0:51:54 $127.17 $55.00 Total 2 Standbys 10:20:18 20:40:36 $1,314.733/8 10:41:21 11:03:52 0:22:31 2 0:45:02 $127.17 $47.723/8 21:52:20 23:03:36 1:11:16 2 2:22:32 $127.17 $151.05 Community Events Date Start End UH Crew Total Hrs $ / Hr.3/9 6:17:35 6:22:59 0:05:24 2 0:10:48 $127.17 $11.45 Prairie High School Job Fair 3/1 10:00:35 13:05:25 3:04:50 2 6:09:40 $127.17 $391.75
3/12 13:36:05 14:16:46 0:40:41 2 1:21:22 $127.17 $86.23 Kennedy CPR 3/6 7:45:00 15:38:34 3:56:47 1 3:56:47 $127.00 $501.193/13 23:38:46 23:48:27 0:09:41 2 0:19:22 $127.17 $20.52 Rotary Club New Unit 3/7 10:24:41 13:23:00 2:58:19 2 5:56:38 $127.17 $377.943/14 11:02:19 11:53:18 0:50:59 2 1:41:58 $127.17 $108.06 Kennedy CPR 3/7 7:45:00 15:38:34 7:53:34 2 15:47:08 $127.17 $1,003.723/14 16:16:35 16:30:32 0:13:57 2 0:27:54 $127.17 $29.57 Healthy Family Night Taylor Elementary 3/8 17:23:13 19:40:40 1:08:43 1 1:08:43 $127.17 $145.663/15 5:10:42 5:19:43 0:09:01 2 0:18:02 $127.17 $19.11 SaPaDaPaSo Parade 3/17 10:47:39 14:05:11 3:17:32 2 6:35:04 $127.17 $418.673/15 16:55:32 16:59:08 0:03:36 2 0:07:12 $127.17 $7.63 Total 6 Standbys 22:19:45 39:34:01 $2,838.953/15 21:16:28 21:25:00 0:08:32 2 0:17:04 $127.17 $18.093/17 19:43:33 19:51:59 0:08:26 2 0:16:52 $127.17 $17.873/20 13:55:21 14:05:16 0:09:55 2 0:19:50 $127.17 $21.02 RR Ice Hockey (1) Date Start End UH Crew Total Hrs $ / Hr. Total $3/28 19:14:12 20:12:06 0:57:54 2 1:55:48 $127.17 $122.72 Roughriders Hockey 3/9 17:38:22 21:52:00 2:06:49 1 4:13:38 $127.17 $268.793/31 0:21:51 0:29:11 0:07:20 2 0:14:40 $127.17 $15.54 Roughriders Hockey 3/10 18:21:19 21:42:32 1:40:36 1 3:21:13 $127.17 $213.243/31 13:41:15 13:48:23 0:07:08 2 0:14:16 $127.17 $15.12 Roughriders Hockey 3/14 18:15:12 21:30:00 1:37:24 1 3:14:48 $127.17 $206.443/31 20:14:12 22:26:54 2:12:42 2 4:25:24 $127.17 $281.26 Roughriders Hockey 3/23 18:08:00 21:37:42 1:44:51 1 3:29:42 $127.17 $222.23
Total 21 Standbys 11:18:17 22:36:34 $1,437.62 Roughriders Hockey 3/24 18:35:03 21:43:06 3:08:03 2 3:08:03 $127.17 $398.57Roughriders Hockey 3/31 18:00:10 22:09:51 2:04:51 1 4:09:41 $127.17 $264.60Total 6 Standbys 12:22:34 21:37:05 $1,573.87
Law Enforcement Date Start End UH Crew Total Hrs $ / Hr. Total $Mount Vernon Rd SE 3/5 11:18:26 11:27:52 0:09:26 2 0:18:52 $127.17 $19.99Mount Vernon Rd SE 3/24 0:21:48 0:37:24 0:15:36 2 0:31:12 $127.17 $33.06 CR Titans Football Date Start End UH Crew Total Hrs $ / Hr. Total $17th Ave 3/30 18:48:36 20:02:03 1:13:27 2 2:26:54 $127.17 $155.68 Titans 3/2 17:56:00 22:45:00 2:24:30 1 4:49:00 $127.17 $306.27Total 3 Standbys 1:38:29 3:16:58 $208.74 Titans 3/19 18:25:33 22:01:51 1:48:09 1 3:36:18 $127.17 $229.22
Titans 3/24 18:36:22 21:42:53 1:33:15 1 3:06:31 $127.17 $197.66Total 3 Standbys 5:45:54 11:31:49 $733.15
HazMat Date Start End UH Crew Total Hrs $ / Hr. Total $4th Ave 3/12 21:06:13 23:46:09 2:39:56 2 5:19:52 $127.17 $338.98J Ave NE 3/13 8:49:06 11:18:49 2:29:43 2 4:59:26 $127.17 $317.32J Ave NE 3/13 9:21:28 11:21:13 0:59:53 1 0:59:53 $127.17 $126.91Total 3 Standby 6:09:32 11:19:11 $783.21
Total In Kind Dollars
Special Events SummaryMarch 2018
$7,575.53
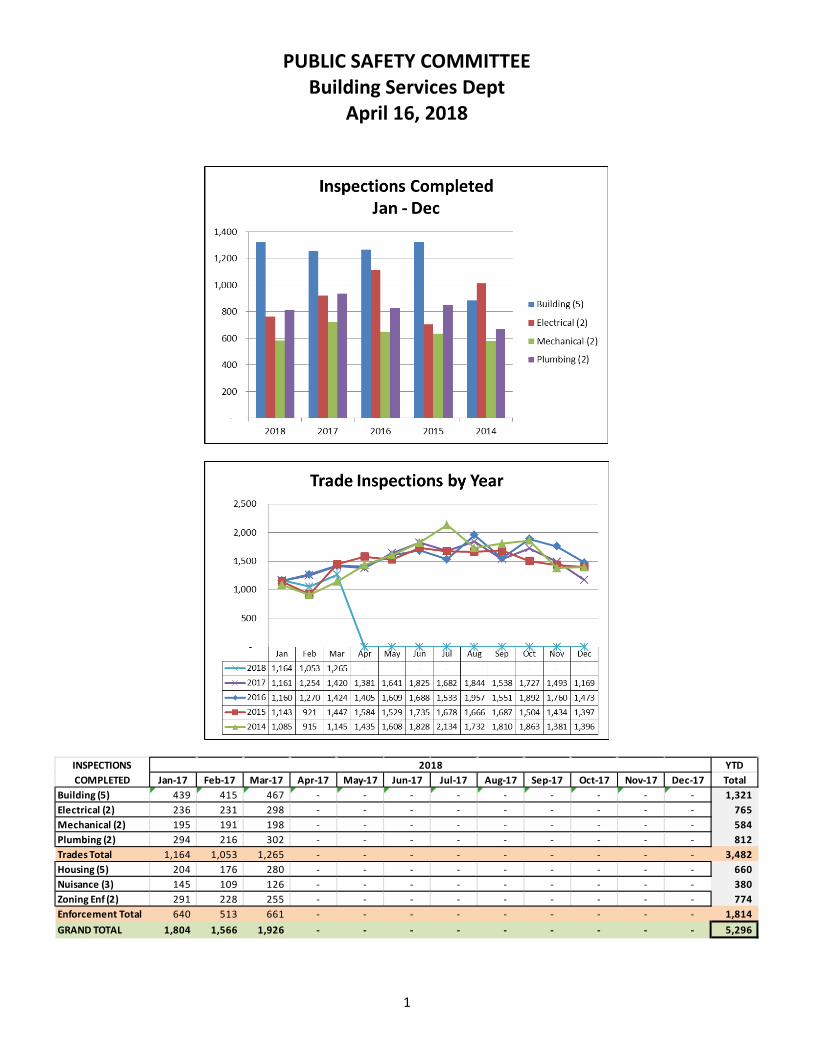
PUBLIC SAFETY COMMITTEE Building Services Dept
April 16, 2018
YTDJan-17 Feb-17 Mar-17 Apr-17 May-17 Jun-17 Jul-17 Aug-17 Sep-17 Oct-17 Nov-17 Dec-17 Total
Building (5) 439 415 467 - - - - - - - - - 1,321 Electrical (2) 236 231 298 - - - - - - - - - 765 Mechanical (2) 195 191 198 - - - - - - - - - 584 Plumbing (2) 294 216 302 - - - - - - - - - 812 Trades Total 1,164 1,053 1,265 - - - - - - - - - 3,482 Housing (5) 204 176 280 - - - - - - - - - 660 Nuisance (3) 145 109 126 - - - - - - - - - 380 Zoning Enf (2) 291 228 255 - - - - - - - - - 774 Enforcement Total 640 513 661 - - - - - - - - - 1,814 GRAND TOTAL 1,804 1,566 1,926 - - - - - - - - - 5,296
INSPECTIONSCOMPLETED
2018
1

Other
Group Inspector Tota
l
Non-
Trad
e
Non-
Trad
e Pe
rcen
tage
Back
-Fill
Beer
/Liq
uor -
Bui
ldin
g
Cons
truct
ion
Com
plai
nt
Dem
oliti
on
Fina
l Bui
ldin
g
Foot
ing
Prog
ress
- Bu
ildin
g
Roug
h-In
Fra
min
g
Stru
ctur
al A
sses
smen
t Hou
sing
Mov
ing
Tem
p CO
Bui
ldin
g
Fina
l Ele
ctric
al
Roug
h-In
Ele
ctric
al
Serv
ice
Entra
nce
Tem
p CO
Ele
ctric
al
Tem
p Po
le E
lect
rical
Fina
l Mec
hani
cal
Fuel
Gas
Tes
t
Roug
h-In
Mec
hani
cal
Tem
p CO
Mec
hani
cal
Stor
mw
ater
Dra
inag
e Co
mpl
aint
Fina
l Plu
mbi
ng
Fuel
Gas
Tes
t
Roug
h-In
Plu
mbi
ng
Sani
tary
/Wat
er
Sew
er F
inal
Tem
p CO
Plu
mbi
ng
Unde
r Flo
or P
lum
bing
Carson 229 15 6.6% 11 15 14 55 18 27 68 6 3 5 1 4 2Dodds 620 134 21.6% 6 24 20 174 50 12 178 22 42 36 8 4 2 26 14 2Miller 166 2 1.2% 1 12 6 37 14 20 57 17 1 1Pump 646 120 18.6% 8 16 34 178 50 20 180 40 30 36 4 2 4 28 14 2Sedlacek 293 11 3.8% 18 100 15 19 58 11 14 39 1 7 5 1 1 1 3Lauderdale 360 11 3.1% 2 1 6 122 133 83 5 6 1 1Lough 407 39 9.6% 1 1 4 3 1 105 146 96 4 17 8 5 13 3Croft 309 48 15.5% 1 4 8 1 6 2 16 144 21 88 8 10Lesmeister 289 23 8.0% 1 1 3 5 2 168 17 79 2 7 3 1Feuerbach 489 23 4.7% 4 1 1 4 2 3 4 2 1 1 145 78 152 40 7 44Morrison 333 18 5.4% 6 9 1 1 1 91 38 112 33 4 37
Building
Electrical
Mechanical
Plumbing
Building
BSD Cross Trade Inspections01/01/2018 to 03/31/2018
PlumbingElectrical Mechanical
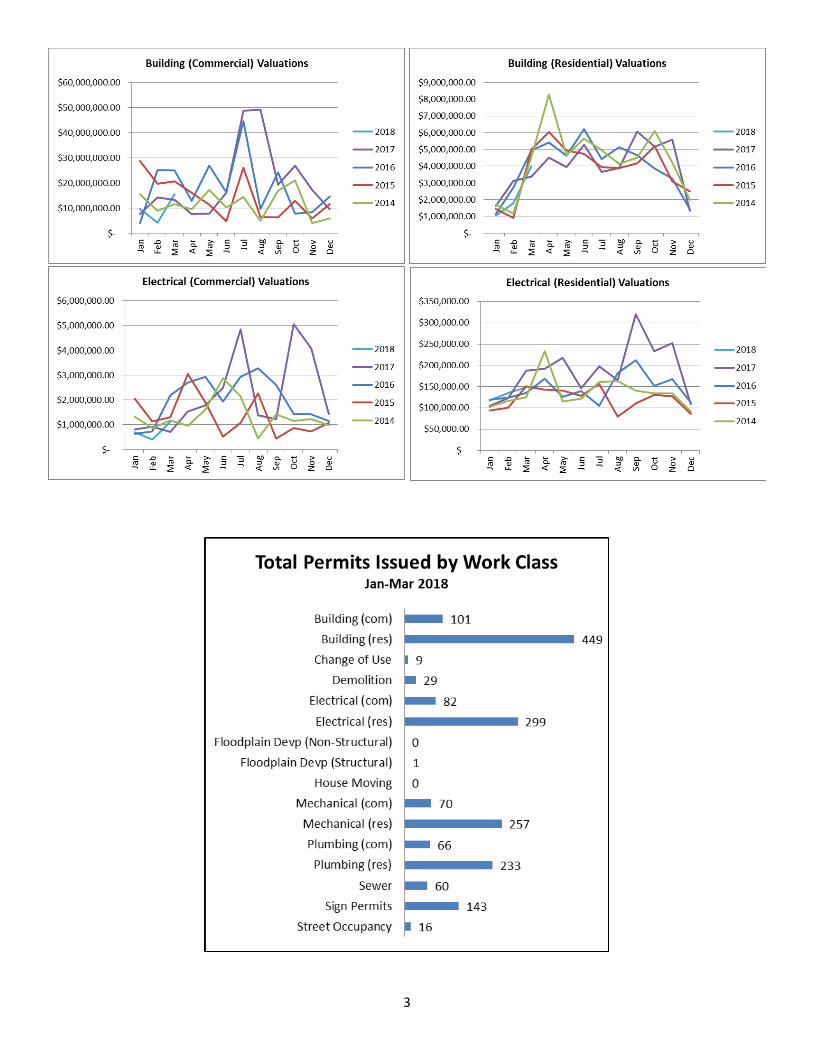
Main Address Building (Commercial) Valuation Main Address Building (Residential) Valuation 1225 Jacolyn Dr SW Cypress Lofts $5,094,800 5120 Shadowood Ln SW New Single Family $204,688600 49th Ave Dr SW Warehouse $4,300,000 5101 Scenic View Ct SW New Single Family $163,908500 1st Ave NE CRBT - 3rd floor $1,844,929 7610 Summerset Ave NE New Multi-Family $161,6725340 Council St NE Marcus Theaters Remodel $1,300,000 7605 Summerset Ave NE New Multi-Family $150,592151 Boyson Rd NE Bowman Woods - Restrooms $570,000 3006 Bryant Blvd SW New Single Family $140,568
Main Address Electrical (Commercial) Valuation Main Address Electrical (Residential) Valuation 600 49th Ave Dr SW Warehouse $385,233 7604 Summerset Ave NE New 2-unit Building $13,5003930 16th Ave SW Transformer / Generator $127,000 914 19th Ave SW Re-wiring $9,0005340 Council St NE Marcus Theaters Remodel $111,500 838 14th St SE Service $6,0001618 Collins Rd NE Generator/Transfer Switch $85,500 1315 Wiley Blvd NW Interior Remodel $5,5003921 J St SW Service $80,000 154 Guildford SE Basement Finish $5,069
Top Five Valuations for Building and Electrical Jan to Mar 2018
2
3

4

Open Requests
Open Requests Jan-
18
Feb-
18
Mar
-18
Animal Related 0 0 0Comment/Question 10 9 7Construction Complaint 58 62 53Economic Development 0 0 0Housing Complaint 74 95 78Sewer Backup 0 0 0Signs - ADA 0 0 0Signs - General 0 2 0Snow Complaint - Sidewalk 0 0 0Stormwater Drainage Complaint 14 14 14Street Complaint 0 0 0Trash/Debris - Commercial Property 0 0 0Trash/Debris - Residential Property 0 0 0Trees 0 0 0Vehicles - On Private Property 17 12 15Vehicles - On Street 0 0 0Subtotal Requests 173 194 167
Request Type TotalCleveland
AreaEllis
HarborKenwood
ParkMound
View
Noelridge
Park
NWNeighbor
sOak HillJackson
SWArea Taylor
Upper NW
Uptown District
Wellington
Heights
Westdale
AreaNot in Nbrhd
Animal Related 0 0 0 0 0 0 0 0 0 0 0 0 0 0 0Comment/Question 7 0 1 0 1 0 0 0 0 0 0 0 1 0 4Construction Complaint 53 0 0 3 0 2 7 3 1 6 0 0 1 0 30Economic Development 0 0 0 0 0 0 0 0 0 0 0 0 0 0 0Housing Complaint 78 1 0 6 0 1 6 0 5 11 1 0 12 0 35Sewer Backup 0 0 0 0 0 0 0 0 0 0 0 0 0 0 0Signs - ADA 0 0 0 0 0 0 0 0 0 0 0 0 0 0 0Signs - General 0 0 0 0 0 0 0 0 0 0 0 0 0 0 0Snow Complaint - Sidewalk 0 0 0 0 0 0 0 0 0 0 0 0 0 0 0Stormwater Drainage Complaint 14 1 0 4 0 1 2 0 0 0 0 0 0 0 6Street Complaint 0 0 0 0 0 0 0 0 0 0 0 0 0 0 0Trash/Debris - Commercial Property 0 0 0 0 0 0 0 0 0 0 0 0 0 0 0Trash/Debris - Residential Property 0 0 0 0 0 0 0 0 0 0 0 0 0 0 0Trees 0 0 0 0 0 0 0 0 0 0 0 0 0 0 0Vehicles - On Private Property 15 0 0 0 1 0 1 0 0 2 0 0 1 0 10Vehicles - On Street 0 0 0 0 0 0 0 0 0 0 0 0 0 0 0Total 167 2 1 13 2 4 16 3 6 19 1 0 15 0 85
Request Type Total NE NW SE SW None CR1 CR2 CR3 CR4 CR5 NoneAnimal Related 0 0 0 0 0 0 0 0 0 0 0 0Comment/Question 7 2 3 1 1 0 3 0 1 1 1 1Construction Complaint 53 13 8 8 18 6 8 9 12 6 14 4Economic Development 0 0 0 0 0 0 0 0 0 0 0 0Housing Complaint 78 13 6 25 31 3 4 14 35 2 19 4Sewer Backup 0 0 0 0 0 0 0 0 0 0 0 0Signs - ADA 0 0 0 0 0 0 0 0 0 0 0 0Signs - General 0 0 0 0 0 0 0 0 0 0 0 0Snow Complaint - Sidewalk 0 0 0 0 0 0 0 0 0 0 0 0Stormwater Drainage Complaint 14 7 3 0 1 3 3 6 1 3 1 0Street Complaint 0 0 0 0 0 0 0 0 0 0 0 0Trash/Debris - Commercial Property 0 0 0 0 0 0 0 0 0 0 0 0Trash/Debris - Residential Property 0 0 0 0 0 0 0 0 0 0 0 0Trees 0 0 0 0 0 0 0 0 0 0 0 0Vehicles - On Private Property 15 7 1 4 3 0 2 5 5 0 3 0Vehicles - On Street 0 0 0 0 0 0 0 0 0 0 0 0Total 167 42 21 38 54 12 20 34 54 12 38 9
Council DistrictsQuadrants
5

Open Code Cases
Open Code Cases Jan-
18
Feb-
18
Mar
-18
BSD Notice & Order 20 24 32BSD Placard 61 58 57BSD Property Complaint - Commercial 5 6 6BSD Property Complaint - Owner Occ 160 155 156BSD Property Complaint - Rental 22 21 18BSD Vacant Property 68 75 81BSD Zoning - Junk/Debris 9 11 11BSD Zoning - Occupancy/Use 51 46 43BSD Zoning - Parking Violation 289 282 261BSD Zoning - Signs 20 15 17BSD Zoning - Structures 19 20 18Building Services 4 3 4Subtotal Code Cases 728 716 704
Code Case Type TotalCleveland
AreaKenwood
ParkMound
View
Noelridge
Park
NWNeighbor
sOak HillJackson
SWArea Taylor
Upper NW
Uptown District
Wellington
HeightsNot in Nbrhd
BSD Notice & Order 32 0 2 2 0 4 2 4 5 0 0 2 11BSD Placard 57 1 3 1 1 6 9 1 5 1 0 18 11BSD Property Complaint - Commercial 6 0 0 3 0 0 1 0 1 0 0 1 0BSD Property Complaint - Owner Occ 156 9 5 10 2 13 12 5 18 3 0 26 53BSD Property Complaint - Rental 18 2 2 0 1 1 1 0 2 0 0 2 7BSD Vacant Property 81 3 6 7 1 5 5 3 12 5 0 13 21BSD Zoning - Junk/Debris 11 0 1 0 0 1 0 2 1 1 0 2 3BSD Zoning - Occupancy/Use 43 0 1 0 1 6 1 1 5 2 0 1 25BSD Zoning - Parking Violation 261 7 8 5 5 42 7 23 34 7 0 10 113BSD Zoning - Signs 17 1 1 1 0 0 0 2 1 0 0 0 11BSD Zoning - Structures 18 0 1 1 0 3 0 1 2 2 0 0 8Building Services 4 0 0 2 0 1 0 0 0 0 0 0 1Total 704 23 30 32 11 82 38 42 86 21 0 75 264
Code Case Type Total NE NW SE SW None CR1 CR2 CR3 CR4 CR5 NoneBSD Notice & Order 32 8 4 6 14 0 7 4 12 1 7 1BSD Placard 57 8 9 30 10 0 3 6 34 5 9 0BSD Property Complaint - Commercial 6 3 0 2 1 0 3 0 3 0 0 0BSD Property Complaint - Owner Occ 156 28 30 54 44 0 19 15 64 11 44 3BSD Property Complaint - Rental 18 3 1 5 9 0 1 2 6 3 4 2BSD Vacant Property 81 24 16 22 19 0 13 13 31 12 12 0BSD Zoning - Junk/Debris 11 0 3 4 4 0 0 1 6 3 1 0BSD Zoning - Occupancy/Use 43 7 12 6 18 0 6 4 10 5 18 0BSD Zoning - Parking Violation 261 39 52 37 133 0 29 20 86 31 91 4BSD Zoning - Signs 17 8 0 5 4 0 4 6 4 1 0 2BSD Zoning - Structures 18 2 8 3 5 0 1 2 4 7 3 1Building Services 4 2 1 0 1 0 2 0 0 1 1 0Total 704 132 136 174 262 0 88 73 260 80 190 13
Quadrants Council Districts
6

7

8


AGETotal2017
% of YTD Total JAN FEB MAR
Total2018
% of YTD Total Diff
% Diff2017-2018
09 1 0.41% 0 0 0 0 0.00% -1 -100.00%
10 3 1.24% 2 0 5 7 2.93% 4 133.33%
11 2 0.83% 1 1 0 2 0.84% 0 0.00%
12 9 3.73% 4 3 2 9 3.77% 0 0.00%
13 23 9.54% 5 13 13 31 12.97% 8 34.78%
14 35 14.52% 11 11 10 32 13.39% -3 -8.57%
15 48 19.92% 13 13 25 51 21.34% 3 6.25%
16 63 26.14% 13 18 19 50 20.92% -13 -20.63%
17 57 23.65% 20 19 18 57 23.85% 0 0.00%
Total Arrests 241 100.00% 69 78 92 239 100.00% -2 -0.83%
RACETotal2017
% of YTD Total JAN FEB MAR
Total2018
% of YTD Total Diff
% Diff2017-2018
AMER INDIAN 0 0.00% 1 2 0 3 1.26% 3 Infinity
ASIAN 1 0.41% 0 0 0 0 0.00% -1 -100.00%
BLACK 120 49.79% 32 39 40 111 46.44% -9 -7.50%
UNKNOWN 3 1.24% 1 0 2 3 1.26% 0 0.00%
WHITE 117 48.55% 35 37 50 122 51.05% 5 4.27%
Total Arrests 241 100.00% 69 78 92 239 100.00% -2 -0.83%
GENDERTotal2017
% of YTD Total JAN FEB MAR
Total2018
% of YTD Total Diff
% Diff2017-2018
FEMALE 84 34.85% 16 27 32 75 31.38% -9 -10.71%
MALE 157 65.15% 53 51 60 164 68.62% 7 4.46%
Total Arrests 241 100.00% 69 78 92 239 100.00% -2 -0.83%
ARREST TIME OF DAY
Total2017
% of YTD Total JAN FEB MAR
Total2018
% of YTD Total Diff
% Diff2017-2018
0000-0759 12 4.98% 5 1 4 10 4.18% -2 -16.67%
0800-1159 75 31.12% 21 23 21 65 27.20% -10 -13.33%
1200-1429 35 14.52% 18 16 22 56 23.43% 21 60.00%
1430-2059 88 36.51% 20 28 34 82 34.31% -6 -6.82%
2100-2359 31 12.86% 5 10 11 26 10.88% -5 -16.13%
Total Arrests 241 100.00% 69 78 92 239 100.00% -2 -0.83%
Juvenile Arrests by Race Sex Age TimeRange.rdl Page 1 of 2
CEDAR RAPIDS POLICEJuvenile Arrests by Race, Gender, Age and Time Range
Arrested 01/01/2018 - 03/31/2018
04/03/2018
10:49:31 AM

RACE & GENDERTotal 2017
% of YTD Total 10 11 12 13 14 15 16 17
Total 2018
% of YTD Total Diff
% Diff2017-2018
AMER INDIAN MALE 0 0.00% 0 0 0 2 1 0 0 0 3 1.26% 3 NA
ASIAN FEMALE 1 0.41% 0 0 0 0 0 0 0 0 0 0.00% -1 -100.00%
BLACK FEMALE 34 14.11% 1 1 1 7 1 3 11 7 32 13.39% -2 -5.88%
BLACK MALE 86 35.68% 5 1 2 15 13 15 13 15 79 33.05% -7 -8.14%
UNKNOWN FEMALE 1 0.41% 0 0 0 0 0 2 0 0 2 0.84% 1 100.00%
UNKNOWN MALE 2 0.83% 0 0 0 0 0 0 1 0 1 0.42% -1 -50.00%
WHITE FEMALE 48 19.92% 0 0 1 1 10 5 6 18 41 17.15% -7 -14.58%
WHITE MALE 69 28.63% 1 0 5 6 7 26 19 17 81 33.89% 12 17.39%
Total Arrests 241 100.00% 7 2 9 31 32 51 50 57 239 100.00% -2 -0.83%
Juvenile Arrests by Race Sex Age TimeRange.rdl Page 2 of 2
CEDAR RAPIDS POLICEJuvenile Arrests by Race, Gender, Age and Time Range
Arrested 01/01/2018 - 03/31/2018
04/03/2018
10:49:31 AM

OFFENSEArrestee Age
Total2017
% of YTD Total JAN FEB MAR
Total2018
% of YTD Total Diff
% Diff2017-2018
ALL OTHER GROUP B OFFENSES
12 2 0.60% 0 0 0 0 0.00% -2 -100.00%13 5 1.51% 1 1 1 3 0.93% -2 -40.00%14 3 0.90% 5 3 8 16 4.94% 13 433.33%15 18 5.42% 3 5 5 13 4.01% -5 -27.78%16 19 5.72% 4 4 5 13 4.01% -6 -31.58%17 8 2.41% 6 9 3 18 5.56% 10 125.00%
Total 55 16.57% 19 22 22 63 19.44% 8 14.55%
ARSON
10 0 0.00% 0 0 1 1 0.31% 1 NA15 0 0.00% 0 0 1 1 0.31% 1 NA
Total 0 0.00% 0 0 2 2 0.62% 2 NA
ASSAULT AGGRAVATED
15 0 0.00% 0 0 1 1 0.31% 1 NA16 3 0.90% 0 0 0 0 0.00% -3 -100.00%
Total 3 0.90% 0 0 1 1 0.31% -2 -66.67%
ASSAULT SIMPLE
09 1 0.30% 0 0 0 0 0.00% -1 -100.00%10 2 0.60% 2 0 2 4 1.23% 2 100.00%11 2 0.60% 1 1 0 2 0.62% 0 0.00%12 5 1.51% 4 1 0 5 1.54% 0 0.00%13 9 2.71% 2 3 6 11 3.40% 2 22.22%14 7 2.11% 0 3 3 6 1.85% -1 -14.29%15 6 1.81% 5 5 2 12 3.70% 6 100.00%16 9 2.71% 0 3 3 6 1.85% -3 -33.33%17 8 2.41% 5 3 1 9 2.78% 1 12.50%
Total 49 14.76% 19 19 17 55 16.98% 6 12.24%
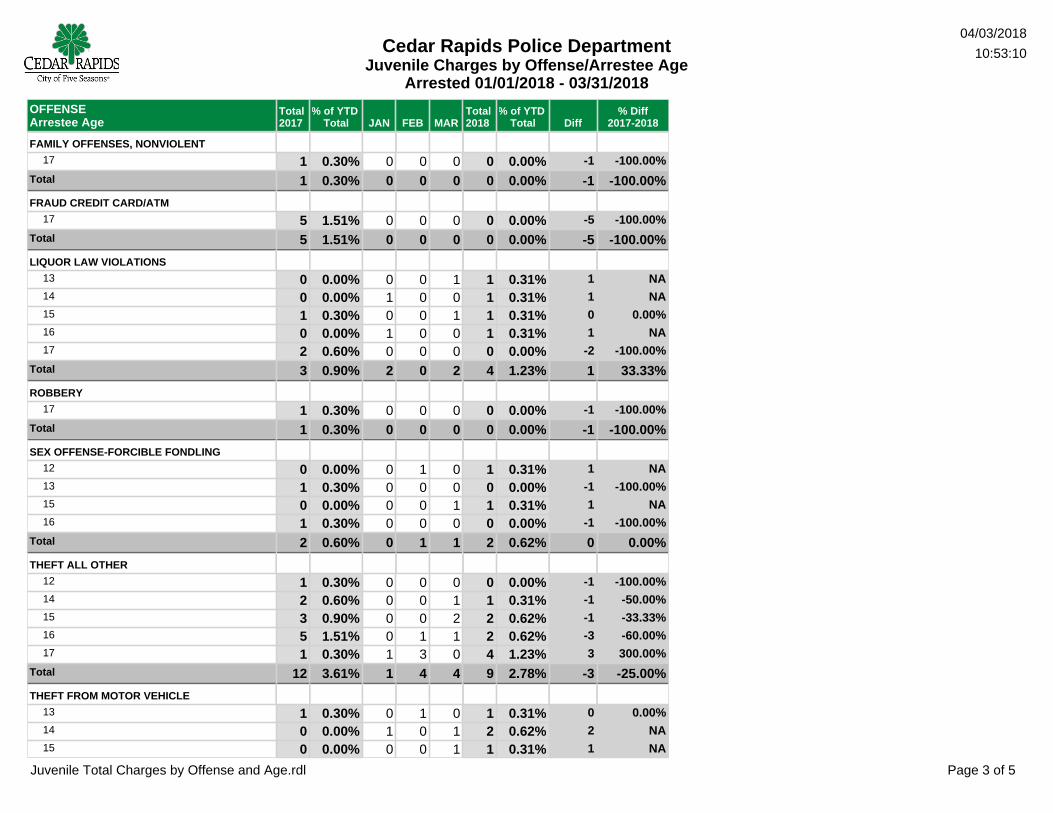
An individual juvenile arrest can have multiple charges per arrest.This table contains counts of all juvenile charges for each IBR OFFENSE category.
Juvenile Total Charges by Offense and Age.rdl
Page 1 of 5
Cedar Rapids Police DepartmentJuvenile Charges by Offense/Arrestee Age
Arrested 01/01/2018 - 03/31/2018
04/03/2018
10:53:10

OFFENSEArrestee Age
Total2017
% of YTD Total JAN FEB MAR
Total2018
% of YTD Total Diff
% Diff2017-2018
BURGLARY
13 4 1.20% 0 0 1 1 0.31% -3 -75.00%14 5 1.51% 0 0 1 1 0.31% -4 -80.00%15 2 0.60% 1 0 2 3 0.93% 1 50.00%16 2 0.60% 0 0 0 0 0.00% -2 -100.00%
Total 13 3.92% 1 0 4 5 1.54% -8 -61.54%
DISORDERY CONDUCT
12 3 0.90% 1 0 1 2 0.62% -1 -33.33%13 5 1.51% 2 4 1 7 2.16% 2 40.00%14 5 1.51% 2 4 0 6 1.85% 1 20.00%15 10 3.01% 3 2 4 9 2.78% -1 -10.00%16 8 2.41% 2 2 8 12 3.70% 4 50.00%17 8 2.41% 1 1 4 6 1.85% -2 -25.00%
Total 39 11.75% 11 13 18 42 12.96% 3 7.69%
DRIVING UNDER THE INFLUENCE
17 0 0.00% 1 0 0 1 0.31% 1 NA
Total 0 0.00% 1 0 0 1 0.31% 1 NA
DRUG EQUIPMENT VIOLATIONS
13 0 0.00% 0 1 0 1 0.31% 1 NA14 1 0.30% 0 0 1 1 0.31% 0 0.00%15 3 0.90% 0 0 0 0 0.00% -3 -100.00%16 5 1.51% 0 1 0 1 0.31% -4 -80.00%17 6 1.81% 1 0 0 1 0.31% -5 -83.33%
Total 15 4.52% 1 2 1 4 1.23% -11 -73.33%
DRUG/NARCOTICS VIOLATIONS
13 0 0.00% 0 2 1 3 0.93% 3 NA14 2 0.60% 0 0 1 1 0.31% -1 -50.00%15 4 1.20% 0 0 0 0 0.00% -4 -100.00%16 5 1.51% 0 2 1 3 0.93% -2 -40.00%17 6 1.81% 3 2 3 8 2.47% 2 33.33%
Total 17 5.12% 3 6 6 15 4.63% -2 -11.76%
Juvenile Total Charges by Offense and Age.rdl
Page 2 of 5
Cedar Rapids Police DepartmentJuvenile Charges by Offense/Arrestee Age
Arrested 01/01/2018 - 03/31/2018
04/03/2018
10:53:10
OFFENSEArrestee Age
Total2017
% of YTD Total JAN FEB MAR
Total2018
% of YTD Total Diff
% Diff2017-2018
FAMILY OFFENSES, NONVIOLENT
17 1 0.30% 0 0 0 0 0.00% -1 -100.00%
Total 1 0.30% 0 0 0 0 0.00% -1 -100.00%
FRAUD CREDIT CARD/ATM
17 5 1.51% 0 0 0 0 0.00% -5 -100.00%
Total 5 1.51% 0 0 0 0 0.00% -5 -100.00%
LIQUOR LAW VIOLATIONS
13 0 0.00% 0 0 1 1 0.31% 1 NA14 0 0.00% 1 0 0 1 0.31% 1 NA15 1 0.30% 0 0 1 1 0.31% 0 0.00%16 0 0.00% 1 0 0 1 0.31% 1 NA17 2 0.60% 0 0 0 0 0.00% -2 -100.00%
Total 3 0.90% 2 0 2 4 1.23% 1 33.33%
ROBBERY
17 1 0.30% 0 0 0 0 0.00% -1 -100.00%
Total 1 0.30% 0 0 0 0 0.00% -1 -100.00%
SEX OFFENSE-FORCIBLE FONDLING
12 0 0.00% 0 1 0 1 0.31% 1 NA13 1 0.30% 0 0 0 0 0.00% -1 -100.00%15 0 0.00% 0 0 1 1 0.31% 1 NA16 1 0.30% 0 0 0 0 0.00% -1 -100.00%
Total 2 0.60% 0 1 1 2 0.62% 0 0.00%
THEFT ALL OTHER
12 1 0.30% 0 0 0 0 0.00% -1 -100.00%14 2 0.60% 0 0 1 1 0.31% -1 -50.00%15 3 0.90% 0 0 2 2 0.62% -1 -33.33%16 5 1.51% 0 1 1 2 0.62% -3 -60.00%17 1 0.30% 1 3 0 4 1.23% 3 300.00%
Total 12 3.61% 1 4 4 9 2.78% -3 -25.00%
THEFT FROM MOTOR VEHICLE
13 1 0.30% 0 1 0 1 0.31% 0 0.00%14 0 0.00% 1 0 1 2 0.62% 2 NA15 0 0.00% 0 0 1 1 0.31% 1 NA
Juvenile Total Charges by Offense and Age.rdl
Page 3 of 5
Cedar Rapids Police DepartmentJuvenile Charges by Offense/Arrestee Age
Arrested 01/01/2018 - 03/31/2018
04/03/2018
10:53:10

OFFENSEArrestee Age
Total2017
% of YTD Total JAN FEB MAR
Total2018
% of YTD Total Diff
% Diff2017-2018
16 2 0.60% 1 2 1 4 1.23% 2 100.00%17 1 0.30% 0 0 1 1 0.31% 0 0.00%
Total 4 1.20% 2 3 4 9 2.78% 5 125.00%
THEFT OF MOTOR VEHICLE
13 0 0.00% 0 0 1 1 0.31% 1 NA15 0 0.00% 1 0 1 2 0.62% 2 NA16 1 0.30% 1 0 0 1 0.31% 0 0.00%17 2 0.60% 0 0 0 0 0.00% -2 -100.00%
Total 3 0.90% 2 0 2 4 1.23% 1 33.33%
THEFT SHOPLIFTING
10 0 0.00% 0 0 1 1 0.31% 1 NA13 3 0.90% 1 0 2 3 0.93% 0 0.00%14 8 2.41% 3 2 0 5 1.54% -3 -37.50%15 11 3.31% 0 1 2 3 0.93% -8 -72.73%16 13 3.92% 5 4 2 11 3.40% -2 -15.38%17 16 4.82% 4 3 7 14 4.32% -2 -12.50%
Total 51 15.36% 13 10 14 37 11.42% -14 -27.45%
TRAFFIC AND NON-REPORTABLE OFFENSES
16 16 4.82% 1 3 2 6 1.85% -10 -62.50%17 14 4.22% 4 7 10 21 6.48% 7 50.00%
Total 30 9.04% 5 10 12 27 8.33% -3 -10.00%
TRESPASS OF REAL PROPERTY
12 1 0.30% 0 0 0 0 0.00% -1 -100.00%14 1 0.30% 0 3 0 3 0.93% 2 200.00%15 1 0.30% 0 2 0 2 0.62% 1 100.00%16 5 1.51% 0 0 1 1 0.31% -4 -80.00%17 2 0.60% 1 0 1 2 0.62% 0 0.00%
Total 10 3.01% 1 5 2 8 2.47% -2 -20.00%
VANDALISM
10 1 0.30% 0 0 1 1 0.31% 0 0.00%12 1 0.30% 1 1 1 3 0.93% 2 200.00%13 0 0.00% 1 6 3 10 3.09% 10 NA14 2 0.60% 2 2 0 4 1.23% 2 100.00%
Juvenile Total Charges by Offense and Age.rdl
Page 4 of 5
Cedar Rapids Police DepartmentJuvenile Charges by Offense/Arrestee Age
Arrested 01/01/2018 - 03/31/2018
04/03/2018
10:53:10

OFFENSEArrestee Age
Total2017
% of YTD Total JAN FEB MAR
Total2018
% of YTD Total Diff
% Diff2017-2018
15 3 0.90% 0 3 7 10 3.09% 7 233.33%16 3 0.90% 0 1 2 3 0.93% 0 0.00%17 2 0.60% 1 2 1 4 1.23% 2 100.00%
Total 12 3.61% 5 15 15 35 10.80% 23 191.67%
WEAPON LAW VIOLATIONS
13 0 0.00% 0 0 1 1 0.31% 1 NA14 1 0.30% 0 0 0 0 0.00% -1 -100.00%15 2 0.60% 0 0 0 0 0.00% -2 -100.00%16 3 0.90% 0 0 0 0 0.00% -3 -100.00%17 1 0.30% 0 0 0 0 0.00% -1 -100.00%
Total 7 2.11% 0 0 1 1 0.31% -6 -85.71%Grand Total 332 100% 86 110 128 324 100% -8 -2.41%
Juvenile Total Charges by Offense and Age.rdl
Page 5 of 5
Cedar Rapids Police DepartmentJuvenile Charges by Offense/Arrestee Age
Arrested 01/01/2018 - 03/31/2018
04/03/2018
10:53:10

Massage Therapy Business Licensing Background:
Currently, the City of Cedar Rapids does not regulate Massage Therapy
businesses. Massage therapy businesses are regulated by the Iowa Board of
Massage Therapy. Organizations, such as the Iowa Network Against Human
Trafficking and Slavery are encouraging local cities to pass ordinances that will
regulate human trafficking and prostitution in massage parlors similar to the one
located at 2323 Mount Vernon Road SE, Spa Magic. Organizations are
participating in this call to action after the May 10, 2017 signing of a legislative
bill, SF445, which repealed Iowa Code Section 152C, which prohibited cities
from levying restrictions or requirements on massage therapists that are not
equally enacted or enforced on other licensed health care practitioners.
Explanation of the Problem:
According to recent news reports, there are approximately 20 massage parlors
in the City of Cedar Rapids. As Cedar Rapids continues to see numbers of
massage type businesses increase, there becomes an increasing concern about
prostitution, human trafficking, sex trafficking, questions about zoning and
licensing requirements, and significant hours spent by Police Officers organizing
and executing undercover stings.
Recently, in Cedar Rapids on March 14, 2018, investigators charged Zhang
Hongli, Spa Magic employee, for prostitution and not having a valid license for
massage therapy. After spending 40+ hours of work on this case, investigators
were able to make a successful arrest. Even though a translator was used during
the interview and arrest of Hongli, she would not provide further information

about the owners of Spa Magic. Currently, the investigation is closed due to the
arrest, however, Spa Magic remains open to the public.
What Other Cities Are Doing:
Other cities such as Newton, Johnston, and Ames have passed local ordinances
that would require massage spas and parlors without licensed cosmetologists to
apply for a Massage Therapy Business License through their local City Clerk’s
Office. Local ordinances from the aforementioned cities have the following
characteristics:
• Explains purpose is not to discourage legitimate licensed massage therapy businesses but rather regulate businesses that engage in unauthorized practice of massage therapy
• Define Massage Therapy Business, Massage Therapist, Massage Patron, Massage Therapy, and Reflexology
• License requirements and fees (fees range from $50 to $150) • Application process • Granting or denial of license requirements/process • Provide exemptions for certain Massage Therapy Businesses • Outlines grounds for denial, revocation, or suspension • Provides an appeal process • Provides restriction and regulation such as regulates hours of business • Outlines penalties
Possibilities for Cedar Rapids:
In Cedar Rapids, the most significant barrier with massage parlors and spas
engaged in illegal activity is addressing the issue with the owner of the business.
In some cases, even though police have arrested one employee engaged in
criminal activity, there could easily be additional therapists willing to participate
in the same activity. Unfortunately, this would require investigators to restart their
investigation. By regulating businesses with required licensing, it would provide
the City with knowledge of the massage parlors’ locations, as well as assist
investigators with policing those engaged in illegal activity

VIOLENT CRIME 2017YTD2017
YTD2018 Diff Diff %
MURDER AND NON-NEGLIGENT MANSLAUGHTER (09A ) 6 0 1 1 NA
MURDER 6 0 1 1 NA
SEX OFFENSE FORCIBLE - RAPE (11A ) 28 9 8 -1 -11.11%
SEXUAL ABUSE - RAPE 28 9 8 -1 -11.11%
ROBBERY (120 ) 121 26 19 -7 -26.92%
ROBBERY 120 26 19 -7 -26.92%
ROBBERY 3RD DEGREE 1 0 0 0 NA
AGGRAVATED ASSAULT (13A ) 202 55 49 -6 -10.91%
ASSAULT - WILLFUL INJURY 11 3 3 0 0.00%
ASSAULT DOMESTIC ABUSE IMPEDING BREATHING / CIRCULATION 16 3 11 8 266.67%
ASSAULT DOMESTIC ABUSE SIMPLE 1 0 0 0 NA
ASSAULT DOMESTIC ABUSE WITH INJURY (WITHOUT INTENT) 17 7 0 -7 -100.00%
ASSAULT DOMESTIC ABUSE WITH INTENT TO COMMIT SERIOUS INJURY 32 11 10 -1 -9.09%
ASSAULT SIMPLE 3 2 0 -2 -100.00%
ASSAULT USE OR DISPLAY OF DANGEROUS WEAPON 85 16 19 3 18.75%
ASSAULT WITH INJURY (WITHOUT INTENT) 21 11 0 -11 -100.00%
ASSAULT WITH INTENT TO INFLICT SERIOUS INJURY 9 1 2 1 100.00%
ASSAULT-GOING ARMED WITH INTENT 3 1 2 1 100.00%
ASSAULTS ON PEACE OFFICER AND FIRE FIGHTERS 1 0 0 0 NA
ATTEMPT TO COMMIT MURDER 3 0 2 2 NA
TOTAL OFFENSES VIOLENT CRIME 357 90 77 -13 -14.44%
PROPERTY CRIME 2017YTD2017
YTD2018 Diff Diff %
ARSON (200 ) 14 4 5 1 25.00%
ARSON 14 4 5 1 25.00%
BURGLARY (220 ) 941 197 177 -20 -10.15%
ATTEMPTED BURGLARY 53 12 11 -1 -8.33%
BURGLARY 888 185 166 -19 -10.27%
POCKET-PICKING (23A ) 4 1 1 0 0.00%
THEFT POCKET PICKING 4 1 1 0 0.00%
PURSE-SNATCHING (23B ) 1 0 0 0 NA
THEFT PURSE SNATCHING 1 0 0 0 NA
SHOPLIFTING (23C ) 1126 282 280 -2 -0.71%
THEFT SHOPLIFTING 1126 282 280 -2 -0.71%
THEFT FROM BUILDING (23D ) 6 1 3 2 200.00%
THEFT FROM BUILDING 6 1 3 2 200.00%
THEFT FROM COIN-OPERATED MACHINE OR DEVICE (23E ) 3 0 0 0 NA
THEFT FROM COIN OPERATED MACHINE 3 0 0 0 NA
THEFT FROM MOTOR VEHICLE (23F ) 751 129 142 13 10.08%
THEFT FROM VEHICLE 751 129 142 13 10.08%
THEFT OF MOTOR VEHICLE PARTS/ACCESSORIES (23G ) 168 37 45 8 21.62%
THEFT AUTO PART OR ACCESSORY 26 7 4 -3 -42.86%
THEFT OR LOST PLATE 142 30 41 11 36.67%
1PD Activity Comparison Report - YTD.rdl
Statistics included in this report are subject to change due to the progression of the case/investigation. If a case is determined to be Unfounded, it will not be counted in the totals. These incidents do not reflect the total number of victims.
04/05/2018CEDAR RAPIDS POLICEACTIVITY COMPARISON
01/01/2017 - 04/05/201701/01/2018 - 04/05/2018
02:27:36 PM

PROPERTY CRIME 2017YTD2017
YTD2018 Diff Diff %
THEFT ALL OTHER (23H ) 1794 374 363 -11 -2.94%
AGGRAVATED THEFT 14 4 6 2 50.00%
COMPUTER THEFT-3RD DEGREE 1 1 0 -1 -100.00%
THEFT ALL OTHER 1779 369 357 -12 -3.25%
THEFT OF MOTOR VEHICLE (240 ) 355 80 71 -9 -11.25%
OPERATING VEHICLE WITHOUT OWNER`S CONSENT 51 14 13 -1 -7.14%
THEFT OF MOTOR VEHICLE 304 66 58 -8 -12.12%
TOTAL OFFENSES PROPERTY CRIME 5163 1105 1087 -18 -1.63%
ALL OTHER CRIME 2017YTD2017
YTD2018 Diff Diff %
KIDNAPPING (100 ) 8 2 1 -1 -50.00%
FALSE IMPRISONMENT 5 2 1 -1 -50.00%
KIDNAPPING-1ST DEGREE 2 0 0 0 NA
KIDNAPPING-3RD DEGREE 1 0 0 0 NA
SEX OFFENSE-FORCIBLE - SODOMY (11B ) 14 5 7 2 40.00%
SEXUAL ABUSE - SODOMY 14 5 7 2 40.00%
SEX OFFENSE-FORCIBLE - SEXUAL ASSAULT WITH AN OBJECT (11C ) 6 3 0 -3 -100.00%
SEXUAL ABUSE - WITH AN OBJECT 6 3 0 -3 -100.00%
SEX OFFENSE-FORCIBLE - FONDLING (11D ) 39 12 5 -7 -58.33%
ASSAULT WITH INTENT TO COMMIT SEXUAL ABUSE 3 2 1 -1 -50.00%
INDECENT CONTACT WITH A CHILD 12 4 0 -4 -100.00%
LASCIVIOUS ACTS WITH A CHILD 12 4 4 0 0.00%
LASCIVIOUS CONDUCT WITH A MINOR 1 1 0 -1 -100.00%
SEXUAL ABUSE - FORCIBLE FONDLING 9 1 0 -1 -100.00%
SEXUAL EXPLOITATION BY A COUNSELOR OR THERAPIST-CLASS D FE 1 0 0 0 NA
SEXUAL MISCONDUCT WITH OFFENDERS 1 0 0 0 NA
ASSAULT SIMPLE (13B ) 1222 323 305 -18 -5.57%
ASSAULT - WILLFUL INJURY 1 0 0 0 NA
ASSAULT DOMESTIC ABUSE IMPEDING BREATHING / CIRCULATION 97 21 18 -3 -14.29%
ASSAULT DOMESTIC ABUSE SIMPLE 162 43 42 -1 -2.33%
ASSAULT DOMESTIC ABUSE WITH INJURY (WITHOUT INTENT) 248 74 65 -9 -12.16%
ASSAULT DOMESTIC ABUSE WITH INTENT TO COMMIT SERIOUS INJURY 4 2 1 -1 -50.00%
ASSAULT SIMPLE 376 90 103 13 14.44%
ASSAULT USE OR DISPLAY OF DANGEROUS WEAPON 5 3 0 -3 -100.00%
ASSAULT WITH INJURY (WITHOUT INTENT) 263 73 54 -19 -26.03%
ASSAULT WITH INTENT TO INFLICT SERIOUS INJURY 1 0 0 0 NA
ASSAULTS ON PEACE OFFICER AND FIRE FIGHTERS 65 17 22 5 29.41%
ASSAULT INTIMIDATION (13C ) 5 1 4 3 300.00%
BOMB THREATS 1 0 0 0 NA
INTIMIDATION WITH A DANGEROUS WEAPON 3 1 4 3 300.00%
STALKING 1 0 0 0 NA
EXTORTION/BLACKMAIL (210 ) 0 0 2 2 NA
EXTORTION 0 0 2 2 NA
2PD Activity Comparison Report - YTD.rdl
Statistics included in this report are subject to change due to the progression of the case/investigation. If a case is determined to be Unfounded, it will not be counted in the totals. These incidents do not reflect the total number of victims.
04/05/2018CEDAR RAPIDS POLICEACTIVITY COMPARISON
01/01/2017 - 04/05/201701/01/2018 - 04/05/2018
02:27:36 PM

ALL OTHER CRIME 2017YTD2017
YTD2018 Diff Diff %
COUNTERFEITING/FORGERY (250 ) 315 93 55 -38 -40.86%
COUNTERFEITING 226 72 35 -37 -51.39%
FORGERY 89 21 20 -1 -4.76%
FALSE PRETENSES/SWINDLE/CONFIDENCE GAMES (26A ) 116 27 18 -9 -33.33%
FRAUDULENT PRACTICE 116 27 18 -9 -33.33%
CREDIT CARD/AUTOMATIC TELLER MACHINE FRAUD (26B ) 351 81 58 -23 -28.40%
FALSE USE OF CREDIT CARDS/ATM CARDS 351 81 58 -23 -28.40%
IMPERSONATION (26C ) 100 30 32 2 6.67%
IMPERSONATING A PUBLIC OFFICIAL 1 0 1 1 NA
THEFT OF IDENTITY 99 30 31 1 3.33%
EMBEZZLEMENT (270 ) 1 0 0 0 NA
THEFT - EMBEZZLEMENT 1 0 0 0 NA
STOLEN PROPERTY OFFENSES (280 ) 7 1 0 -1 -100.00%
POSSESSION OF STOLEN PROPERTY 7 1 0 -1 -100.00%
VANDALISM (290 ) 1132 279 240 -39 -13.98%
CRIMINAL MISCHIEF 1115 276 234 -42 -15.22%
CRIMINAL MISCHIEF - 5TH DEGREE ($0-100) 14 3 6 3 100.00%
CRIMINAL MISCHIEF IN VIOLATION OF INDIVIDUALS RIGHTS 3 0 0 0 NA
DRUG/NARCOTICS VIOLATIONS (35A ) 924 284 212 -72 -25.35%
AIDING AND ABETTING TO MANUFACTURE 2 0 1 1 NA
DELIVERY OF CONTROLLED SUBSTANCE 28 7 5 -2 -28.57%
DISTRIBUTION TO PERSON UNDER AGE EIGHTEEN 1 0 0 0 NA
MANUFACTURING CONTROLLED SUBSTANCE 1 0 0 0 NA
POSSESSION OF CONTROLLED SUBSTANCE 702 208 160 -48 -23.08%
POSSESSION OF CONTROLLED SUBSTANCE - 2ND OFFENSE 1 0 0 0 NA
POSSESSION OF CONTROLLED SUBSTANCE W/INTENT TO DELIVER 81 35 22 -13 -37.14%
POSSESSION OF CONTROLLED SUBSTANCE W/INTENT TO DELIVER-1000` 2 1 1 0 0.00%
POSSESSION OF METH 5 GRAMS OR LESS 2 1 0 -1 -100.00%
POSSESSION OF PRESCRIPTION DRUG 97 29 21 -8 -27.59%
PROHIBITED ACTS 7 3 2 -1 -33.33%
DRUG EQUIPMENT VIOLATIONS (35B ) 643 205 143 -62 -30.24%
DRUG PARAPHERNALIA 608 193 141 -52 -26.94%
POSSESSION OF DRUG PARAPHERNALIA 34 12 2 -10 -83.33%
POSSESSION OF PRECURSORS 1 0 0 0 NA
PORNOGRAPHY/OBSCENE MATERIAL (370 ) 12 10 9 -1 -10.00%
INVASION OF PRIVACY --NUDITY 0 0 1 1 NA
SEXUAL EXPLOITATION OF A MINOR 12 10 8 -2 -20.00%
PROSTITUTION (40A ) 4 1 1 0 0.00%
PROSTITUTION 4 1 1 0 0.00%
WEAPON LAW VIOLATIONS (520 ) 150 39 25 -14 -35.90%
ANNUAL PERMIT TO ACQUIRE-TRANSFER PROHIBITED 1 1 0 -1 -100.00%
CARRYING CONCEALED WEAPON 29 12 8 -4 -33.33%
CARRYING WEAPONS 70 19 8 -11 -57.89%
CARRYING WEAPONS, PENALTY ENHANCED 2 1 0 -1 -100.00%
3PD Activity Comparison Report - YTD.rdl
Statistics included in this report are subject to change due to the progression of the case/investigation. If a case is determined to be Unfounded, it will not be counted in the totals. These incidents do not reflect the total number of victims.
04/05/2018CEDAR RAPIDS POLICEACTIVITY COMPARISON
01/01/2017 - 04/05/201701/01/2018 - 04/05/2018
02:27:36 PM

ALL OTHER CRIME 2017YTD2017
YTD2018 Diff Diff %
DISCHARGE OF FIREARMS IN CITY LIMITS 3 0 0 0 NA
DUTY TO CARRY PERMIT TO CARRY WEAPONS 1 0 0 0 NA
FIREARMS 14 2 3 1 50.00%
INTERFERENCE WITH OFFICIAL ACTS WITH INJURY W/WEA OR FIREARM 11 3 3 0 0.00%
POSSESSION OF FIREARM AS FELON 7 1 1 0 0.00%
POSSESSION OR CARRYING FIREARMS UNDER THE INFLUENCE 3 0 1 1 NA
RECKLESS USE OF A FIREARM 2 0 1 1 NA
TRAFFICKING IN STOLEN WEAPONS 5 0 0 0 NA
UNAUTHORIZED POSSESSION OF OFFENSIVE WEAPONS 2 0 0 0 NA
BAD CHECKS (90A ) 65 24 14 -10 -41.67%
THEFT - ACCOUNT CLOSED 17 8 7 -1 -12.50%
THEFT - INSUFFICIENT FUNDS 36 9 7 -2 -22.22%
THEFT - NO ACCOUNT 12 7 0 -7 -100.00%
CURFEW/LOITERING/VAGRANCY VIOLATIONS (90B ) 10 0 0 0 NA
CURFEW FOR MINORS 10 0 0 0 NA
DISORDERLY CONDUCT (90C ) 272 73 55 -18 -24.66%
DISORDERLY CONDUCT 217 55 48 -7 -12.73%
DISORDERLY HOUSE 48 17 7 -10 -58.82%
DISTURBING THE PEACE 1 0 0 0 NA
PUBLIC URINATION 6 1 0 -1 -100.00%
DRIVING UNDER THE INFLUENCE (90D ) 522 159 105 -54 -33.96%
OPERATING WHILE INTOXICATED OR DRUGGED 522 159 105 -54 -33.96%
DRUNKENESS (90E ) 788 206 138 -68 -33.01%
PUBLIC INTOXICATION 788 206 138 -68 -33.01%
FAMILY OFFENSES, NON-VIOLENT (90F ) 380 94 79 -15 -15.96%
CHILD ENDANGERMENT 41 16 7 -9 -56.25%
NEGLECT OR ABANDONMENT OF DEPENDENT PERSON 2 0 0 0 NA
VIOLATING CUSTODIAL ORDER 1 0 0 0 NA
VIOLATION OF NO CONTACT / PROTECTIVE ORDER 73 22 3 -19 -86.36%
VIOLATION OF NO-CONTACT ORDER OR PROTECTIVE ORDER 263 56 69 13 23.21%
LIQUOR LAW VIOLATIONS (90G ) 127 44 22 -22 -50.00%
BOOTLEGGING 2 0 0 0 NA
CONSUMPTION IN PUBLIC PLACES 2 1 1 0 0.00%
CONSUMPTION IN PUBLIC PLACES-INTOXICATION 3 1 0 -1 -100.00%
MISCELLANEOUS PROHIBITIONS 2 0 0 0 NA
OPEN CONTAINER 9 5 1 -4 -80.00%
OPEN CONTAINERS OF ALCOHOL IN MOTOR VEHICLES 80 22 12 -10 -45.45%
OPEN CONTAINRS IN MOTOR VEHICLES -- PASSENGERS 1 0 1 1 NA
PERSONS UNDER LEGAL AGE 28 15 7 -8 -53.33%
TRESPASS (90J ) 210 58 56 -2 -3.45%
CRIMINAL TRESPASS (WITH DAMAGE) 26 9 3 -6 -66.67%
TRESPASS 184 49 53 4 8.16%
ALL OTHER OFFENSES (90Z ) 2739 702 659 -43 -6.13%
ABANDONMENT OF CATS AND DOGS 1 0 0 0 NA
4PD Activity Comparison Report - YTD.rdl
Statistics included in this report are subject to change due to the progression of the case/investigation. If a case is determined to be Unfounded, it will not be counted in the totals. These incidents do not reflect the total number of victims.
04/05/2018CEDAR RAPIDS POLICEACTIVITY COMPARISON
01/01/2017 - 04/05/201701/01/2018 - 04/05/2018
02:27:36 PM

ALL OTHER CRIME 2017YTD2017
YTD2018 Diff Diff %
ACCIDENT-DAMAGE TO VEHICLES (CITY) 2 0 0 0 NA
ACCIDENT-DAMAGE TO VEHICLES (STATE) 5 0 3 3 NA
ACCIDENTS-DEATH OR PERSONAL INJURY 9 0 3 3 NA
ANIMAL ABUSE 3 0 0 0 NA
ANIMAL NEGLECT 2 1 0 -1 -100.00%
ASSAULT DOMESTIC ABUSE WITH INJURY (WITHOUT INTENT) 1 0 0 0 NA
ATTEMPTING TO DISARM A POLICE OFFICER 0 0 1 1 NA
CONSPIRACY - FELONY 3 1 0 -1 -100.00%
CONTEMPT OF COURT 1 0 0 0 NA
DEPENDANT ADULT ABUSE 5 0 0 0 NA
DRUG TAX STAMP 66 21 14 -7 -33.33%
EXPOSING TO COMMUNICABLE DISEASE 1 0 0 0 NA
FAILURE TO APPEAR 5 1 0 -1 -100.00%
FALSE REPORTS 3 1 0 -1 -100.00%
FALSE REPORTS TO LAW ENFORCEMENT AUTHORITIES 1 1 1 0 0.00%
FINANCIAL EXPLOITATION OF A DEPENDENT ADULT 2 0 0 0 NA
FIREWORKS 7 0 1 1 NA
FOREIGN WARRANT 158 42 19 -23 -54.76%
FRAUDULENT APPLICATIONS 40 11 13 2 18.18%
GLUE SNIFFING 1 0 0 0 NA
GRAFFITI PROHIBITED 0 0 1 1 NA
HARASSMENT 154 42 47 5 11.90%
HARASSMENT OF PUBLIC OFFICERS AND EMPLOYEES 1 0 0 0 NA
HARBORING A RUNAWAY CHILD PROHIBITED 1 0 0 0 NA
HOLD ORDER 1 1 0 -1 -100.00%
ILLEGAL DUMPING (REFUSE DISPOSAL) 110 24 24 0 0.00%
INDECENT EXPOSURE 8 2 2 0 0.00%
INTERFERENCE W/OFF ACTS W/INJURY-FELONY 5 1 0 -1 -100.00%
INTERFERENCE W/OFF ACTS W/INJURY-MISDEMEANOR 13 4 4 0 0.00%
INTERFERENCE WITH OFFICIAL ACTS 399 96 100 4 4.17%
INTIMIDATION WITH A DANGEROUS WEAPON 1 1 0 -1 -100.00%
INVASION OF PRIVACY --NUDITY 2 0 0 0 NA
LICENSE REQUIRED (PEDDLERS, SOL 5 0 0 0 NA
LITTER 1 0 0 0 NA
NON-COMPLIANCE OF PLACARDED PROPERTY 16 4 6 2 50.00%
OBSTRUCTION OF EMERGENCY COMMUNICATIONS 29 8 4 -4 -50.00%
ON-GOING CRIMINAL CONDUCT 2 2 0 -2 -100.00%
PARK RULES 34 8 5 -3 -37.50%
PARKS - OPENING AND CLOSING TIMES 1 0 0 0 NA
PERJURY, CONTRADICTORY STATEMENTS AND RETRACTION 1 1 0 -1 -100.00%
PERSONS UNDER LEGAL AGE - TOBACCO 17 1 6 5 500.00%
POSSESSION OF BURGLARS TOOLS 5 0 2 2 NA
PREVENTING APPREHENSION, OBSTRUCTING PROSECUTION OR OBS DEFE 3 1 0 -1 -100.00%
PROHIBITION AGAINST UNLICENSED PERSONS DISTRIBUTING RX 0 0 1 1 NA
5PD Activity Comparison Report - YTD.rdl
Statistics included in this report are subject to change due to the progression of the case/investigation. If a case is determined to be Unfounded, it will not be counted in the totals. These incidents do not reflect the total number of victims.
04/05/2018CEDAR RAPIDS POLICEACTIVITY COMPARISON
01/01/2017 - 04/05/201701/01/2018 - 04/05/2018
02:27:36 PM

ALL OTHER CRIME 2017YTD2017
YTD2018 Diff Diff %
PROVIDING FALSE IDENTIFICATION IFORMATION 127 38 25 -13 -34.21%
PUBLIC EXPOSURE 2 0 1 1 NA
RECKLESS USE OF FIRE 1 0 0 0 NA
RECKLESS USE OF FIRE OR EXPLOSIVES 2 1 1 0 0.00%
REVOCATION OF PROBATION 1 0 0 0 NA
SCREENING CHECKPOINT RESTRICTIONS 2 0 0 0 NA
STRIKING FIXTURES ADJACENT TO ROADWAY (STATE) 9 2 0 -2 -100.00%
STRIKING UNATTENDED VEHICLE (STATE) 3 0 0 0 NA
TAMPERING WITH MOTOR VEHICLE 2 0 0 0 NA
TRANSACTING BUSINESS WITHOUT A LICENSE 0 0 1 1 NA
VIOLATION NOISE PROHIBITION ORDINANCE 2 0 0 0 NA
VIOLATION OF PAROLE 1 0 0 0 NA
VIOLATION OF PROBATION 3 0 0 0 NA
WARRANT 1459 386 374 -12 -3.11%
TOTAL OFFENSES ALL OTHER CRIME 10162 2756 2245 -511 -18.54%
OTHER INCIDENT ACTIVITY - NON REPORTABLE 2017YTD2017
YTD2018 Diff Diff %
METH LAB 2 1 0 -1 -100.00%
SEARCH WARRANT 36 15 5 -10 -66.67%
TOTAL OTHER ACTIVITY 38 16 5 -11 -68.75%
CLEARANCES 2017YTD2017
YTD2018 Diff Diff %
ARREST MADE BUT CA DID NOT FILE 62 15 22 7 46.67%
CHARGED FILED BY COUNTY ATTORNEY 5 3 0 -3 -100.00%
CLEARED BY ARREST 5313 1418 1238 -180 -12.69%
CLEARED BY OTHER CASE 13 6 1 -5 -83.33%
CLOSED @ VIC REQUEST 323 92 73 -19 -20.65%
COUNTY ATTY DID NOT FILE 399 109 87 -22 -20.18%
JUVENILE/NO CUSTODY 1 1 0 -1 -100.00%
LACK SOLVABILITY CRITERIA 998 227 194 -33 -14.54%
LEADS EXHAUSTED 3560 784 653 -131 -16.71%
NON CRIMINAL INCIDENT 41 12 27 15 125.00%
NOT EXCEPTIONALLY CLEARED 112 23 24 1 4.35%
REASSIGNED TO INVESTIGATIONS 7 1 10 9 900.00%
REFERRED TO OTHER JURISDICTION 293 80 32 -48 -60.00%
RETURNED FOR FURTHER INVESTIGATION 2 0 1 1 NA
RUNAWAY/MISSING RETURNED/LOCATED 7 3 0 -3 -100.00%
SUMMONS ISSUED 3 1 2 1 100.00%
VIC DID NOT COOPERATE W/INVESTIGATION 100 25 19 -6 -24.00%
WARR REQUEST RESUBMITTED TO CTY ATTY 1 1 3 2 200.00%
WARRANT ISSUED 406 92 99 7 7.61%
WARRANT REQUEST 212 60 56 -4 -6.67%
TOTAL CLEARANCES 11858 2953 2541 -412 -13.95%
6PD Activity Comparison Report - YTD.rdl
Statistics included in this report are subject to change due to the progression of the case/investigation. If a case is determined to be Unfounded, it will not be counted in the totals. These incidents do not reflect the total number of victims.
04/05/2018CEDAR RAPIDS POLICEACTIVITY COMPARISON
01/01/2017 - 04/05/201701/01/2018 - 04/05/2018
02:27:36 PM

CASE LOAD 2017YTD2017
YTD2018 Diff Diff %
ASSIGNED CID 2765 672 635 -37 -5.51%
ASSIGNED PATROL 13827 3457 3100 -357 -10.33%
TOTAL CASE LOAD 16592 4129 3735 -394 -9.54%
SELF-INITIATED AND NON-SELF-INITIATED CALLS FOR SERVICE 2017YTD2017
YTD2018 Diff Diff %
SELF INITIATED 65886 19595 15274 -4321 -22.05%
NON SELF INITIATED 80886 18714 22509 3795 20.28%
TOTAL SELF-INITIATED AND NON-SELF-INITIATED CALLS FOR SERVICE 146772 38309 37783 -526 -1.37%
SELF-INITIATED CALLS FOR SERVICE BY CALL TYPE 2017YTD2017
YTD2018 Diff Diff %
ASSIGNMENT 2716 692 391 -301 -43.50%
BAR CHECK 581 202 94 -108 -53.47%
BUSINESS CHECK 12113 3047 4045 998 32.75%
CMVI 6 0 2 2 NA
CR COPS PROJECT 15567 5063 315 -4748 -93.78%
FOOT PATROL 440 119 119 0 0.00%
INVESTIGATION 7402 1940 1800 -140 -7.22%
MOTEL CHECK 245 81 88 7 8.64%
SCHOOL CHECK 3007 1140 1079 -61 -5.35%
SELECTIVE ENFORCEMENT PROJECT 4640 1508 2104 596 39.52%
SUBJECT STOP 2168 430 382 -48 -11.16%
TRAFFIC STOP 14644 4673 4208 -465 -9.95%
WARRANT 2357 700 647 -53 -7.57%
TOTAL SELF-INITIATED CALLS FOR SERVICE BY CALL TYPE 65886 19595 15274 -4321 -22.05%
FIELD CONTACTS 2017YTD2017
YTD2018 Diff Diff %
TOTAL FIELD CONTACTS ISSUED 364 66 90 24 36.36%
TRAFFIC ARRESTS FOR DWLUS AND OWI 2017YTD2017
YTD2018 Diff Diff %
DWLUS 1322 371 336 -35 -9.43%
OPERATING WHILE INTOXICATED OR DRUGGED 520 160 103 -57 -35.63%
TOTAL TRAFFIC ARRESTS FOR DWLUS AND OWI 1842 531 439 -92 -17.33%
OTHER TRAFFIC ACTIVITY 2017YTD2017
YTD2018 Diff Diff %
HIT & RUN 816 210 222 12 5.71%
TOW - CIVIL 2182 613 511 -102 -16.64%
TOTAL OTHER TRAFFIC ACTIVITY 2998 823 733 -90 -10.94%
TraCS ECCO CITATIONS 2017YTD2017
YTD2018 Diff Diff %
TOTAL TraCS ECCO CITATIONS 9866 2943 2527 -416 -14.14%
7PD Activity Comparison Report - YTD.rdl
Statistics included in this report are subject to change due to the progression of the case/investigation. If a case is determined to be Unfounded, it will not be counted in the totals. These incidents do not reflect the total number of victims.
04/05/2018CEDAR RAPIDS POLICEACTIVITY COMPARISON
01/01/2017 - 04/05/201701/01/2018 - 04/05/2018
02:27:36 PM

CITIZEN ASSISTANCE SUMMARY January, February, March 2018
January On 1/04/18, a citizen reported a suspicious vehicle at a business on the NE side. Officers arrived and asked the occupant to exit his vehicle because they could smell a marijuana odor coming from the vehicle. The occupant took off running, and was caught a short time later. The suspect was charged with Interference with Official Acts, Possession with Intent to Deliver, Violation of the Drug tax Stamp and Carrying Weapons. On 1/05/18, a call was received that people were inside a business stealing copper. Officers located three suspects inside the building. One suspect had warrants for Public Intoxication; Theft 2nd, OWI; and another suspect had a Mittimus for Theft 5th and was charged with PDP. All of the subjects were charged with Criminal Trespass.
On 1/06/18, several citizens contacted the Police Department advising that a subject was armed with a large knife and acting strange at a business on the SE side. Officers located the suspect, and he was arrested for Possession of a Controlled Substance – Meth, Possession of Drug Paraphernalia and Carrying Weapons.
On 1/13/18, a citizen reported a disturbance at a business on the SW side where a male was wandering around the dumpster. Officers located the suspect, and he was arrested for Public Intoxication and Possession of Controlled Substance – Meth and Cocaine.
On 1/19/18, a citizen reported a disturbance at a downtown parking ramp. The witness reported several subjects causing damage to ceiling tiles and lights in the parking ramp. Officers located three subjects, and confirmed they were the suspects who caused the damage. One suspect was charged with Criminal Mischief and Trespass and another was charged with Criminal Trespass.
On 1/24/18, Dispatch received a call reporting a subject prowling garages near a school. Officers located the suspect, and he was arrested on a valid warrant. Suspect was also in possession of marijuana, drug paraphernalia and an X Box.
On 1/26/18, a citizen reported an assault in progress in the parking lot on the SW side. Officers arrived on scene, and the suspect took off running. Officers were able to locate the suspect, and he was charged with Assault Domestic Abuse – With Injury, Public Intoxication and Interference with Official Acts.
1
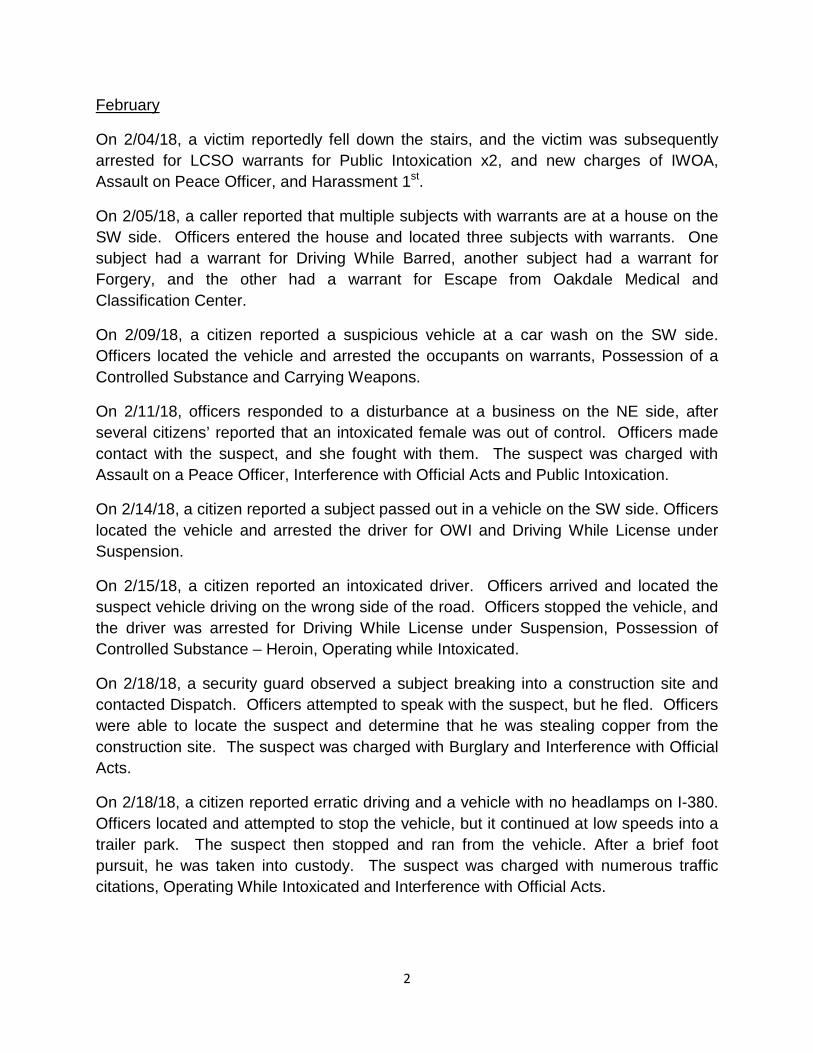
February
On 2/04/18, a victim reportedly fell down the stairs, and the victim was subsequently arrested for LCSO warrants for Public Intoxication x2, and new charges of IWOA, Assault on Peace Officer, and Harassment 1st.
On 2/05/18, a caller reported that multiple subjects with warrants are at a house on the SW side. Officers entered the house and located three subjects with warrants. One subject had a warrant for Driving While Barred, another subject had a warrant for Forgery, and the other had a warrant for Escape from Oakdale Medical and Classification Center.
On 2/09/18, a citizen reported a suspicious vehicle at a car wash on the SW side. Officers located the vehicle and arrested the occupants on warrants, Possession of a Controlled Substance and Carrying Weapons.
On 2/11/18, officers responded to a disturbance at a business on the NE side, after several citizens’ reported that an intoxicated female was out of control. Officers made contact with the suspect, and she fought with them. The suspect was charged with Assault on a Peace Officer, Interference with Official Acts and Public Intoxication.
On 2/14/18, a citizen reported a subject passed out in a vehicle on the SW side. Officers located the vehicle and arrested the driver for OWI and Driving While License under Suspension.
On 2/15/18, a citizen reported an intoxicated driver. Officers arrived and located the suspect vehicle driving on the wrong side of the road. Officers stopped the vehicle, and the driver was arrested for Driving While License under Suspension, Possession of Controlled Substance – Heroin, Operating while Intoxicated.
On 2/18/18, a security guard observed a subject breaking into a construction site and contacted Dispatch. Officers attempted to speak with the suspect, but he fled. Officers were able to locate the suspect and determine that he was stealing copper from the construction site. The suspect was charged with Burglary and Interference with Official Acts.
On 2/18/18, a citizen reported erratic driving and a vehicle with no headlamps on I-380. Officers located and attempted to stop the vehicle, but it continued at low speeds into a trailer park. The suspect then stopped and ran from the vehicle. After a brief foot pursuit, he was taken into custody. The suspect was charged with numerous traffic citations, Operating While Intoxicated and Interference with Official Acts.
2

March
On 3/01/18, a disturbance was reported at the Library. Officers arrived on scene and located the suspect, who fought with officers and attempted to disarm one of them. The suspect was charged with Interference with Official Acts and Disarming a Police Officer.
On 3/02/18, a suspicious person was reported concerning a male leaning up against the garage, who the owner does not know. Officers located the subject and determined he was unresponsive due to a heroin overdose. Officers requested an ambulance for the victim.
On 3/09/18, police received a report of a subject with a weapon at a business on the SW side. The distraught subject was reported near a car with a handgun and a bottle of liquor. The suspect was located by officers, and he was ordered to keep his hands in the air. The officer located a Hi Point 9mm and several shell casings. The suspect was charged with Public Intoxication and Carrying Weapons.
On 3/17/18, an officer responded to a citizen compliant of an intoxicated driver on the NE side. Officers located the suspect vehicle, and the driver was arrested for Operating While Intoxicated.
On 3/18/18, officers responded to a call on the SW side regarding a suspicious person. Officers located the suspect and attempted to stop him. The suspect fled, but was arrested for Interference with Official Acts. The suspect also had a warrant for Probation Violation.
On 3/21/18, officers responded to a student complaint near Coe College of a suspicious subject. The subject then forced his way into a residence, was located by officers, and charged with Criminal Mischief.
On 3/27/18, several citizens reported a subject suffering from a mental health issue on the NE side. Officers made contact with the victim, and they utilized Foundation 2 to help assist getting the victim treated for their medical condition.
3

Juvenile Arrests at Schools Charts.rdl Page 1 of 2 4/3/2018 10:52:13 AM
CEDAR RAPIDS POLICE DEPARTMENTJuvenile Arrests at Schools
Arrested 1/1/2018 - 3/31/2018

Juvenile Arrests at Schools Charts.rdl Page 2 of 2 4/3/2018 10:52:13 AM
CEDAR RAPIDS POLICE DEPARTMENTJuvenile Arrests at Schools
Arrested 1/1/2018 - 3/31/2018

1
PUBLIC SAFETY & YOUTH SERVICES
April 16, 2018
NUISANCE PROPERTY UPDATE
Since October 1, 2013 there have been 4,602 Founded Calls for Service of Chapter 22A which have affected 3,002 properties. Of the 22A Founded Calls for Service, 659 have met the threshold of 22A and have been deemed Nuisance Properties since the program started. Since October 1, 2014, 489 Nuisance Properties have been brought back into compliance. Of the 4,169 Tier C Founded Calls for Service, only 152 have resulted in a Nuisance Property Designation. SAFE-CR has billed $62,847.18 for Police Calls for Service and has collected $36,041.50.
Based upon the following charts and graphs, property owners are abating the nuisance after they receive a Call for Service letter. Only 3.6% of Tier C violations have risen to a Nuisance Property Designation and only 13.7% of Nuisance Properties have had additional 22A violations billed.
Nuisance Properties by the Numbers Total Nuisance Properties since 10/01/2013: 659 Active Nuisance Properties: 170
Commercial: 2 Owner Occupied: 115
Rental Properties: 53 Total In Compliance Properties: 489 Nuisance Property Abatement Plans: 8 Nuisance Properties in Grace Period: 3 Nuisance Properties in Fee Period: 167 Charges Sent for Police Calls for Service: 194 Number of Properties Billed: 90 Total Billed: $62,847.18 Number of Administrative Appeals: 61 Designations Reversed: 9
Designations Upheld: 51 Waiting on Decision: 1 Appeals Scheduled: 0
2
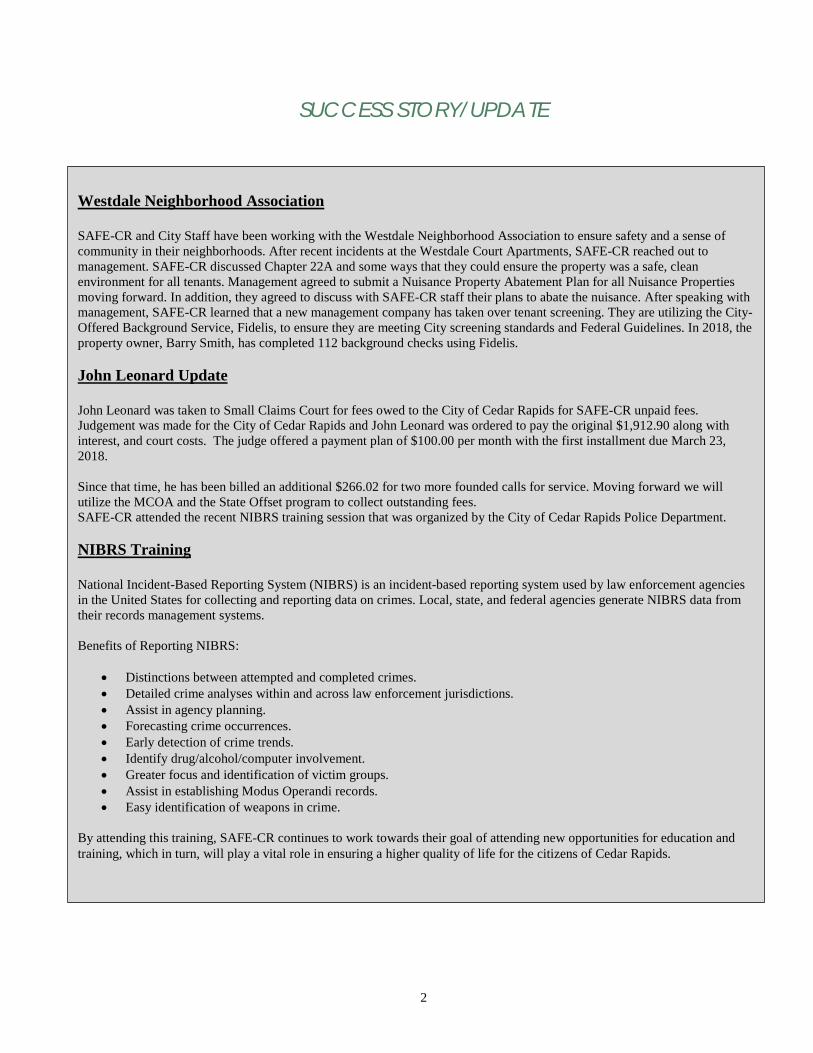
SUCCESS STORY/UPDATE
A Cedar Rapids property owner with numerous rental properties had been experiencing issues with repeated Police Calls for Service. SAFE-CR team members worked with the landlord to provide education about background checks and utilizing the various other resources that SAFE-CR provides for the citizens of Cedar Rapids.
This landlord is now utilizing SAFE-CR’s background check service, which provides the most extensive and most thorough background checks on prospective tenants. The landlord has also been utilizing the Call for Service log on the City of Cedar Rapids website to investigate Calls for Service on current tenants, as well as prospective ten
Westdale Neighborhood Association SAFE-CR and City Staff have been working with the Westdale Neighborhood Association to ensure safety and a sense of community in their neighborhoods. After recent incidents at the Westdale Court Apartments, SAFE-CR reached out to management. SAFE-CR discussed Chapter 22A and some ways that they could ensure the property was a safe, clean environment for all tenants. Management agreed to submit a Nuisance Property Abatement Plan for all Nuisance Properties moving forward. In addition, they agreed to discuss with SAFE-CR staff their plans to abate the nuisance. After speaking with management, SAFE-CR learned that a new management company has taken over tenant screening. They are utilizing the City-Offered Background Service, Fidelis, to ensure they are meeting City screening standards and Federal Guidelines. In 2018, the property owner, Barry Smith, has completed 112 background checks using Fidelis. John Leonard Update John Leonard was taken to Small Claims Court for fees owed to the City of Cedar Rapids for SAFE-CR unpaid fees. Judgement was made for the City of Cedar Rapids and John Leonard was ordered to pay the original $1,912.90 along with interest, and court costs. The judge offered a payment plan of $100.00 per month with the first installment due March 23, 2018. Since that time, he has been billed an additional $266.02 for two more founded calls for service. Moving forward we will utilize the MCOA and the State Offset program to collect outstanding fees. SAFE-CR attended the recent NIBRS training session that was organized by the City of Cedar Rapids Police Department. NIBRS Training National Incident-Based Reporting System (NIBRS) is an incident-based reporting system used by law enforcement agencies in the United States for collecting and reporting data on crimes. Local, state, and federal agencies generate NIBRS data from their records management systems. Benefits of Reporting NIBRS:
• Distinctions between attempted and completed crimes. • Detailed crime analyses within and across law enforcement jurisdictions. • Assist in agency planning. • Forecasting crime occurrences. • Early detection of crime trends. • Identify drug/alcohol/computer involvement. • Greater focus and identification of victim groups. • Assist in establishing Modus Operandi records. • Easy identification of weapons in crime.
By attending this training, SAFE-CR continues to work towards their goal of attending new opportunities for education and training, which in turn, will play a vital role in ensuring a higher quality of life for the citizens of Cedar Rapids.
3
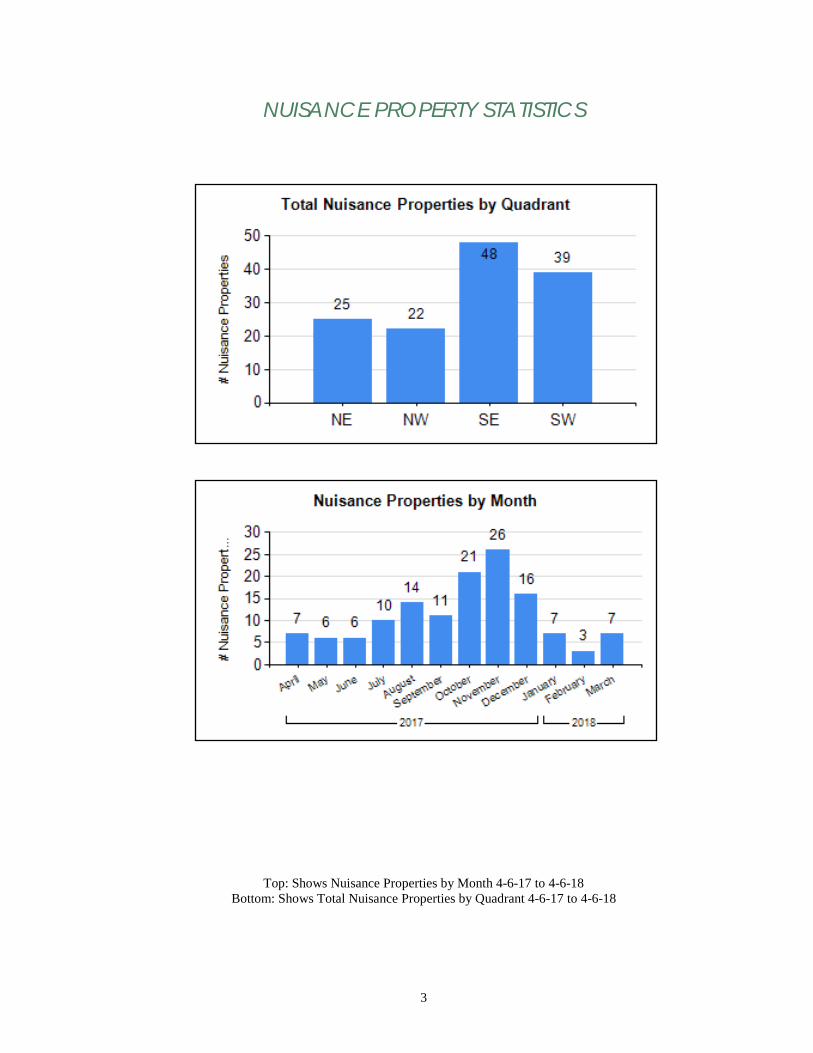
NUISANCE PROPERTY STATISTICS
Top: Shows Nuisance Properties by Month 4-6-17 to 4-6-18 Bottom: Shows Total Nuisance Properties by Quadrant 4-6-17 to 4-6-18

4
NUISANCE PROPERTIES STATISTICS (CONTINUED)
The pie charts below show Nuisance Activity categorized by each tier of 22A.03 separated by month from 4-6-17 to 4-6-18.

5
NUISANCE PROPERTY STATISTICS (CONTINUED)
NUISANCE ACTIVITY Included with this newsletter is a report titled “Founded Nuisance Activity” which indicates all Nuisance Activity that has occurred between 4-6-17 and 4-6-18. Both the property owner and property occupant are notified via mail of Founded Nuisance Activity. Each property owner listed on the Founded Nuisance Activity report has been sent a Call for Service letter to the contact address listed on the City Assessor’s website indicating there has been Nuisance Activity on their property. In addition, a copy is mailed to the property occupant. The graphs below present the Nuisance Activity that has occurred by month and by quadrant since 4-6-17.

6
NUISANCE PROPERTY STATISTICS (CONTINUED) The pie charts below show Nuisance Activity and Nuisance Designation by Tier from 10-1-2013 to 4-6-2018. The breakdown between owner occupied and rental properties is shown as well.

7
Nuisance Activity Statistics for NE Quadrant
Top: Shows Nuisance Activity in NE Quadrant by Type of Activity 04-06-17 to 04-06-18 Bottom Left: Shows Total Nuisance Activity in NE Quadrant by Tier 04-06-17 to 04-06-18
Bottom Right: Shows Total Nuisance Activity in NE Quadrant by Month 04-06-17 to 04-06-18

8
Nuisance Property Statistics for NE Quadrant
Top: Shows Nuisance Properties in NE Quadrant by Type of Activity 04-06-17 to 04-06-18 Bottom Left: Shows Nuisance Properties in NE Quadrant by Tier 04-06-17 to 04-06-18
Bottom Right: Shows Nuisance Properties in NE Quadrant by Month 04-06-17 to 04-06-18

9
Nuisance Property Statistics for NW Quadrant
Top: Shows Nuisance Activity in NW Quadrant by Type of Activity 04-06-17 to 04-06-18 Bottom Left: Shows Total Nuisance Activity in NW Quadrant by Tier 04-06-17 to 04-06-18
Bottom Right: Shows Total Nuisance Activity in NW Quadrant by Month 04-06-17 to 04-06-18
10
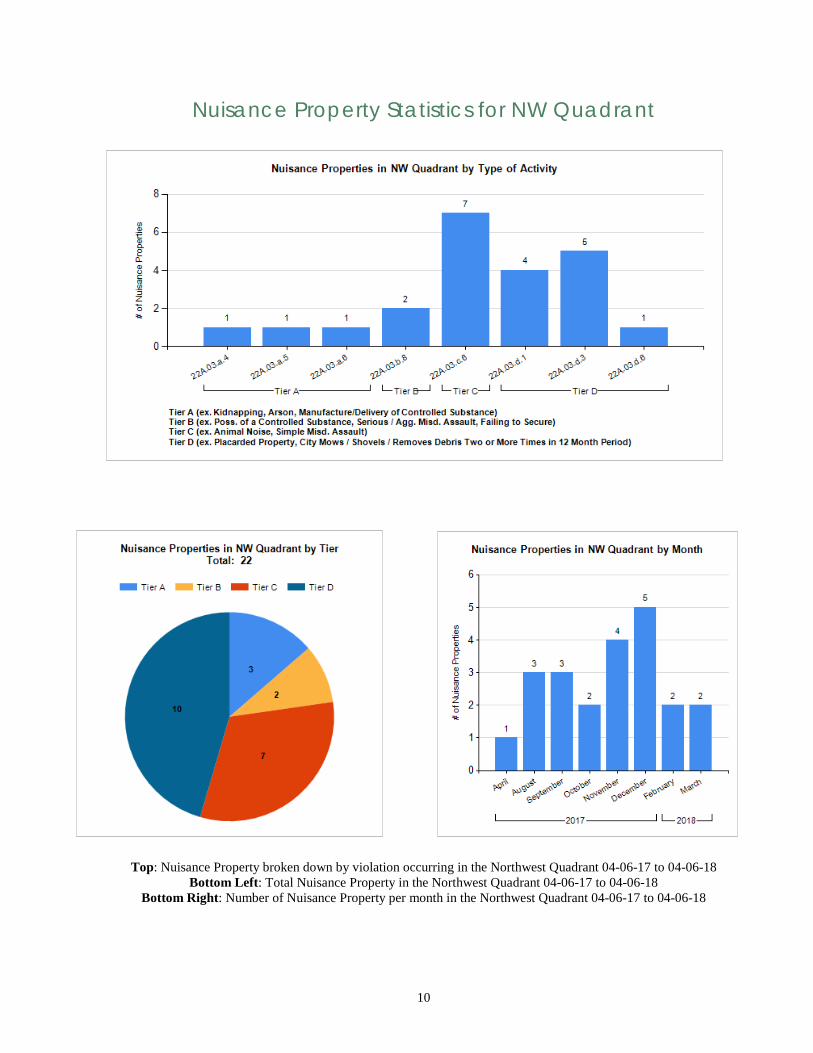
Nuisance Property Statistics for NW Quadrant
Top: Nuisance Property broken down by violation occurring in the Northwest Quadrant 04-06-17 to 04-06-18
Bottom Left: Total Nuisance Property in the Northwest Quadrant 04-06-17 to 04-06-18 Bottom Right: Number of Nuisance Property per month in the Northwest Quadrant 04-06-17 to 04-06-18
11
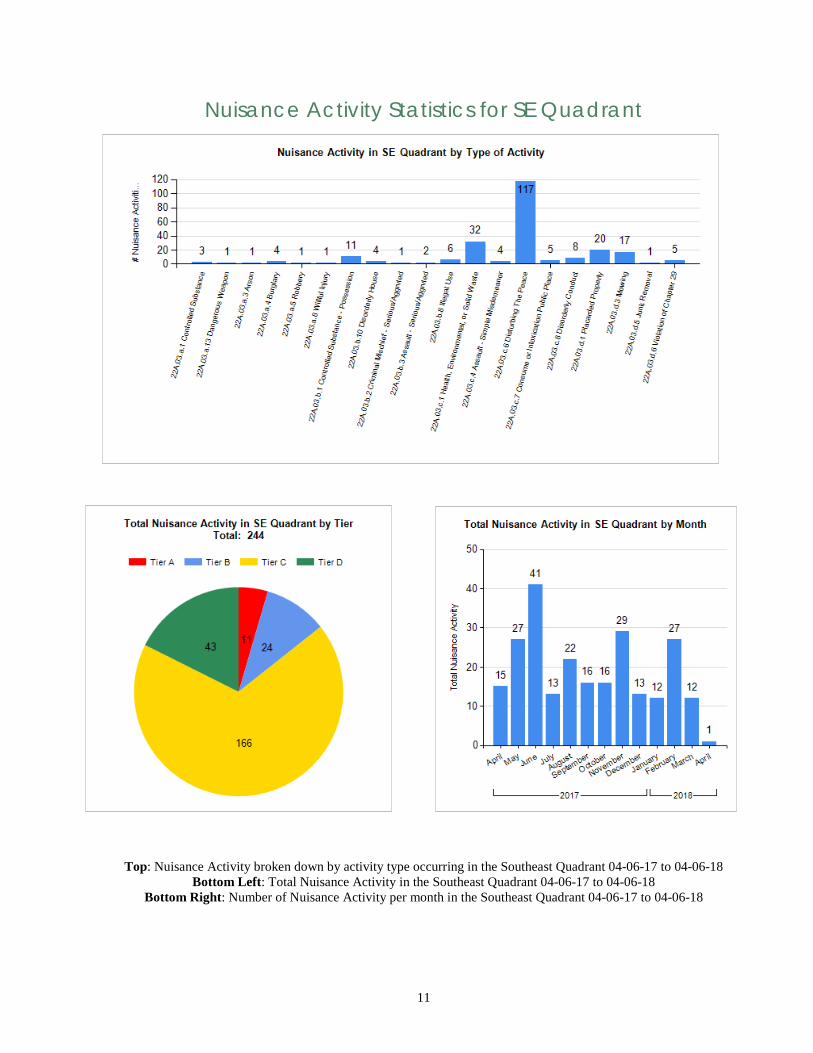
Nuisance Activity Statistics for SE Quadrant
Top: Nuisance Activity broken down by activity type occurring in the Southeast Quadrant 04-06-17 to 04-06-18 Bottom Left: Total Nuisance Activity in the Southeast Quadrant 04-06-17 to 04-06-18
Bottom Right: Number of Nuisance Activity per month in the Southeast Quadrant 04-06-17 to 04-06-18
12
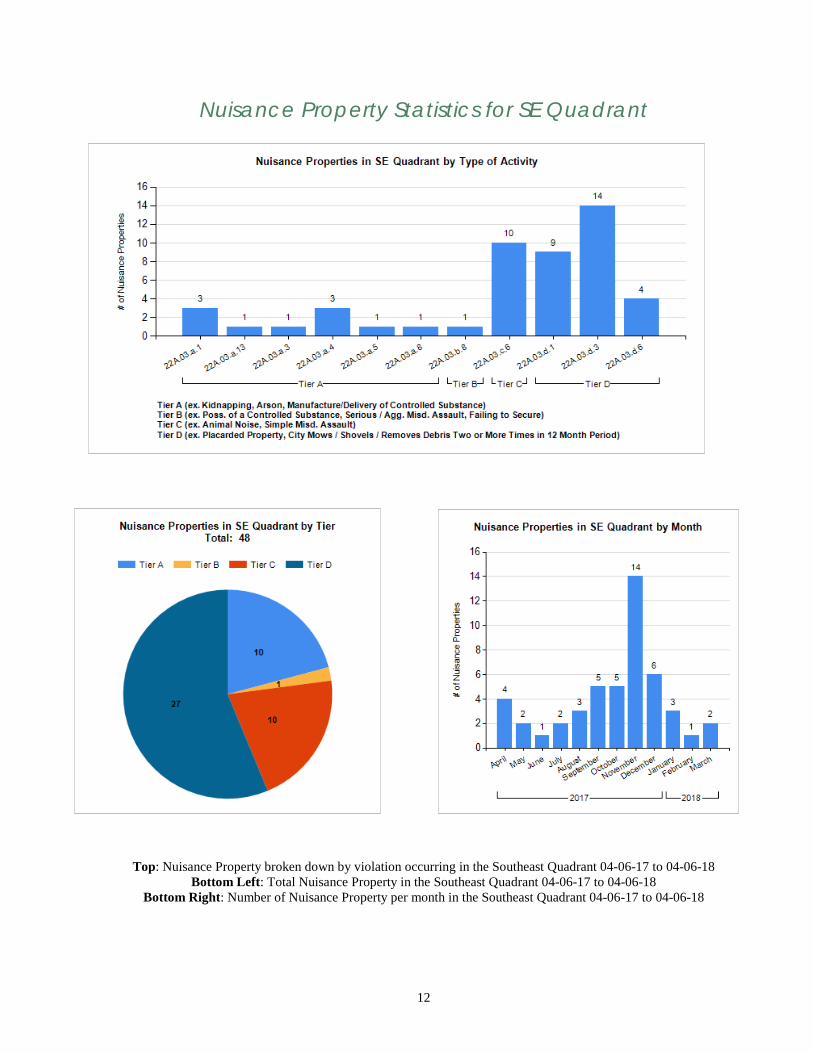
Nuisance Property Statistics for SE Quadrant
Top: Nuisance Property broken down by violation occurring in the Southeast Quadrant 04-06-17 to 04-06-18 Bottom Left: Total Nuisance Property in the Southeast Quadrant 04-06-17 to 04-06-18
Bottom Right: Number of Nuisance Property per month in the Southeast Quadrant 04-06-17 to 04-06-18
13
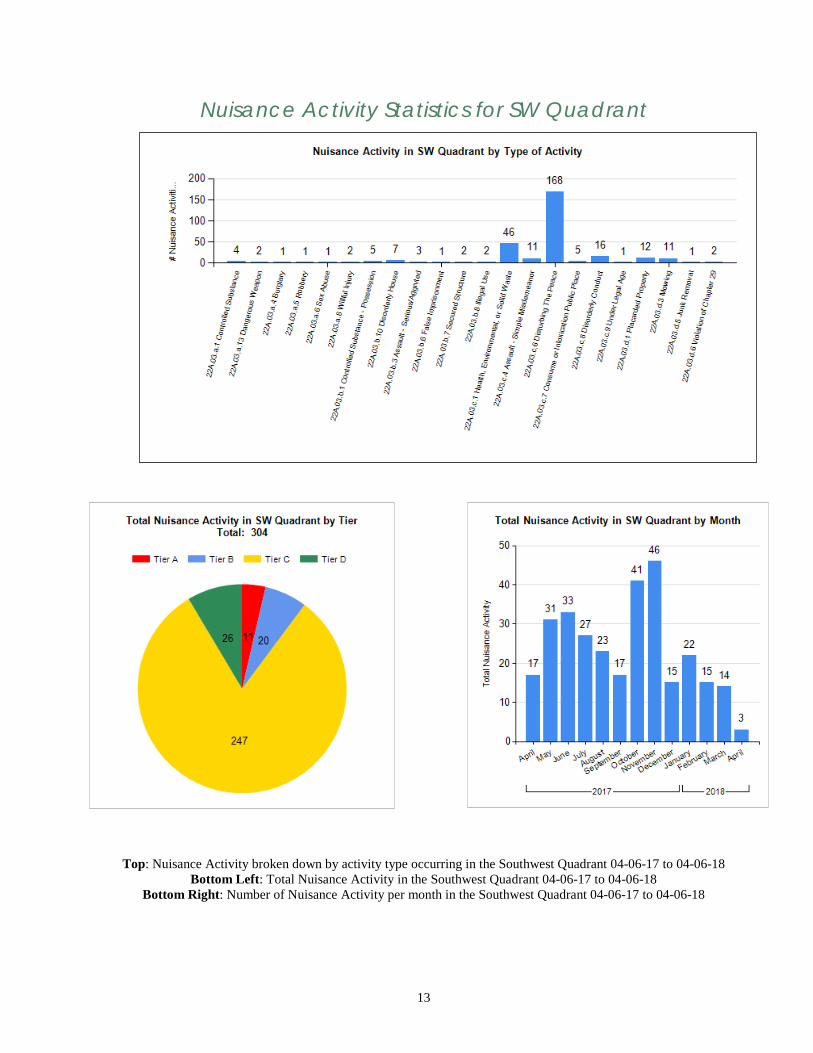
Nuisance Activity Statistics for SW Quadrant
Top: Nuisance Activity broken down by activity type occurring in the Southwest Quadrant 04-06-17 to 04-06-18 Bottom Left: Total Nuisance Activity in the Southwest Quadrant 04-06-17 to 04-06-18
Bottom Right: Number of Nuisance Activity per month in the Southwest Quadrant 04-06-17 to 04-06-18

14
Nuisance Property Statistics for SW Quadrant
Top: Nuisance Property broken down by violation occurring in the Southwest Quadrant 04-06-17 to 04-06-18 Bottom Left: Total Nuisance Property in the Southwest Quadrant 04-06-17 to 04-06-18
Bottom Right: Number of Nuisance Property per month in the Southwest Quadrant 04-06-17 to 04-06-18

15
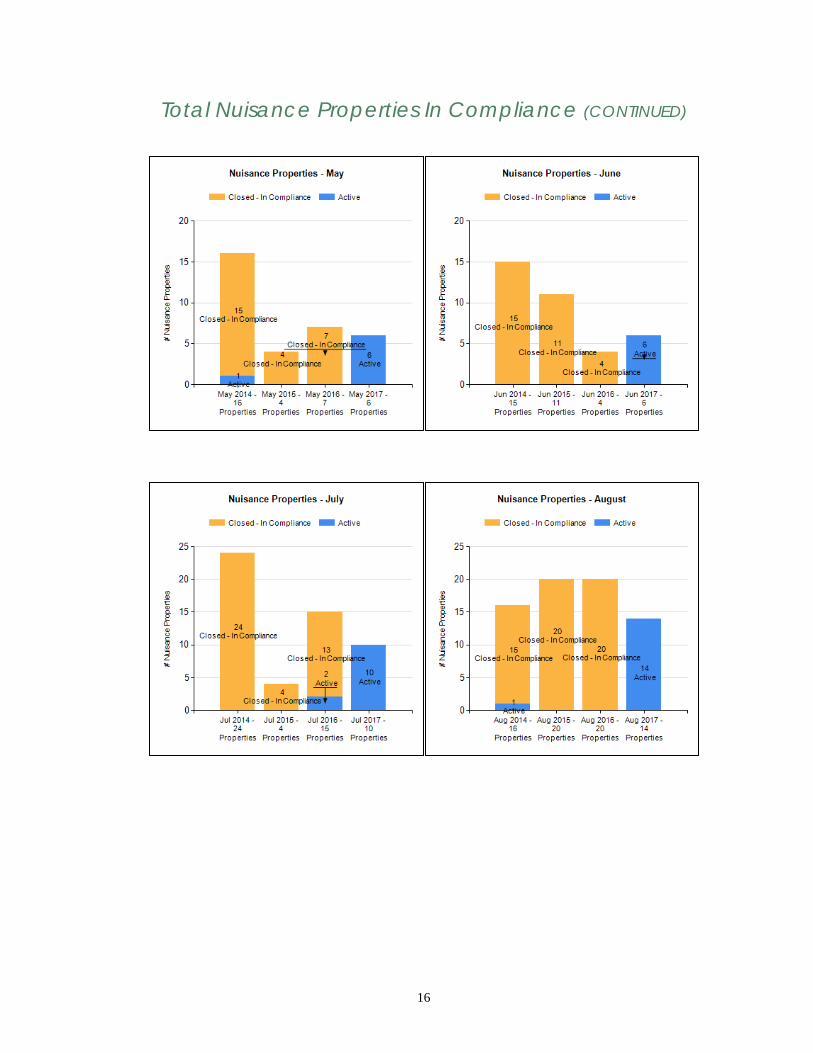
Total Nuisance Properties In Compliance
After a property is deemed a Nuisance Property, it will carry the Nuisance Property designation for one year from the date of the last Notice of Violation. The graphs below compare Nuisance Properties that are either Active or In Compliance in one year intervals. Attached is a report titled “Nuisance Properties in Compliance” including addresses of properties now In Compliance with Chapter 22A.
16
Total Nuisance Properties In Compliance (CONTINUED)

17
Total Nuisance Properties In Compliance (CONTINUED)

18
Total Nuisance Property by Council District
This table presents the total number of Nuisance Properties in each Council District since October 1, 2013.
Total Properties In Compliance by Council District
The table below presents all the Nuisance Properties that now hold the status In Compliance by Council District.
District 22A.03.a 22A.03.b 22A.03.c 22A.03.d Total CR1 44 9 26 33 112 CR2 19 2 12 29 62
CR3 78 10 68 135 291 CR4 19 1 25 33 78
CR5 43 11 21 41 116 Total 203 33 152 271 659
District 22A.03.a 22A.03.b 22A.03.c 22A.03.d Total CR1 35 8 22 21 86 CR2 17 2 10 19 48
CR3 65 8 50 95 218 CR4 14 0 20 23 57 CR5 31 9 16 24 80 Totals 162 27 118 182 489

19
Neighborhood Summary The table below presents all the Nuisance Properties in each neighborhood since the program started
in October 2013.
Section
Quadrant Neighborhood 22A.03.a 22A.03.b 22A.03.c 22A.03.d Neighborhood Total
NE
Misc. NE 34 3 16 20 73
Kenwood Park 3 0 1 12 16
Mound View 18 6 10 18 52
Noelridge Park 1 1 3 2 7
NW
Misc. NW 8 1 14 17 40
Cleveland Area 0 0 2 2 4
Northwest Neighbors 13 2 11 19 45
Upper NW 4 0 8 8 20
SE
Misc. SE 17 1 12 26 56
Kenwood Park 1 0 0 0 1
Oak Hill Jackson 9 2 8 29 48
Uptown District 2 0 0 1 3
Wellington Heights 44 5 42 61 152
SW
Misc. SW 28 6 7 18 59
Cleveland Area 0 0 1 4 5
Southwest Area 5 0 3 6 14
Taylor 10 4 7 24 45
Westdale Area 6 2 7 3 18
Total Nuisance Properties 203 33 152 271 659

20
Neighborhood Summary In Compliance
Section
Quadrant Neighborhood 22A.03.a 22A.03.b 22A.03.c 22A.03.d Neighborhood
Total
NE
Misc. NE 27 3 12 13 55
Kenwood Park 3 0 1 6 10
Mound View 14 6 10 14 44
Noelridge Park 1 1 2 1 5
NW
Misc. NW 6 0 11 11 28
Cleveland Area 0 0 2 2 4
Northwest Neighbors 12 1 9 15 37
Upper NW 3 0 6 6 15
SE
Misc. SE 14 1 10 17 42
Oakhill Jackson 8 1 6 18 33
Uptown District 2 0 0 1 3
Wellington Heights 38 4 33 47 122
SW
Misc. SW 20 6 6 10 42
Cleveland Area 0 0 1 2 3
Southwest Area 3 0 2 5 10
Taylor 7 2 2 12 23
Westdale Area 3 2 5 2 12
Total Nuisance Properties 162 27 118 182 489

21
BACKGROUND CHECKS
The number of background checks requested through RentPrep has remained fairly consistent over the past several months. In April 17 background checks were conducted. These checks were ordered by a total of 10 registered landlords with the City of Cedar Rapids. Overall, there have been 6,576 background checks ordered by 488 landlords. The background checks consist of a 50-state criminal history search, active Iowa warrants, Cedar Rapids arrests, as well as checks of the National Sex Offender Registry and the National Terrorist List. Landlords also have the option to order additional screenings including Social Security Verification, Eviction Histories, and Lien/Bankruptcy Histories. 8 of the 17 (47.06%) background checks in April 2018 included these additional screens and 1,943 of the 6,576 (29.55%) total background checks included them. 9 of the 17 (52.94%) individuals screened in April 2018 yielded at least one reportable hit on their criminal history. Overall, 2,774 of the 6,576 (42.18%) background checks have at least one reportable offense in their criminal history. In accordance with the Fair Credit Reporting Act, a misdemeanor crime is reportable for 7 years and a felony is reportable for the lifetime of the individual. Overall Statistics 49.07% of the prospective tenants currently living in Cedar Rapids yielded a reportable criminal history (1821 of 3711) 46.95% of the prospective tenants currently living in Linn County yielded a reportable criminal history (2087 of 4445) 44.46% of the prospective tenants currently living in Iowa yielded a reportable criminal history (2430 of 5465) 30.96% of the prospective tenants currently living outside of Iowa yielded a reportable criminal history (344 of 1111) The top 5 misdemeanor and felony violations found are shown below. The offenses are broken down by state of arrest, as many states have different qualifications for offenses (i.e. what may be a misdemeanor in one state is a felony in another). All offenses shown below are defined by the Iowa State Code unless otherwise noted.
Most Common Offenses Found on Background Checks Misdemeanors Felonies
Public Intoxication (851) 1. Burglary 3rd Degree (134) Theft 5th Degree (523) 2. Theft 2nd Degree (127) Possession of a Controlled Sub. (469) 3. Forgery (117) Operating without a Valid License (429) 4. OWI 3rd and Subsequent (104) Driving While Barred (382) 5. Controlled Substance Violation (79)
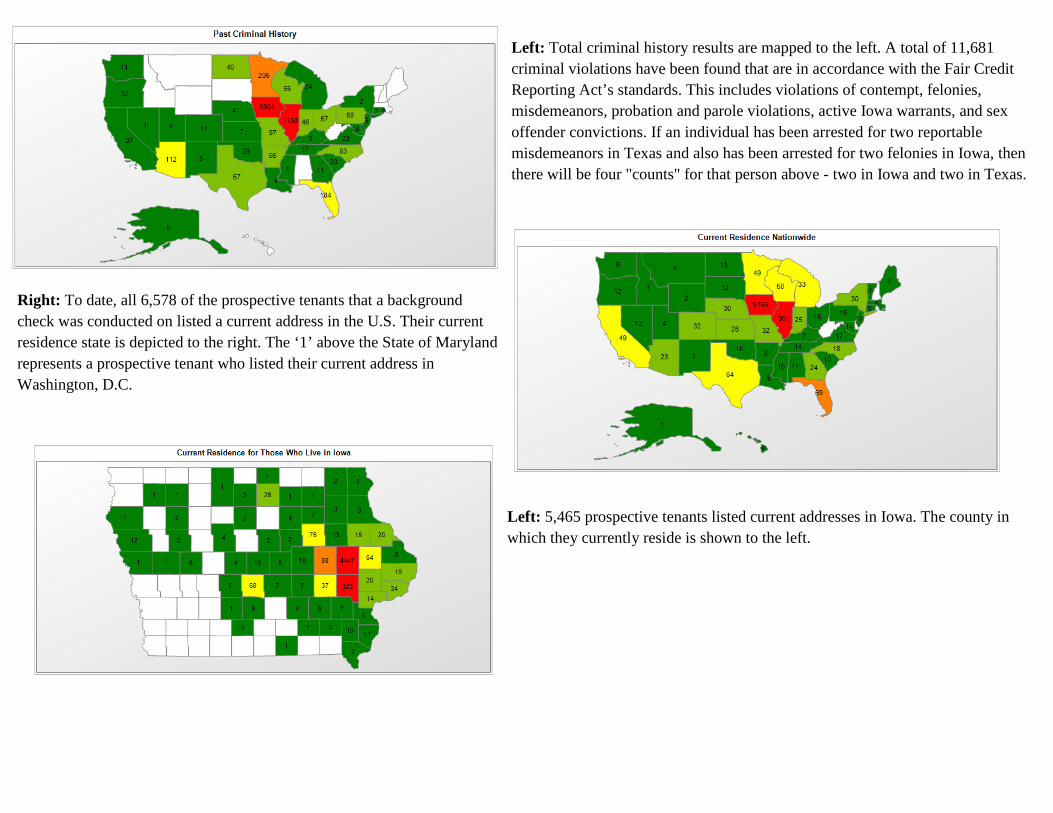
Left: Total criminal history results are mapped to the left. A total of 11,681 criminal violations have been found that are in accordance with the Fair Credit Reporting Act’s standards. This includes violations of contempt, felonies, misdemeanors, probation and parole violations, active Iowa warrants, and sex offender convictions. If an individual has been arrested for two reportable misdemeanors in Texas and also has been arrested for two felonies in Iowa, then there will be four "counts" for that person above - two in Iowa and two in Texas.
Right: To date, all 6,578 of the prospective tenants that a background check was conducted on listed a current address in the U.S. Their current residence state is depicted to the right. The ‘1’ above the State of Maryland represents a prospective tenant who listed their current address in Washington, D.C.
Left: 5,465 prospective tenants listed current addresses in Iowa. The county in which they currently reside is shown to the left.

City of Cedar Rapids Section 8 Housing Choice Voucher Program:
April 2018 Quarterly Participant Report
Background Information The Section 8 Housing Choice Voucher (HCV) Program is funded through the U.S. Department of Housing and Urban Development (HUD) and
administered locally by the City of Cedar Rapids Housing Services Division. The purpose of the program is to provide monthly payments on behalf
of the tenant, to the landlord to assist the household with their rent.
Update: On November 15, 2016 the waiting list opened to accept pre-applications to the Section 8 HCV program. Approximately 1,321 pre-
applications were accepted and the waiting list was closed. See Figure 1 for additional information.
Update: There are currently 91 active participants in our Family Self Sufficiency Program and 54 families have a positive escrow account balance. 1
family graduated this quarter, receiving a total of $5,296 in escrow funds.
Below is demographic information gathered about program participants of the City of Cedar Rapids Section 8 Housing Choice Voucher Program. FIGURE 1: FIGURE 2:
End of Participation: January 1, 2018 – March 31, 2018
Of 1,073 Total Tenants - 35 Ended Participation
Number of
Tenants
%
Ended
Reason for Ending Participation
22 63% Left in Good Standing
13 37% Terminated for Program Violations
Of the 13 Program Violators
0
Terminated for Criminal Activity
13
Terminated for other Program Violations
New Waiting List Admissions:
Zip Code before
Admission % of the New Admissions
Linn / Benton County 95%
Other IA Counties 2%
Other States (3) 3%
Applicant families on
waiting list 1,166

Active Participants Demographics
The demographics in this section of the report reflect information gathered in April 2018 on active participants in the Section 8 HCV program. Please
note that demographics may vary based on participants leaving the program or moving to other jurisdictions when the aggregate numbers were
pulled.
Currently 16% of participant families are 62 years old or older and 47% have a disabled head of household. Currently 50% of participants are
families with children.
FIGURE: 3
FIGURE: 4
Figure 3 shows an average monthly share of rent paid by participants
is $220. The average monthly subsidy paid by our PHA (to the
Landlord) is $415 for April 2018. On average, the contract rent is $624
per participant.
FIGURE: 5
Figure 5 shows 73% of our active households as of April 2018 had an
annual income of $15,000 or less.
Figure 4 shows 88.2% of families participating in the program in April
2018 were households of 4 or less persons.
For more information about program demographics, contact the
City’s Housing Services Office at (319) 286-5872. To learn more
about the program, visit the “Section 8 Rent Assistance” page of
the City’s website, www.CityofCR.com.
19%
31%23%
13%
7%4% 3%
Household Income
Less than $5,001
$5,001 - $10,000
$10,001 - $15,000
$15,001 - $20,000
$20,001 - $25,000
$25,001 - $30,000
$30,001+
Active Participants Average Rents
Tenant Rent
$220
HAP $ $415
Contract Rent
$ 635
April 2018 Household Members
Household Member
Size
# of
Families
Percentage
1 470 43.8%
2 172 16.0%
3 170 15.8%
4 135 12.6%
5 77 7.2%
6 36 3.4%
7 8 0.7%
8 1 0.1%
9 3 0.3%
10 1 0.1%
Total 1073


![Short Voyages to the Land of Gregarious Animals: Political Aesthesia in 'Sto Lyko' and 'Sweetgrass' [prepublished draft version]](https://static.fdokumen.com/doc/165x107/632239ec807dc363600a5734/short-voyages-to-the-land-of-gregarious-animals-political-aesthesia-in-sto-lyko.jpg)


