Virtual Inter faces: Research and Applications - NATO STO
201
- __ 'ACE RESEA_.-. . - DEVELOPMENT 7 RUE ANCELLE 92200 NEUILLY SUR SEINE FRANCE . A AQARD CONFERENCE PROCEEDINQS541 Virtual Interfaces: Research and Applications (Les Interfaces Viielles entre Recherche et Applications) Pqprrs presented at the AdloJpan Medical Panel Sympoaiwn held iR Uh. Portugal, 1&i1-22nd October 1993. I - NORTH ATLANTIC TREATY ORGANIZATION I Published May
-
Upload
khangminh22 -
Category
Documents
-
view
1 -
download
0
Transcript of Virtual Inter faces: Research and Applications - NATO STO
- _ _ 'ACE RESEA_.-. . - DEVELOPMENT 7 RUE ANCELLE 92200 NEUILLY SUR SEINE FRANCE
.
A
AQARD CONFERENCE PROCEEDINQS 541
Virtual Inter faces: Research and Applications (Les Interfaces Viielles entre Recherche et Applications)
Pqprrs presented at the AdloJpan Medical Panel Sympoaiwn held iR Uh. Portugal, 1&i1-22nd October 1993.
I
- NORTH ATLANTIC TREATY ORGANIZATION
I
Published May

AGARD-CP-541
r
”
ADVISORY GROUP FOR AEROSPACE RESEARCH & DEVELOPMENT 7 RUE ANCELLE 92200 NEUILLY SUR SEINE FRANCE
AGARD CONFERENCE PROCEEDINGS 541
Virtual Interfaces: Research and Applications (Les Interfaces Virtuelles entre Recherche et Applications)
Papers presented at the Aerospace Medical Panel Symposium held in Lisbon, Portugal, 18th-22nd October 1993.
North Atlantic Treaty Organization Organisation du Traite de I’Atlantique Nord
I

The Mission of AGARD
According to its Charter, the mission of AGARD is to bring together the leading personalities of the NATO nations in the fields of science and technology relating to aerospace for the following purposes:
- Recommending effective ways for the member nations to use their research and development capabilities for the common benefit of the NATO community;
- Providing scientific and technical advice and assistance to the Military Committee in the field of aerospace research and development (with particular regard to its military application);
- Continuously stimulating advances in the aerospace sciences relevant to strengthening the common defence posture;
- Improving the co-operation among member nations in aerospace research and development;
- Exchange of scientific and technical information;
- Providing assistance to member nations for the purpose of increasing their scientific and technical potential;
- Rendering scientific and technical assistance, as requested, to other NATO bodies and to member nations in connection with research and development problems in the aerospace field.
. The highest authority within AGARD is the National Delegates Board consisting of officially appointed senior representatives from each member nation. The mission of AGARD is carried out through the Panels which are composed of experts appointed by the National Delegates, the Consultant and Exchange Programme and the Aerospace Applications Studies Programme. The results of AGARD work are reported to the member nations and the NATO Authorities through the AGARD series of publications of which this is one.
.. ”
Participation in AGARD activities is by invitation only and is normally limited to citizens of the NATO nations.
The content of this publication has been reproduced directly from material supplied by AGARD or the authors.
Published May 1994
Copyright 0 AGARD 1994 All Rights Reserved
ISBN 92-835-0746-0
Printed by Specialised Printing Services Limited 40 Chigwell Lane, Loughton, Essex IGl0 312
Preface
The overall effectiveness of aerospace systems can be greatly improved by more efficient use of human performance and human decision making. Most aerospace systems that involve a human and a responsive machine appear limited by the design of the interface between them. These interfaces support the human’s situational awareness and provide interpreted command and control for mechanistic implementation.
Recent advances in. technologies for information display and sensing of human movements, combined with computer based models of natural and artificial environments, have led to the introduction of so-called virtual interfaces. Virtual interfaces offer increased flexibility and naturalness, so are considered for use in several domains including aviation, training, design, simulation and robotics.
Papers presented at this symposium considered issues of research and application in virtual interfaces broadly defined. Issues of technology integration for system development were considered separately from issues of movement monitoring or sensory display. Issues of human performance measurement were presented in the context of both research and application. A description of systems in engineering development for cockpit and for telesurgery was also presented.
Preface
L’efficacitC globale des systkmes atrospatiaux peut &tre considCrablement amCliorCe par I’exploitation plus judicieuse des performances humaines et I’emploi effectif de la prise de dCcision humaine. La plupart des systkmes akrospatiaux qui mettent en prksence un &tre humain et une machine interactive semblent &tre limitis par le type d’interface qui les rCunit. Ces interfaces renforcent la perception de la situation par I’opCrateur humain et foumissent des ClCments interpr6tC.s de commandement et de contr6le pour application mCcanique.
Les progrks rCalisCs rCcemment dans le domaine des technologies de l’affichage des donnCes et de la dCtection des mouvements humains, alliCs aux moddes informatisCs des milieux naturels et artificiels, ont conduit i la mise en place d’interfaces dites virtuelles. Les interfaces virtuelles offrent plus de souplesse et de nature1 et elks sont donc envisagCes pour les domaines tels que I’aviation, la formation, la conception et la robotique.
Les communications prCsentCes lors de ce symposium examinaient certains sujets de recherche et de leurs applications dans le domaine des interfaces virtuelles dans le sens large du terme. Les questions concernant I’intCgration des technologies aux fins du dCveloppement des systkmes ont CtC considCr6es sCparCment des questions de suivi des mouvements ou de I’affichage sensoriel. Les questions concernant I’Cvaluation des performances humaines ont CtC prCsentCes dans le double contexte de la recherche et des applications. Une description des sysdmes destinCs i I’habitacle et i la tClCchirurgie et actuellement au stade de dCveloppement de I’ingtnierie a tgalement CtC fournie.
... 111

Aerospace Medical Panel
Chairman: Prof. Dr Med. L. Vogt Institut fur Flugmedizin DLR Postfach 90 60 58 Linder Hohe D-5 1 147 Koln 90 Germany
Deputy Chairman: Colonel P. Vandenbosch VSM Director Aeromedical Services BAF Kwartier Koning Albert 1 er Raketstraat 70 B-l I30 Brussels Belgium
TECHNICAL PROGRAMME COMMITTEE
Dr J.F. Tangney (Chairman) AFOSWNL 1 I O Duncan Ave.- Suite B1 15 Bolling AFB
United States DC 20332-0001
Dr K.R. Boff AUCFH Bldg 248 - 2255 H. Street Wright-Patterson AFB
United States OH 45433-7022
Ms J. Davies British Aerospace Defence Ltd Military Aircraft Division Farnborough Aerospace Centre PO Box 87 Farnborough Hants CUI4 6YU United Kingdom
Local Coordinator Major N.P. Ribeiro Base do Lumiar Centro de Medica Aeronautica 1600 Lisbon Portugal
Mail from Europe:
Attn: AMP Executive 7, rue Ancelle
AGARD-OTAN .
Dr S. Hart Chief, Rotorcraft Human Factors NASA Ames Research Center Moffett Field CA 94035 United States
Dr A. Ltger Sextant Avionique Rue Toussaint Castros BP 91 33 I66 Saint Mtdard en Jalles France
Dr J. Smit Head, Research and Development National Aerospace Medical Center Karnpweg 3 - PO Box 22 3769 ZG Soesterberg The Netherlands
Host Nation Coordinator Col. A. Entrudo Director - Direccao de Saude Forca Aerea Portugesa AV. Leite de Vasconcelos Alfragide - Amadora Portugal
PANEL EXECUTIVE
Major R. Poisson, CAF
Mail from USA and Canada:
Attn: AMP Executive PSC 116
AGARD-NATO
-_
92200 Neuilly-sur-Seine APO AE 09777 France
Tel: 33( 1) 47 38 57 60 Telex: 610176 (France)
Telefax: 33 ( I ) 47 38 57 99
iv
Contents
Pre face/PrCface
Aerospace Medical Panel and Technical Programme Committee
Technical Evaluation Report by J.F. Tangney
Keynote Address - A Research Agenda for Virtual Environments by R.S. Kalawsky
SESSION I - SYSTEM INTEGRATION 1
Task-Specific Usability Requirements for Virtual Information Environments: Interface Design and Data Representation for Human Operators of Complex Medical Systems -
by M.S. Nilan
- Profile Analysis of After-Effects Experienced during Exposure to Several Virtual Reality Environments
by R.S. Kennedy, M.B. Jones, M.G. Lilienthal and D.L. Harm
On the Feasibility of Virtual Environments in Medicine
Interfaces Vocales pour les Systemes Operationnels
by A.C.M. Dumay and G.J. Jense
par F. Marque, T. LabarrQe et F. Nee1
SESSION I1 - SYSTEM INTEGRATION 2
Le Grand Ecran Interactif: Un Outil de Dialogue Multimodal pour les Futures Cabines de Pilotage
par B. Barbier, E. Filliatre et I. Irigaray
Immersive Virtual Environments as Trainer: System Design from a Cognitive Stance by M. Wierda, P.C. van Wolffelaar and W. van Winsum
Creation of a Virtual World to Study Human Spatial Perception during Sustained Acceleration
by T.L. Chelette, R.L. Esken and E.J. Martin
The DRA Virtual Cockpit Research Programme
Virtual Reality Evolution or Revolution
by Jheson
by C. Grimsdale
Page
iii
iv
Reference
T
K
5
V
Reference
SESSION I11 - SENSORY TECHNOLOGY PLUS EVALUATION
Manual Tracking Performance using a Virtual Hand Controller: A Comparison Study by R.G. Eggleston, W.P. Janson and S . Adapalli
A Non-Intrusive Way to Measure Point of Gaze by G.D.R. Zon, H.A. Mooij and J. Bouwens
Operator Gaze Position Control Interfaces: Investigation of Psychophysical and Operational Parameters
Orientation du Regard sous Facteur de Charge - Aspects Methodologiques - Resultats Preliminaires (Gaze Orientation under G, load - Methodological Aspects - Preliminary Results)
A Comparison of Two Examples of Magnetic Tracker Systems
by D.M. Stampe, E.M. Reingold and J.J. Grodski
par P.B. Sandor, I. Hortolland, F. Poux et A. LCger
by M. Williams
I SESSION IV - HUMAN PERFORMANCE ISSUES
Attenuating the Disorienting Effects of Head Movement during Whole-Body Rotation using a Visual Reference: Further Tests of a Predictive Hypothesis
Some Side-Effects of Immersion Virtual Reality
by B.D. Lawson, F.E. Guedry, A.R. Rupert and A.M. Anderson
by E.C. Regan
Visual Accommodation to Virtual Image Displays when Knowledge of Object Distance Conflicts with Optical Distance
by J.C. Kotulak, S.E. Morse and R.W. Wiley
Low Cost Software-Based Rendering and Stereoscopic Interfaces for Teleoperation and Virtual Reality
Approche Experimentale du Son 3D: Mbthodologie et RCsultats Preliminaires
by D.M. Stampe and J.J. Grodski
par L. Pellieux et autres
The Use of a Tactile Interface to Convey Position and Motion Perceptions by A.H. Rupert, F.E. Guedry and M.F. Reschke
vi
10
11
12
13
14
15 ...
16 -
17
18
19
20
TECHNICAL EVALUATION REPORT
by
John F. Tangney, Ph.D. Air Force Office of Scientific Research
Washington DC 20332-0001
1. INTRODUCTION
The Aerospace Medical Panel held a Synpxbm on Virtual Interfaces: Research and Applications" at facilities of the Portugese Air Force W e d in Lisbon, Portugal, 18-22 October 1993. Twenty papers were presented along with an invited address and three video- taped demonstrations of interlace technologies, and some round table discussion of major issues for research and development. Papers represented contributions by five NATO countries, with ninety registrants in attendance
% representing hnrefve NATO countries.
2. THEME
At the 72nd Business Meeting of the Aerospace Medical Panel, hekl October 1991 in Rome Italy, approval was obtained for a symposium to present the current state of research and development in synthetic interfaces with the goal of informing system designers who might be considering the use of such interfaces in aerospace environments.
Discussion of this topic at previous Business Meetings revealed a broad interest in the topic of virtual interfaces, but too few sustained efforts in research or development acmss the NATO countries to support lengthy consideration of the lessons learned or the research findings that might be used to inform efforts of other member countries.
By fall of 1991, however, efforts using virtual interfaces were underway in several NATO countries It a b became increasingly clear that the multidisciplinary nature of the research and the number of options possible for implementing any interface desiin were sufficiently large that a symposium for reports of progress would benefit all. A greater degree of coupling between these efforts then became a secondary
goal of the planned symposium to consider virtual interfaces in aerospace application domains.
3. PURPOSE AND SCOPE
The interface between humans and machines is changing dramatically in aerospace occupations with the introduction of new sensing technologies that permit continuous monitoring of human movements, and new di iay technologies that can provide substiies for the m a l experiences of vision, hearing, touch and other senses. When used in combination, these technologies can be used to create a "virtual interface" for human operators through the closed kop computerized contrd of their sensory experience.
Effective implementation of virtual interfaces presents a number of challenges to basic and applied research scientists. System designers must seled components from a varied assortment of hardware and software for each job implemented. The specifications for these components can vary widely. Human factors scientists must specify the costs and benefii, in terms of human performance, of using these technologies for specific work environments and must adapt these technologies to different tasks. Basic researchers are challenged to develop more complex models of human performance that can be used to constrain the design process.
Papers were solicited on three broad topics of virtual interface: (1) the sensing of human movement and pasture, (2) the display of informati to human operators, and (3) the issues of system integration. Submitted papers were reviewed by the technical program committee, as approved by the Aerospace Medical Panel, consisting of Dr. K. Boff (US), Dr. J. Davies (UK), Dr. S. Hart (US), Dr. A.
Technical Evaluation Report an Aerospace Medical Panel Sympasium on 'Virtual Inletfaces: Research and AppIicarions'. October 1993.
Lager (FR), and Dr J. Smit (NE). This committee was ass**ted by a NATOprovlded advisor, Dr N. Durlach (US).
4. SYMPOSIUM PROGRAM
The synposium included a keynote address MI the research agenda for virtual interfaces delivered by Professor Kalawsky of the UK, and four technical sessions: (1) System integration I , chaired by Dr. J. Davies (UK); (2) System Integration II, chaired by Dr. J. Smit (NE); (3) Sensory Technology plus Evaluation, chaired by Dr. A Leger (FR) and LCdr D. Dolgin (US); and (4) Human Performance Issues, chaired by Lcd S. P o w (IT) and Dr. K. Boff (US).
Video-taped demonstrations were also shown, on the use of virtual interfaces for telesurgery, architectural design, and telerobotics. A general discussion capped the meeting in an attempt to reach consensus on conclusions and recommendations.
5. TECHNICAL EVALUATION
In his keynote address, Professor Kalawsky surveyed the domain of virtual interfaces, including issues of definition, application, research, and business decisions affecting pmgress in the field. He proposed adopting a three part definition that includes computer- based models of an environment (autonomy) combined with an ability for human interacbn (interaction) done in a way that supports natural modes of human interaction (presence). In this suwey of application domains and research issues, he noted the relative maturity of visual display devices (for example) compared to other interface technologies of tactile displays or haptic sensing (for example). He concluded by emphasizing the need for truly collaborative multidisciplinary work at a system level to afford progress in the field.
5.1
This session included descriptions of systems for training. medicine and general graphical user interfaces.
A broad overview of interface design was provided by Nilan (paper XI), emphasizing an efficiency criterion to distinguish the value of one
interface desiin from another. Without mentioning specific ways that efficiency of two or more designs niight be measured and compared, Nilan pointed to examples where guidlines for design were extracted from social psychological reseach and cognitive research to greatly improve the speed and accuracy of performance using the redesigned interfaces. Such general guidlipes can be applied in dtferent task domains by extensive first use of user surveys, for example. The paper describes one example involving the redesign of a graphical user interface that more naturally matches information requirements to operator inputs needed to gather the information.
The Kennedy (paper #E) report on motion sickness is reportd later in the sedion MI Human Performance.
Medical applications for virtual environments were surveyed by Dumay and Jense (paper M), who presented a ltaxonomy of application domains (including m e d i i education, training, surgery and rad b y ) that might take
optimistic about the potential for virtual systems, Dumay mentioned a currenl lack of commercial availabilii and suggested that this may be due, in part, to a lack of hiah precision devices for display (visual, tactile, and force feedback) and suitable models of medi i objects.
A system for training air traffic controllers was described in a paper by Marque and colleagues (paper #). The system is not fully virtual, kn relies extensively on voice recognition and artifcial speech, combined with some expert systems, to replace the human teacher in a simulation environment. Performance of the speech recognition system is described in some detail, and provides an example of the ways that multi-sensory processing might be used to add value to existing traiiping regimes.
5.2 7 The combined use of multi-sensory virtual interface for pilots w s described by B a h i i and colleagues (paper #5), in an effort to increase the naturalness of the human machine interface by including vision, speech and gestural devices in a single system.l Several experiments were described using the system in which the speed
advantage of virtual 7 nterfaces. while generally ,
T-3 I
of decision-making or response execution was measured for each of several interface design o p t b .
Novel appmaches to system design were outlined by Wierda and colleagues (paper 4%) and described in the context of a virtual trainer for vehicular control (driiing). An approach based on cognitive engineering can intuitiiely be shown to pmvide a means for separating the design goak of a system from the implementation strategies for meeting those goals. For example, a complete model of the deciskn making during vehicular control could be used to automate c e M i portions through systems of expert aiding or through impmvements to the human interface.
An apparatus for measuring human performance under acceleration was descn'bed by Chelette and colleagues (papef#7) and used to assess the magnitude of the G-excess illusion under conditions of several constant G(z) bads and static head yaws. The apparatus, implemented on a centrifuge, includes helmet mounted virtual visual displays, combined head tracking, and a device for recording hand position to indicate . perceived spatial attitude. The device permits experimental manipulation of the coupling . Ween visual and vestibular inputs to human operatom Primary results concern the sensilii*ity of iuusOry till (pitch and roll) to head position under G-bad.
A prototype and testbed for a virtual cockpit was described by lneson (paper #8), with emphasis on the implementing hardware and the display formats for prlnwy flight mntd. The system features selectible display options (e.g. visual stereo, variable temin features) and establishes an apparatus for assessment of primary design options and human facton issues in virtual flight contrd. One interesting human factor issue concerns the possible contusion of head and akcraft attitude change (given some transport delay in visual image generation).
A pmduct for high-realism in virtual visual displays was presented by Grimsdale (paper #9) with integrated hardware and software that support near real-time updates of realistically rendered complex objects (such as an automobile imaged with glints, wflections, shadows and texturing).
5.3 p
Petformam with a novel virtual hand conW..~ was compared with a standard joy-stick controller in a preliminary report of experiments by Eggteston (paper #lo). Primary findings concern rough equivalence between controllers in a task of single axis continuous tracking. Methodologii issues were also raised concerning techniques of comparing dev-ices whose parametric descriptions may not be valid (in this case, in terms of underlying kinematics).
A device for measuring point of gaze was used in an experiment reported by Zon and colleagues (paper ell) to assess the increased accuracy in reporting visual detail as dwell time of fixations increase. The device incorporates an infrared camera for tracking eye position (with respect to head) using the bright pupil method, and a six degree of lreedom head tracking module. Calibration of the device and its specifcations are described together with the data mentioned earlier.
A second device lor measuring point of gaze was reported by Stampe (paper #12) and used to demonstrate how caliative functions could be performed continuwsly and adaptively in environments where the positions of some targets lor eye-movements are known. Human lacton issues of keyboard me visual displays were also discussed in the context of matched resolution both spat-d (between precision of eye position measures and spacing of targets) and temporal (the optimal fixation dwell time to indicate selection of the taiget rather than search). Experbnents demonstrate that, as an input device, visual selection could provide bandwidul sufficient for several special PUP=.
A device for head and eye position monitoring, installed in a centrifuge, was described by Sandor and colleagues (paper # 13). E 9 movements were recorded using a comeal reflex technique, with head movements recorded by tracking helmet mounted infrared emitten. This technique does not use magnetic field sensing and so is well suited to the environment of a centrifuge. Preliminary results are reported in the tracking of continuous and saltatory visual

T-4
targets with combined head and eye movements under (up to) 6 G(z).
Extensive data were repotted on the relative performance of two commercially available podtbn sensing d e v i i by Williams (paper #14). Measured factors include stability, noise, cross-talk. linearity, and distortion caused by metallic interierence. Some delailed discussion of the devices was presented together with a description of the evaluation scheme. Differences are repotted that would affect the selection of one device over another for different operating environments or different design SPecif i iOnS.
5.4
A newly constNded centrifuge based flight simulator was described by Lawson and colleagues (paper #IS). In a series of experiments to examine ameliomting effects of visual cues in disorientihg situations of head movements under G fields, in this case produced by rotating supine subjects about a vertical axis passing through the head. Primary results concem findings similar to those found with other axes of rotation: in the datk, weaker disorientation during accelleration than during constant velocity; with visual stimuli, these effects are attenuated. Results are discussed in terms of potential problems with centrifuge based flight simulations.
Two papers presented data suggesting that stomach awareness may develop when using virtual environments. Kennedy and colleagues (paper #2) described a scoring system used to assess the degree and the nature of mdion sickness. Data support the notion that three types of effect (nausea, disorientation, and ocubmotor) may be produced. The pattern of effects appear stable at different installations, qgesthg that each effect may be produced by a specifc failure to provide fidelity in implementation.
The second paper concerning motion sickness like reports was presented by Regan (paper #IS). who desuibed the frequency and magnitude of malaise in approximately 150 subjects. After twen!y minutes, roughly five percent withdraw from the experiment due to malaise, with mughly hall showing malaise at
level two or greater. bartially wccesfu~ coping strategies are also reported. These indude reductions in the frequency, speed and magnitude of head mavements.
Retinal image quality may be degraded under some conditions of vimal imagery. Kotulak and colleagues (paper 117) report nokaptical factors can determine monocular visual accommodation in a fraction of viewers H the optical dietance and physical distance of seen objects differs by a large factor (as can pippen, for example, with vision aiding devices). Most virhral systems are b i i l a r . however, so these results may no! extend to the maprity of those systems.
A sottware suite of hls for generating virtual imagery on personal computers was described and offered by Stampe and Grodski (paper #Is). The software prarideS the capability for wim drawings, and stereo dispiays at reasonable fram rates. The software inckrdes a set of mathematical routines that provide mltiple viewpoints of the $ame virtual objects for multiple viewers.
Issues in three dimnsional audio for virtual interfaces was degcribed by Pelliew and colleagues (paper e o ) , using a faciliiy foi measuring individual Head-Related Transfei Functions (HRTFs) mat describe the weighting of sou+ sources at different locations. Experiments are reported on accuracy of locating virtual audm swrces in three space. Individual differences are reported. Greater accuraoy in bimuth v m s elevation is reported. The use of audio cues to enhance situational awareness and to localize threats was also discussed.
A navel tactile display device was described by Rupert and colleagues (papar MO) and used to convey attitude information to pibts wearing the device (an array of kctile stimulators wrapped mainly around the torso). With the device, precision in maintaining fixed bank and roll could be maintained after some practice. The formatting of tactile displays to convey basic flihl information was also discussed.
5.5
Sevml applications were demonstrated on videotape. These included telesurgery, m e d i i
I
T-5
training, architectural design, and voice other work needs to be done to adapt the tools inpuVwtput systems. for use in virtual environments.
6. CONCLUSIONS
No systems using virtual interfaces are yet fielded. With few exceptions (paper RS), system level devebpment also is not yet underway among NATO laboratories reporting here. Conceptual desQns and partial implementations, however, are easily found for applications in medicine (paper #3), training (keynote paper and paper M), and design (paper #9). Impediments to system development currently appear to include three major factors, associated with technology, design, and research. Technokgical impediments indude uncertainty about how best to monilor human performance (papers #4, 5, 6, I O . 11. 12, 13, 14). Design issues concern how to select among wmemus desiin options, in a principled way, by measuring any performance benefits of virtual intdam (papers # I , 3, 8. 18). Research issues concern how best to predii the perceptual effects of imperfectly rendered or
* symboliiUy encoded natural environments - @apers #6, 7, 15, 17, 19, 20), how to pmvide
necessary computational resources for virtual -- disphys (papers #9, 18). and perhaps most
- impoitant for m a l use, how to eliminate the malaise experienced by a portion of the population using virtual environments (papers U;! and 16).
7. RECOMMENDATIONS
Aerospace m e d i i applications for virtual inteffaces are not suffciently distinct from appliMtiins in other domains (e.g. command and control, lrainh and simulation. design) to warrant a completely distinct research and development effort devoted to aeromedicine.
The took for construction of virtual interfaces derive from multiple disciplines. Research on tools can pmeed independently of research on systems. Examples from thii meeting indude devices for monitoring head, eye and hand movements, and speech production. Other examples inciude visual, auditory, and tactile displays. Performance monitoring and display technologies have appliibns in domains broader than virtual interfaces. As a result.
The constellation of took used to implement a demonstration of virhral technology, even if readily available, do not sufficiently constrain the design options. As a result, additional research is needed on concept definition and performance evaluation (against technologies currently used) to demonstrate that virtual solutions to interface problems add unique capability or provide measureable perfonnance benefits.


K- 1
A RESEARCH AGENDA FOR VIRTUAL ENVIRONMENTS
Professor R.S. Kalawsky British Aerospace Defence Ltd
Military Aircraft Division Brough
North Humberside UK
HU15 1EQ
1. SUMMARY During recent years a great deal has been written and discussed about Virtual Reality. In fact Virtual Reality has received almost unprecedented press and media coverage. News and views of its capabilities have been made and along with films and amusement games, Virtual Reality has been portrayed to the general public as an experience within a fantasy world. Most people now associate Virtual Reality as a 'new' technology which consists of a helmet mounted display, a glove-like device and a high performance graphics system. They do not
. realise that Virtual Reality is not a new technology and the aforementioned description of it is only one type of a virtual interface system. Concepts underlying virtual
-- environment systems look set to revolutionise the future aerospace business. With cutbacks in defence spending there is even greater need to employ cost effective measures to improve the efficiency of the business. Applications are likely to range from simulation, cockpit design studies, maintainability assessment, more cost effective training through to complete product visualisation. However, key issues have to be identified and addressed before being developed and applied to a specific task or application.
This paper explains the difference between Virtual Reality and Virtual Environment systems and discusses the requirements of a Virtual Environment System. Moreover, key outstanding research issues are highlighted and recommendations for the way ahead are given.
2. WHAT DO WE MEAN BY VIRTUAL ENVIRONMENTS ? Virtual Reality, Virtual Environments, Artificial Reality, Cyberspace, and Synthetic Environments are a few of the terms used to describe the same concept. Although Virtual Reality is the term that has become the most popular, a great deal of research has to be undertaken before we can achieve virtual reality. Therefore, the term 'Virtual Environments' seems to be a more appropriate term to use. Ellis' (1993) suggests that virtual environment systems are a form of personal simulation system.
Most people associate Virtual Environments with a helmet mounted display, a glove-like device and a high performance graphics system, but such a system is only one type of a virtual interface system.
Today, it is awkward and difficult to define a virtual interface system because as yet there are no clear or consistent definitions to guide us. Many definitions have been proposed, but probably the best abstract description for a virtual interface system is given by Zeltze8 (1991).
The definition is based on a model that 'assumes' that any Virtual Environment has three components: 1. A set of modeldobjects or processes. 2. A means of modifying the states of these models. 3. A range of sensory modalities to allow the participant to experience the virtual environment.
Zeltzer represents these components on a unit cube with vectors relating to autonomy, interaction and presence. (Refer to Figure 1)
Virtual reality
(1.0.0)
Aulonomy
Conventional CAD or automation
(o'o.o) Interaction
Figure 1 Zeltzer's Autonomy, and Presence Cube
Autonomy refers t0.a qualitative measure of the virtual object's ability to react to events and stimuli. Where no reaction occurs then the autonomy is 0 whereas for maximum autonomy a value of 1 is assigned. Scaling between 0 and 1 in this context is purely qualitative.
Presented at an AGARD Meeting on 'Virtual Interfaces: Research and Applicarions', Ocrober 1993.
K-2
Interaction refers to the degree of access to the parameters or variables of an object. A rating of 0 applies to non real time control of the variables. For example, variables initialised during compilation or at the beginning of execution. A value of 1 is assigned for variables that can be manipulated in real time during program execution. Modem graphics systems allow a very high degree of interaction. However, it is necessary to consider the complexity of the application. A very complex application program may not be able to run in real time.
Presence, or rather the degree of presence provides a crude measure of the fidelity of the sensory input and output channels. The degree of presence has a high dependency on the task requirements - hence the application has a bearing.
At the point (O,O,O) on Zeltzer’s cube is represented the very early graphics systems that were programmed in non real time batch mode. These early systems exhibited no interactivity. Examples include graph plotters and chart recorders. Diagonally opposite this point is our aiming point where we have maximum autonomy, interactivity and presence. This is virtual reality. The sensory simulation would be so complete that we would not be able to distinguish the virtual environment from the real world. The point (0, 1,O) can be achieved today where the user can control essentially all the variables of an object or model during programm execution. This can be achieved in real time. A point approaching (O,l,l) probably represents the status of virtual environments where we can experience a high degree of interactivity with a reasonable degree of presence. Unfortunately, the degree of automation of the objects in the virtual environment is relatively low. The point (l,O, 1) represents the situation where there is a high degree of presence and autonomy but the interactivity is low. An example of this would be a fully autonomous virtual environment where the human becomes a passive observer but is fully immersed in the virtual environment. The only freedom the observer would have is the ability to control their viewpoint. Any change of viewpoint would be oblivious to the objects in the virtual environment.
When the author first attended one of Zeltzer’s presentations he was not convinced that the abstract representation of a virtual environment would serve any purpose. However he now finds that when explaining the different categories of virtual environments, Zeltzer’s conceptual tool is a very useful aid.
3. OUTSTANDING RESEARCH ISSUES There are a’vast array of issues that relate to a virtual environment system. Whilst our understanding in many
areas is quite advanced, our overall understanding of the requirements of a virtual environment system are less clear. Even though we may not necessarily need to achieve virtual reality in the truest sense, we are unable to quantify the requirements of lesser capable systems.
It is tempting to jump on the virtual reality bandwagon and deal only with the technology aspects of the field. However, if the technology is to move forwards then it is be necessary to examine the task before the technology is applied. Only by doing this will it be possible to consider what attributes a virtual environment system brings to the task that cannot be achieved by alternative and lower cost solutions. A business analysis will almost certainly be undertaken which will examine (to a ‘first-order’ assessment) the technological problems that may be encountered. In many respects the business case will provide the necessary justification for employing a virtual environment system.
3.1 Human Perception in Virtual Environments Our understanding of human perception and human factors issues regarding virtual environments is still in its infancy. A considerable amount of research in this area is very important because it is needed to focus the development of enabling technologies. Major research areas include:
3.1.1 Visual perception (i) Spatial resolution - What display spatial resolution is required for a particular task?
-
(ii) Field of view is a difficult parameter to specify. However, to achieve an immersive virtual environment a field of view of 100” or more may be required. To achieve a wide field of view a very large optical system is required. The main aim will be to determine what field of view is needed to perform the task effectively.
(iii) Binocular overlap - This parameter is related to the total display field of view. To achieve stereo displays a degree of binocular overlap is required. Partial overlapping binocular fields may be used to produce a very wide field of view. However, the amount of binocular overlap is important and must be ‘tuned’ to suit the application. Perceptual and human performance studies must be undertaken to determine if a partial overlap solution is appropriate.
(iv) Temporal resolution - What display update or refresh rate is acceptable for a given task? The higher the update requirement the greater the computational performance will be needed.
(v) Visual representation of the virtual environment must be investigated to determine the nature of the scene to be
K-3
used for the application. Some applications may require very high fidelity displays whilst other applications may suffice with simplified, cartoon like images. Obviously, there are large differences between these visual representations. How ‘real’ should the virtual environment appear? The answer must address the spatial and temporal fidelity of the virtual environment. Cost will be a determining factor.
(vi) Is an immersive or desk top system required? (This question can only be answered after consideration of the task, the complexity of the system and the cost.)
3.1.2 Auditory perception (i) In auditory environments the area requiring a great deal more research is the field of 3-D audio localization. Generation of spatialised sound can be achieved with high performance digital signal processors. However, individual differences in pinnae shape can lead to errors when non-personalised head related transfer functions (HRTF) are used. Occasionally a sensation of non- externalization can be experienced. This means that the listener does not perceive the sensation that the sound originates outside the head. Further work is required in characterising HRTF’s and determining the causes for
- lack of externalization in some subjects. Simpler 3-D audio localizer systems do not take account of effects such as reflection and reverberation. These are
-” characteristics of a real environment. Therefore, work . must be undertaken to examine the importance of accurate
modelling of the acoustical environment. Sound in a real environment undergoes multiple reflections from a range of material types before it reaches the ear. Moreover, sound can be received from a single source via a direct path and many indirect routes. These sound waves combine in the ear to give a very complex waveform. The importance of the secondary reflections and indirect path sound signals must be quantified. If these characteristics have to be modelled it will be important to develop second generation audio localizer systems with an order of magnitude improvement in performance.
-
(ii) Improved H R F - To achieve an acceptable degree of spatial auditory localization it is necessary to determine the individual’s HRTF and use this in the audio localisation system. Ideally, a more generalized solution is required that works for many users and eventually becomes user independent.
(iii) Cues for range and localization. It is known that to determine both range and orientation of the sound signal the type of auditory cue presented to the listener is very important. This is particularly so when first time recognition of sound is required.
(iv) Externalization - Many users of spatial sound systems complain that the sound appears to be localized within the head. In other words externalization does not occur. This effect may be a function of the HRTF not being compatible with the listener.
3.1.3 HaptidKinaesthetic Systems (i) In comparison to visual and auditory environments, haptic environments are still in their infancy. To maintain a high degree of presence in the virtual environment it is probable that there will have to be direct contact with virtual objects. Discrete approaches are currently being undertaken to stimulate the tactile and kinaesthetic senses. These are largely confined to force reflecting joysticks, hand/arm exoskeletons and tactile feedback gloves. On investigation, the human haptic system is considerably more complex than one realizes. To convey haptic stimulations it is necessary to take account of surface skin and sub-surface physical properties of the tissues.
(ii) The human hapticlkinaesthetic systems need to be characterized and consideration must be given to temporal variations. Manipulation strategies in real world systems should be determined for a range of tasks. Object characteristics such as compliance and roughness must be defined in a way that these parameters can be encapsulated in a CAD/Virtual environment modelling program. To provide computer synthesised haptic responses it will be necessary to develop a computational model of the physical properties of the skin and underlying tissues.
(iii) In order to apply forces to the hand and arm it is necessary to use a form of exoskeleton into which the hand and arm is inserted. The problem of safety must be addressed because forces of the order of 10 Newtons will be applied. There seems to be no alternative to the exoskeleton but to couple haptic ani kinaesthetic forces to the operator.
(iv) Work is required in the development of lightweight sensors and actuators to keep the overall mass of the exoskeleton at an acceptable level. The bandwidth and frequency response of a force reflecting system needs to be quantified by careful experimentation. Current tactile stimulation systems are essentially stand alone demonstrations of a field of mechanically activated (or pneumatic) ‘points’. Depending on the technology used they either provide small reactive areas (each area covering several square millimetres) or an array of extendable points at a density of 112 mm.
(v) A key element to the development of a haptic display system is a complete analysis of the biomechanical properties of the skin.
K-4
(vi) Bandwidth - To perceive detailed surface texture information it is important to characterize the haptic and kinaesthetic system in terms of bandwidth and dynamic response. If a haptic actuator system is to be built then it must have a bandwidth that exceeds that of the human perception system. A similar requirement exists for force reflective devices, except that the problems of supporting an exoskeleton must be addressed. The actuation system must not only provide the right level of force feedback but it must overcome the mass, inertia and friction of the exoskeleton system.
(vii) Resolution - Equally important to the bandwidth of the haptic system is the resolution of the actuator system used to convey the sensation of touch. The spatial resolution and dynamic range are important parameters.
(viii) Strategies pegonned by the human with haptic tasks must be analyzed in a way that allows the actuator technology to be simplified. It is probably impractical to replicate all the cues provided by picking up an object. Therefore it will be necessary to isolate the dominant cues and ensure that these are presented with a sufficient level of fidelity.
4. Performance Metria The area of performance metrics is extremely important for determining the effectiveness of a particular virtual environment solution. Without any form of metric it is very difficult to match the human operator to the virtual environment. Moreover, it will be almost impossible to optimise the man machine interface because we have to rely on subjective opinion. The problems of defining suitable performance metrics is not unique to the field of virtual environments. Indeed the whole field of man machine interfacing is desperately calling for a set of standard performance criteria. If a suitable set of metrics were to exist then it would be easy to quantify the benefits that a virtual environment system brings over and above alternative approaches. The author encourages researchers to think very carefully about the advantages of applying a series of metrics to the field of virtual environments. Once a set of metrics has been established then hesitant potential investors may be convinced of the real benefits brought by virtual environment technology.
5. Virtual Environment Technology (i) Displays - Urgent research is required to assist the development of true 1000 x 1000 pixel colour displays. These should be full colour, high update rate and be contained within a small package size of about 25.4 mm square. High resolution - Future display resolution requirements are likely to approach the limiting resolution of the eye (1 minute of one) with several minutes of arc being a more practical requirement.
Variable resolution - It is well known that the human eye has excellent visual acuity in the region of the fovea. Outside this area the spatial resolution falls off dramatically. It may be possible to develop a display system that is matched to the resolution of the human eye. This will mean using an eye slaved high resolution insert. Eye slaved high resolution patches seem to offer the necessary resolution over relatively small angular sub- tenses. However, there is a question regarding the performance of the eye tracking technology and the dynamic response of the high resolution patch deflection system. Displays embodying this approach will be expensive.
(ii) Space tracking technology Low phase lag - Without doubt one of the critical areas of space tracking systems (and virtual environments) is the requirement for low phase lag. The phase lag will probably have to be less than 5 mS if the lags are not to affect the performance of the operator. Particular care has to taken when interpreting what is meant by phase lag - as described in Chapter 6. Resolution requirements for tracking systems probably do not need to exceed 0.1 mm in translation and 0.01' in angular terms. For many applications translation resolution of the order of 1 mm and angular resolution of - 0.1 O may be quite adequate.
(iii) Multiple object tracking - It will be desirable to track .' multiple objects within a virtual environment. For . example - the user's head, and possibly both hands. With most current tracking systems the effective update rate of each tracked object is divided by the number of tracking sensors used. This reduction in update rate is due to the synchronisation or multiplexing of trackers in the system. Unfortunately, this is a consequence of the technology used in the tracking system. A better method of tracking multiple objects is required that does not use multiplexed sensors. Moreover, if the whole body is to be tracked in terms of limb position then this amounts to a considerable number of sensors. Apart from the update problems, the large number of cables connecting the sensors to the tracking electronics becomes a significant problem. Ideally, a wireless tracking system should be used. In the future, image processing systems may be able to determine the position of multiple objects without the need to cable up the participant. However, this will demand considerable processing performance and high resolution imaging sensors.
(iv) Image generators - Virtual environments place severe timing constraints on image generation systems. Whilst very high performance can undoubtedly be achieved there is a concern that the architectures of these systems do not lend themselves to the demanding performance required. As described in Chapter 6 the key parameter is the
K-5
system throughput time. This figure must be considerably better then current values of 40 mS -100 mS. Apart from designing graphic system architecture to suit the virtual environment application, benefits can also be obtained by employing predictive filtering techniques. Different algorithms must be studied to determine if they offer any real advantage. Low latency architectures - Current graphics platforms may need to be redesigned with low latency architectures in mind. This requirement derives from the need to couple head tracking systems to the later stages of the graphics system. It is tempting to employ the standard RS232 interface of the graphics system for the space tracking system. Unfortunately, this interface is not usually designed for real time applications. As a consequence, attempts to send large amounts of high speed data through this interface results in an unacceptable interrupt load on the host processor. This means that more time is spent servicing the interrupt than in dealing with graphics drawing operations. Update rate - The question of update rate is an interesting one. At the moment the computer graphics industry is concerned with increasing the spatial resolution of a display in preference to display update rate. However, for a virtual environment application this may be the complete opposite of what is required. Spatial resolution
- could be secondary to display update rate. Urgent research is required to determine whether high frame rate
--displays should be used in favour of high resolution . displays. One factor in favour of the high frame display
is the limitation in display resolution of current helmet mounted displays. There seems to be little point in wasting computational effort when the display device cannot resolve the fine detail. Motion prediction - There is some merit in being able to use motion prediction methods to compensate for inherent system lags. Provided the motion of an object can be expressed by means of a motion equation, it is possible that previous motion data can be used to predict where the object will be during the next few iterations. Parameters such as velocity and acceleration profiles are used in the prediction process. In the case of the user’s head it will be necessary to determine the dynamics of the human head. Kalman filters could be used to predict where the object or head would be during the next few frames.
6. Virtual Environment Software Engineering (i) Visual programming languages -To build the synthetic environment from a collection of library routines, the majority of software tools for virtual environment applications rely on a competent ‘C’ programmer being available. In contrast to this the VPL RB2 virtual environment programming tools rely on visual programming techniques. These visual programming techniques allow people, with fairly minimal computer
literacy, to create and maintain a virtual environment. With these tools it is possible to create a fully interactive virtual environment without writing any software. The visual programmer constructs the virtual environment by linking objects in the virtual environment with behaviourial constructs. These are represented on screen by icons and simple ‘wiring diagrams’. Whilst the highest performance virtual environments will be programmed at a basic level ,the use of a visual programming language will be of great benefit to the person interested in rapid prototyping. As computer graphics systems become more powerful, the performance difference between visual programming languages and conventional programming techniques will converge. As virtual environments become larger, then visual programming techniques may result in significant cost savings that far out-weigh conventional approaches.
(ii) Database standards - All virtual environment systems rely on an underlying database standard on which to represent the objects of the environment. In some ways the database is rather like a CAD type database standard. (Some virtual environment software packages are actually based on well known CAD standards.) However, a virtual environment system will generally require considerably more data to describe the environment. Not only is it necessary to describe the geometrical and spatial relationships of objects, but other parameters such as behaviour must be specified. This includes responses to external events or stimuli such as collisions and also includes mass and feel. To date there are no standards in this area. A virtual environment standard is an obvious requirement.
(iii) Virtual environment modelling. The whole area of modelling for virtual environments needs attention. At the moment there are no standards developing and there is a danger that future virtual environment systems will have to support multiple standards. If some measure of standardization does not come soon then organisations will have invested effort in their chosen standard and will be reluctant to move to another standard. With a virtual environment it will be necessary to store additional attribute information about an object such as texture (feel), weight, compliance and so on. Therefore, we have an opportunity to develop an open standard that can be used by everyone.
(iv) Multiple participants - In order to create multiple participant virtual environments, it will be necessary to develop communication protocols so that consistent databases can be maintained for each user. This means that if one participant moves an object in his virtual environment, then the corresponding object in another participant’s environment is updated accordingly. The problems of networking in database systems should be
K-6
reasonably well understood. However, some work will be required to ensure that efficient protocols are developed that allow real time operation.
(v) Use of virtual environments inside the virtual environment systems - The high level of interactivity within a virtual environment is one of the strengths of the technology. However, this interactivity will only be of value if the design work that is undertaken within the virtual environment can be used outside the virtual environment.
7. PHILOSOPHICAL REFIECTIONS It is easy to become excited by virtual environments and the potential they offer. However, it is very important to resist this initial burst of enthusiasm and direct one’s attention to the task of determining what the key issues of the system should be. It will be necessary to address the nature of the user interface and to understand the system requirements. Only when this has been undertaken should consideration be given to the type of technology that should be employed. Care must also be taken to address the human factors issues inevitably associated with complex man machine interfaces.
An equally important issue that must be addressed along with the human factors and the associated engineering, is a thorough business analysis. Nearly all ventures in high technology systems will fail unless the business issues have been properly addressed. From the author’s perspective there are many people who having heard of the term Virtual Reality believe that the subject is all about helmet mounted displays and glove like devices. However, virtual reality or virtual environments is much more than a helmet mounted display and glove device. The business decision makers must be made to understand the wider issues of virtual environments. They must realise that a virtual environment is a synthetic computer generated representation of a physical system. A representation that allows a user to interact with the synthetic environment as if it were real. One of the distinct advantages being that the user is not bounded by limitations presented by the real world. For instance, virtual environments could be used to prototype a product during the early part of its life cycle. The interactivity of a virtual environment would allow the user to explore alternative configurations before the product is manufactured. This approach means that design and development risks could be removed early in the manufacturing life cycle. In many respects the world is already moving towards rapid prototyping systems or synthetic design environments. The benefits of these systems are already established. A virtual environment system addresses the totality of such design and rapid prototyping systems by allowing the user to achieve a higher level of interactivity than can be afforded by
computer aided design (CAD) systems. It would be wrong to suggest that every prototyping system will require total immersion in the virtual environment. Some design tasks may be better served by a traditional CAD system but during the latter stages of design a more immersive system may be required. Therefore, a key requirement is the ability to move between these different prototyping systems by providing the designer with the right level of immersion for the task. Ideally the transition between the different prototyping stages would be seamless and extend into the manufacturing process. The concept of assessing ease of manufacture and ease of assembly is extremely exciting. This could be further extended into customer product training whist the product is being manufactured. Manufacturing processes based on a virtual environment could revolutionize the way we design and manufacture things in the future.
8. RECOMMENDATIONS FOR THE WAY AHEAD There is little doubt that current generation virtual environment .peripherals are limited in terms of resolution. However, by conducting research into the human factors requirements it will be possible to match the technology to the human interface. The affordable high resolution full colour helmet mounted display is already on its way and so to are the high performance computer systems. Advances in the other technologies - such as tracking systems and haptickinaesthetic feedback display systems are moving at a slightly slower pace. As -- people recognize the importance of virtual environments . then improvements will be made. From a virtual environment scientist’s point of view it will be necessary to provide human factor’s guide lines so that the technology may be appropriately developed. Would be developers of the technology (including software) are advised to consider the standardization of interfaces. This will make it easier to take advantage of improved technology as it emerges. It is hoped that this paper will act as a baseline of knowledge which we can all build up our understanding of the next generation human to machine interface.
9. A STRATEGY FOR FUTURE RESEARCH The aerospace community is well placed to retain a leading position in the field of virtual environments providing that a coordinated research effort is maintained. Rather than undertake ad-hoc research without any clear objectives it is necessary to agree a research agenda with identifiable objectives and deliverables against clear business drivers.
10. REFERENCES 1. Ellis S.R., (1993) from forward in Kalawsky: The Science of Virtual Reality and Virtual Environments, Addison-Wesley, 1993.

K-7
2. Zeltzer D., (1992) Autonomy, Interaction, and Presence, Presence, Vol 1, Number 1
3. Research Directions in Virtual Environments, Computer Graphics, Volume 26, Number 3, August 1992
4. Kalawsky R.S. 2he Science of Virtual Reality and Virtual Environments, Addison-Wesley, 1993
11. ACKNOWLEDGEMENTS This paper is based on an extract from a book published by Addison-Wesley Publishers in 1993. Kalawsky: The Science of Virtual Reality and Virtual Environments Addison-Wesley Publishers Ltd @ 1993. Finally, kind permission to publish this article by British Aerospace is gratefully acknowledged.

TASK-SPECIFIC USABILITY REQUIREMENTS FOR VIRTUAL INFORMATION ENVIRONMENTS: INTERFACE DESIGN AND DATA REPRESENTATION FOR HUMAN
OPERATORS OF COMPLEX MEDICAL SYSTEMS
Michael S. Nilan, Ph.D. 4-206 Center for Science & Technology
School of Information Studies Syracuse University
Syracuse, NY 1 3244-4 100 USA Internet: [email protected]
SUMMARY
The National Research Council has identified “usabil- ity” as one of two major requirements for coherent development of computer and information systems overthe nextten years [Ref7]. Theuseof multisensory virtual environment technology to display and pro- vide access to system functions and data relevant to large-scale, complex, potentially volatile medical tasks (e.g., telepresence surgery) increases the (already critical) need for unobtrusive, transparent interface designs and data representations. Unfortunately, the medical community must take responsibility for pro- viding requirements specifications to the computer industry or else be forced to adapt to existing technical constraints [Ref IO].
*
.
Recent research in interface design and data organiza- tion/ representation for two dimensional computer applications indicates that dynamic representations of the specific task or problem that the human operator is performing is very effective [Ref 81. Employing a task-specific, “user-based” methodology, steps in the task resolution are organized into a dynamic model of the task. Linked to this model are the functional system requirements and information/data need re- quirements divided into specific content requirements, display requirements (including spatial organization), and system help requirements. The resultant model is readily interpretable by system designers and in addi- tion, provides them with specific task-related system evaluation criteria. Usability advantages of dynamic task representations include: minimal systemhppli- cation training requirements for operators; and coher- ent, comprehensible and uncluttered sensory field organization of system functions, relevant data and help information. Because of its ability to provide specific task-related requirements to system design- ers, this methodological approach will insure maxi- mum usability of high performance computing (in- cluding virtual reality technology) for critical medical applications.
1. INTRODUCTION - USABILITY CONCERNS
“I t is becoming increasingly clear that the comfort of a goodfit between man and machine is largely absent from the technology of the information age.”
- John Sedgwick, The Atlantic Monthly, March 1993, p. 96
Everyone is becoming anxious to solve the usability problem, from popular writers like John Sedgwick [Ref 151 representing users in general to national policy groups like theNational Research Council [Ref 71 representing the computer industry, federal policy makers, and academia. There are several conditions that have generated this interest in usability including:
a trend towards distributed computing along with the accompanying increase in complexity for users;
a general shift from a manufacturing economy to a service economy, i.e., a shift from a product orien- tation to a service orientation over the last twenty years or so and, in the computer industry, over the last couple of years;
the current economic recession, particularly in com- puter related industries, e.g., the newest hardware platforms and software updates haven’t sold very well;
management in user organizations’ concerns with the “hidden” cost of training associated with new applications, application updates or new workers; and
very widespread frustration of users in general with the lack of simple coherency in system design, particularly across applications.
Presented at an AGARD Meeting on ‘Virtual Interfaces: Research and Applications’, October 1993.
1-2
The introduction of the IBM Personal Computer just over ten years ago, in addition to stimulating the information explosion, was a major catalyst in the spread of computerized systems from laboratories and data processing departments to virtually every aspect of human activity. Until very recently, the concern for usability was primarily the concern of vendor market- ing departments while the “real” system designers focused on smaller, faster, flashier, more gimmicks, etc. based upon the technology (e.g., the perplexing profusion of graphic icons in Microsoft Word, version 5.1 and just about all virtual reality applications). In essence, the range of capabilities of systems have not matched well with the range of user needs and system features have been represented to users in a confusing variety of cryptic forms. This is not to say that designers weren’t interested in usability but rather that it was not as high on their agendas as it has been on users’ agendas. And yet, the aphorism about hardware being ten years ahead of the software persists.
Concurrent with this shift within systems develop- ment organizations towards more usable systems, the users were learning a few lessons as well. They have learned, for example, that their most important invest- ment is in their data and being able to easily employ that data to solve problems, make decisions and plan rather than investing in the newest, fastest, highest resolution hardware. They are also getting a good sense of how much time and energy needs to be invested in learninghraining to get existing systems to do even the rudimentary data manipulations that the systems are capable of, and these systems still don’t do what the users need.
In spite of the incredible things that computerized systems can do, the feeling users are getting is that most of these systems are solutions running around looking for problems. Users already have problems and those problems are not adequately reflected in existing systems. While there are some very notable exceptions to this, e.g., Lotus 1-2-3, for the most part, the American free enterprisenotion of inventing some- thing and then marketing it has been a serious impedi- ment to addressing users’ needs, a problem originat- ing at the management level of system design organi- zations. After all, if the market was buying the systems, why change? Consequently, usability in existing systems is quite poor. If this is the case for so- called “stand alone” applications, i t is doubly so for distributed high performance computing and commu- nications (HPCC) technology that might be able to facilitate complex medical problems.
2. SYSTEMS DESIGN: IN THE BEGINNING ... A major source of assumptions and insight into com- puter system design comes from the seminal work of Herbert Simon and Alan Newell. In The Sciences of the Artificial [Ref 161, Simon established an ap- proach to system design based upon simulation of human cognitive processes (i.e., creating systems which demonstrate the ability to arrive at a function- ally equivalent solution to a problem or task) as a means by which designers can learn about designing systems and, at the same time, learn about human cognition. His justification for this “isomorphism” approach is that there are two sources of insight into human cognition, the internal (i.e., what actually goes on when people think) and the external (i.e., watching the actions people use to solve problems, etc. and developing functional simulations of the process and outcome). Simon argued that the internal source of insight is not available to designers but that is all right because the external is just as good. At least two generations of system designers (i.e., computer scien- tists, computer engineers, cognitive psychologists, programmers, etc.) have followed this assumption in their approach to design through their approaches to the user interface and data representation. Note that this is the era that led up to the current situation where usability has become much more essential to effective system design and even essential to the economic prosperity of the United States [Ref 71.
One way to interpret Simon’s argument is that some- how, technology stands apart or is different from human behavior. I would propose a different picture of technology, i.e., that rather than being something separate from human cognition, I would argue that all technology is a derivative of human cognition. The etymological origin of the word “technology” stems from “technique” and even further back to the Greek “technos,” both of which essentially refer to the pro- cess by which a problem is solved or something is accomplished. In fact, virtually all technological applications are an extension of human cognitive, sensory and motor capabilities [Ref 91. Further, one of the most serious problems with systems development right now can be explained by a process that builds new technology on top of old technology without effectively checking back with the human problem that stimulated the application in the first place. A vicious circle is established where technological ap- plications are supplying insight into design rather than the original human needs. This is particularly trouble- some since we weren’t very good at understanding
user needs when we designed the old technology. In this sense, it would seem that Simon’s argument is a bit tautological and, with regards the usability problem, is not likely to provide much insight into users’ needs. In other words, I disagree with Simon that the internal is inaccessible and I feel that the external is not sufficient for usability concerns. How can technology NOT be inherently tied to human perceptions of the problem being addressed by the system? One of the other assumptions of the user-based approach is that the ideal model for human-computer interaction is human to human interpersonal communication. This means that one of the essential “places” to search for insight into system design is internal; exactly opposite from the strategy espoused by Simon.
One of the costs to usability that has resulted from the adoption of Simon’s logic is that systems have been designed, presented to theuser, and the user must adapt hidher behavior to the system, i.e., the user must become more like the system in order to effectively employ it. The user-based approach argues that sys- tems must become more like users [Ref 31 and that this is not only do-able, it is imperative.
Using a database application as an example, early database management systems (DBMS) were highly “structured” in that the user (after spending a lot of time learning the application) could do only a very few things that had been programmed into the system. The Simon-driven response to user dissatisfaction has been to create (relatively) “unstructured” DBMS systems that are supposed to allow the user to do anything the programmers could dream up plus anything the users could articulate indicating what they “wanted” (see [Ref 31). Users are no more experts in knowledge acquisition than are system designers. As a result, the user is overwhelmed by the variety/complexity and has no idea how to proceed to make effective use of the system functionalities (even if the representation was comprehensive and somehow comprehensible through training). What is really needed is a design approach that emphasizes functions known to be useful to users which are then represented in a semi-structured man- ner so that the user has guidance from other users who have solved the same problem, made the same deci- sion, etc., rather than menus or ranges established by designers and programmers. What is not clear in practice or in the literature is how designers might do this or whether users might more productively specify what they need because designers are obviously not doing this.
1-3
In practice, the focus on usability is often placed on the user interface and this remains a very vexing problem in system design:
“Not only is there disagreement about how to arrive at a good user interface design, it is not even clear who, on the development team, should be responsible for this task. In short, we don’t know who or what kind of knowledge is most advantageous in producing good inter- face design. The responsibility for the user interface has been relegated to a variety of people with a variety of backgrounds (Bailey, [Ref I]).
There are other aspects of system design that effect usability, of course, including the logic by which the user cognitively organizes the various functions that the system offers (including which functionalities of solving the particular problem have been incorporated into the system), the way that data are organized in the system (both “help” data or documentation as well as data that are being manipulated by the system), and data representation or the form that the data are given to the user. The argument here is that we need to adopt a strategy for understanding users that is quite different from Simon’s if we are to coherently address usability. The reader should note that I am not quarreling with all of Simon’s approach but rather those aspects that are not effective for usability concerns.
3. MEDICAL COMMUNITY NEEDS
The medical community is notably behind other scien- tific counterparts in the deployment of computing technology. A number of reasons contribute to this lag in adoption including:
the relative lack of specialized systems appropriate for medical practitioner and administrative prob- lems beyond office automation;
the already incredible intellectual demands on train- ing physicians that leaves little or no room for specialized information technology training;
the expense of existing HPCC medical systems (e.g., CAT, NMRI);
the high marketing pressure on and resultant confu- sion of physicians and hospital administrators for a wide variety of computerized (and non-computer- ized) systems;

1-4
the potential complexity of many medical task situ- ations (both in terms of specific activities within a particular task as well as in terms of the complexities within an activity); and
the relatively large investment in existing systems (so-called “legacy” systems).
Not only are system designers not effectively repre- senting the user in generalized applications, but they are philosophically and methodologically unable to understand the unique needs of the medical commu- nity. For example, from the technological perspec- tive, the imaging needs of physicians and surgeons do not always (or even very often) require the very high resolutions that might be useful in other scientific contexts. The surgeon for example, needs to “see” what s h e is doing and what is behind the externally visible surface. A resolution of 640 X 480 would be quite sufficient if, what was underneath the tissue that is being cut with a scalpel is visible as well. The issue here is not one of resolution but making visible “hid- den” aspects of the problem at hand. Processing speed of the image display may be an issue, but resolution is not (in the vast majority of cases). For the majority of surgical procedures that are carried out, the precision of the scalpel plus or minus 2 mm is sufficient. The “real” problem is revealing hidden layers accurately. Another example might be a physician examining MRI data. The problem is differentiating one tissue type from another (e.g., healthy from diseased tissue). Again, high resolution or three-dimensional views are not likely to address this visualization problem. Un- fortunately, none of the existing work on visualization has addressed this specific combination of needs.
On the administrative side, particularly in mobile military health care communities, maintaining patient record systems which include text as well as images and sound is an extremely difficult distributed prob- lem. These records may be needed by a surgeon in an operating theater and at the same time by a specialist thousands of miles away. While the technical capabil- ity might be available, because of the relative crude- ness of user interfaces, task-oriented data manage- ment systems, and ad hoc data representation, it is currently not feasible.
So, in spite of the relatively impressive gains in computing power, speed, bandwidth, imaging, etc., the “fit” for a reasonable deployment of HPCC infor- mation and computing systems in medicine remains elusive. There are two very compelling reasons how-
ever, that make medicine a perfect market segment to force the issue of usability:
the medical community lags behind other scientific and engineering professions in the use of high performance computing and communications; and
the medical community represents a VERY large market (particularly of late due to the potential of HPCC to contribute to reducing the costs of health care reform).
In a real sense however, most high performance com- puting and communications, including virtual envi- ronment technologies, represent “solutions looking for a problem” [Ref IO]. What this paper will argue however, is that if the concern is usability (as defined above), the idea is NOT to fit problems to available technology but to fit technology (and/or to develop technology) to address problems as those problems are understood by the users. To see how users under- stand problems, we need to look at knowledge acqui- sition and representation.
4. KNOWLEDGE ACQUISITION AND REPRESENTATION
Basically, what is needed in system design is a way of interacting with users that generates lists of functions that users employ to solve their problems, etc. and a way to represent those functions to system designers so that the resulting system is inherently (or with minimal learning required to be) understandable to users. The most important “place” this must be done is where users cognitively interact with the system, i.e., at the user interface and where data is represented to the user (or the user.employs an internal data representation to search for data relevant to the task at hand).
Recently, there have been some interesting develop- ments in conceptualizing approaches for understand- ing user needs (e.g., [Ref 181). Among the more innovative approaches to understanding users, I would include Lucy Suchman’s [Ref 171 efforts at Xerox to try ethnographic methods to find out what users need. She is immersing herself in actual problem or decision contexts (what Dennis Wixon [Ref 191 calls “contex- tual design”) and observing the dynamics. Donald Norman, who is currently working with Apple, em- ploys his “user-centered’’ design [Ref 141 via “cogni- tive engineering” so that he can make better design decisions. The Association for Computing
Machinery’s Special Interest Group on Computer and Human Interaction (ACWSIGCHI) has begun to dis- cuss alternative approaches to figuring out exactly what it is that users want (e.g., [Ref 61 discussing ethnographic versus experimental psychological ap- proaches). However, there is no agreement on “what” should be looked at in human behavior to insure usability nor is there an agreement on “how,” i.e., methods.
In terms of “what” to look at, the relationship between human beings and technology suggests that we look at how people perceive that they solve problems, make decisions, plan, etc. and see if there are any patterns across users; we start with the problem rather than with what the technology can or might be able to do. We cannot literally get inside peoples’ heads, but we can develop very detailed and valid pictures of how people perceive their problem solving processes. We know we can do this because people teach each other through language (either in direct conversations or vicariously via books, articles, training manuals, etc.). Fortu- nately, there is a growing body of literature (e.g., [Ref 41, [Ref 81) that indicates:
.’
-- people experience a problem or decision as a se- quence of actions or steps over time;
although there are some differences in the amount of detail between novices and experts in how they perceive a particular problem, there are also distinct patterns common to both, i.e., certain actions or steps that are taken in the same time order; and
there are also patterns in the language that users employ to refer to actions or steps (because they are trying to communicate).
So, for the knowledge acquisition aspect of system design, the user-based approach has adopted observa- tion techniques and strategies from clinical psychol- ogy, ethnomethodology and communication science. The resulting frame-based methodology (e.g., see [Ref 21) has users describe their view of the problem solving process in the order that the actions or steps occurred to them (this can be done with recall techniques or in real-time). The researcher represents these “action objects” to the user as a sequence (on three by five cards for example) that is intended to be isomorphic with what the user actually did (or is doing) in solving the problem. This idiosyncratic model of the steps in the problem solving process is then used as a dynamic mnemonic device to elicit further details about what theuser was thinking, what information the user needed
at that point in time, what tools were used at that point in time, what the user was trying to accomplish, etc. This approach has several advantages:
the user-based researcher is asking the user to com- municate hidher actual experience with a problem (i.e., one representation of the internal experience) rather than a hypothetical or experimental problem;
because this structure is used to probe for detail in the user’s internal experience, it allows for time-specific details to be probed in more detail; and
all elaborations on the cognitive experience of the user are linked to this dynamic mnemonic structure (the utility of this analytically will be discussed below).
The resulting knowledge structure has both temporal and spatial structural features. The arrangement of the steps in the problem in a time order should be able to help system designers know “when” the user will need system functions or help or specific kinds of data. The “what” the user needs is a spatial representation of the cognitive activities of the user’s needs at that point in time. Note that the spatial features can be arranged according to their importance or their frequency of use across users, etc.
One of the most common complaints that traditional knowledge engineers have at this point is that they feel that there is too much variance in the ways that human beings perceive their environments leading to the conclusion that we cannot use this kind of perceptual data to create knowledge representations suitable for system design. However, if there really is chaotic variance, language for communication should be im- possible (and it obviously isn’t) and technological applications would have to be different for each person (and they don’t). So, theuser-based approach employs users’ dynamic descriptions of the way that they per- ceive their own problem solving, deciding, planning in a task specific context.
There are some powerful advantages as a “side effect” of this source of insight into user needs. For example, when people talk, they have to talk about one thing at a time and they usually start at the beginning and end at the end. We know that conscious attention is serial, i.e., one thing at a time. We also know that people experience existence (and therefore problem solu- tions, decisions, etc.) as changes over time. The isomorphism here between cognitive functions, expe- rience and communication is a powerful source of
1-6
validity. Another advantage of 1 is approach is that users tend to employ language that is inherently mean- ingful to them and the person they are talking to (i.e., the user-based knowledge engineer). The communi- cation capability is a significant usability consider- ation that is passes, along with the knowledge struc- ture, to the system designer (as discussed below).
Although there are a variety of specific methods suitable for in-person interviews, self-reporting, etc., there are also a number of semi-automated methods that could be employed as long as the user-based conceptual approach is taken as a guideline. For example, Maes & Kozierok at the MIT Media Lab [Ref 51 are working on neural network-based “intelli- gent agents” which collect data about how aparticular user does things on the system, detects patterns in the user’s behavior, and eventually does those things for the user. By employing such an agent at a “higher” level in the system, designers could learn about pat- terns ucross users in a real-time fashion. Another example is “CommTool” being developed for the New York State Center for Advanced Technology in Computer Applications and Software Engineering [Ref 131. This is a system-level software tool that allows users to communicate with system designers from the rapid prototyping stage through the imple- mentation stage and into the maintenance stage (refer- ring to the software lifecycle). In addition, CommTool also provides analytic guidance for directing the user feedback to the appropriate system person (i.e., infor- matioddata providers, system maintenance people, system designers and analysts, managers, etc.).
The way this type of knowledge is represented for system designers is identical with the analytic proce- dures used by researchers to interpret results across users (see [Ref 111 for a detailed example with a desktop publishing application). An “action by cog- nition” matrix is created where the steps in the prob- lem solving process (in time order) that all users agreed upon constitute the horizontal dimension. This is the basic interface structure. All user access to system functions, to help information, to data created in the process of using the application, etc. are via this “action” dimension of the matrix. For each one of these steps, all of the activities across users in between and including the agreed upon step are set up as a secondary action level. At this level, an expert would see everything s/he needs to do at a particular point in the problem solving process and a novice would immediately get an idea of what kinds of things are possible. Linked (in a hypertext sense) to this second- ary action level, are all the system functions necessary
for completing that particular step in the process. Included in system functions are network communi- cations links, specialized display requirements, etc. Also linked are all help files so that a novice could get help directly oriented to the particular point in the problem solving process that s k e was at that point in time. Finally, supporting data either commonly used in the problem solving process or that is produced as a byproduct of the process are also managed from this secondary level. The range of system functions, help messages, and data that are linked to each action step represent the system assistance in the “cognitive” aspects of the problem solving process. While this description is obviously an abstract characterization and some of the nitty gritty details are left out (see [Ref 113 for a more detailed description), the “action by cognition” model is really a cognitive communication model because:
first it is used for establishing communications between the user-based knowledge engineer and the users;
second, a derivation of the model is used to a communicate the users’ needs to the system de- signer;
then it is employed to represent the system to the user in the interface; and
finally, the model can be used as a system evaluation tool with a variety of task-based evaluation criteria beyond the normal “time on task” or “percentage correct” measures (which actually measure user performance, not system performance).
Regarding virtual reality technologies and their incor- poration into more complex task situations, a concep- tual proof of concept of a “system design space” was implemented for the U. S. Air Force Office of Scien- tific Research [Ref 121. The purpose of this project was to illustrate how even extremely complex, distrib- uted, high performance computing and communica- tions architectures and performance requirements could be linked to complex user-based knowledge struc- tures for specific tasks. The demonstration of the capability was implemented on virtual reality technol- ogy at Rome Labs (Griffiss Air Force Base) in New York State. While complexity per se is not the point of employing task-specific usability requirements as the foundation for system design, complexity in the form of detailed process, associated information needs, associated (both computerized and non-computer- ized) tools and sub-processes, datamanagement across
a distributed organizational network, etc. can AL be coordinated in this manner. In fact, this is the only manner in the literature where all system design con- siderations can be represented in the same “design space.”
5. CONCLUSIONS
The argument of this paper is that the user-based approach goes beyond the existing approaches to sys- tem design in the following ways:
the role of the user is seen as conceptually central to the design process because human-computer inter- action itself is seen as a basic human-to-human process;
instead of asking the users what they want or need and instead of observing users’ external behaviors and then inferring what is going on inside their heads, users’ knowledge/experience is an integral part of the user-based approach; and
users’ descriptions of their perceptions of problem solving, decision making and planning processes are used to create dynamic knowledge structures that are used to stimulate the users’ memory, to facilitate the communication between knowledge engineers and system designers, to provide a knowledge represen- tation structure for interface design and data organi- zation, and is used for subsequent system evaluation.
--
The user-6ased approach to knowledge acquisition, knowledge representation and (recently) to informa- tion system evaluation, is a relatively new approach. It has, however, been tested, evaluated, and found to be extremely useful in addressing the usability problem in system design. The reader should be aware that the user-based approach represents another source of in- sight into the design process. Existing efforts by cognitive psychologists, computer engineers, software engineers, etc. need to be continued, but any system design team should have at least one user-based knowl- edge engineer to insure that users are adequately rep- resented in the design process.
For the medical community, this paper argues that historical forces (e.g., increasing demands for usabil- ity, health care reform), economic forces (e.g., reces- sion in the computer industry, potential market that the medical community represents), the increasing gap between technological capabilities and the medical community’s exploitation of that technology, and, most importantly, the needs of the medical community
itself can be we I served by developing user-based descriptions of their needs for presentation to system designers in the computer industry. Coalitions among health care organizations (both public and private) as well as coalitions among categories of health care professionals (e.g., laproscopic surgeons, health care maintenance organization administrators, military health care administrators, etc.) can reduce the cost and dramatically increase the effectiveness of HPCC and virtual environments in solving their information and communication needs. While virtual environments represent great potential for addressing complexity issues and, as an emerging technology have their own technical constraints, the issue of usability is funda- mental to the future of all computing technologies. The medical community can take the lead in usability improvements, help develop HPCC to address its own problems and at the same time facilitate improvements in usability for other user communities.
ACKNOWLEDGMENTS
The author would like to acknowledge the assistance of the School of Information Studies at Syracuse University, the New York State Center for Advanced Technology in Computer Applications and Software Engineering, the Alex Nason Foundation of New York City, and the U. S . Air Force Office of Scientific Research for their support of the various research projects reported on in this paper. The author would also like to thank the following Ph.D. students, without whom, these projects would have been impossible: Joanne Silverstein, R. David Lankes, Bob Travica, and Bhaskaran Balakrishnan.
REFERENCES
1. Bailey, G. (1993). Iterative Methodology and Designer Training in Human-Computer Interface Design. In the Proceedings of INTERCHI, 1993 (Amsterdam, The Netherlands, 24 April-29 April, 1993) New York: ACM, pp. 198-205.
2. Dervin, B. (1 983). An Overview of Sense-Making Research: Concepts, Methods, and Results to Date. Paper presented at the International Com- munication Association Annual meeting (May 26 - May 30, 1983, Dallas).
3. Dervin, B. & Nilan, M. S . (1986). Information Needs and Uses. In M. E. Williams (Ed.), Annual Review of Information Science & Technology, 21, pp. 3-33.
4. Katzer, J. & Fletcher, P. T. (1992). The Informa- tion Environment ofManagers. In M. E. Williams (Ed), Annual Review of Science and Technol- ogy, 27, pp. 227-263.
5 . Maes, P. & Kozierok, R. (in press). Learning Interface Agents. Proceedings of American Association for Artificial Intelligence '93.
6. Nardi, B.,Gilbert,N.,Mantei,M., &McCarthy, J. (1 993). Mixing oil and water? Ethnography versus Experimental Psychology in the study of computer-mediated communication. In the Pro- ceedings of INTERCHI, 1993 (Amsterdam, The Netherlands, 24 April-29 April, 1993) New York: ACM, pp. 3-6.
7. National Research Council (I 992). Computing the Future: A Broader Agenda for Computer Science and Engineering. Washington, D. C.: National Academy Press.
8. Nilan, M. S . (1992). Cognitive Space: Using Virtual Reality for Large Information Resource Management Problems. Journal of Communi- cation, 42:4, pp. 115-135.
9. Nilan, M.S. (1993). Speculations on the Impact of Global Electronic Networks on Human Cognition and Human Organization. Electronic Network- ing, (in press). Copies available from the author.
10. Nilan, M. S., Silverstein, J. L. & Lankes, R. D. (1993) Whose Reality? The VR Technology Agenda in Medicine. AI Expert Virtual Reality '93: Special Report, pp. 33-37.
11. Nilan, M. S . (in preparation). User-Based Infor- mation/ Communication Systems: Using Sense- Making to Create a Desktop Publishing Help and Training System. In B. Dervin (Ed.), Methodol- ogy Between the Cracks: Theory and Method for the Qualitative and Quantitative Study of Human Communication. Copies available from the author.
13. Nilan, M. S . & Travica, B. (in preparation). CommTool: A Tool of User-Based Software De- sign, Refinement and Evaluation. Copies are available from the author.
14. Norman, D. A. (1986). CognitiveEngineering. In D. A. Norman & S . W. Draper (Eds.), User Centered System Design: New Perspectives on Human-Computer Interaction. Hillsdale, NJ: Lawrence Erlbaum Associates, pp. 3 1-61.
15. Sedgwick, J. (1993). The Complexity Problem. The Atlantic Monthly, 27:3, pp. 96-104.
16. Simon, H. A. (1969). The Sciences of the Arti- ficial. Cambridge, MA: MIT Press.
17. Suchman, L. (1987). Plans and Situated Ac- tions: The Problem of Human-Machine Com- munication. Cambridge: Cambridge University Press.
18. Winograd, T. & Flores, F. ( I 986). Understand- ing Computers and Cognition: A New Foun- dation for Design. Menlo Park, CA: Addison- Wesley.
19. Wixon, D., Holtzblatt, K. & Knox, S . (1990). Contextual Design: An Emergent View of Sys- tem Design. In Proceedings of the Conference on Human Factors in Computing Systems (Se- attle, April 1 - April 5,1990), New York: ACM, pp. 331-336.
12. Nilan, M.S. & Lankes, R.D. (1992). User-Based Requirements for Large-scale Distributed Infor- mation Management Systems: Representations for System Designers. Report to the U. S . Air Force Office of Scientific Research.

2- 1
PROFILE A N A L Y S l S OF AFTER- EFFECTS EXPERlb:NCED D U R l N G EXPOSURE TO SE V E RAI. V 1: RTUAL RE AL. Z T Y E N V I K O N M E N T S
Robert S. Kennedy, PhD Essex Corporation
1040 Woodcock Road, S u i t e 227 Orl.ando, F1 32803
Marshall B. Jones, PhD Behavioral Sci.ences Departrnent
Mi. Lton S. lfershey Medical Center 500 Unive r s i ty Dri.ve lfershey, PA 17033
CDR Mi.chae1. G . Li1.5.enthal
1901. N . Rcaureguard Street , #SO4 Al.exandri.a, VA 2231.1
Defense Modc1.hg and Si.nul.ati.on O f f ice
Deborah L . H a r m , PhD Code SD- 5Johnson Space Center
Houston, T X 77058
Motj.on s i c k n e s s sympt.oms are an - unwanted by-product of exposure t o
vi.rt-ual. envi.ronment.s , This probl.em i s n o t new and was r epor t ed i n t h e e a r l y f l . i g h t simu l a t o r s and experi.ments on ego motions and vect-ion. The c a r d i n a l symptom of motion s i c k n e s s is , of cour se , vomi.t.i.ng, b u t t h i s symptom i s ordinari.1.y preceded by a varj.ety of o t h e r symptoms. I n his c l a s s i c s t u d i e s of motion s i c k n e s s conducted b e f o r e and du r ing World War I T , G . R. Wendt introduced a t h r e e p o i n t s c a l e t o score motion s i c k n e s s beyond a vomi t h o - vomi t di.chotomy . L a t e r , Navy s c i e n t i s t s developed a Motion Sickness Quest ionnaire (MSQ), o r i g i n a l l y for use i n a s lowly r o t a t i n g room. I n the Last 20 yea r s the MSQ has been used i n a series of s t u d i e s of a i r , sea, and space s i c k n e s s . Only r e c e n t l y , however, has it been apprec ia t ed t h a t syniptorn p a t t e r n s i n t h e MSQ are n o t uni.for.-m b u t vary w i t h t h e way s i c k n e s s i.s induced. Tn seasi.ckncss , for exam
pl.e, nausea i s t h e most prominent symptom. Tn Navy si.mul.ators, how- e v e r , t h e most coniinon symptom is eye s t r a i n , e spec ia l . l y when cathode r ay tubes are employed i n t h e s imula - t i o n . The 1.at ter r e s u l t was obtai.ned i n a survey of over 1,500 pi.l.ot exposures. Using t h i s da t abase , Kssex s c i e n t i s t s conducted a f a c t o r anal.ysis of t h e MSQ. We found t h a t s i g n s and symptoms of motion s i c k n e s s f e l l mainly i n t o t h r e e c l u s t e r s : 1) ocul.omotor d i s t u r b a n c e , 2) nausea and r e l a t e d neu rovege ta t ive probl.ems, and 3) d i s o r i e n t a t i o n , a t a x i a , and vert-igo. We have s i n c e rescored the MSQ r e s u l t s obtained 5.n Navy si.mula- t o r s i n terms of these t h r e e com- ponents . and o t h e r p r o f i l e s obtained from t h r e e d i f € w e n t v i r t u a l r e a l . i t y systems t o profj.1.es obtained i n sea s i c k n e s s , space s i c k n e s s , and a l coho l i n t o x i c a t i o n . W e w i l l show examples of t h e s e va r ious profi .1.e~ and p o i n t o u t s imu 1. ar i t ies and d i. f f e r snces among them which i n d i c a t e a s p e c t s of what might be c a l l e d "virtuaL- r e a l i t y s ickness" .
W e have a lso compared t h e s e
Presenred at an AGARD Meeting on 'Virtual Interfaces: Research and Applications', October 1993.
2-2
1 INTRODUCTION _-_-.̂ ...-I ..------.-.--
1.n inany areas of advancing tech- nology, i.t is n o t uncotnmon t o f ind unwanted by- products . These nega t ive consequences can become serious probl.ems i.f they n o t a n t i c i p a t e d and resolved e a r l y j.n the systems development process . Mofzion s i ckness l i k e syupt<oms , disequi.1.i.brium arid o t h e r p o s t e f f e c t s are examples of t h e probl.enis faced by t h e t r a i n i n g device i n d u s t r y i n the p a s t teen years and have been te rmed s imula to r s i c k - nes s (Crosby & Kennedy, 1.982).
S imula tors , by des ign , p r e s e n t rearranged and a l t e r e d pe rcep tua l wor1.d~ and are a sub cl.ass of t h e newly developing v i r t -ua l r ea l . i t y (VR) syst-ems. W e b e l i e v e tha t VR s i ckness is l i k e l y t o occur and shou1.d be addressed as techno1.ogies develop.
Sj.mu1.ator s i ckness was f i r s t r epor t ed over 30 yea r s ago i.n two st+udi.es by Havron and B u t l e r (1957) and Mi.ller and Goodson (1960) . S ince tha t time, t h e numbers of s t u d i e s and r e p o r t s of s imula to r s i ckness have increased a t an exponent ia l ra te ; t h e r e was as much pub1.i.shed on s h ~ u l a t o r s i ckness s i n c e 1990 as i n al.1 previ.ous y e a r s . A sbmuI.ator s i ckness program, sponsored by t h e U . S. Naval A i r Systems Command, began i n a formal. way i n 1.982 and ini t*ial . ly emphasized problem d e f i n i t i o n . A series of si.niuI.ators was surxmyed and the i.ncidence documented (Kennedy, Lj.l.ient-ha1, Rerbaum, Ba1.tzl.e~ & McCaul.ey, 1987) . Then t h e U. S. Navy sponsored two workshops a t tended by persons knowledgeable i n v i s u a l ves t ibuLar i n t e r a c t i o n s . Reports from the workshops, i n the form of g u i d e l i n e s and sugges t ions f o r r e sea rch (Kennedy, Rerbaum, I, i. 1 i.entha 1 , Dun Lap , Mu 1 1 i g an , & Funaro, 1987) r x s u l t e d i.n a fie1.d manual (N'L'SC, Simul.ator Si.ckness, 1989) which is c u r r e n t l y i n use i n t h e U . S . and some NATO c0unt.r-i.es. S ince then , t h e emphasis has s h i f t e d t o t h e i d e n t i f i c a t i o n of t h e nauseogenic propert- ies of t h e stimul.us, part;j (*irI.arl.y t h e i n e r t - i a l
f o r c e s and, t o some e x t e n t , the v i s u a l charac t -e r i s t i c s of t h e sti.mu1.u~.
Cruc ia l t o t h e des ign of simu1ator:s is s p e c i f i c a t i o n of t h e equipment parameters t.ha t w i. 1. I. p rmno t e t. ra i n i ng e€ f ec t- i.venes s and real i s m , but, a 1.so avoid s imula to r s i ckness . IIowever, t.he techno Logical. advances which have provided t h e opport-unity f o r in- creased fiBe1.it.y have, i n t u r n , placed greiater demands on o t h e r tol .erances on si.mu1.ator subsysterns ( e . g . , responses of visual. and motion base systems and the i r interact . ion) . Visual d i s p 1.ay sys tems combine d i-- ve r se methodologies f o r gene ra t ing and enhanc i.ng visual. i.nformat ion , and someti.mes through misalignment, fai.I.ure, o r o t h e r fac t -ors , eyest-rajn and o t h e r symptoms r e l a t e d t o moti.on s i ckness may be experienced. Y e t pi.1.ots may be unaware of the source of t h e s e d i f fj.cult*j.es and are there- fo re sometlmes unable t o provide enough information f o r t h e v i s u a l d i s p l a y engineer t o i d e n t i f y and cotr:ect the problem. Needless t o say , s t anda rds and s p e c i f i c a t i o n s t o address those problems are a l s o lack i.ng . As more arid mor;e f a c i l i t i e s have begun human f a c t o r s programs t o develop v i r i -ua l environment-s f o r t r a i n ! ng, operat.i.ona1 and recrea- ti.ona1 usage, a f t - e r e f f e c t s are in- c r e a s i n g l y being repor ted i n much the same manner as was found i n simu1.ator usage. Tndecd, a r e c e n t i s s u e of Presence (Vol 1, Number 3 , Summer 1.992) had been devoted t o a r t i c l e s which r e l a t e d s imula to r s i ckness app1.i.cations t o vi.rtua1. r ea l . i t y sys - tems and a t a recent* conference (Vi.rtua1. Rea Li ty Annual. 1nt.ernat i.ona1 Symposion, 1.993) on v i r tua l . r e a 1 . j . t ~ (VR) systeiiis , several . papers al.luded t-o the requirement f o r v i r t u a l rc>al.ity t e c h n o l o g i s t s t o a t tcnd t o v i s u a l vest,ibuI.ar 3.ntxxact-j.ons si.nce they are t h e l i k e l y source of VR si .ckness, We p r e d i c t khat VR s i ck - ness wi.1.1 be s u f f ic ien t - ly l i k e o ther forms of motion s i ckness and s i m - u l a t o r s i ckness t h a t important
2-3
diagnostic i.nformation is available by maki.ng comparisons of the symptom data. Historically, scientists involved in the experimental study of motion sickness employ motion sickness symptomatology question- naires (Kennedy, Tolhurst, & Graybi.el, 1965) to handle the problem of different symptoms being experienced by individuals. The HSQ reflects the polysymptomatic nature of simulator sickness in that multiple symptoms are taken into account in the diagnostic scoring.
The theory behi.nd scal.ing motion sickness severity is that vomiting, the cardinal sign of motion sickness, 3.s ordinarily preceded by a combi- nation of symptoms (Lentz & Cuedry, 1978; McNally & Stuart, 1942; Money, 1970). Therefore, in order to score motion sickness beyond merely a vomitho-vomit dichotomy, Wendt (1968) i.niti.al.ly employed a three-
. point continuum scale in a series of . studies on motion sickness. This
scale was used to assess motion ~. sickness symptomatology, whereby
vomiting was rated higher than "nausea without vomiting" which, in turn, was rated higher than discom- fort. Navy scientLsts developed a Motion Sickness Questionnaire (MSQ) consisting of a checkl.ist of symptoms ordinarily associated with motion sickness for use in sea and air sickness studies (Kennedy et al., 1965). These symptoms included: cerebral (e.g., headache), gastro- i.ntesti.na1 (e.g., nausea, burping, emesis), psychological (e.g., anxiety, depression, apathy). and other less characteristic indicants of motion sickness such as "full.ness of the head." A response was re- quired for each symptom using a rating of "none", "slight", "mod- erate", or "severe" (or in some cases "yes" o r "no"). From this checklist, a diagnostic scoring procedure was app1.ied resulting in a single, five- point symptomatology scale, serving as a global score reflecting overall discomfort. expanded in studies of seasickness conducted by the U. S. Coast Guard,
The five point scale was
with the cooperation of the U.S. Navy, (Wiker & Pepper, 1978; Wiker, Kennedy, McCauley, & Pepper 1979a, b; Wiker, Pepper, h HcCauley, 1981). These scoring techniques are useful in that they permit quantitative analyses and comparisons of motion sickness in different conditi.ons, exposures, and environments. How- ever, a deficiency for the study of simulator sickness is that the sing global score does not reveal information about the potentia1,ly separable dimensions of simulator sickness and it lacked statistical normalization properties. It was
e
argued that such infomation could be informative about the nature of sim- ulator sickness and may also serve a diagnostic function; not just about the individual but to signal diff- erences in the equipment factors (e.g., visual distortion; motion characteristics) which may differ- enti.ally cause the sickness.
2 METHOD
Simulator Sickness Questionnaire (SSQ)
In order to obtain information about separab1.e dimensions of simulator sickness, >lo00 Motion Sickness Questionnaires (MSQ) have been factor analyzed (Lane & Kennedy, 1988; Kennedy, Lane, Rerbaum & Lilienthal. 1993). produced three specific factors and one general factor. The three fac- tors form the basis for three SSQ subscales. These subscales or dim- ensions appear to operate through different "target" systems in the human to produce undesirable sym- ptoms. subscale are based on the report of symptoms which relate to gastroin- testinal distress such as nausea, stomach awareness, salivation, and burping. Scores on the Visuomotor (VI subscale reflect the report of oculomotor-related symptoms such as eyestrain, difficulty focusing, blurred vision, and headache. Scores on the Disorientation (D) subscale are related to vestibular disarrange- ment such as dizziness and vertigo.
The results of that study
Scores on the g m (NI
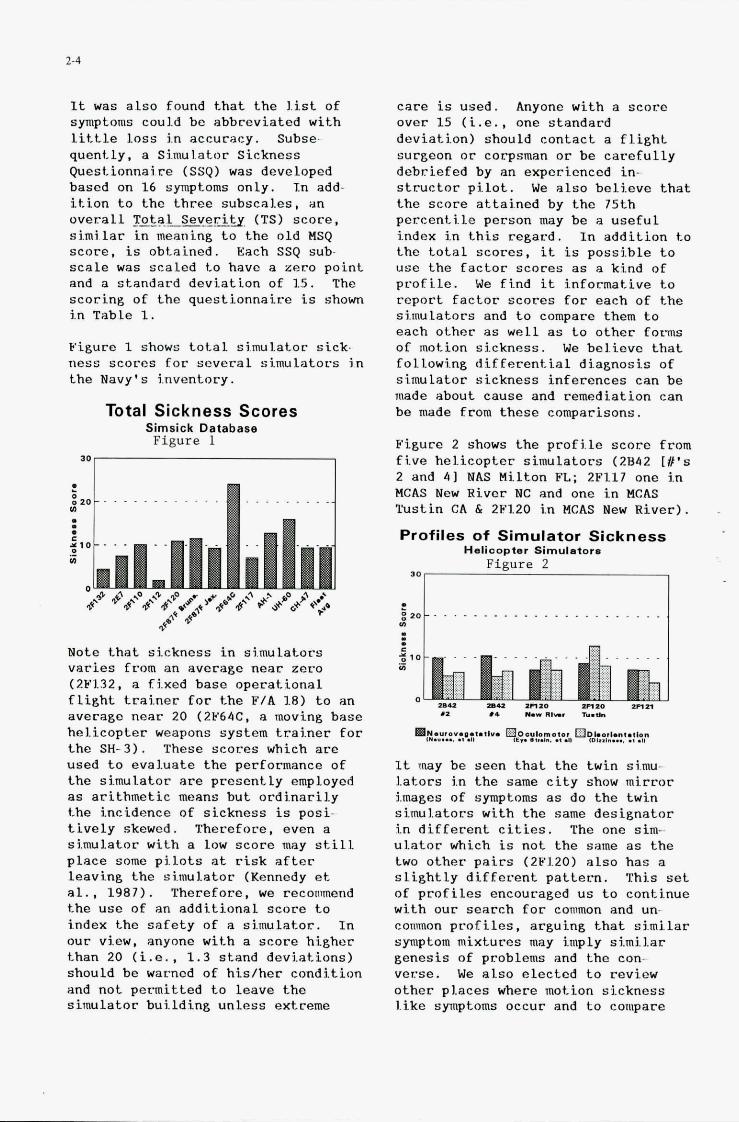
2-4
It was also found that the list of symptoms could be abbreviated with little loss in accuracy. Subse- quently, a Simulator Sickness Questionnai.re (SSQ) was developed based on 16 symptoms only. In add- ition to the three subscales, an overall T'a.1 Severity. (TS) score, simi.lar in meaning to the old MSQ score, is obtained. Each SSQ sub- scale was scaled to have a zero point and a standard deviation of 15. The scoring of the questionnaire is shown in Table 1.
Figure 1 shows total simulator sick- ness scores for several simulators i.n the Navy's inventory.
Total Sickness Scores Simsick Database Figure 1
. . . . . . . . .
Note that sickness in simulators varies from an average near zero (2F132, a fixed base operational flight trainer for the F/A 1.8) to an average near 20 (2b'64C, a moving base heLicopter weapons system trainer for the SH-3). These scores which are used to evaluate the performance of the simulator are presently employed as arithmetic means but ordinarily the incidence of sickness is posi- tively skewed. Therefore, even a simulator with a low score way still place some pilots at risk after leaving the si.mu1ator (Kennedy et al., 1987). Therefore, we recommend the use of an additional score to index the safety of a simulator. In our view, anyone with a score higher than 20 (i.e., 1.3 stand deviations) should be warned of hidher condition and not permitted to leave the simulator building unless extreme
care is used. Anyone with a score over 15 (i.e.. one standard deviation) should contact a flight surgeon or corpsman or be carefully debriefed by an experienced in- structor pilot. the score attained by the 75th percentile person may be a useful index in this regard. In addition to the total scores, it is possible to use the factor scores as a kind of profile. We find it informative to report factor scores for each of the si.mulators and to compare them to each other as well as to other forms of motion sickness. We believe that following differential diagnosis of simulator sickness inferences can be made about cause and remediation can be made from these comparisons.
Figure 2 shows the profile score from five helicopter simulators (2842 1 % ' ~ 2 and 41 WAS Milton FL; 2F117 one in HCAS New River NC and one in MCAS Tustin CA 6 2Fl.20 in HCAS Uew River).
Profiles of Simulator Sickness
We also believe that
H e l i c o p t e r S i rnulatore 30 Figure 2
It may be seen that the twin si.mu- lators in the same city show mirror images of symptoms as do the twin simulators with the same designator in different cities. The one sim- ulator which is not the same as the two other pairs (2F1.20) also has a slightly different pattern. This set of profiles encouraged us to continue with our search for common and un- common profiles, arguing that si.milar symptom mixtures may imply simi1.a~ genesis of problems and the con- verse. We also elected to review other places where motion sickness Like symptoms occur and to compare
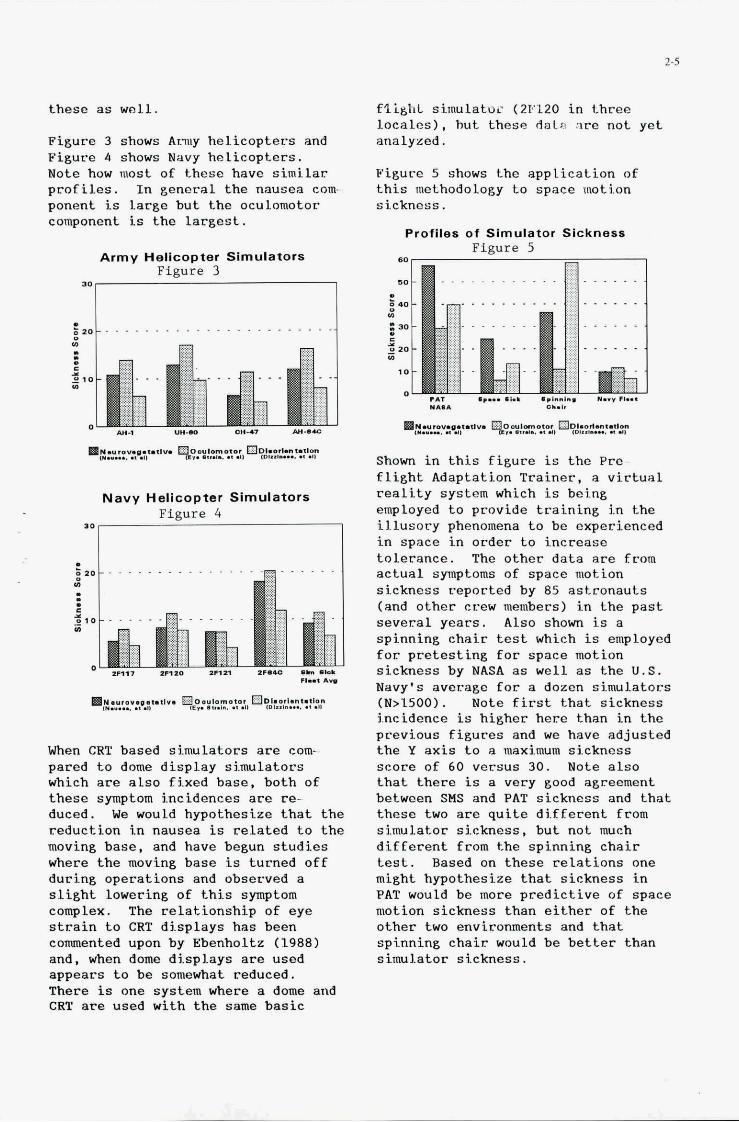
these as well.
Figure 3 shows Army helicopters and Figure 4 shows Navy helicopters. Note how most of these have similar profiles. In general the nausea com- ponent is large but the oculomotor component is the largest.
Army Helicopter Simulators Figure 3
Navy Helicopter Simulators
'"F
When CRT based simulators are com- pared to dome display simulators which are also fixed base, both of these symptom incidences are re- duced. We would hypothesize that the reduction in nausea is related to the moving base, and have begun studies where the moving base is turned off during operations and observed a slight lowering of this symptom complex. The relationship of eye strain to CRT displays has been commented upon by Ebenholtz (1988) and, when dome di.sp1.ays are used appears to be somewhat reduced. There is one system where a dome and CRT are used with the same basic
fli&hL simulatoc (2F120 in three locales), hut these dnls are not yet analyzed.
Figure 5 shows the application of this methodology to space motion sickness.
Profiles of Simulator Sickness Figure 5
. . . . . . . . . . . . ......
. . . . . . . . . . . . . .
. . . . . . . .
. . . . . .
SI... .*. .,a"",". *.. "PI... "1.l 0I.h
.k?2,Y:%?-J- %?.Y!,Z?A% %:o?2:2.T
Shown in this figure is the Pre- flight Adaptation Trainer, a virtual reality system which is being employed to provide training in the illusory phenomena to be experienced in space in order to increase tolerance. The other data are from actual symptoms of space motion sickness reported by 85 astronauts (and other crew members) in the past several years. Also shown is a spinning chair test which is employed for pretesting for space motion sickness by NASA as well as the U . S . Navy's average for a dozen simulators (N>1500). Note first that sickness Incidence is higher here than in the previous figures and we have adjusted the Y axis to a maximum sickness score of 60 versus 30. Note also that there is a very good agreement between SHS and PAT sickness and that these two are quite different from simulator sickness, but not much different from the spinning chair test. Based on these relations one might hypothesize that sickness in PAT would be more predictive of space motion sickness than either of the other two environments and that spinning chair would be better than simulator sickness.

2-6
Figure 6 shows three virtual real.ity systems, a11 of which employ head mounted displays and the NASA PAT virtual reality system.
HMD System Profiles Figure 6
7 0 , I . . . . . . . . . .
. . . . .
. . . . .
. . . . .
. . . . .
. . . . .
m~:h,~v:,tzt.*,". 0.YI.rn .*.I Ei3o,..r*n,.*1.n $.. ...I". ..................... Note that the NASA Crew Station Research and Development System resembles the VR system from the UK and the NASA PAT system, but is slightly different from the U.S. A m y Research Institute's VR system. Reasons for this may be uncovered by comparing the various equipment features of the different systems.
Figure 7 compares alcohol i.nduced discomfort (at .1S mg/dL) with sea sickness and simulator slckness along with space motion sickness and sick- ness symptoms in the NASA VHS device.
Spectral Profiles for Sickness Figure 7
. . . . . . . . . . . . . . . . . . . . ".
. -U* ........ ..m. W. U....l -"Aw ................... .-a..
Note that with motion on. the W S resembles space sickness, although the magnitude of the effects are stronger in the VHS. Note that the fixed base NASA VHS resembles sea sickness. We believe that using symptom profi.les such as these can
shed light on the possible causes of the maladies, particularly if modifi- cations to the devices can be made and then symptoms examined to deter- mine whether and where changes in symptom mixture have occured.
Crucial to the design of VR systems is specification of the equipment parameters that will promote training effectiveness and realism, but also avoid sickness. However, the tech- nological advances which have provided the opportunity for in- creased fidelity have, in turn, placed greater demands on other tolerances on simulator subsystems (e.g., responses of visual and motion base systems and their interaction). Misalignment or asynchrony among sim- ulation modalities and channels and other failures may occasion eyestrain and other symptoms related to motion sickness. Yet, evaluators of these systems may be unaware of the complex nature of these causes and be unable to detect their presence and are, therefore, unable to provide enough information for the visual display engineer to identify and correct the problem. Needless to say, standards and specifications to address these problems are also lacking. In conse- quence, effective training may be compromised, and components and subsystems may be purchased that cannot be used, and so the buyer does not get good value for their acqui- sition dollars.
Our experience with system develop- ment suggests that assessing effects on humans usually comes late in the development process at a time when the design is virtually frozen. but VR systems are brand new and under development. We think that the first technical step in improving systems so that they do not induce sickness is to quantify, as accurately as possible, the problem(s) that are experienced by the humans who wi1.1 use them. The causes cannot be determined until there is a suitable assessment of the "criterion". This
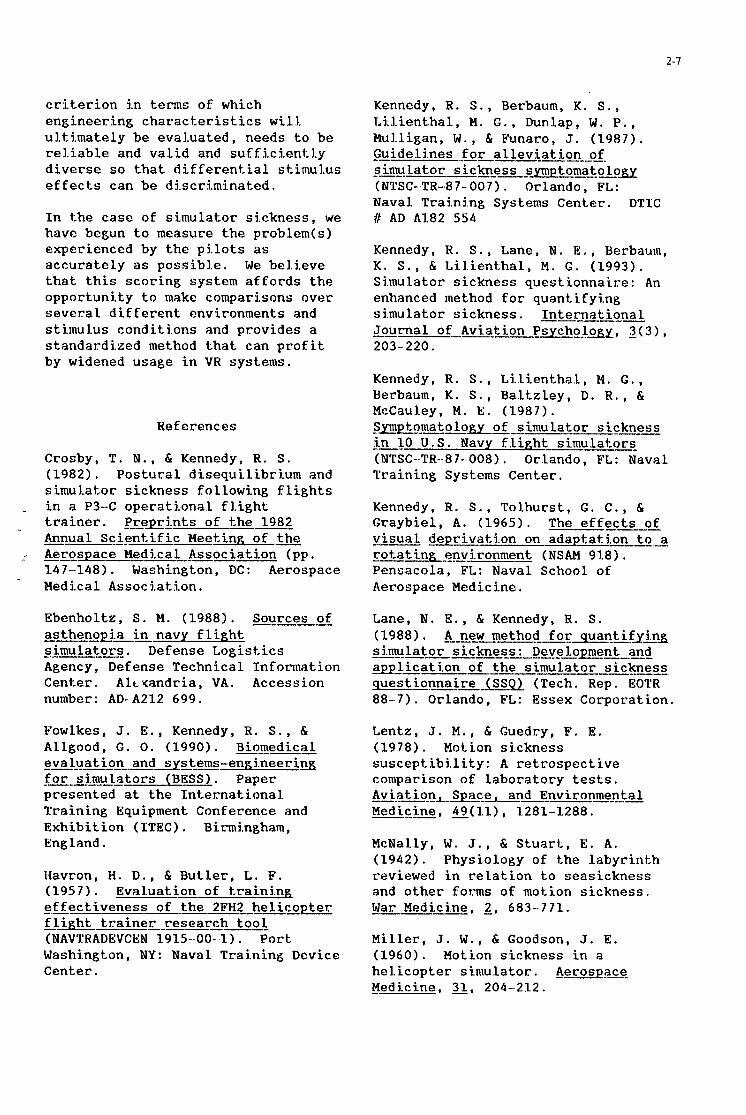
2-7
criterion in terms of which engineering characteristics will ultimately be eval.uated, needs to be reliable and valid and sufficient-ly diverse so that differential stimulus effects can be discriminated.
In the case of simulator sickness, we have begun to measure the problem(s) experienced by the pilots as accurately as possib1.e. We believe that this scoring system affords the opportunity to make comparisons over several different environments and stiinul.us condit,I.ons and provides a standardized method that can profit by widened usage in VR systems.
References
Crosby, T. N., & Kennedy, R. S. (1982). Postural disequilibrium and simu1.ator sickness following flights
trainer. _Preprints of the 1982 ---_----- Annual Scientific Meeting of the
- .. Aerospace Medical Association (pp. 147-1481. Washington, DC: Aerospace
- Medical Association.
- in a P3-C operational fl.ight
Ebenholtz, S. M. (1988). Sources of ----- asthenop-ia -- in navy f light -.--.--- simulators. Defense Logistics Agency, Defense Technical Infomation Center. Altuandria, VA. Accession number: AD--A212 699.
Fowlkes, J. E., Kennedy, R. S., & Allgood, G. 0. (1.990). Biomedical --1--1_---.-. evaluation and sys tems-engineering _-----.-- for simulators (BESS). Paper presented at the Internat iona I. Training Equipment Conference and Exhibition (ITEC) . Bimj.ngham, England.
Havron, H. D., & Butler, L. F. (1957). Eval.uati.- of trainhg -- effectiveness of the 2FH2 helicopter flight trainer research tool (NAVTRADEVCEN 1915--00-1). Port; Washingt-on, NY: Naval Traj.ning Device Center.
--
Kennedy, R. S., Berbaum, K. S., Li.I.ientha1, M. G., Dunlap, W. P., MuI.l.igan, W., & Punaro, J. (1.987). -- Gu id e 1 in e s for a 1 1 e v i a t i on-f -----I__---__ s imu La t o r s i ckne s s s p p t omat,o_lcgy (NTSC-,TR-87-007). Orlando, FL: Naval. Trai.nj.ng Systems Center. DTIC # AD A182 554
Kennedy, R. S., Lane, N. E., Berbaum, K. S., & LiLient-hal, M. G. (1993). Simulator sickness quest-ionnaire: An enhanced method for quant.ifyi.ng simulator sickness. International --_-.__._-_ Journal of Aviation Psycholsy, 3(3), 203- 220.
Kennedy, R. S., Lilienthal, M. G., Berbaum, K. S., Baltzley, D. R., & McCaul.ey, M . E. (1987). S ymp toma t o logy of s imu 1 at or s i.cknes s -- ;.n 10 U.S. Navy flight simulators (NTSC--TR--87-008). Orlando, FL: Naval Training Systems Center.
Kennedy, R. S., Tolhurst, G . C., & Graybiel, A. (1965). The effects of visual dep-rivation on adaptation t o 2 rotating environment (NSAM 91.8). Pensacola, F’L: Naval School of Aerospace Medicine.
-- -I_
Lane, N. E., & Kennedy, R. S. (1988). A new method for quantifyin& I-------------.---- simulator sickness : Devel.opment and application of the simulator sickness. questionnaire (SSQ) (Tech. Rep. EOTR 88-7). Orlando, FL: Essex Corporation.
Lentz, J. M., & Guedry, F. E. (1978). Hot-ion sickness suscept.ibility: A retrospective comparison of laboratory tests. iIli-ati.on, Space, and Environme-n$& FleacjS, 49,(7.1), 7.281-1288.
. .
McNal.ly, W. J., & Stuart, E. A. (1942). Physiology of the labyrinth reviewed in rel.ation to seasickness and other forms of motion sickness. War Medicine, 2, 683-771.
Miller, J. W., & Goodson, J. E. (1960). Motj.on sickness in a heLicopter simulator. Aerospace Medicine, 31, 204--212.
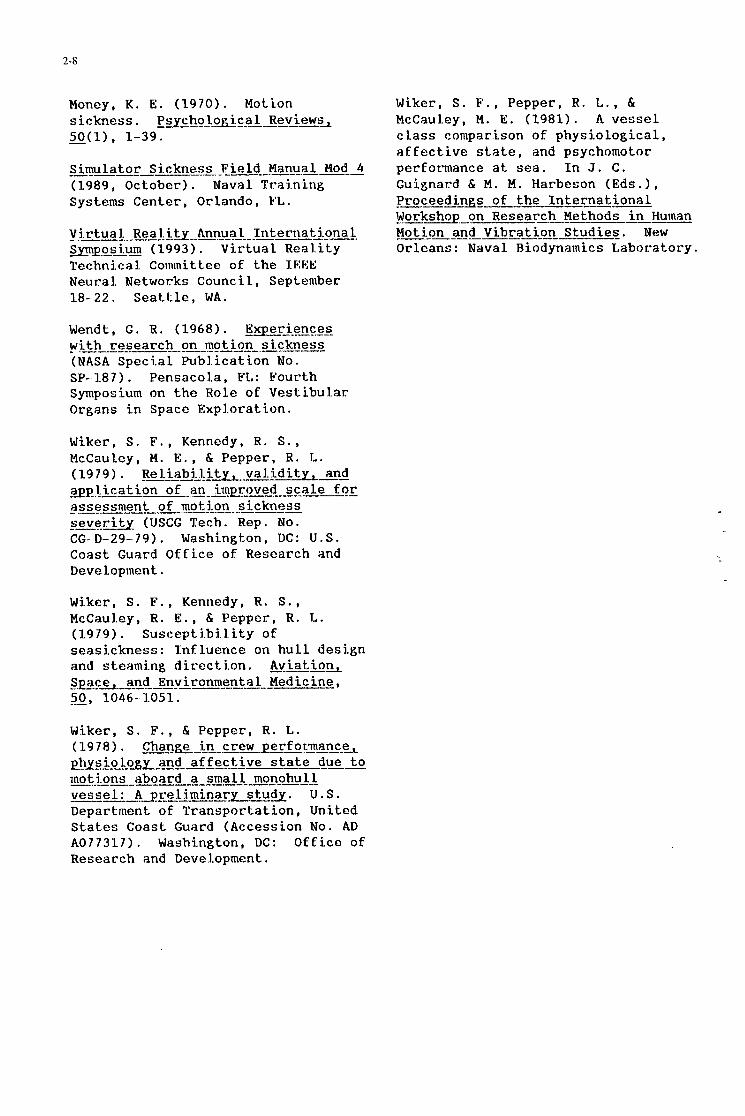
2-8
Money, K . E . (1970). Motion s i c k n e s s . PsychoLo*cal Reviews, - 5 0 ( 1 ) , 1-39.
Simulator Si.ckness F i e l d Manual Mod 4 (1989, October) . Naval T r a h i n g Systems Center , Orlando, E’L.
_______I_ __.- - _-_-_____._.___.-
V j. r t u a I. --Regl.l,dl\nnga 1 I n t e rna t i. ona 1. mFos i .um (1993). V i r t u a l R e a l i t y Technical Cosinittee of t h e IEF:E Neural. Networks Council , September 18- 2 2 . Seat-Lle, WA.
Wendt, G . R . (1968). Experiencgs - with ____I__.______ r e s e a r c h on motion ___________-- s i c k n e s s (NASA Speci.al Publ. ication No. SP- 187). Pensacol.a, FL.: Fourth Symposium on t h e Role of Ves t ibu la r Organs i n Space Expl.oration.
Wiker, S. F . , Kennedy, R . S., McCaul.ey, M . E . , & Pepper, R . TA. (1979). Rel.iabi.l.ity, v a l i d i t y , and e p l . i c a t i o n of an improved s c a l e fog - assessment .- -_ __- of motion - ..-I_--- s i c k n e s s ----- seve r i& (USCG Tech. Rep. No. CG-D-29- 79). Washington, DC: U.S. Coast Guard Offi.ce of Research and Devel.opment .
Wiker, S. F . , Kennedy, R . S., McCi3u].ey, R . E . , & Pepper, R . TA. (1979). Suscept j .bi . l i ty of s eas i ckness : I n f l u e n c e on hul.l desi.gn and steaming d i r e c t i o n . Aviat-ion, -- Space, a-nd Environmental Medicine, 50, 1046- 1.051.
Wiker, S. F . , & Pepper, R. I.. ( 19 78) . ckaa_nge i n crew peqfo&lnance ,- ghygolpgy and a f f e c t i v e s t a t e due t o motj.ons aboard a sinal1 -monohu 11 ---.. v e s s e l : A g r e l i m i n a r y _----I-- ---- s k u a . U.S. Department of T ranspor t a t ion , United S t a t e s Coast Guard (Accession No. AD A077317). Washington, DC: O f f i c e of Research and DeveLopment .
Wiker, S. F . , Pepper, R . L . , & McCaul.ey, M. E . (1981). A vessel c l a s s comparison of physi.ologica1, a f f e c t i v e s t a t e , and psychomotor perforruance a t sea. I n J . C . Guignard & M . M . Harbeson (Eds. 1, Proceedings of t h e I n t e r n a t i o n a l Workshop-on Research Methods i n Human Motion and Vib ra t ion S t u d i e s . N e w Orleans : Naval. Biodynamics Laboratory.
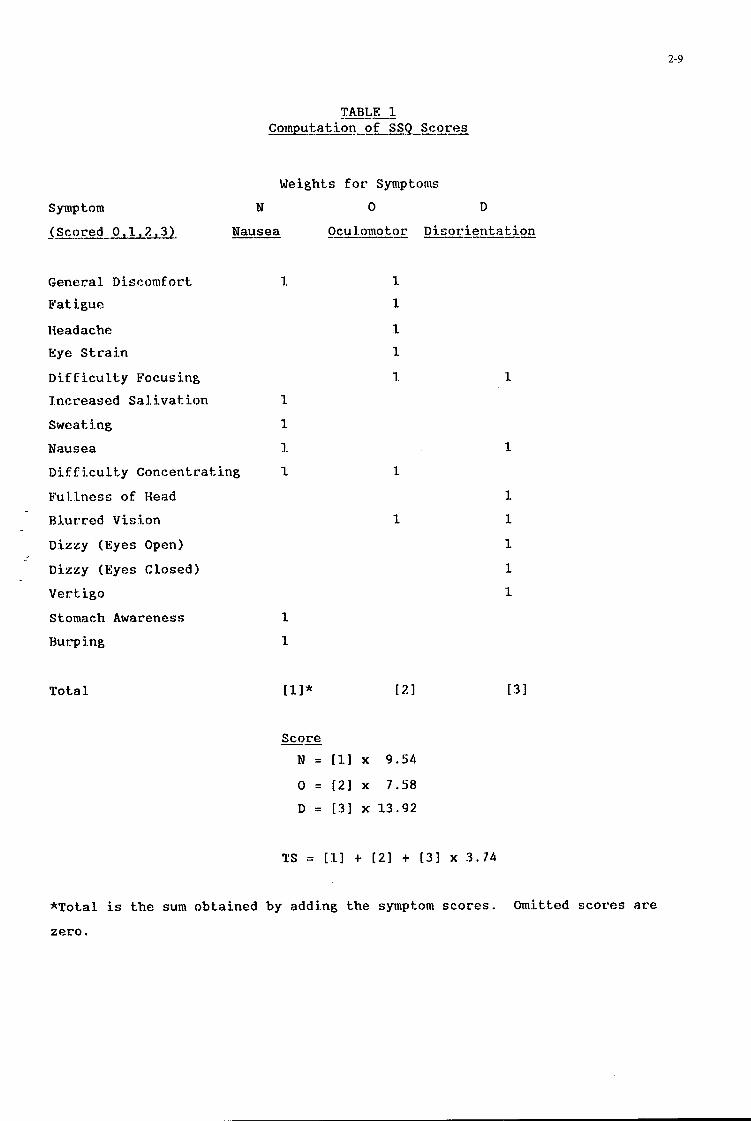
2-9
Synip tom
- (Scored ^_..___ 0,l. 2!!3J
Gene r a 1 D i s comfort
Fa t iguc
Headache
Eye S t r a i n
D i f f i c u l t y Focusing
lnc reased Sal.i.vat-.ion
Sweating
Nausea
TABLE 1 Computation of S S Q - S c , x s
--.-
Weights f o r Symptorus
N 0 D
Ocu 1.omo t o r D i. s o r i e n t a t ion ---I__-- _I_-.---
Nausea
1. 7. 1
1
1
3.
Dif f i c u l t y Concentrat ing 1
F u l l n e s s of Head
Bl.urred Visi.on
Dizzy (Eyes Open)
Dizzy (Eyes Cl.osed)
Vert. igo
Stomach Awareness
Burping
1
1
Tot-a1 [11* 121
Score -I
N = [l] x 9.54
0 = [2] x 7.58
D = [ 3 ] x 13.92
TS = [I] + [21 + 131 x 3.74
1
1
131
*Total. is t h e sum obtai.ned by adding t h e symptom scores.
ze ro .
Omitted s c o r e s are

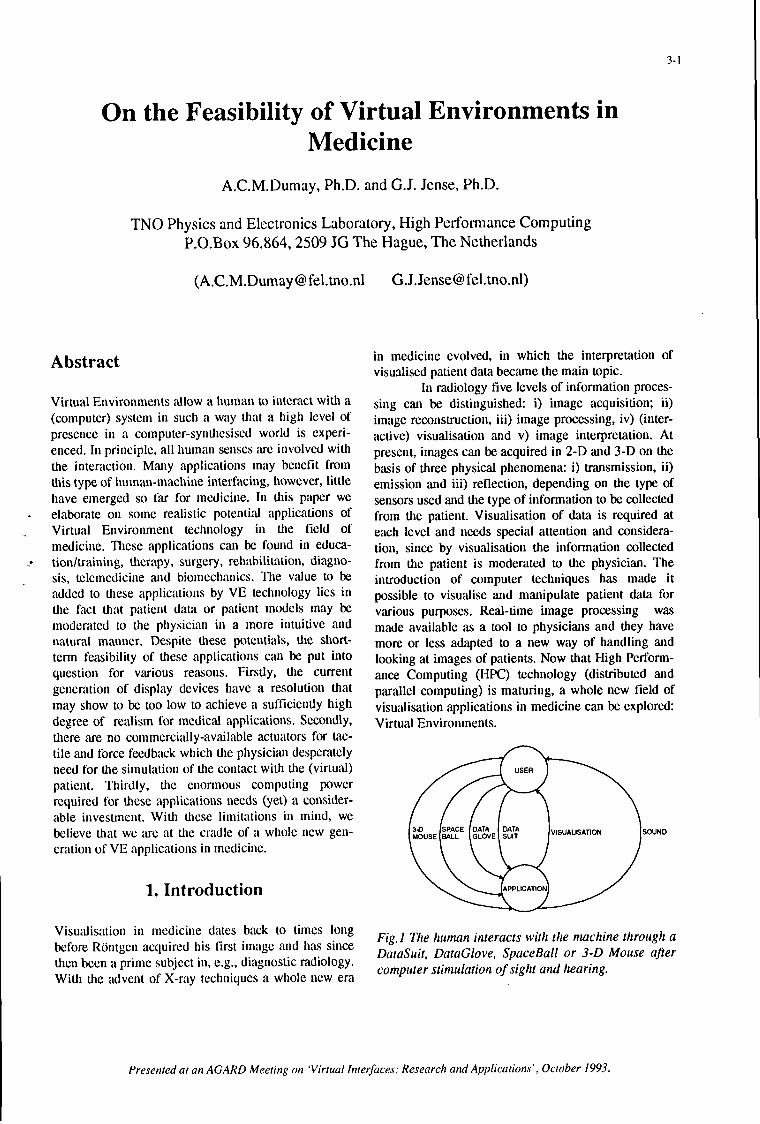
3- I
On the Feasibility of Virtual Environments in Medicine
A,C.M.Dumay, Ph.D. and G.J. Jense, Ph.D.
TNO Physics and Electronics Laboratory, High Performance Computing P.O.Box 06.864,2509 JG The Hague, The Netherlands
([email protected] [email protected])
Abstract
Virtual Eiivironments allow a human to interact with a (computer) system in such a way that a high level of presence in a computer-syiidicsiscd world is experi- enced. In principle, all human senses are involved with the interaction. Many applications may benefit froin this type of human-machine interfacing, however, little have emerged so far for medicine. In this paper we elaborate on some realistic potential applications of Virtual Environinent technology in the field of medicine. These applications can be found in educa- tionltraininy, therapy, surgery, rehabiliUtion, diagno- sis, tcleinedicirie and biomechanics. The value to be added to Uiese applications by VE technology lies in the fact that patient data or paticnt models may be moderated to the physician in a more intuitive and natural manner. Despite Uiese potentials, the short- tenn feasibility of these applications can be put into question for various reasons. Firstly, Uie current generation of display devices have a resolution that may show to be too low to achieve a sufficiently high degree of realism for medical applications. Secondly, there are no coininercially-av,?l~ble actuators for tac- tile aid force feedback which Uie physician desperately need for the simulation of tlie contact wilh tlie (virtual) patient. Thirdly, the enorinous computing power required for lhese applications iiecds (yet) a consider- able invesunent. With these limitations in mind, we bclieve that we are at the crtidle of a whole new gen- eration of VE applications in medicine.
-
-0
1. Introduction
Visualisation in medicine dates back to tunes long before Riintgen acquired his first image and has since tlxn been a prime subject in, e.g., diagnostic radiology. With the advent of X-ray techniques a whole new era
in medicine evolved, in which the interpretation of visualised patient data became the main topic.
In radiology five levels of information proces- sing can be distinguished: i) image acquisition; ii) image reconstruction, iii) image processing, iv) (inter- active) visualisation and v) image interpretation. At present, images can be acquired in 2-D and 3-D on the basis of three physical phenomena: i) transmission, ii) emission and iii) reflection, depending on the type of sensors used and the type of information U> be collected froin the patient. Visualisation of data is required at each level and needs special attention and considera- tion, since by visualisation the information collected from the patient is moderated to the physician. The introduction of computer techniques has made it possible to visualise and manipulate patient data for various purposes. Real-time image processing was made available as a tool to physicians and they have more or less adapted to a new way of handling and looking at images of patients. Now that High Perform- ance Computing (HPC) technology (distributed and parallel computing) is maturing, a whole new field of visualisation applications in medicine can be explored: Virtual Environments.
SOUND
Fig.1 The human interacts with the machine through a DaruSuit, DutaGlove, SpuceBull or 3 -0 Mouse uper coniputer stinzulation of sight and hearing.
Presented at an AGARD Meeting on ‘Virtual Interfaces: Research and Applications’, October 1993.
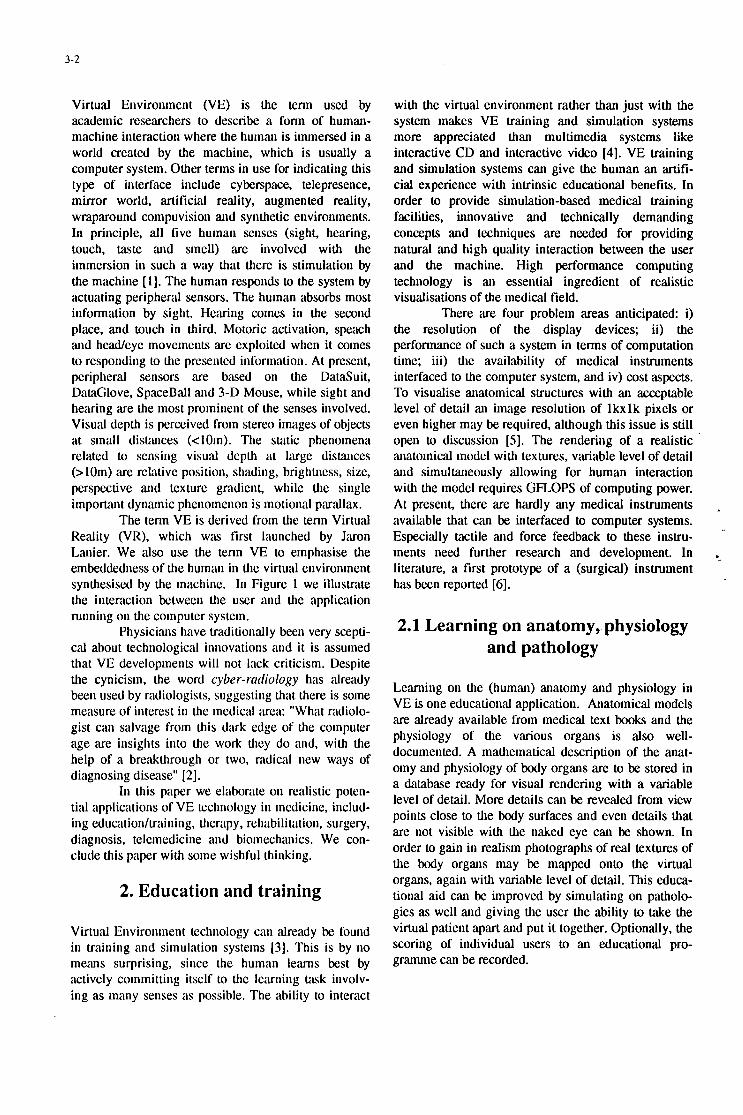
3-2
Virtual Environment (VE) is the tenn used by academic researchers to describe a fonn of human- machine interaction where the humn is immersed in a world created by the machine, which is usually a coinputer system. Other terms in use for indicating this type of interface include cyberspace, telepresence, mirror world, artificial reality, augmented reality, wraparound compuvision and synthetic environments. In principle, all five human senses (sight, hearing, touch, taste and smell) are involved with the immersion in such a way that there is stimulation by the machine [I] . The human responds to the system by actuating peripheral sensors. The human absorbs most infonnation by sight. Hearing comes in the second place, and touch in third. Motoric activation, speach and headeye movements are exploited when it comes to responding to the presented information. At present, peripheral sensors are based on the Datasuit, DahGlove, SpaceBall and 3-D Mouse, while sight arid hearing are the most prominent of the senses involved. Visual depth is perceived from stereo images of objects at small disti-uices (elom). The static phenomena related to sensing visual depth at large distmces (>loin) are relative position, shading, brightness, size, perspective and texture gradient, while the single important dynamic phenomenon is motional parall,ax.
The tenn VE is derived from Uie tenn Virtual Reality (VR), which was first launched by Jaron Lanier. We also use the tenn VE to emphasise the embeddedness of the human in the virtual environment synthesised by the machine. In Figure 1 we illustrate the interaction between the user and the appliution running on the coinputer system.
Physicians have traditionally been very scepti- cal about technological innovations and it is assumed that VE developinen& will not lack criticism. Despite the cynicism, the word cyber-rdiology has already been used by radiologists, suggesting that there is some measure of interest in the medical area: "What radiolo- gist can salvage from this dark edge of the coinputer age are insights into Uie work Uiey do and, with the help of a bre'akthrough or two, radical new ways of diagnosing disease" [2].
In this paper we elaborate on realistic poten- tial applications of VE technology in medicine, includ- ing education/training, therapy, rehabilitation, surgery, diagnosis, telemedicine and biomechanics. We con- clude this paper with some wishful thinking.
2. Education and training
Virtual Environinent technology can already be found in training and siinulatioii systems [3]. This is by no meillis surprising, since the human lecanis best by actively coininitting itself to the learning t i i k involv- ing as many senses as possible. The ability to interact
with the virtual environment rather than just with the system makes VE training and simulation systems more appreciated than multimedia systems like interactive CD and interactive video [4]. VE training and simulation systems can give the human an artifi- cial experience with intrinsic educational benefits. In order to provide simulation-based medical training facilities, innovative and technically demanding concepts and techniques are needed for providing natural and high quality interaction between the user and the machine. High performance computing technology is an essential ingredient of realistic visualisations of the medical field.
There are four problem areas anticipated: i) the resolution of the display devices; ii) the performance of such a system in terms of computation time; iii) the availability of medical instruments interfaced to the computer system, and iv) cost aspects. To visualise anatomical structures with an acceptable level of detail an image resolution of lkxlk pixels or even higher may be required, although this issue is still open to discussion [5]. The rendering of a realistic anatomical model with textures, variable level of detail and simultaneously allowing for human interaction with the model requires GFLOPS of computing power. At present., there are hardly any medical instruments available that can be interfaced to computer systems. Especially tactile and force feedback to these instru- ments need further research and development. In . literature, a first prototype of a (surgical) instrument has been reported [6].
.
2.1 Learning on anatomy, physiology and pathology
Learning on the (human) anatomy and physiology in VE is one educational application. Anatomical models are already available froin medical text books and the physiology of the various organs is also well- documented. A mathematical description of the anat- omy and physiology of body organs are to be stored in a &abase ready for visual rendering with a variable level of detail. More dehils can be revealed from view points close to the body surfaces and even details that are not visible with the naked eye can be shown. In order to gain in realism photographs of real textures of the body organs may be mapped onto the virtual organs, again with variable level of detail. This educa- tional aid can be unproved by simulating on patholo- gies as well and giving the user the ability to take the virtual patient apart and put it together. Optionally, the scoring of individual users to an educational pro- gramme can be recorded.
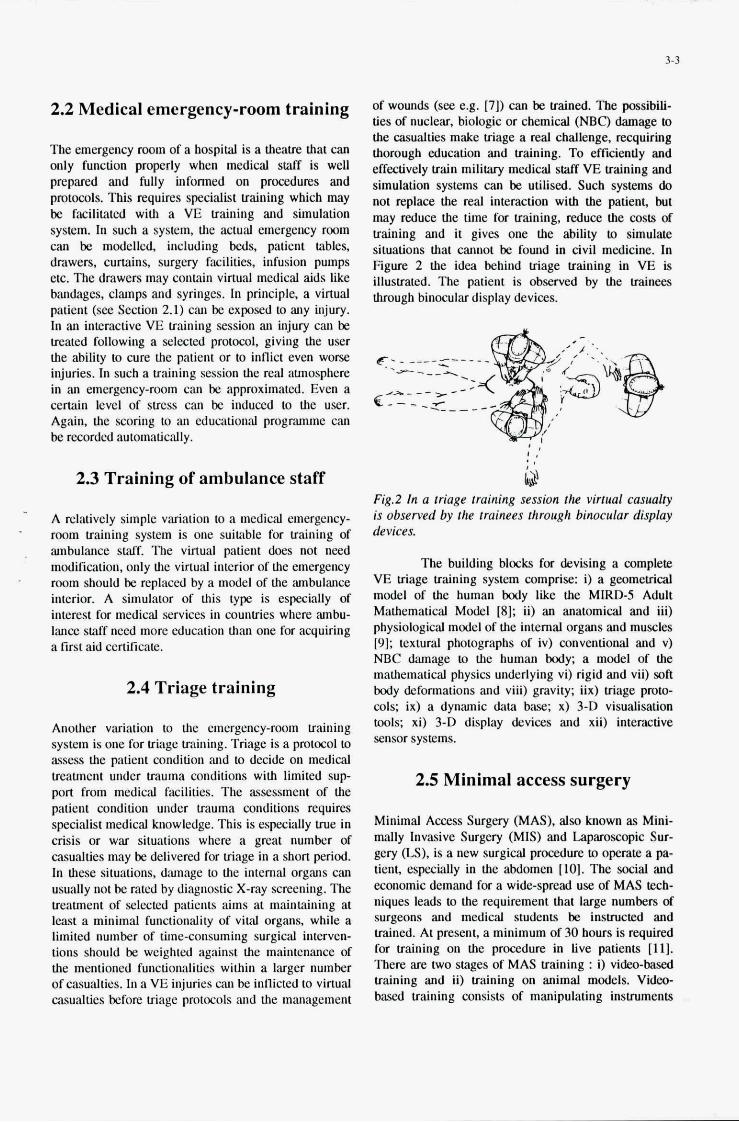
3-3
2.2 Medical emergency-room training
The emergency room of a hospital is a theatre that can only function properly when medical slaff is well prepared and fully informed on procedures and protocols. This requires specialist training which may be facilitated with a VE training and simulation system. In such a system, the actual emergency room can be modelled, including beds, patient tables, drawers, curtains, surgery facilities, infusion pumps etc. The drawers may contain virtual medical aids like bandages, clamps and syringes. In principle. a virtual patient (see Section 2.1) can be exposed to any injury. In an interactive VE training session an injury can be treated following a selected protocol, giving the user the ability to cure the patient or to inflict even worse injuries. In such a training session the real atmosphere in an emergency-mm can be approximated. Even a certain level of stress can be induced to the user. Again, the scoring to an educational prognmme can be recorded automatically.
of wounds (see e.g. [7]) can be trained. The possibili- ties of nuclear, biologic or chemical (NBC) damage to the casualties make triage a real challenge, requiring thorough education and training. To efficiently and effectively train military medical staff VE training and simulation systems can be utilised. Such systems Q not replace the real interaction with the patient, but may reduce the time for training, reduce the costs of training and it gives one the ability to simulate situations that cannot be found in civil medicine. In Figure 2 the idea behind triage training in VE is illustrated. The patient is observed by the trainees through binocular display devices.
2.3 Training of ambulance staff
A relatively simple variation to a medical emergency- room training system is one suitable for training of ambulance staff. The virtual patient does not need modification, only the virtual interior of the emergency room should be replaced by a model of the ambulance interior. A simulator of this type is especially of interest for medical services in countries where ambu- lance staff need more education than one for acquiring a fmt aid certificate.
- .
-
2.4 Triage training
Another variation to the emergency-room training system is one for triage training. Triage is a protocol to assess the patient condition and to decide on medical Veatment under trauma conditions with limited sup- port from medical facilities. The assessment of the patient condition under trauma conditions requires specialist medical knowledge. This is especially true in crisis or war situations where a great number of casualties may be delivered for triage in a short period. In these situations, damage to the internal organs can usually not be raw by diagnostic X-ray screening. The treatment of selected patients aims at maintaining at least a minimal functionality of vital organs, while a limited number of time-consuming surgical interven- tions should be weighted against the maintenance of the mentioned fnnctionalities within a larger number of casualties. In a VE injuries can be inflicted to virtual casualties before triage protocols and the mnnagement
Fig.2 In a triage training session rhe virtual casualty is observed by the lrainees lhrough binocular display devices.
The building blocks for devising a complete VE triage training system comprise: i) a geometrical model of the human body like the MIRD-5 Adult Mathematical Model [8]; U) an anatomical and iii) pbysiological model of the internal organs and muscles 191; textural photographs of iv) conventional and v) NBC damage to the human body; a model of the mathematical physics underlying vi) rigid and vu) soft body deformations and viii) gravity; ux) triage pmto- cols; ix) a dynamic dam base; x) 3-D visnalisacion tools; xi) 3-D display devices and xu) interactive sensor systems.
2 5 Minimal access surgery
Minimal Access Surgery (MAS), also known as Mini- mally Invasive Surgery (MIS) and Laparoscopic Sur- gery ( L S ) , is a new surgical procedure to operate a pa- tient, especially in the abdomen [lo]. The social and economic demand for a wide-spread use of MAS tech- niques leads to the requirement that large numbers of surgeons and medical students be instructed and uained. At present, a minimum of 30 hours is required for training on the procedure in live patients [ll]. There are two stages of MAS training : i) video-based training and ii) training on animal models. Video- based training consists of manipulating instruments
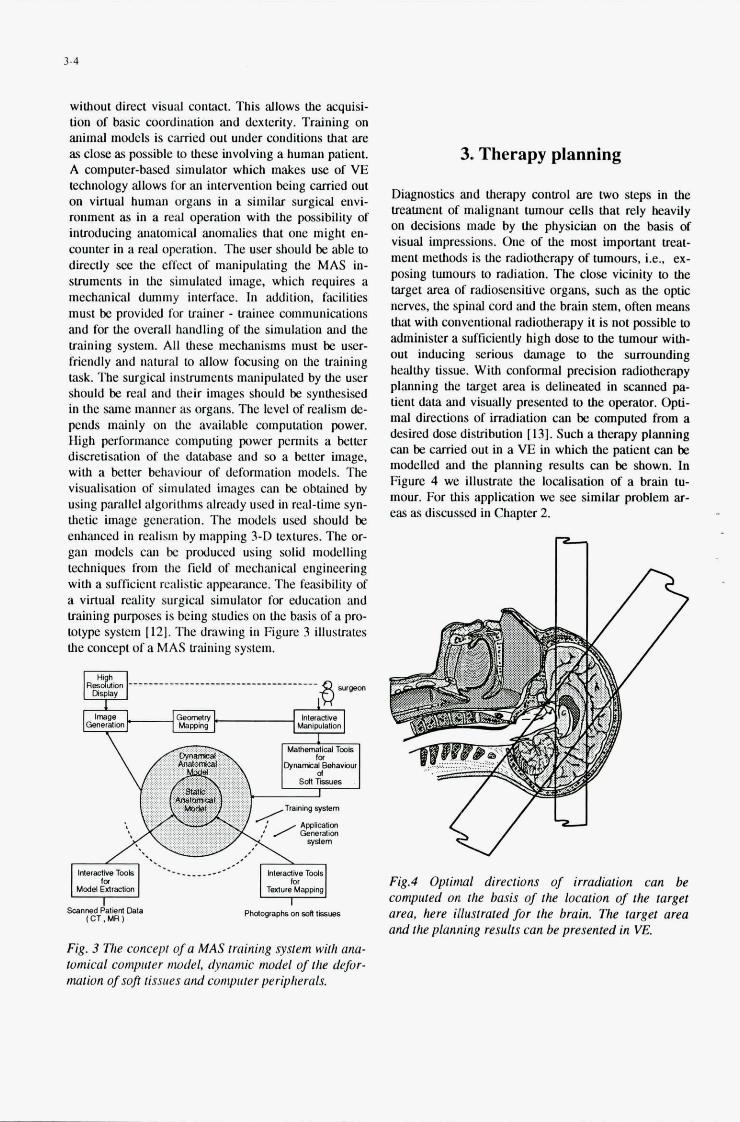
3-4
without direct visual conwt. This allows the acquisi- tion of basic coordination and dexterity. Training on animal models is carried out under conditions that are as close. as possible to these involving a human patient. A computer-based simulator which makes use of VE technology allows f a an intervention being carried out on vinual human organs in a similar surgical envi- ronment as in a real operation with the possibility of introducing anatomical anomalies that one might en- counter in a real operation. The user should be able to directly see the effect of manipulating the MAS in- stcumenu in tlie simulated image, which requires a mechanical dummy interface. In addition, facilities must be provided for trainer - uainee communications and for the overall handling of the simulation and the vaining system. All these mechanisms must be user- friendly and natural to allow focusing on the training task. The surgical instruments manipulated by the user should be real and their images should be synthesised in the Same manner as organs. The level of realism de- pends mainly on the available computation power. High performance computing power pennits a better discretisation of the database and so a better image, with a better behaviour of deformation models. The visualisation of simulated images can be obtained by using parallel algorilluns already used in real-time syn- thetic h i g e generation. The models used should be enhanced in realism by mapping 3-D textures. The or- gan models can be produced using solid modelling techniques from the field of mechanical engineering with a sufficient realistic appearance. The feasibility of a virtual reality surgical simulator for education and training purposes is being studies on the basis of a pro- totype system [12]. The drawing in Figure 3 illustrates the concept of a MAS training system.
3. Therapy planning
Diagnostics and therapy control are two steps in the Vealment of malignant tumour cells that rely heavily on decisions made by the physician on the basis of visual impressions. One of the most important m- men1 methods is the radiotherapy of tumours, i.e., ex- posing tumours to radiation. The close vicinity to the target area of radiosensitive organs. such as tbe optic nerves, the spinal cord and the brain stem, often means that with conventional radiotherapy it is not possible to administer a sufticienlly high dose to the tumour with- out inducing serious damage to the surrounding healthy tissue. With conformal precision radiotherapy planning the target area is delineated in scanned pa- tient data and visually presented to the operator. Opti- mal directions of irradiation can be computed from a desired dose distribution [13]. Such a thaapy planning can be carried out in a VE in which the patient can be modelled and the planning results can be shown. In Figure 4 we illustrate the localisation of a brain tu- mour. For this application we see similar problem ar- eas as discussed in Chapter 2.
c Mqpinp 7 Phdoprspkon s d treusr
(CT. MR I
Fig. 3 Tile concept of a MAS training system with a m - tomical comprrter nwdel, dynaniic model of the defor- mation of sojl tissues and contpriter peripherals.
Fig.4 Oplinurl directions of irradiation can be computed on the basis of the location of the target area, here illustrated for the brain. The farget area and llie planning results can be presented in VE.
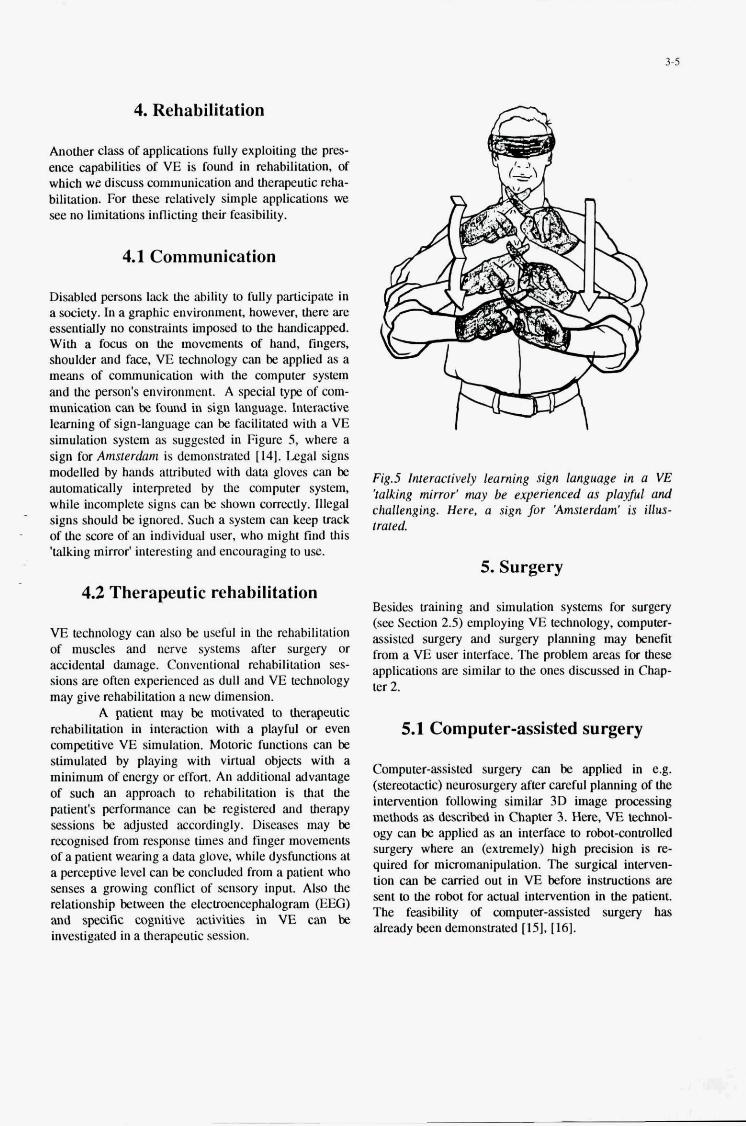
4. Rehabilitation
Another class of applications fully exploiting the pres- ence capabilities of VE is found in rehabilitation, of which we discuss communication and therapeutic reha- bilitation. For these relatively simple applications we see no limitations inflicting their feasibility.
4.1 Communication
Disabled persons lack the ability to fully participate in a society. In a graphic environment, however, there are essentially no coustraiuts imposed to the handicapped. With a focus on the movements of hand, fmgefs, shoulder and filce, VE technology can be applied as a means of communication with the computer system and the person's environment. A special type of com- municatiou can be found in sign language. Interactive learning of sign-language can be facilitated with a VE simulation system as suggested in Figure 5, where a sign for Amsterdnm is demonstrated [ 141. Legal signs modelled by hands aUributed with data gloves can be automatically interpreted by the computer system, while incomplete signs can be shown correctly. Illegal signs should be ignored. Such a system can keep track of the score of an individual user, who might find !his 'talking mirror' interesting and encouraging to use.
-
4.2 Therapeutic rehabilitation
VE technology GUI also be useful in the rehabilitation of muscles and nerve systems after surgery or accidental damage. Conventional rehabilitation ses- sions are often experienced as dull and VE technology may give rehabilitation a new dimension.
A patient may be motivated to lhefapeutic rehabilitation in interaction with a playful or even competitive VE simulation. Motoric functions can be stimulated by pIaying with virtual objects with a minimum of energy or effort. An additional advantage of such an approach to rehabilitation is that the patient's performance can be registered and therapy sessions be adjusted accordingly. Diseases may be recognised from response times and finger movements of a patient wearing a data glove, while dyshnctions at a perceptive level can be concluded from a patient who senses a growing conflict of sensory inpu~ Also the relationship between the electroencephalogram (EEG) and specific cognitive activities in VE can be investigated in a therapeutic session.
3-5
Fig.5 Interactively learning sign language in a VE 'talking mirror' may be experienced as playful and challenging. Here, a sign for 'Amsterdam' is illus- trated
5. Surgery
Besides training and simulation systems for surgery (see Section 2.5) employing VE technology, computer- assisted surgery and surgery planning may benefit from a VE user interface. The problem areas for these applications are similar to the ones discussed in Chap- ter 2.
5.1 Computer-assisted surgery
Computer-assisted surgery can be applied in e.g. (stereotactic) neurosurgery after careful planning of the intervention following similar 3D image processing methods as described in Chapter 3. Here, VE leehnol- ogy can be applied as an interface to robot-mnmlled surgery where an (extremely) high predsion is re- quired for micromanipulation. The surgical interven- tion can be carried out in VE before inst.ructions are sent to the mbot for actual intervention in the patient The feasibility of computer-assisted surgery has already been demonstrated [151, [161.
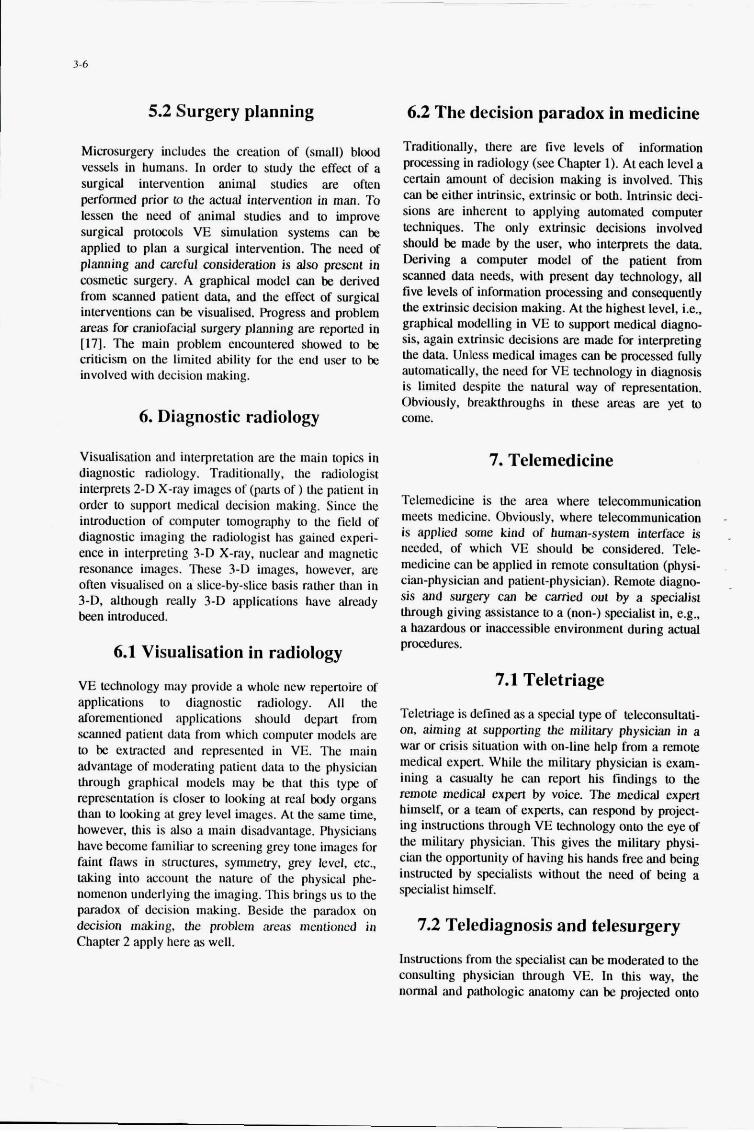
3-6
5.2 Surgery planning
Micmsurgery includes the creation of (small) blood vessels in humans. In order to study the effect of a surgical intervention animal studies are often performed prior to the actual intervention in man. To lessen the need of animal studies and to improve surgical protocols VE simulation systems can be applied to plan a surgical intervention. The need of planning and careful consideration is also present in cosmetic surgery. A graphical model can be derived from scanned patient data, and the effect of surgical interventions can be visualised. Progress and problem a r m for craniofacial surgery planning are reporred in [171. The main problem encountered showed to be criticism on the limited ability for the end user to be involved with decision making.
6. Diagnostic radiology
Visualisation and interpretation are the main topics in diagnostic radiology. Traditionally. the radiologist interprets 2-D X-ray images of @arts of) the patient in order to support medical decision making. Since the introduction of computer tomography to the field of diagnostic imaging the radiologist has gained experi- ence in interpreting 3-D X-ray, nuclear and magnetic reSOnance images. These 3-D images, however, are often visualised on a slice-by-slice basis rather than in 3-D, although really 3-D applications have already been iIlKoduCed.
6.1 Visualisation in radiology
VE technology may provide a whole new repertoire of applications to diagnostic radiology. All the aforementioned applications should depart from scanned patient data from which computer models are to be extracted and represented in VE. The main advantage of moderating patient data to the physician through graphical models may be that this type of representation is closer to looking at real body organs than to looking at grey level images. At the same time, however, this is also a main disadvantage. Physicians have become familiar to screening grey tone images for faint flaws in suuctures, symmetry, grey level, etc., taking into account the nature of the physical phe- nomenon underlying the imaging. This brings us to the paradox of decision making. Beside the paradox on decision making, the problem areas mentioned in Chapter 2 apply here as well.
6.2 The decision paradox in medicine
Traditionally, there are five levels of information processing in radiology (see Chapter 1). At each level a certain amount of decision making is involved. This can be either inuinsic, extrinsic or both. Intrinsic W- sions are. inherent to applying automated computer techniques. The only extrinsic decisions involved should be made by the user, who interprets the data Deriving a cornpuler model of the patient from scanned data needs, with present day technology, all five levels of information processing and consequently the extrinsic decision making. At the highest level, i.e., graphical modelling in VE to support medical diagno- sis. again extrinsic decisions are made for interpreting the data. Unless medical images can be processed fully automatically, the need for VE technology in diagnosis is limited despite the natural way of representation. Obviously, breakthroughs in these arm are yet to come.
7. Telemedicine
Telemedicine is the area where telecommunication meets medicine. Obviously, where telecommunication is applied some kind of human-system interface is needed, of which VE should be considered. Tele- medicine can be applied in remote consultation @hysi- cian-physician and patient-physician). Remote diagnc- sis and surgery can be carried out by a specialist through giving assistance to a (non-) specialist in, e.g., a hazardous or inaccessible environment during actual procedures.
7.1 Teletriage
Telecriage is defined as a special type of telmnsultati- on. aiming at supporting the military physician in a war or crisis situation with on-line help fmm a remote medical expert. While the military physician is exam- ining a casualty he can report his findings to the remote medical expert by voice. Tbe medical expert himself, or a team of experts, can respond by project- ing instructions through VE technology onto the eye of the military physician. This gives the military physi- cian the opportunity of having his hands free and beiig instructed by specialists without the need of being a specialist himself.
7.2 Telediagnosis and telesurgery
Instructions from the specialist can be moderated to the consulting physician through VE. In this way, the normal and pathologic anatomy can be projected onto
3-1
the eye of the consulting physician while examining the patient. The same can be done for surgical instructions. Hazardous environments can be found in war situations while submarines and other MVY vessels in full operation are considered to be inaccessible environments. Telemedicine can be particularly inter- esting to support peace keeping efforts of (united) nations in politically and military instable areas with a poor (medical) infrastructure.
Fig6 The posture of a patient can De recognised using relutively sinzple sensur systems and presented in a VE to the palient. who con watch his posture from any position and correct for it.
8. Biomechanics
Virtual Environments can also be interesting for the field of biomechanics. Relatively simple sensor systems c<an be applied for human posture recognition, which in its turn can be applied to interactive posture correction. Figure 6 illustrates a "help yourself" posture correction session. The latter is of interest to disabled persons, sporting persons and physically active persons, and can be integrated in the process of designing optimal equipment for the individual of group of individuals. In this manner, optimal seats for cars, cockpits, miliuuy tanks, etc., can be developed.
9. Conclusions
In this paper we elaborate on applications of VE technology in medicine which we consider feasible. We identify the following application areas: i) educa- tion and training, including education on anatomy, physiology and pathology, medical emergency-room training, training of ambulance staff, triage training and minimal access surgery training; ii) conformal ra- diotherapy planning; iii) rehabilitation, including com- munication and therapeutic rehabilitation; iv) surgery, including computer-assisted stereotactic neurosurgery and planning of microsurgery and cosmetic surgery; v) diagnostic radiology; vi) telemedicine for consultation purposes and vii) biomechanics for interactive posture recognition and correction and the design of equip- ment. The most promising of these areas is education and training, since VE technology primarily allows the user to actively committing itself to a learning task with as many senses as possible.
The feasibility of the aforementioned applica- tions can be put into question for various reasons. Firstly, the current generation of display devices has a resolution that may show to be too low for realistic medical applications. At present, some diagnostic ap- plications are supposed to need a resolution of 4Kx4K pixels! Secondly, there are no commercially-available actuators for tactile and force feedback which the physician desperately need for the contact with the (virtual) patient. Thirdly, there is a need of GFLOPS of computing power. Although this is basically not a problem area, the financial investment needed to acquire that computing power may delay the develop- ments. Finally, despite the realism that can be achieved within virtual environments, VR applications remain models of the real world: models cannot replace the real world ! This is true in general and for medicine in particular. We do not suggest applying VE training and simulation systems instead of "training on the spot", but see it 'as an additional educational tool, shortening the training period effectively and efficiently. We share Lanier's feeling in foreseeing a coming revolution on the use of computer models of humans and human organs in diagnosis and treatment [18]. However, to our understanding of medical decision making in diagnosis, quite some breakt- hroughs are required, possibly overruling the 'traditional' levels of information processing. There is great need of new data paradigms to support real-time medical visualisation.
With these limitations and problem areas in mind, we believe that we are at the cradle of a whole new generation of applications of Virtual Environment Technology in medicine.
3-8
References
[ 11 SAukstakalnis and D.Blatner, Silicon Mirage, Berkeley: Peachpit Press, 1992. 1993.
[2] P.L.Ogle, "Is the World ready for Cyber-Radiology ?," Diagnostic Imaging Internutionul, May 1993,
[3] G.J.Jense and F.Kuijper, "Virtual Environments for Adapted Trainers a i d Simulators," Proc. Int. Training Equipment Conference, pp.49-57, 1993.
[4] P.Vossen, "New Approaches to Medical Training. A patient simulator," submitted.
[5] H.Fujita, M.L.Giger and K.Doi, "Investigation of Basic Imaging properties in Digital Radiography: 12. Effect of Matrix Configuration on Spatial Resolution," Med.Phys., vo1.15, pp.384-390, 1988.
[6] D.Sims, "The Point Where Lines Converge", IEEE Comput. Gruph. and Appl., no. July, pp.7-8, 1993.
[7] J.Dolin, Th.Scalca, L.M,uinor, S.Sclafani, et al., "The Management of Gunshot Wounds to the Face," The Joiirnul of Truunur, vo1.33, pp.508- 515, 1992.
[8] Inteniational Coinmission on Radiation Units aid Measurements, Phantoms a i d Computational Models in Therapy, Diagnosis and Protection,
[9] T.Schiem,uin, M.Bomans, U.Tiede and K.H. Hohne, "Interactive 3D-Segmentation," ProcSPIE Visuulizution in Biomedicul Coniputing, vol. 1808,
[lo] P.Tesm and B.Delaitre, Cliiriirgie Digestive par voie Coelioscopiyue, Paris: fjditions Maloine, 1991.
[ 111 M.D.Noar, "Endoscopy Simulation: A Bnve New World'?," Endoscopy, vo1.23, pp.147- 149, 1991.
[ 121 R.M.Satava, "Virtual Reality Surgical Simulator. The First Steps,'' In J.D.Mabrey, ed. Proc. of the USASOC Surgeon's Conference, 5-8 December
[ 131 S. Webb, "Optunisation of Confonnal Radiother- apy Dose Distributions by Simulated Annealing", Ptiys. Med. Biol., vo1.34, pp.1349-1370, 1989.
[ 141 L.Koenen, T.Bloem and R.Janssen, Geburentuul. De Tau1 vun Doven in Nederlund, (Sign Lnngituge. The Lcrngiiuge of the Deuf in the Netherlunds,) Amsterdam: Nijgh & Van Ditmar, 1993.
[lS]W.S.Ng, B.L.Davies, R.D.Hibberd and A.G. Timoney, "Robotic Surgery," IEEE Eng. Med. Bioi., pp.120-125, 1993.
[16] B.Preising, T.C.Hsia and B.MittelsL,?t, "A Literature Review: Robots in Medicine", IEEE Eng. in Med. Biol., no. June, pp.13-22, 1991.
[ 171 C.McEwan, R.Robb and I.Jackson, "Cr,miofacial Surgery Planning and Simulation: Current Pro- gress and Problem Areas," in H.U.Lemke, M.L.
Rhodes, C.C.Jaffe and R.Felix, e&., Proc. Inf. Symp. CAR '89, pp.398-402, 1989.
[18] N.Hays, "Lanier 'Rants' about New VR Issues," IEEE Comput. Graph. and Appl., no. May, p.85,
p.5.
I ICRU Report 48,1992.
pp.376-383, 1992.
1992, pp.12-14.
- I
4- I
INTERFACES VOCALES
POUR LES SYSTEMES OPERATIONNELS
AIDE A LA FORMATION ET L'ENTRAINEMENT
DES CONTROLEURS DE TRAFIC AERIEN
T. Labarrere F. Nee1 Sextant Avionique
9, Rue de Champagne BP 91 BP 133 33166 Saint MCdard en Jalles Cedex
France France France
LIMSUCNRS
9 14 03 Orsay Cedex
F. Marque Centre d'Etude de la Navigation ACrienne
9 1200 Athis-Mons
I INTRODUCTION
Place sous 1'6gide du Ccntre d'Etudcs dc l a Navigation Airicnne (CENA) le projet PAROLE utilise les potentialitis compldmentaires d'industriels (STERIA INGENIERIE ET TELECOM, SEXTANT AVIONIQUE et VECSYS) ct d'un organisme de recherche (LIMSI) quant h I'itude et la rialisation d'un outil da idc h la I'ormation ct I'cntrainemcnt dcs contr6leurs adriens.
concepts dIHM vocalc, pcrmct d'cnvisagcr tine application opdrationncllc du procluit I'AROLE dans lcs cen t r a de formation des contrOlcurs clc 1;i
Navigation Airicnnc.
Cc documcnt prdscntc I'architccturc ct Ics diffdrents co!istituants dc PAROLE avnnt tl'cn Cvaluer Ics applications I'ulurcs possihlcs. II prkisc dc plus la mithodologic suivic, hascc sur Ics principcs d'dtudc du langagc naturcl.
Bas6 sur I'utilisation concomitantc d'unc interfacc I1 GENERALITES vocalc (synthkse ct rcconnaissancc de la parolc) ct d'un supcrviseur gdrant I C dialogue, le prototypc est Le traf'ic adricn suhit dcs modilicotions clc ch;ii.gca h memc d'exploitcr complktcmcnt IC canal audio. dont IC puhlic est rigulitrcmcnt avcrti ... C c w
activitd connait globalcmcnt, tine ci.oiss;iiicc Aujourd'hui, la validation par lcs op6rationncls des continuc dcpuis IC d&ut dc son histoirc ; cn 1953,
Presented at an AGARD Meeting on 'Virtual Interfaces: Research and Applications', October 1993.
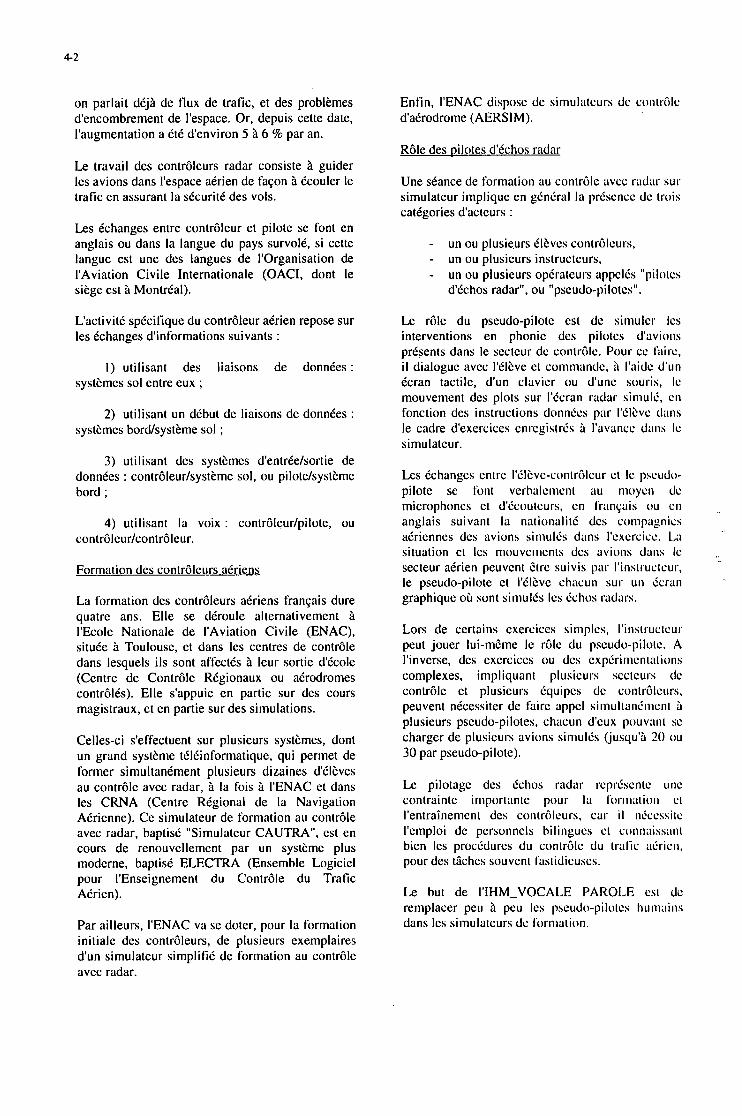
4-2
on parlait dtjB de tlux de trafic, et des problkmes d'encombrement de I'espace. Or, depuis cette date, I'augmentation a CtC denviron 5 B 6 % par an.
Le travail des contrbleurs radar consiste B guider les avions dans I'espace aCrien de fac;on B Ccouler le trafic en assurant la stcuritt des vols.
Les tchanges entre contr6leur et pilote se font en anglais ou dans la langue du pays survolt, si cette langue est une des langues de I'Organisation de I'Aviation Civile Internationale (OACI, dont le sikge est h Monlrtal).
L'activitt sptcitique du contr6leur atrien repose sur les Cchanges d'informations suivants :
1 ) utilisant des liaisons de donndes: systkmes sol entre eux ;
2) utilisant un dtbut de liaisons de donnCes : systkmes bordhystkmc sol ;
3) utilisant des systkmes d'entrtelsortie de donndcs : contrbleur/systkme sol, ou pilote/systkme bord ;
4) utilisant la voix : contr6leur/pilote, ou contr6lcur/contr6leur.
Formation des contr6lcurs atriens
La formation des contr6leurs atriens franpis dure quatrc ans. Elle se dtroule alternativemcnt h I'Ecole Nationale de I'Aviation Civile (ENAC), situte B Toulouse, et dans les centres de contr6le dans lesquels ils son1 affectis 2 leur sortie d'tcole (Centre de Contrble Rtgionaux ou atrodromes contrblts). EIle s'appuie en partie sur des cours magistraux, et en partie sur des simulations.
Celles-ci s'effectuent sur plusieurs systkmes, dont un grand syst2me ttltinformatique, qui permet de former simultantment plusieurs dizaines ddlkves au contr6le avec radar, B la fois B I'ENAC et dans les CRNA (Centre Rtgional de l a Navigation Atrienne). Ce simulateur de formation au contr6le avec radar, baptist "Simulateur CAUTRA", est en cours de renouvcllemcnt par un systkme plus modcrne, baptist ELECTRA (Ensemble Logiciel pour I'Enseignement du Contr6le du Trafic Adrien).
Par ailleurs, I'ENAC va se doter, pour la formation initiale dcs contraleurs, de plusieurs cxemplaires d'un simulateur simplitit de formation au contr6le avec radar.
Enfin, I'ENAC dispose dc simulatcurs de contrfilc d'atrodrome (AERSIM).
R61e des ~ilotes d'tchos radar
Une sCance de formation au conwOlc avcc radar sur simulateur implique en gdndral la prdscncc de trois cattgories dacteurs :
- - un ou plusicurs instructcurs, -
un ou plusicurs ClEvcs contr0lcurs,
un ou plusicurs opdratcurs appclds "pilotcs dCchos radar", ou "pseudo-pilotcs".
Le r61e du pseudo-pilotc cst dc siniulcr Ics interventions en phonie dcs pilotcs d'avions prtsents dans le sccteur de contr0lc. Pour cc laire, i l dialogue avcc I'CIEvc ct commandc, B I'aidc d'un tcran tactile, d'un clavicr ou d'unc souris, le mouvement des plots sur I'dcran radar simuld, en fonction des instructions donnfcs par I'ClEvc dans le cadre d'excrcices cnrcgistrds B I'avancc diuis IC simulateur.
Les tchanges cntre I'ClEvc-contidlcur et IC pscudo- pilote se font vcrbalcmcnt au moycn de microphones ct d'dcoulcurs, en I'rilnpis ou cn anglais suivant la nationalitf dcs compugnics atrienncs des avions simulds dans I'cxcrcicc. La situation et Ics mouvemcnts des avions dans le secteur atrien pcuvcnt etrc suivis par I'instructcur, le pseudo-pilotc et I'fIEvc chncun sur u n Ccran graphique oh sont simulds Ics fchos radars.
Lors de certains cxcrciccs siinplcs, I'instructcur peut jouer hi-memc IC rOlc du pscudo-pilotc. A I'inverse, des exercices ou des cxp~riiiicntntions complexes, i mpl iquant pl usicurs scctcurs de contrble et plusicurs dquipcs dc contrfilcurs. peuvent ntcessiter dc fairc appcl simultant5riicnt :I plusieurs pscudo-pilotes, chacun d'cux pouvant se charger de plusicurs avions simulds Cjusqu'h 20 ou 30 par pseudo-pilote).
Le pilotagc des fchos radar rcprfscntc uiic contrainte importnntc pour la lormution et I'entrainemcnl dcs contrfilcurs, car i I niccssitc I'cmploi de personnels bilingucs et connitissiint bien les procddures du contrOlc du tralic acricn, pour des tlchcs souvcnt I'astidicuscs.
Le but de I'IHM-VOCALE PAROLE est de remplacer pcu h pcu Ics pscudo-pilotcs humains dans lcs simulateurs de lormation.
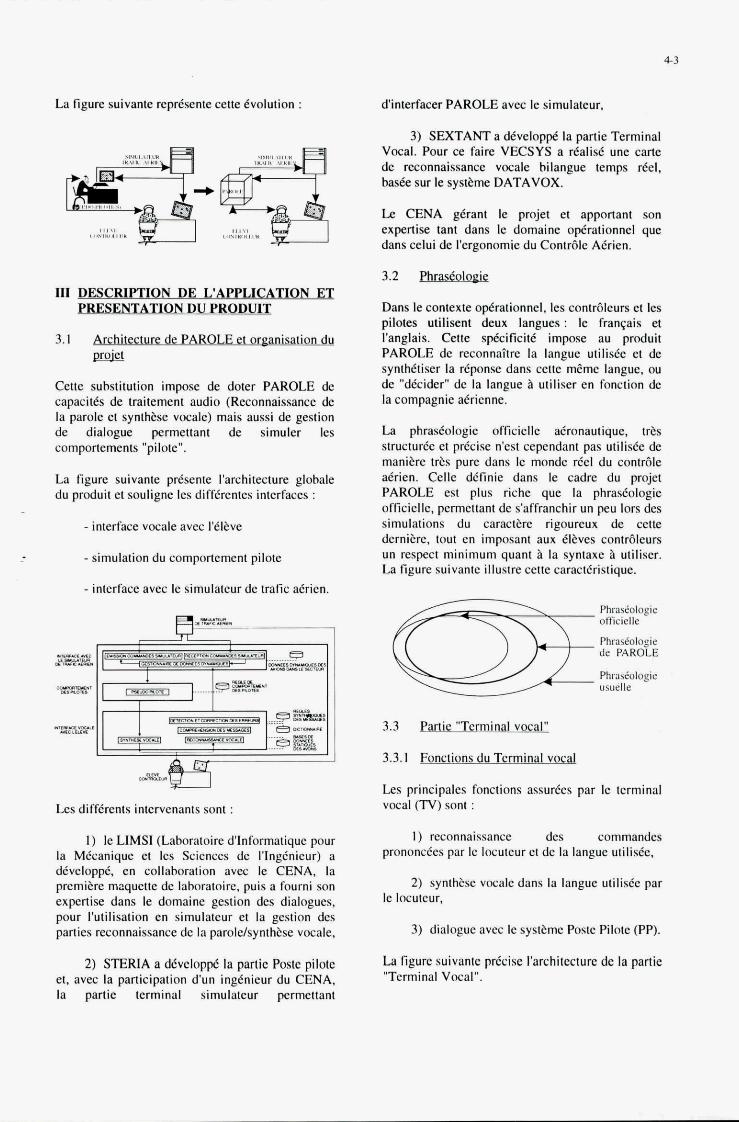
4-3
La figure suivante repdsente cette evolution :
III DESCRIPTION DE L'APPWCA TION ET PRESENT ATION DU PRODUIT
3. I Architecture de PAROLE et oreanisation du gK&l
Cette suhstitution impose de doter PAROLE de capacites de traitement audio (Reconnaissance de la parole et synthese vocale) mais aussi de gestion de dialogue permettant de simuler les comportements "pilote".
La figure suivante prbente I'architecture glohale du produit et souligne les differentes interfaces :
- interface vocale avec l'6ltve
- simulation du comportement pilote
- interface avec le simulateur de trafic akrien.
I ' I ...... 111-
Les differents intervenants sont :
I ) le LIMSI (Lahoratoire d'hformatique pour la Mkcanique et les Sciences de I'IngCnieur) a develop@, en collaboration avec le CENA, la premiere maquette de labratoire. puis a fourni son expertise dans le domaine gestion des dialogues, pour I'utilisation en simulateur et la gestion des parties reconnaissance dc la paroldsynthtse vocale.
2) STERlA a d6velopp5 la partic Poste pilote et. avec la participation dun ingbieur du CENA. la partie terminal simulateur permettant
d'interfacer PAROLE avec le simulateur.
3) SEXTANT a developpe la partie Terminal Vocal. Pour ce faire VECSYS a realise une carte de reconnaissance vocale hilangue temps del, basee sur le systi?me DATAVOX.
Le CENA &ant le projet et apportant son expertise tant dans le domaine ophationnel que dans celui de I'ergonomie du Contr6le A6rien.
3.2 Phras6ologie
Dans le contexte o@rationnel. les contraleurs et les pilotes utilisent deux langues: le francais et I'anglais. Cette sp6cificit6 impose au produit PAROLE de reconnaitre la langue utilisee et de synthktiser la rkponse dans cetle meme langue, ou de "dkider" de la langue ?i utiliser en fonction de la compagnie aerienne.
La phrasCologie officielle adronautique. trks structude et pdcise n'est cependant pas utilisk de manitre t&s pure dans le monde reel du contr6le atien. Celle dCfinie dans le cadre du projet PAROLE est plus riche que la phraseologie officielle, permettant de s'affranchir un peu lors des simulations du caractbre rigoureux de cette derniere, tout en imposant aux elhes contr6leurs un respect minimum quant a la syntaxe ?i utiliser. La figure suivante illustre cette caractfristique.
Phnseologie ofticielle
Phraseologic de PAROLE
PhrsrCologie usuelle
3.3 Partie "Terminal vocal"
3.3.1 Fonctions du Term inal vocal
Les principales fonctions assurees par le terminal vocal (TV) sont :
1) reconnaissance des commandes prononcfes par le locuteur et de la langue utilis6e.
2) synthtse vocale dans la langue utilisie par le locuteur,
3) dialogue avec le systeme Poste Pilote (PP).
La figure suivante pdcise I'architecture de la partie "Terminal Vocal".
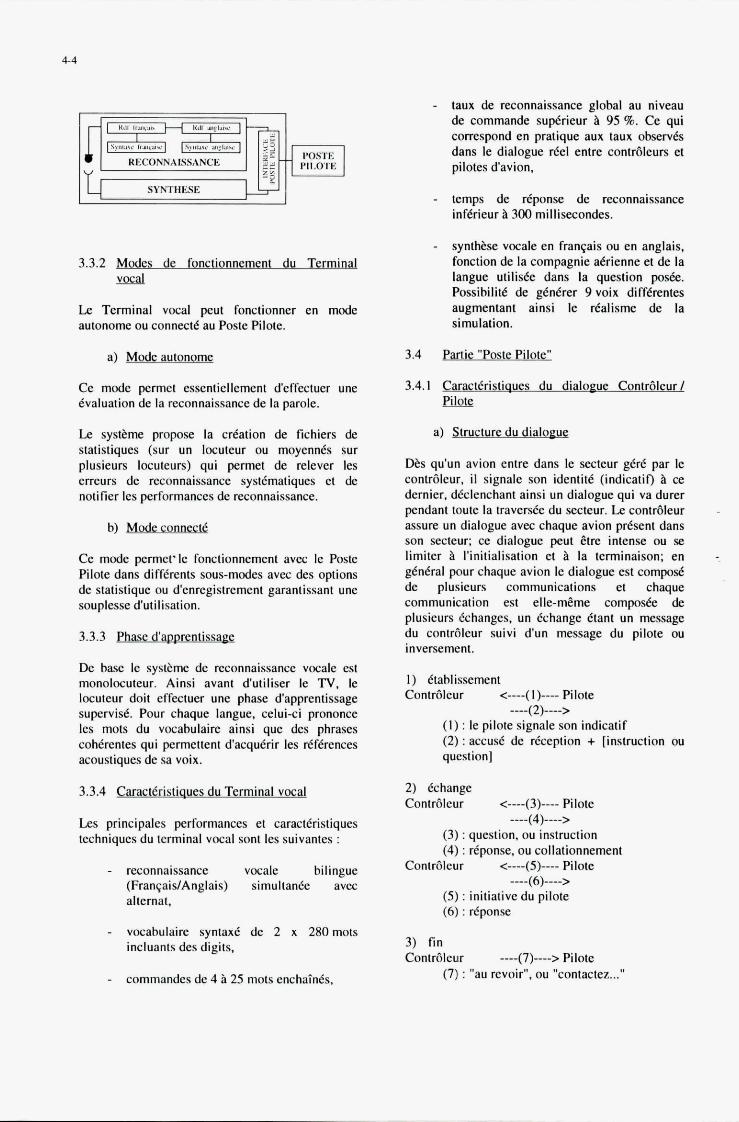
3.3.2 Modes de fonctionnement du Terminal vocal
Le Terminal vocal peut fonctionner en mode autonome ou connect6 au Poste Pilote.
a) Mode autonome
Ce mode permet essentiellement deffectuer une evaluation de la reconnaissance de la parole.
Le sys the propose la creation de fichiers de statistiques (sur un locuteur ou moyennes sur plusieurs locuteurs) qui permet de relever les erreurs de reconnaissance systematiques et de notifier les performances de reconnaissance.
b) Mode connect6
Ce mode permet'le fonctionnement avec le Poste Pilote dans diffirents sous-modes avec des options de statistique ou d'enregistrement garantissant une souplesse d'utilisation.
3.3.3 Phase dapprentissaee
De hase le systime de reconnaissance vocale est monolocuteur. Ainsi avant d'utiliser le TV, le locuteur doit effectuer une phase dapprentissage supervise. Pour chaque langue, celui-ci prononce les mots du vocahulaire ainsi que des phrases cohkrentes qu i permettent dacqukrir les references acoustiques de sa voix.
3.3.4 Caracteristiaues du Terminal vocal
Les principales performances et caracteristiques techniques du terminal vocal sont les suivantes :
reconnaissance vocale hilingue (FranqaidAnglais) simultanke avec alternat,
vocahulaire syntax6 de 2 x 280 mots incluants des digits.
commandes de 4 B 25 mots enchain&.
- taux de reconnaissance global au niveau de commande sup6rieur 95 ?6. Ce qui correspond en pratique aux taux observ& dans le dialogue del entre contr6leurs et pilotes davion,
temps de r6ponse de reconnaissance inferieur B 300 millisecondes.
synthkse vocale en franqais ou en anglais, fonction de la compagnie aerienne et de la langue utiliske dans la question poske. Possihilitd de genkrer 9 voix differentes augmentant ainsi le realisme de la simulation.
3.4 Partie "Poste Pilote"
3.4.1 Caracteristiaues du dialoeue Contraleur I rn
a) Struc lure du d ialogue
J X s qu'un avion entre dans le secteur gCrC par le contr6leur. il signale son identite (indicatif) B ce dernier. declenchant ainsi un dialogue qui va durer pendant toute la traverske du secteur. Le contraleur assure un dialogue avec chaque avion present dans son secteur; ce dialogue peut &tre intense ou se limiter B I'initialisation et B la terminaison; en -.
general pour chaque avion le dialogue est compo& de plusieurs communications et chaque communication est elle-m&me compode de plusieurs &changes. un echange etant u n message du contr6leur suivi d u n message du pilote ou inversement.
-
I ) 6tahlissement Contr6leur e----( I)---- Pilote _ _ _ _ (2) _ _ _ _ >
( I ) : le pilote signale son indicatif (2) : accuse de reception + [instruction ou question]
2) khange Contr6leur <----(3)---- Pilote
(3) : question. ou instruction (4) : riponse, ou collationnement
Contr6leur <----(5)---- Pilote
_ _ _ _ (4) _ _ _ _ >
____ (6) _ _ _ _ > ( 5 ) : initiativedu pilote (6) : riponse
3) fin Contr6leur ----(7)----> Pilote
(7) : "au revoir". ou "contactez ..."
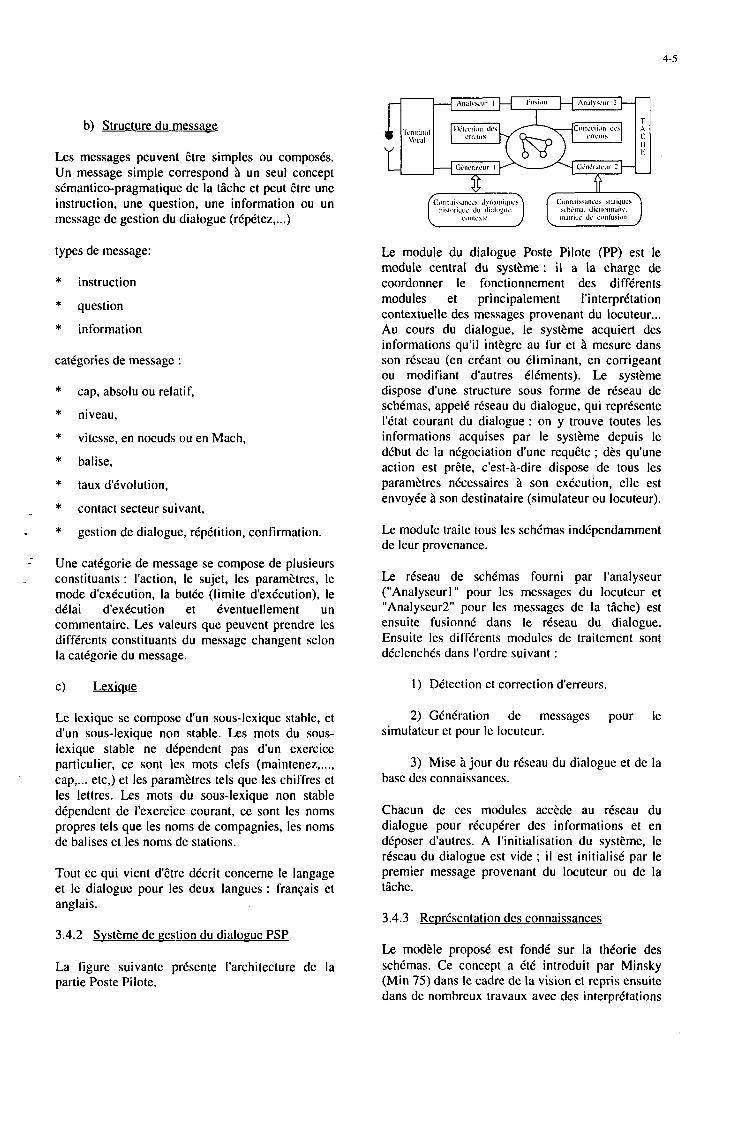
4-5
b) Structure du message
Les messages peuvent Ctre simples ou composts. Un message simple correspond B un seut concept stmantico-pragmatique de la tdche et peut Ctre une instruction, une question, une information ou un message de gestion du dialogue (rtpttez, ...)
types de message:
* instruction
* question
* information
cattgories de message :
* cap, absolu ou relatif,
* niveau, * * balise,
* taux d'tvolution,
* contact secteur suivant, *
vitesse, en noeuds ou en Mach,
gestion de dialogue, rtpdtition, confirmation.
-- Une cattgorie de message se compose de plusieurs constituants : I'action, le sujet, les paramktres, le mode d'extcution, la but& (limite d'extcution), le ddlai d'exicution et tventuellement un commentaire. Les valeurs que peuvent prendre les diffdrents constituants du message changent selon la cattgorie du message.
-
e ) Lexiaue
Le lexique se compose d'un sous-lexique stable, et d'un sous-lexique non stable. Les mots du sous- lexique stable ne dtpendent pas d'un exercice particulier, ce sont les mots clefs (maintenez, ..., cap, ... etc,) et les paramktres tels que les chiffres et les lettres. Les mots du sous-lexique non stable dtpendent de l'exercice courant, ce sont les noms propres tels que les noms de compagnies, les noms de balises et les noms de stations.
Tout ce qui vient d'ttre dtcrit concerne le langage et le dialogue pour les deux langues : franpis et anglais.
3.4.2 Svstkme de gestion du dialogue PSP
La figure suivante prtsente I'architecture de la partie Poste Pilote.
Le module du dialogue Poste Pilote (PP) est le module central du systkme : il a la charge de coordonner le fonctionnement des difftrents modules et principalement I'interprttation contextuelle des messages provenant du locuteur ... Au cours du dialogue, le systkme acquiert des informations qu'il intkgre au fur et B mesure dans son rtseau (en crtant ou tliminant, en corrigeant ou modifiant d'autres tldments). Le systkme dispose d'une structure sous forme de rtseau de schtmas, appelt rtseau du dialogue, qui reprtsente I'ttat courant du dialogue : on y trouve toutes les informations acquises par le systkme depuis le dtbut de la nfgociation d'une requCte ; dks qu'une action est prCte, c'est-&dire dispose de tous les paramktres ntcessaires B son extcution, elle est envoyte ?I son destinataire (simulateur ou locuteur).
Le module traite tous les schtmas indtpendamment de leur provenance.
Le rdseau de schtmas fourni par I'analyseur ("Analyseurl " pour les messages du locuteur et "Analyseur2" pour les messages de la tlche) est ensuite fusionnt dans le rtseau du dialogue. Ensuite les difftrcnts modules de traitement sont dtclenchds dans I'ordre suivant :
1) Dttection et correction d'erreurs.
2) Gtntration de messages pour le simulateur et pour I C locuteur.
3) Mise B jour du rtseau du dialogue et de la base des connaissances.
Chacun de ces modules accEde au rtseau du dialogue pour rtcuptrer des informations et en deposer dautres. A I'initialisation du systkme, le reseau du dialogue est vide ; i I est initialid par le premier message provenant du locuteur ou de la tlche.
3.4.3 Reprdsentation des connaissances
Le modkle propost est fondt sur la thtorie des schdmas. Ce concept a ttt introduit par Minsky (Min 75) dans le cadre de la vision et repris ensuite dans de nomhreux travaux avec des interprttations
4-6
trks difftrentes (Bob 77). La philosophie des schimas est de reprtsenter chaque objet ou concept par sa description (ensemble de champs) : puis lors de la phase de comprthension, de vtrifier dans quelle mesure un texte ou un message p e u t se rapporter B la description ainsi formaliste.
Les connaissances sur le langage. les actions, I'association entre messages et actions rtalist par la tdche, les contraintes rtgissant les composants des messages et le contexte, les messages du systkme destints B I'usager et associt B difftrents contextes et le contexte de la tdche.
On dtfinit une cattgorie comme un sous-ensemble d'actions, B chaque cattgorie correspond donc un sous ensemble de messages. A chaque cattgorie de messages, on associe u n schtma. Toutes les connaissances ntcessaires ?i I'analyse et B la comprthension du message sont reprtsenttes dans le schtma. Pour la dtfinition et la manipulation de schtmas on a dtfini u n noyau de langage de schtmas. Dans un schCma, on distingue plusieurs types de champs: des champs instancits directement par analyse du message, des champs constants dont la valeur est htritte directement du schtma descripteur, des champs instancits B partir du contexte et des champs instancits B I'aide d'une fonction qui fournit une valeur calculte B partir des valeurs des autres champs. II y a aussi des champs associts B des sous-schtmas permettant d'ttablir des liens avec d'autres schtmas. A chaque champ, sont donc associts des indicateurs servant de directives pour I'instanciation. Le schema renferme aussi la difinition (dtclarative) des rkgles de contraintes de validitt, les commandes simulateur (buts) ainsi que les messages de retour vers le locuteur.
Le systkme traite en simultant des messages en anglais et en franqais. A chaque catCgorie reprtsentant un ensemble de messages en frangais correspond une cattgorie reprtsentant I'Cquivalent en anglais. II y a donc autant de schtmas pour le franqais que pour I'anglais.
A chaque avion prtsent dans le secteur atrien du contr8leur. on associe toutes les informations le concernant. Ceci permet au systkme d'avoir une image de I'ttat de I'univers de chaque avion. Cest ce qu'on appelle le confexte de la rciche. Le systkme garde une trace des messages traitts (historique du dialogue qui est different du rtseau du dialogue).
3.4.4 Analyse des messages
Dans PAROLE, I'analyse d'un message provenant du locuteur est dirigte directement par la tdche, c'est-B-dire que le message est analyse en sachant
qu'il doit correspondre B une action ou B un concept prtdttermint et connu du systkme; on utilise des heuristiques permettant d'associer le message prononct B I'un des concepts (dtcrit par les schtmas) de la base de connaissances. L'analyse d'un message consiste alors B determiner sa cattgorie puis B instancier le schtma correspondant ?i cette cattgorie. L'instanciation consiste B collecter B partir du message des informations pour les inclure dans le schtma. L'exploration du message est orientCe par les directives correspondant B chaque champ. La langue du message est donnee par le systkme de reconnaissance, ce qui permet d'activer les schtmas et le dictionnaire de la langue concernte.
Lanalyseur de messages reqoit en entree une suite de mots et dtlivre en sortie une structure representant le message sous forme d'un rtseau de schtmas.
3.4.5 Wection des erreurs
La reconnaissance automatique de la parole introduit dans la comprkhension des messages un paramktre perturbateur dli au non-ddterminisme de la reconnaissance. Le systkme doit etre capable de dttecter les erreurs cornmises par la partie reconnaissance de la parole ou Cventuellement le locuteur, et extraire un sens d'un message mCme incomplet (partiellement reconnu) : i I doit tgalement, le cas Cchtant, &tre susceptible d'en dttecter I'incohtrence ou I'ambiguitt, et y remtdier afin de minimiser le nombre d'tchanges et, ainsi, tviter de rejeter le message dans son inttgralitt, chaque fois que cela est possible (Ber 84).
I
-
Deux principes sont utilists pour le contrale de coherence d'un message : la limitation du domaine de variabilitt et la redondance de I'information (How 89): par exemple, dans le message "descendez au niveau 230", I'information apportte par "dcscendez" est inclue dans I'information "niveau 230" et dans la connaissance du niveau actuel. Trois types de contraintes ont pu Ctre distinguts :
- Contraintes globales pour toutes les cattgories,
- Contraintes rtgissant les champs d'une mEme cattgorie,
- Contraintes propres 2 chaque champ du schtma.
Ces contraintes sont inttgrdes de faqon declaratives dans le schtma lors de sa dtfinition. Le module de contrale de validitt parcourt tous les schimas du
4-7
reseau pour vtrifier la validitt de chacun de ces schtmas, en dtclenchant les rbgles de contraintes stmantico-pragmatiques assocites A chaque schema. Si une rbgle n'est pas vCrifiCe, le champ concern6 est marquC en constquence.
3.4.6 Correction des erreurs
Des tests effectuts avec quatre locuteurs sur un corpus de 50 phrases prononctes 2 fois, ont montrt que I'erreur la plus frtquente du systbme de reconnaissance (plus de la moitit des cas : 56 %) Ctait une erreur de confusion. Les tests ont ainsi permis de dCfinir une matrice de confusion entre les mots comportant pour chaque mot une liste, ordonnte selon la frtquence de confusion, de tous les mots susceptibles dCtre confondus avec ce mot. La matrice n'est pas symttrique.
- questions qui sont en gtntral des demandes de prtcision sur le message prtctdent du locuteur, permettant la comprthension du message ponctuel.
Le systkme parcourt tout le rtseau et empile dans une liste tous les messages B envoyer. Les messages A gtntrer sont dttermints par I'Ctat du schtma : s'il est errone le systbme gtnbre une question, ainsi toutes les informations manquantes vont &tre demandtes par le systbme auprbs du locuteur; I'Ctat des schtmas concernts est mis en attente dintervention du locuteur. S'il s'agit dun schema satisfait, le systkme gCnbre un message dont la nature est prtcisCe dans le schema descriptif : i l peut s'agir d'une rtponse A une question, d'un accust de reception, d'une ripttition ou d'un collationnement.
Exemple : IV ERGONOMIE DU PRODUIT
(9 : 2 noeuds niveau) (7 : 5) (cap : 4)
Le systbme cherche dans le schtma erront un champ bien instancit (ilot de confiance) voisin (prtdtcesseur ou successeur) d'un champ errone ; A partir du mot correspondant A ce champ dans le message, on essaie de retrouver le mot correct en utilisant, dune part, la syntaxe locale et, d'autre part, la matrice de confusion. Le mot non compatible est remplact par un mot avec lequel i I peut Ctre confondu et qui figure dans la liste autoriste des prtdtcesseurs ou successeurs du mot considtrt comme ilot de confiance, et I'instanciation est recommencte sur tout le message ce qui permet de prendre en compte la rtpercussion due B cette correction.
-
--
Message prononct : "tournez gauche cap 2 3 0" Message reconnu : "tournez gauche 4 2 3 0" Aprks la correction du sujet, le message reconnu devient "tournez gauche cap 2 3 0".
3.4.7 Gentration de messages
Les messages h gtntrer sont de 4 types :
- reponse A une question poste par le locuteur.
- messages de confirmation B la suite d'une action demandte par le locuteur et rtaliste par le systtme,
- messages de gestion du dialogue (rtpttition, rappel, attente, accuse de rtception),
4.1 Synthkse vocale
Lors d'un entrainement des contr6lcurs atriens, I'environnement de simulation doit Ctre le plus proche possible de la rtalitt. Pour ce faire, le systbme de synthtse vocale a it6 dttermint quant B sa capacitt dc gtndrer des voix difftrentes prtsentant plusieurs intonations.
De plus, on part du principe que, plus une simulation est complexe, plus le langage utilist est fiche, en vocabulaire comme en tournures de phrases. PAROLE offre la possibilitt de maitriser la complexit6 du langage, permettant ainsi aux instructeurs de rtgler cette complexitt sur la complexitt des simulations. C'est une partie trks importante pour I'apprentissage des tlches du contr6leur atrien.
4.2 Reconnaissance de la parole
Les conditions d'enregistrements sont dtterminantes dans les mesures de taux de reconnaissance. Pour I'application PAROLE, le contexte peut etre jug6 "favorable" compte tenu :
- de I'hahitude que les contraleurs atriens exptrimentis ont B parler dans un microphone,
- de I'utilisation d'un alternat microphone au dibut et B la fin des messages contr6leurs,
- de I'ambiance peu bruittc des sallcs de formation, non reprtsentative de celles de contr6le.
4-8
V PERSPECTIVES D'APPLICATION DE PAROLE
De base, PAROLE a ttt dtfini et rtalist pour se substituer aux pilotes dans la formation et I'entrainement des contrbleurs atriens. Les difftrentes Cvaluations optrationnelles ont permis. avec la participation de contrbleurs de Roissy- Charles de Gaulle, de valider les principes ergonomiques du produit et de vtrifier les performances globales de reconnaissance.
De manitre h valider plus en profondeur le produit, PAROLE sera install6 en 1994 au CRNA de Bordeaux.
La solution dtveloppte dans le cadre du projet PAROLE permet daugmenter :
- la performance de I'intervention de I'instructeur, en assurant une partie des exercices de fac;on autonome,
- la qualitt de la formation : le systtme permet au contrbleur adrien de s'exercer autant de fois qu'il le veut sans trop dtpendre de son instructeur.
Moyennant quelques modifications, ainsi que des mises B jour, ce produit peut Ctre adapt6 :
- h dautres simulateurs, que ce soit pour le contrble atrien ou pour le pilotage des avions,
- h d'autres vocabulaires ou syntaxes,
- aux autres langues de I'OACI.
I1 peut Cgalement @tre u t i l i d , du fait du traitement multilingue et de la comprthension des langages de type optratif, dans dautres sccteurs d'activitt, tels que transport fern6 (formation des conducteurs, des aiguilleurs ...), transport maritime (formation des pilotes, des contr8leurs maritimes ...).
Ces applications peuvent concerner aussi bien les domaines civils que militaires.
Dans le domaine de la navigation atrienne, PAROLE sera utilist par le nouveau simulateur de trafic atrien h I'ENAC, pour la formation des contrbleurs.
Lavenir de la Navigation ACrienne commence h se dessiner; i I est fait d'tchanges de donntes entre le systEme sol et le systtme bord, permettant une plus
grande richesse dinformations, et une plus grande fluiditt du trafic.
De ce fait, des moyens de dialogue entre le contrbleur et le systtme sol sont B I'ttude, ce sys3me envoyant ensuite au systkme bord les instructions de contrble.
Du fait que tous les avions ne seront pas Cquipis immtdiatement de ces nouveaux systtmes, le contrbleur atrien devra toujours donner Cgalement son instruction de contrble pour le canal vocal VHF.
Une extension possible de PAROLE sera par exemple de le coupler h un calculateur interrogeant I'avion sur son Cquipement, et choisissant ainsi si le message doit etre envoyt au systtme bord directement, avec retour devant les yeux du pilote, par stcuritC, ou par le canal audio VHF, vers les haut-parleurs du poste de pilotage.
BiblioeraDhie
C. Bailleul (86) : "Evaluation d'un systPme LL reconnaissance vocale dans les tciches de contr6le ae'rien", Actes des 16tmes Journtes d'Etude sur la Parole.
(BER 84) D. Btroule, F. Ntel, "Une approche des probltmes lie's d la communication parle'e homme- machine", 4kme Congrt AFCET-INRIA "Reconnaissance des formes et intelligence artificielle", Paris 25-26 Janvier 1984.
(Bob 77) D.G. Bobrow et al., "GUS: a frume- driven dialog system". Artificial Intelligence 8(2),155-173, 1977.
P. Falzon (82) : "Les communications verbales en situation de travail - Analyse des restrictions du langage naturel", Rapport technique INRIA nx 19.
(Fa1 83) P. Falzon "Understanding a technical language, A schema-based approach". Rapport technique NO 237 INRIA 1983.
(Gau 82) J. -L. Gauvain. "Reconnaissance de mots enchahe's et de'tection de mots dans la parole continue". Thtse de troisitme cycle, Paris XI, Juin 1982.
(Ger 93) M. GERLACH, R. ONKEN, "Speech InpurYOutput as inte$aces devices for commuriicution between aircraft pilots and the pilot assistant systeme "CASSY", joint ESCA- NATO/RSG ETRW on "Applications of speech technology" Lautrach, 16-17 Sept 93.
4 9
(How 89) J. Howes "Dialogue supervision and error correction strategy for a spoken madmachine inregace" The structure of Multimodal Dialogue. ed M. Taylor, F. Ndel, D. Bouwhuis. North.Holland 1989.
(Lev 80) S . E. Levinson and K.L. Shipley, "A conversational-mode airline information and reservation system using speech input and output". The bell systems Technical Journal 59 (1980), 119-137.
F. MARQUE, S . TRINH, D. ABADIE, "Exemple d'application a la formation des contr6leurs de trafc ae'rien : projet PAROLE", Ecole d'automne 1992.
F. MARQUE, "PAROLE : du prototype ir l'industrialisation" Ergo IA 1992.
(Mat 92) K. MATROUF, F. NEEL "Use of upper level knowledge to imporve human machine interuction", 2nd Venaco workshop "the structure of multimodal dialogue" ESCA ETRW. Acquafredda di Maraica, Italy, September 16-20- 1991.
(Mat 90) K. Matrouf, "Un syst2me de dialogue oriente' par la tdche", Th2se de I'universitt Paris
- XI, Septembre 1990.
(Min 75) M. Minsky, "A framework for representing knowledge" in P.H. WINSTON, tditeur THE PSYCHOLOGY OF COMPUTER VISION, MC GRAW HILL, 1975.
(HWi 77) J. Wolf and W. Woods "The Hwim speech understanding system", in Trends in speech recognition, Prentice-Hall, Englewood Cliffs, pp 3 16-339, 1977.


5- I
LE GRAND ECRAN INTERACTIF: UN OLITIL DE DIALOGUE MULTlMODAL POUR LES FUTURES CABINES DE PILOTAGE
B. Barbier, E. Filiatre, I. Jrigaray SEXTANT Avionique
Rue Toussaint Cauos. B.P.91 33166 Saint-Midard-en-Jalles Cedex
France
SUMMARY The aperimenfa/ h - u p descrikd here is cmtituted of a large size projectwn xreen displaying an image on which an opcrarrar acts in real rime, ruder confrd of a spec@ dialogue soJhare. using several c m r o l devices (speech recognizer, numeric h a glove, ocdomefer). Various human ccmnumicaIim~ channels are then simcrltaneousely used: viswn and audition for the system-to-manflm. voice, gesture and gaze. for rlu man-to-system flow Varwus ways of using and asmiaring these commwkxtion c h l s allow to elaboia~e a multimodal dialogue
SOMMAIRE La maquette explrimsltale d M t e ici est constitu& d'un &ran de gnnde taille pr&entant une image sur laquelle un Opcrateur agit en temps r6el. sous le conn6le d'un logiciel de dialogue SpeCialiSr;. au moym de diffkents dispositifs de commande (analysw vocal gant num&ique, oculomktre). Plusieurs CMBUX de communication humaine sont ainsi
- exploit6s simultan6ment: visuel et auditif pour le flux systirme-homme. vocal. gesNel e3 crutomoteur pour le flux hclmmesyshe. Les divas modes d'utilisation de c h a m d'eux et les diffbentes fapm de les associa permettent d'etablir un dialogue h modalit& multiples.
INTRODUCTION Les performances de I'apsociatim nhmef-pilote timnent pour une bonne part h la qualit6 du dialogue &hang6 enue le pilote et le syshe-avion. La puissance missante des s y s h a n fuans ne pourra &llement Etre mise 1 pmfit qu'i condition de disposer d'une interfw capable de v6hiculer des messages de plus m plus riches et de plus en plus denses. sans augmenter pour nutant la charge de travail globale. Le concept du Grand k a n Interactif qui va Stre d h i t constime I'une des solutions possible pour attemdre ce but. La maqueue expkimentale d'mterfw qui a 616 d&eIopp& a pour objectif d'6valuer les possibilit6s d'un tel systime et constitue 6galement M support d'6Nde pour I'oplimisation du dialogue bomme-sys&me.
LES LIMITATIONS DES CABMES DE PILOTAGE ACTUELLES Le travail de pilotage des akonefs modernes ne consiste plus seulement h wmmander et amu6ler duectement le vol. mais aussi h dialoguer avec le systirme-avion.
L'interfaoe homme-syshe des cabines de pilotage actuelles est srmchlr6e de la fapn suivante: - &I syst&me vas le pilote. les informations son: visuelles. elles mt donnees en planche de bold sur des insuurnents 6leclm0-m&miques et sur des visualisations Clecmmtques
$sentant des symbologies synh6tiques ou des figurations tssues de cspteun d'images . - du pilote vers le syshe-avion, les wmmandes sont effecN& h l'aide de dispositifs manuels.
Cem sttucture d'interfece souffre de plusieurs limitations: 1") Seuls les canaux visuel et manuel son: mis 1
contribution. 2') Le fractionnement de la plancbe de bord en plusieurs
huipements de visualisation limite le mode de p6sentation de l'information visuelle: partition en plusieurs figurations disjomtes. de position et de taille fixe. -*3") Les dispositifs de commande sont simples, avec peu de de+ de l ibed et ne pmposent qu'une unique mcdalit6 d'utilisation (par exemple bouton poussoir ou mtatif). Lm commandes complexes s'effectuent alms en ectivwt plusieurs dispositifs suivant une p.occdure sp&ifiiue; cclleci est d'autant plus lourde P meme en oeuvre que ces dispositifs son1 differem et d i s p k dans la cabine.
4') C&s dispositifs de wmmande manuelle ou de conn6le visuel d6di6s h m e fonction @cifique qui nkst que rarement activk restent p r h en permanence d m le cockpl riduisant d'autant le volume disponible.
UNE VOIE POUR LE FUTUR: LE GRAND ECRAN INTERACTIF L'Ctude des possibilit6s d'wolution des cabines du funu nous a amen6 1 concevoir la maquette de Grand k a n Interactif. Celle-ci est compos& - d'un &ran unique occupant la totalit6 de la plwche de bord. - de nouveaux m6dia d'enu6e ( s y s h e de mesun de la direction du regard s y s h e de reconnaissance vocale. syseme de reconnaissance gestuelle) - d'un syn!hitisw vocal.
Ceue maquem d'interfaoe offre les avantages suivants: - elle permu d'exploiter simultdment plusieurs cnnaux de communication, aussi hien wmme moyen d'aquisitim q w comme effecteur. - elle enrichit consid6rablement le conterm et la densit6 des messages &hang& p i c e aux capscit& des nouveaux m6dias de communication qu'elle offre, - elle perme3 la mmbinaison de plusieurs m6dias d'en116e selon diffkentes modalitis pour r&liser me m h commande offrant ainsi la capacit6 de "wmmandes multimodales". - elk procure une grande diversit6 de pr6sentations graphiques de l'& du systhe (figurations mobiles. aJUStab"bles en taille, superposables). - elle foumit sur le mbne &ran un retour visuel permanent de la wmmande en wurs. offrant ainsi la capaciti de "commande sur image",
Presented at an AGMD Meeting on 'Virtual Inferfaces: Research and Applications', October 1993.
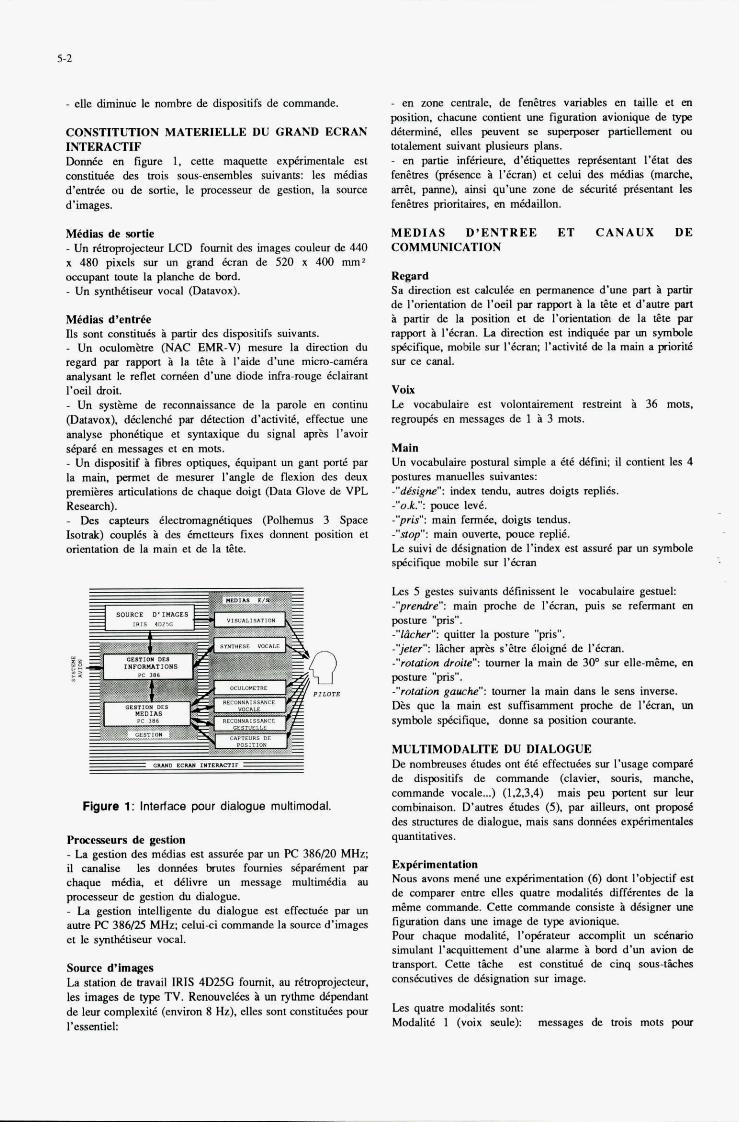
5-2
- elle diminue le nombre de dispositifs de commande. - en wne centrale. de fensues variables en taille et en position, chacune wntient tme figuration avionique de type
CONSTITUTION MATERIELLE DU GRAND ECRAN determid. elles peuvent se supporn partiellemat ou INTERACTIF totalement suivant plusieurs p l m . Dormee en figure 1, cette maquette expirimentale est - en partie infhieure, d'itiqucttes rep5sentwt I'itat des wnstih16e des trois sous-ensembles suivants: les medias fensues (prksence h I'Cnan) et celui des m a a s (marche. d'enu6e ou de sortie, le processern de gestion. la source mit, parme). ainsi qu'une zone de s k u i t 6 @sentant les d'images. fencues prioritaires, en m&laillon.
Medlss de surtie - Un hoprojecteur LCD fournit des images couleur de 440 x 480 pixels sur un grmd k a n de 520 x 400 mm2 occupant mute la planche de bord - Un synth&eur v d (Datavox).
M 6 d k d'entrCe ns m t wnstituks P park des dupositifs suivants. - Un oculomia (NAC EMR-V) m e m la direction du regard par rappm 1 la tste 1 I'aide d'une mim-cam&a analysmt le reflet w m h n d'tme d i d e infra-muge klairant I'oeil droit. - Un s y s h e de reconnaissance de la parole en continu (Datavox). declenchi par d6tection d'activit6. effecNe une analyse phonitique et syntaxique du signal aprk I'avoir stpad en messages et en mots. - Un dispositif h fibres optiques, iquipant un gant port6 par la main, permet de mesurer I'angle de flexion des deux premik articulations de &que doigt (Data Glove de VPL Research). - Des capteurs ilectromagn6tiques (Polhemus 3 Space Isotrak) wuplis i des hetteurs fues donnent position et orientation de la main et de la &e.
Figure 1: Interface p u r dialogue muhimodal.
pmfesseurs de pstloo - La gestion des mains est assu& par un PC 386120 MHz; il canalise, les do& brutes foumies &parhen1 par cheque m6dia. et d6livre un message multim&ia au processeur de gestion du dialogue. - La gestion mblligente du dialogue est effechI6e par un autre PC 386/25 MHZ, celuici wmmmde la source d'images et le synthetiaelu vocal.
Source d'hnages La station de travail JRIS 4D25G fournit. au &opojecteur, les images de type TV. Renowelks B un rylhme d&pendant de leyr wmplexit6 (envimn 8 Hz), elles sont wnstiN6es pour I'esmtiel:
MEDIAS D'ENTREE ET CANAUX DE COMMUNICATION
R e g 4 Sa direction est calcul6e en permanence d'une part 1 psrtir de l'orinuation de 1 ' 4 par rapport P la tate et &autre part i panir de la position et de I'aienution de Is 6te par rappnt i I 'han . La direction est idiqu6e par M symbole s p k i i u e , mobile SUI I'Cnan; I'activit6 de la main a lxiorit.4 SUI ce canal.
voix Le vocabulaire est volontairemeut resueint 1 36 mots. regmupis en messages de 1 1 3 mots.
Main Un vocabulaire postural simple a 6th & f ~ , il contient le6 4 postures mmuelles suivmtes: -"dcsigne": index tendu, autres doigts replie. -"o.k.": pouce levi. -"pris": main fenn6e. doigts tendus. -"stop": main ouverte, puce replii. Le suivi de designation de I'index est ass^ par un symbole +cirque mobile sur I'kran
LeJ 5 gestes suivants definissent le vocabulaire gesmel: -'prendre? main proche de I 'kan. puis se refennmt en
-"l&her": quitter Is posture "pris". -'yeter'': Iicher aprh sXue iloigni de I'Cnm. -"romwn droiu": murner la main de 300 SUI elle-mime, en posture "pris". -"rotation grurchc": tourner la main dans le sem inverse. DLs que la main est suffiiramment proche de I'Cnan, nn symbole sp6cifique. donne sa position wurante.
MULTIMODALITE DU DIALOGUE De mmhreuses ~ N & S ont i t6 effectu6es SUI I'usage corn@ de dispositifs de c o d (clavier, souris, manche. commmde vocale ... ) (1.2.3.4) mais peu portent sur leur combinaim. Dautres itudes (5). par ailleurs, ont propo.4 des smcnues de dialogue, mais sans donneS expirimentales quantitatives.
posture 'Pris".
Experhnentntka Nous a v m men6 une expkimmtation (6) &mt I'ohjenif est de comparcr enue d e s quatre modalit6s diffhtes de la mcme wmmmde. Cette mmmande wnsiste i &igner tme figuration dans une image de type avioniqw. Porn chaque modalit6. I'opirateur m p l i t un &ai0 simulmt I'aEquittement d'une d a m e i bord d'un avion & uanspnt Cette &he est wnstiN6 de cinq sous-&hes cons6mtives de designation SUI image.
Les quaae modalitis sont: Modalit6 1 (voix seule): messages de trois mots pour
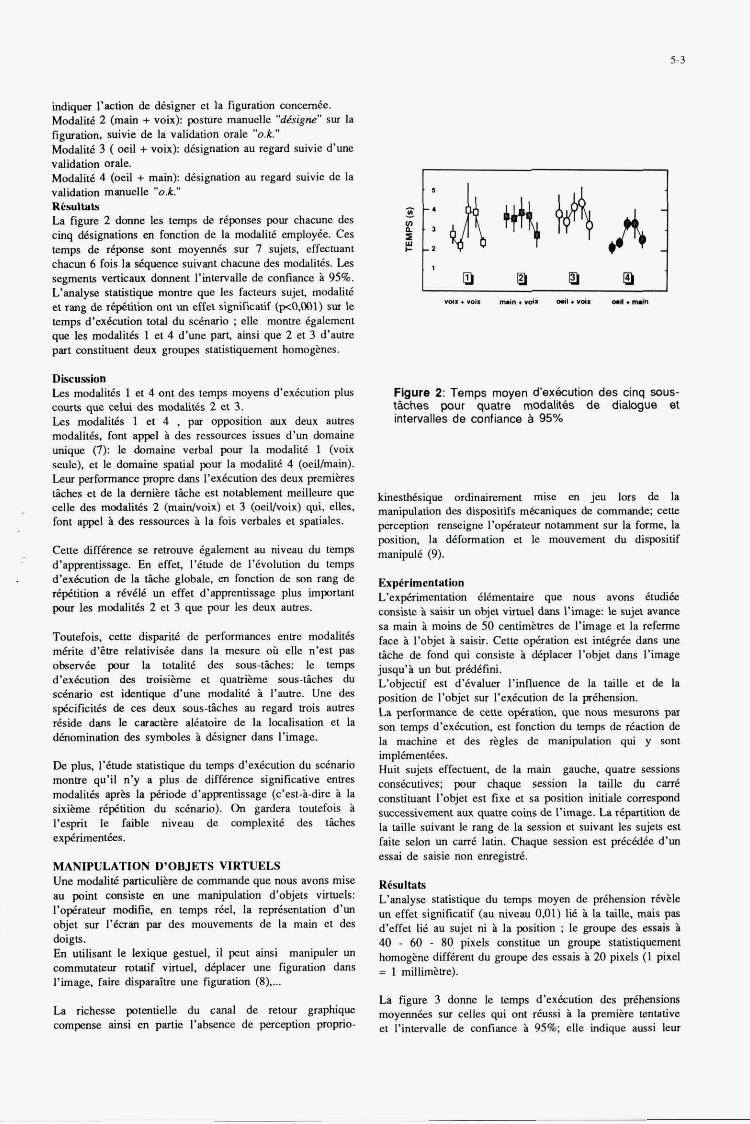
5.3
indium l'action de &signer et la figuration concern&. Modaliti 2 (main + voix): posture manuelle "dh18ne" sur la figuration, suivie de la validation orale "0.t"
Modalit6 3 ( oeil + voix): d&ignaIion nu regard suivie d'une validation orale. Modalit6 4 (oeil + main): d6signation nu regard suivie de la validadon mmuelle "0.k." R h l t a k La figure 2 donne les temps de r+nses pour chacune des c h q &signations en foncuon de la modaliti employ&. Ces temps de rcpOnse son1 moyam& sur 7 sujets. effectuant chmm 6 fois la dquence suivant chacune des modalitis. Le8 segments verticaux donnent I'mtervalle de confiance B 95%. L'analyse statistique montre que les facteurs sujet, modaliti et rang de r6$.kkm on1 un effei signifkatif (pc0,Ool) SUI le temps d ' exh t ion total du s&nario ; elk montre $dement que lei modalitCI 1 et 4 d'une pars ainsi que 2 et 3 d'autre p m constituent deux group statistiquement homogines.
Diseussbn Les modaliI& 1 et 4 ont des temps moyens d'exkution plus courts que wlui des modahtCI 2 et 3. Les modalit& 1 et 4 . par opposition BUX deux autres modalit&, font appel i des ressources issues d'un Qmaine unique (7): le domaine verbal pour la modalit6 1 (vok seule), et le domaine spatial pour la modahti 4 (oeiVmain). Leu performance propre dws l'exkution des deux premihes ticks et de la dernih t khe est notablement meilleure que celle des mcdalit6s 2 (mainlvoix) et 3 (oeilkoix) qui. elles. font appel B des ressoums i la fois verbales et spatiales.
Cette diffbence se retmuve galement au niveau du temp d'apprentissage. En effet, I'6tude de l'€volution du temp d 'exht ion de la tiche globale, en fonction de son rang de r+tition a 1.5~616 un effet d'apprentissage plus important pour les modalitis 2 et 3 que pow les deux autres.
Toutefois. cette T i t 6 de performances entre modalit& mirite d'Etre relativlde dans la mesure ob elle n'est pas oberv6e pour la totalit6 des sous-tkhes: le temps d'exkution des troisi&me et qualnhme sous-k3ches du scinario est identique d'une modalit6 B I'autre Une des s&ificit& de ces deux sous-fiches au regard trois autres &side dans le caracere al5atoire de la localisation et la dhomination des symboles i &signer dans I'image.
De plus, I'6tude stahstique du temps d'exkution du s&nario montre qu'il n'y a plus de diffkence significative entres modalitis aprts la *ode d'apprentissage @'est-&due B la s k i h e r6Htition du s&nario). On gardm toutefois i I'esplt le faihle niveau de mmplexit6 des tkhes expirimentks.
MANIPULATION D'OBJETS VIRTUELS Une modaliti particuliire de mmrnande que mus a v m mise nu point mnsiste en une manipulation d'objets VirNek: I'o+steur modifie, en temps del, la reprCSentation d'un objet sur I ' k a n par des mouvements de la main et des doigts. En utilisant le lexique gestuel, il p u t ainsi manipuh un commutateu~ mtatif vinuel. d6pla~er une figuration dans I'image. faire disparpitre une figuration (8). ... La richesse potmtielle du canal de retour graphique compense ainsi en partie I'absence de perception proprio-
Figure 2: Temps moyen d'exkution des cinq sous- t W e s pour quatre modalt6s de diamue et intervalles de confiance a 95%
kinesth6sique ordinairemat mise en jeu I o n de la manipulation des dispositih mkeniques de commande; cette perception renseigne l'opirnteur~notmnment sur h forme, In positio- la &formation et le mouvement du dipsi t i f manipul6 (9).
Expkrimentatbn L'expkimentation Cl6mentaire que nous a v m &udi& urnsiste B saisir M objet virtuel d m I'image: le sujet wance sa main i moins de 50 centim&tres de I'image et la referme face i I'objet i saisir. Cette opixation est intigr6.e dens une tiche de fond qui cmis te i! d6placez I'objet duns I'image jusqu'a un but pred.5fini. L'objectif est d'6valuer I'intluence de la taille et de la position de I'objet sur l'exkution de la p r 6 h i o n . La performance de cette *ation. que nous m e m n s p a son temps d'exkution, est fonctim du temps de r6action de la machine et des &gles de manipulation qui y sont
Huit sujefs effectuent, de la main gauche, quatre sessions cons&utives; pow chaque session la taille du c d constiuant l'objet est fixe et sa position initiale comespond succescivement aux quatre wins de l'image. La r6patition de la taille suivant le rang de la session et suivant les sujets est faite selon un cm.5 latin. Chque session est prWk d'un essai de saisie non enregist6
R6sult.b L'analyse statistique du temps moyen de +hemion r&&- un effet significatif (U niveau 0.01) 1% i la taille. mais pas d'effet lit nu sujet ni la position ; le group des a& i 40 - 60 - 80 pixels mnstitue un gmupe statistiquement homogke diffkent du group des essais B 20 pixels (1 pixel = 1 miIlim6ue).
La figure 3 donne le temps d'exkution des prihensions moyenn&s sur celles qui ont rhussi j, la premiire tentative et I'intervalle de confiance i 95%; elle indique aussi leur
impl&enI6es.
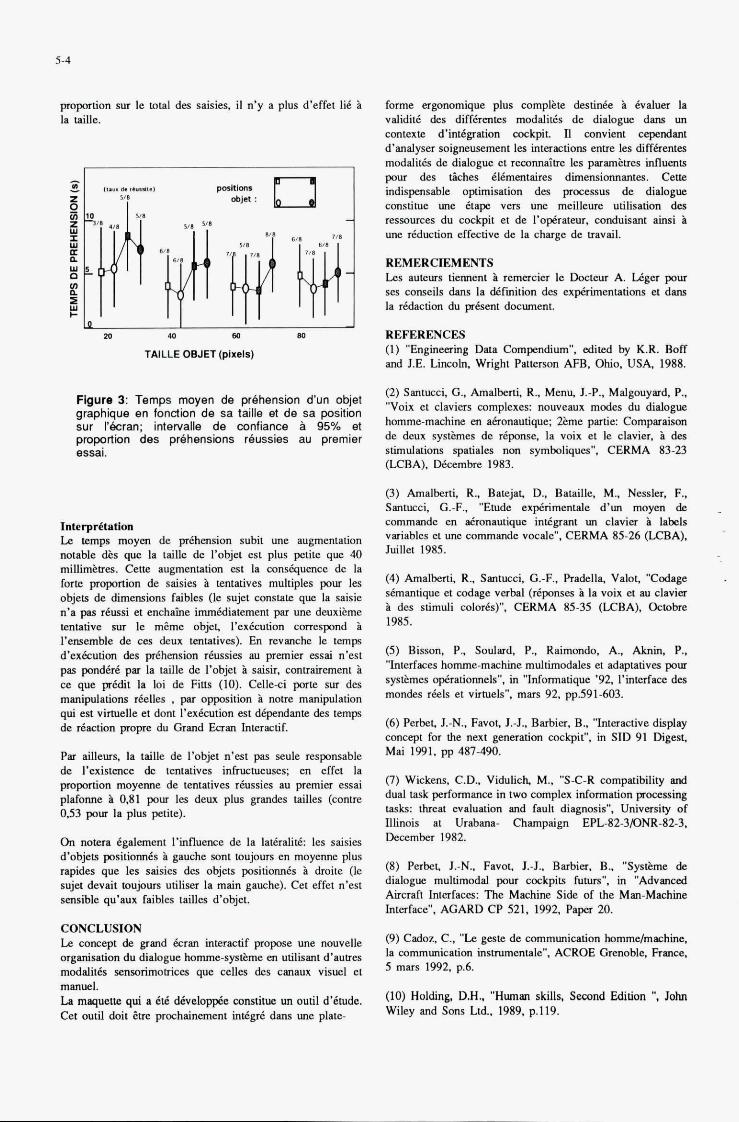
5-4
proportion w le total des saisies, il n'y a plus d'effet U4 h forme ergonomque plus compl&te des- h &valuer la la taille. validit6 des diffhentes modalit6s de dialogue dans un
mtexte d'indgration cockpit. n mnvient cependant d'analyser soigneusement ler interactions enue les diffhentes modalik de dialogue et reconnaitre les paramhues influents pow des k h e s Blknentaires dimensionnantes. Cene m d i s p a b k optimisation des processus de dialogue CCnrstiNe me etape vers une meilleure utilisation der ressources du cockpit et de l'ophatnu, d u i s a n t h i B une rawtion effective de la charge de travail.
REMERCIEMENTS Les auteurs tiennent h remercier le Docteur A. Uger pow sa conseils dans la &f i t i on des w+imentations u dans la n5daction du pr&ent document.
t (I.". d.,ML., z
I I 10 (0 e4 m REFERENCES
TAILLE OBJET (pixeis) (1) "Engineaing Data Canpendium". edited by K.R. Boff and J.E. Lincoln. Wright Patterson AFB. Ohio, USA, 1988.
(2) Santucci G.. Amalbnti. R., Menu, J.-P., Malgouyard, P..
graphique en fondion de sa taille et de sa position rkran; intervalle de confiance a g5vo et hmme-machine en akonautique; %me partie: Cornparaison
propoflion des pdhensions rbusies au premier de deux s y s b e s de dponse, la voix et le clavier, h des essai. stimulations spatiales non symboliques", CERMA 83-23
(LCBA). k m b r e 1983.
Figure 3: Temps moyen de prehension d'un obiet sqvoix et claviers complexes: nouveaux modes du
InterprCtation Le trmps moyen de ehens ion subit une augmentation notable dks que la taille de l'objet est plus petite que 40 millimhues. Cene augmentation est la cons6quence de la forte propmion de saisies h tentarives multiples pour les objets de dimensions faibles (le sujet constate que la saisie n'a pas riussi et enchaine imm&iidiatanent par une deuxihme tentative sur le mSme objet, l 'exhtion correspond i l'ensemble de cer deux tentatives). En revanche le temps d 'exht ion des prihension r6ussies nu premier s s a i n'est pas pond&& par la taille de l'objet h saisir, contrairement 1 cc que @dit la loi de Fim (10). Celleci pone sur des manipulations rhlles , par opposition i noue manipulation qui est virmelle et dont I'exhtion est d6pedmte des temp de &clion pmpre du Grand b a n Interactif.
Par silleurs, la taille de l'objet n'est pas seule responsable de I'existenE de tentatives infructueuses; en effu la proportion moyenne de tentatives r h s i e s nu premia essai plaforme 1 0.81 pour les deux plus grandes tailles (conue 0.53 pour la plus petite).
On notera Bgalment l'influence de la latiraliti;: les saisies d'objets positiormis B gauche son1 toujours en moyenne plus rapides que ler saisies des objets positimBs i dmite (le SU@I devait toupurs utiliser la main gauche). Cet effet n'est sensible qu'aux faibles milles d'objet.
CONCLUSION La concept de grand &an interactif pmpose une nouvelle organisation du dialogue homme-systi?me en utilisant d'auues modaliles sensorimouices que celles des cmaux visuel et manuel. La maqueue qui a it6 d&el&e mtiue un outil d'CNde. Cet outil doit Sue pmchainunent indgr6 dans une plate-
(3) Amalberti R.. Batejas D., Bataille, M., Nessler. F.. Swtucci G.-F. "EN& expkimentale d'un moyen de commande en Gmnautique intigrant un clavier L labels variables et une commande vocale". CERMA 85-26 (LCBA). Juillet 1985.
(4) Amalberti. R., Santucci. C.-F.. Pradella. Valot, "Codage Semantique et codage verbal (dponses 1 la voix et nu clavia h des stimuli col016s)". CERMA 85-35 (LCBA). OEtobre 1985.
( 5 ) Bisson. P., Suulard. P.. Raimondo. A., &in. P.. "Interfaces homme-machine multimodales et adaptatives pour syst8mes opkationnels", in "Informatique '92, l'interface des mondes riels et VirNels". m m 92, pp.591-643.
(6) Pertet, L-N.. Favot, J J . . Barbier, B.. 'Interactive display concept for the next generation coclrpit". in SID 91 Digest, Mai 1991. pp 487-490.
(7) Wickens. C.D.. Vtdulich M.. "SC-R compatibility and dual task performanw in two complex information pocessing tasks: h e a t evaluation and fault diagnosis". University of Ilhnois at Urabana- Champaign EPL82-3DNR-823. December 1982.
(8 ) Perbet, LN.. Favot, J.-J.. Barbier. B.. "Systime de dialogue multimodal pour mkpi ts fuaus". in "Advanced A h a f t Interfaces: The Machine Side of the Man-Machine Interface", AGARD CP 521. 1992, Papa 20.
(9) Cadoz. C., "Le geste de communication homme/machine, la communication instrumentale". ACROE Grenohle, France. 5 mars 1992, p.6.
(lo) Holding, D.H.. "Human skills, Second Edition ". John Wiley and Sons Ltd.. 1989. p.119.
6- I
Immersive Virtual Environments as trainer: system design from a cognitive stance
M. Wierda, P.C. van Wolffelaar, W. van Winsum
Traffic Research Centre University of Groningen
P.O.Box 69 9750 AB H a m The Netherlands
Summary
Many of today’s training-simulators for ’guiding, steering or flying’ a vehicle are designed to have a safe, environmentally clean, flexible and cost effective edu- cational environment. It is claimed that the training effectiveness can be increased significantly if the star- ting point of the design would be shifted from the ’enabling technology’ position to a cognitive approach of the task to be learned in the simulator. An outline is given of this approach, encompassing a behavioral task- analysis, a cognitive process model and an analysis of the educational goals in terms of cognitive and percep- tual skills. It is concluded that knowledge in the domains of cognitive science and artificial intelligence is hardly used while this knowledge may bring about training simulators of a significantly other quality.
-
--
.
I Introduction
Raise for yourself the following academic question. Someone asks you to build a training simulator for, say a military combat helicopter. Only the best apparatus is good enough, the simulator must be state of the art. You’ll have an unlimited budget, but you’ll have only one year. What would you do?
Probably you’ll acquire an Avens & Sutherwater or Clearsand Picture graphical computer, the best, with full-screen texture rendering and anti-aliasing capable of rendering a trizilion polygons. Next you might con- sider building a cockpit but buying a complete one from the helicopter manufacturer is more easy. The cockpit is put into a dome, on an Oilpressure Industries six degrees of freedom motion platform. You’ll probably make sure that this company also provides for the soft- ware drivers to toss around the simulator in accordance with the (subjective) motions of the Helicopter. On top of the Heli you might mount multiple video-projectors. Or, if you are modem, you might use a Head Mounted Display, allowing to omit the dome, projectors and cockpit. Next step might be hiring software experts who
take care of the vehicle’s dynamic characteristics by implementing process functions. They also might use Plurigem, a software package designed for 3D model- ling, to build a combat environment including the gra- phical representation of a number of potential targets, for example a tank, nicely tucked away in a brushwood. Luckily for the trainee, the graphical computer allows for an ’infra-red-image’ visor. A last step might be a visit to the Heli manufacturer’s training centre to find out how the flight training is structured. This knowledge is used by another bunch of software experts who hurry to schedule a flight-training plan, inclusive of the edu- cational goals and required skill levels in each stage. Then, once more in a hurry since almost 12 months have past, you might present the full functional prototype to the client. He is very pleased and orders a dozen simu- lators. You might feel relieved and satisfied since you have done everything you possibly could have and the Heli-simulator probably has the highest possible trai- ningseffect.
But have you really done everything you could and does the simulator have an optimal educational effect?
The main argument of this paper will be that a significant improvement is possible and a crucial step is overseen. Or even worse, the starting point of the project might be wrong. This is true if, and it must be stressed that it is a conditional argument, the goals of the use of the simulator are ’only’:
1 - cost effective training compared to a real-flight- training, given its independence of weather, logistic requirements, operational costs etcetera:
2 - the safety of the pilot, instructor and persons in the vicinity of the training facilities:
3 - the facility to train ’infrequent’ hazardous scena- rio’s;
4 - to compare behavioral improvement over time and between trainees in, possibly, ’exactly’ the same flight environment,
and that the goal is NOT to use the simulator techni- que to qualitatively enhance the learning process in both the operational control of the vehicle and the tactical and
This paper is based on a research program initiated and supported by the Ministry of Transport and Public Works, Directorate-General of Transportation.
Presented at an AGARD Meeting on ‘Virtual Interfaces: Research and Applications’, October 1993.
6-2
strategical skills (In section 4 the three distinguished behavioral levels will be defined).
This chapter will outline a strategy for building a Virtual Training Environment (VTE) aiming at the full- blown education/training of men in control of a vehicle. Starting point of this strategy is locating ’the man at the wheel’ (or, generally ’at the vehicle controls’) in the heart of system. As such, VTE enabling technology (the capabilities of graphical computers, motion platforms, Head Mounted Displays, force-feedback, audio and headtrackers, see for an overview Wierda, 1993), has no other role than the formation of restrictions. In other words, we will follow the line thought of what a trainee should be learned and how and then, secondary, find out how it can be achieved by using the ’goodies’ of the enabling technology. The latter task will be addressed only very shortly since today’s technical restrictions will be outdated tomorrow.
Throughout the text explicit examples of a VTE for driving will be used, which is built at the Traffic Re- search Centre. However the conclusions of the approach and recommendations should be applicable in the de- sign of other VTE’s as well and in particular for training of the skills to manoeuvre through a space (driving, flying airplanes and helicopters, controlling trains and armored vehicles).
The strategy has four stages, each will be outlined in subsequent sections. The first step is describing the required task-performance in elementary behavioral elements. The result is called a normative analysis (sec- tion 2). The analysis serves two purposes in the formu- lation of a cognitive process model of the task, step two in the approach (section 3). Firstly the normative analy- sis prescribes the required output of the cognitive pro- cess model and secondly it allows an assessment of the relevance of each sensory channel for building up an internal, mental model of a particular task-environment. As such the process model concentrates on the way humans form mental representations of an environment and how these representations are used to perceive ’changes’ in that environment. In a subsequent stage a formalization of ’learning’ is given in terms of changes in the internal, mental model (section 4). In aconcluding section some typical aspects using a Head Mounted Display in a VTE are discussed (section 5) . Based on the cognitive model and the educational goals a VTE may be explicitly designed to bring about the required internal changes in the trainee.
Requirements for ’a’ VTE include what elements of the environment must be present, how feedback should be given and what sensory channels are to be used to generate a situational awareness in the trainee that al- lows himher to learn and to guarantee that the effect of training will generalize to the task in the ’real world’. This last step is not dealt with since it will be different for each type of task, only examples of the TRC driving simulator will be given. This chapter is concluded by discussing some critical system components of a VTE, in particular the Head Mounted Display.
2 Analyzing the required behavior
A normative task analysis is a list of necessary beha- vioral elements for performing a specific task adequa- tely. For convenience and usability the elements are clustered around so called manoeuvres. For instance in driving all finely detailed behavior when exiting a high- way is given (McKnight & Adams, 1970) or in riding a bicycle the required behavior is scrutinized around ma- noeuvres as ’turning left on a non-regulated intersec- tion’ (Wierdaet al, 1989). Theresulting taxonomy is not intended to, nor capable of predicting and/or explaining observed human behavior psychologically. In fact the analysis even does not take into account that the task is normally performed by a human. If we would be able to build a fully automated car then the best guarantee that it will drive safely would be that the automaton could generate behavior according to the taxonomy.
A taxonomy may have many purposes, in the strate- gy of designing a VTE only two will be used. Firstly, it prescribes the range of behavior the cognitive process model should account for, or better, should predict. Secondly, the taxonomy can be used to evaluate the relative significance of each sensory channel (seeing, hearing, olfactories, propriocepsis, kinesthetic etcetera) in the overall perception of a specific task-environment. As such this analysis results in requirements for the cognitive process model with respect to ’perception’ and it allows an assessment of the required fidelity of the VTE components. If, for example, one is designing a VTE using a Head Mounted Display (HMD) for a Stinger launching site it may be clear that the operator needs to see the incoming jetfighter in time: the pictorial resolution of the HMD must allow the perception of the ’enemy’s jet’ from quite a distance (see Jense & Kuij- per, 1992)
3 . A CO nitive process model of the task to be learne B
A taxonomy of behavioral elements required for a particular task can be used to find the relevant percep- tual goals of the different perceptual channels. In next paragraph an example is given for ’visual perception during driving’. Perceptual processes in other sensory channels ‘are skipped, firstly, because the examples gi- ven are from the ’driving’ task in which visual percep- tion is dominant (both in the taxonomy and in accident causation, see Wierda, in press, Staughton & Storie, 1977) and, secondly, since an elaboration on all sensory channels would take too much space. It should be noted that the method of analysis might be valid for any task-environment. The example below is an excerpt, for a full version see Wierda and Aasman. 1991.
6- I
Immersive Virtual Environments as trainer: system design from a cognitive stance
M. Wierda, P.C. van Wolffelaar, W. van Winsum
Traffic Research Centre University of Croningen
P.O.Box 69 9150 AB Haren The Netherlands
Summary
Many of today’s training-simulators for ’guiding, steering or flying’ a vehicle are designed to have a safe, environmentally clean, flexible and cost effective edu- cational environment. It is claimed that the training effectiveness can be increased significantly if the star- ting point of the design would be shifted from the ’enabling technology’ position to a cognitive approach of the task to be learned in the simulator. An outline is given of this approach, encompassing a behavioral task- analysis, a cognitive process model and an analysis of the educational goals in terms of cognitive and percep- tual skills. It is concluded that knowledge in the domains of cognitive science and artificial intelligence is hardly used while this knowledge may bring about training simulators of a significantly other quality.
- -
-‘
1 Introduction
Raise for yourself the following academic question. Someone asks you to build a training simulator for, say a military combat helicopter. Only the best apparatus is good enough, the simulator must be state of the art. You’ll have an unlimited budget, but you’ll have only one year. What would you do?
Probably you’ll acquire an Avens & Sutherwater or Clearsand Picture graphical computer, the best, with full-screen texture rendering and anti-aliasing capable of rendering a trizilion polygons. Next you might con- sider building a cockpit but buying a complete one from the helicopter manufacturer is more easy. The cockpit is put into a dome, on an Oilpressure Industries six degrees of freedom motion platform. You’ll probably make sure that this company also provides for the soft- ware drivers to toss around the simulator in accordance with the (subjective) motions of the Helicopter. On top of the Heli you might mount multiple video-projectors. Or, if you are modem, you might use a Head Mounted Display, allowing to omit the dome, projectors and cockpit. Next step might be hiring softwareexperts who
take care of the vehicle’s dynamic characteristics by implementing process functions. They also might use Plurigem, a software package designed for 3D model- ling, to build a combat environment including the gra- phical representation of a number of potential targets, for example a tank, nicely tucked away in a brushwood. Luckily for the trainee, the graphical computer allows for an ’infra-red-image’ visor. A last step might be a visit to the Heli manufacturer’s training centre to find out how the flight training is structured. This knowledge is used by another bunch of software experts who hurry to schedule a flight-training plan, inclusive of the edu- cational goals and required skill levels in each stage. Then, once more in a hurry since almost 12 months have past, you might present the full functional prototype to the client. He is very pleased and orders a dozen simu- lators. You might feel relieved and satisfied since you have done everything you possibly could have and the Heli-simulator probably has the highest possible trai- ningseffect.
But have you really done everything you could and does the simulator have an optimal educational effect?
The main argument of this paper will be that a significant improvement is possible and a crucial step is overseen. Or even worse, the starting point of the project might be wrong. This is true if, and it must be stressed that it is a conditional argument, the goals of the use of the simulator are ’only’:
1 - cost effective training compared to a real-flight- training, given its independence of weather, logistic requirements, operational costs etcetera;
2 - the safety of the pilot, instructor and persons in the vicinity of the training facilities;
3 - the facility to train ’infrequent’ hazardous scena- rio’s:
4 - to compare behavioral improvement over time and between trainees in, possibly, ’exactly’ the same flight environment,
and that the goal is NOT to use the simulator techni- que to qualitatively enhance the learning process in both the operational control of the vehicle and the tactical and
This paper is based on a research program initiated and supported by the Ministry of Transport and Public Works, Directorate-General of Transportation.
Presented a! an AGARD Meering on ‘Virtual Interfaces: Research and Applications’, October 1993.
6-2
strategical skills (In section 4 the three distinguished behavioral levels will be defined).
This chapter will outline a strategy for building a Virtual Training Environment (VTE) aiming at the full- blown education/training of men in control of a vehicle. Starting point of this strategy is locating ’the man at the wheel’ (or, generally ’at the vehicle controls’) in the heart of system. As such, VTE enabling technology (the capabilities of graphical computers, motion platforms, Head Mounted Displays, force-feedback, audio and headtrackers, see for an overview Wierda, 1993), has no other role than the formation of restrictions. In other words, we will follow the line thought of what a trainee should be learned and how and then, secondary, find out how it can be achieved by using the ’goodies’ of the enabling technology. The latter task will be addressed only very shortly since today’s technical restrictions will be outdated tomorrow.
Throughout the text explicit examples of a VTE for driving will be used, which is built at the Traffic Re- search Centre. However theconclusions of the approach and recommendations should be applicable in the de- sign of other VTE’s as well and in particular for training of the skills to manoeuvre through a space (driving, flying airplanes and helicopters, controlling trains and armored vehicles).
The strategy has four stages, each will be outlined in subsequent sections. The first step is describing the required task-performance in elementary behavioral elements. The result is called a normative analysis (sec- tion 2). The analysis serves two purposes in the formu- lation of a cognitive process model of the task, step two in the approach (section 3). Firstly the normative analy- sis prescribes the required output of the cognitive pro- cess model and secondly it allows an assessment of the relevance of each sensory channel for building up an internal, mental model of aparticular task-environment. As such the process model concentrates on the way humans form mental representations of an environment and how these representations are used to perceive ’changes’ in that environment. In a subsequent stage a formalization of ’learning’ is given in terms of changes in the internal, mental model (section 4). In aconcluding section some typical aspects using a Head Mounted Display in a VTE are discussed (section 5) . Based on the cognitive model and the educational goals a VTE may be explicitly designed to bring about the required internal changes in the trainee.
Requirements for ’a’ VTE include what elements of the environment must be present, how feedback should be given and what sensory channels are to be used to generate a situational awareness in the trainee that al- lows himher to learn and to guarantee that the effect of training will generalize to the task in the ’real world’. This last step is not dealt with since it will be different for each type of task, only examples of the TRC driving simulator will be given. This chapter is concluded by discussing some critical system components of a VTE, in particular the Head Mounted Display.
2 Analyzing the required behavior
A normative task analysis is a list of necessary beha- vioral elements for performing a specific task adequa- tely. For convenience and usability the elements are clustered around so called manoeuvres. For instance in driving all finely detailed behavior when exiting a high- way is given (McKnight & Adams, 1970) or in riding a bicycle the required behavior is scrutinized around ma- noeuvres as ’turning left on a non-regulated intersec- tion’ (Wierdaetal, 1989). Theresulting taxonomy is not intended to, nor capable of predicting and/or explaining observed human behavior psychologically. In fact the analysis even does not take into account that the task is normally performed by a human. If we would be able to build a fully automated car then the best guarantee that it will drive safely would be that the automaton could generate behavior according to the taxonomy.
A taxonomy may have many purposes, in the strate- gy of designing a VTE only two will be used. Firstly, it prescribes the range of behavior the cognitive process model should account for, or better, should predict. Secondly, the taxonomy can be used to evaluate the relative significance of each sensory channel (seeing, hearing, olfactories, propriocepsis, kinesthetic etcetera) in the overall perception of a specific task-environment. As such this analysis results in requirements for the cognitive process model with respect to ’perception’ and it allows an assessment of the required fidelity of the VTE components. If, for example, one is designing a VTE using a Head Mounted Display (HMD) for a Stinger launching site it may be clear that the operator needs to see the incoming jetfighter in time: the pictorial resolution of the HMD must allow the perception of the ’enemy’s jet’ from quite a distance (see Jense & Kuij- per, 1992)
3. A CO nitive process model of the task to be learne B
A taxonomy of behavioral elements required for a particular task can be used to find the relevant percep- tual goals of the different perceptual channels. In next paragraph an example is given for ’visual perception during driving’. Perceptual processes in other sensory channels are skipped, firstly, because the examples gi- ven are from the ’driving’ task in which visual percep- tion is dominant (both in the taxonomy and in accident causation, see Wierda, in press, Staughton & Storie, 1977) and, secondly, since an elaboration on all sensory channels would take too much space. It should be noted that the method of analysis might be valid for any task-environment. The example below is an excerpt, for a full version see Wierda and Aasman, 1991.
6-3
Examples of visual perceptual goals while driving:
- 1 Determination of lateral and longitudinal position, changes in these positions and alternations in the changes (lateral and longitudinal speed and accelera- tion respectively) - 2 Same as 1 but for heading angle - 3 Detection of obstacles - 4 Localization and reading of route indications - 5 Localization, classification and recognition of roadusers - 6 Recognition of prototypical, actual traffic situation - 7 Control over the orientation of the selective visual perceptual system (via body-, head-, and eye-move- ments and shifts of attention)
The perceptual cognitive process model must be capable of achieving, at least, the enumerated goals. In the outline of the theory, called 3 1/2D model, we will omit an extensive discussion of the low level visual processes such as contour detection, based on motion of a ’blob’ against a background, detection of closed con- tours by boundary tracing and the detection of separated fields by distinguishable ’features’. We will assume that elementary visual routines are capable of deriving an internal representation from the retinal impression (in other words: ’data driven’). For a description of the full
- theory see Wierda & Aasman, 1991. - Results of elementary visual routines add to a repre-
sentation that captures the visual environment in sepa- -- rated blobs while the orientation of the surface of the
blob is roughly known. A qualitatively important step is the transformation
from this low level ’blob’ representation (no objects and backgrounds are identified yet!) to an object centered spatial representation. The 3 1/2D theory claims that a blob is analyzed in terms of a main and an auxiliary axis. The first roughly indicates the orientation, for example a vector running from the feet to the head in case we perceive a human torso, while the auxiliary axis indica- tes the ’volume’ of the object. These internal repre- sentations are called generalized cones or object skeletons, the idea of ’summarizing’ objects originates from Marr (1982). Complex objects, for example a human figure inclusive of torso, head, arms, hands legs and feet, are composed of series of generalized cones. The main axes of the constituents are hierarchically connected to the prime main axis via slots. The latter specify the allowed movements of the elements with respect to the main axis. The number of formal variables (axes, degrees of freedom) is surprising low with the consequence that vast numbers of hierarchical con- structed objects can be remembered with a minimum of storage capacity. Moreover recognition is simplified tremendously: any bottom up perceived object may be compared with any remembered skeleton, from any viewing angle by internally manipulating the remembe- red skeletons. Examples of the internal manipulations are rotation of the main axis to compensate for the viewing angle and enlargement to compensate for vie- wing distance.
A skeleton representation and the transformation with the set of axes can explain the recognition of a stationary object. However, even during straight driving only a fraction of the retinal input is unchanged, yet we are capable of recognizing an entire scene in a flash. Wierda and Aasman, 1991, proposed to add a single vector to an object’s skeleton representation that indi- cates the direction and pace of movement along the main axis. This aspect of an object is represented ex- plicitly and, as such, is ’remembered’ as an integral part of a three dimensional (3D) object. It allows the recogni- tion of objects, for example a nearly ’invisible’ car (sic), by degredated contours and its typical speed. For this reason the theory has been called the 3 1/2D theory: the three dimensions of space and an abstracted dimension of time. The long term memorized skeletons are easily updated with values for the axes and vectors when comparable but significantly different objects and situa- tions are encountered, estabilshing a ’working memory’ version. Among others the long term effect of leaming is that 3 1/2D models of objects are clustered into compositions, forming new 3 1/2D models. It is claimed that infra-structure is represented as a 3 l/2D model as well as objects. Composition of these models together with those for moving objects results inprororypes for dynamic, 3 1/2D situations, in which spational and temporal relations are explicitly represented. Note that these complex prototypes are learned when the models are encountered jointly. An example is the formation of a complex 3 1/2D model for a typical situation on an intersection, inclusive of the most likely presence and place of roadusers on collision course, from single 3 1/2D prototypes of ’cars’, ’pedestrians’ and ’infrastruc- ture’ (see Wierda and Aasman, 1991, pages 68-71).
An important aspect of adequate spational/temporal visual prototypes is the use of the prototype’s parameter values, acting as default terminal values, when these parameters for axes and speed vectors are not immedi- ately available from bottom up perception. This process is considered one of the most important pathways in ’Top Down’ or ’cognitively driven’ perception. The activation of default values may explain why we (as ’experts’ in a certain task) are capable of generating a vivid and detailed awareness of our spatial environment even when visual input may be seriously hampered. In next paragraph the shift from bottom up to top down perception is used to explain expertise.
An important difference between novices and ex- perts in controlling a vehicle is the amount of a priori knowledge, structured in the visual prototypes, that are used in perceiving the environment. The task of the expert may be limited to testing his hypothesis based on the Top Down knowledge from the prototypes while the novice has to extract far more ’knowledge’ about his task environment Bottom Up, in other words via his sensory channels. This claim may have great conse- quences for the designer of a VTE: the virtual environ- ment for an expert must be consistent with his expectations and may need no detailing except for cri- tical elements, in other words ’visual cues’, by which prototypes are recognized. In contrast the VTE for a
6-4
novice needs to have high fidelity with respect to the sensory stimulation. To put it boldly, a simulator for training novices must represent the task environment in details.
4 . Learning in a W E from a cognitive stance
In this section some recommendations for a VTE will be given that are derived from the 3 1/2D theory and the taxonomy. Before doing so a distinction will have to be made in task levels when ’making a trip or flight’ with a vehicle. The goal of distinguishing levels of perfor- mance is to stipulate the applicability of the taxonomy (section 2) and 3 1/2D theory (section 3) for a wide range of VTE’s. The levels can be discriminated, among others, by placing them on a time dimension: while a control level encompasses tasks ranging from millise- conds to seconds, the manoeuvering level takes seconds to minutes and the strategical level may take hours to years (Michon, 1985). On the strategical level, one decides how a trip has to be made: by train, taxi, car or whatever. Once a mode of transportation is chosen and the trip is started only every once and a while a decision about what route to follow must be made. Decisions on the strategical level determine the task-environment on the manoeuvering or tactical level. On this second level discrete decisions are made on short term trajectories and actions. Examples are what path to follow when negotiating an intersection with the intention to turn left. Also included are the visual search strategies: for exam- ple, one ’recognizes’ that a potential dangerous situa- tion may be encountered and starts looking for cues of the dangerous object or person. Driving in a residential area with parked cars and playing children is a practical example.
The control level of task performance, the last and ’lowest’ level, includes high rate first-, second- and third-order control loops. For instance the control of lateral position requires constant adjustments by steer- ing (first order loop). For this reason the level is also called the operational level. In flight, to give an other example, the control altitude, rate of ascent and descent and changes in these rates are first, second and third. order control loops respectively. Control tasks are car- ried out by human subjects by executing ’automatic action patterns’, provided that they are experienced. We may add that these tasks require a finely graded repre- sentation of the vicinity. It is important to note that tactical decisions have a direct effect on the operational level: tactics define the operational goals. For example, the recognition of the potential dangerous situation of parked cars and playing children should give new para- meters to the control loops: one is inclined to brake faster and harder.
The significance of the distinction in task-levels lies in the fact that qualitatively different learning environ- ments are required for each level and therefor different- ly designed VTE’s. In the following paragraphs a VTE
for the control level and maneuvering level will be discussed.
If a pilot (or a driver) needs to be trained in operatio- nal control of the plane (or car) using a simulator, the fidelity of the controls and their effect must be high, probably requiring a six degrees of freedom motion platform and ergonomically well designed pedals, yo- kes and other controls. In other words, such a VTE may turn out to be very costly. Above that, the operational control of a vehicle is a typical ’perceptual-motor’ skill. Generally the speed of acquiring this type of skill can be described by a power law (Newell & Roosenbloom, 198 1). And indeed Wierda, Brookhuis and Van Schagen (1987) found a power law for the speed with which young children learn to control their bicycle. If the finding may be generalized to other types of vehicles we might conclude that the trainee learns the control task quickly during the first hours of experience. After ha- ving arrived at a relatively high level of performance in a short time the learning process continues endlessly but at a very slow pace. In this context it makes hardly sense to build an expensive VTE to train subjects on the operational level: the required high fidelity of the con- trols, vehicle model, visualization hardware and motion system require much effort and a huge budget while ’the real vehicle’ might be necessary for a limited amount of time. Yet, the VTE for a helicopterpilot described in the introduction will not be capable of training anything - else but the operational control. As such the justification - of the use of a simulator in the training of operational control of a certain vehicle is a matter of weighing the -.
’costs’ per hour of the simulator and the real vehicle. Costs in this context need not to be restricted to financial consequences but may also refer to effects on the envi- ronment and the safety of the pilot and instructor.
A simulator’s flexibility in choosing and designing environments seems to make it the ultimate training device for tasks on the manoeuvering level. However, the design of a VTE to be applied in training on this level is rather complex given the following line of thought. Acquiring expertise in manoeuvering a vehicle is achie- ved by the formation of hierarchical structured 3 1/2D prototypes, see section 3. As such the trainee must experience a wide range of interactions with others in the environment, whether in combat, driving or flying, while the others behave to a large extend ’naturally’.
Generating ’natural’ behavior in real time is truly a complex task since, we will use a driving simulator as an example, the other roaduser will have to interact among each other and with the subject in the simulator. The range of artificial behavior of the ’other roadusers’ in the simulator environment should be as large in real traffic, otherwise it would never appear to be natural. The others should overtake, negotiate intersections, make emergency brakes, ’swerve’ naturally, slow down for curves etcetera. Perhaps surprisingly a taxonomy and a cognitive model such as described in sections 2 and 3 are badly needed to ’move’ the artificial roadusers (See Van Winsum, 199 1). Effectively ’other’ roadusers in the VTE are autonomous in their interactions, inclu-
sive the interactions with the trainee in the VTE. This would mean that the situations encountered by the trai- nee are not predictable, once the simulation is started. This would be a major drawback: an instructor, a human or possibly an automaton, needs the capability to bring the trainee in those traffic situations in which the forma- tion of spational/temporal prototypes is optimal. As such the ’other roadusers’ must be controllable to a certain extend. Therefore the VTE at the Traffic Re- search Centre (TRC) has been equipped with a Scenario Specification Language allowing the deliberate set up of precisely defined traffic situations (Van Wolffelaar & Van Winsum, 1992). These scenarios that define the intentions of other roadusers are triggered when the trainee passes a certain geographical point in the driving environment. The trainee will never know that the traf- fic situation is a ’set up’: he will experience his ride through the traffic environment as natural. Currently the VTE is tested on effectiveness (Wierda, 1993).
In conclusion of this section it is stated that a VTE is very promising to learn people to navigate a vehicle in an interactive environment. However an extensive cog- nitive model of the driver’s (pilot’s) task is required firstly since it is the base for the Artificial Intelligence of others in the environment and, secondly, since it is required to assess the ongoing formation of spatio- nalhemporal prototypes in order to present the trainee exactly those traffic (flight-combat) situations in which the formation of prototypes is maximalized. One must not underestimate the required effort to build and apply these models.
- -
5. Using a Head Mounted display in a VTE
The core of learning how to manoeuvre a vehicle in a crowded environment is developing the skill to appre- hend the actions and intentions of ’others’ in the envi- ronment. Only with this skill one can take the right decisions on what path to follow, what speed to maintain and what formal rules to apply. Since the main source of information about intentions of ’others’ is the way they move their vehicle through the environment, the training facility should focus on these movements. The- refore the VTE should have the facility to visualize explicitly the movements of others and the movement of the trainee’s vehicle offline by which implicitly the intentions and interactions in the situation are made clear to the trainee. In practice, a trainee in the VTE at the Traffic Research Centre will encounter specific scenario’s (without knowing it) in which his behavior, inclusive of choice of speed, gear, steering, visual scan- ning behavior etcetera, is judged. When this behavior is suboptimal the simulation is postponed and the scena- rio is played back. The significance of the Head Moun- ted Display is the capability to look around during the play-back. Above that different viewing angles can be chosen. Currently the viewing point can be set in any of the cars of ’others’ in the situation and it may also be set in a helicopter viewmode. In the latter viewing point the
6-5
three dimensional/temporal properties of the traffic si- tuation become crisp clear. It is important to note that this form of augmented feedback (see Sanders, 1991) is immediate: the intention of the mining is to accelerate the spatio-temporal reasoning and therefore the feed- back is given in a spatio-temporal form. This is consi- dered an important improvement relative to a classical instruction. In the latter case an instructor gives verbal hints, for example “you should pay more attention to motorized traffic coming from the right if you negotiate such an intersection”. The trainee must interpret the message, transform it into a spatio-temporal repre- sentation and applying it to the just encountered traffic situation while he/she could already be involved in a subsequent traffic situation.
The merits of an HMD in a VTE are manifold, but general. The most important one is the impact of the VTE on the situational awareness of the subject. This effect has been explained by the isolation of the sub- ject’s sensory system from the ’real, actual’ world. Furthermore the stereoscopic view makes the spaciness of the environment so compelling that the entire envi- ronment will become ’believable’, even though seeing depth through stereopsis (Marr & Poggio, 1979) is of no importance (in flight) or relative importance (driving) in the actual task (Wierda, in press).
A last to be mentioned merit of an HMD in a VTE designed for training on the tactical level is that the trainee can be prevented to focus his attention on the instruments and vehicle controls: they simply are not visualized. This state of affairs may sound odd, but it is a commonly heard complaint from instructors (both in flight and driving lessons) that trainees spent too much time looking at odometers and other instruments and take too much time looking at their hands when apply- ing the vehicle’s controls. By simply not visualizing the instruments and controls the trainee is forced ’to look outside’ and forced to build up rapidly an internal rep- resentation of the spational layout of the controls.
6. Conclusion
Virtual Training Environments using a Head Moun- ted Display are an important extension to simulator technology. An HMD-VTE combines the capabilities of simulators and the compellingness through immersi- on of the HMD technique. However, it is observed that even large scale projects to build VTE’s for flight, driving and other vehicle control are technology driven, while we expect the largest improvement in training effectiveness on the manoeuvering level of the task. As such complex cognitive process models are required for two reasons. Firstly, the training environment should focus on the interactions between ’others’ in the envi- ronment, whether other roadusers in driving or enemies in a combat flight. As such these ’others’ must behave ’real time’ and ecologically valid. Secondly, if specific environments are to be presented to the trainee to opti- malize the training’s effectiveness one must understand
6-6
the learning process of the trainee in terms of the forma- tion of spatio-temporal prototypes. It is claimed that the disciplines of cognitive science and Artificial Intelli- gence can provide us with the required process models, in fact this has been partly done in the case of the VTE at the Traffic Research Centre. However one must not underestimate the required effort to apply these models and therefore it would be wise to take the cognitive approach as a starting point in the design of a VTE in stead of starting to build a VTE and, once it has been realized in hardware, being forced to conclude that the VTE might be great for training the control of a vehicle on the operational level but that the tasks on the tactical level must be excluded.
References
Jense, G.J. & Kuijper, F. (1992). Virtual reality re- search at TNOFEL. Proceedings of the 2nd ESA Work- shop on Simulators for European Space Programmes. Report ESA-WPP-039. Noordwijk: ESA.
Marr, D., Poggio, T. (1979). A computational theory of human stereo vision. Proceedings of the Royal Socie- ty of London.
Marr, D. (1982). Vision. San Francisco: Freeman.
McKnight. A.J. & Adams, B.B. (1970). Driver edu- cation task analysis. Volume I : Task Descriptions. Re- port 11-7336. Alexandria, VA: Human Resource Research Organization.
Michon, J.A. (1985). A critical view of driver beha- vior models: what do we know, what should we do. In L. Evans en R.C. Schwing (Eds.), Human behavior and traffic safety. New York: Plenum.
Newell, A.N. & Roosenbloom, P. (1981). Mecha- nisms of skill acquisition and the law of practice. In J.R. Anderson (Ed.): Cognitive skills and their acquisition. Hillsdale, New York: Erlbaum.
Newell, A.N. (1990). Unified theories of cognition. London: Harvard University Press.
Sanders, A.F. (1991). Simulation as a tool in the measurement of human performance. Ergonomics, 34, 995-1024.
Wierda, M., Schagen, I.N.L.G. van, Brookhuis, K.A., Rothengatter, J.A. (1989). Normatieve analyse van defietstaak. (A normative analysis of riding a bicycle). VK-89-29. Haren: Traffic Research Centre.
Wierda,M.,Brookhuis,K.A.,Schagen,I.N.L.G. van (1987). Elementairefietsvaardigheden en mentale be- lasting. (Basic skills for riding a bicycle and mental effort) VK-87-08. Haren: Traffic Research Centre.
Wier&i,M., & Aasman, J. (1991)Seeinganddriving, computation, algorithms and implementation. VK 91- 06. Haren: Verkeerskundig Studiecentrum.
Wierda,M. (1993). PACT, een geautomatiseerde rij- instructie in een Virtuele Omgeving. (PACT, an aut@ mated driving instruction in a Virtual Environment) VK 93-02. Haren, Traffic Research Centre.
Wierda, M. (In Press). Beyond the eye: cognitive factors in drivers’ visual perception. In: A. Gale (Ed.): Proceedings of the Fifth international conference on Vision in Vehicles. London: Taylor & Francis.
Winsum, W. van. (1991). Cognitive and normative analysis of car driving. Haren: Traffic Research Centre.
Wolffelaar, P.V. van & Winsum, W. van. (1992). A new driving simulator including an interactive, intelli- gent traflc environment. Proceedings of the 3rd Inter- national Conference on Vehicle Navigation and Information Systems. Piscataway, New Jersey: Institute of Electrical and Electronic Engineers.
Staughton, G.C., Storie, V.J. (1977). Methodology of an in-depth accident investigation survey. Report LR 762. Crowthorne: Transportation and Road Research Laboratory.
7- I
Creation of a Virtual World to Study Human Spatial Perception during Sustained Acceleration
Tamara L. Chelette and Robert L. Esken Armstrong Laboratory, ALICFBS Bldg 29, 2245 Monahan Way
Wright-Patterson Air Force Base, OH, 45433-7008, USA
Eric J. Martin Systems Research Laboratories, Inc.
2800 Indian Ripple Road Dayton, OH, 45440, USA
1. SUMMARY The staff of the Combined Stress Branch has completed the integration of a system to allow quantitative measurement of perceived attitude while under sustained acceleration. Equipment involved included the computer control system of the Dynamic Environment Simulator (DES), a computer generated graphics system, a virtual world helmet mounted display, and a tactile device for 'reporting attitude perception. The use of a new perceived attitude measurement system in this experiment required not only the technical achievement of the distributed system on the DES, but also required a battery of parameter characterization and basic psychophysical
- performance studies. In addition, we recorded several confounds and issues concerning the use of a helmet mounted
" visual system for attitude information as well as head and neck support limitations of such a system. Experimental results include basic psychophysical accuracy and precision, evidence supporting the haptic system sensitivity to a G-excess illusion (even while the vestibular system is maintained at a constant position relative to the G vector), and modeling of pooled response that supports and quantifies the vestibular component of the G-excess illusion.
- _
2. INTRODUCTION Spatial Disorientation (SD) of pilots continues to be a very serious human factors issue in the United States Air Force and Navy [1,2,3]. In the Air Force, SD results in 8 to 10 aircraft crashes and pilot deaths yearly [4]. A common mishap scenario is low level banked turns while looking up at a lead aircraft [5,6]. Many scholars have theorized andlor investigated the human vestibular response to tilt while varying the magnitude of the gravitoinertial field. Perceptual response metrics have included [7] placement of some external object, simulated aircraft controlled flight recovery [8,9], verbal descriptions of scales [lo] or vection [ll], manual keyboard inputs [12], and coded hand signals [13]. Some researchers have combined metrics in order to overcome the limitations or assumptions required of a single response [12]. Placement of external lines or points can be influenced by optical illusions [14]. Control recovery metrics bring the subject into an
interactive role that immediately influences perception [ 151. Subjective reporting of perception usually requires subjects to translate an internal sensation to some other medium such as words or force.
In addition to the difficulty in objectively measuring vestibular response, ground based research is confounded by the necessity to use high angular velocities to alter the gravitoinertial field strength. Thus, vestibular response is a product of both tilt and angular velocity.
Although there is some evidence that the semicircular canals can become tilt sensitive under the influence of alcohol [16], most of the cited studies support the theory that the otolith organs are the primary vestibular sensors of tilt, and many of them support the theory that shear displacement between macula and otoconia is the excitation stimulus [17, 181. The G-excess illusion is believed to originate in the otoliths. While in a prolonged coordinated turn, pilots often must look out the cockpit to find other aircraft or survey a target. If the head is tilted with respect to the aircraft, and the aircraft is sustaining greater than 1 G, caused by the banked turn, an illusion of excessive head tilt may result giving rise to the interpretation that the aircraft has rolled out of the turn to some extent (Figure 1). I f a "correction" is made for this erroneous sensation, the aircraft can overbank and loose altitude. I f this situation persists, the aircraft can slice downward at a fatal velocity. The G-excess effect has been implicated in over 40 of the 70+ SD related USAF Class A mishaps since 1982 [19]. It is this particular illusion, the G-excess effect, that was investigated in this series of experiments.
The objective of this study was to determine if the effect of head tilt in a greater than one G environment on perception of attitude could be demonstrated and quantified using a ground based human centrifuge. Head tilts were accomplished not only in the body pitch axis, but also in body roll axis via head yaw. Although this type of head movement is fairly unique in vestibular research, it is a common and necessary head position in an aircraft cockpit. For example, formation flying
Presented at an AGARD Meeting on 'Virtual Interfaces: Research and Applications', October 1993.

1-2
may require a pilot to maintain a gaze up and toward one shoulder by 45". During air to ground missions, pilots may yaw their heads as much as 120" and gaze downward to assess munitions targets. Air to air combat can frequently require the 'check six' maneuver where the pilot must attempt to look directly behind him ('six-o'clock'). The focus of the response measurement was on perception of self attitude as reported by hand position. This approach was designed to take advantage of the intuitive behavior most people exhibit of placing the palm of their hand parallel to the surface of the earth when asked to report the horizon. This unique combination of stimulus-response was designed to be sensitive to the potential illusions elicited on a ground based centrifuge.
3. METHODS The general method for this experiment was to collect a measure of the subject's perceived orientation while s/he was at a steady state G level and actively accomplishing some known head tilt. The greater than one G was provided by a man-rated centrifuge and the head aiming task was accomplished with a visual virtual reality system. The subject's perceived orientation was collected by instructing them to orient the palm of their right hand such that it was parallel with the perceived horizon while their hand was suspended in a multi-gimbaled transducer. The details regarding this equipment as well as the motivation and methods of the experimentation follow.
Equipment The primary piece of equipment was the Dynamic Environment Simulator (DES), a three axes, 19 foot radius, man-rated centrifuge located at the Armstrong Laboratory, Wright-Patterson Air Force Base, Ohio. The acceleration was imposed by the rotation of the DES and "auto-vectoring" of the cab such that the resultant force vector acted along the longitudinal axis of the body (Gz). Any cab pitch or roll deviations introduced as independent variables in this study were with respect to this resultant G, vector. In accomplishing cab tilts, the entire subject environment including the subject's seat is tilted. Subjects were seated in a F-16-like 30' back seat, restrained with a five point harness, and provided cardiovascular support with a CSU-13BIP standard anti G-suit. Subjects also wore a standard issue HGU-5WP flight helmet and a MBU-l2/P oxygen mask, primarily to support communications and the visual virtual reality system.
The method for incorporating the head aiming task involved a visual virtual reality system and an associated head tracker (Figure 2). The visual virtual reality system, developed by VPL Research, Inc., was an Eye Phone model number EP-01 driven by an XTAR Corp. Super Falcon 4000 graphics package with a 30 Hz update rate. The head tracker used was a Polhemus Navigation Sciences 3Space Isotrak system
utilizing low frequency magnetic field technology to determine the position and orientation of a six degree-of-freedom sensor. The sensor was mounted on the helmet and the visual scene projected in the eye phones was slaved to the motion of the sensor, and therefore, the motion of the head.
Collection of the subject's perceived orientation was accomplished using a device developed in-house and known as the Tactile Perceived Attitude Transducer (TPAT) [20]. This device consists of an aluminum hand plate with a glove suspended on the underside (Figure 2). When the subject's hand is inserted into the glove, finger and wrist restraints secure the hand such that the back of the subject's hand is firmly affixed to the underside of the hand plate. The hand plate is mounted on a pitch axis gimbal that is anchored to a steel captured bearing in the roll axis. The captured bearing is mounted on a steel pivot providing yaw motion. Movements of the gimbal, bearing, and pivot may be accomplished simultaneously allowing hand motion in three angular degrees of freedom. These movements are detected by potentiometers which are recorded as pitch, roll, and yaw positions. This device takes advantage of the natural inclination to describe one's orientation in space by positioning the suspended palm parallel to the perceived horizon.
Subjects .. . The nine volunteer subjects (seven male, two female) in this- study were all members of the Armstrong Laboratory Sustained Acceleration Panel. They were active duty military personnel with extensive centrifuge experience but limited,, flight experience. The research protocol and procedures were reviewed and approved by the Armstrong Laboratory Human Use Review Committee.
Target Tracking Task A visual image was provided by the virtual reality goggles. The image consisted of two components: a spherical target that was driven in software to drift to prescribed locations in the visual field, and a reticule slaved to the position sensor mounted on the helmet (Figure 3). Subjects were instructed to perform as if' they were flying at night and watching the moon while simultaneously placing their right hand parallel with the horizon. The head tilts were realized by drifting the spherical target to the desired pitch and yaw angle while the subject followed it with the reticule by moving his or her head as if the reticule was etched on a pair of glasses. Target drift was followed by a twelve second vestibular stabilization period, throughout which the reticule would blink. Upon cessation of the blinking, the subject would orient their hand in the manner described and mark that particular hand position by pulling a trigger on the flight stick with the left hand.
Head Tilt Calibration Subjects were seated in a 30" back seat and secured with a
1-3
five point seat harness. They then donned the helmet and acquired a snug fit. The virtual reality goggles were then mounted on the helmet with a series of nylon straps and a set of spring loaded ear pieces fashioned from a pair of welding goggles. This mounting scheme was designed to decrease the torque resulting from the protruding goggles, which weighed 2 Ibs. and 1 ounce, by distributing the load nearer the helmet's center of gravity. Once a comfortable yet firm fit was achieved, the calibration routine was initiated.
The calibration procedure involved slaving the Polhemus position sensor mounted on the top of the helmet and the visual image displayed in the goggles to the head position. This was accomplished by instructing the subject to assume a neutral head position with negligible pitch or roll. The sensorlgoggle system was then zeroed, or boresighted, at this position. Using a visible red light pointer mounted on the helmet, the point of light was projected onto a white measuring tape hanging plumb in the centrifuge cab. Distance between the subject's eye and the hanging tape was obtained via a yardstick with a bubble level secured to it to ensure a measurement parallel to the true horizon. The target would then drift to its new position in the pitch axis, the subject would track it by moving his head, and the change in the position of the point of light would be measured. The arcsine of the ratio of these distances yielded the angles accomplished within 1". These four pitch angles were stored with the data set for each data collection session and used as the actual head position in the data analysis.
Preliminary Experimentation Since this combination of equipment represented a new technique for perceptual research, extensive preliminary testing was performed to examine issues such as training effects, visual feedback, numerical feedback, accuracy, precision, and non-vestibular sensitivity to tilt under Gz. Descriptions of this testing are beyond the scope of this article but can be found in reference [21]. The following is a brief synopsis of the salient findings.
-
'
Spatial information regarding reported position fed back visually confused the subjects when displayed at positions other than straight ahead and thus decreased their accuracy at reporting environmental tilt. Numeric feedback regarding perceptual error did not confuse subjects and thus improved their performance, however no residual group training effect was demonstrated after the feedback was removed.
Repeated measures of reported environmental tilt showed no statistically significant bias in either pitch or roll axis with the head level or pitched upward 45".
Before designing the final experiment, the investigators wanted to know if the non-vestibular components of perception were
also sensitive to an increased Gz environment. When the environment was tilted to counter the head movement such that the vestibular system input remained unchanged, subjects could still accurately report environmental tilt at one Gz. However subjects showed an overestimation of tilt at 3 Gz while in pitch prone positions. Thus haptic input alone is sufficient to cause a pitch illusion.
Final Experimental Design The experimental design incorporated four cab environment pitch angles (-So, O", 5 " , and lo") and four head pitch angles (-30", O", 30", and 45"). In order to reduce the number of trials a subject would endure in a data collection session, either cab environment angle or head pitch was equal to zero, resulting in a total of seven paired cab pitchlhead pitch permutations. These paired conditions were presented randomly such that the subject never knew whether or not the cab was offset from zero during a given trial. Separate models were constructed with respect to the head pitch and cab environment pitch factors. The cab environment angles chosen were comparable to the expected magnitude of the illusion.
The Gz levels incorporated were earth-normal 1.0, 1.4, 2.0, and 4.0. Four Gz was selected as the maximum Gz level as subjects had difficulty supporting the VPL helmet mounted system at any greater Gz level for the required length of time. The 1.0 Gz trials were accomplished first before proceeding to the induced Gz trials (1.4, 2.0, and 4.0). The induced Gz trials were initially presented randomly until it was suspected that the frequent decelerations associated with a random presentation introduced nausea in more susceptible participants. In order to reduce the number of potentially nauseogenic decelerations, an ordinal presentation was employed (1.4, 2.0, 4.0, 1.4, 2.0, 4.0, etc.) until it was determined that head motion during the tracking task combined with a deceleration was causing the discomfort. Thereafter, subjects were instructed to maintain their current head position until the centrifuge arm speed stabilized, then acquire the target and wait the aforementioned 12 seconds to indicate their perceived attitude. The twelve second stabilization period was selected in order to mitigate the dynamics of the semicircular canals from contributing to the perception and reporting of attitude. With this technique, it was possible to return to the random presentation of Gz level. Each subject, therefore, experienced one data collection session with an ordinal Gz presentation and one with a random sequence, except our most susceptible subject, who received the ordinal sequence in both sessions.
Finally, head yaw is a highly relevant movement in the fighter cockpit and serves to translate head pitch sensation into aircraft roll. Thus three head yaw conditions were introduced: 0", 45", and 90". This was accomplished by mounting the
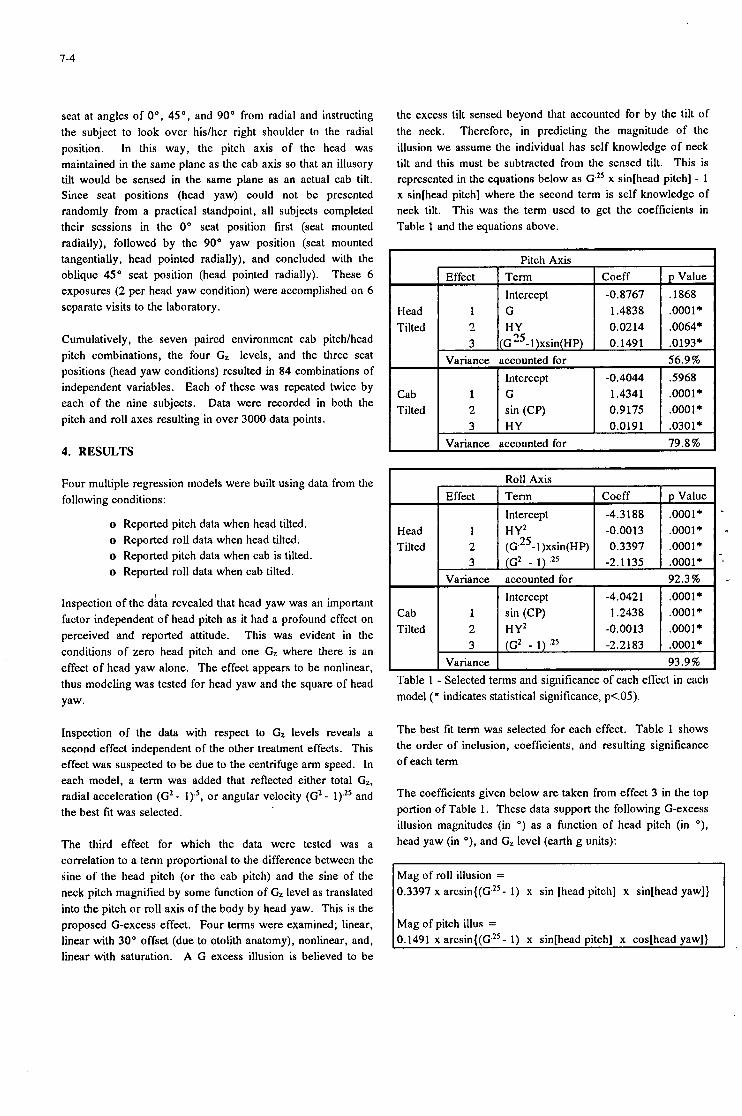
1-4
Effect Term Coeff Intercept -0.8767
Head 1 G 1.4838 Tilted 2 n Y 0.0214
3 (G25-l)xsin(HP) 0.1491
seat at angles of O", 45", and 90" from radial and instructing the subject to look over hislher right shoulder to the radial position. In this way, the pitch axis of the head was maintained in the same plane as the cab axis so that an illusory tilt would be sensed in the same plane as an actual cab tilt. Since seat positions (head yaw) could not be presented randomly from a practical standpoint, all subjects completed their sessions in the 0" seat position first (seat mounted radially), followed by the 90" yaw position (seat mounted tangentially, head pointed radially), and concluded with the oblique 45" seat position (head pointed radially). These 6 exposures (2 per head yaw condition) were accomplished on 6 separate visits to the laboratory.
p Value
.0001*
.0064*
.0193*
.1868
Cumulatively, the seven paired environment cab pitchlhead pitch combinations, the four Gz levels, and the three seat positions (head yaw conditions) resulted in 84 combinations of independent variables. Each of these was repeated twice by each of the nine subjects. Data were recorded in both the pitch and roll axes resulting in over 3000 data points.
Cab Tilted
4. RESULTS
Variance accounted for 56.9% Intercept -0.4044 .5968
1 G 1.4341 .0001* 2 sin (CP) 0.9175 .0001* 3 HY 0.0191 .0301*
Variance accounted for 79.8%
Four multiple regression models were built using data from the following conditions:
o Reported pitch data when head tilted. o Reported roll data when head tilted. o Reported pitch data when cab is tilted o Reported roll data when cab tilted.
Roll Axis Effect Term Coeff p Value
Intercept -4.3188 .0001* Head 1 HYZ -0.0013 .0001* Tilted 2 (G.25-l)xsin(HP) 0.3397 .0001*
3 (Gz - 1) 2' -2.1135 .0001* Variance accounted for 92.3%
Intercept -4.0421 .0001* Cab 1 sin (CP) 1.2438 .0001* Tilted 2 HY2 -0.0013 .0001*
3 (Gz - 1) 2 5 -2.2183 .0001* Variance 93.9 % I
Inspection of the data revealed that head yaw was an important factor independent of head pitch as it had a profound effect on perceived and reported attitude. This was evident in the conditions of zero head pitch and one Gz where there is an effect of head yaw alone. The effect appears to be nonlinear, thus modeling was tested for head yaw and the square of head yaw.
4
-'
Inspection of the data with respect to Gz levels reveals a second effect independent of the other treatment effects. This effect was suspected to be due to the centrifuge arm speed. In each model, a term was added that reflected either total Gz, radial acceleration (G2 - l).', or angular velocity (Gz - l)." and the best fit was selected.
The third effect for which the data were tested was a correlation to a term proportional to the difference between the sine of the head pitch (or the cab pitch) and the sine of the neck pitch magnified by some function of Gz level as translated into the pitch or roll axis of the body by head yaw. This is the proposed G-excess effect. Four terms were examined; linear, linear with 30" offset (due to otolith anatomy), nonlinear, and, linear with saturation. A G excess illusion is believed to be
the excess tilt sensed beyond that accounted for by the tilt of the neck. Therefore, in predicting the magnitude of the illusion we assume the individual has self knowledge of neck tilt and this must be subtracted from the sensed tilt. This is represented in the equations below as G." x sin[head pitch] - 1 x sin[head pitch] where the second term is self knowledge of neck tilt. This was the term used to get the coefficients in Table 1 and the equations above.
The best fit term was selected for each effect. Table 1 shows the order of inclusion, coefficients, and resulting significance of each term
The coefficients given below are taken from effect 3 in the top portion of Table 1. These data support the following G-excess illusion magnitudes (in ") as a function of head pitch (in O ) ,
head yaw (in O ) , and Gz level (earth g units):
0.3397 x arcsin{ (G." - 1) x sin [head pitch] x sin[head yaw]}
Mag of pitch illus =
7-5
When the head is kept- level, but the cab (representing the aircraft) actually tilts with respect to the net gravitoinertial vector (uncoordinated turn), these data indicate that subjects will accurately assess the tilt without a significant illusion. This is most likely due to the sensitivity of the other haptic sensing cues that provide information about tilt when actual tilt occurs. This is consistent with the conclusions of the preliminary phases of this experiment.
The nonlinear term was selected for inclusion in the head tilt models because it consistently fit the data better than the other three proposed terms for the G-excess effect. However, none of the differences among the terms was statistically significant. Thus any one of these functions could be used as an estimate. The apparent success of the nonlinear term is likely due to the nonlinear elastic properties of the macula-otoconia interface of the otolith organs. The apparent insignificance of the anatomical otolith orientation (30 " offset) is likely due to the lifelong adaptation to such. The apparent attenuation of the sine function while under Gz (i.e., the 0.3397 coefficient) is most likely due to the amplified haptic signals and acute attention to orientation during experimental Gz exposure.
common in formation flying, can result in a sensation of aircraft underbank. Intended corrective action actually overbanks the aircraft, causing loss of altitude. Downward head pitches during turning, as is common during bombing or strafing runs, can cause a sensation of overbanking. Intended corrective action actually underbanks the aircraft, causing altitude gain which could lead to midair collision when in formation flight. Although this illusion can be accounted for in ground based centrifuge simulator testing, pilot training should be provided in flight, not only to avoid confounding sensations, but to teach the necessary flight control behavior in such situations.
Acknowledgments The authors wish to acknowledge the valuable experimental design contributions of Dr. Alan Benson, Dr. Donald Parker, Dr. Kent Gillingham, and Dr. Henning von Gierke. The authors wish to extend their appreciation also to William Albery, Thomas Hundt, Deepa Naishadham, Chuck Goodyear, Systems Research Laboratories, Inc. and the entire support staff of the Dynamic Environment Simulator Faciltiy. The authors are also grateful to the subjects who patiently participated in these experiments.
5. CONCLUSIONS 7. REFERENCES
The data described above support the hypothesis that pitching the head while in an excess Gz environment (> 1) can cause an $usory sensation of vehicle tilt. This illusion occurs in the pitch axis if the head is forward, however translates to the roll ilxis as the head is turned toward one shoulder. This effect can be reproduced on a ground based centrifuge provided confounding factors are taken into account in the model. Subjects demonstrated that true vehicle tilt up to 10" is accurately assessed without any significant illusion while head tilts in the -30" to +45" range up to 4 Gz can cause illusionary tilts up to approximately 10" as well.
The magnitudes of illusions demonstrated in this experiment were based on a steady state response to a sustained head position and Gz level. However, physiological evidence of rate sensitive otolithic cells [22] combined with in-flight evidence that supports sensitivity to rate of head movement [9] necessitates the caveat that actual occurrence of the G-excess illusion may result in significantly larger transient illusory angles.
6. RECOMMENDATIONS
Pilots should be made aware of the possibility and magnitude of the G-excess effect. Training protocols should include the caveat that head pitches can cause erroneous sensations of under or overbanking of their aircraft. Special attention must be paid at low altitude to avoid disaster [SI. Specifically, an upward head pitch combined with a head yaw into a turn, as is
1. DeHart R. Human factors problems in the Tactical Air Command. Aviat Space & Environ Med. 1986; 57:725-8.
2. Wanstall B. Helping combat pilots survive. lnteravia Aerospace Review. Mar 1990.
3. Bellenkes A, Bason R, Yacavone DW. Spatial disorientation in Naval aviation mishaps: A review of class A incidents from 1980 through 1989. Aviat Space & Environ Med. 1992: 63:128-131.
4. Lyons TJ, Freeman JE. Spatial Disorientation (SD) mishaps in the U. S. Air Force. Paper presented at the 61st Annual Scientific Meeting of the Aerospace Medical Association. Abstract # 62. May 1990. New Orleans, LA
5 . Lyons TJ, Gillingham KK, Thomae CA, Albery WB. Flying Safety. Low-level turning and looking mishaps.
Oct 1990.
6. English AL. A lifesaver called GCAS. Flying Safety. Jan 1990.
7. Working Group on Evaluation of Tests for Vestibular Function, Committee on Hearing, Bioacoustics, and Biomechanics (CHABA), Commission on Behavioral and Social Sciences and Education, National Research Council. Evaluation of Tests for Vestibular Function.
1-6
Aviat Space & Environ Med. 1992; 63:21I(al-a34).
8. Lyons TJ, Gillingham KK, Teas DC, Ercoline WR, Oakley C. The effects of acoustic orientation cues on instrument flight performance in a flight simulator. Aviat Space & Environ Med. 1990: 61:699-706.
9. Guedry FE, Rupert AH. Steady state and transient G- excess effects. Aviat Space & Environ Med. 1991; 62:252-3.
10. Fulgham, D. Spatial Disorientation. Technology Today. 1989. March.
11. Previc FH, Mullen TJ. A comparison of the latencies of visually induced postural change and self-motion perception. J of Vestibular Research. 1991; 1:317-23.
12. Hosman RJAW, van der Vaart JC. Motion perception and vehicle control. In: Warren R & Wertheim AH, eds. Perception and control of self motion. Hillsdale NJ: Lawrence Erlbaum Assoc. 1990; 399-423
13. Malcolm R, Melvill Jones G. Erroneous perception of vertical motion by humans seated in the upright position. Acta Otolyng 1974; 77:274-283.
14. Cohen MM. Elevator illusion: Influences of otolith organ activity and neck proprioception. Perception & Psychophysics. 1973 ; 14:40 1-406.
15. Stoffregen TA, Riccio GE. An ecological theory of orientation and the vestibular system. Psychological Review. 1988; 95:3-14.
16. Money KE. Disorientation with alcohol and acceleration. Presented at the 6th Interservice/lndustry Acceleration Colloquium. 1992. Dayton, OH.
17. Grant JW, Best W. Otolith organ mechanics: lumped parameter model and dynamic response. Aviat Space 8~ Environ Med. 1987; 58:970-976.
18. Grant JW, Cotton JR. A model for otolith dynamic J of Vestibular response with a viscoelastic gel layer.
Research. 1990; 1:139-52.
19. Freeman, J., (1990), Personal letter from Air Force Inspection and Safety Center toT. L. Chelette re: Spatial Disorientation Mishaps, dtd 11 May, 1990.
21. Chelette TL, Martin El, Albery WB. The Nature of the G Excess Illusion. Technical Report. AL-TR-92-0182.
22. Anderson JH, Blanks RHI, Precht W. Response characteristics of semicircular canal and otolith systems in cats. I. Dynamic responses of primary vestibular fibers. Exp Brain Research. 1978; 32:400-21.
20. Chelette TL. Developing a Technique for measuring the Human Factors Society Test & Eva1 G excess illusion.
Tech Grp Newsletter, 1991; 6(3):2-6.
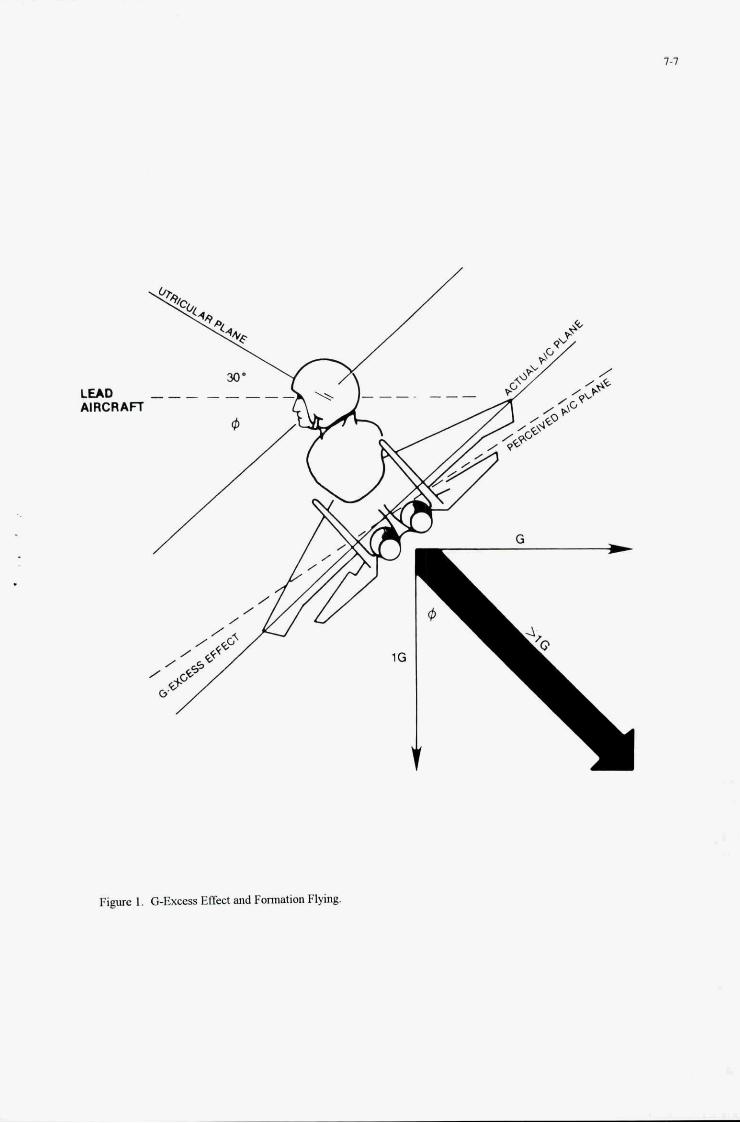
Figure 1. G-Excess Effect and Formation Flying.
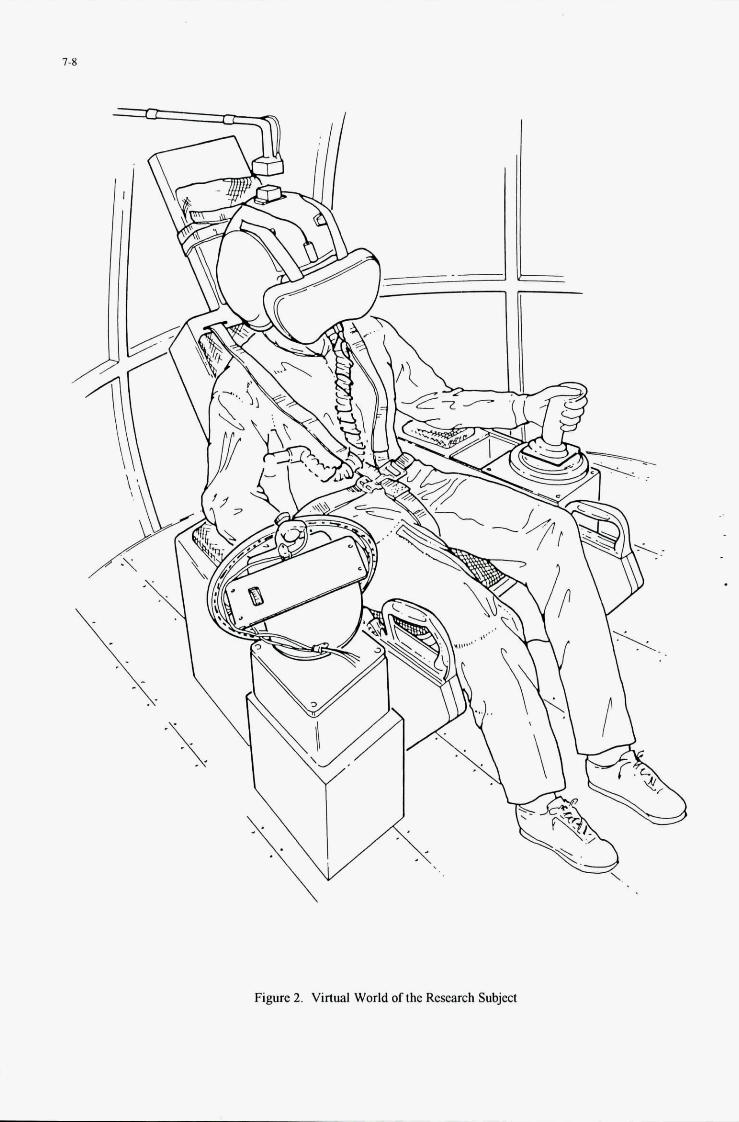
7-8
.
\
Figure 2. V i World of the Research Subject

7-9
1
Figure 3. Task as Viewed through the Virtual Reality Goggles.


8- 1
TEE DRA VIRTUAL COCKPIT RESEARCH PROGRAMME
Judith Ineson Flight Systems Department Defence Research Agency
Farnborough, Hants, GU14 6TD United Kingdom
SUMMARY
The aim of this paper is to describe work in progress at the Defence Research Agency (DRA) Farnborough on the Virtual Cockpit, with particular emphasis on format design and development.
the concept of the Virtual Cockpit is of interest, and the ways in which it differs from the common understanding of Virtual Reality. The potential advantages and disadvantages of such a man-machine interface are discussed. The overall aims of the DRA Virtual Cockpit research programme are listed,
- together with a more detailed discussion of the areas of concern in the presentation of visual information.
The paper reviews the reasons why
The current status of the research - programme is described. The hardware
being used for this programme comprises a head-coupled binocular helmet-mounted display (HMD) system in a skeletal cockpit rig with stereoscopic, computer generated graphics, and a set of demonstration formats showing examples of the type of imagery which might be employed in a Virtual Cockpit. This is followed by a description of APHIDS (Advanced Panoramic Helmet Interface Demonstrator System) - a more capable Virtual Cockpit research rig currently being built for DRA, and of its strengths and limitations. The paper concludes with an outline of how APHIDS will be employed in the next stage of the research programme.
1 INTRODUCTION
Today's military pilot has to assimilate and interpret a vast quantity of information. As his aircraft becomes more complex and "intelligent" and the world around him becomes more dangerous, he is in danger of becoming overwhelmed with data to the point where he can no longer do his job efficiently.
The manner in which information is presented to the pilot affects his workload. The aim of a visual display is to give him the information he needs
in a form which he can interpret with the minimum of cognitive effort, whilst taking his attention from his main flying task for as short a time as possible. Thus, in a fast jet, primary flight information is now displayed head-up so that the time the pilot spends looking into the cockpit is reduced. It is also collimated so that he need not spend time re-focusing his eyes. Some information, such as the pitch ladder and the bomb-fall line, which relates directly to world around him, can be seen superimposed on the real scene, facilitating the interpretation of the display. The head-up display can also relay a sensor image to the pilot, giving him a view of the scene ahead of him, which improves his night and bad-weather flying capability.
The head-up display has, however, a limited field of view and is fixed to the aircraft, so that the information is available only when the pilot is looking ahead. The next logical step was to mount the display on the helmet so that the pilot always has flight information available. Displaying a sensor image which is pointed in the same direction as the head produces a visually coupled system, such as the IHADSS system which is in service in the Apache.
A visually coupled system, consisting of a wide field of view, binocular helmet display together with good quality image generators and display sources, offers the potential to create a virtual cockpit, where most or all visual information is delivered to the pilot on the helmet display. It is hoped that the pilot's workload can be reduced by making as much information as possible spatially appropriate by projecting it so that it appears to be placed in the outside world or within the cockpit. A binaural sound system could likewise place sounds correctly in the world around the pilot. Other information which is important to the pilot can be fixed on the helmet display, so that it is always available. Pictorial data can be used instead of digital or textual if it makes the information
Presented at an AGARD Meeting on 'Virtual Interfaces: Research and Applications', October 1993.
8-2
more easily interpretable. Colour spatial depth can be used to class information so that time spent in searching for information can be reduced.
or f Y
Because so much information has been moved onto the helmet display, ways of interacting with the information will need to be explored. There has already been a substantial amount of research in the field of direct voice input (DVI) for airborne applications, and it is likely to be an important part of the virtual cockpit. However, head and eye direction and finger position can be tracked and might be useful alternative methods of controlling the aircraft systems.
The virtual cockpit ' offers many potential benefits. With a visually coupled system, information can be overlaid on the real world so that features can be highlighted or cued. The field of regard is unlimited and the pilot can "see" through the aircraft structure, thus enabling the pilot to maintain visual contact with objects which would not be visible in a normal cockpit. Other non-world related information can be made static on the helmet so that it is always visible, or placed in a particular direction relative to the world or the aircraft, or kept stationary at a given point within the aircraft. This ability to lock the information to a relevant frame of reference should provide a natural, informative and interactive interface between the pilot and elements of the world around him.
There are also many potential problems to be overcome. Poor physical or optical characteristics, although tolerable in the laboratory, would make a helmet-mounted display unusable in flight by producing double images and eye fatigue. There have been some reports of misinterpretation of information and disorientation whilst using helmet-mounted displays, due to confusion between head and aircraft movements. Inadequate display resolution will result in large or illegible text and symbols. The quantity of information which will be displayed will need careful management to avoid clutter.
It is worth mentioning the ways in which the virtual cockpit deviates from the accepted concept of Virtual Reality. Virtual Reality attempts to create a compelling, synthetic, interactive world which replaces the real world. The user
feels that he is part of the artificial world, and great emphasis is placed on the exclusion of the real world from the user's conscious mind. He interacts with the artificial world very much as he would the real world; by sight, sound, voice, movement and touch, but, unlike the real world, his actions are physically inconsequential.
In contrast, the aim of the virtual cockpit is to augment the real world by supplying more information than the pilot can derive from his view of the outside scene. It is a tool to help him to interpret what is going on around him, but it may be subject to error and misinterpretation. We do not wish to convince the pilot that his imagery is real or to make him feel that he is in any way insulated from the real world. His actions have real and immediate consequences both to himself and to the world around him. Virtual Reality and the virtual cockpit employ similar hardware and software techniques, and so appear superficially similar, but the fundamental aims of the two concepts are in opposition and must not be confused.
2 AIMS OF THE DRA PROGRAMME
The virtual cockpit is not a new 1 concept, and it has been a research topic for some time. The DRA programme has so far been mainly concerned with advancing the enabling technologies sufficiently to produce equipment of high enough quality to allow an adequate exploration of the idea, and this interest will continue. However, equipment is now becoming available to start serious research in ground rigs. The first objective of this work must be to demonstrate the basic utility of the concept, that is whether or not the virtual cockpit has the potential to be a useful tool for the future pilot.
There are many areas of concern. The generation of a suitable set of formats to be presented to the pilot on the display are clearly a major part of the research programme, and there are many potential perceptual problems which could interfere with the easy use of the display. Ways of colour coding information so that it can be more easily found or so that it attracts attention is under continuing investigation, and now stereoscopy will add a new dimension to the debate. The investigations into the new control methods mentioned above will be vital to make the HMD part of an interactive

8-3
tool. 3-dimensional sound cues could be a useful aid to help the pilot to relate sounds correctly in the world around him when applied to, for example, warnings or a wingman's voice.
The programme is exploratory, and is largely aimed at providing suggestions about the viability of the concept rather than laying down rules, and one of the results of the initial DRA programme will be to suggest a variety of usable solutions to formats and control problems so that they can be investigated more thoroughly in later phases of the programme. It is intended that the programme should supply practical advice for the specification of in-service virtual cockpit systems, for example field of view, resolution, display quality, whether colour is necessary or desirable, the power of the image generator, the maximum tolerable lags in the system, the resolution and accuracy of databases and the allowable mis-match between displayed and real features.
3 THE FORMAT DEVELOPMENT PROGRAMME * My main interest is in the display - formats: what information to give the
pilot and how best to display it. 3 Figure 1 shows an example of the type of
image which might be used during low level flight in a fast jet, when the pilot's view of the terrain is constrained by operational or meteorological factors. Spatially and functionally, the image can be split into three major areas, as shown in Figure 2: the pilot's "head-out" view of the terrain over which he is flying, the primary flight data, and the "head-down'' images containing the tactical and systems overviews. Each of these components of the overall image is intended to supply specific information, however each also raises a collection of uncertainties which must be resolved before a reasonably optimised set of display formats can be created.
3.1 Head-out scene
The head-out scene is the pilot's view of the terrain over which he is flying, and the contents of the image will depend greatly on the flying conditions. In Figure 1 there is a synthetic terrain with associated navigational and tactical features surrounding a sensor image in the centre of the picture, which provides a scene which is correct for the pilot's head direction. A l s o present, at the left
side of the picture, is the image from a magnified, narrow field of view sensor which is locked onto a target on the ground. Areas of concern include
How to draw the terrain overlay and its associated features under various meteorological conditions.
How the synthetic features are to be merged with the sensor image, or the natural view, which features should be included and whether this selection depends on the visibility of the terrain.
How much mis-registration of the synthetic imagery with the real world can be tolerated, and what resolution is required for the databases used to draw the imagery.
Whether stereoscopy is of use in general flying, or only for specific parts of the mission, such as landing or refuelling, when the external objects are sufficiently close to have a discernable stereoscopic disparity.
How much image distortion is tolerable, for example, geometric differences between the images seen by the two eyes could give the user a misleading view of the world, and fusional difficulties could result in short- or long- term visual strain.
Primary Flight Data
The primary flight data replaces the information currently shown on the head-up display, and includes such items as attitude, vertical and horizontal speed, height and velocity vector. In Figure 1, attitude is given by the dots at pitch and heading intervals of loo, and heading can be read from the compass values on the Oo pitch line. These give the effect of flying inside a sphere which is positionally centred on the aircraft but which is rotationally static in the outside world. Height and speed are shown as scales at the top of the picture, and these are fixed within the helmet display so that they are always visible.
Some of the areas we wish to examine are :
a) Which information is needed all
8-4
the time, and which should be available on request.
Which information to place in which frames of reference, for example attitude information should be space stabilised (stationary with respect to inertial space), but should height and speed be helmet stabilised (fixed within the helmet display), and so be always available, or aircraft stabilised (stationary within the aircraft), giving a strong cue to the forward direct ion.
How to make the different frames of reference unambiguous, so that head and aircraft movements can be differentiated.
Whether the use of a small stereoscopic disparity would help to separate the primary flight information from the background, and whether colour can help the pilot to select and assimilate the information.
3.3 Head-down imagery
The head-down imagery replaces the cockpit instrument panel. It will contain items such as systems monitoring and management displays, weapons management displays and plan and perspective maps, all of which are not part of the pilot's view of the external world. Below the sensor image in Figure 1 there is a perspective map, looking down on the aircraft and the surrounding terrain, with overlaid tactical and navigational features. Below this is a weapons control format and a systems summary.
the head-down displays at will and, assuming the use of stereoscopy, position them stably wherever he pleases within the virtual cockpit.
The pilot will be able to call up
All of the formats need to be designed with due regard for the limited resolution of the HMD, which will affect the size and legibility of text and symbols, and on the size of the formats in the field of view. The aim will be to create easily interpretable formats which need as little visual or cognitive attention as possible.
Also of interest is the positioning of the formats in depth. Formats placed close to the pilot will be perceived as items separate from the
rest of the imagery, and will also be within easy reach if a finger tracker is employed. Set against this is the time needed to alter the convergence of the eyes, and this will need investigation.
3.4 General points
There are many peculiarities of computer generated imagery which could become important when viewed on a binocular helmet, as well as some problems specific to helmet displays. Some of the main questions to be addressed include:
a) What is the effect of the raster structure of the display on the legibility of text and on the perception of stereoscopically presented imagery, and will part or all of the image will benefit from antialiasing to disguise the raster structure.
b) How the perceptual disturbances caused by the finite update rate of the display can be overcome. It is possible to perceive single objects as multiple objects, and there can be an apparent shearing' or smearing effect in the image - caused by head movements during the finite frame period of a scanned display device.
c) How to minimise the effects of latency, such as swimming of the image and mis-registration of the image with the outside world.
d) What is an acceptable field of view for the HMD, and if this is achieved by using optics with a partial overlap, how to minimise the perceptual problems caused by the brightness discontinuity at the boundary.
e) There are several things which could affect the visual comfort of the helmet, such as the mis- match between focus and disparity when using stereoscopic imagery, the effect of seeing a close cockpit interior behind the distant helmet imagery and whether the distant imagery should be collimated or displayed closer than infinity.
f) How can the judicious use of colour and stereoscopy help to reduce clutter and classify information, thus making the series of overlaid images more
8-5
easily interpretable.
4 THE CURRENT STATUS OF THE DRA PROGRAMME
Whilst waiting for the development of more sophisticated hardware and software, Flight Systems department has built a facility in-house in order to provide a demonstration of some aspects of the virtual cockpit and to start investigations into the formats.
4.1 Hardware
The hardware consists of a frame containing a seat, sidestick, throttle, HOTAS switches and a Head Position Sensor And Loading Mechanism (H-PSALM) which is attached to a head-mounted display. This is known as the VEIL rig (Virtual Environment Integration Laboratory) (Fig 3).
The display currently in use is the "Tin Hat", which was built in-house and uses a pair of commercial colour LCD displays as image sources. The images are binocular, with variable overlap, a brightness of 15 it Lamberts, and the transparent combiners give a see-through
field of view with a resolution of 200 x - of 50%. Each ocular has a 23O x 17O
: 300 pixels.
Also available is a binocular helmet-mounted display built by GEC, which has a SO0 field of view and better resolution and dynamic range than the Tin Hat, but which is monochrome. H- PSALM is being modified to accommodate the helmet, which is larger than the Tin Hat.
Both of the head-mounted display systems take standard 625 line, PAL video signals as inputs, one for each eye.
The computer hardware for the demonstration package consists of a Sun 31260 workstation and two Silicon Graphics Personal Iris workstations connected by Ethernet, as shown in Figure 4. The Silicon Graphics machines are dedicated to producing the imagery for the two eyes, and run identical software with slightly displaced viewpoints to generate the appropriate disparities for imagery which is intended to be stereoscopic. The Sun runs the aircraft model, collects data from the controls and the head tracker and calculates head position and orientation. It also generates data for the head loader and sends aircraft and
controls data across the Ethernet to the Silicon Graphics machines.
4.2 Imagery demonstration software
A software package was written to demonstrate the essential components of virtual cockpit imagery. The software currently runs on the VEIL rig, but the graphics software would transfer easily to any Silicon Graphics hardware. Figures 5-9 show some general pictures of the imagery, and the following sections describe the component formats in more detail. It should be noted that the figures are monochromatic reductions of colour pictures, and have lost fine detail and colour contrast.
The figures are drawn with a field of view of 48O x 36', except for the control format in figure 9, which has a field of view of 23O x 17O.
4.2.1 Head-out scene
The outside world was limited to a purely synthetic scene generated from a rectangular grid of spot heights - the generating function is either sinusoidal or flat, although work is in progress to include a database from real terrain containing simple cultural and tactical features. The graphics machines do not allow texture to be applied easily, and so this aspect was not explored. Three types of terrain representation can be demonstrated - patchwork, height-shaded and sun-shaded (Figs 5-7).
Stereoscopy was not included in the terrain drawing for two reasons: given the coarse resolution of the display it is unlikely that any stereo effects would be visible unless the observer was very close to the terrain, and to allow the demonstration of the visual separation of the primary flight display from the background world by placing them in separate depth planes.
4.2.2 Primary flight display
Two examples of primary flight displays are included in the demonstration. The first is a simple head-up display (Fig 7), which uses a pitch ladder as the attitude indicator. The velocity vector is the aircraft symbol in the top left quadrant, and this is used as the reference point for the other symbols. Height and speed are displayed using counter-pointer dials, above the velocity vector, and between them is a 5:l scaled heading tape. To the right and left of the
8-6
velocity vector are the vertical speed and angle of attack scales. This format is aircraft stabilised, and SO appears fixed in the forward field of view as though displayed on a traditional head- up display.
attitude "birdcage" , giving the pilot the impression that he is flying inside a transparent sphere marked with lines of elevation and heading. Height and speed can be shown either as aircraft stabilised dials (Figs 5 , 6), as in the HUD format, or as a pair of head stabilised bars showing deviation from the demanded height and speed rather than absolute height and speed (Fig 8 ) . The bar changes colour when the deviation is greater than preset limits. The actual value of speed and height is shown alongside the bar. The aircraft symbol shows the velocity vector, and the bar on the aircraft symbol the vertical velocity.
The second format is based on an
Both formats include lines drawn parallel to the edges of the display to define the head axes, so that head and aircraft movements can be readily differentiated.
The primary flight display formats can be separated from the terrain background by adding a stereoscopic separation - four levels of disparity, and hence depth,are available within the demonstration package.
4 . 2 . 3 Head-down imagery
Due to programming complexity and the constraints of the available hardware, only two simple head-down displays are demonstrated. Both are effectively flat panels placed about a metre in front of the pilot. The first is a flight control monitoring format (Fig 5 ) , which contains a plan of the aircraft's control surfaces with nearby pointers and scales to show their movements.
The second format (Fig 9) is a simple menu which allows the user to alter the formats in the demonstration package, for example changing the terrain type, the amount of stereoscopic disparity on the primary flight display, and switching the flight controls format off and on. The format is called up and controlled using switches on the control grips, and the functions available are shown in Figure 10.
5 THE FUTURE PROGRAMME
The facility described above demonstrates a range of aspects of the virtual cockpit, including several methods of drawing terrain, some ideas for displaying primary flight data, and for presenting monitoring and control information. The basic concept of a background terrain overlaid with 3- dimensional information is demonstrable, and is useable within the constraints of the ground rig. The effectiveness of even a small stereoscopic separation as an aid to differentiating different types of imagery can be clearly seen when using the rig.
Also demonstrable are various detrimental effects, such as the loss of textual information due to poor resolution and colour range, the restrictions of a narrow field of view and the irritations of a slow update rate. These result directly from the quality of the present hardware, and clearly much of the future work on the virtual cockpit must await better equipment.
In the meantime, the present equipment will allow useful work to continue. Experiments are planned to look at the legibility of different : fonts when drawn rotated on a raster display, and on the effects of antialiasing and a stereo separation on the legibility of text. Improvements in the hardware will include a new head-mounted display with better image quality and field of view, which will not only give a more compelling demonstration of the formats, but, with the inclusion of suitable databases, will allow work to start on large scale features such as flight path marking. In order that work can continue on the primary flight display, the H-PSALM rig is being modified to take the GEC helmet, and this will also enable some comparisons to be made between colour and monochromatic formats.
The Ministry of Defence is funding the design and build of a more sophisticated virtual cockpit rig known as APHIDS (Advanced Panoramic Helmet Interface Demonstrator System), currently under construction by GEC- Marconi Avionics at Rochester. It is hoped that APHIDS will prove adequate for much of our future work: the helmet-mounted display will be a full colour, 60° field of view system, and the powerful image generation system and fibre-optic, reflective memory data
8-7
transmission system should provide vastly superior imagery to the VEIL rig, with a much reduced latency. The APHIDS hardware also includes head and eye tracking, DVI and a 3-dimensional sound system. The software includes off-line tools to help with format design and a real-time system to manage the hardware, fly the aircraft model, control the mission and draw the imagery.
The formats developed on the VEIL rig will be transferred to the APHIDS cockpit so that format development can continue with the better display equipment and the formats can be tested under a more representative environment. Work will also take place to study alternative control methods, used in conjunction with the formats.
tracking finger position, but a finger tracker is being developed under a separate programme and this will eventually be included in the APHIDS rig so that the designation of virtual switches by hand can be compared with the other control mechanisms.
APHIDS at present lacks any way of
APHIDS also does not include a method of importing or synthesising a sensor insert into the computer generated scene, as illustrated in Figure 1. both technical and perceptual problems in dealing with such sensor inserts, this is seen as a deficiency, which we will attempt to rectify in the future. Also missing is a way of presenting an outside scene beyond the helmet, so that ways of merging the synthetic imagery with the real world, in different weather conditions, can be addressed. It is however hoped that this facility can also be added during future hardware development.
Since there are likely to be
6 CONCLUSIONS
Flight Systems Department of the DRA has an active research programme aimed at investigating the potential benefits of the virtual cockpit. Both technological and human factors problems are being considered. A low technology research rig, VEIL, has been built, which runs a "flying" demonstration of some candidate formats, and which is now being used for more detailed work on format design. Improvements to the rig are in hand, and it is anticipated that it will remain useful as a prototyping tool.
Work is proceeding on the more
advanced APHIDS hardware and software. When it becomes available, these formats can be refined and tested more rigorously. Research into control mechanisms will become an important part of the programme, and when sufficiently mature, will be combined with the formats to be tested in a mission context.
ACKNOmE WEMENTS
This work is being carried out with the support of the Procurement Executive of the Ministry of Defence.
0 British Crown Copyright 1993/DRA Published with the permission of the Controller of Her Britannic Majesty's Stationery Office
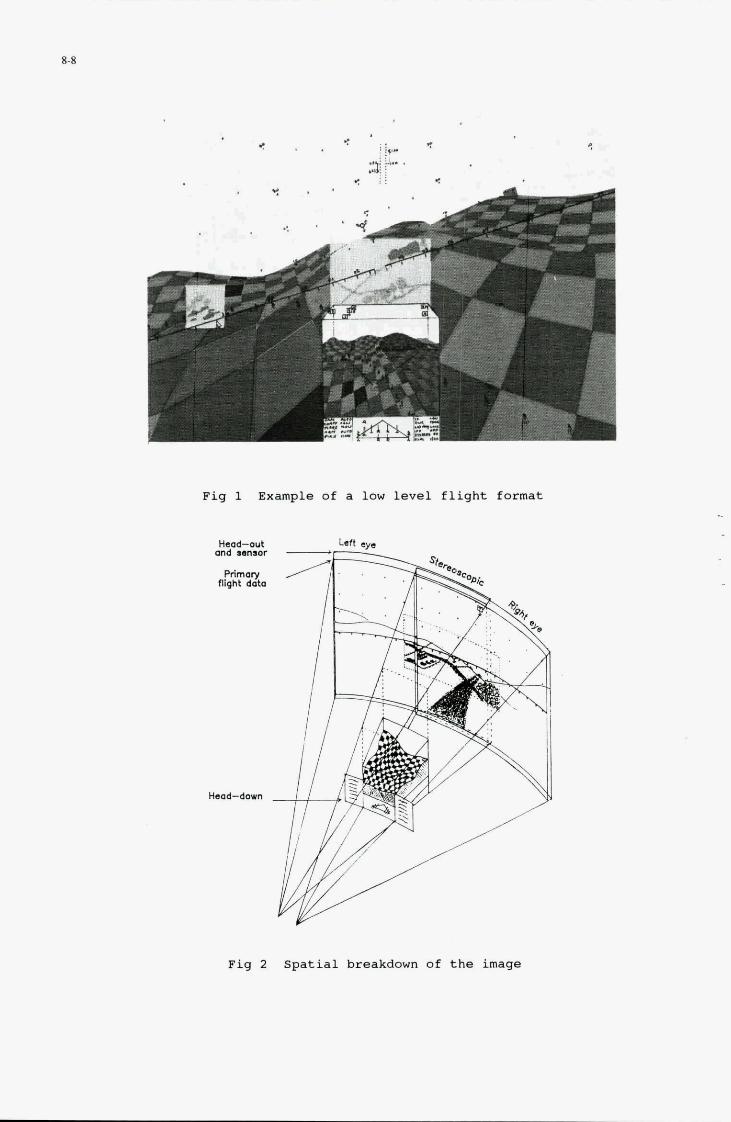
8-8
Fig 1 Example of a low level flight format
Head-out and nnaar
flight duta PrimWj
Head-down
Fig 2 Spatial breakdown of the image
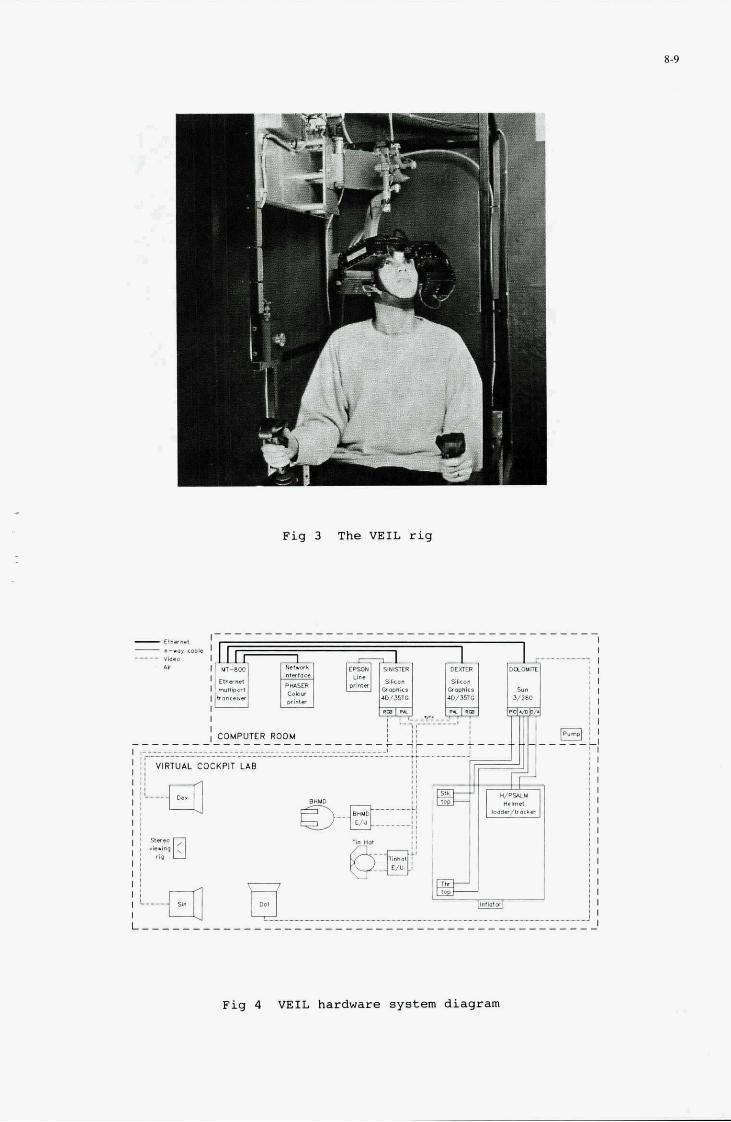
Fig 3 The VEIL r i g
I
I
Fig 4 VEIL hardware system diagram
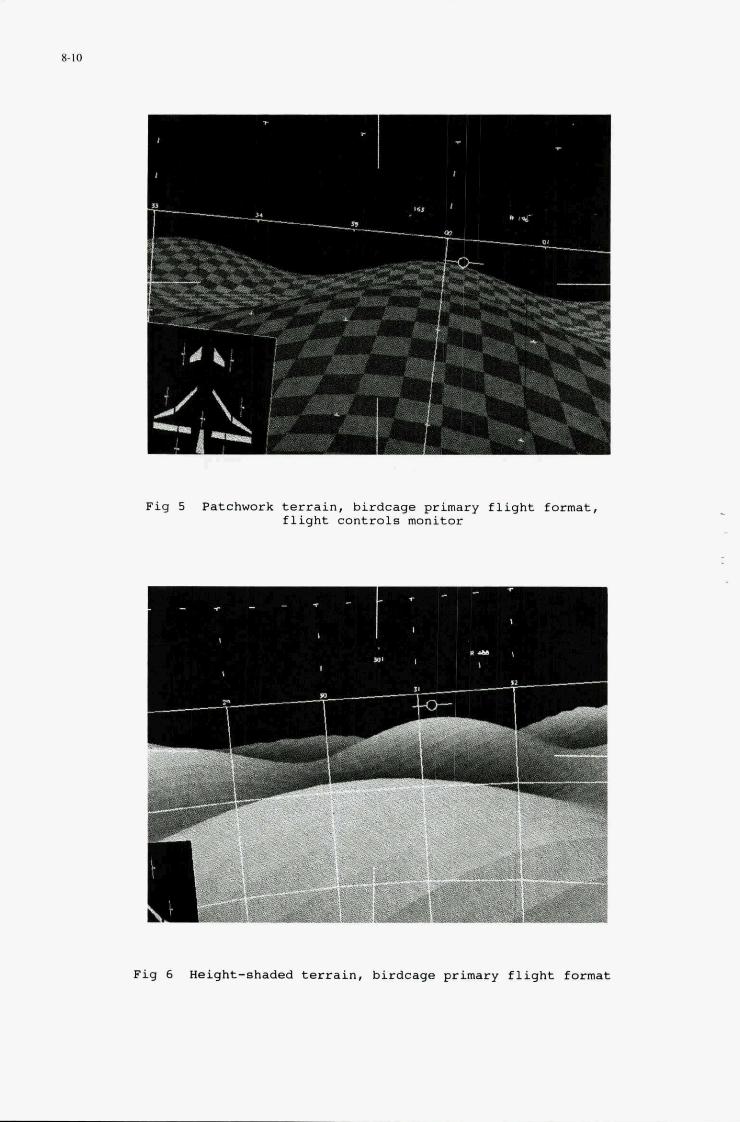
8-10
. I
.. I
., I l l
I r
a
Fig 5 Patchwork terrain, birdcage primary flight format, flight controls monitor
Fig 6 Height-shaded terrain, birdcage primary flight format
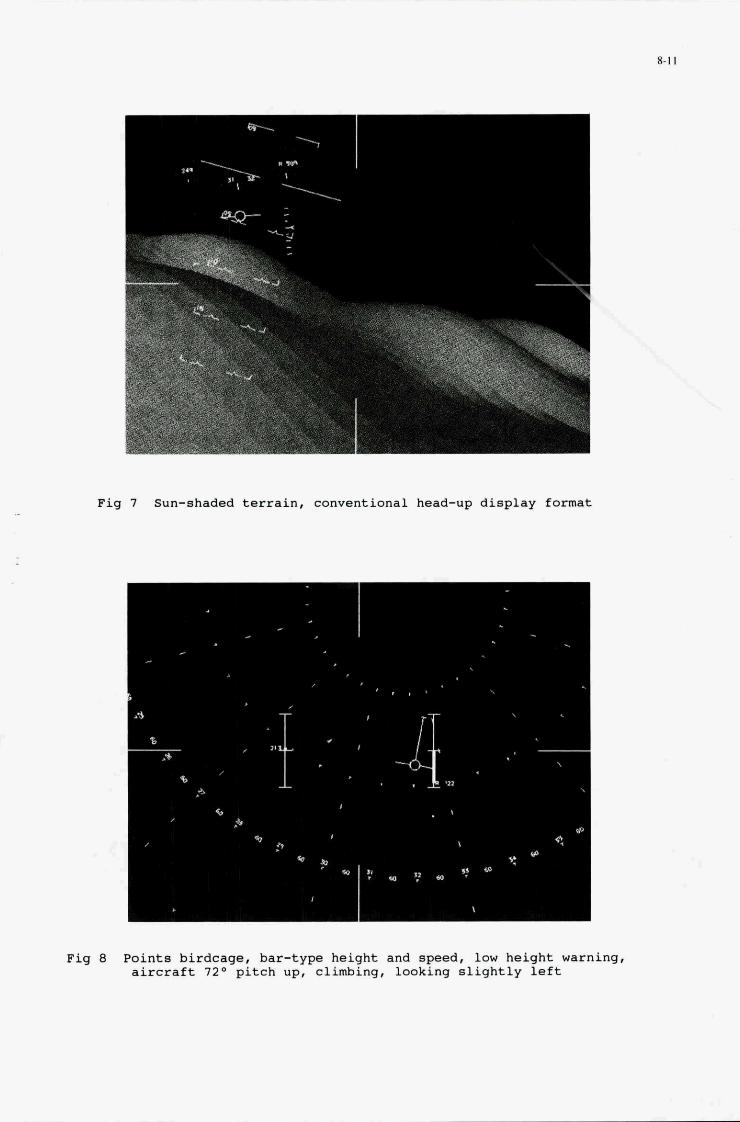
Fig 7 Sun-shaded terrain, conventional head-up display format
I
"I ?
fQ ? ro
I
-
,
P e,
P
Fig 8 Points birdcage, bar-type height and speed, low height warning, aircraft 7 Z 0 pitch up, climbing, looking slightly left
8-1 I
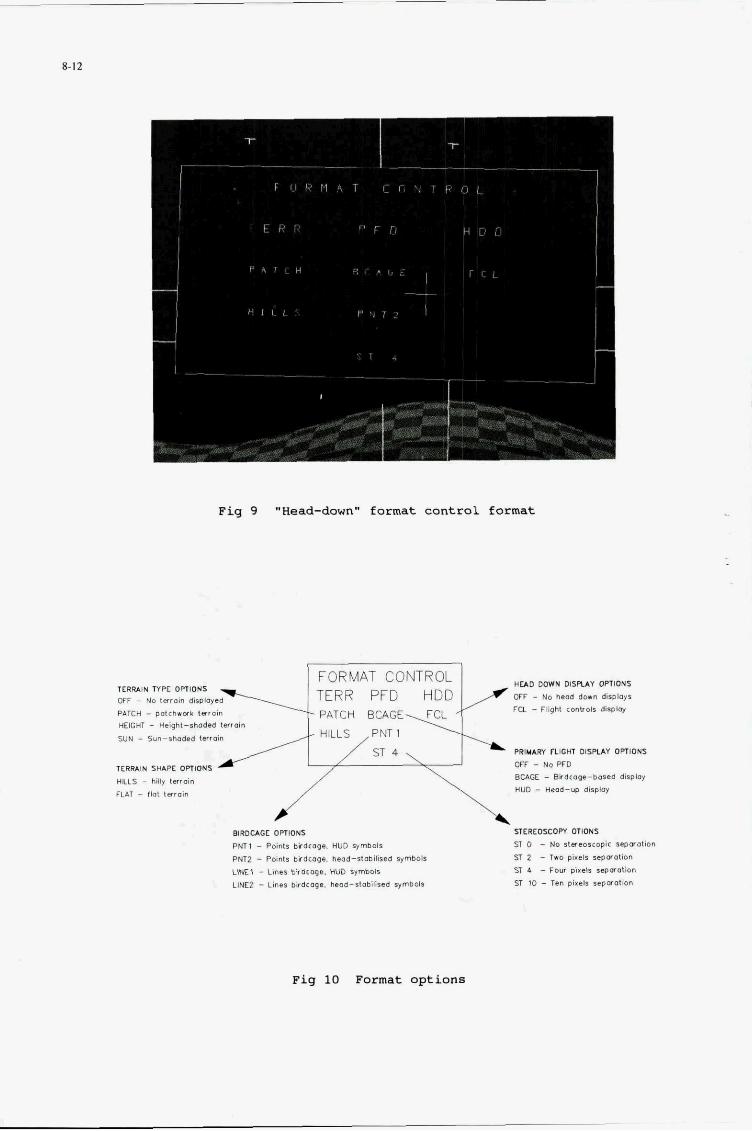
8-12
T I
Fig 9 "Head-down" format control format
FORMAT CONTROL H a 0 OWN DISPUY OPTIONS OFF - No hemd down dlsplop \ F a - fiigm rontroit dlspiv
TERR PFD HDD / TERlUlN MPE OPTIONS OFF - No l a r d n d l s l q e d
HEIGHT - Hsqhl-*heded taroin SUN - Suo-shedrd tnroln HILLS PNTl
PATCH - palrhwcrk t m a m -PATCH ECAGE FCL '
n 4 , PRlYARl KlGHT OiSPUY OPTIONS OFF - No PFD E U G E - Bracow-bored d W o y HUD - Hesd-w dlrpl4
1ERRIlN SHLPE OPTIONS HILLS - hily laroin FIAT - !lot lerroin
J BIRDCAGE OPTIONS PNTl - Points bcdcope. HUO ymboll
PNTZ - Points brdmge, hmd-.tobIli9ea WYmDOII
LlMI - Lhn birdroge. HUD ymbolr LINE2 - Lines brdtoge. head-stabilised n/mbob
F i g 10 Format options
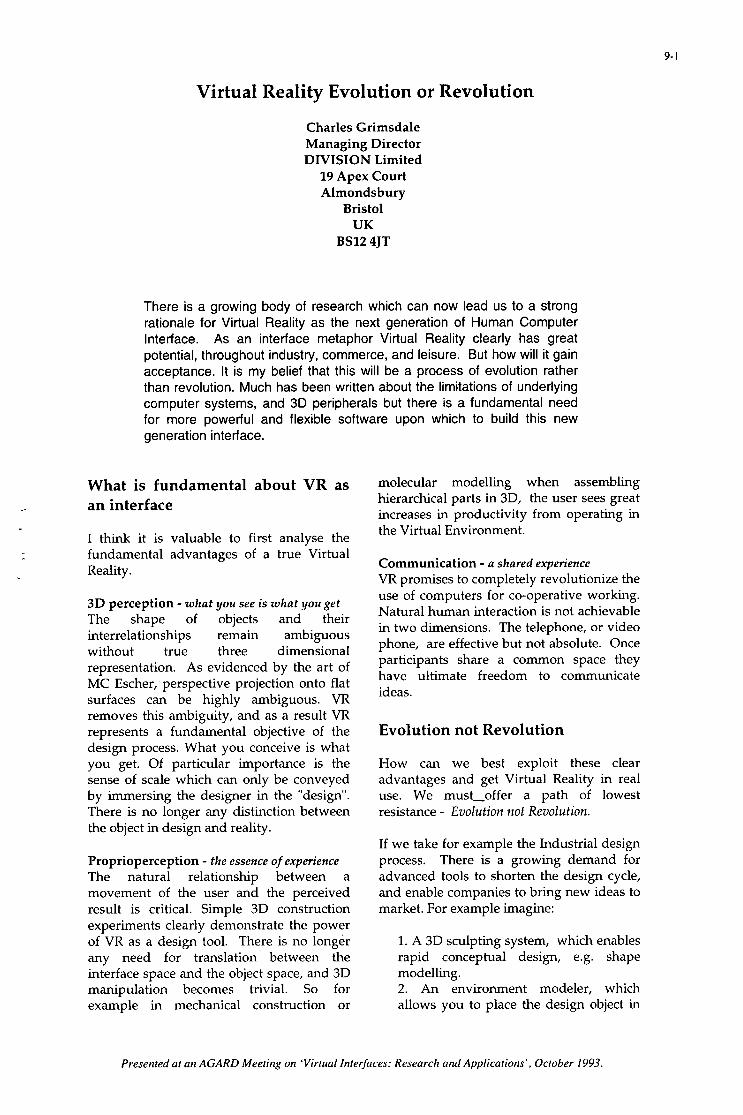
9- I
Virtual Reality Evolution or Revolution
Charles Grimsdale Managing Director DIVISION Limited 19 Apex Court Almondsbury
Bristol UK
BS12 4JT
There is a growing body of research which can now lead us to a strong rationale for Virtual Reality as the next generation of Human Computer Interface. As an interface metaphor Virtual Reality clearly has great potential, throughout industry, commerce, and leisure. But how will it gain acceptance. It is my belief that this will be a process of evolution rather than revolution. Much has been written about the limitations of underlying computer systems, and 3D peripherals but there is a fundamental need for more powerful and flexible software upon which to build this new generation interface.
What is fundamental about VR as molecular modelling when assembling hierarchical parts in 3D, the user sees great increases in productivity from operating in the Virtual Environment.
an interface
I think it is valuable to first analyse the fundamental advantages of a true -Virtual Reality. Communication - a shared experience
VR promises to completely revolutionize the
3D perception - what you see is what you get The shape of objects and their interrelationships remain ambiguous without true three dimensional representation. As evidenced by the art of MC Escher; perspective projection onto flat surfaces can be highly ambiguous. VR removes this ambiguity, and as a result VR represents a fundamental objective of the design process. What you conceive is what you get. Of particular importance is the sense of scale which can only be conveyed by immersing the designer in the "design". There is no longer any distinction between the object in design and reality.
Proprioperception - the essence of experience The natural relationship between a movement of the user and the perceived result is critical. Simple 3D construction experiments clearly demonstrate the power of VR as a design tool. There is no longer any need for translation between the interface space and the object space, and 3D manipulation becomes trivial. So for example in mechanical construction or
use of computers for co-operative working. Natural human interaction is not achievable in two dimensions. The telephone, or video phone, are effective but not absolute. Once participants share a common space they have ultimate freedom to communicate ideas.
Evolution not Revolution
How can we best exploit these clear advantages and get Virtual Reality in real use. We must-offer a path of lowest resistance - Evolution not Revolution.
If we take for example the Industrial design process. There is a growing demand for advanced tools to shorten the design cycle, and enable companies to bring new ideas to market. For example imagine:
1. A 3D sculpting system, which enables rapid conceptual design, e.g. shape modelling. 2. An environment modeler, which allows you to place the design object in
Presented at an AGARD Meeting on 'Virtual Interfaces: Research and Applications', October 1993.
context. e.g place the CAM shaft in the CAM guides. Place the Hi Fi in a real living room. Place the new desktop computer on a typical desk. 3. A multi user design environment, in which engineers, managers and customers, can study and discuss a design, all immersed in the same virtual environment.
Each of these capabilities could be easily achieved by providing extensions to existing industry standard tools. What is required is a flexible software toolkit with integrated 3D peripherals at a reasonable incremental cost, running on standard platforms. Simple tools can then be built to wrap around existing packages such as 3D Studio, Wavefront, or CATIA. If an optional VR extension to such packages were available at low cost the market demand would naturally be considerable. The technical advantages of a VR solution are clear, the commercial advantages follow naturally. However compatibility with existing market leading tools is an essential beginning.
Over the last three or four years the Virtual Reality industry has been in an early Research Phase. Many different groups have looked at what might be possible. The primary focus has been on evaluating new interface devices, such as gloves, wands, 3D mice, stereo visual systems, tactile displays etc.. and studying the underlying metaphors and psychometrics of the VR interface. Virtual Reality must now progress to a new phase of market acceptance. This requires stable platforms, and software which enables existing software vendors to trivially Virtualize their products, and encourages a new generation of software developers to establish advanced VR products.
A new phase in development
Much attention has been given to the mechanics of VR. Particularly the development of new 3D peripherals. The fundamental hardware requirements of a good VR platforms are in some cases still inadequate, but progress in the development of graphics, audio, and compute performance is very rapid. The reslut is that standard workstation
platforms such as Silicon Graphics are becoming more VR capable, and specialised systems such the DIVISION Provision and Supervision platforms more affordable.
In order to establish this new generation of man machine interface, what is required is required above all else is a new generation of operating environment. A software environment that integrates 3D computer generated images, 2D images (stills, and full motion), 3D sound, and 3D control. In the way that X Windows, and Microsoft Windows provide a flexible development environment for 2D window based interfaces, which also enforces a standard look and feel, a new generation of software environment is required which provides the foundation for a true 3D look and feel. This software must be evolutionary building upon well established standard environments. We need a methodology which will co-exist with todays 2D interfaces, and add value where it is really required.
This software environment must be as flexible as possible, providing a completely application independent interface. We must look beyond the high levels tools, such as authoring, modelling, animation, or scripting tools, at the common Application Programming Interface (AH) which underlies these tools. This is the software upon which applications are developed and must be equally viable as a programming interface for molecular modelling, as it is for architectural design, or flight simulation. This API must be supported by a powerful Runtime environment which ensures that interactive 3D applications run efficiently regardless of the target platform. This Runtime software must hide the must provide support for a wide range of 3D peripherals, and for multi-participant networked Virtual Realities.
Given a well developed API and Runtime environment available on a wide range of platforms applications will start to emerge. These applications will automatically inherit a standard look and feel which will facilitate rapid acceptance within the user community .
A foundation for Progress

9-3
Over the last three years DMSION has developed dVS, a very flexible and open software environment upon which advanced 3D interfaces can be built. dVS augments existing operating systems to provide the highest possible performance on a wide range of platforms. Based upon a distributed architecture which exploits the natural parallelism of a 3D interface, dVS is the next step in Client/Server architectures; it is a Client/Client, or Actor based architecture.
A Distributed Approach The basic principle is to enable different components of the user interface to execute in parallel and where possible upon different processors. Defining such a distributed model greatly simplifies the process of interface development, and improves performance, regardless of whether the target machine is parallel.
Multiple dVS sewers (Actors)
The diagram above flustrates a typical dVS configuration. The user code is quite independent of, and runs in parallel with servers (Actors) dedicated to the main display and sensor tasks of the 3D interface. dVS provides a very high level interface between user code and the standard Actors which provide visual, and audio simulation, collision detection, tracking, etc.. This level of abstraction between application software and the mechanics of the interface is very important. It ensures much greater portability of applications, and upgrade ability. Advances in graphics, audio, or i/o hardware can be exploited by enhancing only the relevant i/o Actor. The user's application code does not even need to be recompiled. Upward compatibility is easily ensured, and performance maximized on a given platform.
The Actor model It is very natural to decompose a complex virtual environment into a collection of completely autonomous 3D objects. dVS provides the infrastructure under which these objects coexist. This is a very powerful metaphor, and greatly simplifies
the problem of creating complex environments. The ultimate form of 3D Clip Art will become possible when we can encapsulate all attributes of an object, visual, acoustic, behavioral, etc. in a single piece of dynamically instantiable software, an Actor, which represents that object and which can be loaded at any time. Imagine an Actor which represents an autonomous automobile. This Actor responds to other objects (of known type, e.g. roads, trees, pedestrians) in a defined way, and defines the visual, acoustic, and other properties of the automobile. You then have a 3D object which can be sold to numerous customers, who want to include auto's in their virtual environments.
The API dVS provides a very concise and powerful Application Programming Interface in the form of the VCToolkit. This is a Library of ANSI 'C functions which manipulate high level V i a l Environment Objects. An Object contains a number of basic attributes such as visual, audio, constraint, and collision attributes. The Vaoolkit also has a powerful event processing mechanism which allows call backs (actions) to be assigned to particular events. This interface is ultimately flexible and completely abstracts the developer from the underlying hardware.
Multiple Participants Another careful consideration for the whole dVS design has been support for multiple user's, in a common shared environment. The distributed nature of dVS naturally supports this concept. The whole core of the dVS software is concerned with maintaining the consistency of data among multiple Actors, and these Actors can of course represent different users.
High Level Tools dVS is a powerful platform-independent foundation for developing and running VR applications. However developing new applications does require programming effort. There is a clear need for higher level
9-4
tools which allow non-programmers to develop virtual worlds.
DMSION has developed a unique Virtual World simulation and authoring package called AMAZE, which allows users to quickly build and experience virtual environments. This Actor runs on top of the basic dVS Runtime. Whole environments can be constructed without writing a single line of code. The base geometry of these worlds can be imported from standard CAD packages such as AutoCAD, or 3D Studio. Further attributes such as sound, animation, etc.. can then be added. This software has proved incredibly flexible, and has been used to prototype many applications from golf course construction, to molecular modelling.
Other high level tools are needed to facilitate the entry to Virtual Reality, tools for Acoustic modelling, and geometric modelling, and complex behaviour modelling. With the stable foundations of a software environment such as dVS such tools can now be rapidly developed.
Conclusions
Rapid progress within the Virtual Reality market now depends upon widespread application development and acceptance. This is most likely to be a more evolutionary than revolutionary process, with existing software vendors slowly virtualiig their products. However before existing software vendors will consider making the necessary investment they must have stable system software upon which to build. The development of dVS and other solid VR development toolkits is essential to this process of evolution.
10-1
MANUAL TRACKING PERFORMANCE USING A VIRTUAL HAND CONTROLLER: A COMPARISON STUDY
Robert G. Eggleston Human Engineering Division
Armstrong Laboratory Wright-Patterson AFB, Ohio 45433-7022
United States
William P. Janson and
Sridhar Adapalli Logicon Technical Services
PO Box 317258 Dayton, Ohio 45430
United States
ABSTRACT This study compares a virtual hand controller (magnetic sensor attached to a glove) with a physical displacement stick in a single-axis manual control task. Three different control/display (C/D) ratios were used with each controller. Control performance was found to vary significantly with C/D ratio. When across-device comparisons were made at identical C/D ratios, a slight but significant performance advantage was found for the displacement stick at one C/D level. When between- device comparisons were made on the basis of a performance matching technique, thy results were comparable for the virtual and physical hand controllers. The issue of how to best match test conditions to achieve an unbiased comparison of control devices is addressed. Arguments are advanced in favor of using the performance based matching technique. From this perspective, the data are interpreted to support the claim that comparable manual control performance can be achieved with a virtual hand controller.
"
-
INTRODUCTION New technology makes it possible to produce a "virtual" hand controller. Any technique that can sense the movement of a body segment (e.g. hand, arm, etc.) and convert this data to orientation and position information at real-time rates may be used to create a virtual controller. A popular method is to use a magnetic sensing system coupled to a computer and display device to provide a closed loop control system. If the sensor is affixed to the hand, say by a glove, then a virtual hand controller is formed.
There are two general domains where a virtual hand controller may have value. First, a virtual hand controller may be a suitable substitute for a physical hand controller that is designed as an interface to a physical vehicle or system. A virtual control may provide a more natural mapping between user movements and desired changes in vehicle/system state. For example, coordinated vehicle translations and rotations could be controlled by translational and rotational hand-arm movements, respectively. This might lead to improved pilot performance with a force vectoring aircraft like the X-31 and it could lend itself to a natural mapping for translational and rotational control of a helicopter.
The second domain is the rapidly growing area of virtual environments. Here, a virtual hand controller could be used to control a virtual object, instrument, machine, or vehicle from inside the environment. That is, the human perceives him or her self to be behaving inside the synthetic environment. In this application, hand control could come in the form of direct manipulation of virtual objects by natural body movements, such as a set of body gestures interpreted as commands for guidance and navigation 9f self-movement, or as the manual operation of a virtual control device, like a stick or mouse, attached to a virtual system/vehicle. In the latter case, the distinction between these two domains (interface to physical systems and interface to virtual systems) should disappear to the extent that sensory and information feedback from a virtual device corresponds to the physical one.
Whether one is controlling a physical system, a virtual system, or self-movement with virtual methods, it is important to determine the level of performance that can be achieved by these new methods. One probably would not substitute a virtual hand controller for a physical controller unless control performance was at least as good, if not better, than with a physical method. Performance in virtual space often will not be an end in itself. The virtual environment will be used for training new skills, practicing procedures to maintain proficiency, or it will be connected through a suitable computer based system to physical instruments and systems that respond in real-time to computer interpretations of a person's movements as input commands. Thus, human manual performance in virtual space must be adequate to support effective transfer of training as well as skillful control of robotic end effectors. What level of control performance is needed? How do human performance design requirements interact with hardware, software and computational modeling properties of virtual systems?
This study is the first in a set of experiments that have been formulated to provide answers to these questions. With respect to a virtual hand controller. the first question to ask is: can a person achieve control performance comparable to that obtainable with a physical control device? In this paper, we report the results of an experiment which addressed this question by comparing control performance between a virtual hand controller, fashioned from a magnetic tracker, and a
Presented at an AGARD Meeting on 'Virtual Interfaces: Research and Applications', October 1993.
10-2
conventional side-mounted displacement stick. Control performance with these types of devices was assessed with a compensatory tracking task.
An Unbiased Comparison Conceptually, our goal is to determine the relationship between the optimal performance obtainable with a physical controller vs. the optimal performance achievable with a virtual controller for a given control system. In order to construct a fair (unbiased) comparison, the challenge is to be able to specify control-display conditions that will produce "optimal" performance for each device. These conditions may not be identical for each actuator.
It is known that manual control performance is affected by the ratio of control element movement to the movement of the controlled object portrayed on a feedback display. A high control/display (C/D) ratio improves performance for some task conditions while a low C/D ratio is best for others. Many complex tasks require a trade-off between C/D ratios to achieve optimal performance (Ref. 1.2). In these instances, control performance varies as an inverted-U shape function with C/D ratio. Further, the optimal C/D ratio may change with properties of the control actuator (Ref. 3). We can use the inverted-U functional relationship as the basis for objectively establishing an unbiased comparison of control devices. However, the problem of selecting the proper levels of C/D ratio for each device becomes an issue. In other words, we must now solve the problem of how to match control devices in terms of C/D ratio. Since C/D ratio may interact with actuator-specific properties, this presents a new problem.
Several methods for matching devices suggest themselves: physical identity, performance based, or effort based. The Physical Identity method is straightforward; just select one or more C/D ratios and assume performance co-varies equally across device type with this variable. If the assumption is invalid, however, the resulting comparisons will produce a biased assessment. The Performance Based method requires control performance data be collected at several C/D ratios for each device type. Then, across-device matches are formed on a high-high, low-low, etc. performance basis. A preliminary experiment. or prior data. will be needed to aid in the selection of C/D levels in order to ensure they bracket the C/D range where optimal performance is expected to occur. To establish an Effort Based method, the same procedures used to define appropriate C/D ratios on the basis of performance data must again be employed, only this time an effort metric would be used. While it is not necessary for the high-high match between devices to be at the "optimal" performance point for an unbiased comparison. if the optimal point can be identified, the resulting comparison would provide absolute performance as well as relative performance information.
In the present study, the physical control device was an ordinary side-mounted displacement stick and the control task was single axis. Hence, rotation angle in the vertical plane was the controlled variable (i.e., roll axis for an aircraft). Our virtual
hand controller also responded to angular rotation. Thus on the surface at least, the same C/D ratio might be expected to have the same impact on performance with both types of controllers. But under closer inspection, this expectation becomes more difficult to defend. The displacement stick is a spring loaded, return-tocenter type with the point of rotation located several inches below the region where it is held by the user. The kinematic movement of the arm required by this arrangement is a rotation about the shoulder and a translation about the elbow to produce a rotation of the stick. This is not the same movement required by the virtual device. It requires a rotation of the hand about the forearm to produce the controller output, a related but different kinematic action. The two devices also differed in the magnitude of force required to produce a unit rotation output, and to recenter the controller. As a result, it is not at all clear that optimal performance for both devices will be obtained at the same C/D ratio.
Preliminary performance data has been collected from three subjects using the controllers for this study. The data clearly showed the effect of different C/D ratios on control performance, and also suggested that optimal performance would be achieved at a higher C/D ratio for the virtual device relative to the physical one, but the difference in optimal C/D ratio was not large. Thus, while the pilot data suggests a Performance Based method is likely to be a good way to match devices, since this was a small data set and differences were not large, a straight physical matching technique cannot be ruled - out as an appropriate method. Accordingly, we designed the - experiment in a manner that would allow us to use both methods. In addition, we collected subjective workload data that - could also be used to establish an Effort Based matching procedure. However, C/D ratios were not selected on this basis and, therefore, we cannot be confident the C/D levels used actually bracket "optimal" (least) effort for each control device type.
METHOD Experimental Design A two-factor, within-subjects design was employed. The factors were: Device Type (physical displacement stick and a virtual device consisting of a magnetic tracker attached to a glove) and C/D ratio (0.7, 1.4, 2.1. and 2.8). These values reflect the size of rotation angle (degrees) required to translate a cursor 1 .O cm. laterally. Based on the pilot data, C/D ratios were nested under Device Type. For the physical device (STICK), C/Ds 0.7, 1.4 and 2.1 were used. For the virtual device (GLOVE), C/Ds 1.4, 2.1, and 2.8 were used. Control performance was expected to produce an inverted-U shaped curve as a function of C/D for each device type. Thus, using a Performance Based matching method, STICK 1.4 data should be compared with GLOVE 2.1 data. If a Physical Based matching method is used, then STICK 1.4 and STICK 2.1 should be compared with GLOVE 1.4 and GLOVE 2.1, respectively. Presentation order of the treatment conditions were organized according to a Latin Square to counterbalance treatment order across subjects.
10-3
Apparatus The study was conducted in the Virtual Environment Interface Laboratory (VEIL) at the Armstrong Laboratory, located at Wright-Patterson AFB, Ohio.
Hand Controllers Two types of hand controllers were used for this study: a virtual hand controller and a displacement joystick. The Virtual Hand Controller was produced by mating a standard issue Nomex flyers glove (summer type GS/FRP-2/Mil-G-8118) with an Ascension Technology Corporation "Bird" magnetic orientation/ position tracking system, model #6BI001. The sensor was affixed to the back of the flight glove, approximately in the region aligned with the center of the palm of the subject's hand. The Bird transmitter was located approximately 19 cm (7 inches) in front of the sensor. Only x- axis orientation information was processed for the single-axis tracking task used in this study. The Bird was configured in "point mode" and standard filter settings were used. Orientation information was passed over an RS-232 link to a 386 personal computer which housed the plant dynamic and image generation algorithms. From there, the error signal was sent to a black and white television monitor for visual feedback to the subject.
The displacement stick was produced by Measurement Systems Corporation, model #12494. This is a spring-loaded, retum-to-
-center isotonic stick. Only x-axis deflections were recorded for - this experiment. Analog signals from the STICK were passed through an analog-to-digital converter to the same plant. image
-generation algorithms, and display used with the Virtual Hand Controller (GLOVE).
Due to processing requirements associated with the Bird magnetic tracking system, RS-232 communications, and graphics processing, there was a transport delay of approximately 58 msec when the GLOVE was included in the system. To ensure comparability across control systems, a delay was added to the displacement stick (STICK) to equate transport delay across devices. Conversely, a nonlinearity in the STICK movement response around the center position (i.e. a dead band) had to be added to the GLOVE to match the two systems.
C o c k p i t Both hand controllers were installed in a single-seat cockpit simulator. The STICK was mounted on the right console approximately 48 cm in front of the seat back. Subjects were instructed to hold their hand (GLOVE controller) in the same location in the virtual device conditions. In these conditions, the displacement stick was removed from the cockpit. An adjustable height armrest was used to provide arm support. Visual feedback for the tracking task was provided by a monochrome television monitor (approximately 19 cm by 14 cm) which was located at eye level approximately 66 cm straight ahead of the subject.
Subjects Six right-handed male members of a contractor maintained subject pool (age range from 19 to 23 years old) served as paid subjects. All subjects were screened to ensure they did not have any visual or physical anomalies that would restrict their ability to perform the task. As an additional incentive to maintain motivation for high performance across all Qeatment conditions, a cash bonus was awarded to the two highest scores in each condition.
Task The Critical-instability Tracking Task (CIT). introduced by Jex and his colleagues in 1966, was used for this experiment. This task has been used for many years as an aid to the design of manual control systems for military aircraft. It is a first-order compensatory tracking task with an unstable element lambda whose rate of change varies nonlinearly with time. The operator attempts to minimize error that is induced by hisher own actions as expressed through the unstable pole lambda. Tracking continues until a preset error magnitude is exceeded. Using the standard conditions described by Jex (Ref. 4), a typical trial lasts on the order of 20-40 seconds. Details of the plant dynamics task can be found in Ref. 5 .
Because of its unstable nature, the CTT presents a challenging manual control problem. It is easy to learn and subjects with no experience with flight control systems can achieve performance levels similar to those of skilled pilots. Thus, it is believed to tap fundamental aspects of human manual control performance (Ref. 6).
It is well known that a person behaves as an adaptive controller and can compensate in different ways to disturbances and control dynamics (Ref. 7,8). Thus, strategy differences across subjects can introduce interpretation problems when assessing operator control performance. The C n minimizes this problem by forcing the operator's dynamic behavior to a limit by making phase and gain margins progressively more stringent until control is lost (Ref. 5). Control behavior, therefore, is made comparable at this limit point, which is indexed by the magnitude of lambda. It has been shown that CIT performance is affected by the type of control device used. Performance with a force stick is significantly better than with a displacement stick (Ref. 3). Thus, the CIT should be able to detect performance differences due to device type. It is on this basis that we selected the C'IT as a good task to use to compare performance between a virtual and a physical hand controller.
The CTT was implemented on a 386 IBM compatible computer. The error signal from a control device (either the STICK or GLOVE) was conditioned and fed into the plant dynamics. The generated error signal was used to drive the horizontal location of a cursor presented on the monitor. The cursor was in the shape of a + sign with arm lengths of 7.3 mm (vertical) and 8.7 mm (horizontal) and contained a 3.2 mm by 4.8 mm hole cut from its center. A reference mark, a + sign the size of the hole, was stationary at the center of the screen. Thus, when there was no tracking error, the cursor symbol and reference symbol fused
10-4
to form an unbroken + sign. ,4 thin white circle, centered on the reference mark and 12.7 cm (5 inches) in diameter, defined the permissible error limit. Once the cursor crossed this line, the screen would go blank and, after delay of about a second, a numeric score indicating the lambda level when control was lost was posted on the screen until the next trial began.
Procedure Subjects were run one at a time in sessions that lasted about 45 minutes each. No more than one session per subject was administered per day. A session contained 50 trials which lasted (nominally) 30 seconds each. The f i s t 10 trials in each session were treated as warm up trials and were not included in the data analysis. Trials were delivered when the subject was ready, usually at 2-5 second spacing. A two-minute rest break was scheduled after every ten trials and could be requested at any other time. Subjects were randomly assigned to a treatment order sequence. Testing in a treatment condition stopped once tracking performance showed evidence of leveling off at an asymptote, which was identified by a preset performance criteria. The performance criterion was defied by two tests. The median lambda scores from three consecutive sessions were submitted to a regression analysis. If the fust and third session's predicted values were found to be within 5% of each other, the first test was passed. The second test measured the difference between the actual median values for sessions two and three. These values had to be within 5% of each other to pass this test. The Fist test indicates when performance has leveled off (zero slope) for three sessions. The second test guards against nonlinearities that could escape detection by the first test. Together, they provide a stringent criteria for performance consistency. The competitive and monetary incentives (explained below) helped to ensure that this consistency is first evidenced at the highest obtainable level of performance. Test trials were administered in this manner until all treatment conditions were completed. Subjects did not know the criteria factors used to define completion of a treatment condition.
Subjects were instructed to sbive for maximum performance by always attempting to minimize tracking error. While the challenge of the task frequently provides sufficient motivation by itself, two additional methods were used to promote sustained high motivation. First, high scores from each condition were posted for public inspection (coded by subject number). Second, a financial bonus was awarded at the end of the study to the two top scores in each treatment condition.
For the GLOVE conditions, the subjects were instructed at the beginning of each session to position their right hand over a fiducial mark located on the right cockpit console at the centerline mounting location for the STICK. While hand posture was not strictly controlled, subjects were asked to place their hand in a manner simulating a grip on a stick and to find a comfortable position near a vertical alignment. This hand position was entered into the computer as the zero reference point for hand-arm rotation. At the beginning of each trial. the subject had to return the GLOVE controller to this position. This alignment task was aided by the use of a small target circle
shown on the display and a small + sign which showed hand position. Once this position was held for 2 seconds, the tracking task appeared on the display and hand movements were coupled to the plant dynamics.
At the conclusion of each treatment condition, subjects completed a questionnaire eliciting observations and comments about the task and their performance. In addition, the NASA Task Load Index (TLX) was administered to assess workload at the conclusion of the first and last session of each treatment condition. Workload is defined by six subscales: mental demand, physical demand, temporal demand, own performance, effort, and frustration. After a condition is rated in terms of these scales, a paired-comparison procedure using the six scales is completed to establish weighting factors that reflect individual models of workload. A detailed discussion of this workload measurement instrument can be found in (Ref. 9).
RESULTS The conventional tracking performance measure for the CTT is the value of lambda at the time when control is lost. All analyses were performed on mean lambda score per session (40 data points) for each of the three sessions (per condition) when the subject passed the performance criterion. All subjects required six or more sessions to meet this criterion in their first treatment condition, but showed savings in subsequent conditions.
An ANOVA was accomplished on the performance data using Subject, Order, and Condition as the variables. Condition had six levels, each defining a different Device Type (virtual vs. physical) and C/D ratio combination. With this statistical design. as opposed to the nested experimental design, the expected individual differences between subjects and any residual order effect can be separated out from the main variable of interest (Condition). A significant effect was found for Subject (E (5.20) = 50.60, p< .0001). Order (5.20) = 16.51, p < .OO01), and Condition a (5,20) = 18.11. p < .0001). These three variables accounted for 95.5% of the total variance.
The slight order effect can be seen in Figure 1. A post hoc analysis of the Order variable using the Tukey HSD test (alpha = .05. critical range = 4.445) indicated that performance on each subject's first treatment was significantly less than on those in order positions 3-6. In addition, performance on the treatment administered second was significantly less than those for order positions 4-6. Thus, in spite of the conservative criterion used to estimate the cessation of training effects, some additional learning was still evident in the data.
The main interest of the experiment involves the Condition variable. Each level of this variable combined a C/D ratio and controller type. Mean performance for each condition is shown in Figure 2. Highest performance was achieved with the STICK- C/D 2.1 and GLOVE-C/D 2.8 conditions, with the difference between the two being negligible. Slightly lower but comparable performance was achieved with the STICK-C/D 1.4 and GLOVE-C/D 2.1 arrangement. The lowest scores were
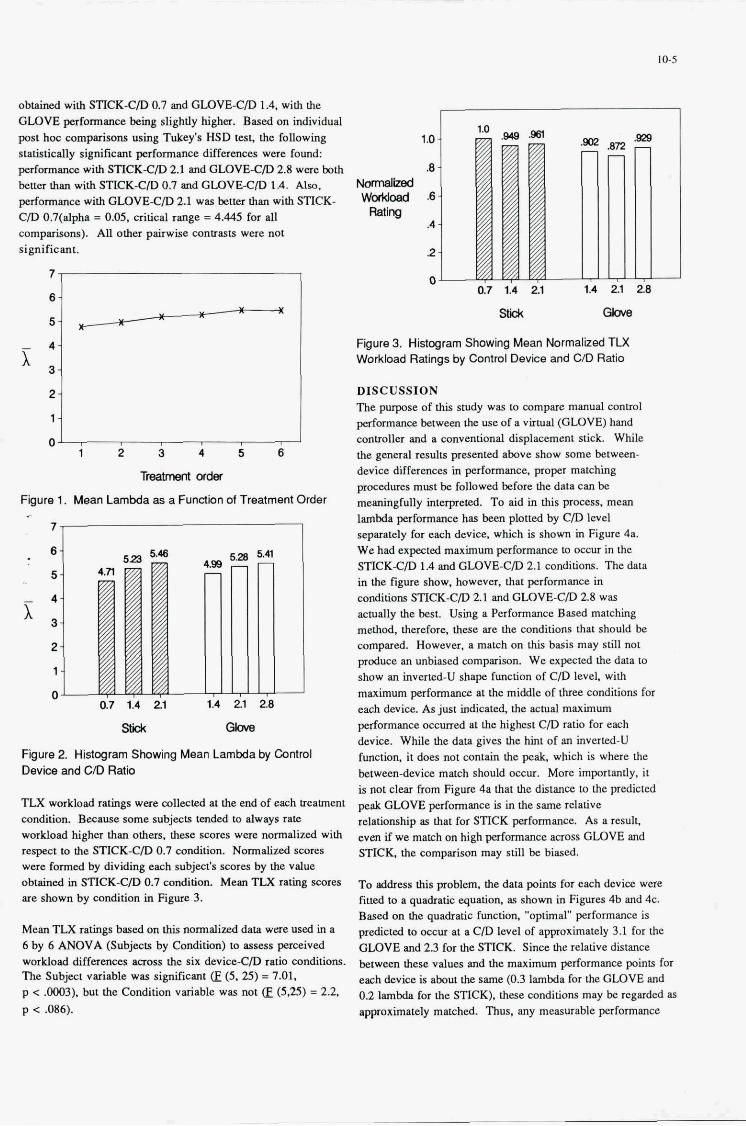
better than with STICK-CID 0.7 and GLOVE-CID ld. Also, performance with GLOVEEID 2.1 was better than with STICK- c/o 0.7(d* = 0.05. CIi!kd range = 4.445 for & wmpuisonr). AU other pairwise contrasts were not significant.
obtained with STICK-CID 0.7 and GLOVE-C/D 1.4. with the GLOVE performance being slightly h i g h . Based on individual post hoc wmp&ons usin& Tukey's HSD test. the following statistically significant performance differences were found wrformance. with STICKXD 2.1 and GLOVE-CD 2.8 were both
1 n .8
m k e d . WaMOad .6
A MIW
2
n
x 4 ] 3
1 2 3 4 5 8
Tr6€&lMt&
Figure 1. Mean Lambda as a Fundion of Treatment Order
J B
sw Gbve
Fgure 2. Histogram Showing Mean Lambda by Control Device and C/D Ratio
TLX workload ratings wen collected at the end of each keahnent condition Because some subjects tended to always rate workload higher than othaa. these swres were normalized with respect to the STICK-CD 0.7 condition. Normalized scores were formed by dividing each subject's swre8 by the value obtained in STICK-C/D 0.7 wndition. Mean TIX rating scores are shown by condition in Figure 3.
Mean TLX ratings based on this normalized data w a e used in I 6 by 6 ANOVA (Subjects by Condition) to assess perceived
" 017 1.4 21
sw Gbve
Fgure 3. Histogram Showing Mean Normalized T U Workload Ratings by Control Device and CAI Ratio
DISCUSSION The purpose of this study was to mmpare manual wntml performance h w e e n the use of a virmal (GLOVE) hand wntroller and a wnventional displacement stick. While the general results presented above show some betwccn- device differences in performance. proper matching procedures must be followed before the data can be meaningfully interpreted. To aid in this process, mean lamtda performance has been plotted by C/D level separately for each device, which is shown in Figure 4a. We had expected maximum performance to OCCUI in the STICKC/D 1.4 and GLOVE-CID 2.1 wnditions. The data in the figure show, however, that performance in wnditions STICK-C/D 2.1 and GLOVE-C/D 2.8 was actually the hest. Using a Performance Based matching method. therefore, these are the conditions that should be wmpued. However, a match on this basis may still not produce an unbiased wmparison. We expected the data to show an inverted-U shape function of CID level, with maximum performma at the middle of three conditions for each device. As just indicated, the actual maximum performance occuned at the highest C/D ratio for each device. While the data gives the hint of M inverted-U function, it does not contain the peak, which is where the between-device match should occur. More importantly, it is not clear from Figure 48 that the distance. to the predicted peak GLOVE performance is in the same relative relationship as that for STICK performance. As a result, even if we match on high performance MOSS GLOVE and STICK, the comparison may still he biased.
To address this problem, the data points for each device were fitted to a quadratic equation, as shown in Figures 4b and 4c. B d on the quadratic function, "optimal" performance is predicted to OCM at a CID level of approximately 3.1 for the GLOVE and 2 3 for the STICK. Since the relative distance
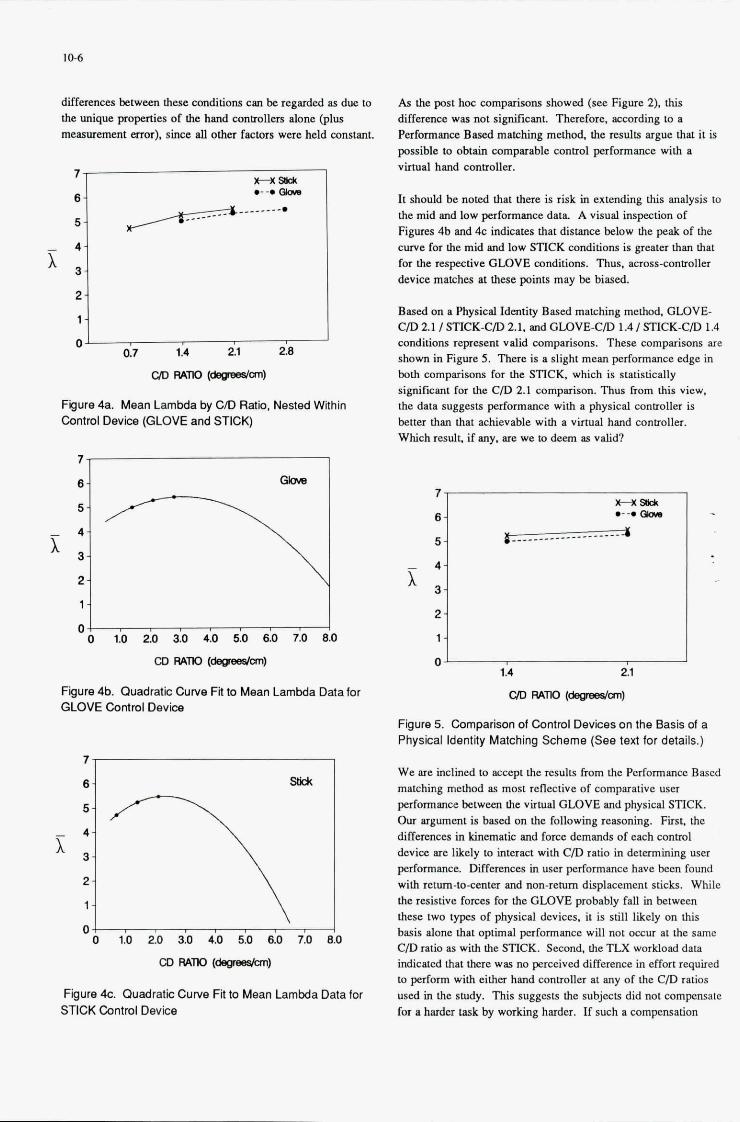
10-6
differences between these conditions can be regarded as due to the unique propenies of the hand controllers alone (plus measurement mor), since all other factors were held constant.
w w .--e a
7
8
5 / I
*L 1 2.8
2.1 0 0.7 1.4
CID wno ~ r w m e s w
Figure 4a. Mean Lambda by C/D Ratio, Nested Within Control Device (GLOVE and STICK)
7
8 Gbve
0 l 1 0 1.0 2.0 3.0 4.0 5.0 6.0 7.0 8.0
CD wTl0 (degeeslan)
Figure 4b. Quadratic Curve Ft to Mean Lambda Data for GLOVE Control Device
x
Figure 4c. Quadratic Curve Fit to Mean Lambda Data for STICK Control Device
As the post hoc comparisons showed (see Figure 2). this difference was not significant. Therefore, according to a Performance Based matching method, the results argue th, it is possible to obtain comparable control performance with a virtual hand controller.
It should be noted that there is risk in extending this analysis to the mid and low performance data A visual inspection of Figures 4b and 4c indicates that distance below the peak of the curve for the mid and low STICK conditions is greater than that for the respective GLOVE conditions. Thus, across-controller device matches at these points may be biased.
Based on a Physical Identity Based matching method. GLOVE- C/D 2.1 / STICK-C/D 2.1. and GLOVE-C/D 1.4/ STICK-C/D 1.4 conditions represent valid comparisons. These comparisons are shown in Figure 5 . There is a slight mean performance edge in both comparisons for the STICK. which is statistically significant for the C/D 2.1 comparison. Thus from this view. the data suggests performance with a physical controller is better than that achievable with a virtual hand controller. Which result. if any. are we to deem as valid?
x 3 4j
Figure 5. Comparison of Control Devices on the Basis of a Physical Identity Matching Scheme (See text for details.)
We are inclined to accept the results from the Performance Based matching method as most reflective of comparative user performance between the virtual GLOVE and physical STICK. Our argument is based on the following reasoning. First, the differences in kinematic and force demands of each control device are likely to interact with C/D ratio in detennining user performance. Differences m user performance have been found with rem-to-center and non-retum displacement sticks. Whilc the resistive forces for the GLOVE probably fall in between these two types of physical devices, it is still likely on this basis alone that optimal performance will not occur at the same C/D ratio as with the STICK. Second, the TLX workload data indicated that there was no perceived difference in effort required to perform with either hand controller at any of the C/D ratios used m the study. This suggests the subjects did not compensate for a harder task by working harder. If such a compensation
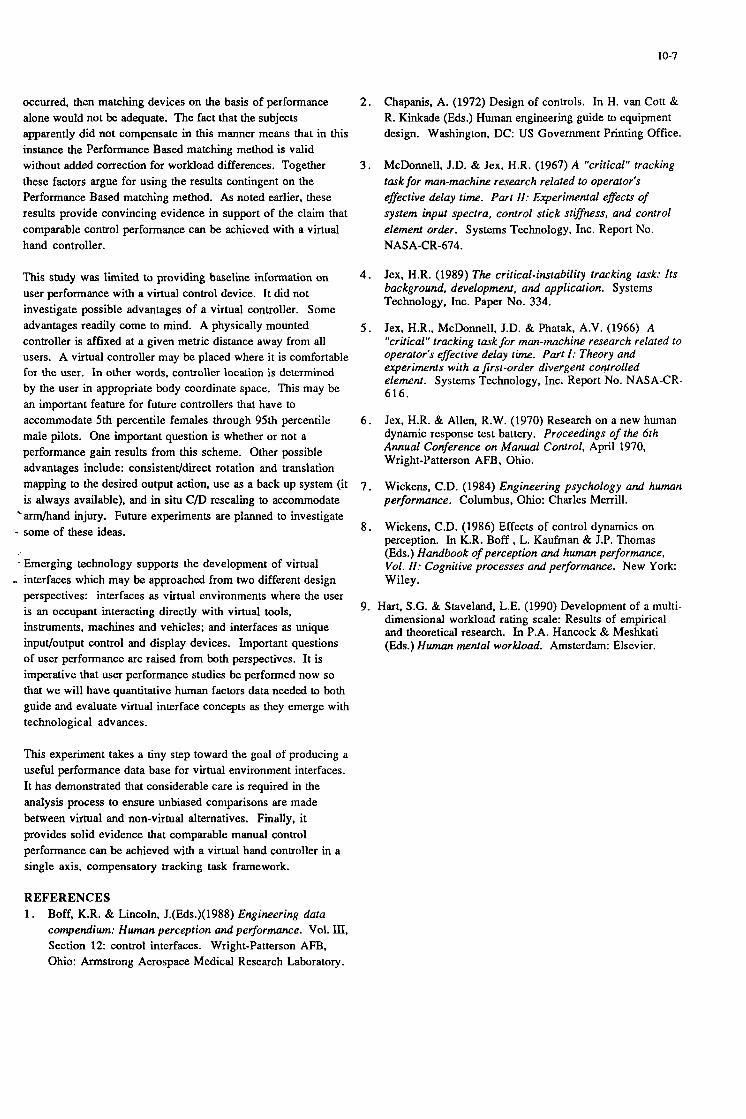
10-7
occurred, then matching devices on the basis of performance alone would not be adequate. The fact that the subjects apparently did not compensate in this manner means that in this instance the Performance Based matching method is valid without added correction for workload differences. Together these factors argue for using the results contingent on the Performance Based matching method. As noted earlier, these results provide convincing evidence in support of the claim that comparable control performance can be achieved with a virtual hand controller.
2 .
3 .
This study was limited to providing baseline information on user performance with a virtual control device. It did not investigate possible advantages of a virtual controller. Some
controller is affixed at a given metric distance away from all users. A virtual controller may be placed where it is comfortable for the user. In other words, controller location is determined by the user in appropriate body coordinate space. This may be an important feature for future controllers that have to accommodate 5th percentile females through 95th percentile male pilots. One important question is whether or not a performance gain results from this scheme. Other possible advantages include: consistent/direct rotation and translation mapping to the desired output action, use as a back up system (it is always available), and in situ C/D rescaling to accommodate
'armhand injury. Future experiments are planned to investigate - some of these ideas.
4 .
advantages readily come to mind. A physically mounted 5 .
6.
7 .
8 .
- Emerging technology supports the development of virtual - interfaces which may be approached from two different design
perspectives: interfaces as virtual environments where the user -
Chapanis, A. (1972) Design of controls. In H. van Cott & R. Kinkade (Eds.) Human engineering guide to equipment design. Washington, DC: US Government Printing Office.
McDonnell, J.D. & Jex, H.R. (1967) A "critical" tracking task for man-machine research related to operator's effective delay time. Part 11: Experimental effects of system input spectra, control stick stiffness, and control element order. Systems Technology, Inc. Report No. NASA-CR-674.
Jex, H.R. (1989) The critical-instability tracking task: Its background, development, and application. Systems Technology, Inc. Paper No. 334.
Jex, H.R., McDonnell. J.D. & Phatak. A.V. (1966) A "critical" tracking task for rnan-machine research related to operator's effective delay time. Part I : Theory and experiments with a first-order divergent controlled element. Systems Technology, Inc. Report No. NASA-CR- 616.
Jex, H.R. & Allen, R.W. (1970) Research on a new human dynamic response test battery. Proceedings of the 6th Annual Conference on Manual Control, April 1970, Wright-Patterson AFB, Ohio.
Wickens, C.D. (1984) Engineering psychology and human performance. Columbus, Ohio: Charles Merrill.
Wickens, C.D. (1986) Effects of control dynamics on perception. In K.R. Boff , L. Kaufman & J.P. Thomas (Eds.) Handbook of perception and human performance, Vol. 11: Cognitive processes and performance. New York: Wiley.
Y. Hart. S.G. & Staveland. L.E. (1990) Development of a multi- dimensional workload rating scale: Results of empirical and theoretical research. In P.A. Hancock & Meshkati (Eds.) Human mental workload. Amsterdam: Elsevier.
is an occupant interacting directly with virtual tools, instruments, machines and vehicles; and interfaces as unique inpudoutput control and display devices. Important questions of user performance are raised from both perspectives. It is imperative that user performance studies be performed now so that we will have quantitative human factors data needed to both guide and evaluate virtual interface concepts as they emerge with technological advances.
This experiment takes a tiny step toward the goal of producing a useful performance data base for virtual environment interfaces. It has demonstrated that considerable care is required in the analysis process to ensure unbiased comparisons are made between virtual and non-virtual alternatives. Finally, it provides solid evidence that comparable manual control performance can be achieved with a virtual hand controller in a single axis, compensatory tracking task framework.
REFERENCES 1. Boff, K.R. & Lincoln, J.(Eds.)(1988) Engineering data
compendium: Human perception and performance. Vol. III, Section 12: control interfaces. Wright-Patterson AFB, Ohio: Armstrong Aerospace Medical Research Laboratory.

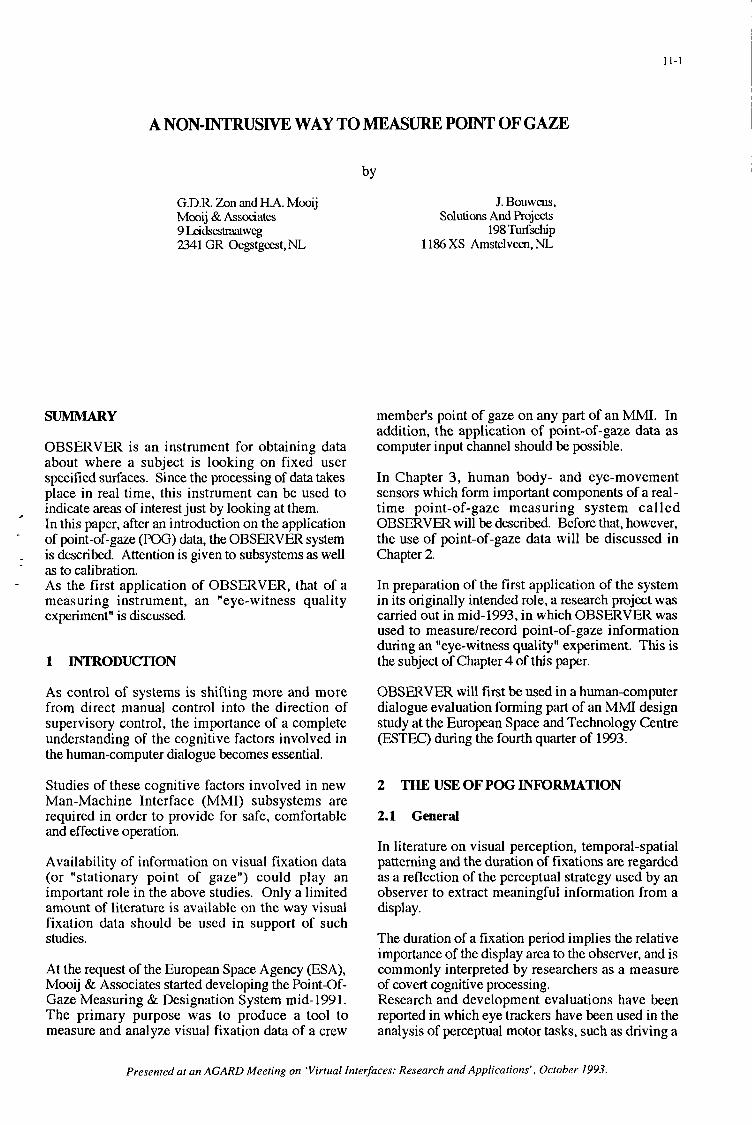
1 1 - 1
A NON-INTRUSIVE WAY TO MEASURE POINT OF GAZE
G.D.R. Zon and H.A. Mmij Mooij & Assodates
2341 GR Oegstgeest, NL 9Leidsestraatweg
SUMMARY
OBSERVER is an instrument for obtaining data about where a subject is looking on fixed user specified surfaces. Since the processing of data takes place in real time, this instrument can be used to indicate areas of interest just by looking at them. In this paper, after an introduction on the application of point-of-gaze (FOG) data, the OBSERVER system is described. Attention is given to subsystems as well as to calibration. As the first application of OBSERVER, that of a measuring instrument, an "eye-witness quality experiment" is discussed.
1 INTRODUCIION
As control of systems is shifting more and more from direct manual control into the direction of supervisory control, the importance of a complete understanding of the cognitive factors involved in the human-computer dialogue becomes essential.
Studies of these cognitive factors involved in new Man-Machine Interface (MMI) subsystems are required in order to provide for safe, comfortable and effective operation.
Availability of information on visual fixation data (or "stationary point of gaze") could play an important role in the above studies. Only a limited amount of literature is available on the way visual fixation data should be used in support of such studies.
At the request of the European Space Agency (ESA), Mooij & Associates started developing the Point-Of- Gaze Measuring & Designation System mid-1991. The primary purpose was to produce a tool to measure and analyze visual fixation data of a crew
J. Bouwens. Solutions And Projects
198 Tdschip 11% xs Amstelveen. NL
member's point of gaze on any part of an MMI. In addition, the application of point-of-gaze data as computer input channel should be possible.
In Chapter 3, human body- and eye-movement sensors which form important components of a real- time point-of-gaze measuring system cal led OBSERVER will be described. Before that, however, the use of point-of-gaze data will be discussed in Chapter 2.
In preparation of the first application of the system in its originally intended role, a research project was carried out in mid-1993. in which OBSERVER was used to measurelrecord point-of-gaze information during an "eye-witness quality" experiment. This is the subject of Chapter 4 of this paper.
OBSERVER will first be used in a humancomputer dialogue evaluation forming part of an MMI design study at the European Space and Technology Centre (ESTEC) during the fourth quarter of 1993.
2 THE USE OF POG INM)RMATION
2.1 General
In literature on visual perception, temporal-spatial patterning and the duration of fixations are regarded as a reflection of the perceptual strategy used by an observer to extract meaningful information from a display.
The duration of a fixation period implies the relative importance of the display area to the observer, and is commonly interpreted by researchers as a measure of covert cognitive processing. Research and development evaluations have been reported in which eye trackers have been used in the analysis of perceptual motor tasks, such as driving a
Presented at an AGARD Meeting on 'Virtual Interfaces: Research and Applications', October 1993.
11-2
car, flying an aircraft and certain sports activities. The method of data gathering in most cases was by recording the images of a "scene camera" with an overlay of a cursor indicating the measured eye line of gaze. The large disadvantage of this technique is that frame-by-frame digitizing after the tests is required in order to enter point-of-gaze information into a computer for analysis of the data. OBSERVER eliminates this drawback, since it enables automated point-of-gaze determination. The following section discusses two areas of application of a measuring tool for a crew member's point of gaze on any part of an MMI. For practical purposes, (e.g. the mass of data) only systems with digital output can be used with success in these cases.
2.2 Point-of-Gaze Data for Evaluations
Mission-Planning System for Tactical Aircraft
The development of computer-processing power in recent years has led to an emphasis on factors such as speed of task execution and speed of data access in systems like those used in mission planning for tactical aircraft. The importance of rapid completion of the entire planning task, or part of it. is obvious.
The development of these systems has not primarily been driven by crew requirements, but rather by the developing technology. A consequence of this design approach is that, although technology has improved some aspects of the mission planning process, full advantage has not been taken of the technological advances available. A better approach to the design of mission-planning systems would be to have the design of the interface (MMI) become a driving factor, since this area is becoming the main constraint with respect to improving the effectiveness of mission-planning, Reference 1. The design should be based on the crew-task relationship rather than on the task alone. A major implication of this approach is that the choice of technology may be derived from the definition of the man-machine interface. Point-of- gaze data measured and recorded during the evaluation by trained pilots of various options for MMI of mission planning systems could be beneficial. Statistical analysis of point-of-gaze fixation data would be an important post-processing activity.
Control of System ana! Experiments in Spacecraft
As more computer support and control a r e introduced, the operation of systems by crew on board spacecraft is changing drastically. There are very few flight opportunities, which means there is
also little opportunity for evolutionary development of new systems or building up confidence through regular use.
In the future space station, the crew has a variety of tasks in both spacecraft system control and on-board experiment control. It is known that on-board crew time as well as ground-based crew time (for training) will be limited, resulting in conflicting requirements: the crew being involved in ever more activities while having ever less time available for training on each particular function, Reference 2.
ESA has contracted Mooij & Associates to employ OBSERVER in the evaluation of competing designs for user interfaces for controlling systems and experiments on board spacecraft.
2.3 Poinhf-Gaze Data for System Control
In searching for new and better interfaces between systems and their users, it can be very useful to exploit an additional mode of communication between the two parties. Typical human-computer dialogues are rather biased in the direction of communication from the computer to the user. Animated graphical displays, for example, can rapidly communicate large quantities of data, but the inverse communication channel has a very low bandwidth. The availability of an additional, rapid information channel from the user to the computer would be helpful, particularly if it requires little effort on the part of the user. Since OBSERVER measures a user's point of gaze - his focal point on a given surface - and reports it in real time, it is possible to use point of gaze as an input medium in user-computer interaction, and thus for system control.
Following are some arguments in favour of using point of gaze, amongst other, as a computer input channel:
Point of gaze has a high bandwidth due to the fact that eye muscles, being extremely fast, are able to respond more quickly than most other muscles.
Point of gaze, based primarily on eye motion, can be beneficial under high-g loading (eye motion under high-g loading is perfectly feasible).
Shifting point of gaze comes naturally and requires no conscious effort.
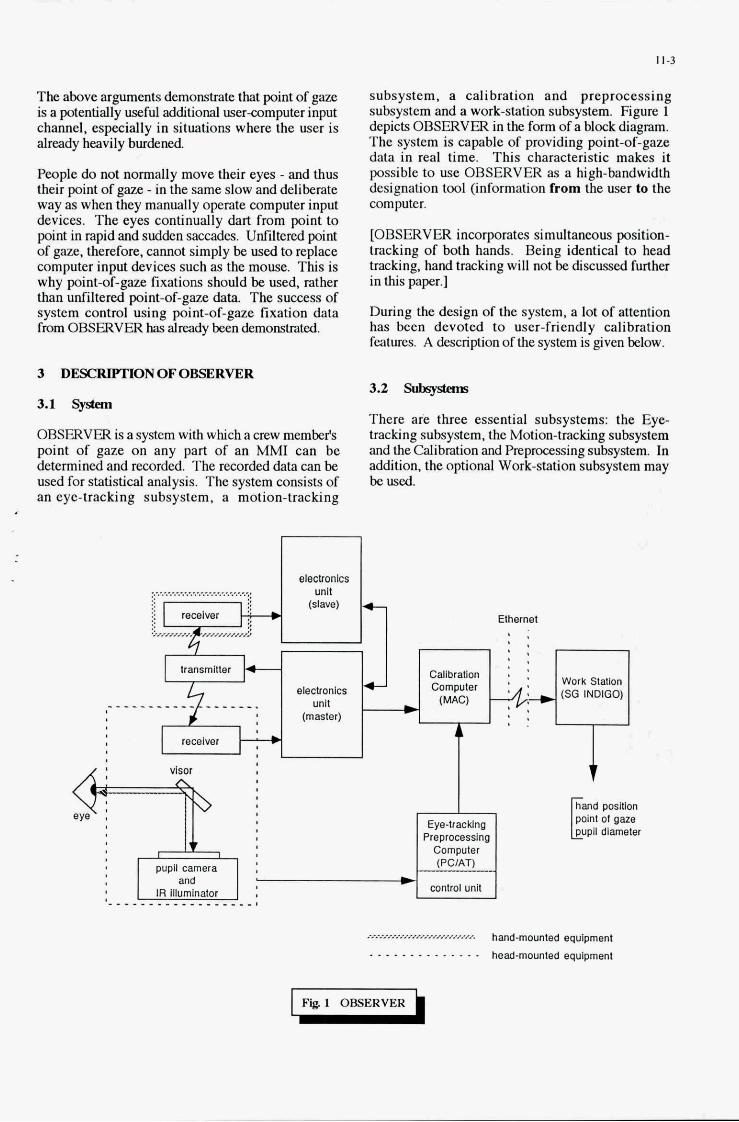
The above arguments demonstrate that point of gaze is a potentially useful additional useramputer input channel, especially in situations where the user is already heavily burdened.
People do not normally move their eyes - and thus their point of gaze - in the same slow and deliberate way as when they manually operate computer input devices. The eyes continually dart from point to point in rapid and sudden saccades. Unfiltered point of gaze, therefore, cannot simply be used to replace computer input devices such as the mouse. This is why point-of-gaze fixations should be used, rather than unfiltered point-of-gaze data. The success of system control using point-of-gaze fixation data from OBSERVER has already been demonstrated.
eleclronics unit
(slave)
eiectronics unit
(master)
3 DESCRIPIlONOFOBSERVER
+
Calibration + Computer - (MAC)
t
3.1 System
OBSERVER is a system with which a crew member's point of gaze on any part of an MMI can be determined and recorded. The recorded data can be used for statistical analysis. The system consists of an eye-tracking subsystem, a motion-tracking
r l
subsystem, a calibration and preprocessing subsystem and a work-station subsystem. Figure 1 depicts OBSERVER in the form of a block diagram. The system is capable of providing point-of-gaze data in real time. This characteristic makes it possible to use OBSERVER as a high-bandwidth designation tool (information from the user to the computer.
[OBSERVER incorporates simultaneous position- tracking of both hands. Being identical to head tracking, hand tracking will not be discussed further in this paper.]
During the design of the system, a lot of attention has been devoted to user-friendly calibration features. A description of the system is given below.
3.2 Suhsys@ns
There are three essential subsystems: the Eye- tracking subsystem, the Motion-tracking subsystem and the Calibration and Preprocessing subsystem. In addition, the optional Work-station subsystem may be used.
visor
pupil camera and
iR Illuminator .................
Preprocessing Computer
Ethernet
* I
Work Station
' , I .
t
hand-mounted equipment
head-mounted equipment
................................................. ..............
Fig.1 OBSERVER U
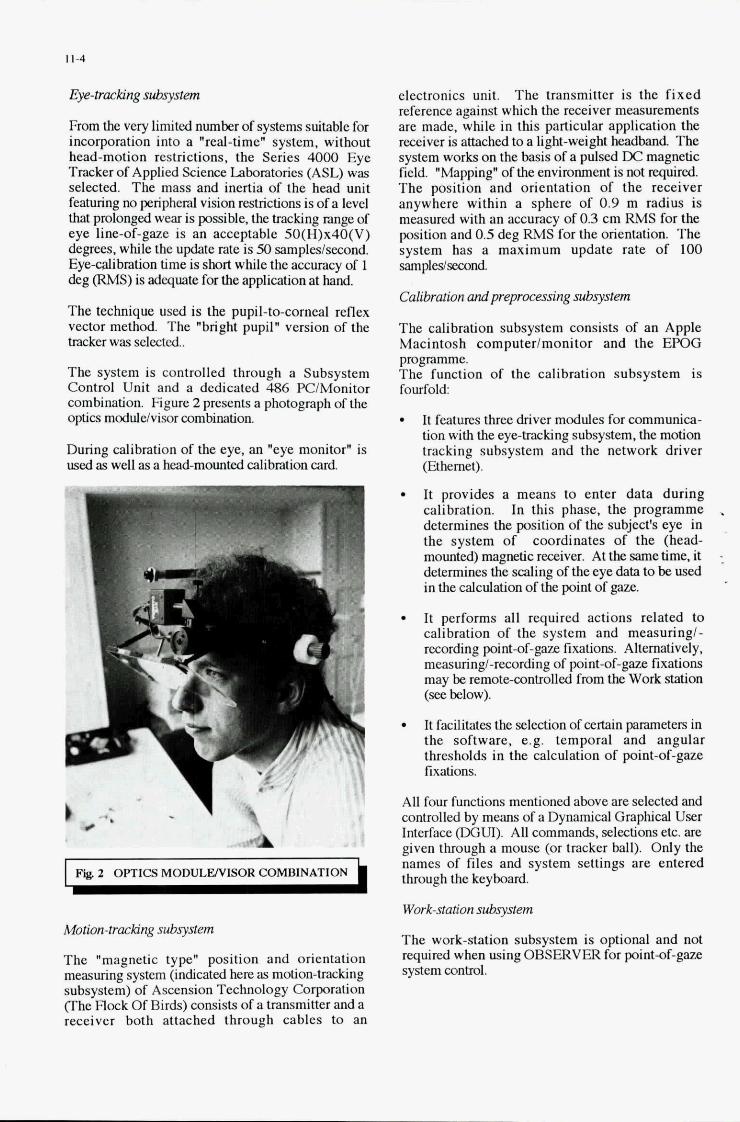
11-4
Eye-tracking subsystem
From the very limited number of systems suitable for incorporation into a "real-time" system, without head-motion restrictions, the Series 4000 Eye Tracker of Applied Science Laboratories (ASL) was selected. The mass and inertia of the head unit featuring no peripheral vision restrictions is of a level that prolonged wear is possible. the tracking range of eye line-of-gaze is an acceptable 50(H)x40(V) degrees, while the update rate is 50 samples/second. Eye-dibration time is short while the accuracy of 1 deg ( R M S ) is adequate for the application at hand.
The technique used is the pupil-to-corneal reflex vector method. The "bright pupil" version of the hacker was selected.
The system is controlled through a Subsystem Control Unit and a dedicated 486 PC/Monitor combination. Figure 2 presents a photograph of the optics mcduldvisor combination.
During calibration of the eye, an "eye monitor" is used as well as a head-mounted calibration card
I ~b 2 OPTICS MODULWISOR COMBINATION
Motion-tracking s h y s t e m
The "magnetic type" position and orientation measuring system (indicated here as motion-tracking subsystem) of Ascension Technology Corporation (The Flock Of Birds) consists of a transmitter and a receiver both attached through cables to an
electronics unit. The transmitter is the f ixed reference against which the receiver measurements are made, while in this particular application the receiver is attached to a light-weight headband The system works on the basis of a pulsed Dc magnetic field. "Mapping" of the environment is not required. The position and orientation of the receiver anywhere within a sphere of 0.9 m radius is measured with an accuracy of 0.3 cm RMS for the position and 0.5 deg RMS for the orientation. The system has a maximum update rate of 100 sampleslsecond
Calibration and preprocessing subsystem
The calibration subsystem consists of an Apple Macintosh computerlmonitor and the EPOG programme. The function of the calibration subsystem is fourfold . .
.
.
It features three driver modules for communica- tion with the eye-tracking subsystem, the motion tracking subsystem and the network driver (Ethernet).
It provides a means to enter data during calibration. In this phase, the programme determines the position of the subject's eye in the system of coordinates of the (head- mounted) magnetic receiver. At the same time, it determines the scaling of the eye data to be used in the calculation of the point of gaze.
It performs all required actions related to calibration of the system and measuring/- recording point-of-gaze fmtions. Alternatively. measuring/-recording of point-of-gaze fixations may be remotecontrolled from the Work station (see below).
It facilitates the selection of certain parameters in the software, e.g. temporal and angular thresholds in the calculation of point-of-gaze fixations.
All four functions mentioned above are selected and controlled by means of a Dynamical Graphical User Interface (DGUI). All commands, selections etc. are given through a mouse (or tracker ball). Only the names of files and system settings are entered through the keyboard.
Work-sta'on subsystem
The work-station subsystem is optional and not required when using OBSERVER for point-of-gaze system control.
The function of the work station is to store a high volume of measured data and provide a powerful platform for data analysis and visualization at a remote location. The work-station subsystem consists of a computerhonitor and the EPOGClient software programme. This programme facilitates recording of point-of-gaze fixation data in the work- station subsystem. The present target work-station computer is a Silicon Graphics Indigo, although in principle any system, computer and suchlike may be coupled to OBSERVER via Fithemet
3.3 Calibration
To calibrate the eye tracker for use with a particular person, a short routine is performed during which data are loaded while this person alternately looks at nine points on a head-mounted calibration card. To be able to determine the vector describing the receiver-toeye separation, a short calibration routine is executed by the person under guidance of a test director. In t h i s routine, the position of surfaces with respect to a room-fixed reference system is established as well. Several tools have been developed for use in the calibration routine (a stylus temporarily to b e attached to the magnetic receiver and an eye-line bracket attached to the 'room" incorporating a "sight", a "receiver docking device" and a "receiver dummy block").
3.4 systemoutput
The pre-processed data related to point-of-gaze fixations are:
S w n g time of fixation Duration of fixation Surface identification X and Y of fixation Pupildiameter Distance eye to surface
The update rate of real-time point-of-gaze fixations is 20 ms.
4 EYE-WITNJSQUALCI'YEwERloMElVr
4.1 General
Following the above description of the system. a psychological experiment will now be described which was conducted with OBSERVER.
The problem discussed in this document concerns the fact that research into what subjects tend to remember about certain situations usually consists of asking them questions pertaining to the various
stimuli to which they have been exposed during the test. As a rule, this is a satisfactory way of obtaining an impression of what people have remembered. A relevant example of this is an experiment taken by Wagenaar and Boer, Reference 3. the procedure of which was as follows:
Test subjects were shown a number of slides of aquarelles (phase 1). The slides told the story of a man leaving his home by car and a woman coming out of a shop. Their paths crossed literally on a pedestrian crossing which resulted in an accident
One of the slides showed the man wanting to turn right at a junction while the traffic light was red (turning right on a red light is not allowed in the Netherlands).
Having carried out a diverting task, one half of the subjects was asked whether there had been a pedestrian crossing the street when the man wanted to turn right at the traffic lights. The other half of them was asked the same question, with the exception that the term 'traffic lights' was replaced by 'stop sign'. This is misleading information after exposure to the slide (phase 2). When subsequently shown two slides, i.e. the original one and another in which the traffic lights had been replaced by a stop sign, and asked which of the two they had seen, a number of the subjects selected the second slide (with the stop sign) (phase 3). The experiment entailed more. but this will suffice for the purpose of introducing the following.
After reading the Wagenaar and Boer's (Ref. 3) article on this experiment and having been made aware of the possibilities offered by the OBSERVER, it seems reasonable to assume that there must be a way of determining what test subjects actually see while looking at the slides. Information like that may well be a useful supplement to the above experiment, since it will provide not only answers to the questions posed, but also tell us at what the subjects were looking or, at any rate, what details they were looking at for any length of time.
In the experiment described here, the same slides were used as the ones used by Wagenaar and Boer (Ref. 3). Questions were made to go with each one of the slides, while for the specific slide with the traffic light. the questions described above were used. Subsequently, black and white photocopies were made of all slides. For each photocopy made, another was made in which one detail had been altered, for example, traffic lights altered into a stop sign. The slides were presented to the subjects as before, only this time they were monitored by the OBSERVER. For two slides it was recorded at what details the subjects had been looking.
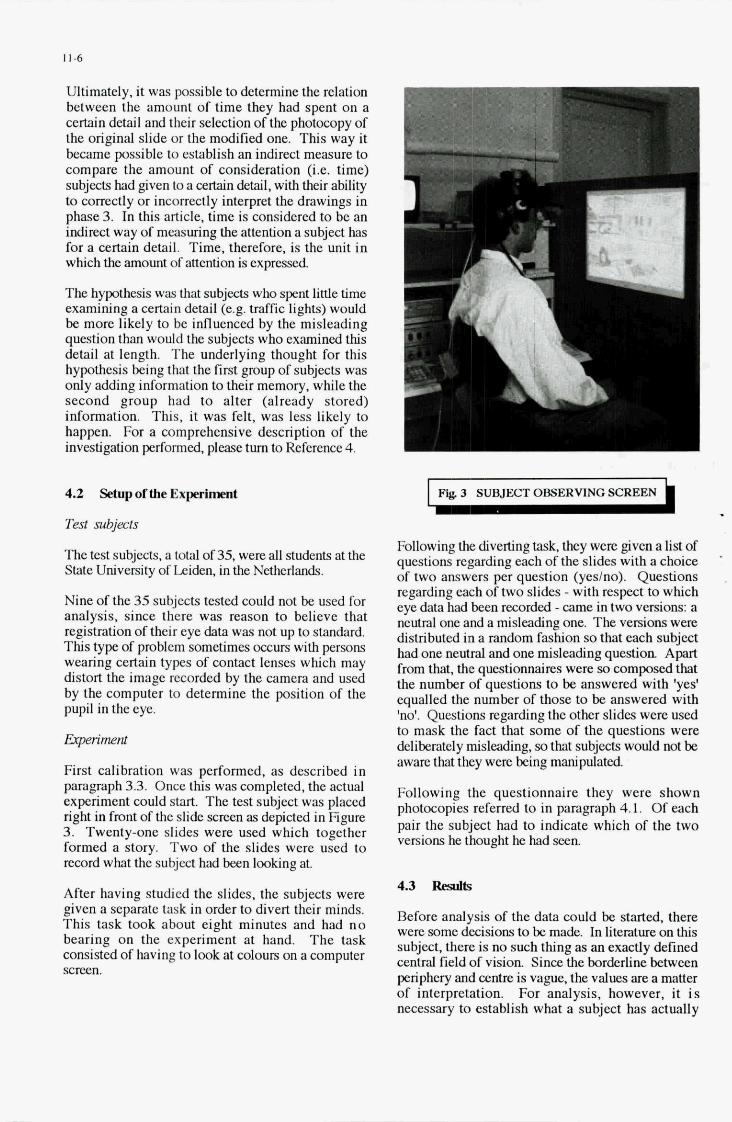
11-6
Ultimately, it was possible to determine the relation between the amount of time they had spent on a certain detail and their selection of the photocopy of the original slide or the modified one. This way it became possible to establish an indirect measure to compare the amount of consideration (i.e. time) subjects had given to a certain detail, with their ability to correctly or incorrectly interpret the drawings in phase 3. In this article, time is considered to be an indirect way of measuring the attention a subject has for a certain detail. Time, therefore, is the unit in which the amount of attention is expressed
The hypothesis was that subjects who spent little time examining a certain detail (e.g. traffic lights) would be more likely to be influenced by the misleading question than would the subjects who examined this detail at length. The underlying thought for this hypothesis being that the first group of subjects was only adding information to their memory, while the second group had to alter (already stored) information. This, it was felt, was less likely to happen. For a comprehensive description of the investigation performed, please turn to Reference 4.
4.2 setupoftheExperlmwt
Test subjects
The test subjects. a total of 35. were all students at the SIate University of Leiden. in the Netherlands.
Nine of the 35 subjects tested could not he used for analysis, since there was reason to believe that registration of their eye data was not up to standard. This type of problem sometimes occurs with persons wearing certain types of contact lenses which may distort the image recorded by the camera and used by the computer to determine the position of the pupil in the eye.
First calibration was performed, as described in paragraph 3.3. Once this was completed, the actual experiment could start. The test subject was placed right in front of the slide screen as depicted in Figure 3. Twenty-one slides were used which together formed a story. Two of the slides were used to record what the subject had been looking at.
After having studied the slides, the subjects were given a separate task in order to divert their minds. This task took about eight minutes and had n o bearing on the experiment at hand. The task consisted of having to look at colours on a computer screen.
F@ 3 SUBJECT OBSERVING SCREEN .
Following the diverting task, they were given a list of questions regarding each of the slides with a choice of two answers per question (yeslno). Questions regarding each of two slides - with respect to which eye data had been recorded - came in two versions: a neutral one and a misleading one. The versions were distributed in a random fashion so that each subject had one neutral and one misleading question. Apart from that, the questionnaires were so composed that the number of questions to be answered with 'yes' equalled the number of those to he answered with 'no'. Questions regarding the other slides were used to mask the fact that some of the questions were deliberately misleading, so that subjects would not be aware that they were being manipulated
Following the questionnaire they were shown photocopies referred to in paragraph 4.1. Of each pair the subject had to indicate which of the two versions he thought he had seen
4.3 ReWk
Before analysis of the data could be started, there were some decisions to he made. In literature on this subject, there is no such thing as an exactly defined central field of vision. Since the borderline between periphery and centre is vague, the values are a matter of interpretation. For analysis, however, it is necessary to establish what a subject has actually
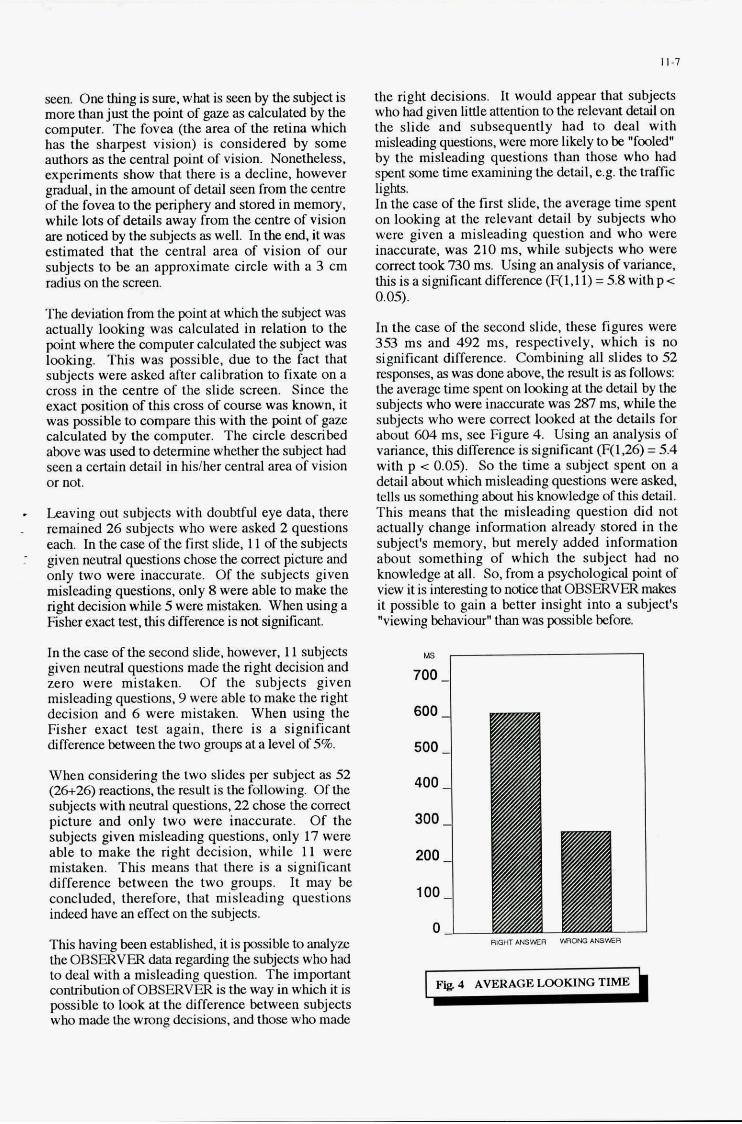
11-7
the right decisions. It would appear that subjects who had given little attention to the relevant detail on the slide and subsequently had to deal with misleading questions, were more likely to be "fooled" by the misleading questions than those. who had spent some time examining the detail, e.g. the traffic
In the case of the first slide, the average time spent on looking at the relevant detail by subjects who were given a misleading question and who were inaccurate, was 210 ms, while subjects who were correct took 730 ms. Using an analysis of variance, thisisasignificantdifference(F(1,11)=5.8withpc 0.05).
lights.
In the case of the second slide, these figures were 353 ms and 492 ms. respectively, which is no significant difference. Combining all slides to 52 responses, as was done above, the d t is BS follows: the average time spent on looking at the detail by the. subjects who were inaccurate was 281 ms, while the subjects who were correct looked at the details for about 604 ms, see Figure 4. Using an analysis of variance, this difference is significant (F(1.26) = 5.4 with p c 0.05). So the time a subject spent on a detail about which misleading questions were asked, tells us something about his knowledge of this detail. This means that the misleading question did not actually change information already stored in the subject's memory, but merely added information about something of which the subject had no knowledge at all. So, from a psychological p in t of view it is interesting to d c e that OBSERVER makes it possible to gain a better insight into a subject's "viewing behaviour" than was possible before.
seen One thing is sure, what is seen by the subject is more than just the p in t of gaze as calculated by the computer. The fovea (the area of the retina which has the sharpest vision) is considered by some authors as the central point of vision. Nonetheless, experiments show that there is a decline, however gradual, in the amount of detail seen from the centre of the fovea to the periphery and stored in memory, while lots of details away from the centre of vision are noticed by the subjects as well. In the end, it was estimated that the central area of vision of our subjects to be an approximate circle with a 3 cm radius on the screen.
The deviation from the point at which the subject was actually looking was calculated in relation to the point where. the computer calculated the subject was looking. This was possible, due to the fact that subjects were asked after calibration to fixate on a cross in the centre of the slide screen. Since the exact position of this cross of course was known, it was possible to compare this with the point of gaze calculated by the computer. The circle described above was used to determine whether the Subject had seen a certain detail in hislher central area of vision or not
Leaving out subjects with doubtful eye data, there remained 26 subjects who were asked 2 questions each. In the case of the first slide, 11 of the subjects given neutral questions chose the correct picture and only two were inaccurate. Of the subjects given misleading questions, only 8 were able to make the right decision while 5 were mistakem When using a Fisher exact test, this difference is not significant
In the case of the second slide, however, 11 subjects given neutral questions made the right decision and zero were mistaken. Of the subjects given misleading questions, 9 were able to make the right decision and 6 were mistaken. When using the Fisher exact test again, there is a significant difference between the two groups at a level of 5%.
When considering the two slides per subject as 52 (26+26) mctions, the result is the following. Of the subjects with neutral questions, 22 chose the correct picture and only two were inaccurate. Of the subjects given misleading questions, only 17 were able to make the right decision, while 11 were mistaken. This means that there is a significant difference between the two groups. It may be concluded, therefore, that misleading questions indeed have an effect on the subjects.
This having been established, it is possible to analyze the OBSERVER data regarding the subjects who had to deal with a misleading question. The important contribution of OBSERVER is the way in which it is possible to look at the difference between subjects who made the wrong decisions, and those who made
- - .
:I- 500
200
100
0 1
FIg 4 AVERAGE LOOKING TIME
11-8
In conclusion, it could be said that the point of gaze data generated by OBSERVER may be used as a way to indirectly measure a subject's attention. The ordinary way of measuring that which is stored in memory is by asking the subject questions about a certain event or situation with which he is familiar. And, this information may be reliable if subjects are not influenced after - or even before - exposure to that event or situation When subjects have not given any attention to the details about which they are questioned, they tend to be easily influenced by a misleading question. OBSERVER represents a less influenceable and more accurate way of measuring attention in (experimental) situations.
5 CONCLUSION
OBSERVER is a user-friendly measuring device, delivering point-of-gaze fixation data without interfering with a person wearing the light-weight headband holding optics, visor and a miniature magnetic receiver.
It has been shown that the Series 4ooo Eye Tracker of ASL and The Flock Of Birds position and orientation measuring system of Ascension are
robust sensors which performed well in the very first experiment with the system ("eye-witness quality experiment").
On the basis of the experience gained with OBSERVER, it is expected that point-of-gaze fixa- tion data can be very helpful in MMI development.
6 REEERENCES
1. "Mission Planning S stems for Tactical Aircraft
Report313.1992. (PreFlight and In- d ight)", AGARD Advisory
2. Ockels, W.J., "A New Approach to Spacecraft Crew System Operations", B A Journal 1992, Vol. 16, pp. 233-236.
3. Wagenaar, W.A. and Boer, J.P.A. "Misleading Post-Event Information: Testing Parametrized Models of Integration in Memory", Acta F'sychologica, 66, pp. 291-306.
4. Zon, G.D.R. "The Use of Point-Of-Gaze Measurement in Memory Research", Thesis October, 1593.
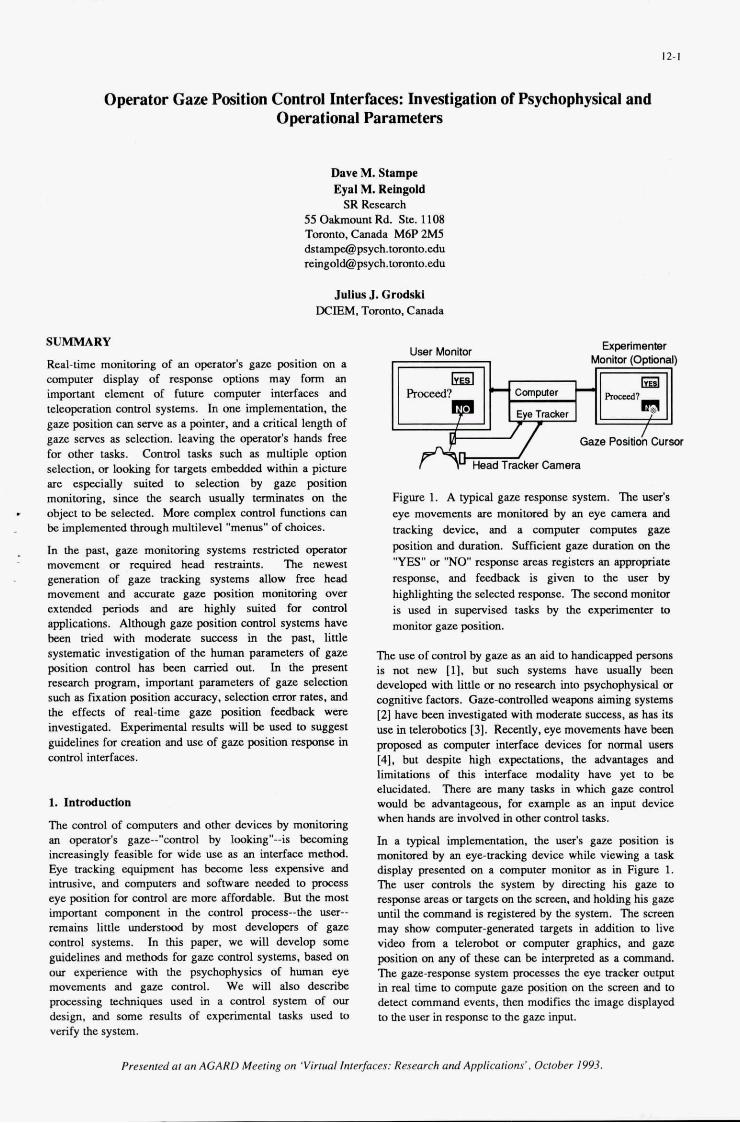
12-1
Operator Gaze Position Control Interfaces: Investigation of Psychophysical and Operational Parameters
Dave M. Stampe Eyal M. Relngold
SR Research 55 Oakmount Rd. Ste. 1108 Tomnto. Canada M6P 2M5 [email protected] r e ingo ld@psych . t . edu
Julius J. Crodskl DCIEM. Tomnto. Canada
SUMMARY
Real-time monitoring of an operator's gaze position on a computer display of response options may form an important element of future computer interfaces and teleoperation control systems. In one implementation, the gaze position can serve as a pointer, and a critical length of gaze serves as selection. leaving the operator's hands free for 0 t h ~ tasks. Control tasks such as multiple option selection. or lwking for iargets embedded within a picture are especially suited to selection by gaze position monitoring, since the search usually terminates on the - object to be selected. More wmplex control functions can
. be implemented through multilevel "menus" of choices.
In the past, gaze monitoring systems restricted operator movement or required head restraints. The newest generation of gaze tracking systems allow free head movement and accurate gaze position monitoring over extended periods and are highly suited for control applications. Although gaze position control systems have been tried with moderate success in the past, little systematic investigation of the human parameters of gaze position control has been carried out. In the present research program. important parameters of gaze selection such as fuation position ~ccu~acy , selection err01 rates, and the effects of real-time gaze position feedback were investigated. Experimental results will be used to suggest guidelines for creation and use of gaze position response in conwl interfaces.
1. Introduction
The control of computers and other devices by monitoring an operator's gaze--"control by looking"--is becoming increasingly feasible for wide use as an interface method. Eye tracking equipment has become less expensive and intrusive. and computers and software needed to process eye position for control are more affordable. But the most important component in the control process-the user-- remains little understood by most developers of gaze control systems. In this paper, we will develop some guidelines and methods for gaze control systems, based on our experience with the psychophysics of human eye movements and gaze control. We will also describe processing techniques used in a control system of OUT design. and some results of expeximental tasks used to verify the system.
&primenter Monitw (Ophnal) User Monitor
Head Tracker Camera
Figure 1. A typical g m response system. The user's eye movements are monitored by an eye camera and mcking device, and a computer computes gam position and duration. Sufficient gaze duration on the "YES" or 'WO response areas registers an appropriate response, and feedback is given to the user by highlighting the selected response. The second monitor is used in supervised tasks by the expeximenter to monitor gaze position.
The use of control by gaze as an aid to handicapped persons is not new [l], but such systems have usually been developed with little or no research into psychophysical or cognitive factns. Gaze-controlled weapons aiming systems [Z] have been investigated with moderate succas. as has its use in telerobotics [3]. Recently, eye movements have been proposed as computer interface devices for normal usem [4]. but despite high expectations, the advantages and limitations of this interface modality have yet to be elucidated. There are many tasks in which gaze control would be advantageous. for example as an input device when hands are. involved in other control tasks.
In a typical implementation, the user's g m position is monitored by an eye-tracking device while viewing a task display presented on a computer monitor as in Figure 1. The user controls the system by directing his gaze to response areas or targets on the screen. and holding his gaze until the command is registered by the system. The screen may show computer-generated targets in addition to live video frmn a telembot or computer graphics, and gaze position on any of these can be interpreted as a command. The gaze-response system processes the eye mcker output in real time to compute gaze position on the screen and to detect command events, then modifies the image displayed to the user in response to the gaze input.
Presenredar an AGARD Meering on 'Vinual Inrerfaces: Research and Applicarions', Ocrober 1993.
2. Characteristics d Human Eye Movements
Studies of the spatial and temporal characteristics of human eye movements provide impatant information for the design of gaze mml systems. Eye movement may be divided into two phases: fuations and saccades. Fixations are periods when the eye remains stationary, gathering visual data, and are typically 150 to 500 m8u: in duratim In a pursuit eye motion, the eye moves smoothly to track a slowly moving object: this is similar m function to a fuation. Saecsdes are rapid (up to 800' per scmnd) motions of the eye fmm one f u h position to another.
Rcswrch has shown that the position of gaze during a Fuation indicates the locus of visual attention. Gazc tends to be captured by objects in an image, and it is difficult to fuate blank areas on a scxm intentionally. Rewrdings of gaze position also show that gaze may be b t e d m the m m of a cluster of objects. maximizing the information derived from each fixation. Gazc is also captured by moving objects in a some, or by new objects sppearing. This caphue can be extremely rapid: express spceades may
In normal vision gaze position shiftr rapidly, an average of four times per second. The study of the duration and ordo of fuation of objects. WO& or other gaze targets is an important tool of psychological d into the mechanisms of reading, problem solving, and perception The duxation of a Fuation on an object cornsponds to the amount of cognitive processing it requires, and fixations longer than 500 msu: may be sccll during difficult tasks. These temporal parameters will be imprunt in the design of gaze mml interfaces as well.
begin less than loo msec after appcmmm of an objm.
3. Human Factors of Gnze Control
To the user. gaze umml feels quite natural, due to the closc link between atrention and gaze position. Response by holding gaze on a target until a responsc is registexed is especially natural, and is ideally suited to search within pichues or response mays. Oncc the search or rqmnse target (e.g. an item in a menu) is found all the user need do is to &ue fuating it until the mpmse is registered. This is a highly intuitive response method, requiring M
mining and resulting in fast reaction times. Targets can be sclected even when embedded within pictures or a dense mays of other objects.
O w control acts as an extension of the u s d s ability to manipulate the world. Althougb objects in the world (except other humans) do not usually respond to OUT gaze. users immediately accept this method of interaction without n e 4 for training. TO maintain the user's belief m the link between gaze and mponse. the gaze mml s y s m must be interactive: it must rapidly and predictably translate commands in the form of eye movements into system responses. These responses may take the form of presenting the next trial in an experiment, highlighting the selected response. or carrying out a command such as moving a piece on a displayed game board. The feedback serves to infonn the user that the command has teen regismed. and must be visible while gaze runsins on the response target.
Redicubility is essential for g w conhnl systems. If the user looks at a response target. it is diseonecrring if the target next to it is selected This may occur because the eye backing system hac miscalculated the gaze position due to system noise or drift. performance is also degradcd if the gaze time required to select a mpmse is unpredictable or if selection does not occur at all. Sucb amrs will cause the user to distrust the system and 'inpair performance substantially. Careful layout of mponse ma on the
use of high quality eye hacking systems. drift canction. and use of the reliable Mponse detection methods discussed blow will prevent these problems.
Achieving rapid mpnses to gaze input requires an mtegraud system capable of real-time pmaasing of data fmm the. eye tracker into gaze position. Other pmaasing requ id includes detection of saccsdcs, fixation and blinks. generation of gaze respmse events, and llpdating the display for user feedback and infmmatiar presentation. Delays btwm any user response (via button p ~ s . voice key. or eye movement) and resulting changed of the display must be short and predictable: real-time p l o a s s i n g systems aw dcsigncd to fulfiu this requirement.
4. Implementallan Iasacg
To make gaze response practical. pychophysical and implementation issues relating to respons error rates. response ~~~~gnition, and user fedback must be addwad. ?he nccd for d - t ime mtemctive systun response. the effects of eye mcking muracy on prrfonoance, and some methods for comcting gaze position drift will be discussed. Tcdmiqucs for analyzing the eye movement data for g m respmse events will be intmduwd and evaluated
4.1 EyeTrnddng Devlees
The basis of any gaze mhul interface is the eye tracking dcvtce. Many mhniques have bccn developed fm monitoring eye position. but only a few have the characteristics required for reliable gaze connu1 systems. The environmental requirements for the opoation of the eye uacking ~ t e m must be considcrcd as weU systems that requirc head restraints or total darkness are unlikely to meet human factors requirements.
The eye uacking device function is utilized to detsrmine the user's gaze position in the display of response tarpets and information. The uacker itself typically measures the eye position in a vi& image of the eye, by pupil position and/or by areflection fmm the unnea of the eye. This position must then be mvcrted to a gaze position by a mathematical transformation. determined by a system Ealibntion. The culibration measures several (typically 5 or 9) point cmespondmm between gaze position and eye tracker output to wmpute the Coefticient of this function 151. Each point is collected by displaying a target on the display device and recording the eye hacker's data as the subject fuatcs the target The accuracy with which the target is fuated and the position of the eye for each point is measurcd will determine the accuracy to which gaze position can be m e a s d later.
Movements of the user's head in relation to the display device will cause the relationship betwcm eye position and
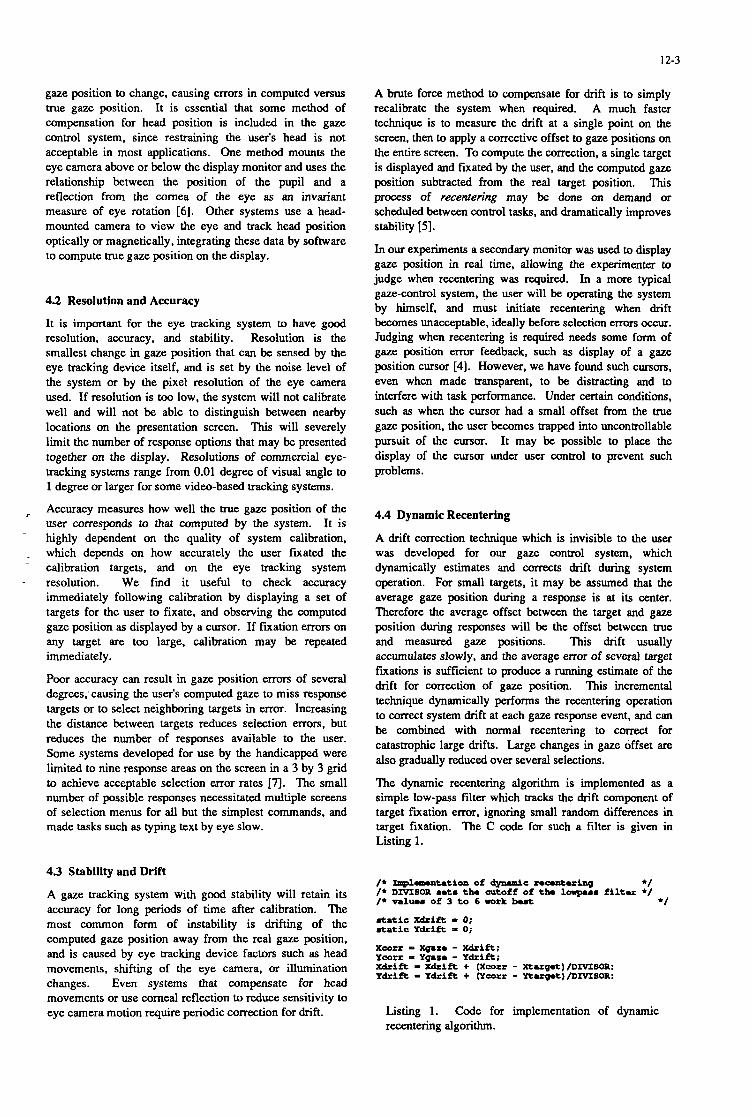
12-3
gaze position to change, causing errors in computed versus true gaze position. It is essential that some method of compensation for head position is included in the gaze control system, since restraining the user's head is not acceptable in most applications. One method mounts the eye camera above or below the display monitor and uses the relationship between the position of the pupil and a reflection from the cornea of the eye as an invariant measure of eye rotation [ 6 ] . Other systems use a head- mounted camera to view the eye and track head position optically or magnetically, integrating these data by software to compute true gaze position on the display.
4.2 Resolution and Accuracy
It is important for the eye tracking system to have good resolution, accuracy, and stability. Resolution is the smallest change in gaze position that can be sensed by the eye tracking device itself, and is set by the noise level of the system or by the pixel resolution of the eye camera used. If resolution is too low, the system will not calibrate well and will not be able to distinguish between nearby locations on the presentation screen. This will severely limit the number of response options that may be presented together on the display. Resolutions of commercial eye- tracking systems range from 0.01 degree of visual angle to 1 degree or larger for some video-based tracking systems.
Accuracy measures how well the true gaze position of the user corresponds to that computed by the system. It is highly dependent on the quality of system calibration, which depends on how accurately the user fixated the calibration targets, and on the eye tracking system
- resolution. We find it useful to check accuracy immediately following calibration by displaying a set of targets for the user to fixate, and observing the computed gaze position as displayed by a cursor. If fixation errors on any target are too large, calibration may be repeated immediately.
Poor accuracy can result in gaze position errors of several degrees, causing the user's computed gaze to miss response targets or to select neighboring targets in error. Increasing the distance between targets reduces selection errors, but reduces the number of responses available to the user. Some systems developed for use by the handicapped were limited to nine response areas on the screen in a 3 by 3 grid to achieve acceptable selection error rates [7]. The small number of possible responses necessitated multiple screens of selection menus for all but the simplest commands. and made tasks such as typing text by eye slow.
.
4 3 Stability and Drifl
A gaze tracking system with good stability will retain its accuracy for long periods of time after calibration. The most common form of instability is drifting of the computed gaze position away from the real gaze position, and is caused by eye tracking device factors such as head movements, shifting of the eye camera, or illumination changes. Even systems that compensate for head movements or use corneal reflection to reduce sensitivity to eye camera motion require periodic correction for drift.
A brute force method to compensate for drift is to simply recalibrate the system when required. A much faster technique is to measure the drift at a single point on the screen, then to apply a corrective offset to gaze positions on the entire screen. To compute the correction, a single target is displayed and fixated by the user, and the computed gaze position subtracted from the real target position. This process of recentering may be done on demand or scheduled between control tasks, and dramatically improves stability [5 ] .
In our experiments a secondary monitor was used to display gaze position in real time, allowing the experimenter to judge when recentering was required. In a more typical gaze-control system, the user will be operating the system by himself, and must initiate recentering when drift becomes unacceptable, ideally before selection errors occur. Judging when recentering is required needs some form of gaze position error feedback, such as display of a gaze position cursor [4]. However, we have found such cursors, even when made transparent, to be distracting and to interfere with task performance. Under certain conditions. such as when the cursor had a small offset from the true gaze position, the user becomes trapped into uncontrollable pursuit of the cursor. It may be possible to place the display of the cursor under user control to prevent such problems.
4.4 Dynamic Recentering
A drift correction technique which is invisible to the user was developed for our gaze control system, which dynamically estimates and corrects drift during system operation. For small targets, it may be assumed that the average gaze position during a response is at its center. Therefore the average offset between the target, and gaze position during responses will be the offset between true and measured gaze positions. This drift usually accumulates slowly, and the average error of several target fixations is sufficient to produce a running estimate of the drift for correction of gaze position. This incremental technique dynamically performs the recentering operation to correct system drift at each gaze response event, and can be combined with normal recentering to correct for catastrophic large drifts. Large changes in gaze offset are also gradually reduced over several selections.
The dynamic recentering algorithm is implemented as a simple low-pass filter which tracks the drift component of target fixation error, ignoring small random differences in target fixation. The C code for such a filter is given in Listing 1.
/* lhpl-tation of dynamic rmcantuing */ /* DIVISOR s.Cs tb cutoff of tb. lowpass filtu */ /* values of 3 to 6 work b u t +/
m t a t i c Xdrift - 0; mtatic Y d r i f t = 0 ;
X w r r = +am - Xdrift; Ywrr = Y q a m - Y d r i f t ; xdrift - X d r i f t + (xcorr - X t u p t ) / D I V I S O R : Y d r i f t Y d d f t + (Ycorr - r t r r p t ) / D I V I S O R :
Listing 1. Code for implementation of dynamic recentering algorithm.
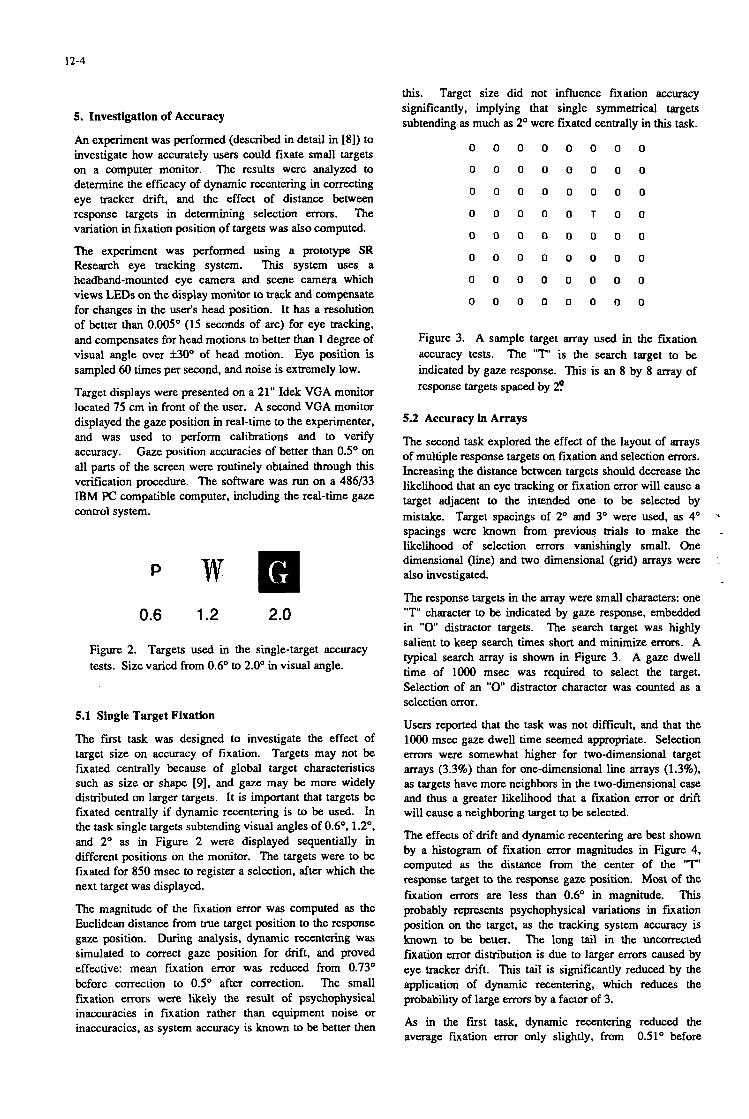
12-4
5. Investigation of Accuracy
An experiment was performed (described in detail in [SI) to investigate how accurately users could fixate small targets on a computer monitor. The results were analyzed to determine the efficacy of dynamic recentering in correcting eye tracker drift, and the effect of distance between response targets in determining selection errors. The variation in fixation position of targets was also computed.
The experiment was performed using a prototype SR Research eye tracking system. This system uses a headband-mounted eye camera and scene camera which views LEDs on the display monitor to track and compensate for changes in the user's head position. It has a resolution of better than 0.005' (15 seconds of arc) for eye tracking, and compensates for head motions to better than 1 degree of visual angle over f30' of head motion. Eye position is sampled 60 times per second, and noise is extremely low.
Target displays were presented on a 21" Idek VGA monitor located 75 cm in front of the user. A second VGA monitor displayed the gaze position in real-time to the experimenter, and was used to perform calibrations and to verify accuracy. Gaze position accuracies of better than 0.5' on all parts of the screen were routinely obtained through this verification procedure. The software was run on a 486133 IBM PC compatible computer, including the real-time gaze control system.
0.6 1.2 2.0
Figure 2. Targets used in the single-target accuracy tests. Size varied from 0.6' to 2.0' in visual angle.
5.1 Single Target Fixation
The first task was designed to investigate the effect of target size on accuracy of fixation. Targets may not be fixated centrally because of global target characteristics such as size or shape [9], and gaze may be more widely distributed on larger targets. It is important that targets be fixated centrally if dynamic recentering is to be used. In the task single targets Subtending visual angles of 0.6', 1.2". and 2' as in Figure 2 were displayed sequentially in different positions on the monitor. The targets were to be fixated for 850 msec to register a selection, after which the next target was displayed.
The magnitude of the fixation error was computed as the Euclidean distance from true target position to the response gaze position. During analysis, dynamic recentering was simulated to correct gaze position for drift, and proved effective: mean fixation error was reduced from 0.73' before correction to 0.5' after correction. The small fixation errors were likely the result of psychophysical inaccuracies in fiation rather than equipment noise or inaccuracies, as system accuracy is known to be better then
this. Target size did not influence fixation accuracy significantly, implying that single symmetrical targets subtending as much as 2' were fixated centrally in this task.
0 0 0 0 0 0 0 0
0 0 0 0 0 0 0 0
0 0 0 0 0 0 0 0
O O O O O T O O
0 0 0 0 0 0 0 0
0 0 0 0 0 0 0 0
0 0 0 0 0 0 0 0
O O Q Q O O O O
Figure 3. A sample target array used in the fmation accuracy tests. The " T is the search target to be indicated by gaze response. This is an 8 by 8 array of response targets spaced by 2Q
5.2 Accuracy In Arrays
The second task explored the effect of the layout of arrays of multiple response targets on fixation and selection errors. Increasing the distance between targets should decrease the likelihood that an eye tracking or fixation error will cause a target adjacent to the intended one to be selected by mistake. Target spacings of 2' and 3' were used, as 4' spacings were known from previous trials to make the likelihood of selection errors vanishingly small. One dimensional (line) and two dimensional (grid) arrays were also investigated.
The response targets in the array were small characters: one "T' character to be indicated by gaze response, embedded in "0" distractor targets. The search target was highly salient to keep search times short and minimize errors. A typical search array is shown in Figure 3. A gaze dwell time of loo0 msec was required to select the target. Selection of an "0" distractor character was counted as a selection error.
Users reported that the task was not difficult, and that the lo00 msec gaze dwell time seemed appropriate. Selection errors were somewhat higher for two-dimensional target arrays (3.3%) than for one-dimensional line arrays (1.3%), as targets have more neighbors in the two-dimensional case and thus a greater likelihood that a fixation error or drift will cause a neighboring target to be selected.
The effects of drift and dynamic recentering are best shown by a histogram of fixation error magnitudes in Figure 4. computed as the distance from the center of the " T response target to the response gaze position. Most of the fixation errors are less than 0.6' in magnitude. This probably represents psychophysical variations in fixation position on the target, as the tracking system accuracy is known to be better. The long tail in the uncorrected fmation error distribution is due to larger errors caused by eye tracker drift. This tail is significantly reduced by the application of dynamic recentering, which reduces the probability of large errors by a factor of 3.
As in the first task, dynamic recentering reduced the average fixation e m only slightly, from 0.51' before
*
-
:
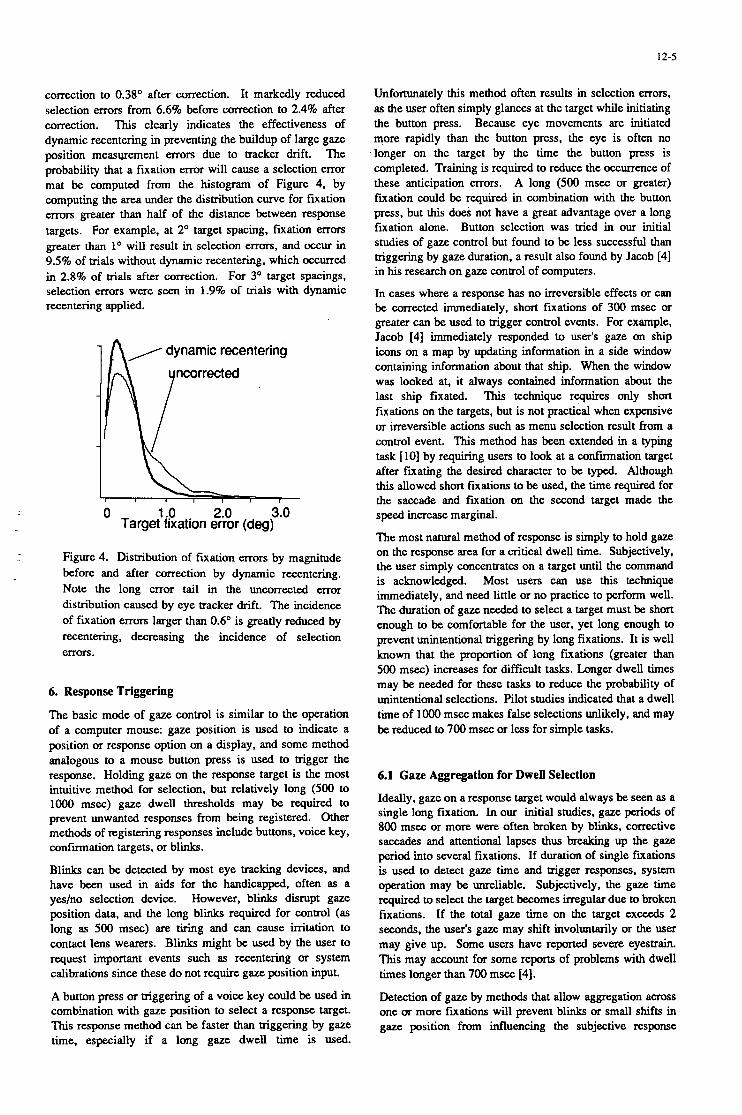
12-5
correction to 0.38" after correction. It markedly reduced selection e m from 6.6% before correction to 2.4% after correction. This clearly indicates the effectiveness of dynamic recentering in preventing the buildup of large gaze position measurement errors due to tracker drift. The probability that a fiation error will cause a selection error mat be computed from the histogram of Figure 4, by computing the area under the distribution curve for fiation errors greater than half of the distance between response targets. For example, at 2" target spacing, f iation errors greater than 1" will result in selection errors, and occur in 9.5% of trials without dynamic recentering, which occurred in 2.8% of trials after correction. For 3" target spacings, selection errors were seen in 1.9% of trials with dynamic recentering applied.
/ dynamic recentering
ncorrected
i- I
0 1 .o 2.0 3.0 Target fixation error (deg)
Figure 4. Distribution of fiation errors by magnitude before and after correction by dynamic recentering. Note the long error tail in the uncorrected error distribution caused by eye tracker drift. The incidence of fiation errors larger than 0.6" is greatly reduced by recentering, decreasing the incidence of selection errors.
6. Response Triggering
The basic mode of gaze control is similar to the operation of a computer mouse: gaze position is used to indicate a position or response option on a display, and some method analogous to a mouse button press is used to trigger the response. Holding gaze on the response target is the most intuitive method for selection, but relatively long (500 to lo00 msec) gaze dwell thresholds may be required to prevent unwanted responses from being registered. Other methods of registering responses include buttons, voice key. confirmation targets, or blinks.
Blinks can be detected by most eye tracking devices, and have been used in aids for the handicapped, often as a yes/no selection device. However, blinks disrupt gaze position data, and the long blinks required for control (as long as 500 msec) are tiring and can cause irritation to contact lens wearers. Blinks might be used by the user to request important events such as recentering or system calibrations since these do not require gaze position input.
A button press or triggering of a voice key could be used in combination with gaze position to select a response target. This response method can be faster than triggering by gaze time, especially if a long gaze dwell time is used.
Unfortunately this method often results in selection errors, as the user often simply glances at the target while initiating the button press. Because eye movements are initiated more rapidly than the button press, the eye is often no longer on the target by the time the button press is completed. Training is required to reduce the occurrence of these anticipation errors. A long (500 msec or greater) fiation could be required in combination with the button press, but this does not have a great advantage over a long fiation alone. Button selection was tried in our initial studies of gaze control but found to be less successful than triggering by gaze duration, a result also found by Jacob [4] in his research on gaze control of computers.
In cases where a response has no irreversible effects or can be corrected immediately, short fixations of 300 msec or greater can be used to trigger control events. For example, Jacob [4] immediately responded to user's gaze on ship icons on a map by updating information in a side window containing information about that ship. When the window was looked at, it always contained information about the last ship fixated. This technique requires only short fixations on the targets, but is not practical when expensive or irreversible actions such as menu selection result from a control event. This method has been extended in a typing task [lo] by requiring users to look at a confirmation target after fixating the desired character to be typed. Although this allowed short fixations to be used, the time required for the saccade and fiation on the second target made the speed increase marginal.
The most natural method of response is simply to hold gaze on the response area for a critical dwell time. Subjectively. the user simply concentrates on a target until the command is acknowledged. Most users can use this technique immediately, and need little or no practice to perform well. The duration of gaze needed to select a target must be short enough to be comfortable for the user, yet long enough to prevent unintentional triggering by long fixations. It is well known that the proportion of long fixations (greater than 500 msec) increases for difficult tasks. Longer dwell times may be needed for these tasks to reduce the probability of unintentional selections. Pilot studies indicated that a dwell time of lo00 msec makes false selections unlikely, and may be reduced to 700 msec or less for simple tasks.
6.1 Gaze Aggregation for Dwell Selection
Ideally, gaze on a response target would always be seen as a single long fixation. In our initial studies, gaze periods of 800 msec or more were often broken by blinks, corrective saccades and attentional lapses thus breaking up the gaze period into several fixations. If duration of single fiations is used to detect gaze time and trigger responses, system operation may be unreliable. Subjectively, the gaze time required to select the target becomes irregular due to broken fixations. If the total gaze time on the target exceeds 2 seconds, the user's gaze may shift involuntarily or the user may give up. Some users have reported severe eyestrain. This may account for some reports of problems with dwell times longer than 700 msec [4]. Detection of gaze by methods that allow aggregation across one or more fixations will prevent blinks or small shifts in gaze position from influencing the subjective response

12-6
delay of the gaze control system. Detecting fiations is the first step in the gaze aggregation, as blinks or tracker artifacts often appear as short or misplaced fixations. Fixations are def ied as periods when eye position is stationary and are separated by saccades, which may be detected by rapidly changing eye position as described in [5 ] . Only data from fiations that exceed a time threshold of 80 msec (the shortest psychophysically valid fiation duration) are integrated into the gaze period.
After the fixation duration exceeds this validation threshold, its data must be integrated into the gaze estimate as each data sample arrives from the eye tracker. This allows the control response to be triggered at the instant that gaze time exceeds the dwell threshold, instead of at the end of the fiation. Position of gaze may be estimated by computing a running mean of the position data of all data points for all fiations in the gaze.
Gaze periods may be defined by detecting tightly clustered sequences of fixations. For arrays of response targets with well-defied positions. it is sufficient to define a region on the display for each target for gaze aggregation. Sequential fiations falling into a target's gaze region are aggregated to determine the gaze time. This simple method of aggregation may fail if the locus of gaze falls near the edge of a target's region, as some of the fixations in the gaze may fall outside the region and terminating the gaze period prematurely.
When targets are tightly packed or selection of targets is unstructured displays such as video images or pictures is required, a more robust method of gaze aggregation is needed. Cluster aggregation [l l] integrates groups of fiations into a single gaze position, which can then be used to select a response target. The basic algorithm compares the position of each fiation to the center of gravity of a potential cluster, computed as the average of positions weighted by duration of each fixation. If the fiation is closer than a critical distance to the cluster, it is added to the cluster, otherwise the fixation begins a new gaze cluster.
For gaze control systems, a real-time variant of cluster aggregation is used. As each gaze position data point arrives from the eye tracker, it is integrated into the current fiation's average position, which is compared to the cluster's center of gravity. If the fiation is sufficiently close to the cluster, the position data is also integrated into the cluster's position. If the fiation's position deviates sufficiently from the cluster's position, the fixation's data is removed from the cluster and the fiation's data used to start a new cluster. When the number of samples in the gaze cluster exceeds the gaze response dwell time, the position of the cluster is used to determine what target or position on the display has been selected.
6.2 Integrated Gaze Control
To integrate gaze control with complex computer software, it must be encapsulated with a simple and standard communications method. The most usable paradigm is that used by mouse-driven GUI (graphical user interfaces) such as the operating system of the Macintosh or Windows. Here, the application software draws or creates interface elements such as menus or dialog boxes, and mouse clicks or other selection events are processed by the operating
system and relayed back to the software as control events. It is clear that gaze control can emulate the mouse in these systems easily, although its feasibility to replace the mouse for applications such as drawing or text editing is not as clear.
In the implementation of such a system. processing of eye tracker data in gaze control systems would take place in real time, including calculation of gaze location on the screen and saccade and fiation detection and blink rejection. Gaze would be aggregated by cluster or region to produce current gaze position and duration, and responses would be triggered when gaze is in a valid target's response region and exceeds the dwell time threshold. Target gaze regions would be predefined by application or system software and used for fiation aggregation or to identify the selected target when cluster aggregation is used.
The response would be processed immediately to give user feedback such as proceeding to the next menu screen or highlighting of the selected response. If implemented, dynamic recentering would be performed automatically at the time of each selection. These operations will ensure stable and predictable responses. Control events would be passed back to application software for appropriate processing.
THE QUICK RED FOX JUHPEO OVER THE LAZY BROUN 006 THE-QUICK-REO-
,_
A E I O U < O :
B C D e G H J
K L M N P Q R
S T V W X Y Z
Figure 5 . The screen layout of the typing task. All letter targets are separated by 4' to keep selection error rates low. The backspace and space targets are at the right end of the top row of targets. The top part of the screen contains the text to be typed as well as the typed output. Letters are highlighted for 300 msec as they are typed: the "F" is highlighted in this picture.
7. Sample Gaze-Control Tasks
Two gaze-control tasks are presented which investigate the feasibility of the interface method for practical uses. In the f i t task, typing by eye is implemented and compared to results by other researchers. In the second task, a board game requiring substantial mental effort is played to determine if gaze response and cognitively demanding activities are compatible.

12-7
7.1 Typing by Eye
Typing by eye is one of the most common tasks to be implemented in eye-movement control systems for the handicapped. It is unfortunate that little investigation has been done into its efficiency in the past, perhaps because of the focus on the implementation of such systems rather than on research. Typing requires at least the full alphabet as response alternatives, and demands high resolution and accuracy from gaze-control systems if all characters are to selectable at once. Where very few response alternatives per screen are available, multiple-level menu screens have been used [7], but resulted in relatively slow typing speeds.
The goal in this task was to evaluate the users' impressions and error rates during typing. The screen layout is shown in Figure 5, and used a 7 by 4 grid of 1.2" letters spaced by 4" horizontally and vertically. The top part of the screen contained the line of text to be typed and a space for display of the typed output. The users typed by fixating the desired letter for 750 msec, with gaze aggregated within a 4" square region centered on each target. Dynamic recentering was applied at each selection to correct for system drift. Selection feedback was given by placing a round highlight spot on the letter for 300 msec as in Figure 5. If the user continued to fixate the character, it was typed repeatedly.
Each user typed three text samples: the first was a practice trial where users typed their name or other random input. In the second trial, users typed the sentence "THE QUICK
total of 48 characters. In the third trial, users typed "
INTERACTING WITH COMPUTERS AND CONTROL BY E Y E , 44 characters. Characters typed and use of the backspace were recorded along with fixation data.
Users found the typing method interesting, but slower than manual typing. The gaze dwell time of 750 msec subjectively seemed limiting especially during the last typing trial, but in reality typing speed did not increase during the experiment. The time spent in selection of each typed character was only 40% of the 1870 msec average time required to type each character. The remaining 1120 msec (an average of three fixations) was spent in searching for the character in the typing array. It is expected that search time will decrease with practice, permitting shorter dwell times to be used.
Errors were classified by counting backspaces and examining the typed output: transcription errors included missed characters or spelling mistakes (4 instances in 1400 characters typed). Selection errors were scored if a spelling mistake involved a letter adjacent to the correct letter on the selection grid, and occurred 5 times out of 1400 characters typed (0.36%). The low selection error rate for the 4" target spacing can be compared to the 1.9% error rate for 3" spacing and 3.4% for the 2' spacing measured in the search task discussed earlier. Error rates also compare well to the 1.3% reported for a 54-character typing screen [12], which can be expected to require much closer target spacing.
It is apparent that typing by eye is much slower than manual typing. with most time spent searching for the character to be typed. With much practice, search time may be minimized and the dwell time may be reduced further. Research has shown that typing by touch screen can be as fast as 500 msec per character (25 W M ) , and by mouse at
RED FOX JUMPED OVER THE LAZY BROWN DOG', a .
-
-
700 msec (1 7 W M ) [ 131. Typing by eye can probably be as fast once character positions in the typing array are memorized.
Pairs: 2 Flips: 17
Figure 6. The screen layout used in the "Concentration" game task. Squares are 4' in size and are numbered to encourage central fixation. Once fixated, squares "flip" to reveal a large letter or three- letter word. The number of flips and pairs found are displayed at the top left of the screen.
7.2 "Concentration" Game
It is important to investigate gaze control in conjunction with a more complex cognitive task. which increases the probability of very long fmations and therefore of unintentional responses. The game of "Concentration" was chosen, as it is easy to learn and to implement in software. In this game, players flip numbered squares to reveal letters or words. The objective is to reveal matching pairs of letters or words. If a pair of nonmatching letters or words are revealed. both are hidden again. This task requires a broad memory span and careful search strategy to minimize the number of flips required to reveal all pairs.
The game screen layout used is shown in Figure 6 and consisted of a 5 by 4 grid of 4" squares. As it is difficult to fixate the center of a large blank area, each square is numbered in its center to provide a target for gaze. Central fixation of the squares helps to reduce selection errors and improve dynamic recentering perfmance. The current score in total flips and pairs revealed was displayed at the upper left comer of the screen. A gaze duration of lo00 msec, aggregated within the region of the square, caused the small number to be replaced by a larger word or letter. This change was salient enough that no other selection feedback was required. If the flipped square was the second in a nonmatching pair, both tokens were hidden 600 msec later.
Users reported the method of play to be interesting and intuitive, although the game itself was not easy. An average of 43 flips and 100 seconds were required to complete each game. The dwell time of lo00 msec was judged to be correct for the task by all users. Even though many long fixations were seen due to the difficulty of the task were seen. none resulted in unwanted responses,

12-8
suggesting that a lo00 msec dwell time maybe sufficient for complex tasks.
Use of a shorter dwell time of 700 msec caused some subjects to report the subjective impression that the computer was anticipating their responses, flipping squares on the board before the user was aware of initiating the action. It is difficult to determine whether such anticipatory responses in fact match the responses that would have been made with to longer dwell times, or were simply unintended selections. Such anticipatory actions have been reported by other researchers when short dwell times are used [4].
8. Discussion
In considering the use of gaze control for any application. the human factors of the task must be considered carefully. Fine control of gaze position is not always possible: gaze tends to be attracted to visual objects, and is difficult to control on blank areas of the display. Adding extra detail to the display such as the numbers at the centers of squares in the board game task discussed earlier, or a grid of dots to help fixations be accurately placed on blank areas can be expected to improve task performance.
Eye movements have many automatic characteristics, and initial fixations on response targets may be influenced by global aspects of a display such as position and shape of targets [9]. Increasing gaze dwell times may also produce more accurate secondary fixations to improve fixation accuracy and decrease selection errors. h g dwell times may also result in more accurate task performance [8], as the dwell time allows the user to cOrrect erroneous response choices. This increased accuracy must be considered against the increase in task performance time.
Some tasks may require careful design if they are to be used with gaze control. For example, if gaze control options are presented on an aircraft heads-up display, fixations on external objects may cause false selections. Gaze also may be stationary during driving, tending to rest on the center of visual flow. Long fixations to perform selections may impede operation of vehicles by preventing the operator from scanning the instruments or field of view. Using button selection of the fixated response option rather than gaze dwell time may be superior to gaze dwell time in such environments.
Accuracy of gaze on response targets was found to be very good, with mean fixation errors of 0.5" or better. Targets of up to 2 O is size were fixated as accurately as smaller targets, but it is expected that very large targets (>4O) will not be fixated centrally, instead being fixated near an edge or comer. Adding central detail to such targets may be helpful. The greatest cause of selection errors was found to be drift, which dynamic recentering helped to reduce. Target spacings of 4" showed vanishingly small selection error rates, while target spacings of 2" or 3" showed low but significant error rates, largely due to drift. If an eye tracking system without drift was used, target spacing of 2" or less might be practical. However, it might be difficult to locate the desired response option in a large array of such tightly packed targets, degrading task performance.
Gaze control should be very useful in target designation tasks. In tasks where detailed image analysis is needed,
gaze control may be used to concentrate image processing resources around the operator's point of gaze, substantially reducing processing requirements. Targeting of moving or stationary objects in a real scene by gaze may not be accurate enough for tracking or weapons control applications, due to psychophysical fixation inaccuracies or eye tracking resolution. It is possible to use gaze position to guide an image processing computer to search for exact target location in the image or to lock onto a moving target.
9. Conclusions
In general, the results from the experimental tasks suggest that gaze response is intuitive and reliable enough to be practical in many teleoperation and computer interface applications. All users performed a wide variety of control tasks without need for any training, and were enthusiastic about the natural quality of selection by looking. These positive subjective impressions were further supported by the speed and accuracy scores for the tasks.
Gaze control can be learned quickly, and feels natural to the user. However, gaze control is a simulated, nonphysical interaction method and depends on predictable and correct operation and prompt and visible response feedback to maintain the illusion of control. Users quickly become frustrated or hesitant if selection times become variable or response selections are incorrect. The real-time processing methods described in this paper help to improve system stability by making selection times independent of blinks or eye tracker artifacts. and reducing selection errors due to drift. These methods were verified in the experimental tasks described in this paper.
Important to the success of the paradigm was the ability to precisely place gaze on response targets and to hold the gaze for long enough to mgger the response. Although natural gaze is often broken by blinks or refixation. the aggregation of gaze by cluster or segment resulted in reliable selections and predictable gaze times. Users had no difficulty with dwell times requiring gaze periods as long as 1000 msec. This is in marked contrast to reported difficulty with dwell times over 700 msec by Jacob [4], who used only single fixation as a measure of gaze duration.
Psychophysical limits on accuracy of gaze placement were not large enough to be a problem in response selection. The main source of selection errors appeared to be the result of occasional drifts in the eye tracking system. Such drift could be corrected by the use of dynamic recentering. which reduced probability of selection mrs by 66%.
If eye trackers with low resolution or with rapid drifting such as that caused by head movements are used, response targets must be widely separated, reducing the number of response options that may be placed on the display screen. Multiple-level menus of screens may be used to expand the number of options available, at the cost of increased selection time.
The typing and game-playing tasks were representative of gaze control computer interfaces. These tasks required reliable selection between many response targets, which mandates high-quality eye tracking devices with good accuracy and low drift. User comfort is important if gaze control is to be accepted by computer users, requiring
12-9
headband-mounted or desktop eye trackers that do not constrain head motion.
10. References
1.
2.
3.
4.
5.
6.
7.
Laefsky, I.A. & Roemer, .R. A. (1978). A real-time control system for CAI and prosthesis. Behavioral Research Methods & Instrumentation. 10(2), 182- 185. Abbey. (1968) Guide Weapons of Aircraft, US. Patea 3 3 763 75 Razden. R. and Kielsr, A. (1991). Eye Slaved Pointing Device for Teleoperator Control. Proceedings of the
Jacob. R.J.K. (1991). The use of eye movements in human-computer interaction techniques: What you look at is what you get. ACM Tramactions on Information Systems, 9(3). 152-169. Stampe, D.M. (1993). Heuristic filtering and reliable calibration methods for video-based pupil-tracking systems. Behavioral Research Met-. Instruments, & Computers, 25(2), 137-142.
SPIE, ~1388, ~ ~ 3 6 1 - 3 7 1
Merchant, J. et al. (1974). Remote measurement of eye direction allowing subject motion over one cubic foot of space. IEEE Tramactions on Biomedical Engineering, 21,309-3 17 Frey, L.A, White, K.P. Jr., & Hutchinson, T.E. (1990). Eye-gaze word processing. IEEE Transactions on System, Man, and Cybernetics. 20(4), 944-950.
8. Stampe, D.M. andReingold, E.M. (1993). Eye Movements as a Response Modality in Psychological Reaserch. In J. Findlay (Ed.), Eye Movement Research: Mechanisms, Processes, and Applications (In Press) Findlay, J.M. & Crawford. T.I. (1976). The visual control of saccadic eye movements: Evidence for limited plasticity. In R. Groner, C. Menz, D.F. Fisher. & R. Monty (Eds.), Eye movements andpsychological processes: International views @p. 115-127). Hillsdale, NJ: Lawrence Erlbaum Associates. Charbonnier, C. and Masse, M. (1993) Typing Controlled by Ocular Command. Poster paper presented at the Seventh European Conference on Eye Movements, Durham, Sept. 1993 Kundel, H.L., Nodine, C.F., & Krupinski. E.A. (1989). Searching for lung nodules: Visual dwell indicates locations of false-positive ,and false-negative decisions. Investigative Radiology, 24.472-478. Spaepen, A.J. & Wouters, M. (1989). Using an eye- mark recorder for alternative communication. In A.M. Tjoa, H. Reiterer, and R. Wagner (Eds.). Computers for Handicapped Persons. (pp. 475-478). Vienna: R. Oldenbourg. Andrew, S. (1991). Improving touchscreen keyboards: Design issues and a comparison with other devices. Interacting with Computers, 3(3), 253-269.
9.
10.
11.
12.
13.
13-1
Orientation du regard sous facteur de Charge
Aspects methodologiques
Resultats preliminaires
Gaze Orientation under Gz-load
Methodological Aspects Preliminary Results
Patrick B. SANDOR* I sa bel le t i ORTOLLAN D*
Frederic POUX*
*Centre d’Essais en Vol, LAboratoire de MBdecine A6roSpatiale Division Biodynamique, F-91228 Bretigny sur Orge, FRANCE
Alain LEGER **
**Sextant Avionique, Division Visualisations et Interfaces Rue Toussaint Catros, F-33400 Le Haillan, FRANCE
R h u m b : La direction du regard d’un sujet soumis Si une acce-
leration GI en centrifugeuse a et6 calculee en condition tQte libre. Le mouvement de I’oeil etait mesure par un oculometre du type pupille-reflet corneen, le mouvement de la tQte par un systeme 6lectro-optique de detection de la position de casque. La tQte du sujet etait positionnee approximativement au centre d’un hemisphere de 1,80m de diametre. La face interne de cet hemisphere constitue un &ran sur lequel un spot laser est envoyb. La LDV du
.. sujet est calculee a partir de la direction de I’oeil dans le ’.
repere mobile de la tQte. Une procedure de correction - d’erreur de parallaxe permet de calculer le point d’intersec-
tion de la LDV et de I’ecran, determinant ainsi les ecarts cible-point de regard.
Apres validation statique de la chaine de mesure, deuxexperimentations preliminaires sous facteur de charge ont et6 conduites. Les resultats obtenus demontrent la faisabilite de la methode de designation dans I’environne- ment experimental. Les ameliorations necessaires a I’ac- quisition de donnees permettant une etude quantitative precise ont Bgalement et6 determinees.
Introduction :
Les environnements aeronautiques actuels des avi- ons de chasse amenent progressivement une augmenta- tion de la masse et souvent un deplacement du centrage des dispositifs portes sur la tQte. Dans ce cadre, les systemes de type viseur de casque pourraient beneficier, en plus de la detection de la position de la tQte, de la detection de la direction du regard (Ligne-De-Visee LDV) du pilote. Dans le futur, I’utilisation de la LDV permettrait I’amelioration de I’interface Homme-systbme, aussi bien pour les applications militaires que civiles. Dans le do- maine militaire, les conditions de vol sous facteur de charge constituent un domaine d’emploi particulibrement interessant.
Summary : Gaze in head-free condition was computed under
Gz-load. Eye movements were measured with an oculometer using the pupil-to-corneal reflexmethod. Head movements were measured with an electro-optic system. The subject‘s head was at the centre of a hemisphere (diameter 1.80 m). The internal face of this hemisphere was forming a screen on which a laser spot was to be projected. The subject‘s line-of-sight (ligne-de-vide LDV) was computed, i.e. the direction of the eyeball in the head frame, which is mobile relative to the space. A procedure of correction ofthe parallaxerror allowed the determination of the Point-of-Gaze, which is the intersection point of the LDV with the screen.
After static validation, two pilot experiments were performed under low G,-load. Results showed feasibility of the method in the experimental environment, an pursuit errors were quantified. Improvements are proposed.
L‘integration d’un systeme de mesure de mouvement de I’oeil et d’un systeme de mesure de mouvement de la tQte a et6 entreprise au Laboratoire de MBdecine ABrospa- tiale du Centre d’Essais en Vol depuis plusieurs annbes. Deux experimentations successives menees sous accele- ration dans une nacelle de la centrifugeuse humaine du laboratoire. Elles etaient fondees sur I’erreur mesuree entre le point de regard, c’est-A-dire le point d’intersection de la LDV avec 1’6cran constituant le support de la cible, et la position de la cible.
Cet article prbsente les resultats de ces experiences, et une analyse des difficultes techniques rencontrees.
Presented at an AGARD Meeting on ‘Virtual Interfaces: Research and Applications’, October 1993.
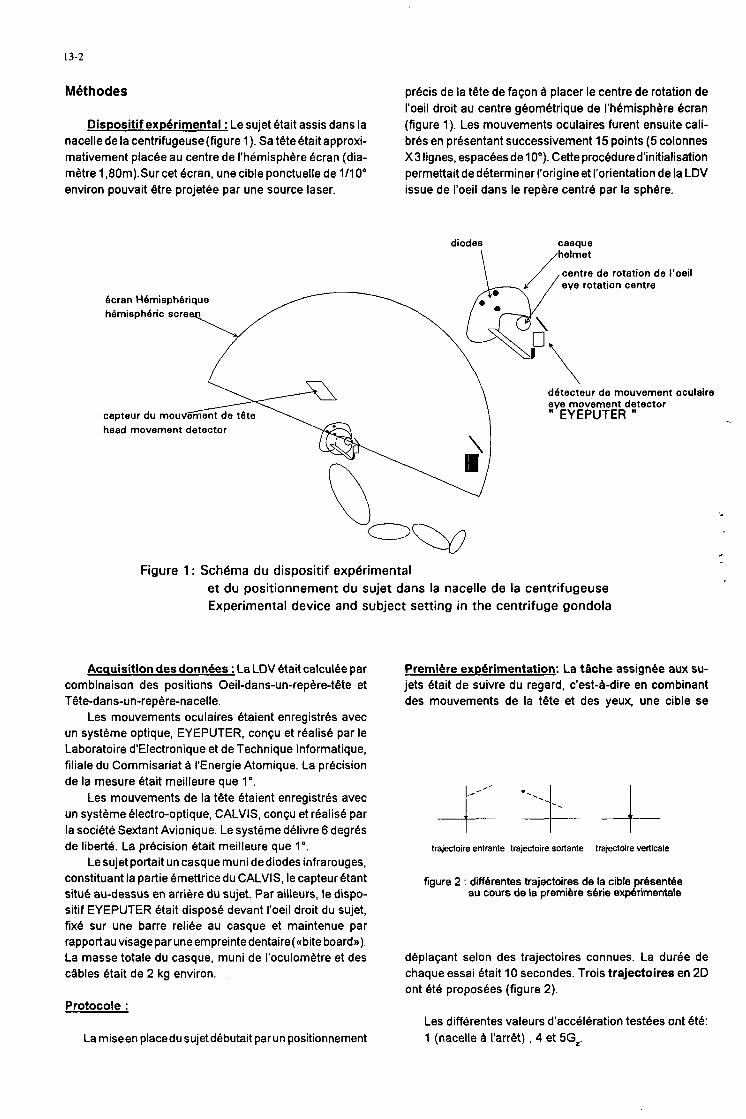
13-2
Mbthodes precis de la tdte de faGon A placer le centre de rotation de I'oeil droit au centre geometrique de I'hemisphere &ran (figure 1). Les mouvements oculaires furent ensuite cali- bres en presentant successivement 15 points (5 colonnes X3 lignes, espacees de 10'). Cette procedured'initialisation permettait de determiner I'origine et I'orientation de la LDV issue de I'oeil dans le repere centre par la sphere.
Dispositif expbrimental : Le sujet etait assis dans la nacelle de la centrifugeuse (figure 1). Sa tQte Btait approxi- mativernent placee au centre de I'hernisph8re &ran (dia- metre 1,80m).Surcet ecran, une cible ponctuelle de 1/10" environ pouvait dtre projetbe par une source laser.
diodes casque
centre de rotation de I'oeil eye rotation centre
4cran HBmisph6rique h4misph4ric scre
Figure 1 : Schema du dispositif experimental e t du positionnement du sujet dans la nacelle de la centrifugeuse Experimental device and subject setting in the centrifuge gondola
Acquisition des donn6es : La LDV etait calculee par combinaison des positions OeiI-dans-un-repere-tdte et Tdte-dans-un-repere-nacelle.
Les rnouvements oculaires 6taient enregistres avec un systeme optique, EYEPUTER, conGu et realise par le Laboratoire d'Electronique et de Technique Inforrnatique, filiale du Comrnisariat I I'Energie Atomique. La precision de la mesure Btait meilleure que 1".
Les mouvernents de la tdte Btaient enregistres avec un systerne electro-optique, CALVIS, c o n y et realise par la societe Sextant Avionique. Le systeme delivre 6 degres de libert6. La precision etait rneilleure que 1".
Le sujet portait un casque rnuni de diodes infrarouges, constituant la partie ernettrice du CALVIS, le capteur etant situ6 au-dessus en arriere du sujet. Par ailleurs, le dispo- sitif EYEPUTER etait dispose devant I'oeil droit du sujet, fixe sur une barre reliee au casque et rnaintenue par rapportau visage paruneempreintedentaire(ccbite board,). La masse totale du casque, rnuni de I'oculornetre et des csbles Btait de 2 kg environ.
Protocole :
La rniseen placedu sujetdebutait parun positionnement
Premiere exphrimentation: La tache assignee aux su- jets etait de suivre du regard, c'est-A-dire en combinant des rnouvernents de la tdte et des yeux, une cible se
trajectoire entrante trajectoire sortante trajectoire verticale
figure 2 : diffbrentes trajectoires de la cible prbsentee au cours de la premiere sbrie experimentale
deplacant selon des trajectoires connues. La duree de chaque essai etait 10 secondes. Trois trajectoires en 20 ont et& proposees (figure 2).
Les differentes valeurs d'acceleration testees ont bte: 1 (nacelle A I'arrdt) , 4 et 5Gz.
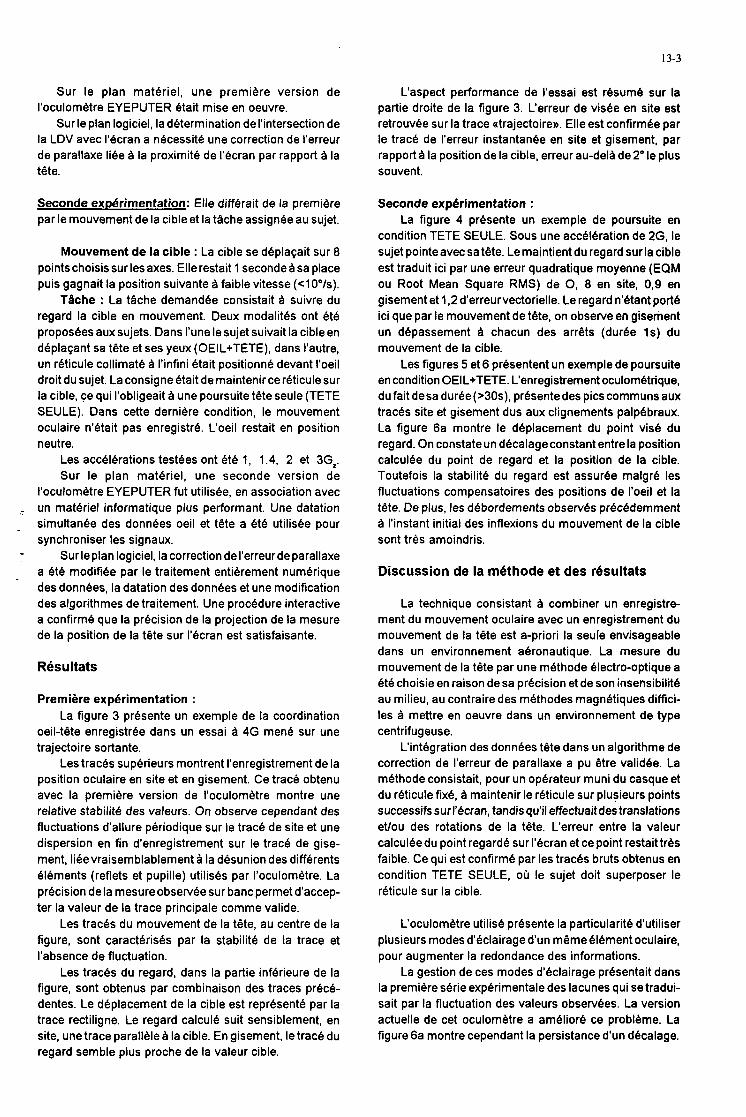
13-3
Sur le plan materiel, une premiere version de I’oculometre EYEPUTER etait mise en oeuvre.
Sur le plan logiciel, la determination de I’intersection de la LDV avec 1’6cran a necessite une correction de I’erreur de parallaxe liee B la proximite de I’bcran par rapport B la tQte.
Seconde expbrimentation: Elle differait de la premiere par le mouvement de la cible et la tache assignee au sujet.
Mouvement de la cible : La cible se d6plaCait sur 8 points choisis sur les axes. Elle restait 1 seconde B sa place puis gagnait la position suivante B faible vitesse (clO”/s).
Tiche : La tache demandee consistait B suivre du regard la cible en mouvement. Deux modalites ont et6 proposees aux sujets. Dans I’une le sujet suivait la cible en deplacant sa tQte et ses yeux (OEIL+TETE), dans I’autre, un reticule collimate A I’infini etait positionne devant I’oeil droit du sujet. La consigne etait de maintenir ce reticule sur la cible, ce qui I’obligeait B une poursuite tQte seule (TETE SEULE). Dans cette derniere condition, le mouvement oculaire n’6tait pas enregistre. L‘oeil restait en position neutre.
Les accelerations testees ont et6 1, 1.4, 2 et 3Gz. Sur le plan materiel, une seconde version de
I’oculometre EYEPUTER fut utilisee, en association avec ~ un materiel informatique plus performant. Une datation
simultanee des donnees oeil et tdte a et6 utilisee pour synchroniser les signaux.
Sur leplan logiciel, la correction de I’erreurde parallaxe a et6 modifiee par le traitement entierement numerique des donnees, la datation des donnees et une modification des algorithmes de traitement. Une procedure interactive a confirm6 que la precision de la projection de la mesure de la position de la tQte sur 1’8cran est satisfaisante.
Rdsultats
Premiere experimentation : La figure 3 presente un exemple de la coordination
oeil-tQte enregistree dans un essai a 4G men6 sur une trajectoire sortante.
Les traces superieurs montrent I’enregistrement de la position oculaire en site et en gisement. Ce trace obtenu avec la premiere version de I’oculometre montre une relative stabilite des valeurs. On observe cependant des fluctuations d’allure periodique sur le trace de site et une dispersion en fin d’enregistrement sur le trace de gise- ment, lieevraisemblablement B la desunion des differents Blements (reflets et pupille) utilises par I’oculometre. La precision de la mesureobservee sur banc permet d’accep- ter la valeur de la trace principale comme valide.
Les traces du mouvement de la tQte, au centre de la figure, sont caracteris& par la stabilite de la trace et I’absence de fluctuation.
Les traces du regard, dans la partie inferieure de la figure, sont obtenus par combinaison des traces prec6- dentes. Le deplacement de la cible est represente par la trace rectiligne. Le regard calcul6 suit sensiblement, en site, une trace parallele B la cible. En gisement, le trace du regard semble plus proche de la valeur cible.
L‘aspect performance de I’essai est resume sur la partie droite de la figure 3. L‘erreur de v i d e en site est retrouvee sur la trace utrajectoirex Elle est confirmee par le trace de I’erreur instantanee en site et gisement, par rapport B la position de la cible, erreur au-delB de 2” le plus souvent.
Seconde experimentation : La figure 4 presente un exemple de poursuite en
condition TETE SEULE. Sous une acc6leration de 2G, le sujet pointeavec sa tQte. Le maintient du regard sur la cible est traduit ici par une erreur quadratique moyenne (EQM ou Root Mean Square RMS) de 0, 8 en site, 0,9 en gisement et 1,2 d’erreurvectorielle. Le regard n’etant porte ici que par le mouvement de tete, on observe en gisement un depassement I chacun des arrQts (duree 1s) du mouvement de la cible.
Les figures 5 et 6 presentent un exemple de poursuite en condition OEIL+TETE. L‘enregistrement oculombtrique, du fait desa durBe(>30s), presentedes pics communs aux traces site et gisement dus aux clignements palpebraux. La figure 6a montre le deplacement du point vise du regard. On constate un decalage constant entre la position calculee du point de regard et la position de la cible. Toutefois la stabilite du regard est assuree malgre les fluctuations compensatoires des positions de I’oeil et la tbte. De plus, les debordements observes prec6demment B I’instant initial des inflexions du mouvement de la cible sont tres amoindris.
Discussion de la mdthode et des rdsultats
La technique consistant B combiner un enregistre- ment du mouvement oculaire avec un enregistrement du mouvement de la tdte est a-priori la seule envisageable dans un environnement abronautique. La mesure du mouvement de la tQte par une methode 6lectro-optique a et6 choisie en raison de sa precision et de son insensibilite au milieu, au contraire des methodes magnetiques diffici- les B mettre en oeuvre dans un environnement de type centrifugeuse.
L‘integration des donnees tQte dans un algorithme de correction de I’erreur de parallaxe a pu Qtre validee. La methode consistait, pour un operateur muni du casque et du reticule fixe, B maintenir le reticule sur plusieurs points successifs sur I’ecran, tandis qu’il effectuait des translations et/ou des rotations de la tbte. L‘erreur entre la valeur calculee du point regard6 sur 1’6cran et ce point restait trbs faible. Ce qui est confirm6 par les traces bruts obtenus en condition TETE SEULE, oh le sujet doit superposer le reticule sur la cible.
L‘oculometre utilise presente la particularit6 d’utiliser plusieurs modes d’eclairage d’un mQme 616ment oculaire, pour augmenter la redondance des informations.
La gestion de ces modes d’eclairage presentait dans la premiere serie experimentale des lacunes qui se tradui- sait par la fluctuation des valeurs observees. La version actuelle de cet oculom6tre a ameliore ce probleme. La figure 6a montre cependant la persistance d’un decalage.
13-4
Ce decalage variant d’un sujet B I’autre, il apparait lie A la difficult6 pour un sujet de determiner par hi-mQme une position zero de son oeil. Les materiels, utilises lors des phases d’initialisation de la position de la tQte et de calibrage preliminaire des mouvements oculaires, etant incompatibles entre eux, le decalage observe est vraisem- blablement dG 8 une derive oculaire insensible, entre ces deux phases. La position zero de I’oeil A I’initialisation de la tQte correspondrait alors B quelques degres lors du calibrage oculaire. Pour verifier ce point, nous avons procede a un nouveau calcul de la position deregard aprbs avoir introduit un decalage dans les donnees oculombtriques (figure 6b). Ce rajustement a m h e les valeurs de I’EQM B 0,8 en site, 0,Q en gisement et 1,2 en vectoriel dans cet essai.
Perspectives
La detection de I’intersection de la ligne de v i d e avec les objets de I’environnement est une perspective &dui- sante qui pose encore de nombreux problbmes. Les capteurs utilises ici devraient beneficier d’avancees tech- niques, en terme de fiabilite et stabilite des valeurs obte- nues, de frequence de mesure et de diminution de la masse supportbe par la tQte. L‘intbgration de ces capteurs dans une boucle de commande pose le probleme du traitementdesdonnbes(parexemple1e rejetdes artefacts). II se pose le probleme de I’ergonomie de ce type de dispo- sitif. Les experimentations decrites ici ont demande une procedure d’installation extrdmement rigoureuse, lice 8 I’heterogenbite des capteurs employes et leur complexitb.
En dernier lieu, la stabilite de I’oculom8tre face I I’oeil necessitait I’emploi d’une empreinte dentaire.
Si une telle methode est possible en laboratoire, en pratique, les dispositifs envisages devront prendre en compte leurs procedures d’emploi dbs la conception. Compte-tenu des installations deja implantees sur les casques, un systeme port6 sur la tQte devrait constituer une entit6 dont la realisation relhve de I’industrie, et la validation du laboratoire.
Conclusion
Dans cette experimentation pilote, I’intersection de la ligne de v i d e d’un sujet avec un &ran hemispherique le recouvrant a et6 calculee en centrifugeuse. La faisabilite de I’experience et les r6sultats prelirninaires obtenus montrent I’int6rQt de la methode, cornparbe B la designa- tion par la direction de la tQte. Un developpement ultbrieur pourrait beneficier des enseignements futurs, ergonomiques et physiologiques, que I’usage d’un tel dispositif permet d’esperer.
Remerciements: Les auteurs remercient Monsieur Dominique MASSE et son 6quipe du CENLETI pour leurs conseils et Monsieur Rene VALLET du CEV-LAMAS pour son trbs important travail technique.
Ce travail a et6 realise grhce a la commande 89/1528 de la Direction des Recherches Etudes et Techniques.
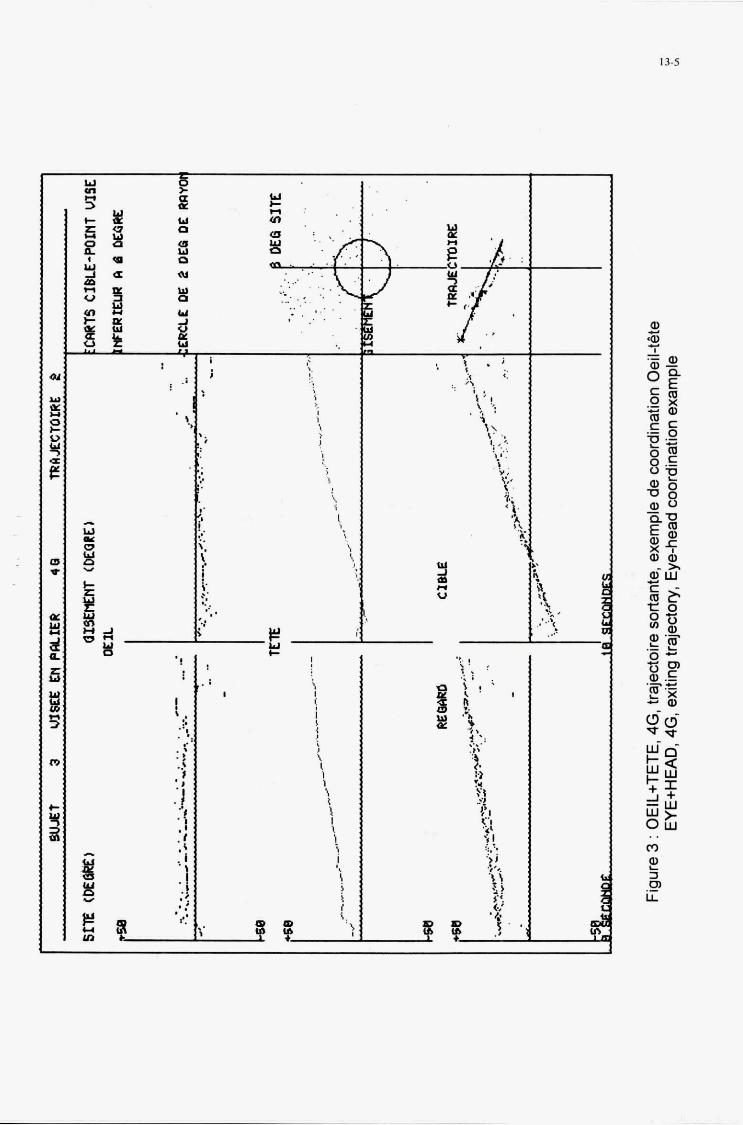
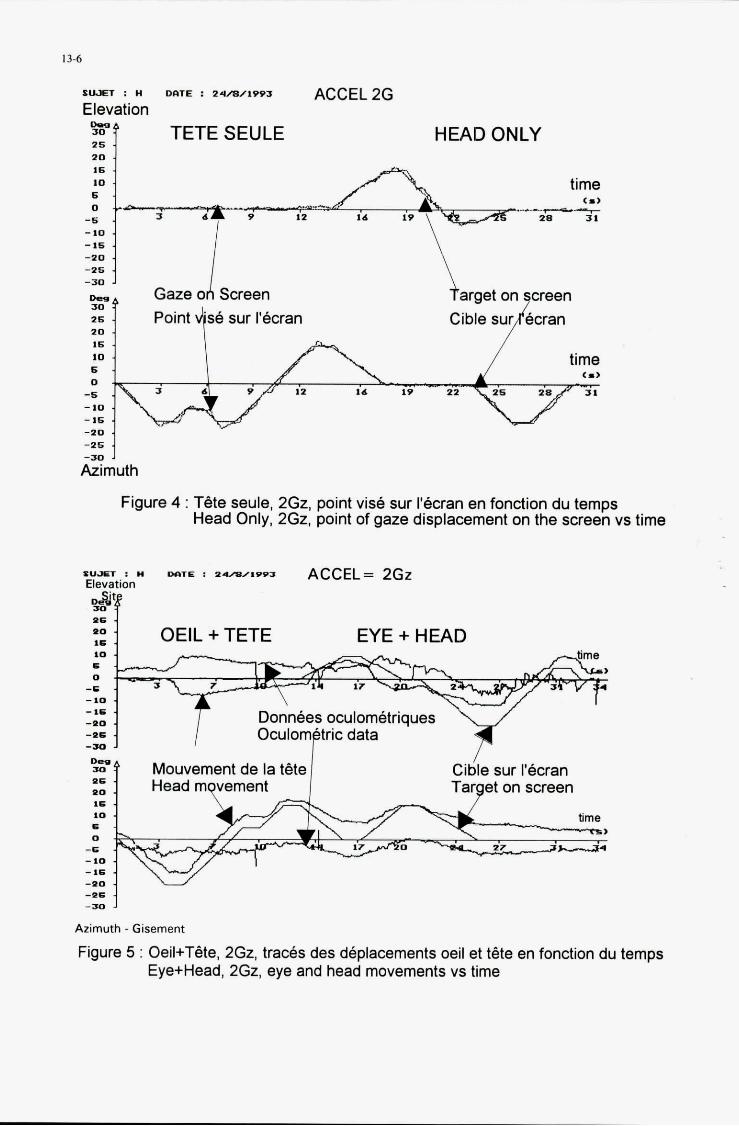
13-6
SUJET : H OIITE : 24/8/1993 ACCEL 2G Elevation %-f 26 TETE SEULE HEAD ONLY 20
time
-6 - 10 -16 -20 -26
0-q 30 26 20 16 10 6 0
-6 - 10 - 16 -20 -25
x -30 J Gazeo Screen Point 'se sur 1'6cran 4
Figure 4 : T&e seule, 2Gz, point vise sur I'Bcran en fonction du temps Head Only, 2Gz, point of gaze displacement on the screen vs time
10 5 0
-6 -IO - 16 -SO
-30 -ss
D=- 30 PC LO 15 LO 5 0
-6 - 10 - 15 -SO --Ls -30
Azimuth - Gisement
Figure 5 : Oeil+Tkte, 2Gz, traces des deplacements oeil et tete en fonction du temps Eye+Head, 2Gz, eye and head movements vs time
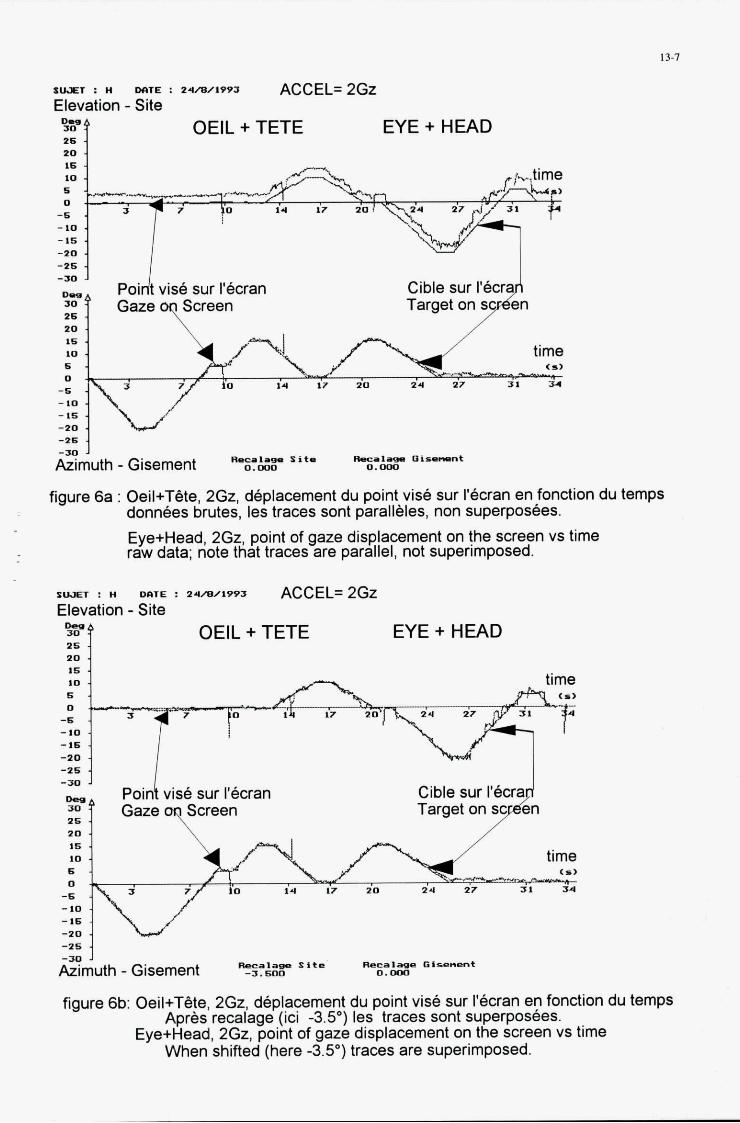
Su.ET : H M T E : 24/8/1993 ACCEL= 2Gz Elevation - Site
OElL + TETE EYE + HEAD 2 0
-2s 4 I Poi rl t vise sur 1'8cran
-30
26 Gaze TScreen 2 0 16 LO 6 0
-5 -10
-26
-11- O i Y n E n t E m u t h - Gisement RIu1w- 0.000 0.000
figure 6a : Oeil+TBte, 2Gz, deplacement du point vise sur I'ecran en fonction du temps donnees brutes, les traces sont parallbles, non superposbes. Eye+Head, 2Gz, point of gaze displacement on the screen vs time raw data; note that traces are parallel, not superimposed.
SUFT : H DaiE : zwwiws ACCELZ2GZ Elevation - Site
OElL + TETE =7 2 6 EYE + HEAD
10 15 10 6 0
-6 -10 -16 -20
vise sur I'Bcran -16 j -sa
zf 25 Gaze oyScreen 20 4 \
Cible sur I'ecra
16 10 6 0
-6 -10
-2s
z m u t h - Gisement
figure 6b: Oeil+TBte, 2Gz, deplacement du point vise sur I'Bcran en fonction du temps Apres recalage (ici 3.5") les traces sont superposbes.
Eye+Head, 2G2, point of gaze displacement on the screen vs time When shifted (here -3.5") traces are superimposed.

14-1
A Comparison of Two Examples of Magnetic Tracker Systems
M. W Warns Human Factors Department
Sowerby Research Centre FPC 267 British Aerospace
Bristol BS12 7QW United Kingdom
INTRODUCTION SUMMARY
This paper is an account of an investigation of the performance of various position measuring devices which use low frequency AC or pulsed DC magnetic fields. They are used in many applications in com- puter graphics, and now for "Virtual Reality", where it is necessary to estimate the observer's direction of gme. As part of the Sowerby Research Centre's pro- gramme of eye movement research one such system is being integrated with a video based eye-tracker.
There seems to be no independent, published assess- ment covering all aspects of all the ayRtems which are of interest to this research programme. This paper aims to fill that gap: it includes information relat- ing to the static performance of two measuring sys- tems: the %Space Polhemus Tracker and the Ascen- sion Technologies' "Bird", The measurements relate to repeatability, noise, crosCtalk, stability, range and linearity. The influence of metal objects close to the transducers is also investigated. In most respects the "Bird" sensor was found to be more appropriate for this application.
Since the early experiments of Ivor Sutherland, (Ref. 15), using mechanical linkages and subsequently ultra- sonic rangefinders, there have been many attempts at making devices which can inform a computer of the locations and orientations of its user's limbs. The im- portance of the fidelity of such information increases as the demand arises not just in Interactive Virtual Environments (IVES) but also in weapons aiming sys- tems (examples of the Polhemus magnetic tracking system, a commercial version of which is investigated here, were flown in F4s in 1972 see also Ref. 13) In an attempt to develop an environment more suited to a pilot's tasks in the future, means for providing a completely enclosed cockpit have been sought (for example the "Super-Cockpit" Programme at Wright- Patterson Airbase and also the VCASS or Visually Coupled Airborne System Simulator). Thie usually implies that a pilot will fly using cues which are syn- thetic and provided by computer generated imagery. In an alternative scenario it may be necessary to pro- vide computer enhanced or highlighted imagery from, for example, infra-red sensors. In both of these cases it may be necessary to determine where the pilot is looking (e.g. Ref. 17) and any inadequacies in the tracking systems may be apparent as mis-registration of imagery or as image lag.
Magnetic tracking systems coupled with Helmet Mounted Displays (HMDs) have been reported by many Virtual Reality researchers from low cost aids for disabled children (Ref. 12) to the NASA Ames HMD project used for tele-robotics applications (Ref. 8). A less "conventional" use of such trackers was, in combination with VPL's Dataglove, to drive a speech synthesiser via a neural network gesture recogniser (Ref. 7). The VCASS system mentioned above had tracking systems specially manufactured for it (Ref. 14).
At British Aerospace's Sowerby Research Centre work is being pursued relating to eye movements and direc- tion of regard in free-space, particularly in relation to eye-pointing tasks. Ideally an accuracy of better than 0.1 degrees and a few millimetres is required. A video based eye tracker is used which is helmet mounted
Presented at an AGARD Meeting on 'Virrual Interfaces: Research and Applications', October 1993.
14-2
and so, in order to ascertain direction of regard in free space, it necessary to know the position and ori- entation of the helmet wearer's head. The problem is more subtle than thie since it has been shown that sig- nificant amounts of helmet slippage can be expected to occur during voluntary head movements (Ref. 11). In our circumstances it is necessary, therefore, to also ascertain the orientation of the helmet with regard to the wearer's head and so two, simultaneous, measure- ments need to be made. For some tracking system this means sacrificing measurement rate because mul- tiple sensors are multiplexed and so it haa been nec- essary to find more suitable ones.
Although comprehensive summary surveys of track- ing technologies exist (Ref. lo), with the exception of Adelstein et alia, there has been little detailed work published by independent assessors of these tracking systems appropriate for the work in BAe's Research Programme. Partial investigations are documented in several papers (Ref. 4, 5, 6, 9 and 16). The present paper describes work carried out to contrast the static precision and accuracy of the data generated from two commercially available magnetic tracking systems, it complements work presented in reference 1, which deals with some of the dynamic properties of both of these trackers.
The Polhemus 3-Space
Until recently the only commercially available mag- netic tracking system has been the "Polhemus 3- Space" tracker. This is a flexible system which has options in firmware and hardware which allows the tracking of six degrees of freedom and also allows the device to be configured as a "digitiser". In this context, the latter means that a pointer may be run over the surface of a body to allow its geometry to be recorded aa a series of vertices and perhaps incorpo- rated in a computer model. The Polhemus consists of an electronics unit and, 'depending on the model, may have one transmitter and receiver connected to it or up to two transmitters and four receivers. The receivers have dimensions 25 x 15 x 10 mm and the transmit- ter has dimensions approximately 65 x 35 x 35mm. The electronics unit communicates with a host com- puter across either an Rs-232C serial link or across a proprietary eight bit parallel bus.
The data returned from the device are in the form either of simple x,y and z co-ordinates in space plus orientation angles (roll, u imuth and elevation), or as quaternions which encode the orientation as a vector in space. The Polhemus transmits its data either in ASCII form, as literal string representations of the numbers with five significant figures (a total of forty five bytes per record for six degrees of freedom - x, y, e, azimuth, roll and pitch), or in "binary format". The latter is an encoded format where the data is trans- mitted,= a guard byte with its most significant bit set on, denoting the start of a new record, and then the
data for each degree of freedom is transmitted with their most significant bits set to zero. The "missing" bits are placed in the guard byte. This requires only fifteen bytes per record. With a m-um baud rate of 19.2kbaudl it is possible to achieve a 60Hs sampling frequency of all six degrees of freedom only in binary mode. A significant drawback for this system in our application is that using multiple sensors causes the effective sampling rate to be reduced because of the previously mentioned multiplexing effect (this draw- back is still present when using multiple electronics units because the transmitter fields have to be syn- chronised ).
The following two tables, (1 & 2) describe the man- ufacturer's claimed properties of the 3-Space Isotrak and the %Space DigitiserTracker.
Recently a competing system has appeared, manu- factured by Ascension Technology, called "The Bird". Not to be outflown, Polhemus have replied with an- other system whose details were not known at the time of writing but prelaunch specification claims ap- peared in the press of lOOHz sampling rate and "im- proved accuracy and range".
The Bird - an extended avian simile
The Bird has been designed with Virtual Reality (VR) applications in mind. Its technology is based on pulsed DC magnetic fields. The purpose of thie is to reduce the effects of eddy currents in metal objects proxi- mal to its receiver and transmitter (as the magnetic field is held constant during the D.C. part of the "D.C. pulse", the eddy currents die away exponen- tially). Details of the design of the system and how it subtracts out the effects of the Earth's magnetic field are described in U.S. patents 4,849,692,(Ref. 2) and 4,945,305 (Ref. 3).
The Bird cleverly uses field coils in pairs (e.g. X and Y, Y and Z etc.) in order to increase the signal strength at the measuring position without increas- ing the current demands of the generating antennae or the necessary flux density in each coil. The mea- surements the Bird makes may be synchronised to a CRT synch signal. In this mode it may sample at up to 144Hz and is configured as a single transmitter (whose dimensions are 80 x 80 x 80mm and is thus significantly larger than the equivalent device for the Polhemus system) and a receiver, both attached to a system box. The system gets its power from a remote DC power supply, perhaps to reduce mains-borne or re-radiated interference from the transformer.
The system box contains an 80186 processor, plus an- cillary communications hardware which supports Rs- 232 and RS-485 protocols. The latter is also used for inter-communication between multiple "Birds" when it is known as a "Fast Bird BUS". Communication on the serial bus at up to 115.2kbaud is possible with the
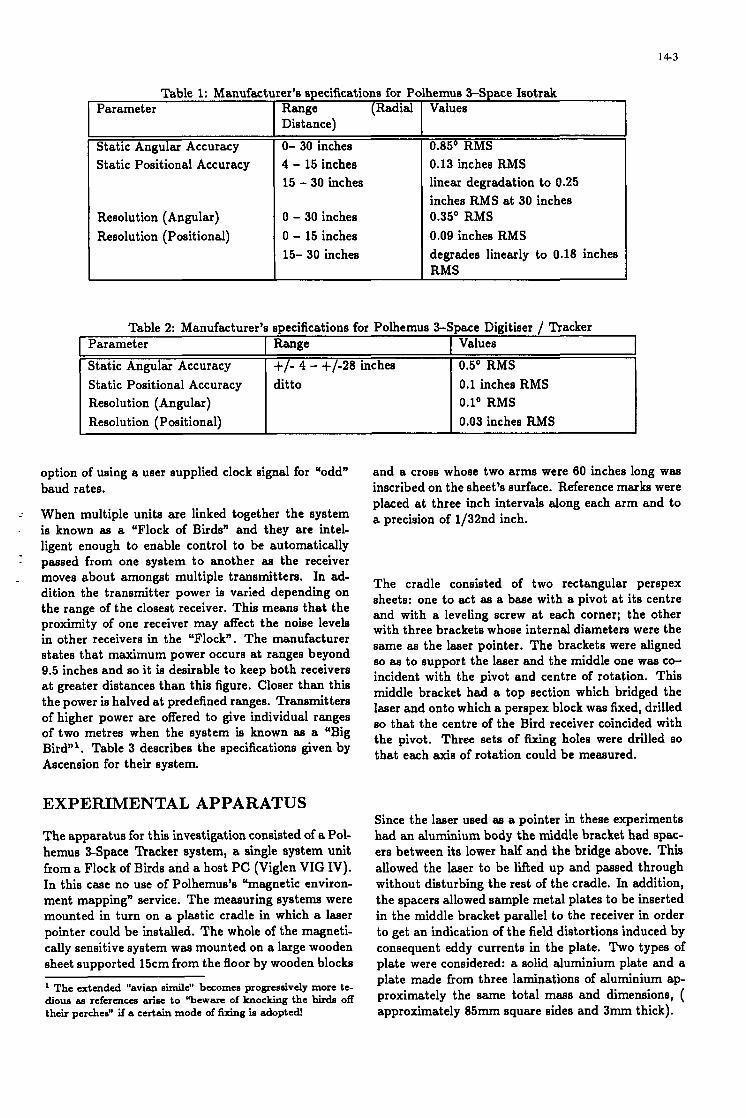
I 4 3
Parameter Range Static Angular Accuracy Static Positional Accuracy ditto Resolution (Angular) Resolution (Positional)
+/- 4 - +/-28 inches
Table Parameter
Values
0.5' RMS 0.1 inches RMS 0.1' RMS 0.03 inches RMS
Manufac -.
Static Angular Accuracy Static Positional Accuracy
Resolution (Angular) Resolution (Positional)
er's specifications for Pi Range (Radial Distance)
0- 30 inches 4 - 15 inches 15 - 30 inches
0 - 30 inches 0 - 15 inches 15- 30 inches
iemus %Space Isotrak Values
0.85O RMS 0.13 inches RMS linear degradation to 0.25 inches RMS at 30 inches 0.35' RMS 0.09 inches RMS degrades linearly to 0.18 inches RMS
option of using a user supplied clock signal for "odd" baud rates.
-- When multiple units are linked together the system - is known as a "Flock of Birds" and they are intel-
ligent enough to enable control to be automatically 1 passed from one system to another as the receiver - moves about amongst multiple transmitters. In ad-
dition the transmitter power is varied depending on the range of the closest receiver. This means that the proximity of one receiver may affect the noise levels in other receivers in the "Flock". The manufacturer states that maximum power occurs at ranges beyond 9.5 inches and so it is desirable to keep both receivers at greater distances than this figure. Closer than this the power is halved at predefined ranges. Transmitters of higher power are offered to give individual ranges of two metres when the system is known as a "Big Birdn1. Table 3 describes the specifications given by Ascension for their system.
EXPERIMENTAL APPARATUS
The apparatus for this investigation consisted of a Pol- hemus %Space Tracker system, a single system unit from a Flock of Birds and a host PC (Viglen VIG IV). In this case no use of Polhemus's "magnetic environ- ment mapping" service. The measuring systems were mounted in turn on a plastic cradle in which a laser pointer could be installed. The whole of the magneti- cally sensitive system was mounted on a large wooden sheet supported 15cm from the floor by wooden blocks
The extended "avian simile" becomes propessively more t 5 dioua BS references arise to "beware of knocking the birds off their perches" if e certain mode of fixing is adopted!
and a cross whose two arms were 60 inches long was inscribed on the sheet's surface. Reference marks were placed at three inch intervals along each arm and to a precision of 1/32nd inch.
The cradle consisted of two rectangular perspex sheets: one to act as a base with a pivot at its centre and with a leveling screw at each corner; the other with three brackets whose internal diameters were the same as the laser pointer. The brackets were aligned so as to support the laser and the middle one was co- incident with the pivot and centre of rotation. This middle bracket had a top section which bridged the laser and onto which a perspex block was fixed, drilled so that the centre of the Bird receiver coincided with the pivot. Three sets of fixing holes were drilled so that each axis of rotation could be measured.
Since the laser used as a pointer in these experiments had an aluminium body the middle bracket had spac- ers between its lower half and the bridge above. This allowed the laser to be lifted up and passed through without dieturbing the rest of the cradle. In addition, the spacers allowed sample metal plates to be inserted in the middle bracket parallel to the receiver in order to get an indication of the field distortions induced by consequent eddy currents in the plate. Two types of plate were considered: a solid aluminium plate and a plate made from three laminations of aluminium ap- proximately the same total m a s and dimensions, ( approximately 85mm square sides and 3mm thick).
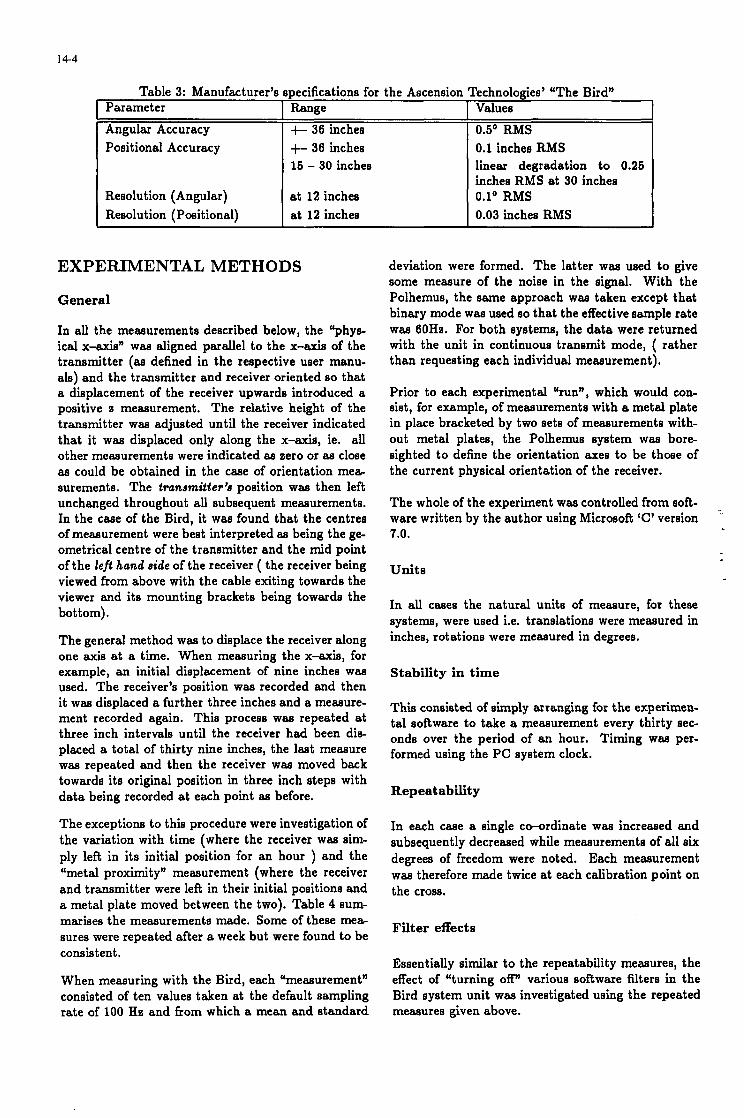
14-4
Parameter
Angular Accuracy Positional Accuracy
Range +- 36 inches +- 36 inches 16 - 30 inches
Resolution (Angular) Resolution (Positional)
at 12 inches at 12 inches
Technologies' 'The Bird" Values 0.5' RMS 0.1 inches RMS linear degradation to 0.26 inches RMS at 30 inches 0.1' RMS 0.03 inches RMS
EXPERIMENTAL METHODS
General
In all the measurements described below, the "phys- ical x-axie" was aligned parallel to the x-axis of the transmitter (as defined in the respective user manu- als) and the transmitter and receiver oriented so that a displacement of the receiver upwards introduced a positive z measurement. The relative height of the transmitter was adjusted until the receiver indicated that it was displaced only along the x-axis, ie. all other measurements were indicated as zero or as close a8 could be obtained in the case of orientation mea- surements. The tranamitter'a position was then left unchanged throughout all subsequent measurements. In the case of the Bird, it was found that the centres of measurement were best interpreted as being the ge- ometrical centre of the transmitter and the mid point of the left hand side of the receiver ( the receiver being viewed from above with the cable exiting towards the viewer and its mounting brackets being towards the bottom) . The general method was to displace the receiver along one axis at a time. When measuring the x-axb, for example, an initial displacement of nine inches was used. The receiver's position was recorded and then it was displaced a further three inches and a measure- ment recorded again. This process was repeated at three inch intervals until the receiver had been dis- placed a total of thirty nine inches, the last measure was repeated and then the receiver was moved back towards its original position in three inch steps with data being recorded a t each point as before.
The exceptions to this procedure were investigation of the variation with time (where the receiver was sim- ply left in its initial position for an hour ) and the 'metal proximity" measurement (where the receiver and transmitter were left in their initial positions and a metal plate moved between the two). Table 4 sum- marises the measurements made. Some of these mea- sures were repeated after a week but were found to be consistent.
When measuring with the Bud, each 'measurement" consisted of ten values taken at the default sampling rate of 100 HZ and from which a mean and standard
deviation were formed. The latter was used to give some measure of the noise in the signal. With the Polhemus, the same approach was taken except that binary mode was used so that the effective sample rate was 60Ha. For both systems, the data were returned with the unit in continuous transmit mode, ( rather than requesting each individual measurement).
Prior to each experimental "run", which would con- sist, for example, of measurements with a metal plate in place bracketed by two sets of measurements with- out metal plates, the Polhemus system was bore- sighted to define the orientation axes to be those of the current physical orientation of the receiver.
The whole of the experiment was controlled from soft- ware written by the author using Microsoft 'C' version 7.0.
Units
In all cases the natural units of measure, for these system, were used i.e. translations were measured in inches, rotations were measured in degrees.
Stability in time
This consisted of simply arranging for the experimen- tal software to take a measurement every thirty s e c onds over the period of an hour. Timing was per- formed using the PC system clock.
Repeatability
In each case a single co-ordinate was increased and subsequently decreased while measurements of all six degrees of freedom were noted. Each measurement was therefore made twice at each calibration point on the cross.
Filter effects
Essentially similar to the repeatability measures, the effect of 'turning of€" various software filters in the Bird system unit was investigated using the repeated measures given above.
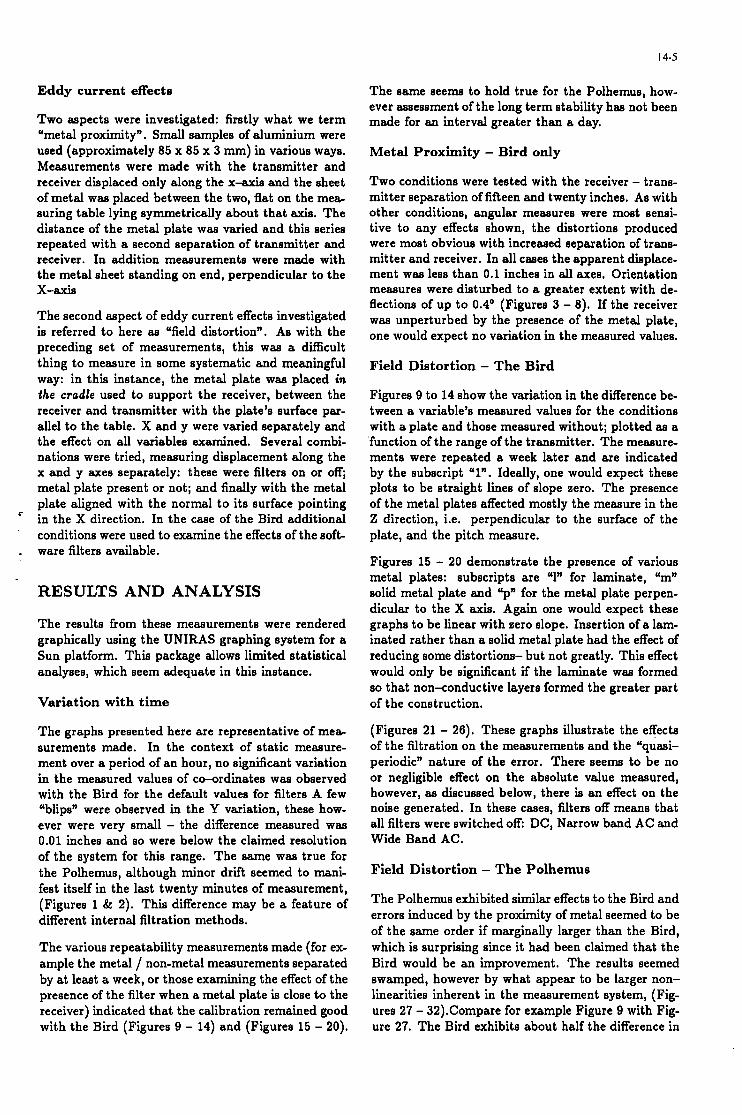
14-5
Eddy current effects
Two aspects were investigated: firstly what we term "metal proximity". Small samples of aluminium were used (approximately 85 x 85 x 3 mm) in various ways. Measurements were made with the transmitter and receiver displaced only along the x-axis and the sheet of metal was placed between the two, flat on the mea- suring table lying symmetrically about that axis. The distance of the metal plate was varied and this series repeated with a second separation of transmitter and receiver. In addition measurements were made with the metal sheet standing on end, perpendicular to the X-axis
The second aspect of eddy current effects investigated is referred to here as 'Yield distortion". As with the preceding set of measurements, this was a difficult thing to measure in some systematic and meaningful way: in this instance, the metal plate was placed in the cradle used to support the receiver, between the receiver and transmitter with the plate's surface par- allel to the table. X and y were varied separately and the effect on all variables examined. Several combi- nations were tried, measuring displacement along the x and y axes separately: these were filters on or 0%
metal plate present or not; and finally with the metal plate aligned with the normal to its surface pointing in the X direction. In the case of the Bird additional
. conditions were used to examine the effects of the soft-
. ware filters available.
RESULTS AND ANALYSIS
The results from these measurements were rendered graphically using the UNIRAS graphing system for a Sun platform. This package allows limited statistical analyses, which seem adequate in this instance.
Variation with time
The graphs presented here are representative of mea- surements made. In the context of static measure- ment over a period of an hour, no significant variation in the measured values of co-ordinates was observed with the Bird for the default values for filters A few "blips" were observed in the Y variation, these how- ever were very small - the difference measured was 0.01 inches and so were below the claimed resolution of the system for this range. The same was true for the Polhemus, although minor drift seemed to mani- fest itself in the last twenty minutes of measurement, (Figures 1 & 2). This difference may be a feature of different internal filtration methods.
The various repeatability measurements made (for ex- ample the metal / non-metal measurements separated by at least a week, or those examining the effect of the presence of the filter when a metal plate is close to the receiver) indicated that the calibration remained good with the Bird (Figures 9 - 14) and (Figures 15 - 20).
The same seem to hold true for the Polhemus, how- ever assessment of the long term stability has not been made for an interval greater than a day.
Metal Proximity - Bird only
Two conditions were tested with the receiver - trans- mitter separation of fifteen and twenty inches. As with other conditions, angular measures were most sensi- tive to any effects shown, the distortions produced were most obvious with increased separation of trans- mitter and receiver. In all cases the apparent dieplace- ment was less than 0.1 inches in all axes. Orientation measures were disturbed to a greater extent with de- flections of up to 0.4' (Figures 3 - 8). If the receiver was unperturbed by the presence of the metal plate, one would expect no variation in the measured values.
Field Distortion - The Bird
Figures 9 to 14 show the variation in the difference be- tween a variable's measured values for the conditions with a plate and those measured without; plotted as a 'function of the range of the transmitter. The measure- ments were repeated a week later and are indicated by the subscript "1". Ideally, one would expect these plots to be straight lines of slope aero. The presence of the metal plates affected mostly the measure in the Z direction, i.e. perpendicular to the surface of the plate, and the pitch measure.
Figures 15 - 20 demonstrate the presence of various metal plates: subscripts are "1" for laminate, Urn" solid metal plate and "p" for the metal plate perpen- dicular to the X axis. Again one would expect these graphs to be linear with aero slope. Insertion of a lam- inated rather than a solid metal plate had the effect of reducing some distortions- but not greatly. This effect would only be significant if the laminate was formed so that non-conductive layers formed the greater part of the construction.
(Figures 21 - 26). These graphs illustrate the effects of the filtration on the measurements and the "quasi- periodic" nature of the error. There seem to be no or negligible effect on the absolute value measured, however, as discussed below, there is an effect on the noise generated. In these cases, filters off means that all filters were switched off: DC, Narrow band AC and Wide Band AC.
Field Distortion - The Polhemus
The Polhemus exhibited similar effects to the Bird and errors induced by the proximity of metal seemed to be of the same order if marginally larger than the Bird, which is surprising since it had been claimed that the Bird would be an improvement. The results seemed swamped, however by what appear to be larger non- linearities inherent in the measurement system, (Fig- ures 27 - 32).Compare for example Figure 9 with Fig- ure 27. The Bird exhibits about half the difference in

14-6
Table 4 A Summary of Measurements made "X" indicates measurement was made
Parameter I Polhemus I Bird X linearity and repeatabil- I X IX ity Y linearity and repeatabil- ity Across parameter "cross- talk" Metal Proximity Field Distortion: solid metal in X-Y plane Field Distortion: solid metal in Y- Z plane Field Distortion: laminate in X-Y plane Signal Noise: effect of software filters Signal Noise: effect of metal proximity Signal Noise and Range Time stability of Signal Noise and accuracy
X
X
- X
X
X
-
X X
error in X that the Polhemus does and does so in a linear fashion.
The distortions introduced by the metal plate are most obvious in the Polhemus in the pitch measurements ( when using x as the independent variable) where devi- ations of several degrees are observed at the extremes of the measured ranges. In other cases the individual spread of the trajectories is too great to allow definite isolation of the effects of the metal plate. Other differ- ences were apparent when comparing the effect on all variables of varying Y (Figures 33 - 38). In thie case the Polhemus seemed to behave less well, its orienta tion measurements varying as much as the unfiltered values from the Bird. The poorest performance seem to be in measuring roll, where the amplitude of the non-linearities is approximately 4 O alone! (Figure 37)
X
X
X X
X
X
X
X
X X
The Polhemue system was tested only with filters present: in this case, as with the Bird, there was lit- tle difference between the two conditions where metal was close to the receiver and with no metal close.
Range
With both system there is a trade off of noise against range. With standard configurations, however, it is clear that the Bird has a "hard limit" of around 36 inches whereas the Polhemus exhibits a gradual d e terioration to 60 inches. It has not been tested to 60 inches but thie is the manufacturer's claim. The evidence in the measurements which have been made certainly supports the assertion that noise increases with range, the apparent error in X did not increase linearly, however.
Signal Noise DISCUSSION
The results for the Bird are summarised in the Table 5. For static measurements, as presented here, small but measurable differences in the amount of noise present could be discerned when metal was introduced close to the receiver and the filters were turned off. With filters switched on the difference in noise levels were almost unmeasurable whether metal was present or not, turn- ing off the filters produced an increase in noise which was a function of range. When metal waa present, however, the mean increase in noise (ie averaged over the domain of separations) was approximately twice that of the receiver without metal present, (Table 5).
The results presented here are consistent with those presented elsewhere for a Polhemus Isotrak (Ref. 5). Burdea et al. (Ref. 5) did not test their system to the same range as presented here but those data which can be compared are in agreement. In addition, there is some evidence for errors introduced to measured "X" displacements by physical displacements in "Y" as re- ported here but, perhaps because the measurements were carried out a t a greater "X" range then those reported by Burdea et al., the effects themselves are greater. Bryson (Ref. 4), also presents data which
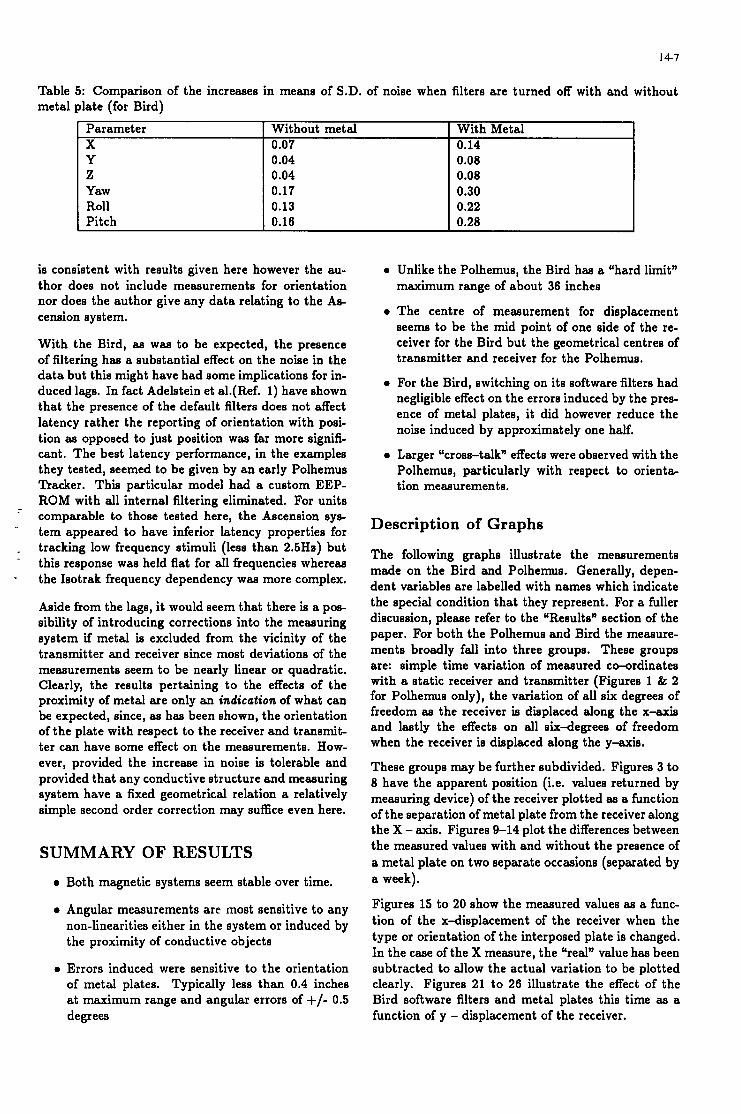
14-7
Table 5: Comparison of the increases in means of S.D. of noise when filters are turned off with and without metal plate (for Bird)
Parameter X Y Z Yaw Roll Pitch
Without metal 0.07 0.04 0.04 0.17 0.13 0.16
is consistent with results given here however the au- thor does not include measurements for orientation nor does the author give any data relating to the As- cension system.
With the Bird, as was to be expected, the presence of filtering has a substantial effect on the noise in the data but this might have had some implications for in- duced lags. In fact Adelstein et al.(Ref. 1) have shown that the presence of the default filters does not affect latency rather the reporting of orientation with posi- tion as opposed to just position was far more signifi- cant. The best latency performance, in the examples they tested, seemed to be given by an early Polhemus Tracker. This particular model had a custom EEP- ROM with all internal filtering eliminated. For units comparable to those tested here, the Ascension eye- tem appeared to have inferior latency properties for tracking low frequency stimuli (less than 2.5H5) but this response was held flat for all frequencies whereas the Isotrak frequency dependency was more complex.
- -
-
-
Aside from the lags, it would seem that there is a pos- sibility of introducing corrections into the measuring system if metal is excluded from the vicinity of the transmitter and receiver since most deviations of the measurements seem to be nearly linear or quadratic. Clearly, the results pertaining to the effects of the proximity of metal are only an indication of what can be expected, since, as has been shown, the orientation of the plate with respect to the receiver and transmit- ter can have some effect on the measurements. How- ever, provided the increase in noise is tolerable and provided that any conductive structure and measuring system have a fixed geometrical relation a relatively simple second order correction may suffice even here.
SUMMARY OF RESULTS
0 Both magnetic systems seem stable over time.
0 Angular measurements are most sensitive to any non-linearities either in the system or induced by the proximity of conductive objects
0 Errors induced were sensitive to the orientation of metal plates. Typically less than 0.4 inches at maximum range and angular errors of +/- 0.5 degrees
With Metal 0.14 0.08 0.08 0.30 0.22 0.28
0 Unlike the Polhemus, the Bird has a "hard limit" maximum range of about 36 inches
0 The centre of measurement for displacement seems to be the mid point of one side of the re- ceiver for the Bird but the geometrical centres of transmitter and receiver for the Polhemus.
0 For the Bird, switching on its software filters had negligible effect on the errors induced by the pres- ence of metal plates, it did however reduce the noise induced by approximately one half.
0 Larger "cross-talk" effects were observed with the Polhemus, particularly with respect to orienta- tion measurements.
Description of Graphs
The following graphs illustrate the measurements made on the Bird and Polhemus. Generally, depen- dent variables are labelled with names which indicate the special condition that they represent. For a fuller discussion, please refer to the "Results" section of the paper. For both the Polhemus and Bird the measure- ments broadly fall into three groups. These groups are: simple time variation of measured co-ordinates with a static receiver and transmitter (Figures 1 & 2 for Polhemus only), the variation of all six degrees of freedom as the receiver is displaced along the x-axis and lastly the effects on all six-degrees of freedom when the receiver is dieplaced along the y-axis.
These groups may be further subdivided. Figures 3 to 8 have the apparent position (i.e. values returned by measuring device) of the receiver plotted as a function of the separation of metal plate from the receiver along the X - axis. Figures 9-14 plot the differences between the measured values with and without the presence of a metal plate on two separate occasions (separated by a week).
Figures 15 to 20 show the measured values as a func- tion of the x-displacement of the receiver when the type or orientation of the interposed plate is changed. In the case of the X measure, the "real" value has been subtracted to allow the actual variation to be plotted clearly. Figures 21 to 26 illustrate the effect of the Bird software filters and metal plates this time as a function of y - displacement of the receiver.
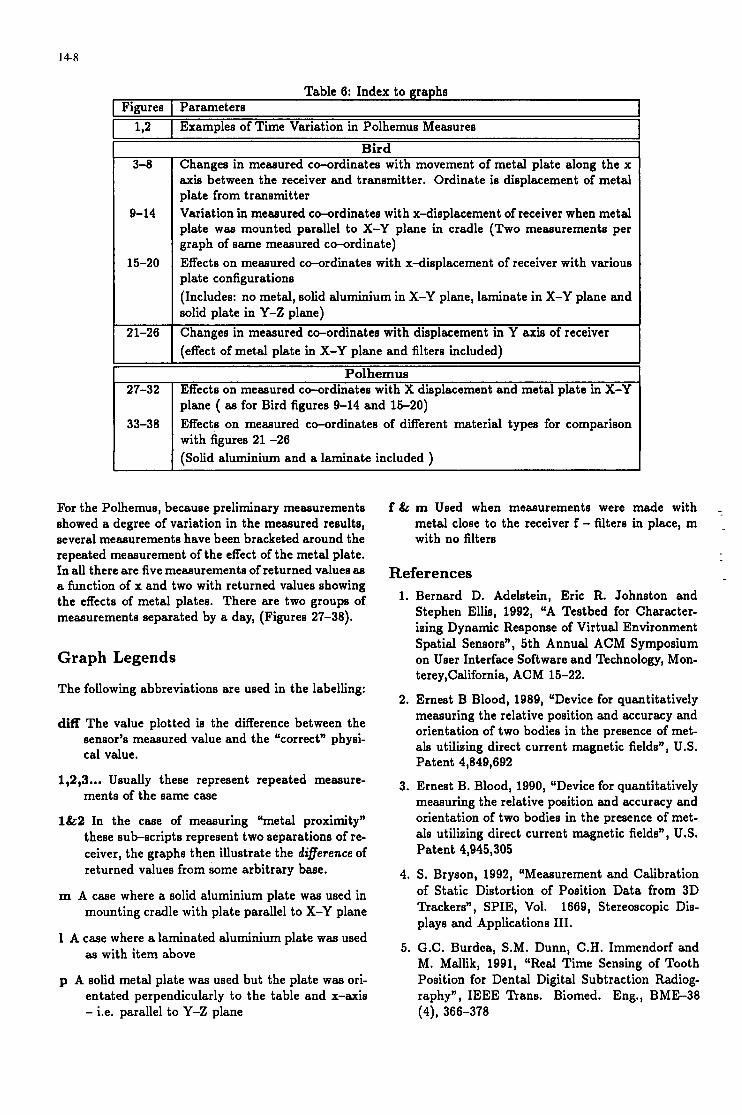
14-8
I
Bird 3-8
9-14
15-20
21-26
27-32
33-38
Changes in measured co-ordinates with movement of metal plate along the x axis between the receiver and transmitter. Ordinate is displacement of metal plate from transmitter Variation in measured co-ordinates with x-displacement of receiver when metal plate was mounted parallel to X-Y plane in cradle (Two measurements per graph of same measured co-ordinate) Effects on measured co-ordinates with x-displacement of receiver with various plate configurations (Includes: no metal, solid aluminium in X-Y plane, laminate in X-Y plane and solid plate in Y-Z plane) Changes in measured co-ordinates with displacement in Y axis of receiver (effect of metal plate in X-Y plane and filters included)
Polhemus Effects on measured coordinates with X displacement and metal plate in X-Y plane ( as for Bird figures 9-14 and 15-20) Effects on measured co-ordinates of different material types for comparison with figures 21 -26 (Solid aluminium and a laminate included )
For the Polhemus, because preliminary measurements showed a degree of variation in the measured results, several measurements have been bracketed around the repeated measurement of the effect of the metal plate. In all there are five measurements of returned values as a function of x and two with returned values showing the effects of metal plates. There are two groups of measurements separated by a day, (Figures 27-38).
Graph Legends
The following abbreviations are used in the labelling:
diff The value plotted is the difference between the sensor's measured value and the Ucorrect" physi- cal value.
1,2,3 ... Usually these represent repeated measure- ments of the same case
1&2 In the case of measuring "metal proximity" these subscripts represent two separations of re- ceiver, the graphs then illustrate the diference of returned values from some arbitrary base.
m A case where a solid aluminium plate was used in mounting cradle with plate parallel to X-Y plane
1 A case where a laminated aluminium plate was used as with item above
p A solid metal plate was used but the plate was ori- entated perpendicularly to the table and x-axis - i.e. parallel to Y-Z plane
f & m Used when measurements were made with - metal close to the receiver f - filters in place, m with no filters
References 1. Bernard D. Adelstein, Eric R. Johnston and
Stephen Ellii, 1992, UA Testbed for Character- izing Dynamic Response of Virtual Environment Spatial Sensore", 5th Annual ACM Symposium on User Interface Software and Technology, Mon- terey,California, ACM 15-22.
2. Ernest B Blood, 1989, UDevice for quantitatively measuring the relative position and accuracy and orientation of two bodies in the presence of met- als utilieing direct current magnetic fields", U.S. Patent 4,849,692
3. Ernest B. Blood, 1990, UDevice for quantitatively measuring the relative position and accuracy and orientation of two bodies in the presence of met- als utilizing direct current magnetic fields", U.S. Patent 4,945,305
4. S. Bryson, 1992, UMeasurement and Calibration of Static Distortion of Position Data from 3D Trackers" , SPIE, Vol. 1669, Stereoscopic Dis- plays and Applications 111.
5. G.C. Burdea, S.M. Dunn, C.H. Immendorf and M. Mallik, 1991, "Real Time Sensing of Tooth Position for Dental Digital Subtraction Radiog- raphy", IEEE Trans. Biomed. Eng., BME-38 (4), 366-378

14-9
6. J.C. Chung, M.R Hark, F.P. Brooks, H. Fucha, M.T. Kelley,J.Hughes, M.Ouh-young, C. Che- ung, R.L. Holloway and M. Pique, "Explor- ing Virtual World8 with Head mounkd Dim- playa",l969, SPIE Vol. 1083, Three Dimensional Visualisation and Dmplay Technologieo.
7. S. Sidney Feh and Geoffrey E. Hinton, 1990, 'Building Adaptive In te rkes with Neural Net-
Human Computer Interaction Interact '90, (eds. D. Diaper et al.), p.685688, ELevicr Science Publiahcrs
8. S.S. Fisher, M. McGreevy, J. Humphriei and W. Robiiett,l986, Virtual Environment Display Syitem", Proc. 1986 Workshop on Interactive 3D Graphics, p.77-87
Liisng, Chrk Shaw and Mark GreenJ991, 'On Tcmporal-Spatial Reali.m in Virtual Reality En- vironment", ACM UIST '91,
W O I ~ The G10ve-W Pilot Strategy", 1990, in
9. Jiandong
10. Kenneth Meyer, Hugh L. Applewhite and Frank A. BioccaJ992, "A Survey of Paition Trackers", PraKncc, Vol 1, No. 2, Spring 1992
11. C.N. Neary, I.J. Bate, L.F. Heller and M. Willisrm, "Helmst Slippage During VLud "tack- iq The Effect of Voluntary Hesd Movement", Aviation, Space and Environmental Medicine, July 1993, p623-630
12. Randy Paunch, April 1991, "Virtual Reality on Five Dollars a Day", ACM SIGCHI Conference Proceedings, New or lean^^ 1991, p265-270
13. W. Polhemun and C.B. Langford, T h e Integra- tion of Helmet Mounted Sight and Display Tech- nology with Automated Target Handoff Tech- nology", Proceedings of National Aerospace and Electronics Conference, Ohio, May 1977, p. 962- 967
-
14. Warren Robiiett, 1992, "Synthetic Experience: A Proposed Taxonomy", paper presented at the International Summer Institute on the State of the Art in Computer Graphics and submitted to Preaencc, 16th kbrnary, 1992
15. Ivor E. Sutherland, 1968, 'A head mounted thncdinaluional &play", 1968 Fall Joint Com- puter Conference, AFIPS Conference Proceed- in@, Vol. 33, p.757-764.
16. J i - tbg Wang , Ronald Asuma, Gary Bishop, Vernon ChiJohn Eyleo and Henry Fuchs, 1990, '"hcking a head mounted &play in a room lired environment with head-mounted eamerea', SPIE volume 1290 Helmet Mounted Displaya 11, 1990
17. Graham Warwick, Simon Elliott, Ari Egori and Gibert Sebon, 1993, "Looks Can Kd", Flight International, 3-9 February, 1993, p.33-36
'I
'I
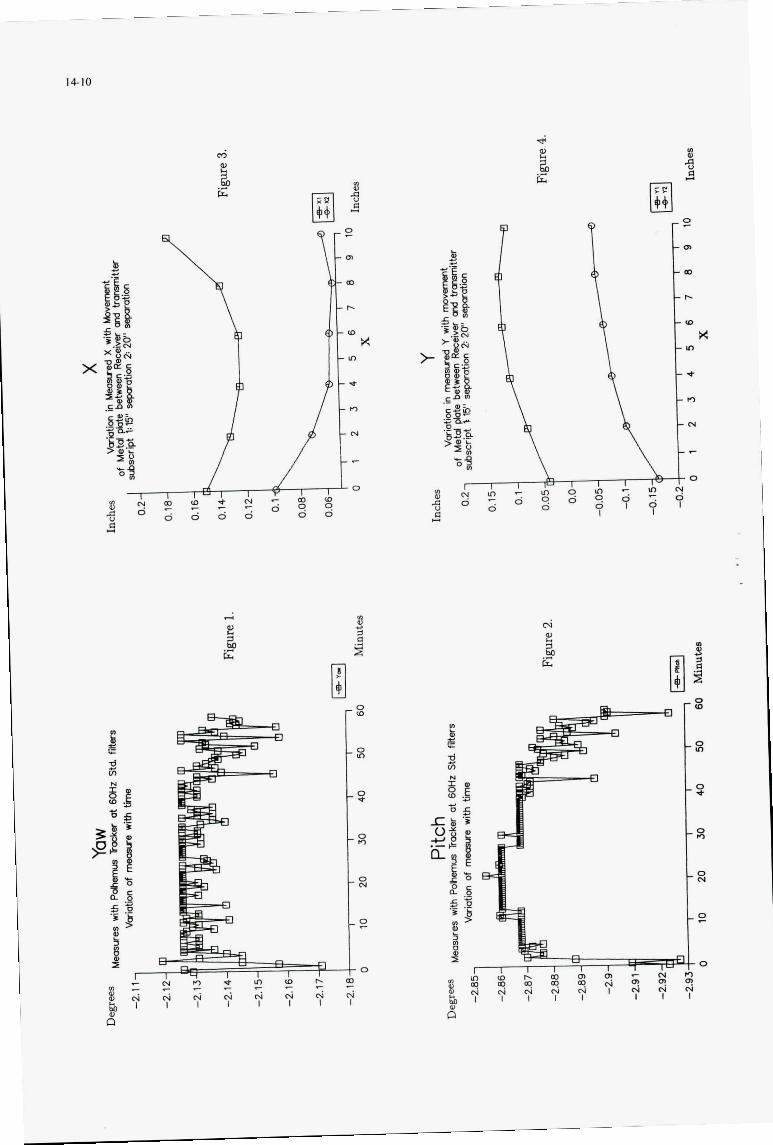
z k
8 c a s
4
I;: k
k I;:
- = -0 l
--(D
--IC
--(D
X - m
- * --*)
- N
- 7
-- 0
2 I
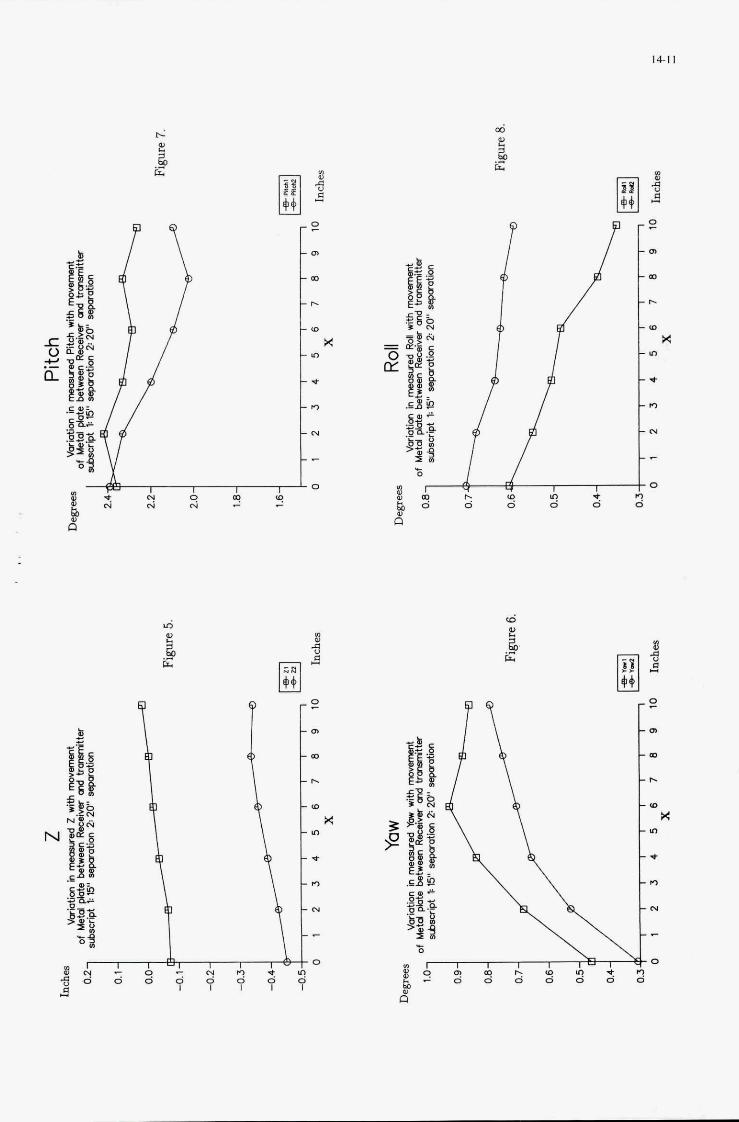
0
L 0
z m
W
r-
W
X Lo
t
n
N
- 0
n
2 m
m
b
ID
X Lo
+
n
N
,.-
0

m
14 3 U s 10 n
x VI N
X 0 N
Y
2
*
R
8 1 0 4 - ? I
4 k 2 0
n
I
I I I I I V I - z q n
0 7 2 3 I I 1 I 4 ; 9 0
0
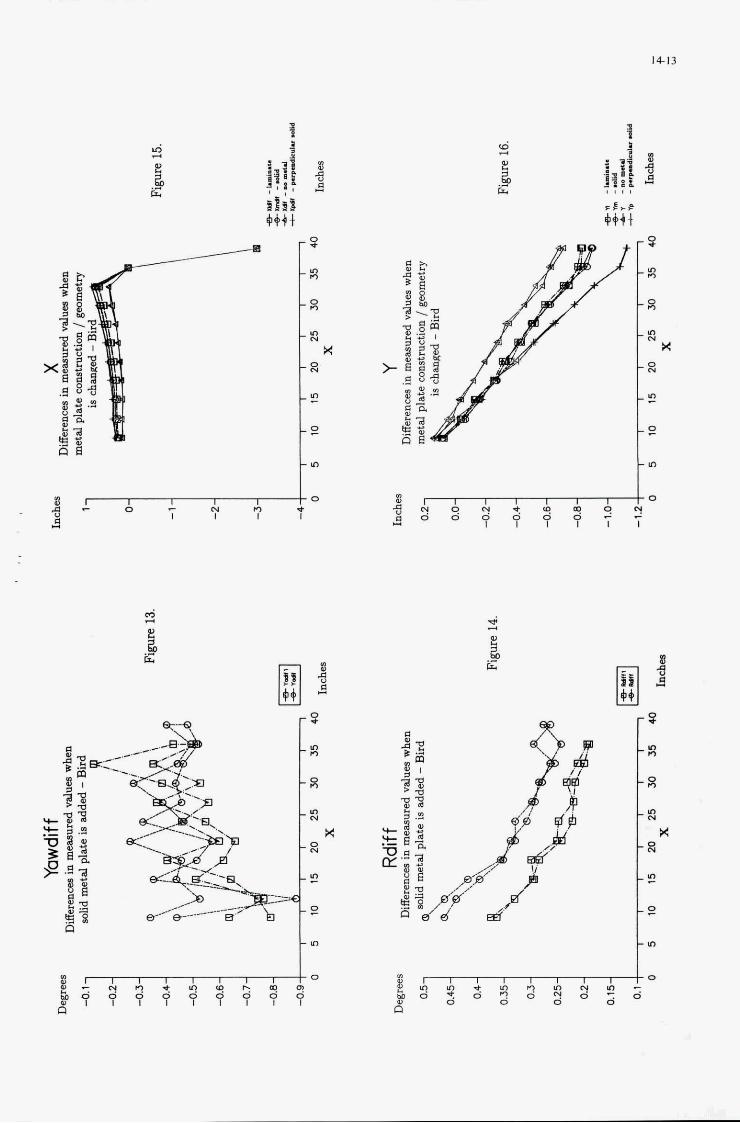
14-13
-3
- a -4
-3
- 8
- 2
X
t!
t*
, -3
-4
-a -3
X - 0
N
- 2
-s!
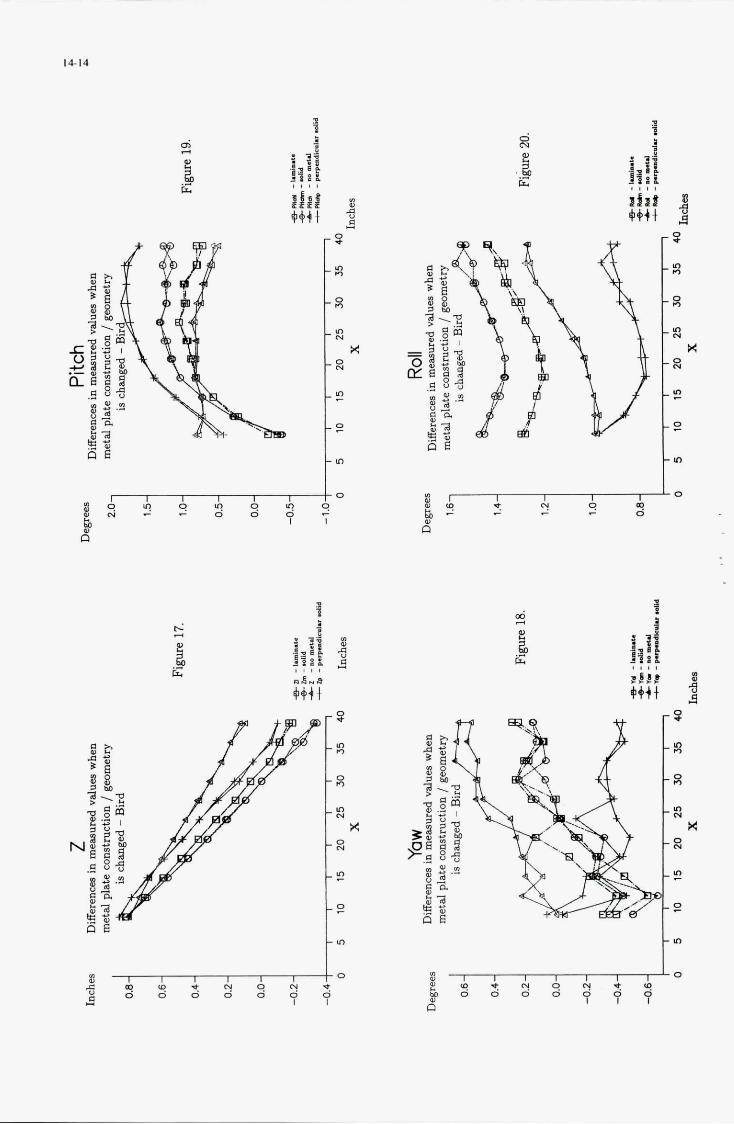
1414
, - 3
_!n I?
-x -0
N
x 0
- N
- e
- 2
-0
m 4
- 3 -10 c)
-x -0
N
x -0
N
-5
- z
-0
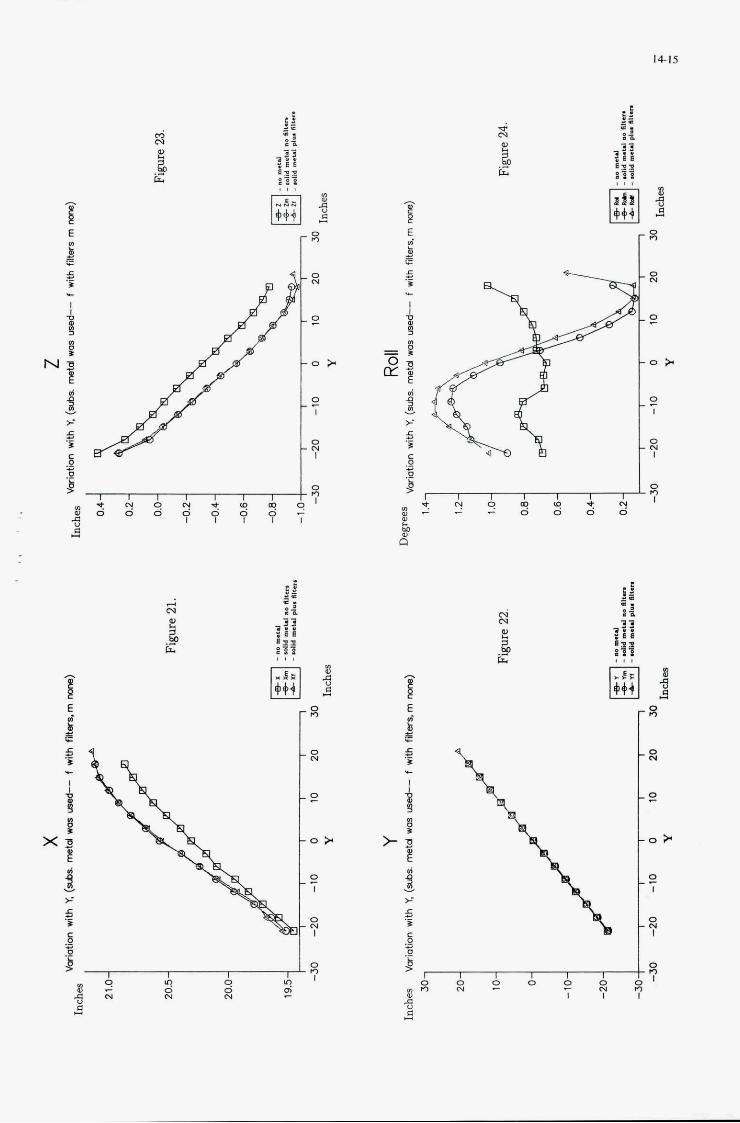
X
3
c a
T e E
cu N
kl c
::
0 N
2
o *
: I
0 N I
0 n I
a
a
z
o *
I? I
0 N I
0
I n
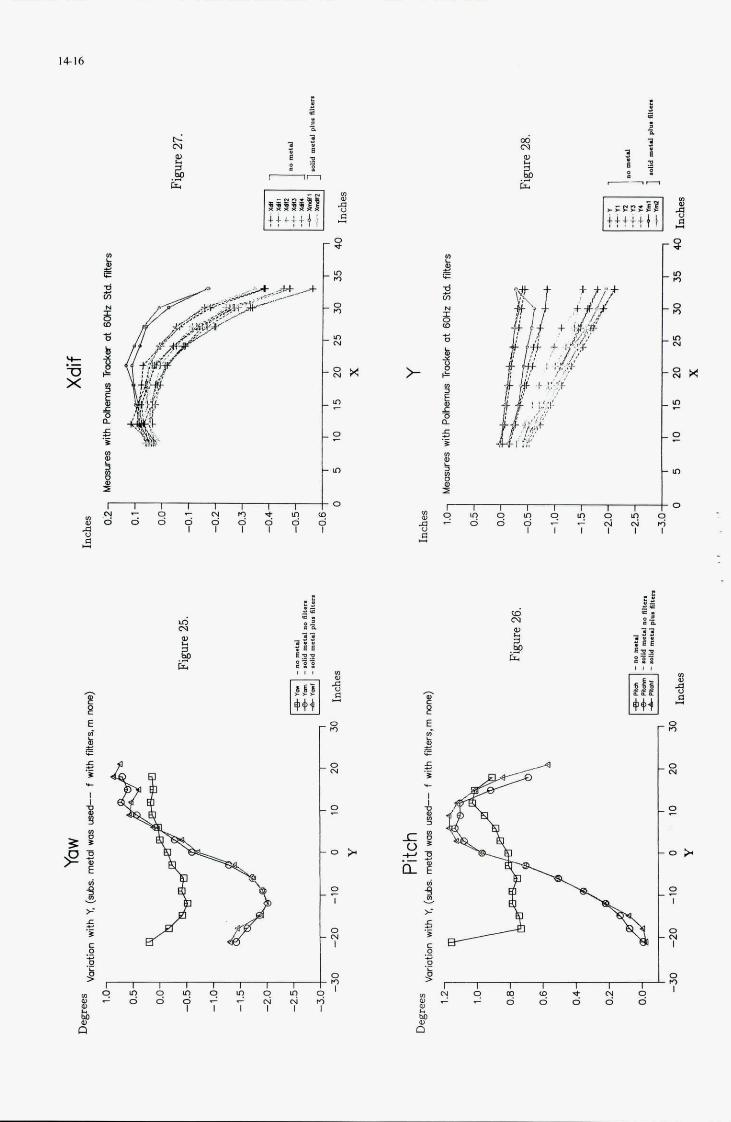
14-16
r-’ N
..- k! LI
- 0 N
- 0
- 0 * -:
I
0 - N
I
s 1
I L
- 0 N
-0,
- 0 * -2
I
0 - N
I
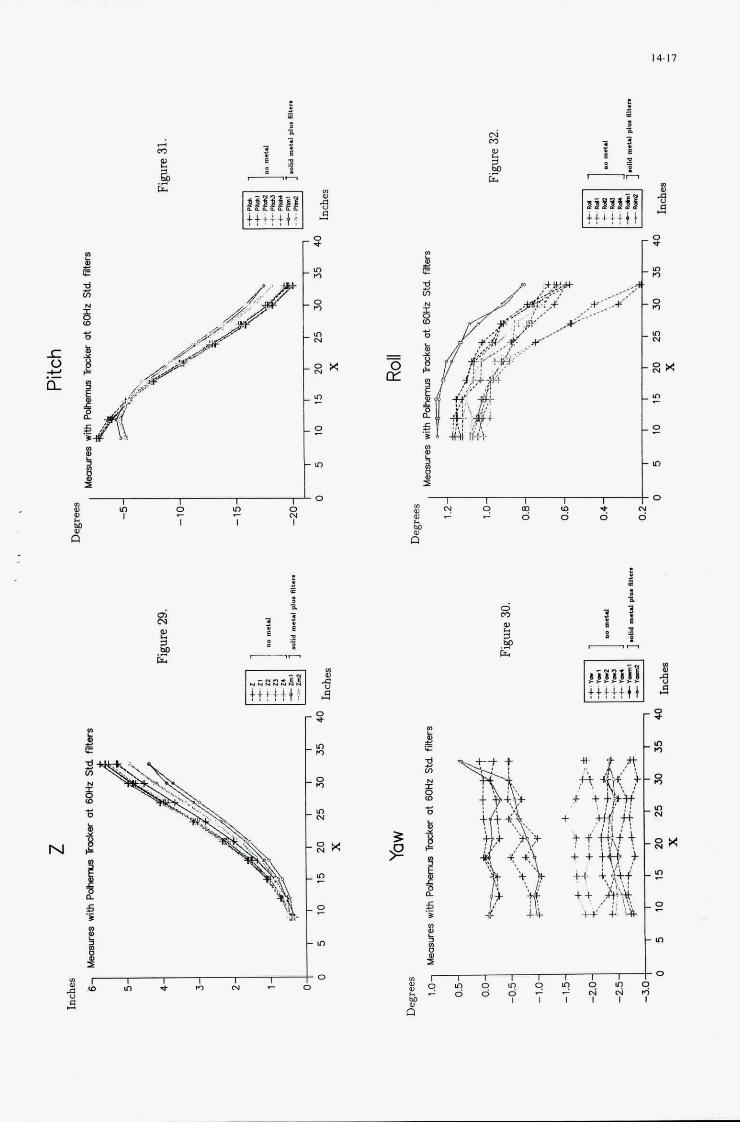
1417
4 m
4
9 0 B -6 3 1 8
r a
d m
5 i;:
d
1 a a
1 i I._

14-18
w m
m m
0 n 8
::
0 - 0 ) l
11 I
0 N I
0
7
I I I I m 9 t - o! - [ y I I I
d
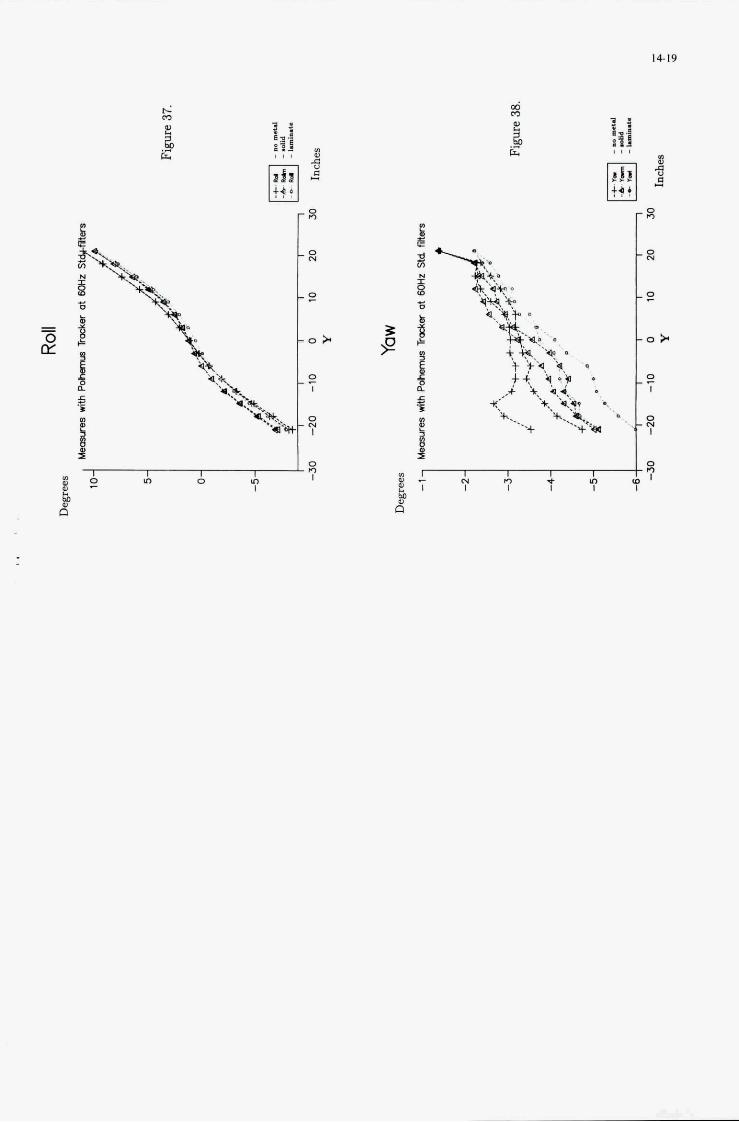
1419
x D N
0
o b
0
8
x
I
I
I

15-1
ATTENUATING THE DISORIENTING EFFECTS OF HEAD MOVEMENT DURING
FURTHER TESTS OF A PREDICTIVE HYPOTHESIS
B. D. Lawson F. E. Guedry A. R. Rupert
A. M. Anderson
Naval Aerospace Medical Research Laboratory Acceleration Division
51 Hovey Road Pensacola, Florida 32508- 1046
USA
WHOLE-BODY ROTATION USING A VISUAL REFERENCE:
SUMMARY Research has shown that when subjects are seated upright and asked to perform an earthward head movement in the dark during whole-body rotation, they find the head movement disorienting if ‘it is preceded by prolonged rotation at constant velocity, but not if it is made during the initial acceleratory phase of rotation. The disorienting effects of a head movement after prolonged constant velocity rotation can be attenuated by providing a visual reference to the Earth before the head movement. However, humans may not respond to vestibular or optokinetic stimulation the same way for different planes of motion. We tested the disorienting effects of an earthward head movement during rotation about a vertical axis to see if the attenuating effect of a visual reference would be altered. Some subjects were tested while lying on their side and some while lying on their back. Subjective reports concerning head movements in the dark were similar to previous research, suggesting that an acceleratory stimulus in the plane of rotation will attenuate disorientation, regardless of the plane of rotation tested. Likewise, the visual reference attenuated the disorientation that is usually associated with a head movement following prolonged constant velocity rotation. However, the visual reference did not appear to exert as strong an attenuating effect as it had for subjects seated upright. The implication of this finding for the design of centrifuge-based flight simulators is discussed.
-
-
INTRODUCTION It is well known that if an individual is rotated and performs head movements in an axis that is not parallel to the axis of whole- body rotation, he will report feelings of spatial disorientation and eventually experience symptoms characteristic of motion sickness. This type of stimulation is known as Coriolis cross-coupling (CCC). Guedry and Benson (1978) demonstrated that the antecedent presence of an acceleratory stimulus to the horizontal semicircular canals ameliorates the disorienting effects of an earthward head movement in roll during whole-body rotation in the z-axis while seated upright. Guedry (1978) hypothesized that the aftereffects of large-field optokinetic stimulation in the horizontal plane will similarly modify activity in the vestibular nuclei as though the horizontal semicircular canals had been stimulated directly, thus attenuating the effects of CCC. Consistent with this explanation, his subjects no longer found earthward roll head movements after prolonged constant velocity rotation to be as disorienting if they were preceded by viewing an earth-fixed visual reference.
Thus, for the experimental situations that have been observed so far, certain kinds of preexisting vestibular activity (Guedry and Benson, 1978) or visual activity (Guedry, 1978) will decrease the amount of disorientation that an individual experiences during CCC stimulation. This finding should be interesting to the designers of centrifuge- based flight simulators, because any simulator profile that requires prolonged angular velocities about the central rotation
Presented at an AGARD Meeting on ‘Virtual Interfaces: Research and Applications’, October 1993.
15-2
axis coupled with angular motion of the simulator trainee's head (or the simulator cabin) about other nonparallel axes, will generate disorienting CCC stimulation. For example, to simulate the "g-forces" a pilot would experience during a steep bank and turn, a gimbaled centrifuge cabin could be used which would swing out from the central axis of the centrifuge during rotation. However, a much higher rate of rotation would inevitably occur in the centrifuge than during actual flight, enhancing the CCC effect. In fact, calculations show that even a 300-foot radius centrifuge would still generate appreciable angular velocity in the pitch plane of the semicircular canals during some of the more vigorous simulations, such as accelerating to 9 GZ within 9 sec. To use a centrifuge to properly simulate the forces present in high-performance flight operations without producing disorientation during head movements, it will be necessary to understand the combinations of visual and vestibular information that can and cannot be expected to attenuate the disorienting effects of CCC stimulation. Certain types of visual displays presented with a virtual interface may reduce disorientation and simulator sickness while others may worsen it.
The main goal of this study was to test the observations of Guedry and Benson (1978) and Guedry (1978) for head movements made during previously untested axes of bodily rotation. There are good practical and scientific reasons to do these further tests. From the practical standpoint, we expect that trainees in centrifuge-based flight simulator operations would be required to make head movements in all three axes to perform their simulator duties, and likewise, that simulator cabins would be rotated in'various axes to simulate various profiles of aircraft motion. Therefore, it is operationally important when considering the feasibility of centrifuge-based simulator training to have an appreciation of the perceptual responses of the trainee undergoing simultaneous rotation in multiple axes.
From the scientific standpoint, testing other axes of rotation is fundamental to understanding the process of human visual- vestibular integration in three dimensions. It appears that a wide variety of perceptual and gaze responses to real (or perceived) whole- body rotation are different in different axes of rotation, and we might expect these
I ifferences to affect the extent to which the disorienting effects of CCC stimulation can be attenuated by antecedent visual or vestibular inputs (see Guedry, 1974; Young, Oman, and Dichgans, 1975; Fetter, Hain, and Zee, 1986; Guedry, et al, 1990). Another way in which responses to rotation in the yaw plane may differ with other axes of rotation is the extent of directional symmetry they exhibit within a given axis of motion. Although response to CW and CCW yaw rotation about the earth-vertical, z axis is basically symmetrical (Matsuo and Cohen, 1984), there is evidence from animal research that vestibulo-ocular responses may be directionally asymmetrical during rotation about an earth-vertical axis while lying on the side (Money and Scott, 1962; Money and Friedberg, 1964; Money, McLeod, and Graybiel, 1965; Collins and Guedry, 1967; Darlot, Lopez-Borneo, and Tracey, 1981; Matsuo and Cohen, 1984). Whether there is an asymmetry in the vertical vestibulo-ocular reflex of humans is less clear; however, it cannot be ruled out (Hixson and Niven, 1969; Guedry and Benson, 1970 and 1971; Baloh, Richman, Lee, and Honrubia, 1983). z Researchers have .also reported directional - asymmetries in the ability to visually suppress vertical nystagmus, differences in 1
the degradation of visual acuity depending on . the predominant beat direction of nystagmus, and directional differences in optokinetic nystagmus, perception of vection, and postural reactions while viewing an optokinetic stimulus moving in pitch (Money, et al, 1965; Hixson and Niven, 1969; Guedry and Benson, 1970, 197 1 ; Benson and Guedry, 1971; Barnes, Benson, and Prior, 1978; Guedry, 1970; Matsuo and Cohen, 1984; Young, Oman, and Dichgans, 1975; Lestienne, Soechting, and Berthoz, 1977).
The present study consisted of four experiments to test the ability of antecedent vestibular and visual information to attenuate the disorienting effects of an earthward head movement following whole-body rotation in the previously untested pitch and roll plane of the head. We also investigated the possibility of directional differences in the attenuating effects of antecedent vestibular and visual information within a given axis of rotation.
METHODS Subjects: Sixty-four research volunteers participated in the four experiments described
15-3
in this paper, with 16 subjects participating in each experiment. The majority of subjects in this study were naval officers awaiting assignment into flight training. Most of the subjects had little or no previous experience in rotating experiments, flight simulators, or acrobatic flight.
Materials: A Stille-Werner rotating chair and controller were used for testing. The original testing chair was replaced by a rotating litter with a hinged headrest, which could be triggered manually to allow for the head to drop passively 20 deg below the horizontal. The head movement was partially damped by padded stops and by the padded surface under the subject’s head. An open framework made of PVC tubing was mounted on the litter and permitted the subject to view the interior of the earth-fixed experimental chamber through thin black vertical struts that were fixed relative to himself. (This was similar to the viewing conditions in Guedry, 1978.) The experimental chamber was a regular eight-sided polystyrene enclosure with a ceiling of the same material, whose walls each measured 4 ft wide and 8 ft tall. The white walls, ceiling, and visible portions of the floor were covered with black circular
- dots of 6 inches in diameter. The dots were placed pseudo-randomly such that an average of 45.5 dots were placed on each 4 ft x 8 ft panel; thus, 28.4% of the interior of the white chamber was covered with black dots. The distance from the subject’s eye to the middle of any given wall was about 56.5 inches, and the distance from the subject’s eye to the ceiling was about 60 inches. Thus, a given black dot would subtend not more than 6.1 deg of visual angle and not less than 5.7 deg, respectively. The rotating apparatus and the experimental chamber are shown in Figure 1.
Procedure: We positioned our subjects with their heads in the center of rotation and resting on the hinged headrest. In experiments 1A and 2A, subjects were positioned with their right sides down. In experiments 1B and 2B, they were tested while lying on their backs. The bodily positions assumed by subjects and the conditions for each experiment are shown schematically in Figures 2 and 3.
Subjective Measures: We asked the subjects in each experiment to compare the
two types of head movements using paired- comparisons, and tell us which one they perceived to be more ‘abnormal.’ In experiments 1A and lB, subjects were given four separate opportunities to compare a head movement made in the dark immediatelv after accelerating up to a constant dwell velocity (ACC HM) to a head movement performed after 1 min of rotation at constant velocity (CONST HM). In experiments 2A and 2B, they similarly compared a head movement performed after 1 min of rotation at constant velocity in the dark (DK HM) to a head movement made in the dark after 1 min of rotation while viewing the illuminated interior of the exDerimenta1 chamber (LT HM). A stationary rest period was allowed after each head movement, to ensure that all feelings of disorientation and all cardinal symptoms of motion sickness had abated for 2 min before the next rotation sequence (and subsequent head movement) was initiated. The comparison between the first and the second head movement of any pair was usually separated by no more than a 3-min interval for most subjects. Subjects made two comparisons between the two types of head movements (for a total of four head movements) on testing day 1, then took a 48- h rest before making two more comparisons on testing day 2. The four comparisons (of eight head movements) were made in random order and random rotation direction.
We chose the rotational velocity and the amplitude of the head movements to be mild enough to induce very little motion sickness (pilot study, n = 7). However, we carefully monitored any symptoms of motion sickness our subjects reported (Graybiel, Wood, Miller, and Cramer, 1968, Lawson, 1993). We also asked them to rate each of the head movements in terms of the magnitude of perceived ‘disturbance’ and ‘disorientation’ it evoked (Guedry and Oman, 1992; Guedry and Correia, 1971). Subjects were able to anchor their judgments of ‘abnormality’ by making several practice head movements before undergoing rotation, and a practice rotation that did not involve any head movement. These two baseline conditions were used as “normal” references for subsequent statistical analysis of ratings data. Immediately after making each head movement, subjects responded with the rating ‘none’, ‘minimal’, ‘moderate’, or ‘major’ to a variety of questions, which are briefly paraphrased below:
15-4
‘DISTURBANCE’: 1) “How immediately disturbing, abhorrent, or distressing was that head movement (versus baseline), from whether or not it was sickening?’ 2) “How immediately startling, exciting, or arousing was that head movement (versus baseline), apart from whether or not i t was sickening?’
‘DISORIENTATION’: 3) “How abnormal did that head movement feel (versus baseline) in perceived size and direction?’ 4) “How abnormal did your body orientation seem versus baseline as a result of that head movement; i.e., did your body seem to tilt, tumble, dive, or otherwise move out of the horizontal plane of rotation?’
‘MOTION SICKNESS’: 5 ) “Please rate the magnitude of the following: nausea (including stomach awareness or discomfort), increased salivation, cold sweating, drowsiness, headache, dizziness, flushindwarmth, and skin pallor (rate by self observation in a mirror).”
In summary, subjects compared different pairs of head movements (CONST HM versus ACC HM and DK HM versus LT HM) to tell which felt more abnormal, and they also rated each head movement along a variety of dimensions during the baseline and rotating phases of the study. The median of four paired comparison judgments from each subject was included in an analysis of the Kendall coefficient of agreement, while median ratings of each head movement were analyzed with a Wilcoxon signed-ranks test.
RESULTS Results are described separately for each of the four experiments, and are summarized in Table 1. Results for experiments 1A and 1B below describe paired comparisons between CONST HMs and ACC HMs, while results for experiments 2A and 2B refer to comparisons between DK HM and LT HM. We expected that CONST HM and DK HM will tend to evoke more abnormal perceptual effects.
Results of Experiment 1A (On Side in Dark): Fourteen of sixteen subjects were able to distinguish between ACC HM and CONST HM in all four of the paired comparisons they made, always calling CONST HM a more ‘abnormal’ experience.
Conversely, no subject judged ACC HM as more abnormal than CONST HM in all four comparisons. Considering the pooled data from all 16 sub’ects, the Kendall coefficient
four comparisons, which was significant at a < .001. In directional comparisons, 11/16 subjects did not tend to rate one direction of rotation as being more ‘abnormal’ than another (X2 = .14 for median of two judgments, a > .70 for n = 16).
of agreement X d = 15.01 for the median of all
Subjective ratings of each head movement during rotation were contrasted to the baseline conditions (HM without rotation and rotation without HM). Regardless of direction of rotation, subjects rated CONST HM as more disturbing, more startling, and more likely to induce abnormal perceptions of head and body orientation versus the baseline conditions. (Wilcoxon signed-rank tests: tie-corrected z 2 2.1 1, p I .038). They were able to make these judgments even though they experienced little or no motion sickness as a result of CONST HM (z = 1.62 at p = . lo). Conversely, no consistent I perceptual effects were identified for ACC - HM (i.e., no ratings significantly different from the baselines and independent of direction of rotation). In fact, ACC HM . tended to produce somewhat motion sickness than rotation without any head movement at all (z 2 2.12 at p I .034). The best measures for distinguishing ACC HM from CONST HM were the subject’s judgments of how disturbing and startling the head movement felt (see items 1 and 2 described in “Methods”). These measures distinguished CONST HM from the baselines regardless of rotation direction (z 2 2.11 at p I .034), and showed no difference for ACC HM versus the baselines or for one baseline condition versus another.
Results of Experiment 1B (On Back in Dark): Of a total sixteen, six subjects judged CONST head movement as a more ‘abnormal’ experience than ACC HM in glJ - four comparisons, while no subject found ACC HM more abnormal in all four comparisons. The Kendall coefficient of agreement X2 = 11.39 for median of four comparisons was significant at a < .001 for n = 16. 11/16 subjects did not tend to rate one direction of rotation as being more
‘abnormal’ than another (X2 = .25 for median of two judgments, a > S O for n = 16).
Regardless of direction of rotation, subjects usually rated the CONST HM as more disturbing, more startling, and more likely to induce abnormal perceptions of head and body orientation versus the baseline conditions. (z 2 1.89, p I .059 for all ratings compared). They also tended to experience slight motion sickness as a result of CONST HM (z 2 2.18, p I .029 for every contrast except CW rotation CONST HM versus CW rotation without head movement, where z = 1.81 at p = .07). Robust and consistent differences from the baseline conditions were not obvious during ACC HM. The best measure for distinguishing CONST HM from ACC HM was the subject’s judgments of how disturbing the head movement felt (item 1 in “Methods”). This measure usually distinguished CONST HM from the baselines regardless of rotation direction (all z 2 1.89 at p I .059), and showed no difference for ACC HM versus the baselines or for one baseline condition versus another.
Results of Experiment 2A (On Side with Visual Reference): Five of sixteen subjects judged the head movement made during constant velocity in the dark (DK HM) as a more ‘abnormal’ experience than the head movement made during constant velocity after viewing the visual reference (LT HM) in all four comparisons. subject found the LT HM more abnormal in all four comparisons. The Kendall coefficient of agreement was X2 = 3.13 for the median of all four comparisons, which did not quite reach significance (a = .08 for n = 16 subjects). However, 13/16 subjects found the DK HM to be more disorienting than the LT HM on the first opportunity they had to make a comparison, while 3 subjects could not distinguish any difference (X2 = 5.29 at a < .02, n = 16). Eight subjects did not tend to rate one direction of rotation as being more ‘abnormal’ than another. Of the 8 subjects who did tend to rate one direction as more abnormal, 3 chose the CCW (pitch forward) direction on both opportunities to compare, and none chose the CW (pitch backward) direction on both opportunities. Overall, there was no significant directional preference (X2 = 1.3 for median of two judgments, a > .20 for n = 16).
15-5
Subjective ratings of each head movement were highly variable, and consistent perceptual effects did not emerge from this analysis.
Results of Experiment 2B (On Back with Visual Reference): Of sixteen, six subjects judged the DK HM as a more ‘abnormal’ experience than the LT HM in all four comparisons, while no subject found the LT HM more abnormal in all four comparisons. The Kendall coefficient of agreement was X2 = 6.25 for the median of all four comparisons, which was significant at a < .02 for all 16 subjects. Ten subjects found the DK HM more disorienting than the LT HM on their - first opportunity to make a comparison ( ~ 2 = 1.75 n.s. at a > .lo, n = 16). Twelve subjects did not tend to rate one direction of rotation as being more ‘abnormal’ than another (X2 = .05 for median of two judgments, a > S O for n = 16). Subjective ratings of each head movement were variable, and no consistent perceptual effects emerged from this analysis.
DISCUSSION The Potential Benefits and Drawbacks of a Centrifuge-based Flight Simulator: Flight simulators are a safe and relatively low-cost way of supplementing flight training. It is reasonable to expect that they will become a more integral part of flight training as they become increasingly more sophisticated and realistic. For example, if a virtual reality interface could be successfully coupled with a centrifuge-based motion platform, trainers would obtain more flexibility in the choice and the combination of acceleratory and visual information, making it possible to simulate a greater variety of high performance flight profiles with increased realism. However, it is important to recognize that disorientation and nausea will be evoked by certain combinations of centrifuge rotation with movements of the trainee’s head (or his simulator cabin), and with particular visual stimuli. It is not sufficient to ignore this problem by simply allowing simulator trainees to adapt to these effects. Some situations that would cause disorientation in centrifuge-based simulators would probably not be disorienting during the actual flight operations being simulated (Gilson, Guedry, Hixson, and Niven, 1973), thus trainees might adapt in ways that are not
15-6
ht (Ken laltzlev,
appro riate to real fli Lilienthal. Berbaum.
edy , and
McCauley, '1989). If centrifuge-baskd flight simulation is to be feasible without the risk of such negative transfer in flight training, it will be necessary to systematically identify simulator scenarios that produce disorientation only when it would occur during actual flight, and also to test the extent to which certain kinds of vestibular and visual information can attenuate these disorienting effects in cases where they are unavoidable during simulator training.
Head Movements in the Dark With and Without Acceleratory Information in the Plane of Body Rotation: The current study supports the idea that CCC stimulation will not be disorienting when it is immediately preceded by certain types of vestibular or visual information. Subjective reports concerning head movements in the dark were similar to previous research, suggesting that an antecedent acceleratory stimulus in the plane of rotation will attenuate feelings disorientation during CCC, regardless of whether the plane of body rotation tested is predominantly in the yaw, pitch, or roll plane of the semicircular canals. As summarized in Table 1, 100% of the subjects tested by Guedry and Benson (1978) judged the CONST HM as more disorienting than the ACC HM on their first (and only) opportunity to make a comparison, while 94% of the subjects in experiment 1A (on side in dark) and 63% of the subjects in experiment 1B (on back in dark) said the same thing on their first comparison. This antecedent acceleratory stimulus was particularly helpful in ameliorating feelings of disturbance, abhorrence, or distress that accompany CCC stimulation. It appears that the acceleratory stimulus is most helpful during CCC stimulation following rotation in the yaw axis of the head and least helpful following rotation in the roll axis of the head. The subjective reports following multiple exposures to CCC stimulation also indicate that the roll axis shows the weakest results of the three. However, the differences between the roll and pitch axes of rotation should not be over-emphasized, since the ratings that subjects made concerning each head movement indicated that they did not feel greatly abnormal perceptual effects during CCC stimulation in either the roll the pitch axes of rotation. It is likely that the mild CCC stimulus chosen for this study is
n ticeably disorienti g in the yaw plane, but only moderate effects exist in the roll and the pitch planes. This interpretation is consistent with the predominant feelings of body motion that subjects tend to perceive in each case. A subject sitting upright in the dark and rotating for a prolonged period at some constant velocity in the vertical axis tends to feel either a forward or a backward pitching sensation (depending upon the direction of rotation) if he executes a rightward head movement earthward. During normal circumstances, the detection of even the slightest real pitching motion while seated upright would be quite alarming and might be interpreted as a potential fall outside of the base of support. It would also require immediate postural compensation. On the other hand, a subject lying on his side or on his back making an earthward head movement during similar circumstances will tend to perceive rotation about his own longitudinal z-axis, as if he were simply rolling over in bed. The detection of a moderate motion of this type while lying securely restrained to a platform should not be quite as alarming or require the same postural adjustments.
Head Movements After Prolonged Rotation With and Without a Preceding Earth-fixed Visual Reference: Providing subjects with a visual reference prior to CCC stimulation tended to attenuate the disorientation associated with head movement following prolonged constant velocity rotation. However, the visual reference often did not appear to exert as strong an attenuating effect as the antecedent acceleratory information had for the experiments conducted in the dark. Moreover, the extent to which a visual reference will ameliorate the effects of CCC seems to depend upon the subject's plane of body rotation prior to the head movement. Guedry (1978) found that, depending upon the subject's gaze instructions, 8 1 - 100% of subjects receiving CCC stimulation after rotation in the yaw plane of the canals found the DK HM to be more disorienting than the LT HM on the first (and only) opportunity they had to make the comparison (see Table 1). When subjects were positioned on their sides in the present study and rotated in the pitch plane of the canals (experiment 2A), 81% reported that a DK HM was more disorienting than a LT HM on their first opportunity to make the comparison.
15-7
However, when subjects were positioned on their backs and rotated in the roll plane of the canals (experiment 2B), only 63% reported that a DK HM was more disorienting than a LT HM on their first opportunity to make the comparison. Moreover, the percentage of subjects in experiments 2A and 2B who felt that the visual reference was helpful on all - four of the opportunities they had to compare DK HM and LT HM was much lower. It appears that an antecedent visual reference is most helpful in attenuating the initial effects of a single CCC stimulus after yaw rotation and least helpful after roll rotation. The paired comparisons suggest that the attenuating effects of a visual reference during a single CCC stimulus are not necessarily maintained during repeated stimulation. It is possible that this is partially attributable to shifts in judging criteria over time or to the mild nature of the CCC stimulus employed.
Lack of Trends in Subjective Ratings Data: The results discussed above focus mostly on the paired comparisons subjects made between DK HMs and LT HMs, that is,
- on their choice of which type of head movement was more perceptually abnormal.
1 Subjective ratings were also made separately - for each head movement in terms of the
magnitude of the effect of CCC stimulation. These ratings were inconsistent and less likely to show significant differences than the paired comparison data. The specific subjective aspect of the CCC stimulation (e.g., disturbance, disorientation, motion sickness) that was attenuated by the visual reference tended to vary from subject to subject. The overall trend was for median ratings to be higher (i.e., more abnormal) for DK HM versus head movement without rotation, but this was the trend for LT HM versus head movement without rotation.
We draw three inferences from the collective trends in the paired comparisons ratings data: a) although the particular subjective aspect of the CCC effect that is attenuated by visual stimulation will vary, subjects are nevertheless sensitive to an overall attenuation of the perceptual effects when they make paired comparisons; b) it appears that although a visual reference attenuates the effects of CCC stimulation, it does not abolish them altogether; c) the magnitude of the subjective ratings (especially for motion sickness) suggests that the particular CCC
stimulus used in this study was a fairly mild one for the body orientations tested (i.e., on side and on back) and may not be as amenable to measurement via subjective ratings as it is by a more sensitive paired comparison.
Validation of Comparison With Past Research Findings: It is possible that the results of the current study are not directly comparable to the experiment of Guedry, 1978, since there were many differences in protocol (e.g., rotation profile and dwell velocity, amplitude and nature of the head movement, and the exact nature of the visual stimulus). This possibility was tested in a recent follow-up study (see experiment 3, Table 1). Subjects (n = 12) were seated upright and restrained by a lap belt and a bite plate which allowed for a 20-deg earthward head movement strictly in the roll plane of the canals (along with some lateral head translation towards the right shoulder). They accelerated in the yaw plane of canals at 3 deg/s2 to 90 de& for 2 min, then decelerated at 3 deg/s2. They compared a head movement after 1 min of rotation in the dark (DK HM) to a head movement made (in the dark) after rotating for 1 min while viewing the illuminated interior of the polka-dotted chamber (LT HM). Most (92%) of these subjects found the DK HM to be more disorienting than LT HM on their first (and only) opportunity to make a comparison. These results further support the notion that a visual reference will be more helpful in ameliorating the effects of a single CCC stimulation for the original yaw rotations tested by Guedry.
Testing for Directional Asymmetries Within a Given Axis of Rotation: Subjects in the current study did not report any difference between the CW and CCW directions of rotation in any of the four experiments conducted. It is possible that such differences exist, but that they do not become apparent until higher rates of rotation are employed. It is also possible that directional differences were masked by the instructions to the subject to consider the different head movements collectivelv when comparing the different directions of rotation. For example, a subject might typically make one DK HM and one LT HM during CW rotation, then compared both of these head movements to both head movements (DK HM and a LT HM) during CCW rotation.
15-8
This pooled comparison is of particular concern when we consider that the primary focus of the subject's attention would have been on distinguishing differences between the DK HM and the LT HM, and only secondarily on distinguishing differences between head movement during CW versus CCW rotation.
These problems were addressed in four control experiments where the subject's or& task was to compare head movements made in either direction of rotation. These experiments were identical to the four main experiments reported in this study, with some important exceptions. Subjects (total n = 47) were rotated (once in each direction) up to a constant velocity of 120 de&. Half of the subjects were rotated in the CW direction first, and half in the CCW direction first. In control experiments 1C and ID, they compared a DK HM in the CW direction to a DK HM in the CCW direction. In control experiments 2C and 2D, they compared a LT HM in each direction of rotation. No prominent directional asymmetries were seen in the attenuating effects of antecedent vestibular or visual stimulation (X2 5 3.0 at a 2.09, n = 11-12 in each control experiment).
The Role of Neck Kinesthesia: We should note that the control and appreciation of normal head movements is not solely achieved by the integration of visual and vestibular information alone, but is also dependent on the rich source of kinesthetic information available from the muscles and joints of the neck. Moreover, the time constant of integration that renders small differences in the duration of each subject's head movements negligible from the standpoint of the angular impulse delivered to the semicircular canals may indeed make a difference to the neck spindle receptors. To establish that effects reported so far result primarily from an outcome of the integration of visual and vestibular sources of information, we used a protocol in which the importance of active control of the neck musculature is diminished. Firstly, our subjects were rotated with their heads resting on a pad and strapped to a headrest. Secondly, they practiced making manually- triggered passive head movements until subject and experimenter both agreed that the head movement looked and felt like a passive drop. For example, when subjects were interviewed following (the first) experiment
IA, 15/16 said that &l of the head movements they made felt passive. However, there is probably no such thing as a truly passive movement, especially of the head. In a further attempt to indirectly assess the possible role of neck information in this study, we ran an individual who presented as normal, except that he had suffered bilateral damage to the his labyrinths due to the administration of gentamycin 5 years earlier. This subject was unable to distinguish between DK HM and LT HM or between CONST HM and ACC HM during either on- side or on-back rotation. We conclude that whil:: neck information is important to the control and appreciation of head movement, the present study has been adequately controlled such that neck kinesthesia is probably not sufficient per se to account for the effects we have described. Nevertheless, conditions that produce altered kinesthetic control of the neck can influence an individual's spatial awareness. Lackner and DiZio (1989, 1992) found that increasing the load to the head (with a mass) increased the disorientation and motion sickness evoked by CCC stimulation and by sinusoidal rotation under conditions where the vestibular stimulus was kept constant (Lackner and DiZio, 1989; 1992).
Summary: Our results collectively support the notion that the presence of an earth-fixed visual reference prior to a CCC stimulus tends to attenuate the disorientation an individual feels. We have extended the research of Guedry and Benson (1978) and Guedry (1978) to previously untested axes of rotation and found that the visual reference will tend to be most helpful in attenuating the effects of a single CCC stimulus when the predominant plane of stimulation of the vestibular system prior to the head movement is in yaw. Our observations indicate that while the designers of centrifuge-based flight simulator profiles may not be too troubled by differences in visual-vestibular integration in one direction of rotation versus another, they will have to address differences that exist for one axis of rotation versus another. It may also be necessary to take into account the amount of experience the trainee has had with the CCC stimulus. This makes the problem of centrifuge-based flight simulation a difficult one, indeed. Fortunately, group trends are consistent, that is, whenever the visual reference less helpful in attenuating
15-9
the effects of CCC stimulation, it still appears to be of some benefit.
ACKNOWLEDGMENTS This research was sponsored by the Naval Medical Research and Development Command under ONR grant number N0014/90/J/1549.
The views expressed in this article are this of the authors and do not reflect the official policy or position of the Department of the Navy, Department of Defense, not the U.S. Government.
Volunteer subjects were recruited, evaluated, and employed in accordance with the procedures specified in the Department of Defense Directive 3216.2 and Secretary of the Navy Instruction 3900.39 series. These instructions are based upon voluntary informed consent and meet or exceed the provision of prevailing national and international guidelines.
REFERENCES
Baloh, R. W., Richman, L., Lee, R. D., and Honrubia, V. 1983. The dynamics of vertical eye movements in normal human subjects. Aviation, Space, and Environmental Medicine, 54: 32-38.
--
Barnes, G. R., Benson, A. R., and Prior, J. 1978. Visual-vestibular interaction in the control of eye movement. Aviation, Space, and Environmental Medicine. 49: 557-564.
Benson, A. J., and Guedry, F. E. 1971. Comparison of tracking-task performance and nystagmus during sinusoidal oscillation in yaw and pitch. Aerospace Medicine. 42L 593-601.
Cohen, B., Matsuo, V., and Raphan, T. 1977. Quantitative analysis of the velocity characteristics ,
of optokinetic nystagmus and optokinetic after- nystagmus. Journal of Physiology (London), 270: 321 -344.
Collins, W. E., and Guedry, F. E. 1967. Duration of angular acceleration and ocular nystagmus from cat and man. I. Responses from the lateral and vertical canals to two stimulus durations. Acta Otolaryngolica, 64: 373-387.
Darlot, C., Lopez-Borneo, J., and Tracey, D. 1981. Asymmetry of vertical vestibular nystagmus in the cat. Experimental Brain Research, 41: 420-426.
ocular reflex. Experimental Brain Research, 64: 208-216.
Gilson, R. D., Guedry, F. E., Hixson, W. C., and Niven, J. I. 1973. Observations on perceived changes in aircraft attitude attending head movements made in a 2-g bank and turn. Aerospace Medicine, 44: 90-92.
Graybiel, A., Wood, C. D., Miller, E. F., and Cramer, D. B. 1968. Diagnostic criteria for grading the severity of acute motion sickness. Aerospace Medicine, 39: 453-455.
Guedry, F. E. 1970. Vision during angular acceleration considered in relation to aerospace operations. In: Stahle, J. (Ed.), Vestibular Function on Earth and in Space. Oxford: Pergammon. 27-34.
Guedry, F. E. 1974. Psychophysics of vestibular sensation. In: Kornhuber, H. H. (Ed.), Handbook of Sensory Physiology. New York: Springer. Vol vu2,3- 154.
Guedry, F. E. 1978. Visual counteraction of nauseogenic and disorienting effects of some whole- body motions: A proposed mechanism. Aviation, Space, and Environmental Medicine, 49 (1): 36-4 1.
Guedry, F. E., and Benson, A. J. 1970. Tracking performance during sinusoidal stimulation of the vertical and horizontal semicircular canals. In: Busby, D. E. (Ed.), Recent Advances in Aerospace Medicine. Dordrecht, Holland: Reidel. 276-288.
Guedry, F. E., and Benson, A. J. 1971. Nystagmus and visual performance during sinusoidal stimulation of the vertical semicircular canals. NAMRL- 1 13 1. Pensacola, FL: Naval Aerospace Medical Research Laboratory.
Guedry, F. E., and Benson, A. J. 1978. Coriolis cross-coupling effects: Disorienting and nauseogenic or not? NAMRL- 123 1. Pensacola, FL: Naval Aerospace Medical Research Laboratory. Aviation, Space, and Environmental Medicine, 49: 29-35.
Guedry, F. E., and Correia, M. J. 1971. Vestibular function in normal and in exceptional conditions. In: Masterson, R. (Ed.), Handbook of Behavioral Neurobiology. NY-London: Plenum Press, Vol. 1 : 3 53 -407.
Guedry, F. E., Norman, J. T., Turnipseed, G. T. and Rupert, A. H. 1990. Vestibular responses and motion sickness during pitch, roll, and yaw sinusoidal whole-body oscillation. NAMRL-1352. Pensacola, FL: Naval Aerospace Medical Research Laboratory.
Fetter, M., Hain, T. C., and Zee, D. S . 1986. Influence of eye and head position on the vestibulo-

15-10
I Money, K. E., Mc Leod, M. E., and Graybiel, A. 1965. Effect of vision on the two directions of vertical post-rotatory nystagmus. Proceedings of The Canadian Federal Biological Society, 8: 13.
Nutall, J. B. 1958. The problem of spatial orientation. Journal of the American Medical Association, 166: 431-438.
Guedry, F. E., and Oman, C. E. 1992. Vestibular stimulation during a simple centrifuge run. NAMRL- 1353. Pensacola, FL: Naval Aerospace Medical Research Laboratory.
Hixson, W. C., and Niven, J. I. 1969. Directional differences in visual acuity during vertical nystagmus. NAMI-1079. Pensacola, FL: Naval Aerospace Medical Institute.
Kennedy, M. A., Lilienthal, K., Berbaum, S., Baltzley R., McCauley E. 1989. Simulator sickness in U. S . Navy Flight Simulators. Aviation, Space, and Environmental Medicine, 60: 10-16.
Lackner, J. R. , and DiZio, P. 1989. Altered Sensory-Motor Control of the Head as an Etiological Factor in Space-Motion Sickness. Perceptual and Motor Skills, 68: 784-786.
Lackner, J. R., and DiZio, P. Altered Loading of the Head Exacerbates Motion Sickness and Spatial Disorientation. Presented at Aerospace Medical Association meeting, May 10, 1992, Miami, FL.
Lawson, B. D. 1993. Human physiological and subjective responses during motion sickness induced by unusual visual and vestibular stimulation. Doctoral Dissertation. NASA NGT 50306. Waltham, MA: Ashton Graybiel Spatial Orientation Laboratory, Brandeis University.
Lestienne, F., Soechting, J., and Berthoz, A. 1977. Postural readjustments induced by linear motion of visual scenes. Experimental Brain Research, 28: I 363-384.
I Matsuo, V., and Cohen, B. 1984. Vertical optokinetic nystagmus and vestibular nystagmus in the monkey: Up-down asymmetry and effects of gravity. Experimental Brain Research, 53: 197-2 16. I
I
, I
Money, K. E., and Friedberg, J. 1964. The role of the semicircular canals in causation of motion sickness in the dog. Canadian Journal of
I Physiological Pharmacology, 42: 793-801.
Money, K. E., and Scott, J. W. 1962. Functions of separate receptors of non-auditory labyrinth of the cat. American Journal of Physiology, 202: 121 1 - 1220.
Raphan, T., Matsuo, V., and Cohen, B. 1979. Velocity storage in the vestibulo-ocular reflex arc (VOR). Experimental Brian Research, 35: 229-248.
Reason, J. T. and Diaz, E. 1970. The effects of visual reference on adaptation to Coriolis acceleration. FPRC Report 1303. London: Ministry of Defence (Air Force Dept.).
Young, L. R., Oman, C. M., and Dichgans, J. 1975. Influence of head orientation on visually induced pitch and roll sensation, Aviation, Space, and Medicine. 46: 264-268.
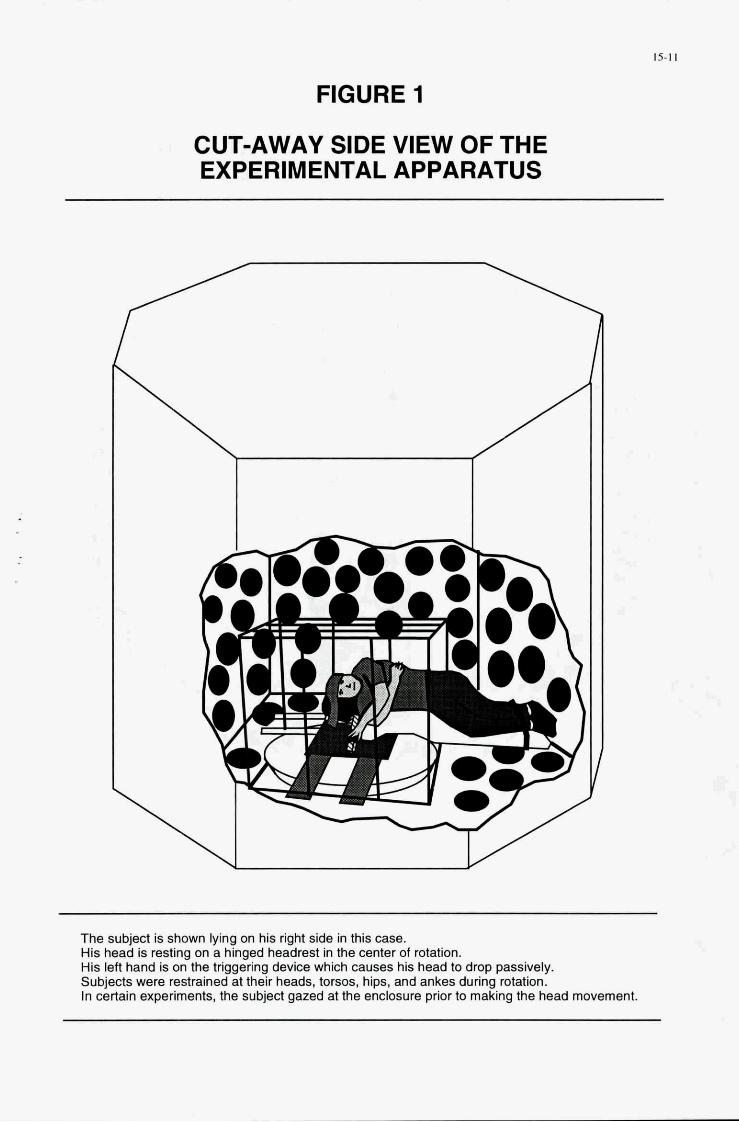
15-1 I
FIGURE 1
CUT-AWAY SIDE VIEW OF THE EXPERIMENTAL APPARATUS
The subject is shown lying on his right side in this case. His head is resting on a hinged headrest in the center of rotation. His left hand is on the triggering device which causes his head to drop passively. Subjects were restrained at their heads, torsos, hips, and ankes during rotation. In certain experiments, the subject gazed at the enclosure prior to making the head movement.

15-12
FIGURE 2
TOP-DOWN VIEW OF THE TWO BODY ORIENTATIONS TESTED
In experiments 1A and 28 subjects were rotated while lyin on their right sides.
In experiments 1B and 28 they were rotated while lying on their backs.
Experiments 1A and 18 were run in darkness.
Experiments 2A and 28 were run with the chamber illuminated prior to each head movement.

15-13
FIGURE 3
DESCRIPTION OF THE 4 EXPERIMENTS THAT COMPRISED THE CURRENT STUDY
EXPERIMENT - 1B
28
HEAD ROTATION BODY MOVEMENT AXIS POSITION
A--
HEAD MOVEMENT TOWARD GROUND
"PITCH" ROTATION ON SIDE t Gz Earth
L&\ HEAD MOVEMENT TOWARD GROUND
"ROLL" ROTATION ON BACK $. Gz Earth
EXPERIMENT 1A: Subjects (n=l6) were positioned ont their sides and accelerated in darkness at 15 dg/s2 to a constant velocity of 90 dg/s for 2 mins, then decelerated at 3 dg/s2 to a stop. They compared an earthward head movement made e y i el upon reaching constant velocity (ACC HM) to a head movement performed aft- of rotation at constant velocity (CONST HM). The Coriolis cross-coupling (CCC) stimulus was the same in either case, but the acceleratory information available to the vestibular apparatus was not (see Guedry and Benson, 1978).
EXPERIMENT 1 B: The protocol of experiment 1A was followed with subjects (n=16) lying on their backs.
EXPERIMENT 2A: Subjects (n=l6) were positioned on their sides and accelerated at 3 dg/s2 to 90 dg/s for 2 mins, then decelerated at 3 dg/s2. They compared a head movement after 1 minute of rotation in the dark (DK HM) to a head movement made (in the dark) after rotating for 1 minute -g the illuminated interior of the polka-dotted chamber (LT HM). The CCC stimulus was the same in either case, but visual information about the rotation was available to the vestibular nucleus during the LT HM (see Guedry , 1978).
EXPERIMENT 28: The protocol of experiment 2A was followed with subjects (n=l6) lying on their backs.
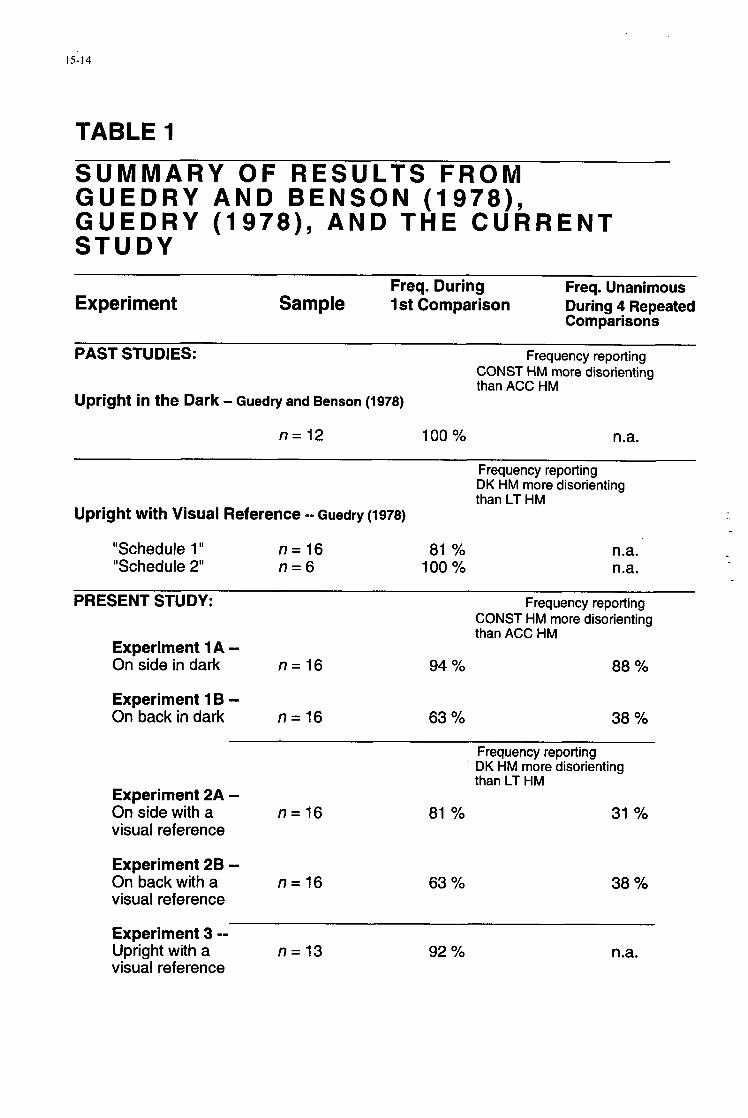
15-14
TABLE 1
SUMMARY O F RESULTS FROM GUEDRY AND BENSON (1978) , GUEDRY (1978) , AND THE CURRENT STUDY
Freq. During Freq. Unanimous Experiment Sample 1 st Comparison During 4 Repeated
PAST STUDIES: Frequency reporting
Upright in the Dark -- Guedry and Benson (1978)
Comparisons
CONST HM more disorienting than ACC HM
n = 12 100 Yo n.a.
Frequency reporting DK HM more disorienting than LT HM
Upright with Visual Reference -- Guedry (1978)
"Schedule 1 'I n = 16 81 % "Schedule 2" n = 6 100 %
n.a. n.a.
PRESENT STUDY: Frequency reporting CONST HM more disorienting than ACC HM
Experiment 1 A -- On side in dark n = 16 94 Yo 08 %
Experiment 1 B -- On back in dark n = 1 6 63 Yo 38 Yo
Experiment 2A -- On side with a visual reference
n = 16
Experiment 28 -- On back with a n = 1 6 visual reference
Frequency reporting DK HM more disorienting than LT HM
81 % 31 Yo
63 Yo 38 %
Experiment 3 -- Upright with a n = 1 3 92 % n.a. visual reference
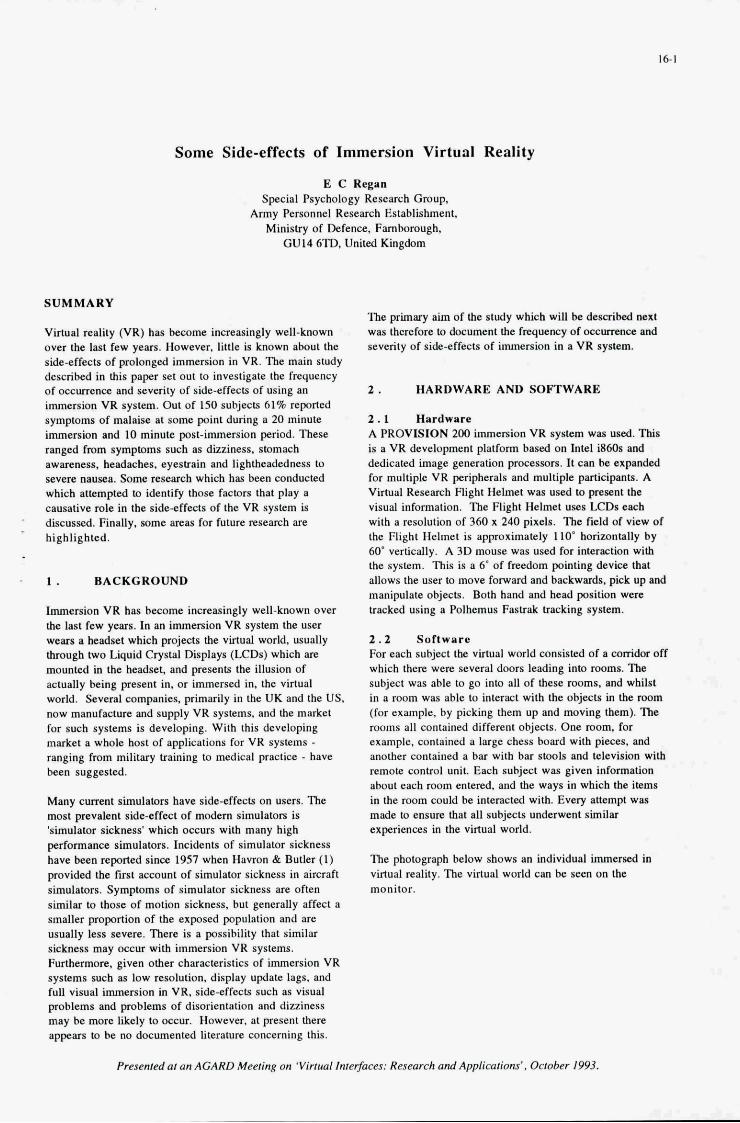
Some Side-effects of Immersion Virtual Reality
E C Regan Special Psychology Research Group,
Army Personnel Research Establishment. Ministry of Defence, Farnborough,
GU14 6TD, United Kingdom 'I
SUMMARY
Virtual reality (VR) has become increasingly well-known over the last few years. However, little is known about the sideeffects of prolonged immersion in VR. The main study described in lhis paper set out to investigate the frequency of oCcurrence and severity of side-effects of using an immersion VR system. Out of 150 subjects 61% reported symptoms of malaise at some point during a 20 minute immersion and 10 minute post-immersion period. These ranged tium symptoms such as dizziness. stomach awareness, headaches. eyestrain and lightheadedness to severe mnsea. Some research which has been conducted which altempted to identify those factors that play a causative role in the sideeffects of the VR system is discussed. Finally, some areas for future research are highlighted.
- 1. BACKGROUND
Immersion VR has become increasingly well-known over the last few years. In an immersion VR system the user wears a headset which projects the virtual world, usually tbmugh two Liquid Crystal Displays (LCDs) which are mounted in the headset. and presents the illusion of actually being present in. or immersed in, the virtual world. Several companies, primarily in the UK and the US, now manufacture and supply VR systems, and the market for such systems is developing. With this developing market a whole host of applications for VR systems - ranging tium military training to medical practice - have been suggested.
Many current simulators have side-effects on users. The most prevalent side-effect of modern simulators is 'simulator sickness' which occurs with many high performancc simulators. Incidents of simulator sickness have been reported since 1957 when Havron & Butler (1) provided the tint account of simulator sickness in aircraft simulators. Symptoms of simulator sickness are often similar to those of motion sickness, but generally affect a smaller proportion of the exposed population and are usually less severe. There is a possibility that similar sickness may Furthermore. given other characteristics of immersion VR systems such as low resolution, display update lags, and full visual immersion in VR, side-effects such as visual problems and problems of disorientation and dizziness may he more likely to occur. However, at present there appears to he no documented Literature concerning this.
with immersion VR systems.
The primary aim of the study which will be described next was therefore to document the frequency of occurrence and severity of side-effects of immersion in a VR system.
2 . HARDWARE AND SOFI'WARE
2 . 1 Hardware A PROVISION 200 immersion VR system was used. This is a VR development platform based on Intel i860s and dedicated image generation processors. It can be expanded for multiple VR peripherals and multiple parlicipanta. A Virtual Research Flight Helmet was used to present the visual information. The Flight Helmet user LCDs each with a resolution of 360 x U 0 pixels. The field of view of the Flight Helmet is approximately 110' horizontally by 60' vertically. A 3D mouse was used for interaction with the system. ?%is is a 6' of freedom pointing device that allows the user to move forward and backwards, pick up and manipulate objects. Both hand and head position were tracked using a Polhemus Fasts& tracking system.
2 . 2 Sof tware For each subject the virtual world consisted of a corridor off which there were several doors leading into rooms. The subject was able to go into all of these rooms, and whilst in a room was able to interact with the objects in the room (for example, by picking them up and moving them). The rooms all contained different objects. One room, for example, contained a large chess board with pieces. and another contained a bar with bar suWlr and television with remote control unit Each subject was given information about each rmm entered, and the ways in which the items in the room could be interacted with. Every altempt wa8 made to ensure that all subjects underwent similar experiences in the virtual world.
The photograph below shows an individual immersed in virtual reality. The virtual world CM he seen OD the monitor.
Presented at an AGARD Meeting on 'Virtual Inteqaces: Research and Applications', October 1993.
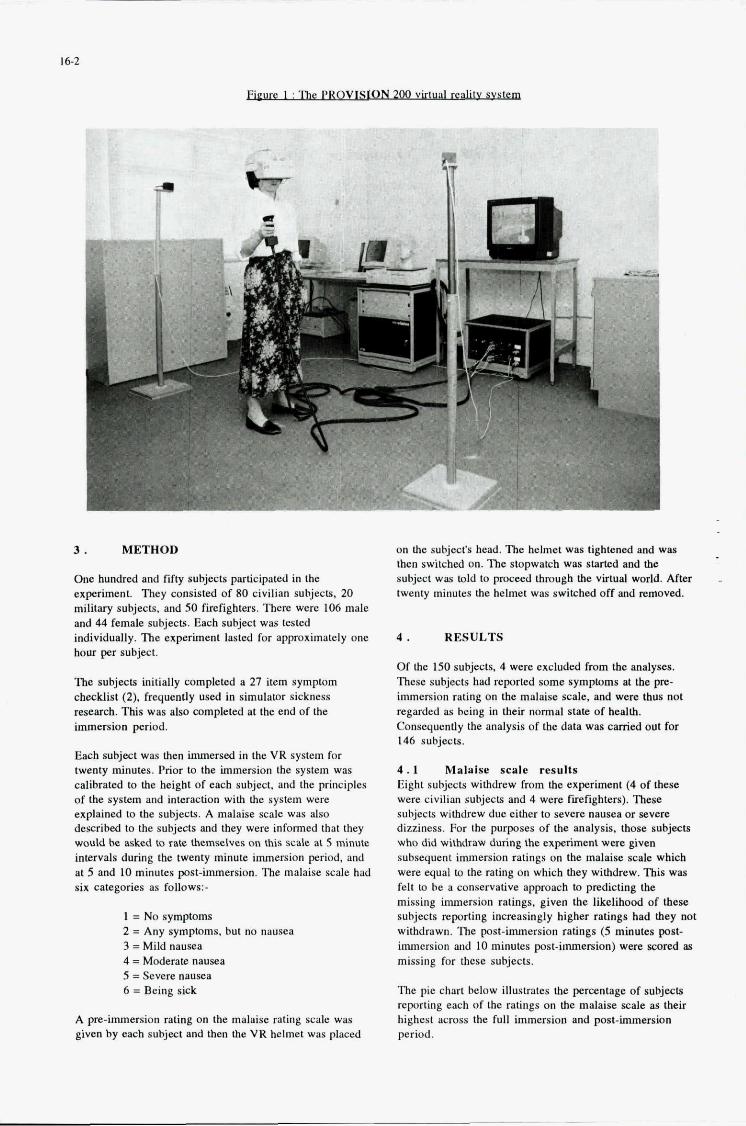
9 m
3. METHOD
One hundred and f@ subjects participated in the experiment. They consisted of 80 civilian subjects, 20 military subjects. and SO firefighters. There were 106 male and 44 female subjects. Each subject was tested individually. The experiment lasted for approximately one hour per subject.
The subjects initially completed a 27 item symptom checklist (2)- frequently used in simulator sickness research. This was also completed at the end of the immersion period.
Each subject was then immersed in the VR system for twenty minutes. Prior to the immersion the system was calibrated to the height of each subject. and the principles of the system and interaction with the system were explained to the subjects. A malaise d e was also described to the subjects and they were informed that they would be asked to rate themselves on this scale at 5 minute intervals during the twenty minute immersion period, and at 5 and 10 minutes post-immersion. The malaise scale had six categories as follows:.
1 = No symptom 2 = Any symptoms. hut no nausea 3 =Mild nausea 4 =Moderate nausea 5 = Severe nausea 6 = Being sick
A pre-immersion rating on the malaise rating scale was given by each subject and then the VR helmet was placed
on the subject's head. The helmet was tightened and was then switched on. The stopwatch was started and the subject was told to proceed through the virtual world. After twenty minutes the helmet was switched off and removed.
4 . RESULTS
Of the 150 subjects. 4 were excluded from the analyses. These subjects had reported some symptoms at the p immersion rating on the malaise scale. and were thus not regarded as being in their normal state of health. Consequently the analysis of the data was carried out for 146 subjects.
4 . 1 Malalse scale results Eight subjects withdrew from the experiment (4 of these were civilian subjects and 4 were fxefighters). These subjects withdrew due either to severe nausea or severe dizziness. For the purposes of the analysis, those subjects who did withdraw during the experiment were given subsequent immersion ratings on the malaise scale which were equal to the rating on which they withdrew. This was felt to he a conservative approach to p'wlicting the missing immersion ratings. given the likelihood of these subjects reporting increasingly higher ratings had they not withdrawn. The post-immersion ratings (5 minutes p a t - immersion and 10 minutes post-immersion) were scored as missing for these subjects.
The pie chart below illustrates the percentage of subjects reporting each of the ratings on the malaise scale as their highest across the full immersion and post-immersion period.
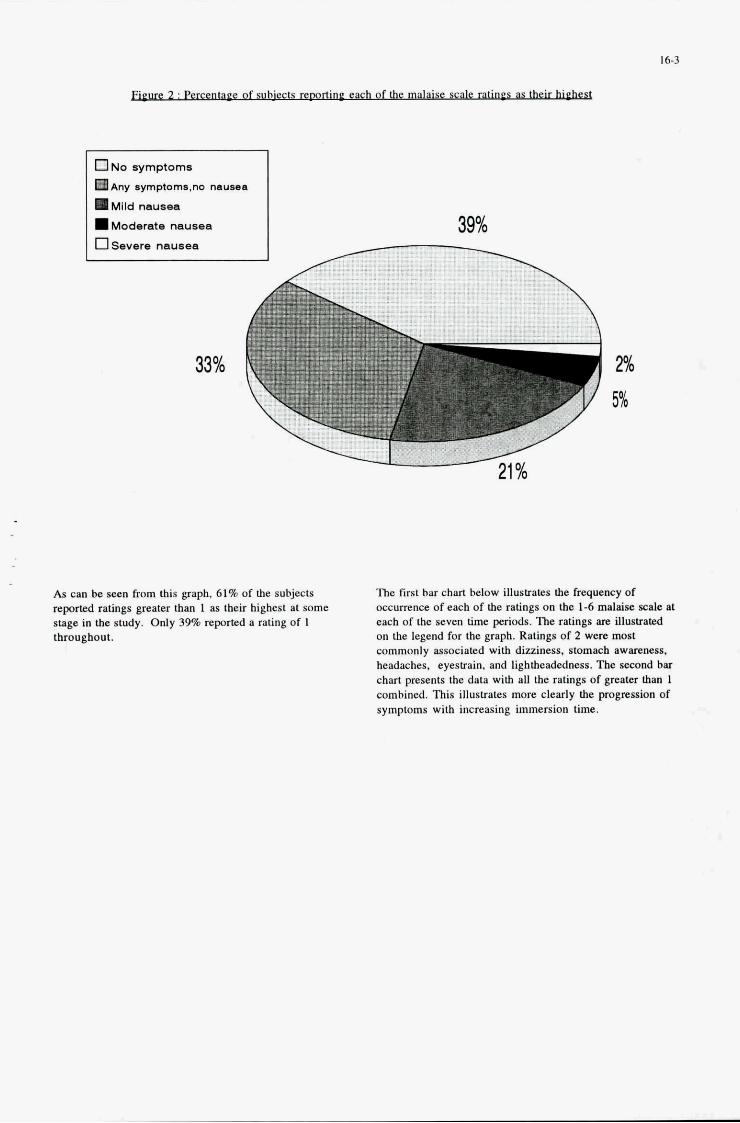
U NO symptoms
H~ny symptorna,no nausea
Mild nausea Moderate nausea 39% ..
0 Severe nausea
33% -2% 5%
As can be seen from this graph, 61% of the subjects reported ratings gream than 1 as their highest at some stage in the study. Only 39% reporled a rating of 1 throughout.
The fust bar chart below iUUstrates the frequency of occurrence of each of the ratings on the 1-6 malaise sede nt each of the seven time periods. The ratings are illustrated on the legend for the graph. Ratings of 2 were most commonly associated with dizziness, stomach awareness. headaches. eyeshin. and lightheadedness. The second bar chart presents the data with all the ratings of greater than 1 combined. This illustrates more clearly the progression of symptoms with increasing immersion time.
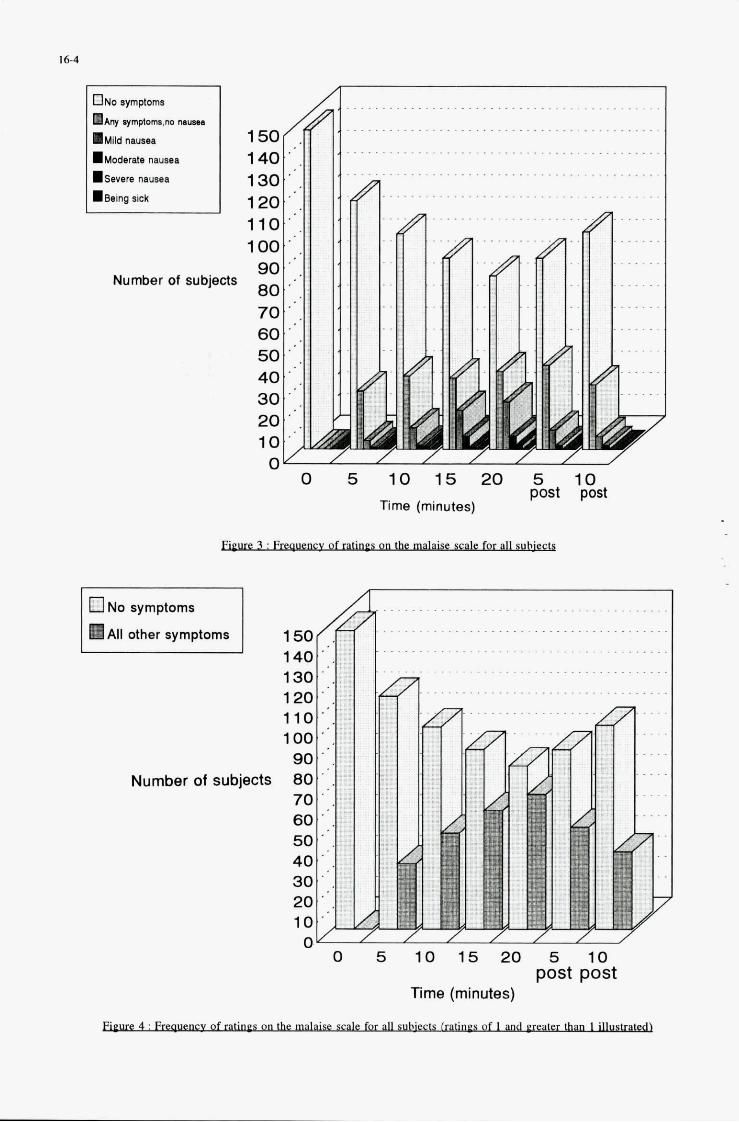
16-4
ONO aympoma
HAny ymptom.no lyyu
h l l d naumr.
hoderate n a u m
I s e v e r e nausea
b e i n g rick
Number of subjects
.........................................
..........................................
..........................................
.....................
. . . . . . . . .
0 5 10 15 20 5 10 post post
Time (minutes)
.All other symptoms
Number of subjects
........................................
........................................
.... . . . . . . . . . . . . . . . . . . . . . . . . . . . . . 150 140
" 0 5 10 15 20 5 10
post post Time (minutes)
ofland-
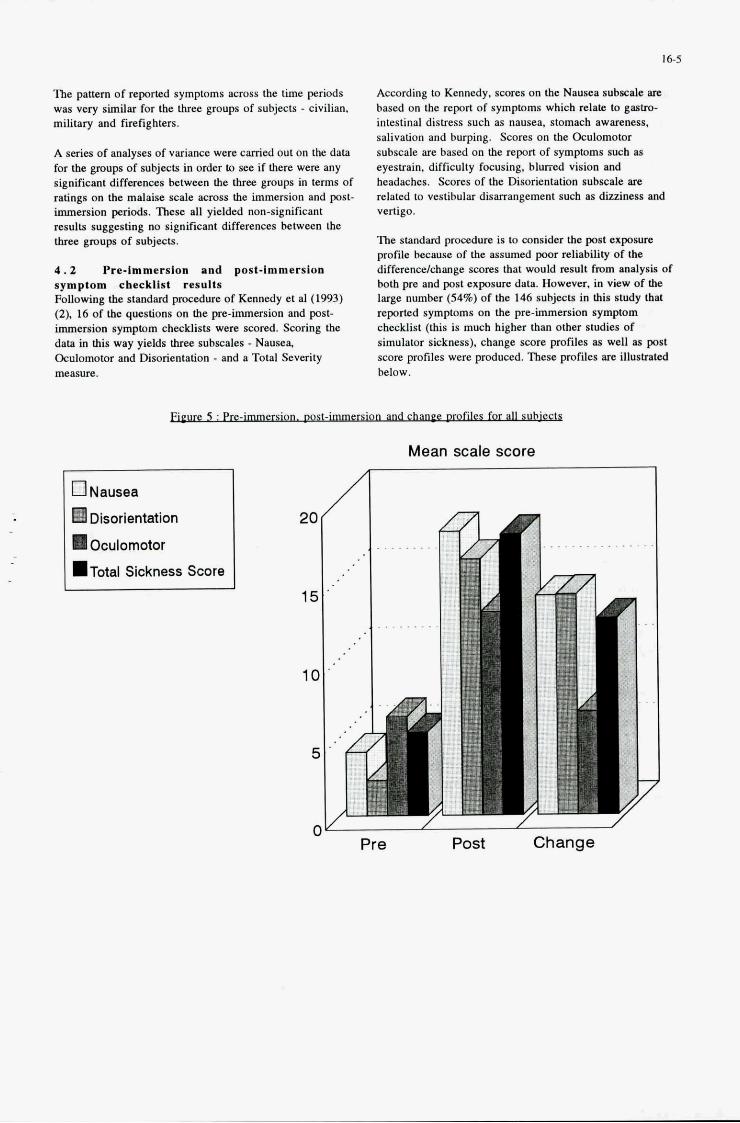
The pattern of reported symptoms m s s the time periods was very similar for the lhree groups of subjects - civilian, military and fmfighters.
A series of analyses of variance were carried out ou the data for the gmups of subjects in order to see if there were any significant differeuces betwccn the three gmups in terms of ratings on the malaise scale across the immersion and post- immersion prriods. These all yielded non-significant results suggesting no significant differences between the throe gmups of subjects.
4 .2 Pre-immerslun and post-Immersion symptom checkllst results Following the standard prncedure of Kennedy et al (1993) (2). 16 of the questions on the pre-immersion and post- immersion symptom checklists were swred. Scoring the dah in this way yields three subscales - Nausea, Oculomotor and Disorientation - and a Total Sevwity measure.
Acwrdiug to Kennedy, scores on the Nausea subrale are based on the report of symptoms which relate to gastro- intestinal distress such as nausea. stomach awareness, salivation and burping. Scores on the Oculomotor subscale are based on the reporl of symptoms such a i eyestrain, difficulty focusing, blurred vision and headaches. Scores of the Disorientation subscale BIC
related to vestibular disarrangement such as dizziness and vertigo.
The standard procedure is to consider the post exposure profile because of the assumed poor retiabfity of the differendchange swres that would mult h m annlysis of both pre and post exposure data. However. in v k w of the large number (54%) of the 146 subjects in this study that reporled symptoms on the pre-immersion symptom checklist (this is much higher than other studies of simulator sickness), change w e profiles as well as post score profiles were produced. T h e profiles are illustrated below.
Mean scale score
.Total Sickness Score
20/
15 '
10 '
5 '
. . . . .
/ / / Pre Post Change

The pmfdes were very similar for the three groups of subjects in terms of the paUem and magnitude a m s s the subscales.
These pmNes suggest thas with the PROVISION 200 system. nausea is the most significant problem. followed by disorientation and then oculomotor problems.
5 . DISCUSSION
This data would enable the side-effects of the VR system used in this study to be compared with the sideeffects of other VR systems and other simulators assessed using the same material. The results from this study suggest a high incidence of self-reported malaise resulting from the use of the immersion VR system. The incidence did not differ in a statistically significant manner for the three groups of subjects employed in this study. which suggests that the results found in this study CM be generalized to most subject populations. However, there are two reasons why the data must be treated with a degree of caution. Firstly, it must be stressed that the level of symptoms reported in other VR systems may be higher or lower than the level reported in this system. The data presented here can only be cited witb reference to the PROVISION 200 VR system with the peripherals used in this study. although the data may be suggestive of a more general incidence of malaise likely to occur with the use of all current VR systems. Secondly. the present experimental pmcedure could be viewed 88 having encouraged subjects lo dwell on their internal states. and, through constant prompting. to report symptoms that nugbt othenvlse have gone unobserved (it IS interesting to note in this wntext that 54% of the subjects reported symptoms on the pre-immersion symptom checklist).
Notwithstanding these reservations. however, it would appear that adverse side-effects are sufficiently wmmon to threaten the success of further studies using the VR system and of applications for the technology in its present state of development - 61% of the subjects in the present sample qorted some symptoms of malaise which ranged b m symptoms such as headaches and eyestrain to severe nausea; 5% of the subjecls had to withdraw from the experiment due to severe nausea or severe dizziness. Consequently some furlher research has been wndwted which has attempted to identify those factors that play a causative mle in the side-effects of the VR system. This will be discussed next. This will be followed by a discussion of some areas for future research.
5 . 1 Further research
Whilst every attempt was made in the experiment detailed above to ensure that all subjects underwent similar experiences during their immersion, differences between subjects in terms of behaviour whilst in the virtual world inevitably occurred. Subjects were free to control their bead movements and their sped of inleraction with the system. Consequently some subjects clearly moved more slowly and cautiously through the virtual world than others and made fewer head movements. These 'cautious' subjecls frequently reporled that they would have felt more nauseous had they engaged in more rapid movements. Thus they
appeared to have developed wping strategies which enabled them to tolerate the system for lhe given time period. Interestingly it has been reported that pilots may develop strategies such as restricting head movements to reduce simulator sickness symptomatology.
The extent to which encouraging pronounced head movements and rapid interaction with the system may produce increased nausea was investigated by muiring a new group of 44 subjects who did not take part in the previous study lo undergo a fixed set of actions whilst in the VR system. This set of actions was designed to maximise head movements and speed of interaetion with the system. The immersion lasted for 10 minutes. The malaise scale ratings of these subjects were compared with the malaise scale ratings of the subjects in the previous study (up to the 10 minute period) who were free to mhol their head movements and speed of inleraction with the system.
However, analyses of variance on the data for the two groups yielded non-significant results at the 5% level (even when the subjects scoring 1 (no symptoms) throughout were removed from the analyses). However the analysis at 5 minutes was significant at the 10% level.
It would appear therefore that no statistically signiftcant difference in malaise scale ratings occurs at the 10 minute immersion point between subjects who am engaging in pronounced head movements and rapid interaction with the system and subjects who are making head movements at their will and moving at their own speed. At 5 minutes some differences may exist. Thus whilst pronounced head movements and rapid interaction may initially cause higher levels of symptoms. subjects appear to adapt to these requirements at 10 minutes. It would wnsequently appear that factors other than subjecw' method of interacting with the virtual environment must be largely responsible for the level of side-effects reported.
.
28% of the subjects in the study detailed above were found lo experience mild, moderate, or severe nausea. Such nausea is a classic symptom of simulator sickness, which is frequently acknowledged as having much in wmmon with motion sickness. We are quite Bccustomed to motion sickness inducing situations (ie. situations in which information presented to the visual and vestibular system is contradictory) when seated (eg. in cars and trains) but not when standing up.
In additioo, when standing up and interacting with the virtual environment subjects have the facility to make natural walking movements (within a restricted area) as well as movements via the 3D mouse. Some people in the previous study took advantage of this facility and frequently made small physical movements. Such movements may act as a source of wnfusion when made in conjunction with movements via the 3D mouse and may partly contribute to subjects. experience of adverse side- effects such as dizziness and disorientation. On the other hand, however. such movements may provide useful kinaesthetic and vestibular cues to body position and movement which may attenuate such adverse side-effects.
16-7
Consequently it is possible that seating subjects during a VR immersion may affect levels of reported malaise.
44 subjects were immersed in the VR system for 10 minutes. 24 subjects stood during their immersion and 20 subjects were seated.
However, analyses on the data for the two groups yielded non-significant results (even when those scoring 1 (no symptoms) throughout were removed from the analyses) suggesting no significant difference between the two groups of subjects in terms of their ratings on the malaise scale across the immersion period.
It would appear, therefore, that no statistically significant difference in malaise scale ratings occurs between subjects who are standing during their immersion and subjects who are sitting during their immersion.
illarv distance 33% of the subjects who experienced symptoms in the initial study reported ocular associated problems - these were eyestrain, difficulty focusing, blurred vision, headaches and visual fatigue.
In the PROVISION 200 system the two LCDs in the headset are a fixed distance apart, with the difference between the images projected to these LCDs set in the software to the average male inter-pupillary distance. The experimental hypothesis was that the subjects who did report ocular problems in the previous study would be those with the greatest inter-pupillary distance deviations from the fixed system configuration. The inter-pupillary distance of 50 of the subjects in the initial experiment was measured using an inter-pupillary distance ruler.
1- -
--
The hypothesis was not found to be supported for the group of 50 subjects as a whole. The only significant finding was related to subjects with an inter-pupillary distance less than the system configuration (which was the majority of subjects). For these subjects there was some suggestion that those subjects with ocular problems did have the greatest deviations from the system configuration.
5 . 2 Future research
One of the areas for future research concerns subjects' method of movement through the virtual environment.
1 V'
It is likely that the method of movement in the virtual world, via the 3D mouse, makes a significant contribution to the level of reported nausea. It produces a classic motion sickness type situation in which the inputs of the visual, vestibular and kinaesthetic systems are incongruent with each other and previous experience - the visual system suggesting body movement and the other systems suggesting a static body position. The contribution of the method of moving through the virtual world to the reported nausea could be investigated by facilitating more natural methods of movement through the virtual world. One possibility would be to couple subjects' movements on a treadmill to their movements through the virtual world. This would allow subjects to actually walk through a virtual environment thus providing them with all the normal vestibular cues to movement. Levels of nausea would be
expected to fall in such a situation.
Habituation A second area for future research concerns the issue of habituation to the side-effects of immersion in VR. Immersion in VR is an unusual and novel experience. It takes some time to become accustomed to wearing the VR Flight Helmet and to the methods of movement and interaction with the virtual environment. It is possible that repeated immersions in the VR system will produce a decrease in side-effects as subjects become more accustomed to, and confident about, interaction with the system. Clearly there would also be the possibility of a systematic desensitization occurring with repeated exposure. Further research could address the issue of whether subjects will habituate with repeated immersions in VR. There is some suggestion that habituation may lead to reduced symptoms during immersion. but greater levels of post-immersion symptoms. After effects of simulator exposure have been observed in experienced simulator users. Consequently it would be appropriate for research investigating habituation effects to assess levels of malaise amongst subjects over longer post-immersion periods than those employed in the first study reported.
Levels of concen t r w Finally, some evidence appears to suggest that concentration levels are related to severity of simulator sickness, with relatively greater degrees of concentration being associated with relatively lower levels of sickness. Some subjects appeared to have to concentrate more than others during the immersion, particularly when using the 3D mouse to pick up and manipulate objects. The effect of varying levels of concentration on adverse side-effects of the system could be experimentally investigated. Clearly if increasing concentration does reduce the seventy of side- effects of the system then any further uses of the technology for experimental research purposes or for particular applications should attempt to maximize the concentration levels of the users.
Research into these issues would provide further information on the side-effects of immersion in VR reported, and may help in the identification of methods of reducing these side-effects.
6. CONCLUSION
In conclusion, the main study described in this paper set out to investigate the frequency of occurrence and severity of side-effects of using an immersion VR system. The results of this study suggested that adverse side-effects are sufficiently common to threaten the success of further research using VR and of applications for the technology in its present state of development. Some further research has consequently been conducted which attempted to identify those factors that play a causative role in the side- effects of the VR system. This research and areas for future research have been discussed.
British Crown Copyright 1993/MOD Published with the permission of the Controller of Her Britannic Majesty's Stationary Office

16-8
7 . REFERENCES
1 . Havron M D & Butler L F, 1957: Evaluation of training effectiveness of the 2FH2 helicopter flight trainer research tool. Naval Training Device Center, Port Washington, New York, NAVTRADEVCEN 1915-00-1.
2 . Kennedy R S, Lane N E, Berbaum K S & Lilienthal M G A, 1993: Simulator sickness questionnaire (SSQ): a new method for quantifying simulator sickness. International Journal of Aviation Psychology, 3 (in press).
17-1
SUMMARY
VISUAL ACCOMMODATION TO VIRTUAL IMAGE DISPLAYS WHEN KNOWLEDGE OF OBJECT DISTANCE
CONFLICTS WITH OPTICAL DISTANCE
John C. Kotulak, Stephen E. Morse and Roger W. Wiley US Army Aeromedical Research Laboratory
PO Box 577 Fort Rucker
Alabama 36362-0577 United States
In virtual image displays, the image is typi- cally at or near optical infinity, while the object may be at any distance. This can cre- ate a conflict between the known distance of a target and its optical distance. If accom- modation is drawn to the known distance of the object rather than the optical distance of its image, considerable retinal image blur can result. To determine whether this actually occurs, we measured the accommodation of seven young adult subjects with a dynamic infrared optometer. The subjects viewed a coUimated virtual image of a target mono- cularly through third generation night vision goggles (ANVIS). Although the target itself was positioned randomly at either 6.0, 1.0'0.5, or 0.33 m from the observer, its image was maintained at infinity by compensatory ad- justments of the ANVIS objective lens. The observer was aware fully of the actual distance of the target. A simulated clear starlight night sky condition was used in order to de- grade image quality such that the accommo- dative feedback loop was "semiopen," an intermediate state between the closed and open loop conditions of previous experiments. The results show that for some subjects, knowledge of object distance is a more power- ful cue for accommodation than the image's optical distance; however, for the majority of subjects, this is not the case. The subjects who were susceptible to the knowledge of ob- ject distance cue reported severe blur when the object was nearby. We also found that these same subjects, i.e., the susceptible ones, tend to have a more proximal dark focus than those whose accommodation is not influenced by knowledge of object distance. The linkage between dark focus and susceptibility to prox- imal influences has not been previously de- monstrated and needs to be explored further.
INTRODUCTION
During ordinary viewing, the observer typi- cally sees a real object, and a clear image of this object is formed on the observer's retinas. The process of changing the focus of the eyes such that the retinal images remain clear at varying viewing distances is called "accom- modation." Accommodation $guided by both physiologic and psychologic stimuli. Retinal image blur is the principal physiologic stim- ulus (1)' and perceived object distance is the principal psychologic stimulus (2). Normally, retinal image blur and perceived distance act in harmony in that when both cues are avail- able, accommodation is more accurate than when only one of them is present (3).
However, under virtual reality conditions such as in flight simulators or in aircraft equipped with helmet mounted displays, a mismatch can occur between retinal image blur and per- ceived distance. This is because the observer no longer sees the real world, but instead views an optical image of the world. Al- though the image typically is placed at or near optical infinity, it may convey a psychological sense of nearness. This sense of nearness may derive from the object which is being imaged, if the object is something that the obseiver would expect to find close by, such as the flight controls in a simulator (4). The sense of nearness also could derive from the close proximity of the display to the eye.
Under optimal conditions accommodation can deal effectively with the mismatch between conflicting physiologic and psychologic cues (5-7). Such conditions are referred to as "closed loop," which describes the state of the negative feedback loop of the accommodative control system when target contrast and lumi- nance are high, and when the quality of the
Presented at an AGARD Meeting on 'Virtual Interfaces: Research and Applications', October 1993.
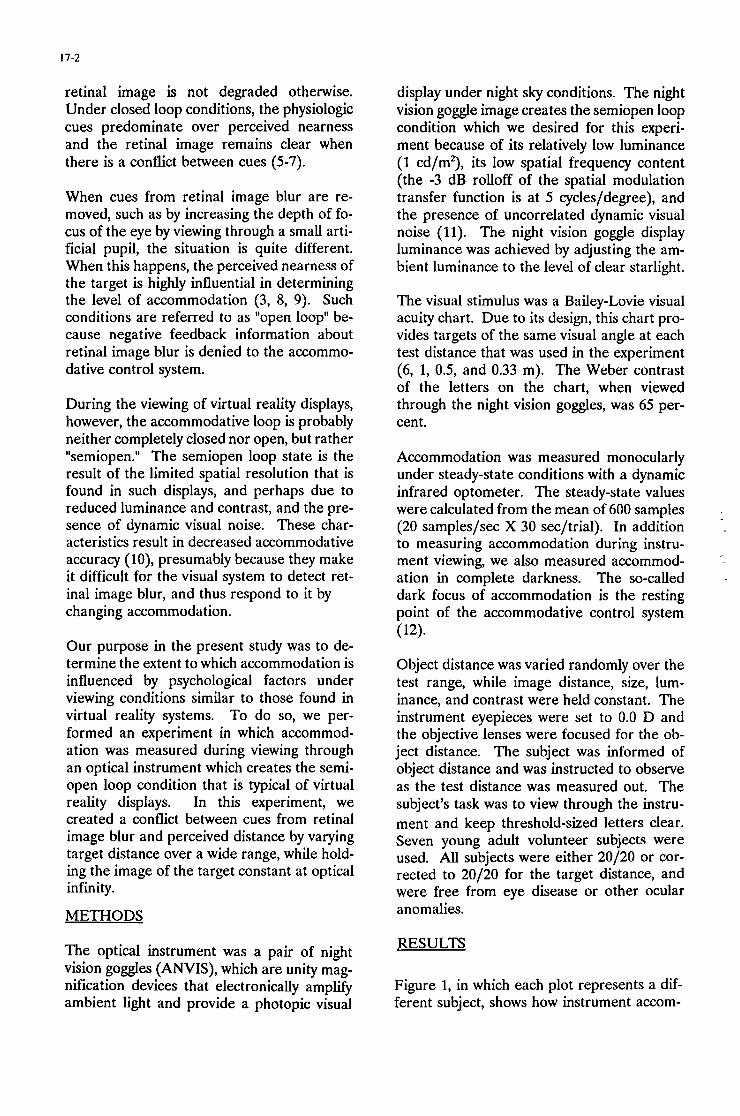
17-2
retinal image is not degraded otherwise. Under closed loop conditions, the physiologic cues predominate over perceived nearness and the retinal image remains clear when there is a conflict between cues (5-7).
When cues from retinal image blur are re- moved, such as by increasing the depth of fo- cus of the eye by viewing through a small arti- ficial pupil, the situation is quite different. When this happens, the perceived nearness of the target is highly influential in determining the level of accommodation (3, 8, 9). Such conditions are referred to as "open loop" be- cause negative feedback information about retinal image blur is denied to the accommo- dative control system.
During the viewing of virtual reality displays, however, the accommodative loop is probably neither completely closed nor open, but rather "semiopen." The semiopen loop state is the result of the limited spatial resolution that is found in such displays, and perhaps due to reduced luminance and contrast, and the pre- sence of dynamic visual noise. These char- acteristics result in decreased accommodative accuracy (lo), presumably because they make it difficult for the visual system to detect ret- inal image blur, and thus respond to it by changing accommodation.
Our purpose in the present study was to de- termine the extent to which accommodation is influenced by psychological factors under viewing conditions similar to those found in virtual reality systems. To do so, we per- formed an experiment in which accommod- ation was measured during viewing through an optical instrument which creates the semi- open loop condition that is typical of virtual reality displays. In this experiment, we created a conflict between cues from retinal image blur and perceived distance by varying target distance over a wide range, while hold- ing the image of the target constant at optical infinity.
METHODS
The optical instrument was a pair of night vision goggles ( A N V I S ) , which are unity mag- nification devices that electronically amplify ambient light and provide a photopic visual
display under night sky conditions. The night vision goggle image creates the semiopen loop condition which we desired for this experi- ment because of its relatively low luminance (1 cd/m2), its low spatial frequency content (the -3 dB rolloff of the spatial modulation transfer function is at 5 cycles/degree), and the presence of uncorrelated dynamic visual noise (11). The night vision goggle display luminance was achieved by adjusting the am- bient luminance to the level of clear starlight.
The visual stimulus was a Bailey-Lovie visual acuity chart. Due to its design, this chart pro- vides targets of the same visual angle at each test distance that was used in the experiment (6, 1, 0.5, and 0.33 m). The Weber contrast of the letters on the chart, when viewed through the night vision goggles, was 65 per- cent.
Accommodation was measured monocularly under steady-state conditions with a dynamic infrared optometer. The steady-state values were calculated from the mean of 600 samples (20 samples/sec X 30 sec/trial). In addition to measuring accommodation during instru- ment viewing, we also measured accommod- ation in complete darkness. The so-called dark focus of accommodation is the resting point of the accommodative control system (12).
Object distance was varied randomly over the test range, while image distance, size, lum- inance, and contrast were held constant. The instrument eyepieces were set to 0.0 D and the objective lenses were focused for the ob- ject distance. The subject was informed of object distance and was instructed to observe as the test distance was measured out. The subject's task was to view through the instru- ment and keep threshold-sized letters clear. Seven young adult volunteer subjects were used. All subjects were either 20/20 or cor- rected to 20/20 for the target distance, and were free from eye disease or other ocular anomalies.
RESULTS
Figure 1, in which each plot represents a dif- ferent subject, shows how instrument accom-
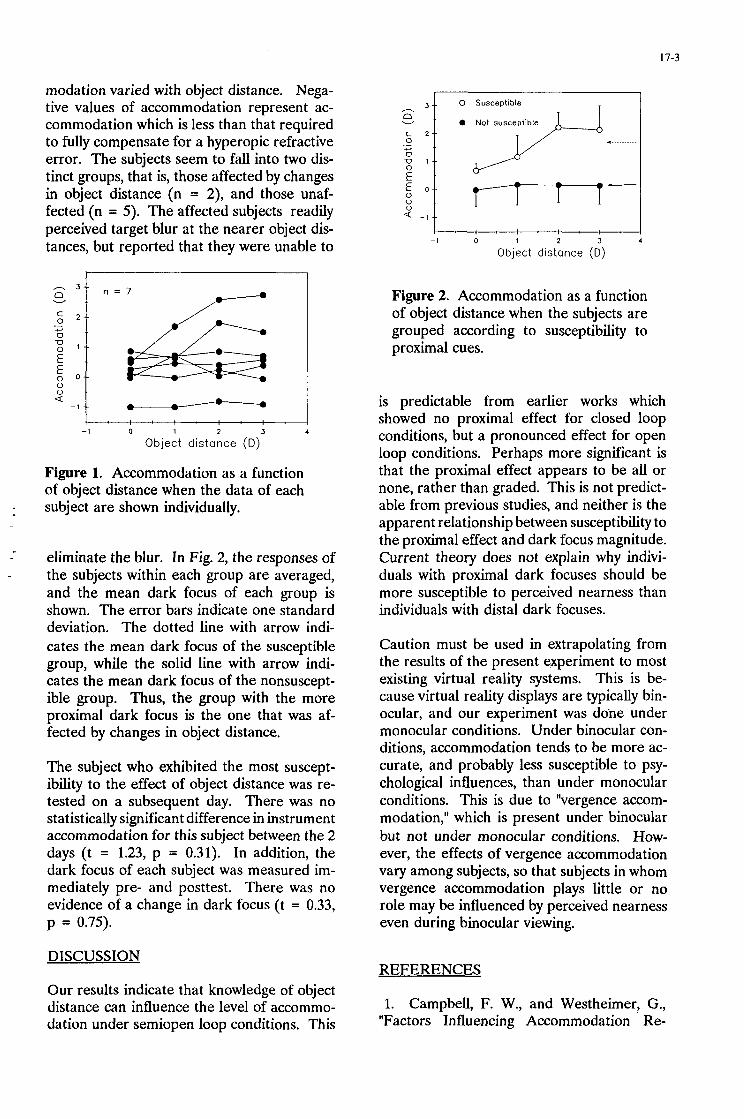
17-3
, h
v n
c 2 0
U U 1 0 s .
.- +-
modation varied with object distance. Nega- tive values of accommodation represent ac- commodation which is less than that required to fully compensate for a hyperopic refractive error. The subjects seem to fall into two dis- tinct groups, that is, those affected by changes in object distance (n = 2), and those unaf- fected (n = 5). The affected subjects readily perceived target blur at the nearer object dis- tances, but reported that they were unable to
_ _ 0 Susceptible
0 Not susceptible - -
' '
--
Figure 1. Accommodation as a function of object distance when the data of each subject are shown individually.
eliminate the blur. In Fig. 2, the responses of the subjects within each group are averaged, and the mean dark focus of each group is shown. The error bars indicate one standard deviation. The dotted line with arrow indi- cates the mean dark focus of the susceptible group, while the solid line with arrow indi- cates the mean dark focus of the nonsuscept- ible group. Thus, the group with the more proximal dark focus is the one that was af- fected by changes in object distance.
The subject who exhibited the most suscept- ibility to the effect of object distance was re- tested on a subsequent day. There was no statistically significant difference in instrument accommodation for this subject between the 2 days (t = 1.23, p = 0.31). In addition, the dark focus of each subject was measured im- mediately pre- and posttest. There was no evidence of a change in dark focus (t = 0.33, p = 0.75).
- 1 0 1 2 3 1
Object distance (D)
Figure 2. Accommodation as a function of object distance when the subjects are grouped according to susceptibility to proximal cues.
is predictable from earlier works which showed no proximal effect for closed loop conditions, but a pronounced effect for open loop conditions. Perhaps more significant is that the proximal effect appears to be all or none, rather than graded. This is not predict- able from previous studies, and neither is the apparent relationship between susceptibility to the proximal effect and dark focus magnitude. Current theory does not explain why indivi- duals with proximal dark focuses should be more susceptible to perceived nearness than individuals with distal dark focuses.
Caution must be used in extrapolating from the results of the present experiment to most existing virtual reality systems. This is be- cause virtual reality displays are typically bin- ocular, and our experiment was done under monocular conditions. Under binocular con- ditions, accommodation tends to be more ac- curate, and probably less susceptible to psy- chological influences, than under monocular conditions. This is due to "vergence accom- modation," which is present under binocular but not under monocular conditions. How- ever, the effects of vergence accommodation vary among subjects, so that subjects in whom vergence accommodation plays little or no role may be influenced by perceived nearness even during binocular viewing.
DISCUSSION REFERENCES
Our results indicate that knowledge of object distance can influence the level of accommo- dation under semiopen loop conditions. This
1. Campbell, F. W., and Westheimer, G., "Factors Influencing Accommodation Re-
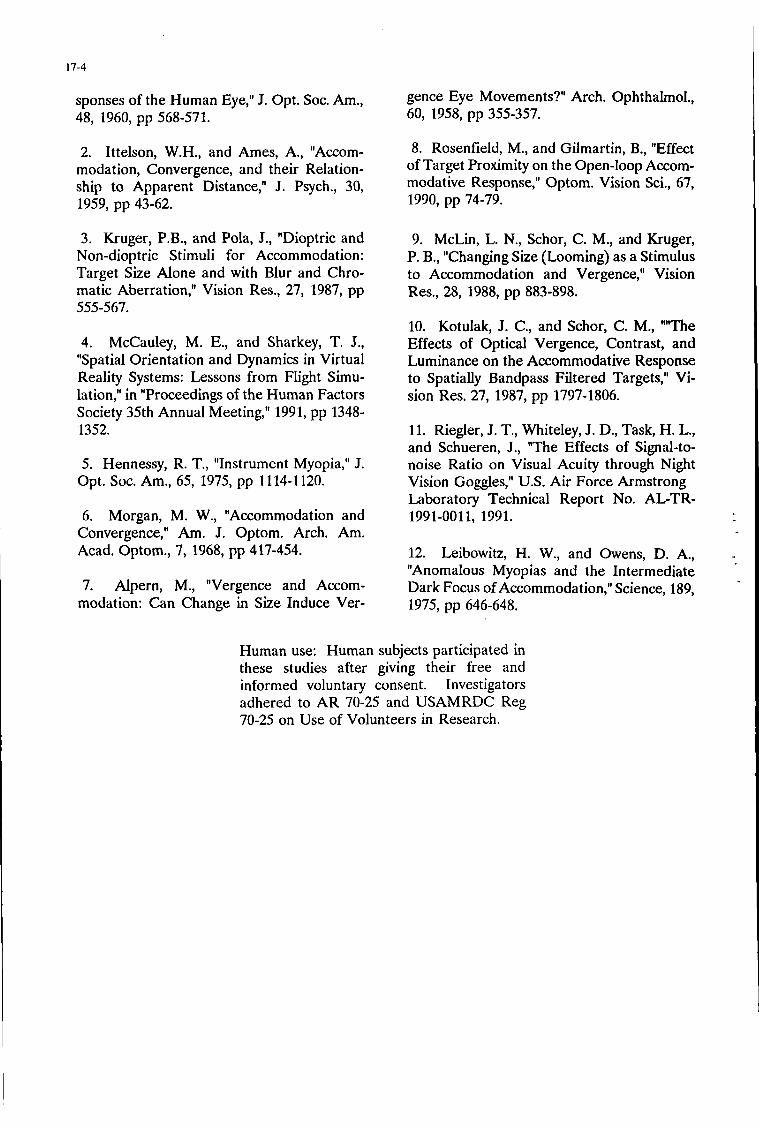
17-4
sponses of the Human Eye," J. Opt. Soc. Am., 48, 1960, pp 568-571.
2. Ittelson, W.H., and Ames, A., "Accom- modation, Convergence, and their Relation- ship to Apparent Distance," J. Psych., 30, 1959, pp 43-62.
3. Kruger, P.B., and Pola, J., "Dioptric and Non-dioptric Stimuli for Accommodation: Target Size Alone and with Blur and Chro- matic Aberration," Vision Res., 27, 1987, pp 555-567.
4. McCauley, M. E., and Sharkey, T. J., "Spatial Orientation and Dynamics in Virtual Reality Systems: Lessons from Flight Simu- lation," in "Proceedings of the Human Factors Society 35th Annual Meeting," 1991, pp 1348- 1352.
5. Hennessy, R. T., "Instrument Myopia," J. Opt. Soc. Am., 65, 1975, pp 1114-1120.
6. Morgan, M. W., "Accommodation and Convergence," Am. J. Optom. Arch. Am. Acad. Optom., 7, 1968, pp 417-454.
7. Alpern, M., Vergence and Accom- modation: Can Change in Sue Induce Ver-
gence Eye Movements?" Arch. Ophthalmol., 60, 1958, pp 355-357.
8. Rosenfield, M., and Gilmartin, B., "Effect of Target Proximity on the Open-loop Accom- modative Response," Optom. Vision Sci., 67, 1990, pp 74-79.
9. McLin, L. N., Schor, C. M., and Kruger, P. B., "Changing Size (Looming) as a Stimulus to Accommodation and Vergence," Vision Res., 28, 1988, pp 883-898.
10. Kotulak, J. C., and Schor, C. M., ""The Effects of Optical Vergence, Contrast, and Luminance on the Accommodative Response to Spatially Bandpass Filtered Targets," Vi- sion Res. 27, 1987, pp 1797-1806.
11. Riegler, J. T., Whiteley, J. D., Task, H. L., and Schueren, J., T h e Effects of Signal-to- noise Ratio on Visual Acuity through Night Vision Goggles," U.S. Air Force Armstrong Laboratory Technical Report No. AL-TR- 1991-0011, 1991.
12. Leibowitz, H. W., and Owens, D. A., "Anomalous Myopias and the Intermediate Dark Focus of Accommodation," Science, 189, 2975, pp 646-648.
Human use: Human subjects participated in these studies after giving their free and informed voluntary consent. Investigators adhered to AR 70-25 and USAMRDC Reg 70-25 on Use of Volunteers in Research.
18-1
Low Cost Software-Based Rendering and Stereoscopic Interfaces for Teleoperation and Virtual Reality
Dave M. Stampe SR Research
55 Oakmount Rd. Ste. 1108 Toronto, Canada M6P 2M5 ds [email protected]
Julius J. Grodski DCIEM, Toronto, Canada
SUMMARY
Many interface systems require generation of 3D graphics, whether as the entire display in virtual reality systems or as an overlay on live video in teleoperation. Costs must be kept low to make such systems practical, but real-time response speed must not be sacrificed.
Described here is a very low-cost rendering and VR support package for 386 and 486 PCs, which requires no added hardware to achieve real-time drawing rates (20 to 60 frames per second). It includes integral support for generation and display of stereoscopic graphics in many formats, including field-alternate displays using LCD shutter glasses, and wide-angle head-mounted displays. Many common PC interface devices are supported, including mouse, joystick, 6D pointing devices, and head trackers.
. Inexpensive PC multimedia cards allow output to be recorded on a VCR, or overlaid onto live video, including stereoscopic TV images from teleoperated remote cameras. Full source code is available, allowing the software to be customized for any application.
1. Introduction
Generation of three-dimensional computer graphics is a basic requirement of many computer interfaces, from CAD design tools to scientific visualization and virtual reality (VR). Such graphics range from simple wireframe drawings to photorealistic raytraced images used in computer art and movies. The most demanding of all computer graphics applications are those that require images to be produced in real time, such as flight simulators and VR. Expensive special-purpose hardware is often needed to achieve required drawing speeds of 10 to 60 frames per second.
In applications where depth judgments are important, stereoscopic imaging of live video or computer-generated graphics is advantageous. It requires the generation of suitable left and right eye images from two video cameras or by the computer such that when viewed by an observer, they simulate the process of lefdright "live" viewing of the environment. The observer interprets differences between the left and right eye images as depth information in the scene.
Stereoscopic imaging using video has been in use for decades in the field of teleoperation and telerobotics. Real-
time stereoscopic computer graphics is a capability that is much more recent then stereoscopic video, as twice the drawing rate or a second set of rendering hardware is required to produce both eye's views. Stereoscopic computer graphics are an essential part of V i Reality (VR) applications, while in teleoperation it is advantageous to have the capability to overlay stereoscopic computer graphics on stereoscopic video. Computer-generated imagery has seen limited use in teleoperation due to the cost and limited power of graphics generators and workstations capable of producing real-time three- dimensional graphics. Stereoscopic graphics are rarely used. as they are expensive in terms of computer resources and require careful attention to real and "virtual" (computer graphics simulated) camera setup.
2. Augmented Teleoperation
Early uses of stereoscopic computer graphics in teleoperation focused on the simulation of a manipulator operating in a remote task environment [1,2.3]. Fully immersive systems using head-mounted displays (HMD), such as the Virtual Reality Systems [4] and the Virtual Interface Environment Workstation (VIEW) [5,6] were state of the art as of the mid-late 80s, and inspired the development of totally computer-generated virtual environments, as in today's VR systems.
Concurrently, low-budget methods involving the combination of remote stereoscopic video and real-time computer graphics were evolving [7,8]. The graphics were generated by a Commodore Amiga computer, which used a M68000 processor and included custom graphics hardware to speed wireframe rendering. A genlock overlay device allowed display of the graphics overlaid on stereoscopic video on the computer monitor, and LCD glasses were used to view the image. Video was generated remotely from two color CCD cameras, and could be recorded for later analysis.
Although the Amiga was the fastest low-budget solution for real-time stereoscopic graphics available at the time, more imaging power was needed to render complex moving images. Advanced hardware such as the Silicon Graphics IRIS graphics workstations have been used more recently in the work at the Jet Propulsion Laboratory [9] and at the University of Toronto [10,11], but at a substantial increase in system cost. One advantage of the IRIS for graphics generation is that extensive graphics support libraries are available, whereas the Amiga software had to be written by hand.
Presented at an AGARD Meeting on 'Virrual Interfaces: Research and Applications', October 1993.
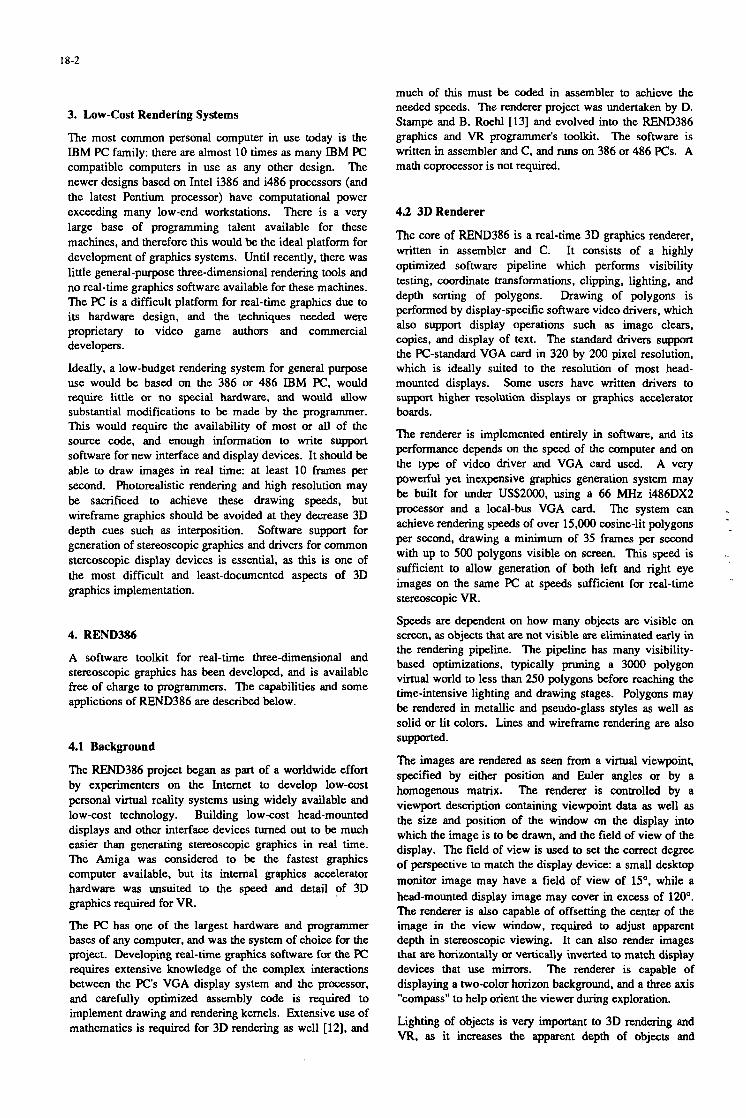
18-2
3. Low-Cost Rendering Systems
The most common personal computer in use today is the IBM PC family: there are almost 10 times as many IBM PC compatible computers in use as any other design. The newer designs based on Intel i386 and i486 processors (and the latest Pentium processor) have computational power exceeding many low-end workstations. There is a very large base of programming talent available for these machines, and therefore this would be the ideal platform for development of graphics systems. Until recently, there was little general-purpose three-dimensional rendering tools and no real-time graphics software available for these machines. The PC is a difficult platform for real-time graphics due to its hardware design, and the techniques needed were proprietary to video game authors and commercial developers.
Ideally, a low-budget rendering system for general purpose use would be based on the 386 or 486 IBM PC, would require little or no special hardware, and would allow substantial modifications to be made by the programmer. This would require the availability of most or all of the source code, and enough information to write support software for new interface and display devices. It should be able to draw images in real time: at least 10 frames per second. Photorealistic rendering and high resolution may be sacrificed to achieve these drawing speeds, but wireframe graphics should be avoided at they decrease 3D depth cues such as interposition. Software support for generation of stereoscopic graphics and drivers for common stereoscopic display devices is essential. as this is one of the most difficult and least-documented aspects of 3D graphics implementation.
4. REND386
A software toolkit for real-time three-dimensional and stereoscopic graphics has been developed, and is available free of charge to programmers. The capabilities and some applictions of REND386 are described below.
4.1 Background
The REND386 project began as part of a worldwide effort by experimenters on the Internet to develop low-cost personal virtual reality systems using widely available and low-cost technology. Building low-cost head-mounted displays and other interface devices turned out to be much easier than generating stereoscopic graphics in real time. The Amiga was considered to be the fastest graphics computer available, but its internal graphics accelerator hardware was unsuited to the speed and detail of 3D graphics required for VR.
The Pc has one of the largest hardware and programmer bases of any computer, and was the system of choice for the project. Developing real-time graphics software for the FC requires extensive knowledge of the complex interactions between the PC's VGA display system and the processor, and carefully optimized assembly code is required to implement drawing and rendering kernels. Extensive use of mathematics is required for 3D rendering as well [12]. and
much of this must be coded in assembler to achieve the needed speeds. The renderer project was undertaken by D. Stampe and B. Roehl [13] and evolved into the REND386 graphics and VR programmer's toolkit. The software is written in assembler and C, and runs on 386 or 486 PCs. A math coprocessor is not required.
4.2 3D Renderer
The core of REND386 is a real-time 3D graphics renderer, written in assembler and C. It consists of a highly optimized software pipeline which performs visibility testing, coordinate transformations, clipping, lighting, and depth sorting of polygons. Drawing of polygons is performed by display-specific software video drivers, which also support display operations such as image clears, copies, and display of text. The standard drivers support the PC-standard VGA card in 320 by 200 pixel resolution, which is ideally suited to the resolution of most head- mounted displays. Some users have written drivers to support higher resolution displays or graphics accelerator boards.
The renderer is implemented entirely in software, and its performance depends on the speed of the computer and on the type of video driver and VGA card used. A very powerful yet inexpensive graphics generation system may be built for under US$2000, using a 66 MHz i486DX2 processor and a local-bus VGA card. The system can achieve rendering speeds of over 15.000 cosine-lit polygons per second, drawing a minimum of 35 frames per second with up to 500 polygons visible on screen. This speed is sufficient to allow generation of both left and right eye images on the same Pc at speeds sufficient for real-time stereoscopic VR.
Speeds are dependent on how many objects are visible on screen, as objects that are not visible are eliminated early in the rendering pipeline. The pipeline has many visibility- based optimizations, typically pruning a 3000 polygon virtual world to less than 250 polygons before reaching the time-intensive lighting and drawing stages. Polygons may be rendered in metallic and pseudo-glass styles as well as solid or lit colors. Lines and wireframe rendering are also
The images are rendered as seen from a virtual viewpoint. specified by either position and Euler angles or by a homogenous matrix. The renderer is controlled by a viewport description containing viewpoint data as well as the size and position of the window on the display into which the image is to be drawn, and the field of view of the display. The field of view is used to set the COrrect degree of perspective to match the display device: a small desktop monitor image may have a field of view of 15", while a head-mounted display image may cover in excess of 120'. The renderer is also capable of offsetting the center of the image in the view window, required to adjust apparent depth in stereoscopic viewing. It can also render images that are horizontally or vertically inverted to match display devices that use mirrors. The renderer is capable of displaying a two-color horizon background, and a three axis "compass" to help orient the viewer during exploration.
Lighting of objects is very important to 3D rendering and VR. as it increases the apparent depth of objects and
supported.
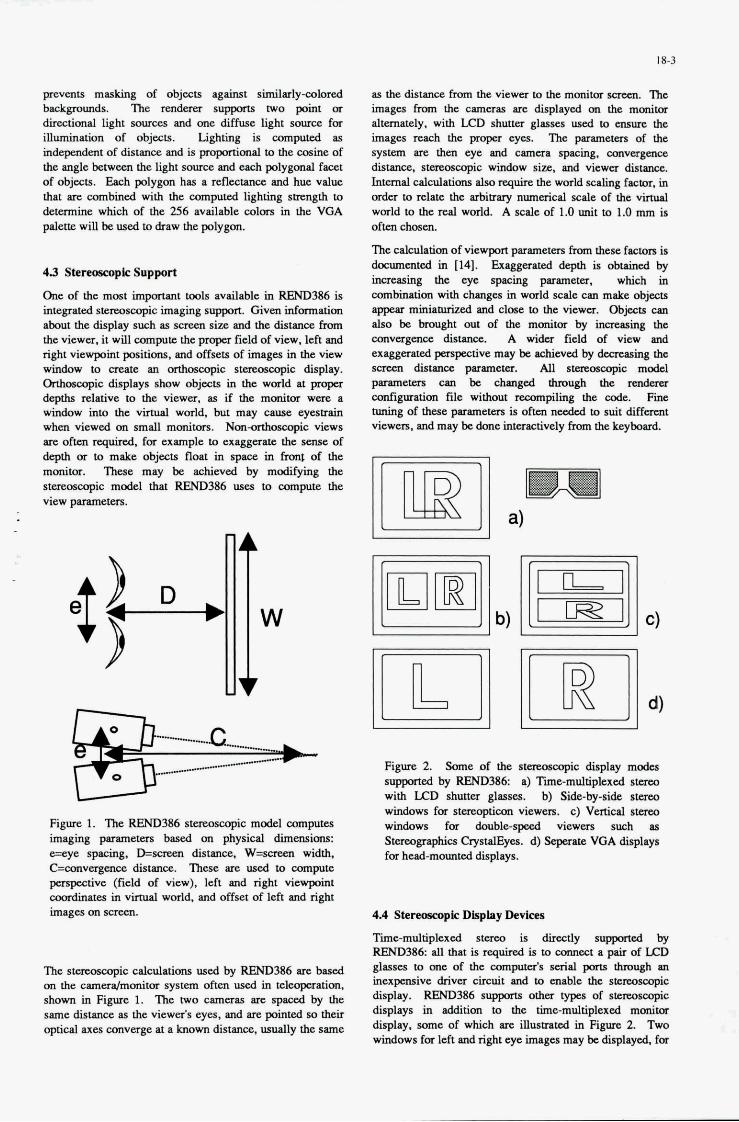
-- ..
18-3
as the distancc frum the viewer to the monitor ecrrxn Ihe images frum the cameras arc displayed on the monitor alternately. with LCD shutta glasses used to cnnrn the images reach the proper eyes. The p.ramctas of the system arc then eye and camera spacing. CDnvergema distance. smwsmpic window size. and viewa disuncc.
mQ to relate the arbiumy nunuical d e of the vifilal world to the real world. A scale of 1.0 unit to 1.0 mm is often chosen
The calculation of v i e w p i paramem fmn these f a c m is duxuncntcd in 1141. Exaggcnrcd depth is obtained by inueasiig thc eyc spacing paraneta, which in combination with changes in world d e can make objects appear miniatmized and clcde to the viewer. Ob+ can also be bmught out of the monitor by W i n g the omvergema distance. A wida field of view and exaggerated perjpcctve m y be achieved by dccwing the scseen distancc p.rrmctcr. All sTerroQcopic modcl
amfiguration file without recanpiling the codc. Finc
viewers. and may be h e inrarctl 'vely from the keyboard.
Intcrnalcaldations also require the w o r l a w factor, in
pamncters cw be chplgced duough the rsndcra
aming of these paranetas is o h necdod to suit dwawlt
pvents masking of objects against similarly-colored
directional light sources and one diffuse light source fm illumination of objects. Lighting is computed as depemkmt of distancc .and is to the wsme of the angle between the light source and eacb polygonal facet of objects. Edch polygon has a reflectance and hue value that arc combmed with the computed ligbting s m g t h to determine which of the 256 available mlm in the VGA pnlette will be used to draw the p o l y p .
backpmb. ~ r e n d e r e r ~ t w o p o i n t m
4 3 Stereasmpk Support
One of the most impoarmt took avfulable m REND386 is integrated stemsmpic imaging support. Given intannation about the display such as SCrcQl size and the disuncc from
an onhoscopie 8- display.
the v i c r ~ ~ , it will compute the pmpcr field of view. left and right viewpint positions. and offsets of images in the new window to CIWte Onhoscapie displays show objects in the world at pmpu depths d a t i v e to the viewer, as if the monitor wcre a window into the vinual woM, hut may cause eyesaain when viewed on mall monitors. N o n - c u h x q i c views arc oilen quired. for example to exaggaate the smse of depth or to make objects float in spacc in fnmt of the mmtor. These may be achieved by modifying the sfcrcQpcopie model that REND386 usen to compute the view panmeters.
#.- Figure 1. Ihc REND386 sfClCOSCOPl 'c model computes imaging parameters b a d on physical dimensions: e=eyespacing,D=scteendistance,W=scmnwidth. c=unvcrgace distance. These arc used to compute p p t i v e (field of view), left and right viewpoint coordinuw in virmal world, and offEt of left and right images on screo~
The stocoseopic calculations used by REND386 arc based on the cam&&tor system often used in tclcopaation. shown in Figure 1. llte two cameras m spaced by the same distance as the viewer's eyes, and arc pointed M their optical axes canverge at a known distance. usually the same
I- b) L"J1 c)
Pigun 2. Some of the stocoseopic diaphy modcs suppmad by REND386 a) Tie-multiplexed ~lterm with LCLI shutta glasses. b) Side-by-side stereo windows for S t e m p t i C D n viewm. c) veltical staeo windows for double-spccd viewm such UI
Stereographies CrystalEyCs. d) Scpentc VGA displays fm head-mounted displays.
4A Stenosfopk Display Devices
Tic-multipkxed sterw is directly supponed by REND386 111 that is requ id is to amnect apairof LQ) glasses to one of the compufds &al pons tbmugh m inexpmsive driver circuit and to enable the smuxwpic display. REND386 s q p x b other typss of stcm.oswpic displays in addition to the time-multiplexed monitor display, m e of which arc illustrated in Figure 2. Two windows for leti and right eye images may he displayed, for
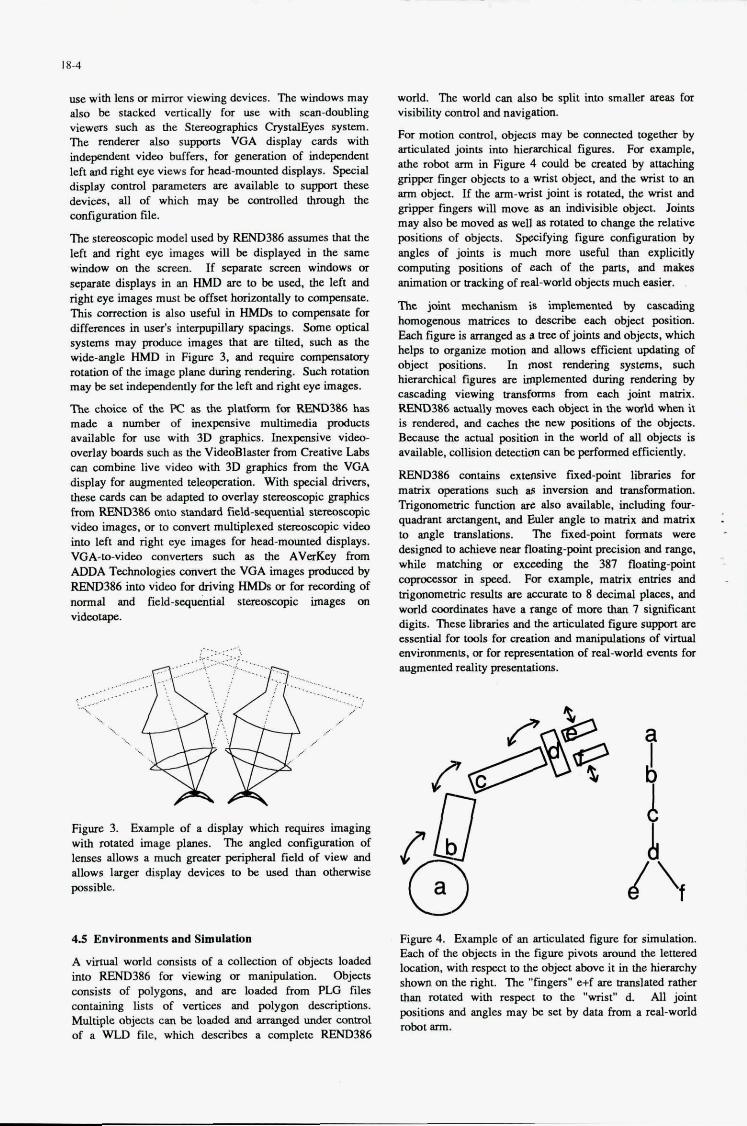
I a-4
use with lens or mirrm viewing devices. The windows may also be stacked vmically for use with scan-doubling viewm such as the Stcrmgraphcs CrystnlEycs system. The rendcru also suppons VGA display cards with
left a d right eye news for hud-mounted displays. Spccid display wnml parameters are available to suppant these deviw. all of which may be ammlled ulrough the diguration file.
ThCStcrmscoplc ' model used by REND386 assumes that the left and right eye images will be displayed in the same window on the serem. If scparare scrcen windows or scparatc displays in an HMD are to be used, thc left and right eye images must be oftset horizontally to compensate. ms comztion is also ugcful in HMDS to compcnsatc for differences in user's interpupillmy spacings. Some optical systems may produce images that are tilted, such as the wide-angle HMD in Figure 3. and require mmpehpuory rotation of the image plmc during Icndcring. Such rotation may be set independently for the left and right eye images.
The choice of the PC BS the platform for REND386 has nude a n u m k of inexpensive multimedia products availnble for use with 3D graphics. Inexpensive vidm- overlay bards such as tbe VideoBlaster fmm Creative Labs can combine live video with 3D gmphics fmm the VGA display for augmented teleopemtion. With special drivers,
fmm REND386 onto standad field-seipntid s w c vidw images, or to amven multiplexed stemmmpk vidm into left and right eye images for head-mounted displays. VGA-to-vidm mvcr tm such as the A V R ~ fmm ADDA Technologies amvezt the VGA imases p t u d d by
nonnd and field-sequcntal staewcqic images on videotapz.
independm video buffers, for generution of in-t
thcsc urds Mnbe adaptedto overlay stmoseopl 'c graphics
REND386 into vidm for driving HMDS or for reeaading of
Figure 3. Example of a display which required imaging with rotated image planes. 'Ihe &ed d i p a t i o n of lenses allows a much greatex paiphaal field of view and allows l q e r display dcviccs to be used than otherwk possible.
4.5 Envimnmene and Stmulatbn
A virtual world m i s t s of a collection of objects loaded into REND386 for viewing or manipulation. Objects m i s t s of polygons. and are loaded fmm PLG files ammining lists of vcrticcs and polygon dcsaiptions. Multiple objects can be loaded and arranged under anum1 of a WWD file. which desoibcs a complete REND386
world. Ihe world can also be split into smaller mas for visibility conml and navigation.
Por motion mml, objecw may be connectai together by articulated joints into hierarchical figures. For example. athe robt arm in Figure 4 could be created by attaching grippa h g u objects to a wrist object, and the wrist to an arm object If the Um-aniSt joint is rotated, the wrist and &per fingm will move as an indivisible object. Joints may also be moved as well as routed to change the relative positions of objects. Sp~cifying figure d p a t i o n by angles of joints is much more useful than explicitly computing positions of each of the puts. and makes animation or tracking of d-world objects much easier.
The joint mcchrmism is implemented by ensding homogenous mlaiccs to desuibe each object position. Ench figure is smnged as d me of joints and objccrs. which helps to organize motion and allows efficient updating of object positions. In most Iondering systems, iuch hicrnchical tigum are implemented dnring roldrzing by easuding viewing transfnms fmm each joint matrix. REND386 a c d y moves uch object in the world when it is remked. and cachcs thc new positions of thc objects. Because the actual position in the world of all objects is available. collision detection can be p f o m d efficiently.
REND386 uatams ' extensive fued-point h i e s for matrix opaationa such a~ invmion and trmsformatim Trigonometric function arc also available, incl- four- quadrant mtangent. and Eulcr angle to matrix and matrix to angle translations. The fixed-point formats were designed to achieve near floating-point pmision and range, while matching or exceeding thc 387 floating-point wpmcessor in speed. For example. mauix entries and trigommetric results are acmrate to 8 decimal places. and worldmordinateshavearmgeofmareth~7signifrcmt digits. Theselibraries and the articulaudfigurc fllppmt arc csscntid for tools for creation and manipuluions of virnul envimmncnts, or for rep.wma 'on of zul-world events for a u g m c n t e d r c a l i t y ~ o n s .
Figure 4. Example of an Sniculaud figum for simulation. Each of the objects in the Qvre pivots amuud thc lettered location, with rcspDct to the object h e it in the hierarchy &own on the right. Thc " h g m " wf are translaud nthcr than rotafod with mpcct to the "wrist" d All joint positions and angles may be set by data fmm a red-world robot arm.

18-5
4.6 Virtual Reality Toolkit
REND386 was developed especia-/ to provide a means for creation of simple virtual reality systems. The renderer easily produces the 10 frames per second required for usable VR systems [15] even when producing both left and right eye images for stereoscopic presentation via HMD. Support for three-dimensional manipulation devices and even an inexpensive gestural interface device (the Nintendo PowerGlove) is built in. Navigation and manipulation devices such as mouse, trackball. and joystick are supported, as are head trackers. New devices can be interfaced by writing loadable drivers or by modifying the software.
Head-mounted displays are supported by modifying the stereoscopic display model to match the field of view and display spacing of each device. There is little standardization in HMD design, and parameters may vary even between eyes of the same display. Special video cards or VGA-to-video converters may be used to drive the HMD displays. The stereoscopic rendering support is designed to be flexible enough to support almost any display device.
REND386 includes a mechanism to integrate head tracker data into viewpoint control for proper image generation to the HMD. The articulated-figure mechanism is used to build a body for the viewer, to which head-viewpoint and hand-manipulators can be attached. The head tracker then controls the head-body joint, and the 3D manipulation device controls the hand-body joint. The body can then be moved through the virtual world, with the hand and viewpoint properly anached. The body can also be attached to moving objects in the world, allowing the viewer to "ride" objects or to be moved in complex trajectories.
Creation and control of autonomous objects in the world can be performed through a simple animation control language that allows objects perform cyclic motions, to react to the presence of the viewer or to be triggered by the manipulation device. More complex motions, such as copying the motions of a real-world device, can be implemented by adding C code to the system to directly control joint positions.
5. Conclusions
Virtual reality, visualization and teleoperation augmented with stereoscopic graphics require real-time three- dimensional rendering of graphics. Low cost is important for many applications, but development of rendering software from scratch is out of the question in most cases.
REND386, a software toolkit for realtime graphics on the IBM PC platform, includes many features to make experimentation and development of new systems easy. V i a l worlds and environments are easily created and modified, and can contain autonomous objects. It is possible to interface the virtual world to the real world by adding object-control code: for example, an articulated model of a robot arm could be moved in synchrony with a real arm by transferring real joint angles to the model. This could be used in an augmented teleoperation application.
Stereoscopic displays are easily created with REND386. and can support a variety of display devices, including LCD glasses and HMDs. Video overlay boards allow stereoscopic graphics and stereoscopic video to be combined for operator aids or comparisons. For example, wireframe outlines of a moving virtual object could superimposed on video of the real object to judge the match between modeled and actual motions.
REND386 supplies a substantially complete software base for 3D graphics and stereoscopic displays for the IBM Pc and compatible computers. These computers can provide a cost-effective and widely supported platform for experimentation and applications. Unlike other rendering or graphics packages, full source code is available to the programmer, allowing new display modes or new interface devices to be added.
6. Availability
REND386 is available in the form of a demonstration executable or as source code by FTP from several sources on the Internet. The most recent upgrades are always available from sunee.uwaterloo.ca. Documentation on file formats is included with the demonstration software and is explained in detail in [ 141. The software and source code is available free of charge for non-commercial uses.
7. References
T.B. Sheridan, "Supervisory Control of remote manipulators, vehicles and dynamic processes: Experiments in command and display aiding". Advances in Man-Machine Systems Research.
K. Fernandez & E. Hinman, "The use of computer graphic simulation in the development of on-orbit telerobotic systems", Robots 11: 17th International Symposium on Industrial
W.S.Kim. F. Tendick & L.W.Stark, "Visual enhancements in pick-and-place tasks: Human operators controlling a simulated cylindrical manipulator", IEEE J.Robotics & Automation,
K.B. Evans, "Head Mounted Displays for Telepresence and Workstations", Roc. Second Workshop on Military Robotics Applications, Kingston, Ont..Canada. 8-11 Aug. 1989, pp. 50- 56.
S.S. Fisher, E.M.Wenze1. C. Coler. and M.W. McGreevy, " V i interface environment workstations", 32nd Roc. Human Factors Society, 1988,91-95.
J.D. Foley "Interfaces for advanced computing", Scientific American, Oct.1987,
P. Milgram, D. Drascic, and J.J. Grodski, "
Stereoscopic Video + Superimposed Computer Stereographics: Applications in Teleoperatrion", Roc. Second Workshop on Military Robotics
V011,1984, pp.49-137.
Robots. April 1987,21: 45-53.
Vol. RA-3(5), Oct. 1987,418425.
127-1 35.

18-6
Applications, Kingston, Ont, Canada, 8-11
(8) P. Milgram, D. Drascic, and J.J. Grodski, "Enhancement of 3-D video displays by means of superimposed stereo-graphics", Proc. 35th Annual Meeting of Human Factors Society, (pp.1457-1461). San Francisco, CA., 1991.
(9) W.S.Kim and A.K.Eejczy, Graphics Displays for Operrator Aid in Telemanipulation", IEEE
AUg, 1989, p ~ . 20-25.
SMC, 1991, pp.1059-1067.
(10) J.J.Grodski, P. Milgram, and D. Drascic. "Real and Virtual World Stereoscopic Displays for Teleoperation". Proc. 31 DRG Seminar on Robotics in the Battlefield, NATO/DRG. Tech. ROC. AC/243-TP/3, C2.0C2.16
(11) D. Drascic. J.J. Grodski. P. Milgram, P.Wong, S. Zhai, and K. Ruffo. "SV+SG: Stereoscopic Video with Stereoscopic Graphics", Video Proc. INTERCHI'93, Amsterdam, 25-29 April 1993.
(12) J.D.Foley. A. van Dam, S.K.Feiner, and J.F.Hughes, "Computer Graphics: Rinciples and Practice", Addison-Wesley. 1990
(13) D.M. Stampe and B.Roehl. "The REND386 Project -- History and Current Status." In Virtual Realities: Anthology of Industry and Culture.(In press)
(14) D.M. Stampe. B.Roehl. and J.Eagan. " V i Reality Creations", Waite Group Press, Corte Madera CA. 1993
(15) S. Bryson "Implementing Virtual Reality: V i Reality Hardware" SIGGRAPH '93 Course Notes #43. pp. 1.3.1-1.3.26. 1993
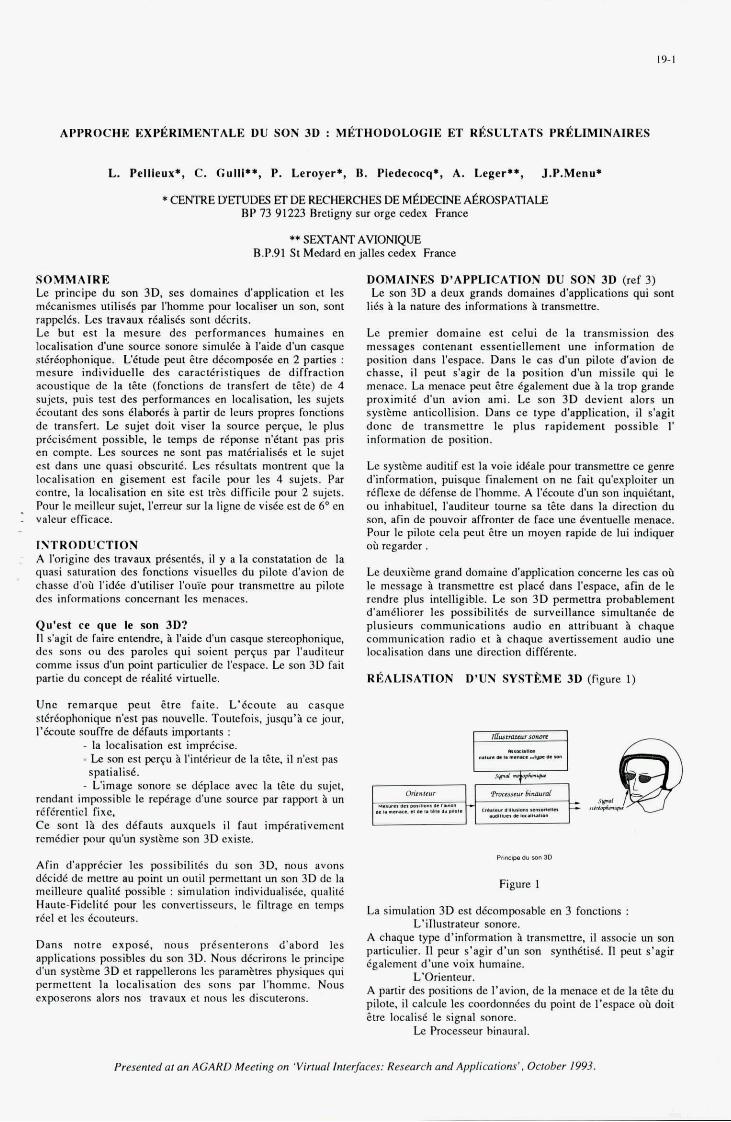
APPROCHE EXPBRIMENTALE DU SON 3D : Mi?THODOLOGIE ET RfiSULTATS PRBLIMINAIRES
L. Pellleux', C. Gulll**, P. Leroger., B. Pledecocq*, A. Leger**, J.P.Meou*
* CENTRE LYENDES ET DE RECHERCHES DE M6oECINE A~ROSPATIALE BP 73 91223 Bretigny sur orge cedex France
** SEXTAW AVIONIQUE B.P.91 St Medard en jalles cedex France
SOMMAIRE Le principe du son 3D, ses domaines d'application et les m6canismes utilis6s par I'homme pour localiser un son. sont rappeles. Les travaux rkalids sont dkcrits. Le but est la mesure des performances humaines en localisation d'une source sonore simulCe B I'aide d'un casque stfr&phonique. Letude peut Cue dkomposCe en 2 parties : mesure individuelle des caracteristiques de diffraction acoustique de la tCle (fonctions de transfert de tCte) de 4 sujets. puis test des performances en localisation. les sujets Ccoutant des sons 6labores B partu de leun propres fonctions de transfert. Le sujet doit viser la source perpe. le plus prkidment possible, le temps de r6ponse n'6tant pas pris en wmpte. Les sources ne sont pas matkialises et le sujet est dans une quasi obscurit6. Les r6sultats monuent que la localisation en gisement est facile pour les 4 sujets. Par conue. la localisation en site est trks difficile pour 2 sujets. Pour le meilleur sujet, l'erreur sur la ligne de v ike est de 6 O en valeur efficace.
ISTRODUCTION A I'origine des uavaux pr6sentbs. il y a la constatation de la quasi saturation des fonctions visuelles du pilote d'avion de chasse doh I'id6c d'utiliser I'ouIe pour uansmettre au pilote des informations wncemant les menaces.
Qu'est ce que le son 3D? 11 s'agit de faire entendre, 1 I'aide d'un casque stereophonique, des sons ou des paroles qui soient perqus par I'auditeur comme issus dun point particulier de I'espace. Le son 3D fait partie du concept de realit6 virtuelle.
Une remarque peut Ctre faite. L'Ccoote au casque stirwphonique n'est pas nouvelle. Toutefois. jusqu'i ce jour, I'koute soulfre de defauts importants :
- la localisation est impricise. - Le son est p e r p B I'interieur de la ttte, il n'est pas
- L'image sonore se diplace avec la tCte du sujet. rendant impossible le repirage dune source par rapport 1 un rifirenticl fixe. Ce sont 11 des defauts auxquels il faut impirativement remedier pour qu'un syskme son 3D cxiste.
Afin d'apprkier les possihilitks du son 3D, nous mons dCcide de metue au point un outil permettant un son 3D de la meillcure qualite possible : simulation individualisee, qualit6 Haute-FidelitC pour les convertisseurs. le filuage en temps r6el et Ics icouteurs.
Dans notre expose. nous pr6senterons d'abord les applications possibles du son 3D. Nous dicrimns le principe dun systime 3D et rappellerons ICs parambtres physiques qui permettent la localisation des sons par I'homme. Nous exposerons alors nos travaux et nous les discuterons.
spatialis6.
DOMAINES D'APPLICATION DU SON 3D (n 3)
lies 1 la nature des informations 1 uansmettre.
Le premier domaine est celui de la transmission des messages contenant essentiellement une information de position dans l'espace. Dans le cas d'un pilote d'avion de chaise. il peut s'agir de la position d'un missile qui le menace. La menace peut Ptre Cgalement due B la trop grande proximitf d'un avion ami. Le son 3D devient alors un systeme anticollision. Dims ce type d'application. il s'agit donc de transmettre le plus rapidement possible I' information de position.
Le systbme auditif est la voie ideale pour transmeme ce genre d'information. puisque finalement on ne fait qu'exploiter un riflexe de difense de I'homme. A I'6coute d'un son inquietant. ou inhabituel, I'auditeur toume sa tCte dans la duestion du son, afin de p u v o u affronter de face une dventuelle menace. Pour le pilote cela peut 5tre un moyen rapide de lui indiquer oh regarder
Le deuxibme grand domaine d'application conceme les cas ob le message A transmettre est place dans l'espace, afm de le rendre plus intelligible. Le son 3D permetua probablement d'am6liorer les possibilites de surveillance simultan6e de plusieurs communications audio en attribuant B chaque communication radio et B chaque averlissement audio une localisation dam une direction diffkente.
RfiALISATlON
Le son 3D a deux grands domaines #applications qui sont
D'UN SYSTkME 3D (figure 1)
Plnnpd" . o n m
Figure 1
La simulation 3D est decomposable en 3 fonctions :
A chaque type d'mformation i transmeme. il associe un son particulier. I1 peur s'agir d'un son synth6tis6. I1 peut s'agu egalemenl d'une voix humaine.
L'Orienteur. A partir des positions de I'avion, de la menace et de la tCte du pilote. il calcule les coordonn6es du point de l'espace oh doit &re localisC le signal sonore.
L'illusuateur sonore.
Le Processcur binaural.
Presented a1 an ACARD Meeting on 'Virtual Inlerfaces: Research and Applications'. October 1993.
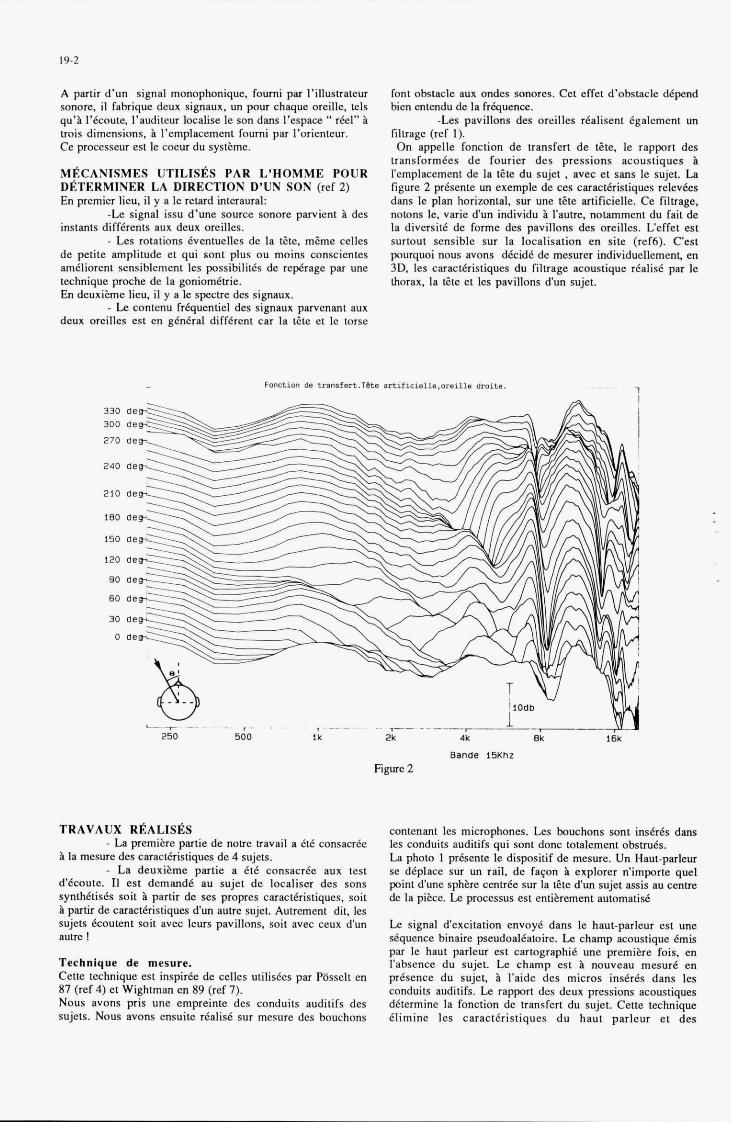
19-2
A partir d'un signal monophonique. fourni par I'illustrateur sonore. il fabrique deux signaux, un pour chaque oreille. tels qu'h I'keoute. I'auditeur localise le son dans I'espace ** r&I" B trois dimensions, h I'emplacement fourni par I'orienteur. Ce processeur est le uKur du systsme.
MkCANISMES UTILISkS PAR L'HOMME POUR DkTERMlNER LA DIRECTION D'UN SON (ref 2) En premier lieu, il y a le retard interaural:
-Le signal issu d'une source sonore parvient i des instants diff6rents nux deux oreilles.
- Les rotations Lventuelles de la &e. m h e celles de petite amplitude et qui sont plus ou moins conscientes ameliorent sensiblement les pssibilit6s de rephge par une technique prcche de la goniomCtrie. En deuxikme lieu, il y a le spectre des signaux.
- Le contenu h6quentiel des signaux parvenant nux deux oreilles est en gh6ral diff6rent car la t&te et le tome
font obstacle aux ondes sonores. Cet effet d'obstacle d6-d bien entendu de la frhuence.
-Les pavillons des oreilles r6alisent 6galement un tiltrage (ref 1). On appelle fonction de transfert de ate, le rapport des
transformees de fourier des pressions acoustiques b I'emplacement de Is t&te du sujet , avec et sans le sujet. La figure 2 prbsente un exemple de ces caract6istiques relevees dans le plan horizontal, sur une t&te srtificielle. Ce filtrage. notons le. varie d'un individu h I'autre. notnmment du fait de la diversit6 de forme des pavillons des oreilles. Ueffet est surtout sensible sur la localisation en site (ref6). Pest puquoi nous avons dkeid6 de mesurer individuellement, en 3D. les caract6ristiques du tiltrage acoustique rCalis6 DBT le thorax. la t6te et les pavillons d'un sujet.
Band0 i5Khz
TRAVAUX RkALISkS - La premibe partie de notre travail a 6th consank
h la mesure des caract6ristiques de 4 sujets. - La d e u x i h e partie a 616 consacr& nux test
dUcoute. I1 est demand6 nu sujet de localiser des sons synthktisds soit i partix de ses propres caractbristiques. soit B pa& de earact6ristiques d'un autre sujet. Autrentent dit, les sujets 6wutent soit avec leurs pavillons. soit avec ceux dun autre I
Technique de mesure. Cette technique est inspirk de celles u t i l i s h par P6sselt en 87 (ref 4) et Wightman en 89 (ref 7). Nous avons pris une empreinte des conduits auditifs des sujets. Nous avons ensuite r6alid sur mesure des bouchons
contenant les microphones. Les bouchons sont ins6d.s dans les conduits auditifs qui sont done totdement obsau6s. La photo 1 preSente le dispositif de mesure. Un Haut-parleur se diplace sur un rail, de fapn B explorer n'importe que1 p i n t d'une sphke centr6e sur la a t e d'un sujet assis nu centre de la pike. Le processus est entikement automatid
Le signal d'excitation envoy6 dans le haut-parleur est une &quence binaire pseudoalkatoire. Le champ acoustique 6mis par le haut parleur est cartographi6 une premike fois, en I'absence du sujet. Le champ est B nouveau mesur6 en pr6sence du sujet, i I'aide des micros indr6s dans les conduits auditifs. Le rapport des deux pressions acoustiques d6termine la fonction de transfert du sujet. Cette technique 6limine les caract6ristiques du haul parleur et des
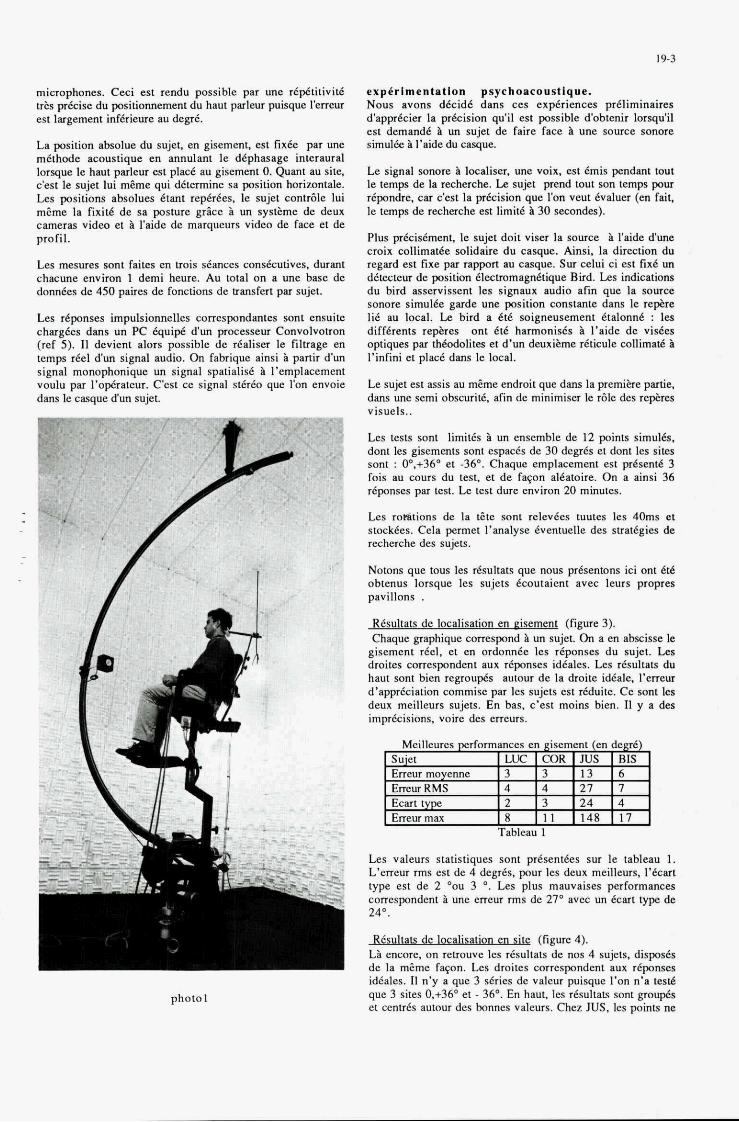
microphones. Ceci est rendu possible par une r6p6titivite trh prkise du positimement du haut p a r l w puisque I'erreur est largement infhieure nu degr6.
La position absolue du sujet. en gisement, est fix& par une methode acoustique en annulant le dephasage interaural lorsque le haut parleur est placC nu gisement 0. Quant nu site, c'est le sujet lui msme qui d6termine sa position horizontale. Les positions absolues etant rephkes. le sujet contrale lui msme la fixite de sa posture g r k e B un systkme de deux cameras video et B I'aide de marqueurs video de face et de profil.
Les mesures sont faites en trois dances conskutives, durant chacune environ 1 demi heure. Au total on a une base de d m & s de 450 paires de fonctions de transferl par sujet.
Les rbponses impulsionnelles correspondantes son[ ensuite charghs dans un PC & u i g d'un processeur Convolvotron (ref 5). 11 devient alors possible de realiser le filtrage en temps del d'un signal audio. On fabrique ainsi B partir d'un signal monophonique un signal spatialisd B I'emplacement voulu par I'op6rateur. C'est ce signal st6rb que l'on envoie dans le casque bun sujet.
. _ _ -
c
8 . J
* )
photo1
19-3
e x p h i m e n t a t l o n psychoacoustlque. Nous nvons dCcid6 dans ces expCriences preliminnires d'apprkier la pk i s ion qu'il est possible d'ohtenir lorsqu'il est demand6 1 un sujet de faire face B une source sonore sinul& B I'aide du q u e .
Le signal sonore B localiser, une voix. est h i s pendant tout le temps de la recherche. Le sujet pmnd tout son t emp pour repondre, car c'est la prkision que I'on veut &valuer (en fait. le temps de recherche est limite B 30 secondes).
Plus prkis&ment, le sujet doit viser la source B l'aide dune croix collimatee solidaire du casque. Ainsi. la direction du regard est fixe par rapport nu casque. Sur celui ci est fixe un detecteur de position 6lecmmagn&ique Bud. Les indications du bird assemissent les signaux audio afm que la source sonore simul6e garde une position constante dans le rephe lie nu local. Le bird a 6t6 soigneusement CtalonnC : les diffkrents repkes ont et6 harmonids B I'aide de visdes optiques par thbdolites et d'un deuxieme reticule collimate I'infini et place dans le local.
Le sujet est assis nu m6me endroit que dans la premike partie. dans une semi obscurit6. afin de minimiser le r6le des repbes visuels..
Les tests sont limit& B un ensemble de 12 points simulh. dont les gisements sont espaces de 30 de& et dont les sites Font : 0',+36" et -36'. Chaque emplacement est present6 3 fois nu cows du test, et de fagon al6atoire. On a ainsi 36 rkponses par test. Le test dure environ 20 minutes.
Les rok$tions de la t2te son[ relevees tuutes les 4Oms et stockhes. Cela permet l'analyse eventuelle des strategies de recherche des sujets.
Notons que tous les resultlts que nous pr6sentons ici ont et6 obtenus lorsque les sujets h u t a i e n t avec leurs propres pavillons . Resultats de localisation en E i s e m (figure3). Chaque graphique correspond B un sujet. On a en abscisse le
gisement reel, et en ordonnee les reponses du sujet. Lea droites correspondent aux reponses ideales. Les resultats du haut sont bien regroue autour de la droite idkale. I'erreur d'apprkiation commise par les sujets est dddte. Ce sont les deux meilleurs sujets. En bas. c*est moins bien. Il y a des imprkisions. voire des erreurs.
Tableau 1
Les valeurs statistiques sont pr&sent&s sur le tableau 1. L'erreur rms est de 4 de&, pour les deux meilleurs, I'kart type est de 2 'ou 3 '. Les plus mauvaises performances correspondent ?a une eneur rms de 21" avec un kart type de 24'.
(figure4). . . La encore. on retrouve les resultats de nos 4 sujets. disposes de la msme fqon. Les droites correspondent aux rhponses id6ales. Il n'y a que 3 shies de valeur puisque I'on n'a test6 que 3 sites 0.+36' et - 36'. En haut. les resultats sont groupCS et centres autour des bennes valeurs. Chez JUS. les points ne
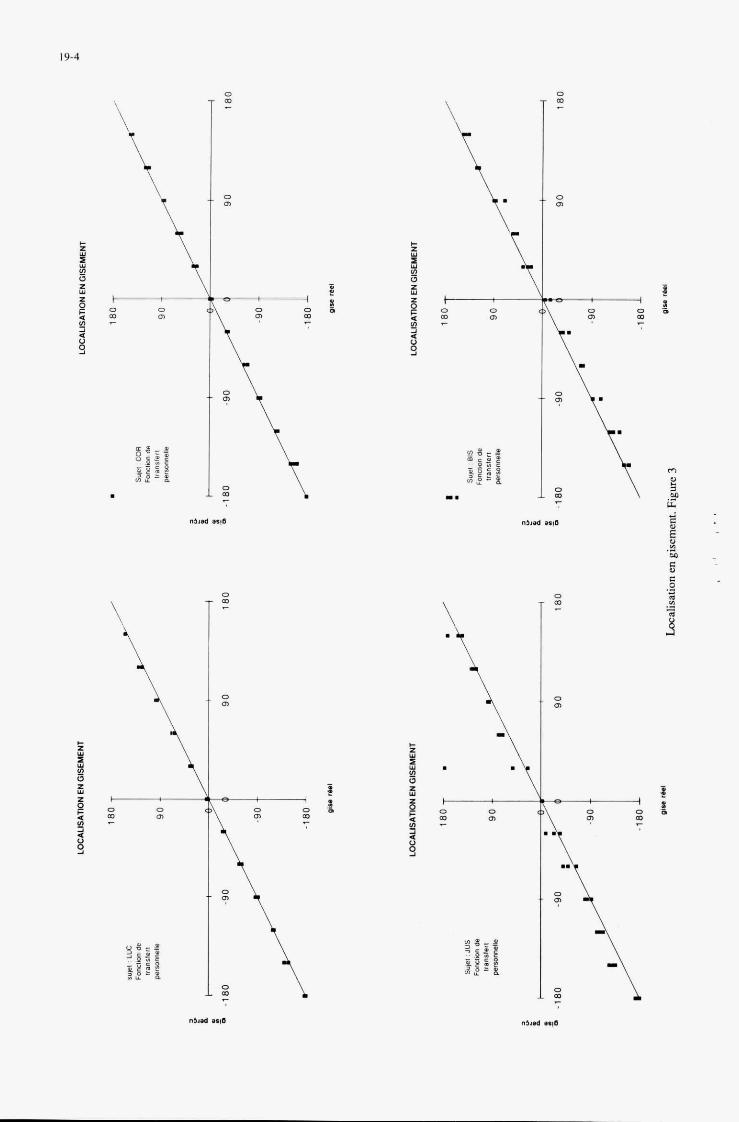
19-4
0 - m -
r

19-5
/ -91
Localisation en site. Figure 4
sont pas trop dispers6s. mais les valeurs centrales surtout B +36" sont dkalies. Les sons venant & haut sont alors perps moins haut qu'ils ne le sont. Noae demin sujet, qui etait le moins enhain6 semble r+ndre de fqon al6atoire.
L-e de vi& (tableau 3) est certainement le meilleur c r i t h de localisation. Cette eneur correspond h I'angle form6 pm la direction v i d e pm le sujet et la vraie direction de la source. Pour 2 sujets. l 'meur rms est de 6 et 8' avec un kcart type de 3 et 5". Pour les 2 Bums sujets. les resultas sont moins bons : 26O avec un kcart type d'une vingtaine de degris.
Tableau 2
Les valeurs statistiques sont present& sur le tableau 2 L'erreur rms est 5" et 7 avec des k a r t s type de 3 et 5" pour les 2 meilleurs.
19-6
DISCUSSION Les r6sultats de nos deux meilleurs sujets. tels qu’ils sont pr6sentes semhlent atre du mame ordre. Et pourtant. ils correspondent A des strategies de recherche du site tout B fait diffhentes. En effet deux strat6gies se dbgagent:
- une strat6gie “visuelle”. Pendant la recherche en site, le sujet con6e” un gisement proche de celui de la source. Disons qu’il place la source dans son champ visuel.
- une strathgie “auditive”. De fqon d6IibMe. le sujet tend sa meilleure oreille vers la source. C’est la strat6gie des aveugles. Une fois le site d6termin6, le sujet vient se placer face B la source, ainsi que cela lui est demandb.
Le premier sujet. LUC, a une strategie visuelle. II a atteint ses meilleures performances des la %me seance et ses mouvements de tete son1 assez limit&. COR par contre n’a atteint les performances indiquks qu’apres avoir adopt6 la strategie auditive et en faisant beaucoup d’efforts.
CONCLUSION Mis A part le fait qu’il y a encore beaucoup de travail 1 foumir et de nombreux tests psychoacoustiqucs B r6aliser. il apparait que si la localisation en gisemcnt est facile, celle en site est nettement plus difkicile. Certains sujets 6tmt nettement plus aptcs que d’autres. des prohlemes de selection vont apparaitre. cette s6lection ne pouvant se faire B partir des tests audiom6viques classiques. Qumt A ces tests classiques, ils devront 6largir la hande de fr&uence analys& car une bonne localisation en site nkessite une audition intkgre dans les hautes fr6quences. au del i de la hande conversationnelle habituellement test&. Entin. sachant que la semihilit6 en haute W u e n c e est souvent la premiere atteinte lors de l’exposition au bruit, voila encore une raison pour renforcer la protection du personnel.
REMERCIEMENTS Les IraVaUX pr6scntes O M 616 r6alids duns le cadre d‘une etude tinanc& par la DCAE / S T E / AV1 (Direction des Constructions ACronautiques, Service Technique des T6lkommunications et des Equipements dronautiques ).
BIBLIOCRAPHIE 1 Batteau D.W. . The role of the pinna in human
localisation. Proceedings of the royal society of London.Scries 8,168. pp 158-180 ( 1967 )
2 Blauen J. .Spatial hearing. MIT Press, Cambridge. MA (1983)
3 Doll T.J.:Development of simulated directionnal audio for cockuit auulications. ramart AAMRL TR 86- .. .. 014 (1986).
4 Posselt C. Schroter I. Opitz M..Divenyi P.L. , Blauert J. . Generation of binaural signals for research and home entertainment. 12hrne congri?s d’acoustique. B l d Toronto (1986 ).
5 Wenzel E.M.. Wightman F.L.. Foster S.H. A virtual display system for conveying th ree -dmens iod acoustic information. Proceedings of h e hum- factors society 32nd annual meeting(pp86- 90)Santa Monica.CA:Human Fac~ors society.
6 Wenzel E. .Wightman F. . Kistler D. . Foster S.:Acoustic origins of individual diffaences in soun Suppl 1 Vol 84. Fa111988.
7 Wightman F.L. Kistler D.J. . Headphone simulation of free field listening. I:Stimulus synthesis.J.Acoust.Soc.Am.85(2)pp858-867 February 1989
20- 1
THE USE OF A TACTILE INTERFACE TO CONVEY POSITION AND MOTION PERCEPTIONS
A. H. Rupert I s 2
F. E. Guedry M. F. Reschke
1 Naval Aerospace Medical Research Laboratory Acceleration Division
51 Hovey Road Pensacola, Florida 32508- 1046
2 NASA Johnson Space Center (SDS) Space Biomedical Research Institute
Mail Code SD-5 Houston, Texas 77058- 1 1 13
3 University of West Florida Department of Psychology Building 13, Room 201
1 1000 University Parkway Pensacola, Florida 325 14
USA
SUMMARY Under normal terrestrial conditions, perception of position and motion is determined by central nervous system integration of concordant and redundant information from multiple sensory channels (somatosensory, vestibular, visual), which collectively yield veridical perceptions. In the acceleration environment experienced by pilots, the somatosensory and vestibular sensors frequently present false information concerning the direction of gravity. When presented with conflicting sensory information, it is normal for pilots to experience episodes of disorientation. We have developed a tactile interface that obtains veridical roll and pitch information from a gyro-stabilized attitude indicator and maps this information in a one-to-one correspondence onto the torso of the body using a matrix of vibrotactors. This enables the pilot to continuously maintain an awareness of aircraft attitude without
reference to visual cues, utilizing a sensory channel that normally operates at the subconscious level. Although initially developed to improve pilot spatial awareness, this device has obvious applications to 1) simulation and training, 2) nonvisual tracking of targets, which can reduce the need for pilots to make head movements in the high-G environment of aerial combat, and 3) orientation in environments with minimal somatosensory cues (e.g., underwater) or gravitational cues (e.g., space).
INTRODUCTION In our day-to-day terrestrial activities, position and motion perception is continuously maintained by accurate information from three independent, overlapping, and concordant sensory systems: the visual, the vestibular (or inner ear), and the somatosensory systems (skin, joint and muscle sensors). These complementary and reliable sources of information are integrated in the central
Presented at an AGARD Meeting on ‘Virtual Interfaces: Research and Applications’, October 1993.
20-2
nervous system to help the organism formulate an appropriate motor response. The relative contribution of the various senses involved in the perception of one's orientation can be significantly altered by exposure to unusual sensory environments, resulting in perceptions that are no longer veridical,
For example, somatosensory pressure cues are markedly reduced underwater, while in the military aviation environment, the almost continuous changes in acceleration and direction of aircraft motion expose aircrew to a resultant gravitoinertial force that is constantly changing in magnitude and direction. Under such circumstances, somatosensory and vestibular information concerning the direction of "down" may be incorrect, and increased reliance must be placed on visual information. Unfortunately, varying gravitoinertial force fields can also produce visual illusions of motion and position. Thus, in unusual sensory environments, the central nervous system has the added responsibility of determining which sensory information is valid.
Understandably, the typical spatial disorientation mishap occurs when the visual orientation system is compromised (e.g., temporary distraction, increased workload, transit ions between visual and meteorological conditions, or reduced visibility). The central nervous system must then compute orientation with the remaining vestibular and somatosensory information that is at its disposal, however, this information is frequently incorrect. It is no wonder that spatial orientation is markedly impaired in the underwater and aerospace environments. Indeed, it is a physiologically normal response to experience spatial disorientation in such circumstances. Virtual reality displays offer the opportunity to "correct" the position and motion illusions that occur in unusual accelerat ion and proprioceptive environments.
Current simulators and virtual reality devices use visual displays to adequately convey the perception of static position and attitude.
However, a veridical awareness of dynamic motions (e.g., changes in attitude, velocity, and acceleration) is inadequately maintained by visual information alone and requires the addition of proprioceptive (somatosensory and vestibular) cues. For example, motion- based simulators attempt to simulate maintained acceleration either by utilizing 1) transient linear acceleration with "washout" of motion cues accompanied by visual represen tation of acceleration, or 2) change of pitch (tilt) to convey prolonged linear acceleration. Both methods possess inherent deficiencies. The former method is restricted by the limited linear travel available in current simulators, and in the latter method, linear motion perception is "contaminated" with the unavoidable canal stimulus produced in affecting a change in pitch. The current models of perception are capable of predicting responses for simple conditions of static vision and constant acceleration, however, the experiments required to extend the model to include the dynamic conditions experienced in aviation have not yet been carried out.
Cutaneous sensory information is not currently used to provide position or motion information to pilots. We propose that spatial orientation can be continuously maintained by providing information from the aircraft attitude sensor to the pilot through the nonutilized sensory channel of touch (Rupert, Mateczun, and Guedry, 1990).
One approach is to use a torso harness fitted with multiple electromechanical tactors that can continuously update the pilot's awareness of position. This is analogous to the way our brain obtains orientation in the terrestrial environment. Thus, the pilot should be able to maintain orientation information in the absence of a visual horizon or during inevitable gaze shifts from the aircraft instrument panel. This device should free the pilot to devote more time to weapons delivery systems and other tasks requiring visual attention.
The rationale for utilizing touch to convey position and motion perception and to overcome vestibular, visual, and auditory
20-3
illusions produced by unusual acceleration environments is based largely on knowledge about the ontology of sensory development (Fig. 1). In most vertebrates, the proprioceptive tactile system is the first sensory system to develop, followed by the vestibular system, then the auditory system, and finally the visual system (Gottlieb, 1971). In fact, the proprioceptive systems of somatosensory and vestibular function develop a rich interaction in utero. This follows logically since the somatosensory system needs information very early in development concerning the direction of the gravity vector in order to properly control the antigravity and gravity muscles. It is only much later in development that the auditory and visual systems are integrated into this already well-functioning proprioceptive system. The primacy of touch and somatosensation in the development of orienting behavior has been demonstrated in several neurophysiological and anatomical studies (Meredith and Stein,
~ 1986a,b). We propose that by providing -" veri d i c a1 somatosensory orient at i o n
information the illusory effects present in unusual acceleration and proprioceptive environments can be reduced to improve human performance in many facets of the military theater.
PROCEDURES AND INITIAL OBSERVATIONS We constructed a series of prototype devices to determine whether a pilot could maintain normal orientation and control over an aircraft using tactile cues. Multiple tactors were placed on a torso suit to represent all directions of roll and pitch (Fig. 2). An aircraft attitude sensor (Fig. 3) provided roll and pitch information to an IBM portable computer that selected (via circuit designed in-house) the appropriate pattern of stimulation for a given combination of pitch and roll. The circuit takes data from an IBM (or compatible) PC parallel printer port and expands it to drive a matrix of stimulators (Cushman, 1993). Although the current matrix is an 8 x 24 (146 element) array, the user can define a maximum of 16 x 16 elements.
The tactors in the prototype display are miniature electromechanical speakers 1/8 of an inch in thickness and 1 inch in diameter. The stimulus waveform consists of 10 pulses of a 150 Hz rectangular pulse train operating at a 10% duty cycle, followed by a break of approximately 450 ms. A stretch lycra suit maintains an appropriate interface pressure between the tactor and the skin. The software programs to drive the tactors evolved continuously in response to feedback from each user and have been tailored to meet the requirements of each community (e.g., attitude awareness for aircraft vice vehicle velocity information for diving submersibles).
One program that we developed and tested in an aircraft conveys the direction of "down," or the gravity vector. To experience in the laboratory the sensation of roll and/or pitch as presented to the pilot, the gyro-attitude sensor was replaced with a joystick, which permitted subjects to experience the same tactile sensation on the ground and visually observe the equivalent aircraft orientation changes represented on the computer by standard aircraft attitude indicator symbology.
In this configuration, most subjects could learn within 30 min how to ascertain within 5 deg the pitch and roll information presented on their torso display. The pitch and roll limits of the current display are Ifr15 deg and k45 deg respectively. Alternatively, subjects using the device in a closed-loop configuration could position by tactile cues alone the simulated attitude of the aircraft to within 5 deg of accuracy in pitch and roll. Similar accuracies were attained in actual flights in aircraft with no reference to instruments or outside visual cues.
When used to convey constant velocity, the column in the direction of the desired perception was stimulated first and followed by sequential activation of the three paired columns to each side of the first column stimulated. The perception was similar to the feeling of directed flow of fluid over the torso with the direction defined by the first column stimulated and the velocity
20-4
determined by the stimulus interval between activation of column pairs.
DISCUSSION Preliminary results both in aircraft and in the laboratory indicate that orientation awareness can be maintained nonvisually in environments known to produce spatial disorientation. This device has many applications in addition to aircraft control.
When used in aircraft simulators (either with or without a motion base) to indicate attitude and changes in attitude or velocity, it will provide the pilot or trainee with additional cues that can be used for aircraft control, when transferring to the aircraft.
Studies by the U.S. Army (Simmons, Lees, and Kimbal, 1978a,b) indicate that pilots in instrument flight conditions spend more than 50 % of their visual scan time attending to two instruments, the ADUattitude indicator and the directional gyro. By presenting this information nonvisually, pilots will be free to attend to other tasks and instruments that do require vision attention. Thus, not only will the introduction of spatial orientation information offered by tactile cues reduce spatial disorientation mishaps, it will also improve the mission effectiveness of the operator.
A person who is tapped by another on the shoulder or torso reflexively turns his attention to the area stimulated. The torso suit can take advantage of this basic reflex to direct attention to any target that is on sonar or radar or is being electronically tracked. Currently, for pilots, naval flight officers, or radar operators to acquire targets, they must devote their attention to the radar screen, cognitively ascertain the direction to which to direct their gaze, and then carry out the motor act of acquiring the target. In high workload environments with multiple targets, it is possible to represent one or possibly more targets tactually and aid pilots/operators in the rapid identification of friend or foe. An increasingly prevalent training technique in the military is interactive simulation of war theaters with multiple pilots engaged in the same dogfight, but with each in their own simulator. Tactile
cues will improve the situational awareness of all participants. This device has obvious applications to personnel in command and control centers who need to maintain an awareness of geographic location of incoming information from a wide variety of platforms (ship, aircraft, tanks, infantry, satellite, systems, etc.) from multiple geographic sites. Civilian applications include air traffic controllers and dispatchers.
Space applications to improve astronaut performance fall into several categories. In space, astronauts are deprived of any constant proprioceptive reference to indicate down. An appropriate model of our torso suit could be interfaced with an accurate inertial platform reference to give astronauts a continuous perception of orientation at a low level of awareness, in a manner analogous to the situation on Earth. In extra vehicular activities (EVA), this device could be used to present a constant point of reference, such as the floor of the space shuttle, the position of a satellite or telescope being repaired, or even the direction of the center of the earth. During EVA activities, the only sensory indication of velocity is currently provided by vision. Using the velocity presentation mode mentioned earlier, the astronaut can have indications of motion as good or even better that those available on Earth. This device can thus overcome the limitations of the vestibular system, which does not detect constant rotation or constant velocity, and instead of providing "virtual" reality, can go one step further to "hyper-reality" or better than normal maintenance of orientation.
This device offers a countermeasure to the sensory-motor disorders associated with adaptation to the microgravity conditions in space and readaptation to 1 G on returning from earth orbit. Space motion sickness, or space adaptation syndrome, has been attributed either wholly or in part to a rearrangement of proprioceptive sensory information, especially the absence of continuous vestibular otolith stimulation and reduced somatosensory information. Some astronauts have indicated that it is discomforting on entering orbit to lose the
20-5
sense of orientation awareness. By providing astronauts with a somatosensory reference to "down," and an enhanced awareness of motion (velocity information), they should be able to maintain an accurate perception of position and motion during transition periods.
Finally, the problem of sensory-motor incoordination on return to 1 G may be reduced by providing continuous position and motion cues throughout the mission. For example, we may be able to attenuate the otolith tilt-translation reinterpretation effect (Parker, 1985) that develops in space and disturbs an astronaut's sensory-motor readaptation to 1 G upon reentry. The torso suit would provide accurate somatosensory information that would not confirm the troublesome vestibular signals that cause this effect. Thus, we would expect that if astronauts were trained to attend to this reliable source of information, the magnitude of this problem could be significantly reduced.
- There are a variety of well-known tactile . illusions that will serve to enhance the effectiveness of tactile torso and limb
- devices. When using multiple stimulators, as in the torso vest, it is possible to take advantage of basic psychophysical principles to effect changes in perceived magnitude, position, and motion of the stimulus. For example, the perceived magnitude of a pair of vibrotactile stimuli presented in close temporal succession is dependent on the relative frequencies of the two stimuli (Verrillo and Gescheider, 1975). The perceived position of two tactile pulses presented in rapid succession at different spatial locations will appear as a single moving source (Kirman, 1974). The latter principle was used in the torso suit to create the sensation of motion or directional flow over the thorax. Using these and other sensory illusions, it is actually possible to create compelling position and motion perceptions using fewer tactors than in our current prototype suit. Hans-Leukss Teuber (1956) demonstrated that the number of dimensions of a perception will exceed that of the physical stimuli. By varying only the frequency and intensity, his subjects
.
experienced changes in pitch, density, volume, and loudness. Given the large number of available stimulus parameters (intensity, frequency, body position, interstimulus interval, multiple tactors, etc.), it will be possible to tactually present a wide variety of perceptions to convey position, motion, and target information in a way analogous to the observations of Teuber.
This tactile interface will contribute to basic research concerning haptic contributions to the interaction and integration of sensory information and vestibular brainstem reflexes, as well as the perceptual phenomena perceived at the cortical level. Inclusion of the haptic component will permit us to further refine and extend our model of sensory-motor interaction. The ultimate practical goal is to provide accurate predictive information to enhance the effectiveness of human factors engineers in the design of improved man-machine interfaces.
ACKNOWLEDGMENTS This research was sponsored in part by the Naval Medical Research and Development Command under project number 63706N M0096.002-7056.
The views expressed in this article are those of the authors and do not reflect the official policy or position of the Department of Defense, the Department of the Navy, nor the U. S. Government.
Volunteer subjects were recruited, evaluated, and employed in accordance with the procedures specified in the Department of Defense Directive 3216.2 and Secretary of the Navy Instruction 3900.39 series. These instructions are based on voluntary informed consent and meet or exceed the provision of prevailing national and international guidelines.
REFERENCES Cushman, W. B. 1993. A parallel printer port to matrix driver with high current DAC output. Behavior Research Methods, Instruments, and Computers. 25 (1): 48-52.
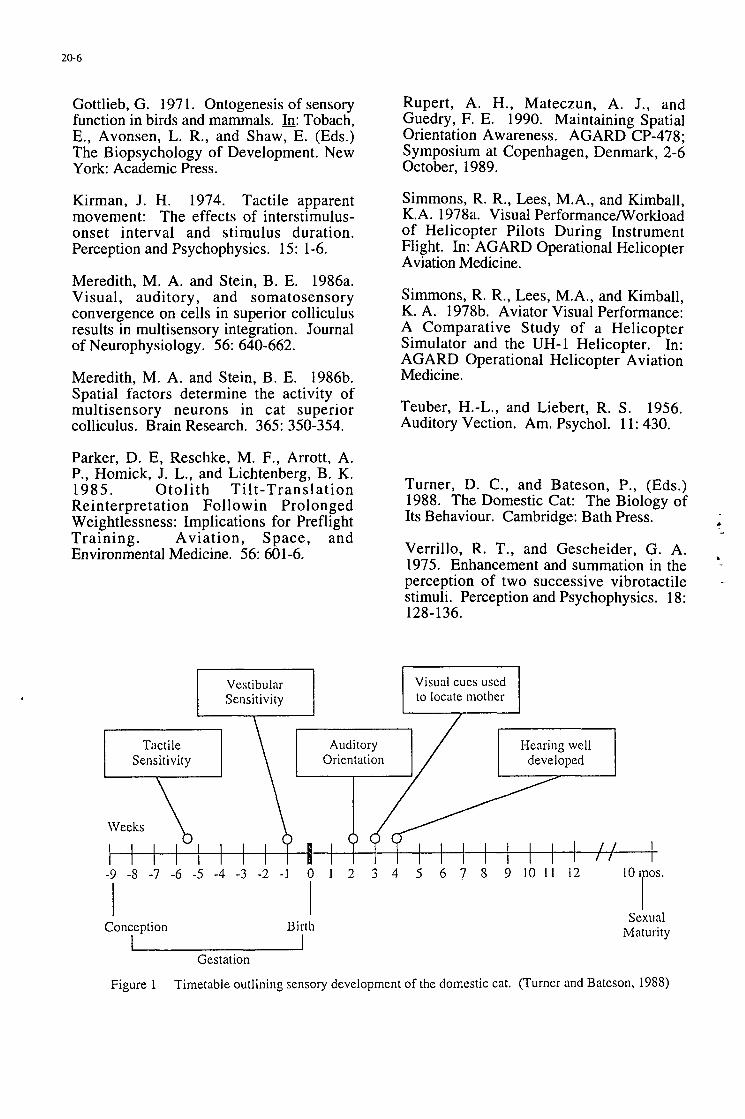
20-6
Gottlieb, G. 197 1. Ontogenesis of sensory function in birds and mammals. In: Tobach, E., Avonsen, L. R., and Shaw, E. (Eds.) The Biopsychology of Development. New York: Academic Press.
Kirman, J. H. 1974. Tactile apparent movement: The effects of interstimulus- onset interval and stimulus duration. Perception and Psychophysics. 15: 1-6.
Meredith, M. A. and Stein, B. E. 1986a. Visual, auditory, and somatosensory convergence on cells in superior colliculus results in multisensory integration. Journal of Neurophysiology. 56: 640-662.
Meredith, M. A. and Stein, B. E. 1986b. Spatial factors determine the activity of multisensory neurons in cat superior colliculus. Brain Research. 365: 350-354.
Parker, D. E, Reschke, M. F., Arrott, A. P., Homick, J. L., and Lichtenberg, B. K. 1985. Otoli th Tilt-Translation Reinterpretation Followin Prolonged Weightlessness: Implications for Preflight Training. Aviation, Space, and Environmental Medicine. 56: 601 -6.
Rupert, A. H., Mateczun, A. J., and Guedry, F. E. 1990. Maintaining Spatial Orientation Awareness. AGARD CP-478; Symposium at Copenhagen, Denmark, 2-6 October, 1989.
Simmons, R. R., Lees, M.A., and Kimball, K.A. 1978a. Visual Performance/Workload of Helicopter Pilots During Instrument Flight. In: AGARD Operational Helicopter Aviation Medicine.
Simmons, R. R., Lees, M.A., and Kimball, K. A. 1978b. Aviator Visual Performance: A Comparative Study of a Helicopter Simulator and the UH-1 Helicopter. In: AGARD Operational Helicopter Aviation Medicine.
Teuber, H.-L., and Liebert, R. S. Auditory Vection. Am. Psychol. 1 1 : 430.
1956.
Turner, D. C., and Bateson, P., (Eds.) 1988. The Domestic Cat: The Biology of Its Behaviour. Cambridge: Bath Press.
Verrillo, R. T., and Gescheider, G. A. 1975. Enhancement and summation in the perception of two successive vibrotactile stimuli. Perception and Psychophysics. 18: 128- 136.
Vcstibular Sensitivity
Visual CUCS used to locate mother
Auditory Hcnring well Oricntation developed
Weeks
-9 -S -7 -6 -5 -4 -3 -2 -1 0 1 2 3 4 5 6 7 S 9 10 11 12 10 ipos.
Conception I
Birth I
I Sexual
Maturity
.
Gestation
Figure 1 Timetable outlining sensory development of the doinestic cat. (Turner and Bateson, 1988)
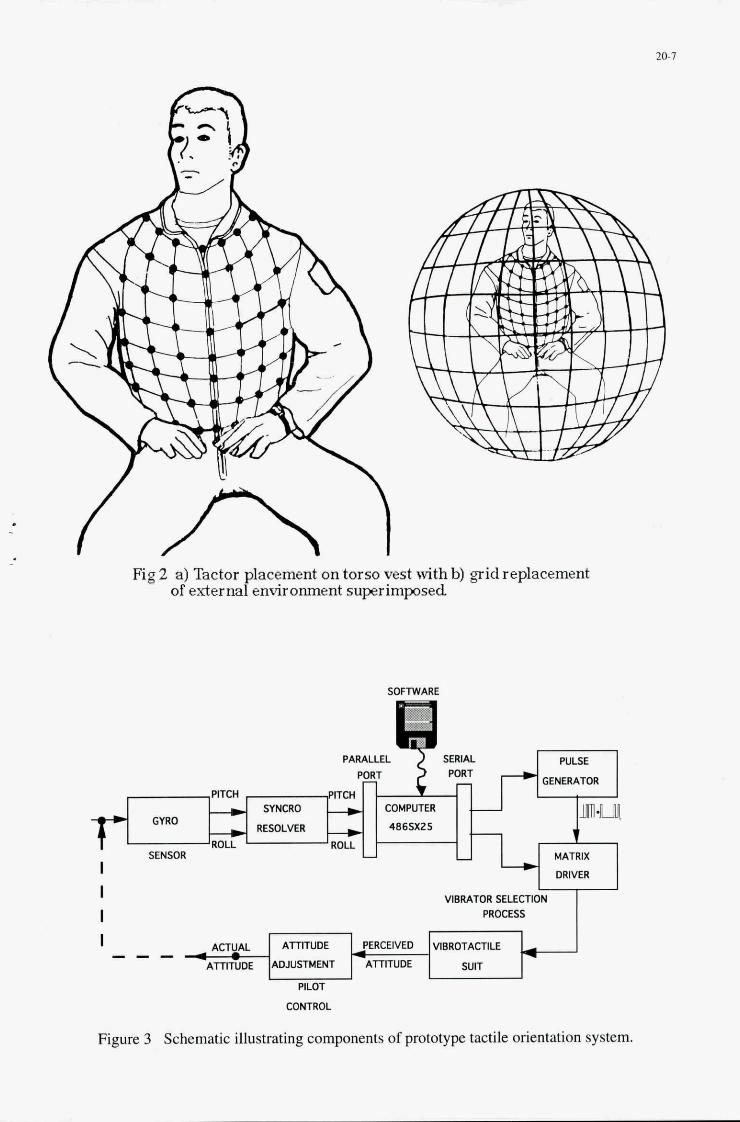
20-7
'I
Fig 2 a) Tactor placement on torso vest with b) grid replacement of external environment superimposed
S O W A R E
I
I I VIBRATOR SELECT1
I AclUAL ATnTUDE VISROTACTILE , - - - - -A*DE MJUSTMENT sum
PILOT
CONTROL
Figure. 3 Schematic illustrating components of prototype tactile orientation system.

REPORT DOCUMENTATION PAGE
1. Recipient’s Reference 2. Originator’s Reference 3. Further Reference 4. Serurity Classification -
of Document UNCLASSIFIED/ 1 AGARD-CP-541 I ISBN 92-835-0746-0 I UNLIMITED
I I
5. Originator Advisory Group for Aerospace Research and Development North Atlantic Treaty Organization 7 rue Ancelle, 92200 Neuilly sur Seine, France
VIRTUAL INTERFACES: RESEARCH AND APPLICATIONS 6. Title
I. Presented at the Aerospace Medical Panel Symposium held in Lisbon, Portugal, 18th - 22nd October 1993.
8. Author(s)/Editor(s) 9. Date
various May 1994 I
0. Author(s)/Editor’s Address 11. Pages
Various I92
I There are no restrictions on the distribution of this document. Information about the availability of this and other AGARD unclassified publications is given on the back cover.
Human systems Virtual technologies Balance Aerospace medicine Simulation Spatial orientation Human factors engineering Telerobotics Situational awareness Sensory processing Vision Cockpits Display devices Hearing Pilots Human interface Haptics Training
2. Distribution Statement
3. KeywordslDescriptors
4. Abstract
Recent advances in technologies for information display and sensing of human movements, combined with computer based models of natural and artificial environments, have led to the introduction of so-called virtual interfaces. Virtual interfaces offer increased flexibility and naturalness, so are considered for use in several domains including aviation, training, design, simulation.
Papers presented at this symposium considered issues of research and application in virtual interfaces broadly defined. Issues of technology integration for system development were considered separately from issues of movement monitoring or sensory display. Issues of human performance measurement were presented in the context of both research and application.
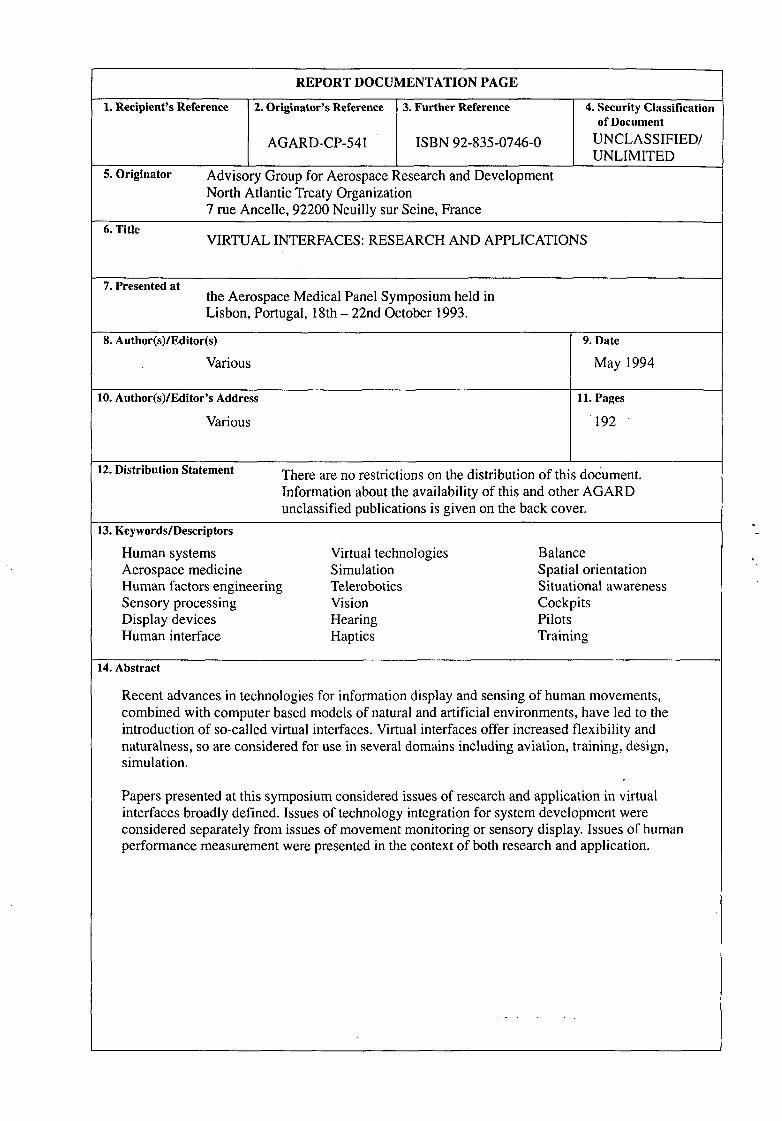
I
1. Recipient’s Reference 2. Originator’s Reference 3. Further Reference 4. Security Classification
AGARD-CP-541 ISBN 92-835-0746-0 UNCLASSIFIED/ of Document
UNLIMITED
8. Author(s)/Editor(s)
Various
LO. Author(s)/Editor’s Address
Various
~~
14. Abstract
Recent advances in technologies for information display and sensing of human movements, combined with computer based models of natural and artificial environments, have led to the introduction of so-called virtual interfaces. Virtual interfaces offer increased flexibility and naturalness, so are considered for use in several domains including aviation, training, design, simulation.
9. Date
May 1994
11. Pages
‘192 .
Papers presented at this symposium considered issues of research and application in virtual interfaces broadly defined. Issues of technology integration for system development were considered separately from issues of movement monitoring or sensory display. Issues of human performance measurement were presented in the context of both research and application.


00 C I 'G
6 2
M c .-

t; W z Y
CT
0
W
W W
2
N A T O -@- O T A N
7 RUE ANCELLE * 92200 NEUILLY-SUR-SEINE
FRANCE
TWcopie (1)47.38.57.99 * Telex 6 I O I76
DIFFUSION DES PUBLICATIONS ACARD NON CLASSIFIEES
Aucun stock de publications n’a existe i AGARD. A partir de 1993, AGARD dktiendra un stock limit6 des publications associees aux cycles de conferences et cours sp6ciaux ainsi que les AGARDographies et les rap orts des groupes de travail, organisis et publies ?i partir de 1993 inclus. Les demandes de renseignements doivent btre adressees a AGARD par Ettre ou par fax 1 l’adresse indiquee ci-dessus. Veuillez nepus iiliphoner. La diffusion initiale de toutes les publications del’AGARD est effectu6e aupres des pays membres del’OTAN par I’intermidiaire des centres de distribution nationaux indiques ci-dessous. Des exemplaires su ICmentaires euvent parfois btre obtenus aupres de ces centres (a I’exception des Etats-Unis). Si vous souhaitez recevoir toutes les pu/%cations de l’lGARD, ou simplement celles qui concernent certains Panels, vous pouvez demander a Ztreinclu sur la liste d‘envoi de l’un de ces centres. Les publications de I’AGARD sont en vente auprks des agences indiquies ci-dessous, sous forme de photocopie ou de microfiche.
CENTRES DE DIFFUSION NATIONAUX ALLEMAGNE
Fachinformationszentrum. Karlsruhe D-75 14 Eggenstein-Leopoldshafen 2
BEL G I Q UE Coordonnateur AGARD-VSL Etat-Major de la Force ACrienne Quartier Reine Elisabeth Rue d‘Evere, 1140 Bruxelles
Directeur du Service des Renseignements Scientifiques Ministere de la Defense Nationale Ottawa, Ontario K1A OK2
CANADA
DANEMARK Danish Defence Research Establishment Ryvangs Alle 1 P.O. Box 2715 DK-2100 Copenhagen 0
INTA (AGARD Publications) Pintor Rosales 34 28008 Madrid
NASA Headquarters Attention: CF 37, Distribution Center 300 E Street, S.W. Washington, D.C. 20546
O.N.E.R.A. (Direction) 29, Avenue de la Division Leclerc 92322 Chitillon Cedex
Hellenic Air Force Air War College Scientific and Technical Library Dekelia Air Force Base Dekelia, Athens TGA 10 10
ESPAGNE
0 ETATS-UNIS
FRANCE
GRECE
ISLANDE Director of Aviation c/o Flugrad Reykjavik
Aeronautica Militare Ufficio del Delegato Nazionale all‘AGARD Aeroporto Pratica di Mare 00040 Pomezia (Roma)
Voir Belgique
Norwegian Defence Research Establishment Attn: Biblioteket P.O. Box 25 N-2007 Kjeller
Netherlands Delegation to AGARD
ITALIE
LUXEMBOURG
NORVEGE
PAYS-BAS
National Aeros ace Laboratory NLR P.O. Box 9050f 1006 BM Amsterdam
Forca ABrea Portuguesa Centro de Documentac5o e Informacio Alfragide 2700 Amadora
Defence Research Information Centre Kentigern House 65 Brown Street Glasgow G2 8EX
Milli Savunma Ba$kanh& ARGE Daire Baskanhb ( RG ) Ankara
1 PORTUGAL
ROYAUME UNI
TURQUIE
YS% Le centre de distribution national des Etats-Unis ne dktient PAS de stocks des publications de I’AGARD.
D’eventuelles demandes de photocopies doivent etre formulees directernent auprks du NASA Center for Aerospace Information (CASI) 21 I’adresse suivante:
AGENCES DE VENTE NASA Center for ESNInformation Retrieval Service The British Library
Aerospace Information (CASI) European Space Agency Document Supply Division 800 Elkridge Landing Road Linthicum Heights, MD 21090-2934 75015 Paris West Yorkshire LS23 7BQ United States France Royaume Uni Les demandes demicrofiches ou de photocopies dedocuments AGARD (y compris les demandes faites auprbs du CASI) doivent comporter la denomination AGARD, ainsi que le numiro de sBried’AGARD (par exemple AGARD-AG-3 15 . Des informations analogues, telles que
commande des rapports AGARD et des rapports consultatifs AGARD respectivement. Des references bibliographiques completes ainsi que des resumes des publications AGARD figurent dans les joumaux suivants:
10, rue Mario Nikis Boston Spa, Wetherby
le titre et la date de publication sont souhaitables. Veuiller noter qu’il y a lieu de specifier AG ARd -R-nnn et AGARD-AR-nnn lors de la
Scientifique and Technical Aerospace Reports (STAR) publie par la NASA Scientific and Technical Information Program Springfield NASA Headquarters (51T) Washington D.C. 20546 Etats-Unis Etats-Unis
Government Reports Announcements and Index (GRAM) publie par le National Technical Information Semce
Virginia 22 16 1
(accessible 6galement en mode interactif dans la base de donnees bibliographiques en ligne du NTIS, et sur CD-ROM)
Imprimt par Specialised Printing Services Limited 40 Chigwell Lane, Loughton, Essex IGlO 3Tz
7R IE ANCELLE * 92200 NEUILLY-SUR-SEINE
FRANCE
Telefax (1)47.38.57.99 * Telex 6 I O I76
DISTRIBUTION OF JNCLASSIFIEP AGARD PUBLICATIONS
I
AGARD holds limited quantities of the publications that accompanied Lecture Series and Special Courses held in 1993 or later, and of AGARDographs and Working Group reports published from 1993 onward. For details, write or send a telefax to the address given above. Please do not telephone. AGARD does not hold stocks of publications that accompanied earlier Lecture Series or Courses or of any other publications. Initial distributionof all AGARDpublicationsismade toNATOnations through theNationalDistribution Centreslisted below.Furthercopiesare sometimes available from these centres except in the United States). If you have a need to receive all AGARD publications, or just those
publications may be purchased from the Sales Agencies listed below, in photocopy or microfiche form. relating to one or more specific AGARD $ anels, they may be willing to include you (or your 0rganisation)on their distribution list. AGARD
BELGIUM Coordonnateur AGARD - VSL Etat-Major de la Force ABrienne Quartier Reine Elisabeth Rue d'Evere, 1140 Bruxelles
Director Scientific Information Services Dept of National Defence Ottawa, Ontario K1A OK2
CANADA
DENMARK Danish Defence Research Establishment Rvvanes All6 1 P.O. B';x 2715 DK-2 100 Copenhagen 0
FRANCE O.N.E.R.A. (Direction) 29 Avenue de la Division Leclerc 92322 Chltillon Cedex
Fachinformationszentrum Karlsruhe D-75 14 Eggenstein-Leopoldshafen 2
Hellenic Air Force Air War College Scientific and Technical Library Dekelia Air Force Base Dekelia, Athens TGA 1010
Director of Aviation c/o Flugrad Reykjavik
Aeronautica Militare Ufficio del Delegato Nazionale all'AGARD Aeroporto Pratica di Mare 00040 Pomezia (Roma)
GERMANY
GREECE
ICELAND
ITALY
NATIONAL DISTRIBUTION CENTRES LUXEMBOURG
See Belgium
Netherlands Delegation to AGARD NETHERLANDS
National Aerospace Laboratory, NLR P.O. Box 90502 1006 13M Amsterdam
Norwegian Defence Research Establishment Attn: Biblioteket P.O. Box 25 N-2007 Kjeller
ForCa Atrea Portuguesa Centro de DocumentaCIo e InformaCBo Alfragide 2700 Amadora
INTA (AGARD Publications) Pintor Rosales 34 28008 Madrid
Milli Savunma Baskanl@ (MSB) ARGEi Daire Baskanh& (ARGE) Ankara
UNITED KLNGDOM Defence Research Information Centre Kentigern House 65 Brown Street Glasgow G2 8EX
NASA Headquarters Attention: CF 37, Distribution Center 300 E Street, S.W. Washington, D.C. 20546
NORWAY
PORTUGAL
SPAIN
TURKEY
UNITED STATES
The United States National Distribution Centre does NOT hold stocks of AGARD publications. Applications for copies should be made direct to the NASA Center for Aerospace Information (CASI) at the address below.
SALES AGENCIES NASA Center for
Aerospace Information (CASI) 800 Elkridge Landing Road Linthicum Heights, MD 21090-2934 United States France
ESNInformation Retrieval Service European Space Agency 10, rue Mario Nikis 75015 Paris
The British Library Document Supply Centre Boston Spa, Wetherby West Yorkshire LS23 7BQ United Kingdom
Requests for microfiches or photocopies of AGARD documents (including requests lo CASI) should include the word 'AGARD'and the AGARD serial number (for example AGF-AG-315) . . .. Collateral information such as title and niihlicitinn :- ,-I--:--I-' - *' Tte that
phical AGARnRonnec nnrl A ,-I.-------- -
Scien 4 publi Infor NAS Wash Unite
i. I . 1 *