Key World2013
82
Key World Energy STATISTICS 2013 Mobile app also available
Transcript of Key World2013

KeyWorld
EnergySTATISTICS
2013
Mobile
app also
available

T
S
A
T
S
I
T
I
C
S
KEY WORLDENERGY
STATISTICS

2
IEA participating countries
AustraliaAustria
BelgiumCanada
Czech RepublicDenmark
FinlandFrance
GermanyGreece
HungaryIreland
ItalyJapanKorea
LuxembourgNetherlands
New ZealandNorwayPoland
PortugalSlovak Republic
SpainSweden
SwitzerlandTurkey
United KingdomUnited States

3
The InternationalEnergy Agency
The IEA, which was established in November 1974, has overthe years gained recognition as one of the world’s mostauthoritative sources for energy statistics. Its all-encompassingannual studies of oil, natural gas, coal, electricity andrenewables are indispensable tools for energy policy makers,companies involved in the energy field and scholars.
In 1997 the IEA produced a handy, pocket-sized summary ofkey energy data. This new edition responds to the enormouslypositive reaction to the books since then. Key World EnergyStatistics from the IEA contains timely, clearly-presented dataon the supply, transformation and consumption of all majorenergy sources. The interested businessman, journalist orstudent will have at his or her fingertips the annual Canadianproduction of coal, the electricity consumption in Thailand, theprice of diesel oil in Spain and thousands of other useful energyfacts.
Gathering and analysing statistics is one of the important IEAfunctions. But the Agency – an autonomous body within theOrganisation for Economic Co-operation and Development –also:
■ administers a plan to guard member countries against therisk of a major disruption of oil supplies;
■ coordinates national efforts to conserve energy and developalternative energy sources, as well as to limit pollution andenergy-related climate change; and
■ disseminates information on the world energy market andseeks to promote stable international trade in energy.

TABLEOF
CONTENTS
TABLEOF
CONTENTS
TABLEOF
CONTENTS

SUPPLY 1
TRANSFORMATION 2
CONSUMPTION 3
ENERGY BALANCES 4
PRICES 5
EMISSIONS 6
OUTLOOK 7
ENERGY INDICATORS 8
CONVERSION FACTORS 9
GLOSSARY 10

TOTAL PRIMARY ENERGY SUPPLYWorld
Other**
Natural gasOil
Biofuels and waste
Coal/peat NuclearHydro
0
2 000
4 000
6 000
8 000
10 000
12 000
14 000
1971 1975 1980 1985 1990 1995 2000 2005 2011
World* total primary energy supply from 1971 to 2011by fuel (Mtoe)
1973 and 2011 fuel s hares of TPES
6 109 Mtoe 13 113 Mtoe
*World includes international aviation and international marine bunkers.**Other includes geothermal, solar, wind, heat, etc.
1973 2011
Other**0.1%
Hydro1.8%
Nuclear0.9%
Naturalgas
16.0%
Oil46.0%
Coal/peat24.6%
Biofuelsand waste
10.6% Hydro2.3%
Nuclear5.1%
Naturalgas
21.3%Oil
31.5%
Coal/peat28.8%
Biofuelsand waste
10.0% Other**1.0%
SUPPLY
6
OECD
Other**
Natural gasOil
Biofuels and waste
Coal/peat NuclearHydro
0
1 000
2 000
3 000
4 000
5 000
6 000
1971 1975 1980 1985 1990 1995 2000 2005 2012
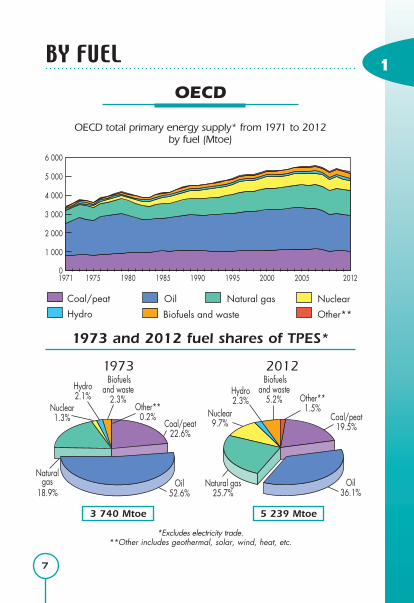
OECD total primary energy supply* from 1971 to 2012by fuel (Mtoe)
1973 and 2012 fuel shares of TPES*
3 740 Mtoe 5 239 Mtoe
*Excludes electricity trade.**Other includes geothermal, solar, wind, heat, etc.
1973 2012
Other**0.2%
Hydro2.1%
Nuclear1.3%
Naturalgas
18.9%Oil
52.6%
Coal/peat22.6%
Biofuelsand waste
2.3% Other**1.5%
Hydro2.3%
Nuclear9.7%
Biofuelsand waste
5.2%
Oil36.1%
Natural gas25.7%
Coal/peat19.5%
BY FUEL 1
7

TOTAL PRIMARY ENERGY SUPPLYWorld
Non-OECD Europe and EurasiaNon-OECD AmericasAsia*
Middle EastChinaOECD
Bunkers**Africa
0
2 000
4 000
6 000
8 000
10 000
12 000
14 000
1971 1975 1980 1985 1990 1995 2000 2005 2011
World total primary energy supply from 1971 to 2011by region (Mtoe)
1973 and 2011 regional shares of TPES
6 109 Mtoe 13 113 Mtoe
*Asia excludes China.**Includes international aviation and international marine bunkers.
OECD61.3%
Middle East0.8%
Bunkers**3.0%
Non-OECDEurope
andEurasia15.4%
Non-OECDAmericas
3.5%Asia*5.5%
China7.0%
OECD40.5%Middle East
4.9%
Africa5.3%
Non-OECD Europeand Eurasia
9.0%
Non-OECDAmericas
4.5%Asia*12.1%
China20.9%
Africa3.5%
Bunkers**2.8%
SUPPLY
8
1973 2011

OECD
OECD EuropeOECD Asia OceaniaOECD Americas
0
1 000
2 000
3 000
4 000
5 000
6 000
1971 1975 1980 1985 1990 1995 2000 2005 2012
OECD total primary energy supply* from 1971 to 2012by region (Mtoe)
1973 and 2012 regional shares of TPES*
3 740 Mtoe 5 239 Mtoe
*Excludes electricity trade.
1973 2012
BY REGION 1
9
OECD Europe36.8%
OECD Americas52.1%
OECDAsia Oceania
11.1%
OECD Europe33.2%
OECD Americas49.8%
OECDAsia Oceania
17.0%

Crude Oil Production
Non-OECD Europe and EurasiaChina
Middle EastNon-OECD Americas AfricaAsia**
OECD
0
1 000
2 000
3 000
4 000
5 000
1971 1975 1980 1985 1990 1995 2000 2005 2012
Crude oil* production from 1971 to 2012by region (Mt)
1973 and 2012 regional shares ofcrude oil* production
*Includes crude oil, NGL, feedstocks, additives and other hydrocarbons.**Asia excludes China.
1973 2012
SUPPLY
10
Asia**3.2%
Non-OECDEurope
andEurasia15.7%
Middle East36.7%
OECD23.9%
China1.9%
Non-OECDAmericas
8.5% Africa10.1%
Asia**4.1%Non-
OECDEurope
andEurasia16.2%
Middle East32.5%
OECD21.7%
China5.0%
Non-OECDAmericas
9.6% Africa10.9%
2 869 Mt 4 142 Mt

Producers, net exporters and net importersof crude oil*
Net importers Mt
United States 500
People’s Rep. of China 251
Japan 177
India 172
Korea 125
Germany 90
Italy 77
France 64
Singapore 58
Netherlands 57
Others 508
Total 2 079
Net exporters Mt
Saudi Arabia 353
Russian Federation 247
Islamic Rep. of Iran 122
Nigeria 121
United Arab Emirates 114
Iraq 108
Venezuela 93
Kuwait 89
Canada 82
Angola 79
Others 574
Total 1 9822012 data
2011 data
2011 data
% ofProducers Mt world total
Saudi Arabia 544 13.1
Russian Federation 520 12.6
United States 387 9.3
People’s Rep. of China 206 5.0
Islamic Rep. of Iran 186 4.5
Canada 182 4.4
United Arab Emirates 163 3.9
Venezuela 162 3.9
Kuwait 152 3.7
Iraq 148 3.6
Rest of the world 1 492 36.0
World 4 142 100.0
1
11
*Includes crude oil, NGL, feedstocks, additivesand other hydrocarbons.

Asia*1.0%Non-OECD
Europe and Eurasia22.3%
MiddleEast2.1%
China0.5% Non-OECD
Americas 2.0%
Africa 0.8%
Asia*9.1%
Non-OECDEurope and Eurasia
25.3%
MiddleEast
15.8%OECD35.8%
China3.1%
Non-OECDAmericas
5.0%
Africa5.9%
OECD71.3%
Natural Gas Production
Non-OECD Europe and EurasiaChina
Middle EastNon-OECD Americas AfricaAsia*
OECD
1971 1975 1980 1985 1990 1995 2000 2005 20120
600
1 200
1 800
2 400
3 000
3 600
Natural gas production from 1971 to 2012 by region (billion cubic metres)
1973 and 2012 regional shares ofnatural gas production
1 226 bcm 3 435 bcm
*Asia excludes China.
1973 2012
SUPPLY
12

Producers, net exporters and net importers* of natural gas
Net importers bcm
Japan 122
Germany 70
Italy 68
Korea 48
Turkey 45
United States 43
France 43
United Kingdom 37
People’s Rep. of China 36
Ukraine 32
Others 283
Total 827
Net exporters bcm
Russian Federation 185
Qatar 120
Norway 109
Canada 57
Algeria 48
Turkmenistan 37
Indonesia 37
Netherlands 34
Nigeria 27
Malaysia 21
Others 154
Total 8292012 data
2012 data
2012 data*Net exports and net imports include pipeline gas and LNG.
% ofProducers bcm world total
United States 681 19.8
Russian Federation 656 19.1
Qatar 160 4.7
Islamic Rep. of Iran 158 4.6
Canada 157 4.6
Norway 115 3.3
People’s Rep. of China 107 3.1
Saudi Arabia 95 2.8
Netherlands 80 2.3
Indonesia 77 2.2
Rest of the world 1 149 33.5
World 3 435 100.0
1
13

Coal Production
Non-OECD Europe and EurasiaChina
Middle EastNon-OECD Americas AfricaAsia**
OECD
1971 1975 1980 1985 1990 1995 2000 2005 20120
1 000 2 000 3 000 4 000 5 000 6 000 7 000 8 000 9 000
Coal* production from 1971 to 2012by region (Mt)
1973 and 2012 regional shares ofcoal* production
3 073 Mt 7 831 Mt
*Includes steam coal, coking coal, lignite and recovered coal.**Asia excludes China.
1973 2012
Asia**3.9%
Non-OECD Europeand Eurasia
24.5%
OECD55.6%
China13.6%
Non-OECDAmericas
0.2%Africa2.2%
Asia**15.2%
Non-OECDEurope and Eurasia
8.8%
OECD26.0%
Non-OECDAmericas
1.3%
Africa 3.4%
China45.3%
SUPPLY
14
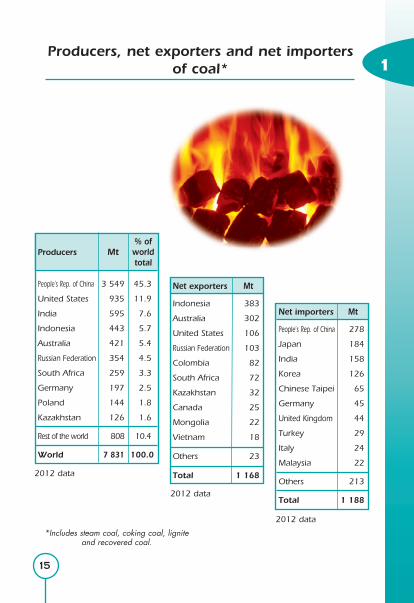
Producers, net exporters and net importersof coal*
Net importers Mt
People’s Rep. of China 278
Japan 184
India 158
Korea 126
Chinese Taipei 65
Germany 45
United Kingdom 44
Turkey 29
Italy 24
Malaysia 22
Others 213
Total 1 188
Net exporters Mt
Indonesia 383
Australia 302
United States 106
Russian Federation 103
Colombia 82
South Africa 72
Kazakhstan 32
Canada 25
Mongolia 22
Vietnam 18
Others 23
Total 1 1682012 data
2012 data
2012 data
*Includes steam coal, coking coal, ligniteand recovered coal.
% ofProducers Mt world total
People’s Rep. of China 3 549 45.3
United States 935 11.9
India 595 7.6
Indonesia 443 5.7
Australia 421 5.4
Russian Federation 354 4.5
South Africa 259 3.3
Germany 197 2.5
Poland 144 1.8
Kazakhstan 126 1.6
Rest of the world 808 10.4
World 7 831 100.0
1
15

Nuclear Production
Non-OECD Europe and Eurasia
Other**ChinaAsia*OECD
0
500
1 000
1 500
2 000
2 500
3 000
1971 1975 1980 1985 1990 1995 2000 2005 2011
Nuclear production from 1971 to 2011by region (TWh)
1973 and 2011 regional shares ofnuclear production
203 TWh 2 584 TWh
*Asia excludes China.**Other includes Africa, Non-OECD Americas and the Middle East.
1973 2011
Other**1.4%
Asia*3.1%
Non-OECD Europeand Eurasia
11.4%
Asia*1.3%
Non-OECD Europeand Eurasia
5.9%
OECD92.8%
OECD80.8%
China3.3%
SUPPLY
16

Producers of nuclear electricity
Net installed capacity GW
United States 102
France 63
Japan 44
Russian Federation 24
Korea 19
Ukraine 13
Canada 13
Germany 12
People’s Rep. of China 12
United Kingdom 10
Rest of the world 57
World 3692011 data
2011 data
Sources: IEA,International AtomicEnergy Agency.*Excludes countries
with no nuclear production.
% ofProducers TWh world total
United States 821 31.8
France 442 17.1
Russian Federation 173 6.7
Korea 155 6.0
Germany 108 4.2
Japan 102 3.9
Canada 94 3.6
Ukraine 90 3.5
People’s Rep. of China 86 3.3
United Kingdom 69 2.7
Rest of the world 444 17.2
World 2 584 100.0
% of
Country nuclear
(top-ten in total
producers) domestic electricity generation
France 79.4
Ukraine 46.3
Korea 29.8
United States 19.0
United Kingdom 18.9
Germany 17.9
Russian Federation 16.4
Canada 14.7
Japan 9.8
People’s Rep. of China 1.8
Rest of the world* 11.5
World 11.7
2011 data
1
17

Hydro Production
Non-OECD Europe and EurasiaChina
Middle EastNon-OECD Americas AfricaAsia**
OECD
0
1 000
2 000
3 000
4 000
1971 1975 1980 1985 1990 1995 2000 2005 2011
Hydro* production from 1971 to 2011by region (TWh)
1973 and 2011 regional shares ofhydro* production
1 294 TWh 3 566 TWh
*Includes pumped storage.**Asia excludes China.
1973 2011
Asia**4.3%
Non-OECDEurope
and Eurasia11.6%
MiddleEast0.3%
OECD71.9%
China2.9%
Non-OECDAmericas
6.8%Africa2.2%
Asia**7.7%
Non-OECDEurope and
Eurasia8.1%
Middle East0.6%
China19.6%
Non-OECDAmericas20.1%
Africa3.2%
OECD40.7%
SUPPLY
18

Producers of hydro* electricity
*Includes pumped storage.**Excludes countries
with no hydro production.
% ofProducers TWh world total
People’s Rep. of China 699 19.6
Brazil 428 12.0
Canada 376 10.5
United States 345 9.7
Russian Federation 168 4.7
India 131 3.7
Norway 122 3.4
Japan 92 2.6
Venezuela 84 2.3
Sweden 67 1.9
Rest of the world 1 054 29.6
World 3 566 100.0
2011 data
% of
Country hydro
(top-ten in total
producers) domestic electricity generation
Norway 95.3
Brazil 80.6
Venezuela 68.6
Canada 59.0
Sweden 44.3
Russian Federation 15.9
People’s Rep. of China 14.8
India 12.4
Japan 8.7
United States 7.9
Rest of the world** 13.6
World 16.1
Net installed GW
capacity
People’s Rep. of China 194
United States 101
Brazil 81
Canada 75
Japan 48
Russian Federation 47
India 38
Norway 30
France 25
Italy 22
Rest of the world 338
World 999
2010 data
Sources: IEA,United Nations.
2011 data
1
19

20
TRANSFORMATION
Refining by Product
Other productsAviation fuels
Fuel oilMotor gasoline
Middle distillatesLPG/ethane/naphtha
0
1 000
2 000
3 000
4 000
5 000
1971 1975 1980 1985 1990 1995 2000 2005 2011
World refinery production from 1971 to 2011 by p roduct (Mt)
1973 and 2011 shares ofrefinery production by product
2 719 Mt 3 896 Mt
1973 2011
Aviationfuels4.2%
LPG/ethane/naphtha5.8%
Otherproducts
9.2%Fueloil
33.8%
Motorgasoline21.0%
Middle distillates 26.0%
Aviationfuels6.4%
LPG/ethane/naphtha9.5%
Otherproducts13.1%Fuel
oil13.2%
Motorgasoline23.1%
Middle distillates 34.7%

21
2
Producers, net exporters and net importersof oil products
Net importers Mt
Japan 34
People’s Rep. of China 25
Indonesia 22
Mexico 22
France 19
Hong Kong (China) 19
Brazil 17
Germany 15
Singapore 15
Australia 13
Others 229
Total* 430
Net exporters Mt
Russian Federation 100
United States 61
India 47
Saudi Arabia 42
Venezuela 31
Kuwait 31
Korea 21
Algeria 17
Qatar 17
Islamic Rep. of Iran 17
Others 134
Total* 5182011 data
2011 data
2011 data
% ofProducers Mt world total
United States 824 21.1
People’s Rep. of China 417 10.7
Russian Federation 248 6.4
India 207 5.3
Japan 169 4.3
Korea 127 3.3
Germany 100 2.6
Brazil 99 2.5
Canada 93 2.4
Saudi Arabia 92 2.4
Rest of the world 1 520 39.0
World 3 896 100.0
*The discrepancy between total net exports and total net imports arises from different data sources and possible misallocation
of bunkers into exports for some countries.

22
TRANSFORMATION
Refining by Region
0
1 000
2 000
3 000
4 000
5 000
1971 1975 1980 1985 1990 1995 2000 2005 2011
Non-OECD Europe and EurasiaChina
Middle EastNon-OECD Americas AfricaAsia**
OECD
World refinery throughput* from 1971 to 2011 by region (Mt)
1973 and 2011 regional shares ofrefinery throughput*
2 738 Mt 3 945 Mt
*Includes crude oil, NGL, refinery feedstocks, additives and other hydrocarbons.**Asia excludes China.
1973 2011
Asia**3.3%
Non-OECDEurope
and Eurasia13.9%
MiddleEast3.7%
OECD67.1%
China1.5%
Non-OECDAmericas
8.8%Africa1.7%
Asia**11.9%
Non-OECDEurope
and Eurasia9.1%
OECD50.1%
China11.0% Non-OECD
Americas6.7%
Africa2.8%
MiddleEast8.4%
23
2
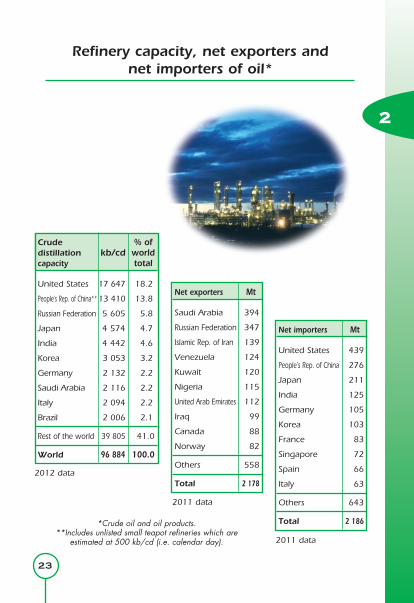
Refinery capacity, net exporters andnet importers of oil*
Net importers Mt
United States 439
People’s Rep. of China 276
Japan 211
India 125
Germany 105
Korea 103
France 83
Singapore 72
Spain 66
Italy 63
Others 643
Total 2 186
Net exporters Mt
Saudi Arabia 394
Russian Federation 347
Islamic Rep. of Iran 139
Venezuela 124
Kuwait 120
Nigeria 115
United Arab Emirates 112
Iraq 99
Canada 88
Norway 82
Others 558
Total 2 1782012 data
2011 data
2011 data
*Crude oil and oil products.**Includes unlisted small teapot refineries which are
estimated at 500 kb/cd (i.e. calendar day).
Crude % ofdistillation kb/cd worldcapacity total
United States 17 647 18.2
People’s Rep. of China** 13 410 13.8
Russian Federation 5 605 5.8
Japan 4 574 4.7
India 4 442 4.6
Korea 3 053 3.2
Germany 2 132 2.2
Saudi Arabia 2 116 2.2
Italy 2 094 2.2
Brazil 2 006 2.1
Rest of the world 39 805 41.0
World 96 884 100.0

24
TRANSFORMATION
Electricity Generation by Fuel
Hydro Other**NuclearFossil thermal
0
4 000
8 000
12 000
16 000
20 000
24 000
1971 1975 1980 1985 1990 1995 2000 2005 2011
World electricity generation* from 1971 to 2011 by fuel (TWh)
1973 and 2011 fuel shares ofelectricity generation*
6 115 TWh 22 126 TWh*Excludes pumped storage.
**Other includes geothermal, solar, wind, biofuels and waste, and heat.
Other**0.6%Hydro
21.0%
Nuclear3.3%
Natural gas12.2%
Oil 24.6%
Coal/peat38.3%
Other**4.5%
Nuclear11.7%
Oil 4.8%
Coal/peat41.3%
Natural gas21.9%
Hydro15.8%
1973 2011

25
2
Electricity productionfrom fossil fuels
Natural gas TWh
United States 1 045
Russian Federation 519
Japan 374
Islamic Rep. of Iran 160
Mexico 156
United Kingdom 147
Italy 145
Egypt 117
Korea 116
India 109
Rest of the world 1 964
World 4 852
Oil TWh
Japan 153
Saudi Arabia 142
Islamic Rep. of Iran 67
Mexico 48
Indonesia 42
United States 40
Kuwait 36
Pakistan 34
Russian Federation 27
Egypt 25
Rest of the world 444
World 1 058
2011 data
2011 data
2011 data
Coal/peat TWh
People’s Rep. of China 3 723
United States 1 875
India 715
Japan 281
Germany 272
South Africa 243
Korea 225
Australia 173
Russian Federation 164
Poland 141
Rest of the world 1 332
World 9 144

26
TRANSFORMATION
Electricity Generation by Region
0
4 000
8 000
12 000
16 000
20 000
24 000
1971 1975 1980 1985 1990 1995 2000 2005 2011
Non-OECD Europe and EurasiaChina
Middle EastNon-OECD Americas AfricaAsia**
OECD
World electricity generation* from 1971 to 2011 by region (TWh)
1973 and 2011 regional shares ofelectricity generation*
6 115 TWh 22 126 TWh
*Excludes pumped storage. **Asia excludes China.
Asia**2.6%
Non-OECDEurope
and Eurasia16.7%
MiddleEast0.5%
China2.8%
Non-OECDAmericas
2.5%
Asia**9.9%Non-OECD
Europeand Eurasia
7.8%
Middle East3.8%
China21.5%
Non-OECDAmericas
5.0%Africa3.1%Africa
1.8%
OECD73.1%
OECD48.9%
1973 2011

27
2
Producers, net exporters and net importersof electricity
Net importers TWh
Italy 46
United States 37
Brazil 36
Finland 14
Argentina 10
Netherlands 9
Thailand 9
Hong Kong (China) 8
Austria 8
Croatia 8
Others 97
Total 282
Net exporters TWh
France 56
Paraguay 46
Canada 37
Russian Federation 23
Czech Republic 17
People’s Rep. of China 13
Bulgaria 11
United Arab Emirates 8
Sweden 7
Ukraine 6
Others 58
Total 2822011 data
2011 data
2011 data** Gross production minus production from pumped storage plants.
% ofProducers* TWh world total
People’s Rep. of China 4 716 21.3
United States 4 327 19.6
Russian Federation 1 053 4.8
India 1 052 4.8
Japan 1 043 4.7
Canada 637 2.9
Germany 602 2.7
France 557 2.5
Brazil 532 2.4
Korea 520 2.4
Rest of the world 7 087 31.9
World 22 126 100.0

28
CONSUMPTION
T O T A L F I N A L C O N S U M P T I O NWorld
Other***
Natural gasBiofuels and waste**Coal/peat
Electricity
Oil
0
2 000
4 000
6 000
8 000
10 000
1971 1975 1980 1985 1990 1995 2000 2005 2011
World* total final consumption from 1971 to 2011 by fuel (Mtoe)
1973 and 2011 fuel shares oftotal final consumption
*World includes international aviation and international marine bunkers. **Data prior to 1994 for biofuels and waste final consumption have been estimated.
***Other includes geothermal, solar, wind, heat, etc.
1973 2011Other***
1.6%Electricity
9.4%
Natural gas14.0% Oil
48.1%
Coal/peat13.7%
Other***3.4%
Electricity17.7%
Natural gas15.5%
Oil40.8%
Coal/peat10.1%
Biofuelsand waste**
12.5% Biofuels
and waste** 13.2%
4 674 Mtoe 8 918 Mtoe

3
29
OECD
Other*
Natural gasBiofuels and wasteCoal/peat
Electricity
Oil
0
500
1 000
1 500
2 000
2 500
3 000
3 500
4 000
1971 1975 1980 1985 1990 1995 2000 2005 2011
OECD total final consumption from 1971 to 2011 by fuel (Mtoe)
1973 and 2011 fuel shares oftotal final consumption
*Other includes geothermal, solar, wind, heat, etc.
1973 2011Other*0.7%
Electricity11.5%
Natural gas17.7%
Coal/peat10.8%
Other*1.8%
Electricity22.0%
Natural gas20.0%
Oil47.8%
Coal/peat3.4%
Biofuelsand waste
3.0%
Biofuelsand waste
5.0%
Oil56.3%
B Y F U E L
2 816 Mtoe 3 651 Mtoe

Asia**6.3%
Non-OECDEurope
and Eurasia13.5%
Middle East0.7%
OECD60.4%
China7.9%
Africa3.8%
Asia**12.5%
Non-OECD Europeand Eurasia
8.3%
Middle East4.8%
OECD41.0%
China18.4%
Non-OECDAmericas
5.1%
Africa5.9%
Non-OECDAmericas
3.5%Bunkers***
3.9%
Bunkers***4.0%
30
CONSUMPTION
World
4 674 Mtoe 8 918 Mtoe
*Data prior to 1994 for biofuels and waste final consumption have been estimated. **Asia excludes China.
***Includes international aviation and international marine bunkers.
1973 2011
T O T A L F I N A L C O N S U M P T I O N
Non-OECD Europe and EurasiaAsia**
Middle EastChinaOECD
Bunkers***AfricaNon-OECD Americas
0
2 000
4 000
6 000
8 000
10 000
1971 1975 1980 1985 1990 1995 2000 2005 2011
1973 and 2011 regional shares oftotal final consumption*
World total final consumption* from 1971 to 2011by region (Mtoe)

3
31
1973 and 2011 regional shares oftotal final consumption
2 816 Mtoe 3 651 Mtoe
1973 2011
OECD
OECD total final consumption from 1971 to 2011by region (Mtoe)
0
500
1 000
1 500
2 000
2 500
3 000
3 500
4 000
OECD EuropeOECD Asia OceaniaOECD Americas
1971 1975 1980 1985 1990 1995 2000 2005 2011
B Y R E G I O N
OECD Europe36.3%
OECD Americas53.0%
OECDAsia Oceania
10.7%
OECD Europe33.5%
OECD Americas50.6%
OECDAsia Oceania
15.9%

32
CONSUMPTION
Coal*
Non-energy useOther** TransportIndustry
0
200
400
600
800
1 000
1971 1975 1980 1985 1990 1995 2000 2005 2011
Total final consumption from 1971 to 2011by sector (Mtoe)
1973 and 2011 shares ofworld coal* consumption
640 Mtoe 904 Mtoe
Other**37.4%
Transport5.2%
Industry 56.5%
Non-energy use0.9% Other**
14.6%Transport
0.4%
Industry 80.7%
Non-energy use4.3%
*Coal refers to coal/peat. **Includes agriculture, commercial and public services, residential, and non-specified other.
1973 2011
T O T A L F I N A L C O N S U M P T I O N

3
33
Oil
0
500
1 000
1 500
2 000
2 500
3 000
3 500
4 000
Non-energy useOther* TransportIndustry
1971 1975 1985 1995 1980 1990 2000 2005 2011
Total final consumption from 1971 to 2011by sector (Mtoe)
1973 and 2011 shares ofworld oil consumption
2 250 Mtoe 3 633 Mtoe
*Includes agriculture, commercial and public services,residential, and non-specified other.
1973 2011
B Y S E C T O R
Other*12.0% Transport
62.3%
Industry8.9%
Non-energyuse
16.8%
Other*23.1%
Transport 45.4%
Industry19.9%
Non-energyuse
11.6%

34
CONSUMPTION
Natural gas
0
300
600
900
1 200
1 500
Non-energy useOther* TransportIndustry
1971 1975 1985 19951980 1990 2000 2005 2011
Total final consumption from 1971 to 2011by sector (Mtoe)
1973 and 2011 shares ofworld natural gas consumption
652 Mtoe 1 380 Mtoe
*Includes agriculture, commercial and public services, residential,and non-specified other.
1973 2011Other*39.7% Non-energy
use2.8%
Non-energyuse
12.4%Transport
2.7%
Industry 54.8%
Other*44.2%
Transport6.7%
Industry 36.7%
T O T A L F I N A L C O N S U M P T I O N

3
35
Electricity
Other* TransportIndustry
0 200 400 600 800
1 000 1 200 1 400 1 600 1 800
1971 1975 1985 19951980 1990 2000 2005 2011
Total final consumption from 1971 to 2011by sector (Mtoe)
1973 and 2011 shares ofworld electricity consumption
439 Mtoe 1 582 Mtoe
*Includes agriculture, commercial and public services, residential, and non-specified other.
1973 2011Other*44.1%
Transport2.4%
Industry 53.5%
Other*55.8%
Transport1.6%
Industry 42.6%
B Y S E C T O R

36
ENERGY
BALANCES
SIMPLIFIED ENERGYWorld
1973
SUPPLY AND Coal/ Crude Oil Natural Nuclear Hydro Biofuels Other(b) TotalCONSUMPTION peat oil products gas and waste(a)
Production 1 479.01 2 938.38 - 993.05 53.05 110.19 644.57 6.13 6 224.36
Imports 140.01 1 561.28 407.65 73.40 - - 0.12 8.14 2 190.61
Exports -130.40 -1 612.99 -442.73 -72.56 - - -0.19 -8.27 -2 267.15
Stock changes 12.30 -19.68 -16.40 -15.09 - - 0.06 - -38.82
TPES 1 500.92 2 866.99 -51.48 978.80 53.05 110.19 644.55 6.00 6 109.01
Transfers - -46.76 48.78 - - - - - 2.02
Statistical diff. 7.52 12.00 -6.77 4.78 - - -0.17 -0.03 17.32
Electricity plants -557.08 -22.91 -317.91 -160.52 -52.95 -110.19 -2.45 502.41 -721.60
CHP plants -86.40 - -28.62 -50.84 -0.10 - -0.91 100.94 -65.93
Heat plants -7.81 - -0.90 -0.68 - - -0.80 7.11 -3.08
Blast furnaces -81.53 - -2.72 - - - -0.06 - -84.31
Gas works 9.87 -0.60 -9.07 -6.21 - - - - -6.01
Coke ovens(c) -100.69 - -0.68 -0.19 - - -0.02 - -101.59
Oil refineries - -2 782.24 2 761.31 - - - - - -20.93
Petchem. plants - 5.09 -5.37 - - - - - -0.28
Liquefaction plants -0.73 0.23 - - - - - - -0.50
Other transf. - - -0.12 -0.03 - - -23.14 - -23.28
Energy ind. own use -35.06 -2.59 -158.81 -106.78 - - -0.20 -57.68 -361.10
Losses -8.97 -7.07 -0.27 -6.03 - - -0.25 -43.14 -65.73
TFC 640.04 22.15 2 227.36 652.29 - - 616.56 515.61 4 674.01
Industry 361.89 16.42 432.21 356.95 - - 91.52 286.35 1 545.32
Transport (d) 33.00 - 1 019.05 17.72 - - 0.24 10.60 1 080.60
Other 239.14 0.00 520.05 259.26 - - 524.80 218.67 1 761.93
Non-energy use 6.01 5.73 256.05 18.37 - - - - 286.16
(a) Biofuels and waste final consumption has been estimated. (b) Other includes geothermal, solar, wind, electricity and heat, etc. (c) Also includes patent fuel and BKB plants.(d) Includes international aviation and international marine bunkers.
(Mtoe)

37
4
World
2011
(a) Other includes geothermal, solar, wind, electricity and heat, etc. (b) Also includes patent fuel and BKB plants.(c) Includes international aviation and international marine bunkers.
(Mtoe)
BALANCE TABLE
SUPPLY AND Coal/ Crude Oil Natural Nuclear Hydro Biofuels Other(a) TotalCONSUMPTION peat oil products gas and waste
Production 3 850.54 4 132.97 - 2 805.35 674.01 300.17 1 310.64 128.08 13 201.76
Imports 696.75 2 299.34 1 077.39 865.30 - - 13.89 55.78 5 008.45
Exports -726.24 -2 210.80 -1 164.02 -861.72 - - -11.64 -55.82 -5 030.23
Stock changes -44.99 -1.94 3.05 -21.98 - - -0.74 - -66.60
TPES 3 776.06 4 219.57 -83.58 2 786.95 674.01 300.17 1 312.15 128.05 13 113.38
Transfers -0.34 -169.12 195.38 - - - 0.02 - 25.94
Statistical diff. -143.75 6.79 3.52 10.31 - - -0.08 -1.74 -124.94
Electricity plants -2 075.41 -41.61 -203.82 -711.28 -670.42 -300.17 -81.07 1 624.79 -2 459.00
CHP plants -180.77 -0.01 -25.55 -313.98 -3.57 - -42.75 329.47 -237.16
Heat plants -109.45 -0.83 -11.71 -92.93 -0.02 - -10.82 189.23 -36.53
Blast furnaces -190.85 - -0.61 -0.08 - - -0.06 - -191.60
Gas works -6.32 -0.00 -3.82 3.18 - - -0.03 - -7.00
Coke ovens(b) -59.09 - -2.61 -0.00 - - -0.02 - -61.72
Oil refineries - -4 023.86 3 989.31 -0.85 - - - - -35.40
Petchem. plants - 31.37 -31.81 - - - - - -0.44
Liquefaction plants -17.55 9.57 - -10.74 - - - - -18.72
Other transf. -0.06 1.22 -2.79 -3.59 - - -54.63 -0.35 -60.20
Energy ind. own use -85.43 -6.47 -206.71 -267.51 - - -10.77 -207.25 -784.14
Losses -3.42 -7.87 -0.69 -18.97 - - -0.19 -173.79 -204.93
TFC 903.62 18.76 3 614.51 1 380.50 - - 1 111.74 1 888.41 8 917.53
Industry 728.93 10.67 312.48 506.38 - - 198.15 800.14 2 556.74
Transport (c) 3.41 0.02 2 265.21 92.52 - - 58.61 25.16 2 444.94
Other 132.05 0.50 435.55 610.23 - - 854.99 1 063.11 3 096.43
Non-energy use 39.22 7.56 601.27 171.36 - - - - 819.42
38
ENERGY
BALANCES
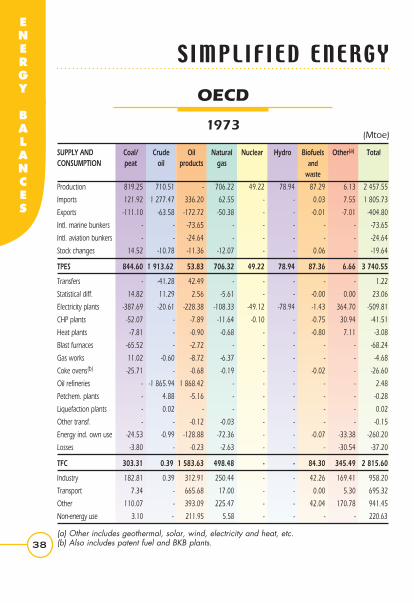
SUPPLY AND Coal/ Crude Oil Natural Nuclear Hydro Biofuels Other(a) TotalCONSUMPTION peat oil products gas and waste
Production 819.25 710.51 - 706.22 49.22 78.94 87.29 6.13 2 457.55
Imports 121.92 1 277.47 336.20 62.55 - - 0.03 7.55 1 805.73
Exports -111.10 -63.58 -172.72 -50.38 - - -0.01 -7.01 -404.80
Intl. marine bunkers - - -73.65 - - - - - -73.65
Intl. aviation bunkers - - -24.64 - - - - - -24.64
Stock changes 14.52 -10.78 -11.36 -12.07 - - 0.06 - -19.64
TPES 844.60 1 913.62 53.83 706.32 49.22 78.94 87.36 6.66 3 740.55
Transfers - -41.28 42.49 - - - - - 1.22
Statistical diff. 14.82 11.29 2.56 -5.61 - - -0.00 0.00 23.06
Electricity plants -387.69 -20.61 -228.38 -108.33 -49.12 -78.94 -1.43 364.70 -509.81
CHP plants -52.07 - -7.89 -11.64 -0.10 - -0.75 30.94 -41.51
Heat plants -7.81 - -0.90 -0.68 - - -0.80 7.11 -3.08
Blast furnaces -65.52 - -2.72 - - - - - -68.24
Gas works 11.02 -0.60 -8.72 -6.37 - - - - -4.68
Coke ovens(b) -25.71 - -0.68 -0.19 - - -0.02 - -26.60
Oil refineries - -1 865.94 1 868.42 - - - - - 2.48
Petchem. plants - 4.88 -5.16 - - - - - -0.28
Liquefaction plants - 0.02 - - - - - - 0.02
Other transf. - - -0.12 -0.03 - - - - -0.15
Energy ind. own use -24.53 -0.99 -128.88 -72.36 - - -0.07 -33.38 -260.20
Losses -3.80 - -0.23 -2.63 - - - -30.54 -37.20
TFC 303.31 0.39 1 583.63 498.48 - - 84.30 345.49 2 815.60
Industry 182.81 0.39 312.91 250.44 - - 42.26 169.41 958.20
Transport 7.34 - 665.68 17.00 - - 0.00 5.30 695.32
Other 110.07 - 393.09 225.47 - - 42.04 170.78 941.45
Non-energy use 3.10 - 211.95 5.58 - - - - 220.63
(a) Other includes geothermal, solar, wind, electricity and heat, etc.(b) Also includes patent fuel and BKB plants.
OECD
1973
SIMPLIFIED ENERGY
(Mtoe)

39
4
SUPPLY AND Coal/ Crude Oil Natural Nuclear Hydro Biofuels Other(a) TotalCONSUMPTION peat oil products gas and waste
Production 977.83 898.48 - 979.64 544.02 119.38 261.61 72.95 3 853.90
Imports 376.48 1 514.88 561.41 653.99 - - 12.41 35.96 3 155.14
Exports -296.66 -355.11 -537.54 -300.72 - - -6.95 -35.81 -1 532.79
Intl. marine bunkers -0.00 - -89.33 - - - - - -89.33
Intl. aviation bunkers - - -88.17 - - - - - -88.17
Stock changes 5.39 12.50 4.21 -15.68 - - -0.39 - 6.04
TPES 1 063.04 2 070.75 -149.42 1 317.24 544.02 119.38 266.68 73.10 5 304.78
Transfers - -51.95 66.83 - - - 0.02 - 14.90
Statistical diff. -9.09 -2.52 1.87 8.96 - - 0.03 0.09 -0.66
Electricity plants -766.26 -10.02 -54.04 -367.04 -540.97 -119.38 -44.11 776.64 -1 125.18
CHP plants -82.03 - -13.97 -108.46 -3.02 - -34.27 147.92 -93.83
Heat plants -4.56 - -1.01 -7.59 -0.02 - -6.03 14.56 -4.64
Blast furnaces -52.02 - -0.61 -0.08 - - - - -52.71
Gas works -2.09 - -3.27 3.75 - - -0.03 - -1.64
Coke ovens(b) -8.75 - -1.21 -0.00 - - -0.01 - -9.97
Oil refineries - -2 028.89 2 039.25 -0.85 - - - - 9.51
Petchem. plants - 27.84 -28.30 - - - - - -0.46
Liquefaction plants -0.76 1.33 - -1.94 - - - - -1.36
Other transf. 0.00 0.15 -2.79 -0.42 - - -0.43 -0.35 -3.84
Energy ind. own use -14.06 -0.08 -114.36 -110.29 - - -0.18 -78.02 -316.98
Losses -0.93 - -0.01 -3.18 - - -0.04 -62.33 -66.48
TFC 122.48 6.62 1 738.97 730.11 - - 181.63 871.62 3 651.43
Industry 98.51 2.14 109.83 266.24 - - 72.28 287.35 836.36
Transport 0.13 0.01 1 107.34 23.56 - - 41.75 9.27 1 182.06
Other 21.17 0.34 198.70 409.55 - - 67.60 575.00 1 272.35
Non-energy use 2.66 4.13 323.11 30.76 - - - - 360.66
(a) Other includes geothermal, solar, wind, electricity and heat, etc.(b) Also includes patent fuel and BKB plants.
OECD
2011
BALANCE TABLE
(Mtoe)

40
PRICES
Crude Oil
monthly averages
0
20
40
60
80
100
120
140
160
Jan-91 Jan-93 Jan-95 Jan-97 Jan-99 Jan-01 Jan-03 Jan-05 Jan-07 Jan-09 Jan-11 Jan-13
WTIDubaiNorth Sea
Key crude oil spot pricesin USD/barrel
Oil Products
020406080
100120140160180
HFO Gasoil Gasoline
monthly averagesJan-91 Jan-93 Jan-95 Jan-97 Jan-99 Jan-01 Jan-03 Jan-05 Jan-07 Jan-09 Jan-11 Jan-13
Rotterdam oil product spot pricesin USD/barrel
Source for all prices: Based on Argus. Copyright © 2013 Argus Media Ltd - All rights reserved.

*The weighted average for European Union member states is based only on importsfor which prices are available and may include different components in different time periods.
**LNG ***Pipeline
5
41
Coal
JapanEU member states*
quarterly averages
0 20 40 60 80
100 120 140 160 180
1Q1983 1Q1987 1Q1991 1Q1995 1Q1999 1Q2003 1Q2007 1Q2011
Steam coal import costsin USD/tonne
Natural Gas
Belgium*** Spain***Japan** USA*** Germany***yearly averages
0 2 4 6 8
10 12 14 16 18
1984 1986 1988 1990 1992 1994 1996 1998 2000 2002 2004 2006 2008 2010 2012
Natural gas import pricesin USD/MBtu

42
PRICES
RETAIL PRICES(a) IN SELECTED
(a) Prices are for 1st quarter 2013 for oil products, and annual 2012 for other products. (b) Low sulphur fuel oil; high sulphur fuel oil for Canada, Ireland, Mexico, New Zealand, Turkey and the United States.(c) For commercial purposes.
Heavy fuel oil Light fuel oil Automotive Unleaded for industry(b) for households diesel oil(c) premium(d)
(tonne) (1 000 litres) (litre) (litre)
Australia .. .. .. 1.611Austria 787.97 1 285.31 1.16 1.869Belgium 719.64 1 154.87 1.643 2.216Canada 732.89 1 218.27 1.296 1.389Chile .. 1 342.21 .. 1.682Czech Republic 554.27 1 254.46 1.543 1.867Denmark 905.73 2 033.16 1.614 2.265Estonia .. 1 342.53 1.495 1.772Finland .. 1 490.08 1.657 2.161France 754.20 1 274.28 1.527 2.079Germany 703.63 1 137.63 1.597 2.114Greece 811.62 1 717.62 1.512 2.266Hungary 730.94 x 1.517 1.912Ireland 1 132.67 1 448.63 1.664 2.112Israel c 2 071.73 c 2.125Italy 877.74 1 904.45 1.85 2.343Japan 951.41 1 082.34 1.301 1.662Korea 915.72 1 276.99 .. 2.057Luxembourg .. 1 054.16 1.432 1.796Mexico 567.74 x 0.775 0.911Netherlands 684.18 .. 1.589 2.329New Zealand 679.27 .. 0.979 1.85Norway .. 1 759.80 1.861 2.588Poland 779.61 1 279.85 1.427 1.748Portugal 1 092.19 1 707.24 1.712 2.13Slovak Republic 691.01 .. 1.574 2.004Slovenia .. 1 366.61 1.539 2.012Spain 752.26 1 242.60 1.5 1.903Sweden 1 458.88 2 098.14 1.819 2.26Switzerland 736.24 1 102.43 1.721 1.924Turkey 1 229.65 1 922.02 2.403 2.68United Kingdom c 1 116.81 1.842 2.094United States 704.81 1 079.83 1.063 0.983

5
43
(d) Unleaded premium gasoline (95 RON); unleaded regular for Japan. (e) Gross calorific value. (f) Brown coal for Turkey... not available x not applicable c confidential
Nat. gas for Nat. gas for Steam coal Electricity for Electricity for industry households for industry(f) industry households (MWh GCV(e)) (MWh GCV(e)) (tonne) (MWh) (MWh)
.. .. .. .. .. Australia .. 90.34 229.43 .. 253.92 Austria 35.99 91.45 .. 126.61 249.94 Belgium 11.90 34.36 .. .. .. Canada .. 125.01 .. 126.70 185.38 Chile 48.82 87.63 c 144.87 198.95 Czech Republic .. 123.09 .. 104.15 383.43 Denmark 45.61 65.79 .. 100.96 138.95 Estonia 45.75 62.51 280.76 103.89 194.87 Finland 51.14 83.76 .. 116.33 174.77 France 51.04 90.32 .. 148.71 338.75 Germany 66.76 138.05 .. 133.74 180.53 Greece 47.85 60.43 .. 131.57 204.16 Hungary 45.58 86.75 .. 155.20 270.32 Ireland c x x 107.69 151.39 Israel .. .. .. 291.79 288.40 Italy .. .. 150.55 194.27 276.76 Japan 64.80 69.18 .. .. 93.08 Korea 50.53 74.62 .. 111.70 209.25 Luxembourg .. 30.36 x 114.74 90.20 Mexico 38.62 98.70 .. 109.51 238.24 Netherlands 21.62 108.72 c 94.34 231.76 New Zealand x x .. 57.56 135.98 Norway 43.96 70.06 109.41 114.59 190.87 Poland 52.70 102.28 232.19 147.30 260.67 Portugal 52.53 68.39 .. 169.74 229.64 Slovak Republic 64.38 98.49 .. 117.77 193.44 Slovenia 43.97 106.50 .. .. .. Spain 63.32 156.89 .. 89.19 223.96 Sweden 71.71 106.77 152.53 130.24 204.16 Switzerland 41.15 50.24 98.02 148.22 184.75 Turkey 38.45 73.65 148.61 134.17 220.74 United Kingdom 12.74 35.22 81.37 66.98 118.83 United States
OECD COUNTRIES in USD/unit

CO2 Emissions by Fuel
1973 and 2011 fuel shares ofCO2 emissions**
15 628 Mt of CO2 31 342 Mt of CO2
*World includes international aviation and international marine bunkers.**Calculated using the IEA’s energy balances and the Revised 1996 IPCC Guidelines.
CO2 emissions are from fuel combustion only. ***Other includes industrial wasteand non-renewable municipal waste.
1973 2011
44
EMISSIONS
World* CO2 emissions** from 1971 to 2011by fuel (Mt of CO2)
Natural gasOilCoal/peat Other***
0
5 000
10 000
15 000
20 000
25 000
30 000
35 000
1971 1975 1980 1985 1990 1995 2000 2005 2011
Natural gas20.2%
Oil35.3%
Coal/peat44.0%
Natural gas14.4%
Oil50.6%
Coal/peat35.0%
Other***0.5%
Other***0.0%

1973 and 2011 regional shares ofCO2 emissions**
15 628 Mt of CO2 31 342 Mt of CO2
*World includes international aviation and international marine bunkers, which are shown together as Bunkers. **Calculated using the IEA’s energy balances and the Revised 1996
IPCC Guidelines. CO2 emissions are from fuel combustion only. ***Asia excludes China.
Asia***11.1%
Non-OECD Europeand Eurasia
8.7% Middle East 5.1%
OECD 39.4%
China25.5%
Non-OECDAmericas
3.5%Africa3.1%
Bunkers 3.6%
Asia***3.1%
Non-OECD Europeand Eurasia
16.2% Middle East0.8%
OECD 66.1%
China5.8%
Non-OECDAmericas
2.6%
Africa1.8%
Bunkers 3.6%
CO2 Emissions by Region
45
6
World* CO2 emissions** from 1971 to 2011by region (Mt of CO2)
Non-OECD Europe and Eurasia
Non-OECD Americas Asia***
Middle EastChinaOECDBunkers
Africa
0
5 000
10 000
15 000
20 000
25 000
30 000
35 000
1971 1975 1980 1985 1990 1995 2000 2005 2011
1973 2011

46
OUTLOOK
O U T L O O K F O R W O R L D T P E STPES Outlook by Fuel
Other**
Natural gas
Hydro
Oil*
Nuclear
Coal/peat
0 2 000 4 000 6 000 8 000
10 000 12 000 14 000 16 000 18 000
NPS 450S NPS 450S NPS 450S NPS 450S1990 20112020 2025 2030 2035
Total Final Consumption by Sector in 2035
11 750 Mtoe 10 390 Mtoe
*Includes international aviation and international marine bunkers.**Other includes biofuels and waste (referred to as ”bioenergy” in WEO 2012),
geothermal, solar, wind, tide, etc.***Based on a plausible post-2012 climate-policy framework to stabilise the long-term
concentration of global greenhouse gases at 450 ppm CO2-equivalent.
NPS: New Policies Scenario(based on policies under consideration)
450S: 450 Scenario***(based on policies needed to limit global average temperature increase to 2 °C)
New Policies Scenario 450 Scenario
Industry29.8%
Non-energy use8.3%
Buildingsand
agriculture34.0% Transport
27.9%
Industry30.7%
Non-energy use9.4%
Buildingsand
agriculture33.9% Transport
26.0%
(Mtoe)

47
7
(Source: IEA, World Energy Outlook 2012)
NPS: New Policies Scenario(based on policies under consideration)
450S: 450 Scenario***(based on policies needed to limit global average temperature increase to 2 °C)
TPES Outlook by Region
0 2 000 4 000 6 000 8 000
10 000 12 000 14 000 16 000 18 000
NPS 450S NPS 450S NPS 450S NPS 450S1990 20112020 2025 2030 2035
OECD China Asia* Non-OECD Europe and Eurasia
Middle East Africa Non-OECD Americas Bunkers**
CO2 Emissions by Region in 2035
37 037 Mt of CO2 22 055 Mt of CO2
*Asia excludes China.**Includes international aviation and international marine bunkers.
***Based on a plausible post-2012 climate-policy framework to stabilise the long-term concentration of global greenhouse gases at 450 ppm
CO2-equivalent. CO2 emissions are from fuel combustion only for both scenarios.
New Policies Scenario 450 Scenario
OECD28.0%
China27.6%
Asia*18.6%
Non-OECD Europeand Eurasia
8.2%Middle East
6.4%
Africa3.4%
Non-OECD Americas3.9% Bunkers**
3.9%
OECD27.6%
China22.4%
Asia*19.6%
Non-OECD Europeand Eurasia
9.1%
Middle East7.7%
Africa3.4%
Non-OECD Americas4.5% Bunkers**
5.7%
T O 2 0 3 5
(Mtoe)

48
ENERGY
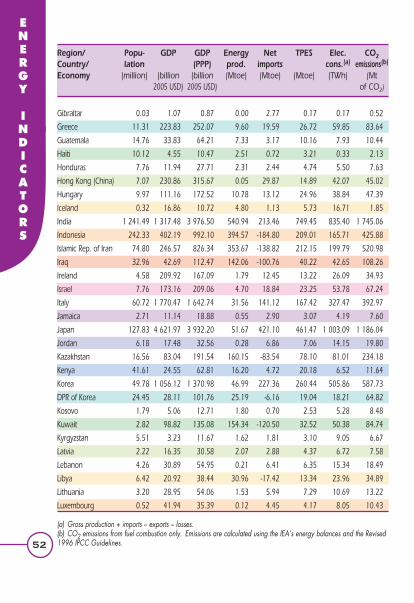
INDICATORS
Selected Indicators for 2011
Region/ Popu- GDP GDP Energy Net TPES Elec. CO2Country/ lation (PPP) prod. imports cons.(a) emissions(b)
Economy (million) (billion (billion (Mtoe) (Mtoe) (Mtoe) (TWh) (Mt 2005 USD) 2005 USD) of CO2)
(a) Gross production + imports – exports – losses.(b) CO2 emissions from fuel combustion only. Emissions are calculated using the IEA’s energy balances and the Revised 1996 IPCC Guidelines.
World 6 958 52 486 70 313 13 202 - 13 113(c) 20 407 31 342(d)
OECD 1 241 38 239 37 906 3 854 1 622 5 305 10 205 12 341
Middle East 209 1 271 2 489 1 788 -1 106 647 737 1 607
Non-OECD Europe and Eurasia 340 1 597 3 666 1 822 -623 1 176 1 525 2 743
China 1 351 4 426 10 286 2 433 408 2 743 4 475 8 000
Asia 2 313 3 386 8 749 1 405 252 1 593 1 904 3 484
Non-OECD Americas 460 2 298 4 403 797 -186 589 942 1 087
Africa 1 045 1 267 2 814 1 104 -390 700 619 968
Albania 3.22 11.05 25.28 1.49 0.71 2.17 6.38 3.87
Algeria 35.98 119.37 275.00 145.85 -103.27 41.85 41.18 103.88
Angola 19.62 56.77 102.55 92.16 -77.99 13.58 5.01 15.72
Argentina 40.77 276.25 631.91 77.24 5.14 80.11 120.86 183.56
Armenia 3.10 6.18 15.85 0.89 1.87 2.72 5.20 4.66
Australia 22.76 899.11 848.02 296.73 -179.65 122.89 239.31 396.77
Austria 8.42 335.39 304.26 11.51 23.51 33.02 70.39 68.49
Azerbaijan 9.17 28.61 81.50 59.96 -47.15 12.56 15.64 26.79
Bahrain 1.32 18.14 27.41 18.08 -7.86 9.51 12.95 22.68
Bangladesh 150.49 86.94 236.14 26.09 5.56 31.29 39.53 54.12
Belarus 9.47 45.22 124.96 4.30 24.60 29.50 34.37 66.04
Belgium 10.98 407.96 364.66 18.21 49.43 59.09 88.62 108.59
Benin 9.10 5.41 12.99 2.11 1.81 3.76 0.87 4.68
Bolivia 10.09 12.57 45.43 18.00 -10.09 7.70 6.44 15.25
Bosnia and Herzegovina 3.75 13.04 28.55 4.62 2.36 7.10 12.24 22.81
Botswana 2.03 12.53 26.44 0.98 1.25 2.22 3.18 4.69
Brazil 196.66 1 126.72 2 021.34 249.20 28.61 270.03 480.12 408.00
Brunei Darrussalam 0.41 10.07 18.55 18.69 -14.61 3.83 3.46 8.91

49
8
TPES/ TPES/ TPES/ Elec. CO2/ CO2/ CO2/ CO2/ Region/ pop. GDP GDP (PPP) cons./pop. TPES pop. GDP GDP (PPP) Country/ (toe/capita) (toe/000 (toe/000 (kWh/ (t CO2/ (t CO2/ (kg CO2/ (kg CO2/ Economy 2005 USD) 2005 USD) capita) toe) capita) 2005 USD) 2005 USD)
(c) TPES for world includes international aviation and international marine bunkers as well as electricity and heat trade.(d) CO2 emissions for world include emissions from international aviation and international marine bunkers.
1.88 0.25 0.19 2 933 2.39 4.50 0.60 0.45 World
4.28 0.14 0.14 8 226 2.33 9.95 0.32 0.33 OECD
3.10 0.51 0.26 3 532 2.48 7.70 1.26 0.65 Middle East
3.46 0.74 0.32 4 492 2.33 8.08 1.72 0.75 Non-OECD Europe and Eurasia
2.03 0.62 0.27 3 312 2.92 5.92 1.81 0.78 China
0.69 0.47 0.18 823 2.19 1.51 1.03 0.40 Asia
1.28 0.26 0.13 2 046 1.84 2.36 0.47 0.25 Non-OECD Americas
0.67 0.55 0.25 592 1.38 0.93 0.76 0.34 Africa
0.68 0.20 0.09 1 983 1.78 1.20 0.35 0.15 Albania
1.16 0.35 0.15 1 145 2.48 2.89 0.87 0.38 Algeria
0.69 0.24 0.13 256 1.16 0.80 0.28 0.15 Angola
1.97 0.29 0.13 2 965 2.29 4.50 0.66 0.29 Argentina
0.88 0.44 0.17 1 678 1.72 1.50 0.75 0.29 Armenia
5.40 0.14 0.14 10 514 3.23 17.43 0.44 0.47 Australia
3.92 0.10 0.11 8 359 2.07 8.13 0.20 0.23 Austria
1.37 0.44 0.15 1 706 2.13 2.92 0.94 0.33 Azerbaijan
7.18 0.52 0.35 9 782 2.39 17.13 1.25 0.83 Bahrain
0.21 0.36 0.13 263 1.73 0.36 0.62 0.23 Bangladesh
3.11 0.65 0.24 3 628 2.24 6.97 1.46 0.53 Belarus
5.38 0.14 0.16 8 072 1.84 9.89 0.27 0.30 Belgium
0.41 0.70 0.29 95 1.24 0.51 0.86 0.36 Benin
0.76 0.61 0.17 638 1.98 1.51 1.21 0.34 Bolivia
1.89 0.54 0.25 3 263 3.21 6.08 1.75 0.80 Bosnia and Herzegovina
1.09 0.18 0.08 1 568 2.12 2.31 0.37 0.18 Botswana
1.37 0.24 0.13 2 441 1.51 2.07 0.36 0.20 Brazil
9.44 0.38 0.21 8 517 2.32 21.94 0.88 0.48 Brunei Darrussalam

50
ENERGY
INDICATORS
(a) Gross production + imports – exports – losses.(b) CO2 emissions from fuel combustion only. Emissions are calculated using the IEA’s energy balances and the Revised 1996 IPCC Guidelines
Bulgaria 7.48 33.55 88.16 12.37 7.14 19.22 35.74 49.22
Cambodia 14.31 9.31 29.79 3.79 1.57 5.33 2.40 4.03
Cameroon 20.03 19.86 41.72 8.19 -1.36 6.72 5.41 5.11
Canada 34.48 1 234.78 1 232.87 409.03 -158.46 251.85 565.73 529.84
Chile 17.27 157.22 263.74 9.88 24.85 33.57 61.76 76.31
People’s Rep. of China 1 344.13 4 194.94 9 970.61 2 432.50 378.62 2 727.73 4 432.90 7 954.55
Chinese Taipei 23.39 470.55 782.59 13.59 97.25 108.58 241.87 264.66
Colombia 46.93 193.77 415.77 120.50 -87.50 31.61 52.86 66.69
Congo 4.14 8.12 15.94 16.67 -14.11 1.66 0.73 2.06
Dem. Rep. of Congo 67.76 10.09 22.31 24.75 -0.14 24.50 6.73 3.27
Costa Rica 4.73 26.00 50.74 2.41 2.45 4.66 8.74 6.68
Cote d’Ivoire 20.15 17.36 31.84 11.88 -0.63 11.23 4.12 5.89
Croatia 4.41 46.27 70.31 3.79 4.68 8.44 16.70 18.77
Cuba 11.25 57.34 64.98 5.67 5.67 11.19 14.96 27.97
Cyprus* 0.80 19.27 20.97 0.10 2.65 2.37 4.77 6.93
Czech Republic 10.50 151.18 252.99 32.06 12.03 43.43 66.01 112.68
Denmark 5.57 260.14 181.61 21.01 -1.66 18.00 34.10 41.68
Dominican Republic 10.06 50.04 86.99 0.79 6.74 7.38 9.07 18.03
Ecuador 14.67 47.45 112.27 28.33 -14.38 12.94 18.18 30.93
Egypt 82.54 123.22 457.79 88.21 -9.55 77.65 138.37 188.44
El Salvador 6.23 18.61 37.56 2.24 2.10 4.32 5.19 6.03
Eritrea 5.42 1.15 2.80 0.60 0.17 0.77 0.29 0.51
Estonia 1.34 15.16 24.29 5.04 0.78 5.60 8.38 19.30
Ethiopia 84.73 21.58 82.97 32.11 2.32 34.06 4.65 5.86
Finland 5.39 209.75 172.59 17.09 19.17 34.75 84.80 55.61
France 65.12 2 249.13 1 958.74 136.07 126.40 252.83 476.50 328.31
Gabon 1.53 10.43 21.48 14.27 -11.99 2.00 1.45 2.18
Georgia 4.49 8.81 21.65 1.12 2.46 3.54 8.60 6.26
Germany 81.78 3 048.69 2 827.99 124.19 199.04 311.77 579.21 747.58
Ghana 24.97 16.94 41.25 10.11 0.61 10.55 8.53 10.82
Region/ Popu- GDP GDP Energy Net TPES Elec. CO2Country/ lation (PPP) prod. imports cons.(a) emissions(b)
Economy (million) (billion (billion (Mtoe) (Mtoe) (Mtoe) (TWh) (Mt 2005 USD) 2005 USD) of CO2)

51
8
2.57 0.57 0.22 4781 2.56 6.58 1.47 0.56 Bulgaria
0.37 0.57 0.18 168 0.76 0.28 0.43 0.14 Cambodia
0.34 0.34 0.16 270 0.76 0.26 0.26 0.12 Cameroon
7.30 0.20 0.20 16 406 2.10 15.37 0.43 0.43 Canada
1.94 0.21 0.13 3 576 2.27 4.42 0.49 0.29 Chile
2.03 0.65 0.27 3 298 2.92 5.92 1.90 0.80 People’s Rep. of China
4.64 0.23 0.14 10 340 2.44 11.31 0.56 0.34 Chinese Taipei
0.67 0.16 0.08 1 126 2.11 1.42 0.34 0.16 Colombia
0.40 0.20 0.10 175 1.24 0.50 0.25 0.13 Congo
0.36 2.43 1.10 99 0.13 0.05 0.32 0.15 Dem. Rep. of Congo
0.98 0.18 0.09 1 848 1.43 1.41 0.26 0.13 Costa Rica
0.56 0.65 0.35 204 0.52 0.29 0.34 0.19 Cote d’Ivoire
1.91 0.18 0.12 3 789 2.22 4.26 0.41 0.27 Croatia
0.99 0.20 0.17 1 329 2.50 2.49 0.49 0.43 Cuba
2.95 0.12 0.11 5 939 2.92 8.63 0.36 0.33 Cyprus*
4.14 0.29 0.17 6 288 2.59 10.73 0.75 0.45 Czech Republic
3.23 0.07 0.10 6 124 2.32 7.48 0.16 0.23 Denmark
0.73 0.15 0.08 901 2.44 1.79 0.36 0.21 Dominican Republic
0.88 0.27 0.12 1 239 2.39 2.11 0.65 0.28 Ecuador
0.94 0.63 0.17 1 677 2.43 2.28 1.53 0.41 Egypt
0.69 0.23 0.11 833 1.40 0.97 0.32 0.16 El Salvador
0.14 0.67 0.27 53 0.67 0.09 0.44 0.18 Eritrea
4.18 0.37 0.23 6 255 3.44 14.40 1.27 0.79 Estonia
0.40 1.58 0.41 55 0.17 0.07 0.27 0.07 Ethiopia
6.45 0.17 0.20 15 742 1.60 10.32 0.27 0.32 Finland
3.88 0.11 0.13 7 318 1.30 5.04 0.15 0.17 France
1.30 0.19 0.09 942 1.09 1.42 0.21 0.10 Gabon
0.79 0.40 0.16 1 917 1.77 1.39 0.71 0.29 Georgia
3.81 0.10 0.11 7 083 2.40 9.14 0.25 0.26 Germany
0.42 0.62 0.26 342 1.03 0.43 0.64 0.26 Ghana
TPES/ TPES/ TPES/ Elec. CO2/ CO2/ CO2/ CO2/ Region/ pop. GDP GDP (PPP) cons./pop. TPES pop. GDP GDP (PPP) Country/ (toe/capita) (toe/000 (toe/000 (kWh/ (t CO2/ (t CO2/ (kg CO2/ (kg CO2/ Economy 2005 USD) 2005 USD) capita) toe) capita) 2005 USD) 2005 USD)
*Please refer to geographical coverage section for more details.
52
ENERGY
INDICATORS
(a) Gross production + imports – exports – losses.(b) CO2 emissions from fuel combustion only. Emissions are calculated using the IEA’s energy balances and the Revised 1996 IPCC Guidelines.
Gibraltar 0.03 1.07 0.87 0.00 2.77 0.17 0.17 0.52
Greece 11.31 223.83 252.07 9.60 19.59 26.72 59.85 83.64
Guatemala 14.76 33.83 64.21 7.33 3.17 10.16 7.93 10.44
Haiti 10.12 4.55 10.47 2.51 0.72 3.21 0.33 2.13
Honduras 7.76 11.94 27.71 2.31 2.44 4.74 5.50 7.63
Hong Kong (China) 7.07 230.86 315.67 0.05 29.87 14.89 42.07 45.02
Hungary 9.97 111.16 172.52 10.78 13.12 24.96 38.84 47.39
Iceland 0.32 16.86 10.72 4.80 1.13 5.73 16.71 1.85
India 1 241.49 1 317.48 3 976.50 540.94 213.46 749.45 835.40 1 745.06
Indonesia 242.33 402.19 992.10 394.57 -184.80 209.01 165.71 425.88
Islamic Rep. of Iran 74.80 246.57 826.34 353.67 -138.82 212.15 199.79 520.98
Iraq 32.96 42.69 112.47 142.06 -100.76 40.22 42.65 108.26
Ireland 4.58 209.92 167.09 1.79 12.45 13.22 26.09 34.93
Israel 7.76 173.16 209.06 4.70 18.84 23.25 53.78 67.24
Italy 60.72 1 770.47 1 642.74 31.56 141.12 167.42 327.47 392.97
Jamaica 2.71 11.14 18.88 0.55 2.90 3.07 4.19 7.60
Japan 127.83 4 621.97 3 932.20 51.67 421.10 461.47 1 003.09 1 186.04
Jordan 6.18 17.48 32.56 0.28 6.86 7.06 14.15 19.80
Kazakhstan 16.56 83.04 191.54 160.15 -83.54 78.10 81.01 234.18
Kenya 41.61 24.55 62.81 16.20 4.72 20.18 6.52 11.64
Korea 49.78 1 056.12 1 370.98 46.99 227.36 260.44 505.86 587.73
DPR of Korea 24.45 28.11 101.76 25.19 -6.16 19.04 18.21 64.82
Kosovo 1.79 5.06 12.71 1.80 0.70 2.53 5.28 8.48
Kuwait 2.82 98.82 135.08 154.34 -120.50 32.52 50.38 84.74
Kyrgyzstan 5.51 3.23 11.67 1.62 1.81 3.10 9.05 6.67
Latvia 2.22 16.35 30.58 2.07 2.88 4.37 6.72 7.58
Lebanon 4.26 30.89 54.95 0.21 6.41 6.35 15.34 18.49
Libya 6.42 20.92 38.44 30.96 -17.42 13.34 23.96 34.89
Lithuania 3.20 28.95 54.06 1.53 5.94 7.29 10.69 13.22
Luxembourg 0.52 41.94 35.39 0.12 4.45 4.17 8.05 10.43
Region/ Popu- GDP GDP Energy Net TPES Elec. CO2Country/ lation (PPP) prod. imports cons.(a) emissions(b)
Economy (million) (billion (billion (Mtoe) (Mtoe) (Mtoe) (TWh) (Mt 2005 USD) 2005 USD) of CO2)

53
8
5.48 0.16 0.19 5 355 3.04 16.66 0.48 0.59 Gibraltar
2.36 0.12 0.11 5 292 3.13 7.40 0.37 0.33 Greece
0.69 0.30 0.16 537 1.03 0.71 0.31 0.16 Guatemala
0.32 0.71 0.31 32 0.66 0.21 0.47 0.20 Haiti
0.61 0.40 0.17 710 1.61 0.98 0.64 0.28 Honduras
2.11 0.06 0.05 5 949 3.02 6.37 0.20 0.14 Hong Kong (China)
2.50 0.22 0.14 3 895 1.90 4.75 0.43 0.27 Hungary
17.97 0.34 0.53 52 376 0.32 5.81 0.11 0.17 Iceland
0.60 0.57 0.19 673 2.33 1.41 1.32 0.44 India
0.86 0.52 0.21 684 2.04 1.76 1.06 0.43 Indonesia
2.84 0.86 0.26 2 671 2.46 6.97 2.11 0.63 Islamic Rep. of Iran
1.22 0.94 0.36 1 294 2.69 3.28 2.54 0.96 Iraq
2.89 0.06 0.08 5 701 2.64 7.63 0.17 0.21 Ireland
3.00 0.13 0.11 6 927 2.89 8.66 0.39 0.32 Israel
2.76 0.09 0.10 5 393 2.35 6.47 0.22 0.24 Italy
1.13 0.28 0.16 1 548 2.48 2.80 0.68 0.40 Jamaica
3.61 0.10 0.12 7 847 2.57 9.28 0.26 0.30 Japan
1.14 0.40 0.22 2 289 2.80 3.20 1.13 0.61 Jordan
4.72 0.94 0.41 4 892 3.00 14.14 2.82 1.22 Kazakhstan
0.48 0.82 0.32 157 0.58 0.28 0.47 0.19 Kenya
5.23 0.25 0.19 10 162 2.26 11.81 0.56 0.43 Korea
0.78 0.68 0.19 745 3.41 2.65 2.31 0.64 DPR of Korea
1.41 0.50 0.20 2 942 3.35 4.73 1.68 0.67 Kosovo
11.54 0.33 0.24 17 876 2.61 30.07 0.86 0.63 Kuwait
0.56 0.96 0.27 1 644 2.15 1.21 2.07 0.57 Kyrgyzstan
1.97 0.27 0.14 3 028 1.73 3.41 0.46 0.25 Latvia
1.49 0.21 0.12 3 601 2.91 4.34 0.60 0.34 Lebanon
2.08 0.64 0.35 3 731 2.62 5.43 1.67 0.91 Libya
2.28 0.25 0.13 3 337 1.81 4.13 0.46 0.24 Lithuania
8.04 0.10 0.12 15 511 2.50 20.10 0.25 0.29 Luxembourg
TPES/ TPES/ TPES/ Elec. CO2/ CO2/ CO2/ CO2/ Region/ pop. GDP GDP (PPP) cons./pop. TPES pop. GDP GDP (PPP) Country/ (toe/capita) (toe/000 (toe/000 (kWh/ (t CO2/ (t CO2/ (kg CO2/ (kg CO2/ Economy 2005 USD) 2005 USD) capita) toe) capita) 2005 USD) 2005 USD)

54
ENERGY
INDICATORS
(a) Gross production + imports – exports – losses.(b) CO2 emissions from fuel combustion only. Emissions are calculated using the IEA’s energy balances and the Revised 1996 IPCC Guidelines.
FYR of Macedonia 2.06 7.28 19.51 1.78 1.43 3.12 8.17 9.07
Malaysia 28.86 187.28 409.05 84.27 -4.05 75.91 122.12 193.96
Malta 0.42 6.79 9.64 0.05 2.16 0.86 1.95 2.47
Mexico 109.22 956.82 1 463.10 228.21 -35.96 186.17 249.67 432.30
Republic of Moldova 3.56 3.73 10.59 0.12 3.24 3.33 5.23 7.89
Mongolia 2.80 4.06 11.73 19.31 -15.21 3.61 4.34 13.04
Montenegro 0.63 2.89 6.62 0.79 0.40 1.18 3.57 2.50
Morocco 32.27 78.99 143.54 0.77 17.39 17.28 26.49 50.16
Mozambique 23.93 9.75 20.61 12.77 -2.48 10.20 10.99 2.85
Myanmar 48.34 18.37 75.02 22.39 -8.39 14.06 5.77 8.25
Namibia 2.32 9.33 13.91 0.33 1.30 1.59 3.44 3.13
Nepal 30.49 10.53 33.71 9.04 1.45 10.39 2.87 4.06
Netherlands 16.69 690.53 619.62 64.40 29.24 77.42 117.45 174.47
Netherlands Antilles* 0.23 2.71 2.43 0.00 4.88 2.50 1.10 5.15
New Zealand 4.42 119.53 110.60 16.13 3.18 18.17 41.40 30.31
Nicaragua 5.87 7.60 19.76 1.53 1.58 3.04 3.08 4.53
Nigeria 162.47 166.75 363.42 256.93 -138.22 118.32 24.45 52.85
Norway 4.95 319.64 231.47 195.35 -165.84 28.14 114.78 38.10
Oman 2.85 43.55 72.06 73.51 -49.51 25.28 19.03 63.48
Pakistan 176.75 137.99 428.41 65.07 19.82 84.84 79.14 136.28
Panama 3.57 25.61 49.16 0.82 5.50 4.06 6.84 9.36
Paraguay 6.57 10.36 31.91 7.34 -2.56 4.86 8.07 4.91
Peru 29.40 119.83 265.69 23.37 -2.05 20.58 36.95 44.68
Philippines 94.85 136.26 345.03 23.89 18.04 40.45 61.50 77.12
Poland 38.53 399.89 692.21 68.51 34.57 101.31 147.67 300.00
Portugal 10.65 194.10 228.08 5.31 19.08 23.08 51.19 48.08
Qatar 1.87 109.99 145.84 211.23 -175.70 33.29 30.11 71.38
Romania 21.39 113.93 233.27 27.57 7.63 35.83 53.17 81.78
Russian Federation 141.93 947.18 2 103.54 1 314.88 -571.81 730.97 927.21 1 653.23
Saudi Arabia 28.08 387.14 601.82 601.72 -404.10 187.07 226.57 457.30
Region/ Popu- GDP GDP Energy Net TPES Elec. CO2Country/ lation (PPP) prod. imports cons.(a) emissions(b)
Economy (million) (billion (billion (Mtoe) (Mtoe) (Mtoe) (TWh) (Mt 2005 USD) 2005 USD) of CO2)

55
8
1.51 0.43 0.16 3 956 2.91 4.40 1.25 0.47 FYR of Macedonia
2.63 0.41 0.19 4 232 2.56 6.72 1.04 0.47 Malaysia
2.05 0.13 0.09 4 659 2.88 5.90 0.36 0.26 Malta
1.70 0.19 0.13 2 286 2.32 3.96 0.45 0.30 Mexico
0.94 0.89 0.31 1 471 2.37 2.22 2.12 0.75 Republic of Moldova
1.29 0.89 0.31 1 551 3.61 4.66 3.21 1.11 Mongolia
1.87 0.41 0.18 5 644 2.12 3.95 0.86 0.38 Montenegro
0.54 0.22 0.12 821 2.90 1.55 0.64 0.35 Morocco
0.43 1.05 0.50 459 0.28 0.12 0.29 0.14 Mozambique
0.29 0.77 0.19 119 0.59 0.17 0.45 0.11 Myanmar
0.68 0.17 0.11 1 478 1.97 1.35 0.34 0.23 Namibia
0.34 0.99 0.31 94 0.39 0.13 0.39 0.12 Nepal
4.64 0.11 0.12 7 036 2.25 10.45 0.25 0.28 Netherlands
10.92 0.92 1.03 4 786 2.06 22.48 1.90 2.12 Netherlands Antilles*
4.11 0.15 0.16 9 378 1.67 6.87 0.25 0.27 New Zealand
0.52 0.40 0.15 525 1.49 0.77 0.60 0.23 Nicaragua
0.73 0.71 0.33 151 0.45 0.33 0.32 0.15 Nigeria
5.68 0.09 0.12 23 174 1.35 7.69 0.12 0.16 Norway
8.88 0.58 0.35 6 687 2.51 22.30 1.46 0.88 Oman
0.48 0.61 0.20 448 1.61 0.77 0.99 0.32 Pakistan
1.14 0.16 0.08 1 916 2.31 2.62 0.37 0.19 Panama
0.74 0.47 0.15 1 229 1.01 0.75 0.47 0.15 Paraguay
0.70 0.17 0.08 1 257 2.17 1.52 0.37 0.17 Peru
0.43 0.30 0.12 648 1.91 0.81 0.57 0.22 Philippines
2.63 0.25 0.15 3 833 2.96 7.79 0.75 0.43 Poland
2.17 0.12 0.10 4 806 2.08 4.51 0.25 0.21 Portugal
17.80 0.30 0.23 16 099 2.14 38.17 0.65 0.49 Qatar
1.68 0.31 0.15 2 486 2.28 3.82 0.72 0.35 Romania
5.15 0.77 0.35 6 533 2.26 11.65 1.75 0.79 Russian Federation
6.66 0.48 0.31 8 068 2.44 16.28 1.18 0.76 Saudi Arabia
TPES/ TPES/ TPES/ Elec. CO2/ CO2/ CO2/ CO2/ Region/ pop. GDP GDP (PPP) cons./pop. TPES pop. GDP GDP (PPP) Country/ (toe/capita) (toe/000 (toe/000 (kWh/ (t CO2/ (t CO2/ (kg CO2/ (kg CO2/ Economy 2005 USD) 2005 USD) capita) toe) capita) 2005 USD) 2005 USD)
*Please refer to geographical coverage section for more details.

56
ENERGY
INDICATORS
Senegal 12.77 10.58 22.18 1.66 2.13 3.51 2.49 5.67
Serbia 7.26 28.42 71.38 11.17 4.87 16.19 32.48 49.78
Singapore 5.18 177.26 277.80 0.93 79.00 33.45 43.57 64.77
Slovak Republic 5.44 62.11 112.99 6.42 11.29 17.35 28.87 33.86
Slovenia 2.05 39.24 51.59 3.76 3.52 7.25 13.97 15.26
South Africa 50.59 298.09 489.59 162.58 -17.31 141.37 237.47 367.60
Spain 46.13 1 183.83 1 244.51 31.78 105.16 125.57 258.48 270.32
Sri Lanka 20.87 36.00 102.86 5.33 5.38 10.42 10.23 14.98
Sudan* 44.63 40.51 91.65 34.76 -17.80 16.62 6.72 14.51
Sweden 9.45 416.51 331.89 32.50 18.84 49.04 132.57 44.90
Switzerland 7.87 436.15 311.63 12.33 14.38 25.37 62.73 39.86
Syrian Arab Republic 20.82 35.88 95.00 23.61 -2.99 19.99 37.68 53.20
Tajikistan 6.98 3.42 14.32 1.54 0.89 2.40 13.39 2.99
United Rep. of Tanzania 46.22 20.99 59.90 19.26 1.64 20.75 4.27 6.26
Thailand 69.52 210.25 530.78 68.74 54.22 119.15 154.19 243.19
Togo 6.16 2.60 5.70 2.28 0.56 2.76 0.72 1.25
Trinidad and Tobago 1.35 18.18 29.81 42.16 -21.07 20.92 8.44 40.78
Tunisia 10.67 39.50 88.14 7.53 2.23 9.50 13.85 21.13
Turkey 73.95 614.68 994.25 32.06 80.16 112.46 197.94 285.73
Turkmenistan 5.11 15.22 42.47 65.24 -40.04 24.71 12.48 61.55
Ukraine 45.71 95.29 290.93 85.48 47.75 126.44 167.40 285.36
United Arab Emira 7.89 221.56 333.73 190.12 -107.12 66.11 83.79 165.89
United Kingdom 62.74 2386.63 2063.34 129.54 72.52 188.07 346.16 443.01
United States 312.04 13 225.90 13 225.90 1 784.77 457.62 2 191.19 4 127.31 5 287.18
Uruguay 3.37 24.33 44.85 1.87 2.86 4.43 9.51 7.57
Uzbekistan 29.34 23.28 85.18 57.27 -9.51 47.75 47.71 110.22
Venezuela 29.28 181.84 329.61 200.76 -129.50 70.20 97.73 159.22
Vietnam 87.84 78.64 264.63 66.60 -6.77 61.21 94.28 137.36
Yemen 24.80 18.59 51.24 18.93 -11.50 7.26 4.51 20.71
Zambia 13.48 10.43 19.28 7.77 0.77 8.46 8.17 2.10
Zimbabwe 12.75 5.60 3.79 8.61 0.71 9.31 10.12 9.46 (a) Gross production + imports – exports – losses.(b) CO2 emissions from fuel combustion only. Emissions are calculated using the IEA’s energy balances and the Revised 1996 IPCC Guidelines.
Region/ Popu- GDP GDP Energy Net TPES Elec. CO2Country/ lation (PPP) prod. imports cons.(a) emissions(b)
Economy (million) (billion (billion (Mtoe) (Mtoe) (Mtoe) (TWh) (Mt 2005 USD) 2005 USD) of CO2)

57
8
0.28 0.33 0.16 195 1.61 0.44 0.54 0.26 Senegal
2.23 0.57 0.23 4 473 3.08 6.86 1.75 0.70 Serbia
6.45 0.19 0.12 8 404 1.94 12.49 0.37 0.23 Singapore
3.19 0.28 0.15 5 306 1.95 6.22 0.55 0.30 Slovak Republic
3.53 0.18 0.14 6 806 2.11 7.43 0.39 0.30 Slovenia
2.79 0.47 0.29 4 694 2.60 7.27 1.23 0.75 South Africa
2.72 0.11 0.10 5 604 2.15 5.86 0.23 0.22 Spain
0.50 0.29 0.10 490 1.44 0.72 0.42 0.15 Sri Lanka
0.37 0.41 0.18 150 0.87 0.33 0.36 0.16 Sudan*
5.19 0.12 0.15 14 029 0.92 4.75 0.11 0.14 Sweden
3.22 0.06 0.08 7 972 1.57 5.06 0.09 0.13 Switzerland
0.96 0.56 0.21 1 810 2.66 2.56 1.48 0.56 Syrian Arab Republic
0.34 0.70 0.17 1 920 1.25 0.43 0.87 0.21 Tajikistan
0.45 0.99 0.35 92 0.30 0.14 0.30 0.10 United Rep. of Tanzania
1.71 0.57 0.22 2 218 2.04 3.50 1.16 0.46 Thailand
0.45 1.06 0.48 117 0.45 0.20 0.48 0.22 Togo
15.54 1.15 0.70 6 271 1.95 30.29 2.24 1.37 Trinidad and Tobago
0.89 0.24 0.11 1 297 2.22 1.98 0.53 0.24 Tunisia
1.52 0.18 0.11 2 677 2.54 3.86 0.46 0.29 Turkey
4.84 1.62 0.58 2 445 2.49 12.06 4.04 1.45 Turkmenistan
2.77 1.33 0.43 3 662 2.26 6.24 2.99 0.98 Ukraine
8.38 0.30 0.20 10 619 2.51 21.02 0.75 0.50 United Arab Emirates
3.00 0.08 0.09 5 518 2.36 7.06 0.19 0.21 United Kingdom
7.02 0.17 0.17 13 227 2.41 16.94 0.40 0.40 United States
1.31 0.18 0.10 2 822 1.71 2.25 0.31 0.17 Uruguay
1.63 2.05 0.56 1 626 2.31 3.76 4.74 1.29 Uzbekistan
2.40 0.39 0.21 3 338 2.27 5.44 0.88 0.48 Venezuela
0.70 0.78 0.23 1 073 2.24 1.56 1.75 0.52 Vietnam
0.29 0.39 0.14 182 2.85 0.83 1.11 0.40 Yemen
0.63 0.81 0.44 606 0.25 0.16 0.20 0.11 Zambia
0.73 1.66 2.46 793 1.02 0.74 1.69 2.50 Zimbabwe
Sources: Energy data: IEA. Population: OECD/World Bank. GDP and GDP(PPP) (in 2005 USD): OECD/World Bank/CEPII (Paris).*Please refer to geographical coverage section for more details.
TPES/ TPES/ TPES/ Elec. CO2/ CO2/ CO2/ CO2/ Region/ pop. GDP GDP (PPP) cons./pop. TPES pop. GDP GDP (PPP) Country/ (toe/capita) (toe/000 (toe/000 (kWh/ (t CO2/ (t CO2/ (kg CO2/ (kg CO2/ Economy 2005 USD) 2005 USD) capita) toe) capita) 2005 USD) 2005 USD)

CONVERSION FACTORS
58
General conversion factors for energy
Conversion factors for mass
Conversion factors for volume
To: kg t lt st lb
From: multiply by:
kilogramme(kg) 1 0.001 9.84×10⁻⁴ 1.102×10⁻³ 2.2046
tonne(t) 1000 1 0.984 1.1023 2204.6
longton(lt) 1016 1.016 1 1.120 2240.0
shortton(st) 907.2 0.9072 0.893 1 2000.0
pound(lb) 0.454 4.54×10⁻⁴ 4.46×10⁻⁴ 5.0×10⁻⁴ 1
To: TJ Gcal Mtoe MBtu GWh
From: multiply by:
TJ 1 238.8 2.388×10⁻⁵ 947.8 0.2778
Gcal 4.1868×10⁻³ 1 10–7 3.968 1.163×10⁻³
Mtoe 4.1868×10⁴ 107 1 3.968×10⁷ 11630
MBtu 1.0551×10⁻³ 0.252 2.52×10⁻⁸ 1 2.931×10⁻⁴
GWh 3.6 860 8.6×10⁻⁵ 3412 1
To: galU.S. galU.K. bbl ft3 l m3
From: multiply by:
U.S.gallon(gal) 1 0.8327 0.02381 0.1337 3.785 0.0038
U.K.gallon(gal) 1.201 1 0.02859 0.1605 4.546 0.0045
barrel(bbl) 42.0 34.97 1 5.615 159.0 0.159
cubicfoot(ft3) 7.48 6.229 0.1781 1 28.3 0.0283
litre(l) 0.2642 0.220 0.0063 0.0353 1 0.001
cubicmetre(m3) 264.2 220.0 6.289 35.3147 1000.0 1

9
59
Selected country-specific net calorific values
**crude oil for the top-ten producers in 2012.
*Defaults for OECD Europe were also applied to non-OECD Europe and Eurasia countries.
*steam coal for the top-ten producers in 2012.
Crudeoil**
Oilproducts
SteamCoal*
toe/tonne
RussianFederation 1.005 SaudiArabia 1.016UnitedStates 1.033 People’sRep.ofChina 1.000 IslamicRep.ofIran 1.019Venezuela 1.069 Iraq 1.023Kuwait 1.016 Mexico 1.114 UnitedArabEmirates 1.018
toe/tonne
People’sRep.ofChina 0.597UnitedStates 0.537 India 0.443 Indonesia 0.565 SouthAfrica 0.566 RussianFederation 0.602Australia 0.582 Kazakhstan 0.446Colombia 0.653 Poland 0.543
Default net calorific values
OECD OECD OECDNon-OECD Europe* Americas AsiaOceania
toe/tonne
Refinerygas 1.182 1.149 1.149 1.149Ethane 1.182 1.180 1.180 1.180Liquefiedpetroleumgases 1.099 1.130 1.139 1.130Motorgasoline 1.051 1.070 1.065 1.070Aviationgasoline 1.051 1.070 1.065 1.070Gasolinetypejetfuel 1.027 1.070 1.065 1.070Kerosenetypejetfuel 1.027 1.065 1.063 1.065Kerosene 1.027 1.046 1.025 1.046Gas/dieseloil 1.017 1.017 1.017 1.034Fueloil 0.955 0.960 1.017 0.960Naphtha 1.051 1.075 1.032 1.075Whitespirit 1.041 1.027 1.027 1.027Lubricants 1.003 1.003 1.025 1.003Bitumen 0.931 0.955 0.927 0.931Paraffinwaxes 0.955 0.955 0.955 0.955Petroleumcoke 0.764 0.764 0.807 0.764Non-specifiedoilproducts 0.955 0.955 0.955 0.955

CONVERSION FACTORS
60
*for the top-ten producers in 2012.Note: to calculate the net calorific value, the gross calorific value is multiplied by 0.9.
Natural gas*
Figures for electricity production, trade, and final consumption are calculated using the energy content of the electricity (i.e. at a rate of 1 TWh = 0.086 Mtoe). Hydro-electricity production (excluding pumped storage) and electricity produced by other non-thermal means (wind, tide/wave/ocean, photovoltaic, etc.) are accounted for similarly using 1 TWh = 0.086 Mtoe. However, the primary energy equivalent of nuclear electricity is calculated from the gross generation by assuming a 33% conversion efficiency, i.e. 1 TWh = (0.086 ÷ 0.33) Mtoe. For geothermal and solar thermal, if no country-specific information is reported, the primary energy equivalent is calculated as follows:n 10% for geothermal electricity;n 50% for geothermal heat;n 33% for solar thermal electricity;n 100% for solar thermal heat.
kJ/m3
United States 38 080
Russian Federation 38 232
Qatar 41 400
Islamic Rep. of Iran 39 356
Canada 38 560
Norway 39 600
People’s Rep. of China 38 931
Saudi Arabia 38 000
Netherlands 33 339
Indonesia 40 600
Conventions for electricity
Selected country-specific gross calorific values

1061
�Coal/peat� �Coal/peat� includes�all�coal,�both�primary� (including�hard�coal�and� lignite)� and� derived� fuels� (including� patent� fuel,� coke�oven�coke,�gas�coke,�BKB,�gas�works�gas,�coke�oven�gas,�blast�furnace�gas�and�other�recovered�gases).�Peat� is�also� included�in�this�category.
Hard coal� �Hard�coal�comprises�anthracite,�coking�coal�and�other�bituminous�coal.
Steam coal� �Steam�coal�comprises�anthracite,�other�bituminous�coal�and�sub-bituminous�coal.
Crude oil� �Crude� oil� comprises� crude� oil,� natural� gas� liquids,� refinery�feedstocks�and�additives�as�well�as�other�hydrocarbons.
Oil products� �Oil� products� comprises� refinery� gas,� ethane,� LPG,� aviation�gasoline,�motor�gasoline,�jet�fuels,�kerosene,�gas/diesel�oil,�fuel�oil,�naphtha,�white�spirit,� lubricants,�bitumen,�paraffin�waxes,�petroleum�coke�and�other�oil�products.
Natural gas� �Natural�gas�includes�both�“associated”�and�“non-associated”�gas.
Nuclear� �Nuclear� shows� the� primary� heat� equivalent� of� the� electricity�produced�by�a�nuclear�power�plant�with�an�average� thermal�efficiency�of�33%.
Hydro� �Hydro� shows� the� energy� content� of� the� electricity� produced�in� hydro� power� plants.� Hydro� output� excludes� output� from�pumped�storage�plants.
� �Biofuels� and� waste� comprises� solid� biofuels,� liquid� biofuels,�biogases,� industrial� waste� and� municipal� waste.� Biofuels� are��defined�as�any�plant�matter�used�directly�as�fuel�or�converted�into� fuels� (e.g.� charcoal)� or� electricity� and/or� heat.� Included�here� are� wood,� vegetal� waste� (including� wood� waste� and�crops�used�for�energy�production),�ethanol,�animal�materials/wastes� and� sulphite� lyes.� Municipal� waste� comprises� wastes�produced� by� residential,� commercial� and� public� services,�that�are�collected�by� local�authorities� for�disposal� in�a�central�location�for�the�production�of�heat�and/or�power.�
Other� �Other�includes�geothermal,�solar,�wind,�tide/wave/ocean�energy,�electricity� and� heat.� Unless� the� actual� efficiency� of� geothermal�and�solar�thermal�is�known,�the�quantity�of�geothermal�and�solar�energy�entering�electricity�generation�is�inferred�from�the�electricity/heat� production� at� geothermal� and� solar� plants� assuming� an�average�thermal�efficiency�of:
� n 10%�for�geothermal�electricity;� n 50%�for�geothermal�heat;� n 33%�for�solar�thermal�electricity;� n 100%�for�solar�thermal�heat.
� �For� solar� PV,� wind� and� tide/wave/ocean� energy,� the�quantities� entering� electricity� generation� are� equal� to� the�electrical� energy� generated.� Direct� use� of� geothermal� and�
G L O S S A R Y
Biofuels and waste

GLOSSARY
62
solar� heat� is� also� included� here.� Electricity� is� accounted� for�at� the� same� heat� value� as� electricity� in� final� consumption��(i.e.�1�GWh�=�0.000086�Mtoe).�Heat�includes�heat�that�is�produced�for�sale�and�is�accounted�for�in�the�transformation�sector.�
Production� Production� is� the� production� of� primary� energy,� i.e.� hard�coal,� lignite,� peat,� crude� oil,� NGLs,� natural� gas,� biofuels� and�waste,� nuclear,� hydro,� geothermal,� solar� and� the� heat� from�heat�pumps� that� is� extracted� from� the�ambient� environment.�Production� is� calculated� after� removal� of� impurities� (e.g.�sulphur�from�natural gas).�
� �Imports� and� exports� comprise� amounts� having� crossed� the�national� territorial�boundaries�of� the�country,�whether�or�not�customs�clearance�has�taken�place.
� a) Oil and natural gas � �Quantities� of� crude� oil� and� oil� products� imported� or� exported�
under� processing� agreements� (i.e.� refining� on� account)� are�included.�Quantities�of�oil�in�transit�are�excluded.�Crude�oil,�NGL�and� natural� gas� are� reported� as� coming� from� the� country� of�origin;�refinery�feedstocks�and�oil�products�are�reported�as�coming�from�the�country�of�last�consignment.�Re-exports�of�oil�imported�for� processing� within� bonded� areas� are� shown� as� exports� of�product�from�the�processing�country�to�the�final�destination.
� b) Coal/peat� �Imports� and� exports� comprise� the� amount� of� fuels� obtained�
from�or�supplied�to�other�countries,�whether�or�not�there�is�an�economic� or� customs� union� between� the� relevant� countries.�Coal�in�transit�is�not�included.
� c) Electricity� �Amounts� are� considered�as� imported�or� exported�when� they�
have�crossed�the�national�territorial�boundaries�of�the�country.
� �International�marine�bunkers�covers�those�quantities�delivered�to�ships�of�all�flags�that�are�engaged�in�international�navigation.�The�international�navigation�may�take�place�at�sea,�on�inland�lakes�and�waterways,�and�in�coastal�waters.�Consumption�by�ships�engaged�in�domestic�navigation�is�excluded.�The�domestic/international�split�is�determined�on�the�basis�of�port�of�departure�and�port�of�arrival,�and� not� by� the� flag� or� nationality� of� the� ship.� Consumption� by�fishing�vessels�and�by�military�forces�is�also�excluded.
� �International�aviation�bunkers�covers�deliveries�of�aviation�fuels�to�aircraft� for� international� aviation.� Fuels� used� by� airlines� for� their�road�vehicles�are�excluded.�The�domestic/international�split�should�be� determined� on� the� basis� of� departure� and� landing� locations�and�not�by�the�nationality�of�the�airline.�For�many�countries�this�incorrectly� excludes� fuel�used�by�domestically�owned�carriers� for�their�international�departures.
Internationalaviation bunkers
Imports and exports
Internationalmarine bunkers
Other (ctd.)

1063
Stock changes� �Stock� changes� reflects� the� difference� between� opening� stock�levels�on�the�first�day�of�the�year�and�closing�levels�on�the�last�day�of�the�year�of�stocks�on�national�territory�held�by�producers,�importers,�energy�transformation�industries�and�large�consumers.�A�stock�build�is�shown�as�a�negative�number,�and�a�stock�draw�as�a�positive�number.
� �Total�primary�energy� supply� (TPES)� is�made�up�of�production�+� imports� –� exports� –� international� marine� bunkers� –�international�aviation�bunkers�±�stock�changes.�For�the�world�total,� international� marine� bunkers� and� international� aviation�bunkers�are�not�subtracted�from�TPES.
Transfers� �Transfers�includes�both�interproduct�transfers,�products�transferred�and�recycled�products.�
� �Statistical� differences� includes� the� sum� of� the� unexplained�statistical�differences�for�individual�fuels,�as�they�appear�in�the�basic�energy�statistics.� It�also� includes� the�statistical�differences�that�arise�because�of�the�variety�of�conversion�factors�in�the�coal/peat�and�oil�columns.
� �Electricity�plants� refers� to�plants�which�are�designed� to�produce�electricity�only.�If�one�or�more�units�of�the�plant�is�a�CHP�unit�(and�the�inputs�and�outputs�can�not�be�distinguished�on�a�unit�basis)�then� the� whole� plant� is� designated� as� a� CHP� plant.� Both� main�activity�producers�and�autoproducer�plants�are�included�here.
� �Combined� heat� and� power� plants� refers� to� plan����ts� which� are�designed� to� produce� both� heat� and� electricity,� sometimes�referred�as�co-generation�power�stations.�If�possible,�fuel�inputs�and� electricity/heat� outputs� are� on� a� unit� basis� rather� than�on�a�plant�basis.�However,� if�data�are�not�available�on�a�unit�basis,�the�convention�for�defining�a�CHP�plant�noted�above�is�adopted.�Both�main�activity�producers�and�autoproducer�plants�are�included�here.�
Heat plants� �Heat�plants�refers�to�plants�(including�heat�pumps�and�electric�boilers)�designed�to�produce�heat�only,�which�is�sold�to�a�third�party� under� the� provisions� of� a� contract.� Both� main� activity�producers�and�autoproducer�plants�are�included�here.
Blast furnaces� �Blast�furnaces�contains�inputs�to�and�outputs�of�fuels�from�blast�furnaces.
Gas works� �Gas�works� is� treated�similarly� to�electricity�generation,�with� the�quantity�produced�appearing�as�a�positive�figure�in�the�coal/peat�column� or� the� natural� gas� column� after� blending� with� natural�gas,�inputs�as�negative�entries�in�the�coal/peat�and�oil�products�columns,�and�conversion�losses�appearing�in�the�total�column.
Combined heat and power plants
Total primaryenergy supply(TPES)
Electricityplants
Statisticaldifferences

GLOSSARY
64
� �Coke�ovens�contains�losses�in�transformation�of�coal�from�primary�to�secondary�fuels�and�from�secondary�to�tertiary�fuels�(hard�coal�to�coke�and�patent�fuel,�lignite�to�BKB,�etc.).�
Oil refineries� �Oil�refineries�shows�the�use�of�primary�energy�for�the�manufacture�of�finished�oil�products�and�the�corresponding�output.�Thus,�the�total� reflects� transformation� losses.� In� certain� cases� the� data� in�the�total�column�are�positive�numbers.�This�can�be�due�to�either�problems�in�the�primary�refinery�balance�or�to�the�fact�that�the�IEA�uses�regional�net�calorific�values�for�oil�products.�
� �Petrochemical� plants� covers� backflows� returned� from� the�petrochemical� industry.�Note� that�backflows� from�oil�products�that� are� used� for� non-energy� purposes� (i.e.� white� spirit� and�lubricants)�are�not�included�here,�but�in�non-energy�use.�
Liquefaction plants� �Liquefaction�plants�includes�diverse�liquefaction�processes,�such�as�coal�liquefaction�plants�and�gas-to-liquid�plants.
� �Other� transformation� covers� non-specified� transformation� not�shown�elsewhere,� such�as� the� transformation�of�primary� solid�biofuels�into�charcoal.
� �Energy� industry� own� use� contains� the� primary� and� secondary�energy� consumed� by� transformation� industries� for� heating,�pumping,�traction�and�lighting�purposes�[ISIC�05,�06,�19�and�35,�Group�091�and�Classes�0892�and�0721].
Losses� �Losses� includes� losses� in� energy� distribution,� transmission� and�transport.�
� �Total�final�consumption�(TFC)� is�the�sum�of�consumption�by�the�different� end-use� sectors.� Backflows� from� the� petrochemical�industry�are�not�included�in�final�consumption.
Industry� �Industry� consumption� is� specified� in� the� following� subsectors�(energy�used�for�transport�by�industry�is�not�included�here�but�reported�under�transport):�
� n Iron�and�steel�industry�[ISIC�Group�241�and�Class�2431];�� n ��Chemical� and� petrochemical� industry� [ISIC� Divisions� 20
and�21]�excluding�petrochemical�feedstocks;� n �Non-ferrou��s� metals� basic� industries� [ISIC� Group� 242� and�
Class 2432];�� n �Non-metallic� minerals� such� as� glass,� ceramic,� cement,� etc.�
[ISIC�Division�23];� n Transport�equipment�[ISIC�Divisions�29�and�30];� n �Machinery�comprises� fabricated�metal�products,�machinery�
and� equipment� other� than� transport� equipment� [ISIC�Divisions�25�to�28];
Petrochemical plants
Other transformation
Total final consumption (TFC)
Energy industry own use
Coke ovens

1065
� n �Mining� (excluding� fuels)� and� quarrying� [ISIC� Divisions� 07�and�08�and�Group�099];�
� n Food�and�tobacco�[ISIC�Divisions�10�to�12];� n Paper,�pulp�and�printing�[ISIC�Divisions�17�and�18];� n �Wood� and� wood� products� (other� than� pulp� and� paper)�
[ISIC�Division�16];� n Construction�[ISIC�Divisions�41�to�43];�� n Textile�and�leather�[ISIC�Divisions�13�to�15];� n �Non-specified� (any� manufacturing� industry� not� included�
above)�[ISIC�Divisions�22,�31�and�32].
Transport� �Transport� includes�all� fuels�used� for� transport� [ISIC�Divisions�49�to 51].� It� includes� transport� in� industry� and� covers� domestic�aviation,� road,� rail,� pipeline� transport,� domestic� navigation�and� non-specified� transport.� Fuel� used� for� ocean,� coastal� and�inland�fishing�(included�under�fishing)�and�military�consumption�(included� in� other� non-specified)� are� excluded� from� transport.�Please�note� that� international�marine�and� international�aviation�bunkers�are�also�included�here�for�world�total.�
Other� �Other� covers� residential,� commercial� and� public� services� [ISIC�Divisions�33,�36-39,�45-47,�52,�53,�55,�56,�58-66,�68-75,�77-82,�84� (excluding� Class� 8422),� 85-88,� 90-99],� agriculture/forestry�[ISIC�Divisions� 01� and�02],� fishing� [ISIC�Division�03]� and�non-specified�consumption.�
� �Non-energy� use� covers� those� fuels� that� are� used� as� raw�materials�in�the�different�sectors�and�are�not�consumed�as�a�fuel�or�transformed�into�another�fuel.�Non-energy�use�also�includes�petrochemical�feedstocks.�Non-energy�use� is�shown�separately�in�final�consumption�under�the�heading�non-energy�use.��
Non-energy use
Industry (ctd.)
Unit abbreviations
bcm billion�cubic�metres MBtu million�British�thermal�units
Gcal gigacalorie Mt million�tonnes
GCV gross�calorific�value� Mtoe million�tonnes�of�oil�equivalent
GW gigawatt MWh megawatt�hour
GWh gigawatt�hour PPP purchasing�power�parity
kb/cd thousand�barrels�per�calendar�day t metric�ton�=�tonne�=�1�000�kg
kcal kilocalorie TJ terajoule
kg kilogramme toe tonne�of�oil�equivalent�=�107�kcal
kJ kilojoule TWh terawatt�hour
kWh kilowatt�hour USD United�States�dollar

GLOSSARY
66
GEOGRAPHICALCOVERAGE
OECD1 Australia, Austria, Belgium, Canada, Chile, the Czech Republic,Denmark, Estonia, Finland, France, Germany, Greece, Hungary,Iceland, Ireland, Israel, Italy, Japan, Korea, Luxembourg, Mexico,the Netherlands, New Zealand, Norway, Poland, Portugal,theSlovak Republic,Slovenia,Spain,Sweden,Switzerland,Turkey,theUnitedKingdomandtheUnitedStates.
MiddleEast Bahrain, Islamic Republic of Iran, Iraq, Jordan, Kuwait, Lebanon,Oman, Qatar, Saudi Arabia, Syrian Arab Republic, United ArabEmiratesandYemen.
Albania, Armenia, Azerbaijan, Belarus, Bosnia and Herzegovina,Bulgaria,Croatia,Cyprus2,Georgia,Gibraltar,Kazakhstan,Kosovo3,Kyrgyzstan, Latvia, Lithuania, the Former Yugoslav Republic ofMacedonia, Malta, Republic of Moldova, Montenegro3, Romania,Russian Federation, Serbia3, Tajikistan, Turkmenistan, Ukraine andUzbekistan.
China People’sRepublicofChinaandHongKong(China).Asia Bangladesh, Brunei Darussalam, Cambodia, Chinese Taipei, India,
Indonesia, Democratic People’s Republic of Korea, Malaysia,Mongolia, Myanmar, Nepal, Pakistan, Philippines, Singapore,Sri Lanka,Thailand,VietnamandOtherAsia.
Argentina, Bolivia, Brazil, Colombia, Costa Rica, Cuba, DominicanRepublic,Ecuador,ElSalvador,Guatemala,Haiti,Honduras,Jamaica,NetherlandsAntilles4,Nicaragua,Panama,Paraguay,Peru,TrinidadandTobago,Uruguay,VenezuelaandOtherNon-OECDAmericas.
Africa Algeria, Angola, Benin, Botswana, Cameroon, Congo, DemocraticRepublic of Congo, Côte d’Ivoire, Egypt, Eritrea, Ethiopia, Gabon,Ghana, Kenya, Libya, Morocco, Mozambique, Namibia, Nigeria,Senegal, South Africa, Sudan5, United Republic of Tanzania, Togo,Tunisia,Zambia,ZimbabweandOtherAfrica.
1. OECD includes Estonia and Slovenia starting in 1990. Prior to 1990, data for these two countries are included in Non-OECD Europe and Eurasia.2. NotebyTurkey:The information in this document with reference to “Cyprus” relates to the southern part of the Island. There is no single authority representing both Turkish and Greek Cypriot people on the Island. Turkey recognises the Turkish Republic of Northern Cyprus (TRNC). Until a lasting and equitable solution is found within the context of the United Nations, Turkey shall preserve its position concerning the “Cyprus issue”. NotebyalltheEuropeanUnionMemberStatesoftheOECDandtheEuropeanUnion:The Republic of Cyprus is recognised by all members of the United Nations with the exception of Turkey. The information in this document relates to the area under the effective control of the Government of the Republic of Cyprus.3. Serbia includes Kosovo from 1990 to 1999 and Montenegro from 1990 to 2004.4. The Netherlands Antilles was dissolved on 10 October 2010, resulting in two new constituent countries, Curaçao and Saint Maarten, with the other islands joining the Netherlands. However, due to a lack of detailed data, the IEA secretariat’s data and estimates under the Netherlands Antilles cover the whole territory of the former Netherlands Antilles.5. South Sudan became an independent state on 9 July 2011. However, due to a lack of detailed data, the Secretariat’s data and estimates under Sudan cover the whole territory of Sudan as it was on 1 January 2011.Note: The countries listed above are those for which the IEA secretariat has direct statistics contacts. This document is without prejudice to the status of or sovereignty over any territory, to the delimitation of international frontiers and boundaries and to the name of any territory, city or area. In this publication “country” refers to country or territory, as the case may be.
Non-OECDEuropeandEurasia
Non-OECDAmericas

67
Ten Annual Publications
Energy Statistics of OECD Countries, 2013 Edition
No other publication offers such in-depth statistical coverage. It is intended for anyone involved in analytical or policy work related to energy issues. It contains data on energy supply and consumption in original units for coal, oil, natural gas, biofuels/waste and products derived from these primary fuels, as well as for electricity and heat. Complete data are available for 2010 and 2011 and supply estimates are available for the most recent year (i.e. 2012). Historical tables summarise data on production, trade and final consumption. Each issue includes definitions of products and flows and explanatory notes on the individual country data.
Published July 2013 - Price e120
Energy Balances of OECD Countries, 2013 Edition
A companion volume to Energy Statistics of OECD Countries, this publication presents standardised energy balances expressed in million tonnes of oil equivalent. Energy supply and consumption data are divided by main fuel: coal, oil, natural gas, nuclear, hydro, geothermal/solar, biofuels/waste, electricity and heat. This allows for easy comparison of the contributions each fuel makes to the economy and their interrelationships through the conversion of one fuel to another. All of this is essential for estimating total energy supply, forecasting, energy conservation, and analysing the potential for interfuel substitution. Complete data are available for 2010 and 2011 and supply estimates are available for the most recent year (i.e. 2012). Historical tables summarise key energy and economic indicators as well as data on production, trade and final consumption. Each issue includes definitions of products and flows and explanatory notes on the individual country data as well as conversion factors from original units to tonnes of oil equivalent.
Published July 2013 - Price e120
S T A T I S T I C S P U B L I C A T I O N S

68
Energy Statistics of Non-OECD Countries, 2013 Edition
This publication offers the same in-depth statistical coverage as the homonymous publication covering OECD countries. It includes data in original units for more than 100 individual countries and nine main regions. The consistency of OECD and non-OECD countries’ detailed statistics provides an accurate picture of the global energy situation for 2010 and 2011. For a description of the content, please see Energy Statistics of OECD Countries above.
Published August 2013 - Price e120
Energy Balances of Non-OECD Countries, 2013 Edition
A companion volume to the publication Energy Statistics of Non-OECD Countries, this publication presents energy balances in thousand tonnes of oil equivalent and key economic and energy indicators for more than 100 individual countries and nine main regions. It offers the same statistical coverage as the homony-mous publication covering OECD countries, and thus provides an accurate picture of the global energy situation for 2010 and 2011. For a description of the content, please see Energy Balances of OECD Countries above.
Published August 2013 - Price e120
Electricity Information 2013
This reference document provides essential statistics on electricity and heat for each OECD member country by bringing together information on production, installed capacity, input energy mix to electricity and heat production, input fuel prices, consumption, end-user electricity prices and electricity trades.
Published August 2013 - Price e150

69
Coal Information 2013
This well-established publication provides detailed information on past and current evolution of the world coal market. It presents country-specific statistics for OECD member countries and selected non-OECD countries on coal production, demand, trade and prices. This publication represents a key reference tool for all those involved in the coal supply or consumption stream, as well as institutions and governments involved in market and policy analysis of the world coal market.
Published August 2013 - Price e165
Natural Gas Information 2013
A detailed reference work on gas supply and demand, covering not only the OECD countries but also the rest of the world. Contains essential information on LNG and pipeline trade, gas reserves, storage capacity and prices. The main part of the book, however, concentrates on OECD countries, showing a detailed gas supply and demand balance for each individual country and for the three OECD regions, as well as a breakdown of gas consumption by end-user. Import and export data are reported by source and destination.
Published August 2013 - Price e165
Oil Information 2013
A comprehensive reference book on current developments in oil supply and demand. The first part of this publication contains key data on world production, trade, prices and consumption of major oil product groups, with time series back to the early 1970s. The second part gives a more detailed and comprehensive picture of oil supply, demand, trade, production and consumption by end-user for each OECD country individually and for the OECD regions. Trade data are reported extensively by origin and destination.
Published August 2013 - Price e165

70
Renewables Information 2013
This reference document brings together in one volume essential statistics on renewables and waste energy sources. It presents a detailed and comprehensive picture of developments for renewable and waste energy sources for each of the OECD member countries, encompassing energy indicators, generating capacity, electricity and heat production from renewable and waste sources, as well as production and consumption of renewable and waste products.
Published August 2013 - Price e110
CO2 Emissions from Fuel Combustion, 2013 Edition
In order for nations to tackle the problem of climate change, they need accurate greenhouse gas emissions data. This publication provides a basis for comparative analysis of CO2 emissions from fossil fuel combustion, a major source of anthropogenic emissions. The data in this book are designed to assist in understanding the evolution of the emissions of CO2 from 1971 to 2011 for more than 140 countries and regions by sector and by fuel. Emissions were calculated using IEA energy databases and the default methods and emissions factors from the Revised 1996 IPCC Guidelines for National Greenhouse Gas Inventories.
Published November 2013 - Price e165

71
Two Quarterlies
Oil, Gas, Coal and Electricity, Quarterly Statistics
This publication provides up-to-date, detailed quarterly statistics on oil, coal, natural gas and electricity for the OECD countries. Oil statistics cover production, trade, refinery intake and output, stock changes and consumption for crude oil, NGL and nine selected oil product groups. Statistics for electricity, natural gas and coal show supply and trade. Import and export data are reported by origin and destination. Moreover, oil as well as hard coal and brown coal production are reported on a worldwide basis.
Published Quarterly - Price e120, annual subscription e380
Energy Prices and Taxes
This publication responds to the needs of the energy industry and OECD governments for up-to-date information on prices and taxes in national and international energy markets. It contains crude oil import prices by crude stream, industry prices and consumer prices. The end-user prices for OECD member countries cover main petroleum products, gas, coal and electricity. Every issue includes full notes on sources and methods and a description of price mechanisms in each country. Time series availability varies with each data series.
Published Quarterly - Price e120, annual subscription e380

72
Electronic Editions
CD-ROMs and Online Data Services
To complement its publications, the Energy Data Centre produces CD-ROMs containing the complete databases which are used for preparing the statistics publications. State-of-the-art software allows you to access and manipulate all these data in a very user-friendly manner and includes graphic facilities. These databases are also available on the internet from our online data service.
n Annual CD-ROMS / Online Databases
• Energy Statistics of OECD Countries, 1960-2012 Price: e550• Energy Balances of OECD Countries, 1960-2012 Price: e550• Energy Statistics of Non-OECD Countries, 1971-2011 Price: e550• Energy Balances of Non-OECD Countries, 1971-2011 Price: e550• Combined subscription of the above four series Price: e1 400
• Electricity Information 2013 Price: e550• Coal Information 2013 Price: e550• Natural Gas Information 2013 Price: e550• Oil Information 2013 Price: e550• Renewables Information 2013 Price: e400• CO2 Emissions from Fuel Combustion, 1971-2011 Price: e550
n Quarterly CD-ROMs / Online Databases
• Energy Prices and Taxes Price: (four quarters) e900
A description of these services is available on our website: http://data.iea.org
All the annual and quarterly online databases are also accessible over the internet on a pay-per-view basis. The databases can be accessed either for a single data point or for time series.

73
Other Online Services
The Monthly Oil Data Service
The IEA Monthly Oil Data Service provides the detailed databases of historical and projected information which is used in preparing the IEA monthly Oil Market Report (OMR). The IEA Monthly Oil Data Service comprises three packages available separately or combined as a subscriber service on the Internet. The data are available at the same time as the official release of the Oil Market Report.
The packages include:• Supply, Demand, Balances and Stocks Price: e6 000• Trade Price: e2 000• Field-by-Field Supply Price: e3 000• Complete Service Price: e9 000
A description of this service is available on our website: www.iea.org/stats/mods.asp.
The Monthly Gas Data Service
The Monthly Gas Data Service provides monthly natural gas data for OECD countries:
• supply balances in terajoules and cubic metres;• production, trade, stock changes and levels where
available, gross inland deliveries, own use and losses;• highly detailed trade data with about 50 imports origins
and exports destinations;• LNG trade detail available from January 2002.
The databases cover the time period January 1984 to current month with a time lag of two months for the most recent data.
• Monthly Gas Data Service: Natural Gas Balances & TradeHistorical plus 12 monthly updates Price: e800
A description of this service is available on our website: http://data.iea.org.

74
Moreover, the IEA statistics website contains key energy indicators by country, graphs on the world and OECD’s energy situation evolution from 1971 to the most recent year available, as well as selected databases for demonstration.
The IEA statistics site can be accessed at: www.iea.org/statistics/.
Note: The prices quoted for Electronic Editions are for single-user licences. Please contact us for information on multi-user licence prices.
For more information, please feel free to contact the Energy Data Centre of the IEA by
E-mail: [email protected] Phone: +33 (0)1 40 57 66 25.
INTERNATIONAL ENERGY AGENCY9, rue de la Fédération, 75739 Paris Cedex 15 - France
Energy Stats
A wealth ofEnErgy
StAtSat your
fingertips
www.iea.org
KeyWorld
EnergyStAtiSticS
iEAEnErgy
StAtS: free download to your iPhone
and iPad on itunes and
AppShopper

Energy Stats
A wealth ofEnErgy
StAtSat your
fingertips
www.iea.org
KeyWorld
EnergyStAtiSticS
iEAEnErgy
StAtS: free download to your iPhone
and iPad on itunes and
AppShopper

76
Oil Market Report
Each month, the primary source of data on supply, demand, stocks, prices and refining
Since its appearance in 1983, the International Energy Agency’s Oil Market Report (OMR) has become the definitive source of information on world oil market fundamentals, covering supply, demand, OECD stocks, prices and refining as well as OECD and selected non-OECD trade.
The OMR provides the most extensive, up-to-date statistical data available on current world oil market trends. It is the first and exclusive source to present official government statistics from all OECD countries, as well as selected data from non-OECD countries.
The main market movements of the month are highlighted in a convenient summary, while detailed analysis explains recent market developments and provides an insight into the months ahead. It is the only regular short-term analysis of the oil industry available based on information obtained from the extensive IEA network of contacts with government and industry.
The OMR provides both historical data and supply/demand forecasts for the year ahead. Featuring tables, graphs and statistics, it provides all the data and analysis necessary to track the oil market and to identify trends in production, consumption, refining, inventories in OECD countries and prices for both crude and products.
Additionally, subscribers to the OMR receive a copy of the annual Medium-Term Oil Market Report (MTOMR) which examines key industry themes. These include the impact of the global economic slowdown on oil demand, upstream and downstream investment levels, the likely pace of development of biofuels and non-conventional oil supplies, likely oil products availability and oil price formation. The MTOMR provides detailed supply and demand forecasts for crude oil and oil products looking five years forward, and since its inception in 2006 the report has become a standard industry reference.
To subscribe electronically, please see our website at www.oilmarketreport.org
Annual subscription rate for single electronic copy: _2 200

77
World Energy Outlook 2013
A new global energy landscape is emerging, resetting long-held expectations for our energy future. Incorporating these recent developments and world-class analysis, World Energy Outlook 2013 presents a full update of energy projections through to 2035 and insights into what they mean for energy security, climate change, economic development and universal access to modern energy services. Oil, coal, natural gas, renewables and nuclear power are all covered, along with an update on developments in subsidies to fossil fuels and renewable energy.This year World Energy Outlook also gives a special focus to topical energy sector issues:�� Redrawing the energy-climate map: the short-term measures that
could keep the 2°C target within reach, and the extent to which low-carbon development could leave fossil-fuel investments stranded.
�� Energy in Brazil: how a vast and diverse resource base – from renewables to new offshore discoveries – can meet the growing needs of the Brazilian economy and open up new export markets.
�� Oil supply, demand and trade: a fresh look at the economics and decline rates of different types of oil production around the world, the prospects for light tight oil inside and outside North America, along with new analysis of oil products and the refining sector.
�� The implications for economic competitiveness of the changing energy map: what the major disparities in regional energy prices might mean for major energy-intensive industries and the broader impact on economic growth and household purchasing power.
�� The global spread of unconventional gas supply, including the uptake of the IEA “Golden Rules” to address public concerns about the associated environmental and social impacts.
�� Energy trends in Southeast Asia, a region that is exerting a growing influence in the global energy system.
The World Energy Outlook is recognised as the most authoritative source of strategic analysis of global energy markets. It is regularly used as input to the development of government policies and business strategies and raises public awareness of the key energy and environmental challenges the world is facing.
For more information please see: www.worldenergyoutlook.orgOrder now at www.iea.org/books
or by emailing [email protected] Price: _150

78
N O T E S

79
N O T E S

80
© OECD/IEA, 2013
International Energy Agency (IEA)9 rue de la Fédération, 75739 Paris Cedex 15, France.
Please note that this publication is subject to specific
restrictions that limit its use and distribution.
The terms and conditions are available online at
http://www.iea.org/termsandconditionsuseandcopyright/
This publication reflects the views of the International Energy Agency (IEA)
Secretariat but does not necessarily reflect those of individual IEA member
countries. The IEA makes no representation or warranty, express or implied, in
respect to the publication’s contents (including its completeness or accuracy) and
shall not be responsible for any use of, or reliance on, the publication.
Printed in France by SOREGRAPHCover design: IEA, Photo credits: © Image 100
Inside photos: Pages 11, 13, 17, 21 and 25 – © Photodisc
Pages 15 and 27 – © Brand X
Pages 19 and 23 – © Digital Stock
The paper used for this document and the forest from which it comes have receivedFSC certification for meeting a set of strict environmental and social standards.
The FSC is an international, membership-based, non-profitorganisation that supports environmentally appropriate, socially beneficial,
and economically viable management of the world‘s forests.

9, rue de la Fédération75739 Paris Cedex 15
www.iea.org