Key Indicators for Asia and the Pacific 2021 Country Tables
10
1 Key Indicators for Asia and the Pacific 2021 Kyrgyz Republic Item 2000 2001 2002 2003 2004 2005 2006 2007 2008 2009 2010 2011 2012 2013 2014 2015 2016 2017 2018 2019 2020 POPULATION Total population a as of 1 January (million) 4.9 4.9 5.0 5.0 5.1 5.1 5.2 5.2 5.3 5.3 5.4 5.5 5.6 5.7 5.8 5.9 6.0 6.1 6.3 6.4 6.5 Population density (persons/km²) 24 25 25 25 25 26 26 26 26 27 27 27 28 28 29 29 30 31 31 32 33 Population (% annual change) 1.4 1.0 0.9 0.9 1.2 1.2 1.0 1.1 0.8 1.1 1.3 1.1 1.4 2.0 2.0 2.1 2.1 2.0 1.9 2.1 2.1 Urban population (% of total population) 34.7 34.8 34.9 34.7 34.9 34.8 34.4 34.4 34.2 34.1 34.1 34.0 33.9 33.6 33.6 33.7 33.7 33.8 33.9 34.0 34.2 LABOR FORCE calendar year (‘000) 1,913 1,939 2,116 2,143 2,177 2,261 2,285 2,344 2,380 2,420 2,456 2,490 2,497 2,469 2,504 2,544 2,547 2,525 2,539 2,584 2,595 Employed 1,768 1,787 1,850 1,930 1,991 2,077 2,096 2,153 2,184 2,216 2,244 2,278 2,286 2,263 2,303 2,352 2,364 2,351 2,383 2,443 2,445 Agriculture, forestry, and fishing 939 946 908 835 775 800 760 742 743 719 699 700 688 717 727 689 633 541 483 443 447 Mining and quarrying 9 8 8 13 14 12 12 13 13 15 18 17 13 10 9 9 10 13 27 32 20 Manufacturing 113 112 125 140 153 164 178 180 178 173 175 173 174 157 160 174 181 237 286 289 279 Electricity, gas, steam, and air-conditioning supply; water supply; sewerage, waste management, and remediation activities 20 21 29 35 39 35 36 38 38 39 41 39 51 46 48 43 48 39 31 43 45 Construction 43 44 60 102 144 154 181 205 222 244 240 249 259 245 254 266 283 256 247 287 289 Wholesale and retail trade; repair of motor vehicles and motorcycles 188 194 220 258 282 302 308 317 319 316 337 346 346 360 348 365 369 387 374 395 391 Transportation and storage b 63 65 91 98 113 116 120 133 134 145 148 147 138 142 146 162 168 190 195 200 193 Accommodation and food service activities 13 15 25 34 44 49 49 58 66 82 83 87 84 80 85 100 109 116 143 164 161 Information and communication c 27 26 27 31 30 28 28 27 31 Financial and insurance activities 7 8 8 10 9 8 10 10 12 16 18 18 23 22 25 26 26 32 36 34 35 Real estate activities 29 30 30 28 38 34 36 46 50 55 58 56 6 8 10 10 8 9 9 5 5 Others 344 345 347 378 381 404 406 410 409 414 427 447 478 452 464 478 498 505 524 522 551 Underemployed ... ... ... ... ... ... ... ... ... ... ... ... ... ... ... ... ... ... ... ... ... Unemployed d 144 152 266 212 186 184 189 191 196 204 212 212 210 206 202 192 184 174 156 141 150 Unemployment rate (%) 7.5 7.8 12.5 9.9 8.5 8.1 8.3 8.2 8.2 8.4 8.4 8.5 8.4 8.3 8.0 7.6 7.2 6.9 6.2 5.5 5.8 Labor force (% annual change) 0.6 1.4 9.1 1.3 1.6 3.8 1.1 2.6 1.5 1.7 1.5 1.4 0.3 -1.1 1.4 1.6 0.1 -0.9 0.5 1.8 0.5 Labor force participation rate (%) ... ... 64.4 64.0 63.7 64.8 65.5 65.1 65.4 64.4 64.2 64.9 64.2 62.5 62.4 62.4 61.5 60.1 59.8 60.2 ... Male ... ... 74.0 73.3 74.4 75.9 77.3 77.2 76.5 76.3 76.6 77.5 77.3 76.4 75.0 75.5 75.4 75.0 75.4 75.7 ... Female ... ... 55.3 55.1 53.5 54.2 54.2 53.6 54.8 53.1 52.3 52.8 51.8 49.2 50.4 49.9 48.3 45.9 45.1 45.5 ... NATIONAL ACCOUNTS calendar year (Som million) At Current Prices GDP by industrial origin at current market prices 65,357.9 73,883.3 75,366.7 83,871.6 94,350.7 100,899.2 113,800.1 141,897.7 187,991.9 201,222.9 220,369.3 285,989.1 310,471.3 355,294.8 400,694.0 430,489.4 476,331.2 530,475.7 569,385.6 619,102.7 598,344.5* Agriculture, forestry, and fishing 22,344.2 25,520.1 25,929.8 28,199.5 28,215.1 28,739.4 32,638.2 38,142.4 44,150.9 37,750.9 38,459.3 47,375.0 51,706.5 52,007.6 58,976.8 60,530.1 61,134.6 66,386.8 66,477.4 72,219.0 80,817.1* Mining and quarrying 351.5 377.4 362.9 409.5 609.7 556.4 488.7 643.7 1,001.7 1,072.3 1,384.8 2,168.8 2,724.5 2,546.2 2,616.6 3,323.7 3,056.0 5,073.1 5,810.7 11,681.0 9,821.5* Manufacturing 11,831.4 13,033.5 9,834.2 11,133.4 14,459.5 12,968.0 12,509.0 14,074.9 24,850.7 28,630.5 37,356.5 52,245.2 37,479.3 56,023.2 54,799.7 60,487.1 73,518.2 79,522.7 81,219.8 91,076.4 101,771.6* Electricity, gas, steam, and air-conditioning supply 4,166.9 3,633.1 3,287.2 2,988.8 3,075.6 3,896.7 3,937.4 3,882.8 2,672.0 4,369.1 6,848.5 9,196.7 7,962.0 6,239.3 7,485.3 7,215.9 8,902.2 13,323.3 15,819.7 13,705.8 13,710.8* Water supply; sewerage, waste management, and remediation activities 812.4 769.9 992.8 1,036.8 889.7 1,099.2 1,386.3 2,222.0 1,384.4 1,359.6* Construction 2,734.4 2,780.8 2,579.2 2,446.6 2,319.3 2,725.9 3,041.9 5,070.4 9,880.3 13,488.6 12,169.1 14,078.3 20,166.3 22,466.5 29,780.3 36,042.0 39,873.3 45,557.4 51,386.5 58,531.8 49,589.8* Wholesale and retail trade; repair of motor vehicles and motorcycles 7,906.4 9,008.7 10,752.9 12,725.4 15,072.5 18,001.6 20,883.9 25,445.2 30,712.6 33,865.4 35,179.7 43,252.0 49,393.6 58,675.2 71,183.1 80,824.0 85,226.8 94,571.5 102,023.7 108,966.0 96,807.6* Transportation and storage 1,466.2 1,935.1 2,339.6 2,659.2 3,108.3 3,282.8 3,191.5 4,697.9 7,539.2 9,485.6 10,571.0 13,101.0 14,651.4 13,916.8 14,962.3 16,730.3 18,214.3 20,648.2 21,401.0 24,578.8 18,020.2* Accommodation and food service activities 484.1 589.5 839.1 1,235.8 1,465.2 1,350.6 1,549.0 1,707.9 2,453.2 2,652.2 2,762.0 4,163.1 4,284.0 5,659.8 7,248.0 8,024.2 8,499.5 8,922.1 9,442.0 10,020.3 5,898.6* Information and communication 947.8 1,160.0 1,505.8 1,854.8 2,936.8 3,334.9 3,695.7 5,863.2 7,285.9 8,185.2 8,323.0 11,133.8 14,956.3 15,740.5 17,157.6 18,423.4 16,605.2 16,385.8 14,897.7 16,450.1 15,945.7* Financial and insurance activities 296.6 819.8 1,131.2 1,264.6 1,795.3 2,250.8 2,986.4 4,801.0 6,939.0 8,023.4 8,573.9 9,956.0 11,365.6 13,422.1 15,593.0 15,464.5 15,122.9 17,872.5 21,466.7 23,932.8 24,048.3* Real estate activities 6,225.8 7,262.5 8,318.2 9,863.0 11,244.1 11,815.9 13,812.7 13,962.6 17,754.6 17,304.1* Professional, scientific, and technical activities 1,891.6 1,971.2 2,307.3 2,353.3 2,514.5 2,814.1 3,321.7 4,325.5 7,549.7 9,165.2 10,671.1 5,148.0 5,194.3 5,203.7 6,746.0 6,730.7 6,887.2 8,563.2 10,749.0 8,624.8 8,901.4* Administrative and support service activities 1,021.7 1,235.2 1,591.5 1,945.2 1,808.0 2,056.3 2,420.1 2,457.0 2,845.1 2,856.6* Public administration and defense; compulsory social security 2,490.6 3,741.3 3,947.3 3,875.6 4,324.0 4,659.8 5,053.9 6,137.6 8,660.1 10,757.7 12,448.2 14,455.4 15,875.4 17,761.2 21,053.7 23,170.9 25,642.6 30,076.4 32,981.9 36,400.4 38,918.7*
-
Upload
khangminh22 -
Category
Documents
-
view
5 -
download
0
Transcript of Key Indicators for Asia and the Pacific 2021 Country Tables

1Key Indicators for Asia and the Pacific 2021
Kyrgyz RepublicItem 2000 2001 2002 2003 2004 2005 2006 2007 2008 2009 2010 2011 2012 2013 2014 2015 2016 2017 2018 2019 2020
POPULATIONTotal populationa as of 1 January (million) 4.9 4.9 5.0 5.0 5.1 5.1 5.2 5.2 5.3 5.3 5.4 5.5 5.6 5.7 5.8 5.9 6.0 6.1 6.3 6.4 6.5Population density (persons/km²) 24 25 25 25 25 26 26 26 26 27 27 27 28 28 29 29 30 31 31 32 33 Population (% annual change) 1.4 1.0 0.9 0.9 1.2 1.2 1.0 1.1 0.8 1.1 1.3 1.1 1.4 2.0 2.0 2.1 2.1 2.0 1.9 2.1 2.1Urban population (% of total population) 34.7 34.8 34.9 34.7 34.9 34.8 34.4 34.4 34.2 34.1 34.1 34.0 33.9 33.6 33.6 33.7 33.7 33.8 33.9 34.0 34.2
LABOR FORCE calendar year (‘000) 1,913 1,939 2,116 2,143 2,177 2,261 2,285 2,344 2,380 2,420 2,456 2,490 2,497 2,469 2,504 2,544 2,547 2,525 2,539 2,584 2,595 Employed 1,768 1,787 1,850 1,930 1,991 2,077 2,096 2,153 2,184 2,216 2,244 2,278 2,286 2,263 2,303 2,352 2,364 2,351 2,383 2,443 2,445 Agriculture, forestry, and fishing 939 946 908 835 775 800 760 742 743 719 699 700 688 717 727 689 633 541 483 443 447 Mining and quarrying 9 8 8 13 14 12 12 13 13 15 18 17 13 10 9 9 10 13 27 32 20 Manufacturing 113 112 125 140 153 164 178 180 178 173 175 173 174 157 160 174 181 237 286 289 279 Electricity, gas, steam, and air-conditioning supply; water supply; sewerage, waste management, and remediation activities 20 21 29 35 39 35 36 38 38 39 41 39 51 46 48 43 48 39 31 43 45 Construction 43 44 60 102 144 154 181 205 222 244 240 249 259 245 254 266 283 256 247 287 289 Wholesale and retail trade; repair of motor vehicles and motorcycles 188 194 220 258 282 302 308 317 319 316 337 346 346 360 348 365 369 387 374 395 391 Transportation and storageb 63 65 91 98 113 116 120 133 134 145 148 147 138 142 146 162 168 190 195 200 193 Accommodation and food service activities 13 15 25 34 44 49 49 58 66 82 83 87 84 80 85 100 109 116 143 164 161 Information and communicationc 27 26 27 31 30 28 28 27 31 Financial and insurance activities 7 8 8 10 9 8 10 10 12 16 18 18 23 22 25 26 26 32 36 34 35 Real estate activities 29 30 30 28 38 34 36 46 50 55 58 56 6 8 10 10 8 9 9 5 5 Others 344 345 347 378 381 404 406 410 409 414 427 447 478 452 464 478 498 505 524 522 551 Underemployed ... ... ... ... ... ... ... ... ... ... ... ... ... ... ... ... ... ... ... ... ...Unemployedd 144 152 266 212 186 184 189 191 196 204 212 212 210 206 202 192 184 174 156 141 150 Unemployment rate (%) 7.5 7.8 12.5 9.9 8.5 8.1 8.3 8.2 8.2 8.4 8.4 8.5 8.4 8.3 8.0 7.6 7.2 6.9 6.2 5.5 5.8Labor force (% annual change) 0.6 1.4 9.1 1.3 1.6 3.8 1.1 2.6 1.5 1.7 1.5 1.4 0.3 -1.1 1.4 1.6 0.1 -0.9 0.5 1.8 0.5Labor force participation rate (%) ... ... 64.4 64.0 63.7 64.8 65.5 65.1 65.4 64.4 64.2 64.9 64.2 62.5 62.4 62.4 61.5 60.1 59.8 60.2 ... Male ... ... 74.0 73.3 74.4 75.9 77.3 77.2 76.5 76.3 76.6 77.5 77.3 76.4 75.0 75.5 75.4 75.0 75.4 75.7 ... Female ... ... 55.3 55.1 53.5 54.2 54.2 53.6 54.8 53.1 52.3 52.8 51.8 49.2 50.4 49.9 48.3 45.9 45.1 45.5 ...
NATIONAL ACCOUNTS calendar year (Som million)At Current PricesGDP by industrial origin at current market prices 65,357.9 73,883.3 75,366.7 83,871.6 94,350.7 100,899.2 113,800.1 141,897.7 187,991.9 201,222.9 220,369.3 285,989.1 310,471.3 355,294.8 400,694.0 430,489.4 476,331.2 530,475.7 569,385.6 619,102.7 598,344.5* Agriculture, forestry, and fishing 22,344.2 25,520.1 25,929.8 28,199.5 28,215.1 28,739.4 32,638.2 38,142.4 44,150.9 37,750.9 38,459.3 47,375.0 51,706.5 52,007.6 58,976.8 60,530.1 61,134.6 66,386.8 66,477.4 72,219.0 80,817.1* Mining and quarrying 351.5 377.4 362.9 409.5 609.7 556.4 488.7 643.7 1,001.7 1,072.3 1,384.8 2,168.8 2,724.5 2,546.2 2,616.6 3,323.7 3,056.0 5,073.1 5,810.7 11,681.0 9,821.5* Manufacturing 11,831.4 13,033.5 9,834.2 11,133.4 14,459.5 12,968.0 12,509.0 14,074.9 24,850.7 28,630.5 37,356.5 52,245.2 37,479.3 56,023.2 54,799.7 60,487.1 73,518.2 79,522.7 81,219.8 91,076.4 101,771.6* Electricity, gas, steam, and air-conditioning supply 4,166.9 3,633.1 3,287.2 2,988.8 3,075.6 3,896.7 3,937.4 3,882.8 2,672.0 4,369.1 6,848.5 9,196.7 7,962.0 6,239.3 7,485.3 7,215.9 8,902.2 13,323.3 15,819.7 13,705.8 13,710.8* Water supply; sewerage, waste management, and remediation activities 812.4 769.9 992.8 1,036.8 889.7 1,099.2 1,386.3 2,222.0 1,384.4 1,359.6* Construction 2,734.4 2,780.8 2,579.2 2,446.6 2,319.3 2,725.9 3,041.9 5,070.4 9,880.3 13,488.6 12,169.1 14,078.3 20,166.3 22,466.5 29,780.3 36,042.0 39,873.3 45,557.4 51,386.5 58,531.8 49,589.8* Wholesale and retail trade; repair of motor vehicles and motorcycles 7,906.4 9,008.7 10,752.9 12,725.4 15,072.5 18,001.6 20,883.9 25,445.2 30,712.6 33,865.4 35,179.7 43,252.0 49,393.6 58,675.2 71,183.1 80,824.0 85,226.8 94,571.5 102,023.7 108,966.0 96,807.6* Transportation and storage 1,466.2 1,935.1 2,339.6 2,659.2 3,108.3 3,282.8 3,191.5 4,697.9 7,539.2 9,485.6 10,571.0 13,101.0 14,651.4 13,916.8 14,962.3 16,730.3 18,214.3 20,648.2 21,401.0 24,578.8 18,020.2* Accommodation and food service activities 484.1 589.5 839.1 1,235.8 1,465.2 1,350.6 1,549.0 1,707.9 2,453.2 2,652.2 2,762.0 4,163.1 4,284.0 5,659.8 7,248.0 8,024.2 8,499.5 8,922.1 9,442.0 10,020.3 5,898.6* Information and communication 947.8 1,160.0 1,505.8 1,854.8 2,936.8 3,334.9 3,695.7 5,863.2 7,285.9 8,185.2 8,323.0 11,133.8 14,956.3 15,740.5 17,157.6 18,423.4 16,605.2 16,385.8 14,897.7 16,450.1 15,945.7* Financial and insurance activities 296.6 819.8 1,131.2 1,264.6 1,795.3 2,250.8 2,986.4 4,801.0 6,939.0 8,023.4 8,573.9 9,956.0 11,365.6 13,422.1 15,593.0 15,464.5 15,122.9 17,872.5 21,466.7 23,932.8 24,048.3* Real estate activities 6,225.8 7,262.5 8,318.2 9,863.0 11,244.1 11,815.9 13,812.7 13,962.6 17,754.6 17,304.1* Professional, scientific, and technical activities 1,891.6 1,971.2 2,307.3 2,353.3 2,514.5 2,814.1 3,321.7 4,325.5 7,549.7 9,165.2 10,671.1 5,148.0 5,194.3 5,203.7 6,746.0 6,730.7 6,887.2 8,563.2 10,749.0 8,624.8 8,901.4* Administrative and support service activities 1,021.7 1,235.2 1,591.5 1,945.2 1,808.0 2,056.3 2,420.1 2,457.0 2,845.1 2,856.6* Public administration and defense; compulsory social security 2,490.6 3,741.3 3,947.3 3,875.6 4,324.0 4,659.8 5,053.9 6,137.6 8,660.1 10,757.7 12,448.2 14,455.4 15,875.4 17,761.2 21,053.7 23,170.9 25,642.6 30,076.4 32,981.9 36,400.4 38,918.7*
2 Key Indicators for Asia and the Pacific 2021
Kyrgyz RepublicItem 2000 2001 2002 2003 2004 2005 2006 2007 2008 2009 2010 2011 2012 2013 2014 2015 2016 2017 2018 2019 2020
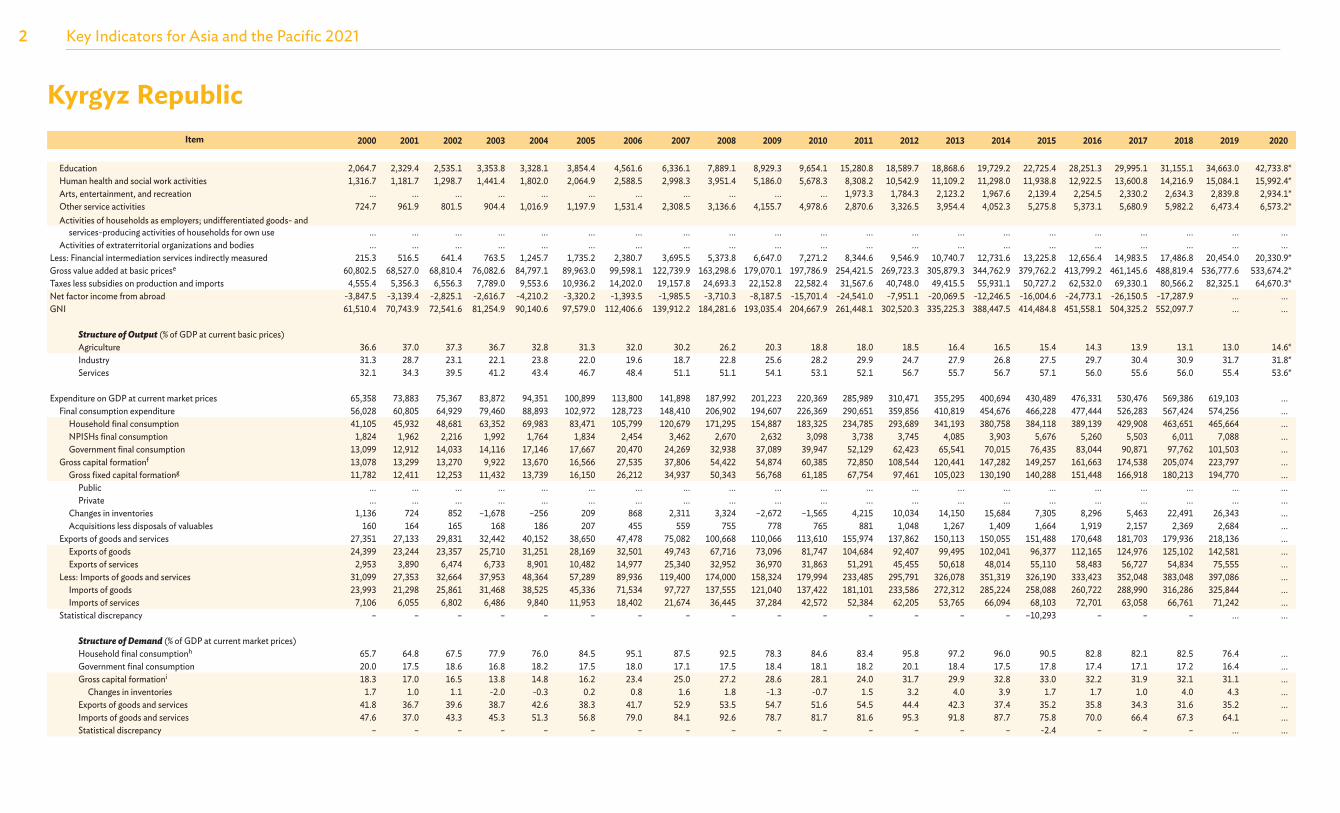
Education 2,064.7 2,329.4 2,535.1 3,353.8 3,328.1 3,854.4 4,561.6 6,336.1 7,889.1 8,929.3 9,654.1 15,280.8 18,589.7 18,868.6 19,729.2 22,725.4 28,251.3 29,995.1 31,155.1 34,663.0 42,733.8* Human health and social work activities 1,316.7 1,181.7 1,298.7 1,441.4 1,802.0 2,064.9 2,588.5 2,998.3 3,951.4 5,186.0 5,678.3 8,308.2 10,542.9 11,109.2 11,298.0 11,938.8 12,922.5 13,600.8 14,216.9 15,084.1 15,992.4* Arts, entertainment, and recreation ... ... ... ... ... ... ... ... ... ... ... 1,973.3 1,784.3 2,123.2 1,967.6 2,139.4 2,254.5 2,330.2 2,634.3 2,839.8 2,934.1* Other service activities 724.7 961.9 801.5 904.4 1,016.9 1,197.9 1,531.4 2,308.5 3,136.6 4,155.7 4,978.6 2,870.6 3,326.5 3,954.4 4,052.3 5,275.8 5,373.1 5,680.9 5,982.2 6,473.4 6,573.2* Activities of households as employers; undifferentiated goods- and services-producing activities of households for own use ... ... ... ... ... ... ... ... ... ... ... ... ... ... ... ... ... ... ... ... ... Activities of extraterritorial organizations and bodies ... ... ... ... ... ... ... ... ... ... ... ... ... ... ... ... ... ... ... ... ...Less: Financial intermediation services indirectly measured 215.3 516.5 641.4 763.5 1,245.7 1,735.2 2,380.7 3,695.5 5,373.8 6,647.0 7,271.2 8,344.6 9,546.9 10,740.7 12,731.6 13,225.8 12,656.4 14,983.5 17,486.8 20,454.0 20,330.9*Gross value added at basic pricese 60,802.5 68,527.0 68,810.4 76,082.6 84,797.1 89,963.0 99,598.1 122,739.9 163,298.6 179,070.1 197,786.9 254,421.5 269,723.3 305,879.3 344,762.9 379,762.2 413,799.2 461,145.6 488,819.4 536,777.6 533,674.2*Taxes less subsidies on production and imports 4,555.4 5,356.3 6,556.3 7,789.0 9,553.6 10,936.2 14,202.0 19,157.8 24,693.3 22,152.8 22,582.4 31,567.6 40,748.0 49,415.5 55,931.1 50,727.2 62,532.0 69,330.1 80,566.2 82,325.1 64,670.3*Net factor income from abroad -3,847.5 -3,139.4 -2,825.1 -2,616.7 -4,210.2 -3,320.2 -1,393.5 -1,985.5 -3,710.3 -8,187.5 -15,701.4 -24,541.0 -7,951.1 -20,069.5 -12,246.5 -16,004.6 -24,773.1 -26,150.5 -17,287.9 ... ...GNI 61,510.4 70,743.9 72,541.6 81,254.9 90,140.6 97,579.0 112,406.6 139,912.2 184,281.6 193,035.4 204,667.9 261,448.1 302,520.3 335,225.3 388,447.5 414,484.8 451,558.1 504,325.2 552,097.7 ... ...
Structure of Output (% of GDP at current basic prices) Agriculture 36.6 37.0 37.3 36.7 32.8 31.3 32.0 30.2 26.2 20.3 18.8 18.0 18.5 16.4 16.5 15.4 14.3 13.9 13.1 13.0 14.6* Industry 31.3 28.7 23.1 22.1 23.8 22.0 19.6 18.7 22.8 25.6 28.2 29.9 24.7 27.9 26.8 27.5 29.7 30.4 30.9 31.7 31.8* Services 32.1 34.3 39.5 41.2 43.4 46.7 48.4 51.1 51.1 54.1 53.1 52.1 56.7 55.7 56.7 57.1 56.0 55.6 56.0 55.4 53.6*
Expenditure on GDP at current market prices 65,358 73,883 75,367 83,872 94,351 100,899 113,800 141,898 187,992 201,223 220,369 285,989 310,471 355,295 400,694 430,489 476,331 530,476 569,386 619,103 ... Final consumption expenditure 56,028 60,805 64,929 79,460 88,893 102,972 128,723 148,410 206,902 194,607 226,369 290,651 359,856 410,819 454,676 466,228 477,444 526,283 567,424 574,256 ... Household final consumption 41,105 45,932 48,681 63,352 69,983 83,471 105,799 120,679 171,295 154,887 183,325 234,785 293,689 341,193 380,758 384,118 389,139 429,908 463,651 465,664 ... NPISHs final consumption 1,824 1,962 2,216 1,992 1,764 1,834 2,454 3,462 2,670 2,632 3,098 3,738 3,745 4,085 3,903 5,676 5,260 5,503 6,011 7,088 ... Government final consumption 13,099 12,912 14,033 14,116 17,146 17,667 20,470 24,269 32,938 37,089 39,947 52,129 62,423 65,541 70,015 76,435 83,044 90,871 97,762 101,503 ... Gross capital formationf 13,078 13,299 13,270 9,922 13,670 16,566 27,535 37,806 54,422 54,874 60,385 72,850 108,544 120,441 147,282 149,257 161,663 174,538 205,074 223,797 ... Gross fixed capital formationg 11,782 12,411 12,253 11,432 13,739 16,150 26,212 34,937 50,343 56,768 61,185 67,754 97,461 105,023 130,190 140,288 151,448 166,918 180,213 194,770 ... Public ... ... ... ... ... ... ... ... ... ... ... ... ... ... ... ... ... ... ... ... ... Private ... ... ... ... ... ... ... ... ... ... ... ... ... ... ... ... ... ... ... ... ... Changes in inventories 1,136 724 852 –1,678 –256 209 868 2,311 3,324 –2,672 –1,565 4,215 10,034 14,150 15,684 7,305 8,296 5,463 22,491 26,343 ... Acquisitions less disposals of valuables 160 164 165 168 186 207 455 559 755 778 765 881 1,048 1,267 1,409 1,664 1,919 2,157 2,369 2,684 ... Exports of goods and services 27,351 27,133 29,831 32,442 40,152 38,650 47,478 75,082 100,668 110,066 113,610 155,974 137,862 150,113 150,055 151,488 170,648 181,703 179,936 218,136 ... Exports of goods 24,399 23,244 23,357 25,710 31,251 28,169 32,501 49,743 67,716 73,096 81,747 104,684 92,407 99,495 102,041 96,377 112,165 124,976 125,102 142,581 ... Exports of services 2,953 3,890 6,474 6,733 8,901 10,482 14,977 25,340 32,952 36,970 31,863 51,291 45,455 50,618 48,014 55,110 58,483 56,727 54,834 75,555 ... Less: Imports of goods and services 31,099 27,353 32,664 37,953 48,364 57,289 89,936 119,400 174,000 158,324 179,994 233,485 295,791 326,078 351,319 326,190 333,423 352,048 383,048 397,086 ... Imports of goods 23,993 21,298 25,861 31,468 38,525 45,336 71,534 97,727 137,555 121,040 137,422 181,101 233,586 272,312 285,224 258,088 260,722 288,990 316,286 325,844 ... Imports of services 7,106 6,055 6,802 6,486 9,840 11,953 18,402 21,674 36,445 37,284 42,572 52,384 62,205 53,765 66,094 68,103 72,701 63,058 66,761 71,242 ... Statistical discrepancy – – – – – – – – – – – – – – – –10,293 – – – ... ...
Structure of Demand (% of GDP at current market prices) Household final consumptionh 65.7 64.8 67.5 77.9 76.0 84.5 95.1 87.5 92.5 78.3 84.6 83.4 95.8 97.2 96.0 90.5 82.8 82.1 82.5 76.4 ... Government final consumption 20.0 17.5 18.6 16.8 18.2 17.5 18.0 17.1 17.5 18.4 18.1 18.2 20.1 18.4 17.5 17.8 17.4 17.1 17.2 16.4 ... Gross capital formationi 18.3 17.0 16.5 13.8 14.8 16.2 23.4 25.0 27.2 28.6 28.1 24.0 31.7 29.9 32.8 33.0 32.2 31.9 32.1 31.1 ... Changes in inventories 1.7 1.0 1.1 -2.0 -0.3 0.2 0.8 1.6 1.8 -1.3 -0.7 1.5 3.2 4.0 3.9 1.7 1.7 1.0 4.0 4.3 ... Exports of goods and services 41.8 36.7 39.6 38.7 42.6 38.3 41.7 52.9 53.5 54.7 51.6 54.5 44.4 42.3 37.4 35.2 35.8 34.3 31.6 35.2 ... Imports of goods and services 47.6 37.0 43.3 45.3 51.3 56.8 79.0 84.1 92.6 78.7 81.7 81.6 95.3 91.8 87.7 75.8 70.0 66.4 67.3 64.1 ... Statistical discrepancy – – – – – – – – – – – – – – – -2.4 – – – ... ...

3Key Indicators for Asia and the Pacific 2021
Kyrgyz RepublicItem 2000 2001 2002 2003 2004 2005 2006 2007 2008 2009 2010 2011 2012 2013 2014 2015 2016 2017 2018 2019 2020
At Constant PricesGDP by industrial origin at previous year’s market prices 51,397 68,836 73,871 80,665 89,765 94,185 104,030 123,522 153,819 193,418 200,274 233,495 285,737 344,361 369,592 416,224 449,155 498,909 550,411 595,581 565,757* Agriculture, forestry, and fishing 17,453 23,970 26,313 26,758 29,358 27,041 29,227 33,165 38,471 47,120 36,780 39,161 47,966 53,077 51,722 62,607 62,265 62,501 68,116 68,124 73,003* Mining and quarrying ... 352 383 366 505 571 514 473 702 1,079 1,033 1,673 2,984 2,552 2,539 3,939 4,220 4,842 4,967 7,099 9,065* Manufacturing 11,259 12,905 11,616 11,589 11,379 12,026 11,134 13,302 17,060 22,538 31,874 39,206 37,840 55,292 54,423 51,377 64,024 78,446 83,554 87,568 84,522* Electricity, gas, steam, and air-conditioning supply ... 3,842 3,215 3,630 3,033 3,125 3,870 4,234 3,594 2,603 4,860 8,000 9,725 7,819 6,738 7,478 7,028 9,802 14,023 15,241 14,075* Water supply; sewerage, waste management, and remediation activities ... 758 774 828 1,058 1,068 919 1,157 1,803 2,138 1,355* Construction 2,265 2,844 2,820 2,523 2,579 2,727 3,247 4,025 5,619 12,062 10,995 12,475 18,257 23,471 28,558 34,631 39,397 43,029 49,110 56,878 49,221* Wholesale and retail trade; repair of motor vehicles and motorcycles 7,127 8,460 9,782 12,099 15,102 16,893 20,682 23,163 27,878 31,423 31,982 38,680 47,886 52,991 63,695 76,227 87,301 91,268 99,953 108,038 91,824* Transportation and storage 1,264 1,368 1,923 2,486 2,952 3,026 3,458 3,469 5,526 7,306 9,908 11,596 14,168 15,544 14,469 15,060 16,741 19,933 21,246 22,299 16,988* Accommodation and food service activities 145 444 693 1,049 1,424 1,647 1,617 1,750 1,935 2,556 2,399 3,229 4,649 4,855 6,207 7,910 8,790 9,223 9,582 10,155 5,498* Information and communication 922 974 1,208 1,705 2,300 3,762 3,792 6,479 8,315 8,270 8,513 10,167 12,178 17,301 16,830 17,711 16,739 13,826 16,245 14,824 15,812* Financial and insurance activities 120 274 839 1,252 1,322 1,914 2,690 3,229 5,091 7,416 7,743 9,749 10,497 11,807 13,836 15,878 15,501 15,639 18,784 22,058 24,316* Real estate activities ... 5,847 6,116 7,178 8,321 9,785 11,316 12,424 13,359 14,824 17,344* Professional, scientific, and technical activities 1,325 1,899 1,908 2,312 2,451 2,563 2,881 3,488 4,767 7,634 9,614 3,812 5,087 5,058 4,966 6,665 7,099 7,080 7,895 9,951 8,735* Administrative and support service activities ... 931 952 1,257 1,664 2,000 1,611 2,340 2,500 2,797 2,882* Public administration and defense; compulsory social security 2,618 2,506 3,821 3,994 4,058 4,386 4,649 5,145 6,316 8,880 10,725 13,006 14,832 15,622 17,459 21,053 23,828 25,949 30,379 33,258 36,947* Education 1,668 2,220 2,458 2,561 3,398 3,385 3,803 4,564 6,426 8,001 8,903 9,776 16,011 18,656 19,219 20,100 23,350 29,121 30,765 31,744 35,199* Human health and social work activities 1,068 1,273 1,220 1,205 1,415 1,858 2,032 2,629 2,987 3,939 5,275 5,637 8,474 10,710 11,238 11,445 12,116 13,112 13,659 14,503 15,091* Arts, entertainment, and recreation 170 ... ... ... ... ... ... ... ... ... ... 1,576 1,687 1,812 2,147 1,955 2,017 2,230 2,384 2,764 2,859* Other service activities 254 913 848 832 959 1,060 1,253 1,557 2,290 2,938 4,064 2,583 2,939 3,282 4,198 4,196 5,253 4,625 5,750 5,616 6,558* Activities of households as employers; undifferentiated goods- and services-producing activities of households for own use ... ... ... ... ... ... ... ... ... ... ... ... ... ... ... ... ... ... ... ... ... Activities of extraterritorial organizations and bodies ... ... ... ... ... ... ... ... ... ... ... ... ... ... ... ... ... ... ... ... ...Less: Financial intermediation services indirectly measured 75 204 531 710 802 1,332 2,091 2,557 3,924 5,756 6,434 8,304 8,820 9,938 11,084 12,974 13,266 13,112 15,628 18,571 20,781*Gross value added at basic pricese 47,583 64,039 68,514 73,650 81,431 84,651 92,755 108,113 133,052 168,009 178,232 209,558 254,201 299,171 318,200 358,112 396,246 433,438 478,446 511,309 490,512*Taxes less subsidies on production and imports 3,814 4,797 5,356 7,015 8,334 9,535 11,275 15,409 20,767 25,409 22,042 23,937 31,536 45,190 51,392 58,112 52,909 65,471 71,965 84,272 75,245*Net factor income from abroad ... ... ... ... ... ... ... ... ... ... ... ... ... ... ... ... ... ... ... ... ...GNI ... ... ... ... ... ... ... ... ... ... ... ... ... ... ... ... ... ... ... ... ...
Growth of Output (% annual change) GDP 5.4 5.3 -0.0 7.0 7.0 -0.2 3.1 8.5 8.4 2.9 -0.5 6.0 -0.1 10.9 4.0 3.9 4.3 4.7 3.8 4.6 -8.6* Agriculture 2.6 7.3 3.1 3.2 4.1 -4.2 1.7 1.6 0.9 6.7 -2.6 1.8 1.2 2.7 -0.5 6.2 2.9 2.2 2.6 2.5 1.1* Industry 8.8 4.5 -9.0 12.7 3.0 -9.8 -6.9 10.3 14.0 -0.3 2.5 7.5 -11.4 30.2 5.7 2.9 7.1 8.6 5.9 8.0 -10.3* Services 5.8 3.8 4.2 7.4 11.7 8.4 9.4 12.4 10.7 2.6 -1.3 7.1 6.3 4.8 4.5 3.5 3.2 3.3 2.9 3.3 -9.3*
Expenditure on GDP at previous year’s market prices 51,397 68,836 73,871 80,665 89,765 94,185 104,030 123,522 153,819 193,418 200,274 233,495 285,737 344,361 369,592 416,224 449,155 498,909 550,411 595,581 ... Final consumption expenditure 45,823 56,819 63,035 77,341 85,028 94,395 119,615 132,040 164,453 182,383 198,504 244,679 318,340 383,335 420,745 451,661 464,902 503,311 549,356 571,599 ... Household final consumption 34,345 41,985 48,119 61,447 68,644 76,077 99,871 108,448 136,869 146,273 159,363 200,797 261,426 317,627 351,006 376,851 381,764 414,980 451,224 466,947 ... NPISHs final consumption 1,606 1,903 2,033 1,687 1,621 1,640 1,819 2,760 2,965 2,682 2,454 3,042 3,708 3,540 4,555 4,166 5,566 4,233 6,108 6,361 ... Government final consumption 9,873 12,931 12,883 14,207 14,764 16,678 17,925 20,832 24,620 33,429 36,688 40,840 53,206 62,168 65,184 70,644 77,573 84,099 92,024 98,291 ... Gross capital formationf 10,732 12,346 12,441 9,804 12,263 15,541 25,391 31,561 43,061 51,759 52,043 64,208 103,755 114,056 139,342 143,892 161,330 172,749 202,480 221,318 ... Gross fixed capital formationg 9,727 11,556 11,495 11,468 12,280 15,160 24,125 29,036 39,554 54,644 52,746 58,480 92,668 98,489 123,398 135,078 151,342 165,345 178,610 192,836 ... Public ... ... ... ... ... ... ... ... ... ... ... ... ... ... ... ... ... ... ... ... ... Private ... ... ... ... ... ... ... ... ... ... ... ... ... ... ... ... ... ... ... ... ... Changes in inventories 877 629 782 –1,832 –200 180 893 2,080 2,798 –3,520 –1,357 4,994 10,098 14,299 14,535 7,197 8,198 5,314 21,668 25,801 ... Acquisitions less disposals of valuables 129 162 164 168 184 200 374 446 709 635 653 734 989 1,267 1,409 1,618 1,790 2,090 2,202 2,681 ...
4 Key Indicators for Asia and the Pacific 2021
Kyrgyz RepublicItem 2000 2001 2002 2003 2004 2005 2006 2007 2008 2009 2010 2011 2012 2013 2014 2015 2016 2017 2018 2019 2020
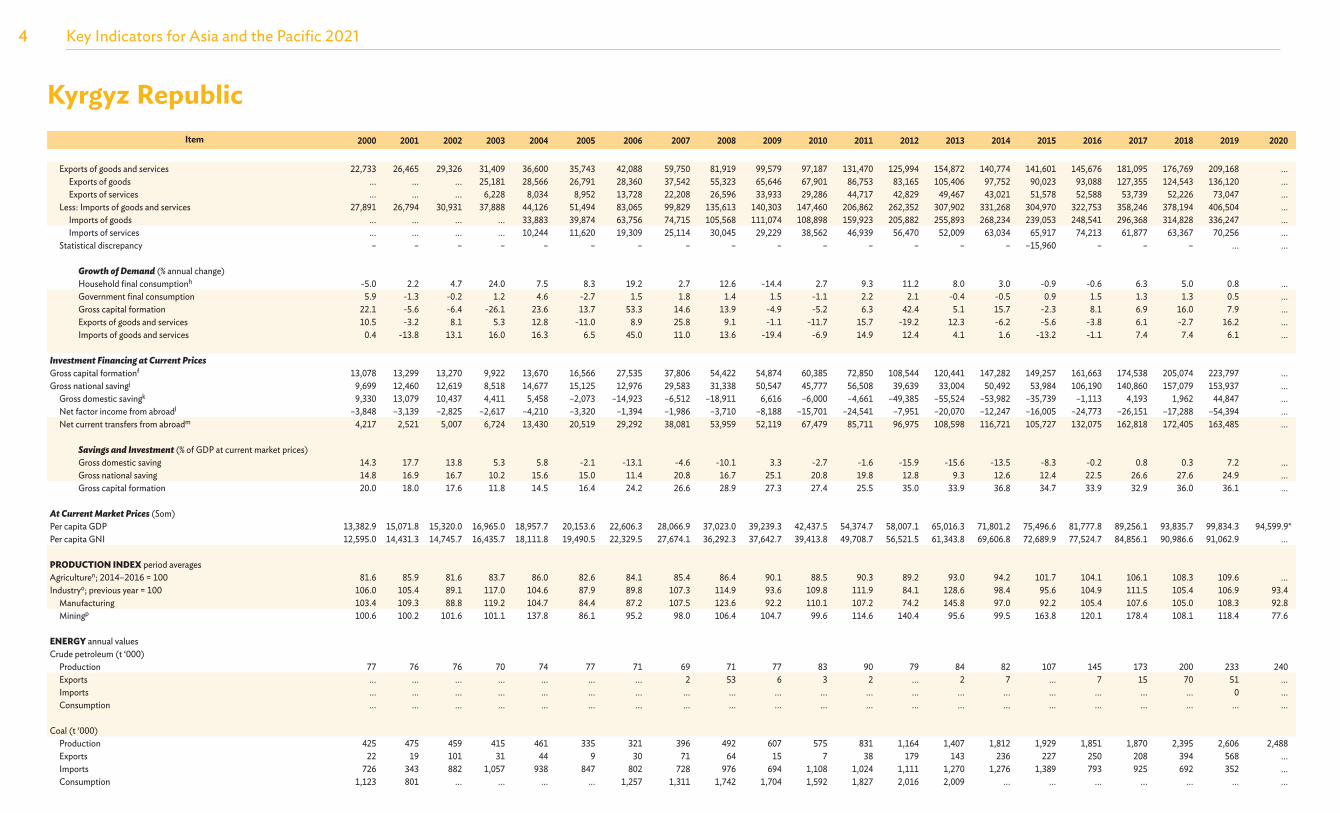
Exports of goods and services 22,733 26,465 29,326 31,409 36,600 35,743 42,088 59,750 81,919 99,579 97,187 131,470 125,994 154,872 140,774 141,601 145,676 181,095 176,769 209,168 ... Exports of goods ... ... ... 25,181 28,566 26,791 28,360 37,542 55,323 65,646 67,901 86,753 83,165 105,406 97,752 90,023 93,088 127,355 124,543 136,120 ... Exports of services ... ... ... 6,228 8,034 8,952 13,728 22,208 26,596 33,933 29,286 44,717 42,829 49,467 43,021 51,578 52,588 53,739 52,226 73,047 ... Less: Imports of goods and services 27,891 26,794 30,931 37,888 44,126 51,494 83,065 99,829 135,613 140,303 147,460 206,862 262,352 307,902 331,268 304,970 322,753 358,246 378,194 406,504 ... Imports of goods ... ... ... ... 33,883 39,874 63,756 74,715 105,568 111,074 108,898 159,923 205,882 255,893 268,234 239,053 248,541 296,368 314,828 336,247 ... Imports of services ... ... ... ... 10,244 11,620 19,309 25,114 30,045 29,229 38,562 46,939 56,470 52,009 63,034 65,917 74,213 61,877 63,367 70,256 ... Statistical discrepancy – – – – – – – – – – – – – – – –15,960 – – – ... ...
Growth of Demand (% annual change) Household final consumptionh -5.0 2.2 4.7 24.0 7.5 8.3 19.2 2.7 12.6 -14.4 2.7 9.3 11.2 8.0 3.0 -0.9 -0.6 6.3 5.0 0.8 ... Government final consumption 5.9 -1.3 -0.2 1.2 4.6 -2.7 1.5 1.8 1.4 1.5 -1.1 2.2 2.1 -0.4 -0.5 0.9 1.5 1.3 1.3 0.5 ... Gross capital formation 22.1 -5.6 -6.4 -26.1 23.6 13.7 53.3 14.6 13.9 -4.9 -5.2 6.3 42.4 5.1 15.7 -2.3 8.1 6.9 16.0 7.9 ... Exports of goods and services 10.5 -3.2 8.1 5.3 12.8 -11.0 8.9 25.8 9.1 -1.1 -11.7 15.7 -19.2 12.3 -6.2 -5.6 -3.8 6.1 -2.7 16.2 ... Imports of goods and services 0.4 -13.8 13.1 16.0 16.3 6.5 45.0 11.0 13.6 -19.4 -6.9 14.9 12.4 4.1 1.6 -13.2 -1.1 7.4 7.4 6.1 ...
Investment Financing at Current PricesGross capital formationf 13,078 13,299 13,270 9,922 13,670 16,566 27,535 37,806 54,422 54,874 60,385 72,850 108,544 120,441 147,282 149,257 161,663 174,538 205,074 223,797 ...Gross national savingj 9,699 12,460 12,619 8,518 14,677 15,125 12,976 29,583 31,338 50,547 45,777 56,508 39,639 33,004 50,492 53,984 106,190 140,860 157,079 153,937 ... Gross domestic savingk 9,330 13,079 10,437 4,411 5,458 –2,073 –14,923 –6,512 –18,911 6,616 –6,000 –4,661 –49,385 –55,524 –53,982 –35,739 –1,113 4,193 1,962 44,847 ... Net factor income from abroadl –3,848 –3,139 –2,825 –2,617 –4,210 –3,320 –1,394 –1,986 –3,710 –8,188 –15,701 –24,541 –7,951 –20,070 –12,247 –16,005 –24,773 –26,151 –17,288 –54,394 ... Net current transfers from abroadm 4,217 2,521 5,007 6,724 13,430 20,519 29,292 38,081 53,959 52,119 67,479 85,711 96,975 108,598 116,721 105,727 132,075 162,818 172,405 163,485 ...
Savings and Investment (% of GDP at current market prices) Gross domestic saving 14.3 17.7 13.8 5.3 5.8 -2.1 -13.1 -4.6 -10.1 3.3 -2.7 -1.6 -15.9 -15.6 -13.5 -8.3 -0.2 0.8 0.3 7.2 ... Gross national saving 14.8 16.9 16.7 10.2 15.6 15.0 11.4 20.8 16.7 25.1 20.8 19.8 12.8 9.3 12.6 12.4 22.5 26.6 27.6 24.9 ... Gross capital formation 20.0 18.0 17.6 11.8 14.5 16.4 24.2 26.6 28.9 27.3 27.4 25.5 35.0 33.9 36.8 34.7 33.9 32.9 36.0 36.1 ...
At Current Market Prices (Som)Per capita GDP 13,382.9 15,071.8 15,320.0 16,965.0 18,957.7 20,153.6 22,606.3 28,066.9 37,023.0 39,239.3 42,437.5 54,374.7 58,007.1 65,016.3 71,801.2 75,496.6 81,777.8 89,256.1 93,835.7 99,834.3 94,599.9*Per capita GNI 12,595.0 14,431.3 14,745.7 16,435.7 18,111.8 19,490.5 22,329.5 27,674.1 36,292.3 37,642.7 39,413.8 49,708.7 56,521.5 61,343.8 69,606.8 72,689.9 77,524.7 84,856.1 90,986.6 91,062.9 ...
PRODUCTION INDEX period averagesAgriculturen; 2014–2016 = 100 81.6 85.9 81.6 83.7 86.0 82.6 84.1 85.4 86.4 90.1 88.5 90.3 89.2 93.0 94.2 101.7 104.1 106.1 108.3 109.6 ...Industryo; previous year = 100 106.0 105.4 89.1 117.0 104.6 87.9 89.8 107.3 114.9 93.6 109.8 111.9 84.1 128.6 98.4 95.6 104.9 111.5 105.4 106.9 93.4 Manufacturing 103.4 109.3 88.8 119.2 104.7 84.4 87.2 107.5 123.6 92.2 110.1 107.2 74.2 145.8 97.0 92.2 105.4 107.6 105.0 108.3 92.8 Miningp 100.6 100.2 101.6 101.1 137.8 86.1 95.2 98.0 106.4 104.7 99.6 114.6 140.4 95.6 99.5 163.8 120.1 178.4 108.1 118.4 77.6
ENERGY annual valuesCrude petroleum (t ‘000) Production 77 76 76 70 74 77 71 69 71 77 83 90 79 84 82 107 145 173 200 233 240 Exports ... ... ... ... ... ... ... 2 53 6 3 2 ... 2 7 ... 7 15 70 51 ... Imports ... ... ... ... ... ... ... ... ... ... ... ... ... ... ... ... ... ... ... 0 ... Consumption ... ... ... ... ... ... ... ... ... ... ... ... ... ... ... ... ... ... ... ... ...
Coal (t ‘000) Production 425 475 459 415 461 335 321 396 492 607 575 831 1,164 1,407 1,812 1,929 1,851 1,870 2,395 2,606 2,488 Exports 22 19 101 31 44 9 30 71 64 15 7 38 179 143 236 227 250 208 394 568 ... Imports 726 343 882 1,057 938 847 802 728 976 694 1,108 1,024 1,111 1,270 1,276 1,389 793 925 692 352 ... Consumption 1,123 801 ... ... ... ... 1,257 1,311 1,742 1,704 1,592 1,827 2,016 2,009 ... ... ... ... ... ... ...
5Key Indicators for Asia and the Pacific 2021
Kyrgyz RepublicItem 2000 2001 2002 2003 2004 2005 2006 2007 2008 2009 2010 2011 2012 2013 2014 2015 2016 2017 2018 2019 2020
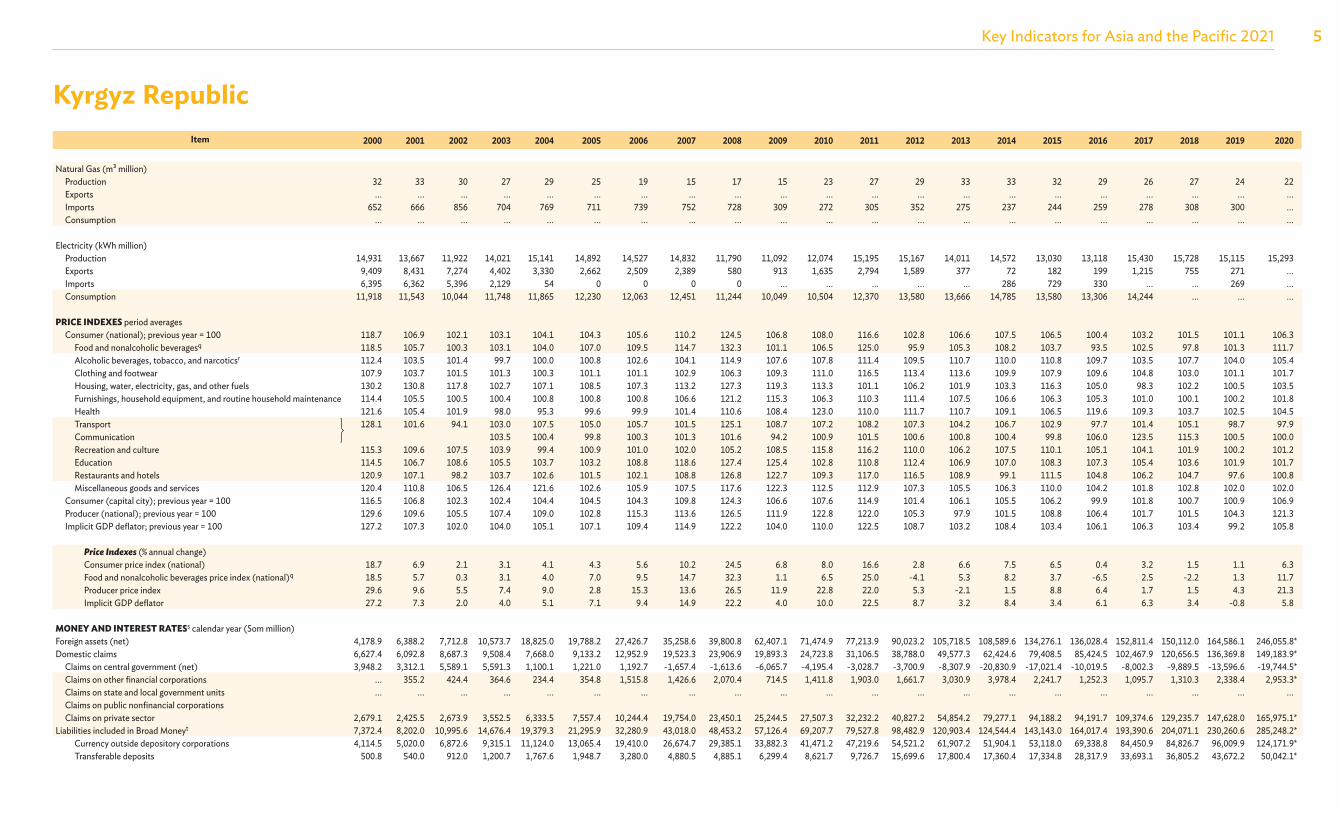
Natural Gas (m³ million) Production 32 33 30 27 29 25 19 15 17 15 23 27 29 33 33 32 29 26 27 24 22 Exports ... ... ... ... ... ... ... ... ... ... ... ... ... ... ... ... ... ... ... ... ... Imports 652 666 856 704 769 711 739 752 728 309 272 305 352 275 237 244 259 278 308 300 ... Consumption ... ... ... ... ... ... ... ... ... ... ... ... ... ... ... ... ... ... ... ... ...
Electricity (kWh million) Production 14,931 13,667 11,922 14,021 15,141 14,892 14,527 14,832 11,790 11,092 12,074 15,195 15,167 14,011 14,572 13,030 13,118 15,430 15,728 15,115 15,293 Exports 9,409 8,431 7,274 4,402 3,330 2,662 2,509 2,389 580 913 1,635 2,794 1,589 377 72 182 199 1,215 755 271 ... Imports 6,395 6,362 5,396 2,129 54 0 0 0 0 ... ... ... ... ... 286 729 330 ... ... 269 ... Consumption 11,918 11,543 10,044 11,748 11,865 12,230 12,063 12,451 11,244 10,049 10,504 12,370 13,580 13,666 14,785 13,580 13,306 14,244 ... ... ...
PRICE INDEXES period averages Consumer (national); previous year = 100 118.7 106.9 102.1 103.1 104.1 104.3 105.6 110.2 124.5 106.8 108.0 116.6 102.8 106.6 107.5 106.5 100.4 103.2 101.5 101.1 106.3 Food and nonalcoholic beveragesq 118.5 105.7 100.3 103.1 104.0 107.0 109.5 114.7 132.3 101.1 106.5 125.0 95.9 105.3 108.2 103.7 93.5 102.5 97.8 101.3 111.7 Alcoholic beverages, tobacco, and narcoticsr 112.4 103.5 101.4 99.7 100.0 100.8 102.6 104.1 114.9 107.6 107.8 111.4 109.5 110.7 110.0 110.8 109.7 103.5 107.7 104.0 105.4 Clothing and footwear 107.9 103.7 101.5 101.3 100.3 101.1 101.1 102.9 106.3 109.3 111.0 116.5 113.4 113.6 109.9 107.9 109.6 104.8 103.0 101.1 101.7 Housing, water, electricity, gas, and other fuels 130.2 130.8 117.8 102.7 107.1 108.5 107.3 113.2 127.3 119.3 113.3 101.1 106.2 101.9 103.3 116.3 105.0 98.3 102.2 100.5 103.5 Furnishings, household equipment, and routine household maintenance 114.4 105.5 100.5 100.4 100.8 100.8 100.8 106.6 121.2 115.3 106.3 110.3 111.4 107.5 106.6 106.3 105.3 101.0 100.1 100.2 101.8 Health 121.6 105.4 101.9 98.0 95.3 99.6 99.9 101.4 110.6 108.4 123.0 110.0 111.7 110.7 109.1 106.5 119.6 109.3 103.7 102.5 104.5 Transport 128.1 101.6 94.1 103.0 107.5 105.0 105.7 101.5 125.1 108.7 107.2 108.2 107.3 104.2 106.7 102.9 97.7 101.4 105.1 98.7 97.9 Communication 103.5 100.4 99.8 100.3 101.3 101.6 94.2 100.9 101.5 100.6 100.8 100.4 99.8 106.0 123.5 115.3 100.5 100.0 Recreation and culture 115.3 109.6 107.5 103.9 99.4 100.9 101.0 102.0 105.2 108.5 115.8 116.2 110.0 106.2 107.5 110.1 105.1 104.1 101.9 100.2 101.2 Education 114.5 106.7 108.6 105.5 103.7 103.2 108.8 118.6 127.4 125.4 102.8 110.8 112.4 106.9 107.0 108.3 107.3 105.4 103.6 101.9 101.7 Restaurants and hotels 120.9 107.1 98.2 103.7 102.6 101.5 102.1 108.8 126.8 122.7 109.3 117.0 116.5 108.9 99.1 111.5 104.8 106.2 104.7 97.6 100.8 Miscellaneous goods and services 120.4 110.8 106.5 126.4 121.6 102.6 105.9 107.5 117.6 122.3 112.5 112.9 107.3 105.5 106.3 110.0 104.2 101.8 102.8 102.0 102.0 Consumer (capital city); previous year = 100 116.5 106.8 102.3 102.4 104.4 104.5 104.3 109.8 124.3 106.6 107.6 114.9 101.4 106.1 105.5 106.2 99.9 101.8 100.7 100.9 106.9 Producer (national); previous year = 100 129.6 109.6 105.5 107.4 109.0 102.8 115.3 113.6 126.5 111.9 122.8 122.0 105.3 97.9 101.5 108.8 106.4 101.7 101.5 104.3 121.3 Implicit GDP deflator; previous year = 100 127.2 107.3 102.0 104.0 105.1 107.1 109.4 114.9 122.2 104.0 110.0 122.5 108.7 103.2 108.4 103.4 106.1 106.3 103.4 99.2 105.8
Price Indexes (% annual change) Consumer price index (national) 18.7 6.9 2.1 3.1 4.1 4.3 5.6 10.2 24.5 6.8 8.0 16.6 2.8 6.6 7.5 6.5 0.4 3.2 1.5 1.1 6.3 Food and nonalcoholic beverages price index (national)q 18.5 5.7 0.3 3.1 4.0 7.0 9.5 14.7 32.3 1.1 6.5 25.0 -4.1 5.3 8.2 3.7 -6.5 2.5 -2.2 1.3 11.7 Producer price index 29.6 9.6 5.5 7.4 9.0 2.8 15.3 13.6 26.5 11.9 22.8 22.0 5.3 -2.1 1.5 8.8 6.4 1.7 1.5 4.3 21.3 Implicit GDP deflator 27.2 7.3 2.0 4.0 5.1 7.1 9.4 14.9 22.2 4.0 10.0 22.5 8.7 3.2 8.4 3.4 6.1 6.3 3.4 -0.8 5.8
MONEY AND INTEREST RATESs calendar year (Som million)Foreign assets (net) 4,178.9 6,388.2 7,712.8 10,573.7 18,825.0 19,788.2 27,426.7 35,258.6 39,800.8 62,407.1 71,474.9 77,213.9 90,023.2 105,718.5 108,589.6 134,276.1 136,028.4 152,811.4 150,112.0 164,586.1 246,055.8*Domestic claims 6,627.4 6,092.8 8,687.3 9,508.4 7,668.0 9,133.2 12,952.9 19,523.3 23,906.9 19,893.3 24,723.8 31,106.5 38,788.0 49,577.3 62,424.6 79,408.5 85,424.5 102,467.9 120,656.5 136,369.8 149,183.9* Claims on central government (net) 3,948.2 3,312.1 5,589.1 5,591.3 1,100.1 1,221.0 1,192.7 -1,657.4 -1,613.6 -6,065.7 -4,195.4 -3,028.7 -3,700.9 -8,307.9 -20,830.9 -17,021.4 -10,019.5 -8,002.3 -9,889.5 -13,596.6 -19,744.5* Claims on other financial corporations ... 355.2 424.4 364.6 234.4 354.8 1,515.8 1,426.6 2,070.4 714.5 1,411.8 1,903.0 1,661.7 3,030.9 3,978.4 2,241.7 1,252.3 1,095.7 1,310.3 2,338.4 2,953.3* Claims on state and local government units ... ... ... ... ... ... ... ... ... ... ... ... ... ... ... ... ... ... ... ... ... Claims on public nonfinancial corporations Claims on private sector 2,679.1 2,425.5 2,673.9 3,552.5 6,333.5 7,557.4 10,244.4 19,754.0 23,450.1 25,244.5 27,507.3 32,232.2 40,827.2 54,854.2 79,277.1 94,188.2 94,191.7 109,374.6 129,235.7 147,628.0 165,975.1*Liabilities included in Broad Moneyt 7,372.4 8,202.0 10,995.6 14,676.4 19,379.3 21,295.9 32,280.9 43,018.0 48,453.2 57,126.4 69,207.7 79,527.8 98,482.9 120,903.4 124,544.4 143,143.0 164,017.4 193,390.6 204,071.1 230,260.6 285,248.2* Currency outside depository corporations 4,114.5 5,020.0 6,872.6 9,315.1 11,124.0 13,065.4 19,410.0 26,674.7 29,385.1 33,882.3 41,471.2 47,219.6 54,521.2 61,907.2 51,904.1 53,118.0 69,338.8 84,450.9 84,826.7 96,009.9 124,171.9* Transferable deposits 500.8 540.0 912.0 1,200.7 1,767.6 1,948.7 3,280.0 4,880.5 4,885.1 6,299.4 8,621.7 9,726.7 15,699.6 17,800.4 17,360.4 17,334.8 28,317.9 33,693.1 36,805.2 43,672.2 50,042.1*
6 Key Indicators for Asia and the Pacific 2021
Kyrgyz RepublicItem 2000 2001 2002 2003 2004 2005 2006 2007 2008 2009 2010 2011 2012 2013 2014 2015 2016 2017 2018 2019 2020
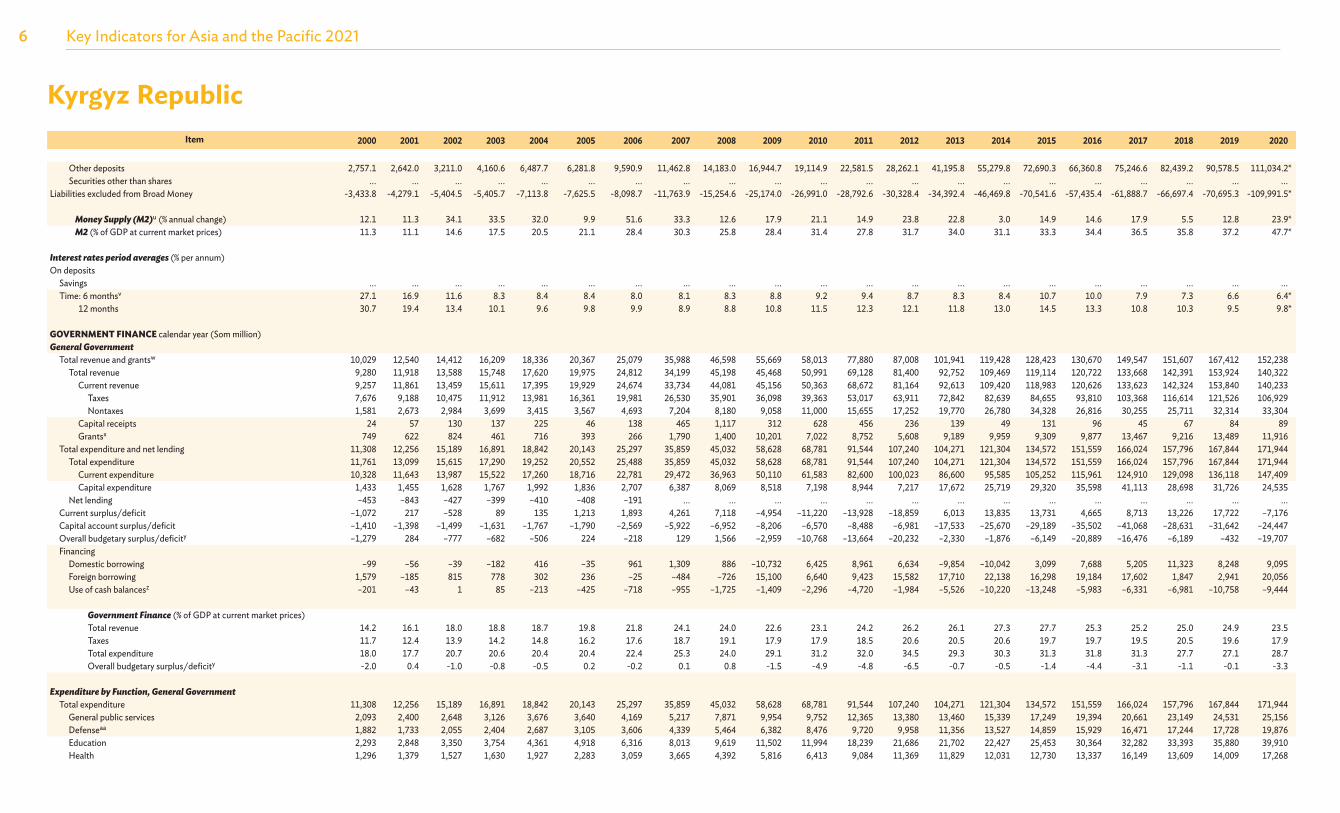
Other deposits 2,757.1 2,642.0 3,211.0 4,160.6 6,487.7 6,281.8 9,590.9 11,462.8 14,183.0 16,944.7 19,114.9 22,581.5 28,262.1 41,195.8 55,279.8 72,690.3 66,360.8 75,246.6 82,439.2 90,578.5 111,034.2* Securities other than shares ... ... ... ... ... ... ... ... ... ... ... ... ... ... ... ... ... ... ... ... ...Liabilities excluded from Broad Money -3,433.8 -4,279.1 -5,404.5 -5,405.7 -7,113.8 -7,625.5 -8,098.7 -11,763.9 -15,254.6 -25,174.0 -26,991.0 -28,792.6 -30,328.4 -34,392.4 -46,469.8 -70,541.6 -57,435.4 -61,888.7 -66,697.4 -70,695.3 -109,991.5*
Money Supply (M2)u (% annual change) 12.1 11.3 34.1 33.5 32.0 9.9 51.6 33.3 12.6 17.9 21.1 14.9 23.8 22.8 3.0 14.9 14.6 17.9 5.5 12.8 23.9* M2 (% of GDP at current market prices) 11.3 11.1 14.6 17.5 20.5 21.1 28.4 30.3 25.8 28.4 31.4 27.8 31.7 34.0 31.1 33.3 34.4 36.5 35.8 37.2 47.7*
Interest rates period averages (% per annum)On deposits Savings ... ... ... ... ... ... ... ... ... ... ... ... ... ... ... ... ... ... ... ... ... Time: 6 monthsv 27.1 16.9 11.6 8.3 8.4 8.4 8.0 8.1 8.3 8.8 9.2 9.4 8.7 8.3 8.4 10.7 10.0 7.9 7.3 6.6 6.4* 12 months 30.7 19.4 13.4 10.1 9.6 9.8 9.9 8.9 8.8 10.8 11.5 12.3 12.1 11.8 13.0 14.5 13.3 10.8 10.3 9.5 9.8*
GOVERNMENT FINANCE calendar year (Som million)General Government
Total revenue and grantsw 10,029 12,540 14,412 16,209 18,336 20,367 25,079 35,988 46,598 55,669 58,013 77,880 87,008 101,941 119,428 128,423 130,670 149,547 151,607 167,412 152,238 Total revenue 9,280 11,918 13,588 15,748 17,620 19,975 24,812 34,199 45,198 45,468 50,991 69,128 81,400 92,752 109,469 119,114 120,722 133,668 142,391 153,924 140,322 Current revenue 9,257 11,861 13,459 15,611 17,395 19,929 24,674 33,734 44,081 45,156 50,363 68,672 81,164 92,613 109,420 118,983 120,626 133,623 142,324 153,840 140,233 Taxes 7,676 9,188 10,475 11,912 13,981 16,361 19,981 26,530 35,901 36,098 39,363 53,017 63,911 72,842 82,639 84,655 93,810 103,368 116,614 121,526 106,929 Nontaxes 1,581 2,673 2,984 3,699 3,415 3,567 4,693 7,204 8,180 9,058 11,000 15,655 17,252 19,770 26,780 34,328 26,816 30,255 25,711 32,314 33,304 Capital receipts 24 57 130 137 225 46 138 465 1,117 312 628 456 236 139 49 131 96 45 67 84 89 Grantsx 749 622 824 461 716 393 266 1,790 1,400 10,201 7,022 8,752 5,608 9,189 9,959 9,309 9,877 13,467 9,216 13,489 11,916 Total expenditure and net lending 11,308 12,256 15,189 16,891 18,842 20,143 25,297 35,859 45,032 58,628 68,781 91,544 107,240 104,271 121,304 134,572 151,559 166,024 157,796 167,844 171,944 Total expenditure 11,761 13,099 15,615 17,290 19,252 20,552 25,488 35,859 45,032 58,628 68,781 91,544 107,240 104,271 121,304 134,572 151,559 166,024 157,796 167,844 171,944 Current expenditure 10,328 11,643 13,987 15,522 17,260 18,716 22,781 29,472 36,963 50,110 61,583 82,600 100,023 86,600 95,585 105,252 115,961 124,910 129,098 136,118 147,409 Capital expenditure 1,433 1,455 1,628 1,767 1,992 1,836 2,707 6,387 8,069 8,518 7,198 8,944 7,217 17,672 25,719 29,320 35,598 41,113 28,698 31,726 24,535 Net lending –453 –843 –427 –399 –410 –408 –191 ... ... ... ... ... ... ... ... ... ... ... ... ... ...Current surplus/deficit –1,072 217 –528 89 135 1,213 1,893 4,261 7,118 –4,954 –11,220 –13,928 –18,859 6,013 13,835 13,731 4,665 8,713 13,226 17,722 –7,176Capital account surplus/deficit –1,410 –1,398 –1,499 –1,631 –1,767 –1,790 –2,569 –5,922 –6,952 –8,206 –6,570 –8,488 –6,981 –17,533 –25,670 –29,189 –35,502 –41,068 –28,631 –31,642 –24,447Overall budgetary surplus/deficity –1,279 284 –777 –682 –506 224 –218 129 1,566 –2,959 –10,768 –13,664 –20,232 –2,330 –1,876 –6,149 –20,889 –16,476 –6,189 –432 –19,707Financing Domestic borrowing –99 –56 –39 –182 416 –35 961 1,309 886 –10,732 6,425 8,961 6,634 –9,854 –10,042 3,099 7,688 5,205 11,323 8,248 9,095 Foreign borrowing 1,579 –185 815 778 302 236 –25 –484 –726 15,100 6,640 9,423 15,582 17,710 22,138 16,298 19,184 17,602 1,847 2,941 20,056 Use of cash balancesz –201 –43 1 85 –213 –425 –718 –955 –1,725 –1,409 –2,296 –4,720 –1,984 –5,526 –10,220 –13,248 –5,983 –6,331 –6,981 –10,758 –9,444
Government Finance (% of GDP at current market prices) Total revenue 14.2 16.1 18.0 18.8 18.7 19.8 21.8 24.1 24.0 22.6 23.1 24.2 26.2 26.1 27.3 27.7 25.3 25.2 25.0 24.9 23.5 Taxes 11.7 12.4 13.9 14.2 14.8 16.2 17.6 18.7 19.1 17.9 17.9 18.5 20.6 20.5 20.6 19.7 19.7 19.5 20.5 19.6 17.9 Total expenditure 18.0 17.7 20.7 20.6 20.4 20.4 22.4 25.3 24.0 29.1 31.2 32.0 34.5 29.3 30.3 31.3 31.8 31.3 27.7 27.1 28.7 Overall budgetary surplus/deficity -2.0 0.4 -1.0 -0.8 -0.5 0.2 -0.2 0.1 0.8 -1.5 -4.9 -4.8 -6.5 -0.7 -0.5 -1.4 -4.4 -3.1 -1.1 -0.1 -3.3
Expenditure by Function, General GovernmentTotal expenditure 11,308 12,256 15,189 16,891 18,842 20,143 25,297 35,859 45,032 58,628 68,781 91,544 107,240 104,271 121,304 134,572 151,559 166,024 157,796 167,844 171,944 General public services 2,093 2,400 2,648 3,126 3,676 3,640 4,169 5,217 7,871 9,954 9,752 12,365 13,380 13,460 15,339 17,249 19,394 20,661 23,149 24,531 25,156 Defenseaa 1,882 1,733 2,055 2,404 2,687 3,105 3,606 4,339 5,464 6,382 8,476 9,720 9,958 11,356 13,527 14,859 15,929 16,471 17,244 17,728 19,876 Education 2,293 2,848 3,350 3,754 4,361 4,918 6,316 8,013 9,619 11,502 11,994 18,239 21,686 21,702 22,427 25,453 30,364 32,282 33,393 35,880 39,910 Health 1,296 1,379 1,527 1,630 1,927 2,283 3,059 3,665 4,392 5,816 6,413 9,084 11,369 11,829 12,031 12,730 13,337 16,149 13,609 14,009 17,268
7Key Indicators for Asia and the Pacific 2021
Kyrgyz RepublicItem 2000 2001 2002 2003 2004 2005 2006 2007 2008 2009 2010 2011 2012 2013 2014 2015 2016 2017 2018 2019 2020
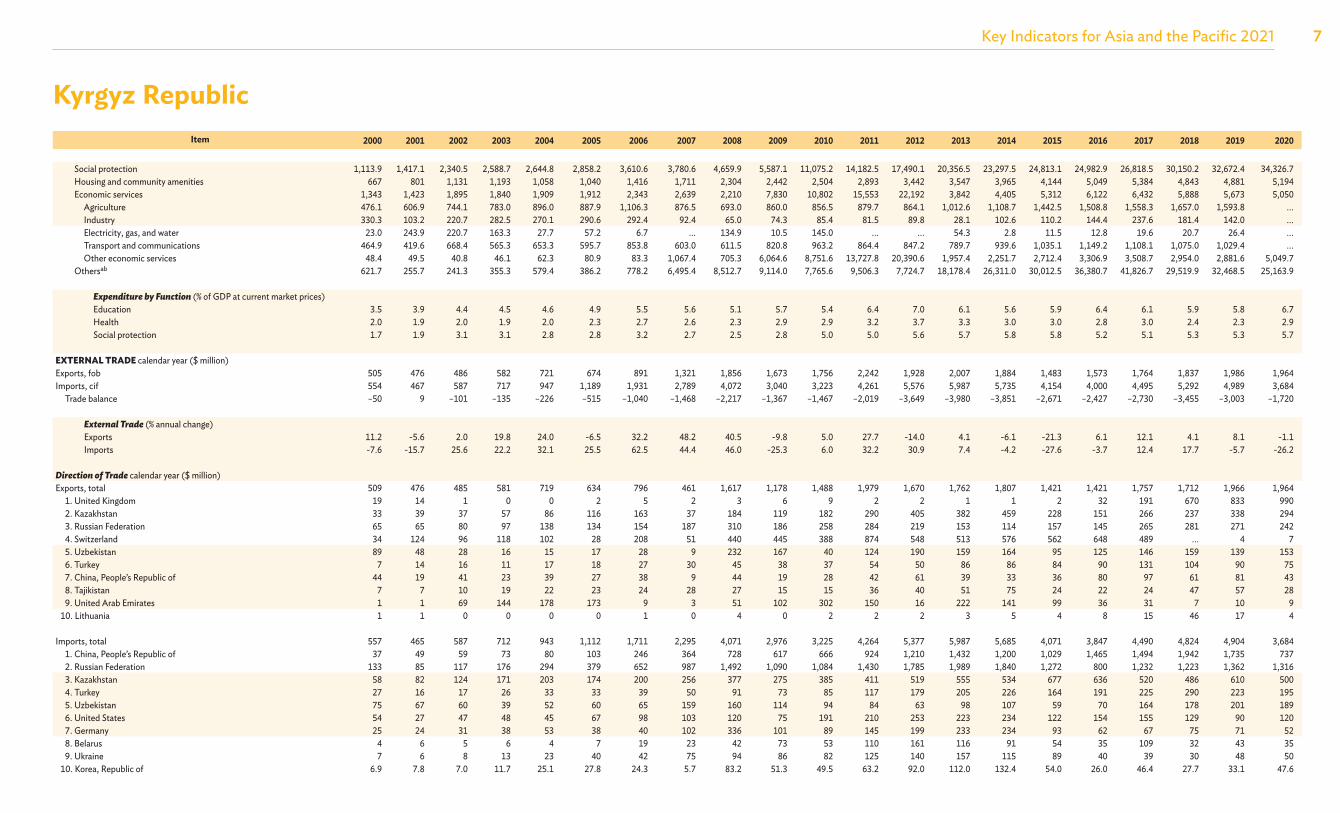
Social protection 1,113.9 1,417.1 2,340.5 2,588.7 2,644.8 2,858.2 3,610.6 3,780.6 4,659.9 5,587.1 11,075.2 14,182.5 17,490.1 20,356.5 23,297.5 24,813.1 24,982.9 26,818.5 30,150.2 32,672.4 34,326.7 Housing and community amenities 667 801 1,131 1,193 1,058 1,040 1,416 1,711 2,304 2,442 2,504 2,893 3,442 3,547 3,965 4,144 5,049 5,384 4,843 4,881 5,194 Economic services 1,343 1,423 1,895 1,840 1,909 1,912 2,343 2,639 2,210 7,830 10,802 15,553 22,192 3,842 4,405 5,312 6,122 6,432 5,888 5,673 5,050 Agriculture 476.1 606.9 744.1 783.0 896.0 887.9 1,106.3 876.5 693.0 860.0 856.5 879.7 864.1 1,012.6 1,108.7 1,442.5 1,508.8 1,558.3 1,657.0 1,593.8 ... Industry 330.3 103.2 220.7 282.5 270.1 290.6 292.4 92.4 65.0 74.3 85.4 81.5 89.8 28.1 102.6 110.2 144.4 237.6 181.4 142.0 ... Electricity, gas, and water 23.0 243.9 220.7 163.3 27.7 57.2 6.7 ... 134.9 10.5 145.0 ... ... 54.3 2.8 11.5 12.8 19.6 20.7 26.4 ... Transport and communications 464.9 419.6 668.4 565.3 653.3 595.7 853.8 603.0 611.5 820.8 963.2 864.4 847.2 789.7 939.6 1,035.1 1,149.2 1,108.1 1,075.0 1,029.4 ... Other economic services 48.4 49.5 40.8 46.1 62.3 80.9 83.3 1,067.4 705.3 6,064.6 8,751.6 13,727.8 20,390.6 1,957.4 2,251.7 2,712.4 3,306.9 3,508.7 2,954.0 2,881.6 5,049.7 Othersab 621.7 255.7 241.3 355.3 579.4 386.2 778.2 6,495.4 8,512.7 9,114.0 7,765.6 9,506.3 7,724.7 18,178.4 26,311.0 30,012.5 36,380.7 41,826.7 29,519.9 32,468.5 25,163.9
Expenditure by Function (% of GDP at current market prices) Education 3.5 3.9 4.4 4.5 4.6 4.9 5.5 5.6 5.1 5.7 5.4 6.4 7.0 6.1 5.6 5.9 6.4 6.1 5.9 5.8 6.7 Health 2.0 1.9 2.0 1.9 2.0 2.3 2.7 2.6 2.3 2.9 2.9 3.2 3.7 3.3 3.0 3.0 2.8 3.0 2.4 2.3 2.9 Social protection 1.7 1.9 3.1 3.1 2.8 2.8 3.2 2.7 2.5 2.8 5.0 5.0 5.6 5.7 5.8 5.8 5.2 5.1 5.3 5.3 5.7
EXTERNAL TRADE calendar year ($ million)Exports, fob 505 476 486 582 721 674 891 1,321 1,856 1,673 1,756 2,242 1,928 2,007 1,884 1,483 1,573 1,764 1,837 1,986 1,964 Imports, cif 554 467 587 717 947 1,189 1,931 2,789 4,072 3,040 3,223 4,261 5,576 5,987 5,735 4,154 4,000 4,495 5,292 4,989 3,684 Trade balance –50 9 –101 –135 –226 –515 –1,040 –1,468 –2,217 –1,367 –1,467 –2,019 –3,649 –3,980 –3,851 –2,671 –2,427 –2,730 –3,455 –3,003 –1,720
External Trade (% annual change) Exports 11.2 -5.6 2.0 19.8 24.0 -6.5 32.2 48.2 40.5 -9.8 5.0 27.7 -14.0 4.1 -6.1 -21.3 6.1 12.1 4.1 8.1 -1.1 Imports -7.6 -15.7 25.6 22.2 32.1 25.5 62.5 44.4 46.0 -25.3 6.0 32.2 30.9 7.4 -4.2 -27.6 -3.7 12.4 17.7 -5.7 -26.2
Direction of Trade calendar year ($ million)Exports, total 509 476 485 581 719 634 796 461 1,617 1,178 1,488 1,979 1,670 1,762 1,807 1,421 1,421 1,757 1,712 1,966 1,964 1. United Kingdom 19 14 1 0 0 2 5 2 3 6 9 2 2 1 1 2 32 191 670 833 990 2. Kazakhstan 33 39 37 57 86 116 163 37 184 119 182 290 405 382 459 228 151 266 237 338 294 3. Russian Federation 65 65 80 97 138 134 154 187 310 186 258 284 219 153 114 157 145 265 281 271 242 4. Switzerland 34 124 96 118 102 28 208 51 440 445 388 874 548 513 576 562 648 489 ... 4 7 5. Uzbekistan 89 48 28 16 15 17 28 9 232 167 40 124 190 159 164 95 125 146 159 139 153 6. Turkey 7 14 16 11 17 18 27 30 45 38 37 54 50 86 86 84 90 131 104 90 75 7. China, People’s Republic of 44 19 41 23 39 27 38 9 44 19 28 42 61 39 33 36 80 97 61 81 43 8. Tajikistan 7 7 10 19 22 23 24 28 27 15 15 36 40 51 75 24 22 24 47 57 28 9. United Arab Emirates 1 1 69 144 178 173 9 3 51 102 302 150 16 222 141 99 36 31 7 10 9 10. Lithuania 1 1 0 0 0 0 1 0 4 0 2 2 2 3 5 4 8 15 46 17 4
Imports, total 557 465 587 712 943 1,112 1,711 2,295 4,071 2,976 3,225 4,264 5,377 5,987 5,685 4,071 3,847 4,490 4,824 4,904 3,684 1. China, People’s Republic of 37 49 59 73 80 103 246 364 728 617 666 924 1,210 1,432 1,200 1,029 1,465 1,494 1,942 1,735 737 2. Russian Federation 133 85 117 176 294 379 652 987 1,492 1,090 1,084 1,430 1,785 1,989 1,840 1,272 800 1,232 1,223 1,362 1,316 3. Kazakhstan 58 82 124 171 203 174 200 256 377 275 385 411 519 555 534 677 636 520 486 610 500 4. Turkey 27 16 17 26 33 33 39 50 91 73 85 117 179 205 226 164 191 225 290 223 195 5. Uzbekistan 75 67 60 39 52 60 65 159 160 114 94 84 63 98 107 59 70 164 178 201 189 6. United States 54 27 47 48 45 67 98 103 120 75 191 210 253 223 234 122 154 155 129 90 120 7. Germany 25 24 31 38 53 38 40 102 336 101 89 145 199 233 234 93 62 67 75 71 52 8. Belarus 4 6 5 6 4 7 19 23 42 73 53 110 161 116 91 54 35 109 32 43 35 9. Ukraine 7 6 8 13 23 40 42 75 94 86 82 125 140 157 115 89 40 39 30 48 50 10. Korea, Republic of 6.9 7.8 7.0 11.7 25.1 27.8 24.3 5.7 83.2 51.3 49.5 63.2 92.0 112.0 132.4 54.0 26.0 46.4 27.7 33.1 47.6

8 Key Indicators for Asia and the Pacific 2021
Kyrgyz RepublicItem 2000 2001 2002 2003 2004 2005 2006 2007 2008 2009 2010 2011 2012 2013 2014 2015 2016 2017 2018 2019 2020
BALANCE OF PAYMENTSac calendar year ($ million)Current account balance -74.7 -17.6 -30.4 -42.5 28.5 -34.3 -264.2 -227.9 -707.6 -202.3 | -312.9 -448.6 -1,011.3 -967.2 -1,255.9 -1,068.9 -788.1 -481.8 -997.0 -1,073.2 349.2* Balance on goods 4.7 31.1 -73.3 -132.8 -170.6 -418.7 -886.5 -1,275.8 -1,879.2 -1,119.7 | -1,202.2 -1,555.2 -2,576.8 -2,780.4 -2,807.5 -2,240.8 -2,136.5 -2,383.3 -3,033.8 -2,626.0 -1,412.9* Exports 510.9 480.3 498.1 590.3 733.2 686.8 906.0 1,337.8 1,874.4 1,693.8 | 1,778.7 2,380.7 2,588.3 2,833.2 2,482.7 1,619.0 1,607.9 1,813.9 1,916.0 2,042.9 2,009.6* Imports -506.2 -449.2 -571.4 -723.1 -903.8 -1,105.5 -1,792.4 -2,613.6 -3,753.5 -2,813.6 | 2,980.9 3,935.9 5,165.1 5,613.6 5,290.2 3,859.8 3,744.4 4,197.2 4,949.9 4,669.0 3,422.5* Balance on services -167.8 -100.8 -63.8 -63.7 -115.8 -119.9 -130.1 29.4 -304.5 -289.6 | -201.2 -103.6 -335.8 -13.5 -326.1 -204.6 -203.5 -92.0 -133.0 61.8 -154.3* Credit 79.0 95.2 148.3 163.4 217.6 276.0 420.3 727.4 937.8 659.8 | 600.1 860.2 987.4 1,089.3 896.6 848.9 841.0 823.8 829.9 1,082.7 422.8* Debit -246.8 -196.0 -212.1 -227.1 -333.4 -395.9 -550.5 -698.0 -1,242.2 -949.5 | 801.3 963.9 1,323.1 1,102.8 1,222.7 1,053.5 1,044.5 915.8 962.9 1,020.8 577.1* Balance on primary income -300.6 -626.8 -160.0 -411.0 -297.6 -251.0 -350.7 -371.6 -251.0 -779.3 -329.6* Credit 34.2 54.8 30.6 41.9 41.9 39.1 26.1 31.2 40.8 37.0 29.8* Debit 334.8 681.6 190.6 452.9 339.5 290.1 376.9 402.7 291.9 816.3 359.4* Balance on secondary income 88.4 52.1 106.7 154.0 314.9 504.4 752.4 1,018.5 1,476.0 1,207.0 | 1,391.1 1,837.1 2,061.3 2,237.7 2,175.3 1,627.5 1,902.7 2,365.1 2,420.9 2,270.3 2,246.1* Credit 90.8 57.6 109.5 161.0 332.5 542.1 802.8 1,097.5 1,556.3 1,292.1 | 1,532.7 2,044.1 2,339.2 2,610.7 2,610.3 1,976.8 2,271.8 2,830.4 2,974.3 2,835.6 2,744.6* Debit -2.4 -5.5 -2.9 -7.0 -17.6 -37.7 -50.4 -79.0 -80.2 -85.0 | 141.6 207.0 277.9 373.0 435.0 349.2 369.1 465.3 553.4 565.3 498.6*Capital account -11.4 -32.0 -7.9 -0.9 -19.9 -20.5 -43.9 -74.9 -5.7 16.3 | -11.1 64.1 166.1 280.3 65.8 79.1 112.6 131.3 335.0 88.5 79.8* Credit ... ... ... ... ... ... ... ... ... ... | 108.6 157.3 183.8 297.4 81.9 89.1 121.9 140.6 347.8 101.1 91.3* Debit ... ... ... ... ... ... ... ... ... ... | 119.7 93.2 17.7 17.0 16.1 10.0 9.4 9.3 12.7 12.7 11.5*Financial account 71.1 40.7 90.1 -12.7 133.2 22.5 332.8 968.6 392.4 401.0 | -453.4 -946.1 -670.5 -700.4 -534.5 -700.1 -595.5 -478.0 -201.3 -465.7 348.2* Direct investment -6.9 -1.1 4.7 45.5 131.5 42.6 182.0 208.9 377.1 189.6 | -437.6 -693.5 -292.9 -626.1 -232.9 -1,009.1 -579.0 78.1 -44.3 -336.7 511.6* Portfolio investment -1.3 1.2 -12.0 6.0 -9.5 2.3 -3.0 -28.3 -4.5 -13.9 | -27.1 0.3 -5.7 -4.8 -0.1 129.0 7.2 24.9 9.2 -25.0 -15.1* Financial derivatives 25.8 17.6 -5.1 -20.0 -20.5 – – – – – | – – 0.4 0.1 0.5 -5.3 -6.3 -2.8 0.4 -0.0 0.3* Other investment 53.5 23.1 102.5 -44.3 31.6 -22.3 153.8 788.0 19.8 225.3 | 11.2 -252.9 -372.2 -69.6 -302.0 185.2 -17.5 -578.2 -166.6 -104.1 -148.6*Net errors and omissions 0.9 8.0 -22.4 67.3 -22.8 62.4 160.2 -340.7 418.0 42.8 | -52.6 -466.4 305.7 37.1 389.7 210.4 385.5 -412.1 297.1 565.7 -203.4*Overall balance -14.1 -0.8 29.3 11.3 119.0 30.1 184.9 325.2 97.1 257.8 | 76.8 95.1 131.0 50.7 -265.9 -79.2 305.6 15.3 -163.6 46.7 -122.7*Reserves and related items 14.1 0.8 -29.3 -11.3 -119.0 -30.1 -184.9 -325.2 -97.1 -257.8 | -76.8 -95.1 -131.0 -50.7 265.9 79.2 -305.6 -15.3 163.6 -46.7 122.7*International investment position -1,866.9 -1,660.0 -1,811.8 -1,922.8 -2,031.6 -1,741.3 -1,922.9 -2,864.5 -2,828.3 -2,250.7 | -1,754.4 -2,762.1 -3,846.0 -5,114.1 -5,820.8 -6,646.1 -6,829.9 -7,265.9 -7,409.0 -7,512.6 -6,706.1*
Balance of Payments (% of GDP at current market prices) Exports 37.3 31.4 31.0 30.7 33.1 27.9 32.0 35.2 36.5 36.1 37.2 40.0 40.0 39.3 33.7 24.8 23.4 23.6 23.2 23.0 26.1* Imports 36.9 29.4 35.6 37.6 40.9 44.9 63.2 68.7 73.0 60.0 62.4 66.2 79.9 77.8 71.8 59.1 54.5 54.5 59.9 52.6 44.5* Balance on goods 0.3 2.0 -4.6 -6.9 -7.7 -17.0 -31.3 -33.6 -36.6 -23.9 -25.2 -26.2 -39.8 -38.6 -38.1 -34.3 -31.1 -30.9 -36.7 -29.6 -18.4* Current account balance -5.5 -1.2 -1.9 -2.2 1.3 -1.4 -9.3 -6.0 -13.8 -4.3 -6.5 -7.5 -15.6 -13.4 -17.1 -16.4 -11.5 -6.3 -12.1 -12.1 4.5* Overall balance -1.0 -0.1 1.8 0.6 5.4 1.2 6.5 8.6 1.9 5.5 1.6 1.6 2.0 0.7 -3.6 -1.2 4.5 0.2 -2.0 0.5 -1.6*
INTERNATIONAL RESERVES as of end of period ($ million)Total 261.8 286.5 317.3 399.3 564.5 612.4 817.2 1,176.7 1,224.7 1,584.8 1,720.4 1,835.1 2,066.0 2,238.4 1,957.5 1,777.9 1,969.8 2,177.0 2,156.0 2,424.7 2,809.7 Gold, national valuation 22.8 23.0 28.5 34.7 36.4 42.6 52.8 69.5 71.9 90.8 116.8 132.1 162.9 139.8 152.7 144.0 170.6 289.6 460.3 701.2 1,017.9 Foreign exchange 238.3 262.2 288.2 354.3 508.3 564.5 731.1 1,093.4 1,097.6 1,331.9 1,431.9 1,525.9 1,717.3 1,900.6 1,623.9 1,449.9 1,615.1 1,718.0 1,558.7 1,575.8 1,664.9 Reserve position in the IMF 0.0 0.0 0.0 0.0 0.0 0.0 0.0 0.0 0.0 0.0 0.0 0.0 0.0 0.0 0.0 0.0 0.0 0.1 0.2 0.2 0.4 SDRs 0.7 1.3 0.6 10.3 19.9 5.3 33.3 13.8 55.3 162.1 171.7 177.0 185.8 198.0 180.8 184.1 184.1 169.3 136.9 147.6 126.5
EXCHANGE RATES (Som–$)End of period 48.30 47.72 46.09 44.19 41.62 41.30 38.12 35.50 39.42 44.09 47.10 46.48 47.40 49.25 58.89 75.90 69.23 68.84 69.85 69.64 82.65 Average of period 47.70 48.38 46.94 43.65 42.65 41.01 40.15 37.32 36.57 42.90 45.96 46.14 47.00 48.44 53.65 64.46 69.91 68.87 68.84 69.79 77.35
9Key Indicators for Asia and the Pacific 2021
Kyrgyz RepublicItem 2000 2001 2002 2003 2004 2005 2006 2007 2008 2009 2010 2011 2012 2013 2014 2015 2016 2017 2018 2019 2020
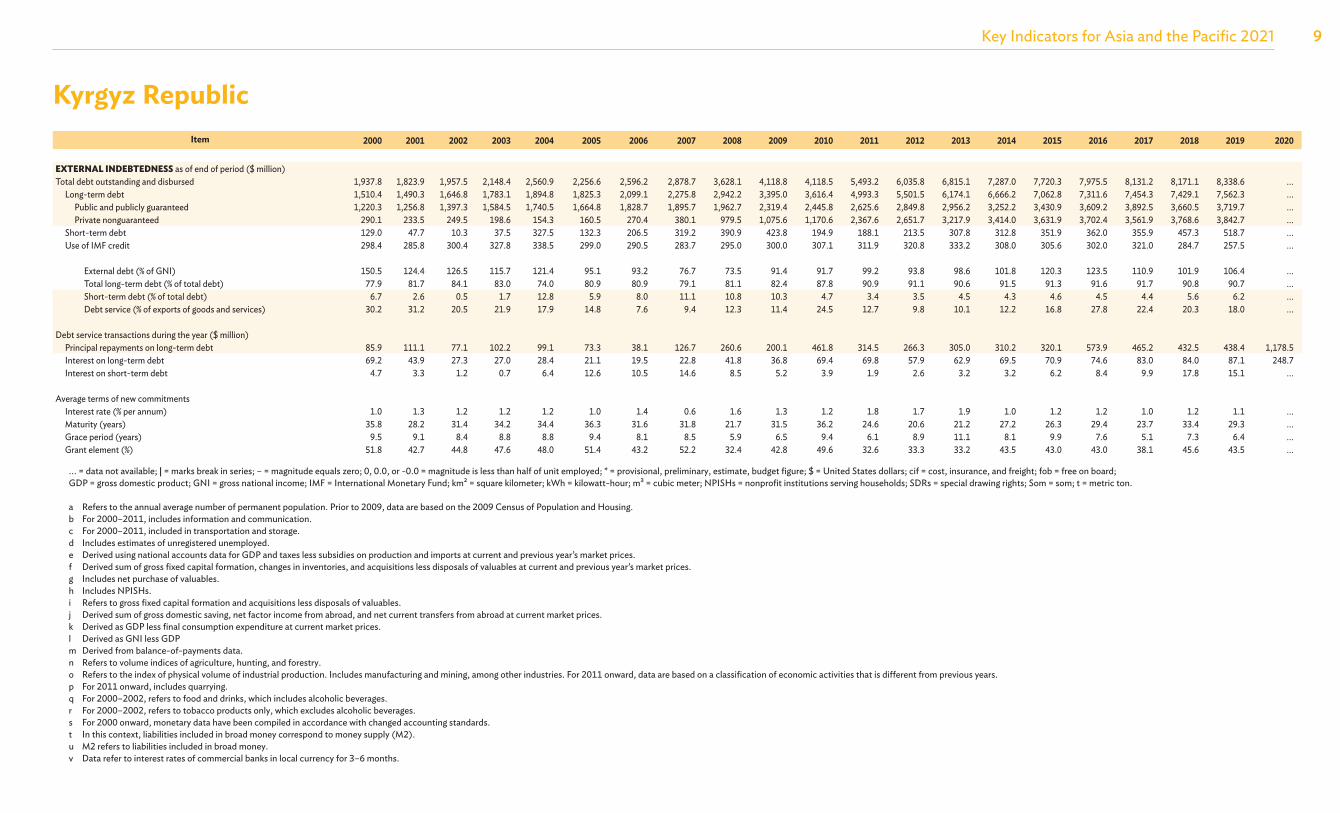
EXTERNAL INDEBTEDNESS as of end of period ($ million)Total debt outstanding and disbursed 1,937.8 1,823.9 1,957.5 2,148.4 2,560.9 2,256.6 2,596.2 2,878.7 3,628.1 4,118.8 4,118.5 5,493.2 6,035.8 6,815.1 7,287.0 7,720.3 7,975.5 8,131.2 8,171.1 8,338.6 ... Long-term debt 1,510.4 1,490.3 1,646.8 1,783.1 1,894.8 1,825.3 2,099.1 2,275.8 2,942.2 3,395.0 3,616.4 4,993.3 5,501.5 6,174.1 6,666.2 7,062.8 7,311.6 7,454.3 7,429.1 7,562.3 ... Public and publicly guaranteed 1,220.3 1,256.8 1,397.3 1,584.5 1,740.5 1,664.8 1,828.7 1,895.7 1,962.7 2,319.4 2,445.8 2,625.6 2,849.8 2,956.2 3,252.2 3,430.9 3,609.2 3,892.5 3,660.5 3,719.7 ... Private nonguaranteed 290.1 233.5 249.5 198.6 154.3 160.5 270.4 380.1 979.5 1,075.6 1,170.6 2,367.6 2,651.7 3,217.9 3,414.0 3,631.9 3,702.4 3,561.9 3,768.6 3,842.7 ... Short-term debt 129.0 47.7 10.3 37.5 327.5 132.3 206.5 319.2 390.9 423.8 194.9 188.1 213.5 307.8 312.8 351.9 362.0 355.9 457.3 518.7 ... Use of IMF credit 298.4 285.8 300.4 327.8 338.5 299.0 290.5 283.7 295.0 300.0 307.1 311.9 320.8 333.2 308.0 305.6 302.0 321.0 284.7 257.5 ...
External debt (% of GNI) 150.5 124.4 126.5 115.7 121.4 95.1 93.2 76.7 73.5 91.4 91.7 99.2 93.8 98.6 101.8 120.3 123.5 110.9 101.9 106.4 ... Total long-term debt (% of total debt) 77.9 81.7 84.1 83.0 74.0 80.9 80.9 79.1 81.1 82.4 87.8 90.9 91.1 90.6 91.5 91.3 91.6 91.7 90.8 90.7 ... Short-term debt (% of total debt) 6.7 2.6 0.5 1.7 12.8 5.9 8.0 11.1 10.8 10.3 4.7 3.4 3.5 4.5 4.3 4.6 4.5 4.4 5.6 6.2 ... Debt service (% of exports of goods and services) 30.2 31.2 20.5 21.9 17.9 14.8 7.6 9.4 12.3 11.4 24.5 12.7 9.8 10.1 12.2 16.8 27.8 22.4 20.3 18.0 ...
Debt service transactions during the year ($ million) Principal repayments on long-term debt 85.9 111.1 77.1 102.2 99.1 73.3 38.1 126.7 260.6 200.1 461.8 314.5 266.3 305.0 310.2 320.1 573.9 465.2 432.5 438.4 1,178.5 Interest on long-term debt 69.2 43.9 27.3 27.0 28.4 21.1 19.5 22.8 41.8 36.8 69.4 69.8 57.9 62.9 69.5 70.9 74.6 83.0 84.0 87.1 248.7 Interest on short-term debt 4.7 3.3 1.2 0.7 6.4 12.6 10.5 14.6 8.5 5.2 3.9 1.9 2.6 3.2 3.2 6.2 8.4 9.9 17.8 15.1 ...
Average terms of new commitments Interest rate (% per annum) 1.0 1.3 1.2 1.2 1.2 1.0 1.4 0.6 1.6 1.3 1.2 1.8 1.7 1.9 1.0 1.2 1.2 1.0 1.2 1.1 ... Maturity (years) 35.8 28.2 31.4 34.2 34.4 36.3 31.6 31.8 21.7 31.5 36.2 24.6 20.6 21.2 27.2 26.3 29.4 23.7 33.4 29.3 ... Grace period (years) 9.5 9.1 8.4 8.8 8.8 9.4 8.1 8.5 5.9 6.5 9.4 6.1 8.9 11.1 8.1 9.9 7.6 5.1 7.3 6.4 ... Grant element (%) 51.8 42.7 44.8 47.6 48.0 51.4 43.2 52.2 32.4 42.8 49.6 32.6 33.3 33.2 43.5 43.0 43.0 38.1 45.6 43.5 ...
... = data not available; | = marks break in series; – = magnitude equals zero; 0, 0.0, or -0.0 = magnitude is less than half of unit employed; * = provisional, preliminary, estimate, budget figure; $ = United States dollars; cif = cost, insurance, and freight; fob = free on board; GDP = gross domestic product; GNI = gross national income; IMF = International Monetary Fund; km² = square kilometer; kWh = kilowatt-hour; m³ = cubic meter; NPISHs = nonprofit institutions serving households; SDRs = special drawing rights; Som = som; t = metric ton. a Refers to the annual average number of permanent population. Prior to 2009, data are based on the 2009 Census of Population and Housing. b For 2000–2011, includes information and communication. c For 2000–2011, included in transportation and storage. d Includes estimates of unregistered unemployed. e Derived using national accounts data for GDP and taxes less subsidies on production and imports at current and previous year’s market prices. f Derived sum of gross fixed capital formation, changes in inventories, and acquisitions less disposals of valuables at current and previous year’s market prices. g Includes net purchase of valuables. h Includes NPISHs. i Refers to gross fixed capital formation and acquisitions less disposals of valuables. j Derived sum of gross domestic saving, net factor income from abroad, and net current transfers from abroad at current market prices. k Derived as GDP less final consumption expenditure at current market prices. l Derived as GNI less GDP m Derived from balance-of-payments data. n Refers to volume indices of agriculture, hunting, and forestry. o Refers to the index of physical volume of industrial production. Includes manufacturing and mining, among other industries. For 2011 onward, data are based on a classification of economic activities that is different from previous years. p For 2011 onward, includes quarrying. q For 2000–2002, refers to food and drinks, which includes alcoholic beverages. r For 2000–2002, refers to tobacco products only, which excludes alcoholic beverages. s For 2000 onward, monetary data have been compiled in accordance with changed accounting standards. t In this context, liabilities included in broad money correspond to money supply (M2). u M2 refers to liabilities included in broad money. v Data refer to interest rates of commercial banks in local currency for 3–6 months.

10 Key Indicators for Asia and the Pacific 2021
Kyrgyz Republic w For 2016–2017, not equal to sum of revenues and grants due to inclusion of contributions/deductions for social needs. x Includes balance of special funds, budget and mutual funds, and other revenue items other than official grants. y For 2007 onward, overall budgetary surplus/deficit excludes net lending. z Refers to residual of financing and domestic and foreign borrowing. aa Includes internal security. ab For 2007 onward, consists of expenses for the acquisition of nonfinancial assets and environmental protection. ac For 2000–2009, data are based on the IMF’s Balance of Payments Manual (fifth edition). For 2010 onward, data are based on the IMF’s Balance of Payments and International Investment Position Manual (sixth edition). In addition, for 2000 onward, data have been revised due to adjustment of unrecorded imports from the People’s Republic of China, and improved coverage of private external debt statistics.
Sources: Population National Statistical Committee of the Kyrgyz Republic (NSC). Official communication, 15 March 2021; past communication. Labor Force NSC. Official communication, 15 March 2021; past communication; official website. http://www.stat.kg/en/statistics/ (accessed 24 May 2021). National Accounts NSC. Official communication, 15 March 2021; past communication; official website. http://www.stat.kg/en/statistics/ (accessed 24 May 2021). Structure of Output Asian Development Bank estimates using data from the NSC. Growth of Output For 2000–2018: NSC. Official communication, 15 March 2021; past communication; official website. http://www.stat.kg/en/statistics/ (accessed 24 May 2021). For 2019–2020: Asian Development Bank estimates. Production Index Agriculture Food and Agriculture Organization of the United Nations. FAOSTAT Database. http://www.fao.org/faostat/en/#data (accessed 9 June 2020) Industry NSC. Official communication, 15 March 2021; past communication. Mining Manufacturing Energy NSC. Official communication, 15 March 2021; past communication. Price Indexes NSC. Official communication, 15 March 2021; past communication. Money and Interest Rates National Bank of the Kyrgyz Republic (NBKR). Official Communication, 29 March 2021; past communication. Government Finance NSC. Official communication, 15 March 2021; past communication. External Trade NSC. Official communication, 15 March 2021; past communication. Direction of Trade International Monetary Fund (IMF). Direction of Trade Statistics. http://data.imf.org/ (accessed 28 May 2021) Balance of Payments For 2000–2019: NBKR. Official communication, 21 April 2020; past communication. For 2020: NBKR. Official Communication, 29 March 2021; past communication. International Reserves IMF. International Financial Statistics. http://data.imf.org/ (accessed 8 June 2021). Exchange Rates For 2000–2019: IMF. International Financial Statistics. http://data.imf.org/ (accessed 19 June 2020). For 2020: IMF. International Financial Statistics. http://data.imf.org/ (accessed 8 June 2021). External Indebtedness World Bank. International Debt Statistics. https://data.worldbank.org/products/ids (accessed 8 June 2021).