List of tables
169
1 Doctoral Dissertation Politecnico di Torino, DENERG, Torino IT Instituto de Técnicas Energéticas, Universidad Politécnica de Catalunya, Barcelona SP SELECT+ PhD Programme Carbon Capture, Utilization, and Storage (CCUS) and how to Accelerate the Development and Commercialization of Carbon Capture Technologies and Carbon-Based Products in the European and United States Markets Alicia Soto (32 nd Cycle) Supervisors Prof. Massimo Santarelli (POLITO), Supervisor Prof. Ignasi Casanova (UPC), Supervisor Doctoral Examination Committee: Prof. Dr. Marc A. Rosen, University of Ontario Institute of Technology, Canada Prof. Dr. Adam D. Hawkes, Imperial College, UK Politecnico di Torino June 29 th , 2021 UNIVERSITAT POLITÈCNICA DE CATALUNYA BARCELONA TECH
-
Upload
khangminh22 -
Category
Documents
-
view
0 -
download
0
Transcript of List of tables

1
Doctoral Dissertation Politecnico di Torino, DENERG, Torino IT
Instituto de Técnicas Energéticas, Universidad Politécnica de Catalunya, Barcelona SP
SELECT+ PhD Programme
Carbon Capture, Utilization, and Storage (CCUS) and how to Accelerate the
Development and Commercialization of Carbon Capture Technologies and
Carbon-Based Products in the European and United States Markets
Alicia Soto
(32nd Cycle)
Supervisors Prof. Massimo Santarelli (POLITO), Supervisor
Prof. Ignasi Casanova (UPC), Supervisor
Doctoral Examination Committee:
Prof. Dr. Marc A. Rosen, University of Ontario Institute of Technology, Canada
Prof. Dr. Adam D. Hawkes, Imperial College, UK
Politecnico di Torino
June 29th, 2021
UNIVERSITAT POLITÈCNICADE CATALUNYABARCELONA TECH

2
his thesis is licensed under the Creative Commons License Attribution; Non-commercial- No
Derivative Works 4.0 International: see http://www.creativecommons.org. The text may be
reproduced for non-commercial purposes, if credit is given to the original author.
I hereby declare that the content and organization of this dissertation constitutes my own
original work and does not compromise in any way the rights of third parties, including those relating
to the security of personal data.
------------------------------------------
Alicia Soto
Los Angeles, CA, June 29, 2021

3
SUMMARY
Global warming and climate change concerns have triggered international efforts to reduce the
amount and concentration of CO2 emissions to ward-off massive economic and environmental
damages. In recent years, the development of efficient and cost-effective technologies for reducing
anthropogenic CO2 emissions have been gaining momentum all over the world.
The main subject of this work revolves around the CO2 molecule, a low-value, low-energy,
stable waste gas, often available in large quantity in single locations. This work examines some
viable avenues to capture, utilize, and store CO2 (CCUS)- with the ultimate goal of reducing GHGs
emissions and global warming. Moreover, the study also examines various paths to accelerate the
commercialization of the carbon-based products and their technologies.
Currently CCU technologies are experiencing various stages of performance and maturity;
nonetheless, there are significant advancements in CCU technologies that have progressed in the past
ten years; various technologies showing promising commercial scalability and advanced mobility
features. Furthermore, the swift decline of costs for many renewable sources (mainly solar and wind)
has made low-cost, near-zero-carbon electricity abundant in terms of capacity and locality.
Consequently, this has driven some markets to offer electricity at affordable cost and, in some cases
even negative prices. Because renewable electricity is gradually decreasing in price, there has been
an increase cognizance on prospective new applications, (e.g., CCU and CCUS) considering turning
this trend into a profitable venture.
This work focuses on six major aspects related to emerging renewable energy based CCUS
processes and technologies:
1. A thorough investigation of three emerging renewable energy technologies and processes
(RETP) (i.e., biogas & fuel cells, synthetic fuels, mineral carbonation of fly ashes) that fall into the
CCUS paradigm and are either special, relatively new, or advanced forms of the mainstream energy
sources. Each RETP CCUS’s explanation is followed by its market share, challenges, implications
for increased adoption, prospects, and drawbacks.
2. Analysis of experimental work related to the direct use of CO2-containing fuel of biological
origins to supply an electrochemical process devoted to the production of power at high efficiency.
Furthermore, the work analyzes a case study called DEMOSOFC located at a wastewater treatment
plant (WWTP) in Torino, Italy. It looks at the production of energy by utilizing biogas produced at
WWTPs and reports findings of the use of Carbon (contained in CO2) as it is to produce power and
heat (in CHP configuration) using fuel cells; specifically, solid oxide fuel cells.
3. Analysis of experimental and modeling work done at Politecnico di Torino linked to the use
of the Carbon molecule to produce synthetic fuels (e-methane (CH4) and e-methanol (CH3OH)) by
means of two processes: steam electrolysis + methanation, and steam electrolysis + methanol
production.

4
4. Analysis of the chemical process called mineral carbonation (MC), a carbon capture
utilization and storage (CCUS) technology that can capture large quantities of CO2 and convert it
into stable carbonate products that can easily be used in the cement and concrete market. The work
brings forward pragmatic evidence that MC production has the potential to deliver net positive
revenue and its commercial feasibility is a realistic venture. However, the prospective of a new
direction of cementation by the carbonation of FA is still maturing but with great potential for
accelerated commercialization. The intensification of environmental and economic benefits
generated by this new pathway for cementation are substantial if compared to the current methods
of using FA in the construction industry. Yet, existing carbon policies and regulations, restricting the
use of fly ashes (mainly those ashes containing larger quantities of calcium-HCFA) can impact the
progress of carbon capture technologies and the commercialization of carbon-based products.
5. The examination of the potential commercialization of CCUS technologies by identifying
four major markets and eight product categories critical to driving further investments and innovation
at an accelerated pace. Funding and incentives are necessary for most of these products to accelerate
development and achieve full-scale commercial roll out capability. The major markets and product
discussed in this chapter are: (1) Markets- Building materials, chemical intermediates, fuels,
polymers (2) Products- carbonate aggregates, methanol, formic acid, syngas, liquid fuels, methane,
polyols and polycarbonates.
6. It assesses the continuing increase in RETP CCUS despite the Covid-19 pandemic resulting
from a mixture of past policies, regulations, incentives, and innovations embedded in the power
sectors of many forward-thinking countries. Furthermore, it looks at the future of RETP CCUS post-
pandemic period.

5
SOMMARIO
Le preoccupazioni per il riscaldamento globale e il cambiamento climatico hanno innescato gli
sforzi internazionali per ridurre la quantità e la concentrazione delle emissioni di CO2 per scongiurare
enormi danni economici e ambientali. Negli ultimi anni, lo sviluppo di tecnologie efficienti e
convenienti per ridurre le emissioni di CO2 antropogeniche ha preso piede in tutto il mondo.
L'argomento principale di questo lavoro ruota intorno alla molecola di CO2, un gas di scarto a
basso valore, a bassa energia e stabile, spesso disponibile in grandi quantità in singole località.
Questo lavoro esamina alcune strade percorribili per catturare, utilizzare e immagazzinare la CO2
(CCUS), con l'obiettivo finale di ridurre le emissioni di gas serra e il riscaldamento globale. Inoltre,
lo studio esamina anche vari percorsi per accelerare la commercializzazione dei prodotti a base di
carbonio e delle loro tecnologie.
Attualmente le tecnologie CCU stanno vivendo vari stadi di performance e maturità; tuttavia,
ci sono progressi significativi nelle tecnologie CCU che hanno progredito negli ultimi dieci anni;
varie tecnologie che mostrano una promettente scalabilità commerciale e caratteristiche di mobilità
avanzate. Inoltre, il rapido declino dei costi di molte fonti rinnovabili (principalmente solare ed
eolico) ha reso l'elettricità a basso costo e quasi a zero emissioni di carbonio abbondante in termini
di capacità e località. Di conseguenza, questo ha spinto alcuni mercati a offrire elettricità a costi
accessibili e, in alcuni casi, anche a prezzi negativi. Poiché l'elettricità rinnovabile sta gradualmente
diminuendo di prezzo, c'è stato un aumento della conoscenza delle nuove applicazioni potenziali,
(per esempio, CCU e CCUS) considerando di trasformare questa tendenza in un'impresa redditizia.
Questo lavoro si concentra su sei aspetti principali relativi ai processi e alle tecnologie emergenti
di CCUS basati sull'energia rinnovabile:
1. Un'indagine approfondita di tre tecnologie e processi emergenti di energia rinnovabile
(RETP) (cioè, biogas e celle a combustibile, combustibili sintetici, carbonatazione minerale di ceneri
volanti) che rientrano nel paradigma CCUS e sono speciali, relativamente nuovi, o forme avanzate
delle fonti di energia tradizionali. La spiegazione di ogni RETP CCUS è seguita dalla sua quota di
mercato, dalle sfide, dalle implicazioni per una maggiore adozione, dalle prospettive e dagli
svantaggi.
2. Analisi del lavoro sperimentale relativo all'uso diretto del combustibile contenente CO2
di origine biologica per alimentare un processo elettrochimico dedicato alla produzione di energia
ad alta efficienza. Inoltre, il lavoro analizza un caso di studio chiamato DEMOSOFC situato in un
impianto di trattamento delle acque reflue (WWTP) a Torino, Italia. Esso esamina la produzione di
energia utilizzando il biogas prodotto presso il WWTP e riporta i risultati dell'uso del carbonio
(contenuto nella CO2) per produrre energia e calore (in configurazione CHP) utilizzando celle a
combustibile; in particolare, celle a combustibile a ossido solido.

6
3. Analisi del lavoro sperimentale e modellistico svolto presso il Politecnico di Torino
legato all'utilizzo della molecola del Carbonio per produrre combustibili sintetici (e-metano (CH4)
ed e-metanolo (CH3OH)) attraverso due processi: elettrolisi a vapore + metanazione, ed elettrolisi a
vapore + produzione di metanolo.
4. Analisi del processo chimico chiamato carbonatazione minerale (MC), una tecnologia di
cattura, utilizzo e stoccaggio del carbonio (CCUS) che può catturare grandi quantità di CO2 e
convertirla in prodotti carbonati stabili che possono essere facilmente utilizzati nel mercato del
cemento e del calcestruzzo. Il lavoro porta avanti la prova pragmatica che la produzione MC ha il
potenziale per fornire un reddito netto positivo e la sua fattibilità commerciale è un'impresa realistica.
Tuttavia, la prospettiva di una nuova direzione di cementazione tramite la carbonatazione di FA è
ancora in fase di maturazione ma con un grande potenziale di commercializzazione accelerata.
L'intensificazione dei benefici ambientali ed economici generati da questo nuovo percorso per la
cementazione sono sostanziali se paragonati agli attuali metodi di utilizzo dell'AF nell'industria delle
costruzioni. Tuttavia, le politiche e i regolamenti esistenti sul carbonio, che limitano l'uso delle ceneri
volanti (principalmente quelle ceneri che contengono maggiori quantità di calcio-HCFA) possono
avere un impatto sul progresso delle tecnologie di cattura del carbonio e sulla commercializzazione
dei prodotti a base di carbonio.
5. L'esame della potenziale commercializzazione delle tecnologie CCUS identificando
quattro mercati principali e otto categorie di prodotti critici per guidare ulteriori investimenti e
innovazione ad un ritmo accelerato. I finanziamenti e gli incentivi sono necessari per la maggior
parte di questi prodotti per accelerare lo sviluppo e raggiungere una capacità di lancio commerciale
su larga scala. I principali mercati e prodotti discussi in questo capitolo sono: (1) Mercati - materiali
da costruzione, intermedi chimici, combustibili, polimeri (2) Prodotti - aggregati carbonati,
metanolo, acido formico, syngas, combustibili liquidi, metano, polioli e policarbonati.
6. Valuta il continuo aumento di RETP CCUS nonostante la pandemia di Covid-19
derivante da una miscela di politiche passate, regolamenti, incentivi e innovazioni incorporati nei
settori energetici di molti paesi lungimiranti. Inoltre, guarda al futuro di RETP CCUS dopo la
pandemia.

7
Acknowledgements
This research was partially funded by Erasmus Mundus Joint Doctoral Programme
Environomical Pathways for Sustainable Energy Services (SELECT+).
Additional research and mobility funding are provided by POLITO, UPC and InnoEnergy
PhD school.
Publications (Journal articles):
1. Parigi D., Giglio E., Soto A., Santarelli M., Power-to-fuels through CO2 utilization and
high-temperature electrolysis: A technical and economical comparison between synthetic methanol and methane, Journal of Cleaner Production, Volume 226, 20 July 2019, Pages 679-691
2. Gandiglio M., Lanzini A., Soto A., Leone P., Santarelli M., Enhancing the energy efficiency of wastewater treatment plants through co-digestion and fuel cell systems, Frontiers in Environmental Science, Volume 5, 30 October 2017, Article number 70
Publications (Conference Proceedings):
1. EU-SPRI2019: The changing entrepreneurial finance landscape: challenges for policy
conference- September 24-25, 2019; Turin, IT. Extended abstract for submission: “Carbon capture utilization and storage (CCUS) and the effects financial markets, regulatory framework, and policy changes have in the commercial acceleration of carbon-based products in the concrete/construction industry in the U.S. and European markets.
2. IRMBAM: International Research Meeting in Business and Management- April 2017. Paper submitted: “Analysis of waste treatment sector as a driver for SOFC cost reduction and commercialization”.
3. ISEFI: International Symposium on Environmental and Energy Finance Issues- March 2017. Paper submitted: “Analysis of waste treatment sector as a driver for SOFC cost reduction and commercialization”
4. InnoEnergy Iberdrola Challenge 2017. Paper submitted: “From sludge to energy: the nexus between renewable energy technologies and decentralized wastewater treatment facilities for the sustainable development of third-world countries”

8
TABLE OF CONTENTS
CHAPTER 1. INTRODUCTION AND OVERVIEW 18
1.2. THE CCU MARKET 24
1.3. RENEWABLE ENERGY TECHNOLOGIES, THEIR MARKET, AND THE COVID19 PANDEMIC 26
1.4. BIOGAS PRODUCTION AND UTILIZATION AT FULL-SCALE WASTEWATER TREATMENT PLANT 29
51.. POWER-TO-FUEL THROUGH CARBON DIOXIDE RE-UTILIZATION AND HIGH-TEMPERATURE ELECTROLYSIS: TECHNICAL AND
ECONOMICAL COMPARISON BETWEEN SYNTHETIC METHANOL AND METHANE 31
1.6. MINERAL CARBONATION OF HIGH CALCIUM FLY ASH 34
1.7. CARBONATED FLY ASH MARKETS 35
1.8. POLICIES AND REGULATORY FRAMEWORK 36
1.9. THESIS PLAN 37
CHAPTER 2. STATE OF THE ART FOR CCU TECHNOLOGIES 39
2.1. CARBON CAPTURE TECHNOLOGIES 41
2.2. CARBON DIOXIDE UTILIZATION (CO2U) 42
2.3. CONVERSION PROCESSES 44
2.3..1 .CONVERSION TO INORGANIC PRODUCTS (MINERAL CARBONATION) 44
2.3.2. CHEMICAL UTILIZATION 45
2.3..3. BIOLOGICAL UTILIZATION 45
2.4. CONVERSION PROCESSES FOR SPECIFIC CARBON-BASE PRODUCTS 45
2.4.1. CONVERSION OF CO2 INTO FUELS AND CHEMICALS 45
2.4.2. EMERGING TECHNOLOGIES FOR CO2 CONVERSION INTO CHEMICALS AND FUELS BASED ON PRODUCT 46
2.5. METHANE PRODUCTION 47
2.6. FUEL (HYDROCARBON) PRODUCTION 47
2.7. CONSTRUCTION MATERIALS AND MINERALS 48
CHAPTER 3. BIOGAS PRODUCTION AND UTILIZATION AT FULL-SCALE WWTP 50
3.1 KINETICS 51
3.2 CATALYSTS 52
3.3. PRODUCTION OF BIOGAS 53
3.3.1 TECHNICAL ASSESSMENT OF A COHESIVE ANAEROBIC DIGESTER AND SOLID OXIDE FUEL CELL (SOFC) SYSTEM 54
3.4. CASE STUDY (DEMOSOFC) 55
3.5. ANALYSIS OF WASTE TREATMENT SECTOR AS A DRIVER FOR SOFC COST REDUCTION 56
3.5.1 GENERAL FUEL CELL BACKGROUND 57

9
3.5.2 THE WWTP AS A ‘STARTING MARKET’ FOR THE SOFC TECHNOLOGY 58
3.5.3 RENEWABLE ENERGY FINANCIAL SCHEMES 63
3.5.4 METHODOLOGY 64
3.5.6 EVALUATION OF THE SOFC SYSTEM ANNUAL COSTS AT DIFFERENT PRODUCTION VOLUMES 66
3.5.7 RESULTS 69
CHAPTER 4. POWER-TO-FUEL THROUGH CO2 REUTILIZATION & HIGH-
TEMPERATURE ELECTROLYSIS TECHNICAL AND ECONOMICAL COMPARISON BETWEEN
SYNTHETIC METHANOL AND METHANE
4.1. CO2 CAPTURE AND CO2 NEUTRAL FUELS 74
4.2. E-FUELS-RELATED TECHNOLOGIES 75
4.3 METHODOLOGY 79
4.3.1. METHANE PRODUCTION 79
4.3.2. METHANOL PRODUCTION 81
4.4. TECHNOLOGY DESCRIPTION 83
4.4.1. ELECTROLYSIS 83
4.4.2. FUEL SYNTHESIS 84
4.4.3. UPGRADING 85
4.4. EFFICIENCY ANALYSIS AND THERMAL INTEGRATION 86
4.5. ECONOMIC METHODOLOGY 87
4.5.1. COST ESTIMATION METHODOLOGY 87
4.5.2. CALCULATION ASSUMPTIONS 89
4.6. RESULTS AND DISCUSSION 92
4.6.1. THERMAL INTEGRATION AND PLANTS ENERGY PERFORMANCE 92
4.6.2. ECONOMIC RESULTS 95
CHAPTER 5. MINERAL CARBONATION OF FLY ASH 100
5.1. MINERAL CARBONATION 102
5.2 FLY ASH 105
5.3 FLY ASH UTILIZATION 111
5.4 COAL POWER PLANTS AND CO2 EMISSIONS IN U.S., E.U, AND CHINA 113
5.5 CCP PRODUCTION AND UTILIZATION IN THE U.S. AND EU 115
5.6 REGULATORY FRAMEWORK IN EU AND US AND FLY ASH MANAGEMENT 116
5.6.1 FLY ASH MANAGEMENT 116
5.6.2 FLY ASH REGULATORY FRAMEWORK- U.S. AND E.U. 117

10
5.6.3. HIGH CALCIUM FLY ASH REGULATORY FRAMEWORK- U.S. AND EU 120
5.6.4. MINERAL CARBONATION OF HIGH CALCIUM FLY 122
5.6.5. MARKET CONSIDERATIONS FOR CARBONATED FLY ASHES 122
CHAPTER 6. MARKET, COSTS, AND POLICIES ON CCUS U.S_VS._E.U 125
6.1 CARBON REMOVAL WITH CCS TECHNOLOGIES 125
6.1.1. WHAT DOES CARBON REMOVAL MEAN? 126
6.2. THE TWOFOLD TASK OF CCS IN CLIMATE CHANGE MITIGATION 126
6.2.1. REDUCING EMISSIONS 126
6.3 CIRCULAR CARBON ECONOMY 127
6.4. CO2 UTILIZATION AND STORAGE PATHWAYS 128
6.5. CO2 UTILIZATION, STORAGE, AND THE CARBON CYCLE 129
6.6. COST OF CARBON CAPTURE 130
6.6.1. THE IMPORTANCE OF LIMITING SYSTEM COST 131
6.6.2. THE ROLE OF TECHNOLOGY DEPLOYMENT IN COST REDUCTIONS 132
6.7. ECONOMIES OF SCALE 132
6.8. OVERCOMING THE TECHNOLOGY ‘VALLEY OF DEATH’: THE ROLE OF A VALUE ON CARBON 133
6.9. HOW TO ACCELERATE THE COMMERCIALIZATION OF CCS TECHNOLOGIES 134
6.9.1. CLOSING THE GAP BETWEEN SYNTHETIC FUEL AND FOSSIL FUEL 134
6.10. CARBON PRICING 135
6.11. UNDERSTANDING EU’S ETS 138
6.12. UNDERSTANDING CARBON PRICING IN THE U.S. 140
6.12.1. THE THREE PILLARS OF US CCS POLICY 142
6.13. CCS INFRASTRUCTURE 143
6.13.1. HISTORY OF ENACTED CCS POLICY IN THE U.S. 143
6.13.2. MAJOR CCS BILLS INTRODUCED IN 2021 144
6.13.3. LINKING EU AND US EMISSION TRADING SYSTEM 145
CHAPTER 7. CONCLUSIONS 148
7.1 BIOGAS PRODUCTION TO GENERATE ELECTRICITY AND HEAT BY USING FUEL CELLS: 149
7.2. PRODUCTION OF SYNTHETIC FUEL- METHANE AND METHANOL 150
7.3. PRODUCTION OF CARBONATED FLY ASH 151
7.4. FINAL REMARKS 152
8. REFERENCES 153

11
LIST OF ACRONYMS, PARAMETERS AND SUBSCRIPTS
Acronyms
CHP Combined heat and power
EL Electrolyzer
EMS Energy management strategy
EPS Electro Power System
EU European Union
FC Fuel cell
GDP Gross domestic product
GHG Greenhouse gas
G2P Gas to power
LCOE Levelized cost of energy
LF Load factor
LHV Lower heating value
NPC Net present cost
OM Operation and maintenance
PEMFC PEM fuel cell
PV Photovoltaic
P2C Power-to-chemicals
P2G Power-to-gas
P2L Power-to-liquid
P2X Power-to-X
RES Renewable energy source
WT Wind turbine
XRD X-Ray powder diffraction
Parameters
A heat exchange area (m2)
BEC bare erected cost ($)
C cost ($ MWh-1) or ($ kg-1)
CF Cash flow ($)
Cp purchasing equipment cost for components operating at base
conditions ($)
DA gas diffusivity (m2 s-1)
De diffusion coefficient (m2 s-1)
Dep depreciation

12
Dp diameter of the catalyst particle (m)
E chemical energy (MWh)
EPCC engineering, procurement and construction cost ($)
Exp operating expenses ($)
f cost scaling factor
FM Material factor
Fp Pressure factor
h
molar enthalpy (J mol-1)
k’ ratio between the rate constant calculated with the LHHW
expression and the concentration of the reactant in the catalyst
volume (s-1)
LHV
lower heating value (J kg-1)
n
molar flow rate (mol s-1)
NPV
net present value ($)
Rev
operating revenues ($)
rt
tax rate
S
equipment cost attribute
TOC
total overnight capital ($)
TPC
total plant cost ($)
Tx
taxes ($)
U
global heat transfer coefficient (kW m-2 K-1)
UF
utilization factor
W
power (W)
ΔTml
logarithmic mean temperature difference (K)
η
efficiency
τi
Tortuosity coefficient
φ
Thiele modulus
𝛷
heat flow rate (kW)
Subscripts
0
base conditions

13
an
anode
cat
cathode
compr
compression
el
electrical
in
inlet
LT
lifetime
min
minimum
n
reference year
out
outlet
PP
pinch point
prod
product

14
LIST OF TABLES
TABLE 1. ATMOSPHERIC LIFETIME AND SOURCES OF THREE MAJOR GHG’S [5] ................... 19
TABLE 2. SUMMARY OF ANNUAL WET AND GASEOUS RESOURCE AVAILABILITY IN U.S ..... 62
TABLE 3. INPUT PARAMETERS FOR THE BASE CASE SCENARIO. ............................................. 65
TABLE 4. CASE STUDIES DEFINITION, IN RELATION TO BIOGAS PRODUCTION ....................... 66
TABLE 5. MARKET ASSESSMENT: CRITERIAL FOR SELECTING TECHNOLOGIES ……………76
TABLE 6. PINCH ANALYSIS RESULTS FOR BOTH PLANTS ....................................................... 93
TABLE 7. EFFICIENCY COMPARISON BETWEEN THE ANALYZED PLANTS ................................ 94
TABLE 8. METHANATION PLANT .......................................................................................... 95
TABLE 9. METHANOL PRODUCTION PLANT .......................................................................... 96
TABLE 10. COST COMPARISON BETWEEN THE PLANTS .......................................................... 96
TABLE 11. SOME DEFINITION OF FLY ASH TYPES ACCORDING TO EN 197-1+ASTM C618 . 108
TABLE 12. TYPICAL VALUES FOR FLY ASH TYPE F AND TYPE C ………………………….109
TABLE 13. CHEMICAL COMPOSITION FOR FA PRODUCED BY DIFFERENT COAL TYPES ......... 110

15
LIST OF FIGURES
FIG. 1.GLOBAL AVERAGE TEMPERATURE ANOMALY [3] ........................................... 19
FIG. 2. ANNUAL CO2 EMISSIONS GROWTH [3] .......................................................... 20
FIG. 3. GLOBAL GHG EMISSIONS BY GAS [6] ........................................................... 21
FIG. 4. WHERE DO GHG GLOBAL EMISSIONS COME FROM-2016 [3] ......................... 21
FIG. 5. WHERE DO GHG GLOBAL EMISSIONS COME FROM-2017 [3] ......................... 22
FIG. 6. SUMMARY OF CO2 CAPTURE TECHNOLOGIES [8] .......................................... 23
FIG. 7. CLIMATE POLICIES WILL REDUCE GHG EMISSIONS, BUT NOT QUICKLY
ENOUGH TO REACH GLOBAL TARGETS [3] .......................................................... 24
FIG. 8. POTENTIAL CO2 REDUCTION OF CO2 EMISSION DUE TO IMPLEMENTING
STRATEGIC ACTIONS KEY [11] ............................................................................ 25
FIG. 9. POTENTIAL INCREASE IN MARKET SIZE DUE TO IMPLEMENTATION OF
STRATEGIC ACTIONS KEY [11] ............................................................................ 26
FIG. 10. ACROSS THE WORLD, RENEWABLE ENERGY DEMAND JUMPED AFTER THE
COVID-19 LOCKDOWN, [15] ............................................................................... 28
FIG. 11. VALUE-ADDED ANAEROBIC DIGESTION OF BIOMASS-TO-BIOGAS,
BIOMETHANE, ELECTRICITY, C-RICH AND ...... FERTILIZERS AND ALGAE-DERIVED
VALUE-ADDED PRODUCTS [27] .......................................................................... 30
FIG. 12. SYNTHETIC METHANE FROM CAPTURED CO2 USING RENEWABLE ENERGY
[41] ..................................................................................................................... 33
FIG. 13. METHANOL FUEL FROM CO2- SYNTHESIS CAPTURED CO2 USING SURPLUS
ELECTRICITY [41] ................................................................................................ 33
FIG. 14. COST BREAKDOWN FOR E-FUELS [5] ............................................................ 35
FIG. 15. CARBON CAPTURE, UTILIZATION AND STORAGE (CCUS) [61] ................... 40
FIG. 16. CO2 UTILIZATION ECOSYSTEM [68] ............................................................ 40
FIG. 17. CO2 CAPTURE PROCESSES [9] .................................................................... 42
FIG. 18. OPTIONS FOR REDUCING CO2 EMISSIONS OR CAPTURING EMITTED CO2
FROM THE ATMOSPHERE [63] ............................................................................. 43
FIG. 19. ROUTES FOR DIRECT AND INDIRECT CONVERSION OF CCU PROCESSES AND
SOURCES OF CO2 [81] ........................................................................................ 44

16
FIG. 20. EX. OF ROUTES FOR DIRECT AND INDIRECT CONVERSION OF CO2 INTO FUELS
AND CHEMICALS [81] .......................................................................................... 48
FIG. 21. ROUTES FOR THE CONVERSION OF CARBON DIOXIDE INTO CONSTRUCTION
MATERIALS [81] .................................................................................................. 49
FIG. 22. WASTE-TO-ENERGY PRODUCTION SYSTEM AT SMAT’S WWTP
(DEMOSOFC) ................................................................................................... 56
FIG. 23. WWTP DATABASE FOR EUROPE [152] ........................................................ 60
FIG. 24. SPATIAL DISTRIBUTION AND INFLUENT RANGE OF 15,014 PNNL
CATALOGUED TREATMENT PLANTS [153] .......................................................... 61
FIG. 25. RESULTS FOR THE ANNUAL COSTS EVALUATION FOR DIFFERENT UNITS
PRODUCED. ......................................................................................................... 67
FIG. 26. SENSITIVITY ANALYSIS ON INFLUENCE OF ELECTRICITY PRICE (IN €/KWH)
ON ANNUAL SAVINGS .......................................................................................... 68
FIG. 27. LEARNING CURVES FOR SOFC SPECIFIC INVESTMENT COST, STACK
REPLACEMENT COST AND MAINTENANCE COST [165] ........................................ 70
FIG. 28. SOFC INSTALLATIONS AND FINAL INVESTMENT COST FOR THE DIFFERENT
SCENARIOS. ......................................................................................................... 71
FIG. 29. TECHNICAL AND ECONOMIC LAYOUT OF THE PRODUCTION OF SYNTHETIC
FUELS (METHANE AND METHANOL) .................................................................... 74
FIG. 30. CO2 UTILIZATION DIAGRAM [168] ............................................................... 74
FIG. 31. CO2 RECYCLED SYNTHETIC FUEL CYCLES [169] ......................................... 75
FIG. 32. MARKET ASSESSMENT: TOP 4 MARKETS IN TERMS OF ENVIRONMENTAL
IMPACT AND COMMERCIAL OPPORTUNITY [11] .................................................. 77
FIG. 33. SYNTHETIC METHANE PRODUCTION OVERVIEW [188] ................................. 80
FIG. 34. CO2 UTILIZATION DIAGRAM [186] ............................................................... 81
FIG. 35. SYNTHETIC METHANOL PRODUCTION OVERVIEW [193] ............................... 82
FIG. 36. A MODEL SIMULATING THE PROPOSED SYSTEM OPERATION FOR METHANE
AND METHANOL PRODUCTION PLANT ................................................................. 83
FIG. 37. COMPOSITE CURVES FOR HOT AND COLD STREAMS: METHANE (A) AND
METHANOL (B) SYNTHESIS .................................................................................. 93
FIG. 38. TOTAL PLANT COST SHARING FOR THE PLANTS: METHANE (A) AND
METHANOL (B) .................................................................................................... 95

17
FIG. 40. COST OF THE PRODUCT VS. ELECTRICITY PRICE FOR DIFFERENT CO2 COSTS:
METHANE (A) AND METHANOL (B) SYNTHESIS.................................................... 97
FIG. 41. FUEL COST BY VARYING USE FACTOR AND SOEC COST WITH ELECTRICITY
PRICE = 0: METHANE (A) AND METHANOL (B) ..................................................... 98
FIG. 42. SIMPLIFIED SCHEMATIC OF UPC’S EXPERIMENTAL HCFA CARBONATION
PROCESS ............................................................................................................ 101
FIG. 43. THERMODYNAMIC STABILITY DIAGRAM OF CARBON [220] ....................... 103
FIG. 44. VARIOUS PROCESS ROUTES OF ACCELERATED CARBONATION FOR CO2
CAPTURE [225] .................................................................................................. 104
FIG. 45. THE PROCESS OF HYDRATION [214] ........................................................... 106
FIG. 46. CO2 EMISSIONS FROM CEMENT MANUFACTURE [224] ............................... 107
FIG. 47. VARIOUS POSSIBLE UTILIZATION OF FLY ASH [266] .................................. 112
FIG. 48. GLOBAL FLY ASH MARKET SHARE, BY APPLICATION, 2019 [267] .......... 112
FIG. 49. TOTAL NET SUMMER CAPACITY OF RETIRED AND RETIRING COAL UNITS U.S.
(2010-2025) [277] ............................................................................................ 114
FIG. 50. STOCKS AND NET FLOWS OF CO2 INCLUDING POTENTIAL UTILIZATION AND
REMOVAL PATHWAYS [336] ............................................................................. 129
FIG. 52. CARBON DIOXIDE UTILIZATION AND REMOVAL CYCLE [83] ..................... 130
FIG. 53. THE COST OF CO2 AVOIDED FIRST OF A KIND FROM THE GLOBAL COST OF
CCS [338] ......................................................................................................... 131
FIG. 54. THE EVOLUTION LENDING RATES WITH POLICY AND INCREASED
DEPLOYMENT RATES FOR CCS FACILITIES [338] .............................................. 132
FIG. 55. CARBON PRICING MAP [364] .................................................................... 137
FIG. 56. DAILY EU ETS CARBON MARKET PRICE [370] .......................................... 139
FIG. 57. TIMELINE OF MAJOR CCS POLICY ENACTED IN THE US [349] .................. 143

18
Introduction and Overview
The world is entering an era where renewables will make up an increasing share of our
electricity supply; moreover, this electricity stock will extend to other energy forms and the
production of carbon-based commodities. Effective shifts of global energy systems could well foster
wide-ranging economic growth, energy efficiency and affordability, and energy supply security.
However, despite the enormous efforts to mitigate environmental depredation, it is sorely evident
that we are extremely far to meet the targets for preventing temperature rise of 1.5°C to which nearly
all nations have agreed [1].
According to Our World in Data journal, the global average temperatures have increased by
more than 1℃ since pre-industrial times (Fig. 1). The global average temperature rise is usually
given as the combined temperature change across both land and the sea surface. However, it is
important to note that land areas change temperature, both warming and cooling much more than
oceanic areas. Overall, global average temperatures over land have increased around twice as much
as the ocean [2].
Furthermore, the Northern Hemisphere has more mass, therefore, the change in average
temperature north of the equator has been higher than the Southern Hemisphere. Finally, there are
some regions in the world where temperatures can be more extreme. At very high latitudes, especially
near the Poles, warming has been upwards of 3°C, and in some cases exceeding 5°C. These are,
unfortunately, often the regions that could experience the largest impacts such as sea ice, permafrost,
and glacial melt. Monitoring the average global temperature

19
Fig. 1.Global average temperature anomaly [3]
Multiple gases contribute to the greenhouse effect that sets Earth’s temperature over
geologic time. However, the three main GHGs responsible for a large portion of recent
global warming are: CO2, CH4, N2O (Table 1) [4].
Table 1. Atmospheric lifetime and Sources of three major GHG’s [5]
Greenhouse gas Chemical
formula
Atmospheric
lifetime-yrs. Major Sources
Carbon Dioxide CO2 100
Fossil fuel combustion;
Deforestation; Cement
production
Methane CH4 12 Fossil fuel production;
Agriculture; Landfills
Nitrous Oxide N2O 121
Fertilizer application;
Fossil fuel and biomass
combustion; Industrial
processes

20
This work will mainly focus on the GHG of CO2 and three processes related to CCUS. Figure
2 shows the growth of global emissions from the mid-18th century up to 2019. It can be observed that
prior to the Industrial Revolution emissions of CO2 were relatively low. In 1950 the world emitted
just over 5 billion tons of CO2; by 1990 this discharge had quadrupled to 22 billion tons. Emissions
have continued to grow rapidly; today the world emits over 36 billion tons each year [3]. Emissions
growth has slowed over the last few years, but they have yet to reach their peak.
Most of the CO2 emissions is due to the combustion of fossil fuel and industrial processes in
order to generate electricity and heat (Fig. 3) [6]. Additionally, other industrial processes related to
the production to steel, cement, and some chemicals play a significant role in the emissions of GHGs.
Global GHGs emissions can also be broken down by a range of sectors and processes. The
overall picture demonstrates that almost three-quarters of emissions come from energy use; almost
one-fifth from agriculture and land use; and the remaining 8% from industry an waste (Fig. 4) [3].
Lastly, Figure 5 shows the production of CO2 (i.e., production-based CO2 not where is finally
consumed) by country. The three major emitters are Asia, North America, and Europe. Asia is by far
the largest emitter, accounting for 53% of global emissions (based on 2017 data), approximately 10
billion tons each year, more than one-quarter of global emissions. North America- dominated by the
U.S.- is the second largest regional emitter at 18% of global emissions; followed closely by Europe
(EU-28) with 17% [3].
Fig. 2. Annual CO2 emissions growth [3]

21
Fig. 3. Global GHG Emissions by Gas [6]
Fig. 4. Where do GHG global emissions come from-2016 [3]

22
Fig. 5. Where do GHG global emissions come from-2017 [3]
CCUS is an appealing approach to combat global warming not only because of its
prospective for emissions curtailment but also because it allows for the creation of valuable
commodities such as fuels, construction materials, plastics, and other useful products.
There are different commercial technologies to capture CO2 from a stationary source
(e.g., coal-fired power plants). The CCUS process usually involves CO2 separation (either from the
flue gas or other intermediate streams) followed by pressurization, transportation, and sequestration.
According to the International Energy Agency’s roadmap, 20% of the total CO2 emissions should be
removed by CCUS by year 2050 [7].
There are three categories of CO2 capture systems that could be used at power
stations and industrial emitters: post-combustion, pre-combustion and oxy-firing (Fig. 6) [8].
In post-combustion capture, CO2 is separated from the flue gas after the combustion of fossil
fuel. This process can be added, or retro-fitted, to existing power stations, either coal or natural gas-
fired.
During pre-combustion capture the fossil fuel is reacted with steam and oxygen, producing
a synthetic gas (syngas) which is made up of mostly carbon monoxide (CO), carbon dioxide, and
hydrogen (H2). An additional reaction with water (known as a water gas shift) can be used to convert
the residual carbon monoxide to CO2 and additional hydrogen. The CO2 is removed, and the H2 can
then be combusted or oxidized electrochemically to produce electricity [9].

23
Oxy-firing combustion capture includes the combustion of fuel (coal or gas) in pure oxygen
or oxygen-enriched air. The process can produce about 75% less flue gas than air-fueled combustion
and the exhaust consists of between 80-90% CO2. The remaining gas is water vapor, which simplifies
the CO2 separation step. An air separation plant is required to produce pure oxygen for the process
from air.
Fig. 6. Summary of CO2 capture technologies [8]
Cutting carbon emissions takes smart policies, innovative technologies, business leadership, and
simple steps to shrink our own carbon footprint [4]. As depicted in Figure 7, current climate and
energy policies could decrease global warming relative to a world with no climate policies in place.
It can also be observed, future GHG emissions states under a variety of assumptions: (1) no climate
policies; (2) current policies continue to be implemented; (3) if all countries realized their current
and future pledges and targets to reduce GHG emissions; (4) follow the crucial pathways that are
fitting with curbing global warming to 1.5°C or 2°C [10].

24
Fig. 7. Climate policies will reduce GHG emissions, but not quickly enough to reach global targets [3]
1.1 The CCU Market
CCUS is a noteworthy path towards remediating global warming, especially in the short-to-
medium term, during a complete transition to decarbonization. Moreover, it allows for the creation
of valuable commodities based on the Carbon atom.
A comprehensive market assessment study finalized in 2016 by the Global CO2 Initiative
(GCI), presents a roadmap for potential commercialization of CCU technologies through 2030. The
work identified four major markets and eight product categories critical to driving further
investments and innovation at an accelerated pace. Funding and incentives are necessary for most of
these products to accelerate development and achieve full-scale commercial roll out capability [11].
• Building materials or Concrete
o Carbonate aggregates
• Chemical Intermediates
o Methanol
• Formic acid
o Syngas
• Fuels
o Liquid fuels
o Methane
• Polymers (polyols and polycarbonates)

25
The National Energy Technology Laboratory (NETL) research revealed that
noteworthy advancement in carbon capture and utilization (CCU) and carbon capture,
utilization, and storage (CCUS) has been made in the past ten years, with many
technologies demonstrating to be scalable [12].
According to GCI the market size and CO2 reduction potential can be significantly impacted
by taking action now. Figure 8 below demonstrates the potential CO2 reduction due to implementing
strategic key actions from five markets. For example, the fuel market can increase the CO2 reduction
by 15-fold (from 0.03 b tons to 0.5b tons). Moreover, the market for CO2-based fuels can be
quadrupled by 2025 (from $50b to $200b) (Fig. 9) [11].
Fig. 8. Potential CO2 reduction of CO2 emission due to implementing strategic actions key [11]
According to GCI the recommended strategic actions to meet climate goals and accelerate
commercialization of carbon-based products are [11]:
• Technology: fund applied research on technologies and applications that have the highest
CO2 abatement potential.
• Market: make funding available to established collaborations among research institutes,
start-ups, governments and corporations for process integration of CO2 conversion, hydrogen
generation and carbon capture.
With strategic actions
implemented Without strategic
action

26
• Policy: supportive policies can help start and build markets for CO2U products.
Fig. 9. Potential increase in market size due to implementation of strategic actions key [11]
At full scale, five CO2U products could create a market over US$800 billion by 2030. CO2U
has the potential of utilizing 7 billion metric tons of CO2 per year by 2030- the equivalent of
approximately 15% of current annual global CO2 emissions [11].
1.2 Renewable energy technologies, their market, and the Covid19
pandemic
Nearly every international climate change scenario under the 2015 Paris Agreement shows
the need for a vast ramp-up in CCUS technologies to meet global targets. Timing matters, not just
scale.
CCUS technologies must be deployed at scale swiftly if the Paris Agreement’s objective of
holding the increase in the global average temperature to well below 2℃ above pre-industrial levels
is to be attained [13].
With strategic actions
implemented Without strategic action

27
Prior to the recent Covid-19 pandemic, the enactment of the rules for the Paris Agreement
were expected to be finalized in 2020 [13]. However, due to the global pandemic the 26th
Conference of the Parties was rescheduled for November 2021 in Glasgow, Scotland [14].
The Covid-19 crisis has caused people to have limited social freedom, massive loss of jobs,
and worldwide deaths. On the other hand, it has led to a decline in domestic waste because people
who are quarantined for long periods of time are fearful of waste due to their sociological distresses.
Moreover, the decrease of GHG emissions has significantly declined due to the abridged use of major
means of transportation, the reduction of industrial operations, and the educational and social
constraints. However, these changes in paradigm have not been enough to curtail air pollution and
the damaging escalation of global warming.
Despite all the worldwide challenges the pandemic has caused, the growth in renewable has
not diminished. In 2021, renewables are expected to show their resilience; the majority of the delayed
projects are expected to come online, leading to a rebound in new installations [15]. As a result, 2021
is forecast to reach the same level of renewable electricity capacity additions as in 2019. Despite the
rebound, combined growth in 2020 and 2021 is almost 10% lower compared to the previous IEA
forecast published in October 2019 [16].
Covid-19 has brought the generation of energy from fossil fuels to breaking point. As the
lockdown measures were introduced, global energy demand dropped precipitously at levels not seen
in 70 years [15]. The IEA estimated that overall energy demand contracted by 6% and energy-related
emissions decrease by 8% for 2020. Moreover, projections estimated a drop in oil demand of
approximately 9% and coal 8% while crude oil is at record-low prices [16].
With the fall in demand, renewable sources (mainly wind and solar) saw their share in
electricity substantially increase at record levels in many countries [17]. In less than 10 weeks, the
U.S. increased its renewable energy consumption by nearly 40% and India by 45%; Italy, Germany,
and Spain set new records for variable renewable energy integration to the grid (Fig. 10) [15].
However, the renewable energy market has experienced a downfall due to problems such as delays
in the supply chain, problems in tax stock markets, and the risk of not being able to benefit from
government incentives ending in 2020 [18] and most likely in 2021 as well

28
% Of Increase of RES in the grid, by country
Number of weeks since lockdown began
Fig. 10. Across the world, Renewable Energy demand jumped after the Covid-19 Lockdown, [15]
Although the pandemic is circumstantial and unexpected, the current outcome for the power
sector is not. The continuing increase in renewable energy into the grid results from a mixture of past
policies, regulations, incentives, and innovations embedded in the power sectors of many forward-
thinking countries [15].
These are three key factors behind the increase in renewable energy during this crisis:
1. Renewables have been supported by favorable policies. In many countries, renewables
receive priority through market regulation. The priority for the first batch of energy to the network
is given to the less expensive source, favoring cheaper and cleaner sources.
2. Continuous innovation. Renewable energy has become the cheapest source of energy.
IRENA recently reported that the cost of solar had fallen by 82% over the last 10 years [19], while
Bloomberg New Energy Finance (BNEF) states that renewable energy is now the cheapest energy
source in two-thirds of the world [20].
3. Preferred investment. Renewable energy has become investors' preferred choice for new
power plants. For nearly two decades, renewable energy capacity has grown steadily, and now 72%
of all new power capacity is a renewable plant [21].
As businesses, industry, and households focus on resuming their operations, the lockdown
offers a real sense of opportunity for the energy sector. It creates plenty of lessons about clean energy
policy, changes in
demand patterns, and knowledge for a greener grid without compromising the security of
supply. It also begins further opportunities for investment and innovation [15] . Imperial College
reported on June 2020, that renewable power shares offer investors not only higher total returns
relative to fossil fuels but also lower annualized volatility [22].

29
As governments begin to structure new regulations and support businesses for the post-
Covid-19 world, they are drawing up stimulus plans in an effort to counter the economic damage
from the coronavirus and secure greater investment to become more competitive. These stimulus
packages offer excellent opportunities [18] to ensure that crucial tasks of building a safe and
sustainable energy future does not get lost among the flurry of immediate priorities.
Large-scale investment to boost the development, deployment and incorporation of clean
energy technologies (e.g., solar, wind, hydrogen, batteries, CCUS) needs to be an essential part of
governments’ plans because it will bring the dual benefits of stimulating economies and accelerating
clean energy transitions [18]. Strong political backing can provide clear policies and long-term plans,
governments can reduce the uncertainty that is holding back investors and business from channeling
far more money into sectors like renewables [23].
The coronavirus crisis is already doing substantial damage around the world. Rather than
compounding the tragedy by allowing it to hinder clean energy transitions, we need to seize the
opportunity to help accelerate them. At the heart of the matter is energy [7], which is responsible for
more than two-thirds of global greenhouse gas emissions [4]. To put the world firmly on track to
meet international climate goals, the industry and governments need to take action to make sure those
emissions peak as soon as possible and then put the effort toward driving them into a steep decline
[23].
1.3 Biogas production and utilization at full-scale wastewater treatment
plant
“Biogas” is a gas produced by anaerobic fermentation of different forms of organic matter
and is composed mainly of CH4 and CO2 (Fig. 11). With little to no processing, biogas can be burned
on-site to heat buildings and power boilers. Biogas can be used for combined heat and power (CHP)
operations, or biogas can simply be turned into electricity using a combustion engine, fuel cell, or
gas turbine, with the resulting electricity being used on-site or sold onto the electric grid [24].
Biogas systems turn the cost of waste management into a revenue opportunity [25].
Converting waste into electricity, heat, or vehicle fuel provides a renewable source of energy that
can reduce dependence on foreign oil imports, reduce GHG emissions, improve environmental
quality, and increase local jobs [24].
The U.S. has over 2,200 sites producing biogas: 191 anaerobic digesters on farms,
approximately 1,500 anaerobic digesters at wastewater treatment plants (only 250 currently use the
biogas they produce)
and 576 landfill gas projects. By comparison, Europe has over 10,000 operating digesters; some
communities are essentially fossil fuel free because of them [26].

30
Fig. 11. Value-added anaerobic digestion of biomass-to-biogas, biomethane, electricity, C-rich and
fertilizers and algae-derived value-added products [27]
Different studies have focused on solutions to increase the energy efficiency of WWTPs.
The goal of having WWTPs as net energy producers is an ambitious yet feasible one [28] [29]. The
self-sufficiency target is deemed an achievable one since wastewater already contains two to four
times the amount of energy needed for the wastewater treatment process [30].
Reducing energy consumption and increasing the efficiency of energy production are both
required to have positive energy WWTPs. Measures to reach self-sufficient WWTPs are listed below
[31].
• Process optimization: this approach consists in installing smart meters [32] within the plant
and developing control systems for the optimal operation of aeration systems and water pumps
(aeration is part of the secondary biological treatment, which takes more than 50% of the overall
electrical consumption [33] [34]). EPRI has estimated that, in wastewater facilities, 10-20% energy
savings are possible through better process control and optimization [35].
• Enhanced biogas yield: currently, anaerobic digestion (AD) biogas can only provide around
50% of the total energy consumption [36]. However, sludge pre-treatments [30] can lead to an
increase of the biomethane yield.
• Efficient on-site combined power and heat (CHP) generation: the use of fuel cell systems
(e.g., SOFC plants) can increase further the on-site electricity generation, which is key to self-
sufficiency.
• Co-digestion of sludge with food waste is also an interesting option to increase the overall
biogas output.
Self-sufficiency has been already achieved, for example, in the Strass im Zillertal
Wastewater Treatment Plant in Austria [37]. Here, thanks to sludge pre-thickening systems,

31
improvement of the aeration system, development of an innovative nitrogen removal equipment and
increasing the CHP efficiency, energy self-sufficiency has been reached already in 2005 [37] when
the onsite production overtook electrical consumption.
In this context, the use of the CO2 compound contained in the biogas stream is used to
enhance the energy conversion process. In this case CO2 takes part in the energy transition pathway
which is portion of the utilization part in the CCUS procedure. In fact, the second part of this work
concentrates on a case study where a high-efficiency fuel-cell based CHP is used to promote self-
sufficiency within a medium-size plant located in Torino (IT). The 174 kWe Solid Oxide Fuel Cell
(SOFC) produces energy from biogas with an electrical efficiency above 53% and zero pollutant
emissions to the atmosphere. The system will cover around 30% of the WWTP electrical load.
(Frontiers).
1.4 Power-to-fuel through carbon dioxide re-utilization and high-
temperature electrolysis: technical and economical comparison between
synthetic methanol and methane
E-fuels are synthetic fuels, resulting from the mixture of ‘green or e-hydrogen’ formed by
the electrolysis of water with renewable electricity and CO2 captured either from a concentrated
source (e.g., flue gases from an industrial site) or from the air (via direct air capture, DAC). E-fuels
are also described in the literature as electrofuels, power-to-X (PtX), power-to-liquids (PtL), power-
to-gas (PtG) and synthetic fuels [38].
1.1.1. Feedstock-related technologies
Hydrogen electrolysis
E-hydrogen (also called ‘green hydrogen’) is used as a feedstock for producing e-fuels. It
can also be a final product in itself. It is produced by electrolysis from water.
Different electrolysis technologies can be used for producing hydrogen. These include low-
temperature (50 to 80°C) technologies such as an alkaline electrolysis cell (AEC), proton exchange
membrane cell (PEMC), or high-temperature (700 to 1,000°C) processes using a solid-oxide
electrolysis cell (SOEC) [39].
CO2 capture
The production of e-fuels requires CO2 which can be obtained from various sources
including biomass combustion, industrial processes (e.g., flue gases from fossil oil combustion),
biogenic CO2, and CO2 captured directly from the air. E-fuels production routes consist of e-
hydrogen reacting with captured CO2, followed by different conversion routes according to the final
e-fuel (such as the methanization route for e-methane; methanol synthesis for e-methanol. E-fuel
costs are currently relatively high (up to 7 euros/liter) but are expected to decrease over time due to

32
economies of scale, learning effects and an anticipated reduction in the renewable electricity price;
this is expected to lead to a cost of 1–3 euros/liter (without taxes) in 2050. therefore be 1–3 times
higher than the cost of fossil fuels by 2050. The most important drivers for the future cost of e-fuels
are the costs of power generation and the capacity utilization of conversion facilities [39].
E-fuels advantages:
The main advantages of these low-carbon fuels are [39]:
• E-fuels achieve a significant CO2 reduction versus their equivalent fossil-based fuels,
offering a compelling complementary alternative for low-CO2 mobility
• E-fuels have a higher energy density compared to electricity and can thus be used in the
aviation and shipping sectors where no electricity-based alternatives can be found in the short
to medium term.
• Liquid e-fuels are easier (and relatively inexpensive) to store, and transport compared to
electricity. They can be kept in large-scale stationary storage over extended periods, and
mobile storage in vehicle tanks, which can compensate for seasonal supply fluctuations and
contribute to enhancing energy security.
• Existing infrastructure can remain in use for transportation and storage (for example, gas
transport networks, liquid fuels distribution infrastructure (pipelines), filling stations,
storage facilities, and the entire rolling stock and fuel-based vehicle fleets).
• Some e-fuels could be deployed immediately across the whole transport fleet without any
major changes in engine design. Liquid e-fuels are an alternative technology for reducing
GHG emissions in both existing and new vehicles without requiring the renewal of the
fleet.
• A high blending ratio is potentially possible when adding methane to natural gas, and liquid
e-fuels to conventional fossil fuels, provided they meet the corresponding specifications.
• E-fuels would likely have positive impacts on environmental air quality because of the
favorable combustion characteristics of the molecules produced.
• Finally, these synthetic molecules could be used also as precursors of other chemical
processes and products, widening their market capabilities.
In the analysis of our work, two different plants are considered to produce synthetic fuels
from hydrogen and CO2. Both plants have been assessed from a technical and economic
outlook.

33
Examining the methane production plant (Fig. 12), the great exothermicity of the reaction
allows for an exceptional thermal integration between the fuel synthesis and the steam generation,
minimizing and making almost zero the external heat requirement. The strong thermal integration,
combined with the high conversion reached within the catalytic reactors, leads to high conversion
efficiency (≈ 77%). On the other hand, for the methanol production (Fig. 13) a higher reaction
pressure is required. Therefore, if the higher reaction pressure is combined with the minimal heat
available from the reactor, the efficiency of the system is diminished (≈ 58%) because of the larger
demand for external energy. The need of higher pressure for methanol production means that the
initial investment and O&M costs are greater [40].
Fig. 12. Synthetic Methane from captured CO2 using renewable energy [41]
Fig. 13. Methanol fuel from CO2- Synthesis captured CO2 using surplus electricity [41]
When evaluating a sensitivity analysis, it was visible that the two studied systems present
similar economic performance, unlike the difference between the efficiency of the two analyzed

34
concepts, as the marked cost of the two-fossil counterpart (fossil methane and fossil-produced
methanol) are different.
It was concluded that, to produce an economically attractive market for e-methane and e-
methanol, in the present market conditions, the production plants should maintain a utilization factor
of approximately 50%, the cost of SOECs should be near to 1050 €/kW and the electricity required
to run the system needs to be supplied from renewable sources at a low cost (below 40-50 $/MWh)
[40].
1.5 Mineral carbonation of high calcium fly ash
The work also examines the process of mineral carbonation (MC), a carbon capture
utilization and storage (CCUS) technology that can capture large quantities of CO2 and convert it
into stable carbonate products that can easily be used in the concrete market. The focus of this
investigation is the process of mineralizing fly ash (FA) by CO2, two underutilized by-products
formed at coal power plants, with the purposes of creating carbonated fly ash (CFA). CFA is a
commodity that can permanently capture CO2 but also has the advantage to be a complementary
cementitious material used in the concrete/construction industry.
The evaluation of the work brings forward pragmatic evidence that MC production has the
potential to deliver net positive revenue and its commercial feasibility is a realistic venture. However,
the prospective of a new direction of cementation by the carbonation of FA is still maturing but with
great potential for accelerated commercialization. The intensification of environmental and
economic benefits generated by this new pathway for cementation are substantial if compared to the
current methods of using FA in the construction industry. Yet, existing carbon policies, especially
those referring to S&R, are shown to have a weak influence in the advancement of this enterprise.
Well-designed policies can help start and build markets for CCUS technologies; moreover, they will
play an important role in the future success of these innovations.
MC technology is one type of CCUS technologies that has the capacity of capturing and
storing CO2 while transforming it to solid inorganic carbonates (e.g., calcium and magnesium
carbonate minerals) by means of chemical reactions. It is one of the few CCUS alternatives that
results in permanent storage of CO2 as a solid, with no need for long term monitoring [42]. Due to
the product’s stability over long periods of time it makes it ideal for the construction industry (Fig.
14); furthermore, it eliminates the concern of potential CO2 leaks that could pose safety or
environmental risks [43].
However, MC reaction progresses at an extremely slow rate under natural ambient
conditions, to the degree that it limits the realization of any economic benefits of CO2 sequestration
[44]. The process could be enhanced and industrially applied to fix gaseous CO2 into a solid
carbonate regulating the operating variables and accelerating the kinetic of the process [45].
Currently there are different techniques to carry-out this endeavor; nevertheless, in all these cases,
the process is referred as accelerated carbonation.

35
The use of fly ash has great prospective to diminishing GHG emissions by reducing mining
activities, reducing CO2 creation during the fabrication of materials that can be replaced by fly ash
(e.g. Portland cement), curtailing the disposal problem usually in storage ponds and waterways, and
aiding in the development of land utilization [46]. Moreover, with the necessity of controlling the
emissions of CO2 at local point-source, the use of coal combustion fly ash as a feedstock for CO2
storage, has the benefit of on-site application at coal- fired power plants [47]. In this way the costs
for carbon capture and storage, transfer, disposal, and treatment are reduced. Consequently, the final
carbonated product is much safer for disposal or has the potential for re-use as a construction material
or additive [48].
1.6 Carbonated Fly Ash Markets
The biggest near-term prospect for utilizing CO2 is in cement used in concrete materials [49].
This is because of the large volume of these materials used commercially, their permanence, and the
favorable chemistry that revolves around it. The billions of tons of CCUS potential in cement denote
low-margin, highly standardized markets that are challenging to penetrate with new products [50].
Successful businesses to date have concentrated on making incremental modifications to traditional
concrete formulation to abate the acceptance challenges, or on niche markets. Sizeable infiltration
into the billion-ton global cement market will be very slow by this scheme. On the other hand, the
use of carbonated solids, such as CFA, does not face such significant difficulties to enter the market,
Fig. 14. Cost breakdown for e-fuels [5]

36
but does face significant cost burdens. With building materials being so economical, even in high-
priced markets like California, it is unlikely that an industrial process making a CO2 -based product
will be competitive simply on price. For a type of business like this to flourish, long-term policy
frameworks need to be established.
The billions of tons of prospective market and carbon mitigation also seem to require important
technology development to be accessible. Direct CO2 utilization as an additive in conventional
products is the most technologically mature approach, and if regulatory acceptance can be realized,
this method could utilize certain percent CO2 by weight of concrete in construction applications
where the “green” approach of the product is valued. With the EU, US, and China all showing signs
of such valuation, this market will most likely expand. Especially in the EU, cement manufacturers
are reporting their carbon footprints and contending to lower them. This effort is largely focused on
more efficient clinker production and using less clinker, which has resulted in a 22% reduction in
carbon footprint for the European manufacturer Heidelberg Cement since 1990 [51]. Efforts such as
this will have a major impact on overall emissions, and as efficiency limits are reached, these
companies may be expected to take on new carbonation tactics to continue their reductions.
1.7 Policies and Regulatory Framework
The case for policies to support CCUS technologies and carbon-based products is strong. There
is a need to explore both incentives and credits as well as carbon price.
A carbon price can create enticements for CO2 utilization in two ways. First, capturing CO2 and
using it in an economically valuable product could be the cheapest compliance strategy for some
emitters. In the short- term this may be unlikely in most cases due to the high cost of CO2 capture
and conversion [52]. However as capture and utilization costs drop, there will be more occurrences
in which this is a company’s best compliance approach. Second, a carbon price may help incentivize
private-sector investments in research and development on CO2 utilization, if market participants
expect the price to endure for the medium or long term [53].
Last year’s climate conference in Katowice failed to agree on a rule book for market-based
cooperation of how to make NDCs (nationally determined contribution) more uniform under the
Paris Agreement. However, market-based mitigation policies are spreading around the world and
carbon pricing initiatives at national and subnational level are being complemented by emerging
international market schemes [54]
CO2 utilization can be pursued to create products using new methods, materials, or
feedstocks. In many cases, the products will need to follow existing codes and standards to be
accepted in the marketplace. Often, there can be barriers within the codes and standards framework
that dissuade products made using new technologies [55]. Codes and standards are typically overseen
by members of government and industry and developed by consensus-based and voluntary
commissions. Often, there are few incentives to update or expand existing standards. Further, even

37
if the willingness exists, the changes to the regulatory framework can occur slowly. A process
extending to 10 years is not unusual. The route to acceptance under codes and standards can be long
enough to discourage the entrance of new technology into the market [56].
1.8 Thesis Plan
I. Chapter 1: Introduction and Overview
Describes the main goal of this work. It gives an overall view of each of the chapters
contained in this document as it related to CO2 global management, based on renewable energy
technologies and processes (RETP), that have the likelihood to be commercialize within the next ten
years. It shows three different archetypes of renewable energy technologies which are collected
under the umbrella classification of CCUS. Furthermore, it discusses the markets, business
opportunities, policies, and the status of renewable energy technologies during the Covid-19
pandemic.
II. Chapter 2: State of the art for CCUS technologies
Examines three emerging RETP (i.e., biogas & fuel cells, synthetic fuels, mineral
carbonation of fly ashes) that fall into the CCUS paradigm and are either special, relatively new, or
advanced forms of the mainstream energy sources. Each RETP sources’ explanation is followed by
its market share, challenges, implications for increased adoption, future prospects, and drawbacks.
III. Chapter 3: Biogas production and utilization at full-scale wastewater treatment
plant
Discusses a particular case related to the use of a CO2-blended gas in the processes of energy
production using high temperature fuel cells such as SOFC. The use of CO2 added to a carbon
containing gas (i.e., natural gas or biogas) can have a positive effect on the process driven by the
electrochemical machine, both in terms of preservation of the anodic electrode and in terms of global
energy balance of the process.
IV. Chapter 4: Power-to-fuels through carbon dioxide re-utilization and high-
temperature electrolysis: A technical and economical comparison between
synthetic methanol and methane
This chapter presents some pathways to alternative mid- to long-term CCU options,
specifically, the capture and transformation of CO2, to produce sustainable, synthetic hydrocarbon
or carbonaceous fuels (e.g., e-methane and e-methanol), mainly for the transportation industry.

38
V. Chapter 5: Mineral carbonation of high-calcium fly ashes, business
opportunities, and policies & regulations related to this CCUS technology
This chapter reviews the process of mineral carbonation (MC), a CCUS technology that can
capture large quantities of CO2 and convert it into stable carbonate products that can easily be used
in the concrete market. The focus of this investigation is the process of mineralizing fly ash (FA) by
CO2, two underutilized by-products formed at coal power plants, with the purposes of creating
carbonated fly ash (CFA). CFA is a commodity that can permanently capture CO2 but also has the
advantage to be a complementary cementitious material used in the concrete/construction industry.
Additionally, it discusses potential business opportunities and policies and regulations related to this
rising renewable energy technology and process.
VI. Chapter 6: CCUS emerging technologies and processes market
It examines the potential commercialization of CCUS technologies by identifying four major
markets and eight product categories critical to driving further investments and innovation at an
accelerated pace. Funding and incentives are necessary for most of these products to accelerate
development and achieve full-scale commercial roll out capability. The major markets and product
discussed in this chapter are: (1) Markets- Building materials, chemical intermediates, fuels,
polymers (2) Products- carbonate aggregates, methanol, formic acid, syngas, liquid fuels, methane,
polyols and polycarbonates.
VII. Chapter 7: Conclusions
This chapter depicts the overall denouement of CCUS technologies, their market, policies &
regulations, and the influence of the Covid-19 pandemic in the present and future status of RETP
CCUS.

39
State of the Art for CCU Technologies
CCUS refers to a group of technologies that comprises the capture of CO2 from large point
sources including power generation or industrial facilities that use either fossil fuels or biomass for
fuel; distributed sources (e.g., CO2 concentrated in the air through the direct air capture technology),
and biological sources (e.g., anaerobic digestion biogas undergoing an upgrading process often
leaves a concentrated CO2 stream as by-product), or from bio-syngas coming from the gasification
of biomass of mixed origin [57] [58]. If not being used on-site (ex-situ), the captured CO2 is
compressed and transported by pipeline, ship, rail or truck to be used in a variety of applications or
injected into deep geological formations (including depleted oil and gas reservoirs or saline
formations) which trap the CO2 for permanent storage. The extent to which CO2 emissions are
reduced in near terms depends on how much of the CO2 is captured from the point source and whether
and how the CO2 is used (Fig. 15) [59].
The term CO2 utilization’ refers to the use of CO2, at concentrations above atmospheric
levels, directly or as a feedstock in industrial or chemical processes, to produce valuable carbon-
containing products [60].
Carbon utilization technologies convert gaseous carbon waste feedstocks (carbon dioxide or
methane) into a wide range of commercial products and applications [61]. Generally, CCU can be
categorized into three main pathways: mineral carbonation to produce construction materials,
chemical conversion to produce chemicals and fuels, and biological conversion to produce chemicals
and fuels. Methane utilization pathways include chemical and biological conversion to produce
chemicals and fuels, as well as the direct use of methane as a fuel [62]. These technologies have the
potential to transform waste streams into resources, reduce greenhouse gas emissions, and in some
cases generate positive economic returns (Fig. 16) [63].
The process of CO2 utilization is receiving increasing interest from the scientific community.
This is in part due to climate change concerns and partly because utilizing CO2 as a feedstock can
result in a less expensive or cleaner production process compared with using conventional
hydrocarbons [64]. CO2 utilization is often fostered as a way to reduce the net costs—or increase the

40
profits—of reducing emissions or removing carbon dioxide from the atmosphere, hence, a way to
assist the scaling of mitigation or removal efforts [65].
The landscape of CCU is multifaceted and diverse. It involves an extensive array of applications
(e.g., conversion to building materials, conversion to liquid fuels), technologies (e.g.,
electrochemical conversion using fuel cells, thermal catalysis), energy requirements (i.e. exothermic
vs. highly endothermic), and settings (i.e. large industrial sites vs. distributed applications) [66].
It seems that there is enough potential and opportunity to grow commitment of resources into
CCUS. It also appears that planning and investment decisions remain hindered by a lack of
information, the dynamic nature of the technology, markets, and the changing policy landscape [67].
Fig. 15. Carbon Capture, Utilization and Storage (CCUS) [61]
Fig. 16. CO2 utilization ecosystem [68]

41
Carbon Capture Technologies
Meeting international climate goals, including net-zero emissions, will surely require some form
of carbon removal. Carbon removal can neutralize or offset emissions where direct mitigation is
currently technically challenging or excessively expensive, such as some industrial processes and
long- distance transport [58]. Bioenergy carbon capture and storage (BECCS) and direct air capture
storage (DACS) are an energy sector contribution to carbon removal and, if successfully deployed,
can also mitigate slower progress in emissions reductions outside the energy sector [69]. Another
key attraction of CO2 capture technology is that it can be retrofitted to existing plants, many of which
have been recently constructed or existing plants which permits have been renewed [70].
CO2 is created during combustion and the type of combustion process directly affects the
choice of an appropriate CO2 removal process. There are three main CO2 capture systems associated
with different combustion processes, namely, post-combustion, pre-combustion and oxyfuel
combustion (Fig. 17) [9].
• pre-combustion: based on the scaled industrial processes for the production of hydrogen and
chemical commodities fuel feedstocks (i.e., coal and natural gas) are converted into syngas (H2 and
CO) via gasification, steam reforming, auto thermal reforming, or partial oxidation and then CO is
transferred into CO2 by water, with more hydrogen produced (the so-called water–gas shift reaction,
WGS), followed by carbon capture system to remove CO2. After CO2 is captured, the hydrogen-rich
fuel gas is utilized for power and heat generation such as boilers, gas turbines, and fuel cells [71].
• post-combustion: to capture CO2 in the exhaust gases once the fuel has been fully burned
with air. The commercially available post-combustion capture process is the chemical absorption-
based aqueous amine solution, such as 30% monoethanolamide (MEA) solution. Post-combustion is
considered as a more viable capture option for existing coal-fired plants [71].
• capture in oxy-combustion involves the combustion of fuel feedstocks in a nearly pure
oxygen (95–99%) or O2– CO2–rich environment, resulting in a flue gas with very high CO2
concentration, where the capture of CO2 is thus normally not needed, and CO2 is basically ready for
sequestration. However, in order to obtain nearly pure oxygen (>95%) usually a cryogenic air
separation unit is required for oxygen separation from air, which makes the whole process costly
[71].

42
Fig. 17. CO2 Capture Processes [9]
Extensively used cleanup technologies for methane or CO2 can be generally split into four
classes: (i) chemical absorption with basic media, normally aqueous, or physical absorption in liquid
media; (ii) application of low temperatures (cryogenic); (iii) adsorption on a solid surface, followed
by later removal under a temperature and/or pressure change; and (iv) membrane separation [9].
Within these categories are a numeral of specific processes, prominent by the solvent,
sorbent, or membrane used; processing conditions; and subsequent purity of the desired products(s).
Selection of a particular process is greatly dependent on the specific gas stream to be treated and the
conditions required for the purified gas stream. Each cleanup system has distinctive features,
advantages, and disadvantages which comprise energy consumption, capital costs, and the
production of by-product streams of contaminated cleanup media for removal [72].
Carbon Dioxide Utilization (CO2U)
CO2U is the use of CO2 to produce or generate economically valuable products or services
[73]. A wide range of CO2 utilization technologies are reviewed in this chapter, including CO2 to
chemicals, fuels, and durable materials, CO2 to mineral carbonation and construction materials, as
well as CO2 to biological algae cultivation and enzymatic conversion (Fig 18).
Enhanced oil recovery (EOR), enhanced coal-bed methane (ECBM), and enhanced geothermal
system (EGS) [74], are excluded from this work. Furthermore, CO2 has also been used as refrigerant,
as an extractive solvent, and as an additive in food and beverage products; as technologically mature
processes that do not involve chemical transformations [75], these products are also outside the scope
of this work.

43
Fig. 18. Options for reducing CO2 emissions or capturing emitted CO2 from the atmosphere [63]
The ranges of CO2 utilization cover both direct and indirect applications. CO2 can be naturally
converted into materials via photosynthesis, ultimately producing biomass. Direct or technological
use of CO2 includes applications such as the extraction of compounds with supercritical CO2, dry
cleaning, and food industry uses, among others [76]. Indirect application use takes place given the
fact that carbon free energy from renewable sources is available, captured CO2 can be converted into
useful commodity materials, chemicals, and fuels that are currently produced from fossil fuels, such
as oil and natural gas, using engineered chemical and biological processes [68]. Within indirect
applications, carbon dioxide is transformed through conversion processes into value-added products
(thermo-/electro-chemical and biological conversion of CO2). This results in secondary compounds
that can substitute their conventional counterparts, such as building materials, cement, CO2-cured
concrete, fuels, and chemicals [77].
When carbon-based products are used to produce marketable commodities, CO2U
opportunities include both direct and indirect applications (Fig. 19). In the first case, the main direct
uses of carbon dioxide include food and beverages production, metals fabrication, heat transfer
medium in refrigeration and supercritical power systems, yield boosting for biological processes
(e.g., algae harvesting and fertilizers production) and injection into reservoirs for either enhanced oil
recovery (EOR) or enhanced gas recovery (EGR). In all the above-mentioned processes, the CO2
molecule remains unchanged in its chemical form and is entrenched in the service production process
after impurities are eliminated [78].
In the case of indirect applications, CO2 is transformed through conversion processes that break
its chemical bonds and permits its conversion (upgrade) into value-added products. Both

44
thermocatalytic conversion, electro-chemical reduction and biological conversion of CO2 can be
applied. CO2 is thus converted into [79]:
• secondary compounds that can substitute their conventional counterparts, such as building
materials such as cement, concrete, and aggregates, or
• substitute fossil-based material with alternative synthetic resources, such as fuels and
chemicals to be introduced in the chemical, transport and energy production sectors (e.g.,
methane, methanol, Fischer-Tropsch, olefins, ethanol) [80].
Often, the conversion to fuels and chemicals requires an intermediate step where syngas is
produced (mixture of CO, CO2, H2 and CH4), before conversion to the end-products [79].
Fig. 19. Routes for direct and indirect conversion of CCU processes and sources of CO2 [81]
Conversion Processes
2.3.1. Conversion to inorganic products (mineral carbonation)
Carbon dioxide into minerals and construction materials can follow in-situ and ex-situ
processes [82]. In-situ CO2 processes inject carbon dioxide into geological storages rich in silicates
and alkaline aquifers. By reaction of CO2 with minerals, calcium and magnesium silicates and
carbonates can be obtained. With ex-situ applications, the carbonation process is chemically
sustained in industrial plants, favoring the production of sodium, magnesium, calcium carbonates
and sodium bicarbonate [83].
Mineral carbonation converts stable CO2 into an even more stable form of carbon, typically
a carbonate, which can be used to produce construction materials such as concrete [84].
Mineralization encompasses reaction of minerals (mostly calcium or magnesium silicates) with CO2

45
to give inert carbonates [85]. The reaction to form carbonates itself requires no energy inputs, on the
contrary, it releases heat, although significant energy is typically required to generate the requisite
feed minerals [75]. The current blockage, however, for viable mineral carbonation processes on an
industrial scale is the reaction rate of carbonation. Moreover, new formulations of materials such as
concrete will require testing and property validation before being accepted by users and regulators
for the market [86].
2.3.2. Chemical Utilization
It is possible to use CO2 for the production of fuels and chemicals by reacting it with other
molecules and/or providing electrochemical, photo-chemical, or thermal energy [87]. These
conversions require catalysts to overcome kinetic barriers. Because carbon in CO2 is in its most
highly oxidized form, many of the resulting reactions are reductions, either through the addition of
hydrogen or electrons [88]. Catalysts are important not only for making the transformation possible,
but also for reducing the energy inputs to (ideally) the minimum amount dictated by the
thermodynamics of the transformation, and discovery of appropriate catalysts and development of
energy-efficient processes are current bottlenecks [75].
2.3.3. Biological Utilization
Biological conversion involves using photosynthetic and other metabolic processes inherent
to plants, algae, bacteria, and fungi to produce higher-value chemicals [89]. Several factors have
expanded the collection of bio-based products that can be synthesized directly from CO2, including
the large number of CO2-utlizing microorganisms, genetic modification of microorganisms, and
tailoring enzymatic/protein properties through protein engineering. Biological utilization has a large
range of potential uses in the development of commercial products, including various biofuels,
chemicals, and fertilizers. However, biological utilization rates and scalability remain challenges
[88].
Conversion processes for specific carbon-base products
2.4.1. Conversion of CO2 into fuels and chemicals
The challenges associated with the conversion of CO2 into fuels and chemicals are primarily
related to both its kinetic and thermodynamic stability [39]. CO2 cannot be converted into commodity
chemicals or fuels without significant inputs of energy and contains strong bonds that are not
particularly reactive [90]. As a consequence, many of the available transformations of CO2 require
stoichiometric amounts of energy-intensive reagents. This can often generate significant amounts of
waste and can result in large greenhouse gas footprints. The grand challenge for converting CO2
waste streams into useful products is to develop processes that require minimal amounts of

46
nonrenewable energy, are economically competitive, and provide substantial reductions in
greenhouse gas emissions compared to existing technology [75].
2.4.2. Emerging technologies for CO2 conversion into commodity chemicals and
fuels based on product
1. Methanol Production
Methanol (CH3OH), usually is synthesized from syngas (H2 + CO) obtained directly from
fossil fuels [91]. A small amount of CO2 (up to 30 percent) is generally added to the feed to improve
performance [92]. This is successful in part because the mechanism of methanol production
involves the initial conversion of CO and H2O to CO2 and H2 via the water gas-shift reaction (Eq.
1). In fact, the development of methods to increase the amount of CO2 in the syngas feed without
causing a large decrease in methanol yield represents an opportunity to utilize waste CO2 that is
produced during syngas production. Although this strategy is only viable if excess H2 is available,
it could improve current technology and increase plant efficiency [88].
CO + H2O ⇌ H2 + CO2 (Eq. 1)
The direct hydrogenation of CO2 to methanol could provide a more sustainable synthetic
route if coupled with low-carbon methods for the production of H2 [91] [93]. Furthermore, the
development of a practical method for the synthesis of methanol from CO2 could also facilitate a
transition toward a methanol economy, in which methanol is used either directly as a fuel or as a
source of H2 [94].
Researchers have developed several catalysts and reactors for direct hydrogenation of CO2
to methanol, but high rates and high methanol selectivity have only been possible using high
pressures (>300 bar) [91] [95]. The cost of this technology presently is not competitive with the cost
of methanol synthesis from syngas [75].
Improved catalysts are critically needed if the direct hydrogenation of CO2 to methanol is to
replace methanol production from syngas. At this stage, significant amounts of research into the
direct hydrogenation of CO2 to methanol have focused on using heterogeneous copper-based
catalysts that are closely related to those used for CO conversion to methanol [93]. In recent years
there have also been a number of reports of catalysts for CO2 hydrogenation to methanol which use
metals other than copper and show promising activity [96] [97]. Two general challenges for catalyst
development are product inhibition by water (the by-product of CO2 hydrogenation) and poor
selectivity because of the competing reverse water gas-shift reaction between CO2 and H2 to generate
CO and H2O. Once more efficient catalysts are developed, further attention can be given to factors
such as stability, cost, sustainability, and scale-up potential. Additionally, although ultimately a

47
large-scale catalyst for direct methanol hydrogenation will almost certainly be heterogeneous,
research into homogeneous catalysts, which is occurring in the academic community, may prove
valuable for guiding the development of heterogeneous systems and for niche applications where a
small amount of methanol is generated, for example as fuel to power a portable device [95].
Finally, research is currently ongoing into the electrochemical reduction of CO2 to methanol
in which protons and electrons are used as the H2 source. To date, however, most work reports the
formation of methanol as a by-product [98]. Further exploratory and mechanistic research will be
required to identify even more selective (and stable) catalysts that do not require organic electrolytes
before electrocatalytic methanol production from CO2 can be considered for larger-scale application.
Methane Production
Methane is widely used as a fuel and to make syngas [99]. Similarly, to methanol production,
the synthesis of methane can be done exploiting the reaction between anthropogenic CO2 and
renewable hydrogen. Under equation (Eq. 2), the hydrogenation of CO2 produces methane and water
as by-product (Sabatier reaction) [100]. The operating temperatures are generally slightly higher than
for methanol production and similar pressure values (250-400°C). The catalysts in this case are
generally Ni-, Rh- or Ru-based [79] [101].
CO2 + 4H2 ⇌ CH4 + 2H2O (Eq. 2)
Research continues on the design of improved catalysts [100]. At this stage, the hydrogenation
of CO2 to methane is not practical on a large scale and is unlikely to be so in the near future given
the low price and abundant availability of methane from natural gas [88]. Additionally, there will be
a significantly greater economic value in converting CO2 to many other chemicals compared with
methane. As for the aforementioned thermochemical CO2-to-methane processes, at this time the
electrocatalytic conversion of CO2 to methane, despite continued progress in the development of
more selective catalysts, probably will not be pursued on a large scale given the global availability
of low-cost methane derived from natural gas [75].
Fuel (Hydrocarbon) Production
Given that the majority of CO2 that is released in the atmosphere is from the combustion of
fossil fuels, the development of methods to synthesize fuels from CO2 could result in a closed carbon
cycle, where increases in concentration of CO2 in the atmosphere will be minimal [88]. This can only
be achieved if the electricity or H2 that is used to reduce CO2 is generated from carbon-free sources,
and if the carbon waste gases created by the combustion of the fuel are recaptured and reutilized
[75]. In principle, methane and methanol could be used as fuels and systems for the conversion of
CO2 into these molecules are actively being pursued. Therefore, in this section only the state of

48
technology for the conversion of CO2 into hydrocarbon fuels with more than two carbons will be
described. The Fischer-Tropsch process is used to convert CO and H2 into liquid fuels and has been
commercialized on a large scale [102]. One approach for producing fuels from CO2 could involve
initially electrochemically synthesizing CO from CO2 and then in a second thermal step combining
the CO with sustainably produced H2 to produce fuels via the conventional Fischer-Tropsch process
[75]. Alternatively, a significant amount of research is currently being performed to develop systems
that can perform Fischer-Tropsch chemistry starting from CO2 in a single reactor using a single
catalyst. In this chemistry the first step is generally the reverse water gas-shift reaction to generate
CO from CO2 (Eq 1). This CO then reacts with H2 to form liquid fuels through a mechanism based
on the conventional Fischer-Tropsch reaction (Fig. 6) (Eq 20).
(2n + 1) H2 + n CO → Cn H2n+2 + n H2O (Eq. 3)
Fig. 20. Ex. of routes for direct and indirect conversion of CO2 into fuels and chemicals [81]
Construction Materials and Minerals
The conversion of CO2, a low-energy molecule, into solid mineral carbonates is one of only
a few thermodynamically favorable reactions involving CO2 and can be accomplished at near-
ambient temperatures. For this reason and because of the tremendous size of the construction
materials market, mineral carbonation is considered to be among the largest and most energy-
efficient routes for CO2 utilization [75].
Fixation of carbon dioxide into minerals and construction materials can follow in-situ and
ex-situ processes (Fig. 21) [103]. In-situ CO2 fixation processes inject carbon dioxide into geological

49
storages rich in silicates and alkaline aquifers. By reaction of CO2 with minerals, calcium and
magnesium silicates (Eq.4) and (Eq. 5) and carbonates can be obtained. With ex-situ applications,
the carbonation process is chemically sustained in industrial plants, favoring the production of
sodium, magnesium, calcium carbonates and sodium bicarbonate [79]. Such materials can be further
utilized in cement production and construction processes (e.g., utilization of CaO, CO2-cured
concrete, building aggregates) [104]. Generally, the processes of carbonation of CO2 generates heat,
and so the formation of carbonates is favored at low temperatures [105].
CaSiO3 + CO2 ↔ CaCO3 + SiO2 (+90kJ
molCO2
wollostonite formation) (Eq. 4)
Mg2SiO4 + 2CO2 ↔ 2MgCO3 + SiO2 (+89kJ
molCO2
olivine formation) (Eq. 5)
Fig. 21. Routes for the conversion of carbon dioxide into construction materials [81]

50
Biogas Production and Utilization at
Full-Scale Wastewater Treatment Plant
The growing scarcity and increase demand for water, food, and energy are imminent threats the
world is collectively facing. In order to tackle these problems, waste (e.g. wastewater and municipal
waste, among others) is now being considered more as a resource than as a discarded source [106].
Intensive research efforts have been made to develop processes for converting methane into
more valuable products. CO2 reforming of methane shows noteworthy environmental and economic
benefits by consuming two major greenhouse gases, carbon dioxide (CO2) and methane (CH4 ), to
produce synthetic gas (i.e. syngas) (CO+3H2), a key industrial intermediate [107].
Most synthesis gas is produced by the steam reform reaction (Eq. 1) in large furnaces to supply
the necessary energy for this highly endothermic reaction (consumes heat ∆𝐻 = 206𝑘𝐽
𝑚𝑜𝑙 ) [108].
CH4 + H2O (catalyst) → CO + 3H2 (Eq. 1)
Industrially, steam reforming is performed over a Ni/Al2O3 catalyst [109]. The typical problem
is the tendency of carbon deposition on the catalyst. Consequently, steam reactors must be operated
with higher H2O/CH4 ratios than the stoichiometric value. To reduce the carbon deposition, not only
is an excess of water needed but also a high temperature of approximately 1073 ºK must be utilized
[58]. For this reason, steam reforming requires a large amount of fuel and very high heat fluxes.
Carbon dioxide can be considered an oxidizing agent for the oxidation of methane, in lieu of
oxygen or water for the production of syngas via a reaction called CO2/dry reforming of methane,
(DRM) [110] (Eq.2).
CO2 + CH4 ↔ 2CO + 2H2 ( ∆H = 247kJ
mol ) (Eq. 2)
DRM is one of the most important processes used in the production of syngas. In that case,
DRM contains the most reduced form CH4 combined with its most oxidized form of carbon CO2.
The DRM reaction is favored by low pressure, however, the strong C-H bonds (439 kJ mol-1) in
methane leads to an endothermic process that requires high temperatures for CH4 conversion [111].
However, this process is not widely used in the gas processing industries because of rapid catalyst

51
deactivation due to carbon deposition [112]. DRM reaction needs high temperature in the presence
of a metal catalyst, as reactions are extremely endothermic. The DRM process offers some
advantages over SRM of methane, out of which the most significant is the production of syngas with
low H2/CO ratio, more suitable for synthesis of liquid chemicals and fuels. An archetypal application
is the production of methanol and Fischer-Tropsch synthesis H2/CO, which can be produced by DRM
[113] [99]. DRM also significantly reduces the environmental aspect of the reaction, as methane and
carbon dioxide are greenhouse gases (GHGs).
A particular case is related to the use of a CO2-blended gas in the processes of energy production
using high temperature fuel cells (like Molten Carbonate Fuel Cells – MCFC and Solid Oxide Fuel
Cells – SOFC). In this case the use of CO2 added to a carbon containing gas (e.g.., natural gas or
biogas) can have a positive effect on the process driven by the electrochemical machine, both in
terms of preservation of the anodic electrode and in terms of global energy balance of the process.
Carbon dioxide can be utilized to activate the reaction of DRM inside the stack of fuel cells,
thus promoting three important effects:
• Protecting the anode from phenomena of carbon deposits.
• Transforming the methane molecule into “superior” molecules (H2 and CO) for
electrochemical reactions. These molecules are more active electrochemically than methane. The
production of syngas can act as a suitable fuel in electrochemical machines such as high temperature
fuel cells. Moreover, the DRM driven directly on the anode of a high temperature fuel cell will drive
a reaction which is endothermic, hence, generating an effect of heat sink that reduces the need for
external cooling and increases the overall efficiency of a system (e.g., SOFC system). In this context,
considering the global thermal balance of these reactions; consideration needs to be given to the
reverse water-gas shift reaction (RWGS) (Eq.3), which is mildly exothermic (produces heat, ( ∆H =
−41kJ
mol ) , the Boudouard reaction (Eq.4), and the methane decomposition reaction (Eq.5) are side
reaction in reforming [110] [114]:
H2 + CO2 ↔ CO + H2O ( ∆H298K0 = −39.5
kJ
mol ) (Eq.3)
2CO ↔ C + CO2 ( ∆H298K0 = −171
kJ
mol ) (Eq.4)
CH4 ↔ C + 2H2 ( ∆H298K0 = 75
kJ
mol ) (Eq.5)
Kinetics
Although many researchers have led investigations on the reforming mechanism, there still are
some contentions regarding the details of the precise reaction mechanism and the rate-determining
steps (RDS) [115]. For example, the number of RDSs is still disputed by some scientists. Some
researchers stated that the mechanism of the dry reforming reaction was one single RDS, while others
testified a mechanism with two RDSs for the same reaction [116]. The main motives for the

52
differences in the reported reforming mechanism can be credited to two facts: (1) the different
supports and sponsors employed in the reforming reaction may result in the disparity of the reforming
mechanism, which has been observed by some research groups; and (2) the mechanism
investigation was conducted at different temperatures, which may remarkably affect the
reforming mechanism and the RDS [117]. Several different kinetic models have been reported.
Most of the kinetic models are based on the reversible dissociative adsorption on the catalyst
active site to produce H2, or on the reversible and dissociative adsorption of CO2 on the support
to yield CO [118].
Catalysts
Based on the above argument, it seems that the maximum activity and H2/CO ratio and the
minimum carbon deposition can be attained at high temperatures (e.g., higher than 817 °C). On
the other hand, when the reaction occurs at high temperatures, high energy utilization makes
this process impracticable for industrial applications [119]. The use of catalytic systems may
lead to greater activity at lower temperatures and, consequently, the decrease of the energy
consumption in the process, which would permit this technology to get closer to an economical
process [120]. Thermodynamic calculations showed that the temperature needed for 50% CO2
conversion in DRM without catalyst is 1035°C (1308 °K), but on the source of existing literature
data, very high CH4 and CO2 conversions can be achieved in temperatures as low as 700 °C
using catalytic systems [113].
Over-all, it has been acknowledged that the catalytic CO2 reforming of methane has a bi-
functional mechanism. CH4 can be adsorbed and activated by the active sites of most of the
transition metals, mainly groups VIII b of the periodic table, while CO2 is adsorbed and
activated by oxides [118]. Thus, the DRM reaction can be catalyzed by most of the transition
metals supported on oxides [112].
Over the past two decades, concentrated efforts have been dedicated by many research
groups to advance catalysts that can achieve high catalytic activity and stability with maximum
H2/CO molar ratio and minimum coke formation for DRM at low temperatures [112].
Notwithstanding numerous publications and evaluation between different catalysts in
diverse reaction conditions in the literature, there still are some contentions regarding the main
active and stable catalyst in DRM [99]. Although, the performances of catalysts can be affected
by an array of factors other than composition, such as content of active components, preparation
methods, calcinations ambient, calcinations temperature, reduction and activation measures,
precursors of active components, etc., it is well acknowledged that nickel has the best catalytic
performance among all examined catalysts except for the noble metals [112]. In the case of
noble metal catalysts, some researchers stated that Pd showed the highest activity and stability
while others reported that Rh and Ru catalysts revealed the highest activity and stability among

53
the noble metals [121]. Likewise, there is an continuing disagreement between researchers
concerning Ni and noble metals to choose which one has the best catalytic behavior during
DRM [120]. Many researchers described higher catalytic activity for Ni-based catalysts in contrast
with metals catalysts, while some other researchers reported that noble metals have enhanced
catalytic activity than Ni-based catalysts [122]. Undeniably, on a mole for mole basis, Ni is about
10,000 times cheaper than Pt and 200 times cheaper than Pd [123]. Therefore, from sensible and
industrial viewpoints, Ni-based catalysts are the most attractive and promising for DRM [122].
Ni-based catalysts have a propensity to experience deactivation via carbon deposition and
sintering and hence significant efforts have been devoted to improving these catalysts [120]. Tactics
to advance the activity and stability of Ni-based catalysts for DRM have concentrated mostly on the
breakthrough of improved supports and suitable promoters/Ni-based catalysts [122]. Researchers
conveyed both positive and negative results for the addition of a second and/or third metal (bimetallic
and tri-metallic) on the implementation of catalysts. SiO2 and Al2O3 are two of the most examined
catalyst supports with high melting points and specific surface areas. MgO, CaO, CeO2, La2O3, TiO2
and ZrO2 are also frequently studied [119].
The effects of the precursor, preparation circumstances, type of reactor (including plasma
reactors, fixed and fluidized bed reactors, membrane reactors), heating method, reduction method,
feed composition, and space velocity on the reforming reaction were examined [110]. Nonetheless,
there have been accounts showing that the application of plasma may be a suitable method to induce
high conversions of CO2 and CH4. However, plasma technologies are very expensive, and the
utilization of electrical current to produce plasma may be counterproductive to the carbon balance
[110].
Production of biogas
The activity related to the use of CO2 inside an energy production process has been developed
in the case of a stream of biological origin (so, Carbon neutral) and containing a large amount of
CO2: biogas produced in wastewater treatment plants (WWTPs) with the goal of converting these
plants as net energy producers. The concept revolves around researching technological measures to
upsurge self-sufficiency in WWTPs. This feat is deemed to be an achievable target since wastewater
already contains two to four times the amount of energy needed for the wastewater treatment process.
The organic matter contained in the wastewater can serve as a source of energy to eventually
manage the WWTP. Organic matter is retrieved as sludge, which is processed in large tanks called
anaerobic digesters (AD) to produce biogas. The in-situ accessibility of biogas provides the
opportunity to cover a substantial portion of WWTPs electricity and thermal demands. Biogas can
be transformed into electrical and thermal energy by utilizing high temperature fuel cell generators.

54
Different studies have focused on solutions to increase the energy efficiency of WWTPs.
Reducing energy consumption and increasing the efficiency of energy production are both required
to have positive energy WWTPs. Measures to reach self-sufficient WWTPs are listed below:
Process optimization: this approach consists in installing smart meters [7] within the plant
and developing control systems for the optimal operation of aeration systems and water pumps
(aeration is part of the secondary biological treatment, which takes more than 50% of the overall
electrical consumption [124] [125]. EPRI has estimated that, in wastewater facilities, 10-20%
energy savings are possible through better process control and optimization [56].
Enhanced biogas yield: currently, anaerobic digestion (AD) biogas can only provide
around 50% of the total energy consumption. However, sludge pre-treatments can lead to an
increase of the biomethane yield [126].
Efficient on-site combined power and heat (CHP) generation: the use of fuel cell
systems (e.g., SOFC plants) can increase further the on-site electricity generation, which is key
to self-sufficiency.Co-digestion of sludge with food waste is also an interesting option to
increase the overall biogas output.
In the next section (3.4) a case study called DEMOSOFC will be presented; a medium-
scale (174 kWe) distributed Combined Heat and Power (CHP) system based on Solid Oxide
Fuel Cell (SOFC) and fed with locally available biogas produced in an industrial-scale
wastewater treatment plant.
3.3.1. Technical assessment of a cohesive anaerobic digester and solid oxide fuel cell
(SOFC) system
Globally there is an increasing focus on looking for alternative technologies able to
generate power, at the same time respecting the environment and saving energy.
It is in this context that electrochemical fuel cell devices meet with great approval, owing
to their high energy efficiency with reduced environmental impact generators. When these are
fed by a derived biological gas the energy system becomes relevant in the context of
environmentally sustainable energy production. Biogas is the product of biological processing
of waste with no economic value and compared to other fuels has the great advantage of being
renewable and free from NMHC (non-Methane Hydrocarbons). It is recognized by the United
Nations Development Program as one of the most important decentralized energy resources
[127].
The technique of anaerobic digestion is widely used for biogas production, whereby the
degradation of organic substances take place in an oxygen-free environment.
The selection and evaluation of the fuel cell is conducted in relation to the characteristics
of the input fuel and to the energy performances, power, and efficiency, achievable from its
feeding.

55
Biogas production plants from different sources are becoming more and more diffused around
Europe. The biogas produced can be split in two streams and sent:
• To an upgrading system (to be converted in high CH4 containing gas)
• To high-efficient conversion device (SOFC) for electricity and heat production.
However, in both processes there is the need to manage the residual gases (exhaust from the
SOFC and off gas from the upgrading system) in order to reduce CO2 emissions in atmosphere.
There is the possibility to combine the two residual flows for CCU, in order to transform a waste
flow into a resource.
The potential of this type of system is the capability to produce not only heat & power (with
very high efficiency), but also, green fuels and chemicals through a dedicated management of the
CO2 recovered from the system, all this starting from a renewable energy source like biogas.
As the DEMOSOFC case study will show, an anaerobic digestion plant is combined with a high
temperature fuel cell system. This system was studied both from an energetic and environmental
point of view, for the distributed generation of both electrical and thermal energy.
Case Study (DEMOSOFC)
The European project DEMOSOFC coordinated by Politecnico di Torino focuses on the
installation of the first industrial size plant in Europe able to convert the sludge from a wastewater
treatment process into clean and high efficiency energy by using SOFC technology that can use
directly natural gas or biogas. SOFCs are the most efficient and fuel flexible devices among the
different fuel cell types available. The total project budget is around 5.9 million euro and is financed
by European Union with 4.2 million euro in the framework of the Horizon 2020 program.
The DEMOSOFC plant covers around 30% of the site needs (provided by the grid) and 100%
of the thermal requirement. The system consists of the installation of three fuel cell modules able to
co-produce 175 kW of electrical power and 90 kW of thermal power, with an electrical efficiency of
53%.
The system is installed in the SMAT Collegno wastewater treatment plant (Turin), where
currently biogas is produced from anaerobic digestion of sewage sludge. Biogas – a renewable fuel
– is first cleaned (Sulphur contaminants are removed) and then sent to the fuel cell where high
efficiency electrical energy is produced (with an electrical efficiency up to 50%, while traditional
competitors like engines and turbines reach only 35-38 %). The system is also cogenerative since the
heat recovery from the exhaust gases is also performed (Fig.22).
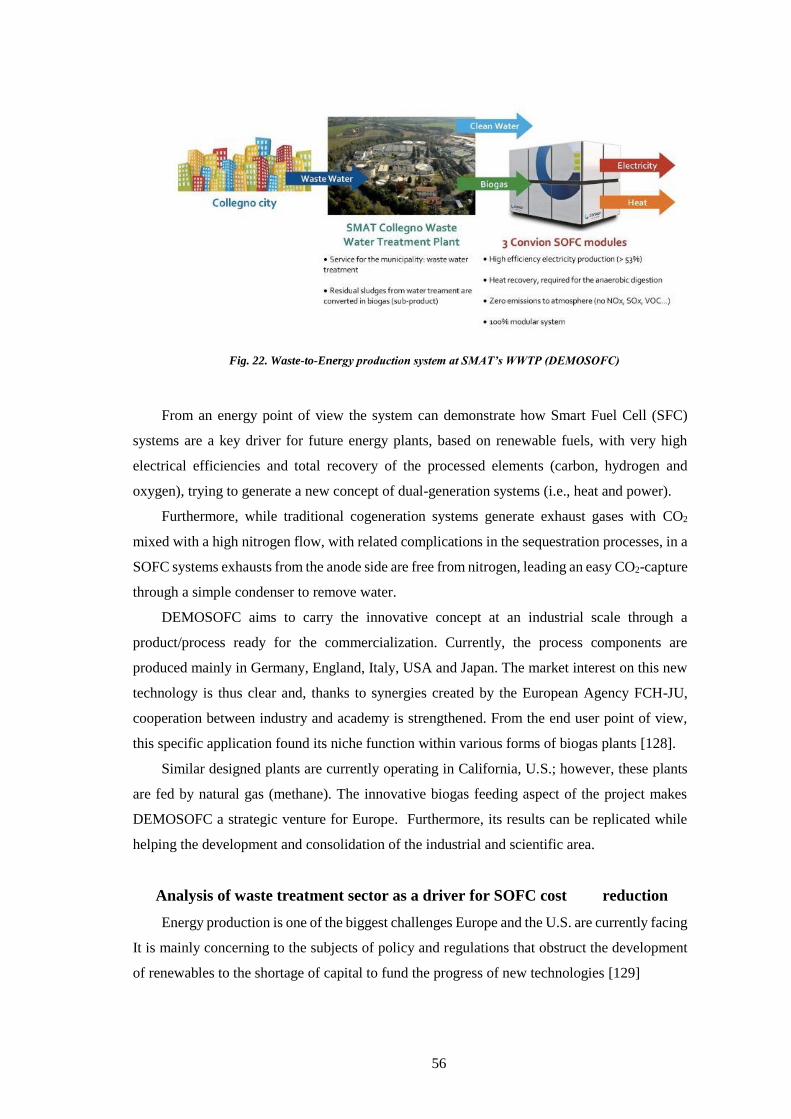
56
Fig. 22. Waste-to-Energy production system at SMAT’s WWTP (DEMOSOFC)
From an energy point of view the system can demonstrate how Smart Fuel Cell (SFC)
systems are a key driver for future energy plants, based on renewable fuels, with very high
electrical efficiencies and total recovery of the processed elements (carbon, hydrogen and
oxygen), trying to generate a new concept of dual-generation systems (i.e., heat and power).
Furthermore, while traditional cogeneration systems generate exhaust gases with CO2
mixed with a high nitrogen flow, with related complications in the sequestration processes, in a
SOFC systems exhausts from the anode side are free from nitrogen, leading an easy CO2-capture
through a simple condenser to remove water.
DEMOSOFC aims to carry the innovative concept at an industrial scale through a
product/process ready for the commercialization. Currently, the process components are
produced mainly in Germany, England, Italy, USA and Japan. The market interest on this new
technology is thus clear and, thanks to synergies created by the European Agency FCH-JU,
cooperation between industry and academy is strengthened. From the end user point of view,
this specific application found its niche function within various forms of biogas plants [128].
Similar designed plants are currently operating in California, U.S.; however, these plants
are fed by natural gas (methane). The innovative biogas feeding aspect of the project makes
DEMOSOFC a strategic venture for Europe. Furthermore, its results can be replicated while
helping the development and consolidation of the industrial and scientific area.
Analysis of waste treatment sector as a driver for SOFC cost reduction
Energy production is one of the biggest challenges Europe and the U.S. are currently facing
It is mainly concerning to the subjects of policy and regulations that obstruct the development
of renewables to the shortage of capital to fund the progress of new technologies [129]

57
A paradigm shift is currently changing our understanding of the need of technological
innovations, supply, policies, and environmental deployment regulations for the successful
growth of green technologies [129].
According to the European Commission, the delay of climate action would require additional
investment expenditure of around € 100 billion /year between 2030 and 2050. Unfortunately this
would not reduce investment needs before 2030 by a comparable amount [130].
The quick deployment of large-scale (> 10 MWs) [131] projects involving a new renewable
energy technology with a low-carbon footprint is one of the European Commission’s goals to achieve
a low-carbon society in the near future [132].
In the U.S. as mentioned in the Annual Energy Outlook 2021 (AEO2021) [133], the U.S. Energy
Information Administration (EIA) projected that the share of renewables in the U.S. electricity
generation mix would increase from 21% in 2020 to 42% in 2050. Wind and solar generation are
responsible for most of that growth. The renewable share is projected to increase as nuclear and coal-
fired generation decrease and the natural gas-fired generation share remains relatively constant [133].
By 2030, renewables will collectively surpass natural gas to be the predominant source of generation
in the United States. Solar electric generation (which includes photovoltaic (PV) and thermal
technologies and both small-scale and utility-scale installations) will surpass wind energy by 2040
as the largest source of renewable generation in the United States [134].
3.5.1. General fuel cell background
A fuel cell (FC) consists of an anode and a cathode with an electrolyte in the middle that utilizes
electrochemical reactions, rather than combustion, to produce energy (very similar to a battery).
Consequently, GHG are significantly reduced; byproducts are only water, heat, and, a reduced
amount of carbon dioxide - all of which can be re-used for other applications [135].
FCs are among the most promising clean energy technologies currently in existence [136]. They
are expected to play a significant role in order to attain the EU’s objective of achieving an overall
80% reduction in the EU emissions by 2050 (compared to 1990) [137]. In the U.S. the Fuel Cell &
Hydrogen Energy Association (FCHEA) reported that FCs could reduce the nation’s carbon
emissions by 16% by 2050 and greater FC’s deployment could also reduce carbon emissions in the
U.S. transportation sector by 30% and lower NOx emissions by 36% [138]. Moreover, FC’s have
been drawing interest from the scientific community due to their high-energy efficiency; clean
energy production, high power density, site and fuel flexibility, and uninterruptible power supply
system, amongst other attributes [139].
There are different types of FCs, and they vary depending on their design, size, type of fuel
they use to operate, and choice of electrolyte. SOFC, is one types of FC, and it can reach efficiencies
of up to 60% when fueled with natural gas or biogas. WWTP facilities are, by nature, usually located
close to populated areas, consequently making them large producers of biogas from sludge, which

58
are a by-product of the water treatment activity [140]. Biogas is a mixture of methane and carbon
dioxide (typically 60% CH4 and 40% CO2) and it is considered a clean fuel source to produce
electricity and heat. WWTPs employ the process of anaerobic digestion (AD) to produce
biogas. Anaerobic digesters are usually part of the WWTP system; therefore making these
facilities very attractive to implement distributed generation (DG) applications [30]
3.5.2. The WWTP as a ‘starting market’ for the SOFC technology
WWTPs are producing biogas as a sub-product of the entire plant. Anaerobic digestion for
biogas production is a way to stabilize the sludge flow and reducing its organic load: for this reason,
biogas can be considered as a free fuel for the plant.
WWTPs are intensive energy consumers, especially concerning electricity needed to fuel the
pumps and aeration systems. Consequently, the possibility of self-producing high efficiency energy
and reducing grid-dependence is seen as a key driver for WWTPs to adopt circular technologies
[141]. As mentioned above, SOFC systems show no emissions to atmosphere since no combustion
of fuel is performed. This is another driver, especially in a future perspective, because of
continuously reduced national and regional emission limits, especially for what concerning NOx,
SOx, PM and organic compounds.
In short, WWTPs offer an attractive context to implement SOFCs as these plants offer the
required biogas to fuel SOFC, while operating WWTPs requires vast amounts of energy. The SOFC
technology thus allows translating a by-product in a productive energy source, thereby partially
closing the loop of production, while simultaneously reducing the emission of harmful substances
[142].
However, the main criticality related to biogas use in SOFCs is the need for a biogas cleaning
system, which is a non-standard component required when biogas is fed to SOFCs. Compared to
traditional CHP system, SOFCs are more sensitive to biogas contaminants such as Sulphur and
siloxanes. Fortunately, biogas resulting from WWTPs shows relative low levels of contaminants
further contributing to the attractiveness of WWTPs as a market opportunity to implement SOFCs.
Because of a relative ‘clean’ biogas, SOFCs installations in WWTPs usually required only a single
stage contaminants removal, by using adsorption materials [143].
Italy
Wastewater treatment plants often require significant amount of heat and power in order to
operate, thus accounting for a large percentage of a municipal’s energy cost [144]–[146]. In Europe,
WWTPs account for more than 1% of the electrical consumption, with a total estimated electricity
consumption of 15,021 GWh/year spread among 22,558 plants [32]. Furthermore, energy for
wastewater treatment (WWT) is likely see a global increase of 20%-30% within the next 15 years

59
due to increasing population and capita consumption, stricter discharge requirements, and aging
infrastructure [147].
In the U.S. municipal wastewater treatment plants are estimated to consume more than 30
terawatt hours per year of electricity, which equates to about $2 billion in annual electric costs.
Electricity alone can constitute 25-40% of a WWTP’s annual operating budget and make up a
significant portion of a given municipality’s total energy bill [148]
The allure of introducing SOFC into the WWTP market goes beyond the advantage of fuel
flexibility; for example [149]:
1. With WWTPs there is no need to build an entire infrastructure just to be able to incorporate
a SOFC system. Therefore, the initial investment associated with the construction of incorporating
the system is minimal in the whole scheme of things.
2. WWTPs already have a pool of experience professionals, which can operate and maintain
the SOFC system [147].
3. The need for incorporating external sources of power to be able to operate is minimize when
utilizing SOFCs. Because of the decreased use of imported electricity from the central electric power
source, the load placed on the electric grid is minimized.
4. While traditional cogeneration systems produce exhaust gases with CO2 mixed with a high
nitrogen flow, with related difficulties in the sequestration processes, in a SOFC systems exhausts
from the anode side are free from nitrogen, leading an easy CO2-capture through a simple condenser
to remove water [150].
As seen in Fig. 23, WWTP distribution in Italy is composed of a high number of micro and
small plants, working with a reduced entering load, and few large size plants which are serving the
capital cities or aggregation of medium size cities (Turin, Rome, Milan, aggregated Tuscany and
Veneto cities). Total number of WWTPs in Italy is 5,672, and average entering load is 12,324 P.E.
served. Production of biogas is currently performed in large system where traditional CHP systems
show better performance. Internal combustion engines (ICEs) can show up to 42-43% efficiency
when MWs size systems are installed. However, when smaller system are analyzed, the efficiency
drops at around 35% making the initial investment less rewarding [151]. SOFCs in contrast are
modular systems, which can guarantee a constant and high efficiency (higher than 50-55 %) at every
size, from kW to MW size. These higher efficiency rates, combined with more flexible
employability, makes SOFC especially appealing for application in WWTPs allowing to fully
capture the benefits of the biogas.

60
Fig. 23. WWTP Database for Europe [152]
United States
In 2016, the Pacific Northwest National Laboratory (PNNL) estimated a total of 15,014 sludge
generation of publicly owned treatment works (POTW) in the U.S. [153]. These POTWs provide
most of the wastewater treatment in the United States, treating 35 billion gallons of wastewater
produced each day by 238.2 million Americans, or 76% of the U.S.’s population. The remainder of
the population is served by decentralized or private septic [153].
Additional insights can be gained by placing the 15,014 facilities documented by PNNL into
size categories based on total existing flow in millions of gallons per day (mgd) (Fig. 24). The report
indicates that 23% of the U.S. population is served by 0.3% of the POTWs which comprise facilities
of more than 100 mgd, 40 plants in total. A further observation indicates that 63% of the U.S.
population is served by POTWs of 10 mgd-100 mgd or 3.7% of all POTWs, 522 POTWs in total
[153].

61
Fig. 24. Spatial distribution and influent range of 15,014 PNNL catalogued treatment plants [153]
Historically, the concept of “waste-to-energy” has referred to any of several highly mature
technologies (e.g., incineration or anaerobic digestion) that decrease waste volumes. Landfill
capacity scarcity, coupled with increasingly stringent disposal regulations, is necessitating novel
waste management solutions. In particular, the notion that waste streams represent valuable
feedstocks to produce biofuels and bioproducts is gaining currency. These feedstocks include
inedible fats and greases, biogas from landfills, dairies, wastewater treatment plants, and the organic
fraction of municipal solid wastes (Table 2). Conversion of these feedstocks into renewable natural
gas, diesel, and aviation fuels is just beginning to gain market traction; it represents a significant
opportunity for additional expansion.

62
Table 2. Summary of Annual Wet and Gaseous Resource Availability in U.S [153]
Terrestrial feedstocks are currently the largest resource generated for the bioeconomy, estimated
at 572 million dry tons for 2017, and have traditionally constituted the primary focus of the
Bioenergy Technologies Office (BETO) [154]. However, the resource assessment conducted by the
National Renewable Energy Lab (NREL) and PNNL indicates that wet waste feedstocks,
summarized in Table 1, could also make significant contributions to the bioeconomy and domestic
energy security goals [153].
When combining the primary waste streams of interest: sludge/biosolids, animal manure, food
waste, and fats, oils, and greases, a supplemental 77 million dry tons per year are generated. Of this
total, 27 million dry tons is currently being beneficially used (e.g., fertilizer, biodiesel, compost),
leaving 50 million dry tons available for conversion to biofuels, bioproducts or biopower. Gaseous
waste streams (biogas and associated natural gas) contribute an additional 734 trillion Btu (TBtu),
bringing the total energy potential of these feedstocks to over 2.3 quadrillion Btu. Additionally,
these streams contain methane, the second most prevalent greenhouse gas, which constituted 12% of
net U.S. emissions in 2014 according to the U.S. Environmental Protection Agency’s (EPA’s)
greenhouse gas inventory [155] significant potential to valorize these energy dense streams while
simultaneously reducing harmful emissions [153].

63
Wet and gaseous waste streams are widely geographically distributed, frequently in areas of
high population density, affording them unique current and emerging market opportunities (Fig. 24).
The size of POTWs, landfills, rendering operations, and grease collectors overlay with the largest
population centers nationwide. Therefore, when compared to terrestrial feedstocks, these waste
streams are largely aggregated and any derivative biofuels, bioproducts, or biopower are close to end
markets [153].
At the same time, however, this proximity to populations markets often correlates with more
stringent regulatory landscapes for disposal. Therefore, the value proposition presented by these
waste streams commonly includes avoiding disposal costs as opposed to an independent biorefinery
that requires stand-alone profitability. Aided by these and related factors, public and private entities
are actively exploring and deploying novel solutions for waste stream valorization. Potential
competition between biofuels, bioproducts, and other beneficial uses will likely be a key element of
future markets, and clearly merits further analytical and modeling investigation [153].
While there are advantageous market and policy factors unique to these feedstocks, they are
subject to significant compositional, geographic, and temporal variability. This variability creates
unique challenges and requires conversion technologies that are tailored towards particular families
of feedstocks. Wet and gaseous feedstocks also represent a unique set of challenges in terms of
feedstock acquisition and handling. The PNNL report explores conversion possibilities for both wet
and gaseous feedstocks at a wide variety of technology readiness levels. With some exceptions, the
early-stage nature of many of these technologies suggests an “all-of-the-above” strategy at relatively
low initial funding levels can provide an environment that encourages natural selection of solutions
as they move closer to market. The U.S. Department of Energy’s Small Business Innovation
Research program might be an excellent vehicle to pursue such a strategy [153].
3.5.3. Renewable energy financial schemes
The deployment of biogas projects need three elements for success: unwavering legislative
structure, easy clear permitting measures, and accessibility to financing [156]. Financial entities will
fund a project depending on the projected financial fulfillment compared to the project’s risks and
its credit worth of the stock hold. Usually, the financial success of a biogas project depends on the
availability of government financial support schemes. In some countries, it is feasible to receive
financial funding for a project from public sources, low-interest loans, grants, or other assistance that
encourage the roll-of renewable energy projects [157].
This study examines the inclusion of SOFC systems fueled by biogas within WWT facilities
and the feasible monetary schemes that can fund the initial capital cost for the roll-out of such
projects [156].
California’s Public Utilities Commission has implemented a successful financial incentive
program called Self Generation Incentive Program (SGIP) [149]. This program provides financial

64
incentives for the installation of new renewable energy technologies that are installed to meet the
total eligible project cost of a facility. The program can easily be adapted to suit the deployment and
development of other countries’ biogas fed SOFC projects. The SGIP for FC is designed as follows:
for on-site biogas projects 30 kW or larger, 50% of incentive will be received up-front; 50% will be
received based on actual kWh production over the first 5 years. For projects under 30kW, 100% of
the incentive will be paid up front [149] [158].
3.5.4. Methodology
The aim of the analysis presented in this section is to understand how SOFC commercialization
process could start thanks to installations in a specific and selected market, such as WWTPs. By
illustrating the economic costs and benefits of installing SOFCs in WWTPs, the qualitative benefits
from the technology are translated into monetary value. By doing so, this analysis sheds light on the
conditions under which the application of this technology becomes commercially viable.
Furthermore, the implementation of a pilot case provides real-life data, which in turn reduces
uncertainty related to the assumptions underlying the calculations and could, serve as an attractive
reference point for other applications. As a pilot case, we consider the application of SOFCs in
WWTPs in Italy (i.e., DEMOSOFC).
The analysis on the potential number of SOFCs installations in Italy has been based on the
European WWTPs database from the Environmental Energy Agency (EEA) [152]. The Urban
Wastewater Treatment Directive data viewer enables an easy access and analysis of the data reported
under the article 15 of the Urban Wastewater Treatment Directive (UWWTD. The map (Fig. 2)
reflects the most recent available information at the EU-level on implementation of the UWWTD in
EU 27 based on data reported by the Member States (for reference years 2011 or 2012) in 2013.
From this tool, data on directive compliance, capacity and entering load, and type of treatments, for
all the WWTPs in Europe can be accessed. Data has been extracted for Italy. The information on
biogas production in the listed WWTPs is not available, for this reason the analysis has been based
on plants that are being defined as ‘eligible’ for biogas production. The eligibility depends on the
plant size, in particular, on the entering load, in terms of P.E.
From internal communications with the local WWTP’s owner [159], the minimum plant size
for biogas production has been defined, 20,000 P.E., confirmed also by literature sources [160],
[161]. The main reason for this limit is linked to economic profitability of anaerobic digestion: fixed
cost related to this technology are quite high and make the overall investment not competitive under
a certain size. The value is varying between country to country and is depending on the technology
learning and cost reduction for anaerobic digestion, even if it is a commercial product. For this study,
a reference number has been chosen and kept constants for all the analyses.
In Italy, 5,672 WWTPs are presented in the database, but only 83.5% of them shows related
data on entering load and/or capacity. Among the total plants, 670 shows an entering load ≥ 20,000

65
P.E., corresponding to 11.85% of the total plants. These numbers confirm the distribution of WWTPs
in Italy by size of a high number of small-medium size plants. All WWTPs in Italy have an average
entering load of 12,324 P.E., hence making it lower than the mandatory limit.
The ‘eligible’ 670 plants are the ones considered for biogas production and consequently for
SOFCs systems installation. The analysis has been first developed for a ‘base case’ scenario,
followed by other studies to show the influence of different parameters. The methodology for
calculating the SOFC power installed for each plant is presented below:
1) Calculation of the biogas potential production in the WWTP. Starting from the entering load
for each plant (in P.E.), the potential biogas production can be determined by means of the biogas
production rate, expressed in liters of biogas produced per P.E. per day. This number is strongly
changing from plant to plant, depending on the technology and the process management involved in
the sludge line. For this reason, a base value of 15 L biogas/ P.E./ day (Table 2), referred to the local
SMAT Collegno WWTP (see DEMOSOFC project website for more information [149]), was chosen
as starting value. Higher productivity rates can be reached and are already measured in other
WWTPs.
2) Calculation of the biogas Lower Heating Value (LHV). From the biogas potential
production, the methane content should be used to calculate the inlet power (in terms of LHV)
contained in biogas. The analysis, for all the case studies, has been performed using a fixed 60%
methane content.
3) Calculation of the SOFC power installed. The available fuel (biogas) is used for electricity
production by means of an SOFC system. By knowing the amount of biogas available in each plant
and the efficiency of the SOFC’s system, it is possible to calculate the maximum amount of power,
which can be produced from that fuel using that technology.
Table 3. Input parameters for the base case scenario.
Parameter Value Unit
Minimum plant size for biogas
production 20,000 P.E.
Biogas production rate 15 L biogas/ P.E. / day
Methane content in biogas 60 %
SOFC electrical efficiency (target) 60 %
This procedure has been repeated for all the ‘eligible’ WWTPs. The potential SOFC installed
power is consequently determined, starting from the biogas power by means of the SOFC electrical
efficiency. Industrial size SOFC systems currently show efficiency higher than 55%. The efficiency
has been fixed to a target value (60%) for the base case and varied in the other scenario (Table 3).

66
By means of the presented methodology, the total number of SOFCs installed has been
determined. The minimum plant size, 20,000 P.E., in the base case scenario, corresponds to a SOFC
system of 45-kW electrical. This size has also been considered as the standard SOFC module size
and results, when expressed in number of units, are always referred to a 45-kW electrical SOFC
module.
Table 3 shows the other investigated scenarios for what concerning biogas production rate and
SOFC efficiency. Scenarios are linked to the variability of two parameters:
• Biogas production rate. The specific biogas production yield is strongly varying from plant
to plant. It can be influence by external temperature, by pre-treatments on the inlet biomass to the
anaerobic digester, by the quality of the inlet wastewater and many other factors. For this reason,
different values have been analyzed, starting from 10 L biogas/PE/day and reaching a target value
of 40 L biogas/PE/day.
• SOFC electrical efficiency. Current SOFC efficiency is 53% [162] in the framework of the
DEMOSOFC project, where an industrial size SOFC will be installed in a local WWTP.
Nevertheless, there are commercially available systems, which currently show lower performance,
and other advanced SOFC, which are reaching (or have already reached) a 60% efficiency from fuel
to AC power. For this reason, a variation of this parameter has been also considered from 50 to 60%.
Table 4. Case studies definition, in relation to Biogas production rate and SOFC electrical efficiency
Base Case Worst Case Current
Case Target Case
Biogas production
rate L biogas/PE/day 15 10 25 40
SOFC electrical
efficiency % 60 50 55 60
By crossing the variation range of these two parameters, the three scenarios have been identified
(Table 4). Starting from the number of units that could be delivered by a company producing SOFCs
in a WWTPs sector in Italy (670 installations), to finally understanding the range of the potential
decisive price driving the WWTP’s market supply in Italy.
3.5.5. Evaluation of the SOFC system annual costs at different production volumes
In order to evaluate the number of units that should be ameliorated (from an economic point of
view) to drive the SOFC stationary market by means of an incentive program, a simple economic
evaluation has been performed.
The analysis has been done on the evaluation of plant annual savings calculated as the difference
between the plant costs (investment and operation costs) and the revenues linked with the savings in
electricity bought from the grid. The evaluation is shown for a 45-kW system, corresponding to one

67
SOFC unit. The same concept could be applied to larger installations. The annual costs have been
evaluated for different SOFC production volumes related costs (Fig. 4 and Fig. 5) and a trend for the
annual savings at different production volumes level has been calculated.
Assumption and input data for this analysis are:
• Time period on which the analysis is performed: 10 years
• Capacity factor of the system: 95%
• Cost of electricity: initially assumed 15 c€/kWh as in the DEMOSOFC real case study, but
then varied between 5 and 20 c€/kWh.
• SOFC system size: 45 kW electrical
• Clean-up cost: equal to the LCOE’s calculation (1,000 €/kW investment cost and 1c€/kWh
operating cost)
• Cost for the plant preparation and system installation: equal to the LCOE’s calculation (1,500
€/kW)
The annual cost has been determined as the sum of the investment cost – spread over the chosen
time period – and the operating cost. The annual revenues are related to the savings in electricity
thanks to the CHP installation. The difference among these two values is the annual savings which
can be negative (plant is losing money) or positive (plant saving/earning money).
Results are shown in Fig. 25 for different production volumes. The total costs are shown with
the red line; revenues with the green line; and the difference (savings) with the blue line. As shown,
savings start to be positive from 191 units produced (8.6 MW), however, when the Italian WWTP’s
potential number of installations reaches 2,497 units, an annual saving of 21,541 € is generated based
on the installation of 45 kW SOFC-based CHP plant.
Fig. 25. Results for the annual costs evaluation for different units produced.

68
Fig. 26. Sensitivity analysis on influence of electricity price (in €/kWh) on annual savings
Since prices of electricity fluctuate depending on the country, production plant, plant size, and
the overall electricity purchased (yearly) from the grid, a sensitivity analysis reliant on these values
is proposed, with results for 5, 10, 15 and 20 c€/kWh electricity price. Savings are shown in Fig. 5
The price of electricity strongly influences the break-even point among costs and revenues,
since revenues are proportional to the cost of electricity (Fig. 26). For the lowest energy price (5
c€/kWh), break-even is never reached between costs and revenues, meaning that SOFCs are not yet
commercially suitable for markets where electricity price is very low; in these areas, an important
driver for SOFCs commercialization could be the environmental advantages SOFCs are offering.
With a 10 c€/kWh electricity price, the break-even point is reached at 1564th unit produced
(70.4 MW), alongside a SOFC investment cost of 3,452 €/kW. The break-even point shifts
downward at 191 units produced at the 15 c€/kWh electricity price scenario. In the aforementioned
SOFCs’ investment cost the system starts to be profitable at 6,420 €/kW.
Finally, in the high electricity price scenario (20 c€/kWh), SOFCs start generating income (10-
year period) after the 52nd unit is produced (2.3 MW). The break-even point related SOFC cost is
9,404 €/kW.
A final analysis is conducted when the break-even point (SOFC installation investment has a
positive value) starts generating savings for the plant (10 yrs.). Therefore, the actual break-even point
is reached when the minimum number of units need to be subsidies by an incentive program. Further
analyses should be devoted to the understanding of the competitiveness of the SOFCs solution
compared to the traditional systems for biogas exploitation such as ICE and micro-turbines. A fully
market entry of the technology will be reached when annual savings are not only positive but also
greater than the competition.

69
3.5.6. Results
The economic profile of a SOFCs installation, assuming today’s costs, is not profitable from
investment point of view. For this reason, policies and subsidies should be considered to support a
certain portion of the 670 installations, until a competitive cost is reached.
In the analysis of the ‘base case’ scenario, the following results have been obtained:
• 112 MWs can be installed in Italy considering a standard SOFC module size of 45 kW for
2,497 units.
• The installation of 2,497 units could lead to a robust reduction in SOFC’s price.
• Investment cost: 3,007 €/kW (-83% with respect to the current scenario).
• Stack replacement cost: 549 €/kW/replacement (-79.7% with respect to the current scenario).
• Maintenance cost: 2,508 €/yr. (-58% with respect to the current scenario).
• Number of replacements during a lifetime (20 yrs.): 2.92
This scenario generates an LCOE (assuming the same current cost for the clean-up unit) equal
to 5.95 c€/kWh, nearly 70% lower than the current scenario.
The SOFCs installation in WWTPs has been considered as a potential driver to reduce the fuel
cell specific cost. The current SOFC cost scenario (Fig. 27) investment cost higher than 17,000 €/kW,
a stack replacement cost of 2,710 €/kW/replacement, and a maintenance cost of 6,000 €/y. With this
input data and the current cost for biogas cleanup system (investment cost 1,000 €/kW and
maintenance cost 1 c€/kWh [163]), the LCOE of the SOFCs installation in a 20 year period is equal
to 19.56 c€/kWh, considerably higher than the current price of electricity for typical user in Italy
[164].

70
Fig. 27. Learning curves for SOFC specific investment cost, stack replacement cost and maintenance cost
[165]

71
Results for the sensitivity analysis are shown in Fig. 28. Biogas production rate has a strong
influence on the number of installations, together with the SOFC’s efficiency. Number of potential
MWs to be installed varied from 55 (worst case scenario) to 318 (target scenario). Despite the
high variation in terms of MWs and units installed, the ‘final’ SOFC’s investment cost is less
variable, ranging from 2,212 to 3,707 €/kW (Fig. 5). This is due to the exponential trend of the
learning curve (Figure 27): the curve displays a strong cost reduction up to 1,000 units and then the
trend slowly reduces to a target value of around 2,000 €/kW. In all the analyzed scenarios, even the
worst case, the potential number of SOFCs installation is higher than 1,000 units, therefore, the
resulting SOFC cost shows less variations compared to the volumes.
Fig. 28. SOFC installations and final investment cost for the different scenarios.

72
Power-to-Fuel Through CO2 Reutilization & High-Temperature Electrolysis
Technical and Economical Comparison Between Synthetic Methanol and
Methane
This chapter presents some pathways to alternative mid- to long-term CCU options, specifically,
the capture and transformation of CO2, to produce sustainable, synthetic hydrocarbon or
carbonaceous fuels, mainly for the transportation industry.
Power-to-X technologies are considered to play a significant role in the CCU paradigms. They
convert electricity from renewable energy into hydrogen, methane or liquid fuels which are then
utilized to drive climate-neutral vehicles. This renewable fuels could also substitute the fossil fuels
used in relation to heat supply [166]
Most of the infrastructures serving the transport industry mainly relies on petrol, heavy fuel oil,
and kerosene and this is likely to stay unchanged as a transitional period is sustained over many years
to come, especially in some applications such as the aviation industry. One solution could be to use
chemical processes to convert electricity into gas or liquid fuels, which are referred to as e-fuels.
These e-fuels can then be used in the transportation industry (e.g., to power cars, trucks, and
airplanes). These renewable fuels (produced from renewable electricity) could substitute fossil fuels
not only in the transport industry, but also it can be used for heating and industrial purposes.
The term ‘Power-to-X’ includes all procedures that convert electricity, (i.e., power) into other
energy vectors X [167]. In order to get the big picture, energy supply needs to be observed from an
integrated perspective, instead of considering electricity generation, transport, and industry
separately; therefore, innovations are crucial for the development of a new paradigm.
Considering the expected growth of renewable energy, many studies see great potential for
Power-to-X technology; however, aside from a few exceptions, there are currently only few
marketable options. The problem is that manufacturing costs are still too high, therefore investors
usually favor fossil fuels since the resources are readily available, and they are less expensive.
In other words, in order to commercialize synthetic fuels, the approach has to revolve around
the concept of the large-scale CCU, and how this challenging approach could assume an important
role in undertaking the issue of global CO2 emissions.
E-fuels can be considered as part of the energy transition. There are three main possible
strategies (among others) involving CO2 conversion by physicochemical approaches: sustainable (or
renewable) synthetic methanol, synthetic methane production derived from the CO2 recovered from
the flue gases expelled from coal, gas, or oil-fired electric power stations, and photochemical

73
production of synthetic fuels [167]. Although these three archetypal areas vary in their final
applications, the underline thermodynamic considerations revolve around the conversion process:
hence the utilization of CO2. Also, the CO2 captured from flue gases need to be considered as a
transitory solution, because the final goal is to capture CO2 directly from the air in order to determine
the effect of perfect carbon equilibrium.
Among the possible E-fuels, the focus was geared towards the analysis on e-methane (a gas-
form e-fuel) and e-methanol (a liquid-form e-fuel). In both cases the process consists of mixing
hydrogen produced by electrolysis (power to hydrogen) with CO2 in order to achieve hydrogenation
synthesis via a catalytic reactor.
An energy analysis is then performed, with special consideration to the thermal integration
(minimization of external heat requirements) via pinch analysis, as well as a final estimation of
power-to-fuel overall efficiency. The study demonstrates that power-to-methane and power-to-
methanol process can achieve efficiency of up to ≈ 77% and ≈ 59%, respectively. The energy analysis
(based on the process modeling developed for both the systems) and the heat exchange network
design enabled the development of capital expenditure estimation.
An economic analysis comparison for the production cost of both synthetic fuels was performed
with the purpose of highlighting any potential risk related with the systems. The economic analysis
considered the effect on synthetic fuel cost of some parameters as electrolysis specific costs, the
expenditure for carbon dioxide, electricity price, and yearly operating hours (capacity factor of the
plant). In the work, we have concentrated the analysis on the technological option of high
temperature solid oxide electrolyzer (SOEC), because of its higher electrical efficiency and its
potential to have a positive thermal integration with other sections of the entire transformation chain.
The results show that for both systems the SOEC electrolyzer is the greatest capital expenditure of
the design. Methanol synthesis plant showed lower efficiency and higher investment costs; on the
other hand, fossil-based methanol has higher costs ($/MWh) than fossil methane; thus, the breakeven
point of electricity price (i.e., that making economically comparable synthetic and fossil fuel) is
similar for the two considered cases.
It was concluded that, to produce an economically attractive market for e-methane and e-
methanol, the production plants should maintain a utilization factor of approximately 50%, the cost
of SOECs should be near to 1050 €/kW and the electricity required to run the system needs to be
supplied from renewable sources at a very low cost (below 40-50 $/MWh).

74
Fig. 29. Technical and economic layout of the production of synthetic fuels (methane and methanol)
Figure 29 is a graphical overview of the two chemical processes used to synthesize methane
and methanol from CO2, H2O and the use of renewable energy. The goal is the compare the
efficiency between the two processes when producing both e-fuels. The graph also depicts the
economic analysis by comparing synthetic vs. fossil-based methane and methanol. Finally, a cost
comparison is conducted in order to determine which of the two e-fuels would be the most
economically attractive to investor’s bottom line when compared to fossil fuel alternatives.
CO2 capture and CO2 neutral fuels
CO2 neutral fuels are synthetic hydrocarbons produced from recycled carbon dioxide and water
(Fig. 30). These molecules are split and subsequently synthesized into fuels by employing renewable
energy such as wind and solar energy. After synthetic fuel combustion process, the CO2 emitted is
recycled (Fig. 31). This CO2 is captured from point source initially, but eventually must include
direct air capture to account for emission from inherently dispersed source such as petrol-driven
motor cars, airplanes and gas-fired household appliances. By recapturing and re-using the CO2
emitted, the CO2 cycle is closed, establishing an equilibrium condition.
Fig. 30. CO2 utilization diagram [168]

75
Fig. 31. CO2 recycled synthetic fuel cycles [169]
The conversion of carbon dioxide into fuels and chemicals permits for the displacement of
fossil-based compounds used in the chemical, transport, power production, pharmaceutical sectors.
Nowadays there are different commercial technologies to capture carbon dioxide from energy
production processes. Three technology routes are currently most intensively discussed: CO2-capture
from the flue gas stream after combustion (post-combustion), the use of nearly pure oxygen for fuel
combustion instead of air which increases the CO2-concentration of the flue gas (Oxy-fuel) or the
CO2-capture from the reformed synthesis gas of an upstream gasification unit (Pre-combustion)
[170].
Integrated gasification combined cycle (IGCC) and oxy-coal combustion (OCC) are promising
alternatives for CO2-free power generation. IGCC plants integrated with CCS are more affordable,
due to integration with the more effective CO2 pre-combustion capture technology, with an energy
penalty of about 7–10 percentage points. Also, oxy-fuel combustion can be an interesting solution
for CO2-free power generation from coal and other fossil fuels, involving a flue gas mainly composed
by CO2 and water vapor, which can be easily separated [171].
When considering cost, the oxy-fuel combustion could reach better results: for example, in a
cement production the oxy-fuel leads to achieve an increase of the 32% of the production cost (with
respect to the 102% of increase for the post combustion capture). The lower CO2 avoidance cost is
represented by oxy- fuel option with 55 € per ton of avoided CO2 [66]. Carbon dioxide conversion
into syngas has been recently studied to reduce emissions and improve the efficiency of coal
gasification processes [172].
E-fuels-related technologies
The Global CO2 Initiative (GCI) led a market assessment by applying five key criteria CO2
potential, permanence of capture, willingness to pay, ease of implementation, side effects and co-
benefits), both economic and environmental to assess CO2-based products (Table 5) [56]. GCI based
its conclusion on a five-year research that was completed in early 2016.

76
Table 5. Market Assessment: Criterial for selecting technologies [11]
The detailed market assessment study found that carbon utilization has the potential to reduce
carbon emissions over 10% by 2030 [56].
The study analyzed the current state of CO2 utilization, assessing almost 180 global technology
developers based on their stage of development, addressable market size, number of developers, and
potential for CO2 mitigation. Momentum is favorable for four major markets: building materials,
chemical intermediates, fuels, and polymers (Fig. 32) [11].

77
Fig. 32. Market Assessment: Top 4 markets in terms of environmental impact and commercial opportunity [11]
Even though the manufacturing of polymers through CCU technologies is not yet economically
favorable, other CCU technologies, such as mineral carbonation and concrete curing for the
development of building materials, are currently readily scalable and partially commercialized [11].
According to GCI’s research, the markets for fuels and chemical intermediates (e.g., methanol and
methane), present the broadest areas of market applications.
Methane is mostly used in three key sectors: transportation, electricity production and civil
heating sector [173]. Furthermore, due to the gradual global outspread of the creation and
advancement of clean electricity policies, methane can play a fundamental role in the near future.
This is especially the case when considering the substitution of fossil methane with renewable
methane, in the form of bio-methane and synthetic methane (which is the analysis conducted in this
study).
Methanol production is one of the most effective and mature CCU routes. Syngas is converted
into methanol by the exothermic reaction (Eq.1):
CO + 2H2(g) → CH3OH, ( ∆H298K0 = −91.0
kJ
mol ) (Eq.1)
Methanol can already be used as substitute fuel in internal combustion engines (ICE)-powered
cars (including hybrid cars and plug in models) with minor modifications to existing engines and
fuel systems [94]. Methanol can also be used to produce dimethyl ether (DME) via its dehydration
or employed as a reagent for transesterification reactions in biodiesel production [174]. Several
studies have focused on methanol synthesis, e.g., integrated with enhanced gas recovery [175] or

78
biogas production [176]. Under normal conditions, methanol is a liquid that permits for easy storage,
transportation, and distribution, a similar process used with gasoline and diesel fuel.
To sum up, methanol production is one of the most effective and mature CCU routes with
hydrogenation of CO2 because it can be considered a commodity chemical (not only DME, but also
ethylene, and propylene, two chemicals produced in large amounts by the petrochemical industry)
[38].
It is worth noticing that both methane and methanol, can also be utilized in fuel cells to produce
electricity; either directly [177][178] or indirectly, after an external reforming process converting the
fuel into hydrogen and carbon monoxide [179][180].
The main energy input for these conversion technologies is usually considered as renewable.
This is an important requirement for these technologies, the primary energy input needs to have a
low CO2 emissions intensity to have a positive balance of CO2 reduction in the whole process.
In the renewable source domain, the largest exponents are currently solar, wind, and
hydropower. However, the progressive dispersal of renewable energy has caused some issues related
to the energy system management due to the natural intermittency of renewable energy sources
(RES). Over the last twenty years RES has grown at an average annual rate of 2.2%; solar and wind
power penetration increased with average annual rates of 46.2 and 24.3%, respectively [181]. In this
context, the need of effectual management in the face of the increasing amount of RES-based
electricity can be confronted in various ways, most likely also considering solutions based on power-
to-gas and power-to-liquid technologies; through these technologies it is feasible to store power
directly into an existing infrastructure (e.g., the gas network) evading the waste of RES or its
limitations. In fact, thanks to power-to-fuel paradigms, RES development can also meet non-electric
energy needs such as fuels for transportation and industry feedstock, which currently rely on fossil
fuels. Therefore, the conversion of surplus renewable electricity into a more appropriate chemical
feedstock (power-to-liquid and power-to-gas) could help offset RES intermittency while delivering
a diverse mix of energy carriers. If recycled CO2 is used in the fuel synthesis process, consequently,
the overall emissions reduction will follow [182].
In the power-to-fuel pathway, low-cost surplus electricity is used to feed the electrolysers that
generate hydrogen (H2) from water. The subsequent catalytic reaction between H2 and CO2 allows
the production of gaseous methane or liquid methanol. Focusing on electrolysis, two low-
temperature technologies are available: alkaline and proton exchange membrane (PEM) electrolyzer
operating in the range 60-90 °C and 40-80 °C, respectively [183]. However, a more encouraging
technology (in terms of conversion efficiency) is the one that incorporates solid oxide electrolysis
cells (SOEC): the operating temperature (700–900 °C) of this device is higher than the technologies
mentioned above [184]. High-temperature solid oxide electrolysis system can achieve better results
of a PEM system (energy efficiency until 14% higher, reaching a maximum efficiency of 75.9%)
working at high hydrogen production rates (i.e., high current density) [182].

79
Nevertheless, the deployment and commercialization of new technologies developed to produce
synthetic fuels must be economically appealing to investors, especially if compared to current prices
of fossil derived commodities. To generate an attractive market, it is vital to advance and apply
certain facets of the development of the synthetic fuels production, for example: reducing the cost of
certain electrolysis technologies and using of the electricity input in periods of low market prices of
the commodity.
In this context, the goal is to compare two different types of production plants designed to
produce methane and methanol through the process of high-temperature electrolysis carried out by
solid oxide electrolysers (SOEC). The first plant is based on the coupling between steam electrolysis
and two catalytic reactors fed with a stoichiometric mixture of hydrogen and carbon dioxide (H2/CO2
molar ratio of 4) slightly diluted with unreacted steam. The resulting chemical reaction allows the
production of a synthesis gas with high methane content. The second plant differs from the first one
for the reactor section: the H2-CO2-H2O mixture feeds a high-pressure catalytic reactor where
methanol, water and carbon monoxide are formed. A subsequent distillation allows to separate the
methanol from the other by-products. Energy analysis has been carried out to evaluate the power-to-
fuel overall efficiency, while economic analysis enabled the comparison between synthetic and
fossil-based (conventional) fuels. The analysis of the two concepts allowed to underline potential
and drawbacks related to the considered processes and technologies. If compared to other previous
studies [185] [186], in this analysis a comparison between SOEC-based methanol and methane is
carried out, both from an energy and economic standpoint. The comparison highlights the
dissimilarities in terms of process design, overall power-to- fuel efficiency and synthetic fuel
production cost (including its sensitivity to CO2, electricity and SOEC price).
Methodology
4.3.1. Methane production
The synthesis of methane can be done exploiting the reaction between anthropogenic carbon
dioxide and renewable hydrogen (Fig. 33). Under exothermic reaction (Eq.2), the hydrogenation of
CO2 produces methane and water as by-products (Sabatier reaction).
CO2(g) + 4H2(g) ↔ CH4 + 2H2O(g) ( ∆H298K0 = −165.0
kJ
mol ) (Eq.2)
The operating temperatures are generally slightly higher than to produce methanol (250-400°C)
at similar pressure values. Several metals such as Ni, Ru, Rh, and Co may be used as the catalyst
for the methanation reaction. Ni-based catalysts represent a good compromise due to relatively high
activity, suitable CH4 selectivity, and low raw material price [187]. The catalysts in this case are
generally Ni-, Rh- or Ru-based [40]

80
Fig. 33. Synthetic methane production overview [188]
The equilibrium of the reaction is influenced by pressure and temperature; in thermodynamic
equilibrium and high pressure favors the production of methane; however, high temperature limits
methane formation. Catalytic methanation reactors are usually operated at temperatures between
200°C and 600°C and at pressures ranging from 1 to 100 bar. As previously mentioned, methanation
reaction is highly exothermic; consequently, this presents a major problem because a methanation
reactor must have suitable temperature control to prevent thermodynamic limitation and catalyst
sintering [189]. In large-scale industrial applications and for continuous operations, the temperature
control is attained with a series of adiabatic fixed-bed reactors and intercooling of the stream between
each reactor. However, power-to-gas processes are implemented at smaller scales, with intermittent
operations, for which adiabatic reactors are not suitable. In this context, isothermal reactors where a
cooling fluid directly chills the reacting mixture are usually preferred. Other types of reactors such
as fluidized bed reactors, three-phase reactors or structured reactors are also being researched,
however these technologies are still in the development phase [190]. By rising the allowable
temperatures for methanation catalysts, methane synthesis can be performed by a once-through
method in quasi-isothermal reactors cooled by evaporating water which generates saturated steam.
Under favorable conditions, such systems may produce a synthetic natural gas (SNG) with methane
content above 90 mol.-% in only one catalytic step [191].

81
4.3.2. Methanol production
Methanol can be produced from CO2 in two different ways: in one step or in two steps. The one
step conversion is the direct hydrogenation of CO2 to methanol. The two-step conversion reduces
CO2 into CO by breaking the carbon dioxide C=O bond through the reverse water gas shift (RWGS)
reaction, and then into methanol by the reaction between CO and H2. In this analysis, the conversion
of CO2 in one step was employed. Some routes of conversion of CO₂ to produce fuels are shown in
the following Figure 34.
Fig. 34. CO2 utilization diagram [186]
Exothermal reactions (3) and (4) allow the production of methanol starting from hydrogen and
CO or CO2, respectively. The RWGS reaction (5) occurs in parallel [192].
CO(g) + 2H2(g)→ CH3OH(l) ( ∆H298K0 = −128.0
kJ
mol ) (Eq.3)
CO2(g) + 3H2(g)→ CH3OH(l) ( ∆H298K0 = −87.0
kJ
mol ) (Eq.4)
CO2(g) + H2(g)→ CO(g) + H2O(g) ( ∆H298K0 = +41.0
kJ
mol ) (Eq.5)
RWGS and one of the two hydrogenation reactions are enough to completely describe the
system. Methanol synthesis is exothermic and involves a decreasing number of moles, thus it is
favored at relatively low temperature and high pressure [192].

82
The process depends on availability of waste heat in the power plant to provide thermal energy
to the process in order to have a significant abate of CO₂. In the absence of these thermal sources,
CO₂ abatement is almost null [186].
The methanol synthesis is composed by four main steps (Fig. 35):
1. H₂ production (water electrolysis unit)
2. Syngas compression
3. Methanol formation reaction
4. Methanol distillation
Fig. 35. Synthetic methanol production overview [193]
In methanol production (Fig. 35) the conversion rate is dependent on temperature, thus the key
challenge in the design of reactor systems deals with the reaction heat rejection, to follow as close
as possible the highest rate as the reaction advances. A significant number of concepts are
commercially available today to achieve low catalyst volume, low outlet temperature (high
conversion), heat recovery at high temperature (good energy efficiency) and low by-product
formation. A possible concept consists in a multi-tubular reactor cooled with evaporating water,
where each tube is filled with the solid catalyst.

83
Technology description
A model simulating both methane and methanol production plant is proposed. The first model
aims to reproduce a system based on high-temperature steam electrolysis and methanation, while the
second simulates a coupling between high temperature steam electrolysis and direct hydrogenation
of CO2 to produce liquid methanol. Both models were built using the software Aspen PlusTM. For
all simulations Peng-Robinson state equation has been chosen as thermodynamic model (Aspen
PlusTM, 2000). A scheme summarizing the main units and components for both the processes is
presented in Fig. 36.
CATHODEELECTROLYTE
ANODE
H₂O
H₂O
CO₂
CO₂
O₂
O₂
H₂ + H₂O
H₂
H₂O
H₂O
H₂O H₂O
H₂O
CH₃OH
CH₄
H₂ + H₂O
H₂
ReactionHeat
ExternalHeat
non-reacted gases
High-Telectrolysis
High-Telectrolysis
Distillation column
Steam Electrolysis + Methanation
Steam Electrolysis + Methanol Production
ReactionHeat
ElectricitySurplus
ElectricitySurplus
Reactor 1 Reactor 2
Reactor
CATHODEELECTROLYTE
ANODE
Fig. 36. A model simulating the proposed system operation for methane and methanol production plant
4.4.1. Electrolysis
The inlet water is pumped to compensate pressure drop during evaporation and to enable
pressurized electrolysis at 15 bar, thus avoiding any further post-compression of the produced
hydrogen at cathode side (in this process it has been assumed that methanation occurs at 15 bar).
Reacting water is heated up to have superheated steam at electrolysis inlet. SOEC-based electrolysis
unit has been modeled according to the water reduction reaction (6):
2H2O → 2H2 + O2 (Eq.6)
A steam fractional conversion, also known as reactant utilization (RU), has been fixed to 80%.
If the RU value is exponentially increased this may lead to an increase of diffusion overvoltage
caused by the so-called starvation phenomenon. The cathode outlet is cooled down to 35 °C in order

84
to condensate and remove water confined in the SOEC outlet stream, therefore shifting the chemical
equilibrium of the subsequent catalytic hydrogenation reactions towards the products. In the
Appendix an Aspen PlusTM flowsheet demonstrates the electrolysis process modeling.
A plant size of 10 MW has been fixed to perform a system comparison between methanol
and methane production: electrolysis power can be defined according to a First Law balance
(Eq.7). The size has been iteratively calculated by adjusting the inlet water flow rate.
𝑊𝑒𝑙 = ∑𝑛𝑜𝑢𝑡 * h𝑜𝑢𝑡 – ∑𝑛
𝑖𝑛 * h𝑖𝑛 = 𝑛𝑜𝑢𝑡,𝑐𝑎𝑡 * h𝑜𝑢𝑡,𝑐𝑎𝑡 + 𝑛𝑜𝑢𝑡,𝑎𝑛 * h𝑜𝑢𝑡,𝑎𝑛 ― 𝑛𝑖𝑛 * h𝑖𝑛 (Eq.7)
4.4.2. Fuel Synthesis
For both methane and methanol synthesis, inlet CO2 is compressed up to the fixed
hydrogenation pressure and then mixed with H2.
Methanation unit consists of two isothermal intercooled reactors with intermediate
condensation of the produced water, because H2O removal shifts chemical equilibrium towards
products (methane and steam). The reactors considered for the two-step methane synthesis are fixed
bed isothermal reactors where boiling water on the shell side is used to remove the reaction heat
(methanation is powerfully exothermal). Operating temperature (300°C) is controlled changing the
pressure of the boiling water. The model used to describe this reactor is a PFR (plug flow reactor)
under the following assumptions: one-dimensional heterogeneous model; negligible radial
temperature gradient, and axial dispersion in the reactor tube; no temperature gradient through
catalyst pellet. An inlet pressure of 15 bar has been set according to a previous work [184].
A Langmuir-Hinshelwood-Hougen-Watson (LHHW) kinetic model has been used as rate
equation: kinetics for methane synthesis in a nickel-based catalyst has been taken from the open
literature [194].
The transport phenomena as diffusion resistance within the catalyst pellet have been considered
to evaluate the effect on reactor kinetics. The single spherical particle of catalyst can be treated as a
porous medium. An equivalent diffusion coefficient (De) can be defined starting from the gas
molecular diffusivity and other parameters related to the catalyst pellet as porosity and tortuosity:
typical values can be found in the open literature [195].
The effect of transport limitation has been considered through the effectiveness factor,
expressing the ratio between the moles of the reactant converted and the moles that would react if
the concentration and the temperature inside were constant (Eq.8); where Dp is the diameter of the
catalyst particle and k’ is the ratio between the rate constant calculated with the LHHW expression
and the concentration of the reactant in the catalyst volume. The effectiveness factors calculated
(0.35÷0.4) are different for the two reactors because the CO2 concentration is not the same.

85
Multiplying the kinetic factor of the LHHW expression by the effectiveness factor, it is possible to
consider the effect of the CO2 diffusion inside the pores of the catalyst (Eq.9).
η = 3 φ2⁄ ∗ (( φ/tanhφ) − 1) (Eq.8)
η = 3 φ2⁄ ∗ ( φ/tanhφ) − 1) (Eq.9)
Where φ is the Thiele modulus
Methanol synthesis unit presents only one reactor with a recirculation of the non-reacted gases.
The reacting stream is heated up to the reaction temperature and injected into the fixed bed isothermal
reactor. After the reactor, water and methanol are condensed and separated from the non-reacted
gases in a knock-out drum. Part of the non-reacted gases (5%) is purged to minimize the
accumulation of by-products in the reaction loop. The liquid stream leaving the knock-out drum is
called crude methanol: it is composed of methanol, water, and residual gases. The crude methanol is
laminated to 1.2 bar through two valves before entering the distillation column.
The packed bed reactor is filled with Cu/ZnO/Al2O3 commercial catalyst pellets. For this
catalyst, the model proposed by Vanden Bussche and Froment can describe with good precision the
reactions of methanol production and the RWGS reaction. The model assumes that the CO2 is the
main source of carbon for the synthesis. In addition, the model considers the inhibitory effect of
water formed by the RWGS reaction. The activation energies of reactions were readjusted by
Mignard and Pritchard to better represent the experimental data, which also expanded the application
range of the model up to 75 bar [192] [196].
4.4.3. Upgrading
In the methane synthesis process a condenser enables the removal of nearly all the water
produced during the hydrogenation reaction. A molecular sieve can retain residual water and carbon
dioxide; the water in the gas pipeline should be maintain at low concentrations because the dew point
of SNG must remain below a fixed value. The integration of two intercooled compressors brings the
gas pressure to a value of 60 bar: a typical pressure value of natural gas in main pipelines.
In the methanol production plant, the residual gases contained in the flow that originates from
the reactor, are completely separated from the liquid contained the reactor outlet (mainly composed
by water and methanol) in a flash tank. The remaining stream is heated to 80°C in an exchanger and
then directed to a distillation column. The column was simulated using the Aspen PlusTM modelling
tool known as ‘RadFrac’. The water is discharged from the bottom of the column at 102 °C; it
contains a small amount of methanol and residual gases. Furthermore, gaseous methanol is
discharged from the top section of the column at a pressure of 1 bar and temperature of 64°C; the
discharge also contains small traces of water and non- reactant gases. During the chemical process,
trivial amounts of by-products such as dimethyl ether (DME), alcohols, and other hydrocarbons may

86
remain within the distillation column feed; hence leading to a possible accumulation of small
amounts of methanol at the top of the column. However, this would not preclude its use as fuel [186].
Methanol is then compressed and cooled to 40°C and a flash drum separates non-reactant gases
from liquid methanol.
Efficiency Analysis and Thermal Integration
Some parameters affecting energy analysis, such as the methanation reactors length, the
CO2/H2 ratio and the methanol synthesis reactor temperature must be briefly discussed.
As a constraint for methanation unit, outlet CH4 fraction has been set equal to 95 mol.-%
(corresponding to a CO2 conversion of ≈ 98.9 %). The length of the first reactor has been
iteratively adjusted to minimize the overall length (i.e., the catalyst load) of the unit: the second
reactor length follows because of the first reactor length, due to the constraint on the overall
conversion. In other words, the second reactor must be long enough to enable the achievement
of the specified conversion.
Such optimization led to fix the length of the first reactor equal to 1.2 meters (0.5 m for the
second reactor), reaching an overall length minimum. This result has a fundamental importance
in the following evaluation of the cost of the methanation system: the bare cost of the reactors
and the cost of the catalyst inside the tubes of the reactors are minimized.
As seen in reactions (Eq.3), (Eq.4) and (Eq.5), three reactions occur in parallel in the
methanol production: CH3OH formation from CO and CO2 and reverse water gas shift. Due to
the equilibrium between the reactions and to the recirculation of the non-reacted gases, a
sensitivity analysis to find the reaction temperature and the ratio between the reactants that
allows the highest methanol production rate is required. During the design of the methanol
production unit the electrolysis system size has been fixed to correctly compare the methane
and methanol plant, implying a fixed hydrogen production. Temperature and H2/CO2 ratio affect
the reaction kinetics. It is worth noticing that the methanol yield decreases when the CO2 flow
increases. Furthermore, by increasing the CO2 feed some by-products are also produced (e.g.,
CO). Both CO2/H2 ratio and reaction temperature have been simultaneously adjusted in order
to optimize the methanol synthesis unit: the maximum value for methanol yield was reached
with values of 0.43 and 270 °C for CO2/H2 and temperature, respectively. During the
optimization reactor length was kept constant.
Exothermal methanation reaction carried out within the catalytic reactors provides heat that
could be used to evaporate the water required by the electrolysis section. Water pressure
(affecting evaporation heat) can be iteratively adjusted to have a perfect match between heat
generated (by the reaction) and heat required (by the evaporation). Pump outlet pressure results
near 20 bar (against 15 bar needed within the electrolyzer), to make coincide the latent heat of
evaporation of the water with the available heat at the two reactors. The following lamination

87
in a valve allows to have the correct pressure at the SOEC inlet. For this reason, evaporation duty
(as well as reaction heat) is not considered during the following thermal integration procedure.
Methanol synthesis reactor works in isothermal condition: reactor cooling is required to reject
the reactions heat. The reactions that occur in methanol synthesis are less exothermic if compared to
the CO2 methanation: the heat available at the reactor is thus not enough to cover the thermal energy
required by the evaporator as it occurred in the previous case. For this reason, the evaporating stream
before the electrolyzer has been divided between the heat provided from the reactor and the heat that
is needed from an external source.
Pinch analysis has been carried out to minimize the external heat requirement (i.e., maximizing
efficiency) and to design the heat exchangers network (HEN). A minimum temperature difference
between hot and cold streams has been set equal to 20 °C, in order to guarantee an optimum choice
between the heat exchange area and the HEN cost [197].
Economic Methodology
The aim of this section is to illustrate assumptions and procedures in order to compare the
methanol and methane production from an economic standpoint and understand how these
technologies could fit in the current fuel market.
4.6.1. Cost Estimation Methodology
The capital expenditure calculation has been derived from the methodology proposed for the
energy system studies by the National Energy Technology Laboratory (NETL) of the US Energy
Department [12]. Four levels of capital cost have been considered: Bare Erected Cost (BEC),
Engineering, Procurement and Construction Cost (EPCC), Total Plant Cost (TPC) and Total
Overnight Capital (TOC). Furthermore, these four capital costs are labeled “overnight costs” and are
expressed in “base-year” dollars. They do not consider financing costs nor escalation expenses. The
base year is the first year of capital expenditure.
BEC is quantified based on an itemized list of all process equipment required for a project,
together with the estimated cost of all materials and labor needed to complete the installation;
furthermore, it is expressed in base-year.
EPCC encompasses the BEC plus the cost of services provided by the engineering, procurement
and construction contractor, i.e., related to a contract arrangement used in some industries where the
contractor is responsible for all services and activities related to the project. These services and
activities include detailed engineering design, contractor permitting, and project/construction
management costs. Usually, this additional cost varies between 8% to 10% of BEC: in this work a
value of 9% has been assumed. TPC comprises the EPCC plus project and process contingencies.
Contingencies are funds added to the base cost estimate to compensate for cost estimate
inaccuracies caused by uncertainty and risk exposure. For a small pilot plant, the project and process

88
contingencies are estimated at 25% of BEC. This contingency is evaluated at 20% of the sum
of EPCC and Process Contingency. TOC comprises the TPC plus additional overnight costs,
including owner’s costs. Owner’s costs are composed of several addends: The Inventory Capital
(calculated as 0.5% of TPC for spare parts); the land’s cost (3000 $/acre plus a land surface of
2 acres were assumed); financing cost (estimated as 2.7% of TPC), the cost of securing financing
the project, plus fees and closing costs; however, it does not include interest accrued during
construction. Additional owner’s costs were calculated as 15% of TPC [184].
If the TOC of a plant is known, it is possible to calculate the cost of the products through
the net present value (NPV) analysis. NPV is the sum of all the discounted future cash flows
and is determined by calculating the costs (negative cash flows) and benefits (positive cash
flows) for each period of an investment; typically for one year. After the cash flow for each
period is calculated, the present value of each one is achieved by discounting its future value at
a periodic rate of return dictated by the market. Because of its simplicity, NPV is a useful tool
to determine whether a project or investment will result in a net profit or a loss. A positive NPV
results in profit, while a negative NPV results in a loss. The net present value can be calculated
as (Eq.10):
NPV = −TOC + ∑
LTn=1
CFn
(1+i)n (Eq.10)
The summation of all the cash flows (CF) considered in the analysis has been made up to
the useful life of the plant, which in this work has been estimated at 30 years.
The cash flow has been calculated as the balance between the operating revenues, expenses
and taxes (Eq.11):
CFn = Revn – Expn - Txn (Eq.11)
The revenues are given by the sale of the desired product (methane or methanol) and by
the oxygen by-product. Expenses are composed by the operation and maintenance (O&M) costs
and by the costs of the external flows needed from the plants (i.e., electrical energy, carbon
dioxide and water) (Eq.12).
𝐸𝑥𝑝𝑛 = 𝐹𝐼𝑋𝑂𝑀 + 𝑈𝐹 ∗ (𝑉𝐴𝑅𝑂𝑀 + 𝐶𝐶𝑂2 ∗ 𝑀𝐶𝑂2 + 𝐶𝑒𝑙 + 𝐸𝑒𝑙 + 𝐶𝐻2𝑂 ∗ 𝑀𝐻2𝑂) (Eq.12)
O&M are divided into two components; one that is depending on the operating hours of
the plant, called variable O&M (VAROM), and the other that is constant called fixed O&M
(FIXOM).

89
Yearly income taxes are calculated as the product between taxable income and tax rate. Taxable
income is obtained by subtracting to operating revenues the operating expenses and the depreciation
(Eq.13).
𝑇𝑥𝑛 = 𝑟𝑡 ∗ (𝑅𝑒𝑣𝑛 ―𝐸𝑥𝑝𝑛 ― 𝐷𝑒𝑝𝑛) (Eq.13)
The depreciation is a technical-accounting procedure for the distribution of a multi-year cost
over the estimated years of life of the plant: it is constant and can be obtained dividing TOC over the
amortization period, considered as the lifetime of the plant.
The final cost of the product (Cprod, expressed in $/MWh) has been calculated as the selling price
ensuring NPV equal to zero at the end of the operating life of the plant with a fixed discount rate
(that is also an internal rate of return).
4.6.2. Calculation Assumptions
In this section the estimation of the BEC of the designed components (for both treated plants)
was investigated. The equipment cost has been linked to an attribute of the component. The general
formula (valid for various type of components) is the following (Eq.14):
Log10 ∗ 𝐶p0 = 𝑘1 + 𝑘2 ∗ log10 (𝐴) + 𝑘3 [log10 (𝐴)]
2 (Eq.14)
where A is the capacity or size parameter for the equipment and k1, k2 and k3 are constant values
depending on the specific equipment type. The previous formula provides the purchasing equipment
cost for components operating at base conditions (Cp
0
) which are identified by atmospheric operating
pressure and a defined temperature level. In the open literature [198], the methodology to obtain the
BEC for actual operating condition starting from base conditions is provided for some equipment.
Operating conditions affect design and materials utilized. Pressure effect has been considered
through a pressure factor (Fp) (Eq.15):
log10 𝐹𝑝 = 𝐶1 + 𝐶2 ∗ log10 (𝑃) + 𝐶3 ∗ [log10 (𝑃)]2
(Eq.15)
where C1, C2 and C3 are constant values depending on the equipment type and p is pressure
expressed in bar(g). Temperature effect, and consequently the material choice, is represented by a
material factor (FM), that is provided by tables and diagrams. Therefore, the BEC can be calculated
as (Eq.16):
𝐶BM = 𝐶p0 (𝐵1 +𝐵2 𝐹M ∗𝐹P) (Eq.16)
The values of B1 and B2 are given for different components. Both Fp and FM are greater than
one. For compressors and pumps the size parameters for the estimation of the purchasing equipment

90
cost are the fluid power and the shaft power, respectively. Pressure factor Fp is present only for
pumps, while material factors FM have been chosen considering the maximum temperature reached.
Cost estimation for heat exchangers is provided as a function of the heat exchange area. From
the pinch analysis (which will be presented later) it is possible to calculate the surface for each
exchanger (Eq.17):
𝛷 = 𝑈 • 𝐴 • 𝛥𝑇𝑚𝑙 (Eq.17)
where Φ is the heat flow, U is the global heat transfer coefficient, A is the heat exchange
area and ΔTml is the logarithmic mean temperature difference. U depends on the physical state
(liquid, gaseous, phase changing) of the involved streams, temperature, and pressure. Heat
transfer coefficient for each fluid coupling has been taken from literature [199]. Pressure factor
𝐹𝑝 and material factor 𝐹𝑀 have been used to calculate the purchasing cost of the equipment: for
high-temperature heat exchangers a Ni-alloy was considered as material.
Fixed bed reactors have been designed considering the quantity, diameter, and length of
the tubes. The considered reactors have the following shell-and-tubes structure: the reacting
mixture flows inside the pipes that are filled with catalyst pellets; meanwhile outside each tube,
the coolant (evaporating water) removes the generated heat. The bare cost of reactors has been
estimated according to equation (Eq.14) and (Eq.15), considering them as shell and tube reactors
and by utilizing the overall external tube area as cost parameter. The catalyst mass inside each
reactor has been calculated; due to the catalyst deactivation it must be substituted to maintain
the activity of the reactions at a chosen value. The cost and replacement expense of the catalyst
will be discussed in a subsequent section. Comparable to the heat exchangers, pressure factor
Fp and material factor FM, have been used to calculate the purchasing cost of the equipment. The
methanol reactor works at a high pressure (75.7 bar); hence, significantly affecting the cost.
Prices for the various components composing the distillation segment of a methanol plant
can be obtained from the literature [200]. However, the available information is limited to
specific component sizes; therefore, in order to scale and estimate the cost of a customized piece
of equipment, the following relationship between BEC and size was utilized [198] (Eq.18):
𝐶 = 𝐶0 • (S/ S0) f (Eq.18)
S is the equipment cost characteristic that can represent size or capacity and f is a cost
scaling factor smaller than 1. Subscripts 0 refers to equipment with the base (i.e., available)
attribute, and S depends on the considered component, in this case it corresponds to the flow
rate. The scaling factor (sometime referred to a cost exponent) normally depends on the specific

91
type of equipment. It is set to a default value of 0.6 giving the “six-tenths-rule” [87] when preferred
estimation methods are not available.
The estimation cost of a SOEC, which is the component that has the greater impact on the plant
cost, has been prepared by following information found in the literature [201]. The SOEC cost
included in the economic analysis was realized by considering the perspective of market experts. The
cost is contingent on several factors, such as the presence of research and development (R&D)
financial backing that funding to support the innovations in materials and technology and the
increasing in the production that strongly break down the prices (sometimes this is called RD&D
that stands for Research, Development and Deployment). In this analysis four different cases were
considered:
• The capital cost of a SOEC, considering current R&D financial funding and no production
scale-up, is estimated to be 2500 €/kW by the year 2020 (this value represents the 10th percentile of
the expert’s evaluations).
• The capital cost of a SOEC, considering current R&D financial funding and no production
scale-up, is estimated to be 1050 €/kW by the year 2030 (this value represents the 50th percentile of
the expert’s evaluations, i.e., the average value)
• The capital cost of a SOEC, considering current R&D financial funding and no production
scale-up, is estimated to be 750 €/kW by the year 2030 (this value represents the 10th percentile of
the expert’s evaluations).
• The capital cost of a SOEC, considering current R&D financial funding and production scale-
up, is estimated to be 450 €/kW by year 2030 (this value represents the 10th percentile of the expert’s
evaluations).
FIXOM
FIXOM is independent of the effective operating hours of the plant. The estimated costs of the
plant include: the yearly catalyst replacement for methanation (valued at 15539 $/m3) [12] and the
catalyst replacement for the methanol reactor (fixed at 118 $/kg) [200]. Other costs considered are
the labor cost, set at 75,000 $ per year/per worker. Considering that the plant is highly automated,
only one operator is considered in the calculations [184]. The conventional maintenance cost has
been considered equal to 0.5% of TOC. Also, the stack replacement of the electrolysis section must
be considered. This replacement is associated with the cells limited life cycle. Usually, the lifetime
of a stack is estimated at 5 years, but in this work the replacement cost is spread during the whole
lifetime of the plant, considering it as the 2.5% of the TOC.

92
VAROM
VAROM depends on the Utilization Factor (UF), representing the ratio between the yearly
operating hours of the plants and the total hours in a year. The costs usually considered are
related to the external requirement of the system in terms of carbon dioxide, water, and
electricity usage. In this work, the cost of CO2 has been valued of 9 $/t. However, this CO2 cost
could oscillate between 3 $/t and 9 $/t over time [202]. Additionally, a long-term CO2 avoidance
cost is estimated at 0.43 $/t [181]. Other costs considered are water, set at 1 $/t [169]; electricity
cost has been weighed at values ranging from 0 - 100 $/MWh to take into account various
scenarios and the current electricity market price [200].
GLOBAL ASSUMPTION
Oxygen produced in the electrolysis section is a by-product that can be sold: its price has
been considered equal to 79 $/t according to the open literature [203]. A tax rate of 20 % has
been considered during the discounted cash flow analysis.
Energy prices in the EU depend on a range of diverse supply and demand market conditions
that include geopolitical situation, the national energy mix, import diversification, network
costs, environmental protection costs, severe weather conditions, and levels of excise and
taxation. Natural Gas (methane) prices is affected by the end user; therefore, two different
values (defining the price interval) have been considered: an industrial customer price equal to
37 $/MWh and a household customer price equal to 80 $/MWh. These values include taxes and
levies for household consumers; however, it excludes refundable taxes and levies for industrial
consumers (Eurostat, 2017, http://ec.europa.eu/eurostat.).
The methanol market involves a price volatility that is associated to the variation of crude
oil prices. For this reason, an upper and a lower bound price have been considered (“Methanex
Web page.,” 2018, https://www.methanex.com). MeOH lower and upper bound prices have
been set at 69 and 90 $/MWh (on LHV basis), respectively.
Results and Discussion
4.7.1. Thermal integration and plants energy performance
Figure 37 shows the composite curves for both the systems. Three zones should be noted:
(i) the pinch point, i.e., where minimum temperature difference (20 °C) between hot and cold
fluids occurs; (ii) the external heat requirement, represented by the difference between hot and
cold composite curves in the right side of the charts; (iii) the wasted heat represented by the
difference between hot and cold composite curves in the left side of the chart. In the methanation
case, the plateaus corresponding to water evaporation (cold fluids) and reaction heat (hot fluids)

93
are not presented. The reason being the good coupling between the available heat at the methanation
reactors and the thermal requirement for the evaporation before the electrolysis.
Fig. 37. Composite curves for hot and cold streams: methane (a) and methanol (b) synthesis
In Table 6 the main results related to the minimization of external heat are presented. The
methanation plant demonstrates a superior integration because of its lower external heat requirement
which eventually will affect the entire efficiency evaluation. The lower energy input for methane
production is due to the ideal match between the heat produced (reaction cooling) and the heat
required (evaporation). In the case of methanol, the rejected heat realized during the exothermal
reaction can still be exploited to evaporate water; nonetheless it represents only a fraction of the
required heat duty for evaporation. The heat produced by the reaction (145.2 kW) is smaller than
the thermal energy required by the evaporator (436.6 kW). Only ≈ 33% of the evaporation heat is
provided by the reactor cooling, while the remaining amount should be provided by external means
or via thermal integration with hot process streams.
Table 6. Pinch Analysis Results for both plants
SOEC + Methanation SOEC + Methanol production
Tpp (℃) 790 209
𝚽heat,min (kW) 40 802
𝚽cool,min (kW)
1145 1210
The overall system efficiency can be calculated as the ratio between the chemical power of the
products (methane and methanol) based on the heating value and the total energy input. This ratio is

94
composed of the AC electric input for electrolysis, the power to drive compressors and pumps,
and the energy required for the electric heaters needed to provide the external thermal energy.
Efficiency can be expressed through the following formula (Eq.19):
η = Powerproduct ÷ Wel = LHVproduct * m product ÷ Wel (Eq.19)
Table 7 summarizes the comparison between the two analyzed systems focusing on energy
consumption, production, and performance. The higher compression work needed for the
methanol production is due to the different pressure present in the methanation unit (about 15
bar) and in the methanol synthesis reactor (75 bar). Required electricity for pumping before
electrolysis is slightly higher in the case of methanation, as the water pressure has been
increased to allow the coupling of the heat requirement in evaporation with the thermal power
available to the reactors of methanation, as previously pointed out. The total electricity
requirement (Wel,input,TOT) takes also into account that electrolysis unit is fed with a direct current
input: an AC/DC conversion efficiency of 98 % has been considered. It is worth noticing that
the methanation process presents a higher efficiency if compared to the methanol production.
This is mainly caused by two factors: the largest amount of external thermal energy needed by
the methanol plant and the lower conversion rate in the methanol synthesis unit.
Table 7. Efficiency comparison between the analyzed plants
SOEC + Methanation SOEC + Methanol Production
Win,SOEC (kW)
10,000 10,000
Wcompr,CO2 (kW)
118 319
Wcompr, plant (kW)
52 384
Wpump (kW)
5.9 4.4
Wexternal heating (kW)
40 802
Wel input, TOT (kW)
10,419 11,713
LHV product (MJ/kg)
50.2 19.9
Product mass flow (kg/s)
0.16 0.35
Chemical power (kW)
8,034 6,883
Energy requirement
(kWh/kg)
18.1 9.4

95
4.7.2. Economic Results
Figure 38 shows the capital cost composition for methane and methanol plants. As presented,
the SOEC cost impact is higher in the methanation plant because of the lower total investment cost
with respect to the methanol plant. The higher pressure and the greater heat exchange duty needed
in the methanol production represent the main cost difference between the two plants.
Fig. 38. Total plant cost sharing for the plants: methane (a) and methanol (b)
The total plant cost (TPC) for all the components of both plants needs to be escalated from the
available year to the chosen base year. The base year to which all cost estimations refer to is 2017.
The assumptions that are useful for capital cost estimation are summarized in the tables below (Table
8 and Table 9). The base cases for the economic analysis of both plants have been done considering
a possible, near-term scenario in the SOEC price (2030 R&D 1 x 50th). Even though the TPC ($) for
SOEC is the same for both plants, the pie charts above represent the share cost of all the components.
Table 8. Methanation Plant

96
Table 9. Methanol Production Plant
Table 10 summarizes the main economic results; these values are obtained considering the
baseline assumption for some parameters such as: utilization factor (0.8), oxygen selling price
(79 $/t), and carbon dioxide cost (9 $/t) (According to the IEA the price of CO2 in 2017 for
advanced economies ranges between 5-16 USD/tCO2 and for emerging economies between 0-
5 USD/tCO2) [204]. Electricity cost in the base case has been set equal to 30 $/MWh but it will
be varied during the sensitivity analyses. The costs for a methanol synthesis plant are higher if
compared to a methane plant. These expenditures are related to capital costs, O&M costs, and
electricity (due to the lower power-to-fuel overall conversion efficiency). Moreover, the energy
per year stored in chemical form is lower for the methanol plant. Although the two technologies
are not so different in terms of economy return because of the competitive prices of the fossil
methane in the actual market.
Table 10. Cost comparison between the plants
CH4 synthesis MeOH synthesis
TPC ($) 16,956,281 24,307,718
TOC ($) 20,387,450 29,223,877
O&M ($/yr.) 687,789 858,379
CO2 cost ($/yr.) 100,518 173,487
H2O cost ($/yr.) 22,860 22,860
Electricity cost ($/yr.) 2,190,504 2,462,440
Energy production (MWh/yr.) 56,305 48,237
Figure 39 describes the variation of cost of the products as a function of the electricity cost,
setting a utilization factor equal to 0.8, and by considering various scenario of the SOECs cost.
2,500 €/kW case illustrates the current SOEC price; the breakeven point is reached only if the
electricity cost consumed is nearly zero (in the cases of “industrial natural gas” and “MeOH low
price”). As shown in the scenarios on future cost reduction for SOECs, the breakeven point
takes place at higher electricity price. The linear behavior of the lines describes the product cost,
a linear dependence from the electricity cost. The slopes of these lines are steeper in the case of
methanol; this means that the impact of the electricity cost is higher for the methanol due to the

97
lower efficiency of methanol production. Each curve has been obtained with a carbon dioxide cost
of 9 $/t.
When considering the household market prices of natural gas (NG) for a single-family
household, it appears that the methanation process improves when compared to methanol production.
Fig. 39. Synthetic fuel cost by varying electricity cost and SOEC price scenario: methane (a) and methanol (b)
synthesis
Figure 40 represents the cost of the products (methane and methanol, respectively) as a function
of the electricity price, still setting a utilization factor equal to 0.8, for a specific SOEC cost equal to
1050 $/kW, but in this case the results are highly dependent on the cost of CO2. The distance between
the two lines is greater in the case of a methanol synthesis plant. The cause for this phenomenon is
the higher amount of CO2 required from the stoichiometry of the methanol formation reaction.
Fig. 40. Cost of the product vs. electricity price for different CO2 costs: methane (a) and methanol (b) synthesis.

98
Figure 41 shows the combined impact of the SOEC stacks specific cost and the utilization
factor (UF) on the synthetic fuel price. In this last case some optimistic assumptions have been
taken in order to simulate a future power-to-fuel scenario: the electrical energy cost has been
set to zero considering that power-to-fuel plants should exploit surplus energy from a network
that can provide the power free of charge, thus if the power-to-fuel system offer a service to the
electric grid in terms of surpluses mitigation. In addition, the CO2 cost has been fixed at 3 $/t,
using the threshold value considered in the previous cases, awaiting those developments of
carbon sequestration technologies become cost efficient, hence lowering the cost of captured
CO2. The tax rate has been set to zero, implying there is/are incentive/s provided by supportive
entities interested in lowering the cost of these “green” technologies.
Fig. 41. Fuel cost by varying use factor and SOEC cost with electricity price = 0: methane and methanol
As expected, an increase of the utilization factor results in a lower synthetic fuel production
cost. This is due to the lower impact of the capital expenditure; given this position remains equal
while the number of equivalent operating hours (i.e., the produced fuel mass/energy) per year
rises.
𝑈𝐹 represents the fraction of the operating time during the year: in a power-to-fuel scenario
the UF is not so high because it represents the time in which the electrical energy has a price
close to zero. Considering the current price of a SOEC stack, the breakeven point is reached at
UF equal to 50% for the NG household price, while a higher UF (≈ 85%, not shown in the
figure) is required to compete with the current industrial NG market price. If the power-to-fuel
system operates as an energy storage system; UF equal to 85% signifies frequent electricity

99
surpluses (≈ 7500 hours per year). Nonetheless, when evaluating power-to-fuel operations in a more
realistic manner, the value of UF becomes lower and the cost of electricity is cheap.
If a SOEC cost of 1050 €/kW is considered, the framework changes substantially; the breakeven
point is attained with a UF equal to 45 % (that implies ≈ 4000 yearly operating hours) to reach a
production cost comparable to the NG industrial price. As expected, as the breakeven 𝑈𝐹 decreases,
the SOEC specific cost shrinks. Under the most optimistic assumption (i.e., free electricity, CO2
price of 3 $/t and SOEC cost equal to 450 $/kW) the breakeven occurs at UF equal to 25 % (synthetic
methane competitive with industrial fossil NG).
The situation is slightly different for methanol; with the current costs of SOEC, the creation of
a competitive market can be achieved if UF is between 65% and 80% (not shown in the figure). In
the scenario with SOEC cost equal to 750 €/kW, on the other hand, with a UF between 42% and 50%
it is possible to compete with fossil-based methanol.
The very low cost of fossil NG for industrial use means that it is very difficult to contend the
economic benefits if compared to synthetic natural gas. The production of methanol, on the other
hand, compensates for the greater investment and operating costs with a higher market price.
Results of this analysis show that the economic viability of power-to-gas for grid injection requires
the reduction of capital cost (especially of the SOEC) and the availability of low electricity prices.
Nevertheless, it is possible to generate revenue from financial investments if some major changes in
the current development of the technology occur. Some of these changes are: boost R&D efforts
(especially on electrolysis technology) and project costs optimization (e.g., mutualization of
infrastructures, standardization of procedures and equipment). The exploitation of low-priced
renewable electricity (e.g., 30 $/MWh for 6500 hours/year) requires an energy mix with very high
share of technologically- mature wind and solar power produced by these sources and including their
integration with other conventional power sources within the electric grid. This target could be
achieved either through tax exemptions, policy incentives or specific project configurations (e.g.,
power-to-gas plant located close to industrial sites already exempted from the tax or to baseload
production plant, depending on the regulation framework), amongst other possible solutions.
Finally, with a review of the economic analysis for the methanol plant it was evident that the
commercialization of a cost-efficient technology could be achieved in the medium to long term
(approximately 15-20 years) (Dairanieh et al., 2016). It is imperative that resources are invested in
R&D efforts, especially those related to electrolysis technology and scale effects of the SOEC
system. Moreover, the power-to-methanol process could become economically viable if the fuels
produced by the plant are not taxed (i.e., competing with prices of taxed-gasoline).

100
Mineral Carbonation of Fly Ash
Coal fired thermal power plants are large emitters of CO2; however, coal is extensively relied
upon for power generation. Furthermore, coal combustion also produces ashes (e.g., fly ashes), a
solid byproduct, usually discarded in landfills or waterways. To be able to continue the use of coal
for energy production, low-cost technologies must be developed for capturing, utilizing, and storing
CO2 (CCUS). One possible CCUS solution entails the practice of using hi-tech applications for
capturing CO2 from the flue gas of a coal power plant; the recovery of fly ashes produced by the
combustion of coal; the mineral carbonation (MC) process to produce carbonated fly ashes (CFA);
and the use of these ashes for the concrete/construction industry.
Mineral carbonation is a CCUS technology that can capture large amounts of CO2 and convert
it to solid inorganic carbonates using chemical reactions. MC is one of the only options that results
in permanent storage of CO2 as a solid, with no need for long term monitoring. Due to the product’s
stability over long periods of time it makes it ideal for the construction industry; furthermore, it
eliminates the concern of potential CO2 leaks that could pose safety or environmental risks.
Current R&D activities in MC are focused on attaining energy efficient reactions and reaction
rates feasible for storage of substantial volumes of CO2 from industrial processes by means of
industrial waste such as fly ash. (accelerated mineral carbonation).
Fly ash, an inorganic deposit remaining after coal combustion, is divided into two groups: Type
F (low-calcium) and Type C (high-calcium) a.k.a. high-calcium fly ash (HCFA) [205]. The two
types of fly ash are based on its source of origin and composition (i.e., type of coal that is burned).
Type F fly ash is normally produced from burning anthracite or bituminous coal whereas HCFA is
produced from burning lignite or sub- bituminous coal. HCFA, for the most part, is preferred over
Type F fly ash because of its higher content of calcium. When HCFA is used as a complementary
cementitious material it can augment some of the physical, behavioral, and structural properties of
the concrete (e.g., compressive strength, workability, etc.). Nevertheless, when “carbonated” HCFA
is used as a complementary cementitious material it can boost some of these concrete properties if
compared to the use of just HCFA [206].
The prospective for using fly ash as a complementary cementitious material in concrete has
been known almost since the start of the last century, although it wasn't until the mid-1900s that
significant utilization of fly ash in concrete began following the pioneering research conducted at the

101
University of California, Berkeley [207]. The last 50 years has seen the use of fly ash in concrete
grow dramatically with close to 15 million tons used in concrete, concrete products and grouts in the
U.S. in 2005 [208].
The use of fly ash has great prospective to diminishing GHG emissions by reducing mining
activities, decreasing CO2 production during the production of materials that can be substituted by
fly ash (e.g., Portland cement), minimizing the disposal problem usually in storage ponds, and
helping in the improvement of land utilization. However, the prospective of a new route of
cementation by the carbonation of fly ash is still under development but with great potential for
accelerated commercialization. The escalation of environmental and economic benefits created by
this new pathway for cementation are significant if compared to the current methods of using fly ash
in the construction industry.
The work utilizes the data of a recent experimental investigation preformed at UPC as part
of a work’s analysis. The experiment consisted of the accelerated carbonation of HCFA under dry
and moist conditions, at various temperatures and pressures. The HCFA (consisting of 35.27% CaO)
used in the UPC experiment came from a coal plant located in Greece. The source of the CO2
utilized in the experiment was intentionally mixed in the lab with the purpose of mimicking
“untreated” CO2 (i.e., the unadulterated flue gas from a coal power plant= 84% NO2, 14% CO2, 1%
H2O). The experiment demonstrated that the highest carbonation efficiency (55.2% and 132.7
g/CO2/kg fly ash, related to the total CaO %) came from HCFA in dry conditions, at 160°C, 2 hours,
and 6 bars. However, results showed that rising the pressure and temperature enhances the process
of carbonation, as well as the presence of moderate amounts of water vapor in the CO2 gas flow
[205]. The study ultimately concluded that approximately 21% of all CO2 emissions of a coal-
burning power plant could potentially be sequestered as carbonates (Fig. 42) [206].
Fig. 42. Simplified schematic of UPC’s experimental HCFA carbonation process
Highlights of the HCFA carbonation process:
• Carbonation reactor has a small footprint and is placed near the coal power plant

102
• Flue gas from the coal gasification is already pressurized (6 bars) and is redirected to the
carbonation reactor
• HCFA with 21% content of free CaO is transferred to the carbonation reactor immediately
after production from coal processing (2 tons of fly ash is carbonated over 2 hours)
• Carbonation reaction conditions: 6 bars, 160 C0, 2 hours for 1 part of fly ash fitting to the
reactor size (2 tons). The reaction inside the reactor is:
CaO + CO2 → CaCO3 (ΔH = -167 kJ
molCO2
)
Carbonation of HCFA ashes has two benefits: (i) reduction of CO2 emissions produced by
fossil fuel power plants and (ii) increase the utilization rate of these fly ashes [209] [210] [211].
Carbonation process changes properties of HCFA by lowering the free lime content, what in
consequence can allow the use of this material for cement production [212] [213] [214].
This Chapter also identifies parallels and nonconformities between fly ash (mainly HCFA)
classifications ASTM International and EU Standards of the most frequently used specifications
governing certain cement and concrete applications. Technological advances in fly ash applications
are developing rapidly; however, the shortage of regulatory reaction to these technological advances
may impede the adoption of those technologies
Finally, the Chapter assesses the market and business potentials for developing new fly ash
configurations (e.g., carbonated fly ash) and its use in the construction industry.
Mineral Carbonation
Under the framework of CCUS, there is a process called accelerated carbonation (chemical
adsorption). In this process, alkaline materials are reacted with CO2 in the presence of moisture to
accelerate the reaction to a timescale of a few minutes or hours [215]. CO2 utilization by
mineralization as carbonates is related to the accelerated carbonation technology (ACT). Mineral
carbonation is one of few technologies that work as both capture and storage technologies [216]. One
of the advantages of MC is the stability of the formed carbonated products over extended periods of
time. Thus, there would be little need to monitor the disposal sites and the associated risks would be
very low [217].
The basic goal of accelerated carbonation is to mimic the natural silicate rock weathering
processes in which CO2 reacts with metal oxide bearing materials to form stable and insoluble
carbonates, with calcium- or magnesium-oxide being the most favorable metal oxide in reacting with
CO2 (Fig. 43). The process is exothermic and thermodynamically favored, with typical enthalpies of
reaction ranging from 50 to 100 kJ/mole, depending on the resource materials utilized [218] [219].
The energy demand for mineralization is high mainly to overcome the slow reaction kinetics,
as high reaction pressures and temperatures are recommended [220]. Factors that affect the kinetics

103
of the carbonation reaction are exposure conditions, such as CO2 partial pressure, source and
concentration, temperature, water/vapor content, porosity and permeability [221].
Fig. 43. Thermodynamic stability diagram of carbon [220]
Industrial residues such as steel making slags, combustion residues, waste concrete, fly ashes,
etc. are alkaline and also appear to be potential raw materials for CO2 sequestration by accelerated
carbonation because these materials are generally rich in metal oxides including calcium,
magnesium, aluminum, iron, and manganese oxide [222].
Currently, accelerated carbonation processes have been focused on assessing and
maximizing the storage of CO2 by optimizing the operating conditions including pressure, retention
time, temperature, gas-to-solid (G/S) ratio in direct routes, gas-to-liquid (G/L) ratio and gas-liquid-
solid (G/L/S) ratio in aqueous routes, gas humidity, gas flow rate, liquid flow rate, particle size, and
solid pretreatment processes [223].
Mineral carbonation encompasses a series of reactions that can take place in a single or a
multi-step process, also known as direct and indirect carbonation, respectively [224]. In a single-step
process, the extraction of the metal from the mineral medium and the carbonate precipitation occurs
simultaneously in the same reactor [225]. Direct carbonation takes place under high pressure
conditions in either dry or aqueous media. Multi-step or indirect carbonation is when alkaline earth
metal is first extracted from the mineral matrix and subsequently carbonated, it usually involves pre-
treatment of used minerals Fig. 44. [223].

104
Fig. 44. Various process routes of accelerated carbonation for CO2 capture [225]
The process of MC of CO2 offers a pathway for long-term storage as part of the CCUS
procedure. CO2 reacts with Ca or Mg-rich minerals to form a carbonate along with the release of heat
energy, as shown in Equation (1) to Equation (4), [226]. The strategy consists in activating abundant
natural silicate rocks, such as wollastonite (𝐶𝑎𝑆𝑖𝑂3), olivine (𝑀𝑔2𝑆𝑖𝑂4), and serpentine
(𝑀𝑔3𝑆𝑖𝑂5(𝑂𝐻)4) [227] [228]:
CaSiO3 + CO2 ↔ CaCO3 + SiO2 (∆H° = −90kJ
molCO2
wollostonite) (Eq.1)
Mg2SiO4 + CO2 ↔ 2MgCO3 + SiO2 (∆H° = −89kJ
molCO2
olivine) (Eq. 2)
Mg3SiO5(OH4) + 3CO2 ↔ 3MgCO3 + 2SiO2 + 2H2O (∆H° = −64kJ
molCO2
serpentine) (Eq.3)
CaO + CO2 ↔ 2CO + 2H2 (∆H° = +247kJ
molCO2
) (Eq. 4)
The use of pure CO2 is not vital for mineral carbonation as the presence of impurities such
as NOx in flue gas will not restrict with the carbonation reaction [57]. Therefore, the separation and
capture step that produces a pure stream of CO2 can be omitted as waste emissions containing CO2
can be used directly [125].
The main advantage of MC is the formation of stable carbonates capable of storing CO2 for
long periods of time [229], without the risk of CO2 leakage as in CCS [230]. However, this
technology is not fully matured for large-scale applications as the energy penalization and costs are
still too high [231].
In the case of silicate rocks, carbonation can be carried out either ex-situ in a chemical
processing plant after mining and pretreating the silicates, or in-situ, by injecting CO2 in silicate-rich
geological formations or in alkaline aquifers [232]. In-situ carbonation is an operation similar to
geological storage, while ex-situ carbonation involves processing steps requiring additional energy

105
input that are difficult to compensate for with the energy released by the carbonation reaction [233].
Following the lab experiments conducted at UPC this chapter will focus on processes and practices
that follow ex-situ mineral carbonation and direct carbonation routes [234].
Mineral carbonation offers the opportunity to create products and generate applications that
implements CCUS processes. Direct and indirect carbon mineralization of natural and industrial
alkaline materials offer the opportunity to produce a range of tailored carbonation products and by-
products as construction and building materials [235] [236]. Process adaptation or post-processing
can be employed to further expand the range of products to include higher-value ones. Applications
include structural materials (e.g., cements, concrete, and mortars), nonstructural materials (e.g., for
road-base, erosion, sea, and flood protection barriers), and calcium- and magnesium-based
carbonates that may be used for different applications (e.g., as additives for protective coatings such
as paints and polymers) [237]. In construction applications carbonate solids can provide cementitious
binding of the components of the building product, or structural support (as an aggregate or filler)
[238]. Furthermore, the carbonation of alkaline industrial waste may also be applied to immobilize
or extract heavy metals, stabilize chemically metastable mineral phases, or even store energy or
provide carbon to microalgae [239].
Furthermore, waste materials such as steel slag, bauxite residue and air pollution control
(APC) residues are good candidates for conversion into building materials using CO2. Companies in
different parts of the world are scaling up businesses using these waste materials; together they
consume around 75 kilo tonnes (kt) of CO2 annually. The British company Carbon8 uses around 5
kt/yr. of CO2 to convert around 60 kt/yr. of APC residues into lightweight aggregates as a component
of building materials [240].
Fly Ash
Fly ash is a by-product of coal combustion power plants [241]. Compared with natural
minerals, it has numerous advantages as a feedstock for carbon dioxide mineral carbonation,
including low materials cost, high reactivity, absence of pretreatment requirement, and ease of
availability near CO2 emission sources [84]. Specifically, fly ash usually has alkaline oxides such as
calcium oxide (CaO) and magnesium (MgO), which are the perfect feedstocks for CO2 sequestration
because of their high reactivity [242].
According to ACI 116R, fly ash is a pozzolanic material that is defined as siliceous or
siliceous and aluminous material and possesses little or no cementitious value [243]. When it reacts
with calcium hydroxide (lime) in the presence of water it forms a soluble compound that
encompasses cementitious properties similar to cement. Pozzolanic activity of fly ash is an indication
of the lime fly ash reaction. It is mostly related to the reaction between reactive silica of the fly ash
and calcium hydroxide which produce calcium silicate hydrate (C-S-H) gel which has binding
properties [244].

106
The main objective of using fly ash in most of the cement concrete applications is to get
durable concrete at reduced cost. Concrete is a heterogeneous mixture of cement, aggregate, and
water which when mixed thoroughly form a rock like structure capable of withstanding heavy loads
[229]. When cement gets reacted with water it tends to form a cementitious gel which is capable of
binding different materials together.
This process of reaction between cement and water is named as hydration1 [245] and it is an
exothermic process i.e., heat gets evolved during this process, at the same time some quantity of
calcium hydroxide is also formed which doesn’t have any impact on the strength point of view on
concrete in that state (Fig. 45) [246].
Fig. 45. The process of hydration [214]
The process of hydration:
Portland cement + H2O = (C-S-H) + Ca (OH) 2{free lime liberated}
Fly ash + Ca (OH) 2 = (C-S-H) {additional cementitious paste}
(C-S-H) -Calcium Silicate Hydrate
The process of hydration accounts for the use of Portland cement. Portland cement (or
Ordinary Portland cement- OPC) is the most common and inexpensive type of cement in general use
around the world as a basic ingredient of concrete, mortar, stucco, and non-specialty grout [206].
According to ASTM C150, Portland cement is a hydraulic cement (cement that not only hardens by
reacting with water but also forms a water-resistant product) produced by pulverizing clinkers which
1 The cement in concrete mix liberates free lime when it starts to hydrate with water. Fly ash in concrete mix produces
cementitious paste by reacting with this free lime only. Fly ash in concrete mix can be active only after the availability of
sufficient free lime, hence fly ash component of concrete starts reacting after a little while only.

107
consist essentially of hydraulic calcium silicates, usually containing one or more of the forms of
calcium sulfate as an inter-ground addition [247].
It is well known that the production of cement is a major source of greenhouse gas emissions,
accounting for about 8 percent of all such releases [218]. The production of cement releases
greenhouse gas emissions both directly and indirectly: the heating of limestone releases CO2 directly,
while the burning of fossil fuels to heat the kiln indirectly results in CO2 emissions [222].
The direct emissions of cement occur through a chemical process called calcination.
Calcination occurs when limestone, which is made of calcium carbonate, is heated, breaking down
into calcium oxide and CO2. This process accounts for ~50 percent of all emissions from cement
production [230].
Indirect emissions are produced by burning fossil fuels to heat the kiln. Kilns are usually
heated by coal, natural gas, or oil, and the combustion of these fuels produces additional CO2
emissions, just as they would in producing electricity [248]. This represents around 40 percent of
cement emissions. Finally, the electricity used to power additional plant machinery, and the final
transportation of cement, represents another source of indirect emissions and account for 5-10
percent of the industry’s emissions (Fig. 46) [222].
Fig. 46. CO2 emissions from cement manufacture [224]
The use of fly ash as partial replacement of clinker in cement or as direct addition to the
concrete solves an environment problem for the setting and the power plant [249]. The fly ash as a
substitute of the cement will also provide a profit by reducing CO2 emission in the cement production
process, and an energy saving when fly ash replaces some of the energy- intensive produced cement
[250]. Production of 1 ton cement generally produces 1 ton CO2 [207].

108
Another benefit is the reduction of toxic metals and radon in fly ash deposed into ponds and
landfills [251]. Fly ashes may contain very small amounts of toxic metals that are leachable [252].
Incorporation of fly ash in concrete solves this problem because hydration products of both Portland
cement and blended Portland cement can form complexes that permanently tie up the toxic cations
released by fly ash [3].
Historically, fly ash has been used in concrete at levels ranging from 15% to 25% by mass
of the cementitious material component.; these levels can improve some of the durability and
structural properties of concrete, especially long-term compressive strength and heat of hydration
[253] [254]. The actual amount used varies widely depending on the application, the properties of
the fly ash, specification limits, and the geographic location and climate. Higher levels (30% to 50%)
have been used in massive structures (for example, foundations and dams) to control temperature
rise. In recent decades, research has demonstrated that high dosage levels (40% to 60%) can be used
in structural applications, producing concrete with good mechanical properties and durability [255].
According to ASTM C618, the most widely used specification of fly ash in North America,
divides fly ash into two classes based on its source of origin and composition. The two classes are:
Type F (low-calcium 8% CaO) and Type C (high-calcium 20% CaO) a.k.a. high-calcium fly ash
(HCFA) [256]. The two types of fly ash are based on its source of origin and composition (i.e., type
of coal that is burned). However, the variation of the fly ashes is not only attributed to the source of
origin, but it can also vary within the same plant [257].
Nonetheless, the European specification BS EN 197-1 has another definition for Type F and
Type C fly ashes called Type V and Type W respectively. The main difference between these classes
is the amount of calcium, silica, alumina and iron. Tables 11 and 12 summarizes the differences.
Table 11. Some definition of fly ash types according to EN 197-1 and ASTM C618 [258] [259]
Low calcium fly ash High calcium fly ash Fly ash from Bituminous coal and anthracite Subbituminous and lignite
Reaction
characteristic Pozzolanic Pozzolanic and hydraulic
Definition by
EN 197-1
Type V: Siliceous fly ash Type W: Calcareous fly ash
10% reactive CaO
25% reactive SiO2 < 5% LOI
< 1% free lime
10% reactive CaO 25% reactive SiO2 when
CaO is 10-15%
If CaO > 15% the compressive
strength 10
MPa at 28 days (NS-EN 196-1)
< 5% LOI
Class F Class C
Definition by
ASTM C618
SiO2 + Al2O3 + Fe2O3 70%
Free moisture, max. 3.0%
LOI, max 6.0%
SO3, max 5.0%
CaO, max: no limit
Amount retained when wet sieved on
45 m: Max. 34%
SiO2 + Al2O3 + Fe2O3 50%
Free moisture, max. 3.0%
LOI, max 6.0%
SO3, max 5.0%
CaO, max: no limit
(Note: CaO > 10%)
Amount retained when wet sieved on
45 m: Max. 34%

109
Table 12. Typical values for fly ash Type F and Type C [260]
Typical values (wt.%) Class F Class C
SiO2 35-60
CaO 1-35 < 15wt.-% >15 wt.-% (in Canada Class CI: 8-12%
Class C> 20%
Fe2O3 4-20
Al2O3 10-30
Fly ashes consist mostly of silicon dioxide (SiO2), aluminum oxide (Al2O3) and iron oxide
(Fe2O3) [261]. The pozzolanic properties of the fly ash are not governed so much by the chemistry
but by the mineralogy and particle size of the ash [262]. Variations in the chemical composition of
fly ashes are, therefore, natural. These governing properties of the ashes are credited to the coal-fired
furnace which are controlled by the type of coal and the processing conditions of the furnace [257].
There are basically four types of coal, each vary in heating value, chemical composition, ash
content, and geological origin [263]. Type F fly ash is normally produced from burning anthracite2
or bituminous3 coal whereas HCFA is produced from burning lignite4 or sub- bituminous5 coal [264].
Table 13 shows the chemical compositional of the three most common types of coal [264]. HCFA,
for the most part, is preferred over Type F fly ash because of its higher content of calcium [244].
However, utilization of HCFA is limited in order to avoid delayed carbonation of excess lime and
the subsequent appearance of microcracks due to the expansive nature of such carbonation reaction.
This limitation leads to most of HCFA materials being currently collected in storage ponds [10].
With the present practice of HCFA disposal in ponds (generally in the form of slurry), the total land
2 Anthracite is the highest rank of coal. It is a hard, brittle, and black lustrous coal, often referred to as hard coal,
containing a high percentage of fixed carbon (86-97%) and a low percentage of impurities. processes a higher amount of
heat per unit mass than the other types of coal. It does not ignite easily and does not produce smoke; therefore, it burns
cleanly.
3 Bituminous coal is a middle rank coal between subbituminous and anthracite. Bituminous coal is the most abundant
type of coal. It is often called soft coal and it has slightly lower carbon content than anthracite (45-86%) and there is water,
hydrogen, sulfur and few other impurities. It is soft and contains a substance called bitumen, which is like tar. Bituminous
coal is produced from sub bituminous coal when it undergoes more organic metamorphism.
4 Lignite is used almost exclusively for electric power generation lignite is a young type of coal. Lignite is brownish
black, has a high moisture content (up to 45 %), and a high Sulphur content. Lignite is more like soil than a rock and tends
to disintegrate when exposed to the weather. Lignite is also called brown coal.
5 It does not have the same shiny luster as higher ranked coals. As the name suggests, it has lower carbon content
than bituminous coal (35%-45%) and is primarily used for electricity generation

110
required for ash disposal is approximately 82,200 ha [243]. Consequently, disposal and management
of HCFA is a major problem in coal-fired power plants.
Table 13. Chemical composition for fly ashes produced by different coal types [264]
Components
(wt.%) Bituminous Sub-bituminous Lignite
SiO2 20-60 40-60 15-45
Al2O3 5-35 20-30 10-25
Fe2O3 10-40 4-10 4-15
CaO 1-12 5-30 15-40
Mg 0-15 1-6 3-10
SO3 0-4 0-2 0-10
Na2O 0-4 0-2 0-6
K2O 0-3 0-4 0-4
LOI 0-15 0-3 0-5
Type F: produced by the burning of harder, older anthracite and bituminous coal with more
than 70wt% of SiO2 + Al2O3 + Fe2O3. This fly ash is pozzolanic in nature and displays no significant
hydraulic behavior. Possessing pozzolanic properties, the glassy silica and alumina of Type F fly ash
requires a cementing agent, such as Portland cement, quicklime, or hydrated lime, with the presence
of water in order to react and produce cementitious compounds [265].
Type C (HCFA): High Calcium Fly Ash, is rich in calcium oxide (10-50%), produced from
the burning of younger lignite or sub-bituminous coal, with contents of SiO2 + Al2O3 + Fe2O3
between 50 and 70%, with varying amounts of carbon as measured by the loss of ignition (LOI)
[249]. Lignite and sub-bituminous coal fly ash is characterized by higher concentrations of calcium
and magnesium oxide and reduced percentages of silica and iron oxide, as well as lower carbon
content, compared with bituminous coal fly ash. Very little anthracite coal is burned in utility boilers,
so there are only small amounts of anthracite coal fly ash [264].
In addition to having pozzolanic properties, also has some self-cementing properties. In the
presence of water, Type C fly ash will harden and gain strength over time. Unlike Type F, self-
cementing Type C fly ash does not require an activator. Alkali and sulfate (SO4) contents are
generally higher in Type C fly ashes. Type C will generate more heat of hydration than Type F. Type
C ash will generate more strength at early ages than Type F [265].
Fly ash is widely employed as a superior substitute for Portland cement in the construction
industry, primarily because of its pozzolanic and cementitious properties [257]. Fly ash typically
replaces around 20% to 30% of the total Portland cement used in construction activities [218]. When
added to concrete, the properties of HCFA improve by: (i) high strength, (ii) higher durability (iii)
relative lower drying shrinkage, (iv) reduced heat of hydration, (v) reduced sulphate attack and
reduced efflorescence, (vi) decreased permeability, (vii) higher setting time. Furthermore, the

111
workability improves by: (i) light weight concrete, (ii) improved, (iii) reduced segregation and bug
holes, (vi) reduced bleeding, (vii) less sand needed in the mix to produce required workability [260].
Fly ash utilization
There are many applications for the use of fly ash, this means that the characteristics of fly
ash need to be diverse and fit the required chemical process in order to obtain the final carbon-base
product. Some of these applications are; cement and concrete (utilizes around 45% of the global fly
ash market share), fills & embankments, waste stabilization, mining, oilfield services, and road
stabilization Figure 47 and Figure 48. Furthermore, the most utilized applications are [264]:
1) Structural fill applications rest primarily on the ability of the material to be compacted to a
reasonably strong layer of low unit weight. This is primarily a function of particle size distribution,
and to some extent of the content of spherical particles. The chemical characteristics of fly ash are
secondary, although the post compaction cementation provided by some high-calcium fly ash is
likely to prove beneficial.
2) Highway applications require that chemical considerations come into play, however, this is
not the most important requirement. Stabilization of some base courses (and stabilized sub grades)
may rest on lime fly ash chemical reactions, i.e., the classical ‘‘pozzolanic’’ reaction, with lime.
Nevertheless, the most important chemical requirement for highway applications is that fly ash
contains sufficient so that it can react with the lime. Some road base applications of fly ash depend
on the physical effects of fly ash incorporation rather than its reaction with lime.
3) Fly ash used as raw material for cement and concrete applications post the greatest demand.
The required characteristic is uniformity and chemical consistency of the raw material (i.e., need for
consistency regardless of the days the fly ash is collected).

112
Fig. 47. Various possible utilization of fly ash [266]
Fig. 48. Global Fly Ash Market Share, by Application, 2019 [267]
Fly ash typically replaces around 20% to 30% of the total Portland cement used in
construction activities [268]. The need for infrastructure has been increasing at significant pace due
to the rapid growth in global population, especially in developing countries such as China and India.
This has led to an increase in construction activities throughout the globe.
Fly ash is extensively used in the construction industry as an environmentally sustainable
substitute for Portland cement. However, lack of global awareness about the benefits of using fly ash
as construction material is hindering the fly ash market. Furthermore, the sector is controlled by a

113
few of major producers, which are careful about pioneering new products that contest their current
business models. In the lack of a strong carbon-pricing indication, there is minimum short-term
economic incentive to make changes [269]. Unconventional materials are often not readily available
at the scale required. Meanwhile, architects, engineers, contractors and clients are justifiably cautious
about innovative building materials. Implementing novel practices also indicates a critical role for
millions of workers involved in using concrete across all spectrums of the market [270].
Coal Power Plants and CO2 emissions in U.S., E.U, and China
The number of plants newly under construction each year is falling even faster, down 66% in
2019 compared to 2015, according to the latest annual status report from Global Energy Monitor
[271]. Meanwhile, coal retirements are at historically unprecedented levels, with the 34GW of
closures in 2019 a close third behind 2015 (37GW) and 2018 (35GW) [268].
Some 80 countries use coal to generate electricity, up from 66 in 2000. Since then, 15
countries have added coal capacity for the first time and one country; Belgium has phased it out
[272]. Another 19 countries, responsible for 5% of current capacity, have pledged to phase out coal
as part of the “Powering Past Coal Alliance” [273], led by the UK and Canada. This now officially
includes Germany, home to the world’s fifth-largest coal fleet and some 2% of the global total [274].
Since 2000, the most dramatic changes have taken place in China. Its coal fleet grew five-
fold between 2000 and 2019 to reach 1,005GW, nearly half the global total [275]. China is the
world’s largest CO2 emitter and uses half the coal consumed each year, so its future path is
disproportionately important for global efforts to tackle climate change [276].
A wave of retired power plants has cut US coal capacity by 105GW since 2010 and another
71GW is already planning to close, according to Global Energy Monitor. This would shrink the US
fleet by half, from 327GW in 2000 to 175GW in 2024 [277].
Global CO2 emissions declined by 5.8% in 2020, or almost 2 Gt CO2 – the largest ever
decline and almost five times greater than the 2009 decline that followed the global financial crisis
[278]. Despite the decline in 2020, global energy-related CO2 emissions remained at 31.5 Gt, which
contributed to CO2 reaching its highest ever average annual concentration in the atmosphere of 412.5
parts per million in 2020 [279] – around 50% higher than when the industrial revolution began [280].
Global coal use is expected to rebound in 2021 and drive an increase in global CO2 emissions
of around 640 Mt CO2. This would push emissions from coal to 14.8 Gt CO2: 0.4% above 2019 levels
and only 350 Mt CO2 short of the global high in coal-related CO2 emissions of 2014 [278]. The
power sector accounted for less than 50% of the drop in coal-related emissions in 2020, but it
accounts for 80% of the rebound, largely due to rapidly increasing coal-fired generation in Asia
[276].
China’s emissions are likely to increase by around 500 Mt CO2. With energy demand and
emissions already growing in 2020, in 2021 CO2 emissions in China should be 6%, or almost 600

114
Mt CO2, above 2019 levels [278]. All fossil fuels should contribute to higher CO2 emissions in China
in 2021, but coal is expected to dominate, contributing 70% to the increase, predominantly due to
greater coal use in the power sector. Despite China’s rapid growth in generation from renewables,
output from coal-fired power plants has increased by 330 TWh, or nearly 7%, between 2019 and
2021 [281].
In the United States, CO2 emissions in 2021 are expected to rebound by more than 200 Mt
CO2 to 4.46 Gt CO2 yr. remain 5.6% below 2019 levels and 21% below 2005 levels. CO2 emissions
from coal are expected to be almost 12% below 2019 as coal use for electricity generation is likely
to recover only 40% of the ground lost to renewables and natural gas in 2020 (Fig. 49). Oil use, the
biggest contributor to CO2 emissions in the United States, should remain almost 6% below 2019
levels as transport activity remains curtailed across 2021 [282].
Fig. 49. Total net summer capacity of retired and retiring coal units U.S. (2010-2025) [277]
CO2 emissions are likely to rebound less in the European Union, as the economic outlook is
dimmer than in other parts of the world. The expected increase of 80 Mt CO2 in 2021 will reverse
only one-third of 2020’s drop [283]. EU emissions in 2021 should stand at 2.4 Gt. Most of the 90 Mt
CO2 drop in power sector emissions in 2020 will endure through 2021, with a slight anticipated
increase in coal and gas-fired generation in 2021 reversing only 10% of the 2020 drop. The share of
coal in electricity generation in the European Union has declined almost three-percentage points
from 2019 to 2021, to less than 14% [278].
CO2 emissions from advanced economies have fallen by 1.8 Gt CO2 since 2000, and their share
in global emissions has declined by twenty percentage points to less than one-third of the global total
[269].
Poland, the Czech Republic, Romania and Bulgaria continue to depend heavily on lignite
power. Plans for a phase-out are crucial if the European Union is aiming to abide with the Paris
Agreement. Such plans are necessary not only to create a coal-free EU but also because lignite power

115
plants have swung from being an asset to a liability as lower electricity price and higher carbon prices
have crushed their economies [284].
Nevertheless, Poland has moved closer to ending reliance on coal after the government, the
country’s largest mining firm and unions agreed to phase out all coal mines by 2049. It was the first
time Poland has put a timeline on ending coal and puts the country in line to meet EU’s climate target
of net-zero carbon emissions by 2050, which had previously been rejected by Warsaw as unrealistic.
A big motivator was the “Law and Justice (PiS)-led government” was forced to shift its position
due to the rising costs of emissions permits required within the EU’s cap-and-trade system and the
effects of the Covid-19 pandemic, which has reduced demand for electricity and exacerbated a long-
term structural decline in prices [285].
The country generates about 75% of its electricity from coal — second only to Germany in
Europe and making Poland the ninth-largest coal producer in the world. The new plan
foresees renewable energy sources accounting for at least 32% of electricity by 2030 [284].
CCP Production and Utilization in the U.S. and EU
Coal combustion products (CCPs) include combustion residues such as boiler slag, bottom
ash and fly ash from different types of boilers as well as desulphurization products like spray dry
absorption product and FGD gypsum [286]. CCPs are mostly used in the building material industry,
road and underground coal mine construction, recultivation and restoration purposes in open cast
mining. In most cases CCPs are used as a replacement for natural materials; consequently,
contributing to the sustainable development of environmental activities by avoiding the need to
quarry natural resources. Furthermore, CCPs helps reduce energy demand as well as CO2 emissions
generated by the manufacturing process of the products which are replaced, and they lead to energy
savings when used in mixtures with wet raw materials.
The CCP production worldwide is estimated to be around 700 million tones (MT), with fly ash
constituting about 75–80% of the total ash produced; approximately, 80% Type F and 20% Type C
[287]. In Europe, over 40 MT of CCP is produced [288] and approximately 27 MT is of fly ash
utilized [289]; however, a significant amount of ash is still expected to be disposed of in landfills
[290]. A large fraction of the coal ash in the world, about 70% of the total production, is typically
disposed of as a waste in utility disposal sites [291].
In the United States, around 79 MT of CCP is produced by coal-burning power plants and 41
MT is utilized [4].
According to the American Coal Ash Association (ACAA), fly ash use in concrete increased
slightly as overall coal ash recycling rate decline in 2019 [292].
Fifty-two percent of the coal ash produced during 2019 was recycled –marking the fifth
consecutive year that more than half of the coal ash produced in the United States was beneficially
used rather than disposed. The volume of fly ash used in concrete increased 1 percent over the

116
previous year, but most other uses saw significant declines, leading to an overall decrease in
recycling activity of 31 percent [207]. Forty-one million tons of coal combustion products were
beneficially used in 2019 out of 78.6 million tons that were produced. The rate of ash utilization
decreased from 58.1percent to 52.1 percent and the total volume of material utilized decreased by
18.4 million tons compared to the previous year. Coal ash production volume decreased 23 percent
(or 23.6million tons) from 2018 levels [293]. Some examples as it relates to the utilization of fly ash
in the cement production and pond closure activities are [207]:
Regulatory framework in EU and US and fly ash management
5.6.1. Fly ash management
Managing large quantities of fly ash is a concern for every developed nation in the world,
the unease intensified by the extensive range of chemical and physical properties that fly ash exhibits.
Operators of coal-fired power plants must manage costs, revenues, and risk to be prosperous.
Successfully managing fly ash has become a progressively important piece of total success for power
plants. In the fly ash/cement/concrete/construction business environment, power plants must
carefully control expenses, capital commitments and risks and smart management of coal combustion
products provides a significant opportunity in several important ways: [294]
• Cost reduction and cost management for landfill: managing fly ash results in landfill cost
avoidance by reducing current ash disposal expenses and by delaying or avoiding the significant
costs of future landfill or pond development.
• Evading or Reducing Future Liability: recycling fly ash means reducing the chances that, in
the future, environmental regulators will take actions aimed at a fly ash disposal site.
• An Environmentally Friendly Solution: beneficiation and utilization of fly ash is a “green”
solution that turns expenses into revenue and demonstrates a utility’s commitment to the environment
and the communities in which they do business
For fly ash to gain acceptance by potential users, it must not only be available economically,
but at a uniform quality as well. The physical properties and chemical composition of fly ash
produced by each coal-burning power plant is dependent upon the characteristics of the coal that is
used as fuel, the type of equipment employed, and the way it is operated and maintained. Since these
characteristics vary from plant to plant, from country to countries, and from local communities- it is
not unexpected that fly ash properties vary from source to source. In addition, fly ash collected at
any one source will change as the demand on the power plant varies from base to peak loading
conditions and as conditions within the producing plant change. These considerations, as well as the
fact that coal-burning electric utilizes are primarily concerned with the production and sale of electric
power, contribute to the difficult in producing a fly ash of uniform quality. Added to this is the

117
further obstacle that each product with fly ash utilization potential has individual quality
requirements [295].
Cement with fly ash additive must be marketed as a separate product, and as such, separate
handling, storage, stocking, etc., are involved [296]. Also, the blending of the two materials requires
special techniques to ensure uniformity of the cement. The economics of handling and transportation
do not allow for the mass utilization of fly ash in this manner without the combined cooperation of
power plants and Portland cement producers [295].
5.6.2. Fly ash regulatory framework- U.S. and E.U.
As the use of CCPs is either standard or project related the national regulations for the use
in different applications must be considered. Basically, all standards deal with fly ash or pulverized
fuel ash from coal (Europe, Australia/New Zealand and Japan), specifically anthracite, bituminous,
subbituminous and lignite (USA, India and China) or also blended coal mixtures (Russia) [297].
These standards contain chemical and physical properties of the ash. It must be noted that the
standards are used in combination with application standards and other regulations, including
environmental requirements [298].
Only the European Standards cover co-combustion of defined materials in specific amounts
to ensure ashes characteristics are within a defined range. In addition, processing is covered for ashes
which basically follow EN 450-1 standard except for fineness and LOI. Ashes can be processed in
suitable production facilities through classification, selection, sieving, drying, blending, grinding or
carbon reduction, or by a combination of these processes [259]. Such processed fly ash may consist
of fly ashes from different sources, each conforming to the basic definitions required to meet the
criteria of the standard. South Africa uses the EN standard in full and Israel has implemented it with
minor deviation by exclusion of co-combustion and quality control systems Table 14 [2].

118
Table 14. Typical Properties of International Standards [299][259][2]
The definitions all address the collection of fly ash from the flue gas by electrostatic
precipitators or other collection methods. They address siliceous and/or calcareous ash (Europe,
Japan, India, Russia) or Class F and Class C depending on the coal burned in the USA and China.
Characterization of calcareous (class C) fly ash from siliceous (class F) requires that the amount of
reactive calcium oxide in the Class C ash is greater than 10% [299][2][259].
In Europe, the cement standard EN 197-1 defines two types for calcareous fly ash: a W1
class with reactive lime content of 10 to 15 % and reactivity test as for siliceous type ash; and a W2
class with more than 15 % of reactive lime considered as a binder with own compressive strength
requirement [259] [269]. In addition, there are rules for consideration higher Sulphur contents. The
chemical and physical requirements of the standards are compiled in Table 15 based on their reactive
evaluation for siliceous (Type F) or calcareous (Type C).

119
Table 15. Scope and definitions of EU and USA used standards for fly ash in concrete and cement [249][259]
Another difference between ASTM C618 and EN 450-1 that is worth mentioning relates to
the disposal of fly ashes in landfills. In the United States, bottom and fly ashes from coal power
plants are typically mixed before the disposal into landfills to meet the U.S. Environmental
Protection Agency (EPA) requirements. Conversely, in many European countries, the fly ash is not
mixed with bottom ash but rather handled as a special waste. In this instance, the bottom ash is often

120
recycled and used as a material in pavement and other similar products [300]. To simplify the
efficient use and disposal of fly ash, regional authorities around the world have developed a variety
of classification strategies. Most fly ash end-users are only interested with the local specifications.
The selection of fly ash is generally predicted upon the expense of transporting the ash that meets
the minimum criteria for the project, a practice that is not likely to change in the immediate future
[301].
ASTM C618, ASTM 311, and AASHTO M 295 specifications for fly ash represent the
primary documents used by U.S. state and federal agencies to determine the suitability of a fly ash
source for use in concrete. Other countries have broadly similar specifications for fly ash. As recent
as the first quarter of 2021, the ACI (American Concrete Institute), published a document [299]
where it compares specifications from the United States, Canada, Europe, Australia, and New
Zealand, noting similarities and differences. Despite its common use, several criticisms of the ASTM
C618 specification exist and are discussed in the document. Specifically, concerns exist regarding
its dependence on strength activity index testing for determination of fly ash reactivity and strength
generation potential, and loss on ignition for quantification of unburnt carbon content, as these tests
relate somewhat poorly to performance of the fly ash in concrete. Recently developed test methods
that could improve some of the most problematic components of the ASTM C618 specification are
discussed [299].
In the U.S., an assessment of the impact of existing specifications on the extent of fly ash
utilization involves some vague parameters, and credible and meaningful information is not always
available. User attitude is a consideration. There have been occasions where if sufficiently
motivated, a user can circumvent a provision in a specification, either by allowing an exception, or
sometimes by writing their own specification, or by altering a specification. This suggests a basic
inadequacy in the current specifications. On the other hand, European standards and testing
requirements are more restrictive than similar standards in the US; all applications are not needing
standardized concrete, and the potential utility of the studied fly ash materials could be improved by
mechanical treatments. Furthermore, implementing these standards in Europe tend to be more
successful than in the U.S.; mainly because they are more detailed and better monitored than the
standards in the U.S.
5.6.3. High Calcium Fly ash regulatory framework- U.S. and EU
High Calcium Fly Ashes are reactive materials that often do not meet the limits of some
countries national and local standards. Therefore, most of the lignite coal produced around the
world have not been fully exploited. As previously mentioned, the classification of fly ashes is
deeply correlated with the type of coal that is burnt, many efforts are being taken to develop a
“standardize” specification that can be used in many global applications. However, because of
121
dissolute experiences when utilizing HCFA in certain applications, efforts of standardization has
been delayed [302].
The resources of high calcium fly ash are large, however, this type of ash is usually
described by low silica content, a high content of free lime and an increased content of sulfur
compounds [303]. It could be used in concrete following the requirements of ASTM C618, Class C,
but in Europe, it does not meet the requirements defined in standard EN450-1 [304]. At the moment,
HCFA is not in common use in European countries despite positive examples of its suitability
provided by Greek and Turkish researchers [213].
When HCFA is used as a complementary cementitious material it can augment some of the
physical, behavioral, and structural properties of the concrete (e.g., compressive strength,
workability, etc.) [221]. However, the possibility of using HCFA as concrete additive is not well
established, especially in relation to the durability of concrete structures in aggressive environment
[305]. Due to the high content of lime, HCFA cannot be used to a big extent for building purposes
and is currently collected in storage ponds [306].
In 2019 the United States mined and burnt 53 MT of lignite coal, or 8% of the total coal
production of the country. Additionally, 44% of coal was subbituminous; 48% was bituminous, and
<1% was Anthracite [307]. Consequently, the type of fly ash generated was mostly Type F. However,
Type C is also widely available given that 44% of the fly ash produced is generated by the
combustion of subbituminous coal. Currently in the U.S., more than 50% of the concrete placed
contains fly ash. Furthermore, the most utilized type of fly ash for admixture is Type F.
According to ECOBA [289], the amount of HCFA produced in Europe is more than 50% of
the total fly ash generated by burning hard coal and lignite [289]. In the EU lignite coal is the most
predominate type of coal used at coal power plants, especially in countries such as Poland where
almost all the coal burnt is lignite; consequently, the type of fly ash generated is mostly Type C.
Nevertheless, the lack of standards for its utilization has negative impact for the economy and the
environment [308].
The most widely known standards in the U.S., for the use of FA and HCFA as a supplement
of cement to produce concrete is ASTM C618 [249]. Unfortunately, this specification does not
clearly address the use of HCFA in cement/concrete applications. In recent years, regulatory entities
have been revising construction codes, standard, and specifications with the goal of improving the
clarity of the requirements and making them more detailed in order to avoid many loopholes that are
present in the current standards.
The USA standard references that the amount of lime of Class C is typically higher. Though
recently being published the standard is again under revision where the lime content in the ASTM
standard will be defined to 18 % [299] [299]. With this it is questioned whether the lime levels and
related experiences can be associated as the lime content in class F may have been more than 10 %
and only the reference to the used coal may be valid for this.

122
As part of the ASTM revisions, one of the main subjects is addressing changes to ASTM
C 618 to classify fly ash by calcium oxide content rather than the sum of the oxides. Going
forward, fly ash with a calcium oxide content of 18% or less will be classified as Class F and
above 18% as Class C. The American Association of State Highway and Transportation
Officials (AASHTO) approved this change in their M 295 specification [309].
Below are some additional C 618 specification developments underway at ASTM:
• a new Class B on the use of milled bottom ash in concrete
• blending of in-spec and out-of-spec fly ash
• blending of Class C and Class F fly ash
• blending of fly ash, natural pozzolans, and other materials to create a new SCM
In Europe there is the EN450-1 for the use of siliceous fly ashes in concrete. However, when
assessing specifications for HCFA(s), there is no general existing regulation level for the utilization
of this waste in concrete [310], but their use in blended type cements is covered by EN197 Standards
[311]. The other Standards that refer or allow the use of HCFA(s) are the EN13282 about Hydraulic
Road binders and EN14227 about hydraulic bound mixtures [312], [313].
5.6.4. Mineral carbonation of High Calcium Fly
A possibility to valorize such waste materials is to reduce their total lime content through
mineral carbonation techniques. Recent experiments on accelerated carbonation of HCFA under dry
and moist conditions, at various temperatures, pressures and compositions, show that the mineral
carbonation of a variety of HCFA (with up to 35 wt.% bulk CaO) can reach very high efficiencies
under industrial flue gas conditions [7]. Another study performed by UCLA show that HCFA that
reacts with CO2 in moist environments, at ambient pressure, and sub-boiling temperatures, produce
robustly cemented solids whose properties are enough for use in structural construction [16].
5.6.5. Market considerations for carbonated fly ashes
Construction materials including Portland cement, concrete, and mineral aggregates comprise
the largest material flows in the world, second only to water. Each year, nearly 30 billion tons of
concrete [314] are produced globally from a production base of 4.1 billion tons of Portland cement
[315]. Given the scale of these markets, mineral carbonation products may have the potential to
utilize up to 1 gigaton (Gt) of CO2 annually if they were to replace existing products [11].
According to Villere, the large production volumes offer substantial economies of scale for
conventionally produced products, resulting in costs on the order of $50 per ton for concrete [316]
$100 per ton for Portland cement, and $10 per ton for aggregates [317]. Taken together, these
numbers define a cost basis for both existing and emerging construction materials. They also

123
highlight some of the challenges that any new product might face: competition with well-entrenched
products with low costs that can be produced worldwide [75].
Whilst the construction sector offers large material movements cumulatively, the
manufacture of construction materials is a localized activity. For example, in the U.S. there are 5,500
ready-mix concrete plants, [318] hundreds of precast concrete plants, [319] and nearly 100 Portland
cement production plants [320]. This localization and fragmentation imply that if mineral
carbonation is to be used to produce construction materials that can replace existing materials; (i)
CO2 will need to be consumed
in many discrete locations to produce a range of materials and products, and (ii) the logistics of
CO2 access and transportation of manufactured products will be critical for economic viability [75].
There are many efforts under way to manufacture construction materials via mineral
carbonation. Most are being commenced by startup companies and precommercial entities, which
fall into two groupings: (i) those producing binding agents in concrete (examples include Solidia
Technologies, Carbon Upcycling UCLA, CarbonCure, and Carbstone Innovation) and (ii) those
producing synthetic aggregates (examples include Carbon8 Systems and Blue Planet) [77].
Each of these approaches maximizes the use of the thermodynamic ease of mineral
carbonation and the potential for cementation offered by calcium carbonate. Though, these activities
are in the early stage, they underline the potential for CO2 utilization in the construction materials
markets. Conversely, the scalability and market viability of these approaches are influenced by
various factors: (i) the purity and the availability of CO2, (ii) the availability of low-cost alkaline
reagents and/or facilities for their manufacture at scale, (iii) the low-cost, commoditized nature of
the existing analogous products, Portland cement and concrete, (iv) limiting building codes and
standards wherein compliance is often a function of the material composition (e.g., cement-based
chemistries) rather than their engineering performance, and (v) the net amount of CO2 utilization that
can be achieved [75]
In order to develop the market for carbonated fly ashes, the matter of construction codes and
standards need to be addressed. In general, it is desirable that a new product achieves performance
equality, or idyllically performance benefits, when compared to the product that it will be replacing.
While this reasoning makes sense for a vast number of applications, in construction, the line becomes
a bit blurred. This is because the construction sector has gained pragmatic confidence in the use of
Portland cement and traditional concrete as construction materials, and construction industry
standards are infamously slow to change. Furthermore, construction standards and codes are often
jurisdictional (e.g., city by city or state by state). This results in fragmented compliance and
acceptance standards that may inhibit or delay the market entry and adoption of new products [11].
A further complication is that construction standards are often prescriptive rather than performance
based; as such, they often define the compositions of materials that can be used [75]. Pending external
forcing through legislation preferential government purchasing programs, or the imposition of CO2

124
taxes and penalties, this is a substantial challenge that must be overcome before the use of carbonated
materials can become widespread within the construction sector. Among other elements, this requires
moving to a system of harmonized performance-based standards, which will accelerate the adoption
and acceptance of new materials for construction applications and new tools that can model and
predict long-term performance of new materials [75].
125
Market, Costs, and Policies on CCUS
U.S. vs. EU
As nations grow their energy portfolios, fossil fuels are expected to meet a large part of the
world’s energy demand for many years. Accelerating deployment and commercialization of carbon
capture technology is vital to reduce emissions from carbon fueled power plants, and from industrial
plants such as cement, steel, and chemicals manufacturing.
As momentum builds in the global effort to stop climate change, numerous countries are
launching transitions to a lower-carbon economy, driving influential investors to look increasingly
for resulting opportunities to put capital to work. Subsequently, a pool of patrons and forward-
thinking investors are noticing that they can both help the world decrease its carbon footprint and
generate a return for their clients through investment tools from carbon capture credits to carbon
capture technology and commercialization of carbon-based products. While the transition will
happen over decades, now’s the time to start thinking about ways to invest in the burgeoning carbon
asset class.
In the midst of worldwide COVID-19 lockdowns, the global CO2 emissions fell to levels
that the world has not seen since in decades; moreover, authorities and companies did not dither in
their commitment to battle climate change. While this is good news, it also exposes how much more
still needs to be done to lower emissions; even with the pandemic, unabetted fossil fuels still provide
about 80% of primary energy and global emissions [321].
The year 2020 also saw the increase attention of nations and industries who had pledge to
achieve cost-effective net-zero emissions with CCUS by 2050. Furthermore, initiatives such as the
Race to Zero and the Climate Ambition Alliance helped mobilized coalitions representing 708 cities;
24 regions; 2,360 businesses; 163 of the biggest global investors; and 624 Higher Education
Institutions, to build momentum around the shift to a decarbonized economy ahead of COP26, where
governments must strengthen their contributions to the Paris Agreement [322].
Carbon removal with CCS technologies
The task of carbon removal in climate change mitigation1.5°C, compared to pre-industrial
levels. The 1.5°C mitigation pathways project carbon removal in the order of 100–1000 gigatonnes
of CO2 over the 21st century [323]. Carbon removal would be used to counterbalance for residual

126
emissions and achieve net negative emissions to limit global warming to 1.5°C. The two elements in
the climate change mitigation pathways – emission reductions and removals – are behind the
reckoning of net zero emissions, and net negative emissions thereafter. The role of emission
reductions and removals in the mitigation of climate change will change over time. It is widely agreed
that emission reductions should be prioritized on the pathway to net zero. This, however, will change
once net zero emissions are achieved; net zero is a point on the journey, not the final destination.
Carbon removal will become the main driver of climate ambition in the second half of the century
[324].
6.1.1. What does carbon removal mean?
There is no general established definition of carbon removal. “Carbon removal” is used to
describe approaches that can remove CO2 from the atmosphere and store it away permanently. Other
terms like “greenhouse gas removal” (covers CO2 and other GHGs) or “negative emissions” are often
used in the same context. However, negative emission technologies (NETs) are sometimes used
interchangeably with carbon removal. Whether a NET delivers carbon removal, depends on the
details of how it is used in practice, as described in the list below [324].
There is a list of four criteria that could be used to determine whether a climate solution or
technology can deliver greenhouse gas removal [325].
• Physical greenhouse gases are removed from the atmosphere.
• The removed gases are stored out of the atmosphere in a manner intended to be permanent.
• Upstream and downstream greenhouse gas emissions associated with the removal and
storage and included in the emission balance.
• The total quantity of atmospheric greenhouse gases removed and permanently stored is
greater than the total quantity of greenhouse gases emitted to the atmosphere.
The twofold task of CCS in climate change mitigation
CCS technologies have a dual role in climate change mitigation. First and foremost, CCS
technologies can reduce emissions from energy intensive industries and power generation. Secondly,
CCS technologies can be used for carbon removal from the atmosphere. The main applications for
emission reductions and carbon removal are as follows [326]:
6.3.1. Reducing emissions
• Decarbonization of heavy industry, most notably reducing emissions from the
production of cement, steel and chemicals. These sectors are amongst the hardest to abate due
to their inherent process emissions and high temperature heat requirements. CCS provides one
of the most mature and cost-effective options for reducing emissions from these sectors.

127
• Clean hydrogen production by contributing as an enabler of the hydrogen economy via blue
hydrogen production.
• Reducing emissions from recently built power plants, in particular coal and gas facilities in
Asia [327] CCS provides the foundation for technology-based carbon removal, including BECCS
and DACCS [328]. BECCS includes the conversion of biogenic Waste-to -Energy with CCS which
reduces landfill and methane production, and which does not require additional production of
biomass.
Circular Carbon Economy
The concept of a Circular Carbon Economy (CCE) was developed by King Abdullah
Petroleum Studies and Research Center (KAPSARC) helps to address this risk by creating a
framework that recognizes and values all emission reduction options [329]. The CCE builds upon
the well-established Circular Economy concept, which consists of the “three Rs” of Reduce, Reuse
and Recycle, works well in describing an approach to sustainability considering the efficient
utilization of resources and wastes, but has proven manifestly inadequate as a framework for defining
climate action. To be effective, a fourth R must be added; Remove, creating a new concept the
Circular Carbon Economy (CCE) [330]. The CCE provides for the removal of carbon dioxide from
the atmosphere (Carbon Direct Removal or CDR) and the prevention of carbon dioxide, once
produced, from entering the atmosphere using carbon capture and storage (CCS) [331]. The CCE
establishes a framework that respects the analysis of the Intergovernmental Panel on Climate Change
(IPCC) and many others, that all conclude that CCS and CDR, alongside all other options, are
essential to achieve climate targets [332].
Measures taken under the Remove dimension of the Circular Carbon Economy contribute to
climate mitigation by storing carbon dioxide in the geosphere (CCS or DAC with geological storage)
or in the biosphere (nature-based solutions such as afforestation). However, CO₂ stored in the
biosphere via nature-based solutions may be susceptible to release due to natural phenomena such
as fires, droughts or disease (of plants). Technology-based solutions such as CCS and DAC with
geological storage offer extremely secure and permanent storage of CO₂, which is not susceptible to
disruption from fire or weather, as well as requiring very little land for facilities with a capacity to
provide multi mega-tonne per annum abatement [333].
In recent years, climate change mitigation and adaptation efforts and treaties such as the Paris
Agreement have led to financiers and investors including the environmental and social impact of
companies in decision making processes. At the same time, businesses across sectors are searching
for ways to stay competitive while improving their environmental and social impact [334].
The circular economy is an economic system that combines economic, environmental and
social prosperity. Circular businesses typically employ strategies that aim to extend the lifespan of
products and materials for as long as possible, at their highest value. Waste is designed out of the

128
system by using resources in cyclical ways. Moreover, the circular economy assumes the use of
renewable energy for production processes and aims to foster social inclusivity [334].
Implementing circularity in business activities essentially entails incorporating externalities
(i.e., impact) in the business and revenue model. Compared to their linear counterparts, circular
companies may have a lower financial performance, due to the costs incurred for activities that have
a positive economic, environmental or social impact. Therefore, in striving for a fair assessment of
a company’s performance, it is key to create a level playing field and rate all companies the
same way. This requires different information and different assessment frameworks. Here, circular
Impact measurement can offer a solution. In addition to the financial management information
provided in financial statements, companies and financiers are looking for additional information
with which they can optimize business operations and better estimate risks. Relating circular impact
to financial impact can enable more substantiated decision-making and unveils a company’s license
to operate [334].
CO2 utilization and storage pathways
The capture and utilization of CO2 to produce valuable products may diminish the net costs
of reducing emissions or removing CO2 from the atmosphere. This section looks at various
pathways for the utilization of carbon dioxide. CO2 utilization often indicates manners to reduce
the net costs—or grow the profits—of reducing emissions or removing CO2 from the
atmosphere, in other words, it’s a way to support the scaling of mitigation or removal efforts
[90]. CO2 utilization is frequently viewed as a steppingstone towards or a distraction away
from the successful realization of CCS at scale [335].
There is a wide array of carbon utilization options (Fig. 50), each carbon utilization
pathway has specific characteristics in terms of technical maturity, market potential, economics,
and CO2 reduction impact. Given this diversity, implementing both broad-based policies and
sector-specific ones together will have the greatest impact on CCU development [83].

129
Fig. 50. Stocks and net flows of CO2 including potential utilization and removal pathways [336]
CO2 utilization, storage, and the carbon cycle
The amount of carbon dioxide that is utilized by a pathway is not necessarily the same as the
amount of carbon dioxide removed or carbon dioxide stored. CO2 utilization does not necessarily
reduce emissions and does not necessarily deliver a net climate benefit, once indirect and other
effects have been accounted for. The various concepts overlap and relate to each other, however,
they are very distinct from each other. Some CCU processes achieve carbon dioxide removal (CDR)
from the atmosphere, and some involve CCS. CCS itself can contribute either to the mitigation of
CO2 (e.g., by reducing net emissions from a gas-fired power plant) or to atmospheric removals (e.g.,
by direct air carbon capture and storage, or DACCS); CCS does not necessarily imply CDR.
Furthermore, CCS and CDR can fail to deliver a climate benefit [83].
For CO2 utilization to contribute usefully to the reduction of atmospheric CO2
concentrations, the scale of the pathways must be meaningful in comparison with the net flows of
CO2 shown in Fig. 52. The flow of CO2 through the different utilization pathways can be
represented by a combination of different steps (labels A to L; Fig.3, Table 1). Utilization pathways
often involve removal (A or B) and storage (D, E or F); however, the permanence of CO2 storage
varies greatly from one utilization pathway to another, with storage timeframes ranging from days
to millennia [83].

130
Fig. 51. Carbon dioxide utilization and removal cycle [83]
Cost of Carbon Capture
The cost of capturing CO2 from power stations has halved over the past decade and the next
generation of capture technologies offer further reductions in cost. The lowest cost opportunities for
CCS can deliver multi-million tonne CO2 abatement at a single facility, at a cost of less than USD20
per tonne [337].
CO₂, is significantly more than from industrial point sources. However, the cost is falling
and will fall further due, if nothing else, to economies of scale that arise from plant capacities
increasing from thousands of tonnes per year to millions of tonnes per year. That cost may be $300
per tonne of CO₂ or less within the next decade. Currently, abatement costs approach or exceed
$1000 per tonne for some sectors, and for others, there are no technologies that can reduce emissions
to zero [337]
6.6.1 Understanding the cost profile of CCS
The capital cost of CCS often includes investments of billions of dollars, which in
comparison to the capital investments of other sources of clean energy, such as wind and solar –both
of which are at a smaller scale and require smaller absolute investments –can seem expensive.
However, capital costs are not a suitable benchmark to assess whether an emissions reduction
technology is expensive because they do not reflect the true cost of reducing emissions. There are
different ways to manage the cost of CCS, including for example $/t of CO2 avoided.

131
Notwithstanding CCS’ flexibility, power generation equipped with CCS, which can be
around $60/tCO2 [338] when in vicinity to quality geologic storage resources, is frequently used as
a singular cost reference for CCS. Furthermore, the levelized cost of electricity (LCOE) is also often
cited. However, LCOE fails to account for essential network support and balancing services many
of which cannot be provided by intermittent renewables, but which traditional generation equipped
with CCS is ideally suited to. Bringing flexibility, dispatchability, reliability, energy security, and
low emissions–all important attributes in a net-zero grid penetrated by high-levels of renewables- is
a strength of CCS often overlooked as these attributes are not covered by LCOE which neglects to
reflect overall system cost [338]. Most importantly, as outlined above, there are various industries
which CCS can help to decarbonize, with some of these applications such as natural gas processing,
ethanol and, fertilizer production starting at $20/tCO2 [338]. As previously mentioned, as a general
rule, not all carbon capture applications are created equal in terms of cost (Fig. 53) [338], and the
higher the purity of the CO2 in the flue gas waste stream, the lower the cost to capture.
Fig. 52. The cost of CO2 avoided first of a kind from the Global Cost of CCS [338]
6.6.2. The importance of limiting system cost
To reach global climate goals in line with limiting warming to 1.5 degrees Celsius, the IPCC
estimates that an average of $3 trillion will need to be invested in the energy system each year until
2050 [339] ; about twice as much as current investment. However, there are low-cost and high cost
decarbonization on pathways, and analysis has shown that the inclusion of CCS diminishes the
overall system cost of decarbonization. For example, the IPCC found that it would be 138 per cent
more expensive to reach global climate goals without the deployment of CCS [340]. With regards to

132
US power grid decarbonization, studies have concluded that the availability of firm low-carbon
resources such as natural gas with CCS consistently lowers decarbonized energy system costs,
reducing cost up to 60 percent in zero-CO2 cases [341]. Hence, CCS deployment is vital to a globally
equitable and least cost energy transition.
6.6.3. The role of technology deployment in cost reductions
Cost should not be a deterrent to investment. Rather, cost reductions are one of the prime
reasons why investment in CCS today is important as the learning that results from deploying CCS
will inevitably deliver cost reductions, which can also increase and improve access to the technology
globally.
As with many technologies that are not widely deployed, the cost of capital for CCS facilities
is currently high. Considering the potentially large amounts of capital investment, high costs
of capital are a significant factor driving up overall project cost. However, with increasing
deployment the cost of capital is expected to fall (Fig. 54) [338].
Fig. 53. The Evolution lending rates with policy and increased deployment rates for CCS facilities [338]
Larger average CCS plant sizes, as well as evolving business models such as hubs and cluster
approaches where multiple sources of CO2 share transportation and geologic storage infrastructure
are expected to achieve economies of scale and further drive down unit costs. In the meantime,
governments and private sector continue to invest in R&D and keep on working on the growth the
next generation of technologies that will cut costs even more.
Economies of Scale
In order to realize wide-scale deployment of CCUS, policy incentives are needed [342].
Three primary actions improve the feasibility of wide-scale CCUS deployment: placing a value on

133
CO2 through a carbon tax or other policy instrument, lowering risks to investment through financial
support from grant funding or other provisions from federal and state government [331] and
facilitating the development of CO2 transport and storage infrastructure [331] [7].
Because fossil fuels are forecast to continue to dominate primary energy supplies, and strong
demand for industrial goods requiring high-temperature heat (including cement, steel, and
chemicals) persists, CCUS remains an effective tool for policymakers to address climate change
problems. To foster industrial scale CCUS development, a carbon tax could be utilized to incentivize
CCUS, using its revenues to reduce CCUS costs [343].
Carbon Capture and Storage are essential technologies to help achieve the ambition of net
zero anthropogenic greenhouse gas emissions by 2050. As with all solutions, the cost of deployment
of CO2 capture, transport and storage systems is of vital economic and environmental importance.
This importance will continue to increase as the scale and breadth of CCS deployment grows around
the world. The Global CCS Institute [202] has developed this report to describe the factors that drive
current and future costs of the technology. Key drivers of CCS cost include economies of scale
(which incentivizes the development of CCS hubs to build scale); partial pressure of CO2in the source
gas (lower partial pressures are more challenging), which mean there is variation in CCS costs from
industry to industry; energy costs (in the forms of heat and electricity); and technological innovation
[344].
Overcoming the technology ‘valley of death’: The role of a value on carbon
To contribute to emissions reductions at scale and reach climate goals, the deployment of
large-scale CCS facilities needs to scale-up 100-fold between now and 2050 [344]. To spur
deployment, and to overcome what some refer to as the technology ‘valley of death’–the stage of
successful demonstration yet high-capital cost and various factors of uncertainty undermining at-
scale deployment –government policy is essential. In addition, as a climate change technology, CCS
is deployed only to reduce emissions and for the pure climate benefit. In the absence of a value on
carbon that reflects the externalities of emissions, companies will not deploy the technology because
there is no incentive to do so [338].
Therefore, a value on carbon is necessary for the large-scale deployment of CCS and to make
the business case for deployment. In fact, IEA [7] has estimated that as much as 450 MtCO2 could
be captured and stored globally with a commercial incentive as low as $40/t of CO2by deploying
CCS on the many low-cost opportunities available. However, according to the World Bank, 80 per
cent of CO2 emissions are not priced or priced at below $10/t while the International Monetary Fund
suggests it should be around $75/t of CO2 [345] to meet climate targets.
There are multiple ways of creating a value on carbon which includes tax credits, like the
U.S. section 45Q awards, a carbon market like the European Union Emissions Trading System, and

134
a credit-based system like California’s Low Carbon Fuel Standard (LCFS). Mechanisms such as loan
guarantees and capital grants that reduce the cost of capital can help lessen overall project cost.
For example, 45Q and the California LCFS CCS Protocol [346] are designed to make the
business case for CCS. 45Q will eventually provide $35/t of CO2 stored via enhanced oil recovery
(EOR) and $50/t of CO2 for CO2 through geologic storage [347]. The California LCFS was trading
close to $200/t of CO2 in the first months of 2020 [348]. Already, projects that could result in at least
a doubling of US CO2 capture capacity have been announced as a result of 45Q or 45Q and the LCFS,
demonstrating that a value on carbon can make an effective business case to deploy CCS [349].
How to accelerate the commercialization of CCS technologies
Technologies develop from initial observations and concepts, through laboratory studies and
bench scale equipment, all the way through to pilot-scale and eventually full-scale commercial
service.
One of barriers to commercialization is the cost to research, develop and deploy a new
technology. However, there are ample opportunities to drive down the cost of carbon capture and to
shorten project deployment timelines, through economies of scale, modularization, heat integration,
process optimization, combined with next-generation technologies.
Currently, there are many capture technologies in the near-commercial pipeline (e.g.,
building materials) that could be more cost- effective and efficient in capturing CO2. All elements
of the carbon capture and storage value chain are mature and have been in commercial operation for
decades. However incremental improvements in those technologies have and will continue to reduce
their cost. For example, the cost of capture from a coal fired power station has reduced by around
50% over the past 10-15 years [344]. Those improvements arise from learning by doing, through
competition between vendors, through larger developments that take advantage of economies of
scale, and through commercial synergies that reduce the risk and therefore the cost of investing in
CCS [350] .
6.9.1. Closing the gap between synthetic fuel and fossil fuel
Achieving the Paris Agreement long-term temperature goal requires closing the ambition
and action gap. G20 countries have a crucial role to play in realizing increased climate policy
ambition. Synthetic electro fuels (e-fuels) were identified as one of the key policy areas and
promising options for intergovernmental cooperation between the G20 nations [351].
The main benefit of fossil fuels versus synthetic fuels is because to their cost advantage on
an energy basis. Fossil fuels have an important role in the world economy, it is an incredibly
important commodities in the worldwide, leading to a highly competitive environment.

135
The main environmental problem with fossil fuels is with their combustion process which
releases fossil carbon back into the atmosphere, which will become increasingly expensive in a
carbon-constrained world.
One area where synthetic fuels have an advantage is being able to help balance the electrical
grid, which is likely to suffer from the ever-greater risks of the excess supply of electrical energy
[352].
The other important consideration is to account where the carbon itself came from. There
should instinctively be a difference if the carbon came from a biogenic source and therefore was
already above ground when it was captured by the biomass (thus reducing atmospheric CO2), as
opposed to carbon that was captured from a fossil fuel-based power plant, where the carbon has come
from underground. If the fuel is eventually combusted without the carbon being captured again, then
the carbon from the biomass can be argued to be rereleased back to the atmosphere without the
addition of a further carbon atom. In comparison, if the carbon atom was originally from a fossil fuel
source, if the synthetic hydrocarbon is eventually combusted without the carbon being captured
again, then this will provide an additional carbon atom into the atmosphere [352].
Carbon Pricing
Carbon pricing is a cost-effective policy tool that governments and companies can use as part
of their broader climate strategy [353]. It creates a financial incentive to mitigate emissions through
price signals. By incorporating climate change costs into economic decision-making, carbon pricing
can help encourage changes in production and consumption patterns, thereby underpinning low-
carbon growth [354]. Furthermore, by giving all emitters the same incentive to reduce their
emissions, a pricing mechanism can cost-effectively reduce emissions [355].
There is a growing consensus among both governments and businesses on the fundamental
role of carbon pricing in the transition to a decarbonized economy [355]. For governments, carbon
pricing is one of the instruments of the climate policy package needed to reduce emissions. In most
cases, it is also a source of revenue, which is particularly important in an economic environment of
budgetary constraints. Businesses use internal carbon pricing to evaluate the impact of mandatory
carbon prices on their operations and as a tool to identify potential climate risks and revenue
opportunities. Finally, long-term investors use carbon pricing to analyze the potential impact of
climate change policies on their investment portfolios, allowing them to reassess investment
strategies and reallocate capital toward low-carbon or climate-resilient activities [356].
1) Main types of carbon pricing an emissions trading system (ETS) is a system where emitters
can trade emission units to meet their emission targets. To comply with their emission targets
at least cost, regulated entities can either implement internal abatement measures or acquire emission
units in the carbon market, depending on the relative costs of these options. By creating supply and

136
demand for emissions units, an ETS establishes a market price for GHG emissions. The two
main types of ETSs are cap-and-trade and baseline-and-credit [357]:
• Cap-and-trade system is a market-based environmental policy that places a limit on harmful
pollutants and creates a market-based price on emissions. Companies need to hold permits to cover
their emissions; these permits, often called “allowances,” can be purchased or sold at prices
determined by supply and demand [358]. The cap on GHG emissions generates a firm limit on what
is permissible in any given region. This restriction strengthens over time, requiring agencies to
continue making improvement toward better systems. It is a process that usually takes between 10
to 20 years to start reaching levels that are considered to be acceptable to the environment [359].
• Hybrid approaches – those that combine aspects of command-and-control and market-based
incentive policies – are often discussed in the literature and increasingly used in practice. These
approaches are appealing to policymakers because they often combine the certainty associated with
a given emissions standard with the flexibility of allowing firms to pursue the least costly abatement
method. However, hybrid approaches are not always the most economically efficient approach
because either the level of abatement or the cost of the policy is greater than what would be achieved
through the use of a market-based incentive approach [360].
2) Carbon tax or emissions fee is a fee that a government imposes on any company that
burns fossil fuels. The purpose of a carbon tax is to expose the true cost of burning
carbon. Those costs are experienced by those who bear the consequences, such as
homeowners, farmers, and eventually the government. Carbon taxes make sure companies
and consumers pay for the external costs they enforce on society [361].
3) Cap and trade and carbon tax instruments are market-based approaches that may be
used to reduce GHG emissions. In many ways, a cap-and-trade program and carbon tax
would produce similar effects. Both would place a market price on GHG emissions (directly or
indirectly), and both would increase the relative market price of more carbon-intensive energy
sources, particularly coal, which generate greater emissions per unit of energy. This result could lead
to the displacement of these sources with lower carbon-intensive sources, including renewables; spur
innovation in emission reduction technologies; and stimulate actions that may decrease emissions,
such as efficiency improvements [362].
4) An offset mechanism designates the GHG emission reductions from project- or program-
based activities, which can be sold either domestically or in other countries. Offset programs issue
carbon credits according to an accounting protocol and have their own registry. These credits can be
used to meet compliance under an international agreement, domestic policies or corporate citizenship
objectives related to GHG mitigation [363].

137
5) RBCF is a funding approach where payments are made after pre-defined outputs or
outcomes related to managing climate change, such as emission reductions, are delivered and
verified. Many RBCF programs aim to purchase verified reductions in GHG emissions while at the
same time reduce poverty, improve access to clean energy and offer health and community benefits
[363].
6) Internal carbon pricing is a tool an organization uses internally to guide its decision-
making process in relation to climate change impacts, risks and opportunities [363].
For governments, the choice of carbon pricing type is based on national circumstances and
political realities (Fig. 55). In the context of mandatory carbon pricing initiatives, ETSs and carbon
taxes are the most common types. The most suitable initiative type depends on the specific
circumstances and context of a given jurisdiction, and the instrument’s policy objectives should be
aligned with the broader national economic priorities and institutional capacities. ETSs and carbon
taxes are increasingly being used in complementary ways, with features of both types often combined
to form hybrid approaches to carbon pricing. Some initiatives also allow the use of credits from offset
mechanisms as flexibility for compliance [362].
Fig. 54. Carbon Pricing Map [364]
The large circles represent cooperation initiatives on carbon pricing between subnational
jurisdictions. The small circles represent carbon pricing initiatives in cities. In previous years,
Australia was marked as having an ETS in operation. However, the Safeguard Mechanism functions
like a baseline-and-offsets program, falling outside the scope of the definition of ETS used in this

138
report. Therefore, the system was removed from the map. Rio de Janeiro and Sao Paolo were marked
as considering the implementation of an ETS based on scoping work done in 2011 and 2012
respectively. Given there have been no updates since, the these were removed from the map.
Note: Carbon pricing initiatives are considered “scheduled for implementation” once they have
been formally adopted through legislation and have an official, planned start date. Carbon pricing
initiatives are considered “under consideration” if the government has announced its intention to
work towards the implementation of a carbon pricing initiative and this has been formally confirmed
by official government sources. The carbon pricing initiatives have been classified in ETSs and
carbon taxes according to how they operate technically. ETS not only refers to cap-and-trade
systems, but also baseline-and-credit systems as seen in British Columbia. The authors recognize
that other classifications are possible.
Many companies utilize the carbon price they have in mandatory initiatives as a basis for
their internal carbon price. Some companies adopt a range of carbon prices internally to take into
account different prices across jurisdictions and/or to factor in future increases in mandatory carbon
prices. GHG emissions can also be implicitly priced through other policy instruments such as the
removal of fossil fuel subsidies, energy taxation, support for renewable energy, and energy efficiency
certificate trading [362].
Understanding EU’s ETS
The ETS is the EU’s main carbon pricing tool and covers emissions from the power
generation sector, industry and intra-European flights, amounting to about 40% of total EU emissions
[365]. It is a cap-and-trade system. A quantity cap of allowances is set and distributed to participants,
including through auctions. However, there the risk of carbon leakage, of firms moving their
activities to countries with laxer climate rule to control costs, remains. Carbon leakage distorts the
trading system and is counterproductive to the process of reducing emissions [366]. This risk can be
avoided by giving some ETS allowances for free [367].
Also, the system is designed so that the quantity of allowances reduces in a steady and
predictable manner (known as the linear reduction factor) [251]. Auction prices are determined by
the quantity offered at any given time and the level of demand [368]. Since 2009, a combination of
factors (economic crisis and high imports of international credits) has led to a surplus of allowances,
which ultimately resulted in a prolonged period of lower carbon prices (from €20-€25/tonne of
carbon dioxide from 2005 to 2008, to €10-€15 between 2009 and 2011, and €5-€10 between 2012
and 2018) [365].
A Market Stability Reserve [369] was introduced in 2019 as a long-term solution to address
this excess-supply. The surplus of allowances is largely due to the economic crisis (which reduced
emissions more than anticipated) and high imports of international credits. This has led to lower

139
carbon prices and thus a weaker incentive to reduce emissions. In the short term, the surplus risks
undermining the orderly functioning of the carbon market. In the longer term it could affect the
ability of the ETS to meet more demanding emission reduction targets cost-effectively. Since the
system started in 2019, the carbon price has risen to the current level of €50.14 as of June 4, 2021;
however, it has gone as high as €56.35 on May 14, 2021 (Fig. 56) [370].
Fig. 55. Daily EU ETS carbon market price [370]
However, carbon prices will have to keep rising if they are to contribute materially to EU
decarbonization. It is of course difficult to identify a ‘target’ price, but there have been attempts to
identify the level of pricing that can cause behavioral change. The Stiglitz-Stern High-Level
Commission on Carbon Prices [371], for example, concluded that the carbon price should be between
$40-$80 in 2020 and then between $50-$100 in 2030 if it is to reduce emissions.
The current EU price thus remains too low to reduce emissions in a manner consistent with
EU climate objectives. Therefore, this year will be decisive for Europe’s climate policy, with a wide
range of new legislation promised to align current EU climate and energy policies with a new
emissions reduction target [372]. The 2030 climate and energy framework also include EU-wide
targets and policy objectives for the period from 2021 to 2030. The key targets for 2030 are: At least
40% cuts in greenhouse gas emissions (from 1990 levels); At least 32% share for renewable energy;
At least 32.5% improvement in energy efficiency [373].
The announcement of the European Green Deal recovery package and new 2030 mitigation
targets has triggered wide-ranging changes for the European Union ETS. In 2020, the European
Green Deal was also announced, including a proposal for the European Climate Law legislating a
2050 climate neutrality objective and a 2030 Climate Target Plan to reduce net emissions by at least

140
55% by 2030. As part of this, there will be a revision of the EU ETS, with a proposal expected in
June 2021 to align it with the more ambitious 2030 target. In addition to considering a more ambitious
cap trajectory and reviewing the Market Stability Reserve (MSR), the EU is planning to extend the
ETS to maritime transport, ensure the contribution of the aviation sector is in line with new
objectives, and assess the possibility of also extending carbon pricing to the trans- port and buildings
sectors with a view to harmonizing economic incentives to reduce emissions while also raising
revenue for climate action and addressing social and distributional concerns [374].
National carbon pricing instruments were also launched in several European countries.
Following its departure from the EU, the United Kingdom stopped participating in the EU ETS on
January 1, 2021. On the same day, the U.K. ETS came into operation, closely resembling the design
of Phase 4 of the EU ETS. Covering the power, industry, and domestic aviation sector, the cap will
reduce emissions by 4.2 Mt annually and will be revised in 2024 in line with the country’s 2050 net-
zero trajectory. Germany’s national fuel ETS also came into operation, covering all fuel emissions
not regulated under the EU ETS — around 40% of national GHG emissions. The Netherlands
Industry Carbon Tax Act (Wet CO2-heffing industry) entered into force on January 1, 2021, with a
rate of EUR 30 (USD) stayed around the auction floor price of USD 16.68. Though auctions were
under subscribed in May and August 2020, stronger demand returned by November. In the Regional
Greenhouse Gas Initiative (RGGI), prices also remained relatively stable. This provides
a stark contrast to the 2007–2008 financial crisis and subsequent economic downturn, which led to
sustained price depressions across multiple systems [374].
In 2021, the revised EU ETS Directive entered into force, outlining the policy framework
for the fourth trading phase (2021–2030). Compared to the third phase, revisions in the fourth phase
include: (i) strengthening the annual rate of the cap reduction from 1.74% to 2.2%; (ii) implementing
the MSR (in operation since 2019); (iii) better targeting leakage and allocation rules; and (iv)
establishing the Innovation Fund for innovative and breakthrough technologies and the
Modernization Fund to help Member States modernize their power sector. The 2021 cap for the EU
ETS is set at 1572 MtCO2e for stationary installations, while the cap for emissions from the domestic
aviation sector is 38 MtCO2e [364].
Understanding Carbon Pricing in the U.S.
In the US there is no national carbon pricing system to lower global warming-causing
emissions. The two basic proposed options are either a carbon tax or a cap-and-trade (or cap-and-
dividend) system. In the United States, President Biden is exploring the idea of a border adjustment
tax on countries that fail to meet their climate obligations [375], making the United States the only
country without a national carbon price to be openly considering border adjustments.
In the US, where environmental justice concerns have gained increasing prominence, the
Transportation and Climate Initiative Program’s draft rules propose the creation of equity advisory

141
bodies and annual reviews of the Program’s equity impacts, as well as dedicating a share of revenues
to ensuring overburdened and underserved communities benefit from the Program [376].
New trends boost ventures of successful deployment of CCUS. The United States leads the
global deployment of carbon capture and storage (CCS) technologies. A progressive policy
framework and sustained government support have launched the roll-out of the next generation of
CCS facilities. With impacts of climate change becoming ever more devastating, and the need to
eliminate emissions as soon as possible, these are welcome developments. However, reaching net-
zero emissions climate goals will require a 100-fold scale-up of CCS facilities between now and
2040, demanding further supportive policies and mechanisms [7].
Most carbon pricing developments in the United States are taking place on the subnational
level. These include California, Hawaii, Massachusetts, Oregon, Pennsylvania, the RGGI, the
Transportation and Climate Initiative Program, and Washington [364].
California, changes to California's Cap-and-Trade Program that were required by Assembly
Bill 398 (Chapter 135, Statutes of 2017) [377] took effect on January 1, 2021. The major changes to
the program are (i) establishment of a price ceiling, (ii) changing from a three-tier allowance price
containment reserve to a two-tier reserve below the price ceiling, and (iii) reductions in the use of
offset credits, especially for those generated from projects that do not provide "direct environmental
benefits in the state." Under the upcoming 2022 Scoping Plan update, the California Air Resources
Board (CARB) will be assessing suite of climate policies to chart the course to achieving carbon
neutrality by 2045. As part of this update, CARB may identify additional opportunities to further
strengthen the Cap-and-Trade Program to ensure it continues its role to help the state meet its GHG
reduction targets. In 2019, the U.S. Department of Justice challenged the constitutionality of
California's market linkage with Québec based on alleged violations of constitutional precepts, the
most important being the Foreign Affairs Doctrine. In a July 17, 2020, decision, the U.S. District
Court for the Central District of California ruled in favor of California, which affirmed the
constitutionality of the program's linkage with Québec.
Hawaii Climate change policies for Hawaii are being coordinated under the state’s Climate
Change Mitigation and Adaptation Commission as mandated by Act 32, Session Laws of Hawaii
2017. One option, among others, that is being considered is carbon pricing. Carbon tax bills have
been introduced in the 2020 and 2021 sessions; however, they have not passed to date. The State
Energy Office, a member of the Commission, released a carbon tax study [378] in February 2021.
The report modeled different policy packages to assess impact on emissions and considered revenue
recycling options to address the distributional impacts of a carbon price.
Massachusetts in 2020: Limits on Emissions from Electricity Generators system reduced the
share of allowances distributed through free allocation from 75% to 50%. The remainder, after an
adjustment to account for banked allowances, were distributed via auctions. The system will increase

142
to full auctioning by 2021. In 2021, Massachusetts finalized a new climate program establishing
climate targets for 2030. The Massachusetts ETS may be revised to align with these targets.
Oregon In line with the Executive Order on Climate Action (Executive Order 20-04), the
Department of Environmental Quality of Oregon submitted a report in June 2020, both of which
focused on program options to cap and reduce emissions. However, the details of the program have
not yet been determined, and it is not clear whether the program will be a baseline-and-credit or a
cap-and-trade system.
Pennsylvania's Department of Environmental Protection released an update of its earlier
proposal in April 2020 for a power sector ETS covering CO2 emissions. The proposed regulation is
largely consistent with the system design features of the Regional Greenhouse Gas Initiative (RGGI)
Model Rule. A final proposal is expected in 2021, with 2022 as the earliest start date for
Pennsylvania's ETS to join RGGI. It is estimated that Pennsylvania's power sector will emit
approximately 40% of emissions covered under RGGI when the state becomes a part of the program.
Pennsylvania’s inclusion would significantly increase the size of RGGI’s carbon market.
Regional Greenhouse Gas Initiative Virginia began participating in RGGI as of January 1,
2021, after the final legislation for establishing an ETS and participating in RGGI was adopted in
February 2020. On February 2, 2021, RGGI states [379] also announced a plan for a third program
review.
In the first three months of 2021, legislators in the United States House of Representatives
and the United States Senate introduced five bills that aim to accelerate the deployment of carbon
capture and storage (CCS). This accomplishment is remarkable for several reasons: first, because of
the depth and breadth of the policy provisions inherent in the bills; second, because all of the bills
have bipartisan cosponsors; and third, because of the speed with which the bills were released. From
a political standpoint, it is noteworthy that these bills were introduced at all. Fresh off the passage of
the Energy Act of 2020, a giant bill that effectively triples Congress’ yearly authorized spending
levels for CCS [380].
The new policy landscape with the new bills aimed at the long-term growth of CCS industry.
Thus, CCS shows evidence that it might be the only major climate change technology that possesses
such a robust level of support from Congress. The increase in both enacted and introduced CCS
legislation over the past three years should encourage many more potential developers and investors
to get serious about deploying CCS.
6.12.1. The Three Pillars of US CCS Policy
1) CCS policy measures implemented in the US can be grouped in one of three distinct
categories: Research, Development and Demonstration (RD&D), 2) Market Development, 3)
Infrastructure. It is best to think of these categories as pillars because they work in tandem to support
wide scale CCS deployment; all three must be present in some form to fully secure the initiative
[349].

143
2) CCS Research, Development and Demonstration (RD&D)
From bench-scale research to large-scale demonstration facilities, CCS-RD&D has historically
been the first policy pillar to be constructed around the globe and has consequently provided the
most robust support for advancing CCS technology. Many governments are currently funding CCS
RD&D programs [381]
3) CCS Market Development
The ‘Markets’ pillar includes any policy that supports the business case for companies to invest
in CCS facilities. Examples of policies that fall under this category are tax credits, carbon prices,
carbon trading markets, regulations and standards that require a certain amount of ‘low carbon’
energy generation [349].
CCS Infrastructure
Infrastructure is the third pillar and encompasses policies that facilitate CO2 transportation,
utilization and underground storage. These measures frequently involve regulations, permitting,
licensing and citing as well as the creation of common carrier pipelines or other policy trifecta is
necessary to achieve the 100-foldincrease needed to meet climate scenarios laid out by the
Intergovernmental Panel on Climate Change (IPCC) [328]. Individual facilities can and do exist
apart from policy support, but in order to accelerate the deployment of CCS facilities and the growth
of a truly global industry, all three policy pillars will need to be s significantly strengthened
[349].
6.13.1. History of enacted CCS Policy in the U.S.
Since 1997 the US has implemented major CCS policies (Fig. 57)
Fig. 56. Timeline of major CCS policy enacted in the US [349]
In 2021 the US finalized the ‘Treasury Department and IRS 45Q Guidance’ along with the
five major CCS Bills.

144
The Final Guidance of 2021 was approved on January 6th, 2021. The Treasury Department
and IRS issued their Final Guidance for the administration of the 45Q tax credit. This Guidance
provides certainty for CCS project investors and developers by establishing transparency about how
to build a CCS project to achieve the full value of the reformed 45Q tax credit in a timely manner
[382].
6.13.2. Major CCS Bills Introduced in 2021
On 3 January 2021 the 117thCongress was sworn in. It includes the most closely divided
House and Senate in decades. Yet, in the space of three months, this new Congress has introduced
five major bipartisan bills to increase the deployment of CCS.
ACCESS 45Q Act –H.R. 1062
On 16 February, Representative David McKinley (R-WV) and original co-sponsor Rep. Marc
Veasey(D-TX) introduced the ACCESS 45Q Act [382]. As its title suggests, the bill would amend
45Q to include a100% direct pay option (cash payments in lieu of the tax deduction), a 10-year
extension (end of 2035) of the commence construction deadline (the date when a project must break
ground) to qualify for the credit and would also allow 45Qthe same exception against the base erosion
and anti-abuse tax (BEAT)as is enjoyed by wind and solar tax credits. (The BEAT is a form of
alternative minimum tax for corporations to ensure multinationals cannot use deductions based off
taxes paid abroad to reduce their US tax liabilities below a certain threshold.) Currently, the ACCESS
45Q Act has five Republican and five Democratic cosponsors [349].
1) Carbon Capture Modernization Act –S. 661, H.R. x
This bill, introduced on 10 March, amends the statutory language passed in 2005 and 2008 to
allow coal-fired power generation carbon capture retrofits to profit from the 30% 48A tax
credit. Specifically, the bill would relax the efficiency requirements for new and retro fit
projects if they have CCS equipment on the thereby making it technically possible for a coal-
fired power generation facility to deploy carbon capture technology and meet the efficiency
requirements to qualify for the tax credit. In total, there is $1.25 billion authorized for facilities
that can invest in a CCS retrofit [383].
2) Storing CO2 and Lowering Emissions (SCALE) Act –H.R. 8995
Introduced on 17 March, the SCALE Act [384] is the first major bipartisan bill introduced in both
chambers of Congress to focus solely on the third policy pillar: CCS infrastructure. It builds on the
INVEST CO2 Act introduced by Rep. Cheri Bustos in 2019 [385] and authorizes $4.9 billion in
spending over 5 years. Major bill provisions include: 1) The establishment of the CO2Infrastructure
Finance and Innovation Act (CIFIA) program which would make flexible, low-interest loans for
CO2transport infrastructure projects available and provide grants for initial excess capacity on new
infrastructure in order to incentivize building bigger pipelines; 2) The establishment of the Secure

145
Geologic Storage Infrastructure Development Program to make cost-sharing available for the
development of large-scale saline geologic storage sites that can serve as hubs for multiple CCS
facilities; 3) More funding for Environmental Protection Agency(EPA) Class VI permitting (the
permit needed to do underground CO2storage)in saline geologic formations and gives grants that
benefits states establishing their own Class VI permitting programs; 4) Grants for states and
municipalities to buy low and zero-carbon products made from CO2and carbon oxides [349].
3) Carbon Capture, Utilization and Storage Tax Credit Amendments Act–S. x.
On 25 March, an evenly split bipartisan group of six Democrats and six Republicans introduced the
Carbon Capture, Utilization and Storage Tax Credit Amendments Act [386]. It contains three
provisions (with minor variations) found in the ACCESS 45Q Act. First, the bill extends the
commence construction deadline for 45Q project eligibility but only for 5 years. (It’s 10 years in
ACCESS 45Q.) It also establishes a direct pay for both 45Q and 48A tax credits. Moreover, it allows
45Q the same exception against the BEAT tax as is enjoyed by wind and solar tax credits. Like the
Carbon Capture Modernization Act, the Carbon Capture, Utilization and Storage Tax Credit
Amendments Act would fix the 48A tax credit language to make coal-fired power retrofits eligible
for a 30% investment tax credit. Finally, the Carbon Capture, Utilization and Storage Tax Credit
Amendments Act increases the 45Q credit value from $50 to $120 per metric ton for direct air
capture (DAC)facilities that capture and securely store carbon dioxide (CO2) in saline geologic
formations and from $35 to $75 per ton for DAC facilities that store captured CO2 in oil and gas
fields [349].
4) Financing Our Energy Future Act –S. x., H.R. x.
One day after the introduction of the Carbon Capture, Utilization and Storage Tax Credit
Amendments Act,26 March, five Democratic and four Republican Senators introduced the Financing
Our Energy Future Act, and a Democrat and Republican Representative released the same bill in the
House [387]. The bill allows CCS projects to avail themselves of tax-advantaged master limited
partnerships (MLPs). By doing this, it reduces the cost of equity and provides CCS developers with
access to capital on better terms. MLPs are important tool for financing all types of CCS projects
including DAC and also carbon utilization projects [349].
6.13.3. Linking EU and US Emission Trading System
A global carbon market is frequently called as the most cost-effective way to reach emission
reduction goals [388]. The EU and the US are considered the two largest integrated economies in the
world. A transatlantic link between EU’s emissions trading system (ETS) and US’s federal system
would not only be a strong political indication for the formation of a global carbon market but would
remove competitive concerns between these two key players triggered by different carbon prices
[389]. If a combined EU-US market was established, this transatlantic market would provide the

146
cornerstone for the overall international climate system, with subsequent expansions to other
developed and developing countries [390].
Corporations are also exploring possibilities to source credits closer to where their clients
are, for instance, in Western Europe and the United States. For some companies, in particular those
serving consumer markets, the possibility to establish a clear correlation between their local
environmental impact and crediting projects is attractive, and there is a willingness to pay a higher
price than the average in the market. This is fostering a growing number of local standards covering
emissions that are not tapped by other existing carbon pricing instruments. North America is
purchasing most of its carbon credits in its region, with buyers in Oceania purchasing 41% of their
credits locally. The share of local carbon credits bought by European buyers, in contrast, remains
small. However, buyers’ willingness to pay more than three times as much for these credits is leading
to a growth in the number of local European standards, with four new standards having been launched
in the past two years [364].
However, the environmental and economic benefits of emissions trading and by extension
of linking crucially depend on the design of the trading systems. Particular areas of concern are the
protection of the environmental integrity of the trading system as a whole, avoidance of negative
economic or distributional impacts, and protection of design choices made in the establishment of an
ETS [391]. Possible mechanisms for linking the EU to an US ETS could include direct and indirect,
bilateral and unilateral links, as well as various possible legal mechanisms to implement the link,
such as treaties or more informal agreements [392].
Linking means that one system’s trading units can be used, directly or indirectly, by a
participant in another system for compliance. The inclusion of more participants entails a greater
diversity of sources and more abatement options. This should in turn lead to improved market
liquidity and result in a more efficient allocation of resources towards least-cost abatement measures
and thus lead to lower overall compliance costs [393] [394]. As an additional benefit, linked trading
schemes with harmonized prices eliminate any competitive distortions that might arise from different
pre-link carbon prices between linking partners. Linking the emerging domestic systems could also
be politically significant since they would serve to underpin the top-down approach of the
international climate regime by a bottom-up process which might further strengthen the international
regime via bi- and plurilateral agreements [395] [396].
Nevertheless, these possible advantages are based on a best-case scenario where countries
establish environmentally effective emissions trading systems and then link them with each other
[397]. Real-life emissions trading systems will not necessarily be environmentally effective. The
environmental benefits of emissions trading and, by extension, of linked trading schemes are highly
dependent on the design of a trading system. Most importantly, the amount of emission reductions
achieved by cap-and-trade stems not from the trading as such, but from the stringency of the cap
[398].

147
The environmental effectiveness of emissions trading is also determined by whether cost-
containment features such as price caps are used. Through linking, such features would impact the
combined trading scheme and thus impair rather than enhance its environmental effectiveness [399].
It is therefore not advisable to link emissions trading systems without any regard to their design. To
the contrary, key features that determine the environmental effectiveness of trading schemes, such
as the cap and cost-containment features, should be harmonized prior to linking [400] [399].
The economic and technical side of ETS linking political drivers and barriers have so far
been underrepresented. There have been some attempts in employing the concept of linking
activities of the EU: (1) a failed linking attempt: EU ETS–California Cap-and-Trade Program [401];
(2) a successful linking treaty: EU ETS–Switzerland Emissions Trading System; and (3) an agreed-
upon but not realized link: EU ETS–Australia Carbon Pricing Mechanism [402].

148
7. Conclusions
The main subject of this work revolves around the CO2 molecule, a low-value, low-energy,
stable waste gas, often available in large quantity in single locations. This work examines some
viable avenues to capture, utilize, and store CO2 (CCUS)- with the ultimate goal of reducing GHGs
emissions and global warming. Moreover, the study also examines various paths to accelerate the
commercialization of the carbon-based products and their technologies.
New CO2 use pathways, involving chemical and biological technologies, offer opportunities
for future CO2 use. Many of these pathways are still in an early stage of development, but early
opportunities are already being realized. When comparing the technologies utilized to create the two
carbon-based products (synthetic fuels and carbonates) and biogas to produce electricity, it was
observed that when fly ash reacts with CO2 through the process of mineral carbonation, it converts
carbon into a thermodynamically stable and insoluble solid that can store CO2 for long periods of
time. Carbonated products are considered a permanent CO₂ storage solution; conversely, synthetic
liquids are a reuse technology which do not permanently store CO₂, hence, CO2 is converted into a
less stable product. Additionally, the conversion of CO2 into syngas is even less stable since the
final product is a gas, making it the least ideal product to store CO2.
Carbon dioxide can be captured from gaseous waste streams containing CO2 by using
technologies that are commercially accessible and by the implementation of established chemical
processes.
Currently CCU technologies are experiencing various stages of performance and maturity;
nonetheless, there are significant advancements in CCU technologies that have progressed in the past
ten years; various technologies showing promising commercial scalability and advanced mobility
features. Furthermore, the swift decline of costs for many renewable sources (mainly solar and wind)
has made low-cost, near-zero-carbon electricity abundant in terms of capacity and locality.
Consequently, this has driven some markets to offer electricity at affordable cost and, in some cases
even negative prices. Because renewable electricity is gradually decreasing in price, there has been
an increase cognizance on prospective new applications, (e.g., CCU and CCUS) considering turning
this trend into a profitable venture.

149
The reality of CCU/CCUS is multifaceted and complicated. It embraces an extensive
assortment of applications (e.g., synthetic fuels from CO2 conversion using electrolysis of water and
carbonated fly ash for the cement and concrete industry), technologies (e.g., electrochemical
conversion using fuel cells, thermo-catalytic conversion to produce polymers, mineral carbonation)
energy necessities (i.e., exothermic vs. highly endothermic), and locales (i.e., sizable industrial sets
vs. distributed applications). Consequently, the ultimate value and extent of carbon utilization will
depend on future technology, economics, and policy drivers.
The long-term mitigation impact of carbon utilization technologies will depend on the life-
cycle emissions from production through the end use of the product. Important aspects defining the
mitigation potential of carbon utilization technologies and resulting products include the GHGs
emissions associated with the product production, the volume of carbon embedded in the product
(depending on the size of the product market and amount of carbon incorporated), the product
lifetime during use, and ultimately the carbon captured in the product at end of use. Different
products and processes will have different resulting mitigation impacts, and carbon waste stream
utilization may be pursued for reasons other than long-term carbon mitigation.
Decisions about whether to commercialize a product are complex. It is necessary to establish
proof of value, that is, to determine if the technology either addresses a limitation of the current
market (such as by lowering the cost or increasing the lifespan of a product) or fills a new need in
the market. Issues associated with capital expenditure, regulations, and availability of feedstocks are
all crucial and may vary depending on the location in which a new technology is being implemented.
Commercialization considerations are also time dependent; a technology that is not commercially
viable today may become so in the future because of market, policy, or societal changes. Similarly,
regional factors may dictate commercial viability such that technologies that are commercially viable
in one region may not be feasible elsewhere. Because carbon utilization involves goals related to the
mitigation of greenhouse gas emissions, environmental considerations are also important for
evaluating these technologies [403]
When evaluating the three carbon capture technologies and their products the following factors
were observed.
Biogas production to generate electricity and heat by using fuel cells:
The allure of introducing solid oxide fuel cells into the WWTP market goes beyond the
advantage of fuel flexibility. While traditional cogeneration systems produce exhaust gases with
CO2 mixed with a high nitrogen flow, with related difficulties in the sequestration processes, in a
SOFC systems exhausts from the anode side are free from nitrogen, leading an easy CO2-capture
through a simple condenser to remove water. However, the main criticality related to biogas use in
SOFC is the need for a biogas cleaning system, which is a non-standard component required when
biogas is fed to SOFC. Compared to traditional CHP system, SOFC are more sensitive to biogas

150
contaminants such as Sulphur and siloxanes. Fortunately, biogas resulting from WWTP shows
relative low levels of contaminants further contributing to the attractiveness of WWTP as a market
opportunity to implement SOFC. Because of a relative ‘clean’ biogas, SOFC installations in WWTP
usually required only a single stage contaminants removal, by using adsorption materials.
Production of synthetic fuel- methane and methanol
Two different plants are to produce synthetic fuels from hydrogen and carbon dioxide have been
assessed from a technical and economic outlook. A variation cost of both products (methane and
methanol, respectively) as a function of the electricity cost for a specific SOEC cost equal to 1,050
$/kW, parametrized with the cost of CO2 as a market commodity. The distance between the two lines
is greater in the case of a methanol synthesis plant, due to the higher amount of CO2 required from
the stoichiometry of the methanol formation reaction (Fig. 39).
Reviewing the methane production plant, the abundant exothermicity of the reaction allows for
an exceptional thermal integration between the fuel synthesis and the steam generation, minimizing
and making almost zero the external heat requirement. The strong thermal integration, combined
with the high conversion reached within the catalytic reactors, leads to high conversion efficiency (≈
77%). On the other hand, for the methanol production a higher reaction pressure is required.
Therefore, if the higher reaction pressure is combined with the minimal heat available from the
reactor, the efficiency of the system is diminished (≈ 58%) because of the larger demand for external
energy. The need of higher pressure for methanol production means that the initial investment and
O&M costs are greater.
With fixed electrolysis size (10 MW) the carbon dioxide utilization for the methanol synthesis
case is higher than the CO2 consumed for methane production (1,594 kg/h vs. 2,751 kg/h), due to the
stoichiometry of the involved chemical reactions.
When evaluating a sensitivity analysis, it was visible that the two considered systems present
similar economic performance, unlike the difference between the efficiency of the two analyzed
concepts. With current (2,500 $/kW) SOEC specific cost the breakeven electricity price (enabling
the production cost comparable with the upper fossil-based bound) is very low: it equals 3 and 20
$/MWh for synthetic methanol and methane, respectively. The electrolysis section cost decrease
allows a wider spectrum of acceptable electricity prices: e.g., below 40 and 60 $/MWh for synthetic
CH3OH and CH4, respectively, in the most optimistic SOEC cost assumption (450 $/kW). In the
scenario assuming no cost for input electricity (situation occurring more and more in different
developed countries), the capacity (or utilization) factor ensuring the competitiveness of power-to-
fuel system is in the range between 20-50% (synthetic methane) or 30-60% (synthetic methanol).
It was concluded that, to produce an economically attractive market for e-methane and e-
methanol, in the present market conditions, the production plants should maintain a utilization factor
of approximately 50%, the cost of SOECs should be near to 1050 €/kW and the electricity required

151
to run the system needs to be supplied from renewable sources at a very low cost (below 40-50
$/MWh).
Production of carbonated fly ash
The progress of commercially feasible carbonation technologies is affected by gaps in our
understanding of carbonation processes, technical challenges fronting various carbonation
approaches, and an array of economic and social factors affecting the possible costs and market
penetration of mineral carbonation technologies. Furthermore, the potential influence of these
measures to climate change is prone to be limited as demand for these products becomes saturated.
Also, the regulations and standards- mainly, the study of codes and specification framework are
usually overseen by members of government and industry. Additionally, the hurdle to accelerate the
route to make any changes to the regulatory framework so to not discourage investors can
consequentially hinder the entrance of a new technology into the market.
Given the very large material movements in the construction sector, this industry offers an
incredible potential for CO2 utilization. However, simulating and integrating CO2 from extensively
distributed sources with a variety of potential consumers and construction product types and markets
poses logistical and commercial challenges. Additionally, research is needed to develop predictive
accelerated aging evaluation methodologies for mineral carbonation. These models would help
minimize the risk of new technologies and simplify their introduction into conservative market
applications where extensive performance data are necessary to institute codes for use.
The specifications for the utilization of fly ash (EN 450-1) in the production of concrete are
very restrictive, especially for Type C or HCFS ashes. In fact, there are no general existing regulation
on the European level for using this by-product in the construction industry. In contrast, the
American specifications related to fly ash and HCFA are somewhat vague and they have several
loopholes that are being misused in when fly ashes are used in some projects. The is an immediate
need to do more testing and research to be able to revise the current specifications- mainly ASTM
C618.
In Europe there is a large production of HCFA due to the sizable amount of lignite burnt at
coal power plants. Carbonation as a HCFA pre-treatment will make this material compatible with
cement materials. Mineral carbonation technology would permit to bind the surplus of the free
calcium in HCFA with anthropogenic CO2. This process will change some of the chemical and
physical properties of the fly ash and therefore enabling the use of the by-product to more
applications. Moreover, by introducing the MC technology at thermal and municipal plants will help
mitigate the emission of CO2.
After further developing the MC process there needs to be more advanced research to study
the durability and strength of cement-based products that include HCFA. This will result in the
development of other technologies, the use of the product in more applications, the advancement of

152
deploying large scale projects- ultimately facilitating and accelerating the commercialization of the
technology and the carbon-base product.
Final Remarks
Determining the commercialization potential of a new product or process needs
consideration of factors beyond the technology and economic feasibility, for example, market-
focused and legal mechanisms. Market-focused entails an evaluation of the end market size,
competitiveness and perception of the technology in question; while legal components include
consideration of regulatory matters, intellectual property, and standards and norms in the market of
interest.
Carbon Capture is a high-cost abatement option and will remain so in the short‐term and,
unlike renewable energy and energy efficiency, it does not generate revenues if there is no carbon
price or a commercial market for the captured CO₂. Current carbon prices (around 50 €/tonCO2
according to the ETS system) are well below carbon capture costs because current short‐term
emissions targets can be met without the use of capturing systems.
Moving away from conventional processes and products will require a number of
developments such as: (i) education of producers and consumers; (ii) new standards; (iii) prevailing
research and development to address the issues and barriers challenging emerging technologies; (iv)
government funding for development and deployment of emerging technologies; (v) rules and
regulations to address the intellectual property problems related to the diffusion of new technologies;
and (vi) financial incentives (e.g., through carbon trading mechanisms) to make emerging low-
carbon technologies, which may have a higher initial costs, competitive with the conventional
processes and products.

153
References
[1] IRENA, “Untapped potential for climate action: Renewable energy in Nationally Determined
Contributions.” 2017.
[2] D. Harris, C. Heidrich, and J. Feuerborn, “Global aspects on Coal Combustion Products.”
Coaltrans Conferences, Sep. 2019.
[3] H. Ritchie and M. Roser, “CO₂ and Greenhouse Gas Emissions,” Our World Data, 2020.
[4] Center for Climate and Energy Solutions, “Global Emissions,” 2019.
[5] Center for Climate and Energy Solutions, “Main Greenhouse Gases,” 2014.
[6] USEPA and IPCC, “Global Emissions by Gas,” 2020 2014.
[7] IEA, “‘World Energy Outlook Analysis, 2019.’”
[8] B. Llamas et al., “Greenhouse Gas Emissions – Carbon Capture, Storage and Utilisation,”
2016, doi: 10.5772/63154.
[9] M. Kanniche, P. Jaud, J. Valle-Marcos, and J. Amann, “Pre-combustion, Post-combustion and
Oxy-combustionin thermal power plant for CO capture.” Applied Thermal Engineering,
Elsevier, 2009.
[10] Climate Action Tracker, “Temperatures; Addressing global warming,” 2021.
[11] The Global CO2 Initiative, “Global Roadmap for Implementing CO2 Utilization.” Nov. 2016.
[12] DOE and NETL, “Cost and Performance Baseline for Fossil Energy Plants Vo.2: Coal to
synthetic natural gas and ammonia.” National Energy Technology Laboratory, 2011.
[13] M. Brazilian and K. Coddington, “Carbon capture, utilization, and storage under the Paris
Agreement.,” Apr. 2020.
[14] Glasgow City Council, “COP26,” 2020.
[15] World Economic Forum, “COVID-19 is a game-changer for renewable energy. Here’s why,”
Jun. 2020, [Online]. Available: https://www.weforum.org/agenda/2020/06/covid-19-is-a-
game-changer-for-renewable-energy/
[16] IEA, “COVID-19, exploring the impacts of the Covid-19 pandemic on global energy markets,
energy resilience, and climate change,” 2020. [Online]. Available:
https://www.iea.org/topics/covid-19
[17] IEA, “Covid-19 impact on renewable energy growth,” 2020. [Online]. Available:
https://www.iea.org/reports/renewable-energy-market-update/covid-19-impact-on-renewable-
energy-growth
[18] IEA and F. Birol, “Put clean energy at the heart of stimulus plans to counter the coronavirus
crisis,” Mar. 2020.
[19] IRENA, “Renewable Power Generation Costs in 2019,” Jun. 2020.
[20] Bloomberg NEF, “Scale-up of Solar and Wind Puts Existing Coal, Gas at Risk,” Apr. 2020.
[21] IRENA, “Renewables Account for Almost Three Quarters of New Capacity in 2019,” Apr.
2020.
[22] Imperial College, “Energy Investing: Exploring Risk and Return in the Capital Markets,” 2020.
[23] F. Birol, “The energy sector is crucial for cutting global emissions. It’s time to step up to the
challenge,” Jan. 23, 2020.
[24] S. Tanigawa, “Biogas: Converting Waste to Energy,” Environmental and Energy Study
Institute, 2017. [Online]. Available: www. eesi.org
[25] NREL, “Energy Analysis, Biogas Potential in the U.S.”
[26] American Biogas Council and Water Environment Federation, “Biogas Market Snapshot.”
Biogas Opportunities Roadmap, 2018.
[27] W. Budzianowski, “Value-added carbon management technologies for low CO2 intensive
carbon-based energy vectors.” Energy Technology, 2012.
[28] P. L. McCarty, J. Bae, and J. Kim, “Domestic Wastewater Treatment as a Net Energy
Producer–Can This be Achieved?,” Environ. Sci. Technol., vol. 45, no. 17, pp. 7100–7106,
Sep. 2011, doi: 10.1021/es2014264.
[29] X. Hao, R. Liu, and X. Huang, “Evaluation of the potential for operating carbon neutral
WWTPs in China,” Water Res., vol. 87, pp. 424–431, Dec. 2015, doi:
10.1016/j.watres.2015.05.050.
[30] WERF (Water Environment Research Foundation), “WERF Energy Factsheet,” 2016.

154
[31] M. Gandiglio, A. Lanzini, A. Soto, P. Leone, and M. Santarelli, “Enhancing the Energy
Efficiency of Wastewater Treatment Plants through Co-digestion and Fuel Cell Systems,”
Front. Environ. Sci., vol. 5, p. 70, Oct. 2017, doi: 10.3389/fenvs.2017.00070.
[32] S. Longo et al., “Monitoring and diagnosis of energy consumption in wastewater treatment
plants. A state of the art and proposals for improvement,” Appl. Energy, vol. 179, no. October,
pp. 1251–1268, 2016, doi: 10.1016/j.apenergy.2016.07.043.
[33] U.S. ENVIRONMENTAL PROTECTION AGENCY, “Energy Efficiency in Water and
Wastewater facilities - A guide for developing and implementing greenhouse gas reduction
programs,” 2013.
[34] J. Daw, K. Hallett, J. Dewolfe, and I. Venner, “Energy Efficiency Strategies for Municipal
Wastewater Treatment Facilities,” 2012.
[35] C. Copeland, “Energy-Water Nexus: The Water Sector’s Energy Use,” 2014.
[36] X. Hao, R. Liu, and X. Huang, “Evaluation of the potential for operating carbon neutral
WWTPs in China,” Water Res., vol. 87, pp. 424–431, 2015, doi: 10.1016/j.watres.2015.05.050.
[37] WERF (Water Environment Research Foundation), “Sustainable Treatment: Best Practices
from the Strass im Zillertal Wastewater Treatment Plant,” 2010.
[38] F. Monaco, A. Lanzini, and M. Santarelli, “Making synthetic fuels for the road transportation
sector via solid oxide electrolysis and catalytic upgrade using recovered carbon dioxide and
residual biomass,” J. Clean Prod, vol. 170, pp. 163–173, 2018.
[39] M. Yugo and A. Soler, “A look into the role of e-fuels in the transport system in Europe (2030–
2050),” Concawe Rev., vol. 28, no. 1, Oct. 2019.
[40] D. Parigi, E. Giglio, A. Soto, and M. Santarelli, “Power-to-fuels through carbon dioxide Re-
Utilization and high-temperature electrolysis: A technical and economical comparison between
synthetic methanol and methane,” J. Clean. Prod., vol. 226, pp. 679–691, Jul. 2019, doi:
10.1016/j.jclepro.2019.04.087.
[41] SPIRE Project, “(Methanol fuel from CO2) - Synthesis of methanol from captured carbon
dioxide using surplus electricity.”
[42] S. Tian and J. Jiang, “Sequestration of Flue Gas CO2 by Direct Gas–Solid Carbonation of Air
Pollution Control System Residues,” Environ. Sci. Technol., vol. 46, no. 24, pp. 13545–13551,
Dec. 2012, doi: 10.1021/es303713a.
[43] W. Liu et al., “CO2 sequestration by direct gas–solid carbonation of fly ash with steam
addition,” J. Clean. Prod., vol. 178, pp. 98–107, Mar. 2018, doi:
10.1016/j.jclepro.2017.12.281.
[44] G. Costa, R. Baciocchi, A. Polettini, R. Pomi, C. D. Hills, and P. J. Carey, “Current status and
perspectives of accelerated carbonation processes on municipal waste combustion residues,”
Environ. Monit. Assess., vol. 135, no. 1–3, pp. 55–75, Nov. 2007, doi: 10.1007/s10661-007-
9704-4.
[45] M. H. El-Naas, M. El Gamal, S. Hameedi, and A.-M. O. Mohamed, “CO2 sequestration using
accelerated gas-solid carbonation of pre-treated EAF steel-making bag house dust,” J. Environ.
Manage., vol. 156, pp. 218–224, Jun. 2015, doi: 10.1016/j.jenvman.2015.03.040.
[46] C. Siriruang, P. Toochinda, P. Julnipitawong, and S. Tangtermsirikul, “CO2 capture using fly
ash from coal fired power plant and applications of CO2-captured fly ash as a mineral
admixture for concrete,” J. Environ. Manage., vol. 170, pp. 70–78, Apr. 2016, doi:
10.1016/j.jenvman.2016.01.010.
[47] A. Ben Ghacham, E. Cecchi, L.-C. Pasquier, J.-F. Blais, and G. Mercier, “CO2 sequestration
using waste concrete and anorthosite tailings by direct mineral carbonation in gas–solid–liquid
and gas–solid routes,” J. Environ. Manage., vol. 163, pp. 70–77, Nov. 2015, doi:
10.1016/j.jenvman.2015.08.005.
[48] J. Patricio, A. Angelis-Dimakis, A. Castillo-Castillo, Y. Kalmykova, and L. Rosado, “Region
prioritization for the development of carbon capture and utilization technologies,” J. CO2 Util.,
vol. 17, pp. 50–59, Jan. 2017, doi: 10.1016/j.jcou.2016.10.002.
[49] T. Dutzik, “How the Wisconsin Policy Research Institute Gets the Economics of Energy Policy
Wrong,” p. 11.
[50] “Green Branding – Cashing in on the Eco-Market.”
https://www.wipo.int/wipo_magazine/en/2009/02/article_0011.html (accessed Jun. 17, 2019).

155
[51] D. Sandalow, R. Aines, J. Friedmann, C. McCormick, and S. McCoy, “ISEF 2017-Carbon
Dioxide Utilization (CO2U) ICEF Roadmap 2.0. Draft October 2017,” LLNL-TR-739322,
1410036, Oct. 2017. doi: 10.2172/1410036.
[52] Asian Development Bank, “Decoding Article 6 of the Paris Agreement,” Asian Development
Bank, Manila, Philippines, May 2018. doi: 10.22617/TIM189218-2.
[53] “ICEF2016-CO2U_Roadmap.pdf.”
[54] S. Moazzem, M. G. Rasul, and M. M. K. Khan, “Energy recovery opportunities from mineral
carbonation process in coal fired power plant,” Appl. Therm. Eng., vol. 51, no. 1–2, pp. 281–
291, Mar. 2013, doi: 10.1016/j.applthermaleng.2012.09.021.
[55] C. Müller, “Use of cement in concrete according to European standard EN 206-1,” HBRC J.,
vol. 8, no. 1, pp. 1–7, Apr. 2012, doi: 10.1016/j.hbrcj.2012.08.001.
[56] D. I. Dairanieh, “A Roadmap for the Global Implementation of Carbon Utilization
Technologies,” p. 30.
[57] D. W. Keith, G. Holmes, D. St. Angelo, and K. Heidel, “A Process for Capturing CO2 from
the Atmosphere.” 2018.
[58] M. Bui et al., “Carbon capture and storage (CCS): the way forward,” Energy Environ. Sci., vol.
11, no. 5, pp. 1062–1176, 2018, doi: 10.1039/C7EE02342A.
[59] IEA, “Energy Technology Perspectives 2020.”
[60] B. Davidson, H. Loos, and O. R. De Coninck, “IPCC Special Report: Carbon Dioxide Capture
and Storage.” (Cambridge Univ. Press, 2005.
[61] UNECE, “TECHNOLOGY BRIEF CARBON CAPTURE, USE AND STORAGE (CCUS).”
2020.
[62] “Transforming Industry through CCUS,” p. 62.
[63] Secretary of Energy Advisor Board (SEAB), “Letter Report of Task Force on RD&D Strategy
for CO2Utilization and/or Negative Emissions atthe Gigatonne Scale,.” 2016.
[64] N. von der Assen and A. Bardow, “Life cycle assessment of polyols for polyurethane
production using CO2 as feedstock: insights from an industrial case study.” Green Chem.,
2014.
[65] C. Ampelli, S. Perathoner, and G. Centi, “CO2 utilization: an enabling element to move to a
resource- and energy-efficient chemical and fuel production.” Philos. Trans. R. Soc. Lond.,
2015.
[66] Wilhelm Kuckshinrichs and Forschungszentrum Jülich, “Carbon Capture and Utilization as an
Option for Climate Change Mitigation: Integrated Technology Assessment,” Springer, 2015,
[Online]. Available: https://doi.org/0.1007/9783319119434
[67] “2009-Carbon capture and storage technologies in the European power market.pdf.”
[68] R. Chauvy and G. De Weireld, “CO2Utilization technologiesin Europe: Ashortreview.” Energy
Technology, Sep. 2020.
[69] “20 Years of Carbon Capture and Storage - Accelerating Future Deployment,” Carbon
Capture, p. 115.
[70] J. Davison and K. Thambimuthu, “An overview of technologies and costs of carbon dioxide
capture in power generation,” Proc. Inst. Mech. Eng. Part J. Power Energy, vol. 223, no. 3,
pp. 201–212, May 2009, doi: 10.1243/09576509JPE625.
[71] X. Wang and C. Song, “Carbon Capture From Flue Gas and the Atmosphere: A Perspective.”
Frontiers, Dec. 2020.
[72] P. Bumb, R. Kumar, and P. Khakharia, “Demonstration of advanced APBS solvent at TNO’s
CO2 capture pilot plant.” Energy Procedia, May 2015.
[73] “ISEF Roadmap Final 2017.pdf.”
[74] U.S. Chamber of Commerce, “CO2 Enhanced Oil Recovery.” 2012.
[75] The National Academies of Sciences, Engineering, Medicine, “Gaseous CarbonWaste Streams
Utilization: Status and Research Needs.” TheNational Academies Press, 2019.
[76] P. Navarrete and F. Vega, “Energy Sources, Part A Recover.” Util. Environ. Eff., 2019.
[77] D. I. Dairanieh, “Carbon Dioxide Utilization (CO2U) – ICEF Roadmap 1.0- Tokyo, Japan.”
2016.
[78] H. Mikulčić et al., “Flexible Carbon Capture and Utilization technologies in future energy
systems and the utilization pathways of captured CO 2,” 2019, doi:
10.1016/j.rser.2019.109338.

156
[79] R. Viscardi, “Utilization of CO2.” ENEA, Nov. 2020.
[80] A. Rafiee, K. R. Khalilpour, and D. Milani, CO2 Conversion and Utilization Pathways.
Elsevier Inc., 2018. doi: 10.1016/b978-0-12-813306-4.00008-2.
[81] IEA, “World Energy Outlook 2019,” Nov. 2019.
[82] A. Azdarpour, M. Asadullah, E. Mohammadian, H. Hamidi, R. Junin, and M. A. Karaei, “A
review on carbon dioxide mineral carbonation through pH-swing process,” Chem. Eng. J., vol.
279, pp. 615–630, Nov. 2015, doi: 10.1016/j.cej.2015.05.064.
[83] C. Hepburn, E. Adlen, E. Caster, and S. Fuss, “The technological and economic prospects for
CO2 utilization and removal.” Perspective, Nov. 2019.
[84] L. Ji and H. Yu, “Carbon dioxide sequestration by direct mineralization of fly ash,” in Carbon
Dioxide Sequestration in Cementitious Construction Materials, Elsevier, 2018, pp. 13–37. doi:
10.1016/B978-0-08-102444-7.00002-2.
[85] M. Fernandezbertos, S. Simons, C. Hills, and P. Carey, “A review of accelerated carbonation
technology in the treatment of cement-based materials and sequestration of CO2,” J. Hazard.
Mater., vol. 112, no. 3, pp. 193–205, Aug. 2004, doi: 10.1016/j.jhazmat.2004.04.019.
[86] M. Kant, “Overcoming Barriers to Successfully Commercializing Carbon Dioxide Utilization,”
Front. Energy Res., vol. 5, p. 22, Sep. 2017, doi: 10.3389/fenrg.2017.00022.
[87] R. Turton, R. C. Bailie, W. B. Whiting, and J. A. Shaelwitz, Analysis, Synthesis, and Design
of Chemical Processes, 4th ed. Pearson Education International, 2013.
[88] Nationa Research Council, “Climate Intervention: Carbon Dioxide Removal and Reliable
Sequestration.” The National Academies Pres, 2015.
[89] Y. Yang, “Synergetic conversion of microalgae and CO2 into value-added chemicals under
hydrothermal conditions.” Green Chem., 2019.
[90] C. Ampelli, S. Perathoner, and G. Centi, “CO2 utilization: an enabling element to move to a
resource- and energy-efficient chemical and fuel production.” Philos. Trans. R. Soc. Lond.,
2015.
[91] A. Alvarez and A. Bansode, “Challenges in the greener production of formates/formic acid,
methanol, and DME by heterogeneously catalyzed CO2 hydrogenation processes.” Chemical
Review, 2017.
[92] S. Jadhay and D. Vaidya, “Catalytic carbon dioxide hydrogenation to methanol: A review of
recent studies.” Chemical Engineering Research and Design, 2014.
[93] I. Ganesh, “Conversion of carbon dioxide into methanol—a potential liquid fuel: Fundamental
challenges and opportunities (a review).” Renewable and Sustainable Energy Reviews, 2014.
[94] G. Olah, “Beyond Oil and Gas: The Methanol Economy,” Angew. Chem. Int. Ed., vol. 44, pp.
2636–2639, 2005.
[95] W. Wang, “CO2 hydrogenation to formate and methanol as an alternative to photo- and
electrochemical CO2 reduction.” Chemical Reviews, 2015.
[96] F. Studt, “Discovery of a Ni-Ga catalyst for carbon dioxide reduction to methanol.” Nature
Chemistry, 2014.
[97] O. Martin, “Indium oxide as a superior catalyst for methanol synthesis by CO2 hydrogenation.”
Angewandte Chemie International Edition, 2016.
[98] C. Constentin, “Catalysis of the electrochemical reduction of carbon dioxide.” Chemical
Society Reviews, 2013.
[99] Y. Vafaeian, M. Haghighi, and S. Aghamohammadi, “Ultrasound assisted dispersion of
different amount of Ni over ZSM-5 used as nanostructure catalyst for hydrogen production via
CO2 reforming methane,” Energy Convers. Manag., vol. 76, pp. 1093–1103, 2013.
[100] X. Su and B. Liang, “Catalytic carbon dioxide hydrogenation to methane: A review of recent
studies.” Journal of Energy Chemistry, 2016.
[101] S. M. Jarvis and S. Samsatli, “Technologies and infrastructures underpinning future CO2 value
chains: A comprehensive review and comparative analysis,” Renew. Sustain. Energy Rev., vol.
85, pp. 46–68, Apr. 2018, doi: 10.1016/j.rser.2018.01.007.
[102] J. Artz and A. Bardow, “Sustainable conversion of carbon dioxide: An integrated review
of catalysis and life cycle assessment.” Chemical Reviews, 2018.
[103] A. Sanna, M. Uibu, G. Caramanna, R. Kuusik, and M. M. Maroto-Valer, “A review of mineral
carbonation technologies to sequester CO 2,” Chem Soc Rev, vol. 43, p. 8049, 2014, doi:
10.1039/c4cs00035h.

157
[104] C. Hepburn et al., “The technological and economic prospects for CO2 utilization and
removal,” Nature, vol. 575, no. 7781. Nature Publishing Group, pp. 87–97, Nov. 07, 2019. doi:
10.1038/s41586-019-1681-6.
[105] E. Alper and O. Yuksel Orhan, “CO2 utilization: Developments in conversion processes,”
Petroleum, vol. 3, no. 1, pp. 109–126, Mar. 2017, doi: 10.1016/j.petlm.2016.11.003.
[106] T. Asano, F. L. Burton, and H. L. Leverenz, “WATER REUSE: ISSUES, TECHNOLOGIES,
AND APPLICATIONS,” Eng Sanit Ambient, p. 3, 2008.
[107] D. Allen, “Gaseous Carbon Waste Streams Utilization Status and Research Needs,” DOE-
BCST--7935, 1733359, Oct. 2018. doi: 10.2172/1733359.
[108] P. Basu, Biomass Gasification, Pyrolysis and Torrefaction, Third Edition., 3 vols. Science
Direct, 2018. [Online]. Available: https://doi.org/10.1016/B978-0-12-812992-0.00001-7
[109] X. Wang, J. Liu, N.-Q. Ren, H.-Q. Yu, D.-J. Lee, and X. Guo, “Assessment of Multiple
Sustainability Demands for Wastewater Treatment Alternatives: A Refined Evaluation Scheme
and Case Study,” Environ. Sci. Technol., vol. 46, no. 10, pp. 5542–5549, May 2012, doi:
10.1021/es300761x.
[110] N. Rahemi, M. Haghighi, A. Babaluo, F. Jafari, and P. Estifaee, “Synthesis and
Physicochemical characterization of Ni/Al2O3-ZrO2 manocatalyst prepared via impregnation
method and treated with non thermal plasma for CO2,” J. Ind. Eng. Chem., vol. 19, pp. 1566–
1576, 2013.
[111] A. Rafiee, K. Khalipour, and D. Milani, Polygeneration with Polystorage for Chemical and
Energy Hubs. Academic Press, 2019. [Online]. Available: https://doi.org/10.1016/B978-0-12-
813306-4.00008-2
[112] T. Monroy, L. Abella, S. Gallardo, and H. Hinode, “Catalytic Dry Reforming of Methane Using
Ni/MgO-ZrO2 Catalyst,” Elsevier, no. Advances in Gas Processing, pp. 145–152, Jan. 2010.
[113] S. Mehdi and N. Rahemi, “Dry Reforming of greenhouse gases CH4/CO2 over MgO-Promted
Ni-Co/Al2O3-ZrO2 nanocatalyst: effect of MgO additon via so-gel method on catalytic
properties and hydrogen yield,” J. Sol-Gel Sci. Technol., vol. 70, pp. 111–124, 2014.
[114] Q. Zhang, T. Zhang, Y. Shi, B. Zhao, and M. Wang, “A sintering and carbon-resistant Ni-SBA-
15 catalyst prepared by solid-state grinding method for dry reforming of methane,” Elsevier,
vol. 17, pp. 10–19, 2017.
[115] M. Soustelle, Modes with Rate‐determining Steps, vol. 1. Wiley Online Library, 2011.
[Online]. Available: https://doi.org/10.1002/9781118604243.ch8
[116] Z. Y. Zhang, W. P. Malachowski, R. L. Van Etten, and J. E. Dixon, “Nature of the rate-
determining steps of the reaction catalyzed by the Yersinia protein-tyrosine phosphatase.,” J.
Biol. Chem., vol. 269, no. 11, pp. 8140–8145, Mar. 1994, doi: 10.1016/S0021-9258(17)37171-
5.
[117] S. Kozuch and J. Martin, The Rate‐Determining Step is Dead. Long Live the Rate‐Determining
State!, vol. 12. European Chemical Societies Publishing, 2011.
[118] G. Mills, H. Jónsson, and G. K. Schenter, “Reversible work transition state theory: application
to dissociative adsorption of hydrogen,” Surf. Sci., vol. 324, no. 2–3, pp. 305–337, Feb. 1995,
doi: 10.1016/0039-6028(94)00731-4.
[119] S. Bocanegra, O. Scelza, and S. de MIGUEL, “MODIFICATION OF SELECTIVITY AND
CARBON DEPOSITION DURING THE INITIAL STAGES OF THE n-BUTANE
DEHYDROGENATION OVER MONO AND BIMETALLIC CATALYSTS,” p. 1.
[120] F. Niu, Z. Yan, B. T. Kusema, M. Bahri, O. Ersen, and V. V. Ordomsky, “Disassembly of
Supported Co and Ni Nanoparticles by Carbon Deposition for the Synthesis of Highly
Dispersed and Active Catalysts,” p. 16.
[121] H. Wu, V. La Parola, G. Pantaleo, F. Puleo, A. Venezia, and L. Liotta, “Ni-Based Catalysts for
Low Temperature Methane Steam Reforming: Recent Results on Ni-Au and Comparison with
Other Bi-Metallic Systems,” Catalysts, vol. 3, no. 2, pp. 563–583, Jun. 2013, doi:
10.3390/catal3020563.
[122] Y.-L. Du, X. Wu, Q. Cheng, Y.-L. Huang, and W. Huang, “Development of Ni-Based Catalysts
Derived from Hydrotalcite-Like Compounds Precursors for Synthesis Gas Production via
Methane or Ethanol Reforming,” Catalysts, vol. 7, no. 12, p. 70, Feb. 2017, doi:
10.3390/catal7020070.

158
[123] A. Haseloer et al., “Ni, Pd, and Pt complexes of a tetradentate dianionic thiosemicarbazone-
based O^N^N^S ligand,” Dalton Trans., vol. 50, no. 12, pp. 4311–4322, 2021, doi:
10.1039/D1DT00272D.
[124] “DIRECTIVE (EU) 2018/ 2001 OF THE EUROPEAN PARLIAMENT AND OF THE
COUNCIL - of 11 December 2018 - on the promotion of the use of energy from
renewable sources,” p. 128.
[125] B. Sreenivasulu, D. V. Gayatri, I. Sreedhar, and K. V. Raghavan, “‘A journey into the process
and engineering aspects of carbon capture technologies,’” Renew. Sustain. Energy Rev., vol.
41, pp. 1324–1350, Jan. 2015, doi: 10.1039/C7EE02342A.
[126] D. P. Vuuren, S. Deetman, J. van Vliet, M. van de Berg, B. J. van Ruijven, and B. Koelbl, “The
role of negative CO2 emissions for reaching 2 °C—insights from integrated assessment
modelling,” Clim. Change, vol. 118, no. 1, pp. 15–27, May 2013, doi: 10.1007/s10584-012-
0680-5.
[127] UNDP, “Final Report_Terminal Evaluation of the Increasing Access to Affordable Renewable
Energy Services Project.” Mar. 2020.
[128] “FCH JU report on socio-economic impact.pdf.”
[129] J. Pollex and A. Lenschow, “Surrendering to growth? The European Union’s goals for research
and technology in the Horizon 2020 framework,” J. Clean. Prod., 2016, doi:
10.1016/j.jclepro.2016.10.195.
[130] Interparliamentary Committee, “European Parliament - national Parliaments From COP Paris
to 2050 : a roadmap towards an innovative low-carbon , resource-efficient Europe,” vol. 2015,
no. December, pp. 1–9, 2015.
[131] G. Aerts, M. Dooms, and E. Haezendonck, “Knowledge transfers and project-based learning
in large scale infrastructure development projects: an exploratory and comparative ex-post
analysis,” Int. J. Proj. Manag., vol. 35, no. 3, pp. 224–240, 2016, doi:
10.1016/j.ijproman.2016.10.010.
[132] E. Baker, V. Bosetti, L. D. Anadon, M. Henrion, and L. Aleluia Reis, “Future costs of key low-
carbon energy technologies: Harmonization and aggregation of energy technology expert
elicitation data,” Energy Policy, vol. 80, pp. 219–232, 2015, doi: 10.1016/j.enpol.2014.10.008.
[133] “Annual Energy Outlook 2021,” presented at the Annual Energy Outlook 2021, Feb. 2021.
[Online]. Available: https://www.eia.gov/outlooks/aeo/
[134] EIA, “EIA projects renewables share of U.S. electricity generation mix will double by 2050.”
Feb. 08, 2021. [Online]. Available: https://www.eia.gov/todayinenergy/detail.php?id=46676
[135] National Fuel and Research Center, “Build-Up of Distributed Fuel Cell Value In California :
2011 Update Background and Methodology,” 2011.
[136] FCH2JU, “FUEL CELLS and HYDROGEN 2 JOINT UNDERTAKING Annual Work Plan,”
no. 559, 2016.
[137] G. Ple??mann and P. Blechinger, “How to meet EU GHG emission reduction targets? A model
based??decarbonization pathway for Europe’s electricity supply system??until 2050,” Energy
Strategy Rev., vol. 15, pp. 19–32, 2017, doi: 10.1016/j.esr.2016.11.003.
[138] FCHEA, “FCHEA: Hydrogen and Fuel Cell Economy Could Support Millions of Jobs by
2050,” Apr. 14, 2021. [Online]. Available: https://hydrogen-central.com/fchea-hydrogen-fuel-
cell-economy-jobs-2050/
[139] V. G. Gude, “Wastewater treatment in microbial fuel cells - An overview,” J. Clean. Prod.,
vol. 122, pp. 287–307, 2016, doi: 10.1016/j.jclepro.2016.02.022.
[140] B. Wett, K. Buchauer, and C. Fimml, “Energy self-sufficiency as a feasible concept for
wastewater treatment systems,” Proc. IWA Lead. Edge Technol. Conf. Singap., pp. 21–24,
2007.
[141] “Analysis of waste treatment sector as a driver for SOFC cost reduction and
commercialization.docx.”
[142] “Advance Utilization and Management of Biogas-V2.docx.”
[143] Y. Shen, J. L. Linville, M. Urgun-Demirtas, M. M. Mintz, and S. W. Snyder, “An overview of
biogas production and utilization at full-scale wastewater treatment plants (WWTPs) in the
United States: Challenges and opportunities towards energy-neutral WWTPs,” Renew. Sustain.
Energy Rev., vol. 50, pp. 346–362, Oct. 2015, doi: 10.1016/j.rser.2015.04.129.

159
[144] G. Chan and L. D. Anadon, “A new method for supporting public decision making on R & D :
An example in energy,” pp. 1–30.
[145] K. Hayashi, M. Yokoo, and Y. Yoshida, “Solid Oxide Fuel Cell Stack with High Electrical
Efficiency,” NTT Tech. Rev., pp. 243–249, 2013.
[146] ISO and International Standards Organization, EN ISO 14044:2006 - Environmental
Management: Life Cycle Assessment; Requirements and Guidelines. 2006, p. 46. doi:
10.1136/bmj.332.7550.1107.
[147] Eastern Research Group Inc. et al., “Opportunities for Combined Heat and Power at
Wastewater Treatment Facilities : Market Analysis and Lessons from the Field Combined Heat
and Power Partnership,” US EPA CHP Partnersh., no. October, p. 57, 2011.
[148] DOE, “WastewaterTreatment Data Guide_Final_0118,” no. DOE/EE-1700, p. 35, Dec. 2017.
[149] “DEMOSOFC project official website,” 2016. www.demosofc.eu (accessed Dec. 20, 2015).
[150] G. Tchobanoglous, H. Leverenz, and P. Gikas, “IMPACTS OF NEW CONCEPTS AND
TECHNOLOGY ON THE ENERGY SUSTAINABILITY OF WASTEWATER
MANAGEMENT,” in Climate Change, Sustainable Development, and Renewable Energy
Sources, 2009, no. October 15-17.
[151] M. Gandiglio, D. Drago, and M. Santarelli, “Techno-economic Analysis of a Solid Oxide Fuel
Cell Installation in a Biogas Plant Fed by Agricultural Residues and Comparison with
Alternative Biogas Exploitation Paths,” Energy Procedia, vol. 101, no. September, pp. 1002–
1009, 2016, doi: 10.1016/j.egypro.2016.11.127.
[152] European Environment Agency, “Urban Waste Water Treatment maps,” 2015.
http://www.eea.europa.eu/data-and-maps/uwwtd/interactive-maps/urban-waste-water-
treatment-maps-1 (accessed Jan. 12, 2017).
[153] PNNL and DOE, “Biofuels and Bioproducts from Wet and Gaseous Waste Streams:
Challenges and Opportunities.” Sep. 2017.
[154] Bioenergy Technologis Office & Renewable Energy, “Bioproduct Production.” BETO U.S.,
2017.
[155] US EPA, “Inventory of U.S. Greenhouse Gas Emissions and Sinks: 1990-2014.” Apr. 15, 2016.
[156] E. Grande and A. Peschke, “Transnational cooperation and policy networks in European
science policy-making,” Res. Policy, vol. 28, no. 1, pp. 43–61, 1999, doi: 10.1016/S0048-
7333(98)00099-7.
[157] K. Ericsson and Lunds universitet, Biogenic carbon dioxide as feedstock for production of
chemicals and fuels: A techno-economic assessment with a European perspective. Lund: Miljö-
och energisystem, LTH, Lunds universitet, 2017.
[158] “California’s Renewables Portfolio Standard (RPS) Program (2016),” p. 4.
[159] “SMAT, Società Metropolitana Acque Torino S.p.A., Turin, IT.” http://www.smatorino.it/
[160] P. Jenicek, J. Bartacek, J. Kutil, J. Zabranska, and M. Dohanyos, “Potentials and limits of
anaerobic digestion of sewage sludge: Energy self-sufficient municipal wastewater treatment
plant?,” Water Sci. Technol., vol. 66, no. 6, p. 1277, Jul. 2012, doi: 10.2166/wst.2012.317.
[161] “Enerwater EU project official website.” http://www.enerwater.eu
[162] Convion Fuel Cell Systems, “Convion product focus,” 2016. http://convion.fi/
[163] Argonne National Laboratory, “Gas Clean-Up for Fuel Cell Application Workshop,” pp. 1–32,
2014.
[164] “EUROSTAT Energy price statistics.”
[165] Roland Berger Strategy Consultants, Advancing Europe’s energy systems: Stationary fuel cells
in distributed generation. A study for the Fuel Cells and Hydrogen Joint Undertakinng. 2015.
doi: 10.2843/088142.
[166] Fuel Cells and Hydrogen Joint Undertaking (Fuel Cells and Hydrogen Joint Undertaking JU).
and Roland Berger Strategy Consultants., Advancing Europe’s energy systems :stationary fuel
cells in distributed generation : a study for the Fuel Cells and Hydrogen Joint Undertaking.
LU: Publications Office, 2015. Accessed: Mar. 29, 2021. [Online]. Available:
https://data.europa.eu/doi/10.2843/088142
[167] European Parliament. Directorate General for Parliamentary Research Services., Tecnalia., and
Institute of Studies for the Integration of Systems (ISIS)., Methanol :a future transport fuel
based on hydrogen and carbon dioxide? : economic viability and policy options. LU:

160
Publications Office, 2014. Accessed: Apr. 11, 2021. [Online]. Available:
https://data.europa.eu/doi/10.2861/57305
[168] D. Schlereth, “Kinetic and Reactor Modeling for the Methanation of Carbon Dioxide,” 2015.
[169] C. Graves, “ustainable hydrocarbon fuels by recycling CO2 and H2O with renewable or nuclear
energy,” Renew. Sustain. Energy Rev., 2010.
[170] P. Markewitz et al., “Worldwide innovations in the development of carbon capture
technologies and the utilization of CO2,” Energy Environ. Sci., vol. 5, no. 6, p. 7281, 2012,
doi: 10.1039/c2ee03403d.
[171] Pettinau, A., Ferrara, F., Tola, V., Cau, G., “Techno-economic comparison between different
technologies for CO2-free power generation from coal.,” 2017, [Online]. Available:
https://doi.org/10.1016/j.apenergy.2017.02.056
[172] C. P. Andrea Bassani, “Acid Gas to Syngas (AG2STM) technology applied to solid fuel
gasification: Cutting H2S and CO2 emissions by improving syngas production,” Elsevier, vol.
184, pp. 1284–1291, Dec. 2016.
[173] IEA, “Natural Gas Information 2018: Overview.” IEA, Jul. 27, 2018. [Online]. Available:
https://webstore.iea.org/natural-gas-information-2018-overview
[174] G. Bozzano and F. Manenti, “Efficient methanol synthesis: Perspectives, technologies and
optimization strategies,” Prog. Energy Combust. Sci., vol. 56, pp. 71–105, 2016.
[175] M. Luu, D. Milani, and A. Abbas, “Analysis of CO2 utilization for methanol synthesis
integrated with enhanced gas recovery,” J. Clean. Prod., vol. 112, pp. 3540–3554, 2016.
[176] R. O. dos Santos and L. de Sousa Santos, “Simulation and optimization of a methanol synthesis
process from different biogas sources,” J. Clean Prod, vol. 186, pp. 821–830, 2018.
[177] M. Goor, S. Menkin, and E. Peled, “High power direct methanol fuel cell for mobility and
portable applications,” Int. J. Hydrog. Energy, vol. 44, pp. 3130–3143, 2019.
[178] B. C. Ong, S. K. Kamarudin, and S. Basri, “Direct Liquid Fuel Cells: A review,” Int. J. Hydrog.
Energy, vol. 42, pp. 10142–10157, 2017.
[179] L. Barelli, G. Bidini, F. Gallorini, and M. Poniz, “SOFC stack coupled with dry reforming,”
Appl. Energy, vol. 192, pp. 498–507, 2017.
[180] A. Chitsaz, M. Sadeghi, and E. Ghanbarloo, “Exergoenvironmental comparison of internal
reforming against external reforming in a cogeneration system based on solid oxide fuel cell
using an evolutionary algorithm,” Energy Technol., vol. 144, pp. 420–431, 2018.
[181] E. Giglio et al., “Power-to-Gas through High Temperature Electrolysis and Carbon Dioxide
Methanation: Reactor Design and Process Modeling.,” Ind Eng Chem Res, vol. 57, pp. 4007–
4018, 2018.
[182] A. Varone and M. Ferrari, “Power to liquid and power to gas: An option for the German
Energiewende,” Renew. Sustain. Energy Rev., vol. 45, pp. 207–218, 2015.
[183] X. L. Yan and R. Hino, Nuclear Hydrogen Production Handbook. Taylor & Francis Group.,
2011.
[184] E. Giglio, A. Lanzini, M. Santarelli, and P. Leone, “Synthetic natural gas via integrated high-
temperature electrolysis and methanation : Part I - energy performance,” J. Energy Storage,
vol. 1, pp. 22–37, 2015a.
[185] V. Uusitalo, S. Vaisanen, E. Inkeri, and E. Soukka, “Potential for greenhouse gas emission
reductions using surplus electricity in hydrogen, methane, and methanol production via
electrolysis,” Energy Convers. Manag., vol. 134, pp. 125–134, 2017.
[186] E. S. Van-Dal and C. Bouallou, “Design and simulation of methanol production plant from
CO2 hydrogenation,” J. Clean Prod., vol. 57, pp. 38–45, 2013.
[187] S. Abates, K. Barbera, E. Giglio, F. Deorsola, and R. Pirone, “Synthesis, Charactization, and
Activity Pattern of Ni-Al Hydrotalcite Catalysts in CO2 Methanation,” Ind Eng Chem Res, vol.
55, pp. 8299–8308, 2016a.
[188] Electrochaea, “Electrochaea,” Online. [Online]. Available: http://www.electrochaea.com/
[189] M. Gotz et al., “Renewable Power-to-Gas: A technological and economic review,” Renew.
Energy, vol. 85, pp. 1371–1390, 2016.
[190] Enea Consulting, “The potential of Power-to-gas: Technology review and economic potential
assessment.” 2016.
[191] A. Betucco, Synthetic Natural Gas (SNG) from coal and biomass: a survey of existing process
technologies, open issues and perspectives. University of Padova: DIPIC, 2010.

161
[192] K. M. VandenBussche and G. F. Froment, “A Steady-State Kinetic Model for Methanol
Synthesis and the Water Gas Shift Reaction on a Commercial Cu/ZnO/Al2O3 Catalyst,” J.
Catal., vol. 161, pp. 1–10, 1996.
[193] Online, “‘Askja Energy.’”, [Online]. Available: https://askjaenergy.com/
[194] F. Koschany, “On the kinetics of the methanation of carbon dioxide oncoprecipitated
NiAl(O)xFranz,” Appl. Catal. B Environ., 2015.
[195] J. O. Maloney, Perry’s Chemical Engineer’s Handbook, 8th ed. McGraw-Hill, 2008.
[196] D. Mignard, “Methanol synthesis from flue-gas CO2 and renewable electricity: a feasibility
study,” Int. J. Hydrog. Energy, 2003.
[197] I. C. Kemp, “Pinch Analysis and Process Integration: A User Guide on Process Integration for
the Efficient Use of Energy,” Elsevier, 2007.
[198] R. Turton, “Analysis, Synthesis and Design of Chemical Processes.” Pearson Education, 2008.
[199] K. J. Bell, “Estimate S&T exchanger design,” J. Oil Gas, pp. 59–68, 1978.
[200] M. Perez-Fortes, J. C. Schoneberg, A. Boulamanti, and E. Tzimas, “Methanol synthesis using
captured CO2 as raw material: Techno-economic and environmental assesment.,” Appl.
Energy, vol. 161, pp. 718–732, 2016.
[201] O. Schmidt, “Future cost and performance of water electrolysis: An expert elicitation study,”
Int. J. Hydrog. Energy, 2017.
[202] Global CCS Institute, “Accelerating the Uptake of CCS: Industrial use of Captured Carbon
Dioxide,” 2011.
[203] M. Gassner, “Thermo-economic optimisation of the integration of electrolysis in synthetic
natural gas production from wood,” Energy J., 2007.
[204] IEA, “IEA G20 Hydrogen report: Assumptions.”
[205] A. Ćwik, I. Casanova, K. Rausis, N. Koukouzas, and K. Zarębska, “Carbonation of high-
calcium fly ashes and its potential for carbon dioxide removal in coal fired power plants,” J.
Clean. Prod., vol. 202, pp. 1026–1034, Nov. 2018, doi: 10.1016/j.jclepro.2018.08.234.
[206] Z. Wei et al., “Clinkering-free cementation by fly ash carbonation,” J. CO2 Util., vol. 23, pp.
117–127, Jan. 2018, doi: 10.1016/j.jcou.2017.11.005.
[207] T. Adams, “Fly Ash Use in Concrete IncreasesSlightlyAs Overall Coal Ash Recycling Rate
Declines.” ACAA, Dec. 2020.
[208] ACAA, “Beneficial use of coal combustion products.” ACAA, 2019.
[209] W. Liu et al., “CO 2 sequestration by direct gas–solid carbonation of fly ash with steam
addition.” J. Clean. Prod., 2018.
[210] A. Uliasz-Bochenczyk, “Waste used for CO2 bonding via mineral carbonation.” Miner.
Resour. Manag., 2007.
[211] K. S. Lackner, C. Wendt, and D. P. Butt, “Carbon dioxide disposal in carbonate mineral.”
Energy Technology, 1995.
[212] IEA, “Cement technology roadmap plots path to cutting CO2 emissions 24% by 2050.” Apr.
2018.
[213] J. Papayianni, “Use of a high-calcium fly ash in blended type cement production.” Cem. Concr.
Compos., 1993.
[214] S.-L. Pei, S.-Y. Pan, X. Gao, Y.-K. Fang, and P.-C. Chiang, “Efficacy of carbonated petroleum
coke fly ash as supplementary cementitious materials in cement mortars,” J. Clean. Prod., vol.
180, pp. 689–697, Apr. 2018, doi: 10.1016/j.jclepro.2018.01.055.
[215] D. Y. C. Leung, G. Caramanna, and M. M. Maroto-Valer, “An overview of current status of
carbon dioxide captureand storage technologies.” Renewable and Sustainable Energy Reviews,
2014.
[216] J. M. Matter and P. B. Kelemen, “Permanent storage of carbon dioxide in geological
reservoirs by mineralcarbonation.” Nat Geosci., 2009.
[217] G. Murithi, L. Petrik, O. Fatoba, and W. Gitari, “Comparison of CO2 capture by ex-situ
accelerated carbonation and in-situ naturally weathered coal fly ash.” Journal of Environmental
Management, 2012.
[218] S. Elenova, S. Teir, J. Salminen, and C. J. Fogelholm, “Fixation of CO2 by Carbonating
Calcium Derived from Blast Furnace Slag.” Energy Technology, 2008.

162
[219] R. Baciocchi, G. Costa, and R. Pomi, “The Effects of Accelerated Carbonation on CO2
Uptake and Metal Release from Incineration APC Residues.” Incineration APC Residues,
Waste Management, 2009.
[220] F. Doucet, “Scoping Study on CO2 Mineralization Technologies.” Council of Geoscience,
2011.
[221] J. S. Cho, S. M. Kim, H. D. Chun, G. W. Han, and C. H. Lee, “Carbon Dioxide Capture with
Accelerated Carbonation of Industrial Combustion Waste,” Int. J. Chem. Eng. Appl., pp. 60–
65, 2011, doi: 10.7763/IJCEA.2011.V2.76.
[222] S.-Y. Pan and P.-C. Chiang, “CO2 Capture by Accelerated Carbonation of Alkaline Wastes: A
Review on Its Principles and Applications.” Aerosol and Air Quality Research, 2012.
[223] G. Costa, “Accelerated Carbonation of Minerals and Industrial Residues for Carbon Dioxide
Storage.” Università Degli Studi Di Roma, 2009.
[224] D. N. Huntzinger, J. S. Gierke, and L. L. Sutter, “Mineral Carbonation for Carbon
Sequestration in Cement Kiln Dust from Waste Piles.” Hazard. Mater., 2009.
[225] M. Ibrahim, A. Benamor, and S. Al-Sobhi, “Carbon Mineralization by Reaction withSteel-
Making Waste: A Review.” MDPI, Feb. 2019.
[226] J. C. Abanades et al., “This summary, approved in detail at the Eighth Session of IPCC
Working Group III (Montreal, Canada, 22-24 September 2005), represents the formally agreed
statement of the IPCC concerning current understanding of carbon dioxide capture and
storage.,” p. 16.
[227] W. J. J. Huijgen and R. N. J. Comans, “Carbon dioxide sequestration by mineral carbonation,”
p. 52.
[228] S. L. Phillips, F. V. Hale, L. F. Silvester, and M. D. Siegel, “Thermodynamic tables for nuclear
waste isolation (No. LBL--22860).” Lawrence Berkely Lab., 1988.
[229] K. S. Lackner, “A Guide to CO2 Sequestration.” Science Direct, 2003.
[230] A. A. Olajire, “A review of mineral carbonation technology in sequestration of CO2,” J. Pet.
Sci. Eng., vol. 109, pp. 364–392, Sep. 2013, doi: 10.1016/j.petrol.2013.03.013.
[231] V. Rangel-Hernandez, C. Damian-Ascencio, J. Belman-Flores, and A. Zaleta-Aguilar,
“Assessing the Exergy Costs of a 332-MW Pulverized Coal-Fired Boiler,” Entropy, vol. 18,
no. 8, p. 300, Aug. 2016, doi: 10.3390/e18080300.
[232] M. Azadi, M. Edraki, and F. Farhang, “Opportunities for Mineral Carbonation in Australia’s
Mining Industry.” MDPI-Sustainability, Feb. 2019.
[233] R. Viscardi, “Utilization of CO2.” Nov. 2020.
[234] M. Mazzotti, “Mineral carbonation and industrial uses of CO2.” IPCC Special Report on CCS.
[235] G. Gadikota, C. Natali, C. Boschi, and A. Park, “Morphological changes during enhanced
carbonation of asbestos containing material and its comparison to magnesium silicate
minerals.” J. Hazard. Mater., 2013.
[236] G. Gadikota, S. H. Jang, and A. Park, “Carbonation of silicate minerals and industrial wastes
and their potential use as sustainable construction materials.” ACS Symposium Series,
American Chemical Society, 2015.
[237] N. Stern and A. Benjamin, “Climate change is a result of the greatest market failure the world
has seen.” The Guardian, 2007.
[238] E. Alper and Y. Orhan, “CO2 utilization: Developments in conversion processes, Petroleum.”
2017.
[239] DOE, “Mission Innovation. Accelerating the Clean Energy Revolution.” Report of the Carbon
Capture, Utilization and Storage Experts’ Workshop, Sep. 2017.
[240] “Carbon8.” Carbon8 (web page), 2019. [Online]. Available: www.c8s.co.uk
[241] DOE, “ACAA 2006 fall meeting. United States.” 2006.
[242] S. Tian and J. Jiang, “Sequestration of Flue Gas CO 2 by Direct Gas–Solid Carbonation of Air
Pollution Control System Residues,” Environ. Sci. Technol., vol. 46, no. 24, pp. 13545–13551,
Dec. 2012, doi: 10.1021/es303713a.
[243] M. R. Senapati, “Fly ash from thermal power plants – waste management and overview.”
Current Science- India, Jun. 2011.
[244] ACI Committee 232, “Use of Fly Ash in Concrete- ACI 232.2R-03.”
[245] E. E. Chang, C. H. Chen, Y. H. Chen, and S. Y. Pan, “Performance Evaluation for
Carbonation of Steel-Making Slags in a Slurry Reactor.” J. Hazard. Mater., 2011.

163
[246] T. A. Haug, R. A. Kleiv, and I. A. Munz, “Investigating Dissolution of Mechanically
Activated Olivine for Carbonation Purposes.” Appl. Geochem., 2010.
[247] ASTM, “Standard Specification for Coal Fly Ash and Raw or Calcined Natural Pozzolan
for Use in Concrete- ASTM C618-08.”
[248] M. Fernandezbertos, S. Simons, C. Hills, and P. Carey, “A review of accelerated carbonation
technology in the treatment of cement-based materials and sequestration of CO2,” J. Hazard.
Mater., vol. 112, no. 3, pp. 193–205, Aug. 2004, doi: 10.1016/j.jhazmat.2004.04.019.
[249] ASTM, “Standard Specification for Coal Fly Ash and Raw or Calcined Natural Pozzolan for
Use in Concrete- ASTM C618.”
[250] L. Ellis, A. Badel, M. Chiang, and R. Park, “Toward electrochemical synthesis of cement—An
electrolyzer-based process for decarbonating CaCO3 while producing useful gas streams.”
PNAS, Aug. 2019.
[251] EU Commission, “Emissions cap and allowances.” 2020.
[252] A. Mazzella, M. Errico, and D. Spiga, “CHEMICAL CHARACTERIZATION AND
ECONOMIC EVALUATION OF THE COAL FLY ASH PRE-WASHING AND
CARBONATION PROCESS,” p. 13, 2019.
[253] L. Bulíková and F. Kreste, “Comparison of mechanical properties of clays treated by siliceous
and calcareous fly ash.” Cement Wapno Beton, 2019. [Online]. Available:
https://dspace.vsb.cz/bitstream/handle/10084/138448/1425-8129-
2019v24i3p167.pdf?sequence=1
[254] P. Miera, J. Golaszewski, and Z. Giergiczny, “Influence of Amount of Calcareous Fly Ash on
Heat of Hydration of Portland Cement. In IOP Conference Series: Materials Science and
Engineering (Vol. 603, No. 4, p. 042081).” IOP Publishing, 2019.
[255] M. Marceau, J. Gajada, and M. RanGeem, “Use of Fly Ash in Concrete: Normal and High
Volume Ranges.” Portland Cement Association, 2002.
[256] M. Thomas, “Optimizing the use of fly ash in concrete,” Portland Cem. Assoc., 2007.
[257] V. M. Malhotra and P. K. Metha, “High-Performance High-V olume Fly Ash Concrete:
Materials, Mixture Proportioning, Properties, Construction practice, and Case Histories.” Jan.
2005.
[258] “ASTM Standard C618: 2012, Standard Specification for Coal Fly Ash and Raw or Calcined
Natural Pozzolan for Use in Concrete.” ASTM International, 2013.
[259] C. materials and building European Standards, “European Standards BS EN 450-1:2012, Fly
ash for concrete Definition, specifications and conformity criteria.” Aug. 2012.
[260] N. Bhanumathidas and N. Kalidas, “Fly ash: The resource for construction industry.” Indian
Concrete Journal, Apr. 2003.
[261] M. Senapati and J. Banerjee, “Advances in particulate emissions control.” Institution of
Engineers (India), Nov. 1999.
[262] S. Bremseth, “Fly ash in concrete A literature study of the advantages and disadvantages.”
SINTEF Building and Infrastructure, 2010.
[263] Japans Environmental Agency, “Essay of metals and other contaminants in industrial wastes-
Notification No. 13.” 1973.
[264] M. Ahmaruzzaman, “A review on the utilization of fly ash.” Progress in energy and combustion
science, Dec. 2009.
[265] C. Argiz, E. Menendez, and A. Moragues, “Fly ash characteristics of Spanish coal-fired power
plants.” Instituto de Ciencias de la Construcción Eduardo Torroja (CSIC), Mar. 2016.
[266] European Standard, “BS EN 197-1:2011.” 2011.
[267] Fortune Business Insight, “Fly Ash Application Analysis.” 2019.
[268] M. Gray, “Earth to investors: Paris Agreement requires one coal unit to close every day until
2040.” Carbon Tracker, May 2018.
[269] D. Y. C. Leung, G. Caramanna, and M. M. Maroto-Valer, “An overview of current status of
carbon dioxide capture and storage technologies,” Renew. Sustain. Energy Rev., vol. 39, pp.
426–443, Nov. 2014, doi: 10.1016/j.rser.2014.07.093.
[270] W. Cole, W. Frazier, P. Donohoo-Vallett, T. Mai, and P. Das, “2018 Standard Scenarios
Report: A U.S. Electricity Sector Outlook,” Renew. Energy, p. 72, 2018.
[271] Endcoal, “Boom and Bust 2020.” 2020.

164
[272] S. Evans, “Seven charts show why the IEA thinks coal investment has already peaked.”
CarbonBrief, Jul. 2017.
[273] Powering Past Coal Alliance, “Powering Past Coal Alliance: Declaration.” 2016.
[274] J. Wettengel, “Spelling out the coal exit – Germany’s phase-out plan.” Clean Energy Wire, Jul.
2020.
[275] World Coal Association, “Discover coal’s contribution to societies and economies across the
globe.” 2020.
[276] “Analysis: IEA cuts coal growth outlook in half as China peaks.” IEA, Nov. 2016.
[277] Institute for Energy Research, “U.S. Coal-Fired Power Plants Continue to Retire.” Feb. 2020.
[278] IEA, “CO2 emissions 2021,” Glob. Energy Rev. 2021, p. 55, 2021.
[279] NOAA, “Despite pandemic shutdowns, carbon dioxide and methane surged in 2020.” NOAA
Research News, Apr. 2021.
[280] “Global Energy Review 2020,” p. 55, 2020.
[281] M. Standaert, “Despite Pledges to Cut Emissions, China Goes on a Coal Spree.” Yale
Environment 360, Mar. 2021.
[282] CarbonBrief, “IEA: World can reach ‘net zero’ emissions by 2060 to meet Paris climate goals.”
Jun. 2017.
[283] H. J. Feuerborn, “Coal Combustion in Europe- an update on Production and Utilization,
Standarization and Regulation.” May 2011.
[284] “Poland’s coal-phaseout plans: Fact or fiction?” D.W. Business, 2019.
[285] “Poland’s ruling PiS party wins most votes: partial results.” D.W. Business, 2019.
[286] H. J. Feuerborn, “Coal ash utilisation over the world and in Europe.” Workshop on
Environmental and Health Aspects of Coal Ash Utilization, 2005.
[287] R. C. Joshi and R. P. Lohia, “Fly ash in concrete -production, properties and uses.” Gordon
and BreachScience Publishers, 1997.
[288] D. Mishra and J. Yu, “Green Concrete under Normal and Heat Curing with Fly Ash from China
and India.” The 13th International Conference on Waste Management and Technology
(ICWMT 13), Mar. 2018.
[289] ECOBA, “European Coal Combustion Products- Annual Report.” 2005.
[290] O. US EPA, “Global Greenhouse Gas Emissions Data,” US EPA, Jan. 12, 2016.
https://www.epa.gov/ghgemissions/global-greenhouse-gas-emissions-data (accessed Apr. 16,
2021).
[291] R. C. Joshi, “Fly Ash – Production, Variability and Possible Complete Utilization.” Indian
Geotechnical Conference, 2010.
[292] ACAA, “BENEFICIAL USE OF COAL COMBUSTION PRODUCTS- AN AMERICAN
RECYCLING SUCCESS STORY.” 2018.
[293] ACAA, “CCPS: not jus for concrete. Coal Ash Makes the Grade in Highway Construction.”
ACAA, 2019.
[294] Uniash, “An economical move towards Green Power.” ISO, GAB, ICAB.
[295] The Aerospace Corporation-Office of Corporate Planning, “Final Report Technical and
Economic Factors Associated with Fly Ash Utilization.” Jul. 1971.
[296] ZE Power Group Inc., “2021 brings big changes to the carbon market landscape.” Jan. 2021.
[297] K. Ohenoja, V. Wigren, and M. Illikainen, “Applicability of Fly Ash from Fluidized Bed
Combustion of Peat, Wood, or Wastes to Concrete.” Waste and Biomass Valorization, 2019.
[298] K. Szczygielsky, “TEFRA® Project – the usage of the anthropogenic minerals as CO2
emission reduction materials,.” World of Coal Ash, 2017.
[299] P. Suraneni, L. Burris, and C. Shearer, “ASTM C618 Fly Ash Specification: Comparison with
Other Specifications, Shortcomings, and Solutions.” American Concrete Institute- Materials
Journal, Jan. 2021.
[300] K. Jinyoung, T. Kazi, and N. Boo Hyun, “Material Characterization of Municipal Solid Waste
Incinerator (MSWI) Ash As Road Construction Material.” American Society of Civil
Engineers, 2014.
[301] R. Kelly, “Parallels and Nonconformities in worldwide fly ash classification: the need for a
robust universal classiication system for fly ash.” World of Coal Ash (WOCA), 2015.
[302] J. Papayianni, S. Tsimas, and A. Moutsatsou, “Standardization aspects concerning High
Calcium Fly Ashes.” World of Coal Ash (WOCA), 2009.

165
[303] M. Marks, M. A. Glinicki, and K. Gibas, “Prediction of the Chloride Resistance of
ConcreteModified with High Calcium Fly Ash UsingMachine Learning.” MDPI- Materials,
2015.
[304] T. Naik, S. Singh, and M. Hossain, “Properties of high performance concrete systems
incorporating largeamounts of high-lime fly ash.” High-calcium fly ash.Cem. Concr. Res.,
2000.
[305] Transparency Market Research, “Chemicals & Materials- Market Research Report.” 2021.
[306] M. Ahmaruzzaman, “A review on the utilization of fly ash,” Prog. Energy Combust. Sci., vol.
36, no. 3, pp. 327–363, Jun. 2010.
[307] EIA, “Coal Explained. Coal prices and outlook.” 2021.
[308] ecoba, “Production and Utilization of CCPs in 2016 in Europe (EU 15) [kilo tonnes (metric)].”
2016.
[309] LafargeHolcium- US, “Tackling the Fly Ash Supply Issue.” Materials- The Perform.
[310] I. Papayianni, S. Tsimas, and A. Moutsatsou, “Standardization aspects concerning high
calcium fly ashes,” 3rd World Coal Ash WOCA Conf. 4-7th May Lexingt. USA Proc., 2009.
[311] EN 197-1:2011, “Cement. Part 1: Composition, specifications and conformity criteria for
common cement.” 2011.
[312] EN and 450-1:2013, “UNE-EN 450-1:2013. Fly ash for concrete - Part 1: Definition,
specifications and conformity criteria.” 2012.
[313] C. Heidrich, H. Feuerborn, and A. Weir, “Coal Combustion Products : a Global Perspective,”
World Coal Ash Conf. 22-25th April Lexingt. USA, 2013.
[314] World Business Council for Sustainable Development, “The Cement Sustainability Initiative.”
2009. [Online]. Available: https://www.wbcsd.org/Sector-Projects/Cement-Sustainability-
Initiative
[315] USGS, “Mineral commodity summaries 2017: U.S. Geological Survey.” 2017. [Online].
Available: https://doi.org/10.3133/70180197
[316] P. Villere, “Industry Data Survey.The Concrete Producer.” 2015. [Online]. Available:
https://www.concreteconstruction. net/producers/2015-industry-data-survey
[317] USGS, “Mineral Commodity Summaries 2018. Reston, VA: U.S. Geological Survey.” 2018.
[318] NRMCA, “Surveys & Benchmarking.” [Online]. Available: https://www.nrmca.org
[319] PCI, “How Precast Builds.” [Online]. Available: https://www.pci.org/
[320] Portland Cement Association, “U.S. Portland Cement Industry: Plant Information Summary.”
2013.
[321] J. Hackett, “Investing in Carbon Capture Strategies.” Capital Markets- Sustainable Finance,
Nov. 2020.
[322] EnviroLab and NewClimate Institute., “Accelerating Net Zero: Exploring Cities, Regions, and
Companies’ Pledges to Decarbonise.” Sep. 2020.
[323] IPCC, “Mitigation pathways compatible with 1.5°C in the context of sustainable development.”
2018.
[324] Global CCS Institute, “Carbon removal with CCS technologies.” 2021.
[325] S. E. Tanzer and A. Ramirez, “When are negative emissions negative emissions?’, Energy and
Environmental Science,” pp. 1210–1218, 2019.
[326] World Resources Institute, “Carbon Removal in the United States.” Sep. 2018.
[327] J. Friedman, A. Zapantis, and B. Page, “Net-Zero and Geospheric Return: Actions Today for
2030 and Beyond.” 2020.
[328] Global CCS Institute, “Global Status of CCS.” 2020.
[329] KAPSARC, “Achieving Climate Goals by Closing the Loop in a Circular Carbon Economy.”
Jun. 2019.
[330] Circular Economy, “The circularity gap report. Circle Economy.” 2021.
[331] Global CCS Institute, “Technology Readiness and cost of CCS.” Mar. 2021.
[332] J. Rogelj et al., “Mitigation Pathways Compatible with 1.5°C in the Context of Sustainable
Development,” p. 82.
[333] Iberdrola, “The circular economy, a new model for sustainable production and consumption.”
2020.
[334] Circular Economy, “HOW TO FIND THE VALUE OF CIRCULAR IMPACT IN
BUSINESS.” 2021.

166
[335] “The Potential and Limitations of Using Carbon Dioxide.” The Royal Society, 2017.
[336] J. Bobeck, J. Peace, and F. Ahmad, “CARBON UTILIZATION—A VITAL AND
EFFECTIVE PATHWAY FOR DECARBONIZATION.” Center for Climate and Energy
Solutions, Aug. 2019.
[337] Global CCS Institute, “Remove: Carbon capture and storage.” Aug. 2020.
[338] L. Beck and L. Temple-Smith, “Iss CCS expensive?” Global CCS Institute, May 2020.
[339] IPCC, “Strengthening and Implementingthe Global Response, Global Warming of 1.5°C.”
2018.
[340] IPCC, “Climate Change 2014: Synthesis Report. Contribution of Working Groups I, II and III
to the Fifth Assessment Report of the Intergovernmental Panel on Climate Change.” 2014.
[341] N. Sepulveda, D. Jenkins, F. Sisternes, and R. Lester, “The Role of Firm Low-Carbon
Electricity Resources in Deep decarbonisationof Power Generation,” vol. 2, no. 11, pp. 2403–
2420, 2018.
[342] EPA, “Greenhouse Gas Reporting Program (GHGRP)- Greenhouse Gas Reporting Program
for 2019.” 2019.
[343] LSU Center for Energy Studies, “Overlooked Opportunity: Incentivizing Carbon Capture
through Carbon Tax Revenues.” Dec. 2020.
[344] Global CCS Institute, “TECHNOLOGY READINESS AND COSTS OF CCS,” Mar. 2021.
[345] International Monetary Fund, “Putting a Price on Pollution.” 2019.
[346] Global CCS Institute, “The LCFS and CCS Protocol.” 2019.
[347] Global CCS Institute, “The US Section 45Q Tax Credit for Carbon Oxide Sequestration –An
Update.” 2020.
[348] California Air Resources Board, “California Air Resources Board. Weekly Credit Reports.”
2020.
[349] Global CCS Institute, “Surveying the US Federal CCS Policy Landscape in 2021.” May 2021.
[350] IEA-GHG, “ASSESSMENT OF EMERGING CO2 CAPTURE TECHNOLOGIES AND
THEIR POTENTIAL TO REDUCE COSTS.” Dec. 2014.
[351] German Environment Agency, “Options for multilateral initiatives to close the global 2030
climate ambition and action gap - Policy field synthetic efuels.” Feb. 2021.
[352] G. Wilson and P. Styring, “Why Synthetic Fuels Are Necessary in Future Energy Systems,”
Front. Energy Res., Jul. 2017.
[353] United Nations, “An Introduction for Policymakers: Carbon Taxation in the Context of the
United Nations.” Committee of Experts on International, Oct. 2020.
[354] World Bank, “High-Level Commission on Carbon Prices.” 2017.
[355] M. Hafstead, “Carbon Pricing.” Resources for the future, Aug. 2020.
[356] “Carbon Trading 101: The Basics.” Brookers Carbon Pty Ltd, Australia, 2010.
[357] R. Stavins, “Carbon Taxes vs. Cap and Trade: Theory and Practice,” Harv. Proj. Clim.
Agreem., vol. ES 2019-9, Nov. 2019.
[358] Center for American Progress, “Cap and Trade,” Energy and Environment, Jan. 2008.
[359] L. Gaille, “20 Cap and Trade System Pros and Cons.” Vittana Finance, Apr. 2019.
[360] EPA, “Economic Incentives.”
[361] Carbon Tax Center, “What’s a carbon tax?” Jul. 2020.
[362] Congressional Research Service, “A Brief Comparison of Two Climate Change Mitigation
Approaches: Cap-and-Trade andCarbon Tax(or Fee).” Jan. 2021.
[363] K. Rose and E. Mann, “Climate Countdown: Carbon Pricing.” The world bank.
[364] The World Bank, “State and Trends of Carbon Pricing 2021,” 2021, doi: 10.1596/ 978-1-4648-
1728-1.
[365] M. Demertzis and S. Tagliapietra, “Carbon price floors: an addition to the European Green
Deal arsenal.” Bruegel, Mar. 2021.
[366] EU Commission, “Carbon leakage.” 2021.
[367] EU Commission, “Guidelines on certain State aid measures in the context of the greenhouse
gas emission allowance trading scheme post-2012.” Jun. 2012.
[368] EU Commission, “Union-wide quantity of allowances to be issued under the EU Emissions
Trading System for 2021,” Comm. Decis. EU 20201722, Nov. 2020.
[369] EU Commission, “Market Stability Reserve.” 2021.

167
[370] EMBER, “Daily EU ETS carbon market price (Euros),” Jun. 2021, [Online]. Available:
https://ember-climate.org/data/carbon-price-viewer/
[371] The World Bank, “Report of the High-Level Commission on Carbon Prices.” 2017.
[372] EU Commission, “State of the Union: Commission raises climate ambition and proposes
55%cut in emissions by 2030.” Sep. 2020.
[373] EU Commission, “2030 climate & energy framework.” 2021.
[374] EU Commission, “Stepping up Europe’s 2030 Climate Ambition: Investing in a Climate-
Neutral Future for the Benefit of our People.” 2020.
[375] “U.K.’s Boris Johnson Considers G-7 Bid on Green Border Levie,” Bloomberg, Feb. 2021.
[376] “Transportation and Climate Initiative Program Draft Model Rule.” Mar. 2021. [Online].
Available: https://www.transportationandclimate.org/sites/default/files/TCI-P-Draft-Model-
Rule-March-2021.pdf
[377] C. Zabin, “Putting California on the High Road: A Jobs and Climate Action Plan for 2030.”
UC Berkeley Labor Center, Sep. 2020.
[378] Hawaii State Energy Offic, “Hawaii Carbon Pricing Stu.” 2021.
[379] “Jurisdictions covered under RGGI: Connecticut, Delaware, Maine, Maryland, Massachusetts,
New Hampshire, New Jersey, New York, Rhode Island, Vermont, and Virginia.”
[380] Global CCS Institute, “US Congress Passes Energy Bill with Significant Provisions for Climate
and Carbon Capture.” 2020.
[381] D. Rassool, “Overview of Organisations and Policies Supporting the Deployment of Large-
Scale CCS Facilities.” Global CCS Institute, 2020.
[382] C. McKinley, “Access to 45Q Act of 2021.” Jan. 2021.
[383] J. Hoeven, “Carbon Capture Modernization Act. 2021.” 2021.
[384] C. Coons, “SCALE Act. 2021.” Jan. 2021.
[385] C. Bustos, “INVEST CO2Act. 2019.” 2019.
[386] T. Smith, “Capitol Lead Bipartisan Senate Effort to Reduce Greenhouse Emissions with
Carbon Capture Legislation 2021.” Jan. 2021.
[387] Global CCS Institute, “CO2RE. 2020.” 2020.
[388] Center for Climate and Energy Solutions, “Cap and Trade vs. Taxes,” Mar. 2009.
[389] OECD, “InteractionsBetween Emission Trading Systems and Other Overlapping Policy
Instruments.” General Distribution Document, Environment Directorate, OECD, Paris, 2011.
[390] EU Commission, “Towards a Comprehensive Climate Change Agreement in Copenhagen:
Communication from theCommission to the European Parliament, the Council, the European
Economic and Social Committee and the Committee ofthe Regions,.” 2009.
[391] EU Commission, “EU Emissions Trading System (EU ETS).” 2021.
[392] W. Sterk, M. Mehling, and A. Tuerk, “Prospects of linking EU and US Emission Trading
Schemes: Comparing the Western Climate Initiative, the Waxman-Markey and the Lieberman-
Warner Proposals.” Apr. 2009.
[393] E. Haites and F. Mullins, “Linking Domestic and Industry Greenhouse Gas Emission Trading
Systems.” 2001.
[394] O. Edenhofer, C. Flachsland, and R. Marschinski, “Towards a Global CO2 Market: Expertise
for the Policy Planning Staffin the Federal Foreign Office.” Potsdam Institute for Climate
Impact Research, May 2007.
[395] BDI, “Positionspapier: Erwartungen der Deutschen Industrie an die Klimakonferenzen2008
und 2009.” 2008.
[396] Blue Green Alliance, “Blue Green Alliance Policy Statement on Climate Change Legislation.”
Mar. 2009.
[397] R. Lipsey and K. Lancaster, “The general theory of second best,” Rev. Econ. Stud. 24, pp. 11–
23, 1956.
[398] “Flachsland et al. - 2009 - To link or not to link benefits and disadvantages.pdf.”
[399] M. Mace, I. Millar, C. Schwarte, J. Anderson, and D. Broekhoff, “Analysis ofthe Legal and
Organisational Issues arising in Linking the EU Emissions Trading Scheme to Other Existing
and EmergingEmissions Trading Schemes.” European Commission DG-Environment,Climate
Change and Air, 2008.

168
[400] W. Sterk, M. Braun, M. Haug, and C. Korytarova, “Ready to Link up? Implications for Design
Differencesfor Linking Domestic Emission Trading Schemes: Joint Emissions Trading as a
Socio-Ecological Transformation,.” JET-SETProject, 2006.
[401] “Edwin Woerdman and Kotzampasakis - 2020 - Linking the EU ETS with California’s Cap-
and-Trade.pdf.”
[402] C. Unger, Linking the European Union emissions trading system : political drivers and
barriers. New York: Abingdon Oxon, 2021.
[403] S.-Y. Pan, P.-C. Chiang, W. Pan, and H. Kim, “Advances in state-of-art valorization
technologies for captured CO 2 toward sustainable carbon cycle,” Crit. Rev. Environ. Sci.
Technol., vol. 48, no. 5, pp. 471–534, Mar. 2018, doi: 10.1080/10643389.2018.1469943.