Intercensal Growth of Population - Linguistic Survey Of India
Upload
khangminh22Category
view
7download
0
CENSUS OF INDIA 2001
GENERAL POPULATION TABLES
ORISSA (Table A-1 to Table A-4)
<:'1'1 <t> I fl:i ':J,-LSl I'blP11 llR]['<IfI)
OFFICE OF THE DIRECTOR OF CENSUS OPERATIONS ORISSA
DATA PRODUCT NUMBER
21-011-2001 - Cen-Book (E)

CONTENTS
PREFACE
FIGURES AT A GLANCE
Map relating to position of Orissa in India 2001
Map relating to Administrative Divisions
SECTION-I
GENERAL NOTE
Census Concepts and Definitions
SECTION-II
TABLE A-I : NUMBER OF VILLAGES, TOWNS, H01JSEHOLDS,
POPULATION AND AREA
Fly Leaf
Statements-I to 8
Diagram-Percentage share of districts to total area, Onssa, 200 I
Diagram regarding Area and percentage to total Area
Diagram regarding Population, India and States - 200 I
Diagram regarding Population, State and Dlstricts- 2001
Table A-I (Part-I)
Table A-I (Part-II)
Appendix A-I
Annexure to Appendix-I to Table A-I
TABLE A-2 : DECADAL VARIATION IN POPULATION SINCE 1901
FI)' Leaf
Statements- I to 3
Diagram-Growth rate of Population 1901-200 I-India and Orissa
Table A-2
Appendix A-2
TABLE A-3 VILLAGES BY POPULATION SIZE CLASS
Fly Leaf
Statements- I and 2
Table A-3
Appendix A-3
( iii)
Pages
(v)
(vii)
(IX)
("-)
1-14
10-14
15-174
17
22-33
23
35
36
37
39-63
64-81
82-105
106-174
175-210
177
178-198
199
201-208
209-210
211-259
213
213-219
220-255
256-259

TABLE A-4 : TOWNS AND URBAN AGGLOMERATIONS CLASSJFIED BY
POPULATION SIZE CLASS IN 2001 WITH VARIATION SINCE 190]
Fly Leaf
Statements-l to 13
Diagram regarding GrO\vth of Urban PopulatIon sho\ving percentage (J 90 J -200 I)
AlphabetIcal Itst of Towns and Urban Agglomeration~
Table A-4
Appendix-l
Appendix-2
Appendix-3
~ 1\ )
Pages
261-358
263
264-321
321
325-32R
329-353
354-357
358

PREFACE
The Census of India has been occupylllg unIque pO~ltlOIl III global '-.ccnann as It ')cr\'e~ a'> a goldmll1e
of II1formatlOn III prOVIding data 011 SOClo-eCOnOIl1IC and cultural aspect" of billIon plu~ human re,>ollrces liVIng
111 thIs coulltr). Keepmg pace WIth the changlllg clrcum .... tances of the country the millennIUm Cen'>us of India
200 I has adopted sevcral Ilew innovatIons at alll1o~t all the stage~ nght fmm the preparatory effort'> to the
data processmg and dissemmatlOn As a specw\ feature. the IIltroducllon oflCR I echnology ba~ed full) computer
exercIse startll1g from the automatic dIgital comerslon of data through scannlllg of the household schedule to
on screen computer a,>sisted coding. htcllitated qUick and accurate proces'>lng of data and generation of tables
catering to the needs of the planner'> and data u~ers The present volume entItled '"The General Population
Tables" deab V\ Ith A serie'> tables VIZ. A-I to A-4 out ot \\ hlch A-2 & A-4 hm e been prepared manually
at thiS Directorate wherea..., tablc~ A-I & A-3 h,1\ e been generated \\ Ith the help of Computer Progralllllllllg
Population figures projected In rable A-I presenh data 011 Rural and l irban area" of thc Statc It 1'-,
diVIded into two Parh-A-I (Part-I) deals \\Ith PolIce StatIon \\l'>e Rural and lJrban area~ \\hereas A-I
(Part-ll) pre~el1ts data for urban units of the State r1w·, table II1clude~ hab\ted and ul1mhab\ted \ Illage~ and
toV\ns With area III sq. km . number of household" and population \\ Ith thclr "ex-break.up 1 able ;\-2 pro\ Ides
the decadal variation III population since 190 I a<; adJusted for ne\\ Iy created 27 dlstncts of the ..,tate accordlllg
to 200 I Census. Table A-3 prOVides details of \ Illages cla,,'>ified by population. ~Ize and cIa .... ., \\ hereas trcnd
of urballlzatlon IS shown In rable A-4 The general note in hegll1nl11g of thl~ volume gives a "nap,>hot a'> to
ho\\> the 200 I Ccn"us \\,as conducted 111 thc state by 11Igh lIghtll1g It" '>allent feature" hlCh table I" Supp~)rted
by a flyleaf to familiarize the readers about the Importance and coverage of data given 111 the fable The
analysis of the data has bcel1 supported by number of ~tatement" and appcndlce"
ThiS publication I~ the outcome orthe .I0m1 etTort" of Cen~us 01\, l~IOI1. Office of the Regl'>trar (Jeneral
& Census COlllmlssloner. India and Directorate of Cen"us OperatIon'>. Orissa Thc forcIl1Cl'-,( ac"-no\\ ledgement
of ll1debtednes ... is due to Shn J. K Bal1thla. lAS. f>,-Regl';trar Gelleral & ('CI1"II'> COlllllll"'''IOl1er. India and
hl<; worthy slIccessor. Shrl D. K Sikri. lAS. AddItional Secrctary and Regl"trar General & Cen,>ul., C OIl1I11I~Sloncr.
IndIa for affording us the valuable gUidance and encouragement at ever) stage to bring out thiS publicatIon
I am indebted to Dr D. Roy Choudhury, Deputy Registrar General (C & -I). Shn Ananda Kumar. JOll1t Director.
Shn .lagan LaL Deputy Director and staff members of the Cen,>u" and Tabulation Diy ISlon of Office of the
Registrar General. India. New DelhI for provldll1g all sorts ofas~i:-.tancc in the presentation ofthl'> pllhllcatlon
In the CenslIs Directorate, lowe my gratItude to Shn M Saran. lAS. the thcn DIrector of Censlls OperatloIls
under whose able gtlldance and leadershIp the entire Cen<;ll" Operati(m~ \\as cunductcd :",ucces",tull) and lnttlatcd
thiS project I am thank.ful to SI1f1 P. Barad. A",sl<;tant Director. ~hn J r Rout. Rc'>carch Officer (Map). Shri

D. Sethy. S.I Gr I, Shri 0 Sahoo. S.I Gr.l and Shn P K. Sahno. S.l (ir III \\ ho \\orked \er) hard In the
finalizatIOn of this publication. I will do injustice if I will not mention the names of Shn Mahes\\ar Naya"-.
S.1. Gr.III, Shri Pramoda Patnaik, Compiler and Shri Nabin Chandra Sahli, Stenographer Gr.lIl for their untiring
efforts in bringing out thIS publication.
I shall feel all our effolis amply rewarded if this \olume sen es the need for ""hfeh ft has been de:'fgncd
Bhubaneswar
I st September, 2008
(VI)
DINABANDHll BEHERA
Deputy Director of Censu~ Operations
Ons'-,a, Bhuoanes\\ar

FIGURES AT A GLANCE
Total Population
Decemllal population Growth Rate 1991-200 I
Area in Km 2
Den'>lty of population per Km~
Sex Ratio (Number of females per I ,000 male~)
Literacy Rate (Excluding children in the age-group 0-6)
Percentage of Urban Popu latlon to Total Population
Percentage to total Population
(i) Main Workers
(ii) Marginal Workers
(JIl) Non- Workers
Break up of Main Worker~
Percentage among Mall1 Workers
Cu1trvators
(vti)
Total
Rural
Urban
Per~ons
Males
Female~
Person~
Males
Females
Persons
Males
Female~
Persons
Males
Female~
Persons
Males
Females
Persons
Males
Females
Persons
Males
Females
Persons
Males
Female.;;
ORISSA STATE
16,804,660
18,660,570
IR,144.090
3 L2R7.422
15,748.970
15,538,452
5,517238
2,911.600
2,605,638
16.25
155,707
236
972
63.1
753
50.5
150
26.1
42.9
87
12.7
9.6
15.9
61 2
47.5
75.3
35.8
375
272

AgrIcultural Labourers
Household Industry Workers
Other Worker"
Percentage of Scheduled Castes to total PopulatIon
Percentage of Scheduled TrIbes to total PopulatIon
Total Number of Households
Total Number ofYtllages
Total Number ofTO\\n,>
(VIII)
PCI'>on"
Melle...,
Fe nlcl Ie"
PCI ~Oll~
Male"
I emale"
PCI...,on"
Icmak"
Male,>
female..,
Person ....
M,lle ....
female"
lotal
Inhdblted
lln1l1habtted
219
196
38 1
,9 (,
16 )
16 ')
16 (1
22 1
225
7,738.065
51,349
-l7,529
3820
118

,0
·0
....
ARABIAN SEA \
I
t"
"
a
.,. .. ,.. '" ;'1' 0.,. ... 0
~~ f//I fII ..
\
N 0 I A
iOlenNi
PONOICHERRY '01 tdI!:t. 'Y
TAMt.NADU
f .~·
N
INDIA POSITION OF ORISSA IN INDIA
BOUHOARV, WTERN4~ ---- 1IOUNONfr'. STATE I U,T,-_
CN'ITALOf' STATE.I U.T. CNIIfAL OF INOlA A
Klt.OMETRES
100 0 100 200 300 «lO ! !
BAY o F
BENGAL
lbe~""""_01~ ...,..lIIId .... _. 0JandigaItt.
,. . POfIPCHEMY
o c E A N
(ix)
2.l

. ... •
" .. ..
. <II
• a ~
i th Z 0 UJ i :; ....
~ 0
~ Ii
~ ~ ~ --z i i
. ... ..
S
a 101 E ~ ~ i
I
0
ta
(x)
. o ..
..
. ... •
i &
i . ... •
SECTION-I GENERAL NOTE

GENERAL NOTE
I he pnpulatmn enUllleratlon of Cen~us of India,
20D I for the :-..tatc a .... a \\ hole \\ a~ undertaken betv,een
9111 to 28 II I ebruar) 20() I (both da) ~ IIlCIU~lve) \\ Ith
a revl'>lonal r(_)lIlld from I I Man.:h t(_) 5111 March 2001 The Cen"lI:-' 1110nll:11t, the referral time at which the
snap of the population I.., taken, \\a'> 00 h(_)ur~ of I"
March, :200 I (I nl J] the I C)C) I ccn .... lh the '>unn .... c of J ,I
M::\rch \\ a~ LIken to he the cen .... u" moment I he
hOLl"ek" .... per .... on .... a .... ha .... heen the u .... ual pracllce \\cre
CIlUlllenlteci (In thi.: Illght ~lr 2R'" f cbrunry, 2001
I lie lndlall Ccn .... u'> ha .... a 1,)llg tradltlun 01 Ic!ca .... lIlg
the populatloll data Oil a pnn 1 .... lonal h.hl'> \\ 1111111 a .... hort
tlille after the c(llllpktWIl of the populatlOll
CIlUillcratll1l1 r he populatloll total-.. arc huilt lip by
each elllllller<ltul right rrnll1 the page tOl<ll" or a fe\\
Item:-"l)fdata for each page of tile 11l1u .... c1101d "chedulc.
\\hlch an: then eOIl'>ulHJated at the enumerator· .... block
level I he total" at \anoll,> ad111l11l .... trlltl\e lc\eI" arc
COIl"olldated tlllough a proce .... " of :-,ucce .... "I\c
aggregalloll I he entm: e\.ercl..,e of:lggregatlull right
troll1 the eIlUmeratl)r· .... nlnek le\ el tl) the "wte le\ el
I') completed \\ 1111111 ,I .... hor! .... pan
I he data Item .... 011 \\ hleh the pnn 1 .... lollal total ....
\\ere cullected and eompiled for each '>c\. \\ere
population, chtld population III the age group 0-6, literate
population. malll \\ orker'o, marglt1al \\ l)rkcr~, nlln
\\orker'> alld categoric" of m:llll ami margll1al \\orJ..er"
Since the actual pruce:-'..,Illg and rinallahulatl()11 of
thiS huge \ lllulllC of data takc~ tlIllC. provIsional data
relatlllg to :-'0l11C key a:-,pect'> urthe population become
c\.trcmel) u~eful to the data u,>er"
Just after the completion of thc population
enumeration thc prO\j~lollal population totah for the
'>tate and dl~tnet were relea;.;cd on 30 th March, 200 I
through Paper I of 200 I Thl'> publication cOlltall1~
data un tornl population, populatIon III the age group
0-6 and ltterate~ for all the distriCt... and the state. The
proVisional total::, are based on a qlllck tabulation from
the ab'>tracb prcpared by the enumerators at
enumeration block lc\ el and aggregated at the dl'o{rIct
level b_\ the Principal Censu~ Offlcer:-, (DI .... trict
Magl~trate & Col lector) of the concerned di-;tnct
Illlmedlatel) after eUlllpletion of the field work
3
I hl<; apart. t\\O more publications III the "erie.., of publication" on provI'>lonallOtab are Paper 2 and Paper
J of 200 I Paper 2 of 200 I present:-, data on rural
urban break lip of population and Its characteristics
along \\ Ith population growth rate of Cities and to\', ns and the Paper 3 of200 1, the la~t 111 the :-,erJe~ contall1"
data 011 rna 111 \\ orker". marglllal workcr.., and 11011-
\\ orkcro, ( he pro\ 1:-' ilma I figun: .... an: con1l rmed l)11 I) alter thl;; fi:lcd Il1 cen'>u ........ cheduk .... are full) pnxl: .... scd III the computer and fintl I rubltcatilln I" completed
I he final population {otals arc pre'.cnkd III
dtllerent volumes 1 he pre..,cnt \ olullle rrc'>ellh '\ I to A - cf tables for total population as dctatled bclo\\
A -
/\
A -
A-
I
'1 -
.., _i
4
Area, Houses and Population
Decadal \'anat]l)n In population "Illce
1901
Villages claSSified b) populatlOi1 si/e
-, o\v11" and llrban /\gglomeratllllh
cla~slfied b) pl)pulatlon III 2001 \\ Ith
vanatlon Sillce 1901
The .... ecolld volullle pre:-,ellh Primary Cell'.us
Ab..,tract (PCA) The PCA I.., an Important gencral
population table ba<;ed on full count and prm Ides ba .... lc
data of 200 I ccnsu" The tables contalllcd In thl ....
\ olume present detail,> relatll1g to area, !lumher of occupied re'>ldentlal house". household~, population b)
.... e\., total population III thl .... age group ()-(> '-.cheduk:d
Ca"te and Scheduled ~rrJbe populatIon, literate pCI .... on'>,
malll \\orker'> claSSified In to four IIldu'>tnal categl\t·lc'l.
margll1al worh.er~ and non-\vorker~
The primary census abstract ofgelleral population
and the prImary census abstract of scheduled C<htc~
and ~chedLllcd trIbes arc prc~cllted :"eparatel y 111 [\\0
volume"
Planning for preparatory measures:
The first step towards cen~L1" takll1g relaTe .... [0
preparation of a complete and L1ndupltcatcd lI .... t "f elll geographical area'>, which Include DI'Itnch -r a 11 .... I I ....
Police ~tatlon..,/Commllility De\ ell1pmcllt B lod, '>'
Vtllagc:o. and Town.., 111 the Stak The finalt/atl'll1 (11'
thl:-' II:-'{ pre-supposes the free7ing of all adlllllll'>trative

bounddnes across the ':>tdte at a given pomt of time well m advance of mitlatlllg the census takmg An
updated and unduphcated Itst of all these admlllistratl\"'~ Ul1lts IS an es'>entlal pre-requIsite for a ~ystematlc and complete coverage of all areas m the state and thereby the enumeration of each lI1dlvldual 111 the state \\ Ithollt any omiSSion or duplication This exercise also It1volves obtall1mg the latest maps of the police stations and towns from the Tahstldars and executive offIcers respectively after all the admlllistration units of the state were frozen as on 31,r December 1999
In thIS regard the Government of India constituted a fechnlcal AdVIsory Committee (TAC) 1I1 February, 1998 to adVise the government on technical Is,>ues related to holdmg of the Census of IndIa, 200 I As part of the census preparatIOns, the lor Data users Conference was held on Apn L 1998
In thiS two-day conference, representatl\ es of vanous MlI1lstnes of Government of India, State Governments, Population Research Centres, Statistical Institutes, U t1IVersltles, Emment Demographers and Socldl SCientists mamly dl,:>cussed vanous questIOns that could pOSSibly be Included lIthe 200 I census questIOnnaire Based on the d_lIberatlon" of the conference, a draft questIOnnaIre was developed and was placed for diSCUSSIon betore the Technical AdVisory Committee Thereafter, the census questIOnnaIre was presented 111 the field dUring July 1999 111 the State The pretest was undulated With the help of the staff drawn from the local school teachers m the State
fhe result and the field expenence ot the pretest \\Jere dlscu,>sed 111 the fir~t conference of the DIrectors ot Census OperatIOns 111 September 1999 After prolonged dISCUSSIOn, certalll useful suggestIOns
merged WhICh were taken Into account for J edeslgnmg the contents of the houselist The reVised house!Ist schedule and Its Il1structlon manual were agam submitted to the technIcal committee for Its
suggestIons
Smce 1961 and untIl 1991 Census, two sets of questIOnnaIres, one for the mdlvldual slIp and another for the household schedule were canvassed dUring the population enumeratIOn The adequacy and the utIlity of the II1dlvldual slIp and the household schedule for the populatIon enumeratIon of Census of IndIa, 2001 was thorough Iy reVIewed MajOrity of participants 111
the data users conference advocated for the use of one compact household schedu Ie whIch mcol porates
all the clement-. ot IIldl\ Idudl ,>llp tOl easy canV<b'>lng dnd cost reducmg Thl'> \\a" abo accepted b) the TechnIcal Ad" ISOI) Committee and fmally It \\a.., deCided to adopt only the hou,>ehold ,>chedule for populatIon enumel atlon at the C CIlSU'> ot India 200 I 1 he content'> clnd the tormat;;; of the houscllst and household schedule deVised tor the Lensllc, ot Indld 200 I \\ere deliberated upon e .... tenslvely 111 the technical sub-group,> ot the fechnlcal Advl<;0ry COmll1lttee befOl e finalization by the Government ot India In J<lI1uary and July 2000 le'>pectl\cl)
House Listing Operations :
The census operations 111 [ndld are conducted III
two phases, Ie, house numbenng and the hou'>ellstll1g operatIOns follo\ved by the populatIon enumeration The objective ot the hou'>e numbenng and hOLlellstll1g operations I'> to sy'>ten1dtlcall) list out all the -.trudlllcs, houses and hou"eho Ids throughout the state tor preparatIon ot a sound frame for conduct of the populatIOn enumeration All the butldll1gs and hou<,ec; wherever necessary are numbered for ea'>: IdentIfIcation at the tlllle of enumeratloll fhe houselJstll1g operations 111 the state of Oll'>sa \'<el e conducted 111 the Month ot Md) 2000 In dddltion to collecting data on characteristic'> of the hou..,c mformatlOn on availability of certalll amCl1Itle'> and a':>sets to the households were collected at the time ot houellstmg operation':>, which pro\' Ide" a comprehen'>l\ e data base on the hOUSing stock of the State, Its quality and the Iivlllg condItions of the occupants
PopulatIOn Enumeration:
The populatIOn enumeratIon III the ~tatc was undertaken between 9 1 Fcbruar) 200 I to 28" February 2001 (Both days IIlcIUSlve) \\Ith a rC\-lslonal roLlnd from 1st March to 51h March, 200 I The cenSll'> moment, the rcfenal time at whIch the snapshot of the population I" taken wa,> 00 00 hour,> of 1 I March 200 I The houseless populatIon cnumerdtcd on the I1Ight of 28,h february, 2001 and the revl~lonallOlll1d \\as undertaken frol11 I" March to 511 March, 2001 by the enumerators 111 their respectl\ e enumeratloll
blocks
The census enumeratol':> and supen I'>or'> were mostl) drawn from among local ~chool teacher,> In the rural arCdS, on an a\ erage one enU111eratoi had to
VISit around one hundl ed and fifty household" CO\ crlllg populatIon ot about seven hundled fitty populatIon \\-hlle In the 1II ban area" It \\a'> around one hundred tlllrt\ households or SI'\. hundred flft) populatIOn

approximately. To assist and monitor the work of the enumerators a supervIsor was appointed for every SIX enumerators
Rural and Urban Areas :
Keeping in view of the data users requIrement, the census data are presented for rural and urban areas separately. The rural areas In the Orissa are vIllages (Mouzas) A village is a smallest unit recognized as such by the local revenue authority. It may have one or more hamlets. There are also unsurveyed villages insIde reserve forests, which are known as forest VIllages. There are also unrecognized cluster of human habituating inside the forest without any speCIfic name under beats of forest guards All these areas namely forest villages and unrecognized clusters of human habitations of forest beats are also considered as Villages for the purpose of census. A revenue Village may be inhabited or uninhabIted All these villages are treated as rural areas of the polIce statlOn/ distrIct! state
The definition adopted for urban areas for the 200 I census is similar to that followed in the 1991 census. The followmg cnteria were adopted for treating a place as urban for the 2001 census.
(a) All statutory towns, i.e, all places with a mUl1lcipal corporation, m un Icipal board, mUl1lclpality, cantonment board or notIfied town area, etc.
(b) All other places which satisfied the following cnteria,
(i) A minimum populatIon of 5000,
(ii) Atleast 75 of the male workIng population engaged in non-agncultural activitIes and allied activities and
(Iii) A density of population of atleast 400 persons per sq km (1000 per sq.mile). The Directors are also given some dIscretion In respect of some marginal cases to include 111 consultatIon wIth State Government, some places that had other distinct urban eharactenstics.
A town with a population of one lakh and above is treated as a city
Census Towns :
All rural units having a population of 4000 or more at the 1991 census were taken up for
exammation because a place having a population of 4000 or thereabout 111 1991 ~ensus was expected to cross 5000 population mark dUring the 10 years or by the time of the 200 I' census For such cases, the composition of work force and the density of population were required to be examined to see whether these qualrfy to be categorIzed as urban. While applymg the test of occupation of the male working populatIOn, only male main workers were conSIdered and the workers engaged In the agflcultural actIvIties namely (I) Cultivators, (II) Agricultural Labourers and (1lJ) Livestock, Forestry, FIshIng and PlantatIons, Orchards, etc were e:xcluded for computmg the percentage of workers engaged 111 non-agncultural occupatIons
Thus, the rural unIts that satIsfied the crrten8 were declared as census towns by the DIrector of Census OperatIons after consultation wIth the State Government
Urban Agglomeration
The concept of urban agglomeratIon adopted for the 1991 Census continued for the 200 I census also Accordlllg to thIS an urban agglomeration IS a continuous urban spread constItuting a town and its adJoinmg urban outgrowths (OGs) or two or more phYSIcally contIguous towns together and any adjo1l1111g urban outgrowths of such towns. In some cases railway colonies, ul1lversity campuses, port areas, mihtary camps, etc. would have came up near a city or statutory town outside its statutory hmits but within the revenue i1mlts of a VIllage or villages contIguous to the town Each such indIVIdual area by Itself may not satisfy the mmimum population hmlt to quahfy It to be treated as an independent urban unit but may deserve to be clubbed wIth the towns as a contmuous urban spread
SItuations in which urban agglomerations would be constituted are as follows.
(i) A city or town wIth one or more contIguous outgrowths
(il) Two or more adjoinmg towns WIth .thelr outgrowths and
(Ill) A City and one or more adjoining towns with theIr outgrowths all of whIch form a contmuous spread
The concept of standard urban area (SUA), whIch came into eXIstence 111 1971 census and continued till
1991 census, was dlscontmued in 2001 census SImilarly, the presentation of census data in some tables at Tahasillevel and police station (portion) level was also discontmued In the 2001 census
Rural Urban Frame:
51,349 vIllages of the sta.te under 485 polIce stations! part police stations spread Over 171 tahslls constItute the rural frame. Of these villages 47,529 are inhabIted and 3820 are uninhabIted
Under the urban frame, there are 105 urban local bodies VIZ., MUnICIpal CorporatIOns, MUniCIpalities and Notified Area Councils wIth two mdustrIal townshIps and 3 I non-statutory census towns In the State
Jurisdictional Changes :
Major JUrisdictIonal changes m the State took place after the 1991 census. The number of dlstncts Increased from 13 to 30 after the 1991 census Barring Sundargarh, Kendujhar and Mayurbhanj dIstrIcts, the rest 10 dIstricts were split up mto 27 dIstricts m the state dunng 1991 to 2001 Census penods.
Census Hierarchy :
The Census Act, 1948 forms the legal baSIS for conduct of census in mdependent IndIa Although the Census Act IS an instrument of central legIslatIOn, III
the scheme of Its executIOn, the state governments provide the adminIstrative support for the actual conduct of the census
The census organizatIOn under the Union Home MII11Stry has been functionmg on a permanent footing ever since 1961 and provld~s a vital contl11U1ty to conceIve, plan and Implement the programme of census takmg in IndIa The organizatIon headed by the Registrar General and Census CommiSSIoner, India has offices In 33 States and U11Ion Territories There are permanent Directorates headed by tbe DIrectors of Census OperatIOns, who are mamly responsible for the conduct of census in their respective JUrisdictIOn
The Registrar General and Census CommIssioner IS assisted by Joint Registrar General, Dy. RegIstrar General, Assistant RegIstrar General, Director, Jomt DIrector, Deputy DIrector, Senior Research Officer, Research Officer, Map Officer, Assistant-DLrector and a host of other officers and staff mm,tly bemg technocrats III vartous branches like Census and Tabulation Data processing, socIal studies, map & VItal statistics etc. The State and Union Territory DIrectorates are headed by Director of Census
OperatIOns who IS dIrectly responsIble to the RegIstrar General and Census CommIssIoner of IndIa for organization and conduct of census WIthin their JUrIsdIctIon The DIrector of Census OperatIons IS assisted by Deputy Directors, ASSistant DIrectors, Research Officers (Map) and Officers and <;taff
Keepll1g ~ vIew of the gigantIC nature of census work, Ministry of Home Affairs. Government of llldia called upon State and local admll1lstratlon to extend theIr help and cooperation to Director of Censlls OperatIOns to accompltsh thIS natIonal task In On~sa Revenue Department is the nodal department between the Government of OrIssa and Government of IndIa
The DIrector of Census Operations. OrIssa JOll1ed on 08 02 1999 He was assIsted by Deputy Directors, ASSIstant DIrectors, Reseqrch Officer t Map) and other officers and staff
The admll1lstratlve Ul1lts as adopted at the time of the 200 I Census are as follows
State of Orrssa
30 DistrIcts
623 Charges
10,275 Supervlsor's Circle
82,061 Enumerator's Block
Durtng the houselIstmg operatIOns 77,494 hOllsltstmg blocks were formed whIch IIlcreased to 82,061 enumeration blocks for the popu latlon enumeratIon
At the dIstrict level, the Dlstnct MagIstrate and Collector was appomted as the Prmcipal Census Officer of the dlstnct and an AddItIOnal DIstrict MagIstrate who was mall1ly responsIble for the smooth and tImely completIon of the census work 111 the d Istnct was apPoll1ted as DIstrIct Censlls Officer The Dlstnct Census Officer was responsIble for demarcatIng the census JunsdlctlOn WIthIn the dIstrict He was also responsIble for appomtment and trallllllg of the enumerators, supervIsors and others drafted for census work. Next to hIm was the sub-dIVISIonal census officer who was responsIble for the admmlstratlve controls for the area under his JurisdIction for smooth conduct of the Census
Below the sub-dIVISIonal census officer, was the charge officer All the Tahstldars of the Tahstls were appomted as the Charge OffIcers where as the ExecutIve Officer of each town was appoInted as the

town census officer He was also known as the charge officer for the concerned town
The Executive Officers of all the Class I towns namely, Cuttack, Raurkela, Sambalpur, Bhubaneswar, Brahmapur and Puri were apPointed as AdditIOnal Distnct Census Officers The Block Development Officers, AdditIOnal TahasIidars, AdditIOnal Executive Officers were appointed as additional charge officers whereas the Sub-Inspector of Schools and Revenue Supervisors and Officers of eqUivalent rank were appoInted as sub-charge officers
Training Inputs :
Traming has always been recogntzed as one of the most vItal ll1puts for smooth and successful conduct of census As it IS not a routine Job, It requires clear understandIng of several census concepts. The enumerators are also to be remmded about the sensItIVIty of the different questIons that are canvassed and given tips on the probl11g techniques. The trainl11g classes were properly structured with the right emphasis on each of the questions The tra111Ing strategIes were chalked out well ahead of time for the population enumeratIOn of 200 I Census The 1I1structlon manuals for the population enumeration were wntten up very elaborately covering every possible situatIon so that the enumerators and supervisors can find solutions to all their problems that may arise dunng the course of their field work. The instructIOn manuals also ~ontall1ed a number of approprIate examples and illustrations filled 111 sample schedules and probmg methods for guidance of the enumerator.
At the preparatory stages, conferences of DIrectors of Census OperatIons and other senIOr officers of the Directorates were held to dISCUSS manual of instructions and schedules
At the state level, the District Census Officers were Imparted traming at the state headquarters by the DIrector of Census Operations, Ortssa The manual of Instructions for the enumerators and supervisors was dIscussed thoroughly The Director of Census Operations, Orissa explained the census concepts, definitIOns and census termmology WIth the help of numerous J11ustrations.
In the second stage, the district census officers Imparted training to all the trammg officers of the district at the district headquarters At the distnct level training classes, representatives of the Director of
Census OperatIons were also present to attend the dlstnct level trainmg classes to clarity the doubts on the technical matters relating to the mstructIOns. etc.
In the thIrd stage, all the tramer officers Imparted trammg to enumerators and supervisors both for the houselistmg and enumeratIOn ComprehenSive trainmg programme and selectIon of tramlng centers both for the tramer officers and enumerators and supervisors were made by the dIstrict authOritIes as per the
gUldelmes Issued by the Director of Census OperatIOns. To make the trainIng sessions lllteractive and interestlllg a number of tramlllg modules were conceIved In addItIon to the traditIOnal approach, the sessIOns were supplemented With mock demonstrations A practical traInlllg was made -compulsory for all traml11g sessions Each census functIOnary was lllsisted upon to fill In five practical blank household schedules as part of the practical traming. The supervisory officer checked the practice schedules and common dIscrepancies and mistakes were discussed and claSSified on an indIvidual baSIS m presence of all enumerators and supervisors before the final round of training The district administration prOVided the necessary support through their active Involvement dunng the training penod In the last round oftrainmg seSSIOn each enumerator was supplied WIth the necessary forms, schedules and other materials reqUired for conducttng census in the respectIve enumeration block.
The Census Act :
The Census of India IS. conducted under the Census Act (Act of XXXVII of 1948). ThiS act empowers the Central Government to notIfy and conduct the census In whole area or part of the country The Census CommISSioner of IndIa and the Director of Census OperatIOns are appointed to ensure smooth takmg of the Census The Act empowers the state or such authority to whom the State Government delegates power to appomt census officers at varIOUS levels, to aid 111, supervise and take the census. ThIS Act also autWorIses the Census OffIcers to ask the prescnbed census questions and legally compels all persons to answer theIr questIOns truthfully The law lays down that the mformation collected at the census Will be used only for statistical purposes and that the information about individuals Will be kept confidential and can not be used as eVidence even 111 a court of law The Act glVes extra ord111ary power to secure all
types of assistance from the local bodies or any other person m order to complete the task.
Post Enumeration Survey (PES) :
Post EnumeratIon Survey (PES) which was earher known as Post Enumeration Check (PEC) has become an integral part of the Census OperatIOns in India sll1ce 1951. Till the earlIer census, the post enumeration survey was used to be conducted only after the population enumeration, but for the first time in the Census of India, 200 I a PES of the houselistmg operatIOns was also conducted after the completIOn of the houselisting operations. The maIO objectives of PES were (I) to get an estimate of under coverage of census houses (II) to get an estimate of under coverage of population and (iIi) to provide an estimate of the extent of the content error with respect to certain selected data items.
Like the prevIOus censuses, post enumeratIOn survey was also conducted for populatIon enumeration in order to assess the extent of omissions and duplicatIons in populatIon enumeration beSides provldmg a measure of the quality of informatIOn on certain items collected in the census lIke age, literacy, educatIOnal level, worked any time last year, whether main or margmal worker, mam actiVity m case of maIO worker, data on surviving and children ever born ahve of ever married women and number of chIldren born alive during last one year in case of currently married women. In other words thiS survey attempts to measure how accurately the persons have been enumerated in census and how preCIsely the particulars of this individuals have been recorded The former prOVides an estimate of the coverage error and the later of the content error
Publicity :
In view of the fact that many feel heSitant to part with personal mformation as sought for in census, adequate pUblIcity campaign is a pre-requIsite for its success in order to get the public support and cooperation. The entire publicity campaign was planned and executed keepmg this m mind as well as for allaying fears that information proVided may not be kept confidential as required .upder the law.
For the populatIon enum eratIon 2001. held from
9th February to 28 th February 2001 the publtclty campaign was more pronounced and aimed to enhancmg awareness about this gIgantic exercise of national importance seeking cooperation of the people
for its success. Special efforts were made to sensitize target groups such as women, children, workers and those sufferIng from disabIlity. ThiS cffort was directed to educate the public about the speCific questIOns relatmg to the target group, which was bemg asked at the Census of India, 200 I Mass :vtedla, such as Newspapers, All India RadiO, TeleVISion, etc were extenSively used to propagate census messages Th IS apart, extensive publiCity campaigns were also launched throughout the State by dlsplaymg posters, organismg debates among school children and through a host of other thmgs.
New Features of the Census of India, 2001 :
Several new mnovatlOns have been IIltroduced at al most all stages of the Census of I nd la, 200 I, right from the preparatory stage to the data processmg and data dlssemmatlon stage. This' mcludes certain fundamental changes m the form and contents of the househst and household schedules, while ma1l1tam1l1g the contmUity and comparability of the baSIC housmg and population characteristiCS with the earlier censuses Some of the new features mtroduced and mnovatlOns made III the Censlls of India. 2001 are discussed below
Permanent Location Code Number (PLCN) :
One of the Important I11pUtS in census takmg IS asslgn1l1g of the locatIOn code numbers of different administrative U111tS The location code number IS a Simple deVice by which every compact geographical area 111 any admll1lstratlve unit can be uniquely Identified Each such admmistratlve unit startmg from state fight down to the village/ ward can be referred to by a combmatlOn of such umque numbers Until 1991 census, a hierarchical codmg system was followed, whereby each adm1111stratlve unit was coded wlthm the next hierarchical administrative U111t serially and systematically followmg a geographical order
The frequent changes in dlstnct and sub-district admll1lstratlve Units durmg the mter-censal peflod posed several problems of study 111 changes m growth and distributIOn of population and their characteristics from one census to another For the Census of India 2001, a system of Permanent LocatIOn Code Number (PLCN) has been adopted by asslgn1l1g to each village wlth1l1 the state a continuous senes from I to N Each vIll~ge has been assigned an eIght digIt code The first \IX digits represent the code of the Village as existing at the present censlis. The last two digits

beIng "00" are kept for accommodating future changes In case of split of an eXistIng village or creation of new villages, etc Smce the permanent location codes have been assigned to each village, theoretically tracIng the precise location of village on account of future jurisdictIOnal changes in the boundanes of varIOUS admInIstrative areas within the state should not pose a problem. It IS imperative that under this scheme, the PLCN assigned to villages at the Census of India, 200 I are adopted In future censuses also to ensure the comparabIlity of the data at the vIllage and other admmistratlve levels
Formation and identification of slum Enumeration Block:
Phenomenon of rapid urbanisation coupled wIth mdustrIalIzation and growth in manufacturing and commercial centres leads to creation of slums The slum enumeration blocks were identified for the first time In census, in each town having population of 50,000 and above. The enumeratIOn blocks in slum areas were formed without cutting across ward boundaries and non-slum areas so as to make It pOSSIble to compile and tabulate specIal tables for 'slums'. ThIS WIll enable the planners and adml11lstrators to visualize the impact and pressure on urban 1I1frastructure and amemties besides housmg and demographic conditIOns of the slum dwellers.
The Houselist Schedule :
In additIOn to the expanding scope of the questions canvassed during the houselisting operations In the 1991 census, the followmg new questions were added 111 the houselist schedule for normal households at the Census of India, 2001.
I) If the census house was used for reSidential or partly residential purposes, the condition of the census house was categorised as good, livable or dilapidated based on the perception and response of the respondent.
II) A question on number of married couple(s) livmg in the household was canvassed
Ill) InformatIOn was sought on the number of married couple(s) having II1dependent room for sleeping.
IV) Information as to whether the wastewater outlet of the house is connected to 'closed drainage' or 'open drainage' or has no drainage was collected.
9
V) A question on avaIlability of bathroom wlthlll the house was included
VI) InformatIOn on availabilIty of kitchen wlthm the house was also sought
VII) AvaIlability of certain assets to the households namely radlO/ tranSistor, television, telephone, bICycle, scooter! motor cycle/moped, car/Jeep, van were also mcluded
VlII) It was also enquired whether any bankll1g service was being avaIled by the household.
Household Schedule
A number of new questions were added In the household schedule in view of the suggestions from poltcy makers, data users and research scholars whIle r~tammg most of the questIOns canvassed dUrIng the 1991 census. The followmg new questIOns were canvassed at the 200 I census.
I) A question on total disabIlity was canvassed in the 1981 census. In the 1991 census, no question 111 disability was Included At the 200 I census a question on total or partial disability was included. The five types of disabilIty In which InformatIOn collected are m seemg, m hearing, III speech, in movement and mental.
II) A new question on 'Travel tQ place of work is canvassed mainly for workers engaged in non-agrIcultural actlvltIes Information on distance from the reSidence to place ofworl-. and the mode of travel to the place of work IS collected.
III) The household ~chedule has a new set of questions for household engaged In cultivatIOn! populatIOn (a) Net areas of land under cultivation/ plantation (b) Net area of land Irrigated and (c) Tenure status rh IS question was not, canvassed In the 1991 census but was canvassed In the 1981 census 111 a sltghtly different Torm.,.
IV) The signature or the thumb ImpreSSIOn of the respondent has been taken on the household schedule for the first time 111 the
\ history of census. ThiS was not only aimed at obtal,ning correct and complete mformation but also for glvmg an OPPOrtUlllty

to the respondents to authenticate the informatIOn provided by them The relatIOnship of the respondent wIth the head of the household was also obtamed
Census help line
Another InnovatIOn of the Census of Ind ta, 200 I was establishmg of Census Help Centres and Census Help Lines/ Telephone Help Lines These were aImed at providing timely technical assistan.ce to the enumerators and supervIsors when they actually begIn the fIeldwork for populatIOn enumeration and subsequently converted for the publIc to regIster their complamts, in case they have not been enumerated. These help centres normally functIOned from 151 February 2001 to yh March, 2001.
In order to meet thIs reqUIrement help centres and telephone help lInes were opened from 15t February, 200 I to 5th March, 200 I in TahsIl headquarters (WIthIn the office premises) in the rural areas and NAC, MUTIlclpality, MUnICIpal CorporatIOn Office in the urban areas In the state The help line number of the local office, through whIch doubts of the filed functionanes can be clanfied was notified as tre census telephone help line At these centres, one c..!nsus charge officer or an additIOnal charge officer was available to provide necessary clanfication to every census enumerator. This arrangement provided immense assistance to the field functIOnarIes engaged m popUlation enumeration, 2001
Census Concepts and Definitions :
Rural-Urban area:
The data III tables on Houses, Household AmenIties and Assets are presented separately for rural and urban areas. The umt of classification m thIS regard is 'town' for urban areas and 'village' for rural areas 'Rural area', generally comprises the populatIon hving in the 'vIllage', which always is the 'revenue village' as recognized by the revenue admInistration of the district having a defInite surveyed boundary. The hamlets of villages, which are situated wlthm the jurisdiction of VIllages, do not have a definite boundary or area distinctly marked or allotted to them Generally, the revenue VIllages are surveyed villages. But there may be unsurveyed VIllages, forest villages or forest clusters, etc Such forest and unsurveyed villages/clusters have also been treated as villages for the census purposes A VIllage may also be uninhabIted. In the Census of
10
India 200 I, the defiTIltlOn of urban area adopted IS
as follows
a) All places with a munlcipaltty, corporation, cantonment board or notIfIed town area commIttee, etc.
b) A place satIsfyIng the follOWIng three cntena SImu Itaneously
I) A mInimum population of5,000;
ii) At least 75 per cent of male workIng populatIon engaget;! m non-agrIcultural purSUItS, and
ni) A denSIty of populatIOn of at least 400 per sq km (1,000 per sq mde)
For identIficatIOn of places whIch would qualIfy to be claSSIfied as 'urban' all VIllages, which, as per the 1991 Census had a populatIon of 4,000 and above, a populatIon denSIty of 400 persons per sq km and havmg at least 75 per cent of male working populatIon engaged In non-agncultural activity were conSIdered. To work out the proportIOn of male workmg populatIon referred to above against b) (Ii), the data relating to main workers were taken into account.
Apart from these, the outgrowths (OGs) of CIties and towns have also been treated as urban under 'Urban AgglomeratIOns'. Examples of out-growths are railway colonies, univerSIty campuses, port areas, mIlItary camps, etc, that may have come up near a statutory town or cIty but wlthm the revenue limits of a VIllage or vi lIages contiguous to the town or CIty. Each such IndIVIdual area by itself may not satIsfy the demographic cntena laid down at (b) above to qualIfy it to be treated as an independent urban unit but may deserve to be clubbed WIth the towns as a contmuous urban spread Thus, the town level data, wherever presented, also includes the data for outgrowths of such towns.
City :
Towns with population of 1,00,000 and above are called cities.
Urban Agglomeration :
An Urban AgglomeratIOn IS a contInUOUS urban spread constItuting a town and its adjoming urban outgrowths (OGs) or two or more phYSIcally contiguous towns together and any adjoInmg urban outgrowths of ,such towns. In some cases raIlway col011les, univerSIty campuses, port areas, etc., may
come up near a CIty or statutory town outsIde ItS statutory limits but within the revenue limIts of a VI II age or VIllages contIguous to the town or cIty Each such mdlvidual area by Itself may not satIsfy the mInImUm population lImit to qualIfy It to be treated as an Independent urban unit but may deserve to be clubbed wIth the town as a continuous urban spread. For the purpose of delineation of Urban Agglomerations during Census of IndIa 200 I, followmg criteria are taken as pre-requisItes.
(a) The core town or at least one of the constItuent towns of an urban agglomeratIOn should necessarIly be a statutory town, and
(b) The total populatIon of all the constItuents (I.e, towns and outgrowths) of an Urban AgglomeratIon should not be less than 20,000 (as per the 1991 Census) WIth these two basic CrIterIa havmg been met, the following are the pOSSIble dIfferent situatIOns III WhICh Urban AgglomeratIons would be constituted .
I) a city or town with one or more contiguous outgrowths;
II) two or more adJoming towns wIth theIr outgrowths; and
iiI) a city and one or more adjOining towns wIth their outgrowths all of whIch form a continuous spread.
Household
A 'household' IS usually a group of persons who normally live together and take theIr meals from a common kItchen unless the exigencies of work prevent any of them from dOing so. Persons m a household may be related or unrelated or a mIx of both However, If a group of unrelated persons live In a census house but do not take theIr meals from the common kitchen, then they are not constItuent of a common household Each such person was to be treated as a separate household The Important link In finding out whether It was a household or not was a common kitchen There may be one member household, two member households or multi-member households.
Institutional household :
A group of unrelated persons who lIve in an instItutIOn and take their meals from a common kItchen IS called an InstitutIOnal Household. Examples of Institutional Households are boarding houses, messes,
1 1
hostels, hotels, rescue homes, Jails, ashrams, orphanages, etc. To make the defil1ltlOn more clearly perceptIble to the enumerators at the Censlls 2001, It
was specifically mentIoned that thIS category or households would cover only those households where a group of unrelated persons hve in an mstltutlon and share a common kItchen
Houseless household :
Households who do not live in buIldings or census houses but lIve III the open on roadside, pavements, 111
hume pipes, under fly-overs and staIrcases. or In the open In places of worship, mandaps, raIlwa) platforms, etc, are treated as Houseless Households
Head of Household :
The head of household for census purposes IS a person who IS recognized as such by the household She or he IS generally the person who bears the chief responslblolty for magagmg the affaIrs of the household and takes deCISion on behalf of the household The head of household need not necessardy be the oldest male member or an earnmg member, but may be a female or a yourger member of either ~ex
Scheduled Castes and Scheduled Tribes:
ArtIcle 341 of the ConstitutIon prOVides that the PreSident may, with respect to any State or UnIOn terntory, speCify the castes, races or trIbes or palis of or groups wIthin castes, races or tribes whIch shall for the purposes of the ConstitutIOn be deemed to be Scheduled Castes 111 relation 10 that State or Union territory Article 342 -SImilarly prOVides for speCificatIon of tribes or tribal COIl1I1lUl1ltle<; or parts of or groups wlthm trIbes or trtbal communIties, which are to be deemed for the purposes of the ConstItution to be Scheduled Tribes 111 relatIon to the vanous States and U11Ion terntones In pursuance of these prOVISions, the Itst of Scheduled Castes and / or Scheduled Tnbes are notified for each State and UnIOn territory and are valid only WIthin the junsdictlon of that State or Union territory and not outSIde
It IS important to mention here that under the ConstItution (Scheduled Castes) Order, 1950, no person who professed a relIgion different from Hinduism was deemed to be a member of a Scheduled Caste in addition to every member of the Ramdasl, Kablrpanthi, Majhabi or SlklIgar caste reSident III Punjab or Pahala and East Punjab States Union were in relation to that State whether the}
professed the Hindu or the Sikh religion. Subsequently, in September t 956, by an amendment, the Presidential Order of t 950 and m all subsequent Presidential Orders relating to Scheduled Castes, the Hindu and the Sikh religIOns were placed on the same footmg with regard to the speCIfication of Scheduled Castes Later on, as per the amendment made 111 the ConstItutIon (Scheduled Castes) Order 1990, the HIndu, the Sikh and the Buddhist were placed on the same footing with regard to the recogmtion of the Scheduled Castes
Literate:
A person aged 7 years and above who can both read and WrIte with understanding in any language IS taken as lIterate. A person who can only read but cannot write is not literate. It is not necessary that to be conSidered as literate, a person should have received any formal education or passed any minImum educational standard. Literacy could also have been achieved through adult literacy classes or through any non-formal educational system People who are blind and can read 111 Braille are treated as literates
Work:
Work IS defined as particIpatIOn In any economIcally productive actIvity with or without compensation, wages or profit Such particlpatton may 'be phYSIcal and/or mental 111 nature Work Involves not only actual work but also includes effective supervision and directIon of work. It even Includes part time help or unpaid work on farm, famIly enterprIse or in any other economic actiyJty All persons engaged 111 'work' as defined above are workers Persons who are engaged in cultivatIOn or milk production even solely for domestIC consumptien are also treated as workers. Reference period for determInIng a person as worker and non-worker IS ')De year precedtng the date of enumeratIOn.
Main worker :
A person who has worked for major part of the reference perIod ( I.e. SIX months or more during the last one year preceding the date of enumeratIOn) in any econom,lcally productive activity IS termed as 'Main worker'
Marginal worker :
A person who worked for less than SIX months of the reference period ('i.e in the last one year precedmg the date of enumeration) in any economic activity is termed as 'Marginal worker'.
12
Non-worker :
A person who has not worked at all In any economically productive activity dUring the reference perIod ( i e last one year precedmg the date of enumeratIon ) IS termed as 'Non worker'
Cultivator :
For purposes of the Census a person IS claSSified as cultivator If he or she is engaged 111 cultivatIon on land owned or held from government or held from pnvate persons or institutions for payment In money, kind or share CultivatIOn includes effective superVISion or direction m cultivation A person who has given out her/hiS land to another person or persons or II1stltutlon(s) for cultivation for m~ney, kllld or ~hare of crop and who does not even supervise or direct cultivatIOn m exchange of land, IS not treated as cultivator Similarly. a person worklllg on another person's land for wages In cash or kll1d or a combmatlon of both (agricultural labourer) IS not treated as cultivator Cultivation IIlvolves pioughlllg, sowmg, harvestmg and production of cereals and millet crops such as wheat, paddy, Jowar, bajfa, ragl. etc, and other crops such as sugarcane, tobacco, ground-nuts, tapioca. etc, and pulses, raw Jute and kindred fiber crop, cotton. cll1chona and other medlcmal plants, fruIt growmg, vegetable growll1g -or keeping orchards or groves, etc CultivatIon does not mclude the follOWIng plantation crops - tea, coffee, rubber, coconut and betel-nLlts (areca)
Agricultural labourer:
A person who works on another person's land for wages rn money or kmd or share IS regarded as an agncultural labourer. She/he has no rIsk In the cultivation, but merely works on another person's land for wages An agrrcu Itural labourer has no rIght of lease or contract on land on which she/he works
Household Industry worker:
Household mdustry IS defined as an Industry conducted by the head of the household herself/himself and or by the members of the household at home or within the village 111 rural areas and only wlthlll the precl11cts of the house where the household lrves rn
urban areas The larger proportIon of workers In household industry should consist of-members of the householdjncluding the head The Industry should not be run on the scale of a registered factory whIch would qualIfy or has to be registered under the Indian Factorres Act and should be engaged 111 manufactUring.

processing. servicing and repairs of goods It does not Include professions such as a pleader. Doctor. Musician. Dancer. Waterman. Astrologer. Dhobl. Barber, etc. or merely trade or business. even I f such professIons, trade or services are run at home by members of the household
Other worker :
A person who has been engaged In some economic actIvity during the reference penod but not as a eu Itlvator or agrIcultural labourer or In Household Industry IS termed as a 'Other Worker (OW),. The type of workers that come under tl1l5 category of 'OW' II1clude all government servant!). municIpal employees, teachers, factory workers. plantatIon workers, those engaged In trade. commerce. business, transport. bankll1g, 111 111 mg. constructIOn, political or social V\ork, prIests. entertalllment artists, etc In effect, all those workers other than cultivators or agncu Itura I labourers or household IIldustry workers are 'Other Workers'
Sex ratio:
Sex ratio IS defined as the Number of females per 1000 males
Sex ratio (0-6 Years)
Number of female populatIon III the age group 0-6 Years per 1000 male population III the same age group
Literacy rate :
LIteracy rate of the populatIon IS defined as the percentage of literates III the age group seven years' and above For different age grollp~ the percentage of literates In that age group gives the IlleraC) rate
Work participation rate :
Percentage of workers (both mUII1 and marginal) to total population
Location Code structure adopted in 2001 Census:
One of the important IIlputs 111 census takmg IS asslgnll1g of the Location Code Numbers at various admll1lstrativc levels The Location Code :\lumber IS a si mp I e dev Ice by \V Il1c h every com pact geographical area in any admll1istrntl\ e unIt can be umquely identified. Each such admll1lstratlve umt starting from State right down to the village/ward can be referred to be a comblllation of slIch unique numbers. Untd the 1991 Censlls, a hierarchical codmg system was followed. whereby each admllllstrative
13
unit was coded wlthm the next higher admmistrative lInlt serially and systematically followll1g a geograph Ical order.
In the Census 200 I. the followmg location code structure has been adopted
Area
State! Union terntory
Dlstnct
Sub-District
Village
Town
Ward
Number of digits
Two digits (WIthin the country)
Two digits (wlthlll the State/ UT)
Four digits ('Withm the district)
Eight digits (wlthm the State/UT)
Eight digits (wtthll1 the district)
Four digits (wlthm the town)
The frequent changes 111 district and sub-distrIct admll1istratlve units durmg the It1ter-censal period posed several problems of study 111 changes In growth and distribution of population and their characteristics from one censlIS to another For the Census of India, 200 I, a system of permanent Location Code Numbers (PLCN) has been adopted by asslgnlt1g to each vIllage wlthlll the State/L'T a contll1110llS senes from I to;'\J Each VIllage has been assigned an eight-digit code. The first six digitS represent the code of the vii lage as eXlstll1g at the present census The last two digits bemg '00' are kept for aecommodatll1g future changes 111 case of SPilt of an existing village or creation of new VIllages etc Since the Permanent LocatIon Codes have been assigned to each village. theoretically traclllg the precIse location of Village on account of future Junsd lctlonal changes in the boundaries of variolls adl11l1llstratlve areas wlthll1 the state should not pose a problem It IS Imperative that under thiS schcme, the PLCN assigned to villages at the Census of India, 200 I, are adopted III future censuses also to ensure the comparaoility of the data at the village and other admmlstratlve levels over a long tllne senes
Abbreviations used :
CB
C M.C
EO
GP
INA
Cantonment Board! Cantonment
CIty Muntcrpal Council
Estate Office
Gram Panchayat
Industrial Notified Area

IT.S Industrial Township N.T Notified Town
M Municlpahty NTA. Notified Town Area
M.B Municipal Board STC. Small Town CommIttee
M.C. Municipal Committee TC. Town Committee/Town Area
M.CI Municipal Council Committee
M Corp. Municipal Corporation/CorporatIOn TMC. Town MUl11cipal CouncIl
N.A NotIfied Area TP Town Panchayat
N.A.C Notified Area Committee/ TS. Township
Notified Area Council CT Census Town
N.P. Nagar Panchayat OG Outgrowth
14
SECTION-II-TABLES A-I: NUMBER OF VILLAGES, TOWNS,
HOUSEHOLDS, POPULATION AND AREA


A-I NUMBER OF VILLAGES, TOWNS, HOUSEHOLDS, POPULATION AND AREA
FLY-LEAF
Table A-I is a basIc populatIOn table which corresponds to the General population table A-I of 1991, 1981,1971,i961 & 1951 Census. The table provides the statistics of number of villagesInhabited & uninhabited separately, number of towns, number of households, population by sex, area m Sq Kms, density of population per Sq Kms accordmg to the 2001 Census at State/District/Police Station/ U.A lelty/Town level
Appendix -1 attached to this table presents the territorial units up to police statIOn level m 200 I and their constituent units, as It was in 1991 Census along with the territorial units, which have been changed during 1991 and 2001 Census These are mdlcated In detail In respect of the area added to and subtracted from the corresponding 1991 jurisdictIOn of the unit
A brief Historical Account of successive changes in the area of the state
At the turn of the century, Orissa represented merely a DIvision of the Bengal Presidency and comprised four distrIcts, VIZ, Cuttack, PUrl, Balasore and Angul-cum-Khondmals Besides, there were 17 Feudatory States wlthll1 ItS jUrIsdictIOn. The year 1905 saw the additIOn of Onssa of Sambalpur distrIct and two Feudatory states of Chhotnagpur, VIZ, Gangpur and Bonai and five Feudatory States from Central Provinces, viz, Patna, Kalahandl, Sonepur, Bamra and Rairakhol By the time the 191 1 Cenus was taken up, the Orissa DiVIsion had 5 distrIcts and 24 Feudatory states Immediately thereafter, I e 111 1912, the Bihar and Onssa ProvlI1ce was formed after the separation of their JUrIsdiction from the Bengal presidency. The composite provlIlcc of Orissa & Bihar contll1ued till 1936 When OrIssa assumed the status of a separate Province It had SIX distrIcts, VIZ., Cuttack, Puri, Balasore, Sambalpur, GanJam and Koraput.
The old dIstrict of Angul-Khondmals was splIt and merged 111 Cuttack and Ganjam respectively. The
17
Ganjam district of Orissa constituted a portion of the
pre-existing GanJam distrIct of Madras Presidency,
viz, Ganjam Agency and a large area of the Ganjam
Plams excludmg Chlcacole, Ichhapur, Sompeta and
Tekkali The area of Orissa Provll1ce as In 1936
was 32,198 sq.mIles A large portion of
Vlzagapatnam Agency constituted the Koraput
distrIct Sambalpur d,stnct gained the Khanar
Zammdari and a portion of Borasambar Zamlndarr
of the Central Provinces, which became the
Nawapara Sub-divIsion.
No territorral changes 111 the constitution of the
State or d,strrct took place for over ten years In the
years 1948 and 1949, all the prmcely States of Onssa
merged with the rest of Orrssa This admll11stratlve
change was legalized on the I st August 1949, when
the 24 ex-States were formally merged with the
Province under the State Merger (Governor's
Provll1ces) Order, 1949, II1creasrng the area of the
state to what It IS now. The ex-States which thus
merged are Athgarh, Tlgirra, Baramba, Narsingpur,
Nrlgrrr, Nayagarh, Daspalla, Khandpara, Ranpur,
Bamra, Ralrakhol, Dhenkanal, Talcher, Pallahara,
Athmallik, Hmdol, KellduJhar, Baudh, Patna, Sonepur,
Gangpur, BonaL Kalahand(and Mayurbhanj
The ex-States of Athgarh, Tlglna, Baramba and
Narslllgpur were Joined with Cuttack dlstrrct; NrIglfl
with Balasore district. Nayagarh, Daspalla,
Khandpara and Ranpur with PUrl district and Bamra
and Ralrkhol with Sambalpur district The Angul
Sub-division of Cuttack dlstnct was separated from
that district ThiS sub-division and the Feudatory
States of Dhenkanal, Talcher, pallahara, Ath'mall!k
and Hrndol were constituted into one district, namely . Dhenkanal The Khondmals and Ballguda agency
areas of GanJam district were taken out and together
With the ex-State of Baudh formed the distrIct of
Baudh-Khondmals The Nuapada Sub-diVISion was

separated from Sambalpur district and was put together wlth the ex-State of Kalahandl to form another dlstnct named Kalahand1. The two ex-states of KenduJhar and MayurbhanJ formed each a separate district with theIr names as such The exStates of Sonapur and Patna were formed into one dIstrict namely Bolangir, whIle the ex-States of Gangapur and Bonal together formed the present Sundargarh dIstrIct. Thus, 13 dIstrIcts had been formed after the merger of the ex-prIncely states by the tIme 1951 Census was taken.
No changes had taken place In the State boundary sInce 1961 However the d Istnct boundaries were changed durmg the decade 1961-71 as per detaIls below
Cuttack, Dhenkanal and Puri
Two vdlages namely, Kabatabandha and Goliamuhapatna were transferred from Gondla PolIce StatIOn of Dhenkanal dlstrict to Dharmasala PolIce StatIon of Cuttack dIstrIct
A portion of Gania PolIce StatlOn of Pun distrIct, Ie, Jorumguma (conslstll1g of 3~ villages sItuated at the northern bank of fiver Mahanadl) was Included In Narsingpur Police StatIon of Cuttack distrIct. Again 31 villages of Kakatpur police station of Puri district transferred to Balikuda police statIOn of Cuttack dIstrIct
28 villages of Sadar police station of Cuttack dIstrIct were transferred to CapItal polIce statIon of Bhubaneswar of Pun dIstrict
Kalahandi and Koraput
Kaslpur police statIon of Sadar-Sub-dlvislOn of Kalahandl dIstrIct was placed under the Rayagada Sub-dIvIsIon of Koraput dIstrict The Junsdiction changes of the distnct boundary were made for the convenience of the admmlstrative reasons No dIstrIct boundary was changed durmg the decade 1971-81 and 1981-91 A massive change in the reorgamzatlon of dlstncts took place dunng the decade 1991-2001 111 whIch the number of dIstricts IIlcreased from 13 to 30 The Boundary at the level of districts, Police stations changed dunng the penod of 1991-2001 were shown in the Appendlx-l
18
Disputed villages : Orissa - Andhra Pradesh
The jUrIsdIctIon over some vIllages 111 Pottangl police statIon of Koraput dlstnct commonly known as "Kotlya Group of Villages" has been under dIspute between OrIssa and Andhra Pradesh The matter IS pendIng for decIsIon by the Supreme Court The Census enumeratIon of 200 I has been completed in thIS disputed area through the census agencIes of both the states 111 pursuance of the Instructions of RegIstrar General and Census CommIssioner, IndIa
Another unsurveyed track under the name of 'Borra' along wIth hamlets under Padua Police statIon of the same Koraput dIstrIct of OrIssa has also been a subject matter of inter-state boundary dIspute between Ortssa and Andhra Pradesh A case was agItated In the Supreme Court The case is sub JudIce at present The area forms a part of Onssa as per the claim of Onssa Govt and thIS area has been shown In the state map publIshed by the state Govt BeSIdes, III the state map of OrIssa publIshed by the Surveyor of India dunng 1977 a tract has also been marked -, DIspute" SlIlce the final verdict of the court has not been pronounced by the Supreme Court, census operatIon has been carried out through the census agencIes of both the states in these areas under the II1structlOns of the Registrar General and Census CommISSIoner of India
The JUrIsdIctIOn of Govt of OrIssa over Manikapatana village of Garabandha PolIce statIon of Gajapatl dIstrIct (Ill the erstwhIle Ganjam dlstnct) is also dIsputed by Government of Andhra Pradesh The census operatIon has also been carned out 111
these vIllages separately by Director of Census OperatIOns of OrIssa and Andhra Pradesh In pursuance to the I nstructlons of the Census CommISSIoner of India The Inter-state boundary dIspute Involved In thIS case has not come to any settlement
A statement showing the lIst of vIllages under dIspute by the Government of Onssa and Andhra Pradesh together With the locatIOn code numbers and 200 I census populatIon of each vIllage as reported by both the States IS furmshed below .

STATEMENTSHOWINGTHENAMESAND POPULATIONOFTHE DISPUTED VILLA GESCOVEREDBYTHE
2001 CENSUS OPERATIONS OF BOTH THE STATES OF ORISSA AND ANDHRA PRADESH
Villages covered by the Census authorities of Orissa Villages covered by the Census authOrities of Andhra Pradesh Remarks
SI Name of Village Location Population Name of Village Location code Population No code No as per 2001 No
Cen~u~
2 3 4 5 6 7
"A' Kotlya Group of Kotlya Group of Villages under
Villages Vnder Pottangi Salur Mandai of VlZlanagaram
PS-0014 of Koraput DlStnct-29 District
Phagu nsenary 04944700 235 Pagu Iachennuru 01337800 250 ( Pagulchenaru)
2 Phattu~enar) 04944800 158 Pattuchennuru 01337600 177 ( Patuchenaru)
3 Mahlpam 04944900 43 Maipalle 01337500 49
4 Hannandan gl 04945000 170 Yeguvamendangl 01338100 178
5 Konadora 04945100 115 Konadam 01337700 109 ( I ) Ilamlet of
(Kandora) Sollplguda village (population given IS for hamlet only)
6 Solapguda 04945200 108 Soliplguda 01337700 110 (2) Population
(Salapguda) given I~ for maIO Village excludmg 1(<; hamlets
7 Dohamba 04945300 202 Dohyamba 01337900 202
8 Barnapadu 04945400 UI Barnaguda 01339100 1;1
( Barnaguda)
9 Madkar(Markar) 04945500 247 Mudakaru 01339200 243
( Madakaru)
10 GanJaJpadar 04947100 780 Gan)albhadra 01339400 193 (3) Population given fur main Village excludmg Its hamlet,
II Kotlya 04947200 506 Kotlya 01339300 251
12 Up perpsem bl 04947300 174 Yeguvasembl 01339700 171
(Eguvasembl)
13 Tala<;embl 04947400 123 Diguvasembi 01339800 326 (4) PopulatIOn
( Dlvasembl) given f or entire Village including Its hamlets
14 Dhullpadar 04947600 179 Du hbhadra 01339600 173 (5) PopulatIOn given for maIO Village excludmg Its hamlets
IS ArJuvalsa 04947700 103 ArJuganlvalasa 01341800 103 (6) Hamlet of Kurukuttl Village (population given IS for hamlet only)
19
STATEMENT SHOWING THE NAMES AND POPULATION OF THE DISPUTED VILLAGES COVERED BY THE
2001 CENSUS OPERATIONS OF BOTH THE STATES OF ORISSA AND ANDHRA PRADESH
VIUages covered by the Census authorities of OrIssa VIllages covered by the Census authOritIes of Andhra Pradesh Remarks
Sl Name ofYI!I~ge Locallon PopulatIOn Name ofYlIlage LocatIOn code PopulatIOn No code No as per 200 I No
Census
2 3 4 5 6 7 8
16 Sldlvalsa 04948000 U[ Cheedlvalasa 01339400 72 (7) Hamlet of GanlaJbhadra village (populallon gIven I~ tor hamlet only)
17 Narlavalasa(N ard 04947800 43 NerallIvalasa 01339900 43 (8) Hamlet of avalasa) Sankl vIllage
(populallon gIven IS for hamlet only)
18 Tadlvalsa 04947900 348 Tadlvalasa 01341800 181 (9) Hamktof Kurukuttl VIllage (populatIOn gIven IS lor hamlet only)
19 Pamkl 04948100 147 Panlkl 01339600 83 (10) Hamlet of DulIbhadra VIllage (population gIven IS tor hamlet only)
20 Ranasmgl 04948200 152 Ranasmglpadu 01339900 153 (II) Hamlet of Sankl VIllage (population gIven IS for hamlet)
21 Sirnagedaa Hamlet of Slmrnagedda 01339900 57 (12) Hamlet of village Sankl vIllage
Ranasmgl (populatIon gIven (LC No IS for hamlet
04948200) only)
"B" Borra Borra group of Village under V t1lages under Pa.duaP.S.- Ananthagiri 00t5 of Koraput Mandai of Dlstnct-29 Y IS akhapatnam
District
Borra 04968700 697 I Borra 01512400 444
2 Ran gIn Igu da Hamlet of 2 Ranjahguda 01513300 21 VIllage (Rangimguda) Borra
3 Phuluguda -do- 3 Pooluguda 01512900 127
4 Korthoguda -do- 4 Kotyaguda 015 t 1900 117
5 Mlmambo -do- S N mn Imamldl 01518400 145
6 Jeruguda alias -do- 6 Jeerugedda Hamlet Janguda of vIllage
Borra
7 Upper Mallput -do- 7 Eguvamamldl 01512200 80
alIaS Upper Mandl
20

STATEMENT SHOWING THE NAMES AND POPULATION OF THE DISPUTED VILLAGES COVERED BY THE
2001 CENSUS OPERATIONS OF BOTH THE STATES OF ORISSA AND ANDHRA PRADESH
Villages covered by the Census authorities of Orissa Villages covered by the Census authorities of Andhra Pradesh Remarks
SI Name of VIII age Locauon code No
PopulatIOn as per 2001
Census,
Name of Village Location code PopulatIOn No No
2 3 4 5 6 7 8
8 Talo-Maltput alias G ategu da
9 Konta Semll!
-do- 8 Getuvalasa 01512100 416
-do- 9 Dlppa1apadu 01512200 Included III
Eguvamarmdl village
10 Bodlhguda alias
Bathll!badl
-do- 10 Bodlhbadl 01511900 Inc luded III
Kotyaguda Village
J J Dolapur -do- 1 J Dekkapuram 01511700 56
"cn MaOikapatana Village under Garabandha P.S.- 0006 of Gajapatl Dlstrlct- 20
Manikyapatna m Village under Mandasa MandaI of Snkakulam District
Mamkapatana 03456400 125 M anlkyapatnam 01131500 45 Hamlet of Smgupuram vIllage (populatIOn given IS for hamlet only)
Area Figures
One of the Important statIstical information
provIded in Table A-I is the statistics of area gIven In
sq. kms as In 1971,1981, 1991 Census, so also In 2001
Census, area (Total) figures are presented at the level
of State, DIstrict, police Station, City, Urban
Agglomeration and Town level
The area figures at State and District level are
supplIed by the Surveyor General, ,India The total area
of the State shown in 200 I is the same as was in
1991 and 1981 Census
The area figures below the district level are
supplied by the local authority. The area figures of
21
towns/cIties/agglomeration are supplIed by the local
bodIes Therefore the area figures of urban area of
the distrIcts are compIled by adding of the area
figures of each town of the distrIct supplied by the
local bodIes The total urban area figure was
subtracted from the total area of the distrIct supplted
by the surveyor General, IndIa to obtain the rural
area figure of the dlstnct DIstrIct Rural/Urban area
figures thus arrived were added up to g.lv~ rural/
urban area figures of the state but sub total of rural
area figures of each police statIon may not be equal
with the figures of rural area of the dIstrIct The
area figures of the State Since 190 I III sq kms are
given below

Year Area in Sq Km of Onssa
1901 62,75052
1911 108,23351
1921 108,21538
1931 108,13768
1941 148,64528
Statement-l given below presents the
geographical area figures as supplied by Surveyor
Year Area 10 Sq Km of Onssa
1951 155,75224
1961 155,82476
1971 155,842.00
1981 155,70700
1991 155,70700
2001 155,70700
General, India for the 200 I Census along With ranh.lI1g of the dlstnct as per area figures
STATEMENT-I Ranking of district In terms of area
State/District Area m sq km given ProportIOn to total Rankmg of by Surveyor Generdl area of state State/DistrIct
2 3 4
ORISSA 155,70700 10000 I Bargarh 5.83700 375 12 2 Jharsuguda 2,081 00 134 29 3 Sambalpur 6.65700 428 9 4 Debagarh 2.94000 189 23 5 Sundargarh 9.71200 624 2 6 KenduJhar 8.30300 533 4 7 Mayurbhanl 1041800 669 8 Baleshwar '380600 244 20 9 Bhadrak 2.50500 161 27 10 Kendrapara 2.64400 170 26 II Jagat Smgh Pur 1.66800 107 30 12 Cuttack 3,93200 253 17 13 Jajapur 2,89900 186 24 14 Dhenkanal 4,45200 286 15 15 Anugul 6.37500 409 11 16 Nayagarh 3.89000 250 18 17 Khordha 2,81300 181 25 18 Pun 3.47900 223 21 19 GanJam 8,20600 527 5 20 GaJapatl 4.32500 278 16 21 Kandhamal 8,021 00 5 15 6
22 Baudh 309800 199 22 23 Sonapur 2.33700 150 28
24 Balanglr 6.57500 422 10
25 Nuapada 3.85200 247 19
26 Kalahandl 7.92000 509 7
27 Rayagada 707300 454 8
28 Nabarangapur 5,291 00 340 14
29 Koraput 8.80700 566 3
30 Malkangm 5.79100 372 n
22

a: :::l 0-
-, Z 0:
0: « «
«
T"'"
« ~~ ~~
:r:
0
:r: ~ ~
::.::: CJ~
0:
0:C!> :r: 0 « zl--(J)""'" ~~
0
« :::lC')
:::lCC! UJ~ 0:
_0
CJ~ o~
>-CD
(J) •
N
...IN 0"- « 1-"""
0: 0 ZLO
« « «CC! a..~ «
... «~ UJ
:2 CO :::c
« 0 CJ
CO :r:
0 CD ::.:::
CO 0:12 « ::.:::
UI 0:
Z
0 -, ~~
:::l
Z
UI « ~ (J)
UJ ~f6
CJ 0 ._ «~
::.::: ...J
a.. 0:
:::lC\l «
0 :::l co~
() Z
~~ LlJ
~&;
0
... « «co
z«l
CO CO(\!
0 :2...t
UJ(\!
G> :::l
I
a.. CJ ~ «
0
<t :::l~
(J)
Cf)":?
...J
0:
:J~ CJO :J~ Z . «""'"
- « CO .... :r: -,
0 I-0 I .... ~ ~ Ul CJLO .... 0:1'-: 0 «C') ._ CO '-.... UI Q; ._ C
CJ z ~
..... ~~ 0
...JC') «
G> :2 a.. CO .c I-
Ul :::l a... cfi
G> «CD
0') 0:CC! all)
CO ::.::: ... 0:
c:
:2
Q,)
:::l
«~
0-
-, 0
0 «
zl=;j
CJ ~
« .
a.. z 0
CJLO
G> «~
a. 0: .
i=
«C') «
~ ~
CO 0
« « ~
«co
z CJ 0
-,1'-:
«;:;Ii
...J «N
>- .
« CJ
«""'" is
~~
0: ~ ~ « 0:
ILO
IC!> ~ ~ a ~
or:
:3:;j 0: B~
ZLO
a. I--Z 0 ~ ~
«
~
«N :::lC!> ::.:::
«~ ...JC'.! «0 «~
:::lC\l «""'" z~ co.,....
z co a Cf)
23

As given in the Staement-I above, it is revealed
that Mayurbhanj district havmg an area of 10.4 18 sq.kms
ranks first among all the districts of the state with a
percentage share of 6 69 to total area of the state
District Jagatsmghapur ranks last with an area of 1,668
sq. kms shanng 1.07 percent of the total area of the
State.
Urban Area
It may be mentioned here that for the first time
In Census all census data were presented separately
for rural and urban areas 111 1951 A fairly strict
definition of urban area was adopted 111 India from
1961 Census. For the 2001 Census the defillltion
adopted for an urban area was by and large the same
as that of 1961, 1971,1981 and 1991 censuses All
places With a Municipality and Notified Area Council
were treated as towns. All other places, which satisfy
the following cnteria, were also treated as an urban
area
(i) a minimum of 5,000 population
(Ii) at least 75 per cent of the male working populatIOn engaged m non-agricultural (and allied) actiVity and
(iiI) a denSIty of population of at least 400 persons per sq km (or 1,000 per sq mile)
A town with a populatIOn of 100,000 and above
was treated as cIty.
As already mentioned that the cntena of urban
areas from 1961 census to 1991 census was almost
same except that of classification of workers, where
25
workers engaged fishlllg, Itvestock, huntlllg fogging,
plantations and orchards etc (fallmg tn Industnal
Category III) were treated as non-agncultural actiVities
in 1961 and 1971 censuses but in 1981 and 1991
censuses workvrs engaged 111 these categories were
treated as non-agricultural activities for the purpose
of classification of male worklllg populatIOn The
procedure as mentioned below was followed to
consider a place as town other than the notified town
i e MuniCipality and Notified Area Counctls
All villages of 1981 census which had a population
of 4,000 and above, a population denSity of 400 persons
per sq km and haVing at feast 75 per cent of male
workll1g population engaged in non-agricultural activity
were considered as towns For calculatll1g the 75 per
cent of male workll1g population engaged 111 non
agncultural activity, only mam workers were taken II1to
account Agncultural workers Include cultivators,
agricultural labourers and workers in tndustnal
category III, namely, livestock, forestry, fishlllg, hunting
and plantations, orchards and allied activities. Sl11ce
the number of workers in Industrial Category III was
not avatlable from the Vtllage Primary Census Abstract
a special tabulation had to be undertaken to ascel1ain
the population of male non-workll1g population for the
purpose of the test of 75 per cent male working
population This test was also applted to those towns,
which had become census towns for the first tllne 111
1981 census and those statutory towns, which were
denotlfied by the concerned local authOrities after the
1981 census

ThIS was done to find out whether these towns could be considered for retentIOn as census towns for the
I 991 census.
In the statement-2 below, the changmg defimtlOn of towns between 1891-200 I IS given.
STATEMENT-2 Criteria for places to be treated as Towns 1891-2001
2001
(a) All places with a MUnicipal Corpaoratl on,MunlclpalIty, Contonment Board or Notified Town Area Committee etc (b)AIl other places which satisfied the follOWIng criterIa (i) a mInimum populatIOn of5,000 (ii) at least 75 percent of mal e workl ng populatIOn engaged In non-agncultural pursuits, and (iii) a density of populatIOn of atleast 400perSqKm (1,000 per SqMlle) The DIrectors were also gIven some discretion I n respect of some margInal cases to Include In consultation with the State Governments, some places that had other distInct urban characterIstics
1941
7 MUnICIpal CorporatIOn MunICipal Area All CivIl hnes not Included m MUniCipal limits Cantonment Every contmuous collectIon of houses InhabIted by not less than 5,000 persons, which the provmclal Supen ntendent may deCide to treat as a town
1991 1981
2 3 (a) All places with a MUniCipalIty Corpaoration, Contonment Board or Notified Town Area Committee etc. (b)AIl other places which satisfied the follOWIng CrItena
(a) All places With a MUniCipality CorpaoratlOn, Contonment Board or Notified Town Area Committee etc (b)AII other places which satisfied the follOWIng critena
(i) a mInimum populatIOn of5,000 (ii) at least 75 percent of male working populatIOn engaged In
non-agricultural PUrsUits, and (ill) a denSity of populatIOn of atleast 400 per Sq Km. (1,000 per Sq Mile) The DIrectors were also gi ven some discretIOn m respect of some margmal cases to Include In consultatIOn with the State Governments, some places that had other dlstmct urban c haractenstl cs
1931
8 MunICIpal CorporatIOn MunIcIpal Area All CIVil lines not Included m MUnICIpal lImIts Cantonment Every other contInUOUS collectIOn of-h~uses mhablted by not less than 5,000 persons, whIch the provIncial Supenntendent deCide to treat as urban in makmg thIS deCISion consideratIOn was given to (a) the character of the populatIon (b) relatIve denSity of dwellt ngs, (c) Imprortance In trade histonc aSSOCiatIOns and to a VOid treatIng as towns overgrown Villages Without urban characatenstlcs
26
(i) a mmlmum populatIOn of5,000 (ii) at least 75 percent of male workIng popOlatlOn engaged m nonagncultural purSUits, and (iii) a denSity of populatIOn of atleast 400 per Sq Km (1,000 per Sq Mile) The Directors were also gl ven some
d Iscrellon In respect of some marginal cases to mclude m consultatIOn With the State Governments, some places that had other dlstmct urban charactenstlcs
1921
9 MUnICIpal CorporatIon MunICIpal Area All Clvlllmes not mcluded m MUniCipal lImits Cantonment Every other contmuous collection of houses Inhabi ted by not less than 5,000 persons, wh ich the prov mCI al Supenntendent may decide to treat as a town for Census purposes. In Indian States whether there were no MUnIclpalttles, thiS definItIOn was reqUired to be extenSively applIed Note , " In deal! ng With questions ansmg under head (6), the provmclal supenntendents will have regard to the character of the populatIOn, the relative denSity ofthe dwellIngs, the Importance of the place as a centre of trade and It'S hlstonc associations and will bear In mInd that It IS deSirable to treat as towns over grown Villages, whIch have urban cha ractenstlcs"

STATEMENT-2 Criteria for places to be treated as Towns 1891-2001
1971
4
- MUnicipal CorpaoratlOn 2 - MUnicipal Area 3 - Town Committee 4 - Notified town Area Committee 5 - Cantonment Board 6 - Selected Places with
1961
5 1 - MUniCipal CorpaoratlOn 2 - MUniCipal Area 3 - Town Committee 4 - Notified town Area Comm Ittee
. 5 - Cantonment Board 6 - Selected Places with
(a) density of not less than 400 persons per Kms
(a) denSity of not less than 1.000 persons per Sq Mile
(b) a population of 5,000 (c) three fourth of the workIng population should be outside agncult ure
(b) a populatIOn of 5,000 (c) three fourth of the workmg populatIOn should be outside agnculture
(d) or any other place which according to the Director possesses pronounced urban charactenstlcs and amenities
(d) or any other place which accordmgto the SuperIntendent of the State possesses pronounced urban characterIstics and amenltl es
1911
10 M u nI clpal Corporat Ion MUniCipal Area All CivIl hnes not Included In :\1unIclpallImlts Cantonment Every other continUOUS collection of houses Inhabited by not I ess than 5,000 persons, which the provincial Superi ntendent may decide to treat as a town for Census purposes, Note However a few places chiefly In the native states which did not satIc;fy the requirements were treated as towns for special purpose "The provincial superIntendents were however mstructed when considenng the question of treatmg places as towns on the baSIS of their popu latlon to take care to exclude such as are merely overgrown Villages and have no urban features It IS true that the discretIOn thus allowed has occasIOnally I ed to a certal n want of uniformity
1901
11 MUlllclpal Corporation Municipal Area All CivIl hnes not Included In MUniCipal limits Cantonment Every other continUOUS collectIOn of houses permanently inhabited by not less than 5,000 persons, which the provincial Supermtendent may deCide to treat as a town for Census purposes
27
1951
6 M UnlCI pal C orporatl on M un IClpal Area Town Area Committee ClvtllInes not Included in MUniCipal lImits Cantonment Test prescribed for dlstmgUl shmg towns from VIllages In dIfferent States were based on ideas common to all states, but they were not Identical nor had they been applied with meticulous Uniformity In case of pnncely states the defi nItl on of town was applIed a lIttle IndlscrImmately
1891
12
Municipal CorporatIOn MUniCipal Area as any place brought under some SimIlar regulatIOn for polIce or sanitary purposes Cantonment (a) Every place where the proportIOn of the trading and Industnal populatIOn to the total IS eq ual to or greater than that of the agrIcultural populatIOn. (b) Every other continUOUS group of houses mhablted by not less than 5,000 peop Ie
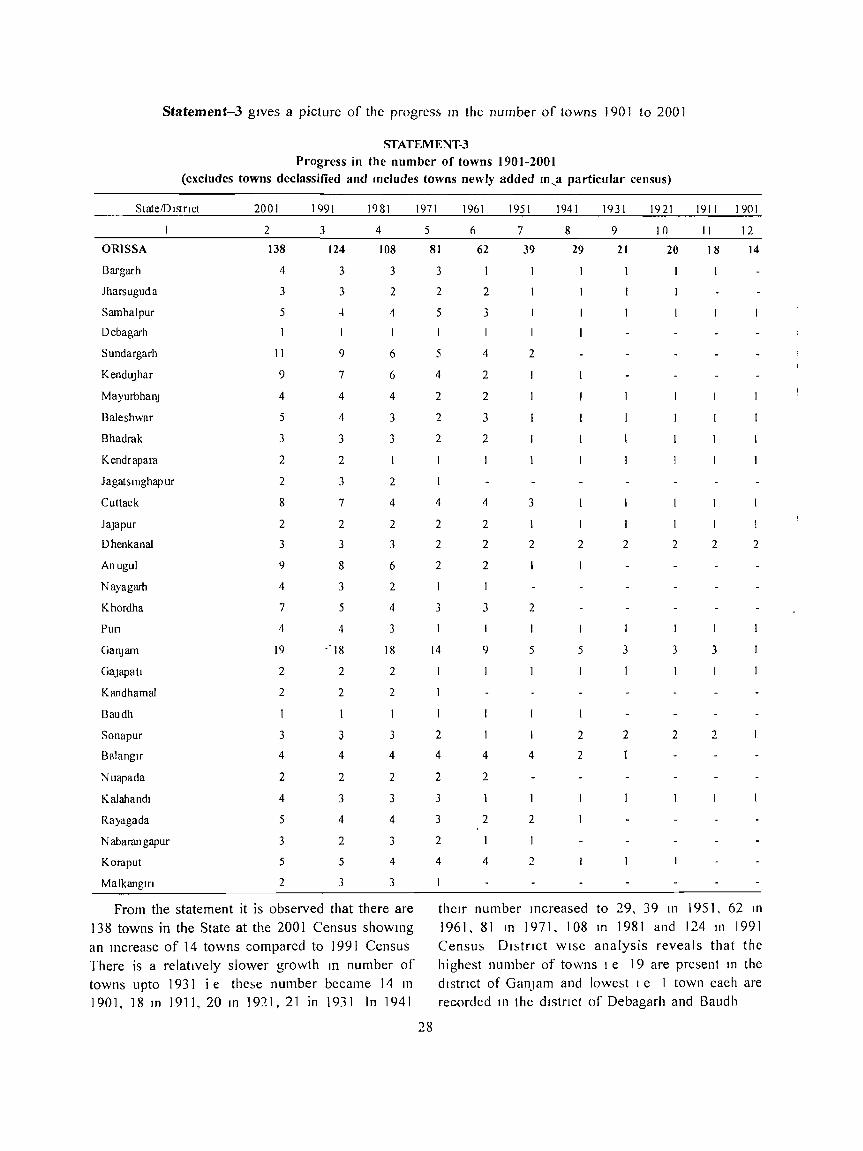
Statement-3 gives a picture of the progress III the number of towns 190 I to 200 I
STATEMENT-3
Progress in the number of towns 1901-2001 (excludes towns declassified and Includes towns newly added In,a particular census)
State!I) Istnct
ORISSA
Bargarh
Jharsuguda
Sambalpur
Debagarh
Sundargarh
KenduJhar
MayurbhanJ
Baleshwar
Bhadrak
Kendrapara
Jagatsmghapur
Cuttack
JaJapur
Dhenkanal
Anugul
Nayagarh
Khordha
Pun
GallJam
GaJapatl
K!lI1dhamal
Baudh
Sonapur
Balanglr
~uapada
Kalahandl
Rayagada
N abar'dI1 gapur
Koraput
Malkangm
2001
2
138
4
3
5
11
9
4
5
3
2
2
8
2
3
9
4
7
4
19
2
2
3
4
2
4
5
3
5
2
1991
3
124
3
3
4
9
7
4
4
3
2
3
7
2
3
8
3
5
4
'-18
2
2
3
4
2
3
4
2
5
3
1981
4
108
3
2
4
6
6
4
3
3
2
4
2
3
6
2
4
3
18
2
2
3
4
2
3
4
3
4
3
From the statement it is observed that there are
138 towns in the State at the 200 I Census shOWIng
an II1crease of 14 towns compared to 199 I Census There is a relatively slower growth In number of
towns upto 1931 I e these number became 14 In
1901, ]8 III 19]1,20 III 1921,21 in 1931 In 1941
1971 1961 1951 1941 1931 1921 1911 1901
5
81
3
2
5
5
4
2
2
2
4
2
2
2
3
14
2
4
2
3
3
2
4
6
62
2
3
4
2
2
3
2
4
2
2
2
3
9
4
2
2
4
7
39
2
3
2
2
5
4
2
8
29
2
5
2
2
9 10 II 12
21 20 18 14
2 2 2 2
3 3 3
2 2 2
their number lIlcreased to 29, 39 111 1951, 62 In
1961, 81 In 1971, 108 III 1981 and 124 In 1991 Census District wise analysis reveals that the
highest number of towns I e 19 are present In the
distrIct of GanJam and lowest leI town each are recorded 111 the distrIct of Debagarh and Baudh
28

The progress of urban populatIon of the State and Dlstnct durmg 190 I and 200 I Census IS revealed m Statement-4.
STATEMENT-4
Progress in Urban populatIOn of state and dIstricts 1901-2001
State!Dstnct 2001 1991 1981 1971 1961 1951 1941 1931 1921 1911 1901
2 3 4 5 6 7 8 9 10 II 12
ORISSA 5,517,238 4,234,983 3,110,287 1845,395 1109650 594,070 412,528 317,254 281,498 275159 254,684
Bargarh
Jharsuguda
Sambalpur
Debagarh
SundargartJ
KenduJhar
MayurbhlDlJ
Baleshwar
Kendrapara
J aga t Sin gh lip u r
Cuttd('k
laJapur
Dhenkanal
Anugul
Nayagarh
Khordha
Pun
GanJam
Ga.J3patl
Kandhamal
Baudh
Sonapu r
Balangu
Nuapada
Kalahandl
Rayagada
Nahamngapur
Korapul
MalkanglrI
103.541
185,885
253778
20,096
629194
213,023
155,700
220,368
141,071
74,137
104,449
641130
72, 980
92,914
158416
37066
805,706
204,028
556,359
52,888
44,094
18025
40,068
154,323
30,038
100,219
115,407
59270
1<)8449
34 (;16
80,547
159,328
205.458
17 .275
525005
166 874
116249
154,152
109,841
63235
76,092
485861
53,431
78 112
110,123
26,244
516,281
163.479
423,753
46.769
35662
15.458
34,830
129.420
25,765
78163
89.326
42,1 17
171,705
34.428
59376
108892
171,584
13,581
409,333
126,356
90,53R
97524
8R,439
27564
54, IIi 8
351,094
43,167
61,324
62,390
15,637
293,014
123.428
338,893
41,496
25,172
12589
28 381
104 844
21,394
59.147
70,735
39,817
137625
32,785
39,231
56544
117,090
8,906
239,685
67347
39951
52,950
47,204
20,079
6,705
24 R,286
30553
30965
20,847
5,209
146,489
77,449
232,939
26,917
10677
8891
14501
721()2
16,877
39,676
42,540
23,56'i
93,660
7,494
It IS shown from Statement - 4 that the urban
populatIOn of the State II1creased from decade sll1ce
1901. In the beglllnlllg part of 20th century i e in 1901
Census, the urban population was only 254,684 dunng
the State Dunng the span of 100 years the urban
populatIon has IIlcreased about 22 times of population
recorded In 1901. The urban popu latlon 111 2001 Census
IS 55,17,238, which is 1499 per cent of total populatIon
(368,04,660) of the State. In the statement. It is
15.375
35,423
57,7,8
6,839
135760
31,964
9,197
13,405
23525
5,711
15367
9,343
28420 9,277
57,214 22851
34,691 18795
15!!30 12253
8,236
8,032
7,085
7077
17.079 15017
6,537
9,004
8,281 6,193
19,405 17,843
19,550 18,283
I 1,880 1262()
'i.204
5,109
13 ,594
4 (,89
12981 12870
6 189 5,lJ68 5613
17,037 21 362 20,880
18 175 18,578 18,518
14,614 l'i 113 15,245
172 97(1 113,351 74,291 65263 51 007 52528 51,364
197911102611,18810,(173110151224112,111
23,203 18,267 15,653 14043 11,463 12,520 12,397
23885
5,815
9,189
(i),776 26487
6,002
60 815 49057 41,055 37,568 38,694 39 (;86 49334
133,136 92043 69,121 49,513 43,356 42,410 25,72'1
22 708 22,270 21,042 20,072 18719 18,370 17336
(J 08S
7108
42551
14,273
1430n
24717
5498
735A
33337
I I 807
18413
7302
28. 943
5740
12890 11,832
16757
10,863
7.416
6,473
7,174
11277 12768 8887
6.376 5945 4,400
10380
41,874 12,504 10,525
29
revealed that after the reorganIzation of districts II1tO 30. the urban populatIOn was found fIrst tllne In 1971 111 the dlstnct of Jagatsinghapur, Kandhamal and Malkangm Similarly 111 the dlstnct of :\'ayagarh and Nuapada urban population was conducted for the first tllne 111 1961 Census and 111 Sundargarh, Khordha and Nabarangapur 111 1951 Census In 2001, the hIghest urban populatIon IS recorded 111 the district of Khordha Ie 8,05,706 and the lowest urban population 1<;
recorded 111 distnct of Baudh I e 18,025

The quantum increase In urban population of State and District In towns of indices IS presented In statement-5 The population of 1901 Census or the year
in which the urban population IS counted for the firs1 time IS taken as base to facilitate an easJ comparison With subsequent census data of urban population
STATEMENT-S
Indices in growth of urban population of State and Districts 1901-200 I base (190 1-100)
StatelDlstncl
ORISSA
Bargarh
Jharsuguda
Sambalpur
Debagarh
Sundargarh
KenduJhar
Mayurbhanl
Baleshwar
Bhadrak
Kendrapara
J agalstnghapur
Cuttack
JaJapur
Dhenkanal
Anugul
Nayagarh
khordha
Pun
GllJapatt
Kandhamal
Baudh
So nap ur
Balanglr
Nuapada
Kalah and I
Ray agad a
N abaran gap ur
Koraput
MalkangJrl
2001
2
2,166
2,208
3,638
1,972
307
4,094
2,366
2,774
1,055
762
486
1,558
1,248
603
749
2,639
637
3,042
414
2,162
305
413
314
451
2,384
210
2,278
1,556
812
2,052
462
1991
3
1,663
1,718
3,119
1,596
264
3,416
1,853
2,071
738
593
415
1,135
946
441
630
1,835
451
1,949
331
li47
270
334
269
392
1,999
181
1776
1,205
577
1,776
459
1981
4
1,221
1,266
2,131
1,333
208
2,664
I 403
1,613
467
478
181
808
684
356
495
1,039
269
1,106
250
1,317
239
236
219
319
1.620
150
1,344
954
545
1.423
437
1971
5
725
837
1 107
910
136
1.5 6()
748
712
254
255
132
100
483
252
250
347
90
553
157
905
155
100
155
163
1,115
118
902
574
323
969
100
The indices as depicted In statement-5 reveals
that there has been a contmuous increase in urban
population at the State level and In most of the dIstricts Among the distrIcts 10 200 I census, the indices of Sundargarh distrIct is the highest in order
30
1961
6
436
328
693
449
105
883
355
506
274
187
104
337
163
187
398
100
252
123
517
131
106
80
657
100
325
333
142
433
1951
7
233
196
261
IX3
87
100
104
165
109
101
80
221
91
147
153
100
99
358
128
96
83
515
268
248
100
299
1941
8
162
176
157
133
100
100
148
93
106
78
145
126
100
83
2(,9
121
100
145
259
247
100
129
1931
9
125
15 I
139
I 17
110
85
99
83
127
88
113
76
192
116
133
100
163
109
1921
10
I II
III
100
106
110
82
98
96
99
91
91
78
169
108
117
145
100
1911
II
108
100
101
106
102
100
102
101
101
80
165
1()6
144
135
1901
12
100
100
100
100
100
100
100
100
100
100
100
100
100
100
of urbanIZatIOn although dlstnct of Khordha had maXlITIum number of urban population as per the statement-4 The lowest mdlces of urbanIzation JO
2001 are notIced In Nuapada distrIct among all the distrIct of the state

Rural Area
It IS customary in census to present census statistics by rural/urban break up. In ordll1ary sense rural area means the populatIon that live 111 vtllages For census purpose, the vIllage is always the revenue village, which is the ultimate unit of area into whIch the country is dIvided for purpose of land revenue The hamlets do not have definite boundarres or areas distinctly marked or allotted to them The hamlets are sItuated wIthin the areas earmarked for the vIllage.
The entire revenue village is one Untt but there may be unsurveyed villages wlthrn forests, etc whIch mainly comprtse tribal people, forest labourers and theIr famtlles Such forest villages have also been treated as villages. So the mhablted villages shown under column 3 of table A-I include not only revenue vIllages having resIdential populatIon but also IIlhablted forest vIllages.
The Statement-6 reveals the total number of vIllages
in each distnct along with the total of uninhabited
Statement-6 shows the State and Dlstnctwlse number of vi Ilages and towns 111 2001 Census.
State/District
ORISSA
Bargarh
Jharsuguda
Sambalpur
Dcbagarh
Sundargarh
Kendujhar
Mayurbhan.l
Baleshwar
Bhadrak
Kendrapam
Jagatsmghap ur
Cuttul..k
Jajapur
Dhcnkanal
Anugul
Nayagarh
Khordha
PUrl
Gan)am
GajapatJ
Kandhamal
Baudh
Sonapur
Balanglr
l',uapada
Kalahandl
Rayagada
N abaran gapur
Koraput
Malkangm
STATEMENT-6 State and Districtwise number of Villages and Towns in 2001
Total no of No of unInhabited VIllages Villages
2 3
5U49 3820
1,207 27
348 2
1,322 84
875 164
1,764 41
2.122 53
3.950 202
2.952 365
1,311 68
1.540 133
UR8 6 I
1,950 94
1.778 203
1.215 139
1.910 249
1.695 164
1.551 1<)3
I. 715 124
3.212 400
1.619 107
2.546 167
1.186 71
959 130
1.794 30
663 15
2.236 137
2.667 200
901 25
2.028 106
1.045 66
31
No of VIllages mcIudcd In
Full
4
Towns
184
I
3
21
9
5 7
57
5
21
5
14
22
2
2
I
3
2
3
Partl
5
No of No of
mhablted Villages Towns
6 7
4 47.529 138
1.180 4
346 3
1.23R 5
711
I. 723 II
2069 9
3,748 4
2 2.587 5
1.243 3
1,407 2
1.227 2
1.856 8
1.575 2
1.076 3
1.661 9
I.531 4
US8 7
1,591 4
2.812 19
1.512 2
2,379 2
1.115 I
829 3
1.764 4
648 2
2.099 4
2.467 5
876 3
1,922 5
979 2
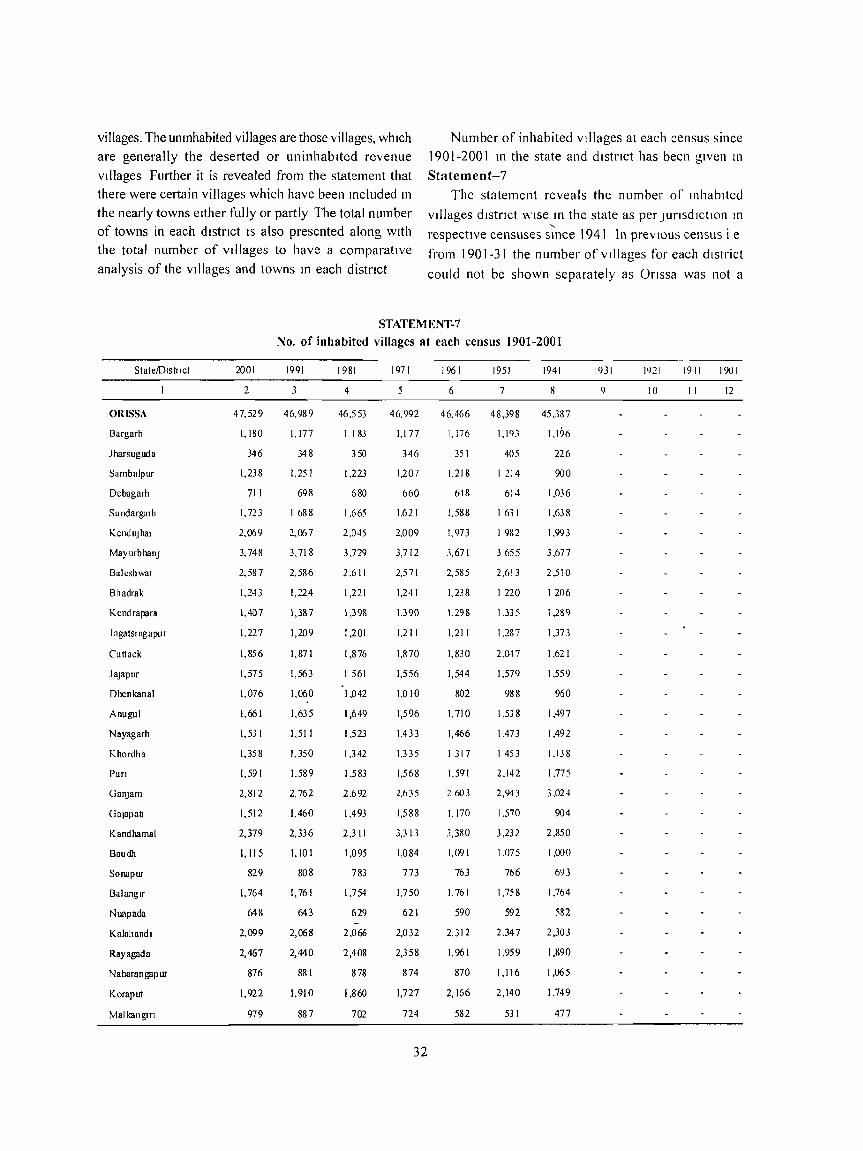
villages. The unmhabited villages are those villages, which
are generally the deserted or uninhabited revenue
Villages Further it is revealed ITom the statement that
there were certain villages which have been ll1cluded 111
the nearly towns either fully or partly The total number
of towns in each dlstnct IS also presented along With the total number of Villages to have a comparative
analysis of the villages and towns In each distnct
Number of inhabited vIllages at each census since
1901-2001 In the state and distrIct has been given 111
Statement-7
The statement reveals the number of Inhabited
villages district wise 111 the state as per JUriSdiction In
respective censuses s~nce 1941 In prevIous census i e
from 1901-31 the number ofvtllages for each district
could not be shown separately as Onssa was not a
State/D:stnct
ORISSA
Bargarh
Jharsuguda
Sambalpur
Debagarh
Sundargarh
KenduJhar
MayurbhanJ
Baleshwar
Bhadrak
Kendrapara
JagatslOgapur
Cuttack
JaJapur
Dhenkanal
Anugul
Nayagarh
Khordha
PUrl
GanJam
Galapall
Kandhamal
Baudh
Sonapur
Balanglr
Nuapada
Kalahandl
Ray agad a
Nabarangapur
Koraput
Malkangm
STATEMENT-7
No. of inhabited villages at each census 1901-2001
2001 1991
2 3
47.529 46,989
1.180 1,177
346 348
1,238 1,251
711 698
1,723 1688
2,069 2.M 7
3.748 3.718
2,587 2.586
1,243 1,224
1,407 1,387
1,227 1,209
1,856 1,871
1,575 1,563
1,076 1,060
1,661 1.635
1.531 1.511
1,358 1,350
1,591 1,589
2.812 2,762
1,512 1,460
2,379 2,336
1,115 1,10 I
829 808
1,764 1,761
648 643
2,099 2,068
2,467 2,440
876 881
1,922 1.910
979 887
1981
4
46,553
1 183
350
1,223
680
1,665
2,045
3.729
2.611
1,221
1,398
1,201
1.876
I 561
1.042
1,649
1,523
[,342
1.583
2.692
1,493
2,311
1,095
783
1.754
629
2,066
2,408
878
1,860
702
1971 1961 1951 1941
5 6 7 8
46.992 46.466 48,398 45,387
1,177 1,176 l,[Q3 1,196
346 351 405 226
1,207 1,218 1 214 900
660 648 614 1,036
1,621 1.588 1 611 1,638
2,009 1.973 1 982 1,99 3
3,712 3,671 3655 3,677
2,571 2.585 2,613 2,510
1,241 1,238 1220 1206
1.390 1,298 1,335 1,289
1,211 1,211 1,287 1.373
1,870 1,830 2,04 7 1,621
1.556 1,544 1,579 1,559
1,010 802 988 960
1,596 1,710 1,538 1,497
1,433 1,466 1,473 1,492
U35 1317 1453 1,138
1,568 1,591 2.142 1,775
2,635 2603 2,943 3,024
1,588 1,170 1.570 904
3,313 3.380 3,232 2,850
1,084 1,091 1,075 1,000
773 763 766 693
1,750 1,761 1,758 1,764
621 590 592 582
2,032 2,312 2,347 2,303
2,358 1,961 1,959 1,890
874 870 1,116 1,065
1,727 2,166 2,140 1,749
724 582 531 477
32
1931 1'l21 1911 1901
9 10 II 12

separate State during those period Orissa became a
separate state only 111 1936. The number of inhabited villages was highest in 1951 This may be due to the fact that many cluster of habItants were grown up in different areas of the state and these were not surveyed by the survey and settlements AuthorIty. Therefore all these cluster of habItatIOns were treated as separate vIllages Such type of villages was mostly found 111 the dIstrict of Cuttack, Pun, GanJam, Koraput, Kalahandl and Kandhamal
Statement- 8 given below shows the quantum and
progress of rural populatIOn of each district of the state SInce 190 I. The rural population of the state has shown as constant increase over the censuses except 111 the census year 1921 when the total populatIOn of the state
also decrease Among all the districts GanJam distrIct has the highest rural populatIOn 111 200 I and almost 111
all census penods The lowest rural populatIOn among al I distrIcts IS noticed In Oebagarh distrIct
STATEMENT-S
Progress in rural population of state and districts 1901-2001
StaterDlstnct 2001 1991 1981 1971 1961 1951 1941 1931 1921 1911 1901
3 4 5 6 7 9 10 11 12
Ons'a 31,287,422 27,424,753 23,259,984 20,099,220 16,439,196 14,051,876 13,355,460 12,173,802 10,877,088 11,103,716 10,048,233
Bargarh 1,242,795 1,126,625 972,978 800,391 677,747 602,840 557,153 494,890 443,978 424,995 371,066
Jharsuguda 323,831 282,826 255,296 232,716 208,547 219,229 206,871 183,723 165,624 103,322 141,041
Sambalpur 681,835 608,131 515,179 435,677 391,222 334,839 313,972 278 903 24\),415 238610 204,399
Debagarh 254,012 216,963 184,090 154,337 115,795 93,058 84704 81,007 72488 69,341 59,882
Sundargarh 1,201,479 1,048,612 928,538 791,073 622,857 536,836 490,708 436,860 377,449 362,138 277,173
KenduJhar 1,348,967 1,170,152 988,266 888,167 711,351 579,098 520,782 460,609 379496 364,702 285,758
MayurbhanJ 2.067,756 1,768,331 1,491,335 1394,249 1,175,623 1,019,548 976,460 883,410 748,125 723,250 604,770
Baleshwar 1,804,140 1,542,431 1,260,203 1,038,280 781,867 635 891 640,983 613,014 605,799 648,262 658,166
Bhadrak 1,192,678 995,993 806,642 692,070 542,151 428,475 428,837 410,054 404,715 436,080 442538
Kendrapara 1,227,868 1,086,266 953,655 803,372 633,627 514 219 497,666 474,005 442, ~21 455,242 443 979
Jagatslnghapur 953,180 857,697 737,333 634,300 ~21, 734 441,309 427,121 407,908 383 188 394,269 384,939
Cuttack 1,699,964 1,567,331 1,368,893 1,166,372 958,723 822,412 831,447 799,730 761,565 783,544 764,923
JdJapur 1,551,361 1,332,746 1,092,926 918,011 740,391 613,607 593,363 566,684 531,353 545,812 532,735
Dhenkana1 973,964 869,758 735,729 634,412 503,317 410,830 363674 310,948 251,942 ~89,600 280100
Anugul 981,587 850,914 723,344 607.690 476,148 398,852 354,712 309,044 250,480 287,294 278,144
Nayagarh 827,450 756,403 667,755 573,289 465,063 392,506 363,652 336,493 303,665 337,561 331,0(>1
l<..hordha 1,071,689 985,733 839,168 712,065 591,297 531,231 516,719 478,128 431,482 479,645 470,409
Pun 1,298,654 1,141,886 982,043 826,358 675,303 576,091 538,137 498,366 444,955 497,950 477,949
GanJam 2,604,276 2,280,303 1,928,735 1,711,905 1,454,325 1,269,788 1,238,933 1,116,395 986,267 1,021,762 931,3CJ4
Gappat! 465,949 407,939 360,775 322,047 262,31i 1 240,728 231,571 205,089 18(1,123 187, J 44 167,504
l<..andhama1 604107 510,619 423,742 383,096 323,991 ~89,182 284 8~5 2(>0 ~57 238206 239,272 211,421
Baudh 355,347 302,164 255,777 219,011 184,348 162,215 159,464 151,112 138,149 138,767 122615
Sonapur 501,767 441,985 369,005 308,077 267,407 234,057 216,406 199,852 178,410 l'\I,4li2 108,844
Ba1anglr 1,182,8711,101,518 956,883 868,917751,620643,125625,751 586,687531,520 460,187329,894
Nuapada 500,652 443,717 371,289 322,017 252,999 219,850 203,379 178,787 150,180 147,489 122,559
Ka1ahandl 1,235,275 1,052,740 887 362 785,299 61\5,302 'i74,O 18 531,071 469,233 393,802 387,061 322,178
Rnvagada 715,702 624,658 538,016 468,793 378, 7~4 322,828 296,247 2 ~6,152 217,200 224,190 186,480
Nabarangapur 966,496 804,542 641,762 524,379 411,945 323,174 294084 248,072 210348 217,118 180,597
Koraput 982,188 857,872 720,881 621,479 551,426 515,343 471,844 39X,043 336,769 357,588 2Y7,440
Malkangln 469,582 187,898 302 384 261 371 141,955 106,637 94 894 80,047 67.874 70,059 58,275
33


.orj2. ~(\I .__, C') CI.{) :::J •
0.. ......
-E ~~ .Qlg" "00 Co ~ . £:0 ()
"0 ~ (L-.:;t - Q) ctlCD £: . U~ ctI .-E E
(()
"0 C ctI (()
£: I (() ,-0
ctI 0 " ~ ......
..... ~ .o~ o 0
06~ :::Jcci E E ro ....,
.~ U; -- -- ____ _ :; z~ 060 C ~
E ro "0 C «
~ 05rj2.
..1::1.{) u ......
. - 0 "0 . Co o 0..
::J "O~ ctl 0 2«>
I.{) ==0) E . ctlC') I-
ctl?fi. -C\j ~co 0) ...... ~.,...:
ctI ..::.t:.~ ctI 0
....... -.:;t ctlC') Cco .... . ctll.{) ~
C~ ctI 0 £: ...... 00 ...... ctI~ .__, 0
~ ......
..I:: (() 0)
"O~ ro 0 ....1"'-0..«> ctlC"':! .cCO "0 C «
£: (()
O)~ "0 0 ctlQ) ..... (\1 0..C') ..... r--.: ctI :::: :J
ro ..... £# (() ...... ro«> ..... C') ~ . ..I::Q) ctl ~
35
o E~ .- «>
..::.t:. ......
..::.t:.(\1
US6
~ ..... 0 ctll.{) ~ CD .- CO CO .
(\I
:::J
Ci~ 06g" cO ctI~ Eo ro o
:;rj2. Q.Q) ._ I"'-c«> ctl • ~o
£: (() 0)
-g~ ..... 0
(L~ roC') >. . ..I::Q)
-g ~
ctl >.~ ~ 0 -(\I ~co £:(0 0) . 0)0
~
o EO' ca«> (()co (()C"':! «C\l
£: .....
"0 C~ ~ 0 ~I.{) ..::.t:.C\l ..... -=;t ~ . £:(\1 ....,
ro~ 0)0 (()C') .~ :;::: £:-.:;t ..I:: ()

,.... C C N as ._ "C s::: s::: ._ U) G) ._ ... o ... . _ ... ... ~ s::: o ._ "C s::: as U) G) ... as ... (/) ,.._ 0 G) ... as
.s::: U)
s::: 0 ._ ... as -::s c. 0 a.
«
C/) ([~ W 0 It--I-"! Or-
([ .... 0 ::::> 0"a_T""" _C') ([0 I-
I C/) w 0 < ([ a_ct-....Jen <~ IO 0 < ::2: I
....J < I 0 zct-<C') ([~ <0 ~ ::::>
I ([
«
I C/) W o < ~ a::&> a_r-([cD «T"""
~ ::::>
<
" C/)ct-
~~
Z <ct>-(.0 ([~ <C\J I «C\J
I I o
« ([ l-I C/)~ «& (['<t «0) I « ~
co «~ """') 0 Zt--:::,~ a_C\J
o z «~ I 0 ::x::C\J ([~ «C\J I """')
« ....J~ < 0
([~ W . ::x::C')
36
« (f)~ (f)&, -LO ([ . 0C')
z < I~ I- 0 (f)en
<"": """')LO « a:
I C/) W o « ([~ a_~ «-.:t: ([" I o Z «
::::> o <~ z 0
....Jt:> ~cD
~ I C/) W o « ([~ a_~ «CX! >-LO I o « ~

...... (Jl 0 0, 0 0 0 0 0 0 0 a a 0 0 0
0 0 0 0
Bargarh 1,346,336
Jharsuguda 509,716
Sambalpur •••••• 935,613
Debagarh ~ 274,108
I\)
a 0 0 a 0 0
Sundargarh 1,830,673
Kendujhar •••••••• _ 1,561,990
I\)
0, 0 0 a 0 0
Mayurbhanj 2,223,456
Baleshwar ••••••••••••• 2,024,508
Bhadrak
Kendrapara
Jagatslnghapu r
• ______ 1,333,749
_-----.1,302,005
• ____ .1,057,629
Cuttack •••••••••••••• 2,341,094 I
Jajapur
Dhenkanal
Anugul
Nayagarh
Khordha
Pun
• _______ 1,624,341
_____ .1,066,878
• _____ 1,140,003
• ___ .864,516
• _________ 1,877,395
• ______ .1,502,682
c:.l ~ a (Jl 0 0 _o 0 0 a 0 0 0 0
Ganjam _---------------.3,160,635
Gajapatl
Kandhamal
Baudh
Sonapur
Balanglr
Nuapada
Kalahandl
Rayagada
Nabarangapur
Koraput
Malkangm
__ .518,837
___ 648,201
__ 373,372
_ •• 541,835
_------1,337,194
__ .530,690
_------1,335,494 ____ 831,109
_____ .1,025,766
• _____ 1,180,637
__ .504,198 I
/
"'D o 'tJ c -Q) ... _ . C tn ... """I _. (") ... tn o ...... o """I _ .
I\) o o .....


A-I (part -I): NUMBER OF VILLAGES, TOWNS, HOUSEHOLDS, POPULATION AND AREA
TotaV Number of VIllages Population Area Popul-State/DlstnctiPollce
Rural/ No of No of m at IOn
StatIOn Urban I n- Un- Towns households square per habltated mhablted
Persons Males Females kIlometre sq km
2 3 4 5 6 7 8 9 10 II
ORISSA Total 47,529 3,820 138 7,738,065 36,804,660 18,660,570 18,144,090 155,707.00 236 Rural 47,529 3,820 6,618,547 31,287,422 15,748,970 15,538,452 152,912.87 205 Urban 138 1,119,518 5,517,238 2,911,600 2,605,638 2,794.13 1,975
Bargarh DIstrict Total 1,180 27 4 296,514 1,346,336 681,500 664,836 5,837.00 231 Rural 1,180 27 276,136 1,242,795 627,986 614,809 5,782.11 215 Urban 4 20,378 103,541 53,514 50,027 54.89 1,886
Palkamal PS Total 101 3 17,581 78.966 39,384 39,582 57940 136 Rural 101 3 17,581 78,966 39384 39.582 57940 136 Urban
lharbandha P.S Total 104 3 20,166 90,332 44,780 45,552 660 SO 137 Rural 104 3 20,166 90,332 44,780 45,552 660 SO 137 Urban
Padmapur P S Total 71 3 r5,335 70,531 35,444 35,087 35370 199 Rural 71 3 12,300 55,089 27,586 27,503 33290 165 Urban 3,035 15,442 7,858 7.584 2080 742
Burden P S Total 52 4 6.583 27.204 13.554 13.650 17360 157 Rural 52 4 6.583 27,204 13.554 13.650 17360 157 Urban
Galstlet P S Total 83 16117 66.197 33.226 32.971 31340 211 Rural 83 16.]17 66.197 33.226 32,971 31340 211 Urban
Melchhamunda P S Total 73 2 14.378 61,500 30,975 30.525 30900 199 Rural 73 2 14.378 61,500 30,975 30.525 30900 199 Urban
Sohela PS Total 93 21.503 94.797 48,025 46.772 42710 222 Rural 93 21,503 94,797 48.025 46,772 42710 222 Urban
Bljepur P S Total 109 23,135 95,843 48.058 47,785 32580 294 Rural 109 23,135 95,843 48,058 47,785 32580 294 Urban
BarapalI PS Total 73 26,841 121.480 62,043 59.437 28275 430 Rural 73 23,001 102,323 52,232 50,091 26860 381 Urban 3.840 19.157 9.811 9.346 1415 U54
Bheden P S Total 96 2 25.933 122.362 62.211 60,151 37400 327 Rural 96 2 25.933 122362 62,211 60151 37400 327 Urban
Bargarh P S Total 61 2 44,836 215,349 110,773 104,576 38822 555 Rural' 61 31,333 146.407 74,928 71.479 36828 398 Urban 2 13,503 68.942 35,845 33,097 1994 3,457
Bhatl! P S Total 84 18,314 84.909 42,955 41,954 45090 188 Rural 84 18.314 84,909 42.955 41,954 45090 188 Urban
Ambabhona P S Total 104 5 13,338 63.671 32.136 31,535 57960 110 Rural 104 5 13,338 63.671 32.136 31,535 57960 110 Urban
Attablra P S Total 76 2 32.454 153.195 77,936 75,259 61360 250 Rural 76 2 32,454 153,195 77,936 75,259 613 60 250
Urban Iharsuguda District Total 346 2 3 106,839 509,716 261,941 247,775 2,081.00 245
Rural 346 2 69,269 323,831 163,985 159,846 1,927.44 168 Urban 3 37,570 185,885 97,956 87,929 153.56 1,211
39

A-I (part -I) : NUMBER OF VILLAGES, TOWNS, HOUSEHOLDS, POPULATION AND AREA
TotaV Number of VIllages PopulatIOn Area Popul-State/Dlstnct/Pollce
Rural/ No of No of In at IOn
Station Urban In- Un- Towns households square per
habltated Inhabited Persons Males Females kIlometre ~km
2 3 4 5 6 7 8 9 10 II
Rengalt PS Total 77 11,448 55,909 28,326 27,583 34210 163 Rural 77 11.448 55,909 28.)26 27583 342 10 163 Urban
Lakhanpur P S Total 34 6,689 32,178 16.)37 15,841 49701 65 Rural 34 6,689 32,178 16.)37 15,841 49701 65 Urban
Belpahar P S Total 4 7,273 35,972 19,297 16,675 5584 644 Rural 4 680 3,146 1,626 1,520 1419 222 Urban 6,593 32,826 17,671 15 155 4165 788
Banaharapalt P S Total 31 8,630 39,219 20,163 19,056 14509 270 Rural 31 8,630 39,219 20,163 19056 14509 270 Urban
Onent P S Total 15,650 77.171 40.432 36,739 4264 1.810 Rural 39 212 113 99 12O 177 Urban 15,611 76,959 40.)19 36,640 4144 1.857
BraJaraJnagar P S Total 33 5,021 24,124 12,302 11822 11678 207 Rural 33 5,021 24,124 12.)02 11822 11678 207 Urban
Jharsuguda P S Total 39 24,994 120,517 62,404 58 113 25407 474 Rural 39 9,628 44.417 22.438 21.979 18360 242 Urban 15.)66 76,100 39,966 36,134 7047 1,080
Lalkera P S Total 91 19,947 91,496 46055 45,441 57690 159 Rural 91 19,947 91.496 46,055 45,441 57690 159 Urban
Kolablra PS Total 36 7,187 33,130 16,625 III 505 172 70 192 Rural 36 7,187 33 130 16625 16,505 172 70 192 Urban
Sambalpur DIstrict Total 1,238 84 5 202,247 935,613 475,122 460,491 6,657,00 141 Rural 1,238 84 149,634 681,835 343,182 338,653 6,513,29 105 Urban 5 52,613 253,778 131,940 121,838 143.71 1,766
Govmdpur PS Total 66 11,592 54,086 26,956 27,130 37300 145 Rural 66 11,592 54,086 26,956 27,130 37300 145 Urban
Mahulpalh P S Total 142 16,363 71223 35,382 35,841 60610 118 Rural 142 16.)63 71,223 35,382 35,841 60610 118 Urban
'<.ochlOda P S Total 142 9 17,741 75,942 38,142 37,800 63194 120 Rural 142 9 14,786 62.356 31,176 31,180 61510 101 Urban 2,955 13,586 6,966 6,620 1684 807
lamanklra P S Total 150 8 12,232 54.108 27.247 26,861 75630 72 Rural 150 8 12,232 54,108 27,247 26,861 75630 72
Urban KlsInda PS Total 75 15 3828 18,019 8964 9,055 12706 142
Rural 75 15 3,828 18,019 8,964 9,055 12706 142
Urban Naktldeul P S Total 67 12 5,560 26,271 13,183 13,088 76394 34
Rural 67 12 - 5,560 26,271 13,183 13,088 76394 34
Urban Ralrakhol P S Total 123 19 10,623 50,151 25,445 24,706 78724 64
Rural 123 19 7,621 36,428 18216 18,212 74987 49
Urban 3,002 13,723 7,229 6494 3737 367
Charamal P S Total 96 9 5,705 27.221 13,839 13,382 47926 57
Rural 96 9 5,705 27221 13,839 13,382 47926 57
Urban
40

A-I (Part -I) : NUMBER OF VILLAGES, TOWNS, HOUSEHOLDS, POPULATION AND AREA
s tate/DJ ~tn ct/P a lie e Station
Number ofYIIlagcs rota II No of Rurall --------
Urban I n- U n- Towns
jUjomura PS
Dhama PS
Burla P S
HJrakud P S
AmthapalI P S
Dhanupall P S.
Sadar P S
Sasan PS
Katarbaga P S
Sambalpur (M)
Debagarh District
Debagarh P S
Barkot PS
Kundhelgola P S
Reamal PS
2
Total Rural Urban Total Rural Urban Total Rural Urban Total Rural Urban Total Rural Urban Total Rural Urban Total Rural Urban Total Rural Urban Total Rural Urban Total Rural Urban
Total Rural Urban
Total Rural Urban Total Rural Urban Total Rural Urban Total Rural Urban
Sundargarh District Total Rural Urban
Hemglr PS Total Rural Urban
habltated inhabited
3
92 92
67 67
33 33
3 3
8 8
4 4
42 42
62 62
. 66
66
711
711
201 201
153 153
131 131
226 226
1,723 1,723
148 148
4
2 2
2 2
3 3
3 3
164 164
14 14
34 34
91 91
25 25
41 41
5 5
5
11
II
:-.10 of households
6
11,094 11.094
9.511 9,511
16802 8059 8.743 6.915 1.314 5.601 2.074 2.074
1,478 1,255
223 9,887 9.300
587 12,636 12636
16,704 16.704
31502
31 502
58,324 53,983
4,341
20,364 16,023 4.341
14.483 14.483
9,158 9.158
14.319 14.319
394,060 262,626 131,434
18.382 18382
41
Persons
7
51,860 51.860
41.703 ..J 1,703
80.326 37.504 42.822 32,881
6,487 26394
9,869 9.869
6.856 5.956
900 46.162 43.452
2.710 58.858 58.858
76.434 76,434
153.643
153,643
274,108 254,012
20,Q96
95.365 75.269 20.096 63.942 63.942
45,036 45.036
69.765 69.765
1,830,673 1,201,479
629,194
75.694 75.694
Population
Males
8
26,203 26.203
21.194 21, 194
41.637 19.184 22453 17.020 3.264
13.756 5021 5,021
3.542 3.074
468 23.424 22.039
1.385 29.793 29.793
38.447 38,447
79.683
79683
138,408 127,890
10,518
48.289 37.771 10.518 32,284 32.284
22.858 22,858
34,977 34,977
935,601 602,578 333,023
38.420 38.420
remales
9
25.657 25.657
20.509 20.509
38.h89 18.320 20.369 15.861 3,223
12.638 4S4X 4848
3.314 2.882
432 22738 21413
1325 29.065 29.065
37987 37987
73,960
73.960
135,700 126,122
9,578
47.076 37.498
9.578 31.658 31,658
22,178 22.178
34,788 34.788
895,072 598,901 296,171
37274 37.274
Area In
square kIlometre
10
Poru 1-atlOn per
~J...111
11
54390 95 54390 95
35220 118 35220 118
19452 413 16590 226 2862 I 496 9743 337 8630 75 11 13 2.371 2090 472 2090 472
1440 476 13 55 440 085 1,059
14782 312 14540 299
242 1.120 24690 238 24690 238
51380 149 51380 149
4648 3306
464S 3.306
2,94000 93 2,91587 87
24.13 833
808 13 118 78400 96 2413 833
751 10 85 751 10 85
61640 73 61640 73
606 10 115 60610 115
9,712.00 188 9,467.24 127
244.76 2,571
92460 92460
82 82

A-I (part -I): NUMBER OF VILLAGES, TOWNS, HOUSEHOLDS, POPULATION AND AREA
TotaV Number of VIllages PopulatIOn Area Popu 1-StatelDlstnct/Pollce
Rural/ No of No ot In atlim
StatIOn Urban In- Un- Towns households square per
habltated Inhabited Persons Males Females kIlometre ~ km
2 3 4 5 6 7 8 9 10 11
Lephnpara P S Total 106 15,709 64.399 32485 3).914 44350 145 Rural 106 15.709 64.399 32.485 3).914 44350 145 Urban
Bhasma PS Total 96 17,024 72.708 36.501 36.207 40330 180 Rural 96 17.024 72,708 36.501 36.207 40330 18U Urban
Sundargarh Town P S Total 2 8196 40.943 21.058 19.885 3900 I U50 Rural 2 557 2.522 1.355 I 167 1517 166 Urban 7.639 38,421 19.703 18.718 2383 1.612
Sundargarh P S Total 87 15.911 65,558 32.767 32.791 52710 124 Rural 87 15.911 65.558 32767 32791 52710 124 Urban
KIn) Irkela P S Total 59 11.680 51.095 25.386 25.709 32140 159 Rural 59 11.680 51.095 25.386 25.709 32140 159 Urban
Talasara PS Total 80 6 16,412 7).643 35.297 36.346 60790 118 Rural 80 6 16,412 71.643 35.297 36.346 60790 118 Urban
Baragaon PS Total 73 15.447 69.987 35.086 34.901 49670 141 Rural 73 15,447 69,987 35.086 34.901 49670 141 Urban
Kutra PS Total 40 11.246 54.990 27,473 27.517 24480 225 Rural 40 11.246 54.990 27473 27.517 24480 225 Urban
RaJagangapur P S Total 84 2 3 29.214 147.333 74.444 72.889 63579 232 Rural 84 2 17948 91.310 45610 45.700 60420 151 Urban 3 11.266 56.023 28834 27.189 31 59 1.773
Ralboga PS Total 44 2 7,408 36,474 18.279 18.195 27950 130 Rural 44 2 7.408 36,474 18.279 18.195 27950 130 Urban
Blramltrapur P.S Total 62 16,222 80,315 40.538 39.777 32582 247 Rural 62 10,298 50,868 25,601 25.267 30398 167 Urban 5,924 29447 14,937 14.510 2184 1.348
Hatlban r s Total 63 10.954 53,452 26,673 26,779 201 50 265 Rural 63 10.954 53.452 26.673 26.779 20150 265 Urban
Blsra P S Total III 16.913 85.463 43.066 42397 38530 222 Rural III 16.913 85,463 43.066 42.397 38530 222 Urban
Bondamunda P S Total 13 5.738 29.182 15.009 14.173 4256 686 Rural 13 2375 12220 6.157 6.063 3660 334 Urban 3.363 16962 8.852 8.110 596 2.846
Brahmanl Tarang P S Total 48 13,638 66.647 34307 32.340 33673 198 Rural 48 9,778 49.043 24.667 24.376 31860 154 Urban 3,860 17,604 9.640 7.964 1813 971
Raghunathapall P S Total 2 4.615 22,420 11.625 10.795 12020 187 Rural 247 1.162 596 566 11086 10 Urban 2 4,368 21,258 11,029 10229 934 2.276
Tangarapall P S. Total 4 2,286 11.689 6.047 5642 4917 238
Rural 4 961 5,022 2576 2,446 4400 114
Urban 1.325 6.667 3,471 3.196 5 17 1.290
Lathlkata P S Total 28 4.616 22.000 11.170 10.830 6360 346
Rural 28 3.019 15.1 04 7.514 7.590 5828 259
Urban 1.597 6.896 3.656 3240 532 1.296
42
.A-J (Part -I) : NUMBER OF VILLAGES, TOWNS, HOUSEHOLDS, POPULATION AND AREA
TotaV Number of VII lages StatelDlstnct/Pollce ________ No of
Rural! Station Urban I n- lJ n- Towns
Bankl PS
2
Total Rural Urban
Kamarposh Balang P STatal
KOIda P S
Lahunlpara P S
Gurundla P S
Tlkaetpah P S
Banel P S
Mahulpada P S
Raurkela (M)
Raurkela Industnal Tov.n~hlp (ITS)
Rural Urban Total Rural Urban Total Rural Urban Total Rural Urban Total Rural Urban Total Rural Urban Total Rural Urban Total
Rural Urban Total Rural Urban
KenduJhar District Total
TelkOl P S
KanJlpam P S
Nayakote P S
Barb" PS
Joda PS
Champua PS
Rural Urban
Total Rural Urban Total Rural Urban Total Rural Urban Total Rural Urban Total Rural Urban Total Rural Urban
habltated inhabited
3
40 40
57 57
53 53
157 157.
74 74
46 46
112 112
35 35
2,069 2,069
139 139
38 38
70 70
44 44
95 95
162 162
4
2 2
3 3
3 3
12 12
53 53
6 6
3 3
3 3
3 3
5
9
9
2
2
I 2
2
No of households
6
3.685 3,685
7.476 7476
7.539 7.539
15.286 14.263
1.023 6.504 0.504
4.492 4.492
12.776 12.776
3,622 3.622
46.385
46.385 44.684
44.684
326,784 283,092
43,692
17.541 17.541
3.747 3.747
7.929 7929
20,517 6820
13.697 23.860 15.555 8.305
25391 22.801
2.590
43
Persons
7
18.585 18.585
35,508 35508
33.211 33211
66890 62.654
4.236 30.960 30.960
21.055 21.055
54.529 54529
16.263 16.263
224.987
224.987 206693
206693
1,561,990 1,348,967
213,023
85.852 85.852
17211 17.211
38.638 38.638
95.199 30739 64 460
108.219 69530 38.689
121.356 107.782
13574
PopulatIOn
Males
8
9.285 9.285
18007 18007
17.022 17.022
33,522 31.255
2267 15.413 15.413
10,505 10.505
27398 27.398
8 184 8.184
121.240
121.240 109394
109.394
790,036 678,455 111,581
43.259 43.259
8.622 8,622
19.072 19,072
49,655 15.712 33,943 55.637 35.558 20.079 61 100 53.918
7.182
Femalcs
9
9.300 9.300
17,501 17,501
16.189 16.189
33.368 31399
1969 15.547 15.547
10550 10550
27131 27,131
8.079 8,079
103747
103747 97.299
97.299
771,954 670,512 101,442
42.593 42.593
8,589 8.589
19566 19.566
45.544 15027 30,517 52.582 33.972 18610 60.256 53864 6.392
Area In
square I"'omctrc
10
34190 34190
38330 38330
33800 33800
PopulatIOn per
sq km
II
54 54
93 93
98 98
416 15 161 41430 151
I 85 2.290 86374 36 86374 36
40150 40150
52 52
31646 172 31646 172
29530 29530
Area Included In
Rourk.ela (ITS)
55 55
12173 1.698
121 73 ].698
8,303.00 188 8,104.41 166
198.59 1,073
82460 104 82460 104
25650 25650
67 67
54990 70 54990 70
27076 352 21790141
5286 1219 43622 248 40980 170
2642 1.464 57440211 56623 190
8 17 1.661

A-I (part -I) : NUMBER OF VILLAGES, TOWNS, HOUSEHOLDS, POPULATION AND AREA
TotaV Number of VIllages PopulatIOn Area Popul-State/DI,tnct/Pollce
Rural! No of No of In at IOn
StatIOn Urban In- Un- Towns household~ ,quare per
habltated inhabited Persons Male" Females kilometre ~km
2 3 4 5 6 7 8 9 10 II
Bana PS Total 109 3 14.538 68,330 33,875 34,455 30410 225 Rural 109 3 14,538 68,330 33,875 34.455 30410 225 Urban
Turumunga P S Total 105 3 13,452 63,523 31.713 31 810 29930 212 Rural 105 3 13,452 63,523 31,713 31.810 29930 212 Urban
Patana PS Total 162 2 19,629 93,577 46,398 47.179 34350 272 Rural 162 2 19,629 93,577 46,398 47,179 34350 272 Urban
Ghatgaon PS Total 128 18,775 92,296 46417 45,879 52730 175 Rural 128 18,775 92 296 46.417 45.879 52730 175 Urban
KenduJhar Sadar P S Total 213 2 27,786 133,365 66.913 06,452 73850 181 Rural 213 2 27,786 133.365 66,913 66,452 73850 181 Urban
KenduJhar Town P S Total 56 3 16,571 82,783 43,261 39.522 83 10 996 Rural 56 3 6,434 30,938 15,775 15.163 5670 546 Urban 10.137 51,845 27.486 24,359 2640 1.964
Pandapara P S Total 95 4 11854 55,507 27.831 27,676 27320 203 Rural 95 4 11,854 55,507 27,831 27,676 27320 203 Urban
Hanchandanpur P S Total 107 4 14,304 69,698 35.170 34528 1,..10370 50 Rural 107 4 14,304 69,698 35,170 34.528 1,403 70 50 Urban
Daltan PS Total 46 3 4,823 23,146 11.92<1- 11,222 5060 457 Rural 46 3 3,771 18,907 9650 9.257 5060 374 Urban 1,052 4,239 2,274 1,965 NA
Ghaslpura P S Total 105 5 21,190 102,171 51,859 50,312 26797 381 Rural 105 5 21,190 102,171 51.859 50312 26797 381 Urban
Samkul PS Total 93 2 14,749 7O,127 35.362 34,765 30381 231 Rural 93 2 14,749 70,127 35,362 34,765 30381 231 Urban
Nandlpada P S Total 122 2 15,825 73,861 37,425 36,436 17570 420 Rural 122 2 15,825 73,861 37,425 36,436 17570 420 Urban
Anandapur P S Total 105 22,592 109,583 55,381 54,202 43029 255 Rural 105 15,751 74,535 37,442 37,093 35300 211
Urban 6,841 35,048 17,939 17.1 09 77 29 453
Soso P S Total 75 3 11,711 57,548 29,162 28,386 21740 265 Rural 75 3 10,641 52.380 26,48<1- 25,896 20995 249
Urban 1,070 5,168 2,678 2,490 745 694
MayurbhanJ District Total 3,748 202 4 472,123 2,223,456 1,123,200 1,100,256 10,418,00 213 Rural 3,748 202 440,680 2,067,756 1,041,057 1,026,699 10,339.40 200
Urban 4 31,443 155,700 82,143 73,557 78.60 1,981
Tmngl P.S Total UO 3 17,953 87,308 43,329 43,979 31680 276 Rural 130 3 17,953 87,308 43,329 43,979 31680 276
Urban BahaldaPS Total 126 4 19,816 92,891 46,150 46,741 34920 266
Rural 126 4 19,816 92,891 46,150 46,741 34920 266
Urban
44

A-I (Part -I) : NUMBER OF VILLAGES, TOWNS, HOUSEHOLDS, POPULATION AND AREA
State/DIstnct/Pollce StatIOn
TotaV Number ofVlIlages No of Rural! --------Urban In- Un- Towns
Gorumahl<;anl P S
Ralrangpur P S
2
Total Rural Urban Total Rural Urban
Ralrangpur Town P STatal Rural Urban
Badampahar P';; Total
Bisol P S
Bangmposl P S
Jharpokhana P S
Chandua PS
Kohana P S
Banpada Sadar P S
Banpada Town P S
Suhapada P S
Muruda PS
Betanatl P S
Rasagobmdapur P S
BmsmgaPS
Barsahl P S
Khunta P S
Rural Urban Total Rural Urban Total Rural Urban Total Rural Urban Total Rural Urban Total Rural Urban Total Rural Urban Total Rural Urban Total Rural Urban Total Rural Urban Total Rural Urban Total Rural Urban Total Rural Urban Total Rural Urban Total Rural Urban
habltatcd mh abHed
3
124 124
115 115
43 43
81 81
145 145
213 213
183 183
117 117
171 171
133 133
8 8
155 155
114 114
120 120
164 164
196 196
190 190
216 216
4
18 18
4 4
12 12
15 15
16 16
6 6
37 37
5 5
5 5
4 4
6 6
13 13
8 8
II 11
6 6
5
No of households
6
9,786 9.786
15622 15.622
9,066 4.833 4,233
12.403 12,403
14,548 14,548
20,292 20,292
19,452 19452
11,696 11696
15,566 15,566
16,200 16,200
2,194 934
1,260 16625 16625
14,843 14,843
17,374 17.374
16.625 16625
21,662 21,662
26,127 26.127
24,643 24643
45
Person,
7
44,423 44.423
73,189 73,189
44,565 22,669 21.896 56,678 56,678
66,183 66,183
92.468 92,468
88,509 88,509
56.770 56,770
72.405 72,405
76,226 76,226
9,963 4,316 5,647
77, 762 77,762
70.123 70123
80,105 80,105
83,632 83,632
103,432 103,432
118,972 118,972
112.878 112878
Population
Males
8
21,943 21,943
36,216 36,216
22,612 11,442 11,170 28,070 28,070
32,890 32,890
46,785 46,785
45,412 45,412
29,028 29,028
36,674 36,674
38.890 38,890
5,149 2.195 2,954
39,389 39.389
35.268 35,268
40.522 40522
42.287 42,287
52,595 52,595
60,522 60,522
56,920 56,920
Females
9
22.480 22.480
36,973 36.973
21,953 11.227 10,726 28.608 28,608
33293 33293
45,683 45,683
43,097 43,097
27,742 27,742
35,731 35,731
37.336 37.336
4814 2 121 2,693
38373 38.373
34.855 34,855
39,583 39,583
41,345 41.345
50,837 50837
58,450 58,450
55"958 55958
Area m
square Idometre
10
Popu 1-at IOn per
sq km
II
30450 146 30450 146
25461 287 25461 287
8387 531 6949 326 1438 1,523
22030 257 22030 257
37890 175 37890 175
68200 136 68200 136
54420 163 54420 163
20918 271 20918 271
24008 302 24008 302
84698 90 84698 90
II 35 878 703 614 432 I 307
29354 265 29354 265
22520 311 22520 311
26570 301 26570 301
23610 354 23610 354
27710 373 277 10 373
32700 364 32700 364
272 00 415 27200 415

A-1 (part -D : NUMBER OF VILLAGES, TOWNS, HOUSEHOLDS, POPULATION AND AREA
TotaV Number ofVlilages PopulatlOn AI ea Popul-State/Dlstnct/Pollce
Rural/ No of "10 0 f In at IOn
Station Urban .In- Un- 10wns households square per
habltated inhabIted Person~ Males Females kIlometre ~ km
2 3 4 5 6 7 8 9 10 11
Udala PS Total 121 20.424 95,018 48,116 46,902 48070 198 Rural 121 17,979 83306 42025 4('281 472 81 176 Urban 2.445 11,712 6,091 5,621 7R9 1,484
Kaptlpada P S Total 99 15,220 70,131 35,701 34.430 177 80 394 Rural 99 15,220 70,131 35,701 34,430 177 80 394 Urban
Sharata P S Total 52 12,006 61,750 3L247 30,503 30890 200 Rural 52 12,006 61,750 3L247 30,503 30890 200 Urban
MahuldIha P S Total 62 7,968 39,435 19,497 19,938 38844 102 Rural 62 7,968 39.435 19.497 19,938 38844 102 Urban
Thakurmunda P S Total 110 10,362 50,680 25312 25,368 62156 82 Rural 110 10.362 50680 25,312 25368 62156 82 Urban
KaranJIa PS Total 154 2 20,976 102831 52,093 50,738 82264 125 Rural 154 2 16,785 8U90 40,817 40,573 80400 101 Urban 4,191 21,441 11,276 10 165 1864 1,150
JashIpur P S Total 254 11 23,465 106935 53,521 53414 88480 121 Rural 254 11 23.465 106,935 53,521 53414 88480 121 Urban
Raruan P S Total 152 12 19.895 93,190 46,410 46780 35980 259 Rural 152 12 19,895 93190 46.410 46780 35980 259 Urban
8anpada (M) Total 19314 95,004 50.652 44.352 3337 2.847 Rural Urban 19,314 95,004 50,652 44.352 3337 2847
Baleshwar District Total 2.587 365 5 403.653 2,024.508 1.036,511 987.997 3.806.00 532 Rural 2,587 365 360,533 1,804.140 921,740 882,400 3.675.32 491 Urban - 5 43,120 220,368 114.771 105.597 130.68 1,686
Ralbal11a P S Total 66 12 13,627 66,885 33,986 32,899 17901 374 Rural 66 12 13,627 66,885 33,986 32,899 17901 374 Urban
Jaleswar P S Total 142 37 24,664 127877 65,348 62529 20169 634 Rural 142 37 20,558 106490 54,443 52.047 18379 579 Urban 4,106 21.387 10.905 10.482 179O 1,195
Bhogral P S Total 320 36 50,401 254,563 130.367 124.196 29270 870 Rural 320 36 50.401 254,563 130,367 124.196 29270 870 Urban
Bahapal P ~ Total 165 49 27,166 151.786 78,033 73.753 24350 623 Rurdl 165 49 27,166 151.786 78,033 73.753 24350 623 Urban
SlnglaPS Total 136 14 22,206 117.315 60.301 57.014 18130 647 Rural 136 14 22,206 117.315 60.301 57.014 18130 647 Urban
Basta PS Total 252 61 26,126 131,867 67.887 63.980 26650 495
Rural 252 61 26,126 131,867 67,887 63,980 26650 495 Urban
Rupsa P S Total 27 5 4.412 22.320 11,451 10.869 3140 711 Rural 27 5 4,412 22.320 11,451 10.869 3140 711 Urban
46

A-I (part -I) : NUMBER OF VILLAGES, TOWNS, HOUSEHOLDS, POPULATION AND AREA
StatelDlstnct/Pollce StatIon
Number ofVJllage~ TotaV No of Rurali --------
Urban I n- U n- fowns
2
Bale\hwar Sadar P S 10tal Rural Urban
Chandlpur P S Total Rural Urban
Remuna P S Toldl Rural Urban
Bampada P S Total Rural Urban
NllagJrl P S Total
Berhampur r s
Oupada PS
Sora P S
Khalra r s
SlmJlm PS
Baleshwar (M)
Bhadrak District
Agarpada P S
Bant P S
Rural Urban Total Rural Urban Total Rural Urban Total Rural Urban Total Rural (Irban Total Rural Urban Total Rural Urban
Total Rural Urban
Total Rural Urban Total Rural Crban
Bhadrak Rural P S Total Rural Urban
Bhandan Pokhan P STatal Rural Urban
Dhamanagar P S Total Rural Urban
habltatcd inhabIted
3 4
237 237
28 28
95. 95
17 17
157 157
61 61
75 75
316 316
261 161
231 232
1,243 1,243
72 72
99 99
173 173
137 137
102 102
31 31
35 35
6 6
8 g
8 8
4 4
25 25
18 18
16 16
68 68
2 2
4 4
5 5
10 10
13 13
5
3
3
No of household,
6
35.990 33.893
2.103 8.141 7760
381 17.174 II 386 5788 3.859 1.970 1.889
24,490 21,484
3 (J06 11.024 11024
6.681 6.681
54.254 49,345
4.909 23963 23.903
28.531 28.531
20.938
20.938
238,888 215,142
23,746
9.726 9726
1 () 382 10.382
54,588 39,250 15,338 19619 19619
18,602 15.476 3.126
47
Persons
7
172.937 162,430
10507 42.838 40.739
2.099 80.978 51.906 29.072 18.800 10.130 8.670
113,410 98.653 14.757 48.592 48.5')2
33.538 33.538
269642 241.848
27.794 123.594 123594
141484 141.484
106.082
106.082
1,333,749 1,192,678
141,071
51.232 51232
56.853 56.853
307.136 214.621
92.515 101.489 101,489
107.884 89,334 18.550
PopulatlOn
Male<;
8
89448 83837
5611 22498 21.380
!.l18 41.773 26.600 15.173 9.750 5.237 4.513
57.590 50.032
7.558 24.793 24.7'}3
16.340 16.340
137.852 123.650
14.202 61.817 61.817
7L586 71.586
55.691
675,642 602,681
72,961
25.7')6 25.796
28620 28.620
156.770 108.707 48.063 51.283 51.283
54,221 44.821
9,400
Female~
9
83489 78.593
4.896 20340 19.359
981 39.205 25.306 .13.899
9.050 4.893 4.157
55,820 48621
7.199 23.799 23.799
17.198 17.198
131.790 118.198
13.592 61.777 61777
69.898 69.898
50.391
50391 /
658,107 589,997
68,110
25436 25436
28233 28,233
150366 105914 44452 50206 50.200
53.663 44.513 9.150
Area In
square kilometre
Popu 1-at IOn
per ~ km
10 II
32849 526 32000 508
849 ].238 8521 503 81 70 499 351 598
12809 632 9762 532 3047 954 2670 704 1990 509 680 I 275
42844 265 40800 242
2044 722 16880 288 16880 288
8400 399 8400 399
41184 655 38820 623 2364 I 176
24860 497 24860 497
38070 372 38070 372
1943 5,460
1943 5,460
2,505.00 532 2.407.45 495
97.55 1,446
89 14 575 89 14 575
11806 482 11806 482
54881 560 51773 415
31 08 2977 19430 522 19430 522
29220 369 27351 327
1869 993

A-I (part -I) : NUMBER OF VILLAGES, TOWNS, HOUSEHOLDS, POPULATION AND AREA
TotaV Number ofVtllage, PopulatlOn Area Popu 1-State/DI~tnct/Pohce
Rurall No of No of In atlOn
StatIOn Urban In- Un- Towns households square per habltated Inhabited
Persons Males Females kIlometre ~km
2 3 4 5 6 7 8 9 10 II
Dhusun PS Total 77 2 18.111 108.401 54.400 54.001 16870 643 Rural 77 2 18.111 108401 54.400 54.DOI 16870 643 Urban
Tlhldl P S Total 153 7 31.70 I 175.589 88.695 86.894 37937 463 Rural 153 7 31.701 175.589 88.695 86.894 37937 463 Urban
Chandabah P S Total 104 4 15,199 88.832 44.891 43.941 18141 490 Rural 104 4 15,199 88,832 44.891 43.941 18141 490 Urban
Bansada P S Total 154 II 19.245 110,653 56,553 54.100 31860 347 Rural 154 II 19.245 110,653 56.553 54100 31860 347 Urban
NaIkamdlhl P S Total 81 6 13,149 75.687 37.783 37.904 20100 377 Rural 81 6 13.149 75,687 37,783 37.904 20100 377 Urban
Basudebpur P S Total 91 4 28,566 149,993 76.630 73,363 29628 506 Rural 91 4 23,284 119.987 61.132 58.855 24850 483 Urban 5.282 30.006 15.498 14.508 '4778 628
Kendrapara DistTict Total 1,407 133 2 271,475 1,302,005 646,438 655,567 2,644.00 492 Rural 1,407 133 258,034 1,227,868 608,380 619,488 2,630.69 467 Urban 2 13,441 74,137 38,058 36,079 13.31 5,570
RaJkamka P S Total 156 12 24975 128.975 61,239 67.736 24920 518 Rurdl 156 12 24.975 128.975 61239 67.736 24920 518 Urban
Aah PS Total 123 9 26.822 134.209 64.107 70,102 22480 597 Rural 123 9 26.822 134.209 64.107 70.102 22480 597 Urban
Pattamundal P S Total 153 5 41.167 197.794 96.442 101.352 541 64 365 Rural 153 5 34.934 165064 79.908 85,156 53910 306 Urban 6.233 32.730 16,534 16.196 25412,886
Kendrapara P S Total 315 13 63,049 306,648 155.089 151.559 39887 769 Rural 315 13 55,841 265.241 133 565 131,676 38810 683 Urban 7,208 41.407 21,524 19.883 1077 3,845
Patkura PS Total 267 15 58,809 256.211 128.542 127.669 38080 673 Rural 267 15 58.809 256.211 128.542 127.669 38080 673 Urban
Mahakalapada P S Total 138 24 28,479 132,867 67.960 64.907 23050 576 Rural 138 24 28,479 132,867 67,960 64.907 23050 576 Urban
RaJ nagar PS Total 255 55 28.174 145.301 73.059 72.242 51980 280 Rural 255 55 28.174 145.301 73.059 72.242 51980 280 Urban
Jagatsinghapur Districffotal 1,227 61 2 221,783 1,057,629 538,881 518,748 1,668.00 634 Rural 1,227 61 198,352 953,180 480,442 472,738 1,626.93 586 Urban 2 23,431 104,449 58,439 46,010 41.07 2,543
Paradlp P S Total 32 7 25,426 112.899 63.218 49.681 9929 1.137
Rural 32 7 7.906 39.274 20.838 18.436 7594 517
Urban 17.520 73.625 42380 31245 2335 3.153
KUJang PS Total 124 12 23.633 120,889 61. 720 59,169 222 70 543 Rural 124 12 23.633 120.889 61.720 59.169 22270 543
Urban
48

A-I (Part -I) : NUMBER OF VILLAGES, TOWNS, HOUSEHOLDS, POPULATION AND AREA
TotaV Nu mber of VIllages StatefDlstnct/PolIce No of
Rural! --------Station
Ersama P S
Tlrtol P S
BalIkuda P S
Naugaon P S
Jagatsmghapur P S
Cuttack District
Mahanga PS
Salepur P S
Jagatpur P S.
Kishannagar P S
Niall PS
Gobmdpur P S
Cuttack Sadar P S
Tangl P S
Choudwar P S
GurudlJhatm P S
Barang P S
Urban
2
Total Rural Urban Total Rural Urban Total Rural Urban Total Rural Urban Total Rural Urban
Total Rural Urban
Total Rural Urban Total Rural Urban Total Rural Urban Total Rural Urban Total Rural Urban Total Rural Urban Total Rural Urban Total Rural Urban rotal Rural Urban Total Rural Urban Total Rural llrban
In- U n-habltated mhablted
3
147 147
305 305
223 223
88 88
308 308
1,856 1,856
191 191
272 272
37 37
109 109
124 124
89 89
126 126
97 97
49 49
84 84
23 23
4
8 8
7 7
12 12
4 4
11 11
94 94
2 2
6 6
2 2
4 4
2 2
9 9
II II
5 5
Towns
5
8
8
2
2
2
2
No of households
6
19,926 19926
39,950 39,950
32,039 32,039
16.469 16,469
64,340 58,429
5,911
466,326 344,349 121,977
32,635 32,635
49,825 49825
11,026 11,026
17,789 17,789
26.447 26,447
16.569 16,569
25,629 25,629
14,800 14,325
475 20,833
9,792 11.041 11,911 11.911
7,241 5.608 1,633
49
Persons
7
97,831 97,831
199,543 199,543
150,963 150,963
73632 73,632
301,872 271,048
30,824
2,341,094 1,699,964
641,130
163,321 163,321
240505 240,505
55.296 55,296
88,233 88,233
132,603 132,603
81,565 81 565
135,694 135,694
76,713 74,179
2.534 107,747
52.519 55,228 58,480 58,480
39087 30,058
9,029
PopulatIon
Males
8
48,982 48,982
99,410 99,410
75534 75,534
36,884 36,884
153 133 137,074
16,059
1,207,781 865,591 342,190
82,717 82,717
121.830 121,830
28,290 28,290
44.835 44,835
66,841 66,841
41,313 41,313
68,945 68,945
39.413 37,799
1.614 56,209 26,722 29.487 29858 29858
20033 15331 4,702
Females
9
48849 48849
100,133 100,133
75.429 75.429
36.748 36.748
148,739 133.974
14,765
1,133,313 834,373 298,940
80,604 80,604
118,675 118675
27.006 27 006
43398 43,398
65762 65,762
40252 40,252
66,749 66,749
37,300 36,380
920 51,538 25.797 25,741 28,()22 28,622
19054 14727 4.327
Area m
square kIlometre
10
PopulatIOn per
sq km
II
23530 416 23530 416
41770 478 41770 47&
25330 596 253 30 596
13950 528 13950 528
39142 771 37370 725
1772 1.740
3,932,00 595 3,710.39 458
221.61 2,893
20720 788 20720 788
29090 827 29090 827
8580 644 8580 644
15540 568 15540 568
19894 667 19894 667
12436 656 12436 656
20400 665 20400 665
16850 455 16365 453
485 522 16852 639 12638 416 4214 1311
23730 246 23730 246
6060 645 5444 552
6 16 1.466

A-I (Part -I) : NUMBER OF VILLAGES, TOWNS, HOUSEHOLDS, POPULATION AND AREA
TotaL' Number of V"I{Ig~' StatelDlstnct/Poilce No of
Rurall -------Station
Athagad P S
Tlgma P S
Bankl P S
Bmdyeswar P S
Badamba PS
Kanpur P S
Narasmghpur P S
Cuttack (M Corp)
Jajapur District
Sukmda P.S
; JbUfI P S
Jalapur Road P ')
(oral P S
Jajapur P S
Mangalpur P S
Bmlharpur P S
Bahchandrapur P S
Urban I n- U n- T 0\\ ns
2
Total Rural Urban Total Rural Urban Total Rural Urban Total Rural Urban Total Rural Urban Total Rural Urban Total Rural Urban Total Rural Urban
Total Rural Urban
Total Rural Urban Total Rural Urban Total Rural Urban Total Rural Urban Total Rural Urban rotal Rural Urban Total Rural Urban Total Rural Urban
hab, tated rnh ab,ted
3
101 101
47 47
89 89
57 57
134 134
69 69
158 158
1,575 1,575
133 133
44 44
41 41
217 217
252 252
96 96
203 203
63 63
4
II II
2 2
9
9
4 4
4 4
9 9
12 12
203 203
24 24
5 5
3 3
14 14
16 16
14 14
5
2
2
No of hou,eholds
6
16.929 13.865 3064
13671 12.236
1.435 32.S28 29.652 3 176 9.811 9.811
27.637 27.637
10822 10,822
18,770 18.770
101.153
101.153
327,129 313,557
13,572
28.562 28,562
11,416 11.416
14.904 6.941 7963
26,087 26,087
48.498 42,889
5,609 28,307 28.307
63097 63,097
20,750 20,750
50
Persons
7
84.775 68.927 15848 (,8,364
60516 784S
154 S70 138 881
15.989 46,609 46,{)0t)
13426t} 134.269
51.90)
51905
86.404 86.40~
534.654
534.654
1,624,341 1,551,361
72,980
142,812 142812
57,561 57,561
76.737 35,996 40.741
138.504 138.504
247,016 214.777
32.239 136.630 136630
295,505 295505
98.703 98.703
Population
.'vIales
8
43314 35 171
S 143 35.125 31036
4.089 79..+36 71 119
8.317 23,523 23523
69405 69,405
26.835 26.835
44,021 44.021
285838
28),S3S
823,747 785,443
38,304
73399 73.399
29.434 29.434
40.049 18425 21.624 70,337 70,337
126,099 109.419
16.680 68.153 68.153
146.403 146.403
49818 49.818
Femaks
9
41461 33.156
7705 33239 29480
3,759 75.434 67762
7.672 23.086 23086
64864 64804
25070 25 1)70
42.383 42.383
248.816
24!Ul16
800,594 765,918
34,676
69.413 69 ~13
28,127 28,127
36.688 17571 19.117 68.167 6S 167
120.917 105,358
15.559 68,477 68,477
149,102 149,102
48.885 ~8 885
Area In
squdfe kilometre
10
Popu 1-at IOn
per "-I km
11
17606 482 16570 416
1036 1530 11902574 11630 520
:2 7'2 2,885 43512 356 42890 324
622 2571 7770 600 77 70 600
37() 40 362 37040 362
19170 271 19170 271
44390 195 44390 195
14916 3,584
149 16 3.58~
2,899.00 560 2.847.84 545
51.16 1,427
571 19 250 571 It} 250
1845S 312 IS45S 312
11786 651 7835 459 3951 I 031
11550 439 31550 439
28425 go9 272 60 788 II 65 2767
18450 741 18450 741
36000 821 36000 821
13220 747 13220 747
A-I (part -I) : NUMBER OF VILLAGES, TOWNS, HOUSEHOLDS, POPULATION AND AREA
TotaV Number of Villages StateJDlstnct/Pollce No of
Rural! -------StatIOn Urban In- Un- Towns
Badachana P S
Dharmasala P S
2
Total Rural Urban Total Rural Urban
Dhenkanal District Total Rural Urban
I3huban P S Total Rural Urban
Kamakshyanagar P S Total Rural Urban
Parajang P S Total
TumusIngha P S
Motunga PS
SalImi PS
BIndol P S
Rasol P S
Rural Urban Total Rural Urban Total Rural Urban Total Rurdl Urban Total Rural lJrban Total Rural Urban
Dhenkanal Sadar P S Total Rural Urban
GandIa P S Total
Anugul District
Palalahada P S.
Khamar PS
Rural Urban
Total Rural Urban
Total Rural Urban rotal Rural Urban
Rengah Dam"ltc P S Total Rural Urban
habltated mhablted
3
166 166
360 360
1,076 1,076
84 84
191 191
128 128
52 52
62 02
64 64
55 55
61 61
208 208
171 171
1,661 1,661
146 146
128 128
37 37
4
42 42
84 84
139 139
24 24
19 19
8 8
13 13
13 13
3 3
2 2
27 27
30 30
249 249
29 29
20 20
6 6
5
3
3
9
9
No of households
6
23,920 23,920
61,588 61,588
222,023 203,537
18,486
18.259 14.508 3.751
32.544 29,494
3.050 31,089 31,089
10051 10051
13,463 13,463
11.217 11.217
7.981 7.981
14,355 14,355
52.948 41.263 11.685 30.116 30.116
230,711 196,825
33,886
12.141 12,141
II 812 11.812
7,633 5,772 1.861
51
Persons
7
114,329 114,329
316544 316.544
1,066,878 973,964
92,914
90.451 70217 20.234
160.443 145.440
15003 147488 147488
48.573 48,573
65,563 65,563
54.145 54.145
39.168 39.168
66082 66.082
251,702 194025
57.677 143263 143263
1,140,003 981,587 158,416
57,293 57,293
55.554 55.554
36488 28373
8,115
Populallon
Males
58.728 58728
161327 161,327
544,001 495,078
48,923
46.010 35.558 10,452 82259 74,277
7.982 73,884 73,884
24.443 24,443
33,584 33.584
27,175 27.175
19,748 19.748
32,616 32,616
131.168 100679
30.489 73114 73 114
587,234 501,368
85,866
29,055 29055
28,067 28,067
19,011 14.644 4.367
Females
9
55,601 55,601
155.217 155,217
522,877 478,886
43,991
44.441 34.659
9782 78.184 71.163
7,021 73,604 73604
24130 24130
J 1,979 31.979
26.970 26970
19420 19420
33.466 33466
120,534 93.346 27188 70.149 70149
552,769 480,219
72,550
28.238 28,238
27,487 27,487
17.477 13.729 3,748
ArCd In
square J..I!ometre
10
PopulatIOn per
3.j km
II
38530 297 38530 297
35240 898 35240 898
4,452.00 240 4,397.99 221
54.01 1,720
22324 405 20520 342
1804 !.I22 94995 169 93R 80 155
11 15 1346 86630 170 86630 170
19940 244 19940 244
15590 421 15590 421
191 00 283 19100 283
272 00 144 272 00 144
35880 184 35R SO 184
68962 365 664 80 292
2482 2324 692 80 207 69280 207
6,375.00 179 6,268.44 157
106.56 1,487
685 DO 68500
84 84
48200 115 48200 115
14425 253 13800 206
625 1.298
A-I (part -I) : NUMBER OF VILLAGES, TOWNS, HOUSEHOLDS, POPULATION AND AREA
TotaV Number of VIllages State/DIstnct/Pohce No of
Rurall --------StatIOn
Kamha P S
N TPC PS
Samal Barrage P S
Talcher Sadar P S
Colltery P S
Blkrampur P S
NALCO PS
Banarpal P S
Anugul PS
Bantala P S
Purunakot P S
Jarapada P S
Chhendlpada P S
Handapa PS
Klshorenagar P S
Thakurgarh P S
Athmalhk PS
Nayagarh District
Urban
2
Total Rural Urban Totdl Rural Urban Total Rural Urban Total Rural Urban Total Rural Urban Total Rural Urban Total Rurdl Urban Total Rural Urban Total Rural Urban Total Rural Urbdn Total Rural Urban Total Rural Urban Total Rural Urban Total Rural Urban Total Rural Urban Total Rural Urban Total Rural Urban
Total Rural Urban
In- Un-habltated mhablted
3
84 84
15 15
47 47
94 94
35 35
13 13
11 II
60 60
96 96
87 87
78 78
81 81
118 118
94 94
138 138
123 123
176 176
1,53] 1,531
4
26 26
2 2
10 10
34 34
13 13
16 16
7 7
4 4
3 3
II II
9 9
12 12
10 ro
26 26
]64 164
Towns
5
I 3
3
4
4
No of households
6
10.435 10435
3425 3,425
7.769 7,769
16,240 9,236 7.004
14.094 5.140 8.954 5517 3.856 1.661 9176 4.870 4.306
12.805 12,805
25,609 17,943 7.666
12,822 12,822
5,354 5,354
13,991 13,991
19,853 19,853
9,271 9,271
10,446 10,446
8.662 8,662
13.656 [ 1.222 2,434
]78,231 171,1l6
7,ll5
52
Persons
7
48.747 48747
15.015 15.015
36262 36.262
85,302 50,304 34.998 66,931 26,125 40.806 26,386 19,328 7.058
45,243 27198 18,045 69.115 69.115
135,282 97.264 38,018 63317 63,317
25,927 25,927
72,624 72,624
96,827 96.827
45,076 45.076
50.607 50.607
43,554 43554
64,453 53,077 11.376
864,516 827,450
37,066
PopulatIOn
Males
8
25.153 25 153
8.030 8.030
18,579 18.579
45697 26,426 19,271 35.780 13.634 22.146 14.003 10.293 3.710
24235 14,620 9.615
35.253 35.253
70.955 50.063 20,892 31,983 31.9S3
13.077 13.077
36,341 36.341
49.358 49,358
22,905 22.905
25.527 25527
21,630 21,630
32.595 26.730
5.865
446,] 77 426,794
19,383
Females
9
23.594 ,23594
6.985 6.985
17.683 17,683
39,605 23,878 15,727 31.151 12,491 18.660 12,383 9,035 3.348
21.008 12.578 8.430
33.862 33.862
64,327 47,201 17126 31.334 31 334
12.850 12850
36283 36.283
47,469 47,469
22.171 22.171
25.080 ~5.080
21,924 2].924
3].858 26,347
5.511
418,339 400,656
17,683
Area m
square kilometre
10
PopulatIOn per
9:j km
II
35551 137 35551 137
2099 715 2099 715
13850 262 13S 50 262
21690 393 191 44 263 25 46 1,375 9739 687 7800 335 1939 2.104 31 09 849 2750 703 359 1,966
4131 1,095 4016 677
I 15 15,691 154 12 448 154 12 448
23903 566 21732 448
21 71 1.751 33170 191 331 70 191
64930 40 64930 40
36780 197 36780 197
54880 176 54880 176
43570 103 43570 103
37370 135 37370 135
46750 93 46750 93
564 70 114 53569 99
2901 392
3,890.00 222 3,852.41 215
37.59 986

A-I (part -I) : NUMBER OF VILLAGES, TOWNS, HOUSEHOLDS, POPULATION AND AREA
State/District/Police Station
Dasapa!!a P S
Ganla P S
Khandapada P S
Fategarh PS
Nayagarh P S
Nuagaon PS
Odagaon PS
Sarankul PS
Ranapur P S
KllOrdha District
Bolagad PS
BegunIa PS
Khordha P S
Chandaka P S
Khandagm r S
Saheednagar P S
Bahanta PS
Bahpatna PS
l"umber at VIllages TotaV 1"<0 of
Rural/ --------Urban In- Un- Towns
2
Total Rural Urban Total Rural Urban Total Rural Urban Total Rural Urban Total Rural Urban Total Rural
Urban Total Rural Urban Total Rural Urban Total Rural Urban
Total Rural Urban
Total Rural Urban Total Rural
Urban Total Rural Urban Total Rural Urban Total Rural Urban Total Rural Urban Total Rural Urban Total
Rural Urhan
habitated inhabited
3
348 348
98 98
145 145
136 136
172 172
98 98
206 206
110 110
218 218
1,358 1,358
143 143
147 147
141 141
44 44
25 25
24 24
81 81
98 98
4
68 68
16 16
19 19
14 14
10 10
7 7
16 16
9 9
5 5
193 193
14 14
13 13
14 14
7 7
3 3
3 3
5
2
2
7
7
No of households
6
20.640 20640
6953 6953
17,988 14,667 3,321
23,511 23,511
32,322 29.517
2,805 8.880 8.880
22118 22,118
20,012 20,012
25807 24,818
989
374,338 200,543 173,795
15.796 15,796
16.471 16,471
31 100 23,878
7,222 9,791 9.414
377 3,207 3,207
6062 6,062
17.118 14.800 2.318
23.843 23.843
53
Person~
7
92,497 92.497
34650 34650
89428 71.936 17,492
112,868 112,868
159,951 145637
14,314 39,941 39,941
102,693 102,693
98084 98084
134.404 129.144
5.260
1,877,395 1,071,689
805,706
82,167 82.167
88.797 88,797
169,703 130,049
39,054 50617 48,765
1852 17,569 17569
32,327 32.327
87.691 74.981 12.710
119774 119,774
Population
Male~
8
47452 47.452
18031 18,031
46.547 37,541
9,006 57,799 57,799
83,704 75,984
7,720 20,600 20,600
53.175 53,175
50983 50.983
67,886 65.229
2,657
986,886 543,490 443,396
41.909 41.909
44,874 44,874
86,999 66.618 20,381 25841 24,895
946 9,051 9,051
16.408 16.408
44.868 38,272 6596
60857 60,857
Females
9
45045 45,045
16619 16619
42,)\81 34,395
8.486 55069 55069
76,247 69653
6.594 19.341 19.341
49,518 49,518
47101 47101
66518 63.915
2,603
890,509 528,199 362,310
40258 40258
43,923 43,923
82,704 64031 18.ti73 24776 23,870
906 8.518 8518
15.919 15.919
42.823 36709
6.114 58917 58917
Are.1 Popu l-In atlon
~quare per k dometre 9:J km
10 II
95050 95050
97 97
41600 41600
83 83
29790 300 27860 258
1930 906 32380 349 32380 349
331 54 482 31600 461
1554 921 31860 125 31860 125
48690 211 48690 211
292 70 335 292 70 335
523 20 257 52045 248
275 I 913
2,813.00 667 2,589.16 414
223.84 3,599
15540 529 15540 529
25777 344 25777 344
40615 418 38077 343
2538 1.539 25740 197 25286 193
454 408 3840 458 3840 458
51 60 626 5160 026
12100 713 11587 047
7 13 I 783 16320 734 1632tl 734

A-I (Part -I) : NUMBER OF VILLAGES, TOWNS, HOUSEHOLDS, POPULATION AND AREA
Total! Number of Villages StatefDlstnct/Pollee N a of Ruralf -------
StatIOn
LIngar~J PS
fatam P S
JankIa P S
Tangl PS
Balugaon P S
Banapur P S
Bhubaneswar (M Corp)
Pun Dlstnct
Delanga P S
Plpill PS
Nlmapada PS
Kakatpllr P S
Konark P S
~atyabadl P S
Chandan pur P S
Sadar PS
BrahmagIrl P S
Urban [n- Un- Towns
2
Total Rural Urban Total Rural Urban Total Rural Urban Total Rural Urban Total Rural Urban Total Rural Urban Total Rural Urban
Total Rura[ Urban
Total Rural Urban Total Rural Urban Tot(ll Rural Urban Total Rural Urban Total Rural Urban Total Rural Urban Total Rural Urban Total Rural Urban Total Rural Urban Total Rural Urban
habltated mhablted
3
47 47
56 56_
148 [48
124 [24
121 [21
159 159
1,591 1,591
123 123
192 192
235 235
165 165
158 158
74 74
165 165
82 82
96 96
217 217
4
6 6
12 12
29 29
21 21
7 7
63 63
124 124
8 8
12 12
"4 4
13 13
13 13
II 11
8 8
6 6 -
13 13
20 20
5
2
2
4
4
No of households
6
5647 4,209 1,438
21A06 10,141 1[,265 19,203 19,203
23,182 23,182
18,566 14,615 3,951
18,667 15,722 2,945
144,279
144.279
287,463 247,682
39,781
17.797 17,797
25.791 23,195
2,596 40,610 37,393
3,217 25,117 25.117
34,297 34,297
12.355 9,356 2,999
31,573 31,573
14,336 14.336
16,105 16.1 05
29,246 29.246
54
Persons
7
30,539 22,942
7,597 113,066
55,109 57,957
108394 108394
130,747 130,747
100.760 78,730 22,030 97.212 80,738 16,474
648,032
648,032
1,502,682 1,298,654
204,028
99,123 99,123
143226 128,963
14,263 192,282 175.367
16,915 124.544 124,544
156,982 156,982
59,289 44,276 15013
173,036 173,036
79,414 79,414
89,638 89,638
176,209 176,209
PopulatlOn
Males
8
15,802 11.713 4,089
58218 28,228 29,990 54.630 54630
66716 66,716
51.974 39,673 12,301 48.000 39646
8,354 360.739
360.739
763,389 657,199 106,190
49,811 49.811
73.060 65,724
7.336 97,609 88,863
8,746 63,259 63.259
79.607 79,607
30,135 22,296
7.839 86,854 86,854
40,353 40.353
45.238 45,238
89,017 89,017
Female~
9
14,737 11,229 3508
54848 26,881 27 967 53.764 53.764
64.031 64.031
48,786 39,057
9.729 49212 41092 8120
287293
287,293
739,293 641,455
97,838
49312 49312
70166 63239 6,927
94,673 86,504
8,169 61285 61.285
77.375 77,375
29,154 21,980 7174
86,182 86.182
39061 39,061
44,400 44,400
87.192 87,192
Area In
~qllare
kilometre
10
Popu 1-atlon per
sq km
II
3480 878 2640 869 840 904
12962 872 10348 533 2614 2.217
23559 460 23559 460
25827 506 25827 506
16010 629 151 92 518
8 18 2.693 44080 221 431 39 187
9-1-3 1,747 13464 4,813
13464 4,813
3,479.00 432 3,403.66 382
75.34 2,708
18068 549 18068 549
19790 724 18910 682
880 1.621 31002 620 29540 594
1462 1.157 25290 492 25290 492
25000 628 25000 628
16878 351 13370 331 35 08 428
30850 561 30850 561
13680 581 13680 581
24790 362 24790 362
72850 242 72850 242

A-I (Part -I) : NUMBER OF VILLAGES, TOWNS, HOUSEHOLDS, POPULATION AND AREA
TotaV Number of VIllages State/Olstnet/Pollce No of
Rural/ --------StatIOn
Krushna Prasad P.S
Pun (M)
GanJam District
Tarasmgl P S
Buguda PS
Bhanlanagar P S
Gangapur P S
Surada I'S
Badagada PS
Urban
2
Total Rural Urban Total Rural Urban
Total Rural Urban
Total Ruml Urban Total Rural Urban Total Rural Urban Total Rural Urban Total Rural Urban Total Rural Urban
ASlka P S Total Rural Urban
Purusottampur P S Total Rural Urban
Kablsuryanagar P S Total Rural Urban
Kodala P S Total Rural Urban
Khahkotc P S Total Rural Urban
Rambha P S Total Rural Urban
Chhatrapur P S Total Rural Urban
Gopalpur P S Total Rural Urban
Hruhmapur Sadar P STatal Rural Urban
In- Un-habltateu mhablt\:d
3
84 84
2,812 2,812
105 105
144 144
133 133
134 134
105 IQ5
241 241
143 143
101 101
122 122
223 223
134 134
87 87
95 95
27 27
51 51
4
16 16
400 400
3 3
<)
9
8 8
15 15
II II
42 42
19 19
7 7
13 13
53 53
51 51
28 28
6 6
4 4
fowns
5
19
19
2
2
2
2
2
2
2
2
No of households
6
9,267 9,267
30969
30,969
644,919 538,530 106,389
17.495 17495
34.119 31.458
2.061 33.078 27 288
5790 29.471 29,471
15838 13.043 2.795
22 ~58 22958
38,410 33.253
5 157 30.349 27.586
2.763 41.024 34.287
6,737 40.985 38598
2387 24.158 22 129
2.029 17,285 152<)4
].991 37.710 31.265 6445
12.624 11305 1319
23451 23451
55
Per.,on~
7
5Ll02 51,102
157,837
157,837
3,160,635 2,604,276
556,359
77.!WO 77 800
157.789 144.532
13257 15<).255 129.545 29.710
144.922 144.922
78.438 63.7<)0 14,648
112.019 112.019
192.442 IM.721l 25714
1177--16 1334<)7
14.249 205.129 169,767
35.662 199.514 187 169
12345 IIlU56 107798
10.958 S6,035 75.319 10716
181964 150.358 31606 60092 53.129
6.663 120560 12() 560
PopulatIOn
Males
8
26.177 26.177
82.26<)
82269
1,581,986 1,295,086
286,900
39 (J03 39003
78 155 71.44 I 6714
7().468
64305 15.163 69.982 69.982
39261 31.80 I
7460 5639() 56.390
95914 82.646 13.268 73.332 66065
7.267 101 569 83.426 III 143 98.136 91952
6.184 59292 53.040
5.652 43,61l11 38.]05
5.383 91.594 75444 16 150 30.582 27 246 3336
61260 61.260
9
24925 24925
75568
75568
1,578,649 1,309,190
269,459
38797 38.797
79634 730<)1 6543
7<) 787
652·10 14.547 74940 74940
39.177 31 98<)
7.18S 55.62~
55.()2~
96528 84 0!l2 • 12446 74414 67432 6982
103860 86341 17519
101378 ~5 217
6161 5<) 464 54158 5306
42347 37014
5333 90.370 74911 15.456 29510 ~6 IS]
3327 59.300 59.100
Area In
square Idomctre
10
PopulatIOn per
sq k.m
II
25850 198 25850 198
1684 9.373
1684 9373
8,206.00 385 7,938.21 328
267.79 2,078
42220 184 42220 184
84055 188 83310 173
745 1.779 ()7664 235 66540 195
II 24 2.643 51120 283 511 20 283
43712 179 43220 148
492 2.977 53780 208 53780 208
51981 370 51320 325
661 3.890 261 72 565 22683 589 3489 408
12648 1624 9654 1.759 2994 1.191
341 19 585 32<) 10 569
1209 1.021 23052515 20203 534
2849 385 21547 399 20770 363
777 1.379 29132 625 27780 541
13522338 77 06 780 7450 717 256 2603
7630 1.580 763() I 580

A-I (part -0: NUMBER OF VILLAGES, TOWNS, HOUSEHOLDS, POPULATION AND AREA
State/Olstnct/Poltce TotaV __ N_u_m_b_er_o_f_V_I_"_ag_e_s_ No of Rural/
StatIOn Urban In- Cn- Towns
Golanthara P S
Nuagaon P S
Olgapahandl P S
larada P S
Patapur P S
Hm.ph PS
I3rahmapur (M)
Ramagm (P) P S
Gtljapatl District
AJva PS
Mohana PS
R lJda)gm PS
iarabandha P S
Parlak.hemundl P S
Kashmagara P S
Serango PS
Rayagada PS
Ramaglrl (Pl P S
2
Total Rural Urban Total Rural Urban Total Rural Urban Total Rural Urban Total Rural Urban Total Rural Urban Total Rural l1rban Total Rural Urban
Total Rural Urban
Total Rural Urban Total Rural Urban Total Rural Urban Total Rural Urban Total Rural Urban Total Rural Urban Total Rural Urban Total Rural Urban Total Rural Urban
habltated mh ablted
3
90 90
178 178
148 148
199 199
190 190
63 63
99 99
1,512 1,512
213 213
263 263
284 284
103 103
133 133
72 72
222 222
115 115
107 107
4
2 2
23 23
24 24
47 47
20 20
5 5
10 10
107 107
18 18
8 8
18 18
12 12
15 15
14 14
12 12
5 5
5 5
5
2
2
No of households
6
26.954 26954
21.894 19,711 2.183
26,503 24.292
2.211 23.140 23.140
38.217 38.217
29.289 25.164 4 125
57796
57.796 2.171 2.171
111,405 100,306
11.099
10.437 10437
13.364 13,364
14.802 14,802
6.101 6.101
26.671 17.872 8.799
11.584 9.184 2,300
13.600 13.600
9.244 9.244
5.602 5.602
56
Persons
7
128.879 128.879
102879 92.077 10.802
125.376 114,486
10.890 108.053 108053
191.598 191598
143.234 121887 21.347
307.792
307.792 10.063 10.063
518,837 465,949
52.888
51.261 51.261
64.547 64.547
73.352 73.352
26.293 26293
119.973 76,876 43.097 49.955 40.164
9791 65,354 65,354
41.507 41.507
26595 20595
PopulatIOn
Males
8
63,858 63858
51081 45.631
5.450 62.730 57.188
5.542 52.740 52.740
97.019 97.619
70.809 59.975 10.834
160.354
160.354 5 169 5.169
255,423 228,862
26.561
25.322 25.322
32.033 32.033
36.257 36.257
12806 12.866
59.746 37.968 21.778 24.619 19.836 4.783
31.501 31,501
20.166 20166
12.913 12913
Females
9
65.021 65.021
51.798 46,446
5.352 62.646 57.298
5.348 55.311 55.313
93.979 93.979
72.425 61.912 10.513
147.438
147.438 4894 4.894
263,414 237,087
26.327
25.939 25.939
32.514 32.514
37.095 37095
13.427 13427
60.227 38.908 21.319 25,336 20.328
5.008 33853 33853
21.34 I 21341
13.682 13682
Area In
square kilometre
10
Popu 1-at IOn per
!'q k.m
I I
18750 687 18750 687
45262 227 446 14 206
648 1.667 32222 389 31200 367
1022 1.066 70036 154 70036 154
47650 402 47650 402
21121 678 19940 61 I
11 81 1.808 7980 3.857
7980 3.857 11957 84 I 1957 84
4,325.00 120 4,311.01 108
13.99 3,780
40100 128 40100 128
51300 12(i 51300 126
70210 104 70210 104
15000 175 15000 175
21463 559 21100 364
3 63 11.872 17196 291 16160 249
1036 945 22387 292 22387 292
39763 104 39763 104
19803 134 19803 134
A~l (part -I) : NUMBER OF VILLAGES, TOWNS, HOUSEHOLDS, POPULATION AND AREA
TotaV Number ofVtllages State/DIstnct/Pollce ________ }.; 0 of
Rural! StatIOn Urbdn [n- Un- Towns
habltated mhablted
2 3
Kandhama[ District Tota[ 2,379 Rural 2,379
Gochhapada P S
Phulahanl P S
Urban
Tota[ Rural Urban Total Rural Urban
Phulabam Town P STatal Rural Urban
KhaJunpada P S Total
G udayaglfl P S
Tlkabah P S
Sarangagarh P S
Phmngla P S
Bahguda PS
Tumudlbandha P S
Bclaghar P S
Kotagarh P S
BrahmaOlgaon P S
Danngbadl P S
Ralkla P S
Baud" Distrtct
Rural Urban Total Rural 1 :rban Total Rural Urban Total Rural Urban rotal Rural Urban Total Rural Urban Total Rural Urban Total Rural Urban Total Rural Urban Total Rural Urban Total RUlal Urban Total Rural Urban
Total Rural Urban
2[5 215
235 235
6 6
164 164
[76 [76
[57 157
88 88
224 224
397 397
90 90
130 130
128 128
82 82
157 157
[30
130
1,115 1,115
4
167 167
II II
12 12
5 5
19 19
7 7
16 16
17 17
38 38
6 6
5 5
6 6
12 12
12 12
71 71
5
2
2
No of households
6
145,676 136,265
9,411
6.885 6.885
8.2S8 8,288
7564 268
7296 9.370 9,370
16.049 13934 2.115
11.105 ll.l 05
7.496 7.496
l0.281 10.281
22.352 22,352
5.244 5.244
3,809 3.809
8001 8.001
6473 6.473
11.450 11.450
11,309 11.309
83,245 79,653
3,592
57
Persons
7
648,201 604,107
44,094
30.62[ 30,621
36376 36.376
35.180 1.290
33.890 38905 38.905
68110 57.906 10.204 46.875 46.875
31,497 31.497
46.638 46.638
100.521 100,521
23.913 23.913
16.835 16.835
37.581 37.581
31.199 31.199
54723 54.723
49.227 49,227
373,372 355,347
18,025
PopulatIOn
Male::.
8
322,799 299,929
22,870
15.188 15 188
18,289 18.289
18.591 684
17.907 19.528 19.528
33708 28.745
4.963 23.244 23,244
15.574 [5.574
23.270 23270
50.127 50,127
11.869 11869
8.254 8.254
18.814 18.814
[5.247 15.247
26.798 26798
24298 24.298
188,155 178,849
9,306
female,
9
325,402 304.178
21,224
15433 15,433
18.087 18087
16.589 606
15.9!O 19.377 19377
34402 29.161 5241
23.631 23.631
15923 15923
23.368 23.368
50394 50.394
12044 12.044
8581 8.581
18.767 IS.767
15952 15952
27 925 27.925
24.929 24929
185,217 176,498
8,719
Area In
square kilometre
10
Populdtlon per ~km
II
8,021.00 81 7,991.76 76
29.24 1.508
35170 351 70
50740 50740
87 87
72 72
IS 40 1.912 240 538
1600 2 118 252 50 154 25250 154
652 54 104 03930 91
1324 771 25400 185 254 00 185
22580 139 225 80 139
88760 53 8X760 53
75910 132 75910 132
15620 153 15620 153
8990 187 8990 187
291 20 129 29120 129
24940 125 24940 125
42780 128 427 80 128
32820 150 32820 150
3,09800 121 3,077.28 115
2072 870

A-1 (Part -0 : NUMBER OF VILLAGES, TOWNS, HOUSEHOLDS, POPULATION AND AREA
TotaV Numher of VIllages State/DlstnctiPolice No of
Rural! -------Statton
Kantamal PS
Manamunda P S
BaunsunI P S
Baudh Sadar P S
Puruna Katak P S
Harbhanga P S
Sonapur District
Dungunpali P S
larbha P S
Sonapur PS
BlramaharalPur P S
Ulunda PS
3Inlka P S
Rampur PS
Balanglr DistrIct
Khaprakhol P S.
Turekela P S
Urban I n- U n- Towns
2
Total Rural L;rban Total Rural Urban lotal Rurdl Urban Total Rural Urban Total Rural Urban Total Rural Urban
Total Rural Lrban
Total Rural Urban rotal RurdJ Urban Total Rural Urban Total Rural Urban Total Rural Urban lotal Rural Urban Total Rural Urban
Total Rural Urban
Total Rural Urban Total Rural Urban
habltated mhdbIled
3
217 217
293 293
83 83
276 276
110 110
136 136
829 829
114 114
181 181
65 65
251 251
98 98
77 77
43 43
1,764 1,764
120 120
79 79
4
9 9
24 24
6 6
13 13
7
7
12 12
130 130
18 18
30 30
II II
47 47
12 12
II II
30 30
3 3
5
3
3
4
4
No of households
6
15.380 15.380
19.653 19.653
7.7X6 7.7'(,6
25187 21.595
3.592 7,422 7.422
7,817 7,817
115,533 107,292
8,241
22.663 22,663
20.731 19.181
1.550 10512 6.839 3.673
26,548 26.548
7.600 7.600
19.030 16.012 3.018 8.449 8.449
303,385 272.975
30,410
16095 16.095
9995 9.995
58
Persons
7
63,654 63,654
88491 88.491
36.932 36,932
117.489 99.464 18,025 31,951 31.951
34.855 34.855
541,835 501.767
40.068
107,307 107,307
93.043 85,054
7,989 5un 33,632 17.540
124,746 124,746
35.510 35.510
89718 75,179 14.539 40,339 40.339
1,337.194 1,182.871
154,323
64.121 64.121
40,298 40,298
Population
Male~
8
3Ui79 31,679
44,588 44588
18,620 18,620
59,574 50,268
9.306 16014 16014
17.680 17.680
275.601 254.805
20.796
54.518 54.518
46.896 42.836
4.060 26.466 17169 9,297
63,398 63.398
17.924 17.924
45.773 38334
7.439 20.626 20.626
673,985 594,182
79,803
31.967 3].967
20.061 20.061
Female,
9
31.975 31.975
43903 43903
18.312 18.312
57.915 49,196
8.719 IS 937 15.937
17.l7S 17.175
266,234 246,962
19,272
52.789 52.789
46147 42.218
3.929 24.706 16463 8243
61.348 61.348
17,586 17586
43945 36.845 7100
19.713 19,713
663.209 588.689
74.520
32.154 32.154
20.237 20.237
Area In
square kilometre
10
PopulatIOn per
oq km
II
65270 98 65270 98
79000 112 79000 112
14400 256 14400 256
85062 138 82990 120
2072 870 14452 221 14452 221
86298 40 86298 40
2,33700 232 2.287.50 219
49.50 809
27981 383 27981 383
42985 216 41690 204
1295 617 233 13 219 21800 154
15 13 1.159 65790 190 65790 190
23830 149 23830 149
33152 271 31010 242
21 42 679 11389 354 11389 354
6,575.00 203 6,502.55 182
72 45 2,130
62530 103 62530 103
24350 165 24350 165
A-l (Part -I) : NUMBER OF VILLAGES, TOWNS, HOUSEHOLDS, POPULATION AND AREA
TotaV Nu mber of Village!> PopulatIOn Area Popul-State/District/Police
Rural/ No at No of In atlOn
StatIOn Urban In- Un- Towns household" square per habltated inhabited
Persons Males Females k. tlometre ~km
2 3 4 5 6 7 8 9 10 11
8clpara P S rotal 105 17,026 68,2()5 34.348 33.R57 50390 135 Rural 105 17,026 68205 34.348 33,857 50390 135 Urhan
KantabanJi P S Total 56 13401 61.375 31020 30.355 172 37 356 Rural 56 9,620 41.280 20.564 20,716 16460 251 Urban 3,781 20,095 10,456 ') 639 777 2,586
Bangomunda P S Total 92 13.933 60,443 30,118 30325 37660 160 Rural 92 13,933 60,443 30118 30325 37660 160 Urban
Smdhekcla P S. Total 106 17342 74,727 37.087 37,640 29530 253 Rural 106 17342 74.727 37.087 37.640 29530 253 Urban
Tltlagarh P S Total 147 4 31.292 137,404 69.095 68309 435 14 316 Rural 147 4 25,238 107.131 53,425 53,706 41980 255 Urban 6,054 30,273 15,670 14,603 1534 1.973
Saintala P S Total 185 5 30 f.27 123,994 62.776 61.218 89870 138 Rural 185 5 30,627 123.994 62,776 61.218 89870 138 Urban
Tushura P S Total 246 6 35,293 158621 79.975 78,646 84690 187 Rural 246 6 35293 158,621 79,975 78 h46 84690 187 Urban
Patnagarh P S Total 190 30.614 128,850 64.777 64073 75256 171 Rural 190 26.732 110.156 55,237 54,919 73430 150 Urban 3,882 18.694 9.540 9,154 1826 1.024
Balanglr P S Total 281 4 57.842 280455 142.962 137.493 93628 300 Rural 281 4 41,149 195 194 98,825 96,369 90520 216 Urban 16693 85261 44,137 4LJ24 3108 2.743
Lotslnga PS Total 157 5 29925 138.701 69.799 68,902 46490 298 Rural 157 5 29,925 138,701 69799 68,902 46490 298 Urban
Nuapada District Total 648 15 2 122,601 530,690 264,396 266,294 3,852.00 138 Rural 648 15 116,329 500,652 249,146 251,506 3,816.77 131 Lrban 2 6,272 30,038 15,250 14,788 35.23 853
lonk P S Total 69 2 14,464 66.583 33.154 33429 38850 171 Rural 69 2 11.066 49,954 24,754 25,200 377 10 132 Urban 3,398 16,629 8,400 8,229 1140 1.459
Nuapada P S rotal 118 2 19,244 87,420 43,417 44,003 97380 90 Rural 118 ' 2 19244 87420 43,417 44,003 97380 90 Urban
Komana P S Total 148 4 24948 106942 53.076 53,866 83140 129 Rural 148 4 24948 106.<)42 53.U76 53866 83140 129 Urban
Khanar P S Total 116 3 24,772 106665 53379 53286 573 13 186 Rural 116 3 21,898 93256 46.529 46,727 54930 170 Urban 2,874 13.409 6.850 6,559 2383 563
Boden PS Total 78 16,509 69,233 34,457 34776 29777 233 Rural 78 [6.509 69.233 34,457 34,776 29777 233 Urban
Stnapalt P S Total 119 3 22,664 93847 46,913 46,934 333 53 281 Rural 119 3 42,664 93,847 46.913 46.934 33353 281 tJrban
59

A-I (Part -I) : NUMBER OF VILLAGES, TOWNS, HOUSEHOLDS, POPULATION AND AREA
TotaV Number ofYIIlages Population Area Popul-StatelDlstnct/Pohce
Rural! No of No of In at IOn
Station Crban In- Un- Towm households square per habltated inhabited
Persons Males Females kilometre ~ km
2 3 4 5 6 7 8 9 10 I I
Kalahandi District Total 2,099 137 4 320,624 1,335,494 667,526 667,968 7,920.00 169 Rural 2,099 137 299,942 1,235,275 615,612 619,663 7,872.32 157 Urban 4 20,682 100,219 51,914 48,305 47.68 2,102
Kokasara PS Total 86 2 33.270 137.739 68,390 69.349 577 60 238 Rural 86 2 33270 137.739 68.390 69349 577 60 238 Urban
Dhardmgarh P S rotal 84 28,013 118,965 60,014 58.951 46100 258 Rural 84 28,013 118,965 60,014 58,951 46100 258 Urban
Kegaon PS Total lOS 3 20.398 83.307 41.287 42.020 38590 216 Rural 105 3 20,398 83,307 41,287 42,020 38590 216 Urban
Sadar P S Total 308 28 41,993 187,121 94,768 92,353 1,08260 173 Rural 308 28 29,718 126,334 63,130 63.204 1,06720' 118 Urban 12,275 60.787 31.638 29,149 1540 3,947
Keslnga P S Total 118 9 29,679 120,521 60,412 60,109 46880 257 Rural 118 9 26,257 103.604 51,831 51,773 45430 228 Urban 3,422 16,917 8,581 8.336 14.50 1,167
Narala P S Total 204 8 23,763 94,598 47,354 47.244 443 10 213 Rural 204 8 23,763 94,598 47,354 47,244 443 10 213 Urban
Madanpur Rampur P S.Total 289 22 29.871 116.655 58,480 58,175 I, 175 90 99 Rural 289 22 29,871 116.655 58,480 58,175 1,17590 99 Urban
Lanjlgarh P S Total 285 37 11,852 52,210 25.720 26,490 89080 59 Rural 285 37 11,852 52,210 25,720 26.490 119080 59 Urban
Thuamul Rampur P S Total 278 20 16,299 65.767 32,483 33284 1,072 30 61 Rural 278 20 16,299 ('5,767 32,483 33.284 1 072 30 61 Urban
Junagarh P S Total 198 7 45,200 190790 95.392 95.398 89614 213 Rural 198 7 41.989 175.031 87.356 87675 88060 199 Urban 3,211 15,759 8,036 7723 1554 1.014
J ayapatna P S Total 144 40,286 167,821 83,226 84.595 74330 226 Rural 144 38,512 161,065 79,567 81,498 74106 217 Urban 1,774 6.756 3,659 3097 224 3,016
Rayagada District Total 2,467 200 5 190,381 831, 109 409,792 421,317 7,07300 118 Rural 2,467 200 165,257 715,702 351,158 364,544 7,01556 102 Urban 5 25,124 115,407 58,634 56,773 57.44 2,009
Ambadala PS fotal 286 44 11016 45,232 22,684 22,548 46360 98 Rural 286 44 11,016 45.232 22,684 22.548 46360 98 Urban
Mumguda P S Total 265 23 14,802 66.371 33,027 33,344 57390 116 Rural 265 23 14.802 66,371 33,027 33344 57390 116 Urban
Blshamakatak P S Total 287 31 18.228 79,179 38,414 40.765 78400 101
Rural 2S7 31 16,650 71.771 34.691 37080 77944 92 Urban 1,578 7.408 3,723 3.685 456 1.625
Gudan PS Total 186 11 13.141 56.345 27,986 28,359 95498 59 Rural 186 II 11.600 49.496 24,576 24.920 95270 52 Urban 1,541 6849 3.410 3439 228 3.004
60

A-I (Part -I) : NUMBER OF VILLAGES, TOWNS, HOUSEHOLDS, POPULATION AND AREA
TotaV Number ofYIllages PopulatIOn Area Porul-State/Olstnct/Pollce
Rural! ' No of No of In atlon
StatIOn Urban In- Un- Towns households square per
habltated mhablted Persons Males Females kIlometre sq t..m
2 3 4 5 6 7 8 9 10 II
Padmapur PS Total 92 7 8,873 38,806 19,280 19.526 32120 121 Rural 92 7 8.873 38806 19.280 19,526 32120 121 Urban
Puttasmg P S Total 58 3 6.444 31,003 14,782 16.221 34190 91 Rural 58 3 6,444 31003 14,782 16.221 34190 91 Urban
Gunupur P S Total 171 8 23,223 99.133 49.430 49.703 83125 119 Rural 171 8 17.874 74.427 36,982 37.445 80447 93 Urban I 5,349 24,706 12.448 12,258 2678 923
Rayagada P S Total 458 23 2 51.987 234.620 115,765 118,855 1,25362 187 Rural 458 23 35.]31 158.176 76.712 81,464 1,22980 129 Urban 2 16.656 76.444 39,053 37,391 2382 3,209
Kalyanasmgpur P S Total 248 17 13.823 59,334 28.557 30777 55430 107 Rural 248 17 13,823 59.334 28,557 30777 55430 107 Urban
Kashlpur P S Total 267 27 16,232 67.254 32,982 34.272 l.259 10 53 Rural 267 27 16,232 67.254 32,982 34272 1.259 10 53 Urban
Tlktrl P S Total 149 6 12,612 53.832 26,885 26947 24680 218 Rurdl 149 6 12.612 53.832 26,885 26,947 24680 218 Urban
NabarangapuT District Total _876 25 3 227,026 1,025,766 515,162 510,604 5,291.00 194 Rural 876 25 214,538 966,496 484,413 482,083 5,253,50 184 Urban 3 12,488 59,270 30,749 28,521 37,50 1,581
Ralghar P S Total 118 30558 158,323 80,006 78.317 61080 259 Rural 118 30558 158,323 80,006 78.317 61080 259 Urban _.
Umarkote P S Total 104 2 33957 169.358 85,519 83,839 1,077 90 157 Rural 104 2 28840 144.499 72.819 71,680 1.05200 137 Urban 5,117 24,859 12,700 12159 2590 960
Chandahandl P S, Total 87 2 16,043 61,076 30,350 30.726 26180 233 Rural 87 2 16,043 61,076 30,350 30,726 26180 233 Urban
Jhangan P S Total 67 15.815 69,808 34,738 35.070 64990 107 Rural 67 15,815 69,808 34,738 35.070 64990 107 Urban
Oabugan P S Total 135 3 28,856 127.351 63,580 63.771 753 10 169 Rural 135 3 28,856 127.351 63,580 63,771 753 10 169 Urban
Paparahandl P S Total 72 20,531 87.204 43,429 43,775 48320 180 Rural 72 20,531 87.204 43.429 43.775 48320 180 Urban
Tentuhkhuntl P S Total 47 13,582 56,973 28434 28,539 24410 233 Rural 47 13,582 56.973 28.434 28.539 24410 233 Urban
Khatlguda P S Total 44 17 7235 27.967 13.776 14.191 16980 165 Rural 44 17 5.720 21.561 10,471 11.090 16782 128 Urban 1.515 6406 3.305 3 101 198 3.235
Nabarangapur P S Total 61 22,920 ]0],084 51.550 49.534 27606 366 Rural 6] 17064 73.079 36,806 36273 26644 274 Urban 5.856 28.005 14.744 1326] 962 29]1
61

A-I (Part -I) : NUMBER OF VILLAGES, TOWNS, HOUSEHOLDS, POPULATION AND AREA
Total! Number of Villages State/DIstnct/Police No of
Rural! --------Station
Kodmga PS
Koraput District
Kotpad PS
Boriguma PS
BhaIrabsmglpur P S
Dasamantapur P S
Lakshmlpur P S
Narayanpatana P S
Kakmguma P S
Koraput P S
Koraput Town P S
Nandapur P S
Slmlhguda P S
DamanJodl P S
Pottangl PS
Padua P S
Sunabeda PS
Urban In- Un- Town~
2
Total Rural Urban
Total Rural Urban
Total Rural Urban Total Rural Urban Total Rural Urban Total Rural Urban Total Rural Urban Total Rural Urban Total Rural Urban Total Rural Urban 10tal Rural Urban Total Rural Urban Total Rural L1rban 10tal Rural Urban Total Rural Urban Total Rural Urban Total Rural Urban
habltated mh ablled
3
141 141
1,922 1,922
104 104
80 80
82 82
III III
71 71
269 269
29 29
123 123
8 8
202 202
19 19
13 13
134 134
103 103
2 2
4
106 106
9 9
13 13
2 2
10 10
13 13
6 6
7 7
5
5
5
No of household~
6
37.529 37.529
284,876 240,294
44,582
24416 21 141 3275
18.733 18.733
15.312 15.312
11.317 11.317
7.860 7.860
19.669 19669
5.483 5,483
15,775 15.775
10538 1.660 8.878
16.769 16.769
4,443 4443
6,478 4.372 2 106
19720 19.720
12319 12.319
14.067 242
13325
62
Persons
7
166622 166.622
1,180,637 982,188 198,449
103.975 89.058 14.917 78.939 78.939
59.622 59622
44.348 44.348
32.838 32.838
88.117 88.117
21488 21.488
60190 60190
45.798 6.250
39.5..J-8 63.621 63.621
16.442 16.442
25.499 17024 8475
85.460 85.460
49.544 49.544
59754 870
58884
PopulatIOn
Males
8
83.780 83780
590,743 488,975 101,768
52 104 44.695
7,409 39.461 39.461
29.528 29.528
21 950 21.950
16.363 16.363
43.520 43.520
10.620 10.620
29.680 29.680
23.581 3.026
20.555 31.419 31,419
8.225 8.225
13.540 8.933 4.607
42.771 42.771
24.609 24.609
30.717 431
30306
Females
9
82842 82.842
589,894 493,213
96,681
51 871 44.363
7508 39478 39.4 78
30094 30.094
22.398 22398
16.4 75 16.4 75
44.597 44.597
10868 10.868
30.510 30.510
22217 3224
18.993 32.202 32202
8.217 8.217
11959 8.091 3868
42689 42.689
24935 24.935
29.017 t39
28578
Ared In
square lilometre
10
Popu 1-allon per
9:I km
II
704 33 218 7M33 218
8,807.00 134 8,618.28 114
188.72 1,052
491 72 211 47877 186
1295 1.152 36880 214 36880 214
34450 173 34450 173
59201 75 592 01 75
32520 101 32520 101
96090 92 %090 92
14420 149 14420 149
67990 89 67990 89
9707 472 3600 174 61 07 648
56460 113 56460 113
16990 16990
97 97
7S 32 326 6600 258 1232 688
R3660 102 83660 102
45580 109 45580 109
3848 675 12 ()O 73 71:> 4X 77()

A-I (Part -I) : NUMBER OF VILLAGES, TOWNS, HOUSEHOLDS, POPULATION AND AREA
TotaV Number of VIllages PopulatIon Area Popu 1': __ State/DIstnct/Pollce
Rural! No of No of In atlon
StatIon Urban In- Un- Towns households squarc per
habItated mhablted Persons Males Fcmales kIlometre ~ km
2 3 4 5 6 7 8 9 10 11
Machh kund P S Total lIS 9 9,556 37885 18,715 19J70 33930 112 Rural 115 9 9556 37,885 18,715 19J70 33930 112 Urban
BOlpanguda P S. Total 297 26 25,776 103,576 51,548 52,028 I 165 16 89 Rural 297 26 25,776 103.576 5U48 52,028 1.165 16 89 Urban
Jeypur P S Total 93 8 35250 156,468 78Jl67 77,601 37560 417 Rural 93 8 18,752 79,843 39,976 39.867 34970 228 Urban 16,498 76,625 38,891 37,734 2590 2.958
Kundura PS Total 67 11,395 47,073 23,505 23568 29530 159 Rural 67 11,395 47073 23,505 23,568 29530 159 Urban
Malkangiri District Total 979 66 2 109,483 504,198 252,507 251,691 5,791.00 87 Rural 979 66 102,076 469,582 234,614 234,968 5,768,09 81 Urban 2 7,407 34,616 17,893 16,723 22.91 1,511
MalkangITI P S Total 178 20 29,845 142,026 71.279 70.747 54906 259 Rural 178 20 24,945 118912 59,326 59,586 53100 224 Urban 4,900 23.114 11.953 11.161 1806 1.280
Mathlh PS Total 142 2 16,256 70,616 35,309 35.307 402 14 176 Rural 142 2 16.256 70,616 35,309 35,307 40214 176 Urban
Muduhpada P S Total 89 9 5,749 23,543 11,601 11,942 78190 30 Rural 89 9 5,749 23.543 11,601 11.942 78190 30 Urban
Chltrakonda P S Total 260 6 12,069 52,145 25,929 26.216 1.30640 40 Rural 260 6 12.069 52,145 25.929 26,216 1,30640 40 Urban
Orkel P S Total 99 9 13,893 62.502 31.216 31.286 45495 137 Rural 99 9 11,386 51.000 25.276 25.724 • 450 10 113 Urban 2.507 11.502 5,940 5.562 485 2.372
Kallmela PS Total 134 12 18,467 88,630 44,570 44,060 1.59030 56 Rural 134 12 18,467 88,630 44,570 44.060 1.59030 56 Urban
M V 79 PS Total 31 6.873 34.149 17.231 16.918 254.66 134 Rural 31 6,873 34.149 17.231 16918 25466 134 Urban
Motu P S Total 46 7 6,331 30,587 15,372 15.215 78134 39 Rural 46 7 6,331 30.587 15,372 15,215 781.34 39 Urban
63

A-I (Part -II): NUMBER OF TOWNS, HOUSEHOLDS, POPULATION AND AREA
State I Dlstnct I Pohce StatIOns I Urban Number Number of Population Aream PopulatIOn per U A IClty !Town of Hou~eholds Persons Males Females square square
Towns kIlometre kIlometre
2 3 4 5 6 7 8 9
Orissa Urban 138 1,119,5185,517,238 2,911,600 2,605,638 2,794.13 1,975
Bargarh District Urban 4 20,378 103,541 53.514 50,027 54.89 1,886
Patkamal P S Urban
Iharbandha P S Urban
PadmapurP S Urban 3.035 15,442 7,858 7,584 208 742
Padmapur (NAC) Urban 3035 15,442 7.858 7584 208 742
Burden P S. Urban
Gmsilet P S Urban
M elchhamunda P .S. Urban
Sohela P S Urban
BIJepur P S. Urban
Barapalt P S Urban 3.840 19157 9811 9.346 14 15 1.354
Barapalt (NAC) Urban 3.840 19.157 9.811 9.346 1415 1.354
Bheden P S Urban
Bargarh P S Urban 2 13,503 68,942 35,845 33,097 1994 3,457
Bargarh (M) Urban 12.368 63,678 33,115 30,563 1672 3,808
Khahapalt (CT) Urban I 135 5.264 2730 2.534 322 1635
Bhath P S Urban
Ambabhona P S. Urban
Attablra P S Urban
Jharsuguda District Urban 3 37,570 185,885 97,956 87,929 153.56 1,211
Rengalt P S Urban
Lakhanpur P S Urban
Bclpahar P S Urban 6.593 32,826 17671 15.155 41 65 788
Belpahar (NAC) Urban 6,593 32,826 17.671 15.155 4165 788
Banaharapah P S Urban
Onent P S Urban - I 15,611 76,959 40.319 36.640 4144 1,857
BraJaraJnagar (M) Urban 15,611 76.959 40.319 36640 4144 1,857
Bralaralnagar P S. Urban
Jharsuguda P S Urban 15.366 76.100 39.966 36,134 7047 1.080
Jharsuguda (M) Urban .
15,366 76,100 39,966 36,134 7047 1,080
Lmkera P S Urban "';
Kolablra P S Urban
64
A-I (Part -11): NUMBER OF TOWNS, HOUSEHOLDS, POPULATION AND AREA
State / Dlstnct / Pohee Stations / Urban Number Number of PopulatIOn Aream PopulatIOn per
U A / City !Town of Households Persons Males Females square square Towns kilometre kilometre
2 3 4 5 6 7 8 9
Sambalpur District Urban 5 52,6]3 253,778 13],940 ]21,838 143.7] ],766
Sambalp ur U A Urban 3 46.656 226.469 117,745 108724 895 2.530
(a) Sarnbalpur Urban 32.312 157.253 81,536 75.717 4975 3.161
(I)Sarnbalpur Town eM) Urban 31,502 153.643 79,683 73.960 4648 3,306 (ll) Dhankauda & Urban 810 3.610 1,853 1.757 327 1.104
Mathapah Area(O G)
(b) BurIa Urban 8.743 42.822 22,453 20.369 2862 1.496
(I) Burla Town (NAC) Urban 7.949 39.204 20,577 18.627 1762 2,225
(n) Amsadha Katapalt Urban 794 3618 1.876 1.742 II 329
Area (0 G)
(c)Hlrakud Town (NAC) Urban 5601 26,394 13.756 12.638 II 13 2,371
Govmdpur P S Urban
Mahulpalh P S Urban
Kochmda P S Urban 2.955 13.586 6.966 6620 1684 807
Kochmda (NAC) Urban 2955 13.586 6.966 6620 1684 807
Jamanklra r S Urban
Klsmda P S. Urban
Naktldeul P S Urban
Ratrakho1 P S Urban 3.002 13.723 7.229 6.494 3737 367
Redhakhol (NAC) Urban 3.002 13723 7.229 6.494 3737 367
Charamal r S Urban
JUlomura P S Urban
Dhama P S Crban
Burla P.S. Urban 8.743 42.822 22.453 20.369 2862 1.496
Burla(NAC) Urban 7.949 39,204 20,577 18,627 1762 2,225
Amsadha Katapah Urban 794 3,618 1.876 1,742 1100 329
Arca(O G)
Hlrakud P S Urban 5.601 26394 13756 12638 II 13 2371
I-hrakud Town (NAC) Urban 5.601 26394 13.756 12113S II 13 2,371
Amthapah P S Crban
Dhanupah P S Urban 223 900 468 432 .085 1,059
Mathapah Area (0 G) Urban 223 900 468 432 085 1,059
Sadar P S Urban 587 2,710 I 385 1.325 242 1,120
Dhankauda Area (0 G ) Urban 587 2,710 1.385 1.325 242 1.120
Sasan P S Urban
Katarbag;l P.S Urban
Sambalpur (M) Urban 31.502 153.643 79683 73,960 4648 3.306
65
A-t (part -II) : NUMBER OF TOWNS, HOUSEHOLDS, POPULATION AND AREA
State I DIstrict / Poltce StatIOns / Urban Number Number of PopulatIon Area 10 PopulatIon per U A IClty ITown of Households
Per~on<; Males Females square square Towns kilometre kIlometre
2 3 4 5 6 7 8 9
Debagarh District Urban 4,341 20,096 10,518 9,578 24.13 833
Debagarh P S Urban 4.341 20.096 10.518 9.578 2413 833
Debagarh (M) Urban 4.341 20.096 10.518 9.578 2413 833
Barkot P S Urban
Kundhelgola P S Urban
Reamal P S Urban
S undargarh District Urban 11 131,434 629,194 333,023 296,]7] 244.76 2,57]
Raurkela U A Urban 3 102,070 484,874 . 258.73 I 226,143 15717 3.085
(a) Raurkela Urban 53,608 259,553 139.732 119,821 NA
(I) Raurkela Town(M) Urban 46,385 224,987 121.240 103,747 Area Included In
(ll)Kulunga Industrtal Estate Rourkela (ITS)
and Other Colony Area (0 G ) Urban 7,223 34.566 18,492 16,074 2409 1,435
(b)Raurkela Industrtal TownshIp Urban 46,009 213360 112,865 100.495 12690 1.681
(I) Raurkela Industrtal Urban 44,684 206.693 109.)94 97.299 12173 1.698
Township (ITS)
(ll) I D L Factory and Other Urban 1,325 6.667 3,471 3.196 5 17 1,290
Colony Area ~ 0 G )
(c) Ja1da Town (C T ) Urban 2.453 11.961 6,134 5.827 618 1,935
Hemglr P S Urban
Lephnpara P S Urban
BhasmaP S Urban
Sundargarh Town P S Urban 7.639 38,421 19,703 18,718 2383 1.612
Sundargarh (M) Urban 7,639 38.421 19,703 18,718 2383 1.612
Sundargarh P S Urban
Ktn.llrkela P S Urban
Ta1asara P S Urban
Baragaon P S Urban
KutraP S Urban
RaJagangapur P S Urban 3 11.266 56023 28.834 27,189 3159 1.773
RaJagangap ur (M) Urban 8,497 43,594 22,464 21.130 2616 1,666
t 0 C L Industrtal Urban . 554 2,196 1,179 1.017 Area inclUded 10
Township (ITS) RaJgangapur (M)
Panposh (CT) Urban 2,215 10,233 5.191 5.042 543 1.885
RaJboga P S Urban
81ramltrapur P S. Urban 5,924 29,447 14,937 14,510 2184 1348
Blramltrapur (M) Urban 5.924 29.447 14.937 14.510 2184 1.348
66

A-I (Part -H) : NUMBER OF TOWNS, HOUSEHOLDS, POPULATION AND AREA
State I District I Pohce Station!> I Urban Number Number of Population Area In Population per
U A IClty I Town of Households Per~ons Males Females square square
Town~ kIlometre k.llometre
2 3 4 5 6 7 8 9
llatlbarl P S Urban
Blsra P S Urban
Bondamunda P.S Urban 3,363 16,962 8,852 8.110 596 2,846
Jgflda& Jhlrpam (0 G.) Urban 3,363 16.962 8,852 8,110 596 2,846
Brahmam Tarang P S Urban 3.860 17.604 9.640 7.964 18 13 971
Kulunga Industrial Estate & Urban 3860 17,604 9,640 7.964 18 13 971
Other Colony Area (0 G )
Raghunathapah P S Urban 2 4,368 21.258 11,029 10,229 934 2,276
lalda Town (C T ) Urban 2,453 11,961 6,134 5,827 6 18 1,935
HatIbandha (C T ) Urban 1.915 9,297 4,895 4.402 3 16 2.942
T angflfap ali P S Urban 1.325 6,667 3,471 3.196 5 17 1,290
I D L Factory & Other Urban 1,325 6,667 3,471 3.196 5 17 1.290
Colony Area (0 G )
Lathlkata P S Urban 1.597 6.896 3.656 3,240 532 1.296
LathIkata (CT) Urban 1,597 6.896 3,656 3,240 532 1.296
Banki P S Urban
Kamarp osh Balang P S Urban
KOlda P S Urban
Lahumpara P S Urban 1,023 4.236 2267 1,969 185 2,290
Tensa(CT) Urban 1,023 4.236 2,267 ].969 185 2,290
GurundmP S Urban
Tlkaetpah P S Urban
Banel P S Urban
Mahulpada P S Urban
Raurkela (M) Urban 46,385 224,987 121,240 103,747 Area mcluded m Rourkela (ITS)
Raurkela Industrial Urban 44.684 206,693 109,394 97.299 121 73 ).698
TownshIp (l T S)
Kendujhar District Urban 9 43,692 213,023 111,581 101,442 198.59 1,073
TeikOI P S. Urban
Kanjlpanl P S Urban
Nayakote P S Urban
BarbII P S Urban 2 13.697 64.460 33,943 30,517 5286 1,219
Barbll (M) Urban 11.092 52,627 27,639 24,988 4144 1,270
Balagoda(Bolam) (CT) Urban 2.605 11,833 6,304 5.529 1142 1,036
Joda P S Urban 8,305 38,689 20,079 18,610 2642 1.464
67

A-I (Part -n) : NUMBER OF TOWNS, HOUSEHOLDS, POPULATION AND AREA
State I Dlstnct I PolIce StatIOns I Urban Number Number of PopulatIon Area 10 PopulatIOn per
U A IClty ITown of Households Persons Males Females square square
Towns k.t1ometre kIlometre
2 3 4 5 6 7 8 9
Joda(M) Urban 8.305 38,689 20,079 18.610 2642 1.464
Chanlpua P S Urban 2 2,590 13,574 7,182 6.392 817 1,661
Champua (CT) Urban 1,509 8.309 4,420 3,889 49 1,696
Ihumpura(CT) Urban 1,081 5,265 2,762 2,503 327 1,610
Bana P S Urban
Turumunga P S Urban
Patana P S Urban
Ghatgaon P S Urban
Kendulhar Sadar P S Urban "-KenduJhar Town P S Urban 10,137 51,845 27486 24,359 264 1964
Kendu]har (M) Urban 10,137 51,845 27,486 24,359 264 1.964
Pandapara P S Urban
Harlchandanpur P S Urban
Daltan P S Urban 1.052 4,239 2,274 1,965 NA
Daltarl (CT) Urban 1.052 4,239 2.274 1,965 NA
Ghaslpura P S Urban
Sa10kul P S Urban
Nandlpada P S Urban
Anandapur P S Urban 6.841 35,048 17,939 17109 77 29 453
Anandapur (NAC) Urban 6841 35048 17,939 17109 77 29 453
Soso P S Urban 1,070 5 168 2,678 2.490 745 694
Bangura (CT) Urban 1,070 5,168 2,678 2.490 745 694
Mayurbhanj DistrIct Urban 4 31,443 155,700 82,143 73.557 78.6 1,981
Banpada U A Urban 20,574 100.651 53606 47,045 3769 2,670
(I) Barlpada Tov.n(M) Urban 19.314 95,004 50.652 44.352 3337 2.847
(11) Poda Astta Busmess Urban 773 3,720 1,876 1.844 285 1.305
Centre Area (0 G )
(111) Subarnarekha IrrIgatIOn Urban 487 1927 1078 849 147 1.311
Project Colony Area (0 G )
TIrlngt P S Urban
Bahalda P S Urban
Gorumahlsam P S Urban
Ralrangp ur P S Urban
Ratrangp ur Town P S Urban 4,233 21.896 11.170 10.726 1438 I 523
68
A-I (Part -II) : NUMBER OF TOWNS, HOUSEHOLDS, POPULATION AND AREA
State / Dlstnct / Pollee StatIons / Urban Number Number of PopulatIOn Area m PopulatIon per U A I CIty / Town of Iiouseholds Persons Males Females ~quare square
Towns "Ilometre kIlometre
2 3 4 5 6 7 8 9
RaJrangpur (NAC) Urban 4.233 21,896 11,170 10.726 1438 1 523
Badampahar P S Urban
BISOI P S Urban
Banginposi P S Urban
Jharpokhana P S Urban
Chandua P S Urban
Kohana P S Urban
Barlpada Sadar P S Urban
Banpada Town P S Urban 1.260 5.647 2.954 2.693 432 1.307
Poda AstJa & Lwol1lpoSI Urban 1260 5.647 2.954 2693 432 1.307
Area (0 G)
Suhapada P S Urban
Muruda P S Urban
Betanatl P S Urban
Rasagobmdapur P S Urban
BatsInl?fl P S Urban
Barsahl P S Urban
Khunta P S Urban
Udala P S. Urban 2.445 11.712 6.091 5.621 789 1.484
Udala(NAC) Urban 2.445 11,712 6,091 5.621 789 1.484
Kaptlpada P S Urban
Sharata P S Urban
M ahuldlha P S Urban
Thakurmunda P S Urban
Karan.lJa P S Urban 4.191 21.441 11.276 10165 1864 1.150
Karanjm (NAC) Urban 4.191 21.441 11.276 10.165 1864 1,150
Jashlpur P S. Urban
Raruan P S Urban
Banpada(M) Urban 19,314 95004 50.652 44.352 3337 2.847
Baleshwar District Urban 5 43,120 220,368 114,771 105,597 130.68 1,686
Baleshwar U A Urban 2 31.099 156.430 82.106 74.324 687 2.277
(a) Baleshwar Urban 25.311 127.358 66,933 60425 38.23 3.331
(I) Baleshwar Town (M) Urban 20,938 106,082 55,691 50.391 1943 5.460
(II) Baleshwar Industnal Urban 4.373 21.276 11,242 10,034 188 L132
Estate (0 G)
(b) RemunaTown (NAC) Urban 5788 29,072 15,173 13899 3047 954
R3Ibama P S Urban
69

A-I (part -11) : NUMBER OF TOWNS, HOUSEHOLDS, POPULATION AND AREA
State I District / Police Stations / Urban Number Number of Population Aream Population per U.A.ICity ITown of Households Persons Males Females square square
Towns kilometre k.i1ometre
2 3 4 5 6 7 ~ 9
laleswarP.S. Urban 4,106 21.387 10,905 10.482 179 1.195
laleswar (NAC) Urban 4,106 21,387 10,905 10,482 17.9 1.195
Bhograi P .S. Urban
BaJiapal P.S Urban ~
Singla P.S. Urban
Basta P.S Urban
RupsaP.S. Urban
Baleshwar Sadar P.S. Urban 2,103 10,507 5.611 4,896 849 1.238
Baleshwar Industrial Urban 2,103 10,507 5,611 4,896 8.49 1.238
Estate (O.G.)
Chandipur P.S. Urban 381 2,099 1.118 9RI 351 598
Baleshwar Industrial Urban 381 2.099 1,I18 9XI 351 598
Estate (O.G )
RemunaP.S. Urban 5,788 29.072 15.173 13,899 30.47 954
Remuna (NAC) Urban 5,788 29,072 15.173 13.899 3047 954
Bampada P.S. Urban 1,889 8.670 4,513 4.157 68 1,275
Baleshwar Industrial Urban 1,889 8,670 4,513 4.157 6.8 1.275
Estate (O.G.)
Nilagiri P.S. Urban 3.006 14,757 7,558 7.199 2044 722
Nilagiri (NAC) Urban 3,006 14,757 7.558 7.199 2044 722
Berhampur P S. Urban
Oupada P.S. Urban
Soro P.S. Urban 4,909 27.794 14.202 13592 23.64 1.176
Soro (NAC) Urban 4.909 27,794 14.202 13,592 2364 1.176
Khaira P.S. Urban
Siml1ia P.S. Urban
Baleshwar (M) Urban 20,938 106,082 55.691 50,391 19.43 5.460
Bhadrak District Urban 3 23,746 ]41,071 72,961 68,] ]0 97.55 1,446
A~rpada P.S. Urban
Bant P.S. Urban
Bhadrak Rural P.S. Urban 15.338 92,515 48.063 44,452 31.08 2.977
Bhadrak (M) Urban 15.}38 92.515 48,063 44.452 31.08 2.977
Bhandari Pokhari P S. Urgan
Dhamana~ P.S. Urban 3.126 18.550 9,400 9,150 18.69 993
70

A-I (part -II) : NUMBER OF TOWNS, HOUSEHOLDS, POPULATION AND AREA
State I District I Police Stations I Urban Number Numher of Population Area in Population per lJ.A./Cit} ITown of Iiouseholds Persons Males Females !>quare square
1'0\\ ns k.ilomctre k.ilometn:
2 3 4 5 6 7 8 '}
Dhamanagar (NAC) Urban 3,126 18.550 9.400 9,150 1869 993
Dhusuri P.S. Urban
Tihldi (l.S. Urban
Chandabali P S. Urban
Bansada P. S. Urban
Naikanidihi P.S. Urban
Basudebpur P.S. Urban 5.282 30,006 15.498 14.508 47.78 62R
Ba<;udebpur (NAC) Urban 5,282 30.006 15,498 14.508 47.78 62R
Kendrapara District Urban 2 13,441 74,137 38,058 36,079 13.31 5,570
Rajkanika P.S. Urban
Aali P.S Urban
Pattamundai P.S. Urban 6.233 32.730 16,534 16.196 2.54 12.8H6
Pattamundal (NAC) Urban 6,233 32.730 16.534 16.196 25<-1 12.886
Kendrapara P.S. Urban 7.208 41.407 21.524 19.883 10.77 3.R45
Kendrapara (M ) Urban 7.208 41.407 21,524 19.883 1077 J.R45
Patkura P .S. Urban
Mahakalapada P S. Urban
Rajnag;;tr P S. Urban
Jagatsinghapur District Urban 2 23,431 104,449 58,439 46,010 41.07 2,543
Paradip P S. Urban 17.520 73.625 42.380 31.245 23.35 3.153
Paradip (NAC) Urban 17,520 73,625 42.380 31.245 23.35 3.153
KujangP.S. Urban
Erslima P.S. Urban
Tirtol P S. Urban
Balikuda P .S. Urban
Naugaon P.S. Urban
Jagatsinghapur P.S. Urban 5,911 30.824 16,059 14.765 17.72 1.740
Jagatsmg}lapur (NAC) Urban 5.911 30.824 16,059 14.765 17.72 1.740
Cuttack District Urban 8 121,977 641,130 342,190 298.940 221.61 2,893
Cuttack. U.A. Urban 2 111.439 587,182 314,101 273.081 195.21 3,008
(a) Cuttack (M .Corp.) Urban 101.153 534,654 285,838 248.816 149.16 }.584
(b)Choudwar Urban 10,286 52.528 28,263 24,265 46.05 1.141
(i) Choudwar Town (M) Urban 8,437 42,622 22.895 19,727 31.08 1,371
71
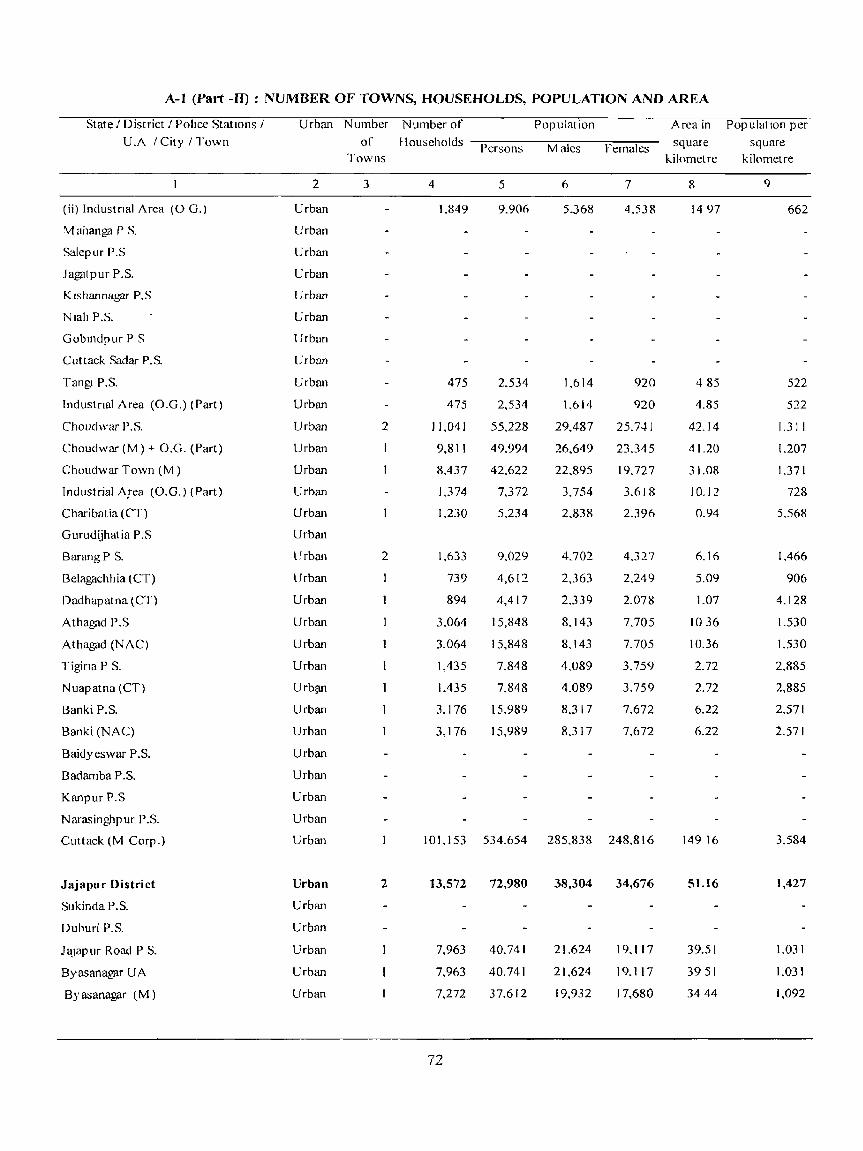
A-I (Part -Tn: NUMBER OF TOWNS, HOUSEHOLDS, POPULATION AND AREA
State I District I Pohee StatIons / Urban Number Number of Population Area in PopulatlOn per U.A I City ITown of Households Persons Males Females square square
Towns kilometre kilometre
2 3 4 5 6 7 8 9
(ii) Industnal Area (0 G.l Urban 1.849 9.906 5.368 4.538 1497 662
Mahanga P S. Urban
Salepur P.S Urban
.lagatpur P.S. Urban
KIshannagar P.S Urban
NIall P.S. Urban
Gobmdpur P S Urban
Cuttack Sadar P.S. Urban
TangJ P.S. Urban 475 2.534 1.614 920 485 522
Industnal Area (0.0.) (Part) Urban 475 2,534 1,614 920 4.85 522
Choudwar P.S. Urban 2 11,041 55,228 29,487 25,741 42.14 UII
Choudwar (M) + O.G. (Part) Urban 9,811 49.994 26,649 23.345 41.20 1.207
Choudwar Town (M) Urban 8,437 42.622 22.895 19,727 31.08 1.371
Industrial Area (0.0.) (Part) Urban 1,374 7,372 3,754 3,618 10.12 728
Charibatia (CT) Urban 1,230 5.234 2.838 2.396 0.94 5.568
Gurudijhatia P.S Urban
BarangP S. Urban 2 1,633 9,029 4.702 4,327 6.16 1,466
Belagachhia (CT) Urban 739 4,612 2.363 2,249 5.09 906
Dadhapatna (CT) Urban 894 4,417 2,339 2,078 1.07 4,128
Athagad P.S Urban 3,064 15,848 8.143 7,705 1036 1.530
Athagad (NAC) Urban 3,064 15,848 8.143 7.705 10.36 1.530
Tigina P S. Urban 1,435 7.848 4,089 3.759 2.72 2.885
Nuapatna (CT) Urbsm 1,435 7.848 4.089 3.759 2.72 2,885
Banki P.S. Urban 3,176 15.989 8.317 7.672 6.22 2.571
Banki (NAC) Urban 3,176 15.989 8.317 7,672 6.22 2.571
Baidyeswar P.S. Urban
I3adamba P.S. Urban
Kanpur P.S Urban
Narasingj1pur P.S. Urban
Cuttack (M Corp.) Urban 101,153 534.654 285,838 248.816 14916 3.584
Jajapur District Urban 2 13,572 72,980 38,304 34,676 51.16 1,427
Sukinda P.S. Urban
Duburi P.S. Urban
J ~Jap ur Road P S. Urban 7,963 40.741 21.624 19,117 39.51 1,031
Byasanagar U A Urban 7,963 40,741 21.624 19.117 3951 1.031
Byasanagar lM) Urban 7,272 37,612 19,932 17,680 3444 1,092
72

A-I (part -If) ; NUMBER OF TOWNS, HOUSEHOLDS, POPULATION AND AREA
State I DIstrict / Police Stations / Urban Number Number of PopulatIon Area III PopulatIon per U.i\. / City / roV. n of Households Persons Males Females square !:>quare
Towns kIlometre kIlometre
2 3 4 5 6 7 8 ')
Educational Area (OG) Urban 691 3.129 1.692 1.437 507 617
Korai ,'.S. Urban
Jajapur P.S Urban 5.609 32.239 16.680 1S.559 11.65 2.767
JaJapur (M) Urban 5.609 32.239 16.680 15.559 1165 2.767
Mangalpur P.S Urban
Binjharpur P.S. Urban
Balichandrapur P.S. Urban
Badachana P.S. Urban
Dharma<;a1a P.S Urban
Dhenkanal District Urban 3 18,486 92,914 48,923 43,991 54.01 1,720
Bhuban P.S. Urban 3,751 20.234 10,452 9,782 1804 1,122
Bhuban (NAC) Urban 3.751 20.234 10,452 9.782 18.04 1.122
Kamakshyanagar P.S. Urban 3.050 15,003 7.982 7.021 11.15 1.346
Kamakshyanagar (NAC) Urban 3.050 15.003 7.982 7.021 11.15 1.346
ParaJang P.S. . Urban
TumuslIIgha P.S. Urban
Motungfl P.S. Urban
BalIml P S. Urban
Hindol P.S. Urhan
Rasol P.S. Urban
Dhenkanal Sadar P.S. Urban 11,685 57,677 30,489 27,188 24.82 2.324
Dhenkanal (M) Urban 11.685 57.677 30.489 27.188 24.82 2.324
GandiaP.S. Urban
Anugul District Urban 9 33,886 158,416 85,866 72,550 106.56 1,487
Palalahada P .S. Urban
Khamar P.S. Urban
Rengali Damsite P.S. Urban 1.861 8. 115 4.367 3.748 625 1.298
Rengali Dam Project Urban 1.861 8.115 4.367 3.748 6.25 1.298
Township (CT)
Kaniha P.S. Urban
N.T.P.C. P.S. Urban
Sarna] Barrage P.S. Urban
Ta1cher Sadar P.S. Urban 7.004 34,998 19,271 15.727 25.46 1.375
Talcher (M) Urban 7,004 34.998 19,271 15.727 25.46 1.375
Colliery P.S. Urban 3 8.954 40.806 22.146 18.660 19.39 2.104
73

A-I (Part -II) : NUMBER OF TOWNS, HOUSEHOLDS, POPULATION AND AREA
State / District / Police Stations I Urban Number Number of Population Area in Population per
U.A I City / Town of Households Persons Males Females square square Towns kilometre kilometre
2 3 4 5 6 7 8 9
Talcher Thermal Power Urban 1.474 6.621 3.619 3.002 2 3.311
Station Township (CT)
Dera Colliery Township (CT) Urban 4,099 18.592 10.156 8,436 7.81 2.381
Ghantapada (CT) Urban 3,381 15.593 R.371 7.222 9.58 1.628
Blkrampur P.S. Urban 1.661 7.058 3.710 3.348 3.59 1.966
Fertilizer Corporation of Urban 1.661 7.058 3.710 3.34& 3.59 1.966
India Township (CT)
NALCO P.S. Urban 4.306 18,045 9.615 8.430 1.15 15.691
Nalco (CT) Urban 4.306 18.045 9,615 8.430 1.15 15.691
Banarpal P.S. Urban
Anugul P.S. Urban 7.666 38,018 20.892 17.126 2171 1,751
Anugul (NAC) Urban 7.666 38.018 20.892 17.126 21.71 1.751
Bantala P S. Urban
Purunakot P.S Urban
Jarapada P.S. Urban
Chhendipada P.S. Urban
Handapa P.S. Urban
Kishorenagar P.S. Urban
Thakurgarh P.S. Urban
Athmallik P.S. Urban 2.434 11,376 5.865 5.511 29.01 392
Athmallik (NAC) Urban 2.434 11.376 5.865 5.511 29.01 392
Nayagarh District Urban 4 7,115 37,066 19,383 17.683 37.59 986
Dasap alia P S Urban
Gania P.S. Urban
Khandapada P S. Urban 2 3,321 17,492 9.006 8,486 193 906
Khandapada (NAC) Urban 1.671 8,757 4,530 4.227 13.06 671
Kantilo (CT) Urban 1.650 8,735 4,476 4.259 6.24 1.400
Fategarh P.S. Urban
Nayagarh P.S Urban 2.805 14.314 7,720 6.594 15.54 921
Nayagarh (NAC) Urban 2.805 14.314 7.720 6.594 15.54 921
Nuagaon P.S. Urban
Odagaon P.S. Urban
SarankuI P.S. Urban
Ranapur P.S. Urban 989 5.260 2,657 2.603 275 1.913
Chandapur (CT) Urban 989 5,260 2,657 2.603 2.75 1.913
74--

A-J (part -In : NUMBER OF TOWNS, HOUSEHOLDS, POPULATION AND AREA
State I District I Police Stations / Urban Number Number of Population Area in Population per 1I.A. I City IT own of Households Persons Males Females square square
rowns kilometre kilometre
2 3 4 5 6 7 8 9
Khordha District Urban 7 173,795 805,706 443,396 362,310 223.84 3,599
Bhubaneswar U.A. Urban 146,213 658.220 366,134 292,086 148.1 4.444
(i) Bhubaneswar (M.Corp) Urban 144,279 64&.032 360,739 287,293 134.64 4,813
(ii) Industrial & Colony Urban 1.934 10.188 5,395 4,793 13.46 757
Area (O.G.)
Bola~d P.S. Urban
Begunia P S Urban
Khordha p.s_ Urban 7.222 39.054 20.3&1 18,673 25.38 1.539
Khordha(M) Urban 7.222 39.054 20.381 18.673 25.38 1,539
Chandaka P.S. Urban 377 1.852 946 906 4.54 408
Industrial & Colony Area (0.0.) (Part) Urban 377 1,852 946 906 4.54 408
Khandagiri P.S. Urban
Saheedna~r P.S. Urban
Balianta P S. Urban 2.318 12.710 6.596 6.114 7.13 1.783
Industrial & Colon) Area (0 0.) (Part) Urban 119 739 360 379 0.52 1.421
Pratapsasan (CT) Urban 2.199 11.971 6.236 5.735 661 1.811
Balipatna P.S. Urban
Lin~aj P.S. Urban 1,438 7.597 4.089 3.508 8.4 904
Industrial & Colony Area (0.0.) (Part) Urban 1.438 7.597 4.089 3,508 8.4 904
Jatan! P S erban 1].265 57.957 29.990 27.967 2614 2.217
Jatani U.A. Urban 11.265 57.957 29.990 27.967 20.14 2.217
Jatani Town (M) Urban 10.432 53.251 27.582 25.669 15.82 3.366
Industrial & Colony Area (O,G.) Urban 833 4.706 2,408 2.298 1032 456
Jankia P.S. Urban
Tangi P.S. Urban
Balu~on P.S. Urban 2 3.951 22,030 1).301 9,729 8.18 2.693
Balu~on (NAC) Urban 2.920 15.823 8,362 7.461 6.39 2.476
Dungamal (CT) Urban 1.031 6.207 3.939 2.2M~ 1.79 3,468
Banapur P.S. Urban 2.945 16.474 8.354 8.120 9.43 1.747
Banapur (NAC) Urban 2.945 16.474 8.354 8.120 9.43 1,747
Bhubaneswar (M .Corp) Urban 144.279 648,032 360.739 287,293 134.64 4,813
Puri District Urban 4 39,781 204,028 106,190 97.838 75.34 2,708
Delan~ P.S. Urban
Pip iIi P.S. Urban 2.596 14.263 7,336 6,927 8.8 1.621
75

A-I (part -IT) : NUMBER OF TOWNS, HOUSEHOLDS, POPULATION AND AREA
State I District I Police Stations I Urban Number Number of Population Area in Population per
U A. / City / Town of Households Persons Males Females square square Towns kilomt.:tre f...Iiometre
2 3 4 5 6 7 8 9
Pip iIi (NAC) Urban 2,596 14,263 7.336 6.927 88 1.621
Nimapada P.S. Urban 3.217 16.915 8.746 8.169 14.62 1.157
N imap ada (N A C) Urban 3.217 16.915 8.746 8.169 14.62 1.157
Gop P S. Urban
Kakatpur P.S. Urban
Konark P.S. Urban 2.999 15.013 7.839 7.174 3508 428
Konark (NAC) Urban 2,999 15.013 7.839 7.174 35.08 428
Satyabadi P.S. Urban
Chandanpur P.S. Urban
Sadar P.S. Urban
Brahmagiri P.S. Urban
Krushna Prasad P.S. Urban
Puri (M) Urban 30,969 157,837 82.269 75.568 16.84 9.373
Ganjam District Urban 19 106,389 556,359 286,900 269,459 267.79 2,078
Tarasingi P.S. Urban
Buguda P.S. Urban 2.661 13.257 6.714 6.543 7.45 1.779
Buguda(NAC) Urban 2.661 13.257 6.714 6,543 7.45 1.779
Bhanjanagar P.S. Urban 2 5.790 29.710 15.163 14.547 11.24 2,643
Bhanjanagar (NAC) Urban 3.834 19.748 10.226 9.522 6.06 3.259
Bellaguntha (NAC) Urban 1.956 9.962 4.937 5.025 5 18 1.923
Gangppur P.S. Urban
Surada P.S. Urban' 2.795 14.648 7.460 7.188 4.92 2.977
Surada (N A C) Urban 2.795 14.648 7.460 7.188 4.92 2.977
Badagpda P.S. Urban
Asika P.S. Urban 2 S,157 25.714 13.268 12,446 6.61 3.890
Asika(NAC) Urban 4.168 20.739 10.722 10.017 531 3.906
Makundapur (CT) Urban 989 4.975 2.546 2.429 13 3,827
Purusottampur P.S. Urban 2,763 14.249 7.267 6.982 3489 408
Purusottampur (NAC) Urban 2.763 14.249 7.267 6.982 34.89 408
Kabisuryanagar P.S. Urban 2 6.737 35.662 18,143 17.519 29.94 1.191
Kavisur:Jyanagpr (NAC) Urban 3,001 16.094 8.286 7.808 18 13 888
Polasara (NAC) Urban 3.736 19.568 9.857 9.711 11.81 1,657
KodalaP.S. Urban 2,387 12.345 6.184 6.161 12.09 1.021 " .....
Kodala (NAC) Urban 2.387 12,345 6,184 6.161 12.09 1.021
Khalikote P.S. Urban 2,029 10,958 5,652 5.306 28.49 385
Khalikote (NAC) Urban 2.029 10.958 5.652 5.306 2849 385
76

A-I (Part -II) : NUMBER OF TOWNS, HOUSEHOLDS, POPULATION AND AREA
State I DIstrict I Police Stations I Urban Number Number of Population Area in Population per U.A. / City / Town of Households Persons Males Females square square
Towns kilometre kilometre
2 3 4 5 6 7 8 9
Rambha P.S. Urban 1.991 10.716 5,383 5,333 7.77 1379
Rambha (NAC) Urban [.991 10.716 5,383 5.333 7.77 1.379
Chhatrapur P S. Urban 2 6,445 31.606 16.150 15.456 [352 2,338
Chhatrapur (NAC) Urban 4.184 20.289 10,333 9.956 4,4 4,611
Ganjam (NAC) Urban 2,261 11.317 5,817 5.500 9.12 1,241
Gopalpur P.S. Urban 1.319 6,663 3,336 3,327 2.56 2,603
Gopalpur (NAC) Urban 1,319 6.663 3.336 3,327 256 2,603
Brahmapur Sadar P.S. Urban
Golanthara P.S. Urban
Nuagaon P.S. Urban 2,183 10.802 5,450 5.)52 648 1,667
Chikiti tNAC) Urban 2,183 10,802 5,450 5,352 6.48 1,667
Digapahandi P.S. Urban 2,211 10,890 5542 5.348 1022 1,066
Digapahandi (NAC) Urban 2.211 10,890 5,542 5,348 1022 1,066
Jarada P.S. Urban
Patapur P.S . Urban . Hinjili P.S. Urban 4,125 21.347 10.834 10.513 11.81 1,808
Hinjllicut (NAC) Urban 4,125 21,347 10.834 10,513 11.81 1,808
Brahmapur (M) . Urban 57,796 307,792 160.354 147.438 79.8 3,857
Ramagiri (P) P.S. Urban
Gajapati District Urban 2 11,099 52,888 26,561 26,327 13.99 3,780
AdvaP S. Urban
Mohana P.S. Urban
R.Udaygiri P.S. Urban
Garabandha P.S. Urban
Parlakhemundi P.S. Urban 8,799 43,097 21.778 21,319 3.63 11.872
Parlakhcmundi (M) Urban 8.799 43.097 21,778 21,319 3.63 11.872
Kashinagpra P.S. Urban 2.300 9.791 4,783 5,008 10.36 945
Kashinagara (NAC) Urban 2,300 9.791 4,783 5.008 10.36 945
Serango P.S Urban
Rayagada P .S. Urban
Ramagiri (P) P.S. Urban
Kandhamal District Urban 2 9,411 44,094 22,870 2],224 29.24 1,508
Gochhapada P.S. Urban
Phulabani P. S. Urban
l'hulabani Town P.S. Urban 7.296 33.890 17.907 15.983 [6 2.118
77

A-I (Part -II) : NUMBER OF TOWNS, HOUSEHOLDS, POPULATION AND AREA
State I Distnct I Police Stations / Urban Number Number of Population Area in Pop ulat IOn per
U.A. ICity ITown of Households Persons Male~ Females square square Towns k.ilometre kilometre
2 3 4 5 6 7 8 9
Phulabam (NAC) Urban 7296 33.890 17.907 15.983 16 2.118
KhaJuripada P.S. Urban
G.Udayagiri P.S. Urban 2.115 10.204 4.963 5.241 13.24 771
G. Udayagiri (NAC) Urban 2.115 10.204 4.963 5.241 1324 771
Tikabali P.S. Urban
Sarangagarh P.S. Urban
Phiringia P.S. Urban
Baliguda P.S. Urban
Tumudibandha P.S Urban
Belaghar P .S. Urban
Kotag;rrh P S. Urban
-Brahmamgaon P S. Urban
Daringbadl P.S. Urban
RaikiaP.S. Urban
Baudh District Urban 1 3,592 18,025 9,306 8,719 20.72 870
Kantamal P.S. Urban
Manamunda P.S. Urban
Baunsuni P.S. Urban
Baudh Sadar P.S. Urban 3.592 18.025 9,306 8.719 2072 870
Baudhgarh (NAC) Urban 3.592 18.025 9,306 8. 719 2072 870
Puruna Katak P.S Urban
Harbhanga P.S Urban
Sonapur Urban 3 8,241 40,068 20,796 19,272 49.5 809
Dunguripali P S Urban
Tarbha P.S. Urban 1,550 7.989 4,060 3.929 1295 617
Tarbha (NAC) Urban 1.550 7.989 4.060 3.929 12.95 617
Sonapur P.S. Urban 3.673 17.540 9.297 8.243 15.13 1.159
Sonapur (M) Urban 3.673 17.540 9.297 8.243 15 13 1.159
Blramaharajpur P.S. Urban
UlundaP.S. Urban
Binika P.S. Urban 3.018 14.539 7.439 7.100 21.42 679
Binika (NAC) Urban 3.018 14.539 7.439 7.100 21.42 679
Rampur P.S. Urban
78

A-I (Part -II) : NUMBER OF TOWNS, HOUSEHOLDS, POPULATION AND AREA
State I District / Police Stations I llrban ~umber Number of PopulatIOn Area in PopulatlOn per
U.A. / CIt) /'1 own of Households Persons Males Females ~quare ~quare
Tov. n5 kilometre kIlometre
2 3 5 6 7 8 C)
Balangir District Urban 4 30,410 ]54,323 79,803 74,520 72.45 2,130
Khaprakhol P.S Urban
Turekela P.S Urban
Bclpara P.S. Urban
Kantabanji P .S. Urban 3.nl 20.095 10.456 9,(J39 7.77 2.580
Kantabanji tNAC) Urban 3.781 20.095 10.456 9.639 7.77 2.586
Bangomunda P.S. Urban
Sindhekela P.S. Urban
Titlagarh P.S Urban 6.054 3D.:n3 15.670 14,603 1534 1,973
Titlagarh U.A. Urban 6.054 30.273 15.670 14,603 15.34 1.973
Tltlagarh (NAC) Urban 5.518 27.904 14.484 13.420 10.36 2.693
D.A.V.College Area (0.0.) Urban 536 2.369 1.186 I.I~D 4.98 476
Saintala P S. Urb~
Tushura P.S Urban
Patnagarh ]l.S. Urban 3,882 18.694 9.540 9.154 18.26 1.024
Patnagarh (NAC) Urban 3.882 18.694 9.540 9.154 18.26 I.rJ24
Balangir P.S. Urban 16.693 85.261 44,137 41,124 31 08 2,743
Balangir ( M ) Urban 16.693 85,261 44,137 41,124 31.08 2.743
Loisinga P.S Urban
Nuapada District Urban 2 6,272 30,038 15,250 14,788 35.23 853
Jonk P.S Urban 3.398 16.029 8.400 X,229 114 1.459
Khanar Road (NAC) Urban 3.398 16,029 8.400 8,229 114 1.459
Nuapada P.S. Urban
Komana P.S. Urban
Khanar P.S. Urban 2.874 13.409 6.850 6.559 2381 563
Khariar (NAC) l'rban 2.874 13.409 6.850 6.559 23.83 563
Boden P.S. Urhan
Sinapali P.S Urban
Kalahandi District Urban 4 20.682 100,219 51.914 48,305 47.68 2.102
Kokasara r.s. llrhan
Dharamgnrh P S. l'rban
Kegaon P S Crban
Sadar P.S. Crhan 12.275 60.787 31.638 29.149 15.4 3.9·17
79

A-I (part -0): NUMBER OF TOWNS, HOUSEHOLDS, POPULATION AND AREA
State / District / Police Stat ions I Urban Number Number of Population Area in Population per
U.A. / City / Town of Households Person~ Males Females square square
Towns kilometre kilometre
2 3 4 5 6 7 S 9
Bhawanipatna (M) Urban 12,275 60.787 31.638 29,149 15.4 3.947
Kcsinga P.S. Urban 3.422 16,917 8.581 8.336 145 1.167
Kesinga (NAC) Urban 3,422 16.917 8.581 8,336 145 1.l67
NaralaP.S. Urban
Madanpur Rampur P.S Urban
Lanjigarh P.S. Urban
Thuamul Rampur P.S. Urban
Junagarh P.S. Urban 3,211 15.759 8.036 7.723 15.54 1.014
Junagarh (NAC) Urban 3.211 15.759 8,036 7.723 15.54 1.014
Jayapatna P.S. Urban 1.774 6,756 3.659 3,097 2.24 3.016
Mukhiguda (CT) Urban 1.774 6.756 3,659 3.097 2.24 3.016
Rayagada District Urban 5 25,124 115,407 58,634 56,773 57.44 2,009
AmbadalaP.S. Urban
Muniguda P.S. Urban
Bishainakatak P.S. Urban 1.578 7,408 3.723 3,685 4.56 1.625
Bishamakatak (CT) Urban 1,578 7,408 3,723 3,685 4.56 1,625
Gudari P.S. Urban 1,541 6,849 3,410 3.439 2.28 3.004
Gudari (NAC) Urban 1,541 6,849 3.410 3,439 2.28 3,004
Padmapur P. S. Urban
Puttasing P.S. Urban
Gunupur P.S. Urban 5,349 24,706 12,448 12.258 26.78 923
Gunupur U A. Urban 5.349 24,706 12,448 12.258 26.78 923
Gunupur (NAC) Urban 4,558 21,198 10.663 10.535 11.65 1.820
Industrial &Educational Urban 791 3,508 1,785 1.723 15.13 232
Area (O.G)
Rayagada P S. Urban 2 16,656 76,444 39.053 37.391 2382 3.209
Rayagada (M) Urban 12.406 57.759 29.519 28.240 18.65 3.097
Chandili (CT) Urban 4,250 18.685 9.534 9,151 5.17 3.614
Kalyanasingpur P.S. Urban
Kashipur P.S. Urban
Tikiri P.S. Urban
Nabarangapur District Urban 3 12,488 59,270 30,749 28,521 37.5 1,581
RaigharPS. Urban
Umarkote P.S. Urban 5.117 24,859 12.700 12.159 259 960 , Umarkote (NAC) Urban 5,117 24,859 12,700 12.159 25.9 960
Chandahandi P.S. Urban
Jharigan P.S. Urban
Dabugan P.S. Urban
Paparahandi P.S. Urban
TentulIkhunti P S. Urban
80

A-I (Part -II): NUMBER OF TOWNS, HOUSEHOLDS, POPULATION AND AREA
State / DIstm;t / Poh("c StatIOns / Urban Number Number of Population Area m Population per
CA / City I fown of ! I ou~chold<; Person~ Male" Femdles square square
1 o"'n~ kIlometre kilometre
2 3 4 5 6 7 8 9
Khatlguda P S Urbdn I 515 6406 3.305 3.101 198 3,235
Khatlguda (CT) Urban 1.515 6.406 3.305 3,101 198 3,235
Nabarangapur P S Urbdn 5,856 28.005 14,744 13,261 962 2911
Nabarangapur (M) Urbdn 5.856 2X 005 14.744 13.261 962 2.911
KodmgaPS Urban
Koraput District Urban 5 44,582 198,449 101,768 96,681 188.72 1,052
Kotpad PS Urban 3.275 14.917 7409 7.508 1295 1.152
Kotpad (NAC) Urban 3,275 14.917 7.409 7,508 1295 152
UongumaPS Urban
Bhalrabsmglpur P S Urban
Dasamantapur P S Urban
Lakshmlpur P S Urban
Ndrayanpatana P S [Jrban
Kak.mguma P S Urban
Koraput PS Urban
Koraput fown P S Urban 8.878 39.5--18 20 "iSS 18993 6107 648
Koraput (NAC) Urbdn 8878 39,548 20555 Iii 1.)93 61 (J7 648
Nandapur P S. Urban
Siffilliguda P S Urban
DamanJodl P S Urban 2 106 8475 4607 3868 1232 688
DamanJodl (CT) Urban 2 106 8,475 4.607 3.868 1232 688
Pottangi P S Urban
PadudP S Urban
~unabedaPS Urban 13.825 58884 30.306 2X.578 7648 770
Sunabcda (NAC') Urban 13.825 58.884 30.306 28. "i78 7648 770
Machhkund P S Urban
801panguda P S Urban
Jeypur P S Urban 16.498 76.625 38J~91 37734 259 2958
Jeypur (M) Urban 16498 76625 38.891 37734 259 2.958
Kundura P S Urban
Malkangiri Disrict Urban 2 7,407 34,616 17.893 16.723 22.91 1,511
Malkangm PS Urban 1 4.900 21.114 11.953 II 161 1806 1280
MalkangJrl (NAC) Urban 4.900 23 114 11.953 II 161 Ie 06 1.280
Mathll! P S Urhan
Mudullpada p" Urban
Chttrakonda P S Urban
Ork.el P S Urban 2507 11502 ~.940 5562 485 2.372
Ballmeld (NAC) Urban 2,507 11.502 5.<)40 5562 485 2.372
KahmelaPS Urban
M V 79 PS Urban
Motu PS Urban
81

SINo.
2
3
State! District! Pollee
Station at 2001
ORISSA
SAMBALPUR DISTRICT
Naktideul P.S. Kisinda P.S. Charamal P.S.
Rairakhol P S. Redhakhol {NAC)
(Newly formed)
BARGARH DISTRICT
(NEWLY
FORMED)
lharbandha P S. (Renamed)
JHARSUGUDA DISTRICT
(~EWLY
FO RJ'\1 ED)
1991 Territorial units
2 ORISSA
SAMBALPUR DISTRICT
Naktideul P.S. KismdaP.S. Charamal P.S.
Rairakhol P.S. (Newly Formed)
Newly formed after 1991
Census
Jagadalpur P.S.
Newly fonned aih:r 1991
Census
A-I: CHANGES IN TERRITORIAL
rcrritOl") added and its area
Name
3
I \ Illage
2 villages
12 villages 16 villages
Entire two Sub-division namely Bargarh
and Padmapur transferred from Samhalpur District
Entire
Entire Jharsuguda Suh-dl\ ISlon
transferred from Sambalpur District
82
Area in ~quarc kilometer
4
0.26
244 244
34.93 37.37
5831.57
2203.13

APPENDIX UNITS DURING 1991-2001
;-..Jame of State/
Dlstncti P S etc
from which Its drea IS
reduced
Terntory reduced and It" area
5
1':aktldeul P S
Charamal P S Charamal P S
Ralrah.hol P S
Sambalpur
DIstnct
Sambalpur
DIstrIct
Name Area In ~quare
6
I bntlre two Sub-dIvIsion namely
Barg:rrh and Padmapur tran~ferred
to newl) formed Bargarh Dlstnct
II EntIre Jhar!>uguda Sub-divIsIon
transferred to new Iy formed
Jharsuguda Dlstnct
III Entire Oebagarh Sub-divIsIon
transferred to newly formed
Oebagarh Dlstnct
1 VIllage
2 VIllages
16 Villages
kilometer
7
5831.57
2203.13
2781.73
026
244
3493
83
Name of State! District! P S etc Net drea Lhdnge
to which area IS added In .... qudre
1\.e\\ Iy formed
l3argarh DIstnct
8
Newly formed Jharsuguda Dlstnct
New I) formed Oebagarh DI<;trIct
KIsmdd P S
Ne\\ I) formed Redhah.ol NAC
under RedhJkhol P S
Nev.l) formed Redhakol NAC
under Ralrah.hol P S
h.llomctre (+or-)
9
-1081041
- 0 26 + 0 26 - 2 44
- 3493
-t- 3717
_,_ 583 J 57
+ 2203 13

SINo.
4
5
(1
7
State/ District! Police
Station at 2001
Lakhanpur P S. 8anaharapalt P.S. (newly formed)
Brajarajnag;rr P.S.
Belpahar P.S.
DEBAGARH DISTRICT
(NEWLY FORMED)
SUNDARGARH DISTRICT
Gurundia P.S. 8anei P S. Brahmamtarang
P.S.(Renamed)
KENDUJHAR DISTRICT
Ghasipura P.S.
Samkul P S Anandapur P S
MAYURBHANJ DISTRICT
Ratrangpur P.S.
Rairangapur Town P S.
(newly formed)
A-t : CHANGES IN TERRITORIAL
1991 Territorial units Territory added and Its area
;--.rame Area m square kIlometer
2 3 4
Lakhanpur P.S. 3 J vIllages 145 09
BraJarajnagar P.S.
8elpahar P.S 2 villages merged wIth l:3elpahar (NAC) 10.26
under same P S
Newly formed after 1991 EntIre Debagarh Sub-division transferred 2781.73 Census from SambaJpur District.
Sundargarh District
Gurundta P.S. Banel P.S 3 Villages 5.96 Kulunga P.S.
Kendujhar Dlstnct
Ghasipura P.S.
Sainkul P S. 2.v dlages 4.81 Anandapur P.S. 3 Villages (merged wllh 4.42
Anandapur(NAC) under same P S
Mayurbhanj District
Rairangpur P.S.
44 vil.luges and Rairangpur Town(NAC) 6949
14.38
83.87
84

APPENDIX UNITS DURING 1991-2001
Name of State/
District/ P.S. etc. from which its area is
reduced
5
Lakhanpur P .S.
Brajarajnagflf P. S
Sambalpur District
Gurundia P.S.
Ghasipura P.S. Ghasipura P.S.
31 villages
2 villages
3 villages
2 villages 3 villages
Territory reduced and its area
Name Area in square
6
kilometer
7
145.09
1026
5.96
4.81 4.42
9.23
44 villages and Rairangpur(NAC) 6949
14.38
83.87 Rairangapur P.S.
85
Name of State! District/ P S. etc. Net area change
to which area is added in square kilometre ( + or - )
8
Newly formed Banaharapali P.S.
13elpahar NAC under Bdpahar
P.S.
Banei P.S.
Sainkul P.S Anandapur (NAC)
Newly formed Rairangpur Town
P.S.
9
- 145.09 .j. 145.09
- 10.26
+ 1026
+278173
- 5.96 + 5.96
- 9.23
+ 4.81 + 4.42
- 83.87
+ 83.87
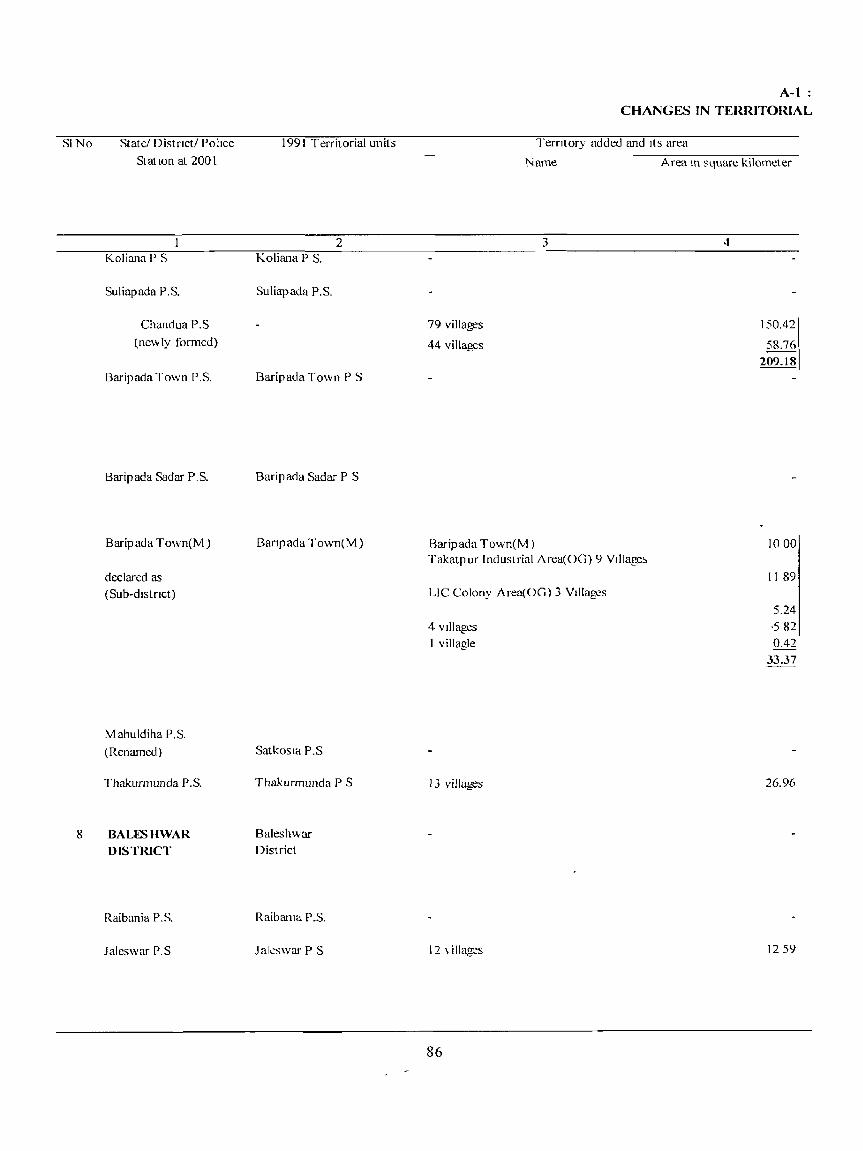
SINo
8
State/ Distnct/ Police
Stat Ion at 2001
Koli::maP S
Suliapada P.S.
Chandua P.S
(newly formed)
Baripada Town P.S.
Baripada Sadar P.S.
Baripada Town(M)
declared as (Sub-district)
Mahuldiha P.S.
(Renamed)
Thakurmunda P.S.
BALFSHWAR DISTRICT
Raibania P.S.
laleswar P.S
1991 Territorial units
2 Koliana P S.
Suliapada P.S.
Baripada Town P S
Baripada Sadar P S
Banpada Town(M)
Satkosla P.S
Thakurmunda P S
Baleshwar District
Raibama P .s.
lalcswar P S
A-I: CHANGES IN TERRITORIAL
Terntory added and Its area
Name Area In square kilometer
79 villages
44 villages
Baripada Town(M)
3
Takatpur Industrial An:a(OG) 9 Village~
Lie Colony Area(OG) 3 Villages
4 Villages 1 villagle
13 villages
12 \ ilIages
86
4
150.42
58.76 209.18
10 00
1189
5.24 ·582 0.42
33.37
26.96
1251)

II: ::::l 0.
~ II:
a: « «
«
,... « ~cf
3:-;!?_ :c
0
:c ~cf
::r::: (9cf
a: a: m
J: 0 « z,....
(/)"<1" ~cf
0
« ::::lM
::::lCC! W-.:t: cc:
_0 (/) .
N
(9-;!?_ oC'":! >-eo -IN 0"""
« 1-"""
a: 0 ZL!)
« « «CC! a...-;!?_ «
... «~ w
::E CO r.
« 0 (9
CO J: ~«i
::r:::
CO a:R « ::r:::
UI a:
0 ....., ~cf
:::)
Z
UI «~ (/)
w t: f6
(90 ._ «~
::r::: -l
~
a:
::JC\l «
0 ::J co,....:
() Z
~cf LlJ
~~
0
cO «00 « CON
Z~
Cl ::E...t
W N
Q) ::::l
X
~ (!l-;!?_ «
0
« ::J~ (/)
CJ)C':1
-l
cc:
:::)-;!?_ C!l0 :::)~ Z . «"<I"
- « ctJ ...., :c
0 """")
~
# 0 L!) N
0 X ... ~cf en (9L!) ... 0:1'-: 0 «M ._ [l)
~ ... UI 9; ._ C
C!l zcf ...... ~~ 0
-lC') «
Q) ~
~
CO .c I-
UI ::::l 0..#
Q) «CD
C) a:CC! Ol()
CO ::r::: ... II:
c:
~
Q)
::::l
«#
0.
"""") ,....
0 «
ZN
(9~
« .
~ Z 0
C!lL!)
Q) «~
c.. a: .
i=
«M «
~#
CO 0
« «-;!?_
«00
z C!l 0
,I'-:
«UI;
-l «N
>- .
« C!l
«"<I" is
~cf
a: ~# « a:
XL!)
xC) ~# (3-;!?_
Or:
:s:;j a: 15#
ZL!)
0."'" Z ° ~#
«
~
«N ::Jm ::r:::
«-.:t: -lC'.! «0 «"'1
::>N «"<I" ZLC":! CO.,....
z CO 0 CJ)
23
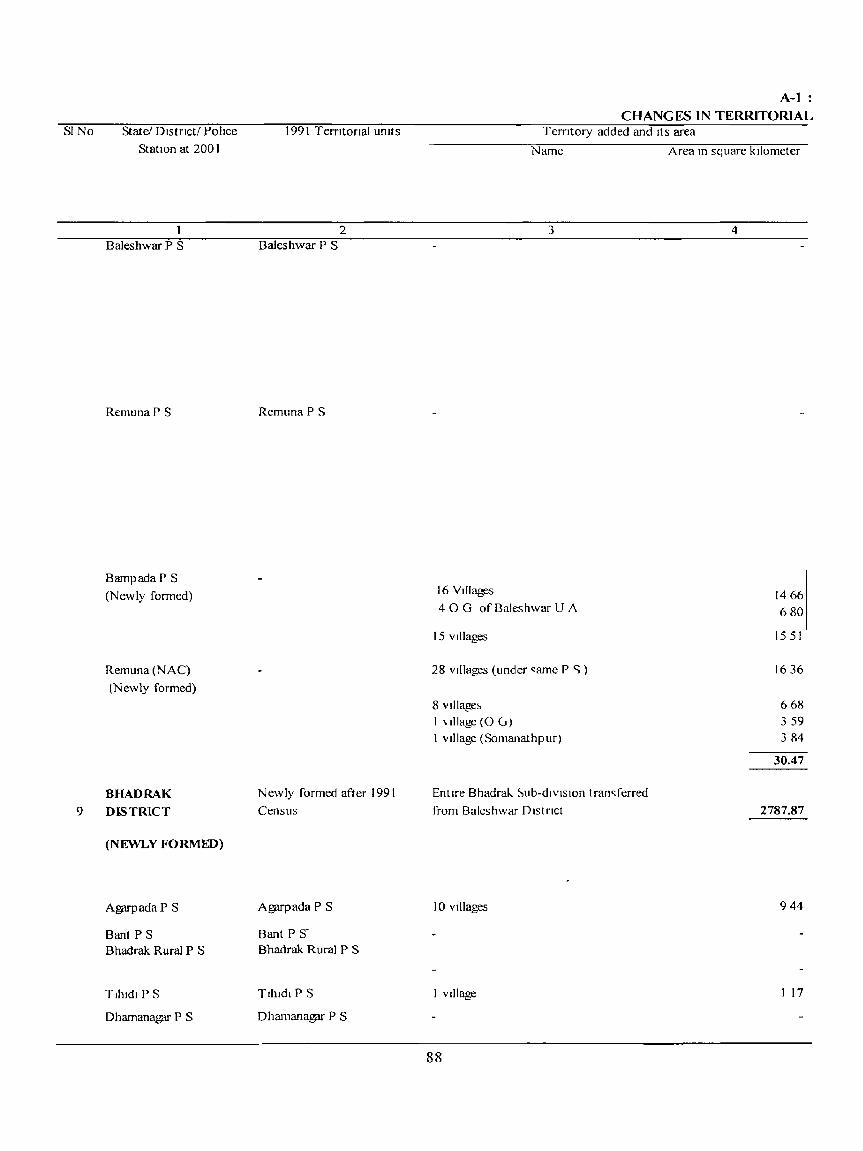
SINo
9
State! District! Pollee
StatIOn at 2001
Baleshwar P S
Remuna P S
BampadaP S
(N ew Iy formed)
Remuna (NAC)
(Newly formed)
BHADRAK
DISTRICT
(NEWLY FORMED)
AgarpadaP S
Bant P S Bhadrak Rural P S
Tlhldl P S
Dhamanagar P S
1991 TerrItorIal UnIts
2 Baleshwar P S
Remuna P S
Newly formed after 1991
Census
A!?flllJ ada P S
Bant P S-Bhadrak Rural P S
Tlhldl P S
DharnanB.gflf P S
A-I: CHANGES IN TERRITORIAL
TCITltory added and Its area
Name
3
16 Villages
4 0 G of Baleshwar U A
15 VIllages
28 VIllages (under "arne P <:; )
8 village~ I \llIagc (0 G) I Village (Somanathpur)
Entire Bhadrak. ~ub-dlvls1on tran"ferred
from Baleshwar Dlstnct
10 Villages
I VIllage
88
Area m square kilometer
4
1466
680
1551
1636
668
359 3 R4
30.47
2787.87
944
I 17

APPENDIX UNITS DURING 1991-2001
N arne of State! Territory reduced and its area
District! P S. etc from whIch its area is
reduced
5
Baleshwar P.S.
Remuna P.S.
Remuna P.S.
Barnpada P S. Bampada P.S. Baleshwar P.S.
Baleshwar DIstrict
Bant P.S.
Bhadrak Rural P.S
I village 16 villages
Name
6
4 vlllages(OO to Baleshwar U.A.)
I VIllage ( OG to Baleshwar U.A. -
Dhalsana)
28 villages
15 villages (Out of 15 villages 8 villages
included In Remuna (NAC) I 0 O.(Ganeswarpur) included in Remuna(NAC) & 6 villages remained in Barnpada
P S.
9 Villages
10 villages
1 village
5 villages
Area In square
kilometer
7
89
384 14.66
6.80
NA
1636
15.51 6.68
3.59
524
10.27
9.44
1.17
18.69
Name ofStatei District/ P S. etc Net area change
to which area i., added
8 Newly formed Remuna(NAC) Newly formed
Bampada P.S. I3arnpada PS.
( Remained as 0.0. to Baleshwar U.A.) Chandipur P.S. (M erged with
Patrapada village which is 0.0. of Baleshwar U.A.)
Newly formed Remun(NAC)
Newly formed Barnpada P.S Included in Remuna (NAC)
Included in Remuna (NAC)
Newly formed Barnpada P S )
Newly formed Remuna (NAC)
Agarpada P.S.
Tlhidl.P.S.
Newly formed Dhamanagar
Town(NAC) under same P.S.
m square KIlometre ( + or - )
9
-25.30
- 5 24
+26.70
+2787.87
+ 9.44
-9.44
-1.17
+ I 17

SI.No. State/ District/ Police
Station at 2001
10 CUTTACK
DISTRICT
Kishannaw P.S. (Renamed)
Gobindpur P.S Niali P.S.
(newly formed)
Cuttack Sadar P.S
Cuttack T own(M C)
II KENDRAPARA DISTRICT
(NEWLY FO RMED)
12 JAGATS INGH-
APUR DISTRICT
(NEWLY FORMED)
1991 TerntonaJumts
2
Cuttack District
Klshorenagar P.S
Gobmdpur P.S.
Cuttack Sadar P.S.
Cuttack (M)
Newly formed after 1991
Census
Newly formed afler 1991
Census
A-I: CHANGES [N TERRITORIAL
Terntory added and Its area
Name Area In ~quare kIlometer
3 4
128 villages 198.94
8 villages & 23.30 GopaJpur Town(CT) 3.95
merged with Cuttack (M C.)
27.25
Entire Kendrapara Sub-division 25'45.61
transferred from Cuttack Dlstnct
Entire Jagatsinghpur Sub-division 1759.21 transferred from Cuttack District
90

APPENDIX UNITS DURING 1991-2001
Name of State! Temtory reduced and Its area
District! P.S. etc. from which Its area is
reduced
Name Area In square
5
Gobindpur P.S
Cuttack Sadar P .S. Gopalp ur (CT)
Cuttack District
Cuttack DIstrict
6
i. Entire Kendrapara Sub-division
transferred to newly formed Kendrapara District
ii. Entire Jagatsingpapur Sub-diviSIOn
transferred to newly formed J agatsingpapur District
iii. Entire Jajapur Sub-division
transferred to newly formed J ajap ur District
128 villages
8 villages Gopalpur Census Town
kIlometer
7
2545.61
1759.21
2787.78
198.94
91
233
°1 3.95
Name of State! District! P.S. etc. "Jet area change
to which area is added In square
8
Newly formed Kendrapara Dls(.
Newly formed J agatsinghapur District
Newly formed Jajapur District
Newly formed Niali P.S.
Cuttack(M Corp.)
kilometre ( + or - )
- 7092 60
- 19894 + 198.94
-2725
+2725
-I- 2545.61
+ 1759.21

SI.No.
13
State! DIstrict! PolIce
Station at 200 I
JAJAPlJR DISTRICT
(NEWLY FOR'VlED)
Sukinda P .S.
Ja)apur Road P.S.
Duburi P.S.
(Newly formed)
Korai P.S. By as an agar (M)
(Renamed)
14 DHENKANAL DISTRICT
Kamakshy
anagar P S.
Tumusinga P.S.
(Newly formed)
15 ANllGUL DISTRICT (NEWLY FORMED)
1991 TerrItorial units
2
Newly formed after 1991
Census
Sukinda P.S
Jajapur Rd.
P.S.
Korai P.S. Jajapur Road (NAC)
Dhenkanal District
Kamakshy
anagar P.S.
Newly formed after 1991
Census
A-I: CHANGES IN TERRITORIAL
Territory added and its area
Name
3
Entire JaJapur Sub-division transferred
from Cuttack District
48 Villages
I village
2 villages
65 villages
EntIre four Sub-divisions namely
Palahada. Talcher. Anugul & Athmallik transferred from Dhenkanal Dlstnct
92
Area in square kIlometer
4
2787.78
183.11
1.47
184.58
1.70
19940
6345.29

APPENDIX UNITS DURING 1991-2001
N arne of State/
Dlstrictl P .S. etc. from which its area is
reduced
Terntory reduced and its .area
'Name Area In square
5
Cuttack DIstrict
Sukinda P .S.
Jajapur Rd.P.S.
Korai P S.
6
48 villages
1 village
2 villages
Entire four Sub-divisions namely
Palahada. Talcher. Anugul & Athmallik transferred to newly formed Anugul DIstrict.
65 villages
Kamakshyanagar P .S. -
Dhenkanal District
kilometer
7
183 II
147
170
6345.29
19940
93
Name of State/ Distrlctl P.S. etc. Net area change
to which area IS added
8
Newly formed Duburi P.S.
Newly formed DuhUTl P.S
By as an agar Town (;'vi)
New Iy formed Anugul District
Newly formed Tumusmga P S.
m square_ kilometre ( + or - )
9
+278778
- 183.11
-1.47
+ 184.58
- [ 70 + 1.70
- 634529
-19940
+ 199.40
+ 6345 29

Sl.No.
16
State/ Dlstrict/ Police
Station at 2001
Sarnal Barrage P S.
Kaniha P.S.
NTPC P.S.
(Newly formed)
Anugul P.S.
NALCO P.S.
Banarpal P.S. (Newly
formed)
PURl DISTRICT
Delanga P.S.
Pun Sadar P.S. Chandanpur P.S
(Newly formed)
17 NAYAGARH DISTRICT (NEWLY FO RMEO)
1991 Terntorial units
2
Sarnal Barrage P. S.
Kaniha P.S.
Anugul P.S.
NALCO P.S
Puri District
Delanga P S.
Pun Sadar P.S
Newly formed after 1991
Census
A-I: CHANGES IN TERRITORIAL
Territory added and Its area
Name
3
I village
17 villages
74 villages
2 VIllages
I village
88 villages
Entire Nayagarh Sub-division transferred
from Puri DIstrIct
94
Area in square kilometer
250
20.99
13708
17.04 154.12
2.48
136.80
3941.14

APPENDIX UNITS DURING 1991-2001
N aJlle oj "'tdte!
DI ... ln(..ll P"" etL
IIlIJll \\ h ILh It ... drCd 1\
leduccd
5
')amul B,lrrage P '"
AIlUgul P <;;
"lAI CO P "
J"tdnl [I A 01
I-..hordhu lJl<;tnLt
run ')ddLlr P <,
Pml DI ... tnd
r I.-rnton reduced J11d It<; area
l\iame
6
1 "Illage
17 villages
74 \ dlages
2 \ 11Iagcs
1 nllre Nu) agarh Suh-ul\ I ... Ion
tr.lIl ... ferred to nc\\ \) lormed
"JeI\ <lgarh DI<;tnct
Lntlre t\\O Suh-dl\lslons name"
KlwrdhJ Lmd Bhuhancs\\ df
Iran<;ferrcd to nc\\ I) lormed
K.hordha DI ... tt ILl
Ared In ... quare
"I]omder
7
2 50
2099
1170g
1704
3941.14
2846.76
136 SO
95
Name of State! DI<;tnctl r "etc Net an:a ch,mge
to \\ hl(..h dfed h ddded
'" alllha P "
NC\'l.I) IOlmed N 1 PC P'"
NC\'l.I) tormed Banarpal P "
-do-
Nc" I) torllled
Nay~h District
Ne,\ly formed
Khordha DI<;tnct
Newly formed Chandanpur P ~
III ~quarc
kilometre
( + or - l
9
- 2 'i0
-1849
+ 20 99
- 13708
- 1704
+ 154 12
-n 7'1',7 9()
+- 2 48
- 136 SO
1- 13680
+ 39<1 I I I
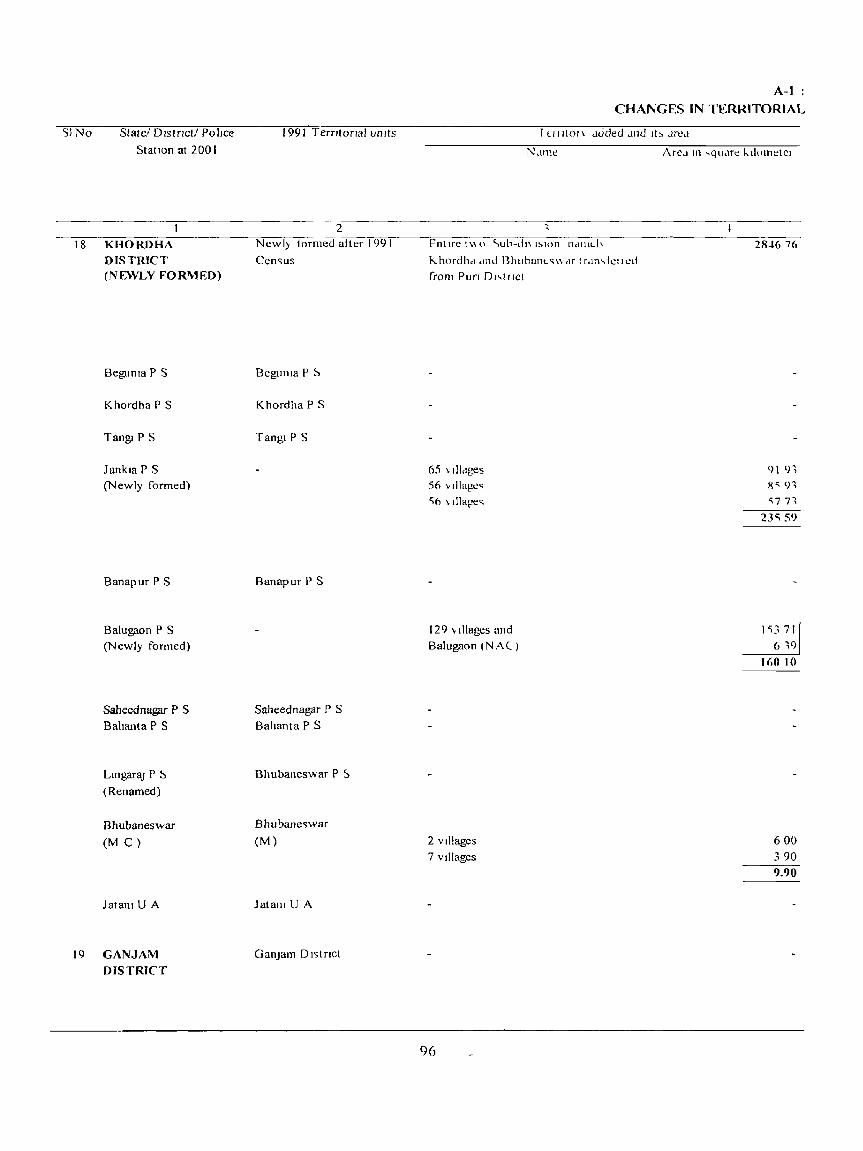
5lNo State/ Dlstrlct/ Police
StatIon at 200 r
18 KHORDHA
19
DISTRICT (NEWLY FORMED)
Beguma P S
Khordha P S
Tang! P S
Jankm P S (Newly formed)
Banapur P S
Balugaon P S (Newly formed)
Saheednagpr P S
Bahanta P S
LmgaraJ P ~
(Renamed)
Bhubaneswar
(M C)
Jatanl U A
GANJAM DISTRICT
1991 Temlonal units
2 Newl) lormed aiter 1991
Cen<;us
Begullla I' ~
Khordha P S
Tang! P S
Banapur P S
Saheednagar P S
Bahanta P S
Bhubaneswar P 5
Bhubane'>war
(M)
Jatam U A
GanJam DI~tnct
A-I:
CHANGES IN TERRITORIAL
1 UlltOI \ .luded Jlld ItO. .lred
Ndl11t!
Fntlre [\HI '.ub-vI\ l~ll)n Ildll1Lh
J<,.hordlld ,Il1U BhuhanL<;\\ df [r<in-..lcll ed
from Pun DJ~t1IC!
65 \ Ilidges
56 village" 'i6 \ lllage<;
129 villages and
Balugaon (N A l )
2 Villages
7 villages
96
ArCd III ,qu.m: kllollletCI
28-16 7()
91<);
R'i '),
"77\
23'::; 59
1 'i3 71 6 \<)
HiO 10
600
390
9.90
APPENDIX UNITS DURING 1991-2001
l\: arne of State/
Districtl P.S. etc.
from which its area is
redul:cd
Terntory reduced and Its area
5
Puri Dbtriet
Begunia P.S Kholdha P.S.
Tangi P.S
Banapur P.S
Saheednagar P .S.
Baltanta P S
Name
(i
65 \ Ilbl:!c~
56 "illages
56 \ Illagc..,
119 \ illa)!c.; and
Balll!lllOn (NAC)
2 \ illage~
7" illages
1 village (Harir~JPur-3l 0 G. of
Jatani U.A.
Entire Parlakhell1l1Ildi Sllb-divl~ioIl
excludlllg60 villages transferred to
ne\\ I)' formed Gajapati J)1~tnct
Area in ~quarc
kilometer
7
91.93
8593
5773
15':; 711 639
160.10
6.00
390
2.48
2983.90
97
Name of State/ Distrlct/ P S. etc. Net area change
to which area IS added in square
&
Nc\\l: formed .Iankia P.~
N ev.ly formed J ankia [' .~.
:--.Ic\\lj formed Jankia P.S
INeWI) formed nalugaon P .S.
Included in BhLlbane~\\ar (M Co)
Included in Rhuhaneswar (M .C.)
Delang P.S OfPlIfl District
Newly formed
(_J ajar at i DIs t net
kilometre
( + or - l
9 + 2846.76
- 91.9:>
- 85.93
- 57.73
+ 235.5l)
-160.10
+ 160.10
- 6 00 - 3. ()O
+ 9.l)()
-2AS
-2983 ')0

SIND.
20
State/ Dlstrictl Police
Stat ion at 200 I
Ramagin P.S.(P)
Jarada P.S.
Nu~onP.S.
Purusottampur P.S.
Kodala P.S.
Kablsurya
naw P.S. (newly formed)
Rambha P.S
Khalikote P.S.
(Newly formed)
GAJAPATI DlSTRICT (Newly fom1ed)
1991 TerntorIal units
2 Ramagiri P.S (P)
Jarada P.S
Nuagaon P.S.
Purusottampur P.S.
Kodala P.S.
Rambha P.S.
Newly formed after 1991
Census
A-I: CHANGES IN TERRITORIAL
1 errit or). added and it" area
Nrunc
3 60 Villages
I village
2 villages
128 villages Kavlsuryanagar(NAC)
Pnlasara TO\"n(NAC)
7 "ilJages
I ()2 \ illages
17 v Illa~'e<;
Khalikote (NAC)
Entire Parlakhcmundi Sub-diVIsIon
e"'(cludln~ 60 \ dlage.., tran"ferrcd frnm
Ganjam District
Area In "lJuare ""olllcter
ScJ.07
0.7-'1
250
SS 17
18 13
II R I
X 37
126.48
Ilq JO
1793
2X 49
230.52
2983.90
APPENDIX
UNITS DURING 1991-2001
Naill": or Statei
Dist riel I P:S. dc. rrom which ils ar,,;a is
reduced
1 ,,;rrit(1f~ n:duc..:Li allli it ~ ,lrGI
Ramilgiri (1') P.S. or
G:!iapali dislril.:t
.larada !'.S.
Rambha P.S.
PurusottamplIr f'.~.
Kodala !'.S
Rmllbha PS Kodala P.S: Rambha P.S.
Nam..:
1 \ illut-'l:
12X \·illag..:s
Km iSlIr~ HIlagar '1 ()II Il(:'-J ,\ C)
Polasara ("0\\ n(NAC)
162 \ illagcs Khalikole rO\\n{NAC)
.\r<':il ill sqllarc
killllllct..:r
7
XX.l7
I X.13
II.XI
108.11
1U7
I Sl J ()
21$,1<)
212.5<)
2.50
CJ9
)\ill11": llrStat..:,' f)1~tricL I' S. ~tc. N~l ar,,;a challg~
t () \\ hieh :IJ'GI i~ added .111 ~qllarc
\Uil1!>1011 P.S .
~l'\\ I~ liml}ed KahL~~lr: illlagm
l'.~.
N~\\ I) l(lfI11Cd "ahis!ll') a11<1r;11'
P:S.
N c\\ I) rorlll,,;d
Rhaliknll.: !l.S.
I ~~\\ I.' rlln,l1~d l":'lmlikol<.: I'.S.
I,odala I'.S,
k i lomet IT
t -,. or - )
+ X·1.07
- 0.74
+ 0.74
-108.11
-2.L'W
- 126.11\
-21.'i.09
.j. DO.52

SI.No.
21
State) District! Police
Station at 2001
Serango P.S: Ramagiri P.S.(P) Ramagiri P.S.(P)
Rayagada P.S.
(Newly formed)
Adva P.S (Renamed)
KANDHAMAL DISTRICT
22 BAUDH
DISTRICT (NEWLV FORMED)
Harbhangil P.S.
Purunakatak P.S.
23 BAlANGIR
DISTRICT
24 SONAPUR DISTRICT (NEWLy FORMED)
Ulunda P.5. (Renamed)
Dunguripali P.S.
Rampur P.S.
(Newly formed)
25 KAlAHANDI
DISTRICT
1991 Territorial units
·2
Serango P.S. Ramagiri P.S.(P) Ramagiri f!.S.(P)
Nalaghat P.S.
Phlllilbani Dist
Newly fonned after 1991
Census
Harbhanga P.S.
Purunakatak P$
Balangjr District
N cw I)' fonned aft cr 1991
Census
Sindhol P.S.
Dunguripali P.S.
Kalahandi Dis!. .
A-I
CHANCE'S IN TERRITORIAL
Territo,) 'added and its area
Name
J
52 villages
62 villages
Entire Baudh Sub-division tntnsfcrrl'd
from Kandhmal Distrid
2 villages
Entire two Sub-uivisions namely
Sonap Llr and l3iramaharqi[lur t ransterrcd
from 8alangir District
4"~ villages
100
Area in square kilometer
.1.16.23
51.-10
397.63
J444.82
1.12
2284.40
113.89
APPENDIX
UNITS' DURING 1991-2001
Name of State/
Dlstru_tI P " etc from \\, hlch Its area 1<;
reduced
TerrItory reduced and It>. area
5
Serango P S
RamagJrt P S (P)
Phulabam Dlsstrlct
Harbhanga P S
Balangtr Dlstnct
Dungunpah P S
Name
52 vIllages
62 villages
60 vIllages
6
Lntlrc 13dudh Sub-dIVIsion
transterred to newly 10rmed Baudh
Dlstnct
2 vIllages
entIre two Sub-dl\ ISlom namely
':ionapur and Blramahar3Jpur
traru.ferred to m;:\\ Iy formed
~onapur DI~tnct
44 vlllage<;
entIre Nuapad Sub-dlvl<;lon
transferred to newl) formed
Nuapada DI~tnct
Area In "quare
kIlometer
7
34623 5140 X407
344482
12
2284.40
11389
3398 13
101
"J dme of I;)tate/ Dlstrlct/ P ') etc
to which area IS added
8
Newly formed Ra) agada P S
1'.ewly formed Ra) dgada P <)
Ramgtrt P ':. at (,anlam Dlst
Newly formed
BdUdh DI'>tnct
Purunakatak P S
Newly formed
\onapur DI<;tnct
Newly formed Rampur P S
Ne\\" tormLlI
NUdpadd DI"tncl
Net area change
In squan::
kIlometre
( + or - )
9
- 346 23 - 51 40 - 84 07
+ 397 61
-344482
+344482
- I 12
+1 12
-228440
+228440
-11389 + I 13 89
-3398 11

SI,No.
26
State.' District! I'nlicc
SIn! iUIl :11 2(){) J
:\ L\J>"\J).\
DISTRICT
(!\,EWU FOR\JED)
Bodell r.s. Sinapali P.S.
27 KORAPIT
I>ISTIUCT
Kotpad I'.S.
DaSlUllan-
taptlr !'.S. Narayallp-
alana !'.S.
KakirigulIl:l P .S.
Sim iliguda !' ,,'i.
Sunabccia P .S.
(Nc\\ty fornH.:d)
Boipariglltia !'.S.
J 991 IcrJ"itmi:11 tlllits
,
1\..:\\ I~ Itll1111.:d ali ... '!' I 'J'! I
CI'Il~lI~
nutl":l1 I' .S.
I,orapllt District
Kotpad I'.S.
()usalllaniapur [l.S.
Narayanpatan<l
('.S.
KakirigulIl:l P.S.
Sil1liligllda P.S.
Boip,lrigutla !'S
A-I
CHANGES IN TERRITORIAL I crritol'\ addl'd allti ih arclI
Naill..:
1.111 in.: '>:lIap;lda '-,lIh-dl\ l~i"ll t 1';111' II:IT""d
frolll r.:.ablt~llldl I )i~II'iL'1
I \ itlagc
.2 \ itlagl's
:2 \ ilbgl's &
Sunabl:da (N;\C)
102
339S.13
11.:n
21.:.'9
0.6 t
22,(lU
12.00 I 7(J.-IX

APPENDIX UNITS DURING 1991-2001
Territory reduced and its area Name of State/
District/ P.S. etc. from which Its area is
reduced
Name Area in square
5
Kalahandi District
Boden P.S.
Dasamantapur P S.
6
4 villages
i. Entire two Sub-divisions namely
Ra) agada and -Cdunupur transferred to ot.!wl) formed Rayagada District
ii. Ent ire N abarangapur Sub-division
and 40 VIllages of Kotpad P S. transferred to newly formed Nabarangapur District
iii. Entire M alkangifl Sub-division and
t\\O villages of Jeypur Sub-di, ision transferred to nc\\ I~ formed :vi alkangiri District
40 villages
I village
2 villages
Narayanpatana P S.
2 \ ilJages &
Sunaht:du (NAC)
!Similiguda P.S.
2 villages
Idlometer
7
II 33
7584.65
5290.99
6120.75
15573
2139
061
12.001 76.48
5 54
103
Name of State/ District! P.S. etc Net area change
to which area is added in square
8
Smapall P.S.
Newly formed Rayagada district
l\ewl) formed
N abarangap ur D 1st net
Newl~ formed M alkangiri District
Kodinga P.S. ofNabarangapur
Distnct Kakiriguma P .S.
Kakinguma P .S.
Newl~ formed Sunabeda P.S.
M athih P S of M alkangiri
DIstrict
kilometre ( + or - )
9
+3398 13
- II 33 + 11.33
-18996.39
-155.73
- 21.39
- 0.61
+ 22 00
-88.48
+ 88,48
- 5 5,1

Sl.No. State! District! Police
Station at 2001
28 RAYAGADA
29
DISTRICT (NEWLY FORMED)
Bishamakatak P.S.
Muniguda P.S.
NABARANGAPUR DISTRICT (NEWLY FORMED)
Paparahandi P.S.
Tentulikhunti P.S.
Kodinga P.S.
30 MALKAN GIRl DISTRICT (NEWLY FORMED)
Mathili P.S.
Motu P.S.
M.V. 79 P.S. (Newly
formed) Kalimela P.S.
(Renamed)
1991 Terntorial units
2 Newly formed after 1991
Census
Bishamakatak P.S.
MunigudaP.S.
Newly formed after 1991
Census
Paparahandi P.S.
Tentulikhunti P S.
KodmgaP.S.
Newly formed after 1991
Census
Mathili P.S.
Motu P.S.
Bhenkatapali P.S
A-I: CHANGES IN TERRITORJAL
Territory added and Its area
Name Area In square kilometer
3 Entire two Sub-divisions namel)
Rayagada and Gunupur transferred from Koraput District
3 villages 1 VIllage
Entire Nabarangapur Sub-division and 40
villages of Kotpad P.S. transferred from Koraput District
2 villages
40 villages
Entire M alkangiri Sub-dIvision and two
VIllages of Jeypur Sub-division transferred from Koraput District
2 villages
25 VIllages
104
4
7584.65
3.22 159
5290.99
6.30
155.73
6120.75
5.54
254.66

APPENDIX UNITS DURING 1991-2001
Name of State!
District! P.S. etc. from which its area IS
reduced
5 Koraput District
Muni~aP.S
Bishamakatak P .S.
Koraput District
Paparhandi P S.
Kotpad P.S. of
Koraput distnct
Koraput District
Boipariguda P.S. of
Koraput district
Motu P.S.
I village 3 villages
2 VIllages
25 villages
Terntory reduced and its area
Name Area in squan:
6
kllometer
7
1.59 3.22
6.30
254.66
105
Name of State/ Distnct! P.S. etc. Net area change
to which area is added
8
M unlguda P .S. Bishamakatak P.S.
Tentulikhunti P.S.
Newly formed M V.79 P.S.
In square kilometre ( + or - )
9
+7584.65
+1.63 -I 63
+5290.99
-6.30
+ 6.30
+ 155.73
+6120.75
+ 5.54
- 254.66
+ 254.66

Name of Districts / P.S.
JHARSUGUDA D1ST. Lakhanpur P.S.
Banaharapali P.s.
ANNEXURE TO APPENDIX - I TO TABLE A-I
From the P.S. (in 1991)
1 Darlipali 2 Chharla 3 Kirarama
2
4 Bandhbahal 5 Khadam 6 Sarandamal 7 Badlmar
8 Gudiali 9 Dudolsingha
10 Plpilikani
II Solpali 12 B h'-) up ali
13 Dalgaon
14 Banharrali 15 Telenpal 16 Negipali 17 Kumbharbandh
18 Rampela
19 Barpall 20 Tilia 21 Singhaipali 22 Ramela 23 Saha,jbahal 24 Rengali 25 Bhejikud 26 Chhadarma 27 Nuaadhapada 28 Sartang
29 Batlaga
30 Bhatli 31 Barangflll1al
Name of Transferred Villages
106
I Darhpali
2 Chharla 3 Kirarama 4 Bandhbahal
5 Khadam 6 Sarandamal 7 Badimal
8 Gudiali
9 Dudolsingha 10 Pipihkani II Solpali 12 Ba<;upali
13 Dalgnon 14 Banharpali 15 Telenpal
16 Negipali
To the P S. (m 2001)
3

Name of Districts / P .S.
SAM BALPUR D1ST Naktldeul P.S
Kisimla P.S.
SUNDARGARH DIST. Gurundia P.S.
Banei P.S
KENDUHlAR DIST.
Ghasipura P.S.
Sainkul P.S.
MA YURBHANJ DIST. Ralrangpur P.S.
ANNEXURE TO APPENDIX - 1 TO TABLE A-I
From the P.S. (in 1991)
2
I Malipadar
1 Khandamuni 2 Kadambapur 3 Sandahichore
1 Siapada
2 Jalasuan
1 Kalarda 2 Tamalbandh 3 Badsimila
4 Sanslmila 5 Pokharia 6 M urugaghutu 7 Dandbose
8 Patepant 9 Purunapani
10 Anandpur 11 Kantabani 12 Panposi
Name of Transferred VIII.ages
TotherS (in 2001)
107
17 Kumbharbandh 18 Rampela 19 BarpalJ 20 Ttlta 21 SmghmpaIJ 22 Ramela
23 Sah <1:1 bah al 24 Rengali 25 Bhejikud
26 Chhadarma
27 Nuaadhapada 28 Sanang 29 Batlaga 30 8hat Ii 31 Barangamal
I Malipadar
/
1 Khandamunt 2 Kadambapur 3 Sandahlchore
1 Siapada 2 Jalasuan
3

Name of Districts I P.S.
Rairangp ur Tow n P S.
ANNEXURE TO APPENDIX - I TO TABLE A-]
From the P.S. (in 1991) 2
13 Badpakhan 14 Palasbani 15 Sanpakhan 16 Gadlgan 17 Sanchampauda 18 Dubulbeda 19 RanJpal 20 Chltmbadi 21 Sijukala 22 Champral 23 Halda 24 Dhanimari 25 Badabaikala 26 TIlaposl 27 Sanabaikala 28 Nadiaposi 29 Bhanjasara 30 Nuagan 31 Gopalbandh 32 Chilikapasi 33 Mahlsanenda 34 Sindurgaun 35 Adipur 36 Rohtnlkudar 37 Nagbhan 38 Bhalubasa 39 Padmapur 40 Budhlakudar 41 Bharandia 42 Asanbani 43 Balabhadrap ur 44 lodamahul
Name of Transferred Villages
To the P.S. (in 2001)
108
I Kalarda 2 Tamalbandh 3 -Badsimila 4 Sansimila 5 Pokhana 6 M urugaghutu 7 Dandbose 8 Patepanl 9 Purunap ant
10 Anandpur II Kantabanl 12 Panposi 13 Badp akhan J 4 Palasbani 15 Sanpakhan 16 Gadigan
3

Name of Districts IPS.
Koliana P.S.
ANNEXURE TO APPENDIX - 1 TO TABLE A-I
From the P S. (in 1991)
I Nodhana 2 Jamjarak
2
3 Hadhadiban~ 4 Satpautia
5 Nuadudhiasole
6 Radasarasposi 7 Kesarpur 8 BarunglSul
9 Chhelikani 10 Sansarasposi 11 Madhapur 12 Kaladam 13 Kothabilla
14 Dudhiasul 15 Baidipur 16 Karkachia 17 Jamsul
18 Keutunimarl 19 Badtilau 20 Baliatilau
Name of Transferred Villages
To the P.S. (in 2001)
109
) 7 Sanchampauda 18 Dubulbeda 19 Ranipal 20 Chltaibadl 21 S~iukala
22 Champrai 23 Halda 24 Dhanimari 25 Badabaikala 26 Tilaposl
27 Sanabai"-ala 28 Nadlaposi
29 Bhanjasara
30 Nua~ 31 Gopalbandh 32 Chilikapasl 33 M ahisanenda 34 Smdurgauri 35 Adipur 36 Rohmikudar 37 Nagbhan
38 Bhalubasa
39 Padmapur 40 Rudhiakudar 41 Bharandia
42 Asanbani 43 Balabhadrapur 44 Jodamahul
3

N arne of Districts IPS.
ANNEXURE TO APPENDIX - 1 TO TABLE A-I
FrornthePS.(in 1991) 2
21 Gayalkata 22 Kalika<lole 23 Rathasul 24 SunaposJ 25 Pandasole 26 Dardara 27 Rangisole 28 Rangibeda 29 Hatimada 30 Nodhabani 31 Sannua~n
32 Tadaki 33 Ramkadah 34 DardJasole 35 Phuljhara 36 JIanl 37 Kuabuda 3& Betnota 39 Dhadipada 40 Dubulabeda 41 Bhagabandha
42 Kal~Jhinei 43 Janjadapal 44 M ankadakenda 45 Gadubhang)l 46 Jhinei 47 Raghunathpur 48 Bhuyangoda 49 Narangtandi 50 Chandua . 51 Tungasul 52 Baunsbani 53 Baghuasul 54 Chalunla 55 Chahalapada 56 Badpalasm 57 Saragchhida 58 Bholabeda 59 Tubulbhadu 60 Badtalla 61 Godargodi 62 Charrnama
63 Nagrasul 64 Ghuntbani 65 B alich at uri 66 Bhugudakata 67 Bankaanla 68 Hatibarl 69 Saluabeda
Name of Transferred Villages
To the P S. (in 2001) 3
110

Name of Districts I P.S.
Suliapada P.S.
ANNEXURE TO APPENDIX - I TO TABLE A-I
Name of Transferred Villages
From the P S (in 1991) To the P.S. (in 2001)
2 70 Bandav 71 Dudhakundl 72 Baragenja 73 Nuhamaha 74 Srichandanpur 75 Sun aria 76 Kakharusole 77 Tulasibanl 78 Kath~dia 79 Kaladam
I Oeuli 2 Badsul 3 Smspada 4 KadapatJa 5 B hagllban i 6 Budhamara 7 lunabanl 8 Nuaglln 9 Padagirisul
10 Tolakachuin II Khadisul 12 Push iglln 13 Sindurgoura 14 Gurrdunlucna 15 Bijay Krushna Chandrapur 16 Sampura 17 Sanjogibandh 18 Pathuri 19 Sarasposi 20 Nabedhi 21 Khandarpada 22 Bedhl 23 Anlakuda 24 Pathara 25 Belirisul 26 Nedhua 27 Dahanimari 28 Podadiha 29 Nadi~
30 Kusum~ole 31 Taldiha 32 Bangriposi 33 lhaliamara 34 Dhabanisul 35 Adiamara 36 Khaikhia 37 Nagasul 38 Tamudiasul
III
3
Naml! "r Distnct", (P.S.
Chandu: - -
ANNEXURE TO APPENDIX - I TO TABLE A -I
from th~ P S. <m 19911
2 39 Andhar.loda 40 RangllIl1at ia 41 Chaksuliapada 42 Dhemanru.ul 43 Khamarpal 44 M asmakati
1\jame llrl ran~terred Village"
112
I Nodhana
2 Jamjarak
'I" the P ~ (in 20M I
3 Hadhadlbangrn
4 Satpautm 5 Nuadudhiasole 6 Badasarasposl 7 Kesarpur 8 Barungasul 9 Chhelik.anl
10 Sansarasposl 11 M adhap ur \2 Kaladam 13 Kothabilla 14 Dudhiasul 15 BaJdipur
16 Karkachia 17 Jamsul \ 8 Keutunlmari 19 Badtilau
20 Baliatilau 21 Gayalkata 22 Kahkasole
23 Rathasul
24 Sunaposi 25 Pandasole
26 Oardara 27 Rangisole 28 Rangibeda 29 Hatimada 30 Nodhabam J I Sannuagan
32 Tadak\ 33 Ramkadali 34 Oardiasole
35 Phuljhara
36 Jiani 37 Kuabuda
38 Betnota 39 Ohadipada 40 Dubulabeda
4 I Bhagabandha 42 Kal~ihmei

Name of Districts / P.S
ANNEXURE TO APPENDIX - 1 TO TABLE A -I
From the P.S. (10 1991)
2
Name of Transferred VIllages
TotheP.S (in 2001)
113
43 J anJ ad ap al 44 M ankadakenda 45 (,adubhanga
46 Jhlnel 47 Raghunathpur 48 Bhuyangoda 49 Narangtandl
50 Chandua 51 Tungasul 52 Baunsbam
53 8aghuasul 54 Chalunia 55 Chahalapada
56 Badpalasm 57 Saragchhlda 58 8holabeda 59 I ubulbhadu 60 Badtalia 61 Godargodl 62 Charmanm
63 Nagrasul
64 Ghuntbani 65 13alichaturi 66 Bhugudakata
67 Bankaanla 68 Hatiban 69 Saluabeda 70 Bandav 71 Dudhakundi
72 Baragenja
73 Nuhamalia 74 Srichandanpur
75 Sunana 76 Kak.harusole
77 Tulasibani 78 Kathgandm 79 Kaladam
I Deuli 2 Badsul
3 Smspada 4 Kadapat ia
5 Bhagabam
6 Budhamarn 7 I unabani
8 Nuagan 9 Padaginsul
10 lolak.achulTl
II Khadi~LlI
3
Name of Districts I P.S.
M ahuldiha P.S.
ANNEXURE TO APPENDIX - 1 TO TABLE A -I
From the P S. (in 1991)
2
Taramara
2 Baghmunda
3 Handifuta 4 Khuntapoi 5 Badbil
6 GobarJoda 7 Suninda
8 Nihan~dl 9 Digidhar
10 Bentakirp ada
II Guliajodi 12 Baliabeda 13 Jodidar
Name of Transferred Villages
To the P.S. (m 2001)
12 Pushi~n 13 Sindurgoura 14 G undurilucha
3
IS I3[ja) Krushna Chandrapur 16 Srunpura
17 Sanjo?-ihandh 18 Pathuri 19 Sarasposi 20 Nahedhi 21 Khandarpada 22 Bedhi
23 Anlakuda '24 Pathara 25 Belirisul 26 Nedhua
27 Dahanimari 28 Podadlha 29 Nadi~n 30 Kusumasole 31 Taldiha 32 Bangriposi 33 Jhaliamara
34 Dhabanisul 35 Adiamara 36 Khalkhia
37 Na~ul 38 Tamudiasul 39 Andharjoda 40 Rangamat ia 41 Chaksuliapada 42 Ohemanasul 43 Khamarpal
44 MaslOakati
Name of Districts / P.S
Thakurmunda P S
BALESHWAR DIST
Raibania P.S.
laleswar P.S
Baleshwar P S.
ANNEXURE TO APPENDIX - 1 TO TABLE A-I
From the P S. (In 1991)
2
I Sukhadukhta
2 Dlhabelabania
3 Thlkrabanapur
4 Chakhari
5 Rajanagar
6 Bazarsul
7 M athuranath 8 Bhanpur
9 Snrampur
10 Shlkarpur
II Mahulia 12 Bilbelbaria
I Sutei
2 Baraghai
3 Shyamraipur
4 Baistambabar
5 Barchhikhunta
6 Chakramrm
7 Ramachandi
N arne of Transferred Villages
To the P.S. (in 2001)
115
1 Taramara
2 Baghmunda 3 Handifuta 4 Khuntapoi
5 Badbll 6 Gobafjoda
7 Suninda
8 Nlhangandl
9 Digtdhar
10 Bentah.lrpada [I Guliajodl
[2 Baliabeda
13 .Iodidar
1 Sukhadukhl3
2 Dihabelabania
3 Thih.rabanap ur
4 Chakhari
5 Raj an agar
6 Bazarsul
7 M athuranath
8 Bhanpur
9 Srirampur
10 Shikarpur [ 1 Mahulia
12 Bllbelbaria
3

Name of Districts / P S
Remuna P S.
I3ampada P.S.
BHADRAK DIST.
Bant P S.
ANNEXURE TO APPENDIX - 1 TO TABLE A-I
Name of I ransferred Villages
From the P S. (in 19(1)
2 8 Uparsankla
9 Chhanpur
10 Sara"watipur 11 Bighnapur
12 Khaparapada 13 Pahadapur 14 AJodhyagnrh Balitanki
J 5 Bellri Saml! Barchhikhunta
16 Balan
I Gambharia
2 Nuagan
3 Ghagorapal
4 Golapat
5 Mangalapur
6 Sasanbada
1 Oranga 2 Parabandha
3 EfJhatJa
4 BOdakmuajlh
5 Manguli
6 Dolapadl
116
To the P.S (10 2001)
I SulCI
2 Baraghm
3 Shyamralpur
4 Balstambabar
5 Barchhikhunt a
6 Chakramral
7 Ramachandl
8 Uparsankla 9 Chhanpur
10 Sara."\\- at Ip ur
II Righnapur 12 Khaparapada
13 Pahadap Uf
1--1 AJodhyagarh 13alitanki
3
15 Bdlfi SamilUarchhikhunta
16 Balan
Gambharia
2 NllQ[!Jln
3 G hagorap al
·1 GolarDI
5 Manlmlapur
6 Sas,mbada

Name of Dlstncts / P S
Agarpaua P ~
Bhddrak Rural P ~
(U r1 ACK D1 .... ,
Gobmdpur P \
Al'oNEXURE TO APPENDIX - 1 TO TABLE A -I
From the P ~ (m 1991)
2 7 Gand<lJ...urd
8 Gopalpur
9 Bodakpatdna
10 Bma) akpuf
I Chakasndharpur
I Krushnap rasad
2 Nua Satanga
3 Puruna Satanga
4 Nachhlgan
5 Sarand
6 Nua Betenda 7 Puruna Betcnda
8 Negtganatallapur
9 Nua Bltapara
10 JahangJrpur
1 I Ange ... \\ dr
12 Bmlspur
13 Ambapada
14 Mahatapan
15 Nlbharan
16 ')Ul11Ud
17 Roklda
18 KantlkuI
19 SalapOi
20 Madhaba
21 Padhanasahl
22 Ratanpur
23 Banamallpur
24 Tampada
25 ')aransa
26 Gundar
'27 Kantl<;al
Name of rran ... ferrcd VIlIage<;
TothePS (m2001)
1 17
I Uranga
2 Parabandha
3 fqlhltld
4 Bodakmuallb ') M anguli
(1 Dolaradl 7 (,andakllTd
8 (Jop air ur
9 l10ddkr atdnd
10 Bma) akpur
1 Lhakm,nJharpur
3

me of Dlstncts / P S
ANNEXURE TO APPENDIX - 1 TO TABLE A-I
FromthePC; (m 1991)
2 28 Patehbanpur 29 Karanga 30 Sudmda 31 Sarakore 32 Satakaha 33 Kurangapara 34 Kapasl 35 M UTIlgan
36 Podana 37 Arakota 38 Badaro 39 Korkor 40 Niall 41 Jalarpur 42 Totagopmathpur 43 BaraboTiia 44 Pubakhanda 45 Harlspur
46 SahanalPur 47 Haladlbasanta 48 Baharana 49 Bagalgarh 50 Le~hanp ur 51 Olansa 52 Waupah 53 Banmundel 54 Athantar 55 Solamanga 56 Bilasuni 57 Taraban 58 Badabanklhatl 59 Malo 60 Dahl,ang 61 Adhanga 62 Khandmunda 63 Balara 64 Athanga 65 Pasanga 66 Sana Banklhatl 67 Pokhangm 68 Deuh 69 Polasara 70 Bagalsahl 71 Kahnupur 72 Anlo-I 73 Anlo -II 74 Kaplleswarpur 75 Kantapara 76 Mahangapada
Nam~ of Transferred Vtllages
fathePS (m2001)
3
118

}., ame of D is, riel s I I' S.
ANNEXURE TO APPEN[)IX - 1 TO TABLE A-I
From the P .t.;. (in 19<;)1)
77 Pahangn
7R ~lIndarda 79 Tihuri
2
80 Baghamara 81 Parimal
82 I3alisahi
83 luanga 84 raradap ara
8S Nuagan
86 Mahangn 87 Alana
88 Bansahi
89 M ~Ihikhandrr <}O Bara Kor-kora
91 Uobindapada 92 Khansara 93 Denga
94 Su bamar ur 95 I:rancha
96 Palasudha 97 Haribll 98 Kulasn 99 Kasarada
100 Badhiasahi I 0 I Pat rakam
I 02 Kh'~.iara 103 Kablchandrapur 104 Raniola
105 Alatalanga 1 06 Barisana
107 Bargurikud 108 Padatira
109 Puichanda 110 Raichandol
I II Sagadai10 112 Karania 1 13 Garapadrr 114 Kati"-ata J 15 Suanlo
116 Dighi 117 Silada
118 Kalakamahi!'>agotha
119 Palasa
120 Sithalo
121 Nati
122 Ekabcruan
123 Sasanpada I 24 13achhasailo
'Name of rranslcrred Villages
To the P S (in 2001)
3
! ! C)

~ame of Districts IPS.
lltP.S.
ANNEXURE TO APPENDIX - 1 TO TABLE A-I
From the P.S. (in 1991)
125 Amarpara 126 Rasimul
2
127 Darikhandaeta 128 Odapada
Name of Transferred Villages
To the P.S. (in 2001)
120
I Krushnaprasad 2 Nua Satang¥l 3 Puruna Salanga 4 Nachhigan
5 Sarana 6 Nua Betenda
7 PUruna Betenda 8 Negiganatailapur 9 Nua Bitapara
10 J ahangirp ur 11 Angeswar 12 Bimspur 13 Ambapada 14 Mahatapari 15 Nlbharan 16 Sunida
17 Roktda 18 Kantikul 19 Salapoi 20 Madhaba 21 Padhanasahi
22 Ratanpur 23 Banamalipur 24 Tampada 25 Saransa 26 Gundar
27 Kantisal
28 Patelibanpur
29 Karanga 30 Sudinda 3 \ Sara\...ore 32 Satakalia 33 Kurangapara 34 Kapasi 35 M untgan 36 Poduna 37 Arakota
38 Badaro
39 Korkor
40 Nmli 41 Jalarpur
42 rotagopinathpur 43 I3arahonia
44 Pubakhanda
3

Name of Districts / P S
ANNEXURE TO APPENDIX - 1 TO TABLE A -I
From the P.S. (m 1991)
2
Name of Transferred Villages
To the P.S. (m 2001)
121
45 Harispur 46 Sahanajpur 47 Haladibasanta 48 Baharana 49 Bagalgarh 50 Lekhanpur 51 Olansa 52 Waupali 53 Barimundcl 54 Athantar 55 Solamanga 56 Bllasuni 57 Tarahan 58 Badabanklhati 59 Malo 60 DahlJung 61 Adhanga 62 Khandmunda 63 Balara 64 Athanga 6S Pasangp 66 Sana Bankihati 67 Pokharigan 68 Dculi 69 Polasara 70 Bagplsahi 71 Kahnupur 72 Anlo -I 73 Anlo-II 74 Kapilcswarpur 75 Kantapara 76 M ahangapada 77 Pahanga 78 Sundarda 79 Tihuri 80 Baghamara 81 Parimal 82 Ballsahi 83 .Juanga 84 Taradapara 85 Nuagan 86 Mahanga 87 Alana 88 Bansahi 89 Majhlkhanda 90 Bara Kor-kora 91 Gobindapada 92 Khansara 93 Denga
3

Name of Distncts ! P.S.
Cut tad.. Sadar P.S
, Cuttack Town (M .Corp.)
ANNEXURE TO APPENDIX - t TO T\BLE A -I
Name 01'1 rall~lerrcd VilJagco.
From the P S. (in 1991) IothcP.~ (m2001)
2
Uttampur
2 Subhadrapur
3 Bhanpur
4 Pratapnagan
5 Snkaruan 6 Arakhakud alias TcIlengapcntha
7 Nuahat
8 BandhachhiJ:.a alias Kacharamal
122
9-1 SII barn ap 11 r 95 I.._rancha
96 Palasudha
97 Ilanh!l
98 Kula....,n
99 Kasarada 100 Badhmsahl
101 Pat raJ,. an I
102 Khajara
103 KahlChandrar ur
104 Raniola
[05 !\ latafanga
106 Bansana
107 I1argurikud
108 Padat If a [09 PUlchanda I J (I Ralchandol
III Sag,l(jailo
112 Karanja
113 G arap ada
I 14 Kat Ik.ata
115 Suanlo
116 Dighl
117 Silada
IIR Kalak.amahi"ag.otha
J 19 PaJasa
120 Slthalo 121 Natl 122 Ekaberuan
123 Sasanpada
124 Bachha.."allo
125 Amarpara
126 Ra..-,IITIul
127 Darikhandaeta
128 Odnpada
UttampUf
2 Subhadrapur
3 I1hanrur
t Pratar nagari
3

]\ame 01 DI.,tnct" P ')
JAIAPI lIZ Dr"l ')u!,.md<l P <;
ANNEXlJRI:. TO APPENDIX - 1 TO TABLE A -1
from the P ') (In 1\)1)1)
2
I Dubun
2 ~aran'ia
3 <;m an gap ur
4 (JdddpUr
S Khuruntl
6 '-,allJanga
7 Bahapal
8 Baghudpal
9 Ranagundl
10 Barakhm
II Rdgctda
12 ~ulIa
13 M andap ada
14 Nadlabhanga
IS Dhanla) apur
16 lamupa::.l
17 Khanddra
18 D hamanagad ILl
19 Manatlra
20 D~amanla
21 Rabana
22 Pankapal
23 M andh<}fp ur
24 N t1al11antdClp ur
25 Rartlkar
26 Sana Pmgal
27 Bada Pmgal
28 Kmtha
29 NnnapalJ
30 Gobdlghatl
11 M mglchera
32 I-latlmunda
3" I3aragadIa
34 Nuagan
3S JakhapUia
36 Chandaa
37 Anh.urapaJ
38 Golagaon
39 Kalhhongaon
to Bharandap~1 41 Mangalpur
42 '-,utabam..,m
43 GobJildapur
44 Bllltikar
""'dme of 1 ran~krrcd VlllagL"
123
rotheP~ (m2001)
3 5 ')nh.aruan
6 Ar<lk.hdk.ud dh~ Tdlengapentha
7 Nuahat
8 Bandhachlma alIa<; "-uLharamal

Name ofDlstncts IPS
JaJapur Road P S
Dubun P S
ANNEXURE TO APPENDIX - J TO TABLE A-J
From the P S (10 1991)
2 45 Badsuhdlhl
46 Panchabatla
47 <)endhapur
48 Dlgambarpur
Name ot 1 ran ... terred VlIlages
To the P ~ (In 2001)
124
Dubun
2 Saransa 3 Sarangapur
4 Gadapur 5 Khuruntl
6 ~allJanga
7 BaIJapat
8 Baghuapal 9 Ranagundl
10 Barakhal
II Ragada
12 Sulia
11 Mandapada
14 Nadtabhanga
15 Dhanlayap ur
16 Jamupasl 17 Khandara
18 Dhamanagadm
19 Manallra
20 Dasamama 21 Rabana 22 Pankapdl 23 M andharp Uf
24 Nl1amamdelpur
25 RmtlKar
26 Sana Pmgal
27 Bada Pmgal
28 Kaltha
29 Nlmapall
10 CJobarghat1
3 I M lfIgIchera
32 Hatlmunda
33 Baragadm 34 Nuagan
35 Jakhapura
36 Chandm
37 Ankurapal
38 Golagan
39 Ka<..hhoflgaon
40 Bharandapasl
41 Mangalpur
42 "ataham<;la 43 CJohtndap ur
3

Name of Districts I P.S
DHENKANAL DIST
Kamakshyanagar P.S.
ANNEXURE TO APPENDIX - I TO TABLE A-I
From the P.S (m 1991)
2
Arnapurnapur (KA) 2 Arnapurnapur (KHA) 3 Dhobahali 4 Nay akatem 5 C1angljodi (J KantapaJ 7 Sirimula 8 Tumusmga 9 Kantlo Kateni
10 Kant iop utasah i II Kotagara 12 Tentulisinga 13 Haridapal 14 M ahugadla 15 Mahulapal 16 Rainarasmghpur Sasan 17 Kamagarapatana 18 Purunadiha 19 Sriran1apur 20 Kantahania 21 Sidhapada 22 II adagarh 23 Godabhanga 24 Kanapal 25 Talajhagadap ada 26 UparaJhagadapada 27 Segar 28 Sambalap ur 29 Karabar 30 SogarJ...atenl 31 M achhm
32 Rabada 33 Sukapada 34 Godanbili 35 Jogidiha 36 Salta 37M aragad ia 38 Rautapada 39 Jaka 40 Dadhikhar
Name of Transferred Villages
fo the P.S. (in 20(1)
44 BIril ikar 45 Bad"ulIclihI 4n Panchahat In 47 Scndhapur 48 Digamharpur
Balungpbadl
3

Name ofDlstncts IPS
Tumustngha P S
ANNEXURE TO APPENDIX - I 10 tABLE A-1
From the P S (m 1991)
2 41 Dakhll1lpasl
42 M anduJ...hura 4] Pandua
44 Jamulhara
45 Mdhulagoda
46 I3alsmga 47 Baruan
48 Ic.hhahdt Ip ur
49 Aglmagoda
50 !<..otarapalt
5 I Khatuahata
52 Khuntahatl
53 Salapacta
54 Kusumalodl 55 \_ldegm
56 Analaherem
57 AmbakholakateIll
58 Kantalhana
59 I3udhlbllh
60 Kantakhol 6 I I3hmrap ur
62 Bhampur
63 ChlictaJ...hmkatelll
6f Aghlragooa
65 lLhhabat Ip ur
Name 01 rrdn<;terred Village ....
126
1 () the P " (111 2()() 1 I
Arnapurnapur (KA)
2 Arnapurnapur (KHA)
1 Dhobahali
'"' Ndyakatenl 5 (JanglJodl
6 Kantapal
7 ')Inmllla
8 llirnusmga
9 !<..antlo "-atel1l
IU Kant lOp utasah I
11 Kotagara
12 Tent 1I II::. mga
13 Handapal
14 Mdhugadm
15 M ahuiapai
16 Ramara<;mg)1pur :..a. .... an
17 Kamagarapdtana
18 Plirunadiha
19 "nramapur
20 Kantabanm
21 ';Iuhapdda
22 ~Iadagarh
23 Godabhanga 24 Kanapai
Name of Dlstncts IPS
ANUCJuL DI'ST
i<...amha P S
ANNEXURE TO APPENDIX - 1 TO TABLE A -1
From the P S (m 199[)
1 GadasIla
2 r..atenl 3 r...aradel
4 Rasol
2
5 Sarathlpal
6 To lakdbeda 7 Pathm amunda
Name of Tran'> terred Villages
Tot he P S (In laC)))
127
25 T ala)hagadap ada 26 UparaJhagadapada
27 Sogar 28 Sambalap ur 29 Karabar 30 Sogarkatenl 31 MachhJa
32 Rabada 33 'Sukapada 34 GodanbIlI
35 JOgIdlha 36 Saha 37M aragad Ia
38 Rautapada 39 Jdka 40 Dadhlkhm 41 Dakhmtpast
42 M andukhura 43 Pandua
44 JamuJhara 45 M ahulagoda 46 Balsmga 47 Baruan 48 Ichhabattpur 49 AgJlIragoda 50 Kotarapalt
51 Khatuahata 52 Khuntabatt 53 Salapada 54 KusumaJodt 55 Udegm 56 Analaberem
57 Ambakholakatem
58 KantaJhana 59 Budhlblllt
60 Kantakhol
61 Bhmrap ur
62 Bhalflpur 63 Chudakhlakatem 64 Aglmagoda 65 Ichhabatlpur
3

Name of Dlstncts IPS
NT PC PS
Samal Barrage P S
Nalco P S
Anugul P S
ANNEXURE TO APPENDIX - 1 TO TABLE A-I
From the P ~ (m 1991)
2 8 Bhllnakanda 9 Lodhabandha
10 Rangabeda 11 BIJlgolpatana
12 Baradangua 13 Ambapal 14 Kandasara 15 Nakuaka 16 KanuslbereOl 17 La'Jnanpur
Ranlagol
I Tulaslpah
2 Gotamara
I Tentolol 2 Pmgua
3 Khamana 4 Pantola 5 Brundabanp ur 6 Dayamdhlpur 7 Kun)aklltlra 8 Niladnpnr-9 Baslldebpllr
10 Kendupah II Bhogabcnnl
12 Abhlmam lIpUf
'\lame of Tran<;(erred Vlllage<;
fothePS (m2001)
128
I Gadaslla
2 Kdtcm 3 Karadel
4 Rasol 5 Sarathlpal
6 T olakabeda 7 Patharamunda 8 Bhlmakanda 9 Lodhabandha
10 Rangabeda
II BIJlgolpatana 12 Barddangua
13 Ambaral 14 Kanda'oara 15 Nakuakd 16 Krlnu'olocn:nt 17 La'Jnanpur
Ran I ago I
3

Name of District'. I P.S
ANNEXURE TO APPENDIX - t TO TABLE A -1
From the P.S. (in 1991)
2 13 Kusupangi 14 N irakarap UT
15 Dasamama 16 Narayanchandpur I 7 Salagadia
18 Boda 19 Chauridiha 20 M andabenni 21 Banarpal 22 Apartipur 23 Bagchara 24 Pandarabharnia 25 Budhapanka 26 Tentulihat 27 Nuahata 28 Joragp.dia 29 Blrabahanpur 30 Ganthigadm 31 Badakhali 32 Gangrjodl 33 Gadasantn 34 Gopigangadharpllr 35 Bhagabatpur 36 Narendrapllr 37 lhajiribahal 38 nangulibedaJungle 39 Nanguliabeda 40 Rajibpur 41 Badaberena 42 Purkia 43 Arehat 44 Kalandap al
:'5 RaOlmunda 46 Kangula 47 Santarapur 48 T alabahal 49 Fulapada 50 Giridihibasia 51 Kainchhabahala 52 Tentulipasi 53 Rankasinga 54 Kusuna 55 Talatali 56 JuharpuT 57 Slmilichhum 58 Chakuriapal 59 Siffiilichhuin Jungle 60 Gadatalamul 61 Harichandbast i
Name of Transferred Villages
To the !'.S (m 2001)
3
129
Name of Dlstncts / P ~
Ranarpal P S
ANNEXURE TO APPENDIX - 1 TO TABLE A-I
FromthcPS (m 1991)
2
62 Talamu\upatanalaml
63 Talamulu-patnabastl
64 Gudmhhum
65 Durgaprasddpllr
66 Khdndanah
67 HUrichandalaml
68 Talamllia sasan
69 M ah I(lharap ur
70 Serenabeda
71 Malhlka
72 Jula<;lpal Jungle
73 Ara 74 TilapangJ
Name of 1 ran'>krred VIllages
Tot he P 5 (In 2001)
130
1 TlIl~lpah
2 Goldmara
I Tentolol
2 Pmgua
3 I<.hamana
4 PaOlolu
5 Brundabanp ur
6 Oa) amdhlpur
7 Kunlakutlra
8 Niladnpur
9 Basudebpur
10 Kendupali
11 Bhogaberml
12 Abhlmanyupur
13 Ku!>updngJ
11 Nlrak.arapur
15 Dd..'>amdOia
16 Nnra) anchandpur
I 7 ~alugad In
18 Boda
19 Chdurrdlha
20 M anddbennl
21 Banarpal
22 Apartlpur
23 BagLhara
:!4 Pandarabharnta
25 Budhdpankd
26 Tentuhhat
27 Nuahdta
2R lorag,\dm
29 I3lrabahanp ur
30 Gdntlllgadm
11 Raddk.hah
32 C,angll(ldl 11 (, dd,l',an t n
1

Name of Dlstncts IPS
KHORDHA DIST
Beguma P S
ANNEXURE TO APPENDIX - 1 TO TABLE A-I
FromthePS (m 1991)
Botalama 2 Dobha
2
3 Mamkpurpatna 4 Gaudpatnd
5 Akhupaddr
6 K huntahandha 7 Jalbhar
Name ot Transierred VIllages
lothePS (m2001}
131
34 Gop 19angadharp ur 35 Bhagabatpur 36 Narendrapur 37 lhallnbahal 38 nangulrbedalungle 39 Nangullabeda
40 Rallbpur 4 [ Badaberena
42 PurJ...m Arehat KalandapaJ Ranrmunda Kangula Santarapur Taiabahal ruJapada (Jlndlhlh::h la J<..,unchhabahal.t Tcntuilpa.'>1 Ranka.<;Jngtl
Ku'>una Talatalt
luharpur '-,lmlltLhhlllll
li1dkun,lp al
<)Imlllchhum lungd Gadatalanlul
61 Hanchandb~tl
62 falanmlupatJ.l1Ulaml 63 Taiamulu-patnahdSll
64 Gudmbhum 65 Durgapr~adpur 66 Khandanah 67 Hanchandalaml 68 Talamula sa~an 69 Mahldhdrapur 70 Serenabeda
71 Malhlla 72 1\llas\pal lungle
73 Am 74 TllapangJ
3
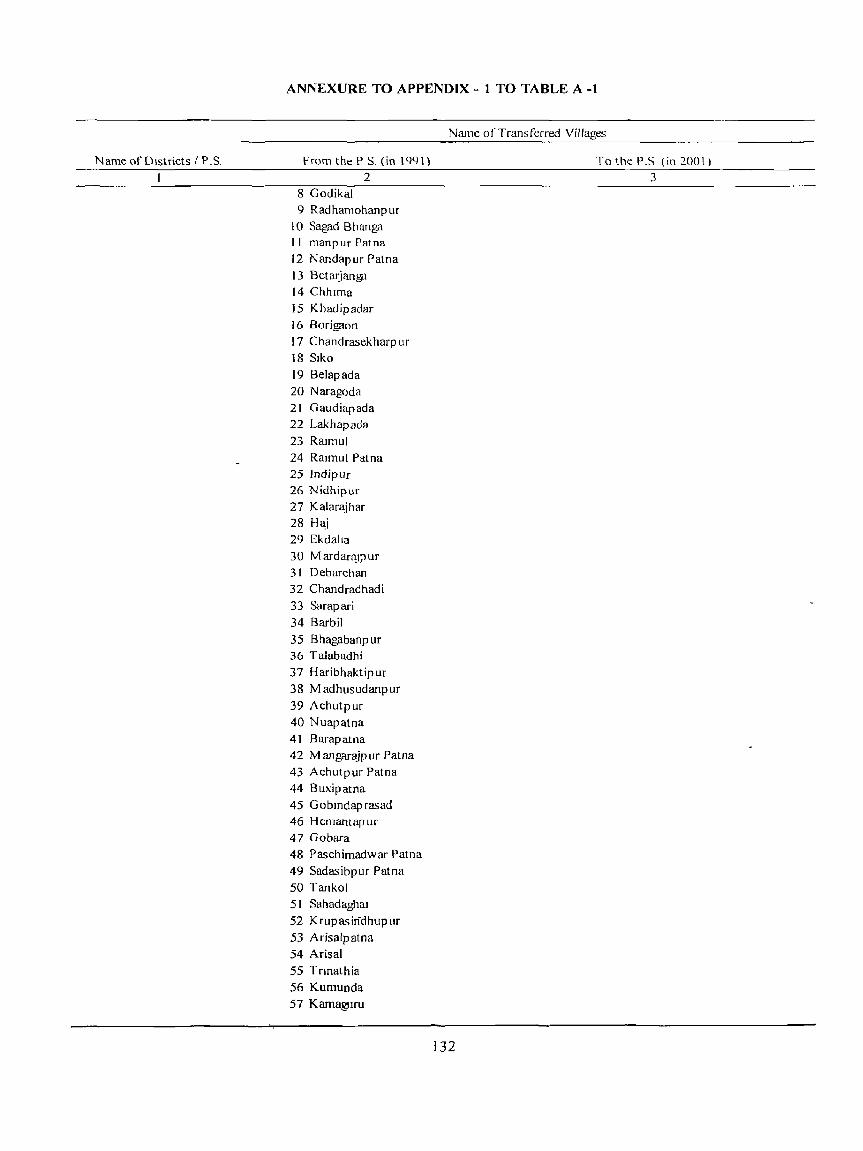
Name of Districts I P.S.
ANNEXURE TO APPENDIX - 1 TO TABLE A-1
From the P S. (in 1991)
2 8 Godikal 9 Radhamahanpur
10 Sagad Bhanga 11 manpur Patna
12 Nandapur Patna
13 Betru:iangp 14 Chhlma 15 Khadipadar 16 Borigaon
17 Chandrasekharpur 18 Slka 19 Belapada
20 Naragoda 21 Gaudiapada 22 Lakhapada
23 RallllUl 24 RaImul Patna 25 Indipur 26 Nidhipur 27 Kalarajhar
28 H~i 29 Ekdal!a
30 M ardaraJp ur 31 Debarchan 32 Chandradhadi
33 Sarapari 34 Barbil
35 Bhagabanpur 36 Talabadhi
37 Haribhaktipur 38 Madhusudanpur
39 Achutpur 40 Nuapatna 4 I Barapatna 42 Mangar~jpur Patna 43 Achutpur Patna 44 Buxip atna 45 Gobmdapra<;ad 46 Hemantapur 47 Gobara 48 Paschimadwar Patna 49 Sadasibpur Patna
50 Tankal 5 I Sahadaghal 52 Krupasin-dhupur
53 Arisalpatna 54 Arisal 55 Trmathia 56 Kumunda 57 Kamaguru
Name afTransferred Villages
Tothe:P.S (in2001) 3
132

Name of DIstricts / P .S.
Khordha P.S.
ANNEXURE TO APPENDIX - I TO TABLE A-I •
Name of Transfern:d Villages
From the P.S. (in 1991) lothePS.(m2001)
2 58 Dudhiajhar 59 KutunIJhara 60 Belapada 61 Atala 62 Nalsingh 63 Totapada 64 Ratamatl 65 Bagheip ut
Gayabandha 2 Na) akat 3 Arang 4 Nimeipur 5 Chhanagiri 6 Rautarap ur 7 Asuradhip 8 .Iankia 9 Ambhabd
10 Hanumantapur 11 Krushnanagar 12 Purusottnmpur 13 Bimalaprasad Patna 14 Kamalaprasad Patna 15 .Iagannathpra~ad Patna 16 Olasingh 17 Kuanrakali Patna 18 Damanbhuin 19 Khaturta 20 lahanga 21 kanpuT 22 Champ ajhar 23 BartI'm 24 Banamaltp liT
25 Raipur 26 Basanta 27 Anda 28 jagannathpur 29 Narangarh 30 Bhagabanpur 31 Panichhatra 32 Kanchilo 33 Mota 34 Godipada 35 Kalibati 36 M undamba (Bahgadia) 37 Kaya 38 Gunthunl 39 Chandramapatpur Sasan 40 Golabisasan 41 Ichhapur
133
3

Name of Districts / P S
Tang! P S
ANNEXURE TO APPENDIX - 1 TO TABLE A -1
From the P ~ (m 19(1)
2 42 Sandhapur 43 Ichhabana 44 Nlrashrya 45 Bhogapur
46 Hadapada 47 Balapur 48 Orlml 49 Durdapur 50 Orabarsmgh 5 I DI!..hk.hald 52 Hlramula 53 Ordkul 54 Dhabalpur 55 Kurumpada 56 MedIn!
Brundabanpur
2 Nuagar 3 Nuagar Patna 4 Harlpur Patna 5 Brahmapada Patna
6 Buddpokhana 7 Chakakamaguru 8 Krushnapur Patna 9 Budhangara Patna
10 Nayapatna II Kanthapur Patna 12 M ormor~Ingha Patna 13 \t1 ormor ~mgl1a 14 Kashlpur
15 Gopmathpur Patna 16 PataJoshlpur 17 Chitrd1.ut
18 Ichhabatl 19 Botanda 20 Balarampur 21 Rameswar
22 langurlh.ona 23 Satmama 24 Sndharp ur 25 Gudabedl 26 Jagatpur 27 Baranuagan 28 Padmapur Patna
29 Kha,u~Ipada
30 Nanapada -
31 Raulahata
32 Barapatna
33 Gauratl Sahl
Name ot 1 ran<,ferred Villdge"
In the P " (m 200 I ) 3
134
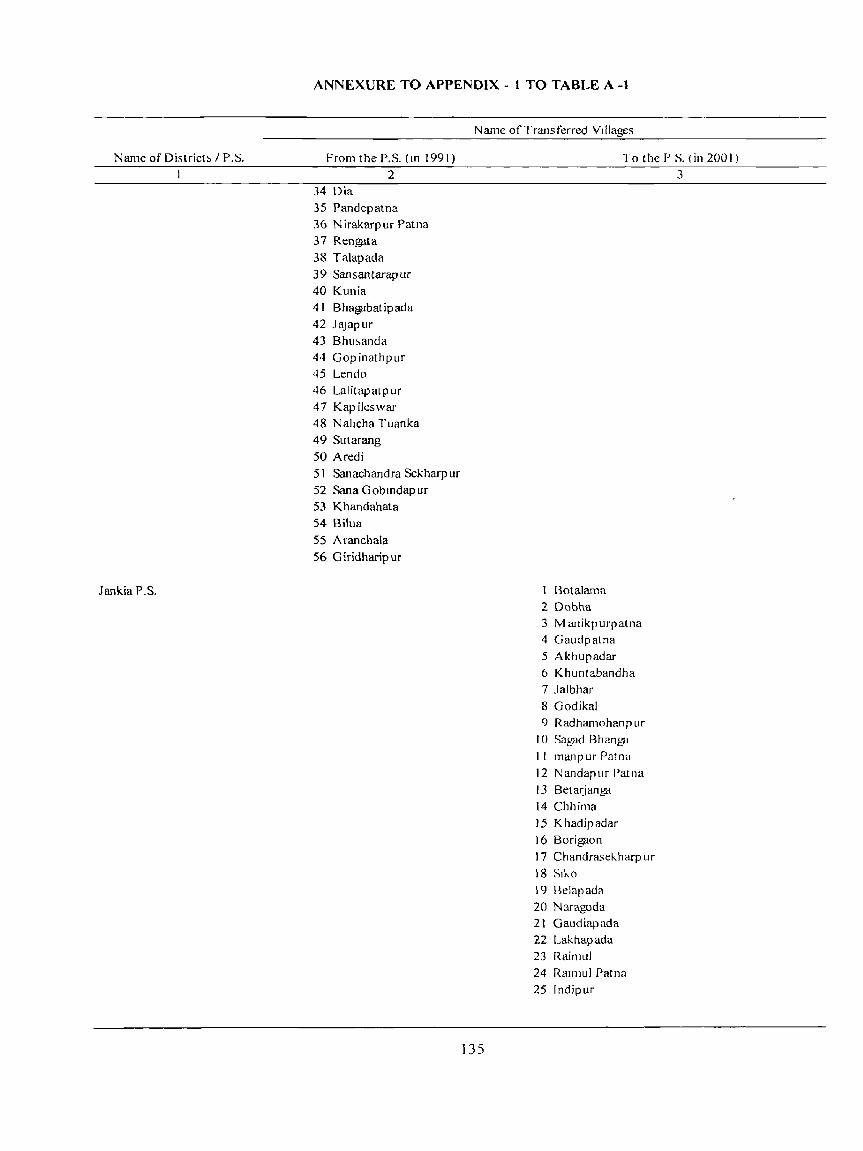
Name of Districts / P.S.
lankia P.S.
ANNEXURE TO APPENDIX - 1 TO TABLE A-I
From the P.S. (m 1991)
2 34 Dia
35 Pandepatna 36 Nirakarpur Patna
37 Ren~lta 38 Talapada 39 Sansantarapur 40 Kunia 41 Bhagabatipada
42 Ja.lapur 43 Bhu~anda 44 Gopinathpur 45 Lendo 46 Lalitapatpur 47 Kapileswar 48 Nahcha Tuanka 49 Sutarang
50 Aredi 51 Sanachandra Sekharp ur 52 Sana Gobmdapur 53 Khandahata
54 Bilua
55 Aranchala
56 Giridharipur
Name of Transferred Villages
To the P S. {in 2001)
135
Botalama 2 Oobha 3 M anikpurpatna 4 Gaudpatna 5 Akhupadar
6 Khuntabandha 7 .lalbhar
8 Godikal 9 Radhamohanp ur
10 Sagad Bhangi! 1 I manp lIr Patna
12 Nandapllr Patna
13 Betar:ianga 14 Chhima
15 Khadipadar
16 Borigaon 17 Chandra<;eKharp ur
18 SIKO
19 Belapada
20 Naragoda 21 Gaudiapada
22 Lakhapada 23 Raimul
24 RaImul Patna
25 Indipur
3

Name of Districts I P.S.
ANNEXURE TO APPENDIX - 1 TO TABLE A-I
From the P S. (m 1991)
2
Name of Transferred Villages
136
20 N idhlpur
'27 Kalar~Jhar
'28 ~11~J
29 Ekdall3
TothePS (in2001)
30 M ardan~Jr lIr 3 I Debarchan
32 Chandradhadl
33 Sarapan
31 Barbil
35 Rhagabanpur 30 J aJabadhi
37 Hal ibhaktlpur
3~ Madhll~udanrur
39 Achutpur 40 Nuapatna
41 Baraputna
42 M angaraJPur Patna
43 AchLltrur Patna
44 BU.\lpmna
45 Gobllldaprasad 46 I krnantap ur
47 Gobara 48 Pa.,.,chlmad\\ ar Patna
49 Sadaslbpur Patna
50 Tankol
51 Sahadaghal
52 Krupasindhup ur 53 Arisalpatna
54 Ansal 55- rrinatf1ta
56 Kumunda 57 Kamagllru
58 Dudhl~Jhar 59 Kutllnljhara
60 BcJapada
61 Atala
62 Nalsingh
03 Totapada
64 Ratamatl
65 Bagheip ut
Gay~bandha
2 Nayakol
3 Arang
4 Nlmelpur
5 Chhanagiri 6 Routarap ur 7 Asuradhlp
8 Jankm
9 Ambhabil

Name of Districts! P.S.
ANNEXURE TO APPENDIX - I TO TABLE A -1
From the P.S. (in 1991) 2
Name of Transferred Villages
13'7
To the P S (in 2001)
10 Hanumantapur II Krushnanagar 12 Purusottamp ur 13 Blmaiaprasad Patna
3
14 Kamalaprasad Patna '5 jagannathprasad Patna 16 OIasingh 17 Kuanrakali Patna 18 Damanbhuin 19 Khatuna 20 lahanga 21 kanpur 22 Champajhar 23 Haripur 24 Banamalipur 25 Raipur 26 Basanta 27 Anda 28 jagannathpur 29 N arangarh 30 Bhagabanpur 31 Pamchhatra 32 Kanchilo 33 Mota 34 Godipada 35 Kalibati 36 M undamba (BaJigadm) 37 Kaya 38 Gunthul1l 39 Chandramapatpur Sasan 40 Golabisasan 41 lchhapur 42 Sandhap ur 43 lchhabana 44 Nirashrya 45 Bhogapur 46 lladapada 47 Balapur 480rimi 49 Durdapur 50 Orabarsingh SI Dikhkhala 52 Hiramula 53 Orakul 54 Dhabalpur 55 Kurumpada 56 Medini
I Brundabanp ur

Name of Di.stricts I P.S
ANNEXURE TO APPENDIX - 1 TO TABLE A-1
From the P.S (in 1991)
2
Name of Transferred Villages
To the P S. (In 2001)
2 Nuagar 3 Nuagar Patna 4 Haripur Patna 5 Brahmapada Patna 6 Badap okharia
7 Chakakamaguru 8 Krushnapur Patna
9 Budhangara Patna 10 Nayapatna 11 Kanthapur Patna 12 Mormorsingha Patna 13 M ormor Smgha 14 Kashipur 15 Gopinathpur Patna 16 Patajoshipur 17 Chitrakut 18 Ichhahatl 19 Botanda 20 Balarampur 21 Ramcswar
22 tangurikona 23 Satmama 24 Sridharp ur 25 Gudabedi 26 Jagatpur
27 Baranuagan 28 Padmapur Patna 29 Khajuripada
30 Nan~pada 31 Raulahata 32 Barapatna 33 Gaura!. Sahi 34 Ola 35 Pandepatna 36 N irakarp ur Pat na
37 Reng<lla 38 Talapada 39 Sansantarap ur
40 Kunm 41 Bhagahatlpada
42 Ja.lap ur 43 Bhusuftda 44 Gllpinathpur
45 Lendo 40 Lahlapatpur 47 Kaplles\\ar 48 Nahcha Tuanka .Jl) Sutarang
5() Aredi
3

Name of Dlstrrcts IPS
Banapur P S
ANNEXURE ro APPENDIX - 1 ro TABLE A -I
FromtheP'.11I11(91)
I Kandha Ambll]har
2 GoradaJhan
3 Jagabandhupur'Sasan
4 No) aka! 5 Pmkarap ur 6 <..,alapddlhl
7 "v1anel
8 Dlf1abandhupur
9 Gotapalli
10 Gamci
1 I Hanpur
12 Kula!
13 Ndakdnthapur
14 J Ib,lI1delplir I') K..,mhclp [,If
16 ~Llnakhala
17 Bad,lp ddar
18 Nachunl
19 Bhabanlpur
20 KOldn
21 Dlkhillpada
22 B'L~lIdelrur
21 Khanatd
24 BI<;lIndlhl
25 T cn! 1Ilidlhi
26 A klLlIh Ip aland
27 Nanclapur
28 "v1 angaralP ur 29 )),U1H)ddrp lIr
30 Dolamllndel ,I M dl1,!m I clp ur "~an
32 KUJnrpur
31 M amlm
34 KUJl1r K..JII Pdtl1d
35 ').)r,1I1<11
16 Ram.hocla
17 Bh.:~ell
38 "'11\ ,1111<;umLupuf 1<) B,mdhtimllnd~j ., () N ,ll ,meld Ih I
·11 (Illp Ik,llltd]l ur
4:2 Padanpur
10th.:I'''> (lll~lJ()l)
51 "al1dLlMlldrd '>eld1drp llr 'i2 ""ana Gohmd Iplll ,), hhanddhdtd
"4 BIIu<I ".:; 1\ ranchLll<l
')6 (J 111dh,mp UI

N arne of Districts I P. s.
ANNEXURE TO APPENDIX - I TO TABLE A-I
From the P.S. (In 19911 2
43 Gopinathpur 44 Harikunda 45 Pat.loshipur Sasan 46 Baratangi 47 Baradihi 48 Dattapur 49 Lokipur 50 Gang;idharpur Sasan 5 I Singip ur Sasan 52 Chhotarapur Sasan 53 Baulabandha 54 Badanmri 55 Sananairi
56 Hariharpur 57 Chanbat ia 58 Santarap ur 59 Kumandala Patana
60 Patharakata 61 Sarla Smghi 62 Pranadeipur 63 M ardar~jpur 64 Karadi 65 Ranasinghapur 66 Nidhipur 67 Kaluri 68 Kumundala 69 Harapur 70 Champatipur
71 Rahanabelh 72 Durag;ipur 73 Khetrapala
74 Samanta Sing!1arpur 75 Brahmanakusadihi
76 Dangua 77 Srikru<;hnap ur 78 Srichandanpur 79 Lambodarp ur 80 Sll<.harpadar 81 Klmbhiripada 82 Harekrushnapur 83 Bankiapalli 84 Ankula
85 Paikakusadihl 86 Damad(lrp ur 87 Purusotamp ur 88 Ambapada 89 Gobardhanpur 90 Parinka San 91 Chasangara 92 Ostapalli
Name of Transferred Villages
TothePS (m2001)
3
t-40

Name of DI,tncts IPS
Balugaon P S
ANNEXURE TO APPENDIX - 1 TO TABLE A -1
From the P ') (m 1991)
2 93 Ankula 94 Ranasmgh Prasad 95 Nllnlkheta ':J6 Belapada 97 Dhuanala 98 Smge~\\ dr 99 Ja) apur
100 hhandualkol 101 (,hlkhald
102 Patd.'>dl11pUl 103 Koduap ur 104 Ragh unat hap ur 105 Bhelen 106 Banamahpur 107 lnlanapur 108 Gabapadar 109 Bldharpur 110 Chhedapadar III Atharbatm 1 12 Aswanpatna 113 Barakul 114 Subudhlpatana 115 G.mdpatl Patna 116 lotapada 117 Khadlkapall1 118 Ra\ agurupur 119 Rautarapalll 120 NlmclInalla 121 Hatlburt 122 Bonasahl 123 Ash\\ an 124 Nuagada 125 Pathara
126 Khanbandha 127 Akhupokhara 128 Dungamal 129 Gadad\\ ar
Name of Transferred Villages
fothePS (m2001)
141
J Kandha Ambalhar 2 Goradalhan 3 Jagabandhupur Sa~an 4 Noyakot 5 Pmkarapur (-, Salapadlhl 7 Manel 8 Dmahandhupur 9 Gotdpalh
10 CJamel 11 Hanpur 12 Kulm
3

~ame 01 DI"tnc\'. P ')
ANNEXURE TO APPENDIX - 1 TO TABLE A-I
Name ot rran"fci rcd Village"
FromthePS (m 1991) TothePS (m2001)
142
[3 N Ilakanthap ur
14 Itbandclp ur 15 Kanhclp ur 16 Sunakhala [7 Badapadar [8 Nachul1l
[9 B hahanIp ur
20 Kotan 21 Dlkhltlpada 22 Basudclpur 23 Khanata
24 BI"undlhl 25 1 cntuhdlhl 26 A leldlhlpatana 27 Nandapur
28 Man!1flralPur 29 Damodarp ur
30 Dolamundel 3 I M an!1fllap ur Sasan 32 Kuanrpur 33 M al1lt In
34 Kuanr Kal! Patl1a
35 'Sarandl 36 Ranchoda 37 Bhc'>en 38 Shyamsundarpur 39 Bandhamundel 40 Naranadlhl 41 Goplk.antapur 42 Padanpur 43 Gop mathpllr 44 Hankunda 45 Pal!oshlpur Sru,an
46 BaratdngI 47 Baradlhl
48 Dattapur
49 Loktpur 50 Gangadharpur Sasan 5 I SmgIp ur Sasan 52 Chhotarapur Sasan
53 Baulabandha 54 Badanatri
55 ~nanatrl 56 Hanharpur 57 Chanbatla 58 Santarap ur 59 Kumandala Pdtdna 60 Pathdrak.ata
61 Sarla \Ing\11
3

Name of lJistncts f P.S
ANNEXURE TO APPENDIX - I TO TABLE A-I
From the P.S (in 1(91)
2
Name of Transferred Villages
To the P.S. (In 2001)
143
62 Pranadeip ur 63 M ardaraJpur M Karadl 65 Ranm,inghapur 66 Nidhipur 67 Kaluri 68 Kumundala 69 fiarapur 70 Champatipur 71 Rahan ahelli 72 Duragapur 73 Khetrapala 74 Samanta Singharpur 75 Brahmanakusadihi 76 Dangua 77 Snkrushnap ur 78 Srichandanp ur 79 Lamhodarp ur 80 Sikharpadar 81 Klmbhrripada 82 J larekrushnapur 83 Bankmpalli 84 Ankula 85 Palkakusadihi 86 Damadarpur 87 Purusotampur 88 Ambapada 89 Gobardhanp ur 90 Pannka Sari 91 Chasangara 92 OstapallJ 93 Ankula 94 Ran as ingh Pra<;ad 95 Nlmikheta 96 Belapada 97 Dhuanala 98 Singeswar 99 .Iayapur
[00 Khandualkol [01 Ghlkhala
102 Patasan ip ur 103 Koduapur 104 Raghunathapur lOS Bheleri 106 BanamalJp ur
107 Inlanapur lOR U abap adar 1(1) Bldharpur 110 Chhedapadar
3

Name ofUIstncts (P S
PURl DIST Pun Sadar P S
ANNEXURE TO APPENDIX - 1 TO TABLE A-I
Name of Transferred VIllages
f'romthePS (m 1991\ To the P S tm 2001) 2
1 Banmula 2 Bedarpada 3 Kapasl 4 Old 5 Bhailipur 6 Jatlpur 7 Pandasur 8 Goudakera 9 Khandlghar
10 Anhan II Antlkera 12 Rua 13 Impma 14 Arolapatna 15 Chasakhand 16 Ankm 17 Karadl 18 Blranara"mg,hpur 19 SamaJalap ur 20 Aplla 21 Ganganarayanpur 22 Jagannathpur 23 BaltpQda 24 Tadas Ramahansapur 25 Alapur 26 Bangurabagaddharp ur 27 Gopmathpur 28 Kahakera 29 Dhola Blranchl Daspur
144
111 Atharbatla 112 Aswanpatna II) Barakul 114 Subudhrpatana 115 Ganapatr Patna 116 Totapada 117 Khadlkapalh 118 Rayagurupur 119 Rautarapalh 120 N Imclmalla 121 Hatlhan 122 Bonasahl 12) A"hwan 1 24 l\. uagada 125 Pathara 126 Kharlbandha 127 Akhupokhara 128 Dungpmal \ 29 Gadadwar
3

Name of Distncts / P.S.
ANNEXURE TO APPENDIX - 1 TO TABLE A -1
Name of Transferred Villages
From the P.S. (in 1991) To the P.S. (m 2001)
2 30 Mahkera 31 Pat~ioshipur
32 Garghmrugasira 33 Sundara 34 Paniorali 35 Paikerapur 36 Odasamala 37 Madhlpur 38 Bhikaripada 39 Chabisabatia 40 Kanchisasan 41 Balia 42 Nabatia 43 Alasana 44 Nahadia 45 Jhinkina Jagannathpur 46 Dasagoba 47 Janakadelpur 48 Chandanpur 49 Rlrapratappur SO Dolagobindpur 51 Birakishorpur
52 Tikara Sorabha 53 Stulitota 54 Siuli 55 Kusupada 56 Laxmanpur 57 Pratapa Ramchandrapur 58 Sateisibatia 59 Puruna Koranga 60 B ijeramchandrap ur 61 Kaupala 62 Bania Kera 63 Kanhei Bid)' adharpur 64 Nlhar Khanrl 65 Kulia Pada 66 Atharap 67 Kalikanuapada 68 Sujanpur 69 Siruli 70 Parakhanda 71 Khamar 72 Kurunt 73 Hantuk 74 Pratap p urushottamp ur
75 Kerandipur 76 Singamapur 77 Krishnanjanpur 78 Birabalabhadrapur 79 Bilapari Bindha
145
3

Name of Dlstncts / P S
Chandanpur P S
ANNEXURE TO APPENDIX - 1 TO TABLE A-I
From the P S (10 1991)
2
80 M alatrpatap ur
81 Jagannath Ballav 82 PUTusottam Ballav 83 Kantaslla 84 T ala,anga 85 Uttarhana 86 N andlkera
87 Tandrkera 88 Kamasasan
"Name 01 1 ransterred Vlllage~
146
Tot he P ~ (In 20lll )
Barrmuld 2 Bedarpada 3 Kapa.~1
40la 5 Bharlrpur
6 Jatlpur 7 Pandasur 8 Goudakerd Y Khandlghar
10 Anhan II Antlh.era
12 Rua 13 Impma 14 Arolapatna J 5 Chasakhand
16 Ankra 17 Karadl 18 Biranaraslllghpur
19 Sam~alapur
20 Aplla 21 Ganganarayanpur
22 Jagllnnathpur 23 BaJrpada
24 Tadas Ramahansap ur
25 Alarur 26 Bangurabagllddharpur 27 Gopmathpur
28 Kalrakera
3
29 Dhola Blranchl Oaspur
30 Mahkera 31 Pataloshrpur 32 GarghmrugllSlra 33 Sundara
34 Panrorah 35 Pmkerapur 36 Oddsamala
37 Madhlpur
38 Bhrkarrpada 39 Chabr<;abatla
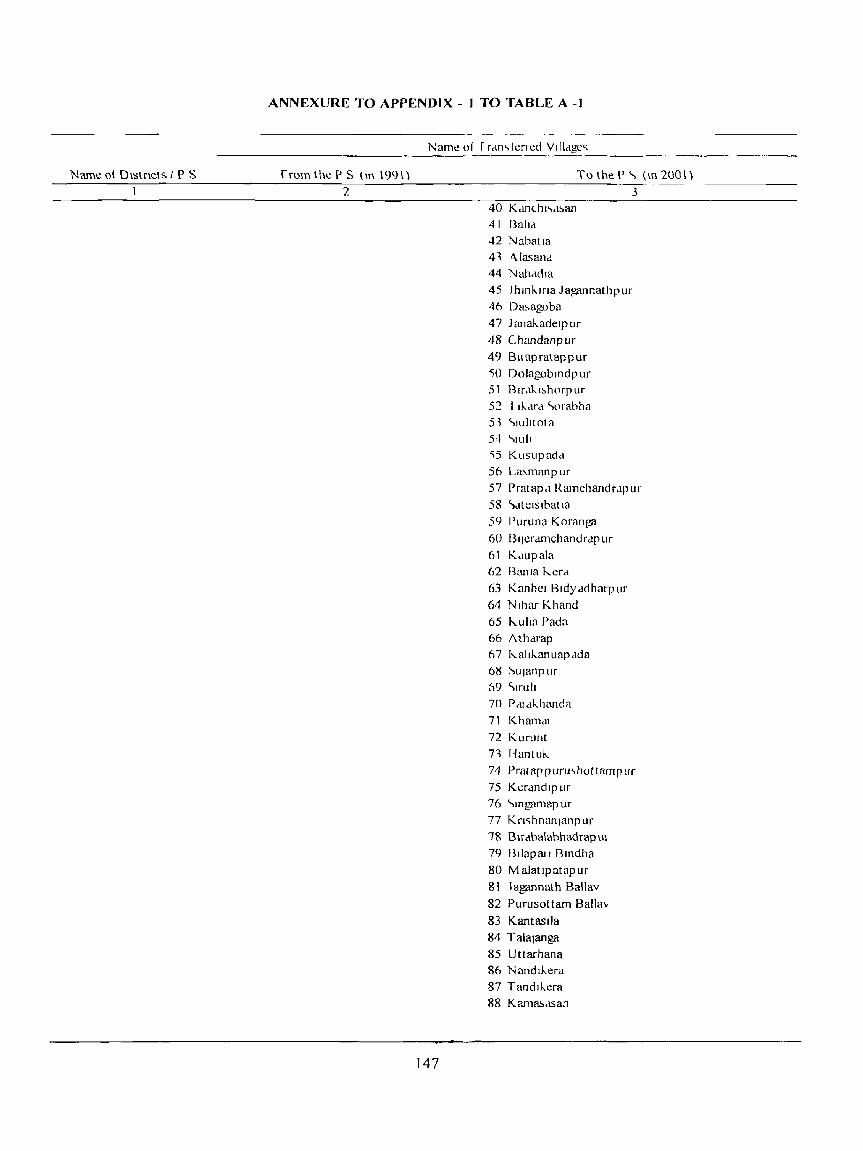
Name 01 DIstricts IPS
ANNEXURE TO APPENDIX - I TO TABLE A-I
from the P S \111 \99\)
2
147
To the p" (m 21J0\)
40 Kdnthl"'d~rul 41 Balld ... 2 Nabatla
41 &..la<;and
44 NahddJa
3
45 Jhmkma Jagannathput
46 Da.-.agoba
47 J rulakadelp lit
48 Chandanpur
49 Bnupratappur
'i0 DoJagobmdp ur 51 Blr,lkl~horpllr
52 I I(,.dtd (;"orabha 5) (;"Iulnota
54 ""11I11
'i5 Kusupadd
56 La"manpur 57 Ptatap,l Ramcl1andr.lpur
58 ~<ltl::lslbatta
59 I'uruna Koran?JI
60 B"erdmchandrdp 1Ir
61 K.tupala 62 Bania J..-erd
63 Kanhel Bldy ddharp lIr
611 Nlhar Khand
65 J..-ulm Pada 66 Athdrap (,,7 kailkanuapdda
68 ~ulanpur (19 ~Iruh
70 Pdldkhanda
71 Khamdl
72 Kurunt
71 Hantuk
7-1 Pratappuru.,hottamrur
75 Ker.lIldlpur
76 <"'mgamapur
77 Kn<;hnanlanpur
78 Blraba\ahhadrapUl 79 I3Jiapru I Bmdha
80 M alatlpatapur 81 lagannath Ballav
82 Purusottam Balla ..
83 Kantaslla 84 Talalanga 85 Uttarhana 86 Nandlkera 87 Tandlkera
88 Kam8.'>.lSan
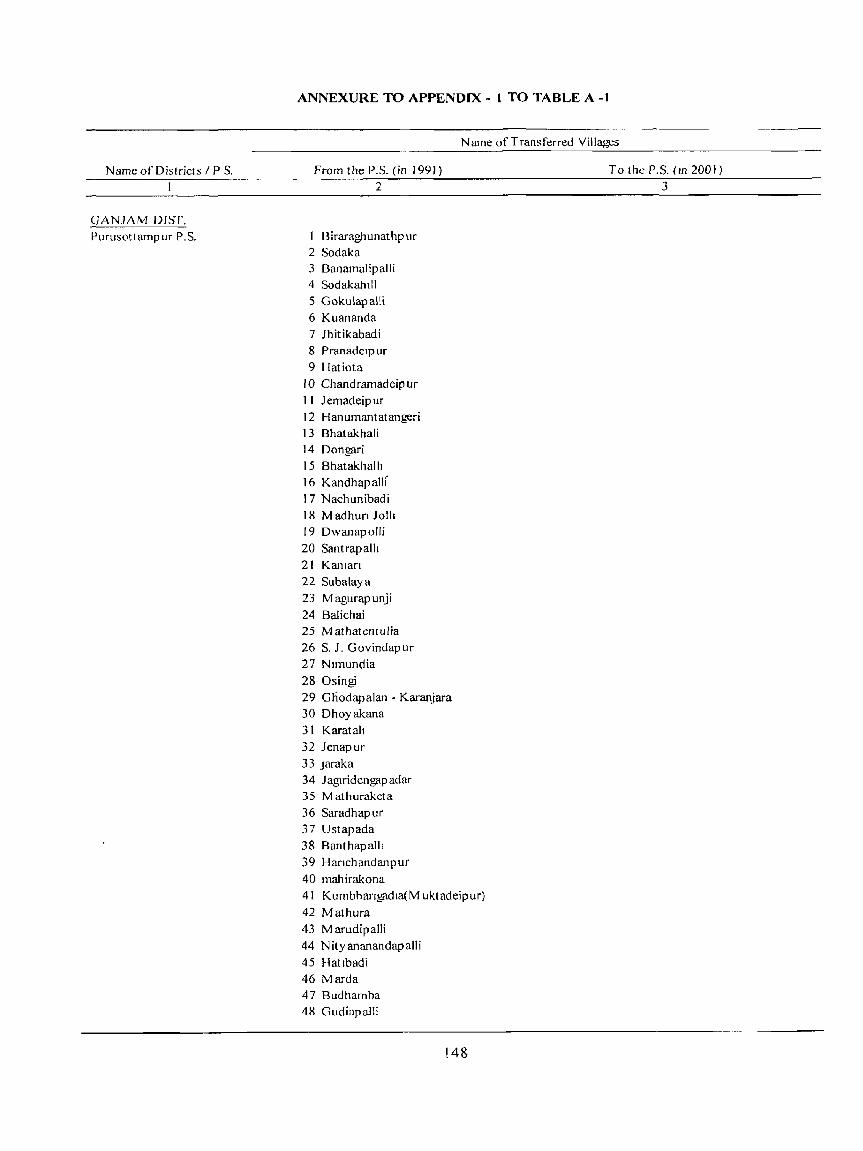
Name of Districts IPS.
GANJAM DIST. Purusottampur P.S.
ANNEXURE TO APPENDIX - I TO TABLE A-1
Name of Transferred Villages
From the P.S. (in 1991) 2
1 Biraragj1unathp ur 2 Sodaka 3 Banamal ip all i 4 Sodakahlll 5 Gokulapalli 6 Kuananda 7 Jhitikabadi 8 Pranadelp ur 9 Hatiota
10 Chandramadeip ur I I J emadeip ur 12 Hanumantatangeri 13 Bhatakhali 14 Dongari 15 Bhatakhalh 16 Kandhapallf 17 Nachunibadi 18 Madhun JollI 19 Dwanap o iii 20 Santrapalh 21 Kaman 22 Subalaya 23 Magurapunji 24 Balichai 25 M athatentulia 26 S . .I. Govindapur 27 Nlmundia 28 Osingi 29 GJ10dapalan - Karanjara 30 Dhoyakana 31 Karatah 32 Jenapur 33 Jaraka 34 Jagtridengapadar 35 M athuraketa 36 Saradhapur 37 Ustapada 38 Banthapalll 39 Hanchandanpur 40 mahirakona 41 Kumbhangadm(M uktadeipur) 42 Mathura 43 M arudipalli 44 Nityananandapalli 45 Hatlbadi 46 Marda 47 Budhamba 48 Gudiapalli
148
To the P.S. (m 2001)
3

Name ofDlstncts / P S
ANNEXURE TO APPENDIX - 1 TO TABLE A -I
Name of Transterred VIllage"
FromtheP,) (In 1991) 2
49 Kakudm
50 ArJunapalh 51 M ardaraJPur 52 Nuapalh 53 Baunsm 54 A<;InlpUr
55 Banapah
56 Gtunthapada 57 Pmkalamuna
58 JamunahIII 59 Badachdhlapada 60 Banda
6 I K usap all I 62 Bhatapada 63 BorasmgJ 64 EkadasI 65 Bahap alii 66 Ambaplla
67 Golamllndla 68 Pathara 69 Sundanapada 70 Sunachadhmpada 7\ Nandmgada 72 Hmdola 73 Inamadengapadar
74 SYdha 7S RampudI 76 Khandakhanda
77 G,mgapur 78 Pratap Blrabalunkeswar
79 Raghunathpalh
80 Badaagula
81 Plthapur 82 Sunapalh 81 Ektal Blrabalunkeswarpur
84 Athagadapatna 85 Patharpdlh 86 M uktamalachdll1ptlpur 87 Duarabagada
88 Degam 89 Bahhata 90 Chotbaunsl Bagada
91 Bankakhmbagada
92 1 ellbagada 93 Choh.ak.hmbagada
94 Khalapa!il 95 Khalrapalh 96 Badamahun 97 Inamtahampalh
149
To the P'" (In 2001)

Name of Districts / P S
Kodala P S
Kabisuryanagar P.S
ANNEXURE TO APPENDIX - J TO TABLE A-I
Name of fran"ferred Villages
From the P S (in 1991) To 1 he P S. ( in 2001 )
98 Bak"lpalIi 99 Ciudml!
100 Bdapur 101 Sanap ankalbad i I 02 Sad abart a N uagan 103 Sandhamara \04 Baliasora 105 Bolasara 106 Sunar(jhola
107 Rheta'>mgl
108 M abanapalli 109 Sanamuktamala , cmadelp ur
110 .larada II I Santararat nap all I 112 Gundoribadi 113 Ambilapalll 114 Tankachhm 1 IS Santarp ur
116 Banei I 17 Badakhanda
118 KhandaberJaganathpur
119 Adhclbaragan 120 Gopapur 121 .lhadabandha ) 22 M ahachhm 123 Ganganapur 124 Badamuktamala .Iemadelpur 125 Changudipadara Nuagam 126 M orabom 127 Amunia 128 Gobindapur
1 Khanduru 2 Kalmba 3 Rukhakana 4 Kan\..arada 5 Kasmthap ur 6 Chandmpada Krushnadaspur 7 Madarangapali
lSi)
1 Biraragllunathpur
2 Sodaka 3 Banamalipalli
4 Sodakahlll 5 GokulapallI 6 Kuananda 7 Jhltikabadl 8 Pranadelp Uf
9 Hati(lta
3

"\lame ofOistricts I P.S.
ANNEXURE TO APPENDIX - t TO TABLE A-t
From the P S (m 1991)
2
Name of Transferred Villages
15 J
To the P S. (in 2001)
10 Chandramadelp ur
11 Jemadelpur
12 lIanumantatangeri 13 Bhatakhal!
14 Dongari 15 BhatakhalJl
16 Kandhapalh
17 Nachunibadl
18 Madhun Jolli
19 Dwanapolli
20 St,nlrapalh
21 Kaman
22 Subala) a 23 M agurap lIn)l 24 l3alldmi
25 M athatentulia
26 S. J Govmdapur
27 Nlmundia
28 Osmgi
3
29 Ghodapalan - Karanjara
30 Ohoyakana
31 Karatali
32 knaJ1l1l 33 ram"" 3·1 J agifldeng.'lp adar
35 M athllraketa
36 Saradhapur
37 llstapada
38 Banthapalh
39 Harichandanpur
40 mahlrakona '~I KlImbharigadla(.'VI ul.!adClpllr)
42 Mathura
4] Marudipalll
44 Nilyananandapalh .15 Hatibadl
·~6 Marda
,17 Budhamha .tR Gudlapa\\i
--19 Kakudia
50 ;\ rj unapalh
51 M ardaraJP UT
52 Nuapalli
53 BaullsLa 54 ;\smip ur
55 BllJl~aiI
56 Glunthapadn
57 Pm"'tiamuna 58 Jamunahill
Name of Dlstncts IPS
ANNEXURE TO APPENDIX - 1 TO TABLE A-I
FromthePS (m 1991)
2
Name of framterred Villages
152
To the P S (m 2001)
59 Badachdhlapada 60 Banda 61 Kusapalh 62 Bhatapddn 63 BorasmgI 64 EJ..ad~1 65 Baltapalh 66 Ambapua 67 Golamundla 68 Pathara 69 Sundanapada 70 Sunachadhlapada 71 Nandmgada 72 Hmdola 73 Inamadengapadar
74 SYdlm 75 Rampudl 76 Khandakhanda 77 Gangapur
3
78 Pratap Blrabalunkesv, ar 79 Raghunathpalh
80 Badaagula 81 Plthapur 82 Sunapalll 83 [ktal Blrabalunkeswarpur
84 Athagadapatna 85 Patharpallr 86 M uktdOlalachamptlpur
87 Duarabagada 88 Degam 89 Bahhata 90 Chotbaunst Bagada
91 Bankakhmbagada
92 Teltbagada 93 Chof..af-.hldbagada 94 KhaJapallt 95 Khmrapall t
96 Badamahun 97 [namtahampalh
98 Bakslpalll 99 Gudlall
100 Belapur 101 Sanapankalbadl 102 Sadabarta N uagan \ 03 Sandhamara \ 04 Bahasord
105 Bolasara 106 Sunan,hola
107 Bhetasmgt
Name of Districts I P.S.
Kodala P.S
ANNEXURE TO APPENDIX - 1 TO "fABLE A-I
From the P.S. (in 1991)
2
I Baurinuapalli 2 Pitanapalli 3 Solabandha 4 Nutan Berhampur 5 AmbaJhara N uap alii 6 Mathura 7 Talapada 8 Pustapur 9 Kanchana
10 Bhatapada II Ranipada 12 Krushnap ur 13 Naikanipalli 14 Kalakhunta Banjara 15 Ghadaka 16 Santabandha 17 M agurabadi
Name of Transferred Villages
153
To the P.S. (in 2001)
3 108 Mahanapalli 109 Sanamuktamala J emadeipur 110 Jarada III Santararatnapalli 112 Gundoribadl I 13 AmbtJapalh J 14 Tankachhai 115 Santarp ur 116 Banei I 17 Badakharida 118 KharidaherJaganathpur 1 19 Adhelbaragan 120 Gopapur 121 Jhadabandha 122 M ahachhai 123 Ganganapur 124 Badamuktamala J emadelp ur 125 Charrgudipadara Nuagun 126 Moraboai 127 Amuma 128 Gobmdap ur
I Khanduru 2 Kalmba 3 Rukhakana 4 Kankarada 5 Kasmthapur 6 C'handJap ada Krushnadasp ur 7 M adarangapali

N arne of D lstncts / P S
Rambha P S
ANNEXURE TO APPE~DlX - 1 TO TABLE A -1
Name 01 1 rdn~ferJcd Yillag,-~
From the P'" (m 19(1)
2
Nolastngh
2 Chhakasmg<l
3 Chatrflgfirhahill
4 Barapola
5 Bolamala 6 <;anabola
7 Bolamalap an Chakamabala Ramp u r
8 Ram Chanorapur
9 Kurumpur
10 Slahapat
II Sansapatbanrar 12 Bolamaleghod.lp ada
13 Bedapalh
14 M aramuagan
15 Gundunptlr 16 Nuapalh
17 Jharapalh
J 8 MaJakholapalh
1 9 R at~O Jap adar
20 Paladhuapallt
21 Kho)apalh
22 Kldpalh
23 Ralpada
24 Khanapalh
25 Badakheta Bilay a Knshna Sasanp ur
26 Jamjholakheta 27 PurunabadaJ..hctd 28 hmtharabanablla No 43 29 /\ltlpurbanabilla
30 Jamelholabat11ar
31 Altlpur
32 Ratnapur
33 Kllmarasmg
34 Kattharabaoabilla No 53
35 Amalapada
36 (_ hhatrallluthahana
37 Badhilluapallt
38 hmth,\d,lbandbl(!c\
19 Smgtpur
40 Pdrmudg.m
41 Kmlhadab,uldbtild
42 I en! uh<lpallt
41 hmthddd
4...J I dJ..hlll:tndp IIf 4 5 R'l!~h\lda,p III 46 ()~t.lp"d" 17 Bmpul
4X Bhlkap 1<1"
154
lothcP<" (1l12001)

Name orOistrict:-, I P.S.
ANNEXURE TO APPENDIX - ) TO TABLE A -1
Name of Trun:-.t'errcd Vlllage~
FromtheP.S (in 1991) To the P S (In 200!)
2 49 Manapalli
50 Kundubadijholamale
51 Kendupata 52 Nutanaha.<;antahunCl
53 Kenchll<lpada
54 Mentapur 55 NutanaJ,.huntapalil
56 (jopalapur
57 Kcndubadl
5R Ku"adhlpahrranalmakh) a Pur
59 Barapadara
60 I3adhmllapalil
61 I3hakuttdlha
62 B iraj,_rllshn3 Saranap ur 63 Chindipitha Chandanpur
64 Purunabcdha 65 ChoLarap ur
66 Kmra."j
67 Manik.) apur
6X Mahcswarapur
69 8agplpur
70 Gupatpur
71 Pmkanhcip ur 72 -, ,angalcswara
73 Nl7ogatotopadara
74 Bakutugulll
75 Tclldiha 76 Nagardihapatana 77 Patharakata
78 Karapadara
79 Langalew,arl-hara
80 Bhelip lit
81 K amaladelp ur
82 Kantirgan
83 Lochapada g·l Patanakanh":lp ur
85 fhekuapalli 86 Sakharap olbanjdra
87 Jcmadclpur
88 13lkrampur
89 Khamar.t
90 Schat tdClp ur
91 Longhara Snkn"hna Saranpur
92 I'amb! agan
l,IJ KuiaklluIllahull.Jara
94 Gurunthl
95 Gump.111I
9() Sl illaltlaJ.."h) llpUl'
97 I' r nrahal.1l11 am
15:'
3

Name of Dlstflcts / P S.
ANNEXURE TO APPENDIX - t TO TABLE A -1
Name of Transferred VIllages
From the P.S. (in 1991)
98 Pathara 99 Odiaalapur
100 Upuliaalep ur 101 Kankei 102 Smgadapalll 103 Phasldl 104 Hajapata 105 Kesapur 106 Gopakuda I 07 Kat h agada 108 Gadabedhabana 1 09 Phul~ihara 110 Maluaghai III Khallikotegada Bedhaban 112 Baunsiapada 113 Nutanatlkapodi 114 Matiabaniara 115 Kadali Basanta 1 16 T eragharm I 17 Basantabana 118 Haripur 119 Tulasipur 120 Atikapodi 121 Sidhapalli 122 Bharasagadakasta 123 Bharasa 124 Bharasanuapalli 125 Paladhuapalh 126 Ghodapada 127 Daunra 128 M arthabilla
129 Bra:.iar~iap ur 130 Banaban.lara 131 Gopapur 132 Chikili 133 KancharapalJi 134 Guhariapata 135 PaJadhuapalJi (142) 136 PaladhuapaUi (143) 137 Karakholahill 138 Pananuagan 139 Chandramanidasbanjara 140 Dalibati 141 N ikarada 142 Hariaamula 143 Kankadkuda 144 Samalanasi 145 Barakuda 146 Cheliakuda
156
TotheP.S (m2001) 3

Name ot Dlstnct'> / P S
Khalhkote P S
ANNEXURE TO APPENDIX - 1 TO TABLE A-I
Name ofTran~lerrcd Village~
FromthePS (m 1991)
2 147 Kumbhldhepa 148 Pltagadla
149 Kanaka 150 Sagumlrlgllendl
lSI Jodtbana
152 Saktrl
153 Dlmtrla 154 M ahulabanka
155 Tmlambaslahpata
156 Karadabadt
157 A Portion ofChthka lake
158 Dhakabalh 159 Matlapun - N A 160 Duttlanuapalh 161 Bama
162 Khanmpada
157
TothePS (m2001)
BaurllludpaJiJ
2 Pltanapalh 1 <'olabandhd
4 Nutan Berhampur
5 Amba,hara 1'<uapalh
6 Mathura
7 Talapada
8 Pustapur
9 K.dnchana
10 Ah.ltapada II Ranlpada
12 hlll<;hndpur
13 N,ukdnlpalh
14 Kalakhunta BanJdrd
15 Ghadaka
16 Santabandha
17 M dgurabadl
I '\]ol.lsmgh 2 (hhakasmga
3 Chatragarhahdl 4 Barapola
5 Bolamala
6 '3anabola
3
7 Bolamalapan Chakanlabala Rampur
8 Ram Chandrapur
9 KlIrumpur 10 C;;mhapat
II San<;apatbanldr
12 Bolamaleghodapada
13 Bedapalh 14 "vIaramuagan
Name 01 DIstricts I P ..,
ANNEXURE TO APPEI',jDIX - J TO TABLE A -I
From the P ~ (m 1(91)
2
158
TotheP<;; (m2001)
15 C,undunpur III NUdpdllt 17 J h,l! <'pall! 18 ~'L1I<lkholdpalli
19 RJI,>olapadar
20 Palddhuapallt 21 "'hOlapd\!1 22 I-..lap,t\11
21 Rmpddd
24 I-.. h'IfI,lp alii
1
25 i3dddkheta BlJd) cI K11,>hna ~L'ianpur
26 LUl1lh'1lakhcta 27 Purunanaddf...hcta 2R I'>.allharal"ldndbda No ~3
29 I\ltlpurhanahllia
30 Jamclholdhdoldr 3) ;\1!lPllf
32 RatnapUf
13 hUtn,lr<L\1I1g. 34 KJltlMrab,mahtila No 51
15 Amdlapdda
36 Chhatrdmllthabana 37 Badhmuapalh 18 Kallh,td.lb,lOdbtll,1
39 <:)m!!Jpur .. Hl Pdrtnuagan 11 .... ,lIt h<lli.lh,mabilld
42 I entuhapdllt n I'>.mthdd.l
H [ ak.hmanapur
·15 Rd!!hudn,>p Llr
In O~tdPddd
17 Blflr [If
18 BhlkJPdc.la 49 M aoapalll 50 l-..unduhmllJholrunak 51 I'>.cndupat.l ')2 l\f ut anab1bantdbdna )1 I-.. cncilu drldda
S4 MCl1lapur
55 N ut,makhllntapalh
56 (JopaJ"puf
57 Kcndllbadl
58 I-..u"'ddhlpahlrdlldlllldkh) a Pur
59 Barapadara
60 BadhmuapaJ1r 61 Bhakut Idlhe!
62 I1lfdi-.ru ... hna "->dranap lIf
61 Chmc.llpltha ( hand<lnpllr
04 Purullahcdha

N arne of D ist riets IPS.
ANNEXURE TO APPENDIX - 1 TO TABLE A -1
FrorntheP.S.(in 1991)
2
Name of Transferred Villages
159
To the P S (in 2001)
65 Chotarap ur
66 Kairasi 67 Manikyapur 68 Mahcs\\arapur 69 Bag<llp ur 70 Gop,t1pur 7l Paikanheip ur 72 Langaleswara
73 Nizogatotopadara 74 8akutugarn
75 Telidiha 76 Nagardihapatana 77 Patharakata 78 Karapadara 79 Langaleswarkhara 80 Bhejiput 81 Kamaladeip ur
82 Kandigan 83 Lochapada 84 Patanakanheip ur 85 Thckuapalli
86 Sakharapoibanjara 87 Jernadeipur 88 l3ikrampur 89 Khamara 90 Sebatidetpur
3
91 Longhara Snkrishna Saran pur 92 Panditag<ln 93 Kalakhuntabanjara
94 Gurunthi
95 Ourapal!:
96 Srinalilakshy ap ur
97 Uparabalantara
98 Pathara 99 Odiaalap ur
100 Upuliaa\epur 101 Kankei 102 Singadapall i
103 Phasidi
\04 H~iapata 105 Kesapur
106 Gopakuda 107 Kathagada
lOS Oadabedhabana 109 Phulajhara 1 10M aluaghal II I Khallikotegada Bedhaban
112 Baunsiapada 113 Nutanatikapodi 114 MatiabanJara

Name of Districts / P.S.
ANNEXURE TO APPENDIX - I TO TABLE A -1
From the P.S. (m 1991) 2
Name of Transferred VIllages
160
To the P.S (in 2OCll)
J J 5 Kadali Basantn 116 T eragharia 117 Basantabana 118 Hanpur 119 Tulasipur 120 Atikapodl 121 Sldhap aliI 122 Bharasagadakasta 123 Bharasa 124 Bharasanuapalh 125 Paladhuapalli 126 Ghodapada 127 Daunra 128 M arthabilla 129 BraJaraJapur 130 Banaban,lara 131 Gopapur 132 Chlklli 133 Kancharap aliI 134 Guhanapata 135 Paladhuapalli ( 142)
136 Paladhuapalli (143)
137 Karakholahill 138 Pananuagan
3
139 Chandramanidasbanjara 140 Dallbati 141 N ikarada 142 Haridamula 143 Kankadkuda 144 Sam alan as I 145 Barakuda 146 Cheliakuda 147 Kumbhidhepa 148 Pitagadia 149 Kanaka 150 Sagumlrigilendi 151 lodlbana 152 Sakiri 153 Dimiria 154 M ahulabanka 155 Tmiambasialipata 156 KaradaBadi 157 A Portion ofChilika Jake 158 0 hakaballi 159 Matiapuri - N A. 160 DUltlanuapall1 161 Bania 162 Kharinrpada
Name of Districts I P.S
Jarada P.S.
Nuagaon P.S.
Ramagiri P S
ANNEXURE TO APPENDIX - 1 TO TABLE A-I
from the P.S. (in 1(91)
2
Kharakharia
Name of Transferred Villages
161
To the P S. (in 2001)
3
Kharakharla
(From Ramagiri P.S ofG~apati DisL) Ran gad
2 Kanhusahi 3 Burudasing
4 Gambharikhol
5 Mahulabada
6 Masanibada 7 Tadakasahi 8 Raghubalaba 9 Karadabada
10 Jubasahl 11 Kumardali 12 Tuparada 13 Chariabada 14 Raikhola
15 Kalasahi
16 Jaliar
17 Luhasingi
18 Tasaranga 19 Gurusingi 20 Bhanabada 21 Lakaisuni 22 M aduaguma 23 Baduabada 24 Dhobaling 25 Gaida
26 Kurugada
27 Gadanga 28 Titinsmgi 29 Tuburusmgi 30 Aliar 31 Gokhanasahi 32 Phulasahi 33 Jungle Block No.32
34 Haladibata 35 Jungle Block No 21
36 Badaanchaba 37 Sanaanchaba
38 Sapuakheta 39 Kamalakheta
40 Rayagada 41 Baligam 42 Tubudia 43 Kanhaimal 44 Silisinga
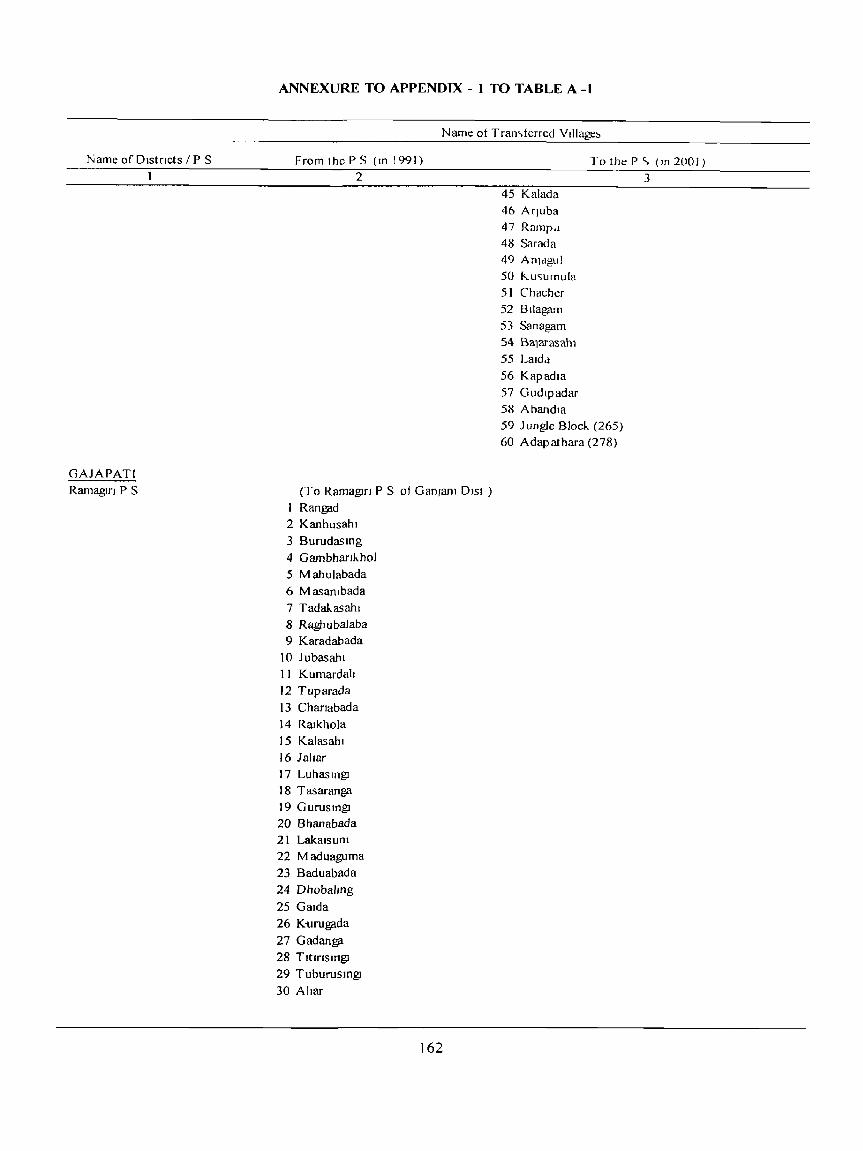
Name ofDlstncts IPS
GAJAPATI RamaglfJ P S
ANNEXURE TO APPENDIX - 1 TO TABLE A -I
Name of Tran'>ferred Village::.
FromthePS (m 1991) To the P ~ (m 200])
2
(To RamagJrJ P S of Ganram DIs! )
Rangpd 2 Kanhusahl
3 Burudasmg
4 GambhankhoJ 5 Mahulabada
6 Masambada 7 Tadakasahl 8 Raghubalaba 9 Karadabada
10 JUbasahl
II Kumardah 12 Tuparada 13 Chanabada
14 Rmkhola 15 Kalasahl 16 JalJar 17 LuhasmgJ 18 Tasaranga 19 GuruSIl1gJ 20 Bhanabada 21 Lakalsum 22 Maduaguma
23 Baduabada 24 Dhobalrng
25 Gmda 26 Kurugada
27 Gadan~ 28 TltIrlSHlgI
29 TuburusmgJ
30 Allar
162
45 Kalada
46 AfJuba 47 Ramp,j
48 Sarada 49 An]dgul 50 !<..u<;umula
51 Chacher 52 Bilagam 53 Sanagam
S4 Ba1arasahl 55 L3Idd 56 Kapadia
57 Gudlpadar 58 Aband13 59 Jungle Block (265) 60 Adapathara (278)
3

• Name of Districts I P .S.
Kamagiri P. S.
ANNEXURE TO APPENDIX - I TO TABLE A-I
From the P.S. (in 1991)
2
3 I Gokhanasahi
32 Phulasahi
33 Jungle Bloc" No.32 34 Haladibata
35 Jungle Block No.21 36 Badaanchaba
37 Sanaanchaba
38 Sapuakheta 39 Kamalakhcta
40 Rayagada
41 Baligam
42 Tubudia
43 Kanhaimal
44 Silislnl?f1 45 Kalada
46 Arjuba
47 Rampa
48 Sarada
49 Anjagul
50 Kusumula
5] Chacher
52 BJJagam
53 Sanagam
54 Bajarasahi
5S Laida
56 Kapadia
57 Gudipadar 58 Abandia
59 Jungle Block (265) 60 Adapathara (278)
I Larada
2 Limichua
3 Narayanpur
4 Lalusahi
5 Parida 6 KaradsingJ
7 Aydal-aransahi
8 Sankarada
9 Kili~da 10 Bisam
II Andhariguma
12 Bagarala
13 Abapur
14 Badagan
15 Rangflda
16 Rupasahi
17 Kuruguba
18 Baanda
Name of Transferred Villages
To the P S. tm 2001)
:I
163
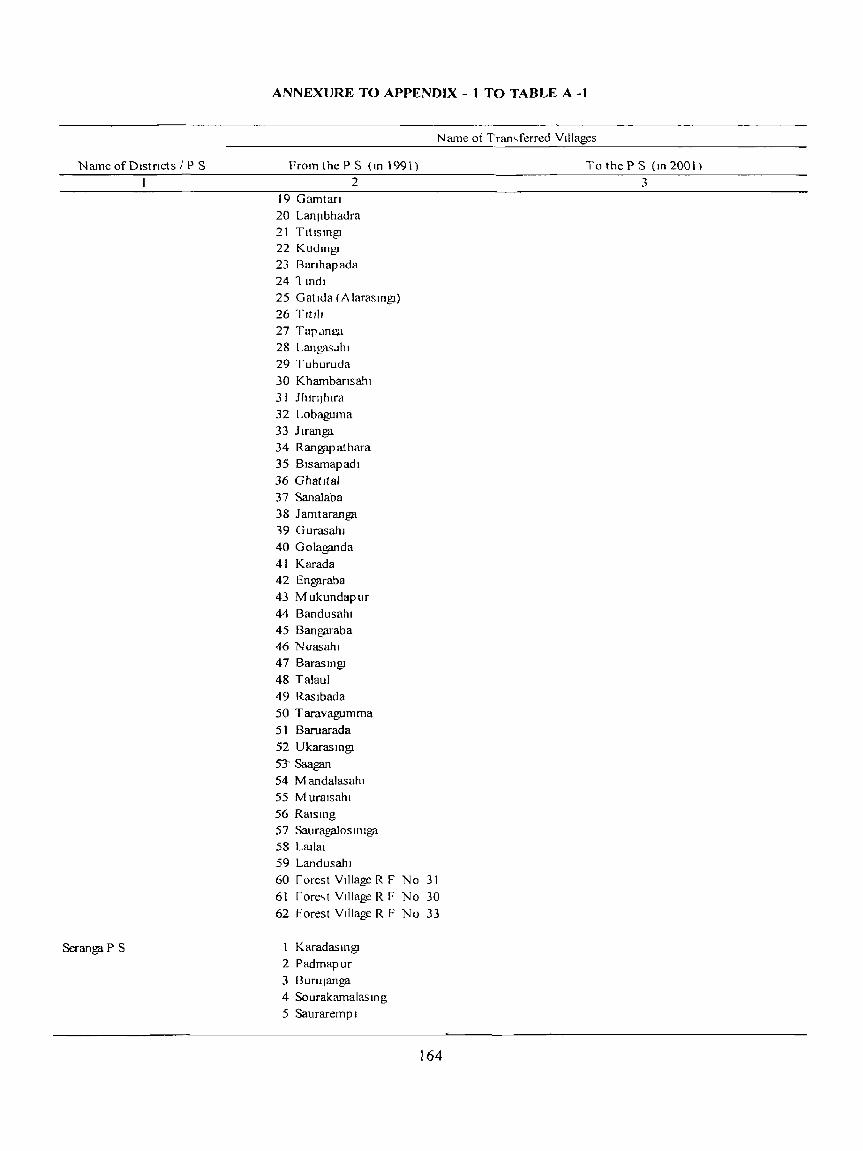
Name of DIstncts J P S
Seranga P S
ANNEXURE TO APPENDIX - 1 TO TABLE A -I
From the P S (10 1991) 2
19 Gamtan 20 Lan)lbhadra 21 TltlsmgI 22 KudmgI 23 8anhapada 24 1 Indl 25 Gatlda (AlarasmgI) 26 Tltlh 27 Tap.1nca 28 Langas.lhl 29 Tuburuda 30 Khambarrsahl 3 I Jhlfl[hlra 32 Lobaguma 33 Jlranga 34 Ran gap athara 35 Bisamapadl 36 Ghatltal 37 Sanalaba 38 Jamtaranga 19 Gurasahl 40 Golaganda 41 Karada 42 Engaraba 43 M ukundap ur 44 Bandusahl 45 Bangaraba 46 Nuasahl 47 BarasmgJ 48 Talaul 49 Raslbada 50 Taravagumma 51 Baruarada 52 UkarasmgI 5'"3- Saagan 54 M andalasahl 55 M urmsahl 56 Ralsmg 57 Sauragaloslmga 58 Lallal 59 Landusahl 60 forest VIllage R F 61 fore"( VIllage R F 62 Forest VIllage R F
1 KaradasmgI 2 Padmapur 3 Bururanga 4 Sourakamalasmg 5 Sauraremp I
No No No
Name of Tran"ferred Villages
TothePS (m2001)
3
31
30
33
164

Name of Dlstncts / P S
ANNEXURE TO APPENDIX - 1 TO TABLE A -1
From the P S (m 1991) 2
6 Knshnapur
7 Souraknshnapur 8 Tudumul 9 Anchala
) 0 SaUr?j.L!dng II Raldd 12 Kaddffital 13 Klkl<;mg
14 Ga\allllbd 15 Artang
16 Dlmlfl"ahI 17 Dambasahl 18 Patlsahl 19 Ranga:,mgI 20 Dumba
21 AlaJhola 22 Rayada 23 Marlaba 24 Kamalsmg
25 TarabasmgI 26 Pekat
27 Up aralabar 28 PadasahI 29-Dumbal
30 M 1l0l"1I1g! 31 T dlamunda 32 Regedlslngl
33 Smdhl"mg - 110
34 SmdhIsmg- 109 35 Pandasahl 36 Abasing!
37 Rayagad
38 Kalthapadar 39 RcmpI 40 Hlrapur 41 Hatlbadl 42 Sunapur
43 Saurasunapur 44 Champasahl 45 Champapur 46 Muhana 47 RaJapur 48 8e1apada 49 Sanatundl 50 Smsahl 51 R F - 29
52 R f - 30
1'-<ame of Transterred VIllages
TotheP S (m 2001)
3
165
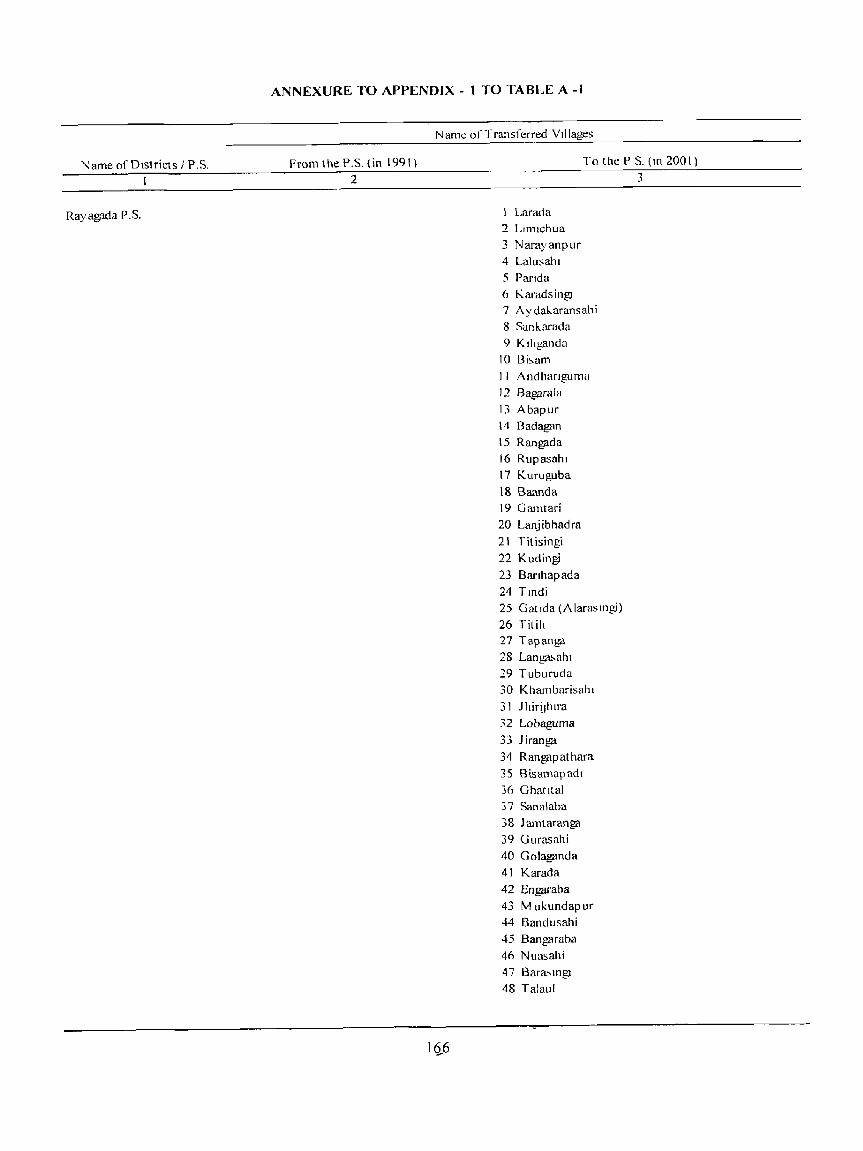
Name of Dlslricts I P.S.
Rayagada P. s.
ANNEXURE TO APPENDIX - I TO TABLE A-I
From the P.S. {in 1991}
2
Name of Transferred Villages
To the P S. (10 2001)
I (i6
1 Larada 2 Lmllchua 3 Nara), anpur
4 Lalusahl 5 Pandn
6 KaradsingJ 7 Aydakaransahi 8 Sunk.arada
9 Kiliganda
I () B i~al11
II Andhanguma
12 Bag,.1.rala 13 Abapur
14 Badagan
15 Rangada
16 Rupasahl
17 Kuruguba 18 Baanda
19 Gamtari 20 Lanjibhadra
21 Titisingi
22 Kudingi
23 Barlhapada
24 Tmdi 25 Gatlda (Alarasmgi)
26 Titili 27 Tapanga
28 Langa."ahl
29 Tuburuda 30 Khambarisahl
31 Jhiri_lhlra
J2 Lobaguma
33 Jiranga
34 Rangapathara
35 Bisamapadl
36 Ghatltal
37 Sanalaba 38 Jamtaranga
39 Gurasahi
40 Golaganda
41 Karada
42 Engaraba 43 M ukundap ur
44 Bandusahi
45 Bangaraba
46 Nuasahi
47 Bara:-.lngJ
48 Talaul
3

Name of Districts / P .S.
ANNEXURE TO APPENDIX - 1 TO TABLE A -1
From the P S. (in 1991)
2
l\.am~ of rransferred Villages
167
rotheP.S (m2001)
49 Raslbada 50 T aravagumma 51 Baruarada 52 l JJ...araslllgJ 53 Saagan 54 Tyj andalasahi 55 M uraIsahi 56 RaJ~mg 57 Sauragnloslmga 58 Lailm 59 Landusahi
3
60 Forest Village R F. No 31 61 Forest Village R F. No 30 62 r orest Village R.F No. 33
1 Karadasmgl 2 Padmapur 3 Burujanga 4 Sourakamalasmg 5 Sauraremp I 6 Krishnapur
7 Sourakrishnapur 8 Tudumul 9 Anchala
10 Sauralalang J J Rmda 12 Kadamta1 13 Klkising 14 Gayaljuba 15 Artang 16 Dlmlnsahi ) 7 Dambasahi
18 Patisahi 19 Rangasingi 20 Dumba 21 Ala,jho!a 22 Rayada 23 Marlaba 24 Kamalsing 25 farabasngJ 26 Pekat 27 Uparalabar 28 Padasahl
29 Dumbal 30 M unisingl 31 Talamunda 32 Regedlsingl 33 Smdhlsing - 1 J 0 3,,) Smdhising - 109

N arne of Districts I p.s.
BAUDH DISTRICT Harbhanga P.S.
Puruna Katak. P.S.
SON APUR DISTRICT Dunguripali P.S.
ANNEXURE TO APPENDIX - 1 TO TABLE A-I
FromtheP.S.(in 1991)
1 Solagadu 2 Buduni
1 Katapali
2
2 Padhanpali 3 Kuklbahal 4 Kalsarpali 5 Rangpur 6 Padhanpali Jungle 7 Badhalu pali 8 SahaJbahal 9 Sarasmal
10 Dhanbasa 11 J lbandadar 12 mahulpali 13 KhaliapaJt 14 May abarha 15 Nalkenpali ]6 Rampur 17 Arnamunda 18 Badkarle 19 Tangar Karle 20 Chadali 21 Chanabeda 22 Sulei
Name of Transferred Villages
TotheP.S (m2001)
168
35 Pandasahi 36 Abasingi 37 Rayagpd 38 Kmthapadar 39 Rempi 40 Hirapur 41 Hatlbadi 42 Sunapur 43 Saurasunapur 44 Champasahi 45 Champapur 46 Muhana 47 Rajapur 48 Be1apada 49 Sanatundl 50 Sinsahl 51 R.F - 29 52 R.F. - 30
I Solagadu 2 Buduni
3

I'<ume of Districts / P.S.
RampUf P.S.
ANNEXURE TO APPENDIX - 1 TO TABLE A-I
From the P.S. (in 1991)
2
23 Andhanbanji
24 SaIepaIi 25 Samarchipa 26 Kamshkanda 27 Gajabandh 28 Kuffidadar 29 Brahmampali 30 Pan darapali
31 Gidhmal 32 Kundupali 33 Dh atukipal i 34 Kandagarh 35 baghahandi 36 Bruragimunda 37 Balenpall
38 Pandakital 39 SiaIinaIi 40 Bankipali 41 Brahmanipali Jungle 42 Sialinalt Jungle 43 And harlbanJ 1 Jungle 44 Salepall Ju ngJe
Name of Transferred Villages
169
To the P.S. (m 2001)
I Kalapali 2 Padhanpali 3 Kuklbahal 4 Kalsarpali 5 Rangpur
3
6 Padhanpali Jungle
7 BadhaJu pali 8 Sahajbahal 9 Sarasmal
10 Dhanbasa 11 Jibandadar 12 mahulpali 13 Khaliapali
14 Mayabarha 15 Naikenpai1 16 Rampur 17 Amamunda 18 Badkarle 19 Tangar Karle 20 Chadali
21 Chanabeda
22 Sulei 23 Andharibanj i 24 Salepali 25 Samarchipa 26 Kainshkanda
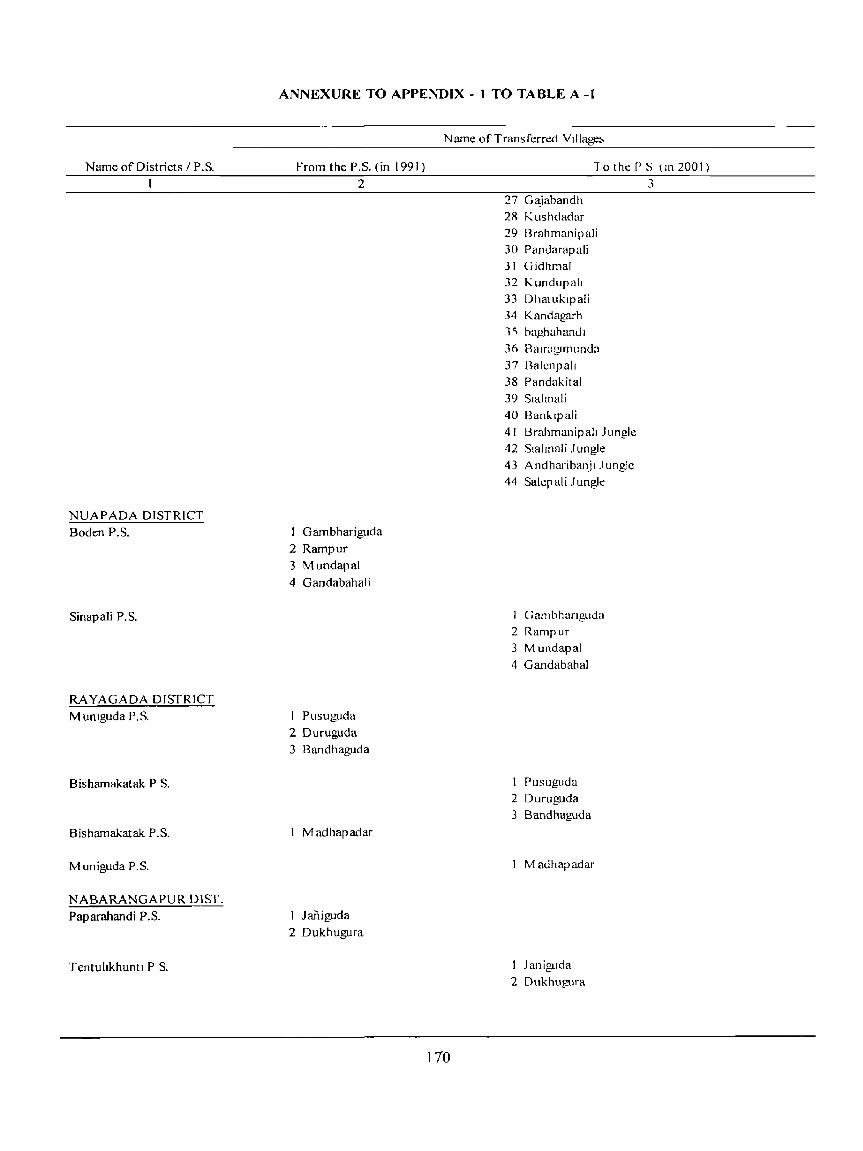
Name of Districts / P.S.
NUAPADA DISTRICT
Boden P.S.
Sinapali P.S.
RA YAGADA DISTRICT
M untguda P .S.
Bishamakatak P S.
Bishamakatak P.S.
M uniguda P.S.
NABARANGAPUR DIST.
Paparahandi P.S.
Tentuhkhuntl P S.
ANNEXURE TO APPENDIX - ] TO TABLE A-I
From the P.S. (in 1991)
2
I Gambhariguda
2 Rampur
3 Mundapal
4 Gandabahali
I Pusuguda
2 Duruguda
3 Bandhaguda
I M adhapadar
I JaiJiguda
2 Dukhugura
Name of Transferred Vtllab>e::.
10 the r S (In 200 I)
170
27 Gajabandh
2R Kushdadar
29 Brahmanipali 30 PanJarapali
31 Gidhmal 32 Kundupalt
33 Dhatuktpali 34 Kandagarh
1"i haghahand t
36 B,lIrugttTIunda
37 Balcnpall
38 Pandakital
39 Srahnali
40 Banklpali 41 Brahmanipali Jungle
42 Sialinali Jungle
43 Andharibanjl Jungle
44 Saler ali Jungle
1 (iambhanh'l.Ida 2 Rampur
3 Mundapal
4 Gandabahal
I Pusuguda
2 Duruguda 3 Bandhaguda
I M adhapadar
I Janiguda
2 Dtlkhu~ra
3
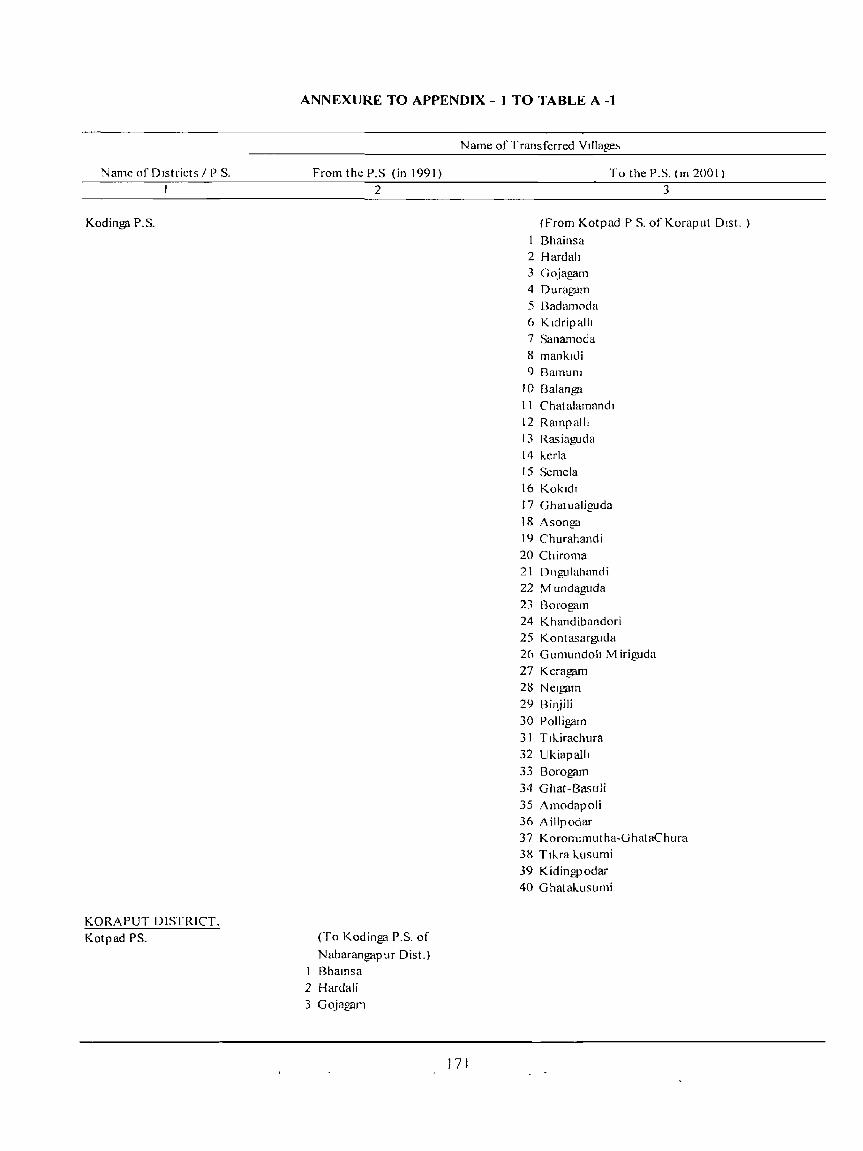
Name or DIstricts IPS.
Kodinga P.S.
KORAPUT DISTRICT.
Kotpad PS.
ANNEXURE TO APPENDIX - 1 TO TABLE A-1
From the P.S (in 1991)
2
(To Kodinga P.S. of
Nabarangapur Dis1.)
Bhamsa
2 Hardali
3 Gojagam
Name of Transferred VIllage»
17 J
To the P.S. (m 2(01)
3
(From Kotpad P S. of Koraput Dlst. )
Bhainsa 2 Hardah J (iojagam
4 Duragam 5 Badam(~da
6 Kldripalll
7 Sanamoda
8 mankldi 9 Bamunl
10 Balanga
II Chatalamandl
12 Rampalll
13 Rasiaguda
t 4 kcrla
15 Scmela
16 Kokldl
17 Ghatualiguda
t 8 Asonga
19 Churahandi
20 Chiroma 21 Dtlgulahandi
22 M undagllda
23 Borogam 24 Khandibandori
25 Kontasarguda 26 GumllndolJ M iriguda
27 Kcragam
28 NClgam 29 Bin}ili
30 Polligam
31 Tlk.irachllra
32 Ukiapalh
33 Borogam
34 Ghat-Basuli
35 Amodapoli 36 Ail1podar 37 Korom;mutha-GhataChura
38 Tlkra kusumi
39 Kidingpodar
40 Ghatakusumi

Name of Districts IPS.
Dasamantpur P.S
Kakiriguma P.S.
Narayanpatna P.S.
Kakiriguma P.S.
Similiguda P S.
ANNEXURE TO APFENDIX - 1 TO TABLE A-I
Name of1 ransferred Villages
From the P.S (in 1991) To the P.S (in 2(01)
2 4 Duragam 5 Badamoda 6 Kidripalli 7 Sanamoda
8 Mankldi 9 Bamuni
10 Balanga II Chatalamandl 12 -Ramp alIi
13 Rasiaguda
14 kerla 15 Semela
16 Kokidi 17 Ghatualiguda
18 Asonga 19 Churahandi
20 Chiroma 21 Dugulahandi 22 M undaguda 23 Borogam
24 Khandibandori
25 Kontasarguda
26 Gumundoli M iriguda 27 Keragam
28 Nelgam 29 Binjili 30 Pollig<lm 31 Tiklrachura 32 Ukiapalli 33 BOTOg<lm
34 Ghat-Basuli
35 Amodapoli
36 Aillpodar 37 Koromimutha-GhataChura 38 Tikra kusumi 39 Kidingpodar
40 Ghatakusuml
1 Tanupur
1 Tolomeetingi (107)
2 Up ermeet IngJ( I 06)
1 Padap alama ( 1 ) 2 BeIda (2)
172
I Tanupur
1 Tolomeetingi (107) 2 Upermeetmgi( 106)
3

Name of Districts / P.S
Sunabeda P S.
Boipanguda P.S.
MALKANGIRI DISTRICT. Motu P S.
M.V. 79 P.S.
ANNEXURE TO APPENDIX - 1 TO TABLE A -1
Name of Transferred Vllla~s
From the P S. (m 1991) TothePS (in 2001)
2
Padapalama ( I)
2 Beida (2) (To Mathili P.S. of Malkangiri Dlst ) Gojiaguda (244)
2 Kamalapadar(245)
I Kurti 2 Wallanpallt 3 Bhubanpalli 4 Ginipalli 5 Pendalbai 6 PotumpalJi 7 Stmilibencha
8 Gorakhapalli 9 Katanpalh
to Tandabai 11 Lachipeta 12 Tokelguda
13 Tamanpalli 14 M urubanpallt
15 Girikanpalli
16 Tigal
17-Jabanpalli 18 Pedawara 19 Telarai 20 Jakalgandi 21 Idugunda 22 Nalagunthi
23 Doganda 24 Kunanpalli 25 Biligura
173
I Kurti
2 Wallanpalli 3 Bhubanp alli 4 Ginipalli 5 Pendalbai 6 Potumpalli 7 Similibencha
8 Gorakhapalli 9 Katanp alii
10 Tandabai-11 Lachipeta 12 Tokelguda
13 Tamanpalli 14 MlIfubanpalli
15 G irikanpalli
3

Name of D1stricts / P s.
Mathilt P S
ANNEXURE TO APPENDIX - 1 TO TABLE A-I
From the P S. (m 1991 ) 2
Name ofT ran"ferred Villages
174
16 Tlgal .17 Jabanpalll
18 Pedaward 19 r claral 20 J akalgand I 21 Idugunda 12 Nalagunthl 23 Doganda 24 Kunanpalll
15 Rtllgura
-r 0 the P S (In 200 I )
3
( flam BOlparlguda P S of Koraput DIs!.) GOJlagl.lda (244)
2 Kamalapadar(245)

A-2: DECADAL VARIATION IN POPULATION SINCE 1901


A-2 : DECADAL VARIATION IN POPULATION SINCE 1901 FLY LEAF
This table furnishes statistics in adjusted population
for the eleven censuses from I -JO 1 to 2001 for state
and districts conforming to thc present jurisdiction of
2001. This table corresponds to table A- 2 of 1991,
1981,1971,1961 and 1951 Censuses.
Decadal variation in population is shown In
abso1ute figures in column - 4 and in term~ u; percentage in Column-5. Figures given in Columns
3,6 & 7 for earlier decades have been adjusted for
the present boundaries for each district and state.
This table, therefore gives much needed comparable
data about growth of popu lation for the last 100
years.
Adjustment of Population
There is a massive change In the area of the
districts due to creation of 17 new districts by the
State Government during the decade 1991-2001
although no change has taken place in area of the
state. Reasons of creation of new districts are JTl~!!1!j'
attributed to administrative conveniences. As a result
of change recasting of population of previous censuses
in respect of 'each district was done basing on the
jurisdictional changes in the boundaries of each district
as done in each census. In Orissa the boundaries of
each district were determined r":~l to 1951 census.
No change in jurisdiction occurred during the decade
1951-61.
The boundaries of the district of Dhenkanal,
Cuttack, Puri, Kalahandi and Koraput were changed
for the convenience of the administration during the
decade 1961-71. The population figures of ,these five
districts were adjusted In previous censuses i.e. from
1901 to 1961 as per the jurisdiction existed at the time
177
of 1971 Census. In the subsequent census the
adjustment in population were carried out as per the jurisdiction prevailing at that time.
In 2001, due to major change in jurisdiction of
different districts recasting of population for census
prior to 1951 is worked out based in certain assumption.
The 1951 Census figures could be actually workeJ
out with the help of District Census Handbooks and
primary census abstracts given therein.
The population of an area transferred for any
particular census prior to 1951 could not be worked out with the help of censuses or the village statistics,
which might have been published for the earlier
censuses. Therefore the population of transferred
areas for census prior to 1951 is estimated in the
following manner.
(l) The population of an area transferred for any particular census prior to 1951 is estimated in the assumption that the ~roportion of the population in the area transferred to the total popt:r1ation of the district in which it was situated at the time of transfer was the same in the particular previous census as it was in 1951.
(2) Distribution by sex of the population so estimated for the previous census is worked out on the basis 6f the Male/Female distribution of the population in that particular previous census of the district in which it was situated at the time of transfer.
Statement-l gives the detai Is on method of
estimation of previous census populatio! for transferred
territories, it also gives the details on creation of new
districts from the old districts along with transfer of
sub-division and police stations etc. from one district
to another.
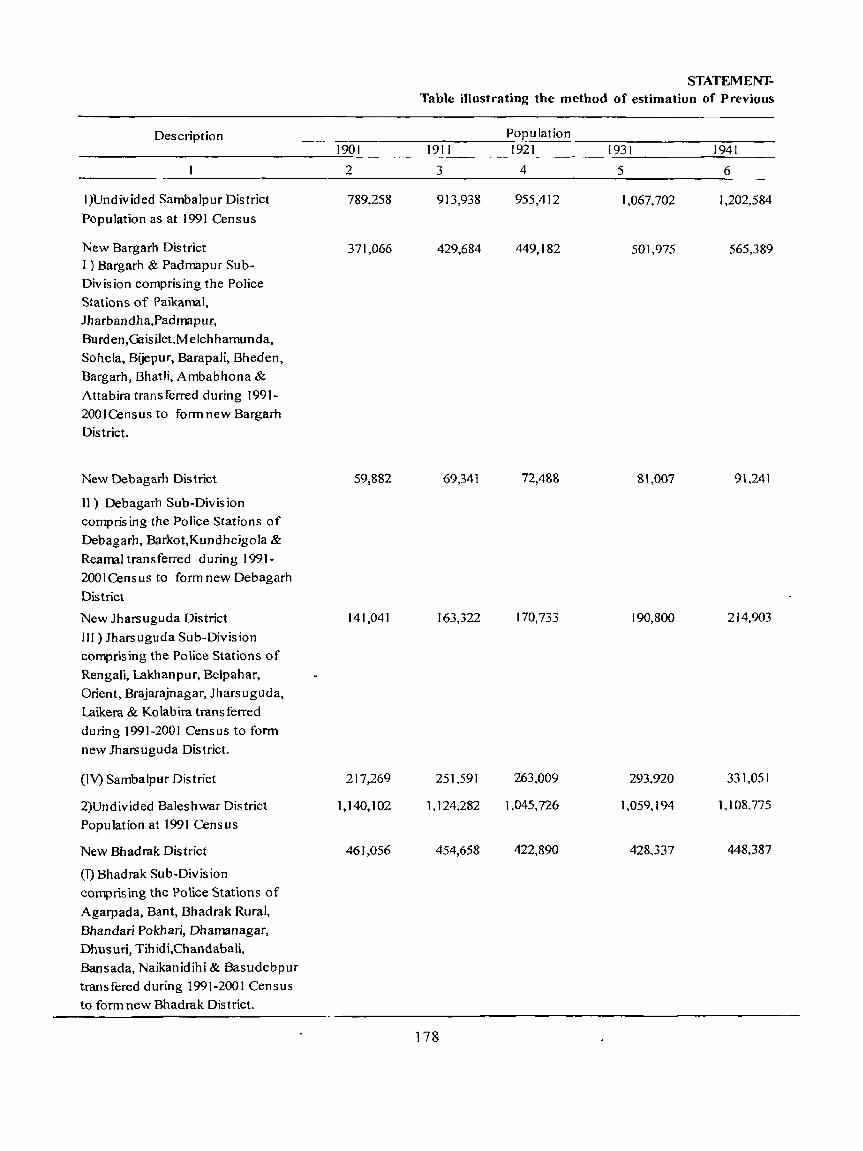
STATEMENT-Table mustrating the method of estimation of Previous
Description Population 1901 1911 1921 1931 1941
2 3 4 5 6
I)Undivided Sambalpur District 789,258 913,938 955,412 1,067,702 1,202,584
Population as at 1991 Census
New Bargarh District 371,066 429,684 449,182 501,975 565,389 I) Bargarh & Padmapur Sub-Division comprising the Police Stations of Paikamal, Jharbandha,Padmapur,
Burden,Gaisilet,Melchhamunda, Soheia, Bijepur, Barapali, Bheden,
Bargarh, Bhatli, Ambabhona &
Attabira transferred during 1991-
200lCensus to form new Bargarh
District.
New Debagarh District 59,882 69,341 72,488 81,007 91,241
II) Debagarh Sub-Division comprising the Police Stations of Debagarh, Barkot,Kundheigola &
Reamal transferred during 1991-200lCensus to form new Debagarh
District
New Jharsuguda District 141,041 163,322 170,733 190,800 214,903
III) Jharsuguda Sub-Division comprising the Police Stations of
Rengali, Lakhanpur, Be1pahar, Orient, Brajarajnagar, Jharsuguda,
Laikera & Kolabira transferred
during 1991-2001 Census to form
new Jharsuguda District.
(IV) Sambalpllr District 217,269 251,591 263,009 293,920 331,051
2)Undivided Baleshwar District 1,140,102 1,124,282 1,045,726 1,059,194 1,108,775
Population at 1991 Census
New Bhadrak District 461,056 454,658 422,890 428,337 448,387
(1) Bhadrak Sub~Division
comprising the Police Stations of
Agarpada, Bant, Bhadrak Rural,
Bhandari Pokhari, Dhamanagar, Dhusuri, Tihidi,Chandabali,
Bansada, Naikanidihi & Basudebpur transfered during 1991-2001 Census to form new Bhadrak District.
178

1 Census Population for transferred territories
1951
7
1.301,804
612,037
98,769
232.634
358,364
1,106,012
447,270
1961
8
1.508,686
693,122
122,634
243,970
448,960
1,415,923
576,842
Population 1971 1981
9 10
1,844,898
839,622
163,243
289,260
552,773
1,830,504
739,274
2,280,976
1,032,354
197,671
364,188
686,763
2,252,808
895.081
]79
1991 2001
11 12
2,697,153 3,065,773
1,207,172 1,346,336
234,238 274,108
442.154 509,716
813,589 935,613
2,802,417 3,358,257
1,105.834 1.333.749
Remarks
13 Population of 1951
Census of new district
X
Population of concerned
calculative year of old
undivided district
Population of1951
Census of old undivided
dlstnct

Description
(II) Baleshwar District
3)Undivided Cuttack District
Population at 1991 Census
New Jagats inghapur Dis triet
I) Jagatsinghapur Sub-Division
comprising the Police Stations of
Paradip,Kujang,Ersama,Tirtol,
Balikuda,Naugaon &
Jagats inghapur trans fered during
1991-2001 Census to form new
Jagatsinghapur District.
New Jajapur District
II) Jajapur Sub-Division
comprising the Police Stations of
Sukinda, Jajapur Road,
KoraUajapur,Mangalpur,8injharpur
Balichandrapur,8adachana &
Dharmasala transfered during 1991-
2001 Census to form new Jajapur
District.
New Kendrapara District
III) Kendrapara Sub-Divis ion
comprising the Police Stations of
Rajkanika, Aali, Pattamundai,
Kendrapara, Patkura. Mahakalapada
& Rajnagar transfered during 1991-
2001 Census to form new
Kendrapara District.
1901
2 679,046
2,205,296
384,939
544,846
459,224
STAT EM El'.'TTable illustrating the method of estimation of Previous
Population 1911 19')1 1931 1941
3 4 5 6 669,624 622.836 630,857 660,388
2.258.749 2.195.263 2.336.883 :2.446,956
394269 383.188 407.908 427.121
558,053 542,368 577.357 604,551
470,355 457,135 486,625 509.546
180

Census Population for transferred territories
PopulatIon Remarks 1951 1961 1971 1981 1991 2001
7 8 9 10 II 12 13 658,742 839,081 1,091,230 1,357,727 1,696,583 2,024,508
2,528,237 3,063,072 3,827,678 4,628,800 5,522,659 6,325,069
441,309 521,734 641,005 79l.501 933,789 1,057,629
624,633 760,117 948,564 1,136,093 1,386,177 1,624,341
526,472 649,457 823,451 981,219 1,149,501 1,302,005
181

Description
Remaining Cuttack District
4) Undivided Dhenkanal District
Population at 1991 Census
New Anugul District
Talcher, Palalahada & Athmalik
Sub-Division comprising the Police
Stations of Pal ala had a, Khamar. Rengali Damsite, Kaniha, Samal Barrage,Talcher Sadar, Colliery, Bikrampur, NA LeO, Anugut, Bantala, Purunakot, Jarapada,
Chhendipada, Handapa,
Kishorenagar, Thakurgarh &
Athmallik transfered during 1991-
2001 Census to fonn new Anugul
District.
Remaining Dhenkanal District
5)Undivided Kandhamal District
Population at 1991 Census
New Baudh District Baudh Sub-Division comprising
the Police Stations of Kant am ai, Manamunda, Baunsuni, Baudh
Sadar, Puruna Katak & Harbhanga
transfered during 1991-2001 Census
to fonn new Baudh District.
1901
2 816,287
570,641
278,144
292,497
334,036
122,615
STATEMENTTable illustrating the method of estimation of Previous
Population 1911 1921 1931 1941
3 4 5 6 836,072 812,572 - 864,993 905,738
589.414 513,885 634,035 740,041
287,294 250,480 309,044 360,714
302,\20 263,405 324,991 379,327
378,039 376,355 411,669 450,059
138,767 138,149 151,112 165,204
182

Census Population for transferred territories
Population Remarks 1951 1961 1971 1981 1991 2001
7 8 9 10 II 12 13 935,823 1,131,764 1,414,658 1,719,987 2,053,192 2.341,094
837,138 1,026,553 1,293.914 1,582,787 1.908,907 2.206,881
408,041 500,033 628,537 785,734 961,037 1,140,003
429,097 526,520 665,377 797,053 947,870 U)66,878
456,895 514,427 621,675 717,28Q... 863,903 1,021,573
167,713 190,436 227,902 268,366 317,622 373,372
183
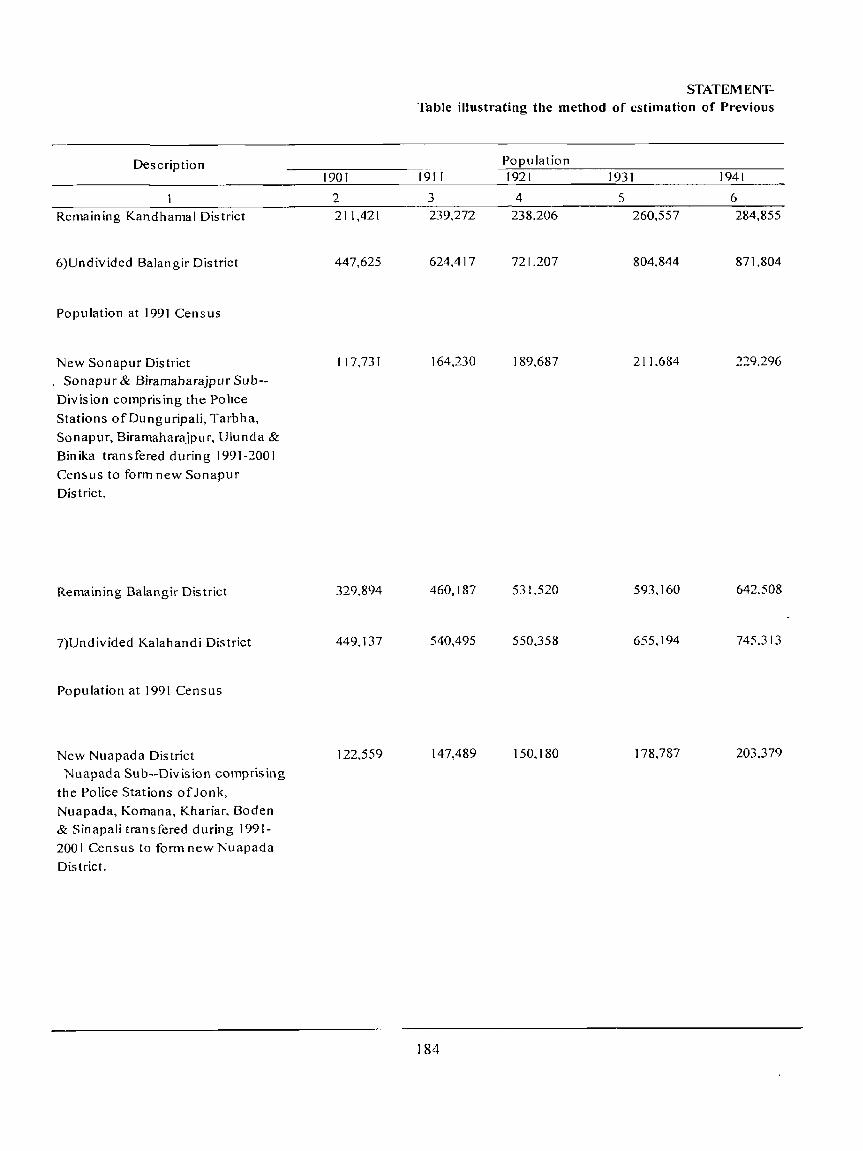
Description
Remaining Kandhamal District
6)Undivided Balangir District
Population at 1991 Census
New Sonapur District , Sonapur & Biramaharajpur Sub-
Division comprising the Pohce
Stations ofDunguripali, Tarbha,
Sonapur, Biramaharajpur, Ulunda &
Binika transfered during 1991-2001
Census to form new Sonapur
District.
Remaining Balangir District
7)Undivided Kalahandi District
Population at 1991 Census
New Nuapada District Nuapada Sub--Division comprising
the Police Stations of Jonk,
Nuapada, Komana, Khariar, Boden
& Sinapali transfered during 1991-
2001 Census to form new Nuapada
District.
1901
2 211,421
447.625
117,731
329.894
449,137
122,559
STATEMENTTable illustrating the method of estimation of Previous
Population 1911 1921 1931 1941
3 4 5 6 239,272 238.206 260,557 284,855
624,417 721.207 804,844 871,804
164,230 189,687 21 1.684 229,296
460,187 531,520 593,160 642.508
540,495 550,358 655.194 745.313
147,489 150.180 178,787 203.379
184

1 Census Population for transferred territories
Population Remarks 1951 1961 1971 1981 1991 2001
7 8 9 10 11 12 13 289,182 323,991 393,773 448,914 546,281 648,201
917,875 1,068.686 1.263.657 1,459.113 1,707,753 1,879.029
241,413 274,515 322,578 397.386 476,815 541,835
676,462 794.171 941,079 1.061,727 1,230,938 1,337,194
805,675 946,874 1,163,869 1,339.192 1,600,385 1,866.1 84
219,850 267.272 338,894 392.683 469,482 530,690
185
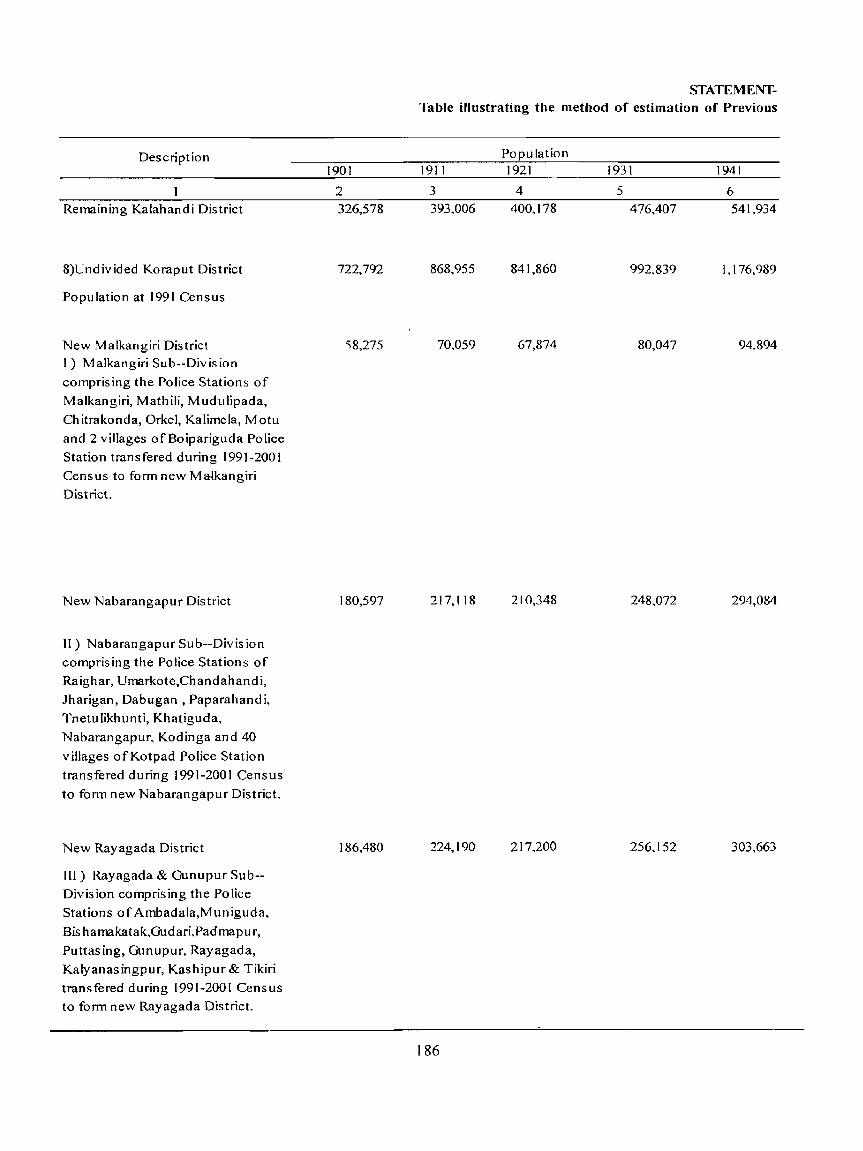
Description
Remaining Kalahandi District
8)Undivided Koraput District
Population at 1991 Census
New Malkangiri District I) Malkangiri Sub--Division
comprising the Police Stations of
Malkangiri, Mathili, Mudulipada,
Chitrakonda, Orkel, Kalimela, Motu
and 2 villages of Boipariguda Police
Station transfered during 1991-2001 Census to form new Malkangiri District.
New Nabarangapur District
II) Nabarangapur Sub--Division comprising the Police Stations of Raighar, Umarkote,Chandahandi, Iharigan, Dabugan ,Paparahandi,
Tnetulikhunti, Khatiguda,
Nabarangapur, Kodinga and 40
villages ofKotpad Police Station
transfered during 1991-2001 Census
to form new Nabarangapur District.
New Rayagada District
III) Rayagada & Ounupur Sub--
Division comprising the Police Stations of Ambadala,Muniguda,
Bishamakatak,Gudari,Padmapur,
Puttasing, Gunupur, Rayagada, Kalyanasingpur, Kashipur& Tikiri
transfered during 1991-2001 Census to form new Rayagada District.
1901
2 326,578
722,792
'18,275
180,597
186,480
STATEMENTTable illustrating the method of estimation of Previous
Population 1911 1921 1931 1941
3 4 5 6
393,006 400,178 476,407 541,934
868,955 841,860 992.839 I.I76,989
70,059 67,874 80,047 94,894
217,118 210,348 248,072 294,084
224,190 217,200 256,152 303,663
186

1 Census Population for transferred territories
Population Remarks 1951 1961 1971 1981 1991 2001
7 8 9 10 II 12 13 585,825 679,602 824,975 946,509 1,130,903 1,335,494
1,322,640 1,561,051 2,043,281 2,484,005 3,012,546 3,541,710
106,637 141,955 268,865 335,169 422,326 504,198
330,476 422,325 547,944 681,579 846.659 1,025,766
341,241 403,471 511,333 608,751 713,984 831,109
187
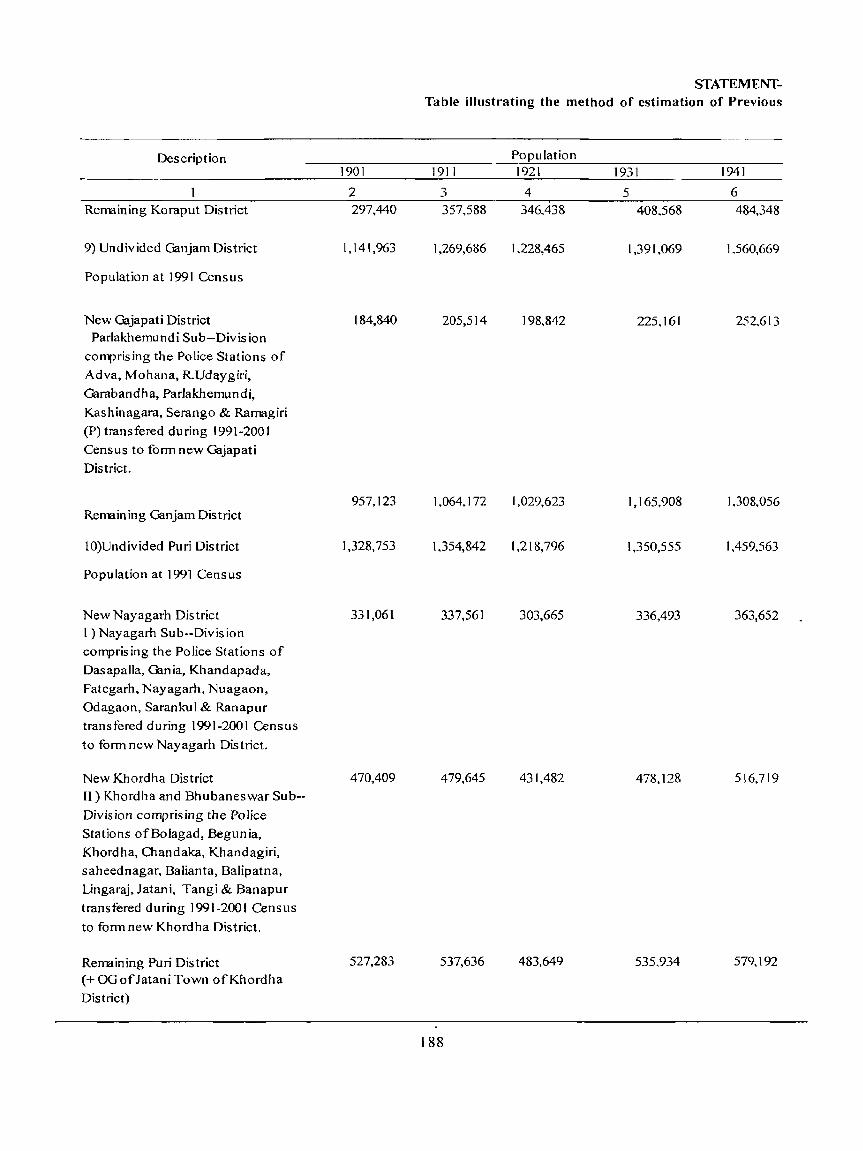
STATEMENT-Table illustrating the method of estimation of Previous
Description Population 1901 1911 1921 1931 1941
2 3 4 5 6 Remaining Koraput District 297,440 357,588 346,438 408,568 484,348
9) Undivided Ganjam District 1,141,963 1,269,686 1,228,465 1,391,069 1,560,669
Population at 1991 Census
New Gajapati District 184,840 205,514 198,842 225,161 252,613 Parlakhemundi Sub--Division
comprising the Police Stations of Adva, Mohana, RUdaygiri,
Garabandha, Parlakhemundi,
Kashinagara, Serango & Ramagiri (P) transfered during 1991-2001
Census to fonn new Gajapati District.
957,123 1,064,172 1,029,623 1,165.908 1.308,056 Remaining Ganjam District
10)Undivided Puri District 1,328,753 1,354,842 1,218,796 1,350,555 1,459,563
Population at 1991 Census
New Nayagarh District 331,061 337,561 303,665 336,493 363,652 I) Nayagarh Sub--Division comprising the Police Stations of Dasapalla, Gania, Khandapada, Fategarh, Nayagarh, Nuagaon,
Odagaon, Sarankul & Ranapur transfered during 1991-2001 Census
to fonn new Nay agarh Dis trict.
New Khordha District 470,409 479,645 431,482 478,128 516,719 II) Khordha and Bhubaneswar Sub--
Division comprising the Police Stations of Bola gad, Begunia, Khordha, Chandaka, Khandagiri, saheednagar, Balianta, Balipatna, Lingaraj, Jatani, Tangi & Banapur
transfered during 1991-2001 Census
to fonn new Khordha District.
Remaining Puri District 527,283 537,636 483,649 535.934 579,192 (+OG ofJatani Town ofKhordha District)
188

t Census Populatioit for transferred territories
Population Remarks 1951 1961 1971 1981 1991 2001
7 8 9 10 11 12 13 544,286 593,300 715,139 858,506 1,029,577 1,180,637
1,624,829 1,872,530 2,293,808 2,669,899 3,158,764 3,679,472
262,998 285,069 348,964 402,271 454,708 518,837
1,361,831 1,587,461 1,944,844 2,267,628 2,704,056 3,160,635
1,575,372 1,865,069 2,340,859 2,921,045 3,590,026 4,244,593
392,506 470,878 578,498 683,392 782,647 864,5 16
557,718 658,073 858,554 1,132,182 1,502,014 1,877,395
625,148 736,118 903,807 1,105,471 1,305,365 1,502,682
189
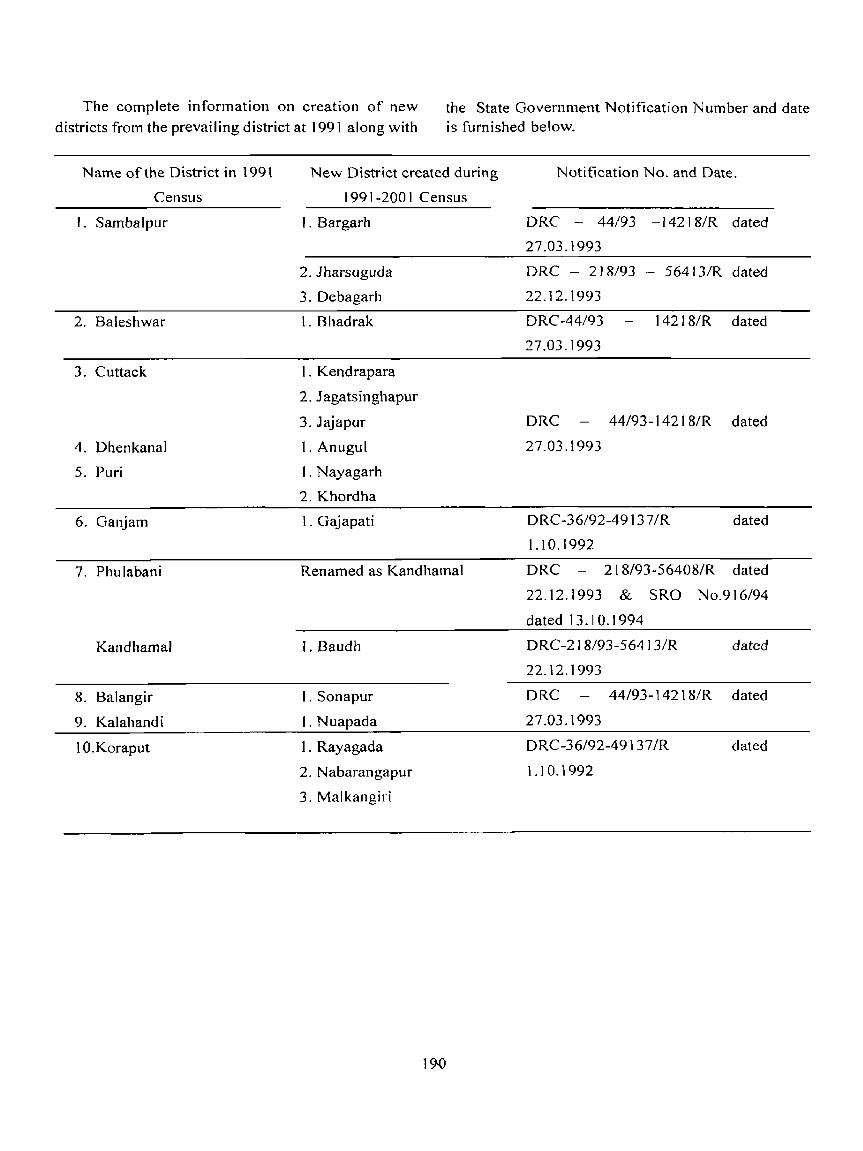
The complete information on creation of new
districts from the prevailing district at 1991 along with the State Government Notification Number and date is furnished below.
Name of the District in 1991
Census
I. Sambalpur
2. Baleshwar
3. Cuttack
4. Dhenkanal
5. Puri
6. Ganjam
7. Phulabani
Kandhamal
8. Balangir
9. Kalahand i
t O.Koraput
New District created during
1991-2001 Census
I. Bargarh
2. Jharsuguda
3.Debagarh
I. Bhadrak
I. Kendrapara
2. Jagatsinghapur
3. Jajapur
1. Anugul
I. Nayagarh
2. Khordha
1. Gajapati
Renamed as Kandhamal
1. Baudh
I. Sonapur
I. Nuapada
1. Rayagada
2. Nabarangapur
3. Malkangiri
190
Notification No. and Date.
DRC - 44/93 -142IS/R dated
27.03.1993
ORe - 21S/93 - 564 J 3/R dated
22.12.1993
DRC-44/93
27.03.1993
1421S/R dated
DRC 44/93-14218/R dated
27.03.1993
ORC-36/92-4913 7/R dated
1.10.1992
DRC - 2l8/93-56408/R dated
22.12.1993 & SRO No.916/94
dated 13.10.1994
ORC-21S/93-56413/R dated
22.12.1993
ORC 44/93-14218/R dated
27.03.1993
ORC-36/92-49 1 37/R dated
1.10.1992
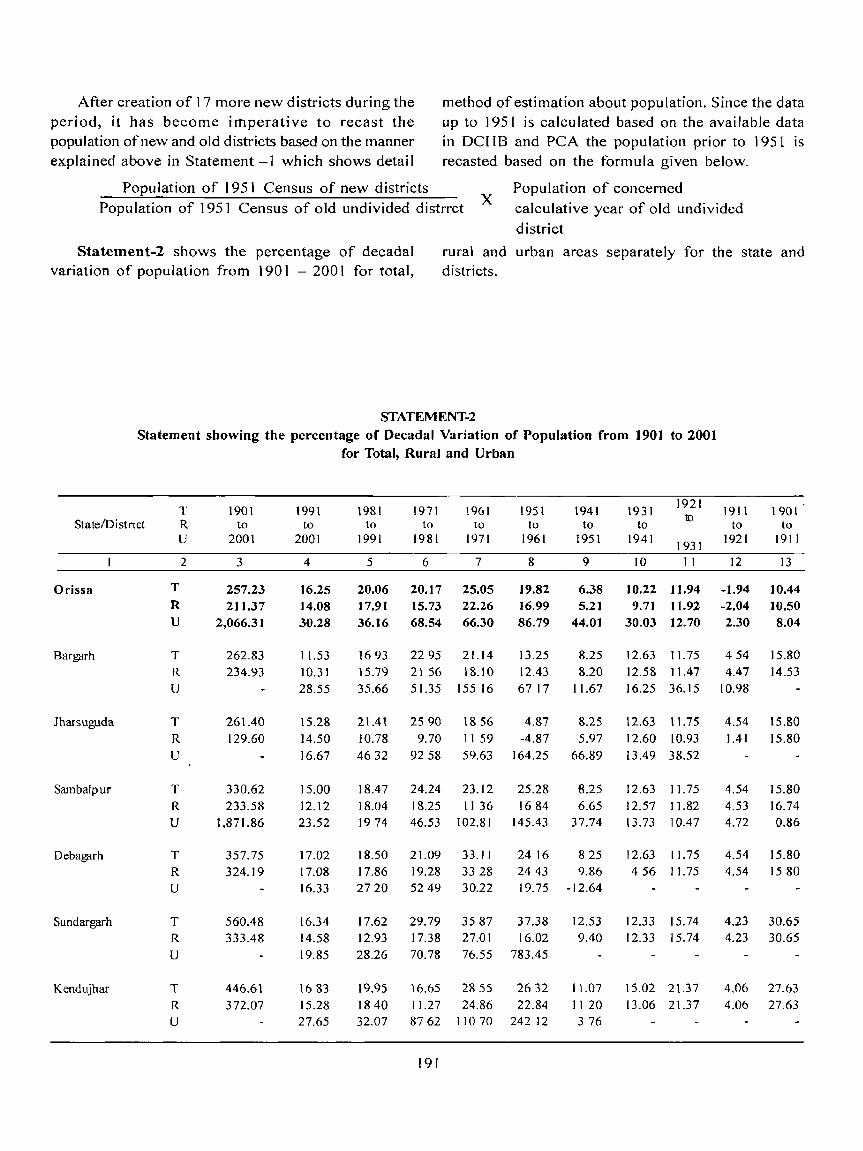
After creation of 17 more new districts during the period, it has become imperative to recast the population of new and old districts based on the manner explained above in Statement -1 which shows detail
method of estimation about population. Since the data up to J 951 is calculated based on the available data in DCHB and PCA the population prior to 1951 is recasted based on the formula given below.
Population of 1951 Census of new districts Population of 1951 Census of old undivided distrrct x Population of concerned
calculative year of old undivided district
Statement-2 shows the percentage of decadal variation of popu lation from 190 I - 200 I for total,
rural and urban areas separately for the state and districts.
STATEMENT-2 Statement showing the percentage of Decadal Variation of Population from 1901 to 2001
for Total, Rural and Urban
State/Distnct T R U
1901 to
2001
1991 to
2001
1981 to
1991
1971 to
1981
1961 to
1971
1951 to
1961
1941 to
1951
\ 931 to
1941
1921 to
Orissa
8argarh
Jharsuguda
Sambalpur
Debagarh
Sundargarh
Kendujhar
T
R U
T R
LJ
T R U
T R U
T R
U
T R
U
T R
U
2 3
257.23 211.37
2,066.31
262.83 234.93
261.40 129.60
330.62 233.58
t,871.86
357.75 324.19
560.48 333.48
446.61 372.07
4
16.25 14.08 30.28
11.53 10.31 28.55
15.28 14.50 16.67
15.00 12.12 23.52
17.02 17.08 16.33
16.34 14.58 19.85
1683 15.28 27.65
5
20.06 17.91 36.16
1693 15.79 35.66
21.41 10.78 4632
18.47
6
20.17 15.73 68.54
2295 21 56 51.35
2590 9.70
9258
24.24
7
25.05 22.26
66.30
21.14 18.10
155 16
1856 11 59 59.63
23.12 18.04 18.25 11 36
8
19.82 16.99 86.79
13.25 12.43 6717
4.87 -4.87
164.25
25.28 1684
9
6.38 5.21
44.01
8.25 8.20
11.67
8.25 5.97
66.89
8.25 6.65
1974 46.53 102.81 145.43 37.74
18.50 17.86 2720
21.09 19.28 5249
33. I I 3328 30.22
2416 825 2443 9.86 19.75 -12.64
17.62 29.79 3587 37.38 12.53 9.40 12.93
28.26
19.95
17.38 27.01 16.02
70.78 76.55 783.45
16.65 2855 2632 18 40 11.27 24.86 22.84 32.07 8762 11070 24212
191
11.07 1120 376
1931 10 II
10.22 11.94 9.71 11.92
30.03 12.70
12.63 It. 75 12.58 11.47 16.25 36.15
12.63 11.75 12.60 10.93 13.49 38.52
12.63 11.75 12.57 11.82 13.73 10.47
12.63 11.75 456 11.75
12.33 15.74 12.33 15.74
15.02 21.37 13.06 21.37
1911 to
1921
12
-1.94 -2.04 2.30
454 4.47
10.98
4.54 1.41
4.54
1901 to
1911
13
10.44 10.50 8.04
15.80 14.53
15.80 15.80
15.80 4.53 16.74 4.72
4.54 4.54
0.86
15.80 1580
4.23 30.65 4.23 30.65
4.06 27.63 4.06 27.63

STATEMENT-2 Statement showing the percentage of Oecadal Variation of Population from t 901 to 2001
for Total, Rural and Urban
State/Oistnct T
R
U
1901
to
2001
1991
to 2001
1981 1971 1961 1951
to 1961
1941 1931 1921 1911 1901
Mayurbhanj
Baleshwar
Bhadrak
Kendrapara
J agats inghap ur
Cuttack
JeUapur
Dhenkanal
Anugul
Nayagarh
Khordha
Puri
2
T R
U
T
R
U
T R U
T R
U
T R U
T R U
T R
U
T
R
U
T R
U
r R U
T R
U
r R
U
3
264.27
241.91 2.67392
19814 174.12
955.40
189.28
169.51
661.80
183.52 176.56
386.30
174.75 147.62
186.80 122.24
1.148.21
198.13
191.21 502.59
264.75 247.72
649.49
309.86 252.91
161.13
149.94
291) 1 ()
127.82
184.99
171. 71
313.56
4
17.98 16.93 33.94
19.33 16.97 42.96
20.61
19.75
28.43
13.27 13.04
17.22
13.26 13.26
37.27
14.02 846
31.96
17.18
16.40 36.59
12.56
11.98
1895
18.62 15.36
43.85
10..16 Y.39
41.24
24.99
R.n 5606
15.12 13 73 24.80
to
1991
5
19.14
to
1981
6
to 1971
7
10.30 19.12
8
17.03 18.57 6.9618.60 1531 28.40 126.62 40.57 206.35
24.96 22.40 58.07
23.55 23.47
24.20
17.15 13.91
129.41
24.42 21.37 84.18
21.08 16.55 87.35
19.16 1R.71 37.28
30.05 27.38 32.79 22.90
-7.45 150.38
28.16 28.97 27.65 26.53
36.07 8458
26.79 26.79 26.84
23.36 23.22 29.19
17 98 23.48 22.86 1822 18.22 17.98 23 48 22.86
40.47 707.87
19.37
14.50
38.38
21.58 2500 17.36 2166
41.41 4354
22.01 19.77 24.79 21.94 1905 23.99 23.7R 41 29 5438
1892
18.22
27.38
22.31 17.64
19.79
15.97
98.04
25.01 11).03
26.37
26.05
33.45
2570 27.63
20.94 16.57 5260
21.69 20.66 7949
n.70 22.51
27.02
2254
19.38
to 1951
9
4.48
to
1941
10
to to 1931 1921
II 12
to 1911
13
10.69 17.94 3.44 1947 441 10.53 18.08 344 19.59
12.03 33.72 006 3.70 6.:31
-0.25 -().79
17.76
-025 -0.08 -3.86
3.32 3.33 3.14
3.32 3.32
3.32 -1.08
52.58
3.32 3.41
-IA5
13.12
12.97
16.70
13 12
12,44
4.118 1.29 -6 99
4.56 1.19 -6.:'4 8.75 473 -2025
4.68 1.29 -6.99
4.58 132 -7.19
0.93 059 -217
4.71 645 -2.81 4. (1) 7 I I -2.79
-5.87 -1364 -3.30
471 6.45 -V~I
4.71 6.45 -2.81
4.71 0.45 -2.81
3.97 501 -2.81
13.83 27.95 -2 YO
4.71 6,45 -2.81 4.71 6.65 -265 4.83 -3.10 -10.02
16.72 2338 -12.81
16.96 23 <12 -13 00
I 1.'16 12 5 I -8 44
1672 23.38 -12.81 1-1.78 23.38 -12.81
-1.39
-1.50 2.JI
-I 39
-140
0.32
2.42 2.54
-D.S7
242
242
242
2.43 2,27
2.42 2.45 1.07
3.29
3.39 0.99
329
3.29
76.51 19928 -12 72 159.93 53 I ()
14.52 13.28 67.83
3267 1717
76.20
I R 08
16.~R
32 ·15
18.13 16.48
~OO.19
31.87 17.85
I (lO.02
22.31
IIU~·I
5937
192
nX6
2327 -I (l ,12
30 :It.
20 ·12 11937
22.78 22 37 2:.35
17.99
I J 31
152.10
17.75
1722 23.97
7.93 7.93
7.93
281
7.93 7.05
19.49
8.07 IOXI -IO()4 1.96 8.07 I[un -IO.O·l 1.96
8 07 HUn -I {) (1·1 I l)6
X 07 1 () X I - I () (I., , 'J6
X()7 1(l,XI -I()()·I 1%
7.IJX 12 (II) -(1)(d ·U X
9.28 -291 -250 -1956

STATEMENT-2 Statement showing the percentage of Decadal Variation of Population from 1901 to 2001
for Total, Rural and Urban
~tatel District T 1901
to 2001
11)91
to 2001
1981 )971
to 1981
1961
to 1971
1951 1941
to 1951
1931
to 1941
1921 1911 1901
Gajapatl
J<.andhamdl
Baudh
Sonapur
Ba!angIr
Nuarada
Kalahandl
"'\I aharangap ur
Koraput
Malkangm
R ... U
'2
T
R U
T R
L
r R
U
T R
U
r R
U
T R U
T R
U
T
R 1I
1 R
U
T
R
U
T
R
U
T R U
3
2]022
17961 206238
18070 178 17 205 OS
20659 18<; 74
20451 18981
36023
36100
35086
30534 25856
313 01
30850
30894 28341
2 177 70
33568 28380
46799
435 17
296 9~
23021
76520 70580
4
1688
1421 3129
14 10 1422
1308
1866
1831 2364
1755
1760 1661
1164
1353
1504
863 739
1924
1304
1283 165R
1809
1734 2822
1640 1458 2920
21 IS 20 13 4071
1467
1449
1558
1939 2106 055
to 1991
5
1925 1823
6 7
1660 22 'il
126""' 1771 25 04 45 49 74 96
13 04 13 07 1271
21 69
2050
1528
1203 54 16
2241 2275 1854
14 00 21 54 1061 1824
41 67 13576
1835 1775 1967 18 14 16 79 18 80 22 79 4 1 59 46 04
1999
1978
2272
1594
15 12 2344
1956
1951 2043
1948 1864
23 19
1978 9572
1282 1012 4529
1587
1530 2676
1473
1300
1751
1521 10401
!850 1561 6959
2680 27 28 1824
2139
1804 32 15 4908 177 45
1729 16 13 2628
2422
2536 578
1993 1900
2476
2600 2828
501
1905 1477 6628
2439
2239
6897
2005 IS 99 4694
2466 1569
33748
193
2673 2377 72 II
2974
2729 12702
2054 1270
12367
8940 84 12
to 1961
8
1657 1453
9
4 II
249
to to 1931 1921
10 II 12
12191324
10 98 13 19
-325 -347
to
191 J
13
II 18
970 4465 3316 3961 1420 223 64 83
839 899 197
1204 1204
1355 1364 JO 73
1371 1425
-337
1740 1687 2764
2157 1508
1601 1590
21 II
1824 1732 3424
2779
2747 42 15
901
700 4468
33 12 33 12
411
395 584
152 152
12 19 1324 I? 91 13 86 483 723
933 938 933 938
-325 -3 75 190
-045 -045
II 18 II 73 596
13 17
13 17
I 52
I 73 -422
933 938 -045 13 17 5 53 9 38 -045 13 17
528
8 16 -4293
8 32 II 60 15 50 3950
39 16
4367
8 28 12 02 17 79
8 94 4 92 -I I 68
528 832 II 60 278 666 1038
9894 15888
8 10 13 75 1905
810 1375 1905
810 1375 1905 8 09 I 3 I 8 19 1 5
869 51 42 1252
1237 897
14829
1237
989
1237 922
13147
1237 1237
1855 1793 15 65 1793
1855 1793 18 55 1793
1855 1793 1854 18 19
1880 885
1855 1793 1855 1793
1550 3950 1550 3950
I 82 2034 1 82 2034
I 82 2034
I 74 20 14 725 35 J I
-3 12 -3 12
-3 12
-3 12
-3 12 -582
-3 12 -3 12
2022 2022
2022
2022
2022 2022
2022 2022

The above statement reveals that the population of Oris~a has increased from 31.7 million in 1991 to 36.9 million in 2001 showing a decadal growth rate of 16,25 percent during the decade 1991-2001 as against 20,06 percent in 1981-1991 and 20.17 percent during the decade 1971-1981. In rural areas of the state the decadal variation in population for the decade 1991-200 I is 14.08 as compared to 17.91 in previous census. In urban areas of the state the rate of growth of population is 30.28 percent in 1991-2001 as compared to 36.16 percent in 1981-1991. The growth rate of urban population in the state is the highest (86.79%) recorded in the decade (1951-61). In total and rural areas of the state the highest growth rates of 25.05 percent and 22.26 percent respectively have been recorded during the decade 1961-71, Amongst the districts the highest growth of24.99 percent is recorded in the district of Khordha during the decade 1991-
200 I and the lowest rate of growth of 8.63 is recorded in the distnct of Balangir. Sixteen districts namely. Oebagarh, Sundargarh, Kendujhar, Mayurbhanj. Baleshwar, Bhadrak, Jajapur, Anugul, Khrodha. Ganjam, Kandham.al, Boudh, Kalahandi, Rayagada. Nabarangapur and Malkangiri ha~e higher growth rate of population as compared to the state average of 16.25 percent during the decade 1991-2001 and the rest fourteen districts have growth rate below the state average.
Taking 100 years of growth history of population, the state population has been increased by three and half times, more than three times in rural and twenty one times in urban population in 2001 as compared to 1901. Statement-3 reveals the charge in sex ratio (females per 1000 males) since 1901 for the state and each district of the state with rural and urban breakup.
STATEMENT-3
State/ District
Orissa
Bargarh
Jharsuguda
Sambalpur
T/R/U
2
T
R
U
T
R
v
T
R
v
T
R
u
Changes in the Sex Ratio (Female per 1000 Males )
1901 1911 1921 1931 1941 1951 1961
3 4 5 6 7 8 9
1,037 1,056_ 1,086 1,067 1,053 1,022 1.001
1,039 1,058 1.089 1.071 1.058 1,029 ]'015
967 947 963 924 914 881 807
1,018 1,029 1.033 1,044 1.035 1.022 1.013
1,018 1.031 1.035 1.045 1,037 1,023 1.019
876 886 959 914 939 778
1.018 1,029 1,033 1,044 1,035 1.016 977
1,018 1,029 1,037 1,051 1,039 1.025 1.005
908 863 934 888 831
1,018 1,029 1,033 1,044 1.035 982 977
1,021 1,028 1,035 1,049 1.037 993 ]'010
971 1,033 1.008 946 1.005 836 781
194
1901-2001
1971 1981 1991 2001
10 II 12 13
988 981 971 972
1.002 999 988 987
845 859 866 895
995 989 979 976
1,000 994 984 979
892 908 921 935
959 954 938 946
989 994 978 975
844 867 870 898
959 958 956 969
996 986 981 987
833 879 887 923

STATEMENT-3 Changes in the Sex Ratio (Female per 1000 Males) J90J-200J
State! District 2001 t/R/U 1901 1911 1921 1931 1941 1951 1961 1971 1981 1991
2 3 4 5 6 7 8 <) 10 II 12 13
Debagarh T 1.018 ['029 1.033 1.044 1.035 1.019 1.00 I 977 969 982 980
R 1.018 1.029 1.033 1,044 1.041 1.021 1.005 981 979 990 986
u 963 982 936 911 841 887 911
Sundargarh T 959 988 1,004 1.013 1.017 1.012 9]5 942 931 936 (j57
R 959 988 1.004 1.013 1.017 1.016 990 993 988 987 994
II 903 630 790 814 842 889
.. Kendujhar T 983 1.004 1.032 1.028 1.011 995 982 977 983 974 977
R 983 1.004 1.032 1.028 1.0 \3 997 992 988 999 990 988
u 887 925 780 839 867 868 909
Mayurbhanj T 1,013 1.011 1,015 1.01] 1,005 1.00] 991 987 989 979 980
R 1,015 1.013 1.0 I 7 1.013 1.008 1.004 996 991 998 987 980
u 782 792 796 763 728 742 810 840 850 872 895
Baleshwar T 1,065 1,087 1.098 1,058 1,024 952 956 965 965 955 953
R 1,070 1.094 1.1 07 1.068 1.030 956 965 971 972 962 957
u 918 903 824 761 842 841 847 844 886 895 920
Bhadrak T 1,065 1.087 1.098 1,058 1.024 1.046 1.000 983 996 985 974
R 1,063 1.085 1.096 1.059 1.026 1.051 1.0 II 992 1.009 995 979
u 1,117 1.152 1.145 1.044 982 939 845 853 880 905 934
Kendrapara T 1,068 1,101 1.159 1,1121.084 1.0381.020 l.or r 1.000 1.007 J.(J14
R 1,070 1,102 I, 161 1.114 1.086 ).039 1.022 1.014 1.004 1.0 II 1.018
u 1,022 1,061 1,101 1,023 975 991 959 884 881 937 948
J agatsingj'lap ur T 1,068 1.1 0 I 1.159 1.112 1.084 1,052 1,049 1.0l7 985 977 903
R 1,068 I.l 0 I 1. 159 1,1 12 1.084 1.052 1,049 1.025 1.012 1)97 984
u 464 678 772 787
195

STATEMENT-3 Changes in the Sex Ratio (Female per 1000 Males) 1901-2001
State! Dlstrid
T/R/U ZOOI 1901 1911 1921 1931 1941 1951 1961 1971 19RI 1991
2 3 4 5 6 7 8 9 10 11 12 13
Cuttack T 1.06R LlOI 1.159 1.112 1.0R~ 986 946 947 937 922 938
R 1,084 1.121 1.182 1.143 1.115 1.02 I 994 988 976 960 964
u 855 843 867 795 786 770 720 771 799 806 874
Ja]apur T L068 1.10 1 U59 1.1 12 1.084 1.056 1.027 L006 995 977 972
R L068 I.l 0 I 1,161 1.1 13 1.086 1.059 1.034 1.014 1.003 975
u 1.072 1,069 1.090 1,024 954 886 810 794 799 879 905
•
Dhenkanal T 1.020 1,035 1.074 1.053 1.030 1.029 1,001 980 967 954 %1
R L021 1.036 1.075 1,055 1,034 1.034 1.008 987 977 962 967
u 1,002 1.001 1.036 1.008 940 908 851 838 851 868 899
Anugul T 1.020 1.035 1,074 1.053 1,030 1,005 980 975 949 942 941
R 1.020 1.035 1,074 1.053 1.032 1,007 992 984 973 963 958
u 920 954 779 739 710 794 845
Nayagarh T 1.009 ].023 1.097 1.078 1.082 1.048 1.021 994 972 958 938
R 1,009 1,023 ].097 ].078 1,082 1.048 1.025 997 975 961 939
u 756 721 825 889 912
Khordha T l.009 1,023 1.097 1,078 1.082 1.046 1,015 964 942 903 902
R 1.009 1,023 1.097 1.078 1.082 1.064 1.047 LOl4 1.001 973 972
u 737 772 753 792 782 817
Puri T 1.009 1.023 ].097 L078 1.082 1.00 I 984 979 972 970 968
R 1.020 1,051 1,130 1.101 1.106 1.014 1.002 991 983 981 976
u 902 733 775 815 808 852 809 862 884 893 921
Ganjam T 1.119 1.159 L223 1.191 1,169 1.127 [.092 1,045 1.033 1.006 998
R 1.119 1,163 1.231 1.1971.180 1.1371.107 1,059 1.048 1.018 1.0 II
u U26 1.062 1.066 1.050 991 999 947 953 948 9~2 939
196

State/ Dlstnct
1 •
G~Japati
Kandhamal
Baudh
Sonapur
Balangir
Nuapada
Kalahandi
Ru) agada
T/R/U
2
T
R
u
T
R
U
T
R
U
T
R
U
T
R
U
T
R
lJ
R
1I
r
R
STATEMENT-3 Changes in the Sex Ratio (Female per 1000 Males) 1901-2001
1901 1911 1921 1931 1941 1951 1961 1971 19RI ll)lJ I 200 1
3 4 5 (, 7 8 I) 10 II l~ 13
1,119 l.I59 L223 1.191 1.1 119 1.0~ 1 1.027 1.02() 1.023 1.027 1.03 I
1.116 1,162 I,234 1,20 I 1.183 1.043 1.03 I 1.029 1.026 I.OJ2
1,156 1,127 1,123 1.090 1.029 1.016 979 980 (1)3
1.013 1,0 I 3 1.018 1.022 1.02 1 1.()25 1.025 1.0l3 1.005 l)l)l) I.IHIX
1.013 1.013 1.018 1.022 1.0l1 1.<)25 1.025 l.01l) 1.(115 1.00X 1.0 I ·1
817 852
1,013 1.013 1.018 1.022 1.021 1)90 988 l)S7
1.013 ]'013 1.018 1.022 1.021 999 991 992 992 989
1.029 961 949 927 913
1,042 1.030 1.028 1.025 1.020 1.012 1.00(l 979
1.047 1.025 1.021 1.02~ 1.022 1.0 I I I.()Oh 9X3
979 - ],089 1.137 1.053 990 1.050 990 ')30
],042 1.030 1.028 1.025 1.020 1.010 ')l)') l)l)5 981 ')X I
1,042 ]'030 1.028 1.026 l.020 1.013 1.00 I I.()()O 1.(101 9iN ')l) I
978 1.005 931{ ')12 9lH 922 910 93 I
1.004 1,024 1.031 1.035 1.035 1.01 I 1.019 1.01 I 1.013 1.I){)2 1.1)(17
1.004 1.02~ 1.031 1.035 1.035 1.0 II 1.021 1.013 l.015 1.005 1.00')
97(, <no 951
1.004 I Jl2..J 1.031 1.035 1.(U5 I.on 1.0:20 1.010 I.OOl) 999 1.1)01
1.005 1.025 1.031 I.03() 1.(US 1.02·1 1.(112 I.OIS 1015 1.()(l6 1.007
892 lJX2 48·1 923 l) II{ 'H()
1)6() ()l)9 1.000 lJ)()·j l)l)6 I OOX 1.111 () 1.00,1 I.02(l 1 012 I.02X
966 lJ99 1.00(l LOO-I 1.009 1.031 1.020
961 957 95' 9\9 l)55
197
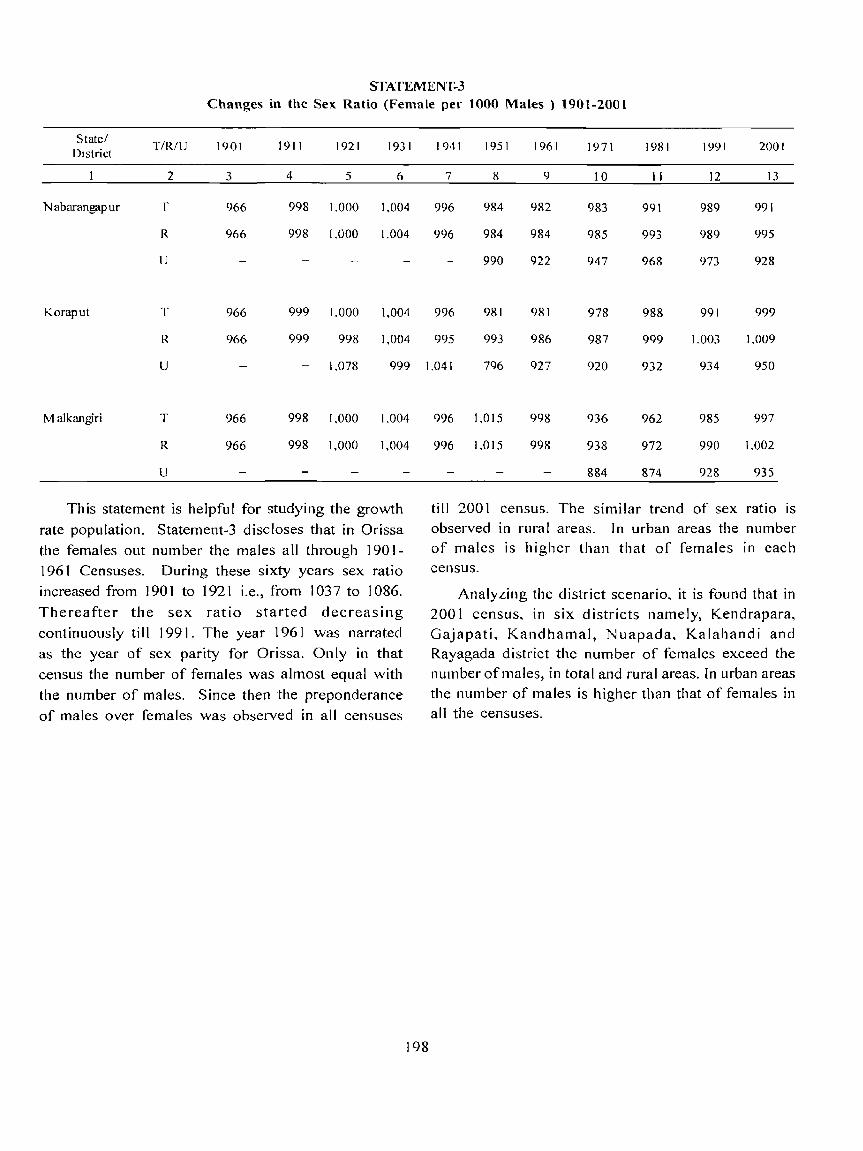
STATEMENT-3 Changes in the Sex Ratio (Female per 1000 Males) 1901-2001
State! T!R!U 1901 1911 1921 1931 1941 1951 1961 1971 1981 1991 2001 DIstrict
2 3 4 5 6 7 8 9 10 II 12 13
Nabarangapur r 966 998 1.000 1,004 996 984 982 983 991 989 991
R 966 998 1.000 1.004 996 984 984 985 993 989 995
U 990 922 947 968 973 928
Koraput T 966 999 1.000 1,004 996 981 981 978 988 991 999
R 966 999 998 1,004 995 993 986 987 999 1.003 1.009
u 1.078 999 [.041 796 927 920 932 934 950
Malkangiri T
R
966
966
998 1,000 1,004
998 1,000 1,004
u
This statement is helpful for studying the growth rate population. Statement-3 discloses that in Orissa the females out number the males all through 1901-1961 Censuses. During these sixty years sex ratio increased from 1901 to 1921 i.e., from 1037 to 1086.
Thereafter the sex ratio started decreasing continuously till 1991. The year 1961 was narrated as the year of sex parity for Orissa. Only in that census the number of females was almost equal with the number of males. Since then the preponderance of males over females was observed in all censuses
198
996 1.015
996 1.015
998
998
936
938
884
962
972
874
985
990
928
997
1.002
935
till 2001 census. The similar trend of sex ratio is observed in rural areas. In urban areas the number of males is higher than that of females in each census.
Analyzing the district scenario, it is found that in 200 1 census, in six districts namely, Kendrapara, Gajapati, Kandhamal, Nuapada, Kalahandi and Rayagada district the number of females exceed the number of males, in total and rural areas. In urban areas the number of males is higher than that of females in all the censuses.

as en en
"i: 0 "'C C as as .-
"'C c:
,.... 0 0 N • ,.... 0 en ,.... C 0 "-... as -::s C. 0 D.. .... 0 Q) ... as a:: .c i 0 ...
CJ
98"£(;
99"t>Z
OS"t>Z
o o .....: C\I
o ~ C\I C\I
199
co cu UJ
UJ :c . .::: .EO
+ + WOG-~66~
~66~-~B6~
~B6 ~- ~L6 ~
~L6k~96~
~96 ~-~56~
~96 ~- ~ 'V6 ~
~ 'V6 ~- ~£6 ~
~£6~-~G6~
o ~ C")
I


A-2: DECADAL VARIATION IN POPULATION SINCE 1901
Decadal Percentage Slate/District Census Year Persons population decadal Males Females
variation variation
2 3 4 5 6 7
Orissa 1901 10,302,917 5,058,100 5,244,817
1911 11,378,875 1,075,958 10.44 5,535,632 5,843,243 1921 11,158,586 -220,289 -1.94 5,350,227 5,808,359
1931 12,491,056 1,332,470 11.94 6,042,255 6,448,801 1941 13,767,988 1,276,932 10.22 6,706,487 7,061,501
1951 14,645,946 877,958 6.38 7,242,892 7,403,054
1961 17,548,846 2,902,900 19.82 8,770,586 8,778,260 1971 21,944,615 4,395,769 25.05 11,041,083 10,903,532 1981 26,370,271 4,425,656 20.17 13,309,786 13,060,485
1991 31,659,736 5,289,465 20.06 16,064,146 15,595,590 2001 36.804,660 5,144,924 16.25 18,660,570 18.144,090
Bargarh 1901 371.066 183,860 187,206
1911 429,684 58.618 15.80 211,797 217,887 1921 449,182 19,498 4.54 220.906 228,276
1931 501,975 52,793 11.75 245.638 256,337
1941 565,389 63.414 12.63 277.837 287,552
1951 612.037 46.648 8.25 302.762 309,275
1961 693,122 81,085 13.25 344.404 348.71 &
1971 839.622 146.500 21.14 420.949 418.673
1981 1,032.354 192.732 22.95 518,993 513,361
1991 1.207,172 174,818 16.93 609,916 597,256
2001 1,346,336 139,164 11.53 68t,500 664,836
Jharsuguda 1901 141,041 69,885 71,156
1911 163,322 22.281 15.80 80,504 82,818
1921 170,733 7.411 4.54 83.966 86,767 1931 190.800 20.067 11.75 93.367 97.433
1941 214.903 24.103 12.63 105,605 109,298
1951 232.634 17.731 8.25 115,367 117,267
1961 243,970 11,336 4.87 123,377 120,593
1971 289,260 45,290 18.56 147,682 141,578
1981 364,188 74,928 25.90 186.398 177,790
1991 442,154 77.966 21.41 228.188 213,966
2001 509,716 67,562 15.28 261.941 247.775
Sambalpur 1901 217,269 107.655 109.614
1911 251,591 34,322 15.80 124,013 127.578
1921 263.009 11.418 4.54 129,346 133.663
1931 293,920 30,911 11.75 143.827 150.093
1941 331.051 37.131 1263 162.682 168.369
1951 358,364 27,313 8.25 180.799 177.565
1961 448.960 9~596- 25.28 227.110 221.850
1971 552.773 !03.813 23 12 282.143 270.630
1981 686.763 133.990 2424 350.686 336.077
1991 813.589 126.826 18.47 415.864 397.725
2001 935.613 122.024 15.00 475.122 460.491
201

A-2 : DECADAL VARIATION IN POPULATION SINCE 1901
Decadal Percentage State/District Census Year Persons populatIon decadal Males Females
variation \ ariatlOn
2 3 4 5 6 7
Oebagarh 1901 59.882 29.671 30.211 1911 69,341 9.459 15.80 34.179 35,162 1921 72,488 3.147 4.54 35,649 36,839 1931 81.007 8.519 1l.75 39.640 41.367 1941 91,241 10,234 1263 44,837 46,404 1951 98,769 7,528 8.25 48,930 49.839 1961 122,634 23.865 24.16 61.272 61.362 1971 163.243 40.609 33 ] ] 82.558 80,685 1981 197,671 34.428 2109 100.392 97,279 1991 234,238 36.567 18.50 118,172 116,066 2001 274.108 39,870 17.02 138,408 135,700
Sundargarh 1901 277,173 141.493 135,680
1911 362,138 84,965 30.65 182,149 179,989 1921 377.449 15.311 423 188.344 189,105 1931 436,860 59,411 1574 216.985 219.875 1941 490.708 53.848 1233 243.296 247.412 1951 552,203 61,495 1253 274.401 277,802 1961 758.617 206.414 3738 396.214 362,403
1971 1,030,758 272,141 35.87 530.836 499,922
1981 1.337.871 307,113 29.79 692,749 645.122 1991 1.573.617 235.746 ]7.62 812.707 760.910 2001 1.830.673 257,056 16.34 935.601 895.072
Kendujhar 1901 285,758 144,072 [41.686
1911 304.702 78.944 2763 182.020 182.682 1921 379,496 14.794 4.06 186.785 192.711 1931 460.609 81.113 21.37 227.143 233.466 1941 529,786 69.177 15.02 263.475 266.311
1951 588,441 58.655 11.07 294.902 293.539
1961 743.3 I 5 154.874 26.32 375.090 368.225
1971 955.514 212.199 28.55 483.334 472.180
1981 1,114,622 159.108 1665 562.157 552.465
1991 1,337,026 222,404 19.95 677.480 659.546
2001 1,561.990 224,964 16.83 790.036 771.954
Mayurbhanj 1901 610.383 303,26fi 307.117
1911 729.218 1 ]8,835 19.47 362.570 366.648
1921 754.314 25.096 3.44 374,319 379.995
1931 889.603 135.289 1794 442.378 447.225
1941 984.741 95,]38 10.69 491,129 493.612
1951 1,028.825 44.084 4.48 514,051 514.774
1961 1,204.043 175,218 17.03 604,756 599.287
1971 1.434.200 230.157 19.12 72].914 7] 2.286
1981 1.581,873 147.673 10.30 795.364 786.509
1991 1.884,580 302.707 1914 952.183 932.397 200[ 2.223.456 338.876 17.98 1.123.200 I.t 00.256
202

A-2: DECADAL VARIATION IN POPULATION SINCE 1901
Decadal Percentage State/Distnct Cen>.us Year Pt:rSons population dec ada I Males Females
vanatlon vanallon
2 '"\ 4 5 6 7
Baleswar 1901 679,046 328.774 350.272 1911 669,624 -9.422 -I 39 320.789 348)05 1921 622.836 -46.788 -6.99 296.827 326,009 1931 630.857 8.021 1.29 306.517 324.340 1941 660.388 29.531 4.68 326.320 334,068 1951 658.742 -1,646 -025 337.476 321.266 1961 839,081 180.339 27.38 428.929 410.152 1971 1.091,230 252.149 30.05 555,443 535.787 1981 1,357.727 266.497 24.42 690,808 666,919 1991 1,696.583 338.856 24.% 867.641 82R.942 2001 2,024.508 327.925 1933 1,036.511 987.997
Bhadrak 1901 461,056 223,229 237,827
1911 454,658 -0.398 -1.39 217.808 236,850 1921 422,890 -31. 768 -6.99 201.538 221,352
1931 428.337 5.447 1.29 208.118 220.219 1941 448.387 20.050 468 221.563 226.824
1951 447.270 -1.117 -0.25 218.590 228,680
1961 576.842 129,572 2897 288.411 288,431
1971 739.274 162,432 28 16 372.899 366.375
1981 895.081 155.807 21.08 4·18.547 446.534 1991 1.1 05.834 210.753 2355 557.017 548.817
200l 1.333.749 227.915 2061 675.642 658.107
Kendrapada 1901 459.224 222.064 237.160
1911 470,355 11.131 242 223,895 246.460 1921 457.135 -13,220 -2.81 21 !Ji87 245,448
1931 486,625 29.490 645 230.445 256,180
1941 509.546 22.921 4.71 244.560 264.986
1951 526,472 16.926 3.32 258.329 268.143
1961 649.457 122,985 2336 321.504 327,953
1971 823,451 : 73.994 26.79 409.537 413.914
1981 981.219 157.768 1916 490.570 490,649
1991 1.149.501 168.282 17 15 572.703 576.798
2001 1.302.005 152,504 13.n 646.438 655.567
Jagatsinghpur 1901 384.939 186.142 198.797
1911 394,269 9,330 2.42 187.677 206,592
1921 383.188 -II.OSI -2.&1 177.444 205.744
1931 407,908 24,720 645 193.168 214.740
1941 427,121 19,213 4.71 205.000 222,121
1951 441.30l) 14,188 3.32 215.106 226.203
1961 521. 734 80,425 1822 254.606 267.128
1971 641,005 119,271 2286 317.864 323.141
1981 791.50 I 150.496 23 48 398.674 392.827
1991 933,789 142,288 17.98 472.412 46U77 2001 1.057.629 123.840 1326 538J{81 518.748
20~
A-2 : DECADAL VARIATION IN POPULATION SINCE 1901
Decadal Percentage StateiDlstnct Census Year Persons populatIOn decadal Males Females
varIatIOn vanatlOn
2 3 4 5 6 7
Cuttack 1901 816,287 394,726 42).561
1911 836,072 19785 242 397,981 438091 1921 812,572 -23,500 -281 376,279 416,293 1931 864,993 52.421 645 409,623 45.5,370 1941 905,738 40.745 471 434.715 471.023 1951 935,823 30,085 332 471.092 464.731 1961 1.131,699 195,876 2093 581.477 550.222 1971 1.414.658 282.959 2500 726.740 687,918
1981 I.719.987 305,329 21 58 887.909 832.078 1991 2.053. I 92 333.205 1937 1,068.469 984.723 2001 2341,094 287,902 1402 1.207.781 L133313
Jajapur 1901 544,846 263,467 28U79
1911 558,053 13,207 242 265.641 292.412 1921 542,368 -15.685 -281 251.156 291.212 1931 577.357 34.989 645 273.412 303,945 1941 604.551 27.194 471 290.158 314.393 1951 624.633 20.082 332 303,824 320.809
1961 760.182 135.549 21 70 374.996 385 186
1971 948,564 188.382 2478 472,892 475,672
1981 1.136,093 187,529 1977 569,537 566,556
1991 1,386,177 250,084 2201 701.005 685.172 2001 1,624,341 238.164 1718 823.747 800.594
Dhenkanal 1901 292,497 144785 147.712
1911 302,120 9.623 329 148471 153.649 1921 263,405 -38.715 -1281 127,033 136.372
1931 324.991 61.586 23.38 158.273 166.718
1941 379,327 54.336 1672 186.827 192.500
1951 429.097 49.770 13 12 211.515 217,582
1961 526.520 97.423 2270 263.136 263.384 1971 665.377 138.857 2637 336.105 329.272 1981 797.053 13 1.676 1979 405,303 39).750 1991 947.870 150.817 1892 485.176 462,694
2001 1,066,878 119,008 1256 544.001 522.877
Anugul 1901 278. ]44 137,681 140.463 191 I 287,294 9.150 329 141,185 146.109 1921 250,480 -36.814 -1281 120,800 129.680 1931 309.044 58,564 2J 38 150,506 158.538 1941 360.714 51670 1672 177,660 183.054 195~ 408.041 47.327 13 12 203472 204569 1961 500,033 91.992 2254 252.484 247.549 1971 628537 128,504 2570 318.229 j 1 0.308 1981 785,734 157,197 2501 403.127 382.607 1991 961.037 175 103 22 31 494,901 466.136 2001 I 140 001 178,966 I~ 62 587,234 'i52769
20~
A-2 : DECADAL VARIATION IN POPULATION SINCE 1901
Decadal Percentage State/District Census Year Persons population decadal Males Fel
variation variation
2 3 4 5 fi
Nayagarh 1901 331.06 I 164.828 1M 191 I 337,56 [ 6,500 1.96 166.831 17(
1921 303.665 -33,896 -1004 144.840 15~
193 [ 336.493 32.828 10.8 [ 161.896 17~
1941 363,652 27.159 8.07 174.693 IS}
1951 392.506 28,854 7.93 191.614 20e 1961 470.878 78.372 19.97 233.001 23, 197[ 578.498 107.620 22.86 290.089 28~
1981 683.392 104.894 [8.13 346.613 33("'
1991 782.647 99.255 1452 399.10 I 38~
2001 864.516 81.869 1046 446.177 41 ~
Khordha 1901 470.409 234.206 231" [ 911 479.645 9.236 [ 96 237.052 242 1921 431.482 -48.163 -1004 205.805 22~
1931 478. [28 46.646 10.81 230.041 24~
1941 516.7\9 38.591 8.07 248.224 26~
1951 557.718 40,999 7.93 272,632 28:: J961 658.073 100,355 17.99 326,593 331 1971 858.554 200.481 3046 437.060 421 1981 1.132.182 273.628 3 [.87 582.885 54<;
1991 [ .502.014 369.832 32.67 789.334 7[2
2001 1.877.395 375.381 24.99 986.886 8ge
Pun 1901 527.283 262.522 26.<1
1911 537.636 10.353 1.96 265.713 271
1921 483.649 -53.987 ~IO.04 230.688 252 1931 535.934 52.285 10.81 257.854 2711 1941 579.192 43.258 807 278.236 30(
1951 625.148 45.956 793 3 \2.472 312 1961 736.118 110.970 17.75 370.949 365 1971 903.807 167.689 22.78 456.689 447
1981 1.105.471 201.664 22.31 560.713 544
1991 1.305,365 199.894 18.08 662.764 642 2001 1.502.682 197.317 15.12 763.389 73CJ
Ganjam 1901 957.123 451.592 50:
1911 1.064.172 107.049 11.18 492.889 571 1921 1.029.623 -34.549 -3:25 . 463.149 56f 1931 1.165.908 136.285 [3.24 532.234 633 1941 1.308.056 142,148 \2.19 603.03 \ 705 1951 1.361.831 53.775 4.11 640,184 721
1961 1.587.461 "225.63-0 16.57 758.688 828 1971 1.944.844 357.383 22.51 950.879 993
1981 2.267.628 322.784 [6.60 I. [ 15.643 1.15[
1991 2.704.056 '136.428 19.25 1.348.0"2 1.356 2001 3.160.635 456.579 16.88 L581.986 un
')II~

A-2: DECADAL VARIATION IN POPULATION SINCE 1901
Decadal Percentage S ta te/Di stri c t Census Year Persons population decadal Males Females
variation vanation
2 3 4 5 6 7
Gajapati 1901 184,840 87,212 97,628
1911 205,514 20,674 11.18 95,187 110.327 1921 198,842 -6,672 -3.25 89,444 109.398 1931 225,161 26,319 13.24 102.786 122.375 1941 252,613 27.452 1219 I 16.458 136.155 1951 262.998 10.385 4.11 128.876 134.122 1961 285.069 22.071 839 140.641 144.428 1971 348,964 63.895 2241 172.281 176.683 1981 402,271 53,307 (528 198.877 203,394 1991 454,708 52.437 13.04 224.329 230.379 2001 518.837 64.129 14.10 255.423 263.414
Kandhamal 1901 211.421 105,038 106.383
1911 239,272 27,851 13 17 118.857 120,415 1921 238.206 -1,066 -0.45 118,063 120.143 1931 260,557 22,351 9.38 128,876 131,681 1941 284,855 24,298 9.33 140,947 143.908 1951 289.182 4.327 152 142.784 146.398 1961 323,991 34.809 1204 159.989 164.002 1971 393,773 69.782 21.54 195.657 198.116 1981 448,914 55.141 14.00 223.859 225.055 1991 546.281 97.367 2169 273.234 273.047 2001 648,201 101.920 18.66 322.799 325.402
Baudh 1901 122,615 60.917 61.698
1911 138,767 16.152 13 17 68.932 69.835 1921 138.149 -6L8 -045 68.471 69.678 1931 151,112 12,963 938 74.742 76,370
1941 165.204 14.092 9.33 81,743 83,461
1951 167.713 2.509 1.52 83,954 83.759
1961 190.436 22.723 13.55 95,696 94.740 1971 227.902 37.466 19.67 114.576 113.326
1981 268,366 40.464 17.75 135.003 133.363 1991 317.622 49.256 1835 159.860 157.762 2001 373.372 55.750 17.55 188.155 185.217
Sonapur 1901 117,731 57.668 60,063
1911 164,239 46,499 39.50 80,910 83,320 1921 189,687 25,457 15.50 93.544 96,143
1931 211,684 21.997 1160 104,514 107.170 1941 229,296 17,612 8.32 113,509 115.787
1951 241,413 12,117 5.28 119,986 121.427
1961 274,515 33,102 13.71 136,868 137.647
1971 322,578 48,063 17.51 161,836 160.742 1981 397,386 74,808 23.19 200,249 197.137 1991 476,815 79,429 19.99 240.985 235.830
2001 541,835 65,020 13.64 275.601 266.234
206

A-2 : DECADAL VARIATION IN POPULATION SINCE 1901
Decadal Percentage State/District Census Year Persons population dec ada I Male..", Females
variatIon variation
2 3 4 5 6 7
Balangir 1901 329,894 161.590 168,304
1911 460,187 130.293 39.50 226.716 233.471 1921 531.520 71.333 15.50 262.117 269,403
J9Jl 593,160 61,640 11.60 292.858 300,302 1941 642,508 49.348 8.32 318.064 324.444
1951 676,462 33.954 5.28 336.620 339.842 1961 794.171 117.709 17.40 397.351 396.820 1971 941.079 146.908 1850 472.129 468,950
1981 1.061. 727 120.648 12.82 532.189 529.538 1991 1.230.938 169.21 I 15.94 621.486 609.452
2001 1.337.194 106.256 8.63 673.985 663,209
Nuapada 1901 122,559 61.165 61,394
II) I I 147.489 24.930 20.34 72.875 74.614
1921 150.180 2,691 1.82 73.962 76.218
1931 178.787 28.607 19.05 87.838 90.949
1941 203,379 24.592 13,75 99.941 103.438
1951 219,850 16,471 8.10 109.339 110.511
1961 267.272 47,422 21.57 132.399 134.873
1971 338.894 71.622 26,80 168.514 170,380
1981 392.683 53.789 15.87 195.105 197.578
1991 469.482 76.799 1956 234.462 235.020
2001 530,690 61.208 1304 264.396 266,294
Kalahandi 1901 326,578 162.985 163.593
1911 393.006 66.428 20.34 194.187 198.819
1921 400.178 7.172 1.82 197.083 203.095
1931 476.407 76.229 19.05 234.058 242.349
1941 541.934 65,527 13.75 266.309 275,625
1951 585,825 43.891 8.10 289.639 296.186
1961 679,602 93,777 16.01 336.367 343.235
1971 824.975 145,373 21.39 410.415 414.560
1981 946.509 121.534 14.73 471.058 475.451
1991 1.130.903 184.394 19.48 565.595 565.308
2001 1.335,494 204.591 18.09 667.526 667,968
Rayagada 1901 186.480 94.842 91.638
1911 224.190 37.710 20.22 112,179 112.011
1921 217.200 -6,990 -3.12 108.613 108.587
1931 256,152 38,952 17.93 127.843 128.309
1941 303,663 47.511 18.55 152.134 151.529
1951 341.241 37.578 1237 169.917 171.324
1961 403.471 -62.230 18.24 200.734 202.737
1971 511.333 107.862 26.73 255.137 256.196 1981 608.751 97.418 19.05 301....105 307.346
1991 713,984 105.233 1729 354.911 359.073
2001 831.1 119 117.125 16.40 409.792 421.317
207
A-2: DECADAL VARIATION IN POPULATION SINCE 1901
Decadal Percentage State/District Census Year Persons population decadal Males Females
variation variation
2 3 4 5 6 7
Nabarangapur 1901 180.547 9[.850 88.747 1911 217.11 S 36.521 20.22 108.641 108A77 J921 210.348 -6.770 -3 12 105.187 105.161 1931 248.072 37.724 1793 1:23.811 124.261 1941 294.084 46.012 18.55 147.335 146.749 1951 330,476 36.392 1237 166.600 163.876 1961 422.325 91.849 27.79 213.062 209.263 1971 547,944 125.619 29.74 276.319 271.625 1981 681.579 133.635 2439 342,270 339.309 1991 846.659 165.080 2..J. 22 425.759 420.900 2001 1.025,766 179.107 21 15 515.162 510.604
Koraput 1901 297.440 151.277 146.163 1911 357.588 60.148 2022 178.928 178.660 1921 346.438 -I 1.150 -3.12 173.241 173.197 1931 408.568 62.130 17.93 203.913 204,655 1941 484,348 75.780 18.55 242,657 241.691 1951 544.286 59.938 12.37 274.742 269.544 1961 593.300 49.014 901 299.441 293.859 1971 715.139 121.839 2054 361.519 353.620 1981 858,506 143.367 2005 431.861 426.645 1991 1.029.577 171.071 19.93 517.074 512.503
2001 1.180.637 151.060 1467 590.743 589.894
Malkangiri 1901 58,275 29.638 28.637 1911 70.059 1 l. 784 20.22 35.056 35.003 1921 67.874 -2.185 -3.12 33.941 33,933 1931 80.047 12.173 1793 39.951 40.096 1941 94.894 14.847 18.55 47.542 47.352 1951 106.637 11.743 12.37 52.917 53.720 1961 141.955 35.318 33 12 71,041 70.914
1971 268.865 126,910 89.40 138,858 130.007
1981 335.169 66,304 24.66 170,842 164.327 1991 422,326 87,157 26.00 212.776 209,550 2001 504.198 81,872 19.39 252,507 251.691
208

A-2 : DECADAL VARIATION IN POPULATION SINCE -1901 APPENDIX
State and Districts at the Census of India 2001 showing area and Population according to territorial jurisdiction in 1991 ~hanges in Population of 1991 adjusted to jurisdiction of 2001
Area In 1991 Popu latio n Population In Net increase or
State/District Area in 2001
1991 acco rdIng to 1991 adj usted to decrease
2001 (Km2) Population (Km2) j ur isdictlOn ju nsdlctlOn 0 f between Cols 5 PrevaIling in 1991 2001 and 6
2 3 4 5 6 7
ORISSA 155.707.0 36.804,660 155.707.0 31.659,736 31,659.736
Bargarh Dlstrict* 5,837.0 1,3 46,336 1,207,172 + 1,207,172
Jharsugud a District* 2,081.0 509,716 442,154 +442.)54
Sambalpur District 6,6570 935,613 17,516.0 2,697,153 813.589 - 1.883,564
Dcbagarh DIstrIct'" 2.9400 274,108 234.238 +234238
Sundarga.il Distnct 9,712.0 1,830,673 9.7120 1.573.617 1.573,617
Kendujhar District 8,3030 1.561.990 8.303.0 1.337.026 1.337,026
Ma) lIrhhan.l I) istrict 10,4180 2.2 23.456 10.4180 1,884.580 1.884,580
Balcshwar Di<;tricl 3,806.0 2,024,508 6,3110 2.802,417 1,696,583 -1,105,834
Bhadrak District* 2.505 () 1,333.749 1,105.834 + 1.105.834
Kendrapara District'" 2,644.0 1,3 02.005 1.149,501 +1,149,501
lagatsinghapur District* 1,668.0 1.057.629 933,789 +933,789
ClIttack District 3,9320 2,341.094 11.142.0 5,522.659 2,053,192 -3.469,467
JaJapur District'" 2.899.0 1.624.341 1.386.177 +1,386,177
D henkanal Dbtrict 4,4520 1.066,878 10,8270 1,908,907 947,870 -961,037
An ugul District'" 6,37.5 () 1.140,003 961,037 +961,037
Nayagarh District* 3,890.0 864.516 782,647 +782,647
Khordha District'" 2.813.0 1.877.395 1.502,014 + 1.502,014
Pun Dlstnct 3,479.0 1.502,682 10.1820 3.590,026 1.305.365 -2,284,661
C:mjanl District 8.206.0 3,160,635 12,531.0 3,158,764 2,704.056 -454,708
(i,l.lapall Distnct'" 4.325.0 5 18,837 454,708 +454,708
I-\.andhamal District** 8.0210 648,201 11,119.0 863,903 546,281 -317.622
BauJh DI~trict* 3,098.0 373,372 317,622 +317.622
Son,lpur District" 2337.0 541.835 476,815 +4 76,815
Ralanglr District 6.57:' 0 J 37.194 8.9130 1.707.753 1.230.938 -476.815
Nuapada District* 3.852.0 530.690 469.482 +4 69.482
Kalahandi District 7.lJ20.0 1,335.494 11.7720 1,600.385 1.130,903 -469,482
Rayagada District* 7.073.0 831.109 713.984 +713,984
Nabarangapur District'" 5.291 I 1,025.766 846,659 +846,659
K ora put D istnc t X.807.0 1,180.637 26.961.0 3,012,546 1.029,577 -1,982.969
Malkangiri Di~trict* 5.791.0 504.198 422,326 +422,326
* Newly created district after 1991 Census "'* Change of dlstnct name of Phulabani after 1991 Census
Note :-
(a) (i) Entire two sub-divisIOns namely Bargarh and Padmapur WIth an area 5,831.57 sq.kms. and population of 1.207,172 were
transferred to newly formed Bargarh district vide Govt. Notification No. DRC 44/93-14218/R dated 2703.93.
( ii) Entire Debagarh sub-division with an area 2.781 73 sq.kms. and populatIon of234.238 was transferred to newly formed
Debagarh district vide Notification No. DRC-218/93-56413/R dated 22 12.93.
209
(IIi) Entire Iharsuguda sub-dIvision with an area 2.203 13 sq kms. and populatIon of 442.154 \\{lS transferred to newly formed
Iharsuguda district vIde Notification No. DRC-2IS/93-56413/R dated 22.1293.
(b) Entire Bhadrak sub-division with an area 2,787.87 sq kms. and populatIon of 1.105,834 was transferred to newly formed
Bhadrak district vide Notification No. DRC-44/93-14218/R dated 27.03 93.
(cl (i) Entire Jagatsinghapur sub-division with an area 1.75921 sq kms and population 01'933,789 was transferred to newl)
formed Jagatsmghapur dlstnct vide NotIficatIOn No DRC-44/93-J42J8IR dated 2703.93.
(ii) Entire JaJapur sub-division With an area 2.787.78 sq.kms. and population of 1.386,177 was transferred to newl) formed
Jajapur district vide NotIficatIOn No ORC'-44/93-14218/R dated 27.03 93.
(iiI) Entire Kendrapara sub-divIsion with an area 2.545.61 sq kms and populatIon of 1.149.50 I was transferred to newly
formed Kendrapara district vide Notification No. DRC-44/93-14218/R dated 27 03.93
(d) Entire four sub-divIsions namely Palalahada. Talcher. Anugul and Athmalik with an area 6.345.29 sq kms and population
of 961 ,037 were transferred to newly formed Anugul dlstnct vide ]\.otilicatlon No ORC-44/93-142 18!R dated 27.03 93.
(e) (i) EntIre Nayagarh sub-division WIth an area 3.941.14 sq.kms and populatIOn of782,647 was transferred to newl) formed
Nayagarh district vide NotIfication No. ORC -44/93-14218/R dated 27 03.93.
(Ii) Entire two sub-divIsion namely Khordha and Bhubaneswar WIth an area 2,846 76 sq kms and population of 1.502.014
were transferred to newly formed Khordha dIstrict vide Notification No. DRC-44/93-14218/R dated 27.03.93
(f) EntIre Parlakhemundi sub-division excluding sixty villages with an area 2.983 90 sq.kms and populatIOn of 454.708. was
transferred to newly formed G~lapati district vide Notification ]\.0. ORC -36/92-49 J 37 /R dated 01 10 92 and ORC -36/92-
491:J IIR dated 01.10.92.
(g) Baudh sub-division With an area 3,444 82 '>q.kms. and population of 317.022 ""as transferred to newly formed Baudh di')tnct
vide Notification No. DRC-218/93-56413/R dated 22.12.93
(h) Entire two sub-divisions namely Sonapur and l3irmaharajpur With an area 2.284.40 sq.kms and populatIon of 476.815 were
transferred to newly formed Sonapur district vide NotificatIOn No DRC-44/93-142IS/R dated 27.03.93.
(I) Entire Nuapada sub-division With an area 3.398 13 sq.kms and populatIOn of 469.482 was transferred to newly formed
Nuapada district vide Notification No.DRC-44/93-1421S/R dated 27 03.93.
CD (i) Entire Malkangiri sub-division and two vIllages from Jeypur sub-dIvision WIth an area 6.120 75sq.kms and population
of 422.326 were transferred to newly formed Malkangiri distnct vIde Notilication No.DRC-36/92-49 I 37/R dated 0 I 1092
and DRC-36/92-491 31 IR dated 01.10.92.
(ii) Entire Nabarangapur sub-division and 40 villages of Kotpad police station with an area 5.290.99 sq.kms and population
of 846,659 were transferred to newly formed Nabarangapur district vide Notification No.DRC-36/92-49J37/R dated
01.10.92 and DRC-36/92-49131/R dated 01 10.92.
(iii) Entire two sub-divisions namely Rayagada and Gunupur with an area 7.584.65 sq kms and population of7 1 3.984 were
transferred to newly formed Rayagada district vIde NotIficatIon No DRC-36/92-4913 7/R dated 01.10.92
(k) Changes enumerated as against footnote (a) (i) (t) Changes enumerated as agaInst footnote (e) (ill
(I) Changes enumerated as against footnote ta) (iIi) (u) Changes enumerated as agamst footnote (t)
(m) Changes enumerated as against footnote ta) (Ii) (v) Changes enumerated as against footnote (g)
(n) Changes enumerated as against footnote (b) (w) Changes enumerated as agamst footnote (h)
(0) Changes enumerated as against footnote (c) (iii) (x) Changes enumerated as against footnote (i)
(p) Changes enumerated as against footnote (c) (i) (y) Changes enumerated as against footnote U) (Ill)
(q) Changes enumerated as against footnote (c) (ii) (L) Changes enumerated as against footnote (i) (il)
(rl Changes enumerated as against footnote (d) (#) Changes enumerated as agamst footnote (j) (i)
(s) Changes enumerated as against footnote (e) (i)
210

TABLE A-3: VILLAGES BY POPULATION SIZE CLASS


A-3 : VILLAGES BY POPULATION SIZE CLASS FLY-LEAF
Table A-3 depicts the classification of total inhabited villages by seven broad population size ranges varying from (i) less than 200 (ii) 200-499 (iii) 500-999 (iv) 1000-1999 (v) 2000-4999 (vi) 5000-9999 and (vii) 10,000 and above specifying rural population in each range in 2001 census.
213
Two statements pertaining to A-3 (rural population) are put further envisaging the percentage of I ural population and the percentage of the total number of villages in partIcular population size range of villages

Statement-l presents the percentage of rural population inhabiting the villages of different population size ranges in the state and the districts in 2001 census.
STATEMENT-l Percentage of population living in villages of various population size with reference to the
Total Rural Population in 2001
StatelDistrict Percenta8e ofeoEulation lIvin8 In Villa8c~ of EOEulution size
Less than 200 200-499 500-999 1000-1999 2000-4999 5000-9999 10.000 +
2 3 4
ORISSA 4.05 15.09 25.85 Bargarh 067 7.93 24.11 lharsuguda 1.31 9.48 27.05 Sambalpur 5.82 1955 26.59 Oebagarh 13.01 31.60 2683 Sundargarh 2.74 15.16 29.88 Kendujhar 2.64 19.03 32.89 Mayurbhanj 401 23.10 3786 Baleshwar 3.41 14.77 2621 Bhadrak l.ll 9.75 21.69 Kendrapara 1.13 11 47 2540 Jagatsinghapur 1.95 14.05 27.50 Cuttack 163 9.57 2289
JaJapur 1.29 937 20.10 Ohenkanal 2.14 8.76 20.06 Anugul 5.44 1745 23.43
Nayagarh 639 15.30 2749
Khordha 2.19 13.31 26.48
Puri 1.77 12.33 2801 Ganjam 2.53 7.07 16.20 Gajapati 17.34 32.78 22.05 Kandhamal 21.57 32.30 22.66
Baudh 13.00 37.90 29.80 Sonapur 3.99 17.93 30.22
Balangir 1.99 19.81 36.38
Nuapada 1.84 11.93 3341
Kalahandi 590 13.20 2479 Rayagada 1831 33.94 24.34
N abaran gapur 064 6.23 21.00
Koraput 7.56 20.53 25.56
Malkangiri 8.69 19.87 22.82
The statement reveals that the maximum percentage of rural population (29.80) in the state are living in the villages of population size range (1000-1999). The same trend is observed in 20 districts of the state with majority of population occupying villages of population size 1000-1999. [n the districts namely, Mayurbhanj, Nayagarh and Balangir the highest percentage of population live in the villages of population size range 500-999. In other five districts namely, Debagarh, Gajapati, Kandhamal, Baudh and
214
5 6 7 8
29.80 21.43 3.5S 020 32.12 27.40 6.67 1.10 3300 2681 2.35 29.05 14.83 4.16 22 08 648
31.33 18.11 2.78
33.46 11.55 043 25.95 908 30 10 19.87 433 I 31 33.52 28.05 5.00 0.88 35.62 25.00 1.38
31 34 23.69 1.47 3340 30.36 2 15 33.11 31.36 477
33.31 3093 480 25.62 22.74 5.32 2561 1975 5.46 2777 2598 4.27 30.57 22.89 443
32.26 32.46 9.48 1456 1327 II 85 6.88 2 26 2.48 15 10 4.20 32.68 15.18
2733 1200 249
3628 15 32 1.22
3307 2031 2,73 13.13 775 2 53 3855 29.10 4.48
28.03 15.18 3 14 21.84 23.92 2.86
Rayagada maximum percentage of population live in the villages of population size range 200-499. In the next two districts namely, Ganjam and Malkangiri, the majority of rural popUlation found in the villages of population size range 2000-4999.
Statement-2 given below presents the percentage of villages and the percentage of rural population by different population size range of villages in 1991 and 2001 census.

STATEMENT-2
Percentage of Villages and Population by class of Villages in 1991 and 2001
Less than 500 500-999 1,000- 1,999
% for No of % of % 10rNo % ot % for No % of
Villages In population at Villages population ot Village<; population
StatelD Istflct Year In thiS In this In 1111', In this In thiS thIs range to
range to range to rangt: to range to range to total No 01
V dlage~ total total No total total No of total
Popu latlOn ofVdlagc<; PopulatIOn VllIage~ Population
2 3 4 5 6 7 8
ORISSA 1991 6083 2289 2283 2763 1226 2862
2001 56 17 \914 2404 2585 1434 2980
Bargnrh 1991 3424 1125 34 92 2625 21 50 3007
2001 2856 860 3525 24 II 25 17 32 12
Jharsuguda 1991 4109 1476 3104 27 16 21 55 3759
2001 3497 1079 3468 27 05 21 10 33 00
Sambalpur 1991 6922 2935 1839 2598 '} 75 2790
2001 64 14 2537 2100 26 59 11 39 2905
Oebagarh 1991 8266 4884 1232 27 18 430 1797
2001 7947 4461 13 92 2683 'i77 2208
Sundargarh 1991 5486 2212 2838 32 15 1303 2S 02
2001 4968 1790 2937 2988 1608 31 33
Kendulhar 1991 5830 2807 284S 3568 II S I 2727
2001 50 17 2167 3059 3289 1643 33 46
MayurbhanJ 1991 6485 3441 2657 38 S I 732 2007
2001 57 12 2711 2999 37 86 I I 05 2595
Bale~h\\ar 1991 6025 23 05 23 28 27 50 1268 29 14
2001 53 65 1818 2578 2621 15 12 30 10
Bhadrak 1991 4486 1522 2761 23 91 2067 3492
2001 3725 1086 2936 21 69 2285 33 52
Kendrapara 1991 4384 1558 31 58 2906 18 17 31 89
2001 3859 1260 31 06 2540 2253 35 62
Jagatsmghapur \991 497\ 1892 2846 28 78 16 54 31 82
2001 4580 1600 2959 27 50 1777 31 34
Cuttack 1991 4228 13 I I 2859 2463 2047 13M
2001 3869 1120 2861 2289 22 ()9 33 40
215

STATEMENT-2 Percentage of Villages and Population by class of Villages in 1991 and 2001
2.000-4.999 5.000-1).1)99 )(1000 T
State / District Year % for~o. of °/0 of 0'0 for No. % (1 f ~o for No llf % of Villages In population 111 of Villages population Villages 111 population
this range to thiS range to in this range 111 th is th IS range to 111 this total No of tutal to total No range to total No. of range to
Village.;;. PopulatIOn ofVlilages. total Villages. total Population Population
2 Q 10 II 12 13 14
ORISSA 1991 3.85 18.42 0.22 2.27 001 0.17
2001 506 21.43 0.38 3.58 001 0.20
Bargarh' 1991 8.41 25.79 085 5.~9 0.08 1. 15
2001 9.83 2740 1.10 0.67 0.09 10
.Iharsuguda 1991 6.32 20A9
2001 8.96 2681 029 235
Sarnbalpur 1991 2.32 1225 032 4.52
2001 3.15 14.83 032 4.16
Debagarh 1991 0.72 6.01
2001 0.84 648
Sundargarh 1991 3.61 1668 o 12 1.03
2001 4.52 18.11 0.35 2.78
Kendu.lhar 1991 1.69 853 005 0.45
2001 276 I I 55 005 0.43
Mayurbhanj 1991 1.26 7.01
2001 1.84 9.08
Baleshwar 1991 3.44 16.43 0.31 320 0.04 0.68
2001 491 1987 046 4.33 0.08 1 31
Bhadrak 1991 637 21.77 0.49 4.18
2001 9.74 28.05 0.72 5.00 008 0.88
Kendrapara 1991 6.34 22.99 0.07 0.48
2001 7.61 25.00 021 1.38
Jagatsinghapur 1991 5.21 19.62 0.08 086
2001 6.68 23.69 0.16 1.47
Cuttack 1991 8.50 27.30 o 16 1.30
2001 1029 30.36 032 2.15
216

S tatelD istr iet
Jajapur
Dhenkanal
Anugul
Nayagarh
Khordha
Puri
GanJam
Gajapati
Kandhamal
Baudh
Sonapur
Balangir
Nuapada
Kalahandi
Rayagada
N abaran gapur
Koraput
Malkangiri
STATEMENT-2 Percentage of Villages and Population by class of Villages in 1991 and 2001
Year
2
1991
2001
1991
2001
1991
2001
1991
2001
1991
2001
1991
2001
1991
2001
1991
2001
1991
2001
1991
2001
1991
2001
1991
2001
1991
2001
1991
2001
1991
2001
1991
2001
1991
2001
1991
2001
Less than 500
%forNo of VIllages In
thIs range to total No. of
VIllages
3
42.74
37.84
4745
43.03
68.01
64 00
67.44
64.53
50.07
4654
50.09
4274
48.66
4548
87.53
85.05
9067
88.23
86.56
81.34
6077
56.94
51.45
47.85
4246
39.35
6567
60.55
8832
85 73
32.01
25.46
71.73
67.33
72,49
72.01
% of populatIon
In this range to
total Populatloll
4
13.26
1066
1344
1090
26.71
22.89
24.55
21.69
18.34
15.50
18.52
14.10
11.54
9.60
52.91
50.12
59.70
5387
59.84
5090
25.38
21.92
24.81
2180
15.82
1377
23.31
19.10
56.61
52.25
10.07
687
33.04
2809
33 18
2856
217
500-999 % forNo ofVlllLlges
in this range to total No
of Villages
5
28.47
27.11
24.06
25 09
1872
20.05
2005
21.23
2R 30
2924
28.19
32.05
2194
20.77
8.15
999
7 19
866
1090
14.17
2500
25.57
33.22
35.09
37.32
34.88
19.15
2068
8.57
10.42
33 83
3196
17.70
1873
1793
16.14
% of population
In til is range to
total Population
6
24.00
20.10
2125
20.06
2495
23.43
28 11
27 .49
27 .39
2648
2764
2801
1940
1620
20.60
22.05
21.73
22.66
2722
29.80
32.19
3022
36.97
36.38
3871
3341
26.68
24.79
2231
2434
26.69
21.00
2803
25 56
28.68
22.82
1.000-1,999 % for No. of Villages
In this range to
total No of Villages
7
20.54
23.18
1981
21.47
9.48
1072
920
10.25
15 78
16.27
16.05
18 10
19.73
21.52
3 15
3.51
1.63
235
2.36
395
11.88
14.35
1260
1372
17.11
21.30
1175
14.10
2.42
2.96
2633
30.02
838
1077
7.:n
766
% of populatIOn
in thiS
range to total
Popu lation
8
34.22
33.11
33.04
3331
2542
25.62
24.96
25.61
29 51
27.77
3020
30.57
33.08
32.26
1550
14.56
9.71
11.85
11.13
15.10
3022
3268
2644
27.33
32.47
36.28
31.27
33.07
12.07
13.13
39.52
3855
25.04
28.03
23 38
2 I 84

STATEMENT-2 Percentage of Villages and Population by class of Villages m 1991 and 2001
2,000-4,999 5,000-9,999 10000 +
State / Dlstnct Year % for No of % of % lorNa 0/0 01 % for No 01 ~o 01 Villages m populatIon In of Vtllages population Villages III population
this range to thIS range to In thiS range In th 1<; th IS range to II1thls total No of total to total No range to total No of range to
Villages PopulatIOn ofVdlages total Villages. total Population Population
2 9 10 II 12 1 "' 14
JaJapur 199] 780 2540 o l5 3 11
200] II II 3 136 076 477
Dhenkanal 1991 830 2956 038 271
2001 967 3093 o 74 480
Anugul 1991 355 2005 024 287
200] 469 2274 054 532
Nayagdrh 199] 304 1900 027 138
2001 353 1975 046 546
Khordha 1991 533 2030 045 333 007 . I 13
2001 736 2598 059 427
Pun 1991 535 2085 032 279
2001 654 2289 057 443
Gafljam 1991 887 3043 080 555
2001 1081 3246 I 42 948
Gajapatl 1991 1 17 1099
2001 145 1327
Kandhamal 1991 043 541 004 121 004 224
2001 063 688 009 226 004 248
Baudh 1991 018 181
2001 054 420
Sonapur 1991 235 1221
2001 314 1518
Balanglr 1991 267 1120 006 058
2001 306 1200 028 249
Nuapada 1991 295 1186 o 16 1 14
2001 432 1532 o 15 I 22
Kalahandl 1991 324 1649 o 19 225
2001 443 2031 024 273
Rayagada 1991 057 633 o 12 268
2001 077 775 o 12 253
N aba ran gapur 1991 749 21 58 034 2 14
2001 1176 2910 080 448
Koraput 1991 209 1250 o 10 139
2001 291 i 5 18 026 3 14
Malkangm 1991 225 1476
2001 398 2392 021 286
ll8

The above statement reveals that in Orissa, the highest percentage of vi lIages are in the popu lation range of less than 500 for both the Censllses 1991 and 200 I. The same trend is noticed in all the districts in 1991 and 200 I except Bargarh and Nabarangapur district where villages having population range 500-999 stand predominant.
The statement further makes Qut that the highest percentage of rural population in Orissa is recorded in the villages having population range 1000-1999 both in 1991 and 200 I Censuses. District wise analysis shows that in 200 I censu~ majority of districts (19 Nos.) in the state are having highest percentage of
219
rural population living in the villages of size 1000-19< Three n umbers of districts namely, Mayurbhal Nayagarh and Balangir have the highest percenta of population living in the villages of population si 500-999.
The next seven numbers of districts, name Debagarh, Gajapati. Kandhamal, Baudh, Rayaga( Koraput and Malkangiri mostly inhabited by tril people are having maximum percentage of populati living in the small villages of population size of It than 500. Galljam, the only district in the state I highest percentage of population living in the villa! of population size 2000-4999.
State {Dlstnct Police StatIon
ORISSA STATE
Bargarll District
Palkamal PS
Jharbandha P S
Padmapur P S
Burden P S
Galsllet P S
Me1chhamunda P S
Sohela P S
BIJepur P S
Barapah P S
Bheden PS
Bargarh P S
Bhall1 P S
Ambabhona P S
Attablra P S
Jllarsuguda District
Rengah PS
Lakhanpur P S
Belpahar P S Banaharapah P S
Onent PS
BraJaraJnagar P S Jharsuguda P S
Lalkera P S
Kolablra P S
Sambalpur District
Govmdpur PS
Mahulpalh P S
Kochmda PS
Jamanklra P S
Klsmda PS
NaktJdeul P S Ralrakhol P S
Charamal PS
Ju)omura P S
Dhama PS
Burla PS
Hlrakud P S
Amthapali P S
Dhanupah PS
Sadar P S
Sasan PS
Katarbaga P S
Debl1garfl District
Debagarh P S
BarkO! P S
Kundhelgola P S
Reamal PS
Total No of InhabIted
Total Rural PopulatIOn
VIllages P
2 3
47.529 31,287,422
1,180 1,242.795
101 78.966
104 90,332
71 55,089
52 27.204
83 66,197
73
93
109
73
96
61
84
104
76
346
77 34
4
31
I
33
39
91
36
1,238
66
142
142
150
75
67
123
96
92 67
33
3
8
4
42
62
66
711
201
153
131
226
61.500
94.797
95,843
102,323
122.362
146.407
84.909
63.671
153,195
323,831
55,909
32.178
3,146
39,219
212
24,124
44,417
91,496
33.130
681,835
54,086
71,223
62,356
54 108
18,0 I 'J
26,271
36,428
27,221
51.860 41,703
37,504
6,487
9,869
5,956
43,452
58.858
76,434
254,012
75,269
63.942
45.036
69,765
4
15.748.970
627.986
39,384
44.780
27.~86
13,554
33.226 30,975
48.025
48 058
52.232 62,211
74 928
42.955
32,136
77,936
163.985
28.326
16,337
1.626
20,163
113
12,302
22,438
46,055
16,625
343,182
26,956
35,382
31. I 76
27,247
8,964
13,183
18,216
13,839
26,203
21,194
19.184
3.264
5.021
3,074
22,039
29,793
38,447
127.890
37,771
32,284
22.858 34,977
F
5
15.538.452
220
614.809
39.582
45.552
27.503
13 650
32 971
30 525
46 772
47.78~
50.091
(,0.151
71.4 79
41954
31.535
75.259
159,846
27.583
15.841
1,520
19 056
99
11.822
21.979
45,441
16.505
338.653
27 130
35.841
31 I RO
26.861
9,055
13,088
18,212
13,382
25.657
20.509
18.320
3,223
4.848
2,882
21,413
29.065
37.987
126.122
37.498
31.658
22,178
34,788
Number
6
12.644
64
8
4
9
9
3
2
2
2
4
15
5
37
8
4
2
5
3
10
5
386
6
33
48
60
45
29
59
47
35 9
3
2
6 4
319
87
55 59
118
A-3: VILLAGES BY
Less than 200
P
7
1.266.503
8,352
1.210
565
981
1.299
246
228 289
168
308
584
1.985
489
4,248
939
253
257
533
532
1,081
653
39,659
845
3.964
4,568
6 573
3.790
2.349
5,771
5.530
3.545
822
351
318
746
487
33.053
8,926
5.910
5.734
12,483
PopulatIOn
M 8
629.567
4.213
604
291
503
646
123
118
149
81 I ~7
285
I 003
253
2.152
459
128
125
282 272
547
339
19,829
422
1.964
2.321
3,252
1.837
!.I8S 2.894
2,795
1.795
396
179
160
383
246
16.597
4.418
3015
2909
6.25'>
F
9
636.936
4.139
606
274
478
6'>3
123
110
140
87 151
299 y82
236
f·096
480
125
132
251
260
534
314
19,830
423
2.000
2.247
3.321
1.953
I 164
2,877
2,735
1.750
426
172
158
363
241
16.456
4508
2.895
2.825
6.22R
POPULATIQN SIZE CLASS
Number
10
14.054
273
30
23
13
211
27
25
16
32
7
15
3 16
38
8
84
20
7
2
7
II
7
21
8
408
20
53 45
62
21
21
41
37
24
25
10
8
18
23
246
70
57
44
75
P
II
4.722.646
98,518
11.000
8,428 4,130
6,548
9,771
8,932
5.481
12.203
2,248
5,876
1.436
6.293 13,068
3,104
30.691
7.204
2.450
631
2.676
212
3.874
2,618
7,893
3,133
133.323
6,820
17,069
14.829
20,608
6.373 7,351
13,377
11,457
8,227
8,118
3,317
2,375
5.734 7,668
80,257
22.866 I R,81 0
u.Jn 24.789
200-499
Population M 12
2.364.676
49.376
5.420
4.204
2.096
3.289
4.889
4,498
2.755 6.088
1.120
3,001
732
3,127
6,579
1,578
15.505
3,658
1.228
332
1.400
113
1.979
1,324
3.900
1.571
66,818
3.414
8,460
7.313
10.329
3.205
3.685
6.699
5.823
4.142
4,116
1,645
1.223
2.914
3,850
40,S 14
11.600
9.469
7.016
12.429
F
13
2.357.970
49,142
5.5XD
4.224
2.034
3.259
4.882
4,434
2.726
6,115
1,128
2.875
704
3. J 66
6.489
1.526
15,186
3.546
1.222
299
1.276 99
1,895
1.294
3,993
1.562
66.505
3.406
8.609 7,516
10,279
3.168
3.666
6,678
5.634
4.085
4.002
1,672
1.152
2.820
3.818
39,743
11.266
9.341
6.77n
12.360
221
Number
14
11,428
416
33
39
32
18
28
23
39
46
26 35
1.4
33
37
13
120
35
13
I
10
10
II
28 12
260
25
40
34
19
7 I (J
20 10
16
20
8
I
3
15
17
14
9~
3{)
28
18
23
p
15
8.086,983
299,583
23.615
28.491
21,757
12.064
21.059
16.80 I
28.112
33.372
1929 I
26.664
10.298
23.678
24.566
9.815
87,584
24.851
9.771
528
7.826
7.632
8.038
19.493
9.445
181.303
17.450
28.022
23.757
12,815
5.3QO
6.262
13.675
7.077
12.350
13.205
5.092
911
2.661
11.387
I 1.651 9.598
68.151
21.177
19.344
11.848
15.782
500-994
Pop ula! lOll
M 10
4.063,276
150.148
11.679
14.112
10.803
6.000
I D,583
8.487
14.053
16.703
9.781
13.534
5.224
11,917
12.308
4.954
44,271
12.609
4.9Q5
259
3.995
3.868
4.0QI
9.799
4,055
91. J 82
8,684
13.960
11,849
6.434
2.729
3,163
6,IW2
3,655
6.293
6,640
2.622
481
1,344
5.754
5.<)14
4.858
34,237
10,55<)
9.771
6.006
7 9() I
F
17
J 49,4
I I. 9
14.3
10.9
6.0
10.4
!U 14.0
16.6
9.5 13.1
5.0
I I. 7
12.2
4.8
43.3
12.2
4.7
2
3.8
3.7
3.9
9.5
4.7
90.1
8.7
14.0
11,9
6.3 2,6
3,0
0.8
3.4
6 0
6.5
2.4
4
1.3
5.6
':-.7
4.7
33,9
10.6
9.5
5.8 7.8
'>tatc ID1'itrlct
Po Itee Stat Ion
ORI~:-'A ~TAl E
Bargar" Distnct PalJ..amal P ~
.Iharbandha P S
Padmaplif P S
Burden PS
G .. w,llct P S
Mclchhamunda P <;
,",ohela P S
1111 e pur P <;
R.!rapall P S
Rheden P S
Rargarh PS
Bhall! P S. i\mbnbhona P S
i\ttablnl P S
Jltllr!lIguda District
Rcngall PS
L aJ..hanpur P S
Belpahar P S Banaharapalt P S
Onent P ~ Brularalnagar P S
IharslIglida P S
Lalkerd P S
Kolablra P S
Sambalpur District
Govtndplir P S Mahulpalll P S
Kochlllda P S
Jamanklra P S
Klsmda P S
Naktldcul P S
Ralrakhol P S
Charamal P S
IllJOmUra P S Dhama PS
Burla PS
Hlraklld P S
Atnthapalt P S
Dhanllpall P S
Sadar PS
Sasan PS
Kalarbaga P.S.
Debagarlr Distriel
Debagarh 1> S
Barh.ot P <;
l\.undhclgola P S
Rcamal PS
Number
18
6.81 "
297
26
35
14
4
22
22
28
23
24
26
J 8
24
II
20
73
II
6
1
8
6
13
21
7
141
11
15
15
8
2
6
3 2
13
12
7
I
4
4
12
12
14
41
12
11
10
8
1 000 1 9<,)9
P
19
9.322,642
399.193
32.062
44.141
20,004
4,982
28.518
28,360
37,200
30,670
34 508
34 184
26,927
33 250
16.77'"
27.612
1 06,883
15.519
8,799
1.987
12,680
7.821
18.407
32,474
9,196
198.101
16,304
19.974
19,202
10.505
2.466
7,528
3,605 3,157
19,020
17.405
9,285
1,913
4.665
5.956
18,057
17,885
21,174
56,088
16.721
15.107
13,662
10,598
Population
M 20
4.697.010
201.470
16.043
21.814
J 0065
2459
14.255
14,265
18.827
15.389
17.633
17.466
13 708
16,934
8513
14.099
53,960
7.852
4,433
1,035
6.385
3946
9,276
16.337
4,696
99,710
8.046
9.863
9.693
5,322
1.193
3.767
I 821
1 566
9.557
8911
4.763
937
2.364
3,074
9,119
9.064
10.650
28,307
8329
7.670
6927
5 381
222
21
4.625.632
197.723
10.019
22.327
9939
2 523
14 263
14 09<;
I !:!.373
15 281
16 87'"
16.71 M
13,219
16,316
X 262
13. 'i 13
52,923
7667
4366
952
6,295
3.87'1
9.131
16.137
4.500
98,391
8258
10.111
9, "'09
"'.183 1,273
3,761
1,784
1.591
9,463
8494 4,522
976
2.30 I
2,882
8,938
8,821
10,524
27,781
8.392
7,437
6 735
5.217
Number
22
2.404
116
4
3 3
1
3
3 7
5
14
17
21
7
3 2'i
31
3
4
3
5
II
4
39
3
4
I ...
4
9
9
6 2
2
2
A-3 : VILLAGES BY 2 (J()O-4 9<,)9
p
23
6.705.531
.HO,S72
1 I ll79
8 707 8217
2311
6603
7 407
17.657
13.457
38.050
49.157
70 673
21 104
7277
78 873
86,816
7.396
10.905
8,171
4264
14 822
30,555
10 703
101,085
7.024 2,194
3,607
2 781
8,718
2.153
10,566
3.663
2.543
11.315
22,842
23,679
16.463
5 579
4,771
6.113
Po[,>uiatlol1
M
24
3,390.649
173.182
'i 63!:!
43"'9 4 J 19
1.160
3 376
3 725
9 109
6.768
19 507
24 926
36 J 45
10692
3 733 39 92'\
-'4,038
3.748
5,553
4.199
2227
7.475
15,472
5,364
51,273
3.533
I 13'i
I 9 I 0
I 383
4416
1,131
5.394
1.846
I 313
5.783
11.518
1 I. 91 1
8,235
2 865
2.3<'9
3,0 II
25
3.314.882
167,390
" 441 4348
4 098
I 151
3.227
3.682
8.548
6.689
18,"'43
24,231
14 '\28
10.412
3."'44
311 948
42.778
3.648
5,352
3.972
2,037
7,347
15 083
5339
49.812
3.491
1.059
I 697
1.198
4 302
1,022
5 172
1,817
1.230
5,532
11,324
11.768
8,228
2,714
2.412
3.102

POPULATION SIZE CLASS
N urn her
26
180
13
4
5
4
2
p
27
1.120.333
82.870
6.119
5.852
8.058
6,173
23 366
33.302
7,609
7.609
28,364
5.643
8.893
13.828
5.000-9.999 Population
M 28
571.482
42.491
3.163
2.961
4. J 10
3,127
12.013
17.117
4,059
4.059
14.370
2,857
4.581
0,932
F 29
548.851
40.379
2.956
2.891
3.9·18 3.()·H,
I 1,353
16.185
3.550
3.550
13.994
2,181'
4.312
6,896
'\;lllll ber
30
5
I (l.!) () (I an cJ abo \ c
PorulatlOn
P M 31 32 ' ,
-'.'
62.784 32.310 30.·,n4
13.707 7.1()(j 6.601
13,707 7,100 A.oO I

State IDlstnct PolIce StatIOn
Sundargarh District Hemglr P <;
Lephnpara P S
Bhasma P<;
Sundargarh Town P S
Sundargarh P S
KtnJlrkela P S
Talasara P S
Baragaon P \
Kutra r S
RaJagangapur P S
Ralboga P S BlramJtrapur P S
Hallban P S
Blsra P S
Bondamunda P S
Brahmanl Tarang P ~
Raghunathapah P <;
Tangarapal IPS
Latlllkata P S
Bank! P S
Kamarposh Balang P S
KOlda P <;
LahunJpara P S
Gurundla P S
TII-.aetpall P S
Banel PS
Mahulpada P S
Kendujhar District
Telkol P S
KanJlpalll P S
Nayakote P S
Barbll P S
Joda P S
Champua PS
Bana PS
Turumunga P S
Patana P S
Ghatgaon P S
KenduJhar Sadar P S
KenduJhar Town P S
Pandapara P S
Hanchandanpur P S
Daltan P.S
Ghaslpura P S. Samkul P<;
Nandlpada P S
Anandapur P S
Soso P S
Mayurbhanj District
T IrIngl P S
Total Rural PopulatIOn Total No of
InhabIted
Villages ----~--------~----------------P M ~
2
1,723
148
106
96
2
87
59
80
73
40
84
44
62
63
1 I I
13
48
4
28
40
57
53
157
74
46
112
35
2,069
139
38
70
44
95
162
109
105
162
128
213
56
95
107
46
105
93
122
105
75
3,748
130
3 4 5
1.201,479
15.694
64.39Q
72.708
2.522
65,558
51,095
71,643
69.987
54,990
91,310
36.474
50.868
53,452
85,463
12,220
49,043
1.162
5.022
15.104
18.58'i
35,508
33,21 I
62,654
30,960
21,055
54,529
16,263
1,348,967
85,852
17,211
38,638
30,739
69,530
107.782
68,330
63,523
93,577
92,296
133,365
30,938
55,507
69,698
18,907
102,171
70,127
73,861
74,535
52,380
2,067,756
87 308
602,578
38,420
32 485
36 50 I
1.355
32,767
25 386
35,297
35,086
27,473
45 610
18,279
25,60 I
26 673
43,066
6.157
24,667
596
2,576
7.514
9285
18,007
17,022
31,255
15,413
10,505
27,398
8.184
678,455
43,259
8,622
19.072
15,7 I 2
35,558
53.9 I 8
33,875
31,713
46,398
46,417
66,913
15.775
27,831
35,170
9,650
51,859
35,362
37,425
37,442
26,484
1,041,057
43.329
224
598,901
37 274
31 914
36 207
I 167
32,791
25,709
36.346
34.901
27 517
45.700
18.195
25.267
26.779
42,397
6,063
24 376
566 2,446
7,590
9,300
17.501
16.189
31.399
15.547
10,550
27.131
8,079
670,512
42,593
8,589
19,566
15,027
33,972
53 864
34,455
31,810
47,179
45,879
66,452
15.163
27,676
34.528
9,257
50,312
34.765
36,436
37,093
25,896
1,026,699
43.n9
. Number
6
316 4~
30
4
I [
8 15
2
II
6
5
3
6
2
6
10
2
11
54
25
13
36
9
292
27
5
13
6
10
23
10
II
23
II
26
II
14
16
14
10
9
22
16
15
745
8
A-3: VILLAGES BY Less than 200
PopulatIOn
P M 7 8
32,914
4,852
2.985
493
916
873
1,256
371
192
1,540
717
570
261
649
172
56
789
1,242
98
1,535
:; 965
2.509
LlIO
1.094
669
35.657
3,381
760
2,016
809
1.315
2.922
1.3 [7
1,470
2,525
1.244
2.803
1.12 I
I. 758 1,897
1.474
1.148
875
2,577
2,375
1.870
82,899
806
16,477 2,498
I 480
248
468 436
624
172 I()~
738
353
283
119
315
80
37
388
636
'iO
787
2,968
1.28 I
539
534
338
17,870
679
362
971
373
675
1,460
656
713
1.281
625
1,436
5~8
908
958
745
575
438
1.289 1,202
966
41,610
402
F
9
16,437
2,354
1,505
245
448
437
632
199
87
802
364
287
142
334
92
19
401
606
48
748
2,997
1.228
571
1.560
331
17,787
1. 702
398
1,045
436
640
I 462
661
757
244
619
1.367
563
850
939
729
573
437
1.288 1,173
904
41,289
404

POPULATION SIZE CLASS
Number
10
540
55
36
34
I [ 7
17
16
[8 7
16
9
22 18
38
2
13
1
9 14
27
20
55
27 [ 9
37
12
746
54
19
24
16
33 49
45
39 64
32 86
23
39
40
21
21
34
43
39
25
1,3%
50
p
II
]82.2]7
17,561
12.] 10
11.049
492 5,767
6,659
5,006 7,059
2,711
5.436 2,989
7,223
6,748
13.420
839
4,397
496
2,663 4,693
9.967
6,705
18.226 8,732
5,757
11.441
4.071
256.636
18,212
6.120
8,641
6,028
11.718
16.868 16,136
13.090 2 [,383
11.835 29.457
7.743
12,611
13,081
6,807
8.033
11.907
14,413
14.072
8.481
477,630
17.524
200-499 Pop ulal IOn
M 12
9].002
8,924
6.066
5,535
252
2,924
3,246
2,439
3,552
1.357
2,739
1.448
3.508 3,377
6,745
411
2,207
246
1.345
2,289
5,072
3,407
9.077
4,276
2., 84 7
5.708
2.005
128,331
9,141
3,013
4,222
3,064
5,918
8,331
8,018
6,554
10,586
5,994 . 14,798
3,815
6,243
6,570
3,457
4,014
5,973
7,276
7.075 4,2M
240.595 8,583
F
13
9].2]5
&,637
6,044
5.514
240
2,843
3.413 2,567
3,507
1.354
2,697
1.541 3,715
3.371 6,675
428
2,190
250
1,318
2.404
4,895
3,298
9,149
4,456
2,910
5,733
2,066
128.305
9,071
3.1 07 4,419
2,964
5,800
8,537
8,118
6.536
10,797
5,841
14,659
3,928
6,368
6.511
3,350
4,019
5,934
7,137
6,997
4.212
237,035 8,94 I
225
Num ber
14
506 29
20
3:-
39
16
2~
32
9
22
19
16
24
38
4
12
2
11
13
18
1(1
40
17
9
26 I [
633
29 12
25
13
32 56
34
39
51
58
62
15
28
27
7
35
29
36
28
17
1,12ot
49
P
15
358.980 20,&48
14.506
24,338
28.293
11.641
21.2 [8
23,094
7.606
15,316
13,650 11.596
17.082
26,665
2,571
8.965
1,262
8.948
8,574
12.209
11.&24
25.809
11.603
6.733
17.421 7,408
443,725
20.522
7.742 17,360
8,711
22,303
38,<J34 24,308
26.739
35,092
41. 03 0 43 396
10,395
19.341
J 8.224 5,1 [8
26,247
20,075
25,795
20,540
11.853
782.786
33.782
500-999 Population
M 16
179.332
10.380
7.296
12,228
14,118
5.857
10.353
11.597
3.806
7,618
6.818
5.816
8.441
13 .3{) I
1.273 4,561
644
4,479
4.280
6.074
5.94(>
12.83 I
5.828
3.397
8,614
3.686
222.595
10,304
3,936
8,568
4.537
11.164
19,486 12,102
13,432
[ 7,309
20.417 21.596
5,385
9.716
9, J43
2,595
13.256
10.260
13.114 10,289
5.986
392,782
16.7RJ
F 17
179.648
10.26&
7.210
12.11(1
14. I 75
5,784
10.865
11.497
J,80(l
7.698
6.832 5,780
8,64 [
13.274
1.2<>R
4.404
618
4.469
4,294
6,135
5,878
12.978
5.775
3,336
8.807
3,722
221,130
10,218
3,806
8,792
4,174
11.139
19.448
12.206
13,307
17.783 20,613
21,800
5,010
9.625
9.081
2.523
12.991
9.815
12.6& 1
10.251
5.867
390,004 16.999
State IDtstnct
Poltee Station
Sundargarh District
HemglT PS
Lephnpara P S
Bhasma PS
Sundargarh Town P S.
Sundargarh P S
KmJlrkela P S
Talasara P S
Baragaon P S
Kutra P S
RaJagangapur P S
Ralboga PS
Blramltrapur P S
Hatlban PS
BIsra PS
Bondamunda P S
Brahmant Tarang P S
Raghunathapall P S
Tangarapall P S
Lathlkata P S
Bankl PS
Kamarposh Balang P S
KOlda P S
Lahuntpara P.S
GurUndt3 PS
Tlkaetpalt P S
Banel PS
Mahulpada P S
Kendujhar DIstrict
Telkol P S
KanJtpant P S
Nayakote P S
Barbtl P S
Joda P S
Champua p$
Bana PS
Turumunga P S
Patana P S
Ghatgaon P S
KenduJhar Sadar P S
Kendlqhar Town P S
Pandapara P S
Hanchandanpur P S
Daltan PS
Ghaslpura P S
Samkul PS
Nandlpada P S
Anaqdapur P S
S050 PS
Mayurbhanj District
Tmngl P S
"
Number
18
277
13
15
19
16 14
14
13
17
22
6
16
15
26
6
17
2
3
10
, 3
7 4
4
II
3
340
24
2
&
8
17
29
18
15
23
24
34
6
13
22
4
32
J 4
17
17
J 3
414
19
1,000-1,999
__ --:: ____ P_o:_p--:-ul--:-a_t t_o_n ___ -=-__ • N um ber P M F
19 20
376,384
15.543 20,816
26,329
19,856
19,693
20,846
19,428
23,914
30.616
7,766
19,223
20,434
35,089
8,638
24,330
1,162
2,704
4,076
13,234
3,429
9,856 5,685
5 186 14,416
4,115
451,303
30,735
2,589
10,621
11,642
22,859
35.537
22,073
20,024
30,431
30,941
44,81 I
9,029
18.989
29 800
5.'i08
43 907
19.302
21.852
23.627
17 026
536,647
24 918
188.808
7.743
10.451
13,243
9.886 9.730
10 288
9.703 11,972
15.246
3.952
9,704
10.314
17,659
4,393
12.228
596
1.302
2,080
6 811
1,701
4,930
2,825
2,614
7,282
2 155
227,701
15,498
1,311
5,311
5,985
I I, 74 7
17,818
10,844
9.922
15 130
15.634
22 578
4,659
9,567
15.039
2.8"3
22.449
9.697
II III
11 918
8630
270.930 12 322
226
21 22
187,576 78
7,800 6
10 365 5
13,086 4
9,970 4
9.963 4
10.558 6
9.725 8
11,942 6
15.370 1 I
3.814 4
9,519 2
10,120 3
17.430 3
4,245
12,102 4
566
1,402
1.996
6,423
1,728
4.926 2,860
2,572
7.134
1,960
223.602
l'i 237
1.278
5.3 [0
5 6"7 11,112
17.719
11.229
10 102
15 30 I
1",307
22.233
4 370
9 422
14.761
26'i5
21 458
960"
10.741
II 709
8.390
265,717
12. "96
2
57
5
2
5
2
I
2
7
7
4
5
5
69
4
A-3 : VILLAGES BY 2000-4999
p
23
217.609
17 090
13.982
10.499
2.030
10,726 12,229
17.962
20.035
20,567
27.932
11.352
5 839
892.7
9,640
11,2(}5
3264
4,716
2.798
2.431
2.269
2026
155.847
13,002
3.549
5,536
13 521
4,496
2,200
4 146
7 246
12 898
2650
2.808 6.(196
22.816
17 968
922l
13.921
13 150
187,794
10.278
PopulatIOn
M 24
109,810
8.875
7 192
<; 247
I 103
" 371 6.117
8.839
10062
10,233
14.018
5.7011
2995
4.422
4,956
5 634
686
2 553
I 449
I 203
1.108 019
78,847
6637
I. 753
2,943
6.823
2 2~" 1,092
2 092
3 747
6 505
1.358
r397
3 460
I I 565
8 994
4 63'>
6,958
6 633
95,140
5 239
25
107,799
8.215
6790
5252
927
5,355 6.112
9,123
9,973
10334
13.914
'i,644
2,844
4,505
4,684
5.661
1.578
2.163
I 349
1.228
1.161
987
77,000
6.365
1,796
2, "93 6,698
2241
I 108
2.054
3.499
6.393
1.292
1,411
3.236
I 1.271
8.974
4 "89 6963
o ~ I 7
92.654
5.039

POPULATION SIZE CLASS 5,000-9,999 10,000 an d abo ve
Num ber P opulallon Num beT P opu\at IOn -------=P------------~~M~------------~F~----- -----~p--------~~M~--------~F~---
26 27 28 29 30 31 32 J3
6 33.315 11,149 16,226
5,355 2,154 2,60 I
2 10,470 5,251 5,219
6,417 3,295 3,122
5,002 2,628 2,374
6,131 3,221 2,910
5,799 3,111 2.688
5,199 3, III 2,688
227

~tatc 1f)lstnct
Poltce'Statlon
Bahalda PS
Gorumahlsanl PC;
Ralrangpur P S
Ralfangpur Town P S
Badampahar P S
BI501 P S
Banglflpo~l P ~
.Iharpokhana P ~
Chandua PS
Kohana P S
Banpada <:>adar P S
Banpada Town P S
<'uhapada PS
Muruda P~
Betanatl P S
Rasagobmdapur P S
Ba1smga PS
Barsahl PS
Khunta P S
Udala PS
Kaptlpada P S
Sharata P S
tv1ahuldlha P S
Thakurmunda P 5
KaranJla P S
Jashlpur P S
Raruan P S
Ba leshwa rDistrict
Ralbanl3 PS
Jaleswar PS
Bhogral P S
Bahapal PS
Smgla PS
Basta P S
Rupsa PS
Baleshwar Sadar P S
Chandlpur P S
Remuna PC;
Bampada PS
Nllagm PS
l:3erhampur P S
Oupada PS.
Sora P S
Khalra P S
SlImlia PS
Bhadrak District
Agarpada P S
Battt 1'.$
Bhadr.tk Rural P S
Bhandan Pokhan P"
Dhamanagar P S
Total No of
Inhabited Villages
2
126
124
115
43
81
145
213
183
I J 7
171
133
8 155
114
120
164
196
190
216
121
99
52
62
rro 154
254
152
2,587
66
142
320
165
136
252
27
237
28
95
17
157
61
75
316
261
232
1.243
72 99
173
137
102
Total Rural Population
P M F
3 4 5
92.891
44.423
73.189
22.669
56,678
66,183
92.468
88,509
56,770
72.405
76,226
4.316
77,762
70,123
80.105
83.632
103,432
118,972
112,878
83.306
70.131
61,750
39,435
50,680 81,390
106.935
93,190
1,804,140
66,885
106,490
254563
151.786
117.315
131.867
22,320
162,430
40.739
51. 90b
10,130
98.653
48,592
33,538
241 848
123.594
141,484
t,1n,678
51,232
56.853
214.621
I OJ 4S9
X933"1
46.150
21,943
36.216
11.442
28,070
32,890
46.785
45,412
29,028
36,674
38.890
2.195
39389
35,268
40,522
42.287
52,595
60,522
56,920
42.025
35.70 I
31.247
19.497
25.312
40.817
53,521
46,410
921,740
33.986
54,443
130,367
78.033
60.30 I
67,887
IIA51
83.837
21.380
26.600
5237
50.032
24.793
16.340
123.650
61.817
71 586
602,681
25.796
28 620
108.707
51.283
44 821
228
46,741
22.480
36.973
11.227
28,608
33.293
45 683
43,097
27.742
35.73l
37.336
2.121
38.373
34,S55
39,583
41.345
50.837
58,450
55.958
41 281
34.430
30,503
19,938
25.368
40.573
53.414
46.780
8112,400
32.899
52,047
124,196
73.753
57,014
63,980
10.869
78 593
19.359
25.306 4893
48 621
23 799
17.198
118.198
61 777
69.898
589,997
25.436
28.233
105.914
'i(J 206
44.513
Number
13
43
14
5
9
33
68
49
23
50
24
21
12
22
39
34
25
44
18
17
4
6
32
30
82 19
586
18
30
53
32
25
73
3
53
8
26
4
40 1<;
26
52
80
48
126
6
18
9
21
10
A-3 : V1LLAGES BY Less than 200
PopulatIOn P M
7 8
I 931
4.097
1.910
597
1.384
4.186
7,666
5.205
2,514
4.385
2,429
61
2.654
1,453
2,352
5,144
4,064
2,676
4.811
1.568
2.006
709 789
3.160
4.210
7,661
2,471
61.468
1.870
2,536
5.786
2,948
2,394
7.433
369
4.76<;
816
2.718
353
4 573
1.178
3.011
5 773
9.107
5 838
13,287
731
2.337
921
2 'i7..J
I 000
954
1,989
930
306
678
2.050
3914
2.700
I 273
2,234
1.187
3 I
1 359
738
1.179
2.557
2.05 I
I 325
2,406
817
1.017
373
403
1.573
2, I 03
3,836
1.225
31,1"7
909
1.300
2.982
1.500
1.202
3.811
181
2,438
424
1.396
187
2305
589
1.441
2,970
4 575
2.937
6,698
367
1.163
465
28~
501
F
977
2.108
980
291
706
2 136
3 752
2.505
1,241
2.151
1.242
30
1.295
715
1.173
2.587
2.013
1.351
2.405
7"1
989
336
386
U87
2.107
3.825
1.246
30,321
961
1.236
2.804
1.448
1.192
3622
188
2.327
392
1322
166
2268
589
I 570
2,803
4.532
290 I
6,589
364
1 174
4%
I 291
499
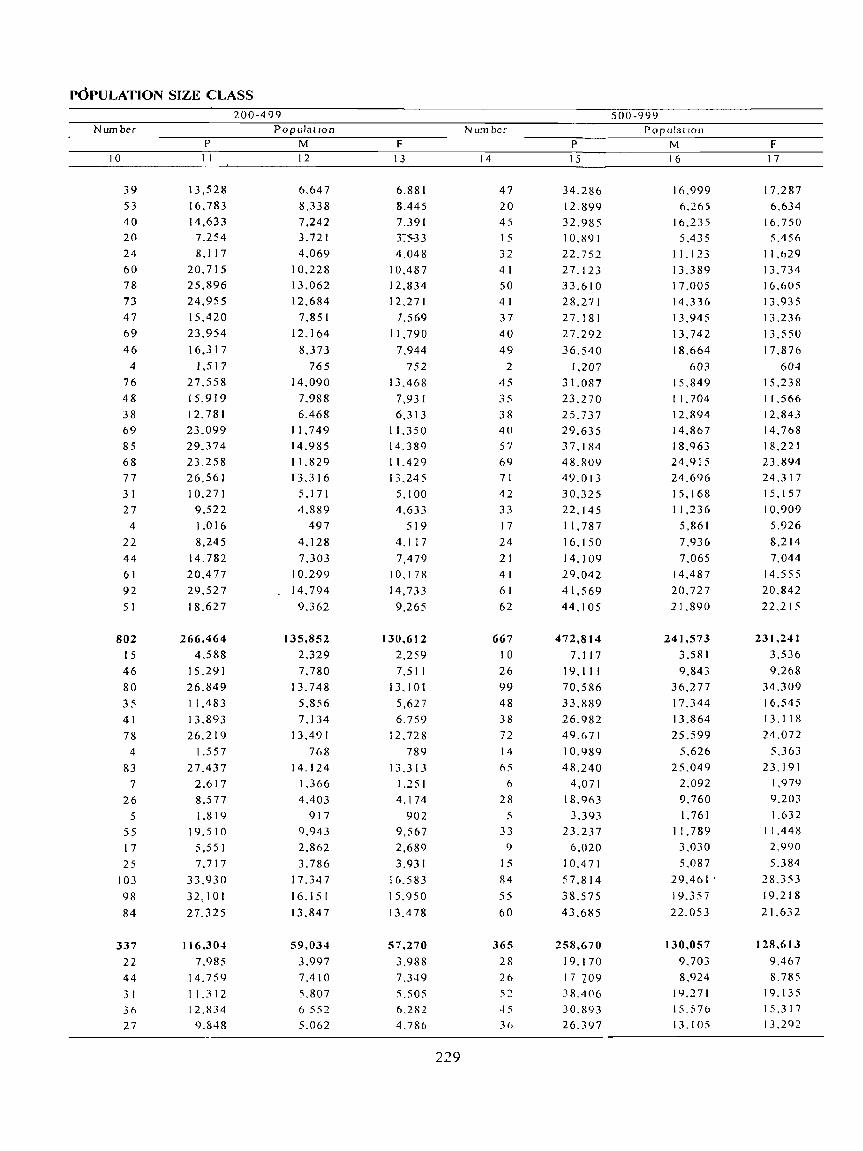
POPULATION SIZE CLASS
Number
10
39
53
40
20
24
60
78
73
47
69
46
4
76
48
38
69
85
68
77
3 I
27
4 22
44
61
92
51
802
15
46
80
35
41
78
4
83
7
26
5
55
17
25
103
98
84
337
22
44 3 I
36 27
P
II
13,528
16,783
14,633
7.254
8.117
20,715
25,896
24,955
15,420
23,954
16,317
1,517
27,558
15,919
12.781
23.099
29.374
23.258
26,561
10,271
9.522
1.016
8,245
14.782
20,477
29,527
18,627
266.464
4,588
15,291
26.849
11.483
13,893
26.219
1.557
27,437
2.617
8.577
1.819
19.510
5,551
7.717
33.930
32, I 0 I
27.325
116.304
7.985
14.759
11.312
12.104
9.848
200-499 PopulatIOn
M 12
6.647
8.338
7.242
3.721
4,069
10.228
13,062
12.684
7.851
12.164
8.373
765
14,090
7.988
6,468
1 I. 749
14.985
11.829
13.316
5, 171
4.889
497
4.128
7.303
10.299 _ 14,794
9.362
135,852
2.329
7,780
13.748
5.856
7,134
13,491
768
14.124
1.366
4,403
917
9.943
2.862
3.786
17.347
16.151
13,847
59.034
3.997
7,410
5.807
6 552
5.062
F 13
6.881
8.445
7.391
33-33
4.048
10,487
12.834
12.271
7,569
11.790
7,944
752
13.468
7,931
6,313
11.350
14.389
11,429
13.245
5.100
4,633
519
4.117
7,479
10,178
14,733
9,265
130,612
2,259
7,511
13,101
5,627
6.759
12.728
789
13.313
1,251
4,174
902
9,567
2,689
3.931
16.583
15,950
13,478
57.270
3.988
7,349
5,505
6.282
4.786
229
Number
14
47
20
45
15
32
41
50
41
37
40
49
2
45
35
38
40
57
69
71
42
33
17
24
21
41
61
62
667
10
26
99
48
38
72
14
65
6
28
5
33 <}
15
84
55
60
365
28
20
52
p
15
34.286
12.899
32.985
10.891
22.752
27.123
33.610
28.271
27.181
27.292
36.540
1.207
31.087
23.270
25.737
29,635
37.11l4
48.809
49.013
30.325
22.145
11,787
16,150
14.109
29.042
41.569
44.105
472,814
7.117
19.111
70.586
33.889
26,982
49.671
10.989
48.240
4.071
18.963
3.393
23.237
6.020
10,4 71
57.814
38.575
43.685
258,670
19.170
17 709 38.4()6
30.893
26.397
500-999 Populatwn
M 16
16.999
6.265
16.235
5.435
II. 123
13.389
17.005
14.336
13.945
13.742
18.664
603 15.849
r 1.704
12.894
14.867
18,963
24.915
24.696
15,168
11,236
5,861
7.936
7.065
14,487
20.727
21.890
241,573
3.581
9.843
36.277
17.344
13.864
25.599
5.626
25.049
2.092
9.760
1.761
11.789
3,030
5.087
29.461 .
19.357
22.053
130,057
9.703
8.924
19.271
15.576 13. [OS
F 17
17.287
6.634
16,750
5.456
11.029
13.734
16.605
13.935
13.236
13.550
17.876
604
15,238
11.566
12.843
14.768
18.221
23.894
24.317
15. I 57
10.909
5.926
8,214
7.044
14.55 :;
20.842
22.215
231,241
3,536
9.268
34.309
16,545
13.118
24.072
5.363
23.191
1,979
9.203
1.632
11.448
2,990
5.384
28.353
19.218
21.632
128.613
9.467
8.785
19.135
15.3 I 7
13.292

State IDlstnct Police Station
Baha1da PS
Gorumahlsanl P S
Ralrangpur P S
RaIrangpur Town P S
Badampahar P S
BISOI P S
Rangmposl P S
Jharpokhana P S
Chandua PS
Kohana P S
Banpada Sadar P S
Banpada Town P S
Sullapada P S
Munida PS
Betanatl P S
Rasagobmdapur P S
Bmsmga PS
Barsahl PS
Khunta P S
Udala PS
Kaptlpada P S
Sharata P S
Mahuldlha P S
Thakurmunda P S
KaranJla P S
Jashlpur P S
Raruan P S
BaleshwarDistrict
Ralbal1la P S
laleswar P S
Bhogral PS
Bahapal P S
Smgla PS
Basta P.S
Rupsa PS
Baleshwar Sadar P.S
Chandlpur P.S
Remuna PS
Bampada PS NJlagin PS
Berhampur P <;
Oupada P.S
Soro P S
Khalra P S
SlmllIa PS
Blradrak District
Agarpada PS
Bant P S
Bhadrak Rural P S
BhandarI PokhaTl P S
!)hal11,IIl~!!.lr P <;
Number
18
22
7
15
3
13
10
14
17
10 II
12
1
13
15
18
II
15
22
23
29
18
18
8
12
22 17
19
391
12
29
70
36
21
23
5
20
14
3 23
15
9
53
24
33
284
14
6
48
29
19
1,000·1,999
P
19
28, \ 55
8,354
20.962
3,927
16.037
11 127
17,472
23,126
11,655
14,347
16,038
1.531
16,463
19.875
24,804
14,212
18.285
27.739
30,263
39,120
24.153
24 933 9,894
15,754
27.661
21.511
24,331
543,121
17,067
39.294
99.943
49,866 28,225-
30,376
7,379
28,739
1.131
19,075
4,565
32,887
20.532
12,339
73.615
32.322
45,766
399,823
17,382
8,381
67,227
40.785
26,334
PopulatIOn M 20
14,048
4,213
10,457
1,980
8,030
5,612
8,801
12, 116
5,959
7,257
8.196
796
8,091
10.048
12,667
7.269
9.275
13,957
J 5.337
19,859
12,282
12,681
4,859
8,000
13.928
10.835
12,055
277,179
8,665
20,190
51.048
25,736
14,463
15,600
3,843
14,835
581
9.738
2,372
16,755
10,510
6.026
37.740
15,934
23,143
201.971
8.657
4,20 I
34,129
20,634
13,133
~30
F
21
14 107
4,141
10,505
1,947
8,007
5,515
8,671
11.010
5.696 7,090
7842
735
8.372
9,827
12,137
6,943
9.010
13,782
14,926
19.261
I 1,871
12,252
5,035
7,754
13.733
10.676
12,276
265,942
8A02
19,104
48,895
24,130
13,762
14.776
3.536
13,904
550
9,337
2,193
16,132
10,022
6.313 35,875
16,388
22.623
197,852
8,72'\
4,180
33,098
20,151
13,20 I
Number
22
5
1
3
I
3
3
2
4
4
5
5
6
4
9
2
I
2
127
10
10
17
10
9 6
15
3
6 5
23
4
7
121
2
5
31
6
10
A-3: VILLAGES BY 2,000-4,999
P
23
14.991
2,290
2.699
8,388
3,032
7,824
6.952
2.427
4.902
9.606
14,431
I I. 542
14,525
16,490
2,230
2,022
12.305
23,305
4,357
2.875
6.667
3.656
358.415
30.226
24,886
46,351
27,779
25,809
18,168
2,026
43,130
9.629
2,573
18.446
15.31 I
63,722
11.489
18,8 7 0
334,503
5.964
13.667
81,232
14,403
25 7 '\ ~
PopulatIOn M
24
7,502
Ll38
1.352
4,170
1 611
4003
3,576
1.2i 7
2.470
4.790
7,314
5,845
7,321
8,496
1,165
1.0 I 0
6,277
11 835 2,171
1.371
1,329
1,878
183,009
15,295
12,540
23, 7~8
14,310
13 277
9,386
I 033
22.137
5 031
1,303
9,240
7,802
32,491
~,800
9606
169,484
3.072
6.922
41,142
7,238
13 020
25
7,489
1,152
1,347
4,218
1,421
3.821
3.376
I 150
2,432
4.816
7,117
5.697
7,204
7,994
1,065
1.012
6.028 11,470
2.186
1,504
3,338
1,778
175,406
14,931
12.346
22,593
13,469
12,532
8,782
993
20,993
4.598
1,270
9,206
7.509
31.231 5,689
9.264
165,019
2,892
6,745
40.090
7:i 65 12 7 3 ~

POPULATION SIZE CLASS 5.000-9 999 I () II 0 0 and abo v e
Num ber Population Number PopulatIOn ------~P~----------~~M~-------------=F------- -----~p~------~~M~----------F~----
26 27 28 29 30 31 32 n
J2 78.190 40.738 37.452 2 23.668 12.242 11.426
6.017 1.207 2 810
5 372 2 790 2 582
5 048 2 554 2 -194
4 25 821 13 287 12 ~H
1 6.463 3 373 3 090 13.549 (1988 n ';61
10 119 'i 2"4 ..\ 865
3 22.475 II 886 10 ';89
6,994 3 641
9 59,639 30.309 29,330 10,452 5.128
2 ) 5 'i23 7.X93 7 (1 Hl
231

State IDlstnct PolIce Station
DhusurI P S
Tlilldl P S
Chandabah P S
Bansada PS
Nalkamdlhl P S
Basudebpur P S
Kendrapara Distrlct" RaJkanlka P S
Aall PS
Pattamllndal P S
Kendrapara P S
Patkllra P S
Mahakalapada P S
Rall1agar P S
Total No of Inhabited
VIllages 2
77
153
104
154
8 \
91
1.407
156
123
153
315
267
138
255
Jagatsinghapur District * Paradlp PS
1,227
32
124
147
305 223
KUJang P S
Ersama P S
Tlrtol P S
Bahkuda PS
Naugaon P S
JagatslIlghaplIr P S
Cuttack District
Mahanga PS
Salepur P S
Jagatpur P S
Klshannagar P S
NIall PS
Gobllldpur P S
Cuttack Sadar P S
Tangl P S
ChoudwaT P.S
GurlldiJhatia P S
BaTang PS
Athagad P S
TlglTla P S
Bankt PS
Baldyeswar P S
Badamba PS
Kanpur P.S
NaraslIlghpur P S
Jajapur District
Suklllda P S
Dubun PS
J3japur Road P S
Koral PS
JaJapur P S
Mangalpur P S
BIIlJharpur P S
88
308
1,856
191
272
37
109
124
89
126
97
49
84
23
101
47
89
57
134
69
158
1,575
133
44 41
217
252
96
203
Total Rural PopulatIOn
p
3
108.401
175,589
88,832
110,653
75,687
119,987
1,227,868
128,975
134,209
165,064
265.241 256,211
132,867
145,301
953.180
39.274
120.889
97,831
199,543
150,963
73.632
271.048
1,699,964
163,321
240,505
55,296
88,233
132,603
81,565
135,694
74,179
52,519
58,480
30,058
68,927
60,516
138,881
46,609
134,269
51,905
86,404
1,551,361
142,812
57,561
35.996
138,504
214,777
136,630
295,505
M 4
~4,400
88,695
44,891
56,553
37,783
61,132
608.380
61.239 64,107
79,908
133.565
128542
67.960
73,059
480,442
20,838
61,720
48,982
99,410
75,534
36,884
137.074
865,591
82,717
121,830
28,290
44,835
66,841
41,313
68,945
37,799
26,722
29,858
15,331
35, \ 71
31,036
71, I 19
23,523
69,405
26,835
44,021
785,443
73,399
29,434
18,425
70.337
109,419
68,153
146,403
232
5
54,001
86 894
43.941
54,100
37,904
58,855
619.488
67,736
70,102
85,156
13 1,676 127,669
64.907
72.242
472,738
18.436
59.169
48.849
100,133
7~.429
36.748
133,974
834,373
80,604
118,675
27,006
43,398
65,762
40,252
66.749
36,380
25,797
28,622
14,727
33,756
29,480
67,762
23,086
64,864
25.070
42,383
765,918
69,413
28 127
17,571
68,167
105.358
68.477
149,102
Number
2
8
3 32
11
6
142 9
II
6
36 15
13
52
174
5
23
22
44 35
6
39
243
19
23
2
II
II
12
II
15
9
19
I')
2
6
7
24
12
44
192
7
3
4
38
34
3 9
A-3 : VILLAGES BY
Les;, than 200 PopulatlOn
P M 7 R
309 151
745 340
203 100
2,718 1,443
957 435
792 400
13,848 6,929
1,233 600
I 262 586
885 40C)
3.898 1,998
1,648 824
)'021 513
3,901 1,9c)9
18,60 I
194
1,766
2.773
4,635
4,291
660
4,282
27,787
2.609
3,069
330 1,162
1,341
1.295
1,341
1,745
1,152
2,397
143
1,841
327
805
628
2,305
1,111
4,186
20.038
1,022
363 340
4,068
3.059
260
I 135
9,356
142
933
I 348
2,338
2,115
336 2 144
14,224
1.324
1,577
175 ~82
669
640
710
915
598
1,230
77 957
169
423
316
1,155 ~~9
2 148
10,208
544
177
167
2.046
562
111
566
F
9
158
405
103
1.275
472
392
6,919
633
676
476
1.900 824
508
1,902
9,245
52
833 1,425
2,297
2,176
324
2.138
13,563
1.285
1,492
155
580
612 655
631
830
554
1.167
66 884
158
382
312
1.150
552
2.038
9,830
478
186
173
2.022
1.497 12c)
569

POPULATION SIZE CLASS
Number
10
II
34
44
34
23
31
401
54 22
41
100
63
39
82
388
5
28
59
128
74
23
71
475
53 66
6
36
23
18
23
30
9
24
3 36
9 18
19
28
19
55
404
38
5
8 84
62
13
29
P
II
3,786
11.515
15,306
10,797
7,741
10,421
140.871
19,739
7,914
14,442
34,628
22,471
13,799
27,878
133.942
1,421
10,437
20.601
44.697
25,403
7,770
23,613
162,633
19.649
21,925
2,350
13,149
8,260
6,068
7,548
10,884
2,577
8,123
1,116
11,43 I
3,752
6,225
6,719
9,528
6,232
17,097
145,350
14,192
1,779
3,001
29,025
23,524
4,919
10,477
200-499
Population
M 12
1,870
5,878
7,670
5,557
3,888
5,343
70,084
9,493
3,709
7,019
17,468
11,024
7.348
14,023
66,819
759
5,354
10,202
22,097
12.642
3,880
11,885
82,880
9,968
11,172
1,213
6,667
4,125
3,033
3,788
5,619
1,273
4,133
564
5,926
1,941
3,173
3,355
4,903
3,2 I 5
8,812
73,877
7,228
883
1,489
14,722
12,095
2,437
-5, 160
F 13
1,916
5,637
7,636
5,240
3,853
5,078
70,787
10,246
4,205
7,423
17,160
11,447
6,451
13,855
67.123
662
5,083
10.399
22.600
(2.761
3.890
11,12_8
79.753
9,681
10,753
1,137
6.482
4,135
3.035
3,760
5,265
1,304
3,990
552
5,505
1,811
3,052
3.364
4.625
3.017
8,285
71,473
6,964
896
1,512
14,303
11,429
2,482
5,317
233
Number
14
18
43
27
46
26
18
437
49
38
45
83
88
44
90
363
7 34
42
83
72
33
92
531
61
105
4
34
39
27
36
31
9
17
8 28
15
15
13
37
21
31
427
38
15
16
59
71
28
50
p
15
12,561
31,720
19,841
32,780
17.200
11,993
311.888
32.591
28.452
32,515
57.013 64,836
31,190
65,291
262.135
5,335
25,566
28,464
59,727
52.084
24,503
66,456
389.047
44,711
76,172
2,603
25,639
28,248
20,555
26,430
22,415
6,316
12,943
6,136
21.076
11.741
11,278
8.762
26.686
15.825
21.511
311 ,832
29.039
12.316
11,882
42,224
51,183
21,1\47
36,780
500-999 PopulatIOn
M 16
6.160 16,034
9.911
16,712
8.613
6,048
154.788
15,475
13,583
15,878
28,747
32.379
15,945
32,781
131.381
2.784
12.988
14,053
29.711
26.099
12.231
33,515
198,009
22.705
38,508
1.388
13,035
14,236
10,363
13,437
11,488
3.194
6.687
3,151
10,696
6,003
5,791
4,407
13,824
8,212
10,884
158,130
14,810
6,095
6,079
21,395
26,137
10.527
18,212
F 17
6,401
15,686
9,930
16.068
8,587
5,945
157.100
17,116
14,869
16,637
28,266
32.457
15,245
32,510
130,754
2,551
12,578
14,411
30,016
25,985
12,272
32,941
191,038
22,006
37,664
1,215
12,604
14.012
10.192
12,993
10.927
3,122
6,256
2,985
10.380
5,738
5,487
4,355
12,862
7,613
10,627
53,702
14.229
6,221
5.803 20,829
25,046
10,620
18.568

State /Dlstnct Police StatIon Number
18
Dhusun PS 27
Tlhldl PS 48
Chandabal! P S 22
Bansada P S 38
Nalkamdlhl P S 16
Basudebpur PSI 7
Kendrapara District" 317
Rajkamka P S 34
Aah PS 35
Pattamundal P S 41
Kendrapara P S 69
Patkura P S 83
Mahakalapada P S 29
RaJnagar P S 26
Jagatsinghapur District" 218
Paradlp P S 7
KuJang PS 23
Ersama P S 16
Tlrtol PS 39
Bahkuda PS 32
Naugaon P S 22
Jagatsmghapur P S 79
Cuttack District 410
Mahanga P S 42
Salepur P S 53
Jagatpur P S 14
Klshannagar PSI 9 Nlah PS 34
Gobmdpur P S 24
Cuttack Sadar P S 3 7
Tangl PS 14
Choudwar PSI 4
Gurudljhatla P S 22
Barang P S 7
Athagad PSI 7
Tlglfla P S 12
Bankl P S 24
Bmdyeswar PSI 3
Badamba P S 28
l\.anpur P S 12
Narasmghpur P S 24
Jajapur District 365 Sukmda P S 34
Dubun PS 13
Jalapur Road P S 9
\<..oral P S 2S
JaJapur P S 69
Mangalpur P S 30
BtnJharpur PS 67
1,000-1,999
P
19
38,67 J
67.828
30,978
53,617 23,211
25,409
437,377
47,894
46,947
58,541
95,275
116,306
38,396
34,018
298,672
10.282
30.774
21.385
53.670
43.874
31,339
107.348
567,791
56,677
72,534
22,143
25,831
47.542
32,317
52,775
18.335
19.943
28,213
10.146
23.557
16.590
34,512
17.986
39.570
16,900
32,220
513.600
45.229
20,552
11,802
34,477
96,625
42,601
100,488
PopulatIOn M 20
19.443
34,293
15.706
27,346
11,570
12,859
216.673
22,631
22,859
28.375
47.866
58,566
19,251
17,125
150.474
5.242 15,521
10.69<)
26.864
22.011
15,789
54.348
288.339
28.617
36,626
11,305
13,095
23.958
16.379
26,741
9281
10 115
14.344
5.130
11.942
8494
17.715
9.125
20.488
8.718
16266
260,484
23.183
10,564
6.066
17,586
49.111
2).288
50,025
234
F 21
19.228
33,535
15,272
26,271
11,641
12,550
220,704
25,263
24.088
30.166
47,409
57,740
19.145
16.893
148,198
5.040
15.2"3 10,686
26.806
21.863
15,550
53.000
279,452
28,060
35,908
10,838
12,736
23,584
15.938
26,034
9.054
<).828
13.869
5016 I I ,61 ~
80%
16.797
8.861
19,082
8.182
15.954
253,ll6
22 046
9,988
5,736
16.891
47,514
21,313 50,463
Number
18
19
8
4
2
16
t07
10
17
20
27
18
10
5
82
8 1 "i
8
10
10
4
27
191
16
25
II
9 16
8
19
7
8
2
4
" 9
24
5
14
5
4
175
14
8 4
II
16
21 44
A-3: VILLAGES BY 2000-4,999
p
23
47.934
58,417
22,504
10,741
4,628
49.258
3U6,988
27,518
49,634
58,681
74,427
50950
31.565 14,213
225.794
22.042
46.884
24,608
28,240
25,311
9.360
69.349
516,149
39,675
66,805
27.870
22.452
41 970
21,330
47,600
20.800
22.531
6,804
12.517
11.022
28.106
71.329
12.514
39.597
11.837
11.390
486,548
40.781
22. "5 I 8,97 t
28.710
40,386
62,459
121.906
Population M 24
24.205
29,346
11,504
5.495
2,366
25,174
151,213
13,040
23.370
28,227
37.486
25.749
16.210
7.131
115,486
11,911
24,130
12.680
14,268
12,667
4,648
35.182
263,413
20, I 03
33,947
14,209
11.4"6
21, 189
10.898
24,269
10.496
11,542
3.464
6.409
:; 6"0
14429
36. "0 I 6.320
20,489
6.131
"i 911
245,636
21.145
I 1.715
4.624
14 588
20.514
31,091
60,297
F 25
23.729
29.071
11.000
5,246
2.262
24.084
155,775
14,4 78
26.264
30.454
36.941
25,20 I
15.355
7,082
110,308
10.131 227q
II (j28
13,972
12,644
4,712
34.167
252,736
19.572
32,858
13 661
10.996
20.781
10432
23.331 10.304
10.989
3340
6 108
5.372
13.677
34.828
6,194
19 108 C; 706
5479
240,912
19 636
1()836
4 347
14 122
19.872
31 368
61 609

POPULATION SIZE CLASS
Num ber
26
2
3
3
3
2
6
2
3
12 2
4
p
27
5,140
5,364
11.498
22.114
16,896
16,896
14,036
5,462
8,574
36,557
5,242
14,732
16.583
73,993 12,549
5,244
24.719
5,000-9,999
Population
M 28
2,571
2,804
5.733 11,308
8,693
8.693
6,926
2.794
4.132
18,726
2,664
7,516
8,546
37, I 08
6,489
2.679
12.143
F 29
2,569
2.560
5.765
10.806
8,203
8.203
7,J] 0
--2.668
4,442
17,831
2,578
7,216
8,037
36,885
6.060
2,565
12,576
235
N um ber
30
10,000 and above
PopulatIOn
P M F 3 I 32 33
10.452 5,128 5.324

State IDlstrlct Police StatIon
Ballchandrapur P S
Badachana P S
Dharmasala P S
Dhenkanal District
Bhuban PS
Kama"-shyanagar P S
ParaJang P S
Tumusmgha P S
Motunga PS
Ballml PS
Hmdol PS
Raso! PS
Dhenkanal Sadar P S
Gandla PS
A nugul District
Palalahada P S
Khamar PS
Rengah Damslte P S
Kal1lha P S NTPC PS
Sarna! Barrage P S
Talcher Sadar P S
Colhery P S
Blkrampur P S
NALCO PS
Banarpal P.S
Anugul PS
Bantala P S
Purunakot P S
Jarapada P S
Chhendlpada P S
Handapa PS
Klshorenagar P S
Thakurgarh P S
Athmalhk P S
Nayagarh District
Dasapalla P S
Gal1la P S Khandapada P S
Fategarh P S
Nayagarh P S
Nuagaon PS
Odagaon PS Sarankul P S
Ranapur PS
Khordha District
Bolagad PS
Begunla PS
Khordha P S
Total No of InhabIted VIllages
2
63
166
360
1,076
84 191
128
52
62 64
55 61
208
171
1,661
146
128
37
84
15
47
94
35
13 II
60
96
87
78 81
118
94
138
123
176
1,531
348
98 145
136
172
98
206 110
218
1,358
143
147
141
Total Rural PopulatIon
P 3
98,703
114,329
316,544
973,964
70217 145,440
147,488
48,573
65,563
54,145
39,168
66,082
194,025
143,263
981,587
57,293
55,554
28,373
48,747
15,015
36,262
50,304
26 125
19,328 27,198
69,115
97,264
63,317
25.927 72,624
96,827
45,076
50,607
43,554
53,077
827"'+5~
92,-1"7
34,650 71,936
112,868
145,637
39,941
102,693
98,084
129,144
1,071,689
82,167
88,797
130.649
M
4
49,818
58,728
161.327
495,078
35,558 74,277
73,884
24,443
33,584 27, I 75
19,748
32,616
100,679
73 114
501,368
29,055
28,067
14,644
25,153 8,030
18,579
26,426
13.634
10.293
14,620
35,253
50,063
31,983
13,077
36,341
49,358
22,905
25,527
21,630
26,730
426,794
47,452
18,031 37,541
57,799
75,984
20,600 53,175
50,983
65,229
543,490
41,909
44,874
66,618
236
F
5
48,885
55,601
155,217
478,886
34 659
71.163
73.604
24.130 31,979
26.970 19420
33 466
93,346
70 [49
480,219
28,238
27,487
13,729
23,594 6,985
17,683
23,878 12,491
9,035
12.578
33,862
47,20 I
31.334
12.850
36,283
47,469
22.171
25,080
21.924
26,347
400,656
45,045
16 619 34.395 5';.069
69653
19341 49 518
47, I 0 I
63,915
528,199
40.258
43 923
64.031
Number
6
4
3(,
54
204
22 3(,
25
12
7
13 12
7
40
30
540
60
39
5
25
3
II
40
14
2 2
10
26
22 33 17
28
30
56
39
78
611
228
50 ~9
14
31 4';
94
25
63
224
23
26
10
A-3 : VILLAGES BY Les<, thdn 200
P 7
372
3A39
5980
20,817
1,907
4 198
2.861
1 350
376
1,458
1.275
355 402 I
3016
53,352
7,339
3,436
351
2 736 199
678
2.715
1 073 175
43
1,027
2,453
2,096
3,415
1.299
2.307
3,082
5,769
4,613
8,546
52,872
19,217
3,995
4.422
1.450 3,4 71
4,294
8.344 2,303
5.376
23,464
2,423
2,362
I 344
Populat1Oll M 8
196 1,789
3030
10,769
1,001
2 153 1,496
66'\
199
746
638 172
2 158
1,541
26,987
3.663 1,7';5
187
1,408 108
354
I 406
568 102
20
513 t ,283
1.025 1,714
655
1.209
1.544
2.916
2.271
4.286
26,770
9.676 2,010
2,240
746
I 806
2.174 4,259
LIS I
2.708
11.887
1,229
1,194
694
r 9
176 1,6'\0
2950
10,048
906
2.04'\
I 365
685 177
712 637
183
1.863 1,475
26,365
3.676
1.681
164
1.328 91
324 1,309
505 73
23
514
1,170
I 071 1,701
644
I 098
1.538
2.853 2,342
4,260
26,102
9,541
1,985
2 182 704
1.66';
2 120 4 085
LI52 2,668
11,577
1.194
1.168
650
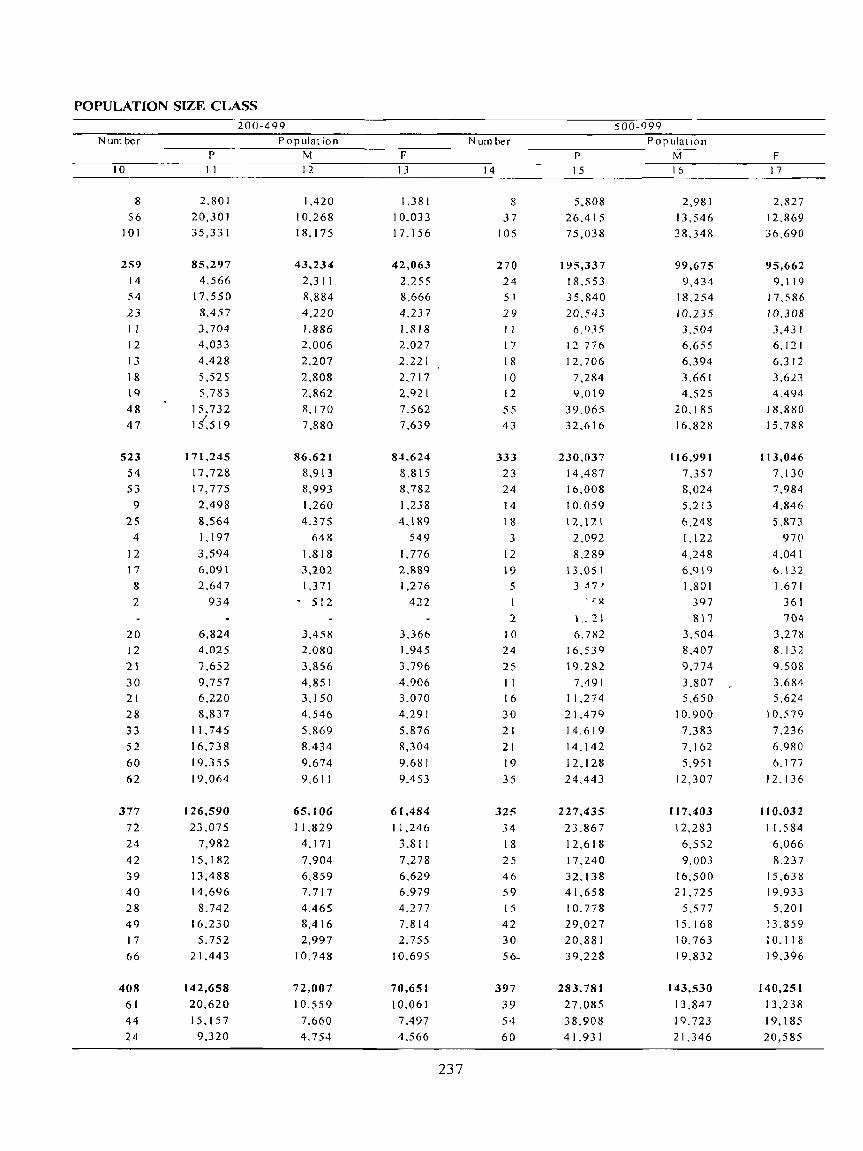
POPULATION SIZE CLASS
Number
10
8
56
101
259
14
54
23
II
12
13
1&
19
48
47
523
54
53
9
25
4
12
17
8
2
20 12
21
30
21
28
33
52
60
62
377
72
24
42
39
40
28
49
17
66
408
61
44 24
P 11
2.80 I
20,301
35,331
85,297
4,566
17.550
8.457
J,704
4,033
4,428
5.525
5,783
15.732 15,519
171,245
17.728 17,775
2.498
8.564
1,197
3,594
6.091
2.647
934
6.824
4.025
7.652
9,757
6,220
8,837
11.745
16.738
19.355
19,064
126,590
23,075
7,982
15,182
13,488
14,696
8.742
16.230
5.752
21.443
142,658
20,620
15.157
9.320
200-499 Population
M 12
1,420
10.268
18.175
43.234
2.311
8,884
4,220
1.886
2.006
2.207
2,808
2.862
R,170
7,880
86,621
8,913
8,993
1,260
4.375
648
1,818
3,202
1,371
- 512
3,458
2.080
3.856
4,851
3,150
4.546
5.869
8,434
9.674
9.611
65.106
11,829
4.171
7.904
6,859
7.717
4.465
8,416
2.997 10,748
72,007
10,559
7.660
4.754
F
13
1,381
10,033
17.156
42,063
2.255
8,666
4.2]7
1.818 2,027
2.221
2,717
2.921
7.562
7,639
84,624
8.815
8,782
1,238
4,189
549
1,776
2,&89
1,276
422
3.366
1.945
3.796
4.906
3,070
4,291
5.876
8.304
9.681
9.453
61,484
11.246
3.811
7,278
6,629
6.979
4.277
7,814
2.755
10.695
70,651
10.061
7,497
4.566
237
Number
14
8
37
105
270
24 51
29
I r 17
18
10
12
55
43
333
23
24
14
18
3
12
19
5
1
2
10
24
25
II
16
30
21
21
19
35
325
34
18
25
46
59
15
42
30
56-
397
39
54
60
P
15
5.808
26.415
75.038
195,337
18.553
35.840
20.543
6,935
12 776
12.706
7,284
9.019
39.065 32,616
230,037
14,487
16,008
10.059
12.121
2.092
8.289
13.051 3 ,17 I
\ .. 1\
6.782 16,539
19.282
7.491
11.274
21.479
14.619
14,142
12,128
24,443
227,435
23.867
12.618
17.240
32.138
41.658
10.778
29,027
20,881
39,228
283.781
27,085
38.908 41.931
500-999 PopulatIOn
M
16
2,981
13,546
38.348
99,675
9,434
18.254
10,235
].504
6.655 6,394
3,661
4.525
20,185
16,828
116,991
7,357
8,024
5.213
6,248
1.122
4.248
6.9\9
1,801
397
817
3.504
8.407
9.774
3,807
5,650
10.900
7.383
7,162
5.951
12,307
117,403
12,283
6,-552
9.003
16,500
21.725
5,577
15.168
10.763
19,832
143.530
13.847
19.723
21.346
F 17
2,827
12.869
36,690
95.662
9.119
17,586
10.308
3.431
6.121
6.312
3.623
4,494
18.880
15.788
113.046
7.130
7.984
4,846
5.873
970
4.041
6. \ 32
1.671
361
704 3.278
8.132
9,508
3,684
5,624
10.579
7.236
6,980
6,177
12.136
1I 0,032
I I. 584
6.066
!U37
15.638 19,933
5.201
13.859
10.118
19.396
140,251
13.238
19.185
20,585
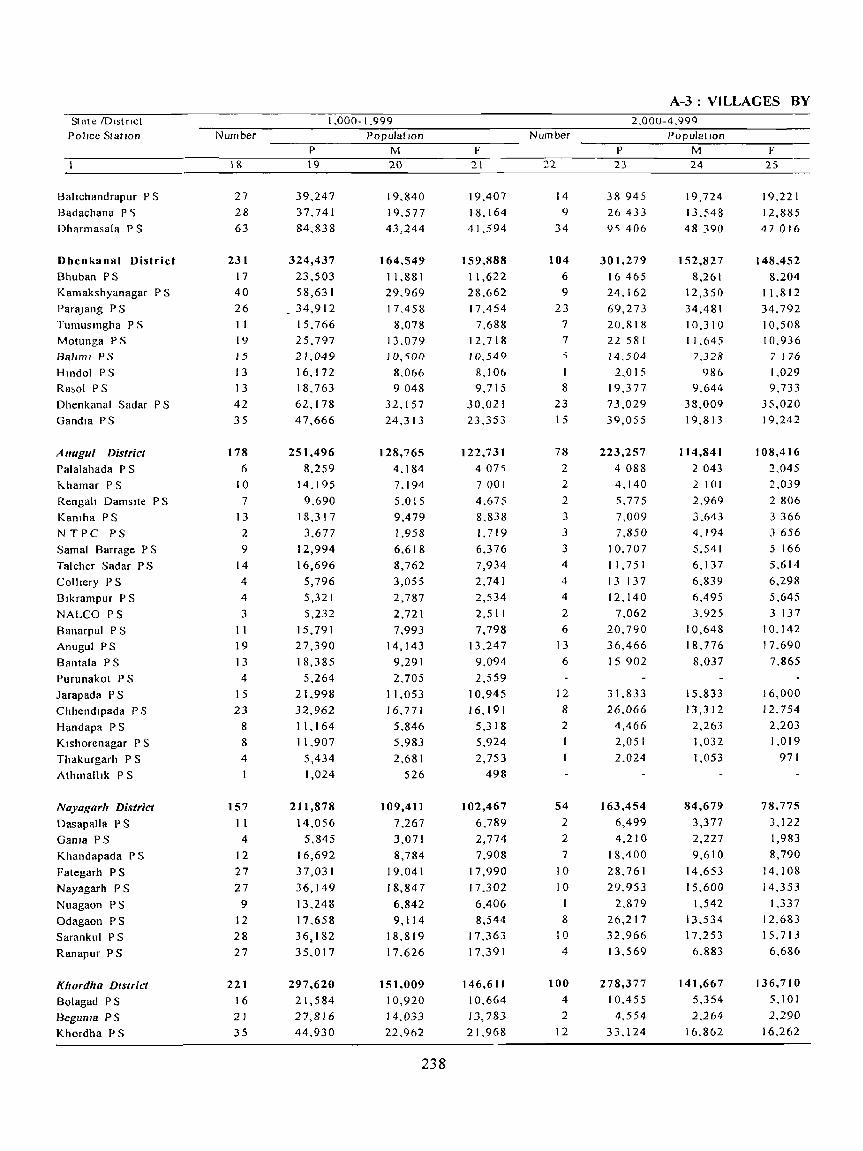
State IDlstnct Police Station
Bahchandrapur P S
Badachana P ')
Dharmasala P S
Dhenkanal District
Bhuban PS Kamakshyanagar P S
Parajang P S
Tumusmgha P S
Motunga PS
Ballml PS
Hmdol PS
Ra~ol P S
Dhenkanal Sadar P S
Gandl3 PS
Anugul District Palalahada P S
Khamar P S
Rengah Damslte P S
Kanlha PS
NT PC PS
Samal Barrage P S
Talcher Sadar P S
CollIery P S
Blkrampur P S
NALCO PS
Banarpal P S
Anugul PS
Bantala P S
Purunakot P S
Jarapada P S
Chhendlpada P S
Handapa PS
Kishorenagar P S
Thakurgarh P S
Athmalhk P S
Nayagarlr District
Dasapalla P S
Ganla PS
Khandapada P S
Fategarh P S
Nayagarh PS
Nuagaon PS
Odagaon PS Sarankul P S
Ranapur PS
KllOrdllO District
Bolagad PS Beguma PS
Khordha P S
Number
1&
27
28
63
231
17
40
26
II
19
15
13
13
42
35
178
6
10
7
13
2
9 14
4
4
3
II
19
13
4
15
23
8 8
4
1
157
I 1 4
12
27
27
9
12
28
27
221
16
21
35
1,000-1,999 Population
P M \9 20
39,247
37,741
84,838
324,437
23,503
58,631
_ 34,912
15,766
25,797
21,049
16,172
18,763
62,178
47,666
251.496
8,259
14,195
9,690
J 8,317
3,677
12,994
16,696
5,796
5,321
5,232
15,791
27,390
18,385
5,264
21,998
32,962
11.164
11,907
5,434
1,024
211,878
14,056
5,845
16,692
37,031
36,149
13,248
17,658
36,182
35,017
297.620
21,584
27,8l6
44,930
19,840
19,577
43,244
164.549
11,881
29,969
17,458
8,078
13,079 10,<;00
8.066 9048
32,157
24,313
128.765
4,184
7,194
5,015
9,479
1.958
6,618
8,762
3,055
2,787
2,721
7,993
14,143
9,291
2,705
11,053
16,771
5,846
5,983
2.681
526
109,411
7,267
3,071
8,784
19,041
J 8,847
6,842
9,114
18,819
17,626
151,009
10,920
J 4,033
22,962
238
F 21
19,407
18.164
41.594
159.888
1I,6ZZ
28.662
17.454
7.688
12.718
10.549
8.106
9.715
30.021
23,353
122,731
4 07~ 700 I
4.675
8.838
1.719
6,376
7,934
2,741
2,534
2.511
7.798
13.247
9.094
2.559
10,945
16,191
5,318
5.924
2,753
498
102.467
6,789
2,774
7,908
17.990
17.302
6,406
8,544
17,363
17,391
146.611
10,664
13,783
2].968
Number
14
9
34
104
6
9
23
7
7 ~
I
8
23
15
78
2 2
2
3
J
3 4
4
4
2
6
13
6
12
8 2
54
2
2
7
10
10
I
8
10
4
100
4
2
12
A-3 : VILLAGES BY 2,00U-4,999
Population P M 23 24
38 945
26433 <}<; 406
301.279
16 465
24.162
69,273
20.818
22 581
14.504
2.015
19,377
73,029
39,055
223,257
4088
4.140
5,775
7,009
7,850
10.707
1 1,751
13 137
12.140
7.062
20,790
36,466
15 902
31.833
26.066
4,466
2,051
2,024
163,454
6,499
4,210
18.400
28,761
29.953
2,879
26,217
32.966
13,569
278,377
10.455
4,554
33.124
19,724
13.548
48 390
152,827
8,261
12,350
34,481
10,310
11.645
7.328
986
9.644
38.009
19,813
114,841
2 043
2 101
2.969
3.643
4.194 5.541
6,137
6.839
6,495
3.925 10,648
18,776
8,037
15.833 13,312
2,263
1,032
1,053
84,679
3,377
2,227
9,610
14.653
15.600
1.542
13,534
17.253
6.883
141.667
5,354
2.264
16.862
F 25
19.221
12,885
47 016
148,452
8,204
11.812
34,792
10,508
10.936 7 176
1,029
9,733
35,020
19.242
108,416
2.045
2,039
2 80b
3 366
] 656
5 166
5,614
6,298
5,645
3 137
10,142
17.690
7,865
16,000
12,754
2,203
1,019
971
78.775
3,122
1,983
8,790
14.108
14,353
1,337
12,683
15.713
6.686
136,710
5,101
2.29D
16,262
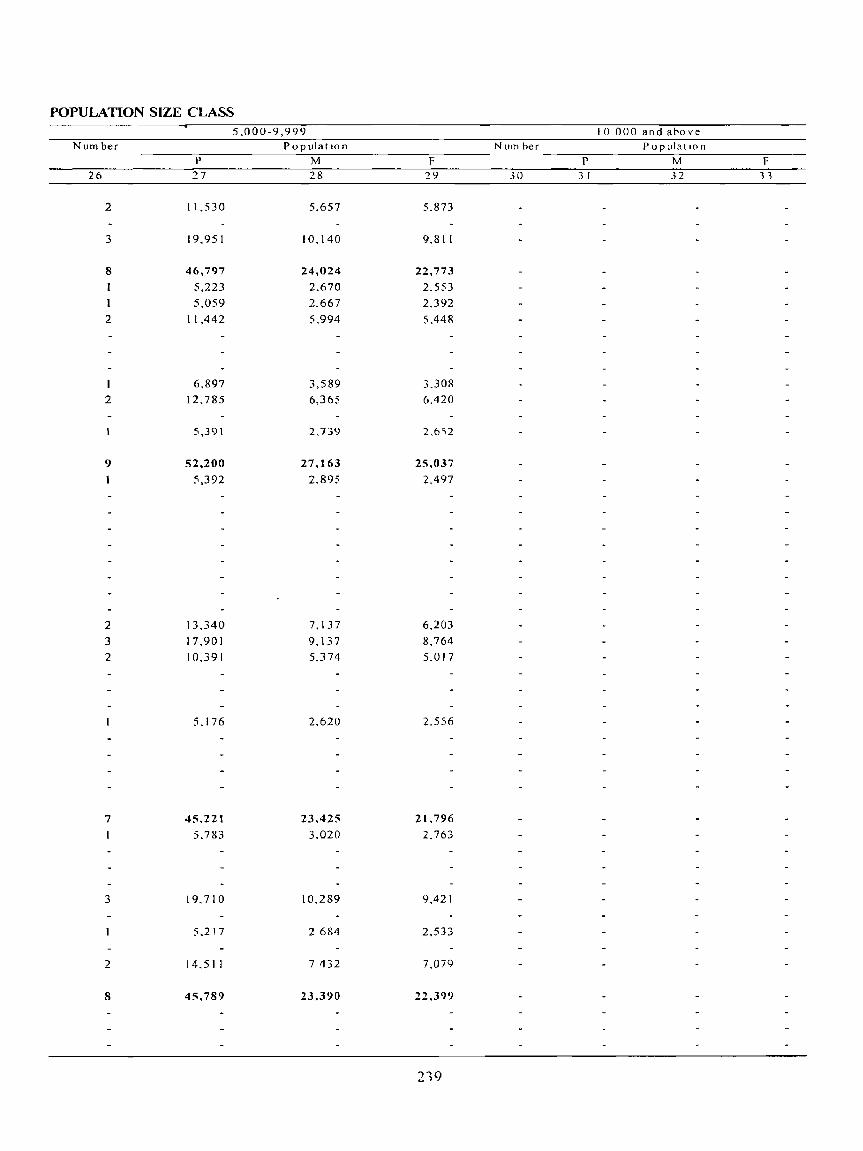
POPULATION SIZE CLASS
Num ber
26
2
3
8
I
I
2
2
9
2
3 2
7
3
2
8
p
27
11.530
19,951
46,797
5,223
5,059
11,442
6,897
12,785
5,391
52,200
5,392
13,340
17,901
10,391
5.176
45,221
5,783
19.710
5,217
14.511
45.789
5.000-9,999 Population
M 28
5.657
10.140
24,024
2.670
2.667
5.994
3,589
6,365
2.739
27,163
2.895
7.137
9,137
5.374
2.620
23.425
3.020
10.289
2684
7 132
23.390
F 29
5.873
9.811
22,773
2.553
2.392
5,448
3.308
6.420
2.6'i2
25.037
2,497
6.203
8,764
5.017
2.556
21.796
2.763
9,421
2.533
7.079
22.399
219
10 000 and ahove Num ber PopulatIOn
P M F
30 3 I 32 n

State /DIstrIct Pohce StatIOn
Chandaka PS
Khandagm P S
Saheednagar P S
Bahanta P S
Ballpatna P S
LmgaraJ PS
Jatanl P S
Jankla P S
Tangl P S
Balugaon PS
Banapur P S
Puri District
Delanga PS
Plptil P S
Nlmapada P S
Gop PS
Kakatpur P S
Konar"- P S
Satyabadl P S
Chandanpur P S
Sadar P S
Brahmagtrl P S
Krushna Prasad P S
Ganjam District
Tarasmgl P S
Buguda PS
BhanJanagar P S
Gangapur PS
Surada PS
Badagada PS
Astka P S
Purusottampur P S
Kablsuryanagar P S Kodala PS
Khahkote P S Rambha PS
Chhatrapur P S
Gopalpur P S
Brahmapur Sadar P S.
Golanthara P S
Nuagaon PS Dlgapahandl P S Jarada P S
Patapur P S
HtnJllt PS
Ramaglfl lP) P S
Gajapati District
Adva P S
Mohana P S
R Udayglri P S
TotalNo of Inhabited Villages
2
44
25
24
81
98
47
56
148
124
121
159
1,591
123
192
235
165
158
74
165
82
96
217
84
2,812
105
144
133
134
lOS
241
143
101
122
223
134
87
95
27
51
90
178
148
199
190
63
99
1,512
213
263
284
Total Rural Population
P M F
345
48.765
17,569
32,327
74,981
119774
22.942
55.109
108,394
130,747
78,730
80,738
1,298.654
99 123
128.963
175 367
124,544
156,982
44,276
173.036
79,414
89,638
176,209
5 J 102
2,604,276
77 ,800
144,532
129,545
144,922
63,790
112,019
166,728
133,497
169,767
187,169
107.798
75,319
150,358
53,429 120,560
128.879
92,077
114,486
108,053
191,598
121,887
10,063
465,949
51.261
64,547
73.352
24,895
9,051
16.408 38,272
60.857
II 713
28 228
54,630
66,716
39,673
39,646
657,199 49,811
65.724
88,863
63,259
79,607
22,296
86,854
40.353
45,238
89,017
26,177
1.295,086
39.003
71,441
64,305
69,982
31,801
56,390
82,646
66,065
83,426
91,952
53,640
38,305
75,444
27,246
61,260
63.858
45,631
57.188
52,740
97,619
59.975
5.169
228,862
25.322
32,033
36,257
240
23.870
8.518
1".919 36,709
58.917
II 229
26.881
53.764
64,031
39.057
41.092
641,455 49,312
63,239
86,504
61.285
77,375
21.980
86,182
39 061
44,400
87.192
24,92'\
1.309.190 38 797
73,091
65.240
74,940
31,989
55.629
84,082
67,432
86,341
95,217
54, IS 8
37,014
74.914
26,183
59,300
65,021
46,446
57,298
55,313
93,979
61,912
4,894
237,087
25.939
32 514
37,095
Number
6
5
4
14
7
l3
3
23
26
19
51
216 21
36
36
23
14
12
14
8
16
24
12
736
23
27
20
22
37
120
20
7
5
77
35
10
6
2
5
71
50 73
33
I
91
799
130
161
162
A-3 : VILLAGES BY Less than 200
PopulatIOn P M
7 8
494
426
1,404
6"3 I 389
211
2,381
3~ 141
2,084
5,152
22,942 2,475
4.203
4158
2,089
1,660
1.294
1,468
700 1,203
2,135
1.557
65,950
1,511
2,741
2,195
1,850
3,453
11,418
1.574
666
91
6,607
3,293
1,345
542
379
47
597
6,729
5,085
5,305
3,338
72
7,112
80,808
13.005
16.271
16721
271
208
740
317
732
118
1,189
1,610
1,019
2,556
11.6S3 1 252
2.120 2,124
1,042
864
648
727
371
625
101
779
32.740
739
1,376
1,092
906
1,693
5,618
758
318
42 3,321
1,612
642
285
214
23
289
3,119
2 576
2,684
I 639
32
3.562
39,015
6,362
7.846
8,043
F 9
223
218
664
326
657
93
1.192
1 531
1,065
2596
11,289
1.223
2081
2,034
1,047
796
646
741
329
578
1,034
778
33.210 772
1,365
1,103
944
1,760
5,800
816 348
49
3,286
1,681
703
257
165
24
308
3,410
2,509
2,621
1,699
40
3,550
41.793
6,643
8,425
8,678

POPULATION SIZE CLASS
Number
10
7
5
6
£4
19
17
19
50 3 I
47
54
464
30 64 69
54
39
29
34
2 I
21
70
33
543
30 22
30 24 26
58
20
20
15
30 32
29
14
I
3
18
4\
30
50
42
7
487
67
81
94
p
11
2.239 1,798
2,169
9,253
6,237
5,962
7,076
17.159 10.926
16,582
18.160
160,145
10,177
21,195
23,426
18,552
14,352
9,466
11.914
7.423
7.495
25.039
11,106
184,181
10.497
7,668 10,351
8,693
8,178
19,361
7,074
7,418
5,427
10.146
9,849
9,724
4,832
414
1.128
6.243
13,589
.. 10,084
17,068
14,020
426
I. 991
152,725
20.195
25,2SI
28,485
200-499 PopulatIOn
M 12
1.120
888
1.096
4.717
3.172
3,074
3.657
8,655
5,584
8,199
8,872
81,126
5.058
10.754
11.814
9,461
7,317
4.777
5.964
3.793
3.797
12,620
5.771
91,572
5.282
3.818
5.131 4,291
4,087
9,618
3,542
3,616
2.683
5,119
4,863
4,875
2.471
202 556
3.030
6.804
5,051
8,255
6,987
204
1,087
74.060
9,721
12,412
13,934
F 13
1.119 910
1,073
_;I,.,536 3,065
2.888 3,419
8,504
5,342
8.383 . 9.288
79,019
5,119
10.441
11,612
9,091
7,035
4.689
5,950
3.630
3,698
12,419
5.335
92,609
5,215
3,850
5,220
4.402
4.091
9,743
3.532
3,802
2.744
5.027
4.986
4.849
2,361
212
572
3.213 6,785
5,033
8,813
7.033
222
904
78,665
10,474
12,869
14,551
24\
NUIll ber
14
10
10 :;
25
31 I I
12
38
32
37
33
510
40
56
75
52
52
21
58
29
33
66
28
584
27
33
33
3U 19
3 I
39
21
33
47
30
22
21
6
5
19
36
29
42
45
15
151
10
16
20
p
15
6,909
7,020
3,173
18.742
22,905
7,941
9,011
27.523
23.136
25.837
23.660
363,758
30.054
37.855
53,669
36,219
36,579
14,490
41,042
21.305 24,626
46,860
21,059
421,842
19.641
24,384
23.020 21,394
12.781
21,445
27,624
14.823
25,721
34,206 2].952
15.051
15.549
4.903
3.781
14,200
25,209
22,574
30.0 II
31. 770
10.843
960
102,768
6,872
10,674
12,228
500-999 PopulatIOn
M II)
3.571
3.644
1,621
9,460
11,632
4.053 4,542
13.77 J
1 1.774
13,035
11.5 I I
183,726
15.092
19.355
27.012 18,216
18.503
7.340
20.543
10,849
12.430
23,624
10,762
209,036
9.817
12,141
11,278
10,323
6.375
10,750
13.709
7.251
12.588
16,699
10,994
7,700
7,860 2,409
1.868
7.008
12,449
11,114
14,603
16,133
5,447
520
50,763
3,440
5.43 I
6.112
F 17
3.338 3,37(>
1.552
9.282 11,273
3,888
4,469
13,752
11.362
12,802
12.149
180,032
14.962
18,500
26,657
18,003
18.076
7,150 20,499
10.456
12.196
23.236
10.297
212,806
9.824
12,243
11.742
11.071
6,406
10,_695
13,915
7.572
13,133
17.507 10,958
7.35 !
7,689
2,494
1.913
7.192
12.760
11,460
15.408
15.637
5,396
440
:Q,005
3.432
5,243
6.116

State IDlstnct Po hce <;tal Ion
Chand aka P ')
I\.handagm P'S
'>aheednagar P S
Bahanta P ~
Balrpatna P <;
I IIlgaraJ P ')
Idlanl P~
lanl...la P <;
langl P ')
Balugaon P ')
Banapur P S
Pun District
Delanga PS
Plpill P S
Nllnapada P'S
Gop PS
Kal...atpur P S
Konarl... P S
Satyabadl P S
Chdnddnpur P S
'>adar pc,
Brahmagm P S
Krushna Prasad P S
GanJam Distnct
Tarasltlgl P S
Bliguda PS
Bhan1anagar P S
(Jangapur P S
'>urada P S
Badagada P S ASII...a P ~
PlifUsottampur P <;
I\.ablsuryanagar P S
I\.odala P S
I\.hallkote P S
Rambha P S
(hhatrapur P S
Gopalpur PS
Brahmapur Sadar P S
Golanthara P S
l\Juagaon P S
Digapahandl P.S
Jdrada P S
I'atapur P S
I11Ilpl! PS
I{amaglfl (P) P S
(, ("apal, District
\dva P'S
\1ohand P S
I{ I daygm P S
Number
18
I" 5
4
5
28
6
15
27
13
14
17
288
24
28
42
26
34
10
40
J 5
J 7
43
9
605
18
45
36
34
16
21
40
33 42
46
24
18
28
8
18
27
24
27
29
49
22
< 53
4
3
4
I 000-1,999
P
21 q2
" 955 5 433 7 847
39 336
7 6"0 20.318
35.059
18.275
19,017
22.858
397,005
33,787
39.600
55 809
34 039
45 470
13.533
55 "02 22 0';1
23.620
61.124
12.468
840,231
24,796
6].782
50 "32 48,940
21,573
28,68-2
56,194
46,064
59,177
66,871
32,394
22,480
39.331 13,588
26,511
38,814
30,654
36,658
38,164
64,220
32,806
67,834
5,055
4.145
4,537
PopulatIOn
M 20
II l) I J
3 073
2 757
40"4
20 000
3 854
10.420
17,788
9386
9,634
11,115
200.702
16 934
20,100
28.279
17,259
23,133
6844
27 842
II 173 11,835
30,979
6,324
416,279
12 )72
30,396
24 949
23 326
10,839
14,581
27,851
22.865
29, J 59
32,613
15,959
I 1.519
19.7 J 5
7,023
13,338
19,030
15,202
18,226
18,523
32.668
16,125
33,824
2,698
2, J 53
2,264
242
F
21
10,529
2,882
2,676
3.793
19,336
3.796
9.898 17,271
8 889
9,383
11,743
196,303
16 853
19 500
27 530
16 780
22 337
6 689
27,660
10880
Il 78" 30 14'i
6,144
423,952
12,424
31.386
25.583
25,614
10,734
14 101
28.343
23,199
30,018
34.258
16,435
10,961
19.616
6,565
13,173
19,784
15,452
18,432
19,641
31.552
16,681
34,010
2.357
1,992
2,273
Number
7
9
13
9
7
10
19
3 4
104
7
7
12
9
17
2
17
9
8
14
2
304
7
17
12
24
7
10
22
18
23
21
II
6
2 I
9 19
19
6
II
4
15
22
22
2
2
4
A-3 : VILLAGES BY 2000 4 999
p
23
17 5 HI
2 370
21 ""2 37 73 'i
27 g62
18 493
26,272
58 275
9 196
10,908
297.281
17 349
20,016
32,908
28,121
46 'i37
'i 493
48 458
27 933
24,503
41.0<; 1
-1 912
845.202
21,355
47.957
31.926
64,045
17 805
24,358
63 279
51.980
"6,913
'i6,597
29,976
1" 697
57.466 25,596
55,442
54,926
15.896
33,535
11,340
43.409
65,704
61,814
6,134
8,176
I 1.381
Population
M
24
X l)2D
I 2,X
10 'n4 I q ,0 I
14 In
9491
13 227
29 'i 'll)
4 707
'i "92
150.905
H 773
10254
16 857
14.404
23 712
2687
24 404
14 167
J 2 413
20 693
2 541
420,710
10,793
23,710
15,932
31,136
8807
12,388
31.287 2'; 82(>
27 977 2H 041
14,9';4
7929
28 68" 12,643
28 210
27 420
7.85J 16,843
5,561
22,501
32 208
31,200
3,101
4,191
5,904
F
25
8 661
I 132
1 (I 618
I R 434
11 6R4
9 (l02
I ., 04"
28 o7b
4489
" 316
146,376
8,576
9,762
16,051
13,717
22.825
2,806
24.054
13 766 12 090
20 358
2,371
424,492
10, "62
24,247
15.994
32,909
8,998
II 970
31 992
26.1 "4
28.936
2!U54
15,022
7 768
28.781
12 953
27,232
27.506
8,039
16.692 'i 779
20 908
33496
30,614
3,033
3,985
5,477

POPULATION SIZE CLASS 5.000-9,999 10,000 and above
Num ber Populat Ion Num ber PopulatlOn ------~p------------~7M~------------~F~------ -----~p--------~~M~--------~F~---
26 27 28 29 30 31 32 33
4 22,781 11.548 11.233
3 16,994 8,763 8,231 6,014 3,079 2,935
9 57,523 29.087 28,436
5.281 2,702 2,579
6.094 3.141 2,953
5,397 2,777 2,620 I 5,524 2,877 2,647
2 12,384 6,078 6,306
2 14,652 7,374 7,278
8,191 4,138 4,053
40 246.870 124,749 122,121
2 11,521 5,923 5,598
6,755 3.435 3,320
2 10,983 5,499 5.484
2 12,546 6,189 6,357
4 22,,438 10.977 11.461
2 12,742 6,157 6,585
2 10,334 5,258 5,076
2 11,022 5,640 5,382
5 32,638 16,428 16.210
1 8,549 4,755 3,794
5 33,651 17,265 16,386
2 14,099 7,081 7,018
6,550 3.378 3,172
1 6,165 3,114 3,05 I
6 34.841 17,691 17,150
2 12.036 5.959 6,077
243

State IDIstnct Police StatIOn
(Jarabandha P S
Parlakhemundl P S
Kashmagara P S Serango P S
Rayagada PS
Ramagm (P) P S
Kandhamal District
Gochhapada P S
Phulabam PS
Phulabanl Town P S
KhaJuTlpada P S
G UdayaglTl P S
Tlkabalr PS
Sarangagarh P S PhlTlngla P S
Baltguda PS
Tumudlbandha P S
Belaghar P S
Kotagarh P S
Brahmalllgaon P S
Darlllgbadl P S
R3Ikla P S
Baud" District * Kantamal P S
Manamunda P S
Baunsum PS
Baudh Sadar P S Puruna Katak P S
Harbhanga P S
Sonapur District Dungunpall P S
Tarbha P S
Sonapur P S
BlramaharaJPur P S
Ulunda P S
BlIllka P S Rampur PS
Balangir District
Khaprakho[ P S
Turekela P S
Belpara P S
Kantabanp P S.
Bang('munda P S
Smdhekela P S
Tltlagarh P S
Saintala P S
Tushura P S Pat Itdgarh P S
]]al.ll'!!.lj P S
1 ol~lIlga P S
Total No of Inhabited Villages
2
103
133 72
222 115
107
2,379
215
235
6 164
176 157
88 224
397 90
130
128
82
157
130
1,115
217
293 83
276 110 136
829 [ 14
181
65 251
98 77 43
1,764
120
79 105
56
92 106 147 185 246
190 281 157
Total Rural PopulatIOn
P 3
26,293
76,876 40,164
65.354 41.507 26,595
604,107 30,621
36.376
1.290 38.905 57,906 46,875
31.497 46,638
100.521 23.913 16.835 37,581
31,199
54.723 49.227
355,347
63.654 88,491
36,932
99.464 31,951 34,855
501,767
107,307
85.054
33.632 124,746
35.5 I 0 75,179
40.339
1,182,871
64.121 40,298
68.205
41.280 60,4,43 74,727
107.131 123.994 158.621 .
110.156 195,194
138.701
M 4
12.866 37.968
19.836 31,501 20,166
12,913
299,929
15.188
18.289
684 19.528 28,745 23,244
15,574 23.270 50,127
11.869 8,254
18,814
15,247
26,798 24,298
]78,849
31,679 44,588 18,620
50,268 16,014 [ 7,680
254,805
54.518 42,836
17,169
63,398
17,924
38,334 20,626
594,182
31.967
20.061 34,348
20.564 30.118 37,087 53,425
62,776
79.975 55.237 98,825 69,799
F 5
13.427 38.908 20.328 33.853 21,341
13,682
304,178 15,433
18,087
606 19.377
29.161 23.631 15,923 23,368
50.394 12.044
8.581 18.767
15.952
27.925
24.929
176,498
31.975 43.903 18,312 49,196
15.937 17.175
246,962
52.789 42,218
16.463 61,348
17.586 36,845
19.713
588.689
32.154 20,237
33.857 20.7 I 6
30.325 37.640 53,706
61.218 78.646 54.919
96.369
68.902
Number
6
57 40 18
115 54
62
1,465
168 173
3 102
84 84
46 153 264
58
110 63 34
60
63
493
107
130 19
107
52 78
201
15 52
14
71
42
6
]79
20 IS 13
I
8 7
19
23 19
28 16
10
A-3 : VILLAGES BY
Less than 200
P
7
5.521 4,371
2.056 11.292 5,484
6087
130.306 13,181
13,212
402
9.496
7.741 8,506
5,292 12,202
22,401 6,170
8.490
6.828
3.349 5,983
7.043
46,207
10,420
13,312
1.974 9,964 4,644
5.893
20,014
1,538 5,384
1.6 I 6
7.476
3.268 604
128
23,606
2,704
1.710 1.954
166
961 1,079
2.394
3.027 2,473 -4,040
1.79 I
1.307
Population M 8
2707 2,190
1.020 5283
2.62.2 2,942
63,741
6550
6,463
228 4,716
3.793 4,184
2,589 5,991
10778 3,002
4,116
3.372
1.548 2,906
3,505
23,125 5,211
6,662
1.001 4,991
2.310 2,950
10,164
795 2,739
826
3 772 1,664
307
61
11,777
1.307 857
987 84
479 543
1,196
1 504 1,235
1.997
909
679
F 9
2814 2,181
1,036
6,009 2,862
3.14'i
66,565
6.63 I 6,759
174 4.780
3.948 4.322 2,703 6,211
11.623
3.168 4.374 3,456
1.801 3,077
3.538
23,082
5,209 6,650
973 4,973
2,334 2,943
9.850 743
2,645
790
3,704
1.604 297
67
11,829 1,397
853
967 82
482
536
1.198 I 523 1,238
2,043
882
628
-------------------------------------------------------------------------------244
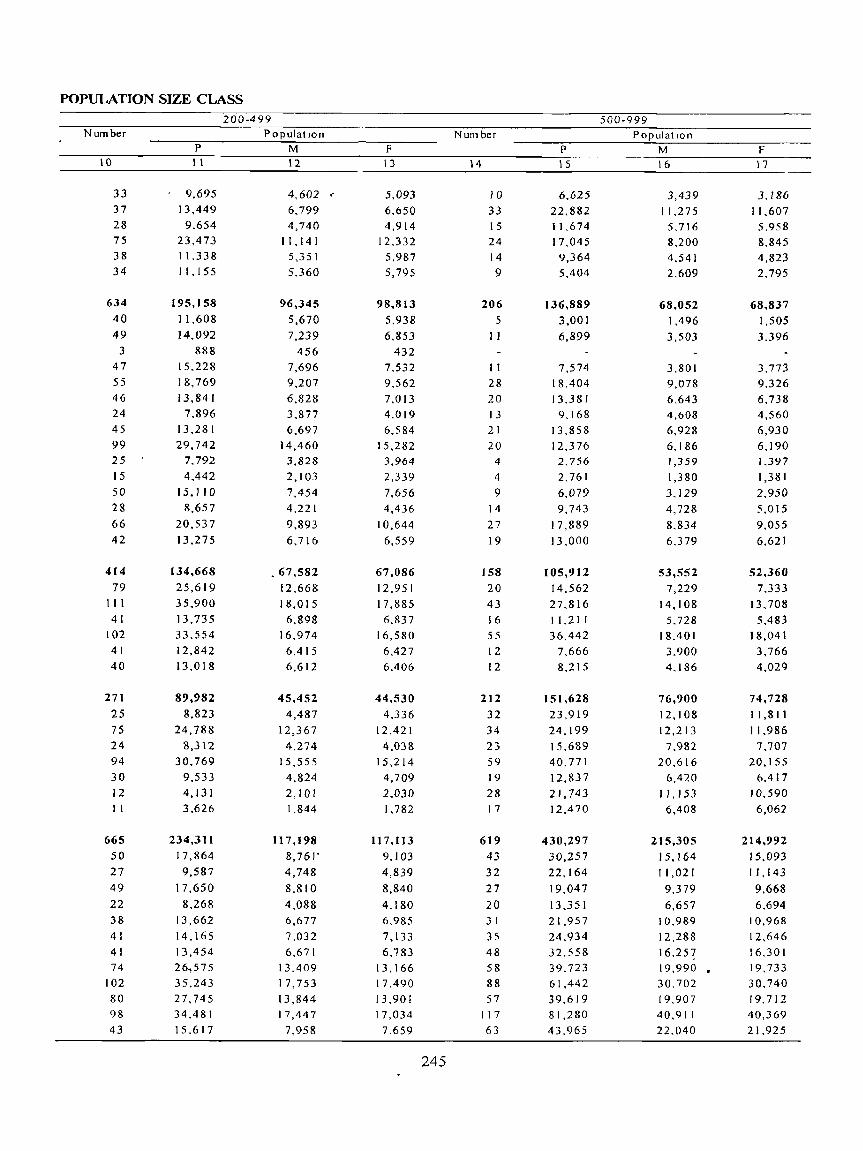
POPULATION SIZE CLASS
Number
10
33 37
28 75 38
34
634
40
49
3 47
55
46 24
45
99 25
15
50 28
66
42
414
79 III 4 [
102
41
40
271
25
75
24 94
30
12 II
665
50
27
49
22 38
4 I
41 74
102
80 98
43
P II
9.695 13,449
9.654 23,473
11.338 11,155
195,158 11,608
14,092
888 15,228
18,769
13,841 7,896
13,281
29,742 7,792
4,442
15,110
8,657
20,537
13,275
134,668
25,619
35,900
13,735
33,554
12,842
13,018
89,982
8,823
24,788
8,312
30,769
9,533
4,131
3,626
234,311
17,864
9,587
17,650
8,268
13,662
14,165
13,454
26,575
35,243
27,745 34,481
15,617
200-499
PopulatIOn
M 12
4.602 r
6,799 4,740
11.141 5,35 I
5,360
96,345
5,670
7,239
456 7,696
9,207
6,828
3,877
6,697
14,460 3,828
2,103
7,454
4,221
9,893
6,716
_ 67,582
12,668
18,015 6,898
16,974
6,415
6,612
45,452
4,487
12,367
4,274
15,555
4,824
2,101
1.844
117,198 8,761'
4,748
8.810
4.088 6,677
7.032 6,671
13.409 17,753
13,844 17,447
7,958
F \ 3
5.093 6.650 4,914
12,332
5.987 5,795
98,813
5.938
6.853
432 7.532
9.562
7,013
4.019 6,584
15.282 3.964
2.339
7.656 4,436
10,644
6,559
67,086
12,951
17,885
6,837
16,580
6,427 6,406
44,530 4,336
12,421
4,038 15,214
4,709
2.030 1,782
117,113
9,103
4,839
8,840
4,180
6,985 7,133
6.783 13,166 17,490
13,90 !
17,034
7.659
245
Number
14
10
33 15
24
14
9
206 5
II
II
28
20
13 21
20 4
4
9
14
27
19
158
20
43
16
55
12
12
212
32
34
23 59
19
28 17
619
43
32
27
20 31
35 48
58 88
57 117
63
P
15
6.625 22,882 11,674
17,045
9,364
5.404
136,889 3,001
6,899
7,574
18.404
13.381 9,168
13,858
12.376 2.756
2,761
6.079 9,743
17,889
13.000
105,912
14.562
27,816 11.21 [
36.442
7,666
8.215
151,628
23.919
24.199
15.689 40,771
12,837
21,743
12.470
430,297
30,257
22.164
19,047
13.351
21.957
24.934
32.558
39.723 61.442
39.619 81.280
43.965
500-999
PopulatIOn
M \ 6
3,439
11,275
5.716 8,200
4,541
2.609
68,052 1,496
3,503
3,801 9,078
6,643 4,(>08
6,928
6,186
1,359
1,380
3.129
4,728
8.834
6.379
53,552
7,229
14,108
5,728
18.401
3.900 4.186
76.900 12,108
12,213
7.982 20,616
6,420
11,153
6,408
215,305
15,164
11,021
9,379
6,657
10,989
12,288
16.25~
19,990 •
30.702
19,907
40.911
22.040
F \ 7
3.186
11.607 5.958
8.845
4.823 2,795
68,837 1,505
3.396
3.773
9.326 6,738
4,560
6,930
6.190 1,397
1,381
2.950
5.015
9.055
6.621
52,360
7.333
13.708
5.483
18.041 3,766 4,02Q
74,728
11,811
11,986
7,707
20,155
6.417
10.590 6,062
214.992
15.093
1 1,143
9,668
6,694
10,968
12.646
16.301 19,733
30.740
19.712
40,369
21.925

Stale (DistrIct Police Station
Garabandha P <,
Parlakhemundl P S
Kashtnagara P S
Serango P S
Rayagada P <;
Ramagm (P) P S
Kandhamal District
Gochhapada P ~
Phulabanl P S
Phulabanr Town P S
KhaJurtpada P S G Udayagm P S Tlkabalt P S
Sarangagarh P S
Phlrmgla PS
Babguda PS Tumudlbandha P S
Belaghar P S
"-otagarh P S
Brahmamgaon P S
Darmgbadl P S
RalkJa P S
Baudlt District '" !<..antamal P <;
Manamunda P S
Baunsulll P S
Baudh <;adar P S
Pllruna "-atal.-.. P S
Harbhanga P S
Sonapur District
Dungunpah P S
Tarbha P ~
Sonapur P S
BlramaharalPur P S
Ulunda PS
Btnlka PS
Rampur P S
Balangir District
Khaprakhol P S
Turekela P S
Belpara P S
KantabanJI P S
Bangomllnda P S Smdhekela P S
Tltlagarh P S
Satntala P S Tushura P <;
Patnagarh P ~
Balanglr P S
LOlslnga P S
Number
18
3
17
9 5
7
56
2 2
3 8 6
4
4
9
2
1
5 4
2
4
44
II
9
5 10
4
5
119
34
17
3
21 6
26
12
242
5
5
13 10
13
21
33 23
30 22 41
26
I 000-1 999
p
19
4.452
21 339 12 040 6059
9.036 1.171
71,597
2.83 I
2.163
3349 10.593
7.834
5.325 5.1 'i I
10984
2.893 1.142
6.497
4.838
2.318
5.679
53,646
13,053 11,463
5.519 13,236
4.746 5,629
164,001
47,698
22,614
4,530
29, I 07
7,459
35.942 16,651
323,310
6.547
6.837
16,612 12,040
15.998
27.556
45 177
30.797 40.230
29.907 55.997 35.612
Population M 2(J
2,118
10 500 6014 3 159 4378
540
36.062
1.472 1.084
I 677
5.421 3 837 2.595 2 514 5 760 I 475
655
3.243
2.336
1.224 2769
27,011
6 571
5.803
2.733 6.747 2.312
2.84'\
83.452
24.268
11.407 2307
14.869
3.789 18.30 I
8.511
163.018
3.305 3435
8449
5.996
8.054
13.724
22.526
15.569 20.517 15.041 28 548 17 854
246
21
2334
10839
6.026 2.900 46'i8
631
35,535
1.359 I 079
1.672 5 172
3997 2 730
2.637
".224 1.418
487
3.254
2.502
1.094
2.910
26,635
6.482
5.660
2.786 6.489 2434 2 784
80.549
23.430
11 207 2,223
14 238
3.670 17,641
8.140
160,292
3 242
3402
8,163 6044
7,944
13 832
22.651 l'i 228
19.713
14.866 27449 17 7'i8
Number
6 2
3
2
15
4
I
2
6
2
2
26
8
3
6
I
5
2
54
2
2
3
2
6 5
7
3 9
14
A-3 : VILLAGES BY 2.000-4 999
P
23
14.835 4,740
7.485 6.2!!5 2.778
41.561
3.258 2399
3.3 I 3 3 816 2 146
10.061 4,302
3 067 4,612
2,483
2,104
14,914
4493 6.268 2,053
2.100
76,142
2 ~.329
8,069
3,485
16.623
2.413
12.759
7.464
141.901
6 749
5,354
7.455
2.764
6.993
13.548 12.732
19.233
8.845 21 645 36 583
Population M 24
7.204
2.346 3 718 3 274
1.462
2 [.277
638 246
I 752
1.905 1,140 5 109
2.205
1.616
2.414 1.244
1.008
7,579
2.260 3.155 1.077
1.087
38,837
12.860 4,110
1,780
8.586 I 227 6,472
3.802
71.621
3,430
2,703
3.739
1.383
3.500
6.]75 6436 !) 768
4448
11,0 r 0
18 429
25
7.63 I 2.394 3 767 3011 \ 316
20.284
1.620 I 153
I 561 \,911 1,006 4952
2.097
1.451 2,198
1.239
1.096
7.335
2.233 3,113
976 I 013
37.305
12.469
3.959 1,705
8 037
1,186
6.287
3.662
70,280
3,3 I 9
2,651
3.716
1.381
3493
6,773 6,296
9,465
4397 10,635 18.154

POPULATION SIZE CLASS
N urn her p
26 ::!.7
2 13.Ct3,)
X 126
29.446
7,588
5,101
2 1).140
~.617
5 (I(J(l-9 <)l)9
•
Population
M
6.61N
2697 1<)21
15.263
4.020
2 536
5 868
2 839
l-~ l)
7.1121
2 X 16
I ~O.:;
14.183
3.568
2565
5,272
2.778
247
I\i I lin ber
~ ! j
10.000 and above
PopulatIOn
f' M r 31 32 33
14,957 7,834 7.123
14 957 7 834 7 123

State IDlstnct Pohee StatIon
Nuapada District
Jonk P S
Nuapada P S
Komana P S
Khanar P S
Boden P S <)mapah P S
District: Kalaha nd i
Kokasara P S
Dharamgarh P S Kegaon P <;
<)adar P S
h.eslIlga P S
Narala P S
Madanpur Rampur P S
I anJlgarh P S 1 huamul RampllT P <;
lunagarh P S
layapatna P S
Rayagada District
\mbadala P S
Mumguda P S
Blshamakatak P S
Gudan PS
Padmapur P S
PuttaslIlg P S
C;unupur P S RayagJda P 5
Kalyanaslngpur P S
KashlpUT P S
Tlkm P S
Nabarallg(lpur
Rmghar PS
Umarkote P S Chandahandl P S
Jhangan P S
Dabugan PS
Paparahandl P S
Tentuhkhuntl P S
KhatJguda P S
Nabarangapur P S
Kodlllga PS
Koraput District Kotpad P S
Bonguma PS.
Bhalrabsmglpur P S
Dasamantapur P S
Lakshmlpur P S Narayanpatana P S
Total No of InhabIted VIllages
2
648
69 118 148
116
78 119
2,099
86
84
105
308
118
204
289
285 278
198
144
2,467
286
265
287
186
92 58
171
458
248
267
149
876
118
104 87
67
135
72
47
44
61
141
1,922
104
80
82
III 71
269
Total Rural PopulatIOn
P
3
500.652
49.954
87,420 106.942
93,256
69,233 93,847
1,235,275
137739
118.965
83,307 126,334
103,604
94,598
116,655
52,210 65,767
175.031
161,065
715,702
45,232
66,371
71,771
49,496
38,806
31,003 74,427
158,176
59,334
67,254
53,832
966,496
158,323 144,499
61,076
69,808
127.351
87,204
56973
21,561
73,079
166,622
982,188
89,058
78,939 59,622
44,348
32,838 88,117
M 4
249,146
24,754
43 417 53,076
46,529
34,457 46,913
615,612
68,390
60.014
41,287
63,130 51,831
47,354
58,480 25,720
32,483 87,356
79,567
351,158
22,684
33,027
34,691
24,576
19,280
14 782
36,982
76,712
28,557
32,982
26,885
484,413
80,006
72,819
30,350
34,738
63,580 43.429
28 434
10,471
36,806
83,780
488,975
44,695
39,461
29,528
21 950 16,363
43,520
248
F
5
251.506
25 200
44 003
53 866 46 727
34,776
46,934
619,663
69,349
58 951
42,020
63,204 51,773
47,244
58,175
26490 33,284
87.675 81,498
364,544 22,548
33,344
37.080
24.920
19.526 16221
37 445
81,464
30.777
34,272
26,947
482,083
78,3 17
71,680
30.726
35.070
63 771 43 77'i
28 539
11.090
36,273
82.842
493,213
44,363
39.4 78 30 094
22 398 16,475
44 597
Number
6
92
6
19
35 II
6
15
769
4
16
134
6
71
130
202 157
38
10
1.348
226
174
159
109
40
14
58
193
156
157
62
54
2
5
9 3 7
2 4
10
4
8
668
7
8
9
40
23
123
A-3 : VILLAGES BY
Less than 200
P
7
• 9, t 98 684
2,230 3,002 1,189
460
1,633
72,845
35
405
2,088
11,753
818
6,980
11,809
17,650
15,936 4,058
1.313
131,036
16.354
15,016
18.357
10243
3,845
1,462
7,065
21.877
16,344
13,544
6,929
6,215
165
690 1.075
386
677
305 513
1,I24
407
873
74,256
730
1,055
1.243
4,524
2,429
13524
PopulatIon M 8
4,573
347
I 085
486 611 230
814
35,806
16
201
I 017
5,805
390
3,451
5,933
8,521
7,786 2,023
663
63.319 8,063
7,349
8 737 5,018
1,835
706 3,519
10403
7,709
6,603
3,377
3,097
90
346
535 195
343
150
251
536
207
444
36,593
358
505
594
2 199
I 201
6,662
F
9
4,625
337 1,145
1.516
578 230
819
37.039
19
204
1,071 'i 948
428
3,529
5,876
9,129
8,150
203'i
650
67.717
8291
7,667
9,620
5,225
2,010
756
3 546
11,474
8.635 6941
3.552
3,118
75 344
540 191
334 1'i5
262
588
200
429
37,663
372
550 649
2325 I 228
6,862

POPULATION SIZE CLASS
Number
10
163
20
27 25
38
20
33
502
12
7
22 77 30
62
87
65
94
28
18
767
48
65 99
5 I 30
23 67
181
71
77
55
169
20
12
25
17
30 14
7
17
7 20
626
32 15 26
42
28
99
P II
59,754
7.858
10.339 8.825
13.985 6,819
11.928
163,068
3.871 2,557
7,977
25,245
10.676
19.465
27.755
19,275 29,959
9,852
6,436
242,888
15,108
20.169
29.325
17.005
9.492 7,689
22,112
57,587
22.381
24.762
17,258
60,211
6,936
3,738
8,803
5,833
11.145 5.271 2,465
5,791
2,857
7,372
201,638
11.164
5,512 8,589
12.788
10.166 31,214
200-499
PopulatIon
M 12
29,592
3,861
5.004 4,395
7,055
3,386 5,891
80,742
1.906 1,271
3,936
12,532
5,360
9.713
13.761
9.530 14,687
4.908
3,138
117,904
7.564
9.889 14.079
&,405
4.703 ),754
11,051
27,319
10.573
12.065
8,502
29,867
3,468
1,878
4.369
2.921 5,538
2,630
1,197
2,771
1,386
3.709
99,820
5,620
2,703
4.254
6,340
5.048 15,343
F 13
30,162
3.997
5.335 4.430
6.930
3.433 6.037
82,326
1,965
1,286
4,041
12,713
5,316
9.752
13.994 9,745
15,272
4,944
3,298
124,984
7.544
10.280 15.246
8.600
4.789
3,935 11,061
30.268
11.808
12,697
8,756
30,344
3,468
1,860
4,434
2,912
5.607 2,641
1.268
3.020
1.471
3,663
101,818
5,544
2.,809 4.335
6.448
5,118
15,871
249
Num ber
14
226
25
53 48
35
27 38
434
18
24
35 70
42
46
44
16
24
60
55
257
8
16
23 19
14
13 32
65
18 28 21
280
32
27
34 17
53 24
13
14
18
48
360
31
27
25
21
II
37
p
15
167.255
17.457 40. [75
34.707 25.578
21.554 27.784
306.162
13.786 [ 7,945
25.300 48,165
29,581
30.799
31.124
9.763
15.146
43.917
40,636
174,226
5.257 [ 0.784
15.264
12.721
9.501 8,188
20.886 45,442
12.171
[ 8.864
15.148
202.935
22,157
19.635
23,554
12,348 38.5 [ I [8,177
9.555
9.968 13,539
35,491
251,057
22.582 [ 9.476
16.126
14.949
7.936
26.808
500-999 PopulatIOn
M 16
82,663
8.582
19,865 [ 7.127
12.733
10.628
13.728
J 52.292
, 6.793
8.983
12,463
24,062
14.772 15,471
15,508
4.813
7,581
21,920
19,926
86,195
2.676 5,384 7.474
6.328
4.703
3.852 10,400
22.410
6.049
9.269
7.650
101,048
[ 1,108
9.791
11.678
6.122 [9.191
9.090
4.766
4,859
6,781
17,662
124,431
11.284
9,693
7.889
7.414-
3.912
13.350
F 17
84,592
8.875
20.310 [ 7.580
12,845
10.926 14.056
153,870
6.993
8.962
12.837 24,103
14,809
15.328
15.616
4.950 7,565
21.997
20,710
88.031
2.581 5.400
7.790
6,393
4.798 4,336
10.486
23.032
6.122 9,595
7.498
101.887
11,049
9.844
11,876
6,226 19,320
9.087
4.789
5,109
6.758
17.829
126,626
11.298
9.783 8,237
7.535 4,024
13,458

State /Dlstnct Pollce Station
Nuapada District Jonk PS
Nuapada PS Komana PS
Kharlar P S
Boden PS
Smapall PS
District:Kalahandi
Kokasara PS
Dharamgarh P S
Kegaon PS
Sadar PS
Kesmga P S
NaTala PS Madanpur Rampur P S LanJlgarh P S Thuamul Rampur P S
Junagarh PS
Jayapatna P S
Rayagada District Ambadala PS
Mumguda PS Bishamakatak P S
GudaTl PS
Padmapur PS
Puttaslng P S Gunupur PS
Rayagada P S
Kalyanasmgpur P S Kashlpur P S Tlkm P S
Nabarangapur Ralghar P S
Umarkote P S
Chandahandl P S
Jhaflgan PS
Dabugan PS
Paparahandl P S
Tentuhkhuntl P S
Khahguda PS Nabarangapur P S
Kodmga PS
Koraput District
Kotpad P S
Bonguma PS
Bhatrabsmglpur P S
Dasamantapur P S
Lakshmlpur P S
Narayanpatana P S
Number
18
138
17
12
35
27
20 27
296
3J
31
27
23
35
21
25
2
53
48
73
2
7
5
7 6
6
10
14
I 4
1 I
263
39
38
16
24
36
25 14
3
26
42
207
29
21
17
7 8
9
',000-' ,999
p
19
181,644
21,670
15,726 45,177
36,156
27,955
34,960
408,540
43,401
43.267
35,807 31,777
49,587
27.938 34,247
2,499
70,520
69,497
93,988
2,529
9,210
6,642
9,527
7,417
8.202 12,652
17,593
1,037
4,682
14,497
372,563
54,854
56,644
21,026
36,310
49.607 37,748
18,985
4,678
37,168
55,543
275.J07
40.52'i
25,372
20,872
9,553
9,615
12.329
Population M 20
90.541
10.842 7,737
22,481
17,893
14.001
17 581
203,676
21.536
21,860
17,836 15,873
24,759
13,918
17,277
1,250
35,061
34,306
47,061
1,318
4,653
3,334
4,825
3,693
3,942 6,272
8,824
515
2,329
7,356
186,897
27,547
28,635
10,483
18,097
24,924
18,684
9,361
2,305
18,796
28,065
137,268
20.355 12,707
10,396
4,737 4,869
6,044
250
F 21
91. t 03
10,828
7,989
22,690
18,263
13.954
17 379
204,864
21,865
21,407
17,971
15,904
24,828
14,020
16,970
1.249 35,459
35,191
46,927
1,211
4,557
3,308
4,702 3,724
4,260
6.380 8,769
522 2,353
7,141
185,666
27,307
28,009
10 543
18,213
24,683
19,064 9,624
2,373
18.372
27.478
] 38.039
20 170
12,665
10,476
4,816 4,746
6285
Number
22
28
7
5 4
5 6
93
22
17
5 4
5 4
2
2
19
12
19
2
2
1
2
4
5
2
103
23
21
3
6
8 5
9
6
22
56
5
8
5 I
I
I
A-3 : VILLAGES BY 2,000-4 999
p
23
76.695
2,285
18,950
15.231
10,242
12,445 17,542
250,938
65,37 )
48,485
12.135 9,394
12,942
9,416
4 812
5522 2,227
46,684
33,950
55,449
5,984
5.009 2,183
2,021
5,462
11.712 15,677
7.401
281,289
62,043
56,681
6,618
14,931
22.392
13,107
25,455
19.108
60,954
149,089
14,057
20.066 12,792
2,534
2.692 4,242
Population M 24
38,712
1 122
9,726
7,581
5.172
6212 8,899
126,023
32,515
24,554
6,035 4,858
6,550
4,801
2,405
2,856 1,179
23,444
16,826
27,421
3,063
2,570
1,067
986
2.528
5.740 7 756
3,711
141,706
31,516
28.592 3,285
7.403
1 I, 134
6,564
12,859
9,636
30,717
74,918
7.078
10.013
6.395
J .260
J 333
2 121
F 25
37.983
1,163
9,224
7,650
5,070
6.233 8,643
124.915
32,856
23,931
6,100 4,536
6,392
4.615 2,407
2.666 1,048
23,240
17,124
28,028
2,921
2,439
1,116
1,035
2,934 5,972
7,921
3,690
139.583
30,527
28.089 3,333
7,528
11.258 6,543
12,596
9,472
30,237
74,171
6.979
10,053
6397
1.274 1,359
2,121

POPULATION SIZE CLASS
N um be ..
26
5
2
3
7
2
2
5
5,000-9,999 10,000 and above Population Number Population
------~P------------~7M~------------~F~------ -----~p--------~~M~--------~F~---
27 28 29 30 31 32 33
6,106
6, I 06
33,722
I 1,275
6,306
6,908
9,233
18,115
6,183
6,530
5,402
43,283
12,168
7, III
5,019
12,596
6,389
30,841
7,458
3,065
3,065
17,073
5.624
3,145
3,596
4,708
9,258
3,182
3,360
2,716
21,798
6,277
3,577
2,450 6,31 I
3,183
15,945
3,840
3,041
3,041
16,649
5,651
3. I 61
3.312
4.525
8.857
3,00 I
3,170
2,686
21,485
5,891
3,534
2,569
6,285
3,206
14.896
3,618
251

A-3 : VILLAGES BY State !Dlstnct Total N~of Total Rural Population Less than 200 PolIce Station I nhablte Number PopulatIOn
Villages P M F P M F 2 3 4 5 6 7 8 9
Kaklriguma P.S. 29 21.488 10,620 10.868 9 1.068 516 552
Koraput PS. 123 60,190 29,680 30,510 45 5,715 2.806 2.909
Koraput Town P S 8 6,250 3,026 3,224
Nandapur P.S 202 63,621 31,419 32.202 87 10.786 5,309 5.477
Simlliguda P S. 19 16,442 8,225 8.217 2 335 176 159
DamanJodi P.S 13 17.024 8,933 8.091
Pottangi P S 134 85,460 42,771 42,689 33 3.925 1,937 1,988
Padua P.S. 103 49.544 24,609 24,935 33 3,60 I 1.754 1,847
Sunabeda P.S 2 870 431 439
Machh kund P.S. 115 37,885 18,715 19,170 55 6.008 2.972 3.036
Boipariguda P.S. 297 103,576 51,548 52,028 165 15,607 7.732 7,875
Jeypur P.S. 93 79,843 39.976 39,867 10 1.403 703 700
Kundura P.S. 67 47,073 23,505 23.568 19 2,303 1.169 1.134
Malk4.ngiri District 979 469,582 234,614 234,968 423 40,804 20,241 20,563
Malkangiri PS 178 118,912 59,326 59.586 43 4,688 2,404 2,284
Mathlli PS. 142 70,616 35,309 35,307 48 4,096 2.099 1.997
Muduhpada P.S. 89 23,543 11,601 11,942 43 4.643 2.189 2,454
Chitrakonda PS 260 52,145 25,929 26.216 177 15.643 7.759 7,884
Orkel PS. 99 51,000 25,276 25,724 40 4,220 2.063 2.157
KalImela PS. 134 88,630 44,570 44,060 46 4,812 2.369 2.443
M V. 79 P.S 31 34,149 17,231 16,918 7 688 352 336
Motu P.S. 46 30,587 15,372 15.215 19 2.014 1.006 1.008
252

POPULATION SIZE CLASS . -200-499 500-999
Number PopulatlOn N urn ber PopulatlOn P M F P M F
10 11 12 13 14 15 16 17
6 1,819 880 939 6 3,915 1,897 2,018
38 12,139 6.043 6,096 23 15,639 7,751 7,888
I 220 99 121 6 4,580 2,231 2,349 84 26.636 13.178 13,458 24 15.610 7.744 7,866
4 993 472 521 6 4,166 . 2,039 2,127
4 1.166 592 574 5 3,908 1,888 2,020 47 15,745 7,868 7,877 29 20,800 10,141 10.659 32 10,534 5,313 5,221 24 16,157 8.107 8,050
240 120 120 I 630 311 319 37 12,007 5,783 6.224 16 9,715 4,871 4,844
80 24,746 12,278 12,468 28 19,546 9,722 9,824
32 9.955 4,893 5,062 25 17,013 8,427 8,586
18 6,005 2,993 3,012 15 11.501 5,760 5,741
282 93.291 45.761 47.530 158 107.166 53.229 53.937
63 22,255 10,869 11,386 46 33,708 16,698 17,010
44 14,862 7.344 7.518 32 21.528 10.649 10,879
34 10,048 4,823 5.225 10 6,429 3,330 3,099
67 20,491 10.176 10.315 14 8,742 4,282 4.460
30 10.262 4,986 5,276 13 8.310 4.122 4.188
31 10.631 5.219 5,412 31 20,000 9,847 10.153
4 1,385 671 714 6 4,376 2,214 2,162
9 3,357 1,673 1,684 6 4,073 2,087 1,986
253

A-3: VILLAGES BY State /DIstrict 1,000-1,999 2000-4999
Pollee Station Number Population Number Population P M F P M F
18 19 20 21 22 23 24 25
Kakmguma PS 4 5,382 2,760 2,622 4 9,304 4,567 4,737
Koraput PS IS 18,591 8,962 9629 2212 I 132 1,080
Koraput Town PS I 1.450 696 754 Nandapur P S 6 7,155 3,434 3,721 3,434 I. 754 1,680
Slmlhguda PS 6 8,875 4,484 4,391 2,073 1,054 1,019
DamanJodl P S 2 2,190 1,094 1,096 3.137 1.557 1,580
Pottangl P S 18 26.027 13,238 12 789 7 18.963 9.587 9,376
Padua P S 12 14.973 7.333 7640 2 4,279 2.102 2.177
Sunabeda PS
Machh kund P S 7 10,155 5,089 5,066
BOlpanguda P S 17 23,455 11.705 11,750 6 14872 7,542 7,330
Jeypur P S 17 23,716 11,828 11.888 8 22,240 11,377 10,863
Kundura PS 11 15,072 7.537 7,535 4 12,192 6,046 6,146
Malkangiri District 75 102,562 51,479 51,083 39 112,306 56,960 55,346
Ma1kanglrl PS 13 18,421 9,268 9.153 U 39.840 20,087 19.753 Mathlll; P S 13 16,192 8,188 8,004 5 13.938 7,029 6,909
Muduhpada PS 2 2,423 1.259 1,164
Chltrakonda PS I 1.336 671 665
Orkel PS 12 16,433 8.064 8,369 4 11,775 6,041 5,734
Kahmela PS 17 22,432 11,372 11,060 8 23,235 11,860 11,375
MY 79 PS 9 14,142 7.069 7,073 5 13,558 6.925 6,633
Motu PS 8 11,183 5.588 5,595 4 9.960 5,018 4,942
254

POPULATION SIZE CLASS 5,000-9,999 10,000 an d abo ve
Number PopulatIon Number PopulatIon ------~p------------~~M~------------~F~------ -----~p--------~~M~--------~F~---
26 27 28 29 30 31 32 33
5,894 2,986 2,908
6,623 3,802 2,821
255
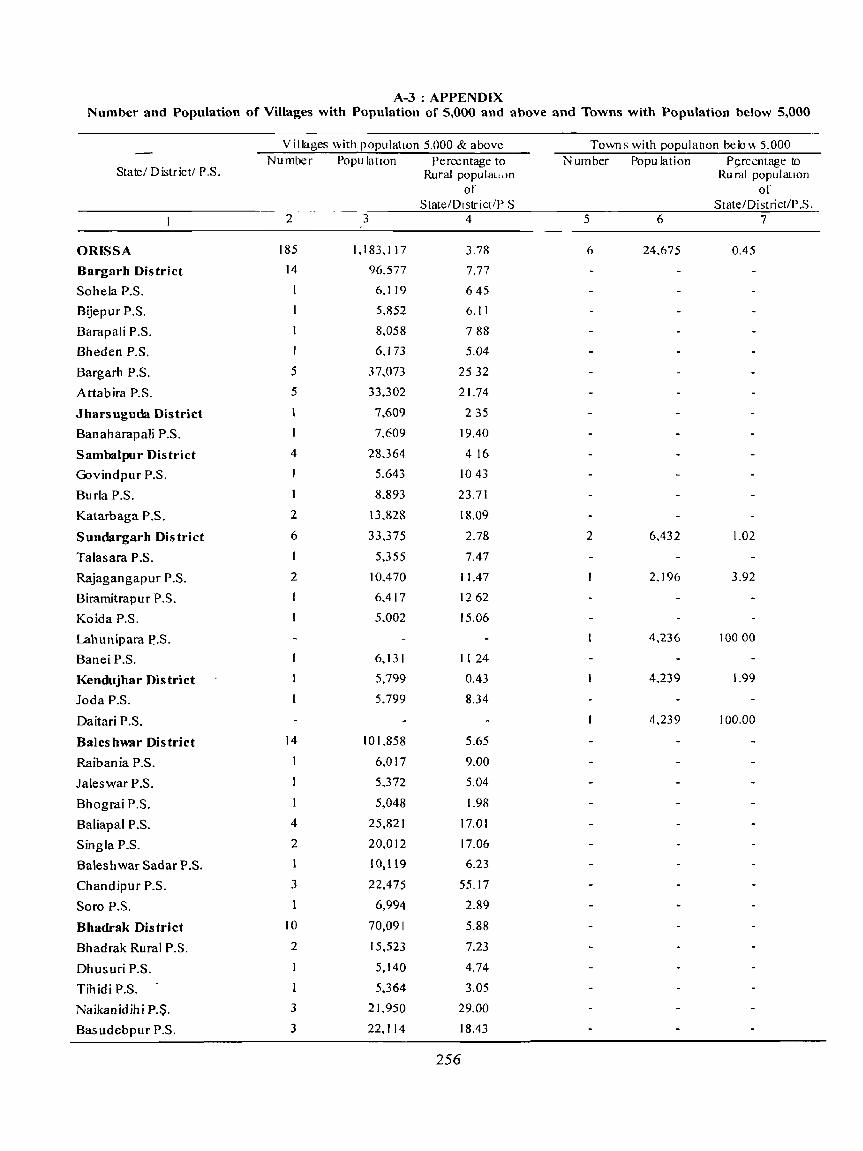
A-3 : APPENDIX Number and Population of Villages with Population of 5,000 and above and Towns with Population below 5,000
Villages with populatIOn 5,000 & above Towns with populatlOn belo", 5.000 Number Popu latlOn Percentage to Number Population Pt,;rcentage to
State/ D istrictl P .S. Rural popul.aJ.JLln Rural populatlOn of of
StatefDlstrict/P S State/District/P .S. 2 3 4 5 6 7
ORISSA 185 1.183.117 3.78 6 24.675 0.45
Bargarh District 14 96.577 7.77
Sohela P.S. I 6.119 645
Bijepur P.S. 5.852 6.11
BarapaJi P.S. 8,058 788
Bheden P.S. I 6,173 5.04
Bargarh P.S. 5 37.073 2532
Attabira P.S. 5 33.302 21.74
Jharsuguda District 7,609 235
Banaharapali P.S. 1 7.609 19.40
Sambalpur District 4 28.364 416
Govindpur P.S. 5.643 1043
Burla P.S. 1 8,893 23.71
Katarbaga P.S. 2 13,828 18.09
Sundargarh District 6 33,375 2.78 2 6,432 1.02
Talasara P.S. 5,355 7.47
Rajagangapur P.S. 2 10,470 11.47 2.196 3.92
Biramitrapur P.S. 6,417 1262
Koida P.S. 5,002 15.06
Lahunipara ~.S. 4,236 10000
BaneiP.S. 6.131 1124
Kendujhar District 5,799 0.43 4,239 1.99
Joda P.S. 5,799 8.34
Daitari P.S. 4,239 100.00
Balesbwar District 14 101,858 5.65
Raibania P.S. 6,017 9.00
Jaleswar P.S. 5,372 5.04
Bhograi P.S. 5,048 1.98
Baliapal P.S. 4 25,821 17.01
Singla P.S. 2 20,012 17.06
Bales h war Sad ar P .S. 1 10,119 6.23
Chandipur P.S. 3 22,475 55.17
Soro P.S. 6,994 2.89
Bhadrak District 10 70,091 5.88
Bhadrak Rural P.S. 2 15,523 7.23
Dhusuri P.S. 5,140 4.74
Tihidi P.S. 5,364 3.05
Naikanidihi P.S. 3 21.950 29.00
Bas udebpur P.S. 3 22,114 18.43
256

A-3 ; APPENDIX Number and Populatlon of VIllages wIth Population of 5,000 and above and Towns with Population below 5,000
Stdte/ D l~trICtl P S
Kendrapara DIstrict
Mahakalapada P S
Jagatsmghapur District
KUjang P S
Tlrtol P S
Cuttack DIstrIct
NtahPS
Barang P ~
Bankl P S
Badamba P S
JaJapur DistrIct
Sukmda P S
Mangalpur P S
Bmjhalpur P S
Bahchandrapul P S
Dharmasala P S
Dhenkanal District
Bhuban P S
hamakshyanagar P S
ParaJang P S
Hmdo! P S
Rasa! P S
Gmdla P S
Anugul DIstrict
Palalahada P S
1\JALC 0 PS
Banarpal P S
Anugul P S
Chhendlpada P S
Nayagarh District
DasapaUa P S
"l\,ayagarh P S
Odagaon P S
Ranapur P S
Khordha District
Ballpatna P S
Tangl P S
Balugaon P S
VIllages with population 5000 &. above )\.U mber Popu kttlOn Percentage to
Rurdl populatIOn of
State!Dlstrlct!P S 2 3 4
J 16 ~1j6 I J~
3 16896 1272
2 14036 147
') 162 452
8574 430
6 36557 1: 15
5242 195
2 14732 1061
3 10 "iX3 1235
12 71, 993 477
2 12519 X 79
'i 244 1, 84
4 21719 X 37
2 11,530 II 68
1, 19951 (J 30
8 46797 480
5221 744
'i 0"i9 3 48
2 II 142 770
() 897 1761
2 12785 191<;
5 191 376
9 52200 532
"i 392 9 41
'"l 1 j 1, 10 +905 -1, 17 YO I 2) 90
2 10191 1 () oX
'i 176 515
7 I':; 221 547
"i n1 625
1 1971 () 11 51
'i 217 5 OX
2 II "ill II 24
R I) n'J 127
4 22 no 19 02
3 10994 1300
(1014 764
257
Town s wltoh populatIOn bela w 5 000 Number PopulatIOn Percentage to
5 6
2 9,029
2 9029
Ru ral population of
State/Dlstnct!P S 7
141
10000
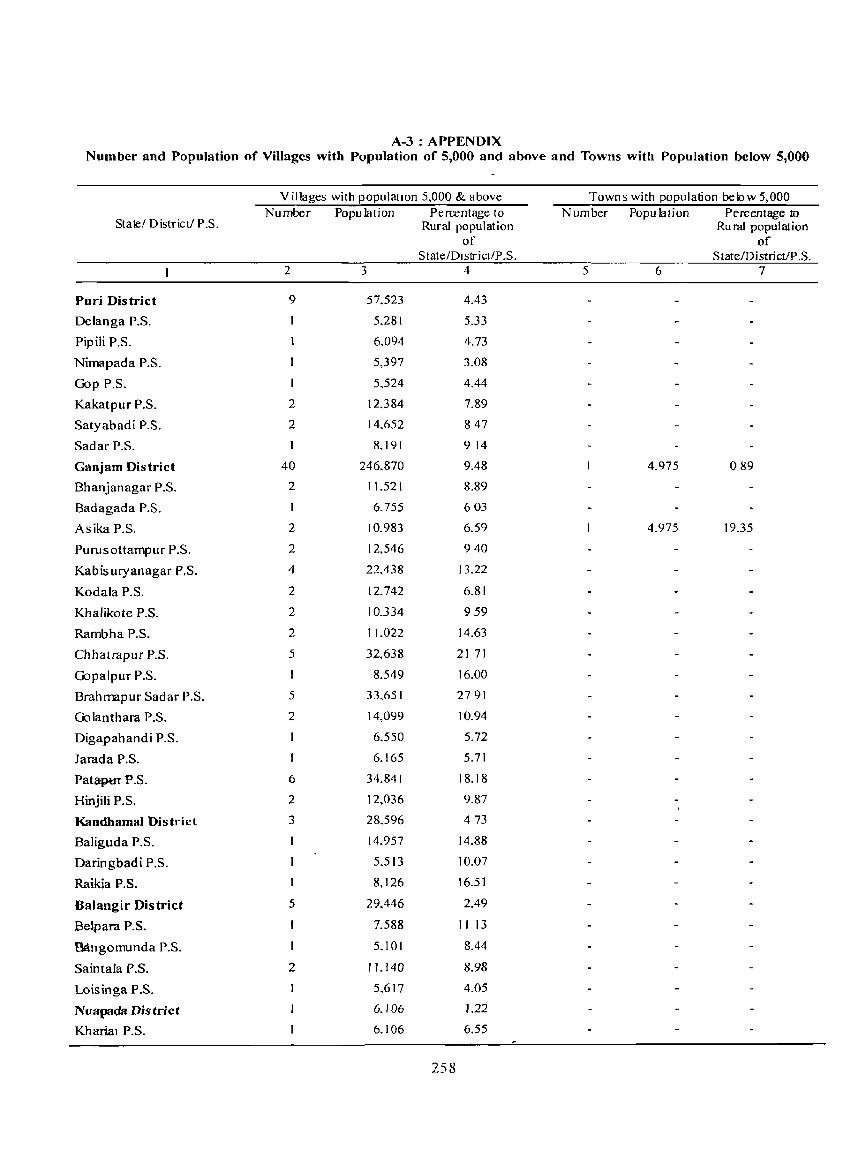
A-3 : APPENDIX Number and Population of Villages with Population of 5,000 and above and Towns with Population below 5,000
Villages with populatIOn 5,000 & above Towns with population below 5,000 Number Population Percentage to Number Population Percentage to
State/ District/ P.S. Rural population Ru raJ population of of
StatelDlstrict/P.S. State/DistricVP.S. 2 3 4 5 6 7
Puri District 9 57,523 4.43
Oelanga P.S. 5.281 5.33
Pipili P.S. 6.094 4.73
Nimapada P.S. 5,397 3.08
Gop P.S. 5.524 4.44
Kakatpur P.S. 2 12.384 7.89
Satyabadi P.S. 2 14.652 847
Sadar P.S. 8,191 914
Ganjam District 40 246.870 9.48 4.975 089
Bhanjanagar P.S. 2 11.521 8.89
Badagada P.S. 6.755 603
Asika P.S. 2 10.983 6.59 4.975 19.35
Purusottampur P.S. 2 12,546 940
Kabisuryanagar P,S. 4 22,438 13.22
Kodala P.S. 2 12.742 6.81
Khalikote P.S. 2 10.]34 959
Rambha P.S. 2 1].022 14.63
Chhatrapur P.S. 5 32,638 2171
Gopalpur P.S. 8.549 16.00
Brahmapur Sadar P,S. 5 33,651 2791
Golanthara P.S. 2 14,099 10.94
Oigapahandi P.S. 6,550 5.72
Jarada P.S. 6.165 5.71
Pata-ptlT P .S. 6 34.841 18.18
Hinjili P.S. 2 12,036 9.87
Kandhamal District 3 28.596 473
BaJiguda P.S. 14.957 14.88
Oaringbadi P.S. 5,513 10.07
Raikia P.S. 8,126 16.51
Balangir District 5 29.446 2.49
Bt$ara P.S. 7.588 11 13
Sdllgomunda P.S. 5.101 8.44
Saintala P.S. 2 1 J, 140 8.98
Loisinga P.S. 5.617 4.05
Nua(J3da Dis trict 6.l06 1.22
Khanall P.S. 6.106 6.55
258

A-3 : APPENDIX Number and Population of Villages with Population of 5,000 and above and Towns with Population below '5,000
Villages with population 5,000 & above Towns with population below 5,000 Number Popu lation Percentage to Number Popu lation Percentage to
State/ District/ P.S. Rural population Ru raJ population of of
State/DistrictiP .S. State/DistrictlP .S . I 2 3 4 5 6 7
Kalahandi District 5 33,722 2.73
Kokasara P.S. 2 11,275 8.19
Dharamgarh P.S. 6,306 5.30
Madanpur Rampur P.S. 6,908 5.92
Jayapatna P.S. I 9,233 5.73
Rayagada District 3 18,115 2.53
Muniguda P.S. 6,183 9.32
Padrmpur P.S. 6,530 16.83
Kashipur P.S. I 5,402 8.03
Nabarangapur District 7 43,283 4.48
Raighar P.S. 2 12.168 7.{j9
Umarkote P.S. 7.111 4.92
Dabugan P.S. I 5,019 3.94
Paparahandi P.S. 2 12.596 14.44
Kodinga P.S. 6.389 3.83
Koraput District 5 30,841 3.14
Borigurm P.S. 7,458 9.45
Koraput P.S. 5,894 9.79
Damanjodi P.S. 6,623 38.90
Boipariguda P.S. 5.350 5.17
Jeypur P.S. 5,516 6.91
Malkangiri District 2 13,453 2.86
Chitrakonda P.S. 5.933 11.38
Kalirnela P.S. 7,520 8.48
259


A-4 : TOWNS AND URBAN AGGLOMERATIONS CLASSIFIED BY POPULATION SIZE CLASS
IN 2001 WITH VARIATION SINCE 1901


A.!4 : TOWNS AND URBAN AGGLOMERATION CLASSIFIED BY POPULATION SIZE CLASS IN 2001 WITH VARIATION SINCE 1901
FLY LEAF
The table A-4 corresponds to table A-4 of 1991, 1981, 197 L 1961 & 1951 censuses and gives the population by sex, decade variation and percentage decade variation in popu lation for all the towns including urban agglomerations for the last 100 years. The status of towns and the area figures of the towns and urban agglomerations are also given in the table Area figures are ho~ever contll1ucd from 1961 census onwards.
The towns/urban agglomerations have been arranged in the order of population size, class of towns. As in 1991 all towns and urban 'agglomerations have been grouped into the following size and classes according to population size.
CLASS POPULATION
100,000 & Above
II 50,000 TO 99,999
III 20,000 TO 49,999
IV 10,000 TO 19,999
V 5,000 TO 9,999
VI Less than 5,000 According to Indian Census tradItion any town
with a population exceeding 1,00,000 is called a city.
An alphabetical list of towns and urban agglomerations is also given at the end of the fly-leaf.
The name of each town/urban agglomeration is shown under col.2 of A-4 table. Corresponding name of the district is also shown under col.3 of the table. In colA the census years since 1901 are shown. The status of the towns and area figures are shown in col.5 and 6 respectively. Total population, males and females of each town for each census since 190 I are shown _in col. 7, 10 and II respectively. Decadal variation and percentage decade variation of each town for each census year are also shoVvn in col.8 and 9 respectively.
-The total urban popUlation of the state for each
of the 10 censllses from 1901 to 1991 is given at the beginning of the table and it is follmved by similar figures for the total of cities/urban agglomerations
263
under Class-£. This followed by each cities/UAs falling under Class-I since 1901 arranged in the order of 2001 population.
Similarly the total of all class-II towns/UAs is given next and this is followed by figures for each town/UA included in Class-II arranged in order of populatIon sInce 1901. For other classes, viz., Class-III to Class VI, the class totals are given first followed by the figures for each town/UA of that class 111 the order of 200 I population. The population figures for towns given for the earlier censuses in this table are as reGorded in the concerned censuses and have not been adjusted t'O the present jurisdiction
. I
In this table the classification of towns/UAs into variolls size classes has been done On the basis of their 2001 population. Each urban agglomeration IS treated as a single unit for classification, i.e., the total population of the urban agglomeration has been taken into account for determining the sIze class and the independent towns const ituting an urban agglomeration have therefore not been considered separately. Below each UA . the constituent towns have also been lIsted.
The figures of class total shown in the table for previoLls censLlses are not the totals of respective population of all towns shown in that class in 2001 census. Class totals are the totals of population of all towns, \vhich on the basis of population were included in that class in those censuses except the towns. \\ hleh are the constituents of urban agglomerations The figures of previous censuses of towns, wh ieh v. ere not treated as towns in those censuse~ are not given because their population figures 111 those censuses were taken in rural areas The places, which \\ere treated a::, to\"ns for the first time in a censm,. the figures of those places for that censlls year have shown under urban areas and find place in the table. If any town was declassified as rural in some-censuses and again classified as to\\ n in subsequent censLlses then. III such eases the population figures are g;, en in this table only for those cenSLlses in which It was treated as town and the populatipn figllre~ are taken for corresponding class total figures for that cenSllS

The census year when it was declassified the figures are shown in rural areas. Such type of cases is found 111 two places in the state. Those are Binika and Soro. Binika in the district of Balangir was treated as town from 1911 to 1941 and was declassified for three censuses, i.e., in 1951, 1961 and 1971. Again in 1981 census Binika was treated as town and is continuing as town in 2001 census also. The trends of growth of population for Binika was not encouraging when it was town in 1911(4,130), in 1921 (3,597), 1931 (3,326) and in 1941 (3,825). Therefore it was taken in rural area in three censuses from 1951 to 1971. Binika was declared as Notified Area Council by the state Govt.
Authority during 1981 census and its population became 11,004 for which that place was again taken as town since 1981 and continuing as such. Similarly Soro in the district of Baleshwar was a town in 1961 census with a population of 13,081. But in 1971 census this place was declassified and treated as rural area. Again in 1981 census it was treated as a town with a population of 18,599 and continuing as such in 2001 census.
Statement-l given below presents the number of cities and towns and their population in state and district during 1901-2001.
STATEMENT-l Growth in the number of Cities and Towns and their population in State and District 1901-2001
Year Class - I
1,00,000 above Class - II
50,000-99.999 Class - (( I
20.000-49.999 Class - IV
10.000-19.999 Class - V
5.000-9.999 Clas:; - VI
Less than t\ II CI asses
No PopulatIOn No PopulatIOn No. Populat Ion No Populat 1011 '\/0 Populat 1011 No Popuiat 1011 1\l() Poruiat](ln
State
1901
1911
1921
1931
1941
1951
1961
2 3
102,505
146,308
1971 4 554.338
1981 6 1.105.123
4 5
51,364
52.528
51.007
65.263
74,291
62.343
3 228,033
2147,132
8 493.184
1991 8 1.772.978 10 620.452
200 I 9 2.516.678
Bargarh District
1901
1911
1921
1931
1941
1951
1961
1971
1981
1991
2001
15 994.827
51.205
63.678
6
3
3
2
3
3
5
8
20
26
29
7
95.943
92,504
71.425
95.390
105,633
8
5
5
6
9 10
76.080 4
77.283 6
93.154 9
II
26.R97
39.113
57.R24
6 84.961 10 68.314
8 113,574 16 115.205
138.055 8 [07.796 23 J?SA J 5
224.943 22 310.647 25 190.064
585.287 23 316.055 30 234.226
760.073 40 541.932 25 196.176
931.204 52731.60"'22 166.7·10
36 1.099.140 48707.58524 174.333
22.865
35.400 2
2
2
264
15.375
23.976
29.342
34.599
2
5.20·'
7.085
8.236
9.197
16,366
5.264
12 11
4.400
3 '3.731
2 !L08R
3.326
3.825
4.956
3 9.655
2 8.357
~ 13.799
3 12.005
(1 24.675
4.6R9
1-1
14
18
20
21
29
15
254.6R4
175.159
281.498
317.254
412.528
39 594.070
62 1.109.650
81 1.&45.395
lOR :U 10.2R7
124 4.234.983
138 5.517.238
3
4
4.689
5.204
7.085
8.236
9.197
15.375
39.2:'1
59.376
SO.547
103.51 [
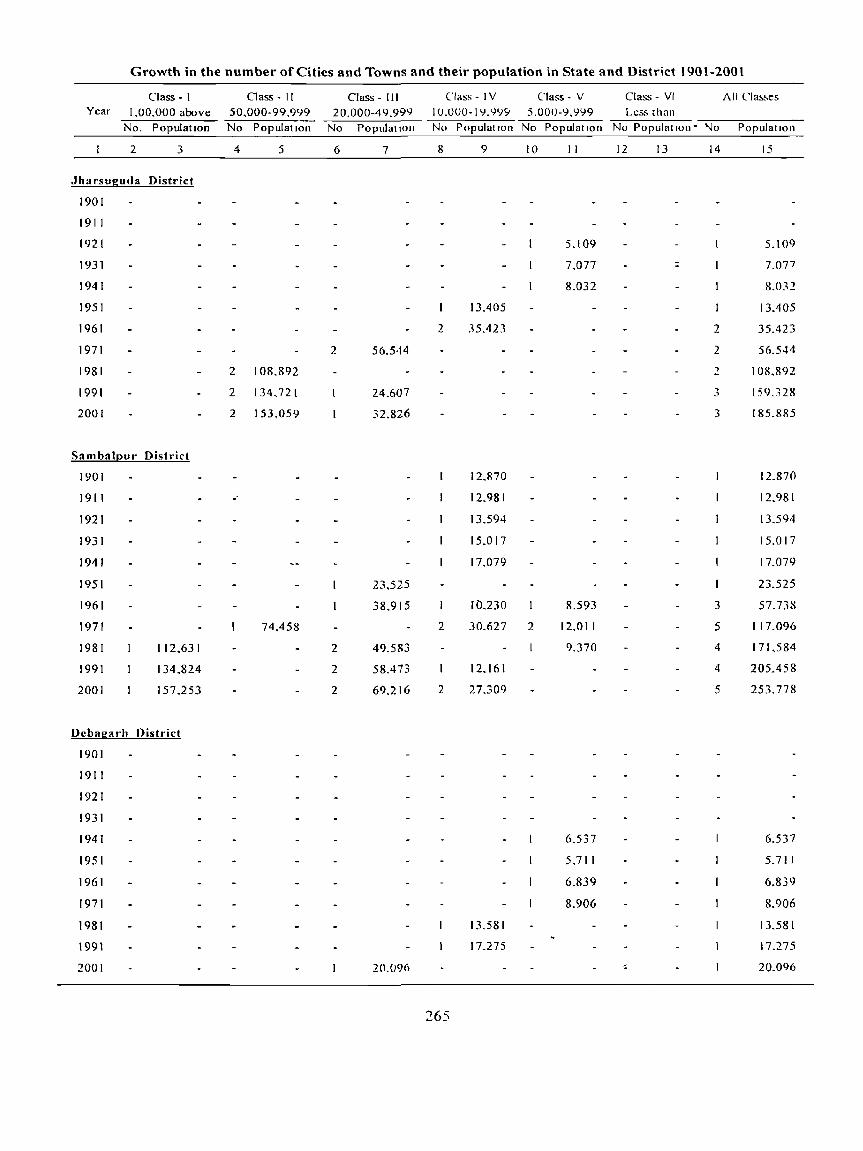
Growth in the number of Cities and Towns and their population in State and District 1901-2001
Class - I Class-II Class - III Class-IV Class - V Class - VI 1\11 l'la~~es Year 1,00,000 above 50,000-99,999 20.000-49,999 IU.OOO-19.W9 5.000-9,999 Lt:ss th<lll
No. Population No Population No Populatloll No Population No PopulatIOn No Population- '10 Population
2 3 4 5 6 7 8 9 10 II 12 13 14 15
Jharsuguda District
1901
1911
1921 5.109 5.109
1931 7.077 : 7.077
1941 8.032 8.032
1951 13.405 13.405
1961 2 35.423 2 35.423
1971 2 56,544 2 56.544
1981 2 108,892 2 108.892
1991 2 134,721 24.607 ~ 159.328 .)
2001 2 153,059 32.826 3 185.885
Sambal[!ur DistI"ict
1901 12,870 12.870
1911 _.
12.981 12,981
1921 13.594 13.594
1931 15.017 15.017
1941 17.079 17.079
1951 23,525 23.525
1961 38.915 [0.230 8.593 3 57.738
1971 74.458 2 30.627 2 12.011 5 117.096
1981 112.631 2 49.583 9.370 4 171,584
1991 134,824 2 58.473 12.161 4 205.458
2001 157,253 2 69.216 2 27.309 5 253.778
Debaga rh District
1901
1911
1921
1931
1941 6.537 6.537
1951 5.711 5.711
1961 6.839 6.839
1971 8.906 8.906
1981 13.581 13.581
1991 17.275 17.275
2001 20.096 ~ 20.096
265

STATEMENT-l Growth in the number of Cities and Towns and their population in State and District 190J -2001
Class - I Class - II Class - III Class - IV Class - V Class - VI All Classes Year 1.00,000 above 50,000-99,999 20,000-49.999 10 000-19 999 5,000-9,999 Less than
No PopoRlatlOn No Population No PopulatIOn No PopulatIOn No Populat IOn No Population No Population
2 J 4 5 6 7 8 9 ]0 II 12 IJ 14 15
Sundargarh District
1901
1911
1921
1931
1941
1951 2 15.367 2 15.367
1961 90.287 20.30\ 2 25,172 4135.760
1971 125,426 3 97,015 17,244 5 239.685
1981 214.521 96.000 3 86.723 12,089 6 409.333
1991 2 385,748 3 103.457 13,116 2 18.085 4.599 9 525,005
2001 2 472,913 3 111.462 2 22.194 2 16 193 2 6.432 II 629.194
Kendujhar District
1901
1911
1921
1931
1941 9,004 9,004
1951 9,343 9.343
\96\ 2 31,964 2 31.964
1971 24,342 2 36,693 6.312 4 67.347
1981 4 111,997 9.515 4.844 6 126.356
1991 4 145,324 11.370 5.746 4,434 7 166.874
2001 2 104,472 2 73.737 11,833 3 18,742 4.239 9 213,023
Mayurbhanj District
1901 5.613 5.613
1911 5.968 5.968
1921 6.189 6.[89
1931 6.193 6.193
1941 8.281 8.281
195\ 9,277 C).277
1961 20,30\ 8.119 228,420
1971 -28.725 11.226 2 39.951
1981 52,989 2 30,413 7.136 4 90.538
1991 69.240 3 47.009 4 116.249
2001 100,651 2 43.337 II. 712 4 155.700
266

STATEMENT-I Growth in the number of Cities and Towns and their population in State and District 1901-2001
Class - I Class-II Class - TIl Class - IV Class - V Class - VI All Classes Year 1,00,000 above 50,000-99,999 20,000-49,999 10,000-19,999 5,000-9,999 Less than
No. PopulatIOn No Population No. PopulatIOn No PopulatIOn No Population No Population No Population
2 3 4 5 6 7 8 9 10 II 12 13 14 15
Baleshwar District
1901 20,880 20.880
19 II 21,362 21,362
1921 17.037 17,037
1931 17,843 17"843
1941 19,405 19,405
195 t 22,&51 22.851
1961 33,931 2 23,283 357,214
1971 46,239 6,711 2 52,950
1981 65,779 2 31,745 3 97.524
1991 101,829 22,737 2 29,586 4 154.152
2001 127,358 3 78.253 14.757 5 220,368
Bhadrak District
1901 18,518 18,518
1911 18,578 18.578
1921 18,175 18.175
1931 18.283 18.283
1941 19,550 19,550
1951 18.795 18.795
1961 25,285 9,406 2 34,691
1971 40,487 6,717 2 47,204
1981 60,600 2 57,852 7,808 4 126,260
1991 76,435 25,236 8,170 3 109,841
2001 92,515 30,006 18,550 3 141,071
Kendrauara District
1901 15,245 [5.245
1911 15,113 '15.113
1921 14,614 14,614
1931 12,620 12,620
1941 I 1.880 11.880
1951 12.253 12,253
1961 15,830 15,830
1971 20,079 20.079
1981 27,564 27,564
1991 2 63,235 2 63,235
2001 2 74.137 2 74,137
267

SfATEMENT-l Growth in the numberofCitJes and Town<;and their population m State and District 1901-2001
Class - I (_lass - II llass III llass - IV Class - V (_ las~ - VI All Classes Year I 00 000 above 50 000-99 999 2000049999 10000-19999 5000-9999 Lc:.s than
No PopulatIOn No PopulatIon No PopuldtlOn No Populdtlon No PopulatIon No Population No Populat Ion
2 3 4 ~ 6 7 8 9 10 11 12 13 14 1 S
JagatslDghdl!ur District
1901
1911
1921
1931
1941
1951
1961
\97\ 6,705 6,705
1981 2 54,168 2 S4 168
1991 2 73,120 2972 3 76092
2001 73,625 30824 - 2 104.449
Cuttdck District
1901 51364 51.364
1911 52,528 52,528
1921 51,007 51007
1931 65.263 65,263
1941 74291 74,291
1951 102,505 5890 4,956 3 113,351
1961 146 308 13.478 2 13 190 4 172,976
1971 205,759 24300 2 18227 4 248 286
1981 295,268 32 144 2 23,682 4 351 094
1991 403 418 36,877 2 28011 3 17,555 7 485,861
2001 534,654 52528 2 31 837 2 13.082 2 9029 8 641 130
Jala[!UI Distnct
1901 12.111 12,111
1911 12241 12,241
1921 II 015 11015
1911 1067, 10673
1941 II 188 II 188
1951 II 026 11026
1961 I) 802 59&9 2 19791
1971 2 30553 2 30553
1981 2 43 167 2 4, 167
1991 2 5,431 2 q nl
2001 2 72 980 2 72 9&0
268
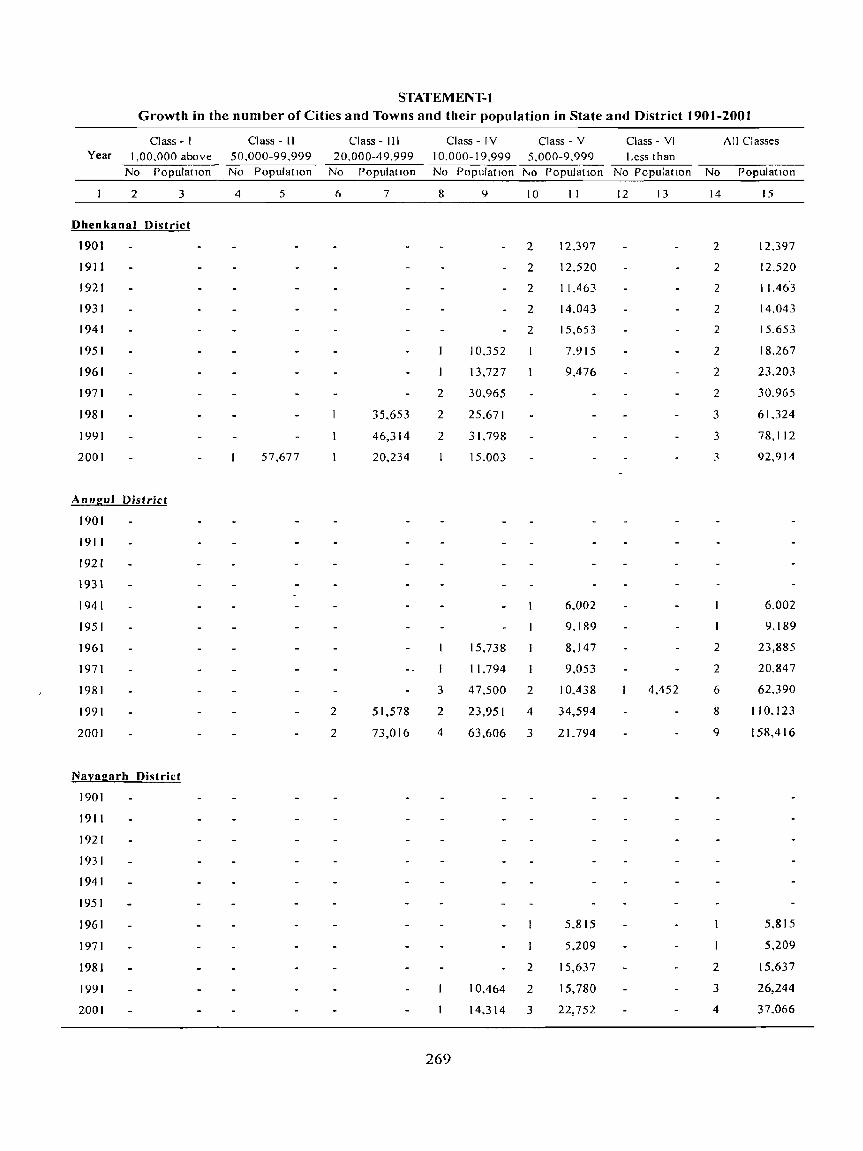
STATEM ENT-I Growth in the number of Cities and Towns and their population in State and District 1901-2001
Class - I Class - II Class - III Class - IV Class - V Class - VI All Classes Year 1,00,000 above 50,000-99,999 20,000-49,999 10,000-19,999 5,000-9,999 Less than
No PopulatIon No PopulatIOn No PopulatIOn No PopulatIon 1\.0 PopulatIOn No PopulatIon No PopulatIon
2 3 4 5 6 7 8 <} 10 II 12 13 14 15
Dhenkanal District
1901 2 12,397 2 12,397
1911 2 12,520 2 12,520
1921 2 11.463 2 11.46'3
1931 2 14,043 2 14,043
1941 2 15,653 2 15,653
1951 10,352 7.915 2 18,267
1961 13,727 9,476 2 23,203
1971 2 30,965 2 30.965
1981 35,653 2 25.671 3 61.324
1991 46,314 2 3L798 3 78,112
2001 57,677 20,234 15.003 3 92,914
Anugul District
1901
1911
1921
1931
1941 6,002 6,002
1951 9,189 9,189
1961 15,738 8,147 2 23,885
1971 1 L794 9,053 2 20,847
1981 3 47,500 2 10,438 4,452 6 62,390
1991 2 51,578 2 23.951 4 34,594 8 1 JO,123
2001 2 73,016 4 63,606 3 21,794 9 158,416
Nal:agarh District
1901
1911
1921
1931
1941
1951
1961 5,815 5,815
1971 5,209 5,209
1981 2 15,637 2 15,637
1991 10,464 2 15,780 3 26,244
2001 14,314 3 22,752 4 37,066
269

srATEMENT-J Growth in the number of Cities and Towns and their population in State and District 1901-2001
Class - I Class - II Class - III Class - IV Class - V Class - VI All Classes Year 1,00,000 above 50,000-99,999 20,000-49,999 10,000-19,999 5 000-9,999 Less than
No PopulatIOn No PopulatIOn No PopulatIOn No Population No PopulatIOn No Population No Population
2 3 4 5 6 7 8 9 10 II 12 13 14 15
Khordha District
1901
191 I
1921
1931
1941
1951 16,512 9,975 2 26.487
1961 38.211 2 28.565 3 66.776
1971 105,491 29,894 15,879 3 151.264
1981 219,21 I 2 64.141 12,003 4 295.355
1991 411,542 50,116 30.591 2 26.106 5 518.355
2001 658,220 57,957 39,054 3 44,268 6.207 7 805,706
Puri District
1901 49,334 49,334
1911 39,686 39.686
1921 38.694 38,694
1931 37,568 37,568
1941 4).055 41,055
1951 49,057 49,057
1961 60,815 .60,815
1971 72,674 72,674
1981 100,942 11,406 8,739 3 121.087
1991 125,199 3 36,206 4 161.405
2001 157,837 3 46,191 4 204,028
Ganjam District
1901 25,729 25,729
1911 31.456 6,042 4,912 3 42.410
1921 32,731 6,134 4,491 3 43,356
1931 37,750 2 11,763 3 49,513
1941 43,536 4 25.587 5 69,123
1951 62,343 4 29,700 5 92,043
1961 76,931 5 49,304 2 6,901 9 133.136
1971 117,662 5 57,542 7 54,152 3.583 14 232.939
1981 162,550 8 106.536 8 65,304 4,503 18 338.893
1991 210,418 13 180.810 4 32,525 18 423.753
2001 307,792 3 62.375 12 164,592 2 16,625 4,97') 19 556,359
270

STATEMENT-l
Growth in the number of Cities and Towns and their population in State and District 1901-2001
Class - I Class - 11 Class - III Class - IV Class - V Class - VI All Classes Year J ,00,000 above 50,000-99,999 20,000-49,999 10,000-19,999 5,000-9,999 Less than
No PopulatIOn No PopulatIOn No Population No PopulatIOn No PopulatIOn No Population No PopulatIOn
2 3 4 5 6 7 8 9 10 I I 12 13 14 15
Gaja(!ati District
1901 17.336 17,336
1911 18.370 18,370
1921 18,719 18,719
1931 20.072 20,072
1941 21.042 21.042
1951 22.270 22,270
1961 22,708 22.708
1971 26,917 26.917
1981 32.317 9.179 2 41,496
1991 36.667 10.102 2 46.769
2001 43.097 9.791 2 52.888
Kandhamal District
1901
1911
1921
1931
1941
1951
1961
1971 10,677 10,677
1981 18.326 6.846 2 25.172
1991 27,154 &.508 2 35.662
2001 33,890 10.204 2 44.094
Baudh District
1901
1911
1921
1931
1941 5.740 5.740
1951 5,498 5,498
1961 6,088 6.088
1971 &.891 8.891
1981 12.589 12,589
1991 15.458 15,458
2001 18.025 18,025
271

STATEMENT-l Growth in the number of Cities and Towns and theIr population in State and District 1901-2001
Class - I Class - II (las'> - I I I Cla,,<; IV lIa,,~ - V Ua"" - VI All Llas5es Year I 00 000 above 50 000-99 999 20 UOO-49 999 10000-19999 5000-9999 I e~~ than
No Population No Populat Ion No Population No Populdtion No Population No Populat Ion No Population
2 3 4 5 6 7 8 9 10 I I 12 13 14 15
Sonauur District
1901 8,887 8,887
1911 8.638 4,130 2 12.768
1921 7680 3.597 2 11277
1931 8,506 1.32h 2 11.832
1941 9065 1825 2 12,890
1951 7,356 7.356
1961 7,108 7,1 08
1971 14.':;0 I 2 14 ':;01
1981 2 21.455 6926 1 28.381
1991 2 27364 7.466 ~ 34830 ,
2001 2 n 079 7989 3 40068
Balangll' Dlstllct
1901
[91 r
1921
1931 6.473 6473
1941 II 105 5,652 2 16,757
1951 13646 3 19.fi91 4 33337
1961 18661 , 23888 4 42,551
1971 15748 3 36414 4 72 162
1981 54943 21 486 2 28.415 4 104.844
1991 69920 25.719 2 13,781 4 12<;.420
2001 85,261 2 50,368 18,694 4 154.123
"Iual!ada District
1901
1911
1921
1931
1941
1951
1961 2 14273 2 14.273
1971 2 16,877 2 16.877
1981 I 1.448 9,946 2 21.394
1991 2 25.765 2 2':; 765
2001 2 300,8 2 30 (n8
272

STATEMENT-J Growth in the number of Cities and Towns and their population in State and District 1901-2001
Clas~ - I Class - II Uass - III Class - IV Class - V Class - VI All Classes Year 1.00.000 above 50.000-99.999 20.000-49.999 10.000-19.90 9 5.000-9.999 Less than
No Population No Population No PopulatIon No Population 1'<0 Population No Population No Population
.2 3 4 5 6 7 8 9 10 II 12 13 14 15
Kalahandi District
1901 4.400 4.400
1911 5,945 5.945
1921 6,376 6,376
1931 7,174 7.174
1941 10.863 10.863
1951 1 1.807 11,807
1961 14.300 14.300
1971 23.264 2 16,412 3 39,676
1981 2 21.326 2 21.326
1991 51.062 2 27.101 3 78.163
2001 60.787 2 32.676 6.756 4 100.219
Rayagada Di!>tl"ict
1901
1911
1921
1931
1941 7.416 7.416
1951 2 18,413 2 18.413
1961 2 24.717 2 24,717
1971 25.064 12.702 4.774 3 42.540
1981 35.838 2 29.199 5,698 4 70.735
1991 48.247 1 34.468 6.611 4 89.326
2001 57.759 24.706 18.685 2 14.257 5 115,407
Nabal'anga[!ul' District
1901
1911
1921
1931
1941
1951 7.302 7.302
1961 10.380 10.380
1971 13.739 9.826 2 23,565
1981 2 33.393 6.424 3 39.817
1991 :U.513 18.60,~ 2 41.1 (7
2001 2 52.864 6.406 ., 59.270
273

STATEMENT-1 Growth in the number of Cities and Towns and their population in State and District 1901-2001
Class - I Class - II Class· TlI Class - IV Class - V Class - VI Less than
All Classes Year 1,00.000 above 50,000-99,999 20,000-49,999 10.000-19,999 5,000-9,999
No. PopulatIon No. PopulatIon No PopulatIOn No PopulatIOn No PopulatIon No Population No PopulatIon
2
Korsput District
1901
1911
1921
1931
1941
1951
1961
1971
1981
1991
2001
3
Malkangiri District
1901
1911
1921
1931
1941
1951
1961
1971
1981
1991
2001
4 5
53,981
2 117,753
2 135,509
3
2
6 7
20,352
25.291
83,804
72,040
34.924
39.548
23,114
The statement reveals that the number of towns and their population increased in all classes of towns except in class IV. In class I, the number of towns increased from 8 to 9 from t 991 to 200 1 with the increase in population from 1,772,978 to 2,516,678. In class II the number of towns increased from IOta 15 and the population increased to 994,827 from 620,452. Similarly in class III towns the number of towns increased from 29 to 36 and the population from 931,264 to 1,099,140. In class V and class VI towns, the number of towns increased from 22 to 24 and from 3 to 6 and the population increased from 166,740 to 174,333 and from 12,005 to 24,675 respectively. Contrary to this the number of towns in class IV
8
2
274
9
10,525
12.504
11.604
13,309
14,917
10
2
15.575 2
28,447
11.502
I I
9.669
8,591
13,829
9,856
5,719
8,475
7,494
17,210
5,981
12 13
2,754
14
2
4
4
4
5
5
3
3
2
15
9.669
10.525
12.504
28.943
41.874
93,660
137.625
171.705
198.449
7,494
32,785 -
34,428
34,616
decreased from 52 to 48 along with the decrease in population i.e. from 731,604 to 707,585. In total the number of towns increased from 124 to 138 during the last decade whereas population increased from 4,234,983 to 5,517,283 displaying 30.28 percent growth rate. The highest percentage of growth of popu 1ation is recorded in class VI towns, i.e., 105.54 percent during ]991-2001. The percentage growth of popUlation is 60.34 percent in class II town, 41.95 percent in class I town, 18.03 percent in class III town and in class V town, the growth rate is at the lowest i.e. 4.55 percent. In class IV town, the growth of population shows a negative trend and it is minus 3.28 percent.

In Statement -1, constituent un its of an urban agglomeration, where the constituents are two or more physically contiguous towns together each town was reckoned as separate towns in their own right and classified according to their own population size and not according to the population size of urban agglomeration unit. Wherever UAs were formed with outgrowth, the population of
outgrowth(s) was added to the corresponding town and the combined population of each town separate and its outgrowth was taken into account for determination of the class.
Statement-2 presents growth in the number of cities and towns and their population expressed in indices with 1901 as base i.e. 1901=100
STATEMENT-2 Growth in the number of Cities and Towns and their population expr~ssed in
Indices with 1901 as base (1901=100)
Year Class - I Class - II Class - III Class - IV Class - V Class - VI All Classes No of Popul- No of Popul- No of Popul- No of Popul- No of Popul- No of Popul- No of Popul-To'Mls atlOn To'MlS atlOn Tov.ns at IOn Towns at ton To'MlS atJOn To'Mls dtlOl1 To'M1s at 1011
2 3 4 5 6 7 8 9 10 II 12 13 14 15
1901 100 00 100 00 100 00 100 00 100 00 100 00 100 00 100 00 100 00 100 00 100 00 100 00
1911 000 227 000 -3 58 0 00 1 58 50 00 45 42 200 00 212 I 2857 ,;& 04
1921 000 -07 -3333 -2555 2000 2244 12500 11498 ioo 00 8382 4286 1053
1931 000 2706 000 -0582000 11671500015398 o 00 -24 41 I 50 00 ~7
"" /
1941 000 4464 000 10 I 6000 4928 30000 32832 000 -1307 10714 6198
195110000 10000 000 21 37 6667 4389 6000 4169 47500 56333 o 00 q 64 178 57 133 26
1961 000 42 73 20000 343 95 166 67 13445 340 00 308 32 'i25 00 606 64 20000---1 1943 342 86 335 70
197130000 44079 10000 18645 56667 5100436000315426500077083 10000 8993 47857 62458
1981 50000 97812 70000 86017 76667 69221 70000 61232 52500 62936 20000 21361 67143 112123
1991 70000 162965 90000 110795 86667 870589400086162 45000 51992 20000 17284 78571 156284
200 I 80000 2355 17 1400 00 1836 B2 1 100 00 1045 62 86000 830 05 500 00 548 15 500 00 460 80 885 71 2066 3 I
In the statement, it is seen that in class I towns, a steady growth is perceived both in the number and population, the number of towns being increased by 8 times and population increased by about 24 times during the period 190 I to 2001. In case of class II, III, IV, V and VI towns, the growth in the number and population of towns takes an irregular trend increasing and decreasing unevenly during the period but portray a manifold increase at the end. The highest increase in the number of towns is found on class n i.e.14 times followed by class III, 11 times, class IV, 9 times, class I. 8 times and class V and VI 5 times each. Viewing popUlation of the town class I town exhibits highest
275
increase in population i.e. 24 times followed by class II 18 times, class 1ll, 10 times, Class IV 8 times and class V and V[ 5 times each.
Taking the case of districts, class I town is found only in case of 8 districts namely, Khordha, Cuttack,Ganjam, Sundargarh, PUrl, Sambalpur, Baleshwar and MaurbhanJ.
Statement-3 given in next page shows the percentage of towns in each class to total number of towns and percentage of population in each' class to total urban population from 1901 to 200 I in state and districts.

STATEMENT-Percentage of Towns in each to lotal Number
in each clas~ to Total urban population
200] 1991 1981 19 7 1 1961 1 (,l51 Vl
Perc en tage 01 Percentage () f Perl,entage of Percentage 01 PcrLcntdge oj PCfl-cn tallc of ~ u No of Popu- No of Popu- Nool Popu- '\1001 Popu- Noot Popn- No 01 Popu-
Towns fahon Towns fatlOn rowns latlon lown" fallon To\~ns fatlOn rown" fallOn
2 3 4 5 6 7 8 9 10 II 12 13
ORISSA STATE
6 52 4561 645 41 86 'i 5'; 35 53 4 94 3004 I 61 13 19 2 ~7 1726
II 10 87 1803 806 14 6" 741 15 8& 247 797 4 )\4 20 ".., 2 ~f, 1049
III 2609 1992 2339 21 99 2407 2444 24 69 ,I 72 12 l)n 2027 12 X2 23 24
IV 3478 1283 41 94 1728 37 04 1742 28 39 7 13 ~~ 49 27 94 20 .:; I I X I':;
V 1739 3 16 17 74 3 94 23 15 631 37 04 12 69 4032 17 13 5898 3003
VI 435 045 142 028 1 78 044 2 47 04" 484 () 87 :2 "6 () 83
8argarh DIStrict
II 25 00 61 50 33 33 63 57
III 33 33 5962 33 33 'i828
IV 5000 33 42 6667 3643 6667 4038 100 00 100 00 ,
V 25 00 5 08 6667 41 72 10000 100 00
VI
Jharsuguda District
II 6667 82 34 6667 8456 I DO 00 I DO 00
III 3333 1766 33 33 1544 100 00 100 00
IV 100 00 100 on 10000 100 00
V
VI
Sa m bal12u r District
2000 61 96 2500 65 62 2500 65 64
II 20 00 63 59
III 4000 2727 5000 2846 5000 2890 33 34 6740 10000 100 00
IV 40 00 1077 25 00 592 4000 26 15 33 31 17 72
V 2500 546 40 00 1026 33 33 14 88
VI
Debagarh District
II
III 100 00 10000
IV 100 00 100 00 100 00 100 00
V 10000 10000 [00 00 [00 00 [00 00 100 00
VI
276

3 of Towns and percentage of Population from 190 I to 2001 in State/District
1941 Peru:ntage 0 I
Noof Popu-Towns latlOn
14
345
1034
27 S9
5<; 17
34<;
15
1 X 01
2<; 60
27 '>3
27 93
o 9~
100 00 100 00
100 00 100 00
100 00 100 00
I ()O 00100 00
1931 Pen .. entdge of
No 01 Popu-1 own~ latlon
16
4 76
14 29
2& 57
4762
4 76
10000
100 00
100 00
17
20 q
3007
2678
21 'i3
O'i
100 00
1 DO 00
100 ()O
1921
Pcr~el1tdge of
]\.0 of I'opu-1 own" lutlon
lR
<; 00
1000
3000
45 00
IlJ 00
Ion on
10000
100 00
277
19
18 12
2':; 37
11 ()9
20 'i-I
2 XX
I () (J n (l
IlJO 00
I ()O 00
19 I 1
Pen .. entdge ,It No 01 Popu-ro~ no;; latlon
20
" ';6
1666
27 7&
1"\ ~,
1667
1011 00
IOU 00
21
19 09
1421
I <)l)
I()ono
1 ()O 00
1 L)() I
Per~entdge 01
'\J () 01 Popu-low no;; latlon
22
7 14
21 n
7 I I
100 00
23
20 17
37 67
2<) &7
I () ':;6
I 7 l
100 00

SfATEMENT-Percentage of Towns in each to Total Number
in each class to Total urban population
2001 1991 1981 1971 1961 1951 til P erc en tage of Percentage of Percentage of Percentage of Percentage of Percenlage of ~
U No of Popu- No of Popu- Noof Popu- Noof Popu- Noof Popu- Noof Popu-Towns latlOn Towns latlOn Towns lallon Towns lallon Towns latlOn Towns latlon
2 3 4 5 6 7 8 9 10 II 12 13
Sundarll:arh District
18 18 75 j 6 2222 7347 1667 5241 2000 52 33
II 1667 2345 25 00 6651
III 2728 1772 33 34 19 71 5000 21 19 6000 4048 25 00 1495
IV 18 18 3 53 II II 2 50 1666 295 2000 7 19 3000 1854
V 18 18 257 22 22 344 100 00 10000
VI 18 18 I 02 II II 088
Kendujhar District
II 2222 4904
III 2222 3462 57 15 8709 6667 8864 25 00 36 14
IV II II 5 55 1429 681 <;000 5449 100 00 100 00
V 33 34 880 1428 344 1666 7 53 25 00 937 100 00 100 00 .
VI II II I 99 1428 266 1667 383
Ma):urhhanl District
25 00 6465
II 2500 5956 2500 58 53
III 5000 27 83 5000 71 90 5000 71 43
IV 25 00 7 52 7500 40 4'~ 5000 33 59 5000 28 10
V 25 00 7 88 5000 28 57 10000 100 00
VI
Baleshwar DIstrict
2000 57 79 2500 6606
II 3333 6745
1II 6000 3551 25 00 1475 5000 8733 3333 5931 100 00 100 00
IV 2000 6 70 5000 19 19 6667 32 55 6667 4069
V 5000 1267
VI
Bhadrakr District
II 33 34 65 58 3334 6959 2500 4800
III 3333 21 27 33 33 2297 5000 45 82 5000 85 77 5000 72 89
IV 3333 13 15 100 00 10000
V 33 33 744 25 00 6 18 5000 1423 5000 27 II
VI
278
3 of Towns and percentage of Population from 1901 to 2001 in StatelDistrict
1941 1931 Percentage of Percentage of
Noof Popu- Nooof Popu-Towns lation Towns lation
14 15 16 17
100 00 100000
10000 100 00 100 00 100 00
10000 10000 10000 100 00
10000 100 00 10000 100.00
1921 Percentage of
Nooof Popu-Towns lation
18 19
100 00 100 00
10000 10000
100 00 10000
279
1911 1901 Percentage of Percenmge of
No of Popu- Nooof Popu-Towns lation Towns I at IOn
20 21 22 23
.. -
10000 10000 100.. 00 100 00
10000 100 00 10000 100.00

STATEMENT-Percentage of Town .. in each to Total Number
in each class to Total urban population
2001 1991 19S1 197] Iq61 1951 J
Percentage of Percentage of Percentdge 01 Percentage 01 PClcentd)!C 01 Pelcen tage 01 ~ ~ "No ot Popu- No of Popu- "N 001 Popu- Nonl Popu- !\io l) I POf1U- [\,0 or Popu-
Towns latlon lown" latlo n 10\\ n~ latlon Town" lalloll r 0 \\n" Idllon I own~ lallon
2 3 4 5 6 7 8 9 10 II 12 13
Kendrapara District
II
III 100 00 100 00 100 00 100 00 100 00 I (JO 00 100 00 100 00
IV 100 on 100 00 100 00 100 '00
V
VI
.Jagatsinghapur DIstrict
II 5000 7049
III "000 29 'i I 6667 9609 100 00 100 00
IV
V 100 00 100 00
VI 33 33 391
Cuttack District
12 "0 83 ,9 14 29 83 03 2'100 R4 10 2'1 00 82 87 2'100 84 58 33 34 9043
II 1250 8 19
III 1428 7 59 25 00 9 16 2" 00 9 79
IV 25 00 497 28 57 'i77 'i0 00 674 25 00 7 79
V 2500 2 04 42 86 3 61 5000 7 34 ':;0 00 7 63 33 33 'i 20
VI 25 00 I 41 31 B 4 37
Jajapur DI~trict
II
III 100 00 10000 100 00 100 00 100 00 100 00
IV 100 00 10000 "i0 00 69 H 100 00 100 00
V '>000 3021>
VI
Dhenkanal District
II 3331 6207
III 3333 21 78 33 33 5929 33 33 58 14
IV 3333 16 15 6667 40 71 6667 41 86 100 00 100 00 500U 'i9 16 5000 5667
V 'i0 00 -10 8-1 "iO 00 43 33
VI
280

3 of Towns and percentage of Population from 1901 to 200t in State/District
1941 1931 Percentage of Percentage of
No.of Popu- No.of Popu-Towns lation Towns lation
14 15 16 17
10000 10000 10000 10000
100 00 100 00 100 00 10000
100 00 100 00 100 00 100 00
1921 1911 1901 Percentage of Percentage of Percentage of
No of Popu- No.of Popu- No.of Popu-fowns )atlon Towns latlOn Towns lalion
18 19 20 21 22 23
10000 10000
J 00 00 10000 10000 10000 10000 100 00
.0000 100 00 100 00 100 00 10000 10000
281

STATEMENT-Percentage of Towns in each to Total Number
in each class to Total urban population
2001 1991 1981 1971 1961 1951 V)
Percen lage of Percentage of Percentage of Percentage of Percentage of Percen lage of E u No of Popu- No of Popu- Noof Popu- Noof Popu- Noof Popu- No of Popu-
Towns iatlon Towns latlOn Towns iatlOn Towns latlOTl Towns latlOn Towns latlOn
2 3 4 5 6 7 8 9 10 II 12 13
Anugul DIstrict
II
III 2222 4609 25 00 4684
IV 4445 40 15 25 00 21 75 5000 76 13 50 00 5657 ~O 00 65 89
V 33 33 13 76 5000 31 41 33 33 1673 50 00 4343 5000 34 II 100 00 100 00
VI 1667 7 14
Nayagarh DIstrict
II
III
IV 25 00 3& 62 3333 3987
V 75 00 61 38 6667 60 13 100 00 100 00 100 00 100 00 100 00 J 00 00
VI
Khordha District
1429 81 69 2000 7939 2500 7422 3334 6974
II 1429 7 19 2000 967
III 1428 4 85 2000 590 5000 21 72 3333 1976 3333 "722
TV 42 86 5 50 4000 504 2500 406 3333 1050 6667 4278 5000 62 34
V 1428 077 5000 3766
VI
Pun DIstrict
2500 77 36 25 00 77 57 33 34 83 36
II 100 00 100 00 10000 10000
III 100 00 100 00
IV 75 00 2264 75 00 2243 3333 942
V 33 33 722
VI
Ganjam District
5 26 55 32 5 56 4966 5 56 4796 7 14 50 51
II 11 II 57 79 20 00 67 73
III 15 79 11 21
IV 63 16 2958 7222 4267 4444 3144 35 72 24 70
V 1053 299 2222 767 4444 1927 5000 23 2'\ 6667 37 03 8000 3227
VI 526 090 5 56 I 33 7 14 1'>4 22 22 ~ 18
282

3 of Towns and percentage of Population from 1901 to 2001 in State/District
1941 1931
Percentage 0 f Percentage of No.of Popu- No of Popu-Towns iatlOn Towns latlOn
14 15 16 17
100 00 100 00 100 00 100 00
2000 6298 33 33 7624
8000 3702 66 67 23 76
1921
Percentage of No of Popu-Towns IatlOn
18
10000
3334
3333
3333
283
19
10000
7549
14 15
1036
1911
Percentage of Noof Popu-Towns iatlOn
20 21
10000 10000
3334 7417
33 33
3333
142S
II 58
1901
Percen tage of Noof Popu-Towns iattOn
22 23
10000 10000
100 00 100 00

SfATEMENT-Percentage of Towns in each to Total Number
in each class to Total urban population
2001 1991 1981 1971 1961 1951
'" Percentage of Percentage of Percentage of Percentage of Percentage of Percentage of E u No.of Popu- No.of Popu- No.of Popu- Noof Popu- No.of Popu- No.of Popu-
Towns latlOn Towns lation Towns latlOn Towns lation Towns lation Towns lation
2 3 4 5 6 7 8 9 10 11 12 13
Gajapati District
II
III 50.00 81 49 5000 7840 5000 77 88 10000 10000 100 00 100 00 100 00 100 00
IV 5000 21 60
V 50.00 18.51 5000 22 12
VI
Kandhamal District
II
III 50.00 7686 5000 76 14
IV 50.00 23.14 5000 72 80 100 00 100 00
V 5000 23.86 5000 2720
VI
Baudh District
11
III -. TV 10000 100.00 10000 10000 100 00 10000
V 100 00 10000 10000 100 00 10000 100 00
VI
Sonapur District
II
LI
IV 6667 80.06 6667 7856 6667 75 60
V 33.33 19.94 3333 21 44 3333 2440 10000 10000 100 DO I DO 00 100 00 100 DO
VI
Balangir District
II 2500 55.25 2500 54.03 2500 5241
III 5000 3264 2500 1987 25 00 2049 25 00 4954
IV 25.00 12.11 5000 26.10 5000 27 10 75 00 5046 25 00 43 86 25 00 4093
V 75 00 56 14 7~ '00 5907
VI
284
3 of Towns and percentage of Population from 1901 to 2001 in State/District
1941
Percentage of No.of Popu-Towns labon
14 15
100 00 100 00
100 00 100 00
5000
5000
7033
2967
5000 6627
5000 33 73
1931 Percentage of
No of Popu-Towns 1 at IOn
16
100 00
<;000
5000
100 00
17
100 00
71 89
28 I I
100 00
1921 Percentage of
No of Popu-Town;, latlOn
18
5000
5000
285
19
68 10
31 90
1911 Percentage of
No of Popu-Towns latlOn
20
50 DO
5000
21
67 65
32 3~
1901 Pert.en tagc oj
No of Puru-fown,> latlon
22 23
10000 10000

SfATEMENT-Percentage of Towns in each to Total Number
in each class to Total urban population
2001 1991 1981 1971 1961 1951 Vl
Percen tage of Percentage of Percentage of Percentage of Percentage of Percen tage of ~ u No of Popu- No of Popu- Noof Popu- Noof Popu- Noof Popu- No.of Popu-
Towns JatlOn Towns latJon Towns tatton Towns JatlOn Towns latlOn Towns JatlOn
2 3 4 5 6 7 8 9 10 II 12 13
Nuapada District
II
III
IV 10000 10000 10000 100 00 5000 53 51
V 5000 4649 10000 100 00 100 00 100 00
VI
Kalahandi District
II 2500 6065 3333 65 33
III 3333 58 63
IV 5000 3261 6667 34 67 10000 10000 100 00 100 00 100 00 10000
V 2500 6 74 6667 41 37
VI
Rayagada District
II 2000 5005
III 2000 21 41 2500 5401 2500 5067 3333 58 92
IV 2000 16 19 5000 38 59 50 00 41 28 33 34 2986 100 00 100 00
V 4000 12 35 25 00 740 25 00 8 OS
VI 33 33 II 22
Nabarangapur District
II
III 6667 89 19 5000 55 83
IV 5000 44 17 6667 8387 5000 5830 100 00 10000
V 3333 1081 33 33 16 13 5000 41 70 100 00 10000
VI
Koraput District
II 4000 6828 4000 68 58 25 00 3922
III 2000 1993 2000 2034 5000 52 35 75 00 8948 25 00 6040 5000 7032
IV 2000 7 52 2000 7 75 25 00 843
V 2000 427 2000 3 ]] 2500 1052 5000 ]3 02 5000 2968
VI 2" 00 658
286

3 or Towns and percentage of Population from 1901 to 2001 in StatelDistrict
1941 1931
Percentage of Percentage of No.of Popu- No.of Popu-Towns lation Towns latlOn
14 15 16 17
'-
10000 10000
100 00 10000
100 00 100 00 10000 10000
10000 10000 10000 10000
1921 1911 1901 Percentage of Percentage of Perc en tage of
No.of Popu- No of Popu- No of Popu-Town" latlOn Town" latlon Towns latlOn
18 19 20 21 22 23
100 00 100 00 100 00 10000
100 00 100 00
100 00 Ion 00
287

2001
Percentage of No of Popu-Town~ lation
2 3
Malkangiri District
11
III
IV
V
VI
5000
5000
66 77
33 23
1991
Percentage 0 I' No of Popu-Towns latK>n
4
6667
33 33
5
8263
1737
1981
Percentage of Noof Popu-Town" lation
6
, -
33 33
6667
7
4751
5249
288
STATEMENTPercentage of Towns in each to Total Number
in each class to Total urban population
1971 1961 1951
Percentage of Percentage of Percentage of Noof Popu- Noof Popu- Noof Popu-[owns latlon lowns latlOn Towns lation
8 9 10 II 12 13
100 00 100 00
3 of Towns and percentage of Population from 1901 to 2001 in State/District
1941 1931 Percentage of Percentage of
No of Pnpu- No of Popu-Towns lacon Towns latlon
14 15 16 17
1921 1911 1901
Percentage of Percentage of Percen tage of No of Popu- No of Popu- No.of Popu-Tovm s latlOn Towns latlOn Towns latJOn
18 19 20 21 22 23
289

The statement reveals that there was no class I town in the state till 1941. In 1951 Cuttack became the only class I town in the State. The proportion of population to total urban population living in class I town was 17.26 percent in 1951 which decreased to 13 .19 percent in 1961 but shows a steady rise from 13.19 percent to 45.61 percent rising all through the period. In case of class 11 and III towns the percentage of number of towns increased from 7.14 to 10.87 and 21.43 to 26.09 respectively during 1901-200 I. In
case of class IV, V and VI towns, the percentage of number of towns decreased from 35.72 to 34.78, 28.57 to 17.39 and 7.14 to 4.35 percent respectively. Similarly the percentage of population living in class fII, IV, V and VI towns decreased comparatively showing increase in favour of class I & n towns.
Statement-4 depicts the percentage of area of towns to total urban area of state and districts and density of population per Sq. Km. in each class during 1991 and 200 I Census.
STATEMENT-4 Percentage of area of towns in each class to total urban area of State and Districts and density of population
per sq.km. in each class
Class
I II III IV V VI
II III IV V VI
II TIl IV V VI
II TIl IV V VI
Percentage of area to total urban area
2
2838 16.80 26.56 23.59 4.33 0.33
30.46
6367 5.87
72.88 27.12
34.62
27.66 3772
2001 DenSity per km2
3
Percentage of area to total urban area
4
ORISSA
3.379 2303 2,008 1402 1.349 28.92 1.055 27.62 1.440 598 2,650 0.43
Baragarh District - 0 I
3,808 32.36
990 67.64 1,635
Jharsuguda District - 02
1,368 79.09 788 20.91
Sambalpur District - 03
3.161 46.78
1.741 37.38 504 1584
290
1991 Density per k m2
5
3,026 ].739 1.265 1.041 1.096 1,102
3,063
840
1,204 832
2,710
1.471 722

STATEMENT-4 Percentage of area of towns in each class to total urban area of State and Districts and density of population
per sq.km. in each class
Class
II
m IV V VI
II
III IV
V VI
I
II III IV V VI
I
II III IV V VI
II III
IV V VI
Percentage of area to total urban area
2
100
61.69
29.35 4.74 3.46 0.76
34.16 52.22
5.75 7.87 NA
47.95
42.01 10.04
29.26
55 1 15.64
2001 DensIty per km2 Percentage of area to
total urban area
3 4
Debagarh District - 04
833 100
Sundargarh District - 05
3.132 59.72
1,552 33.7 1,912 2.45 1,910 3.4
3477 * 073
Kendujhar District - 06
1,540 711 91 1
1,036 623 1.200 267
NA NA
Mayurbhanj District - 07
2,670 42.29
1312 1.484 57.71
Baleshwar District - 08
3,331 40.29
1,087 2277 722 3694
* Area ofGCL LT. is not available but it is added In Rajagangapur(M)
291
1991 Density per km2
5
716
2.555
1,214 2.122 2,105
2.486
870 996
1.173 NA
2.310
1.149
2.435
962 772

STATEMENT-4 Percentage of area of towns in each class to total urban area of State and Districts and density of population
per sq.km. in each class
2001 1991
Class Percentage of area to Density per km2 Percentage of area to Density per k m2 total urban area tota I urb an area
2 3 4 5
Bhadrak District - 09
II 31.86 2,977 36,58 2.451) III 48,98 628 5623 528 IV 19.16 993 V 719 1.337 VI
Kendrapara District - 10
If III 100 5.570 100 4.751 IV V VI
Jagatsinghapur District - II
II 56.85 3,153 III 43.15 1,740 81.96 1,780 IV V VI 18.04 329
Cuttack District - 12
I 67.31 3,584 68.8 3.309 II 20.78 1,141 III 17.54 1.187 IV 7.48 1,920 9.36 1.689 V 1.65 3.574 43 2,307 VI 2.78 1,466
Jajapur District - 13
II HI 100 1.427 100 1.445 IV V VI
Dhenkanal District - 14
n 45.96 2324 III 33.4 1.122 45.95 1.866 IV 20.64 1.346 54.05 1.089 V VI
292
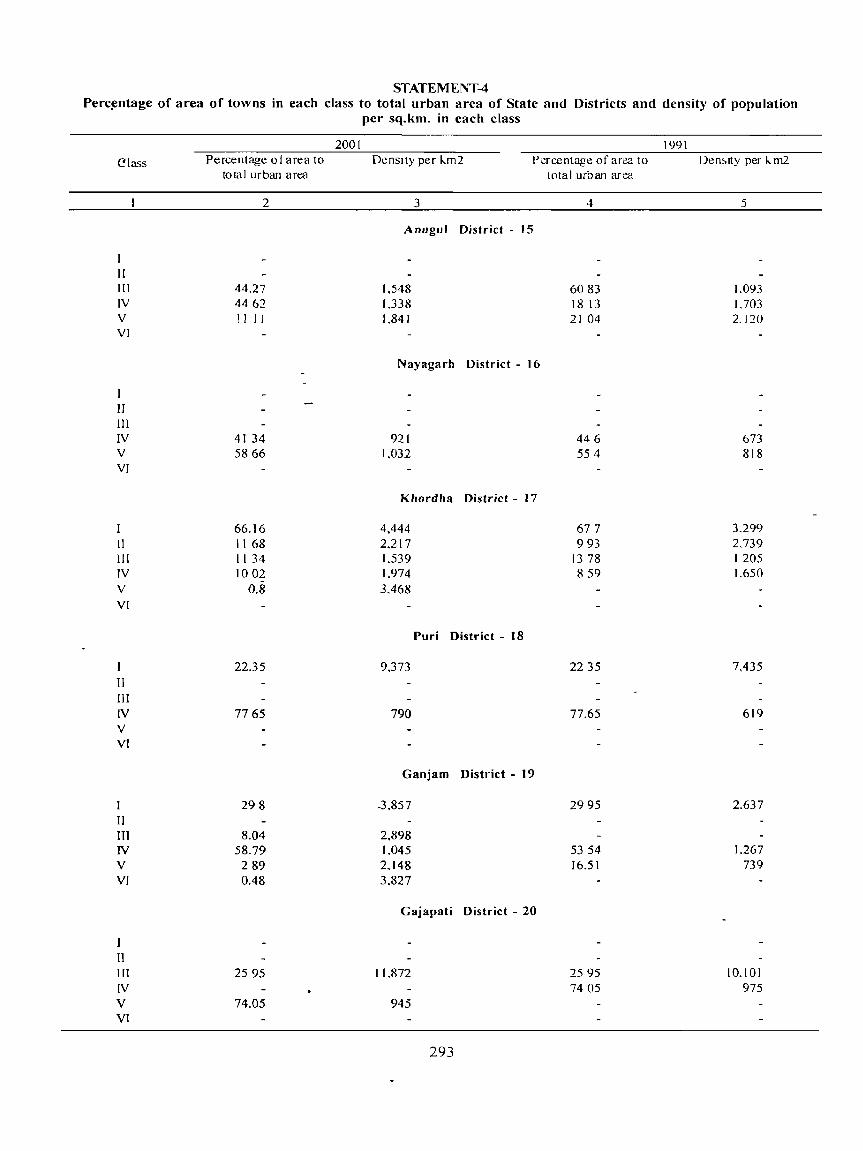
STAT EM E NT-4 Perc~ntage of area of towns in each class to total urban area of State and Districts and density of population
per sq.km. in each class
2001 1991
elass Percentage of area to DensIty per km2. Percentage of area to [)en~lty per km2 total urban an:a Iota I urb an area
2. 3 4 5
Anugul District - IS
II III 44.27 1,548 6083 1.093 IV 4462 L338 18 13 1.703 V 11 11 1.841 2104 2.120 VI
Nayagarh District - 16
II 1lI IV 4134 92.1 446 673 V 5866 1,032 554 818 VI
Khordha District - 17
66.16 4,444 677 3.299 II 1168 2.217 993 2.739 III 1134 1.539 1378 1205 IV 1002 1.974 859 1.650 V 0.8 3.468 VI
Puri District - 18
22.35 9,373 2235 7.435 11 III IV 7765 790 77.65 619 V VI
Ganjam District - 19
298 .3,857 2995 2.637 II III 8.04 2,898 IV 58.79 1.045 5354 1.267 V 289 2.148 16.51 739 VI 0.48 3.827
Gajapati District - 20
II III 2595 1].872 2595 10.1 01 IV 7405 975 V 74.05 945 VI
293

STATEMENT-4 Percentage of area of towns in each class to total urban area of State and Districts and density of population
per sq.km. in each class
2001 1991
Class Percentage 0 farea to Density per km2 Percentage of area to Density per km2 total urban area total urban area
2 3 4 5
Kandhamal District - 21
II III 54.72 2.118 54.72 1.697 IV 45.28 171 V 4528 643 VI
Baudh District - 22
II III IV 100 870 100 746 V VI
Sonapur District - 13
II III IV 73.84 878 73.84 749 V 26.16 617 26.16 577 VI
Balangir District - 24
II 42.9 2,743 42.9 2.250 III 31.9 2.179 21 17 1,677 IV 25.2 1,024 35.93 1.298 V VI
Nuapada District - 25
I II III IV 100 853 100 731 V VI
Kl)lahandi District - 26
II 32.3 3.947 33.89 3,316 III IV 63 1,088 66 II 902 V 4.7 3,016 VI
294

STATEMENT-4 Percentage of area of towns in each class to total urban area of State and Districts and density of population
per sq.km. in each class
2001 1991
Class Percentage of area to Density per km2 Percentage of area to Densrty per k rn2 total urban area total urb an area
1 3 4 5
Rayagada DIstrict - 27
I II 3247 3097 III 4662 923 494 2.587 IV 9 3,614 4456 2.049 V 1191 2.084 604 2900 VI
;-..'abarangapur DIstrict - 28
II III 9472 1.488 24 18 2847 IV 7582 718 V 528 3.235 VI
Koraput DIstrict - 29
I
II 54.25 1.324 5425 1.150 III 3236 64R 3236 572 IV 686 1.152 68(1 1028 V 653 688 653 464 VI
l\1alkangiri District - 30
II III 7883 1.280 IV 21 17 2.372 8358 1.242 V 1642 1.329 VI
295

The statement discloses that the percentage of , area to total urban area In case of ,class I, II and JII towns have Increased during 1991-2001 whereas Itt case of class IV, V and VI the percentage of area to total urban area have decreased during the said i period in the state. The statement further hIghlIghts the density of population per Sq.Km.,
which is increasing 111 all classes of towns in 200 I as compared to 199 I.
Taking the district perspectIve, denSIty of population per Sq.Kms has increased III all classes of towns of the total number of dIstrIcts except Sambalpur, Jajapur and Rayagada districts where density of population shows a decline
The Statement-5 given below shows the number and population of cities and towns of 1991 and 2001 Census arranged In six classes I to VI in the state and dIstricts.
STAT EME NT-5
Number and population of Cities and Towns of 1991 and 2001 Census arranged in Six Classes I to VI
State/ Clas~ of 2001 1991 Percentage Increase and Percentage IJ Istrlct To'" n<; Nool Total No of Total Increase and decrease In mcrea"e or
To\\ ns PopulatIon To", n~ PopulatIon decrease In PopulatIOn of decrease No of Towns Class 1991-2001
2 3 4 5 6 7 8 9
ORISSA All Classes 138 5,517.238 124 4,234,98l 1129 1.282,255 3028
9 2,516678 8 1.772,978 1250 743,700 41 95 (a) (_ lUes \\ Itl1 one mIllIOn and
above populatIOn
(b) Cltle~ WIth 500 000 to 999,999 populatIon 2 1.192.874 100 00 1,192,874 100 00
(c) CItIes wIth 100,000 to 499,999 populatIon 7 1.323,804 8 1.772,978 -1250 -449.174 -2533
II 15 994.827 10 620,452 5000 374,375 6034
III 36 1,099.140 29 931.204 24 14 167,936 18 03
IV 48 707,585 52 731,604 -769 -24.019 -328
V 24 174,333 22 166,740 909 7.593 455
VI 6 24.675 3 12.005 100 00 12,670 10554
Bargarh All Classes 4 103,541 3 80.547 3333 22,994 2855
000
II 63,678 51,205 a 00 12,4 73 24.36
III a 00
r\t 2 34,599 2 29,342 000 5.257 1792
V 5,264- lDD DD 5,264 !DO
VI
296

STATEMENT-5
Number and population of Cities and Towns of 1991 and 2001 Census arranged in Six Classes I to VI
St at c/ Class of 2001 1991 Percentage I ncrease and Percentage District Towns No.of lotal No.of Total increase and decrease in increase or
Towns Population Towns Population decrease in Population of decrease No. of Towns Class 1991-2001
2 3 4 5 6 7 8 9
Jharsuguda All Classes 3 185.R85 3 159,328 0.00 26,557 16.67
[I 2 153.059 2 134.721 0.00 18,338 13.61
III 32.X26 24.607 0.00 8.219 33.40
IV
V
VI
Sambalpur All Classes 5 253.77S 4 205.458 25.00 48.320 23.52
157.253 134.824 n.oo 22.429 16.64 (:.1) Cities \\ ith one million and
abo\c population
(b) Cities with 500.000 to
999.999 population
(c) Cities \,ith 100.000 to
499.999 popUlation 157.253 134.824 0.00 22,429 16.64
[I
III 2 69.216 2 58.4 73 0.00 10,743 18.37
IV 2 27.309 12.161 100.00 15,148 124.56
V
VI
Debagarh All Classes 20,096 17,275 0.00 2.821 16.33
II
III 20,096 100.00 20.096 100.00
IV 17.275 -100.00 -17.275 - -100.00
V
VI
297

STATEMENT-S
Number and population of Cities and Towns of 1991 and 2001 Census arranged in Six Classes I to VI
State/ Class of 2001 1991 Percentage Increase and Percentage District Towns No.of Total No.of Total increase and decrease In increase or
Towns Population Towns PopulatIon decrease In Population of decrease No. of Towns Class 1991-2001
2 3 4 5 6 7 8 9
S undargarh All Classes I I 629,194 9 525,005 22.22 104,189 19.85
2 472,913 2 385.748 0 87.165 22.60 (a) Cities with one million and
above population
(b) Cities with 500,000 to 999,999 popualtion
(c) Cities with 100,000 to 499,999 population
2 472.913 2 385.748 0 87.165 22.60
II
III 3 111.462 3 103.457 0.00 8.005 7.74
IV 2 22,194 13.116 100.00 9.078 61.21
V 2 16,193 2 18.085 000 -1.892 - I 0.46
VI 2 6.432 4.599 100.00 1.833 39.86
Kendujhar All Classes 9 213,023 7 166.874 28.57 46.149 27.65
II 2 104.472 200.00 104,472 10000
III 2 73,737 4 145.324 -10000 -71.587 -49.26
IV I . 11.833 II..no 0.00 463 4.07
V 3 18.742 5.746 200.00 12.996 226 17
VI 4.239 4,434 0.00 -195 -4.40
Mayurbhanj All Classes 4 155.700 4 116,249 000 39.451 3394
100.651 69.240 000 31.411 45.37
(a) Cities with one million and above population
(b) Cities with 500,000 to 999,999 popualtlOn
(c) Cities with 100,000 to 499,999 population 100,651 69,240 000 31.411 4537
II 69.240 -100.00 -69.240 -100.00
III 2 43,337 200.00 43.337 100.00
IV II. 712 3 47.009 -6667 -35.297 -7509
V VI
298
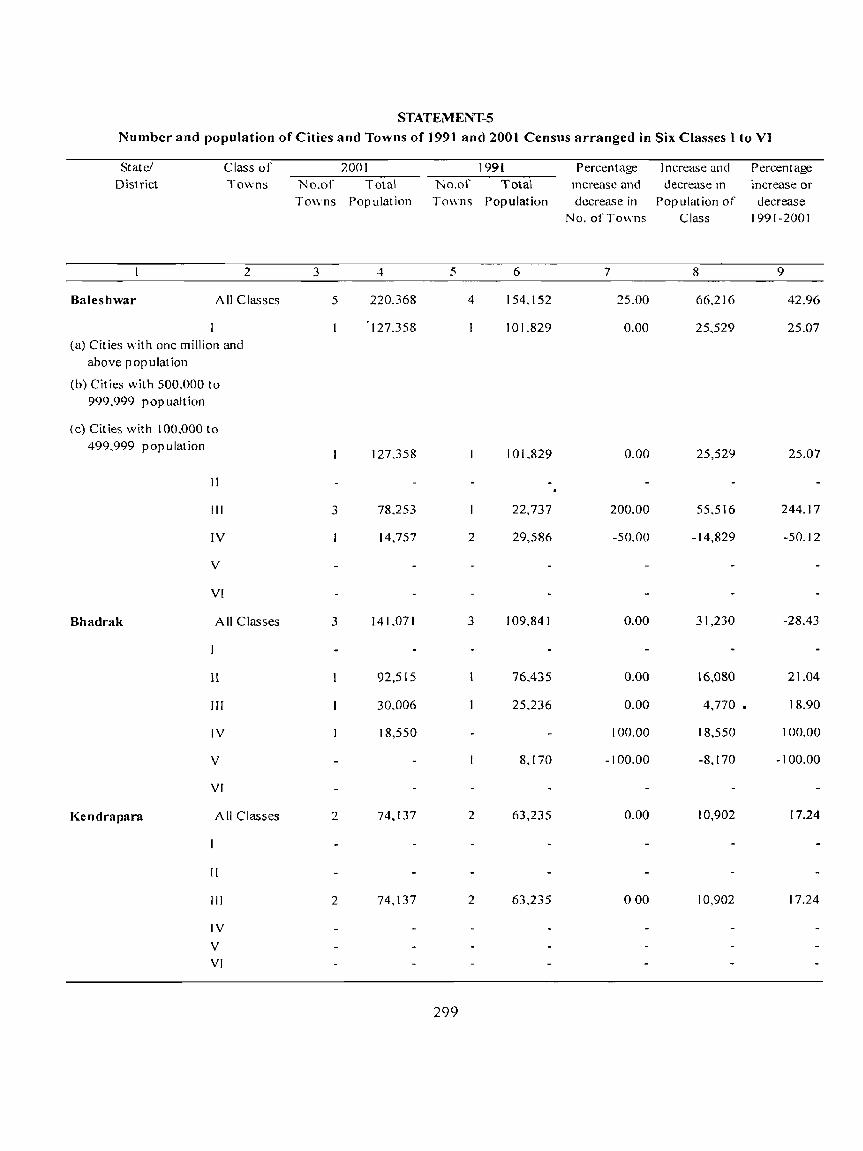
STATEMENT-5
Number and population of Cities and Towns of 1991 and 2001 Census arranged in Six Classes 1 to VI
State! Class of District Towns
2
Baleshwar All Classes
(a) Cities with one million and above population
(b) Cities with 500.000 to 999.999 popualtion
(c) Cities with 100.000 to 499.999 population
Bhadrak
Kendrapara
II
III
IV
V
VI
All Classes
II
III
IV
V
VI
All Classes
[[
III
IV
V
VI
2001 No.of Total No.of Towns Population Towns
3 4 5
5 220.368 4
127.358
127.358
3 78.253
14,757 2
3 141.071 3
92,515
30,006
18,550
2 74.137 2
2 74.137 2
299
1991 Percentage I ncrea<;e and Percentage Total Increase and decrease In increase or
Population decrease in Population of decrease No. of Towns Class 1991-2001
6 7 8 9
154.152 25.00 66.216 42.96
10].829 0.00 25.529 25.07
101.829 0.00 25,529 25.07
22,737 200.00 55.516 244.17
29,586 -50.00 -14,829 -50.12
109,841 0.00 31,230 -28.43
76.435 0.00 16,080 21.04
25.236 0.00 4,770 • 18,90
100.00 18,550 100.00
8,170 -100.00 -8,170 -100.00
63,235 0.00 10,902 17.24
63,235 000 10,902 17.24

STATEMENT-5
Number and population of Cities and Towns of 1991 and 2001 Census arranged in Six Classes I to VI
St at el Class of
District Towns
2
Jagatsinghapur All Classes
II
III
IV
V
VI
Cuttack All Classes
(a) Cities with one million and above population
(b) Cities with 500,000 to 999,999 popualtion
(c) Cities with 100,000 to
499,999 population
Jajapur
II
1Il
IV
V
VI
All Classes
II
III
IV
V
VI
2001 No.of Total No of Towns PopulatIOn Towns
3 4 5
2 104.449 3
73.625
30.824 2
8 641.130 7
534.654
534.654
52.528
2 31.837 2
2 13,082 3
2 9,029
2 72,9S0 2
2 72,980 2
300
1991 Percentage Increase and Percentage Total increase and decrease in increase or
Population decrea.·,e In Population of decrease No.ofTo'hns Class 1991-2001
6 7 9
76.092 -33.33 2!U57 3727
100.00 73.625
73.120 -5000 -42.296 -57.84
2.972 -100.00 -2.972 -100.00
485.861 1429 155.269 31 96
403.,t 18 0 131.236 32.53
403.418 a 131.236 32.53
100.00 52.528 100.00
36,877 -10000 -36.877 -100.00
28,011 000 3,826 13.66
17.555 -50.00 -4.4 73 -25.48
200.00 9.029 200.00
53.431 0.00 19.549 36.59
53,431 0.00 19.549 36.59
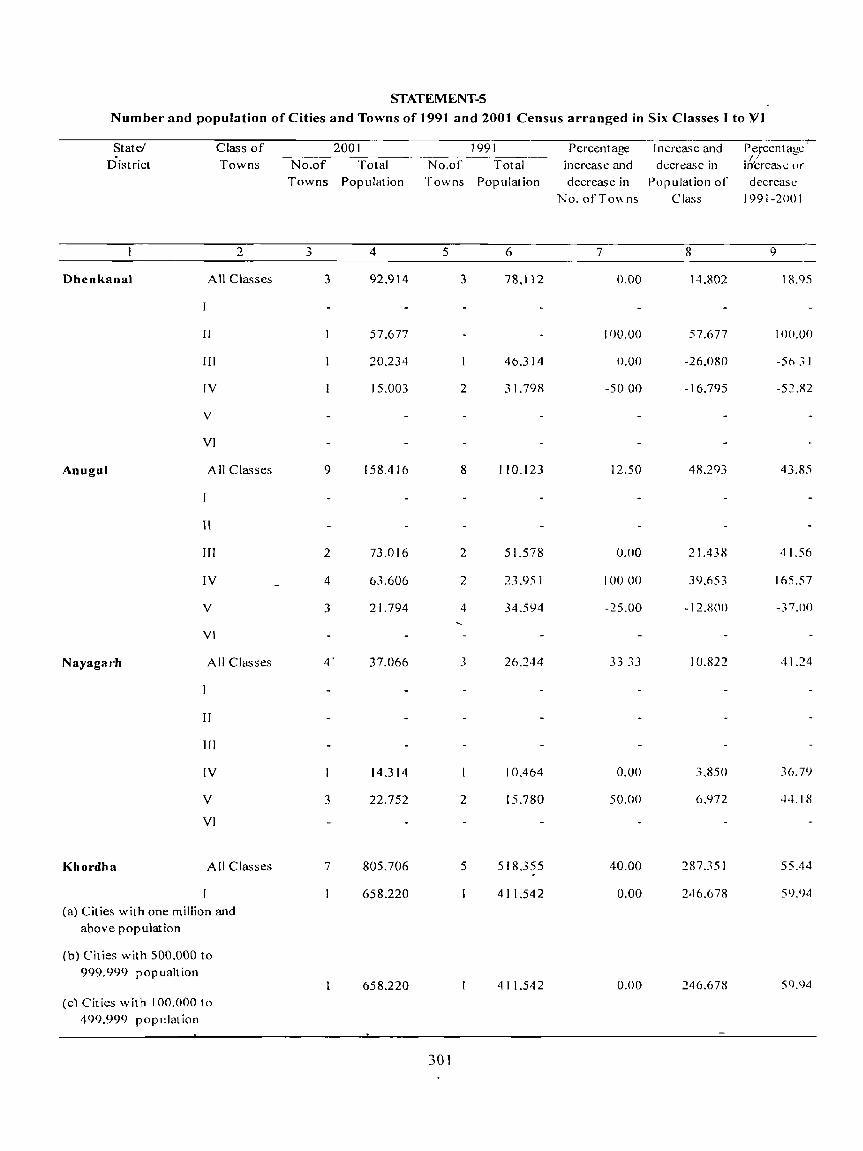
STATEMENT-S
Number and population of Cities and Towns of 1991 and 2001 Census arranged in Six Classes I to VI
State' Class of 2001 1991 Percentage I ncrease and Percentage District Towns No.of Total No.of Total increase and decrease in i~crca:,c or
Towns Pop lIlat ion Towns Population decrease in Porulation of decrease No. ofTo~ns Cla'is I 991-2()() I
2 3 4 5 6 7 s 9
Dhenkanal All Classes 3 92,914 3 78,112 0.00 14.802 18.95
II 57.677 I flO.OO 57.677 100.00
III 20.234 46.314 0.00 -26.OlW -5(1 :; I
IV 15.003 2 31.798 -5000 -16.795 -52.X2
V
VI
Anugul All Classes 9 158.416 8 110.123 12.50 48.293 43.R5
II
III 2 73.016 2 51.578 0.00 2].438 41.56
IV 4 63.606 2 23.951 10000 39.()S3 165.57
V 3 21.794 4 34.51)4 -25.00 -12.S(l() -:n .(10
VI
Nayagarh All Classes 4' 37.066 3 26.244 33 33 10.822 41.24
II
III
IV 14.314 10.464 0.00 3.850 36.79
V 3 22.752 2 15.780 50.00 6.972 'H.IS
VI
Khordha All Classes 7 805,706 5 518.355 40.00 287.351 55.'14
658.220 41 1.542 0.00 246.(J78 59.94
(a) Cities with one million and above population
(b) Cities with 500.000 to 999.999 popualtion
658.220 411.542 0.00 246.678 59.94
(c) Cities with 100.000 to 499.999 population
30\

STATEMENT-5
Number and population of Cities and Towns of 1991 and 2001 Census arranged in Six Classes I to VI
State! Class of 2001 1991 Percentage Increase and Percentage District Towns No.of Total No.of Total Increase and decrea~t: In increase or
Towns Population Town~ PopulatIOn decrease in Population of decrea~e
No ofT owns Cla...;!> 1991-2001
2 3 4 5 6 7 8 9
11 57,957 50.116 () 7.841 15.65
III 39,054 30.591 0 8.463 27.66
IV 3 44,268 2 26,106 50.00 18.162 6957
V 6207 100.00 6.207 100.00
VI
Puri All Classes 4 204.028 4 161.405 0.00 .t2.623 2641
157.837 125.199 000 32.638 26.07 (a) Cities With one million and
above popula~ion
(b) Cities with 500.000 to 999.999 popualtion
(c) Cities with 100.000 to 499.999 population
157.837 125.199 000 32.638 2607
II
II!
IV 3 46,191 3 36.206 000 9.985 2758
V
VI
Ganjam All Classes 19 556,359 18 423.753 5.56 132.606 31.29
307.792 210.4 1 8 000 97.374 4628 (a) Cities with one million and
above population
(b) Cities with 500,000 to 999,999 popualtion
(c) Cities with 100,000 to 499.999 population 307,792 210.418 000 97,374 46.28
II
III 3 62,375 30000 62,375 100.00
IV 12 164.592 13 180.810 -7.69 -16,218 -8.97
V 2 16,625 4 32.525 -50.00 -15.900 -48.89
VI 4,975 100.00 4.975 100.00
302
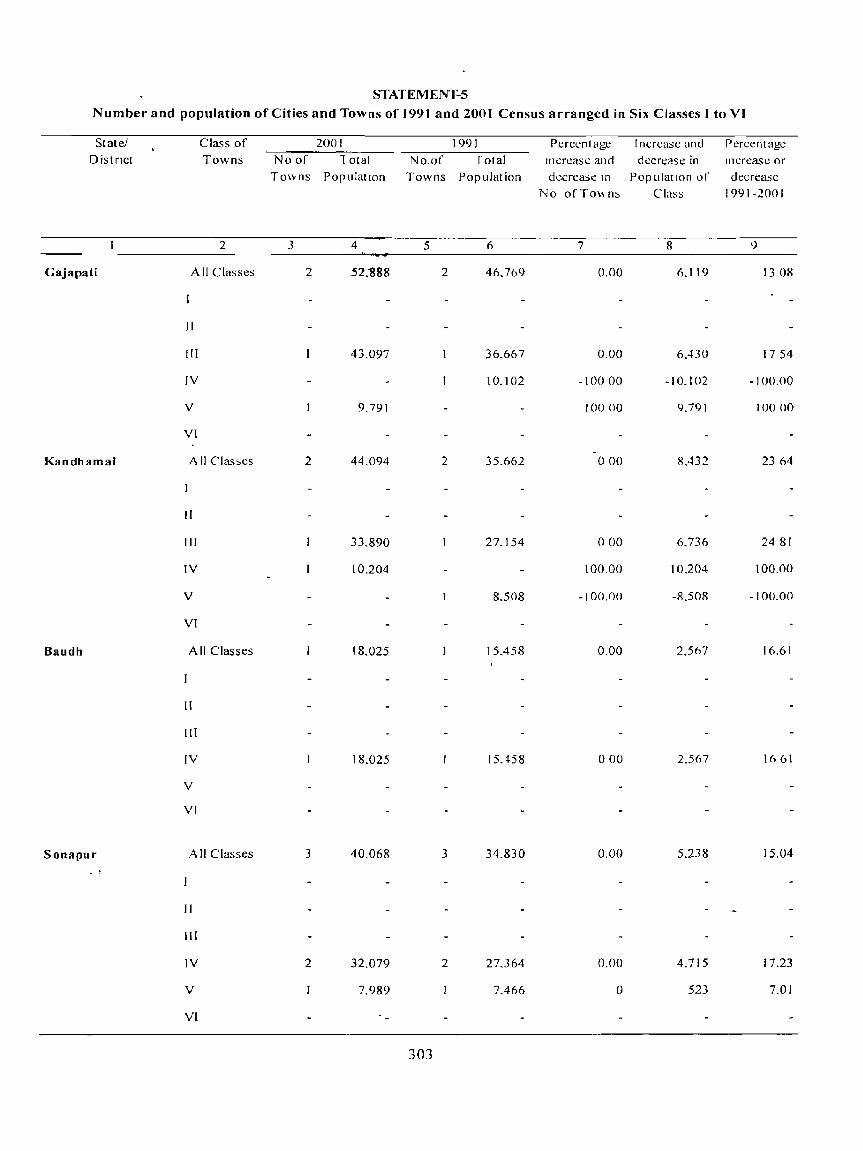
STATEMENT-5
Number and population of Cities and Towns of 1991 and 2001 Census arranged in Six Classes I to VI
State! Class of 2001 1991 Percentage I ncrease and Percentage District Towns No of 10tal No.of Total Illcrease and decn:ase in Illcrea<;c or
Towns Population Towns Population decrease In Population lIf decrease No ofTo\\ n::. Class 1991-2001
2 3 4 5 6 7 9
Gajapati All Classes 2 52;888 2 46.769 0.00 0.119 13 08
II
III 43.097 36.667 0.00 6,.130 1754
IV 10.102 -10000 -10.102 -100.00
V 9.791 10000 9.791 10000
VI
Kandhamal All Clas::.es 2 44.094 2 35.662 000 RA32 2364
" III 33,890 27.154 000 6.736 2481
IV 10.204 100.00 10.204 100.00
V 8.50S -Ioo.no -R.508 -100.00
VI
Baudh All Classes 18.025 15.458 0.00 2.567 16.61
II
III
IV 18.025 15.~58 000 2.567 1061
V
VI
Sonapur All Classes 3 40.068 3 34.830 0.00 5.238 15.04 . ,
II
III
IV 2 32.079 2 27.364 0.00 4.715 17.23
V 7.989 7.466 0 523 7.01
VI
303

STAT EM E NT-5
Number and population of Cities and Towns of 1991 and 2001 Census arranged in Six Classes I to VI
State/ Class of 2001 1991 Percentage Increase and Percentage District Towns No of Total No.of Tota! increase and decrea~e in mcrease or
Towns Population Towns PopulatIOn decrease m Pop u I::!t IOn of decrease No of Towns Cldss 1991-2001
I . 2 3 4 5 6 7 9
Balangir All Classes 4 154.323 4 129.4:20 0.00 24.903 19.24
II 85.26 I 69.nO 0.00 15.341 21.94
III 2 50.368 25.719 100.00 24.649 95.84
IV 18.694 2 33.781 -100.00 -IS.OR7 -44.66
V
VI
Nuapada All Classes 2 30.038 2 25.765 0.00 ,1.273 1658
II
III
IV 2 30.038 2 25.765 0.00 4.273 1658
V
VI
Kalahandi All Classes 4 100.219 3 78.163 33.33 22,056 28.21
II 60.787 513)62 0.00 9,725 19.05
III
IV 2 32.676 2 27.101 0.00 5.575 20.57
V 6.756 10000 6.756 100.00
VI
Rayagada All Classes 5 115.407 4 89.326 0.25 26.081 29.20
II 57.759 100.00 57,759 10000
III 24.706 48.247 0.00 -23.541 -48.79
IV 18.685 2 34,468 -50.00 -15,783 -45.79
V 2 14.257 6,611 100.00 7.646 115.66
VI
304

STATEMENT-5
Number and population of Cities and Towns of 1991 and 2001 Census arranged in Six Classes I to VI
State/ Class of 2001 1991 Percentage Increast.: and Percentage District Towns Noof Total ::-.Jo.of Total increase and decrease in increase or
Towns Population Towns Population decrease in Population of decrease
2
;\Tabarangapur A 11 Classes
II
III
IV
V
VI
Koraput A 11 Classes
II
III
IV
V
VI
Malkangiri A 11 Classes
.11
III
IV
V
VI
3
3
2
5
2
2
4
59.270
52.864
6.406
198.449
135.509
39,548
14917
8.475
34.616
23,114
1].502
The statement reveals that in Orissa the number of towns and their population have increased in all classes of towns during 2001 as compared to 1991 except class IV towns. In class I town the number of towns have increased from 8 to 9 and population from 1,772,978 to 2,516,678 i.e. by 41.95 percent. In class II, the number of towns has increased from 10 to 15 and population increased from 620,452 to 994,827 i e. by 60.34 percent. In class III towns the number of
5
305
2
5
2
3
2
6
42.117
23.513
18.604
171,705
117.753
34.924
13.309
5.719
34.428
28.447
5.981
No. of Towns
7
0.50
10000
-100.00
0.00
0.00
0.00
0.00
0.00
-33 33
10000
-50.00
-100.00
Cla% 1991-2001
8 9
17.153 4073
29.531 124.83
-18.604 -100.00
26.744 15.58
17.756 15.08
4.624 13.24
1.608 12.08
2.756 48.19
188 0.55
23.114 100.00
-16,945 -59.57
-5.981 -100.00
towns have increased from 29 to 36 and population from 931,204 to 1,099,140 by 18.03 percent. Similarly in class V and VI towns number of towns have increased from 22 to 24 and 3 to 6 with percentage increase in population by 4.55 and 105.54 percent respectively. However, reverse is the case in class IV towns where number of towns decreased from 52 to 48 and population decreased from 731,604 to 707,585 showing negative rate of 7.69 percent and 3.28 percent respectively.

The total number of towns increased from 124 to
138 during the last decade and population has in
creased from 4,234,983 to 5,517,238 having 30.28
percent of decadal growth.
Analyzing the district scenario it is found that the total number of towns and cities and urban popu lation of all districts have increased phenomenally during the
last decade except Jagatsinghapur and Malkangiri district where urban population though show a definite increase, the number of towns have shown a negative growth rate i.e. 33.33 each.
Statement- 6 presents the proportion of population in each class of town to total urban population in 1991 - 200 1 in the State.
STATEMENT-6 Proportion of population in each class of Town to Total Urban Population in 2001-1991
State Cities with populatIon over \
milhon
Clti~s ""ith populdtlDn 0.5 to I million
CItIes ""ith popUlation O. \ to 0.5 million
2001 1991 2 3
OR1SSA-21
Class - I Class - II
2001 1991 2001 1991 8 9 10 II
45.61 41.86 18.03 14.65
It is noticed from the statement that the proportion of population living in class I, II and VI is increasing during the decade 1991-2001 as compared to total
2001 1991 2001 1991 4 5 6 7
21.62 23.99 41.86
Cla~s - III Class - IV-VI
2001 1991 2001 1991 12 13 14 15
1992 21 99 16.44 21 50
urban population. But the proporation of popUlation living in class III, IV and V is decreasing in 200 I visa-vis 1991 as related to total urban population.
10';

STATEMENT-7 Movement of Cities and Towns from one class to another during 1991-2001
(a) Indicates number and population of towns \\ hich a particular class of 200 I has received by a process of decrement from the next higher class range (s) of 199 L
(b) Indicates number and population of towns which a particular class of 2001 has received by a process of increment from the next lower or any other lower range at 1991
(c) Indicates number and population of towns which a particular class of 1991 has passed down by a process of decrement to the next lower or any other lower range at 200 I .
(Increment and decrement of towns in the statement relate to their territorial content in 200 I )
StatelDistrict Category of I II Movement 1991 2001 1991 2001
Class No. Population Population Class No. Population Population
2 3 4 5 6 7 8 9 10
ORISSA (a) (b) II 69.240 100.651 III 5 226.642 293.533
(c)
Bargarh (a) (b)
(c)
Sambalpur (a) (b) (c)
Debagarh (a) (b) Cc)
Sundargarh (a) (b)
(c)
Kendujhar (a) (b) III 2 83,977 104,472 (c)
Mayurhhanj (a) (b) II 69,240 100,651
Cc)
Baleshwar (a)
(b)
Cc)
Bhadrak (a) (b)
(e)
307

STATEMENT-7
Category of III IV V Movement 1991 2001 1991 2001 1991 2001
Class No. PopulatIOn Population Class No. Population Population Class No Population Population
2 II 12 13 14 15 16 17 18 19 20 21 22
(a) IV 2 20.957 17.906 (b) IV (i) 12 216.543 260,203 V (I) 6 54,436 75,749
N ,(il) 23,150 29,072 N (ii) 4 45,772 55,620 N 9 45,624 54.630 (c)
(a)
(b) N 5.251 5.264 (c)
(a) (~) N 10,207 13,723
(c)
(a) (b) IV 17,275 20,096
(c)
(a) (b) V 9,564 10,233 N 5,459 6,896
-(c)
(a)
(b) N 2 9,736 10,433
(c)
I (a) \ (b) IV 2 35,720 43,337
(c)
(a) (b) IV Ih,786 21.387
N 23,150 29,072
(c)
(a)
(b) N 14,329 18,550
(c)
308 ---

STATEMENT-7
Category of VI VII (Not treated a~ tll\\ n 20(1)
Movement 1991 PopulatIon 2001 1991 20(l1
Class No. PopulatIon Cla."" No. Population PopulatIon
2 23 24 25 26 27 28 29 30
(a) (b)
N 4 13.346 16.200 (c) V :2 14.151 15.770
VI 2.972 237
(a)
(b) (c)
(a) (b)
(cl
(a) (b) (c)
(a) (b) N 2.196
(c)
(a) (b) (c)
(a) (b) (c)
(a) (b)
(c)
(a)
(b)
(c) V 8.170 9.X37
309
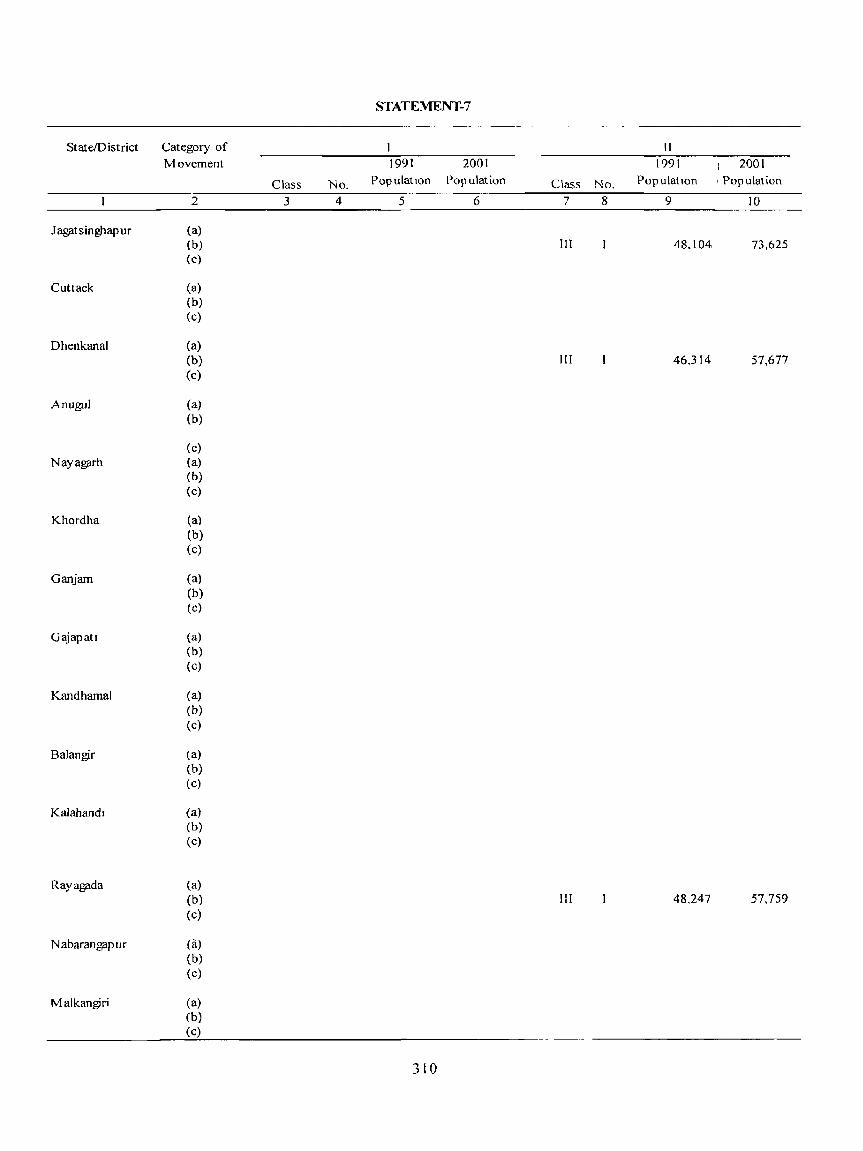
STATEMENT-7
StateiDistrict Category of I II Movement 1991 2001 1991 2001
Class No. Population Population Class No. Population ' Population
2 3 4 5 6 7 8 9 10
J 3.gflt singhap ur (a) (b) III 48.104 73,625 (c)
Cuttack (a) (b) Cc)
Dhenkanal Ca) Cb) 1II 46,314 57,677 (c)
AnuguJ Ca) (b)
(c) Nayagarh (a)
(b) Cc)
Khordha (a) (b) (c)
Ganjam Ca) (b) (c)
Gajapatl (a) (b) (c)
Kandhamal (a) (b) (c)
8alangir Ca) Cb) (c)
Kalahandl (a) (b) (c)
Rayagada Ca) (b) III 48.247 57,759 (c)
N abarangap ur (a) (b) (c)
Malkangiri Ca) (b) Cc)
310

STATEMENT-7
Category of III IV V Movement 1991 2001 1991 2001 1991 2001
Class No. Population Population Class No. Population Population Class No. Population Population
2 II 12 13 14 15 16 17 18 19 20 21 22
(a) (b) (c)
(a) (b) ( c)
(a) (b) IV 18.966 20.234 (c)
(a) IV 10.855 8.115 (b) V 2 18.080 33.638
N I 10,056 11,376 (c) (a) (b) N 4,387 5.260 (c)
(a) (b) N 11,132 11.921 N 4.118 6.207 (c)
(a) (b) IV 3 54,989 62.375 V 2 18.284 21.674 (c)
(a) IV 10,102 9.791 (b) (c)
(a) (b) V 8,50& 10.204 (c)
(a) (b) IV 17.535 20,095 (c)
(a) (b) N 4.756 6.756 (c)
(a) (b) IV 18,317 24.706 N 6,366 7.408 (c)
(a) (b) IV 18.604 24.859 N 5.551 6.406 (c)
(a) (b) IV 18.35 ) :23.1) 4 (c)
311

STATEMENT-7
Category of VI VII (Not treated as town 2001) Movement 1991 Population 2001 1991 2001
Class No Population Class No Population Population
2 23 24 25 26 27 28 29 30
(al (n) (c) VI 2.972 237
(al (b) N 2 8.664 9.029 (c)
(al (b) Ccl
(al (b)
(c)
(a)
(b) (c)
ra) (b)
Ccl
Ca)
(b) N 4,682 4.975 (c)
(al (b) (cl
(al (b)
(c)
(a)
(b) (c)
(al (b) (c)
(a) (b) (c)
ta) (b) (c)
(a)
(b) (c) V 5,981 5.933
312

Statemcnt- 7 given above highlights the movement of cities and towns from one class to another during 1991-2001. The movements of towns from one class to another is perceived in three different ways. Category A indicates the number and population of towns which a particular class of 2001 has received by a process of decrement from the next higher class ranges of 1991. Category B indicates the number and population of towns which a particular class of 2001 received by way of increment from the next lower range or any other lower range of J 991. Category C indicates the number and population of towns which a particular class of 1991 has passed down to by a process of decrement to thc next lower range or any other lower range of 200 I.
While analysing the table, it is observed the movcments of towns from one class to another is mostly found in caategory B i.e., movement from a lower
class to next higher class. In Orissa, in category B, one town moved from class II to Class I, five towns from Class III to Class II, 12 towns from Class IV to Class 1fI, six towns from Class V to Class IV during the period 1991 to 2001. In category A, two towns namely, Kashinagara (NAC) of Gajapati district and Rengali Dam Project Township (CT) of Anugul district moved from Class IV to Class V with population reduced from 20,957 to 17,906. In category C, two census towns namely, Chandabali in Bhadrak district and Chitrakonda in Malkangiri district are declassified and Paradeep Phospate Limited (NAC) in Jagatsinghapur district is denotified, the three towns losing their town identity during 1991-200 1.
Statement- 8 Presents the name of such towns which have not changed their class between 1911 to 200 I. There are no such twons available in the state.
SfATEMENT-8 Name of Towns which have not changed their class between 1911 and 2001
Size Class in 1911 and 2001 Name of Town
2
- Nil -
Statement-9 gives the number and population of in 200 I. These 18 new towns are formed in 14 dis-places not treated as towns in 1991 but treated as tricts of the state and constitute one Class III town, such in 200] arranged by State/ District and size class. fOllr Class IV towns, nine Class V towns and fOllr The statement records 18 places as such in the state Class VI towns.
STATEMENT-9 Number & Population of places not treated as Towns in 1991 but treated as such in 200t arranged by
State/District and size class
State! Total Class -I Class - II Class - III Class - IV Class - V Class -VI District No. Population No. Population No Population No. Population No. Population No. Population No Population
1 2 3 4 5 6 7 8 9 10 II 12 13 14 15
ORISSA 18 155,522 29,072 4 55.620 9 54,630 4 16,200 Bargarh 5.264 5,264
Sambalpur 13.723 13,723 Sundargarh 2 9,092 1 6.896 2.196 Kendujhar 2 10,433 2 10,433 Baleshwar I 29.072 29.072 Bhadrak I 18.550 18.550
Cuttack 2 9.029 2 9,029
Anugul 11.376 11.376
Nayagarh 5.260 5,260
Khordha 2 18,178 11.971 6,207
Ganjam I 4.975 4,975 Kalahandi 6,756 6.756 Rayagada 7.408 7,408
"Nabarangapur 6.406 6,406
313
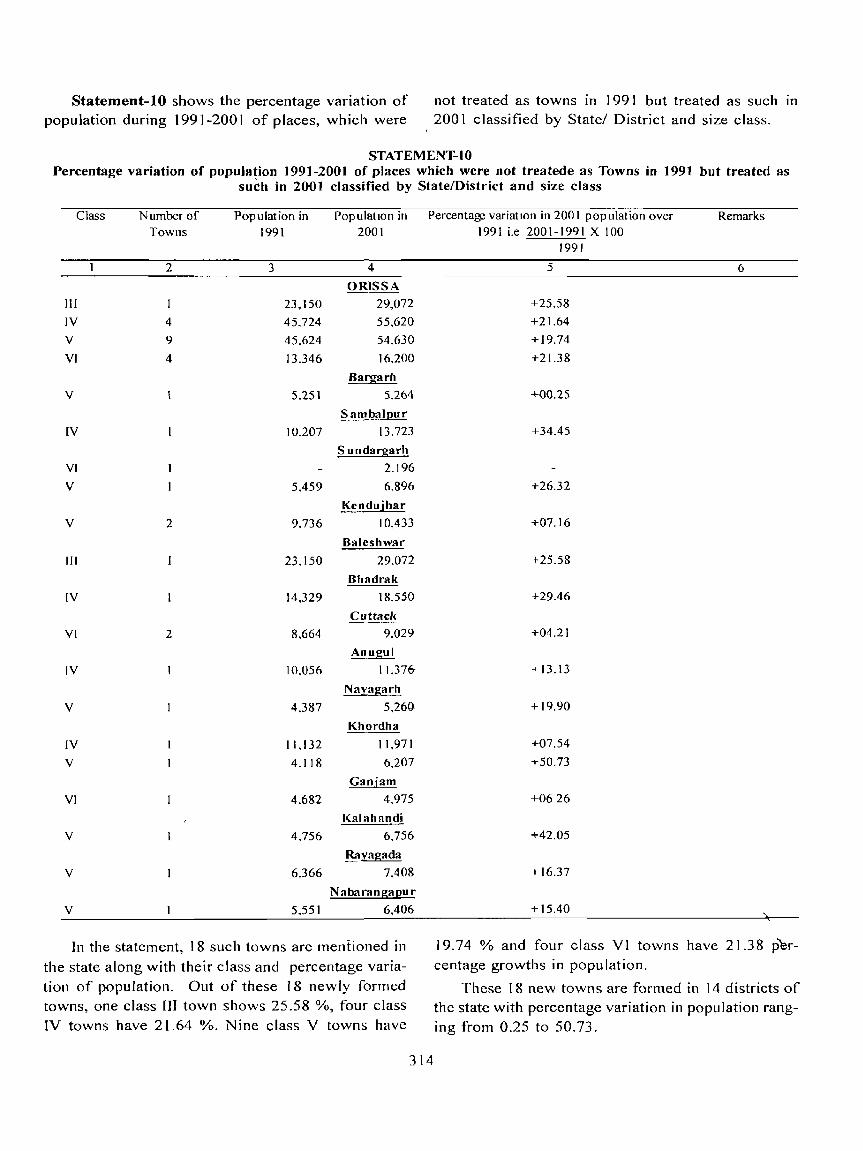
Statement-lO shows the percentage variation of population during 1991-200 I of places, which were
not treated as towns in 199 I but treated as such In
2001 classified by State/ District and size class.
STATEMENT-tO Percentage variation of population 1991-2001 of places which were not treatede as Towns in 199] but treated as
suth in 2001 classified by State/District and size class
Class
III
IV
V
VI
V
IV
VI V
V
III
IV
VI
IV
V
IV V
VI
V
V
V
Number of Towns
2
4
9
4
2
2
Population in 1991
Pop ulattOn in 2001
3
23,150
45.724
45.624
13.346
5.251
10.207
5.459
9.736
23.150
14.329
8.664
10.056
4.387
11.132
4.118
4.682
4
ORISSA
29,072
55.620
54.630
16.200
Bargarh
5.264
Sambalpur
13.723
Sundargarh
2.196
6.896
Kendujhar
10,433
Baleshwar
29.072
Bhadrak
18,550
Cuttack
9.029
Anugul
I J,376
Nayagarh
5,2@
Khordha
11.971
6,207
Ganjam
4.975
Kalahandi
4.756 6.756
Rayagada
6,366 7.408
Nabarangapur
5,55 I 6,406
In the statement, 18 such towns are mentioned in the state along with their class and percentage variation of population. Out of these 18 newly formed towns, one class III town shows 25.58 %, four class IV towns have 21.64 %. Nine class V towns have
Percentage variatIon in 200 I population over 1991 i.e 2001- 1991 X I 00
1991
5
+25.58
+21.64
+19.74
+21.38
+00.25
+34.45
+26.32
+07.16
t-25.58
+29.46
+04.21
+ 13.13
+19.90
+07.54
+50.73
+0626
+42.05
+16.37
+15.40
Remarks
6
19.74 % and four class VI towns have 21.38 percentage growths in population.
These 18 new towns are formed in 14 districts of the state with percentage variation in population ranging from 0.25 to 50.73.
314

Statement- 11 depicts the percentage vanatlon of population 1991-2001 of pmces treated as towns
in 1991 but removed from the list of towns In 2001.
STATEMENT-ll Percentage variation of population 1991-2001 of places treated as Towns in 1991 but removed from the list of
Towns in 2001 classified by State/District and size class
Percentage vanatlon In 200 I population over
Class Number ofTown~ PopulatIOn In 1991 Pop ulat Ion In 200 I 1991 I e 200 I -1991 X tOO
1991
2 3 4 5
ORISSA
v-vr 3 17.123 16.007 -652
BHADRAK
v 8.170 9,837 +2040
JAGATsrNGHAPUR
VI 2,972 237 -9203
MALKANGIRI
v 5,981 5,933 -0 RO
Malkangiri (Chitrakonda) are declassified with percentage variation in population 20.40 and 0.80 respectively. In Jagatsinghapur district, Paradeep Phosphate Town, (NAC) is denotified with percentage variation in population by 92.03.
The statement reveals that three towns in the state are removed from the list of towns in 2001 with percentage variation in 2001 population over 1991 by minus 0.52. It also illustrates that at dIstnct level one census town in Bhadrak (Chandabali) and another in
StateIDl!>trict
ORISSA Bargarh lharsuguda Sambalpur
Debagarh
Sundargarh
KenduJhar MayurbhanJ Baleshwar Bhadrak Kendrapara Jagatsmghapur
STATEMENT-12 Number of Towns of each class during 19Ot-20Ot
Urban Agglomeration has been classified according to total population
2001 1991 1981 1971 1961 1951 1941 1931 1921
2 3 4 5 6 7 8 9 10
All Class
132 119 103 77 59 39 29 21 20 4 3 3 3 I 1 I I 3 3 2 2 2 I I I 3 2 2 3 I I 1 I 1 9 7 4 4 4 2 9 7 6 4 2 4 4 4 2 2 4 4 3 2 3 3 3 3 2 2
2 2 1 2 3 2
315
1911 1901
1 I 12
18 4

StateIDistrict 1
Cuttack
JaJapur Dhenkanal Anugul Nayagarh Khordha Puri
GanJam GaJapatl Kandhamal
Baudh Sonapur Balanglr Nuapada Kalahandt Rayagada Nabarangapur Koraput Malkangm
Class - I ORISSA Bargarh
Jharsuguda
Sambalpur Debagarh Sundargarh KenduJhar MayurbhanJ Baleshwar Bhadrak. Kendrapara Jagatsinghapur
Cuttack
JaJapur Dhenkanal '\nugul
Nayagarh Khordha Pun Ganlam
Galapatl Kandhamal Baudh Sonapur Balanglf Nuapada Kalahandl Rayagada Nabardngapur Koraput Malkangm
STATEMENT-12 Number of Towns of each class dUring 1901-2001
Urban Agglomeration has been classified according to total population
2001 1991 1981 2 3 4
7 6 3 2 2 2 3 3 3 9 8 6 4 3 2
7 5 4 4 4 3
19 18 18 2 2 2
2 2 2 I 1 1 3 3 3 4 4 4 2 2 2 4 3 3 5 4 4 3 2 3 5 5 4 2 3 3
8 7 6
1971 5
3 2 2 2 1 3
14 I
I 2 4 2 3 3 2 4
5
1961 6
3 2 2 2 I
3 I
9
4 2
1951 7
3 I 2
2
5
4
2 2 I
4 2
316
1941 8
2
5
2 2
1931 9
2
I
3
2
1921
10
I 2
I 3
2
1911 II
J
2
J
3
2
1901 12
I
2
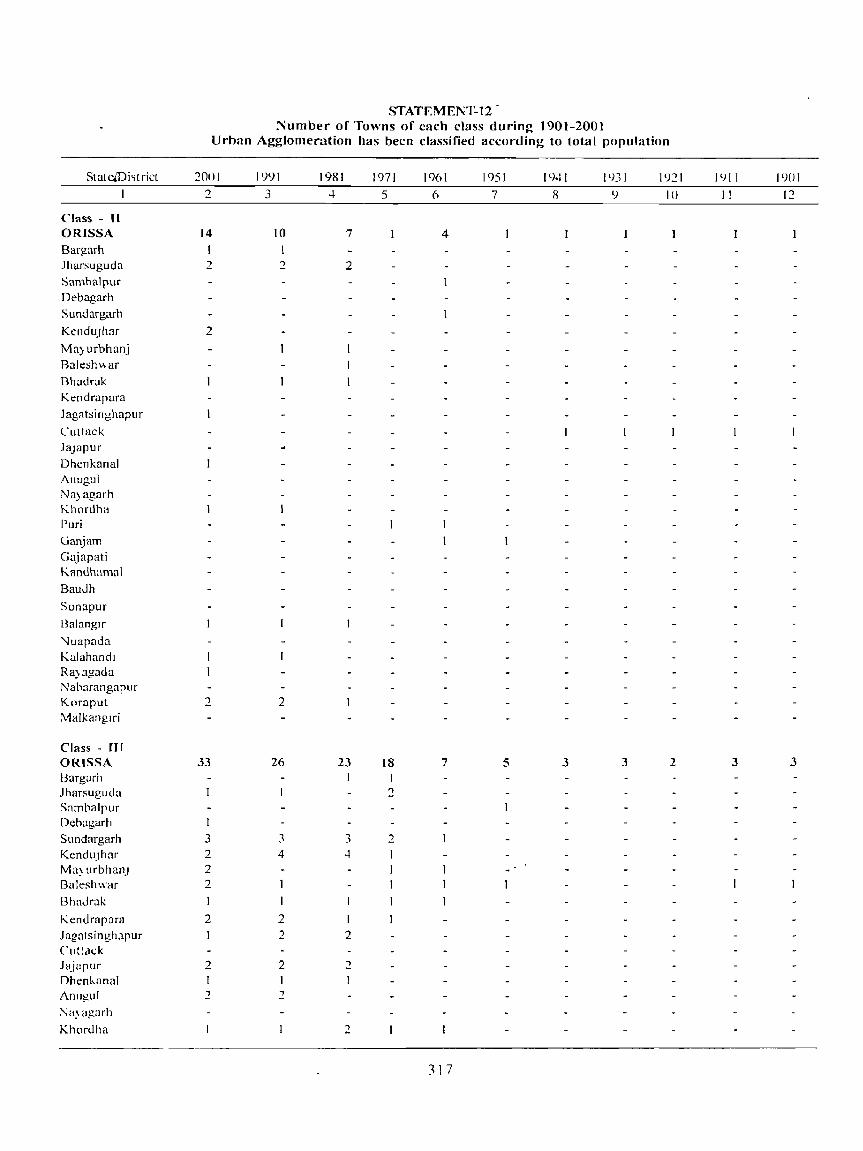
STATEMEN'I:.t2 ~umber of Towns of each class during 1901-2001
Urban Agglomeration has been classified according to total population
State1Di~trict ~O()I 1991 1981 1971 1%1 1951 1C)41 1931 1921 II.) II 1901 I 2 3 4 5 (> 7 R I) J() II I~
Class - II ORISSA 14 10 7 4 Bar!!arh .lharsuguda 2 2 2 Sambalpur Debagarh
Sundargarh
KenduJhar 2
Ma}urbhanj Raleshv.ar
Rhadrak Kendrapara
Jagatsinghapur
Cuttack
JaJapur Dhenkanal Anugul Na)agarh Khon.lha "uri Uanjam Gajapati Kandhamal
Baudh
Sonapur
Balanglr
"luapada Kalahandl Ra)agada Nabarangapur Kl)f;)put 2 2 :vtalkanglri
Class - nr ORISSA 33 26 23 18 7 5 3 3 2 3 3 Bargurh Jharsugudu 2 Samhalpur Dch<igarh
Sundargarh 3 3 3 2
KenduJhar 2 4 4 Ma) urbhan.l 2 Baleshwar 2 Bhadrak I I
Kendrapara 2 2 1 Jagatsinghapur 2 2 Cutlat.:k Jajupur 2 2 2 Dhenkanal Anugul 2 :2
7'/a) agarh
Khordha 2
317

STATEMENT-I 2 Number of Towns of each class during 1901-2001
Urban Agglomeration has been classified according to total population
StdteIDlstl iet 2001 1991 1981 1971 1961 1951 1941 1931 1921 1911 1901 2 3 4 5 6 7 8 9 10 11 12
Pun
(,anldm ~
(JdjUpatJ
Kandhamal Baudh Sondpur .,;
Balanglr 2
Nuapadd
Kalahandl Rayagada Naharangapur 2 Koraput 2 3 Malkangm
Class - IV ORISSA 47 51 39 21 20 8 8 6 6 5 5 Bargarh 2 2 2 I
Jharsuguda 2
~ambdlpur 2
Debdgarh
Sundargarh 2
henduJhar I 2 2 Mu) urbhanJ 3 2 Halc<;h\\ar 2 2 2 Hhadrak
Kt:ndrapara
Jagatsmghapur
Luttack 2 2 2 Ja]apur 2
Dhenkanal 2 2 2
Anugul 4 2 3 Nayagarh I I
Khordha 3 2 2
Pun 3 3 1
GanJam 12 13 8 5 GaJapatl Kandhamal Raudh I ')onapur 2 2 2
BaJanglr 1 2 2 3
Nuapada 2 2 Kalahandl 2 2 2 I
Rayagada 2 2 2 Nabarangapur 2
Koraput 1
Malkangm 2
Class - V ORISSA 24 22 25 30 24 23 16 10 9 6 4 Bargarh I 2 I I Jharsuguda 2 2
318

STATEMENT-12 Number of Towns of each class during 1901-2001
Urban Agglomeration has been classified according to total populatIOn
State/Drstnct 2001 1991 1981 1971 1961 1951 1941 1931 1921 I') II 1901 1 2 3 4 5 6 7 R ') 10 II 12
Sambalpur Oebagarh Sundargarh 2 2 :2
KenduJhar 3 1 'v1aj urbhanJ Baleshv.ar Bhadrak Kendrapara Jagatslnghapur Cuttack 2 3 2 2 Jajapur Dhenkanal 2 2 2 2 '")
Anugul 3 4 2
Na)agar)l 3 2 2
Khordha
PUrI 1 Ganjam 2 4 8 7 6 4 4 2
GaJapatl 1 Kandhamal
Baudh I
Sonapur 2 1 1 l3alanglf 3 3 Nuapdda :2 2 Kalahandl I 2
Rajdgdda 2 2
Nabarangapur
J<....oraput 2
Malkangm 2
Class - VI ORISSA 6 3 3 2 3 2
Bargarh
jharsuguda Sambalpur Dchagarh \undarg.lrh :2 KenduJhar MnyurbhdnJ
Baleshwar
Bhadrak
Kendrapara Jdgatsmghapur
Cuttack 2
JdJdPur Dhenkarldl Anugul Na)agarh
Khordha
Pun
G anJ am 2
(Jal<lrHlll
319
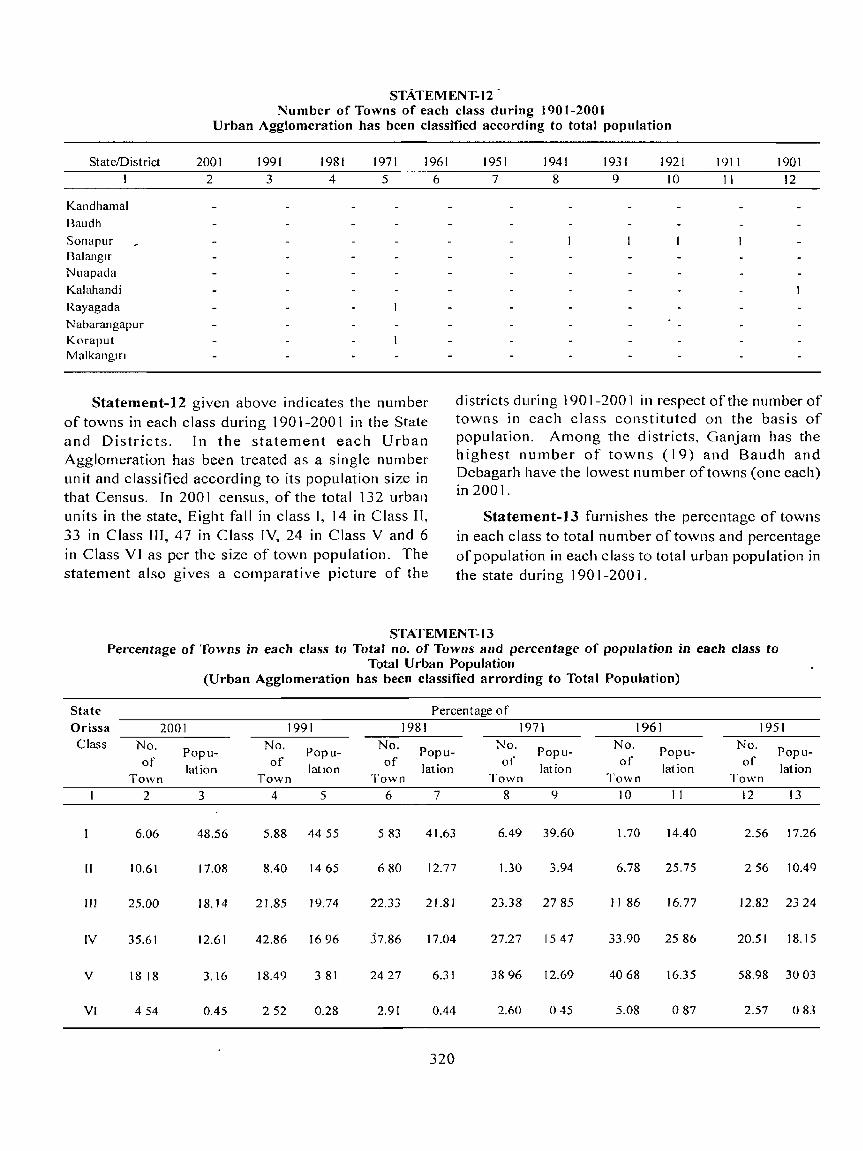
STATEMENT-12 Number of Towns of each class during 1901-2001
Urban Agglomeration has been classified according to total population
StatelDist riet 2001 1991 1981 1971 1961
Kandhamal Baudh
Sonapur Balanglr Nuapada Kalahandi Rayagada Nabarangapur Koraput Malkangm
2 3 4 5
Statement-12 given above indicates the number of towns in each class during 1901-2001 in the State and Districts. In the statement each Urban Agglomeration has been treated as a single number unit and classified according to its population size in that Census. In 2001 census, of the total 132 urban units in the state, Eight fall in class I, 14 in Class II, 33 in Class III, 47 in Class IV, 24 in Class V and 6 in Class VI as per the size of town population. The statement also gives a comparative picture of the
6
1951 1941 1931 1921 1911 1901 7 8 9 10 II 12
districts during 1901-200 1 in respect of the number of towns in each class constituted on the basis of population. Among the districts, Ganjam has the highest number of towns (19) and Baudh and Debagarh have the lowest number of towns (one each) in 200 I.
Statement-13 furnishes the percentage of towns in each class to total number of towns and percentage of population in each class to total urban population in the state during 1901-200 1.
STATEMENT-13 Percentage of Towns in each class to Total no. of Towns and percentage of population in each class to
Total Urban Population (Urban Agglomeration has been classified arrording to Total Population)
State Percentage of Orissa 2001 1991 1981 1971 1961 1951 Class No.
Popu-No.
Popu-No. Popu-
No. Popu-No.
Popu- No. Popu-
of lation of
Jatlon of
lation of
lation of
lation of
lation Town Town Town Town Town Town
2 3 4 5 6 7 8 9 10 11 12 13
6.06 48.56 5.88 4455 583 41.63 6.49 39.60 1.70 14.40 2.56 17.26
II 10.61 17.08 8.40 1465 680 12.77 1.30 3.94 6.78 25.75 256 10.49
II! 25.00 18.14 21.85 19.74 22.33 21.81 23.38 2785 1186 16.77 12.82 2324
IV 35.61 12.61 42.86 1696 37.86 17.04 27.27 1547 33.90 2586 20.51 18.15
V 18 18 3.16 18.49 381 2427 6.31 3896 12.69 4068 16.35 58.98 3003
VI 454 0.45 252 0.28 2.91 0.44 2.60 045 5.08 087 2.57 083
320

STATEMENT-I3 Percentage of Towns in each class to Total no. of Towns and percentage of population in each cIass to
Total Urban Population (Urban Agglomeration has been classified arrording to Total Population)
State Percentage 0 (
Orissa 1941 1931 Class No.
Popu-No.
Popu-of lation of
latlon Town Town
14 IS 16 17
II 345 1801 476 2057
III 1034 2560 14.29 3007
IV 2759 27.53 2857 2678
V 55 17 2793 4762 2153
VI 345 093 4.76 105
Analysing the statement, it is found that in 2001
census the highest percentage of towns (35.61) belong
to Class IV category and lowest percentage of towns (4.54) belong to Class VI categol)' of towns. The
statement also reveals that the highest percentage of urban population (48.56) live in class 1 towns and the lowest percentage of population (0.45) live in class VI towns. Taking different classes of town the
percentage of population living in class I and cla% II
town are steadily increasing during 198 I to 200 I census and the population living in III and V are steadily
decreasing during the said period Thc percentage of
population living in class IV and class VI are at a lower level and showed irregular trend.
1921 1911 190! No.
Popu-No
Popu-No.
Popu-of
lation of
latlon or
Jatl01l Town To\\ n r ()\\ 11
18 19 20 21 22 21
5001812 555 1909 7 14 20 17
1000 2537 1667 3362 21 B 3767
3000 3309 27 78 2809 3572 21.) 87
45 00 2054 3333 1421 2857 1056
1000 288 1667 499 7 14 I 71
i21
Town and Urban Agglomeration have been defined in previolls paragraph; Urban Agglomeration has been taken as a unit not only for 200 I Census but also for previous census to compile the cia"" towns The total figure for only clas,> III all)' past cen"lIs has been worked Ollt as the population total or towns of that particular class III the pal1icular census A constituent of urban agglomeration has been rcch.oned not accord II1g to Its class in a partlclllar cenc;us but accordlllg to the cla~s of urban agglomeration as a whole in that census In case of merger of towns, the merged units are considered as absorbed 111 the urban agglomeratIOn um!. So the un it had not merged town has been presented accordlllg to itc; class III each cenSLJs.


..-0 0 C\I
I ..-0 en ..-co en en .;: 0
"' ~ 0 .-..... .!2 ::::J Q. 0 Q. c co .c .... ~ ..,_ 0 s::. i 0 ....
" CI) C) co ..... C CI) (,) .... CI) D.
o c:) o ,....
co cO co
o c:) 0')
o o co
Il')
cO co
o o I'--
o o (0
o o LO
323
o o -.::t
o g
o c:) (\J
o c:) ,....
o c:)
~B6 ~- ~L6 ~
~L6 ~-~96 ~
~96 ~-~S6 ~
~S6 ~-~p6 ~
~p6 ~-~£6 ~
~£6~-~G6~
~G6 ~- ~ ~6 ~

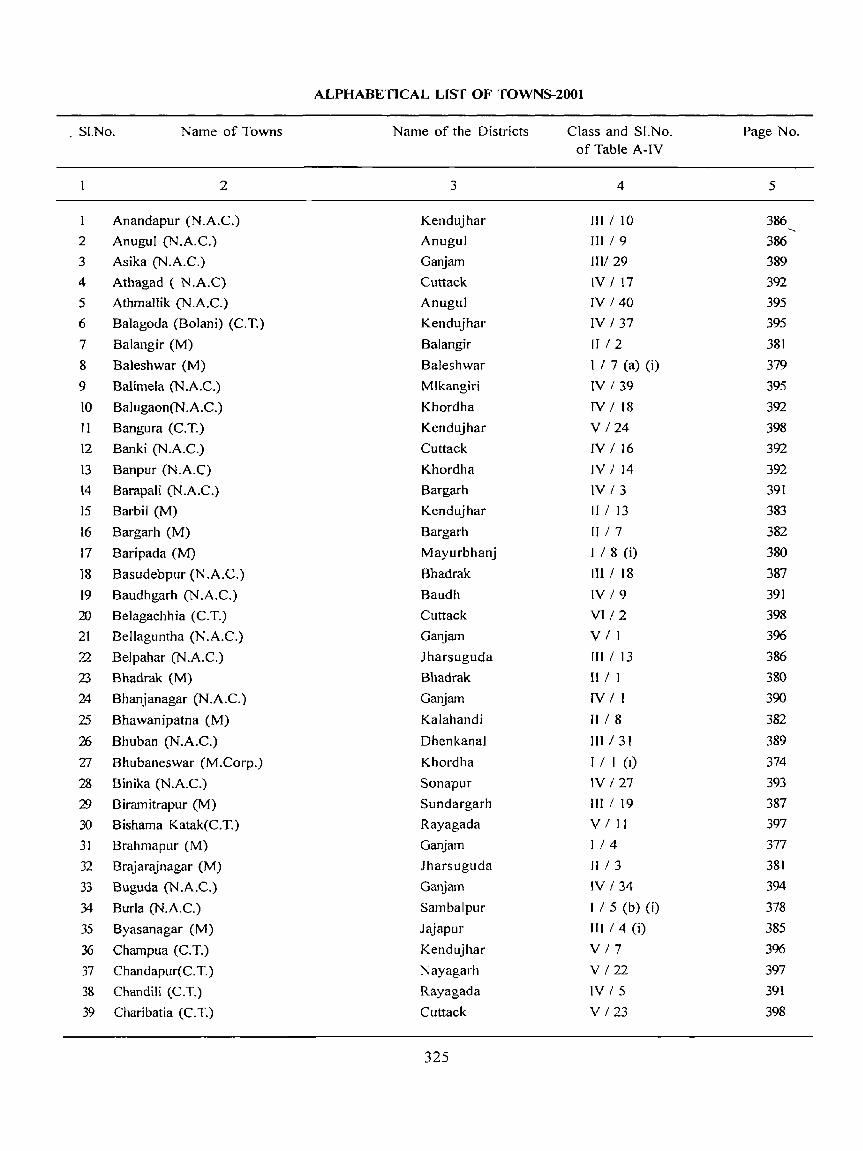
ALPHABETICAL LIST OF TOWNS-200l
. SI.No. Name of Towns Name of the Districts Class and SI.No. Page No. of Table A-IV
2 3 4 5
Anandapur (N.A.C.) Kendujhar HI I 10 386
2 Anugul (N.A.C.) Anugul 1lI / 9 386
3 Asika (N.A.C.) Ganjam Hl/29 389
4 Athagad ( N.A.C) Cuttack IV I 17 392
5 Athmallik (N.A.c.) Anugul IV I 40 395
6 Balagoda (Bolani) (C.T.) Kendujhar IV I 37 395
7 Balangir (M) Balangir !I/2 381
8 Baleshwar (M) Baleshwar I I 7 (a) (i) 379
9 Balimela (N.A.C.) Mlkangiri IV I 39 395
10 BaJugaon(N .A.C.) Khordha IV I 18 392
11 Bangura (C.T.) Kendujhar V 124 398
12 Banki (N.A.C.) Cuttack IV I 16 392
13 Banpur (N.A.C) Khordha IV / 14 392
14 BarapaJi (N.A.C.) Bargarh IV I 3 391
15 Barbil (M) Kendujhar II I 13 383
16 Bargarh eM) Bargarh II/7 382
17 Baripada (M) Mayurbhanj I I 8 (i) 380
18 Basudebpur (N.A.C.) Bhadrak III / 18 387
19 Baudhgarh (N.A.C.) Baudh IV /9 391
20 Belagachhia (C.T.) Cuttack VI/2 398
21 Bellaguntha (N.A.C.) Ganjam V I I 396
22 Belpahar (N.A.C.) Jharsuguda III / 13 386
23 Bhadrak (M) Bhadrak II I ] 380
24 Bhanjanagar (N.A.C.) Ganjam IV I I 390
25 Bhawanipatna (M) Kalahandi II I 8 382
2fj Bhuban (N.A.C.) Dhenkanal I11/31 389
27 Bhubaneswar (M.Corp.) Khordha I I 1 (I) 374
28 Binika (N.A.C.) Sonapur IV / 27 393
'29 Biramitrapur (M) Sundargarh III / 19 387
30 Bishama Katak(C.T.) Rayagada VIII 397
31 Brahmapur (M) Ganjam 1/4 377
32 Brajarajnagar (M) Jharsuguda II / 3 381
33 Buguda (N.A.C.) Ganjam IV 134 394
34 Burla (N.A.C.) Sambalpur 1 I 5 (b) (i) 378
35 Byasanagar (M) Jajapur III / 4 (i) 385
36 Champua (C.T.) Kendujhar V /7 396
37 ChandapurCCT.) Nayagarh V 122 397
38 Chandili (CT.) Rayagada IV 1 5 391
39 Charibatia (CT.) Cuttack V 123 398
325

ALPHABETICAL LIST OF TOWNS-200)
SI.No. Name of Towns Name of the Districts Class and SI.No. Page No. of Table A-IV
2 3 4 5
40 Chhatrapur(N .A.C.) Ganjam III I 30 389
41 Chikiti ( N.A.C.) Ganjam IV / 44 395
42 Choudwar (M) Cuttack I / 2 (b) (i) 375
43 Cuttack (M.Corp.) Cuttack I I 2 (a) 375
44 Dadhapatna (C.T) Cuttack VI/3 398
45 Daitari (C. T.) Kendujhat VI/4 398
46 Damanjodi (C.T.) Koraput V /6 396
47 Debagarh (M) Debagarh III I 32 390
48 Dera Colliery Township (CT) Anugul IV 16 391
49 Dhamanagar (N.A.C.) Bhadrak rv 17 391
50 Dhenkanal (M) Dhenkanal 1I / 12 383
51 Digapahandi (N.A.c.) Ganjam IV /43 395
52 Dungamal Town (C.T) Khordha V / 19 397
53 F.C.l. Township(C.T.) Anugu] V / 12 397
54 GUdayagiri(N.A.C.) Kandhamal IV / 47 395
55 Ganjam (N.A.C.) Ganjam IV / 41 395
56 Ghantapada (CT.) Anugul IV 120 393
57 Gopalpur (N.A.C.) Ganjam . V / 16 397
58 Gudari (N.A.C.) Rayagada V 114 397
59 Gunupur (N.A.C.) Rayagada III /23 (i) 388
ro Hatibandha (C.T.) Sundargarl V 13 396
61 Hinjilicut (N.A.C.) Ganjam iII / 28 389
62 Hirakud (N.A.C.) Sambalpur I / 5 (c ) 378
63 J agatsinghapur(N.A. C.) Jagatsinghapur (II / 16 387
64 J~apur (M) Jajapur 111/15 386
65 Jalda (C.T.) Sundargarh I 1 3 (c ) 376
66 Jaleswar (N.AC.) Baleshwar III 127 389
67 Jatni Town (M) Khordha II / 10 (i) 382
68 Jeypur (M) Koraput 1I/4 381
(:f) Jharsuguda (M) Jharsuguda I1/5 381
70 Jhumpura (C. T.) Kendujhar V 120 397
71 Joda (M) Kendujhar III / 7 385
72 Junagarh(N.AC.) Kalahandi IV / 19 393
73 Kamakshyanagar(N.A C.) Dhenkanal IV / 23 393
74 Kantabanji (N.A.C.) Balangir III 133 390
75 Kantil0 (C.T.) Nayagarh VIS 396
76 Karanjia (N.AC.) Mayurbhanj III /26 389
17 Kashinagara (N.A.C.) Gajapati V /2 3%
78 Kavisurjyanagar(N .A.C.) Ganjam IV / 15 392
326

ALPHABETICAL LIST OF TOWNS-200t
Sl.No .• Name of Towns Name of the Districts Class and SI.No. Page "lo
of Table A-IV
2 3 4 :-;
79 Kendrapara (M) Kendrapara III 1 3 3&l
ro Kendujhar (M) Kendujhar II / 14 3K3
81 Kesinga (N.A.C.) Kalahandi IV / 11 392
82 KhaJiapal i (c. T.) Bargarh V 121 397
83 Khalikote (N.A.c.) Ganjam IV /42 395
84 Khandapada(N .A.C.) Nayagarh V/4 396
85 Khariar \.'l.A.C.) Nuapada IV / 33 394
86 Khariar Road (N.A.C ) Nuapada IV,' 13 392
fr7 Khatiguda (C.T.) Nabarangapur V / 18 397
88 Khordha(M) Khordha III / 6 385
89 Kochinda (N.A.C.) Sambalpur IV 132 394
~ Kodala (N.A.C.) Ganjam IV I 35 394
91 Konark (N.A.C.) Purl IV /22 393
fJ2 Koraput (N.A.c.) Koraput III I 5 385
93 Kotpad (N.A.C.) Koraput IV 124- 391
94 Lathikata(C.T.) Sundargarh V / 13 397
95 Makundapur (C.T.) Ganjam VIII 398
% Malkangiri (N.A.C.) Malkangiri III 1 24 388
97 Mukhiguda (C.T.) Kalahandi V / 15 397
98 Nabarangapur (M) f\: abarangapur III '20 387
99 Nalco (C.T.) Anugul IV 18 391
100 Nayagarh (N.A.C ) Na) agarh IV '28 394-
101 Ni(agiri(N.A.C.) Balc:>hwar IV /25 393
102 Nimapada (N.A.C.) Puri IV /12 392
103 Nuapatna(C.T.) Cuttack V I 10 397
104 O.C.L. tITS) Sundargarh VI '6 398
lOS Padmapur (N.A.C.) Bargarh IV 121 393
106 Panposh( C.T.) Sundargarh IV 146 395
107 Paradip (N A.C.) Jagatsinghapur II ! 6 382
108 Parlakhemundi (M) Gajapti III : 2 3&l
109 Patnagarh (N.A C.) Balanglr IV '4 391
110 Pattamundai (N.A.C.) Kenurapara III I 14 386
III Phulabani (N.A.C'.) Kandhamal III / 12 3R6
112 Plpili (N.A.C.) Puri IV'29 344
113 Polasara (1',.A.C.) Gunjam IV '2 3(X)
114 Pratapsasan( C. T. ) Khordha IV 36 39"
115 Puri CVI) Puri I ' 6 37R
116 Purusottampur (N.A C.) Ganjam IV III 11)·l
117 Rairangpur( N.A.C.) Ma) urbhal1.l III 25 1XX
127

ALPHABETICAL LIST OF TOWNS-200t
SI.No. Name of Towns Name of the Districts Class and SI.No. of Table A-IV
2 3 4
118 Rajagangapur (M) Sundargarh III / I
119 Rambha (N A.C.) Ganjam IV / 45
120 Raurkela (M) Sundargarh I / 3 (a) (i)
121 Raurkela Industrial Township (ITS) Sundargarh I / 3 (b) (i)
122 Rayagada (M ) Rayagada II / II
123 Redhakhol (N.A.C.) Sambalpur IV 131
124 Remuna (N.A.C.) Baleshwar I I 7 (b)
125 Rcngali Dam Project Township (CT) Anugul V / 8
126 Sambalpur (M) Sambalpur I / 5 (a) (i)
127 Sonapur (M) Sonapur IV I 10
128 Sora (N.A.C.) Baleshwar III 121
129 Sunabeda (N.A C.) Koraput 11/9
130 Sundargarh (M) Sundargarh III / 8
131 Surada (N.A.C.) Ganjam IV / 26
132 T.T.P.S. Township(C.T.) Anugul V/I7
133 Talcher (M) Anugul III / II
134 Tarbha (N.A.C.) Sonapur V/9
135 Tensa( C. T.) Sundargarh VII 5
136 Titlagarh (N.A.C.) Balangir III / 17 (i)
137 Udala (N.A.c.) Mayurbhanj rv / 38
138 Umarkote (N.A.c.) Nabarangapur III / 22
ALPHABETICAL LIST OF URBAN AGGLOMERATIONS-200t
SI.No. Name of Towns
2
Baleshwar U.A.
2 Baripada U.A.
3 Bhubaneswar U.A.
4 Byasanagar U.A.
5 Cuttack U.A.
6 Gunupur U.A.
7 Jatani U.A
8 Raurkela U.A.
9 Sambalpur U.A.
10 Titlagarh U.A.
Name of the Districts
3
Baleshwar
Mayurbhanj
Khordha
Jajapur
Cuttack
Rayagada
Khordha
Sundargarh
Sambalpur
Balangir
328
Class and SI.No. of Table A-IV
4
I / 7
I / 8
I / I
III /4
I / 2
1II I 23
II I 10
r I / 3
I I 5
11I/l7
Page No.
5
384
395
376
376
383
394
379
396
377
391
388
382
385
393
397
386
397 398
387
395
388
Page No.
5
378
379
374
385
375
388
382
376
377
387

A-4 : TOWNS AND URBAN AGGLOMERATIONS CLASSIFIED BY POPULATION SIZE CLASS IN 200] WITH VARIATION SINCE 1901
SI Name of TownlUrban State/ CensLJ!, Urban Area III Persons Variation ;,lIlce the 1'v1dle\ Femait:s No Agglomeration Dlstnct Year Statu:, ')quare prcccdlllg (ensu:,
Kilometre Absolute Percentage
2 3 4 5 6 7 8 9 10 II
ORISSA All classes - 10 Agglomerations lind 122 Town~
1901 254,684 129.472 125 212
1911 275,159 20,47<; 804 141 2<}4 133 RoO
1921 281,498 6,339 230 143 392 138.106
1931 317.254 35 756 12 70 104 907 ]52347
1941 412,528 95,274 3003 21i 477 19705J
1951 594,070 181,542 4401 31" 876 278 194
1961 1029 34 I, 109,650 515,580 86 79 613.98& 495 662
1971 1658 46 I 84<;,395 735,745 6630 I 000 ObO 845.33<;
1981 2288 10 3,110.287 1 264,892 68 q I 673 382 1 436.905
1991 254422 4,234,(j83 1,124,690 36 10 2269 191 I 96",792
2001 2794 13 5,517,238 1.282,255 3028 2911 600 2605 638
Class - J ( 100000 and above) - 6 Agglomerations and 2 Towns
1951 102,505 58417 44 088
1961 68 89 159.786 57,281 5"\ 88 93 742 66.044
1971 397 12 730,799 571,013 3q 36 409.023 32),776
1981 524 39 J ,294,939 564.140 77 ]9 712.15'\ 582 784
1991 666 g I 1,886,895 591.956 45 71 1.034 636 852259
2001 793 0 I 2.679,45'i 792,560 4200 1,435.046 1 244.409
Bhubaneswar UA Khordha 1951 16.512 9741 6 771
1961 5025 38,211 21.699 131 41 22.5flO 15 63 J
1971 65 03 105.491 67,280 176 07 61.190 44 30 I
1981 9291 219.211 113,720 107 80 124.820 94.391
1991 124 74 411,542 192.331 87' 74 234,897 176,645
2001 148 10 658.220 246.678 59 (j4 366.134 292 086
( I) Bhubaneswar Khordha 1951 16.512 9 741 6.771
1961 NAC 5025 38,21 I 21.699 131 41 22 580 15.631
1971 NAC 65 03 105.491 67.280 176 07 61.190 44 301
1981 M 9291 219.211 113.720 107 80 124.820 94.391
1991 M 124 74 411.542 192.331 87 74 234.897 176645
200] M Corp 134 64 648.032 236,490 5746 360739 287 293
(il) IndustrIal and Colony Area Khordha 2001 1346 10,188 ').395 4,793
(0 G)
2 Cuttack VA. Cuttack 1901 51.364 27 692 23.672
1911 52.528 1.164 227 28.504 24,024
1921 51.007 -1.521 -290 27.315 23,692
1931 65 263 14.256 2795 36.357 28 906
1941 74.291 9,028 13 83 41.590 32 701
329

A-4 : TOWNS AND URBAN AGGLOMERATIONS CLASSIFIED BY POPULATION SIZE CLASS IN 2001 WITH VARIATION SINCE 1901
\1 Name of TownlUrban State/ Census Urban Area In Persons Vanatlon since the Males Females No AgglomeratIOn District Year Status Square prccedl,ng Census
KIlometre Absolute Percentage
2 3 4 5 6 7 8 9 10 II
-195 I 102,505 28,214 3798 58,417 44,088
1961 6889 159,786 57,281 5588 93,742 66,044
1971 10440 230,059 70,273 43 98 130,738 99,321
\981 10995 327,412 97,353 4232 182,615 144,797
1991 15694 445,746 118,334 36 14 247,819 197,927
2001 195 21 587,182 141,436 31 73 314,101 273,081
(d) luttad. Cuttack 1901 51,364 27,692 23,672
1911 52,528 1,164 227 28,504 24,024
1921 51,007 -1,521 -290 27,315 23,692
1931 65,263 14,256 2795 36.357 28,906
1941 74,291 9,028 1383 41,590 32,701
1951 102,505 28,214 37 98 58,417 44,088
1961 M 5957 146,308 43,803 42 73 84,960 61,348
1971 M 7332 205,759 59.451 4063 115,973 89,786
1981 M 78 87 295,268 89.509 43 50 163.951 13 1.3 1 7
$ 1991 M 125 86 408.869 113,601 3847 227,271 J 81,598
201;11 M Corp 149 16 534,654 125,785 30 76 285.838 248,816
(b) Choudwar Cuttack 1961 932 13.478 8782 4,696
1971 31 08 24,300 10,822 80 29 14,765 9535
1981 3 I 08 32,144 7,844 3228 J 8,664 13,480
1991 31 08 36,877 4,733 1472 20,548 16,329
2001 4605 52,528 I <;,6'; I 4244 28 263 24.265
(I) l. houd\\ ar Cuttack 1961 NAC 932 13,478 8.782 4.696
197 I M 31 08 24,300 10 822 8029 14 765 9,535
1981 M 3 J 08 32.144 7 844 32 28 18.664 13.4RO
1991 M 31 08 36 [>,,77 4,7:33 14 72 20.548 16 329
2001 M 31 08 42 622 5.745 I'; 58 22,895 19.727
(II) IndustrIal Area (0 G) Cuttack 2001 1497 9906 5,368 4,<;38
3 Raurkela UA ~undargarh 1961 9531 90 287 ';8 734 3 I "';3
1971 121 73 172 502 82 21 '; 91 06 98 667 73.83';
1981 139 04 322610 I 'i0.1 08 87 02 180 184 142 426
1991 1"7 17 398 861 76 2 ~4 23 64 218 845 180019
2001 1'i7 17 48·1874 86 0 I 0 21 '>6 2'>8731 226 14,
(a) Raurkela ~undargarh 1971 # 47 076 27 295 19 781
1981 # 96 000 48 924 103 93 54.928 41.072
1991 # 1':;2690 56.690 59 05 84.742 67 948
2001 # 259 "53 106.863 6999 139.732 119821
$ (,opalpur(C'T) Area 395 Sq K.m, With populatIOn oj .:; 4':; 1 (M-2 l!!~X 1-- 2 ':;61)ln 1991 111 erg.~ d In (ullack(M (orp) a, pef 2001
( cn~lI"
# Included In Raurkcla ".tecl 1o~\1l<;hlp tOf 2(101 l11<..IlIded 111 R'llIfkL 1.1 Inuu.,tn .11 10\\ 1I,II1P
310

A-4 : TOWNS AND URBAN AGGLOMERATIONS CLASSIFIED BY POPULATION SIZE CLASS IN 2001 WITH VARIATION SINCE 1901
SI No
Name of Town/U rban Agglomeration
Statel Dlslnct
Census Urban Area In
Year Status Square K.llometre
Persons VanatlOn smce the precedIng Census
Absolute Percentage
2
(I) Raurkela
(II) Kulunga Industnal Estate and
Other Colony Area (0 (J )
(h) Raurkela Indu~tnal Township
(I) Raurkela Industnal Township
(II) [D L.Factory and Other
Colony Area (0 G)
(e) Jalda
4 Brahmapur
3 4 5 6
Sundargarh 197 I NAC #
#
#
#
1981 NAC
1991
2001
'iundargarh 199 I
2001
SlIndargarh 1961
1971
1981
1991
200 I
Sundargarh 196 I
1971
1981
1991
2001
SlIndargarh 198 I
1991
2001
SlIndargarh 198 I
1991
2001
GanJam 1901
1911
1921
1931
1941
1951
1961
1971
1981
1991
2001
M
M
18 13
2409
9531
* 121 73
** 132 86
**13286
** 126 90
NAC 9531
NAC 121 73
NAC 121 73
NAC 12173
ITS 12173
c r CT
CT
II 13
II 13
5 17
6 18
6 18
6 18
M 2227
M 2927
M 76 15
M 7980
M 7980
7
47,076
96,000
140.408
224.987
12,282
34,560
90.287
125,426
21 "~.521
233.058
213.360
90.287
125,426
206.821
215.509
206.693
7.700
17.549
6.667
12.089
13.116
11,961
25.729
31.456
32.731
37,750
43.536
62.343
76,931
117,662
162.550
210.418
307.792
# Included In Raurkela Steel Township, for 2001 Included III Rallrkela Industrial Township
Includmg Raurkela CivIl To'\.\nshlp (NAC)
** Includmg Raurkela CIVIl Township and other Outgrowths
331
8 9
48,924 103 93
44.408 4626
84.579 6024
22.284 181 44
35,139 3892
89.095 7103
18.537
-19.698
35.139
81 395
8.688
-8.816
864
-845
3892
64 89
420
-409
9.849 12791
~10.882 ·6201
1.027
-1.155
8 50
-8 81
5,727 22 26
1.275 4 05
5,019
5.786
18.807
14.588
40.731
44.888
47.868
97.374
1533
15 33
43 20
2340
5294
38 15
2945
4628
Males
10
27.295
54.928
77 857
121.240
6.88"
18,492
58.734
71.372
119.019
127,226
112,865
58.734
71 372
114.848
117.780
109.394
4.171
9,446
3.471
6.237
6.877
6.134
12.103
15.331
16.001
18.490
21,984
31.233
39.890
60,932
84,467
109.460
160,354
Females
11
19.781
41.072
62 55 I
103.747
5.397
16.074
31.553
54.054
95.502
105.832
100,495
31.553
54.054
91.973
97.729
97.299
3.529
8.103
3.196
5.852
6.239
5.827
13626
16.125
16.730
19 260
2 J .552
3].1 10
37.041
56.730
78,083
100.958
147,438

A-4 : TOWNS AND URBAN AGGLOMERATIONS CLASSIFIED BY POPULATION SIZE CLASS IN 2001 WITH VARIATION SINCE 1901
SI Name of TownlUrban State! COlSUS Urban Area In Persons Vanatlon Since the Males Females No AgglomeratIon DlstTlct Year Status Square precedIng Census
Kilometre Absolute Percentage
2 3 4 5 6 7 8 9 10 II
5 Sambalpur LJA Sambalpur 1901 12.870 6,531 6.339
1911 1 ~.981 III 086 6.384 6.597
1921 13,594 613 472 6.770 6.824
1931 15,017 1,423 1047 7.716 7,30 I
1941 17,079 2.062 13 73 8,520 8,559
1951 23.525 6.446 37 74 12.813 10.712
1961 44 81 57,738 34,213 145 43 32,427 25,31 J
1971 7669 J 05.085 47.347 82 00 57,496 47.589
[981 8950 162.214 ">7 129 5436 86.280 75.934
1991 8950 193,297 31.083 19 16 102.556 90.741
2001 8950 226,469 33,172 17 16 117,745 108,724
(a) Sambalpur Sambalpur 1901 12,870 6,531 6,339
1911 12.981 III 086 6.384 6,597
1921 13,,594. 613 4.72 6.770 6,824
1931 15.017 1,423 10.47 7,716 7,301
1941 17.079 2,062 13.73 8.520 8.559
1951 23.525 6,446 37 74 12,813 10,712
1961 2072 38.915 15,390 65.42 21, III 17,803
1971 46 12 74.458 35.543 91 33 40,310 34,148
1981 4975 112.63 I 38.173 51 27 59,526 53, I 05
1991 49 75 134,824 22,193 1970 71,183 63,641
2001 49 75 157,253 22,429 1664 81,536 75,717
(I) Sambalpur Sambalpur 1901 12.870 6,531 6.339
1911 12 981 ill 086 6.384 6,597
1921 13.594 613 472 6,770 6.824
1931 15,017 1,423 1047 7.716 7,301
1941 17,079 2.062 13 73 8.520 8,559
1951 23.525 6,446 37 74 12,813 10,712
1961 M 2072 38,915 15.390 65 42 21. I 12 17,803
1971 M 25 38 64 675 25.760 6620 35.179 29.496
1981 M 4648 110.282 45.607 7052 58.277 52.005
1991 M 4648 131.138 20,856 1891 69.248 61.890
2001 M 4648 153.643 22, "05 17 16 79.683 73.960
( II) Dhankauda and Mathapall ~ambalpur 1971 2074 9.783 5.131 4.652
Area (0 G ) 1981 327 2.349 -7.434 -75 99 1.24<) 1.I 00
1991 3 27 3.686 1.337 5092 1,935 1.751
_ 200 I 327 3,610 -76 -2 06 1,853 1.757
(b) Burla Sambalpur 1961 1528 10,230 6.133 4,097
1971 1762 I" 587 5,3">7 '\2 37 9.041 6.546
1981 2862 27.882 12.295 78 88 15.241 12,641
332

A-4 : TOWNS AND URBAN AGGLOMERATIONS CLASSIFIED BY POPULATION SIZE CLASS IN 2001 WITH VARIATION SINCE 1901
SI N arne of TownlU rban State/ Census Urban Aream Persons Vanatlon Since the Males Females No Aggl omerat Ion District Year Status Square p reced mg C ens us
Kilometre Absolute Percentage
2 3 4 5 6 7 8 9 10 II
1991 2862 34,640 6,758 2424 18.725 15.915
2001 2862 42.822 8.182 23 62 22.453 20.369
( I) Burla Samba1pur 1961 NAC 1528 10230 6.133 4.097
1971 NAC 1762 15.587 5.357 5237 9.041 6.546
1981 NAC 1762 24.694 9,107 5843 13.622 11.072
1991 NAC 1762 31,()87 6,393 25 89 16,898 14,189
2001 NAC 1762 39,204 8, 117 26 11 20,577 18,627
(ii) Amsadhakatapall Area (O.G.) Sambalpur 1981 II 00 3,188 1.619 1.569
1991 11 00 3,553 365 II 4S 1,827 1.726
2001 II 00 3.618 65 1 83 1,876 I, 742
(c) Hlrakud Sambalpur 1961 NAC 881 8,593 5,182 3,411
1971 NAC 1295 15.040 6,447 75 03 8,145 , 6.895
1981 NAC II 13 21. 70 I 6,661 4429 11.513 10.188
1991 NAC II 13 23,833 2,132 982 12,648 I 1.185
2001 NAC II 13 26.394 2,561 1075 13,756 12.638
6 PUrl Pun 1901 49,334 25,932 23,402
1911 39,686 -9,648 -19 56 22,905 16.781
1921 38.694 -991 -2 50 21.805 16,889
1931 37.568 -1,126 -291 20,703 16.865
1941 41.055 3,487 928 22,705 18.350
1951 49,057 8.002 1949 26,487 22.570
1961 M 1683 60.815 II, 758 2397 33.626 27,189
1971 M 1684 72,674 11,859 19 50 39.067 33,M7
1981 M 1684 100,942 28.268 3890 53,789 47.153
\991 M 1684 125. \99 24,257 2403 66.508 5&.691
2001 M 1684 157,837 32,638 2607 82.269 75.568
7 Ba1eshwar UA Baleshwar 1901 20.880 10.886 9,.994
1911 21.362 482 231 11,223 10 139
1921 17,037 -4,325 -20 25 9,342 7 695
1931 17,843 806 473 10,133 7,710
1941 19.405 1,562 8 75 10,532 8.873
1951 22,851 3,446 17 76 12.414 10437
1961 1761 33,931 11.080 4849 18.353 15,578
1971 1943 46,239 12,308 3627 25.246 20993
1981 1943 65,779 19,540 4246 35,216 3Q.563
333

A-4 : TOWNS AND URBAN AGGLOMERATIONS CLASSIFIED BY POPULATION SIZE CLASS IN 2001 WITH VARIATION SINCE 1901
SI N arne of Town/lJ rban State/ Census Urban Aream Person~ VarIatIOn Since the Males I emales No AggJomeratlo n Dlstnct Year Status Square pnxedlng Census
KIlometre Alr.:.olute Pen.entage
2 3 4 5 6 7 8 9 10 II
1991 41 82 101.829 36,050 54 8O 54,551 47,278
200] 68 70 156,430 54 601 53 62 82,106 74,324
(a) Baleshwar Baleshwar 1901 20 880 10,886 9,994
1911 2 J ,362 482 2 31 11,223 10 139
]921 17,037 -4,325 -2025 9,342 7,695
1931 ! 7,843 806 4 73 10, J 33 7,7 JO
1941 19.405 J ,562 8 75 J 0532 8,873
1951 22,851 3,446 17 76 12,414 10,437
1961 1761 33 931 11,080 4849 18,353 15,578
1971 1943 46,239 12,308 3627 25.246 20.993
1981 1943 65,779 19,540 4226 35.216 30,563
1991 41 82 101,829 36,050 54 80 54,55 I 47,278
2001 38 23 127,358 25,529 2507 66,933 60,425
(I) Baleshwar Baleshwar 1901 20,880 10,886 9,994
1911 21,362 482 231 11,223 10,139
1921 17,037 -4,325 -20 25 9,342 7,695
1931 17,843 806 4 73 10,133 7,710
1941 19,405 1,562 8 75 10,532 8,873
1951 22,851 3.446 17 76 12,414 10,437
1961 M 1761 33,931 11,080 4849 18,353 15,578
1971 M 1943 46,239 12,308 3627 25,246 20,993
1981 M 1943 6",779 19,540 4226 35,216 30,563
1991 M 1943 85,442 19,663 2989 45,578 39,864
2001 M 1943 106,082 20,640 24 16 55,691 50,391
(II) Baleshwar !ndustnat Estate (OG) Baleshwar 1991 22 39 16,387 8,973 7.414
2001 18 80 21,276 4,889 29 83 11,242 10,034
(b) Remuna Baleshwar 2001 NAC 3047 29,072 15,173 13,899
8 8arrpada U A MayurbhanJ 1901 5,613 3,149 2,464
1911 5,968 355 632 330 2,638
1921 6,189 221 3 70 3,446 2.743
1931 6,193 4 006 3,515 2,680
1941 8.281 2,088 33 72 4,791 3,490
1951 9,277 996 1203 5,327 3,950
1961 800 20,30 I I 1,024 II R 83 11,407 8,894
1971 800 28,725 8,424 4150 15,890 12,835
1981 2998 52,989 24,264 8447 28,824 24,165
1991 2998 69.240 16,251 3067 37.363 31,877
2001 3769 100,651 31.411 4537 53,606 47,045
334

A-4 : TOWNS AND URBAN AGGLOMERATIONS CLASSIFIED BY POPULATION SIZE CLASS IN 2001 WITH VARIATION SINCE 1901
SI No
N arne of To'MllU rban Aggl omerat 10 n
2
(I) Banpada·
(II) Podaastla Busmess Centre
Area (OG)
(III) Subarnarekha IrngatlOn
Project Colony Area (0 G )
Bhadrak
Stdtei DIStrict
Census Urban Area In Year ~tdtus ">quare
3 4
MayurbhdnJ 190 I
1911
1921
1931
1941
1951
1961
1971
1981
1991
2001
MayurbhanJ 1981
1991
2001
MayurbhanJ 200 I
5
Kilometre
6
M 8 00
M 800
M 1000
M 10 00
M 33 37
2 85
285
2 85
I 47
Persons
7
5,613
5,968
6,189
6,193
8,281
9,277
20,30 I
28 725
40,314
49619
95,004
2,107
2,798
3,720
I 927
Van atlOn s 10 ce th e precedIng Census
Aa.olute Percentage
8
355
221
4
2088
996
632
3 70
o 06
33 72
12 03
I ].024 I 18 83
8,424 41 50
11,5894034
9,305 23 08
45,385 9147
691 3280
922 32 95
Class- II (50,000 - 99,999) - Agglomerations and ]3 Towns
Bhadrak
1901
1911
1921
1931
1941
1951
1961
1971
1981
1991
2001
1901
1911
1921
1931
1941
1951
1961
1971
17922
1684
24938
356 85
46937
NAC 2538
NAC 31 08
51,364
52,528
51,007
65,263
74,291
62,343
285,771
72,674
397,184
620,452
942,299
18,518
\ 8,578
18,175
18,283
19,550
18,795
25,285
40 487
1,164
-1,521
227
-290
14,256 2795
9,028 13 83
-11,948 -1608
223,428 358 39
-213,097 -7457
324,51044653
223,268 5621
321,847 5187
60
-403
108
1,267
-755
032
-2 17
059
693
-386
6,490 3,4 53
I:; 202 60 12
Males
10
3,149
3 330
3,446
3,513
4,791
5,327
11,407
15 890
21 873
26 71';;
50 652
1,074
1,430
1,876
1,078
Females
II
2464
2638
2,743
2 680
3,490
3950
8.894
12 835
IlL441
22.904
44.352
1.033
1,368
1.844
849
27,692 23..672
28,504 24.024
27,31523,692
36,357 28,906
41.59032,701
31233 31,110
164,677 121094
39.067 33,607
21 1,086 186.098
326,968 293,484
493,938 448.361
8,749
8.632
8,472
8,943
9,863
9,694
13,358
21,795
9.769
9946
9703
9.340
9,687
9, I 01
11,?27
18,692
• Takatpur Industnal Area (0 G) 1189 Sq Kms wah populatIOn of 7.349 (M - 3,929. F- 3420) In 1981 dnd area If 89 Sq kms With
populatIOn of 12.258 (M - 6,620, f - 5.638) 10 1991 and LlC Colony Area (0 u) "24 Sq Kms With population of 3,219 ( M -
1.948, F - 1,271) In 1981 and 5 24 Sq Kms '" Ith population of 4,565 (M - 2,598, .. - I 967) In 1991 Included In Banpada U A
335

A-4 : TOWNS AND URBAN AGGWMERATIONS CLASSIFIED BY POPULATION SIZE CLASS IN 2001 WITH VARIATION SINCE 1901
SI No
Name of TOmllUrban AgglomeratIOn
2
2 Balanglr
4 Jeypur
5 Jharsuguda
6 Paradlp
State/ District
C en s us Urban Area In
Year Status Square
3
Balanglr
4
1981
1991
2001
1931
\941
1951
1961
1971
1981
1991
2001
Jharsuguda 196 I
1971
1981
1991
2001
Koraput
Jharsuguda
1921
1931
1941
1951
1961
1971
1981
1991
2001
1921
1931
1941
1951
1961
1971
1981
1991
2001
Jagatstnghapurl97 I
1981
1991
2001
5
Ktlometre
6
NAC 3108
M 3108
M 3108
M 1554
M 3108
M 3108
M 3108
M 3108
777
NAC 4144
NAC 4144
M 4144
M 4144
M 2331
M 2S 90
M 2590
M 2590
M 2590
M 2590
M 25"90
M 7047
M 7047
M 7047
CT 23 31
NAC 23 35
NAC 23 35
NAC 2335
336
Persons
7
60,600
7(,,43"
92 51 <;
6,473
11,105
13,646
18,663
35,748
54,943
69,920
85,261
16,196
31,817
54,033
69,667
76,959
9,669
10,525
12,504
20352
25,291
34,319
53,981
65,246
76,625
5J09
7.077
8.032
13.405
19,227
24,727
54,859
65,054
76,100
6,705
33,042
48,104
73,625
VariatIOn since the precedang Census
Absolute Percentage
8 9
20. I 13 49 68
1583" 26 13
16 080 2 I 0,4
4.632
2,541
5.017
17.085
71 56
22 88
3677
91 54
19.19<; 537
14.977 2726
15,341 2194
15 621 96 45
22,216 69 82
15,634 2893
7,292 1047
856
1.979
8 85
18 8
7.848 62 76
4,939 2427
9,028 35 7
19,662 5729
I 1,265 20 87
11,377 1744
1.968
955
5.373
5,822
5,500
38 52
1349
6689
4343
2861
30,132 12186
10,195 1858
11,046 1698
26.337 3928
15,062 45 58
25,521 53 05
Males
10
32.444
40 1"S
48.063
3 272
5 501
7.068
9.822
18,686
28.584
36.781
44,137
9.109
17,610
29,004
37,440
40,319
4.652
5.264
6.126
10,217
)2,789
17,519
27.682
33, I 09
38,891
2,678
3,798
4,154
7.100
10,239
13.059
29,332
34,728
39,966
4,579
21.259
27,951
42.380
Females
II
28 156
36.077
44.452
3.201
5.604
6,578
8,841
17 062
26.359
33.139
41,124
7,087
14207
25.029
32.227
36640
5,017
5,261
6.378
10.135
12.502
16.800
26,299
32.137
37,734
2.431
3.279
3,878
6,305
8.988
I 1,6tjS
25,527
30,326
36 134
2.126
11 783
20.153
31.245
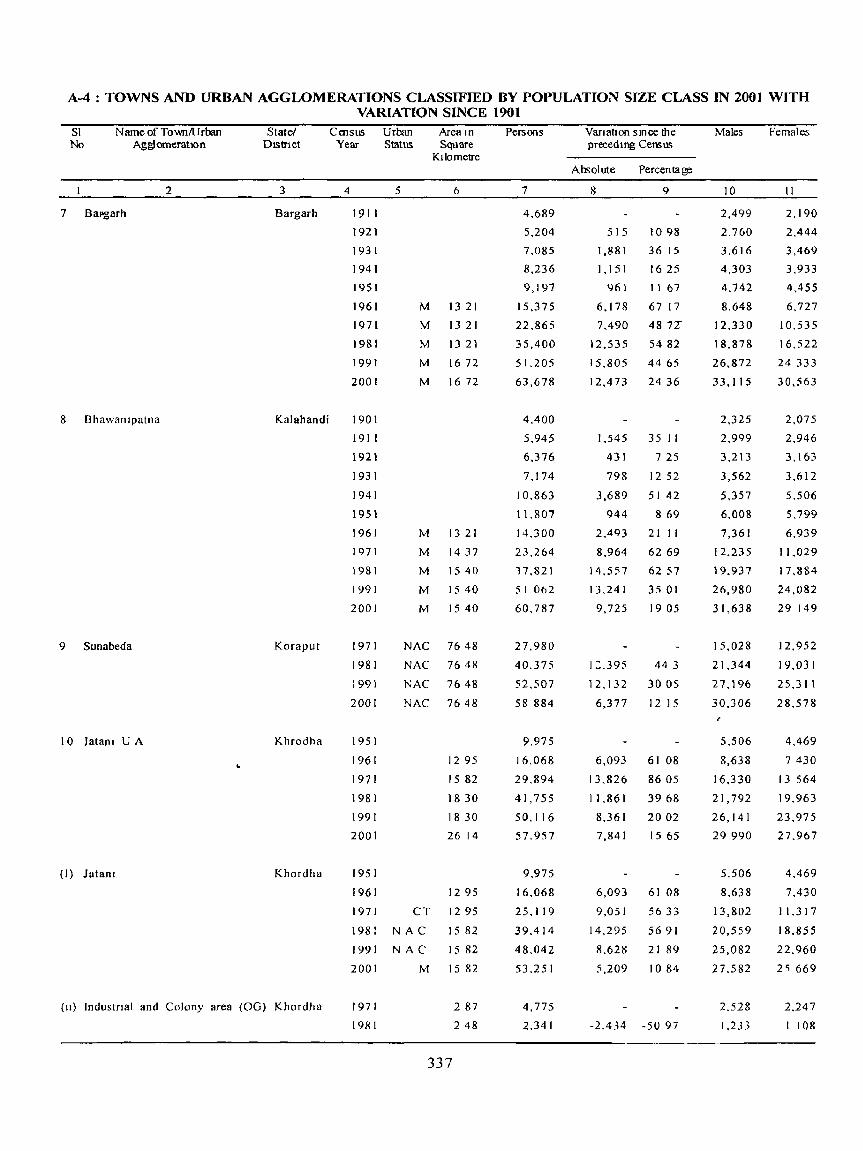
A-4 : TOWNS AND URBAN AGGLOMERATIONS CLASSIFIED BY POPULATION SIZE CLASS IN 2001 WITH VARIATION SlNCE 1901
SI N arne of TOmJlU rban State! Census Urban Area In Persons VariatIOn SJnce the Males Females No Aggiomeratlon DlStnct Year Status Square preceding Census
Kilometre Absolute Percentage
2 3 4 5 6 7 8 9 10 II
7 Bapgarh Bargarh 1911 4.689 2,499 2,190
1921 5.204 515 1098 2,760 2,444
1931 7.085 1,881 36 15 3.616 3,469
1941 8.236 1.151 1625 4,303 3,933
1951 9,197 961 II 67 4.742 4.455
1961 M 1321 15,375 6.178 67 17 8.648 6.727
1971 M 1321 22.865 7.490 48 7'I 12,330 10.535
1981 M 13 21 35,400 12.535 5482 18.878 16,522
1991 M 1672 51.205 15.805 4465 26,872 24 333
2001 M 1672 63,678 12,473 2436 33,115 30.563
8 Bhawampatna Kalahandi 1901 4,400 2.325 2.075
1911 5.945 1.545 35 11 2,999 2,946
1921 6,376 431 7 25 3,213 3.163
1931 7.174 798 12 52 3,562 3,612
1941 10.863 3,689 51 42 5,357 5.506
1951 11,807 944 869 6.008 5.799
1961 M 1321 14.300 2.4Q3 21 11 7,361 6.939
1971 M 1437 23.264 8.964 6269 12,235 11,029
1981 M 1540 17,821 14.557 62 57 19,937 17.884
1991 M 15 40 51 062 13,241 3501 26,980 24.082
2001 M 15 40 60.787 9.725 1905 31,638 29 149
9 Sunabeda Koraput 1971 NAC 7648 27,980 15,028 12.952
1981 NAC 7648 40.375 1:,395 443 21.344 19.031
1991 NAC 7648 52.507 12,132 3005 27.196 25.311
2001 NAC 7648 58 884 6,377 12 15 30.306 28.578
10 Jalanl U A Khrodha 1951 9,975 5.506 4,469
1961 1295 16,068 6,093 61 08 8,-638 7430
1971 15 82 29.894 13.826 8605 16.330 13 564
1981 1830 41,755 11.861 3968 21,792 19.963
1991 18 30 50.116 8.361 2002 26,141 23.975
2001 26 14 57.957 7.841 15 65 29990 27.967
(I) Jalanl Khordha 1951 9.975 5,506 4,469
1961 1295 16,068 6,093 61 08 8.638 7.430
1971 CT 1295 25.119 9.05 I 5633 13,802 11,317
1981 NAC 15 82 39.414 14,295 5691 20,559 18.855
1991 NAC 15 82 48.042 8.628 21 89 25,082 22.960
2001 M 15 82 53.251 5.209 1084 27.582 2 ~ 669
(II) Industrial and Colony area (OG) Khordha 1971 287 4,775 2.528 2.247
1981 248 2.341 -2,434 -50 97 1.233 I 108
337

A-4 : TOWNS AND URBAN AGGLOMERATIONS CLASSIFIED BY POPULATION SIZE CLASS IN 2001 WITH VARIATION SINCE 1901
SI Name of TownlUrban State! CalSUS Urban Area 111 Persons Variation since the Males Females No AgglomeratIOn Dlstnct Year Status Square preced Illg CellS lLS
Ktlometre Absolute [Jtrcentagc
2 3 4 5 6 7 8 9 10 II
1991 248 2,074 -267 -I I 41 1.059 1,015
2001 I U 32 47U6 2632 126 90 2.408 2,298
II Rayagada Rayagada 1951 9.386 4847 4,539
1961 NAC 1295 I't, <;37 5.151 54 88 7.485 7,0<;2
1971 NAC 18 65 2<;.064 10,527 72 42 12,928 12,136
1981 M 18 65 35,838 10,774 4299 18.381 17.457
1991 M 18 65 48.247 12.409 34 63 24 837 23,410
2001 M 186S 57.759 9,512 1972 29.519 28,240
12 Dhenkanal Dhenkanal 1901 5.609 2983 2,626
1911 6,015 1,006 17 94 3489 3,126
1921 6,132 -483 -73 3,243 2,889
1931 7.480 1,348 21.98 3,993 3.487
1941 8,422 942 12 59 4,565 3,857
1951 10.352 1,930 22 92 5,757 4,595
1961 M 4 56 13,727 3,375 32 6 7,742 5.985
1971 M 4 56 1 g, 615 5,888 42 89 10.953 8.662
1981 M 24 82 35 653 16,038 81 76 19.624 16,029
1991 M 24 82 46,314 10,661 299 25,004 21.310
2001 M 24 82 57,677 11,363 24 53 30,489 27,188
13 Barbtl KenduJhar 1961 NAC 44 81 19,340 11,061 8.279
1971 M 4144 24,342 5.002 25 86 13.571 10,771
1981 M 41 44 33,030 8,688 35 69 17,908 15,122
1991 M 41 44 42,032 9,002 27 25 22,705 19,327
2001 M 41 44 52,627 10.595 25 21 27,639 24,988
14 KenduJhar KenduJhar 1941 9,004 4 771 4.233
1951 9,343 339 3 76 4,853 4,490
1961 M 1036 12.624 3,281 35 12 6896 5,728
1971 M 15 54 19,340 6,716 53 20 10,365 8,975
1981 M 15 54 28,059 8.719 45 08 15.281 12,778
1991 M 2640 4 I. 94 5 13.886 4949 22,742 19,203
2001 M 2640 5 r .845 9.900 23 60 27.486 24,359
Class III (20,000 - 49.999) - 3 Agglomel'atiolls and 30 Towns
190 I 95,943 48,921 47.022
1911 92,504 -3,439 -3 58 49.459 43.045
1921 71.425 -2 r .079 -22 79 37.806 33.619
1931 95.390 23.965 33 55 48,797 46.593
1941 10".633 10.243 10 74 55.062 50.571
1951 138.055 32.422 30 69 72 979 65.076
338
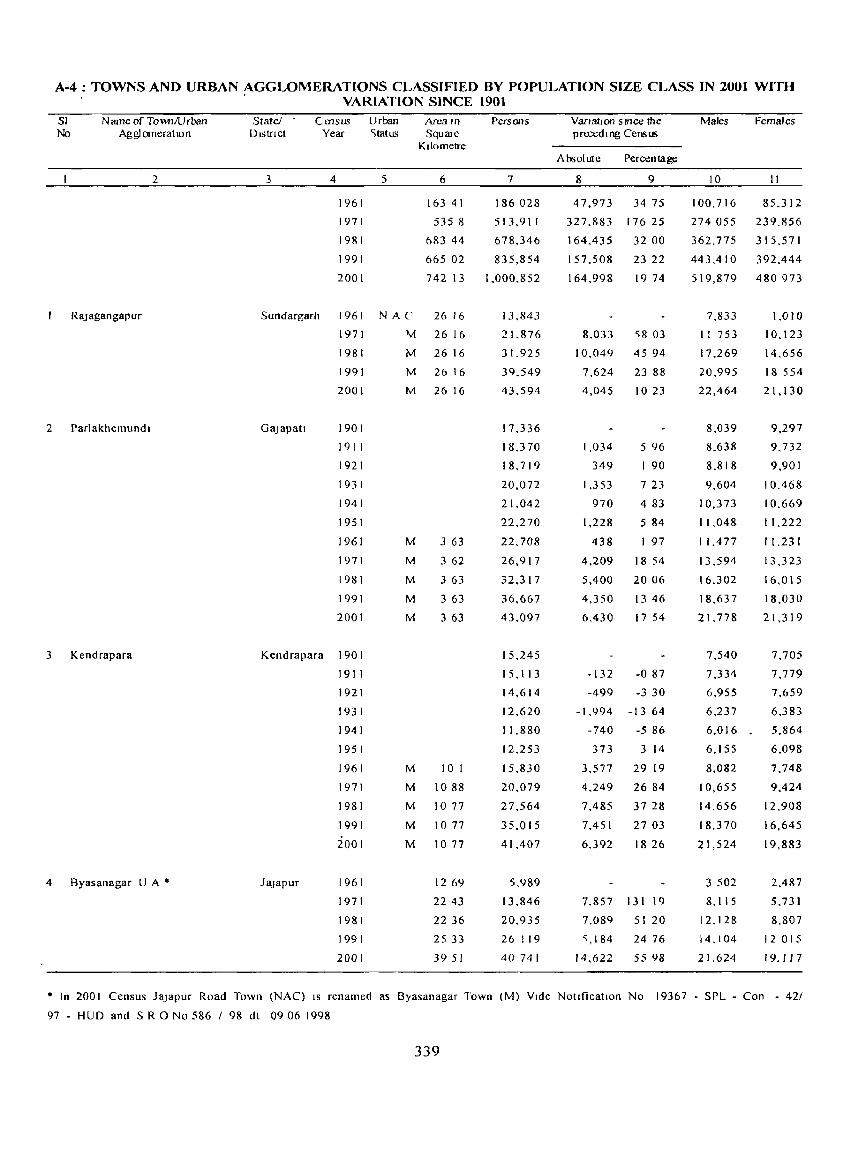
A-4 : TOWNS AND URBAN AGGLOMERATIONS CLASSIFIED BY POPULATION SIZE CLASS IN 2001 WITH VARIATION SINCE 1901
51 Name of TownlUrban State/ - Census Urban Area 111 Persons Variation SUlce the Males Females No AgglomeratIon DIStrIct Year <;tatus Square preceding Census
KIlometre Absolute Percentage
2 3 4 5 6 7 8 9 10 11
1961 163 41 186 028 47.973 3475 100,716 85,312
1971 5358 513,91 [ 327.883 [76 25 274055 239.856
1981 683 44 678,346 164,435 3200 362,775 315.571
199[ 665 02 835,854 157.508 23 22 443,410 392.444
2001 742 13 1,000,852 164,998 19 74 519,879 480973
RaJagangapur Sundargarh [961 NAC 26 16 13,843 7,833 1.010
1971 Iv! 26 16 21,876 8,033 '>8 03 II 753 10,123
1981 M 26 16 31,925 10,049 45 94 17,269 14,656
1991 M 26 16 39,549 7,624 23 88 20,995 18 554
2001 M 26 16 43,594 4,045 10 23 22,464 21.130
2 Pariakhemundl GaJapatl 1901 17.336 8,039 9,297
19 [I 18,370 1,034 596 8,638 9,732
1921 18,719 349 I 90 8,818 9.901
1931 20,072 1,353 7 23 9,604 10.468
1941 21.042 970 4 83 10,373 10.669
1951 22,270 1,228 5 84 11,04& 11,222
1961 M 3 63 22,708 438 I 97 11.477 11.231
1971 M 3 62 26,917 4,209 18 54 13,594 13,323
1981 M 3 63 32.317 5.400 2006 16.302 16,015
1991 M 3 63 36.667 4,350 13 46 18.637 18.030
2001 M 3 63 43,097 6,430 17 54 21,778 21,319
3 Kendrapara Kendrapara 1901 15,245 7,540 7,705
1911 15.113 -132 -087 7,334 7,779
1921 14.614 -499 -3 30 6.955 7.659
1931 12.620 -1.994 -13 64 6.237 6.383
J941 J 1,880 -740 -5 86 6.016 5,864
1951 12,253 373 3 14 6.155 6.098
1961 M 10 [ 15.830 3,577 29 [9 8,082 7.748
1971 M 1088 20.079 4,249 2684 10,655 9.424
198[ M 1077 27.564 7,485 37 28 14,656 12,908
1991 M 1077 35,015 7,451 27 03 18.370 16,645
2001 M 1077 4 J .407 6.392 1826 2) ,524 19,883
4 Byasanagar U A * JaJapur 1961 12 69 5,989 3 502 2.487
1971 22 43 13.846 7.857 I J 1 19 8.115 5.731
1981 22 36 20.935 7,089 51 20 12.128 8,807
1991 25 33 26 119 '\,184 24 76 14,104 12 0 I 5
2001 395) 40741 14,622 55 98 2 J .624 19.117
• In 200) Census JaJapur Road Town (NAC) IS renamed as Byasanagar Town (M) VIde NotificatIOn No 19367 - SPL - Con - 421
97 - HUD and S R 0 No 586 1 98 dt 0906 1998
339

A-4 : TOWNS AND URBAN AGGLOMERATIONS CLASSIFIED BY POPULATION SIZE CLASS IN 2001 WITH VARIATION SINCE 1901
51 No
Name of Town/Urban AggJ omerat Ion
2
(I) Byasanagar
(II) EducatIOnal Area (OG)
5 Koraput
6 Khordha
7 Joda
8 Sllndargarh
9 Anuglll
10 Anandapur
State! DIstnct
3
JaJapur
KOrapll(
Khordha
KenduJhar
Census Urban Area In
Year Status Square Kilometre
4 5 6
1961 NAC 1269
1971 NAC 2243
1981
1991
2001
1991
2001
1961
1971
1981
1991
2001
1961
1971
1981
1991
2001
1971
1981
1991
2001
NAC 2236
NAC 2236
M 3444
NAC
NAC
NAC
NAC
NAC
NAC
NAC
NAC
NAC
NAC
NAC
NAC
NAC
M
297
507
777
97 12
97 12
61 07
61 07
2538
2538
2538
2538
2538
2642
2642
2642
2642
Sundargarh 1951
Anllgul
1961
1971
1981
1991
2001
1961
1971
1981
1991
2001
KendllJhar 1971
1981
1991
2001
M 2382
M 2383
M 2383
M 2383
M 2383
NAC
NAC
NAC
1896
1896
21 71
NAC 2171
NAC 2171
932
NAC 72 87
NAC 72 87
NAC 7729
340
Persons
7
~,989
13.&46
20,935
25.516
37,612
603
3.129
7.461
2 r ,505
31,665
34.924
39.548
12.497
15,879
22.386
30.591
39.054
17,353
26,303
31.069
38.689
5,959
11,329
17.244
23 699
30,352
38,421
15,738
9,053
18.060
24.772
38.018
6.312
24.605
30.278
35,048
VanatJon since the preceding CensLl~
Absolute Percentage
8 9
7,&57 13119
7.089 51 20
4.581 2188
12,096 4741
2,526 4 I & 91
14,044 18823
10 160 47 24
3,259 1029
4,624 1324
3,382 2706
6,507 4098
8.205 36 65
8,463 27 66
8.950 5 I 58
4.766 18 12
7,620 24 53
5,370
5,915
6.455
6,653
8069
90 12
5221
3743
2807
2658
-6,685 -4248
9.007 99 49
6.712 37 17
13.246 5347
18,293 289 g 1
5,673 23 06
4.770 1575
Males
10
3,502
& 115
12,128
13,791
19,932
313
1.692
4,290
11,377
16,546
18.463
20,555
6.465
8.555
11.978
16,305
20,381
9,280
13,588
16,280
20.079
3 171
5.968
9,038
12,292
15,879
19.703
9,094
,_5,671
10,710
13,729
20.892
3.398
13,093
15,883
17.939
Females
II
2.487
5,731
8,807
11,725
17,680
290
1.437
3.171
10, I 28
15,119
[ 6.461
1&,993
6,032
7.324
10,408
14,286
18,673
8,073
12 715
14.789
18,610
2,788
5,361
8,206
11,407
14,473
18 71 g
6,644
3,382
7.350
11,043
17,126
2,914
I 1.512
14,395
17, I 09

A-4 : TOWNS AND URBAN AGGLOMERATIONS CLASSIFIED BY POPULATION SIZE CLASS IN 2001 WITH VARIATION SINCE 1901
SI No
Name of TovvnfUrban Agglomeration
2
1 I Ta1che( *
12 Phulabanl
13 * 8elpahar
14 • Pattamundat
15 Jajapur
16 Jagatsmghapur
17 Tltlagarh U A
State/ District
Crnsus Urban Area In
Year Status 'Square
3
Anugul
4
1941
1951
1961
1971
1981
1991
2001
Kandhamal 1971
1981
1991
2001
Jharsuguda 1991
2001
Kendrapara 1991
2001
1901
1911
1921
1931
1941
1951
1961
1971
1981
1991
2001
Jagatsmghapur1981
1991
2001
Ba1anglr 1941
1951
1961
1971
1981
1991
2001
5
NAC
M
M
M
M
"110 metre
6
1766
1766
1929
2546
25 46
NAC 1554
NAC 1600
NAC 1600
NAC 1600
CT 29 58
NAC 4165
NAC
NAC
M
254
254
11 66
M 1166
M 1165
M 1165
M 1165
NAC 1772
NAC 1772
NAC 1772
1036
15 34
1534
15 34
1534
Persons
7
6.002
9.189
8.147
11.7l)4
16,227
26,806
34.998
10,677
18,326
27,154
33.890
24 607
32.826
28.220
32,730
12, III
12,241
1 LOIS
10,673
11,188
11.026
13,802
16.707
22,232
27 312
32.239
21.126
25 016
30.824
5.652
6,050
7.433
15,840
2 [.486
25.7I 9
30.273
VarIatIOn Since the preceding Census
Absolute Percentage
8 9
3.187 53 10
-1042
3.647
4,433
10,579
8,192
- [ I 34
44 76
37 59
65 19
3056
7,649 7164
8,828 48 17
6.736 24 81
8,2 [9 33 40
4.510
130
-1226
-342
515
-162
2,776
2.905
5.525
5 080
4.927
1598
I 07
-1002
-3 10
483
-I 45
25 18
21 05
3307
22 85
1804
3,890 1841
5,808 23 22
398 704
1,383 2286
8,407 113 10
5.646 35 64
4.233 19 70
4,554 17 71
Males
10
3,126
4.703
4.335
6.315
8.877
14.717
19,271
5.877
10,031
14,737
17.901
13.041
17.671
14,272
16.534
5.845
5,916
5,271
5.274
5.727
5.845
7.430
8.920
I 1.865
14.331
16.680
11.021
12.991
16,059
2.857
3.141
3,9 r 5
8 300
11.268
13,490
15.670
Females
11
2.876
4.486
3,812
5479
7.350
12 089
15,727
4.800
8.295
12.417
15.983
11.566
15,155
13.948
16.196
6266
6.325
5.744
5.399
5,461
5.181
6.372
7.787
10.367
12.981
15.559
10 105
12,025
14.765
2.795
2.909
3 518
7 540
10.218
12.229
14.603
• Talcher was U A In 1991 but 10 2001 It IS an Independent Tov.n I T 1 and other Govt Colonies Area (0 G) haVing art~a 01
163 Sq Kms. With population of 614 (M - 393, F - 221) In 1981 and 780 Sq "111$ With populatIOn of 6.738 (M-3.740. r -2,998) In 1991 Included In Talcher (M) as per 200 I (_ ensus
341 -
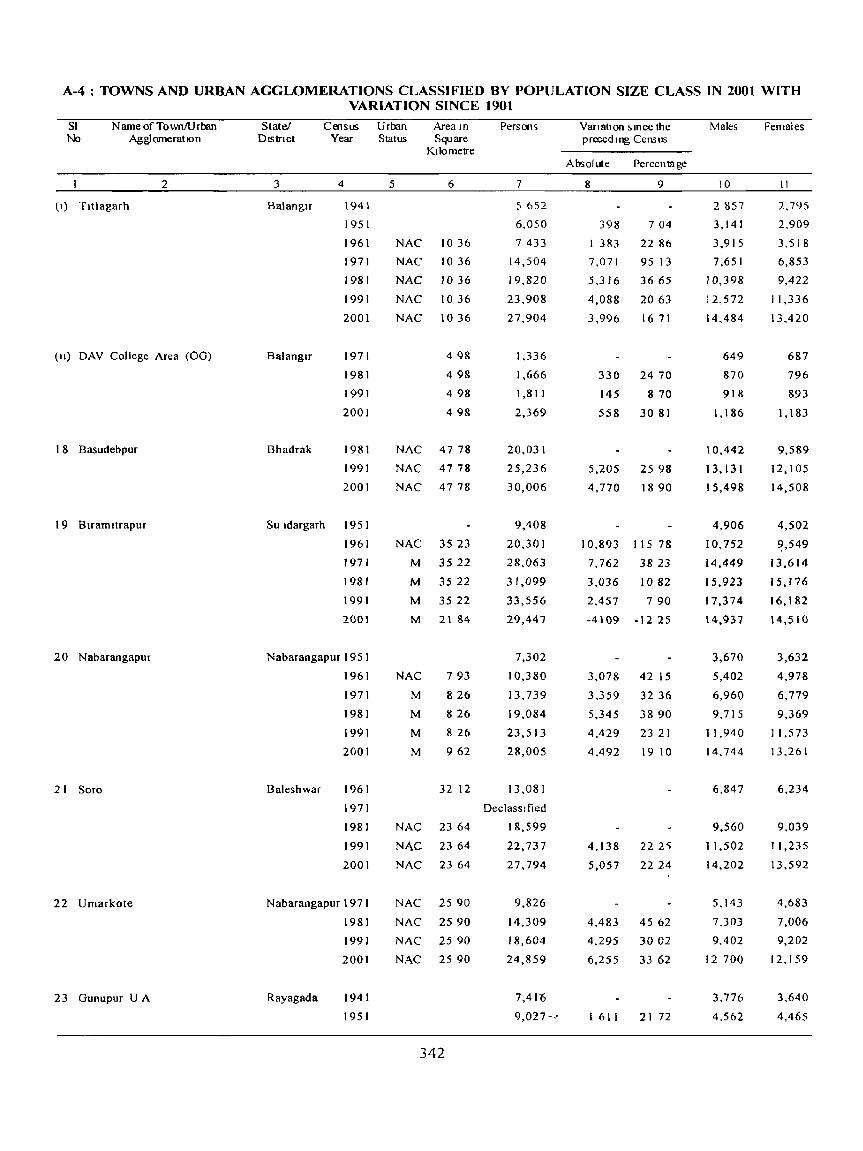
A-4 : TOWNS AND URBAN AGGLOMERATIONS CLASSIFIED BY POPULATION SIZE CLASS IN 2001 WITH VARIATION SINCE ]90]
SI N arne of TownlU rban State! Census Urban Aream Person~ Variation !.tnce the Males Females No Aggl omerat IOn DlStnct Year Status Square preceding Census
Kilometre Absolute Percentage
2 3 4 5 6 7 8 9 ]0 II
tl) Tltlagarh BalanglT 1941 5652 2857 2.795
1951 6.050 398 704 3,141 2,909
1961 NAC 1036 7433 I 383 2286 3,915 3,518
1971 NAC 1036 14,504 7,071 95 13 7,651 6,853
1981 NAC 1036 19,820 5,316 3665 10,398 9,422
1991 NAC 1036 23,908 4,088 2063 12,572 11,336
2001 NAC 1036 27,904 3,996 1671 14,484 13,420
(II) DAV College Area (OG) Balanglr 1971 498 1.336 649 687
1981 498 1,666 330 2470 870 796
1991 498 1,811 145 8 70 918 893
2001 498 2,369 558 3081 1,186 1.183
18 Basudebpur Bhadrak 1981 NAC 47 78 20,031 10,442 9,589
1991 NAC 4778 25,236 5,205 2598 13.131 12,105
2001 NAC 4778 30,006 4,770 1890 15,498 14,508
19 Btramltrapur Su Idargarh 1951 9,408 4,906 4,502
1961 NAC 3523 20.301 10,893 115 78 10,752 ~,S49
1971 M 3522 28,063 7,762 3823 14,449 13,614
1981 M 3522 31,099 3,036 1082 15,923 15,176
1991 M 3522 33,556 2,457 790 17,374 16,182
2001 M 21 84 29,447 -4109 -12 25 14,937 14,510
20 Nabarangapur Nabarangapur 1951 7,302 3,670 3,632
1961 NAC 793 10,380 3,078 42 15 5,402 4,978
1971 M 826 13,739 3,359 3236 6,960 6,779
1981 M 826 19,084 5,345 3890 9,715 9,369
1991 M 826 23,513 4,429 23 21 11,940 11,573
2001 M 962 28,005 4,492 19 10 14,744 13,261
21 Soro Baleshwar 1961 32 12 13,081 6,847 6,234
1971 DeclasSified
1981 NAC 2364 18,599 9,560 9,039
1991 NAc 2364 22,737 4,138 222<; 11,502 11,235
2001 NAC 2364 27,794 5,057 2224 14,202 13,592
22 Umarkote Nabarangapur 1971 NAC 2590 9,826 5,143 4,683
1981 NAC 2590 14,309 4,483 45 62 7,303 7,006
1991 NAC 2590 18,604 4.295 3002 9,402 9,202
2001 NAC 2590 24,859 6,255 33 62 12 700 12,159
23 Gunupur U A Rayagada 1941 7,41"6 3,776 3,640
1951 9,O:l7-'" 1611 21 72 4,562 4,465
342

A-4 :.TOWNS AND URBAN ACGLOMERATIONS CLASSIFIED BY POPULATION SIZE CLASS I~ 2001 WITH VARIATION SINCE 1901
SI. No
Name of To wnll J rhan AgglomeratlOII
2
(I) Gunupur
(ii) Industrial and EducatIOnal
Area (OG)
24 Ma!kangtri
25 R3Jrangpur
26 Karanjia
27 Jeleswar
28 Hinjllicut
State/ Dlstnct
Cen~us Urban Area In Year Status Square
3
Rayagada
Rayagada
4
1961
1971
198 I
1991
2001
1941
1951
1961
1971
1981
1991
2001
2001
Malkanglfl ! 97!
1981
1991
200)
Ma~urbhanj 1961
)97)
198)
1991
200)
MayurbhanJ 198)
Baleshwar
GanJam
1991
2001
1961
1971
1981
1991
2001
1961
1971
1981
1991
2001
5
Kilometre
6
II 66
II 66
I I 05
II 65
26 78
NAC II 66
NAC II 66
NAC II 65
NAC II 65
NAC II 65
15 13
C T 16 29
NAC 18.06
NAC 1806
NAC 18.06
NAC 1438
NAC 14 38
NAC 1438
NAC 1438
NAC 1438
NAC 1864
NAC 1864
NAC 1864
23 57
NAC 1295
NAC 1790
NAC 1790
NAC 1790
I 81
NAC 1140
NAC 1181
NAC 1181
NAC 1181
Per~ons
7
10,180
12.702
16,712
I H. ; 17
2+,706
7.416
9,027
10.1 gO
12.702
16.712
1 S,31 7
21,198
3,508
7.494
15,575
18,351
23,114
8,119
11.226
15,503
18,097
21.896
14,910
17,623
21,441
10.202
6,711
13.146
16,786
21,387
8,028
10,821
13,761
17.676
21,347
Vanatl111l smce the preced I ng l'ensll~
Absolute Percentage
9
1,153 1277
2522 2477
4.010 3157
1.005 () (,(l
6,3S9 3488
1.611 2172
1.153 1277
2,522 24 77
4.010 31.57
1,605 9 60
2,881 1573
8,081 107 83
2,776 17.82
4,763 25 ')5
3, 107 38 27
4,277 38.10
2,594 1673
3,799 2099
2.713 1820
3,818 2166
-3491 -34 22
6,435 9589
3,640 2769
4,601 2741
2,793 3479
2,940 27 I]
3.915 2845
3,671 2077
10
5.148
6.432
lL554
Q.193
12.448
3,77(,
4.562
5.148
6.432
8.55·l
9.193
10,663
1,785
3,477
8.247
Q.52J
11.953
4,292
5,826
SY}I
9.380
11,170
8,026
9.299
11,276
5,777
3.47:l
6,932
8,679
10,905
3,967
5,544
7,034
9,088
10,834
remales
II
",032
n.270
8.158
9,124
12,258
3.040
4,465
5.032
0,270
8.158
9 124
10.535
1.723
3,517
7,328
X,828
I 1. 161
3,827
5,400
7312
8,717
10,726
6,884
8,324
10,165
4.425
3,238
6,214
8.107
10,482
4,061
5,277
6,727
8,588
10.513

A-4 : TOWNS AND URBAN AGGLOMERATIONS CLASSIFIED BY POPULATION SIZE CLASS IN 2001 WITH VARIATION SINCE 1901
SI No
Name of TownlUrban AgglomeratIOn
2
29 ASII.-a
30 Chhatrapur
3 I Bhuban
32 Debagarh
33 KantabanJhl
State/ DIstrIct
Census Urban Area In
Year Status Square
3 4
1911
1921
1931
1941
1951
1%1
1971
1981
1991
2001
1941
1951
1961
1971
1981
1991
2001
Dhenkanal 190 I
1911
1921
1931
1941
1951
1961
1971
1981
1991
2001
Debagarh
Balanglr
1941
1951
1961
1971
1981
1991
2001
1951
1961
1971
1981
1991
2001
5
KIlometre
NAC
NAC
NAC
NAC
NAC
NAC
NAC
NAC
NAC
NAC
6
5 18
5 18
5 31
5 31
5 31
440
647
440
440
440
CT 158
CT I 58
NAC 1804
NAC 1804
NAC 1804
M 18 13
M 18 13
M 24 13
M 24 13
M 24 13
NAC 777
NAC 777
NAC
NAC
NAC
344
777
7 77
777
Persons
7
4,912
4,491
5 015
~ 794
6 379
9,024
12.954
16.394
19.363
20,739
6,227
7,746
7 835
10,835
14,140
17,950
20,289
6,788
~ 90';
5 331
6.563
7.231
7,915
9,476
11,350
15,517
18,966
20,234
6,537
5,711
6,839
8,906
13,581
17,275
20.096
7,741
8.863
10,489
14,818
17,535
20,095
Vanatlon SlOce the preceding Census
Absolute
8
-421
524
779
585
Percentage
9
-8 57
II 67
15 53
10 10
2.645 41 46
3.930 43 55
3,440 2656
2,969 18 II
1.376 7 II
1,519 2439
89 I 15
3,000 3829
3,305 3050
3,810
2,339
2694
13 03
-883 -1301
-574
1,232
668
684
1,561
1,874
4,167
3,449
1,268
-972
23 II
10 18
946
1972
1978
3671
22 23
669
-826 -12 64
1,128 1975
2,067 3022
4.675 5249
3,694 2720
2,8211633
1,122 1449
1,626 1835
4,329 41 27
2,717 1834
2,560 14 60
Males
10
2,372
2,050
2,378
2,866
3,152
4,399
6,619
8,459
9,960
10.722
3,177
3,912
4,087
5,525
7,325
9,122
10,333
3,208
2,768
2,386
3,001
3,480
3,819
4,792
5,895
7,986
9,89S
10,452
3,330
2,882
3,532
4,6{i I
7',.3 77
9, f-.?6
10,518
4,054
4,605
5.443
7.719
9,187
1 0,456
Females
II
2,540
2,441
2,637
2,928
3.227
4.625
6.335
7.935
9,403
10,017
3.050
3.834
3.748
5.310
6,815
8,828
9,956
3.580
3.137
2.945
3,562
3,751
4,096
4.684
5,455
7,531
9,071
9,782
3,207
2,829
3.307
4.245
6.204
8.119
9.578
3,687
4,258
5.046
7.099
8.348
9,639

A-4 : TOWNS AND URBAN AGGLOMERATIONS CLASSIFIED BY POPULATION SIZE CLA~S IN 2001 WITH VARIATION SINCE 1901
SI No
Name of TownlUrban Aggl omeral 10 n
2
BhallJanagar
2 Pola~ara
3 Barapah
4 Patnagarh
'i (handlll
State/ D,slncl
3
Census Urban Area III Year "WIll'; '>qu are
hLlometre
4 5 6
Per~ons
7
Class IV (10,000 - 19,999) - 47 rO\\n"
GanJam
Galllam
Bargarh
Balanglf
Raydgdda
1901
1911
1921
1931
1941
1951
1961
1971
1981
1991
2001
1911
1921
1931
1941
195 I
1961
1971
198]
1991
2001
1971
1981
1991
2001
1971
1981
1991
2001
1951
1961
1971
1981
1991
2001
198]
1991
200\
NAC
NAC
NAC
NAC
NAC
3')2 62
281 45
570 77
69648
6<;922
1062
7
606
606
606
CT II 13
NAC 1181
NAC 1181
NAC 1181
CT 1227
NAl 141'i
NA(_ 14 15
NAC 14 15
2072
NAC 1826
NAC 1826
NAC 1826
NAC 1826
CT
CT
CT
345
'i 17
5 17
5 17
76 080
77 283
93 1"4
84 96 [
113 'i74
ID7 796
286 939
285428
529 843
718488
fi95 624
6042
6 134
6 748
7227
l\ 469
9952
12 3'i3
15 324
17 122
19 748
10 'i79
13 039
168"4
19 'i68
9017
13 639
16 371
191",7
5 900
7,592
10 085
I ~ ')97
16 246
18 694
12 487
16 l'i I
18 685
VanatlOn <;mee the precethng lensu~
A h<;olute
1 201
1<; 871
8 193
28 613
_'i 778
Percenl:Jgc
q
')8
20 ~4
8 8U
33 08
5 09
1791-B 1661q
-I <; I I - 0 '13
24441'i8'i63
18864'i 3'i6
22 864 , 18
92
614
479
242
483
240 I
2971
1 798
2 626
2460
3 81 'i
2 714
4 622
2 n2
2 7R6
692
2493
3 ') 12
2 649
2 448
I 'i2
10 () I
7 I
17 19
17 'I I
24 13
2 ... 05
I I 73
1<;34
232<;
2926
16 10
'i I 26
2003
1702
2868
32 84
34 82
1948
l'i 07
2934
15 69
10 II
<0 7U4 ,<) 316
16 ()O ~ 40 <74
4'; 628 47 <;26
43 '\67 41 194
'17642 'i';9>2
q 16R 'i0 428
I 'i'i 047 111 892
I 'i0 7R~ 134643
277 849 251 994
172 62R 345 86(
3'i8 'i8' 137041
2864
2938
3 289
3 550
4232
'i 231
6447
7970
8 7Q I
10226
'i 191
6 519
839<;
9 857
4636
6940
8316
9 811
2940
~ 91 I
~ 18"
6967
8 292
9 qO
(1690
8327
t) 53.+
3
3 I
34
3 6
42
4 7
5 I;;
7
8
9 '
fi
8
9
4
6
8
9
2
3
4
6
7
9

A-4 : TOWNS AND URBAN AGGLOMERATIONS CLASSIFIED BY POPULATION SIZE CLASS IN 2001 WITH VARIATION SINCE 1901
~I No
N arne of To wn /U rban Aggl omerat 10 n
2
6 Dera Colliery Towhshlp
7 Dhamanagar
8 * Nalco
9 l3audhgarh
10 Sonapur
1 1 J<..esrnga
12 Nlmapada
I 3 Khanar Road
State/ DIstnct
3
Anugul
Bhadrak
Anugul
Baudh
Sonapur
Kalahandt
Pun
Nuapada
Census Urban Area 10
Year Status Square
4
1981
1991
2001
2001
1991
2001
1941
1951
1961
1971
1981
1991
2001
1901
1911
1921
1931
1941
1951
1961
1971
1981
1991
2001
1971
1981
1991
2001
1981
1991
2001
1961
1971
1981
1991
2001
5
CT
CT
CT
Kilometre
6
4 02
7 81
7 81
NAC 1869
CT
CT
15
15
NAC 777
NAC 2072
NAC 2072
NAC 2072
NAC 2072
M 777
M 15 13
M 15 13
M 15 13
M 15 13
NAC 1450
NAC 14 50
NAC 1450
NAC 1450
NAC 1462
NAC 1462
NAC 1462
I 140
NAC 'I 140
NAC 1140
NAC 1140
NAC II 40
346
Persons
7
4,452
13,096
18.592
18,550
8,102
13.045
'i,740
5,498
6,088
8,891
12,589
15.458
18,025
8887
8,638
7,680
8,506
9,065
7,356
7,108
8,084
10,451
14,409
17,540
8,536
11,133
14,127
16,917
11,406
13,658
16,91 S
6,400
9,226
I 1,448
14,027
16,629
Variation Since the precedtng Census
Absolute Percentage
8 9
8.644 194 16
5,496 41 97
9.943 122 72
- 242 -422
590 1073
2,803 46 04
3,698 41 59
2,869 22 79
2.567 1661
- 249 - 2 80
- 958 - I I 09
826 1076
559 657
- 1709 - 18 85
- 248 - 3 37
976 13 73
2,367 2928
3,958 37 87
3 13 I 21 73
2,597
2,994
2,790
3042
26 89
19 75
2.252 19 74
3,257 23 85
2,826 44 16
2,222 24 08
2,579 22 53
2,602 18 55
Males
10
2,566
7,382
10,156
9,400
4,603
9.615
2,829
2,&04
3,123
4.614
6,580
7,972
9,306
4,490
4,112
3.647
4,224
4,548
3,589
3,571
4,160
5,412
7,594
9,297
4,440
5,733
7,223
8,581
6,048
7,167
&,746
3,344
4,704
5,863
7,128
8,400
Females
II
1,886
5,714
8,436
9,150
3,499
8,430
2,911
2,694
2,965
4,277
6,009
7,486
8 719
4,397
4,526
4.033
4,282
4,517
3,767
3,537
3,924
5,039
6,815
8,243
4,096
5,400
6,904
8,336
5,358
6,491
8,169
3,056
4,522
5,585
6,899
8.229
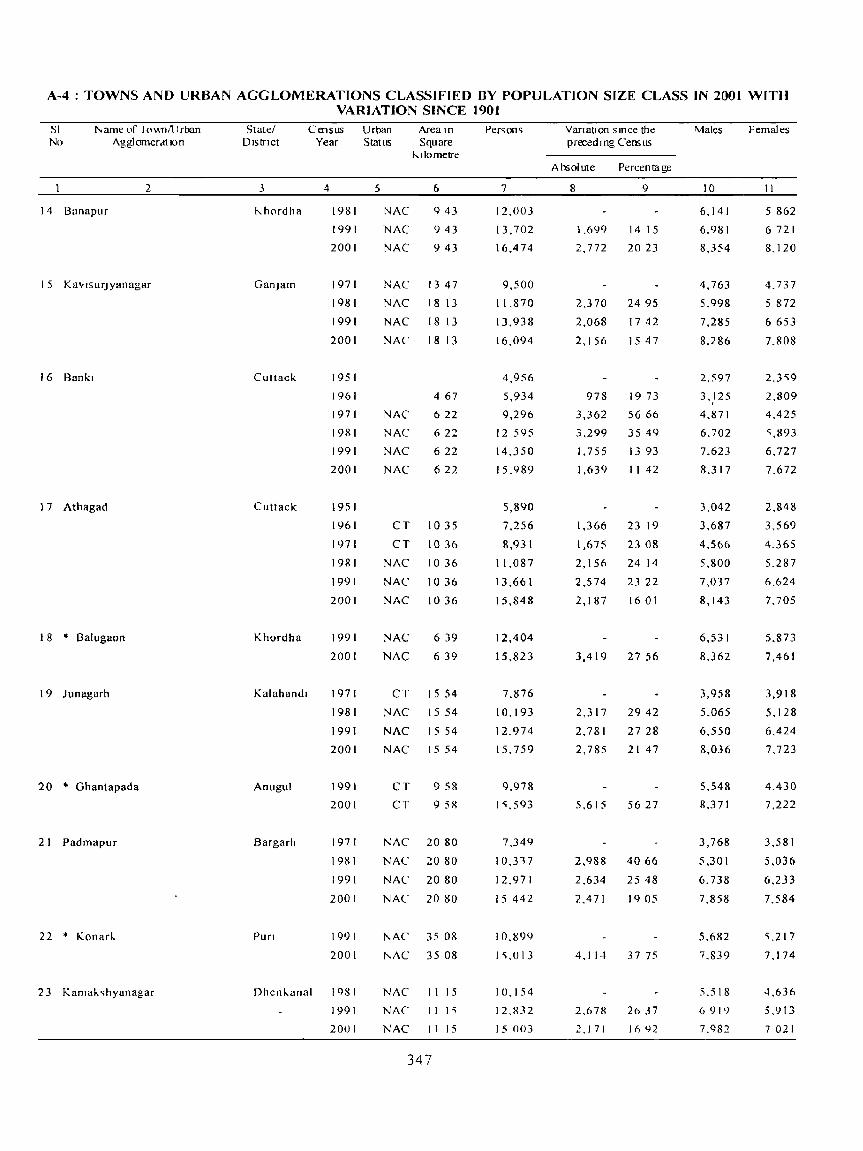
A-4: TOWNS AND URBAN AGGLOMERATIONS CLASSIFIED flY POPULATION SIZE CLASS IN 2001 WITH VARIATION SINCE 1901
SI No
l'. ame l,r I (1\\nll I rban Agglomerdtlon
2
14 Banapur
15 KavlslIrJyanagar
16 Rankl
17 Athagad
I 8 * Salugaon
19 Junagarh
20 • Ghanlapada
21 Padmapur
22 * Konar(..
23 KamaJ..'ihyanagar
State/ Dlstnct
Census Urban Area In Year Status Square
3
J....hordha
GanJam
ClIttack
ClIttack
Khordha
Kalahandl
Anugul
Sargarh
Pun
4
1981
1991
2001
1971
1981
1991
2001
1951
1961
1971
1981
1991
2001
1951
1961
1971
1981
1991
2001
1991
2001
1971
1981
1991
2001
1991
2001
1971
1981
1991
2001
1991
2001
Dhen(..anal 198 I
1991
2001
5
NAC
NAC
NAC
NAC
NAC
NAC
NAC
NAC
NAC
NAC
NAC
J....llometre
6
943
943
943
13 47
18 13
[8 13
18 13
4 67
622
622
622
622
CT 1035
CT 1036
NAC 1036
NAC 1036
NAC 1036
NAC 639
NAC 639
CT 15 54
NAC 1554
NAC 15 54
NAC 1554
CT 958
CT 95R
NAC 2080
NAC 2080
NAC 2080
NAC 2080
l'.AC 35 08
l'.AC 35 08
NAC II 15
NAC 111"
NAC II 15
347
Per'ion'i
7
12,003
13,702
16,474
9,500
11,870
13,938
16,094
4,956
5,934
9,296
12 595
14,350
15,989
5,890
7,256
8,931
11.087
13,661
15,848
12,404
15,823
7,876
10,193
12.974
15,759
9,978
1",593
7,349
10,317
12,971
15 442
10,1199
I 'i,O 13
10.154
12,832
15 003
VarIatIon since the precedIng Census
Ahsolllte
8
1,699
2,772
2,370
2,068
2,156
978
3,362
3,299
I, 755
1,639
Percentage
9
14 15
2023
2495
1742
1547
1973
5666
35 49
13 93
II 42
1,366 23 19
1,675 23 08
2,156 24 14
2,574 23 22
2,187 1601
3,419 2756
2,317 2942
2,781 2728
2,785 2147
5,615 5627
2.988 40 66
2,634 25 48
2,471 1905
4,114 3775
2.678 2637
2,171 1602
Males
10
6,141
6,981
8,354
4,763
5,998
7,285
8,286
2,597
3,} 25
4,871
6,702
7,623
8,317
3,042
3,687
4,566
5,800
7,037
8,143
6,531
8,362
3,958
5,065
6,550
8,036
5,548
8,371
3,768
5,301
6,738
7,858
5,682
7,839
5,518
(, 91 ')
7, <}82
Females
11
5 862
6721
8.120
4,737
5 872
6653
7.808
2,3<;9
2,809
4.425
",893
6.727
7.672
2,848
3,569
4.365
5.287
6,624
7.705
5,873
7,461
3,918
5,128
6,424
7,723
4.430
7,222
3,581
5,036
6.233
7,584
~.217
7.174
4,636
5,913
7 021

A-4 : TOWNS AND URBAN AGGLOMERATIONS CLASSIFIED BY POPULATION SIZE CLASS IN 2001 WITH . VARIATION SINCE 1901 .
SI No
Name of Town/Urban AgglomeratIOn
2
24 Kotpad
25 * Nllaglfl
26 Surada
27 BInlka
28 Nayagarh
29 Plplll
30 Purusottampur
3 I Redhakhol
State/ Dlslnct
3
Koraput
Baleshwar
GanJam
SOlapur
Nayagarh
Pun
GanJam
Census Urban Area In
Year Status Square
4
1961
1971
1981
1991
2001
1991
2001
1941
1951
1961
1971
1981
1991
2001
1911
1921
1931
1941
1951
1961
1971
1981
1991
2001
1961
1971
1981
1991
2001
1981
1991
2001
1971
1981
1991
2001
5
Kdomelre
6
NAC 1036
NAC 1295
NAt 1295
NAC 1295
NAC 1295
NAC 2044
NAC 2044
NAC
NAC
NAC
NAC
NAC
492
492
492
4 92
492
NAC 21,42
NAC 2142
NAC 2142
NAC 15 54
NAC 15 54
NAC 15 54
NAC 1554
NAC I ~ 54
NAC 880
NAC 8 80
NAC 880
CT 1347
NAC 34 89
NAC 3489
NAC 3489
Sambalpur 200 I NAC 3737
348
Persons
7
6,368
9856
II 604
13,30,)
14,917
12.800
14,757
6339
7,106
8.703
9833
11,269
13.268
14 648
4.130
3.597
3 326
3 825
11.004
12.955
14,539
'; 815
';.209
7 760
10 464
14,314
8.739
I I. 649
14 263
8,898
10,739
12,904
14.249
I, 723
VandtiOn Slllce the precedIng ( emus
Absolute Percentage
8 C)
3 488 54 77
1 748 17 74
1 70" 14 69
1.60R 1208
957 1529
767 12 10
1.597 22 47
1 130 12 98
1 436 14 (1
I 999 17 74
I 380 1040
-533 -1291
-271 -7';4
499 15 00
DeclassIfied
1,95 I
1,584
17 73
1223
- 606 - 1042
2.5'; I 4897
2.704 34 85
3,850 3679
2.910 333
2.614 22 44
1,841 2069
2,165 20 16
1,3451042
Males
10
3 0';2
4 8';8
<; 648
6593
7,409
6631
7 ~58
3 149
3.527
4496
5.060
5.623
6 713
7460
I 999
I 630
1 540
I 911
5 600
6,664
7439
3311
3 027
4 523
5.846
7,720
4.436
5.956
7.336
4,418
5.461
6.530
7.267
7.229
Females
II
3316
4 998
~ 9';6
h. 710
7. 'i08
0.169
7.199
3 190
3 qq
4.207
4.771
" 646 6.51<;
7.188
2 131
1.967
1.786
1 914
'; 398
6291
7 100
2,504
2,182
3.237
4.618
6.594
4.303
5.693
6,927
4.480
5,278
6.374
6.982
6,494
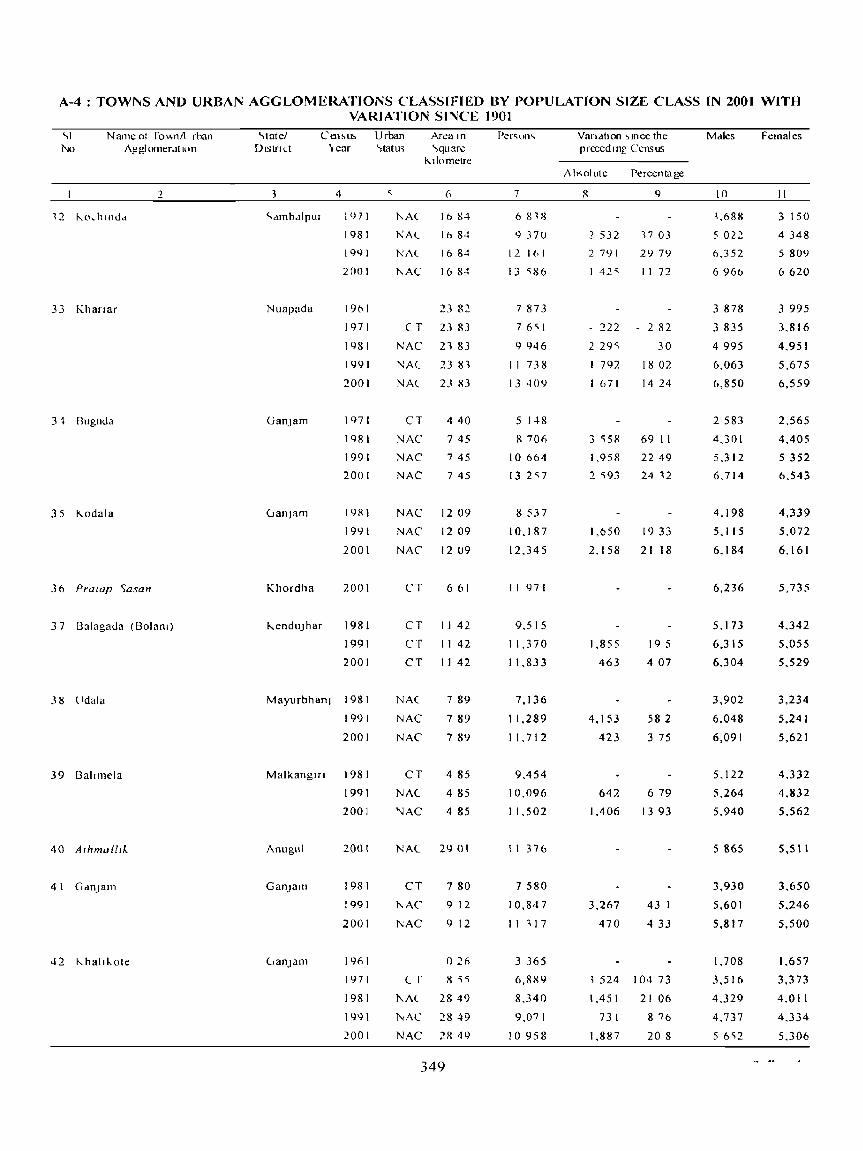
A-4 : TOWl\iS AND URBAN AGGLOMERATIONS CLASSIFIED BY POPULATION SIZE CLASS IN 2001 WITH VARIATION SI"ICE 1901
"I NO
Name ot rov.nll rhan Ag.g1omero.ltILln
33 Khaflar
3 l Buguua
35 ~odala
36 Pralup <;asan
37 Balagada (Bolam)
.38 lfdala
39 Ballmela
40 Athmu/llk
42 ~hallJ,.ote
"tate/ DIstrllt
Cen~ll!> Urban An.:a In 'i ear '>tatu~ '>quare
4
<'dmb,dpur
Nuapada
Khordha
I '-! 7 I
1981
19<)1
2001
1961
1971
1981
1991
2001
1971
I C) 8 I
1991
2001
19S1
19,}1
2001
2001
~enduJhar 1981
1991
2001
Mayurbhanl 198 I
1991
2001
MalkanglTl 198 I
1991
2001
Anugul
GanJam
2001
1981
1991
2001
1961
1971
1981
11)91
2001
~llometre
16 114
NAt- 1684
NAt 1684
]\,AC 16 84
CT
NAC
NAC
23 82
23 83
21 83
23 8,
NAt 23 X3
CT
NAC
NAC
NAC
440
745
745
745
NAC 1209
NAC 1209
NAC 12 U9
CT 661
CT 1142
CT 1142
CT 1142
NAC 789
NAC 789
NAC 789
CT 485
NAt 4 85
"lAC 485
NAC 2901
CT 780
]\,AC
NAC
9 12
9 12
() 2f,
t r 8 'i~
l'.A( 28 49
NAC 2849
NAC 2R 49
349
7
6 8 ~8
'-I 370
12 161
13 ~86
7 873
7 6~ I
9946
I I 738
13 409
5 148
8706
10 664
132'7
8537
10.187
12.345
II 971
9,515
11,370
11.833
7,136
11,289
I I. 712
9.454
10,096
11.502
II 376
7 580
10.847
I 1 ., 17
3 365
6.889
8.340
9,071
10958
VandtJon ~lOce the precedlnr Census
A h<; 01 ute Percentage
9
25321703
2 7') I 29 79
I 42'i II 72
- 222
2 29~
792
I 671
3 'i58
1,958
2 'i93
- 2 82
30
18 02
14 24
69 II
2249
24 12
1,650 19 33
2,158 21 18
1.855
463
4.153
423
642
1.406
3.267
470
195
407
582
375
6 79
13 93
43
433
,524 104 73
1.451 21 06
731 8 76
1.887 208
10
'.688
5 022
6.352
6966
3 878
3 835
4995
6,063
6.850
2583
4.301
5.312
6.714
4,198
5,115
6,184
6,236
5,173
6,315
6.304
3,902
6,048
6,091
5.122
5,264
5,940
5 &65
3,930
5,601
5,817
1.708
3.516
4.329
4.737
5 6~2
Females
II
3 150
4348
5 809
6620
3 995
3.816
4.951
5.675
6,559
2,565
4,405
5352
6.543
4.339
5.072
6.161
5,735
4.342
5.055
5.529
3,234
5.241
5,621
4.332
4.832
5.562
5,511
3.650
5.246
5.500
1.6S7
3.373
4.011
4.334
5.306

A-4: TOWNS AND URBAN AGGLOMERATIONS CLASSIFIED BY POPVLATION SIZE CLASS IN 2001 WITH VARIATION SINCE 1901
SI N arne of Town/U rban Statel Census Urban Area In Persons VanatlOn since the Males Females No Aggl omeratlon District Year Status 'Square precedmg (. ens us
Kilometre Absolute Percentage
2 3 4 5 6 7 8 9 10 11
43 Digapahandl GanJam 1981 NAC 1022 7.853 395'i 3.898
1991 NAC 1022 10.032 2.179 277'i 5208 4.824
2001 NAC 1022 10 890 S58 8 'i5 5 542 5.348
44 Chlkttl Ganlam 1981 NAC 648 8 177 4 142 4035
1991 NAC 648 10.005 f .828 2236 5.189 4.81 (r
2001 NAC 648 10.802 797 797 5.450 5,352
45 Rambha GanJam 1971 NAC 2 59 6.771 3,429 3.342
1981 NAC 7 77 8,196 1 425 21 05 4,084 4,112
1991 NA(' 7 77 9213 1,017 1241 4 591 4,622
2001 NAC 7 77 10,716 1.503 1631 5.383 5,333
46 * Panposh Sundargarh 1991 CT 543 9,564 4,929 4,635
2001 CT 543 10,233 669 699 5,191 5.042
47 G Udayagm Kandhamal 1981 NAC 1324 6,846 3,558 3,288
1991 NAC 1324 8.508 1,662 2428 4.257 4,251
2001 NAC 13 24 10204 1.696 1993 4963 5,241
Class- V (5,000 - 9,999) - 24 Towns
1901 26,897 13,830 13,067
1911 39,113 12.216 4542 19,562 19,551
1921 57,824 18.711 4784 28.963 28.861
1931 68,314 10,490 18 14 34.646 33,668
1941 I 15,205 46,891 6864 59.272 55,933
1951 178,415 63.2 I 0 54 87 93,282 85,133
1961 255 83 181,47 ) 3,056 ) 71 94,703 86,768
1971 422 12 234,226 52.7'i5 2907 122.926 111,300
1981 253 54 196,176 - 38050 - 1624 102,036 94,140
1991 148 17 161,289 -34,887 -17 78 84,686 76.603
2001 121 09 174,333 13,044 809 91,186 83,147
Bellaguntha GanJam 1961 466 5,762 2,809 2,953
1971 CT 466 7,113 1.351 2345 3,480 3,633
1981 NAC 5 18 7,915 802 11 28 3,867 4,048
1991 NAC 5 18 8,838 923 II 66 4,353 4,485
2001 NAC 5 18 9,962 1,124 1272 4.937 5,025
2 Kashmagara OaJapatt 1981 NAC 1036 9,179 4,518 4,661
1991 NAC 1036 10,102 923 1006 4,954 5,148
2001 NAC 1036 9.791 - 311 - 3 08 4,783 5.008
II
350

A-4 : TOWNS AND URBAN AGGLOMERATIONS CLASSIFIED BY POPULATION SIZE CLASS IN 200t WITH VARIATION SINCE 1901
SI No
N arne of Town/U rban Agglomeratlon
2
3 * Hatlbandha
4 • Khandapada
5 Kanttl0
6 • DamanJodl
7 • ChamplIa
State/ Dlstnct
CenslIs Urban Area In
Year Status Square
3 4
SUlldargarh 1991
2001
Nayagarh 1991
Nayagarh
2001
1981
1991
2001
Koraput 1991
2001
KenduJhar 1991
2001
5
CT
CT
NAC
NAC
CT
CT
CT
Kllometre
6
3 16
3. ) 6
13 06
13 06
624
6.24
624
CT 1232
CT 12 32
CT 490
CT 490
8 Rengalt Dam Project TownshIp' Anugul 1981
1991
2001
CT
CT
CT
625
6 25
625
9 Tarbha
10 • Nuapatna
1 I Bishamakatak
12 F C I Township
13 Lalhlkala
14 Gudan
15 Mukhrguda
J 6 Gopalpur
Sonapur
Cuttack
Rayagada
Anugul
1971
1981
1991
2001
1991
2001
2001
1981
1991
2001
Sundargarh 200 I
Rayagada
Kalahandt
1971
1981
1991
2001
2001
1961
1971
NAC 1295
NAC 1295
NAC 1295
NAC 1295
CT
CT
CT
CT
CT
CT
CT
CT
NAC
NAC
NAC
CT
NAC
NAC
351
272
2 72
4 56
3 59
3 59
3 S9
5 32
228
2 28
228
228
2 24
2 85
2 85
Persons
7
8.521
9.297
7.522
8.757
7.877
8.258
8.735
5.719
8,4 75
5.746
8.309
13.213
10.855
8.115
6.417
6.926
7.466
7.989
6,139
7,848
7,408
5 067
9.366
7,058
6.896
4.774
5.698
6,611
6.849
6.756
3.536
3.583
Vanatlon since the precedJng Census
Absolute Percentage
8
776
1.235
381
477
9
9 II
16.42
4 84
5 78
2.756 48 19
2.563 44 60
- 2358 - 1785
- 2740 - 2524
509
540
523
793
7 8
701
1.709 27.84
4.299 84 84
-2.308 - 2464
924
913
238
1935
1602
3.6
33
Males
10
4.538
4.895
3.868
4.530
4.046
4 180
4,476
3,438
4.607
3,062
4.420
8.212
6.437
4.367
3.295
3.463
3.785
4.060
3.223
4.089
3.723
2.970
5.000
3.710
3.656
2.409
2.853
3.325
3,410
3.659
1.80 r 1.795
Females
II
3.983
.. 402
3.054
4.227
3.831
4.078
4,259
2.281
3,868
2.684
3.889
5.001
4,418
3.748
3.122
3,463
3.681
3.929
2.916
3.759
3.685
2.097
4.366
3.348
3,240
2.365
2.845
3.286
3.439
3.097
I. 735
1.788

A-4 : TOWNS AND URBAN AGGLOMERATIONS CLASSIFrED BY POPULATION SIZE CLASS IN 2001 WITH VARIATION SINCE 1901
SI Name of TownlUrban State! Census Urban Ared 111 Persons VanatlOO Sll1ce the Males Females No Agglomeration District Year ">tatus ~quare p reced lIlg C ens us
Kilometre Absolute Percentage
2 3 4 5 6 7 8 9 10 II
1981 NAC 2 ~6 4 503 920 25 68 2.292 2.2 [ I
199[ NAC 2 56 " 403 900 1999 2.741 2,662
2001 NAC 2 56 6,663 1,260 23 32 3.336 3 327
17 TTPS Township Anugul 1981 CT 200 ",371 3.151 2.220
1991 CT 200 7 14X 1,777 33 09 3.971 3,177
2001 CT 200 662 ( - 527 - 7 37 3.619 3.002
18 Khallguda Nabarangapur 200 I (.'1 I 98 6.406 3.305 3.101
19 Dungamal K.hordha 2001 CT I 7Q 6,207 3.939 2.268
20 Jhumpura Kendu1 h ar 2001 CT 327 'i,265 2762 2.'i03
21 Khaltapalr Bargarh 2001 CT 3 22 5,264 2,730 2.534
22 Chandapur Nayagarh 2001 CT 2 7" 5.260 2.657 2.603
23 * ChanbatJa Cuttae,," 1991 CT o Q4 5965 3.309 2.656
2001 (T 094 5.234 - 731 - 1225 2.838 2.396
24 Bangura KenduJhar 2001 CT 745 'i.168 2 678 2 490
( lassS VI ( Below 5.000 ) 6 Towns
1901 4.400 2 325 2,075
1911 13.731 9,331 212 07 6.870 6 861
1921 8,088 -5.643 -41 10 3.680 4,408
1931 3.326 -4 762 -'iX 88 1.5'W 1.786
1941 3.82" 499 15 00 I 911 1.914
1951 4 956 I 131 29 57 2597 2.359
1961 937 9.655 4,699 9.J 81 5.103 4,552
1971 5 13 8.357 -1.298 -13 44 4.204 4 1 S3
1981 658 13.799 5,442 65 12 7.481 6.318
1991 1089 12.005 -1794 -13 00 6,863 5,142
2001 931 24 675 12.670 105 54 12 968 11.707
Makundapur GanJam - ~oo I CT I 30 4975 2. '146 2,429
2 Belagachhw Cuttaek 2001 CT 'I 09 4612 2363 2.249
3 Dadhapalna Cuttack 2001 CT I 07 4.417 2339 2,078
4 Daltan Kendulhar 1981 cr NA 4844 2623 2.221
199\ CT NA 4434 -410 -846 2.364 2.070
2001 CT NA 4,239 -195 -440 2.274 1.965
352
A-4 : TOWNS AND URBAN AG(.LOMERATIO"JS CLASSIFIED BY POPULATION SIZE CLASS IN 2001 WITH VARIATIO~ SINCF 1901
SI N arne of Town/tl rban '>tdte/ l CIl!>ll~ Urban Area 111 l'er!>ons Variation <; mee the Mdk!> rerndles No Aggl omerat IOn Dlstnct Year SWIL];' '>quare precedIng (el1~us
"-110 metre Absolute Percentage
2 3 4 ~ 0 7 R 9 10 II
5 * Tensa ~undargarh 1991 CI 85 4 599 2 '>00 2 099
2001 CI X.:; I 236 -36 , -7 Xc) 2 267 969
6 () C L Jndu~/rwl TOll nshlp * Sundargarh 2001 IT" 2 196 1 17lJ 017
Note Towns treated as such for the fIrst tIme In 1991 Census \\I1I1.:h contlI1ue .I; 10\\11' In lOOI LCll'lI' aft .. ,hl>wn with dstenc
•
(*) on the left
2 Towns treated as sllch for the first tune 111 200 I Census are shown III ItalIc
3 The followlllg abbreviatIOns have been lIsed to describe the CIVIC ;tau'i of the 10\\11'> -
M Corp
M
ITS
NAC
CT
4 NA
00
o C 1 Industrial
9/98 - HUD and
M uI11clpai CorporatIon
MUniCIpality
Industnal TownshIp
NotIfied Area Council
Census Town
Not AvaIlable
Outgrowth
TownshIp (ITS) has been ne\\ly created from Ra)agangapur (M) Vide NOUftL3tlO11 No 42.:;47 - <"PL -Con
S R 0 No 863/98 dated 23 12 1998
353

fhe table A-4 has been supplemented by the folloWIng 2 appendIces
APPENDIX - I EXPLANATORY NOTE - A
Con <;t It uen t Villages
~tateiDlstnct Name of new 1 owns I and
(en<.,u<; Name Revenue
PopulatIOn 1991 Remarks
Record No
I 2 3 4 5 (,
ORISSA
01 Bargarh KhalIapalI Town (CT) Khallapall 36 5,251
03 Sambalpur Redhakhol Town (NAC) I Jharapada 5 105
2 Dlmmkuda 116 270
3 Kalmdar 6 265
4 Bllepur 7 125
5 Blrachandrapur 10 43
6 Barasklakhol II 174
7 Podabalanda 14 714
8 Kuhl 15 109
9 Biswanathpur 9 65
10 RaJrakhol (Rampur) 59 6,715
11 Dalkhaman 114 99
12 Patuhpah 20 128
13 Kelakata 25 263
14 Kendukata 26 91
15 Sundhlmunda 19 438
16 Purunagarh 17 342
17 Bhaluchuan 77 189
18 ChatunI 78 72
05 Sundargarh o C L Industnal Ward No 10 of RaJagangapur NA OCL Industnal
Township (ITS) Town (M) TownshIp has
been created from
Ralagangapur (M)
Lathlkata To\\n (CT) Lathlkata 21 5,459
06 KenduJhar Jhumpura Town-(CT) Jhumpura 84 4,500
Bangura Town (CT) Bangura 17 5236
07 Baleshwar Remuna Town (NAC) I Mendhara 158 428
2 Athantar 140 539
3 Dlharemuna 133 350
4 Ganapal 138 107
5 Jagannathpur 82 409
6 Kanrall 85 749
7 Ramachandl 135 83
8 Hanpur 131 688
9 Ramagar 130 165
10 Brahmanl Chhara 89 328
11 Kurunlapatana 90 i-{i3
354
APPENDIX - 1 EXPLANATORY NOTE - A
Const It uent Villages
StatelDistrict Name of new Towns Land
Census Name Revenue
Population. 1991 RemarJ...s
Record No
2 3 4 5 6
12. Kurunia 91 709
13 Sin:ipur 93 674
14. Balagopalpur 106 UI
15. Bidyadharpur 108 810
16 Bidyadharpur patana 109 80
17. Ganipur 129 1,694
18 Begampur 128 514
19 Madhipur 149 2.541
20. Shyamraipur 146 820
2 I. Purusottampur 145 969
22. Radhanagar 144 190
23.Goudadand 143 504
24.Rudrapur 147 330
25 Salahani 153 332
26 Ganes\\ arpur 152 2.168
27 Srikrushnupur 151 2.083
28 Achutlpur 150 610
29.Naraharipur 127 ).765
30 Bangarganpatana 126 410
31.Bangargan 125 25
32 Somanathpur 215 1.820
33 Halupatana 92 93
34.Sana Purusottampur 14X UI
35. Palasandha 121 UI
36.Keshapur 124 UI
37.Telagaria 122 UI
38.Guhalgam 123 UI
09 Bhadrak Dhamanagar Town (NAC) I. Jayanagar 31 4.616
2. Sampur 61 1.822
3 Dhamanagar 60 5.199
4. Talapada 55 1.560
5 Dakhinabad 91 1.132
12.Cuttack Belagachhia Town leT) Belagachhia 34 4.536
Dadhapatna Town (CT) Dadhapatna 30 4.128
15.Anugul Athmallik Town (~AC) Kaintragarh ISS 6.119
2. Haragaon 156 799
3 Haridanali 147 763
4 Pacheribundha ISO 116
5 Lipungu 153 515
355
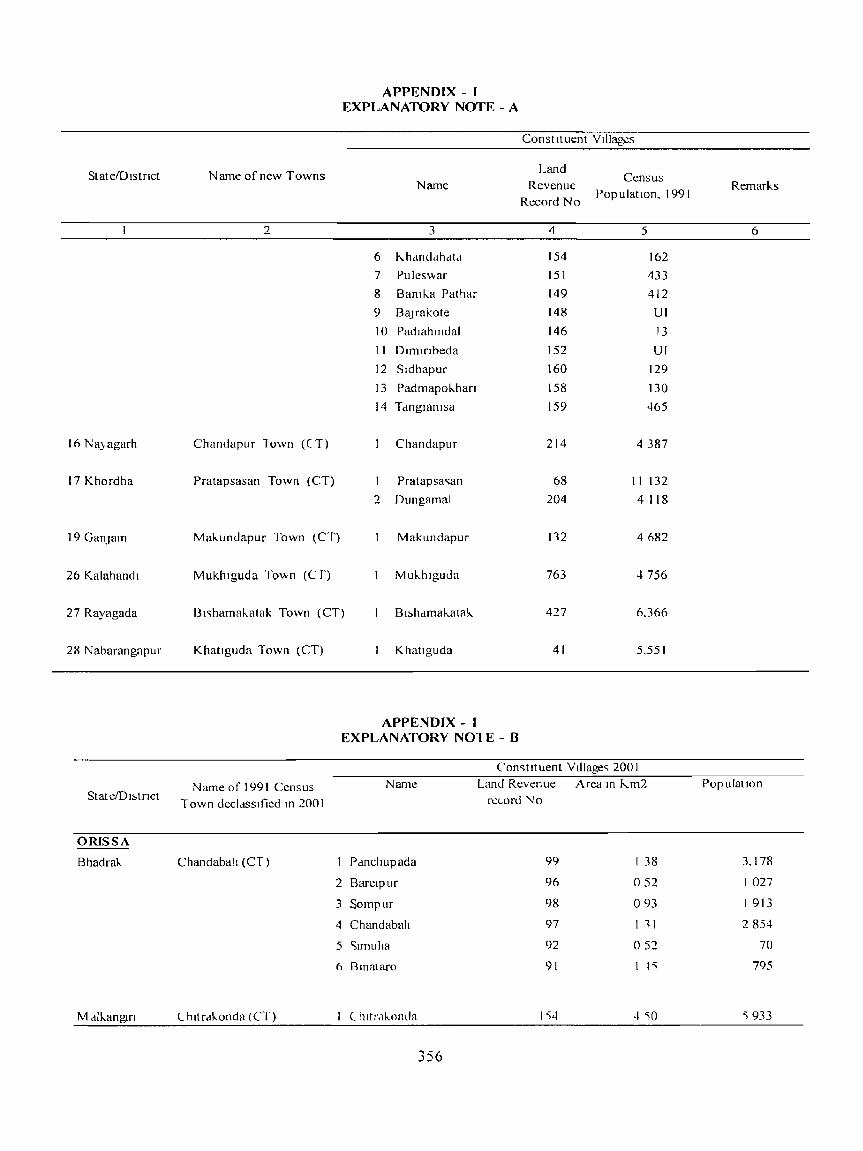
StateiDlstnct
1(> Na)agarh
17 Khordha
19 GanJam
26 Kalahandl
27 Rayagada
28 Nabarangapur
Stat ciD I:-.tnct
ORISSA
BhadraJ..
Malkangtn
APPENDIX - I EXPLANATORY NOTE - A
Constituent Villages
Name of new Towns Land
Name Revenue Census
Record No Population. 1991
2 3 4 5
6 t-..hdnddhdta 154 162
7 Puleswar 151 433
8 Bamk.a Pathar 149 412
9 BaJrakote 148 UI
10 Padl3hmdal 146 13
II Dlmlrlbeda 152 UI
12 Sldhapur 160 129
13 Padmapok.han 158 130
14 Tanglamsa 159 465
Chandapur lown (C T) Chandapur 214 4387
Pratapsasan Town (CT) Pratapsa<;an 68 II 132
2 Dungamal 204 4 118
Mak.undapur Town (CT) Makundapur 112 4682
Mukhlguda To\Vn (C f) Muk.hlguda 763 ... 756
131<;hamak.atak Town (CT) B I:.hamak.atak. 427 6.366
KhatJguda Town (CT)
Name of 1991 Census Town decldSslfied m 2001
Chandabah (en
Lhltrakonda (CT)
Khatlguda 41 5.551
APPENDIX - I EXPLANATORY NOl E - B
Name
Pancilupada
2 Barelpur
3 Sompur
4 Chandabah
5 ~m1Uha
6 Bmataro
C hltrak.onda
356
Con<;tItuent Vtllage<; 200 I Land Revenue Area In I'...m2
flx,ort! "1\10
99
96
98
97
92
91
1')4
I 38
052
093
1 11
052
I I"
Remarks
6
Population
3.17R
1027
1913
2854
70
795
') 933

APPENDIX - I NEW TOWNS ADDED IN 2001 A!\IO TOW:'oJS OF 1991 DECLASSIFIED If', 2001
'\Ie\\ 'J 0\\11<; aJdcu 111 200 J T O\\1lS 0 f 1 IJ') 1 dcc1assIlieu a~ RuraJ 111 :2 00 1
Statel District ]\ameofTown urban Area ill Sq.kms. Name ot l'rhan A rea in
Status Pop ulat IOn r O\\n Statu" Sq.h.m. PopulatIon 2001 1991 2001 19l}j
2 3 4 5 0 7 g <) 10 II ORISSA 13argarh Khaliapali CT 322 5.264 5.251 Samhalpur Rcdhakhol "J'.,AC 3737 13.723 10.207 Sundargarh O.C L. Imlu::.trial ITS Included in 2.196 :-";A
rm"nship * RapgangllPUr (M)
Lathlkata CT 5.32 <1.89() 5.459
KenduJhar Jhllmpura CT 3.27 5.265 4.500
Bangura CT 7.45 5.1 (18 5.230
Baleshwar Rcmuna NAC 30.47 29.072 23.150
Bhudrak Dhamanagar NAC IX 69 18,5."0 14.329 Chundahali cr <1 I I 9.337 8.170
Jaglltsinghapur - I'arulilp :-.lAC 904 237 1.972 Phosphates
Cuttack Belagachhm CI 5.09 4.612 4,53()
Dauhapatna CT 107 ,U17 4.128
Anugul Athmallik NAl' 29.01 11.376 10.056
Nayagarh Chandapur CT 275 5.'loU 4,387 Khordha P rat ap Sa<;an cr I) 61 11.971 I 1.132
Dungamal CT 1.79 6.207 4.118
Ganjam Makundapur (,T 1.3 4.975 4.082
Kulahandl Mukhiguda Cl 2.24 6.756 4.756
Ra) agada Bishamakatak CT 4.56 7.408 6.366
"J aharan gap LI r Khatiguda CT 198 h,clO(J 5.551 M alh.angiri Chltrah.onda (,T 4,5 5.933 5.981
* O.C L. Industrial Township (ITS) has bcm nc\\ ly crcated from Rupgangapur (M) Vlde ]\.otJl'icatlon :-.Jo.42547 - SPL - Con - 9/98-
IIl;O and S R 0 No. 803/98 dated 23 12 199R
Appendh-l furnishes the details on area and population of new towns added in 200 I Census and towns in 1991 Census, which have been, declassified as rural area in 200 1 cen~lIs. There arc 18 new to\vllS added in 200 1 Census and t~o CenslIs towns namely Chandabali and Chitrakonda in 1991 Census are declassified in 200 I Census. This appendi\: is also supplemented with two explanatory notes 'A' & '8'. The explanatol) note' A' sho\\s the names of the constituent villages and their population of 1991 Census, for the towns treated for the first time in 200 1 Censlls.
357
Explanatory note -S' show:::. the constituent villages in wh ich the towns of 199 I Census relapsed after declassified in 200 I Census. The detailed particulars of constituent villages of 18 new towns are given in explanatory note A whereas the constituent villages along with its area and population of Chandabali and Chitrakonda Censtl!> towns which are declassified during 200 I Census is given in the explanatory note -B' to this appendix Paradip Phosphates is the only town \\ ith a population of under 5000 in 1991 Census wh ieh has heen dcnoti fled in 200 I.

Appendix-2 cnlist~ such to\\I1'i, v,hich have L1nd~rgolle change~ in jurisdiction dunng 1991-2001 Census.
APPENDIX - 2 CHANGES IN AREA OF TOWNS BETWI-:EN 1991-2001 AND REASONS THEREOF
State I District "l .. unc: ofTo\\11 Rea"on" fnr thl' change In ,\rea ------~----------------~--------------~----------~----------------------- ------------2 5 ( )R!"~A
Jhar,ut.-'llda
Sundw-~h
KenduJhar '\1 a) urbhanJ Cuttack
J~j<Jpur
AlluguJ
Khmdha
l\. abarangllp ur
[\ t alkungn I
Tklpahar C".;AC)
Birw-nltrarur (:\1)
Anand:lpur (~AC) Burip ada (M) l'uttack ([\1.Cnrp )
B) a<;anagar (M) '"
'I uJchl'r (:\1)
Bhuhune~\\ar tM Curr.)
Naharangapur (M)
Malkan¢n (;-.J.'\C)
Ch,mgt.: ill li.:! nturl,tI IUlI"dld ~on
-do -
-uo --do -
-do -
-do -
-tit> -
-do -
-dn -,\~ per I-'\ecutl\C ()lTict.:r rcport allhlllll~-: 3
\'dla~ ... -.; \ II' .I a;. an3gar(L C :-"0 IJ~).Ba"antrur
(L.l' l'.o IJJ).antl :\,1 adhururO c.~o.13 t) h:J\e
been Illcluded 111 \!allanp.in NAC In 2uOl Cen:=:us hut the area nfthe't: VIIlap.cs are noted
a, "1 'n Sunc) cd"
* In 2001 Cen,us Jajarur Road ro\\1n (1':AC) IS renamed a.<.; Byw;anngJr T()\\n 1'vI) \'llk ;--:otlfication)';ll 1l).1f>7 - ~PL - Con -42'97
- lit '0 :lnd S R.O. No. SR6:9X dated 0906 1998.
The area figures of each such town is also gl \ en for hoth 200 I and 1991 Censuses. The reasons thereof of changes in jurisdiction are also
given in brief. 'I here are )0 1I)\',I1S. the area of\\hich has been changed mail1l) due to <.:hanges in territorial jurisdiction.
APPENDIX-3
Places with a population of under 5,000 in 1991 which were towns in 1991 but have been declassified in 200 I
1\)\\ n {)I~trict Arca In K m2 in 19l) 1 Population In 19Q1
3 4
Paratlip Phnsphatc<; Town (NAC) J agat ... mg hapur 2,972
358
Copyright © 2022 FDOKUMEN