Appendix I – Evidence tables - NICE
246
Appendix I – Evidence tables 2007 Evidence tables Contents 3. What effect does communication have on a woman’s perception of her birth experience? 5 Communication between women and healthcare professionals 5 4. Is there evidence that support in labour for women improves outcomes? 13 Support in labour 13 6. What are the indications for the use of ventouse or forceps? 25 Delay in the second stage of labour – instrument to be used (forceps versus ventouse) 25 Delay in the second stage of labour – instrument to be used (soft ventouse versus hard ventouse) 29 Delay in the second stage of labour – instrument to be used (failed/successful instrumental vaginal birth and CS) 31 7. Are there effective hygiene strategies for vaginal birth out of water to protect both women and babies, and healthcare professionals? 32 8. Are there effective hygiene strategies for vaginal birth in water to protect both women and babies, and healthcare professionals? 32 Hygiene measures during labour 32 9. What are the appropriate definitions of the latent and active phases of the first stage, the second stage, and the third stage of labour? 35 10. Do duration and progress of the first and second stages of labour affect outcomes? 35 Definition of the first stage of labour 35 Duration and definition of delay in second stage of labour 39 Duration and definition of delay in second stage of labour – 2 43 Definition and duration of the third stage of labour – duration of the third stage 45 13. Is there evidence that the assessment of the following, on admission, and throughout labour and the immediate postnatal period, affect outcomes? 46 Observations on presentation in suspected labour (Contraction) 46 Observations during the established first stage of labour 47 Observations during the established first stage of labour (pain assessment during labour) – 1 48 Observations during the established first stage of labour (pain assessment during labour) – 2 50 Observations during the established first stage of labour (pain assessment during labour) – 3 51 Observations during the established first stage of labour (charting of observations) 52 Adjuncts to the use of CTG – computerized systems versus human interpretation 54 15. Is there evidence of factors or interventions that affect outcomes in term prelabour rupture of the membranes? 56 Surveillance following term prelabour rupture of membrane 56 Place of care for women with term prelabour rupture of membrane 58 Risk factors associated with maternal infection following prelabour rupture of membrane 59 Use of intrapartum prophylactic antibiotics 62 Use of intrapartum prophylactic antibiotics 64 Update information February 2017: Sections that have been updated (see addendum files) have been marked with dark grey shading’
-
Upload
khangminh22 -
Category
Documents
-
view
0 -
download
0
Transcript of Appendix I – Evidence tables - NICE

Appendix I – Evidence tables
2007 Evidence tables
Contents 3. What effect does communication have on a woman’s perception of her birthexperience? 5 Communication between women and healthcare professionals 5 4. Is there evidence that support in labour for women improves outcomes? 13 Support in labour 13 6. What are the indications for the use of ventouse or forceps? 25 Delay in the second stage of labour – instrument to be used (forceps versus ventouse) 25 Delay in the second stage of labour – instrument to be used (soft ventouse versus hard ventouse) 29 Delay in the second stage of labour – instrument to be used (failed/successful instrumental vaginal birth and CS) 31 7. Are there effective hygiene strategies for vaginal birth out of water to protectboth women and babies, and healthcare professionals? 32 8. Are there effective hygiene strategies for vaginal birth in water to protect bothwomen and babies, and healthcare professionals? 32 Hygiene measures during labour 32 9. What are the appropriate definitions of the latent and active phases of the firststage, the second stage, and the third stage of labour? 35 10. Do duration and progress of the first and second stages of labour affectoutcomes? 35 Definition of the first stage of labour 35 Duration and definition of delay in second stage of labour 39 Duration and definition of delay in second stage of labour – 2 43 Definition and duration of the third stage of labour – duration of the third stage 45 13. Is there evidence that the assessment of the following, on admission, andthroughout labour and the immediate postnatal period, affect outcomes? 46 Observations on presentation in suspected labour (Contraction) 46 Observations during the established first stage of labour 47 Observations during the established first stage of labour (pain assessment during labour) – 1 48 Observations during the established first stage of labour (pain assessment during labour) – 2 50 Observations during the established first stage of labour (pain assessment during labour) – 3 51 Observations during the established first stage of labour (charting of observations) 52 Adjuncts to the use of CTG – computerized systems versus human interpretation 54 15. Is there evidence of factors or interventions that affect outcomes in termprelabour rupture of the membranes? 56 Surveillance following term prelabour rupture of membrane 56 Place of care for women with term prelabour rupture of membrane 58 Risk factors associated with maternal infection following prelabour rupture of membrane 59 Use of intrapartum prophylactic antibiotics 62 Use of intrapartum prophylactic antibiotics 64
Update informationFebruary 2017: Sections that have been updated (see addendum files) have been marked with dark grey shading’

Prolonged rupture of membrane and intrapartum fever as risk factors of neonatal infection 66 Clinical manifestation of babies 68 Clinical manifestation of babies 69 Postnatal prophylactic antibiotics for babies 70 17. What is the effectiveness of the following interventions or techniques inlabour on outcomes? 71 Eating and drinking in labour 71 Mobilisation 76 Routine interventions in first stage of labour – active management of the first stage of labour 79 Routine interventions in first stage of labour – partogram line management 81 Routine interventions in first stage of labour – routine amniotomy 84 Routine interventions in first stage of labour – routine “amniotomy and oxytocin” 85 Interventions for perceived delay in first stage of labour – amniotomy versus expectant management 86 Interventions for perceived delay in first stage of labour – amniotomy and oxytocin versus oxytocin 93 Interventions for perceived delay in first stage of labour – amniotomy and oxytocin versus oxytocin 94 Interventions for perceived delay in first stage of labour – oxytocin administration (high versus low dose oxytocin for augmentation) 96 Interventions for perceived delay in first stage of labour – oxytocin administration (comparing different oxytocin dosage regimes) 98 Maternal position and pushing – positions in second stage 100 Maternal position and pushing – pushing in the second stage 103 Immersion in water in the second stage 105 18. Is there evidence that the type, frequency and mode of administration of thefollowing pharmacological and non-pharmacological pain relief and regional analgesia influence outcomes? 108 19. When is use of each of these methods of regional analgesia appropriate? 108 20. What observations, above baseline care, should be undertaken on bothmother and baby while using regional analgesia? 108 21. What IV fluids should be used to maintain blood pressure during labour whileusing regional analgesia? 108 22. What is the most effective use of regional analgesia to minimise instrumentaldelivery rates and optimise pain relief in the second stage of labour? 108 Non-invasive analgesic techniques – breathing and relaxation 108 Massage 109 Non-invasive analgesic techniques – immersion in water in the first stage of labour 110 Non-invasive analgesic techniques – injected water papules 113 Non-invasive analgesic techniques – complementary and alternative therapies 114 Non-pharmacological analgesia – transcutaneous electronical nerve stimulation (TENS) 117 Inhalational analgesia – nitrous oxide 118 Intravenous and intramuscular use of opioids for labour 119 Regional analgesia – regional analgesia versus other types of analgesia in labour 133 Regional analgesia – timing of epidural analgesia 139 Regional analgesia – establishing regional analgesia (combined spinal-epidural analgesia versus epidural analgesia) 143 Regional analgesia – establishing regional analgesia (Intrathecal opioid with or without local anaesthetic versus no intrathecal opioid) 146

Regional analgesia – establishing regional analgesia in labour (intrathecal opioids versus epidural local anaesthetics)
148
Regional analgesia – establishing regional analgesia in labour (different doses for initiation of Combined Spinal-Epidural)
149
Regional analgesia – establishing regional analgesia in labour (different doses for initiation of epidural analgesia)
153
Regional analgesia – maintenance of regional analgesia (traditional versus modern regime of epidural analgesia)
154
Regional analgesia – maintenance of regional analgesia (local anaesthetic with opioid versus local anaesthetic without opioid)
155
Regional analgesia – maintenance of regional analgesia (local anaesthetic with opioid versus local anaesthetic without opioid)
158
Regional analgesia – maintenance of regional analgesia (different drugs for epidural analgesia)
161
Regional analgesia – maintenance of regional analgesia (different doses/rates for maintaining epidural analgesia)
180
Regional analgesia – maintenance of regional analgesia (mode of administration)
186
Regional analgesia – care and observations for women with regional analgesia in labour (Preloading with intravenous (IV) infusions for epidural analgesia)
194
Regional analgesia – care and observations for women with regional analgesia in labour (observations for women in labour)
195
Regional analgesia – care and observations for women with regional analgesia in labour (positions and mobilisations)
197
Regional analgesia – care and observations for women with regional analgesia in labour (pushing in second stage)
198
Regional analgesia – care and observations for women with regional analgesia in labour (use of oxytocin for women with regional analgesia)
201
Regional analgesia – effect of epidural fentanyl on breastfeeding 202 Women’s views and experiences of pain and pain relief in childbirth – 1 203 Women’s views and experiences of pain and pain relief in childbirth – 2 205 Risk factors for postpartum haemorrhage 206 29. What is the appropriate definition of perineal or genital trauma? 216 30. What is the effectiveness on perineal or genital trauma (including previous third or fourth degree trauma or female genital mutilation) of the following techniques?
216
31. Is there evidence that the type of assessment used to identify perineal or genital trauma affects outcomes?
216
32. Is there evidence that undertaking repair, the timing, analgesia and method and material of perineal repair affect outcomes?
216
Interventions in the second stage – intrapartum perineal massage 216 Interventions in the second stage – heat/cold 218 Interventions in the second stage – local anaesthetic spray 219 Interventions in the second stage – hand position during birth of baby 220 Interventions in the second stage – routine versus restricted use of episiotomy 223 Interventions in the second stage – vaginal birth following previous third/fourth degree perineal trauma
226
Perineal care – perineal repair (assessment of perineal trauma) 228 Perineal care – perineal repair (undertaking repair) 229 Perineal care – perineal repair (undertaking repair) 230 Perineal care – perineal repair (method of perineal repair) 231 Perineal care – perineal repair (materials for perineal repair) 236 Perineal care – perineal repair (analgesia for perineal pain following perineal repair)
240

33. What is the evidence that different methods of initial neonatal assessment and examination influence outcomes?
243
34. What is the evidence that different methods of neonatal resuscitation influence outcomes?
243
35. Are there effective ways of encouraging mother–infant bonding following birth?
243
Initial neonatal assessment – Apgar score 243 Initial neonatal assessment – infant-mother bonding and promoting breastfeeding
246

Intrapartum care
6
3. What effect does communication have on a woman’s perception of her birth experience?
Communication between women and healthcare professionals Bibliographic information
Study type and evidence level
Aim of study Number of women and their characteristics
Women’s characteristics Outcome measures Results and comments Study summary Additional comments
Hodnett 200267 Systematic review EL 3
To summarise what is known about satisfaction with childbirth, with particular attention to the roles of pain and pain relief.
69 reports of 62 studies included. Total N = over 45000 women who had experienced childbirth from 9 countries
Reviewed items:29 observational studies of childbirth satisfaction. 7 RCTs and 5 systematic reviews of intrapartum interventions (other than pain relief). 20 RCTs and 1 systematic review of intrapartum pain relief methods
Women’s satisfaction with childbirth experience
4 factors found which have greatest impact on satisfaction with childbirth experience: personal expectations; amount of support from caregivers; quality of caregiver-patient relationship and involvement in decision-making.
Concluded that the influences of pain, pain relief, and intrapartum interventions on subsequent satisfaction are important but not as powerful as the influences of the attitudes and behaviours of the caregivers.
Funding: not stated. International review.
Waldenstrom, 2004 68 Longitudinal cohort study EL 2+
To investigate the prevalence and risk factors of a negative birth experience.
N=2541 women(RR = 78%)
44% nulliparous women.13% women aged under 25. 3% non-Nordic background.
Global report of the birth experience.
7% women reported a negative birth experience. Associated risk factors fell into 4 broad categories: unexpected obstetric complications (eg. Emergency CS); factors related to social circumstances (eg. unwanted pregnancy); factors relating to feelings during labour (eg. lack of control); factors relating to care (eg. lack of support during labour, lack of control during labour, degree of participation in decision-making).
A minority of women report negative birth experiences, but where these exist there is evidence that staff attitude and behaviour has a part to play.
Funding: Not stated. Country: Sweden Comments: Multivariate analysis revealed that for multips. lack of support from midwife also a factor associated with negative birth experience.
Green J.M. & Baston H. (2004) 69
Prospective questionnaire before and after study. EL 2+
To understand how issues of internal and external control during labour, birth experience and subsequent well-being relate to one another.
N=1146 women(RR = 60% for first questionnaire; 91% for second questionnaire and 92% for third questionnaire).
43% primips.93% married/living as married 59% “A” levels or equivalent, or higher 95% partner employed Mean age 29.9 years (SD=5.05)
Experience of birth and psychological well-being postnatally. Experience of birth included 3 control outcomes: feeling in control of what staff do to you, feeling in control of your own behaviour, feeling in control during contractions.
Multips. felt signif. more in control than primips. for all 3 control variables. Logistic regression analyses showed feeling in control of staff related primarily to being able to get comfortable, feeling treated with respect and perceiving staff as considerate.
All 3 types of control were important to women and contributed to psychological outcomes. Caregivers have the potential to make a significant difference to women’s experience of childbirth.
Funding: Not stated. Country: UK
5

Evidence tables
7
Bibliographic information
Study type and evidence level
Aim of study Number of women and their characteristics
Women’s characteristics Outcome measures Results and comments Study summary Additional comments
Lavender, 1999 70 Questionnaire survey EL 3
To explore the aspects of a woman’s childbirth experience which she perceives as being important.
N=412 women(RR=67%)
Nulliparous women participating in RCT of timing of intervention during labour.
Women’s reported experience of childbirth.
Thematic analysis revealed the following main categories: support, information, interventions, decision-making, control, pain relief and trial participation.
Approx. 25% women said they wanted to participate in decision-making, but the preferred degree of involvement varied between women. Eg. ‘When I was not getting anywhere pushing, the doctor asked if I wanted help. I was pleased that I was asked and that it was not forced on me. I feel that it was my decision’. ‘They (midwives) explained everything that was happening which was great because when they explained things I felt a lot calmer’
Funding: Not stated. Country: UK Comments: Significant bias likely due to sample being recruits to an RCT of timing of intervention during labour.
Waldenstom U. (1996) 71
Prospective questionnaire survey EL 3
To explore the factors which contribute to women’s experience of birth.
N=1111 women(RR=90%)
Women participating in an RCT to compare birth centre with standard care
Women’s reported experience of childbirth.
Logistic regression analysis identified 5 explanatory variables: involvement in the birth process and midwife support were associated with a positive experience; anxiety, pain and having a first baby were associated with a negative experience
See results Funding: Not stated. Country: Sweden Comments: Significant bias likely due to sample being recruits to an RCT of a birth centre.
Waldenstrom et al, 1996 72
Cross-sectional Questionnaire survey EL 3
To explore the factors which contribute to women’s experience of birth.
N=295 women(RR=91%)
48% primips.96% married or living as married 85% native Swedes Mean age: 29.2 years (SD=2.5)
Women’s reported expectations and experience of childbirth.
Of the 38 variables tested by regression analysis 6 contributed to explaining women’s overall birth experience: support from the midwife, duration of labour, pain, expectations for birth, involvement and participation in the birth process, and obstetric interventions (eg. instrumental birth).
See results. Funding: Not stated. Country: Sweden
Brown & Lumley, 1994 73
Retrospective questionnaire survey EL 3
To explore the factors which contribute to women’s satisfaction with the experience of birth.
N=790 women (RR=71%)
A representative sample of 1193 women living in Victoria, Australia who had given birth 8-9 months previously.
Women’s satisfaction with childbirth experience
When adjusted for parity in a logistic regression model, the following factors were highly related to dissatisfaction with intrapartum care: lack of involvement in decision making (p<0.001); insufficient information (p<0.001); a higher score for
Findings revealed that not having an active say in decisions was associated with a six-fold increase in dissatisfaction among nulliparous women and a fifteen-fold increase
Funding: Victorian Health Promotion Foundation Country: Australia
6

Intrapartum care
8
Bibliographic information
Study type and evidence level
Aim of study Number of women and their characteristics
Women’s characteristics Outcome measures Results and comments Study summary Additional comments
obstetric interventions (p<0.015); and the perception that caregivers were unhelpful (p<0.04).
among multiparous women.
Brown & Lumley, 1998 74
Cross-sectional, retrospective questionnaire survey EL 3
To investigate women’s views and experiences of care in labour and birth.
N=1336(RR=63%)
Women living in Victoria, Australia, who had given birth to a live baby 6-7 months prior to questionnaire distribution.
Women’s reported views and experience of childbirth.
Women were more likely to be dissatisfied if they thought staff had not been very welcoming on their arrival in labour, if they were not given sufficient information, if caregivers had not been helpful or had not offered them reassurance or encouragement. The extent to which women perceived themselves as having a say in decision-making was directly related to their overall rating of intrapartum care.
After adjusting for parity,social factors and obstetric care, caregivers perceived as unhelpful and not having an active say in decisions about their care had the greatest impact on women’s experience of birth.
Final sample under-represented non-English-speaking women, single women and women under 25 years of age compared with all women who gave birth in Victoria during study period. Funding: Victorian Health Promotion Foundation Country: Australia
Creedy et al, 2000 75
Prospective survey (with telephone interview follow-up) EL 3
To determine the incidence of acute trauma symptoms and post-traumatic stress disorder in women as a result of labour and birth experience.
N=592 women recruited antenatally. N=499 PN follow-up (84%) Women aged over 18 years with no obstetric complications in last trimester of pregnancy.
Described as “representative” of women giving birth in Queensland, Australia. 75.6% described feeling “well-prepared” for childbirth, 88.5% were well supported by a partner.
Symptoms of post-traumatic stress including re-experiencing symptoms (eg. Recurrent dreams); avoidance symptoms (eg. Avoids places and activities); arousal symptoms (eg. Difficulty sleeping)
5.6% women showed post-traumatic stress symptoms. Predictors of symptoms included: Emergency CS: B=0.196, T=4.505, p<0.0001 Forceps birth: B=0.173, T=4.043, p<0.0001 High postpartum pain: B=0.164, T=3.771, p<0.0001 Vacuum birth: B=0.135, T=3.102, p<0.003 From the perception of care questionnaire: Technical care and communication: B=0.244, T=-4.601, p<0.0001
Women who experienced both a high level of obstetric intervention and dissatisfaction with care were more likely to develop trauma symptoms than women who reported a high standard of care or low level of intervention.
Funding: not stated Country: Australia
Tarkka et al 2000 76
Questionnaire survey EL 3
To examine factors related to how first time mothers experience childbirth.
N=271 nulliparous women (RR 83%)
Mean age 28 years (range 17-42 years) 94% living in a pair relationship 63% had completed a university degree or college level qualification
Women’s experience of childbirth
Significant predictors related to childbirth experience: Characteristics of attending midwife: regression coefficient 0.26, t=2.75, p=0.007. Attitude of child’s father towards pregnancy: regression coefficient 0.24, t=2.56, p=0.012. Duration of labour and birth: regression coefficient: -0.20, t=-2.16, p=0033.
Childbirth experience is enhanced by positive characteristics of attending midwife, positive attitude of the child’s father, and a short duration of labour and birth.
Funding: Not stated Country: Finland
7

Evidence tables
9
Bibliographic information
Study type and evidence level
Aim of study Number of women and their characteristics
Women’s characteristics Outcome measures Results and comments Study summary Additional comments
VandeVusse 1999 77 Qualitative study EL 3
To analyse how decisions are made during labour.
N=15 women who told 33 birth stories for analysis. All women had given birth in previous 4 months.
8 nulliparous women Age range 18 to 39 years. Number of children of multiparous women: 2 to 7
How decision-making occurs during labour.
Patterns of control identified:Unilateral but contested. Unilateral and uncontested Suspended: waiting Shared (joint) Method of decision-making: Through refusal Through adaptation Through no active decision Through explanations Through requests
When decision-making was increasingly shared between the women and the caregivers, the women expressed more positive emotions.
Funding: Not stated Country: USA
Berg et al 199678 Qualitative study EL 3
To describe women’s encounter with the attending midwife during labour and birth.
N=18 women 6 nulliparous women All women interviewed 2-4 days postnatally following a spontaneous vaginal birth.
Women’s descriptions. Three main themes emerged: to be seen as an individual; to have a trusting relationship; and to be supported and guided on one’s own terms. These themes were associated with a positive birth experience. Examples to illustrate themes: To be seen as an individual: Positive - ‘She treated me with respect, not looking down from a superior position but on the same level’ Negative - ‘But I felt as she always came just two minutes too late…. I felt as if half of her was still in the other room’ To have a trusting relationship: Positive - ‘She was so very nice and gentle and I felt she understood’ Negative - ‘I felt that we didn’t talk, we were not on the same wavelength. We had no direct communication’ To be supported and guided on one’s own terms: Positive - ‘To be advised but not forced…. she encouraged at the right time and she believed that I was able to manage.’
See results Funding: Not stated Country: Sweden
8

Intrapartum care
10
Bibliographic information
Study type and evidence level
Aim of study Number of women and their characteristics
Women’s characteristics Outcome measures Results and comments Study summary Additional comments
Negative - ‘But I was already so scared and it got worse and worse. Finally I felt totally disturbed…. I had to let her know that I wanted to remain untouched’
Halldorsdottir & Karlsdottir 1996 79
Qualitative (phenomenological) study EL 3
To describe women’s experience of labour and childbirth, as seen from the women’s perspectives.
N=14 women Age range 23 to 42 years.Each women had 1 to 4 children. All had had uncomplicated pregnancies and births.
Labour stories Women have a need for a sense of control as well as a need for caring and understanding, eg: ‘Then suddenly this midwife (came), and somehow she helped me to work with …you know to be on top of the wave instead of being in the middle of a huge surge’. Women need a good relationship with the midwife, which included the women feeling safe and secure. Explanation of events and reassurance regarding progress were also important to women. ‘I think it is important that someone explains to you what is happening, you know, describes to you the course of events, tells you want is happening, what is being done to you and if something needs to be done to you’
The midwife perceived as being uncaring seems to have the effect on the woman that she tends to lose a sense of control and the birth experience tends to leave her feeling helpless. Conversely a midwife who is competent and really cares for the woman giving birth can help the woman retain or even regain control.
Funding: Not stated Country: Iceland
Halldorsdottir & Karlsdottir, 1996 80
Qualitative (phenomenological) study EL 3
To explore the essential structure of caring and uncaring encounters during labour and birth.
N=10 women Age range 33 to 42Number of children: 1 to 4. All births in hospital. No complications of pregnancy or birth.
Women’s stories of caring encounters.
The authors summarised 3 traits of the caring midwife which were defined as: Competence: Has the necessary knowledge and skills needed to coach a woman through the journey of labour and delivery. Is responsible, attentive, deliberate and communicates effectively. Genuine concern and respect for the woman: Gives of her or himself, shows solidarity and sharing, is encouraging and supporting, respectful and benevolent.
The researchers concluded that caring encounters were more likely to be associated with positive, often long-lasting, effects on women.
Funding: University of Akureyri Research Fund And The Scientific Fund of the Association of University Graduated Nurses in Iceland Country: Iceland
9

Evidence tables
11
Bibliographic information
Study type and evidence level
Aim of study Number of women and their characteristics
Women’s characteristics Outcome measures Results and comments Study summary Additional comments
Positive mental attitude: Is cheerful and positive, reliable and trustworthy, considerate and understanding. These traits are illustrated by the following quotation: “She was warm, and she was never in a rush, and she seemed to be very competent. She seemed to sense when she was needed and when not, when she should come and when she should be a little reserved … She seemed to understand so well what you were, how you were thinking, what needs you had and such. Somehow she was so well grounded in the event. She had such a deep understanding.” Similarly the authors summarised 3 traits of the uncaring midwife: Lack of competence: Being rough when giving care to women, ineffective communication, not taking the initiative when needed and lack of understanding and flexibility. Lack of genuine concern and respect for the woman as a person: Being thoughtless, strict on routine and rules, not taking notice of woman and lack of co-operation. Being indifferent and untouched by the event as such, lack of interest and understanding in general, being non-supportive and insensitive, and being hurried and in a rush. Negative character traits: Being gloomy and brusque, cold, unkind or harsh. Again a quotation serves to illustrate some of these trait characteristics:
10

Intrapartum care
12
Bibliographic information
Study type and evidence level
Aim of study Number of women and their characteristics
Women’s characteristics Outcome measures Results and comments Study summary Additional comments
“There was nobody that discussed “What would you like to do?” or “What do you want to do?” All that was said was, “Now we do this” and “Now we do that\” and “Now you go here” and “Now you go there”.
McKay et al 1993 81
Qualitative (grounded theory) study EL 3
To explore women’s experience of labour and the care received
N= 20 women who had given birth within the previous 6 months.
Age 18 to 38 years.13 nulliparous women. Race: 16 Caucasian, 3 Hispanic, 1 African American.
Women’s perceptions of care
Many women wanted more information and valued detailed information to explain what was happening. ‘She kept explaining every little detail-what was happening and how long things were going to be and when something was changing. She’d tell me what they were doing, and she wouldn’t do anything before she’d tell me. When you’re more informed of what’s going on instead of them just doing their business and leaving you out of it, that helps out a lot’.
Although women and caregivers appeared to agree about what information women required and how it should be given, caregiver perceptions were more positive than those of the mothers.
Funding: National Nursing |Research Center, National Institutes of Health, US. US Dept. of Health and Human Services Country: USA
McKay 199182 Qualitative (grounded theory) study EL 3
To explore the concepts of empowerment and disempowerment in caregiving during labour and birth.
N= 20 women who had given birth within the previous 6 months.
Age 18 to 38 years.13 nulliparous women. Race: 16 Caucasian, 3 Hispanic, 1 African American.
Examples of empowerment and disempowerment.
Lack of information disempowers women, eg: ‘The biggest thing I can stress is …just explain a little bit more what they’re doing…in layman’s terms’ Caregivers were seen to block women’s worries or concerns by silence, changing the subject or by neutral statements like’ lets see how we go’.
The author postulates that when good care is given in labour, women are empowered and released from unnecessary fear and that being ‘in touch’ with the labouring woman increases her ability to cope and sense of control.
Funding: No stated. Country: USA
Adams, 1990 83
Qualitative study (categorical thematic analysis) EL 3
To enquire into the nature of communication during the second stage of labour.
N=12
Nulliparous women in second stage of labour.
Categories of communication: Innovation Encouragement Directing Educating Questioning Social Professional
Most communication was categorised as being directing, encouraging or educational. Latter 2 categories showed a degree of overlap. Midwives were found to fall into one of 2 groups: those that tend to be directing or those that tend to be encouraging and educating.
Women preferred the educating/encouraging style of communication to that of direction.
Funding: Not stated
11

Evidence tables
13
Bibliographic information
Study type and evidence level
Aim of study Number of women and their characteristics
Women’s characteristics Outcome measures Results and comments Study summary Additional comments
Manogin et al, 2000 84
Descriptive study EL 3
To identify nursing behaviours perceived as caring by women during childbirth
N=31 women
Women with an uncomplicated labour at term, aged 20-40 years, no opioid analgesia within 4 hours of interview.
Women’s perceptions of caring behaviours measured using the Caring Behaviours Assessment tool.
10 most important nurse caring behaviours (mean (SD)): Know what they’re doing: 4.97 (SD 0.18) Know how to handle equipment: 4.94 (SD 0.25) Give treatments and medication on time: 4.94 (SD 0.25) Are there if I need them: 4.90 (SD 0.30) Treat me with respect: 4.87 (SD 0.50) Know how to give injections etc.: 4.87 (SD 0.50) Know when it’s necessary to call the doctor: 4.87 (SD 0.50) Treat me as an individual: 4.84 (SD 0.37) Are kind and considerate: 4.84 (SD 0.37) Reassure me: 4.81 (SD 0.48)
Behaviours perceived by women to be most indicative of caring focused on professional competence and monitoring of the woman’s condition. The most caring behaviours included knowing what they were doing, treating the woman with respect and as an individual, being kind and considerate and reassuring the patient.
Funding: Not stated Country: US
Cheung, 2002 85
Cross-cultural qualitative study EL 3
To provide some insights as to how women’s childbearing experience might be improved.
N=10 Scottish women N=10 Chinese women - samples matched for parity, age and occupation. N=45 health care workers, women’s relatives and friends.
Nulliparous women all given birth in one maternity unit in Scotland.
Women’s views and experiences of care during labour.
Responses to the birth experience are partly related to the woman’s culture with Chinese women being more accepting of care given. Key issues that were common across all the women irrespective of cultural background were choice and feeling of being in control. These were linked to a better emotional outcome. Caregivers’ failure to engage with the woman as a human being was experienced as very traumatic.
Despite cultural differences in expectations, choice and control in childbirth are important to most women irrespective of background.
Funding: Not stated Country: UK (Scotland)
12

Intrapartum care
14
4. Is there evidence that support in labour for women improves outcomes?
Support in labour Bibliographic reference
Study type
Evidence level
Number of women
Women’s characteristics
Intervention Comparison Length of follow-up
Outcome measures Effect size Source of funding
Additional comments
Hodnett 200492
SR
1++
15 RCTs N=12,791
Pregnant women in labour Settings include Australia, Belgium, Botswana, Canada, Finland, France, Greece, Guatemala, Mexico, S.Africa, US
Continuous presence and support during labour and birth By Staff: 8 trials midwife, student midwife nurse By other birth supporters: 7 trials women with or without special training childbirth educator, retired nurse, close female relative, No trial by husbands or partners
Usual care as defined by the trialists
N/A Stratified by type of providerAnalgesia/ anaesthesia Spontaneous Vaginal birth Operative vaginal birth Caesarean section Dissatisfaction with/negative rating of childbirth experience Women’s mental and psychological health Postpartum Depression 1trial, N=6915 (support by specially trained nurse) Low postpartum self-esteem 1 trial, N=724 (Support by retired nurse) Long term outcomes Poor relationship with partner postpartum 1trial, N=6915 (support by specially trained nurse) Postpartum urinary incontinence
tified by type of providerAnalgesia/ anaesthesia (Difference by providers p<0.05) By staff RR 0.97 [0.95 to 0.99] By other birth supporters RR 0.72 [0.49 to 1.05] Spontaneous Vaginal birth (Difference by providers p<0.001) By staff RR 1.03 [1.01 to 1.06] By other birth supporters RR 1.12 [1.07 to 1.18] Operative vaginal birth (Difference by providers p<0.05) By staff RR 0.92 [0.85 to 0.99] By other birth supporters RR 0.59 [0.42 to 0.81] Caesarean section (Difference by providers p=0.05) By staff RR 0.74 [0.61 to 0.90] By other birth supporters RR 0.95 [0.86 to 1.06] Dissatisfaction with/negative rating of childbirth experience (Difference by providers Not significant) By staff RR 0.83 [0.67 to 1.02]
External –none Internal – academic institutes the researchers belong to
Cochrane Review No trial was identified to investigate support by husband or partner
13

Evidence tables
15
Bibliographic reference
Study type
Evidence level
Number of women
Women’s characteristics
Intervention Comparison Length of follow-up
Outcome measures Effect size Source of funding
Additional comments
1trial, N=6915 (support by specially trained nurse) Postpartum faecal incontinence 1trial, N=6915 (support by specially trained nurse)
By non-staffWomen’s mental and psychological health RR 0.64 [0.58 to 0.78] Postpartum Depression 1trial, N=6915 (support by specially trained nurse) RR 0.89 [0.75 to 1.05] Low postpartum self-esteem 1 trial, N=724 (Support by retired nurse) RR 1.07 [0.82 to 1.40] Long term outcomesRR 1.00 [0.80 to 1.23] Poor relationship with partner postpartum 1trial, N=6915 (support by specially trained nurse) RR 0.93 [0.81 to 1.06] Postpartum faecal incontinence 1trial, N=6915 (support by specially trained nurse) RR 0.89 [0.64 to 1.24]
Hodnett 2004100
SR 1+ 2 trials N=1815
Pregnant womenIn the UK and Australia
Provision of antepartum and intrapartum care by the same caregiver (or group of caregivers)
Conventional care
N/A Length of labour(1st stage more than 6 hours) Intervention rate Induction N=1815 Augmentation N=1815 Analgesia N=1815
Length of labour(1st stage more than 6 hours) OR 1.35 [1.08 to 1.68] Intervention rate Induction N=1815 OR 0.83 [0.69 to 1.09] Augmentation N=1815 OR 0.88 [0.71 to 1.10]
No external funding Internal funding from University of Toronto, Canada
Cochrane Review
14

Intrapartum care
16
Bibliographic reference
Study type
Evidence level
Number of women
Women’s characteristics
Intervention Comparison Length of follow-up
Outcome measures Effect size Source of funding
Additional comments
EpiduralN=1815 Cesaerean Section N=1815 Instrumental Vaginal Delivery N=1815 Episiotomy N=1815 Aminotomy N=1001 Perineal trauma Perineal tears N=1815 Not having intact perineum N=1001 Newborn events Apgar score <7 at 1 minute N=814 Apgar score <7 at 5 minute N=814 Apgar score <8 at 1 minute N=1001 Apgar score <8 at 5 minute N=1001 Resuscitation required N=1815 Admission to neonatal units N=1815 Women’s satisfaction and
Analgesia N=1815 OR 0.53 [0.44 to 0.54 Epidural N=1815 OR 0.67 [0.53 to 0.84 Cesaerean Section N=1815 OR 0.94 [0.69 to 1.28] Instrumental Vaginal Delivery N=1815 OR 0.97 [0.71 to 1.33 Episiotomy N=1815 OR 0.75 [0.60 to 0.94] Aminotomy N=1001 OR 0.82 [0.64 to 1.04] Perineal trauma OR 1.28 [1.05 to 1.56] Perineal tears N=1815 OR 0.97 [0.73 to 1.27 Not having intact perineum N=1001 OR 0.61 [0.43 to 0.88] Apgar score <7 at 1 minute N=814 OR 0.86 [0.29 to 2.58]
15

Evidence tables
17
Bibliographic reference
Study type
Evidence level
Number of women
Women’s characteristics
Intervention Comparison Length of follow-up
Outcome measures Effect size Source of funding
Additional comments
assessment of birth experienceUnable to discuss worries in pregnancy N=1001 Not feeling well prepared for labour N=1001 Dissatisfied with intrapartum pain relief N=1001 Labour staff perceived unsupportive N=1001 Not feeling in control during labour N=1001 Failure to enjoy labour N=1001 Inability to discuss postpartum problems N=1001 Not feeling well for child care N=1001 Women’s mortality: none reported N=1815 Babies’ mortality Still birth and neonatal death N=1815
Apgar score <8 at 1 minuteN=1001 OR 0.97 [0.71 to 1.34] Resuscitation required N=1815 OR 2.63 [1.15 to 6.02 Admission to neonatal units N=1815 OR 0.66 [0.52 to 0.83 Unable to discuss worries in pregnancy N=1001 OR 0.97 [0.62 to 1.52] Not feeling well prepared for labour N=1001 OR 0.72 [0.56 to 0.92] Dissatisfied with intrapartum pain relief N=1001 OR 0.64 [0.48 to 0.86] Labour staff perceived unsupportive N=1001 OR 0.83 [0.62 to 1.12] Not feeling in control during labour N=1001 OR 0.72 [0.56 to 0.92] Failure to enjoy labour N=1001 OR 0.48 [0.34 to 0.68] Inability to discuss postpartum problems N=1001
16

Intrapartum care
18
Bibliographic reference
Study type
Evidence level
Number of women
Women’s characteristics
Intervention Comparison Length of follow-up
Outcome measures Effect size Source of funding
Additional comments
OR 0.65 [0.47 to 0.90] Not feeling well for child care N=1001 OR 0.64 [0.49 to 0.85] Women’s mortality: none reported N=1815 OR 0.57 [0.41 to 0.80] Still birth and neonatal death N=1815 OR 1.96 [0.83 to 4.63]
Waldenstrom 1998101
SR 1- 7 trials N=9148
Pregnant women2 trials in England 2 trials in Australia 1 trial in Scotland 1 trial in Canada 1 trial in Sweden
A midwife or small group midwives providing care from early pregnancy to the postnatal period
Standard maternity care
N/A Length of labourIntervention Rate Complications Perineal trauma Intact perineum Newborn events Women’s satisfaction and assessment of birth experience Mortality
Length of 1st stage and 2nd stage6 studies Meta-analysis not possible due to different measures Induction N=8702 OR 0.76 [0.66 to 0.86] Augmentation N=8425 OR 0.78 [0.70 to 0.87] EFM N=6240 OR 0.19 [0.17 to 0.21] Epidural N=8425 OR 0.76 [0.68 to 0.85] Narcotics N=8425 OR 0.69 [0.63 to 0.77] CS N=8703 OR 0.91 [0.78 to 1.05]
Not stated Meta-analysis misconduct
17
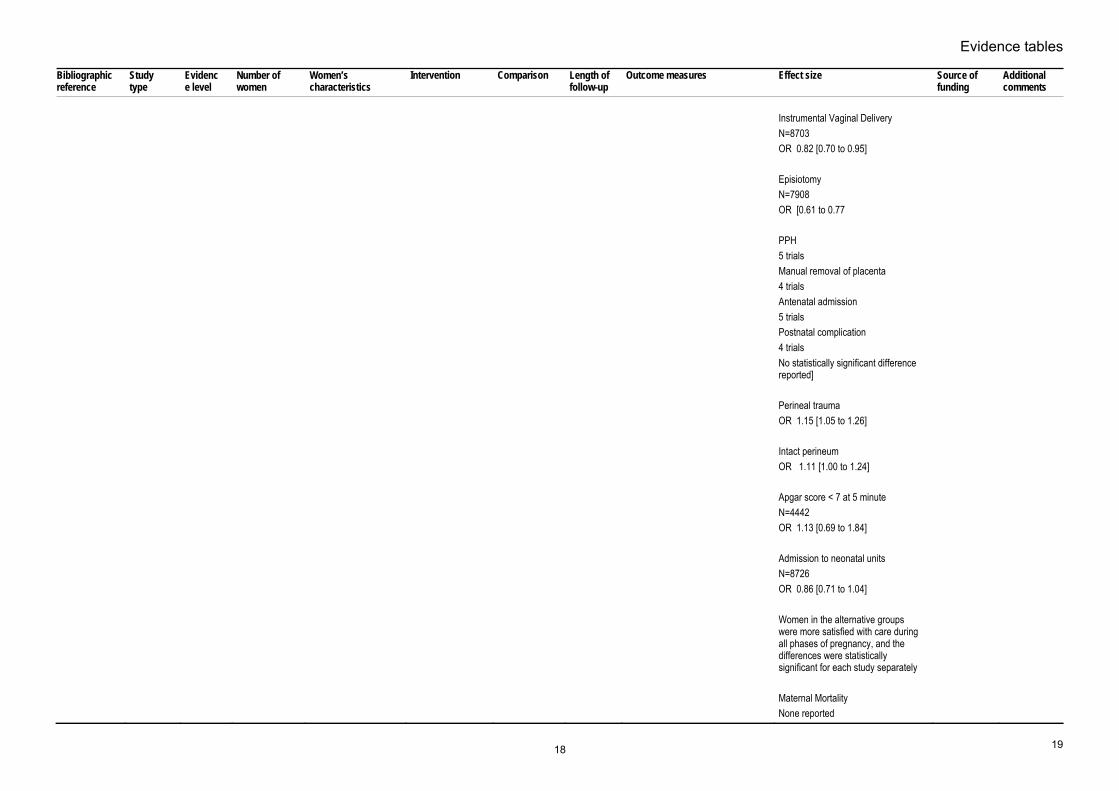
Evidence tables
19
Bibliographic reference
Study type
Evidence level
Number of women
Women’s characteristics
Intervention Comparison Length of follow-up
Outcome measures Effect size Source of funding
Additional comments
Instrumental Vaginal Delivery N=8703 OR 0.82 [0.70 to 0.95] Episiotomy N=7908 OR [0.61 to 0.77 PPH 5 trials Manual removal of placenta 4 trials Antenatal admission 5 trials Postnatal complication 4 trials No statistically significant difference reported] Perineal trauma OR 1.15 [1.05 to 1.26] Intact perineum OR 1.11 [1.00 to 1.24] Apgar score < 7 at 5 minute N=4442 OR 1.13 [0.69 to 1.84] Admission to neonatal units N=8726 OR 0.86 [0.71 to 1.04] Women in the alternative groups were more satisfied with care during all phases of pregnancy, and the differences were statistically significant for each study separately Maternal Mortality None reported
18

Intrapartum care
20
Bibliographic reference
Study type
Evidence level
Number of women
Women’s characteristics
Intervention Comparison Length of follow-up
Outcome measures Effect size Source of funding
Additional comments
Perinatal Mortality N=8730 OR 1.60 [0.99 to 2.59]
Hicks 2003102 RCT 1- N=200 (100 + 100)
Pregnant womenSetting: UK
Continuity of care by a team midwives (Changing Childbirth)
Traditional model of care
4-6 weeks after birth
Intervention rateWomen’s satisfaction and assessment of birth experience
EpiduralRR 0.32 [p=0.024] CS RR 0.64 [p=0.569] Episiotomy RR 0.81 [p=0.815] Women in the pilot group had generally more satisfied with their care, felt that they had more choice over a variety of aspects of care and experienced no compromise in clinical outcomes (P=0.05 or less in each case)
Not stated
Homer 2001, 2002103, 104
RCT 1+ N=1089 (Continuity of care: 550, Standard care 539)
Pregnant womenSetting: Australia (St George Hospital, NSW)
A new community-based model of continuity of care provided by midwives and obstetricians
Standard hospital-based care
8-10 weeks
Interventions Induction Augmentation EFM Epidural Narcotics CS CS (logistic regression controlling various factors) Instrumental Vaginal Delivery Episitomy Complications
InterventionsInduction RR 1.12 NS Augmentation RR 1.11 NS EFM RR 0.90 NS Epidural RR 0.89 NS Narcotics RR 1.15 NS CS RR 0.75 NS CS (logistic regression controlling various factors) OR 0.6 [0.4 to 0.9, p=0.02] Instrumental Vaginal Delivery RR 1.10 NS Episitomy RR 0.94 NS Complications Primary PPH
Australian National Health and Medical research Council & the New South Wales Health Department
19

Evidence tables
21
Bibliographic reference
Study type
Evidence level
Number of women
Women’s characteristics
Intervention Comparison Length of follow-up
Outcome measures Effect size Source of funding
Additional comments
Primary PPH Retained Placenta Newborn events Apgar score at 1minute Apgar score at 5 minute Apgar score <7 at 5 minute Admission to neonatal units Women’s satisfaction and assessment of birth experience Women who had a midwife during labour who they felt that they knew, had a significantly higher sense of control and a more positive birth experience compared with women who reported an un known midwife Mortality Maternal Mortality Neonatal mortality Still birth
RR 1.17 NSRetained Placenta RR 0.59 NS Newborn events Apgar score at 1minute Mean 8.1/7.9 p=0.2 Apgar score at 5 minute Mean 8.9/8.8 p=0.3 Apgar score <7 at 5 minute RR 0.92 p=0.8 Admission to neonatal units OR 0.75 [0.5 to 1.1, p=0.12] Women’s satisfaction and assessment of birth experience Women who had a midwife during labour who they felt that they knew, had a significantly higher sense of control and a more positive birth experience compared with women who reported an un known midwife Mortality Maternal Mortality Non reported Neonatal mortality 4 deaths /550 (intervention) and 4 deaths/539 (control) Still birth 4 deaths/550 (intervention) and 2 deaths/539 (control)
Biro 2000, 2003105, 106
RCT 1+ N=1000 (intervention:502, control: 498)
Pregnant womenSetting: Australia (Monash Medical Centre VIC)
New model of maternity care characterized by continuity of midwifery care from early pregnancy through postpartum period
Standard maternity care
4 months Interventions Induction Augmentation EFM Analgesia Epidural Emergency CS
Interventions Induction OR 1.19 [0.87 to 1.62] Augmentation OR 0.66 [0.48 to 0.90] EFM OR 0.72 [0.54 to 0.97] Analgesia OR 0.94 [0.70 to 1.26]
The Australian Commonwealth Department of Health Services
20

Intrapartum care
22
Bibliographic reference
Study type
Evidence level
Number of women
Women’s characteristics
Intervention Comparison Length of follow-up
Outcome measures Effect size Source of funding
Additional comments
Elective CS Instrumental Vaginal Delivery Episiotomy Mode of birth Spontaneous delivery Perineal trauma Perineal tears (sutured) Perineal tears (unsutured) Intact perineums Newborn events Apgar score < 7 at 5 minute Admission to neonatal units Women’s satisfaction and assessment of birth experience Team midwifery care was associated with increased satisfaction with antenatal, intrapartum, and some aspects of postnatal care. The differences were most obvious for antenatal care Mortality Perinatal Mortality
Epidural OR 0.65 [0.47 to 0.90] Emergency CS OR 1.41 [0.93 to 2.15] Elective CS OR 0.76 [0.46 to 1.24] Instrumental Vaginal Delivery OR 0.72 [0.50 to 1.04] Episiotomy OR 0.64 [0.46 to 0.90] Mode of birth Spontaneous delivery OR 1.14 [0.86 to 1.51] Perineal trauma Perineal tears (sutured) OR 1.16 [0.84 to 1.60] Perineal tears (unsutured) OR 3.54 [1.91 to 6.62] Intact perineums OR 0.82 [0.56 to 1.20] Newborn events Apgar score < 7 at 5 minute OR 1.17 [0.48 to 2.82] Admission to neonatal units OR 0.97 [0.69 to 1.37] Women’s satisfaction and assessment of birth experience Team midwifery care was associated with increased satisfaction with antenatal, intrapartum, and some aspects of postnatal care. The
21

Evidence tables
23
Bibliographic reference
Study type
Evidence level
Number of women
Women’s characteristics
Intervention Comparison Length of follow-up
Outcome measures Effect size Source of funding
Additional comments
differences were most obvious for antenatal care Mortality Perinatal Mortality 5 deaths/ 89 (intervention) & 4 deaths/ 86 (control)
Waldenstrom 2000, 2001107, 108
RCT 1+ N=1000 (495 intervention, 505 control)
Pregnant womenSetting: Australia (Royal Women’s Hospital, VIC)
Team midwife care
Standard Care 2 month Length of labour 1st stage [mean (SD)] 2nd stage [mean (SD)] 3rd stage [mean (SD)] Interventions Induction Augmentation Auscultation CTG Scalp PH Epidural Narcotics CS Forceps Vacuum Episiotomy Complications PPH >=600ml Manual removal of placenta
Length of labour1st stage [mean (SD)] 5,5 (4.4) hr / 6.2 (4.8) hr p=0.17 2nd stage [mean (SD)] 49.5 (51.8) min / 53.9 (57.6) min p=0.21 3rd stage [mean (SD)] 8.1 (15.2) min / 9.4 (21.2) min p=0.90 Interventions Induction OR 1.03 [0.78 to 1.37] Augmentation OR 0.94 [0.69 to 1.26] Auscultation OR 0.76 [0.53 to 1.08] CTG OR 0.81 [0.62 to 1.07] Scalp PH OR 0.78 [0.36 to 1.68] Epidural OR 0.93 [0.7 to 1.24] Narcotics OR 0.78 [0.6 to 1.01]
State of Victoria, Australia
22

Intrapartum care
24
Bibliographic reference
Study type
Evidence level
Number of women
Women’s characteristics
Intervention Comparison Length of follow-up
Outcome measures Effect size Source of funding
Additional comments
Perineal status3rd degree tear Sutured tear Unsutured tear Perineum intact Baby’s outcomes Shoulder Dystocia Prolapsed cord Apgar <7 at 5 min Admission to neonatal units Women’s satisfaction and assessment of birth experience Team midwife care was associated with increased satisfaction, and the differences between the groups were most noticeable for antenatal care, less noticeable for intrapartum care, and least noticeable for postnatal care Mortality Still birth Neonatal Death
CSOR 1.00 [0.66 to 1.51] Forceps OR 0.9 [0.62 to 1.32] Vacuum OR 0.75 [0.33 to 1.71] Episiotomy OR 1.00 [0.74 to 1.35] Complications PPH >=600ml Manual removal of placenta OR 0.6 [0.24 to 1.48] Perineal status 3rd degree tear Sutured tear OR 0.67 [0.49 to 0.92] Unsutured tear OR 1.27 [0.78 to 2.87] Perineum intact OR 1.31 [0.96 to 1.8] Baby’s outcomes Shoulder Dystocia Prolapsed cord Apgar <7 at 5 min OR 1.32 [0.45 to 3.95] Admission to neonatal units OR 1.4 [0.87 to 2.26] Women’s satisfaction and assessment of birth experience Team midwife care was associated with increased satisfaction, and the
23

Evidence tables
25
Bibliographic reference
Study type
Evidence level
Number of women
Women’s characteristics
Intervention Comparison Length of follow-up
Outcome measures Effect size Source of funding
Additional comments
differences between the groups were most noticeable for antenatal care, less noticeable for intrapartum care, and least noticeable for postnatal care Mortality Still birth 4 deaths/ 466 babies (intervention) & 4 deaths/ 475 babies (control) Neonatal Death 1 death/ 466 babies (intervention) & 3 deaths/ 475 babies (control)
The North Staffordshire Changing Childbirth Research Team (2000) 97
Cluster RCT
1 - Caseload N=770 Traditional shared care N=735
All pregnant women chosen as suitable for non-obstetric-led care
Caseload midwifery : One GP attached community midwife with a caseload of 35-40 women. Caseload midwives worked in pairs or threes to provide 24 hour cover.
Shared care with GP: Community midwives part of team providing shared care to women alongside the woman’s GP and hospital-based obstetricians and midwives.
Immediate postnatal period
Duration of labour < 8 hours vs. 8-12 hours vs. > 12 hours Induction of labour Syntocinon augmentation of labour Mode of birth: Spontaneous vainal birth vs. ventouse/forceps vs. emergency CS vs. elective CS vs. multiple/breech birth Intact perineum Episiotomy Tear Stillbirth and neonatal death Advanced resuscitation Admission to neonatal unit
Χ² = 11.74, df=4, p< 0.001 Χ² = 0.08, df=1, p=0.78 Χ² = 7.24, df=1, p=0.01 Χ² = 6.74, df=4, p=0.15 Χ² = 0.13, df=1, p=0.72 Χ² = 0.06, df=1, p=0.94 Χ² = 0.71, df=1, p=0.40 Χ² = 1.15, df=1, p=0.28 Χ² = 0.43, df=1, p=0.51 Χ² = 0.89, df=1, p=0.34
24

Intrapartum care
26
6. What are the indications for the use of ventouse or forceps?
Delay in the second stage of labour – instrument to be used (forceps versus ventouse) Bibliographic reference
Study type
Evidence level
Number of patients
Patient characteristics
Intervention Comparison Length of follow-up
Outcome measures
Effect size Source of funding
Additional comments
Johanson RB;Menon V; 2000 550
Study Type: systematic review of RCTS .
Evidence level: 1++
Number of People: 10 trials.
Inclusion/exclusion: Primiparous and multiparous women who have required assisted delivery with a vacuum extractor or obstetric forceps
Forceps Vacuum extraction (any instrument)
Follow-up period: N/A
Outcome Measures: fetal outcome perineal injury including extension of episiotomy vaginal lacerations and injury to the perineal body maternal perception of short and long term pain
Failed delivery with selected instrument 9 trials n=2849 Peto Odds Ratio 1.69 [1.31, 2.19] Caesarean section 7 trials n=1662 Peto Odds Ratio 0.56 [0.31, 1.02] Use of regional or general anaesthesia 12 trials n=5051 Peto Odds Ratio 0.59 [0.51, 0.68] Significant maternal injury 7 trials n=2582 Peto Odds Ratio0.41 [0.33, 0.50] Moderate/severe pain at delivery 3 trials n=541 Peto Odds Ratio 0.77 [0.53, 1.14] Maternal worries about baby 3 trials n=561 Peto Odds Ratio 2.17 [1.19, 3.94] Severe perineal pain at 24 hours 2 trials n=495 Peto Odds Ratio 0.54 [0.31, 0.93]
Nil
25

Evidence tables
27
Bibliographic reference
Study type
Evidence level
Number of patients
Patient characteristics
Intervention Comparison Length of follow-up
Outcome measures
Effect size Source of funding
Additional comments
Apgar score <7 at 1 minute 3 trials n=822 Peto Odds Ratio 1.13 [0.76, 1.68] Apgar score <7 at 5 minutes 5 trials n=1545 Peto Odds Ratio 1.67 [0.99, 2.81] Cephalhaematoma 6 trials n=1966 Peto Odds Ratio 2.38 [1.68, 3.37] Scalp/face injuries (not cephalhaematoma) 6 trials n=2330 Peto Odds Ratio 0.89 [0.70, 1.13] Use of phototherapy 4 tr
Weerasekera DS;Premaratne S; 2002 551
Study Type: RCT
Evidence level: 1+
Number of People: N=442 (Forceps=238; Vacuum=204).
Inclusion/exclusion: Women in labour 1) >= 37 GWKS 2) the head fully engaged in the pelvis 3) Cervix fully dilated 4) The station of the head below the ischial spines 5) sagital suture in the antero-posterior diameter of the maternal pelvis 6) bladder empty
Forceps (procedure)
Ventouse Follow-up period: 1 month.
Outcome Measures: perineal tears, postpartum haemorrhage, cephalhaematoma, admission to neonatal unit, neonatal death, failure to achieve delivery by the instument, time to be taken to complete the procedures
Third aegree perineal tears RR 0.58 [0.11 to 3.13] Cervical tears RR 0.19 [0.04 to 0.86] NNT 24.62 Ruptured uterus Nil happened PPH RR 0.58 [0.11 to 3.13] Caphalhaematoma RR 7.14 [1.59 to 33.33] NNT 19.83 Baby resuscitated RR 1.02 [0.68 to 1.54]
Not stated
26

Intrapartum care
28
Bibliographic reference
Study type
Evidence level
Number of patients
Patient characteristics
Intervention Comparison Length of follow-up
Outcome measures
Effect size Source of funding
Additional comments
Admission to neonatal unit RR 0.95 [0.40 to 2.27] Perinatal death RR 1.16 [0.07 to 20.00] Failure to achieve delivery by the instument RR 2.04 [1.14 to 3.70] NNT 14.28 Time to be taken to complete the procedures forceps: mean 211.1 vacuum: mean 258.3 p<0.001. Forceps deliveries when performed under defined criteria are as safe as vacuum deliveries to the mother with lesser failure rate and a lower incidence of cephalhaematomas in the neonate compared with vacuum deliveries. .
Mustafa R;Mustafa R; 2002 552
Study Type: RCT
Evidence level: 1+
Number of People: N=50 (vacuum=27; forceps=23).
Inclusion/exclusion: singleton pregnancy cephalic presentation 35 completed gestational weeks women in labour whom indicated instrumental vaginal delivery
Forceps ventouse assisted vaginal delivery
Follow-up period: not stated. a
Outcome Measures: Apgar score No complication Maternal traum
Apgar score less than 7 at 1 minuteVacuum 4/27 Forceps 4/23 RR 0.85 [0.24 to 3.03] Apgar score less than 7 at 5 minute Vacuum 0/27 Forceps 1/23 No neonatal complication Vacuum 20/27 Forceps 17/23 RR 1.00 [0.72 to 1.39] No maternal trauma Vacuum 24/27 Forceps 16/23 RR 1.28 [0.95 to 1.73]. the outcome following delivery with the ventouse was not remarkedly different from that with obstetric forceps in trems of neonatal and maternal morbidity. The study is underpowered that we cannot conclude anything.
Funding: Not stated Source of
Fitzpatrick M;Behan
Study Type:
Evidence Number of People:
Inclusion/exclusion: Primiparous women
Forceps assissted
Ventouse Follow-up period: Not
Outcome Measures: Altered continence Source of Funding:
27

Evidence tables
29
Bibliographic reference
Study type
Evidence level
Number of patients
Patient characteristics
Intervention Comparison Length of follow-up
Outcome measures
Effect size Source of funding
Additional comments
M;O'Connell PR;O'Herlihy C; 2003 Apr 553
RCT level: 1+ N=130 (forcpes=61; vacuum=69).
in labour whom an instrumental delivery was indicated
vaginal delivery
stated. perineal tearfaecal comtinence endoanal ultrasound
RR 2.88 [1.41 to 5.88]NNT 3.89 Continence score Forceps mean=3 Vacuum mean=3 p=0.17 Foecal urgency <5 minutes RR 1.38 [0.65 to 2.91] Perineal discomfort RR 1.28 [0.61 to 2.72] Would choose caesarean section for next delivery RR 1.87 [0.79 to 4.43] Resting pressure (mmHg) Forcpes median=54 Vacuum median=63 p=0.05 Squeeze pressure (mmHg) Forcpes median=86 Vacuum median=96 p=0.11 Squeeze increment (mmHg) Forcpes median=27 Vacuum median=25 p=0.12 Vector Symmetry Index RR 1.3 [0.65 to 2.58]. Symptoms of altered faecal continence are significantly more common following forcpes assissted vaginal delivery Based on continence outcome, when circumstances allow, vacuum should be the instrument of first choice in assissted delivery. .
Irish Health Research Fund
28

Intrapartum care
30
Delay in the second stage of labour – instrument to be used (soft ventouse versus hard ventouse) Bibliographic reference
Study type
Evidence level
Number of patients
Patient characteristics
Intervention Comparison Length of follow-up
Outcome measures
Effect size Source of funding
Additional comments
Johanson R;Menon V; 2005 561
Systematic review - meta-analysis
Evidence level: 1++
9 trials involving 1375 women
Primiparous and multiparous women who have required assisted delivery with a vacuum extractor
Intervention: Use of soft (silicone, plastic or rubber) vacuum extractor cups
Comparison: rigid (metal or plastic) vacuum extractor cups
Follow-up period: N/A
Outcome Measures: perineal injury fetal scalp injury short and long term pain success rate
Fail to deliver with selected instrument 9 trials 1368 women Peto Odds Ratio 1.65 [1.19, 2.29] Significant maternal injury 6 trials 1137 women Peto Odds Ratio 0.85 [0.57, 1.27] Apgar score <7 at 1 minute 4 trials 866 women Peto Odds Ratio 1.21 [0.80, 1.83] Apgar score <7 at 5 minutes 5 trials 765 women Peto Odds Ratio 0.68 [0.35, 1.33] Cephalhaematoma 4 trials 538 women Peto Odds Ratio 0.70 [0.34, 1.44] Phototherapy or jaundice 6 trials 1137 women Peto Odds Ratio 0.73 [0.50, 1.07] Significant scalp trauma 8 trials 1337women Peto Odds Ratio 0.45 [0.34, 0.60] Severe retinal/intracranial haemorrhage 2 trials 218 women
No sources of support supplied
OK
29

Evidence tables
31
Bibliographic reference
Study type
Evidence level
Number of patients
Patient characteristics
Intervention Comparison Length of follow-up
Outcome measures
Effect size Source of funding
Additional comments
Peto Odds Ratio 0.84 [0.27, 2.64] Umbilical artery pH <7.20 1 trial 100 women Peto Odds Ratio 1.00 [0.45, 2.22] Death 1trial 72 women Peto Odds Ratio 1.26 [0.08, 20.85]
30

Intrapartum care
32
Delay in the second stage of labour – instrument to be used (failed/successful instrumental vaginal birth and CS) Bibliographic reference
Study type
Evidence level
Number of patients
Patient characteristics
Intervention Comparison Length of follow-up
Outcome measures
Effect size Source of funding
Additional comments
Murphy DJ;Liebling RE;Verity L;Swingler R;Patel R; 2001 Oct 13 562
Cohort Evidence level: 2+
n=393 (Successful vaginal delivery(VD)=184; immediate CS(CS)=102; CS after instrumental vaginal delivery(VDCS)=107)
women who were fully dilated and needed vaginal instrumental delivery in theatre or CS
Intervention: CS after instrumental delivery
Comparison: successful vaginal delivery & immediate CS
Follow-up period: until discharged
Outcome Measures: blood loss, hospitalisation, SCBU admission. Neonatal trauma,
Blood loss >1LVD=3% CS=9% VDCS=10% p=ns Hospital stay>=6days VD=5% CS=17% VDCS=15% p=ns SCBU admission VD=6% CS=11% VDCS=11% p=ns Neonatal trauma VD=22% CS=2% VDCS=15% p=0.03
Not stated
31

Evidence tables
33
7. Are there effective hygiene strategies for vaginal birth out of water to protect both women and babies, and healthcare professionals? 8. Are there effective hygiene strategies for vaginal birth in water to protect both women and babies, and healthcare professionals?
Hygiene measures during labour Bibliographic reference
Study type
Evidence level
Number of women
Women’s characteristics
Intervention Comparison Length of follow-up
Outcome measures Effect size Source of funding
Additional comments
Lumbiganon 2005117
SR 1++ N=3012 (3 trials)
women in labour chlorhexidine vaginal douching during labour
placebo or other vaginal disinfectant
N/A 1. Maternal outcomes (a) chorioamnionitis (variously defined by the authors); (b) intrapartum fever; (c) intrapartum treatment with antibiotics; (d) postpartum endometritis (variously defined by the authors); (e) maternal side-effects (vaginal irritation, thrush, antimicrobial resistance); (f) serious maternal complication of treatment (e.g. anaphylaxis); (g) laparotomy for infection; (h) hysterectomy; (i) maternal death; (j) satisfaction with care; (k) length of hospital stay; (l) postnatal depression; (m) successful breastfeeding (variously defined by the authors); (n) costs of care; (o) antimicrobial resistance.
Maternal outcomes chlorioamnionitis RR 1.10 [0.86 to 1.42] postpartum endometritis RR 0.83 [0.61 to 1.13] no report about the other maternal outcomes and side-effects of chlorhexidine in these three trials. Neonatal outcomes neonatal pneumonia RR 0.33 [0.01 to 8.09] neonatal meningitis RR 0.34 [0.01 to 8.29] blood culture confirming sepsis RR 0.75 [0.17 to 3.35] perinatal mortality RR 1.00 [0.17 to 5.79] neonatal sepsis RR 0.75 [0.17 to 3.35] newborns to receive antibiotics RR 1.65 [0.73 to 3.74] There was no report about the other neonatal outcomes and side-effects of chlorhexidine in these three trials.
WHO, Khon Kaen University, Thailand and Thomas Jefferson University, USA
All trials in the US
32

Intrapartum care
34
Bibliographic reference
Study type
Evidence level
Number of women
Women’s characteristics
Intervention Comparison Length of follow-up
Outcome measures Effect size Source of funding
Additional comments
2. Neonatal outcomes (a) ophthalmia neonatorum; (b) neonatal pneumonia by clinical assessment and/or chest X-ray; (c) neonatal meningitis by clinical assessment and/or culture; (d) blood culture confirming sepsis; (e) neonatal sepsis (variously defined by the authors); (f) admission to neonatal intensive care unit; (g) length of hospital stay; (h) perinatal mortality; (i) abnormal neurodevelopmental assessment at follow up.
Keane 1998118 Cohort 2+ N=3905 (Cetrimide/chlorhexidine N=1813, Tap water N=2092)
pregnant women in labour
tap water for perineal cleaning
cetrimide/chlorhexidine
N/A Maternal morbidity Fetal morbidity
Temp>38degree OR 1.2 [0.8 to 1.9] use of antibiotics OR 1.02 [0.86 to 1.2] perineal infection OR 1.4 [0.77 to 2.7] perineal breakdown OR 5.8 [0.3 to 999] Caesarean wound infection OR 1.3 [0.8 to 2.0] Neonatal Temp>38 OR 1.4 [0.66 to 3.0] use of antibiotics OR 0.99 [0.82 to 1.2] eye infection OR 1.1 [0.78 to 1.7] cord infection OR 1.3 [0.7 to 2.1]
Nil stated UK
Kovavisarach 1998119
RCT 1- N=2058 (Double-gloving: 1,316
Surgical Gloves used in Perineorrhaphy
Double-gloving Single-gloving N/A Perforation rate All Double Gloving: 5.9% Inner Double Gloving: 2.7%
Not stated Thailand
33

Evidence tables
35
Bibliographic reference
Study type
Evidence level
Number of women
Women’s characteristics
Intervention Comparison Length of follow-up
Outcome measures Effect size Source of funding
Additional comments
Single-gloving:742) Single Gloving: 6.7%
Inner vs. Double p<0.05
Punyatanasakchai 2004120
RCT 1- N=300 (150 sets for double-gloving, 150 sets for single-gloving)
Gloves used in Episiotomy
Double-gloving Single-gloving N/A perforation rates Double inner glove: 4.6% (p<0.05) Double outer glove: 22.6% Single glove: 18%
Not stated Thailand
Kabukuba 1993121
Case-series
3 N=80 Doctors and Midwivesduring obstetric procedures
wearing arm sleeve
without wearing arm sleeve
N/A Contamination rates Use satisfaction
Contamination rates Hands: 3.8%, Arms: 5%, Total: 5%, compared with results from other study (Hands: 23.5%, Arms: 30.1%, Total: 42%) Thought the sleeve had served its purpose: 80% Would use it regularly: 76%
Not stated UK
34

Intrapartum care
36
9. What are the appropriate definitions of the latent and active phases of the first stage, the second stage, and the third stage of labour? 10. Do duration and progress of the first and second stages of labour affect outcomes?
Definition of the first stage of labour Bibliographic information
Study type and evidence level
Aim of study Number of women and women’s characteristics
Women’s characteristics Outcome measures Results and comments Study summary Reviewer comment
Chelmow 1993 278
CSS EL 3
Association between prolonged labour and outocmes
N=10979Pregnant women
Excluding those with risk factors for adverse outcome known before labour Prolonged latent phase as defined Women with normal duration of latent phase
CS Need for newborn resuscitation Apgar<7 at 5 min
CS RR 1.65 [1.32 to 2.06]Need for newborn resuscitation RR 1.37 [1.15 to 1.64] Apgar<7 at 5 min I1.97 [1.23 to 3.16] Definitions: Prolonged latent phase: >12h for nulliparas, >6h for multiparas onset of labour: strong, regular, painful contractions commence onset of active phase: the time when rapid cervical dilation (greater than 1cm/hour) begins, or when 4cm of dilation is reached
See results Country: US
Friedman 1954 279 Case series EL 3
To evaluate effects of various effects on the course of labour, and represent progress of labour graphically.
n=100 nulliparous women..
Includes: 1 breech birth, 1 CS, 1 set of twins, 4 induced labours, 15 oxytocin augmented labours
Rate of cervical dilation during labour.
Early labour: 0 to 2 cm dilation. Duration 1.7 to 15 hours. Mean duration 7.3 hours. First phase of active first stage of labour (acceleration period): 2 to 2.5 cm dilation. Second phase of active first stage (steady period): 3 or 3.5 to 8.5 or 9 cm dilation. Third phase of active stage (decelaration period): 8.5 or 9 to 10cm dilation. Duration of active phase: 1.8 to 9.5 hours, mean 4.4 hours (SD 1.9 hours).
Following an early (latent) period, the first stage fo labour is characterised by cervical dilation which, when plotted graphically, follows a sigmoid curve.
Very heterogenous sample, including use of oxytocin must undermine the generalisability of these findings to all spontaneous, non-augmented labours. Funding: not stated Country: USA
Gross 2005 280 Case series
Describing duration of the first stage
N=932(312 primips., 620 multips.)
“Physiological” births at home or in birthing centres. No ARM, no opiate
Duration of first stage of labour
Primips. :Median=7.3 hours
Upper limits were placed on length of first stage in order to
35

Evidence tables
37
Bibliographic information
Study type and evidence level
Aim of study Number of women and women’s characteristics
Women’s characteristics Outcome measures Results and comments Study summary Reviewer comment
EL 3 In labour
analgesia. Multips:Median=3.9 hours
meet study inclusion criteria (primips. 17 hours, multips 12 hours) therefore data is biased towards shorter labours. Funding: Allgemeine Ortskrankenkasse Hesse; Bremen University; Robert-Bosch Foundation Country: Germany
Kilpatrick 1989 277 Case series EL 3
Compared 4 sub-groups: primips and multips with and without epidural
N=6991(4 sub-groups: 432 primips with epidural490 multips with epidural, 2302 primips without epidural, 3767 multips without epidural) In labour
Women in labour at term, giving birth spontaneously without the use of oxytocin
Duration of first stage of labour
Mean + statistical upper limit (mean+2 SDs): Primips without epidural: 8.1 (16.6) hours Primips with epidural: 10.2 (19.0) hours Multips without epidural: 5.7 (12.5) hours Multips with epidural: 7.4 (14.9) hours
Inappropriate use of mean and standard deviation to calculate upper limit (data not normally distributed). Women using epidural here includes 5% who had a saddle block, usually placed during the second stage. Funding: not stated Country: US
Albers 1996 282 Case series EL 3
Compared duration of labour amongst sub-groups of non-Hispanic white, Hispanic and American Indian women
N=1473(556 primips, 917 multips) In labour
“Low risk” women booked to midwife-led care. No oxytocin or epidurals.
Duration of first stage of labour
Duration of first stage of labourMean + statistical upper limit (mean+2 SDs): Primps: 7.7 hours (19.4 hours) Multips: 5.7 hours (13.7 hours)
No difference between ethnic groups
Inappropriate use of mean and standard deviation to calculate upper limit (data not normally distributed). Funding: not stated Country: US
Albers 1999 283 Case series EL 3
Describing first stage duration
N=2511(806 primips, 1705 multips) In labour
“Low-risk” women who received intrapartum care from certified nurse-midwives. No oxytocin or epidurals.
Duration of first stage of labour. Factors associated with longer first stages of labour
Duration of first stage of labour. Mean + statistical upper limit (mean+2 SDs): Primips: 7.7 hours (17.5 hours)
Inappropriate use of mean and standard deviation to calculate upper limit (data not normally distributed). Associations do not
36

Intrapartum care
38
Bibliographic information
Study type and evidence level
Aim of study Number of women and women’s characteristics
Women’s characteristics Outcome measures Results and comments Study summary Reviewer comment
Multips: 5.6 hours (13.8 hours)Multivariate analysis by logistic regression to discover which variables were associated with longer labours: electronic fetal monitoring, ambulation. .
imply causality Funding: the American College of Nurse-Midwives Country: US
Zhang 2002 284 Case series3
Describing duration of the first stage
N=1329In labour
Nulliparous, spontaneous onset of labour, baby’s birth weight between 2500g and 4000g..
Duration of first stage of labour
Duration of first stage of labourMean = 5.5 hours
US Lower limit placed on length of labour in order to meet study inclusion criteria (< 3 hours not included). Includes oxytocin augmentation and epidurals.
Sharma 2004 287
Case-control study EL 2-
Length of labour and puerperal psychosis
N=34 (puerperal psychosis 17, control 17)
Women who were admitted consecutively with a diagnosis of puerperal psychosis Control group matched with age, parity, and year of delivery
Puerperal psychosis
Duration of labour (details not stated) PP group 11.15h (SD 8.01) VS. Control group 6.56h (SD 3.71)
Funding: Ontario Mental Health Foundation Country: UK
Mahon 23232 288
CSS EL 3
Comparing birth outcome between Labour lasting =<3 hours Vs. Labour with >3hours
N=198(99 short labour, 99 control)
Pregnant womenVertex-presenting BW>=2500g GA>=37weeks In 1990 Duration of labour
Birth outcomes Labour lasting =<3 hoursVs. Labour with >3hours Major perineal lacerations SL 1.0% vs Control 2.0% P:ns PPH SL 18.2% vs Control 25.3% P:ns Apgar <7at 1min SL 3.0% vs Control 2.0% P:ns
Country: US
Abitbol 1994 289 Case-control study (nested) EL 2-
Association between maternal complications and prolonged labour
N=2709 for vaginal birthN=764 for caesarean birth
Women had childbirth at the Jamaica Hospital July 1988-June 1990 Prolonged labour Women with maternal complications in intrapartum period or those without
Maternal complications
Women with vaginal deliveryArrest/no arrest RR 12.5 [4.94 to 23.38] Women with CS Arrest/no arrest RR 28.89 [20.00 to 39.43]
Country: US
Lavender T, Hart A, Walkinshaw S, Campbell
Observational, longitudinal
To assess mean progress in first stage of labour of
N=403 multiparous women giving birth in a midwifery-
Multiparous women with uncomplicated term
Rate of cervical dilatation during first
Mean rate of cervical dilatation: It is noted that several individual
37

Evidence tables
39
Bibliographic information
Study type and evidence level
Aim of study Number of women and women’s characteristics
Women’s characteristics Outcome measures Results and comments Study summary Reviewer comment
E, Alfirevic Z, 2005 290 study EL 3
multiparous women. led unit. pregnancies and labours. stage of labour 2.9 cm/hrMedian: 1.9 cm/hr (10th centile 0.7 cm/hr, 5th centile 0.5 cm/hr). Duration of active first stage (from 4-10cm dilatation): Using median rate of dilatation: 3 hrs 9 min. Upper limit (10th centile): 13 hours.
profiles showed periods of no progress followed by progress. Funding: Liverpool Women’s Hospital Country: UK
38

Intrapartum care
40
Duration and definition of delay in second stage of labour Biblio-graphic reference
Study type Evidence level
Number of women
Women’s characteristics
Intervention Comparison Length of follow-up
Outcome measures
Effect size Source of funding
Additional comments
Cheng YW;Hopkins LM;Caughey AB; 2004 326
Cohort study Evidence level: 2+
N=15759 Women in labour
Intervention: prolonged second stage
Comparison: normal duration of second stage
Follow-up period: N/A
Outcome Measures: postpartum haemorrhage
RR 1.05 (95% CI 0.84 to 1.31)
Myles TD;Santolaya J; 327
Cohort study Evidence level: 2+
N=7818 pregnant women
Prolonged second stage (>120min)
Normal duration of second stage
Intrapartum Outcome Measures: postpartum haemorrhage
RR 2.70, p<0.001 Not stated
Janni W;Schiessl B;Peschers U;Huber S;Strobl B;Hantschmann P;Uhlmann N;Dimpfl T;Rammel G;Kainer F; 2002 328
Cross-sectional
Evidence level: 2+
N=1200 pregnant women
Prolonged second stage labour (over 2hours)
Normal duration of second stage labour
Intrapartum Outcome Measures: PPH
RR 2.3 (95% CI 1.6 to 331) not stated
Kuo, Chen & Wang, 1996 329
Cohort study (un-matched)
Evidence Level 2+
Total N=1915 N=165 prolonged second stage N=1750 not prolonged second stage
Women in second stage of labour at term
Prolonged second stage (> 2 hours)
Not prolonged second stage (<= 2 hours)
Few days postnatally
1 and 5 minute Apgar scores Umbilical blood gas determination Thick meconium staining Fetal trauma Cord blood pH Cord blood base excess NICU admission Length of hospital stay Neonatal death
Factors such as nulliparity (p < 0.005), maternal weight gained during pregnancy (p < 0.01), active phase length (p < 0.05), persistent occiput posterior position (p < 0.05), station at complete cervical dilation (p < 0.05) and a need of instrumental vaginal delivery (p < 0.05) were significantly associated with a prolonged second stage of labor. Outcomes for 0-2 hr second stage vs. > 2 hrs: 5 min Apgar <7: 0.7% vs. 0% Thick meconium: 4.1% vs. 3.0% Trauma to baby: 1.5% vs. 1.8% Hospital stay (days); 3.9 (SD1.2) vs. 3.7 (SD 0.9) NICU admission: 1.4% vs. 0%
Not stated Country: Taiwan
39

Evidence tables
41
Biblio-graphic reference
Study type Evidence level
Number of women
Women’s characteristics
Intervention Comparison Length of follow-up
Outcome measures
Effect size Source of funding
Additional comments
Neonatal death: 0.1% vs. 0%Umbilical artery pH: 7.32 (SD 0.24) vs. 7.33 (SD 0.29) Umbilical cord base excess: -2.6 (SD 1.4) vs. -2.4 (SD 2.8)
Van Kessel, Reid, Newton, Meier, Lentz, 2001 330
Retro-spective case-controlled study
Evidence Level 2+
N=141 Women who had given birth at study hospital between 1982 and 1986. Cases: n=85, women diagnosed as having stress urinary incontinence. Controls: n=88 – matched controls.
Risk factors for stress urinary incontinence
Women without stress urinary incontinence
8 years Stress urinary incontinence
Length of second stage of labour: OR: 1.07 (95% CI 0.9 to 1.3)
Not stated US
Menticoglou, Manning, Harman & Morrison, 1995 331
Retrospec-tive case series
Evidence Level 2+
N=6041 Nulliparous women who reached the second stage of labour and gave birth to a baby weighing > 2500g
Outcomes relating to prolonged second stage of labour (>3 hours)
Outcomes where second stage of labour lasted less than 3 hours
Immediate PN period
Mode of birthLow 5 minute Apgar score Neonatal seizures NICU admission Neonatal death
Probability of spontaneous vaginal birth vs. instrumental vaginal birth vs. CS with increasing durations of second stage: 30 min: 79% vs 17% vs 3.3% 60 min: 73% vs 22% vs 5% 90 min: 65% vs 29% vs 7% 120 min: 56% vs 35% vs 9% 180 min: 38% vs 44% vs 18% 240 min: 25% vs 46% vs 29% 360min: 20% vs 44% vs 37% Probability of perinatal morbidity – Apgar score < 7 vs. admission to NICU vs both+cordpH<7.2: 0 min: 1.46 vs 1.09 vs 0.36 30 min: 1.53 vs 1.17 vs 0.40 60 min: 1.61 vs 1.17 vs 0.44 90 min: 1.86 vs 1.31 vs 0.59 120 min: 2.11 vs 1.37 vs 0.74 180 min: 2.04 vs 1.17 vs 0.73 240 min: 2.28 vs 0.65 vs 0.65 360 min: 2.44 vs 0 vs 0 Neonatal seizures: n=5, all occurred within
Not stated Canada
40

Intrapartum care
42
Biblio-graphic reference
Study type Evidence level
Number of women
Women’s characteristics
Intervention Comparison Length of follow-up
Outcome measures
Effect size Source of funding
Additional comments
150 min No neonatal deaths
Saunders NS;Paterson CM;Wadsworth J; 1992 May 332
Population-based study
Evidence level: 2+
N=25069 Women in second stage of labour
Intervention: prolonged second stage
Comparison: normal duration of second stage
Follow-up period: intrapartum
Outcome Measures: PPH (blood loss more than 500mls)
duration of second stage<120=RR 1 120-179=RR 1.6 [1.3 to 1.9] 180-239=RR 1.7 [1.3 to 2.3] 240-=RR 1.9 [1.2 to 2.8]
Not stated Country: UK
Moon, Smith & Rayburn, 1990 334
Cross sectional study
Evidence level 2+
N=1432 Women in second stage of labour at term with no pregnancy or labour complications
Prolonged second stage (>120 min)
Not prolonged second stage (0-120 minutes)
Immediate PN period
Mode of birthApgar scores Need for ventilatory support Umbilical artery pH < 7.20 Umbilical cord base deficit < 6 NICU admission
0-120 min vs > 120 min:Spontaneous vaginal birth: 91% vs 30%, p<0.001 Forceps/vacuum: 8% vs. 48%, p<0.001 CS for failure to progress: 1% vs 24%, p<0.001 CS for fetal distress: 4% vs 0%, NS 1 min APgar score < 7: 10% vs 22%, p<0.05 5 min Apgar score < 7: 10% vs 16%, NS Need for ventilatory support: 26% vs 32%, NS Umbilical artery pH <7.2: 5.1% vs 3.3%, NS Umbilical cord base deficit < 6: 31% vs 25%, NS NICU admission: 1.7% vs 2%, NS
Not stated Country: US
Lederman, Lederman, Work & McCann, 1978 286
Longitud-inal descriptive study
2- N=30 Nulliparous women without pregnancy or labour complications. Age range 20-32 years.
Level of anxiety 20 min postpartum
Progress in labour Epinephrine level in second stage: Median: 108.0 pg/ml Mean: 134.7 pg/ml (SD 94.6 pg/ml) Anxiety score: Median: 47.6 Mean: 47.4 (SD 13.5) Length of second stage: Median: 1.4 hours Mean: 1.4 hours (SD 0.8 hours) Intercorrelation between anxiety score and length of second stage: -0.24.
The Division of Nursing Health Resources administra-tion Public Health Service Medical Staff Research
Country: US
41

Evidence tables
43
Biblio-graphic reference
Study type Evidence level
Number of women
Women’s characteristics
Intervention Comparison Length of follow-up
Outcome measures
Effect size Source of funding
Additional comments
& Education Fund
Cohen WR; 1977 Mar 335
Cross-sectional
Evidence level: 3
N=4403 pregnant women
Intervention: duration of second stage
Comparison: duration of second stage
Follow-up period: intrapartum
Outcome Measures: postpartum haemorrhage
Apgar score < 7 at 1 min: p<0.03Duration of second stage p<0.001 Puerperal haemorrhage p<0.001
not stated Country: US
Sharma, Smith & Khan, 2004 287
Retrospec-tive matched case control study
2- N=34 Women hospitalized with puerperal psychosis within 4 weeks of giving birth
Puerperal psychosis
No puerperal psychosis
4 weeks Factors associated with puerperal psychosis
Duration of labour shorter for comparison group: 11.15 hours (SD 8.01 hours) vs. 6.56 hours (SD 3.71 hours), p<0.05.
Not stated Country: UK
Mahon, Chazotte & Cohen 1994288
Matched case control study
2+ Short labour n=99 Controls n=99
Short labour <3 hours Includes term pregnancies only.
Short labour Longer labour (> 3 hours) matched for maternal age, parity and birthweight of baby.
3 days postnatally
Placental abruptionMeconium Cocaine history Major perineal laceration Apgar score <7 at 1 min Hyperbilirubinemia
Hort labours vs. controls: Placental abruption: 18.6% vs 1.0%, signif. diff. Meconium: 28.6% vs 21.2%, NS Cocaine history: 13.3% vs 2.0%, signif. diff. Major perineal laceration: 1.0% vs 2.0%, NS. Apgar score <7 at 1 min: 3.0% vs 2.0%, NS Hyperbilirubinemia: 0.0% vs 2.0%, NS NB. Level of significance not stated
Not stated US
Abitbol, Castillo, Udom-Rice, Taylor & Wang, 1994 289
Nested case control study
2- Women who gave birth vaginally n=2709 Women who gave birth via CS n=764
All women giving birth in a particular hospital July 1988 to June 1990
Risk factors associated with arrested labour
Rate of factor in non-arrested labour
Immediate PN period
Cervical-vaginal tear PPH Postpartum fever Urinary retention Disrupted episiotomy complications Extended hospital stay Total number of maternal complications
Vaginal birthsArrested labours vs. not arrested: Cervical-vaginal tear: 25.00 (95% CI 8.68 to 49.13) PPH: RR 12.50 (95% CI 1.56 to 37.96) Postpartum fever: RR 13.33 (95% CI 3.77 to 30.74) Urinary retention: RR 0.00 (95% CI 0.00 to 36.06) Disrupted episiotomy: RR 25.00 (95% CI 0.41 to 57.28) Extended hospital stay: RR 17.69 (95% CI 1.56 to 38.29) Total number of maternal complications: RR 12.50 (95% CI 4.94 to 23.38)
Not stated Country: Jamaica
42

Intrapartum care
44
Duration and definition of delay in second stage of labour – 2 Bibliographic information
Study type and evidence level
Aim of study Number of women and women’s characteristics
Population characteristics
Outcome measures
Results and comments Study summary
Reviewer comment
Albers 1999 283
Observational study EL 3
To describe length of active labour
N=2511 Healthy women in labour at term with no oxytocin or epidural analgesia
Length of active phase of first stage of labour and second stage of labour
Nulliparous women:Mean length of active first stage: 7.7 hours. Upper limit (2 SDs): 17.5 hours Mean length of second stage: 54 minutes (upper limit 146 min) Multiparous women: Mean length of active first stage: 5.6 hours. Upper limit (2 SDs): 13.8 hours Mean length of second stage: 18 minutes (upper limit 64 min) Variables associated with longer active first stage of labour: Nulliparous women: Continuous EFM: OR 2.1 (95% CI 1.7 to 2.5) Ambulation: OR 2.0 (95% CI 1.8 to 2.4) Multiparous women: Ambulation: OR 2.0 (95% CI 1.2 to 1.6) Continuous EFM: 1.4 (95% CI 1.2 to 1.6) Second stage Nulliparous women: Maternal age > 30 years: OR 2.3 )95% CI 2.0 to 2.8) Continuous EFM: OR 1.7 (95% CI 1.5 to 2.1) Multiparous women: Narcotic analgesia: OR 1.6 (95% CI 1.3 to 1.9) Maternal age > 30 years: OR 1.4 (95% CI 1.1 to 1.7)
Funding: American College of Nurse-Midwives Country: US
Albers, Schiff & Gorwoda, 1996 282
Observational descriptive study EL 3
To describe length of active labour and compare this for different ethnic groups
N=1473 Women without pregnancy or labour complications who gave birth at term. Ethnic groups: non-Hispanic white, Hispanic and American Indian women.
Length of active first stage and second stage of labour
Mean length of active first stage for nulliparous women: 7.7 hours Upper limit (+2 SDs): 19.4 hours Mean length of active first stage for multiparous women: 5.7 hours Upper limit: 13.7 hours Mean length of second stage for nulliparous women: 53 min
Funding: Not stated Country: US
43

Evidence tables
45
Bibliographic information
Study type and evidence level
Aim of study Number of women and women’s characteristics
Population characteristics
Outcome measures
Results and comments Study summary
Reviewer comment
Upper limit (+2 SDs): 147 min Mean length of active first stage for multiparous women: 17 min Upper limit: 57 min American Indian women had signif. Shorter second stage compared with non-Hispanic white women, p<0.05.
Kilpatrick & Russel, 1989 277
Descriptive secondary analysis EL 3
To describe length of active first and second stages of labour
N=6991 Women who gave birth spontaneously at term without use of oxytocin during labour.
Active first stage and second stage of labour
Nulliparous women with no epidural:Mean length of active first stage: 8.1 hours Upper limit (95th centile): 16.6 hours Nulliparous women with epidural: Mean length of active first stage: 10.2 hours Upper limit (95th centile): 19.0 hours Multliparous women with no epidural: Mean length of active first stage: 5.7 hours Upper limit (95th centile): 12.5 hours Multliparous women with epidural: Mean length of active first stage:7.4.1 hours Upper limit (95th centile): 14.9 hours Nulliparous women with no epidural: Mean length of second stage: 54 min Upper limit (95th centile): 132 min Nulliparous women with epidural: Mean length of second stage: 79 min Upper limit (95th centile): 185 min Multliparous women with no epidural: Mean length of second stage: 19 min Upper limit (95th centile): 61 min Multiparous women with epidural: Mean length of second stage: 45 min Upper limit (95th centile): 131 min
Epidural analgesia lengthens the duration of both the active first stage of laboru and the second stage of labour for nulliparous and multiparous women.
Funding: National Institute of Health Grant Country: US
44

Intrapartum care
46
Definition and duration of the third stage of labour – duration of the third stage Bibliographic reference
Study type
Evidence level
Number of patients
Patient characteristics
Intervention Comparison Length of follow-up
Outcome measures
Effect size Source of funding
Additional comments
Magann EF;Evans S;Chauhan SP;Lanneau G;Fisk AD;Morrison JC; 2005 358
Cohort Evidence level: 2+
N=6588 pregnant women Intervention: duration of third stage
Comparison: duration of third stage
Follow-up period: intrapartum
Outcome Measures: PPH
at 10 minutesOR 2.1 [1.6 to 2.6] at 20 minutes OR 4.3 [3.3 to 5.5] at 30 minutes OR 6.2 [4.6 to 8.2]) the best predictor for developing PPH from RPC curve 18 minutes
not stated
Combs CA;Laros Jr RK; 1991 359
Cross-sectional
Evidence level: 3
N=12979 pregnant women Intervention: prolonged third stage
Comparison: normal duration of third stage -30min
Follow-up period: postnatal
Outcome Measures: PPH
Spontaneous placenta deliveryestimated blood loss more than 500ml <30min=9.0% 30min-=12.6% p<0.1 difference in Hgb greater than 10 <30min=6.1% 30min-=10.8% p<0.05 Manual traction of placenta estimated blood loss more than 500ml <30min=30.0% 30min-=42.6% p<0.01 difference in Hgb greater than 10 <30min=12.5% 30min-=24.5% p<0.01
not stated
45
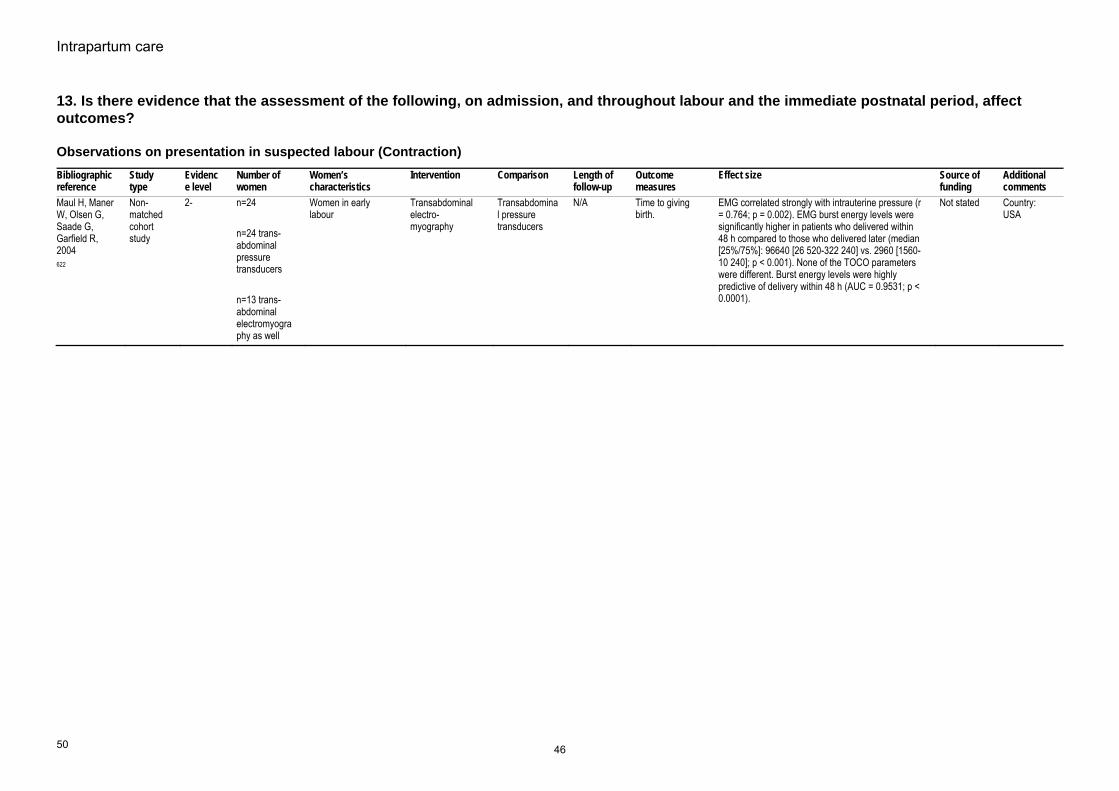
Intrapartum care
50
13. Is there evidence that the assessment of the following, on admission, and throughout labour and the immediate postnatal period, affect outcomes?
Observations on presentation in suspected labour (Contraction) Bibliographic reference
Study type
Evidence level
Number of women
Women’s characteristics
Intervention Comparison Length of follow-up
Outcome measures
Effect size Source offunding
Additional comments
Maul H, Maner W, Olsen G, Saade G, Garfield R, 2004 622
Non-matched cohort study
2- n=24 n=24 trans-abdominal pressure transducers n=13 trans-abdominal electromyography as well
Women in early labour
Transabdominal electro-myography
Transabdominal pressure transducers
N/A Time to giving birth.
EMG correlated strongly with intrauterine pressure (r = 0.764; p = 0.002). EMG burst energy levels were significantly higher in patients who delivered within 48 h compared to those who delivered later (median [25%/75%]: 96640 [26 520-322 240] vs. 2960 [1560-10 240]; p < 0.001). None of the TOCO parameters were different. Burst energy levels were highly predictive of delivery within 48 h (AUC = 0.9531; p < 0.0001).
Not stated Country: USA
46

Evidence tables
51
Observations during the established first stage of labour Bibliographic reference
Study type
Evidence level
Number of women
Women’s characteristics
Intervention Comparison Length of follow-up
Outcome measures
Effect size Source of funding
Additional comments
Abukhalil 1996298
RCT 1- 109 Nulliparous women in spontaneous labour at term
2 hourly vaginal examinations
4 hourly vaginal examinations
N/A Duration of labour No effect Not stated UKStudy under-powered
Ahlden, Andersch, Stigsson & Olegard, 1988 299
Case control study
2- Cases n=26 Controls n=42
Cases: women whose babies had confirmed septicemia. Babies born at more than 36 weeks.
Identification of risk factors for septicemia
Women of corresponding age with babies born at term who did not go on to develop septicemia.
During labour
Stepwise logistic regression to identify factors associated with neonatal sepsis, including number of vaginal examinations
No. (%) of women in sepsis group vs. no. in control group who had >=6 VEs during labour: 15 (58%) vs. 15 (33%), NS.
Not stated Country: Sweden Number of VEs was not found to be associated with neonatal sepsis.
47

Intrapartum care
52
Observations during the established first stage of labour (pain assessment during labour) – 1 Bibliographic information
Study type and evidence level
Aim of study Number of women and women’s characteristics
Women’s characteristics
Outcome measures
Results and comments Study summary Reviewer comment
Ranta P;Spalding M;Kangas-Saarela T;Jokela R;Hollmen A;Jouppila P;Jouppila R; 1995 123
Study Type: Survey of women's expectations and experiences of labour pain. Evidence Level: 2+
Women's views/expectations of labour pain and its management.
n=1091 Women in labour. 33% primiparous women.
Pain scoresSatisfaction with pain relief Satisfaction with care
After administration of pain relief 50% multiparous women still reported pain scores of 8-10 on the BS-11 (this figure was 19% for primiparous women). Eighteen per cent of women rated their pain relief as poor, 37% rated it as moderate, and 45% as good. Views of pain relief were not related to parity. Overall, 95% women stated that they were satisfied with their care during childbirth. Ratings of overall satisfaction were not related to parity, level of pain experienced or pain relief received.
Findings reflect lack of reflective pain relief. Dissatisfaction with childbirth was very low, and was associated with instrumental births, but not with usage of analgesia. 51% of all parturients complained of inadequate pain relief during labour, which, in multiparous women, was significantly associated with second stage of labour.
Despite an apparent low level of effectiveness of pain relief, most women expressed satisfaction with care during labour. This may reflect low expectations of pain relief in this population.
Brown ST;Campbell D;Kurtz A; 1989 306
Study Type: Evidence Level: 3
Pain scales used during labour
Convenience sample n=78
Women in established labour
Scores on pain scales
First pain assessments - 2-5 cm cervical dilation, mean 3.7 cm (SD-0.115). Second pain assessment 6-10 cm, mean 7.8 cm (SD=1.1). Significant differences were found between sets of pain scores for VAS (t=7.59, p<0.001); PPI (t-4.11, p<0.0001); McGill Pain Questionnaire (PRI-R) (t=2.51, p<0.0141). Mean PRI-R scores were higher for women who were younger than 20, for primigravidas, for single women, for women receiving oxytocin and for women who were alone at the time of both pain assessments. Significant differences were also observed between mean BIP (observer) ratings (t=6.21, p<0.0001). BIP ratings were consistently lower than self-reports of pain. Significant correlations were also obtained between different pain measures on repeated measures. The highest correlations were found between scores on the VAS and the McGill Pain Questionnaire at both times 1 and 2 (r=0.62, p<0.0001). Pain during the first stage of labour was also found to correlate with parity. Primiparous women reported significantly higher pain scores than multiparous women.
Women reported a significant increase in pain when cervical dilation was greater than 5 cm. The findings provide support for the validity of the characteristics of pain as assessed in the study.
Findings provide some evidence of validity of pain scales and their applicability in labour.
Sittner B;Hudson DB;Grossman CC;Gaston-Johansson F;
Study Type: Descriptive study. Evidence Level: 2-
Study is descriptive in nature, using a plastic pain scale called the Pain-O-Meter. Includes a list of 15 sensory and 11 affective pain
33 Adolescents (aged 16-19) in labour. 27% living in family on low income. 42% had completed high school.
Pain scores recorded using the 2 scales of the POM.
Scores were recorded at three phases during labour defined by cervical dilation: 2-4 cm, 5-7 cm, 8-10 cm. Mean values of affective and sensory word scores were highest during Phase II (5-7 cm). Scores obtained using the numeric VAS increased with cervical dilation. Mean scores for each phase were: 5.04 (SD 2.35), 5.95 (SD
Findings from the study may provide nurses with a greater understanding of the intensity and quality of pain experienced as
Findings provide support for the validity of using a VAS during labour to assess pain intensity, as well as the use of adjectives to describe
48

Evidence tables
53
Bibliographic information
Study type and evidence level
Aim of study Number of women and women’s characteristics
Women’s characteristics
Outcome measures
Results and comments Study summary Reviewer comment
1998 Feb 309
descriptors and a 10 cm VAS.
3.30) and 7.24 (SD 3.19) respectively. No significant difference noted between primips and multips (small numbers involved).
labour progresses. pain.
Lowe NK;Roberts JE; 1988 Feb 313
Study Type: Descriptive study. Evidence Level: 3
Use of 2 scales from the McGill Pain Questionnaire during labour: 6-point PPI 20 verbal descriptors to describe sensory, affective and evaluative qualities of pain.
n=50 women Women in labour.34% primiparous. Women were caucasian, upper-middle class.
Pain scores The authors reported that the women “responded favourably” to administration of the tool and were usually able to complete both scales between contractions until late in the first stage of labour.
The MPQ was found to be a tool amenable to the measurement of labour pain.
The scoring of scales involving an adjective list make them unsuitable for use in the clinical setting.
Niven C;Gijsbers K; 1984 314
Study Type: Descriptive study. Evidence Level: 3
Pain Rating Index of the McGill Pain Questionnaire presented verbally.
n=23 women Women in labour. Half of the sample were primiparous and all were Caucasian.
Pain scores Women were reported as having “little difficulty” in selecting and reporting words that described their pain.
The MPQ could be considered a relatively cumbersome method of rating pain during labour. However, in the present study it was found acceptable to women.
MPQ may be useful in some research settings but it is less appropriate for use in the clinical setting.
49

Intrapartum care
54
Observations during the established first stage of labour (pain assessment during labour) – 2 Bibliographic reference
Study type
Evidence level
Number of women
Women’s characteristics
Intervention Comparison Length of follow-up
Outcome measures
Effect size Source of funding
Additional comments
Price DD;Harkins SW;Baker C; 1987 304
Cohort Evidence level: 2-
Chronic pain patients n=181 Women in labour n=23
Group of relevance = women in labour. Caucasian, mean age 21, 65% primips., giving birth in a birth centre without pharmacological analgesia.
Intervention: Pain experienced during labour
Comparison: Labour pain experience of women who focus on the pain vs. women who focus on the impending birth. Also: Labour pain vs. other forms of chronic pain.
Follow-up period: During labour only
Outcome Measures: Sensory and affective ratings of pain
VAS ratings of pain sensation intensity increased significantly across stages of labour: Early to active t=5.43, df=21, p<0.0001 Active to transition t=4.5, df=19, p<0.0002 But no signif increase from transition to pushing t=0.10, df=19, p>0.10. VAS ratings of pan affect also increased signif from: Early to active t=4.3 df=21 p<0.0003 Active to transition t=4.5 df=19 p<0.0002 However, VAS ratings of pain affect decreased from transition to pushing t=-2.08 df=19 p<0.05. Pain affect VAS scores were consisitently lower than pain sensation responses (t=3.15 df=19 p<0.005), especially during pushing (t=3.01, df=19, p<0.01)
Part funded by an NIDR grant
Regular use of pain scale during labour may bring focus off the birth and on to the labour pain. For some women this may have a negative effect.
Gross MM;Hecker H;Keirse MJ; 2005 Jun 307
Cross-sectional
Evidence level: 3
30 primips and 20 multips
Women in labour at term
Intervention: Pain and "fitness" (emotional and physical energy or strength) during labour
Comparison: How "fitness" and pain alter as labour progresses
Follow-up period: During labour only
Outcome Measures: Pain and fitness scores (VAS)
Mean pain score increased steadily as labour progressed from 1.4 (SD 2) at the first measurement to 3.0 (SD 3.7) at the third measurement to 4.6 (SD 3.5) at the fifth measurement. An analysis of variance regression model showed a highly significant (p<0.0001) intra-individual relationship between time and pain scores in both primiparous and multiparous women. Most women (21/28) viewed using pain scale positively.
Not stated Use of pain scale during labour viewed positively by most women, but for a few women it was an unwelcome distraction, especially towards the end of labour.
Sheiner EK;Sheiner E;Shoham-Vardi I;Mazor M;Katz M; 1999 315
Cohort Evidence level: 2-
225 Jewish women 192 Bedouin women
Women in established labour
Intervention: Pain experienced during labour
Comparison: Jewish women vs. Bedouin women as assessed by themselves vs. assessment by Jewish carers
Follow-up period: 1 day post-nataly
Outcome Measures: Pain scores - VAS
Self-assessed pain scores: 8.55 vs. 8.53 for Jewish and Bedouin women respectively, p=0.25. Assessed pain by Jewish carers: 8.2 vs. 6.89 for Jewish and Bedouin women respectively, p<0.001 ie. Carers assessed Bedouin women as experiencing lower levels of pain.
Not stated Study raises an important issue - the racial/cultural/ social background of carer compared to those of the woman in labour can affect perceptions of labour pain.
50

Evidence tables
55
Observations during the established first stage of labour (pain assessment during labour) – 3 Bibliographic information
Study type
Evidence level
Number of women and prevalence
Women’s characteristics Type of test Reference standard
Sensitivity, specificity, PPV and NPV
Source of funding
Additional comments
Bonnel AM;Boureau F; 1985 305
Cross sectional study
III 100 women Women in labour at term.Primiparous, middle class women.
Self-assessed pain using a 5-point numerical scale - the Present Pain Intensity Scale. Behavioural observation rating made by carr (Present Behavioural Intensity - PBI)
The 2 scales are compared.
Scores on the PPI and PBI scales Not stated. Importantly, the study shows that carers tend to underestimate the pain women are experiencing during labour.
Beilin Y;Hossain S;Bodian CA; -32676 308
Cross sectional study
III Study analyses data from 3 previous studies. N for each study = 69+96+146 = 311
Women (approx. 50% primps.) in labour at term requesting epidural analgesia.
0-10 verbal numeric pain scale.
Scores on pain scale are compared with women's need for additional pain relief following administration of epidural analgesia.
Final pain score and need for further pain relief.
Not stated Findings suggest that following administration of epidural analgesia women expect to experience no or very little pain.
Revill SI;Robinson JO;Rosen M;Hogg MI; 1976 Nov 310
Cohort study
III n=10 women in labour with pethidine administered n=10 women in labour without pethidine
Women in labour (no other details given)
Use of 15 cm VAS Use of scale by women with and without pethidine administered during labour
Pain scoresAbility to assess one-fifth of the distance of the VAS
The Welsh OfficeMedical Research Council
Study very small-scale so evidence provided is weak.
Wuitchik M;Bakal D;Lipshitz J; 1989 Jan 311
Cohort study
II 115 recruited, 89 provided pain scores.
Women in labour at 36 weeks or over. Predominantly white, middle class women. Low risk obstetrically. 75% primiparous women.
Use of the Present Pain Intensity Scale (PPI)
PPI scores made during the latent phase as a predictor of labour outcome.
Length of latent phaseLength of active first stage of labour Length of transition phase of labour Length of second phase of labour Mode of birth
Grant from the Alberta Mental Health Advisory Council
The study also involved assessment of cognitive activity (eg. distress levels) during labour. These were also found to be high in the latent phase for women who went on to have long labours.
Baker A;Ferguson SA;Roach GD;Dawson D; 312
Cross sectional study
III n=13 womenn=9 midwives
Women in labour at term (5 primips. and 8 multips).
Self-reported and midwife- assessed pain as measured by the Short-form McGill Pain Questionnaire Midwives ratings of pain.
Self-report vs. midwife-assessment of labour pain
Pain scores Clinical Development Research Committee of the Queen Elizabeth Hospital, Adelaide, SA.
Despite the finding that midwives tend to underestimate a woman's pain at higher intensity levels, the authors do not underline this point, nor suggest that midwife assessment alone is inadequate.
51

Intrapartum care
56
Observations during the established first stage of labour (charting of observations) Bibliographic reference
Study type
Evidence level
Number of women
Women’s characteristics
Intervention Comparison Length of follow-up
Outcome measures
Effect size Source of funding
Additional comments
WHO 1994 Jun 4 301
RCT Evidence level: 1+
8 hospitals (partogram=4 no partogram=4), and 35484 women
women in labour Intervention: use of WHO partogram
Comparison: no partogram
Follow-up period: intra-partum period
Outcome Measures: length of labour, mode of deliveries, augmentation, postpartum sepsis
all nulliparous normal women: Duration of labour (median, (5-95 percentile) No partogram=5.58h (1.17-21.9) Partogram=5.75h (1.40-17.7) p=0.518 Women whose labour lasted > 18h RR 0.56 [0.47 to 0.67] NNT 30.13 Labour augmented RR 0.43 [0.39 to 0.47] NNT 5.44 postpartum sepsis RR 0.09 [0.03-0.31] NNT 136.84 Spontaneous Cephalic delivery RR 1.05 [1.03 to 1.08] NNT 25.49 cs RR 0.70 [0.61 to 0.81] NNT 34.21 all parous normal women: Duration of labour (median, (5-95 percentile) No partogram=2.83h (0.42-15.2) Partogram=3.08h (0.60-13.1) p=0.245 Women whose labour lasted > 18h RR 0.40 [0.30 to 0.52] NNT 47.46
the WHO Safe Motherhood Operations Research and the Special Programme of Research, Development and Research Training in Human Reproduction
52
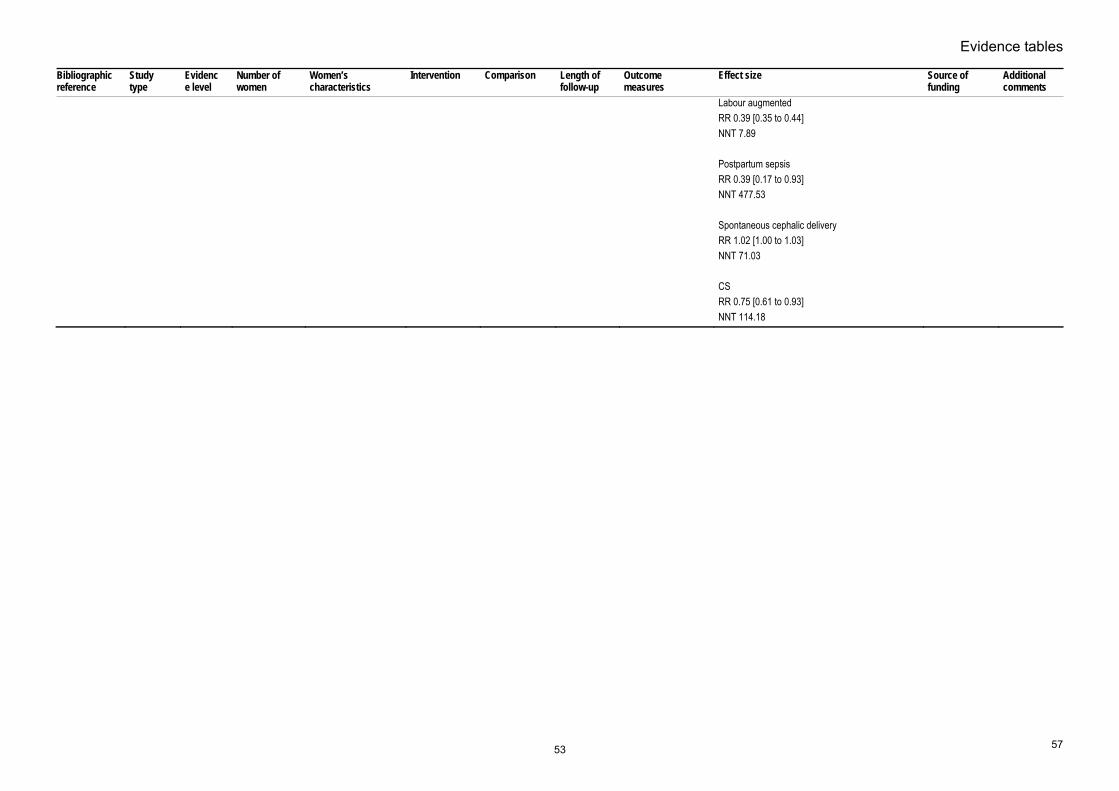
Evidence tables
57
Bibliographic reference
Study type
Evidence level
Number of women
Women’s characteristics
Intervention Comparison Length of follow-up
Outcome measures
Effect size Source of funding
Additional comments
Labour augmentedRR 0.39 [0.35 to 0.44] NNT 7.89 Postpartum sepsis RR 0.39 [0.17 to 0.93] NNT 477.53 Spontaneous cephalic delivery RR 1.02 [1.00 to 1.03] NNT 71.03 CS RR 0.75 [0.61 to 0.93] NNT 114.18
53

Evidence tables
73
Adjuncts to the use of CTG – computerized systems versus human interpretation Bibliographic information
Study type Evidence level Number of patients and prevalence
Women’s characteristics
Type of test Reference standard
Sensitivity, specificity, PPV and NPV Source of funding Additional comments
Keith et al (1995) 495
Multi-centre comparative study. (UK)
II 17 expert clinicians interpretation of 50 FHR tracings
FHR tracings representing a cross-section of outcomes, including poor outcome and CS resulting in good neonatal outcome.
Computerised interpretation of FHR tracing
Compared with that of expert clinicians.
Good agreement between computerised system and experts, 67.33%, kappa=0.31, p<0.001. Computer system very consistent: 99.16%, kappa=0.98, p<0.001. Computerised system recommended no unnecessary intervention in cases of normal birth with good outcome. Computerised system identified: 2/3 incidences of birth asphyxia; 2/4 examples of metabolic acidosis; and 2/5 incidences of acidosis with no significant metabolic component. This was as good as the majority of experts for birth asphyxia, but fewer than all reviewers for metabolic acidosis and fewer than all but one of the reviewers for acidosis.
Not stated
Taylor et al (2000) 496
Prospective observational study (UK)
III 7 expert clinicians interpretation of 24 25-minute segments of FHR tracings.
24 intrapartum FHR tracings. None of the babies required admission to SCBU.
Computerised interpretation of FHR tracing
compared with that of expert clinicians.
Inter-rater reliability between 7 experts:Baseline FHR: r=0.93; Number of decelerations: r=0.93 Type of decelerations: r=0.93 Baseline variability: kappa=0.27 Accelerations: r=0.27.
Computerised interpretation of the tracings showed good agreement with the experts regarding: Baseline FHR: r=0.91 to 0.98; Number of decelerations: r=0.82 to 0.91.
Intra-class correlations were lower for: Number of late decelerations: r=0.68 to 0.85; Number of accelerations: r=0.06 to 0.80. Variability: kappa=0.00 to 0.34.
Not stated
Todros et al (1996) 497
Prospective correlational study (Italy)
III 2 expert clinicians and 2 non-expert clinicians interpretation of 63 FHR tracings.
25-minute segment of 63 FHR tracings from high and low risk women in labour.
Computerised interpretation of FHR tracing
compared with that of expert and non-expert clinicians.
Computerised system compared with:Expert 1 (kappa values): FHR: 0.48 Variability: 0.74 No. of accelerations: 0.58 No. of decelerations: 0.45
Expert 2: FHR: 0.18 Variability: 0.16 No. of accelerations: 0.64 No. of decelerations: 0.41
Not stated
54
acarty
Highlight
acarty
Highlight
acarty
Highlight
acarty
Highlight
acarty
Highlight
acarty
Highlight
acarty
Highlight
acarty
Highlight
acarty
Highlight
acarty
Highlight
acarty
Highlight
acarty
Highlight

Intrapartum care
74
Bibliographic information
Study type Evidence level Number of patients and prevalence
Women’s characteristics
Type of test Reference standard
Sensitivity, specificity, PPV and NPV Source of funding Additional comments
Non-expert 1:FHR: 0.24 Variability: 0.65 No. of accelerations: 0.37 No. of decelerations: 0.54
Non-expert 2: FHR: 0.36 Variability: 0.69 No. of accelerations: 0.48 No. of decelerations: 0.54
Chung et al (1995) 498
Retrospective observational study (UK)
III 73 complete intrapartum FHR tracings (for labours > 3 hours)
FHR tracings for women in labour with complications (e.g. IUGR, PIH, post-term)
Computerised interpretation of FHR tracing
Compared with umbilical arterial blood pH and base excess.
Computer system classified 50 babies (69%) as normal, of whom 49 (98%) had an umbilical artery pH > 7.15. Of the 23 (31%) babies identified by the computer system as having acidosis, 7 (30%) had a pH < 7.15. The overall accuracy of the computer system was 77%, with a sensitivity of 88% and a specificity of 75%.
Computer system identified 50 (69%) babies as normal, 46 (92%) of whom had a base excess of >= -8mmol/l. Of the 23 babies (31%) classified by the computer system as abnormal, 13 (57%) had a base excess < -8mmol/l. The overall accuracy was 81% with a sensitivity of 76% and a specificity of 82%.
Not stated
Nielsen et al (1988) 499
Retrospective observational study (Denmark)
III 4 experienced obstetricians’ interpretation of 50 FHR tracings.
50 FHR tracings of the last 30 minutes of the first stage of labour.
Computerised interpretation of FHR tracing
compared with that of experienced clinicians. Reference standards: 1 minute Apgar score, umbilical artery pH, base excess and need for resuscitation.
Computer system was able to indicate whether a baby would be born in a healthy state or compromised with 86% accuracy. Specificity: 94%, Positive predictive value: 85%, Negative predictive value: 86%, Sensitivity: 69% - i.e. it did not identify 5 of the 16 compromised babies. This level of accuracy was higher than that obtained from the 4 obstetricians, the best of whom achieved the same degree of sensitivity but only 59% specificity (ie. correctly identifying 20 of the 34 healthy babies from their FHR tracing).
Not stated
Mongelli et al (1997) 500
Retrospective observational study. (UK)
III 12 clinical experts’ interpretation of 60 FHR tracings.
Sixty 40-minute sections of FHR recordings.
Computerised interpretation of FHR tracing
Compared with that of experienced clinicians.
Concordance between expert ratings and between computer interpretation and that of experts both high - r > 0.9. 95% confidence interval for the difference between computer and expert ratings was -12 to 15 bpm compared with -10 and 10 bpm for the difference between experts.
Not stated
55
acarty
Highlight
acarty
Highlight
acarty
Highlight
acarty
Highlight
acarty
Highlight
acarty
Highlight
acarty
Highlight
acarty
Highlight
acarty
Highlight
acarty
Highlight
acarty
Highlight
acarty
Highlight
acarty
Highlight
acarty
Highlight
acarty
Highlight
acarty
Highlight

Evidence tables
97
15. Is there evidence of factors or interventions that affect outcomes in term prelabour rupture of the membranes?
Surveillance following term prelabour rupture of membrane Bibliographic reference
Study type
Evidence level
Number of patients
Patient characteristics
Intervention Comparison Length of follow-up
Outcome measures Effect size Source of funding
Additional comments
Dare MR;Middleton P;Crowther CA;Flenady V;Varatharaju B; 2006 442
RCT Evidence level: 1+
12 trials involving 6814 women.
Women at term with pre-labour rupture of membranes (PRoM)
Intervention: Planned early birth (before 24 hours of PRoM) by induction of labour or caesarean section.
Comparison: Expectant management for at least 24 hours.
Follow-up period: Few days postantally (results from neonatal infection screen)
Outcome Measures: Women's outcomes: Maternal mortality Caesarean section Chorioamnionitis Endometritis Postpartum fever Operative vaginal birth Maternal satisfaction Views of care Neonatal outcomes: Mortality Neontal infection/sepsis Time from RoM to birth Apgar scores Use of mecahical ventilation
Planned vs. expectant Maternal mortality (1 trial): 0/61 vs. 0/62. CS (12 trials): 333/3401 vs. 360/3413; RR 0.94 (95% CI 0.82 to 1.08). Chorioamnionitis (9 trials): 226/3300 vs. 327/3311; RR 0.74 (95% CI 0.56 to 0.97). Endometritis (4 trials): 5/217 vs. 19/228; RR 0.30 (95% CI 0.12 to 0.74). Postpartum fever (5 trials): 82/2747 vs. 117/2774; (95% CI 0.69 to 1.17). Operative vaginal birth (7 trials): 487/2786 vs. 502/2825; RR 0.98 (0.84 to 1.16). Maternal satisfaction - "nothing liked" (1 trial): 138/2517 vs. 320/2524; RR 0.43 (95% CI 0.36 to 0.52). Maternal satisfaction - "nothing disliked" (1 trial): 821/2517 vs. 688/2524; RR 1.20 (95% CI 1.10 to 1.30). Fetal/perinatal mortality (6 trials): 3/2946 vs. 7/2924; RR 0.46 (95% CI 0.13 to 1.66). Time from RoM to birth (5 trials): WMD -9.53 hours (95% CI -12.96 to -6.10). Apgar score <7 at 5 mins. (7 trials): 335/3000 vs. 366/3005 (95% CI 0.81 to 1.07). Mechanical ventilation (3 trials): 25/2566 vs. 28/2592 (95% CI 0.46 to 2.12). Neonatal infection (10 trials): 74/3210 vs. 93/3196 (95% CI 0.61 to 1.12). NICU or SCBU admission (6 trials): 356/2825 vs. 484/2854; RR 0.73 (95% CI 0.58 to 0.91). Sub-group analyses: Parity - no significant differences found between nulliparous and multiparous women. Digital vaginal examinations vs. no digital vaginal examinations -
NHS programme for Research and Development, UK Dept. of Obstetrics and Gynaecology, The University of Adelaide, Australia.
The 12 included trials all involve women of at least 37 weeks completed pregnancy. 6 trials included induction of labour by oxytocin; 4 trials included induction of labour by prostaglandins, 1 trials included a comparison of induction of labour by oxytocin and prostaglandin; 1 trial involved induction of labour by Caulophyllum.
56

Intrapartum care
98
Bibliographic reference
Study type
Evidence level
Number of patients
Patient characteristics
Intervention Comparison Length of follow-up
Outcome measures Effect size Source of funding
Additional comments
Chorioamnionitis (4 trials vs. 2 trials): RR 1.00 (95% CI 0.43 to 2.33) vs. RR 0.97 (95% CI 0.69 to 1.35). Neonatal infection (3 trials vs. 2 trials): RR 0.43 (95% CI 0.12 to 1.52) vs. 0.44 (95% CI 0.05 to 3.60). Maternal antibiotic propylaxis (All women vs. some women): Chorioamnionitis (1 trial vs. 4 trials): RR 1.02 (95% CI 0.62 to 1.69) vs. RR 0.62 (0.51 to 0.76). Endometritis (2 trials vs. 2 trials): RR 0.26 (95% CI 0.09 to 0.74) vs. RR 0.44 (95% CI 0.07 to 2.93). Postpartum fever (1 trials vs. 2 trials): RR 0.42 (95% CI 0.12 to 1.49) vs. RR 0.75 (95% CI 0.55 to 1.02). Neonatal infection: 1 trial vs. 5 trials): 0.10 (95% CI 0.01 to 1.81) vs. 0.86 (95% CI 0.62 to 1.19).
Seaward PG;Hannah ME;Myhr TL;Farine D;Ohlsson A;Wang EE;Hodnett E;Haque K;Weston JA;Ohel G; 1998 Sep 300
Cohort Evidence level: 2+
Definite or probable neonatal infection - N=133 No infection N=4897
Women on labour at term with pre-labour RoM
Intervention: Predictors of neonatal infection including: parity, smoking, maternal Group B strep status, maternal antibiotics before birth.
Comparison: No neonatal infection
Follow-up period: Within 24 hours of birth
Outcome Measures: Neonatal infection: clinical signs of infection plus one of a number of clinical/lab. Tests inc. blood clultures and chest X-ray.
5 varibales found to be associated with definite or probable neonatal infection: clinical chorioamnionitis (OR 5.89, CI 3.68 to 9.43); postive maternal Group B strep status (OR 3.08, CI 2.02 to 4.68) 7 or 8 VE s (OR 2.37, CI 1.03 to 5.43); tinme from membrane rupture to active labour => 48 hours or 24 to < 48 hours vs. < 12 hours (Ors 2.25 and 1.97, CI s 1.21 to 4.18 and 1.11 to 3.48 respectively) and maternal antibiotics before birth (OR 1.63, CI 1.01 to 2.62).
Medical Research Council of Canada grant
Not causal.
57

Evidence tables
99
Place of care for women with term prelabour rupture of membrane Bibliographic reference
Study type
Evidence level
Number of patients
Patient characteristics
Intervention Comparison Length of follow-up
Outcome measures
Effect size Source of funding
Additional comments
Hannah ME;Hodnett ED;Willan A;Foster GA;Di Cecco R;Helewa M; 2000 Oct 443
Case-control
Evidence level: 2+
Home - 653 Hospital - 1017
Pre-labour RoM at term
Intervention: Management of pre-labour RoM at home
Comparison: Management in hospital
Follow-up period: Immediate PN period (exact length not stated)
Outcome Measures: Clinical chorioamnionitis Maternal antibiotics CS P-N fever Did not like anything labour care Would participate in study again Neonatal infection Care in NICU > 24 hours
Home vs. HospitalClinical chorioamnionitis: 10.1% vs. 6.4%, p=0.006 Maternal antibiotics: 28.2% vs. 17.5%, p<0.001 CS: 13.0% vs. 8.9%, p=0.007 P-N fever: NS Did not like anything labour care: 4.3% vs. 8.7%, p<0.001 Would participate in study again: 61.4% vs. 55.8%, p=0.02 Neonatal infection: NS Care in NICU > 24 hours: 13.0% vs. 9.1%, p=0.01 Neonatal antibiotics: 15.3% vs. 11.5%, p=0.02 Multiple logistic regression showed primips. more likely to receive antibiotics before birth if managed at home (OR 1.52, CI 1.04 to 2.24).
Grant from Canadian Medical Research Council
Nulliparous women even worse off with home management. Multips in home group more likely to say would participate in similar study again.
Jomeen J;Martin CR; 2002 444
Cross sectional study
Evidence level: 2-
Intervention group n=29 Control group n=27
Women with term PRoM over 37 weeks' gestation with low-risk pregnancies.
Intervention: Conservative management of term PRoM at home
Comparison: Compared with in-patient hospital care.
Follow-up period: Few days postnatally (results of infection screen)
Outcome Measures: PRoM to labour PRoM to birth Maternal infection screen (HVS) Neonatal infection Temperature on admission and onset of labour Mode of birth Labour onset Augmentation Apgar score at 1 and 5 mins.
Home vs. Hospital PRoM to labour (min.): 1270.46 (SD 697.02) vs. 1084.46 (SD 621.37), t va;ue 1.03, p=0.31. PRoM to birth (min.): 1883.61 (SD 761.73) vs. 1619.56 (706.61) Maternal infection (HVS on admission): 7/28 vs. 9/27, chi-square 0.46, p=0.49. Maternal infection (HVS at onset of labour): 14/24 vs. 11/23, chi-square 0.52, p=0.47. All maternal mean temperatures < 37.0 degrees C at 6, 12, 18 and 24 hours for both groups. Spontaneous vaginal birth: 24/29 vs. 22/27, NS. Spontaneous onset of labour: 17/29 vs. 17/27, chi-square 0.11, p=0.74. Labour augmented: 21/29 vs. 14/27, chi-square 2.52, p=0.11. Neonatal infection screen negative: 12/17 (12 not screened) vs. 11/12 (15 not screened), chi-square 2.98, p=0.23.
Not stated Underpowered, therefore findings not useful in deciding appropriate management.
58

Intrapartum care
100
Risk factors associated with maternal infection following prelabour rupture of membrane Bibliographic reference
Study type
Evidence level
Number of patients
Patient characteristics
Intervention Comparison Length of follow-up
Outcome measures
Effect size Source of funding
Additional comments
Dare MR;Middleton P;Crowther CA;Flenady V;Varatharaju B; 2006 442
RCT Evidence level: 1+
12 trials involving 6814 women.
Women at term with pre-labour rupture of membranes (PRoM)
Intervention: Planned early birth (before 24 hours of PRoM) by induction of labour or caesarean section.
Comparison: Expectant management for at least 24 hours.
Follow-up period: Few days postantally (results from neonatal infection screen)
Outcome Measures: Women's outcomes: Maternal mortality Caesarean section Chorioamnionitis Endometritis Postpartum fever Operative vaginal birth Maternal satisfaction Views of care Neonatal outcomes: Mortality Neonatal infection/sepsis Time from RoM to birth Apgar scores Use of mechanical ventilation
Planned vs. expectant Maternal mortality (1 trial): 0/61 vs. 0/62. CS (12 trials): 333/3401 vs. 360/3413; RR 0.94 (95% CI 0.82 to 1.08). Chorioamnionitis (9 trials): 226/3300 vs. 327/3311; RR 0.74 (95% CI 0.56 to 0.97). Endometritis (4 trials): 5/217 vs. 19/228; RR 0.30 (95% CI 0.12 to 0.74). Postpartum fever (5 trials): 82/2747 vs. 117/2774; (95% CI 0.69 to 1.17). Operative vaginal birth (7 trials): 487/2786 vs. 502/2825; RR 0.98 (0.84 to 1.16). Maternal satisfaction - "nothing liked" (1 trial): 138/2517 vs. 320/2524; RR 0.43 (95% CI 0.36 to 0.52). Maternal satisfaction - "nothing disliked" (1 trial): 821/2517 vs. 688/2524; RR 1.20 (95% CI 1.10 to 1.30). Fetal/perinatal mortality (6 trials): 3/2946 vs. 7/2924; RR 0.46 (95% CI 0.13 to 1.66). Time from RoM to birth (5 trials): WMD -9.53 hours (95% CI -12.96 to -6.10). Apgar score <7 at 5 mins. (7 trials): 335/3000 vs. 366/3005 (95% CI 0.81 to 1.07). Mechanical ventilation (3 trials): 25/2566 vs. 28/2592 (95% CI 0.46 to 2.12). Neonatal infection (10 trials): 74/3210 vs. 93/3196 (95% CI 0.61 to 1.12). NICU or SCBU admission (6 trials): 356/2825 vs. 484/2854; RR 0.73 (95% CI 0.58 to 0.91). Sub-group analyses: Parity - no significant differences found between nulliparous and multiparous women. Digital vaginal examinations vs. no digital vaginal examinations - Chorioamnionitis (4 trials vs. 2 trials): RR 1.00 (95% CI 0.43 to 2.33) vs. RR 0.97 (95% CI 0.69 to 1.35). Neonatal infection (3 trials vs. 2 trials): RR 0.43 (95%
NHSprogramme for Research and Development, UK Dept. of Obstetrics and Gynaecology, The University of Adelaide, Australia.
The 12 included trials all involve women of at least 37 weeks completed pregnancy. 6 trials included induction of labour by oxytocin; 4 trials included induction of labour by prostaglandins, 1 trials included a comparison of induction of labour by oxytocin and prostaglandin; 1 trial involved induction of labour by Caulophyllum.
59

Evidence tables
101
Bibliographic reference
Study type
Evidence level
Number of patients
Patient characteristics
Intervention Comparison Length of follow-up
Outcome measures
Effect size Source of funding
Additional comments
CI 0.12 to 1.52) vs. 0.44 (95% CI 0.05 to 3.60). Maternal antibiotic propylaxis (All women vs. some women): Chorioamnionitis (1 trial vs. 4 trials): RR 1.02 (95% CI 0.62 to 1.69) vs. RR 0.62 (0.51 to 0.76). Endometritis (2 trials vs. 2 trials): RR 0.26 (95% CI 0.09 to 0.74) vs. RR 0.44 (95% CI 0.07 to 2.93). Postpartum fever (1 trials vs. 2 trials): RR 0.42 (95% CI 0.12 to 1.49) vs. RR 0.75 (95% CI 0.55 to 1.02). Neonatal infection: 1 trial vs. 5 trials): 0.10 (95% CI 0.01 to 1.81) vs. 0.86 (95% CI 0.62 to 1.19).
Seaward PG;Hannah ME;Myhr TL;Farine D;Ohlsson A;Wang EE;Haque K;Weston JA;Hewson SA;Ohel G;Hodnett ED; 1997 Nov 446
Cohort Evidence level: 2+
SVD N=3589 Instrumental birth N=943 CS N=496 Total N= 5028
Women in labour at term with pre-labour RoM
Intervention: Predictors of clinical chorioamnionitis and postpartum fever inc. maternal age, smoking, Group B strep. Status.
Comparison: Women without clinical chorioamnionitis or postpartum fever.
Follow-up period: Exact duration not clear - extends to immediate PN period
Outcome Measures: Chorioamnionitis: Total duration of membrane rupture, latent interval, duration of active labour, number of V.E.s aftermembrane rupture, internal FHR monitoring, meconium stained liquor, onset of labour. Postpartum fever: As above plus mode of delivery.
335 women (6.7%) had clinical chorioamnionitis. 6 variables found to be independently associated with chorioamnionitis: > 8 Ves (OR 5.07, CI 2.51 to 10.25); duration of active labour => 12 hours (OR 4.12, CI 2.46 to 6.90); meconium stained liquor (OR 2.28, CI 1.67 to 3.12)time from RoM to onset of labour 24-48 hours (OR 1.77, CI 1.27 to 2.47); positive culture for Group B Strep. (OR 1.71, CI 1.23 to 2.38). 146 womn (3%) had postpartum fever. Most predictive variable for this was occurrence of clinical chorioamnionitis (OR 5.37, CI 3.6 to 8.0). Other predictrive variables inc. total duration of labour > 12 hours (OR 4.86, CI 2.07 to 11.41); caesarean birth (OR 3.97, CI 2.20 to 7.20) maternal antibiotic admin. Before birth (OR 1.94, CI 1.06 to 3.57) operative vaginal birth (OR 1.86, CI 1.15 to 3.00) and Group B strep colonisation (OR 1.88, CI 1.18 to 3.00).
Medical Research Council of Canada grant.
As before, theis is a retrospective analysis of association - no cause/effect can be proven.
Hannah ME;Hodnett ED;Willan A;Foster GA;Di Cecco R;Helewa M; 2000 Oct 443
Case-control
Evidence level: 2+
Home - 653 Hospital - 1017
Pre-labour RoM at term
Intervention: Management of pre-labour RoM at home
Comparison: Management in hospital
Follow-up period: Immediate PN period (exact length not stated)
Outcome Measures: Clinical chorioamnionitis Maternal antibiotics CS P-N fever Did not like anything abour care Would participate in study again Neonatal infection Care in NICU > 24 hours
Home vs. HospitalClinical chorioamnionitis: 10.1% vs. 6.4%, p=0.006 Maternal antibiotics: 28.2% vs. 17.5%, p<0.001 CS: 13.0% vs. 8.9%, p=0.007 P-N fever: NS Did not like anything abour care: 4.3% vs. 8.7%, p<0.001 Would participate in study again: 61.4% vs. 55.8%, p=0.02 Neonatal infection: NS Care in NICU > 24 hours: 13.0% vs. 9.1%, p=0.01 Neonatal antibiotics: 15.3% vs. 11.5%, p=0.02 Multiple logistic regression showed primips. more likely to receive antibiotics before birth if managed at home (OR 1.52, CI 1.04 to 2.24).
Grant from Canadian Medical Research Council
Nulliparous women even worse off with home management. Multips in home group more likely to say would participate in similar study again.
Apuzzio RCT Evidence Intervention Women at term (38 to Intervention: Comparison: Follow-up Outcome Measures: Expectant management vs. immediate induction of Not stated Lack of
60

Intrapartum care
102
Bibliographic reference
Study type
Evidence level
Number of patients
Patient characteristics
Intervention Comparison Length of follow-up
Outcome measures
Effect size Source of funding
Additional comments
JJ;Fenmore B;Ganesh V; 1990 447
level: 1- (conservative/expectant management) n=35 Control group (induction of labour) n=32
41 weeks) with PRoM Expectant management of term PRoM
Immediate induction of labour fro PRoM.
period: Few days postnatally (results from neonatal septic screen)
Duration of rupture of membranes Duration of labour Birth by caesarean section Number of Ves Intraamniotic infection Endmetritis Neonatal sepsis Apgar score < 7
labour Duration of labour (mean/hours): 10.44 (SD 5.5) vs. 14.1 (SD 6.0) Duration of ruptured membranes (mean/hours): 28.6 (SD 23.5) vs. 28.0 (SD 24.0) No. of V.E.s (mean): 3.9 vs. 5.7 Caesarean birth: 7/35 vs. 9/32, NS. Intraamniotic infection: 0/35 vs. 3/32, NS Endometritis: 4/35 vs. 10/32, p=0.04. Neonatal sepsis: 0/35 vs. 0/32. Apgar < 7: 1/35 vs. 2/32.
blinding and quasi-randomisation undermine the validity of the findings. This is compounded by the differences in length of labour and number of V.E.s between the 2 groups.
Ezra Y;Michaelson-Cohen R;Abramov Y;Rojansky N; 2004 448
Case controlled study
Evidence level: 2+
Cases n=132 Controls n=279
Women with term PRoM (>=37 weeks' gestation) and uncomplicated pregnancies. Cases - signs of infection Controls - no signs of infection
Intervention: Risk factors of matrnal or neonatal sepsis following term PRoM.
Comparison: Women with signs of infection following term PRoM compared with those with no signs of infection following term PRoM.
Follow-up period: Few days postnatally (results from neonatal infection screen)
Outcome Measures: Maternal infection Neonatal infection
Variables found to be independentaly associated with infections after term PRoM; Nulliparity: OR 1.92 (95% CI 1.19 to 3.00) >=7 V.E.s: OR 2.70 (95% CI 1.66 to 4.34) Caesarean birth: OR 4.16 (95% CI 2.02 to 9.01)
Not stated
61

Evidence tables
103
Use of intrapartum prophylactic antibiotics Bibliographic reference
Study type
Evidence level
Number of patients
Patient characteristics
Intervention
Comparison Length of follow-up
Outcome measures Effect size Source of funding
Additional comments
Flenady V;King J; 2002 450
Systematic review - meta-analysis
Evidence level: 1+
2 trials N=733 and N=105
Women in labour at term with pre-labour rupture of membranes.
Intervention: 2 RCTs of antibiotic prophylaxis
Comparison: Placebo or no treatment
Follow-up period: Not clear - but includes length of PN stay for mother and baby
Outcome Measures: Maternal infection (chorioamnionitis and endometritis) Maternal length of hospital stay Matrnal adverse drug reaction Apgar score at 5 min. Neonatal early onset infection Neonatal positive blood culture Length of neonatal stay Pneumonia Meningitis Neonatal mechanical ventilation Perinatal mortality
Use of antibiotics resulted in a signif. reduction in: endometritis (RR 0.09, CI 0.01 to 0.73); maternal infectious morbidity 3% vs. 7% (RR 0.43, CI 0.23 to 0.82. NNT 25, CI 14 to 100); and a reduction in the neonatal length of hospital stay (reported by 1 trial) (MD -0.90, CI -1.34 to -0.46).
Not stated Care needed in applying these findings to our population of women in spontaneous labour after term prelabour RoM. Would seem to apply to those women who go into labour withinn 24 hours (which is a large proportion)
Dare MR;Middleton P;Crowther CA;Flenady V;Varatharaju B; 2006 442
RCT Evidence level: 1+
12 trials involving 6814 women.
Women at term with pre-labour rupture of membranes (PRoM)
Intervention: Planned early birth (before 24 hours of PRoM) by induction of labour or caesarean section.
Comparison: Expectant management for at least 24 hours.
Follow-up period: Few days postantally (results from neonatal infection screen)
Outcome Measures: Women's outcomes: Maternal mortality Caesarean section Chorioamnionitis Endometritis Postpartum fever Operative vaginal birth Maternal satisfaction Views of care Neonatal outcomes: Mortality Neontal infection/sepsis Time from RoM to birth Apgar scores Use of mecahical ventilation
Planned vs. expectant Maternal mortality (1 trial): 0/61 vs. 0/62. CS (12 trials): 333/3401 vs. 360/3413; RR 0.94 (95% CI 0.82 to 1.08). Chorioamnionitis (9 trials): 226/3300 vs. 327/3311; RR 0.74 (95% CI 0.56 to 0.97). Endometritis (4 trials): 5/217 vs. 19/228; RR 0.30 (95% CI 0.12 to 0.74). Postpartum fever (5 trials): 82/2747 vs. 117/2774; (95% CI 0.69 to 1.17). Operative vaginal birth (7 trials): 487/2786 vs. 502/2825; RR 0.98 (0.84 to 1.16). Maternal satisfaction - "nothing liked" (1 trial): 138/2517 vs. 320/2524; RR 0.43 (95% CI 0.36 to 0.52). Maternal satisfaction - "nothing disliked" (1 trial): 821/2517 vs. 688/2524; RR 1.20 (95% CI 1.10 to 1.30). Fetal/perinatal mortality (6 trials): 3/2946 vs.
NHS programme for Research and Development, UK Dept. of Obstetrics and Gynaecology, The University of Adelaide, Australia.
The 12 included trials all involve women of at least 37 weeks completed pregnancy. 6 trials included induction of labour by oxytocin; 4 trials included induction of labour by prostaglandins, 1 trials included a comparison of induction of labour by oxytocin and prostaglandin; 1 trial involved induction of labour by
62

Intrapartum care
104
Bibliographic reference
Study type
Evidence level
Number of patients
Patient characteristics
Intervention
Comparison Length of follow-up
Outcome measures Effect size Source of funding
Additional comments
7/2924; RR 0.46 (95% CI 0.13 to 1.66).Time from RoM to birth (5 trials): WMD -9.53 hours (95% CI -12.96 to -6.10). Apgar score <7 at 5 mins. (7 trials): 335/3000 vs. 366/3005 (95% CI 0.81 to 1.07). Mechanical ventilation (3 trials): 25/2566 vs. 28/2592 (95% CI 0.46 to 2.12). Neonatal infection (10 trials): 74/3210 vs. 93/3196 (95% CI 0.61 to 1.12). NICU or SCBU admission (6 trials): 356/2825 vs. 484/2854; RR 0.73 (95% CI 0.58 to 0.91). Sub-group analyses: Parity - no significant differences found between nulliparous and multiparous women. Digital vaginal examinations vs. no digital vaginal examinations - Chorioamnionitis (4 trials vs. 2 trials): RR 1.00 (95% CI 0.43 to 2.33) vs. RR 0.97 (95% CI 0.69 to 1.35). Neonatal infection (3 trials vs. 2 trials): RR 0.43 (95% CI 0.12 to 1.52) vs. 0.44 (95% CI 0.05 to 3.60). Maternal antibiotic propylaxis (All women vs. some women): Chorioamnionitis (1 trial vs. 4 trials): RR 1.02 (95% CI 0.62 to 1.69) vs. RR 0.62 (0.51 to 0.76). Endometritis (2 trials vs. 2 trials): RR 0.26 (95% CI 0.09 to 0.74) vs. RR 0.44 (95% CI 0.07 to 2.93). Postpartum fever (1 trials vs. 2 trials): RR 0.42 (95% CI 0.12 to 1.49) vs. RR 0.75 (95% CI 0.55 to 1.02). Neonatal infection: 1 trial vs. 5 trials): 0.10 (95% CI 0.01 to 1.81) vs. 0.86 (95% CI 0.62 to 1.19).
Caulophyllum.
63

Evidence tables
105
Use of intrapartum prophylactic antibiotics Bibliographic reference
Study type
Evidence level
Number of patients
Patient characteristics
Intervention Comparison Length of follow-up
Outcome measures Effect size Source of funding
Additional comments
Flenady V;King J; 2002 450
Systematic review - meta-analysis
Evidence level: 1+
2 trials N=733 and N=105
Women in labour at term with pre-labour rupture of membranes.
Intervention: 2 RCTs of antibiotic prophylaxis
Comparison: Placebo or no treatment
Follow-up period: Not clear - but includes length of PN stay for mother and baby
Outcome Measures: Maternal infection (chorioamnionitis and endometritis) Maternal length of hospital stay Matrnal adverse drug reaction Apgar score at 5 min. Neonatal early onset infection Neonatal positive blood culture Length of neonatal stay Pneumonia Meningitis Neonatal mechanical ventilation Perinatal mortality
Use of antibiotics resulted in a signif. reduction in: endometritis (RR 0.09, CI 0.01 to 0.73); maternal infectious morbidity 3% vs. 7% (RR 0.43, CI 0.23 to 0.82. NNT 25, CI 14 to 100); and a reduction in the neonatal length of hospital stay (reported by 1 trial) (MD -0.90, CI -1.34 to -0.46).
Not stated Care needed in applying these findings to our population of women in spontaneous labour after term prelabour RoM. Would seem to apply to those women who go into labour withinn 24 hours (which is a large proportion)
Dare MR;Middleton P;Crowther CA;Flenady V;Varatharaju B; 2006 442
RCT Evidence level: 1+
12 trials involving 6814 women.
Women at term with pre-labour rupture of membranes (PRoM)
Intervention: Planned early birth (before 24 hours of PRoM) by induction of labour or caesarean section.
Comparison: Expectant management for at least 24 hours.
Follow-up period: Few days postantally (results from neonatal infection screen)
Outcome Measures: Women's outcomes: Maternal mortality Caesarean section Chorioamnionitis Endometritis Postpartum fever Operative vaginal birth Maternal satisfaction Views of care Neonatal outcomes: Mortality Neontal infection/sepsis Time from RoM to birth Apgar scores Use of mecahical ventilation
Planned vs. expectant Maternal mortality (1 trial): 0/61 vs. 0/62. CS (12 trials): 333/3401 vs. 360/3413; RR 0.94 (95% CI 0.82 to 1.08). Chorioamnionitis (9 trials): 226/3300 vs. 327/3311; RR 0.74 (95% CI 0.56 to 0.97). Endometritis (4 trials): 5/217 vs. 19/228; RR 0.30 (95% CI 0.12 to 0.74). Postpartum fever (5 trials): 82/2747 vs. 117/2774; (95% CI 0.69 to 1.17). Operative vaginal birth (7 trials): 487/2786 vs. 502/2825; RR 0.98 (0.84 to 1.16). Maternal satisfaction - "nothing liked" (1 trial): 138/2517 vs. 320/2524; RR 0.43 (95% CI 0.36 to 0.52). Maternal satisfaction - "nothing disliked" (1 trial): 821/2517 vs. 688/2524; RR 1.20 (95% CI 1.10 to 1.30). Fetal/perinatal mortality (6 trials): 3/2946 vs. 7/2924; RR 0.46 (95% CI 0.13 to
NHS programme for Research and Development, UK Dept. of Obstetrics and Gynaecology, The University of Adelaide, Australia.
The 12 included trials all involve women of at least 37 weeks completed pregnancy. 6 trials included induction of labour by oxytocin; 4 trials included induction of labour by prostaglandins, 1 trials included a comparison of induction of labour by oxytocin and prostaglandin; 1 trial involved induction of labour by Caulophyllum.
64
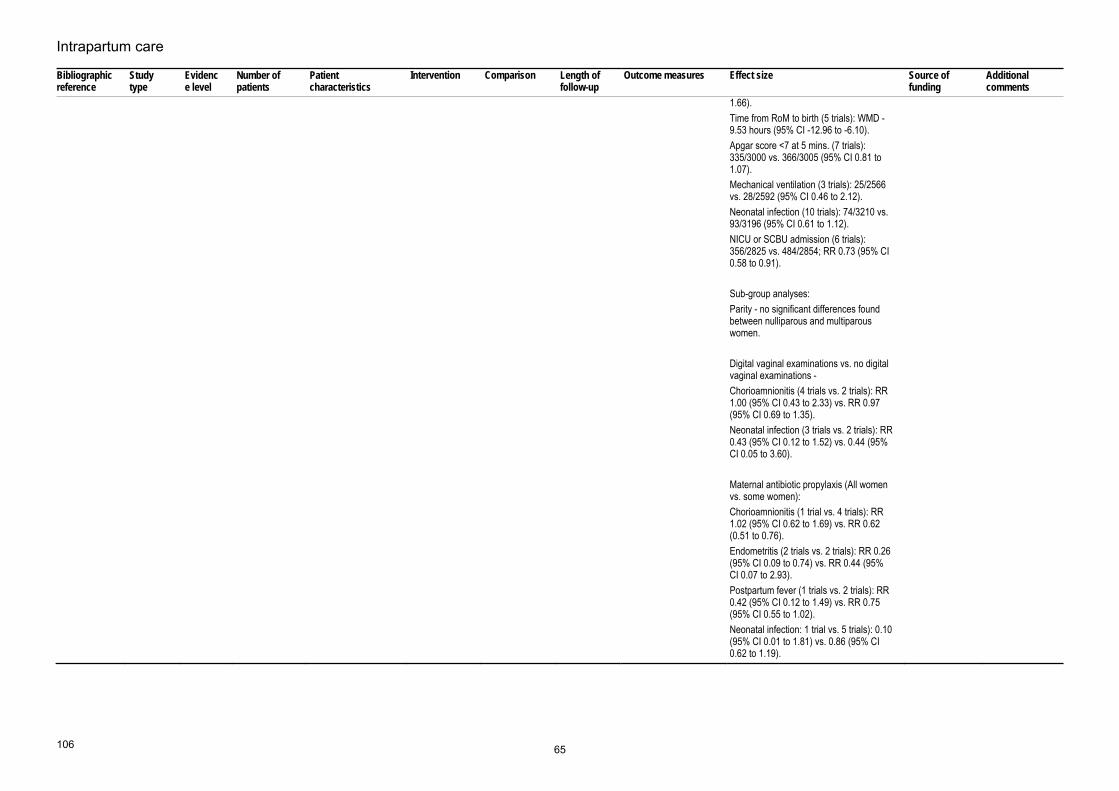
Intrapartum care
106
Bibliographic reference
Study type
Evidence level
Number of patients
Patient characteristics
Intervention Comparison Length of follow-up
Outcome measures Effect size Source of funding
Additional comments
1.66).Time from RoM to birth (5 trials): WMD -9.53 hours (95% CI -12.96 to -6.10). Apgar score <7 at 5 mins. (7 trials): 335/3000 vs. 366/3005 (95% CI 0.81 to 1.07). Mechanical ventilation (3 trials): 25/2566 vs. 28/2592 (95% CI 0.46 to 2.12). Neonatal infection (10 trials): 74/3210 vs. 93/3196 (95% CI 0.61 to 1.12). NICU or SCBU admission (6 trials): 356/2825 vs. 484/2854; RR 0.73 (95% CI 0.58 to 0.91). Sub-group analyses: Parity - no significant differences found between nulliparous and multiparous women. Digital vaginal examinations vs. no digital vaginal examinations - Chorioamnionitis (4 trials vs. 2 trials): RR 1.00 (95% CI 0.43 to 2.33) vs. RR 0.97 (95% CI 0.69 to 1.35). Neonatal infection (3 trials vs. 2 trials): RR 0.43 (95% CI 0.12 to 1.52) vs. 0.44 (95% CI 0.05 to 3.60). Maternal antibiotic propylaxis (All women vs. some women): Chorioamnionitis (1 trial vs. 4 trials): RR 1.02 (95% CI 0.62 to 1.69) vs. RR 0.62 (0.51 to 0.76). Endometritis (2 trials vs. 2 trials): RR 0.26 (95% CI 0.09 to 0.74) vs. RR 0.44 (95% CI 0.07 to 2.93). Postpartum fever (1 trials vs. 2 trials): RR 0.42 (95% CI 0.12 to 1.49) vs. RR 0.75 (95% CI 0.55 to 1.02). Neonatal infection: 1 trial vs. 5 trials): 0.10 (95% CI 0.01 to 1.81) vs. 0.86 (95% CI 0.62 to 1.19).
65

Evidence tables
107
Prolonged rupture of membrane and intrapartum fever as risk factors of neonatal infection Bibliographic reference
Study type
Evidence level
Number of patients
Patient characteristics
Intervention Comparison Length of follow-up
Outcome measures
Effect size Source of funding
Additional comments
Seaward PG;Hannah ME;Myhr TL;Farine D;Ohlsson A;Wang EE;Hodnett E;Haque K;Weston JA;Ohel G; 1998 Sep 300
Cohort Evidence level: 2+
Definite or probable neonatal infection - N=133 No infection N=4897
Women on labour at term with pre-labour RoM
Intervention: Predictors of neonatal infection including: parity, smoking, maternal Group B strep status, maternal antibiotics before birth.
Comparison: No neonatal infection
Follow-up period: Within 24 hours of birth
Outcome Measures: Neonatal infection: clinical signs of infection plus one of a number of clinical/lab. Tests inc. blood cultures and chest X-ray.
5 variables found to be associated with definite or probable neonatal infection: clinical chorioamnionitis (OR 5.89, CI 3.68 to 9.43); positive maternal Group B strep status (OR 3.08, CI 2.02 to 4.68) 7 or 8 VE s (OR 2.37, CI 1.03 to 5.43); tinme from membrane rupture to active labour => 48 hours or 24 to < 48 hours vs. < 12 hours (Ors 2.25 and 1.97, CI s 1.21 to 4.18 and 1.11 to 3.48 respectively) and maternal antibiotics before birth (OR 1.63, CI 1.01 to 2.62).
Medical Research Council of Canada grant
Not causal.
Heath 2004 453 Cross sectional study
3 N=568 All infants with group B streptococcal disease younger than 90days
Prolonged rupture of membrane>18h
No prolonged rupture of membrane
Neonatal group B streptococcal disease
44% had prolonged rupture of membrane assumed incidence of GBS disease 0.72 per 1000 livebirths [0.66 to 0.78]
Nil
Oddie 2002 455 Case-control study
2+ N=37 cases of GBS disease and N=147 hospital control
Early onset neonatal group B streptococcal sepsis
Prolonged rupture of membrane >18h and prelabour rupture of membrane
no prolonged rupture of membrane >18h or prelabour rupture of membrane
Neonatal Early onset neonatal group B streptococcal sepsis
Prolonged rupture of membrane >18hAdjusted RR 4.8 [0.98 to 23.1] Prelabour rupture of membrane Adjusted RR 3.6 [0.7 to 17.6]
Northern Neonatal Network
Anderson 2004 454
Cross sectional study
3 N=61 Infants with blood culture positive GBS sepsis or meningitis
Prolonged rupture of membrane and maternal pyrexia
No prolonged rupture of membrane and maternal pyrexia
neonatal blood culture positive GBS sepsis or meningitis
Prolonged rupture of membrane19% Maternal pyrexia 16%
Not stated
Bramer 1997 451
Case control study
2+ N=41 cases plus N=123 hospital controls
Neonatal early onset GBS related cases
Maternal pyrexia and prolonged rupture of membrane
No maternal pyrexia and prolonged rupture of membrane
neonatal Maternal pyrexia and prolonged rupture of membrane
Maternal temperature increases by 0.1 degree above 37.4 degree OR 2.0 [95% CI 1.4 to 2.8] Interval from rupture of membrane to birth OR per hour between 8 and 24 hours 1.0 [95% CI 0.92 to 1.1] Prolonged rupture of membrane OR 2.0 [95% CI 0.47 to 9.6]
Not stated
Marlowe 1997 456
Cohort study
2- Infants of 205 women with a history of
Infants of women with a history of prolonged rupture
prolonged rupture of
No prolonged rupture of
Neonatal Neonatal infection 8.2% yielded positive blood culture, where 0.1% had positive blood culture from the remaining 8586 infants of mothers without prolonged rupture of
Not stated
66
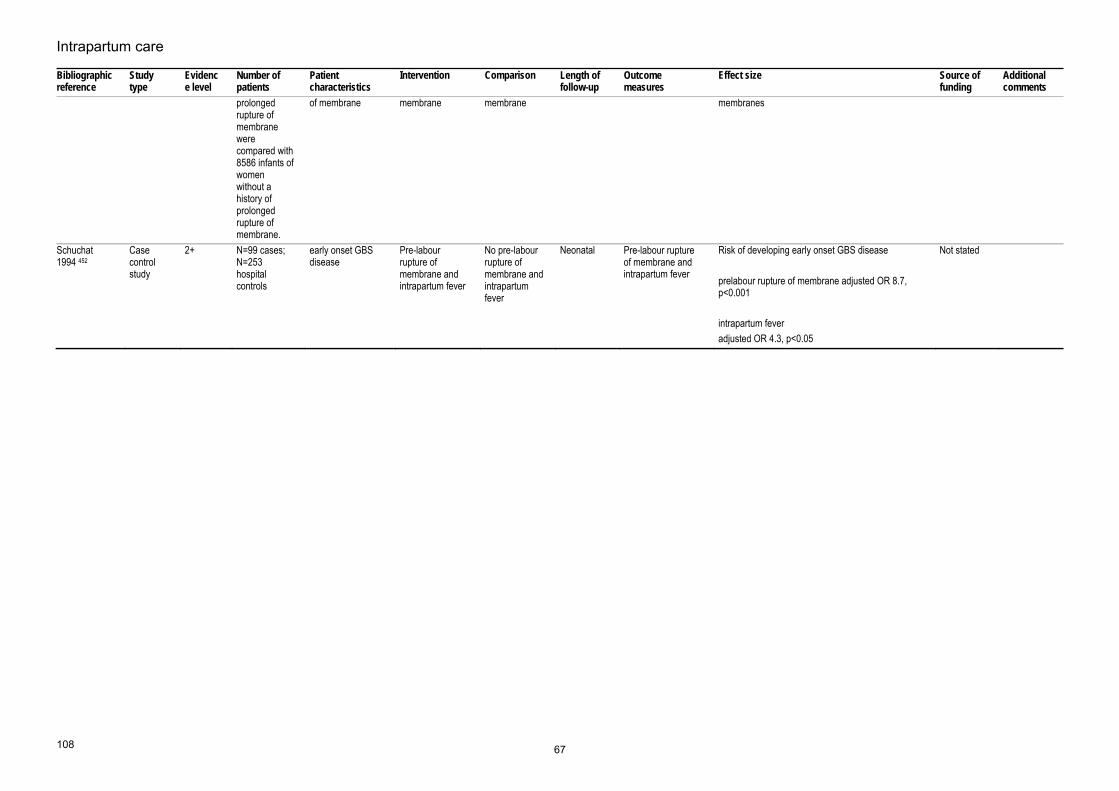
Intrapartum care
108
Bibliographic reference
Study type
Evidence level
Number of patients
Patient characteristics
Intervention Comparison Length of follow-up
Outcome measures
Effect size Source of funding
Additional comments
prolonged rupture of membrane were compared with 8586 infants of women without a history of prolonged rupture of membrane.
of membrane membrane membrane membranes
Schuchat 1994 452
Case control study
2+ N=99 cases; N=253 hospital controls
early onset GBS disease
Pre-labour rupture of membrane and intrapartum fever
No pre-labour rupture of membrane and intrapartum fever
Neonatal Pre-labour rupture of membrane and intrapartum fever
Risk of developing early onset GBS disease prelabour rupture of membrane adjusted OR 8.7, p<0.001 intrapartum fever adjusted OR 4.3, p<0.05
Not stated
67

Evidence tables
109
Clinical manifestation of babies Bibliographic reference
Study type
Evidence level
Number of patients
Patient characteristics
Intervention Comparison Length of follow-up
Outcome measures
Effect size Source of funding
Additional comments
Marlowe 1997 456
Cohort study
2+ N=175 Infants of women with a history of prolonged rupture of membrane
prolonged rupture of membrane
6 symptomaticinfants were compared with 9 asymptomatic infants
Neonatal Neonatal infection Out of the six symptomatic infants, all had abnormal complete blood counts (abnormal white blood cell counts 2; abnomal neutrophil count 5; high band/metamyelocyte count 4; increased immature to total neutrophil ratio 4). Of the nine asymptomatic infants, seven had abnormal complete blood counts, five with high white blood cell count, five with a high neutrophil count, two had a high band/metamyelocyte count, and one with a high immature to total neutrophil. The sensitivity of the complete blood count was 86% and specificity 66%
Not stated
68

Intrapartum care
110
Clinical manifestation of babies Bibliographic information
Study type and evidence level
Aim of study Number of patients and patient characteristics
Population characteristics Outcome measures
Results and comments Study summary Reviewer comment
Escobar 2000 458 Case-series evidence level=3
Onset of symptoms for neonatal infection
N=18299 newborns with 2000gm BW or greater N=2785 with complete blood count and/or blood culture
N=18299 newborns with 2000gm BW or greater N=2785 with complete blood count and/or blood culture
Age at developing sepsis
75.8% of infants with sepsis were first noted to be at risk for sepsis before or at the moment of birth, and 91.2% were identified by 12 hours of age
Lin 2001457 Case series Onset of symptoms for neonatal infection
N=109 Newborn infants37% of preterm infants who developed GBS sepsis
Age at developing sepsis (GBS)
The median age at onset was 20 minutes ranging from 0 to 77 hours 63% of the infants showed clinical signs within one hour of age and 90% were symptomatic within 12 hours
69

Evidence tables
111
Postnatal prophylactic antibiotics for babies Bibliographic reference
Study type
Evidence level
Number of patients
Patient characteristics
Intervention Comparison Length of follow-up
Outcome measures Effect size Source of funding
Additional comments
RLS Ungerer, O Lincetto, W McGuire, H Saloojee, AM Gulmezoglu 2006 459
Systematic review
1+ 2 RCT ( but 1RCT cannot be applied treatment (n = 24) and a non-treatment group (n = 25). )
Asymptomatic term newborn infants, in the first day of life, born to mothers having one or more risk factors for neonatal infection, and who did or did not receive intrapartum antibiotic treatment
Immediate, prophylactic use of antibiotics,
later, selective use of antibiotics based on clinical or laboratory evidence suggesting infection
neonatal Neonatal mortality, all causes Neonatal sepsis (confirmed with positive blood culture) Any systemic neonatal infection: sepsis, pneumonia, meningitis, other deep infection such as osteomyelitis (as defined by researchers) Admission to neonatal intensive care unit with signs of infection Secondary outcomes: Neonatal mortality due to infection Use of antibiotics (proportion receiving any antibiotics) Unsatisfactory clinical or bacteriologic response after 48-72 hours of treatment, necessitating change in antibiotic regimen Total days of antibiotics Side effects of antibiotics (fungal infection, diarrhea, other) Readmission to hospital with signs of infection Length of hospital stay
Neonatal sepsis. (RR 0.12 [95% CI 0.01 to 2.04])
Nil
Escobar 2000 458
Cohort study
2+ N=18299 newborns with 2000gm BW or greater N=2785 with complete blood count and/or blood culture
newborns of 2000g or more, without major abnormalities for sepsis
initial asymptomatic status
symptomatic neonatal Risk of neonatal infection Risk of infection OR 0.27 [95% CI 0.11 to 0.65] highest antepartum temperature 101.5F or higher: OR 5.78 [95% CI 1.57 to 21.29] Rupture of membrane for 12 hours or longer OR 2.05 [95% CI 1.06 to 3.96] low absolute neutrophil count for age OR 2.82 [95% CI 1.50 to 5.34] meconium in amniotic fluid OR 2.24 [95% CI 1.19 to 4.22]
Not stated
70

Intrapartum care
118
17. What is the effectiveness of the following interventions or techniques in labour on outcomes?
Eating and drinking in labour Bibliographic reference
Study type
Evidence level
Number of women
Women’s characteristics
Intervention Comparison Length of follow-up
Outcome measures
Effect size Source of funding
Additional comments
Gyte G;Richens Y; 2006 111
Systematic review
Evidence level: 1+
3 RCTs- 2465 women. + 578 women intervention - one of three antacids control-nothing/ each other + 1287 women intervention- H2 receptor antagonist control -antacid + 600 women intervention - 2 dopamine antagonists control- saline/each other
Women in normal labour singleton full-term pregnancy cephalic position
Intervention: 3 RCTs were identified that assessed the routine administration of drugs (antacids, H2 receptor antagonists, dopamine antagonists) compared with placebo/ no treatment and compared with other drugs for reducing the incidence of gastric aspiration
Comparison: For each set of studies: a group of drugs vs placebo/ no treatment or, drugs from one group vs drugs from another or drugs within groups. Women who ate vs those who did not. Women who had narcotic pain relief vs those who did not.
Follow-up period: Intrapartum period
Outcome Measures: primary outcome measure - incidence of gastric aspiration in the mother. Other maternal outcomes: signs of gastric aspiration adverse effects of drugs morbidity mortality haemorrhage CS general anaesthesia Neonatal outcomes: apgar score admission to special care adverse effects of drugs morbidity mortality establishment of breast feeding long term effects
Vomiting: antacids vs no intervention (RR 0.46, 95% CI 0.27 - 0.77, n=578) Gelusil vs Maalox (RR 0.83, 95% CI 0.39 - 1.75, n=300) Gelusil vs Mylanta II (RR 1.32, 95% CI 0.58 - 2.99, n=325) Maalox vs Mylanta II (RR 1.59, 95% CI 0.69 - 3.65, n= 285) H2 receptor antagonists vs antacids (RR 0.96, 95% CI 0.73 - 1.27, n=1287) dopamine antagonist with pethidine vs placebo / no treatment with pethidine (RR 0.40, 95% CI 0.23-0.68, n= 584) metoclopramide vs perphenazine (RR 1.45, 95% CI 0.47 - 1.47, n=393) H2 receptor antagonist vs antacids CS (RR 0.93, 95% CI 0.59 - 1.47, n=1287) emergency general anaesthesia (RR 0.92, 95% CI 0.62 - 1.35, n= 1287) postpartum haemmorhage (RR 0.83, 95% CI 0.08 - 9.14, n= 1287) stillbirth (RR 0.69, 95% CI 0.17 - 2.89, n=1287)
University College Hospitals London UK
Evidence presented in Cochrane review is limited, and trial numbers are too small to be conclusive about the effect of anatacids, dopamine antagonists and H2 receptor antagonists on vomiting and other outcomes
71
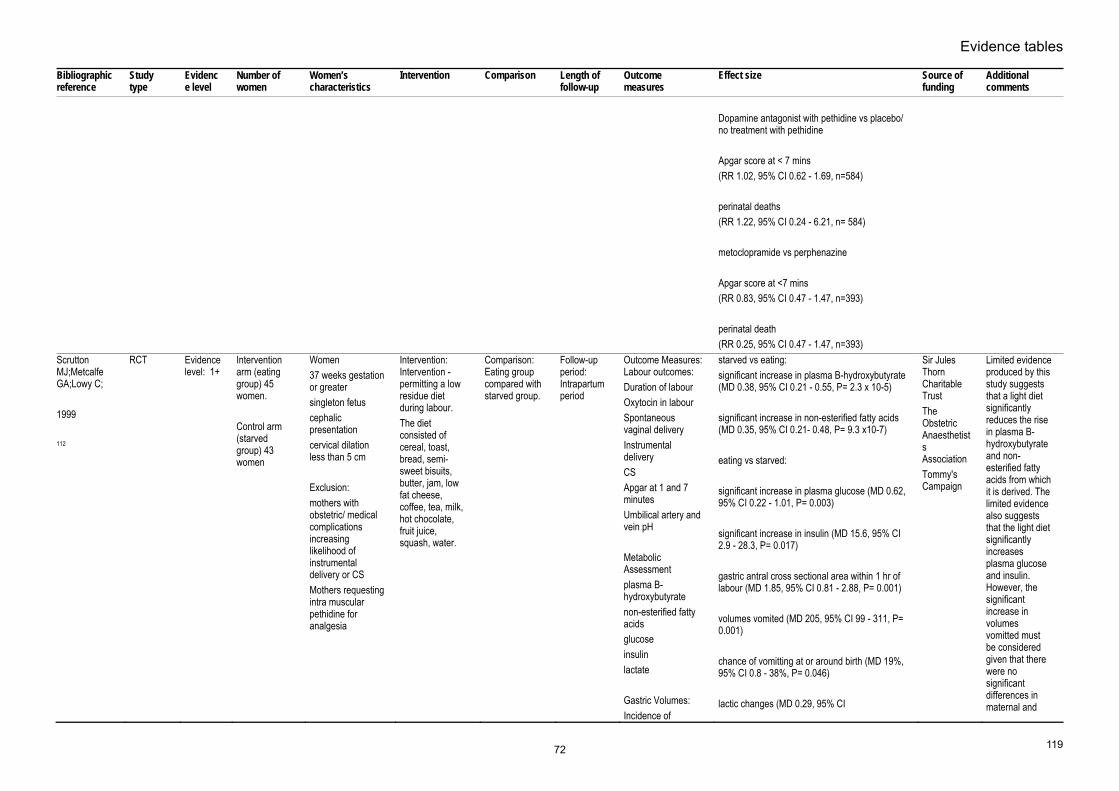
Evidence tables
119
Bibliographic reference
Study type
Evidence level
Number of women
Women’s characteristics
Intervention Comparison Length of follow-up
Outcome measures
Effect size Source of funding
Additional comments
Dopamine antagonist with pethidine vs placebo/ no treatment with pethidine Apgar score at < 7 mins (RR 1.02, 95% CI 0.62 - 1.69, n=584) perinatal deaths (RR 1.22, 95% CI 0.24 - 6.21, n= 584) metoclopramide vs perphenazine Apgar score at <7 mins (RR 0.83, 95% CI 0.47 - 1.47, n=393) perinatal death (RR 0.25, 95% CI 0.47 - 1.47, n=393)
Scrutton MJ;Metcalfe GA;Lowy C; 1999 112
RCT Evidence level: 1+
Intervention arm (eating group) 45 women. Control arm (starved group) 43 women
Women37 weeks gestation or greater singleton fetus cephalic presentation cervical dilation less than 5 cm Exclusion: mothers with obstetric/ medical complications increasing likelihood of instrumental delivery or CS Mothers requesting intra muscular pethidine for analgesia
Intervention: Intervention - permitting a low residue diet during labour. The diet consisted of cereal, toast, bread, semi-sweet bisuits, butter, jam, low fat cheese, coffee, tea, milk, hot chocolate, fruit juice, squash, water.
Comparison: Eating group compared with starved group.
Follow-up period: Intrapartum period
Outcome Measures: Labour outcomes: Duration of labour Oxytocin in labour Spontaneous vaginal delivery Instrumental delivery CS Apgar at 1 and 7 minutes Umbilical artery and vein pH Metabolic Assessment plasma B-hydroxybutyrate non-esterified fatty acids glucose insulin lactate Gastric Volumes: Incidence of
starved vs eating: significant increase in plasma B-hydroxybutyrate (MD 0.38, 95% CI 0.21 - 0.55, P= 2.3 x 10⁻⁵) significant increase in non-esterified fatty acids (MD 0.35, 95% CI 0.21- 0.48, P= 9.3 x10⁻⁷) eating vs starved: significant increase in plasma glucose (MD 0.62, 95% CI 0.22 - 1.01, P= 0.003) significant increase in insulin (MD 15.6, 95% CI 2.9 - 28.3, P= 0.017) gastric antral cross sectional area within 1 hr of labour (MD 1.85, 95% CI 0.81 - 2.88, P= 0.001) volumes vomited (MD 205, 95% CI 99 - 311, P= 0.001) chance of vomitting at or around birth (MD 19%, 95% CI 0.8 - 38%, P= 0.046) lactic changes (MD 0.29, 95% CI
Sir Jules Thorn Charitable Trust The Obstetric Anaesthetists Association Tommy's Campaign
Limited evidence produced by this study suggests that a light diet significantly reduces the rise in plasma B-hydroxybutyrate and non-esterified fatty acids from which it is derived. The limited evidence also suggests that the light diet significantly increases plasma glucose and insulin. However, the significant increase in volumes vomitted must be considered given that there were no significant differences in maternal and
72

Intrapartum care
120
Bibliographic reference
Study type
Evidence level
Number of women
Women’s characteristics
Intervention Comparison Length of follow-up
Outcome measures
Effect size Source of funding
Additional comments
vomittingvolume of vomitting gastric antral cross sectional area
-0.71 to 0.12, P=0.167) No difference in labour and fetal outcomes (only means (SD) reported
fetal outcomes.
Scheepers H;Thans MCJ;de Jong PA;Esses GGM;Le Cessie S;Kanhai HH; 2002 115
RCT Evidence level: 1+
carbohydrate solution group - 102 women placebo group - 99 women
nulliparous womensingleton fetus cephalic presentation early labour ( 2cm - 4cm ) Exclusion criteria elective CS multiple preganancies diabetic direct risk for CS
Intervention: Caloric intake in early stages of labour : a) influence incidence of vaginal and abdominal instrumental deliveries b) effect on labour progression
Comparison: women in carbohydrate group compared with women in placebo group small standardised amounts of food and drink were allowed on specific demand
Follow-up period: intrapartum period
Outcome Measures: Maternal outcomes: Duration of labour need for augmentation and pain medication incidence of abdominal and vaginal instrumental deliveries Fetal Outcomes: fetal presentation Bith weight Apgar scores fetal arterial cord pH
carbohydrate vs placebo: need for augmentation (RR 0.83, 95% CI 0.55 - 1.26) need for opiates (RR 0.96, 95% CI 0.44 - 2.11) epidural (RR 1.56, 95% CI 0.89 - 2.73) Entonox (RR 3.64, 95% CI 0.72 - 15.8) spontaneous birth (RR 0.90, 95% CI 0.68 - 1.17) instrumental births ( RR 0.78, 95% CI 0.52 - 1.17) CS (RR 2.9, 95% CI 1.29 - 6.54) Carb vs placebo gps - no significant difference in Apgar scores at 1 min (P= 0.17) Apgar scores at 5 mins (P= 0.18) Arterial umbilical cord pH ( P= 0.07)
Not disclosed
There is no evidence of difference in labour progression, need for pain medication, mode of birth and fetal outcomes between the two groups.
Scheepers HC;de Jong PA;Essed GG;Kanhai HH; 2004 Dec 113
RCT Evidence level: 1+
carbohydrate solution group - 100 placebo group - 102
included: nulliparous women singleton fetus cephalic presentation Excluded: diabetics risk for CS pre-term birth
Intervention: Caloric intake (oral carbohydrate ingestion) just before start of second stage of labour : a) effect on clincal outcome b) effect on maternal and fetal metabolism
Comparison: Carbohydrate group vs placebo group for clinical outcomes Subgroup of 30 women ( 15 each arm) to assess effect of oral carb intake on maternal and fetal metabolites.
Follow-up period: Intrapartum period
Outcome Measures: Maternal: progression of labour Need for augmentation mode of birth reasons for instrumental births Neonatal outcomes: Apgar at 1 minute Apgar at 5 minutes Arterial umbilical cord ph
carbohydrate vs placebo ( maternal outcomes) spontaneous birth ( RR 0.15, 95% CI 0.88 - 1.30) instrumental birth ( RR 1.05, 95% CI 0.69 - 1.60) CS (RR 0.15, 95% CI 0.02 - 1.16) carbohydrate vs placebo (no significant differences in neonatal outcomes) Apgar scores at 1 min (P = 0.22) Apgar scores at 5 mins (P= 0.32)
Not reported There is no evidence of difference in mode of birth and fetal and neonatal acid base balance between the two groups during labour.
73
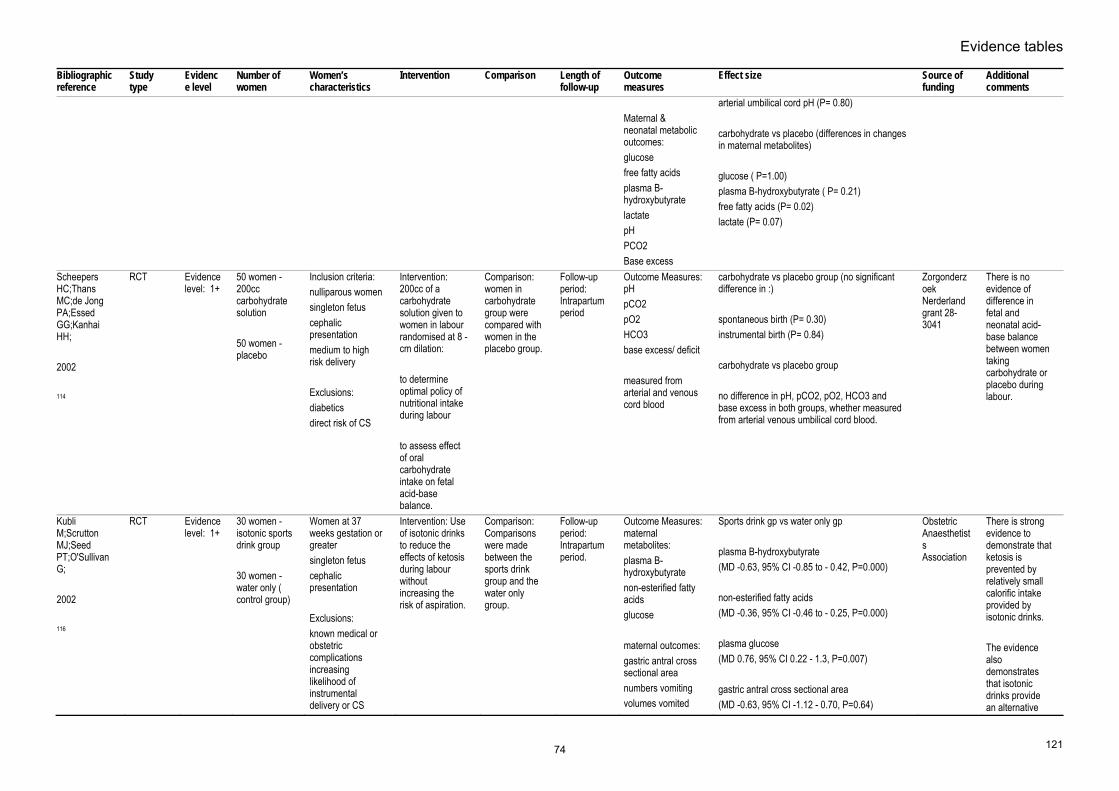
Evidence tables
121
Bibliographic reference
Study type
Evidence level
Number of women
Women’s characteristics
Intervention Comparison Length of follow-up
Outcome measures
Effect size Source of funding
Additional comments
Maternal & neonatal metabolic outcomes: glucose free fatty acids plasma B-hydroxybutyrate lactate pH PCO2 Base excess
arterial umbilical cord pH (P= 0.80) carbohydrate vs placebo (differences in changes in maternal metabolites) glucose ( P=1.00) plasma B-hydroxybutyrate ( P= 0.21) free fatty acids (P= 0.02) lactate (P= 0.07)
Scheepers HC;Thans MC;de Jong PA;Essed GG;Kanhai HH; 2002 114
RCT Evidence level: 1+
50 women - 200cc carbohydrate solution 50 women - placebo
Inclusion criteria: nulliparous women singleton fetus cephalic presentation medium to high risk delivery Exclusions: diabetics direct risk of CS
Intervention: 200cc of a carbohydrate solution given to women in labour randomised at 8 - cm dilation: to determine optimal policy of nutritional intake during labour to assess effect of oral carbohydrate intake on fetal acid-base balance.
Comparison: women in carbohydrate group were compared with women in the placebo group.
Follow-up period: Intrapartum period
Outcome Measures: pH pCO2 pO2 HCO3 base excess/ deficit measured from arterial and venous cord blood
carbohydrate vs placebo group (no significant difference in :) spontaneous birth (P= 0.30) instrumental birth (P= 0.84) carbohydrate vs placebo group no difference in pH, pCO2, pO2, HCO3 and base excess in both groups, whether measured from arterial venous umbilical cord blood.
Zorgonderzoek Nerderland grant 28-3041
There is no evidence of difference in fetal and neonatal acid-base balance between women taking carbohydrate or placebo during labour.
Kubli M;Scrutton MJ;Seed PT;O'Sullivan G; 2002 116
RCT Evidence level: 1+
30 women - isotonic sports drink group 30 women - water only ( control group)
Women at 37 weeks gestation or greater singleton fetus cephalic presentation Exclusions: known medical or obstetric complications increasing likelihood of instrumental delivery or CS
Intervention: Use of isotonic drinks to reduce the effects of ketosis during labour without increasing the risk of aspiration.
Comparison: Comparisons were made between the sports drink group and the water only group.
Follow-up period: Intrapartum period.
Outcome Measures: maternal metabolites: plasma B-hydroxybutyrate non-esterified fatty acids glucose maternal outcomes: gastric antral cross sectional area numbers vomiting volumes vomited
Sports drink gp vs water only gp plasma B-hydroxybutyrate (MD -0.63, 95% CI -0.85 to - 0.42, P=0.000) non-esterified fatty acids (MD -0.36, 95% CI -0.46 to - 0.25, P=0.000) plasma glucose (MD 0.76, 95% CI 0.22 - 1.3, P=0.007) gastric antral cross sectional area (MD -0.63, 95% CI -1.12 - 0.70, P=0.64)
Obstetric Anaesthetists Association
There is strong evidence to demonstrate that ketosis is prevented by relatively small calorific intake provided by isotonic drinks. The evidence also demonstrates that isotonic drinks provide an alternative
74

Intrapartum care
122
Bibliographic reference
Study type
Evidence level
Number of women
Women’s characteristics
Intervention Comparison Length of follow-up
Outcome measures
Effect size Source of funding
Additional comments
labour ourcomes: duration of labour oxytocin mode of birth Neonatal outcomes: Apgar<7 at 1 min Apgar < 7 at 5 mins umbilical artery pH umbilical vein pH
volume vomited within 1 hr of birth (MD 65, 95% CI -141- 271, P=0.49) volume vomited throughout labour (MD 66, 95% CI -115 - 246, P=0.46) No significant difference in labour outcomes (data presented as means)
source of nutrition that is rapidly emptied from the stomach and absorbed by the GI tract There is limited evidence that labour outcomes were not compromised in either group.
75

Evidence tables
123
Mobilisation Bibliographic reference
Study type
Evidence level
Number of women
Women’s characteristics
Intervention Comparison Length of follow-up
Outcome measures
Effect size Source of funding
Additional comments
Simkin & O’Hara, 2002 86
Systematic review
1- N=2773 women
14 RCTs involving women in labour
Upright position during first stage of labour
Horizontal position during first stage of labour
Immediate PN period
Pain: maternal perceptions and observer ratings. Uterine contractions: intensity, frequency, efficiency. Women’s preferences
One consistent finding across studies: none report higher degree of comfort in the supine position.
Not stated The included trials are of variable quality and include different outcome measures. Hence the low EL grading and the inability to pool data.
Bloom et al, 1998 87
RCT 1+ N=1067 women
Women with uncomplicated pregnancies in active labour between 36 and 41 weeks gestation.
Walking during the first stage of labour
No walking (usual care)
Duration of established labour
Length of labour (first stage and first+second stage) Labour augmentation with IV oxytocin Episiotomy Shoulder dystocia Mode of birth: spontaneous, forceps, caesarean section Apgar scores (1 and 5 min) Umbilical artery pH Intubation in delivery room Neonatal seizures
No significant differences between groups for any of the studies maternal or infant outcomes.
Not stated Country: US
MacLennan et al, 1994 88
RCT 1+ N=196 women
Women in established labour following an uncomplicated pregnancy, with a single fetus between 37 and 42 weeks gestation
Walking during the first stage of labour
Recumbent position during labour
Duration of established labour
Length of labour (total duration) Labour augmentation with IV oxytocin Epidural analgesia Narcotic analgesia Abnormal CTG Apgar scores (1 and 5 min)
No significant differences found between groups. The Queen Victoria Hospital Research Foundation Hewlett Packard ltd. Cadbury Schweppes Pty Ltd.
Only 37 of the 96 women allocated to the ambulant group (39%) actually chose to ambulate for 30 mins. or longer.
76

Intrapartum care
124
Bibliographic reference
Study type
Evidence level
Number of women
Women’s characteristics
Intervention Comparison Length of follow-up
Outcome measures
Effect size Source of funding
Additional comments
Mode of birth Country: Australia
Flynn et al, 1978 89
RCT 1- N=68 women
Women inestablished labour who had expressed antenatally a desire to be ambulant during labour
Walking during the first stage of labour
Lateral position in bed
Duration of established labour
Fetal heart rate patterns: accelerations, decelerations, beat-to-beat variation Length of first stage of labour Uterine contractions: strength, frequency Need for augmentation: IV oxytocin, IV prostaglandin, oral prostaglandin Epidural analgesia Narcotic analgesia Mode of birth: spontaneous, assisted breech, forceps, caesarean section Third stage blood loss Apgar scores (1 and 5 min)
Fetal heart rate: More women in ambulant group had fetal heart rate accelerations (10 vs. 1, p<0.01) and fewer decelerations 4 vs. 17, p<0.005) First stage of labour significantly shorter (4.1 vs. 6.7 hours, p<0.001) Contractions were less frequent in the ambulant group (8.53 vs. 10.13 in 30 min, p<0.05) but stronger (55.53 vs. 46.54 mmHg, p<0.005) Significantly more ambulant women used no analgesia during labour (20 vs. 0, p<0.001) The overall dose of pethidine administered to ambulant women was signif. lower (103 vs. 153 mg, p<0.001) Apgar scores were significantly better for babies born to women in the ambulant group (1 min: 8.8 vs. 7.5, p<0.001; 5 min: 9.9 vs. 9.4, p<0.05
Not stated Country: UK
Molina et al, 1997 90
RCT 1+ 100 women acting as their own controls (ie. alternating between positions)
Women in established labour
Vertical position during first stage of labour
Horizontal position during first stage of labour
Established labour until to end of first stage of labour
Pain (maternal perception)
As labour progressed women reported less pain in the horizontal position compared with the vertical position: For continuous abdominal pain: 4-5 cm p<0.05 8-9 cm p<0.05 For continuous lumbar pain: 6-7 cm p<0.05 8-9 cm p<0.05 Abdominal pain during contractions: 6-7 cm p<0.01 8-9cm p< 0.05 Lumbar pain during contractions: 4-5 cm p<0.05 6-7 cm p< 0.01
Argentine Foundation Against Pain
Country: Argentina
77

Evidence tables
125
Bibliographic reference
Study type
Evidence level
Number of women
Women’s characteristics
Intervention Comparison Length of follow-up
Outcome measures
Effect size Source of funding
Additional comments
8-9 cm p<0.05
Andrews & Chrzanowski, 1990 91
RCT 1+ N=40 women
Primiparous women in spontaneous labour at 38-42 weeks’ gestation following an uncomplicated pregnancy with a single fetus presenting head first in an anterior position.
Upright position for first stage of labour
Recumbent position for first stage of labour
Study period: 4-9 cm cervical dilation
Length of most active phase of labour (4-9 cm cervical dilation) Maternal comfort (as measured by observer)
Women in upright group had signif. shorter active phase of labour (mean difference 90.25 minutes, p=0.003). No signif. difference was found re women’s comfort in labour
Not stated Country:US
78

Intrapartum care
126
Routine interventions in first stage of labour – active management of the first stage of labour Bibliographic reference
Study type
Evidence level
Number of women
Women’s characteristics
Intervention Comparison Length of follow-up
Outcome measures
Effect size Source of funding
Additional comments
Frigoletto FD;Lieberman E;Lang JM;Cohen A;Barss V;Ringer S;Datta S; 1995 Sep 21 316
RCT Evidence level: 1+
N=1934 (active =1017; usual =1017)
women in labourfull-term pregnancy singleton vertex spontaneous onset of labour no complication
Intervention: Active management of labour (one-to-one nursing care; standardised criteria for the diagnosis of labour; amniotomy within one hour; cervical examination every two hour; oxytocin 4-40mU per min)
Comparison: usual care
Follow-up period: intra-partum
Outcome Measures: Method of delivery; use of epidural
Spontaneous Vaginal DeliveryRR 1.1 [0.8 to 1.4] Instrumental vaginal delivery RR 0.8 [0.6 to 1.2] CS - stage 1 RR 0.9 [0.5 to 1.4] CS - stage 2 RR 0.9 [0.3 to 2.4] Epidural RR 0.8 [0.8 to 0.9] Fever (women) RR 0.6 [0.4 to 0.9]
the National Institute of Child Health and Human Development and by Brigham and Women's Hospital and the Harvard Community Health Foundation
Rogers R;Gilson GJ;Miller AC;Izquierdo LE;Curet LB;Qualls CR; 1997 317
RCT Evidence level: 1+
N=405 (active=200; routine=205)
low risk women in labour nulliparous
Intervention: Active management (diagnosis of labour; early amniotomy; high dose oxytocin for slow in progress (6-36 mL per min; 2-hourly cervical examination; one-to-one nursing support)
Comparison: routine care
Follow-up period: intrapartum
Outcome Measures: length of labour; mode of delivery; neonatal outcomes; complication
EpiduralRR 1.03 [0.85 to 1.24] length of labour - first stage active=8.5(4.5SD) control=10.1(5.9SD) p<0.001 length of labour - second stage active=1.0(1.0SD) control=1.1(1.4SD) p=ns Spontaneous vaginal delivery RR 1.04 [0.92 to 1.17] CS RR 0.64 [0.35 to 1.18] Fever (women) RR 1.06 [0.65 to 1.74] Apgar score < 7 at 5 min RR 1.03 [0.15 to 7.21] NICU admission RR 0.26 [0.03 to 2.27]
National Center for Research Resources
Sadler LC;Davison T;McCowan LM; 2000 Jul
RCT Evidence level: 1+
N=651 (active=320; routine=331)
nulliparouswomen in spontaneous labour at term singleton
Intervention: active management of labour (labour defined as regular painful contractions
Comparison: routine care
Follow-up period: 6 weeks
Outcome Measures: mode of deliver, duration of labour, and maternal satisfaction
EpiduralRR 1.08 [0.92 to 1.28] Spontaneous vaginal delivery RR 0.96 [0.87 to 1.05] CS RR 0.97 [0.60 to 1.56]
Auckland Health Care, the Health Research Council of New Zealand, and the Evelyn Bond Obstetric Research Fund
79

Evidence tables
127
Bibliographic reference
Study type
Evidence level
Number of women
Women’s characteristics
Intervention Comparison Length of follow-up
Outcome measures
Effect size Source of funding
Additional comments
318
cephalicwithout fetal distress
occurring at least once in five minutes lasting at least 40 seconds, early amniotomy, two hourly vaginal examination, oxytocin for slow progress)
Admission to neonatal unitRR 1.10 [0.57 to 2.14] Maternal Infectious morbidity RR 1.12 [0.72 to 1.74] Satisfied with labour and delivery care RR 1.04 [0.94 to 1.15] Would choose the same management plan RR 1.05 [0.94 to 1.18]
Tabowei TO;Oboro VO; 2003 Jan 319
RCT Evidence level: 1+
N=549 (active=221; routine=227)
women in spontaneous labour nulliparous singleton cephalic no complication
Intervention: active management (diagnosis of labour; one-to-one constant support by nurse-midwife; early amniotomy; two hourly vaginal examination; oxytocin (6-36 mU per min) for slow progress)
Comparison: routine management
Follow-up period: intra-partum
Outcome Measures: duration of labour; mode of delivery
duration of labour - first stageactive=271(69SD) routine=394(70SD) p<0.001 duration of labour -second stage active=60(13SD) routine=62(13SD) p=0.10
not stated
80

Intrapartum care
128
Routine interventions in first stage of labour – partogram line management Bibliographic reference
Study type
Evidence level
Number of women
Women’s characteristics
Intervention Comparison Length of follow-up
Outcome measures
Effect size Source of funding
Additional comments
Lavender T;Alfirevic Z;Walkinshaw S; 1998 Sep 302
RCT Evidence level: 1++
N=928 (2h=315, 3h=302, 4h=311)
primigravid women with uncomplicated pregnancies who presented in spontaneous labour at term
Intervention: to have their progress of labour recorded on a partogram with an actional line 2 and 3 hours to the right of the alert line. If the progress reached the actional line, a diagnosis of prolonged labour was made and managed to a protocol
Comparison: to have their progress of labour recorded on a partogram with an actional line 4 hours to the right of the alert line.
Follow-up period: intrapartum period
Outcome Measures: CS, maternal satisfaction, augmentation, duration of labour, analgesia, PPH, Apgar score and admission to neonatal unit
2h vs 4hRandomisation - delivery time Median D -7min [-52 to 36] Action line crossed OR 1.5 [1.2 to 2.1] Action taken OR 1.3 [0.9 to 1.9] Amniotomy only OR 0.9 [0.6 to 1.3] Syntocinon used OR 1.0 [0.7 to 1.4] Epidural OR 1.3 [0.9 to 1.8] Blood loss more than 500mls OR 1.0 [0.6 to 1.6] Satisfaction Score MD 3.5 [1.7 to 5.3] CS total OR 0.8 [0.5 to 1.2] CS fetal distress OR 1.0 [0.4 to 2.4] CS failure to progress OR 0.7 [0.4 to 1.3] Instrumental delivery OR 0.9 [0.6 to 1.4] Apgar score less than 7 at 5min OR 1.5 [0.4 to 7.3] SCBU admission OR 3.9 [0.4 to 191.2] 3h vs 4h Randomisation - delivery time Median D 17min [-28 to 60] Action line crossed OR 1.1 [0.8 to 1.6] Action taken OR 1.2 [0.8 to 1.7] Amniotomy only
Not stated
81

Evidence tables
129
Bibliographic reference
Study type
Evidence level
Number of women
Women’s characteristics
Intervention Comparison Length of follow-up
Outcome measures
Effect size Source of funding
Additional comments
OR 1.1 [0.8 to 1.5]Syntocinon used OR 1.1 [0.8 to 1.6] Epidural OR 1.0 [0.7 to 1.4] Blood loss more than 500mls OR 1.4 [0.8 to 2.4] Satisfaction Score MD 1.7 [-0.8 to 3.5] CS total OR 1.8 [1.1 to 3.2] CS fetal distress OR 1.8 [0.6 to 5.5] CS failure to progress OR 1.8 [0.9 to 3.4] Instrumental delivery OR 0.9 [0.6 to 1.4] Apgar score less than 7 at 5min OR 0.8 [0.2 to 3.9] SCBU admission OR 0.5 [0.009 to 9.9] 2h vs 4h Randomisation - delivery time Median D 10min [-35 to 54] Action line crossed OR 1.7 [1.3 to 2.4] Action taken OR 1.6 [1.1 to 2.2] Amniotomy only OR 1.0 [0.7 to 1.4] Syntocinon used OR 1.2 [0.9 to 1.6] Epidural OR 1.3 [1.8 to 0.9] Blood loss more than 500mls OR 1.0 [0.6 to 1.6] Satisfaction Score MD 5.2 [3.4 to 7.0] CS total
82

Intrapartum care
130
Bibliographic reference
Study type
Evidence level
Number of women
Women’s characteristics
Intervention Comparison Length of follow-up
Outcome measures
Effect size Source of funding
Additional comments
OR 1.4 [0.8 to 2.4]CS fetal distress OR 1.7 [0.6 to 5.2] CS failure to progress OR 1.2 [0.6 to 2.4] Instrumental delivery OR 0.9 [0.6 to 1.3] Apgar score less than 7 at 5min OR 1.2 [0.3 to 5.0] SCBU admission OR 2.0 [0.3 to 22.0]
Pattinson RC;Howarth GR;Mdluli W;Macdonald AP;Makin JD;Funk M; 2003 May 303
RCT Evidence level: 1++
N=696 (aggressive=344; expectant=350)
healthy nulliparous women in active labour, at term, with a health singleton pregnancy cephalic presentation
Intervention: aggressive management (using a single line partogram, a vaginal examination every two hours and use of an oxytocin infusion if the line was crossed)
Comparison: expectant management (using a two line partogram, with the alert line and a parallel action line four hours to the right, with a vaginal examination every four hours. If the action line was reached, oxytocin was started)
Follow-up period: one month
Outcome Measures: CS, augmentation, neonatal outcomes, perinatal death
CSRR 0.68 [0.50 to 0.93] Operative deliveries RR 0.73 [0.56 to 0.96] Oxytocin use RR 1.51 [1.10 to 2.07] Received Analgesia RR 1.01 [0.93 to 1.11] Apgar <8 at 1 min RR 1.24 [0.93 to 1.65] Perinatal death RR 7.12 [0.37 to 137.37]
the South African Medical Research Council
83

Evidence tables
131
Routine interventions in first stage of labour – routine amniotomy Bibliographic reference
Study type
Evidence level
Number of women
Women’s characteristics
Intervention Comparison Length of follow-up
Outcome measures
Effect size Source of funding
Additional comments
Cammu 1996321
RCT 1+ N=306 (intervention=152; control=154)
Nulliparous women in labour
Early routine amniotomy with selective oxytocin
Conservative management
Perinatal Mode of birth, interventions, duration of labour and neonatal outcomes
Epidural RR 1.11 [0.78 to 1.56]Spontaneous vaginal birth RR 0.99 [0.88 to 1.11] CS RR 1.52 [0.44 to 5.28] Duration of first stage WMD -29.00min [-62.08 to 4.08] Duration of second stage WMD 2.00min [-1.92 to 5.92] Apgar score less than 7 at 5 minute RR 1.27 [0.35 to 4.63] Admission to neonatal unit RR 0.38 [0.10 to 1.41]
Not stated Belgium New meta-analysis was performed
Lopez-Zeno JA;Peaceman AM;Adashek JA;Socol ML; 1992 Feb 13 322
RCT Evidence level: 1+
N=705 (active=351; traditional=354)
women in labournulliparous singleton cephalic no complication spontaneous labour
Intervention: active management(amniotomy within one hour of start of labour; cervical examination every two hour; augmentation of oxytocin (6-36mU per min)
Comparison: traditional management
Follow-up period: intra-partum
Outcome Measures: mode of delivery; epidural; length of labour; complications; neonatal outcomes
EpiduralRR 1.00 [0.91 to1.10] CS 0.75 [0.50 to 1.11] Spontaneous vaginal delivery 1.11 [0.98 to 1.25] length of labour - first stage active=5.05(2.33SD) control=6.72(3.64SD) p<0.001 length of labour - second stage active=1.44(0.97SD) control=1.43(1.08SD) p=ns chorioamnionitis RR 0.46 [0.26 to 0.82] NNT=18.77 endometritis RR 0.50 [0.22 to 1.16]
not stated
84

Intrapartum care
132
Routine interventions in first stage of labour – routine “amniotomy and oxytocin” Bibliographic reference
Study type
Evidence level
Number of women
Women’s characteristics
Intervention Comparison Length of follow-up
Outcome measures
Effect size Source of funding
Additional comments
Cohen 1987 323
RCT 1+ N=150 (intervention=75; control=75)
Nulliparous women in labour with mixed ethnicity
Use of oxytocin in addition to early routine amniotomy
Conservative management of labour
Perinatal Mode of birth, duration of labour and neonatal outcomes
Spontaneous vaginal birth RR 0.97 [95% CI 0.82 to 1.14] CS RR 0.91 [95% CI 0.41 to 2.01] Latent phase MD –0.73 hours [95% CI -0.84 to –0.62] Active phase MD 0.24 hours [95% CI 0.12 to 0.36] Deceleration phase MD 0.00 hours [-0.02 to 0.02] Apgar score 1 min MD 0.35 [95% CI 0.30 to 0.40] 5 min MD 0.02 95% CI [0.00 to 0.04]
Not stated
85

Evidence tables
133
Interventions for perceived delay in first stage of labour – amniotomy versus expectant management Bibliographic reference
Study type
Evidence level
Number of women
Women’s characteristics
Intervention Comparison Length of follow-up
Outcome measures
Effect size Source of funding
Additional comments
Fraser WD;Turcot L;Krauss I;Brisson-Carrol G; 2005 537
Systematic review - meta-analysis
Evidence level: 1++
9 trials women requiring augmentation
Intervention: amniotomy
Comparison: an attempt to conserve the membranes
Follow-up period: N/A
Outcome Measures: Labour events, mode of delivery, maternal complication, neonatal outcomes, maternal satisfaction, duration of labour
Amniotomy to shorten spontaneous labourCessation of contractions 1trial 925women OR 0.33 [0.17, 0.64] Use of oxytocin 8 trials 3908 women OR 0.79 [0.67, 0.92] Use of analgesia (epidural/narcotics) 7 trials 3459 women OR 0.99 [0.84, 1.17] Dystocia 1 trial 925 women OR 0.63 [0.48, 0.82] Cord prolapse 1 trial 925 women OR 0.14 [0.00, 6.84] Abnormal or suspect fetal heart rate 3 trials 1217 women OR 1.06 [0.80, 1.42] Caesarean section 8 trials 4008 women OR 1.26 [0.96, 1.66] Instrumental vaginal delivery 8 trials
No sources of support supplied
86
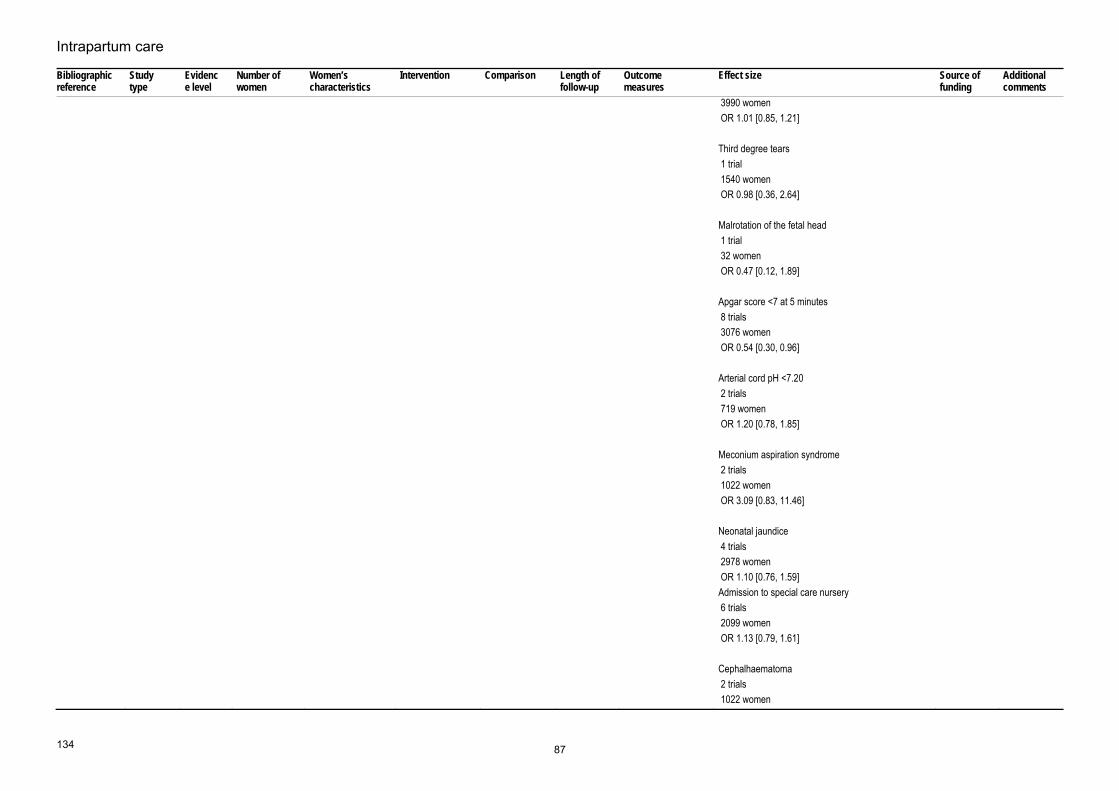
Intrapartum care
134
Bibliographic reference
Study type
Evidence level
Number of women
Women’s characteristics
Intervention Comparison Length of follow-up
Outcome measures
Effect size Source of funding
Additional comments
3990 women OR 1.01 [0.85, 1.21] Third degree tears 1 trial 1540 women OR 0.98 [0.36, 2.64] Malrotation of the fetal head 1 trial 32 women OR 0.47 [0.12, 1.89] Apgar score <7 at 5 minutes 8 trials 3076 women OR 0.54 [0.30, 0.96] Arterial cord pH <7.20 2 trials 719 women OR 1.20 [0.78, 1.85] Meconium aspiration syndrome 2 trials 1022 women OR 3.09 [0.83, 11.46] Neonatal jaundice 4 trials 2978 women OR 1.10 [0.76, 1.59] Admission to special care nursery 6 trials 2099 women OR 1.13 [0.79, 1.61] Cephalhaematoma 2 trials 1022 women
87
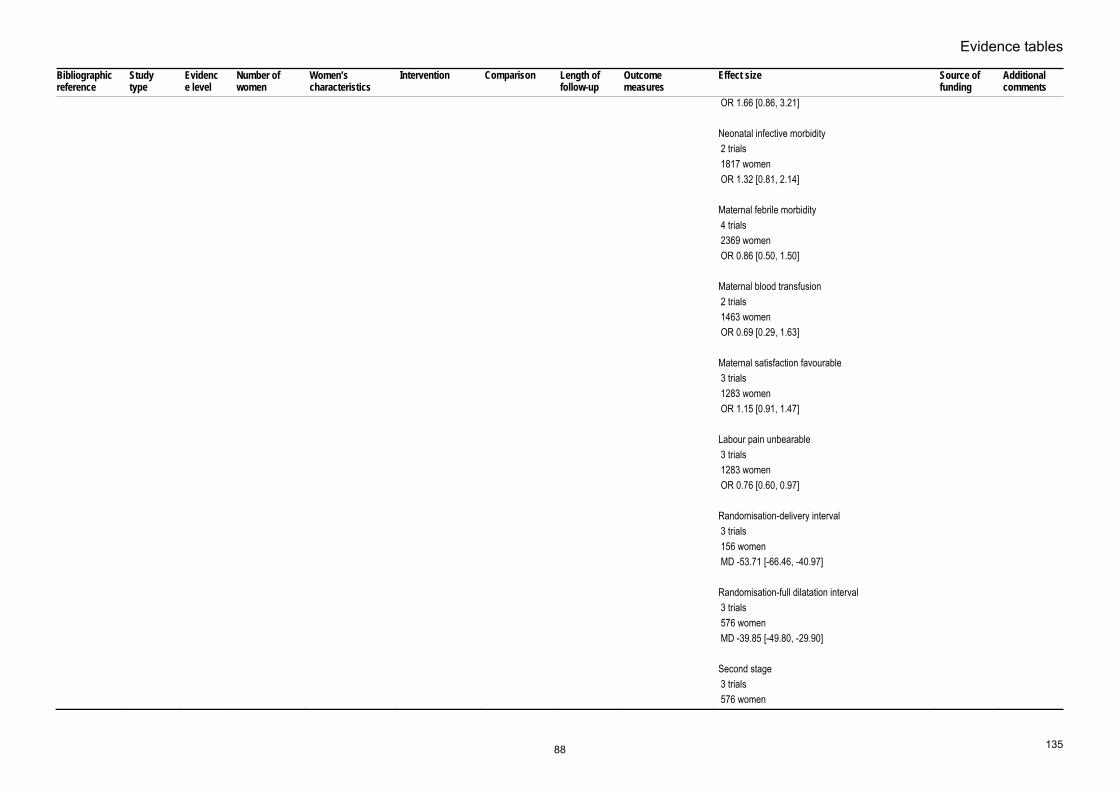
Evidence tables
135
Bibliographic reference
Study type
Evidence level
Number of women
Women’s characteristics
Intervention Comparison Length of follow-up
Outcome measures
Effect size Source of funding
Additional comments
OR 1.66 [0.86, 3.21] Neonatal infective morbidity 2 trials 1817 women OR 1.32 [0.81, 2.14] Maternal febrile morbidity 4 trials 2369 women OR 0.86 [0.50, 1.50] Maternal blood transfusion 2 trials 1463 women OR 0.69 [0.29, 1.63] Maternal satisfaction favourable 3 trials 1283 women OR 1.15 [0.91, 1.47] Labour pain unbearable 3 trials 1283 women OR 0.76 [0.60, 0.97] Randomisation-delivery interval 3 trials 156 women MD -53.71 [-66.46, -40.97] Randomisation-full dilatation interval 3 trials 576 women MD -39.85 [-49.80, -29.90] Second stage 3 trials 576 women
88

Intrapartum care
136
Bibliographic reference
Study type
Evidence level
Number of women
Women’s characteristics
Intervention Comparison Length of follow-up
Outcome measures
Effect size Source of funding
Additional comments
MD -3.06 [-6.21, 0.10] Amniotomy to shorten spontaneous labour in nulliparae Cessation of contractions 1 trial 925 women OR 0.33 [0.17, 0.64] Use of oxytocin 5 trials 2404 women OR 0.87 [0.73, 1.04] Use of analgesia (epidural/narcotics) 5 trials 2403 women OR 0.94 [0.76, 1.15] Dystocia 1 trial 925 women OR 0.63 [0.48, 0.82] Cord prolapse 1 trial 925 women OR 0.14 [0.00, 6.84] Abnormal or suspect fetal heart rate 1 trial 694 women OR 0.93 [0.67, 1.31] Caesarean section 5 trials 2517 women OR 1.14 [0.85, 1.54] Instrumental vaginal delivery
89

Evidence tables
137
Bibliographic reference
Study type
Evidence level
Number of women
Women’s characteristics
Intervention Comparison Length of follow-up
Outcome measures
Effect size Source of funding
Additional comments
5 trials 2488 women OR 1.03 [0.85, 1.24] Malrotation of the fetal head 1 trial 32 women OR 0.47 [0.12, 1.89] Apgar score <7 at 5 minutes 5 trials 2518 women OR 0.94 [0.67, 1.33] Arterial cord pH <7.20 2 trials 719 women OR 1.20 [0.78, 1.85] Meconium aspiration syndrome 2 trials 1022 women OR 3.09 [0.83, 11.46] Neonatal jaundice 3 trials 2383 women OR 1.05 [0.70, 1.58] Admission to special care nursery 4 trials 1996 women OR 1.13 [0.78, 1.62] Cephalhaematoma 2 trials 1022 women OR 1.66 [0.86, 3.21] Neonatal infective morbidity
90

Intrapartum care
138
Bibliographic reference
Study type
Evidence level
Number of women
Women’s characteristics
Intervention Comparison Length of follow-up
Outcome measures
Effect size Source of funding
Additional comments
2 trials 1353 women OR 1.43 [0.85, 2.41] Maternal febrile morbidity 4 trials 2369 women OR 0.86 [0.50, 1.50] Maternal blood transfusion 2 trials 1463 women OR 0.69 [0.29, 1.63] Maternal satisfaction favourable 3 trials 1283 women OR 1.15 [0.91, 1.47] Labour pain unbearable 3 trials 1283 women OR 0.76 [0.60, 0.97] Randomisation-delivery interval 2 trials 117 women MD -53.67 [-66.50, -40.83] Randomisation-full dilatation interval 3 trials 298 women MD -39.45 [-50.10, -28.80] Second stage 3 trials 308 women MD -3.02 [-6.25, 0.21] Amniotomy to shorten spontaneous labour in multiparae
91

Evidence tables
139
Bibliographic reference
Study type
Evidence level
Number of women
Women’s characteristics
Intervention Comparison Length of follow-up
Outcome measures
Effect size Source of funding
Additional comments
Use of oxytocin 1 trial 940 women OR 1.22 [0.67, 2.21] Use of analgesia (epidural/narcotics) 1 trial 940 women OR 1.14 [0.80, 1.63] Caesarean section 1 trial 940 women OR 2.65 [0.75, 9.29] Instrumental vaginal delivery 1 trial 940 women OR 1.20 [0.65, 2.21] Neonatal jaundice 1 trial 531 women OR 3.61 [0.89, 14.75] Randomisation-full dilatation interval 1 trial 269 women MD -54.00 [-101.37, -6.63] Second stage 1 trial 269 women MD -3.20 [-14.72, 8.32]
92

Intrapartum care
140
Interventions for perceived delay in first stage of labour – amniotomy and oxytocin versus oxytocin Bibliographic reference
Study type
Evidence level
Number of women
Women’s characteristics
Intervention Comparison Length of follow-up
Outcome measures
Effect size Source of funding
Additional comments
Rouse DJ;McCullough C;Wren AL;Owen J;Hauth JC; 1994 Jun 538
RCT Evidence level: 1+
N=118 (amniotomy=58; control=60)
Nulliparous and Parous women with active phase arrest
Intervention: routine amniotomy followed by oxytocin
Comparison: oxytocin followed by selective amniotomy
Follow-up period: intra-partum
Outcome Measures: duration to delivery, mode of delivery, neonatal outcomes, maternal complication
randomisation to deliveryMD -0.70 [-1.55 to 0.15] CS RR 1.21 [0.34 to 4.28] Maternal Infection Amniotomy=7/60 Control=0/58 P=0.01 Neonatal infection RR 4.83 [0.58 to 40.13]
not stated
93

Evidence tables
141
Interventions for perceived delay in first stage of labour – amniotomy and oxytocin versus oxytocin Bibliographic reference
Study type
Evidence level
Number of women
Women’s characteristics
Intervention Comparison Length of follow-up
Outcome measures
Effect size Source of funding
Additional comments
Cardozo L; Pearce JM; 1990 Feb 539
RCT Evidence level: 1+
N=926 (oxytocin=465; control=461)
women requiring augmentation (active phase abnormalities) Nulliparous and parous
Intervention: Amniotomy and oxytocin
Comparison: amniotomy only
Follow-up period: intra-partum
Outcome Measures: mode of delivery
NulliparousCS RR 0.41 [0.20 to 0.81] Multiparous CS RR 0.38 [0.14 to 1.01]
not stated
Bidgood KA;Steer PJ; 1987 Jun 540
RCT Evidence level: 1+
N=61 (amniotomy+high-dose oxytocin(H)=19; amniotomy+low dose oxytocin(L)=21; control(A)=20)
women progressing slowly nulliparous
Intervention: amniotomy and high or low dose oxytocin
Comparison: amniotomy only
Follow-up period: intra-partum
Outcome Measures: mode of delivery, duration of labour, neonatal outcomes
CSH=5/19 L=7/21 A=9/20 Duration of second stage H=2.07(1.1) L=3.6(2.0) A=2.45(1.4) Apgar score <7 at 5 min H=0/19 L=1/21 A=1/20
Action Research for the Crippled Child
Blanch G;Lavender T;Walkinshaw S;Alfirevic Z; 1998 541
RCT Evidence level: 1+
N=61 (oxytocin& amniotomy=21; amniotomy only=20; expectant=19)
nulliparous and multiparous women requiring augmentation
Intervention: amniotomy and oxytocin
Comparison: amniotomy only or expectant
Follow-up period: intra-partum
Outcome Measures: randomisation to delivery, mode of delivery, neonatal outcome, maternal satisfaction
oxytocin + amniotomy vs. amniotomy randomisation to delivery intervention=266(166SD) control=406(184SD) p=0.01 Epidural 0.2 [0.05 to 0.95] CS 2.8 [0.4 to 32.6] Apgar <7 at 5 min intervention=1/21 control=1/20 admission to SCBU
not stated
94

Intrapartum care
142
Bibliographic reference
Study type
Evidence level
Number of women
Women’s characteristics
Intervention Comparison Length of follow-up
Outcome measures
Effect size Source of funding
Additional comments
intervention=1/21control=0/20 Satisfaction score intervention=149(23SD) control=140(28SD) p=0.30
95
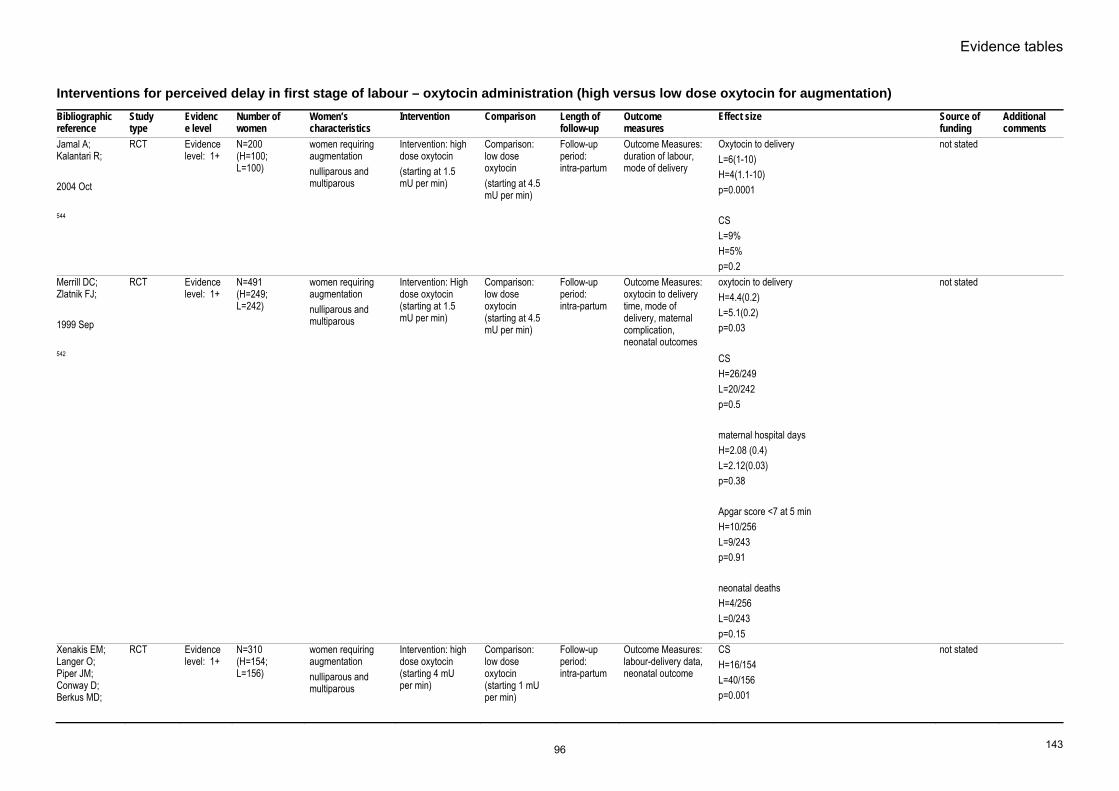
Evidence tables
143
Interventions for perceived delay in first stage of labour – oxytocin administration (high versus low dose oxytocin for augmentation) Bibliographic reference
Study type
Evidence level
Number of women
Women’s characteristics
Intervention Comparison Length of follow-up
Outcome measures
Effect size Source of funding
Additional comments
Jamal A; Kalantari R; 2004 Oct 544
RCT Evidence level: 1+
N=200 (H=100; L=100)
women requiring augmentation nulliparous and multiparous
Intervention: high dose oxytocin (starting at 1.5 mU per min)
Comparison: low dose oxytocin (starting at 4.5 mU per min)
Follow-up period: intra-partum
Outcome Measures: duration of labour, mode of delivery
Oxytocin to deliveryL=6(1-10) H=4(1.1-10) p=0.0001 CS L=9% H=5% p=0.2
not stated
Merrill DC; Zlatnik FJ; 1999 Sep 542
RCT Evidence level: 1+
N=491 (H=249; L=242)
women requiring augmentation nulliparous and multiparous
Intervention: High dose oxytocin (starting at 1.5 mU per min)
Comparison: low dose oxytocin (starting at 4.5 mU per min)
Follow-up period: intra-partum
Outcome Measures: oxytocin to delivery time, mode of delivery, maternal complication, neonatal outcomes
oxytocin to deliveryH=4.4(0.2) L=5.1(0.2) p=0.03 CS H=26/249 L=20/242 p=0.5 maternal hospital days H=2.08 (0.4) L=2.12(0.03) p=0.38 Apgar score <7 at 5 min H=10/256 L=9/243 p=0.91 neonatal deaths H=4/256 L=0/243 p=0.15
not stated
Xenakis EM; Langer O; Piper JM; Conway D; Berkus MD;
RCT Evidence level: 1+
N=310 (H=154; L=156)
women requiring augmentation nulliparous and multiparous
Intervention: high dose oxytocin (starting 4 mU per min)
Comparison: low dose oxytocin (starting 1 mU per min)
Follow-up period: intra-partum
Outcome Measures: labour-delivery data, neonatal outcome
CSH=16/154 L=40/156 p=0.001
not stated
96

Intrapartum care
144
Bibliographic reference
Study type
Evidence level
Number of women
Women’s characteristics
Intervention Comparison Length of follow-up
Outcome measures
Effect size Source of funding
Additional comments
1995 Dec 543
Apgar score <7 at 5 minnone reported admission to neonatal unit H=4.6% L=5.6% p=ns
Bidgood KA; Steer PJ; 1987 Jun 540
RCT Evidence level: 1+
N=61 (amniotomy+ high-dose oxytocin(H)=19; amniotomy + low dose oxytocin(L)=21; control(A)=20)
women progressing slowly nulliparous
Intervention: amniotomy and high or low dose oxytocin
Comparison: amniotomy only
Follow-up period: intra partum
Outcome Measures: mode of delivery, duration of labour, neonatal outcomes
CSH=5/19 L=7/21 A=9/20 Duration of second stage H=2.07(1.1) L=3.6(2.0) A=2.45(1.4) Apgar score <7 at 5 min H=0/19 L=1/21 A=1/20
Action Research for the Crippled Child
97

Evidence tables
145
Interventions for perceived delay in first stage of labour – oxytocin administration (comparing different oxytocin dosage regimes) Bibliographic reference
Study type
Evidence level
Number of women
Women’s characteristics
Intervention Comparison Length of follow-up
Outcome measures
Effect size Source of funding
Additional comments
Majoko F; 2001 Nov 545
RCT Evidence level: 1+
N=258 (H=125; L=133)
women requiring augmentation nulliparous
Intervention: high dose oxytocin (starting dose 4 mU per min)
Comparison: low dose oxytocin (starting dose 10 mU per min)
Follow-up period: intra-partum
Outcome Measures: mode of delivery, length of labour, neonatal outcome
CSRR 0.95 [0.42 to 2.15] Augmentation to delivery >360 min RR 0.36 [0.21 to 0.62] Neonatal death RR 0.70 [0.12 to 4.14] Apgar score less than 6 RR 1.75 [0.43 to 7.16] admission to neonatal unit RR 1.20 [0.62 to 2.33]
not stated
Satin AJ; Leveno KJ; Sherman L; McIntire D; 1994 546
RCT Evidence level: 1+
n=1167 women in labour Intervention: 20-minute dose Start at 6mU/min, increase by 6mU/20min till 42mU/min
Comparison: 40-minute dose Start at 6mU/min, increase by 6mU/40min till 42mU/min
Follow-up period: intra-partum
Outcome Measures: CS for dystocia Uterine hyperstimulation Chorioamnionitis Admission to neonatal unit
CS for dystociaOR 0.65 [0.43 to 0.97] Uterine hyperstimulation OR 1.3 [0.98 to 1.7] Chorioamnionitis OR 0.97 [0.66 to 1.4] Admission to neonatal unit OR 1.3 [0.77 to 2.4] All OR adjusted
not stated
Lazor LZ; Philipson EH; Ingardia CJ; Kobetitsch ES; Curry SL; 1993 Dec 547
RCT Evidence level: 1+
n=487 women in labour Intervention: 15-minute dose Start at 1mU/min, increase 1mU/15min till 5mU/min, increase by 1-2 mU/15min
Comparison: 40-minute dose Start at 1mU/min, increase 1.5mU/40min till 7mU/min, then increase by 1.5-3.0 mU/40min
Follow-up period: intra-partum
Outcome Measures: Fetal distress Uterine hyperstimulation CS Maximum oxytocin dose Oxytocin time Apgar
15- versus 40-min doseFetal distress RR 1.68 p<0.005 Uterine hyperstimulation RR 1.69 p<0.001 CS RR 1.42 p=0.16 Maximum oxytocin dose 15min=8.2mU/min; 40min=6.5mU/min; p<0.001 Oxytocin time 15min=5.4h; 40min=5.8h; p=ns Apgar <7 at 1 min
not stated
98

Intrapartum care
146
Bibliographic reference
Study type
Evidence level
Number of women
Women’s characteristics
Intervention Comparison Length of follow-up
Outcome measures
Effect size Source of funding
Additional comments
RR 1.42p=ns Apgar <7 at 5 min Nil reported
Cummiskey KC;Gall SA;Yusoff DM; 1989 548
RCT Evidence level: 1+
N=94 (pulse=46; continuous=48)
women who required augmentation in labour
Intervention: repeated pulsatile injection of oxytocin (start at 1mU per pulse (10 seconds every 8 mins), doubled every 24 min)
Comparison: continuous infusion of oxytocin (start at 1mU/min, increase by 1mU/20min)
Follow-up period: intra-partum
Outcome Measures: Oxytocin to birth Pain relief Epidural Dysfunctional contraction Average level of oxytocin Total amount of oxytocin
Oxytocin to birthPusatile=401.8(43.9)min; continuous=386.0(36.6) min; p=ns Pain relief RR 0.98, p=ns Epidural RR 1.04, p=ns Dysfunctional contraction RR 1.04, p=ns Average level of oxytocin Pulsatile=2.1(0.4)mU/min; continuous=4.1(0.4)mU/min; p<0.001 Total amount of oxytocin Pulsatile=1300(332)mU; continuous=1803(302)mU; p<0.001
not stated
Arulkumaran S;Yang M;Ingemarsson PS;Ratman SS; 1989 Dec 549
RCT Evidence level: 1+
n=68 nulliparous women in labour
Intervention: Oxytocin start at 2.5mU/min, increase by 2.5mU/30min Till uterine contraction 6 in 15 mins
Comparison: Oxytocin start at 2.5mU/min, increase by 2.5mU/30min Till uterine activity of 1750kPas/15 mins
Follow-up period: intra-partum
Outcome Measures: Maximum dose Hyper- stimulation CS Apgar <5 at 1 min
Maximum doseFrequency=8.3(3.7)mU/min; Uterine activity=8.0(3.1)mU/min Hyper-stimulation RR 0.54 p=ns CS RR 2.00 p=ns Apgar <5 at 1 min RR 0.33 p=ns
Shaw Foundation and Turf Club of Singapore
99

Evidence tables
147
Maternal position and pushing – positions in second stage Bibliographic reference
Study type
Evidence level
Number of women
Women’s characteristics
Intervention Comparison Length of follow-up
Outcome measures
Effect size Source of funding
Additional comments
Gupta & Hofmeyr 2005 336
Systematic review
1+ 19 trials involving 5764 women
Pregnant women in the second stage of labour
Upright position for second stage of labour
Supine or lithotomy
Immediate PN eriod
Duration of second stage Mode of birth Episiotomy Perineal tears Blood loss > 500ml Severe pain during second stage Abnormal FHR patterns Manual removal of placenta Women’s views of birth Admission to NICU Birth injury Neonatal death
Duration of second stage of labour (10 trials): mean reduction 4.29 minutes (95% CI 2.95 to 5.64) Assisted births (18 trials): RR 0.84 (95% CI 0.73 to 0.98) Episiotomies (12 trials): RR 0.84 (95% CI 0.79 to 0.91) Second degree tears (11 trials): RR 1.23 (95% CI 1.09 to 1.39) Estimated blood loss greater than 500 ml (11 trials): RR 1.68 (95% CI 1.32 to 2.15) Severe pain during the second stage (1 trial): RR 0.73 (95% CI 0.60 to 0.90) Abnormal fetal heart rate patterns (1 trial): RR 0.31 (95% CI 0.08 to 0.98). No significant differences were demonstrated for: Analgesia or anaesthesia used during the second stage of labour (7 trials): 0.97 (95% CI 0.93 to 1.02) Third or fourth degree perineal tears (4 trials): RR 0.91 (95% CI 0.31 to 2.68) Need for blood transfusion (2 trials): RR 1.66 (95% CI 0.70 to 3.94) Manual removal of placenta (3 trials): RR 1.71 (95% CI 0.86 to 3.30) Unpleasant birth experience (1 trial): RR 0.89 (95% CI 0.63 to 1.26) Dissatisfaction with the second stage of labour (1 trial): RR 1.01 (95% CI 0.39 to 2.65) Feeling out of control (1 trial): RR 1.00 (95% CI 0.77 to 1.31) Admission to NICU (2 trials): RR 0.81 (95% CI 0.51 to 1.31) Birth injuries (1 trial): 1.50 (95% CI 0.26 to 8.79) Perinatal death (3 trials): RR 0.75 (95% CI 0.17 to 3.29)
HRP-UNDP UNFPA WHO World Bank Special Programme in Human Reproduction Effective Care Research Unit, University of Witwatersrand, South Africa
Albers LL;Anderson D;Cragin L;Daniels SM;Hunter C;Sedler KD;Teaf D;
Evidence level: 2+
Study population n=3049 Women with spontaneous, vaginal births at term
Women with normal,vaginal births at term.
Intervention: Study to determine factors associated with perineal trauma.
Comparison: Not comparative study.
Follow-up period: N/A
Outcome Measures: Spontaneous perineal tear Episiotomy
Predictors of Episiotomy:Nulliparous women: Terminal fetal bradycardia: OR 9.4 (95% CI 8.5 to 10.3) Warm compresses: 0.3 995% CI 0.0 to 0.8) Prolonged second stage: 2.5 (95% CI 1.8 to 2.6)
Shannon Award from the National Institute of Nursing Research/National Institutes of
A well-conducted, large study but need to bear in mind that US practce differs from
100

Intrapartum care
148
Bibliographic reference
Study type
Evidence level
Number of women
Women’s characteristics
Intervention Comparison Length of follow-up
Outcome measures
Effect size Source of funding
Additional comments
1996 Jul 337
n=2595 "Hands on" midwifery care of perineum during birth: OR 0.6 (95% CI 0.2 to 0.9) Multiparous women: Epidural analgesia: OR 2.2 (95% CI 1.8 to 2.6) Warm compresses: 0.3 (95% CI 0.0 to 1.0) Terminal fetal bradycardia: OR 3.7 (95% CI 2.7 to 4.7) Predictors of spontaneous tears: Nulliparous women: Lateral position for birth: OR 0.6 995% CI 0.2 to 1.0) Warm compresses: 0.3 995% CI 0.0 to 0.8) Lithotomy position for birth: OR 1.5 (95% CI 1.1 to 1.9) Multiparous women: Prolonged second stagwe: OR 2.7 (95% CI 2.3 to 3.1) Epidural analgesia: OR 1.4 (95% CI 1.2 to 1.6) Warm compresses: 0.6 (95% CI 0.3 to 0.9) Terminal fetal bradycardia: OR 3.8 (95% CI 2.9 to 4.7) Oils/lubricants: OR 1.7 (95% CI 1.4 to 2.0)
Health UK practice (eg. Widespread use of mid-line episiotomy) an this is an associational analysis only, no cause/effect proven.
Stremler R;Hodnett E;Petryshen P;Stevens B;Weston J;Willan AR; 2005 Dec 338
RCT Evidence level: 1+
Intervention group (hands and knees position) n=70 Control group (no hands and knees position) n=77
Women in early or active labour at term with baby in occipital posterior position as diagnosed by ultrasound scan.
Intervention: Hands and knees position for second stage of labour for as much time as possible (to exceed 30 minutes) in a 60 minute period.
Comparison: Any position in second stage of labour except hands and knees or any position in which the abdomen is suspended.
Follow-up period: Few days postnatally.
Outcome Measures: Fetal head rotation - as determined by ultrasound scan. Back pain (SF-MPQ [score range 0-45], PPI [score range 0-5]and a VAS [score range 0-10].
Hands and knees vs. other position:Fetal head rotation: 11 (16%) vs. 5 (7%) (RR 2.42 [95% CI 0.88 to 6.62]. Back pain scores (Between treatment group difference: VAS: -0.85 (95% CI -1.47 to -0.22), p=0.0083. PPI: -0.50 (95% CI -0.89 to -0.10), p=0.014. SF-MPQ: -2.60 (95% CI -4.91 to -0.28), p=0.028.
Canadian Institute of Health Research, the American Nurses Foundation/Sigma Theta Tau International, the Faculty of Nursing, University of Toronto.
Ragnar I;Altman D;Tyden T;Olsson S; 2006
RCT Evidence level: 1+
Kneeling (intervention) n=138 Sitting (controls) n=133
Nulliparous women in labour at term with no complications
Intervention: Kneeling position for second stage of labour
Comparison: Sitting position for second stage of labour
Follow-up period: 3 days postnatally
Outcome Measures: Duration of second stage Use of oxytocin during first and second stage Vaginal lacerations
Kneeling vs. sitting position:Duration of second stage (minutes):48.5 (SD 27.6) vs. 41.0 (SD 23.4), NS. Use of oxytocin during first and second stage: 54 (51%) vs. 48 (43%), NS. Vaginal lacerations: 69 (65%) vs. 72 (64%), NS. Sphincter rupture: 3 (3%) vs. 6 (5%), NS.
Not stated No significant differences seen for any clinical outcomes. Not clear whether
101

Evidence tables
149
Bibliographic reference
Study type
Evidence level
Number of women
Women’s characteristics
Intervention Comparison Length of follow-up
Outcome measures
Effect size Source of funding
Additional comments
339 Sphincter ruptureApgar score 10 at 10 minutes Duration of postpartum stay Women's views of pregnancy, first and second stages of labour including pain, positions and support from carers
Apgar score 10 at 10 minutes: 107 (95%) vs. 100 (94%), NS. Duration of postpartum stay (days): 2.4 (SD 0.8) vs. 2.3 (SD 0.8), NS. Women's views: Did you experience the position comfortable for giving birth?: OR 0.5 (95% CI 0.1 to 0.9), p=0.03, favours kneeling. Did you feel vulnerable in the position?: OR 2.1 (95% CI 0.9 to 4.6), p=0.05, favours kneeling. Did you feel sagfe in the assigned position?: OR 0.9 (0.7 to 1.3), p=0.7. How much did you participate during the pushing?: OR 1.2 (95% CI 0.9 to 1.2), p=0.13. Did you experience the second stage as long?: 1.4 OR 1.4 (95% CI 0.8 to 0.9), p=0.002, favours kneeling. How much pain did you experience in the assigned position?: OR 1.3 (95% CI 1.1 to 1.9), p=0.01, favours kneeling. Did you experience postpartum perineal pain?: OR 1.9 (95% CI 1.3 to 2.9), p=0.001, favours kneeling. Do you consider your delivery difficult?: OR 1.7 (95% CI 1.4 to 2.0), p=0.01.
"vaginal lacerations" described here refers to perineal lacerations. If not, there is only reference to shincter laceration in terms of perineal truama.
Downe, Gerret & Renfrew, 2004 176
RCT 1- N=107 Nulliparous women using epidural analgesia in the second stage of labour
Lateral position for the passive second stage of labour
Sitting position for the passive second stage of labour
3 months Total length of second stage Mode of birth: Instrumental vs. spontaneous birth Episiotomy vs. other
106.3 min (SD 62.2) vs.121.0 min (57.4), NS χ² = 3.9, df=1, p=0.05 (95% CI 0.40 to 1.01) χ² = 3.8, df=1, p=0.05 (95% CI 0.44 to 1.00)
102

Intrapartum care
150
Maternal position and pushing – pushing in the second stage Bibliographic reference
Study type Evidence level
Number of women
Women’sCharacteristics
Intervention Comparison Length of follow-up
Outcome measures
Effect size Source of funding
Additional comments
Bloom, Casey, Schaffer, MeIntire & Leveno, 2005 340
RCT 1+ Intervention group n=163 Comparison group n=157
Nulliparous women with uncomplicated labours and without epidural analgesia
Coached pushing Uncoached pushing
Immediate PN period
Length of second stage Mode of birth Perineal trauma 5 min Apgar score Umbilical artery pH MSL Resuscitation required Sepsis workup NICU admission Stillbirth or neonatal death
Coached vs uncoachedLength of second stage (mins): mean 46.3 (SD 41.5) vs 59.1 (SD 49.1), p=0.014 Spontaneous vaginal birth: 93% vs 95%, NS Forceps birth: 4% vs 4%, NS CS: 3% vs 1%, NS Episiotomy: 26% vs 20%, NS Second degree tear: 24% vs 20% Third or fourth degree tear: 11% vs 9%, NS 5 min Apgar score <= 7: n=1 vs n=0, NS Umbilical artery pH 7.1 or less: 4% vs 4%, NS MSL: 22% vs 13%, p=0.028 Bag/mask resuscitation required: 4% vs 3%, NS Sepsis workup: 4% vs 8%, NS NICU admission: n=0 vs n=1, NS Stillbirth or neonatal death: None
National Institute of Child Health and human Development
Country: US
Schaffer, Bloom SL, Casey BM, McIntire DD, Nihira MA, and Leveno 2005341
RCT 1+ N=128 women
Nulliparous women in spontaneous established labour at 36-41 weeks gestation following an uncomplicated pregnancy.
Coached pushing with breath-holding and encouraged to make each push last 10 sec.
Uncoached pushing. Woman encouraged simply to do “what comes naturally”.
3 months postnatally
Bladder capacityFirst urge to void Detrusor overactivity Urodynamic stress incontinence
Coached group showed signif. decreased bladder capacity (427ml vs. 482 ml, p<0.05) and decreased first urge to void (160 ml. vs. 202 ml, p<0.025). There was no signif. increase in other outcomes studied.
Supported by National Institute for Child Health and Development
2 groups well matched for maternal, infant and intrapartum characteristics. Country: US
Parnell C, Langhoff-Roos J, Iversen R, & Damgaard P, 1993 342
RCT 1- N=350 women
Women in established labour expecting their first vaginal birth at 37 weeks gestation or more.
Forced pushing with breath-holding once the baby’s head was visible (spontaneous pushing prior to that point).
Spontaneous pushing throughout second stage
Intrapartum only
Duration of second stage of labour Trauma to perineum and birth canal: Episiotomy, perineal tears, deep lacerations, anal sphincter
No signif. differences found between the 2 groups for any outcome measures
The Danish Association of Midwives
Country: Denmark
103

Evidence tables
151
Bibliographic reference
Study type Evidence level
Number of women
Women’sCharacteristics
Intervention Comparison Length of follow-up
Outcome measures
Effect size Source of funding
Additional comments
Thomson, 1993 343
RCT 1- N=32 women
Nulliparous women in labour at 37 weeks of pregnancy or more, single, cephalic fetus, no maternal or infant complications that would effect the management of second stage .
Spontaneous pushing
Forced pushing with breath-holding.
Immediate PN period
Duration of second stage of labour Trauma to perineum and birth canal: need for repair Baby’s condition at birth: Need for resuscitation Venous cord pH, blood gases and base excess Women’s views of the second stage of labour
Second stage of labour signif. longer in the spontaneous pushing group (means (SD): 121.4 minutes (58.4) vs. 58 minutes (42), p=0.002) (but see comments column). No other signif. differences were noted between the 2 groups, including women’s views of second stage.
Not stated The duration of the first stage of labour was significantly longer in the spontaneous pushing group (means (SD): 12.32 hours (5.13) vs. 7.88 hours (2.62), p=0.005). Country: UK
Knauth DG and Haloburdo, 1986 344
RCT 1- N=27 Nulliparous women in labour at term. All women were aged between 20 and 30 years and had attended a childbirth preparation programme
Breath-holding pushing technique, with pushes lasting 10-15 sec
Exhalation pushing technique, encouraged to exhale slowly and push for the duration of the exhalation.
Intrapartum only
Duration of second stage of labour Analgesia and anaesthesia used by women during second stage Abnormal fetal heart rate patterns
30% fetuses in the breath-holding group showed severe variable decelerations compared with 17.6% in the exhalation pushing group. 30% fetuses in breath-holding group maintained fetal heart rate pattern with normal base-line variability compared with 58.8% in the exhalation group. No other differences were found. No statistical analysis ispresented.
Not stated The final sample of women represents a fairly small proportion of the 94 women who originally agreed to participate in the study. It appears that a number of women were dropped from the analysis after randomisation for not complying with the study protocol thus undermining the reliability of the findings. Country: USA
104

Intrapartum care
152
Immersion in water in the second stage Bibliographic reference
Study type
Evidence level
Number of patients
Patient characteristics
Intervention Comparison Length of follow-up
Outcome measures
Effect size Source of funding
Additional comments
Cluett 2004128 SR 1+
8 RCT (2939 women).
Pregnant women
The use of any kind of bath tub/pool that allows immersion compared with no immersion during the first stage of labour The use of any kind of bath tub/pool that allows immersion compared with no immersion during the second stage of labour
Comparison of different kinds and sizes of baths, i.e. whirlpool versus bath tub/pool Comparison of different additives Comparisons of early versus late immersion in water during labour
N/A Maternal outcomesFetal outcomes Neonatal outcomes Caregiver outcomes
Immersion versus no immersion in the first stage of labour Maternal outcomes Four trials provided data on epidural/spinal analgesia/anaesthesia and there was a statistically significant reduction in the incidence of epidural/spinal/paracervical analgesia/anaesthesia amongst women allocated to immersion in water during the first stage of labour compared to those not allocated to water immersion (471/1196 versus 521/1210; odds ratio (OR) 0.84, 95% confidence interval (CI) 0.71 to 0.99). Of these trials reported that 183/393 (46%) of the women allocate to water immersion did not actually use water. However, they analysed the data on an intention to treat basis, and do not provide subgroup analysis by actual intervention received. Four trials provided data on duration of the first and second stages of labour, and there were no statistically significant differences. Six trials reported on the incidence of operative delivery. Overall there was no statistically significant difference; assisted vaginal delivery incidence immersion compared to non-immersion (OR 0.83, 95% CI 0.66 to 1.05) and caesarean section rate immersion compared to non-immersion (OR 1.33, 95% CI 0.92 to 1.91). There were no statistically significant differences between the benefits and risks associated with the use of water immersion during labour on parameters such as perineal trauma: episiotomy (171/550 versus 186/554; OR 0.89, 95%CI 0.68 to 1.15 ), second degree tears (95/550 versus 104/554; OR 0.90, 95% CI 0.66 to 1.23) and third/fourth degree tears (39/1162 versus 29/1179; OR 1.38, 95% CI 0.85 to 2.24). One trial reported maternal pain and women who used water immersion during the first stage of labour reported statistically significant less pain (using ordinal descriptors) than those not labouring in water (40/59 versus 55/61; OR 0.23, 95% CI 0.08 to 0.63). One trial confirmed the biophysiological effect of immersion in water on the effect of blood pressure changes; systolic (mean 120.3 mmHg versus 127.5 mmHg; weighted mean difference (WMD) -7.20, 95% CI -13.12 to -1.28), diastolic (mean 62.8 mmHg versus 73 mmHg; WMD -10.20, 95% CI -13.70 to -
No sources of support supplied
105

Evidence tables
153
Bibliographic reference
Study type
Evidence level
Number of patients
Patient characteristics
Intervention Comparison Length of follow-up
Outcome measures
Effect size Source of funding
Additional comments
6.70); and mean arterial pressure (mean 83.7 versus 127.5; WMD -10.50, 95% CI -14.68 to -6.32) were statistically significantly reduced in the immersion group. Neonatal outcomes Five trials reported on APGAR scores at five minutes and there was no significant difference in the incidence of a score of less than seven at five minutes between groups, (OR 1.59, 95% CI 0.63 to 4.01). Two trials reported admissions to the neonatal intensive care unit and found no difference in admission rates between groups, (OR 1.05, 95% CI 0.68 to 1.61). Infection rates were very low (6/629 versus 3/633) and reported in four trials (OR 2.01, 95% CI 0.50 to 8.07;. Caregiver outcomes No trial describes any injuries or satisfaction outcomes for care givers. Immersion versus no immersion in the second stage of labour The one trial evaluating immersion during the second stage of labour demonstrated a significant difference in the pushing experience of the women. Fewer women in the immersion group felt that they did not cope satisfactorily with their pushing efforts (3/60 versus 12/57). There were no significant differences in any of the outcomes measured such as trauma to the perineum, episiotomy (3/60 versus 4/59) and second degree tears (13/60 versus 11/59), admission to neonatal intensive care unit (3/60 versus 5/60) and the neonate's temperature at birth more than 37.5º Celsius (8/55 versus 3/54). Early versus late immersion One trial compared early versus late immersion during the first stage of labour and found significantly higher epidural analgesia rates in the early group (42/100 versus 19/100; OR 3.09, 95% CI 1.63 to 5.84) and an increased use of augmentation of labour (57/100 versus 30/100; OR 3.09, 95% CI 1.73 to 5.5.4).
Woodward J and Kelly S 2004357
RCT 1- 80 women participated 60 randomised 20 non randomised preference arm
Pregnant women
Water birth Land birth 6 weeks Mode of birth, Needs for epidural, maternal satisfaction, intact perineum, Apgar score, cord gas
Spontaneous vaginal birth RR 1.21 p=0.17 Needs for epidural analgesia RR 0.42 [95%CI 0.17 to 1.11] Intact perineum RR 0.75 [0.31 to 1.81]
Northampton General Hospital NHS Trust
Only 10 out of 40 received allocation
106

Intrapartum care
154
Bibliographic reference
Study type
Evidence level
Number of patients
Patient characteristics
Intervention Comparison Length of follow-up
Outcome measures
Effect size Source of funding
Additional comments
23 (water 10/40, land 13/20) received allocation
Apgar score less than 8 at 5 minutes Water=1/40; Land=0/20 Cord A pH Water=7.23 (range 7.037 to 7.403) Land=7.18 (range 7.045 to 7.260)
107

Evidence tables
155
18. Is there evidence that the type, frequency and mode of administration of the following pharmacological and non-pharmacological pain relief and regional analgesia influence outcomes? 19. When is use of each of these methods of regional analgesia appropriate? 20. What observations, above baseline care, should be undertaken on both mother and baby while using regional analgesia? 21. What IV fluids should be used to maintain blood pressure during labour while using regional analgesia? 22. What is the most effective use of regional analgesia to minimise instrumental delivery rates and optimise pain relief in the second stage of labour?
Non-invasive analgesic techniques – breathing and relaxation Bibliographic reference
Study type
Evidence level
Number of women
Women’s characteristics
Intervention Comparison Length of follow-up
Outcome measures
Effect size Source of funding
Additional comments
Huntley AL, et al (2004) 125
Systematic review of 1 RCT
Systematic review 1+
N=54 Women in 7th month of pregnancy
Respiratory autogenic training (RAT) (Focussed breathing with progressive muscle relaxation) – 9 weekly sessions
“Usual” childbirth education classes (number of classes not stated)
“Some days” postnatally
Pain during labour: hourly self-rated measurements using a “pain thermometer” during labour (100-point scale), retrospective self-rating of overall pain during labour (5-point scale), birth experience.
No significant differences between groups. NB. A signif. reduction in reported pain during the first stage of labour is noted for the RAT group (p<0.02) but only after removal of “unbalanced initial anxiety levels” between the 2 groups. No further details given.
Not stated. Although the women attended different AN preparation classes there is no mention made of any difference in breathing and relaxation method used or degree of usage. Also 20 women were lost to follow-up following randomisation.
108

Intrapartum care
156
Massage Bibliographic reference
Study type
Evidence level
Number of women
Women’s characteristics
Intervention Comparison Length of follow-up
Outcome measures Effect size Source of funding
Additional comments
Huntley AL, et al (2004) 125
Systematic review
1+ 1 RCT and 1 prospective cohort study involving 118 women
Women in established labour.
Massage by partner (initially taught by nurse-midwife) for 20-30 min. periods throughout first stage of labour. Reassuring touch by nurse-midwife for a period of 5-10 sec. after each verbal expression of anxiety for 30 min. intervention period at end of forst stage of labour (8 – 10 cm cervical dilation).
Usual care, including coaching in breathing – no massage taught to partner and no extra reassuring touch
Early postpartum period
Pain: Women’s reports using on 5-point Likert scale. Stress during labour: Women’s reports, partners’ reports Women’s blood pressure during intervention. Mood: woman’s reports during labour (depression scale and VAS “feeling good” scale); women’s reports immediately postnatally (depression scale) Anxiety/agitated behaviour: Blind observer’s ratings (inc. facial expressions); verbal expressions of anxiety; women’s PN reports of intrapartum anxiety Duration of labour: partners’ reports of labour progress, data from medical records Obstetric complications (composite score) Neonatal complications (composite score) Days spent in hospital
Women’s reports of pain signif. lower in massage group (mean score reduction 5.0 to 3.5 in massage group vs. an increase from 4.3 to 5.0 in the control group, p<0.05). Stress during labour signif. lower in massage group (p<0.001 by women’s ratings, p<0.05 by partners’ ratings) Women’s blood pressure signif. lower during intervention (touch) (mean 116/75 vs. 130/80) Mood signif. improved for women in massage group (p<0.05 for intrapartum depression scores, VAS scores of “feeling good” and postnatal depression scores). Anxiety/agitated behaviour: both signif. lower for massage group ((p<0.01 and p<0.001 respectively). Signif. higher number of positive facial expressions reported for women in massage group (p<0.05). No. of verbal expressions of anxiety during intervention period signif. reduced in reassuring touch group (mean 8(SD 5.5) vs. 14(SD 2.6), p<0.05); PN scores for intrapartum anxiety signif. lower in touch group (18 (SD 3.3) vs. 28 (SD 2.3), p<0.05). Duration of labour: Partners’ ratings of labour progress signif. higher for massage group (p<0.05); charted duration of labour signif. shorter for women in massage group (mean 8.5 hours vs. 11.3 hours, p<0.05). No signif. differences found for obstetric and neonatal complications. Signif. shorter hospital stay for women in massage group (mean 1.3 vs. 2.2 days, p<0.05).
Not stated Not possible to pool data due to differences between interventions and outcome measures. Both trials US.
Simpkin PP & O’Hara M (2002) 86
Systematic review
1+ 2 RCTs involving 84 women
Women in established labour.
Massage by partner (initially taught by nurse-midwife or researcher) for 20-30 min. periods throughout first stage of labour.
Usual care, including coaching in breathing in RCT and control “casual attendance” by researcher in prospective study.
Early postpartum period
Pain: Women’s reports using on 5-point Likert scale; nurse-rated pain using the Present Behavioural Intensity (PBI) scale.
Pain lower in the massage group during the intervention compared to the control group (5.0 to 3.5 reduction vs. an increase of 4.3 to 5.0). Statistical analysis not reported. Lower scores on PBI scale for women in massage group during all 3 phases of labur (p<0.002).
Not stated Not possible to pool data due to differences between comparators and outcome measures. 1 US trial US, 1 trail Taiwan
109

Evidence tables
157
Non-invasive analgesic techniques – immersion in water in the first stage of labour Bibliographic reference
Study type
Evidence level
Number of women
Women’s characteristics
Intervention Comparison Length of follow-up
Outcome measures
Effect size Source of funding
Additional comments
Cluett 2004 128
SR 1
8 RCT (2939 women).
Pregnant women The use of any kind of bath tub/pool that allows immersion compared with no immersion during the first stage of labour The use of any kind of bath tub/pool that allows immersion compared with no immersion during the second stage of labour
Comparison of different kinds and sizes of baths, i.e. whirlpool versus bath tub/pool Comparison of different additives Comparisons of early versus late immersion in water during labour
N/A Maternal outcomesFetal outcomes Neonatal outcomes Caregiver outcomes
Immersion versus no immersion in the first stage of labour Maternal outcomes Four trials provided data on epidural/spinal analgesia/anaesthesia and there was a statistically significant reduction in the incidence of epidural/spinal/paracervical analgesia/anaesthesia amongst women allocated to immersion in water during the first stage of labour compared to those not allocated to water immersion (471/1196 versus 521/1210; odds ratio (OR) 0.84, 95% confidence interval (CI) 0.71 to 0.99). Of these trials reported that 183/393 (46%) of the women allocate to water immersion did not actually use water. However, they analysed the data on an intention to treat basis, and do not provide subgroup analysis by actual intervention received. Four trials provided data on duration of the first and second stages of labour, and there were no statistically significant differences. Six trials reported on the incidence of operative delivery. Overall there was no statistically significant difference; assisted vaginal delivery incidence immersion compared to non-immersion (OR 0.83, 95% CI 0.66 to 1.05) and caesarean section rate immersion compared to non-immersion (OR 1.33, 95% CI 0.92 to 1.91). There were no statistically significant differences between the benefits and risks associated with the use of water immersion during labour on parameters such as perineal trauma: episiotomy (171/550 versus 186/554; OR 0.89, 95%CI 0.68 to 1.15 ), second degree tears (95/550 versus 104/554; OR 0.90, 95% CI 0.66 to 1.23) and third/fourth degree tears (39/1162 versus 29/1179; OR 1.38, 95% CI 0.85 to 2.24). One trial reported maternal pain and women who used water immersion during the first stage of labour reported statistically significant less pain (using ordinal descriptors) than those not labouring in water (40/59 versus 55/61; OR 0.23, 95% CI 0.08 to 0.63). One trial confirmed the biophysiological effect of immersion in water on the effect of blood pressure changes; systolic (mean 120.3 mmHg versus 127.5 mmHg; weighted mean difference (WMD) -7.20, 95% CI -13.12 to -1.28), diastolic (mean 62.8 mmHg versus 73 mmHg; WMD -10.20, 95% CI -13.70 to -
No sources of support supplied
110

Intrapartum care
158
Bibliographic reference
Study type
Evidence level
Number of women
Women’s characteristics
Intervention Comparison Length of follow-up
Outcome measures
Effect size Source of funding
Additional comments
6.70); and mean arterial pressure (mean 83.7 versus 127.5; WMD -10.50, 95% CI -14.68 to -6.32) were statistically significantly reduced in the immersion group. Neonatal outcomes Five trials reported on APGAR scores at five minutes and there was no significant difference in the incidence of a score of less than seven at five minutes between groups, (OR 1.59, 95% CI 0.63 to 4.01). Two trials reported admissions to the neonatal intensive care unit and found no difference in admission rates between groups, (OR 1.05, 95% CI 0.68 to 1.61). Infection rates were very low (6/629 versus 3/633) and reported in four trials (OR 2.01, 95% CI 0.50 to 8.07;. Caregiver outcomes No trial describes any injuries or satisfaction outcomes for care givers. Immersion versus no immersion in the second stage of labour The one trial evaluating immersion during the second stage of labour demonstrated a significant difference in the pushing experience of the women. Fewer women in the immersion group felt that they did not cope satisfactorily with their pushing efforts (3/60 versus 12/57). There were no significant differences in any of the outcomes measured such as trauma to the perineum, episiotomy (3/60 versus 4/59) and second degree tears (13/60 versus 11/59), admission to neonatal intensive care unit (3/60 versus 5/60) and the neonate's temperature at birth more than 37.5º Celsius (8/55 versus 3/54). Early versus late immersion One trial compared early versus late immersion during the first stage of labour and found significantly higher epidural analgesia rates in the early group (42/100 versus 19/100; OR 3.09, 95% CI 1.63 to 5.84) and an increased use of augmentation of labour (57/100 versus 30/100; OR 3.09, 95% CI 1.73 to 5.5.4).
Cluett 2004 129 RCT 1- N=99 Nulliparous women with dystocia (cervical dilation rate < 1 cm/hour in active labour) at low risk of complications.
Interventions: Immersion in water in birth pool
Standard augmentation for dystocia (amniotomy and intravenous oxytocin).
Postnatal Main outcome measures: Primary: epidural analgesia and operative delivery rates. Secondary: augmentation rates
Results: epidural analgesia RR 0.71 (95% confidence interval 0.49 to 1.01) operative delivery RR 0.98 (0.65 to 1.47), augmentation RR, 0.74 (0.59 to 0.88) any form of obstetric intervention (amniotomy, oxytocin, epidural, or operative delivery) RR 0.81
Not stated
111

Evidence tables
159
Bibliographic reference
Study type
Evidence level
Number of women
Women’s characteristics
Intervention Comparison Length of follow-up
Outcome measures
Effect size Source of funding
Additional comments
with amniotomy and oxytocin, length of labour, maternal and neonatal morbidity including infections, maternal pain score, and maternal satisfaction with care.
(0.67 to 0.92), Babies admitted to the neonatal unit 6 v 0, P = 0.013 Apgar score, infection rates, or umbilical cord pH: Not significant
112

Intrapartum care
160
Non-invasive analgesic techniques – injected water papules Bibliographic reference
Study type
Evidence level
Number of women
Women’s characteristics
Intervention Comparison Length of follow-up
Outcome measures
Effect size Source of funding
Additional comments
Huntley AL, et al (2004) 125 and Simkin PP & O’Hara M (2002) 86
Systematic review
1+ 4 RCTs involving 451 women
Women in labour with lower back pain
4 intradermal injections of 0.5-1.0 ml sterile water into the lower back
In 1 trial –intradermal saline injections. In 1 trial – subcutaneous sterile water injections or subcutaneous saline injections. In 1 trial – subcutaneous saline injections In 1 trial – compared with “standard care” including back massage, use of whirlpool bath, liberal mobilisation or TENS.
Onset of established labour until immediate PN period
Lower back pain: as perceived by woman and measured on a VAS, reported by midwife and subsequent use of other analgesia. Duration of labour Mode of birth: Babies’ condition: Apgar scores
Signif. decreased lower back pain at 10 minutes and up to 2 hours (length of follow-up of pain measurement ranged from 45 mins. – 3 hours) for all modes of pain assessment (level of significance varies between studies). No other consistent significant findings
Not stated Use of different comparators and timing of pain assessments means pooling of data is not possible.
Martensson L et al (2000) 131
RCT with cross-over design (women acting as their own controls)
1+ N=100 women
Healthy women aged 18-45 years. (Not pregnant)
0.1 ml intradermal injection of sterile water into lower back
0.5 ml subcutaneous injection of sterile water into lower back
None Experienced pain during the sterile water injections, measured using a VAS.
Intradermal injections signif. more painful than subcutaneous injections (mean score on VAS 60.8 vs. 41.3, p<0.001)
Not stated Sweden
113

Evidence tables
161
Non-invasive analgesic techniques – complementary and alternative therapies Bibliographic reference
Study type
Evidence level
Number of women
Women’s characteristics
Intervention Comparison Length of follow-up
Outcome measures
Effect size Source of funding
Additional comments
Lee MK;Chang SB;Kang DH; 2004 Dec 132
RCT Evidencelevel: 1+
N=75 (acupressure=36; touch=39)
women in labour Intervention: SP6 acupuncture
Comparison: SP6 touch control
Follow-up period: intrapartum
Outcome Measures: pain scale, duration of labour
use of analgesicsRR 0.54 [0.20 to 1.43] Visual Analog Pain Scale pre SP6=5.8(1.8); control=6.3(2.3) post SP6=6.4(1.8); control=7.6(1.9) F=6.646; p=0.01 after 30 min SP6=7.0(1.8); control=8.3(1.8) F=5.657, p=0.02 after 60 min SP6=7.7(1.5); control=8.9(1.7) F=6.783, p=0.01 length od labour - first stage SP6=108.3(52.1); control=146.3(60.7) p=0.009 length of of labour - second stage SP6=30.3(22.6); control=44.8(40.0) p=0.006
not stated
Ramnero A;Hanson U;Kihlgren M; 2002 Jun 133
RCT Evidence level: 1+
N=90(acupuncure=46; control=44)
women in labour Intervention: acupuncture
Comparison: no acpuncture
Follow-up period: intrapartum
Outcome Measures: pain intensity, degree of relaxation, delivery outcome
spontaneou vaginal deliveryRR 0.98 [0.89 to 1.08] CS RR 0.96 [0.18 to 20.35] duration of labour - second stage acupuncure=5.3(3.33); control=5.6(3.85) MD -0.25 [-1.75 to 1.26] Epidural RR 0.52 [0.30 to 0.92] Mean pain score acupuncure=6.6(1.51); control=6.8(1.40) MD -0.29 [-0.90 to 0.32] Mean relaxation score MD -0.93 [-1.66 to -0.20]
Orebro County Research Committee
Skilnand E;Fossen D;Heiberg E;
RCT Evidence level: 1+
N=208 (acupuncure=106; control=102)
women in labour Intervention: Acupuncture
Comparison: false acupuncture
Follow-up period: intrapartum
Outcome Measures: Visual analog pain scale, use of other analgesia,
Visual analog pain scaleonly presented in a graph significantly lower for intervention group p<0.01
Not stated
114

Intrapartum care
162
Bibliographic reference
Study type
Evidence level
Number of women
Women’s characteristics
Intervention Comparison Length of follow-up
Outcome measures
Effect size Source of funding
Additional comments
2002 Oct 134
mode of delivery EpiduralRR 0.39 [0.21 to 0.75] Spontaneous vaginal delivery RR 1.06 [0.96 to 1.18] CS RR 0.72 [0.17 to 3.15]
Nesheim BI;Kinge R;Berg B;Alfredsson B;Allgot E;Hove G;Johnsen W;Jorsett I;Skei S;Solberg S; 2003 May 135
RCT Evidence level: 1+
N=198 (acupuncture=106; control=92)
women in labour at term
Intervention: acupuncture
Comparison: no acupuncture
Follow-up period: intrapartum
Outcome Measures: requirement for other pain reliefs
spontaneous vaginal deliveryRR 1.02 [0.92 to 1.12] no use of analgesia RR 1.84 [1.11 to 3.04] NNT=6.46
not stated
Cyna AM;McAuliffe GL;Andrew MI; 2004 Oct 136
Systematic review - meta-analysis
Evidence level: 1+
5 RCT & 14 comparative studies including 8395 women
women in labour Intervention: Hypnosis
Comparison: else
Follow-up period: N/A
Outcome Measures: labour analgesia requirement, pain score in labour
use of pharmacological pain relief3 RCT RR 0.51 [0.28 to 0.95] use of labour augmentation 2 RCT RR 0.31 [0.18 to 0.52] spontaneous vaginal delivery 1 RCT RR 1.67 [1.13 to 2.67] no RCT reported pain scores
Not stated
Phumdoung S;Good M; 2003 Jun 138
RCT Evidence level: 1+
N=110(music=55; control=55)
primiparou women in labour
Intervention: soft music without lyrics for 3 hours starting early in the active phase of labour
Comparison: no music
Follow-up period: intrapartum
Outcome Measures: Visual Analog Sensation of Pain Scale & Visual Analog Distress of Pain
Sensation of Pain (pre and 3 hourly posttests for three times) F(1107)=18.69, p<0.01 effect size=0.15 Distress of Pain (as above) F(1107)=14.87, p<0.001 effect size=0.12
not stated
Smith CA;Collins CT;Cyna AM;Crowther CA; 2005
Systematic review - meta-analysis
Evidence level: 1+
Seven trials involving 366 women
All women whether primiparous or multiparous, and in spontaneous or induced labour, in the first and second stage of labour
Intervention: Complementary and alternative therapies used in labour with or without concurrent use of pharmacological or non-
Comparison: any
Follow-up period: N/A
Outcome Measures: Maternal satisfaction or maternal emotional experience with pain management in
Aromatherapy Use of pharmacological pain relief 1 trial 22 women RR 2.50 [0.31, 20.45] Spontaneous vaginal delivery from aromatherapy 1 trial 22 women
No sources of support supplied
115

Evidence tables
163
Bibliographic reference
Study type
Evidence level
Number of women
Women’s characteristics
Intervention Comparison Length of follow-up
Outcome measures
Effect size Source of funding
Additional comments
137 pharmacological interventions
labour; Use of pharmacological pain relief in labour; Length of labour; mode of delivery; instrumental vaginal delivery; need for augmentation with oxytocin; perineal trauma (defined as episiotomy and incidence of second or third degree tear); maternal blood loss (post partum haemorrhage defined as greater than 600 ml); perception of pain experienced; satisfaction with general birth experience; assessment of mother-baby interaction; and breastfeeding at hospital discharge; Apgar score less than seven at five minutes; admission to neonatal intensive care unit; need for mechanical ventilation; neonatal encephalopathy.
RR 0.93 [0.67, 1.28] Instrumental delivery from aromatherapy 1trial 22women RR 0.83 [0.06, 11.70] Caesarean section from aromatherapy 1 trial 22 women RR 2.54 [0.11, 56.25] Audio-analgesia compared with control Maternal satisfaction with pain relief from sea noise 1 trial 24 women RR 2.00 [0.82, 4.89] MUSIC 1 trial There was no statistical difference in the frequency of pain medication use between groups, with 12 episodes of pain medication use in the experimental group and 19 in the control group.
116

Intrapartum care
164
Non-pharmacological analgesia – transcutaneous electronical nerve stimulation (TENS) Bibliographic reference
Study type
Evidence level
Number of women
Women’s characteristics
Intervention Comparison Length of follow-up
Outcome measures
Effect size Source of funding
Additional comments
Carroll D;Moore RA;Tramer MR;McQuay HJ; 1997 139
Systematic review - meta-analysis
1+ 877 women (TENS=436; control=441)
women requiring analgesia in labour
TENS Sham TENS or no treatment
Follow-up period: N/A
Outcome Measures: Pain scales, additional pain relief
additional analgesiaRR 0.88 [0.72 to 1.07] Pain scales etc narrative summary: none showed positive
Not stated Country: UK
117

Evidence tables
165
Inhalational analgesia – nitrous oxide Bibliographic reference
Study type
Evidence level
Number of women
Women’s characteristics
Intervention Comparison Length of follow-up
Outcome measures
Effect size Source of funding
Additional comments
Rosen MA; 2002 May 140
Systematic review - meta-analysis
1+ 11 RCTs women in labour Nitrous oxide other dosages and other analgesics
Follow-up period: N/A
Outcome Measures: efficacy, adverse events(progress of labour, nausea, vomiting, dreams, dizziness, unconsciousness, and neonatal outcomes)
all narrative summary Efficacy 11 RCT no quantitative objective evidence provided progress of labour 2 RCT No evidence of difference nausea, vomiting 7 RCT Inconclusive due to not adequately matched controls neonatal outcomes no evidence of difference
not stated Country: US
118

Intrapartum care
166
Intravenous and intramuscular use of opioids for labour Bibliographic reference
Study type
Evidence level
Number of women
Women’s characteristics
Intervention Comparison Length of follow-up
Outcome measures
Effect size Source of funding
Additional comments
Bricker L;Lavender T; 2002 May 141
Systematic review - meta-analysis
1+ 48 trials involving more than 9800 women.
Women in labour (at or near term)
Pain relief in labour:IM pethidine vs. placebo IM tramadol vs. IM pethidine IM meptazinol vs. IM pethidine IM diamorphine vs. IM pethidine IM pentazocine vs IM pethidine IM nalbuphine vs IM pethidine IM butorphanol vs. IM pethidine IM tramadol
IM administration of different opioids IM administration of different doses of same opiods IM opioids vs IV opioids IV administration of different opioids IV opioids - bolus vs PCA Parenteral opioids vs epidural Opioids alone vs. with co-drug
Follow-up period: Immediate postnatal period eg. Apgar score of baby and need for resus.
Outcome Measures: Main outcomes: maternal satisfaction with pain relief approx. 2 hours after administration, neonatal resuscitation. Other outcomes: Maternal: VAS score or other pain score approx. 2 hours after administration; any further pain relief (other than epidural); epidural; nausea; vomiting; use of antiemetics; drowsiness/sleepiness; oxytocin augmentation; time from randomisation/first dose to birth; CS; instrumental vaginal birth; woman not satisfied with birth experience (PN); woman not satisfied with analgesia (PN). Baby: administation of naloxone; Apgar score < 7 at 5 min.; baby death; admission to NICU or transitional care; feeding problems; problems with mother/infant interation.
Overall: little evidence of differences between different opioids and modes of administration. Signif. findings were: IM pethidine vs IM placebo: Woman not satisfied with pain relief 1-2 hours after administration RR 0.86 (95% CI 0.74 to 0.99); p=0.04, favours pethidine. Woman not satisfied with pain relief postnatally RR 0.47 (95% CI 0.32 to 0.67); p=0.00004, favours pethidine. IM tramadol vs IM pethidine: VAS 1-2 hours after admin. WMD 13.2 (95% CI 0.37 to 26.03); p=0.04, favours pethidine. IM meptazinol vs IM pethidine: Vomiting during labour RR 1.25 (95% CI 1.07 to 1.47); p=0.006, favours pethidine. Drowsiness/sleepiness during labour RR 0.74 (95% CI 0.62 to 0.88); p=0.0007, favours meptazinol. IM diamorphine vs IM pethidine: Woman not satisfied with pain relief 2 hours after administration RR 0.63 (95% CI 0.43 to 0.94); p=0.02, favours diamorphine. VAS 1-2 hours after admin. WMD -9.00 (95% CI -10.21 to -7.79); p<0.0001, favours diamorphine. Vomiting during labour RR 0.39 (95% CI 0.17 to 0.86); p=0.02, favours diamorphine. Time from randomisation/first dose to birth WMD 0.40 (95% CI 0.26 to 0.54); p<0.0001, favours pethidine. IM pentazocine vs IM pethidine:
Not stated
119

Evidence tables
167
Bibliographic reference
Study type
Evidence level
Number of women
Women’s characteristics
Intervention Comparison Length of follow-up
Outcome measures
Effect size Source of funding
Additional comments
Further pain relief (excl. epidural)RR 1.69 (95% CI 1.22 to 2.32); p=0.001, favours pethidine. Nausea during labour RR 0.39 (95% CI 0.18 to 0.83); p=0.01, favours pentazocine. IM nalbuphine vs IM pethidine: Nausea during labour RR 0.23 (95% CI 0.08 to 0.63); p=0.004, favours nalbuphine. Vomiting during labour RR 0.31 95% CI 0.14 to 0.69); p=0.004, favours nalbuphine. Time from randomisation/first dose to birth WMD 0.51 (95% CI 0.06 to 0.96); p<0.03, favours pethidine. IM tramadol 50mg vs. 100mg: Woman not satisfied with pain relief 1-2 hours after administration RR 3.86 (95% CI 1.99 to 7.46); p=0.00006 IM pethidine 40-50mg vs 80-100mg: Pain score 2 hours after administration WMD 0.35 (95% CI 0.01 to 0.69); p=0.04, favours 80-100mg pethidine. Further pain relief (excl. epidural) RR 2.67 (95% CI 1.43 to 4.97); p=0.002, favours 80-100mg pethidine. IV pethidine vs IM pethidine: Further pain relief (excl. epidural) RR 0.13 (95% CI 0.02 to 0.95); p=0.04, favours IM pethidine. IV morphine vs IV pethidine: Pain score 2 hours after administration WMD -0.20 (95% CI -0.34 to -0.06); p=0.004 ??? Check, favours IV morphine (if difference is true) Drowsiness/sleepiness during labour RR 0.05 (95% CI 0.00 to 0.82); p=0.04, favours IV pethidine.
120

Intrapartum care
168
Bibliographic reference
Study type
Evidence level
Number of women
Women’s characteristics
Intervention Comparison Length of follow-up
Outcome measures
Effect size Source of funding
Additional comments
IM pethidine + lorazepam vs IM pethidine + placebo: Pain score 2 hours after administration WMD -22.00 (95% CI -37.50 to -.50); p=0.005, favours pethidine + lorazepam. Drowsiness/sleepiness during labour RR 4.50 (95% CI 1.11 to 18.27); p=0.04, favours pethidine + placebo. Postnatally, woman not satisfied with pain relief RR 0.05 (95% CI 0.00 to 0.85); p=0.04, favours pethidine + lorazepam. IM pethidine + diazepam vs. IM pethidine + placebo: Nausea and vomiting during labour RR 0.70 (95% CI 0.57 to 0.86); p=0.0008, favours IM pethidine + placebo. IM pethidine + metoclopramide vs. IM pethidine + placebo: Further pain relief (excl. epidural) RR 0.62 (95% CI 0.46 to 0.84); p=0.002, favours IM pethidine + metoclopramide. Nausea during labour RR 0.71 (95% CI 0.55 to 0.94); p=0.006, favours IM. RR 0.05 (95% CI 0.00 to 0.82); p=0.04, favours IV pethidine. IM pethidine + lorazepam vs IM pethidine + placebo: Pain score 2 hours after administration WMD -22.00 (95% CI -37.50 to -.50); p=0.005, favours pethidine + lorazepam. Drowsiness/sleepiness during labour RR 4.50 (95% CI 1.11 to 18.27); p=0.04, favours pethidine + placebo. Postnatally, woman not satisfied with pain relief RR 0.05 (95% CI 0.00 to 0.85); p=0.04, favours pethidine + lorazepam. IM pethidine + diazepam vs. IM pethidine + placebo: Nausea and vomiting during labour RR 0.70 (95% CI 0.57 to 0.86); p=0.0008, favours IM pethidine + placebo.
121
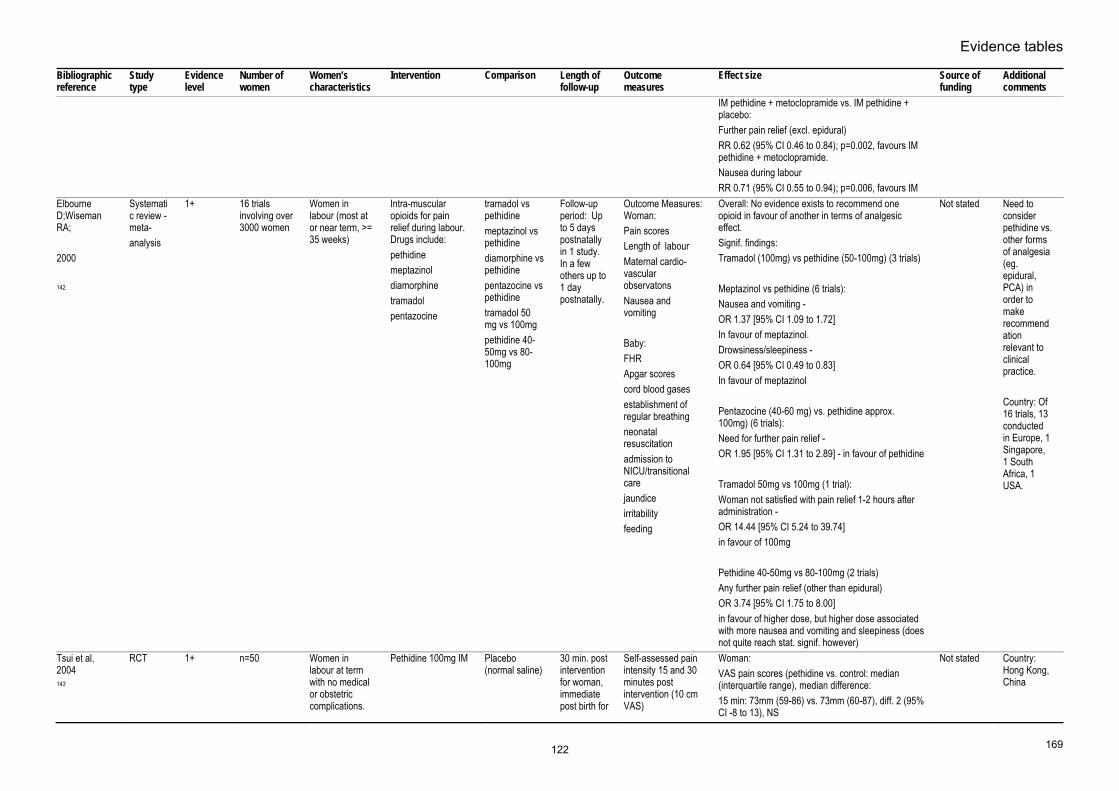
Evidence tables
169
Bibliographic reference
Study type
Evidence level
Number of women
Women’s characteristics
Intervention Comparison Length of follow-up
Outcome measures
Effect size Source of funding
Additional comments
IM pethidine + metoclopramide vs. IM pethidine + placebo: Further pain relief (excl. epidural) RR 0.62 (95% CI 0.46 to 0.84); p=0.002, favours IM pethidine + metoclopramide. Nausea during labour RR 0.71 (95% CI 0.55 to 0.94); p=0.006, favours IM
Elbourne D;Wiseman RA; 2000 142
Systematic review - meta- analysis
1+ 16 trials involving over 3000 women
Women in labour (most at or near term, >= 35 weeks)
Intra-muscular opioids for pain relief during labour. Drugs include: pethidine meptazinol diamorphine tramadol pentazocine
tramadol vs pethidine meptazinol vs pethidine diamorphine vs pethidine pentazocine vs pethidine tramadol 50 mg vs 100mg pethidine 40-50mg vs 80-100mg
Follow-up period: Up to 5 days postnatally in 1 study. In a few others up to 1 day postnatally.
Outcome Measures: Woman: Pain scores Length of labour Maternal cardio-vascular observatons Nausea and vomiting Baby: FHR Apgar scores cord blood gases establishment of regular breathing neonatal resuscitation admission to NICU/transitional care jaundice irritability feeding
Overall: No evidence exists to recommend one opioid in favour of another in terms of analgesic effect. Signif. findings: Tramadol (100mg) vs pethidine (50-100mg) (3 trials) Meptazinol vs pethidine (6 trials): Nausea and vomiting - OR 1.37 [95% CI 1.09 to 1.72] In favour of meptazinol. Drowsiness/sleepiness - OR 0.64 [95% CI 0.49 to 0.83] In favour of meptazinol Pentazocine (40-60 mg) vs. pethidine approx. 100mg) (6 trials): Need for further pain relief - OR 1.95 [95% CI 1.31 to 2.89] - in favour of pethidine Tramadol 50mg vs 100mg (1 trial): Woman not satisfied with pain relief 1-2 hours after administration - OR 14.44 [95% CI 5.24 to 39.74] in favour of 100mg Pethidine 40-50mg vs 80-100mg (2 trials) Any further pain relief (other than epidural) OR 3.74 [95% CI 1.75 to 8.00] in favour of higher dose, but higher dose associated with more nausea and vomiting and sleepiness (does not quite reach stat. signif. however)
Not stated Need to consider pethidine vs. other forms of analgesia (eg. epidural, PCA) in order to make recommendation relevant to clinical practice. Country: Of 16 trials, 13 conducted in Europe, 1 Singapore, 1 South Africa, 1 USA.
Tsui et al, 2004 143
RCT 1+ n=50 Women in labour at term with no medical or obstetric complications.
Pethidine 100mg IM Placebo (normal saline)
30 min. post intervention for woman, immediate post birth for
Self-assessed pain intensity 15 and 30 minutes post intervention (10 cm VAS)
Woman:VAS pain scores (pethidine vs. control: median (interquartile range), median difference: 15 min: 73mm (59-86) vs. 73mm (60-87), diff. 2 (95% CI -8 to 13), NS
Not stated Country: Hong Kong, China
122

Intrapartum care
170
Bibliographic reference
Study type
Evidence level
Number of women
Women’s characteristics
Intervention Comparison Length of follow-up
Outcome measures
Effect size Source of funding
Additional comments
baby.
Self-assessed level of sedation 15 and 30 minutes post intervention (10cm VAS) Woman’s satisfaction with pain relief 30 minutes post intervention (5-point Likert scale) Babies’ Apgar scores Cord blood gases and pH Resuscitation required Admission to NICU
30 min: 78mm (61-91) vs. 54mm (41-75), diff. -17 (95% CI -30 to -4, p<0.05 VAS sedation scores (pethidine vs. control: median (interquartile range), median difference: 15 min: 41mm (14-61) vs. 68mm (48-75), diff. 24 (95% CI 8 to 43), p<0.05 30 min: 47mm (18-69) vs. 54mm (51-88), diff. 26 (95% CI 8 to 41, p<0.05 Satisfaction scores: 2 (2-3) vs. 1 (1-2), p<0.001 8% women in pethidine group were totally dissatisfied compared with 60% in the control group. No women in either group reported being totally satisfied with pain relief. 8 women in the pethidine group required no further analgesia compared with 1 in the control group (p=0.011). No significant differences noted for other maternal outcomes. Baby: Apgar score < 7 at 1 min. n=3 vs.n=4, NS Apgar score <7 at 5 min. n=0 for both groups Umbilical arterial pH 7.26 (SD 0.09) vs. 7.27 (SD 0.09), NS Umbilical arterial pH 7.26 (SD 0.09) vs. 7.27 (SD 0.09), NS Umbilical arterial BE (n=26) -6.51 (SD 2.76) vs. -6.57 (SD 2.99), NS Admission to NICU 1 in each group
Keskin HL;Keskin EA;Avsar AF;Tabuk M;Caglar GS; (2003) 144
RCT 1+ Pethidine group n=29 Tramadol group n=30.
Primiparous women in labour at term, no medical or obstetric problems.
Pethidine 100 mg IM
tramadol 100 mg IM
Immediate PN ie. 5 minute Apgar score.
Length of labourPain scores Nausea Vomiting Fatigue Drowsiness Baby: Apgar at 1 min. Apgar at 5 min. Respiratory distress
No signif. differences (p>0.05) in: length of labour; Apgar scores at 1 and 5 mins.; respiratory distress; pain scores after 10 min.. The incidence of "respiratory distress" and hypoxemia was quite high however, n=3 (10.3%) in pethidine group and n=7 (23.3%) in tramadol group. It is stated that all neonates recovered with supplementary oxygen therapy in the NICU. Signif. differences (p<0.05) in favour of pethidine for: Pain scores at 30 and 60 min. after administration (details of statistical analysis not given) Nausea at 30 and 60 min. after administration Fatigue 60 min. after administration (details of statistical analyses not given, only p values).
Not stated Country: Turkey Trustworthiness of findings in doubt due to lack of detail re comparative statistics and small sample sizes involved.
123

Evidence tables
171
Bibliographic reference
Study type
Evidence level
Number of women
Women’s characteristics
Intervention Comparison Length of follow-up
Outcome measures
Effect size Source of funding
Additional comments
Pethidine seems to be a better alternative than tramadol in obstetric analgesia because of its superior analgesic efficacy and low incidence of maternal side-effects.
Fairlie et al, 1999 145
RCT 1+ n=133 (81 intervention group, 80 control group)
Women in labour at term booked for midwifery care.
IM diamorphine (primips. 7.5mg, multips 5mg)
IM pethidine (primips. 150mg, multips 100mg). All women also received prochloroperazine at the same time as the trial drugs.
Woman –24 hours postnatally. Baby – immediately post birth.
Woman: Pain intensity at intervals of 30 mins. post drug administration to a maximum of 3 hours (VAS plus verbal scales). Level of sedation and maternal vomiting 1 hour post drug administration. Mode of birth Baby: Apgar scores Neonatal resuscitation Admission to SCBU Neonatal morbidity
Primiparous woman (diamorphine vs. pethidine) mean (SEM): VAS at 60 min: 52mm (5) vs. 62 (5), NS Moderate or severe verbal pain score at 60 min: n=22 (67%) vs. n=26 (74%), NS None or slight pain relief at 60 min: n=8 (24%) vs. n=17 (49%), NS Second dose of narcotic administered: n=3 (9%) vs. n=3 (9%), NS Epidural administered: n=17 (50%) vs. n=16 (46%), NS Global assessment of pain relief as poor or fair 24 hours postnatally: N=16 (47%) vs. n=18 (51%), NS Multiparous woman (diamorphine vs. pethidine) mean (SEM): VAS at 60 min: 64mm (5) vs. 71 (4), NS Moderate or severe verbal pain score at 60 min: n=26 (84%) vs. n=33 (100%), p=0.02 (Fisher’s exact test) None or slight pain relief at 60 min: n=15 (48%) vs. n=21 (64%), NS Second dose of narcotic administered: n=6 (19%) vs. n=4 (12%), NS Epidural administered: n=4 (13%) vs. n=4 (13%), NS Global assessment of pain relief as poor or fair 24 hours postnatally: N=21 (70%) vs. n=26 (79%), NS Side effects, all women (n): Moderately drowsy/asleep at 60 min: 16 (25%) vs. (26%), NS Vomiting: 7 (11%) vs. 19 (28%), p=0.02 (Fisher’s exact test) SVD: 52 (80%) vs. 52 (80%) Instrumental birth: 11 (17%) vs. 12 (18%), NS CS: 2 (3%) vs. 4 (6%), NS Meconium staining after drug administration: 9 (14%) vs. 13 (19%), NS
Not stated UK (Scotland) 28 women (16+12) excluded from the analysis as they gave birth within 60 minutes of entering the trial.
124
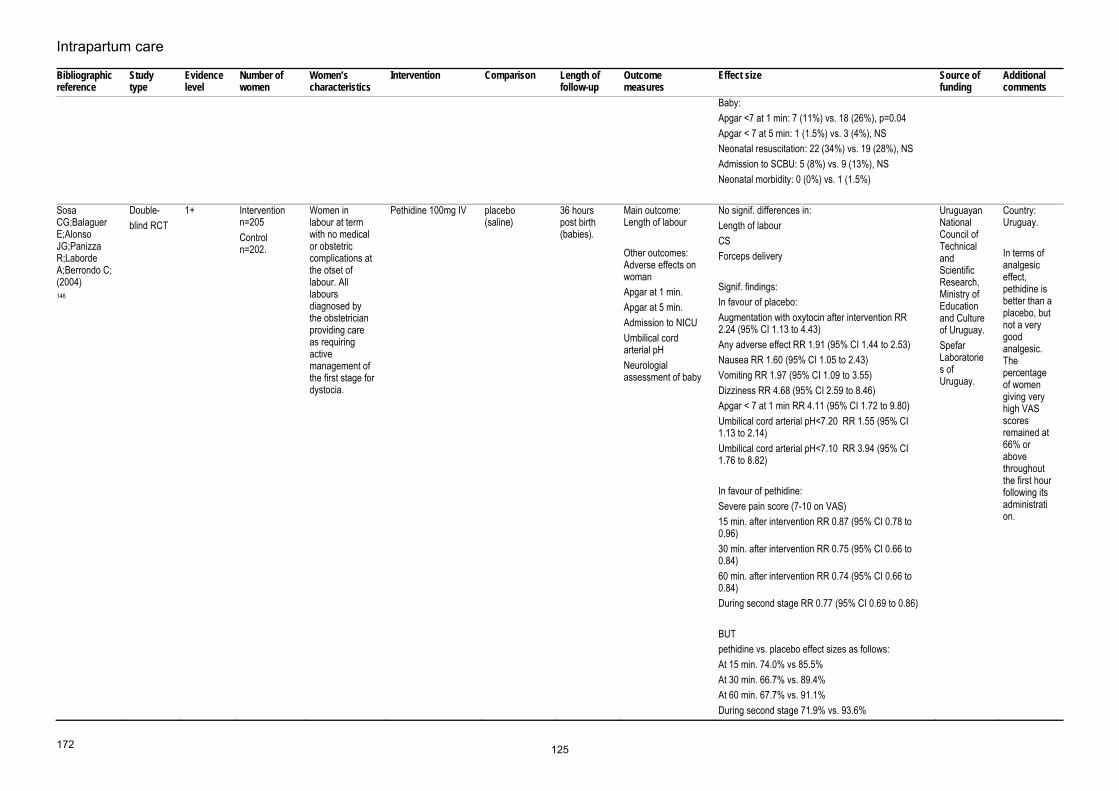
Intrapartum care
172
Bibliographic reference
Study type
Evidence level
Number of women
Women’s characteristics
Intervention Comparison Length of follow-up
Outcome measures
Effect size Source of funding
Additional comments
Baby:Apgar <7 at 1 min: 7 (11%) vs. 18 (26%), p=0.04 Apgar < 7 at 5 min: 1 (1.5%) vs. 3 (4%), NS Neonatal resuscitation: 22 (34%) vs. 19 (28%), NS Admission to SCBU: 5 (8%) vs. 9 (13%), NS Neonatal morbidity: 0 (0%) vs. 1 (1.5%)
Sosa CG;Balaguer E;Alonso JG;Panizza R;Laborde A;Berrondo C; (2004) 146
Double- blind RCT
1+ Intervention n=205 Control n=202.
Women in labour at term with no medical or obstetric complications at the otset of labour. All labours diagnosed by the obstetrician providing care as requiring active management of the first stage for dystocia.
Pethidine 100mg IV placebo (saline)
36 hours post birth (babies).
Main outcome: Length of labour Other outcomes: Adverse effects on woman Apgar at 1 min. Apgar at 5 min. Admission to NICU Umbilical cord arterial pH Neurologial assessment of baby
No signif. differences in:Length of labour CS Forceps delivery Signif. findings: In favour of placebo: Augmentation with oxytocin after intervention RR 2.24 (95% CI 1.13 to 4.43) Any adverse effect RR 1.91 (95% CI 1.44 to 2.53) Nausea RR 1.60 (95% CI 1.05 to 2.43) Vomiting RR 1.97 (95% CI 1.09 to 3.55) Dizziness RR 4.68 (95% CI 2.59 to 8.46) Apgar < 7 at 1 min RR 4.11 (95% CI 1.72 to 9.80) Umbilical cord arterial pH<7.20 RR 1.55 (95% CI 1.13 to 2.14) Umbilical cord arterial pH<7.10 RR 3.94 (95% CI 1.76 to 8.82) In favour of pethidine: Severe pain score (7-10 on VAS) 15 min. after intervention RR 0.87 (95% CI 0.78 to 0.96) 30 min. after intervention RR 0.75 (95% CI 0.66 to 0.84) 60 min. after intervention RR 0.74 (95% CI 0.66 to 0.84) During second stage RR 0.77 (95% CI 0.69 to 0.86) BUT pethidine vs. placebo effect sizes as follows: At 15 min. 74.0% vs 85.5% At 30 min. 66.7% vs. 89.4% At 60 min. 67.7% vs. 91.1% During second stage 71.9% vs. 93.6%
Uruguayan National Council of Technical and Scientific Research, Ministry of Education and Culture of Uruguay. Spefar Laboratories of Uruguay.
Country: Uruguay. In terms of analgesic effect, pethidine is better than a placebo, but not a very good analgesic. The percentage of women giving very high VAS scores remained at 66% or above throughout the first hour following its administration.
125

Evidence tables
173
Bibliographic reference
Study type
Evidence level
Number of women
Women’s characteristics
Intervention Comparison Length of follow-up
Outcome measures
Effect size Source of funding
Additional comments
In terms of analgesic effect, pethidine is better than a placebo, but not a very good analgesic. The percentage of women giving very high VAS scores remained at 66% or above throughout the first hour following its administration. This, plus maternal side effects and effect on the baby must call into question its appropriateness.
Soontrapa et al 2002 147
RCT 1+ Intervention group n=42 Control group n=42
Women in active labour at term with no medical or obstetric complications (cervical dilation 3-5 cm, painful contractions 3-4 in 10 min.)
Women < 75 kg: 50 mg pethidine IV Women>75 kg: 75 mg pethidine IV (Co-intervention 25 mg promethazine hydrochloride for women with nausea/vomiting)
Placebo:Women < 75 kg: 1 ml saline IV Women > 75 kg: 1.5 ml saline IV
24 hours postpartum
Outcomes recorded 15, 30 and 60 min. after administration: Self-reported pain (VAS) Observer-rated sedation (5-point Likert sale) Fetal heart rate (FHR) Woman’s pulse, respiratory rate and BP In addition: Nausea/vomiting, dizziness Mode of birth Baby’s Apgar scores at 1 and 5 minutes Administration of naloxone Woman’s views of pain relief 1 day postnatally
No signif. differences noted in FHR, woman’s BP, pulse or respiratory rate. Pain scores (median (25th and 75th percentiles) pethidine vs. control group: O min: 5.5 (5-7) vs. 5.5 (5-7), NS 15 min: 6.0 (5-8) vs. 7.0 (6-8), NS 30 min: 7.0 (5-9) vs. 8.0 (6-9), NS 60 min: 8.0 (6-10) vs. 8.5 (7-10), NS (NB. Mean scores also showed no signif. diff.) Pain increment scores pethidine vs. control group at different times (mean (SD)): 0-15 min: 0.30 (1.54) vs. 1.14 (1.00), p=0.004 0-30 min: 0.88 (2.10) vs. 1.81 (1.50), p=0.022 0-60 min: 1.40 (2.17) vs. 2.48 (1.50), p=0.01 Nausea/vomiting: pethidine vs. control 15 (36%) vs. 2 (4.8%), p=0.001. Dizziness: pethidine vs. control 11 (26.4%) vs. 0 (0%), p<0.001 Satisfied with pain relief 1 day postnatally pethidine vs. control: 23.8% vs. 7.10%, p=0.0347. Note: Low percentage of women satisfied with pethidine as pain relief (23.8%)
Not stated Thailand
Olofsson 1996 148
Dose-finding study
3 n=17 Women in active labour, contracting at least 3 contractions in every 10 minutes with cervical dilation of at least 4cm requesting
IV morphine N/A None Pain intensityLevel of sedation (both measured using a 10cm VAS).
Pain intensity (measured following 4 doses of morphine): mean 85mm (range 53 to 100mm) to 70mm (46 to 99mm), z=2.46, p=0.01; Wilcoxen test). No. of women experiencing back pain: 13/14 to 4/14, p=0.01. Abdominal pain not reduced in 14/17 women. Sedation scores: 0mm (range 0 to 0mm) to 78mm (56.1 to 99.5mm), p<0.05.
Karolinska Institute Foundation Swedish Medical Research Council
Country: Sweden
126

Intrapartum care
174
Bibliographic reference
Study type
Evidence level
Number of women
Women’s characteristics
Intervention Comparison Length of follow-up
Outcome measures
Effect size Source of funding
Additional comments
analgesia. N=11 nulliparous women Mean age 30.0 years (range 19 to 40 years)
No differences in neonatal outcome reported.
Torsten and Ragnar Soderbergs Foundation
Isenor L;Penny-MacGillivray T; 1993 Jul 149
RCT 1+ IV pethidine n=19 IM pethidine n=20.
Women in labour at term. No obstetric or medical complications.
IV pethidine - initial bolus of 25mg + infusion rate of 60mg/kg, plus intermittent boluses of 25mg/hour as required.
IM pethidine 50-100mg
2-3 days postpartum.
Main outcome measure: Pain during labour as measured using a 10cm VA, recorded at administration of analgesia and 30 min. thereafter. Other outcomes: Woman: Pulse, BP and respiratory rate Assessment of contractions Side-effects of medication Levels of sedation (5-point Likert scale) Mode of birth PN assessment of satisfaction wth pain relief Baby: Apgar scores Resuscitation interventions Baby's vital signs
Maternal physiological measurements - no signif. differences eg. respiratory rate: IV: range 19.5 to 22.4 IM: range 18.0 to 23.6 Pain: IV pethidine signif. lower overall levels of pain from times 1.5 hours to 4.0 hours. IV vs. IM: 1.0 hour: 60.3 vs. 69.8, NS 1.5 hours: 58.7 vs. 78.2, p=0.0376 2.0 hours: 71.6 vs. 88.9, p=0.0419 2.5 hours: 80.0 to 92.1, p=0.0436 3.0 hours: 74.9 vs. 95.0, p=0.0106 3.5 hours: 79.6 vs. 96.1, p=0.0263 4.0 hours: 73.8 vs. 98.2, p=0.0190 4.5 hours: 93.3 vs. 90.3, NS Notes: It is not clear whether the pain score given is a mean. Statistical test is an F-test (no figures given). Women in IM group received signif. less pethidine (mean=82mg) compared with the IV group (mean=121mg). 8 women in the IM group also used Entonox compared with 1 in the IV group. 4 women in the IV group received one additional bolus of 25mg pethidine and 1 woman received 2 additional boluses. Sub-group analysis on women in IV group who received 50-100mg pethidine (n=10) still showed a signif. lower pain score.
Not stated Canada
Nelson KE;Eisenach JC; 2005
RCT 1- Total n=45 (n=15 in each study group)
Women in active labour with uncomplicated pregnancy and requesting analgesia.
1mg butorphanol 0.5mg butorphanol + 25mg pethidine
50mg pethidine
Duration of labour
Main outcome: Pain, intensity and affective magnitude (0-10 verbal scale and pain affective adjective list
Pain intensity before vs. after drug administration (mean (SEM)): Butorphanol: 7.2 (=/-0.6) vs. 5.5 (=/-0.8), p<0.05 Pethidine: 7.4 (+/-0.4) vs. 5.2 (+/-0.5), p<0.05 Both: 7.4 (+/-0.4) vs. 4.7 (+/-0.8), p<0.05
Not stated Country: USA
127

Evidence tables
175
Bibliographic reference
Study type
Evidence level
Number of women
Women’s characteristics
Intervention Comparison Length of follow-up
Outcome measures
Effect size Source of funding
Additional comments
150
respectively).Other outcomes: Nausea (0-10 verbal scale) Sedation (0-10 verbal scale) FHR abnormalities
No signif. difference between groups re degree of pain relief. Pain affective magnitude before vs. after drug administration (mean (SEM)): Butorphanol: 14.4 (=/-1.4) vs. 11.0 (=/-1.6), NS Pethidine: 16.4 (+/-1.5) vs. 8.2 (+/-1.2), p<0.05 Both: 13.4 (+/-1.8) vs. 4.7 (+/-1.2), p<0.05 Pethidine and pethidine+butorphanol combination signif. reduced affective magnitude, but butorphanol alone did not. Sedation increased after all drug treatments to a similar degree. Nausea was unaffected by drug treatment. FHR abnormalities were not signif. different between treatment groups (n=5,3,5 butorphanol, pethidine, both respectively) Self-assessments made between 6th and 7th contraction post drug administration (13-16 minutes in practice). EL 1- because a number of women excluded post randomisation. No details on how many women involved or what exclusion categories they fell into.
Blair JM et al (2005) 151
RCT 1+ n=40 (20 in each group)
Women in established labour
Remifentanil 40μg with a 2 minute lockout
Pethidine 15mg with a 10 minute lockout
Pain intensity (10 cm VAS), sedation score (5-point Likert scale), vital signs, nausea and anxiety (repeated every 30 minutes) Assessments of women’s satisfaction with analgesia (10-point VAS). Continuous pulse oximetry and continuous FHR monitoring for 1 hour following the commencement of PCA.
No significant differences were noted for pain intensity scores between the 2 groups (overall mean (SD) remifentanil: 6.4 cm (1.5); pethidine: 6.9 cm (1.7)). No significant differences noted for levels of nausea, sedation, anxiety or time spent with oxygen saturation <94% or < 90%. Satisfaction scores at 60 minutes were significantly higher for remifentanil than pethidine (median [interquartile range]: 8.0 [7.5-9.0] vs. 6.0 [4.5-7.5]; p=0.029). No significant differences were noted for classification of FHR tracings, Apgar scores or cord blood pH. Thirty minutes after birth babies in the pethidine group had significantly lower Neurologic Adaptive Capacity Scores, but there was no difference after 120 minutes.
Not stated Country: UK
Volikas I & Male D (2001) 152
RCT 1- Intervention n=9 Comparison n=8
Women in established labour
IV bolus of remifentanil 0.5μg/kg with a lockout period of 2 minutes
Bolus of 10mg pethidine with a lockout period of 5 minutes.
30 mins. post birth
Pain (VAS score), nausea and itching immediately prior to administration of analgesia, at hourly intervals post administration
No significant difference in the initial baseline mean VAS score for pain (pethidine 47mm; remifentanil 48mm). Mean VAS score for pain throughout labour was reported as being significantly lower in the remifentanil group (actual value not given).
Not stated Country: UK The trial was terminated early due to
128

Intrapartum care
176
Bibliographic reference
Study type
Evidence level
Number of women
Women’s characteristics
Intervention Comparison Length of follow-up
Outcome measures
Effect size Source of funding
Additional comments
throughout labour, and again 30 minutes after giving birth. Women’s vital signs 1 and 5 minute Apgar scores
Post birth VAS score also reported to be significantly lower for women in the remifentanil group (again actual value not stated). No significant differences were found for nausea or itching between the 2 groups. No episodes of maternal hypotension, bradycardia or respiratory rate < 12 were recorded. Median Apgar scores at 1 and 5 minutes were found to be significantly lower in babies born to mothers who had received pethidine (median(range) at 1 minute – remifentanil: 9 (9-9); pethidine: 5.5 (5-8), p=0.01; at 5 minutes – remifentanil: 10 (9-10); pethidine: 7.5 (6-9), p=0.04). One baby in the pethidine group was admitted to the neonatal unit.
concerns over the neonatal effects noted in the pethidine group.
Morley-Forster PK (2000) 153
RCT 1- n=23 (n=11 fentanyl; n=12 alfentanil)
Women in established labour
Fentanyl: loading dose of 50 μg IV. PCA of 10 μg with a lockout of 5 minutes. Background infusion of 20 μg/h was maintained.
Alfentanil: loading dose of 500 μg IV. PCA of 100 µg with a background infusion of 200µg/h.
24 hours Hourly measurements drug dose received, total dose, sedation score and side-effects. VAS pain scores recorded every 30 minutes. Neonatal effects: by Apgar scores, umbilical venous and arterial blood gases and neuro-behavioural scores recorded at 4 and 24 hours
No significant differences in the 2 groups for VAS pain scores from 1 to 3 cm cervical dilation (mean (SD) fentanyl: 61.0mm (19.6); alfentanil: 67.3mm (29.2)) or 4 to 6cm cervical dilation (mean (SD) fentanyl: 54.9mm (24.9); alfentanil: 67.7mm (20.2)). Mean VAS pain scores at 7 to 10 cm cervical dilation were significantly higher in the alfentanil group compared with the fentanyl group (64.6mm (12.2) vs. 85.7mm (13.9), p<0.01). No significant differences were observed for VAS scores for sedation, incidence of nausea and incidence of pruritis. Five of the 12 women receiving alfentanil described the pain relief as inadequate compared with 1 of the 9 in the fentanyl group (NS). No significant differences in neonatal outcome with regard to Apgar scores, neuro-behavioural scores, umbilical venous pH or naloxone requirement (fentanyl: n=4; alfentanil: n=2).
Not stated Country: Canada
McInnes et al, 2004 154
RCT 1+ Intervention group n=177 Control group n=179
Women in labour at term, booked for midwife care and requesting diamorphine analgesia (the usual IM analgesia used in Scotland)
IV PCA diamorphine - loading dose of 1.2 mg diamorphine IV and a PCA pump set to deliver 0.15mg diamorphine per dose with a 5 minute lock out period (maximum dose 1.8 mg per hour).
IM diamorphine – primigravid women 7.5mg, multigravid women 5.0mg . All women also given 3mg buccal Stemetil
6 weeks postnatally.
Main outcomes: analgesia requirements during labour and women’s satisfaction with pain relief. Secondary outcomes: women’s perceptions of pain in labour, side-effects and clinical outcomes for woman and baby.
Primigravid women: PCA group used significantly less analgesia than those in the IM group (PCA mean 1.7mg/h, IM mean 3.2mg/h; difference -1.5mg/h (95% CI -1.1 to -1.9mg/h), p<0.001). Slightly more women in PCA group opted for an epidural (68/113 vs. 60/115, RR 1.15 (95% CI 0.92 to 1.45), and fewer in the PCA group remained in the trial until the baby was born (35/113 vs. 50/115, RR 0.71 (0.05 to 1.01). Mean minimum VAS score for primigravid women in the IM group was lower than that for the PCA group (6.7 vs. 5.3, difference 1.4; 95% CI 0.8 to 2.0). There was no difference in mean maximum VAS scores. Mean minimum verbal descriptor scores were significantly lower for primigravid women in the IM group (% stating pain was “unbearable”: 5% vs 25%; RR 4.71 (95% CI 2.01
Not stated Country: UK (Scotland)
129

Evidence tables
177
Bibliographic reference
Study type
Evidence level
Number of women
Women’s characteristics
Intervention Comparison Length of follow-up
Outcome measures
Effect size Source of funding
Additional comments
to 11.01).Findings also suggested a poorer birth experience for women in the PCA group when remembered 6 weeks postnatally: PCA (n=85) vs. IM (n=94) Enjoyed birth: 59% vs. 68%, RR 0.87 (95% CI 0.69 to 1.09) Felt in control of labour (completely or quite): 61% vs. 70%, RR 0.87 (95% CI 0.70 to 1.08) Pain in labour was unbearable: 30% vs. 21%, RR 1.48 (95% CI 0.89 to 2.47) Very satisfied with pain relief in labour: 19% vs. 29%, RR 0.65 (95% CI 0.38 to 1.13) Received analgesia too late: 31% vs. 19%, RR 1.61 (95% CI 0.94 to 2.73) Very satisfied with diamorphine in labour: 8% vs. 28%, RR 0.27 (95% CI 0.12 to 0.63) Very dissatisfied with diamorphine in labour: 35% vs. 7%, RR 5.08 (95% CI 2.22 to 11.61) Would use diamorphine again: 34% vs. 61%, RR 0.56 (95% CI 0.40 to 0.79) Length of labour: 9.4 hours vs. 10.6 hours, difference -1.2 (95% CI -2.3 to -0.1) Em CS: 17% vs. 14%, RR 1.23 (96% CI 0.67 to 2.27) Spontaneous vaginal birth: 58% vs. 54%, RR 1.07 (96% CI 0.85 to 1.35) 1 min Apgar (mean): 8.3 vs. 8.1, diff 0.2 (95% CI -0.2 to +0.7) 5 min Apgar (mean): 9.6 vs. 9.3, diff 0.3 (95% CI 0.0 to 0.6) Cord blood pH (mean): 7.37 vs. 7.36, diff 0.01 Resuscitated: 12% vs. 18%, RR 0.68 (95% CI 0.36 to 1.27) Required IPPV: 4% vs. 9%, RR 0.51 (95% CI 0.18 to 1.44) Admitted to SCBU: 2% vs. 2% Skin to skin contact: 81% vs. 91%, RR 0.88 (95% CI 0.79 to 0.98) Breastfed at birth: 67% vs. 73%, RR 0.92 (95% CI 0.77 to 1.10) Multigravid women: PCA group used significantly less analgesia than those in the IM group (PCA mean 1.5mg/h, IM mean 3.1 mg/h; difference -1.6mg/h (95% CI --2.1 to -
130

Intrapartum care
178
Bibliographic reference
Study type
Evidence level
Number of women
Women’s characteristics
Intervention Comparison Length of follow-up
Outcome measures
Effect size Source of funding
Additional comments
1.1mg/h), p<0.001). The number of women who opted for an epidural was the same in both groups (10/66 vs. 9/62, RR 1.04 (95% CI 0.45 to 2.40). Significantly fewer women in the PCA group remained in the trial until the baby was born (40/66 vs. 49/72, RR 0.77 (0.61 to 0.97). Mean minimum VAS score for multigravid women in the IM group was lower than that for the PCA group (6.8 vs. 5.9, difference 0.9; 95% CI 0.0 to 1.9). There was no difference in mean maximum VAS scores. Mean minimum verbal descriptor scores were lower for primigravid women in the IM group, but not significantly so (% stating pain was “unbearable”: 34% vs 20%; RR 1.70 (95% CI 0.89 to 3.23). Findings also suggested a poorer birth experience for multigravid women in the PCA group when remembered 6 weeks postnatally: PCA (n=66) vs. IM (n=62) Enjoyed birth: 59% vs. 78%, RR 0.76 (95% CI 0.58 to 1.00) Felt in control of labour (completely or quite): 68% vs. 78%, RR 0.88 (95% CI 0.69 to 1.11) Pain in labour was unbearable: 44% vs. 29%, RR 1.56 (95% CI 0.91 to 2.65) Very satisfied with pain relief in labour: 9% vs. 25%, RR 0.39 (95% CI 0.15 to 1.01) Received analgesia too late: 44% vs. 19%, RR 2.32 (95% CI 1.20 to 4.49) Very satisfied with diamorphine in labour: 2% vs. 29%, RR 0 07 (95% CI 0.01 to 0.53) Very dissatisfied with diamorphine in labour: 31% vs. 7%, RR 4.29 (95% CI 1.33 to 13.80) Would use diamorphine again: 44% vs. 75%, RR 0.59 (95% CI 0.42 to 0.84) Length of labour: 6.1 hours vs. 62 hours, difference -0.2 (95% CI -1.2 to +0.8) Em CS: 9% vs. 5%, RR 1.88 (96% CI 0.49 to 7.19) Spontaneous vaginal birth: 80% vs. 90%, RR 0.89 (96% CI 0.77 to 1.03) 1 min Apgar (mean): 8.3 vs. 8.0, diff 0.3 (95% CI -0.2 to +0.9) 5 min Apgar (mean): 9.4 vs. 9.1, diff 0.3 (95% CI 0.0 to 0.6) Cord blood pH (mean): 7.37 vs. 7.37, diff 0.00 Resuscitated: 18% vs. 31%, RR 0.59 (95% CI 0.31 to 1.12)
131

Evidence tables
179
Bibliographic reference
Study type
Evidence level
Number of women
Women’s characteristics
Intervention Comparison Length of follow-up
Outcome measures
Effect size Source of funding
Additional comments
Required IPPV: 8% vs. 11%, RR 0.67 (95% CI 0.22 to 2.00) Admitted to SCBU: 2% vs. 2% Skin to skin contact: 79% vs. 81%, RR 0.98 (95% CI 0.82 to 1.16) Breastfed at birth: 67% vs. 56%, RR 1.19 (95% CI 0.89 to 1.59)
Thurlow 2002 155
RCT (unblinded)
1- n=18 interven-tion group n=18 compar-ison group
Women in early labour excluding those weighing <50kg or >100kg. N=13 nulliparous women in each group
Remifentanil PCA(20 μg bolus over 20sec., 3 min. lockout, no background transfusion.)
Pethidine 100mg (IM) + antiemetic
Duration of labour only
Pain scores (10cm VAS) Overall effectiveness of analgesia Midwives’ assessments of overall effectiveness of analgesia
Median pain scores at 1 hour: 72 vs. 48, p<0.0004, favours remifentanil PCA. Median maximum scores over 2 hours: 82.5 vs. 66.5, p=0.009, favours remifentanil PCA. Women’s overall assessment of effectiveness: �²=12.10, p=0.002, favours remifentanil. Midwives’ assessment of effectiveness: �²=12.80, p=0.002, favours remifentanil. Haemoglobin saturation<=94%: n=7 remifentanil vs. n=2 pethidine.
Not stated Country: UK
132

Intrapartum care
180
Regional analgesia – regional analgesia versus other types of analgesia in labour Bibliographic reference
Study type
Evidence level
Number of women
Women’s characteristics
Intervention Comparison Length of follow-up
Outcome measures
Effect size Source of funding
Additional comments
Anim-Somuah M;Smyth R;Howell C; 2005 156
Systematic review - meta-analysis
1+ Original review - 21 studies involving 6664 women. 3 studies excluded because outside the scope of guideline: 19 studies involving 5705 women
Women in spontaneous labour at >=36 weeks of pregnancy. NB. One trial included women in spontaneous labour and induced labour.
All modalities of epidural analgesia (with or without opioids)
Non-epidural pain relief or no pain relief
Follow-up period: Immediate PN period
Outcome Measures: Primary outcomes: Woman's perceptions of pain relief in labour Instrumental birth CS Apgar score<7 at 5 min. Maternal satisfaction with pain relief during labour Long term backache Secondary outcomes: 44 secondary outcomes are listed relating to: Other measures of pain relief Side effects for woman Woman's vital signs Neonatal outcomes - both short and long term
Findings re-analysed excluding 3 studies not relevant to this systematic review (RR (95% CI)): CS (16 studies): 1.08 (0.92 to 1.26) CS for fetal distress (9): 1.31 (0.88 to 1.94) CS for dystocia (10): 0.93 (0.71 to 1.22) Instrumental birth (14): 1.34 (1.20 to 1.50) Women's satisfaction with intrapartum pain relief (5): 1.18 (0.92 to 1.50) Woman's perception of pain relief in first stage (2): WMD -15.67 (-16.98 to -14.35) Woman's perception of pain relief in second stage (2): WMD -20.75 (-22.50 to -19.01) Woman's satisfaction with childbirth experience (1): 0.95 (0.87 to 1.03) Perceived feeling of poor control in labour (1): 1.17 (0.62 to 2.21) Need for additional pain relief (13): 0.05 (0.02 to 0.17) Maternal hypotension (6): 58.49 (21.29 to 160.66) Nausea and vomiting ((7): 1.03 (0.87 to 1.22) Fever >38 degrees C (2): 4.37 (2.99 to 6.38) Drowsiness (3): 1.00 (0.12 to 7.99) Urinary retention (3): 17.05 (4.82 to 60.39) Malposition (4): 1.40 (0.98 to 1.99) Perineal repair (1): 1.05 (0.93 to 1.18) Postnatal depression (1): 0.63 (0.38 to 1.05) Long-term backache (2): 1.00 (0.89 to 1.12) Apgar score <7 at 5 min. (8): 0.76 (0.40 to 1.44) Length of first stage (8): 28.68 (-23.65 to 81.01) Length of second stage (10) WMD 16.24 (6.71 to 25.78) Oxytocin augmentation (10): 1.19 (1.02 to 1.38) Meconium staining of liquor (4): 1.01 (0.79 to 1.30) NICU admission (5): 1.08 (0.62 to 1.90)
Not stated Re-running of the meta-analyses made little difference to the findings of the review. One exception: umbilical artery pH < 7.2 - no longer signif. favours epidural group, with 3 trials removed finding is NS. Country: International
133

Evidence tables
181
Bibliographic reference
Study type
Evidence level
Number of women
Women’s characteristics
Intervention Comparison Length of follow-up
Outcome measures
Effect size Source of funding
Additional comments
Umbilical artery pH<7.2 (5): 0.87 (0.71 to 1.07)Naloxone administration (4): 0.15 (0.06 to 0.40)
Leighton BL;Halpern SH; 2002 May 158
Systematic review - meta-analysis
Evidence level: 1+
14 RCTs involving 4324 women 2 prospective studies involving 397 women.
Women in labour at term. 10 trials enrolled only primiparous women. 1 trial enrolled only multiparous women. 8 trials included only women in spontaneous labour, 2 included women in spontaneous labour and those with induced labour. 4 trials did not report labour onset.
Intervention: Epidural analgesia. Includes epidural with background continous infusion (n=5), PCEA (n=3) as well as bolus "top ups" (n=7). One propsctive cohort study included either combined spinal/epidural or epidural, both maintained with continous epidural.
Comparison: Opioid analgesia, including pethidine IM, pethidine IV, butorphanol IV, fentanyl IV PCA..
Follow-up period: 12 month follow-up for 1 study. Most other studies include follow-up only to immediate postnatal period.
Outcome Measures: Woman: Length of labour (first and second stage) Oxytocin post analgesia Fever (>38 degrees C) Hypotension Nausea Pain Mode of birth Satisfaction with pain relief Back pain Urinary incontinence Baby: FHR abnormalities Apgar scores Umbilical artery pH Need for naloxone treatment Initiation of breastfeeding
Woman (OR or WMD with 95% CI):Pain, first stage: -40mm (-42 to -38), p<0.0001. Pain, second stage: -29mm (-38 to -21), p<0.001. Length of first stage of labour: 26 min. (-8.0 to 60.0), NS. Length of second stage of labour: 15 min. (9.0 to 22.0), p<0.05. Oxytocin post analgesia: 2.80 (1.89 to 4.16), p<0.05. Fever (>38 degrees C): 5.6 (4.0 to 7.8), p<0.001. Hypotension: 74.2 (4.0 to 1375?)p<0.001. Nausea: 1.4 (0.78 to 2.71, NS. Instrumental vaginal birth: 2.08 (1.48 to 2.93), p<0.05. Instrumental vaginal birth for dystocia: 1.53 (0.29 to 8.08), NS. CS: 1.00 (0.77 to 1.28), NS. Satisfaction with pain relief: 0.27 (0.19 to 0.38), p<0.001. Mid back pain at 3 months: 1.4 (0.9 to 2.3), NS. Low back pain at 3 months: 1.0 (0.6 tp 1.6), NS. Mid back pain at 12 months: 1.0 (0.5 to 1.8, NS. Low back pain at 12 months: 1.4 (0.9 to 2.3), NS. Urinary incontinence: signif. higher rate asociated with epidural use in the immediate postpartum, but this difference not evident at 3 or 12 months. Baby: FHR abnormalities or intrapartum meconium: 1.0 (0.75 to 1.33), NS. 1 min Apgar score < 7: 0.54 (0.35 to 0.82), p<0.05. 5 min Apgar score < 7: 0.54 (0.23 to 1.26), NS.
Department of Anesthesiology, Weill Medical College of Cornell University, New York.
7 of the 14 RCTs scores 3 (highest score on Jadad quality scale), 2 scored 2, and 2 scored 1. 3 RCTs were not rated. Some treatment cross-over: in 9 studies some women assigned to the paretnal opioid group received epidural analgesia, in 6 studies some women assigned to epidural analgesia received either no analgesia or parental opioids. 4 studies did not report cross-over.
134

Intrapartum care
182
Bibliographic reference
Study type
Evidence level
Number of women
Women’s characteristics
Intervention Comparison Length of follow-up
Outcome measures
Effect size Source of funding
Additional comments
Low umbilical artery pH (<7.15 or <7.20): 1.0 (0.18 to 5.44), NS. Umbilical artery pH <6.99: 1.0 (0.14 to 7.15), NS. Need for naloxone: 0.20 (0.10 to 0.44), p<0.01.
Reynolds F;Sharma SK;Seed PT; 2002 Dec 159
Systematic review - meta-analysis
Evidence level: 1+
8 RCTs involving 2268 women and 5 non RCTs involving 185 women.
Women in labour at term. Includs primiparous and multiparous women. 1 RCT and 2 non-RCTs include induced labours. 2 non-RCTs mode of onset of labour not stated. 1 RCT includes 16 women who gave birth by CS under epidural, included as labouring under epidural.
Intervention: Epidural analgesia. RCTs: n=3 with background infusion, n=5 with bolus injections only. Non-RCTs: n=5 bolus injection only.
Comparison: Opioid analgesia including IM pethidine, IV pethidine, PCA pethidine, IV butorphanol.
Follow-up period: At birth
Outcome Measures: Umbilical artery pH Umbilical artery base excess
Based on RCTs only:Umbilical artery pH: WMD 0.009 (95% CI 0.002 to 0.015), p=0.007, favours epidural. Base excess: WMD 0.779 mEq/l (95% CI 0.056 to 1.502), p=0.035, favours epidural.
Not stated Only RCTs findings are reported. Heterogeneity between RCTs is reported as being low. Inclusion of findings from all studies increases heterogeneity between studies, suggesting inconsistencies in these studies.
Philip J;Alexander JM;Sharma SK;Leveno KJ;McIntire DD;Wiley J; 1999 May 160
RCT Evidence level: 1+
Intervention group (epidural) n=358 Control group (IV PCA) n=357
Women in labour at term with no medical or obstetric complications.
Intervention: Epidural analgesia
Comparison: IV PCA pethidine
Follow-up period: Few days postnatally
Outcome Measures: Primary outcome: Maternal temperature > 38 degrees C
Incidence of women's temp. > 38 degrees:Epidural: 54/358 (15%) vs. PCA: 14/357 (4%) p<0.001 Maternal temp. > 38 degrees by parity: Primps. With epidural: 47/197 (24%) vs. Primips with PCA: 9/189 (5%) vs. P<0.001 Multips. with epidural: 7/161 (4%) Multips with PCA: 6/168 (3%) NS Stepwise logistic regression: Intrapartum factors associated with women's temp >38 degrees (with fever vs. without): Prolonged labour > 12 hours: 71% vs. 23%, p<0.001 Internal fetal monitoring: 81% vs. 47%, p<0.001
Not stated Approx. 90% babies born to women with temp. > 38 degrees C received screening for neonatal sepsis and antibiotic therapy, even though none were found to have positive blood cultures. The proportion receiving septic screen and antibiotic therapy was the same, irrespective of the form of intrapartum analgesia used.
135

Evidence tables
183
Bibliographic reference
Study type
Evidence level
Number of women
Women’s characteristics
Intervention Comparison Length of follow-up
Outcome measures
Effect size Source of funding
Additional comments
Oxytocin augmentation: 58% vs. 21%, p<0.001
Lieberman E;Davidson K;Lee-Parritz A;Shearer E; 2005 161
Cohort Evidence level: 2+
Epidural analgesia n=1439 No epidural n=123
Women in labour at term. Spontaneous labour n=698 Induced labour n=864
Intervention: Epidural analgesia
Comparison: No epidural analgesia
Follow-up period: During labour only
Outcome Measures: Primary outcomes: poistion of fetus throughout labour: Position at enrollment (early labour, < 4cm cervical dilation) Position at onset of epidural analgesia, or after 4 hours. Position in late labour (> 8cm cervical dilation) Position at birth (prior to any instrumental rotation) Secondary outcome: Mode of birth
Of women with an OP baby at birth only 31% (59/190) had a fetus in the OP position at enrollment in early labour. Occiput posterior during labour with epidural vs. without epidural: Enrollment: 23.4% vs. 26.0%, NS. Epidural/4 hours: 24.9% vs. 28.3%, NS. Birth: 12.9% vs. 3.3%, p=0.002. Epidural was not associated with OT position at any stage of labour. Multinomial logistic regression examined association of epidural analgesia with position of baby at birth. Model controlled for maternal age, height, BMI, birth weight, gestational age, sex of baby, induction of labour, fetal position on enrollment and placental position. Epidural analgesia associated with a 4-fold increase in the risk of OP postion at birth compared with OA position at birth - adjusted OR 4.0 (95% CI 1.4 to 11.1). Not associated with increased risk of OT position at birth - adjusted OR 1.3 (95% CI 0.6 to 3.0). Mode of birth: Spontaneous birth by position at birth: OA: 76.2% OT: 13.5% OP: 17.4% p<0.001 Instrumental birth: OA: 17.5% OT: 12.7% OP: 17.9% NS CS: OA: 6.3% OT: 73.8% OP: 64.7%
National Institute of Child Health and Human Development grant.
Despite a number of methodological flaws, the study does seem to provide evidence that epidural analgesia effects the position of baby at birth and therefore mode of birth.
136

Intrapartum care
184
Bibliographic reference
Study type
Evidence level
Number of women
Women’s characteristics
Intervention Comparison Length of follow-up
Outcome measures
Effect size Source of funding
Additional comments
p<0.001Alexander JM;Sharma SK;McIntire DD;Leveno KJ; 2002 162
RCT Evidence level: 1+
PCEA n=226 PCA pethidine n=233
Women in spontaneous labour at term
Intervention: Epidural analgesia
Comparison: PCA pethidine
Follow-up period: Duration of labour
Outcome Measures: Primary outcomes: Length of active first stage of labour Length of second stage of labour Secondary outcomes: Rate of cervical dilation Mode of birth
Spontaneous labour without oxytocin augmentation: Median (1st and 3rd quartiles): Epidural vs. PCA pethidine Active first stage of labour (hours): 4.9 (3.5, 6.1) vs. 3.5 (2.0, 5.0), p<0.001 Rate of cervical dilation (cm/hour): 1.2 (0.9, 1.6) vs. 1.5 (1.0, 2.5), p=0.001 Second stage (hours): 0.7 (0.4, 1.1) vs. 0.6 (0.3, 0.9), p=0.046 Total length of labour (hours): 5.6 (4.1, 7.3) vs. 4.1 (2.7, 5.7), p<0.001 Spontaneous labour with oxytocin augmentation: Active first stage of labour (hours): 7.0 (4.8, 10.0) vs. 6.0 (4.0, 9.7), p=0.50 Rate of cervical dilation (cm/hour): 0.8 (0.6, 1.2) vs. 0.9 (0.7, 1.5), p=0.41 Second stage (hours): 0.8 (0.5, 1.2) vs. 0.7 (0.3, 1.3), p=0.64 Total length of labour (hours): 8.0 (5.3, 11.1) vs. 7.6 (4.6, 10.3), p=0.42
Not stated Country: USA For women in spontaneous labour without oxytocin augmentation epidyural analgesia is associated with a significantly lengthened active first and second stage of labour compared with PCA pethidine analgesia. For women with oxytocin augmentation this difference is not apparent.
Macarthur 1995 163
Prospective cohort study
2+ Women with epidural analgesia n=164 Women without epidural analgesia n=165
All women in labour. Exclusion: women with pre-pregnancy back pain.
Epidural analgesia
No epidural 6 weeks postpartum
Postpartum lower back pain. (self-report, numeric pain score and interference with daily activities).
Numeric pain scores for new onset back pain:Epidural vs. no epidural: One day: 1 (0 to 8) vs. 0 (0 to 8), p=0.09. 7 days: 0 (0 to 7) vs. 0 (0 to 7), p=0.815. 6 weeks: 0 (0 to9) vs. 0 (0 to 5), p=0.148. (Mann-Whitney U test) New onset back pain: One day: n=56 vs. n=42, adjusted RR 2.05 (95% CI 1.07 to 3.92). 7 days: n=22 vs. n=23, adjusted RR 1.09 (95% CI 0.48 to 2.48) 6 weeks: n=16 vs. n=8, adjusted RR 3.17 (95% CI 0.91 to 11.03).
Eriksson 2006 164
Popula-tion-based cohort
3 N=94, 217 giving birth in 52 maternity units.
All singleton, vaginal births in Sweden 1998-2000. Includes spontaneous and
Epidural analgesia
No epidural analgesia
None Mode of birth Non-elective CS:Epidural rate 20-29%: 9.1%, OR 0.84 (95% CI 0.77 to 0.93). Epidural rate 30-39%: 10.4%
Not stated Country: Sweden
137

Evidence tables
185
Bibliographic reference
Study type
Evidence level
Number of women
Women’s characteristics
Intervention Comparison Length of follow-up
Outcome measures
Effect size Source of funding
Additional comments
study Unit of analysis = maternity unit.
induced onset labours and labours with obstetric risk factors.
Epidural rate 40-49%: 10.6%Epidural rate 50-59%: 10.3% 60-64%: 9.1%, OR 0.85 (95% CI 0.77 to 0.93) Instrumental birth: Most common in units with epidural rate 50-59%, OR 1.23 (95% CI 1.18 to 1.26) Least common in units with epidural rate 30-39%: 14.1%, OR 0.88 (95% CI 0.84 to 0.92).
138
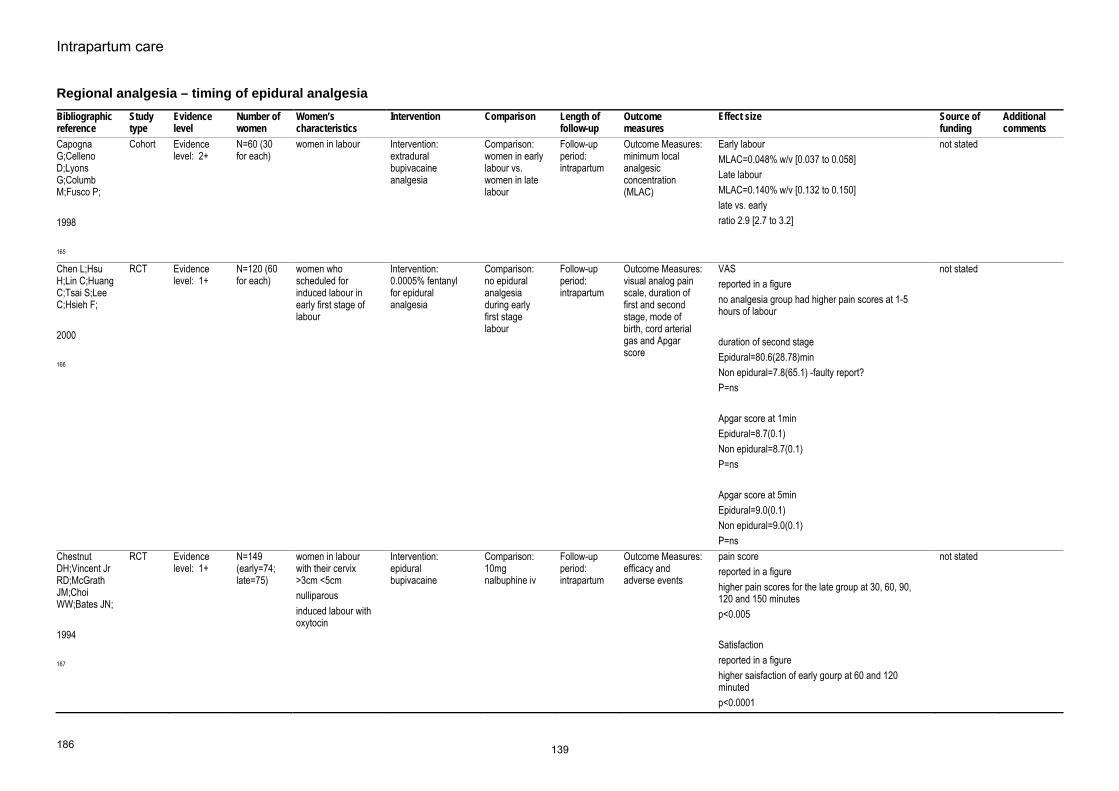
Intrapartum care
186
Regional analgesia – timing of epidural analgesia Bibliographic reference
Study type
Evidence level
Number of women
Women’s characteristics
Intervention Comparison Length of follow-up
Outcome measures
Effect size Source of funding
Additional comments
Capogna G;Celleno D;Lyons G;Columb M;Fusco P; 1998 165
Cohort Evidence level: 2+
N=60 (30 for each)
women in labour Intervention: extradural bupivacaine analgesia
Comparison: women in early labour vs. women in late labour
Follow-up period: intrapartum
Outcome Measures: minimum local analgesic concentration (MLAC)
Early labourMLAC=0.048% w/v [0.037 to 0.058] Late labour MLAC=0.140% w/v [0.132 to 0.150] late vs. early ratio 2.9 [2.7 to 3.2]
not stated
Chen L;Hsu H;Lin C;Huang C;Tsai S;Lee C;Hsieh F; 2000 166
RCT Evidence level: 1+
N=120 (60 for each)
women who scheduled for induced labour in early first stage of labour
Intervention: 0.0005% fentanyl for epidural analgesia
Comparison: no epidural analgesia during early first stage labour
Follow-up period: intrapartum
Outcome Measures: visual analog pain scale, duration of first and second stage, mode of birth, cord arterial gas and Apgar score
VASreported in a figure no analgesia group had higher pain scores at 1-5 hours of labour duration of second stage Epidural=80.6(28.78)min Non epidural=7.8(65.1) -faulty report? P=ns Apgar score at 1min Epidural=8.7(0.1) Non epidural=8.7(0.1) P=ns Apgar score at 5min Epidural=9.0(0.1) Non epidural=9.0(0.1) P=ns
not stated
Chestnut DH;Vincent Jr RD;McGrath JM;Choi WW;Bates JN; 1994 167
RCT Evidence level: 1+
N=149 (early=74; late=75)
women in labour with their cervix >3cm <5cm nulliparous induced labour with oxytocin
Intervention: epidural bupivacaine
Comparison: 10mg nalbuphine iv
Follow-upperiod: intrapartum
Outcome Measures: efficacy and adverse events
pain score reported in a figure higher pain scores for the late group at 30, 60, 90, 120 and 150 minutes p<0.005 Satisfaction reported in a figure higher saisfaction of early gourp at 60 and 120 minuted p<0.0001
not stated
139
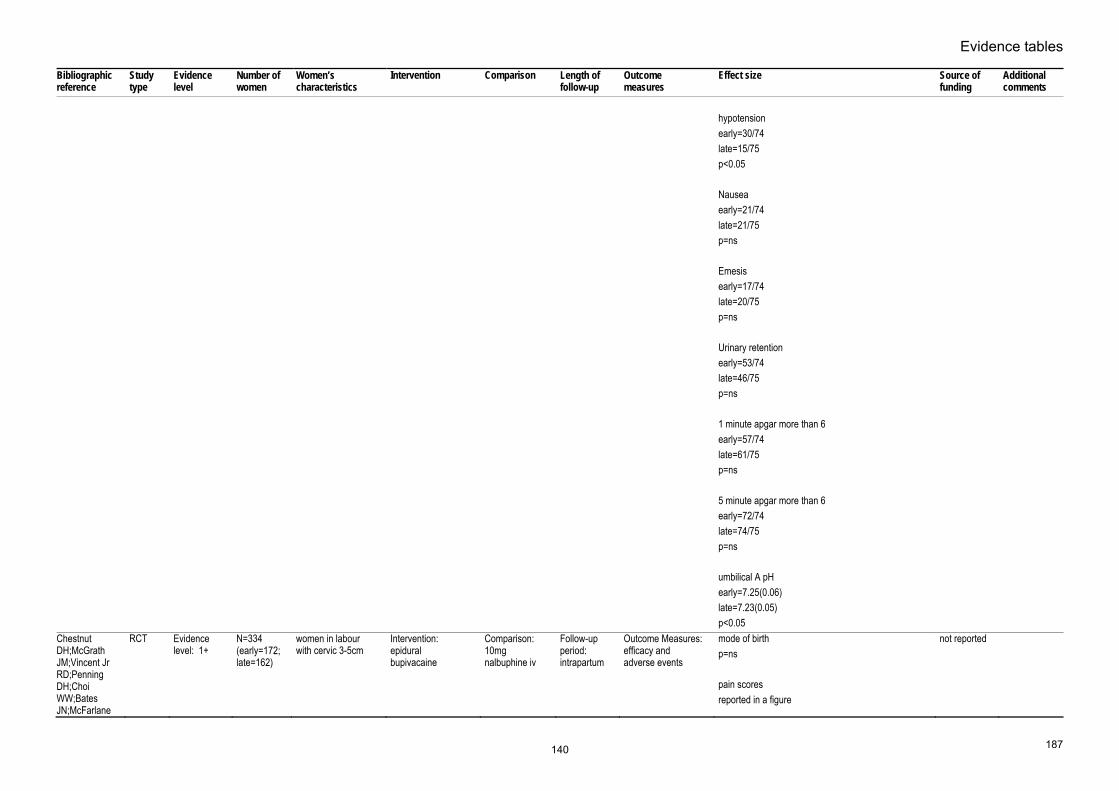
Evidence tables
187
Bibliographic reference
Study type
Evidence level
Number of women
Women’s characteristics
Intervention Comparison Length of follow-up
Outcome measures
Effect size Source of funding
Additional comments
hypotension early=30/74 late=15/75 p<0.05 Nausea early=21/74 late=21/75 p=ns Emesis early=17/74 late=20/75 p=ns Urinary retention early=53/74 late=46/75 p=ns 1 minute apgar more than 6 early=57/74 late=61/75 p=ns 5 minute apgar more than 6 early=72/74 late=74/75 p=ns umbilical A pH early=7.25(0.06) late=7.23(0.05) p<0.05
Chestnut DH;McGrath JM;Vincent Jr RD;Penning DH;Choi WW;Bates JN;McFarlane
RCT Evidence level: 1+
N=334 (early=172; late=162)
women in labour with cervic 3-5cm
Intervention: epidural bupivacaine
Comparison: 10mg nalbuphine iv
Follow-up period: intrapartum
Outcome Measures: efficacy and adverse events
mode of birthp=ns pain scores reported in a figure
not reported
140

Intrapartum care
188
Bibliographic reference
Study type
Evidence level
Number of women
Women’s characteristics
Intervention Comparison Length of follow-up
Outcome measures
Effect size Source of funding
Additional comments
C; 1994 168
higher scores for late at 30, 60, 90 and 120 minutes Satisfaction reported in a figure higher satisfaction rate for early group at 60, 120 and 180 minutes 1 minute apgar more than 6 early=130/172 late=125/162 p=ns 5 minutes apgar more than 6 early=168/172 late=158/162 p=ns umbilical A pH early=7.25(0.07) late=7.23(0.07) p<0.05
Luxman D;Wolman I;Groutz A;Cohen JR;Lottan M;Pauzner D;David MP; 1998 169
RCT Evidence level: 1+
N=60 (30 for each)
women in labour Intervention: epidural bupivacaine with cervical dilatation less than 4 cm
Comparison: the same dose of epidural epidural bupivacaine with cervical dilatation equal to or more than 4 cm
Follow-up period: intrapartum
Outcome Measures: duration of second stage, mode of birth, and Apgar score at 1 and 5 minutes
instrumental birthearly=4/30 late=5/30 p=ns CS early=2/30 late=3/30 p=ns Apgar score <8 early=1/30 late=1/30 p=ns duration of second stage early=41.1(19.0) late=37.9(16.0) p=ns
not stated
Wong RCT Evidence N=728 nulliparous women Intervention: Comparison: Follow-up Outcome Measures: CS interium
141

Evidence tables
189
Bibliographic reference
Study type
Evidence level
Number of women
Women’s characteristics
Intervention Comparison Length of follow-up
Outcome measures
Effect size Source of funding
Additional comments
CA;Scavone BM;Peaceman AM;McCarthy RJ;Sullivan JT;Diaz NT;Yaghmour E;Marcus RJ;Sherwani SS;Sproviero MT;Yilmaz M;Patel R;Robles C;Grouper S; 2005 Feb 17 170
level: 1+ (intrathecal=366; systemic=362)
whose cervics dilated less than 4 cm with spontaneous labour
intrathecal fentanyl intravenous hydromorphine injection
period: intrapartum
duration of labour, pain scores, Apgar scores, mode of birth
MD -2.9 [-9.0 to 3.0] Instrumentral vaginal birth MD 3.6 [-2.9 to 10.1] verbal pain score MD -4.0 [-3.0 to -3.0] Nausea intrathecal>systemic p<0.001 oxytocin MD 1.2 [-5.7 to 8.1] Apgar score less than 7 at 1 min MD -7.4 [-13.5 to 1.1] Apgar score less than 7 at 5 min MD -1.1 [-3.4 to 1.1]
Ohel 2006 171 RCT 1+ N=449 Nulliparous term women in early labour (at less than 3cm of cervical dilatation)
Immediate initiation of epidural analgesia at first request
Delay of epidural until at least 4cm of cervical dilatation
Perinatal Mode of birth and interventions
CS rateRR 1.18 p=0.77 the use of oxytocin in the first stage RR1.07, p=0.57 Spontaneous vaginal birth RR 0.91, p=0.85 Less women in the early epidural group showed preference to the care of the other group than the late epidural group (RR 11.1 p<0.001)
Not stated
142

Intrapartum care
190
Regional analgesia – establishing regional analgesia (combined spinal-epidural analgesia versus epidural analgesia) Bibliographic reference
Study type
Evidence level
Number of women
Women’s characteristics
Intervention Comparison Length of follow-up
Outcome measures
Effect size Source of funding
Additional comments
Hughes D;Simmons SW;Brown J;Cyna AM; 2005 207
System-atic review - meta-analysis
1+ Includes 14 RCTs involving 2047 women.
Healthy women in labour requesting epidural analgesia in the first stage of labour. Most studies stipulated uncomplicated pregnancy. Exclusion criteria varied: 4 studies reported no exclusion criteria, 1 study excluded women with induced labours, 6 studeis excluded women who had received opioid analgesia within 3-4 hours of epidural administration.
Intervention: Combined spinal-epidural analgesia. Trials included different drugs, dosages and method of epidural drug delivery.
Comparison: Epidural (traditional or low dose)
Follow-up period: Immediate PN period
Outcome Measures: Primary outcome: Onset of pain relief from onset of injection 24 other outcomes studied, including: women's satisfaction with pain relief Degree of mobilisation Side-effects and complications Mode of birth Neonatal outcomes
95% CI given in parentheses. Time from first injection to effective analgesia (4 trials): WMD -5.50 (-6.47 to -4.52)* Need for rescue analgesia (5): OR 0.80 (0.60 to 1.08)* Number of women satisfied with analgesia (2): OR 4.69 (1.27 to 17.29) Number of women who mobilise (5): OR 1.07 (0.82 to 1.39) Post dural puncture headache (9): OR 1.46 (0.37 to 5.71) Known dural tap (6): 1.77 (0.53 to 5.94) Number of women requiring blood patch for PDPH (6): OR 1.47 (0.24 to 8.98) Pruritis (9): OR 2.79 (1.87 to 4.18)* Urinary retention (2): OR 0.89 (0.39 to 2.00) Nausea/vomiting (8): OR 1.36 (0.87 to 2.14) Hypotension (10): OR 0.98 (0.39 to 2.44) Headache (any) (2): OR 0.33 (0.05 to 2.11) Sedation (1): OR 1.03 (0.36 to 2.96) Labour augmentation required (6): OR 0.90 (0.70 to 1.16) Augmentation after analgesia (1): 0.40 (0.15 to 1.06) Spontaneous vaginal birth (12): OR 1.03 (0.84 to 1.25) Instrumental birth (10): OR 0.91 (0.72 to 1.15) CS (10): OR 1.02 (0.81 to 1.30) Umbilical arterial pH (4): WMD 0.00 (-0.03 to 0.02) Umbilical venous pH (3): WMD -0.01 (-0.03 to 0.02)* Apgar score < 7 at 5 mins (3): OR 0.53 (0.10 to 2.95) Apgar score < 8 at 5 min (4): OR 1.22 (0.52 to 2.83) Number admitted to neonatal unit (2): 0.68 (0.33 to 1.41)
Not funded
The significant findings of reduced time for onset of pain relief and incidence of pruritis are both associated with a high degree of heterogeneity between meta-analysed studies, undermining the reliability of the findings.
Zeidan AZ; 2004 208
RCT Evidence level: 1+
CSE group n=50 EPI group n=51
Healthy, primiparous women in first stage of labour, gestation > 36 weeks, cervical dilation < 4cm when
Intervention: Combined spinal epidural - Spinal component: bupivicaine 0.25% 0.5ml
Comparison: Low-dose epidural. Initial bolus (10-20 ml) of bupivicaine
Follow-up period: 1 day postpartum
Outcome Measures: Woman's assessment of adequacy of analgesia Time to onset of
CSE group vs. EPI groupOnset of analgesia: VAS<30mm at: 5 min: 100% vs. 41.2%, p<0.05, favours CSE group 10 min: 100% vs. 51%, p<0.05, favours CSE group
Not stated Both groups included high incidence of oxytocin use (70% and 65%) for
143
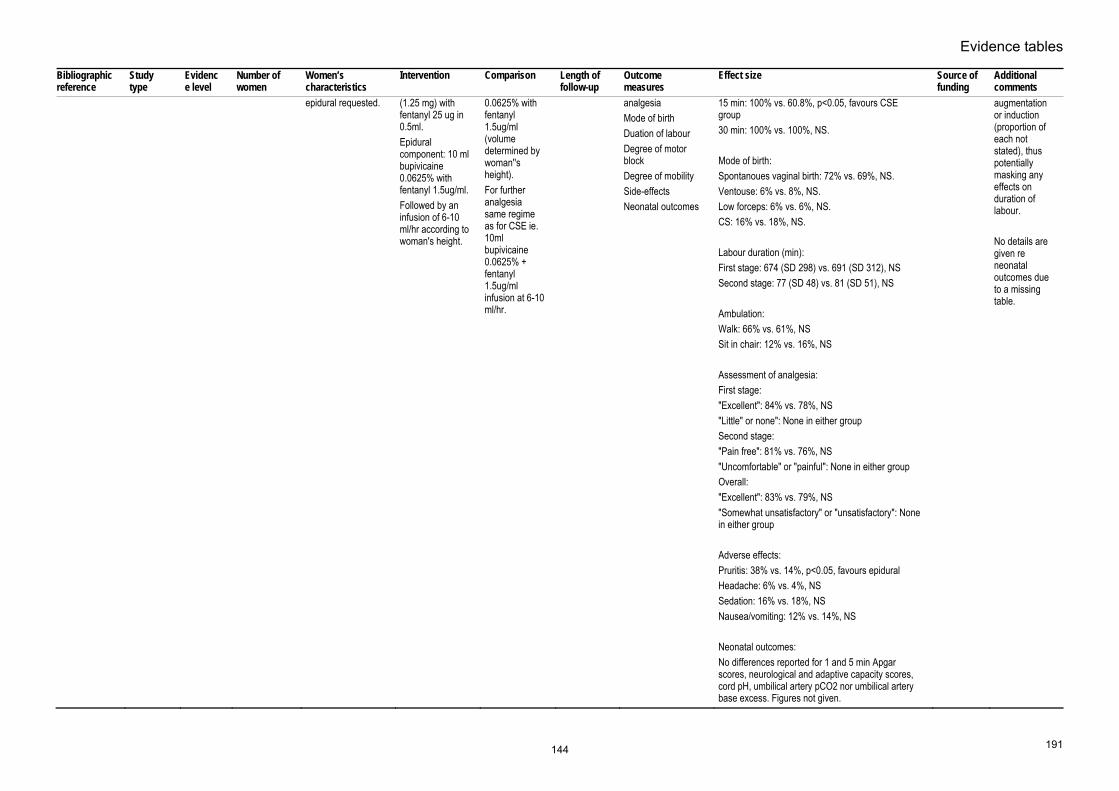
Evidence tables
191
Bibliographic reference
Study type
Evidence level
Number of women
Women’s characteristics
Intervention Comparison Length of follow-up
Outcome measures
Effect size Source of funding
Additional comments
epidural requested. (1.25 mg) with fentanyl 25 ug in 0.5ml. Epidural component: 10 ml bupivicaine 0.0625% with fentanyl 1.5ug/ml. Followed by an infusion of 6-10 ml/hr according to woman's height.
0.0625% with fentanyl 1.5ug/ml (volume determined by woman''s height). For further analgesia same regime as for CSE ie. 10ml bupivicaine 0.0625% + fentanyl 1.5ug/ml infusion at 6-10 ml/hr.
analgesiaMode of birth Duation of labour Degree of motor block Degree of mobility Side-effects Neonatal outcomes
15 min: 100% vs. 60.8%, p<0.05, favours CSE group 30 min: 100% vs. 100%, NS. Mode of birth: Spontanoues vaginal birth: 72% vs. 69%, NS. Ventouse: 6% vs. 8%, NS. Low forceps: 6% vs. 6%, NS. CS: 16% vs. 18%, NS. Labour duration (min): First stage: 674 (SD 298) vs. 691 (SD 312), NS Second stage: 77 (SD 48) vs. 81 (SD 51), NS Ambulation: Walk: 66% vs. 61%, NS Sit in chair: 12% vs. 16%, NS Assessment of analgesia: First stage: "Excellent": 84% vs. 78%, NS "Little" or none": None in either group Second stage: "Pain free": 81% vs. 76%, NS "Uncomfortable" or "painful": None in either group Overall: "Excellent": 83% vs. 79%, NS "Somewhat unsatisfactory" or "unsatisfactory": None in either group Adverse effects: Pruritis: 38% vs. 14%, p<0.05, favours epidural Headache: 6% vs. 4%, NS Sedation: 16% vs. 18%, NS Nausea/vomiting: 12% vs. 14%, NS Neonatal outcomes: No differences reported for 1 and 5 min Apgar scores, neurological and adaptive capacity scores, cord pH, umbilical artery pCO2 nor umbilical artery base excess. Figures not given.
augmentation or induction (proportion of each not stated), thus potentially masking any effects on duration of labour. No details are given re neonatal outcomes due to a missing table.
144

Intrapartum care
192
Bibliographic reference
Study type
Evidence level
Number of women
Women’s characteristics
Intervention Comparison Length of follow-up
Outcome measures
Effect size Source of funding
Additional comments
MacArthur 2004 209
Prospective matched cohort study
2+ n=350 in each of 3 epidural trial groups (total n=1050). n=351 in no epidural group
Epidural group: Nulliparous women who requested epidural for pain relief during labour. Comparison group matched for date of delivery, mode of birth and ethnic group.
Combined spinal epidural analgesia
Traditional epidural analgesia and no epidural
12 months postpartum
Long-term backache
Long-term backache:CSE vs. traditional epidural: OR 1.31 (95% CI 0.92 to 1.82), favours CSE. Non-epidural group vs. traditional epidural group: OR 1.46 (95% CI 1.02 to 2.09), favours no epidural.
Not stated Country: UK
145

Evidence tables
193
Regional analgesia – establishing regional analgesia (Intrathecal opioid with or without local anaesthetic versus no intrathecal opioid) Bibliographic reference
Study type
Evidence level
Number of women
Women’s characteristics
Intervention Comparison Length of follow-up
Outcome measures
Effect size Source of funding
Additional comments
Mardirosoff C;Dumont L;Boulvain M;Tramer MR; 2002 Mar 185
Systematic review - meta-analysis
Evidence level: 1+
N=3513 (24 trials)
women in labour Intervention: intrathecal opioids
Comparison: any other
Follow-up period: intrapartum
Outcome Measures: fetal bradycardia, mode of delivery
FHR abnormalitiesRR 1.17 [0.87 to 1.57] Fetal bradycardia RR 1.81 [1.04 to 3.14] CS RR 1.03 [0.87 to 1.21] Spotaneous vaginal birth RR 1.01 [0.95 to 1.07] Apgar less than 7 at 5 min RR 1.17 [0.44 to 3.11] Pruritis opioids in control RR 1.71 [0.97 to 3.02] no opioids in control RR 29.6 [13.6 to 64.6]
not stated
Wong CA;Scavone BM;Slavenas JP;Vidovich MI;Peaceman AM;Ganchiff JN;Strauss-Hoder T;McCarthy RJ; 2004 210
RCT Evidence level: 1+
N=108 (N=18 for each)
women in labour requiring epidural analgesia
Intervention: intrathecal fentanyl with different doses with bupivacaine for initiation A 0mcg B 5mcg C 10mcg D 15mcg E 20 mcg F 25 mcg
Comparison: A 0mcg B 5mcg C 10mcg D 15mcg E 20 mcg F 25 mcg
Follow-up period: intrapartum
Outcome Measures: efficacy
duration of analgesiaA 27(18) B 65(37) C 75(35) D 84(35) E 104(24) F 84(32) min mild variable decelerations/late decelerations A 3/0/18 B 1/0/18 C 1/1/18 D 0/1/18 E 1/2/18 F 2/0/18
not stated
Lim Y;Sia AT;Ocampo CE;
RCT Evidence level: 1+
N=40(20 for each)
women in labour requesting epidural
Intervention: levobupivacaine plus fetanyl for initiation of
Comparison: without fentanyl
Follow-up period: intrapartum
Outcome Measures: adverse events
Levo plus fentanyl versus without fentanyl Pruritis 13/20 vs 2/20
not stated
146

Intrapartum care
194
Bibliographic reference
Study type
Evidence level
Number of women
Women’s characteristics
Intervention Comparison Length of follow-up
Outcome measures
Effect size Source of funding
Additional comments
2004 211
analgesia epidural analgesia
Motor block 5/20 vs 3/20Nausea 3/20 vs 2/20 Vomiting 2/20 vs 4/20 Fetal bradycardia 2/20 vs 0/20 Hypotension 3/20 vs 0/20 Satisfaction 98 (94-100) vs 96 (89-100)
147

Evidence tables
195
Regional analgesia – establishing regional analgesia in labour (intrathecal opioids versus epidural local anaesthetics) Bibliographic reference
Study type
Evidence level
Number of women
Women’s characteristics
Intervention Comparison Length of follow-up
Outcome measures
Effect size Source of funding
Additional comments
Bucklin BA;Chestnut DH;Hawkins JL; 2002 Jan 212
Systematic review - meta-analysis
Evidence level: 1+
7 trials women in labour requiring analgesia
Intervention: intrathecal opioids
Comparison: epidural local anaesthetics
Follow-up period: intrapartum
Outcome Measures: analgesia, mode of birth, adverse events
spontaneous vaginal birthRR 1.10 [0.34 to 1.85] pruritis RR 14.10 [13.39 to 14.80] Nausea RR 0.94 [0.01 to 1.88]
not stated
148

Intrapartum care
196
Regional analgesia – establishing regional analgesia in labour (different doses for initiation of Combined Spinal-Epidural) Bibliographic reference
Study type
Evidence level
Number of women
Women’s characteristics
Intervention Comparison Length of follow-up
Outcome measures
Effect size Source of funding
Additional comments
Palmer CM;Van Maren G;Nogami WM;Alves D; 1999 Jul 217
RCT Evidence level: 1+
N=90 (30 for each arm)
women in labour requesting epidural analgesia
Intervention: intrathecal Fentanyl plus bupivacaine 1.25mg or 2.5mg
Comparison: fentanyl 25mcg only
Follow-up period: intrapartum
Outcome Measures: Efficacy, adverse events
duration of analgesia2.5; 108(20)min 1.5; 94(25)min none; 92(23)min Pruritis score 2.5 19(5) 1.5 31(6) none 24(4)
Interim
Chan SY;Chiu JW; 2004 Oct 213
RCT Evidence level: 1+
N=40(20 for each)
women in labour requesting analgesia
Intervention: intrathecal 2.5mg levobupivacaine plus 25mcg fentanyl
Comparison: 1.25 levobupivicaine plus 12.5mcg fentanyl
Follow-up period: intrapartum
Outcome Measures: efficacy and adverse events
A=2.5mg levobupivacaine plus 25mcg fentanylB=1.25 levobupivicaine plus 12.5mcg fentanyl VAS 30min after A=19/20 B=20/20 High sensory block 30min after A=T4 B=T4 Duration of anagesia A=101.4(26.64)min B=90.6(28.03)min Satisfaction score A=92(9.2) B=94(10.0) Hypotension A=2/20 B=1/20 Motor block 30min after A=15/20 B=5/20 Pruritis A=4/20
not stated
149

Evidence tables
197
Bibliographic reference
Study type
Evidence level
Number of women
Women’s characteristics
Intervention Comparison Length of follow-up
Outcome measures
Effect size Source of funding
Additional comments
B=4/20 Nausea A=0/20 B=1/20 Fetal bradycardia A=1/20 B=0/20
Lee BB;Ngan Kee WD;Hung VY;Wong EL; 1999 Dec 214
RCT Evidence level: 1+
N=49 (Bupivacaine1.25mg plus 25mcg Fentanyl=24; 2.5mg bupivacaine plus 25 mcg fentanyl=25)
women in labour requesting epidural analgesia
Intervention: 1.25mg Bupivacaine plus 25 mcg fentanyl for Combined spnail-epidural analgesia (A)
Comparison: 2.5mg bupivacaine plus 25 mcg fentanyl (B)
Follow-up period: intrapartum
Outcome Measures: efficacy
Median duration of analgesiaA 75 (75-105) B 120(90-120) Motor block >0 A 0/24 B 7/24 Satisfaction score A 8 (7.6 to 9.7) B 8 (7.3 to 10)
not stated
Palmer CM;Cork RC;Hays R;Van MG;Alves D; 1998 215
RCT Evidence level: 1+
N=84(12 for each)
women in labour requesting analgesia
Intervention: intrathecal fentanyl
Comparison: 1=5mcg 2=10mcg 3=15mcg 4=20mcg 5=25mcg 6=35mcg 7=45mcg
Follow-up period: intrapartum
Outcome Measures: pain score, duration of analgesia, BP, adverse events dose-response curve
duration of analgesiap<0.05 for 5mcg versus 15-45mcg p<0.05 for 10mcg versus 25-45mcg Mean maximum pruritis score 1=21(22) 2=26(16) 3=41(21) 4=55(20) 5=35(24) 6=53(28) 7=45(22)
not stated
Stocks GM;Hallworth SP;Fernando R;England AJ;Columb MO;Lyons G; 2001 Apr
RCT Evidence level: 1+
N=120 women in labour requesting analgesia
Intervention: intrathecal fentanyl
Comparison: 1=0mcg 2=5mcg 3=15mcg 4=25mcg
Follow-up period: intrapartum
Outcome Measures: efficacy and adverse events
Bupivacaine requirement (MLAD)1=1.99[1.71 to 2.27] 2=0.69[0.35 to 1.02] 3=0.71[0.00 to 1.53] 4=0.85[0.58 to 1.13] Onset of analgesia (min) 1=8.8(4.16)
not stated
150

Intrapartum care
198
Bibliographic reference
Study type
Evidence level
Number of women
Women’s characteristics
Intervention Comparison Length of follow-up
Outcome measures
Effect size Source of funding
Additional comments
216 2=10.2(4.01)3=10.2(4.13) 4=8.6(3.35) Duration of analgesia (min) 1=43.1(19.81) 2=56.1(17.26) 3=68.5(33.43) 4=77.2(25.95) Bromage 1=5[4-5] 2=5[4-5] 3=5[4-5] 4=5[5] Pruritis 1=0(0) 2=12(40) 3=18(60) 4=22(73)
Celeski DC;Heindel L;Haas J;Vacchiano CA; 1999 Jun 218
RCT Evidence level: 1+
N=56 (25mcg=21; 37.5mcg=18; 50mcg=17)
women in labour requesting epidural analgesia
Intervention: intrathecal fentanyl
Comparison: differen doses (25, 37.5 and 50 mcg)
Follow-up period: intrapartum
Outcome Measures: efficacy and adverse events
25mcg versus 37.5 & 50 mcgNausea 0.64 Pruritis 1.0 Abnormal FHR 0.579 Hypotension 0.432 50mcg versus 25 and 37.5mcg Nausea none Pruritis 1.0 Abnormal FHR 0.391 Hypotension 0.231
not stated
151

Evidence tables
199
Bibliographic reference
Study type
Evidence level
Number of women
Women’s characteristics
Intervention Comparison Length of follow-up
Outcome measures
Effect size Source of funding
Additional comments
duration of analgesia 25mcg=95.62(43.3)min 37.5mcg=105.78(46.8)min 50mcg=99.24(42.6)min
152

Intrapartum care
200
Regional analgesia – establishing regional analgesia in labour (different doses for initiation of epidural analgesia) Bibliographic reference
Study type
Evidence level
Number of women
Women’s characteristics
Intervention Comparison Length of follow-up
Outcome measures
Effect size Source of funding
Additional comments
Plaat FS;Royston P;Morgan BM; 1996 221
RCT Evidence level: 1+
N=60(30 for each)
women in labour requesting epidural analgesia
Intervention: bupivacaine 15mg plus fentanyl 50 mcg for initiation of epidural analgesia
Comparison: bupivacaine 25mg plus fentanyl 50 mcg
Follow-up period: intrapartum
Outcome Measures: efficacy and adverse events
duration of analgesia15mg: 80 (35-100) min 25mg: 98 (25-300) min Number able to raise leg 15mg: 100% 25mg: 77% Number able to walk 15mg: 77% 25mg: 20%
not stated
Christiaens F;Verborgh C;Dierick A;Camu F; 1998 Mar 220
RCT Evidence level: 1+
N=58 (0.5% bupivacaine(1)=19; 0.2% bupivacaine(2)=19; 0.1% bupivacaine(3)=20)
women in labour requesting epidural analgesia
Intervention: 0.2 or 0.1% bupivacaine for epidural analgesia
Comparison: 0.5%
Follow-up period: intrapartum
Outcome Measures: efficacy
Onset of analgesia1 12(8)min 2 7(2)min 3 11(6)min duration of analgesia 1 43(21)min 2 100(26)min 3 120(21)min
not stated
Beilin Y;Galea M;Zahn J;Bodian CA; 1999 Jun 219
RCT Evidence level: 1+
N=68 0.2%=28 0.15%=28 0.1%=12
women in labour requesting epidural analgesia
Intervention: Ropivacaine 0.2% for initiation of epidural analgesia
Comparison: ropivacaine 0.15% and 0.10%
Follow-up period: intrapartum
Outcome Measures: efficacy and adverse events
duration of analgesia0.20% 110(32)min 0.15% 96(38)min 0.10% 64(28)min No motor block 0.20% 22/28 0.15% 16/28 0.10% 4/12 Hypotension 0.20% 2/28 0.15% 1/28 0.10% 0/12 FHR decelerations non reported
not stated
153

Evidence tables
201
Regional analgesia – maintenance of regional analgesia (traditional versus modern regime of epidural analgesia) Bibliographic reference
Study type
Evidence level
Number of women
Women’s characteristics
Intervention Comparison Length of follow-up
Outcome measures
Effect size Source of funding
Additional comments
Comparative Obstetric Mobile Epidural Trial (COMET) Study Group; 2001 Jul 222
RCT Evidence level: 1++
N=1054 (traditional epidural=353; CSE=351; low-dose infusion=350)
nulliparous women requesting epidural
Intervention: intermittent epidural (traditional epidural)
Comparison: continuous infusion
Follow-up period: intrapartum
Outcome Measures: mode of delivery, adverse events
spontaneous vaginal birthOR 0.93 [0.67 to 1.30] CS OR 1.56 [1.10 to 2.21] Apgar score less than 7 at 1 min OR 0.54 [0.35 to 0.83] Apgar score less than 7 at 5 min OR 0.29 [0.08 to 1.07]
NHS R&D
154

Intrapartum care
202
Regional analgesia – maintenance of regional analgesia (local anaesthetic with opioid versus local anaesthetic without opioid) Bibliographic reference
Study type
Evidence level
Number of women
Women’s characteristics
Intervention Comparison Length of follow-up
Outcome measures
Effect size Source of funding
Additional comments
Elliott RD; 1991 224
RCT Evidence level: 1+
N=75 (0.125%bupivacaine+fentanyl=24; 0.25%bupivacaine=24; 0.125%bupivacaine=27)
women in labour requesting epidural analgesia
Intervention: bupivacaine 0.125%
Comparison: bupivacaine plu fentanyl
Follow-up period: intrapartum
Outcome Measures: mode of birth, efficacy, adverse events
spontaneous vaginal birthRR 1.00 [0.26 to 3.81] CS RR 0.64 [0.10 to 4.15] duration of second stage MD -4.00 [-38.21 to 30.21] Onset of analgesia MD 9.00 [-94.75 to 112.75] urinary retention RR 2.61 [0.75 to 9.11] no motor block RR 1.16 [0.29 to 4.62] total dose MD 17.00 [-4.13 to 38.13] mg apgar score less than 7 at 1 min RR 2.38 [0.41 to 13.75] apgar score less than 7 at 5 min RR 2.63 [0.10 to 68.07] Satisfaction first stage RR 0.21 [0.05 to 0.87] second stage RR 1.21 [0.36 to 4.07]
not stated
Enever GR;Noble HA;Kolditz D;Valentine S;Thomas TA; 1991 225
RCT Evidence level: 1+
N=61 (bupivacaine plus dimorphine=19; bupivacaine plus fentanyl=21; bupivacaine alone=21)
women in labour requestng epidural analgesia
Intervention: bupivacaine alone
Comparison: bupivacaine plus fentanyl
Follow-up period: intrapartum
Outcome Measures: efficacy, mode of birth, adverse outocmes
spontaneous vaginal birthRR 1.00 [0.26 to 3.81] CS RR 1.00 [0.18 to 5.63] hypotension RR 0.75 [0.17 to 3.31]
not stated
155

Evidence tables
203
Bibliographic reference
Study type
Evidence level
Number of women
Women’s characteristics
Intervention Comparison Length of follow-up
Outcome measures
Effect size Source of funding
Additional comments
pruritis RR 0.32 [0.01 to 8.26] nausea/vomiting RR 0.63 [0.09 to 4.23] no motor block RR 0.75 [0.17 to 3.31]
Russell R;Quinlan J;Reynolds F; 1995 226
RCT Evidence level: 1+
N=60(30 for each arm)
women in labour requesting epidural analgesia
Intervention: 0.125% bupivacaine
Comparison: 0.0625% bupivacaine plus 2.5mcg/ml fentanyl
Follow-up period: intrapartum
Outcome Measures: efficacy, mode of birth
spontaneous vaginal birthRR 0.79 [0.43 to 1.44] CS RR 1.25 [0.37 to 4.21] duration of second stage MD -4.00 [-11.27 to 3.27]
not stated
Russell R;Reynolds F; 1996 227
RCT Evidence level: 1+
N=399 (without opioid=200; with opioid=199)
women in labour requesting epidural analgesia
Intervention: 0.0625% bupivacaine plus 2.5mcg/ml fentanyl
Comparison: 0.125% bupivacaine
Follow-up period: intrapartum
Outcome Measures: efficacy, mode of birth, neonata outcomes
spontaneous vaginal birthRR 0.79 [0.43 to 1.44] CS RR 1.25 [0.37 to 4.21] duration of second stage MD -7.0 [-24.55 to 10.55] hypotension none reported pruritis RR 0.04 [0.00 to 0.60] nausea/vomiting RR 0.75 [0.18 to 3.07] no motor block RR 0.48 [0.30 to 0.77]
not stated
Reynolds F;Russell R;Porter J;Smeeton N;
RCT Evidence level: 1+
N=587 (plain bupivacaine=296; with fentanyl=291)
women in labour requesting epidural analgesia
Intervention: plain bupivacaine (0.125%)
Comparison: 0.0625% bupivacaine plus opioid
Follow-up period: intrapartum
Outcome Measures: efficacy, mode of birth, adverse
spontaneous vaginal birthRR 0.90 [0.76 to 1.08]
not stated
156

Intrapartum care
204
Bibliographic reference
Study type
Evidence level
Number of women
Women’s characteristics
Intervention Comparison Length of follow-up
Outcome measures
Effect size Source of funding
Additional comments
2003 228
events CSRR 1.25 [0.37 to 4.21] duration of second stage MD -5.00 [-11.31 to 1.31] Apgar score less than 7 at 1 min RR 0.88 [0.58 to 1.35] Apgar score less than 7 at 5 min RR 10.81 [0.60 to 194.70]
Porter J;Bonello E;Reynolds F; 1998 Jul 229
RCT Evidence level: 1+
N=134(without=70; with=68)
women in labour requesting epidural analgesia
Intervention: bupivacaine plus fentanyl for epidural analgesia
Comparison: bupivacaine only
Follow-up period: intrapartum
Outcome Measures: efficacy, mode of delivery, adverse events
NACS>35 at 2 hoursRR 1.07 [0.91 to 1.26] NACS>35 at 24 hours RR 1.07 [0.95 to 1.22]
not stated
Chestnut DH;Owen CL;Bates JN;Ostman LG;Choi WW;Geiger MW; 1988 230
RCT Evidence level: 1+
N=80 (without=39; with=41)
women in labour requesting epidural analgesia
Intervention: bupivacaine only
Comparison: bupivacaine plus fentanyl
Follow-up period: intrapartum
Outcome Measures: efficacy, adverse events, mode of birth
spontaneous vaginal birthRR 1.05 [0.74 to 1.50] CS RR 1.23 [0.45 to 3.33] duration of second stage MD 12.00 [-17.20 to 41.20] pruritis RR 0.23 [0.05 to 1.01] urinary retention RR 0.69 [0.45 to 1.05] Nausea/vomiting RR 1.15 [0.57 to 2.29] no motor block RR 0.42 [0.27 to 0.65]
not stated
157
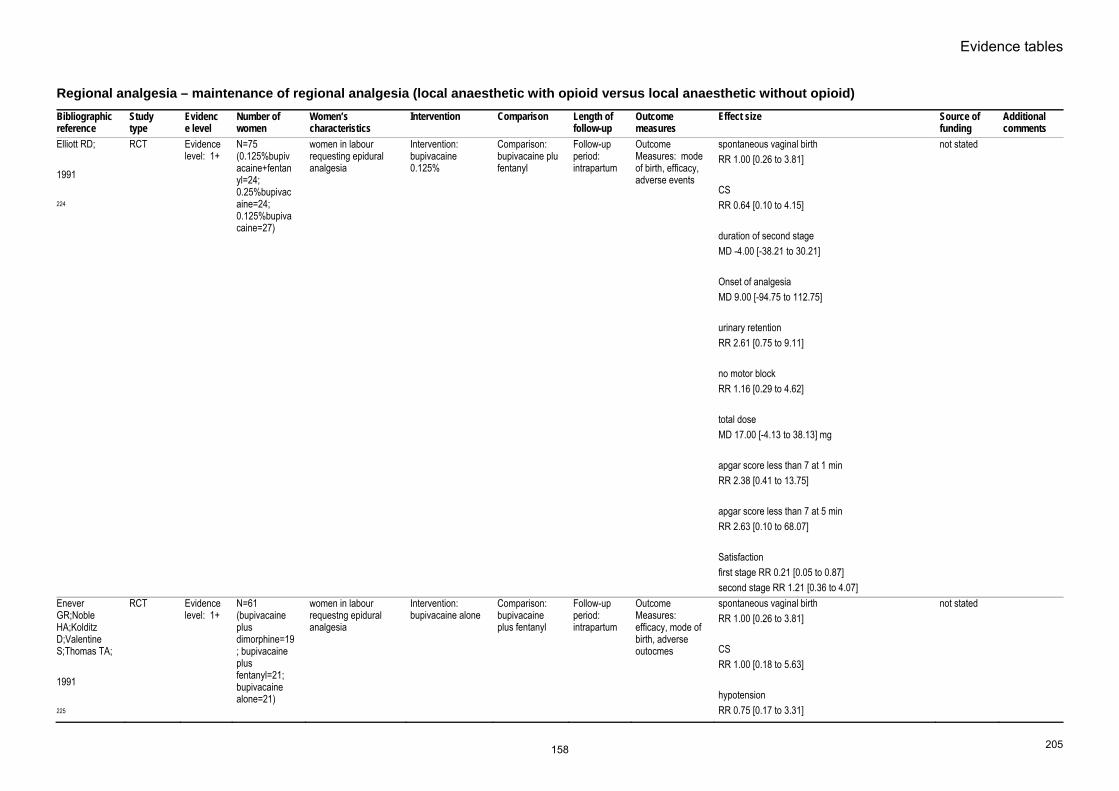
Evidence tables
205
Regional analgesia – maintenance of regional analgesia (local anaesthetic with opioid versus local anaesthetic without opioid) Bibliographic reference
Study type
Evidence level
Number of women
Women’s characteristics
Intervention Comparison Length of follow-up
Outcome measures
Effect size Source of funding
Additional comments
Elliott RD; 1991 224
RCT Evidence level: 1+
N=75 (0.125%bupivacaine+fentanyl=24; 0.25%bupivacaine=24; 0.125%bupivacaine=27)
women in labour requesting epidural analgesia
Intervention: bupivacaine 0.125%
Comparison: bupivacaine plu fentanyl
Follow-up period: intrapartum
Outcome Measures: mode of birth, efficacy, adverse events
spontaneous vaginal birthRR 1.00 [0.26 to 3.81] CS RR 0.64 [0.10 to 4.15] duration of second stage MD -4.00 [-38.21 to 30.21] Onset of analgesia MD 9.00 [-94.75 to 112.75] urinary retention RR 2.61 [0.75 to 9.11] no motor block RR 1.16 [0.29 to 4.62] total dose MD 17.00 [-4.13 to 38.13] mg apgar score less than 7 at 1 min RR 2.38 [0.41 to 13.75] apgar score less than 7 at 5 min RR 2.63 [0.10 to 68.07] Satisfaction first stage RR 0.21 [0.05 to 0.87] second stage RR 1.21 [0.36 to 4.07]
not stated
Enever GR;Noble HA;Kolditz D;Valentine S;Thomas TA; 1991 225
RCT Evidence level: 1+
N=61 (bupivacaine plus dimorphine=19; bupivacaine plus fentanyl=21; bupivacaine alone=21)
women in labour requestng epidural analgesia
Intervention: bupivacaine alone
Comparison: bupivacaine plus fentanyl
Follow-up period: intrapartum
Outcome Measures: efficacy, mode of birth, adverse outocmes
spontaneous vaginal birthRR 1.00 [0.26 to 3.81] CS RR 1.00 [0.18 to 5.63] hypotension RR 0.75 [0.17 to 3.31]
not stated
158

Intrapartum care
206
Bibliographic reference
Study type
Evidence level
Number of women
Women’s characteristics
Intervention Comparison Length of follow-up
Outcome measures
Effect size Source of funding
Additional comments
pruritis RR 0.32 [0.01 to 8.26] nausea/vomiting RR 0.63 [0.09 to 4.23] no motor block RR 0.75 [0.17 to 3.31]
Russell R;Quinlan J;Reynolds F; 1995 226
RCT Evidence level: 1+
N=60(30 for each arm)
women in labour requesting epidural analgesia
Intervention: 0.125% bupivacaine
Comparison: 0.0625% bupivacaine plus 2.5mcg/ml fentanyl
Follow-up period: intrapartum
Outcome Measures: efficacy, mode of birth
spontaneous vaginal birthRR 0.79 [0.43 to 1.44] CS RR 1.25 [0.37 to 4.21] duration of second stage MD -4.00 [-11.27 to 3.27]
not stated
Russell R;Reynolds F; 1996 227
RCT Evidence level: 1+
N=399 (without opioid=200; with opioid=199)
women in labour requesting epidural analgesia
Intervention: 0.0625% bupivacaine plus 2.5mcg/ml fentanyl
Comparison: 0.125% bupivacaine
Follow-up period: intrapartum
Outcome Measures: efficacy, mode of birth, neonata outcomes
spontaneous vaginal birthRR 0.79 [0.43 to 1.44] CS RR 1.25 [0.37 to 4.21] duration of second stage MD -7.0 [-24.55 to 10.55] hypotension none reported pruritis RR 0.04 [0.00 to 0.60] nausea/vomiting RR 0.75 [0.18 to 3.07] no motor block RR 0.48 [0.30 to 0.77]
not stated
Reynolds F;Russell R;Porter J;Smeeton N;
RCT Evidence level: 1+
N=587 (plain bupivacaine=296; with fentanyl=291)
women in labour requesting epidural analgesia
Intervention: plain bupivacaine (0.125%)
Comparison: 0.0625% bupivacaine plus opioid
Follow-up period: intrapartum
Outcome Measures: efficacy, mode of birth, adverse
spontaneous vaginal birthRR 0.90 [0.76 to 1.08]
not stated
159

Evidence tables
207
Bibliographic reference
Study type
Evidence level
Number of women
Women’s characteristics
Intervention Comparison Length of follow-up
Outcome measures
Effect size Source of funding
Additional comments
2003 228
events CSRR 1.25 [0.37 to 4.21] duration of second stage MD -5.00 [-11.31 to 1.31] Apgar score less than 7 at 1 min RR 0.88 [0.58 to 1.35] Apgar score less than 7 at 5 min RR 10.81 [0.60 to 194.70]
Porter J;Bonello E;Reynolds F; 1998 Jul 229
RCT Evidence level: 1+
N=134(without=70; with=68)
women in labour requesting epidural analgesia
Intervention: bupivacaine plus fentanyl for epidural analgesia
Comparison: bupivacaine only
Follow-up period: intrapartum
Outcome Measures: efficacy, mode of delivery, adverse events
NACS>35 at 2 hoursRR 1.07 [0.91 to 1.26] NACS>35 at 24 hours RR 1.07 [0.95 to 1.22]
not stated
Chestnut DH;Owen CL;Bates JN;Ostman LG;Choi WW;Geiger MW; 1988 230
RCT Evidence level: 1+
N=80 (without=39; with=41)
women in labour requesting epidural analgesia
Intervention: bupivacaine only
Comparison: bupivacaine plus fentanyl
Follow-up period: intrapartum
Outcome Measures: efficacy, adverse events, mode of birth
spontaneous vaginal birthRR 1.05 [0.74 to 1.50] CS RR 1.23 [0.45 to 3.33] duration of second stage MD 12.00 [-17.20 to 41.20] pruritis RR 0.23 [0.05 to 1.01] urinary retention RR 0.69 [0.45 to 1.05] Nausea/vomiting RR 1.15 [0.57 to 2.29] no motor block RR 0.42 [0.27 to 0.65]
not stated
160

Intrapartum care
208
Regional analgesia – maintenance of regional analgesia (different drugs for epidural analgesia) Bibliographic reference
Study type
Evidence level
Number of women
Women’s characteristics
Intervention Comparison Length of follow-up
Outcome measures
Effect size Source of funding
Additional comments
Burke D;Henderson DJ;Simpson AM;Faccenda KA;Morrison LMM;McGrady EM;McLeod GA;Bannister J; 1999 231
RCT Evidence level: 1+
N=137(Levobupivacaine=68; Bupivacaine=69)
ASA I or IIfull term early labour requesting epidural age 18-40 singleton
Intervention: 0.25% levobupivacaine epidural
Comparison: bupivacaine 0.25%
Follow-up period: intrapartum
Outcome Measures: Duratiob of labour, mode of delivery, onset, duration, BP and neonatal outcomes
InducedL=17/68 B=11/69 Augmented L=17/68 B=26/69 Duration of labour first stage L=9.38(3.51) B=10.08(5.23) Duration of second stage L=1.45(1.15) B=1.51(1.04) Mode LS:ID:VD L=14:32:22 B=18:21:30 Hypotension L=8/68 B=5/69 Onset L=12min[5-39] B=12min[2-50] Duration L=49min[3-129] B=51min[7-157] Bromage grade=0 L=84% B=83% adverse events
Chiroscience
161

Evidence tables
209
Bibliographic reference
Study type
Evidence level
Number of women
Women’s characteristics
Intervention Comparison Length of follow-up
Outcome measures
Effect size Source of funding
Additional comments
L=25/68B=17/69 Apgar less than 7 at 1 min L=6/68 B=9/69
Camorcia M;Capogna G;Columb MO; 2005 Mar 232
RCT Evidence level: 1++
N=97(Bupivacaine=32; Levobupivacaine=33; Bupivacaine=32)
primiparous women requesting first stage labour analgesia with full term gestation in singleton pregnancies with cephalic presentation
Intervention: spinal ropivacaine 2.5mg levobupivacaine 2.5mg
Comparison: bupivacaine 2.5mg
Follow-up period: intrapartum
Outcome Measures: Analgesic Potency Ratios adverse events
Analgesic Potency RatiosDixon and Messey Method B vs L 0.81 [0.69 to 0.94] p<0.01 B vs R 0.65 [0.56 to 0.76] p<0.001 L vs R 0.80 [0.70 to 0.92] p<0.01 Probit Regression B vs L 0.79 [0.70 to 0.88] p<0.01 B vs R 0.62 [0.55 to 0.69] p<0.001 L vs R 0.79 [0.70 to 0.88] p<0.01 Maternal hypotension R=1/32 L=1/33 B=2/32 Nausea/vomiting R=0/32 L=0/33 B=0/32 Bromage scale=0 R=31/32 L=25/33 B=24/32 p=0.03 Straight leg test=0 R=30/32 L=22/33 B=22/32 p=0.02 Perineal squeezing=0 R=28/32
not stated
162

Intrapartum care
210
Bibliographic reference
Study type
Evidence level
Number of women
Women’s characteristics
Intervention Comparison Length of follow-up
Outcome measures
Effect size Source of funding
Additional comments
L=21/33B=10/32 p<0.0001
El-Moutaz H;El-Said A;Fouad M; 2003 233
RCT Evidence level: 1++
N=60(30 for each arm)
ASA I or IIhealthy requesting epidural analgesia singleton term age 18-40 in spontaneous active labour
Intervention: Levobupivacaine 0.25% epidural
Comparison: racemic bupivacaine 0.25%
Follow-up period: intrapartum
Outcome Measures: onset of pain relief duration of pain relief sensory block motor block advers events
OnsetL=13min[9 to 25] B=14min[8 to 27] Duration L=46min[35-72] B=49min[30-78] mode of delivery SD:ID:CS L=21:7:2/30 B=22:5:3/30 Bromage scale Grade 0:1:2:3 L=23:4:2:1 B=22:4:3:1 Apgar less than 7 at 1 min L=3/30 B=4/30
not stated
Lim Y;Ocampo CE;Sia AT; 2004 234
RCT Evidence level: 1+
N=60 (20 for each arm)
women in labour requesting epidural analgesia
Intervention: Ropivacaine and Levobupivacaine
Comparison: Bupivacaine
Follow-up period: intrapartum
Outcome Measures: efficacy, adverse events
duration of analgesiaB 76.3(5.9)min R 52.6(4.0) L 51.5(3.4) Motor Block B 5/20 R 2/20 L 0/20 Nausea/vomiting B 1/20 R 1/20 L 1/20 Hypotension
not stated
163

Evidence tables
211
Bibliographic reference
Study type
Evidence level
Number of women
Women’s characteristics
Intervention Comparison Length of follow-up
Outcome measures
Effect size Source of funding
Additional comments
B 1/20R 0/20 L 1/20
Lyons G;Columb M;Wilson RC;Johnson RV; 1998 Dec 235
RCT Evidence level: 1+
N=60(30 for each)
ASA Irequesting epidural cervical dilatation less than 5cm
Intervention: Levobupivacaine 0.07% epidural
Comparison: bupivacaine 0.07%
Follow-up period: intrapartum
Outcome Measures: MLAC
Dixon & MasseyMLAC L=0.083%[0.065 to 0.101] B=0.081%[0.055 to 0.108] L vs. B 0.98[0.67 to 1.41] molar conc MLAC L=2.87 [2.25 to 3.49] mmol/l B=2.49 [1.69 to 3.32] mmol/l L vs. B 0.87 [0.60 to 1.25] motor block Bromage score=0 L=15/30 B=12/30
Chiroscience
Sah N;Vallejo MC;Ramanathan S;Golebiewski K; 2005 236
RCT Evidence level: 1+
N=53(B=28;L=25)
MultiparousAAA I or II in labour requesting analgesia
Intervention: CSEBupivacaine 2.5mg plus fentanyl 25mcg
Comparison: CSE levobupivacaine 2.5mg plus fentanyl 25mcg
Follow-up period: intrapartum
Outcome Measures: duration of second stage mode of delivery duration o block
duration of sensory blockB=114.86min(26.27) L=101.25min(35.21) p=0.132 none had motor block duration of second stage B=40.91min(63.05) L=23.12min(24.30) Mode of delivery B versus L VD 30/34 vs 31/33 FD 1/34 vs 2/33 CS 3/34 0/33 pruritus B=22/34 L=24/33 nausea/vomiting B=3/34
not stated
164

Intrapartum care
212
Bibliographic reference
Study type
Evidence level
Number of women
Women’s characteristics
Intervention Comparison Length of follow-up
Outcome measures
Effect size Source of funding
Additional comments
L=0/33Polley LS;Columb MO;Naughton NN;Wagner DS;Van d;Goralski KH; 2003 237
RCT Evidence level: 1+
N=70(35 for each arm)
women term in active labour cervical dilatation 3-7cm requesting epidural analgesia
Intervention: levobupicaine epidural 0.01%
Comparison: ropivacaine epidural 0.01%
Follow-up period: intrapartum
Outcome Measures: block, probit regression analysis
L versus Rbaseline maternal MAP 94(13.2) vs 94(12.1) mmHG lowest maternal MAP 82(9.0) vs 85(10.3) mmHg Block onset time 22(7.5) vs 23(9.2) min Offset time 63(17.9) vs 75(24.4) min Bromage score 0[0to0] for both Logistic regression analysis Drug p=0.26 Probit regression analysis EC50 L=0.09%[0.09 to 0.10] R=0.09%[0.08 to 0.11]
internal resource only
Benhamou D;Ghosh C;Mercier FJ; 2003 238
RCT Evidence level: 1++
N=94 (47 for each arm)
women in labour requiring or electing to receive epidural analgesia age 18-40 years AAA class 1 or 2 term cephalic cervical dilatation not more than 5cm VAS not more than 30
Intervention: Levobupivacaine 0.11% 20ml epidural
Comparison: ropivacaine 0.11% 20ml
Follow-up period: intrapartum
Outcome Measures: minimum local analgesic concentration; adverse events
MLACL=0.077%[0.058 to 0.096] R=0.092%[0.082 to 0.102] MD=-0.015%[-0.037 to 0.008] L versus R 1.193 [0.911 to 1.476]
Chiroscience
Purdie NL;McGrady EM; 2004 239
RCT Evidence level: 1++
N=54 (Ropivacaine=26; Levobupivacaine=28)
singletonat least 37 weeks gestation cephalic presentation active labour cervical dilatation no more than 6cm
Intervention: PCA epidural ropivacaine 0.1% plus fentanyl 0.0002%
Comparison: levobupivacaine 0.1% plus 0.0002% fentanyl
Follow-up period: intrapartum
Outcome Measures: onset and duration of analgesia, VAS, requiring top-ups
Median & [IQR]Onset of analgesia R=30min[15to45] L=38min[19to51] Duration of analgesia R=35min[20to37] L=34min[25to50] VAS30min R=22[5to51] L=44[19to67] VAS60min R=14[1to24] L=19[10to30] VAS120min
not stated
165
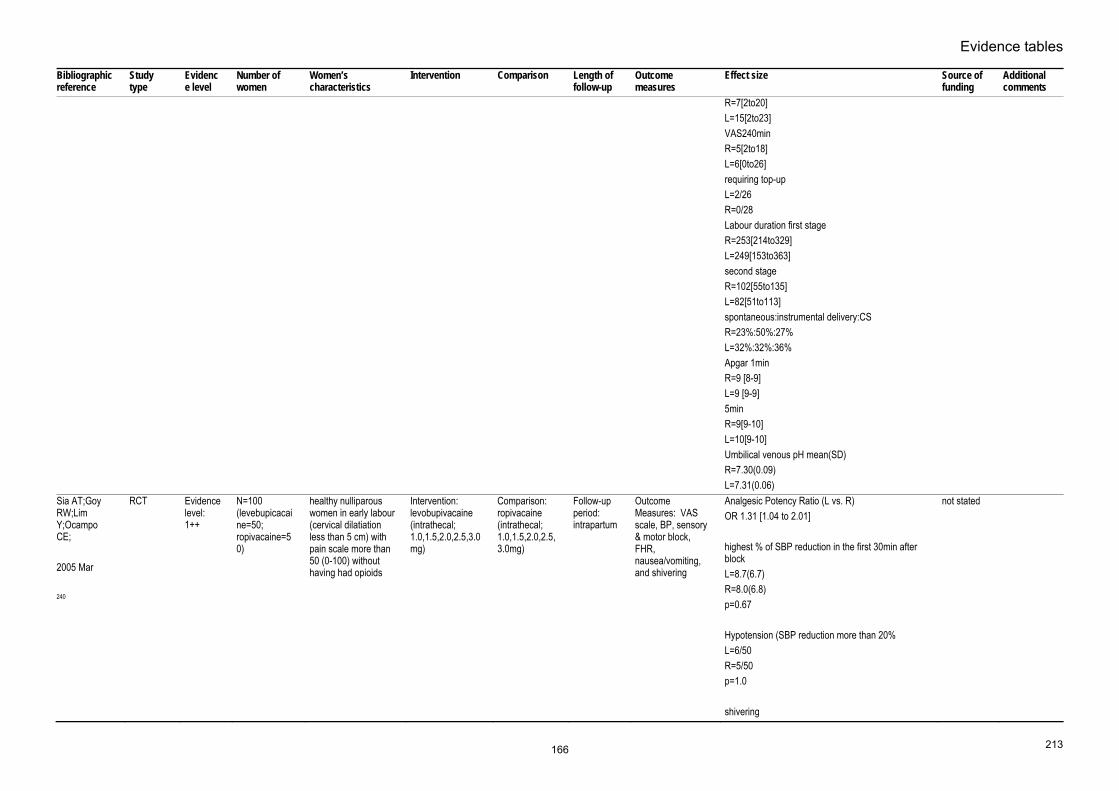
Evidence tables
213
Bibliographic reference
Study type
Evidence level
Number of women
Women’s characteristics
Intervention Comparison Length of follow-up
Outcome measures
Effect size Source of funding
Additional comments
R=7[2to20]L=15[2to23] VAS240min R=5[2to18] L=6[0to26] requiring top-up L=2/26 R=0/28 Labour duration first stage R=253[214to329] L=249[153to363] second stage R=102[55to135] L=82[51to113] spontaneous:instrumental delivery:CS R=23%:50%:27% L=32%:32%:36% Apgar 1min R=9 [8-9] L=9 [9-9] 5min R=9[9-10] L=10[9-10] Umbilical venous pH mean(SD) R=7.30(0.09) L=7.31(0.06)
Sia AT;Goy RW;Lim Y;Ocampo CE; 2005 Mar 240
RCT Evidence level: 1++
N=100 (levebupicacaine=50; ropivacaine=50)
healthy nulliparous women in early labour (cervical dilatiation less than 5 cm) with pain scale more than 50 (0-100) without having had opioids
Intervention: levobupivacaine (intrathecal; 1.0,1.5,2.0,2.5,3.0mg)
Comparison: ropivacaine (intrathecal; 1.0,1.5,2.0,2.5,3.0mg)
Follow-up period: intrapartum
Outcome Measures: VAS scale, BP, sensory & motor block, FHR, nausea/vomiting, and shivering
Analgesic Potency Ratio (L vs. R)OR 1.31 [1.04 to 2.01] highest % of SBP reduction in the first 30min after block L=8.7(6.7) R=8.0(6.8) p=0.67 Hypotension (SBP reduction more than 20% L=6/50 R=5/50 p=1.0 shivering
not stated
166

Intrapartum care
214
Bibliographic reference
Study type
Evidence level
Number of women
Women’s characteristics
Intervention Comparison Length of follow-up
Outcome measures
Effect size Source of funding
Additional comments
L=3/50R=1/50 p=0.61 Nausea/vomiting L=3/50 R=1/50 p=0.61 Bromage score L=7/50 R=9/50 p=0.9 Abnormal FHR L=4/50 R=5/50 p=1.0
Supandji M;Sia ATH;Ocampo CE; 2004 241
RCT Evidence level: 1++
N=40 (ropivacaine=20; levobupivacaine=20)
healthy nulliparous women with cervical dilatation 3-5cm in labour
Intervention: 0.2% 10ml ropivacaine
Comparison: 0.2% 10ml levobupivacaine
Follow-up period: intrapartum
Outcome Measures: duration of analgesia; boold pressure; motor block
duration of analgesiaL=90.50min(SD31.72) R=103.30min(SD37.52) AUC time15-time0 median[range] R=562.5VAS/min[400-1125] L=650.5VAS/min[475-1275] Lower limb motor block R=6/20 L=4/20 hypotension none in both groups nausea/vomiting none in both groups Fetal bradycardia non in both groups
not stated
Asik I;Goktug A;Gulay I;Alkis N;Uysalel A;
RCT Evidence level: 1+
N=53(B/F=28; R/F=25)
women in labour requesting epidural analgesia
Intervention: ropivacaine
Comparison: bupivacaine
Follow-up period: intrapartum
Outcome Measures: efficacy and
spontaneous vaginal birthRR 1.49 [0.89 to 2.51]
not stated
167

Evidence tables
215
Bibliographic reference
Study type
Evidence level
Number of women
Women’s characteristics
Intervention Comparison Length of follow-up
Outcome measures
Effect size Source of funding
Additional comments
2002 242
adverse eventsCS RR 2.24 [0.22 to 23.23] onset of analgesia MD 0.70[-1.35 to 2.75] duration of analgesia MD -14.10 [-23.61 to -4.59] hypotension none reported nausea/vomiting RR 0.75 [0.14 to 4.11] no motor block (bromage score =0) RR 1.92 [1.25 to 2.93]
Campbell DC;Zwack RM;Crone LA;Yip RW; 2000 Jun 243
RCT Evidence level: 1+
N=40 (20 for each)
women in labour requesting epidural analgesia
Intervention: Ropivacaine
Comparison: bupivacaine
Follow-up period: intrapartum
Outcome Measures: efficacy and adverse events
spontaneous vaginal birthRR 1.49 [0.89 to 2.51] CS RR 2.00 [0.20 to 20.33] duration of second stage MD 6.00 [-22.23 to 34.23]min duration of analgesia MD 2.00 [-13.22 to 17.22] min hypotension none reported nausea/vomiting RR 0.33 [0.01 to 7.72] apgar less than 7 at 1 min none reported
not stated
Chua NP;Sia AT;Ocampo CE;
RCT Evidence level: 1+
N=32 (16 for each)
women in labour requesting epidural analgesia
Intervention: PCEA ropivacaine
Comparison: bupivacaine
Follow-up period: intrapartum
Outcome Measures: efficacy and
spontaenous vaginal birthRR 1.13 [0.59 to 2.16]
not stated
168

Intrapartum care
216
Bibliographic reference
Study type
Evidence level
Number of women
Women’s characteristics
Intervention Comparison Length of follow-up
Outcome measures
Effect size Source of funding
Additional comments
2001 244
adverse eventsCS RR 0.80 [0.26 to 2.45] duration of second stage MD 3.00 [-15.39 to 21.39] min hypotension RR 0.50 [0.05 to 4.98] nausea/vomiting RR 3.00 [0.13 to 68.57] no motor block RR 1.18 [0.79 to 1.77] apgar score less than 7 at 1 min RR 0.50 [0.05 to 4.98] apgar score less than 7 at 5 min none reported
Dresner M;Freeman J;Calow C;Quinn A;Bamber J; 2000 Dec 245
RCT Evidence level: 1+
N=203 (ropi=102; bupi=101)
women in labour requesting epidural analgesia
Intervention: ropivacaine
Comparison: bupivacaine
Follow-up period: intrapartum
Outcome Measures: efficacy and adverse events
spontaneous vaginal birthRR 0.89 [0.69 to 1.16] CS RR 1.05 [0.62 to 1.78] satisfaction rate RR 1.04 [0.96 to 1.13]
not stated
Eddleston JM;Holland JJ;Griffin RP;Corbett A;Horsman EL;Reynolds F; 1996 246
RCT Evidence level: 1+
N=104 (ropi=52; bupi=51)
women in labour Intervention: ropivacaine for extradural analgesia
Comparison: bupivacaine
Follow-up period: intrapartum
Outcome Measures: efficacy and adverse events
spontaneous vaginal birthRR 1.36 [0.98 to 1.88] CS RR 0.82 [0.27 to 2.51] no motor block RR 1.67 [0.92 to 3.03]
not stated
Evron S;Glezerman
RCT Evidence level:
N=565(Bupivacaine=313;Ro
nulliparous and parous women in
Intervention: 0.125%
Comparison: 0.2%
Follow-up period:
Outcome Measures: FHR,
PrimiNormal FHR
not stated
169

Evidence tables
217
Bibliographic reference
Study type
Evidence level
Number of women
Women’s characteristics
Intervention Comparison Length of follow-up
Outcome measures
Effect size Source of funding
Additional comments
M;Sadan O;Boaz M;Ezri T; 2004 247
1++ pivacaine=252)
laboursingleton ASA I or II term Cervical dilatation 2.5-6cm
bupivacaine ropivacaine intrapartum duration of labour, sensory block, motor block, duration, hypotension
B=94%; R=92%duration of second stage B=68.7[50.0]; R=71.0[54.6]min mode sv;id;cs B=80%;10.2%;9.6%; R=81.4%;7%;11.5% Multipara Normal FHR B=93.9%; R=94.9% duration of second stage B=37.1[39.5]; R=35.1[42.3]min mode sv;id;cs B=87.1%;4.7%;8.1%; R=90.6%;3.6%;5.7% Primi Apgar at 1min B=8.69[0.93];R=8.62[1.11] Apgar at 5 min B=9.77[0.47];R=9.71[0.52] Cord pH B=7.28[0.06];R=7.42[0.70] Multi Apgar at 1min B=8.77[0.75];R=8.86[0.56] Apgar at 5 min B=9.82[0.45];R=9.83[1.16] Cord pH B=7.28[0.64];R=7.25[0.27] Primi Bromage score=0 first stage B=16.9%;R=42.4% p<0.0001 Bromage score=0 second stage B=16.3%;R=42.4% p<0.0001 Total dose B=79.3[35.8]mg;R=110[46.9]mg p<0.0001
170

Intrapartum care
218
Bibliographic reference
Study type
Evidence level
Number of women
Women’s characteristics
Intervention Comparison Length of follow-up
Outcome measures
Effect size Source of funding
Additional comments
Duration of analgesiaB=308[141]min;R=290[154]min Hypotension B=0.6%; R=0.0% Primi Bromage score=0 first stage B=13.5%;R=39.5% p<0.0001 Bromage score=0 second stage B=12.8%;R=40.4% p<0.0001 Total dose B=59.4[27.6]mg;R=89.2[49.2]mg p<0.0001 Duration of analgesia B=246[144]min;R=242[140]min Hypotension B=0.0%; R=0.71%
Fernandez-Guisasola J;Serrano ML;Cobo B;Munoz L;Plaza A;Trigo C;Del Valle SG; 2001 May 248
RCT Evidence level: 1+
N=98 (ropi=47; bupi=51)
women in labour Intervention: ropivacaine for epidural analgesia
Comparison: bupivacaine
Follow-up period: intrapartum
Outcome Measures: efficacy and adverse events
spontaneous vaginal birthRR 1.09 [0.47 to 1.50] CS RR 1.09 [0.23 to 5.11] duration of second stage MD -10.00 [-26.86 to 6.86] hypotension RR 1.09 [0.23 to 5.11] no motor block RR 1.04 [0.92 to 1.17] apgar score less than 7 at 1 min RR 0.36 [0.04 to 3.36] apgar score less than 7 at 5 min none reported
not stated
171

Evidence tables
219
Bibliographic reference
Study type
Evidence level
Number of women
Women’s characteristics
Intervention Comparison Length of follow-up
Outcome measures
Effect size Source of funding
Additional comments
Umbilical A pHMD -0.01 [-0.03 to 0.01] satisfaction rate RR 1.02 [0.98 to 1.06]
Finegold H;Mandell G;Ramanathan S; 2000 249
RCT Evidence level: 1+
N=100 (50 for each)
women in labour Intervention: ropivacaine for epidural analgesia
Comparison: bupivacaine
Follow-up period: intrapartum
Outcome Measures: efficacy and adverse events
spontaneous vaginal birthRR 1.07 [0.77 to 1.50] CS RR 1.38 [0.60 to 3.13] duration of second stage MD -28.60 [-58.34 to 1.14] apgar score less than 7 at 1 min none reported apgar score less than 7 at 5 min none reported
not stated
Gaiser RR;Venkateswaren P;Cheek TG;Persiley E;Buxbaum J;Hedge J;Joyce TH;Gutsche BB; 1997 250
RCT Evidence level: 1+
N=75 (ropi=37; bupi=38)
women in labour Intervention: ropivacaine for epidural analgesia
Comparison: bupivacaine
Follow-up period: intrapartum
Outcome Measures: efficacy and adverese events
spontaneous vaginal birthRR 1.34 [0.92 to 1.93] CS RR 1.37 [0.33 to 5.70] Onset of analgesia MD -1.00 [-1.97 to -0.03] no motor block RR 0.46 [0.23 to 0.92] apgar score less than 7 at 1 min RR 0.41 [0.08 to 1.99] apgar score less than 7 at 5 min RR 0.33 [0.01 to 7.93] umbilical A pH MD 0.02 [0.02 to 0.02]
not stated
172

Intrapartum care
220
Bibliographic reference
Study type
Evidence level
Number of women
Women’s characteristics
Intervention Comparison Length of follow-up
Outcome measures
Effect size Source of funding
Additional comments
NACS>35 at 2hrRR 1.16 [0.98 to 1.37] NACS>35 at 24 h RR 1.06 [0.95 to 1.18]
Halpern SH;Breen TW;Campbell DC;Muir HA;Kronberg J;Nunn R;Fick GH; 2003 Jun 251
RCT Evidence level: 1+
N=555 (ropi=279; bupi=276)
women in labour Intervention: ropivacaine for epidural analgesia
Comparison: bupivacaine
Follow-up period: intrapartum
OutcomeMeasures: efficacy and adverse events
spontaneous vaginal birthRR 1.11 [0.94 to 1.32] CS RR 0.74 [0.54 to 1.02] duration of second stage MD 0.00 [-17.48 to 17.48]min duration of analgesia MD -25.00 [-78.36 to 28.36] min apgar score less than 7 at 1 min RR 0.95 [0.65 to 1.38] apgar score less than 7 at 5 min RR 2.15 [0.76 to 6.11] umbilical A pH MD -0.01 [-0.02 to 0.03]
not stated
Hughes D;Hill D;Fee JP; 2001 Nov 252
RCT Evidence level: 1+
N=40 (20 for each)
women in labour Intervention: ropivacaine for combined spinal-epidural analgesia
Comparison: bupivacaine
Follow-up period: intrapartum
Outcome Measures: efficacy and adverse events
onset of analgesiaMD 0.00 [-1.43 to 1.43] min duration of analgesia MD -10.00 [-22.41 to 2.41] min hypotension none reported nausea/vomiting none reported no motor block RR 1.58 [1.09 to 2.30]
not stated
173

Evidence tables
221
Bibliographic reference
Study type
Evidence level
Number of women
Women’s characteristics
Intervention Comparison Length of follow-up
Outcome measures
Effect size Source of funding
Additional comments
abnormal fetal heart tracenone reported
Irestedt L;Ekblom A;Olofsson C;Dahlstrom A;Emanuelsson B; 1998 253
RCT Evidence level: 1+
N=24 (12 for each)
women in labour Intervention: ropivacaine for epidural analgesia
Comparison: bupivacaine
Follow-up period: intrapartum
Outcome Measures: efficacy and adverse events
spontaneous vaginal birthRR 1.25 [0.47 to 3.33] CS RR 3.00 [0.14 to 65.90] hypotension none reported no motor block RR 0.67 [0.14 to 3.17]
not stated
Lee BB;Ngan Kee WD;Ng FF;Lau TK;Wong ELY; 2004 254
RCT Evidence level: 1+
N=346 (173 for each)
women in labour Intervention: ropivacaine for epidural analgesia
Comparison: bupivacaine
Follow-up period: intrapartum
Outcome Measures: efficacy and adverse events
spontaneous vaginal birthRR 0.92 [0.71 to 1.19] CS RR 1.02 [0.76 to 1.36] hypotension RR 0.87 [0.54 to 1.40] no motor block RR 1.07 [1.00 to 1.15] apgar score less than 7 at 1 min RR 1.00 [0.43 to 2.34] apgar score less than 7 at 5 min RR 0.33 [0.01 to 8.13] satisfaction rate RR 1.04 [0.98 to 1.10]
not stated
McCrae AF;Jozwiak H;McClure JH; 1995 255
RCT Evidence level: 1+
N=40 (20 for each)
women in labour Intervention: ropivacaine for extradural epidural
Comparison: bupivacaine
Follow-up period: intrapartum
Outcome Measures: efficacy and adverse events
spontaneous vaginal birhRR 0.60 [0.27 to 1.34] CS RR 0.33 [0.04 to 2.94] hypotension
Astra Pain Control
174

Intrapartum care
222
Bibliographic reference
Study type
Evidence level
Number of women
Women’s characteristics
Intervention Comparison Length of follow-up
Outcome measures
Effect size Source of funding
Additional comments
RR 1.00 [0.39 to 2.58] nausea/vomiting RR 1.50 [0.28 to 8.04] no motor block RR 0.88 [0.39 to 1.95] apgar score less than 7 at 1 min RR 0.50 [0.14 to 1.73] apgar score less than 7 at 5 min none reported
McCrae AF;Westerling P;McClure JH; 1997 256
RCT Evidencelevel: 1+
N=22 (ropi=10; bupi=12)
women in labour Intervention: ropivacaine for extradural analgesia
Comparison: bupivacaine
Follow-up period: intrapartum
Outcome Measures: efficacy and adverse events
spontaneous vaginal birhRR 1.03 [0.51 to 2.06] CS RR 3.55 [0.16 to 78.56] duration of second stage MD 0.00 [-17.48 to 17.48]min hypotension RR 1.20 [0.31 to 4.69] no motor block RR 0.96 [0.35 to 2.64] abnormal fetal heart trace RR 1.20 [0.20 to 7.05] apgar score less than 7 at 5 min none reported
Astra Pain Control
Meister GC;D'Angelo R;Owen M;Nelson KE;Gaver R; 2000 Mar
RCT Evidence level: 1+
N=50 (25 for each)
women in labour Intervention: ropivacaine for epidural analgesia
Comparison: bupivacaine
Follow-up period: intrapartum
Outcome Measures: efficacy and adverse events
duration of analgesiaMD 36.00 [-84.16 to 156.16]min no motor block RR 2.43 [1.23 to 4.81] satisfaction rate
not stated
175

Evidence tables
223
Bibliographic reference
Study type
Evidence level
Number of women
Women’s characteristics
Intervention Comparison Length of follow-up
Outcome measures
Effect size Source of funding
Additional comments
257 RR 1.00 [0.89 to 1.12]Merson N; 2001 Feb 258
RCT Evidence level: 1+
N=68 A high bupivacaine=17 B high ropivacaine=19 C low bupivacaine=16 D low ropivacaine=16
women in labour requesting epidural analgesia
Intervention: A high bupivacaine 0.25% B high ropivacaine 0.25% C low bupivacaine 0.125% D low ropivacaine 0.125%
Comparison: A high bupivacaine 0.25% B high ropivacaine 0.25% C low bupivacaine 0.125% D low ropivacaine 0.125%
Follow-up period: intrapartum
Outcome Measures: mode of birth
Sponatenous vaginal birthA 10/17 B 9/19 C 9/16 D 9/16 CS A 4/17 B 4/19 C 6/16 D 3/16
not stated
Muir HA;Writer D;Douglas J;Weeks S;Gambling D;Macarthur A; 1997 Jun 259
RCT Evidence level: 1+
N=60 (ropi=34; bupi=26)
women in labour Intervention: ropivacaine for epidural analgesia
Comparison: bupivacaine
Follow-up period: intrapartum
Outcome Measures: efficacy and adverse events
no motor blockRR 1.38 [0.95 to 1.99] apgar score less than 7 at 1 min RR 1.15 [0.21 to 6.37] NACS >35 at 24h RR 0.95 [0.83 to 1.08]
not stated
Owen MD;D'Angelo R;Gerancher JC;Thompson JM;Foss ML;Babb JD;Eisenach JC; 1998 Mar 260
RCT Evidence level: 1+
N=51 (ropi=26; bupi=25)
women in labour Intervention: ropivacaine for patient-controlled epidural analgesia
Comparison: bupivacaine
Follow-up period: intrapartum
Outcome Measures: efficacy and adverse events
spontaneous vaginal birthRR 0.75 [0.49 to 1.15] CS RR 0.96 [0.27 to 3.43] no motor block RR 1.92 [0.54 to 6.87] satisfaction RR 0.96 [0.89 to 1.06]
not stated
Owen MD;Thomas JA;Smith T;Harris LC;D'Angelo R; 2002
RCT Evidence level: 1+
N=50 (25 for each)
women in labour Intervention: ropivacaine for epidural analgesia
Comparison: bupivacaine
Follow-up period: intrapartum
Outcome Measures: efficacy and adverse events
spontaneous vaginal birthRR 0.71 [0.43 to 1.15] CS RR 0.83 [0.29 to 2.38] duration of second stage MD 24.00 [-8.67 to 56.67]
not stated
176

Intrapartum care
224
Bibliographic reference
Study type
Evidence level
Number of women
Women’s characteristics
Intervention Comparison Length of follow-up
Outcome measures
Effect size Source of funding
Additional comments
261 hypotension RR 2.00 [0.80 to 5.02] nausea/vomiting RR 0.50 [0.05 to 5.17] no motor block RR 1.31 [0.82 to 2.08] apgar score less than 7 at 1 min RR 1.00 [0.43 to 2.34] apgar score less than 7 at 5 min RR 0.33 [0.01 to 7.81]
Parpaglioni R;Capogna G;Celleno D; 2000 262
RCT Evidence level: 1+
N=173 (ropi=88; bupi=85)
women in labour Intervention: ropivacaine for epidural analgesia
Comparison: bupivacaine
Follow-up period: intrapartum
Outcome Measures: efficacy and adverse events
onset of analgessiaMD 1.00 [-1.65 to 3.65] min duration of analgesia MD 29.30 [18.52 to 40.08] hypotension none reported abnormal feta heart trace none reported
not stated
Pirbudak L;Tuncer S;Kocoglu H;Goksu S;Celik C; 2002 263
RCT Evidence level: 1+
N=40 (20 for each)
women in labour Intervention: ropivacaine for patient controlled epidural analgesia
Comparison: bupivacaine
Follow-up period: intrapartum
Outcome Measures: efficacy and adverse events
spontaneous vaginal birthRR 1.12 [0.91 to 1.38] CS none reported duration of second stage MD -10.10 [-17.59 to -2.61]min duration of analgesia MD -2.80 [-43.04 to 37.44] nausea/vomiting RR 1.00 [0.07 to 14.90]
not stated
177

Evidence tables
225
Bibliographic reference
Study type
Evidence level
Number of women
Women’s characteristics
Intervention Comparison Length of follow-up
Outcome measures
Effect size Source of funding
Additional comments
apgar score less than 7 at 1 min none reported apgar score less than 7 at 5 min none reported
Shah MK;Sia ATH;Chong JL; 2000 264
RCT Evidence level: 1+
N=40 (20 for each)
women in labour Intervention: intrathecal ropivacaine
Comparison: bupivacaine
Follow-up period: intrapartum
Outcome Measures: efficacy and adverse events
nausea/vomitingnone reported
not stated
Stienstra R;Jonker TA;Bourdrez P;Kuijpers JC;Van Kleef JW;Lundberg U; 1995 265
RCT Evidence level: 1+
N=76 (ropi=39; bupi=37)
women in labour Intervention: ropivacaine for epidural analgesia
Comparison: bupivacaine
Follow-up period: intrapartum
Outcome Measures: efficacy and adverse events
spontaneous vaginal birthRR 1.15 [0.67 to 1.99] CS RR 1.26 [0.49 to 3.30] no motor block RR 1.18 [0.89 to 1.55] apgar score less than 7 at 1 min RR 0.81 [0.30 to 2.20] apgar score less than 7 at 5 min RR 2.85 [0.31 to 26.15] NACS >35 at 24 hours RR 1.03 [0.97 to 1.08] Satisfaction RR 1.00 [0.88 to 1.14]
not stated
Bolukbasi D;Sener EB;Sarihasan B;Kocamanoglu S;Tur A; 2005 Oct 266
Evidence level: 1+
N=40 (bupivacaine=20; ropivacaine=20)
women in labour requiring regional analgesia
Intervention: Ropivacaine epidural analgesia initiated with 8ml of 0.0625% solution plus fentanyl 50mcg and maintained with a continuous infusion of
Comparison: Bupivacaine epidural analgesia initiated with 8ml of 0.0625% solution plus fentanyl 50mcg and maintained with a
Follow-up period: intrapartum
Outcome Measures: efficacy, adverse events, mode of birth
no motor blockBupivacaine=18/20 Ropivacaine=20/20 Duration of second stage Bupivacaine=40.05(4.03)min Ropivacaine=35.10(3.52)min
not stated
178

Intrapartum care
226
Bibliographic reference
Study type
Evidence level
Number of women
Women’s characteristics
Intervention Comparison Length of follow-up
Outcome measures
Effect size Source of funding
Additional comments
0.0625% solution with fentanyl 2 mcg/ml
continuous infusion of 0.0625% solution with fentanyl 2 mcg/ml
Spontaneou vaginal birthBupivacaine=20/20 Ropivacaine=20/20 Severe hypotension Bupivacaine=0/20 Ropivacaine=0/20 Nausea/vomiting Bupivacaine=0/20 Ropivacaine=1/20 Pruritis Bupivacaine=3/20 Ropivacaine=4/20 Backache Bupivacaine=2/20 Ropivacaine=2/20 Shivering Bupivacaine=1/20 Ropivacaine=1/20 Fetal bradycardia Bupivacaine=2/20 Ropivacaine=2/20 Umbilical aretrial pH Bupivacaine=7.28(0.50) Ropivacaine=7.28(0.45)
179

Evidence tables
227
Regional analgesia – maintenance of regional analgesia (different doses/rates for maintaining epidural analgesia) Bibliographic reference
Study type
Evidence level
Number of women
Women’s characteristics
Intervention Comparison Length of follow-up
Outcome measures
Effect size Source of funding
Additional comments
Beilin Y;Nair A;Arnold I;Bernstein HH;Zahn J;Hossain S;Bodian CA; 2002 267
RCT Evidence level: 1+
N=89 Control=23 0.125% bupivacaine=22 0.04% bupivacaine=22 0.0625% bupivacaine=22
women in labour requesting epidural analgesia
Intervention: 0.04% bupivacaine plus 1:600,000 epinephrine 0.0625% bupivacaine
Comparison: normal saline 0.125% bupivacaine
Follow-up period: intrapartum
Outcome Measures: mode of birth
spontaneous vaginal birthcontrol 0/23 0.125% 6/22 0.04% 1/22 0.0625% 1/22
not stated
Benhamou D;Hamza J;Eledjam J;Dailland P;Palot M;Seebacher J;Milon D;Heeroma K; 1997 268
RCT Evidence level: 1+
N=133 4ml=34 6ml=34 8ml=33 10ml=32
women in labour requesting epidural analgesia
Intervention: Ropivacaine 2mg/ml A 4ml/hr B 6ml/hr C 8ml/hr D 10ml/hr
Comparison: A 4ml/hr B 6ml/hr C 8ml/hr D 10ml/hr
Follow-up period: intrapartum
Outcome Measures: satisfaction, motor block, mode of birth
Satisfied with pain reliefA 25/34 B 30/34 C 28/33 D 19/32 no motor block A 21/34 B 18/34 C 16/33 D 13/32 Spontaneous vaginal birth A 22/34 B 22/34 C 25/33 D 20/32 CS A 1/34 B 2/34 C 1/33 D 2/32
not stated
Bernard JM;Le RD;Vizquel L;Barthe A;Gonnet JM;Aldebert A;Benani RM;Fossat
RCT Evidence level: 1+
N=203 (4ml/8min=100; 12ml/25min=103)
women in labour requesting epidural analgesia
Intervention: large bolus 12ml/25min
Comparison: typical preparation; 4ml/8min
Follow-up period: intrapartum
Outcome Measures: mode of birth, dose
spontaneous vaginal birth4ml/8min=67/100 12ml/25min=74/103 CS
not stated
180

Intrapartum care
228
Bibliographic reference
Study type
Evidence level
Number of women
Women’s characteristics
Intervention Comparison Length of follow-up
Outcome measures
Effect size Source of funding
Additional comments
C;Frouin J; 2000 Feb 203
4ml/8min=2/10012ml/25min=4/103 Apgar less than 7 at 1 min 4ml/8min=2/100 12ml/25min=3/103 Total dose 4ml/8min=40.8(17.2)mg 12ml/25min=60.9(23.0)mg
Cascio MG;Gaiser RR;Camann WR;Venkateswaran P;Hawkins J;McCarthy D; 1998 Nov 270
RCT Evidence level: 1+
N=126 4ml=33 6ml=31 8ml=31 10ml=32
women in labour requesting epidural
Intervention: Ropivacaine 2mg/ml A 4ml/h B 6ml/h C 8ml/h D 10ml/h
Comparison: A 4ml/h B 6ml/h C 8ml/h D 10ml/h
Follow-up period: intrapartum
Outcome Measures: satisfaction, mode of birth, neonatao outcomes
Satisfactionbefore delivery(%) A 82 B 91 C 97 D 84 close to discharge (%) A 85 B 84 C 94 D 97 Neonatal Outcomes 1 min Apgar more than 7 (%) A 91 B 84 C 84 D 97 5 min Apgar more than 7 (%) A 100 B 97 C 97 D 100 15 min NACS >34 (%) A 79 B 77 C 74
Astra Pain Control AB
181

Evidence tables
229
Bibliographic reference
Study type
Evidence level
Number of women
Women’s characteristics
Intervention Comparison Length of follow-up
Outcome measures
Effect size Source of funding
Additional comments
D 88 2h NACS >34 (%) A 91 B 94 C 94 D 91 Spontaneous vaginal birth (%) A 76 B 74 C 74 D 75 CS (%) A 6 B 10 C 3 D 3
Ewen A;McLeod DD;MacLeod DM; 1986 271
RCT Evidence level: 1+
N=53 (0.08%=25; 0.25%=28)
women in labour requesting epidural analgesia
Intervention: 0.08% bupivacaine
Comparison: 0.25% bupivacaine
Follow-up period: intrapartum
Outcome Measures: efficacy, adverse events
A 0.08%B 0.25% duration of analgesia A 481(44) min B 458 (37)min spontaneous vaginal birth A 5/25 B 2/28 CS A 4/25 B 10/28
not stated
Li DF;Rees GA;Rosen M; 1985 Mar 272
RCT Evidence level: 1+
N=98 I 19 II 20 III 20 IV 19 V 20
women in labour requesting analgesia
Intervention: 0.0625% Bupivacaine (group II)
Comparison: I no bupivacaine III-V 0.125% bupivacaine with different rate
Follow-up period: intrapartum
Outcome Measures: eifficacy, adverse events
total doseI 135.2(52.2)mg II 165.2(67.2) III 170.8(64.9) IV 161.0(52.0) V 197.9(63.6)
not stated
182

Intrapartum care
230
Bibliographic reference
Study type
Evidence level
Number of women
Women’s characteristics
Intervention Comparison Length of follow-up
Outcome measures
Effect size Source of funding
Additional comments
no motor blockI 5.3% II 5% III 5% IV 0% V 0%
Merson N; 2001 Feb 258
RCT Evidence level: 1+
N=68 A high bupivacaine=17 B high ropivacaine=19 C low bupivacaine=16 D low ropivacaine=16
women in labour requesting epidural analgesia
Intervention: A high bupivacaine 0.25% B high ropivacaine 0.25% C low bupivacaine 0.125% D low ropivacaine 0.125%
Comparison: A high bupivacaine 0.25% B high ropivacaine 0.25% C low bupivacaine 0.125% D low ropivacaine 0.125%
Follow-up period: intrapartum
Outcome Measures: mode of birth
Sponatenous vaginal birthA 10/17 B 9/19 C 9/16 D 9/16 CS A 4/17 B 4/19 C 6/16 D 3/16
not stated
Noble HA;Enever GR;Thomas TA; 1991 273
RCT Evidence level: 1+
N=56( 0.125% bupivacaine=21; 0.062% bupivacaine=17; 0.031% bupivacaine=18)
women in labour requesting epidural analgesia
Intervention: 0.031% and 0.062% bupivacaine
Comparison: 0.125% bupivacaine
Follow-up period: intrapartum
Outcome Measures: efficacy, adverse events, mode of birth
A 0.125%B 0.062% C 0.031% no motor block A 4/21 B 9/17 C 6/18 hypotension A 4/21 B 3/17 C 1/18 Nausea/vomiting A 3/21 B 5/17 C 3/18 Pruritis A 1/21 B 1/17 C 1/18
not stated
183

Evidence tables
231
Bibliographic reference
Study type
Evidence level
Number of women
Women’s characteristics
Intervention Comparison Length of follow-up
Outcome measures
Effect size Source of funding
Additional comments
spontaneous vaginal birth A 6/21 B 10/17 C 7/18 CS A 4/21 B 2/17 C 4/18
Stoddart AP;Nicholson KEA;Popham PA; 1994 274
RCT Evidence level: 1+
N=78 (high dose=40; low dose=38)
women in labour requesting epidural analgesia
Intervention: High dose (0.125%) bupivacaine
Comparison: low dose(0.0625%)bupivacaine
Follow-up period: intrapartum
Outcome Measures: mode of birth, efficacy
duration of epiduralhigh 440.9(42); low 403.0(34.8) spontaneous vaginal birth high 15/40; low 19/38 CS high 4/40; low 3/38
not stated
Thorburn J;Moir DD; 1981 275
RCT Evidence level: 1+
N= 517 (A0.5%6-8ml=161; B0.25%10-14ml=173; C0.25%6-8ml=183)
women in labour requesting epidural analgesia
Intervention: bupivacaine 0.25% 10-14ml and 6-8ml for epidural analgesia
Comparison: bupivacaine 0.5% 6-8ml
Follow-up period: intrapartum
Outcome Measures: mode of birth, satisfaction, adverse events
spontaneous vaginal birthA 31.7% B 38.7% C 53% CS A 17% B 13.8% C 13.1% Satisfied with the pain relief A 74% B 72.9% C 59.4% No motor block A 34% B 43.2% C 57.1% Hypotension A 3.8%
not stated
184

Intrapartum care
232
Bibliographic reference
Study type
Evidence level
Number of women
Women’s characteristics
Intervention Comparison Length of follow-up
Outcome measures
Effect size Source of funding
Additional comments
B 6.9%C 4.9%
Sia AT;Ruban P;Chong JL;Wong K; 1999 Nov 276
RCT Evidence level: 1+
N=50(25 for each arm)
women in labour requesting epidural analgesia
Intervention: 0.125% ropivacaine PCEA
Comparison: 0.2% ropivacaine
Follow-up period: intrapartum
Outcome Measures: satisfaction, mode of birth, duration of second stage, adverse events
Satisfaction0.125=90(71-100) 0.2=100(52-100) duration of second stage 0.125=83.7(47)min 0.2=99.5(55)min Spontaneous vaginal birth 0.125=13/22 0.2=10/25 CS 0.125=4/25 0.2=2/25 Apgar more than 7 at 1 min 0.125=23/25 0.2=22/25 Apgar more than 7 at 1 min none reported motor block 0.125=4/25 0.2=11/25 Hypotension 0.125=2/25 0.2=3/25 Nausea 0.125=0/25 0.2=1/25
not stated
185

Evidence tables
233
Regional analgesia – maintenance of regional analgesia (mode of administration) Bibliographic reference
Study type
Evidence level
Number of women
Women’s characteristics
Intervention Comparison Length of follow-up
Outcome measures
Effect size Source of funding
Additional comments
Chua SM;Sia AT; 2004 Jun 188
RCT Evidence level: 1+
N=42(21 for each)
nulliparous women in labour requesting epidural
Intervention: intermittent bolus of epidural analgesia
Comparison: continuous infusion
Follow-up period: intrapartum
Outcome Measures: Pain score, adverse events
hypotensionOR 1.54 [0.24 to 9.75] no motor block OR 1.00 [0.06 to 17.12] duration of analgesia MD 58.0 [45.42 to 70.58]
not stated
D'Athis F;Macheboeuf M;Thomas H;Robert C;Desch G;Galtier M;Mares P;Eledjam JJ; 1988 Mar 189
RCT Evidence level: 1+
N=44 (22 for each arm)
low risk women in labour requesting epidural
Intervention: intermittent bolus for epidural analgesia
Comparison: continuous infusion
Follow-up period: intrapartum
Outcome Measures: mode of delivery, efficacy
spontaneous vaginal birthOR 1.00 [0.30 to 3.33] CS OR 1.28 [0.32 to 5.01] Onset of analgesia MD -5.27 [-5.45 to -5.09]
not stated
Eddleston JM;Maresh M;Horsman EL;Young H;Lacey P;Anderton J; 1992 Aug 190
RCT Evidence level: 1+
N=80(40 for each arm)
low-risk primigravidae requesting epidural analgesia
Intervention: intermittent bolus for epidural analgesia
Comparison: continuous infusion
Follow-up period: intrapartum
Outcome Measures: mode of birth, adverse events
spontaneous vaginal birthOR 1.66 [0.68 to 4.02] CS OR 1.00 [0.29 to 3.41] hypotension OR 1.54 [0.24 to 9.75] urinary retention OR 0.85 [0.28 to 2.61] abnormal FHR OR 0.68 [0.24 to 1.94]
not stated
Hicks JA;Jenkins JG;Newton MC;Findley IL; 1988
RCT Evidence level: 1++
N=73 (intermittent=35; continuous=38)
low-risk women in labour requesting epidural
Intervention: intermittent bolus for epidural analgesia
Comparison: continuous infusion
Follow-up period: intrapartum
Outcome Measures: efficacy, mode of birth, adverse events
spontaneous vaginal birthOR 1.82 [0.71 to 4.62] CS OR 0.42 [0.10 to 1.75]
not stated
186

Intrapartum care
234
Bibliographic reference
Study type
Evidence level
Number of women
Women’s characteristics
Intervention Comparison Length of follow-up
Outcome measures
Effect size Source of funding
Additional comments
191 hypotension
OR 1.11 [0.35 to 3.55] urinary retention OR 0.95 [0.38 to 2.39] no motor block OR 1.65 [0.61 to 4.48] total dose MD -17.00 [-41.49 to 7.49]
Lamont RF;Pinney D;Rodgers P;Bryant TN; 1989 192
RCT Evidence level: 1+
N=381 (intermittent=193; continuous=188)
low-risk women in labour requesting epidural
Intervention: intermittent bolus for epidural analgesia
Comparison: continuous infusion
Follow-up period: intrapartum
Outcome Measures: mode of birth, adverse events, efficacy
spontaneous vaginal birthOR 0.94 [0.60 to 1.46] CS OR 1.33 [0.61 to 2.88] duration of second stage MD 12.00 [-9.63 to 33.63] min hypotension OR 1.45 [0.66 to 3.22] abnormal FHR trace OR 1.77 [0.96 to 3.24] admission to neonatal unit OR 3.02 [0.80 to 11.32]
not stated
Smedstad KG;Morison DH; 1988 193
RCT Evidence level: 1+
N=57 (intermittent=29; continuous=28)
low-risk women in labour requesting epidural analgesia
Intervention: intermittent bolus for epidrual analgesia
Comparison: continuous infusion
Follow-up period: intrapartum
Outcome Measures: mode of birth, efficacy, adverse events
sponetaneous vaginal birthOR 4.93 [1.47 to 16.54] CS OR 0.80 [0.24 to 2.59] duration of second stage MD 3.19 [-34.8 to 41.2] min apgar less than 7 at 1 min OR 7.79 [0.38 to 157.97]
not stated
187

Evidence tables
235
Bibliographic reference
Study type
Evidence level
Number of women
Women’s characteristics
Intervention Comparison Length of follow-up
Outcome measures
Effect size Source of funding
Additional comments
apgar less than 7 at 5 min OR 5.36 [0.25 to 116.76]
Wong CA;Ratliff JT;Sullivan JT;Scavone BM;Toledo P;McCarthy RJ; 2006 Mar 194
Evidence level: 1+
N=126 (intermittent bolus=63; continuous infusion=63)
women in labour requring epidural analgesia
Intervention: intermittent epidural bolus (initiated with combined spinal and epidual analgesia, and then 6ml of bupivacaine 0.625mg/ml and fentanyl 2mcg/ml bolus every 30 minutes)
Comparison: continuous infusion (12ml/h of the same solution after 15 minutes)
Follow-up period: intrapartum
Outcome Measures: mode of birth
Spontaneous vaginal birthOR 1.00 [0.24 to 4.19] CS OR 3.05 [0.12 to 76.26]
partly by B. Braun Medical Inc
Lim Y;Sia AT;Ocampo C; 2005 Oct 195
Evidence level: 1+
N=60 (intermittent bolus=30; continuous infusion=30)
women in labour requiring epidural analgesia
Intervention: Intermittent bolus of epidural analgesia (initiated with combined spinal-epidural analgesia with 25mcg of fentanyl followed by 5ml bolus of 0.1% levobupivacaine with fentanyl 2mcg/ml every 30 minutes)
Comparison: continuous infusion(the same solution 10m/h)
Follow-up period: intrapartum
Outcome Measures: mode of birth and adverse events
Spontaneous viginal birthOR 1.15 [0.41 to 3.20] CS OR 0.86 [0.29 to 2.55] hypotension OR 5.35 [0.25 to 116.31] pruritis OR 0.73 [0.24 to 2.21] motor block no case reported
not stated
van der Vyver M;Halpern S;Joseph G; 2002 Sep 196
Systematic review - meta-analysis
Evidence level: 1+
9 trials; 640women
women in labour rquesting epidural analgesia
Intervention: Patient-controlled epidural analgesia
Comparison: continuous infusion
Follow-up period: intrapartum
Outcome Measures: unscheduled anaesthetic interventions; drug dose, motor block, efficacy, satisfaction, obstetric and neonatal outcomes
no unscheduled interventionsRD 27 [18 to 36]% drug dose MD -3.92 [-5.38 to -2.42] no motor block RD 18 [6 to 31] % Maternal satisfaction RD 0.0 [-11 to 10] % CS
not stated
188

Intrapartum care
236
Bibliographic reference
Study type
Evidence level
Number of women
Women’s characteristics
Intervention Comparison Length of follow-up
Outcome measures
Effect size Source of funding
Additional comments
RD 4 [-8 to 1] % duration of second stage MD -10.33 [-21.59 to 0.93] min hypotension RD -1% [-3 to 2] Nausea RD 5 [-8 to 18] %
Saito M;Okutomi T;Kanai Y;Mochizuki J;Tani A;Amano K;Hoka S; 2005 197
RCT Evidence level: 1+
N=58 (29 for each arm)
low-risk women in labour requesting epidural analgesia
Intervention: Patient controlled epidural analgesia
Comparison: continuous infusion
Follow-up period: intrapartum
Outcome Measures: doses, adverse events, mode of birth
spontaneous vaginal birthPCEA 13/29; CEI 16/29 duration of second stage PCEA 2.7(2.0) hours Nausea PCEA 1/29; CEI 0/29 no hypotension reported
not stated
Gambling DR;McMorland GH;Yu P;Laszlo C; 1990 198
RCT Evidence level: 1+
N=58 (PCEA=30; Intermittent top-up=28)
nulliparous women in labour requesting epidural analgesia
Intervention: Patient-controlled Epidural Analgesia
Comparison: Intermittent top-up bolus by Anaesthesist
Follow-up period: intrapartum
Outcome Measures: mode of birth, duration of labour, neonatal outcomes
Duration of secodn stagePCEA=2.3(0.26)h CIT=1.9(0.22)h Spontaneous vaginal birth PCEA=7/30 CIT=9/28 CS PCEA=9/30 CIT=5/28 Apgar score less than 7 at 1 min PCEA=6/30 CIT=3/28 Apgar score less than 7 at 5 min none
Abbott Laboratories
Paech MJ;
RCT Evidence level: 1+
N=50 (25 for each)
low-risk women in labour requesting epidural analgesia
Intervention: Patient controlled boluses for
Comparison: midwife controlled
Follow-up period: intrapartu
Outcome Measures: satisafaction;
spontaneous vaginal birthPCEA 12/25; MCEA 10/25
The King Edward Memorial
189

Evidence tables
237
Bibliographic reference
Study type
Evidence level
Number of women
Women’s characteristics
Intervention Comparison Length of follow-up
Outcome measures
Effect size Source of funding
Additional comments
1991 199
epidural analgesia boluses m mode of birth, apgar, adverse events
CS PCEA 6/25; MCEA 6/25 1 min apgar less than 7 PCEA 5/25; MCEA 5/25 satisfaction first stage PCEA 23/25; MCEA 23/25 satisfaction second stage PCEA 8/13; MCEA 14/17 Nausea PCEA 11/25; MCEA 9/25 Pruritus PCEA 5/25; MCEA 5/25 hypotension PCEA 6/25; MCEA 2/25
Hospital Research Foundation
Paech MJ;Pavy TJG;Sims C;Westmore MD;Storey JM;White C; 1995 200
RCT Evidence level: 1+
N=167 (PCEA 82; SCEA 85)
women in labour requesting epidural analgesia
Intervention: Patient controlled intermittent bolus for epidural analgesia
Comparison: Staff-administered intermittent bolus
Follow-up period: intrapartum
Outcome Measures: satisfaction, adverse events, mode of birth, neonatal outcomes
Satisfaction - first stagePCEA 0.67 satisfied SAEA 0.78 second stage PCEA 0.55 SAEA 0.65 Overall PCEA 0.99 SAEA 0.98 Hypotension PCEA 0.08 SAEA 0.08 Pruritus PCEA 0.38 SAEA 0.33
not stated
190

Intrapartum care
238
Bibliographic reference
Study type
Evidence level
Number of women
Women’s characteristics
Intervention Comparison Length of follow-up
Outcome measures
Effect size Source of funding
Additional comments
Urinary Retention PCEA 0.69 SAEA 0.51 spontaneous vaginal delivery PCEA 0.43 SAEA 0.56 CS PCEA 0.14 SAEA 0.18 Apgar less than 7 at 1 min PCEA 0.21 SAEA 0.17
Halonen P;Sarvela J;Saisto T;Soikkeli A;Halmesmaki E;Korttila K; 2004 201
RCT Evidence level: 1+
N=176(PCEA=86; Bolus=90)
Women in labour requesting epidural analgesia
Intervention: patient-controlled epidural analgesia
Comparison: bolus technique
Follow-up period: intrapartum
Outcome Measures: mode of birth, adverse events,efficacy
Spontaneous vaginal birthBolus=66/90 PCEA=61/86 CS Bolus=6/90 PCEA=14/86 Apgar score less than 7 at 5 min Bolus=5/90; PCEA=6/86 Umbilical pH less than 7.20 Bolus=26/90; PCEA=29/86 Duration of analgesia Bolus=4.0(3.5, 4.4)h PCEA=4.3(3.8, 4.8)h
EVO-grants
Gambling DR;Huber CJ;Berkowitz J;Howell P;Swenerton JE;Ross PL;Crochetiere CT;Pavy TJ;
RCT Evidence level: 1+
N=68 (A=14; B=14; C=13; D=14; E=13)
Women in labour requesting epidural analgesia
Intervention: patient controlled epidural analgesia bolus dose/locktime interval A 2ml/10min B 3ml/15min
Comparison: E 8ml/hr continuous
Follow-up period: intrapartum
OutcomeMeasures: Satisfaction score, motor block, mode of birth
No motor blockA 12/14 B 11/14 C 8/13 D 8/13 E 6/13
Bard, Canada
191

Evidence tables
239
Bibliographic reference
Study type
Evidence level
Number of women
Women’s characteristics
Intervention Comparison Length of follow-up
Outcome measures
Effect size Source of funding
Additional comments
1993 Mar 202
C 4ml/20minD 6ml/30min
Spontaneous vaginal birthA 8/13 B 6/14 C 4/13 D 7/14 E 3/13 CS A 2/13 B 4/14 C 2/13 D 2/14 E 1/13 Apgar score less than 7 at 1min A 1/13 B 3/13 C 4/13 D 3/13 E 1/13 Apgar score less than 7 at 5 min none reported
Bernard JM;Le RD;Vizquel L;Barthe A;Gonnet JM;Aldebert A;Benani RM;Fossat C;Frouin J; 2000 Feb 203
RCT Evidence level: 1+
N=203 (4ml/8min=100; 12ml/25min=103)
women in labour requesting epidural analgesia
Intervention: large bolus 12ml/25min
Comparison: typical preparation; 4ml/8min
Follow-up period: intrapartum
Outcome Measures: mode of birth, dose
spontaneous vaginal birth4ml/8min=67/100 12ml/25min=74/103 CS 4ml/8min=2/100 12ml/25min=4/103 Apgar less than 7 at 1 min 4ml/8min=2/100 12ml/25min=3/103 Total dose 4ml/8min=40.8(17.2)mg 12ml/25min=60.9(23.0)mg
not stated
Siddik-Sayyid SM;Aouad MT;Jalbout
RCT Evidence level: 1+
N=66 (22 for each)
women in labour requesting epidural analgesia
Intervention: Patient controlled epidural analgesia
Comparison: A 3ml/ 6 min B 6ml/ 12min
Follow-up period: intrapartu
Outcome Measures: duration of labour,
duration of second stageA 70.2(63.6)min
not stated
192

Intrapartum care
240
Bibliographic reference
Study type
Evidence level
Number of women
Women’s characteristics
Intervention Comparison Length of follow-up
Outcome measures
Effect size Source of funding
Additional comments
MI;Zalaket MI;Mouallem MR;Massouh FM;Rizk LB;Maarouf HH;Baraka AS; 2005 Jan 204
different bolus volumn / lockout A 3ml/ 6 min B 6ml/ 12min C 9ml/ 18min
C 9ml/ 18min m mode of birth, B 58.2(28.3)minC 80.8(57.5)min Spontaneous vaginal birth A 12/22 B 16/22 C 14/22 CS A 4/22 B 3/22 C 1/22
Stratmann G;Gambling DR;Moeller-Bertram T;Stackpole J;Pue AF;Berkowitz J; 2005 205
RCT Evidence level: 1+
N=60 5-min lockout=29 15min lockout=31
women in labour requesting epidural analgesia
Intervention: Patient controlled epidural analgesia 5 min lockout
Comparison: 15 min lock out
Follow-up period: intrapartum
Outcome Measures: pain score, adverse events
Pain score (median)15m=79 5m=82 Nausea post 2h 15m=2/31 5m=13/25 pruritis post 2h 15m=19/31 5m=20/25 hypotension post 2 h 15m=0/31 5m=0/25
not stated
193

Evidence tables
241
Regional analgesia – care and observations for women with regional analgesia in labour (Preloading with intravenous (IV) infusions for epidural analgesia) Bibliographic reference
Study type
Evidence level
Number of women
Women’s characteristics
Intervention Comparison Length of follow-up
Outcome measures
Effect size Source of funding
Additional comments
Hofmeyr GJ; 2000 172
Systematic review - meta-analysis
Evidence level: 1+
6 trials Women undergoing regional analgesia during labour
Intervention: Prophylactic intravenous fluid preloading before regional analgesic administration
Comparison: dummy or no prophylactic preloading
Follow-up period: N/A
Outcome Measures: Maternal outcomes including blood pressure; fetal heart rate changes; perinatal outcomes
HypotensionHigh-dose local anaesthetic relative risk (RR) 0.07, 95% confidence interval (CI) 0.01 to 0.53; 102 women Low-dose local anaesthetic RR 0.73, 95% CI 0.36 to 1.48; 260 women Spinal opioid only no cases of maternal hypotension in either group (total of 30 women) Fetal heart rate (FHR) abnormalities high dose local anaesthetic epidural RR 0.36, 95% CI 0.16 to 0.83; 102 women low-dose epidural trials (Kinsella 2000; Kubli 2003) RR 0.64, 95% CI 0.39 to 1.05; 233 women CSE RR 0.70, 95% CI 0.36 to 1.37; 32 women Delivery mode assisted vaginal delivery RR 0.96, 95% CI 0.28 to 3.28 caesarean section: RR 0.87, 95% CI 0.17 to 4.42); total of 30 women Other outcomes Apgar scores RR of 0.54, 95% CI 0.05 to 5.78 (102 women) for Apgar scores less than seven at one minute.
South African Medical Research Council SOUTH AFRICA Australian Department of Health and Ageing AUSTRALIA
194

Intrapartum care
242
Regional analgesia – care and observations for women with regional analgesia in labour (observations for women in labour) Bibliographic reference
Study type
Evidence level
Number of women
Women’s characteristics
Intervention Comparison Length of follow-up
Outcome measures
Effect size Source of funding
Additional comments
Mayberry LJ;Clemmens D;De A; 2002 May 173
Systematic review - meta-analysis
Evidence level: 1+
19 RCTs Total n=2708 women
Women in labour at term with epiudral analgesia
Intervention: Epidural analgesia - including traditional bolus epiudrals, CSE and continuous infusion (including 1 trial of PCEA)
Comparison: Follow-up period: All studies included labour outcomes only eg. immediate side-effects.
Outcome Measures: Side effects of epidural including: pruritis, nausea and vomiting, shivering, voiding inability, sedation, hypotension and impaired motor ability.
Hypotension (16 studies): Range 0% - 50%, average incidence 10.5% across 44 trial groups. In 16 trial groups there were no incidences of hypotension, covering a wide range of epidural agents including opioids. 8 trial groups reported an incidence of hypotension above 20%, these also included a range of epidural agents, including groups with and without opioids, both as epidural agents and intrathecally. Mobilisation: No or minimal impaired motor ability (Bromage or modified Bromage test) (8 studies): Range 76% - 100%, overall incidence at least 87.7%. Ability to walk during labour (8 studies): Range 15.3% - 100%. Voiding difficulty (4 studies): Ability to micturate “spontaneously” (3 studies): 0-68%, average incidence 27.5%. Need for catheterisation (1 study): 28% - 61%, average incidence 41.3%. Sedation (5 studies): Range 1% - 56%, average incidence 21%. Highest levels of sedation (32% - 56%) were found in women who received 5 to 10μg sufentanil. Pruritis: 17 studies involving drug combinations including opioids: incidence of pruritis range 8% - 100%, average 62%. Highest incidences occurred in groups with highest doses of opioid. 8 study groups from 6 trials who did not receive opioids: Range 0% - 4%. Nausea and vomiting: Nausea (7 studies): range 0% - 30%, average 7.3%. Nausea + vomiting (5 studies): Range 0% - 20.0%, average 4.6%. Shivering: 1 case reported in each of 2 studies that reported this side-effect.
Funding: Not stated
195

Evidence tables
243
Bibliographic reference
Study type
Evidence level
Number of women
Women’s characteristics
Intervention Comparison Length of follow-up
Outcome measures
Effect size Source of funding
Additional comments
Anim-Somuah M;Smyth R;Howell C; 2005 156
Systematic review - meta-analysis
Evidence level: 1+
Original review - 21 studies involving 6664 women. 3 studies excluded because outside the scope of guideline: 19 studies involving 5705 women
Women in spontaneous labour at >=36 weeks of pregnancy. NB. One trial included women in spontaneous labour and induced labour.
Intervention: All modalities of epidural analgesia (with or without opioids)
Comparison: Non-epidural pain relief or no pain relief
Follow-up period: Immediate PN period
Outcome Measures: Primary outcomes: Woman's perceptions of pain relief in labour Instrmental birth CS Apgar score<7 at 5 min. Maternal satisfaction with pain relief during labour Long term backache Secondary outcomes: 44 secondary outcomes are listed relating to: Other measures of pain relief Side effects for woman Woman's vital signs Neonatal outcomes - both short and long term
Findings re-analysed excluding 3 studies not relevant to this systematic review (RR (95% CI)): CS (16 studies): 1.08 (0.92 to 1.26) CS for fetal distress (9): 1.31 (0.88 to 1.94) CS for dystocia (10): 0.93 (0.71 to 1.22) Instrumental birth (14): 1.34 (1.20 to 1.50) Women's satisfaction with intrapartum pain relief (5): 1.18 (0.92 to 1.50) Woman's perception of pain relief in first stage (2): WMD -15.67 (-16.98 to -14.35) Woman's perception of pain relief in second stage (2): WMD -20.75 (-22.50 to -19.01) Woman's satisfaction with childbirth experience (1): 0.95 (0.87 to 1.03) Perceived feeling of poor control in labour (1): 1.17 (0.62 to 2.21) Need for additional pain relief (13): 0.05 (0.02 to 0.17) Maternal hypotension (6): 58.49 (21.29 to 160.66) Nausea and vomiting ((7): 1.03 (0.87 to 1.22) Fever >38 degrees C (2): 4.37 (2.99 to 6.38) Drowsiness (3): 1.00 (0.12 to 7.99) Urinary retention (3): 17.05 (4.82 to 60.39) Malposition (4): 1.40 (0.98 to 1.99) Perineal repair (1): 1.05 (0.93 to 1.18) Postnatal depression (1): 0.63 (0.38 to 1.05) Long-term backache (2): 1.00 (0.89 to 1.12) Apgar score <7 at 5 min. (8): 0.76 (0.40 to 1.44) Length of first stage (8): 28.68 (-23.65 to 81.01) Length of second stage (10) WMD 16.24 (6.71 to 25.78) Oxytocin augmentation (10): 1.19 (1.02 to 1.38) Meconium staining of liquor (4): 1.01 (0.79 to 1.30) NICU admission (5): 1.08 (0.62 to 1.90) Umbilical artery pH<7.2 (5): 0.87 (0.71 to 1.07) Naloxone administration (4): 0.15 (0.06 to 0.40)
Not stated Re-running of the meta-analyses made little difference to the findings of the review. One exception: umbilical artery pH < 7.2 - no longer signif. favours epidural group, with 3 trials removed finding is NS.
196

Intrapartum care
244
Regional analgesia – care and observations for women with regional analgesia in labour (positions and mobilisations) Bibliographic reference
Study type
Evidence level
Number of women
Women’s characteristics
Intervention Comparison Length of follow-up
Outcome measures
Effect size Source of funding
Additional comments
Roberts CL; Algert CS; Olive E; 2004 Dec 174
System-atic review - meta-analysis
Evidence level: 1+
Review of 5 RCTs involving 1161 women.
Women in labour at term with uncomplicated pregnancies with epidural analgesia in the first stage of labour. 3 studies included primiparous women only. 4 trials included women with induced labours.
Intervention: Ambulation and/or upright position during first stage of labour with epidural.
Comparison: Sitting in bed, lying in bed, ambulation discouraged, recumbant in bed.
Follow-up period: Duration of labour and the birth.
Outcome Measures: Primary outcome: Mode of birth Secondary outcomes: Oxytocin augmentation Duration of first stage Duration of second stage Extra doses of analgesia Satisfaction with analgesia Hypotension FHR abnormalities Motor block Bladder catheterisation Headache Low Apgar at 1 minute Low Apgar at 5 minutes
Findings reported as RR or WMD with 95% confidence intervals. Instrumental birth (5): 1.16 (0.93 to 1.44) CS (5): 0.91 (0.70 to 1.19) SVD (5): 0.97 (0.89 to 1.06) Oxytocin augmentation (5): 0.99 (0.90 to 1.08) Duration of first stage (2): WMD 32.6 (-4.0 to 69.3) Duration of second stage (2): WMD 2.5 (-15.2 to 20.2) Duration of labour (2): WMD -48.5 (-77.0 to -20.1) Extra doses of analgesia (2): 0.57 (0.22 to 1.48) Satisfaction with analgesia (2): 1.07 (1.00 to 1.16) Hypotension (3): 1.12 (0.52 to 2.45) FHR abnormalities (2): 0.83 (0.56 to 1.22) Motor block (3): 0.52 (0.10 to 2.61) Bladder catheterisation (1): 0.75 (0.58 to 0.96) Headache (1): 1.00 (0.14 to 7.02) Low Apgar at 1 minute (2): 0.87 (0.30 to 2.51) Low Apgar at 5 minutes (4): 1.03 (0.34 t 3.12)
National Health and Medical Research Council of Australia
Roberts et al, 2005 175
System-atic review
1+ 2 studies involving 281 women n=166 upright n=115 recumbent
Women with uncomplicated pregnancies with epidural analgesia in labour at 36 weeks or more gestation.
Upright position Recumbent position
Immediate postpartum period
Mode of birthLength of labour Perineal trauma PPH Maternal satisfaction Neonatal wellbeing
CS: RR 0.57 (95% CI 0.28 to 1.16)Instrumental birth: RR 0.77 (95% CI 0.46 to 1.28) Duration of second stage (1 study): 109 vs. 132 minutes, p=0.019, favours upright group. No other significant differences found for maternal or neonatal outcomes.
National Health and Medical Research Council of Australia
197

Evidence tables
245
Regional analgesia – care and observations for women with regional analgesia in labour (pushing in second stage) Bibliographic reference
Study type
Evidence level
Number of women
Women’s characteristics
Intervention Comparison Length of follow-up
Outcome measures
Effect size Source of funding
Additional comments
Torvaldsen S;Roberts CL;Bell JC;Raynes-Greenow CH; 2005 177
Systematic review - meta-analysis
Evidence level: 1+
5 RCTs included involving 462 women.
Women in labour at term. Includes spontaneous onset and induced labours.
Intervention: Discontinuation of epidural analgesia in late first stage of labour (> 8 cm cervical dilation).
Comparison: Continuation of epidural analgesia.
Follow-up period: Duration of labour and birth of the baby.
Outcome Measures: Primary outcome: Mode of birth Secondary outcomes: Duration of second stage Fetal malposition Inadequate pain relief Low Apgar score at 1 minute Umbilical artery pH
Note: RR <1 favours discontinued epidural. Relative risk (fixed effects model) reported with 95% confidence interval. Number of included trials reported in parentheses after comparison. Instrumental birth (5): 0.84 (0.61 to 1.15) CS (4): 0.98 (0.43 to 2.25) SVD (4): 1.11 (0.95 to 1.30) Duration of second stage (3): WMD -5.80 (-12.91 to 1.30), favours discontinued. Fetal malposition (4): 1.36 (0.73 to 2.56) Inadequate pain relief (4): 3.68 (1.99 to 6.80) Low Apgar score at 1 minute (4): 1.55 (0.94 to 2.55) Umbilical artery pH (3): 3.92 (0.45 to 34.21)
Commonwealth Depat. Of Health and Ageing, Australia National Health and Medical Research Council, Australia Centre for Perinatal Health Services, Au
Discontinuation of epidural analgesia for the second stage of labour does not significantly affect instrumental birth rates but does lead to a significant increase in women's dissatisfaction with second stage pain relief.
Roberts, Torvaldsen, Cameron & Olive, 2004 178
System-atic review
1+ Review of 5 RCTs involving 1161 women.
:Women in labour at term with uncomplicated pregnancies with epidural analgesia in the first stage of labour. 3 studies included primiparous women only. 4 trials included women with induced labours.
Delayed pushing in second stage with epidural
Immediate or early pushing in second stage with epidural.
3 months postpartum
Mode of birthDuration of second stage Duration of pushing Perineal trauma PPH Maternal fever Dyspareunia at 3 months Apgar scores PPV for resuscitation Admission to NICU Umbilical artery pH Infant trauma Perinatal death
Instrumental births: RR 0.94, 95% CI 0.84 to 1.01.Mid-pelvic or rotational instrumental births (5 trials): RR 0.69, 95% CI 0.55 to 0.87, favours delayed pushing. Second stage CS: RR 0.77 (95% CI 055 to 1.08), favours delayed pushing. Total duration of second stage (min) (3 trials): WMD 58.2, 95% CI 21.51 to 94.84 Duration of pushing (min) (2 trials): WMD 1.11, 95% CI -20.19 to 22.40 Episiotomy (4 trials): RR .097, 95% CI 0.88 to 1.06 Perineal laceration (5 trials): RR 0.90, 95% CI 0.70 to 1.17 PPH (3 trials): RR 1.04, 95% CI 0.86 to 1.26 Intrapartum maternal fever (2 trials): RR 1.36, 95% CI 0.68 to 2.73 Dyspareunia at 3 months postpartum (1 trial): RR 1.15, 95% CI 0.63 to 2.10 Faecal incontinence at 3 months postpartum (1 trial): RR 1.47, 95% CI 0.94 to 2.29 Maternal satisfaction with labour care (1 trial): RR 0.97, 95% CI 0.82 to 1.13
National Health and Medical Research Council, Australia.
International
198
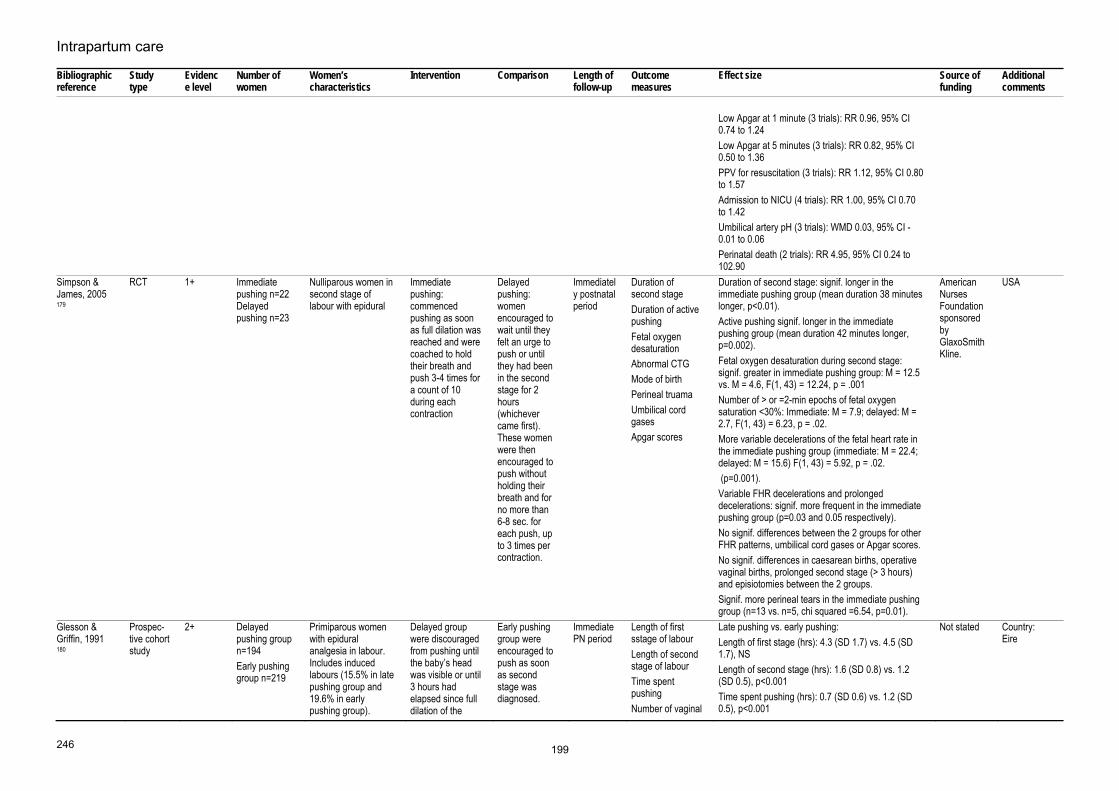
Intrapartum care
246
Bibliographic reference
Study type
Evidence level
Number of women
Women’s characteristics
Intervention Comparison Length of follow-up
Outcome measures
Effect size Source of funding
Additional comments
Low Apgar at 1 minute (3 trials): RR 0.96, 95% CI 0.74 to 1.24 Low Apgar at 5 minutes (3 trials): RR 0.82, 95% CI 0.50 to 1.36 PPV for resuscitation (3 trials): RR 1.12, 95% CI 0.80 to 1.57 Admission to NICU (4 trials): RR 1.00, 95% CI 0.70 to 1.42 Umbilical artery pH (3 trials): WMD 0.03, 95% CI -0.01 to 0.06 Perinatal death (2 trials): RR 4.95, 95% CI 0.24 to 102.90
Simpson & James, 2005 179
RCT 1+ Immediate pushing n=22 Delayed pushing n=23
Nulliparous women in second stage of labour with epidural
Immediate pushing: commenced pushing as soon as full dilation was reached and were coached to hold their breath and push 3-4 times for a count of 10 during each contraction
Delayed pushing: women encouraged to wait until they felt an urge to push or until they had been in the second stage for 2 hours (whichever came first). These women were then encouraged to push without holding their breath and for no more than 6-8 sec. for each push, up to 3 times per contraction.
Immediately postnatal period
Duration of second stage Duration of active pushing Fetal oxygen desaturation Abnormal CTG Mode of birth Perineal truama Umbilical cord gases Apgar scores
Duration of second stage: signif. longer in the immediate pushing group (mean duration 38 minutes longer, p<0.01). Active pushing signif. longer in the immediate pushing group (mean duration 42 minutes longer, p=0.002). Fetal oxygen desaturation during second stage: signif. greater in immediate pushing group: M = 12.5 vs. M = 4.6, F(1, 43) = 12.24, p = .001 Number of > or =2-min epochs of fetal oxygen saturation <30%: Immediate: M = 7.9; delayed: M = 2.7, F(1, 43) = 6.23, p = .02. More variable decelerations of the fetal heart rate in the immediate pushing group (immediate: M = 22.4; delayed: M = 15.6) F(1, 43) = 5.92, p = .02. (p=0.001). Variable FHR decelerations and prolonged decelerations: signif. more frequent in the immediate pushing group (p=0.03 and 0.05 respectively). No signif. differences between the 2 groups for other FHR patterns, umbilical cord gases or Apgar scores. No signif. differences in caesarean births, operative vaginal births, prolonged second stage (> 3 hours) and episiotomies between the 2 groups. Signif. more perineal tears in the immediate pushing group (n=13 vs. n=5, chi squared =6.54, p=0.01).
American Nurses Foundation sponsored by GlaxoSmithKline.
USA
Glesson & Griffin, 1991 180
Prospec-tive cohort study
2+ Delayed pushing group n=194 Early pushing group n=219
Primiparous women with epidural analgesia in labour. Includes induced labours (15.5% in late pushing group and 19.6% in early pushing group).
Delayed group were discouraged from pushing until the baby’s head was visible or until 3 hours had elapsed since full dilation of the
Early pushing group were encouraged to push as soon as second stage was diagnosed.
Immediate PN period
Length of first sstage of labour Length of second stage of labour Time spent pushing Number of vaginal
Late pushing vs. early pushing:Length of first stage (hrs): 4.3 (SD 1.7) vs. 4.5 (SD 1.7), NS Length of second stage (hrs): 1.6 (SD 0.8) vs. 1.2 (SD 0.5), p<0.001 Time spent pushing (hrs): 0.7 (SD 0.6) vs. 1.2 (SD 0.5), p<0.001
Not stated Country: Eire
199
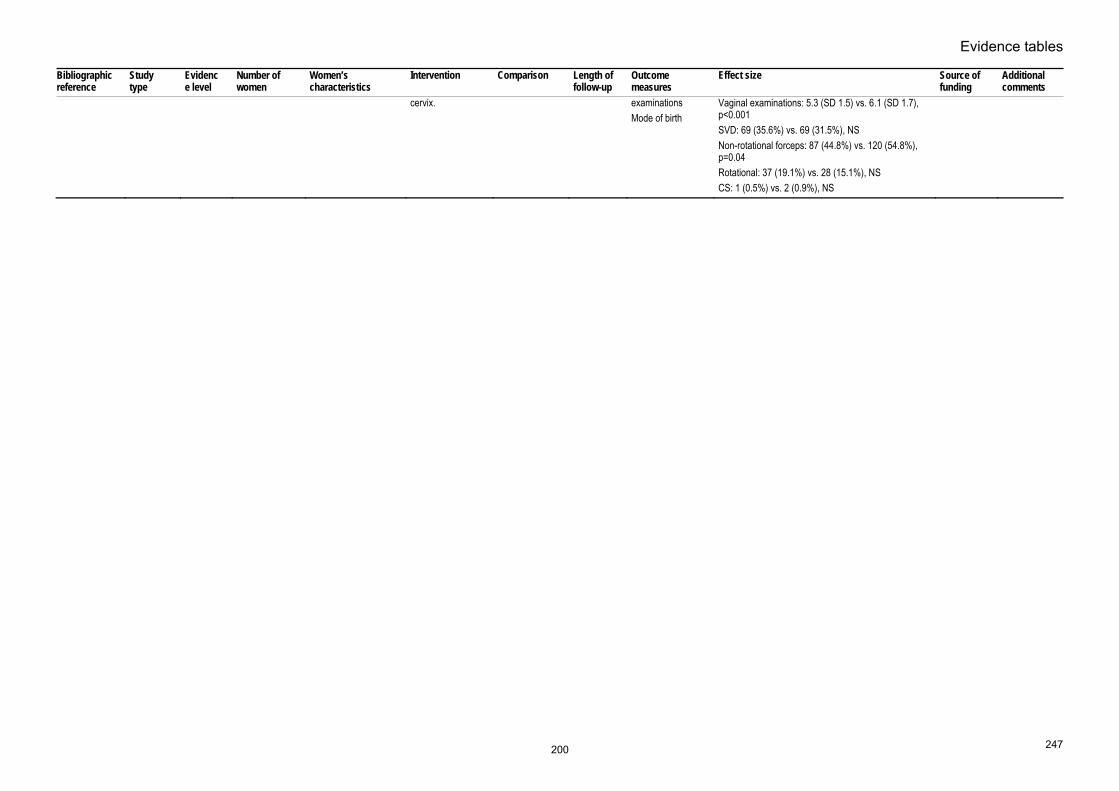
Evidence tables
247
Bibliographic reference
Study type
Evidence level
Number of women
Women’s characteristics
Intervention Comparison Length of follow-up
Outcome measures
Effect size Source of funding
Additional comments
cervix. examinationsMode of birth
Vaginal examinations: 5.3 (SD 1.5) vs. 6.1 (SD 1.7), p<0.001 SVD: 69 (35.6%) vs. 69 (31.5%), NS Non-rotational forceps: 87 (44.8%) vs. 120 (54.8%), p=0.04 Rotational: 37 (19.1%) vs. 28 (15.1%), NS CS: 1 (0.5%) vs. 2 (0.9%), NS
200

Intrapartum care
248
Regional analgesia – care and observations for women with regional analgesia in labour (use of oxytocin for women with regional analgesia) Bibliographic reference
Study type
Evidence level
Number of women
Women’s characteristics
Intervention Comparison Length of follow-up
Outcome measures
Effect size Source of funding
Additional comments
Saunders NJ;Spiby H;Gilbert L;Fraser RB;Hall JM;Mutton PM;Jackson A;Edmonds DK; 1989 Dec 9 181
RCT Evidence level: 1+
N=226 (oxytocin=108; placebo=118)
primiparous women with adequate epidural analgesia in whom dilation of the cervix had been achieved wihout prior stimulation with oxytocin
Intervention: An infusion of oxytocin (2mU/min increasing to a maximum of 16 mU/min)
Comparison: placebo
Follow-up period: intrapartum
Outcome Measures: duration of second stage, mode of delivery, fetal condition at birth, postpartum blood loss, and the incidence of perineal trauma
Duration of second stageOxytocin=134min(5.2) Control=151min(4.6) MD 17.0 min [3.8 to 31.4] p=0.01 Mode of delivery Spontaneous Oxytocin=54;control=47 Non rotational Foceps/ventouse Oxytocin=33; control=56 Rotational Foceps/ventouse Oxytocin=19; control=11 p=0.03 CS Oxytocin=2; control=4 Postpartum blood loss oxytocin=333ml(27.5); control=352ml(16.8) MD 19.0ml [-1 to 49] Apgar score at 1 min oxytocin=8.1(0.14); control=8.1(0.13) MD 0.0[-0.31 to 0.45] Apgar score at 5 min oxytocin=9.3(0.05); control=9.3(0.05) MD 0.0[-0.17 to 0.14] episiotomy or 2nd degree tear oxytocin=71; control=93 p=0.04
Birthright and the Royal College of Obstetricians
201

Evidence tables
249
Regional analgesia – effect of epidural fentanyl on breastfeeding Bibliographic reference
Study type
Evidence level
Number of women
Women’s characteristics
Intervention Comparison Length of follow-up
Outcome measures
Effect size Source of funding
Additional comments
Beilin et al 2005 186
RCT Evidence level: 1+
No fentanyl n=60 Intermediate fentanyl n=59 High dose fentanyl n=58
Women who had previously breastfed who were requesting epidurla anlagesia for labour.
Intervention: Amount of fentanyl in epidural analgesia.
Comparison: No fentanyl vs. intermediate (1-150 micrograms) vs. high dose (over 150 micrograms)
Follow-up period: 6 weeks postpartum
Outcome Measures: Breastfeeding, breastfeeding problems
Within 24 hours of birth: no fentany group and intermediate dose fentanyl groups n=6 (10%) vs. high dose fentanyl group n=12 (21%), p=0.09. The proportion of women having some difficulty breastfeeding within the first 24 hours was also assessed by a lactation consultant no signif. diffs. Infant’s Neurologic and Adaptive Capacity Score (NACS): median scores 35, 34 and 32 in the no fentanyl, intermediate dose fentanyl and high dose fentanyl groups respectively, p=0.03. No longer breastfeeding at 6 weeks: 1 in the no fentanyl group, 3 in the intermediate fentayl group and 10 in the high dose fentanyl group (p=0.002). Problem reported within 24 hours of birth vs. no problem more likely to have stopped breastfeeding by 6 weeks, 29% vs. 6%, p=0.004. Babies with umbilical cord fentanyl concentration > 200pg/ml signif. less likely to be breastfeeding at 6 weeks than babies in than babies with fentanyl concentration < 200pg/ml, p=0.02.
Not known It appears than lower doses of fentanyl (<150 microgrammes), or epidural without fentayl, may be better in terms of breastfeeding outcome than high dose fentanyl.
Jordan S;Emery S;Bradshaw C;Watkins A;Friswell W; 2005 187
Cross-sectional
3 n=425 Primiparous women who gave birth at term to a healthy baby.
Epidural fentanyl. Other forms of intrapartum analgesia including epidural with local anaesthetic only, IM opioid and Entonox.
Follow-up period: Discharge from hospital.
Outcome Measures: Method of feeding at discharge from hospital.
The final model contained 5 variables as follows:Caesarean section (OR 0.25, 95% CI 0.13 to 0.47); Woman’s occupation (OR 0.63, 95% CI 0.40 to 0.99); Antenatal feeding intention (OR 0.12, 95% CI 0.08 to 0.19), Woman’s age (OR 0.90, 95% CI 0.85 to 0.95); Fentanyl dose (OR 1.004, 95% CI 1.000 to 1.008, for each microgram administered). The model is predictive of 51.7% of the variation in infant feeding. Bottle feeding is predicted for 75.3% of cases and breastfeeding for 83.3% of cases.
Wales Office of Research and Development for Health and Social Care
This effect is marginal however. The study does not differentiate between spinal and epidural analgesia. Country: UK (Wales)
202

Intrapartum care
250
Women’s views and experiences of pain and pain relief in childbirth – 1 Bibliographic reference
Study type
Evidence level
Number of women
Women’s characteristics
Intervention Comparison Length of follow-up
Outcome measures
Effect size Source of funding
Additional comments
Hodnett ED; 2002 May 67
Systematic review - meta-analysis
Evidence level: 2++
Observational/descriptive studies: 35 reports of 29 studies included in review. Over 14,000 women in total from 9 countries. Intervention studies: 13 reports of 5 systematic reviews and 7 randomised controlled trials. Over 27,000 women included.
Women in labour or women who had experienced labour.
Intervention: Review includes RCTs, systematic reviews, descriptive studies.
Comparison: Follow-up period: Ranged from few days to 1 year postpartum.
Outcome Measures: Women's satisfaction with childbirth experience, with care during labour or with pain relief; measures of pain; women's views of childbirth experience.
Four factors emerge as the most important influences on women's experience of childbirth: personal expectations; amount of support from caregivers; quality of caregiver-woman relationship; involvement in decision-making. These factors appear to be so important that they over-ride the influence of all other factors including: age; SES; ethnicity; childbirth preparation; the physical birth environment; pain; immobility; medical interventions; and continuity of care.
Not stated Need to remember that pain relief and satisfaction with pain relief are not the same thing. The impact of pain and pain relief on satisfaction is much greater if expectations are unmet.
Dickinson JE;Paech MJ;McDonald SJ;Evans SF; 2003 122
RCT 2+ Epidural group (EPI) n=493 Continuous midwifery support (CMS) n=499
Primiparous women in labour at term. No medical or obstetric compications.
Types of pain relief during labour: combined spinal-epidural with PCA vs. continuous midwifery support + other forms of pain relief inc. IM pethidine, entonox and non-pharmacological methods.
Combined spinal-epidural with PCA vs. continuous midwifery support + other forms of pain relief inc. IM pethidine, entonox and non-pharmacological methods.
Follow-up period: 6 months postpartum
Outcome Measures: Women's satisfaction with midwifery support Women's satisfaction with pain relief Level of pain experienced Ability to cope with intrapartum pain Participation in intrapartum decision-making
Satisfaction wih midwifery support: 85% women in both groups very satisfied with midwifery support during labour. Post-birth recollection of pain level prior to administration of allocated analgesia (median (interquartile range)): CMS 80mm (65, 92) vs. EPI 85mm (75, 96), p=0.29 Post-analgesia pain scores: CMS 75 (42, 86) vs. EPI 27 (5, 46), p=0.0001 CMS significantly poorer findings compared with EPI for the following outcomes: Dissatisfaction with pain relief: CMS 10% vs. EPI 1% (no further figures given) Expectations of pain relief met or surpassed: CMS 10% vs. EPI 95% (no further figures given) Negative/very negative feelings about pain relief: CMS 10% vs. EPI 1% (no further figures given) Able to cope reasonably or very well with labour pain: CMS 50% vs. EPI 90% Satisfaction with pain relief during labour: CMS 65% vs. EPI 90% Satisfaction with pain relief during birth:
NH & MRC grant
Study confirms that use of epidural does not undermine the feeling of achievement and control associated with giving birth. In addition, neither does the presence of severe pain. The high levels of satisfaction expressed, and overall desciption of labour and birth as a positive
203

Evidence tables
251
Bibliographic reference
Study type
Evidence level
Number of women
Women’s characteristics
Intervention Comparison Length of follow-up
Outcome measures
Effect size Source of funding
Additional comments
CMS 67% vs. EPI 92%Satisfaction with medical staff regarding pain support: CMS median 75 (IQR 45, 89) vs. EPI 84 (75, 95) There were no significant differences between groups regarding (median scores and interquartile ranges): Participation in intrapartum decision-making: CMS 5 (4,5) vs, EPI 5 (4,5), p=0.35 Satisfaction with midwifery support: CMS 95 (88, 100) vs. EPI 96 (90, 100), p=0.24 Satisfaction with support from medical staff: CMS 82 (65, 96) vs. EPI 84 (65, 97), p=0.39 Achievement of labour expectations: CMS 3 (2,4) vs. EPI 3 (2,4), p=0.32 Achievement of birth expectations: CMS 2 (2,5) vs, EPI 2 (2,5), p=0.54 Overall labour experience: CMS 4 (3,4) vs. EPI 4 (3,4), p=0.74 Overall birth experience: CMS 4 (4,5) vs. EPI 4 (3,5), p=0.60 6 month questionnaire (n=642, respone rate 64.7%): Plan to use epidural for next labour: Women in CMS signif. less likely to plan to use an epidural in subsequent labour OR 0.64 (95% CI 0.47 to 0.89). Factors associated with planned use of epidural for next labour were induction of labour in index labour (OR 2.4 (95% CI 1.2 to 4.7) and use of epidural in index pregnancy (OR 28.1 (95% CI 14.5 to 54.7).
experience most likely reflects the fact that most women also reported that their expectations were met. Country: Australia
204

Intrapartum care
252
Women’s views and experiences of pain and pain relief in childbirth – 2 Bibliographic information
Study type and evidence level
Aim of study Number of women and women’s characteristics
Women’s characteristics
Outcome measures
Results and comments Study summary Reviewer comment
Ranta P;Spalding M;Kangas-Saarela T;Jokela R;Hollmen A;Jouppila P;Jouppila R; 1995 123
Study Type: Survey of women's expectations and experiences of labour pain. Evidence Level: 2+
Women's views/expectations of labour pain and its management.
n=1091 Women in labour. 33% primiparous women.
Pain scores Satisfaction with pain relief Satisfaction with care
After administration of pain relief 50% multiparous women still reported pain scores of 8-10 on the BS-11 (this figure was 19% for primiparous women). Eighteen per cent of women rated their pain relief as poor, 37% rated it as moderate, and 45% as good. Views of pain relief were not related to parity. Overall, 95% women stated that they were satisfied with their care during childbirth. Ratings of overall satisfaction were not related to parity, level of pain experienced or pain relief received.
Findings reflect lack of reflective pain relief. Dissatisfaction with childbirth was very low, and was associated with instrumental births, but not with usage of analgesia. 51% of all parturients complained of inadequate pain relief during labour, which, in multiparous women, was significantly associated with second stage of labour.
Despite an apparent low level of effectiveness of pain relief, most women expressed satisfaction with care during labour. This may reflect low expectations of pain relief in this population.
Capogna G;Alahuhta S;Celleno D;De Vlieger H;Moreira J;Morgan B;Moore C;Pasqualetti P;Soetens M;Van Zundert A;Vertommen JD; 1996 124
Study Type: Multi-centre European survey Evidence Level: 3
Pain relief received during labour.
Italy n=150 (1 hospital)UK n=119 (1 hospital) Belgium n=133 (2 hospitals) Finland n=101 (1 hospital) Portugal n=108 (1 hospital) Total n=611
Primiparous women in last month of pregnancy.
Women's expectations and experiences of pain and pain relief, satisfaction with analgesia, satisfaction with childbirth.
Women who expected more pain before receiving analgesia were more likely to be satisfied with analgesia (Spearman's r 0.15, p=0.001) women who experienced higher levels of pain following administration of analgesia were less satisfied with apin relief (Spearman's r -0.66, p<0.0001). Maternal satisfaction with overall childbirth experience was positively correlated with pain expectations (Spearman's r 0.23, p<0.001); pain before analgesia (Spearman's r 0.16, p<0.001); negatively with pain after analgesia (Spearman's r -0.30, p<0.001). Pain did not correlate with women's eduicational level or social class. The hospital where the woman gave birth was the most important determinant of the mode of birth (logistic linear regression model, p<0.0001). Rate of assisted vaginal births ranged between 2 and 43%, epidural rates ranged between 23 and 75%. Note: All hospitals involved in study were tertiary centres with above average epidural rates.
Generally women's satisfaction with analgesia and the birth experience were high. The most satisfied women were those who expected more pain, were satisfied with the analgesia received and had good pain relief following administration of analgesia.
Study again underlines role of expectations in women's experience of childbirth. Focus is mainly on pain relief therefore other components of satisfaction eg. midwifery support, involvement in decision-making are not considered.
205

Intrapartum care
312
Risk factors for postpartum haemorrhage Bibliographic reference
Study type
Evidence level
Number of patients
Patient characteristics
Intervention Comparison Length of follow-up
Outcome measures
Effect size Source of funding
Additional comments
Gilbert L;Porter W;Brown VA; 1987 Jan 571
Case-control
Evidence level: 2-
N=437 (PPH=86 non-PPH=351)
pregnant women Intervention: parity, labour induction, mode of birth, duration of labour, oxytocin
Comparison: PPH or non-PPH
Follow-up period: during pregnancy
Outcome Measures: PPH
Parity p<0.001Induction of labour p<0.001 Duration of first stage p<0.001 Duration of second stage p<0.001 Mode of birth p<0.001
not stated
Henry A;Birch M;Sullivan EA;Katz S;Wang YA; 2005 572
Case-control
Evidence level: 2+
N=250(125 for each)
pregnant women Intervention: obstetric risk factors
Comparison: PPH or non-PPH
Follow-up period: during pregnancy
Outcome Measures: PPH
past history of PPHadjusted OR 14.11 [1.62 to 123.06] prolonged second stage longer than or equal to 60min, adjusted OR 2.68 [1.27 to 5.64] forceps birth adjusted OR 3.47 [1.35 to 8.91] incomplete/ragged membranes adjusted OR 3.56 [1.52 to 8.36]
not stated
Bais JMJ;Eskes M;Pel M;Bonsel GJ;Bleker OP; 2004 573
Cross-sectional
Evidence level: 3
N=3464 pregnant womennulliparous
Intervention: obstetric risk factors
Comparison: developing PPH or not
Follow-up period: N/A
Outcome Measures: PPH (blood loss more than 500 or 1000mls)
Risk factor for moderate PPH(500ml or more blood loss) retained placenta adjusted OR 7.83 [3.78 to 16.22] prolonged third stage (longer than 30 min) adjusted OR 2.61 [1.83 to 3.72] multiple pregnancy adjusted OR 2.60 [1.06 to 6.39] episiotomy adjusted OR 2.18 [1.68 to 2.81] macrosomia (weight more than or equal to 4kg) adjusted OR 2.11 [1.62 to 2.76] perineal trauma (laceration severer than or equal to first degree) adjusted OR 1.40 [1.04 to 1.87] west European race
not stated
206
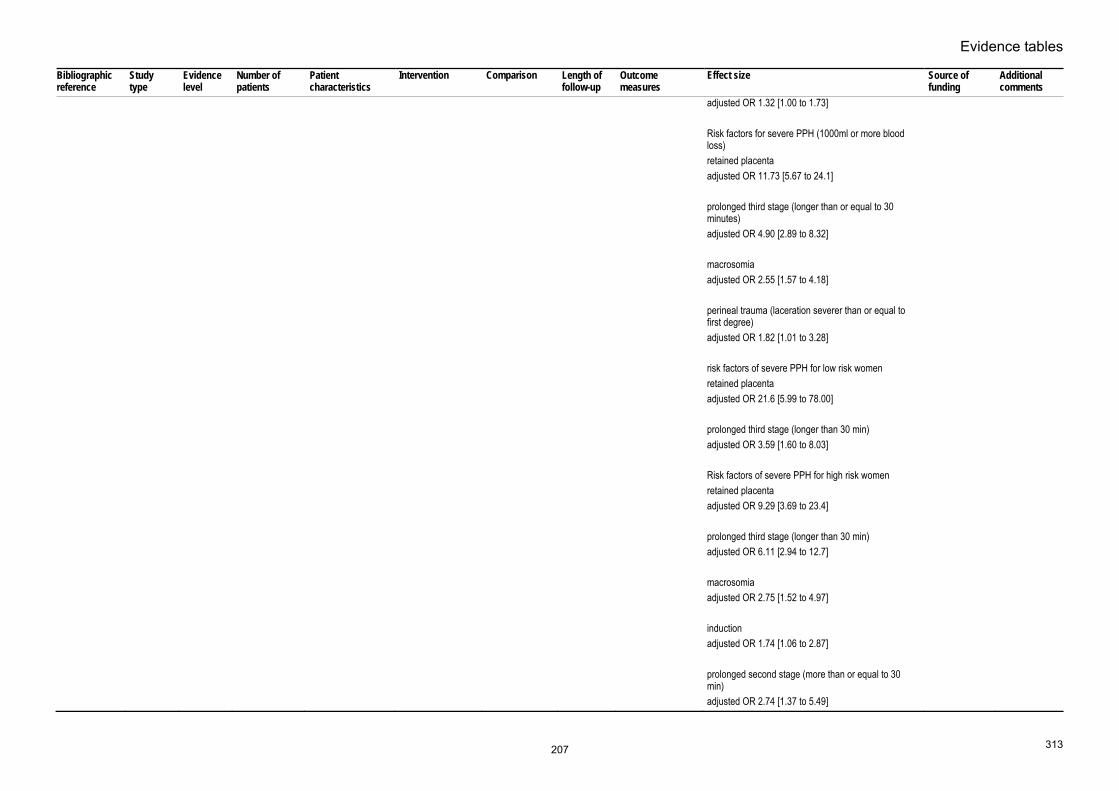
Evidence tables
313
Bibliographic reference
Study type
Evidence level
Number of patients
Patient characteristics
Intervention Comparison Length of follow-up
Outcome measures
Effect size Source of funding
Additional comments
adjusted OR 1.32 [1.00 to 1.73] Risk factors for severe PPH (1000ml or more blood loss) retained placenta adjusted OR 11.73 [5.67 to 24.1] prolonged third stage (longer than or equal to 30 minutes) adjusted OR 4.90 [2.89 to 8.32] macrosomia adjusted OR 2.55 [1.57 to 4.18] perineal trauma (laceration severer than or equal to first degree) adjusted OR 1.82 [1.01 to 3.28] risk factors of severe PPH for low risk women retained placenta adjusted OR 21.6 [5.99 to 78.00] prolonged third stage (longer than 30 min) adjusted OR 3.59 [1.60 to 8.03] Risk factors of severe PPH for high risk women retained placenta adjusted OR 9.29 [3.69 to 23.4] prolonged third stage (longer than 30 min) adjusted OR 6.11 [2.94 to 12.7] macrosomia adjusted OR 2.75 [1.52 to 4.97] induction adjusted OR 1.74 [1.06 to 2.87] prolonged second stage (more than or equal to 30 min) adjusted OR 2.74 [1.37 to 5.49]
207

Intrapartum care
314
Bibliographic reference
Study type
Evidence level
Number of patients
Patient characteristics
Intervention Comparison Length of follow-up
Outcome measures
Effect size Source of funding
Additional comments
Chichakli LO;Atrash HK;MacKay AP;Musani AS;Berg CJ; 1999 574
Cross-sectional
Evidence level: 3
N=763 pregnant women Intervention: obstetric risk factors
Comparison: developing PPH or not
Follow-up period: N/A
Outcome Measures: mortality due to PPH
Age<20 RR 1.00 [0.7 to 1.4] 20-24 RR 1 25-29 RR 1.6 [1.2 to 1.9] 30-34 RR 2.8 [2.3 to 3.6] 35-39 RR 5.2 [4.0 to 6.6] 40-49 RR 12.9 [9.2 to 17.9] Mortality Ratio by race White; black; other <20=0.5;1.4; 0.5 20-24=0.5;1.7;0.8 25-29=0.9;2.6;2.1 30-34=1.4; 7.0; 4.6 35-39=2.9; 10.4; 6.2 40-49=6.8; 24.5; 16.3
not stated
Hall MH;Halliwell R;Carr-Hill R; 1985 Jul 575
Cross-sectional
Evidence level: 3
N=36312 pregnant women Intervention: obstetric risk factors
Comparison: developing PPH or not
Follow-up period: N/A
Outcome Measures: PPH
incidence of PPHinduced; not induced; total Primiparae=5.9%;3.5%;4.5% Multiparae=4.5%;2.8%; 3.4% Total=5.2%; 3.1%; 3.9%
Not stated
Magann EF;Evans S;Hutchinson M;Collins R;Howard BC;Morrison JC; 2005 576
Cross-sectional
Evidence level: 3
N=13868 pregnant women Intervention: obstetric risk factors
Comparison: developing PPH or not
Follow-up period: N/A
Outcome Measures: PPH
Risk factors of developing PPH (blood loss 1000ml or greater and/or need for a transfusion) Asian race adjusted OR 1.8 [1.4 to 2.2] maternal blood disorders adjusted OR 1.3 [1.1 to 1.6] prior PPH adjusted OR 1.8 [1.4 to 2.2] history of retained placenta adjusted OR 6.2 [4.6 to 8.2] multiple pregnancy adjusted OR 2.2 [1.5 to 3.2] antepartum haemorrhage adjusted OR 1.8 [1.3 to 2.3]
Not stated
208

Evidence tables
315
Bibliographic reference
Study type
Evidence level
Number of patients
Patient characteristics
Intervention Comparison Length of follow-up
Outcome measures
Effect size Source of funding
Additional comments
genital tract lacerations adjusted OR 1.7 [1.4 to 2.1] macrosomia (4kg or greater) adjusted OR 1.8 [1.4 to 2.3] induction of labour adjusted OR 1.8 [1.4 to 2.2] chorioamnionitis adjusted OR 1.3 [1.1 to 1.7] intrapartum haemorrhage adjusted OR 1.5 [1.0 to 2.3] intrauterine fetal deaths adjusted OR 2.6 [1.1 to 5.7] compound fetal presentation adjusted OR 3.0 [1.1 to 7.3] epidural anaesthesia adjusted OR 1.3 [1.0 to 1.6] prolonged first/second stage of labour first stage adjusted OR 1.6 [1.0 to 1.6] second stage adjusted OR 1.6 [1.1 to 2.1] forceps birth after failed vacuum adjusted OR 1.9 [1.1 to 3.2]
Stones RW;Paterson CM;Saunders NJ; 1993 577
Cross-sectional
Evidence level: 3
N=37497 pregnant women Intervention: obstetric risk factors
Comparison: developing PPH or not
Follow-up period: N/A
Outcome Measures: PPH
Multiple pregnanciesRR 4.46 [3.01 to 6.61] Maternal age <20 years RR 0.81 [0.45 to 1.43] maternal age >35 years
not stated
209

Intrapartum care
316
Bibliographic reference
Study type
Evidence level
Number of patients
Patient characteristics
Intervention Comparison Length of follow-up
Outcome measures
Effect size Source of funding
Additional comments
RR 1.42 [1.00 to 2.02] BMI >27 RR 1.64 [1.24 to 2.17] Para >4 RR 1.09 [0.56 to 2.14] Smoking RR 0.89 [0.66 to 1.21] Antenatal anaemia RR 1.24 [0.82 to 1.89] Essential hypertension RR 1.43 [0.65 to 3.14] Non-proteinuric PIH RR 1.7 [1.16 to 2.50] Proteinuric PIH RR 1.15 [0.32 to 4.19] Indeterminate antepartum haemorrhage RR 1.67 [0.82 to 3.44] Proven abruption RR 12.6 [7.61 to 20.9] Praevia with bleeding RR 13.1 [7.47 to 23.0] Praevia without bleeding RR 11.3 [3.36 to 38.1]
Dewar MJ; 1969 Feb 578
Cohort Evidence level: 2-
N=171 pregnant women Intervention: Anaemia
Comparison: postpartum haemorrhage
Follow-up period: intrapartum
Outcome Measures: Postpartum haemorrhage
women with antenatal Hgb<10.5g/dl and Hct <3511.1% Women with antenatal Hgb<10.5g/dl or Hct <35 2.1% Women with antenatal Hgb 10.5 or greater and/or
not stated
210

Evidence tables
317
Bibliographic reference
Study type
Evidence level
Number of patients
Patient characteristics
Intervention Comparison Length of follow-up
Outcome measures
Effect size Source of funding
Additional comments
Hct 35%13.3%
Ogueh O;Morin L;Usher RH;Benjamin A; 2003 Oct 579
Cross-sectional
Evidence level: 3
N=7641 (703 with low-lying placenta and 6938 normal women)
pregnant women Intervention: low-lying placenta
Comparison: normal lying placenta
Follow-up period: intrapartum
Outcome Measures: PPH (blood loss 500 ml or greater for vaginal birth, 1000ml or greater for casarean section)
adjusted OR 1.72 [1.12 to 2.66], adjusted for maternal age and birth weight
not stated
Guirgis RR;Clark AD;Hogston P;Golland IM;Bevan JR;Francis JG;Higgins B; 1997 580
Cohort Evidence level: 2-
N=800(400 non-smoking and 400 smoking)
pregnant women Intervention: smoking
Comparison: non smoking
Follow-up period: intrapartum
Outcome Measures: postpartum haemorrhage
RR 1.57, p=0.03 Not stated
Cheng YW;Hopkins LM;Caughey AB; 2004 326
Cross-sectional
Evidence level: 3
N=15759 pregnant women Intervention: prolonged second stage
Comparison: normal duration of second stage
Follow-up period: N/A
Outcome Measures: postpartum haemorrhage
RR 1.05 [0.84 to 1.31] Not stated
Janni W;Schiessl B;Peschers U;Huber S;Strobl B;Hantschmann P;Uhlmann N;Dimpfl T;Rammel G;Kainer F; 2002 328
Cross-sectional
Evidence level: 3
N=1200 pregnant women Intervention: prolonged second stage labour (2hours)
Comparison: normal duration of second stage labour
Follow-up period: intrapartum
Outcome Measures: PPH
RR 2.3 [1.6 to 331] not stated
Saunders NS;Paterson CM;Wadsworth J; 1992 May 332
Cross-sectional
Evidence level: 3
N=25069 pregnant women Intervention: prolonged second stage
Comparison: normal duration of second stage
Follow-up period: intrapartum
Outcome Measures: PPH (blood loss more than 500mls)
duration of second stage<120=RR 1 120-179=RR 1.6 [1.3 to 1.9] 180-239=RR 1.7 [1.3 to 2.3] 240-=RR 1.9 [1.2 to 2.8]
not stated
Cohen WR; 1977 Mar 335
Cross-sectional
Evidence level: 3
N=4403 pregnant women Intervention: duration of second stage
Comparison: duration of second stage
Follow-up period: intrapartum
Outcome Measures: postpartum haemorrhage
duration of second stage and puerperal haemorrhagep<0.001
not stated
211

Intrapartum care
318
Bibliographic reference
Study type
Evidence level
Number of patients
Patient characteristics
Intervention Comparison Length of follow-up
Outcome measures
Effect size Source of funding
Additional comments
Myles TD;Santolaya J; 327
Cross-sectional
Evidence level: 3
N=7818 pregnant women Intervention: prolonged second stage (>120min)
Comparison: normal duration of second stage
Follow-up period: intrpartum
Outcome Measures: psotpartum haemorrhage
RR 2.70, p<0.001 not stated
Sebire NJ;Jolly M;Harris JP;Wadsworth J;Joffe M;Beard RW;Regan L;Robinson S; 2001 581
Cross-sectional
Evidence level: 3
N=325395 pregnant women Intervention: increased body mass index (25 or greater)
Comparison: normal body mass index
Follow-up period: postnatal
Outcome Measures: PPH (blood loss greater than 1000ml)
BMI 25-30adjusted OR 1.16 [99%CI 1.12 to 1.21] BMI >30 adjusted OR 1.39 [99%CI 1.32 to 1.46] controlling for other factors including ethnicity, parity, age and history of hypertension
not stated
Usha Kiran TS;Hemmadi S;Bethel J;Evans J; 2005 582
Cross-sectional
Evidence level: 3
N=60167 pregnant women Intervention: increased body mass index (greater than 30)
Comparison: normal body mass index
Follow-up period: intrapartum
Outcome Measures: PPH (blood loss greater than 500ml)
OR 1.5 [1.2 to 1.8] not stated
Robinson HE;O'Connell CM;Joseph KS;McLeod NL; 2005 583
Cross-sectional
Evidence level: 3
N=142404 pregnant women Intervention: over weight (over 90kg)
Comparison: normal weight
Follow-up period: postnatal
Outcome Measures: developing PPH
moderately overweight women (90 – 120kg) adjusted OR 1.12 [1.02 to 1.22] severely overweight women (heavier than 120kg) adjusted OR 1.07 [0.80 to 1.42]
not stated
Sebire NJ;Jolly M;Harris J;Regan L;Robinson S; 2001 Jan 584
Cross-sectional
Evidence level: 3
N=215105 pregnant women Intervention: low body mass index (20-25)
Comparison: normal body mass index
Follow-up period: postnatal
Outcome Measures: PPH
PPHadjusted OR 0.85 [99%CI 0.80 to 0.90] severe PPH adjusted OR 0.83 [99%CI 0.72 to 0.95]
not stated
Olesen AW;Westergaard JG;Olsen J; 2003 Jul585
Cross-sectional
Evidence level: 3
N=47021 pregnant women Intervention: postterm pregnancy
Comparison: term
Follow-up period: postnatal
Outcome Measures: PPH
adjusted OR 1.37 [1.28 to 1.46] not stated
Jolly MC;Sebire NJ;Harris JP;Regan L;Robinson S; 2003 586
Cross-sectional
Evidence level: 3
N=350,311 pregnant women Intervention: macrosomia (birth weight more than 4kg and birth weight heavier than 90th centile)
Comparison: normal birth weight
Follow-up period: N/A
Outcome Measures: developing PPH
babies whose birth weight were more than 4kgadjusted OR 2.01 [99%CI 1.93 to 2.10] babies whose birth weight more than 90th centile adjusted OR 1.63 [99%CI 1.56 to 1.71]
not stated
212

Evidence tables
319
Bibliographic reference
Study type
Evidence level
Number of patients
Patient characteristics
Intervention Comparison Length of follow-up
Outcome measures
Effect size Source of funding
Additional comments
McEwan HP;Murdoch R; 1966 Oct 587
Cross-sectional
Evidence level: 3
N=7,992 pregnant women Intervention: macrosomia
Comparison: normal size babies
Follow-up period: N/A
Outcome Measures: developing PPH
RR=1.81 no p-value not stated
Stotland NE;Caughey AB;Breed EM;Escobar GJ; 2004 Dec 588
Cross-sectional
Evidence level: 3
N=146,526 pregnant women Intervention: macrosomia
Comparison: normal birth weight
Follow-up period: N/A
Outcome Measures: developing PPH
4000-4499g birth weightadjusted OR 1.69 [1.58 to 2.10] 4500-4999g birth weight adjusted OR 2.15 [1.86 to 2.48] 5000g or greater birth weight adjusted OR 2.03 [1.33 to 3.09]
not stated
Wollschlaeger K;Nieder J;Koppe I;Hartlein K; 1999 589
Cross-sectional
Evidence level: 3
N=7363 (birth weight 4kg or greater=956; birth weight 3-3.9kg=6407)
pregnant women Intervention: macrosomia(4kg or greater)
Comparison: normal birth weight(3-3.9kg)
Follow-up period: N/A
Outcome Measures: developing PPH
RR 1.77, p<0.001 not stated
Jolly M;Sebire N;Harris J;Robinson S;Regan L; 2000 590
Cross-sectional
Evidence level: 3
N=385,120 pregnant women Intervention: age 35 years or greater
Comparison: age less than 35 years
Follow-up period: N/A
Outcome Measures: developing PPH
age 35-40 and moderate PPHadjusted OR 1.14 [99%CI 1.09 to 1.19] age greater than 40 and moderate PPH adjusted OR 1.27 [99%CI 1.15 to 1.39] age 35-40 and severe PPH adjusted OR 1.28 [99%CI 1.16 to 1.41] age greater than 40 and severe PPH adjusted OR 1.55 [99%CI 1.29 to 1.88]
not stated
Ohkuchi A;Onagawa T;Usui R;Koike T;Hiratsuka M;Izumi A;Ohkusa T;Matsubara S;Sato I;Suzuki M;Minakami H; 2003 591
Cross-sectional
Evidence level: 3
N=10,053 pregnant women Intervention: age 35 years or older
Comparison: age younger than 35 years
Follow-up period: N/A
Outcome Measures: developing PPH
When vaginal birthadjusted OR 1.5 [1.2 to 1.9] When CS adjusted OR 1.8 [1.2 to 2.7]
not stated
213

Intrapartum care
320
Bibliographic reference
Study type
Evidence level
Number of patients
Patient characteristics
Intervention Comparison Length of follow-up
Outcome measures
Effect size Source of funding
Additional comments
Babinszki A;Kerenyi T;Torok O;Grazi V;Lapinski RH;Berkowitz RL; 1999 Sep 592
Cross-sectional
Evidence level: 3
N=2642(133 great-grand multiparas, 314 grand multiparas and 2195 multiparas)
pregnant women Intervention: parity Comparison: parity
Follow-up period: N/A
Outcome Measures: developing PPH
multiparous=0.3%grand-multiparous=1.9% p=0.001
not stated
Bugg GJ;Atwal GS;Maresh M; 2002 593
Cross-sectional
Evidence level: 3
N=794 (397 for each)
pregnant women Intervention: grand-multiparous
Comparison: multiparous
Follow-up period: N/A
Outcome Measures: developing PPH
OR 1.18 [0.6 to 2.4] not stated
Chang A;Larkin P;Esler EJ;Condie R;Morrison J; 1977 Mar 5 594
Cross-sectional
Evidence level: 3
N=2634(low parity=2543; high parity=91)
pregnant women Intervention: high parity (more than 4)
Comparison: low parity
Follow-up period: N/A
Outcome Measures: developing PPH (>600ml)
low=5.0%high=7.5% p=0.76
not stated
Henson GL;Knott PD;Colley NV; 1987 595
Cross-sectional
Evidence level: 3
N=11420(grand-multiparous=216)
pregnant women Intervention: grand-multiparous (5 or more)
Comparison: multiparous
Follow-up period: N/A
Outcome Measures: developing PPH
higher incidence for grand multiparous p<0.01 not stated
Humphrey MD; 2003 596
Cross-sectional
Evidence level: 3
N=15,908 (653 grand multiparous women, compared with 15255 women with lower parity)
pregnant women Intervention: grand multiparous
Comparison: multiparous
Follow-up period: N/A
Outcome Measures: developing PPH
OR 1.36 [0.99 to 1.87] not stated
Irvine LM;Otigbah C;Crawford A;Setchell ME; 1996 597
Cross-sectional
Evidence level: 3
N=458 (229 grand multiparity with controls matched for age with one parity)
pregnant women Intervention: grand multiparity
Comparison: multiparity
Follow-up period: N/A
Outcome Measures: developing PPH
estimated blood lossgrand=310+/-255ml control=263+/-306ml p>0.01 PPH grand=15% control=15%
not stated
Toohey JS;Keegan Jr KA;Morgan MA;Francis
Cross-sectional
Evidence level: 3
N=764(382 grand multiparous women,
pregnant women Intervention: grand-multiparity
Comparison: 2-4 parity
Follow-up period: N/A
Outcome Measures: developing PPH
OR 0.97 [0.57 to 1.63] not stated
214

Evidence tables
321
Bibliographic reference
Study type
Evidence level
Number of patients
Patient characteristics
Intervention Comparison Length of follow-up
Outcome measures
Effect size Source of funding
Additional comments
J;Task S;DeVeciana M; 1995 598
compared with aged matched controls with 2-4 parity)
Yasmeen S;Danielsen B;Moshesh M;Gilbert WM; 2005 599
Cross-sectional
Evidence level: 3
N=290,572 (grand multipara=25,512; multipara=260,060)
pregnant women aged 30years or older
Intervention: parity Comparison: parity
Follow-up period: N/A
Outcome Measures: developing PPH
grand multiparity, compared with multiparityadjusted OR 1.2 [1.1 to 1.3]
not stated
215

Intrapartum care
322
29. What is the appropriate definition of perineal or genital trauma? 30. What is the effectiveness on perineal or genital trauma (including previous third or fourth degree trauma or female genital mutilation) of the following techniques? 31. Is there evidence that the type of assessment used to identify perineal or genital trauma affects outcomes? 32. Is there evidence that undertaking repair, the timing, analgesia and method and material of perineal repair affect outcomes?
Interventions in the second stage – intrapartum perineal massage Bibliographic reference
Study type
Evidence level
Number of patients
Patient characteristics
Intervention Comparison Length of follow-up
Outcome measures
Effect size Source of funding
Additional comments
Stamp G;Kruzins G;Crowther C; 2001 May 26 345
RCT Evidence level: 1+
Treatmetn group n=708 Control group n=750
Women with singleton pregancy in late labour
Intervention: Perineal massage during late first and second stages of labour.
Comparison: Massage vs. no massage
Follow-up period: 3 months
Outcome Measures: Main outcome: Perineal trauma Other outcomes: Vaginal pain Dyspareunia Intercourse not resumed Urinary urgency Loss of urinary control Boel urgency Loss of bowel control
Relative risk with 95% confindence interval.Massage group vs. control group. Perineal truama: Intact perineum: 198/708 vs. 171/632; RR 1.03 (0.87 to 1.23). Episiotomy: 176/708 vs. 170/632; RR 0.92 (0.77 to 1.11). First degree tear: 122/708 vs. 106/632; RR 1.03 (0.81 to 1.30). Second degree tear: 190/708 vs. 164/632; RR 1.03 (0.86 to 1.24). Third degree tear: 12/708 vs. 23/632; RR 0.47 (0.23 to 0.93). 1 4th degree tear in control group. Pain outcomes: At 3 days: Vaginal pain: 416/597 vs. 359/499; RR 0.97 (0.90 to 1.05). Worst pain moderate or severe: 210/597 vs. 192/499; RR 0.91 (0.78 to 1.07). At 10 days: Vaginal pain: 184/632 vs. 187/555; RR 0.86 (0.73 to 1.02). Worst pain moderate or severe: 56/632 vs. 63/555; RR 0.78 (0.55 to 1.10). At 3 months: Vaginal pain: 58/503 vs. 54/436; RR 0.93 (0.66 to 1.32). Dyspareunia: 78/503 vs. 68/436; RR 0.9 (0.74 to 1.34).
Research and Development Grants Advisory Committee of the Commonwealth Dept. Of Health, Housing and Community Services Australian College of Midwives
Authors point out that the study is underpowered to detect a difference in incidences of third degree tears. The difference seen here may be a chance occurrence but it does highlight a need for a larger study powered to detect any possible difference attributable to intrapartum perineal massage.
216

Evidence tables
323
Bibliographic reference
Study type
Evidence level
Number of patients
Patient characteristics
Intervention Comparison Length of follow-up
Outcome measures
Effect size Source of funding
Additional comments
Intercourse not resumed: 49/503 vs. 60/436; RR 0.71 (0.50 to 1.01). Worst pain moderate or severe: 19/503 vs. 14/436; RR 1.18 (0.60 to 2.32). Urinary urgency: 139/503 vs. 111/436; RR 1.09 (0.88 to 1.34). Loss of urinary control: 123/503 vs. 115/436; RR 0.93 (0.74 to 1.15). Bowel urgency: 115/503 vs. 111; RR 0.90 (0.72 to 1.13). Loss of bowel control: 36/503 vs. 35/436; RR 0.89 (0.57 to 1.39).
Albers, Sedler, Bedrick, Teaf & Peralta, 2005 348
RCT 1+ N=1211 Healthy pregnant woman allocated to midwifery care
Warm compresses to perineal area during second stage
Massage with lubricantduring second stage Or No touching of the perineum until crowning of the baby’s head
Postnatal outpatient follow-up (timing not reported)
Warm compresses vs. massage vs. hands off Any trauma Trauma sutured First degree tears Second degree tears Third degree tears
76.7% vs. 76.7% vs. 77.7%, NS 20.5% vs. 18.6% vs. 21.8%. NS 24.4% vs. 22.6% vs. 22.0%, NS 17.3% vs. 18.1% vs. 18.3%, NS 0.7% vs. 1.0% vs. 0.5%
217
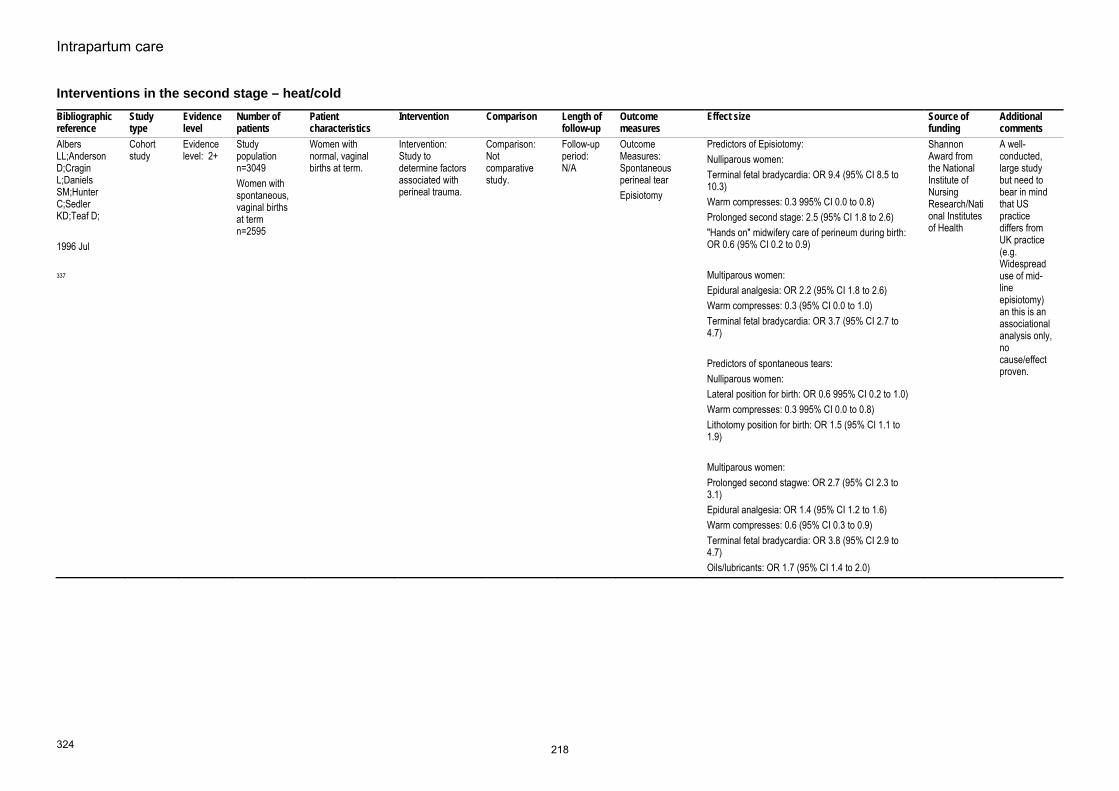
Intrapartum care
324
Interventions in the second stage – heat/cold Bibliographic reference
Study type
Evidence level
Number of patients
Patient characteristics
Intervention Comparison Length of follow-up
Outcome measures
Effect size Source of funding
Additional comments
Albers LL;Anderson D;Cragin L;Daniels SM;Hunter C;Sedler KD;Teaf D; 1996 Jul 337
Cohort study
Evidence level: 2+
Study population n=3049 Women with spontaneous, vaginal births at term n=2595
Women with normal, vaginal births at term.
Intervention: Study to determine factors associated with perineal trauma.
Comparison: Not comparative study.
Follow-up period: N/A
Outcome Measures: Spontaneous perineal tear Episiotomy
Predictors of Episiotomy:Nulliparous women: Terminal fetal bradycardia: OR 9.4 (95% CI 8.5 to 10.3) Warm compresses: 0.3 995% CI 0.0 to 0.8) Prolonged second stage: 2.5 (95% CI 1.8 to 2.6) "Hands on" midwifery care of perineum during birth: OR 0.6 (95% CI 0.2 to 0.9) Multiparous women: Epidural analgesia: OR 2.2 (95% CI 1.8 to 2.6) Warm compresses: 0.3 (95% CI 0.0 to 1.0) Terminal fetal bradycardia: OR 3.7 (95% CI 2.7 to 4.7) Predictors of spontaneous tears: Nulliparous women: Lateral position for birth: OR 0.6 995% CI 0.2 to 1.0) Warm compresses: 0.3 995% CI 0.0 to 0.8) Lithotomy position for birth: OR 1.5 (95% CI 1.1 to 1.9) Multiparous women: Prolonged second stagwe: OR 2.7 (95% CI 2.3 to 3.1) Epidural analgesia: OR 1.4 (95% CI 1.2 to 1.6) Warm compresses: 0.6 (95% CI 0.3 to 0.9) Terminal fetal bradycardia: OR 3.8 (95% CI 2.9 to 4.7) Oils/lubricants: OR 1.7 (95% CI 1.4 to 2.0)
Shannon Award from the National Institute of Nursing Research/National Institutes of Health
A well-conducted, large study but need to bear in mind that US practice differs from UK practice (e.g. Widespread use of mid-line episiotomy) an this is an associational analysis only, no cause/effect proven.
218

Evidence tables
325
Interventions in the second stage – local anaesthetic spray Biblio-graphic reference
Study type
Evidence level
Number of women
Women’s characteristics
Intervention Comparison Length of follow-up
Outcome measures
Effect size Source of funding
Additional comments
Sanders, Peters & Campbell 2006349
RCT 1+ Intervention group n=93 Control group n=92
Women in second stage of labour with no labour complications and without epidural.
Lidocaine spray to perineum when birth thought to be imminent
Application of placebo spray
1 week PN Main outcome: Pain during birth Secondary outcomes: Vaginal trauma Neonatal resuscitation Women’s feelings during birth Perineal trauma
Pain during birth (mean (SD): lidocaine: 76.9 (21.6) vs. placebo 72.1 (22.2), difference between means 4.8 (-1.7 to 11.2), p=0.14. Adjustmenting for the differences between trial groups: 6.3 (-0.8 to 13.3), p=0.081. Most secondary outcomes were similar between groups including: vaginal trauma, neonatal resuscitation, feelings during birth, overall rating of birth experience, sutured after birth and perineal pain 1 week after birth. There was a significantly lower incidence of 2nd degree perineal trauma in the lidocaine group: 28.0% vs. 44.6%, RR 0.63 (95% CI 0.42 to 0.93), p=0.019. Women in the lidocaine spray group were also less likely to report dyspareunia on resumption of sexual intercourse L 27.1% vs. 52.7%, RR 0.52 (95% CI 0.35 to 0.76), p=0.0004.
Not stated The authors point out that the large number of secondary analyses undertaken means these differences could be chance findings. Country: UK
219

Intrapartum care
326
Interventions in the second stage – hand position during birth of baby Bibliographic reference
Study type
Evidence level
Number of women
Women’s characteristics
Intervention Comparison Length of follow-up
Outcome measures
Effect size Source of funding
Additional comments
McCandlish R;Bowler U;van Asten H;Berridge G;Winter C;Sames L;Garcia J;Renfrew M;Elbourne D; 1998 Dec 346
RCT Evidence level: 1+
Hands poised n=2740 Hands on n=2731
Pregnant women anticipating a normal vaginal birth. Exclusions: planned water birth, elective episiotomy.
Intervention: Hands poised by attending midwife (ie. not flexing baby's head or "guarding" the perineum.)
Comparison: Hands on (applying pressure to flex baby's head and pressure on perineum as baby's head is born)
Follow-up period: 3 months
Outcome Measures: Main outcome: Perineal pain at 10 days postpartum Other outcomes: Perineal pain at 2 days postpartum Perineal pain at 3 months postpartum Duration of second stage Duration of third stage Manual removal of placenta Blood loss Perineal trauma Other genital trauma Suturing of perineal trauma
Pain outcomes, hands poised vs. hands on (n (%)):At 10 days: Pain felt in previous 24 hours: None: 1748 (65.5%) vs. 1816 (68.6%); NS. Some: 910 (34.1%) vs. 823 (31.1%); RR 1.10 (95% CI 1.01 to 1.18). Mild: 627 (23.5) vs. 554 (20.9); NS. Moderate: 246 (9.2%) vs. 233 (8.8%); NS. Severe: 37 (1.4%) vs. 36 (1.4%); NS. At 2 days: Pain felt in previous 24 hours: None: 807 (30.0%) vs. 761 (28.3%); NS. Some: 1871 (70.0%) vs. 1915 (71.3%); NS. Mild: 738 (27.5) vs. 773 (28.8); NS. Moderate: 994 (37.0%) vs. 1004 (37.4%); NS. Severe: 139 (5.2%) vs. 138 (5.1%); NS. At 3 months: Pain felt in previous week: None: 2314 (91.90%) vs. 2296 (92.43%); NS. Some: 171 (6.8%) vs. 176 (7.1%); NS. Mild: 113 (4.5) vs. 124 (5.0); NS. Moderate: 53 (2.1%) vs. 46 (1.94%); NS. Severe: 5 (0.2%) vs. 6 (0.2%); NS. Blood loss at birth >=500ml: 143 (5.2%) vs. 123 (4.5%); NS. Manual removal of placenta: 71 (2.6%) vs. 42 (1.5%); RR 1.69 (99% CI 1.02 to 2.78) Perineal trauma: 2nd degree trauma (inc. episiotomy): 1011 (36.9%) vs. 1002 (36.6%); NS. Episiotomy: 280 (10.2%) vs. 351 (12.9%); RR 0.79 (90% CI 0.65 to 0.96). 3rd/4th degree tear: 40 (1.5%) vs. 31 (1.2%); NS. Other genital trauma:
Medical Research Council Southmead Health Services NHS Trust
The higher incidence of episiotomy in the hands on group and the differences in findings according to the midwife's stated preference for hand on or poised are confounders in this trial.
220

Evidence tables
327
Bibliographic reference
Study type
Evidence level
Number of women
Women’s characteristics
Intervention Comparison Length of follow-up
Outcome measures
Effect size Source of funding
Additional comments
Vaginal trauma:1686 (61.5%) vs. 1671 (61.2%); NS.Anterior trauma: 1064 (38.8%) vs 1005 (36.8%); NS. Trauma sutured: 1636 (59.7%) vs. 1605 (58.8%); NS. Neonatal outcomes: Apgar score < 6 at 5 mins: 9 (0.3%) vs. 9 (0.3%); NS. Oxygen given at birth: 479 vs. 457; NS. Intubation: 26 vs. 25; NS. Admitted to additional care within 11 days:132 vs. 118; NS. Fully breastfeeding at 2 days: 1515 (56.4%) vs. 15116 (56.4%); NS Fully breastfeeding at 10 days: 1483 (52.9%) vs. 1428 (53.9%); NS. Fully breastfeeding at 3 months: 571 (22.7%) vs. 594 (23.9%); NS. Other outcomes at 10 days: Urinary problems reported by woman: 238 (8.9%) vs. 197 (7.4%); NS. Bowel problems as reported by woman: 676 (25.3%) vs. 604 (22.8%); NS. Other outcomes at 3 months: Dyspareunia: 376 (15%) vs. 342 (13.7%); NS. Not resumed sexual intercourse: 331 (13.1%) vs. 346 (13.9%); NS. Urinary problems in past week: 607 (24.0%) vs. 602 (24.2%); NS. Bowel problems in past week: 414 (16.4%) vs. 392 (15.8%); NS. Durations (median (interquartile range)): 2nd stage (mins): 23 (10-56) vs. 22 (10-52); NS. 3rd stage: 6 (5-9) vs. 6 (5-8); NS.
Mayerhofer, Bodner-Adler, Adler, Rabl, Kaider, Wagenbichler, Joura, Husslein, 2002
Quasi-randomised trial
1+ N=1076 women
Women in second stage of labour with no complications
“Hands on” method of delivery of baby’s head
“Hands poised” method
Immediate PN period
Perineal traumaLabial and vaginal trauma Length of second stage Manual removal of placenta
The rate of first and second degree perineal trauma was similar for the 2 trial groups (hands on 29.8%; hands poised 33.7%, NS), although there was a higher rate of third degree trauma in the hands on group (n=16 (2.7%) vs. n=5 (0.9%)). Women in the hands on group were more likely to have an episiotomy performed than women in the hands poised group: 17.9% vs. 10.1%, p<0.01. No
Not stated Country: Austria
221

Intrapartum care
328
Bibliographic reference
Study type
Evidence level
Number of women
Women’s characteristics
Intervention Comparison Length of follow-up
Outcome measures
Effect size Source of funding
Additional comments
347 difference was observed between groups regarding labial and vaginal trauma, length of the second stage of labour or manual removal of placenta (hands on n=10 (1.7%) vs. hands poised n=7 (1.3%). Neonatal outcomes were very similar between the 2 groups with only 1 baby in each group having an Apgar score < 7 at 5 minutes.
222

Evidence tables
329
Interventions in the second stage – routine versus restricted use of episiotomy Bibliographic reference
Study type
Evidence level
Number of patients
Patient characteristics
Intervention Comparison Length of follow-up
Outcome measures
Effect size Source of funding
Additional comments
Carroli G;Belizan J; 1998 350
Systematic review - meta-analysis
Evidence level: 1+
6 RCTs including 4850 women.
Pregnant women having a vaginal birth.
Intervention: Restrictive use of episiotomy
Comparison: Routine use of episiotomy
Follow-up period: £ months (2 trials) 3 years (1 trial)
Outcome Measures: Number of episiotomies Assisted birth rate Severe vaginal/perineal trauma Posterior perineal trauma Anterior genital trauma Need for suturing Estimated blood loss Perineal pain Dyspareunia Healing complications Urinary incontinence Apgar score < 7 at 1 minute Admission to SCBU
Relative risks reported with 95% confidence interval calculated using a fixed effects model. Restrictive vs. routine No. of episiotomies (7 trials): 673/2441 vs. 1752/2409; RR 0.38 (0.35 to 0.41) Assisted birth rate (4 trials): 58/1842 vs. 70/1814; RR 0.79 (0.56 to 1.11). Severe vaginal/perineal trauma (3 trials): 87/2155 vs. 77/2129; RR 1.11 (0.83 to 1.50). Severe perineal trauma (5 trials): 45/1943 vs. 56/1907; RR 0.80 (0.55 to 1.16). Any posterior perineal trauma (4 trials): 744/1039 vs. 849/1040; RR 0.88 (0.84 to 0.92). Any anterior trauma (4 trials): 425/2144 vs. 243/2198; RR 1.79 (1.55 to 2.07). Need for suturing perineal trauma (5 trials): 1327/2080 vs. 1768/2053; RR 0.74 (0.71 to 0.77). Estimated blood loss at birth (1 trial): Mean 214.0 (SD162.0) vs. mean 272.0 (SD 160.0); WMD -58.00 (-107.57 to -8.43). Moderate/severe perineal pain at 3 days (1 trial): 30/94 vs. 32/71; RR 0.71 (0.48 to 1.05). Any perineal pain at discharge (1 trial): 371/1207 vs. 516/1215; RR 0.72 (0.65 to 0.81). Perineal pain at 10 days (1 trial): 99/439 vs. 101/446; RR 1.00 (0.78 to 1.27). Moderate/severe perineal pain at 10 days (1 trial): 37/49 vs. 36/446; RR 1.04 (0.67 to 1.63). Use of oral analgesia at 10 days (1 trial): 13/439 vs.
Shell Fellowship administered by the Liverpool School of Tropical Medicine
All meta-analyses were run for mediolateral episiotomies only with no change in findings.
223

Intrapartum care
330
Bibliographic reference
Study type
Evidence level
Number of patients
Patient characteristics
Intervention Comparison Length of follow-up
Outcome measures
Effect size Source of funding
Additional comments
6/446; RR 1.47 (0.63 to 3.40). Any perineal pain at 3 months (1 trial): 33/438 vs. 35/437; RR 0.98 (0.62 to 1.55). Moderate/severe perineal pain at 3 months (1 trial): 13/438 vs. 9/457; RR 1.51 (0.65 to 3.49). No attempt at intercourse in 3 months (1 trial): 39/438 vs. 44/457; RR 0.92 (0.61 to 1.39). Any dyspareunia in 3 months (1 trial): 228/438 vs. 233/457; RR 1.02 (0.90 to 1.16). Dyspareunia at 3 months (1 trial): 96/438 vs. 82/457; RR 1.22 (0.94 to 1.59). Ever suffering dypareunia in 3 years (1 trial): 52/329 vs. 45/345; RR 1.21 (0.84 to 1.75). Perineal haematoma at discharge (1 trial): 47/1148 vs. 49/1148; RR 0.96 (0.65 to 1.42). Healing complications at 7 days (1 trial): 114/555 vs. 168/564; RR 0.69 (0.56 to 0.85). Perineal wound dehiscence at 7 days (1 trial): 25/557 vs. 53/561; RR 0.48 (0.30 to 0.75). Perineal infection (1 trial): 9/555 vs. 10/578; RR 1.02 (0.48 to 2.16). Urinary incontinence at 3 months (2 trials): 140/775 vs. 147/794; 0.98 (0.79 to 1.20). Any urinary incontinence at 3 years (1 trial): 112/329 vs. 124/345; RR 0.95 (0.77 to 1.16). Pad wearing for urinary incontinence (1 trial): 31/329 vs. 28/345; RR 1.16 (0.71 to 1.89). Apgar score < 7 at 1 min. (3 trials): 71/1904 vs. 65/1895; RR 1.09 (0.78 to 1.51).
224

Evidence tables
331
Bibliographic reference
Study type
Evidence level
Number of patients
Patient characteristics
Intervention Comparison Length of follow-up
Outcome measures
Effect size Source of funding
Additional comments
Admission to SCBU (3 trials, 2 with no incidences): 28/498 vs. 38/502; RR 0.74 (0.46 to 1.19) ** check
Andrews, Sultan, Thakar & Jones, 2006 353
Cross sectional observational study
EL 3 N=241 Women giving birth vaginally for the first time
Assessment of perineal trauma by experienced researcher
Assessment of perineal trauma by clinician attending the birth
Immediate postnatal period
Identification of factors associated with confirmed 3rd and 4th degree trauma
Multiple logistic regression:Higher birthweight p=0.021 Mediolateral episiotomy OR 4.042 (95% CI 1.71 to 9.56), p=0.001 Episiotomies angled closer to the midline significantly associated with anal sphincter injuries: 26° vs. 37°, P = 0.01.
225

Intrapartum care
332
Interventions in the second stage – vaginal birth following previous third/fourth degree perineal trauma Bibliographic information
Study type and evidence level
Aim of study Number of patients and patient characteristics
Population characteristics
Outcome measures
Results and comments Study summary Reviewer comment
Dandolu V;Gaughan JP;Chatwani AJ;Harmanli O;Mabine B;Hernandez E; 2005 Apr 354
Study Type: Evidence Level: 3
Recurrence of 3rd and 4th degree perineal trauma amongst women giving birth vaginally following previous 3rd or 4th degree perineal trauma.
n=18, 888 initial population n=16, 152 subsequent births, of which 14, 990 were vaginal births.
Women who sustained anal sphincter lacerations during primary birth.
Perineal trauma Rate of recurrence of anal sphincter laceration:Women with 3rd degree tear following first birth (n=9684): Total anal sphincter lacerations: 454 (4.69%) 3rd degree tears: 374 (3.86%) 4th degree tears: 80 (0.83%) Women with 4th degree tear following first birth (n=5306): Total anal sphincter lacerations: 410 (7.73%) 3rd degree tears: 225 (4.24%) 4th degree tears: 185 (3.49%) Women with 3rd or 4th degree tear following first birth (n=14 990): Total anal sphincter lacerations: 864 (5.76%) 3rd degree tears: 599 (4.0%) 4th degree tears: 265 (1.76%) Risk factors for recurrence of anal sphicter lacerations (odds ratio with 95% confidence interval): Episiotomy (global) + prior laceration: OR 2.6 (2.25 to 3.04). Episiotomy alone without instruments + prior laceration: OR 1.7 (1.46 to 1.92). All forceps + prior laceration: OR 3.0 ( 2.2 to 4.0). Forceps + episiotomy + prior laceration: OR 3.6 (2.6 to 5.1). Forceps, no episiotomy + prior laceration: OR 1.4 (0.7 to 2.9). All vacuum + prior laceration: OR 2.2 (1.76 to 2.69). Vacuum + episiotomy + prior laceration: OR 2.7 (2.14 to 3.39) Vacuum, no episiotomy + prior laceration: OR 1.0 (0.6 to 1.7).
Prior anal sphincter laceration does not appear to be a significant risk factor fo recurrence of laceration. Operative vaginal birth, paerticualrly with episiotomy, increases the risk of recurrent laceration as it does for initial laceration.
In the US study episiotomy would be midline.
Harkin R;Fitzpatrick M;O'Connell PR;O'Herlihy C; 2003 355
Study Type: Evidence Level: 3
Consequences of a vaginal birth following severe perineal trauma subsequent to a previous vaginal birth.
n=56 Women having a vaginal birth within 3 years of sustaining 3rd or 4th degree perineal trauma following a previous vaginal birth.
Perineal traumaFaecal incontinence
Perineal trauma (nil/minimal symptoms vs. significant symptoms): Episiotomy: 27 vs. 1 Perineal laceration: 11 vs. 1 Intact perineum: 3 vs. 0 Recurrent third degree tear: 2 vs. 0 Faecal incontinence scoring after primary third degree tear vs. after subsequent birth (n=45): 0-2: 39 vs. 33
Although anal sphincter injury was increased five-fold at next delivery compared with all multiparae, 95% women delivering vaginally after previous third degree tear did not sustain further overt sphincter damage. Recurrence was not predictable using pre-
NB. 2 women suffered a second 3rd/4th degree tear in their subsequent birth. Neither woman suffered symptoms of faecal incontinenceeither antenatally in the second pregnancy or postnatally following repair of a second 3rd/4th degree tear. One additional woman
226

Evidence tables
333
Bibliographic information
Study type and evidence level
Aim of study Number of patients and patient characteristics
Population characteristics
Outcome measures
Results and comments Study summary Reviewer comment
3-4: 3 vs. 4 5-6: 1 vs. 0 6-10: 2 vs. 3 Not assessed: 0 vs. 5
delivery anal physiology testing.
developed severe symptoms following the subsequent birth. This was related to irritable bowel syndrome. Outcome measures of social debilitation and incontinence of flatus would have added to the meaningfulness of the findings which are rather narrowly defined.
Sangalli MR;Floris L;Faltin D;Weil A; 2000 Aug 356
Study Type: Evidence Level: 3
Consequences of a vaginal birth after a previous 3rd or 4th degree perineal tear.
n=208 women with history of previous 3rd or 4th degree tear - initial sample. N=114 women folowing subsequent vaginal birth - final sample.
Women who had had a vaginal birth following a previous 3rd or 4th degree tear.
Knowledge of anal sphincter tear Faecal incntinence Incontinent to flatus Faecal urgency
Characteristics of women in study, women with 3rd degree tears vs. women with 4th degree tears (%(n)): Knowledge of tear: 14.7 (19) vs. 20.8 (10), NS. Presently incontinent: 11.6 (15) vs. 25.0 (12), p=0.049. Presently incontinent of flatus: 4.7 (6) vs. 8.2 (4), NS. Presently incontinent of liquid stool: 6.2 (8) vs. 10.2 (4), NS. Presently incontinent of solid stool: 0.8 (1) vs. 6.1 (3), NS. Present faecal urgency: 10.9 (14) vs. 10.5 (5), NS. Previous surgery for incontinence: 0 (0) vs. 4.2 (2), NS. Medical advice or treatment for incontinence: 20.7 (6/29) vs. 33.3 (6/18), NS. Third degree tears: incontinence in subsequent births (n=129) (no subsequent births vs. 1, 2 or 3 subsequent births): Presently incontinent (stool or flatus): 10/49 vs. 5/80, p=0.03. Presently faecally incontinent: 7/49 vs. 2/80, p=0.03. Faecal urgency: 7/49 vs. 7/80, NS. Incontinent or urgency: 17/49 vs. 12/80, p=0.02. Fourth degree tears: incontinence in subsequent births (n=48) (no subsequent births vs. 1, 2 or 3 subsequent births): Presently incontinent (stool or flatus): 1/14 vs. 11/34, NS. Presently severely faecally incontinent or undergone surgery for incontinence: 0/49 vs. 9/34, p=0.04. Faecal urgency: 1/14 vs. 4/34, NS. Incontinent or urgency: 2/14 vs. 16/34, NS.
In a subsequent pregnancy, careful evaluation is necessary and a caesarean birth may be advisable for womenwith previous major sphincter trauma.
227
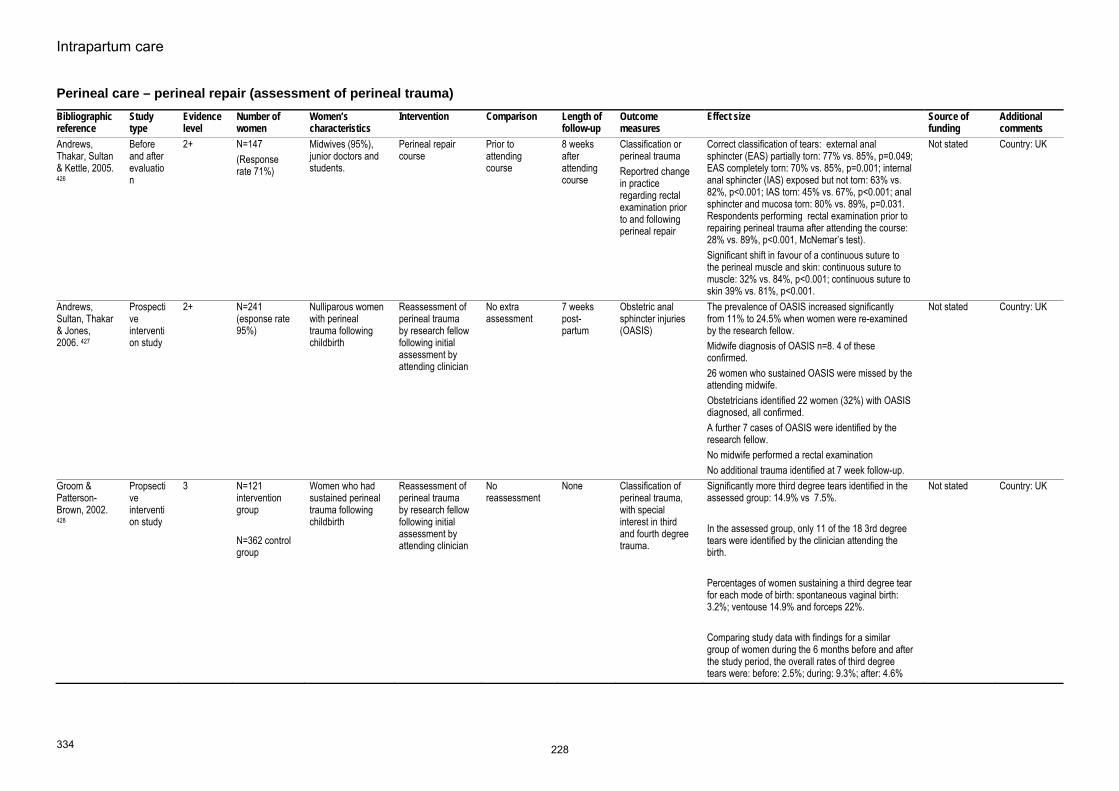
Intrapartum care
334
Perineal care – perineal repair (assessment of perineal trauma) Bibliographic reference
Study type
Evidence level
Number of women
Women’s characteristics
Intervention Comparison Length of follow-up
Outcome measures
Effect size Source of funding
Additional comments
Andrews, Thakar, Sultan & Kettle, 2005. 426
Before and after evaluation
2+ N=147 (Response rate 71%)
Midwives (95%), junior doctors and students.
Perineal repair course
Prior to attending course
8 weeks after attending course
Classification or perineal trauma Reportred change in practice regarding rectal examination prior to and following perineal repair
Correct classification of tears: external anal sphincter (EAS) partially torn: 77% vs. 85%, p=0.049; EAS completely torn: 70% vs. 85%, p=0.001; internal anal sphincter (IAS) exposed but not torn: 63% vs. 82%, p<0.001; IAS torn: 45% vs. 67%, p<0.001; anal sphincter and mucosa torn: 80% vs. 89%, p=0.031. Respondents performing rectal examination prior to repairing perineal trauma after attending the course: 28% vs. 89%, p<0.001, McNemar’s test). Significant shift in favour of a continuous suture to the perineal muscle and skin: continuous suture to muscle: 32% vs. 84%, p<0.001; continuous suture to skin 39% vs. 81%, p<0.001.
Not stated Country: UK
Andrews, Sultan, Thakar & Jones, 2006. 427
Prospective intervention study
2+ N=241 (esponse rate 95%)
Nulliparous women with perineal trauma following childbirth
Reassessment of perineal trauma by research fellow following initial assessment by attending clinician
No extra assessment
7 weeks post-partum
Obstetric anal sphincter injuries (OASIS)
The prevalence of OASIS increased significantly from 11% to 24.5% when women were re-examined by the research fellow. Midwife diagnosis of OASIS n=8. 4 of these confirmed. 26 women who sustained OASIS were missed by the attending midwife. Obstetricians identified 22 women (32%) with OASIS diagnosed, all confirmed. A further 7 cases of OASIS were identified by the research fellow. No midwife performed a rectal examination No additional trauma identified at 7 week follow-up.
Not stated Country: UK
Groom & Patterson-Brown, 2002. 428
Propsective intervention study
3 N=121 intervention group N=362 control group
Women who had sustained perineal trauma following childbirth
Reassessment of perineal trauma by research fellow following initial assessment by attending clinician
No reassessment
None Classification of perineal trauma, with special interest in third and fourth degree trauma.
Significantly more third degree tears identified in the assessed group: 14.9% vs 7.5%. In the assessed group, only 11 of the 18 3rd degree tears were identified by the clinician attending the birth. Percentages of women sustaining a third degree tear for each mode of birth: spontaneous vaginal birth: 3.2%; ventouse 14.9% and forceps 22%. Comparing study data with findings for a similar group of women during the 6 months before and after the study period, the overall rates of third degree tears were: before: 2.5%; during: 9.3%; after: 4.6%
Not stated Country: UK
228

Evidence tables
335
Perineal care – perineal repair (undertaking repair) Bibliographic reference
Study type
Evidence level
Number of women
Women’s characteristics
Intervention Comparison Length of follow-up
Outcome measures
Effect size Source of funding
Additional comments
Fleming VE;Hagen S;Niven C; 2003 Jul 429
RCT. 1+ Experimental group (non-suturing) n=41 Control arm (suturing) n=33
Primigravid women with perineal lacerations following the spontaneous birth of a baby of at least 37 weeks gestation.
Suturing of first and second degree perineal tears
Non-suturing of perineal lacerations
6 weeks Outcome Measures: Pain (1 day, 10 days and 6 weeks postpartum) Healing (1 day, 10 days and 6 weeks postpartum)
Median (range) and difference in median with 95% confidence interval and p values. Sutured vs. unsutured McGill Pain Questionnaire total score: Day 1: 11 (0-33) vs. 10 (0-44); 1 (-2 to 4.999), NS. Day 10: 0 (0-18) vs. 0 (0-33); 0 (0 to 0.001), NS. 6 weeks: 0 (0-28) vs. 0 (0-7); 0 (0 to 0), NS. *** ALL NEED CHECKING Healing (REEDA scores): Day 1: Approximation: 1 (0-3) vs. 2 (1-3); -1 (-1.0001 to 0), p<0.001. Total: 4 (0-9) vs. 5 (1-10); -1 (-2 to 0), NS. Day 10: Approximation: 1 (0-2) vs. 2 (0-3); -1 (-1.0001 to -0.0003), p=0.003. Total: 1 (0-6) vs. 2 (0-8); -1 (-1 to 0), NS. 6 weeks: Approximation: 1 (0-1) vs. 1 (0-3); 0 (-0.9999 to 0.0001), p=0.001. Total: 0 (0-3) vs. 1 (0-3); -1 (-1.0001 to -0.0003), p=0.003.
Grant from the Chief Scientist’s Office, Scotland.
While acknowledging the small sample size, the results show persistent evidence of poorer wound approximation in those women who had not been sutured. There is some uncertainty regarding the statistical analysis employed in this study. Awaiting information from author.
229

Intrapartum care
336
Perineal care – perineal repair (undertaking repair) Bibliographic information
Study type and evidence level
Aim of study Number of women and patient characteristics
Women’s characteristics
Outcome measures
Results and comments Study summary Reviewer comment
Salmon D; 1999 430
Study Type: . Evidence Level: 3
Women's experiences of perineal repair and subsequent healing.
n=6 Women who have undergone perineal repair following childbirth.
Women's reported experiences.
Emergent themes: Experiences of interpersonal relationships during suturing: Importance of communication between women and health professional Importance of good pain relief during suturing Women feeling "being patched up" Enduring a procedure that had to be "got through" The feelings associated with coming to terms with perineal trauma: Severity of negative emotions (anger, upset, frustration) Concerns about the degree of skill of practitioners Failing to be heard and taken seriously
Improvements in care are necessary in the areas of interpersonal skills and perineal suturing.
Very biased, small study but it does highlight the depth of psychological trauma associated with a poor experience of perineal repair, and lack of care during perineal healing.
230

Evidence tables
337
Perineal care – perineal repair (method of perineal repair) Bibliographic reference
Study type
Evidence level
Number of women
Women’s characteristics
Intervention Comparison Length of follow-up
Outcome measures
Effect size Source of funding
Additional comments
Kettle C;Johanson RB; 1998 431
Systematic review.
1+ 4 RCTs involving 1864 women. Switzerland, Denmark x 2, UK.
Women who had sustained perineal trauma and required suturing following instrumental or spontaneous vaginal birth.
Continuous subcuticular suture
interrupted sutures
3 months post-partum
Short-term pain (up to day 10) Analgesia (up to day 10) Resuturing (up to 3 months) Long term pain (up to 3 months) Dyspareunia (up to 3 months) Failure to resume pain-free intercourse (up to 3 months) Removal of suture material (up to 3 months)
Peto odds ratio with 95% confidence intervals. Continuous vs. interrupted: Short-term pain (up to day 10) (3 trilas): 160/789 vs. 218/799: OR 0.68 (0.53 to 0.86) Analgesia (up to day 10) (2 trials): 56/527 vs. 65/541; OR 0.86 (0.58 to 1.26). Resuturing (up to 3 months) (2 trials, 1 with no incidences): 3/487 vs. 3/531; OR 1.11 (0.22 to 5.53). Long term pain (up to 3 months) (1 trial): 58/465 vs. 51/451; OR 1.12 (0.75 to 1.67). Removal of suture material (up to 3 months) (1 trial): 121/465 vs. 16/451; OR 0.61 (0.46 to 0.80). Failure to resume pain-free intercourse (up to 3 months) (1 trial): 157/465 vs. 144/451; OR 1.09 (0.82 to 1.43) Dyspareunia (up to 3 months) (3 trials): 172/775 vs. 184/749; OR 0.88 (0.69 to 1.12).
No funding. The continuous subcuticular technique of perineal repair may be associated with less pain in the immediate postpartum period than the interrupted suture technique. The long-term effects are less clear. The authors also note that whilst 3 studies used the same suture material (Dexon) throughout the repair, one trial compared repair using chromic catgut with repair using Dexon. Also, there was considerable heterogeneity between studies regarding skill and training of persons carrying out the repair
Kettle C;Hills RK;Jones P;Darby L;Gray R;Johanson R; 2002 Jun 29 432
RCT UK
1+ Continuous group n=771 Interrupted group n=771
Women with a second degree tear or episiotomy following a spontaneous vaginal birth.
Continuous suturing technique for perineal repair (vaginal wall, perineal muscle and skin)
interrupted sutures.
12 months post-partum
Primary outcome: pain at 2 days, 10 days, 3 months and 12 months. Other outcomes: At 10 days: Pain relief Pain walking Pain sitting Pain passing urine Pain opening
Odds ratios with 95% confidence intervals.Continuous vs. interrupted Pain at 2 days: 530/770 vs. 609/770; OR 0.59 (0.44 to 0.79). Pain at 10 days: 204/770 vs. 338/769; OR 0.47 (0.35 to 0.61). Pain at 3 months: 70/751 vs. 96/741; OR (0.70 (0.46 to 1.07).
Iolanthe Midwifery Trust Ethicon/Johnson & Johnson University of Birmingham Clinical trials unit
Continuous repair can prevent one woman in 6 from having pain at 10 days. Although the trial was conducted across sites - a central delivery suite of a large hospital and a community midwifery unit, no
231

Intrapartum care
338
Bibliographic reference
Study type
Evidence level
Number of women
Women’s characteristics
Intervention Comparison Length of follow-up
Outcome measures
Effect size Source of funding
Additional comments
bowels At 3 months: Dyspareunia 12 months: Dyspareunia
Pain at 12 months: 31/700 vs. 47/689; OR 0.64 (0.35 to 1.16). At 10 days: Pain relief: 66/770 vs. 104/769; OR 0.60 (0.40 to 0.92). Pain walking: 244/770 vs. 329/769; OR 0.62 (0.47 to 0.82). Pain sitting: 304/770 vs. 423/769; OR 0.54 (0.41 to 0.70). Pain passing urine: 200/770 vs. 277/769; OR 0.63 (0.47 to 0.83). Pain opening bowels: 315/766 vs. 369/761; OR 0.74 (0.57 to 0.97). Dyspareunia at 3 months: Standard polyglactin: 47/298 vs. 48/290; OR 0.94 (0.53 to 1.69). Rapidly absorbed polyglactin: 51/283 vs. 54/303; OR 1.01 (0.58 to 1.76). Subtotal: 98/581 vs. 102/593; OR 0.98 (0.72 to 1.33). Dyspareunia at 12 months: Standard polyglactin: 45/332 vs. 52/322; OR 0.81 (0.46 to 1.44). Rapidly absorbed polyglactin: 49/326 vs. 39/345; OR 1.39 (0.77 to 2.51). Subtotal: 94/658 vs. 91/667; OR 1.05 (0.77 to 1.43). Suture removal at 10 days: 4/770 vs. 56/769; OR (0.17 (0.10 to 0.28). Suture removal between 10 days and 3 months: 22/751 vs. 63/741; OR 0.36 (0.23 to 0.55). Sutures uncomfortable at 2 days: 273/770 vs. 318/770; OR 0.78 (0.46 to 0.74). Sutures uncomfortable at 10 days: 133/770 vs. 204/769; OR 0.58 (0.64 to 0.96). Sutures tight at 2 days: 12/770 vs. 31/770;
mention is made regarding comparisons between sites.
232

Evidence tables
339
Bibliographic reference
Study type
Evidence level
Number of women
Women’s characteristics
Intervention Comparison Length of follow-up
Outcome measures
Effect size Source of funding
Additional comments
OR 0.40 (0.22 to 0.74).Sutures tight at 10 days: 22/770 vs. 51/769; OR 0.43 (0.27 to 0.69). Wound gaping at 2 days: 9/770 vs. 1/771; OR 0.69 (0.30 to 1.61). Wound gaping at 10 days: 23/770 vs. 50/769; OR 0.46 (0.29 to 0.74). Satisfaction with repair at 3 months: 628/751 vs. 560/741; OR 1.64 (1.28 to 2.11). Satisfaction with repair at 12 months: 603/700 vs. 542/689; OR 1.68 (1.27 to 2.21). Back to normal within 3 months: 414/700 vs. 332/689; OR 1.55 (1.26 to 1.92)..
Gordon B;Mackrodt C;Fern E;Truesdale A;Ayers S;Grant A; 1998 Apr 433
RCT UK
1+ Experimental group n=890 Control group n=890
Women who had sustained a perineal tear (first or second degree) or had an episiotomy following a spontaneous or instrumental vaginal birth
Two-stage perineal repair (leaving skin unsutured)
3 stage perineal repair.
3 months. At 24-48 hours and 10 days: Any pain in last 24 hours (mild, moderate, severe) Analgesia for pain in last 24 hours Tight stitches Stitches not comfortable Appearance of perineum - gaping At 10 days: Healing Sutures removed 3 months: Any pain in last 24 hours Analgesia in last week Resumption of sexual intercourse Dyspareunia Resumption of pain free
2 stage vs. 3 stage repair.At 2 days: Any pain in last 24 hours: 545/885 (62%) vs. 569/889 (64%); RR 0.96 (95% CI 0.90 to 1.03). Analgesia in last 24 hours: 400/885 (45%) vs. 392/889 (44%); NS. Tight stitches:162/885 (18%) vs.196/889 (22%); NS. Perineum gaping: 203/885 (23%) vs. 40/889 (4%); chi-square=125.9, 1 df, p<0.00001. At 10 days: Any pain in last 24 hours: 221/886 (25%) vs. 244/885 (28%); RR 0.90 (95% CI 0.77 to 1.06). Analgesia in last 24 hours: 73/886 (8%) vs. 69/885 (8%); NS. Tight stitches:126/886(14%) vs.163/885 (18%); RR 0.77 (95% CI 0.62 to 0.96), p=0.02. Perineum gaping: 227/886 (26%) vs. 145/885 (16%); chi-square=22.21, 1 df, p<0.00001. Healing by 1st intention: 661/886 (75%) vs. 740/885 (84%); chi-square=21.21, 1 df,
The National Birthday Trust; East Anglia Region Locally Organised Research Scheme; Ethicon ltd.
Two stage repair of perineal trauma leaving the skin unsutured appears to reduce pain and dyspareunia 3 months postpartum. There are no apparent disadvantages, in particular no evidence of increased risk of breakdown of the repair or need for resuturing. The differences in reported pain are more at 10 days and not at 3 months apart from a small difference in reported dyspareunia. The use of a mixture of statistical methods make some of the
233

Intrapartum care
340
Bibliographic reference
Study type
Evidence level
Number of women
Women’s characteristics
Intervention Comparison Length of follow-up
Outcome measures
Effect size Source of funding
Additional comments
intercourseRemoval of suture material
p<0.0001.Healing by second intention: 219/886 (25%) vs. 137/885 (15%); NS. Breaking down: 5/886 vs. 7/885; NS. Suture material removed: 26/886 (3%) vs. 67/885 (8%); chi-square=18.21, 1 df, p<0.0001. At 3 months: Any pain in last week: 64/828 (8%) vs. 87/836 (10%); NS. Analgesia in last week: 1/828 (0%) vs. 7/836 (1%); NS. Resumption of sexual intercourse: 704/828 (85%) vs. 712/836 (85%); NS. Dyspareunia: 128/890 (14.3%) vs. 162/890 (18.2%); RR0.80 (95% CI 0.65 to 0.99), p=0.04. *CHECK Resumption of pain-free intercourse: 576/828 (70%) vs. 551/836 (66%); NS. Known suture material removed at any time: 59/828 (7%) vs. 98/836 (11%); RR 0.61 (95% CI 0.45 to 0.83). Resuturing required: 4/828 (0%) vs. 9/836 (1%); NS.
findings difficult to interpret.
Grant A;Gordon B;Mackrodat C;Fern E;Truesdale A;Ayers S; 2001 Jan 434
RCT. UK
1+ Experimental group n=396 Control group n=397
Women requiring surgical repair of an episiotomy, first or second degree tear following a spontaneous vaginal birth or instrumental vaginal birth.
2 stage perineal repair (ie. no suturing of skin)
3 stage repair. 1 year Perineal painPerineum "feels different" Need for resuturing Dyspareunia at first and now Failure to resume pain-free intercourse
Relative risks with 95% confidence interval.Two-stage vs. three stage repair: Persistent pain: 28/396 vs. 26/396; RR 1.08 (0.64 to 1.80). Area cut or torn feels different: 117/395 vs. 157/396; RR 0.75 (0.61 to 0.91). Sub-group analysis: Method of birth: Instrumental: 45/123 vs. 55/124; RR 0.82 (0.61 to 1.12). Spontaneous: 72/272 vs. 102/272; RR 0.71 (0.55 to 0.91). Type of operator: Interrupted technique: 57/209 vs. 87/202; RR0.63 (0.48 to 0.83). Mixed technique: 46/133 vs. 55/136; RR 0.86 (0.63 to 1.17). Subcuticular: 14/53 vs. 15/58; RR 1.02
The National Birthday Trust; East Anglia Region Locally Organised Research Scheme; Ethicon ltd.
Two-stage repair of perineal trauma leaving the skin unsutured appears to reduce the likelihood of the perineum feeling different from before birth. There were no apparent disadvantages. Sub-group analysis by mode of birth showed that the significant reduction in women reporting that the perineum felt different was more marked following instrumental birth than spontaneous
234

Evidence tables
341
Bibliographic reference
Study type
Evidence level
Number of women
Women’s characteristics
Intervention Comparison Length of follow-up
Outcome measures
Effect size Source of funding
Additional comments
(0.55 to 1.91). Resutured: 1/396 vs. 6/397, NS. Dyspareunia at first: 142/391 vs. 148/390; NS. Dyspareunia now: 39/391 vs. 42/391; NS. Failure to resume pain free intercourse: 40/392 vs. 45/392 (0.89 (0.59 to 1.33).
vaginal birth, and the difference more marked where an interrupted suture technique had been used for perineal repair rather than a subcuticular or mixed technique.
Oboro, 2003. 435
RCT 1+ N=1077 women with 3 month follow up of 823 women
Women requiring perineal repair following childbirth. N=438 nulliparous women
Two-layered perineal repair (leaving skin unsutured)
Three-layered perineal repair
3 months postpartum
Perineal painTight sutures Analgesia use Inflammation and bruising Wound gaping
Perineal pain: 57% vs. 65%, RR 0.87 (95% CI 0.78 to 0.97); Tight sutures: 25% vs., 38%, RR 0.67 (95%CI 0.54 to 0.82). Analgesia use: 34% vs. 49%, RR 0.71 (95% CI 0.60 to 0.83); Inflammation/bruising: 7% vs. 14%, 0.50 (95% CI 0.33 to 0.77)’ All favour 2 stage repair. Wound gaping (skin edges > 0.5cm apart) was more prevalent in the 2 stage repair group: 26% vs. 5%, RR 4.96 (95% CI 3.17 to 7.76). The differences regarding perineal pain and analgesia was still apparent at 14 days and 6 weeks postpartum in favour of the 2 stage repair group. The difference in wound gaping was much smaller by 14 days: 21% vs. 17%, RR 1.25 (95% CI 0.94 to 1.67). No difference in wound breakdown: 3% vs. 2%: RR 1.27 (95% CI 0.56 to 2.85). At 3 months postpartum: dyspareunia: 10% vs. 17%, RR 0.61 (95% CI 0.43 to 0.87), favours 2 stage repair.
Not stated The authors point out that the differences in short-term pain found in this study may be due to the fact they used catgut for most of the perineal repairs rather than a synthetic absorbable suture material. Country: Nigeria
235

Intrapartum care
342
Perineal care – perineal repair (materials for perineal repair) Bibliographic reference
Study type
Evidence level
Number of women
Women’s characteristics
Intervention Comparison
Length of follow-up
Outcome measures
Effect size Source of funding
Additional comments
Kettle C;Johanson RB; 2006 436
Systematic review
1+ 8 trials included involving 3642 women.
Women requiring perineal repair following childbirth
Absorbable synthetic suture material 7 trials used polyglycolic acid (Dexon) and 1 trial used polyglactin (Vicryl).
Catgut 3 months. Short-term painAnalgesia use Suture dehiscence Resuturing of wound Long-tem pain Dyspareunia Removal of suture material
Outcomes expressed as Peto Odds Ratio with 95% confidence interval: Short-term pain (day 3 or less): 0.62 (0.54 to 0.71); 8 trials. Short-term pain (days 4-10): 0.71 (0.58 to 0.87); 3 trials. Analgesia use up to day 10: 0.63 (0.52 to 0.77); 5 trials. Suture dehiscence: 0.45 (0.29 to 0.70); 5 trials. Resuturing of wound: 0.26 (0.10 to 0.66); 4 trials. Long-term pain: 0.81 (0.61 to 1.08); 2 trials. Dyspareunia at 3 months: 0.94 (0.75 to 1.19); 3 trials. Removal of suture material: 2.01 (1.56 to 2.58); 2 trials.
Absorbable synthetic suture material for perineal repair following childbirth appears to decrease women's experience of short-term pain. The length of time taken for the synthetic material to be absorbed is of concern. Authors also note that the trial quality is varied, including shortfalls in randomisation, concealment of treatment allocation and blinding of assessors. Differences in skill level of clinicians may be very different eg. suture dehiscence in one trial was 37/71 for the control group and 12/77 for the experimental group, whilst in another trial there were no incidences of suture dehiscence.
Upton, Roberts, Ryan, Faulkner, Reynolds & Raynes-Greenow, 2002 437
RCT Australia
1+ Polyglactin n=194. Chromic catgut n=197.
Women requiring perineal repair following a spontaneous birth. Excluded: Women with third degree tears.
Polyglactin 910 for perineal repair
chromic catgut.
6 months Short-term painLonger-term pain (6 weeks, 3 months, 6 months) Resumption of sexual intercourse Dyspareunia Removal of suture material
Adjusted odds ratio with 95% confidence interval. Polyglycolic vs. catgut. Any perineal pain: Day 1: 122/172 vs. 133/174; aOR 0.64 (0.39 to 1.06) Day 3: 112/187 vs. 124/188; aOR 0.70 (0.46 to 1.08). 6 weeks: 27/184 vs. 24/184; aOR 1.06 (0.58 to 1.93). 3 months: 17/167 vs. 14/174; aOR 1.20 (0.56 to 2.53). 6 months: 9/158 vs. 5/159; aOR 1.77 (0.57 to 5.47). Resumed intercourse: 6 weeks: 62/178 vs. 70/178; OR 0.88 (0.57 to 1.36).
Davis and Geck (manufacturers of polyglactin)
Reduced short-term perineal pain in women repaired with polyglycolic acid compared with catgut. There is a possibility that polyglycolic acid is associated with worse longer-term outcomes None of the differences noted in the findings from this trial reached statistical significance, either with crude odds ratios or adjusted odds
236
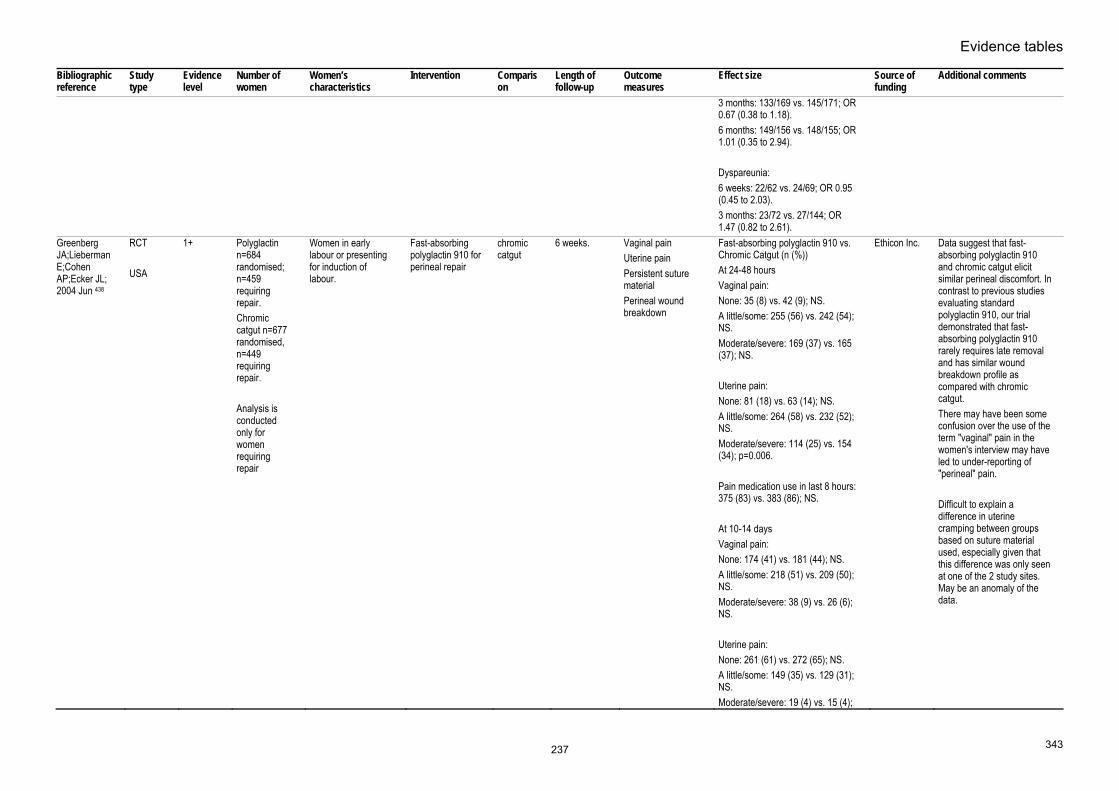
Evidence tables
343
Bibliographic reference
Study type
Evidence level
Number of women
Women’s characteristics
Intervention Comparison
Length of follow-up
Outcome measures
Effect size Source of funding
Additional comments
3 months: 133/169 vs. 145/171; OR 0.67 (0.38 to 1.18). 6 months: 149/156 vs. 148/155; OR 1.01 (0.35 to 2.94). Dyspareunia: 6 weeks: 22/62 vs. 24/69; OR 0.95 (0.45 to 2.03). 3 months: 23/72 vs. 27/144; OR 1.47 (0.82 to 2.61).
Greenberg JA;Lieberman E;Cohen AP;Ecker JL; 2004 Jun 438
RCT USA
1+ Polyglactin n=684 randomised; n=459 requiring repair. Chromic catgut n=677 randomised, n=449 requiring repair. Analysis is conducted only for women requiring repair
Women in early labour or presenting for induction of labour.
Fast-absorbing polyglactin 910 for perineal repair
chromic catgut
6 weeks. Vaginal painUterine pain Persistent suture material Perineal wound breakdown
Fast-absorbing polyglactin 910 vs. Chromic Catgut (n (%)) At 24-48 hours Vaginal pain: None: 35 (8) vs. 42 (9); NS. A little/some: 255 (56) vs. 242 (54); NS. Moderate/severe: 169 (37) vs. 165 (37); NS. Uterine pain: None: 81 (18) vs. 63 (14); NS. A little/some: 264 (58) vs. 232 (52); NS. Moderate/severe: 114 (25) vs. 154 (34); p=0.006. Pain medication use in last 8 hours: 375 (83) vs. 383 (86); NS. At 10-14 days Vaginal pain: None: 174 (41) vs. 181 (44); NS. A little/some: 218 (51) vs. 209 (50); NS. Moderate/severe: 38 (9) vs. 26 (6); NS. Uterine pain: None: 261 (61) vs. 272 (65); NS. A little/some: 149 (35) vs. 129 (31); NS. Moderate/severe: 19 (4) vs. 15 (4);
Ethicon Inc.
Data suggest that fast-absorbing polyglactin 910 and chromic catgut elicit similar perineal discomfort. In contrast to previous studies evaluating standard polyglactin 910, our trial demonstrated that fast-absorbing polyglactin 910 rarely requires late removal and has similar wound breakdown profile as compared with chromic catgut. There may have been some confusion over the use of the term "vaginal" pain in the women's interview may have led to under-reporting of "perineal" pain. Difficult to explain a difference in uterine cramping between groups based on suture material used, especially given that this difference was only seen at one of the 2 study sites. May be an anomaly of the data.
237

Intrapartum care
344
Bibliographic reference
Study type
Evidence level
Number of women
Women’s characteristics
Intervention Comparison
Length of follow-up
Outcome measures
Effect size Source of funding
Additional comments
NS. Pain medication use in last 8 hours: 81 (19) vs. 88 (21); NS. At 6-8 weeks Vaginal pain: None: 135 (77) vs. 97 (72); NS. A little/some: 37 (21) vs. 31 (23); NS. Moderate/severe: 3 (2) vs. 6 (4); NS. Uterine pain: None: 141 (81) vs. 113 (84); NS. A little/some: 33 (19) vs. 15 (11); NS. Moderate/severe: 1 (1) vs. 6 (4); p=0.017 Pain medication use in last 8 hours: 8 (5) vs. 14 (10); p=0.048. Painless bowel movement: 151 (79) vs.120 (81); NS. Persistent suture material: 2(1) vs. 2 (1): NS. Perineal wound breakdown: 4 (2) vs. 3 (2): NS.
Kettle C;Hills RK;Jones P;Darby L;Gray R;Johanson R; 2002 Jun 29 432
RCT. UK
1+ Rapidly absorbed synthetic suture material n=772 Standard form of synthetic suture material n=770 2x2 factorial study design also
Women with a second degree tear or episiotomy following a spontaneous vaginal birth.
Rapidly absorbed synthetic suture material
Standard synthetic suture material
12 months Primary outcome: pain at 10 days. Other outcomes: At 10 days: Pain relief Pain walking Pain sitting Pain passing urine Pain opening bowels
Odds ratios with 95% confidence intervals. Rapidly absorbed vs standard form. Pain at 10 days: OR 0.84 (95% CI 0.68 to 1.04), p=0.10, favours rapidly absorbed. Pain relief: OR 0.55 (95% CI 0.36 to 0.83), p=0.0002 Pain on walking: OR 0.74: (95% CI 0.56 to 0.97), p=0.004.
Iolanthe Midwifery Trust Ethicon/Johnson & Johnson University of Birmingham Clinical trials unit
Country: UK
238
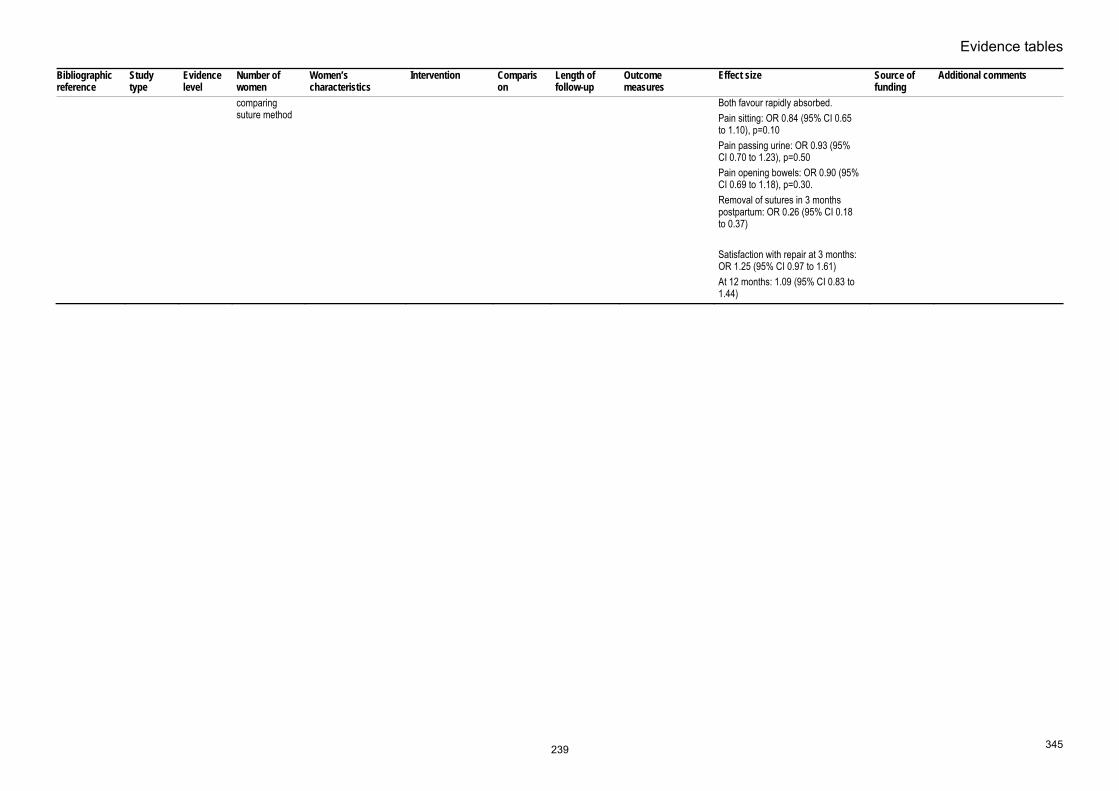
Evidence tables
345
Bibliographic reference
Study type
Evidence level
Number of women
Women’s characteristics
Intervention Comparison
Length of follow-up
Outcome measures
Effect size Source of funding
Additional comments
comparing suture method
Both favour rapidly absorbed.Pain sitting: OR 0.84 (95% CI 0.65 to 1.10), p=0.10 Pain passing urine: OR 0.93 (95% CI 0.70 to 1.23), p=0.50 Pain opening bowels: OR 0.90 (95% CI 0.69 to 1.18), p=0.30. Removal of sutures in 3 months postpartum: OR 0.26 (95% CI 0.18 to 0.37) Satisfaction with repair at 3 months: OR 1.25 (95% CI 0.97 to 1.61) At 12 months: 1.09 (95% CI 0.83 to 1.44)
239

Intrapartum care
346
Perineal care – perineal repair (analgesia for perineal pain following perineal repair) Bibliographic reference
Study type
Evidence level
Number of women
Women’s characteristics
Intervention Comparison Length of follow-up
Outcome measures
Effect size Source of funding
Additional comments
Hedayati H;Parsons J;Crowther CA; 2003 439
Systematic review.
1+ 3 RCTs involving 249 women Department of Obstetrics and Gynaecology, University of Adelaide, Australia.
Women with repaired episiotomy or second degree tear following childbirth.
Rectal non-steroidal anti-inflammatory drug (NSAID) suppositories for pain relief (one trial indomethacin, 2 trials diclofenac).
Placebo 72 hours post-partum
: Any pain experienced in first 24 hours postpartum. Any pain experienced 24-72 hours postpartum. Use of additional analgesia for perineal pain in first 12 hours postpartum. Use of additional analgesia for perineal pain in first 24 hours postpartum. Use of additional analgesia for perineal pain in first 48 hours postpartum. Use of additional analgesia for perineal pain in first 72 hours postpartum.
Relative risk (random effects model) with 95% confidence intervals. Any pain experienced in first 24 hours: RR 0.37 (0.10 to 1.38) (2 trials). Any pain experienced 24-72 hours: RR 0.73 (0.53 to 1.02) (1 trial). Pain experienced in first 24 hours: Mild: RR 1.12 (0.70 to 1.80) (2 trials). Moderate: RR 0.13 (0.02 to 0.76) (2 trials). Severe: RR 0.21 (0.01 to 4.12) (2 trials) Pain experienced 24-72 hours: Mild: RR 0.98 (0.62 to 1.55) (1 trial). Moderate: RR 0.39 (0.13 to 1.15) (1 trial). Severe: RR 0.20 (0.01 to 3.96) (1 trial) Use of additional analgesia for perineal pain in first 12 hours: RR 0.20 (0.07 to 0.53) (1 trial). Use of additional analgesia for perineal pain in first 24 hours: RR 0.31 (0.17 to 0.54) (1 trial). Use of additional analgesia for perineal pain in first 48 hours: RR 0.63 (0.45 to 0.89) (1 trial). Use of additional analgesia for perineal pain in first 72 hours: RR 0.52 (0.25 to 1.10) (1 trial).
Commonwealth Department of Health and Ageing, Australia
NSAID rectal suppositories are associated with less pain up to 24 hours after giving birth, and less additional analgesia is required. More research is required regarding long-term effects and maternal satisfaction with treatment. Whilst this review suggests NSAID rectal suppositiories are effective pain relief following perineal repair, there is no evidence comparing them with other analgesics eg. paracetomol.
Dodd JM;Hedayati H;Pearce E;Hotham N;Crowther CA; 2004 Oct 440
RCT Australia
1+ Treatment group: n=67 Control group: n=66
Women with a second degree tear of greater, or episiotomy following vaginal birth. Exclusion criteria: Sensitivity to NSAIDs, pre-eclampsia, PPH > 1000ml, manual removal of placenta.
Diclofenac rectal suppositories 2 x 100mg, immediately following suturing and 12-24 hours postpartum.
Placebo 6 weeks Pain at 24 hours: at rest, with movement, sitting, walking, passing urine, having bowels open. Pain at 48 hours: at rest, with movement, sitting, walking, passing urine, having bowels open. Pain at 10 days: at rest, with movement, sitting, walking, passing
Relative risks (RR) presented with 95% confidence interval. Treatment vs. placebo 24 hours after birth- at rest: SF-MPQ total score (n=56 and 53): median 6 (IQR 3-11) vs. 7 (3-12); p=0.33. VAS: mean 2.8 (SD 0.3) vs. 3.9 (0.3): RR -1.1 (-1.9 to -0.3); p=0.01. PPI (n=58 and 56): mean 31 (SD 53.4) vs. 32 (57.1); RR 0.9 (0.7 to 1.3); p=0.69. 24 hours after birth - with movement: SF-MPQ total score (n=57 and 53): median
Not stated
The use of rectal NSAIDs is a simple, effective and safe method of reducing the pain experienced by women following perineal trauma within the first 24 hours following childbirt Note that the suppository was inserted immediately following suturing in order to provide
240

Evidence tables
347
Bibliographic reference
Study type
Evidence level
Number of women
Women’s characteristics
Intervention Comparison Length of follow-up
Outcome measures
Effect size Source of funding
Additional comments
urine, having bowels open. Use of additional analgesia. Pain at 6 weeks: at rest, with movement, sitting, walking, passing urine, having bowels open. Use of additional analgesia
6 (IQR 2-13) vs. 9 (5-14); p=0.15.VAS: mean 3.3 (SD 0.3) vs. 4.7 (0.3): RR -1.4 (-2.3 to -0.5); p=0.004. PPI (n=49 and 54): mean 22 (SD 44.9) vs. 37 (68.5); RR 0.7 (0.5 to 0.9); p=0.02. 24 hours after birth - other activities: Pain with walking (n=61 and 55): n=33 (54%) vs. 39 (71%); RR 0.8 (0.6 to 1.0); p=0.06. Pain on sitting (n=60 and 57): n=36 (60%) vs. 43 (75%); RR 0.8 (0.6 to 1.0); p=0.07. Pain pasing urine (n=58 and 57): n=17 (29%) vs. 26 (46%); RR 0.6 (0.4 to 1.0); p=0.07. Pain on opening bowels (n=38 and 24): n=8 (21%) vs. 11 (48%); RR 0.6 (0.2 to 0.9); p=0.04. 48 hours after birth- at rest: SF-MPQ total score (n=57 and 57): median 4 (IQR 2-9) vs. 4 (3-6); p=0.86. VAS: mean 2.6 (SD 0.3) vs. 3.0 (0.3): RR -0.4 (-1.2 to 0.4); p=0.34. PPI (n=56 and 55): mean 23 (SD 41.1) vs. 23 (41.8); RR 1.0 (0.6 to 1.5); p=0.94. 48 hours after birth - with movement: SF-MPQ total score (n=60 and 55): median 4.5 (IQR 1.5-9.5) vs. 4 (2-9); p=0.90. VAS: mean 2.9 (SD 0.3) vs. 3.6 (0.3): RR -0.6 (-1.6 to -0.3); p=0.17. PPI (n=54 and 54): mean 22 (SD 40.7) vs. 26 (48.2); RR 0.9 (0.6 to 1.3); p=0.44. 48 hours after birth - other activities: Pain with walking (n=60 and 54): n=34 (57%) vs. 33 (61%); RR 1.1 (0.7 to 1.7); p=0.63. Pain on sitting (n=60 and 57): n=40 (65%) vs. 36 (68%); RR 1.0 (0.7 to 1.2); p=0.70. Pain passing urine (n=58 and 57): n=19 (33%) vs. 18 (34%); RR 1.0 (0.6 to 1.6); p=0.89. Pain on opening bowels (n=38 and 24):
effective pain relief in this period.
241

Intrapartum care
348
Bibliographic reference
Study type
Evidence level
Number of women
Women’s characteristics
Intervention Comparison Length of follow-up
Outcome measures
Effect size Source of funding
Additional comments
n=10 (26%) vs. 13 (54%); RR 0.6 (0.3 to 1.1); p=0.10. Use of additional analgesia prior to discharge: n=54 (81%) vs. 57 (86%); RR 0.9 (0.8 to 1.1); p-0.37. Time from birth to first analgesia (hours): median 6.4 (IQR 3.5-10.5) vs. 5.8 (2.9-10.2). At 10 days and 6 weeks postnatally no differences in perineal pain present or pain with other activities as detailed above.
242

Evidence tables
349
33. What is the evidence that different methods of initial neonatal assessment and examination influence outcomes? 34. What is the evidence that different methods of neonatal resuscitation influence outcomes? 35. Are there effective ways of encouraging mother–infant bonding following birth?
Initial neonatal assessment – Apgar score Bibliographic information
Study type
Evidence level
Number of women/infants and prevalence
Women’s/infants’ characteristics
Type of test Reference standard
Sensitivity, specificity, PPV and NPV Source of funding Additional comments
van de Riet JE;Vandenbussche FP;Le Cessie S;Keirse MJ; 1999 Apr 418
Cohort study
II 42 studies newborn infants pH arterial 7.10 pH arterial 7.20 pH arterial 7.00 pH arterial 7.10 pH arterial 7.20
Neonatal deaths Neonatal deaths CP CP CP
Sensitivity 25.29% (95% CI 18.83% to 31.75%) Specificity 89.29% (95% CI 88.44% to 90.13%) PPV 7.39% (95% CI 5.29% to 9.50%) NPV 97.25% (95% CI 96.78% to 97.71%) Accuracy 87.19% (95% CI 86.29% to 88.09%) Sensitivity 46.15% (95% CI 35.09% to 57.22%) Specificity 86.76 % (95% CI 84.44% to 89.07%) PPV 24.83% (95% CI 17.80% to 31.86%) NPV 94.44% (95% CI 92.81% to 96.08%) Accuracy 83.24% (95% CI 80.80% to 85.68%) Sensitivity 7.14% (95% CI 0.00% to 14.93%) Specificity 96.97% (95% CI 91.12% to 100.00%)
Not stated
243

Intrapartum care
350
Bibliographic information
Study type
Evidence level
Number of women/infants and prevalence
Women’s/infants’ characteristics
Type of test Reference standard
Sensitivity, specificity, PPV and NPV Source of funding Additional comments
PPV 75.00% (95% CI 32.56% to 100.00%) NPV 45.07% (95% CI 33.50% to 56.64%) Accuracy 46.67% (95% CI 35.38% to 57.96%) Sensitivity 17.44% (95% CI 9.42% to 25.46%) Specificity 91.95% (95% CI 89.42% to 94.47%) PPV 29.41% (95% CI 16.91% to 41.92%) NPV 85.27% (95% CI 82.11% to 88.43%) Accuracy 79.92% (95% CI 76.52% to 83.33%) Sensitivity 18.87% (95% CI 8.33% to 29.40%) Specificity 85.21% (95% CI 81.94% to 88.48%) PPV 12.99% (95% CI 5.48% to 20.50%) NPV 89.98% (95% CI 87.13% to 92.82%) Accuracy 78.26% (95% CI 74.67% to 81.85%)
Chong DS;Karlberg J; 2004 Jan 419
Cohort study
II 45059 newborn infants Apgar score neonatal deaths neonatal deaths not stated
Gaffney G;Sellers S;Flavell V;Squier
Cohort study
II 609 infants Apgar (5) 0-1:2-10 CP at 3-5 years Sensitivity 6.25% (95% CI 2.06% to 10.44%)
not stated
244

Evidence tables
351
Bibliographic information
Study type
Evidence level
Number of women/infants and prevalence
Women’s/infants’ characteristics
Type of test Reference standard
Sensitivity, specificity, PPV and NPV Source of funding Additional comments
M;Johnson A; 1994 Mar 19 420
Neonatal death Specificity 100.00% (95% CI 100.00%
to 100.00%) PPV 100.00% (95% CI 100.00% to 100.00%) NPV 67.83% (95% CI 63.09% to 72.57%) Accuracy 68.50% (95% CI 63.84% to 73.17%) Sensitivity 65.00% (95% CI 52.93% to 77.07%) Specificity 100.00% (95% CI 100.00% to 100.00%) PPV 100.00% (95% CI 100.00% to 100.00%) NPV 85.00% (95% CI 79.09% to 90.91%) Accuracy 88.27% (95% CI 83.55% to 92.28%)
Moster D;Lie RT;Markestad T; 2002 Jan 421
Cohort study
II 727 children Apgar score Apgar score minor disabilities not stated
Moster D;Lie RT;Irgens LM;Bjerkedal T;Markestad T; 2001 Jun 422
Cohort study
II 235165 children Apgar score Apgar score CP and neonatal deaths not stated
Casey BM;McIntire DD;Leveno KJ; 2001 Feb 15 423
Cohort study
II 151891 infants Apgar score Apgar score immediate neonatal outcomes not stated
245

Intrapartum care
352
Initial neonatal assessment – infant-mother bonding and promoting breastfeeding Bibliographic reference
Study type
Evidence level
Number of women
Women’s characteristics Intervention Comparison
Length of follow-up
Outcome measures
Effect size Source of funding
Additional comments
Dyson L;McCormick F;Renfrew MJ; 2005 424
Systematic review - meta-analysis
Evidence level: 1+
none All those exposed to interventions intended to promote breastfeeding. This includes pregnant women, mothers of newborn infants and women who may decide to breastfeed in the future. Population subgroups of women, such as women from low-income or ethnic groups, are also included in this review. Women and infants with a specific health problem, e.g. mothers with AIDS or infants with cleft palate, are excluded from this review
Intervention: Any intervention aiming to promote the initiation of breastfeeding, which takes place before the first breastfeed
Comparison: any other
Follow-up period: N/A
Outcome Measures: Initiation rate of breastfeeding
none relevant to us Canadian Cochrane Child Health Field Bursary Award CANADA York Centre for Reviews and Dissemination UK
246