PAM 2006 Tables ENG
77
83 Difference between two estimates required for statistical significance 2006 Physical Activity Monitor, excluding CCHS data Percentage tested 1 Sample 10% 20% 30% 40% 50% 60% 70% 80% 90% TOTAL, ADULTS (18+) 4,027 2.0 2.6 3.0 3.2 3.3 3.2 3.0 2.6 2.0 women 2,354 2.6 3.4 3.9 4.2 4.3 4.2 3.9 3.4 2.6 men 1,673 3.0 4.1 4.7 5.0 5.1 5.0 4.7 4.1 3.0 18–24 339 5.9 7.8 9.0 9.6 9.8 9.6 9.0 7.8 5.9 women 178 8.1 10.8 12.4 13.2 13.5 13.2 12.4 10.8 8.1 men 161 8.5 11.4 13.0 13.9 14.2 13.9 13.0 11.4 8.5 25–44 1,493 2.8 3.7 4.3 4.6 4.7 4.6 4.3 3.7 2.8 women 914 3.6 4.8 5.5 5.8 6.0 5.8 5.5 4.8 3.6 men 579 4.5 6.0 6.9 7.3 7.5 7.3 6.9 6.0 4.5 45–64 1,488 2.8 3.7 4.3 4.6 4.7 4.6 4.3 3.7 2.8 women 823 3.8 5.0 5.8 6.2 6.3 6.2 5.8 5.0 3.8 men 665 4.2 5.6 6.4 6.8 7.0 6.8 6.4 5.6 4.2 REGION East 1,014 3.9 5.2 6.0 6.4 6.5 6.4 6.0 5.2 3.9 Newfoundland 252 5.2 7.0 8.0 8.6 8.7 8.6 8.0 7.0 5.2 Prince Edward Island 255 5.2 6.9 8.0 8.5 8.7 8.5 8.0 6.9 5.2 Nova Scotia 255 5.2 6.9 8.0 8.5 8.7 8.5 8.0 6.9 5.2 New Brunswick 252 5.2 7.0 8.0 8.6 8.7 8.6 8.0 7.0 5.2 Quebec 486 3.8 5.0 5.8 6.2 6.3 6.2 5.8 5.0 3.8 Ontario 969 2.7 3.6 4.1 4.4 4.5 4.4 4.1 3.6 2.7 West 1023 2.6 3.5 4.0 4.2 4.3 4.2 4.0 3.5 2.6 Manitoba 251 5.2 7.0 8.0 8.6 8.7 8.6 8.0 7.0 5.2 Saskatchewan 252 5.2 7.0 8.0 8.6 8.7 8.6 8.0 7.0 5.2 Alberta 264 5.1 6.8 7.8 8.4 8.5 8.4 7.8 6.8 5.1 British Columbia 256 5.2 6.9 7.9 8.5 8.7 8.5 7.9 6.9 5.2 North 535 6.5 8.6 9.9 10.6 10.8 10.6 9.9 8.6 6.5 Yukon 252 5.2 7.0 8.0 8.6 8.7 8.6 8.0 7.0 5.2 Northwest Territories 253 5.2 7.0 8.0 8.5 8.7 8.5 8.0 7.0 5.2 Nunavut 30 – – – – – – – – – ENERGY EXPENDITURE Active (≥3 KKD) 1,144 3.7 4.9 5.6 6.0 6.1 6.0 5.6 4.9 3.7 Moderately active (1.5–2.9) 744 4.6 6.1 7.0 7.5 7.6 7.5 7.0 6.1 4.6 Somewhat active (0.5–1.4 KKD) 838 4.3 5.7 6.6 7.0 7.2 7.0 6.6 5.7 4.3 Sedentary (<0.5 KKD) 1,301 3.5 4.6 5.3 5.6 5.8 5.6 5.3 4.6 3.5 1 The difference between two numbers is statistically significant when it is greater than or equal to the value listed in the table beside the appropriate group. For example, lets say 46% of men and 33% of women be considered active. Is the difference (13) significant? To find out, take the lower percentage (33%) and find out the difference required to achieve significance for the corresponding group (women). The value indicated at the intersection of the nearest percentage column and the group row (2.6) is the difference required to achieve significance. Since the difference between 46% and 33% is larger than 2.6, it is possible to state that men are significantly more active than women.
-
Upload
khangminh22 -
Category
Documents
-
view
1 -
download
0
Transcript of PAM 2006 Tables ENG

83
Difference between two estimates required for statistical significance 2006 Physical Activity Monitor, excluding CCHS data
Percentage tested1
Sample 10% 20% 30% 40% 50% 60% 70% 80% 90%
TOTAL, ADULTS (18+) 4,027 2.0 2.6 3.0 3.2 3.3 3.2 3.0 2.6 2.0 women 2,354 2.6 3.4 3.9 4.2 4.3 4.2 3.9 3.4 2.6 men 1,673 3.0 4.1 4.7 5.0 5.1 5.0 4.7 4.1 3.0
18–24 339 5.9 7.8 9.0 9.6 9.8 9.6 9.0 7.8 5.9 women 178 8.1 10.8 12.4 13.2 13.5 13.2 12.4 10.8 8.1 men 161 8.5 11.4 13.0 13.9 14.2 13.9 13.0 11.4 8.5
25–44 1,493 2.8 3.7 4.3 4.6 4.7 4.6 4.3 3.7 2.8 women 914 3.6 4.8 5.5 5.8 6.0 5.8 5.5 4.8 3.6 men 579 4.5 6.0 6.9 7.3 7.5 7.3 6.9 6.0 4.5
45–64 1,488 2.8 3.7 4.3 4.6 4.7 4.6 4.3 3.7 2.8 women 823 3.8 5.0 5.8 6.2 6.3 6.2 5.8 5.0 3.8 men 665 4.2 5.6 6.4 6.8 7.0 6.8 6.4 5.6 4.2
REGION East 1,014 3.9 5.2 6.0 6.4 6.5 6.4 6.0 5.2 3.9
Newfoundland 252 5.2 7.0 8.0 8.6 8.7 8.6 8.0 7.0 5.2 Prince Edward Island 255 5.2 6.9 8.0 8.5 8.7 8.5 8.0 6.9 5.2 Nova Scotia 255 5.2 6.9 8.0 8.5 8.7 8.5 8.0 6.9 5.2 New Brunswick 252 5.2 7.0 8.0 8.6 8.7 8.6 8.0 7.0 5.2
Quebec 486 3.8 5.0 5.8 6.2 6.3 6.2 5.8 5.0 3.8 Ontario 969 2.7 3.6 4.1 4.4 4.5 4.4 4.1 3.6 2.7 West 1023 2.6 3.5 4.0 4.2 4.3 4.2 4.0 3.5 2.6
Manitoba 251 5.2 7.0 8.0 8.6 8.7 8.6 8.0 7.0 5.2 Saskatchewan 252 5.2 7.0 8.0 8.6 8.7 8.6 8.0 7.0 5.2 Alberta 264 5.1 6.8 7.8 8.4 8.5 8.4 7.8 6.8 5.1 British Columbia 256 5.2 6.9 7.9 8.5 8.7 8.5 7.9 6.9 5.2
North 535 6.5 8.6 9.9 10.6 10.8 10.6 9.9 8.6 6.5 Yukon 252 5.2 7.0 8.0 8.6 8.7 8.6 8.0 7.0 5.2 Northwest Territories 253 5.2 7.0 8.0 8.5 8.7 8.5 8.0 7.0 5.2 Nunavut 30 – – – – – – – – –
ENERGY EXPENDITURE Active (≥3 KKD) 1,144 3.7 4.9 5.6 6.0 6.1 6.0 5.6 4.9 3.7 Moderately active (1.5–2.9) 744 4.6 6.1 7.0 7.5 7.6 7.5 7.0 6.1 4.6 Somewhat active (0.5–1.4 KKD) 838 4.3 5.7 6.6 7.0 7.2 7.0 6.6 5.7 4.3 Sedentary (<0.5 KKD) 1,301 3.5 4.6 5.3 5.6 5.8 5.6 5.3 4.6 3.5
1 The difference between two numbers is statistically significant when it is greater than or equal to the value listed in the table beside the appropriate group. For example, lets say 46% of men and 33% of women be considered active. Is the difference (13) significant? To find out, take the lower percentage (33%) and find out the difference required to achieve significance for the corresponding group (women). The value indicated at the intersection of the nearest percentage column and the group row (2.6) is the difference required to achieve significance. Since the difference between 46% and 33% is larger than 2.6, it is possible to state that men are significantly more active than women.

84
Difference between two estimates required for statistical significance 2006 Physical Activity Monitor, excluding CCHS data
Percentage tested
Sample 10% 20% 30% 40% 50% 60% 70% 80% 90%
EDUCATION LEVEL Less than secondary 666 4.8 6.4 7.4 7.9 8.1 7.9 7.4 6.4 4.8 Secondary 962 4.0 5.4 6.1 6.6 6.7 6.6 6.1 5.4 4.0 College 1,285 3.5 4.6 5.3 5.7 5.8 5.7 5.3 4.6 3.5 University 1,047 3.9 5.1 5.9 6.3 6.4 6.3 5.9 5.1 3.9
HOUSEHOLD INCOME < $20,000 447 5.1 6.8 7.8 8.3 8.5 8.3 7.8 6.8 5.1 $20,000–29,999 368 5.6 7.5 8.6 9.2 9.4 9.2 8.6 7.5 5.6 $30,000–39,999 415 5.3 7.1 8.1 8.7 8.8 8.7 8.1 7.1 5.3 $40,000–59,999 671 4.2 5.6 6.4 6.8 7.0 6.8 6.4 5.6 4.2 $60,000–79,999 498 4.8 6.5 7.4 7.9 8.1 7.9 7.4 6.5 4.8 $80,000–99,999 371 5.6 7.5 8.6 9.2 9.4 9.2 8.6 7.5 5.6 ≥ $100,000 638 4.3 5.7 6.5 7.0 7.1 7.0 6.5 5.7 4.3
EMPLOYMENT STATUS Full-time worker 2,146 2.7 3.6 4.1 4.4 4.5 4.4 4.1 3.6 2.7 Part-time worker 331 6.9 9.1 10.5 11.2 11.4 11.2 10.5 9.1 6.9 Unemployed 284 7.4 9.9 11.3 12.1 12.3 12.1 11.3 9.9 7.4 Homemaker 231 8.2 10.9 12.5 13.4 13.7 13.4 12.5 10.9 8.2 Student 139 10.6 14.1 16.2 17.3 17.6 17.3 16.2 14.1 10.6 Retired 818 4.4 5.8 6.7 7.1 7.3 7.1 6.7 5.8 4.4
COMMUNITY SIZE < 1,000 454 5.1 6.8 7.7 8.3 8.5 8.3 7.7 6.8 5.1 1,000–4,999 590 4.5 5.9 6.8 7.3 7.4 7.3 6.8 5.9 4.5 5,000–9,999 359 5.7 7.6 8.7 9.3 9.5 9.3 8.7 7.6 5.7 10,000–74,999 1,046 3.3 4.5 5.1 5.5 5.6 5.5 5.1 4.5 3.3 75,000–299,999 577 4.5 6.0 6.9 7.3 7.5 7.3 6.9 6.0 4.5 ≥ 300,000 706 4.1 5.4 6.2 6.6 6.8 6.6 6.2 5.4 4.1
FAMILY COMPOSITION Living with a partner 2,421 2.2 2.9 3.4 3.6 3.7 3.6 3.4 2.9 2.2 Widowed, divorced, separated 821 3.8 5.0 5.8 6.2 6.3 6.2 5.8 5.0 3.8 Never married 751 3.9 5.3 6.0 6.4 6.6 6.4 6.0 5.3 3.9

85
Difference between two estimates required for statistical significance for Canadian workers 2006 Physical Activity Monitor, excluding CCHS data
Percentage tested1
Sample 10% 20% 30% 40% 50% 60% 70% 80% 90%
TOTAL, ADULTS (18+) 2,471 2.5 3.3 3.8 4.1 4.2 4.1 3.8 3.3 2.5 women 1,358 3.4 4.5 5.2 5.5 5.6 5.5 5.2 4.5 3.4 men 1,113 3.7 5.0 5.7 6.1 6.2 6.1 5.7 5.0 3.7
18–24 200 7.6 10.2 11.7 12.5 12.7 12.5 11.7 10.2 7.6 women 94 12.0 16.0 18.3 19.6 20.0 19.6 18.3 16.0 12.0 men 106 11.3 15.1 17.3 18.5 18.8 18.5 17.3 15.1 11.3
25–44 1,217 3.1 4.1 4.7 5.1 5.2 5.1 4.7 4.1 3.1 women 711 4.4 5.8 6.7 7.1 7.3 7.1 6.7 5.8 4.4 men 506 5.2 6.9 7.9 8.5 8.6 8.5 7.9 6.9 5.2
45–64 994 3.4 4.6 5.2 5.6 5.7 5.6 5.2 4.6 3.4 women 527 5.1 6.8 7.7 8.3 8.5 8.3 7.7 6.8 5.1 men 467 5.4 7.2 8.2 8.8 9.0 8.8 8.2 7.2 5.4
REGION East 583 5.2 6.9 7.9 8.4 8.6 8.4 7.9 6.9 5.2
Newfoundland 140 7.7 10.3 11.8 12.6 12.9 12.6 11.8 10.3 7.7 Prince Edward Island 147 7.5 10.1 11.5 12.3 12.6 12.3 11.5 10.1 7.5 Nova Scotia 153 7.4 9.9 11.3 12.1 12.3 12.1 11.3 9.9 7.4 New Brunswick 143 7.6 10.2 11.7 12.5 12.7 12.5 11.7 10.2 7.6
Quebec 278 5.5 7.3 8.4 9.0 9.1 9.0 8.4 7.3 5.5 Ontario 592 3.8 5.0 5.7 6.1 6.3 6.1 5.7 5.0 3.8 West 595 3.7 5.0 5.7 6.1 6.2 6.1 5.7 5.0 3.7
Manitoba 144 7.6 10.2 11.6 12.4 12.7 12.4 11.6 10.2 7.6 Saskatchewan 142 7.7 10.2 11.7 12.5 12.8 12.5 11.7 10.2 7.7 Alberta 177 6.9 9.2 10.5 11.2 11.5 11.2 10.5 9.2 6.9 British Columbia 132 8.0 10.6 12.2 13.0 13.3 13.0 12.2 10.6 8.0
North 423 6.1 8.1 9.3 9.9 10.1 9.9 9.3 8.1 6.1 Yukon 185 6.7 9.0 10.3 11.0 11.2 11.0 10.3 9.0 6.7 Northwest Territories 211 6.3 8.4 9.6 10.3 10.5 10.3 9.6 8.4 6.3 Nunavut 27
– – – – – – – – –
ENERGY EXPENDITURE Active (≥3 KKD) 783 3.6 4.8 5.4 5.8 5.9 5.8 5.4 4.8 3.6 Moderately active (1.5–2.9) 477 4.6 6.1 7.0 7.5 7.6 7.5 7.0 6.1 4.6 Somewhat active (0.5–1.4 KKD) 560 4.2 5.6 6.4 6.9 7.0 6.9 6.4 5.6 4.2 Sedentary (<0.5 KKD) 651 3.9 5.2 6.0 6.4 6.5 6.4 6.0 5.2 3.9
1 The difference between two numbers is statistically significant when it is greater than or equal to the value listed in the table beside the appropriate group. For example, lets say 46% of male workers and 33% of female workers be considered active. Is the difference (13) significant? To find out, take the lower percentage (33%) and find out the difference required to achieve significance for the corresponding group (female workers). The value indicated at the intersection of the nearest percentage column and the group row (3.4) is the difference required to achieve significance. Since the difference between 46% and 33% is larger than 3.4, it is possible to state that male workers are significantly more active than female workers.

86
Difference between two estimates required for statistical significance for Canadian workers 2006 Physical Activity Monitor, excluding CCHS data
Percentage tested
Sample 10% 20% 30% 40% 50% 60% 70% 80% 90%
EDUCATION LEVEL Less than secondary 225 7.8 10.3 11.9 12.7 12.9 12.7 11.9 10.3 7.8 Secondary 577 4.8 6.5 7.4 7.9 8.1 7.9 7.4 6.5 4.8 College 876 3.9 5.2 6.0 6.4 6.6 6.4 6.0 5.2 3.9 University 767 4.2 5.6 6.4 6.9 7.0 6.9 6.4 5.6 4.2
HOUSEHOLD INCOME < $20,000 102 11.5 15.4 17.6 18.8 19.2 18.8 17.6 15.4 11.5 $20,000–29,999 164 9.1 12.1 13.9 14.8 15.2 14.8 13.9 12.1 9.1 $30,000–39,999 255 7.3 9.7 11.1 11.9 12.2 11.9 11.1 9.7 7.3 $40,000–59,999 437 5.6 7.4 8.5 9.1 9.3 9.1 8.5 7.4 5.6 $60,000–79,999 390 5.9 7.9 9.0 9.6 9.8 9.6 9.0 7.9 5.9 $80,000–99,999 312 6.6 8.8 10.1 10.8 11.0 10.8 10.1 8.8 6.6 ≥ $100,000 533 5.0 6.7 7.7 8.2 8.4 8.2 7.7 6.7 5.0
EMPLOYMENT STATUS Full-time worker 2,066 2.6 3.4 3.9 4.2 4.3 4.2 3.9 3.4 2.6 Part-time worker 331 6.4 8.5 9.8 10.4 10.7 10.4 9.8 8.5 6.4
COMMUNITY SIZE < 1,000 228 7.7 10.3 11.8 12.6 12.8 12.6 11.8 10.3 7.7 1,000–4,999 357 6.2 8.2 9.4 10.1 10.3 10.1 9.4 8.2 6.2 5,000–9,999 208 8.1 10.8 12.3 13.2 13.5 13.2 12.3 10.8 8.1 10,000–74,999 715 4.4 5.8 6.7 7.1 7.3 7.1 6.7 5.8 4.4 75,000–299,999 377 6.0 8.0 9.2 9.8 10.0 9.8 9.2 8.0 6.0 ≥ 300,000 468 5.4 7.2 8.2 8.8 9.0 8.8 8.2 7.2 5.4
FAMILY COMPOSITION Living with a partner 1,597 2.9 3.9 4.4 4.8 4.9 4.8 4.4 3.9 2.9 Widowed, divorced, separated 350 6.2 8.3 9.5 10.2 10.4 10.2 9.5 8.3 6.2 Never married 507 5.2 6.9 7.9 8.4 8.6 8.4 7.9 6.9 5.2

87
Difference between two estimates required for statistical significance for Canadian workers 2006 Physical Activity Monitor, excluding CCHS data
Percentage tested1
Sample 10% 20% 30% 40% 50% 60% 70% 80% 90%
SECTOR Private business 1,172 3.6 4.9 5.6 5.9 6.1 5.9 5.6 4.9 3.6 Government or public organization 918 4.1 5.5 6.3 6.7 6.9 6.7 6.3 5.5 4.1 Not for profit organization 126 11.1 14.8 17.0 18.1 18.5 18.1 17.0 14.8 11.1
INDUSTRY
Trade and commerce 269 6.6 8.8 10.1 10.8 11.0 10.8 10.1 8.8 6.6 Retail and wholesale industries 269 7.6 10.1 11.6 12.4 12.7 12.4 11.6 10.1 7.6
Industry and manufacturing 505 4.8 6.4 7.3 7.9 8.0 7.9 7.3 6.4 4.8 Construction industries 171 9.5 12.7 14.6 15.6 15.9 15.6 14.6 12.7 9.5 Hi-tech industries 51 17.5 23.3 26.7 28.5 29.1 28.5 26.7 23.3 17.5 Transportation/communication 271 7.6 10.1 11.6 12.4 12.6 12.4 11.6 10.1 7.6 Manufacturing industries 138 10.6 14.2 16.2 17.3 17.7 17.3 16.2 14.2 10.6
Finance and services 1,108 3.2 4.3 5.0 5.3 5.4 5.3 5.0 4.3 3.2 Hospitality services 114 11.7 15.6 17.8 19.1 19.5 19.1 17.8 15.6 11.7 Finance and business services 131 10.9 14.5 16.6 17.8 18.2 17.8 16.6 14.5 10.9 Government service industries 216 8.5 11.3 13.0 13.9 14.1 13.9 13.0 11.3 8.5 Education, health and social services 510 5.5 7.4 8.4 9.0 9.2 9.0 8.4 7.4 5.5 Other service industries 137 10.7 14.2 16.3 17.4 17.8 17.4 16.3 14.2 10.7
Agriculture and Forestry 126 9.6 12.8 14.7 15.7 16.1 15.7 14.7 12.8 9.6 NUMBER OF EMPLOYEES
< 10 441 5.9 7.9 9.1 9.7 9.9 9.7 9.1 7.9 5.9 11–49 572 5.2 7.0 8.0 8.5 8.7 8.5 8.0 7.0 5.2 50–99 204 8.7 11.6 13.3 14.3 14.6 14.3 13.3 11.6 8.7 100–249 280 7.5 9.9 11.4 12.2 12.4 12.2 11.4 9.9 7.5 250–499 161 9.8 13.1 15.0 16.1 16.4 16.1 15.0 13.1 9.8 500–999 144 10.4 13.9 15.9 17.0 17.3 17.0 15.9 13.9 10.4 > 1000 367 6.5 8.7 9.9 10.6 10.9 10.6 9.9 8.7 6.5
PROFESSION Labor 344 5.8 7.8 8.9 9.5 9.7 9.5 8.9 7.8 5.8 Skilled trade 408 5.4 7.1 8.2 8.7 8.9 8.7 8.2 7.1 5.4 Clerical 273 6.5 8.7 10.0 10.7 10.9 10.7 10.0 8.7 6.5 Professional 667 4.2 5.6 6.4 6.8 7.0 6.8 6.4 5.6 4.2 Management 436 5.2 6.9 7.9 8.5 8.6 8.5 7.9 6.9 5.2

88
Self Reported Body Mass Index 2005 Canadian Community Health Survey, Statistics Canada
Underweight Healthy weight Overweight Obese
TOTAL, ADULTS (AGE 20 AND OVER) 3% 47% 35% 16% men 1 40 42 17 women 4 53 28 15
20–24 6 64 22 8 men 3 60 28 9 women 10 68 16 7
25–44 3 49 33 15 men 1 41 42 17 women 5 59 23 13
45–64 1 41 38 20 men 1 34 45 21 women 2 48 32 18
65 and older 3 43 39 16 men 1 40 44 15 women 4 46 34 16
PROVINCE
East 2 38 38 23 Newfoundland – 35 39 25 Prince Edward Island 1 38 38 23 Nova Scotia 2 40 37 22 New Brunswick 2 37 38 23
Quebec 3 49 33 15 Ontario 3 47 35 16 West 3 47 35 16
Manitoba 2 42 37 19 Saskatchewan 2 40 37 22 Alberta 2 45 36 16 British Columbia 3 50 33 14
North 2 42 33 24 – Data unavailable because of insufficient sample size.

89
Self Reported Body Mass Index (cont’d) 2005 Canadian Community Health Survey, Statistics Canada
Underweight Healthy weight Overweight Obese
EDUCATION LEVEL Less than secondary 3% 38% 38% 21% Secondary 2 46 35 16 Some post secondary 3 49 32 16 Post secondary completion 2 49 34 15
HOUSEHOLD INCOME < $15,000 4 47 31 19 $15,000-$29,999 3 46 33 18 $30,000-$49,999 3 45 34 18 $50,000-$79,999 2 46 35 17 $80,000 or more 2 47 37 15
EMPLOYMENT STATUS Working Student 5 60 26 10 Working other 2 45 36 17 Non-working student 7 61 25 7 Not working or studying 3 43 35 19
MARTIAL STATUS Living with a partner 2 44 37 17 Widowed, divorced, separated 3 46 34 18 Never married 4 56 27 13
ACTIVITY LEVEL Active (≥ 3KKD)1 2 52 35 11 Moderately active (1.5-2.9 KKD) 2 48 35 14 Somewhat Active (0.5-1.4 KKD) 2 45 36 18 Sedentary (<0.5 KKD) 4 41 33 22
1 Kilocalories/kilogram of body weight/day; an energy expenditure of 3KKD is roughly equivalent to walking one hour every day.

90
Overall health status and chronic conditions 2005 Canadian Community Health Survey, Statistics Canada
Health status
Excellent Very good Good Fair Poor
At least one chronic
condition
TOTAL, ADULTS (AGE 20 AND OVER) 22% 37% 29% 9% 3% 72% men 22 37 29 9 3 67 women 21 38 29 9 3 76
20–24 25 44 26 5 1 56 men 27 43 25 5 1 51 women 23 46 27 4 1 62
25–44 26 42 26 5 1 62 men 26 41 27 5 1 58 women 27 42 25 5 2 67
45–64 21 36 30 10 4 77 men 20 36 31 10 4 73 women 21 36 30 10 4 81
65 and older 12 28 34 19 7 91 men 13 27 34 19 8 88 women 11 28 34 19 7 93
PROVINCE
East 17 40 28 11 4 75 Newfoundland 19 45 23 9 4 74 Prince Edward Island 18 39 28 11 4 75 Nova Scotia 17 40 28 12 4 77 New Brunswick 16 37 31 12 4 74
Quebec 23 35 30 9 2 70 Ontario 22 38 28 9 3 73 West 21 38 29 9 3 71
Manitoba 20 38 30 9 3 71 Saskatchewan 18 38 30 11 3 72 Alberta 22 40 28 9 3 70 British Columbia 22 37 29 9 3 71
North 21 37 31 8 4 63

91
Overall health status and chronic conditions (cont’d) 2005 Canadian Community Health Survey, Statistics Canada
Health status
Excellent Very good Good Fair Poor
At least one chronic
condition
EDUCATION LEVEL Less than secondary 12% 27% 35% 19% 7% 82% Secondary 20 38 30 9 3 70 Some post secondary 21 40 29 8 3 70 Post secondary completion 25 40 26 6 2 70
HOUSEHOLD INCOME < $15,000 13 25 33 19 10 80 $15,000-$29,999 15 29 34 16 7 80 $30,000-$49,999 19 37 32 10 3 73 $50,000-$79,999 22 40 29 7 2 70 $80,000 or more 28 43 23 5 1 68
EMPLOYMENT STATUS Working Student 29 45 23 3 – 62 Working other 24 41 28 6 1 67 Non-working student 28 39 27 5 1 56 Not working or studying 16 30 32 15 7 82
MARTIAL STATUS Living with a partner 22 38 29 8 3 72 Widowed, divorced, separated 16 30 32 16 7 83 Never married 24 40 28 7 2 64
ACTIVITY LEVEL Active (≥ 3KKD)1 31 41 22 5 1 68 Moderately active (1.5-2.9 KKD) 23 41 28 7 2 72 Somewhat Active (0.5-1.4 KKD) 18 38 31 10 3 72 Sedentary (<0.5 KKD) 14 32 34 14 6 74
BODY MASS INDEX Underweight 21 33 30 11 6 69 Healthy Weight 27 39 25 7 3 68 Overweight 20 39 30 9 3 73 Obese 11 31 37 16 5 81
– Data unavailable because of insufficient sample size. 1 Kilocalories/kilogram of body weight/day; an energy expenditure of 3KKD is roughly equivalent to walking one hour every day.

92
Life satisfaction 2005 Canadian Community Health Survey, Statistics Canada
Very
satisfied Satisfied
Neither satisfied nor dissatisfied
Dissatisfied Very dissatisfied
TOTAL, ADULTS (AGE 20 AND OVER) 39% 53% 5% 3% 1% men 37 54 5 3 1 women 40 52 5 3 1
20–24 35 56 6 2 – men 35 56 7 2 <1 women 35 57 6 2 <1
25–44 39 53 6 2 <1 men 37 54 6 3 1 women 41 51 5 2 <1
45–64 39 52 5 3 1 men 38 54 5 3 1 women 40 51 5 3 1
65 and older 39 53 5 3 1 men 39 53 5 3 1 women 39 52 5 4 1
PROVINCE
East 40 53 4 3 1 Newfoundland 38 55 4 3 – Prince Edward Island 42 52 4 2 – Nova Scotia 41 51 5 3 1 New Brunswick 39 54 5 3 –
Quebec 39 54 5 2 1 Ontario 39 52 6 3 1 West 38 53 6 3 1
Manitoba 36 55 5 3 1 Saskatchewan 37 56 5 3 <1 Alberta 40 52 5 3 <1 British Columbia 38 53 6 3 1
North 39 54 5 3 – – Data unavailable because of insufficient sample size.

93
Life satisfaction (cont’d) 2005 Canadian Community Health Survey, Statistics Canada
Very satisfied
Satisfied Neither satisfied nor dissatisfied
Dissatisfied Very dissatisfied
EDUCATION LEVEL Less than secondary 31% 58% 6% 4% 1% Secondary 37 54 5 3 1 Some post secondary 36 54 6 3 <1 Post secondary completion 42 51 5 2 <1
HOUSEHOLD INCOME < $15,000 24 55 11 8 2 $15,000-$29,999 28 58 8 5 1 $30,000-$49,999 33 57 6 3 1 $50,000-$79,999 39 54 4 2 <1 $80,000 or more 49 46 3 1 –
EMPLOYMENT STATUS Working Student 41 53 5 2 – Working other 40 53 5 2 <1 Non-working student 37 54 7 2 – Not working or studying 36 51 7 5 1
MARTIAL STATUS Living with a partner 43 51 4 2 <1 Widowed, divorced, separated 28 57 8 5 1 Never married 31 57 8 4 1
ACTIVITY LEVEL Active (≥ 3KKD)1 48 47 4 2 <1 Moderately active (1.5-2.9 KKD) 42 51 4 2 <1 Somewhat Active (0.5-1.4 KKD) 36 55 6 3 <1 Sedentary (<0.5 KKD) 28 59 8 5 1
BODY MASS INDEX Underweight 31 55 9 4 – Healthy Weight 40 52 5 2 <1 Overweight 40 53 5 3 1 Obese 34 55 6 4 1
– Data unavailable because of insufficient sample size. 1 Kilocalories/kilogram of body weight/day; an energy expenditure of 3KKD is roughly equivalent to walking one hour every day.

94
Self reported mental health 2005 Canadian Community Health Survey, Statistics Canada
Excellent Very good Good Fair Poor
TOTAL, ADULTS (AGE 20 AND OVER) 38% 37% 21% 4% 1% men 39 36 21 4 1 women 36 37 21 4 1
20–24 40 37 19 4 1 men 42 35 19 4 1 women 38 39 19 4 1
25–44 38 38 20 4 1 men 40 37 19 4 1 women 37 39 20 4 1
45–64 38 36 21 4 1 men 39 36 20 4 1 women 37 37 21 5 1
65 and older 34 35 26 4 1 men 34 34 27 4 1 women 34 35 26 4 1
PROVINCE
East 35 38 23 4 1 Newfoundland 40 36 20 3 1 Prince Edward Island 35 42 18 5 – Nova Scotia 33 39 23 4 1 New Brunswick 32 37 25 5 1
Quebec 41 35 20 3 1 Ontario 38 36 20 4 1 West 35 38 22 5 1
Manitoba 34 37 24 4 1 Saskatchewan 34 38 23 5 1 Alberta 35 39 20 5 1 British Columbia 35 37 22 5 1
North 35 37 22 4 – – Data unavailable because of insufficient sample size.

95
Self reported mental health (cont’d) 2005 Canadian Community Health Survey, Statistics Canada
Excellent Very good Good Fair Poor
EDUCATION LEVEL Less than secondary 29% 33% 29% 7% 2% Secondary 37 37 21 4 1 Some post secondary 37 37 20 5 1 Post secondary completion 40 38 18 3 1
HOUSEHOLD INCOME < $15,000 28 31 29 10 3 $15,000-$29,999 31 34 27 6 2 $30,000-$49,999 35 37 23 4 1 $50,000-$79,999 39 38 19 4 1 $80,000 or more 44 38 15 3 <1
EMPLOYMENT STATUS Working Student 40 39 18 3 – Working other 40 38 19 3 1 Non-working student 40 34 21 4 – Not working or studying 34 34 24 6 2
MARTIAL STATUS Living with a partner 39 37 20 3 1 Widowed, divorced, separated 32 34 27 6 2 Never married 36 36 21 5 1
ACTIVITY LEVEL Active (≥ 3KKD)1 44 36 17 3 1 Moderately active (1.5-2.9 KKD) 39 38 19 4 1 Somewhat Active (0.5-1.4 KKD) 36 37 22 4 1 Sedentary (<0.5 KKD) 32 35 26 6 2
BODY MASS INDEX Underweight 33 34 25 7 1 Healthy Weight 38 38 20 4 1 Overweight 38 36 21 4 1 Obese 36 35 23 5 1
– Data unavailable because of insufficient sample size. 1 Kilocalories/kilogram of body weight/day; an energy expenditure of 3KKD is roughly equivalent to walking one hour every day.

96
General stress 2005 Canadian Community Health Survey, Statistics Canada
Not stressed at all
Not very stressed
A bit stressed
Quite stressed
Extremely stressed
TOTAL, ADULTS (AGE 20 AND OVER) 12% 23% 41% 20% 4% men 14 23 41 19 4 women 11 23 42 20 4
20-24 8 26 45 19 3 men 11 29 43 15 3 women 5 22 46 22 4
25-44 7 20 46 24 4 men 8 19 45 23 4 women 6 20 46 24 4
45-64 12 23 40 21 4 men 13 22 41 20 4 women 10 24 40 21 5
65 and older 28 32 30 8 2 men 31 32 27 8 2 women 26 31 32 9 2
PROVINCE
East 14 25 42 16 3 Newfoundland 16 27 43 12 3 Prince Edward Island 11 28 43 16 2 Nova Scotia 13 24 42 18 4 New Brunswick 14 25 41 17 3
Quebec 15 22 37 23 4 Ontario 11 23 43 19 4 West 12 24 42 19 4
Manitoba 10 27 43 16 4 Saskatchewan 10 25 43 18 3 Alberta 10 24 44 19 4 British Columbia 13 24 39 19 4
North 15 27 38 17 3

97
General stress (cont’d) 2005 Canadian Community Health Survey, Statistics Canada
Not stressed at all
Not very stressed
A bit stressed
Quite stressed
Extremely stressed
EDUCATION LEVEL Less than secondary 20% 25% 37% 15% 4% Secondary 12 26 42 17 3 Some post secondary 9 23 43 21 4 Post secondary completion 10 22 42 22 4
HOUSEHOLD INCOME < $15,000 16 22 36 20 6 $15,000-$29,999 17 25 37 16 4 $30,000-$49,999 14 25 41 17 4 $50,000-$79,999 10 23 43 20 3 $80,000 or more 8 22 43 24 4
EMPLOYMENT STATUS Working Student 5 19 45 26 5 Working other 8 21 45 23 4 Non-working student 7 22 46 21 4 Not working or studying 20 29 34 13 4
MARTIAL STATUS Living with a partner 12 23 42 20 4 Widowed, divorced, separated 18 23 36 18 5 Never married 10 23 43 20 4
ACTIVITY LEVEL Active (≥ 3KKD)1 14 25 40 18 3 Moderately active (1.5-2.9 KKD) 11 24 41 20 4 Somewhat Active (0.5-1.4 KKD) 10 23 43 20 4 Sedentary (<0.5 KKD) 12 21 40 21 5
BODY MASS INDEX Underweight 11 20 41 23 5 Healthy Weight 12 24 42 19 4 Overweight 13 23 41 20 4 Obese 12 21 41 21 5
1 Kilocalories/kilogram of body weight/day; an energy expenditure of 3KKD is roughly equivalent to walking one hour every day.

98
Work related stress 2005 Canadian Community Health Survey, Statistics Canada
Not at all stressful
Not very stressful
A bit stressful
Quite stressful
Extremely stressful
TOTAL, ADULTS (AGE 20 AND OVER) 9% 18% 42% 25% 6% men 10 17 43 25 5 women 8 18 41 26 6
20-24 12 25 41 18 4 men 13 25 40 18 4 women 9 25 42 19 5
25-44 7 16 43 27 6 men 7 15 44 28 6 women 7 18 43 27 6
45-64 10 17 41 26 6 men 11 17 42 25 6 women 9 17 40 28 7
65 and older 25 25 36 12 2 men 24 25 36 12 2 women 27 24 34 13 2
PROVINCE
East 12 21 43 20 5 Newfoundland 17 21 42 17 4 Prince Edward Island 11 22 46 19 3 Nova Scotia 10 21 43 21 5 New Brunswick 11 20 44 20 6
Quebec 8 15 39 32 6 Ontario 9 18 43 24 6 West 9 19 43 24 6
Manitoba 9 19 43 22 6 Saskatchewan 8 21 44 22 5 Alberta 8 18 44 24 6 British Columbia 10 19 41 24 6
North 13 21 39 22 6

99
Work related stress (cont’d) 2005 Canadian Community Health Survey, Statistics Canada
Not at all stressful
Not very stressful
A bit stressful
Quite stressful
Extremely stressful
EDUCATION LEVEL Less than secondary 16% 18% 41% 20% 6% Secondary 11 20 42 22 5 Some post secondary 10 21 42 23 5 Post secondary completion 8 16 42 28 6
HOUSEHOLD INCOME < $15,000 16 20 36 22 6 $15,000-$29,999 14 21 39 21 5 $30,000-$49,999 11 20 42 22 6 $50,000-$79,999 8 18 43 26 5 $80,000 or more 7 15 43 29 6
EMPLOYMENT STATUS Working Student 9 21 40 25 5 Working other 9 17 43 26 6 Non-working student 16 27 37 15 5 Not working or studying 14 22 35 21 9
MARTIAL STATUS Living with a partner 9 17 42 27 6 Widowed, divorced, separated 9 18 40 26 7 Never married 10 21 42 22 5
ACTIVITY LEVEL Active (≥ 3KKD)1 11 19 41 24 5 Moderately active (1.5-2.9 KKD) 8 17 42 26 6 Somewhat Active (0.5-1.4 KKD) 8 18 43 26 6 Sedentary (<0.5 KKD) 10 17 42 26 6
BODY MASS INDEX Underweight 10 19 40 25 6 Healthy Weight 9 19 42 25 5 Overweight 9 17 42 26 6 Obese 9 16 42 26 7
1 Kilocalories/kilogram of body weight/day; an energy expenditure of 3KKD is roughly equivalent to walking one hour every day.

100
Barriers to being active1 2006 Physical Activity Monitor
Deadlines at work2 Lack of time due to work2 Somewhat or not at all
Quite a bit or very important
Somewhat or not at all
Quite a bit or very important
TOTAL, ADULTS (18+) 40% 34% 35% 42% women 39 35 34 45 men 41 33 36 39
18–24 42 27 31 43 women 33 31 – 59 men 48 – 37 31
25–44 39 35 33 44 women 40 33 31 45 men 39 37 34 43
45–64 41 36 38 39 women 40 40 40 40 men 41 32 37 39
REGION East 39 34 32 43
Newfoundland 42 35 32 40 Prince Edward Island 47 37 39 38 Nova Scotia 36 33 27 46 New Brunswick 39 35 37 42
Quebec 43 31 44 31 Ontario 38 36 30 47 West 41 35 34 44
Manitoba 46 32 34 43 Saskatchewan 33 32 32 42 Alberta 41 37 39 44 British Columbia 42 35 30 45
North 35 37 35 33 Yukon 37 34 32 37 Northwest Territories 36 36 36 40 Nunavut – – – –
ENERGY EXPENDITURE Active (≥3 KKD3) 43 30 38 38 Moderately active (1.5–2.9 KKD) 36 35 30 46 Somewhat active (0.5–1.4 KKD) 38 36 34 42 Sedentary (<0.5 KKD) 42 37 35 45
1 Data include all persons in the workforce. 2 Mid-scale values make up the balance of responses and are not shown. 3 Kilocalories/kilogram of body weight/day; an energy expenditure of 3 KKD is roughly equivalent to walking one hour every day. – Data unavailable because of insufficient sample size.

101
Barriers to being active1 (cont’d) 2006 Physical Activity Monitor
Deadlines at work2 Lack of time due to work2 Somewhat or not at all
Quite a bit or very important
Somewhat or not at all
Quite a bit or very important
EDUCATION LEVEL Less than secondary 40% 38% 33% 41% Secondary 41 31 40 37 College 43 33 35 42 University 36 39 32 48
EMPLOYMENT STATUS Full-time worker 38 36 33 43 Part-time worker 53 24 47 33
HOUSEHOLD INCOME < $20,000 42 - 50 31 $20,000–29,999 34 43 40 35 $30,000–39,999 37 37 44 40 $40,000–59,999 41 34 30 45 $60,000–79,999 47 29 34 41 $80,000–99,999 34 38 27 46 ≥ $100,000 38 35 37 43
COMMUNITY SIZE < 1,000 39 28 36 31 1,000–4,999 35 34 33 41 5,000–9,999 41 32 31 47 10,000–74,999 44 31 37 39 75,000–299,999 38 34 31 46 ≥ 300,000 38 42 34 47
MARITAL STATUS Living with a partner 39 35 33 42 Widowed, divorced, separated 36 41 41 44 Never married 44 29 37 41
1 Data include all persons in the workforce. 2 Mid-scale values make up the balance of responses and are not shown.

102
Barriers to being active1 (cont’d) 2006 Physical Activity Monitor
Deadlines at work2 Lack of time due to work2 Somewhat or not at all
Quite a bit or very important
Somewhat or not at all
Quite a bit or very important
SECTOR Private business 39% 34% 35% 42% Government or public organization 41 35 36 42 Not for profit organization 37 43 27 53
INDUSTRY
Trade and commerce 51 28 40 34 Retail and wholesale industries 51 28 40 34
Industry and manufacturing 40 35 34 41 Construction industries 39 34 36 39 Hi-tech industries – – – – Transportation / communication 45 32 39 43 Manufacturing industries 40 36 33 39
Finance and services 37 36 32 45 Hospitality services 35 33 33 40 Finance and business services 32 45 32 48 Government service industries 41 32 38 40 Education, health and social services 37 36 31 47 Other service industries 40 35 30 45
Agriculture and Forestry 43 29 45 41 NUMBER OF EMPLOYEES
≤10 43 32 39 37 11–49 35 35 31 47 50–99 44 37 39 43 100–249 38 36 31 41 250–499 43 32 38 45 500–999 37 42 24 49 ≥1000 40 35 36 41
PROFESSION Labour 51 25 39 39 Skilled trade 43 33 37 39 Clerical 40 37 35 45 Professional 34 39 31 46 Management 33 40 30 43
1 Data include all persons in the workforce. 2 Mid-scale values make up the balance of responses and are not shown. – Data unavailable because of insufficient sample size.

103
Barriers to being active1 (cont’d) 2006 Physical Activity Monitor
No place to be active near work2 Roads too busy near work2 Somewhat or not at all
Quite a bit or very important
Somewhat or not at all
Quite a bit or very important
TOTAL, ADULTS (18+) 56% 26% 52% 32% women 55 27 50 35 men 57 26 54 30
18–24 51 26 46 36 women 56 – 47 43 men 47 – 45 –
25–44 58 25 53 31 women 57 27 50 34 men 59 24 56 28
45–64 54 28 53 33 women 50 30 51 34 men 58 26 56 32
REGION East 61 23 57 27
Newfoundland 65 – 53 31 Prince Edward Island 62 26 59 27 Nova Scotia 61 24 55 26 New Brunswick 59 23 61 27
Quebec 55 33 51 35 Ontario 51 27 49 34 West 62 21 57 28
Manitoba 70 – 67 25 Saskatchewan 60 25 51 35 Alberta 58 22 55 30 British Columbia 64 – 57 25
North 56 28 68 23 Yukon 65 22 69 22 Northwest Territories 62 22 66 24 Nunavut – – – –
ENERGY EXPENDITURE Active (≥3 KKD3) 59 25 52 32 Moderately active (1.5–2.9 KKD) 53 30 57 31 Somewhat active (0.5–1.4 KKD) 60 27 54 29 Sedentary (<0.5 KKD) 51 26 48 35
1 Data include all persons in the workforce. 2 Mid-scale values make up the balance of responses and are not shown. 3 Kilocalories/kilogram of body weight/day; an energy expenditure of 3 KKD is roughly equivalent to walking one hour every day. – Data unavailable because of insufficient sample size.

104
Barriers to being active1 (cont’d) 2006 Physical Activity Monitor
No place to be active near work2 Roads too busy near work2 Somewhat or not at all
Quite a bit or very important
Somewhat or not at all
Quite a bit or very important
EDUCATION LEVEL Less than secondary 49% 39% 40% 48% Secondary 53 28 48 34 College 54 26 53 33 University 63 23 59 26
EMPLOYMENT STATUS Full-time worker 55 27 53 32 Part-time worker 56 25 49 36
HOUSEHOLD INCOME < $20,000 68 – 59 – $20,000–29,999 54 33 48 41 $30,000–39,999 51 29 43 43 $40,000–59,999 52 28 44 39 $60,000–79,999 61 28 56 28 $80,000–99,999 52 30 54 33 ≥ $100,000 61 20 57 26
COMMUNITY SIZE < 1,000 52 25 51 22 1,000–4,999 53 30 52 34 5,000–9,999 59 25 55 34 10,000–74,999 52 29 53 33 75,000–299,999 60 25 59 27 ≥ 300,000 61 24 49 35
MARITAL STATUS Living with a partner 57 26 53 32 Widowed, divorced, separated 54 28 52 39 Never married 53 27 51 31
1 Data include all persons in the workforce. 2 Mid-scale values make up the balance of responses and are not shown. – Data unavailable because of insufficient sample size.

105
Barriers to being active1 (cont’d) 2006 Physical Activity Monitor
No place to be active near work2 Roads too busy near work2 Somewhat or not at all
Quite a bit or very important
Somewhat or not at all
Quite a bit or very important
SECTOR Private business 56% 27% 51% 31% Government or public organization 57 24 57 32 Not for profit organization 43 46 43 45
INDUSTRY
Trade and commerce 48 33 50 34 Retail and wholesale industries 48 33 50 34
Industry and manufacturing 56 25 53 32 Construction industries 56 24 57 29 Hi-tech industries 62 – 57 – Transportation / communication 65 21 56 25 Manufacturing industries 53 26 46 38
Finance and services 55 25 52 33 Hospitality services 46 30 31 47 Finance and business services 59 26 53 33 Government service industries 51 29 60 25 Education, health and social services 59 23 54 32 Other service industries 56 – 51 33
Agriculture and Forestry 74 – 60 – NUMBER OF EMPLOYEES
≤10 61 23 58 26 11–49 53 29 50 32 50–99 59 26 55 30 100–249 49 27 46 38 250–499 47 38 45 42 500–999 62 – 63 29 ≥1000 58 26 56 31
PROFESSION Labour 52 27 46 37 Skilled trade 59 25 53 35 Clerical 48 32 43 38 Professional 60 23 59 28 Management 57 29 57 26
1 Data include all persons in the workforce. 2 Mid-scale values make up the balance of responses and are not shown. – Data unavailable because of insufficient sample size.

106
Potential influence on recruitment and turnover 2006 Physical Activity Monitor
Influenced decision to accept current job1,2
Would influence decision to stay1,2
Somewhat, not at all Moderate Quite a bit,
a great deal Somewhat,
not at all Moderate Quite a bit, a great deal
TOTAL, ADULTS (18+) 84% 7% 9% 54% 21% 25% women 85 6 9 56 17 28 men 83 8 9 53 24 23
18–24 80 – – 47 23 30 women 86 – – 51 – – men 75 – – 44 – –
25–44 83 9 8 53 20 26 women 83 8 9 55 17 28 men 82 10 8 52 23 25
45–64 89 4 7 59 19 22 women 89 – – 59 17 24 men 89 – – 58 21 20
REGION East 83 10 7 53 19 28
Newfoundland 89 – – 59 – – Prince Edward Island 80 – – 51 – – Nova Scotia 79 – – 51 – 30 New Brunswick 84 – – 52 – 29
Quebec 83 – – 55 19 26 Ontario 84 8 8 53 21 27 West 86 – 9 56 22 22
Manitoba 89 – – 56 – – Saskatchewan 87 – – 56 23 – Alberta 80 – – 54 20 26 British Columbia 90 – – 60 – –
North 76 12 12 51 23 27 Yukon 79 – – 57 – 30 Northwest Territories 77 – – 48 23 29 Nunavut – – – – – –
ENERGY EXPENDITURE Active (≥3 KKD3) 79 8 13 49 19 32 Moderately active (1.5–2.9 KKD) 89 – – 57 20 23 Somewhat active (0.5–1.4 KKD) 87 8 – 58 20 22 Sedentary (<0.5 KKD) 85 7 8 55 23 21
1 Data include only those persons in the workforce who have opportunities for physical activity at work. 2 “Not applicable” answers make up the balance of responses and are not shown. 3 Kilocalories/kilogram of body weight/day; an energy expenditure of 3 KKD is roughly equivalent to walking one hour every day. – Data unavailable because of insufficient sample size.

107
Potential influence on recruitment and turnover (cont’d) 2006 Physical Activity Monitor
Influenced decision to accept current job1,2
Would influence decision to stay1,2
Somewhat, not at all Moderate Quite a bit,
a great deal Somewhat,
not at all Moderate Quite a bit, a great deal
EDUCATION LEVEL Less than secondary 78% – – 43% 30% 27% Secondary 81 7 12 51 19 30 College 87 8 6 53 22 26 University 86 6 8 61 20 20
EMPLOYMENT STATUS Full-time worker 84 8 8 53 22 25 Part-time worker 86 – – 59 17 25
HOUSEHOLD INCOME < $20,000 84 – – 72 – – $20,000–29,999 73 – – 39 – 40 $30,000–39,999 83 – – 46 28 26 $40,000–59,999 82 – 11 58 16 26 $60,000–79,999 86 – – 52 21 28 $80,000–99,999 86 – – 52 19 29 ≥ $100,000 87 – 9 60 22 18
COMMUNITY SIZE < 1,000 81 – – 60 22 19 1,000–4,999 79 7 – 50 22 29 5,000–9,999 88 – – 60 17 23 10,000–74,999 82 7 11 55 16 29 75,000–299,999 89 – – 59 22 20 ≥ 300,000 85 – – 54 23 24
FAMILY COMPOSITION Living with a partner 86 6 8 57 21 23 Widowed, divorced, separated 86 – – 52 15 33 Never married 78 10 12 48 22 30
1 Data include only those persons in the workforce who have opportunities for physical activity at work. 2 “Not applicable” answers make up the balance of responses and are not shown. – Data unavailable because of insufficient sample size.

108
Potential influence on recruitment and turnover (cont’d) 2006 Physical Activity Monitor
Influenced decision to accept current job1,2
Would influence decision to stay1,2
Somewhat, not at all Moderate Quite a bit,
a great deal Somewhat,
not at all Moderate Quite a bit, a great deal
SECTOR Private business 84% 8% 8% 55% 20% 25% Government or public organization 87 5 8 55 21 25 Not for profit organization 85 – – 44 – 33
INDUSTRY
Trade and commerce 79 – – 47 25 28 Retail and wholesale industries 79 – – 47 25 28
Industry and manufacturing 85 7 8 49 26 25 Construction industries 83 – – 50 – 26 Hi-tech industries 87 – – 63 – – Transportation / communication 87 – – 55 26 19 Manufacturing industries 83 – – 43 – 28
Finance and services 88 4 8 59 18 23 Hospitality services 87 – – 48 – – Finance and business services 94 – – 59 – 29 Government service industries 82 – – 59 22 19 Education, health and social services 88 5 7 60 17 23 Other service industries 92 – – 69 – –
Agriculture and Forestry 82 – – 61 – – NUMBER OF EMPLOYEES
≤10 76 – 17 56 20 24 11–49 89 6 5 53 22 26 50–99 81 – – 42 22 36 100–249 89 – – 61 21 19 250–499 83 – – 52 – 29 500–999 79 – – 55 – – ≥1000 85 – – 54 21 25
PROFESSION Labour 78 – – 51 23 26 Skilled trade 82 8 10 51 20 30 Clerical 88 – – 53 21 26 Professional 88 5 7 61 18 21 Management 85 – 9 55 22 24
1 Data include only those persons in the workforce who have opportunities for physical activity at work. 2 “Not applicable” answers make up the balance of responses and are not shown. – Data unavailable because of insufficient sample size.

109
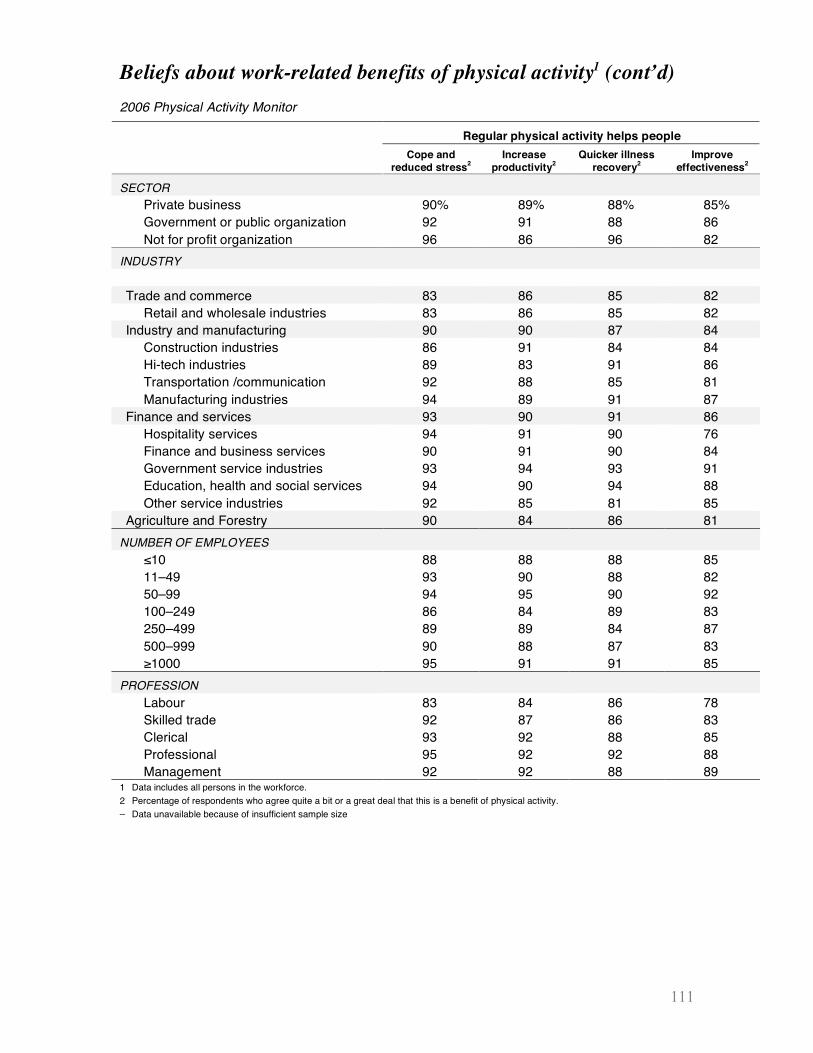
Beliefs about work-related benefits of physical activity1 2006 Physical Activity Monitor
Regular physical activity helps people Cope and reduced
stress2 Increase
productivity2 Quicker illness
recovery2 Improve
effectiveness2
TOTAL, ADULTS (18+) 91% 89% 88% 85% women 94 94 91 90 men 88 86 86 81
18–24 86 85 85 74 women 93 93 88 85 men 81 80 84 67
25–44 93 91 90 88 women 95 95 92 92 men 91 87 88 85
45–64 90 89 88 85 women 92 91 90 89 men 88 88 86 82
REGION East 91 89 89 85
Newfoundland 90 93 92 89 Prince Edward Island 93 89 86 83 Nova Scotia 96 87 89 82 New Brunswick 85 90 88 87
Quebec 88 85 89 83 Ontario 92 91 87 84 West 92 91 89 87
Manitoba 91 91 89 83 Saskatchewan 94 95 91 87 Alberta 90 92 90 91 British Columbia 93 89 89 84
North 89 92 86 85 Yukon 94 95 92 87 Northwest Territories 90 91 90 87 Nunavut – – – –
ENERGY EXPENDITURE Active (≥3 KKD3) 96 94 95 88 Moderately active (1.5–2.9 KKD) 93 90 90 84 Somewhat active (0.5–1.4 KKD) 90 90 87 87 Sedentary (<0.5 KKD) 84 83 82 80
1 Data include all persons in the workforce. 2 Percentage of respondents who agree quite a bit or a great deal that this is a benefit of physical activity. 3 Kilocalories/kilogram of body weight/day; an energy expenditure of 3 KKD is roughly equivalent to walking one hour every day. – Data unavailable because of insufficient sample size

110
Beliefs about work-related benefits of physical activity1 (cont’d) 2006 Physical Activity Monitor
Regular physical activity helps people Cope and reduced
stress2 Increase
productivity2 Quicker illness
recovery2 Improve
effectiveness2
EDUCATION LEVEL Less than secondary 78% 84% 81% 77% Secondary 88 87 87 80 College 93 91 88 87 University 94 92 93 90
EMPLOYMENT STATUS Full-time worker 91 89 89 85 Part-time worker 92 89 86 86
HOUSEHOLD INCOME < $20,000 75 80 71 76 $20,000–29,999 87 90 91 88 $30,000–39,999 91 91 96 80 $40,000–59,999 90 87 87 85 $60,000–79,999 94 92 86 83 $80,000–99,999 95 93 94 92 ≥ $100,000 93 90 90 87
COMMUNITY SIZE < 1,000 86 85 83 76 1,000–4,999 91 90 91 86 5,000–9,999 90 91 87 82 10,000–74,999 92 93 92 88 75,000–299,999 89 87 85 84 ≥ 300,000 93 90 88 87
MARITAL STATUS Living with a partner 92 91 90 88 Widowed, divorced, separated 87 85 86 84 Never married 87 87 86 77
1 Data include all persons in the workforce. 2 Percentage of respondents who agree quite a bit or a great deal that this is a benefit of physical activity. – Data unavailable because of insufficient sample size
111
Beliefs about work-related benefits of physical activity1 (cont’d) 2006 Physical Activity Monitor
Regular physical activity helps people Cope and
reduced stress2 Increase
productivity2 Quicker illness
recovery2 Improve
effectiveness2
SECTOR Private business 90% 89% 88% 85% Government or public organization 92 91 88 86 Not for profit organization 96 86 96 82
INDUSTRY
Trade and commerce 83 86 85 82 Retail and wholesale industries 83 86 85 82
Industry and manufacturing 90 90 87 84 Construction industries 86 91 84 84 Hi-tech industries 89 83 91 86 Transportation /communication 92 88 85 81 Manufacturing industries 94 89 91 87
Finance and services 93 90 91 86 Hospitality services 94 91 90 76 Finance and business services 90 91 90 84 Government service industries 93 94 93 91 Education, health and social services 94 90 94 88 Other service industries 92 85 81 85
Agriculture and Forestry 90 84 86 81 NUMBER OF EMPLOYEES
≤10 88 88 88 85 11–49 93 90 88 82 50–99 94 95 90 92 100–249 86 84 89 83 250–499 89 89 84 87 500–999 90 88 87 83 ≥1000 95 91 91 85
PROFESSION Labour 83 84 86 78 Skilled trade 92 87 86 83 Clerical 93 92 88 85 Professional 95 92 92 88 Management 92 92 88 89
1 Data includes all persons in the workforce. 2 Percentage of respondents who agree quite a bit or a great deal that this is a benefit of physical activity. – Data unavailable because of insufficient sample size

112
Absenteeism1 2006 Physical Activity Monitor
Absent days from work 0 days2 1–5 days2 6 days or more2
TOTAL, ADULTS (18+) 47% 37% 16% women 42 36 22 men 52 37 11
18–24 45 39 15 women – 38 – men 55 40 –
25–44 43 40 17 women 39 39 23 men 46 42 12
45–64 53 31 16 women 48 32 20 men 58 31 12
REGION East 44 41 15
Newfoundland 44 40 – Prince Edward Island 47 40 – Nova Scotia 44 39 – New Brunswick 44 45 –
Quebec 51 33 16 Ontario 43 42 15 West 51 30 19
Manitoba 39 34 27 Saskatchewan 38 37 25 Alberta 51 30 19 British Columbia 59 27 –
North 37 41 22 Yukon 37 42 21 Northwest Territories 39 39 23 Nunavut – – –
ENERGY EXPENDITURE Active (≥3 KKD3) 50 37 13 Moderately active (1.5–2.9 KKD) 44 37 19 Somewhat active (0.5–1.4 KKD) 42 38 20 Sedentary (<0.5 KKD) 50 35 15
1 Data include all persons in the workforce. 2 Time absent from work within the last year due to sickness, injury, or disability. 3 Kilocalories/kilogram of body weight/day; an energy expenditure of 3 KKD is roughly equivalent to walking one hour every day. – Data unavailable because of insufficient sample size.

113
Absenteeism1 (cont’d) 2006 Physical Activity Monitor
Absent days from work 0 days2 1–5 days2 6 days or more2
EDUCATION LEVEL Less than secondary 53% 37% 10% Secondary 51 33 16 College 44 38 18 University 46 39 15
EMPLOYMENT STATUS Full-time worker 46 38 16 Part-time worker 56 30 14
HOUSEHOLD INCOME < $20,000 69 – – $20,000–29,999 47 37 – $30,000–39,999 48 38 14 $40,000–59,999 43 33 24 $60,000–79,999 37 41 22 $80,000–99,999 43 37 20 ≥ $100,000 52 40 8
COMMUNITY SIZE < 1,000 48 36 16 1,000–4,999 49 32 19 5,000–9,999 42 45 13 10,000–74,999 48 34 18 75,000–299,999 46 37 16 ≥ 300,000 47 38 15
MARITAL STATUS Living with a partner 49 36 16 Widowed, divorced, separated 47 34 19 Never married 43 41 16
1 Data include all persons in the workforce. 2 Time absent from work within the last year due to sickness, injury, or disability. – Data unavailable because of insufficient sample size.

114
Absenteeism1 (cont’d) 2006 Physical Activity Monitor
Absent days from work 0 days2 1–5 days2 6 days or more2
SECTOR Private business 54% 33% 13% Government or public organization 35 42 22 Not for profit organization 43 42 –
INDUSTRY
Trade and commerce 48 34 18 Retail and wholesale industries 48 34 18
Industry and manufacturing 54 35 11 Construction industries 64 30 – Hi-tech industries – – – Transportation /communication 58 32 9 Manufacturing industries 47 37 –
Finance and services 41 40 19 Hospitality services 39 40 – Finance and business services 42 47 – Government service industries 32 41 27 Education, health and social services 39 41 20 Other service industries 57 30 –
Agriculture and Forestry 65 27 – NUMBER OF EMPLOYEES
≤10 60 30 10 11–49 45 39 15 50–99 55 25 20 100–249 43 42 16 250–499 42 34 25 500–999 40 43 – ≥1000 41 41 18
PROFESSION Labour 48 33 19 Skilled trade 50 34 17 Clerical 40 42 18 Professional 42 42 16 Management 55 35 11
1 Data include all persons in the workforce. 2 Time absent from work within the last year due to sickness, injury, or disability. – Data unavailable because of insufficient sample size.

115
Workplace injury, illness and stress1 2006 Physical Activity Monitor
Injured while at work
Physically ill because of work
Suffer from stress or emotional condition
because of work
TOTAL, ADULTS (18+) 12% 11% 20% women 10 13 24 men 13 10 17
18–24 21 – 22 women – – – men – – –
25–44 11 12 23 women 10 14 26 men 13 9 20
45–64 9 7 17 women 11 10 22 men 8 – 13
REGION East 11 12 18
Newfoundland – – – Prince Edward Island – – – Nova Scotia – – – New Brunswick – – –
Quebec – – 24 Ontario 14 11 21 West 11 11 18
Manitoba – – 19 Saskatchewan – – – Alberta – – – British Columbia – – –
North 12 9 24 Yukon – – 25 Northwest Territories – – 27 Nunavut – – –
ENERGY EXPENDITURE Active (≥3 KKD2) 11 12 18 Moderately active (1.5–2.9 KKD) 14 13 23 Somewhat active (0.5–1.4 KKD) 9 7 23 Sedentary (<0.5 KKD) 13 11 19
1 Data include all persons in the workforce. 2 Kilocalories/kilogram of body weight/day; an energy expenditure of 3 KKD is roughly equivalent to walking one hour every day. – Data unavailable because of insufficient sample size.

116
Workplace injury, illness and stress1 (cont’d) 2006 Physical Activity Monitor
Injured while
at work Physically ill
because of work
Suffer from stress or emotional condition
because of work
EDUCATION LEVEL Less than secondary 18% – 19% Secondary 16 13 22 College 13 10 19 University 6 10 22
EMPLOYMENT STATUS Full-time worker 11 11 21 Part-time worker 16 12 19
HOUSEHOLD INCOME < $20,000 – – – $20,000–29,999 – – – $30,000–39,999 – 19 28 $40,000–59,999 15 13 23 $60,000–79,999 11 10 19 $80,000–99,999 14 10 22 ≥ $100,000 8 11 20
COMMUNITY SIZE < 1,000 – – 18 1,000–4,999 12 9 16 5,000–9,999 19 – 22 10,000–74,999 13 15 24 75,000–299,999 10 9 19 ≥ 300,000 7 9 20
MARITAL STATUS Living with a partner 10 9 19 Widowed, divorced, separated 11 11 25 Never married 18 18 24
1 Data include all persons in the workforce. – Data unavailable because of insufficient sample size.

117
Workplace injury, illness and stress1 (cont’d) 2006 Physical Activity Monitor
Injured while
at work Physically ill
because of work
Suffer from stress or emotional condition
because of work SECTOR
Private business 9% 8% 19% Government or public organization 15 15 23 Not for profit organization – – 29
INDUSTRY
Trade and commerce – – 21 Retail and wholesale industries – – 21
Industry and manufacturing 13 8 19 Construction industries – – – Hi-tech industries – – – Transportation /communication 12 – 13 Manufacturing industries – – 25
Finance and services 12 15 23 Hospitality services – – – Finance and business services – – 25 Government service industries – – 33 Education, health and social services 10 16 23 Other service industries – – –
Agriculture and Forestry – – – NUMBER OF EMPLOYEES
≤10 9 – 15 11–49 12 15 22 50–99 – – 22 100–249 17 – 20 250–499 – – 23 500–999 – – 25 ≥1000 7 13 21
PROFESSION Labour 21 16 23 Skilled trade 17 15 17 Clerical – – 21 Professional 8 9 22 Management – – 19
1 Data include all persons in the workforce. – Data unavailable because of insufficient sample size.

118
Employer attitude and support for physical activity 2006 Physical Activity Monitor
Perceived employer supportiveness in physical activity1,2
Somewhat or not at all
Very or Extremely
Believe employer support would
promote physical activity3
Believe employer support promotes physical activity
TOTAL, ADULTS (18+) 55% 25% 44% 70% women 56 23 47 69 men 55 25 41 71
18–24 53 24 – 74 women 47 – – 76 men 56 24 – 73
25–44 53 27 45 73 women 55 24 46 74 men 51 29 44 73
45–64 59 22 50 63 women 59 23 52 60 men 60 22 48 67
REGION East 55 23 57 73
Newfoundland 67 – – 83 Prince Edward Island 53 – – 70 Nova Scotia 50 27 – 73 New Brunswick 53 – – 68
Quebec 59 20 31 66 Ontario 55 24 44 74 West 54 30 55 67
Manitoba 57 – – 67 Saskatchewan 41 31 – 70 Alberta 53 28 66 74 British Columbia 58 34 – 56
North 47 32 69 79 Yukon 43 34 – 79 Northwest Territories 47 31 – 81 Nunavut1 – – – –
ENERGY EXPENDITURE Active (≥3 KKD)4 49 33 44 69 Moderately active (1.5–2.9 KKD) 59 23 41 71 Somewhat active (0.5–1.4 KKD) 56 21 51 68 Sedentary (<0.5 KKD) 60 18 40 75
1 Data include all persons in the workforce. 2 Mid-scale values make up the balance of responses and are not shown. 3 Data include only those who perceive no support for physical activity from their employer. 4 Kilocalories/kilogram of body weight/day; an energy expenditure of 3 KKD is roughly equivalent to walking one hour every day. – Data unavailable because of insufficient sample size.

119
Employer attitude and support for physical activity (cont’d) 2006 Physical Activity Monitor
Perceived employer supportiveness for physical activity1,2
Somewhat or not at all
Very or Extremely
Believe employer support would
promote physical activity3
Believe employer support promotes physical activity
EDUCATION LEVEL Less than secondary 57% 22% 47% 69% Secondary 57 24 45 81 College 55 25 39 70 University 54 26 46 63
EMPLOYMENT STATUS Full-time worker 56 25 45 70 Part-time worker 54 23 36 73
HOUSEHOLD INCOME < $20,000 63 – – 56 $20,000–29,999 61 20 45 82 $30,000–39,999 61 20 53 70 $40,000–59,999 57 18 44 76 $60,000–79,999 57 24 46 70 $80,000–99,999 56 22 43 64 ≥ $100,000 50 34 38 67
COMMUNITY SIZE < 1,000 48 31 – 77 1,000–4,999 58 20 49 71 5,000–9,999 52 20 49 64 10,000–74,999 54 27 38 75 75,000–299,999 53 26 46 72 ≥ 300,000 57 24 49 67
FAMILY COMPOSITION Living with a partner 55 25 47 69 Widowed, divorced, separated 59 23 42 76 Never married 55 24 34 72
1 Data include all persons in the workforce. 2 Mid-scale values make up the balance of responses and are not shown. 3 Data include only those who perceive no support for physical activity from their employer. – Data unavailable because of insufficient sample size.

120
Employer attitude and support for physical activity (cont’d) 2006 Physical Activity Monitor
Perceived employer supportiveness for physical activity1,2
Somewhat or not at all
Very or extremely
Believe employer support would
promote activity3
Believe employer support promotes physical activity
SECTOR Private business 56% 25% 44% 71% Government or public organization 56 24 43 67 Not for profit organization 51 29 – 80
INDUSTRY Trade and commerce 64 13 46 78 Retail and wholesale industries 64 13 46 78
Industry and manufacturing 59 23 44 72 Construction industries 48 29 – 80 Hi-tech industries – – – 67 Transportation /communication 54 26 38 65 Manufacturing industries 70 – 52 65
Finance and services 54 26 43 65 Hospitality services 61 22 – 78 Finance and business services 42 32 – 60 Government service industries 42 36 – 68 Education, health and social services 60 20 48 62 Other service industries 57 26 – 68
Agriculture and Forestry 49 30 – 62 NUMBER OF EMPLOYEES
≤10 48 31 37 76 11–49 59 21 43 73 50–99 62 23 36 77 100–249 66 18 39 61 250–499 57 18 – 69 500–999 47 26 – 73 ≥1000 45 32 49 68
PROFESSION Labour 60 21 35 73 Skilled trade 53 25 46 71 Clerical 64 14 53 65 Professional 51 29 38 67 Management 55 26 53 73
1 Data include all persons in the workforce. 2 Mid-scale values make up the balance of responses and are not shown. 3 Data include only those who perceive no support for physical activity from their employer. – Data unavailable because of insufficient sample size.

121
Support for physical activity at work1 2006 Physical Activity Monitor
Employer allows participation in community events2
Employer offers awards or recognition
TOTAL, ADULTS (18+) 30% 10% women 27 9 men 32 12
18–24 29 – women – – men 29 –
25–44 31 10 women 29 9 men 33 11
45–64 27 9 women 23 8 men 32 11
REGION East 40 12
Newfoundland 39 – Prince Edward Island 31 – Nova Scotia 44 – New Brunswick 37 –
Quebec 25 – Ontario 28 12 West 34 10
Manitoba 31 – Saskatchewan 34 – Alberta 35 – British Columbia – –
North 51 19 Yukon 43 – Northwest Territories 49 17 Nunavut – –
ENERGY EXPENDITURE Active (≥3 KKD3) 35 13 Moderately active (1.5–2.9 KKD) 29 11 Somewhat active (0.5–1.4 KKD) 28 7 Sedentary (<0.5 KKD) 25 8
1 Data include all persons in the workforce unless otherwise indicated. 2 Data include only those whose employer offers some degree of support for physical activity. 3 Kilocalories/kilogram of body weight/day; an energy expenditure of 3 KKD is roughly equivalent to walking one hour every day. – Data unavailable because of insufficient sample size.

122
Support for physical activity at work1 (cont’d) 2006 Physical Activity Monitor
Employer allows participation in community events2
Employer offers awards or recognition
EDUCATION LEVEL Less than secondary 8% – Secondary 24 11 College 27 9 University 43 11
EMPLOYMENT STATUS Full-time worker 31 10 Part-time worker 22 11
HOUSEHOLD INCOME < $20,000 – – $20,000–29,999 22 – $30,000–39,999 13 – $40,000–59,999 25 10 $60,000–79,999 31 9 $80,000–99,999 36 8 ≥ $100,000 41 14
COMMUNITY SIZE < 1,000 34 – 1,000–4,999 28 10 5,000–9,999 26 – 10,000–74,999 31 13 75,000–299,999 30 9 ≥ 300,000 34 10
FAMILY COMPOSITION Living with a partner 31 10 Widowed, divorced, separated 33 12 Never married 25 10
1 Data include all persons in the workforce unless otherwise indicated. 2 Data include only those whose employer offers some degree of support for physical activity. – Data unavailable because of insufficient sample size.

123
Support for physical activity at work1 (cont’d) 2006 Physical Activity Monitor
Employer allows participation in community events2
Employer offers awards or recognition
SECTOR Private business 29% 8% Government or public organization 33 14 Not for profit organization 28 –
INDUSTRY
Trade and commerce 25 – Retail and wholesale industries 25 –
Industry and manufacturing 29 10 Construction industries 24 – Hi-tech industries – – Transportation /communication 33 – Manufacturing industries – –
Finance and services 33 13 Hospitality services – – Finance and business services 53 – Government service industries 46 23 Education, health and social services 27 10 Other service industries 25 –
Agriculture and Forestry 31 – NUMBER OF EMPLOYEES
≤10 31 – 11–49 28 5 50–99 35 – 100–249 21 – 250–499 29 – 500–999 38 25 ≥1000 36 14
PROFESSION Labour 18 – Skilled trade 20 8 Clerical 23 – Professional 35 12 Management 51 13
1 Data include all persons in the workforce unless otherwise indicated. 2 Data include only those whose employer offers some degree of support for physical activity. – Data unavailable because of insufficient sample size.

124
Fitness information at work1 2006 Physical Activity Monitor
Fitness/health bulletin board or newsletter
Where to be active in the community
How to become more active
Physical activity seminars or workshops
TOTAL, ADULTS (18+) 32% 25% 28% 26% women 31 27 30 29 men 33 23 26 23
18–24 27 21 25 21 women – – – – men – – – –
25–44 33 25 29 27 women 33 27 32 31 men 33 24 26 23
45–64 33 26 29 26 women 31 28 30 28 men 35 24 27 24
REGION East 37 27 33 30
Newfoundland 31 30 35 31 Prince Edward Island 28 35 33 23 Nova Scotia 46 27 34 31 New Brunswick 29 24 30 31
Quebec 25 19 23 20 Ontario 37 27 29 27 West 30 27 30 27
Manitoba 30 30 40 23 Saskatchewan 32 30 30 29 Alberta 34 27 32 30 British Columbia – – – –
North 32 34 36 24 Yukon 31 32 35 26 Northwest Territories 31 35 36 27 Nunavut – – – –
ENERGY EXPENDITURE Active (≥3 KKD2) 33 26 31 29 Moderately active (1.5–2.9 KKD) 32 24 30 25 Somewhat active (0.5–1.4 KKD) 32 24 31 24 Sedentary (<0.5 KKD) 31 25 22 24
1 Data include all persons in the workforce. 2 Kilocalories/kilogram of body weight/day; an energy expenditure of 3 KKD is roughly equivalent to walking one hour every day. – Data unavailable because of insufficient sample size.

125
Fitness information at work1 (cont’d) 2006 Physical Activity Monitor
Fitness/health bulletin board or
newsletter
Where to be active in the community
How to become more active
Physical activity seminars or workshops
EDUCATION LEVEL Less than secondary 32% 30% 29% 22% Secondary 30 21 22 23 College 34 24 28 23 University 32 28 34 32
EMPLOYMENT STATUS Full-time worker 33 25 28 25 Part-time worker 25 23 28 26
HOUSEHOLD INCOME < $20,000 – – – – $20,000–29,999 27 22 26 27 $30,000–39,999 27 24 22 19 $40,000–59,999 30 25 23 21 $60,000–79,999 31 19 28 21 $80,000–99,999 35 31 32 30 ≥ $100,000 32 27 34 33
COMMUNITY SIZE < 1,000 25 24 23 19 1,000–4,999 34 25 28 24 5,000–9,999 26 25 28 23 10,000–74,999 36 25 33 28 75,000–299,999 29 24 23 24 ≥ 300,000 31 25 29 27
MARITAL STATUS Living with a partner 33 25 29 26 Widowed, divorced, separated 37 32 34 26 Never married 28 21 23 23
1 Data include all persons in the workforce. – Data unavailable because of insufficient sample size.

126
Fitness information at work1 (cont’d) 2006 Physical Activity Monitor
Fitness/health bulletin board or
newsletter
Where to be active in the community
How to become more active
Physical activity seminars or workshops
SECTOR Private Business 26% 19% 22% 18% Government or public organization 41 34 38 37 Not for profit organization 29 30 36 27
INDUSTRY
Trade and commerce 26 16 19 13 Retail and wholesale industries 26 16 19 13
Industry and manufacturing 30 22 22 20 Construction industries – – – – Hi-tech industries – – – – Transportation /communication 33 25 26 26 Manufacturing industries 36 22 23 21
Finance and services 36 30 36 34 Hospitality services 30 28 23 – Finance and business services 31 30 27 – Government service industries 44 31 46 44 Education, health and social services 42 35 43 41 Other service industries 17 – 22 –
Agriculture and Forestry 29 17 – – NUMBER OF EMPLOYEES
≤10 11 15 20 14 11–49 18 17 13 14 50–99 30 22 35 24 100–249 39 24 23 22 250–499 42 28 28 36 500–999 58 36 46 41 ≥1000 52 43 50 46
PROFESSION Labour 31 22 25 23 Skilled trade 33 22 25 22 Clerical 31 29 26 27 Professional 37 30 37 32 Management 27 22 26 22
1 Data include all persons in the workforce. – Data unavailable because of insufficient sample size.

127
Soft supports for activity1 2006 Physical Activity Monitor
Dress-down days Flexible working hours Group discounts
TOTAL, ADULTS (18+) 42% 38% 26% women 45 40 26 men 39 36 26
18–24 34 50 27 women 36 56 – men 33 46 –
25–44 46 40 28 women 50 45 30 men 43 35 26
45–64 38 31 24 women 41 28 24 men 36 34 24
REGION East 48 41 27
Newfoundland 43 35 – Prince Edward Island 41 41 27 Nova Scotia 50 42 34 New Brunswick 49 43 –
Quebec 37 34 30 Ontario 41 37 24 West 45 43 26
Manitoba 54 49 28 Saskatchewan 44 40 – Alberta 43 44 35 British Columbia 44 40 –
North 50 44 21 Yukon 54 59 30 Northwest Territories 51 48 22 Nunavut – – –
ENERGY EXPENDITURE Active (≥3 KKD2) 45 43 31 Moderately active (1.5–2.9 KKD) 47 38 30 Somewhat active (0.5–1.4 KKD) 38 38 28 Sedentary (<0.5 KKD) 37 32 16
1 Data include all persons in the workforce. 2 Kilocalories/kilogram of body weight/day; an energy expenditure of 3 KKD is roughly equivalent to walking one hour every day. – Data unavailable because of insufficient sample size.

128
Soft supports for activity1 (cont’d) 2006 Physical Activity Monitor
Dress-down days Flexible working hours Group discounts
EDUCATION LEVEL
Less than secondary 22% 34% 20% Secondary 37 37 23 College 41 38 24 University 52 41 35
EMPLOYMENT STATUS Full-time worker 42 35 27 Part-time worker 38 52 18
HOUSEHOLD INCOME < $20,000 34 38 – $20,000–29,999 43 31 – $30,000–39,999 30 29 18 $40,000–59,999 36 37 22 $60,000–79,999 48 38 28 $80,000–99,999 42 35 28 ≥ $100,000 45 43 34
COMMUNITY SIZE < 1,000 50 44 – 1,000–4,999 37 34 21 5,000–9,999 38 33 23 10,000–74,999 40 36 27 75,000–299,999 39 45 24 ≥ 300,000 49 41 30
MARITAL STATUS Living with a partner 43 37 27 Widowed, divorced, separated 43 29 23 Never married 38 47 24
1 Data include all persons in the workforce. – Data unavailable because of insufficient sample size.

129
Soft supports for activity1 (cont’d) 2006 Physical Activity Monitor
Dress-down days Flexible working hours Group discounts
SECTOR Private Business 40% 37% 19% Government or public organization 44 38 38 Not for profit organization 55 40 –
INDUSTRY
Trade and commerce 35 35 14 Retail and wholesale industries 35 35 14
Industry and manufacturing 41 35 21 Construction industries 28 35 – Hi-tech industries 71 55 – Transportation /communication 39 40 29 Manufacturing industries 45 – 24
Finance and services 46 37 34 Hospitality services 17 32 – Finance and business services 64 42 32 Government service industries 50 49 48 Education, health and social services 50 33 35 Other service industries 40 37 –
Agriculture and Forestry 38 36 – NUMBER OF EMPLOYEES
≤10 45 47 – 11–49 37 33 12 50–99 38 40 29 100–249 38 32 28 250–499 42 30 31 500–999 50 47 38 ≥1000 47 41 56
PROFESSION Labour 29 37 19 Skilled trade 36 31 21 Clerical 44 30 28 Professional 49 43 33 Management 52 41 28
1 Data include all persons in the workforce. – Data unavailable because of insufficient sample size.

130
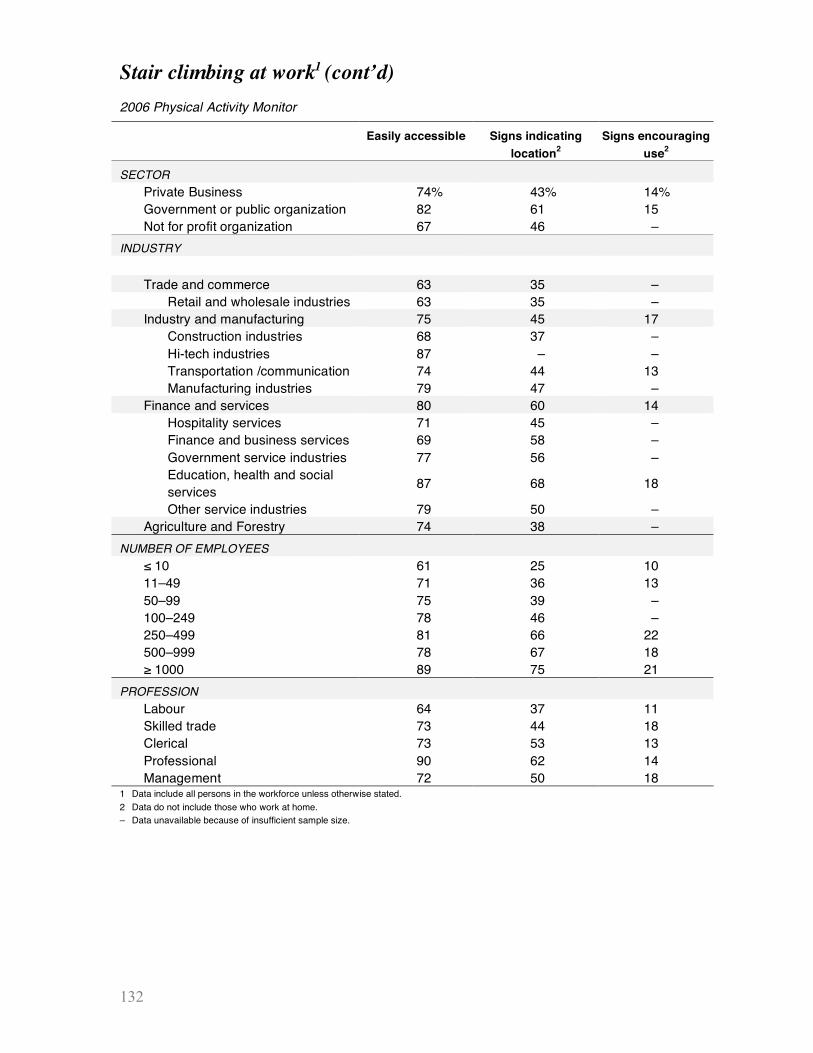
Stair climbing at work1 2006 Physical Activity Monitor
Easily accessible Signs indicating location2
Signs encouraging use2
TOTAL, ADULTS (18+) 76% 49% 15% women 76 52 16 men 76 47 14
18–24 70 35 – women 67 – – men 72 41 –
25–44 76 50 16 women 75 53 17 men 77 48 15
45–64 78 55 14 women 81 61 17 men 76 48 11
REGION East 79 56 20
Newfoundland 79 56 – Prince Edward Island 66 50 – Nova Scotia 85 59 – New Brunswick 73 53 –
Quebec 76 47 12 Ontario 75 48 18 West 76 51 11
Manitoba 71 49 – Saskatchewan 72 43 – Alberta 74 50 – British Columbia 80 54 –
North 77 54 17 Yukon 81 53 – Northwest Territories 79 59 20 Nunavut – – –
ENERGY EXPENDITURE Active (≥3 KKD3) 79 51 15 Moderately active (1.5–2.9 KKD) 76 47 10 Somewhat active (0.5–1.4 KKD) 76 53 16 Sedentary (<0.5 KKD) 71 47 18
1 Data include all persons in the workforce unless otherwise stated. 2 Data do not include those who work at home. 3 Kilocalories/kilogram of body weight/day; an energy expenditure of 3 KKD is roughly equivalent to walking one hour every day. – Data unavailable because of insufficient sample size.

131
Stair climbing at work1 (cont’d) 2006 Physical Activity Monitor
Easily accessible Signs indicating location2
Signs encouraging use2
EDUCATION LEVEL Less than secondary 74% 33% 17% Secondary 71 41 15 College 72 50 16 University 86 60 13
EMPLOYMENT STATUS Full-time worker 77 51 15 Part-time worker 72 39 15
HOUSEHOLD INCOME < $20,000 61 41 – $20,000–29,999 75 40 – $30,000–39,999 73 41 17 $40,000–59,999 75 48 15 $60,000–79,999 77 53 17 $80,000–99,999 74 49 10 ≥ $100,000 80 55 13
COMMUNITY SIZE < 1,000 68 42 – 1,000–4,999 63 34 18 5,000–9,999 81 47 19 10,000–74,999 76 47 14 75,000–299,999 80 51 15 ≥ 300,000 80 61 14
MARITAL STATUS Living with a partner 77 51 15 Widowed, divorced, separated 75 56 17 Never married 73 41 13
1 Data include all persons in the workforce unless otherwise stated. 2 Data do not include those who work at home. – Data unavailable because of insufficient sample size.
132
Stair climbing at work1 (cont’d) 2006 Physical Activity Monitor
Easily accessible Signs indicating location2
Signs encouraging use2
SECTOR Private Business 74% 43% 14% Government or public organization 82 61 15 Not for profit organization 67 46 –
INDUSTRY Trade and commerce 63 35 –
Retail and wholesale industries 63 35 – Industry and manufacturing 75 45 17
Construction industries 68 37 – Hi-tech industries 87 – – Transportation /communication 74 44 13 Manufacturing industries 79 47 –
Finance and services 80 60 14 Hospitality services 71 45 – Finance and business services 69 58 – Government service industries 77 56 – Education, health and social services 87 68 18
Other service industries 79 50 – Agriculture and Forestry 74 38 –
NUMBER OF EMPLOYEES ≤ 10 61 25 10 11–49 71 36 13 50–99 75 39 – 100–249 78 46 – 250–499 81 66 22 500–999 78 67 18 ≥ 1000 89 75 21
PROFESSION Labour 64 37 11 Skilled trade 73 44 18 Clerical 73 53 13 Professional 90 62 14 Management 72 50 18
1 Data include all persons in the workforce unless otherwise stated. 2 Data do not include those who work at home. – Data unavailable because of insufficient sample size.

133
Occasional opportunities at work1 2006 Physical Activity Monitor
Recreational events
Team sports
Physical activity events
Physical activity clubs
Short exercise breaks
TOTAL, ADULTS (18+) 48% 30% 20% 15% 11% women 42 26 19 15 10 men 54 33 20 16 12
18–24 43 32 – – – women – – – – – men 52 38 – – –
25–44 52 32 22 16 12 women 46 28 22 17 10 men 58 37 21 14 14
45–64 46 25 20 14 9 women 41 24 20 11 11 men 52 27 20 17 8
REGION East 43 30 20 16 10
Newfoundland 37 25 – – – Prince Edward Island 37 – – – – Nova Scotia 47 34 21 – – New Brunswick 43 32 – – –
Quebec 48 30 16 – – Ontario 47 29 20 14 13 West 51 30 22 19 9
Manitoba 53 29 – – – Saskatchewan 57 37 – – – Alberta 53 31 30 19 – British Columbia 47 – – – –
North 34 32 32 13 14 Yukon 43 34 31 20 – Northwest Territories 39 31 39 13 – Nunavut – – – – –
ENERGY EXPENDITURE Active (≥3 KKD2) 55 32 23 21 14 Moderately active (1.5–2.9 KKD) 51 27 23 13 11 Somewhat active (0.5–1.4 KKD) 44 31 19 13 8 Sedentary (<0.5 KKD) 42 28 14 11 12
1 Data include all persons in the workforce. 2 Kilocalories/kilogram of body weight/day; an energy expenditure of 3 KKD is roughly equivalent to walking one hour every day. – Data unavailable because of insufficient sample size.

134
Occasional opportunities at work1 (cont’d) 2006 Physical Activity Monitor
Recreational
events Team sports
Physical activity events
Physical activity clubs
Short exercise breaks
EDUCATION LEVEL Less than secondary 38% 22% 12% – – Secondary 47 31 15 14 11 College 47 27 16 14 10 University 54 35 30 20 12
EMPLOYMENT STATUS Full-time worker 50 31 20 15 11 Part-time worker 39 19 15 14 13
HOUSEHOLD INCOME < $20,000 – – – – – $20,000–29,999 32 – – – – $30,000–39,999 36 21 – – – $40,000–59,999 47 23 19 14 10 $60,000–79,999 53 33 22 15 9 $80,000–99,999 48 31 24 18 8 ≥ $100,000 57 41 27 20 15
COMMUNITY SIZE < 1,000 50 28 – – – 1,000–4,999 50 28 17 16 12 5,000–9,999 50 32 22 – – 10,000–74,999 48 25 19 16 13 75,000–299,999 48 30 21 15 – ≥ 300,000 51 35 21 17 11
MARITAL STATUS Living with a partner 51 31 21 16 11 Widowed, divorced, separated 43 26 21 16 – Never married 43 28 15 14 13
1 Data include all persons in the workforce. – Data unavailable because of insufficient sample size.

135
Occasional opportunities at work1 (cont’d) 2006 Physical Activity Monitor
Recreational events
Team sports
Physical activity events
Physical activity clubs
Short exercise breaks
SECTOR Private Business 46% 23% 14% 11% 11% Government or public organization 55 40 30 21 11 Not for profit organization 49 36 – – –
INDUSTRY Trade and commerce 31 16 – – –
Retail and wholesale industries 31 16 – – – Industry and manufacturing 52 31 16 13 12
Construction industries 52 26 – – – Hi-tech industries – – – – – Transportation /communication 50 33 20 18 – Manufacturing industries 53 29 – – –
Finance and services 51 32 27 21 11 Hospitality services 45 – – – – Finance and business services 68 31 39 – – Government service industries 56 42 43 29 – Education, health and social services 48 33 27 22 12
Other service industries 40 – – – – Agriculture and Forestry 50 27 – – –
NUMBER OF EMPLOYEES ≤ 10 28 10 8 7 12 11–49 38 18 12 8 8 50–99 51 22 20 14 – 100–249 47 34 17 13 – 250–499 64 42 28 19 – 500–999 73 57 37 29 – ≥ 1000 66 51 34 28 17
PROFESSION Labour 37 24 13 13 12 Skilled trade 56 29 14 12 10 Clerical 43 22 22 16 – Professional 52 38 27 19 12 Management 53 27 21 14 13
1 Data include all perosns in the workforce. – Data unavailable because of insufficient sample size.

136
Opportunities for physical activity near work1 2006 Physical Activity Monitor
Places to walk or jog
Fitness or sport facilities
Playing fields or open spaces at/near work
TOTAL, ADULTS (18+) 55% 49% 36% women 61 50 39 men 50 49 34
18–24 43 40 23 women 48 41 – men 39 39 23
25–44 58 51 39 women 64 52 43 men 52 50 35
45–64 57 51 39 women 61 50 40 men 53 52 38
REGION East 66 58 42
Newfoundland 55 50 34 Prince Edward Island 63 58 49 Nova Scotia 73 63 41 New Brunswick 66 59 48
Quebec 44 41 29 Ontario 56 47 36 West 62 56 41
Manitoba 58 57 43 Saskatchewan 59 54 43 Alberta 57 56 38 British Columbia 69 56 44
North 63 59 52 Yukon 74 54 55 Northwest Territories 68 68 51 Nunavut – – –
ENERGY EXPENDITURE Active (≥3 KKD2) 58 54 39 Moderately active (1.5–2.9 KKD) 59 50 37 Somewhat active (0.5–1.4 KKD) 58 47 34 Sedentary (<0.5 KKD) 49 45 34
1 Data include all persons in the workforce. 2 Kilocalories/kilogram of body weight/day; an energy expenditure of 3 KKD is roughly equivalent to walking one hour every day. – Data unavailable because of insufficient sample size.

137
Opportunities for physical activity near work1(cont’d) 2006 Physical Activity Monitor
Places to walk or jog Fitness or sport facilities
Playing fields or open spaces at/near work
EDUCATION LEVEL Less than secondary 36% 37 32% Secondary 45 38 28 College 59 53 33 University 66 58 48
EMPLOYMENT STATUS Full-time worker 56 50 36 Part-time worker 55 49 39
HOUSEHOLD INCOME < $20,000 46 39 29 $20,000–29,999 46 32 33 $30,000–39,999 47 40 30 $40,000–59,999 51 48 33 $60,000–79,999 58 52 42 $80,000–99,999 55 48 34 ≥ $100,000 62 55 39
COMMUNITY SIZE < 1,000 60 32 46 1,000–4,999 56 46 50 5,000–9,999 46 43 33 10,000–74,999 52 46 32 75,000–299,999 59 58 36 ≥ 300,000 59 54 36
MARITAL STATUS Living with a partner 58 51 39 Widowed, divorced, separated 59 50 39 Never married 48 46 29
1 Data include all persons in the workforce. – Data unavailable because of insufficient sample size.

138
Opportunities for physical activity near work1 (cont’d) 2006 Physical Activity Monitor
Places to walk or jog Fitness or sport facilities
Playing fields or open spaces at/near work
SECTOR Private Business 50% 45% 29% Government or public organization 65 58 46 Not for profit organization 51 43 37
INDUSTRY Trade and commerce 42 40 27
Retail and wholesale industries 42 40 27 Industry and manufacturing 47 41 27
Construction industries 46 29 30 Hi-tech industries 66 66 – Transportation /communication 47 44 26 Manufacturing industries 47 40 27
Finance and services 66 56 44 Hospitality services 57 49 27 Finance and business services 74 67 28 Government service industries 72 61 42 Education, health and social services 66 55 55
Other service industries 59 48 41 Agriculture and Forestry 55 38 32
NUMBER OF EMPLOYEES ≤ 10 62 46 42 11–49 50 41 37 50–99 50 65 36 100–249 48 44 27 250–499 49 49 28 500–999 64 50 39 ≥ 1000 63 59 36
PROFESSION Labour 41 38 24 Skilled trade 46 46 33 Clerical 58 42 30 Professional 64 59 44 Management 64 49 36
1 Data include all persons in the workforce. – Data unavailable because of insufficient sample size.

139
Fitness instruction or counselling at work1 2006 Physical Activity Monitor
Fitness testing or
activity counselling
Instruction for building a physical
activity program
Instruction in physical activities
TOTAL, ADULTS (18+) 14% 12% 11% women 12 12 10 men 16 11 11
18–24 – 11 – women – – – men – – –
25–44 17 12 10 women 13 14 12 men 19 10 9
45–64 13 11 10 women 11 10 8 men 14 13 12
REGION East 16 13 12
Newfoundland – – – Prince Edward Island – – – Nova Scotia – – – New Brunswick – – –
Quebec – – – Ontario 15 12 10 West 16 12 13
Manitoba – – – Saskatchewan – – – Alberta – – – British Columbia – – –
North 10 13 15 Yukon – – – Northwest Territories – – 16 Nunavut – – –
ENERGY EXPENDITURE Active (≥3 KKD2) 18 15 16 Moderately active (1.5–2.9 KKD) 16 10 10 Somewhat active (0.5–1.4 KKD) 14 12 9 Sedentary (<0.5 KKD) 8 9 6
1 Data include all persons in the workforce. 2 Kilocalories/kilogram of body weight/day; an energy expenditure of 3 KKD is roughly equivalent to walking one hour every day. – Data unavailable because of insufficient sample size.

140
Fitness instruction or counselling at work1 (cont’d) 2006 Physical Activity Monitor
Fitness testing or
activity counselling
Instruction for building a physical
activity program
Instruction in physical activities
EDUCATION LEVEL Less than secondary – – – Secondary 12 11 11 College 14 10 9 University 18 15 12
EMPLOYMENT STATUS Full-time worker 15 11 10 Part-time worker 12 11 11
HOUSEHOLD INCOME < $20,000 – – – $20,000–29,999 – – – $30,000–39,999 – – – $40,000–59,999 11 9 8 $60,000–79,999 10 10 9 $80,000–99,999 19 10 11 ≥ $100,000 22 19 15
COMMUNITY SIZE < 1,000 – – – 1,000–4,999 9 13 13 5,000–9,999 – – – 10,000–74,999 17 12 11 75,000–299,999 17 9 10 ≥ 300,000 16 14 12
FAMILY COMPOSITION Living with a partner 15 12 10 Widowed, divorced, separated 15 10 12 Never married 10 11 13
1 Data include all persons in the workforce. – Data unavailable because of insufficient sample size.

141
Fitness instruction or counselling at work1 (cont’d) 2006 Physical Activity Monitor
Fitness testing or
activity counselling
Instruction to build a physical activity program
Instruction in physical activities
SECTOR Private business 11% 8% 7% Government or public organization 19 16 15 Not for profit organization – – –
INDUSTRY Trade and commerce – – –
Retail and wholesale industries – – – Industry and manufacturing 14 7 7
Construction industries – – – Hi-tech industries – – – Transportation /communication 15 – – Manufacturing industries – – –
Finance and services 17 17 13 Hospitality services – – – Finance and business services – – – Government service industries 25 20 19 Education, health and social services 19 20 15
Other service industries – – – Agriculture and Forestry – – –
NUMBER OF EMPLOYEES ≤ 10 10 8 10 11–49 4 5 5 50–99 – – – 100–249 11 – – 250–499 16 – – 500–999 – – – ≥ 1000 34 22 17
PROFESSION Labour – – – Skilled trade 15 9 11 Clerical – – – Professional 19 15 12 Management 15 13 9
1 Data include all persons in the workforce. – Data unavailable because of insufficient sample size.

142
Amenities at work to support activity1 2006 Physical Activity Monitor
Showers Change areas Bicycle racks
TOTAL, ADULTS (18+) 32% 40% 37% women 27 36 40 men 36 43 34
18–24 25 37 32 women – – – men 31 42 31
25–44 35 42 40 women 29 39 44 men 40 45 37
45–64 32 38 36 women 29 34 39 men 34 41 34
REGION East 32 38 32
Newfoundland 24 29 – Prince Edward Island 29 36 26 Nova Scotia 37 41 36 New Brunswick 32 41 34
Quebec 30 34 39 Ontario 29 40 34 West 38 45 41
Manitoba 35 42 46 Saskatchewan 39 51 34 Alberta 34 42 41 British Columbia 42 47 42
North 31 31 33 Yukon 45 41 49 Northwest Territories 30 31 38 Nunavut – – –
ENERGY EXPENDITURE
Active (≥3 KKD2) 36 47 42 Moderately active (1.5–2.9 KKD) 33 41 37 Somewhat active (0.5–1.4 KKD) 33 40 39 Sedentary (<0.5 KKD) 26 31 30
1 Data include all persons in the workforce. 2 Kilocalories/kilogram of body weight/day; an energy expenditure of 3 KKD is roughly equivalent to walking one hour every day. – Data unavailable because of insufficient sample size.

143
Amenities at work to support activity1 (cont’d) 2006 Physical Activity Monitor
Showers Change areas Bicycle racks
EDUCATION LEVEL Less than secondary 26% 29% 23% Secondary 31 43 33 College 27 35 35 University 41 46 48
EMPLOYMENT STATUS Full-time worker 34 41 39 Part-time worker 22 32 29
HOUSEHOLD INCOME < $20,000 – – – $20,000–29,999 20 29 26 $30,000–39,999 28 38 29 $40,000–59,999 26 41 30 $60,000–79,999 34 42 43 $80,000–99,999 37 40 41 ≥ $100,000 39 45 44
COMMUNITY SIZE < 1,000 31 43 25 1,000–4,999 29 36 29 5,000–9,999 36 41 30 10,000–74,999 30 39 37 75,000–299,999 28 36 40 ≥ 300,000 37 44 46
MARITAL STATUS Living with a partner 33 40 38 Widowed, divorced, separated 36 40 39 Never married 27 38 32
1 Data include all persons in the workforce. – Data unavailable because of insufficient sample size.

144
Amenities at work to support activity1 (cont’d) 2006 Physical Activity Monitor
Showers Change areas Bicycle racks
SECTOR Private Business 25% 33% 27% Government or public organization 45 52 55 Not for profit organization 36 41 39
INDUSTRY Trade and commerce – 23 24
Retail and wholesale industries – 23 24 Industry and manufacturing 32 38 30
Construction industries 20 22 – Hi-tech industries – – – Transportation /communication 41 44 29 Manufacturing industries 40 51 41
Finance and services 36 44 47 Hospitality services 26 55 37 Finance and business services – – 35 Government service industries 45 51 49 Education, health and social services 46 51 60
Other service industries – 32 28 Agriculture and Forestry 46 52 –
NUMBER OF EMPLOYEES ≤ 10 22 26 22 11–49 14 29 19 50–99 33 41 32 100–249 33 40 38 250–499 45 48 57 500–999 49 46 59 ≥ 1000 52 62 62
PROFESSION Labour 26 36 33 Skilled trade 34 41 31 Clerical 26 29 35 Professional 42 49 49 Management 28 36 33
1 Data include all persons in the workforce. – Data unavailable because of insufficient sample size.

145
Fitness facilities at work1 2006 Physical Activity Monitor
Community fitness
facilities
Workplace fitness
facilities
Exercise equipment
at work
Rooms for activity at work
Other opportunities
for activity
TOTAL, ADULTS (18+) 20% 18% 18% 14% 15% women 20 19 19 14 13 men 20 18 18 14 16
18–24 21 – – – – women – – – – – men – – – – –
25–44 19 20 20 16 17 women 21 22 21 17 16 men 17 18 18 15 18
45–64 22 21 19 15 14 women 20 19 17 12 11 men 23 22 22 17 16
REGION East 27 19 17 16 18
Newfoundland – – – – – Prince Edward Island 30 – – – – Nova Scotia 24 – – – 23 New Brunswick 34 – – – –
Quebec 18 19 18 – – Ontario 17 16 16 14 15 West 24 21 20 17 17
Manitoba 27 21 – – – Saskatchewan 34 23 25 – 25 Alberta 24 22 23 – 18 British Columbia – – – – –
North 44 16 15 14 21 Yukon 40 16 17 25 22 Northwest Territories 48 18 17 – 20 Nunavut1 – – – – –
ENERGY EXPENDITURE Active (≥3 KKD2) 22 21 22 19 18 Moderately active (1.5–2.9 KKD) 24 18 19 15 15 Somewhat active (0.5–1.4 KKD) 24 21 19 16 13 Sedentary (<0.5 KKD) 13 14 12 7 13
1 Data include all persons in the workforce. 2 Kilocalories/kilogram of body weight/day; an energy expenditure of 3 KKD is roughly equivalent to walking one hour every day. – Data unavailable because of insufficient sample size.

146
Fitness facilities at work1 (cont’d) 2006 Physical Activity Monitor
Community fitness
facilities
Workplace fitness
facilities
Exercise equipment
at work
Rooms for activity at work
Other opportunities
for activity
EDUCATION LEVEL Less than secondary 14% 12% – – – Secondary 15 13 13 10 11 College 16 15 16 13 12 University 32 30 27 21 23
EMPLOYMENT STATUS Full-time worker 20 19 18 15 15 Part-time worker 20 13 16 12 12
HOUSEHOLD INCOME < $20,000 – – – – – $20,000–29,999 17 – – – – $30,000–39,999 19 – 11 – – $40,000–59,999 15 14 16 11 15 $60,000–79,999 21 20 17 19 18 $80,000–99,999 20 18 17 13 13 ≥ $100,000 29 27 27 21 19
COMMUNITY SIZE < 1,000 28 15 23 – 21 1,000–4,999 26 12 11 14 15 5,000–9,999 30 19 19 – – 10,000–74,999 22 19 19 15 15 75,000–299,999 17 15 14 12 15 ≥ 300,000 16 24 22 17 16
FAMILY COMPOSITION Living with a partner 22 20 19 16 17 Widowed, divorced, separated 20 17 16 9 11 Never married 16 13 15 11 11
1 Data include all persons in the workforce. – Data unavailable because of insufficient sample size.

147
Fitness facilities at work1 (cont’d) 2006 Physical Activity Monitor
Community fitness
facilities
Workplace fitness
facilities
Exercise equipment
at work
Rooms for activity at
work
Other opportunities
for activity SECTOR
Private business 12% 9% 11% 8% 10% Government or public organization 33 35 31 25 23 Not for profit organization 29 – – – –
INDUSTRY Trade and commerce 12 – – – –
Retail and wholesale industries 12 – – – – Industry and manufacturing 10 12 13 9 12
Construction industries 11 – – – – Hi-tech industries – – – – – Transportation /communication 12 13 16 – 14 Manufacturing industries – – – – –
Finance and services 31 28 25 21 19 Hospitality services – – – – – Finance and business services – – – – – Government service industries 30 32 28 30 22 Education, health and social services 45 40 34 29 24
Other service industries – – – – – Agriculture and Forestry – – – – –
NUMBER OF EMPLOYEES ≤ 10 18 8 12 12 12 11–49 17 9 9 8 8 50–99 26 21 20 23 21 100–249 20 18 18 12 10 250–499 20 18 17 – 21 500–999 22 31 29 – 24 ≥ 1000 21 38 34 23 24
PROFESSION Labour 16 – – – 10 Skilled trade 15 16 17 14 14 Clerical 14 16 16 10 12 Professional 29 31 29 24 21 Management 20 13 13 12 11
1 Data include all persons in the workorce. – Data unavailable because of insufficient sample size.

148
Fitness programs at work1 2006 Physical Activity Monitor
Health, fitness, or nutrition programs
Group exercise program
Individualized fitness program
TOTAL, ADULTS (18+) 28% 11% 7% women 30 11 5 men 25 11 9
18–24 23 – – women – – – men – – –
25–44 28 11 8 women 31 11 7 men 25 11 9
45–64 29 12 8 women 31 12 – men 28 11 10
REGION East 36 14 6
Newfoundland 31 – – Prince Edward Island 31 – – Nova Scotia 41 – – New Brunswick 34 – –
Quebec 24 – – Ontario 29 10 7 West 27 8 7
Manitoba 30 – – Saskatchewan 33 – – Alberta 29 – – British Columbia – – –
North 38 10 – Yukon 38 – – Northwest Territories 37 – – Nunavut – – –
ENERGY EXPENDITURE Active (≥3 KKD2) 33 14 10 Moderately active (1.5–2.9 KKD) 30 7 – Somewhat active (0.5–1.4 KKD) 27 11 6 Sedentary (<0.5 KKD) 20 9 –
1 Data include all persons in the workforce. 2 Kilocalories/kilogram of body weight/day; an energy expenditure of 3 KKD is roughly equivalent to walking one hour every day. – Data unavailable because of insufficient sample size.

149
Fitness programs at work1 (cont’d) 2006 Physical Activity Monitor
Health, fitness, or nutrition programs
Group exercise program
Individualized fitness program
EDUCATION LEVEL Less than secondary 30% – – Secondary 23 9 – College 25 10 7 University 34 14 9
EMPLOYMENT STATUS Full-time worker 27 11 8 Part-time worker 28 9 –
HOUSEHOLD INCOME < $20,000 – – – $20,000–29,999 21 – – $30,000–39,999 26 – – $40,000–59,999 22 8 – $60,000–79,999 23 9 – $80,000–99,999 33 11 – ≥ $100,000 34 16 12
COMMUNITY SIZE < 1,000 21 – – 1,000–4,999 30 10 – 5,000–9,999 26 – – 10,000–74,999 30 11 6 75,000–299,999 25 8 – ≥ 300,000 28 15 10
FAMILY COMPOSITION Living with a partner 29 11 7 Widowed, divorced, separated 32 11 – Never married 23 9 8
1 Data include all persons in the workforce. – Data unavailable because of insufficient sample size.
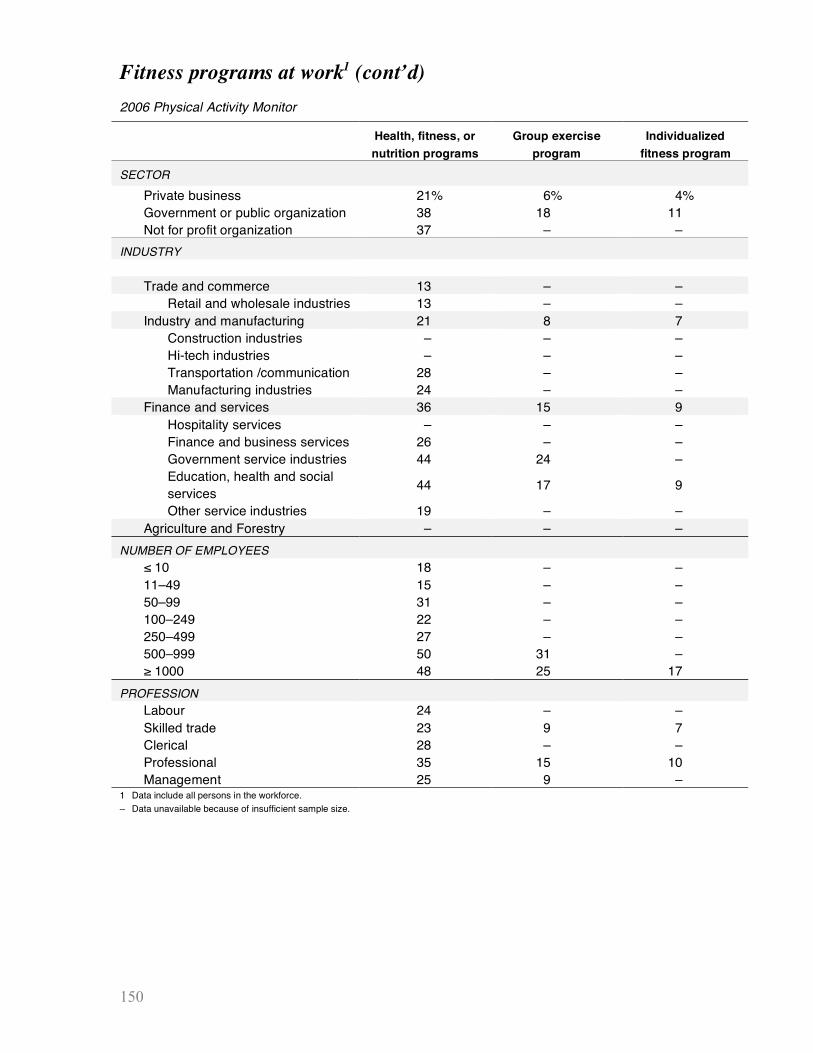
150
Fitness programs at work1 (cont’d) 2006 Physical Activity Monitor
Health, fitness, or nutrition programs
Group exercise program
Individualized fitness program
SECTOR
Private business 21% 6% 4% Government or public organization 38 18 11 Not for profit organization 37 – –
INDUSTRY Trade and commerce 13 – –
Retail and wholesale industries 13 – – Industry and manufacturing 21 8 7
Construction industries – – – Hi-tech industries – – – Transportation /communication 28 – – Manufacturing industries 24 – –
Finance and services 36 15 9 Hospitality services – – – Finance and business services 26 – – Government service industries 44 24 – Education, health and social services 44 17 9
Other service industries 19 – – Agriculture and Forestry – – –
NUMBER OF EMPLOYEES ≤ 10 18 – – 11–49 15 – – 50–99 31 – – 100–249 22 – – 250–499 27 – – 500–999 50 31 – ≥ 1000 48 25 17
PROFESSION Labour 24 – – Skilled trade 23 9 7 Clerical 28 – – Professional 35 15 10 Management 25 9 –
1 Data include all persons in the workforce. – Data unavailable because of insufficient sample size.

151
Management of facilities and programs1,2 2006 Physical Activity Monitor
Employer or management
Designated staff person
Employee group or association
Other person
TOTAL, ADULTS (18+) 44% 32% 20% 16% women 42 28 18 21 men 46 36 23 12
18–24 – – 11 – women – – – – men – – – –
25–44 41 31 21 16 women 40 25 15 22 men 42 36 27 –
45–64 49 33 22 18 women 42 33 – 18 men 55 32 – –
REGION East 37 33 25 20
Newfoundland – – – – Prince Edward Island – – – – Nova Scotia – – – – New Brunswick – – – –
Quebec – – – – Ontario 46 38 – – West 47 26 26 18
Manitoba – – – – Saskatchewan – – – – Alberta – – – – British Columbia – – – –
North 44 30 34 17 Yukon – – – – Northwest Territories – – – – Nunavut – – – –
ENERGY EXPENDITURE Active (≥3 KKD3) 44 40 22 14 Moderately active (1.5–2.9 KKD) 49 22 22 17 Somewhat active (0.5–1.4 KKD) 45 34 – – Sedentary (<0.5 KKD) 39 26 – 21
1 Data include only those who have access to fitness facilities, rooms for physical activity, exercise equipment, or other fitness opportunities at work. 2 Almost 6 percent of respondents do not know who is responsible for managing fitness facilities and programs, and are excluded from the questions. 3 Kilocalories/kilogram of body weight/day; an energy expenditure of 3 KKD is roughly equivalent to walking one hour every day. – Data unavailable because of insufficient sample size.

152
Management of facilities and programs1,2 (cont’d) 2006 Physical Activity Monitor
Employer or management
Designated staff person
Employee group or association
Other person
EDUCATION LEVEL Less than secondary – – – – Secondary 38 40 – – College 45 27 21 21 University 46 34 18 15
EMPLOYMENT STATUS Full-time worker 44 33 22 17 Part-time worker 49 – – –
HOUSEHOLD INCOME < $20,000 – – – – $20,000–29,999 – – – – $30,000–39,999 – – – – $40,000–59,999 42 28 – – $60,000–79,999 50 27 – – $80,000–99,999 36 28 – – ≥ $100,000 41 42 22 16
COMMUNITY SIZE < 1,000 59 – – – 1,000–4,999 50 34 – – 5,000–9,999 – – – – 10,000–74,999 40 35 21 15 75,000–299,999 38 28 – – ≥ 300,000 43 36 – –
FAMILY COMPOSITION Living with a partner 43 33 23 17 Widowed, divorced, separated 58 – – – Never married 42 30 – –
1 Data include only those who have access to fitness facilities, rooms for physical activity, exercise equipment, or other fitness opportunities at work. 2 Almost 6 percent of respondents do not know who is responsible for managing fitness facilities and programs, and are excluded from the questions. – Data unavailable because of insufficient sample size.

153
Management of facilities and programs1,2 (cont’d) 2006 Physical Activity Monitor
Employer or management
Designated staff person
Employee group or association
Other person
SECTOR Private business 46% 25% 24% 16% Government or public organization 42 39 18 15 Not for profit organization – – – –
INDUSTRY Trade and commerce – – – –
Retail and wholesale industries – – – – Industry and manufacturing 50 – – –
Construction industries – – – – Hi-tech industries – – – – Transportation /communication – – – – Manufacturing industries – – – –
Finance and services 40 40 18 17 Hospitality services – – – – Finance and business services – – – – Government service industries – – – – Education, health and social services 44 43 18 13
Other service industries – – – – Agriculture and Forestry – – – –
NUMBER OF EMPLOYEES ≤ 10 56 – – – 11–49 46 23 19 – 50–99 – – – – 100–249 – – – – 250–499 – – – – 500–999 – – – – ≥ 1000 46 35 24 –
PROFESSION Labour – – – – Skilled trade 47 25 – – Clerical – – – – Professional 48 36 25 12 Management 32 – – –
1 Data includes only those who have access to fitness facilities, rooms for physical activity, exercise equipment, or other fitness opportunities at work. 2 Almost 6 percent of respondents do not know who is responsible for managing fitness facilities and programs, and are excluded from the questions. – Data unavailable because of insufficient sample size.

154
Who can access facilities? 1,2 2006 Physical Activity Monitor
Full-time employees
Part-time employees
Contract workers
Retired employees
Employee family
members
Members of the
community TOTAL, ADULTS (18+) 91% 86% 48% 40% 35% 28%
women 89 87 47 35 31 30 men 93 86 49 43 38 26
18–24 94 90 – – – – women – – – – – – men – – – – – –
25–44 92 87 50 43 38 28 women 90 87 50 37 34 31 men 93 87 51 49 42 25
45–64 91 84 41 38 31 26 women 89 87 45 32 24 22 men 92 81 39 42 36 30
REGION East 92 90 40 51 51 40
Newfoundland – – – – – – Prince Edward Island 94 90 – – – – Nova Scotia 96 97 – – – – New Brunswick 93 90 – – – –
Quebec 85 78 – – – – Ontario 91 86 48 38 33 25 West 96 91 49 39 43 27
Manitoba 97 95 – – – – Saskatchewan 95 84 – – – – Alberta 99 94 – – – – British Columbia – – – – – –
North 85 82 44 40 49 41 Yukon 84 83 – – 48 – Northwest Territories 90 84 – – – – Nunavut – – – – – –
ENERGY EXPENDITURE Active (≥3 KKD3) 93 86 45 39 35 24 Moderately active (1.5–2.9 KKD) 90 85 39 36 32 31 Somewhat active (0.5–1.4 KKD) 93 90 63 35 35 36 Sedentary (<0.5 KKD) 88 84 48 49 38 23
1 Data include only those who have access to fitness facilities, rooms for physical activity, exercise equipment, or other fitness opportunities at work. 2 “No” and “Donʼt know” make up the balance of responses and are not listed. In total, “Donʼt know” accounts for 5 to 23 percent of answers for each
question. 3 Kilocalories/kilogram of body weight/day; an energy expenditure of 3 KKD is roughly equivalent to walking one hour every day. – Data unavailable because of insufficient sample size.

155
Who can access facilities? 1,2 (cont’d) 2006 Physical Activity Monitor
Full-time employees
Part-time employees
Contract workers
Retired employees
Employee family
members
Members of the
community EDUCATION LEVEL
Less than secondary 99 92% – – – – Secondary 85 82 35 42 37 17 College 88 82 37 36 35 24 University 96 91 63 41 33 36
EMPLOYMENT STATUS Full-time worker 93 86 47 40 35 27 Part-time worker 89 92 62 42 37 36
HOUSEHOLD INCOME < $20,000 – – – – – – $20,000–29,999 – – – – – – $30,000–39,999 95 83 – – – – $40,000–59,999 89 90 53 50 38 41 $60,000–79,999 88 83 42 33 35 31 $80,000–99,999 92 86 48 39 36 22 ≥ $100,000 93 86 55 41 31 21
COMMUNITY SIZE < 1,000 92 81 – 51 59 – 1,000–4,999 78 75 – 41 38 47 5,000–9,999 93 96 – – – – 10,000–74,999 93 88 43 31 33 26 75,000–299,999 92 84 48 44 37 35 ≥ 300,000 93 90 67 43 32 18
FAMILY COMPOSITION Living with a partner 91 85 44 42 35 26 Widowed, divorced, separated 91 89 63 50 41 42 Never married 95 91 59 28 34 32
1 Data include only those who have access to fitness facilities, rooms for physical activity, exercise equipment, or other fitness opportunities at work. 2 “No” and “Donʼt know” make up the balance of responses and are not listed. In total, “Donʼt know” accounts for 5 to 23 percent of answers for each
question. – Data unavailable because of insufficient sample size.

156
Who can access facilities? 1,2 (cont’d) 2006 Physical Activity Monitor
Full-time employees
Part-time employees
Contract workers
Retired employees
Employee family
members
Members of the
community SECTOR
Private business 85% 80% 45% 35% 40% 18% Government or public organization 96 91 52 45 29 35 Not for profit organization 87 81 – – – –
INDUSTRY
Trade and commerce – – – – – – Retail and wholesale industries – – – – – –
Industry and Manufacturing 89 82 44 40 39 – Construction industries – – – – – – Hi-tech industries – – – – – – Transportation /communication 90 81 – – – – Manufacturing industries – – – – – –
Finance and services 93 90 55 41 32 34 Hospitality services – – – – – – Finance and business services – – – – – – Government service industries 96 90 – 39 – – Education, health and social services
97 95 58 47 32 44
Other service industries – – – – – – Agriculture and Forestry 90 79 – – – –
NUMBER OF EMPLOYEES ≤ 10 77 75 39 42 57 33 11–49 90 81 35 40 44 57 50–99 95 93 – – – – 100–249 100 88 – – – – 250–499 91 82 – – – – 500–999 90 85 – – – – ≥ 1000 94 91 51 40 26 20
PROFESSION Labour 97 97 – – – – Skilled trade 85 77 34 39 29 29 Clerical 81 85 – – – – Professional 96 91 53 39 36 34 Management 90 81 43 39 38 –
1 Data include only those who have access to fitness facilities, rooms for physical activity, exercise equipment, or other fitness opportunities at work. 2 “No” and “Donʼt know” make up the balance of responses and are not listed. In total, “Donʼt know” accounts for 5 to 23 percent of answers for each
question. – Data unavailable because of insufficient sample size.

157
When fitness facilities can be used1,2 2006 Physical Activity Monitor
Before work
During lunch
During work hours
After work/ evenings
On weekends
TOTAL, ADULTS (18+) 75% 82% 57% 82% 61% women 78 82 52 79 61 men 73 82 62 85 62
18–24 71 84 82 81 49 women – – – – – men – – – – –
25–44 75 81 57 82 63 women 81 82 55 82 65 men 69 81 60 83 62
45–64 77 83 51 82 61 women 80 84 41 75 55 men 74 83 59 87 67
REGION East 74 82 52 86 72
Newfoundland – – – – – Prince Edward Island – – – – – Nova Scotia 75 85 – 86 76 New Brunswick – – – 87 –
Quebec 75 74 – 75 – Ontario 73 83 58 80 60 West 80 86 64 87 72
Manitoba 74 83 – 84 – Saskatchewan 79 82 – 92 81 Alberta 86 88 71 86 75 British Columbia – – – – –
North 72 79 56 79 81 Yukon 80 86 58 82 73 Northwest Territories 71 76 – 79 82 Nunavut – – – – –
ENERGY EXPENDITURE Active (≥3 KKD3) 80 84 59 84 57 Moderately active (1.5–2.9 KKD) 71 75 48 82 58 Somewhat active (0.5–1.4 KKD) 81 84 56 79 58 Sedentary (<0.5 KKD) 67 84 65 81 76
1 Data include only those who have access to fitness facilities, rooms for physical activity, exercise equipment, or other fitness opportunities at work. 2 For each question, between 9 and 12 percent of respondents were not able to answer; “donʼt know” and “refused” are excluded from the denominator. 3 Kilocalories/kilogram of body weight/day; an energy expenditure of 3 KKD is roughly equivalent to walking one hour every day. – Data unavailable because of insufficient sample size.

158
When fitness facilities can be used1,2 (cont’d) 2006 Physical Activity Monitor
Before work During lunch During work hours
After work/ evenings
On weekends
EDUCATION LEVEL Less than secondary 75% – – 81% 76% Secondary 77 83 58 87 55 College 67 77 53 78 68 University 81 88 61 82 57
EMPLOYMENT STATUS Full-time worker 76 83 57 83 63 Part-time worker 76 84 65 81 53
HOUSEHOLD INCOME < $20,000 – – – – – $20,000–29,999 – – – – – $30,000–39,999 65 75 – 92 78 $40,000–59,999 67 75 60 73 51 $60,000–79,999 74 79 56 83 59 $80,000–99,999 77 82 55 85 66 ≥ $100,000 81 87 63 83 58
COMMUNITY SIZE < 1,000 75 82 68 78 79 1,000–4,999 67 73 64 80 64 5,000–9,999 77 83 – 94 60 10,000–74,999 74 81 54 80 58 75,000–299,999 71 77 49 77 58 ≥ 300,000 81 88 69 83 60
FAMILY COMPOSITION Living with a partner 77 82 55 81 62 Widowed, divorced, separated 77 86 51 84 68 Never married 67 79 65 84 56
1 Data include only those who have access to fitness facilities, rooms for physical activity, exercise equipment, or other fitness opportunities at work. 2 For each question, between 9 and 12 percent of respondents were not able to answer; “donʼt know” and “refused” are excluded from the denominator. – Data unavailable because of insufficient sample size.

159
When fitness facilities can be used1,2 (cont’d) 2006 Physical Activity Monitor
Before work
During lunch
During work hours
After work/ evenings
On weekends
SECTOR Private business 68% 80% 57% 82% 63% Government or public organization 81 84 55 82 57 Not for profit organization 82 79 68 80 –
INDUSTRY Trade and commerce – – – – –
Retail and wholesale industries – – – – – Industry and Manufacturing 65 78 57 78 64
Construction industries – – – – – Hi-tech industries – – – – – Transportation /communication 59 77 56 64 59 Manufacturing industries – – – – –
Finance and services 82 85 56 85 57 Hospitality services – – – – – Finance and business services – – – – – Government service industries 85 95 74 91 57 Education, health and social services 82 81 52 82 53
Other service industries – – – – – Agriculture and Forestry – – – – –
NUMBER OF EMPLOYEES ≤ 10 63 73 66 82 68 11–49 70 74 44 83 58 50–99 84 86 – 86 49 100–249 84 85 55 81 57 250–499 74 86 – 81 67 500–999 72 80 69 82 69 ≥ 1000 77 87 61 82 63
PROFESSION Labour 76 83 – 85 54 Skilled trade 64 66 45 70 57 Clerical 85 88 60 88 71 Professional 78 86 56 82 57 Management 84 94 68 90 82
1 Data include only those who have access to fitness facilities, rooms 76r physical activity, exercise equipment, or other fitness opportunities at work. 2 For each question, between 9 and 12 percent of respondents were not able to answer; “donʼt know” and “refused” are excluded from the denominator. – Data unavailable because of insufficient sample size.