Experimental Comparison of PAM and CAP Modulation for ...
12
HAL Id: hal-03629673 https://hal.archives-ouvertes.fr/hal-03629673 Submitted on 6 May 2022 HAL is a multi-disciplinary open access archive for the deposit and dissemination of sci- entific research documents, whether they are pub- lished or not. The documents may come from teaching and research institutions in France or abroad, or from public or private research centers. L’archive ouverte pluridisciplinaire HAL, est destinée au dépôt et à la diffusion de documents scientifiques de niveau recherche, publiés ou non, émanant des établissements d’enseignement et de recherche français ou étrangers, des laboratoires publics ou privés. Distributed under a Creative Commons Attribution - NonCommercial - NoDerivatives| 4.0 International License Experimental Comparison of PAM and CAP Modulation for Visible Light Communication Under Illumination Constraints Robin Le Priol, M. Helard, Sylvain Haese, Sebastien Roy To cite this version: Robin Le Priol, M. Helard, Sylvain Haese, Sebastien Roy. Experimental Comparison of PAM and CAP Modulation for Visible Light Communication Under Illumination Constraints. IEEE Pho- tonics Journal, Institute of Electrical and Electronics Engineers (IEEE), 2022, 14 (2), pp.7315811. 10.1109/JPHOT.2022.3148467. hal-03629673
-
Upload
khangminh22 -
Category
Documents
-
view
0 -
download
0
Transcript of Experimental Comparison of PAM and CAP Modulation for ...
HAL Id: hal-03629673https://hal.archives-ouvertes.fr/hal-03629673
Submitted on 6 May 2022
HAL is a multi-disciplinary open accessarchive for the deposit and dissemination of sci-entific research documents, whether they are pub-lished or not. The documents may come fromteaching and research institutions in France orabroad, or from public or private research centers.
L’archive ouverte pluridisciplinaire HAL, estdestinée au dépôt et à la diffusion de documentsscientifiques de niveau recherche, publiés ou non,émanant des établissements d’enseignement et derecherche français ou étrangers, des laboratoirespublics ou privés.
Distributed under a Creative Commons Attribution - NonCommercial - NoDerivatives| 4.0International License
Experimental Comparison of PAM and CAPModulation for Visible Light Communication Under
Illumination ConstraintsRobin Le Priol, M. Helard, Sylvain Haese, Sebastien Roy
To cite this version:Robin Le Priol, M. Helard, Sylvain Haese, Sebastien Roy. Experimental Comparison of PAM andCAP Modulation for Visible Light Communication Under Illumination Constraints. IEEE Pho-tonics Journal, Institute of Electrical and Electronics Engineers (IEEE), 2022, 14 (2), pp.7315811.�10.1109/JPHOT.2022.3148467�. �hal-03629673�
IEEE PHOTONICS JOURNAL, VOL. 14, NO. 2, APRIL 2022 7315811
Experimental Comparison of PAM and CAPModulation for Visible Light Communication
Under Illumination ConstraintsRobin Le Priol , Member, IEEE, Maryline Hélard , Sylvain Haese, and Sébastien Roy , Member, IEEE
Abstract—In this paper, we study different modulation tech-niques for visible light communication (VLC), taking illuminationconstraints into account. Two modulation schemes are compared,namely pulse amplitude modulation (PAM) and carrierless am-plitude and phase (CAP) modulation, through both simulationsand experimental measurements. The data link under study isbased on low-cost components comprising a white light-emittingdiode (LED) and a silicon PIN photodiode. Moreover, the proposedVLC system complies with illumination standards and limits thebrightness level to that of a typical office room. The impact ofthe roll-off factor parameter, which is directly related to the totaloccupied bandwidth, and the maximum achievable throughputfor PAM and CAP are studied. Moreover, adaptive postdistortionbased on a Volterra series expansion is implemented to mitigatethe effects of LED nonlinearity in practice. We also demonstratethat 8-PAM can outperform 64-CAP and discrete multitone (DMT)when the LED nonlinearity is adequately compensated.
Index Terms—Visible light communication (VLC), light-emitting diode (LED) lighting, pulse amplitude modulation (PAM),carrierless amplitude and phase (CAP) modulation, discretemultitone (DMT), indoor illumination.
I. INTRODUCTION
V ISIBLE light communication (VLC) is an emerging opti-cal communication technology based on the use of light-
emitting diodes (LED) to simultaneously deliver illuminationand communication functions. VLC has drawn a lot of attentionin recent years and is expected to become a viable alternative toradio frequency systems, as it provides many advantages such asimmunity to electromagnetic interference, intrinsic robustnessagainst eavesdropping, and low-cost transceivers based on com-mercially available components [1]–[3]. The optical bands of theelectromagnetic spectrum also offer approximately 375 THz oflicense-free bandwidth, thus providing ample room to relievepressure on the radio spectrum. Moreover, currently deployedlighting fixtures can be leveraged to implement VLC since white
Manuscript received November 22, 2021; revised January 14, 2022; acceptedJanuary 28, 2022. Date of publication February 4, 2022; date of current versionFebruary 25, 2022. (Corresponding author: Robin Le Priol.)
Robin Le Priol, Maryline Hélard, and Sylvain Haese are with the Universitéde Rennes, INSA Rennes, CNRS, IETR - UMR 6164, F-35000 Rennes,France (e-mail: [email protected]; [email protected];[email protected]).
Sébastien Roy is with the Department of Electrical and Computer Engineer-ing, University of Sherbrooke, Sherbrooke, QC J1K 2R1, Canada (e-mail:[email protected]).
Digital Object Identifier 10.1109/JPHOT.2022.3148467
LEDs are nowadays widely used for lighting applications [4].Common white LEDs (unlike the more expensive red-green-blue(RGB) LEDs) consist of a blue LED chip coated with a phosphorlayer, producing white light. Unfortunately, their modulationbandwidth does not exceed a few MHz due to the relaxation timeof the phosphor layer, thus severly limiting throughput [5]. Toovercome this, spectrally-efficient signaling schemes are com-monly considered in VLC, such as pulse amplitude modulation(PAM), carrierless amplitude and phase modulation (CAP), anddiscrete multitone (DMT).
In fact, two main approaches are generally considered regard-ing the use of bandwidth. In the first one, the signal is narrowbandand modulated using single-band modulation schemes such asCAP or PAM. In this case, the achieved transmission rate islow and the channel is assumed to be non-frequency-selective,thus no equalization is required. In the second approach, theinformation signal is wideband to improve the bit rate andmulti-band modulation schemes such as multi-band CAP orDMT-based techniques are employed in combination with adap-tive bit-loading while avoiding complex equalization.
Comparisons of PAM, CAP and DMT have been carriedout in the literature for VLC in terms of available bitrates androbustness against LED nonlinear distortions. In [6], the au-thors compared PAM, CAP and DMT on an experimental setupemploying a white LED. Under different signal attenuations,they highlighted the robustness of two-level PAM (2-PAM)against LED nonlinearities, which performed advantageouslywith respect to CAP and DMT. The authors of [7] comparedhigh-order PAM (8-PAM) and CAP (64-CAP) with DMT em-ploying frequency domain equalization. They reported betterperformance for DMT compared to high-order PAM and CAP.Moreover, CAP outperformed PAM for high data rates. In [8],the authors performed an optimization of the roll-off factor anddemonstrated that 4-PAM can outperform 4-CAP and DMT.
It is noteworthy, however, that none of these studies tookinto account the constraints associated with the illuminationfunction. VLC systems employ intensity-modulation and direct-detection (IM/DD), where the transmitted waveform is encodedin the instantaneous radiated optical power. In this context,the desired illumination brightness level limits the total opti-cal power at the receiver, thus impacting communication linkquality. Moreover, the authors of [7] and [8] did not consider anonlinear LED dynamic range and did not provide experimentalresults, yet it is known that LED nonlinear distortions can
This work is licensed under a Creative Commons Attribution-NonCommercial-NoDerivatives 4.0 License. For more information, seehttps://creativecommons.org/licenses/by-nc-nd/4.0/
7315811 IEEE PHOTONICS JOURNAL, VOL. 14, NO. 2, APRIL 2022
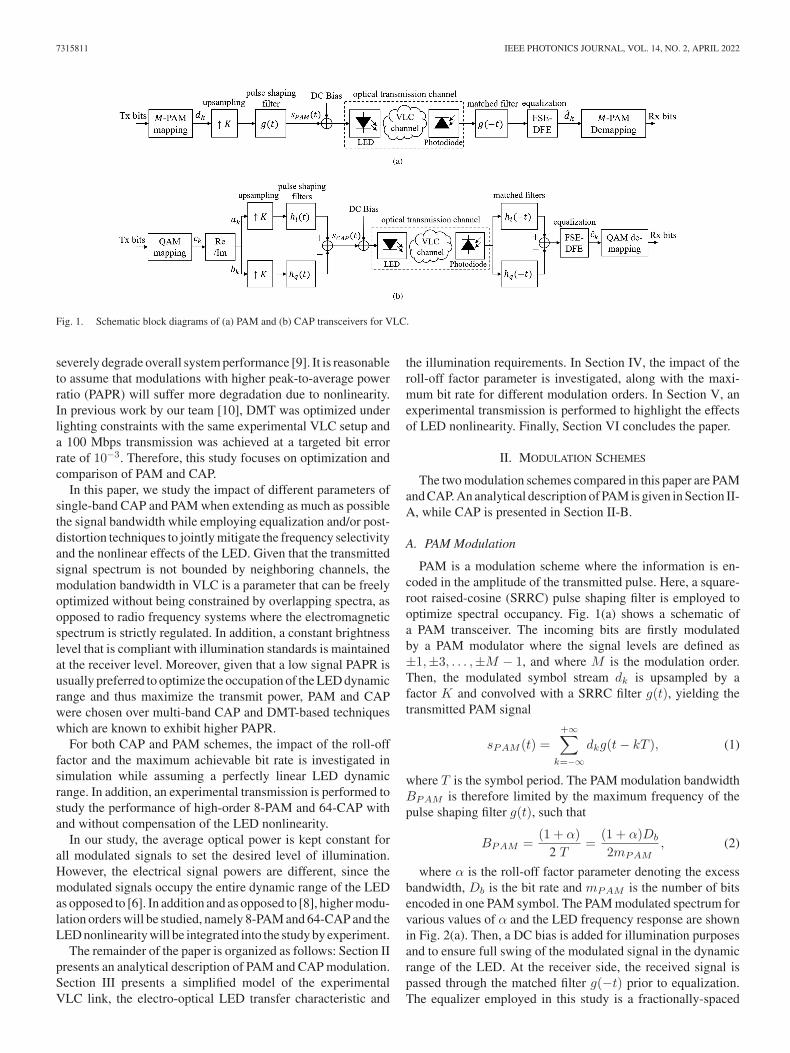
Fig. 1. Schematic block diagrams of (a) PAM and (b) CAP transceivers for VLC.
severely degrade overall system performance [9]. It is reasonableto assume that modulations with higher peak-to-average powerratio (PAPR) will suffer more degradation due to nonlinearity.In previous work by our team [10], DMT was optimized underlighting constraints with the same experimental VLC setup anda 100 Mbps transmission was achieved at a targeted bit errorrate of 10−3. Therefore, this study focuses on optimization andcomparison of PAM and CAP.
In this paper, we study the impact of different parameters ofsingle-band CAP and PAM when extending as much as possiblethe signal bandwidth while employing equalization and/or post-distortion techniques to jointly mitigate the frequency selectivityand the nonlinear effects of the LED. Given that the transmittedsignal spectrum is not bounded by neighboring channels, themodulation bandwidth in VLC is a parameter that can be freelyoptimized without being constrained by overlapping spectra, asopposed to radio frequency systems where the electromagneticspectrum is strictly regulated. In addition, a constant brightnesslevel that is compliant with illumination standards is maintainedat the receiver level. Moreover, given that a low signal PAPR isusually preferred to optimize the occupation of the LED dynamicrange and thus maximize the transmit power, PAM and CAPwere chosen over multi-band CAP and DMT-based techniqueswhich are known to exhibit higher PAPR.
For both CAP and PAM schemes, the impact of the roll-offfactor and the maximum achievable bit rate is investigated insimulation while assuming a perfectly linear LED dynamicrange. In addition, an experimental transmission is performed tostudy the performance of high-order 8-PAM and 64-CAP withand without compensation of the LED nonlinearity.
In our study, the average optical power is kept constant forall modulated signals to set the desired level of illumination.However, the electrical signal powers are different, since themodulated signals occupy the entire dynamic range of the LEDas opposed to [6]. In addition and as opposed to [8], higher modu-lation orders will be studied, namely 8-PAM and 64-CAP and theLED nonlinearity will be integrated into the study by experiment.
The remainder of the paper is organized as follows: Section IIpresents an analytical description of PAM and CAP modulation.Section III presents a simplified model of the experimentalVLC link, the electro-optical LED transfer characteristic and
the illumination requirements. In Section IV, the impact of theroll-off factor parameter is investigated, along with the maxi-mum bit rate for different modulation orders. In Section V, anexperimental transmission is performed to highlight the effectsof LED nonlinearity. Finally, Section VI concludes the paper.
II. MODULATION SCHEMES
The two modulation schemes compared in this paper are PAMand CAP. An analytical description of PAM is given in Section II-A, while CAP is presented in Section II-B.
A. PAM Modulation
PAM is a modulation scheme where the information is en-coded in the amplitude of the transmitted pulse. Here, a square-root raised-cosine (SRRC) pulse shaping filter is employed tooptimize spectral occupancy. Fig. 1(a) shows a schematic ofa PAM transceiver. The incoming bits are firstly modulatedby a PAM modulator where the signal levels are defined as±1,±3, . . . ,±M − 1, and where M is the modulation order.Then, the modulated symbol stream dk is upsampled by afactor K and convolved with a SRRC filter g(t), yielding thetransmitted PAM signal
sPAM (t) =+∞∑
k=−∞dkg(t− kT ), (1)
where T is the symbol period. The PAM modulation bandwidthBPAM is therefore limited by the maximum frequency of thepulse shaping filter g(t), such that
BPAM =(1 + α)
2 T=
(1 + α)Db
2mPAM, (2)
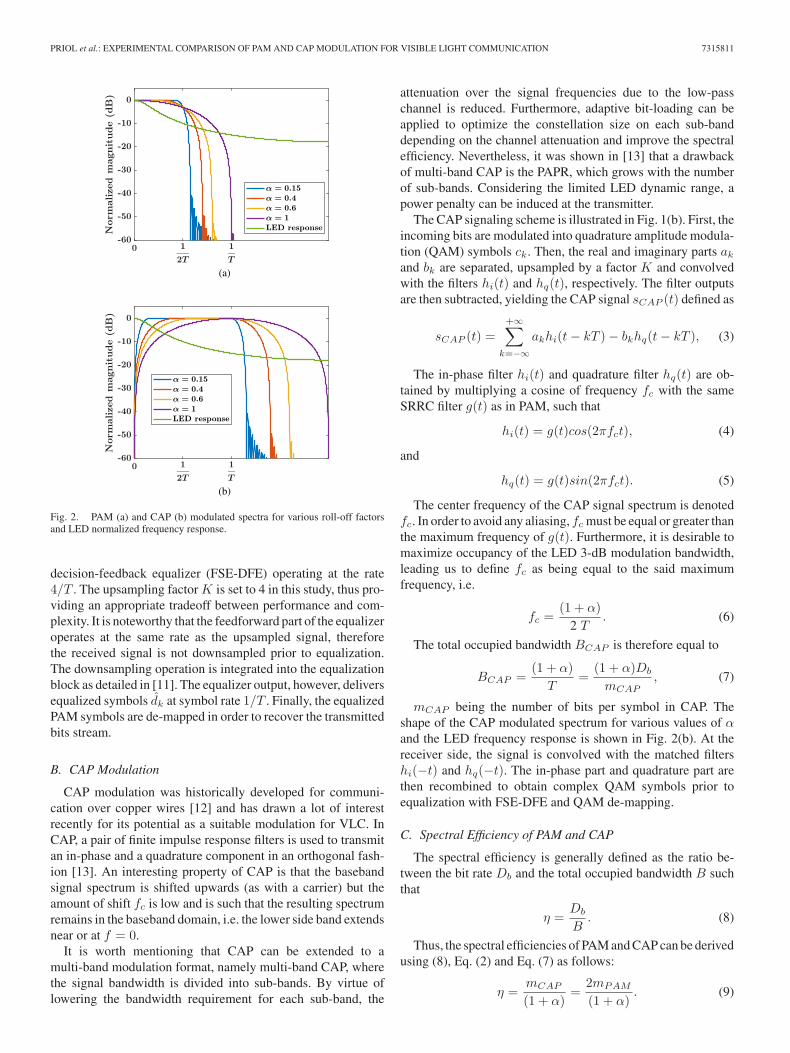
where α is the roll-off factor parameter denoting the excessbandwidth, Db is the bit rate and mPAM is the number of bitsencoded in one PAM symbol. The PAM modulated spectrum forvarious values of α and the LED frequency response are shownin Fig. 2(a). Then, a DC bias is added for illumination purposesand to ensure full swing of the modulated signal in the dynamicrange of the LED. At the receiver side, the received signal ispassed through the matched filter g(−t) prior to equalization.The equalizer employed in this study is a fractionally-spaced
PRIOL et al.: EXPERIMENTAL COMPARISON OF PAM AND CAP MODULATION FOR VISIBLE LIGHT COMMUNICATION 7315811
Fig. 2. PAM (a) and CAP (b) modulated spectra for various roll-off factorsand LED normalized frequency response.
decision-feedback equalizer (FSE-DFE) operating at the rate4/T . The upsampling factor K is set to 4 in this study, thus pro-viding an appropriate tradeoff between performance and com-plexity. It is noteworthy that the feedforward part of the equalizeroperates at the same rate as the upsampled signal, thereforethe received signal is not downsampled prior to equalization.The downsampling operation is integrated into the equalizationblock as detailed in [11]. The equalizer output, however, deliversequalized symbols dk at symbol rate 1/T . Finally, the equalizedPAM symbols are de-mapped in order to recover the transmittedbits stream.
B. CAP Modulation
CAP modulation was historically developed for communi-cation over copper wires [12] and has drawn a lot of interestrecently for its potential as a suitable modulation for VLC. InCAP, a pair of finite impulse response filters is used to transmitan in-phase and a quadrature component in an orthogonal fash-ion [13]. An interesting property of CAP is that the basebandsignal spectrum is shifted upwards (as with a carrier) but theamount of shift fc is low and is such that the resulting spectrumremains in the baseband domain, i.e. the lower side band extendsnear or at f = 0.
It is worth mentioning that CAP can be extended to amulti-band modulation format, namely multi-band CAP, wherethe signal bandwidth is divided into sub-bands. By virtue oflowering the bandwidth requirement for each sub-band, the
attenuation over the signal frequencies due to the low-passchannel is reduced. Furthermore, adaptive bit-loading can beapplied to optimize the constellation size on each sub-banddepending on the channel attenuation and improve the spectralefficiency. Nevertheless, it was shown in [13] that a drawbackof multi-band CAP is the PAPR, which grows with the numberof sub-bands. Considering the limited LED dynamic range, apower penalty can be induced at the transmitter.
The CAP signaling scheme is illustrated in Fig. 1(b). First, theincoming bits are modulated into quadrature amplitude modula-tion (QAM) symbols ck. Then, the real and imaginary parts akand bk are separated, upsampled by a factor K and convolvedwith the filters hi(t) and hq(t), respectively. The filter outputsare then subtracted, yielding the CAP signal sCAP (t) defined as
sCAP (t) =+∞∑
k=−∞akhi(t− kT )− bkhq(t− kT ), (3)
The in-phase filter hi(t) and quadrature filter hq(t) are ob-tained by multiplying a cosine of frequency fc with the sameSRRC filter g(t) as in PAM, such that
hi(t) = g(t)cos(2πfct), (4)
and
hq(t) = g(t)sin(2πfct). (5)
The center frequency of the CAP signal spectrum is denotedfc. In order to avoid any aliasing, fc must be equal or greater thanthe maximum frequency of g(t). Furthermore, it is desirable tomaximize occupancy of the LED 3-dB modulation bandwidth,leading us to define fc as being equal to the said maximumfrequency, i.e.
fc =(1 + α)
2 T. (6)
The total occupied bandwidth BCAP is therefore equal to
BCAP =(1 + α)
T=
(1 + α)Db
mCAP, (7)
mCAP being the number of bits per symbol in CAP. Theshape of the CAP modulated spectrum for various values of αand the LED frequency response is shown in Fig. 2(b). At thereceiver side, the signal is convolved with the matched filtershi(−t) and hq(−t). The in-phase part and quadrature part arethen recombined to obtain complex QAM symbols prior toequalization with FSE-DFE and QAM de-mapping.
C. Spectral Efficiency of PAM and CAP
The spectral efficiency is generally defined as the ratio be-tween the bit rate Db and the total occupied bandwidth B suchthat
η =Db
B. (8)
Thus, the spectral efficiencies of PAM and CAP can be derivedusing (8), Eq. (2) and Eq. (7) as follows:
η =mCAP
(1 + α)=
2mPAM
(1 + α). (9)
7315811 IEEE PHOTONICS JOURNAL, VOL. 14, NO. 2, APRIL 2022
When comparing PAM and CAP modulations at same spectralefficiency, we can note that a higher modulation order will berequired for CAP compared to PAM modulation. In fact, thenumber of bits per symbol in CAP needs to be twice that ofPAM such that mCAP = 2mPAM .
III. VLC LINK MODEL AND ASSUMPTIONS
A. LED Frequency Response Model
The LED impulse response is the main limitation with respectto the modulation bandwidth in the VLC channel. The whiteLED produces white light by combining blue photons that areemitted directly by the blue chip and the photons re-emitted bythe phosphor layer that covers the LED chip.
Therefore, the overall LED response can be modeled as thesum of two channels: the first channel hb(t) corresponds to theblue light response while the second channel hp(t) correspondsto the phosphor layer response. The overall LED impulse re-sponse can be written as [8], [14]
hLED(t) = Gbhb(t) +Gp (hp(t) ∗ hb(t)) , (10)
where ∗ denotes the convolution operator and Gb and Gp arethe power gains associated with the blue light response and thephosophor layer response respectively. Under the assumptionthat most of the received optical power stems from the yellowphotons [15], we have Gp � Gb and a simplified model of theLED response can be derived from (10), such that
hLED(t) = Gp (hp(t) ∗ hb(t)) . (11)
The responses hb(t) and hp(t) can be modeled as simple firstorder low-pass filters [16], i.e.
hb(t) = u(t)e−2πfbt,
hp(t) = u(t)e−2πfpt, (12)
where fb and fp are the 3-dB cut-off frequencies of the blue lightresponse and the phosphor layer response, respectively, and u(t)is the unit step function.
The LED device selected for this study is a low-cost whiteLED (Lumiled LUXEON 3020) with a color temperature of3000 K typically used for lighting applications with a 3-dBmodulation bandwidth measured at 1.47 MHz. The cut-off fre-quencies fb and fp are estimated at 12 MHz and 1.47 MHzrespectively.
The LED frequency response is obtained by taking the Fouriertransform of (11), yielding
HLED(f) = Gp · 1
1 + j
(f
fb
) · 1
1 + j
(f
fp
) . (13)
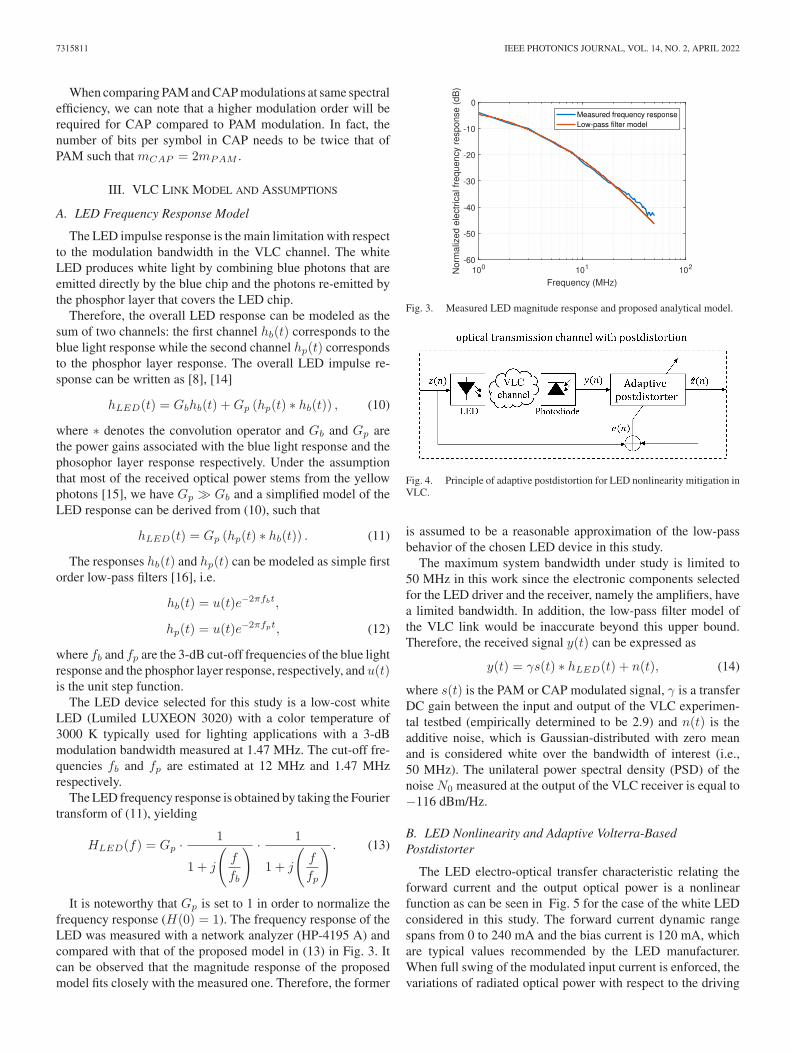
It is noteworthy that Gp is set to 1 in order to normalize thefrequency response (H(0) = 1). The frequency response of theLED was measured with a network analyzer (HP-4195 A) andcompared with that of the proposed model in (13) in Fig. 3. Itcan be observed that the magnitude response of the proposedmodel fits closely with the measured one. Therefore, the former
Fig. 3. Measured LED magnitude response and proposed analytical model.
Fig. 4. Principle of adaptive postdistortion for LED nonlinearity mitigation inVLC.
is assumed to be a reasonable approximation of the low-passbehavior of the chosen LED device in this study.
The maximum system bandwidth under study is limited to50 MHz in this work since the electronic components selectedfor the LED driver and the receiver, namely the amplifiers, havea limited bandwidth. In addition, the low-pass filter model ofthe VLC link would be inaccurate beyond this upper bound.Therefore, the received signal y(t) can be expressed as
y(t) = γs(t) ∗ hLED(t) + n(t), (14)
where s(t) is the PAM or CAP modulated signal, γ is a transferDC gain between the input and output of the VLC experimen-tal testbed (empirically determined to be 2.9) and n(t) is theadditive noise, which is Gaussian-distributed with zero meanand is considered white over the bandwidth of interest (i.e.,50 MHz). The unilateral power spectral density (PSD) of thenoise N0 measured at the output of the VLC receiver is equal to−116 dBm/Hz.
B. LED Nonlinearity and Adaptive Volterra-BasedPostdistorter
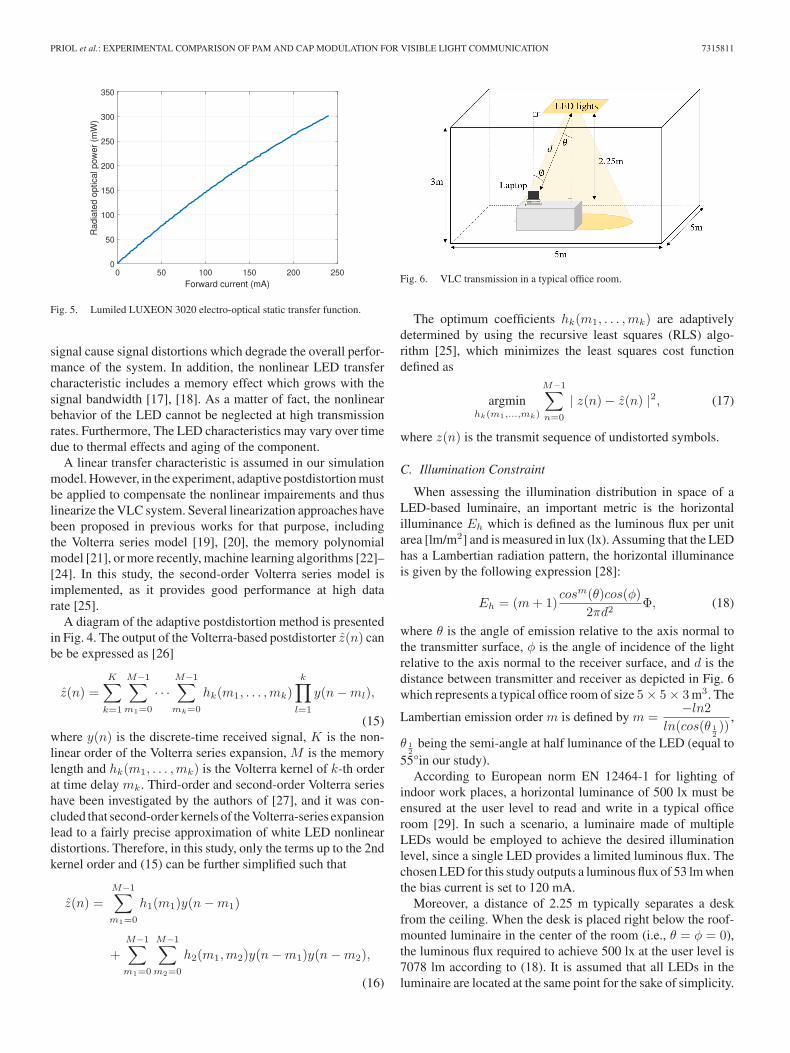
The LED electro-optical transfer characteristic relating theforward current and the output optical power is a nonlinearfunction as can be seen in Fig. 5 for the case of the white LEDconsidered in this study. The forward current dynamic rangespans from 0 to 240 mA and the bias current is 120 mA, whichare typical values recommended by the LED manufacturer.When full swing of the modulated input current is enforced, thevariations of radiated optical power with respect to the driving
PRIOL et al.: EXPERIMENTAL COMPARISON OF PAM AND CAP MODULATION FOR VISIBLE LIGHT COMMUNICATION 7315811
Fig. 5. Lumiled LUXEON 3020 electro-optical static transfer function.
signal cause signal distortions which degrade the overall perfor-mance of the system. In addition, the nonlinear LED transfercharacteristic includes a memory effect which grows with thesignal bandwidth [17], [18]. As a matter of fact, the nonlinearbehavior of the LED cannot be neglected at high transmissionrates. Furthermore, The LED characteristics may vary over timedue to thermal effects and aging of the component.
A linear transfer characteristic is assumed in our simulationmodel. However, in the experiment, adaptive postdistortion mustbe applied to compensate the nonlinear impairements and thuslinearize the VLC system. Several linearization approaches havebeen proposed in previous works for that purpose, includingthe Volterra series model [19], [20], the memory polynomialmodel [21], or more recently, machine learning algorithms [22]–[24]. In this study, the second-order Volterra series model isimplemented, as it provides good performance at high datarate [25].
A diagram of the adaptive postdistortion method is presentedin Fig. 4. The output of the Volterra-based postdistorter z(n) canbe be expressed as [26]
z(n) =
K∑k=1
M−1∑m1=0
· · ·M−1∑mk=0
hk(m1, . . . ,mk)
k∏l=1
y(n−ml),
(15)where y(n) is the discrete-time received signal, K is the non-linear order of the Volterra series expansion, M is the memorylength and hk(m1, . . . ,mk) is the Volterra kernel of k-th orderat time delay mk. Third-order and second-order Volterra serieshave been investigated by the authors of [27], and it was con-cluded that second-order kernels of the Volterra-series expansionlead to a fairly precise approximation of white LED nonlineardistortions. Therefore, in this study, only the terms up to the 2ndkernel order and (15) can be further simplified such that
z(n) =
M−1∑m1=0
h1(m1)y(n−m1)
+
M−1∑m1=0
M−1∑m2=0
h2(m1,m2)y(n−m1)y(n−m2),
(16)
Fig. 6. VLC transmission in a typical office room.
The optimum coefficients hk(m1, . . . ,mk) are adaptivelydetermined by using the recursive least squares (RLS) algo-rithm [25], which minimizes the least squares cost functiondefined as
argminhk(m1,...,mk)
M−1∑n=0
| z(n)− z(n) |2, (17)
where z(n) is the transmit sequence of undistorted symbols.
C. Illumination Constraint
When assessing the illumination distribution in space of aLED-based luminaire, an important metric is the horizontalilluminance Eh which is defined as the luminous flux per unitarea [lm/m2] and is measured in lux (lx). Assuming that the LEDhas a Lambertian radiation pattern, the horizontal illuminanceis given by the following expression [28]:
Eh = (m+ 1)cosm(θ)cos(φ)
2πd2Φ, (18)
where θ is the angle of emission relative to the axis normal tothe transmitter surface, φ is the angle of incidence of the lightrelative to the axis normal to the receiver surface, and d is thedistance between transmitter and receiver as depicted in Fig. 6which represents a typical office room of size 5× 5× 3m3. The
Lambertian emission order m is defined by m =−ln2
ln(cos(θ 12))
,
θ 12
being the semi-angle at half luminance of the LED (equal to55°in our study).
According to European norm EN 12464-1 for lighting ofindoor work places, a horizontal luminance of 500 lx must beensured at the user level to read and write in a typical officeroom [29]. In such a scenario, a luminaire made of multipleLEDs would be employed to achieve the desired illuminationlevel, since a single LED provides a limited luminous flux. Thechosen LED for this study outputs a luminous flux of 53 lm whenthe bias current is set to 120 mA.
Moreover, a distance of 2.25 m typically separates a deskfrom the ceiling. When the desk is placed right below the roof-mounted luminaire in the center of the room (i.e., θ = φ = 0),the luminous flux required to achieve 500 lx at the user level is7078 lm according to (18). It is assumed that all LEDs in theluminaire are located at the same point for the sake of simplicity.
7315811 IEEE PHOTONICS JOURNAL, VOL. 14, NO. 2, APRIL 2022
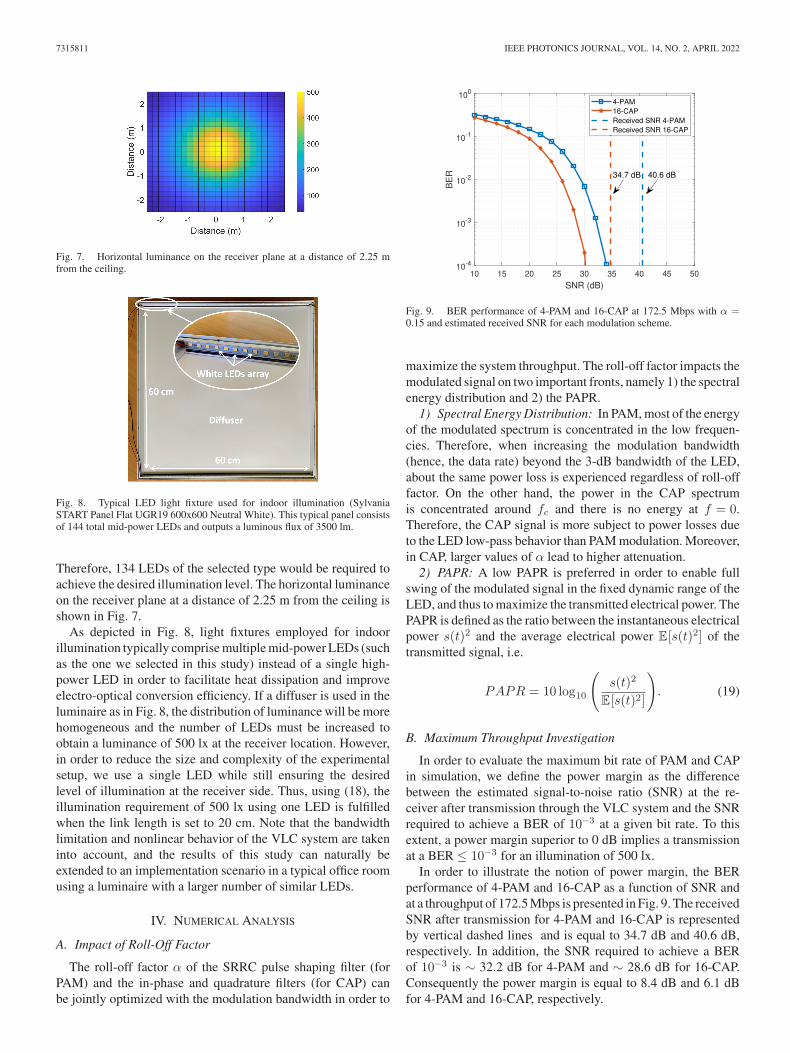
Fig. 7. Horizontal luminance on the receiver plane at a distance of 2.25 mfrom the ceiling.
Fig. 8. Typical LED light fixture used for indoor illumination (SylvaniaSTART Panel Flat UGR19 600x600 Neutral White). This typical panel consistsof 144 total mid-power LEDs and outputs a luminous flux of 3500 lm.
Therefore, 134 LEDs of the selected type would be required toachieve the desired illumination level. The horizontal luminanceon the receiver plane at a distance of 2.25 m from the ceiling isshown in Fig. 7.
As depicted in Fig. 8, light fixtures employed for indoorillumination typically comprise multiple mid-power LEDs (suchas the one we selected in this study) instead of a single high-power LED in order to facilitate heat dissipation and improveelectro-optical conversion efficiency. If a diffuser is used in theluminaire as in Fig. 8, the distribution of luminance will be morehomogeneous and the number of LEDs must be increased toobtain a luminance of 500 lx at the receiver location. However,in order to reduce the size and complexity of the experimentalsetup, we use a single LED while still ensuring the desiredlevel of illumination at the receiver side. Thus, using (18), theillumination requirement of 500 lx using one LED is fulfilledwhen the link length is set to 20 cm. Note that the bandwidthlimitation and nonlinear behavior of the VLC system are takeninto account, and the results of this study can naturally beextended to an implementation scenario in a typical office roomusing a luminaire with a larger number of similar LEDs.
IV. NUMERICAL ANALYSIS
A. Impact of Roll-Off Factor
The roll-off factor α of the SRRC pulse shaping filter (forPAM) and the in-phase and quadrature filters (for CAP) canbe jointly optimized with the modulation bandwidth in order to
Fig. 9. BER performance of 4-PAM and 16-CAP at 172.5 Mbps with α =0.15 and estimated received SNR for each modulation scheme.
maximize the system throughput. The roll-off factor impacts themodulated signal on two important fronts, namely 1) the spectralenergy distribution and 2) the PAPR.
1) Spectral Energy Distribution: In PAM, most of the energyof the modulated spectrum is concentrated in the low frequen-cies. Therefore, when increasing the modulation bandwidth(hence, the data rate) beyond the 3-dB bandwidth of the LED,about the same power loss is experienced regardless of roll-offfactor. On the other hand, the power in the CAP spectrumis concentrated around fc and there is no energy at f = 0.Therefore, the CAP signal is more subject to power losses dueto the LED low-pass behavior than PAM modulation. Moreover,in CAP, larger values of α lead to higher attenuation.
2) PAPR: A low PAPR is preferred in order to enable fullswing of the modulated signal in the fixed dynamic range of theLED, and thus to maximize the transmitted electrical power. ThePAPR is defined as the ratio between the instantaneous electricalpower s(t)2 and the average electrical power E[s(t)2] of thetransmitted signal, i.e.
PAPR = 10 log10
(s(t)2
E[s(t)2]
). (19)
B. Maximum Throughput Investigation
In order to evaluate the maximum bit rate of PAM and CAPin simulation, we define the power margin as the differencebetween the estimated signal-to-noise ratio (SNR) at the re-ceiver after transmission through the VLC system and the SNRrequired to achieve a BER of 10−3 at a given bit rate. To thisextent, a power margin superior to 0 dB implies a transmissionat a BER ≤ 10−3 for an illumination of 500 lx.
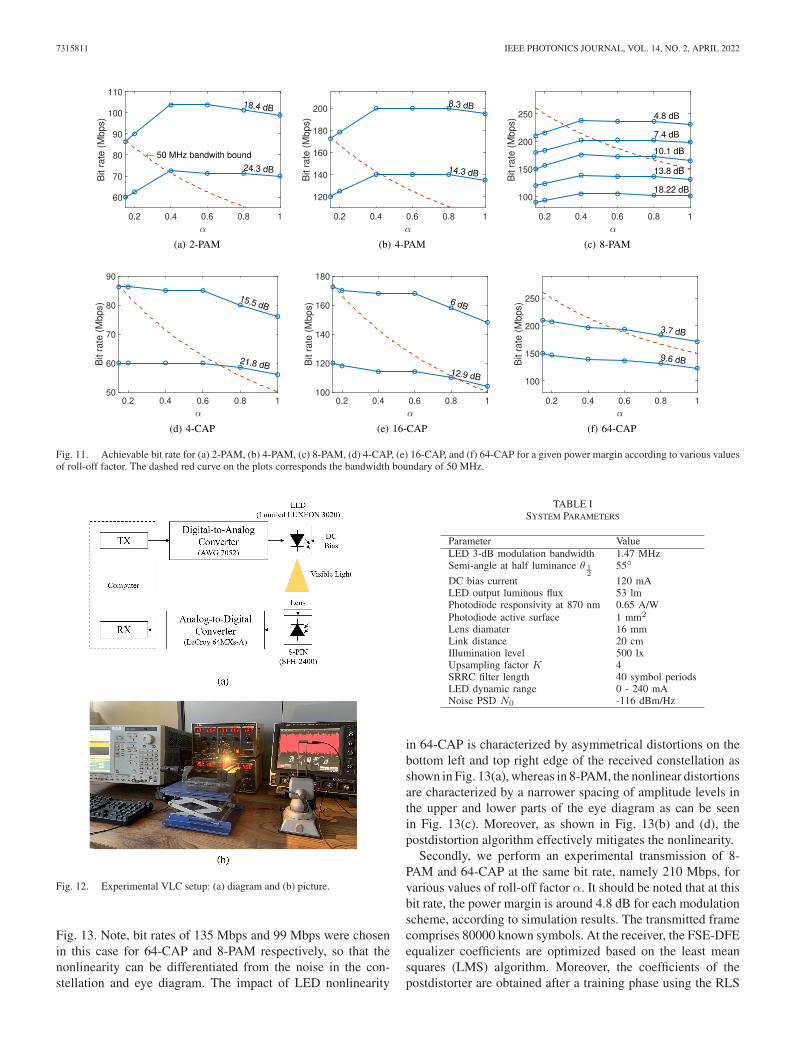
In order to illustrate the notion of power margin, the BERperformance of 4-PAM and 16-CAP as a function of SNR andat a throughput of 172.5 Mbps is presented in Fig. 9. The receivedSNR after transmission for 4-PAM and 16-CAP is representedby vertical dashed lines and is equal to 34.7 dB and 40.6 dB,respectively. In addition, the SNR required to achieve a BERof 10−3 is ∼ 32.2 dB for 4-PAM and ∼ 28.6 dB for 16-CAP.Consequently the power margin is equal to 8.4 dB and 6.1 dBfor 4-PAM and 16-CAP, respectively.

PRIOL et al.: EXPERIMENTAL COMPARISON OF PAM AND CAP MODULATION FOR VISIBLE LIGHT COMMUNICATION 7315811
Fig. 10. PAPR threshold of PAM and CAP signals for a probability Pr thatPr(PAPR > PAPRth) = 10−4 for various roll-off factors.
The results for different power margins according to differentvalues of α are shown in Fig. 11. It should be noted that thedashed red line on the graphs correspond to the 50 MHz band-width bound of the VLC system as explained in Section III-A.For example, as illustrated in Fig. 11(a), for a 2-PAM signal andassuming a 50 MHz total occupied bandwidth, a 86.25 Mbpstransmission at a BER lower than 10−3 can be achieved with a0.15 roll-off factor and a very comfortable 18.4 dB margin. Onthe other hand, a transmission rate of only 72.5 Mbps is achiev-able given a 0.4 factor roll-off, albeit with a higher margin equalto 24.3 dB. It is of interest that for higher modulation bandwidths(obtainable with better electronic components), the red linewould move upwards, indicating higher possible throughputs.
The following observations can be drawn from Fig. 11� For PAM: it can be noticed in Fig. 11(a), (b) and (c) that,
for a given power margin, the maximum bit rate is achievedfor ∼ α = 0.4, i.e., when the PAPR is the lowest, as canbe seen in Fig. 10. Under this condition, the input LEDdriving signal can span the full LED dynamic range andthus the transmitted electrical power can be maximized.Consequently, the power margin is increased, and a higherachievable bit rate can be achieved. It can also be seen thatthe PAPR slightly increases when α approaches 1 (on theorder of 0.5 dB) which accounts for the slightly decreasingbit rate in Fig. 11(a), (b) and (c).
� For CAP: as opposed to PAM; the power loss experiencedby the signal after filtering by the LED impulse responseincreases with the value of α. This can be directly seen inFig. 2(b) which shows the shape of the CAP modulatedspectrum for various values of α and the LED frequencyresponse. As the roll-off increases, the signal spectrumis shifted around a frequency fc = (1 + α)/2 T and issubject to a stronger attenuation after filtering by the LEDresponse. On the other hand, the decreasing PAPR leadsto more power at the receiver. In fact, the PAPR of CAPsignals decreases when the roll-off factor increases to reachits minimum value forα = 0.6 for 4-CAP, 16-CAP and 64-CAP and around 0.55 for 32-CAP as observed in Fig. 10.The power gain inherent to the decreasing PAPR doesnot compensate the power loss due to the attenuation ofthe LED which accounts for the monotonically decreasingcurves in Fig. 11(d), (e) and (f).
In addition, the maximum bit rate for PAM and CAP in amaximum bandwidth of 50 MHz can be achieved with a smallvalue of α, typically 0.15, which yields both a positive powermargin and a minimal bandwidth requirement. Moreover, PAMprovides a power margin gain on the order of 2-3 dB and 1-2 dBfor 2-PAM and 4-PAM, with respect to 4-CAP and 16-CAP,respectively.
Finally, 8-PAM and 64-CAP are compared and revealed toapproximately provide similar total throughput with a slightadvantage of ∼ 1 dB in power margin for 8-PAM. In addition,simulation results (not shown in figure) show that 64-CAPexhibits slightly higher performance than 32-CAP: in fact, for abit rate of 210 Mbps, 64-CAP exhibits a power margin of 3.85 dBcompared to 3.45 dB for 32-CAP.
V. EXPERIMENTAL RESULTS
In this section, an experimental transmission is performed toverify the simulation results for high modulation orders (8-PAMand 64-CAP). Adaptive postdistortion based on the Volterraseries expansion is employed to mitigate the LED nonlinearitydistortion. Performance without postdistorsion is also assessedto evaluate the degree of sensitivty to nonlinear impairements.In addition, a transmission with bit-loading DMT is performedfor comparison with PAM and CAP. As DMT is not a main focusof this paper, this is done to provide a comparative benchmarkrepresenting this popular modulation scheme.
A. Experimental Setup
Fig. 12(a) and (b) show a diagram and a picture of the exper-imental setup, respectively. The VLC transmission proceeds asfollows. Firstly, the PAM and CAP signals are generated offlinewith MATLAB and stored into an arbitrary waveform generatormemory (Tektronix, AWG7052TM, 10 bits resolution). Thelatter performs a digital-to-analog conversion, and the outputmodulated signal is combined with a DC bias current by meansof a custom board to provide the right level of illumination and toensure that the driving signal occupies the entire LED dynamicrange.
At the receiver side, a 16-mm diamter lens concentrates thelight onto a low-cost silicon PIN photodiode (OSRAM SFH-2400) with a 1 mm2 active surface. The photodiode produces aphotocurrent proportional to the received optical power, whichis then converted into a voltage signal using a transimpedanceamplifier circuit. The received signal is finally sampled by areal-time oscilloscope (LeCroy 64 MXs-A), digitized and savedfor subsequent offline processing. The latter includes resam-pling, synchronization, postdistortion, matched filtering, FSE-DFE equalization, symbol de-mapping and BER calculation.The system parameters used in the experiment are summarizedin Table I.
B. Impact of LED Nonlinearity
In order to highlight the effect of nonlinear characteristicof the LED on high-order PAM and CAP, transmissions with64-CAP and 8-PAM were performed and the constellation andeye diagrams with and without postdistortion are shown in
7315811 IEEE PHOTONICS JOURNAL, VOL. 14, NO. 2, APRIL 2022
Fig. 11. Achievable bit rate for (a) 2-PAM, (b) 4-PAM, (c) 8-PAM, (d) 4-CAP, (e) 16-CAP, and (f) 64-CAP for a given power margin according to various valuesof roll-off factor. The dashed red curve on the plots corresponds the bandwidth boundary of 50 MHz.
Fig. 12. Experimental VLC setup: (a) diagram and (b) picture.
Fig. 13. Note, bit rates of 135 Mbps and 99 Mbps were chosenin this case for 64-CAP and 8-PAM respectively, so that thenonlinearity can be differentiated from the noise in the con-stellation and eye diagram. The impact of LED nonlinearity
TABLE ISYSTEM PARAMETERS
in 64-CAP is characterized by asymmetrical distortions on thebottom left and top right edge of the received constellation asshown in Fig. 13(a), whereas in 8-PAM, the nonlinear distortionsare characterized by a narrower spacing of amplitude levels inthe upper and lower parts of the eye diagram as can be seenin Fig. 13(c). Moreover, as shown in Fig. 13(b) and (d), thepostdistortion algorithm effectively mitigates the nonlinearity.
Secondly, we perform an experimental transmission of 8-PAM and 64-CAP at the same bit rate, namely 210 Mbps, forvarious values of roll-off factor α. It should be noted that at thisbit rate, the power margin is around 4.8 dB for each modulationscheme, according to simulation results. The transmitted framecomprises 80000 known symbols. At the receiver, the FSE-DFEequalizer coefficients are optimized based on the least meansquares (LMS) algorithm. Moreover, the coefficients of thepostdistorter are obtained after a training phase using the RLS
PRIOL et al.: EXPERIMENTAL COMPARISON OF PAM AND CAP MODULATION FOR VISIBLE LIGHT COMMUNICATION 7315811
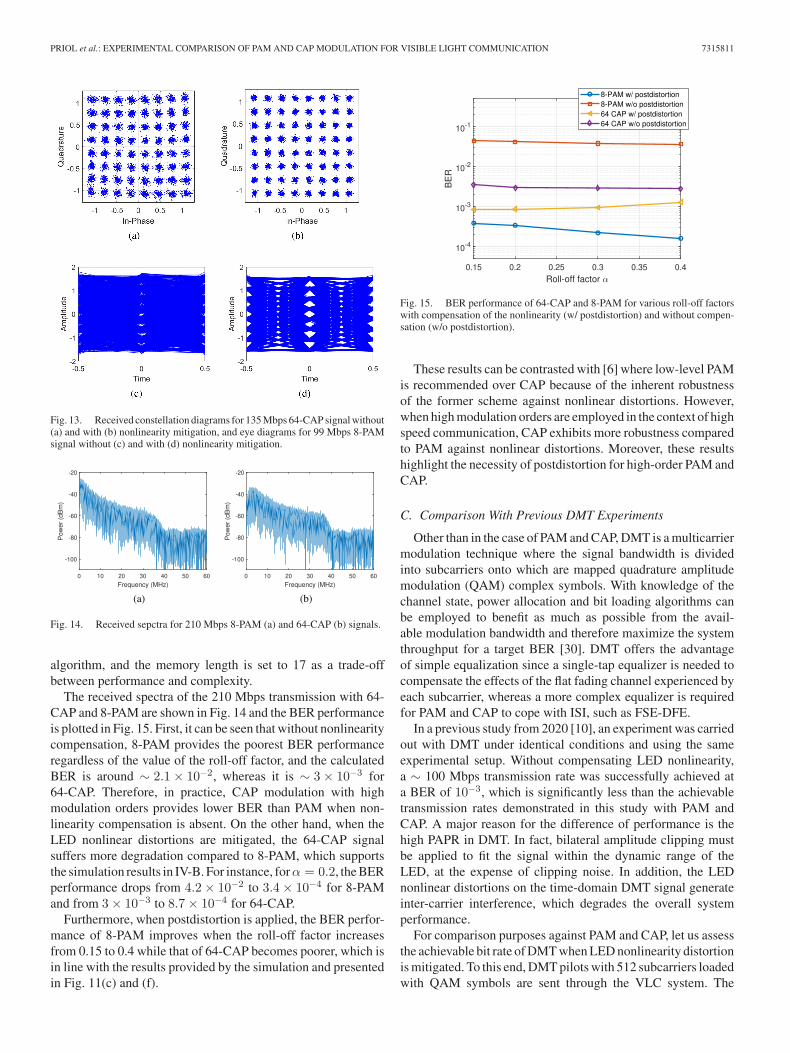
Fig. 13. Received constellation diagrams for 135 Mbps 64-CAP signal without(a) and with (b) nonlinearity mitigation, and eye diagrams for 99 Mbps 8-PAMsignal without (c) and with (d) nonlinearity mitigation.
Fig. 14. Received sepctra for 210 Mbps 8-PAM (a) and 64-CAP (b) signals.
algorithm, and the memory length is set to 17 as a trade-offbetween performance and complexity.
The received spectra of the 210 Mbps transmission with 64-CAP and 8-PAM are shown in Fig. 14 and the BER performanceis plotted in Fig. 15. First, it can be seen that without nonlinearitycompensation, 8-PAM provides the poorest BER performanceregardless of the value of the roll-off factor, and the calculatedBER is around ∼ 2.1× 10⁻², whereas it is ∼ 3× 10⁻³ for64-CAP. Therefore, in practice, CAP modulation with highmodulation orders provides lower BER than PAM when non-linearity compensation is absent. On the other hand, when theLED nonlinear distortions are mitigated, the 64-CAP signalsuffers more degradation compared to 8-PAM, which supportsthe simulation results in IV-B. For instance, forα = 0.2, the BERperformance drops from 4.2× 10⁻² to 3.4× 10⁻⁴ for 8-PAMand from 3× 10⁻³ to 8.7× 10⁻⁴ for 64-CAP.
Furthermore, when postdistortion is applied, the BER perfor-mance of 8-PAM improves when the roll-off factor increasesfrom 0.15 to 0.4 while that of 64-CAP becomes poorer, which isin line with the results provided by the simulation and presentedin Fig. 11(c) and (f).
Fig. 15. BER performance of 64-CAP and 8-PAM for various roll-off factorswith compensation of the nonlinearity (w/ postdistortion) and without compen-sation (w/o postdistortion).
These results can be contrasted with [6] where low-level PAMis recommended over CAP because of the inherent robustnessof the former scheme against nonlinear distortions. However,when high modulation orders are employed in the context of highspeed communication, CAP exhibits more robustness comparedto PAM against nonlinear distortions. Moreover, these resultshighlight the necessity of postdistortion for high-order PAM andCAP.
C. Comparison With Previous DMT Experiments
Other than in the case of PAM and CAP, DMT is a multicarriermodulation technique where the signal bandwidth is dividedinto subcarriers onto which are mapped quadrature amplitudemodulation (QAM) complex symbols. With knowledge of thechannel state, power allocation and bit loading algorithms canbe employed to benefit as much as possible from the avail-able modulation bandwidth and therefore maximize the systemthroughput for a target BER [30]. DMT offers the advantageof simple equalization since a single-tap equalizer is needed tocompensate the effects of the flat fading channel experienced byeach subcarrier, whereas a more complex equalizer is requiredfor PAM and CAP to cope with ISI, such as FSE-DFE.
In a previous study from 2020 [10], an experiment was carriedout with DMT under identical conditions and using the sameexperimental setup. Without compensating LED nonlinearity,a ∼ 100 Mbps transmission rate was successfully achieved ata BER of 10−3, which is significantly less than the achievabletransmission rates demonstrated in this study with PAM andCAP. A major reason for the difference of performance is thehigh PAPR in DMT. In fact, bilateral amplitude clipping mustbe applied to fit the signal within the dynamic range of theLED, at the expense of clipping noise. In addition, the LEDnonlinear distortions on the time-domain DMT signal generateinter-carrier interference, which degrades the overall systemperformance.
For comparison purposes against PAM and CAP, let us assessthe achievable bit rate of DMT when LED nonlinearity distortionis mitigated. To this end, DMT pilots with 512 subcarriers loadedwith QAM symbols are sent through the VLC system. The

7315811 IEEE PHOTONICS JOURNAL, VOL. 14, NO. 2, APRIL 2022
Fig. 16. SNR (a) and number of allocated bits (b) per subcarrier.
sampling frequency of the AWG generator is set to 120 MS/s.At the receiver, the SNR per subcarrier for a target BER of 10−3
is calculated and the number of allocated bits per subcarrier iscomputed using Chow’s algorithm. The results are presentedin Fig. 16(a) and (b). It can be observed that the SNR persubcarrier is significantly improved when the impact of LEDnonlinearity is mitigated with the postdistorter, and the totalnumber of allocated bits in one DMT symbol increases from1646 to 2526. As a result, considering the cost of the cyclingprefix set to 33 samples, the achievable practical transmission bitrate is∼ 95 Mbps and∼ 145 Mbps without and with nonlinearitycompensation, respectively. By comparing these results with thatof V-B, it can be concluded that DMT provides lower throughputthan PAM and CAP.
VI. CONCLUSION
In this paper, two modulation schemes were comparedthrough simulation and experiment, namely PAM and CAPemploying a low-cost white LED and meeting the requirementsof illumination standards for indoor lighting. It appeared thattypical indoor lighting requirements lead to a sufficiently highSNR to enable transmission with high-order PAM and high-order CAP such as 8-PAM or 64-CAP. The impact of the roll-offfactor on the system performance was also studied. It is shownthat a small value of roll-off factor (i.e., 0.15) is preferred toachieve maximum throughput and reduce bandwidth require-ments. However, when no bandwidth limitation is imposed bythe electronic circuitry, the optimum value is around 0.4 forPAM and 0.15 for CAP. The simulation results indicate a slight
advantage for PAM over CAP in terms of achievable through-put. The achievable data rates for both modulation formats arenonetheless similar, and are on the order of a few hundred Mbps.
It was also found that the LED nonlinearity has a significantimpact on the system performance when employing PAM andCAP with a large constellation size, and that the two modulationschemes are affected differently by the nonlinear distortions.Adaptive postdistortion based on the Volterra series expansionwas implemented to cope with the nonlinear behavior of theLED in practice. The performance of highly spectral-efficientmodulation schemes such as 8-PAM and 64-CAP were analyzedwith and without postdistortion. In conclusion, the nonlineardistortions can severely degrade the performance of 8-PAM,whereas 64-CAP shows more robustness. However, when theVLC system is linearized by the postdistorer, 8-PAM is the mostsuitable modulation scheme. In addition, our results indicate thathigh-order CAP and PAM with postdistortion perform substan-tially better than DMT in terms of achievable transmission rateand are suitable for high-speed VLC systems under illuminationconstraints. In this paper, the performance study focused onsingle-band CAP and PAM modulation, which offer very goodperformance in terms of low PAPR in relation with our initialrequirements. A future and interesting extension of this workwould consist in performing an optimization of multi-band CAPwith adaptive bit-loading, as well as variants of DMT suchas DFT-S-OFDM, which has the virtue of reducing the signalPAPR.
REFERENCES
[1] N. Chi, LED-Based Visible Light Communications, ser. Signals and Com-munication Technology, Berlin, Germany: Springer, 2018.
[2] Z. Ghassemlooy, L. N. Alves, S. Zvanovec, and M.-A. Khalighi, VisibleLight Communications, Theory and Applications. Boca Raton, FL, USA:CRC Press, 2017.
[3] D. Karunatilaka, F. Zafar, V. Kalavally, and R. Parthiban, “LED basedindoor visible light communications: State of the art,” IEEE Commun.Surveys Tuts., vol. 17, no. 3, pp. 1649–1678, Jul.–Sep. 2015.
[4] International Energy Agency, “Lighting sales by type in the sustainabledevelopment scenario 2010-2030,” 2020. [Online]. Available:https://www.iea.org/data-and-statistics/charts/lighting-sales-by-type-in-the-sustainable-development-scenario-2010-2030
[5] J.-Y. Sung, C.-W. Chow, and C.-H. Yeh, “Is blue optical filter necessaryin high speed phosphor-based white light LED visible light commu-nications?,” Opt. Exp., vol. 22, no. 17, pp. 20646–20651, Aug. 2014,Art. no. 20646.
[6] G. Stepniak, L. Maksymiuk, and J. Siuzdak, “Experimental comparisonof PAM, CAP, and DMT modulations in phosphorescent white LEDtransmission link,” IEEE Photon. J., vol. 7, no. 3, Jun. 2015, Art. no.7901708.
[7] M.-A. Khalighi, S. Long, S. Bourennane, and Z. Ghassemlooy, “PAM-and CAP-based transmission schemes for visible-light communications,”IEEE Access, vol. 5, pp. 27002–27013, 2017.
[8] G. Stepniak, M. Schuppert, and C.-A. Bunge, “Advanced modulationformats in phosphorous LED VLC links and the impact of blue filtering,”J. Lightw. Technol., vol. 33, no. 21, pp. 4413–4423, Nov. 2015.
[9] S. Dimitrov and H. Haas, Principles of LED Light Communications.Cambridge, U.K.: Cambridge Univ. Press, 2015.
[10] A. Jabban, S. Haese, and M. Helard, “Theoretical and experimentaloptimization of DMT-based visible light communication under lightingconstraints,” EURASIP J. Wireless Commun. Netw., vol. 2020, no. 1,pp. 1–29, Dec. 2020.
[11] R. D. Gitlin and S. B. Weinstein, “Fractionally-spaced equalization: Animproved digital transversal equalizer,” Bell Syst. Tech. J., vol. 60, no. 2,pp. 275–296, 1981.

PRIOL et al.: EXPERIMENTAL COMPARISON OF PAM AND CAP MODULATION FOR VISIBLE LIGHT COMMUNICATION 7315811
[12] G.-H. Im, D. Harman, G. Huang, A. Mandzik, M.-H. Nguyen, and J.-J.Werner, “51.84 Mb/s 16-CAP ATM LAN standard,” IEEE J. Sel. AreasCommun., vol. 13, no. 4, pp. 620–632, May 1995.
[13] K. O. Akande, P. A. Haigh, and W. O. Popoola, “On the implementationof carrierless amplitude and phase modulation in visible light communi-cation,” IEEE Access, vol. 6, pp. 60532–60546, 2018.
[14] N. Anous, T. Ramadan, M. Abdallah, K. Qaraqe, and D. Khalil, “Impactof blue filtering on effective modulation bandwidth and wide-angle oper-ation in white LED-based VLC systems,” OSA Continuum, vol. 1, no. 3,pp. 910–929, Nov. 2018.
[15] H. Le Minh et al., “100-Mb/s NRZ visible light communications using apostequalized white LED,” IEEE Photon. Technol. Lett., vol. 21, no. 15,pp. 1063–1065, Aug. 2009.
[16] T. Luan and K. Qian, “Research on influencing factors of LED frequencyresponse,” in Proc. AIP Conf., 2017, vol. 1864, no. 1, Art. no. 020008.
[17] K. Ying, Z. Yu, R. J. Baxley, H. Qian, G.-K. Chang, and G. T. Zhou,“Nonlinear distortion mitigation in visible light communications,” IEEEWireless Commun., vol. 22, no. 2, pp. 36–45, Apr. 2015.
[18] S. Long, “Indoor channel modeling and high data rate transmission forvisible light communication systems,” Ph.D. dissertation, Fresnel Inst.,École Centrale de Marseille, France, Sep. 2016.
[19] G. Stepniak, J. Siuzdak, and P. Zwierko, “Compensation of aVLC phosphorescent white LED nonlinearity by means of VolterraDFE,” IEEE Photon. Technol. Lett., vol. 25, no. 16, pp. 1597–1600,Aug. 2013.
[20] Y. Wang, L. Tao, X. Huang, J. Shi, and N. Chi, “Enhanced perfor-mance of a high-speed WDM CAP64 VLC system employing Volterraseries-based nonlinear equalizer,” IEEE Photon. J., vol. 7, no. 3, pp. 1–7,Jun. 2015.
[21] H. Qian, S. J. Yao, S. Z. Cai, and T. Zhou, “Adaptive postdistortion fornonlinear LEDs in visible light communications,” IEEE Photon. J., vol. 6,no. 4, pp. 1–8, Aug. 2014, Art. no. 7901508.
[22] J.-K. Lain and Y.-H. Chen, “An ANN-based adaptive predistorter for LEDnonlinearity in indoor visible light communications,” Electronics, vol. 10,no. 8, 2021, Art. no. 948.
[23] X. Li, Q. Gao, C. Gong, and Z. Xu, “Nonlinearity mitigation for VLCwith an artificial neural network based equalizer,” in Proc. IEEE Glob.commun. Workshops, 2018, pp. 1–6.
[24] P. Miao, B. Zhu, C. Qi, Y. Jin, and C. Lin, “A model-driven deep learningmethod for LED nonlinearity mitigation in OFDM-based optical commu-nications,” IEEE Access, vol. 7, pp. 71436–71446, 2019.
[25] Y. Zhou et al., “Comparison of nonlinear equalizers for high-speed visi-ble light communication utilizing silicon substrate phosphorescent whiteLED,” Opt. Exp., vol. 28, no. 2, pp. 2302–2316, 2020.
[26] W. Zhao, “Nonlinearity modelling and mitigation for LED communi-cations,” Ph.D. dissertation, School Elect., Comput. Telecommun. Eng.,Univ. Wollongong, Australia, 2018.
[27] G. Stepniak, M. Kowalczyk, and J. Siuzdak, “Volterra kernel estimationof white light LEDs in the time domain,” Sensors, vol. 18, no. 4, 2018,Art. no. 1024.
[28] Z. Ghassemlooy, W. Popoola, and S. Rajbhandari, Optical Wireless Com-munications: System and Channel Modelling With MATLAB, 2nd ed. BocaRaton, FL, USA: CRC Press, 2018.
[29] Light and Lighting - Lighting of Work Places. Part 1: Indoor Work Places,European Committee for Standardization, Standard EN 12464-1, 2011.
[30] L. Peng, M. Hélard, and S. Haese, “On bit-loading for discrete multi-tonetransmission over short range POF systems,” J. Lightw. Technol., vol. 31,no. 24, pp. 4155–4165, Dec. 2013.