Assessing Competitiveness of Jordanian Olive Production a Policy Analysis Matrix Pam

Applied Bioinformatics 2004:3(1) 31–39© 2004 Open Mind Journals Limited. All rights reserved.
31
O R I G I N A L R E S E A R C H
Representation of mutation pressure andselection pressure by PAM matricesAleksandra Nowicka,1 Pawel Mackiewicz,1 Malgorzata Dudkiewicz,1 Dorota Mackiewicz,1 MariaKowalczuk,1 Joanna Banaszak,1 Stanislaw Cebrat,1 Miroslaw R Dudek2
1Department of Genomics, Institute of Genetics and Microbiology, University of Wroclaw, Wroclaw, Poland; 2Institute of
Physics, University of Zielona Gora, Zielona Gora, Poland
Abstract: This paper analyses the relationship between the mutation data matrix 1PAM/PET91, representing the effect of both mutation
and selection pressures exerted on 16 130 homologous proteins of different organisms, and a mutation probability matrix (1PAM/MPM)
representing the effect of pure mutation pressure on protein coding sequences of the Borrelia burgdorferi genome. The 1PAM/MPM
matrix was derived with the help of computer simulations, which used empirical nucleotide substitution rates found for the B. burgdorferi
genome. Here, it is shown that the frequency of amino acid occurrence is strongly related to their effective survival time. We found that
the shorter the turnover time of an amino acid under pure mutation pressure, the lower its fraction in the proteins coded by the genome and
the more protected by selection pressure is its position in proteins. Results of analyses suggest that during evolution the mutational
pressure has been optimised to some extent to the selection requirements.
Keywords: mutation pressure, selection pressure, PAM matrices, DNA asymmetry
Correspondence: Stanislaw Cebrat, Department of Genomics,Institute of Genetics and Microbiology, University of Wroclaw, ul.Przybyszewskiego 63/77, 51-148 Wroclaw, Poland; tel +48713756303;fax +48713252151; email [email protected]
IntroductionSubstitutions observed in homologous amino acid sequences
are the result of mutations occurring at the DNA level and
the selection process then eliminating the mutations
responsible for damages in the coded proteins that could
otherwise lead to loss of function and/or decrease in fitness
of the organism. Evolutionary distances between amino acid
sequences are usually measured in the estimated number of
amino acid substitutions per site that have happened since
the compared sequences diverged from the common ancestor
and that have been accepted by selection.
To determine the distances between protein sequences,
usually a Markov model of sequence evolution is assumed.
In this model, substitution rates of amino acids become the
elements of a mutation data matrix M, and a simple power
Mt (matrix M multiplied by itself t times) enables calculation
of the substitution probability after time t (with a properly
chosen time unit). The most widely used method for the
calculation of distances between sequences is based on the
mutation data matrix Mij, published by Dayhoff et al (1978),
where i and j represent amino acids, and an element Mij of
the matrix gives the probability that the amino acid in column
j will be replaced by the amino acid in row i after a given
evolutionary time interval. The interval corresponding to 1%
of substitutions between two compared sequences is called
one PAM (percent of accepted mutations), and the
corresponding matrix is denoted as 1PAM. Then, a simple
power Mk of the 1PAM matrix denotes a matrix PAMk that
gives the amino acid substitution probability after k such
intervals. Today, a much more accurate PAM matrix,
published by Jones et al (1992), is available. It was generated
from the results of analysis of 16130 protein sequences. The
large number of compared sequences means it is likely that
the matrix has negligible statistical errors and it can be used
as a reference matrix for the calculation of phylogenetic
distances. The matrix is also known as a PET91 matrix.
Recently, Kowalczuk et al (2001a, 2001b) and
Mackiewicz et al (2002) constructed an empirical table of
nucleotide substitution rates describing the directional
mutational pressure in the Borrelia burgdorferi genome. The
table was obtained by comparing remnants of coding
sequence in intergenic sequences with homologous
sequences of functional genes. The term ‘directional
mutational pressure’ was proposed by Sueoka in 1962 (see
also Sueoka 1988, 1992, 1995) and means that the effect of
mutational pressure on a genome is biased, which is called
directionality, and leads to a specific nucleotide composition
of DNA (eg higher or lower G+C, or DNA asymmetry). This
pressure generates directional changes in DNA composition
more efficiently in the neutral parts of the genome than in
COMPLIMENTARY COPY, PLEASE CIRCULATESubscribe via www.openmindjournals.com/2004_subs.pdfUse discount code 9FEM87 and get a 33% discount off the normal price
Nowicka et al
Applied Bioinformatics 2004:3(1)32
the functioning parts subjected to selection. The B.
burgdorferi genome shows a very strong compositional bias
between the two differently replicating DNA strands (leading
and lagging) (Fraser et al 1997; McInerney 1998; Lafay et
al 1999; Mackiewicz et al 1999c). Such asymmetry is a
common property of many bacterial chromosomes (for
example, see Lobry 1996a, 1996b; Blattner et al 1997; Kunst
et al 1997; Andersson et al 1998; Fraser et al 1998; Freeman
et al 1998; Grigoriev 1998; McLean et al 1998; Salzberg et
al 1998; Mackiewicz et al 1999a, 1999b; Rocha et al 1999;
Romero et al 2000; Lobry and Sueoka 2002). The main cause
of this asymmetry is a different mutational pressure
associated with replication of these strands (for reviews see
Mrazek and Karlin 1998; Frank and Lobry 1999; Tillier and
Collins 2000a; Kowalczuk et al 2001c).
We used the empirical table of nucleotide substitution
rates to simulate pure mutational pressure on the genes lying
on the leading and lagging DNA strands of the B. burgdorferi
genome. Using Monte Carlo methods, we constructed 1PAM/
MPM (mutation probability matrix) matrices for amino acid
substitutions in the genes of leading and lagging DNA
strands, which represent a distance of one PAM between
diverging homologous genes. Next, this table was compared
with the 1PAM/PET91 matrix representing averaged
information from many organisms about both mutation and
selection pressures experienced by amino acid sequences.
Mutation probability matrixconstructionThe DNA sequence of the B. burgdorferi genome (Fraser et
al 1997) was downloaded from the website ftp://
ftp.ncbi.nih.gov/genomes/Bacteria/Borrelia_burgdorferi.
With the help of a computer random number generator we
simulated mutation pressure on the genes from the leading
and lagging DNA strands. The applied value of the mutation
pressure was u = 0.01 (the results are qualitatively the same
for smaller values of u), and nucleotide substitutions followed
the mutation rates from the empirical mutation table, Mnucl
,
which is discussed in previous papers (Kowalczuk et al
2001a, 2001b). In the case of the leading DNA strand, the
substitution rates are the following:
(1)
where WGA
= 0.0667, WGT
= 0.0347, WGC
= 0.0470,
WAG
= 0.1637, WAT
= 0.0655, WAC
= 0.0705, WTG
= 0.1157,
WTA
= 0.1027, WTC
= 0.2613, WCG
= 0.0147, WCA
= 0.0228 and
WCT
= 0.0350. The elements of the matrix give the probability
that the nucleotide in column j, if chosen for mutation (with
probability u), will mutate to the nucleotide in row i during
one replication cycle. The symbols Wij represent the relative
substitution probability of nucleotide j by nucleotide i, and
u represents mutation rate. Wj (in the diagonal in equation 1)
represents the relative substitution probability of nucleotide j:
(2)
and WA
+ WT+ W
C+ W
G= 1. The mutation table representing
the nucleotide substitution frequency in the lagging DNA
strand is an array complementary to Mnucl
(equation 1), where
[G Æ A] for the leading strand corresponds to [C Æ T] for
the lagging strand, etc. In the simulations, for each gene
considered to be the ancestral one, we prepared 105 pairs of
homologous sequences that diverged from this gene in the
course of evolution. The gene evolution was stopped when
the number of substitutions of the coded amino acids between
the homologous protein sequences reached 1%. All the
sequences were translated into amino acids and we
constructed a mutation probability matrix 1PAM/MPM
according to the procedure of Dayhoff et al (1978) and Jones
et al (1992). Table 1 is the resulting mutation matrix, with
substitution probabilities Mij, for genes of the leading DNA
strand. Genes from the lagging DNA strand are represented
in Table 2. The amino acid mutability mj and the fraction f
j
of the amino acid in the compared sequences are presented
in Table 3.
The elements Mij of the 1PAM/MPM matrices in Tables
1 and 2 were scaled with the parameter l, which relates them
to the evolutionary distance of 1% of substitutions and is
equal to 0.00009731 and 0.00010118, respectively, in our
simulations. We introduced the parameter l following the
equation (3) in Jones et al (1992).
Discussion of resultsThe 1PAM/MPM matrices, described in the previous section,
represent amino acid substitution rates in the case of pure
mutation pressure on the leading and lagging DNA strands
of the B. burgdorferi genome. These substitution rates were
compared with those from the 1PAM/PET91 matrix (Jones
et al 1992), which represents both mutational and selection
pressures. To do this, we compared the diagonal elements of
1PAM/MPM and 1PAM/PET91 matrices, ie the probability
W Wj ij
i j
=π
Â
M
uW uW uW uW
uW uW uW uW
uW uW uW uW
uW uW uW uW
A AT AG AC
TA T TG TC
GA GT G GC
CA CT CG C
nucl =
--
--
1
1
1
1

PAM matrices
Applied Bioinformatics 2004:3(1) 33
Table 1 Mutation probability matrix for an evolutionary distance of 1PAM for the leading DNA strand. Values of the matrixelements are scaled by a factor of 105. In the first row and first column: letters represent amino acids, and numbers are the numberof codons representing a given amino acid in the universal genetic code.
A:4 R:6 N:2 D:2 C:2 Q:2 E:2 G:4 H:2 I:3 L:6 K:2 M:1 F:2 P:4 S:6 T:4 W:1 Y:2 V:4
A:4 99027 0.16 0.18 59.94 0.56 0.07 44.17 55.93 0.15 0.48 0.22 0.11 0.20 0.33 79.41 93.79 303.93 0.14 0.19 229.72
R:6 0.13 98784 0.62 0.06 168.08 91.45 0.61 150.71 122.76 39.43 21.11 128.70 93.40 0.13 53.70 101.10 34.57 334.07 0.19 0.31
N:2 0.26 1.14 98925 255.17 2.57 0.54 0.88 0.57 216.52 125.64 0.08 212.56 0.82 0.41 0.11 117.91 93.33 0.005 240.91 0.55
D:2 76.90 0.09 220.03 98935 2.37 0.30 231.98 157.29 128.99 0.37 0.05 0.62 0.002 0.31 0.07 0.50 0.36 0.004 203.35 144.92
C:2 0.092 33.48 0.28 0.30 97443 0.001 0.001 63.79 0.70 0.13 0.19 0.001 0.001 49.69 0.17 66.05 0.12 198.95 99.80 0.16
Q:2 0.03 50.97 0.17 0.11 0.004 99243 31.64 0.06 350.43 0.06 25.17 40.69 0.11 0.001 46.66 0.07 0.07 0.49 0.44 0.06
E:2 63.05 1.06 0.84 258.11 0.01 99.26 99132 172.66 0.53 0.24 0.20 191.20 0.62 0.001 0.06 0.070 0.32 1.27 0.68 131.28
G:4 68.86 227.23 0.47 150.92 482.84 0.17 148.90 99089 0.26 0.30 0.12 0.39 0.29 0.15 0.07 81.95 0.31 282.50 0.41 142.64
H:2 0.04 37.94 36.72 25.37 1.09 194.31 0.09 0.05 98313 0.08 34.53 0.12 0.001 0.28 60.12 0.15 0.08 0.003 110.37 0.07
I:3 1.03 103.20 180.46 0.62 1.67 0.26 0.36 0.53 0.71 99025 105.80 98.29 556.87 178.46 0.53 73.71 366.27 0.01 0.66 260.88
L:6 0.51 60.76 0.12 0.08 2.70 130.04 0.33 0.23 321.64 116.36 99267 0.35 227.63 412.33 341.67 94.37 0.86 304.08 1.01 123.93
K:2 0.23 325.09 294.62 0.99 0.01 184.42 276.23 0.65 0.98 94.85 0.31 99245 230.69 0.002 0.10 0.56 97.39 1.32 0.83 0.53
M:1 0.08 46.66 0.22 0.001 0.003 0.099 0.18 0.10 0.001 106.28 39.50 45.63 98686 0.20 0.04 0.13 38.00 0.87 0.001 37.92
F:2 0.50 0.23 0.42 0.37 467.28 0.003 0.001 0.18 1.71 127.71 268.29 0.001 0.75 98928 1.21 153.06 0.74 1.01 221.34 122.72
P:4 41.90 34.70 0.038 0.03 0.56 54.10 0.02 0.03 125.71 0.13 76.69 0.03 0.05 0.42 98948 107.38 77.27 0.09 0.18 0.14
S:6 165.62 218.67 139.93 0.69 717.21 0.261 0.09 117.55 1.07 60.91 70.90 0.48 0.57 176.73 359.42 98951 260.97 46.97 85.40 0.84
T:4 224.66 31.30 46.37 0.21 0.56 0.12 0.16 0.19 0.22 126.68 0.27 34.91 68.87 0.36 108.26 109.24 98724 0.14 0.20 0.78
W:1 0.014 42.64 0.0003 0.0003 127.47 0.11 0.09 23.91 0.001 0.0002 13.48 0.07 0.22 0.07 0.02 2.77 0.019 98827 0.09 0.05
Y:2 0.18 0.21 153.15 149.92 580.47 0.91 0.45 0.32 413.77 0.29 0.41 0.38 0.003 136.90 0.32 45.75 0.25 0.84 99034 0.33
V:4 329.02 0.55 0.53 161.78 1.43 0.18 131.72 165.97 0.42 174.83 75.52 0.37 133.16 114.93 0.38 0.68 1.52 0.70 0.50 98802
Table 2 Mutation probability matrix for an evolutionary distance of 1PAM for the lagging DNA strand. Values of the matrixelements are scaled by a factor of 105. In the first row and first column: letters represent amino acids, and numbers are the numberof codons representing a given amino acid in the universal genetic code.
A:4 R:6 N:2 D:2 C:2 Q:2 E:2 G:4 H:2 I:3 L:6 K:2 M:1 F:2 P:4 S:6 T:4 W:1 Y:2 V:4
A:4 98988 0.48 0.22 99.27 0.23 0.17 80.77 67.33 0.24 0.38 0.18 0.23 0.15 0.15 98.31 68.81 281.41 0.07 0.131 304.36
R:6 0.25 98274 0.49 0.10 109.80 54.52 0.83 274.23 61.03 23.14 14.24 87.19 35.82 0.07 21.02 96.19 30.30 225.19 0.13 0.50
N:2 0.42 1.76 98997 364.19 2.49 0.82 0.92 0.57 350.08 103.29 0.14 207.33 0.51 0.52 0.26 143.07 111.59 0.001 255.59 0.76
D:2 89.10 0.17 173.92 98788 1.11 0.42 186.85 115.67 160.97 0.19 0.04 0.57 0.001 0.15 0.13 0.47 0.36 0 98.11 134.78
C:2 0.03 26.78 0.17 0.16 98194 0.001 0.001 25.11 0.39 0.04 0.10 0.0003 0.001 33.22 0.05 42.69 0.05 148.32 76.84 0.059
Q:2 0.10 60.88 0.26 0.28 0.002 99031 57.22 0.20 341.68 0.11 41.78 65.56 0.14 0.001 98.30 0.16 0.19 0.37 0.43 0.18
E:2 132.43 2.59 0.80 341.35 0.007 159.64 99060 266.98 0.75 0.26 0.16 211.25 0.29 0.0004 0.17 0.12 0.54 0.41 0.40 215.34
G:4 67.25 520.45 0.30 128.72 195.40 0.34 162.64 99041 0.26 0.14 0.07 0.44 0.12 0.04 0.08 68.29 0.26 90.02 0.16 125.49
H:2 0.08 36.90 59.27 57.07 0.96 184.99 0.15 0.08 98229 0.11 41.70 0.18 0.001 0.37 83.48 0.25 0.14 0.002 132.99 0.13
I:3 1.10 128.16 160.20 0.63 0.99 0.54 0.46 0.42 1.04 99162 199.11 124.93 639.60 203.50 0.87 51.24 354.86 0.003 0.65 404.19
L:6 0.41 61.01 0.17 0.11 1.73 160.29 0.22 0.16 295.46 154.00 99226 0.37 197.93 419.08 308.42 123.09 0.94 122.14 1.08 154.24
K:2 0.63 448.28 298.50 1.70 0.01 301.87 348.61 1.19 1.52 115.97 0.44 99208 157.41 0.002 0.35 0.72 164.79 0.68 0.83 1.14
M:1 0.06 26.59 0.11 0.0004 0.001 0.09 0.10 0.05 0.001 85.72 34.30 22.73 98786 0.15 0.06 0.08 30.811 0.29 0.001 45.72
F:2 0.18 0.16 0.33 0.20 302.91 0.002 0.0003 0.04 1.36 81.71 217.56 0.001 0.44 98983 0.69 113.84 0.39 0.30 211.69 72.54
P:4 60.78 24.70 0.08 0.09 0.24 103.41 0.07 0.05 162.20 0.18 84.57 0.08 0.10 0.36 98896 124.39 105.12 0.07 0.23 0.27
S:6 100.46 266.85 111.14 0.77 485.55 0.39 0.11 99.83 1.14 25.66 79.71 0.39 0.31 142.01 293.76 98944 193.54 58.24 99.07 0.69
T:4 326.51 66.79 68.89 0.46 0.42 0.37 0.38 0.31 0.50 141.25 0.48 70.66 91.51 0.38 197.29 153.81 98724 0.10 0.30 1.51
W:1 0.01 53.02 0.0001 0 143.17 0.08 0.03 11.17 0.001 0.0001 6.71 0.03 0.09 0.03 0.01 4.94 0.01 99353 0.09 0.02
Y:2 0.13 0.22 127.48 102.47 561.11 0.69 0.23 0.15 391.82 0.21 0.45 0.29 0.001 169.55 0.35 63.61 0.24 0.70 99121 0.23
V:4 231.89 0.72 0.31 114.41 0.35 0.23 100.06 95.72 0.30 105.64 52.12 0.32 89.16 47.22 0.33 0.36 1.00 0.13 0.19 98538

Nowicka et al
Applied Bioinformatics 2004:3(1)34
pj that the amino acid j (j= 1 ... 20) stays nonmutated.
We used a particular representation of these values; namely,
with the help of pj we calculated an effective survival time t
j
(Kowalczuk et al 2001a; Nowicka et al 2003) of each amino
acid j:
tj
ª 1/(1– pj) (3)
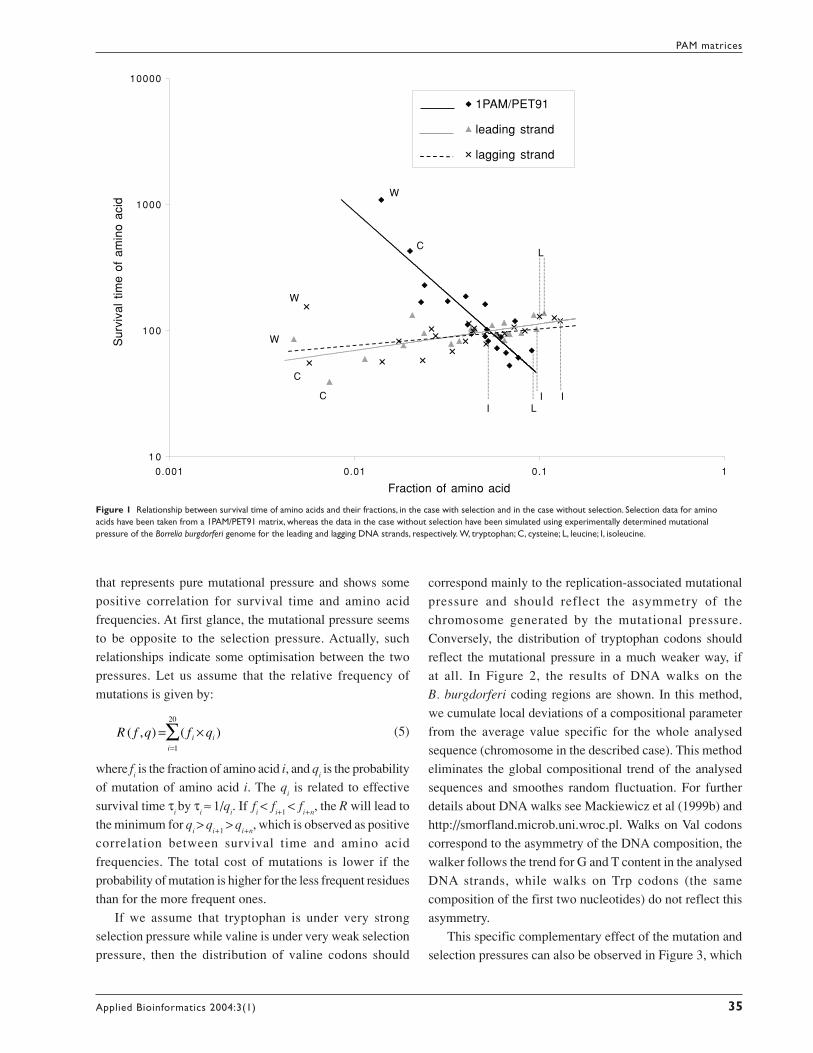
and related it to fraction fj of amino acid j. Figure 1 presents
the relationship between the calculated survival time of
amino acids and their fractions, in a log-log plot. One can
observe that the data are highly correlated and they follow a
power law:
tj ~ f
ja (4)
The value of the exponent in equation (4) is: a ª –1.3 in the
case of selection and mutation pressures described by the
1PAM/PET91 matrix; a ª 0.2 in the case of mutation pressure
(1PAM/MPM) on the leading DNA strand in the B.
burgdorferi genome; and a ª 0.1 in the case of mutation
pressure (1PAM/MPM) on the lagging DNA strand in the
genome.
The Spearman’s correlation coefficients are –0.859 (p =
1.2 ¥ 10–6), 0.570 (p = 0.0087) and 0.523 (p = 0.0179),
Table 3 Relative mutabilities and fractions of 20 amino acidsin the compared sequences for leading and lagging DNAstrands. The mutability of amino acids was normalisedassuming that the mutability of alanine equals 100.
Leading DNA strand Lagging DNA strand
Relative Relative
Amino acid mutability Fraction mutability Fraction
A 100.00 0.0450 100.00 0.0441R 126.09 0.0369 170.64 0.0234N 110.42 0.0673 99.10 0.0837D 109.29 0.0580 119.79 0.0400C 262.91 0.0074 178.54 0.0057Q 77.67 0.0206 95.76 0.0262E 89.88 0.0646 92.86 0.0730G 92.21 0.0557 94.81 0.0445H 173.18 0.0114 175.01 0.0142I 100.12 0.0966 82.82 0.1298L 75.23 0.1063 76.49 0.1004K 77.51 0.0933 78.33 0.1205M 135.01 0.0185 119.94 0.0174F 110.12 0.0692 100.50 0.0521P 108.02 0.0239 109.11 0.0275S 107.78 0.0798 104.38 0.0650T 131.05 0.0334 126.16 0.0516W 127.44 0.0047 63.95 0.0055Y 99.25 0.0428 86.87 0.0417V 123.56 0.0647 144.51 0.0339
respectively. It is worth emphasising that the slopes of a are
the same for the matrix PAMk with high values of k. Thus,
they are universal with respect to evolution intervals.
A similar property was found for the nucleotide
substitution rates from the empirical mutation table Mnucl
. In
this case, the evolutionary turnover time of a given kind of
nucleotide is highly correlated with the frequency of that
nucleotide in the third codon positions of coding sequences
or, in general, in sequences in equilibrium with that
mutational pressure (Kowalczuk et al 2001a).
The matrices 1PAM/PET91 and 1PAM/MPM were
compared with the matrix constructed by Grantham (1974)
describing distances between amino acids according to their
biochemical properties. The Spearman’s correlation
coefficients are –0.500 (PET91 versus Grantham), –0.228
(MPM on the leading DNA strand versus Grantham) and–0.303 (MPM on the lagging DNA strand versus Grantham)
and are statistically significant. The results indicate that the
probability of substitutions between amino acid pairs in the
matrices are negatively correlated with their biochemical
distances, as should be expected. The correlation is stronger
for the PET91 matrix, including more substitutions by similar
residues accepted by selection. Surprisingly, significant
correlation was also found for MPM matrices. It may suggest
that during evolution the mutational pressure described by
these matrices has, to some extent, been optimised to
selection requirements.
Figure 1 shows the relationship between the survival time
of amino acids and their fractions under selection pressure
and in the case without selection. The amino acids that are
less frequent in proteins, like W (tryptophan) or C (cysteine),
have very short turnover times compared with other amino
acids in the case when genes stay under pure mutation
pressure, whereas their turnover time determined by selection
becomes very large. On the other hand, the amino acids like
L (leucine) or I (isoleucine), which are very frequent in
proteins, have a long turnover time and seem to be much
less protected by selection. The negative correlation for the
PET91 matrix including selection constraints may be
explained by the specific properties of tryptophan and
cysteine. These residues have very unique physicochemical
and biochemical properties and are rare. Therefore, their
substitutions (and appearing in other places) are not usually
accepted by selection. This leads to their high survival time
in a PET91 matrix. Conversely, amino acids used more
frequently may be replaced by others that share similar
properties. This leads to low survival time in a PET91 matrix.
More complicated explanation is required for an MPM matrix
PAM matrices
Applied Bioinformatics 2004:3(1) 35
1 0
100
1000
10000
0.001 0.01 0.1 1
1PAM/PET91
leading strand
lagging strand
W
Sur
viva
l tim
e of
am
ino
acid
W
W
C
C
C
LI
L
I I
Fraction of amino acid
Figure 1 Relationship between survival time of amino acids and their fractions, in the case with selection and in the case without selection. Selection data for aminoacids have been taken from a 1PAM/PET91 matrix, whereas the data in the case without selection have been simulated using experimentally determined mutationalpressure of the Borrelia burgdorferi genome for the leading and lagging DNA strands, respectively. W, tryptophan; C, cysteine; L, leucine; I, isoleucine.
R f q f qi
i
i( , ) ( )= ¥=
Â1
20
that represents pure mutational pressure and shows some
positive correlation for survival time and amino acid
frequencies. At first glance, the mutational pressure seems
to be opposite to the selection pressure. Actually, such
relationships indicate some optimisation between the two
pressures. Let us assume that the relative frequency of
mutations is given by:
(5)
where fi is the fraction of amino acid i, and q
i is the probability
of mutation of amino acid i. The qi is related to effective
survival time ti by t
iª 1/q
i. If f
i< f
i+1< f
i+n, the R will lead to
the minimum for qi> q
i+1> q
i+n, which is observed as positive
correlation between survival time and amino acid
frequencies. The total cost of mutations is lower if the
probability of mutation is higher for the less frequent residues
than for the more frequent ones.
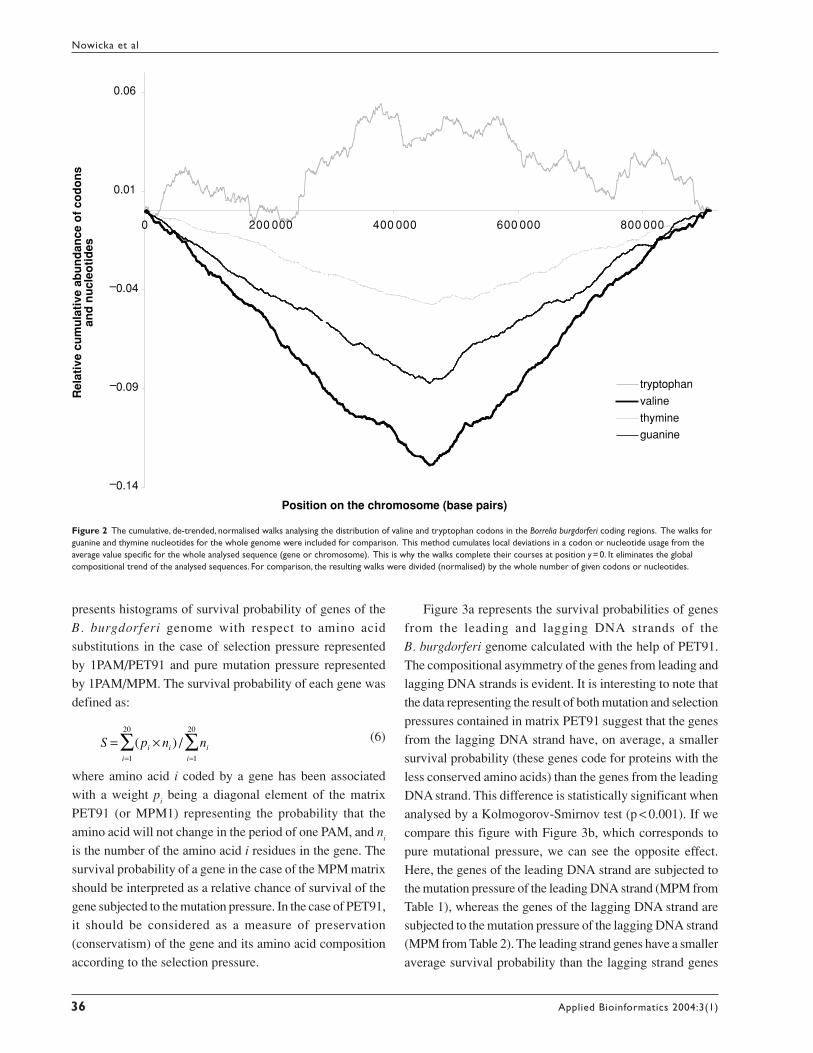
If we assume that tryptophan is under very strong
selection pressure while valine is under very weak selection
pressure, then the distribution of valine codons should
correspond mainly to the replication-associated mutational
pressure and should reflect the asymmetry of the
chromosome generated by the mutational pressure.
Conversely, the distribution of tryptophan codons should
reflect the mutational pressure in a much weaker way, if
at all. In Figure 2, the results of DNA walks on the
B. burgdorferi coding regions are shown. In this method,
we cumulate local deviations of a compositional parameter
from the average value specific for the whole analysed
sequence (chromosome in the described case). This method
eliminates the global compositional trend of the analysed
sequences and smoothes random fluctuation. For further
details about DNA walks see Mackiewicz et al (1999b) and
http://smorfland.microb.uni.wroc.pl. Walks on Val codons
correspond to the asymmetry of the DNA composition, the
walker follows the trend for G and T content in the analysed
DNA strands, while walks on Trp codons (the same
composition of the first two nucleotides) do not reflect this
asymmetry.
This specific complementary effect of the mutation and
selection pressures can also be observed in Figure 3, which
Nowicka et al
Applied Bioinformatics 2004:3(1)36
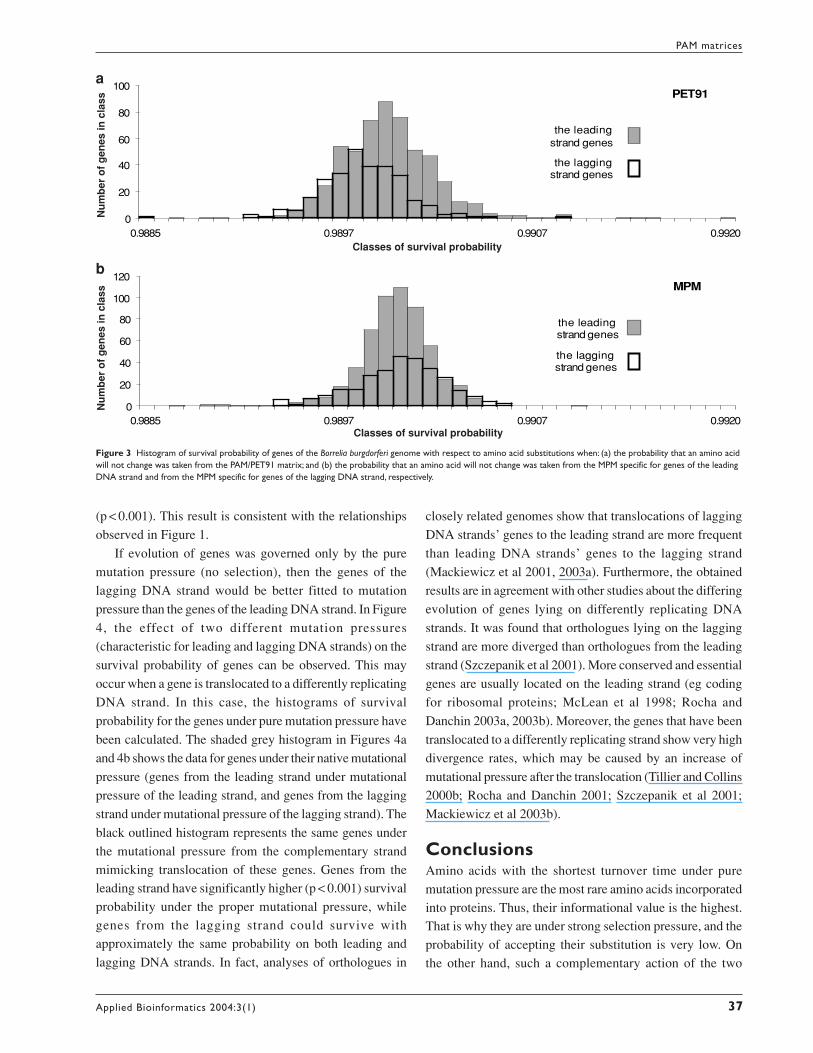
presents histograms of survival probability of genes of the
B. burgdorferi genome with respect to amino acid
substitutions in the case of selection pressure represented
by 1PAM/PET91 and pure mutation pressure represented
by 1PAM/MPM. The survival probability of each gene was
defined as:
(6)
where amino acid i coded by a gene has been associated
with a weight pi being a diagonal element of the matrix
PET91 (or MPM1) representing the probability that the
amino acid will not change in the period of one PAM, and ni
is the number of the amino acid i residues in the gene. The
survival probability of a gene in the case of the MPM matrix
should be interpreted as a relative chance of survival of the
gene subjected to the mutation pressure. In the case of PET91,
it should be considered as a measure of preservation
(conservatism) of the gene and its amino acid composition
according to the selection pressure.
Figure 3a represents the survival probabilities of genes
from the leading and lagging DNA strands of the
B. burgdorferi genome calculated with the help of PET91.
The compositional asymmetry of the genes from leading and
lagging DNA strands is evident. It is interesting to note that
the data representing the result of both mutation and selection
pressures contained in matrix PET91 suggest that the genes
from the lagging DNA strand have, on average, a smaller
survival probability (these genes code for proteins with the
less conserved amino acids) than the genes from the leading
DNA strand. This difference is statistically significant when
analysed by a Kolmogorov-Smirnov test (p < 0.001). If we
compare this figure with Figure 3b, which corresponds to
pure mutational pressure, we can see the opposite effect.Here, the genes of the leading DNA strand are subjected tothe mutation pressure of the leading DNA strand (MPM fromTable 1), whereas the genes of the lagging DNA strand aresubjected to the mutation pressure of the lagging DNA strand(MPM from Table 2). The leading strand genes have a smaller
average survival probability than the lagging strand genes
S p n ni i
i
i
i
= ¥= =
 Â( ) /1
20
1
20
–0.14
–0.09
–0.04
0.01
0.06
0 200 000 400 000 600 000 800 000
Position on the chromosome (base pairs)
tryptophan
valine
thymine
guanine
Rel
ativ
e cu
mu
lati
ve a
bu
nd
ance
of
cod
on
san
d n
ucl
eoti
des
Figure 2 The cumulative, de-trended, normalised walks analysing the distribution of valine and tryptophan codons in the Borrelia burgdorferi coding regions. The walks forguanine and thymine nucleotides for the whole genome were included for comparison. This method cumulates local deviations in a codon or nucleotide usage from theaverage value specific for the whole analysed sequence (gene or chromosome). This is why the walks complete their courses at position y =0. It eliminates the globalcompositional trend of the analysed sequences. For comparison, the resulting walks were divided (normalised) by the whole number of given codons or nucleotides.
PAM matrices
Applied Bioinformatics 2004:3(1) 37
Nu
mb
er o
f g
enes
in c
lass
0
20
40
60
80
100
0.9885 0.9897 0.9907 0.9920
PET91
the leadingstrand genes
the laggingstrand genes
0
20
40
60
80
100
120
0.9885 0.9897 0.9907 0.9920
MPM
the leadingstrand genes
the laggingstrand genes
Classes of survival probability
Classes of survival probability
Nu
mb
er o
f g
enes
in c
lass
(p < 0.001). This result is consistent with the relationships
observed in Figure 1.
If evolution of genes was governed only by the pure
mutation pressure (no selection), then the genes of the
lagging DNA strand would be better fitted to mutation
pressure than the genes of the leading DNA strand. In Figure
4, the effect of two different mutation pressures
(characteristic for leading and lagging DNA strands) on the
survival probability of genes can be observed. This may
occur when a gene is translocated to a differently replicating
DNA strand. In this case, the histograms of survival
probability for the genes under pure mutation pressure have
been calculated. The shaded grey histogram in Figures 4a
and 4b shows the data for genes under their native mutational
pressure (genes from the leading strand under mutational
pressure of the leading strand, and genes from the lagging
strand under mutational pressure of the lagging strand). The
black outlined histogram represents the same genes under
the mutational pressure from the complementary strandmimicking translocation of these genes. Genes from theleading strand have significantly higher (p < 0.001) survivalprobability under the proper mutational pressure, whilegenes from the lagging strand could survive withapproximately the same probability on both leading and
lagging DNA strands. In fact, analyses of orthologues in
closely related genomes show that translocations of lagging
DNA strands’ genes to the leading strand are more frequent
than leading DNA strands’ genes to the lagging strand
(Mackiewicz et al 2001, 2003a). Furthermore, the obtained
results are in agreement with other studies about the differing
evolution of genes lying on differently replicating DNA
strands. It was found that orthologues lying on the lagging
strand are more diverged than orthologues from the leading
strand (Szczepanik et al 2001). More conserved and essential
genes are usually located on the leading strand (eg coding
for ribosomal proteins; McLean et al 1998; Rocha and
Danchin 2003a, 2003b). Moreover, the genes that have been
translocated to a differently replicating strand show very high
divergence rates, which may be caused by an increase of
mutational pressure after the translocation (Tillier and Collins
2000b; Rocha and Danchin 2001; Szczepanik et al 2001;
Mackiewicz et al 2003b).
ConclusionsAmino acids with the shortest turnover time under puremutation pressure are the most rare amino acids incorporatedinto proteins. Thus, their informational value is the highest.That is why they are under strong selection pressure, and theprobability of accepting their substitution is very low. Onthe other hand, such a complementary action of the two
Figure 3 Histogram of survival probability of genes of the Borrelia burgdorferi genome with respect to amino acid substitutions when: (a) the probability that an amino acidwill not change was taken from the PAM/PET91 matrix; and (b) the probability that an amino acid will not change was taken from the MPM specific for genes of the leadingDNA strand and from the MPM specific for genes of the lagging DNA strand, respectively.
a
b

Nowicka et al
Applied Bioinformatics 2004:3(1)38
molecular pressures on the coding sequences guarantees the
gene a relatively high probability of survival.
AcknowledgementsThe work was supported by the State Committee for
Scientific Research grant number 1016/S/IMi/03. MK was
supported by the Foundation for Polish Science. The work
was done under the programme COST Action P10. We
appreciate very much the suggestions of the referee.
ReferencesAndersson SG, Zomorodipour A, Andersson JO et al. 1998. The genome
sequence of Rickettsia prowazekii and the origin of mitochondria.Nature, 396:133–40.
Blattner FR, Plunkett G III, Bloch CA et al. 1997. The complete genomesequence of Escherichia coli K-12. Science, 277:1453–62.
Dayhoff MO, Schwartz RM, Orcutt BC. 1978. A model of evolutionarychange in proteins. In Dayhoff MO, ed. Atlas of protein sequenceand structure. Volume 5 (Suppl 3). Washington: National BiomedicalResearch Foundation. p 345–52.
Frank AC, Lobry JR. 1999. Asymmetric substitution patterns: a review ofpossible underlying mutational or selective mechanisms. Gene,238:65–77.
Fraser CM, Casjens S, Huang WM et al. 1997. Genomic sequence of aLyme disease spirochaete, Borrelia burgdorferi. Nature, 390:580–6.
Fraser CM, Norris SJ, Weinstock GM et al. 1998. Complete genomesequence of Treponema pallidum, the syphilis spirochete. Science,281:375–88.
Figure 4 Effect of changing the mutation pressure on the survival probabilities of genes of the Borrelia burgdorferi genome. (a) The genes of the leading DNA strand aresubject to the mutation pressure of the leading strand (grey bars) and the mutation pressure of the lagging strand (black outlined bars). (b) The genes of the lagging DNAstrand are subject to the mutation pressure of the lagging strand (grey bars) and the mutation pressure of the leading strand (black outlined bars).
0
20
40
60
80
100
120
0.9885 0.9897 0.9907 0.9920
MPM(leading)
genes of leading DNA strand
MPM(lagging)
a
0
10
20
30
40
50
60
0.9885 0.9897 0.9907 0.9920
genes of lagging DNA strand
MPM(lagging)
MPM(leading)
b
Classes of survival probability
Classes of survival probability
Nu
mb
er o
f g
enes
in c
lass
Nu
mb
er o
f g
enes
in c
lass
Freeman JM, Plasterer TN, Smith TF et al. 1998. Patterns of genomeorganisation in bacteria. Science, 279:1827.
Grantham R. 1974. Amino acid difference formula to help explain proteinevolution. Science, 185:862–4.
Grigoriev A. 1998. Analysing genomes with cumulative skew diagrams.Nucleic Acids Res, 26:2286–90.
Jones DT, Taylor WR, Thornton JM. 1992. The rapid generation ofmutation data matrices from protein sequences. Comput Appl Biosci,8:275–82.
Kowalczuk M, Mackiewicz P, Mackiewicz D et al. 2001a. High correlationbetween the turnover of nucleotides under mutational pressure andthe DNA composition [online]. BMC Evol Biol, 1:13. Accessed 17Dec 2001. URL: http://www.biomedcentral.com/1471-2148/1/13
Kowalczuk M, Mackiewicz P, Szczepanik D et al. 2001b. Multiple basesubstitution corrections in DNA sequence evolution. Int J Mod PhysC, 12:1043–53.
Kowalczuk M, Mackiewicz P, Mackiewicz D et al. 2001c. DNAasymmetry and the replicational mutational pressure. J Appl Genet,42:553–77.
Kunst F, Ogasawara N, Moszer I et al. 1997. The complete genomesequence of the gram-positive bacterium Bacillus subtilis. Nature,390:249–56.
Lafay B, Lloyd AT, McLean MJ et al. 1999. Proteome composition andcodon usage in spirochaetes: species-specific and DNA strand-specificmutational biases. Nucleic Acids Res, 27:1642–9.
Lobry JR. 1996a. Asymmetric substitution patterns in the two DNA strandsof bacteria. Mol Biol Evol, 13:660–5.
Lobry JR. 1996b. A simple vectorial representation of DNA sequence forthe detection of replication origins in bacteria. Biochimie, 78:323–6.
Lobry JR, Sueoka N. 2002. Asymmetric directional mutation pressuresin bacteria [online]. Genome Biol, 3:research0058.1–0058.14.Accessed 26 Sep 2002. URL: http://genomebiology.com/2002/3/10/RESEARCH/0058
PAM matrices
Applied Bioinformatics 2004:3(1) 39
Mackiewicz P, Gierlik A, Kowalczuk M et al. 1999a. Asymmetry ofnucleotide composition of prokaryotic chromosomes. J Appl Genet,40:1–14.
Mackiewicz P, Gierlik A, Kowalczuk M et al. 1999b. How does replication-associated mutational pressure influence amino acid composition ofproteins? Genome Res, 9:409–16.
Mackiewicz P, Gierlik A, Kowalczuk M et al. 1999c. Mechanismsgenerating long-range correlation in nucleotide composition of theBorrelia burgdorferi genome. Physica A, 273:103–15.
Mackiewicz P, Kowalczuk M, Mackiewicz D et al. 2002. Replicationassociated mutational pressure generating long-range correlation inDNA. Physica A, 314:646–54.
Mackiewicz D, Mackiewicz P, Kowalczuk M et al. 2003a. Rearrangementsbetween differently replicating DNA strands in asymmetric bacterialgenomes. Acta Microbiol Pol, 52:245–61.
Mackiewicz P, Mackiewicz D, Kowalczuk M et al. 2003b. High divergencerate of sequences located on different DNA strands in closely relatedbacterial genomes. J Appl Genet, 44:561–84.
Mackiewicz P, Szczepanik D, Gierlik A et al. 2001. The differential killingof genes by inversions in prokaryotic genomes. J Mol Evol, 53:615–21.
McInerney JO. 1998. Replicational and transcriptional selection on codonusage in Borrelia burgdorferi. Proc Natl Acad Sci USA, 95:10698–703.
McLean MJ, Wolfe KH, Devine KM. 1998. Base composition skews,replication orientation, and gene orientation in 12 prokaryotegenomes. J Mol Evol, 47:691–6.
Mrazek J, Karlin S. 1998. Strand compositional asymmetry in bacterialand large viral genomes. Proc Natl Acad Sci USA, 95:3720–5.
Nowicka A, Mackiewicz P, Dudkiewicz M et al. 2003. Correlation betweenmutation pressure, selection pressure and occurrence of amino acids.In: Lecture Notes in Computer Science. Volume 2658. Springer-Verlag. p 650–7.
Rocha EP, Danchin A. 2001. Ongoing evolution of strand composition inbacterial genomes. Mol Biol Evol, 18:1789–99.
Rocha EP, Danchin A. 2003a. Gene essentiality determines chromosomeorganisation in bacteria. Nucleic Acids Res, 31:6570–7.
Rocha EP, Danchin A. 2003b. Essentiality, not expressiveness, drives gene-strand bias in bacteria. Nat Genet, 34:377–8.
Rocha EP, Danchin A, Viari A. 1999. Universal replication biases inbacteria. Mol Microbiol, 32:11–16.
Romero H, Zavala A, Musto H. 2000. Codon usage in Chlamydiatrachomatis is the result of strand-specific mutational biases and acomplex pattern of selective forces. Nucleic Acids Res, 28:2084–90.
Salzberg SL, Salzberg AJ, Kerlavage AR et al. 1998. Skewed oligomersand origins of replication. Gene, 217:57–67.
Sueoka N. 1988. Directional mutation pressure and neutral molecularevolution. Proc Natl Acad Sci USA, 85:2653–7.
Sueoka N. 1992. Directional mutation pressure, selective constraints, andgenetic equilibria. J Mol Evol, 34:95–114.
Sueoka N. 1995. Intrastrand parity rules of DNA base composition andusage biases of synonymous codons. J Mol Evol, 40:318–25.
Szczepanik D, Mackiewicz P, Kowalczuk M et al. 2001. Evolution ratesof genes on leading and lagging DNA strands. J Mol Evol, 52:426–33.
Tillier ERM, Collins RA. 2000a. The contributions of replicationorientation, gene direction, and signal sequences to base-compositionasymmetries in bacterial genomes. J Mol Evol, 50:249–57.
Tillier ERM, Collins RA. 2000b. Replication orientation affects the rateand direction of bacterial gene evolution. J Mol Evol, 51:459–63.

Copyright © 2022 FDOKUMEN