General Population Tables, Series 1 Part II-A (i), India
576
CENSUS OF INDIA 1971 SERIES 1 INDIA PART II-A (}) GENERAL POPULATION TABLES A. CHANDRA SEKHAR OF THE INDIAN ADMINISTRATIVE SERVICE Registrar General & Census India
-
Upload
khangminh22 -
Category
Documents
-
view
4 -
download
0
Transcript of General Population Tables, Series 1 Part II-A (i), India
CENSUS OF INDIA
1971
SERIES 1
INDIA
PART II-A (})
GENERAL POPULATION TABLES
A. CHANDRA SEKHAR OF THE INDIAN ADMINISTRATIVE SERVICE
Registrar General & Census Commissioner~ India
paJe
j
44 :)7
69 87
91 95
100 lOT
110
112 117 138 156 161 16~
165
195 ~37
239
268 276 285 297 J09
316 337
339 343 347
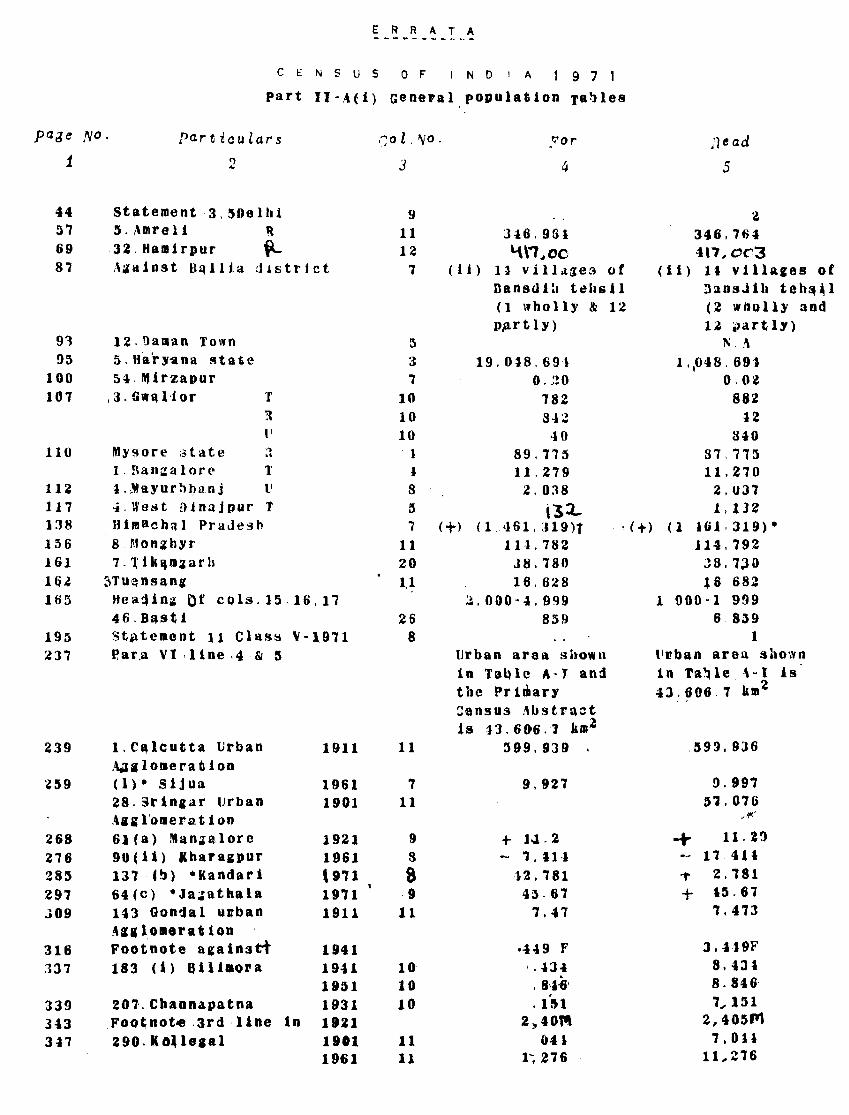
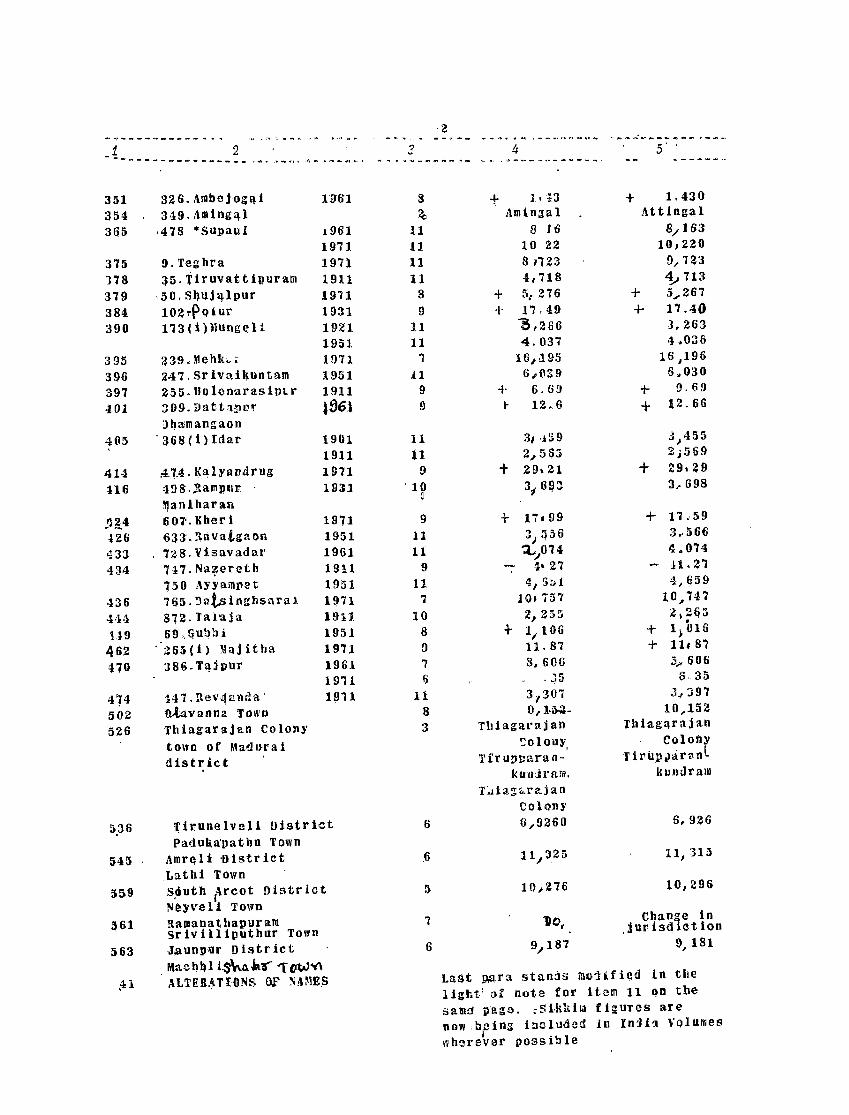
ERR A T A
C ENS U 5 0 FIN 0 I A 971
part II-A(i) GeneFal population Ta~le8
NO. partioulars
2
statement 3,~Oelhi 5.Amreli R 32.Ha.irpur ~ A~alnst ~ql1la district
12.')allan Town 5.Ha'rYllna state 54"fttirzapur
,3.GwQllor T
MY90re :3tate
::l ( I
,,~ .. 1.9an~alorp T 4.~ayurh~anj U 1.~est ainajpur , »1m a aha) PraJe~h
8.Monihyr 7.'J,'ik~lI:larh
3Tu~nsan"
Hea~in~ Of cQls.15,16.17 46.Basti st~te.ent 11 Glass V-1971 Rara VI ,ltne.4 & 5
1.C~lcutta Urban 1911 .<\,,1 i 10 lie rat ion (1)· Sijua 1961 28.:3rlnlar Urban 1901 .\1 it 1'0 lie r a. t i on 6lta) Man,ialore 1921 90(11) IharaiPur 1961 137·C~) ·Kandari , 971 64(C) *Ja;:athala 1971 143 Gon1al uJban 1911 .4'll0.era1 ion Footnote aaainstt 1941 183 (0 81l1.01la 1941
191)1 207', Channapatna 1931
.Footnote ·3rd llne 1n 1'21 290. Ko.lelal 1901
1961
CO l . 'Vo .
3
9 11 12
7
5 3 7
10 10 10 . 1
I S :s
_r,'or
4
J-l6.9IH
'1\'1~OC (ii) 11 villaae3 of
Oansd 1:1 tehs j 1 (1 wholly & 12 p,artly)
19.018.691 0 . .20
182 8.J2
·10 89.',5 11.279
2,O:l8
\ '3:1...
}lead
5
~
346.764 4'7,003
(Ii) 11 v111alos of nansJlh teh~~1 (2 wholly and II l)artly)
N. :\
1.,048.691 O.O~
882 ·12
840 87.,715 11.270
2,U31
7 (+) ( 1 . 461, :11 9)1 L 112
,(+) (1 HLl,319)* l14.792 11
20 1.1
26 8
11
7 11
9
S
8 9
11
10 10 10
11 11
11 L 782 J8.780 16.628
~.000·.a.999
859
Urban araa shown in Tallie A·J an::l the Primary :ensus .\lJstract is ·13.6&6.1 kma
:>99.939 .
9.927
+- J.J.2 - 7.11·1
12.181 ill.6'
7.47
.-1,,, 9 F
l. tJ-l • 8··I.e· . . 1~1
2, 4 o till 041
1--; 276
38.730 16 682
1 QOO-l 999 6 839
1 ('lIban area sl\own in Ta~le <\-1 ls' 43.606.' km 2
.'99.936
9.99'7 '1.076
.,>I'f."
-+- 11.29 17,411
T 2.781 + It'- 67
'''473
3.419F 8.431 8.846' 7 ... 151
2,405P1 7.011
11..216
..... "'l'-. .. --~. _____ ......... 1. 2 ------_ ....... _- ... _-- ........ -...,.~ ...... "' ..... -...........
351 354 365
375 178 379 384 390
395 396 397 401
405
4H U6
.'l!4 126 433 434
436 4·1:1 119 462 no
4,4 502 526
545
~61
563
326.Ambcj'Og~1
349. Amlngq.l ,478 ·Supaul
9,Teghra 35.tl~uvattlpuram
,50,Sl)ujqlpur 102.,.PQ1Ut" 173(i)Mung(,U
?39.~lehk .. i 247, sr ivaHuntam 255.UQloneraslPLf 309.i)att~:!ll'r
)~aimangaon
. 368 (t) ldar
:4.'1-4. H~lyandrug 4!}S .,Rampur: ~anlharaD
607'. Khel'1 633'. ~ava.f..gaon 728. Visavadal' H7.Na~ereth 1'50 Ayyaml1et 765,!lDt.sil\ghs~ral 812.Tataja 69.Gu~bi
·'265(i) Majitha 38S .. T~jpur
1'17. Rev4ul)da' M3:vann~ Town Thiagarajan Colony town of Ma!lu-rai district .
196'1
1961 1971 1971 1911 1971 1931 1921 1951 1071 1951 1911 1961
1901 1911 1971 1931
1971 1951 1961 1911 1951 Uil 19B 1951 1971 1961 1911 1911
rirunelveli District Paduka'patbu Town Amr~li 'District Lathi Town S,liuth f-\rcot District N~yV'el1 Town Ramanathapuram Srivilliputhur Town JillunplJr District
. Mac h III 1.$~A." T "T otJ"(\ ALTERATIQNS Of N,\ME.S
8 ~
11 11 11 11
8 9
11 11
7 11
9 9
11 11
9 '10
~
9 11 11
9
11 7
10 8 {)
7 f)
11 8 3
6
.6
5
7
6
+
4
Amin:;::al 8 16
10 22 81123 '1,718
+ 5t 276 + 17,49
"'8,256 4,037
16,.195 6,039
+ 6,69 I- 12 .. 6
3, ·.1::19 2 ... 565
+ 29\21 31 69:!
-,
t 17.99 3) ~56
';l.,,,0 14 4- 27
4, :);)1 101757
2,255 + l l 106
11. 87 8,606
3,307 O/l,~
TlJiagartl,j an ~olony
I
'1' ir utlI::ar·an·· lomJl' ara,
1':...tia~~rajan
Colony 6,,9250
10,276
5
+ 1,430 Attingal
8/163 10,220
9" 723 4/713
+ 5 .... 267 + 17.40
,1,.263 4.036
16 J196 6.030
+ 9,69
+ 12.66
3,1455 2;569
+ 29.U 3 ... 698
+ 11.59 3,·566 ~. 0'74 U.27 4,~59
1,0 ~ 747 212&3
+ li OlS + Ih87
3",606 8.35
.1,,397 10 .. 152
rhiagq.rajan . ColOil),
Tirilpolafan L kunrlralD
6.926
10,296
ChnD"e in _jurisdIction
9" 181
Last MFa stan:i5 mo:Hfhd in the ligt.t' or note for item 11 on the samg paga. ;: S ikltim figures are now bfing i~C~udod in Inji~ Volumes wherever possIble
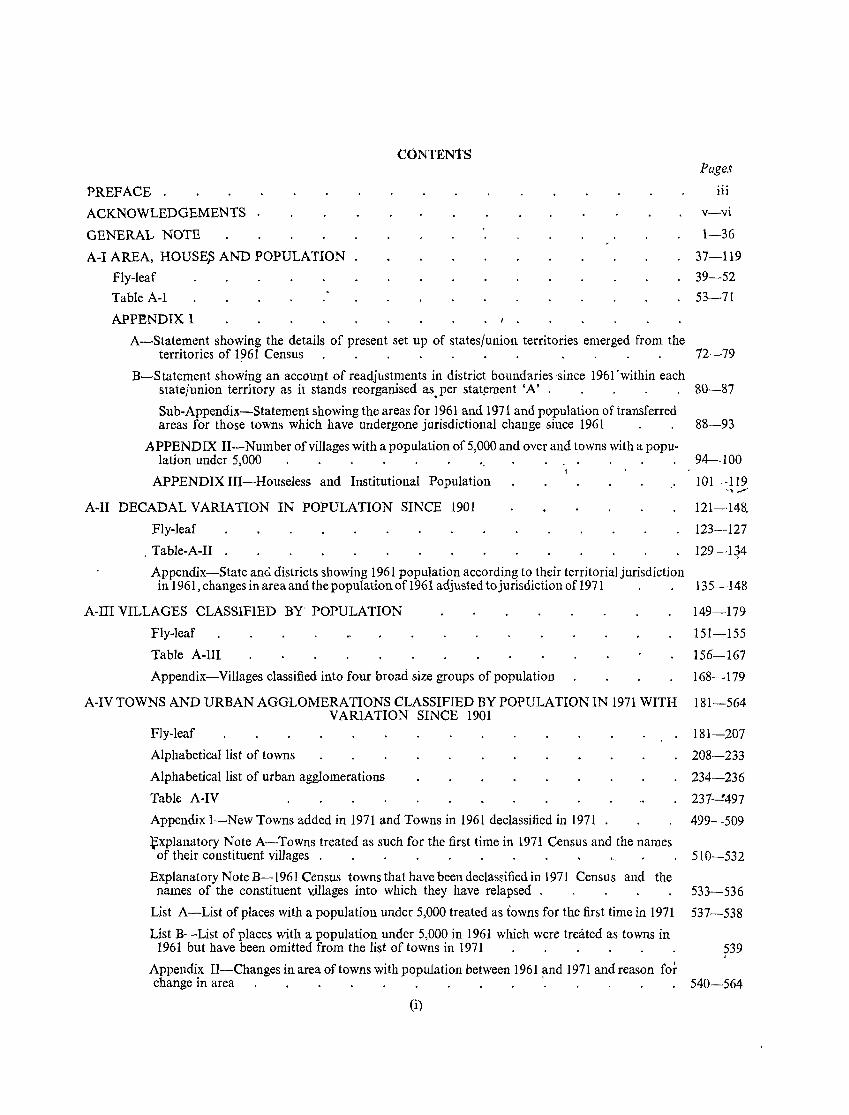
CONTENts Page,~
PREFACE . iii
ACKNOWLEDGEMENTS v-vi
GENERAL NOTE 1-36
A-I AREA, HOUSE$ AND POPULATION 37-119
Fly-leaf 39--52
Table A-I 53-71
APP,eNDIX I
A-Statement showing the details of present set up of states/union territories emerged from the territories of 1961 Census 12-79
B-Statement showing an account of readjustments in district boundaries'since 1961'within each state/union territory as it stands reorganised as. per stat~ment 'A' . 80-87
Sub-Appendix-Statement showing the areas for 1961 and 1971 and population oftransferred areas for those towns which have undergone jurisdictional change since 1961 88-93
APPENDIX H--Number of villages with a popUlation of 5,000 and over and towns with a popu-lation under 5,000 " 94-100
APPENDIX III-Houseless and Institutional Population
A-II DECADAL VARIATION IN POPULATION SINCE 1901
Fly-leaf
, Table-A-II
"
Appendix-State anci. districts showing 1961 population according to their territorial jurisdiction in 1961 , changes in area and the population of 1961 adjusted to jurisdiction of 1971 . .
A-III VILLAGES CLASSIFIED BY POPULATION
Fly-leaf
Table A-Ill
Appendix-Villages classified into four broad size groups of population
A-IV TOWNS AND URBAN AGGLOMERATIONS CLASSIFIED BY POPULATION IN 1971 WITH VARIATION SINCE 1901
Fly-leaf
Alphabetical list of towns
Alphabetical list of urban agglomerations
Table A-IV
Appendix I-New Towns added in 1971 and Towns in 1961 declassified in 1971
:f:xplanatory Note A-Towns treated as such for the first time in 1971 Census and the names of their constituent villages .
Explanatory Note B-1961 Census towns that have been declassified in 1971 Census and the names of the constituent v,illages into which they have relapsed .
List A-List of places with a population under 5,000 treated as towns for the first time in 1971
List B-List of places with a popUlation under 5,000 in 1961 which were treated as towns in 1961 but have been omitted from the list of towns in 1971
Appendix II-Changes in area of towns with popUlation between 1961 and 1971 and reason for change in area '
(i)
101-119 -... / 121-148,
123--127
129-q4
135-148
149-179
151-155
156-167
168-179
181-564
181-207
208-233
234-236
231-!497
499-509
510-532
533-536
537-538
539 ,
540-564

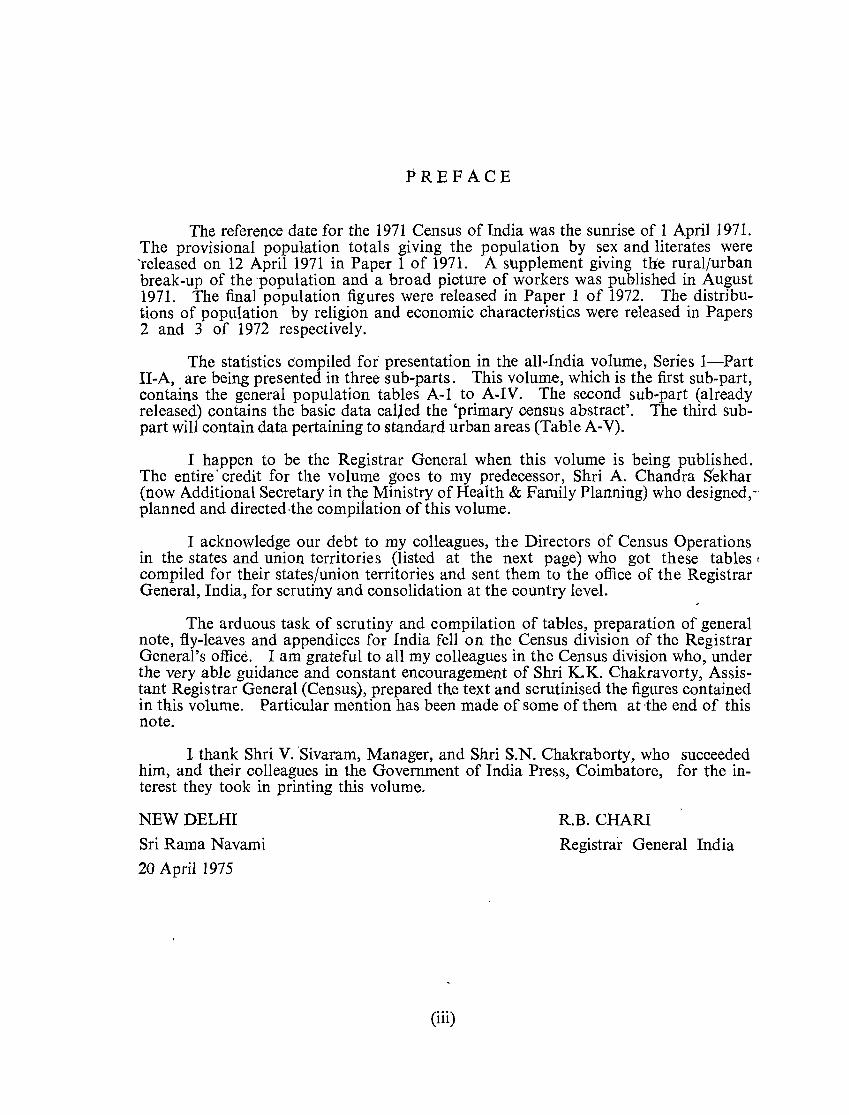
PREFACE
The reference date for the 1971 Census of India was the sunrise of 1 April 1971. The provisional population totals giving the population by sex and literates were 'released on 12 April 1971 in Paper 1 of 1971. A supplement giving the ruralfurban break-up of the 'population and a broad pioture of workers was published in August 1971. The final population figures were released in Paper 1 of 1972. The distributions of population by religion and economic characterjstics were released in Papers 2 and 3 of 1972 respectively.
The statistics c'ompiled for presentation in the all-India volume, Series I-Part II-A, are being presented in three sub-parts. This volume, which is the first sub-part, contains the general population tables A-I to A-IV. The second sub-part (already released) contains the basic data calJed the 'primary oensus abstract'. The third subpart will contain data pertaining to standard urban areas (Table A-V).
I happen to be the Registrar General when this volume is being published. The entire' credit for the volume goes to my predecessor, Shri A. Chandra S'ekhar (now Additional Secretary in th~ Ministry of Health & Family Planning) who designed,planned and directed·the compilation of this volume.
I acknowledge our debt to my colleagues, the Directors of Census Operations in the states and union territories (listed at the next page) who got these tables I
compiled for their states/union territories and sent them to the office of the Registrar General, India, for scrutiny and consolidation at the country level.
The arduous task of scrutiny and compilation of tables, preparation of general note, fly-leaves and appendices for India fell on the Census division of the Registrar General's office. I am grateful to all my colleagues in the Census division who, under the very able guidance and constant encouragement of Shri K.K. Chakravorty, Assistant Registrar General (Census), prepared the text and scrutinised the figures contained in this volume. Particular mention has been made of some of them at the end of this note.
I thank Shri V. 'Sivaram, Manager, and Shri S.N. Chakraborty, who succeeded him, and their colleagues in the Government of India Press, Coimbatore, for the interest they took in printing this volume.
NEW DELHI
Sri Rama Navami
20 Apri11975
(iii)
R.B. CHARI
Registrar General India

1. 2. 3. 4. 5. 6. 7. 8. 9.
10. 11. 12. 13. 14. 15. 16. 17. 18. 19. 20. 21.
1. 2. 3.
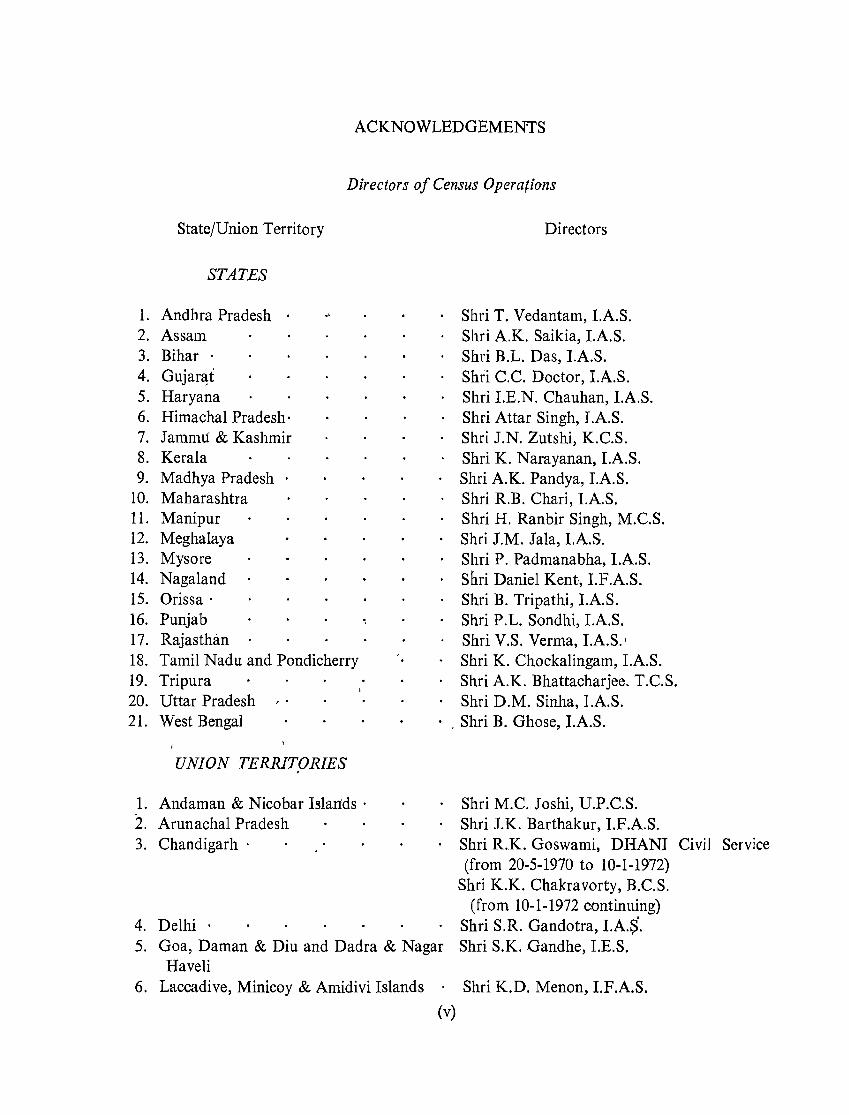
ACKNOWLEDGEMENTS
Directors of Census Operations
State/Union Territory
STATES
Andhra Pradesh .,
Assam Bihar . Gujar'!t Haryana Himachal Pradesh· Jammu & Kashmir Kera1a Madhya Pradesh Maharashtra Manipur Meghalaya Mysore Nagaland Orissa' Punjab Rajasthan Tamil Nadu and Pondicherry Tripura Uttar Pradesh / . West Bengal
UNION TERRITORIES
Andaman & Nicobar Islands· Arunachal Pradesh Chandigarh .
Directors
Shri T. Vedantam, l.A.S. Shri A.K. Saikia, LA~S. Shri B.L. Das, lA.S. Shri C.C. Doctor, LA.S. Shri LE.N. Chauhan, l.A.S. Shri Attar Singh, I.A.S. Shri J.N. Zutshi, K.C.S. Shri K. Narayanan, LA.S. Shri A.K. Pandya, LA.S. Shri R.B. Chari, LA.S. Shri H. Ranbir Singh, M.C.S. Shri J.M. Jala, l.A.S. Shri P. Padmanabha, l.A.S. Shri Daniel Kent, I.F.A.S. Shri B. Tripathi, LA.S. Shri P. L. Sondhi, LA.S. Shri V.S. Verma, LA.S.' Shri K. Chockalingam, LA.S. Shri A.K. Bhattacharjee. T.C.S. Shri D.M. Sinha, l.A.S.
. , Shri B. Ghose, LA.S.
Shri M.C. Joshi, U.P.C.S. Shri J.K. Barthakur, LF.A.S. Shri R.K. Goswami, DHANI Civil Service (from 20-5-1970 to 10-1-1972)
Shri K.K. Chakravorty, B.C.S. (from 10-1-1972 continuing)
4. Delhi . Shri S.R. Gandotra, LA.s'. 5. Goa, Daman & Diu and Dadra & Nagar Shri S.K. Gandhe, I.E.S.
Haveli 6. Laccadive, Minicoy & Amidivi Islands Shri K.D. Menon, LF.A.S.
(v)
CENSUS DIVISION OF REGISTRAR GENERAL'S OFFICE
Shri S.C. Srivastava Shri P.C. Pande . Shri R.P. Bhatnagar Shri LP. Singh . Shri H.C. Aggarwal Shrimati K. K. Chhibber Shri D.C. Verma Shrimati A. Tangri, Shrimati Santosh Mittal and Shfi Babu Ram Sharma
Shri b.P. Gupta Shri Dharam Pal Sarvashri S.N. Behl, N.L. Savita, H.K. Jhamb and S.L. Chaturvedi
Asstt. Central Tabulation Officer Investigator Investigator Statistical Assistant Comput~r
Co mputor Computor Assistant Compilers
Technical Assistant (Printing) Printing Inspector Proof Readers
GENERAL NOTE
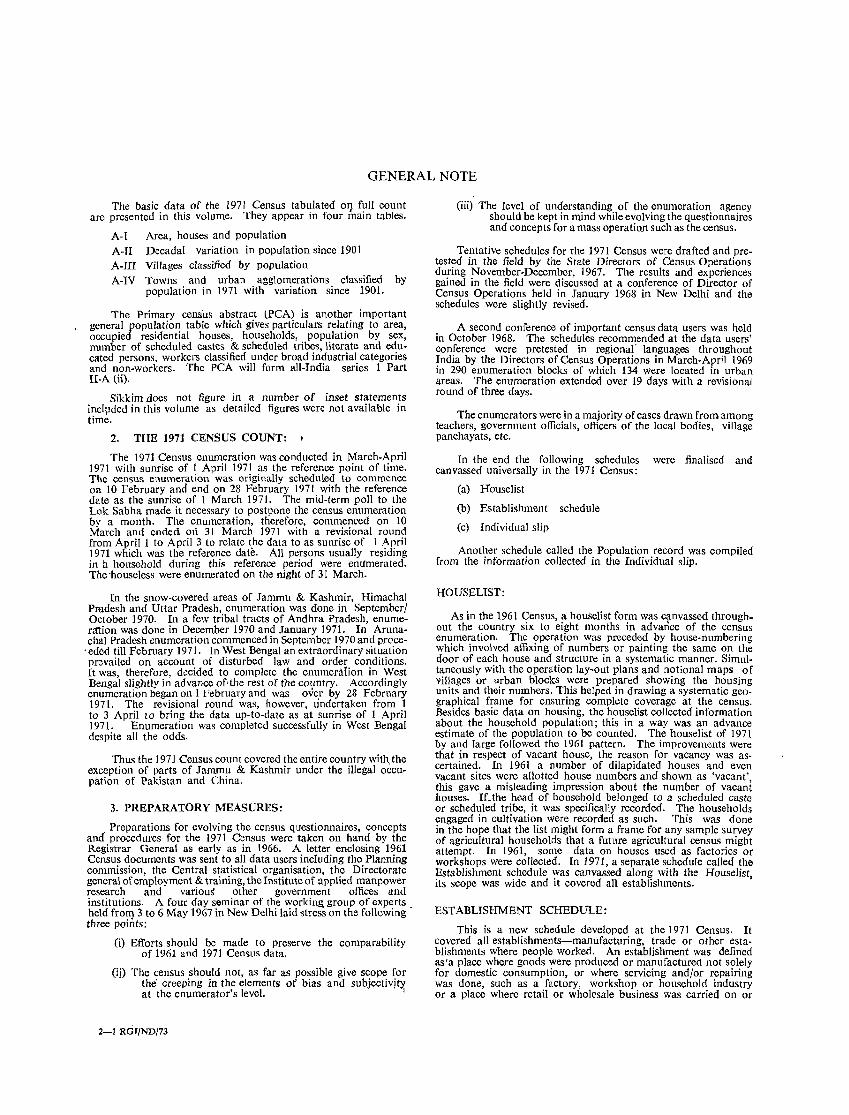
The basic data of the 1971 Census tabulated 01} full count arc presented in this volume. They appear in four main tables.
A-I Area, houses and population A-II Decadal variation in population since 1901 A-III Villages classified by population A-IV Towns and urban agglomerations classified by
population in 1971 with variation since 1901.
The Primary census abstract tPCA) is another important general population table which gives particulars relating to area, occupied residential houses, households, population by sex, number of scheduled castes & scheduled tribes, literate and educated persons, workers classified under broad industrial categories and non-workers. The PCA will form all-India series 1 Part U-A (ii).
Sikkim does not figure in a number of inset statements inch,lded in this volume as detailed figures were not available in time.
2. THE 1971 CENSUS COUNT:
The 1971 Census enumeration was conducted in March-April 1971 with sunrise of I April 1971 as the reference point of time. The census enumeration was originally scheduled to commence on 10 February and end on 28 February 1971 with the reference date as the sunrise of 1 March 1971. The mid-term poll to the Lok Sabha made it necessary to postpone the census enumeration by a month. The enumeration, therefore, commenced on 10 March and ended oli 31 March 1971 with a revisional round from April 1 to April 3 to relate the data to as sunrise of 1 April 1971 which was the reference date. All persons usually residing in 11 household during this reference period were emlmerated. The'houseless were enumerated on the night of 31 March.
In the snow-covered areas of Jammu & Kashmir, Himachal Pmdesh and Uttar Pradesh, enumeration was done in September! October 1970. In a few tribal tracts of Andhra Pradesh, enumer:t1:ion was done in December 1970 and January 1971. In Arunachal Pradesh enumeration commenced in September 1970 and prcce
'eded till February 1971. In West Bengal an extraordinary situation prevailed on account of disturbed law and order conditions. It was, therefore, decided to complete the enumeration in West Bengal slightly in advance oNhe rest of the country. Accordingly enumeration began on 1 Februaryand was over by 28 February 1971. The revisional round was, however, undertaken from 1 to 3 April to bring the data up-to-date as at sunrise of 1 April 1971. Enumeration was completed successfully in West Bengal despite all the odds.
Thus the 1971 Census count covered the entire country with, the exception of parts of Jammu & Kashmir under the illegal occupation of Pakistan and China.
3. PREPARATORY MEASURES:
Preparations for evolving the census questionnaires, concepts ana procedures for the 1971 census were taken on hand by the Registrar General as early as in 1966. A letter enclosing 1961 Census documents was sent to all data users including the Planning commission, the Central statistical organisation, the Directorate general of employment & training, the Institute of applied manpower research and various other government offices and institutions. A four day seminar of the working group of experts _ held from 3 to 6 May 1967 in New Delhi laid stress on the following three points:
(0 Efforts should be made to preserve the comparability of 1961 and 1971 Census data.
(ij) The census should not, as far as possible give scope for the' creeping in the elements of bias and subjectivjty at the enumerator's level. I
2-1 RGI/ND/73
(iii) The level of understanding of the enumeration agency should be kept in mind while evolving the questionnaires and concepts for a mass operation such as the census.
Tentative schedules for the 1971 Census were drafted and' pretested in the field by the State Directors of Census Operations during November-December, 1967. The results and experiences gained in the field were discussed at a conference of Director of Census Operations held in January 1968 in New Delhi and the schedules were slightly revised.
A second conference of important census data users was held in October 1968. The schedules recommended at the data users' conference were pretested in regional" languages throughout India by the Directors of Census Operations in March-April 1969 in 290 enumeration blocks of which l34 were located in urban areas. The enumeration extended over 19 days with a revisional round of three days.
The enumerators were in a majority of cases drawn from among teachers, government officials, officers of the local bodies, village panchayats, etc.
In the end the following schedules were finalised and canvassed universally in the 1971 Census:
(a) Houselist
(b) Establishment schedule
(c) Individual slip
Another schedule called the Population record was compiled from the information collected in the Individual slip.
HOUSELIST:
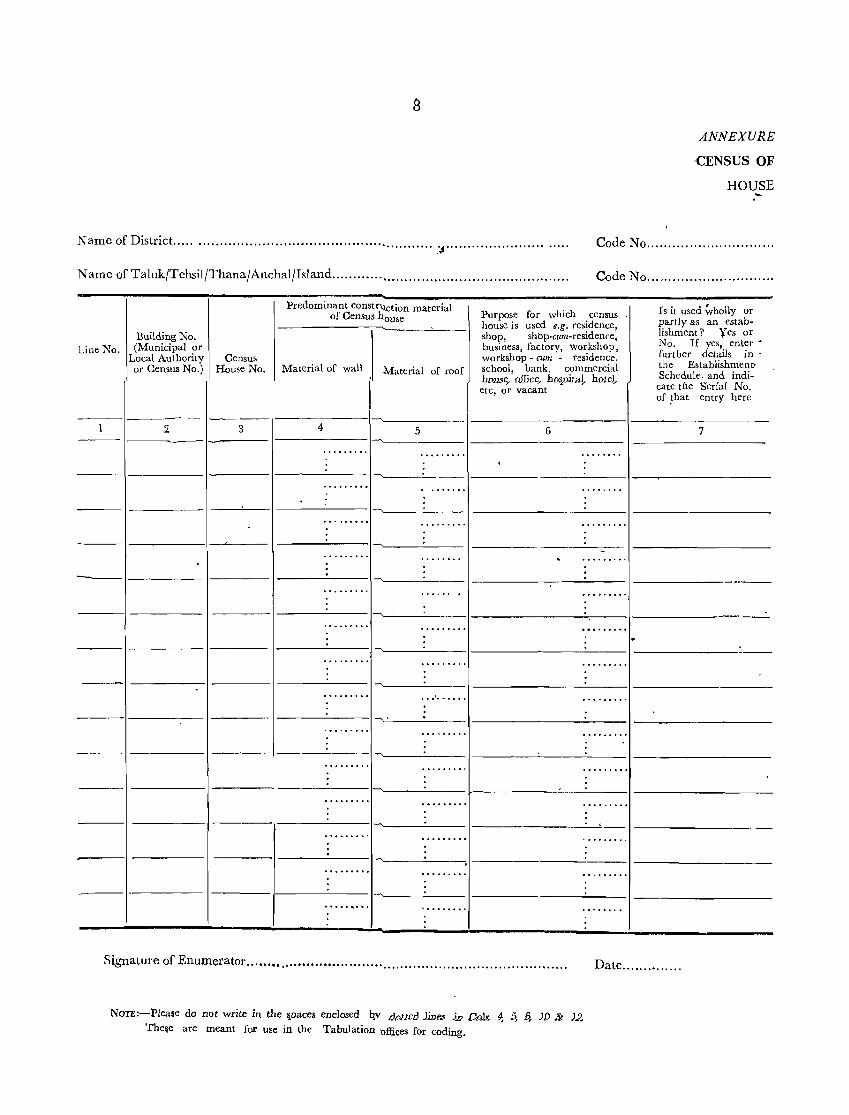
As in the 1961 Census, a houselist form was canvassed throughout the country six to eight months in advance of the census enumeration. The operation was preceded by house-numbering which involved affixing of numbers or painting the same on the door of each house and structure in a systematic manner. Simul· taneously with the operation lay-out plans and notional maps of villages or urban blocks were prepared showing the hOUSing units and their numbers. This helped in drawing a systematic geographical frame for ensuring complete coverage at the census. Besides basic data on housing, the houselist collected information about the household population; this in a way was an advance estimate of the population to be counted. The houselist of 1971 by and large followed the 1961 pattern. The improvements were that in respect of vacant house, the reason for vacancy was ascertained. In 1961 a number of dilapidated houses and even vacant sites were allotted house numbers and shown as 'vacant' this gave a misleading impression about the number of vacant houses. ILthe head of household belonged to a scheduled caste or scheduled tribe, it was specifically recorded. The households engaged in cultivation were recorded as such. This was done in the hope that the list might form a frame for any sample survey of agricultural households that a future agricultural census might attempt. In 1961, sOl11e data on houses used as factories or workshops were collected. In 1971, a separate schedule called the Establishment schedule was canvassed along with the Houselist, its scope was wide and it covered all establishments.
ESTABLISHMENT SCHEDULE:
This is a new schedule developed at the 1971 Census. It covered all establishments-manufacturing, trade or other establishments where people worked. An establishment was defined as'a place where goods were produced or manufactured not solely for domestic consumption, or where servicing and/or repairing was done, such as a factory, workshop or household industry or a place where retail or wholesale business was carried on or
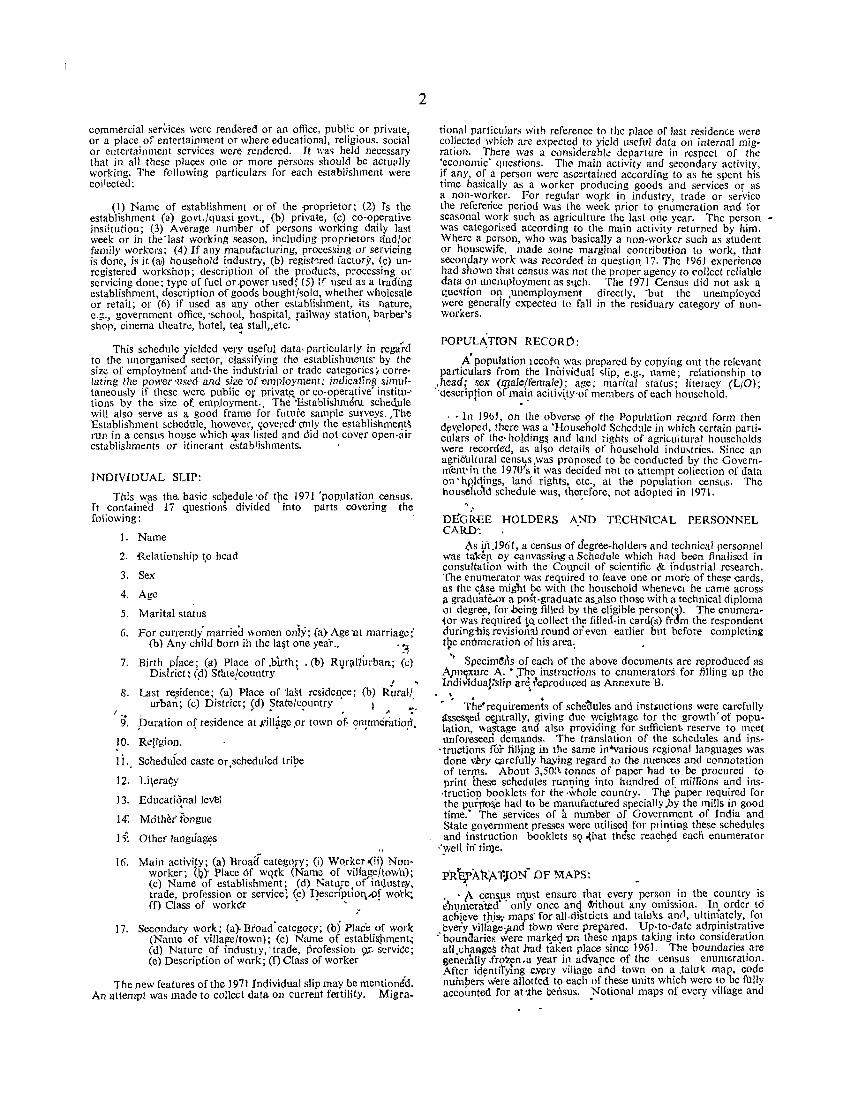
commercial services were rendered or an office, public or private, or a place of entertainment or where educational, religious. social or entertainment services were rendered. It was held necessary that in all these places one or more persons should be actuplly working. The following particulars for each establishment were collected:
(1) Name of establishment or of the 'Proprietor; (2) Is the establishment (a) govt./quasi govt., (b) private, (c) co-operative institution; (3) Average number of persons working daily last week or in the'last working season, including proprietors lind/or family workers; (4) If any manufacturing, processing or servicing is done, is it (aJ) household industry, (b) regist~red factory, (c) unregistered workshop; description of the products, processing or servicing done; type of fuel Of .power used; (5) If used as a trading establishment, description of goods boughtfsold, whether wholesale or retail; or (6) if used as anY other establishment, its nature, e.2:" government office, 'school, hospital, railway station" barber's shop, cinema theatre, hotel, te~ stall"etc.
This schedule yielded very useful data, particularly in regard to the un organised sector, classifying the establishments' by the size of employment and· the industrial or trade categories" correlating the power 'used and size 'of -employment; indicating simultaneously if these were public or privat!l, or co-operative' institu-' tions by the size of. employment.. The 'Establishment sched.ule will also serve as a good frame for future sample surveys. ,The Establishment schedule, however, covered' cmly the estabJishment~ run in a census house which ,was listed and did not cover open-air establishments or itinerant establishments.
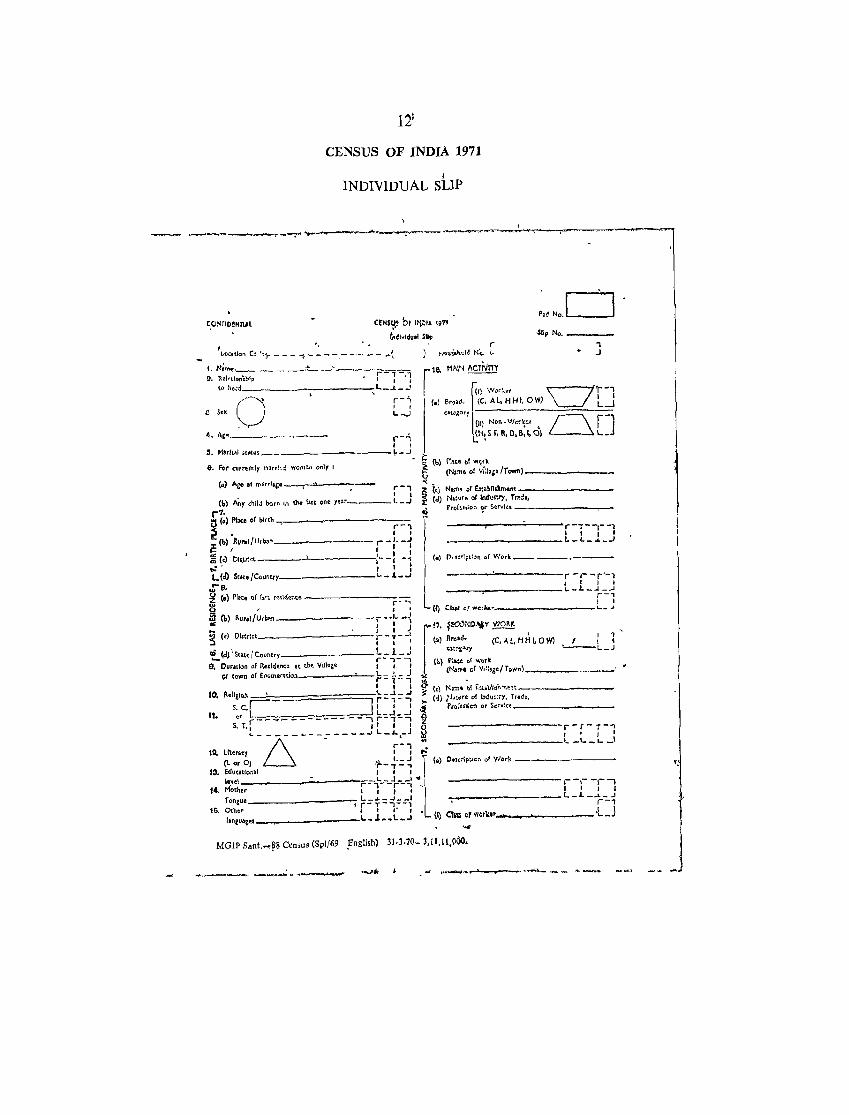
INDIVIDUAL SLIP:
This was the. ba~ic schedule 'of tpe 1971 'poPl-dation census. It contained 17 questions divided rnto parts covering the following:
1. Name
2. Relationship t.o head
3. Sex
4. Age
5. Marital status
6. For currently married women oniy; (a) Age'at marriage;' (b) Any child born ih the Ja§t one year .. . :,
7. Birth piace; (a) Place of .b1.rth; ,(b) RUf\l11urban; (c) District: (~) StateJcountry' •
! ' 8. Last residence; (a) Place of 'last residence; (b) Rural/
urban; (c) District; ~d) ~tate!c~mntry " i... ;.
puration of residence at .will~~e.or town of. ~n~lmeratiop. J "
9.
10. Religion.
1 i . Scheduied caste or ,scheduled trilJe
12. Li(era~y
13. Educatiqnal level
14: Mother' fongue
15: Other langtiag~s
16. Main activi!y; (a) Broaci categQfY; (i) WO,rker.(ii) Nonworker; (9)' Place Of wQrk (Name of village/towh); (c) Name of establishment; (d) Nature o( in<:lustr8, trade, profession or service; (e) Desc~iption.,()f wor~ (f) Class of worker ", y -
17. Secondary work; (a)-Broad'category; (b) Place of work (Name of villap:e/town); (c) Name of establis,hment.; Cd) Nature of industty, -trade, profession 9]'. serviCe; (e) Description of work; (f) Class of worker
1he new features of the 1971 Individual slip may be mentionid. ,An attempt was made to collect data on current fertility. Migra-
2
tional partiCUlars with reference to the place of last residence were collected which are expected to yield useful data on internal migration. There was a conslderabk departure in respect of the :economic' questions. The main activity and secondary activity, If any, of a persoll were asc'~rtained according to as he spent his time basically as a worker producing goods and st."'rvices or as a non-worker. For regular wO.rk in industry, trade or ser'vice the reference period was the week prior to enumeration and for seasonal work such as agriculture the last one year. The person ' was categorised according to the main activity returned by him. Where a person, who was basically a non-worker such as student or housewife, made some marginal contribution to work, that secondary work was recorded in questiof\ 17. The 1961 experience had shown that census was not the proper agency to collect reliable data on unemployment as Sllch. The 1971 Census did not ask a question oJ} .unemployment directly, out the unemployed were generally expecteo to fall in the residuary category of nonworkers.
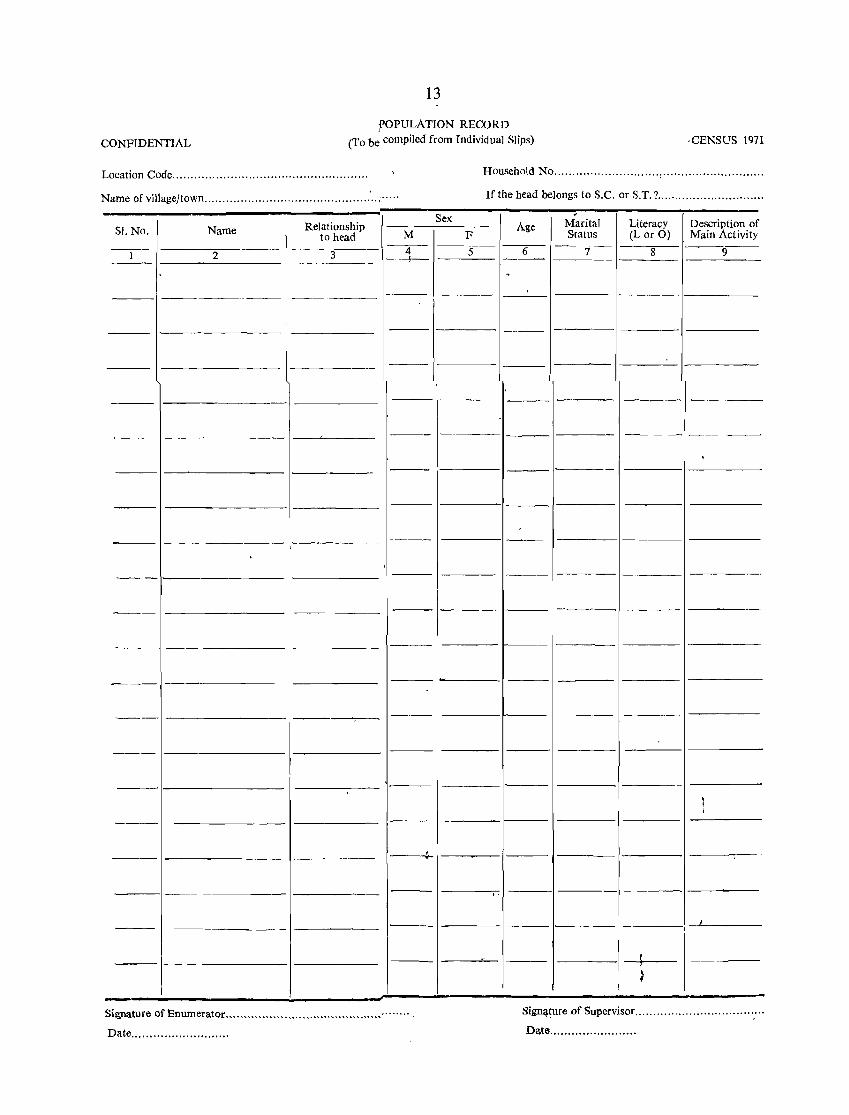
POPUL,<\TroN RECORD:
A' population lecoro was prepared by copying out the relevant particulars from the Individual slip, e.g., name; relationship to
,.head; sex (male(female); age; marital status; literacy (LjO); '<1escription of mai!, aCiliv\tY'of members of each household.
, - In 19b], on the obverse qf the Population recprd form then d~v.eloped, there was a 'Household Schedule in which certain particulars of the· holding~ and land rights of agricultural households were lecorded, as al~o details of household inrlu~tries. Since an agricultural censloS .was proposed to be conducted by the Government-in the 1970's it was decided not to attempt collection of data on 'hp,ldings, land rights, etc., at the population cenSl,S. The househo~d schedule was, the~efore, not adopted in 1971.
DE'G~'EE HOLDERS A.ND TECHNlCAL PERSONNEL CARD~
p..s iiU 961, a census of degree-holders and technical personnel was ta'ken oy canvassing a Schedule which had been finalised in conSUltation with the Cou,ncil of scientific & i'ndustrial research. The enumerator was required to leave one or more of these cards, as the case might be with the household whenevel he came across jl graduate.or a post-graduate as.also those with a technical diploma 01 degree, for being filled by the eligible person(s). The enumera'tor was required t(\ collect the filled-in card(s) frdm the respondent duringili)) revisional round or'even earlier but before completing the enumeration of his area. ~ , " Specim~ns of each of the above documents are reproduced' as
Apnll,xure A .• :rhe instructions to enumerators for filling up the Indivldual:Slip are, feproduced as Annexure B. . , • • The-requirements of sche~ules and inst.t.:uctions were carefully Itsses&,ed c<Qltrally, giving due weightage tor the growth' of population, wastage and also providing for sufficient, reserve to meet unforeseen demands. The translation of the s(,hedules and ins
. tructions tOr filling in the same in~arjous regional languages was done vhy Cllrefully haying regard to the nuences and connotation of terms. About 3,50~ tonnes of paper had to be procured to print these schedules running into hundred of miH10ns and ins·truction booklets for the ·whole country. Ths! paper required for the purrro&e had to be manufactured specially)Jy the mills in good time: The services of 11. number of Government of India and State government presses were utilised for plintiJag these schedules and instruction booklets sQ ~hat these reacht:ld eadi enumerator
··"well in' time.
PRE.rAR:A1;),ON- OF !'VIAPS:
. . A census nl,ust ensure that every person in the country is ebl)merat.ed' . only once an1 ~ithout any omission. ~n. order to achieve this,· maps' for all.dlsttlcts and taluks anel, ultlmately, fOI
,every villl:lg~.)lnd tbwn \vere prel?ared. Up-.to-d.ate adJ11il}istra~ive , bounaaries were marked vn these maps takmg mto conSIderation
all changes that.had taken place since 1961. The boundaries are genedllly,frozen,a year in ad'varce of the census enumeration. After identi'fying eY~ry village afld town on a .taluk map, code numbers' were allotted to each of these units which wefe to be fully accounted for at',the census. potional maps of ever¥ village and
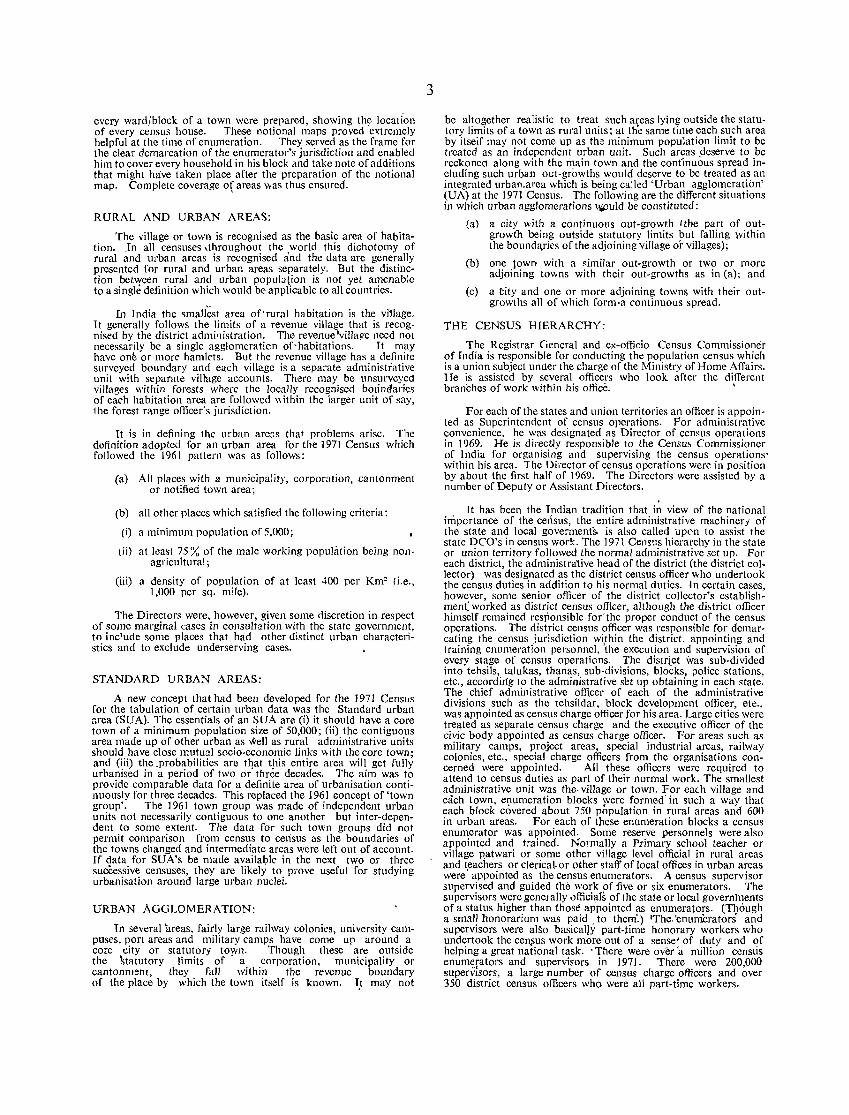
every ward/block of a town were prepared, showing th~ locati'on of every census house. These notional maps proved extremely helpful at the time of enumeration. Thcy served as the frame for the clear demarcation of the enumerator's jurisdiction and enabled him to cover every household in his block and take note of additions that might haVe taken place after the preparation of the notional map. Complete coverage o( areas was thus ensured.
RURAL AND URBAN AREAS:
The village or town is recognised as the basic area of habitation. .In all censuses ,throughout the world this dichotomy of rural and urban areas is recognised and the data are generally presented for rural and urban areas separately. But the distinction between rural and urban popul3(ion is not yet amenable to a single definition which would be applicable to all countries.
In J ndia the small~st area of' rural habitation is the village. It generally follows the limits of a revenue village that is recognised by the district admi'listration. The revenue 'village need not necessarily be a single agglomeraticn of'habitations. It may have one or more hamlets. But the revenue village has a definite surveyed boundary and each villagc is a separate administrative unit with separate viltage accounts. There may be unsurveyed villages within forests where the locally recognised boundaries of each habitation area are followed \\ithin the larger unit of say, the forest range officer's jurisdiction.
It is in defining the urban are::, that problems arise. The definition adopted for an urban area for the 1971 Census which followed the 1961 pattern was as follows:
(a)
(b)
All places with a municipality, corporation, cantonment or notified town area;
all other places which satisfied the following criteria:
(i) a minimum population of 5,000;
(ii) at least 75 % of the male working population being nonagricultural;
(iii) a density of population of at least 400 pcr Km2 (i.e., 1,000 per sq. mile).
The Directors were, however, given some ctiscretion in respect of some marginal cases in consultation with the state government, to inc'ude some places that had other distinct urban characteristics and to exclude underserving cases.
STANDARD URBAN AREAS:
A new concept that had been developed for the 1971 CenSlLs for the tabulation of certain urban data was the Standard urban area (SUA). The essentials of an SUA are (i) it should have a core town of a minimum population size of 50,000; (ii) the contiguous area made up of other urban as well as rural administrative units should have close mutual socio-economic links 'With the core town; and (iii) the .probabilities are that this entire area will get fully urbanised in a period of two or' three decades. The aim was to provide comparable data for a definite area of urbanisation continuously for three decades. This replaced the 1961 concept of 'town group'. The 1961 town group was made of independent urban units not necessarily contiguous to one another but inter-dependent to some extent. The data for such town groups did not permit comparison from census to census as the boundaries of the towns changed and intermediate areas were left out of account. If data for SUA's be made available in the next two or three sucCessive censuses, they are likely to prove useful for studying urbanisation around large urban nuclei.
URBAN AGGLOMERATION:
Tn several hreas, fairly large railway colonies, university campuses, port areas and military camps have come up around a core city or statutory town. Though these are outside the \tatutory limits of' a corporation, municipality or cantonment, they fall within the revenue boundary of the place by which the town its;:lf is known. I,t may not
3
be altogether realistic to treat such areas lying outside the statutory limits of a town as rural units; at the same time each such area by itseif may not come up as the minimum population limit to be treated as an independent urban unit. Such areas .deserve to be reckoned along with the main town and the contInuous spread including such urban out-growths would deserve to be treated as an integrated urban.area which is being called 'Urban agglomeration' (UA) at the 1971 Census. The following are the differcnt situations in which urban agglomerations ~uld be constituted:
(a) a city with a continuous out-growth Ithe part of outgrowtb being outside statutory limits but falling within the bounda.ries of the adjoining village or villages);
(b) one town with a similar out-growth or two or more adjoining towns with their out-growths as in (a); and
(c) a tity and one or more adjoining towns with their outgrowths all of which form·a continuous spread.
THE CENSUS HIERARCHY:
The Registrar General and ex-officio Census Commissioner of fndia is responsible for conducting the population census which is a union subject under the charge of the Ministry of Home Affairs. He is assisted by several officers who look after the different bran'ches of work within his office. '
For each of the states and union territories an officer is appointed as Superintendent of ccnsus operations. For administrative convenience. he was designated as Director of census operations in 1969. He is directly responsible to the Census Commissioner of India for organising and supervising the census operations' within his area. The Director of census operations were in position by about the first half of 1969. The Directors were assisted by a number of Deputy or Assistant Directors.
It has been the Indian tradition that in view of the national importance of the census, the cntire administrative machincry of the' state and local goverments. is also called <lpe-n to assist the state DCO's in census worL The 1971 Cen$'Js hierarchy in the state or union territory followed the normal administrative set up. For each district, the administrative head of the district (the district collector) was designated as the district census officer who undertook the census duties in addition to his normal duties. In certain cases, however, some senior officer of the district collector's establishment: worked as district census officer, although the di,trict officer himself remained responsible for' the proper conduct of the census operations. The district census officer was responsible for demarcating the census jurisdiction within the district, appointing and training enumeration personncl, 'the execution and supervision of every stage of census operations. The district was sub-divided into tehsils, talukas, thanas, sub-divisions, blocks, police stations, etc., according to the administrative sl:t up obtaining in each state. The chief administrative officer of each of the administrative divisions such as the tehsildar, block development officer, etc., was appointed as census charge officer for his area. Large cities were treated as separate census charge and the executive officer of the civic body appointed as ccnsus charge officer. For areas such as military camps, project areas, special industrial areas, railway colonies, etc., special charge officers from the organisations concerned were appointed. All these officers were required to attend to census duties as part of their normal work. The smallest administrative unit was the· village or town. For each village and each town, enumeration blocks were formed' in such a way that each block covered about 750 population in rural areas and 600 in urban areas. For each of these enumeration blocks a census enumerator was appointed. Some reserve personnels were also appointed and trained. Normally a Primary school teacher or village patwari or some other village level official in rural areas and t,eachers or clerical. or other staff of local offices in urban areas were appointed as the census enumerators. A census supervisor supervised and guided the work of five or six enumerators. The supervisors were generally uffici!lls of the state or local governlnents of a status higher than those appointed as enumerators. (Though a small honorarium was paid _ to them'.) !'fhe. 'enumerators and supervisors were also basically part-Jime honorary workers who undertook the cenJms work more out of a sense' of duty and of helping a great national task. . There were over 'a million census enul11t?rators and supervisors in 1971. There were 200,000 superVIsors, a large number of census charge officers and over 350 district census officers who were all part-time workers.
The enwneration staff performs its duties largely as a labour of love. Till the 1951 Census the enumerators were not paid anything at all. In 1961 a small honorarium of about Rs. 15/to 20/- per enumerator (including the cost of house-numbering material) and about Rs. 25/- per supervisor was paid. This small sum hardly met the extra expenses that the enumerator had to incur by his having to attend a minimum of six training classes, sometimes he had to travel more distance, though generally it was ensured that the enumerator need not go more than five miles to altend to enumeration work. It is a tribute to census enumerators that they fulfilled their responsibilities at considerable inconvenience and expense to themselves for no other reason than their realisation that they were entrusted with a vital national task. For the 197] Census the rate of honorarium was raised to Rs. 40/-pe! enumerator and supervisor. The sum of Rs. 40/was paid in two instalments, viz., Rs. 15/- after house-numbering and houselisting and Rs. 25/- after census enumeration. This provided some relief to the enumerators though certainly it could not be considered as a remuneration commensurate with the work turned out.
TRAINING:
Each one in the census hierarchy has to be very clear on what his duties and responsibilities are. He has 'to undertstand census concept5 clearly. Manuals of instructions issued by the Census CommiFsioner or the DCO's invariably contain specimens of a few typical fill,;d in schedules. The regional director gets trained by the Census Commissioner and in his turn imparts intensive training to the district and sub-district census officers and the charge superintendents who themselves train the census enumerators and supervisors. Each supervisor must ensure that every enumerator under him has understood the instructions thoroughly. A good part of the training is spent on demonstration and practice enumeration. The mistakes found during the practice rounds were fully discussed after each practice enumeration.
THE CENSUS ACf:
Tlle census is conducted' under the Census Act (Act No. XXXVII of 1948) tSee annexure C). This act empowers the Central Government to notify and conduct a census in the whole or part of the country. The Census Commissioner of India and the DCO's are appointed to supervise the taking of census. The flet empowers the states or such authority to whom the state governments delegate powers to appoint census officers at various levels to aid in, supervise and take the census. The act authorises the census-takers to ask the prescribed census questions and legally compels all persons to answer the questions truthfully. The law lays down that the information collected at the census wilt be used only for statistical purposes and that the information about individuals will be kept confidential and can not be used as evidence even in a court of law. The act gives extra-ordinary powers to secure all types of assistance from the local bodies or any other person in order to complete the task.
PROVISIONAL TOTALS:
Soon after enwneration was over, the provisional totals were communicated from the enumerators upwards to the DCO's and thereon to the Registrar General, by the quickest possible means. These figures were published on 12 April 1971 within a record time of less than ten days of the completion of census enumeration. Thereafter the census schedules were processed in detail in regional tabulation offices set up in different· parts of the country.
POST-ENUMERATION CHECK:
The post-enumeration check is essential for any systematic and comprehensive enquiry like the population census. It goes into the coverage and validity of the results. It was carried out in April 1971 in certain limited areas. The result of this survey is at annexure D.
4
COMPUTERISATION:
A significant change in 1971 has been the processing of data by computer. In the past censuses, the data had been almost entirely sorted and tabulated manually exccpt that, in 1961, household economic data ",ere processed on a sampling basis on conventional machines. Manual sorting and tabulation have certain limitations. A beginning was, therefore, made in mechanisation when the household economic tables of the 1961 Census were tabulated on conventional machines like sorters, tabulators etc. The Registrar General's Office now has an LB.M. 140i electronic computer with 16-K memory and 6 tape drives. Data for most of the 1971 Census tables are being tabulated on the eomputer'to meet the need for more complicated tabulations with speed and accuracy. But even computerisation of massive data covering a population of five hundred million presented problems. It was, therefore, decided that most of the census tabulations would be based on the processing of 10 per cent of the rural slips and 20 per cent of the urban slips. The data pertaining to 20% of the urban individual slips would be transferred on to punched cards and, thenre to magnetic tape and all the cross-tabulations for urban data would be generated by processing this data on the electronic computer. The cross-tabulation of the rural data would be derived from 10% sample of the individual slips being processed manually. The tabulation of the houselist data has been done on a 20 per cent sample basis and that of Establishment. schedules on.a 100 per cent basis. The data relating. to the housmg and establishments have been processed on the electronic computer. In addition, an advance tabulation at the national level from one per cent sample of the individual slip was done on the computer and data released in.
The basic population particulars for the smallest administrative areas needed for the purpose of revision of electoral constituencies and other administration purposes of the Government were obtained by a lOOper cent manual processing of the enumerated schedules. These are being published in Part-B of Census Handbooks of the_ districts concerned.
TABULATION:
According to the tabulation plan of the 1971 Census, there wi.ll be four tables each, devoted to housing conditions and establishments respectively. The individual slip will yield five General population tables, the Primary census abstract (PCA), nine Economic tables, eight Social and cultural tables, six Migration tables, five Fertility tables, twelve Special tables for degl"ee-holders and technical personnel. Details are given below:
GENERAL POPULATION TABLES:
A-I
A-II
A-III
A-IV
A-V
ECONOMIC TABLES:
B-I Part-A
Part-B
B-I1
R-JII Part-A
Area, houses and population
Decadal variation in population since 1901
Villages classified by population
Towns and urban agglomerations classified by population in 1971 with variation since 1901
Standard urban areas Union/State Primary census abstract Urban block/Village-wise Primary census abstract
Workers & non-workers according to main activity classified by sex and age groups
Female workers and non-workers accordjng to main activity classified by marital status and age groups
Workers and non-workers in cities and noncity urban areas according to main activity by sex and age groups
Classification of workers and non-workers according to main activity by educational levels in urban areas only
Part-B
B-IV Part-A
Part-B
Part-C
Part-D
'B-Y Part-A
Part-B
B-YI Part-A(i)
Part-A(li)
Part-B(i)
Part-B(ii)
B-VII
B-vm
B-IX Part-A
Part-B
Classification of workers and non-workers according to main activity by educational levels in rural areas only
industrial classification of persons at work other than at cultivation as main activity by sex and divisions, major groups and minor groups
Industrial -classification of workers in manufacturing, processing, servicing and repairs on household industry basis as main activity by sex and class of workers
Classification of workers in non-household industry, trade, business, profession or service as main activity by class of workers, age and sex
Industrial classification by sex and class of workers of persons at work in non-household industry, trade, business, profession or service as main activity.
Occupational classification by sex of persons . at work according to mairl activity other than cultivation
Occupational classification by sex and class of workers in non-household industry, trade, business, profession or service as main activity
Occupational classification of persons at w01:k according to main activity other than cultivation classified by sex and age groups in urban areas only .
Occupational classification of persons at work according to main activity other than cultivation classified by sex and· educational levels in urban areas only
Occupational classification of persons at work according to main activity other than cultivation by sex and age groups in rural areas only
Occupational classification of persons at work according to main activity other than cultivation classified by sex and educational levels in rural a,reas only
Secondary work, i.e., persons having main activity (i) cultivators, (ii) agricultural labourers, (iii) household industry, (iv) non-household industry, trade, business or service and (v) non-workers classified by sex and by secondary work as (i) cultivators, (ii) agricultural labourers; (iii) household industry, (iv) non-household industry, trade, business or service
Persons classified as non-workers according to main activity cross-classified by sex, age groups and type of activity
Non-workers categorised as 'others' aged 15 and above classified by sex, age grOllps and educational levels in urban areas only
Non-workers categorised as 'others' aged 15 and above classified by sex, age groups and educational levels in rural areas only
SOCIAL AND CuLTURAL TABLES:
C-I ·Part-A
Part-B (i)
Part.B (ii)
C-1I
Members of households by relationship to head of household classified by age groups (20Yo sample)
Households where the head is a male by relationship of members with the head
Households where the head is a female by relationship of members with the head
Age and marital status
5
C-JII Part-A Part-B
C-rY
C-V
C-YI
C-VII
c-vm Part-A
Part-B
MIGRATION TABLES:
Age, sex and education in all areas Age, sex and education in urban areas only
Single year age returns
Mother-tongue (alphabetical order)
Bilingualism
Religion
Scheduled castes and scheduled tribes
Classification by literacy and industrial category of workers and non-workers according to main activity among scheduled castes
Classification by literacy lj,nd industrial category of workers and non-workers according to main activity among scheduled tribes .
D-I Population classified by place of birth
D-H Migrants classified by place of last residence
D-JII
D-IV
D-V
D-YI
and duration of residence in place of enumeration
Migrants to cities classified by sex, broad age groups, educational levels and in case of workers, by occupational division:;
Population of cities classified by place of last residence and duration of residence
Workers and non-workers according to main activity classified by place of l;tst residence
Migrants classified by place of last residence, age groups, duration of residence and marital status
ESTABLISHMENT TABLES:
E-I
E-I[ Part-A
Part-B
Part-C
B-llI
B-IV
Distribution of establishments by broad types
Distribution of manufacturing, processing or servicing establishments other than household industries classified by registered factories, unregistered workshops and size of employment
Distribution of manufacturing, processing or servicing establishments other than household industries classified by industry, fuel/power used and size of employment
Distribution of household industry, establishments classified by industry, fuel/power used and size of employment
Distribution of trade/commercial establishments classified by.Jhe type of 'business or trade and size of emplby~t
Distribution of establish111¥rlts---.Cother than manufacturing, processing or Se~ing or business and trade establishments) bY... size of employment - "'-.
FERTILITY TABLES (SAMPLE):
F-I Part-A
Part-B
Distribution of currently married women and the related births during the last year by religion, present age and' age at marriage trural)
Distribution of currently married' women and the related births during the last year by religion, present ag~ and age at 'marriage (urban)
F-II Part-A
Part-B
F-1II Part-A
Part-B
F-IY ~art-A
Part-B
F-Y
DlstnbutIon of currently married women and the related births during the last year by education, present age and age at marriage (rural)
Distribution of currently married women and the related births during the last year by education, present age and age at marriage (urban)
Distribution of currently married women and the related births during the last year by religion, duration of marriage and age at marriage (rural)
Distribution of currently married women and the related births during the last year by religion, duration 'of marriage and age at marriage (urban)
Distribution of currently married women and the related births during the last year by education, duration of marriage and age at marriage (rural)
Distribution of currently married women and the related births during the last year by education, duration of marriage and age at marriage (urban)
Distribution of currently married women and the related births during the last year by religion, education groups, present age and age at marriage of the women (rural/urban)
SPECIAL TABLES FOR DEGREE HOLDERS AND TECHNICAL PERSONNEL (DHTP):
G-!
G-II
G-III
G-IY
G-Y
G-Y!
G-YII
G-YlII
-t-IX
G-X
G-XI
G-XII
Distribution of DHTP in each subject field bl level of education
Distribution of DHTP in each subject field ty status and levels of education
Distribution of DHTP by level of education and emoluments classified by sector of employment
Distribution of DHTP by subject field, age groups, and sector of employment further classified by emoluments
Distribution of employed DHTP (other than self-employed) by type of <1rganisation of present employment classified by levels of education and subject fields
Distribution of unemployed DHTP with engineering and technology qualifications classified by degree and diploma levels and' by subject of such degree and diploma
Distribution of DHTP who are unemployed and seeking employment in each subject field by duration of unemployment level of education and sex
Distribution of unemployed degree holders and above in arts, humanities and commerce classified by degrees and their subjects
Distribution of unemployed degree holders and above in science and other selected subjects classified by degrees and their subjects
Distribution of unemployed persons having qualifications in technical/vocational trades by subjects .
DHTP engaged in research by subject field and levels of education
Distribution of D HTP by country of education subiect field, levels of education and sex
6
HOUSING TABLES:
H-I Census houses and uses to which they are put
H-I! Distribution of census houses by predomi-nant material 0:' wall and predominant material of roof
H-Ur Households classified by number of members and by number of rooms occupied
H-IY Households classified by size and tenure status
PUBLICA TIONS:
The IQ71 publications will b<:! made up of 30 series, the first series covering the all-India publications and the remaining series one for each state and union territory in alphabetical order.
Ser ies No.
Territorial unit
• ALL INDIA
2 Andhn: Pradesh 3 Assam* 4 Bihar 5 Gujara! 6 Haryana 7 Himachal Pradesh 8 Jammu & Kashmir 9 Kerala
10 l\Iadhya Pradesh II Maharashtra 12 Manipur 13 Meghalaya 14 Mysore (Karnataka) 15 Nagaland 16 Orissa 17 Punjab 18 Rajasthan 19 Tamil Nadu 20 Tripura 21 Uttar Pradesh 22 West Ben£(al 23 Andaman & Nicobar Islands 24 Chandigarh 25 Dadra & ]\Iagar Haveli 26 Delhi 27 Goa, DDman & Diu 28 Laccadive, Minicoy & Amindivi Islands (Lakshadweep) 20 Arunachal Pradesh 30 Pondicherry
Part and su1)-parts of each series woula cover specified types of cenSllS reports or taoles and thr rart number '1 nd tyre of sllbject coverco would be uniform for all the ferics. The details are indicated below:
Part No. and subject covered
Part-I Census general report
Sub-part No. (ifany). and subject covered
Part 1- A First part or the general report discussing the data yielded from the Primary census abstract and the broad religion and mother tongue distribution. It will cover distribution, growth and density of population. sex ratio, rural and urban differentials, broad literacy rates, population or scheduled castes and scheduled tribes, broad economic categories, etc.
• Includes Mizo district now constituted as union territory of Mizoram.
Part No and subject covcnd
PMt ) General Report-collcld
Sub part No (If any), and subject covered
Part ) B Second PMt andlYSl11g dcmogr4phlc, soc,al cultural and mlgratlOn patterns after the completIOn of the full tabulatIOn pmgr",nme A techrucal note on the samplIng proce,lures IS to be Incorporated In this part
Part I-C SubSIdiary ("bles
Part-ll PM( JI A Umon/Stdte/Umon temtory G~nerdl Census tables on populaUon populatIOn tables and PrImary census ab.tract
Part III EstablIshments report and tables
Part IV-A Housmg tcport and housmg
subSIdIary tables
Part IV-B HOUSIng tables
Part V
Part JI-B Fconomlc tables
Part Jl-C (I) DI,tnbuuon of populatIOn by mpther tongue and relIgIOn and scheduled castes and scheduled tnbes
Part Il-C (11) Other socIal and cultural tables and feruhty tables (Tables on household COIljPOSltJon, Single year age mantal status edUCdt101ldJ levds scheduled castes & scheduled trJbe~, etc bllmguah.m)
Part II D MigratIon tables
J> Jr} 11 l.sP)) _41l-1mJ);} CCDSl}S !acks 0'1 J % sample basls--(Tcchmcal note on sdtlJplmg IS to be mcorporated)
SpecIal tables dnd ethnobraphlc notes on scheduled castes and scheduled \!lbes
Part VI A Town dIrectory
Part VI B SpeCIal surve) reports on
selected towns
Part VI-C
Survey reports of selected VIllages
Part Vll SpecIal report on degree holders and techmcal persqnae]
Part VIII Part VIII-A AdmmlstrdtlOIJ report-enum~ra,IOn AdmInIstratIOn report (for offiCIal use)
Part IX Census atlas
Part VJIJ-B Adnulllstrdtlon report-tabulatIOn (for offiCIal use)
Part IX-A Admmlstrallve atlas
Part X
Dlstnct census handbook
Part (Al VIllage and town dIrectory
Part (B) VIllage and town-WIse Pnmury census abstract
Part (C) AnalytIcal report and admlru~tratlve stalerrentsand dIstrIct census tables
7
p"rt No and subject covered Sub-part No (If any), and subject ,overed
Spec",1 Monographs
M IsccU,IllCOUS (These WIll be publ .. hed as speCIal pd pers 111 each year as and when ready)
(d) SpeCIal studIes taken up by DCO s (b) SpeCial area survey. taken up by RG's office
(c)
(j)
Ce)
(fl (g)
(h)
SpeCIal tables for ,>tandard urban areas
Language survey report Post enumeratIOn check report
Age tables
LIfe tables Report on eSllma!eS of Inter-CClls41 btrth and death rates uSing 1971 hfe tahle and aqe data
(t) Development of Vlt,lI statIStiCS tn IndIa
The vJllage and lown dlrectorv partIculars In the Dlstrrct censlls handb-ook Part-;\ would be pre~ented tehsll WJse wltl11n each dJstllct
Tile Dlstflct renst s hanrlbook Part-B '''Ill glVe Ih" Pllmary census aD.ltract n_guIc> wlthm a dlstrJct tehsJ)-wJse and ~\lthlJ] It for each town and for each \Il1age ror eacl> town the PruralY censu~ abstract figure., would be prOVIded ward-.vI<e and further down to the censl..s enumerator's tkck
Part-C of the Dlstnct census handboo would cOIHam a short-WrIte up and Incorporate admtlllstratJvc statJstlc~ ,md the censl's t ,ble~ of the dIstrict
ANCILLARY STUDIES
( I) Survey 0/ selected tOltllS alld re.!:uney of saine 1961 'Illaj!es selected for soCIa economIc survey
In the 1961 Census, the mam plank of the anCIllary studIes wa!> the SOClo-\.conOmIC sur'lfey of some se\ected ,,\\\age'1., '1.urvey of some selected crafts, of failS and festIvals, consangull1eous marna!les, etc Consldenng th .. fact thdt urbamsatLon on a large scale IS bound to occur, the ancIllary studIes of the 1971 Cen~lIs will be focussed on a wrvey ot some selected towns Other tYICes of projects such a~ a re-survey of a few selected VIllages preVIously covered Will reflect the trends of change An enthnoglaphlc survey of the sch('duled c~stes and scheduled tribes <,\1]1 he undrrtaken
(2) Census /Atl1s Project
The census orgdJ1lSatlOn, perhaps, has b('en the larg('st sll1~le prodmer of maps of the IndIan sub-contment apart from the Survey, 01 India and tre Geological survey But a census atlas as !>uch was brought out only III the 1961 senes Tre 1961 t adltlOn I~ bemg continued m the 1971 Census al~o
It IS proposed to brmg out the Census atlas of IndIa and of mdlvldual states and un,on terntonos The atla~es ot statcsl ulllon terntones have been proposed for deplctmg ~anous aspects of onent"tlOn, phYSIography, demographl<' stru"tUles and trends, urbamsatlcn, af,ncultural census, lnClustllal categones, e!ectncny, tLan<pC'rt and commUI1l,atlOm, traCle and ... ommerce, <ervlces, soclo-cultural aspects of ~chedllied castes and sche(tuled tnbes r<;hgJOn, ian!;uage~, lIteracy and educlltlcn, hou~ll1g and health: etc. Some ~pecJah~ed m-.I" for <:;tandard urban arcas WII! also be pr<.p.ued mdlcatlflg vallOdS u~pects of cen.us data whlGh would be u\dJlal}e on a full count baSI' III tre 1971 Ccnsu. The 'alas senes of th: 1971 census \\JP thus p,esent vaflou~ pOpt,ht 01'
patterns and problems fJ om the smallest lImt Ie el of taluka, teh.ll/sub dlvlslon/pohce statJOn 1I1 vanous ~tates to tl'e dlstnct lcvel for the whole of the cOUJltry
B
ANNEXURE
·CENSUS OF
HOUSE : ...
N arne of District ............................................................. ~ ........................... . Code No ............................ ..
Name of TalukJTehsilJThanaJAnchalJlsland ....................................................... . Code No ............................. .
Line No. Building No. (Municipal or
Local Authority or Census No.)
---1---·--2
Census House No.
3
Predominant constfl-lction material of Census home
---------~~---------~--
Material of wall Material of roof
4 5
Purpose for which . census house is used e.g. reSidence, shop, shbp-cum-residence, business, factory, workshop, workshop - cum - residence, school, bank, commercial hOllS; oJEce/ hD~ita~ hote]/ etc, or vacant
6 ------ --------------~---- -------------_-
----- --------1------ -----.......:----- ~.:__ _______________ _
------- ------------
Is it used ~holly or partly as an establishment? yes or No. If yes, enterfurther details in' the Establishment· Schedule. and indi
cate tne SerIal No. of ~hat entry here
7
---- ------------ -"'----'-----1-----------'-:.,.---1-------------
• •• > ~ 4 ••••
Signature of Enumerator ... ••.•• . " ............................................................... .
NOTE:-Please do not write in the llpaces enclosed qv OPlJetJ Jives JR DoJs. ~ .5,. i} )[) k )2
The~c are meant for use in the Tabulation offices for coding.
Date ............. .
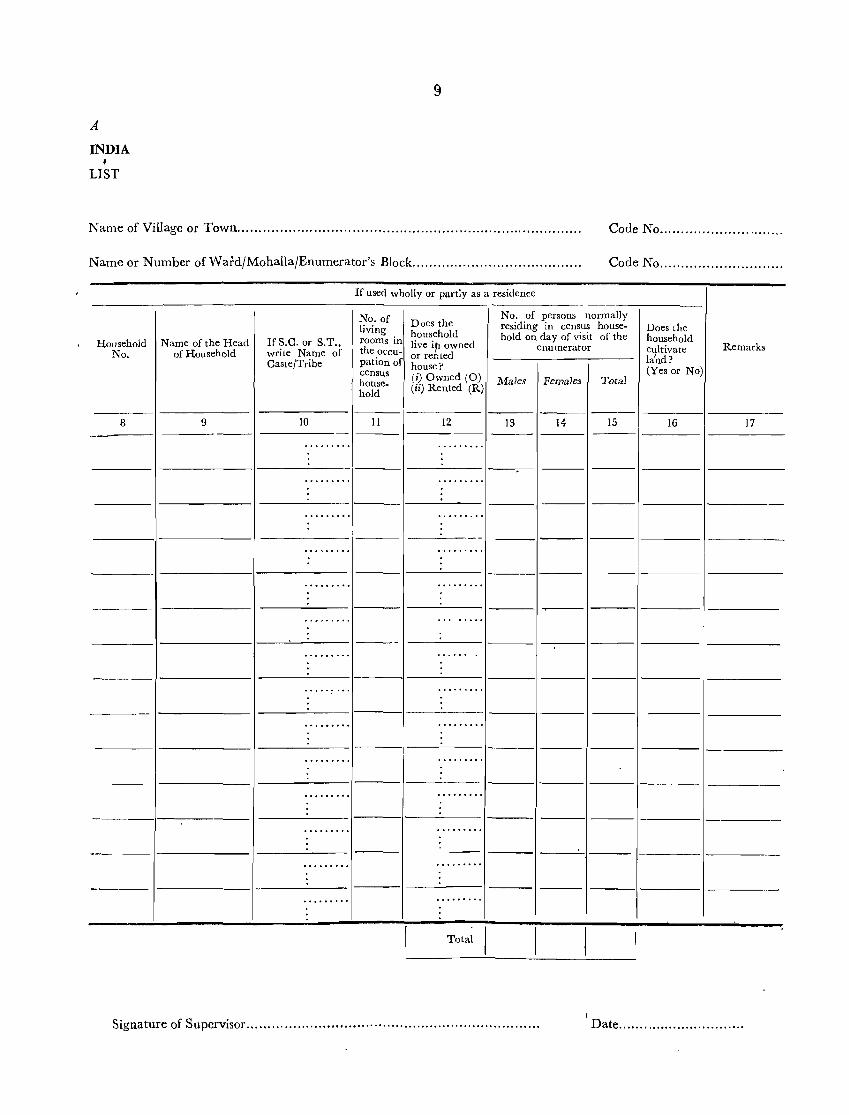
A
INDIA , LIST
9
Name of Village or Towu ................................................................................ . Code No ............................ .
Name or Number ofWardJMohallaJEnumerator's Block ....................................... . Code No ........................... ..
Household No.
8
Name of the Head of Household
9
If S.C. or S.T., write Name of Caste/Tribe
10
If used wholly or partly as a residence
No. of living rooms in the occupation of census household
II
Does the household live if! owned or rented house? Ii) Owned (0) (ii) Rented (R)
12
No. of persons normally residing in census household on day of visit of the
enumerator
Males Females Tota]
13 14 15
._-- ----
Does lhe household clJltivate land? (Yes or No)
16
--------
-------1---- ---'---- --__ - __
I
Remarks
17
Signature of Supervisor. ................................................................... . Date ............................. .
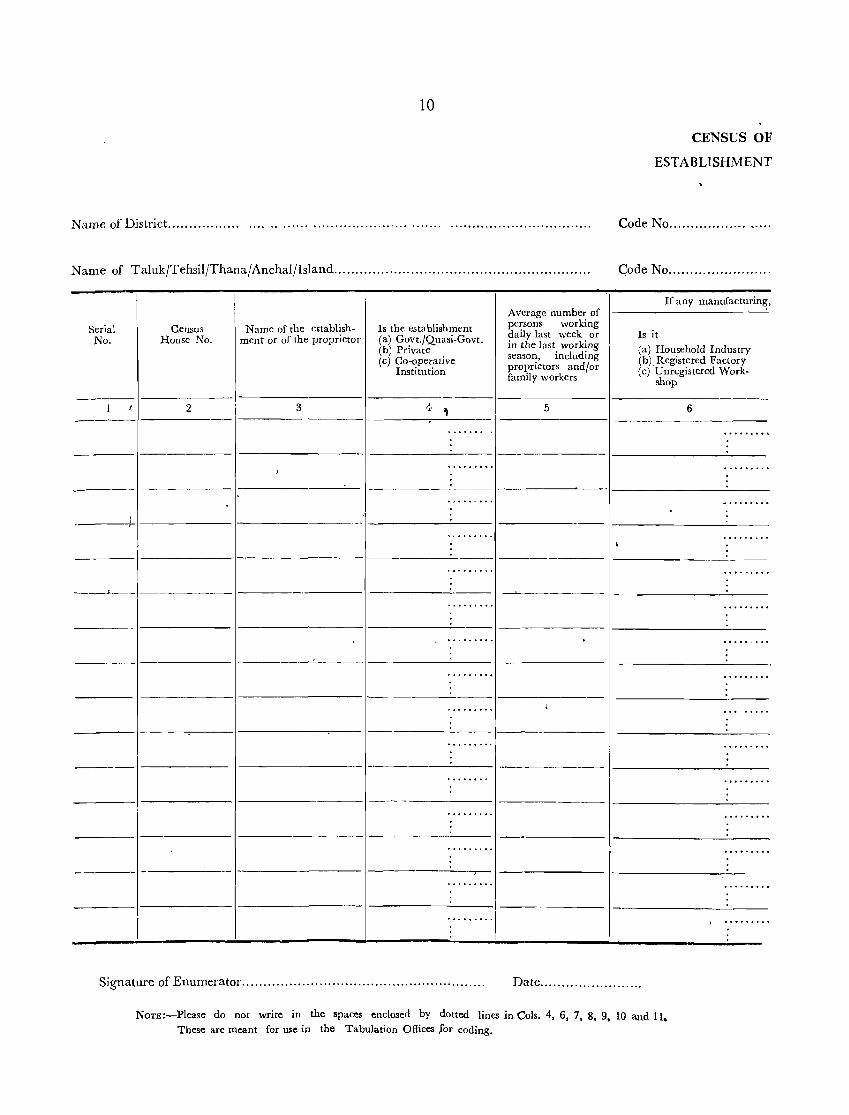
10
Name of District ............................................... ,. ........................................ ..
Name of Taluk/Tehsil/Thana/Anchal/Island ........................................................... .
Serial No.
Census House No.
Name of the elltablishment or of the proprietor
Is the establishment (a) Govt./Quasi-Govt. (b) Private (e) Co-operative
Institution
------- ------------- ------------------ ----------2 3 I;, ,
------- ----------
--------- -------------
·; ........ 1
Average number of persons working daily last week or in the last working season, including proprietors and! or family workers
5
CENSUS OF
ESTABLISHMENT
Code No .................. , .. ..
Code No ....................... -
If any manufacturing,
Is it
(a) Household Industry (b) Registered Factory (e) Unregistered Work-
shop
6
Signature of Enumerator ........................................................ . Date ....................... .
NOTE:-Please do not write in the spaces enclosed by dotted lines in Cols. 4, 6, 7, 8, 9, 10 and II. These are meant for use in the Tabulation Offices Jor coding.
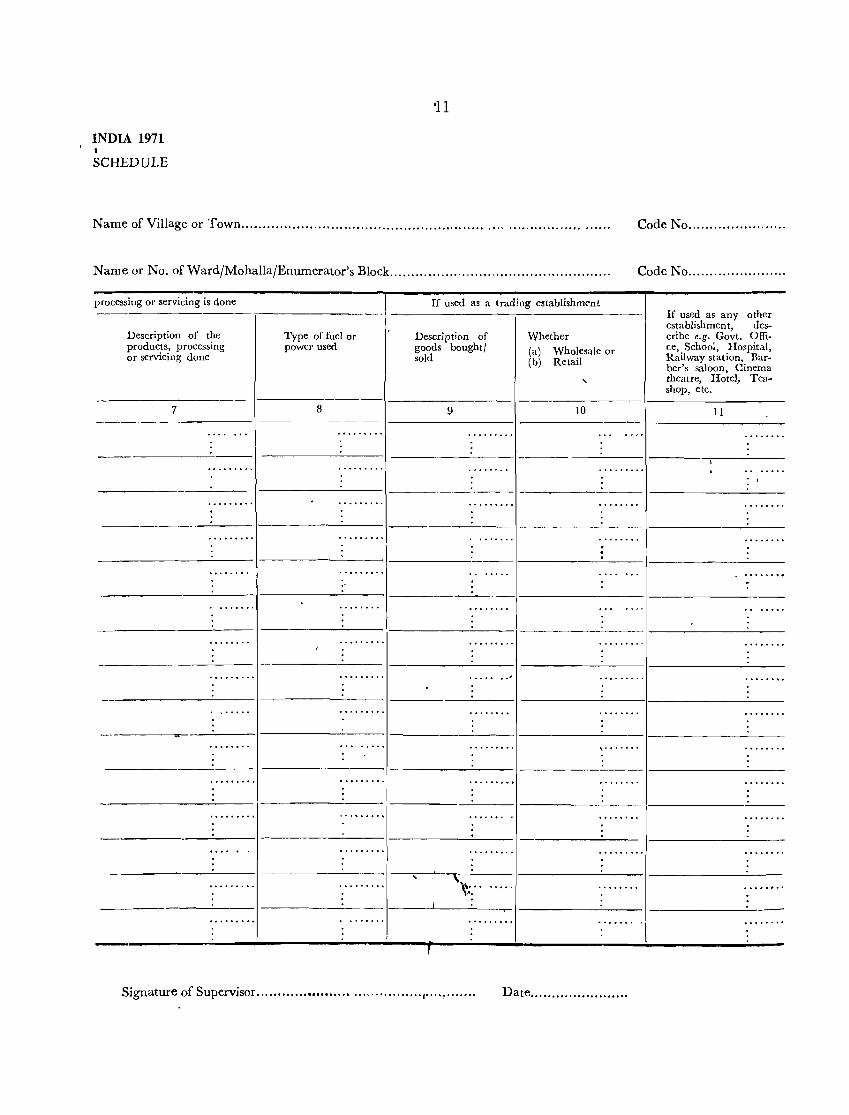
'11
INDIA 1971 t
SCHEDULE
Name of Village or Town ................................................................................... . Code No ..................... ..
Name or No. of WardJMohallajEnumerator's Block ................................................... . Code No ...................... .
processing or servicing is done
Description of the products, processing or servicing done
7
Type of fuel or power used
8
If used as a trading establishment
Description of goods bought! sold
9
Whether
(a) Wholesale or (b) Retail
,
10
If used as any other establishment, describe e.g. Govt. Office, School, Hospital, Railway station, Barber's saloon, Cinema theatre, Hotel, Tea· shop, etc.
11
-----------------1----------------- -------~----~---
: I
------_.:.._-- --------- .-- - ---~--------
------------ ------------
.. '
..........
'\ \\ ....... . \'.
I
r
Signature of Supervisor ...................................... / .... , ..... .. Date ..................... ..
CENSUS OF INDIA 1971
I
INDIVIDUAL SLIP
C.o"fiOfNllJl CEN$o/ bf "i~IA Igll
rndlvldual Slip I ......
I..(lOitton C! '~1r - - - '"7 - - - -. - - '- - - ~(
t.N~.__ ...,
~'dNO'O •
-'Up No. ___ _
, J
2. P.ehlons;tp -'" - ---- -----r-=-:r=:; ,0 he:d ' I I . ___________ } .. _...!._.J
0,
D iex
r le. MAIN AeTN"Y
~I) W.r~" G''r-'
r.) Bro.d. (C. AL, HHI. OW) LJ caugory
II) Non-Worker 0 r-] H~S 1, ft. 015:'. O} L._
r-; , f L.."J
4. ilg. r--i s. Mtrital st"tus .--__ -------~-J 8. ~r currelltly mart!:.:! ~omell only: ... t (b) Pl-ac.t ef VfCft" 5 (N.me 01 vi~ ••• [Tawn) --_____ _
"" i; l<) 1'10"'0 01 e.t,bndmOllt ----------l! (d) Nltur• of Ind."t!)'. r",d ..
(a) Age at m'rrl',._-;~,_ ___ .___ r-, (J,) ~y ,hlld bon'" In Ole last one yur ____ ~ - J
r 7• lj (0) Pl'te of birth
~ frol-t.hIOf'l ~ Scrvk'l _________ _
~ . r-1 "'(b),J\u!'lI/Urban _________ .- _I,_J
F 1 I • ~ (.) "I~trl" ------:- -: -~ ~' , I ' L(d) State/Country ... - .L _ J
':;9. ~ (a) Pllce of ta:t ret\d~t'\ta ----
r-"--I- -, ____________ L L LJ (e) Dr:ter!pt!QJf'I. of '//ork _____ -..--
r -'--r'-, I tit __ ~...,. ________ .... _l. _..l _..J
r-' (I) elm cT we'k<.· __________ L_ ~
Q f-~ 5! (1,) Rur~I/Ur"n ---------- i' _..t __ ( .. : : J r !1. f~"NO,~'1 \'lOM. • S (c) 0:"'1" _____ -_----1- - T --,
, ,I l~) 8",,1.. (C. At. H 1-11. 0 Wl r 1
I f I '---I.._J ~ (d) " Stat< I Country _________ L _1_ J I <>10'·'1
9. Our.ltlon of Re'lde.nt:~ it th~ Vlt\ege r-l-l {b) t;a.::e or '0\'01'11: (If town of E"umem;on L_ J. _ J" (N.",. of V,::.g'/Town) ________ _
r-l--1 .. ' 10. Rellgloh L _1_ J ~ (t) Nt"'> bf .".I>\\,h"'e't
S. Col I r -1- -: ,.. (d) ;J.~:Me of Indu~Lr)'. Trade. or ___ L _.J _ _j'~ P(o;eniC':1 o-r S(r ... k~ _________ _
S. r,f"- - - - - - - - - - - - - i r -r -: ~ L. J 0 -r-r-T-'"
\2. LIt ... ty ~ - -7\ -~ --_- -----, -~-:, ~ ___________ L _:.. - L. _l (L or 0) ~ Do. L_ J t:l (.) O.le~ptIC:'l of Wortc
t3. Edu(atlon.' r -1-1 14. ~~~~er r-- '1L
____ {--_"': ", r -,- -,--, 1 f , I I f I ,
Tongue 1 rL =T.J.::,..J = :1' -::.----------- L - J.. _-L - J IS, Other , , " , • r-,
lon,uo&" '-_.1 __ '-_..1 \1) CIIu OFftOt1t. •• · __ .......... _____ LJ
It.
MGIP Sant ..... ?8 CensuS (Spl/69 _english) 31,3-7Q- 3.tl.Il,OdO •
..... ._ ..... __ • ..-1-_ _ __ ,...._ ........ _
13
:pOPULATION RECORD
CONFIDENTIAL (To be compiled from Tndividual Slips) ·CENSUS 1971
Location Code ..................................................... . Household No ............................. : ........................... .
Name of villageltown ............................................. : .. ; .... . If the head belongs to S.C. or S.T. ? ............................ .
Sex . SJ. No. Name Relationship Age Marital Literacy Description of
to head M F Status (L or 0) Main Activity --- 4 5 6 7 ---9--
1 2 3 8 ------ ---- - . ---
--- ---
---
--- ----
--- . ---
---
---,
-----
--- ----
----
-_-
-------
---
I
1 --_ ---
, ----
--- .. --- -
~ --- I
l
Signature of Enumerator ......................................... " ....... . Si~ture of Supervisor .......... , ........................ .
Date .......................... . Date ...................... ..

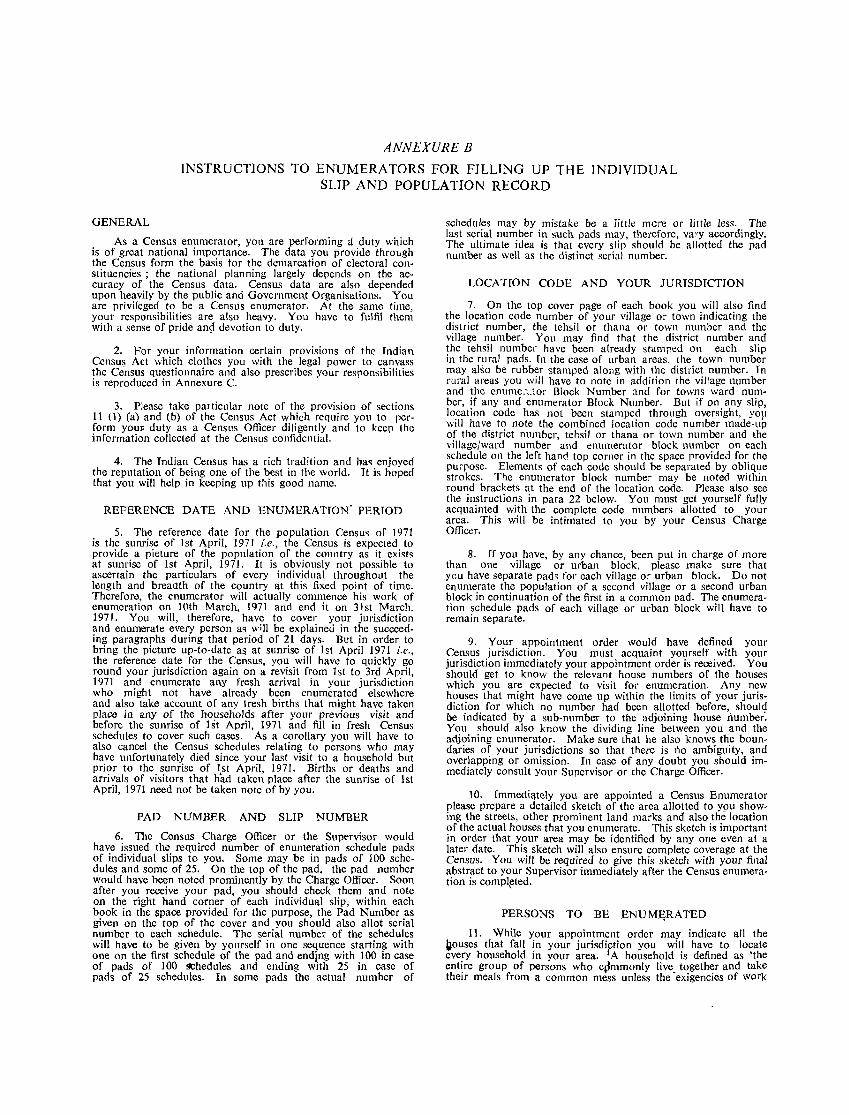
ANNEXURE B
INSTRUCTIONS TO ENUMERATORS FOR FILLING UP THE INDIVIDUAL SUP AND POPULATION RECORD
GENERAL
As a Census enumerator, you are performing a duty which is of great national importance. The data you provide throLJgh the Census form the basis for the demarcation of electoral constituencies; the national planning largely depends on the accuracy of the Census data. Census data are also depended upon heavily by the public and Government Organisations. You are privileged to be a Census enumerator. At the same time, your responsibilities are also heavy. You have to fulfil them with a sense of pride an9 devotion to duty.
2. For your information certain provisions of the Indian Census Act which clothes you with the legal power to canvass the Census questionnaire and also prescribes your responsibilities is reproduced in Annexure C.
3. Please take particular note of the provision of sections 11 (l) (a) and (b) of the Census Act which require you to perform yom duty as a CenSlls Officer diligently and to keep the information collected at the Census confidential.
4. The Indian Census has a rich tradition and ha~ enjoyed the reputation of being one of the best in the world. It is hoped that you will help in keeping up this good name.
REFERENCE DATE AND ENUMERATION" PERIOD
5. The reference date for the population Censu~ of 1971 is the sunrise of 1st April, 1971 i.e., the Census is expected to provide a picture of the population of the country as it exists at sunrise of 1st April, 1971. It is obviously not possible to ascertain the particulars of every individual throughout the length and breaath of the country at this fixed point of time. Therefore, the enumerator will actually commence his work of enumeration on 10th March, 1971 and end it on 31st March. 1971. You will, therefore, have to cover your jurisdiction and enumerate every person as will be explained in the succeeding paragraphs during that period of 21 days. But in order to bring the picture up-to-date as at sunrise of 1st April 1971 i.e., the reference date for the Census, you will have to quickly go round your jurisdiction again on a revisit from 1 st to 3rd April, 1971 and enumerate any fresh arrival in your jurisdiction who might not have already been enumerated elsewhere and also take account of any Iresh births that might have taken place in any of the households after your previous visit and before the sunrise of ISt April, 1971 and fill in fresh Census schedules to cover such cases. As a corollary you will have to also cancel the Census schedules relating to persons who may have unfortunately died since your last visit to a household but prior to the sunrise of lst April, 1971. Births or deaths and arrivals of visitors that had taken place after the sunrise of 1st April, 1971 need not be taken note of by you.
PAD NUMBER AND SLIP NUMBER
6. The Census Charge Officer or the Supervisor would have issued the required number of enumeration schedule pads of individual slips to you. Some may be in pads of 100 schedules and some of 25. On the top of the pad, the pad number would have been noted prominently by the Charge Officer. Soon after you receive your pad, you should check them and note on the right hand corner of each individual slip, within each book in the space provided for the purpose, the Pad Number as given on the top of the cover and you should also allot serial number to each schedule. The serial number of the schedules will have to be given by yourself in one sequence starting with one 'on the first schedule of the pad and ending with 100 in case of pads of 1 00 ~hedules and ending whh 25 in case of pads of 25 schedules. In some pads the actual number of
schedules may by mistake be a little mere or little less. The last serial number in such pads may, therefore, vary accordingly. The ultimate idea is that every slip should be allotted the pad number as well as the distinct serial number.
LOCATION CODE AND YOUR JURISDICTION
7. On the top cover page of each book you will also find the location code number of your village or town indicating the district number, the tehsil or thana or town number and the village number. You may find that the district number and the tehsil number have been already stamped on each slip in the rural pads. rn the case of urban areas, the town number may alSo be rubber stamped along with the district number. Tn rural areas you will have to note in addition the village number and the enume::.tor Block Number and for towns ward number, if any and enumerator Block Number. But if on any slip, location code has not been stamped through oversight, yoP will have to note the combined location code number made-up of the district number, tehsil or thana or town number and the village/ward number and enumerator block number on each schedule on the left hand top corner in the space provided for the purrose. Elements of each code should be separated by oblique strokes. The enumerator block number may be noted within round brackets at the end of the location code. Please also see the instructions in para 22 below. You must get yourself fully acquainted with the complete code numbers allotted to your area. This will be intimated to you by your Census Charge Officer.
8. If Y0H; have, by any chance, been put in charge of more than one VIllage or urban block, please make sure that yeu have separate pad, for each village or urban block. Do not enumerate the population of a second village or a second urban block in continuation of the first in a common pad. The enumeration schedule pads of each village or urban block will have to remain separate.
9. Your appointment order would have defined your Census jurisdiction. You must acquaint yourself with your jurisdiction immediately your appointment order is received. You should get to know the relevant house numbers of the houses which you are expected to visit for enumeration. Any new houses that might have come up within the limits of your jurisdiction for which no number had been allotted before, shoulq be indicated by a sub-number to the adjoining house number. You should also know the dividing line between you and the adjoining enumerator. Make sure that he also knows the boundaries of your jurisdictions so that there is 1\0 ambiguity, and overlapping or omission. In case of any doubt you should immediately consult your Supervisor or the Charge Officer.
10. Immediqtely you are appointed a Census Enumerator please prepare a detailed sketch of the area allotted to ypu showing the streets, other prominent land marks and also the location of the actual houses that you enumerate. This sketch is important in order that your area may be identified by anyone even at a later date. This sketch will also ensure complete coverage at the Census. You will be required to give this sketch with your final abstract to your Supervisor immediately after the Census enumeration is comp~eted.
PERSONS TO BE ENUM~RATED
11. While your appointment order may indicate all the ijouses that fall in your jurisdiction you will have to locate every household in your area. I A household is defined as 'the entire group of persons who c~mmonly live together and take their meals from a common mess unless the "exigencies of work
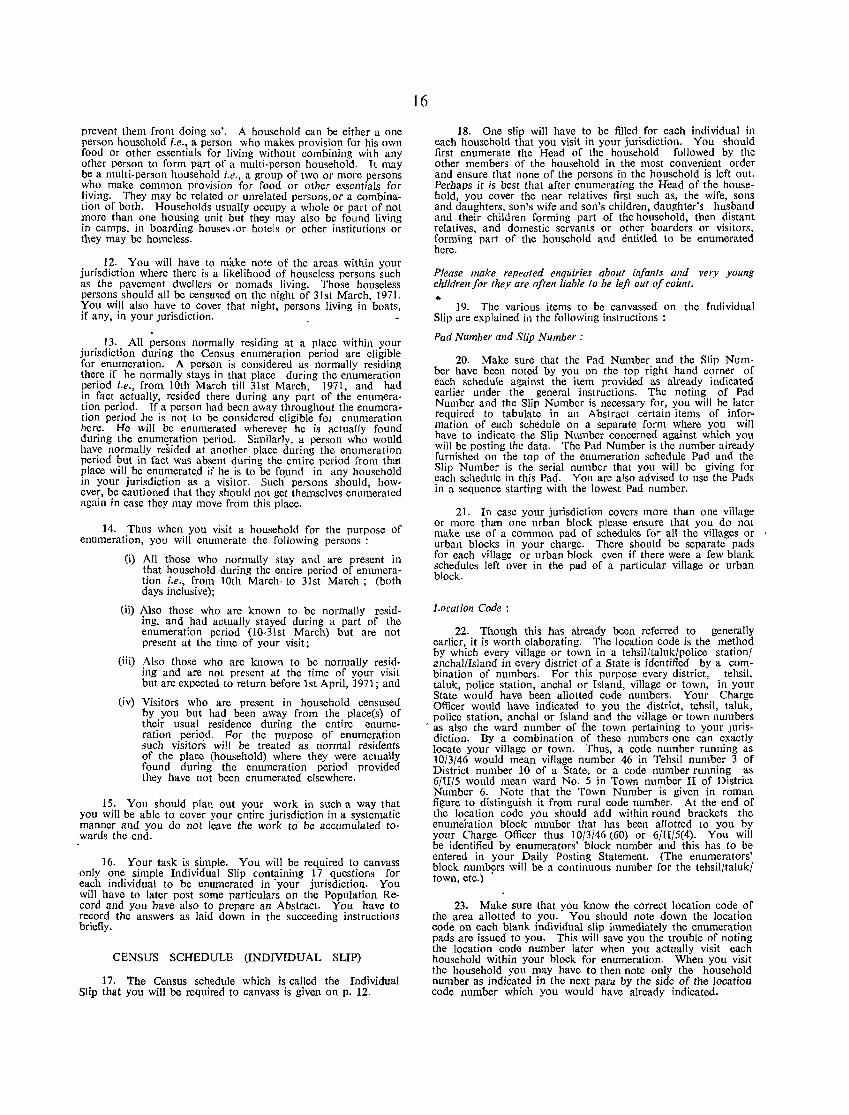
prevent them from doing so'. A household can be either a one person household i.e., a person who makes provision for his own food or other essentials for living without combining with any other person to form part of a mUlti-person household. It may be a multi-person household i.e., a group of two or more persons who make common provision for food or other essentials for living. They may be related or unrelated persons,or a combination of both. Households usually occupy a whole or part of not more than one housing unit but they may also be found living in camps, in boarding house~ .or hotels or other institutions or they may be homeless.
12. You will have to make note of the areas within your jurisdiction where there is a likelihood of house less persons such as the pavement dwellers or nomads living. Those houseless persons should all be censu~ed on the night of 31st March, 1971. You will also have to cover that night, persons living in boats, if any, in your Jurisdiction.
13. All persons normally residing at a place within your jurisdiction during the Census enumeration period are eligible for enumeration. A person is considered as normally residing there if he normally stays in that place during the enumeration period i.e., from 10th March till 31st March, 1971, and had in fact actually, resided there during any part of the enumeration period. If a person had been away throughout the enumeration period he is not to be considered eligible fat enumeration here. He will be enumerated wherever he is actually found during the enumeration period. Similarly, a person who would have normally resided at another place during the enumeration period but in fact was absent during the entire period from that place will be enumerate,d if he is to be found in any household in your jurisdiction as a visitor. Such' persons should, however, be cautioned that they should not get themselves enumerated again in case they may move from this place.
14. Thus when you visit a household for the purpose of enumeration, you will enumerate the following persons:
(i) All those who normally stay and are present in that household during the entire period of enumeration i.e., from 10th March. to 31st March; (both days inclusive);
(ii) Also those who are known to be normally residing, and had actually stayed during a part of the enumeration period (l0·31st March) but are not present at the time of your visit;
(iii) Also those who are known to be normally residing and are not present at the time of your visit but are expected to return before 1st April, 1971; and
(iv) Visitors who are present in household censused by you but had been away from the place(s) of their usual residence during the entire enumeration period. For the purpose of enumeration such visitors will be treated as normal residents of the place (household) where they were actually found during the enumeration period provided they have not been enumerated elsewhere.
15. You should plan out your work in such a way that you will be able to cover your entire jurisdiction in a systematic manner and you do not leave the work to be accumulated towards the end.
16. Your task is simple. You will be required to canvass only one simple Individual Slip containing 17 questions for each individual to be enumerated in ·your jurisdiction. You will have to later post some particulars on the Population Record and you have also to prepare an Abstract. You have to record the answers as laid down in the succeeding instructions briefly.
CENSUS SCHEDULE (INDIVIDUAL SLIP)
17. The Census schedule which is called the Individual Slip that you will be required to canvass is given on p. 12.
16
18. One slip will have to be filled for each individual in each household that you visit in your jurisdiction. You should first enumerate the Head of the household followed by the other members of the household in the most convenient order and ensure that none of the persons in the household is left out. Perhaps it is best that after enumerating the Head of the household, you cover the near relatives first such as, the wife, sons and daughters, son's wife and son's children, daughter's husband and their children forming part of the household, then distant relatives, and domestic servants or other boarders or visitors, forming part of the household and entitled to be enumerated here.
Please make repealed enquiries about infants alld very young children for they are often liable to be left out of count. ...
19. The various items to be canvassed on the Individual Slip are explained in the following instructions:
Pad Numher alld Slip Number:
20. Make sure that the Pad Number and the Slip Number have been noted by you on the top right hand corner of each schedule against the item provided as already indicated earlier under the general instructions. The noting of Pad Number and the Slip Number is necessary for, you will be latcr required to tabulate in an Abstract certain items of information of each schedule on a separate form where you will have to indicate the Slip Number concerned against which you will be posting the data. The Pad Number is the number already furnished on the top of the enumeration schedule Pad and the Slip Number is the serial number that you will be giving for each schedule in this Pad. You are also advised to use the Pads in a sequence starting with the lowest Pad number.
21. In case your jurisdiction covers more than one village or more than one urban block please ensure that you do nut make use of a common pad of schedules for all the villages or urban blocks in your charge. There should be separate pads for each village or urban block even if there were a few blank schedules left over in the pad of a particular village or urban block.
Location Code :
22. Though this has already been referred to generally earlier, it is worth elaborating. The location code is the method by which every village or town in a tehsil/taluk/police station! anchal/lsland in every district of a State is identified by a combination of numbers. For this purpose every district, tehsil, tal uk, police station, anchal or Island, village or town, in your State would have been allotted code numbers. Your Charge Officer would have indicated to you the district, tehsil, taluk, police station, anchal or Island and the village or town numbers
. as also the ward number of the town pertaining to your Jurisdiction. By a combination of these numbers one can exactly locate your village or town. Thus, a code number running as 10/3/46 would mean village number 46 in Tehsil number 3 of District number 10 of a State, or a code number running as 6/II/5 would mean ward No. 5 in Town number II of District Number 6. Note that the Town Number is given in roman figure to distinguish it from rural code number. At the end of the location code you should add within round brackets the enumeration block number that has been allotted to you by your Charge Officer thus 10/3/46 (60) or 6/II/5(4). You will be identified by enumerators' block number and this has to be entered in your Daily Posting Statement. (The enumerators' block numbers will be a continuous number for the tehsil/taluk/ town, etc.) .
23. Make sure that you know the correct location code of the area allotted to you. You should note down the location code on each blank individual slip immediately the enumeration pads are issued to you. This will save you the trouble of noting the location code number later when you actually visit each household within your block for enumeration. When you visit the household you may have to then note only the household number as indicated in the next para by the side of the location code number which you would have already indicated.
Household Number
24. The identifying household number of the household that you are covering at the Census should be noted within the square bracke~s . provided for the purpose. As you may be aware, Houseltstmg and Housenumbering operation was undertaken dur~ng 1970 with a view to numbering each Census house and locatmg all households living in Census houses. In the course of this operation, each Census house was given a number and households found therein would also have been allotted a number. The Census house numbers would be painted on the houses at prominent place, like the pillar pf the main gate top of the main door, etc. Sometimes there may be more per: manent housenumbering plates affixed. In the case of thatched houses, numbers may have been written out on a tin plate or wooden board and left with the households with a request. to preserve the same. You should use this number.
. 25. It may happen that when you visit your area for Census takmg you may come across some Census houses which did not exist at the time of houselisting and therefore, no numbers had actually been allotted to them. You should allot a number after consulting the order of numbering prevailing in your j';lr!sdiction. (Please see Appe~di.x I) and locate the households hvmg therem. For example, If m between buildings 9 and 10 another building has come up; you should allot the number 9/ A to this structure and in case more than one building has come up numbers like 9(A, 9(B, 9(C and so on should be used for the .new str!lctures .then .locate the Census houses in accordance wIth the mstructJOns In Appendix I and thereafter locate the households and allot numbers in the prescribed manner. The household number will be the same as the house number if only one household is living in a house. If there were more than one household then alphabetical sub-numbers within brackets as 19(a), 19(b), etc. will have to be added to the house number to distinguish cach household. It may also happen that the number given at the time of houselisting has been obliterated. You should allot the correct number having regard to the preceding and succeeding buildings.
26. For ~he purpose ~f conv.eniently understanding the ~ouse nUl:nb.ermg system, the InstructIons governing the numbermg of bUlldmgs, Census houses and households are given in Appendix 1.
27. If the hOl4,sehold happens to be an institutional household such as a boarding house,. hostel, hotel; chummery, etc., where a group of unrelated pers(Jns stay together then add 'INST' to the household number.
28., !! you a~e enumerating the houseiess'persons, you should record 0 boldly 1Il the space provided for the household number.
29. In all the individual slips pertaining to the members of the ~ame household, th~ household .number will be repeated. You wIll then start recordmg the particulars of each individual agai~st que~tions indicated in the Individual Slip according to the Instructions that follow.
Please do not write anything in the spaces enclosed by dotted lines in question Nos. 2, 3, 5. 6(b), 7(h), 7(c), 7(d), 8(b), 8(c),8(d), 9-15,16(a), 16(d), 16(e). 16(f), 17(a), 17(d), 17(e), and 17(f). These are meant for writing code numbers in the Tabulation offices.
Question 1: Name
30. Write the name of the person enumerated. If a woman's name is not given out, describe her as 'so and so's wife mother or daughter'. By custom if a woman finds it difficult to give the name of her husband and if the man is absent at the time of enumeration but his particulars have to be recorded write 'so and so's husband' if you have failed to ascertain the name even from the neighbours.
For newly born infants who have not yet been given the name write "baby" and add father's or mother's name.
3-1 RGI/Nr,/73
17
Question 2: Relationship to Head
31. In the case of the Head of the household write 'Head'· The Head of the Household for Census purposes is a person who is recognised as such in the household. He is generally the person who bears the chief responsibility for the maintenance of the household and takes decisions on behalf of the household. The Head of the household need not necessarily be the eldest male member, but may even be a female or a y~>unger member of either sex. You need not enter into any long argument about it but record the name of the person who is recognised by the Household as its Head.
32. In the case of institutions like boarding houses, messes or friends living together in one Census house, 'f.hich should be regarded as households Qf unrelated persons living together which. may be called Institutional Households, the Manager o~ Supenntendent or the person who has administrative responsibility or who by common consent is regarded as the head should be recorded as the Head of the household. <
33. The Manager or Superintendent who does not stay normally i~ the institution should be enumerated at his place of normal residence. You should make sure before filling up the slip for the Manager or Superintendent, etc. of an institutional household that he(she has not been enumerated at any other household.
34. In the case of absence of a normal 'Head', the person on whom the responsibility of managing the affairs of the household falls, should be regarded as the Head.
35. All relationships in this question should be recorded in relation to the Head of the household. Write the relationship in full. Do not use words like 'nephew', 'niece or uncle' but state whether brother's or sister's son or daughter (for nephew or niece) or father's or mother's brother (for uncle) 'Son' will include 'adopted. ~on' or 'step son'; similarly for ~ daughter. In the case of VISitors, boarders, or employees write 'visitor' 'boarder', or 'employee' as the case may be. ' In the case of institution, the members should be recorded as 'unrelated'.
36. If on the check of revisional round between 1st and 3rd April, 1971 the Head of the household as recorded previously is found to have died, the person in the household who succeeds him by common consent as head should be recorded as Head and the relationships in all other slips will have to be suitably corrected. The slip of the deceased Head of the house~ hold will, of course, be cancelled.
Question 3: Sex
37. For males write 'M' and for females write 'F' within the circle indicated against this question. Even for eunuchs and hermaphrodites, write 'M' only. Verify with reference to the name and relationship to Head against questions 1 and 2 respectively that you have noted the sex correctly.
Question 4: Age
38. Record the age of the person in total years completed last birthday. Very often there is a tendency on the part of the individuals to return 'years running' rather than the 'years completed'. Make sure that only the actual number of years completed is recorded.
39. In respect of infants who might not have completed one year by. the day of enumeration their age in completed years should be mvariably shown as '0' as they have nof yet completed one year of age and add 'Infant' in brackets. As was stated under general instructions make sure that infants even if a day old are invariably enumerated. You should not enter the age in months. The age of an infant who has not yet completed one year should invariably be noted as '0' only.
. 40. Age is one of the most important items of demographIC data and you. should ascertain the age with greatest care. Many persons partIcuiarlY1 in the rural areas cannot give their
age correctly. They should be assisted to state the correct age by stimulating their memory with reference to any historical event, etc., well known in the area. Sometimes the age can be ascertained with reference to the age of another person of a known age that may be in the same household or in the neighbouring household or that of a well known person of the village such as Headman of the village. A person can more easily say whether he was older or younger to such a person and by how many yeats. This will help you to record the age more accurately.
Question 5: Marital Status
41. In answering this question use the following abbreviations :
NM : Never Married
M : Currently Married
W:Widowed
S : Separated or Divorced
42. For a person who has never been married at any time before, write 'NM'. For a person currently married, whether for the first or another time and whose marriage is subsisting at the time of enumeration with the spouse living, write 'M'. Write 'M' also for persons who are recognised by custom or society as married and for the persons in stable de facto union. Even if a marriage is disputed in the locality write 'M' if the person concerned says he or she is married or is in stable de facto union. For a widowed person whose husband or wife is dead, and who has not been married again, write 'W'. For a person who- has been separated from wife or husband and is living apart with no apparent intention of living together again or who has been, divorced either by a decree of a law court or by an accepted social or religious-custom but who has not remarried, write'S'. for a prostitute return her marital status as declared by her.
Question 6: For currently married women only
43. This question has to be answered in respect of all currently married women only i.e., all women whose marital status is shown as 'M' against Q. 5. For all others a cross may be put through the two sub-parts of this question.
Question 6 (a): Age at marriage
44. Age at marriage: You should ascertain the age at which the currently married woman whom you are enumerating was married and record that age in completed years. If the currently married woman had been married more than once, the age at which she got married for the first time should be recorded,
Question 6 (b): Any child born in the last one year
45. Any child born in the last one year: You should ascertain if the currently married woman whom you are enumerating gave birth to a child in the last one year prier to the date of enumeration. Since it may be difficult for a person to reckon the exact year with reference to the English calendar dates, the period of one year may be ascertained with reference to a well known festival day which falls close to Feb.-March, as determined by the Census Director of the State. You should ask if a child was born on or after this festival day last year to the date of enumeration. Only if the child was born alive, even if the child had died-soon after birth, should the answer be 'Yes', to this question. Still birth, i.e., a child which is born dead should not be taken into account for this purpose. So while you should make sure that every case of birth of child born alive, even if it is not alive on the. date of enumeration, is reported, you should not reckon it if the child was born lifeless.
46. It is common experience that the birth of the child may not be reported readily if the child is not actually surviving at the time of enumeration. Infant deaths are still high in the country. There is a chance of a number of cases being missed unless specifically questioned about them. It is necessary to record all Ji.ve births even if the child had died soon thereafter
18
or had not survived to the day of enumeration. Therefore, where the initial answer to this question is 'no', you should ask a specific question if there has been a case of child having been born alive in the last one year and later dying before the enumeration date. This is a delicate question and should be asked with tact in a, manner not to offend the sensibility of the respondent. Where a currently married woman first answers that she had no child born in the last one year, you may perhaps question her as follows:
"It has been found in some houses that a child was born and had died soon after or a few days or months later and such cases not been reported. It is my hope that there are no such cases here. Am I right ?"
This may bring in the required response. If she reports 'no' then you can be sure that no birth has been missed. You have to make sure that any live birth that has occurred to the currently married woman in the last one year is netted whether the child is surviving till the date of enumeration or not. Similarly, probe to eliminate still births may be-necessary. For example, when the answer is 'yes' under question 6(b) the enu- , merator might ask if the child is here in this house. If the answer is 'yes', no further question is needed. If 'no', the enumerator might ask where he has gone. The answer may be 'dead' or he has gone elsewhere. If 'dead' then the enumerator might ask when did the child die and this will bring out the fact whether or not it was a still birth.
47. Write 'Yes', if the currently married woman had given birth to a live child from the prescribed festival day last year to the date of enumeration or 'no' if she had not. In case of twin or multiple births, write 2, 3, etc., as the case may be within round brackets after the entry 'Yes'.
Note :-You may find on your revisional round from 1st to 3rd April, 1971 that a child is born to a married woman in a household after your last visit but before the sunrise of 1st April, 1971. You will have to take this into account and corr~ct the answer against the Q. 6 (b) accordingly. You must enqUIre specifically if any such birth has taken place. While ignoripg still births aU other births where the child was born alive eVen if it did not survive long should be taken into account.
Question 7: Birth Place
48. Answer to this question' has to be filled with reference to the place of birth of the persons enumerated and the particulars recorded under the four sub-items of this question.
Question 7 (a): Place of birth
49. Write 'PL' for a person born in the village or town where he is being enumerated. Where 'PL' is noted against this question put 'X' against sub-items (b), (c) and (d).
For those born outside the village or town of enumeration write the actual name of the place against sub-item (a) and fill the other details against sub-items (b), (c) and (d).
Question 7 (b): Rural/Urban
50. For those born outside the village or town of enumeration ascertain if the place of birth was a village or town at the time of his birth. To enable a person to determine whether the place was a town or a village he may be required to indicate the status of the place of birth in comparison with a known town in the neighbourhood of the place of enumeration. You may mention some important urban characteristics to enable the person to make out if the place of his birth was rural or urban, e.g., existence of a local administrative body, Industrial townships declared as towns, etc.
For a person born in a village, write 'R'.
For a person born in a town{city, write 'U'.
For a person born in a foreign country put 'X' against this ~ub-item and also against sub-item (c). If all efforts to classify the place of birth as rural{urban fail, write 'not known'.
Question 7 (c): District
51. For a person born outside the village or town of enumeration but within the district of enumeration write 'D'. For a person born in another district of the State of enumeration, or other State/Union Territory in the country, write the rlame of the district. If the person cannot name the district, .vrite 'not known'.
Question 7 (d): State/Country
52. For persons born within the State of enumeration write 'X' against this item. Make sure that the earlier entries made in sub-items (a), (b) and (c) are consistent with suell. an answer; that is 'PL' might have already been written ag~mst sub-item (a) or 'D' is written against sub-item (c) or any dther district of the State of enumeration is mentioned against subitem (c).
53. Fo'r person born outside the State of enumeration but within the country, write the name of the State/Union Territory where born.
54. For those born outside India, note merely the J1ame of the country and there is no need to enter the name of the constituent State of the foreign country. Where a person cannot name the country, the name of the continent may be noted.
55. For a person born on sea, record 'born at sea', agllinst this sub-item and put 'X' against sub-items (a), (b) and (c), If a person was born in a train, boat or bus, etc., within the couP try, write the particulars in (a),' (b) and (c) with reference to the administrative territory where the event occurred or was registered.
Question 8: Last Residence
56. Answer to this question will have to be filled in respect of every person if he had another place of normal residence irrespective of his place of birth, before he came to the pn;sent place where he is enumerated. Even if a person was born at the place of enumeration, by the nature of his work or for studies, etc., he had shifted subsequently to another village or town and had come back again to the place of enumeration, he shoul,d be deemed to have had another place of residence prior to hiS enumeration here.
The last previous residence is relevant only if he had been outside the village or town of enumeration and not simplY in another house or locality in the same place. For example, if a person born in one part of Bombay City is found residing i(l another part of Bombay at the time of enumeration the cha~e of residence should not be treated as change of pla~e of resiJence because both the areas are comprised in the same City of ]Jombay. Similarly, a person born in hamlet 1 of village Rat11pur and found in hamlet 2 of the same village at the time of enun1eration, should not be deemed to have had any other place of residence than the village where he is enumerated. Where a person had merely gone out to another place or had been Ghiftiug from place to place purely on tour or pilgrimage or for temporary business purposes, he should not be deemed to have had another residence different from the place where he or his fllmily normally resides but if the person had his normal residence, i.e., if his normal home had been elsewhere at any time before he, is enumerated at his place of present residence, irrespective of where he was born, such place of his previous residence should be recorded here.
Question 8 ( a): P)~ce ofJast residence
57. For a person who had been in the village or town of enumeration continuously since birth (except for shiftintil to other places outside the village or town of enumeration (or a purely temporary stay) write 'PL' against sub-item (a) and put 'X' against sub-items (b), (c) and (d).
For a person who had had his last previous residenCe at any place outside the village or .town of enumeration (irre&pective of his place of birth), write the actual name of the village
19
or town where his last residence was against sub-item (a) and fill the other details against sub-items (b), (c) and (d).
Question 8 (b): Rural/Urban
58. For a person who had previously resided outside the place of enumeration ascertain if the place of last previous residence was rural or urban and record the answer. For a person whose last previous residence was a village write 'R'. For a person whose last previous residence was a town/city write 'U'. For a person who last resided in a foreign country write 'X'. For a person whose last previous residence cannot be classified, write 'Not known'.
Rural or Urban status has to be determined with reference to the time of migration from the place of last previous residence to the plaq of enumeration.
For helping the person to determine whether a place was rural or urban, you may mention important urban characteristics as indicated in the instructions against item 7(b) in para 50.
"
Question 8 (c): District
59. For a person who had previously resided in another place, i,e., for whom 'PL' is not written against sub-item (a) you have to fill in this item in the manner indicated below :-
For a person who previously resided in another village or town within the district of enumeration write 'D'. For a person who previously resided in another district of the State/Union Territory of enumeration or of other State/Union Territory in the country, write the name of the district. If he cannot name the district write 'Not known'. For a person whose last previous residence was outside India write 'X' against this sub-item.
Question 8 (d): State/Country
60. For a person whose last previous residence was outside the village or town of enumeration but within the State or Union Territory o"f enumeration write 'X' against this item but if it was outside the State or Union Territory of enumeration but within the country write the name of the State/Union Territory. For a person whose last previous residence was outiside the country write the name of the country and if name of the country is not forthcoming write the name of the continent.
For persons who had not moved out at all from the present place of enumeration from birth (except for purely temporary stay) this sub-item need not be filled and 'X' should be put in respect of persons against this sub-item.
QuestiQn 9: Duration of Residence at the village or town of Enumeration
61. Note here the period of the existing continuous residence in the village or town where the person is being enumerated, in completed years. This will apply to even a person born at the place of enumeration. If he had left this village or town and had lived elsewhere for sometime, i,e., in Q. 8 another place of last residence is reported and has come back again to this village or town, then the duration of residence to be noted against this question is the period of the last continuous residence. But if a person had been away on a temporary visit or tour, etc., that should not be taken as a break in the period of his continuous residence here. If the person was born at the place of enumeration and also had no other place of last residence i.e., 'PL' has been noted in Q. 8(a) then 'X' may be put against Q,9.
For a person whose duration of continuous reSidence at the place of enumeration is less than 1 year, it should be noted as '0'.
Question 10: Religion
62. In answering this question use the following abbreviations:
H: Hinduism
I : Islam
C : Christianity
S : Sikhism B : Budhism
J : Jainism
For others record the actual religion as returned fully.
63. If a person says that he has no religion it may be recorded accordingly. Do not mistake religion for caste which will not be recorded here.
Question 11: Scheduled Caste or Scheduled Tribe
64. You have been furnished with a list of scheduled castes and scheduled tribes notified for your State. Ascertain if the person enumerated belongs to a scheduled caste or scheduled tribe and if he does, then record the name of the scheduled caste or scheduled tribe which should find place in the list furnished to you. The answer should be recorded against the correct rectangle provided for the purpose against this question. For a person who is not a member of any scheduled caste or scheduled tribe write 'X' in both the rectangles.
65. If the person belonging to a scheduled caste or scheduled tribe returns his caste or tribe by synonym or generic name of a caste or a tribe it should be entered only if it finds a place in the list furnished to you. Do not write the names of scheduled castes in general terms as 'Harijan' or 'Achhut'. You should ascertain the name of the caste when it is returned and write it in the rectangle provided for recording the name. Similarly, do not write the names of scheduled tribes in general term as 'Adivasi'. You should ascertain the name of the tribe when it is returned and write it in the rectangle with broken lines provided for recording the same. If a person is negligent and insists on calling himself m.erely 'Harijan' or 'Achhut' or 'Adivasi' as the case may be, tell him that this description is not adequate for Census purposes and persuade him to give out the actual name of the caste or tribe. You should make all efforts to ascertain the correct name of the scheduled caste or scheduled tribe as found in the notified list. If the person merely claims to be a scheduled caste or scheduled tribe but says that he does not belong to any of the notified communities applicable to the area, he will not be entered as a scheduled caste or scheduled tribe.
66. Scheduled castes can belong only to the Hindu or Sikh religions. If a person belongs to scheduled caste, there will be either 'H' or'S' in the answer to question 10. Scheduled tribes may belong to any religion.
Question 12: Literacy (L or 0)
67. Definition of a literate: A pe,son who can both read and write with understanding in any language is to be taken as literate. A person who can merely read but cannot write is not a literate.
68. It is not necessary that a person who is literate should have received any formal education or should have passed any minimum educational standard.
69. For a person who is literate i.e., who can both read and write, record 'L' in the triangle against question 12. If there is any doubt about a person's ability to r,<ad or write, the test that may be applied for reading is his/her ability to read any portion of the printed matter in the Enumerator's Instructions and similarly for writing he/she should be able to write a simple letter. Ability merely to sign one's name is not adequate to qualify a person as being ahle to write with understanding.
2@
If a person claims to be literate in some other language with which the enumerator is not acquainted, the respondent's word has to be taken as correct. Other members of the household may also be able to testify to the literacy of the person eimmerated.
70. For a person who is illiterate i.e., who can neither read nor write or can merely read but cannot write, in any language, write '0' in the triangle against question 12. All children of the age of 4 years or less should be treated as illiterate even if the child is going to a school and may have picked up reading and writing a few odd words.
Question 13: Educational Level
71. This question will be asked of those for whom 'L' has been recorded against question 12. Par a person who is illiterate and '0' has been put against him in the answer to question 12, there is no advantage in ascertaining the educational level even if he had at some stage attended school and passed a standard and had relapsed into illiteracy. In such a case you should put 'X'. You have to ascertain and record the highest educational level attained by a person for whom 'L' is recorded in answer to question 12.
72. For a person who is still studying in a particular class, the highest educational level attained by him will be one that he has actually passed and not the one in which he is studying. For example, a person studying in 1st year B.A. should be recorded as only 'PUC' or 'Higher Secondary' as the case may be. Similarly, a person studying, say, in the'4th year of 'MBBS' should not be noted as 'MBBS' but as 3rd year 'MBBS which is the highest level he has actually attained. If you are not sure whether a person has passed Primary, Middle, Higher Secondary or other definite levels, you may record the actual standard pagsed such as say III standard, VIn standard, 1st year B. Com., etc.
The highest educational level attained by the person enumerated should be recorded. ·-When a person holds both general and technical qualifications both of which are of equivalent level such as say B.Sc. (Zoology) and M.B.B.S. or B.A. (Maths.) and B.E. (Bachelor in Engineering), the technical qualification should be given preference in recording the highest educational level attained. Where the general educational level is higher than the technical educational level or where it is not possible to decide which of the two levels is relatively higher, the highest level of education as returned by the person concerned should be recorded.
In recording the highest educational level of a graduate or a post-graduate subject of specialisation such as B.Sc. (Maths), M.A. (Economics), M.Sc. (Botany), B.Sc. (Agriculture), etc., should be noted. You should not use abbreviations which are not in common use. In such cases, the degree or diploma should be spelt out fully.
73. Whenever you come across graduates or post-graduate as also those with a technical diploma or degree, you will have to issue him a "Degree-holder and Technical Personnel Card" and ask the person concerned to fill it. You should note the location ~ode on the ca:-d while issuin~ it. Pu~ a tick (v) after notmg the educatIOnal level agamst questIOn 13 immediately after you issue a card. When you collect it after some time but before you complete the enumeration of your area cross the tick and put ~ circle. '
You 'Will have to ensure that the card issued to all the graduates and the technical degree or diploma holders are collected back. The non-crossed tick, if any, against question 13 will show that the card has not been collected.
Question 14: Mother-tongue
74. Definition: Mother-tongue is the language spoken in childhood by the person's mother to the person. If the mother died in infantry, the language mainly spoken in the person's home in childhood will be the mother-tongue. In the case of infants and deaf mutes the language usually spoken by other members of the household shall be recorded.
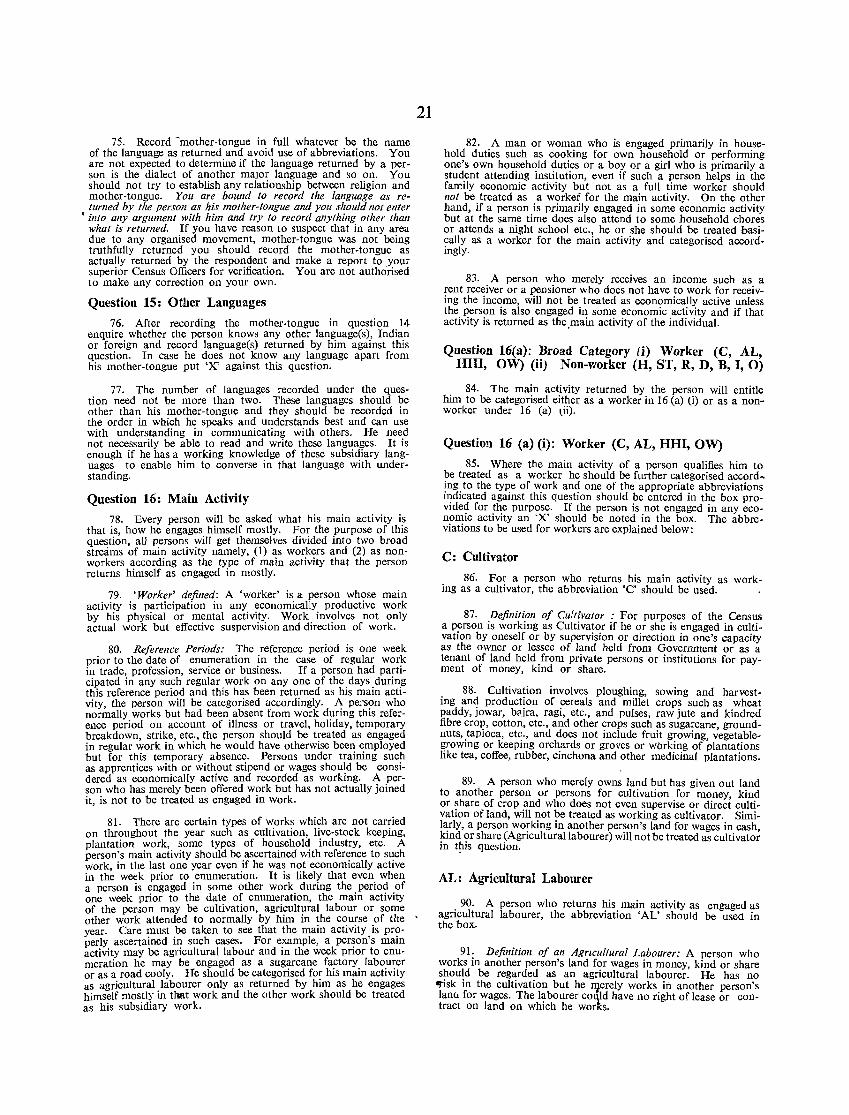
75. Record ~mother-tongue in full whatever be the name of the language as returned and avoid use of abbreviations. You are not expected to determine if the language returned by a person is the dialect of another major language and so on. You should not try to establish any relationship between religion and mother-tongue. You are bound to record the language as returned by the person as his mother-tongue and you should not enter
, into allY argument with him and try to record anything other than what is returned. If you have reason to suspect that in any area due to any organised movement, mother-tongue was not being truthfully returned you should record the mother-tongue as actually returned by the respondent and make a report to your superior Census Officers for verification. You are not authorised to make any correction on your own.
Question 15: Other Languages
76. After recording the mother-tongue in question 14 enquire whether the person knows any other language(s), Indian or foreign and record language(s) returned by him against this question. In case he does not know any language apart from his mother-tongue put 'X' against this question.
77. The number of languages recorded under the question need not be more than two. These languages should be other than his mother-tongue and they should be recorded in the order in which he speaks and understands best and can use with understanding in communicating with others. He need not necessarily be able to read and write these languages. It is enough if he has a working knowledge of these subsidiary languages to enable him to converse in that language with understanding.
Question 16: Main Activity
78. Every person will be asked what his main activity is that is, how he engages himself mostly. For the purpose of this question, all persons will get themselves divided into two broad streams of main activity namely, (1) as workers and (2) as nonworkers according as the type of main activity that the person returns himself as engaged in mostly.
79. 'Worker' defined: A 'worker' is a person whose main activity is participation in any economically productive work by his physical or mental activity. Work involves not only actual work but effective suspervision and direction of work.
80. Reference Periods: The reference period is one week prior to the date of enumeration in the case of regular work in trade, profession, service or business. If a person had participated in any such regular work on anyone of the days during this reference period and this has been returned as his main activity, the person will be categorised accordingly. A person who normally works but had been absent from work during this reference period on account of illness or travel, holiday, temporary breakdown, strike, etc., the person should be treated as engaged in regular work in which he would have otherwise been employed but for this temporary absence. Persons under training such as apprentices with or without stipend or wages should be considered as economically active and recorded as working. A person who has merely been offered work but has not actually joined it, is not to be treated as engaged in work.
81. There are certain types of works which are not carried on throughout the year such as cultivation, live-stock keeping, plantation work, some types of household industry, etc. A person's main activity should be ascertained with reference to such work in tile last one year even if he was not economically active
21
in th~ week prior to enumeration. It is likely that even when a person is engaged in some other work during the period of one week prior to the date of enumeration, the main activity of the pemon may be cultivation, agricultural labour or some other work attended to normally by him in the course of the ' year. Care must be taken to see that the main activity is properly ascertained i~ such cases. For e_xample, a per~on's main activity may be agncultural labour and 111 the week pnor to enumeration he may be engaged as a sugarcane factory labourer or as a road coaly. He should be categorised for his main activity as agricultural labourer only as returned by him as he engages himself mostly in that work and the other work should be treated as his subsidiary work.
82. A man or woman who is engaged primarily in household duties such as cooking for own household or performing one's own household duties or a boy or a girl who is primarily a student attending institution, even if such a person helps in the farr.ily economic activity but not as a full time worker should not be. treated as a worker for the main activity. On the other hand, If a person is primarily engaged in some economic activity but at the same time does also attend to some household chores or attends a night school etc., he or she should be treated basically as a worker for the main activity and categorised accordingly.
83. A person who merely receives an income such as a rent receiver or a pensioner who does not have to work for receiving the income, will not be treated as economically active unless the person is also engaged in some economic activity and if that activity is returned as the.main activity of the individual.
Question 16(a): Broad Category (i) Worker (C, AL, HRI, OW) (ii) Non-worker (H, ST, R, D, B, I, 0)
84. The main activity returned by the person will entitle him to be categorised either as a worker in 16 (a) ti) or as a nonworker under 16 (a) lii).
Question 16 (a) (i): Worker (C, AL, HHI, OW)
85. Where the main activity of a person qualifies him to be treated as a worker he should be further categorised according to the type of work and one of the appropriate abbreviations il~dicated against this question should be entered in the box proVided for the purpose. If the person is not engaged in any economic activity an 'X' should be noted in the box. The abbreviations to be used for workers are explained below:
C: Cultivator
86. For a person who returns his main activity as working as a cultivator, the abbreviation 'C' should be used.
87. Definition of Cultivator : For purposes of the Census a p~rson is working as Cultivator if he or she is engaged in cultivatIOn by oneself or by supervision or Clirection in one's capacity as the owner or lessee of land held from Goverrummt or as a tenant of land held from private persons or institutions for payment of money, kind or share.
88. Cultivation involves ploughing, sowing and harvesting and production of cereals and millet crops such as wheat paddy, jowar, blJjra, ragi, etc., and pulses, raw jute and kindred fibre crop, cotton, etc., and other crops such as sugarcane groundnuts, .tapioca, et~., and does not include fruit growing, ~egetablegrowmg or keepmg orchards or groves or working of plantations like tea, coffee, rubber, cinchona and other medicinal plantations.
89. A person who merely owns land but has given out land to another person or persons for cultivation for money, kind or share of crop and who does not even supervise or direct cultivation of land, will not be treated as working as cultivator. Similll;rly, a person wo!"king in another per~on's land for wages in cash, kmd or share (Agnculturallabourer) Will not be treated as cultivator in t~is question.
AL: Agricultural Labourer
90. A person who returns his main activity as engaged as agricultural labourer, the abbreviation 'AL' should be used in the box.
91: Definition of an Agricultural Labourer: A person who works 111 another person's land for wages in money kind or share should be regarded as an agricultural labourer: He has no 'fisk in the cultivation but he Il)erely works in another person's lanu for wages. The labourer coqld have no right of lease or contract on land on which he works.
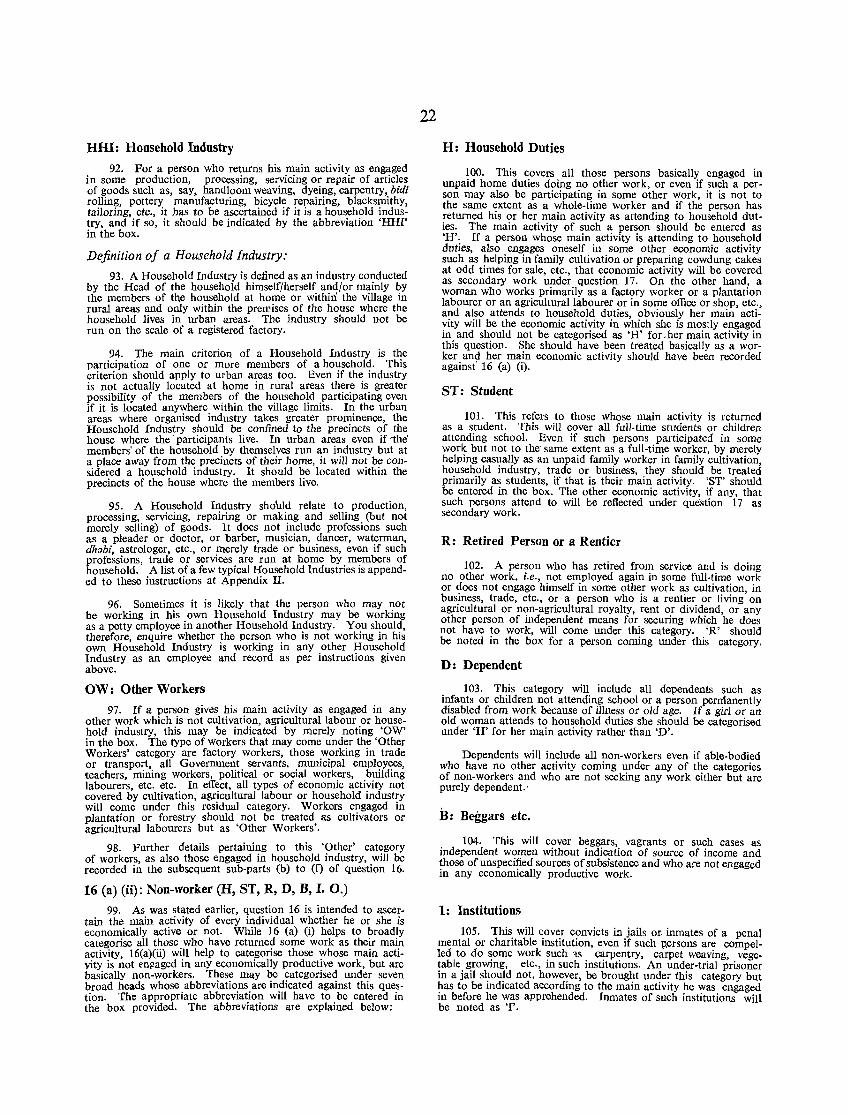
HHI: Household Industry
92. For a person who returns his main activity as engaged in some production, processing, servicing or repair of articles of goods such as, say, handloom weaving, dyeing, carpentry, bidi rolling, pottery manufacturing, bicycle repairing," blacksmithy, tailoring, etc., it has to be ascertained if it is a household industry, and if so, it should be indicated by the abbreviation 'HHf' in the box.
Definition of a Household Industry;
93. A Household Industry is defined as an industry conducted by the Head of the household himself/herself and/or mainly by the members of the household at home or within the village in rural areas and only within the prerrises of the house where the household lives in urban areas. The industry should not be run on the scale of a registered factory.
94. The main criterion of a Household Industry is the participation of one or more members of a h0':lsehol~. This criterion should apply to urban areas too. Even If the mdustry is not actually located at home in rural areas there is greater possibility of the members of the household participating even if it is located anywhere within the village limits. In the urban areas where organised industry takes greater prominence, the Household Industry should be confined to the precincts of the house where the' participants Ii ve. In urban areas even if 'the' members' of the household by themselves run an industry but at a place away from the precincts of their home, it will not be considered a household industry. It should be located within the precincts of the house where the members live.
95. A Household Industry shoUld relate to production, processing, servicing, repairing or makipg and selling. (but not merely selling) of goods. It does not mclude professlOns such as a pleader or doctor, or barber, musician, ~ancer, wat~rman, dhabi astrologer, etc., or merely trade or busllless, even If such profe~sions trade or services are run at home by members of household.' A list of a few typical Household Industries is appended to these instructions at Appendix n.
96. Sometimes it is likely that the person who may not be working in his own Household Industry may be working as a petty employee in another Household Industry. You should, therefore enquire whether the person who is not working in his own Ho~sehold Industry is working in any other Household Industry as an employee and record as per instructions given above.
OW: Other Workers
97. If a person gives his main activity as engaged in any other work which is not cultivation, agricultural labour or household industry, this may be indicated by merely noting 'OW' in the box. The type of workers that may come under the 'Other Workers' category are factory workers, those working in trade or transport all Government servants, municipal employees, teachers milling workers, political or social workers, building laboure{s etc. etc. In effect, all types of economic activity not covered by cultivation, agricultural labour or household industry will come under this residual category. Workers engaged in plantation or forestry should not be treated as cultivators or agricultural labourers but as 'Other Workers'.
98. Further details pertaining to this 'Other' category of workers as also those engaged in household industry, will be recorded i~ the subsequent sub-parts (b) to (f) of question 16.
16 (a) (ii): Non-worker (H, ST, R, D, B, I. 0.)
99. As was stated earlier, question 16 is intended to ascertain the main activity of every individual whether he or she is economically active or not. While 16 (a) (i) helps to broadly categorise all those who have returned some work as their main activity, 16(a)(ii) wi~l help to cate.gorise those ~hose main activity is not enpaged III any economIcally product!ve work, but are basically non-workers. These may be categoflsed under seven broad heads whose abbreviations are indicated against this question. Tho appropriate abbreviation will have to be entered in the box provided. The abbreviations are explained below:
22
H: Household Duties
100. This covers all those persons basically engaged in unpaid home duties doing no other work, or even if such a person may also be participating in some other work, it is not to the same extent as a whole-time worker and if the person has returned his or her main activity as attending to household duties. The main activity of such a person should be entered as 'H'. If a person whose main activity is attending to household duties, also engages oneself in some other economic activity such as helping in family cultivation or preparing cowdung cakes at odd times for sale, etc., that economic activity will be covered as secondary work under question 17. On the other hand, a woman who works primarily as a factory worker or a plantation labourer or an agricultural labourer or in some office or shop, etc., and also attends to household duties, obviously her main activity will be the economic activity in which she is mostly engaged in and should not be categorised as 'H' for. her main activity in this question. She should have been treated basically as a worker and her main economic activity should have been recorded against' 16 (a) (i).
ST: Student
101. This refers to those whose main activity is returned as a student. This will cover all full-time students or children attending school. Even if such persons participated in some work but not to the" same extent as a full-time worker, by merely helping casually as an unpaid family worker in family cultivation, household industry, trade or business, they should be treated primarily as students, if that is their main activity. 'ST' should be entered in the box. The other economic activity, if any, that such persons attend to will be reflected under question 17 as secondary work.
R: Retired Person or a Rentier
102. A person who has retired from service and is doing no other work, i.e., not employed again in some full-time work or does not engage himself in some other work as cultivation, in business, trade, etc., or a person who is a rentier or living on agricultural or non-agricultural royalty, rent or dividend, or any other person of independent means for securing which he does not have to work, will come under this category. 'R' should be noted in the box for a person coming under this category.
D: Dependent
103. This category will include all dependents such as infants or children not attending school or a person permanently disabled from work because of illness or old age. If a girl or an old woman attends to household duties she should be categorised under 'H' for her main activity rather than 'D'.
Dependents will include all non-workers even if able-bodied who have no other activity coming under any of the categories of non-workers and who are not seeking any work either but are purely dependent.'
:B: Beggars etc.
104. This will cover beggars, vagrants or such cases as independent women without indication of soW'ce of income and those of unspecified sources of subsistence and who are not engaged in any economically productive work.
I: Institutions
105. This will cover convicts in jails or· inmates of a penal mental or charitable institution, even if such persons are compelled to do some work such 'ts carpentry, carpet weaving, vegetable growing, etc., in such institutions. An under-trial prisoner in a jail should not, however, be brought under this category but has to be indicated according to the main activity he was engaged in before he was apprehended. Inmates of such institutions will be noted as 'I'.
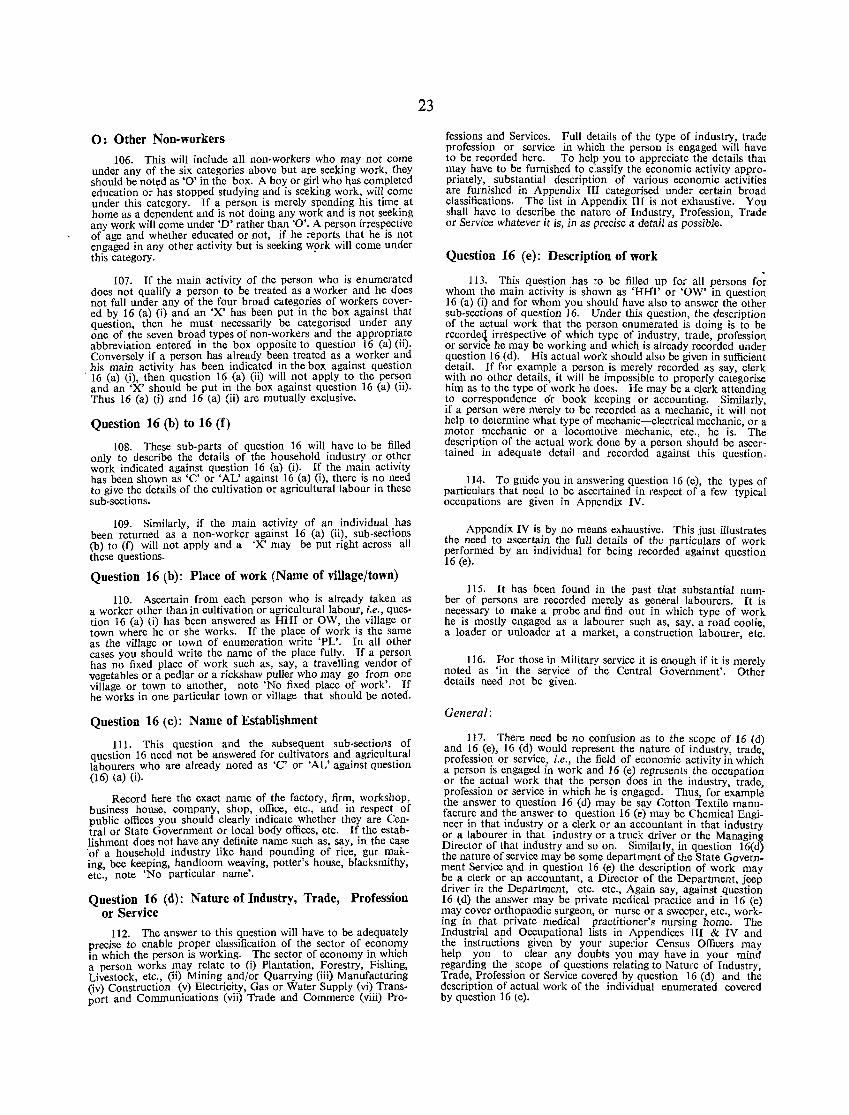
0: Other Non-workers
106. This will include all non-workers who may not come under any of the six categories above but are seeking work, they should be notlld as '0' in the box. A boy or girl who has completed education or has stopped studying and is seeking work, will come under this category. If a person is merely spending his time at home as a dependent and is not doing any work and is not seeking any work will come under 'D' rather than '0'. A person irrespective of age and whether educated or not, if he reports that he is not engaged in any other activity but is seeking wprk will come under this category.
107. If the main activity of the person who is enumerated does not qualify a person to be treated as a worker and he does not fall under any of the four broad categories of workers covered by 16 (a) (i) and an 'X' has been put in the box against that question, then he mU5t necessarily be categorised under any one of the seven broad types of non-workers and the appropriate abbreviation entered in the box opposite to question 16 (a) (ii). Conversely if a person has already been treated as a worker and his main activity has been indicated in the box against question
, 16 (a) 0), then question 16 (a) (ii) will not apply to the person and an 'X' should be put in the box against question 16 (a) lii). Thus 16 (a) 0) and 16 la) (ii) are mutually exclusive.
Question 16 (b) to 16 (f)
108. These sub-parts of question 16 will have to be filled only to describe the details of the household industry or other work indicated against question 16 (a) (i). If the main activity has been shown as 'C' or 'AL' against 16 (a) (i), there is no need to give the details of the cultivation or agricultural labour in these sub-sections.
109. Similarly, if the main activity of an individual has been returned as a non-worker against 16 (a) (ii), sub-sections (b) to (f) will not apply and a 'X' may be put right across all these questions.
Question 16 (b): Place of work (Name of village/town)
110. Ascertain from each person who is already taken as a worker other than in cultivation or agricultural labour, i.e., question 16 (a) 0) has been answered as HHI or OW, the village or town where he or she works. If the place of work is the same as the village or town of enumeration write 'PL'. In all other cases you should write the name of the place fully. If a person has no fixed place of work such as, say, a travelling vendor of vegetables or a pedlar or a rickshaw puller who may go from one village or town to another, note 'No fixed place of work'. If he works in one particular town or village that should be noted.
Question 16 (c): Name of Establishment
111. This question and the subsequent sub-sections of question 16 need not be answered for cultivators and agricultural labourers who are already noted as 'c' or 'AL' against question (16) la) (i).
Record here the exact name of the factory, firm, workshop, business house, company, shop, office, etc., and in respect of public offices you should clearly indicate whether they are Central or State Government or local body offices, etc. If the establishment does not have any definite name such as, say, in the case 'of a household industry like hand pounding of rice, gur making bee keeping, handloom weaving, potter's house, blacksmithy, etc~, note 'No particular name'.
Question 16 (d): Nature of Industry, Trade, Profession or Service
112. The answer to this question will have to be adequately precise to enable pr?per cl~ssification of the sector of ~cono~y in which the person IS workmg. The sector of economy III whIch a person works may relate to (i) Plantation, Forestry, Fishing, Livestock, etc., (ii) Mining and/or Quarrying (iii) Manufacturing (iv) Construction (v) Electricity, Gas or Water Supply (vi) Transport and Communications (vii) Trade and Commerce (viii) Pro-
23
fessions and Services. Full details of the type of industry, trade profession or service in which the person is engaged will have to be recorded here. To help you to appreciate the details that may have to be furnished to classify the economic activity appropriately, substantial description of various economic activities are furnished in Appendix III categorised under certain broad classifications. The list in Appendix III is not exhaustive. You shall have to describe the nature of Industry, Profession, Trade or Service wbatever it is, in as precise a detail as possible.
Question 16 (e): Description of work . 113. Tbis question has to be filled up for all persons for
whom the main activity is shown as 'RHl' or 'OW' in question 16 (a) (i) and for whom you should have also to answer the other sub-sections of question 16. Under this question, the description of the actual work that the person enumerated is doing is to be recorde~ irrespective of which type of industry, trade, profession or service he may be working and which is already recorded under question 16 (d). His actual work should also be given in sufficient detail. If for example a person is merely recorded as say, clerk with no other details, it will be impossible to properly categorise him as to the type of work he does. He may be a clerk attending to correspondence or book keeping or accounting. Similarly, if a person were merely to be recorded as a mechanic, it will not help to determine what type of mechanic-electrical mechanic, or a motor mechanic or a locomotive mechanic, etc., he is. The description of the actual work done by a person should be ascertained in adequate detail and recorded against this question.
114. To guide you in answering question 16 (e), the types of particulars that need to be ascertained in respect of a few typical occupations are given in Appendix IV.
Appendix IV is by no means exhaustive. This just illustrates the need to ascertain the full details of the particulars of work performed by an individual for being recorded agaimt question 16 (e).
115. It has been found in the past that substantial number of persons are recorded merely as general labourers. It is necessary to make a probe and find out in which type of work he is mostly engaged as a labourer such as, say, a road coolie a loader or unloader at a market, a construction labourer, etc:
116. For those in Military service it is enough if it is merely noted as 'in the service of the Central Government'. Other details need not be given.
General:
117. There need be no confusion as to the scope of 16 (d) and 16 (e), 16 (d) would represent the nature of industry trade profession or service, i.e., the field of economic activity i~ which a person is engaged in work and 16 (e) represents the occupation or the actual work that the person does in the industry, trade profession or service in which he is engaged. Thus, for exampl~ the answer to question 16 (d) may be say Cotton Textile manufacture and the answer to question 16 (e) may be Chemical Engineer in that industry or a clerk or an accountant in that industry or a labourer in that industry or a truck driver or the Managing Director of that industry and so on. Similarly, in question 16(d) the nature of service may be some department of the State Government Service a,nd in question 16 le) the description of work may be a clerk or an accountant, a Director of the Department, jeep driver in the Department, etc. etc., Again say, against question 16 (d) the answer may be private medical practice and in 16 (e) may cover orthopaedic surgeon, or nurse or a sweeper, etc., working in that private medical practitioner'S nursing home. The Industrial and Occupational lists in Appendices III & IV and the instructions given by your superior Census Officers may help you to clear any doubts you may have in your mind regarding the scope of questions relating to Nature of Industry, Trade, Profession or Service covered by question 16 (d) and the description of actual work of the individual enumerated covered by question 16 (e).
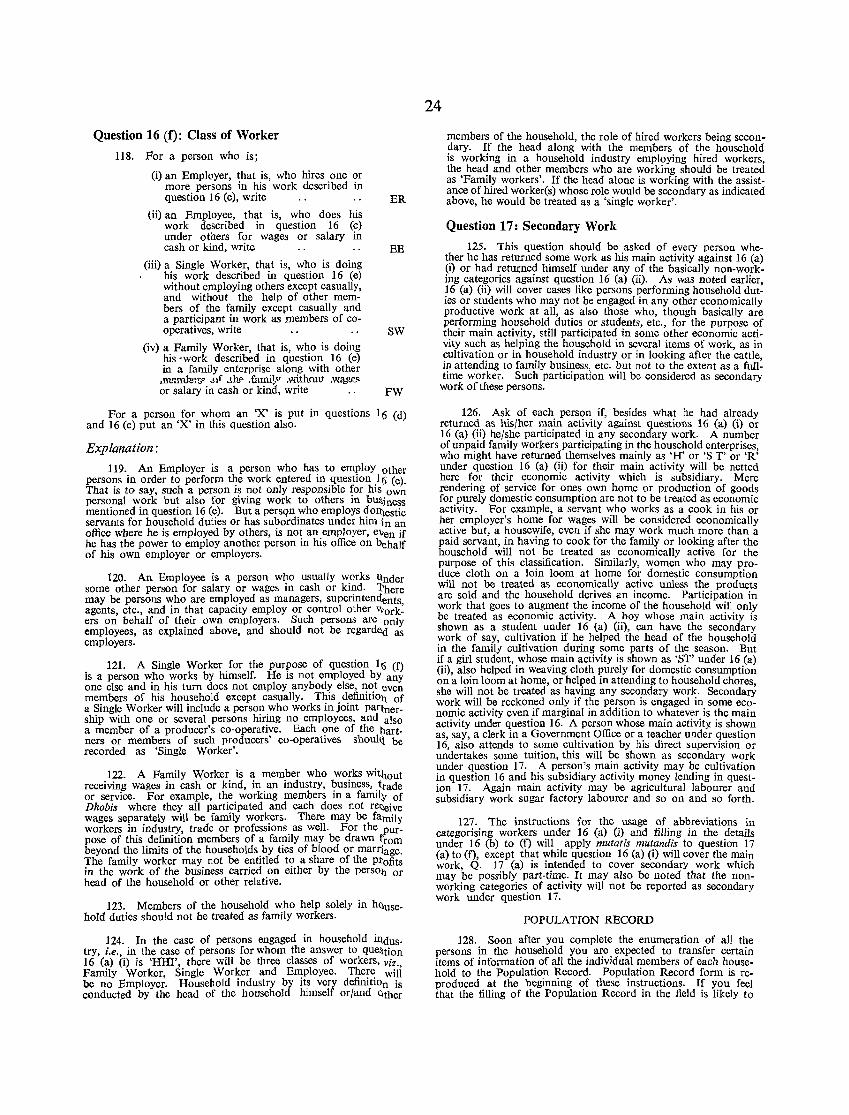
Question 16 (f): Class of Worker
118. For a person who is;
(i) an Employer, that is, who hires one or more persons in his work described in question 16 (e), write
(ii) an Employee, that is, who does his work described in question 16 (c) under others for wages or salary in cash or kind, writc
(iii) a Single Worker, that is, who is doing his work described in question 16 (e) without employing others except casually, and without the help of other members of the family except casually and a participant in work as members of cooperatives, write
(iv) a Family Worker, that is, who is doing his 'work described in question 16 (e) in a family enterprise along with other
.IMmlID'd' .l1f .tll!' .fami1v .withrutt .~.Il.~ or salary in cash or kind, write
ER
EE
SW
FW
For a person for whom an 'X' is put in questions 16 (d) and 16 (e) put an 'X' in this question also.
Explanation:
119. An Employer is a person who has to employ other persons in order to perform the work entered in question 16 (e). That is to say, such a person is not only responsible for his own personal work but also for giving work to others in bUlliness mentioned in question 16 (e). But a pers(i>U who employs dOU)estic servants for household duties or has subordinates under him In an office where he is employed by others, is not an employer, even if he has the power to employ another person in his office on behalf of his own employer or employers.
120. An Employee is a person who usually works ltnder some other person for salary or wages in cash or kind. l:'here may be persons who are employed as managers, superintendents agents, etc., and in that capacity employ or control other Work: ers on behalf of their own employers. Such persons are only employees, as explained above, and should not be regarded as employers.
121. A Single Worker for the purpose of question 16 (f) is a person who works by himself. He is not employed by any one else and in his turn does not employ anybody else, not even members of his household except casually. This definitioll of a Single Worker will include a person who works in joint partnership with one or several persons hiring no employees, and also a member of a producer's co-operative. Each one of the bartners or members of such producers' co-operatives shoull'! be recorded as 'Single Worker'.
122. A Family Worker is a member who works witliout receiving wages in cash or kind, in an industry, business, trade or service. For example, the working members in a family of Dhobis where they all participated and each does not re~eive wages separately will be family workers. There may be family workers in industry, trade or professions as well. For the purpose of this definition members of a family may be drawn from beyond the limits of the households by ties of blood or marriage. The family worker may not be entitled to a share of the profits in the work of the business carried on either by the persoll or head of the household or other relative.
123. Members of the household who help solely in h<lusehold duties should not be treated as family workers.
124. In the case of persons engaged in household ii\dustry, i.e., in the case of persons for whom the answer to que~tion 16 (a) (i) is 'HHI', there will be three classes of workers, viz. Family Worker, Single Worker and Employee. There will be no Employer. Household industry by its very definitiOn is conducted by the head of the household himself or/and ()ther
24
members of the household, the role of hired workers being secondary. If the head along with the members of the household is working in a household industry employing hired workers, the head and other members who are working should be treated as 'Famil.y workers'. If the head alone is working with the assistance of hired worker(s) whose role would be secondary as indicated above, he would be treated as a 'single worker'.
Question 17: Secondary Work
125. This question should be asked of every person whet~er he has returned s.ome work as his main activity against 16 (a) (I) or had returned himself under any of the basically non-working categories against question 16 (a) (ii). As was noted earlier 16 (a) (ii) will cover cases like persons performing household dut: ies or st:udents who may not be engaged in any other economically productive work at all, as also those who, though basically are performipg h~u~ehol~ dutie~ ?r stud~nts, etc., for the purpose of their mam actiVIty, stIll participated In some other economic activity such as helping the household in several items of work as in cultivation or in household industry or in looking after the 'cattle in attending to family business, etc. but not to the extent as a full: time worker. Such participation will be considered as secondary
work oftfiese persons.
126. Ask of each person if, besides what he had already returned as his/her main activity against questions 16 (a) (i) or 16 (a) (ii) he/she participated in any secondary work. A number of unpaid family workers participating in the household enterprises who might have returned themselves mainly as 'H' or'S T' or 'R: under question 16 (a) (ii) for their main activity will be netted here ~or their ~conomic activity which is subsidiary. Mere rendenng of serv~ce for ones. own home or production of goods for purely domestic consumptIOn are not to be treated as economic activity. For example, a servant who works as a cook in his or her employer's home for wages will be considered economically active but, a housewife, even if she may work much more than a paid servant, in having to cook for the family or looking after the household will not be treated as economically active for the purpose of this cla~sification. Similarly, women who may produce cloth on a 10m loom at home for domestic consumption will not be treated as economically active unless the products are sold and the household derives an income. Participation in work that goes to augment the income of the household will only be treated as economic activity. A boy whose main activity is shown as a student under 16 (a) (ii), can have the secondary work of say, cultivation if he helped the head of the household in the family cultivation during some parts of the season. But if. a girl student, .whose l_llain activity is shown as 'S:r' under 16 (a) (11), also helped ll1 weavmg cloth purely for domestic consumption on a loin 100m at home, or helped in attending to household chores she will not be treated as having any secondary work. Secondary work will be reckoned only if the person is engaged in some economic activity even if marginal in addition to whatever is the main activity under question 16. A person whose main activity is shown as, say, a clerk in a Government Office or a teacher under question 16, also attends to some cultivation by his direct supervision or undertakes some tuition, this will be shown as secondary work under question 17. A person's main activity may be cultivation in question 16 and his subsidiary activity money lending in question 17. Again main activity may be agricultural labourer and subsidiary work sugar factory labourer and so on and so forth.
127. The instructions for the usage of abbreviations in categorising workers under 16 (a) (i) and filling in the details under 16 (b) to (f) will apply mutatis mutandis to question 17 (a) to (f), except that while question 16 (a) (i) will cover the main work, Q. 17 (a) is intended to cover secondary work which may be possibly part-time. It may also be noted that the nonworking categories of activity will not be reported as secondary work under question 17.
POPULATION RECORD
128. Soon after you complete the enumeration of all the persons in the household you are expected to transfer certain items of information of all the individual members of each household to the Population Record. Population Record form is reproduced at the beginning of these instructions. If you feel that the filling of the Population Record in the field is likely to
take considerable time there is no objection to the details being posted by you later at home at the end of the day. However soon after you complete the enumeration of all the persons in a household you must note down the Location Code No. and the Household No. on the Population Record and also copy out in Col. 2 all the names of the persons enumerated in the household. This will help you to check with the members of the household and verify if all the persons qualified to be enumerated in the household have been fully enumerated.
The Population Record forms would have been supplied to you in convenient books and each page will normally take the entries of one household. However, if in a large household there are more number of persons than what a single Population Record form can accommodate, you may continue the entries on the next form but note boldly on the top of the continued Population Record as "Continued".
The Population Record hardly calls for any detailed explanation. On the top of each form please note correctly the Location Code No. and the Household No. It is important that you note the Household No. correctly as has been explained in paragraphs 24 to 28 of these instructions: Do not fail to note boldly "INST" in respect of institutional households as explained in paragraph 27 and "0" in respect of houseless households as explained in paragraph 28.
You )Nill be required to furnish information in the Enumerator's Abstract on the total number of occupied residential houses, the Census households, the institutional households and houseless households in your block with reference to the entries made in this P6pulation Record. So please make sure that you have entered the Household No. correctly as this will guide you in posting the required particulars in the Enumerator's Abstract. At the right hand side below the Household No., you will have to record information if the household belongs to S.C./S.T. You would have already ascertained if the head of the household belongs to a Scheduled Caste/Scheduled Tribe with reference to Question 11 of the Individual Slip. If the head belongs to any S.C./S.T., -write S.C./S.T. as the case may be and also the name of S.C./S.T. to which the head of the household belongs.
The columns in the main body of the Population Record are self-explanatory. You have to post them with reference to the information you have collected of each member of the household in the Individual Slip against the relevant questions. However, column 9 of the Population Record may require some explanation. For those who have returned themselves as workers for their main activity against Question 16 (a) (i) of the Individual Slip, while you may note 'C', 'AL' as the case may be, as recorded in the box against Question 16 (a) (i), in respect of those other than cultivators and agricultural labourers, you may please indicate briefly the description of work as recorded in Question 16 (e) of the Individual Slip. ror those who have returned themselves as non-workers for their main activity you may note the same abbreviation as recorded against Question 16 (a) (ii).
ENUMERATION OF HOUSELESS POPULATION
129. You must complete the enumeration of all the persons in all the households in your jurisdiction between 10th March and 31st March, 1971. During this period you should also take note of the possible places where homeless population is likely to live such as on the road side, pavements or in open temple mandaps and the like. On the night of 31st March, 1971 you will have to quickly cover all such houseless population and enumerate them. If there is likely to be a very large number of houseless persons in your jurisdiction whom you may not be able to enumerate single handed in one night you should report to your supervisor so that one or more extra enumerators may be deputed to assist you in the one night enumeration of such houseless persons. You should keep particular watch on the large settlements of nomadic population who are likely to camp on the outskirts of villages. These people will have to be covered on the 31st March. ¥ou should of course make sure that they. have not been enumerated elsewhere. As per instructtions in para28 you should record '0' in bold letters for houseless persons in the space provided for household number.
25
REVISIONAL ROUND
130. In the next three days, i.e., from 1st April, 1971 to 3rd April, 1971, you will have to revisit all the households in your jurisdiction and enumerate any new births that had taken place after your last visit but before the sunrise of 1st April, 1971 and any visitor(s) that had moved into the household and who had been away from his/their place of normal residence throughout the enumeration period, i.e., from 10th March to 1st April, 1971 or an entire household that has moved into your jurisdiction during this period and had not been enumerated anywhere before. In respect of every new birth make sure that you correct the entry in question 6 (b). Please also see the note under para 47.
You will have to ascertain if any death(s) had taken place in any of'the households between your last visit and the sunrise of 1st April, 1971, and cross out the individual slip of the dead person writing boldly across it as 'Died'.
If such a deceased person was recorded as 'Head of the Household' then you will have to find out who is recognised as 'Head' in that household after the deceased person. Accordingly, you will have to put 'Head' in Q. 2 in the individual slip of the person who is now recognised as 'Head' and correct the relationship of all members of the household in their respective individual slips, with reference to their relationship with 'Head' now recognised.
Consequential changes in the Population Record shall also have to be made by you. If you have exhausted the entire population record for recording the particulars of any household and it becomes necessary to record a new birth or any visitor you will fill in another population record form in continuation taking care that the location code, etc., are noted on the second form properly. The serial numbering in the succeeding form for the household should be in continuation of the last serial number of the earlier sheet relating to that household.
ENUMERATOR'S DAILY POSTING STATEMENT
131. Each day you will have to carefully post the information on certain items of each Individual Slip in the prescribed posting forms which have been supplied to you. Do not allow this work to fall into arrears. You are likely to commit errors if you tried to post particulars of a large number of persons after the lapse of more than one day. You will have to total up the columns of the statements and put the information in an Abstract and hand it over along with the complete schedules to your Supervisor. The posting statements should be filled at the end of each day soon after completion of the enumeration for the day. This will plake your work lighter and avoid accumulation and pressure of ",ork at the end and consequent errors in posting. Separate posting forms have been provided for Males and Females and you s~ould take care to post particulars of a person in the right form. This will make it easier to strike the totals of each sex and post the statements. The totals can be struck after the entries are brought up-to-date soon after you complete the enumeration of houseless persons and you have also accounted for the births and deaths since your last visit at the revi£ional round. You will observe that the information to be posted pertains to the items against which geometrical designs are found in the Individual Slip such as the one relating to Q. 3 Sex, Q. 11 Scheduled Caste/Scheduled Tribe. Q. 12 Literacy, Q. 16 (a) ti) and 16 (a) (ii) Worker or Non-worker. It is necessary that you should fiU the Posting Statement with the greatest care.
132. First of aU you should enter Location Code, Name of the village/town, Enumerator's Block No. (No. aUotted to you) and your name (enumerator's) in all the Posting Statements. Then start making relevant entries in the Posting Statements taking care that you enter particulars for 'males' in Males Posting Statement (Form M) and for 'females' in Females Posting Statement (Form F).
133. You are advised to make entries in a sequence starting with lowest Pad No. used by you starting with Slip No. 1 in each Pad so as to avoid duplication or missing of any entries. Both the statements are similar except that one is meant for Male~ and the other for Females. You should not fiU up col. 1 (Final
Serial No.) at the first instance. This co!. will be filled after the revisional round, i.e., after you have brought the count up-todate with reference to sunrise of 1st April, 1971 (see para 130) and also after you have struck the grand total 01 cols. 4 to 13. In cols. 2, 3 and 4 you have to copy Pad No., Slip No. and sex as recorded by you in the slips. Even though there are separate forms of Posting Statements for males and females, yet you are requiIed to copy the sex in co!. 4 from the Individual Slip as this will help as a check in avoiding mistakes in posting. In the remaining columns a tick (v') may be put against the appropriate columns, wherever information is found against the relevant question and a dash (--) may be put where it is not applicable.
134. Cols. 5 and 6 are to be posted with reference to the entries against Q. 11 of the Individual Slip. If a person is noted as belonging to a Scheduled Caste put a tick under Co!. 5 and a dash in Col. 6. If a Scheduled Tribe, put the tick in Col. 6 and dash in Col. 5. If the person is neither a Scheduled Caste nor Scheduled Tribe put a dash under Cols. 5 and 6 of the Posting Statement.
135. Cols. 7 and 8 of the Posting Statement have to be filled with reference to the answer to Q. 12 of the Individual Slip. A person can be either 'L' or '0'. Put the tick or dash in the corresponding column accordingly. It must be noted that there cannot be a dash in both the columns.
136. Cols. 9-13 must be posted with some care. For a person for whom 'c' has been entered in _the box against Q. 16(a){i) a tick V should be put under col. 9 and dash ( -) under cols. 10 to 13. Similarly for a person for whom 'AV, or 'HHI' or 'OW' or 'X' has been recorded against O. 16 (a) (i) a tick (v') may be put under col. 10 or 11 or 12 or 13 respectively and dash ( __ ) under remaining cols. from 9-13. You may please note that where a tick is put in col. 13 it means the person is a
26
non-worker and there must be dash in cols. 9 to 12. As you are likely to use more than one Posting Statement you are advised to strike totals by counting the number of ticks( v) in the relevant column(s) as soon as you have completed entries in one form and strike the grand totals after the Revisional Round. Now proceed to fill up col. 1 in a continuous manner starting with the first entry in the posting statement, while assigning serial number in co!. 1, you should ignore scored-out lines. Thus the grand total of col. 4 will be the last serial number in col. 1.
ENUMERATOR'S ABSTRACT
137. After striking the grand totals in Enumerator's aaily posting statement you have to fill in another form called Enumerator's Abstract. It is most important that this should be done with th(l greatest care. These abstracts will form the basis of the publication of the first reslilts of the Census. In the past Censuse~ the enumerators had given very accurate abstracts and there was hardly any difference between the finally tabulated figures and those furnished in the abstract. You should post these abstracts with care and pass on to your Supervisor as quickly as possible. Y 011 should hand over the enumeration pads neatly bundled along with a sketch of your Enumeration Blork as prescribed in para 10 and the posting statements and the abstract the very next day after the completion of the enumeration. Your work in the posting of the abstracts will be closely checked by your Supervisor. Any carelessness on your part will be taken serious notice of_
With the completion of enumeration and the handing over 0f the posting statements and the abstract and the Census schedule pans your burden is over. If you have done your work well you can have the satisfaction that you have made your humble but invaluable contribution to a vital national task.
ApPENDIX I
PRINCIPLES OF HOUSENUMBERING
Building:
"Building" is generally a single structure but sometimes made up of more than one component units, which is used or likely to be used as dwellings (residences), or establishments such as shops, workshops, factories, etc., or as godowns, store, cattle sheds, etc., or in combination with. any of these such as shop-cum-residence or workshop-cum-residence, etc.
2. Sometime a series of different buildings may be found along a street which are. Joi~ed with o.ne another by common walls on either side leokIng lIke a contmuous structure. These different units are practically independent of one another and likely to have been built at different times and owned by different persons. In such cases though the whole structur~ 'Yith all the adjoining units apparently appears to be one bUlldmg, each portion should be treated as separate building and given separate numbers.
3. If there are more than one structure within an enclosed or open compound (premises) belon!;ing to the same person, e.g., the main house, the s~rvants: quarters, .the garage, etc., only one building number should be gIven f~r thiS group and each. of the constituent separate structure aSSIgned a sub-number lIke 1/1 1/2 1/3 and so on provided these structures satisfy the definition of ~ 'C~nsus House' given hereafter.
4. The buildings should be numberea as follows:
ti) If the locality cO!1si.sts o~ a numbe: of streets !n a village, the blllldmgs.1ll the various streets III a village, should be numbered continuously_ Streets should be taken in uniform order from North-East to South-West. It has been observed that the best way of numbering the buildings is to continue with one consecutive serial on one side of the street
and complete the numbering on that side before crossing over to the end of the other side of the street and continuing with the serial stopping finally opposite to where the first number began.
(ii) In a town/city, enumeration block, the numbering will have to respect the axis of the street and not any pre-conceived geogral'hical direction like North-East, etc.
(iii) Arabic numerals (e.g., 1, 2, 3, ........ ) should be used for building numbers.
(iv) A building uuder construction which is likely to be completed within about a year's time should also oe given a number in the serial.
(v) If a new building either pucca or kachha is found after the house numbering has been completed or in the midst of buildings already numbered, it should be given a new number which may bear an alphabetical sub-number of the adjacent building number, e.p,., 10/A ........ .
NOTE: These should not be numbered as 10/1 or 10/2, etc., 'as such numbering would apply to Census houses within the same building. On the other hand 10 A would mean a separate building that has come up after building No. 10.
Census House No.:
5. A Census house is a building or part of a building having a separate main entrance from the road or common courtyard or stair-case, etc., used or recognised as a separate unit. It may be inhabited or vacant. It may be used for a residential or non-residential purpose or both.
6. If a building has a number of flats or blocks which are independent of one another having separate entrances of their own from the road or a common stair-case or a common courtyard leading to a main gate, they will be considered as separate Census houses. If within a large enclosed area there are separate buildings, then each such building will also be a separate Census house. If all tne structures within an enclosed compound are together treated as one building then each structure with a separate entrance should be treated as a separate Census house.
7. Each Census house s.hould be numbered. If a building by itself is a single Census house, then the number of the Census house is the same as the building number. But if diffei"ent parts or constituent units of a building qualify to be treated as separate Census houses, each Census house should be given a sub-number within brackets to the building number as 10/1, 10/2, etc, or 11/1, 11/2, 11/3, etc.
8. The order in which Census houses within a building are to -be numbered, should be continuous, preferably clock-wise or in any convenient manner if it is difficult to do it clock-wise.
9. The definition of Census house may sometimes be difficui t of application in its literal sense in the context of varying pattc;rns of structures and their usage. For example, in cities and towns, one does come across a situation when a flat in the occupation of one household as residence may be made up four rooms or so and all the rooms may have direct entrance from a common courtyard, or a stair-case. In terms of the definition of a Census house each of these rooms having entrances from the common stair-case, etc., may qualify to be treated as Census houses. But it does not realistically reflect the situation of the number of houses. In such case, 'singleness' of use of these rooms along with the main house by the household should be taken into account and the entire flat comprising four rooms should be treated as one Census house only and assigned one number. If on the other hand each one of these rooms had been separately occupied by independent households and if each portion had separate main entrance then each will be justified to be treated as a separate Census house. In a hostel building even if the door of each room in which an inmate lives opens on to a common verandah or stair-case as it happens almost invariably, the entire hostel building may have to be treated as one Census house only. In some parts of the country in the rural areas, the
27
pattern' of habitation is such ·that a single housenold occupies a group of huts within an enclosed fence which has one main entrance. Each of the apparently separated structures is an integral part of the housing unit as such. In such cases it may be more realistic to treat the group as one Census house. Care should be taken to ascertain if only one household occupies such a unit or shared by more than one household. Thus the definition of a Census house will have to be applied having due regard to the actual situation in such exceptional cases.
. 10. It is u~ual to find in municipal towns/cities that every site-whether bUIlt upon or not are numbered by the municipal authorities on property basis. Such open sites even if they are enclosed by a compound wall should not be listed for Census purposes. Only where a structure with four walls and a roof has cume up should it be treated as a Census house and listed. But in some areas the very nature of construction of houses is such that for example, a conical roof almost touches the ground and an entrance is also provided, and there may not be any wall as such. Such structures should of course be treated as buildings and houses numbered and li~ted.
Household No.
A Household is a group of persons who commonly live together and would take their meals from a common kitchen unless the exigencies of work prevented any of them from doing so. It may be made up of related or unrelated persons. A cook or a servant living in the house of his employers and taking his food there is to be considered as a member of the master's household. A hotel where a number of unrelated persons live together is an institutional household. So is a jail.
11. There may be one or more households in a Census house. If there are more than one household, each of them should be given a separate identifying number. This can be done by using the alphabets as (a), (b), (c), etc., affixed to the Census house number. For example if building No. 2 is also a Census house and has three households, the household numbers will be 2 (a); 2 (b) and 2 (c). If building number 4 has two Census houses, the houses will be numbered as 4/1 and 4/2. If within these houses there are respectively 3 and 2 households then they will be. numbered 4/1 (a), 4/_l~), 4/1(c) ~nd 4/2(a) and 4/2 (b) respectively. If, however, buddlllg No.3 IS also a Census house and has only one household the number to be entered will be 3.
ApPENDIX II
LIST OF A FEW TYPICAL INDUSTRIES THAT CANBE CONDUCTED ON A HOUSEHOLD INDUSTRY BASIS,
(See paras 92-95)
Foodstuffs Production of flour by village chakkis or flour mills, mill
ing or dehusking of paddy, grinding of chillies, turmeric, etc., production of gur, khandsari, boora, etc., production of pickles, chutney, jams, etc., processing of cashew nuts, making of dried vegetables, manufacture of sweetmeats and bakery products, production of butter, ghee, etc., slaughtering and preservation of meat and fish, fish curing, etc., oil pressing ghani.
Beverages
Manufacture of country liquor, toddy, production of soda water, ice, ice-cream, sharbat, etc., processing of coffee, etc.
Tobacco Products
Manufacture of bidi, cigars, cherroots, tobacco, snuff, etc.
Textile Cotton
Cotton ginning, carding, pressing and baling, spinning, etc., dyeing and bleaching of cloth, weaving in handlooms or power-
looms or manufacture of khadi, cloth printing, making of fishing nets, mosquito nets, cotton thread, rope, twine, etc.
I
Textile Jute, Wool or Silk
Similar type of production or processing as mentioned under Textile cotton but pertaining to the material, concerned.
Textile Miscellaneous
Making of durries, carpets, hosiery, embroidery chrochet work, lace garland making, manufacture of headgear ~aking of newar, bed covers, (curtains, pillow, pillow cases) ~tc. making of mattress, quilt (rezai), etc., making of namd~ felt' coconut fibre for upho.lster~, ~aking of brushes, brooms, etc., f~om coconut fibres, cOlr spmrung, manufacture and repair of umbrellas manufacture of dolls and toys (rags and cotton), etc. I
Manufacture of Wood and Wood Products
Sawing and planing of wood, manufacture of wooden furniture, structural goods like beams, door and window frames etc
f ' .,
wooden agricultural implements and their rapair, wooden lacquerware, wooden toys, wood carving, sawdust and plaster figure making, inlay work, match splinters, plywood and veneers, etc., making palm leaf mats, fans, umbrellas, etc., baskets and broomsticks, caning of chairs, making of chicks and khas khas tatties, making of cart wheels, wooden-sandals, etc.
Paper and Paper Products
Manufacture of pulp and paper by hand, making of envelopes, paper made articles, card board boxes, paper flower, paper kites, toys, etc.
Printing an d publishing
Printing works, lithography, block making, book binding, etc.
Leather and Leather Products
Flaying and processing of hides and skins, making leather footwear, wearing apparel of leather and fur, repair of shoes or other leather products.
Rubber, Petroleum and Coal Products
Vulcanising tyres and tubes, manufacture of chappals from torn tyres and other rubber footwear, manufacture of rubber products from natural and synthetic rubber.
Chemicals and Cbemical Products
Manufacture of toys, paints, colours, etc., manufacture of matches, fireworks, perfumes, cosmetics, manufacture of ayurvedic medicines, soap, plastic products, celluloid goods, manufacture of ink, candles, boot polish, etc.
Non-metallic Mineral Products and other than Petroleum and Coal
• Making of bricks, roofing tiles, sanitary fittings, cement statues, stone or marble carvings, manufacture of stone struc-
28 turals, stone dressing and stone crushing, mica splitting and manufacture of other mica products, making of earthenware and pottery, crockery, glass beads and bangles, earthen toys, manufacture of glass products, etc.
Basic Metals and their Products except Machinery and Transport Equipment
Manufacture of iron arms and weapons and their service and repair, iron and steel fmniture, brass, bell-metal utensils, aluminium utensils, tin utensils, copper utensils, etc., nickeling and electroplating, blacksmithy, manufacture and repair of agricultural implements such as ploughshare, etc., making and repairing of locks and trunks, cutlery, manufacture of scales, weights and measures and foundry industry, etc.
Machinery (all kinds other than Transport) and Electrical Equipment
Manufacture of small machine tools and parts, repamng and servicing of fans, radios, domestic electrical appliances, etc.
Transport Equipment
Repairing and servicing of automobiles, manufacture of cycle parts, rickshaw parts, boats and barges, manufacture of animal-drawn and hand-drawn vehicles such as bullock carts, wheel barrow, etc.
Miscellaneous Manufacturing Industries
Repair of spectacles, photographic equipment, goldsmithy, silver filgree industry, gold covering work, bidriware, musical instruments, fountain pens, making of cow-dung cakes, manufacture of sports goods, repairing of petromax lights, making of buttons and beads from conch-shell and horn goods.
ApPENDIX TIl
CLASSIFIED LIST OF ECONOMIC ACTIVITIES (See para 112)
AGRICULTURE, HUNTING, FORESTRY & FISHING
(Do not merely say plantation or fishing, etc., but indicate the appropriate details as given here.)
Plantation Crops
Indicate the type of plantation such as tea, coffee, rubber, tobacco, edible nuts, fruits, ganja, betal nuts, etc.
Livestock Production
. Indicate what kind of livestock is reared such as goats, sheep, horses, pigs, ducks, bees, silk worm, etc. Production of wool, ra\X silk, etc., are also covered in this.
Agricultural Services
Indicate what type of agricultural service, e.g., pest destroying, spraying, operation of irrigation system, animal shearing and livestock services (other than veterinary services), grading agricultural and livestock products, soil conservation, soil testing, etc.
Hunting
Indicate hunting, trapping and game propagation for commercial purpose only.
Forestry and Logging
Apart from planting and conservation of forests, felling and cutting of trees, etc., this would cover production of fuel, gathering of fodder, gums, resins, lac, etc.
Fishing
Sea, coastal and inland water, fishing, pisciculture collec-tion of pearls, conches, shells, sponges, etc. '
MINING AND QUARRYING
(Do not merely say mining or quarrying but indicate fmther details.) Indicate what is mined such as coal, lignite crude petroleum, !latural gas, iron ore, manganese, gold, silver,' copper ore, . quarrYIng of ~tones, clay and sand pits, precious and semiprecIOus stones; mica, gypsum, etc.
MANUFACTURING AND REPAIR
(Do not merely say engaged in a factory but indicate what the manufacturing is concerned with as det~iled here.)
Manufacture of Food Products
Slaughtering, preparation and preservation of meat· dairy products; canning and p:_eservation of fruits and vegetabl~s fish;
grain mill products; bakery products; sugar; boora; common salt; edible oils including vanaspati; processing of tea or coffee; manufacture of ice; animal feeds, starch, etc.
Manufacture of Beverages, Tobacco and Tobacco Products
Rectifying and blending of spirits; wine industries; country liquor and toddy; carbonated water industries; bidi; cigar, cigarettes, zerda, snuff', ·etc.
Manufacture of Cotton Textiles
Cotton ginning, cleaning and baling; spinning, weaving and finishing of cotton in textiles mills; printing; dyeing dnd bleaching of cotton textiles; cotton spinning other than in mills (charkha); khadi production; weaving, etc. in handlooms and power!ooms; etc.
Manufacture of Wool, Silk and Synthetic Fibre Textiles
Wool cleaning, baling and pressing; weaving and finishing in mills and other than in mills; dyeing and bleaching; printing of silk, synthetic textiles; etc.
Manufacture of Jute, Hemp and Mesta Textiles
Spinning and pressing and baling of Jute and Mesta; dyeing; printing and bleaching of jute textiles and manufacture of jute bags are also covered in this.
Manufacture of Textile Products
(Including wearing apparel other than footwear) knitting mills; manufacture of all types of threads, cordage, ropes, etc; embroidery; carpets; rain coats; hats; made up textiles goods (except garments) oil cloth, tarpaulin; coir and coir products; linolium, padding, wadding, etc., are also covered in this.
Manufacture of Wood and Wood Products Furniture and Fixtures
Manufacture of veneer, plywood and their products; sawing and planing of wood; wooden and cane boxes, crates, drums, ,barrels, etc., beams, posts, doors and windows; wooden industrial goods like blocks, handles, etc., cork products; wooden, bamboo and cane furniture and fixture, etc.
Paper and Paper Products and Printing, Publishing and allied Industries
Manufacture of pulp; paper, paper boards and newsprints; container and paper boxes; printing and publishing of newspapers; periodicals, books, etc., engraving, block making, book binding, etc.
Leather and Fur Products
Tanning, currying, etc., of leather; footwear (excluding repair); coats, gloves, currying, dyeing, etc. of fur, fur and skin rugs, etc.
Rubber, Plastic, Petroleum and Coal Products
Tyre and tube industries, foot wear made of vulcanized or moulded rubber; rubber and plastic products; petroleum refineries, production of coaltar in coke ovens, etc.
Cl1emicals and Chemical Products
Manufacture of gases such as acids, alkalis, Oxygen, etc.; fertilisers and pesticides; paints, varnishes; drugs and medicines; perfumes, cosmetics, lotions; synthetic resins, etc., explosive and ammunition and fireworks, etc.
Non-metallic Mineral Products
Structural clay products; glass and glass products; earthen ware and earthen pottery; china ware and porcelain ware; cement, lime and plaster; asbestos, etc.
29
Basic Metal and Alloys Industries
Iron and Steel Industries; casting foundries; ferro-alloys; copper, brass, zinc and brass manufacturing, etc.
Metal Products and Parts except Machinery and Transport Equip ment
Metal cans from tin-plate, sheets metal, barrels, drums, pails, safe, etc.; structural metal products; metal furniture and fixture; hand tools; utensils, cutlery, etc.
Machinery, Machine tools and parts except Electrical Machinery
Agricultural machinery; cranes; road rollers, boilers, diesel engine; refrigerators, air conditioners, etc.
Electrical machinery, Apparatus, Appliances and Supplies and parts
Electrical motors, generators, transformers; insulated wires and cables; dry and wet batteries; radio, television, etc.; X-ray apparatus; electric computors, etc.
Transport equipments and parts
Ship building and repairing locomotives and parts; Railway wagons; coaches, etc.; rail road equipment; motor vehicles; bicycles; aircrafts; push-carts and hand carts, etc.
Other Manufacturing Industries
Do not say other manufacturing industries but write clearly what is being manufactured like manufacture of medical, surgical and scientific equipments; pho,tographic and optical goods; watches; minting of coins; musical instruments, etc.
ELECTRICITY, GAS AND WATER
Indicate if generation and transmission of electric energy or distribution is involved, e.g., manufacture of gas in gas works and its distribution; water supply, i.e., collection, purification and distribution of water, etc.
CONSTRUCTION
tDo not merely say .engaged in construction but give further particulars. Clear details of the type of construction and maintenance such as buildings, road, railway, telegraph, telephone, water ways and water reservoirs, hydro electric projects, industrial plants, activities allied to construction such as plumbing, heating and air conditioning installation, setting of tiles, marble, brick, etc.; construction of electrical installations, etc., should be given.)
WHOLESALE AND RETAIL TRADE & RESTAURANTS AND HOTELS
Food, Textiles, Live Animals, Beverages and Intoxicants
Indicate clearly that the wholesale trade is done in cereals, pulses; foodstuff; textile and textile products; e.g., garments, shirtings, etc.; beverages, intoxicants like wines, opium, ganja, tobacco, etc.; wholesale trade in animals, straw and fodder is also covered in this.
Fuel, Light, Chemicals, Perfumery, Ceramics, Glass
Wholesale trade in medicines, chemicals; fuel lighting products; toilets; porcelain, glass utensil, crockery, etc.
All types of Machinery, Equipment, including Transport and Electrica1 Equipment
Agricultural and industrial machinery, e.g., harvestors, threshers' etc.; electrical machinery; transport equipments, etc-
Miscellaneous Manufacturing
Wholesltle trade in furniture, rubber and rubber products; building materials; clocks, etc., eye-glasses etc., medical and !urgical instruments; precious m~tals, stones and jewellery, etc·
Retail Trade in Food and Food Articles, Beverage, Tobacco and Intoxicants
Indicate clearly that the retail trade is carried in grocery, vegetables. fruit selling, meat, poultry, bakery products, dairy products, pan, bidi, aerated water, etc.
Retail Tralle in Textiles
(Do not merely say engaged in retail trade in textile, but indicate clearly what the retail trade is concerned with). Dealers in textiles (non-ready made), ready-made garments, are some examples.
Retail Trade in Others
Indicate clearly what kind of retail trade it is like, medical shops, booksellers. building material, etc.
Restaurant and Hotels
Restaurants, cafes and other eating places, hotels, rooming houses, camps and other lodging places.
TRANSPORT, STORAGE AND COMMUNICATIONS
(Do not merely say engaged in land, water, air transport but give further particulars.) Indicate what kind of transport such as railways, tramways, motor buses, bullock carts, ekka, tonga, etc.; ocean and coastal water, inland water transport, air
30
transport, services rendered to transport such as packing, crating, travel agencies, etc. It also. includes storage, warehousing, communication such as postal telegraph, wireless, telephone, etc.
FINANCING, INSURANCE, REAL ESTATE AND BUSINESS SERVICES
Indicate clearly whether services belong to banking; credit institutions other than banks, e.g., loan societies, agricultural credit institutions, etc.; money lenders, financiers, etc., provident services; insurance carriers life; fire, marine, aCcident, health, etc. It also includes business services, e.g., purchase and Isale agents and brokers; auctioneering, accounting; data processing; engineering; advertising services, etc.; legal services rendered by advocates, barristers, pleaders, etc.
COMMUNITY, SOCIAL AND PERSONAL SERVICES
It should be clearly indicated whether service belongs to public administration, union government, state government, police service, quasi-government bodies, sanitary services, education, scientific and research, etc.
Personal Services
Do not merely say engaged in personal service but indicate clearly whether it is domestic service, services relating to laundries, cleaning and dyeing plants, hair dressing, photographic studios, international and other extra territorial bodies, etc.
ApPENDIX IV
CLASSIFIED LIST OF OCCUPATIONS i. e. DESCRIPTION OF WORK
(Q. 16 (e) and 17 (e) See Paras 113-114)
Professional, Technical and Related Workers
(Do not merely sayan Engineer, Doctor, Teacher, etc., in describing the work of an individual but furnish more precise particulars as given below.)
Indicate clearly in respect of engineers to what branch they belong such as civil, mechanical, electrical, metallurgical, mining, etc. Tn respect of physicians, state if they are allopathic, ayurvedic, homeopathic, etc. Physiologists and dentists, etc., should be recorded. As regards teachers, state if they are university teachers, secondary school, middle school, primary school, or kindergarten teachers. There are various other types of chemists, physicists, archaeologists, 1'l.urses, pharmacists, health technicians, jurists, social scientists such as economists, statisticians, geographers. historians, anthropologists, etc., as also artists, writers, painters, sculptures, actors, etc., draughtsmen, Jaboratory assistants, librarians, ordained religious workers, astrologers, etc., who will have to be recorded with particulars of their work. '
Administrative, Executive and Managerial Workers (Do not merely say government officer, an officer in a priVate
firm or concern but give further particulars.) They may be in government service or under a local body or in a business firm, manufacturing establishment or a catering establishment or a transport company and so on. Their full description should be recorde.d such as for example, Secretary to the Government of India, District Collector, Municipal Commissioner, Executive Officer of a Panchayat, Director of a firm, Manager of a business concern, Proprietor and Manager of a hotel, elected and legislative officials, aircrafts and ships officers, etc.
Clerical Workers (Do not merely denote the work of a person as a clerk or
office worker but furnish further particulars.) State clearly the type of work done such as cashier, accountant, stenographer, typist, computing clerk. key punch operator, office assistant, guard, brakesman, traffic controller, railway ticket inspector, postman, telephone/teleprinter/wireless operator, record keeper, despatcher, etc., office workers would also include peons, daftaries, etc.
Sale Workers
(Do not merely say a worker in a shop but give details.) It should be clearly recorded whether the proprietor of a business concern engages himself in wholesale or retail trade. Salesman or shop assistants, agents of insurance, brokers in share, auctioneers, commercial travellers, hawkers and street vendors, money lenders, pawn brokers, etc., will also be covered.
Service Workers
(There are all types of service workers such as those engaged as domestic servants or in personal services or in police service or watch and ward, etc. Give precise particulars.) Hotel and n;staurant keepers, house-keepers, matrons, and stewards (domestic and institutional}, cooks, waiters, bartenders and related workers (domestic and institutional) maids and housekeeping service workers, building caretakers, sweepers, cleaners, and related workers, launderers, dry cleaners and pressers, hair dressers, beauticians and related workers, protection service workers, such as watchmen, chowkidars, gate-keepers, etc., other service workers.
Farmers, Fishermen, Hunters, Loggers etc., and Related Workers
Deep sea fishermen, inland river water fishermen, shell gatherers, forest rangers, charcoal burners, forest produce gatherers, plantation managers, farm machine operators, gardeners, toddy tappers, rubber tappers, hunters, bird trappers, etc., will be covered.
Production and other Related Workers, Transport Equipment Operators and Labourers
(This may cover a very large variety of craftsmen and operator ~ etc., whose work will have to be given in adequate detail.) Examples: miners, quarrymen, well drillers, cotton ginners, spinners. dyers, knitters, lace makers, carpet makers, etc., tailors, cutters, hat makers, embroiderers, shoe makers or repairers, saddle makers, leather cutters, etc., blacksmiths, furnacemen, moulders,
etc., cart builders, wheel wrights, cabinet makers, etc., stone cutters, bricklayers, masons, hut builders, thatchers, well diggers, etc., jewellers, goldsmiths, watch and clock makers or repairers, welders and plate cutters, sheet metal workers, machine tool operators, electricians, electrical and electronic wire fitters, radio mechanic, electric linesmen, cable jointers, carpenters, jOiners,
31
sawers, etc., printing type machine operators, proof readers, photo-litho operators, book binders, potters, moulders, fir"mene kilnsmen, blowers and makers of glass, millers, bakers, confectioners, sweetmeat makers, food canners, coffee or tea planters, tobacco curers, graders and blenders of tobacco. bidi or cig.ar makers, snuff or zarda makers, tyre builders, crane or hOlst operators, loaders and unloaders, etc.
ANNEXURE C
THE CENSUS ACT, 1948, ACT No. XXXVII OF 1948
AN ACT TO PROVIDE FOR CERTAIN MATTERS IN CONNECTION WITH THE TAKING OF CENSUS
WHEREAS'it is expedient to provide for the taking of Census in India or any part thereof whenever necessary or desirable and to provide for certain matters in connection with the taking of such Census:
It is hereby enacted as follows:
Short title and extent
1. (J) This Act may be called the Census Act, 1948.
(2) It extends to the whole of India.
Rule of construction respecting enactments not extending to Jammu and Kashmir
2. Any reference in this Act to the Indian Penal Code or the Indian Evidence Act, 1872, shall, in relation to the State of Jammu and Kashmir be construed as a reference to the corresponding enactment in force in that State.
Central ('~vernmcnt to take Census
3. The Central Government, may, by notification in the official Gazette, declare its intention of taking a Census in the whole or any part of the territories to which this Act extends, whenever it may consider it necessary or desirable so to do, and thereupon the Census shall pe taken.
Appointment of Census staff
4. (1) The Central Government may appoint a Census Commissioner to supervise the taking of the Census throughout the area in which the Census is intended to be taken, and Superintendents of Census Operations to supervise the taking of the Census within the several States.
(2) The State Government may appoint persons as Census Officers to take, or aid in, or supervise the taking of the census within any specified local area and such persons, when so appointed, shall be bound to serve accordingly.
(3) A declaration in writing, signed by any authority authorised by the State Government in this behalf, that any person has been duly appointed a Census Officer for any local area shall be conclusive proof of such appointment.
(4) The State Government may delegate to such authority as it thinks fit the power of appointing Census Officers conferred by sub-section {2).
Status of Census authorities as public servants
5. The Census Commissioner, all Superintendents of Census Operations and all Census Officers shall be deemed to be public servants within the meaning of the Indian Penal Code.
3rd September, 1948
Discharge of duties of Census Officers in certain cases
6. (1) Whele the District Magistrate, or such authority as the State Government may appoint in this behalf, by a written order so directs:
(a) every officer in command of any body of men belonging to the naval, military or air forces or of any vessel of war, of India;
(b) every person (except a pilot or harbour-master) having charge or control of a vessel;
(c) every person incharge of a lunatic asylum, hospita I workhouse, prison, reformatory or lock-up or of any • public, charitable, religious or educational institutions;
(d) every keeper, secretary or manager or any sarai, hotel, boarding-house, lodging-house, emigration depot or club';
(e) every manager or officer of a railway or any commercial or industrial establishment; and
(f) every occupant of immovable property wherein at the time of the taking of the Census persons are living;
shall perrorm such of the duties of a Census Officer in relation to the persons who at the time of the taking of the Census are under his command or charge, or are inmates of his house, or are present on or in such immovable property or are employed under him as may be specified in the order.
45 of 1860
(2) All the provisions of this Act relating to Census Officers shall apply, so far as may be, to all persons while performing s1.lch duties under this section, and any perso~ ref~mg or ne~lecting to perform any duty which under thIS sectIon he IS directed to perform shall be deemed to have committed an offence under section 187 of the Indian Penal Code.
Power to call upon certain persons to give assistance
7. The District Magistrate, or such authority as the State Government may appoint in this behalf for any local area, may by written order which shall have effect throughout the extent of -his district or of such local area, as the case may be, call upon-
(a) all owners and occupiers of land, tenure-holders and farmers and assignees of land revenue, or their agents;
(b) all members of the district, municipal, panchayat and other local authorities and officers and servants of such authorities; and
(c) all Dfficers and members of staff of any factory firm or establishment,
to give such assistance as shall be specified in the order toward the taking of a Census of the persons who are, at the time of
the taking of the Census, on the lands of such owners, occupiers, tenure-holders, farmers and assignees, or in the premises of factories, firms and other establishments or within the areas for which such local authorities are established, as the case may be, and the persons to whom an order under this section is directed shall be bound to obey it and shall, while acting in pursuance of such order be deemed to be public servants within the meaning of the Indian Penal Code.
Asking of questions and obligation to answer
8. (1) A Census Officer may ask all such questions of all persons within the limits of the local area for which he is appointed as, by instructions issued in this behalf by the State Government and published in the Official Gazette, he may be directed to ask.
(2) Every person of whom any question is asked under sub-section (l) shall be legally bound to answer such question to the best of his knowledge or belief:
Provided'that no person shall be bound to state the name of any female member of his household, and no woman shall be bound to state the name of her husband or deceased husband or of any other person whose name she is forbidden by custom to mention.
Occupier to permit access and affixing of numbers
9. Every person occupying any house, enclosure, vessel or other place shall allow Census Officers such access thereto as they may require for the purpose of the Census and as, having regard to the customs of the country, may be reasonable and shall allow them to paint on, or affix to, the place such letters, marks or numbers as may be necessary for the purposes of the Census.
Occupier or Manager to fill up schedule
10. (1) SUbject to such orders as the State Government may issue in this behalf, a Census Officer may, within the local area for which he is appointed, leave or cause to be left a schedule at any dwelling house or with the manager or any officer of any commercial or industrial establishment, for the purpose of its being filled up by the occupier of such house or of any specified part thereof or by such manager or officer with such particulars as the State Government may direct regarding the inmates of such house or part thereof, or the persons employed under such manager or officer, as the case may be, at the time of the taking of the Census.
(2) When such schedule has been so left, the said occupier, manager or officer, as the case may be, shall fill it up or cause to be filled up to the best of his knowledge or belief so far as regards the inmates of such house or part thereof or the persons employed under him, as the case may be, at the time aforesaid, and shall sign his name thereto and, when so required, shall deliver the schedule so filled up and signed to the Census Officer to such person as the Census Officer may direct.
Penalties
11. (1) (a) Any Census Officer or any person lawfully required to give assistance towards the taking of a Census who refuses or neglects to use reasonable diligence in performing any duty imposed upon him or in obeying any order issued to him in accordance with this Act or any rule made thereunder, or any person who hinders or obstructs another person in performing any such duty or in obeying any such order, or
(b) any Census Officer who intentionally puts any offensive or improper question or knowingly makes any false return or, without the previous sanction of the Central Government or the State Government discloses any information which he has received by means of, or for the purposes of, a Census return, or
(c) any sorter, compiler or other member of the Census staff who removes, secrets, damages or destroys any Census document or deals with any Census document in a
32
manner likely to falsify or impair the tabulations of Census results, or
(d) any person who intentionally gives a false answer to, or refuses to answer to the best of his knowledge or belief, any question asked of him by a Census Officer which he· is legally bound by Section 8 to answer, or
(e) any person occupying any house enclosure, vessel or other place who refuses to allow a Census Officer such reasonable access thereto as he is required by Section 9 to allow, or
Cf) any person who, removes, obliterates, alters, or damages any letters, marks or numbers which have been painted or affixed for the purpose of the Census, or
(g) any person who, having been required under Section 10 to fill up a schedule, knowingly and without sufficient cause fails to comply with the provisions of that section, 0; m<\kes any false return thereunder, or
(h) any person who trespasses into a Census Office, shall be punishable, with fine which may extend to one thousand rupees and in case of a conviction under part (b) or (c) shall also be punishable with imprisonment which may extend to six months.
(2) Whoever abets any offence under sub-section (1) shall be punishable with fine which may extend to one thousand rupees.
Sanction required for p.rosecutions
12. No prosecution under this Act shall be instituted except with the previous sanction of the State Government or of an authority authorised in this behalf by the State Government.
Operation of other laws not barred
13. Nothing in this Act shall be deemed to prevent any person from being prosecuted under any other law for any act or omission which constitutes an offence under this Act:
Provided that no such prosecution shall be instituted except with the previous sanction referred to in Section 12.
Jurisdiction
14. No Court inferior to that of a Presidency Magistrate ~r a Magistrate of the Second class or in a Part B State, a Magistrate corresponding to a Magistrate of the Second class shall try, whether under this Act or under any other law, any act or omission which constitutes an oftence under this Act.
Records of Census not open to inspection nor admissible in evidence
15. No person shall have a right to inspect any book, register or record made by a Census Officer in the discharge of his duty as such, or any schedule delivered under Section 10, and not withstanding anything to the contrary in the Indian Evidence Act, 1872, no entry in any such book, register, record, or schedule shall be admissible as evidence in any civil proceeding whatsoever or in any criminal proceeding other than a prosecution under this Act or any other law for any act or omission which constitutes an offence under this Act.
Temporary suspension of other laws as to mode of taking'Census in Municipalities
16. Notwithstanding anything in any enactment or rule with respect to the mode in which a Census is to be taken in any municipality, thl; municipal authority, in consultation with the Superintendent of Census Operations, or with such other authority as the State Government, may authorise in this behalf, shall, at the time appointed for the taking of any Census cause the Census of the municipality to be taken wholly or in part by any method authorised by or under this Act.
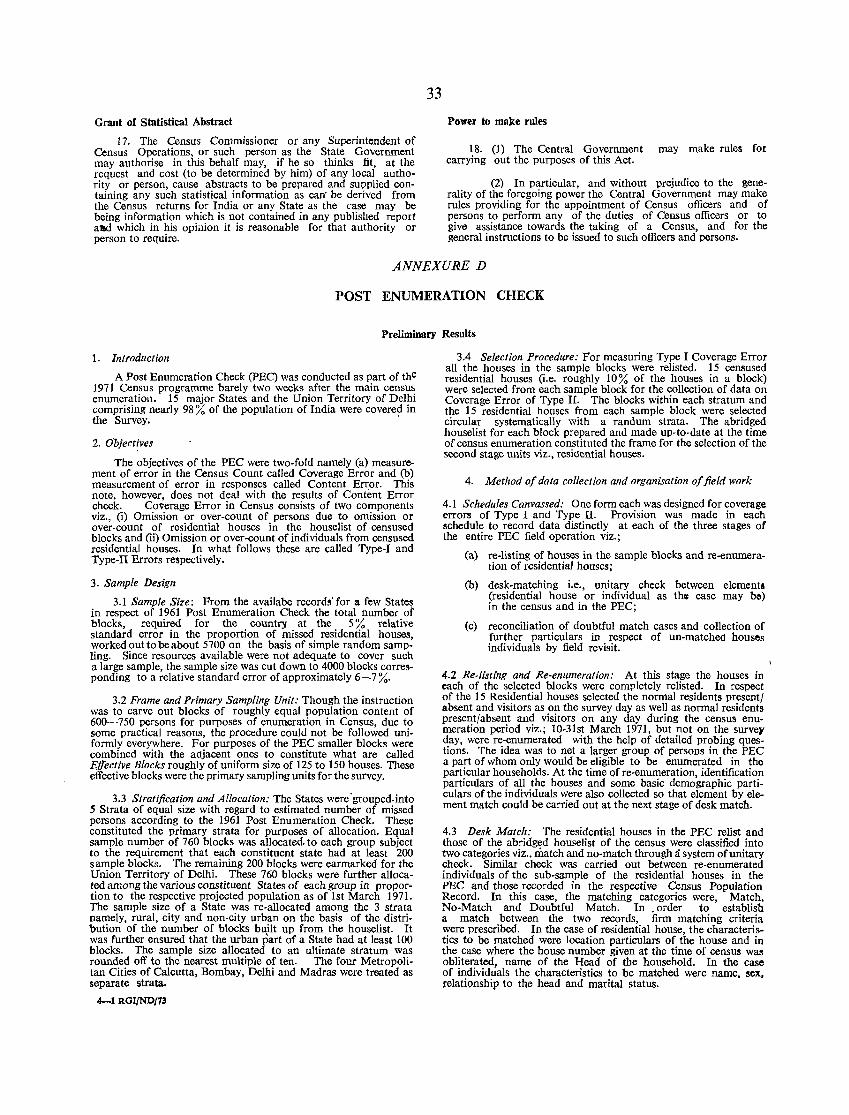
Grant of Statistical Abstract
17. The Census Commissioner or any Superintendent of Census Operations, or such person as the State Government may authorise in this behalf may, if he so thinks fit, at the request and cost (to be determined by him) of any local authority or person, cause abstracts to be prepared and supplied containing any such statistical information as can' be derived from the Census returns for India or any State as the case may be being information which is not contained in any published report a1lld which in his opiilion it is reasonable for that authority or person to require.
33
Power to make rules
18. (1) The Central Government may make rules for carrying out the purposes of this Act.
(2) In particular, and without prejudice to the generality of the foregoing power the Central Government may make rules providing for the appointment of Census officers and of persons to perform any of the duties of Census officers or to give assistance towards the taking of a Census, and for the general instructions to be issued to such officers and persons.
ANNEXUR.E D
POST ENUMERATION CHECK
Preliminary Results
1. Introduction
A Post Enumeration Check (pEC) was conducted as part of the 1971 Census programme barely two weeks after the main census enumeratioll. 15 major States and the Union Territory of Delhi comprising nearly 98 % of the population of India were covered in the Survey. .
2. Object~ves
The objectives of the PEC were two-fold namely (a) measurement of error in the Census Count called Coverage Error and (b) measurement of error in responses called Content En:or. This note, however, does not deal with the results of Content Error check. Co~erage Error in Census consists of two components viz., (i) Omission or over-count of persons due to omission or over-count of residential houses in the houselist of censused blocks and (ii) Omission or over-count of individuals from censused residential houses. In what follows these are called Type-I and Type-II Errors respectively.
3. Sample Design
3.1 Sample Size: From the availabe records' Cor a few State~ in respect of 1961 Post Enumeration Check the total number of blocks, required for the country at the 5 % relative standard error in the proportion of missed residential houses, worked out to be about 5700 on the basis of simple random sampling. Since resources available were not adequate to cover such a large sample, the sample size was cut down to 4000 blocks corresponding to a relative standard error of approximately 6-7 %.
3.2 Frame and Primary Sampling Unit: Though the instruction was to carve out blocks of roughly equal population content of 600-750 persons for purposes of enumeration in Census, due to some practical reasons, the procedure could not be followed uniformly everywhere. For purposes of the PEC smaller blocks were combined with the adjacent ones to constitute what are called Effective Blocks roughly of uniform size of 125 to 150 houses. These effective blocks were the primary sampling units for the survey.
3.3 Stratification and Allocation: The States were "grouped. into S Strata of equal size with regard to estimated number of missed persons according to the 1961 Post Enumeration Check. These constituted the primary strata for purposes of allocation. Equal sample number of 760 blocks was allocated. to each group subject to the requirement that each constituent state had at least 200 sample blocks. The remaining 200 blocks were earmarked for the Union Territory of Delhi. These 760 blocks were further allocated among the various constituent States of each group in proportion to the respective projected population as of 1st March 1971. The sample size of a State was re-allocated among the 3 strata namely, rural, city and non-city urban on the basis of the distribution of the number of blocks built up from the houselist. It was further ensured that the urban part of a State had at least 100 blocks. The sample size allocated to an ultimate stratum was rounded off to the nearest multiple of ten. The four Metropolitan Cities of Calcutta, Bombay, Delhi and Madras were trooted as separate strata.
4-1 RGIfND!73
3.4 Selection Procedure: For measuring Type I Coverage Error all the houses in the sample blocks were relisted. 15 censused residential houses (i.e. roughly 10% of the houses in a block) were selected from each sample block for the collection of data on Coverage Error of Type II. The blocks within each stratum and the 15 residential houses from each sample block were selected circular systematically with a randum strata. The abridged houselist for each block prepared and made up-to-date at the time of census enumeration constituted the frame for the selection of the second stage units viz., resiaential houses.
4. Method of data collection and organisation of field work
4.1 Schedules Canvassed: One form each was designed for coverage errors of Type 1 and Type II. Provision was made in each schedule to record data distinctly at each of the three stages of the entire PEC field operation viz.;
(a) re-listing of houses in the sample blocks and re-enumeration of residential houses;
(b) desk-matching i.e., unitary check between element. (residential house or individual as the case may bo) in the census and in the PEC;
(c) reconciliation of doubtful match cases and collection of further particulars in respect of un-matched houses individuals by field revisit.
4.2 Re-listing and Re-enumeration: At this stage the houses in each of the selected blocks were completely relisted. In respect of the 15 Residential houses selected the normal residents present/ absent and visitors as on the survey day as well as normal residents present/absent and visitors on any day during the census enumeration period viz.; 10-31st March 1971, but not on the survey day, were re-enumerated with the help of detailed probing questions. The idea was to net a larger group of persons in the PEC a part of whom only would be eligible to be enumerated in the particular households. At the time of re-enumeration, identification particulars of all the houses and some basic demographic particulars of the individuals were also collected so that element by element match could be carried out at the next stage of desk match.
4.3 Desk Match: The residential houses in the PEC relist and those of the abridged houselist of the census were classified into two categories viz., match and no-match through a system of unitary check. Similar check was carried out between re-enumerated individuals of the sub-sample of the residential houses in the PEC and those recorded in the respective Census Population Record. In this case, the matching categories were, Match, No-Match and Doubtful Match. In. order to establish a match between the two records, firm matching criteria were prescribed. In the case of residential house, the characteristics to be matched were location particulars of the house and in the case where the house number given at the time of census was obliterated, name of the Head of the household. In the case of individuals the characteristics to be matched were name, sex, relationship to the head and marital status.
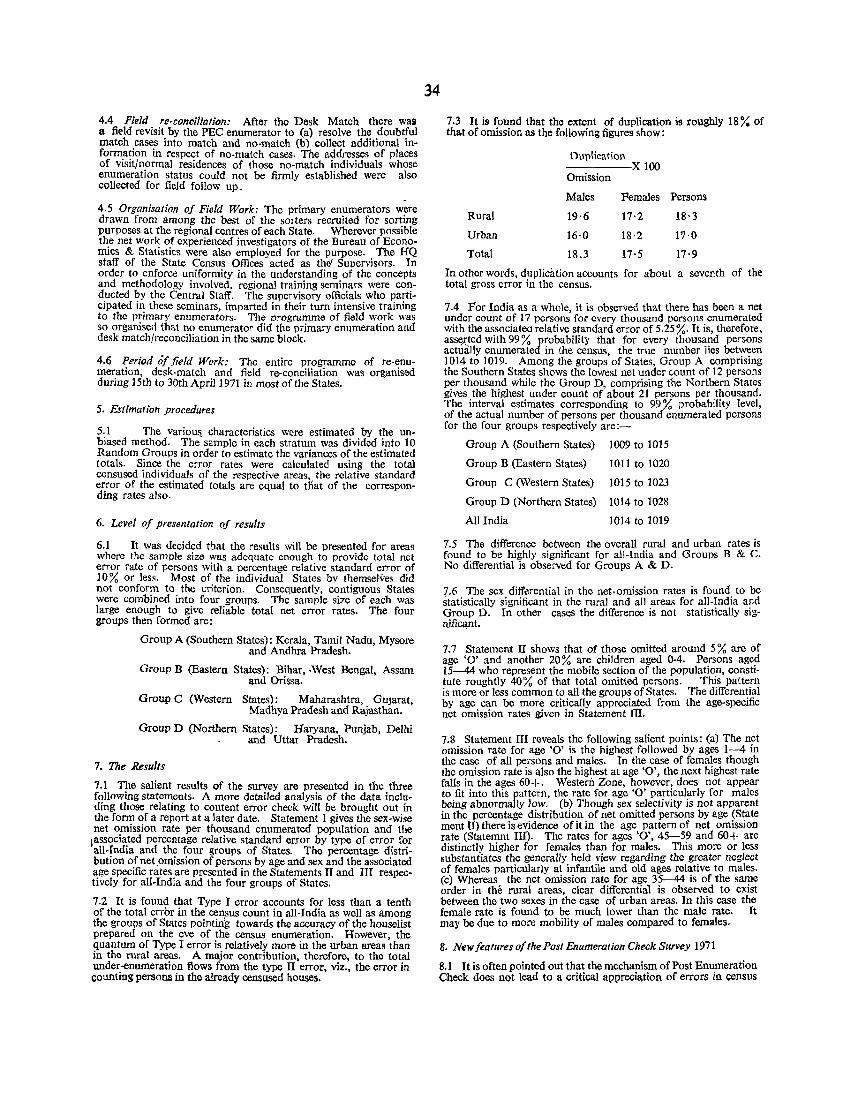
4.4 Field re-conciliation: After the Desk Match there was a field revisit by the PEC enumerator to (a) resolve the doubtful match cases into match and no-match (b) collect additional inform.a~ion in respect of no-match cases. The addresses of places of VIsIt/normal residences of those no-match individuals whose enumeration status could not be firmly established were also collected for field follow up.
4.5 Organisation of Field Work: The primary enumerators were drawn from among the best of the sorters recruited for sorting purposes at the regional centres of each State. Wherever possible the net work of experienced investigators of the Bureau of Economics & Statistics were also employed for the purpose. The HQ staff of the State Census Offices acted as the! Supervisors. In order to enforce uniformity in the understanding of the concepts and methodology involved. regional training seminars were cond.ucted ,?y the Central Staff. The supervisory officials who particIpated In these seminars, imparted in their turn intensive training to the primary enumerators. The programme of field work was so organisert that no enumerator did the primary enumeration and desk match/reconciliation in the same block.
4.6 Period of field Work: The entire programme of re-enumeration, desk-match and field re-conciliation was organised during 15th to 30th April 1971 in most of the States.
5. Estimation procedures
5: 1 The variou& characteristics were estimated by the unbJased method. The sample in each stratum was divided into 10 Random Groups in order to estimate the variances of the estimated totals. :Since the error rates were calculated using the total censused individuals of the respective areas the relative standard error of the estimated totals are equal to that of the corresponding rates also.
6. Level of presentation of results
6.1 It was decided that the results will be presented for areas where the sample size was adcquatc enough to provide total net error rate of persons with a percentage relative standard error of 10% or less. Most of the individual States by themselves did not conform to the criterion. Consequently, contiguous States were combined into four groups. The sample size of each was large enough to give reliable total net error rates. The four groups then fonned are:
Group A (Southern States): Kerala, Tamil Nadu, Mysore and Andhra Pradesh.
Group B (Eastern States): Bihar, .West Bengal, Assam and Orissa.
Group C (Western States): Maharashtra, GUjarat, Madhya Pradesh and Rajasthan.
Group D (Northern States): Haryana, Punjab, DeIhl and Uttar Pradesh.
7. The Results
7.1 The salient results of the survey are presented in the three following statements. A more detailed analysis of the data including those relating to content error check will be brought out in the form of a report at a later date. Statement 1 gives the sex-wise net omission rate per thousand enumerated population and the ~associ~ted percentage relative standard error by type of error for all-Indla and the four groups of States. The percentage distribution of net .omission of persons by age and sex and the associated age specific rates are presented in the Statements If and III respectively for all-India and the four groups of States.
7.2 It is found that Type I error accounts for less than a tenth of the total error in the census count in all-India as well as among the groups of States pointing towards the accuracy of the houselist prepared on the eve of the census enumeration. However, the quantum of Type I error is relatively more in the urban areas than in the rural areas. A major contribution, therefore, to the total under-enumeration flows from the type II error, viz., the error in counting persons in the already censused houses.
34
7.3 It is found that the extent of duplication is roughly 18% of that of omission as the following figures show:
Duplication
Omission X 100
Males Females Persons
Rural
Urban
Total
19·6
16·0
18.3
17·2
18 ·2
17'5
18·3
1'7·0
17·9
In other words, duplication accounts for about a seventh of the total gross error in the census.
7.4 For India as a whole, it is observed that there has been a net under count of 17 persons for every thousand persons enumerated with the associatea relative standard error of 5.25%_ It is, therefore, assl!J:ted with 99 % probability that for every thousand persons actually enumerated in the census, the true number lies between 1014 to 1019. Among the groups of States, Group A comprising the Southern States shows the lowest net under (,Ount of 12 persons per thousand while the Group D, comprising the Northern States gives the highest under count of about 21 persons per thousand. The interval estimates corresponding to 99 % probability level, of the actual number of persons per thousand enumerated persons for the four groups respectively are:-
Group A (Southern States) 1009 to 1015
Group B (Eastern States) 1011 to 1020
Group C (Western States) 1015 to 1023
Group D (Northern States) 1014 to 1028
All India 1014 to 1019
7.5 The difference between the overall rural and urban rates is found to be highly significant for all-India and Groups B & C. No differential is observed for Groups A & D.
7.6 The sex differential in the net. omission rates is found to be statistically significant in the rural and all areas for all-India and Group D. In other cas<;s the difference is not statistically signifiC<lnt.
7.7 Statement IT shows that of those omitted around 5 % are of age '0' and another 20 % are children aged 0-4. Persons aged 15--44 who represent the mobile section of the population, constitute roughtly 40% of that total omitted persons. This pattern is more or less common to all the groups of States. The differential by age can be more critically appreciated from the age-specific net omission rates given in Statement III.
7.8 Statement III reveals the following salient points: (a) The net omission rate for age '0' is the highest followed by ages 1-4 in the case of all persons and males. In the case of females though the omission rate is also the highest at age '0', the next highest rate falls in the ages 60+. Western. Zone, however, does not appear to fit into this pattern, the rate for age '0' particularly for males being abnormally Jow. (b) Though sex selectivity is not apparent in the percentage distribution of net omitted persons by age (State ment II) there is evidence of it in the age pattern of net omission rate (Statemnt III). The rates for ages '0', 45-59 and 60+ are distinctly higher for females than for males. This more or less substantiates the generally held view regarding the greater neglect of females particularly at infantile and old ages relative to males. (c) Whereas the net omission rate for age 35-44 is of the same order in tbe rural areas, clear differentia1 is observed to exist between the two sexes in the case of urban areas. In this case the female rate is found to be much lower than the male rate. It may be due to more mobility of males compared to females.
8. New featllres of the Post Enumeration Check Survey 1971
8.1 It is often pointed out that the mechanism of Post Enumeration Check does not lead to a critical appreciation of errors in census
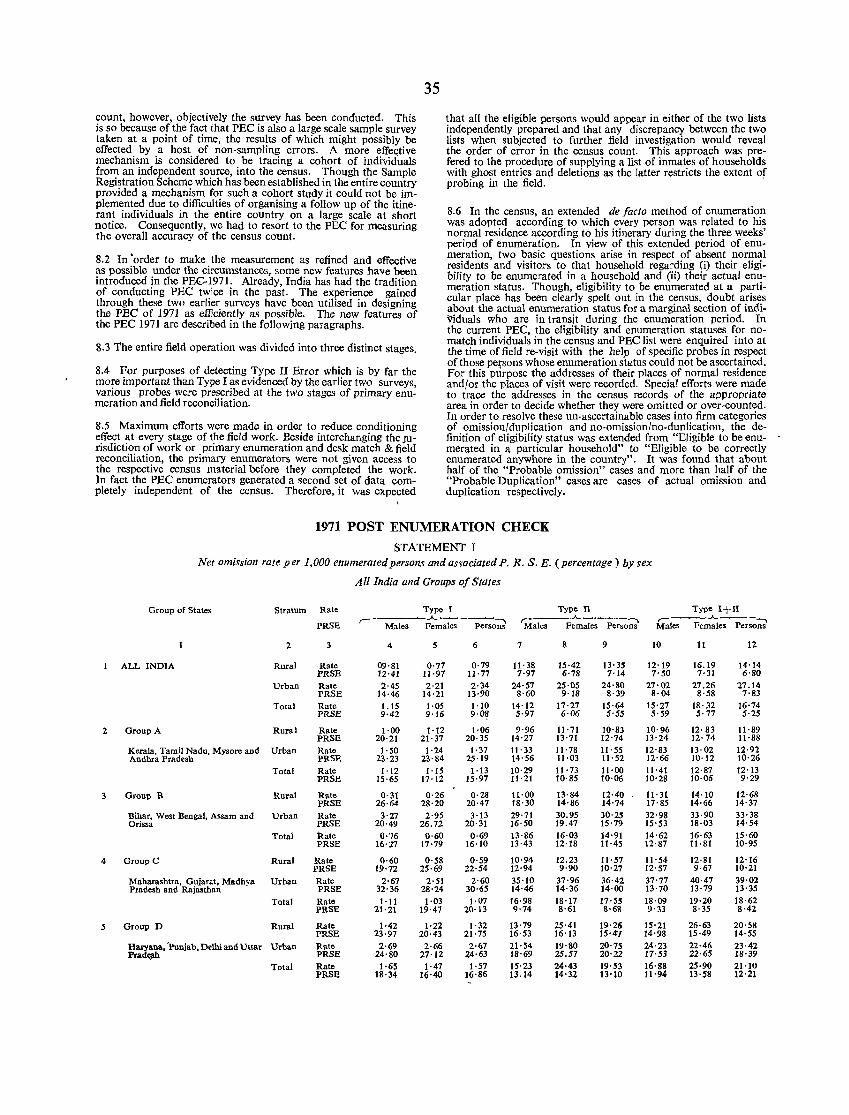
count, however, objectively the survey has been conducted. This is so because of the fact that PEC is also a large scale sample survey taken at a point of time, the results of which might possibly be effected by a host of non-sampling errors. A more effective mechanism is considered to be tracing a cohort of individuals from an independent source, into the census. Though the Sample Registration Scheme which has been established in the entire country provided a mechanism for such a cohort study it could not be implemented due to difficulties of organising a follow up of the itinerant individuals in the entire country on a large scale at short notice. Consequently, we had to resort to the PEe for measuring the overall accuracy of the census count.
8.2 In 'order to make the measurement as refined and effective as possible under the circumstances, some new features have been introduced in the PE(;-1971. Already, India has had the tradition of conducting PEe twice in the past. The experience gained through these two earlier surveys have been utilised in designing the PEe of 1971 as efficiently as possible. The new features of the PEC 1971 are described in the following paragraphs.
8.3 The entire field operation was divided into three distinct stages.
8.4 For purposes of detecting Type II Error which is by far the more important than Type I as evidenced by the earlier two surveys, various probes were prescribed at the two stages of primary enumeration and field reconciliation.
8.5 Maximum efforts were made in order to reduce conditioning effect at every stage of the field work. Beside interchanging the JUrisdiction of work or primary enumeration and desk match & field reconciliation, the primary enumerators were not given access to the respective census material before they completed the work. In fact the PEC enumerators generated a second set of data completely independent of the census. Therefore, it was expected
35
that all the eligible persons would appear in either of the two lists independently prepared and that any discrepancy between the two lists when subjected to further field investigation would reveal the order of error in the census count. This approach was prefered to the procedure of supplying a list of inmates of households with ghost entries and deletions as the latter restricts the extent of probing in the field.
8.6 In the census, an extended de facto method of enumeration was adopted according to which every person was related to his normal residence according to his itinerary during the three weeks' period of enumeration. In view of this extended period of enumeration, two basic questions arise in respect of absent normal residents and visitors to that household regarding (i) their eligibility to be enumerated in a household and (ii) their actual enumeration status. Though, eligibility to be enumerated at a particular place has been clearly spelt out in the census, doubt arises about the actual enumeration status for a marginal section of indi\1iduals who are in transjt during the enumeration period. In the current PEC, the eligibility and enumeration statuses for nomatch individuals in the census and PEC list were enquired into at the time of field re-visit with the help of specific probes in respect of those persons whose enumeration status could not be ascertained. For this purpose the addresses of their places of normal residence and/or the places of visit were recorded. Special efforts were made to trace the addresses in the census records of the appropriate area in order to decide whether they were omitted or over-counted. In order to resolve these un-ascertainable cases into firm categories of omission/duplication and no-omissionfno-duolicatioll, the definition of eligibility status was extended from "Eligible to be enumerated in a particular household" to "Eligible to be correctly enumerated anywhere in the country". It was found that about half of the "Probable omission" cases and more than half of the "Probable Duplication" cases are cases of actual omission and duplication respectively.
1971 POST ENUMERATION CHECK
STATEMENf I Net omission rate per 1,000 enumerated persons and asvociated P. R. S. E. (percentage) by sex
All India and Groups of States
Group of States Stratum Rate Type I Type n Type I+II
PRSE ,.
Males .A.-___ ....... Females Persons
,--_~_.A. ____ ....... Males Females Persons
r----.A.---....... Males Females Persons
2 3 4 5 6 7 8 9 10 11 12
ALL INDIA Rural Rate 09·81 0·71 0·79 11·38 15·42 13· 35 12'19 16.19 14·14 PRSB 12·41 11·97 11·71 7·97 6'78 7·14 7'50 7·31 6·80
Urban Rate 2·45 2·21 2·34 24·57 25·05 24'80 27'02 27.26 27.14 PRSE 14·46 14·21 13·90 8·60 9'18 8·39 8·04 8·58 7'83
Total Rate 1.15 1·05. 1·10 14·12 17·27 15·64 15'27 18·32 16'74 PRSE 9·42 9'16 9'0~ 5·97 6·06 5'55 5'59 5·77 5·25
2 Greup A Rural Rate 1·00 1·12 1·06 9·96 11·71 10·83 10'96 12· 83 11'89 PRSB 20·21 21·37 20·35 14'27 13'71 12'74 13'24 12·74 tI'88
Kerala, Tamil Nadu, Mysore and Urban Rate 1·50 1'24 1·37 11·33 11·78 11·55 12'83 13·02 12·92 Andbra Pradesh PRSB 23·23 23·84 25·19 14'56 11·03 11'52 12·66 10·12 10'26
Total Rate 1·12 1·15 1·13 10·29 11'73 11·00 11'41 12·87 12·13 PRSE 15·65 17'12 15·97 JI·21 10·85 10·06 10'28 10·06 9'29
3 Group B Rural Rate 0·31 0·26 0·28 11·00 13·84 12·40 11· 31 14· 10 12'68 PRSE 26·64 28'20 20·47 18·30 14'S6 14'74 17'S5 14·66 14·37
Bihar, West Bengal, Assam and Urban Rate 3'27 2·95 3·13 29'71 30.95 30·25 32'98 33·90 33·38 Orissa PRSE 20·49 26.72 20·31 16·50 19.47 15'79 15'53 IS·03 14'54
Total kate 0·'16 0·60 0·69 13·86 16·03 14·91 14'62 16·63 15·60 PRSE H>"27 17'79 16·10 13·43 12'18 11·45 12'87 11·81 10·95
4 Group C Rural Rate 0·60 0'58 0·59 10·94 12.23 1l'57 ll'54 12·81 12·16 PRSB 19·72 25·69 22·54 12·94 9·90 10'27 12'57 9·67 10'21
Maharashtra, Gujarat, Madhya Urban Rate 2·67 2·51 2·60 35·10 37·96 36·42 37'71 40·47 39·02 Pradesh and Rajasthan PRSE 32·36 28·24 30·65 14·46 14·36 14·00 13'70 13·79 13·35
Total Rate l·ll 1·03 1·07 16·98 18'17 17'55 18'09 19·20 18·62 PRSE 21'21 19·47 20·13 9'74 8·61 g·68 9'33 8·35 8·42
:s Group D Rural Rate 1·42 1'22 1·32 13'79 25·41 19·26 15'21 26·63 20'58 PRSB 23·97 20·43 21·75 16·53 16'13 15'4', 14'98 15·49 14'55
Haryana, 'Punjab, Delhi and Uttar Urban Rate 2·69 2·66 2·67 21·54 19·80 20'75 24'23 22·46 23·42 Prad¢ PRSB 24'80 27·12 24·63 IS·69 25.57 20'22 17'53 22·65 18'39
Total Rate 1·65 1·47 1·57 15'23 24·43 19·53 16'88 25·90 21'IU PRSE 18'34 16·40 16·86 13.14 14'32 13'10 11'94 13'S8 12'21
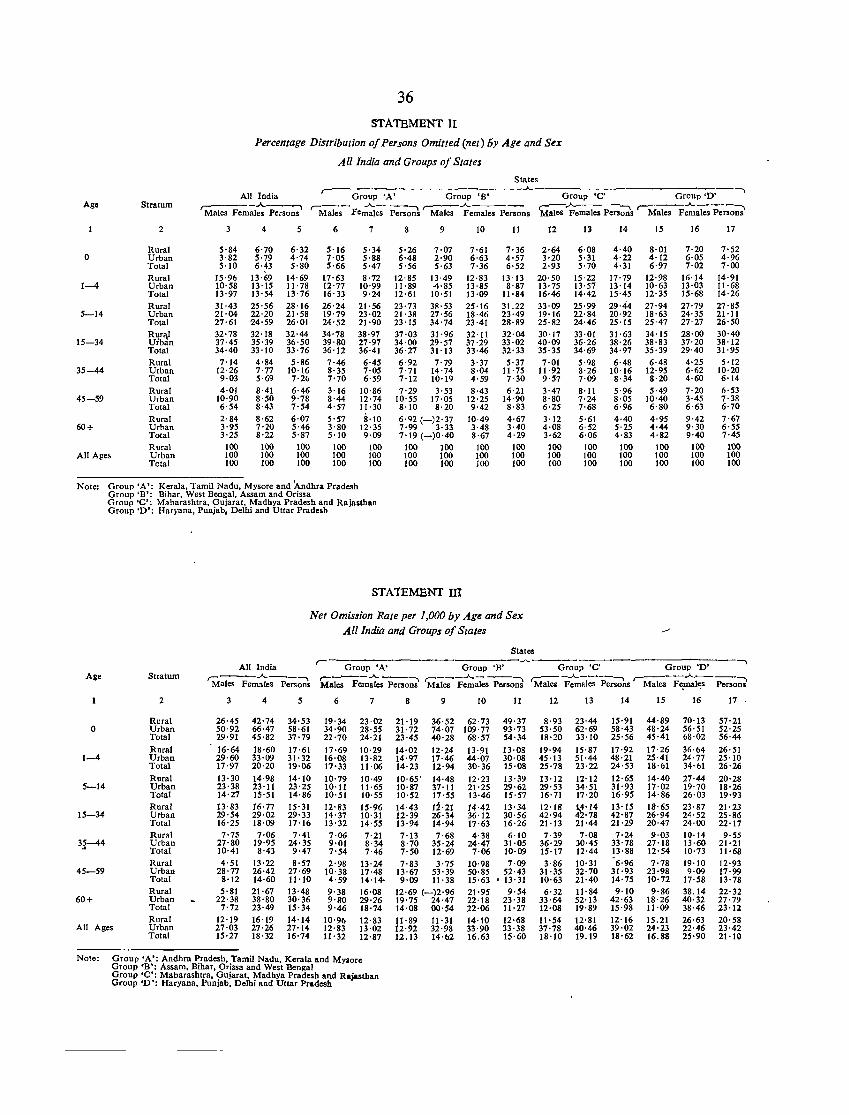
36 STA TBMENT II
Percentage Distribution of Persons Omitted (net) 5y Ag~ and Sex
All India and Groups of States
States
All India r- Group 'A' Group-'-B-' --_..A.. Group 'C' Group '0' Age Stratum
'Males F;;;'-;;j~~;' r-Males-Fe~;- ~;;;,~ 'Ma~~e~e;;ns Males "i>emales Pe;'~ r-Males F~~esPer;'-;;;'
o
1-4
5-14
15-34
35-44
45-59
60+
2
Rural Urban Total Rural Urban Total Rural Urban Total
~~~fn Total Rural Urban Total Rural Urban Total Rural Urban Total
3
5·84 3·82 5'10
15·96 10·58 13·97 31·43 21·04 27'61 32·78 37·45 34·40 7'14
12·26 9·03 4·01
10·90 6·54 2·84 3·95 3·25
4
6·70 5·79 6·43
13·69 13·15 13·54 25·56 22'20 24·59 32·18 35'39 33'10 4'84 7·77 5·69 8·41 8'50 8·43 8'62 7·20 8'22
5
6·32 4'74 5'80
14·69 11'78 13·76 28·16 21·58 26·01 32·44 36'50 33'76 5·86
10·16 7·26 6·46 9·78 7'54 6·07 5·46 5'87
6
5'16 7'05 5'66
17·63 12'77 16'33 26'24 19'79 24'52 34'78 39'80 36'12 7'46 8'35 7'70 3'16 8'44 4'57 5'57 3'80 5'10
7
5'34 5·88 5·47 8·72
10'99 9·24
21·56 23·02 21·90 38·97 27·97 36·41 6·45 7·05 6'59
10·86 12·74 11·30 g'10
12·35 9·09
All Age~ Rural Urban Total
100 100 100
100 100 100
100 100 100
100 100 100
100 100 100
Note: Group 'A': Kerala, Tamil Nadu, Mysore and Andhra Pradesh Group 'B': Bibar, West Bengal, Assam and Orissa Group 'C': M.barashtra, Gujarat, Madhya Pradesh and Rajasthan Group '0': Haryana, Punjab, Delhi and Uttar Pradesh
8
5·26 6·48 5'56
9
7·07 2·90 5'63
12·85 13·49 11'89 4·85 12·61 10'51 23·73 3R·53 21·38 27·56 23'15 34'74 37·03 31·96 34·00 29'57 36·27 31·13 6·92 7·79 7'71 14'74 7·12 10·19 7·29 3'53
10·55 17·05 8'10 8·20
~:~~ (-)~:~j 7'19 (-)0'40
100 100 100 100 100 100
STAtEMENT m
10
7'61 6·63 7'36
12·83 13·85 13·09 25·16 18·46 23·41 32·11 37·29 33·46 3·37 8·04 4'59 8·43
12·25 9·42
10·49 3·48 8·67
100 100 100
11
7'36 4·57 6'52
13·13 8'87
11·84 31.22 23·49 28'89 32·04 33·02 32·33 5·37
11·75 7·30 6·21
14·90 8·83 4·67 3·40 4·29
100 100 100
Net Omission Rate per 1,000 by Age and Sex AI/India and Groups of States
States
12
2'64 3'20 2·93
20·50 13'75 16·46 33·09 19'16 25'82 30'17 40·09 35'35 7·01
11·92 9·57 3·47 8'80 6·25 3·12 4·08 3'62 100 100 100
13
6·08 5·31 5'70
15·22 13·57 14·42 25·99 22'84 24·46 33·01 36·26 34·69 5·98 8'26 7·09 8·11 7·24 7·68 5·61 6'52 6·06
100 100 100
14
4·40 4·22 4·31
17'79 13'14 15·45 29·44 20·92 25'15 31'63 38'26 34·97 6·48
10'16 8·34 5·96 8·05 6·96 4·40 5·25 4·83
100 100 100
IS
8·01 4'12 6·97
12·98 10'63 12·35 27'94 18·63 25·47 34·15 38·83 35·39 6·48
12·95 8'20 5·49
10'40 6·80 4·95 4·44 4·82
100 100 100
16
7·20 6·05 7·02
16·14 13·03 15·68 27·79 24·35 27·27 28·00 37·20 29·40 4·25 6·62 4·60 7·20 3·45 6·63 9·42 9·30 9·40
100 100 100
17
7'52 4·96 7·00
14·91 11·68 14·26 27·85 21·11 26·50 30·40 38·12 31·95
5·12 10·20 6·14 6'53 7·38 6'70 7·67 6·55 7·45
100 100 100
All India r- Group 'N G'C'r-o-u-p-'-B-'- Group 'C' Group '0' -.. Age Stratum ~_..A.. ___ --",\ ,-_---..A.. __ ~ r-----"-----.. cc---..A..---~ ~----...A..----.,
Males Females Persons Males Females Persons Males Females Persons Mal", Females Persons Males F~mal"s PersoUl
o
1-4
5-14
15-34
45-59
60+
2
Rural Urban Total
Rural Urban Total
Rural Urban Total Rural Urban Total Rural Urban Total Rural Urban Total Rural Urban Total
26·45 50·92 29·91
16·64 29·60 17'97 13·30 23·38 14·27 13'83 29'54 16'25 7·75
27'80 10·41 4'51
28'77 8'12 5'81
22·38 7'72
4
42·74 66·47 45·82
18'60 33·09 20·20
14·98 23'11 15'51 16·77 29·02 18·09 7·06
19·95 8·43
13·22 26·42 14·60 21·67 38·80 23·49
5
34'53 58·61 37·79
17·61 31·32 19·06
14'10 23·25 14'86 15·31 29'33 17·16 7·41
24·35 9·47 8'57
27·69 11'10 13·48 30'36 15·34
6
19'34 34'90 22'70
17'69 16'08 17'33 10'79 10'11 10-51
12'83 14'37 13'32 7·06 9'01 7-54 2'98
10'38 4'59 9'38 9'80 9·46
7
23·02 28'55 24·21
10·29 13·82 11·06 10·49 11·65 10'55 15·96 10·31 14'55 7·21 8'34 7·46
13·24 17·48 14'14-16·08 29·26 18·74
All Ages Rural Urban Total
12'19 27·03 15·27
16·19 27·26 18·32
14'14 27'14 16·74
10'96 12'83 11'32
12'83 13·02 12'87
Note: Group 'A': Andhra Pradesh, Tamil Nadu, Kera1a and MYlor. Group 'B': Assam, Bihar, Orissa and West Bengal Group 'C': Maharashtra, Gujarat, Madhya Pradesh and Rljasthan Group '0': Haryana, Punjab, Delhi and Uttar Pradesh
8
21·19 31·72 23·45
14·02 14·97 14·23 10·65' 10'87 10·52 14·43 12·39 13·94
9 10
36·52 62·73 74·07 109'77 40'28 68'57
12·24 13'91 17·46 44·07 12·94 30·36 14·48 12·23 37'11 21'25 17'55 13·46 12·21 14·42 26·34 36'12 14·94 17·63
7·13 7·68 4·38 24·47 8'70 35·24
7'50 12·69 7·83 3·75
13·67 53·39 9·09 11·38
12·69 (-)2'96 19'75 24·47 14·08 00'54
11'89 11·31 12·92 32·98 12.13 14'()2
7·06 10·98 50·85 15'63 21·95 22'18 22·06 14'10 33·90 16.63
II
49·37 93·73 54'34 13·08 30·08 15·08
13·39 29·62 15'57 13'34 30'56 16·26 6·10
31·05 10·09 7·09
52·43 , 13·31
9·54 23'38 11·27 12·68 33·38 15'60
12
8·93 53'50 18'20 19·94 45'13 25·78 13·12 29'53 16·71 12·18 42·94 21'13 7·39
36'29 15'17 3·86
31·35 10·63 6·32
33·64 12·08 11'54 37·78 18'10
13
23·44 62·69 33'10
15·87 51·44 23·22
12'12 34·51 17-20 1.4'14 42'78 21·44 7·08
30·45 12·44 10·31 32·70 21·40 11·84 52'13 19·89 12·81 40·46 19.19
14
15·91 58·43 25'56
17·92 48·21 24·53
12·65 31·93 16·95 13·15 42·87 21·29 7·24
33'78 13'88 '6'96 31·93 14'75 9'10
42'63 15·98 12'16 39·02 18'62
IS
44·89 48'24 45·41
17·26 25·41 IS·1lI
14·40 17·02 14·86 18·65 26·94 20·47 9·03
27·18 12'54 7·78
23·98 10'72 9'86
18·26 11·09 15.21 24·23 16.88
16
70·13 56'51 68·02
36·64 24·77 34'61 27·44 19'70 26·03 23'87 24'52 24·00 10·14 13·60 10·73 19·10 9·09
17·58 38.14 40·32 38·46 26'63 22·46 25·90
17 .
57·21 52'25 56·44
26'51 25'10 26·26
20·28 18·26 19·93 21·23 25'86 22'17 9·55
21'21 11·68 12·93 17·99 13'78 22·32 27·79 23'12 20·58 23·42 21'10
A-I
AREA, HOUSES AND POPULATlON

A-I AREA, HOUSES AND POPULATION
FLY-LEAF
Table A-I is the basic pDpulat\Dn table which cDrrespDnds to' the general pDpulatiDn table A-I Df the 1961 and 1951 Censuses. This table gives the statistics of area in km2, population per km2
number of villages inhabited and uninhabited separately, number of towns, number of O'ccupied residential hO'uses, number O'f hO'usehO'lds and pDpulatiDn by sex accO'rding to' the 1971' ~nsus. The figures are given first fO'r India, states and uniDn territO'ries, fO'llO'wed by districts in each state and uniDn territDry.
There are three appendices attached to' this table.
Appendix-I which gives details Df all the changes in the jurisdictiO'n O'f variO'us administrative units, is presented in the fDrm O'f twO' statements. Statement A gives the details Df the present set up of each state/uniO'n territory as emerged from the terrjtDries O'f 1961 Census. Statement B ShDWS an accO'unt O'f readjustment in district boundaries since 1961 within each state/ uniO'n territDry as it stands reO'rganised as per statement A referred to' abDve. '
A sub-appendix shDwing the areas fDr 1961 and 1971 fO'r thO'se tO'wns which have undergO'ne changes in area since 1961 census, alDngwith PO'PulatiO'n O'f 1961 and 1971 fDr the transferred area O'nly is alsO' given fDr each state/uniO'n territO'ry separately.
Appendix-II ShDWS the number O'f villages with a pDpulatiO'n of 5,000 and over and tDWns with a populatiDn O'f under 5,000 fO'r India, state/uniDn territDry and district separately. One Df the criteria fDr a place to' be treated as tO'wn is that it shO'uld nO'rmally have a pDpulatiDn Df 5,000 and Dver. FDr variDUS reaSDns a few places with a pDpulatiDn Df five thDusand and O'ver are nDt treated as tO'wns while a number Df places with less than 5,000 PO'PulatiDn are treated as tDwns if they pDssess distinct urban characteristics. This appendix enlists such places with their pDpulatiDn.
The appendix alsO' gives the pDpulatiO'n Df the villages and tDwns Df the categDries mentiDned above and the percentage Df rural/urban PO'PulatiDn to' tO'tal O'f rural/ urban pDpulatiO'n. For districts, the precentages have been worked O'n the tDtal of rural/urban population Df the state/uniO'n territDry.
Appendix-III furnishes figures fDr hDuseless pDpulatiDn and institutiO'nal.pDPulatiDn separately fDr rural and urban areas. The figures are given fO'r India, states/uniDn territO'ries and districts.
INTER-STATE TERRITORIAL TRANSFERS
NO' whDlesale inter-state transfers tDDk place between 1961-1971. But a few transfers and changes did take place. They
are listed beIDW:
1. Andhra Pradesh and Mysore
Under the Andhra Pradesh and MysDre (Transfer Df TerritDries) Act, 1968, 5 acres 3 guntas O'f Survey NO'. 19 O'f Abkavaripally village, Bagepalli taluk, KDlar district, weye transferred to' Andhra Pradesh and merged with Hindupur talJ.!k Df Anantapur district Dn 1-10-1968.
2. Andhra Pradesh and Orissa
During the decade the GDvernment Df Orissa laid claims to' a grDUP O'f villages called the KDtiya GrDup O'f villages lying in the, agency pDrtiDn Df Salur taluk Df Srikakulam district and alsO' cDntended that they were under their administrative cDntrDI. The basis fO'r this claim was that this grDUP Df villages lay within Orissa state bDundaries accDrding to' bO'undary line defined in the Orissa State FormatiDn Act O'f 1936. This was not accepted by the GDvernment Df Andhra Pradesh. The dispute remained unresDlved and in 1968 the Government of Orissa filed a suit agaixtst the Government Df Andhra Pradesh in the Supreme
39
CDurt Df India claiming jurisdictiDn Dver these 'villages. The Supreme CDurt issued an interim Drder Dn 2 December, 1968 stating that status quO' ante (as existing O'n 2 December, 1968) be maintained by the parties and that there ShDUld be 110' further ingress O'r egress O'n the territO'ries in dispute O'n the part Df either party. The Registrar General, therefDre, advised the DirectDrs Df Andhra Pradesh and Orissa to' get the census cDun~ dO'ne in the disputed area lying in their respective jurisdictiDns. AccDrdingly enumeratiDn was dDne in the disputed area by the respective DirectDrs. It was further decided that a CDmmDn nDte explaining the pDsitiDn wDuld be given in Part II-A VDlumes O'f Andhra Pradesh, Orissa and All India and alsO' in the CDncerned District census handboDks.
3. Bihar and Uttar Pradesh
FO'llDwing the Trivedi Award to' determine the boundaries Df Bihar and Uttar Pradesh, the Bihar-Uttar Pradesh (AlteratiDn O'f BDundaries) Act, 1968 (Act XXIV O'f 1968) came intO' fO'rce O'n 10 June, 1970. The bDundary strip maps published by Survey O'f India under this act fDrmed the basis fO'r transfer O'f territDries between the twO' states. The villages were generally identified with the help Df these maps and in a few cases where the IDcal habitatiDns cDuld nO't be IDcated with reference to' the names given O'n the maps, these were based Dn the repO'rts O'f IO'cal Dfficers. AccDrdingly 99 villages (30 whO'lIy and rest partly) were transferred frO'm Bihar to Uttar Pradesh and 44 villages (8 WhDlly and rest partly) were transferred frDm Uttar Pragesh to' Bihar.
AlthDugh it was rather late fO'r the census to' adDpt the jurisdictiDns newly carved Dut, the DirectO'rs Df Bihar & Uttar Pradesh tried their UtmDSt to' CO'nfDrm to' these. But the bDundary strip maps themselves, which fO'rmed the basis fO'r such delineatiO'n, in sO'me cases as mentioned above were not cDmplete and hence fO'r such cases they had to' gO' by the repDrts O'f IDcal O'fficers. It was but natural that such repDrts (frO'm two sides) wDuld be cDnflicting at times. The effO'rts Df the twO' DirectDrs to' settle such discrepancies yielded results but in certain cases they alsO' felt helpless because Df the different stands taken by the two sides. The R.G's Office then decided to' present the data having regard to' the new JurisdictiDns to' the extent pDssible and fO'r cDntrDversial cases elabDrate fDDt nO'tes were prDvided to' explain the situatiDn withDut prejudice to' the respective claims Df the twO' sides O'n such areas. The fO'DtnO'tes are reprO'duced in appendix-I tD·table A-I.
4. Territories carved out from Assam
I. Meghalaya:- On April 2, 1970 tho autDnDmous state Df Meghalaya was formed within the state Df Assam vide the Assam ReDrganisatiDn (Meghalaya) Act 1969-ND. (55 O'f 1969) dated 20 December, 1969 comprising the United Khasi and Jaintia hills district as described in sub-paragraph (2) Df paragraph 20 O'f the sixth schedule to' the cDnstitutiO'n (exclusive Df the prDvisD theretO') and. the Garo hills district. A pDrtiDn Df ShillDng tDwn, namely EurO'pean ward, PO'lice bazar ward and JailrDad ward and ShillDng cantDnment remained with Assam. ThDugh these three wards O'f ShillO'ng tDwn and the ShillDng cantO'nment cO'vering an area Df 13 km2 were administratively in Assam as O'n 1-4-71 they have been excluded frO'm Assam and shDwn under Meghalaya fDr statistical purpDses.
By virtue Df the NDrth-Eastern Areas (ReDrganisatiDn) Act 1971 (Act NO'. 81 of 1971) enacted by Parliament, a new state knO'wn as the state Df Meghalaya was fDrmed cDmprising (a) the -territDries which were cDmprised in the autDnO'mDUS state O'f Meghalaya fO'rmed under sectiDn 3 O'f the Assam ReDrganisatiDn (Meghalaya) Act 1969 (55 Df 1969) and (b) SO' much'Df the territDries cDmprised within the cantDnment and municipality Df Shillong as did not fDrm part O'f that autonO'mDUS state. The new state O'f Meghalaya came intO' being Dn 21' January, 1972 and ceased to' fDrm part Df the existing stato Df Assam. In effect Jhe three wards of ShillO'ng runicipality and Shillong
canto)1ll1ent which formed part of Assam, got merged il).. the state' of Meghalaya from this state. . ._
-II. Union territory of Mizoram:'-- By virtue of.the l-l<?rth-.
Eastern Areas (Reorganisation) Act 1971, 'a new union' tern~orr of Mizoram comprising' the territories which were c9rripnse. in the Mizo district in the state of' Assam was constituted. TThhlS union ·territocy also came into being Oll 21 January, 19,72' e data of present union territory of ·Mizoram which. was then 'a district of Assam have, therefore, been presented witliiJl. thP stai~ of Assam.' .(
III. North East Frontier Agency:- At the time of taking 1'71 Census, the North East Froll.tier Agency was a part of A8am administered directly by the Precident of India through thtl overnor of Assam as his agent.
In 1972 NEFA was also formed into a new union territ?ry of Arunachal Pradesh with the territories as specified in ~eg!On 6 of the North-Eastern Areas (Reorganisation) Act 1971. ata
f for NEFA are, however, being shown in this book as those 0
~>'~~'b."'~'b.\ ~"'b.~~"\,~.
5. Territories carved out from the composite state of Pwliab
I. Haryana:-The state of Haryana was carved out of the composite Punjab state on 1 November, 1966 under the Punjab Reorganisation. Act, 1966 with the following ateas:-
(a) Hisar, Gurgaon, Kamal, Mahendragarh and l{ohtak districts.
(b) 'Narwana & Jind tehsils of Sangrur district comprising the new district Of Jind.
(c) (i) Ambala, Jagadhri & Naraingarh tehsils of ~mbala district; and .
(ii) 153 villages and Kalka town of Kharar tehsil transferred to Naraingarh tehsi!.
The areas transferred at (C) (i) and eii) above formed the district of Ambala in the new state of Haryana. The areas transferred under item (C) (ii) above to the Naraingarh tehsil, were later on taken out of the said tehsil so as to form a new tehsil, namely, Kalka tehsil under the Haryana Govefnment Notification No. 4575-E(V)-67/2626, dated 25 July, 1967.
II. Chandigarh:- Under the provision of Punjsb Reorganisation Act 1966, the union territory of Chandiga(h bwas formed which was formerly part of Kharar tehsil of ~m ala district of composite Punjab state. It comprised 36 villa.¢h .an~ two towns, viz., Manimajra and Chandigarh of Kharar te Silo Ambala district.
III. Portion transferred to Himachal Pradesh:-The Hi(Ilachal Pradesh and Bilaspur (New State} Act, 1954 (32 of 1954) fo_r~ed the new state of Himachal Pradesh by uniting the oXlstlllg states of Himachal Pradesh & Bilaspur. Later on under tjIe provision of Punjab Reorganisation Act of 1966 some morii _ar~as from the composite Punjab state were transferred to the oXlstmg union territory of Himachal Pradesh which are as follow> :-
(1) Complete districts of Kangra, Simla and Lahul .& Spiti of Punjab. Later on Kruu district was carve~ out from Kangra district comprising of entire tebsll of Kulu.
(2) Three towns viz. Bakloh, Dalhousie and Dalhousie Cantt. of Gurdaspur district.
(3) Nalagarh tehsil of Ambala district.
(4) 290 villages alongwith Una town of Una tehsil of goshiarpur district.
This union territory attained statehood under the provision of the Stato of Himachal Pradesh Act, 1970 (Act No. 53 of 1970) which was assented to on 25 December, 1970.
40
I V ~ N! V P _IIj J ;,' - The remaining areas of the erstwhile composite Punjab state after excluding portion as outlined above 'under the proVision of the Punjab Reorganisation Act 1966, formed t~e existing Punjab state.
.6. ' Uniol1' territory of Dadra and Nagar Haleli .:. .,. .........
, BX -the Gonstitution (T~th Amendment) Act, 1961 was estabhshed the union territory of Dadra and Nagar Haveli with effect from 11 Au_gust, 1961. A census of this territory was taken on 1 March, 1962. The census figures for this territory were inc,luded with the census . figures of 1961 alongwith the figures
. of the other states in Indian union without making adjustment to bring the data as on 1 March, 1961. In 1971, census was conducted in this territory along with the rest of the country with reference date as at sunrise of 1-4-71.
7. Union territory of Goa, Daman and Diu
. By the Constitution (Twelfth Amendment) Act, 1962 the umon territory of Goa, Daman & Diu was also established with effect from 20 December, 1961. A census of Goa, Daman & Diu wa,s taken by the then Portuguese Government, as on 15 December, 1960. These figures were adopted for the 1961 Census totals of India. No adjustment was, however, made as on 1 March, 1961. In 1971, census was conducted in this territory as on 1-4-71 like other states & union territories of India.
8. Union territory of Pondicherry
With the corning into force of the Constitution (Fourteenth Ar.n~ndment) Act, 1962 the union territory of Pondicherry compnsmg the (onner French Establishments came into being with effect from 16 August, 1962.
The Pondicherry Administration Ordinance, 1962 was promulgated on 6 November, 1962 which was later replaced by the Pondicherry Administration Act, 1962 with effect from 1 July, 1963. The 1961 Census, however, was conducted in this terri· tory on. due dates i.e. 1-3-61 as part of All India census though legally It was not a part of India then. It was being administered on a de facto basis by the External Affairs Ministry of the Government of India under the Foreign jurisdiction act. 1971 Census was conducted in the territory as on 1-4-71 (the reference date) like other states/union territories in India,
9. Manipur
The union territory of Manipur got statehood on 21 January, 1972 under the provision of North-Eastern Areas Re· organisation Act, 1971. There has been no change in the area of Manipur since 1961. The data of 1971 Census for Manipur are, therefore, being published under the category of state.
10. NagaJantl
By the State of Nagaland Act, 1962 (27 of 1962) a new state of Nagaland was created, which comprised the Naga Hills-Tuensang Area to operate from a date to be notified earlier 'formed by Nagaland .(Transitional provision) Regulation 196. and this came into operation with effect from 1 December, 1963 a~ a state. The figures for Nagaland were not shown under the category of state in 1961 Census. The data collected at the census however, r~ated to the position as on 1 March, 1961, the refe: ren~e .date for the census. In 1971 .Census the population statlsttcs of Nagaland are, however, bemg published under the category of state. '
Subsequent to 1971 Census, in accordance with the pro· visions of section 3(2) o~ the state of Nagaland Act, (1962), the state of Nagaland compnsed of three districts but with a view of introducing a more efficient system of administration in the state, it now comprises of seven districts. These districts came into forc,e by an' order of Government of Nagaland with effect from 21 December, 1973. But in this volume the statistics are beiI!g. presented for three districts only as they reflect the posltlon as on 1-4-1971.
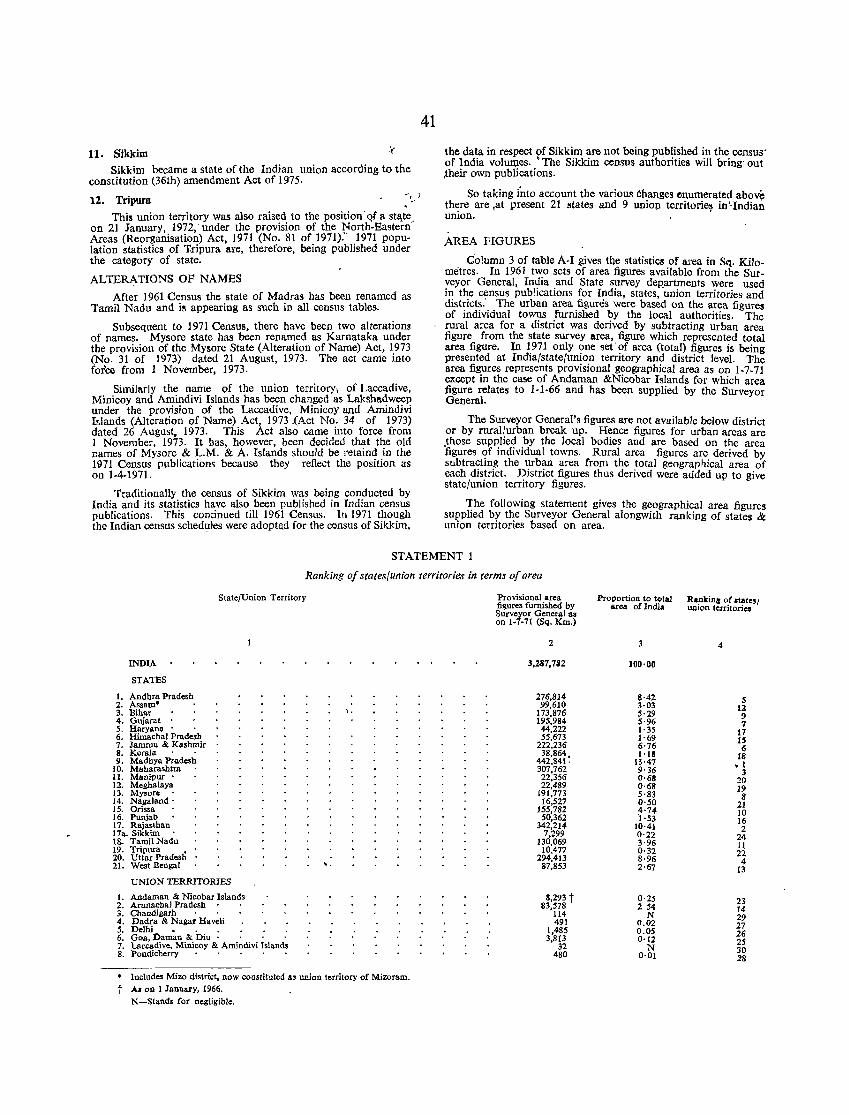
11. Sikkim ~.
Sikkim became a state of the Indian union according to the constitution (36th) amendment Act of 1975.
12. Tripura This union territory was also raised to the position' qf a stl\te,
on 21 January, 1972; under the provision of the ~orth.Eastern Areas (Reorganisation) Act, 1971 (No. 81 of 1971). 1971 popu· lation statistics of T.ripura are, therefore, being published under the category of state.
ALTERATIONS OF NAMES
After 1961 Census the state of Madras has been renamed as Tamil Nadu and is appearing as such in all census tables.
Subsequent to 1971 Census, there have been two alterations of names. Mysore state has been renamed as Karnataka under the provision of the.Mysore State (Alteration of Name) Act, 1973 (No. 31 of 1973) dated 21 August, 1973. The act carrie into foree (rom 1 November, 1973.
Similarly the name of the union territory; of Laccadive, Minicoy and Amindivi Islands has been changed as Lakshadweep under the provision of .the Laccadive, Minicoy and Amindivi Islands (Alteration of Name) Act, 1973 .(Act No. 34 of 1973) dated 26 August, 1973. This Act also came into force from 1 November, 1973. It has, however, been decided that the old names of Mysore & L.M. & A. Islands should be retaind in the 1971 Census publications because they reflect the position as on 1·4·1971.
Traditionally the census of Sikkim was being conducted by India and its statistics have also been published in Indian census publications. This continued till 1961 Census. In 1971 though the Indian census schedules were adopte.d for the census of Sikkim,
41
the data in respect of Sikkim are not being published in the census' of India volUI1,1es. • The Sikkim census authorities will bring' out ,their own publications.
So taking into account the various 6hanges enumerated above th~re are ,at present 21 states and 9 uniOl,) territorie~ in'lndian umon.
AREA FIGURES
Column 3 of table A·I gives tbe statistics of area in Sq. Kilo. metres. In 1961 two sets of area figures available from the Sur. veyor General, India and State survey degartments were used in the census publications for India, states, union territories and districts.' The urban area figures were based on the area figures of individual towns furnished by the local authorities. The rural area for a district was derived by subtracting urban area figure from the state survey area, figure which represented total area figure. In 1,971 only ~me set' ~f area (tot~l) figures is being presented at IndIa/state/umon terrItory and district level. The area figures represents provisional geographical area as on 1-7-71 except in the case of Andaman &Nicobar Islands for which area figure relates to 1·1·66 and has been supplied by the Surveyor General.
The Surveyor General's figures are not available below district or by rural/urban break up. Hence figures for urban areas are ,those supplied by the local bodies and are based on the area figures of individual towns. Rural area figures are derived by subtracting the urban area from the total geographical area of each district. District figures thus derived were added up to give state/union territory figures.
1he following statement gives the g~ographical area figures supplied by the Surveyor General alongwlth ranking of states & union territories based on area.
STATEMENT 1
Ranking of states{union territories in terms of area
INDIA
STATES
1. Andhra Pradesh 2. Assam· 3. Bihar 4. Gujarat . 5. Haryana • 6. Himachal Pradesh 7. Jammu & Kashmir 8. Kerala 9. Madhya Pradesh
10. Maharashtra n. Manipur • 12. Meghalaya 13. My.ore 14. Nagaland' 15. Orissa 16. Punjab 17. Rajasthan 17a. Sikkim 18. Tamil Nadu 19. Tripura , 20. Uttar Pradesh 21. West Bengal
StateJUnion Territory
UNION TERRITORlES
1. Andaman & Nicobar Islands 2. Arunachal Pradesh • 3. Chandigarh 4. Dadra & Naga, Haveli 5. Delhi • . . 6. Goa, Daman & Diu . 7. Laccadive, Minicoy & Amindivi Islands 8. Pondicherry
,.
..
• Includes Mizo district, now constituted a. union territory of Mizoram. t A. on I January, 1966.
N-Stands {or negligible.
Provisional area fillures furnished by Surveyor General a. on 1·7-71 (Sq. Km.)
2
3,287,7&2
276,814 99,610
173,876 195,984 44,222 55,673
222,236 38,864.
442,841, 307,762 22,356 22,489
191,773 16,527
155,782 50,362
342,214 7,299
130,069 10,477
294,413 87,853
8,293 t 83,578
114 491
1,485 3,813
32 480
Proportion to total Ra,nkinll o! .~tes I area of India Wllon terntonea
4
100·00
8·42 S 3·03 12 5·29 9 5·96 7 1· 35 17 1·69 15 6'76 6 1·1S 18
13·47 • 1 9·36 3 0·68 20 0·68 19 5·83 8 0'50 21 ~'74 10 1'53 16
10·41 2 0'22 24 3·96 11 0·32 22 8·96 4 2·67 13
0·25 23 254 14
N 29 0.02 27 0.05 26 0·12 2S
N 30 0·01 28
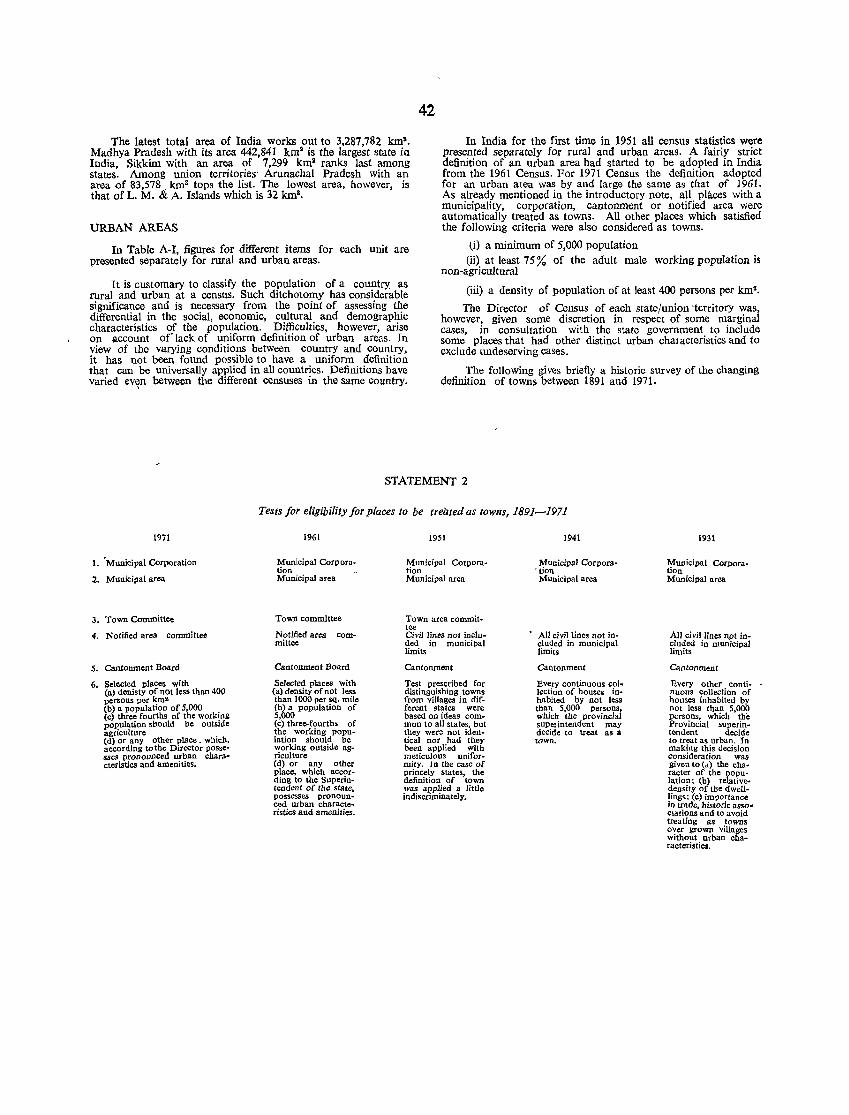
42
The latest total area of India works out to 3,287,782 lan'. Madhya Pradesh with its area 442,841 km! is the largest state in India, Sikkim with an area of 7,299 kmll ranks last among states. Among union territories' Arunachal Pradesh with an area ()f 83,578 < kms tops the list. The lowest area, however, is that of L. M. & A. Islands which is 32 kmll.
In India for the first time in 1951 all census statistics were presented separately for rural and urban areas. A fairly strict definition of an urban area had started to be adopted in India from the 1961 Census. For 1971 Census the definition adopted for an urban area was by and large the same as that of 1961. As already mentioned in the introductory note, all places with a municipality, corporation, cantonment or notified area were automatically treated as towns. All other places which satisfied the following criteria were also considered as towns. URBAN AREAS
til a minimum of 5,000 population In Table A-I, figures for different items for each unit are presented separately for rural and urban areas. (ii) at least 75 % of the adult male working population is
non-agricultural It is customary to classify the population of a country: as
rural and urban at a census. Such ditchotomy has considerable significance and is necessary from the point of assessing the differential in the social, economic, cultural and demographic characteristics of the population. Difficulties, however, arise on account of" lack of uniform definition of urban areas. In view of the varying conditions between country and country, it has not been found possible to have a uniform definition that can be universally applied in all countries. Definitions have varied ev~n between the different censuses in the same country.
(iii) a density of population of at least 400 persons per kula.
1971
1. • Municipal Corporation
2. Municipal area
3. Town Conunittee
4. Notified area committee
S. Cantonment Board
6. Selected places with (a) denisty of not less than 400 persons per km' (b) a population of 5,000 (c) three fourths of the workinll population should be outside agriculture (d) or any other place. which, according to the Director possesseS pronounced urban characteristics and amenities.
The Director of Census of each state/union ·territory was, however, given some discretion in respect of some marginal cases, in consultation with the state government to include some places that had other distinct urban chatacteristics and to exclude undeserving caSes.
The following gives briefly a historic survey of the changing definition of towns between 1891 and 1971.
STATEMENT 2
Tests for eligibility for places to be treated as towns, 1891-1971
1961
Municipal Corporation Municipal area
Town committee
Notified area committee
Cantonment Board
Selected places with (3) density of not less than 1000 per sq. mile (b) a population of 5,000 (c) three-fourths of the working population should be working outside agriculture (d) or any other place, which aCcording to the Superintendent of the state, possesses pronoun .. ced urban characteristics and amenities.
1951
Municipal Corporation Municipal area
Town area co=ittee Civil lines not included in municipal limits
Cantonment
Test prescribed for distinguishing towns from villages in different states were based on ideas common to all states, but they wer~ not identical nor had they been applied with meticulous uniformity. In the ca,e of princely states, the definition of town was applied a little indiscriminately.
1941
Municipal Corpora·tion
Municipal area
,All civil lines not inclUded in municipal limits
Cantonment
livery continuous collection of houses inhabited by not less than 5,000 persons, which the provincial ,upetintendent may decide to treat as a town.
1931
Municipal Corporation Municipal area
All civil lines Apt included in municipal limits
Cantonment
Every other continuous collection of hou,es inhabited by not Ie,s tl)an 5,000 per,ons, which the Provincial superin .. tendent decide to treat as urban. In making this decision consideration was given to (d) the character of the population; lb) relativedensity of the dwelllings; (c) importance in trade, historic associations and to avoid !rea ting as towns OVer grown villages without orban characteristics.
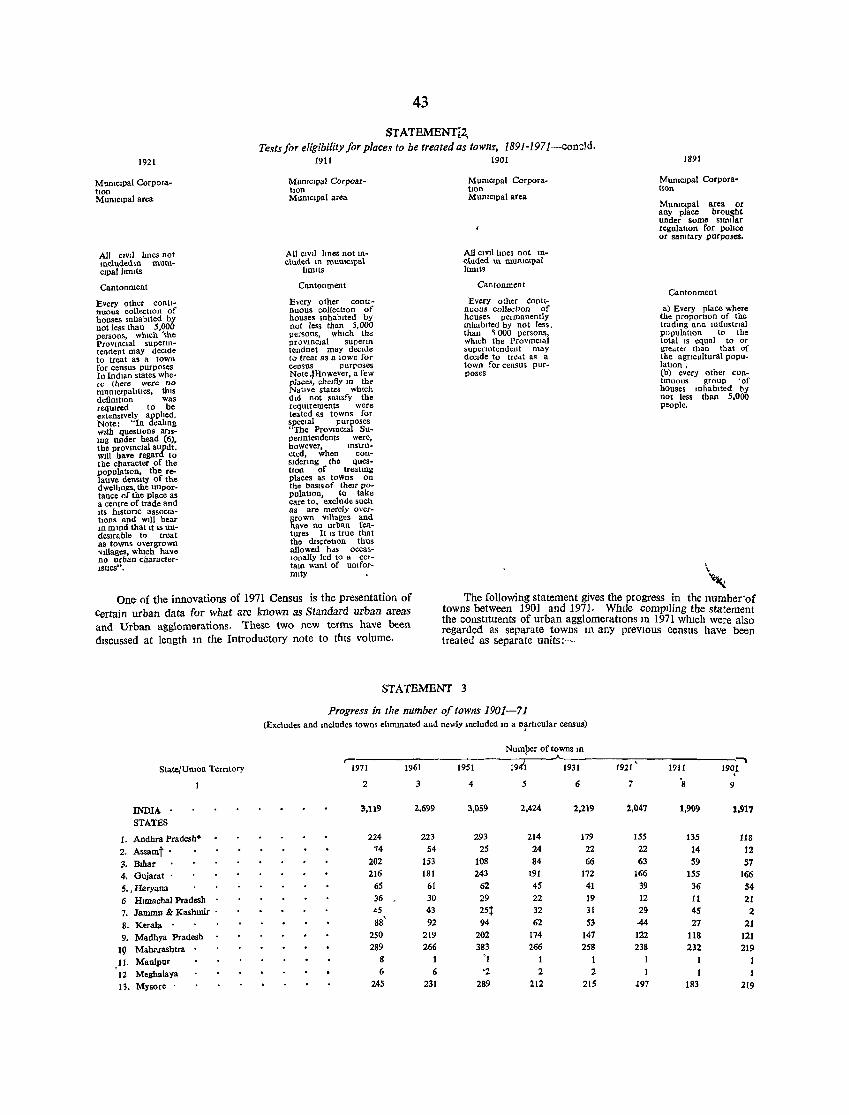
1921
MunICIpal CorporatIon MunICIpal area
All CIVlJ hnes not mc\udedm mumClpal hmlts
Cantonment
Every other contInuolU collectIOn of houses mhablted by not less than 5,000 persons, whIch 'the ProvIncIal supenn .. tendent may deCIde to treat as a town for census purposes In IndIan states where (here were no munlClpabtles, thIS defimtIon was reqUIred to be extensIvely appbed. Note: "In dealIng wzth questIons aTls-109 under head (6), the provmclal supdt. WIll have regard to the character of the populatIOn, the relatIve denSIty of the dwelhngs, the unportance of the place as a centre of trade and Its histonc associatIons and WIll bear 10 mlOd that It IS undesIrable to treat as towns overgrown Villages, wruch have no urban characterlStlCS".
43
STATEMENTi2, Tests for eligibility for places to be treated as towns, 1891-1971-concld.
1911 1901
MunICIpal Corpoarbon MUnICIpal area
All cml Imes not meluded U\ mUniCIpal
limIts
Cantonment
Every other contInuous collectIon of houses InhabIted by not less than 5,000 persons, whIch th" prOVInCial superm tendnet may decIde to treat as a town for census purroses Note .,However, a few places, Cbelfly 10 the Nallve states whIch dId not satIsfy the reqUlrem.ents were teated as towns for specIal purposes "The ProvIncial SuperIntendents were, however, mstru ... cted, when eOQM sldermg the questIon of treatmg places as towns on the baSIS of thelT populatIOn, to take care to, exclude such as are merely ovecM grown VIllages and have no urban features It IS true that the ruscretlOn thus allowed hds occasIOnally led to a cel. ... tam want of umforIOlty
M uDlclpal CorporatlOU MunICIpal area
All clvll hnes not mchlded 10 mUlUClpal hmlts
Cantonment
Every other ~ontlnuous collectIOn of houses permanently mhablted by not less. than ~ 000 persons, which the Provmclal 5upeflutendent may decide to tredt as a town for cenSus PUfM poses
1891
MUnicIpal CorporatIon
MunICIpal area or any place brought under some slmliar regulatIon for polIce or samtary purposes.
Cantonment
a) Every place where the proportIOn of the tradmg ana mdustnal populatwn to the total IS equal to or greater than that of the agncultural populatIon, (b) every other contmuous group 'of hOuses Inhabited by not less than 5,000 people.
\~ One of the innovations of 1971 Census is the presentation of
Certain urban data for what are known as Standard urban areas and Urban agglomerations. These two new terms have been discussed at length In the Introductory note to thIS Ilolume.
The following statement gives the progress in the number'of towns between 1901 and 1971. WhIle compIling the statement the constituents of urban agglomeratIOns 10 1971 which were also regarded as separate towns In any prevIOus census have been treated as separate units:-
STATEMENT 3
Progress in the number of towns 1901-71 (Excludes and mcludes towns ehmmated and newly IOcluded m a D~rtJcular census)
Number of towns IU . --"-,-194'1 1931
"""\ State/Uruon Terrttory 1971 1961 19S1 1921 1911 190,'
2 3 4 5 6 7 8 9
INDIA 3,119 2.699 3,059 2,424 2,219 2,047 1.909 1,917
STATES
1- Andhra Pradesh" 224 223 293 214 179 ISS 135 118
2. Assamt· 74 54 25 24 22 22 14 12
3. Biliar 202 153 108 84 66 63 59 57
4. Gujarat . 216 181 243 191 172 166 ISS 166
S.,Haryana 65 61 62 45 41 39 36 S4
6 Hlmachal Pradesh 36 30 29 22 19 12 11 21
7. Jammu & Kashmir 45 43 . 2St 32 31 29 4S 2
8. Kerala 88 92 94 62 53 44 27 21
9. Madhya Pradesh 250 219 202 174 147 122 118 121
19 Malmrashtra 289 266 383 266 25S 238 232 219
II. Manipur 8 'I 1
12 MegJ,alaya 6 6 '2 2 2 I 1
13. Mysore . 245 231 289 212 215 J97 183 219
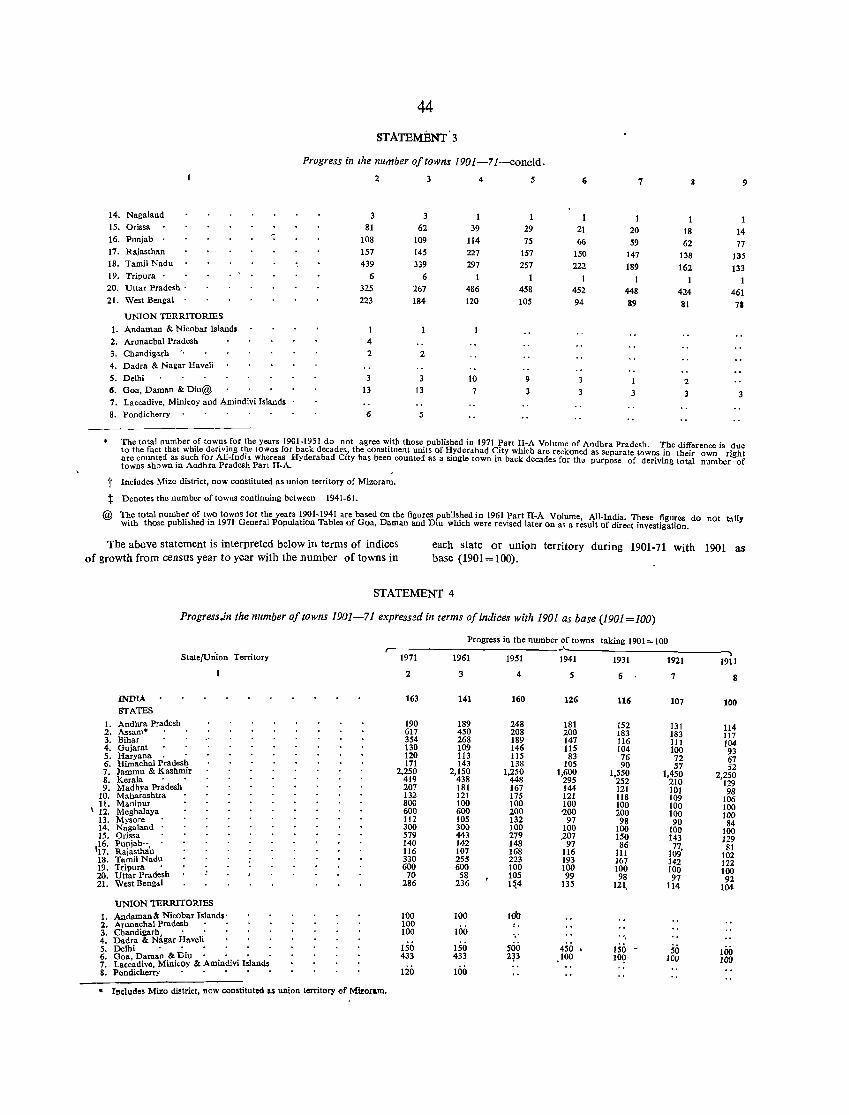
44
STATEMENT' 3
Progress ill lhe number of towns 1901-71-concld.
2 4 5 , 7 9
14. Nagaland 1
15. Orissa 81 62 39 29 21 20 18 14 16. Punjab 108 109 114 7S 66 S9 62 77 17. Raiasthan 157 145 227 157 150 147 138 135 18. Tamil Nadu 439 339 297 257 222 189 162 133 19. Tripura 6 6 1 1 1 20. Uttar Pradesh . 325 267 486 458 452 448 424 461 21. West Bengal 223 184 120 105 94 89 21 7.
UNION TERRITORIES
1. Andaman & Nicobar Islands
2. Arunachal Pradesh 4
3. Chandigarh 2 2 4. Dadra & Nagar Haveli
5. Delhi 10 9 3 1 2 6. Goa, Daman & Diu@ 13 13 7 3 3 3 3 3 7. Laccadive, Minicoy and Amindivi Islands
8. Pondicherry 6 5
The total number of towns for the years 1901-1951 do not agree with those published in 1971 Part II-A Volume of Andhra Pradesh. The difference is due to the fact that while deriving tJ:te towns for back decades, the constituent units of ~yderabad <;:ity which are reckoned as separate towns in their own right are counted as such for All-India whereas Hyderabad City has been counted as a slllgle town 10 back decades for the purpose of deriving total number of towns shown in Andhra Pradesh Part II-A.
t Includes Mizo district, now constituted as nnion territory of Mizoram.
Denotes the number of towns continuing between 1941-61. t @ The total number of two towns for the years 1901-1941 are based on the figures published in 1961 Part II-A Volume, All-India. These figures do not tally
with those published in 1971 General Population Tables of Goa, Daman and Diu which were revised later on as a result of direct investigation.
The above statement is interpreted below in terms of indices of growth from census year to year with the number of towns in
each state or union territory during 1901-71 with 1901 as base (1901 = 100).
STATEMENT 4
Progress.ill the number of towns 1901-71 expressed in terms a/indices with 1901 as base (1901=100)
Progress in the number of towns taking 1901 ~ 100 r- ..A. ..... State/Union Territory 1971 1961 1951 1941 1931 1921 1911
2 3 4 5 6 7 8
INDIA 163 141 160 1Z6 116 107 100 STATES
1. Andhra Pradesh 190 189 248 181 152 131 114 2. Assam· 617 450 208 200 183 183 117 3. Bihar 354 268 189 147 116 111 104 4. Gujarat 130 109 146 US 104 100 93 5. Haryana. . 120 113 115 83 76 72 67 6. Himachal Pradesh 171 143 138 105 90 57 52 7. Jammu & Kashmir 2,250 2,150 1,250 1,600 1,550 1,450 2,250 8. Kerala 419 438 448 295 252 210 129 9. Madhya Pradesh 207 181 167 144 121 101 98 10. M aharashtra 132 121 175 121 118 109 106 11. Manipur 800 100 100 100 100 100 100 \ 12. Meghalaya 600 600 200 '200 200 100 100 13. Mysore 112 105 132 97 98 90 84 14. Nagaland 300 300 100 100 100 100 100 15. Orissa 579 443 279 ,207 150 143 129 .16. Punja]).-, 140 142 148 97 86
1b~' 81 17. Rajasthan 116 107 168 116 111 102 18. Tamil Nadu 330 255 223 193 167 142 122 19. Tripura . 600 600 100 100 100 100 100 20. U Itar Pradesh 70 58 105 99 98 97 92 21. West Bengal 286 236 q4 135 121. 114 104
UNION TERRITORIES
1. Andaman& Nicohar Islands' 100 100 10'0 2. Arunachal Pradesh . . 100
100 3. Chandigarh, . . 100 ',' 4. Dadra & Nagar Haveli
150 150 500 450 150 - 100 5. Delhi . . 50 6. Ooa~ Daman .&, Diu . . 433 433 2p 100 109 100 100 7. Laccadive, MilllCOY & AmindlVl Islands
120 100 8. Pcmdicherry
• Illcludes Mizo district, now cOllstituted !Ill uniOIl territory of Mizoram .
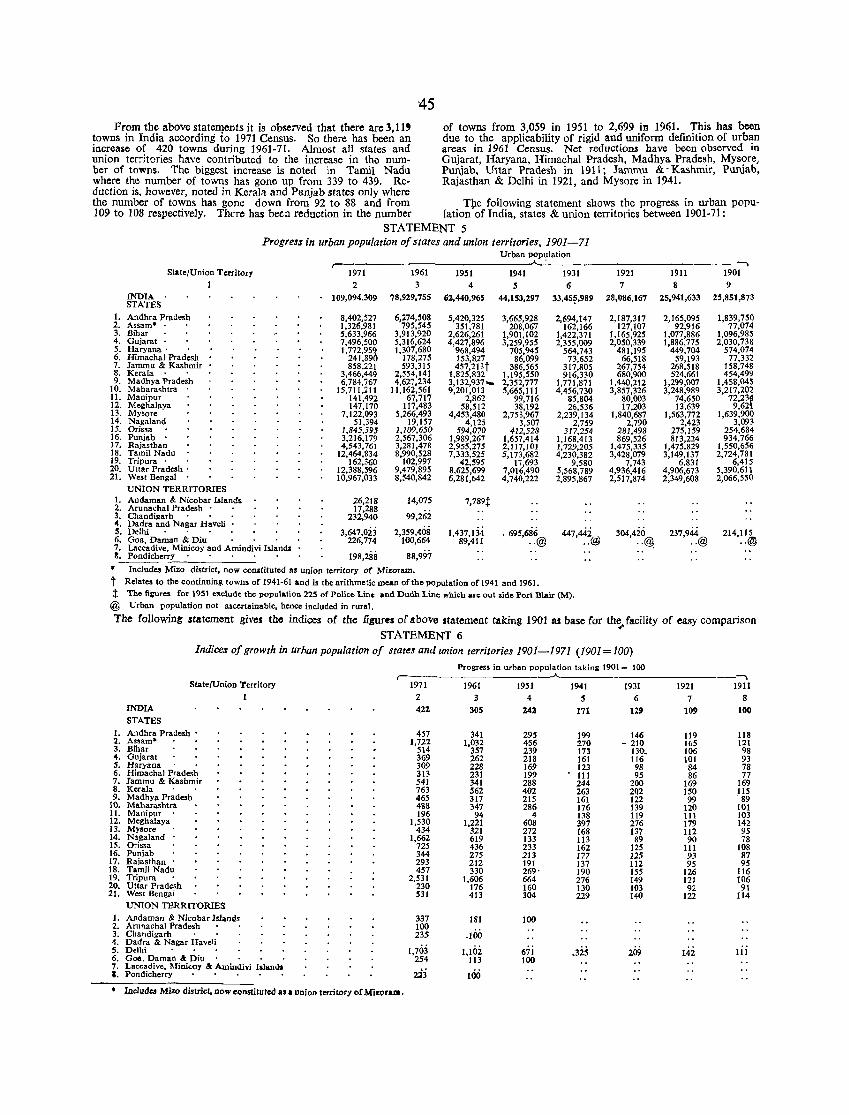
'45 of towns from 3,059 in 1951 to 2,699 in 1961. This has been due to the applicability of rigid and uniform definition of urban areas in 1961 Census. Net reductions have been observed in Gujarat, Haryana, Himachal Pradesh, Madhya Pradesh, Mysore, Punjab, Uttar Pradesh in 1911; Jammu & -Kashmir, Punjab, Rajasthan & Delhi in 1921, and Mysore in 1941.
From the above statements it is observed that there are 3,11' towns in India according to 1971 Census. So there has been an increase of 420 towns during 1961-71. Almost all states aad union territories have contributed to the increase in the number of towns. The biggest increase is noted in Tamil Nadu where the number of towns has gone up from 339 to 439. Reduction is, however, noted in Kerah and PWnjab states only where the number of towns has gone down from 92 to 88 and from Tl;le following statement shows the progress in urban pOPl,l-109 to 108 respectively. There has been reduction in the number lation ofIndia, states & union ten-itories between 1901-71:
STATEMENT 5 Progress in urban population of states and union territories, 1901-71
Urban pop,;,lation r-
State/Union Territory 1971 1961 1951 1941 1931 1 2 3 4 5 6
INDIA 109,094,309 78,929,755 Cil,440,965 44,153,297 33,45~,989 STATES
1. Andhra Pradesh 8,402.527 6,274,508 5,420,325 3.665,928 2,694,147 2. Assam· 1.326,981 795.545 351.781 208.067 162.166 3. Bihar 5.633.966 3.913,920 2.626.261 1.901.102 1.422.371 4. Gujarat • 7.496.500 5.316,624 4,427.896 3,259.955 2,355.009 5. Haryana . 1,772,959 1.307.680 968.494 705.945 564.743 6. Himachal Pradesh 241.890 178.275 153.827 86.099 73.652 7. Jammu & Kashmir 858.221 593.315 457.213t 386.565 317.805 8. Kerala 3,466.449 2.554.141 1.825.832 1.195.550 916,330 9. Madhya Pradesh 6,784,767 4.627,234 3.132.937 .... 2,352,777 1.771.871
10, Maharashtra 15.711.211 11.162,561 9.201.013 5,665.111 4.456.730 11. Manipur 141.492 67.717 2.862 99.716 85.804 12. Meghalaya 147.170 117.483 58.512 38.192 26.536 13. Mysore 7,122.093 5,266.493 4,453,480 2.753.967 2,239.134 14. Nagaland 51,394 19.157 4,125 3.507 2,759 IS. Orissa 1.845.395 1.109.650 594.070 412.528 317.254 16. Punjab 3.216.179 2,567,306 1.989.267 1.657.414 1.168,413 17. Rajasthan 4.543.761 3,281.478 2.955.275 2.117.101 1.729.205 18. Tamil Nadu 12,464.834 8.990.528 7.333.525 5,173,682 4,230.382 19. Tripura . 162.360 102.997 42.595 17,693 9.580 20. Uttar Pradesh . 12.388.596 9,479.895 8.625.699 7.016.490 5.568.789 21. West Bengal 10,967.033 8,540,842 6,281.1>42 4.740,222 2,895.867
UNION TERRITORIES J. Andaman & Nicobar Island. 26.218 14,075 7,789~ 2. Arunachal Pradesh . 17.288
99.262 3. Chandigarh 232.940 4. Dadra and Nagar Haveli .
3.647.oi3 2,359.408 1.437.134 .695,686 447.~~@ s. Delhi 6. Goa. Daman & Diu 226,774 100.664 89,411 .. @ 7. Laccadive. Minicoy and Amindivi Islands 3. Pondicherry 198,288 88,997
• Includes Mizo district, now constituted as union territory of Miroram. t Relates to the continuing towns of 1941-61 and is the arithmetic mean of the popniation of 1941 and 1961. t The fisures for 1951 exclude the population 225 of Police Line and Dudh Lin" which are out side Port Blair (M).
@ Urban population not ascertainable, hence included in rural.
--. 1921 1911 1901
7 8 9
28,086.167 25,941,633 25,851,873
2,187,317 2,165.095 1.839,750 127.107 92.916 77.074
1.165.925 1.077.886 1.096,985 2.050.339 1.886.775 2.030.738
481,195 449.704 574,074 66,518 59.193 77.332
267.754 268.518 158.748 680.900 524.661 454.499
1.440.212 1.299,007 1,458,045 3,857.326 3,248.98Q 3,217,202
80.003 74.650 72.23f 17.203 13,639 9.62
1,840.687 1,563,772 1,639.900 2.790 2.423 3.093
281.498 275,159 254,684 869.526 813,224 934,766
1.475.335 1.475.829 1,550.656 3,428.079 3.149.137 2.724.781
7.743 6.831 6,415 4,936.416 4,906.673 5.390,611 2.517,874 2,349.608 2,066,550
304,420 .. ®,
237.944 .. @
214,115 .. ®
The following statement gives the indices of the figures of above statement taking 1901 as base for th~,Jacility of easy comparjson STATEMENT 6
Indices of growth in urhan population of states and union territories 1901-1971 (1901= 100)
Progress in urban population taking 1901 = 100 r- --.
State/Union Territory 1971 1961 1951 1941 1931 1921 1911 1 2 3 4 5 6 7 8
INDIA 422 30S 242 171 129 109 100 STATES
1. Andhra Pradesh • 457 341 295 199 146 119 118 2. Assam* 1.722 1.032 456 270 - 210 165 121 3. Bihar 514 357 239 173 130, 106 98 4. Gujara! 369 262 218 161 116 101 93 S. Haryana 309 228 169 123 98 84 78 6. Himachal Pradesh 313 231 199 111 95 86 77 7. Jammu & Kashmir 541 341 288 244 200 169 169 8. Kerala 763 562 402 263 202 150 115 9. Madhya Pradesh 465 317 215 161 122 99 89
10. Maharashtra 488 347 286 176 139 120 101 11. Manipur . 196 94 4 138 119 III 103 12. Meghalaya 1.530 1.221 608 397 276 179 142 13. Mysore 434 321 272 168 137 112 95 14. Nagaland 1,662 619 133 113 89 90 78 15. Orissa 725 436 233 162 125 111 108 16. Punjab 344 275 213 177 125 93 87 17. Rajasthan 293 212 191 137 112 95 95 18. Tamil Nadu 457 330 269' 190 155 126 116 19. Tripura 2.531 1.606 664 276 149 121 106 20. Uttar Pradesh 230 176 160 130 103 9:i. 91 21. West Bem~al 531 413 304 229 140 122 114
UNION TERRITORIES 1. Andaman & Nicobar Island. 337 181 100 2. Arunachal Pradesh 100
.100 3. Chandigarh 235 4. Dadra & Nagar Haveli
1,703 1. Hi:! Iii s. Delhi 671 .32S 209 142 6. GOft. Daman &: Diu 254 113 100 7. Laceadive. Minicor & Aminwvi Islands
213 100 •• Pon dicherry
• Includes Mizo district, now constituted a. a ullion territory of Mizoralll .
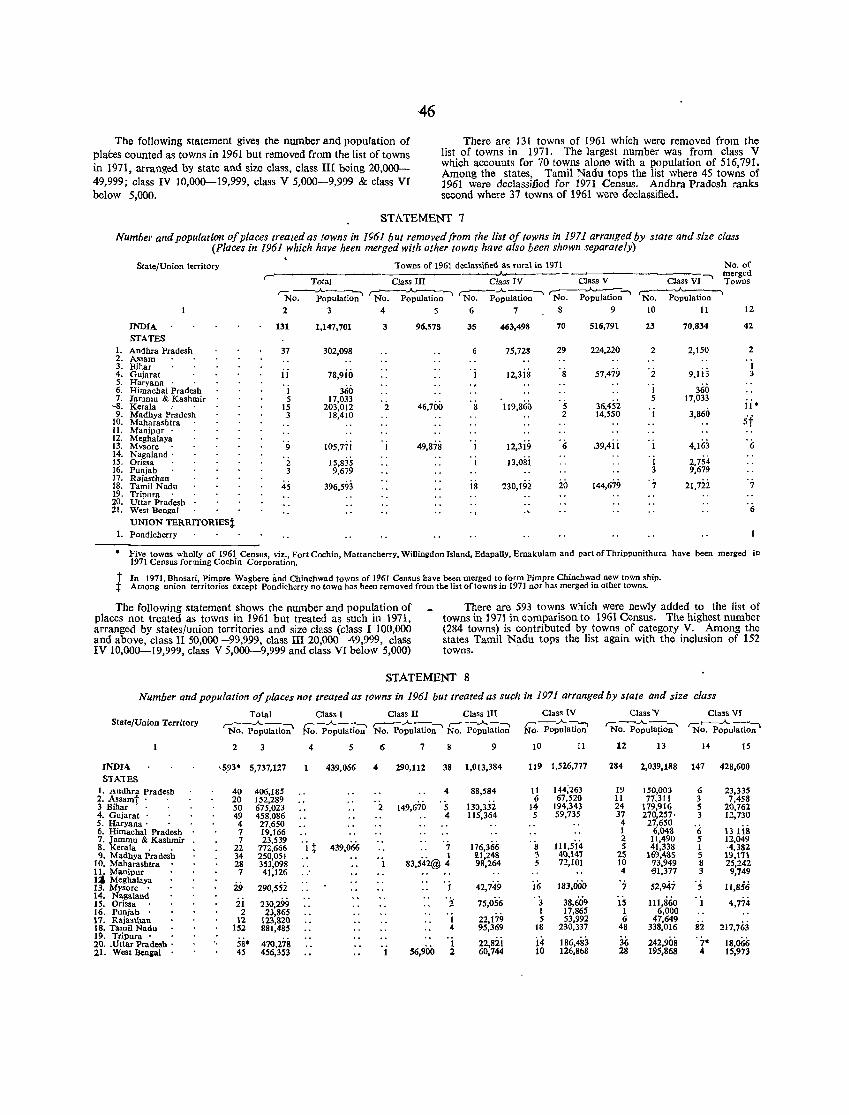
·46
The following statement gives the number and population of plates counted as towns in 1961 but removed from the list of towns in 1971, arranged by state and size class, class III being 20,000-49,999; class IV 10,000--19,999, class V 5,000-9,999 & class VI below 5,000.
There are 131 towns of 1961 which were removed from the list of towns in 1971. The largest number was from class V which accounts for 70 towns alone with a population of 516,791. Among the states, Tamil Nadu tops the list where 45 towns of 1961 were declassified for 1971 Census. Andhra Pradesh ranks second where 37 towns of 1961 were declassified.
STATEMENT 7
Numbe,' and population of places treated as towns in 1961 but removed [rom the list of towns in 1971 arranged by state and size class (Places in 1961 which have heen merged with other towns have also been shown separately)
State/Union territory
Total
'N;;:---;';pulatio-;:;'
2 3
INDIA 131 1,147,701 STATES
1. Andhra Pradesh 37 302,098 2. Assam 3. Bihar
ii 4. Oujarat 78,9io S. Haryana 6. Himachal Pradesh I 360 7. Jammu & Kashmir 5 17,033
-8. Kerala 15 203,012 9. Madhya P~adesh 3 18,410
10. Maharashtra 11. Manipur 12. Meghalaya 13. Mvsore 9 105,77i 14. Nagaland· 15. Orissa 2 15,835 16. Punjab 3 9,679 17. Rajasthan 18. Tamil Nadu 45 396,593 19. Tripura 20. Uttar Pradesh 21. West Bengal
UNION TERRITORIES; 1. Pondicherry
Towns of 1961 declassified as rural in 1971 No. of
Class III ~~-~
No. Population 4 5
3 96,57S
2 46,700
49,878
~ - -C~Jass--v------C-l-a-ss-VI" 'T~';~~ ~.A.--., r:-::--~., ~ No. Population No. Population No. Population
6 7 8 9 10 11 12
35 463,498 70 516,791 23 70,834 42
75,728 29 224,220 2 2,150 2
1 12,3iil 8 57,479 2 9,113
I 360
36,452 5 17,033
8 119,86~ 5 2 14,550 3,860
11'
s'f
12,3i9 6 ,39,4ii 4,163 6
2,754 13,osi 9,679
18 230,I9i 20 144,679 7 21,7ii 7
6
• Five towns wholly of 1961 Census, viz., Fort Cochin, Mattancherry, Willingdon Island, EdapaJly, Ernakulam and part ofThrippunithura have been merged in 1971 Census forming Cochin Corporation.
t In 1971, Bhosari, Pimpre Waghere and Chinchwad towns of 1961 Census have been merged to form Pimpre Chinchwad new town ship. t Among union territories except Pondicherry no town has been removed from the list of towns in 1971 nor has merged in other towns.
The following statement shows the number and population of places not treated as towns in 1961 but treated as such in 1971, arranged by states/union territories and size class (class I 100,000 and above, class II 50,000-99,999, class ill 20,000--49,999, class IV 10,000-19,999, class V 5,000--9,999 and class VI below 5,000)
There are 593 towns which were newly added to the list of towns in 1971 in comparison to 1961 Census. The highest number (284 towns) is contributed by towns of category V. Among the states Tamil Nadu tops the list again with the inclusion of 152 towns. .
STATEMENT 8
Number and population of places not treated as towns in 1961 but treated as such in 1971 arranged by state and size dass
Total Class I Class II Class III Class IV Class'V Class VI State/Union Territory ~--.A.--, r---A..-'-~ ,..----:-.A. --., ..--:::-.A.-., r---...A.~l ,--_ --..A.-- c:r---.A. --,
No. Population No. Population No. Popnlation No. Popnlation No. Populabon No. Populalio~ No. Population
2 3 4 5 6 7 9 10 Il 12 13 14 15
INDIA ·593' 5,737,127 439,066 4 290,112 38 1,013,384 119 1,526,777 284 2,039,188 147 428,600
STATES 1. Andhra Pradesh 40 406,185 4 88,584 II 144;263 19 150,003 6 23,335 2. Assamt . 20 152,289 . 2 149,670 130,33i
6 67,520 11 77,311 3 7,458 3 Bihar . 50 675,023 5 14 194,343 24 179,916 5 20,762 4. Oujarat . 49 458,086 4 115,364 5 59,715 37 270,257' 3 12,730 5. Haryana' 4 27,650 4 27,650
'6 13 I is 6. Himachal Pradesh 7 19,166 1 6,048 7. Jammu & Kashmir 7 23,539
'i t 439,066 176,366 ·s 111,si4 2 11,490 5 12,049
8. Kerala 22 772,666 7 5 41,338 1 ·4,382 9. Madhya Pradesh 34 250,051 1 2.1,248 3 40,141 2S 169,485 5 19,171
10. Maharashtra • 28 353,098 83,S42@ 4 98,264 5 72,101 10 '73,949 8 25,242 It. Manipur 7 41,126 4 -31,377 3 9,749 11. Meghalaya
29 290,5Si 'j 42,749 iii 183,000 '7 52,947 's 11,856 13. Mysore • 14. Nagaland
ii 230,299 '2 75,056 '3 38,609 111,860 4,774 15. Orissa 15 1 16. Punjab 2 23,865
22,179 I 17,865 1 6,000
17. Rajasthan 12 123,820 1 5 53,992 6 47,649 217,763 18. Tamil Nadu 152 881,485 4 95,369 18 230,337 48 338,016 82
19. Tripura 58· 470,278 'i 22,82i i4 186,483 36 242,908 . 7· 18,066 20 .• Uttar Pradesh •
'6,900 21. West Denial 45 456,3'3 2 60,744 10 126,8t>8 28 195,868 4 15,973
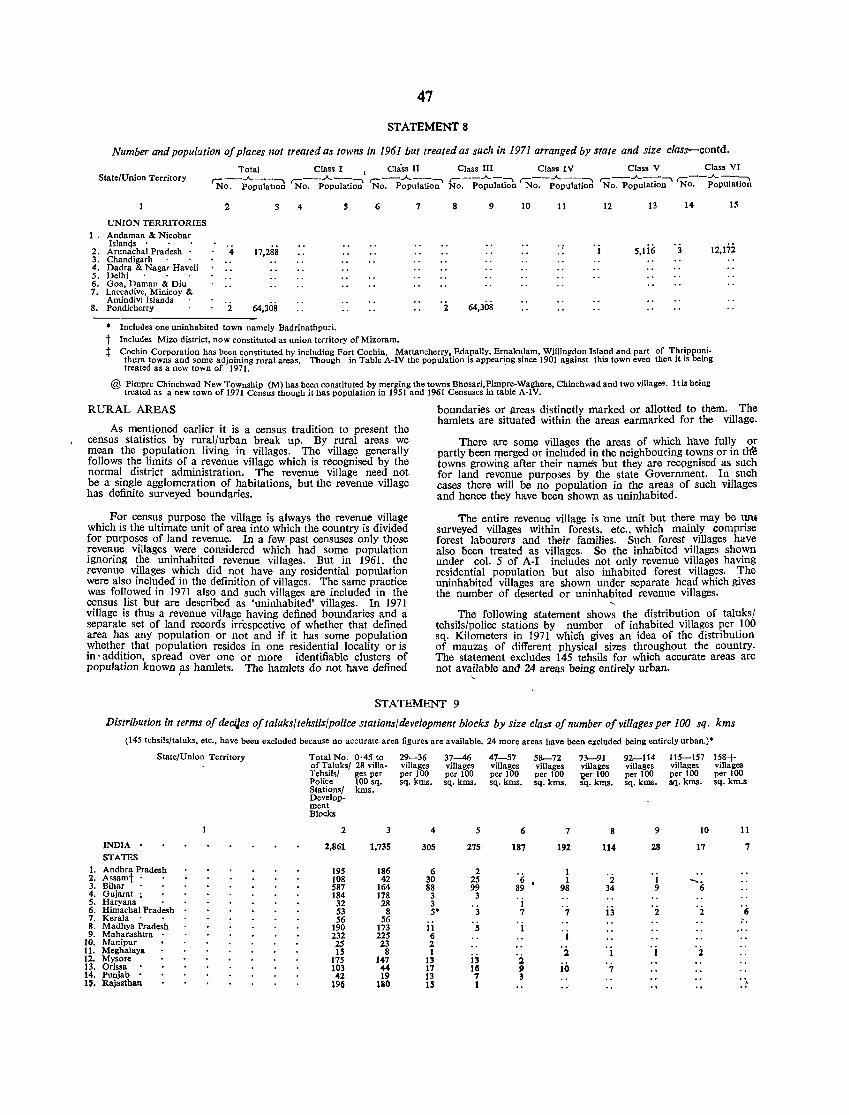
47
STATEMENTS
Number and population 0/ places not treated as towns in 1961 but treated as such in 1971 arranged by state and size class-contd.
State/Union Territory Total Class I I Class n Class III Class IV Class V Clas. VI
r::-_--..A..---., r::-_--..A..---., c---..A..---., ;-__ ..A.._":> ,.....--..A..---., r:---..A..-.--., c:--..A..--:> No. PopulatIon No. Population No. Population No. Population No. Population No. populatIOn No. PopulatIon
UNION TERRITORIES 1. Andaman & Nicobar
2. Is;~~t~hai Pradesh : 3. Chandigarh 4. Dadra & Nagar Haveli 5. Delhi 6. Goa, Daman & Diu 7. Laccadive, Minicoy &
Amindivi Islands 8, Pondicherry
2 3 4
17,288
2 64,308
• Includes one uninhabited town namely Badrinathpuri.
s 6
t Includes Mizo district, now constituted as union territory of Mizoram.
7 8 9 10 11 12 13 14 1~
5,li;; 12,1'7i
2 64,308
t Cochin Corporation has been constituted by including Fort Cochin, Mattancherry, Edapally, Ernakulam, Willingdon Island and part of 'f!lr!ppu!'ithura towns and some adjoining rural areas. Though in Table A-IV the population is appearing since 1901 against this town even then It IS bemg treated as a new town of 1971.
@ Pimpre Chinchwad New Township (M) has been constituted by merging the towns Bhosari, Pimpre-Waghere, Chinchwad and two village~. I t is being treated as a new town of 1971 Census though it has population in 1951 and 1961 Censuses in table A-IV.
RURAL AREAS
As mentioned earlier it is a census tradition to present the census statistics by rural/urban break up. By rural areas we mean the population living in villages. The village generally follows the limits of a revenue village which is recognised by the normal district administration. The revenue village need not be a single agglomeration of habitations, but the revenue village has definite surveyed boundaries.
For census purpose the village is always the revenue village which is the ultimate unit of area into which the country is divided for purposes of land revenue. In a few past censuses only those reveRue villages were considered which had some population ignoring the uninhabited revenue villages. But in 1961, the revenue villages which did not have any residential population were also included in the definition of villages. The same practice was followed in 1971 also and such villages are included in the census list but are described as 'uninhabited' villages. In 1971 village is thus a revenue village having defined boundaries and a separate set of land records irrespective of whether that defined area has any population or not and if it has some population whether that population resides in one residential locality or is in -addition, spread over one or more identifiable clusters of population known ,as hamlets. The hamlets do not have defined
boundaries or areas distinctly marked or allotted to them. Tho hamlets are situated within the areas earmarked for the village.
There are some villages the areas of which have fully or partly been qterged or included in the neighbouring towns or in t~ towns growing after their name's but they are recognised as such for land revenue purposes by the state Government. In such cases there will be no population in the areas of such villages and hence they have been shown as uninhabited.
The entire revenue village is 'one unit but there may be un4 surveyed villages within forests, etc., which mainly comprise forest labourers and their families. Such forest villages have also been treated as villages. So the inhabited v!llages sho:"n under col. 5 of A-I inoludes not only revenue Villages havmg residential population but also inhabited forest villages. The uninhabited villages are shown under separate head which gives the number of deserted or uninhabited revenue villages.
The following statement shows the distribution of taluks/ tehsils/police stations by number of inhabited villages I?er !OO sq. Kilometers in 1971 which gives an idea of the distnbutlon of mauzas of different physical sizes throughout the country. The statement excludes 145 tehsils for which accurate areas are not available and 24 areas being entirely urban.
STATEMENT 9
1. 2. 3. 4. 5. 6. 7. 8. 9.
10. 11. 12. 13. 14. IS.
Distribution in terms 0/ deciJes o/taluks/tehsils/police stations/development blocks by size clas$ o/number o/villages per 100 sq. kms
(145 tehsils/taluks, etc., have been excluded because no accurate area figures are available. 24 more area. have been excluded being entirely urban.)·
State/Union Territory
INDIA STATES Andhra Pradesh Assamt • Bihar • Gujarat ; Haryana Himachal Pradesh KeraJa Madhya Pradesh Maharashtra Manipur Meghalaya My.ore Orissa Punjab • Rajasthan
Total No. 0·45 to of Taluks/ 28 villa-Tehsilsl ges per Police 100 sq. Stations/ kIn •. Develop-ment Blocks
2 3
2,861 1,735
195 186 108 42 587 164 184 178 32 28 53 8 56 56
190 173 232 225 2S 23 IS 8
175 147 103 « 42 19
196 180
29-36 villages per 100 sq. kIn •.
4
305
6 30 88 3 3 S·
11 6 2 1
13 17 13 15
37-46 villages per 100 sq. kms.
5
275
2 25 99
3
3
S
i3 It! 7 1
47-57 villages per 100 sq. krns.
6
187
'(; 89
1 7
2 II 3
58-72 villages per 100 sq. kms.
7
192
1 1
98
7
2
in
73-91 villages lIer 100 sq. kms.
8
114
2 34
ij
"
92-114 villages per 100 sq. km •.
9
28
I 9
2
. i
11S-IS7 158+ villages villages per 100 per 100 sq. kms. sq. km .•
10
17
--, 6
2
2
11
7
~.
,:"
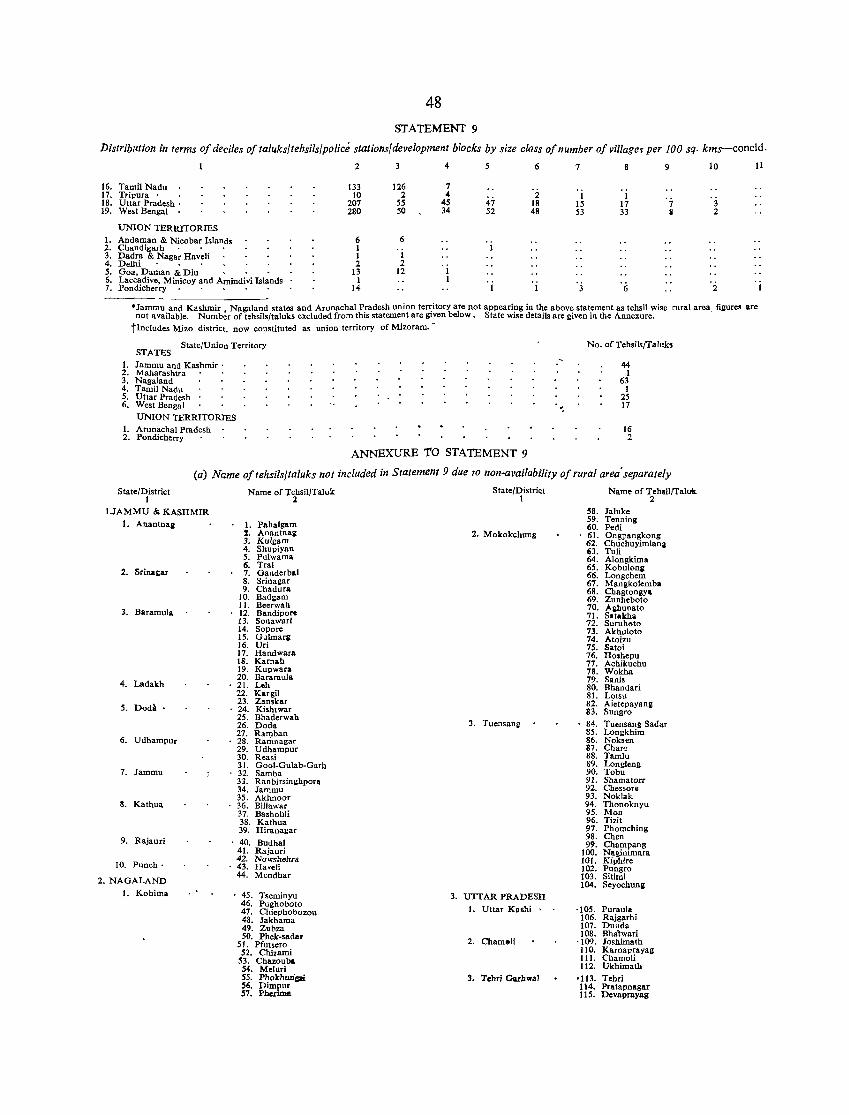
48
STATEMENT 9
Distribution in terms of deciles of taluks/tehsils/police stationsfdevelopmellt blocks by size class of number of villages per 100 sq· kms-concld.
2
16. Tamil Nadu 133 17. Tripura 10 18. Uttar Pradesh· 207 19. West Bengal 280
UNION TERRITORIES 1. Andaman & Nicobar Islands 6 2. Chandigarh· . • 1 3. Dadra & Nagar Haveli I 4. Delhi . . . 2 5. Goa. Daman & Diu 13 6. Laccadive. Minicoy and Amindivi Islands 1 7. Pondicherry. . • . . 14 -----
3 4 5
126 7 2 4
47 55 45 50 34 52
6
1 2
12
6
2 18 48
7
1 15 53
8
1 17 33
6
9
7 i
10
3 2
2
11
• Jammu and Kashmir Nagaland states and Arunachal Pradesh union territory are not appearing in the above statement as tehsil wise rural area fillurl:! are not available. Numb~r of tehsils/taluks excluded from this statement are given below. State wise details are given in the Annexure. .
tIncludes Mizo district. now constituted as union territory of Mizoram. -
STATES State/Union Territory
1. Jammu and Kashmir' 2. Maharashtra 3. Nagaland 4. Tamil Nadu 5. Uttar Pradesh 6. West Bengal
UNION TERRITORIES 1. Arunachal Pradesh 2. Pondicherry
ANNEXURE TO STATEMENT 9
"
No. of Tehsils/Talulal
44 1
63 I
25 17
16 2
(a) NClme oftehsils/taluks not included in Statement 9 due TO non-availability of rural area'separately
State/District 1
I.JAMMU & KASHMIR
I. Anantnall
2. Srillagar
3. Baramula
4. Ladakh
5. Dod~ .
6. Udhampur
7. Jammu
8. Kathua
9. Rajauri
10. Punch·
2. NAGALAND
1. Kohima
Name of r~hsil/Taluk
1. Pahalgam 2. Anantm'lI 3. Kulgam 4. Shupiyan 5. Pulwama 6. Tral 7. Ganderbal 8. Srinallar 9. Chadura
10. Badl:am 11. Beerwah 12. Bandiporo 13. Sonawari 14. Sopore 15. Gu.lmarll 16. Uri 17. Handwara 18. Karnah 19. Kupwara 20. Baramula 21. Leh 22. Kargil 23. Zanskar
. 24. Ki.htwar 25. Bhaderwah 26. Dod .. 27. Ramban 28. Ranmagar 29. Udhampur 30. Reasi 31. Gool-Gulab-Garh 32. Samba 33. Ranbirsinghpora 34. Jammu 35. Akhnoor 36. BiIlawar 37. Bashohli 38. Kathua 39. Hiranagar
40. Budhal 41. Rajauri 42. Nowsbehra 43. Haveli 44. Mendhar
45. Tseminyu 46. Pughoboto 47. Chiephobozou 48. Jakhama 49. Zubza 50. Phek-sader
51. Pfutsero 52. Chi.ami
53. Chazouba 54. Meluri 55. PhokhwiPi 56. Dimpur 57. PIlcrima
State/District I
2, Mokokchunl:
3, Tuensan"
3. UTIAR PRADESH
1. Uttar Kashi •
2. Cham.Ii
3. Tehri Garh ... al
Name of TehsillTaluk 2
58. Jaluke 59. Tenninll 60. Pedi 61. Ongpangkong 62. Chuchuyimlani 63. Tuli 64. Alongkima 65. Kobuloni 66. Longchem 67. Manakolemba 68. Chagtongya 69. Zunheboto 70. Aghunato 71. S .. takha 72. Suruhoto 73. Akhuloto 74. Atoizu 75. Satoi 76. Hoshepu 77. Achikuchu 78. Wokha 79. San is 80. Bhandari 81. Lotsu 82. Aietepayang 83. Sungro
84. Tuen.ang Sadar 85. Longkhim 86. Noksen 87. Charc 88. TlUlllu 89. Longieng 90. Tobu 91. Shamatorr 92. Chessore 93. Noklak 94. Thonoknyu 95. Mon 96. Tizit 97. Phomching 98. Chen 99. Champang
100. Naginimara to l. Kiphire 102. Pungro 103. Sitimi 104. Scyochunll
. 105. Puraula 106. Rajgarhi 107. Dunda 108. Bha\wari
'109. Joshimath 110. Karnaprayag III. Chamoli 112. Ukhimath
·113. Tehri 114. Pratapnagar 115. Devaprayag
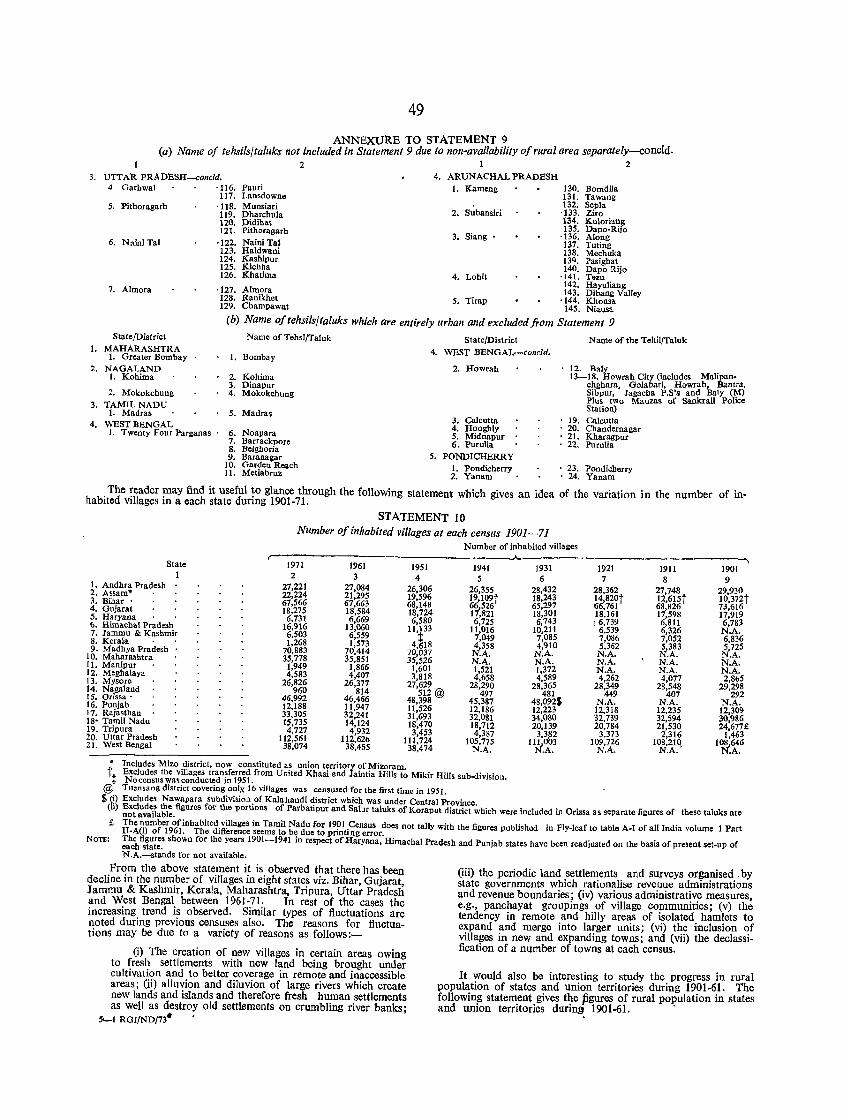
49
ANNEXURE TO STATEMENT 9 (a) Name of tehsils/taluks not included in Statement 9 due to non-availability of rural area separately-concld.
212
3. UTTAR PRADESH--concld. 4. ARUNACHAL PRADESH 4 Garbwal ·1I6. Pauri 1. Kameng 130. Bomdila
117. Lansdowne 131. Tawang
·1I8. Munsiari 2. Subansiri . n~·. ~~~a 121~. gfti~~ula 134. Koloriang
. 135. Dapo-Rijo 121. Pithoragarh 3. Siang • '136. Along
,122. Naini Tal 137. Tuting 123. Haldwani 138. Mecbnka 124. Kashipur 13Q • Pasighat 125. Kichha 140. Dapo Rijo 126. Kbatima 4. Lohit ·141. Tezu
5. Pithoragarh
6. N,lini Tal
142. Hayuliang '127. Almora 143. Dibang Valley 128. Ranikhet 5. Tirap '144. Khonsa 129. Charnpawat 145. Niausa
7. Almora
(b) Name o/tehsils/taluks which are entirely urban and excluded/rom Statement 9 State/District Name of Tehsl/Taluk State/District Name of the Tehil/Taluk
I. MAHARASHTRA 1. Greater Bombay I. Bombay 4. WEST BENGAL-concld.
2. NAGALAND 1. Kohima 2.
2. Howrah Kohima
12. Baly • 13-18. Howrah City (includes Mahpan
chghara, Golabari, Howrah, Bantra, Sibpur, Jagacha P.S's and Ba1y (M) Plus two Mauzas of Sankrail Police Station)
3. ~ Mokokchung 4. ~.
3. TAMILNADU 1. Madras 5.
4. WEST BENGAL 1. Twenty Four Parganas 6.
7. 8. 9.
10. 11.
Dinapur Mokokchung
Madras
Noapara Barrackpore Beighoria Baranagar Garden Reach Metiabruz
3. Calcutta 4. Hooghly 5. Midnapur 6. PuruUa
5. PONDICHERRY 1. Pondicherry 2. Yanam
19. Calcutta 20. Chandernagar 21. Kharagpur 22. Purulia
• 23. Pondicherry . 24. Yanam
The reader may find it useful to glance through the following statement which gives an idea of the variation in the number of inhabited villages in a each state during 1901-71.
STATEMENT 10 Number of inhabited villages at each census 1901-71
Number of inhabited villages ~Jo.-~------____________ .......,
State 1971 1961 1951 1941 1931 1921 1911 1901 1 2 3 4 5 6 7 8 9 1. Andhra Pradesh 27,221 27,084 26,306 26,355 28,432 28,362 27,748 29,930 2. Assam" 22,224 21,295 19,596 19,I09t 18,243 14,820t 12,615t 10,372t 3. Bihar . 67,566 67,663 68,148 66,526 65,297 66,761 68,826 73,616 4. Gujarat 18,275 18,584 18,724 17,821 18,301 18,161 17,598 17,919 5. Haryana 6,731 6,669 6,580 6,725 6,743 ! 6,739 6,811 6,783 6. Himachal Pradesh 16,916 13,060 11,133 11,016 10,211 6,539 6,326 N.A. 7. Jammu & Kashmir 6.503 6,559
4,t18 7,049 7,085 7,086 7,052 6,836 8. Kerala 1,268 1,573 4,358 4,910 5,362 5,383 5,725 9. Madhya Pradesh 70,883 70,414 70,037 N.A. N.A. N.A. N.A. N.A. 10. Maharashtra 35,778 35,851 35,526 N.A. N.A. N.A. N.A. N.A. 11. Manipuf 1,949 1,866 1,601 1,521 1,372 N.A. N.A. N.A. 12. Meghalaya 4,583 4,407 3,818 4,658 4,589 4,262 4,077 2,865 13. Mysore 26,826 26,377 27,629 28,290 28,365 28,349 28,548 29,298 14. Nagaland 960 814 512@ 497 481 449 407 292 15. Orissa' 46,992 46,466 48,398 45,387 48,092$ N.A. N.A. N.A. 16. Punjab 12,188 11,947 11,526 12,186 12,223 12,318 12,235 12,309 17. Rajasthan 33,305 32,241 31,693 32,081 34,080 32,739 32,594 30,986 18' Tamil Nadu 15,735 14,124 18,470 18,712 20,139 20,784 21,530 24,677£ 19. Tripura 4,727 4,932 3,453 4,387 3,382 3,373 2,316 1,463 20. Uttar Pradesh 112,561 112,626 111,724 105,775 111,003 109,726 108,21Q 108,646 21. West Bengal 38,074 38,465 38,474 N.A. N.A. N.A. N.A. N.A.
• Includes Mizo district, now constituted as union territory of Mizoram. t Excludes the villages tran~ferred from United Khasi and Jaintia Hills to Mikir Hills sub-division. ~ No census wa~ conducted m 1951.
@ Tuensang district covering only, 16 villages was ccnsused for the first time in 1951. $ (i) EXcludes Nawapara subdivision.of Kalahandi district which was under Central Province.
(ii) Excludes the figures for the portIOns of Parbatipur and SaiuT taluks of Koraput district which were included in Orissa as separate figures of these talnks are not available. £ The uumber of inhabited villages in Tamil Nadu for 1901 Census does not tally with the figures published in Fly-leaf to table A-I of all India volume 1 Part
II-A(i) of 1961. The difference seems to be due to printing error. NOTE: The figures shown for the years 1901-1941 in respect of Haryana. Himachal Pradesh and Punjab states have been readjusted on the basis of present set-up of each state.
N.A.-stands for not available.
From the above statement it is observed that there has been decline in the number of villages in eight states viz. Bihar, Gujarat, Jammu & Kashmir, Kerala, Maharashtra, Tripura, Uttar Pradesh and West Bengal between 1961-71. In rest of the cases the increasing trend is observed. Similar types of fluctuations are noted during previous censuses also. The reasons for fluctuations may be due to a variety of reasons as follows:-
(i) The creation of new villages in certain areas owing to fresh settlements with new land being brought under cultivation and to better coverage in remote and inaccessible areas; (ii) alluvion and diluvion of large rivers which create new lands and islands and therefore fresh human settlements as well as destroy old settlements on crumbling river banks;
5<--1 RGI/ND/73·
(iii) the periodic land settlements and surveys organised . by state governments which rationalise revenue administrations and revenue boundaries; (iv) various administrative measures, e.g., panchayat groupings of village communities; (v) the tendency in remote and hilly areas of isolated hamlets to expand and merge into larger units; (vi) the inclusion of villages in new and expanding towns; and (vii) the declassification of a number of towns at each census.
It would also be interesting to study the progress in rural population of states and union territories during 1901-61. The following statement gives the ligures of rural population in states and union territories during 1901·61. .
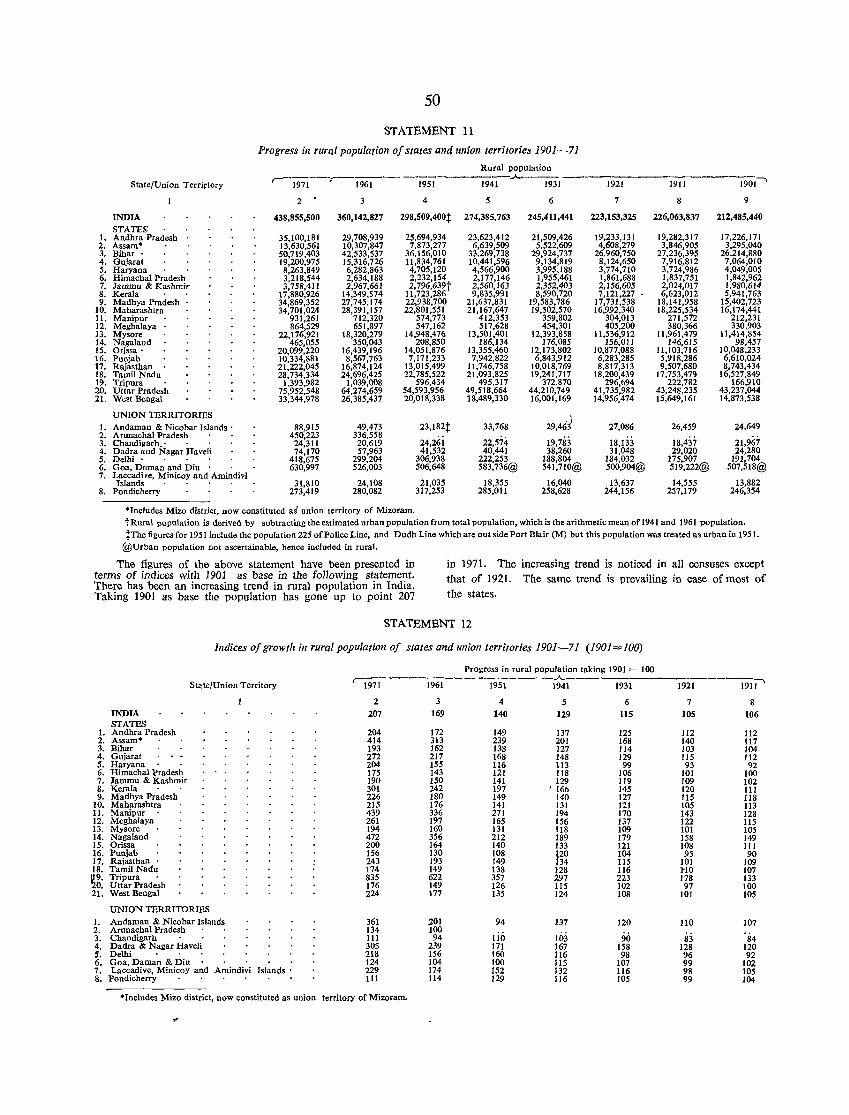
I. 2, 3, 4. 5. 6. 7. 8. 9.
10. II. 12. 13. 14. 15. 16. 17. 18. 19. 20. 21.
I. 2. 3. 4. 5. 6. 7.
8.
50
STATEMENT 11
Progress in rural population of states and union territories 1901-71
Rural population
Stale/Union Terrirtory '--1971--r-196i---i951----i941-.A.--1931---1m----1~--19oi-,
2 3 4 5 6 7 9
INDIA 438,855,500 360,142,827 298,509,400+ 274,385,763 245,411,441 223,153,325 226,063,837 212,485,440
STATES: Andhra Pradesh 35,100,181 29,708,939 25,694,934 23,623,412 21,509,426 19,233,131 19,282,317 17,226,171 Assam· 13,630,561 10,307,847 7,873,277 6,639,509 5,522,609 4,608,279 3,846,905 3,295,040 Bihar' 50,719,403 42,533,537 36,156,010 33,269,738 29,924,737 26,960,750 27,236,395 26,214,880 Gujarat 19,200,975 15,316,726 11,834,761 10,441,596 9,134,819 8,124,650 7,916,812 7,064,010 Haryana 8,263,849 6,282,863 4,705,120 4,566,900 3,995,188 3,774,710 3,724,986 4,049,005 Himachal Pradesh 3,218,544 2,634,188 2,232,154 2,177,146 1,955,461 1,861,688 1,837,751 1,842,962 Jammu & Kashmir 3,758,411 2,967,661 2,796,639t 2,560,163 2,352,403 2,156,605 2,024,017 1,980,614 Kerala 17,880,926 14,349,574 11,723,286 9,835,991 8,590,720 7,121,227 6,623,012 5,941,763 Madhya Pradesh 34,869,352 27,745,174 22,938,700 21,637,831 19,583,786 17,731,538 18,141,958 15,402,723 Maharashtra 34,701,024 28,391,157 22,801,551 21,167,647 19,502,570 16,992,340 18,225,534 16,174,441 Manipur 931,261 712,320 574,773 412,353 359,802 304,013 271,572 212,231 Meghalaya 864,529 651,897 547,162 517,628 454,301 405,200 380,366 330,903 Mysore 22,176,921 18,320,279 14,948,476 13,501,401 12,393,858 11,536,912 11,961,479 11,414,854 Nagaland 465,055 350,043 208,850 186,134 176,085 156,011 146,615 98,457 Orissa· 20,099,220 16,439,196 14,051,876 13,355,460 12,173,802 10,877,088 11,103,716 10,048,233 Punjab 10,334,881 8,567,763 7,171,233 7,942,822 6,843,912 6,283,285 5,918,286 6,610,024 Rajasthan 21,222,045 16,874,124 13,015,499 11,746,758 10,018,769 8,817,313 9,507,680 8,743,434 Tamil Nadu 28,734,334 24,696,425 22,785,522 21,093,825 19,241,717 18,200,439 17,753,479 16,527,849 Tripura 1,393,982 1,039,008 596,434 495,317 372,870 296,694 222,782 166,910 Uttar Pradesh 75,952,548 64,274,659 54,593,956 49,518,664 44,210,749 41,735,982 43,248,235 43,237,044 West Bengal 33,344,978 26,385,437 20,018,338 18,489,330 16,001,169 14,956,474 15,649,161 14,873,538
UNION TERRlTORmS 29,4d Andaman & Nicobar Islands' 88,915 49,473 23,182+ 33,768 27,086 26,459 24,649
Arunachal Pradesh 450,223 336,558 22,574 19,783 18,133 18,437 21,967 Chandigarh_ . 24,311 20,619 24,261
Dadra and Nagar Haveli 74,170 57,963 41,532 40,441 38,260 31,048 29,020 24,280 Delhi . 418,675 299,204 306,938 222,253 188,804 184,032 175,907 191,704 Goa, Daman and Diu 630,997 526,003 506,648 583,736@ 541,710@ 500,904@ 519,222@ 507,518@ Laccadi ve, Minicoy and .t\mindivi Islands 31,810 24,108 21,035 18,355 16,040 13,637 14,555 13,882
Pondicherry 273,419 280,082 317,253 285,011 258,628 244,156 257,179 246,354
*Includes Mizo district, now constituted as union territory of Mizoram. tRural population is derived by subtracting the estimated urban population from total population, which is the arithmetic mean of 1941 and 1961 population. +The figures for 1951 include the popUlation 225 of Police Line, and Dudh Line which are out side Port Blair (M) but this population was treated as urban in 1951.
@Urban population not ascertainable, hence included in rural.
The figures of the above statement have been presented in terms of indices with 1901 as base in the following statement. There has been an increasing trend in rural population in India. Taking 1901 as base the population has gone up to point 207
in 1971. The increasing trend is noticed in all censuses except that of 1921. The same trend is prevailing in case of most of the states.
STATEMENT 12
1ndices of growth in rural population of states and union territories 1901-71 (1901 = 100)
Progress in rural population taking 1901 = 100
State/Union Territory 'l971-----i961---i951---1~1-_____mI---~i-1 ---19i1' 2 4 5 6 7 8
INDIA 207 169 140 129 115 105 106 STATES
1. Andhra Pradesh 204 172 149 137 125 112 112 2. Assam· 414 313 239 201 168 140 117 3. Bihar 193 162 138 127 114 103 104 4. Gujarat 272 217 168 148 129 115 112 5. Haryana 204 155 116 113 99 93 92 6. Himachal Pradesh 175 143 121 118 106 101 100 7. Jammu & Kashmir 190 150 141 129 119 109 102 8. Kerala 301 242 197 J 166 145 120 111 9. Madhya Pradesh 226 180 149 140 127 115 118
10. Maharashtra 215 176 141 131 121 105 113 11. Manipur 439 336 271 194 170 143 128 12. Meghalaya 261 197 165 156 137 122 115 13. Mysore 194 160 131 118 109 101 105 14. Nagaland 472 356 212 189 179 158 149 15. Orissa 200 164 140 133 121 108 111 16. Punjab 156 130 108 t20 104 95 90 17. Rajasthan 243 193 149 134 115 101 109 18. Tamil Nadu 174 149 138 128 116 :1-10 107 ~9. Tripura . 835 622 357 297 223 178 133
O. Uttar Pradesh 176 149 126 115 102 97 100 21. West Bengal 224 177 135 124 108 101 105
UNION TERRITORIES
1. Andaman & Nicobar Islands 361 201 94 137 120 110 107 2. Arunachal Pradesh 134 100
lio 103 90 3. Chandigarh 111 94 83 84 4. Dadra & Nagar Haveli 305 239 171 167 158 128 120 S. Delhi 218 156 160 116 98 96 92 6. Goa, Daman & Diu 124 104 100 115 107 99 102 7. Laccadive. Minicoy and Amindivi Islands' 229 174 152 132 116 98 105 8. Pondicherry 111 114 129 116 105 99 104
·Includes Mizo district, now constituted as union territory of Mizoram •
..
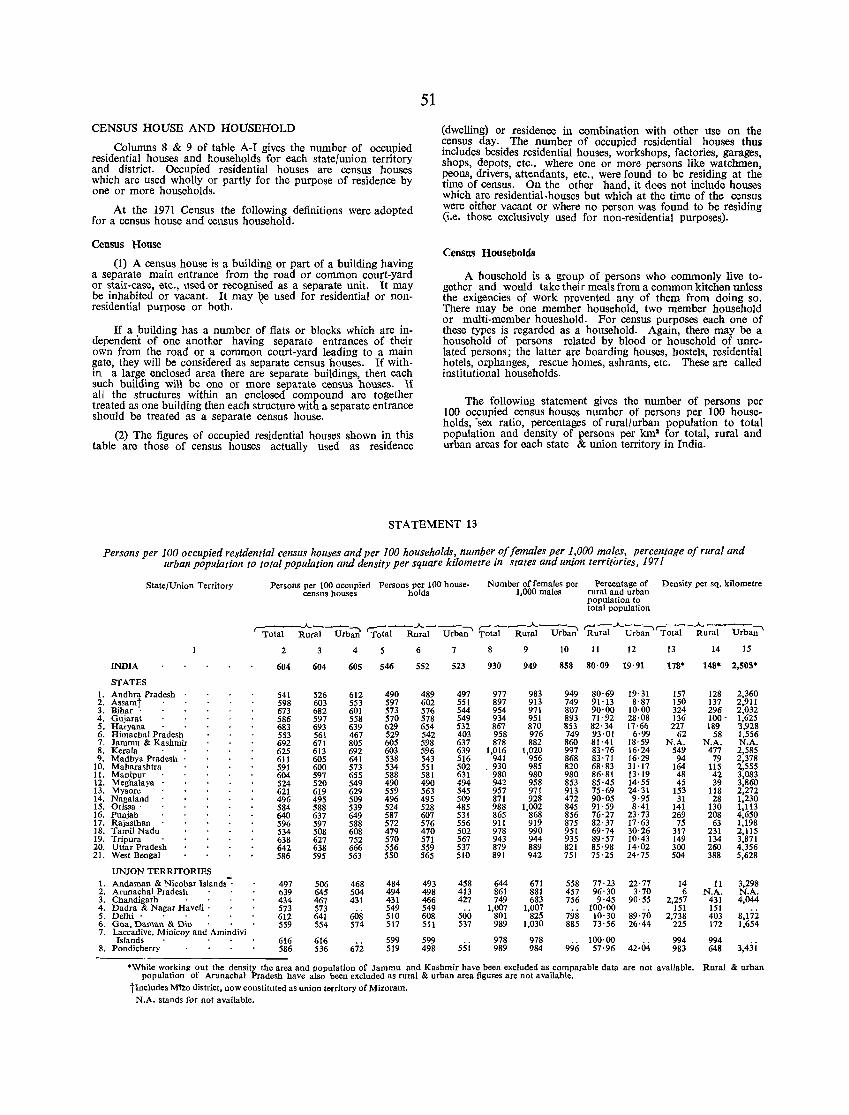
CENSUS HOUSE AND HOUSEHOLD
Columns 8 & 9 of table A-I gives the number of occupied residential houses and households for each state/union territory and district. Occupied residential houses are census houses which are used wholly or partly for the purpose of residence by one or more households.
At the 1971 Census the following definitions were adopted for a census house and census household.
Census House
(1) A census house is a building or part of a building having a separate main entrance from the road or common court-yard or stair-case, etc., used or recognised as a separate unit. It may be inhabited or vacant. It may be used for residential or non-residential purpose or both. \
If a building has a number of flats or blocks which are independent of one another having separate entrances of their own from the road or a common court-yard leading to a main gate, they will be considered as separate census houses. If within a large enclosed area there are separate buildings, then each such building will be one or more separate census houses. If all the structures within an enclosed compound are together treated as one building then each structure with a separate entrance should be treated as a separate census house.
(2) The figures of occupied residential houses shown in this table are those of census houses actually used as residence
51
(dwelling) or residence in combination with other use on the census day. The number of occupied residential houses thm. includes besides residential houses, workshops, factories, garages, shops, depots, etc., where one or more persons like watchmen, peons, drivers, attendants, etc., were found to be residing at the time of census. On the other hand, it does not include houses which are residential.houses but which at the time of the census were either vacant or where no person was found to be residing (i.e. those exclusively used for non-residential purposes).
Census Households
A household is a group of persons who commonly live together and would take thei r meals from a common kitchen unless the exigencies of work prevented any of them from doing so. There may be one member household, two member household or multi-member houeshold. For census purposes each one of these types is regarded as a household. Again, there may be a household of persons related by blood or household of unrelated persons; the latter are boarding houses, hostels, residential hotels, orphanges, rescue homes, ashrams, etc. These are called institutional households.
The following statement gives the number of persons per 100 occupied census houses number of persons per 100 households, 'sex ratio, percentages of rural/urban population to total population and density of persons per km2 for total, rural and urban areas for each state & union territory in India.
STATEMENT 13
Persons per 100 occupied residential census houses and per 100 households: number.of females per 1;000 ml!l~s! percentage of rural and urban popUlation to total population and density per square krlometre III states and umon territories, 1971
State/Union Territory Persons per 100 occupied Persons per 100 house- Number of females per Percentage of Density per sq. kilometre census houses holds 1,000 males rural and urban
population to total population
Total ..A.._ ~--..A..---~ ~_...A..---, ~..A..--'r=--..A.. Rural Urb~ Total Rural Urban Total Rural Urban Rural Urban Total Rural Urba;;-'
2 3 4 5 6 7 8 9 10 11 12 13 14 15
INDIA 604 604 605 546 552 523 930 949 858 80·09 19·91 178' 148' 2,505'
STATES 1. Andhra Pradesh 541 526 612 490 489 497 977 983 949 80·69 19·31 157 128 2,360 2. Assamt 598 603 553 597 602 551 897 913 749 91'13 8·87 150 137 2,911 3. Bihar' 673 682 601 573 576 544 954 971 807 90·00 10·00 324 296 2,032 4. Gujara! 586 597 558 570 578 549 934 951 893 71·92 28·08 136 100' 1,625 5. Haryana 683 693 639 629 654 532 867 870 853 82'34 17·66 227 189 3,928 6. Himachal Pradesh 553 561 467 529 542 403 958 976 749 93·01 6·99 62 58 1,556 7. Jammu & Kashmir 692 671 805 605 598 637 878 882 860 81·41 18'59 N.A. N.A. N.A. 8. Kerala 625 613 692 603 596 639 1,016 1,020 997 83'76 16·24 549 477 2,585 9. Madhya Pradesh 611 605 641 538 543 516 941 956 868 83'71 16·29 94 79 2,378
10. Maharashtra 591 600 573 534 551 502 . 930 985 820 68·83 31 '17 164 115 2,555 11. Manipur 604 597 655 588 581 631 980 980 980 86·81 13·19 48 42 3,083 12. Meghalaya 524 520 549 490 490 494 942 958 853 85·45 14·55 45 39 3,860 13. Mysore 621 619 629 559 563 545 957 971 913 75·69 24·31 153 118 2,272 14. Nagaland 496 495 509 496 495 509 871 928 472 90·05 9·95 31 28 1,230 15. Orissa· 584 588 539 524 528 485 988 1,002 845 91'59 8·41 141 130 1,113 16. Punjab 640 637 649 587 607 531 865 868 856 76'27 23'73 269 208 4,650 17. Raiasthan 596 597 588 572 576 556 911 919 875 82'37 17·63 75 63 1,198 18. Tamil Nadu 534 508 608 479 470 502 978 990 951 69'74 30·26 317 231 2,115 19. Tripura 638 627 752 570 571 567 943 944 935 89'57 10·43 149 134 3,871 20. Uttar Pradesh 642 638 666 556 559 537 879 889 821 85·98 14·02 300 260 4,356 21. West Bengal 586 595 563 550 565 510 891 942 751 75·25 24·75 504 388 5,628
UNION TERRITORIES I. Andaman & Nicobar Islands": 497 506 468 484 493 458 644 671 558 77'23 22·77 14 11 3,298 2. Arunachal Pradesh 639 645 504 494 498 413 861 881 457 96'30 3·70 6 N.A. N.A. 3. Chandigarh 434 467 431 431 466 427 749 683 756 9·45 90·55 2,257 431 4,044 4. Dadra & Nagar Haveli . 573 573
608 549 549
500 1,007 1,007 100'00
89·70 151 151
5. Delhi' 612 641 510 608 801 825 798 10·30 2,738 403 8,172 6. Goa, Daman & Dill 559 554 574 517 511 537 989 1,030 885 73'56 26·44 225 172 1,654 7. Laccadive, Minicoy and Amindivi
Islands 616 616 599 599 5si
978 978 996
100·00 42·04
994 994 3,43i 8. Pondicherry 586 536 672 519 498 989 984 57'96 983 648
'While working out the density the area and population of Jammu and Kashmir have been excluded as comparable data are not available. Rural & urban population of Arunachal Pradesh have also been excluded as rural & urban area figures are not available.
tlncludes Mho district, now constituted as union territory of Mizoram. N.A. stands for not available.
From the above statement it is found that the average number of persons per occupied census house is 6·04 in India as per 1971 Census. It is the highest in case of Jammu & Kashmir' which is 6· 92 persons per occupied house.
In 1961 the figure worked out to 5' 57 persons per occupied house in India. This shows that during the decade the pressure for accommodation has gone up considerably. Moreover in a number of states like Andhra Pradesh, Jammu, & Kashmir, Kerala, Madhya Pradesh, Manipur, Meghalaya, Mysore, Nagaland, Punjab, Tamil Nadu, Tripura & Uttar Pradesh the proportions in urban areas are much higher which again go to prove that pressure of accomodation is higher in urban areas when compared to rural areas.
Similarly the statistics of household accorsling to 1971 Census reveal that average no. of persons per household is 5· 46. In 1961 it was slightly less being·5 ·16 persons per household. In none of the states the figures have gone up beyond 6 persons per household but mostly the trend has been around 5 persons per household.
The sex ratio according to the 1971 Census works out to 930 females per 1,000 males for the country. The corresponding figure for 1961 was 941. It suggests that there has been some disparity in the number of males and females during the decade, but what is disturbing is that the sex ratio is showing a downward trend. Why it is so deserves to be looked into details. Females are more only in Kerala (1016) and Dadra and Nagar Haveli (1007).
1971 Census revealed that 80·09 percent of the total population were residing in rural areas in India. This proportion "has slightly gone down when compared with 1961 figures which was 82'0 per cent. In Himachal Pradesh, however, the proportion of rural population has gone upto 93· 01 per cent, which is the highest among states.
The percentage of urban population in India is 19·91 accor-' ding to 1971 Census. The most urbanised state is Maharash1ra in which 31·17 percent of population is living in urban areas. High industrialization has lead to a greater concentration of the populaion in urban areas. Maharashtra is closely followed by Tamil Nadu in which 30· 26 per cent of popUlation is found in urban areas. The least urbanised state is Himachal Pradesh having 6·99 percent of urban population. The position of union territories is not strictly comparable with the states. The union territories like Chandigarh and Delhi are almost entirely urban.
52
The urban popUlation of Chandigarh is 90.55 percent of the total population and that of Delhi is 89.70 percent. The union territories of Dadra & Nagar Haveli and Laccadive, Minicoy & Amindivi Islands are entirely rural.
DENSITY PER SQUARE KILOMETRE
Column 4 of table A-I gives the population per km!. The density figures per square kilometre for urban areas have been worked out by using the area figures corrected upto two places of decimals obtained by adding the area of individual towns in the respective units. For 'total ' and 'rural' the density is worked out on area figures corrected upto one place of decimal.
The average density of persons per lan" for the country works out to 178 persons; the urban density being 2505 persons lind rural density 148 persons per km2• Among states the highest density of 549 persons per km2 is recorded in Kerala while the lowest density of 31 persons is observed in Nagaland.
For rural areas, West Bengal with a density of 388 persons tops the list among states. The lowest density of 28 is again observed in Nagaland.
For urban areas again West Bengal recorded the highest density of 5,628 persons per km". Among states lowest density of 1,113 persons was recorded in Orissa.
Columns 10, 11 and 12 of table A-I give total population by sex break up. This population represents the residential population as at the sunrise of 1 April, 1971 plus houseless population cO\Jnted on the night of 31 March. 1971. The total population includes institutional and house less population also. The houseless population includes persons who do not have any fixed place of residence but move from place to place, camp at night or jnst live on the streets, in gardens or in open places without erecting a hut or a similar. structure. They may include domestic servants and other workers who do not reside in any house but sleep in the corridors, verandahs, passages in the buildings, or on the streets; wandering or nomadic tribes found to be staying in temporary huts or residing on the grounds; beggars, vagrants , sadhus, fakirs, etc., who are found on the footpaths, streets and in big places like parks, gardens, sea-shores, railway yards, etc.
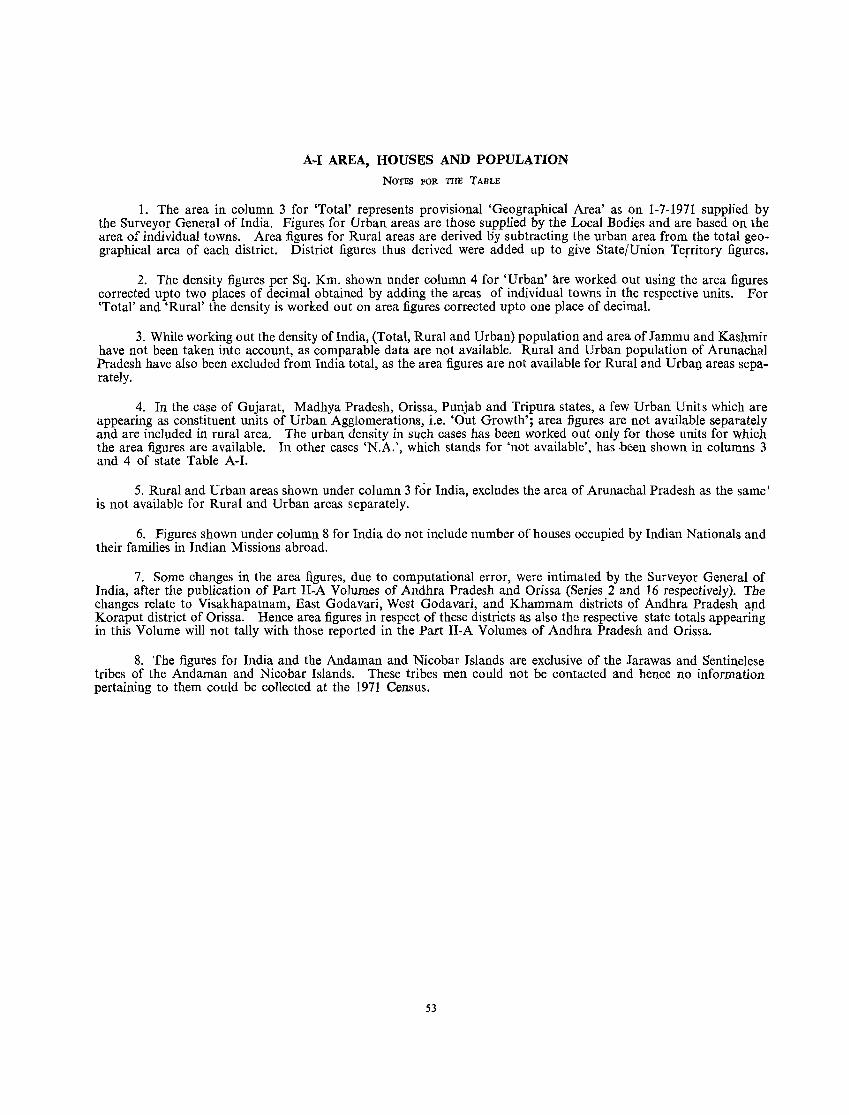
A~I AREA, HOUSES AND POPULATION
NOTES FOR THE TABLE
1. The area in column 3 for 'Total' represents provisional 'Geographical Area' as on 1-7-1971 supplied by the Surveyor General of India. Figures for Urban areas are those supplied by the Local Bodies and are based on the area of individual towns. Area figures for Rural areas are derived oy subtracting the urban area from the total geographical area of each district. District figures thus derived were added up to give State/Union Territory figures.
2. The density figures per Sq. Km. shown under column 4 for 'Urban' are worked out using the area figures corrected upto two places of decimal obtained by adding the areas of individual towns in the respective units. For 'Total' and 'Rural' the density is worked out on area figures corrected upto one place of decimal.
3. While working out the density ofIndia, (Total, Rural and Urban) population and area of Jammu and Kashmir have not been taken into account, as comparable data are not available. Rural and Urban population of Arunachal Pradesh have also been excluded from India total, as the area figures are not available for Rural and Urban areas separately.
4. In the case of Gujarat, Madhya Pradesh, Orissa, Punjab and Tripura states, a few Urban Units which are appearing as constituent units of Urban Agglomerations, i.e. 'Out Growth'; area figures are not available separately and are included in rural area. The urban density in such cases has been worked out only for those units for which the area figures are available. In other cases 'N.A.', which stands for 'not available', has been shown in columns 3 and 4 of state Table A-I.
5. Rural and Urban areas shown under column 3 for India, excludes the area of Arunachal Pradesh as the same I is not available for Rural and Urban areas separately.
6. Figures shown under column 8 for India do not include number of houses occupied by Indian Nationals and their families in Indian Missions abroad.
7. Some changes in the area figures, due to computational error, were intimated by the Surveyor General of India, after the publication of Part II-A Volumes of Andhra Pradesh and Orissa (Series 2 and 16 respectively). The changes relate to Visakhapatnam, East Godavari, West Godavari, and Khammam districts of Andhra Pradesh ap.d Koraput district of Orissa. Hence area figures in respect of these districts as also the respective state totals appearing in this Volume will not tally with those reported in the Part II-A Volumes of Andhra Pradesh and Orissa.
8. The figures for India and the Andaman and Nicobar Islands are exclusive of the Jarawas and Sentinelese tribes of the Andaman and Nicobar Islands. These tribes men could not be contacted and hence no information pertaining to them could be collected at the 1971 Census.
53
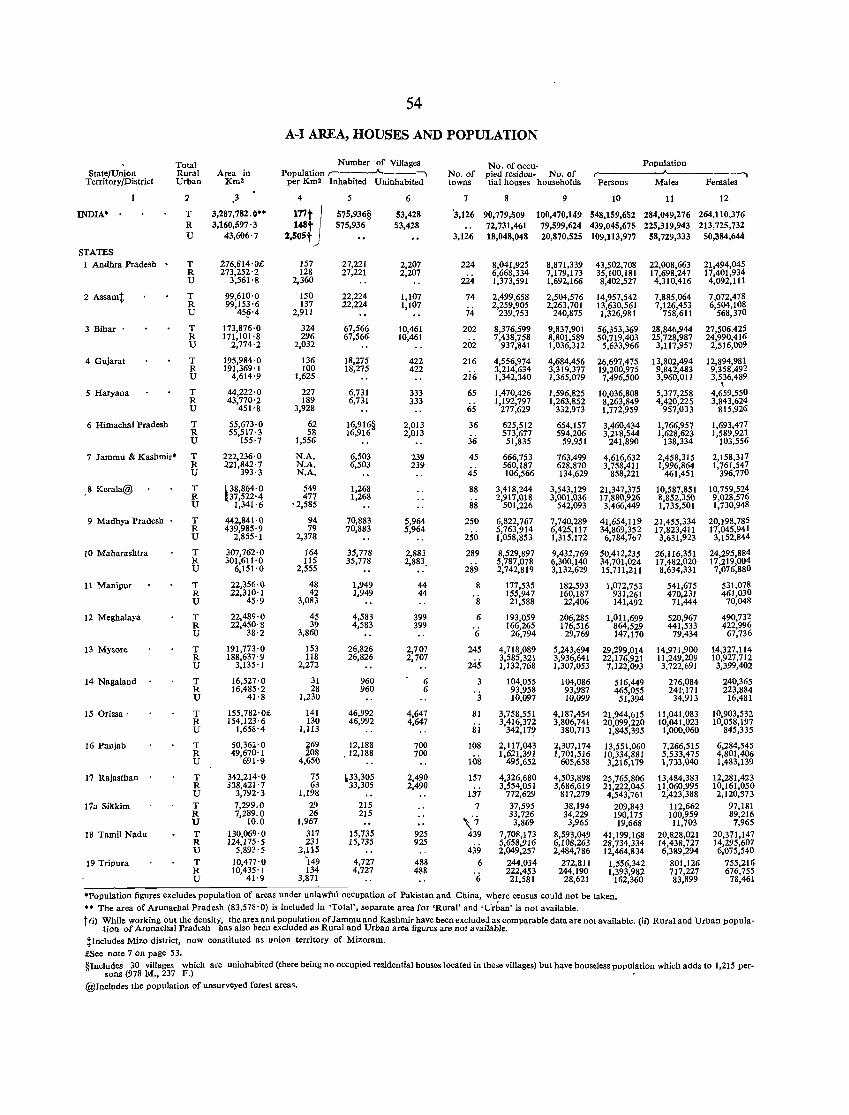
54
A-I AREA, HOUSES AND POPULATION
State/Union Territory/District
INDIA· .
STATES 1 Andhra Pradesh
2 Assamt
3 Bihar'
4 Gujarat
S Haryana
6 Himachal Pradesh
Total Rural Area in Urban Km'
:I
T R U
T R U
T R U
T R U
T R U
T R U
T R U
.3
3,287,782.0" 3,160,597' 3
43,606'7
276,814'0£ 273,252'2
3,561'8
99,610'0 99,153'6
45§'4
173,876'0 171,101'8
2,774'2
195,984'0 191,369'1
4,614'9
44,222'0 43,770'2
451'8
55,613'0 55,517'3
155'7
7 Jammu & Kashmir· T R U
222,236'0 221,842'7
393'3
.8 Kerala@
9 Madhya Pradesh •
10 Maharashtra
11 Manipur
12 Meghalaya
13 Mysore
14 Nagaiand
15 Orissa'
16 Punjab
17 Rajasthan
l1a Sikkim
18 Tamil Nadu
19 Tripura
T R U
T R U
T R U
T R U
T R U
T R U
T R U
T R U
T R U
T R U T R U T R U
T R U
l38,864·0 [37,522'4
1,341'6
442,841'0 439,985'9
2,855'1
307,762'0 301,611'0
6,151'0
22,356'0 22,310'1
45·9
22,489'0 22,450'8
38'2
191,773'0 188,637'9
3,135'1
16,527'0 16,485'2
41'8
155,782'0£ 154,123'6
1,658'4
50,362'0 49,670'1
691'9
342,214'0 338,421'7
3,792' 3 7,299.0 7,289.0
10.0 130,069'0 124,175'5
5,893'5 10,477'0 10,435'1
41'9
Number of Villages Population r-----A.._--,
per Km' Inhabited Uninhabited
4
177tj 148t
2.50St
157 128
2,360
150 137
2,911
324 296
2,032
136 100
1,625
227 189
3,928
62 58
1,556
N.A. N.A. N.A.
549 417
'2,585
94 19
2,318
164 115
2,555
48 42
3,083
45 39
3,860
153 118
2,272
31 28
1,230
141 130
1,113
;(!69 208
4,650
75 63
1,198 29 26
1,967 317 231
2,115 149 134
3,871
5
57S,936§ 575,936
27,221 27,221
22,224 22,224
67,566 67,566
18,275 18,275
6,731 6,731
16,916§ 16,916
6,503 6,503
1,268 1,268
70,883 70,883
35,778 35,118
1,949 1,949
4,583 4,583
26,826 26,826
960 960
46,992 46,992
12,188 .12,188
1.33,305 33,305
215 215
15,735 15,735
4,727 4,727
6
53,428 53,428
2,207 2,207
1,107 1,107
10,461 10,461
422 422
333 333
2,013 2,013
239 239
5,964 5,964
2,883 2,883.
44 44
399 399
2,707 2,707
6 6
4,647 4,647
700 700
2,490 2,490
925 925
488 488
No. of occu- Population No. of pied residen- No. of r- .-------.. towns tial houses households Persons Males Females
7 8 9 10 11 12
'3,126 90,779,509 72,731,461
3,126 18,048,048
100,470,149 548,159,652 284,049,276 264,110,376 79,599,624 439,045,675 225,319,943 213,725,732 20,870,525 109,113,977 58,729,333 50,384,644
224
224 74
74 202
202
216
2ii;
65
65
36
36 45
45
88
88
250
250
289
289 8
8
6
6
245
245
3
'j
81
Iii 108
108 157
U7 7
\7 439
439 6
'6
8,041,925 6,668,334 1,373,591
2,499,658 2,259,905
239,753
8,376,599 7,438,758
937,841
4,556,974 3,214,634 1,342,340
1,470,426 1,192,797
271,629
625,5)2 573,677 51,835
666,753 560,187 106,566
3,418,244 2,917,018
501,226
6,822,767 5,763,914 1,058,853
8,529,897 5,787,078 2,742,819
177,535 155,947 21,588
193,059 166,265
26,794
4,718,089 3,585,321 1,132,768
104,055 93,958 10,097
3,758,551 3,416,372 342,17~
2,117,043 1,621,391
495,652
4,326,680 3,554,051
772,629 37,595 33,726 3,869
7,708,173 5,658,916 2,049,257
244,034 222,453 21,581
8,871,339 7,179,173 1,692,166
2,504,576 2,263,701
240,875
9,837,901 8,801,589 1,036,312
4,684,456 3,319,377 1,365,079
1,596,825 1,263,852
332,973
654,157 594,206
59,951
763,499 628,870 134,629
3,543,129 3,001,036
542,093
7,740,289 6,425,117 1,315,172
9,432,769 6,300,140 3,132,629
182,593 160,187 22,406
206,285 176,516
29,769
5,243,694 3,936,641 1,307,053
104,086 93,987 10,099
4,187,454 3,806,741
380,713
2,307,174 1,701,516
605,658
4,503,898 3,686,619
817,279 38,194 34,229 3,965
8,593,049 6,108,263 2,484,786
272,811 244,190
28,621
43,502,708 35,100,181 8,402,527
14,957,542 13,630,561 1,326,981
56,353,369 50,719,403
5,633,966
26,697,475 19,200,975 7,496,500
10,036,808 8,263,849 1,772,959
3,460,434 3,218,544
241,890
4,616,632 3,758,411
858,221
21,347,375 17,880,926 3,466,449
41,654,119 34,869,352 6,784,767
50,412,235 34,701,024 15,711,211
1,072,753 931,261 141,492
1,011,699 864,529 147,170
29,299,014 22,176,921 7,122,093
516,449 465,055
51,394
21,944,615 20,099,220
1,845,395
13,551,060 10,334,881 3,216,179
25,765,806 21,222,045 4,543,761
209,843 190,115 19,668
41,199,168 28,734,334 12,464,834
1,556,342 1,393,982
162,360
22,008,663 17,698,247 4,310,416
7,885,064 7,126,453
758,611
28,846,944 25,728,987
3,117,957
13,802,494 9,842,483 3,960,011
5,371,258 4,420,225
957,033
1,766,957 1,628,623
138,334
2,458,315 1,996,864
461,451
10,587,851 8,852,350 1,735,501
21,455,334 17,823,411 3,631,923
26,116,351 17,482,020 8,634,331
541,675 470,231
71,444
520,967 441,533
79,434
14,971,900 11,249,209 3,722,691
276,084 241',171
34,913
11,041,083 10,041,023 1,000,060
7,266,515 5,533,475 1,733,040
13,484,383 11,060,995 2,423,388
112,662 100,959 11,703
20,828,021 14,438,727 6,389,294
801,126 717,227 83,899
21,494,045 17,401,934 4,092,111
7,072,478 6,504,108
568,370
27,506.425 24,990,416
2,516,009
12,894,981 9,358,492 3,536,489 , 4,659,550 3,843,624
815,926
1,693,477 1,589,921
103,556
2,158,317 1,761,547
396,170
10,759,524 9,028,576 1,730,948
20,198,785 17,045,941 3,152,844
24,295,884 17,219,004 7,076,880
531,078 461,030
70,048
490,732 422,996
67,736
14,327,114 10,927,712 3,399,402
240,365 223,884
16,481
10,903,532 10,058,197
845,335
6,284,545 4,801,406 1,483,139
12,281,423 10,161,050 2,120,~73
97,181 89,216 7,965
20,371,147 14,295,607 6,075,540
755,216 676,755
78,461
'Population figures excludes population of areas under unlawful occupation of Pakistan and China, where census could not be taken • •• The area of Arunachal Pradesh (83,578 '0) is included in 'Total', separate area for 'Rural' and 'Urban' is not available. tli) While working out the density, the area and population of Jammu and Kashmir have been excluded as comparable data are not available. (ii) Rural and Urban popula-
tion of Arunachal Pradesh has also been excluded as Rural and Urban area figures are not available. tlncludes Mizo district, now constituted as union territory of Mizoram.
£See note 7 on page 53. §Includes 30 villages which are uninhabited (there being no occupied residential houses located in these villages) but have houseless population which adds to 1,215 per-
sons (973 111., 237 F.) . @Includes tile population of unsurveyed forest areas.
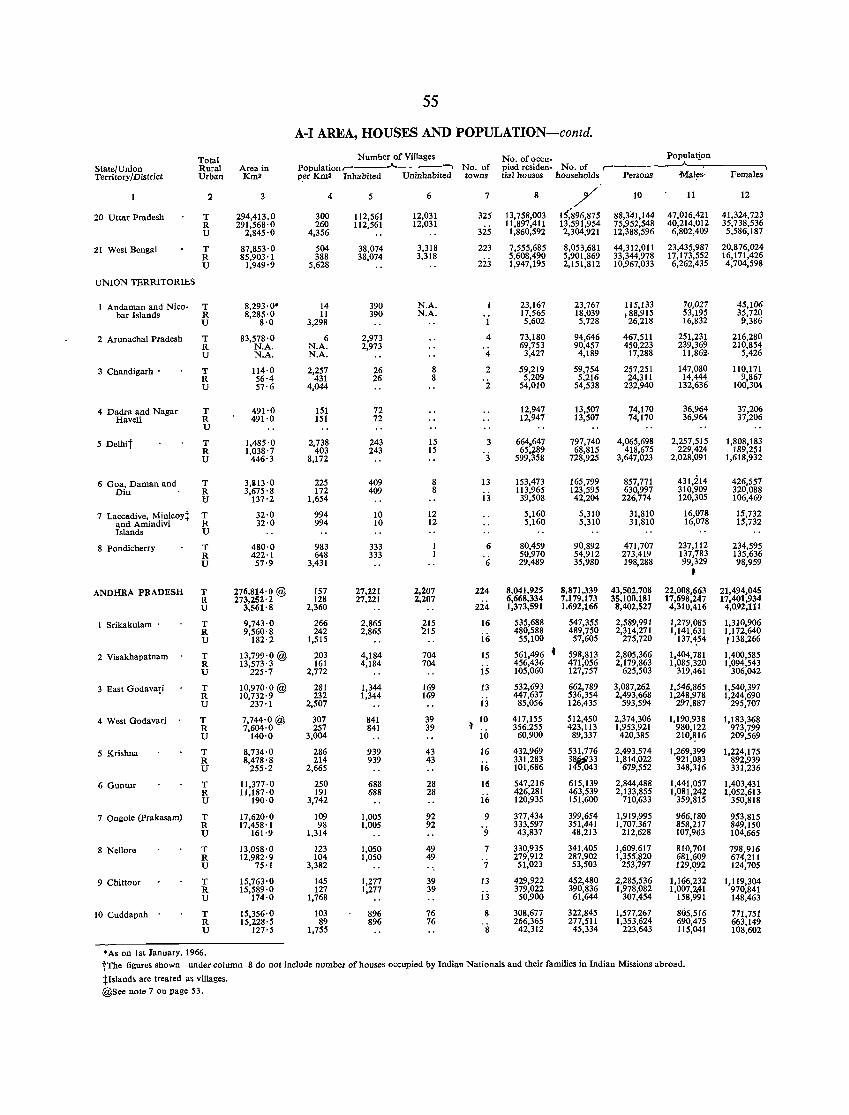
State/Union Territory/District
20 U tlar Pradesh
ZI West Bengal
UNION TERRITORIES
Total Rural Urban
2
T R U
T R U
I Andaman and Nico- T bar Islands R
2 Arunachal Pradesh
3 Chandigarh .
4 Dadra and Nagar Haveli
5 Delhit
6 Goa, Daman and Diu
7 Laccadive, Minicoy+ and Arnindivi Islands
8 Pondicherry
ANDHRA PRADESH
I Srikakulam .
2 Visakhapatnam
3 East Godava~i
4 West Godavari
5 Krishna
6 Guntur
7 Ongole (prakasam)
8 Nellore
9 Chitto or
10 Cuddapah .
U
T R U
T R U
T R U
T R U
T R 1:1
T R U
T R U
T R U
T R U
T R U
T R U
T R U
T R U
T R U
T R U
T R U
T R U
T R U
• As on 1st January, 1966.
Area in Km2
294,413.0 291,568'0
2,845'0
87,853'0 85,903 ·1
1,949'9
8,293'0' 8,285'0
8·0
83,578'0 N.A. N.A.
114·0 56·4 57·6
491'0 491·0
1,485'0 1,038'7
446·3
3,313'0 3,675'8
137·2
32·0 32·0
480·0 422·1 57·9
276,814'0 @ 273,252'2
3,561,8
9,743'0 9,560' 8
182·2
13,799'0 @ 13,573' 3
225'7
10,970·0@ 10,732'9
237·1
7,744'0@ 7,604,0
140·0
8,734·0 8,478'8
255·2
11,377·0 11,187·0
190·0
17,620'0 17,458'1
161·9
13,058·0 12,982'9
75·1
15,763'0 15,589·0
174·0
15,356·0 15,228'5
127·5
55
A-I AREA, HOUSES AND POPULATION-contd.
Number of Villages Populationr-~ ., No. of per Km2 Inhabited Uninhabited towns
4
300 260
4,356
504 388
5,628
14 II
3,298
6 N.A. N.A.
2,257 431
4,044
151 151
2,738 403
8,172
225 172
1,654
994 994
983 648
3,431
157 128
2,360
266 242
1,515
203 161
2,772
281 232
2,507
307 257
3,004
286 214
2,665
250 191
3,742
109 98
1,314
123 104
3,382
145 127
1,768
103 89
1,755
5
112,561 112,561
38,074 38,074
390 390
2,973 2,973
26 26
72 72
243 243
409 409
10 10
333 333
27,221 27,221
2,865 2,865
4,184 4,184
1,344 1,344
841 841
939 939
688 688
1,005 1,005
1,050 1,050
1,277 1,277
896 896
6
12,031 12,031
3,318 3,318
N.A. N.A.
8 8
15 15
8 8
12 12
2,207 2,207
215 ~15
704 704
169 169
39 39
43 43
28 28
92 92
49 49
39 39
76 76
7
325
325 223
2i:i
1
4
4
2
2
3
3
13
13
6
6
224
224 16
ii; 15
15
13
i3 ~ 10
iii 16
16
16
16
9
9
7
7
13
i:i 8
8
No.ofoccu-pied residen- No. of r-ti.1 houses households Persons
8
13,758,003 11,897,411 1,860,592
7,555,685 5,608,490 1,947,195
23,167 17,565 5,602
73,180 69,753
3,427
59,219 5,209
54,010
12,947 12,947
664,647 65,289
599,358
153,473 113,965 39,508
5,160 5,160
80,459 50,970 29,489
8,041,925 6,668,334 1,373,591
535,688 480,588
55,100
561,496 f 456,436 105,060
532,693 447,637
85,056
417,155 356,255
60,900
432,969 331,283 101,686
547,216 426,281 120,935
377,434 333,597 43,837
330,935 279,912 51,023
429,922 379,022 50,900
308,677 266,365
42,312
/' 1(896,875 13,591,954 2,304,921
8,053,681 5,901,869 2,151,812
23,767 18,039 5,728
94,646 90,457
4,189
59,754 5,216
54,538
13,507 13,507
797,740 68,815
728,925
165,799 123,595 42,204
5,310 5,310
90,892 54,912 35,980
8,871,339 7,179,173 1,692,166
547,355 489,750 57,605
598,813 471,056 127,757
662,789 536,354 126,435
512,450 423,113
89,337
531,176 38.PJil33 145',043
615,139 463,539 151,600
399,654 351,441 48,213
341,405 287,902 53,503
452,480 390,836 61,644
322,845 277,511
45,334
10
88,341,144 75,952,548 12,388,596
44,312,011 33,344,978 10,967,033
lI5,133 ~ 88,915 26,218
467,511 450,223
17,288
257,251 24,311
232,940
74,170 74,170
4,065,698 418,675
3,647,023
857,771 630,997
226,774
31,810 31,810
471,707 273,419 198,288
43,502,708 35,100,181
8,402,527
2,589,991 2,314,271
275,720
2,805,366 2,179,863
625,503
3,087,262 2,493,668
593,594
2,374,306 1,953,921
420,385
2,493,574 1,814,022
679,552
2,844,488 2,133,855
710,633
1,919;995 1,707,367
212,628
1,609,617 1,355,820
253,797
2,285,536 1,978,082
307,454
1,577,267 1,353,624
223,643
Population
11
47,016,421 40,214,012
6,802,409
23,435,987 17,173,552 6,262,435
70,027 53,195 16,832
251,231 239,369 1I,86~
147,080 14,444
132,636
36,964 36,964
2,257,515 229,424
2,028,091
431,214 310,909 120,305
16,078 16,078
237,112 137,783 99,329 ,
22,008,663 17,698,247
4,310,416
1,279,085 1,141,631 137,~54
1,404,781 1,085,320
319,461
1,546,865 1,248,978
297,887
1,190,938 980,122 210,~16
1,269,399 921,083 348,316
1,441,057 1,081,242
359,815
966,180 858,217 107,963
810,701 681,609 129,~92
1,166,232 1,007,7.41
158,991
805,516 690,475 115,041
tThe figures shown under column 8 do not include number of houses occupied by Indian Nationals and their families in Indian Missions abroad.
tIslands are treated as villages. @See note 7 on page 53.
Females
12
41,324,723 35,738,536 5,586,187
20,876,024 16,171,426 4,704,598
45,106 35,720 9,386
216,280 210,854
5,426
110,171 9,867
100,304
37,206 37,206
1,808,183 189,251
1,618,932
426,557 320,088 106,469
15,732 15,732
234,595 135,636 98,959
21,494,045 17,401,934
4,092,111
1,310,906 1,172,640 r 138,266
1,400,585 1,094,543
306,042
1,540,397 1,244,690
295,707
1,183,368 973,799 209,569
1,224,175 892,939 331,236
1,403,431 1,052,613
350,818
953,815 849,150 104,665
798,916 674,211 124,705
1,119,304 970,841 148,463
771,751 663,149 108,602
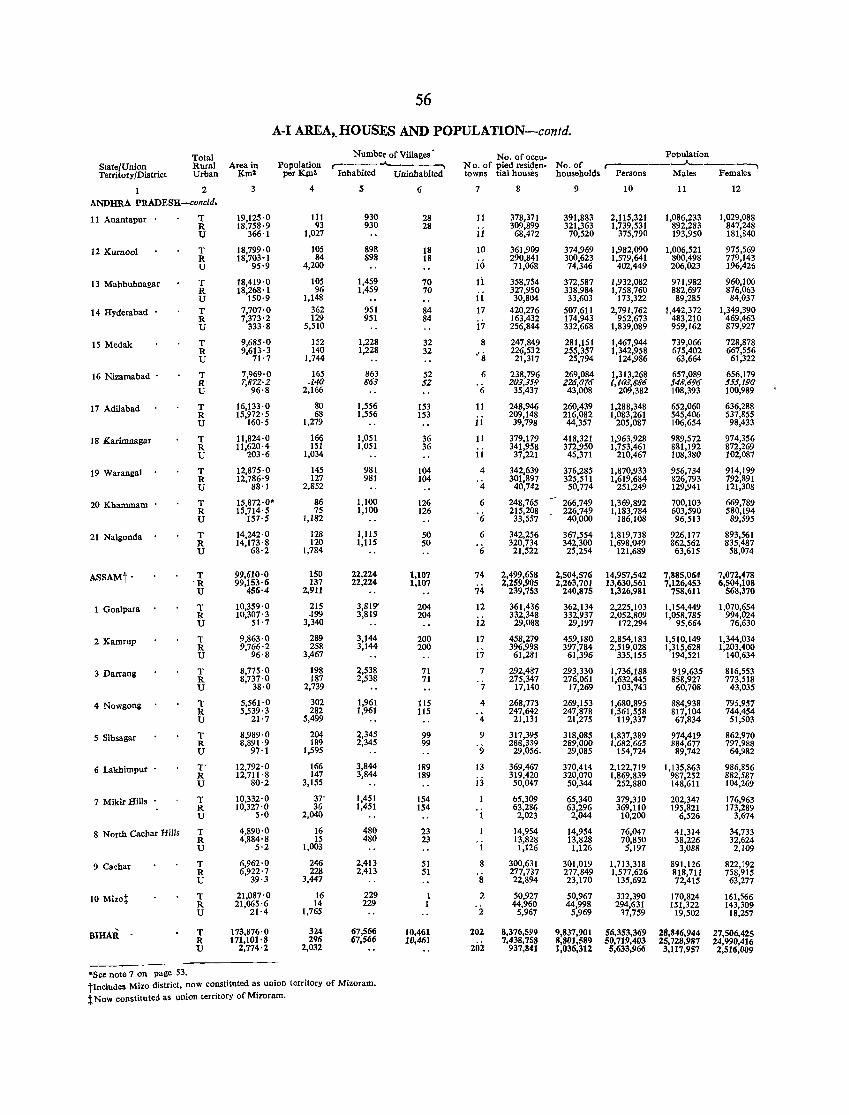
56
A-I AREA,. HOUSES AND POPULATION-conld.
Total State/Union Territory/District
Rural Area in Urban Km2
2
ANDHRA PRADESH-concld.
11 Anantapur ~
12 Kumool
13 Mahbubnagar
14 Hyderabad
15 Medak
16 Nizamabad .
17 Adilabad
18 Karimnagar
19 Warangal
20 Khammam .
21 Nalgonda
ASSAMt·
1 Goalpara
2 Kamrup
3 Darrang
4 Nowgong
5 Sibsagar
6 Lakhimpur
7 Mikir Hills .
8 North Cachar Hills
9 Caohar
10 Milot
BIHAR
'See note 7 on page 53.
lJ
T R U
T R U T R U
T R U
T R U
T R U
T R U
T R U
T R U
T R U
T 'R U
T R U
T R U
T R U
T R U
T R U
T' R U
T R U
T R U
T R U
T R U
T R U
3
19,125·0 18.758·9
366·1
18,799·0 18,703'1
95·9
18,419'0 18,268'1
150·9 7,707·0 7,373'2
333·8
9,685'0 9,613'3
71·7
7,969·0 7,f?7Z'Z
96·8
16,133·0 15,972'5
160·5
11,824'0
l1,~~g:~
12,875'0 12,786'9
88·1
15872·0' 15)14'5
157'S
14,242·0 14,IU:~
99,610'0 99,153'6
456·4
10,359·0 10,307' 3
51'7
9,863·0 9,766'2
96'8
8,775'0 8,737'0
38·0
5,561'0 5,539' 3
21·7
8,989·0 8,891'9
97·1
12,792'0 12,711'8
80·2
10,332'0 10,327'0
5·0
4,890'0 4,884'8
5·2
6,962'0 6,922'7
39·3
21,087'0
21'~n
173,876'0 171,101,8
2,774'2
Number of Villages' Population r----- ......__---.....
per Klu2 Inhabited Uninhabited
4
111 93
1,027
105 84
4,200
105 96
1,148 362 129
5,510
152 140
1,744
165 .14()
2,166
80 68
1,279
166 151
1,034
145 127
2,852
86 75
1,182
128 120
1,784
150 137
2,911
215 .199
3,340
289 258
3,467
198 187
2,739
302 282
5,499
204 189
1,595
166 147
3,155
37' 36
2,040
16 IS
1,003
246 228
3,447
16 14
1,765
324 296
2,032
s
930 930
898 898
1,459 1,459
951 951
1,228 1,228
863 863
1,556 1,556
1,051 1,051
981 981
1,100 1,100
1,115 1,115
22,224 22,224
3,819' 3,819
3,144 3,144
2,538 2,538
1,961 1,961
2,345 2,345
3,844 3,844
1,451 1,451
480 480
2,413 2,413
229 229
67,566 67,566
6
28 28
18 18
70 70
84 84
32 32
52 SZ
153 153
36 36
104 104
126 126
50 50
1,107 1,107
204 204
200 200
71 71
lls 115
99 99
189 189
154 154
23 23
51 51
I 1
10,461 10,461
tIncludes Mizo district, now constituted as uoion territory of Mizoram. t NoVl constituted as union territory of Mi2'oram.
No. of oceu- Population No. of pied residen- No. of r--------"---------., towns tial houses households Persons Males Females
7
11
ii 10
io Ii ii 17
17
8
'8 6
.;;
11
ii 11
ii 4
4
6
'6 6
6
74
74
12
ii 17
i7 7
'7 4
'4 9
'9 13
jj
202
20i
8
378,371 309,899 68,472
361,909 290,841 71,068
358,754 327,950 30,804
420,276 163,432 256,844
247,849 226,532
21,317
238,796 Zm,359
35,437
248,946 209,148 39,798
379.179 341,958 37,221
342,639 301,897
40,742
248,765 215,208
33,557
342,256 320,734 21,522
2,499,658 2,259,905
239,753
361,436 332,348 29,088
458,279 396,998 61,231
292,487 275,347
17,140
268,773 247,642
21,131
317,395 288,339
29,056.
369,467 319,420 50,047
65,309 63,286 2,023
14,954 13,828
1,126
300,631 277,737 22,894
50,927 44,960
5,967
8,376,599 7,438,758
937,841
9
391,883 321,363
70,520
374,969 300,623 74,346
372,587 338,984 33,603
507,611 174,943 332,668
281,151 255,357
25,794
269,084 ZZ6,(J76
43,008
260,439 216,082 44,357
418,321 372,950 45,371
376,285 325,511 50,774
266,749 226,749 40,000
367,554 342,300 25,254
2,504,576 2,263,701
240,875
362,134 332,937
29,197
459,180 397,784
61,396
293,330 276,061
17,269
269,153 247,878
21,275
318,085 289,000
29,085
370,414 320,070 50,344
65,340 63,296 2,044
14,954 13,828
1,126
301,019 277,849 23,170
50,967 44,998
5,969
9,837,901 8,801,589 1,036,312
10
2,115,321 1,739,531
375,790
1,982,090 1,579,641
402,449
1,932,082 1,758,760
173,322 2,791,762
952,673 1,839,089
1,467,944 1,342,958
124,986
1,313,268 1,1(JS,886
209,382
1,288,348 1,083,261
205,087
1,963,928 1,753,461
210,467
1,870,933 1,619,684
251,249
1,369,892 1,183,784
186,108
1,819,738 1,698,049
121,689
14,957,542 13,630,561
1,326.981
2,225,103 2,052,809
172,294
2,854,183 2,519,028
335,155
1,736,188 1,632,445
103,743
1,680,895 1,561,558
119,337
1,837,389 1,682,665
154,724
2,122,719 1,869,839
252,880
379,310 369,110
10,200
76,047 70,850
5,197
1,713,318 1,577,626
135,692
332,390 294,631
n,759
56,353,369 50,719,403
5,633,966
11
1,086,233 892,283 193,950
1,006,521 800,498 206,023
971,982 882,697 89,285
1,442,372 483,210 959,162
739,066 675,402 63,664
657,089 548,696 108,393
652,060 545,406 106,654
989,572 881,192 108,380
956,734 826,793 129,941
700,103 603,590 96,513
926,177 862,562
63,615
7,885,064 7,126,453
758,611
1,154,449 1,058,785
95,664
1,510,149 1,315,628
194,521
919,635 858,927 60,708
884,938 817,104 67,834
974,419 884,677 89,742
1,135,863 987,252 148,611
202,347 195,821
6,526
41,314 38,226 3,088
891,126 818,711 72,415
170,824 151,322
19,502
28,846,944 25,728,987 3,117,957
12
1,029,088 847,248 181,840
975,569 779,143 196,426
960,100 876,063 84,037
1,349,390 469,463 879,927
728,878 667,556 61,322
656,179 S55,190 100,989
636,288 537,855 98,433
974,356 872,269 102,087
914,199 792,891 121,308
669,789 580,194 89,595
893,561 835,487
58,074
7,072,478 6,504,108
568,370
1,070,654 994,024
76,630
1,344,034 1,203,400
140,634
816,553 773,518
43,035
795,957 744,454 51,503
862,970 797,988
64,982
986,856 882,587 104,269
176,963 173,289
3,674
34,733 32,624 2,109
822,192 758,915
63,277
161,566 143,309
18,257
27,506,425 24,990,416 2,516,009
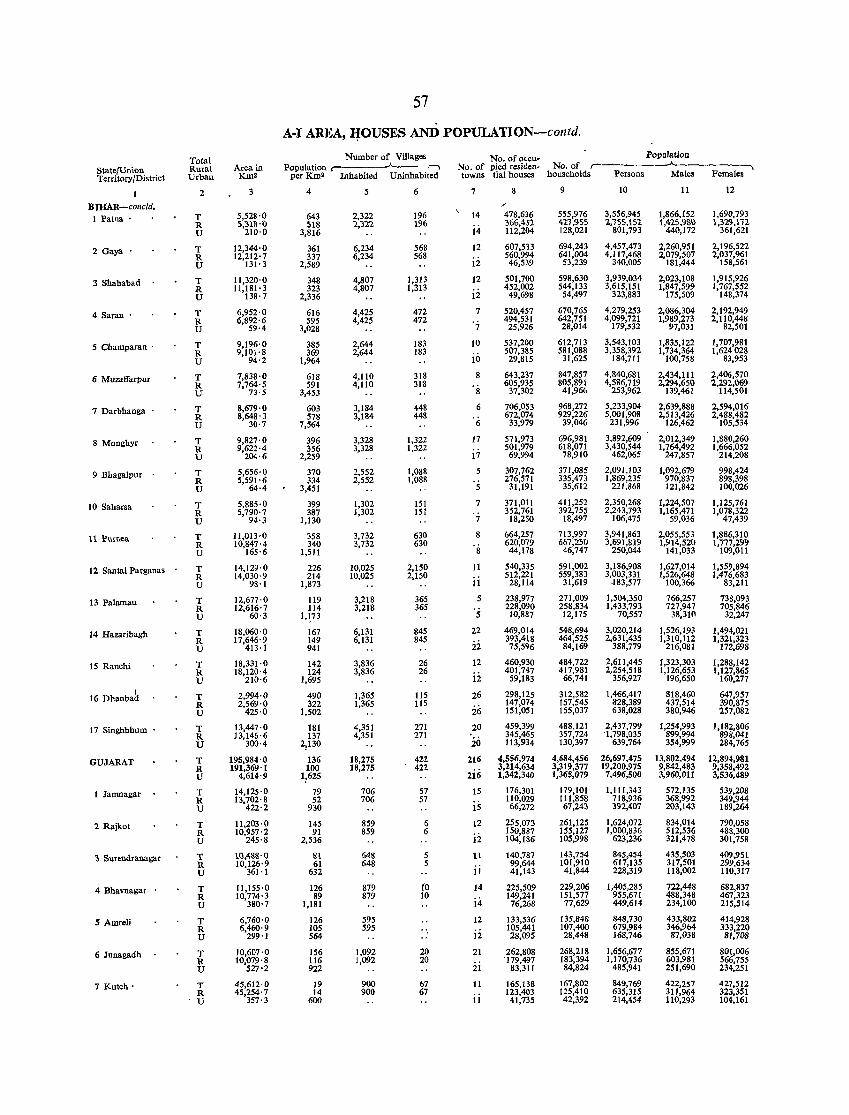
StateJUnion Territory/District
B lHAR-conc/d. 1 Patna •
2 Gaya .
3 Shababad
4 Saran •
5 Champaran .
6 Muzaffarpur
7 Darbbanga .
8 Monghyr
9 Bhagalpur
10 Sabarsa
11 l'urnea
12 Santal Parganas
13 Palamau
14 Hazaribagh
15 Ranchi
I 16 Dhanbad
17 Singhbhum
GUJARAT
I Jamnagar
2 Rajkot
:\ Surendranagar
4 Bhavnagar
5 Amreli
6 Junagadh
7 Kutch'
Total Rural Urban
2
T R U
T R U
T R U
T R U
T R U
T R U
T R U
T R U
T R U
T R U
T R U
T R U
T R U
T R U
T R U
T R U
T R U
T R U
T R U
T R U
T R U
T R U
T R U
T R U
T R U
Area in Kms
3
5,528·0 5,318'0
210·0
12,344'0 12,212'7
131' 3
11,320'0 11,181 ·3
138'7
6,952'0 6,892,6
59·4
9,196'0 9,101'8
94'2
7,838'0 7,764' 5
73'5
8,679'0 8,648'3
30·7
9,827'0 9,622·4
204·6
5,656'0 5,591'6
64·4
5,885·0 5,790'7
94·3
11,013'0 10,847'4
165·6
14,129'0 14,030'9
98'1
12,677'0 12,616'7
60·3
18,060'0 17,646'9
413'1
18,331'0 18,120'4
210·6
2,994·0 2,569'0
425·0
13,447'0 13,146'6
300·4
195,984'0 191,369'1
4,614'9
14,125·0
13'lg~:~
11,203·0 10,957'2
245·8
l0,48tHI 10,126·9
361·1
11,155·0 10,774'3
380·7
6,760'0 6,460·9
299·1
10,607 ·0 10,079'8
527'2
45,612'0 45,254'7
357·3
57
A-I AREA, IfOUSES AND POPULATlON-contd.
Number of Villages Population r---__A.-----.
per Km2 Inhabited Uninhabited
4
643 518
3,816
361 337
2,589
348 323
2,336
616 595
3,028
385 369
1,964
618 591
3,453
603 578
7,564
396 356
2,259
370 334
3,451
399 387
1,130
358 340
1,511
226 214
1,873
119 114
1,~73
167 149 941
142 124
1,695
490 322
1,502
181 137
2,130
136 100
1:625
79 52
930
145 91
2,536
81 61
632
126 89
1,181
126 lOS 564
156 116 922
19 14
600
5
2,322 2,322
6,234 6,234
4,807 4,807
4,425 4,425
2,644 2,644
4,110 4,110
3,184 3,184
3,328 3,328
2,552 2,552
1,302 1,302
3,732 3,732
10,025 10,025
3,218 3,218
6,131 6,131
3,836 3,836
1,365 1,365
4,351 4,351
18,275 18,275
706 706
859 859
648 648
879 879
595 595
1,092 1,092
900 900
6
196 196
568 568
1,313 1,313
472 472
183 183
318 3111
448 448
1,322 1,322
1,088 1,088
lSI 15l
630 630
2,150 2,150
365 365
845 845
26 26
115 115
271 271
422 422
57 57
6 6
5 5
to 10
20 20
67 67
No. of oecu- Population No. of pied residen- No. of r~___A.--------. towns tial houses households Persons Males Females
7
14
i4 12
12
12
ii 7
'7 10
io 8
. 8
6
'6 17
i7 5
5
7
7
8
·s 11
ii 5
·s 22
ii 12
12
26
i6 20
io 216
ZiG 15
15
12
ii H
ji
14
j4
12
ii 21
ii 11
ii
8
478,636 361),4,2 112,204
607,533 560,994 46,539
501,700 452,002
49,698
520,457 494,531
25,926
537,200 507,385 29,815
643,237 605,935
37,302
706,053 672,074
33,979
571,973 501,979 69,994
307,762 276,571
31,191
371,Oll 352,761
18,250
664,257 620,079 44,178
540,335 512,221 28,114
238,917 228,090 10,887
469,014 393,418 75,596
460,930 401,747
59,183
298,125 147,074 151,051
459,399 345,465 113,934
4,556,974 3,214,634 1,342,340
176,301 110,029 66,272
255,073 150,887 104,186
140,787 99,644 41,143
225,509 149,241 76,268
133,536 105,441 28,095
262,808 -179,497
83,311
165,138 123,403 41,735
9
555,976 41'1,955 128,021
694,243 641,004 53,239
598,630 544,133 54,497
670,765 642,751 28,014
612,713 581,088
31,625
847,857 805,891 41,966
968,272 929,226
39,046
696,981 618,071 78,910
371,085 335,473 35,612
411,252 392,755 18,497
713,997 667,250 46,747
591,002 559,383
31,619
271,009 258,834 12,175
548,694 464,525 84,169
484,722 417,981 66,741
312,582 157,545 155,037
488,121 357,724 130,397
4,684,456 3,319,377 1,365,079
179,101 111,858 67,243
261,125 155,127 105,998
143,754 101,910 41,844
229,206 151,577 77,629
135,848 107,400 28,448
268,218 183,394 84,824
167,802 125,410 42,392
10
3,556,945 1,'1SS,lSl
801,793
4,457,473 4,117,468
340,005
3,939,034 3.615,151
323,883
4,279,253 4,099,721
179,532
3,543,103 3,358,392
184,711
4,840,681 4,586,719
253,962
5,233,904 5,001,908
231,996
3,892,609 3,430,544
462,065
2,091,103 1,869,235
221,868
2,350,268 2,243,793
106,475
3,941,863 3,691,819
250,044
3,186,908 3,003,331
.183,577
1,504,350 1,433,793
70,557
3,020,214 2,631,435
388,779
2,611,445 2,254,518
356,927
1,466,417 828,389 638,028
2,437,799 '1,798,035
639,764
26,697,475 19,200,975
7,496,500
1,111,343 718,936 392,407
1,624,072 1,000,836
623,236
845,454 617,135 228,319
1,405,285 955,671 449,614
848,730 679,984 168,746
1,656,677 1,170,736
485,941
849,769 635,315 214,454
11
1,866,152 1 ,4"lS,91\{\
440,172
2,260,951 2,079,507
181,444
2,023,108 1,847,599
175,509
2,086,304 1,989,273
97,031
1,835,122 1,734,364
100,758
2,434,111 2,294,650
139,461
2,639,888 2,513,426
126,462
2,012,349 1,764,492
247,857
1,092,679 970,837 121,842
1,224,507 1,165,471
59,036
2,055,553 ],914,520
141,033
1,627,014 1,526,648
100,366
766,257 727,947
38,310
1,526,193 1,310,112
216,081
1,323,303 1,126,653
196,650
818,460 437,514 380,946
1,254,993 899,994 354,999
13,802,494 9,842,483 3,96D,Dl1
572,135 368,992 203,143
834,014 512,536 321,478
435,503 317,501 118,002
722,448 488,348 234,100
433,802 346,964 87,038
855,671 603,981 251,690
422,257 3Jl,964 110,293
12
1,690,793 l,31~,112
361,621
2,196,522 2,037,961
158,561
1,915,926 1,767,552
148,374
2,192,949 2,110,448
82,501
1,707,981 1,624028
83,953
2,406,570 2,292,069
114,501
2,594,016 2,488,482
105,534
1,880,260 1,666,052
214,208
998,424 898,398 100,026
1,125,761 1,078,322
47,439
1,886,310 1,777,299
109,011
1,559,894 1,476,683
83,211
738,093 705,846
32,247
1,494,021 1,321,323
172,698
1,288,142 1,127,865
160,277
647,957 390,875 257,082
1,182,806 898,041 284,765
12,894,981 9,358,492 3,536,489
539,208 349,944 189,264
790,058 488,300 301,758
409,951 299,634 110,317
682,837 467,323 215,514
414,928 333,220 81,708
801,006 566,755 234,251
427,512 323,351 104,161
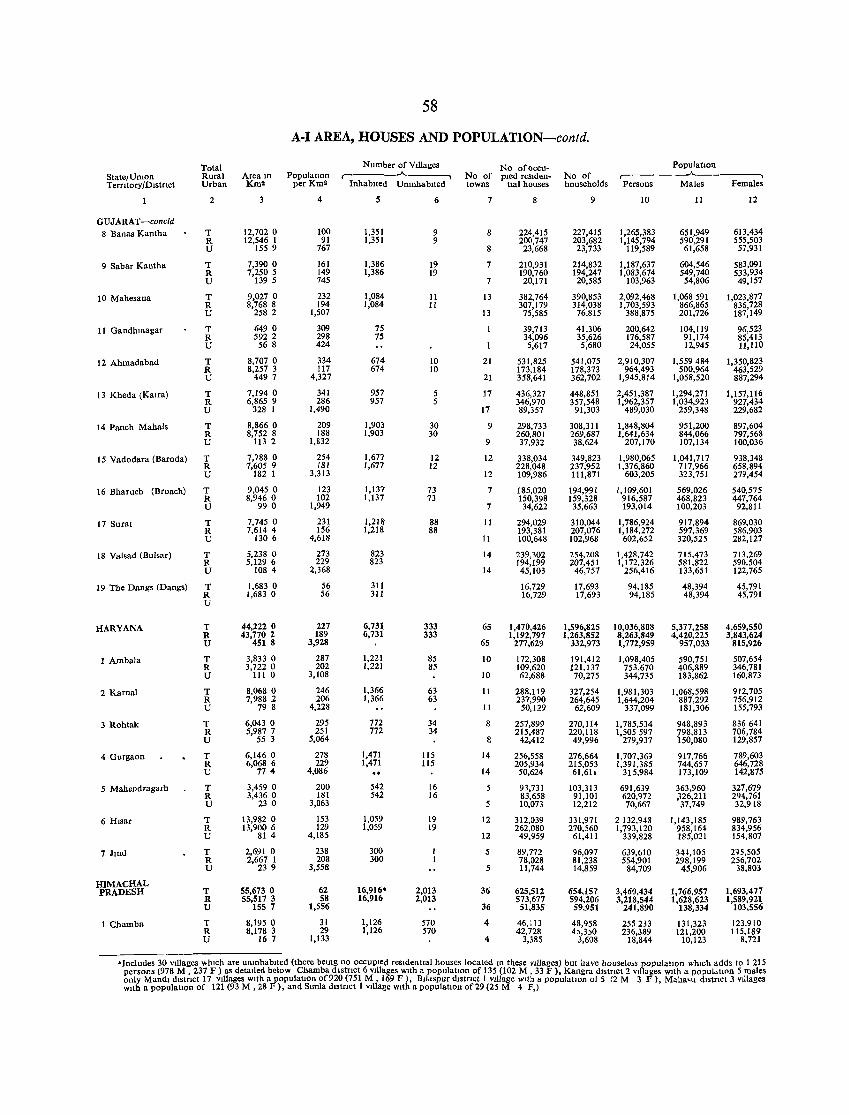
State,Umon TerntoryJDlstnct
GUJARAT-concld 8 Banas Kantha
9 Sabar Kantha
10 Mahesana
11 GandhiOagar
12 Ahmadabad
13 Kheda (Katra)
14 Panch Mahals
15 Vadodara (Baroda)
16 Bharuch (Broach)
17 Surat
18 Valsad (Bulsar)
Total Rural Urban
2
T R U
T R U
T R U
T R U
T R U
T R U
T R U
T R U
T R U
T R U
T R U
19 The Dangs (Dangs) T
HARYANA
1 Ambala
2 Karnal
3 Rohtak
4 Gurgaon
5 Mahendragarh
6 Hlsar
7 Jlnd
lDMACHAL PRADESH
1 Chamba
R U
T R U
T R U
T R U
T R U
T R U
T R U
T R U
T R U
T R U
T R U
Area 10 Km2
12,702 0 12,546 1
1559
7,390 0 7,250 5
1395
9,027 0 8,768 8
258 2
6490 5922
56 8
8,707 0 8,257 3
4497
7,1940 6,865 9
328 I
8,866 0 8,752 8
1132
7,788 0 1,6059
182 I
9,045 0 8,946 0
990
7,745 0 7,6144
1306
5,238 0 5,129 6
108 4
1,683 0 1,683 0
44,222 0 43,770 2
451 8
3,833 0 3,122 0
111 0
8,068 0 7,988 2
79 8
6,043 0 5,987 7
55 3
6,1460 6,068 6
774
3,459 0 3,436 0
23 0
13,982 0 13,900 6
81 4
2,691 0 2,667 1
239
55,673 0 55,517 3
155 7
8,1950 8,178 3
167
58
A-I AREA, HOUSES AND POPULATlON-contd.
Number of Villages Popnlatlon r-- .A.. ___ ..,
per Km2 Inhabited Umnhablted
4
100 91
767
161 149 745
232 194
1,507
309 298 424
334 117
4,327
341 286
1,490
209 188
1,832
254 181
3,313
123 102
1,949
231 156
4,618
273 229
2,368
56 56
227 189
3,928
287 202
3,108
246 206
4,228
295 251
5,064
278 229
4,086
200 181
3,063
153 129
4,185
238 208
3,558
62 58
1,556
31 29
1,133
S
1,351 1,351
1,386 1,386
1,084 1,084
75 7S
674 674
957 957
1,903 1,903
1,677 1,677
1,137 1,137
1,218 1,218
823 823
311 311
6,731 6,731
1,221 1,221
1,366 1,366
772 772
1,471 1,471
542 542
1,059 1,059
300 300
16,916· 16,916
1,126 1,126
6
9 9
19 19
11 11
10 10
5 5
30 30
12 12
73 73
88 88
333 333
85 85
63 63
34 34
115 115
16 16
19 19
2,013 2,013
570 570
No ofoccuNo of pled resldentowns lIal houses
7
8
8
7
7
13
13
21
21
17
17
9
9
12
12
7
1
11
11
14
14
65
65
10
10
11
11
8
8
14
14
5
12
12
5
5
36
36
4
4
8
224,415 200,747 23,668
210,931 190,760 20,171
382,764 307,179 75,585
39,713 34,096 5,617
531,825 173,184 358,641
436,327 346,970 89,357
298,733 260,801 37,932
338,034 228,048 109,986
185,020 150,398 34,622
294,029 193,381 100,648
239,302 194,199 45,103
16,729 16,729
1,470,426 1,192,797
277,629
172,308 109,620 62,688
288,119 237,990
50,129
257,899 215,487
42,412
256,558 205.934 50,624
93,731 83,658 10,073
312,039 262,080 49,959
89,772 78,028 11,744
625,512 573,677 51,835
46,113 42,728
3,385
Population No of ,-------'--------., households Persons Males Females
9
227,415 203,682 23,733
214,832 194,247 20,585
390,853 314,038
76,815
41,306 35,626 5,680
541,075 178,373 362,702
448,851 357,548
91,303
308,311 269,687 38,624
349,823 237,952 111,871
194,991 159,328 35,663
310,044 207,076 102,968
254,208 207,451
46,757
17,693 17,693
1,596,825 1,263,852
332,973
191,412 121,137 70,275
321,254 264,645
62,609
270,114 220,118
49,996
276,664 215,053 61,611
103,313 91,101 12,212
331,971 270,560
61,411
96,097 81,238 14,859
654,157 594,206 59,951
48,958 4),3)0
3,608
10
1,265,383 1,145,794
119,589
1,187,637 1,083,674
103,963
2,092,468 1,703,593
388,875
200,642 176,587 24,055
2,910,307 964,493
1,945,814
2,451,387 1,962,357
489,030
1,848,804 1,641,634
207,170
1,980,065 1,376,860
603,205
1,109,601 916,587 193,014
1,786,924 1,184,272
602,652
1,428,742 1,172,326
256,416
94,185 94,185
10,036,808 8,263,849 1,772,959
1,098,405 753,670 344,735
1,981,303 1,644,204
337,099
1,785,534 1,505597
279,937
1,707,369 1,391,385
315,984
691,639 620,972 70,667
2132,943 1,793,120
339,828
639,610 554,901
84,709
3,460,434 3,218,544
241,890
255233 236,389
18,844
11
651,949 590,291 61,658
604,546 549,740
54,806
1,068591 866,865 201,726
104,119 91,174 12,945
1,559484 500,964
1,058,520
1,294,271 1,034,923
259,348
951,200 844,066 107,134
1,041,717 117,966 323,751
569,026 468,823 100,203
917,894 597,369 320,525
715,473 581,822 133,651
48,394 48,394
5,377,258 4,420,225
957,033
590,751 406,889 183,862
1,068,598 887,292 181,306
948,893 798,813 150,080
917,766 744,657 173,109
363,960 J26,211 37,749
1,143,185 958,164 185,021
34t,l05 298,199
45,906
1,766,957 1,628,623
138,334
131,323 121,200
10,123
12
613,434 555,503 57,931
583,091 533,934 49,157
1,023,877 836,728 187,149
96,523 85,413 11,110
1,350,823 463,529 887,294
1,157,116 927,434 229,682
897,604 797,568 100,036
938,348 658,894 279,454
540,575 447,764
92,811
869,030 586,903 282,127
713,269 590,504 122,765
45,791 45,791
4,659,550 3,843,624
815,926
507,654 346,781 160,873
912,705 756,912 155,793
836 641 706,784 129,857
789,603 646,728 142,875
327,679 294,761 32,918
989,763 834,956 154,807
2'15,505 256,702
38,803
1,693,477 1,589,921
103,556
123,910 115,189
8,721
>Includes 30 Villages "hlch are unmhablted (there bemg no occupied residentIal houses located m these villages) but have housele,s populalIon Which adds to I 215 persons (978 M , 237 F) as detailed below Chamba dlstnct 6 VIllages WIth a populatIOn of 135 (102 M , 33 F), Kangra distrIct 2 Villages With a populatlnn 5 males only Mandl distrIct 17 vlilages with a populatIOn of920 (751 M, 169 F), Blldspur d.stnct 1 v.llage WIth a populatIOn of 5 (2 M 3 F), Maha'u distrIct 3 v!llages WIth a population of 121 (93 M, 28 F), and SImla dlstnct 1 VIllage With a populatIOn of 29 (25 M 4 F,l
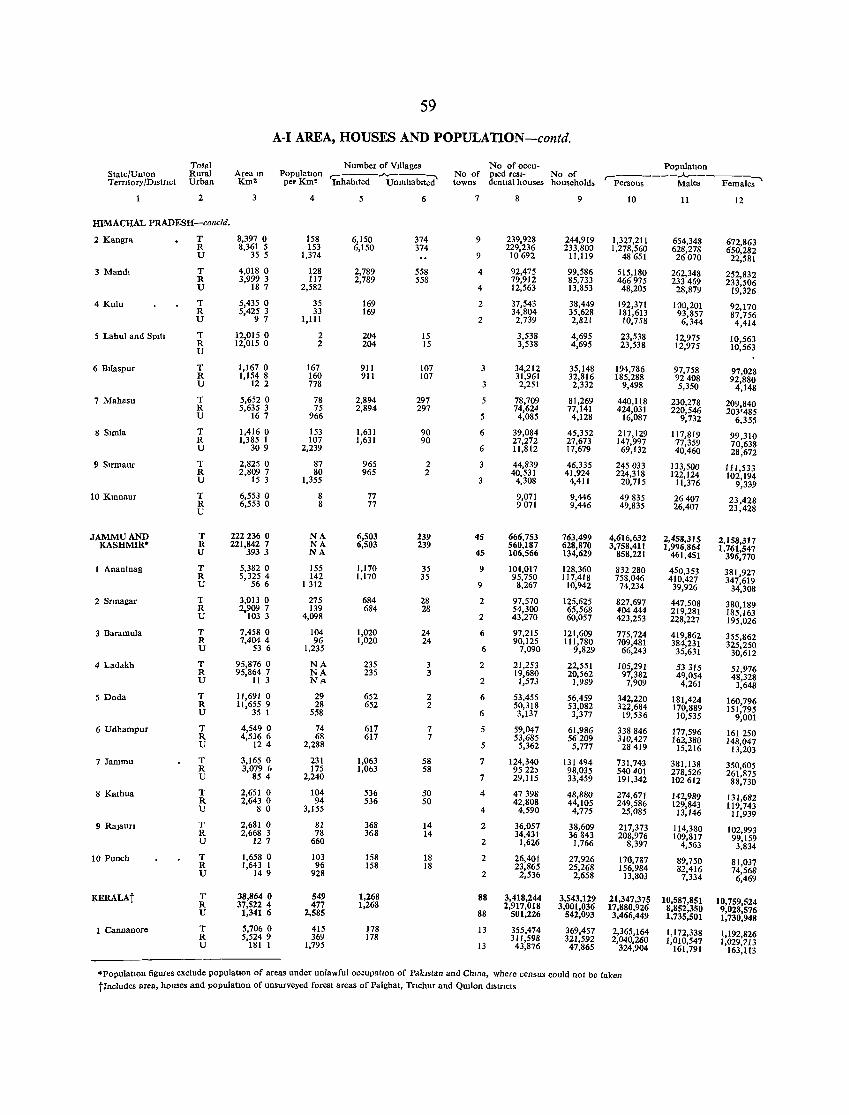
State/UnIon Temtory/Dlstnct
Total Rural Urban
2
HIMACHAL PRADESH-concld.
2 Kangra I;_
3 Mandl
4 Kulu
5 Lahul and Spill
6 Bllaspur
7 Mahasll
8 Simla
9 Slrmaur
10 KInnaur
JAMMU AND KASHMIR"
1 Anantnag
2 Srmagar
3 Baramula
4 Ladakh
5 Doda
6 Udhampur
7 Jammu
8 Kathua
9 RaJauti
10 Punch
KERALAt
1 Cannanore
U
T R U
T R U
T R U
T R U
T R U
T R U
T R U
T R U
T R U
T R U
T R U
T R U
T R U
T R U
T R U
T R U
T R U
T R U
T R U
T R U
T R U
Area m Km'
3
8,397 0 8,361 5
35 5
4,018 0 3,999 3
18 7
5,435 0 5,425 3
9 7
12,015 0 12,015 0
1,167 0 1,154 8
12 2
5,652 0 5,635 3
16 7
1,4160 1,385 1
30 9
2,825 0 2,809 7
15 3
6,553 0 6,553 0
222236 0 221,842 7
3933
5,382 0 5,325 4
566
3,013 0 2.909 7
103 3
7,458 0 7,404 4
53 6
95,876 0 95,864 7
Il 3
11,691 0 11,655 9
35 1
4,549 0 4,536 6
124
3,165 0 3,079 6
85 4
2,651 0 2,643 0
8 0
2,681 0 2,668 3
127
1,658 0 1,643 1
149
38,864 0 37,522 4
1,341 6
5,706 0 5,524 9
181 1
59
A-I AREA, HOUSES AND POPULATlON-contd.
Number of Vdlages PopulatIOn ,------"-----:'\
per Km' InhabIted Unmhablted
4
158 153
1,374
128 117
2,582
35 33
1,111
2 2
167 160 778
78 75
966
153 107
2,239
87 80
1,355
8 8
NA NA NA
155 142
1312
275 139
4,098
104 96
1,235
NA NA NA
29 28
558
74 68
2,288
231 175
2,240
104 94
3,155
81 78
660
103 96
928
549 477
2,585
415 369
1,795
5
6,150 6,150
2,789 2,789
169 169
204 204
911 911
2,894 2,894
1,631 1,631
965 965
77 77
6,503 6,503
1,170 1,170
684 684
1,020 1,020
235 235
652 652
617 617
1,063 1,063
536 536
368 368
158 158
1,268 1,268
178 178
6
374 374
558 558
15 15
107 107
297 297
90 90
2 2
239 239
35 35
28 28
24 24
3 3
2 2
7 7
58 58
50 50
14 14
18 18
No of oecu-No of pled resl- No of towns dentIal houses households
7
9
9
4
4
2
2
3
6
6
3
45
45
9
9
2
2
6
6
2
2
6
6
5
7
7
4
4
2
2
2
2
88
88
13
13
8
239,928 229,236 10692
92,475 79,912 12,563
37,543 34,804 2,739
3,538 3,538
34,212 31,961 2,251
78,709 74,624 4,085
39,084 27,272 11,812
44,839 40,531
4,308
9,071 9071
666,753 560,187 106,566
104,017 95,750 8,267
97,570 54,300 43,270
97,215 90,125
7,090
21,253 19,680 1,573
53,455 50,318 3,137
59,047 53,685
5,362
124,340 9522) 29,115
47398 42,808 4,590
36,057 34,431
1,626
26,401 23,865
2,536
3,418,244 2,917,018
501,226
355,474 311,598 43,876
9
244,919 233,800
11,119
99,586 85,733 13,853
38,449 35,628 2,821
4,695 4,695
35,148 32,816 2,332
81,269 77,141
4,128
45,352 27,673 17,679
46,335 41,924
4,411
9,446 9,446
763,499 628,870 134,629
128,360 117,418
10,942
125,625 65,568 60,057
121,609 111,780
9,829
22,551 20,562
1,989
56,459 53,082 3,377
61,986 56209 5,777
131494 98,035 33,459
48,880 44,105 4,775
38,609 36843
1,766
27,926 25,268
2,658
3,543,129 3,001,036
542,093
369,457 321,592 47,865
PopulatIOn r-.------.A.-----__"
Persons Males Females
10
1,327,211 1,278,560
48651
515,180 466975 48,205
192,371 181,613 10,758
23,538 23,538
194,786 185,288
9,498
440,118 424,031
16,087
217,129 147,997 69,132
245033 224,318
20,715
49835 49,835
4,616,632 3,758,411
858,221
832280 758,046 74,234
827,697 404444 423,253
775,724 709,481 66,243
105,291 97,382 7,909
342,220 322,684
19,536
338846 310,427 28419
731,743 540401 191,342
274,671 249,586 25,085
217,373 208,976
8,397
170,787 156,984
13,803
21,347,375 17,880,926 3,466,449
2,365,164 2,040,260
324,904
11
654,348 628,278 26070
262,348 233469
28,879
100,201 93,857 6,344
12,975 12,975
97,758 92 408 5,350
230,278 220,546
9,732
117,819 77,359 40,460
133,500 122,124
ll,376
26407 26,407
2,458,315 1,996,864
461,451
450,353 410,427 39,926
447,508 219,281 228,227
419,862 384,231 35,631
53315 49,054 4,261
181,424 170,889 10,535
177,596 162,380
15,216
381,138 278,526 102612
142,989 129,843 13,146
114,380 109,817
4,563
89,750 82,416
7,334
10,587,851 8,852,350 1,735,501
1,172,338 1,010,547
161,791
12
672,863 650,282 22,581
252,832 233,506
19,326
92,170 87,756 4,414
10,563 10,563
97,028 92,880
4,148
209,840 203'485
6,355
99,310 70,638 28,672
111,533 102,194
9,339
23,428 23,428
2,158,317 1,761,547
396,770
381,927 347,619
34,308
380,189 185,163 195,026
355,862 325,250
30,612
51,976 48,328 3,648
160,796 151,795
9,001
161250 148,047
13,203
350,605 261,875 88,730
131,682 119,743
11,939
102,993 99,159 3,834
81,037 74,568 6,469
10,759,524 9,028,576 1,730,948
1,192,826 1,029,713
163,113
"PopulatIOn figures exclude populatIon of areas under unlawful occupatIOn of P"k,stan and ChIna, where census could not be taken tIneludes area, houses and populatIOn of unsurveyed forest areas of Palghat, TrIchur and Qwlon dIstrIcts
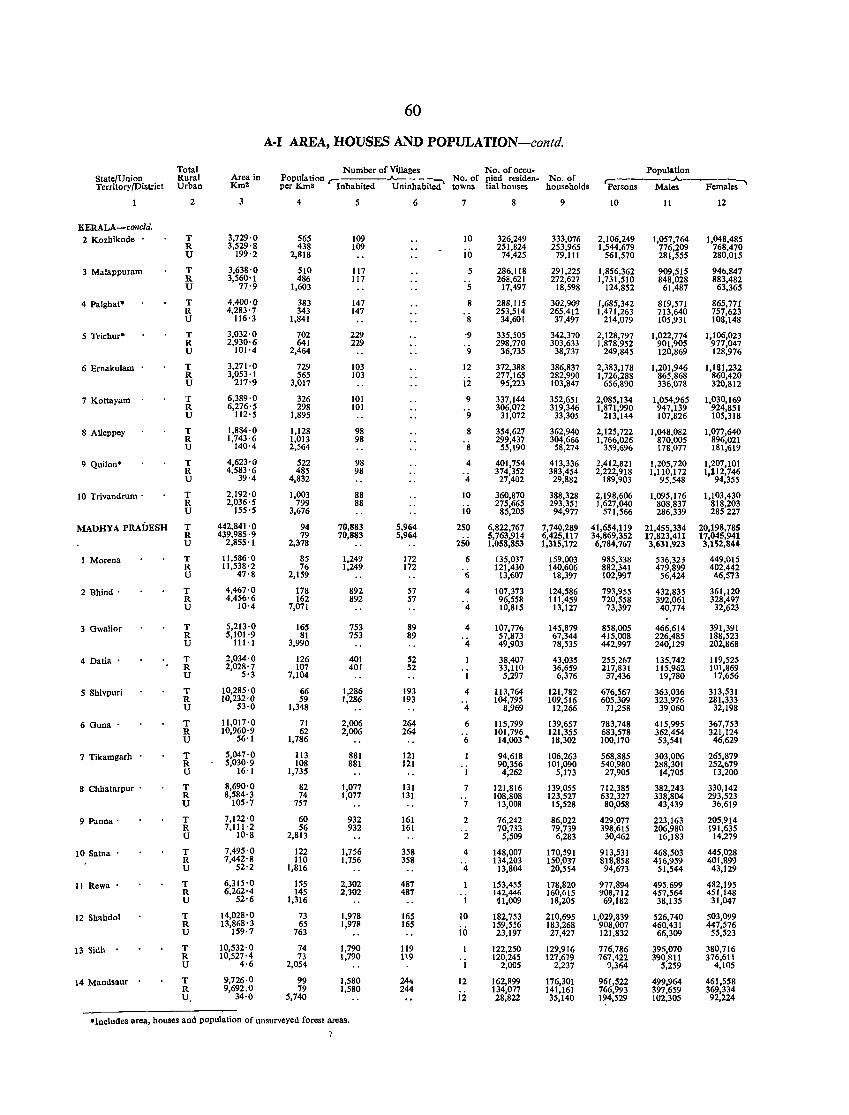
Total State/Union Rural Territory/District Urban
KERALA-co1lC/d. 2 Kozhikode .
3 Malappuram
4 Palghat*
5 Triehur*
6 Ernakulam .
7 Kottayam .
8 AUeppey
9 Quilon*
10 Trivandrum .
MADHYA PRADESH
1 Morena
2 Bhind'
3 Gwalior
4 Datia •
5 Shivpuri
6 Guna .
7 Tikamgarh .
8 Chhatarpur .
9 Panna'
10 Satna
11 Rewa
12 Shahdol
13 Sidh .
14 Mandsaur .
2
T R U
T R U
T R U
T R U
T R U
T R U
T R U
T R U
T R U
T R U
T R U
T R U
T R U
T R U
T R U
T R U
T R U
T R U
T R U
T R U
T R U
T R U
T R U
T R U.
Area in Km2
3
3,729'0 3,529'8
199'2
3,638'0 3,560'1
77'9
4,400'0 4,283'7
116'3
3,032'0 2,930'6
101'4
3,271'0 3,053'1
217-9
6,389-0 6,276'5
112'5
1,884'0 1,743'6
140'4
4,623'0 4,583-6
39'4
2,192'0 2,036'5
155'5
442,841'0 439,985'9
2,855'1
11,586'0 11,538'2
47'8
4,467'0 4,456'6
10'4
5,213'0 5,101'9
111'1
2,034'0 2,028'7
5'3
10,285'0 10,232'0
53'0
11,017'0 10,960'9
56'1
5,047'0 5,030'9
16'1
8,690'0 8,584'3
105'7
7,122'0 7,111'2
10'8
7,495'0 7,442'8
52'2
6,315'0 6,262'4
52'6
14,028'0 13,868' 3
159·7
10,532·0 10,527·4
4·6
9,726·0 9,692.0
34'0
60
A-I AREA, HOUSES AND POPULATION-contd.
Number of Vijlages No. of oeeu-Population r-:. .A-- - - -"":'\ No. of pied residen- No. of per Km2 Inhabited Uninhabited towns lial houses households
4
565 438
2,818
510 486
1,603
383 343
1,84[
702 641
2,464
729 565
3,017
326 298
[,895
[,128 [,0[3 2,564
522 485
4,832
[,003 799
3,676
94 79
2,378
85 76
2,159
178 162
7,07[
165 81
3,990
126 107
7,104
66 59
1,348
71 62
1,786
113 108
1,735
82 74
757
60 56
2,813
122 110
1,816
155 145
1,316
73 65
763
74 73
2,054
99 79
5,740
5
109 109
117 1[7
147 147
229 229
[03 103
IO[ 101
98 98
98 98
88 88
70,883 70,883
1,249 1,249
892 892
753 753
401 401
1,286 1,286
2,006 2,006
881 881
1,077 1,077
932 932
[,756 1,756
2,302 2,302
1,978 1,97S
1,790 1,790
1,580 1,580
6
5,964 5,964
172 172
57 57
89 89
52 52
193 193
264 264
121 121
131 131
161 16[
358 358
487 487
165 165
119 119
244 244
7
10
10
5
5
8
8
-9
9
12
12
9
9
8
8
4
4
10
iiJ 250
250 6
6
4
4
4
4
4
4
6
'6
7
7
2
2
4
4
10
io
[
12
ii
8
326,249 25[,824
74,425
286,118 268,62[
17,497
288,I[S 253,5[4
34,601
335,505 298,770
36,735
372,388 277,165
95,223
337,144 306,072
31,072
354,627 299,437
55,190
401,754 374,352 27,402
360,870 275,665
85,205
6,822,767 5,763,914 1,058,853
135,037 121,430
13,607
107,373 96,558 10,8[5
107,776 57,873 49,903
38,407 33,110 5,297
113,764 104,795
8,969
115,799 101,796 14,003 4
94,618 90,356
4,262
121,816 108,808 13,008
76,242 70,733
5,509
148,007 134,203
13,804
[53,455 142,446 11,009
182,753 159,556 23,197
[22,250 120,245
2,005
162,R99 134,077 28,822
9
333,076 253,965 79,111
291,225 272,627
18,598
302,909 265,412
37,497
342,370 303,633
38,737
386,837 282,990 103,847
352,651 319,346
33,305
362,940 304,666
58,274
4[3,336 383,454 29,882
388,328 293,35[ 94,977
7,740,289 6,425,117 1,315,172
159,003 140,606 18,397
124,586 111,459
13,127
145,879 67,344 78,535
43,035 36,659 6,376
121,782 109,516
12,266
139,657 121,355 18,302
106,263 101,090
5,173
139,055 [23,527 15,528
86,022 79,739
6,283
170,591 150,037 20,554
178,820 160,615 18,205
210,695 183,268 27,427
[29,916 127,679
2,237
176,301 14[,161 35,140
"includes area, houses and population of unsurveyed forest areas.
Popu1&tion
tp;,;;~s--Mai;-'--F-e-m-a1es"""
10
2,106,249 1,544,679
561,570
1,856,362 1,731,5[0
124,852
1,685,342 1,471,263
214,079
2,128,797 1,878,952
249,845
2,383,178 1,726,288
656,890
2,085,134 1,871,990
213,144
2,125,722 1,766,026
359,696
2,4[2,82[ 2,222,918
189,903
2,198,606 1,627,040
571,566
41,654,119 34,869,352 6,784,767
985,338 882,341 102,997
793,955 720,558
73,397
858,005 415,008 442,997
255,267 217,831
37,436
676,567 605,309
71,258
783,748 683,578 100,170
568,885 540,980 27,905
712,385 632,327 80,058
429,077 398,615
30,462
9I3,53 [ 818,858 94,673
977,894 908,712 69,182
1,029,839 908,007 121,832
776,786 767,422
?,31i4
961,522 766,993 194,529
11
1,057,764 776,209 281,555
909,515 848,028
61,487
819,571 713,640 105,931
1,022,774 90[,905 120,869
1,201,946 865,868 336,078
1,054,965 947,139 107,826
[,048,082 870,005 178,077
1,205,720 1,110,172
95,548
1,095,176 808,837 286,339
21,455,334 17,823,411 3,631,923
536,323 479,899
56,424
432,835 392,061 40,774
466,614 226,485 240,129
135,742 115,962 19,780
363,036 323,976
39.060
415,995 362,454 53,541
303,006 288,301
14,705
382,243 338,804 43,439
223,163 206,980
16,183
468,503 416,959
51,544
495.699 457,564
38,135
526,740 460,43 [
66,309
39fi,070 390,811
5,259
499,964 397,659 [02,305
12
1,048,485 768,470 280,015
946,847 883,482
63,365
865,771 757,623 108,148
1,106,023 977,047 128,976
1,181,232 860,420 320,812
1,030,169 924,851 105,318
1,077,640 896,021 181,619
1,207,101 1,112,746
94,355
1,103,430 818,203 285227
20,198,785 17.045.941 3,152,844
449,015 402,442 46,573
361,120 328,497
32,623
391,39[ 188,523 202,868
119,525 101,869 17,656
313,531 281,333
32,198
367,753 321,124 46,629
265,879 252,b79
13,200
330,142 293,523
36,619
205,914 191,635
14,279
445,028 401.899 43,129
482,195 451,148
31,047
503,099 447,576
55,523
380,716 376,61\
4,105
461,558 369,334 92,224
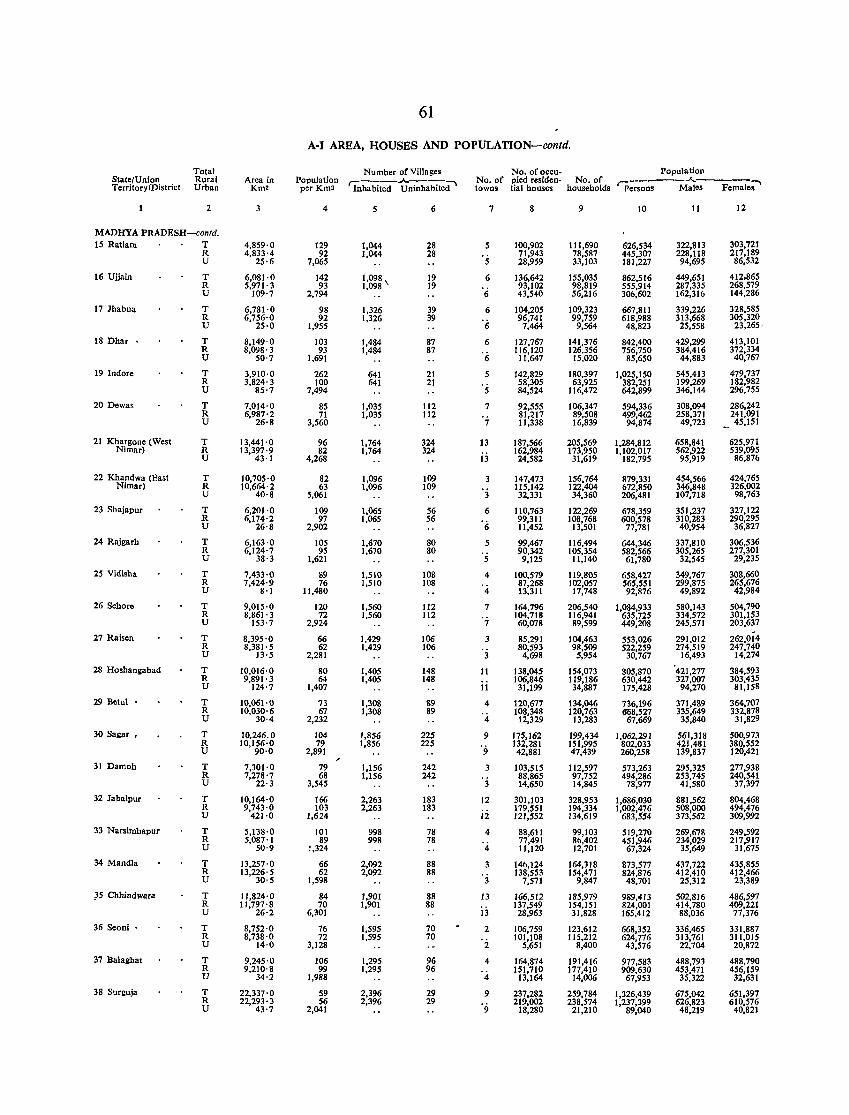
State/Union Territory/District
Total Rural Urban
2
MADHYA PRADESH-conld. IS Ratlam T
16 Ujjain
17 Jhabua
18 Dhar •
19 Indore
20 Dewas
21 Khargone (West Nimar)
22 Khandwa (East Nimar)
23 Shajapur
24 Rajgarh
25 Vidisha
26 Sehore
27 Raisen
28 Hoshan!1;abad
29 Betu! •
30 Sagar.
31 Damoh
32 Jaba1pur
33 Narsirnhapur
34 Mandla
~5 Chhindwara
36 Seoni
37 Balaihat
38 Surguja
R U
T R U
T R U
T R U
T R U
T R U
T R U
T R U
T R U
T R U
T R U
T R U
T R U
T R U
T R U
T R U
T R U
T R U
T R U
T R U
T R U
T R U
T R U
T R U
Area in Km!
3
4,859·0 4,833'4
25·6
6,081·0 5,971'3
109·7
6,781'0 6,756'0
25,0
8,149·0 8,098'3
50'7
3,910·0 3,824'3
85·7
7,014'0 6,987'2
26·8
13,441'0 13,397'9
43·1
10,705'0 10,664'2
40·8
6,201'0 6,174'2
26'8
6,163'0 6,124'7
38·3
7,433'0 7,424'9
8'1
9,015·0 8,861'3
153·7
8,395'0 8,381'5
13'5
10,016·0 9,891'3
124'7
10,061'0 10,030'6
30'4
10,246.0 10,156'0
90·0
7,301'0 7,278'7
22·3
10,164'0 9,743'0
421·0
5,138'0 5,087'1
50'9
13,257'0 13,226'5
30'5
11,824'0 11,797'8
26·2
8,752'0 8,738'0
14·0
9,245'0 9,210'8
34·2
22,337'0 22,293'3
43'7
61
A-I AREA, HOUSES AND POPULATION-contd.
Population per Km>
4
129 92
7,065
142 93
2,794
98 92
1,955
103 93
1,691
262 100
7,494
85 71
3,560
96 82
4,268
82 63
5,061
109 97
2,902
105 95
1,621
89 76
11,480
120 72
2,924
66 62
2,281
80 64
1,407
73 67
2,232
104 79
2,891
79 68
3,545
166 103
1,624
101 89
1,324
66 62
1,598
84 70
6,301
76 72
3,128
106 99
1,988
59 56
2,041
Number of Villages ~---......__---7"\
Inhabited Uninhabited
5
1,044 1,044
1,098, 1,098
1,326 1,326
1,484 1,484
641 641
1,035 1,035
1,764 1,764
1,096 1,096
1,065 1,065
1,670 1,670
1,510 1,510
1,560 1,560
1,429 1,429
1,405 1,405
1,308 1,308
1,856 1,856
1,156 1,156
2,263 2,263
998 998
2,092 2,092
1,901 1,901
1,595 1,595
1,295 1,295
2,396 2,396
6
28 28
19 19
39 39
87 87
21 21
112 112
324 324
109 109
56 56
80 80
lOS 108
112 112
106 106
148 148
89 89
225 225
242 242
183 183
78 78
88 88
88 88
70 70
96 96
29 29
No. of occu- Population No. of pied residen- No. of r:_-----.A.~~-----. towns tial houses households Persons Males Females
7
5
5
6
6
6
'6 6
'6 5
5
7
7
13
13
3
6
'(;
5
5
4
4
7
7
3
'j
11
It
4
'4 9
'9 3
3
12
12
4
'4
3
13
13
2
2
4
4
9
'9
8
100,902 71,943 28,959
136,642 93,102 43,540
104,205 96,741 7,464
127,767 116,120 11,647
142,829 58,305 84,524
92,555 81,217 11,338
187,566 162,984 24,582
147,473 115,142 32.331
110,763 99,311 11,452
99,467 90,342 9,125
100,579 87,268 13,311
164,796 104,718 60,078
85,291 80,593
4,698
138,045 106,846 31,199
120,677 108,348 12,329
175,162 132,281 42,881
103,515 88,865 14,650
301,103 179,551 121,552
88,611 77,491 11,120
146,124 138,553
7,571
166,512 137,549 28,963
106,759 101,108
5,651
164,874 151,710
13,164
237,282 219,002
18,280
9
11t,690 78,587 33,103
155,035 98,819 56,216
109,323 99,759
9,564
141,376 126,356 15,020
180,397 63,925
116,472
106,347 89,508 16,839
205,569 173,950 31,619
156,764 122,404 34,360
122,269 108,768 13,501
116,494 105,354 11,140
119,805 102,057 17,748
206,540 116,941 89,599
104,463 98,509 5,954
154,073 119,186 34,887
134,046 120,763
13,283
199,434 151,995 47,439
112,597 97,752 14,845
328,953 194,334 134,619
99,103 86,402 12,701
164,318 154,471
9,847
185,979 154,151 31,828
123,612 115,212
8,400
191,416 177,410 14,006
259,784 238,574
21,210
10
626,534 445,307 181,227
862,516 555,914 306,602
667,811 618,988 48,823
842,400 756,750
85,650
1,025,150 382,251 642,899
594,336 499,462 94,874
1,284,812 1,102,017
182,795
879,331 672,850 206,481
678,359 600,578 77,781
644,346 582,566 61,780
658,427 565,551 92,876
1,084,933 635,725 449,208
553,026 522,259 30,767
805,870 630,442 175,428
736,196 668,527 67,669
1,062,291 802,033 260,258
573,263 494,286
78,977
1,686,030 1,002,4.76
683,554
519,270 451,946 67,324
873,577 824,876 48,701
989,413 824,001 165,412
668,352 624,776 43,576
977,583 909,630 67,953
1,326,439 1,237,399
89,040
11
322,813 228,tt8 94,695
449,651 287,335 162,316
339,226 313,668 25,558
429,299 384,416 44,883
545,413 199,269 346,144
308,094 258,371 49,723
658,841 562,922 95,919
454,566 346,848 107,718
351,237 310,283 40,954
337,810 305,265 32,545
349,767 299,875 49,892
580,143 334,572 245,571
291,012 274,519
16,493
"421,277 327,007 94,270
371,489 335,649
35,840
561,318 421,481 139,837
295,325 253,745
41,580
881,562 508,000 373,562
269,678 234,029 35,649
437,722 412,410 25,312
502,816 414,780 88,036
336,465 313,761 22,704
488,793 453,471 35,322
675,042 626,823 48,219
12
303,721 217,189 86,532
412,865 268,579 144,286
328,585 305,320 23,265,
413,101 372,334 40,767
479,737 182,982 296,755
286,242 241,091 45,151
625,971 539,095 86,876
424,765 326,002 98,763
327,122 290,295
36,827
306,536 277,301
29,235
308,660 265,676 42,984
504,790 301,153 203,637
262,014 247,740
14,274
384,593 303,435 81,158
364,707 332,878 31,829
500,973 380,552 120,421
277,938 240,541
37,397
804,468 494,476 309,992
249,592 217,917 31,675
435,855 412,466 23,389
486,597 409,221 77,376
331,887 311,015 20,872
488,790 456,159 32,631
651,397 610,576 40,821
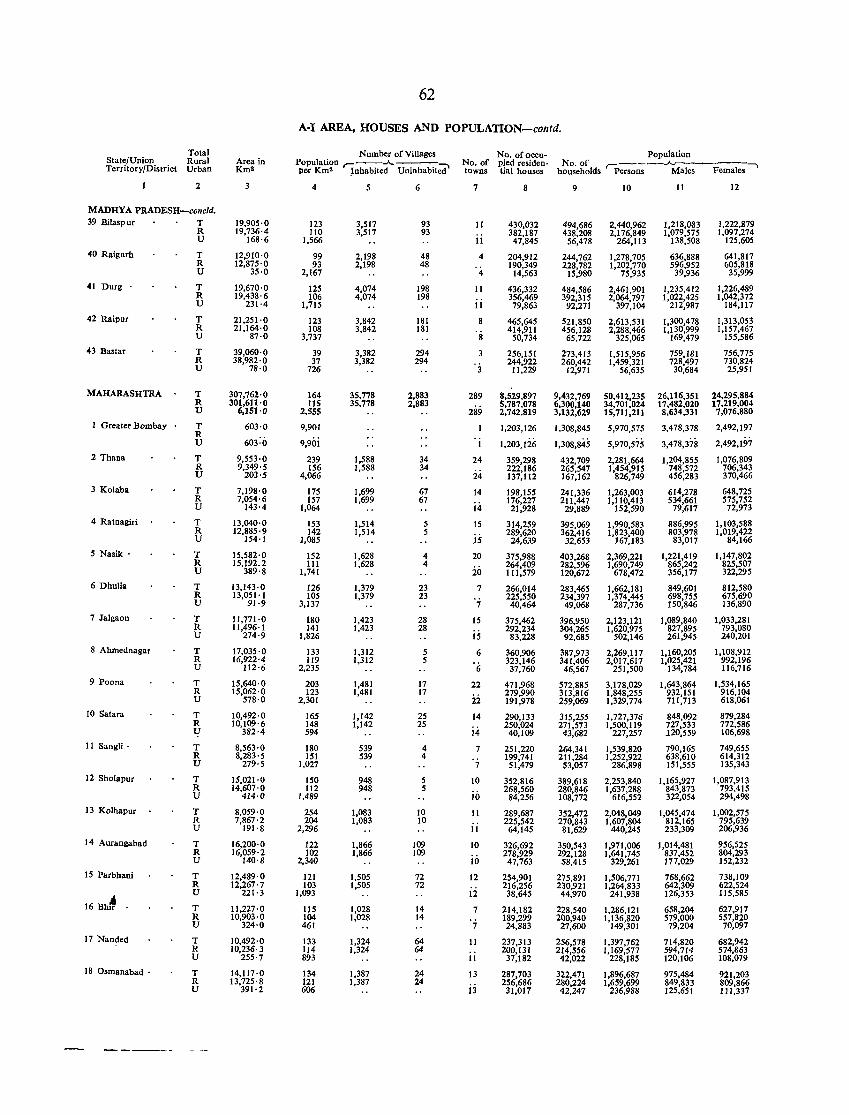
Total State/Union Rural Territory/District Urban
2
MADHYA PRADESH-coneld, 39 Bilaspur
40 Raigarh
41 Durg ,
42 Raipur
43 Bastar
MAHARASHTRA
I Greater Bombay
2 Thana
3 Kolaba
4 Ratnagiri
5 Nasi!< '
6 Dhulia
7 Jalgaon
8 Ahmednagar
9 Poona
10 Satara
11 Sangli .
12 Sholapur
13 Kolhapur
14 Aurangabad
IS Parbhani
16 Bh~ .
17 Nanded
18 Osmanabad .
T R U
T R U
T R U
T R U
T R U
T R U
T R U
T R U
T R U
T R U
T R U
T R U
T R U
T R U
T R U
T R U
T R U
T R U
T R U
T R U
T R U
T R U
T R U
T R U
Area in Krn2
19,905'0 19,736'4
168·6
12,910,0 12,875'0
35·0
19,670,0 19,438'6
231·4
21,251'0 21,164,0
87·0
39,060'0 38,982·0
78·0
307,762,0 301,611'0
6,151'0
603·0
603:0
9,553,0 9,349'5
203'5
7,198'0 7,054'6
143'4
13,040'0 12,885'9
154'1
15,582'0 15,192.2
389'8
13,143'0 13,051'1
91·9
11,771'0 11,496'1
274·9
17,035·0 16,922'4
112·6
15,640,0 15,062'0
578·0
10,492·0 10,109·(,
382·4
8,563'0 8,283 ·5
279·5
15,021·0 14,607,0
414·0
8,059·0 7,867,2
191'8
16,200'0 16,059'2
140'8
12,489'0 12,267'7
221·3
11,227'0 10,903'0
324·0
10,492,0 10,236· 3
255·7
14,117·0 13,725'8
391'2
62
A-I AREA, HOUSES AND POPULATION-contd.
Number of Villages Population r: --..A.. "":'\ per Km2 Jnhabited Uninhabited
4
123 110
1,566
99 93
2,167
125 106
1,715
123 108
3,737
39 37
726
164 115
2,555
9,901
9,90i
239 156
4,066
175 157
1,064
153 142
1,085
152 III
1,741
126 105
3,137
180 141
1,826
133 119
2,235
203 123
2,301
165 148 594
180 151
1,027
150 112
1,489
254 204
2,296
122 102
2,340
121 103
1,093
115 104 461
133 114 893
134 121 606
5
3,517 3,517
2,198 2,198
4,074 4,074
3,842 3,842
3,382 3,382
35,778 35,778
1,588 1,588
1,699 1,699
1,514 1,514
1,628 1,628
1,379 1,379
1,423 1,423
1,312 1,312
1,481 1,481
1,142 1,142
539 539
948 948
1,083 1,083
1,866 1,866
1,505 1,505
1,028 1,028
1,324 1,324
1,387 1,387
6
93 93
48 48
198 198
181 181
294 294
2,883 2,883
34 34
67 67
5 5
4 4
23 23
28 28
5 5
17 17
25 25
4 4
5 5
10 10
109 109
72 72
14 14
64 64
24 24
No. of occu- population No. of pied residen- No. of <: ___ ..A...--____ .....,
towns tial houses households Persons Males Females
7
II
II
4
4
11
II
289
289
I
24
24
14
14
15
is 20
26
7
7
15
15
6
'6 22
22
14
i4
7
7
10
io 11
11
10
10
12
12
7
7
II
11
13
ij
8
430,032 382,187 47,845
204,912 190,349
14,563
436,332 356,469 79,863
465,645 414,911
50,734
256,151 244,922
11,229
8,529,897 5,787,078 2,742,819
1,203,126
1,203.126
359,298 222,186 137,112
198,155 176,227 21,928
314,259 289,620 24,639
375,988 264,409 111,579
266,014 225,550 40,464
375,462 292,234
83,228
360,906 323,146 37,760
471,968 279,990 191,978
290,133 250,024 40,109
251,220 199,741 51,479
352,816 268,560
84,256
289,687 225,542 64,145
326,692 278,929 47,763
254,901 216,256 38,645
214,182 189,299 24,883
237,313 200,131
37,182
287,703 256,686 31,017
9
494,686 438,208
56,478
244,762 228,782
15,980
484,586 392,315 92,271
521,850 456,128
65,722
273,413 260,442
12,971
9,432,769 6,300,140 3,132,629
1,308,845
1,308,84!;
432,709 265,547 167,162
241,336 211,447
29,889
395,069 362,416 32,653
403,268 282,596 120,672
283,465 234,397 49,068
396,950 304,265 92,685
387,973 341,406 46,567
572,885 313,816 259,069
315,255 271,573 43,682
264,341 211,284
53,057
389,618 280,846 108,772
352,472 270,843 81,629
350,543 292,128 58,415
275,891 230,921 44,970
228,540 2()O,940 27,600
256,578 214,556 42,022
322,471 280,224 42,247
10
2,440,962 2,176,849
264,113
1,278,705 1,202,770
75,935
2,461,901 2,064,797
397,104
2,613,531 2,288,466
325,065
1,515,956 1,459,321
56,635
50,412,235 34,701.024 15,711,211
5,970,575
5,970,575
2,281,664 1,454,915
826,749
1,263,003 1,110,413
152,590
1,990,583 1,823,400
167,183
2,369,221 1,690,749
678,472
1,662,181 1,374,445
287,736
2,123,121 1,620,975
502,146
2,269,117 2,017,617
251,500
3,178,029 1,848,255 1,329,774
1,727,376 1,500,119
227,257
1,539,820 1,252,922
286,898
2,253,840 1,637,288
616,552
2,048,049 1,607,804
440,245
1,971,006 1,641,745
329,261
1,506,771 1,264,833
241,938
1,286,121 1,136,820
149,301
1,397,762 1,169,577
228,185
1,896,687 1,659,699
236,988
11
1,218,083 1,079,575
138,508
636,888 596,952 39,936
1,235,412 1,022,425
212,987
1,300,478 1,130,999
169,479
759,181 728,497
30,684
26,116,351 17,482,020 8,634,331
3,478,378
3,478,378
1,204,855 748,572 456,283
614,278 534,661 79,617
886,995 803,978
83,017
1,221,419 865,242 356,177
849,601 698,755 150,846
1,089,840 827,895 261,945
1,160,205 1,025,421
134,784
1,643,864 932,151 711,713
848,092 727,533 120,559
790,165 638,610 151,555
1,165,927 843,873 322.054
1,045,474 812,165 233,309
1,014,481 837,452 177,029
768,662 642,309 126,353
658,204 579,000 79,204
714,820 594,714 120,106
975,484 849,833 125,651
12
1,222,879 1,097,274
125,605
641,817 605,818 35,999
1,226,489 1,042,372
184,117
1,313,053 1,157,467
155,586
756,775 730,824 25,951
24,295,884 17,219,004 7,076,880
2,492,197
2,492,197
1,076,809 706,343 370,466
648,725 575,752 72,973
1,103,588 1,019,422
84,166
1,147,802 825,507 322,295
812,580 675,690 136,890
1,033,281 793,080 240,201
1,108,912 992,196 116,716
1,534,165 916,104 618,061
879,284 772,586 106,698
749,655 614,312 135,343
1,087,913 793,415 294,498
1,002,575 795,639 206,936
956,525 804,293 152,232
738,109 622,524 115,585
627,917 557,820 70,097
682,942 574,863 108,079
921,203 809,866 111,337
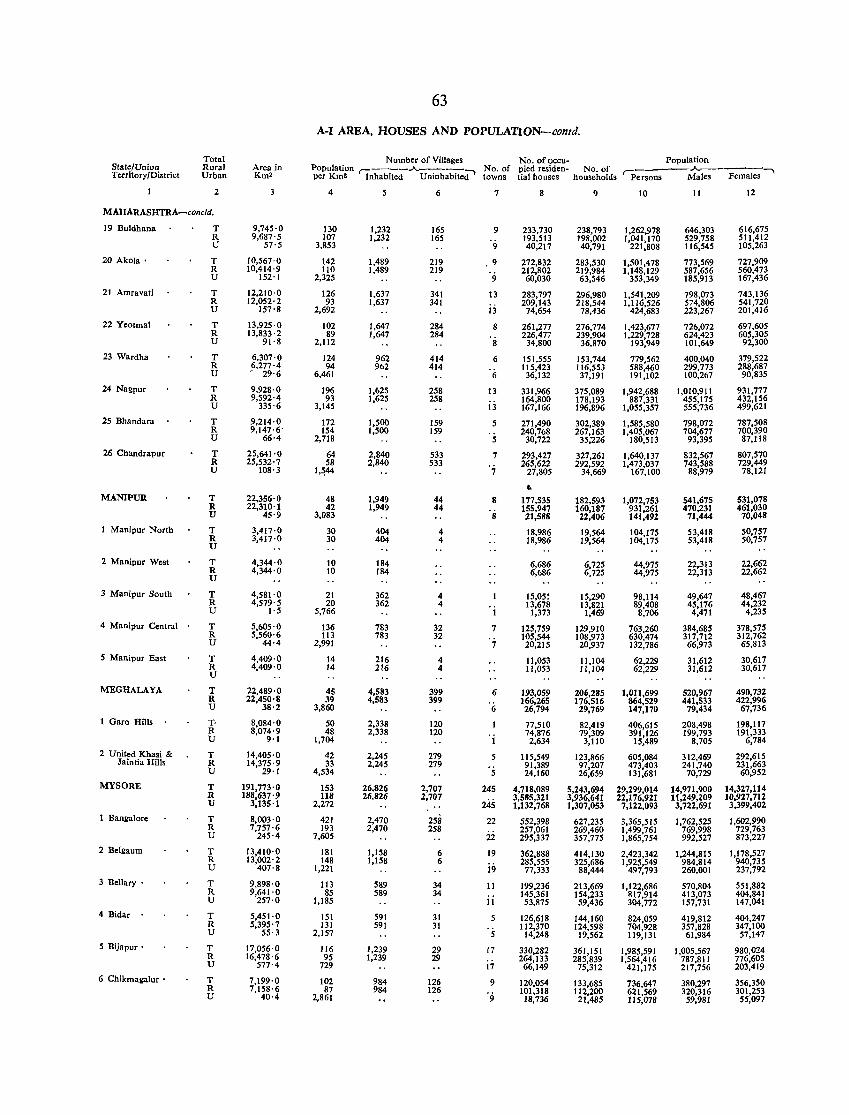
State/Union Territory/District
Total Rural Urhan
2
MAHARASlITRA-concld.
19 Buldhana
20 Akola'
21 Amravati
22 Yeotmal
23 Wardha
24 Nagpur
25 Bhandara
26 Chandra pur
MANIPUR
1 Manipur North
2 Manipur West
3 Manipur South
4 Manipur Central
5 Manipur East
MEGHALAYA
1 Garo Hills
2 United Khasi & Jaintia Hills
MYSORE
1 Bangalore
2 Belllaum
3 Bellary •
4 Bidar .
5 Bijapur'
6 Chikmagalur •
T R U
T R U
T R U
T R U
T R U
T R U
T R U
T R U
T R U
T R U
T R U
T R U
T R U
T R U
T R U
T· R U
T R U
T R U
T R U
T R U
T R U
T R U
T R U
T R U
Area in Km2
3
9,745,0 9,687'5
57·5
10,567,0 10,414'9
152·1
12,210·0 12,052'2
157·8
13,925'0 13,833'2
91·8
6,307'0 6,277 ·4 - 29·6
9,928,0 9,592'4
335·6
9,214·0 9,147·6'
66'4
25,641'0 25,532'7
108·3
22,356'0 22,310'1
45·9
3,417·0 3,417·0
4,344·0 4,344'0
4,581'0 4,579'5
1·5
5,605·0 5,560'6
44·4
4,409'0 4,409'0
22,489'0 22,450'8
38'2
8,084'0 8,074'9
9'1
14,405'0 14,375'9
29'1
191,773'0 188,637'9
3,135'1
8,003'0 7,757'6
245·4
13,410'0 13,002'2
407'8
9,898'0 9,641'0
257·0
5,451'0 5,395'7
55·3
17,056'0 16,478'6
577·4
7,199'0 7,158'6
40·4
63
A-I AREA, HOUSES AND POPULATION-comd.
Number of Villages No. of Dceu- Population Population ,..-----..A.----':'""I No. of pied residen- No. of r:-- ~-----, per Km2 Inhabited Uninhabited towns tial houses households Persons Males Females
4
130 107
3,853
142 110
2,325
126 93
2,692
102 89
2,112
124 94
6,461
196 93
3,145
172 154
2,718
64 58
q44
48 42
3,083
30 30
10 10
21 20
5,766
136 113
2,991
14 14
45 39
3,860
50 48
1,704
42 33
4,534
153 118
2,272
421 193
7,605
181 148
1,221
113 85
1,185
151 131
2,157
116 95
729
102 87
2,861
5
1,232 1,232
1,489 1,489
1,637 1,637
1,647 1,647
962 962
1,625 1,625
1,500 1,500
2,840 2,840
1,949 1,949
404 404
184 184
362 362
783 783
216 216
4,583 4,583
2,338 2,338
2,245 2,245
26,826 26,826
2,470 2,470
1,158 1,158
589 589
591 591
1,239 1,239
984 984
6
165 165
219 219
341 341
284 284
414 414
258 258
159 159
533 533
44 44
4 4
4 4
32 32
4 4
399 399
120 120
279 279
2,707 2,707
258 258
6 6
34 34
31 31
29 29
126 126
7
9
9
9
9
13
13
8
8
6
6
13
i3 5
5
7
7
8
's
1
7
7
6
'(;
I
5
5
245
245
22
22
19
i9 11
11
5
17
17
9
'9
8
233,730 193,513 40,217
272,832 212,802 60,030
283,797 209,143
74,654
261,277 226,477
34,800
151,555 115,423
36,132
331,966 164,800 167,166
271,490 240,768
30,722
293,427 265,622
27,805
.. 177,535 155,947 21,588
18,986 18,986
6,686 6,686
15,05! 13,678
1,373
125,759 105,544 20,215
11,053 11,053
193,059 166,265 26,794
77,510 74,876 2,634
115,549 91,389 24,160
4,718,089 3,585,321 1,132,768
552,398 257,061 295,337
362,888 285,555
77,333
199,236 145,361 53,875
126,618 112,370
14,248
330,282 264,133
66,149
120,054 101,318
18,736
9
238,793 198,002 40,791
283,530 219,984 63,546
296,980 218,544
78,436
276,774 239,904
36,870
153,744 116,553 37,191
375,089 178,193 196,896
302,389 267,163
35,'226
327,261 292,592
34,669
182,593 160,187 22,406
19,564 19,564
6,725 6,725
15,290 13,821
1,469
129,910 108,973 20,937
11,104 11,104
206,285 176,516
29,769
82,419 79,309
3,110
123,866 97,207 26,659
5,243,694 3,936,641 1,307,053
627,235 269,460 357,775
414,130 325,686
88,444
213,669 154,233 59,436
144,160 124,598 19,562
361,151 285,839
75,312
133,685 112,200
21,485
10
1,262,978 1,041,170
221,808
1,501,478 1,148,129
353,349
1,541,209 1,116,526
424,683
1,423,677 1,229,728
193,949
779,562 588,460 191,102
1,942,688 887,331
1,055,357
1,585,580 1,405,067
180,513
1,640,137 1,473,037
167,100
1,072,753 931,261 141,492
104,175 104,175
44,975 44,975
98,114 89,408
8,706
763,260 630,474 132,786
62,229 62,229
1,011,699 864,529 147,170
406,615 391,126
15,489
605,084 473,403 131,681
29,299,014 22,176,921
7,122,093
3,365,515 1,499,761 1,865,754
2,423,342 1,925,549
497,793
1,122,686 817,914 304,772
824,059 704,928 119,131
1,985,591 1,564,416
421,175
736,647 621,569 115,078
11
646,303 529,758 116,545
773,569 587,656 185,913
798,073 574,806 223,267
726,072 624,423 101,649
400,040 299,773 100,267
1,010,911 455,175 555,736
798,072 704,677 93,395
832,567 743,588
88,979
541,675 470,231 71,444
53,418 53,418
22,313 22,313
49,647 45,176 4,471
384,685 317,712 66,973
31,612 31,612
520,967 441,533
79,434
208,498 199,793
8,705
312,469 241,740
70,729
14,971,900 11,249,209
3,722,691
1,762,525 769,998 992,527
1,244,815 984,814 260,001
570,804 413,073 157,731
419,812 357,828 61,984
1,005,567 787,811 217,756
380,297 320,316 59,981
12
616,675 511,412 105,263
727,909 560,473 167,436
743,136 541,720 201,416
697,605 605,305 92,300
379,522 288,687
90,835
931,777 432,156 499,621
787,508 700,390 87,118
807,570 729,449
78,121
531,078 461,030
70,048
50,757 50,757
22,662 22,662
48,467 44,232
4,235
378,575 312,762
65,813
30,617 30,617
490,732 422,996
67,736
198,117 191,333
6,784
292,615 231,663 60,952
14,327,114 10,927,712
3,399,402
1,602,990 729,763 873,227
1,178,527 940,735 237,792
551,882 404,841 147,041
404,247 347,100
57,147
980,024 776,605 203,419
356,350 301,253 55,097
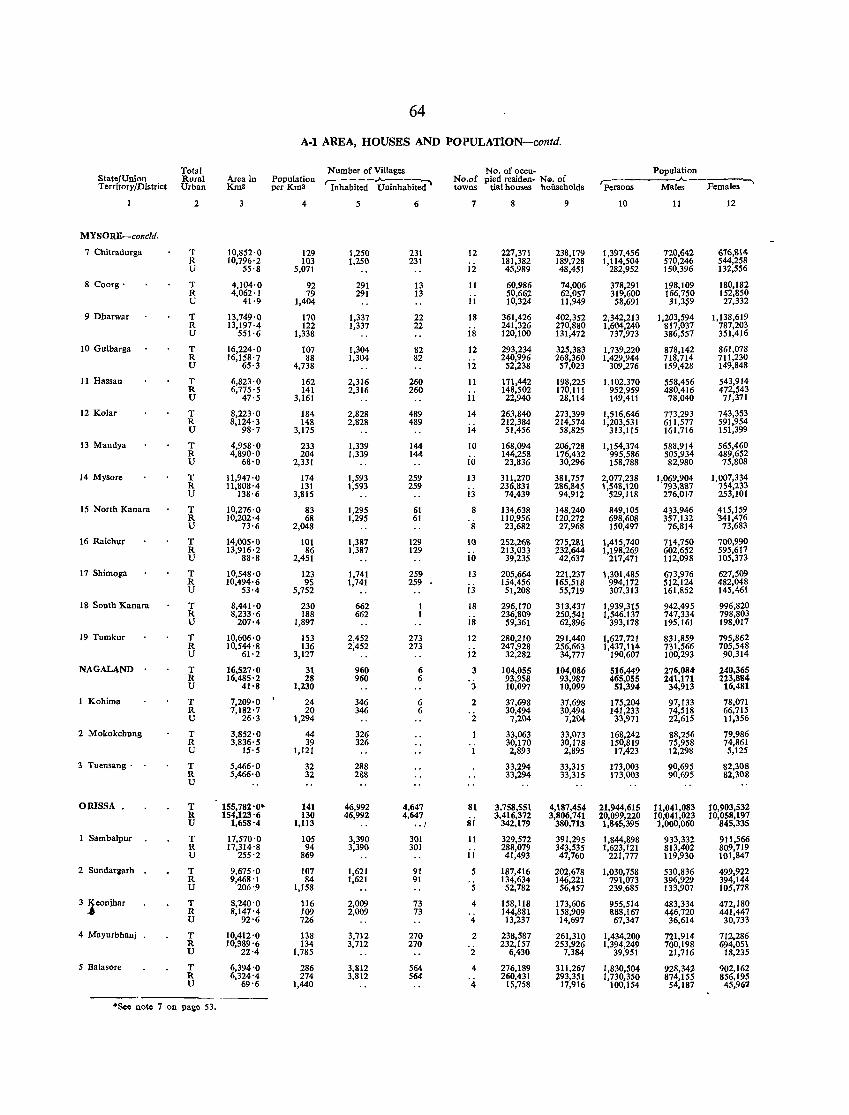
Total State/Union Rural Territory/District Urban
MYSORE-concld.
7 Chitradurga
8 Coorg·
9 Dharwar
10 Gulbarga
11 Hassan
12 Kolar
13 Mandya
14 Mysore
15 North Kanara
16 Raichur
1 g South Kanara
19 Tumkur
NAGALAND .
1 Kohima
2 Mokokchnng
3 Tuensang .
ORISSA.
1 SambaJpur
2 Sundarllarh
3 ~eonjhar
4 Mayurbhanj
5 Dalasore
2
T R U
T R U
T R U
T R U
T R U
T R U
T R U
T R U
T R U
T R U
T R U
T R U
T R U
T R U
T R U
T R U
T R U
T R U
T R U
T R U
T R U
T R U
T R U
·Sec note 7 on page 53.
64
A-I AREA, HOUSES AND POPULATION-contd.
Number of Villages Area in Population ~ - - - --""---7\ Km' per Km" Inhabited Uninhabited
10,852'0 10,796'2
55·8
4,104'0 4,062'1
41·9
13,749'0 13,197'4
551'6
16,224'0 16,158'7
65·3
6,823'0 6,775'5
47'5
8,223'0 8,124'3
98'7
4,958'0 4,890'0
68'0
11,947'0 11,808'4
138·6
10,276'0 10,202'4
73'6
14,005'0 13,916'2
88'8
10,548'0 10,494'6
53'4
8,441'0 8,233'6
207·4
10,606'0 10,544'8
61'2
16,527'0 16,485'2
41'8
7,209'0 7,182'7
26'3
3,852'0 3,836'5
15'5
5,466'0 5,466,0
155,782'0· 154,123-6
1,658'4
17,570'0 17,314'8
255'2
9,675'0 9,468'1
206'9
8,240-0 8,147'4
92'6
10,412'0 10,389'6
22'4
6,394'0 6,324'4
69'6
4
129 103
5,071
92 79
1,404
170 122
1,338
107 88
4,738
162 141
3,161
184 148
3,175
233 204
2,331
174 131
3,815
83 68
2,048
101 86
2,451
123 95
5,752
230 188
1,897
153 136
3,127
31 28
1,230
24 20
1,294
44 39
1,121
32 32
141 130
1,113
105 94
869
107 84
1,158
116 109 726
138 134
1,785
286 274
1,440
5
1,250 1,250
291 291
1,337 1,337
1,304 1,304
2,316 2,316
2,828 2,828
1,339 1,339
1,593 1,593
1,295 1,295
1,387 1,387
1,741 1,741
662 662
2,452 2,452
960 960
346 346
326 326
288 288
46,992 46,992
3,390 3,390
1,621 1,621
2,009 2,009
3,712 3,712
3,812 3,812
6
231 231
13 13
22 22
82 82
260 260
489 489
144 144
259 259
61 61
129 129
259 259
273 273
6 6
6 6
4,647 4,647 .. ,
301 301
91 91
73 73
270 270
564 564
No. of occu- Population No.of pied residen- N0. of --__.A.. --------. towns tial houses households 'Persons Males Females
7
12
12
11
11
18
18
12
12
11
11
14
14
10
10
13
13
8
8
10
10
13
13
18
18
12
12
3
3
2
2
81
si 11
ii 5
5
4
4
2
2
4
4
8
227,371 181,382 45,989
60,986 50,662 10,324
361,426 241,326 120,100
293,234 240,996
52,238
171,442 148,502 22,940
263,840 212,384 51,456
168,094 144,258 23,836
311,270 236,831 74,439
134,638 110,956 23,682
252,2611 213,033
39,235
205,664 134,456 51,208
296,170 236,809 59,361
280,210 247,928
32,282
104,055 93,958 10,097
37,698 30,494 7,204
33,063 30,170 2,893
33,294 33,294
3,758,551 3,416,372
342,179
329,572 288,079 41,493
187,416 134,634 52,782
158,118 144,881 13,237
238,587 232,157
6,430
276,189 260,431
15,758
9
238,179 189,728 48,451
74,006 62,057 11,949
402,352 270,880 131,472
325,383 268,360 57,023
198,225 170,111 28,114
273,399 214,574 58,825
206,728 176,432 30,296
381,757 286,845 94,912
148,240 120,272 27,968
275,281 232,644 42,637
221,237 165,518 55,719
313,437 250,541 62,896
291,440 256,663
34,777
104,086 93,987 10,099
37,698 30,494 7,204
33,073 30,178 2,895
33,315 33,315
4,187,454 3,806,741
380,713
391,295 343,535 47,760
202,678 146,221 56,457
173,606 158,909 14,697
261,310 253,926
7,384
311,267 293,351
17,916
10
1,397,456 1,114,504
282,952
378,291 319,600 58,691
2,342,213 1,604,240
737,973
1,739,220 1,429,944
309,276
1,102,370 952,959 149,411
1,516,646 1,203,531
313,115
1,154,374 995,586 158,788
2,077,238 1,548,120
529,118
849,105 698,608 150,497
1,415,740 1,198,269
217,471
1,301,485 994,172 307,313
1,939,315 1,546,137
393,178
1,627,721 1,437,114
190,607
516,449 465,055
51.394
175,204 141,233 33,971
168,242 150,819 17,423
173,003 173,003
21,944,615 20,099,220 1,845,395
1,844,898 1,623,121
221,777
1,030,758 791,073 239,685
955,514 888,167 67,347
1,434,200 1,394,249
39,951
1,830,504 1,730,350
100,154
11
720,642 570,246 150,396
198,109 166,750 31,3$9
1,203,594 817,037 386,557
878,142 718,714 159,428
558,456 480,416 78,040
773,293 6I1,577 161,716
588,914 505,934 82,980
1,069,904 793,887 276,01-7
433,946 357,132 76,814
714,750 602,652 112,098
673,976 512,124 161,852
942,495 747,334 195,161
831,859 731,566 100,293
276,08.t 241,171 34,913
97,133 74,518 22,615
88,256 75,958 12,298
90,695 90,695
11,041,083 10;041,023 1,000,060
933,332 813,402 119,930
530,836 396,929 133,907
483,334 446,720 36,614
721,914 700,198 21,716
928,342 874,155 54,187
12
676,814 544,258 132,556
180,182 152,850 27,332
1,138,619 787,203 351,416
861,078 711,230 149,848
543,914 472,543 71,371
743,353 591,954 151,399
565,460 489,652 75,808
1,007,334 754,233 253,101
415,159 341,476
73,683
700,990 595,617 105,373
627,509 482,048 145,461
996,820 798,803 198,017
795,862 705,548 90,314
240,365 223,884
16,481
78,071 66,715 11.356
79,986 74,861 5,125
82,308 82,308
10,903,532 10,058,197
845,335
911,566 809,719 101,847
499,922 394,144 105,778
472,180 441,447 30,733
712,286 694,051
18,235
902,162 856,195 45,967
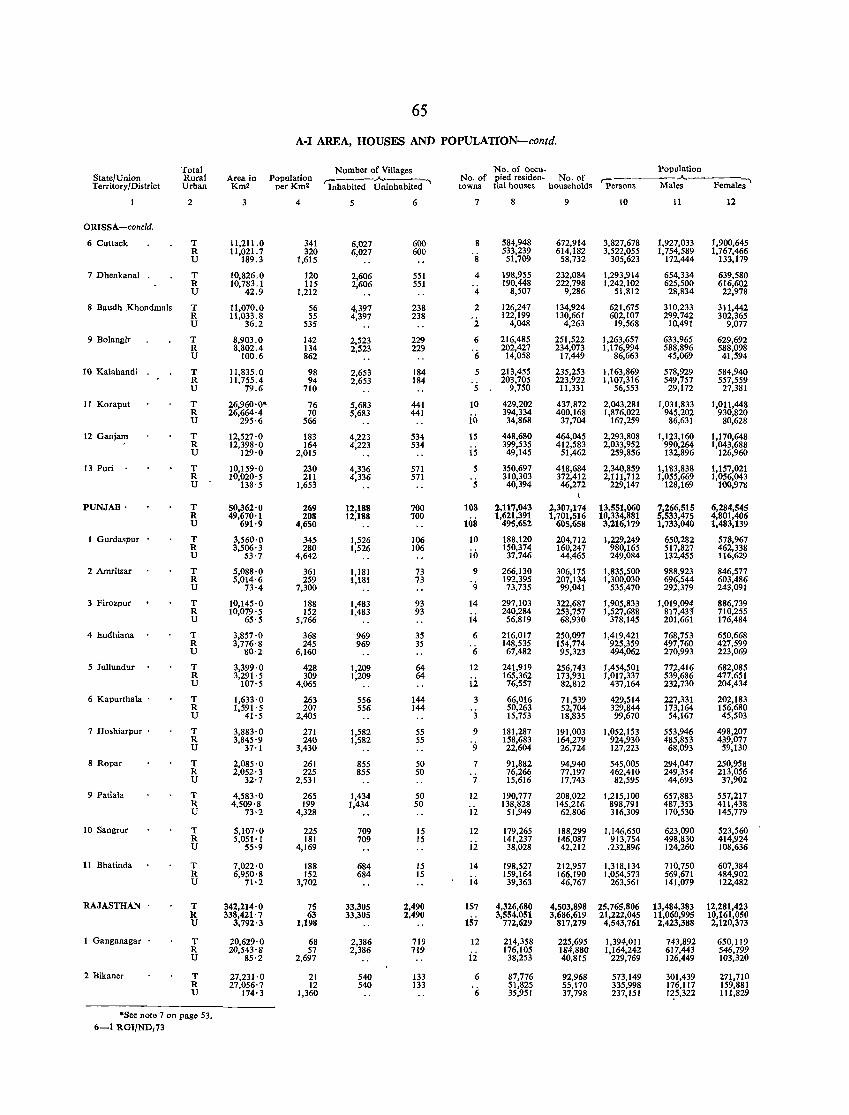
State/Union Territory/District
ORISSA-coneld.
6 Cuttack
7Dhenkanal
8 Baudh Khondmals
9 Bolangir
10 Kalahandi .
11 Koraput
12 Ganjam
13 Puri
PUNJAB .
1 Gurdaspur
2 Amritsar
3 Firozpur
4 l!.udhiana
5 Iullundur
6 Kapurthala .
7 Hoshiarpur
8 Ropar
9 Patiala
10 Sangrur
11 Bhatinda
RAJASTHAN .
1 Ganganagar .
2 Bikaner
Total Rural Urban
2
T R U
T R U
T R U
T R U
T R U
T R U
T R U
T R U
T R U
T R U
T R U
T R U
T R U
T R U
T R U
T R U
T R U
T R U
T R U
T R U
T R U
T R U
T R U
'See note 7 on page 53. 6-1 RGI/ND,73
Area in Km2
3
11,211.0 11,021. 7
189.3
10,826.0 10,783.1
42.9
11,070.0 11,033.8
36.2
8,903.0 8,802.4
100.6
11,835.0 11,755.4
79.6
26,960'0' 26,664'4
295'6
12,527'0 12,398'0
129'0
10,159'0 10,020'5
138'5
50,362'0 49,670'1
691·9
3,560'0 3,506'3
53·7
5,088'0 5,014'6
73'4
10,145'0 10,079'5
65'5
3,857 ·0 3,776'8
80'2
3,399'0 3,291'5
107'5
1,633'0 1,591'5
41'5
3,883'0 3,845'9
37'1
2,085'0 2,052'3
32'7
4,583'0 4,509'8
73-2
5,107'0 5,051'1
55·9
7,022'0 6,950'8
71'2
342,214'0 338,421'7
3,792'3
20,629'0 20,543'8
85'2
27,231'0 27,056'7
174'3
65
A·I AREA, HOUSES AND POPULATION-contd.
Population per Km2
4
341 320
1,615
120 115
1,212
56 55
535
142 134 862
98 94
710
76 70
566
183 164
2,015
230 211
1,653
269 208
4,650
345 280
4,642
361 259
7,300
188 152
5,766
368 245
6,160
428 309
4,065
263 207
2,405
271 240
3,430
261 225
2,531
265 199
4,328
225 181
4,169
188 152
3,702
75 63
1,198
68 57
2,697
21 12
1,360
Number of Villages r:-----..A---.-:-.
Inhabited Uninhabited
5
6,027 6,027
2,606 2,606
4,397 4,397
2,523 2,523
2,653 2,653
5,683 5,683
4,223 4,223
4,336 4,336
12,188 12,188
1,526 1,526
1,181 1,181
1,483 1,483
969 969
1,209 1,209
556 556
1,582 1,582
855 855
1,434 1,434
709 709
684 684
33,305 33,305
2,386 2,386
540 540
6
600 600
551 551
238 238
229 229
184 184
441 441
534 534
571 571
700 700
106 106
73 73
93 93
35 35
64 64
144 144
55 55
50 SO
50 50
15 15
15 IS
2,490 2,490
719 719
133 133
No. of occu- Population No. of pied residen. No. of r:-------.A.------. towns tial houses households Persons Males Females
7
8
·s 4
4
2
2
6
'(;
5
10
io 15
15
5
5
108
108
10
io 9
9
14
14
6
'6 12
12
3
3
9
9
7
7
12
12
12
12
14
i4
157
157 12
ii 6
'6
8
584,948 533,239 51,709
198,955 190,448
8,507
126,247 122,199
4,048
216,485 202,427
14,058
213,455 203,705
9,750
429,202 394,334 34,868
448,680 399,535 49,145
350,697 310,303 40,394
2,117,043 1,621,391
495,652
188,120 150,374 37,746
266,130 192,395 73,735
297,103 240,284 56,819
216,017 148,535 67,482
241,919 165,362 76,557
66,016 50,263 15,753
181,287 158,683 22,604
91,882 76,266 15,616
190,777 138,828
51,949
179,265 141,237 38,028
198,527 159,164 39,363
4,326,680 3,554,051
772,629
214,358 176,105 38,253
87,776 51,825 35,951
9
672,914 614,182
58,732
232,084 222,798
9,286
134,924 130,661
4,263
251,522 234,073
17,449
235,253 223,922
11,331
437,872 400,168 37,704
464,045 412,583
51,462
418,684 372,412 46,272
1
2,307,174 1,701,516
605,658
204,712 160,247 44,465
306,175 207,134 99,041
322,687 253,757 68,930
250,097 154,774 95,323
256,743 173,931 82,812
71,539 52,704 18,835
191,003 164,279 26,724
94,940 77,197 17,743
208,022 145,216
62,806
188,299 146,087 42,212
212,957 166,190 46,767
10
3,827,678 3,522,055
305,623
1,293,914 1,242,102
51,812
621,675 602,107
19,568
1,263,657 1,176,994
86,663
1,163,869 1,107,316
56,553
2,043,281 1,876,022
167,259
2,293,808 2,033,952
259,856
2,340,859 2,111,712
229,147
13,551,060 10,334,881 3,216,179
1,229,249 980,165 249,084
1,835,500 1,300,030
535,470
1,905,833 1,527,688
378,145
1,419,421 925,359 494,062
1,454,501 1,017,337
437,164
429,514 329,844 99,670
1,052,153 924,930 127,223
545,005 462,410 82,595
1,215,100 898,791 316,309
1,146,650 913,754
.232,896
1,318,134 1,054,573
263,561
4,503,898 25,765,806 3,686,619 21,222,045
817,279 4,543,761
225,695 184,880 40,815
92,968 55,170 37,798
1,394,011 1,164,242
229,769
573,149 335,998 237,151
II
1,927,033 1,754,589
172,444
654,334 625,500 28,834
310,233 299,742
10,491
633,965 588,896 45,069
578,929 549,757 29,172
1,031,833 945,202 86,631
1,123,160 990,264 132,896
1,183,838 1,055,669
128,169
7,266,515 5,533,475 1,733,040
650,282 517,827 132,455
988,923 696,544 292,379
1,019,094 817,433 201,661
768,753 497,760 270,993
772,416 539,686 232,730
227,331 173,164 54,167
553,946 485,853 68,093
294,047 249,354 44,693
657,883 487,353 170,530
623,090 498,830 124,260
710,750 569,671 141,079
13,484,383 11,060,995 2,423,388
743,892 617,443 126,449
301,439 176,117 1~5,322
12
1,900,645 1,767,466
133,179
639,580 616,602 22,978
311,442 302,365
9,077
629,692 588,098 41,594
584,940 557,559 27,381
1,011,448 930,820
80,628
1,170,648 1,043,688
126,960
1,157,021 1,056,043
100,978
6,284,545 4,801,406 1,483,139
578,967 462,338 116,629
846,577 603,486 243,091
886,739 710,255 176,484
650,668 427,599 223,069
682,085 477,651 204,434
202,183 156,680 45,503
498,207 439,077
59,130
250,958 213,056 37,902
557,217 411,438 145,779
523,560 414,924 108,636
607,384 484,902 122,482
12,281,423 10,161,050 2,120,373
650,119 546,799 103,320
271,710 159,881 111,829
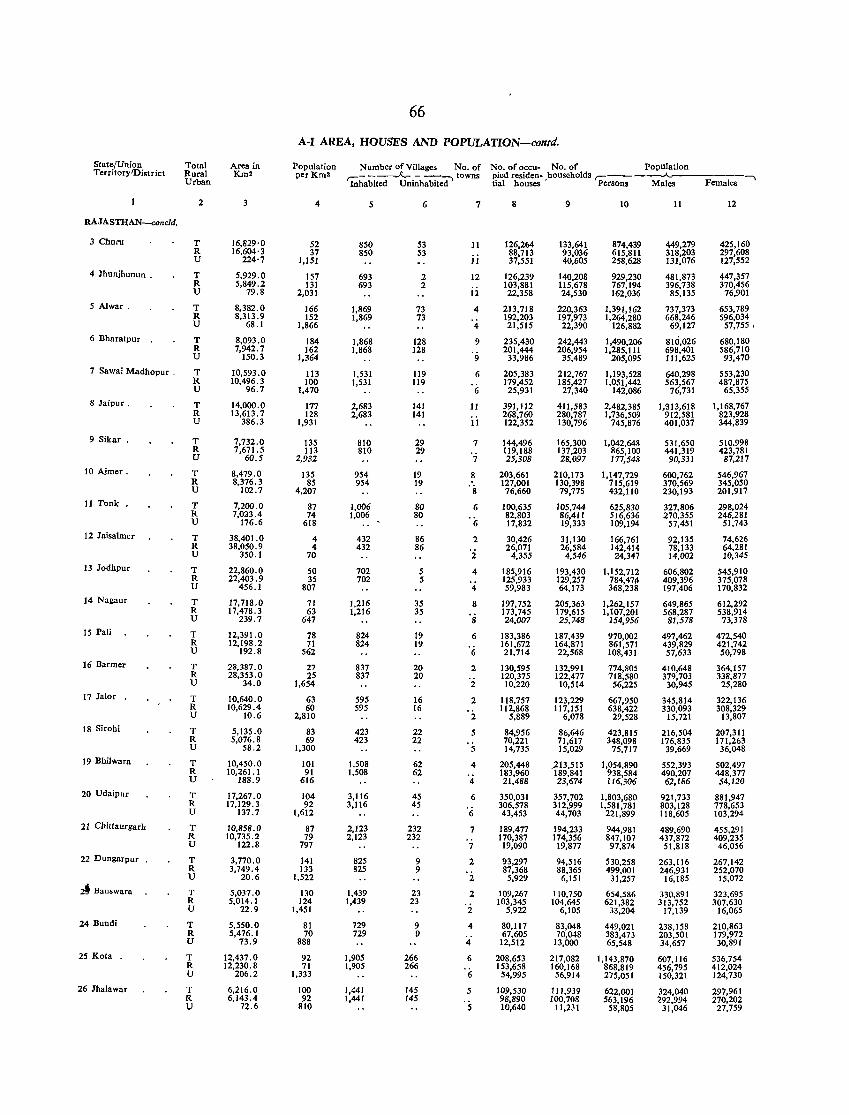
StatefUnion TerritorylDistrict
RAJASTHAN-concld.
3 Churu
4 Jhunjhunun .
5 Alwar.
6 Bharatpur .
7 Sawai Madhopur .
8 Jaipur.
9 Sikar .
10 Ajmer.
II Tonk •
12 Jaisalmer
13 Jodhpur
14 Nagaur
15 Pali
16 Barmer
17 Ja10r .
18 Sirohi
19 Bhilwara
20 Udaipur
21 Chittaurgarh
22 Dungarpur
~ Banswara
24 Bundi
25 Kola.
26 Ihalawar
Total Rural Urban
2
T R U
T R U
T R U
T R U
T R U
T R U
T R U
T R U
T R U
T R U
T R U
T R U
T R U
T R U
T R U
T R U
T R U
T R U
T R U
T R U
T R U
T R U
T R U
T R U
Area in Km2
16,829'0 16,604'3
224'7
5,929.0 5,849.2
79.8
8,382.0 8,313.9
68.1
8,093.0 7,942.7
150.3
10,593.0 10,496.3
96.7
14,000.0 13,613.7
386.3
7,732.0 7,671.5
60.5
8,479.0 8,376.3
102.7
7,200.0 7,0::13.4
176.6
38,401.0 38,050.9
350.1
22,860.0 22,403.9
456.1
17,718.0 17,478.3
239.7
12,391.0 12,198.2
192.8
28,387.0 28,353.0
34.0
10,640.0 10,629.4
10.6
5,135.0 5,076.8
58.2
10,450.0 10,261.1
188.9
17,267.0 17,129.3
137.7
10,858.0 10,735.2
122.8
3,770.0 3,749.4
20.6
5,037.0 5,014.1
22.9
5,550.0 5,476.1
73.9
12,437.0 12,230.8
206.2
6,216.0 6,143.4
72.6
66
A-I AREA, HOUSES AND POPULATION-contd.
Population perKm2
4
52 37
1,151
157 131
2,031
166 152
1,866
184 162
1,364
113 100
1,470
177 128
1,931
135 113
2,932
135 85
4,207
87 74
618
4 4
70
SO 35
807
71 63
647
78 71
562
27 25
1,654
63 60
2,810
83 69
1,300
101 91
616
104 92
1,612
87 79
797
141 133
1,522
130 124
1,451
81 70
888
92 71
1,333
100 92
810
Number of Villages No. of No. of oceu- No. of Population ,-- ------..A..- - --:"'I towns piedresiden- households ,-------"----, Inhabited Uninhabited tial houses' Persons Males Females
5
850 850
693 693
1,869 1,869
1,868 1,868
1,531 1,531
2,683 2,683
810 810
954 954
1,006 1,006
432 432
702 702
1,216 1,216
824 824
837 837
595 595
423 423
1,508 1,508
3,116 3,116
2,123 2,123
825 825
1,439 1,439
729 729
1,905 1,905
1,441 1,441
6
53 53
2 2
73 73
128 128
119 119
141 141
29 29
19 19
80 80
86 86
5 5
35 35
19 19
20 20
16 16
22 22
62 62
45 45
232 232
9 9
23 23
9 9
266 266
145 145
7
11
11
12
12
4
4
9
9
6
6
11
11
7
7
8
8
6
'(;
2
'2 4
4
8
8
6
'6 2
2
2
2
5
5
4
4
6
'6 7
7
2
2
2
2
4
4
6
6
5
S
8
126,264 88,713 37,551
126,239 103,881 22,358
213,718 192,203 21,515
235,430 201,444 33,986
205,383 179,452 25,931
391,112 268,760 122,352
144,496 119,188 25,308
203,661 127,001 76,660
100,635 82,803 17,832
30,426 26,071
4,355
185,916 125,933 59,983
197,752 173,745 24,007
183,386 161,672 21,714
130,595 120,375 10,220
118,757 112,868
5,889
84,956 70,221 14,735
205,448 183,960 21,488
350,031 306,578 43,453
189,477 170,387 19,090
93,297 87,368 5,929
109,267 103,345
5,922
80,117 67,605
12,512
208,653 153,658
54,995
109,530 98,890 10,640
9
133,641 93,036 40,605
140,208 115,678 24,530
220,363 197,973 22,390
242,443 206,954
35,489
212,767 185,427 27,340
411,583 280,787 130,796
165,300 137,203 28,097
210,173 130,398 79,775
105,744 86,411 19,333
31,130 26,584 4,546
193,430 129,257 64,173
205,363 179,615 25,748
187,439 164,871 22,568
132,991 122,477 10,514
123,229 117,151
6,078
86,646 71,617 15,029
,213,515 189,841 23,674
357,702 312,999 44,703
194,233 174,356 19,877
94,516 88,365
6,151
110,750 104,645
6,105
83,048 70,048
13,000
217,082 160,168 56,914
111,939 100,708
11,231
10
874,439 615,811 258,628
929,230 767,194 162,036
1,391,162 1,264,280
126,882
1,490,206 1,285,111
205,095
1,193,528 1,051,442
142,086
2,482,385 1,736,509
745,876
1,042,648 865,100 177,548
1,147,729 715,619 432,110
625,830 516,636 109,194
166,761 142,414 24,347
1,152,712 784,4711 368,238
1,262,157 1,107,201
154,956
970,002 861,571 108,431
774,805 718,580 56,225
667,950 638,422
29,528
423,815 348,098
75,717
1,054,890 938,584 116,306
1,803,680 1,581,781
221,899
944,981 847,107 97,874
530,258 499,001 31,257
654,586 621,382
33,204
449,021 383,473 65,548
1,143,870 868,819 275,051
622,001 563,196
58,805
11
449,279 318,203 131,076
481,873 396,738 85,135
737,373 668,246
69,127
810,026 698,401 111,625
640,298 563,567
76,731
1;313,618 912,581 401,037
531,650 441,319 90,331
600,762 370,569 230,193
327,806 270,355
57,451
92,135 78,133 14,002
606,802 409,396 197,406
649,865 568,287 81,578
497,462 439,829 57,633
410,648 379,703
30,945
345,814 330,093
15,721
216,504 176,835
39,669
552,393 490,207 62,186
921,733 803,128 lt8,605
489,690 437,872 51,818
263,116 246,931
16,185
330,891 313,752
17,139
238.158 203,501 34,657
607,116 456,795 150,321
324,040 292,994
31,046
12
425,160 297,608 127,552
447,357 370,456
76,901
653,789 596,034
57,755 •
680,180 586,710 93,470
553,230 487,875
65,355
1,168,767 823,928 344,839
510.998 423,781
87,217
546,967 345,050 201,917
298,024 246,281
51,743
74,626 64,281 10,345
545,910 375,078 170,832
612,292 538,914 73,378
472,540 421,742 50,798
364,157 338,877
25,280
322,136 308,329
13,807
207,311 171,263
36,048
502,497 448,377 54,120
881,947 778,653 103,294
455,291 409,235 46,056
267,142 252,070
15,072
323,695 307,630
16,065
210,863 179,972 30,891
536,754 412,024 124,730
297,961 270,202
27,759
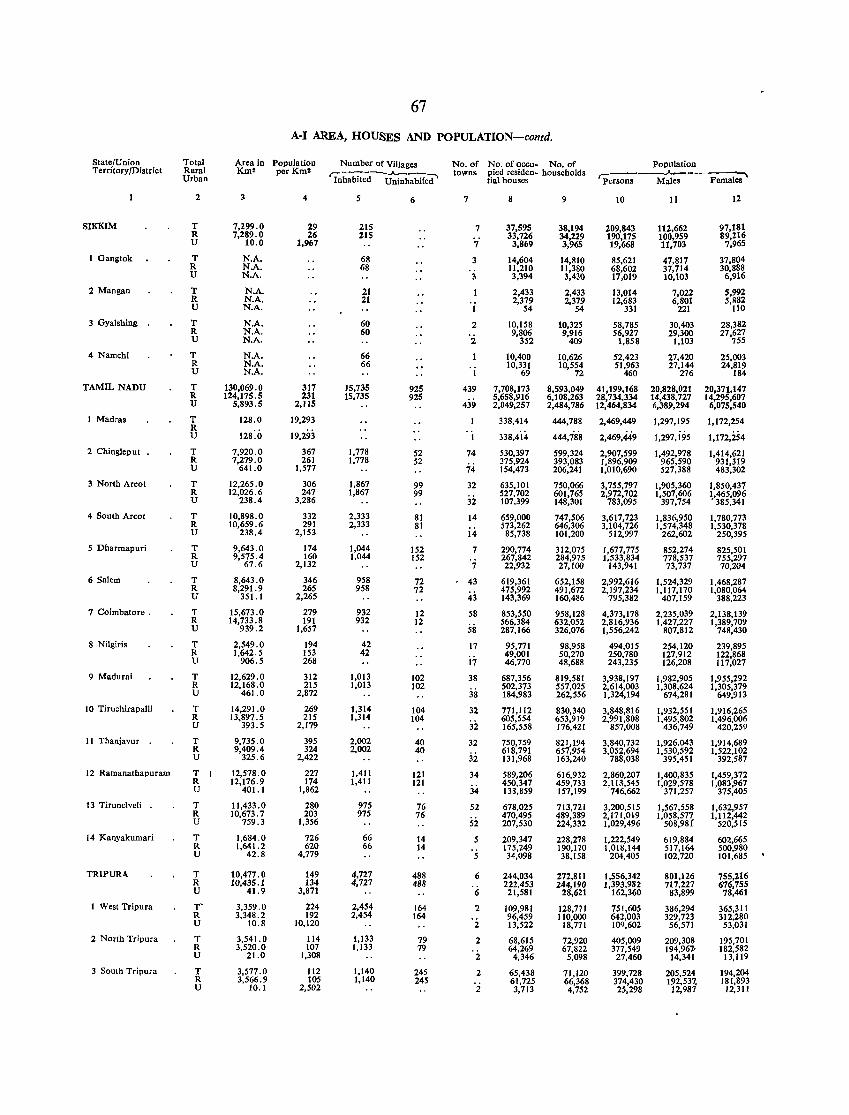
State/Union Territory/District
SIKKIM
1 Oangtok
2 Mangan
3 Oyalshing
4 Namchi
TAMIL NADU
1 Madras
2 Chingleput .
3 North Arcot
4 South Arcot
5 Dharmapuri
6 Salem
7 Coimbatore .
8 Nilgiris
9 Madurai
10 Tiruchirapalli
II Thanjavur .
12 Ramanathapuram
13 Tirunelveli .
14 Kanyakumari
TRJPUR<\
I West Tripura
2 North Tripura
3 South Tripura
Total Rural Urban
2
T R U
T R U
T R U
T R U
T R U
T R U
T R U
T R U
T R U
T R U
T R U
T R U
T R U
T R U
T R U
T R U
T R U
T R U
T R U
T R U
T R U
TR U
T R U
T R U
67
A-I AREA, HOUSES AND POPULATION-conrd.
Area in Population Km2 perKml
3
7,299.0 7,289.0
10.0
N.A. N.A. N.A.
N.A. N.A. NA.
N.A. N.A. N.A.
N.A. N.A. N.A.
130,069.0 124,175.5
5,893.5
128.0
128:0 7,920.0 7,279.0
641.0
12,265.0 12,026.6
238.4
10,898.0 10,659.6
238.4
9,643.0 9,575.4
67.6
8,643.0 8,291.9
351.1
15,673.0 14,733.8
939.2
2,549.0 1,642.5
906.5
12,629.0 12,168.0
461.0
14,291.0 13,897.5
393.5
9,735.0 9,409.4
325.6
12,578.0 12,176.9
401.1
11,433.0 10,673.7
759.3
1,684.0 1,641.2
42.8
10,477 .0 10,435.1
41.9
3,359.0 3,348.2
10.8
3,541.0 3,520.0
21.0
3,577 .0 3,566.9
10.1
4
29 26
1,967
317 231
2,115
19,293
19,293
367 261
1,577
306 247
3,286
332 291
2,153
174 160
2,132
346 265
2,265
279 191
1,657
194 153 268
312 215
2,872
269 215
2,179
395 324
2,422
227 174
1,862
280 203
1,356
726 620
4,779
149 134
3,871
224 192
10,120
114 107
1,308
112 105
2,502
Number of Villages ~-----...A..,.....---"'7"I Inhabited Uninhabifed
5
215 215
68 68
21 21
60 60
66 66
15,735 15,735
1,778 1,778
1,867 1,867
2,333 2,333
1,044 1.044
958 958
932 932
42 42
1,013 1,013
1,314 1,314
2,002 2,002
1,411 1,411
975 975
66 66
4,727 4,727
2,454 2,454
1,133 1,133
1,140 1,140
6
925 925
52 52
99 99
81 81
152 152
72 72
12 12
102 102
104 104
40 40
121 121
76 76
14 14
488 488
164 164
79 79
245 245
No. of No. of oceu- No. of towns pied residen- households
lial houses
7
7
7
3
3
2
'2
1
439
439
74
74
32
32
14
14
7
7
43
43
58
58
17
17
38
38
32
32 32
:ii 34
34
52
52
6
6
"2
2
2
2
2
2
8
37,595 33,726
3,869
14.604 11,210 3,394
2,433 2,379
54
10,158 9,806
352
10,400 10,331
69
7,708,173 5,658,916 2,049,257
338,414
338,4"t4
530,397 375,924 154,473
635,101 527,702 107,399
659,000 573,262 85,738
290,774 267,842 22,932
619,361 475,992 143,369
853,550 566,384 287,166
95,771 49,001 46,770
687,356 502,373 184,983
771,112 605,554 165,558
750,759 618,791 131,968
589,206 450,347 138,859
678,025 470,495 207,530
209,347 175,249 34,098
244,034 222,453
21,581
109,981 96,459 13,522
68,615 64,269
4,346
65,438 61,725 3,713
9
38,194 34,229 3,965
14,810 11,380 3,430
2,433 2,379
54
10,325 9,916
409
10,626 10,554
72
8,593,049 6,108,263 2,484,786
444,788
444,78'8
599,324 393,083 206,241
750,066 601,765 148,301
747,506 646,306 101,200
312,075 284,975 27,100
652,158 491,672 160,486
958,128 632,052 326,076
98,958 50,270 48,688
819,581 557,025 262,556
830,340 653,919 176,421
821,194 657,954 163,240
616,932 459,733 157,199
713,721 489,389 224,332
228,278 190,120 38,158
272,811 244,190
28,621
128,771 110,000
18,771
72,920 67,822
5,098
71,120 66,368 4,752
Population ~----____ J ___________ ~~
persons Males Females
10
209,843 190,175 19,668
85,621 68,602 17,019
13,014 12,683
331
58,785 56,927
1,858
52,423 51,963
460
41,199,168 28,734,334 12,464,834
2,469,449
2,469,449
2,907,599 1,896,909 1,010,690
3,755,797 2,972,702
783,095
3,617,723 3,104,726
512,997
1,677,775 1,533,834
143,941
2,992,616 2,197,234
795,382
4,373,178 2,816,936 1,556,242
494,015 250.780 243,235
3,938,197 2,614,003 1,324,194
3,848,816 2,991,808
857,008
3,840,732 3,052,694
788,038
2,860,207 2,113,545
746,662
3,200,515 2,171,019 1,029,496
1,222,549 1,018,144
204,405
1,556,342 1,393,982
162,360
751,605 642,003 10<>,602
405,009 377,549
27,460
399,728 374,430 25,298
11
112,662 100,959 11,703
47,817 37,714 10,103
7,022 6,801
221
30,403 29,300
1,103
27,420 27,144
276
20,828,021 14,438,727 6,389,294
1,297,195
1,297,i95
1,492,978 965,590 527,388
1,905,360 1,507,606
397,754
1,836,950 1,574,348
262,602
852,274 778,537 73,737
1,524,329 1.117,170
407,159
2,235,039 1,427,227
807,812
254,120 127,912 126,208
1,982,905 1,308,624
674,281
1,932,551 1,495,802
436,749
1,926,043 1,530,592
395,451
1,400,835 1,029,578
371,257
1,567,558 1,058,577
508,98!
619,884 517,164 102,720
801,126 717,227
83,899
386,294 329,723
56,571
209,308 194,967'
14,341
205,524 192,537, 12,987
12
97,181 89,116
7,965
37,804 30,888
6,916
5,992 5,882
110
28,382 27,627
755
25,003 24,819
184
20,371,147 14,295,607
6,075,540
1,172,254
1,172,254
1,414,621 931,319 483,302
1,850,437 1,465,096 • 385,341
1,780,773 1,530,378
250,395
825,501 755,297 70,204
1,468,287 1,080,064
388,223
2.138,139 1,389,709
748,430
239,895 122,868 117,027
1,955,292 1,305,379
649,913
1,916,265 1,496,006
420,259
1,914,689 1,522,102
392,587
1,459,372 1,083,967
375,405
1,632,957 1,112,442
520,515
602,665 500,9&0 101,685
755,216 676,755 78,461
365,311 312,280 53,031
195,701 182,582
13,119
194,204 181,893
12,311
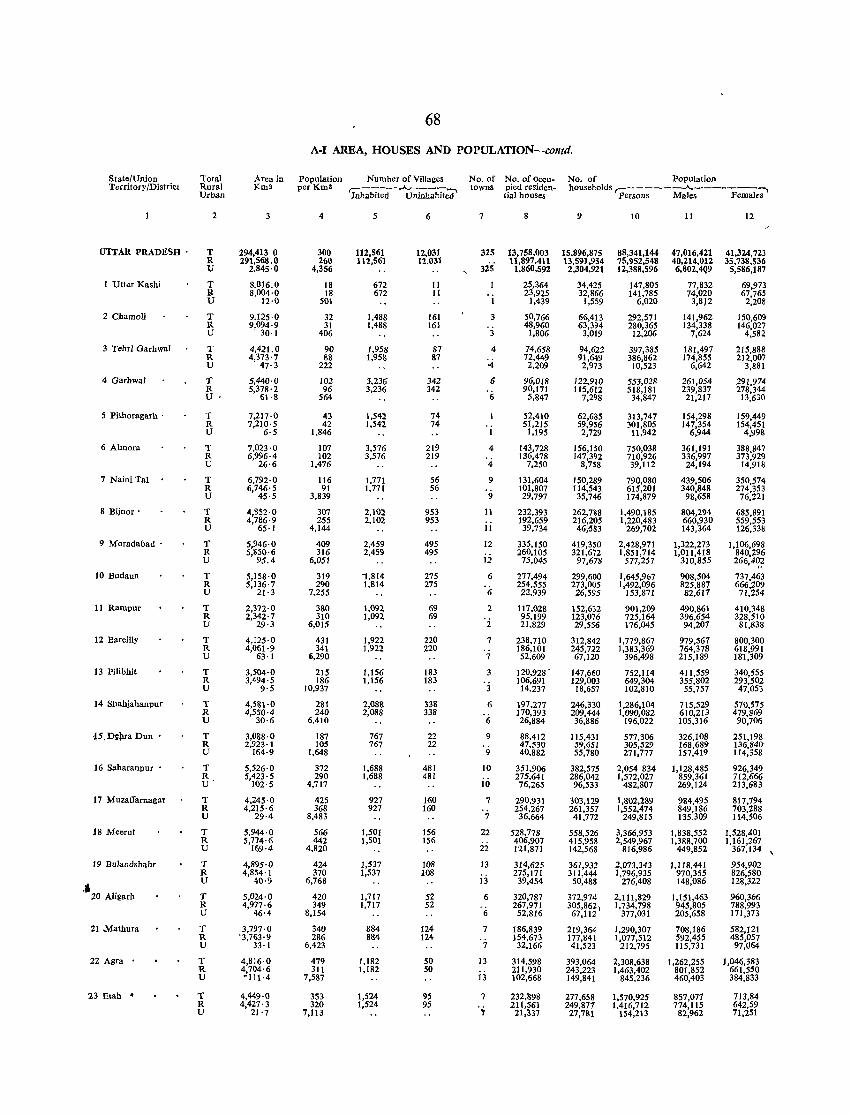
.,
State/Union TerritorY/District
UTIAR PRADESH .
I UtldrKashi
2 Chamoli
3 Tehri Garhwal
4 Garhwal
5 Pithoragarh .
6 Almora
7 Naini Tal
8 Bljnor'
9 Moradabad .
10 Budaun
II Rampur
12 Bareilly
13 Pilibhit
14 Shahjahanpur
16 Saharanpur .
17 Muzaifarnagar
18 Meerut
19 Bulandshahr
20 Aligarh
21..Mathura
22 Agra •
23 Etah •
Total Rural Urban
2
T R U
T R U
T R U
T R U
T R U
T R U
T R U
T R U
T R U
T R U
T R U
T R U
T R U
T R U
T R U
T R U
T R U·
T R U
T R U
T R U
T R U
T R U
T R U
T R U
Area in J(m2
294,413 0 291,568.0
2,845'0
8,016.0 8,004·0
12·0
9,125·0 9,094'9
30·1
4,421.0 4,373'7
47·3
5,440·0 5,378'2
61·8
7,217 ·0 7,210'5
6·5
7,023·0 6,996'4
26·6
6,792·0 6,746'5
45·5
4,852·0 4,786'9
65·1
5,946·0 5,850·6
95.4
5,158·0 5,136'7
21·3
2,372·0 2,342'7
29·3
4,125·0 4,061·9
63·1
3,504·0 3,494'5
9·5
4,5~1'0 4,550·4
30·6
3,088·0 2,923'1
164·9
5,526'0 5,423'5
102·5
4,245·0 4,215'6
29·4
5,944·0 5,774·6
169·4
4,895'0 4,854'1
40·9
5,024·0 4,977·6
46·4
3,797·0 '3,763·9
33·1
4,816·0 4,704'6 -111·4
4,449·0 4,427'3
21'7
68
A-I AREA, HOUSES AND POPULATION-con/d.
Population perKm2
4
300 260
4,356
18 18
501
32 31
406
90 88
222
102 96
564
43 42
1,846
107 102
1,476
116 91
3,839
307 255
4,144
409 316
6,051
319 290
7,255
380 310
6,015
431 341
',290
215 186
10,937
281 240
6,410
187 105
1,648
372 290
4,717
425 368
8,483
566 442
4,820
424 370
6,768
420 349
8,154
340 286
6,423
479 311
7,587
353 320
7,113
Number of Villages c----- ..A.r----~ Inhabited Uninhabited
5
112,561 112,561
672 672
1,488 1,488
1,958 1,958
3,236 3,236
1,542 1,542
3,576 3,576
1,771 1,771
2,102 2,102
2,459 2,459
1,814 1,814
1,092 1,092
1,922 ),922
1,156 1,156
2,088 2,088
767 767
1,688 1,688
927 927
1,501 1,501
1,537 1,537
1,717 1,717
884 884
1,182 1,182
1,524 1,524
6
12,031 12,031
11 11
161 161
87 87
342 342
74 74
219 219
56 56
953 953
495 495
275 275
69 69
220 220
183 183
338 338
22 22
481 481
160 160
156 156
108 108
52 52
124 114
50 SO
95 95
No. of No. of Oecutowns pied residen
tial houses
No. of Population
7
3
3
4
'" 6
6
4
'4 9
9
11
II
12
12
6
6
2
2
7
7
3
6
'6 9
9
10
10
7
7
22
ii 13
13
6
6
7
7
13
i3
7
T
households r-::- - ----..A.-------, persons Males Females
8 9
13,758,003 15,896,875 11,897,411 13,59l,954
1,860,592 2,304,921
25,364 23,925
1,439
50,766 48,960
1,806
74,658 72,449 2,209
96,018 90,171
5,847
52,410 51,215
1,195
143,728 136,478
7,250
131,604 101,807 29,797
232,393 192,659 39,734
335,150 260,105 75,045
277,494 254,555 22,939
117,028 95,199 21,829
238,710 186,101 52,609
120,928' 106,691 14,237
197,277 170,393 26,884
88,412 47,530 40,882
351,906 275,641 76,265
290,931 254,267 36,664
528,778 406,907 121,871
314,625 275,171
39,454
320,787 267,971
52,816
186,839 154,673 32,166
314,598 211,930 102,668
232,898 211,561 21,337
34,425 32,866
1,559
66,413 63,394 3,019
94,622 91,649 2,973
122,910 115,612
7,298
62,685 59,956 2,729
156,150 147,392
8,758
150,289 114,543 35,746
262,788 216,205 46;583
419,350 321,672
97,678
299,600 273,005 26,595
152,632 123,076 29,556
312,842 245,722 67,120
147,660 129,003
18,657
246,330 209,444 36,886
115,431 59,651 55,780
382,575 286,042 96,533
303,129 261,357 41,772
558,526 415,958 142,568
361,932 311,444 50,488
372.974 305,862) 67,112
219,364 177,841 41,523
393,064 243,223 149,841
277,658 249,877 27,781
10
88,341,144 75,952,548 12,388,596
147,805 141,785
6,020
292,571 280,365 12,206
397,385 386,862 10,523
553,028 518,181 34,847
313,747 301,805
11,942
750,038 710,926 39,112
790,080 615,201 174,879
1,490,185 1,220,483
269,702
2,428,971 1,851,714
577,257
1,645,967 1,492,096
153,871
901,209 725,164 176,045
1,779,867 1,383,369
396,498
752,114 649,304 102,810
1,286,104 1,090,082
196,022
577,306 305,529 271,777
2,054 834 1,572,027
482,807
1,802,289 1,552,474
249,815
3,366,953 2,549,967
816,986
2,073,343 1,796,935
276,408
2,111,829 1,734,798
377,031
1,290,307 1,077,512
212,795
2,308,638 1,463,402
845,236
1,570,925 1,416,712
154,213
11 12
47,016,421 41,324,723 40,214,012 35,738,536 6,802,4Q9 5,586,187
77,832 74,020
3,8)2
141,962 134,338
7,624
181,497 174,855
6,642
261,054 239,837 21,217
154,298 147,354
6,944
361,191 336,997 24,194
439,506 340,848 98,658
804,294 660,930 143,364
1,322,273 1,011,418
310,855
908,504 825,887 82,617
490,861 396,654 94,207
979,567 764,378 215,189
411,559 355,802 55,757
715,529 610,213 105,316
326,108 168,689 157,419
1,128,485 859,361 269,124
984,495 849,186 135,309
1,838,552 1,388,700
449,852
1,118,441 970,355 148,086
1,151,463 945,805 205,658
708,186 592,455 115,731
1,262,255 801,852 460,403
857,071 774,115 82,962
69,973 67,765
2,208
150,609 146,027
4,582
215,888 212,007
3,881
291,974 278,344
13,630
159,449 154,451
4,998
388,847 373,929
14,918
350,574 274,353 76,221
685,891 559,553 126,338
1,106,698 840,296 266,402
t,
737,463 666,209 71,254
410,:348 328,510 81,838
800,300 618,991 181,309
340,555 293,502 47,053
570,575 479,869
90,706
251,198 136,840 114,358
926,349 712,666 213,683
817,194 703,288 114,506
1,528,401 1,161,267
367,134 \
954,902 826,580 128,322
960,366 788,993 171,373
582,121 485,057 97,064
1,046,383 661,550 384,833
713,84 642,59 71,251
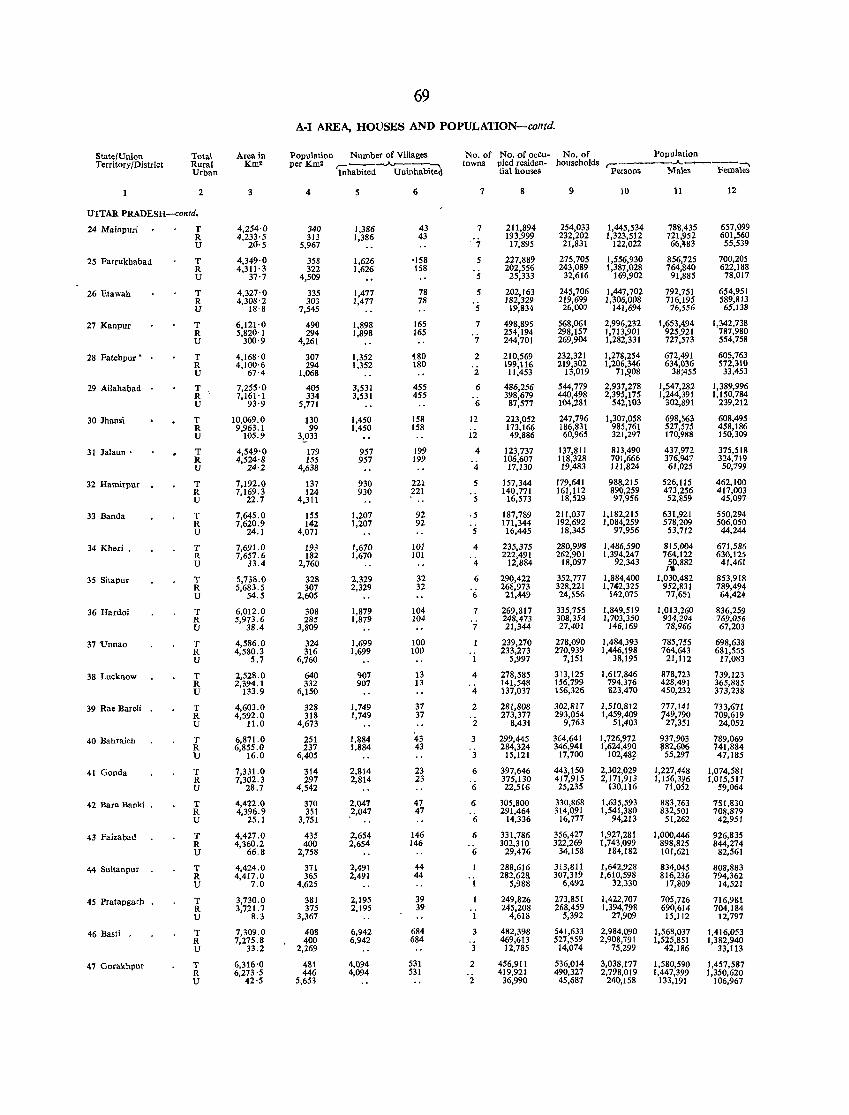
State/Union Territory/District
Total Rural Urban
2
UTTAR PRADESH-contd.
24 Mainpuri
25 Farrukhabad
26 Etawah
27 Kanpur
28 Fatehpur'
29 Allahabad •
30 Jhansi
31 Jalaun •
32 Hamirpur
33 Banda
34 Kheri •
35 Sitapur
36 Hardoi
37 'Unnao
38 Lucknow
39 Rae Bareli •
40 Bahraich
41 Gonda
42 Bara Banki .
43 Faizabad
44 Sultanpur
45 Pratapgarh
46 Basti .
47 Gorakhpur
T R U
T R U
T R U
T R U
T R U
T R U
T R U
T R U
T R U
T R U
T R U
T R U
T R U
T R U
T R U
T R U
T R U
T R U
T R U
T R U
T R U
T R U
T R U
T R U
Area in Km'
3
4,254'0 4,233'5
20'5
4,349,0 4,311' 3
37'7
4,327'0 4,308'2
18'8
6,121'0 5,820'1
300·9
4,168'0 4,100'6
67·4
7,255'0 7,161'1
93'9
10,069.0 9,963.1
105.9
4,549'0 4,524'8
24'2
7,192.0 7,169.3
22.7
7,645.0 7,620.9
24.1
7,691.0 7,657.6
33.4
5,738.0 5,683.5
54.5
6,012.0 5,973.6
38.4
4,586.0 4,580.3
5.7
2,528.0 2,394.1
133.9
4,603.0 4,592.0
11.0
6,871.0 6,855.0
16.0
7,331.0 7,302.3
28.7
4,422.0 4,396.9
25.1
4,427.0 4,360.2
66.8
4,424.0 4,417.0
7.0
3,730.0 3,721.7
8.3
7,309.0 7,275.8
33.2
6,316'0 6,273 '5
42'5
69
A·I AREA, HOUSES AND PO PULATION-contd.
Population Numbet of Villages per Km' r-~----;
Inhabited Uninhabited
4
340 313
5,967
358 322
4,509
335 303
7,545
490 294
4,261
307 294
1,068
405 334
5,771
130 99
3B33
179 155
4,638
137 124
4,311
155 142
4,071
193 182
2,760
328 307
2,605
308 285
3,809
324 316
6,760
640 332
6,150
328 318
4,673
251 237
6,405
314 297
4,542
370 351
3,751
435 400
2,758
371 365
4,625
381 375
3,367
408 400
2,269
481 446
5,653
5
1,386 1,386
1,626 1,626
1,477 1,477
1,898 1,898
1,352 1,352
3,531 3,531
1,450 1,450
957 957
930 930
1,207 1,207
1,670 1,670
2,329 2,329
1,879 1,879
1,699 1,699
907 907
1,749 1,749
1,884 1,884
2,814 2,814
2,041 ,2,047
2,654 2,654
2,491 2,491
2,195 2,195
6,942 6,942
4,094 4,094
6
43 43
'158 158
78 78
165 165
i80 180
455 455
158 158
199 199
221 ,221
92 92
101 101
32 32
104 104
100 100
13 13
37 37
43 43
23 23
47 47
146 146
44 44
39 39
684 684
531 531
No. of No. of oceu· towns pied residen.
tial houses
7
7
7
5
5
5
5
7
7
2
2
6
6
12
ii 4
4
5
'5 .5
5
4
4
6
'6 7
7
1
4
4
2
2
3
3
6
6
6
6
6
'(;
3
2
2
8
211,894 193,999 17,895
227,889 202,556
25,333
202,163 182,329 19,834
498,895 254,194 244,701
210,569 199,116 11,453
486,256 398,679 87,577
223,052 173,166 49,886
123,737 106,607 17,130
157,344 140,771
16,573
187,789 171,344 16,445
235,375 222,491
12,884
290,422 268,973
21,449
269,817 248,473 21,344
239,270 233,273
5,997
278,585 141,548 137,037
281,808 273,377
8,431
299,445 284,324
15,121
397,646 375,130 22,516
30S,800 291,464
14,336
331,786 302,310
29,476
288,616 282,62&
5,988
249,826 245,208
4,618
482,398 469,613 12,785
456,911 419,921
36,990
No. of households
9
254,033 232,202 21,831
275,705 243,089
32,616
245,706 219,699 26,007
568,061 298,157 269,904
232,321 219,302
13,019
544,779 440,498 104,281
247,796 186,831 60,965
137,811 118,328 19,483
179,641 161,112 18,529
211,037 192,692 18,345
280,998 262,901
18,097
352,777 328,221 24,556
335,755 308,354 27,401
278,090 270,939
7,151
313,125 156,799 156,326
302,817 293,054
9,763
364,641 346,941
17,700
443,150 417,915 25,235
330,868 314,091
16,777
356,427 322,269
34,158
313,811 307,319
6,492
273,851 268,459
5,392
541,633 527,559 14,074
536,014 490,327 45,687
Population
'Persons
____ .A._-~:-,\
Males Female.
10
1,445,534 1,323,512
122,022
1,556,930 1,387,028
169,902
1,447,702 1,306,008
141,694
2,996,232 1,713,901 1,282,331
1,278,254 1,206,346
71,~08
2,937,278 2,395,175
542,103
1,301,058 985,761 321,297
813,490 701,666 111,824
988,215 890,259 97,956
1,182,215 1,084,259
97,956
1,486,590 1,394,247
92,343
1,884,400 1,742,325
142,075
1,849,519 1,703,350
146,169
1,484,393 1,446,198
38,195
1,617,846 794,376 823,470
1,510,812 1,459,409
51,403
1,726,972 1,624,490 102,48~
2,302,029 2,171,913
130,rt6
1,635,593 1,541,380
94,213
1,927,281 1,743,099
184,182
1,642,928 1,610,598
32,330
1,422,707 1,394,798
27,909
2,984,090 2,908,791
75,299
3,038,177 2,798,019
240,158
11
788,435 721,952 66,~83
856,725 764,840
91,885
792,751 716,195 76,556
1,653,494 925,921 727,573
672,491 634,036
38;455
1,547,282 1,244,391
302,891
698,563 527,575 170,988
437,972 376,947 61,025
526,115 473,256 52,859
631,921 578,209 53,712
815,004 764,122 ;W,882
1,030,482 952,831 11,651
1,013,260 934,294 78,966
785,755 764,643
21,112
878,723 428,491 450,232
777,141 749,790
27,351
937,903 ~82,606 55,297
1,227,448 1,156,3%
71,052
883,763 832,501
51,262
1,000,446 898,825 101,621
834,045 816,236
17,809
705,726 690,614 15,112
1,568,037 1,525,851
42,186
1,580,590 1,447,399
133,191
12
657,099 601,560 55,539
700,205 622,188 78,017
654,951 589,813 65,138
1,342,738 787,980 554,758
605,763 572,310
33,453
1,389,996 1,150,784
239,212
608,495 458,186 150,309
375,518 324,719 50,799
462,100 417,003 45,097
550,294 506,050 44,244
671,586 630,125
41,461
853,918 789,494 64,424
836,259 769,056 67,203
698,638 681,555
17,083
739,123 365,885 373,238
733,671 709,619 24,052
789,069 741,884 47,185
1,074,581 1,015,517
59,064
751,810 708,879
42,951
926,835 844,274
82,561
808,883 794,362
14,521
716,981 704,184
12,797
1,416,053 1,382,940
33,113
1,457,587 1,350,620
106,967
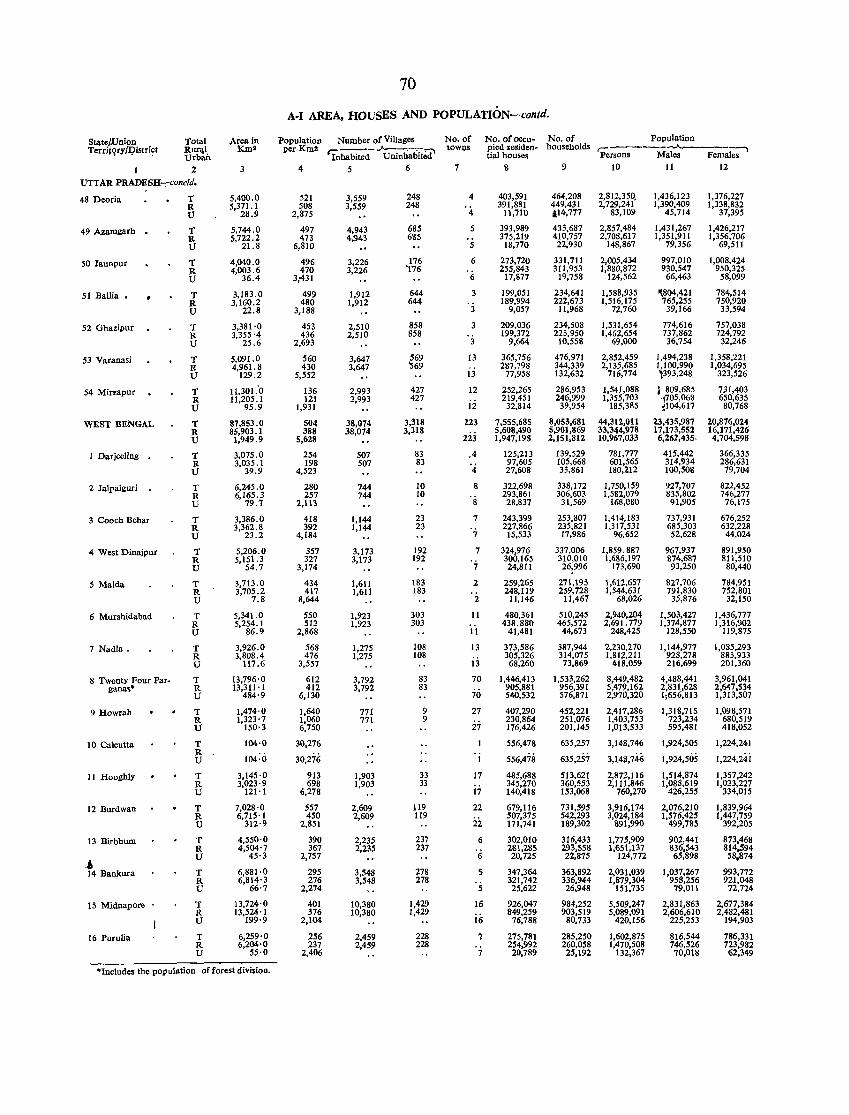
State/Union Terrilqry /1?istri7t
Total Rurl!i Urban
2 UTTAR PRADESH-:-concld.
48 Deoria
49 Azamgarh •
50 Jaunpur
51 Ballia •
52 Ghazipur
53 Varanasi
54 Mirzapur
WEST BENGAL
1 Darjeeling
2 Jalpaiguri .
3 Coach Behar
4 West Dinajpur
5 MaIda
6 Murshidabad
7 Nadia.
8 Twenty Four Parganas"
9 Howrah
10 Calcutta
11 Hooghly
12 Burdwan
13 Birbhum
•• 14 Bankura
15 Midnapore
16 Purulia
T R U
T R U
T R U
T R U
T R U
T R U
T R U
T R U
T R U
T R U
T R U
T R U
T R U
T R U
T R U
T R U
T R U
T R U
T R U
T R U
T R U
T R U
T R U
T R U
;\Tea in J(ma
3
5,400.0 5,371.1
28.9
5,744.0 5,722.2
21.8
4,040.0 4,003.6
36.4
3,183.0 3,160.2
22.8
3,381,0 3,355'4
25.6
5,091.0 4,961. 8
129.2
1l,301.'0 1l,205.1
95.9
87,853.0 85,903.1 1,949.9
3,075.0 3,035.1
39.9
6,245.0 6,165.3
79.7
3,386.0 3,362.8
23.2
5,206.0 5,151.3
54.7
3,713.0 3,705.2
7.8
5,341.0 5,254.1
86.9
3,926.0 3,808.4
117.6
13,796'0 13,311'1
484·9
1,474,0 1,323'7
150·3
104·0
104:0
3,145'0 3,023,9
121'1
7,028'0 6,715'1
312·9
4,550'0 4,5~:j
6,881·0 6,814'3
66'7
13,724'0 13,524'1
199·9
6,259'0 6,204'0
55·0
"Includes the popullllion of forest division.
70
A·I AREA, HOUSES AND POPULATION-contd.
Population Number ofViUages per KIn2 -.f.---.;-;-
4
521 508
2,875
497 473
6,810
496 470
3;431
499 480
3,188
453 436
2,693
560 430
5,552
136 121
1,931
504 388
5,628
254 198
4,523
280 257
l,1l3
418 392
4,184
357 327
3,174
434 417
8,644
550 512
2,868
568 476
3,557
612 412
6,130
1,640 1,060 6,750
30,276
30,276
913 698
6,278
557 450
2,851
390 367
2,757
295 276
2,274
401 376
2,104
256 237
2,406
'Inhabited- Uninhabited' 5 6
3,559 3,559
4,943 4,943
3,226 3,226
1,912 1,912
2,510 2,510
3,647 3,647
2,993 2,993
38,074 38,074
507 507
744 744
1,144 1,144
3,173 3,173
1,611 1,611
1,923 1,923
1,275 1,275
3,792 3,792
771 771
1,903 1,903
2,609 2,609
2,235 2,235
3,548 3,548
10,380 10,380
2,459 2,459
248 248
685 685
176 '176
644 644
858 858
569 '569
427 427
3,318 3,318
83 83
10 10
23 23
192 192
183 183
303 303
108 108
83 83
9 9
33 33
119 119
237 237
278 278
1,429 1,429
228 228
No. of towJ;)S
7
4
4
5
5
6
6
'j
3
'j
13
13
12
12
223
2ij
.4
4
8
8
7
7
7
7
2
2
11
11
13
ij
70
70
27
27
17
i7
22
22
6
6
5
5
16
i6
7
7
No. of oceu- No. of pied residen- households dal houses
8
403,591 391,881
11,710
393,989 375,219
18,770
273,720 255,843
17,877
199,051 189,994
9,057
209,036 199,372
9.664
365,756 287,798
77,958
252,265 219,451 32,814
7,555,685 5,608,490 1,947,195
125,213 97,605 27,608
322,698 293,861 28,837
243,399 227,866 15,533
324,976 300,165 24,811
259,265 248,119
11,146
480,361 438.880
41,481
373,586 305,326 68,260
1,446,413 905,881 540,532
407,290 230,864 176.426
556,478
556,478
485,688 345,270 140,418
679,116 507,375 171,741
302,010 281,285 20,725
347,364 321,742 25,622
926,047 849,259
76,788
275,781 254,992 20,789
9
464,208 449,431 &14,777
433,687 410,757 22,930
331,711 311,953
19.758
234,641 222,673
11,968
234,508 223,950
10,558
476,971 344,339 132,632
286,953 246,999
39.954
8,053,681 5,901,869 2,151,812
139,529 105,668 33,861
338,172 306,603 31,569
253,807 235,821 17,986
337,006 310,010 26,996
271,195 259,728
11,467
510,245 465,572
44,673
387,944 314,075 73,869
1,533,262 956,391 576,871
452,221 251,076 201,145
635,257
635,257
513,621 360,553 153,068
731.595 542,293 189,302
316,433 293.558 22,875
363,892 336.944 26,948
984.252 903,519
80,733
285,250 260,058 25.192
Population c-----......A--------, Persons Males Females
10 11 12
2,812,350. 2,729,241
83,109
2,857,484 2,708,617
148,867
2,005,434 1,880,872
124,562
1,588,935 1,516,175
72,760
1,531,654 1,462.654
69,000
2,852,459 2,135,685
716,774
1,541,088 1,355,703
185,385
44,311.,011 33,344.978 10,967,033
781.777 601,565 180,212
1,750,159 1,582,079
168,080
1,414,183 1,317,531
96,652
1,859.887 1,686,197
173,690
1,612,657 1,544,631
68,026
2,940,204 2,691. 779
248,425
2,230,270 1,812,211
418,059
8,449,482 5,479,162 2,970.320
2,417,286 1.403,753 1,013,533
3,148,746
3,148,746
2,872,116 2,111,846
760,270
3,916,174 3,024.184
891,990
1,775,909 1,651.137
124,772
2,031,039 1,879,304
151.735
5,509,247 5,089,091
420,156
1,602,875 1,470,508
132,367
1,436,123 1,390,409
45,714
1,431,267 1,351,911
79,356
997,010 930,547
66,463
11\804,421 765,255 39,166
774,616 737,862 36,754
1,494,238 1,100,990 ,393,248
I 809,685 ·,705,068 ~104,617
23,435,987 17,173,552
6,262,435.
415,442 314,934 100,508
927,707 835,802 91,905
737,931 685,303 52,628
967,937 874,687 93,250
827,706 791,830
35,876
1,503,427 1,374,877
128,550
1,144,977 928,278 216,699
4,488,441 2,831,628 1;656,813
1,318,715 723,234 595,481
1,924,505
1,924,505
1,514.874 1,088,619
426,255
2,076,210 1,576,425
499,785
902,441 836,543 65,898
1,037,267 958,256 79,011
2,831,863 2.606,610
225,253
816,544 746,526 70,018
1,376,227 1,338,832
37,395
1,426,217 1,356,706
69,511
1,008,424 950,325
58,099
784,514 750,920 33,594
757,038 724,792
32,246
1,358,221 1,034,695
323,526
731,403 650,635 80,768
20,876.024 16,171,426 4,704,598
366,335 286,631 79,704
822,452 746,277
76,175
676,252 632,228 44,024
891,930 811,510 80,440
784,951 752,801 32.150
1,436,777 1,316,902
119,875
1,085,293 883,933 201,360
3,961,041 2,647,534 1,313,507
1,098,571 680,519 418,052
1,224,241
1,224,z.ii
1,357,242 1,023,227
334,015
1,839,964 1,447,759
392,205
873,468 814,594 58.874
993,772 921,048 72,724
2,677,384 2,482,481
194,903
786,331 723,982 62,349
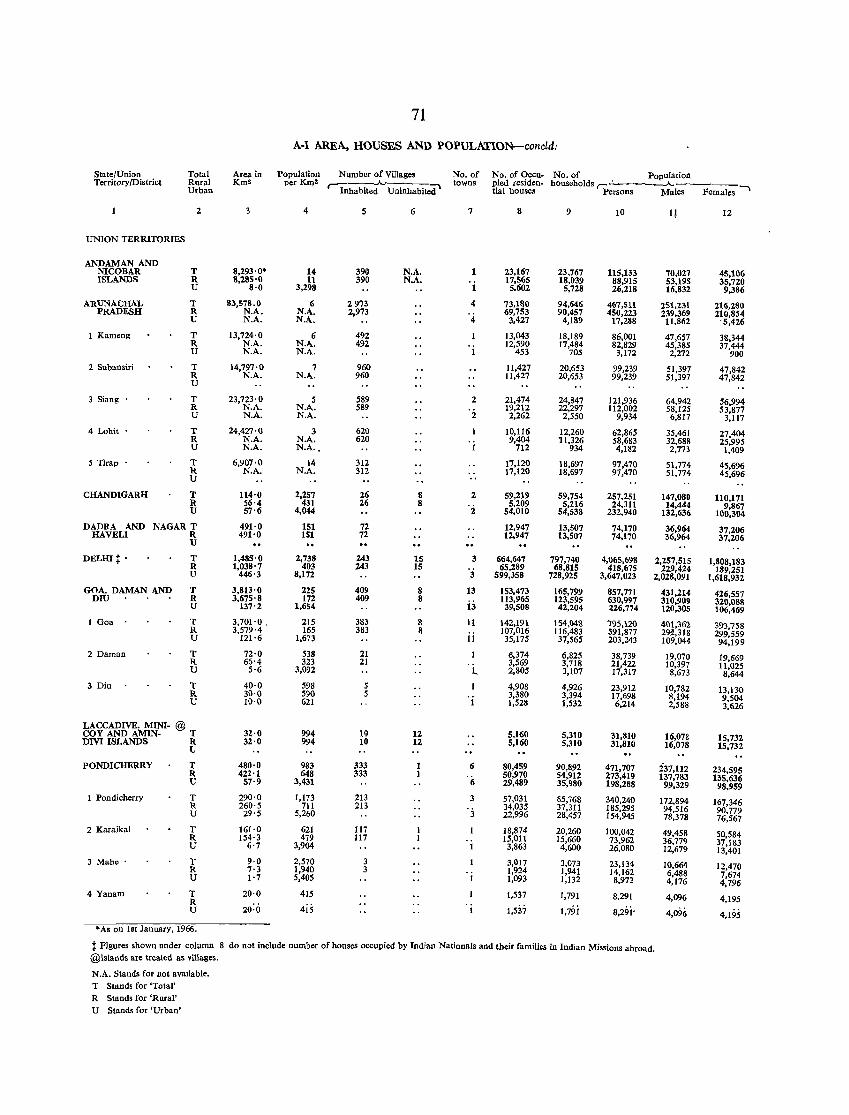
State/Union Territory/District
UNION TERRITORIES
ANDAMAN AND NICOBAR ISLANDS
ARUNACHAL PRADESH
1 Kameng
2 Subansiri
3 Siang
4 Lohit .
5 Tirap .
CHANDIGARH
Total Rural Urban
2
T R U
T R U
T R U
T R U
T R U
T R U
T R U
T R U
DADRA AND NAGAR T HAVELI R
DELm~ •
GOA, DAMAN AND DlU .
1 Goa .
2 Daman
3 Diu
lJ
T R U
T R U
T R U
T R U
T R U
M~C'&b'1MI~- @ T nnnISLANDS R
PONDICUERRY
1 Pondicherry
2 Karaikal
3 Mahe .
4 Yanam
u T R U
T R U
T R U
T R U
T R U
• As on 1st January. 1966.
Area in KmS
8,293'0· 8,285'0
8'0
83,578.0 N.A. N.A.
13,724'0 N.A. N.A.
14,797'0 N.A.
23,723'0 N.A. N.A.
24,427'0 N.A. N.A.
6,907'0 N.A.
114'0 56'4 57·6
491'0 491'0
1,485'0 1,038'7
446'3
3,813'0 3,675'8
137'2
3,701'0, 3,579'4
121'6
72'0 66'4 5'6
40·0 30·0 10·0
32·0 32·0
480·0 422'1
57'9
290'0 260'5 29'5
161'0 154·3
6'7
9·0 7'3 1'7
20'0
20:0
71
A-I AREA, HOUSES AND POPULATION-concld.'
Population Number of Villages No. of per KillS ,.-;---..A" towns
Inhabited Uninhabited'
4
14 11
3,298
6 N.A. N.A..
6 N.A. N.A.
7 N.A.
5 N.A. N.A.
3 N.A. N.A .•
14 N.A.
2,257 431
4,044
151 151
2,738 403
8,172
225 172
1,654
215 165
1,673
538 323
3,092
598 590 621
994 994
983 648
3,431
1,173 711
5,260
621 479
3,904
2,570 1,940 5,405
415
4is
5
390 390
2973 2,973
492 492
960 960
589 589
620 620
312 312
26 26
72 72
243 243
409 409
383 383
21 21
5 5
10 10
333 333
213 213
117 117
3 3
6
N.A. N.A.
8 8
15 15
8 8
8 8
12 12
7
1 . i
4
4
2
2
2
'2
3
3
13
ij
11
11
1.
6
'(;
'j
No. of Occu- No. of Population pied residen- households r:..:..----..A.~--, tial houses Persons Males Females
8
23,167 17,565
5.602
73,11\0 69,753
3,427
13,043 12,590
453
11,427 11,427
21,474 19,212 2,262
10,116 9,404
712
17,120 17,120
59,219 5,209
54,010
12,947 12,947
664,647 65,289
599,358
153,473 113,965 39,508
142,191 107,016 35,175
6,374 3,569 2,805
4,908 3,380 1,528
5,160 5,160
80,459 50,970 29,489
57,031 34,035 22,996
18,874 15,011
3,863
3,017 1,924 1,093
1,537
1,537
9
23,767 18,039
5,728
94,646 90,457
4,189
18,189 17,484
705
20,653 20,653
24,847 22,297
2,550
12,260 11,326
934
18,697 18,697
59,754 5,216
54,538
13,507 13,507
797,740 68,815
728,925
165,799 123,595
42,204
154,048 116,483 37,565
6,825 3,718 3,107
4,926 3,394 1,532
5,310 5,310
90,892 54,912 35,980
65,768 37,311 28,457
20,260 15,660 4,600
3,073 1,941 1,132
1,791
1,79i
10
115,133 88,915 26,218
467,511 450,223 17,288
86,001 82,829 3,172
99,239 99,239
121,936 112,002
9,934
62,865 58,683 4,182
97,470 97,470
257,251 24,311
232,940
74,170 74,170
4,065,698 418,675
3,647,023
857,771 630,997 226,774
'195,120 591,877 203,243
38,739 21,422 17,317
23,912 17,698 6,214
31,810 31,810
471,707 273,419 198,288
340,240 185,295 154,945
100,042 73,962 26,080
23,134 14,162 8,972
8,291
8,29i'
70,027 53,195 16,832
251,231 239,369 11,862
47,657 45,385 2,272
51,397 51,397
64,942 58,125 6,817
35,461 32,688 2,773
51,774 51,774
147,080 14,444
132,636
36,964 36,964
2,257,515 229,424
2,028,091
431,214 310,909 120,305
401,362 29l!,318 109,044
19,070 10,397
8,673
10,782 8,194 2,588
16,078 16,078
i37,112 137,783
99,329
172,894 94,516 78,378
49,458 36,779 12,679
10,664 6,488 4,176
4,096
4,096
12
45,106 35,720
9,386
216,280 210,854
'5,426
38,344 37,444
900
47,842 47,842
56,994 53,877
3,117
27,404 25,995
1,409
45,696 45,696
110,171 9,867
100,304
37,206 37,206
1,808,183 189,251
1,618,932
426,557 320,088 106,469
393,758 299,559 94,199
19,669 11,025
8,644
13,130 9,504 3,626
15,732 15,732
234,595 135,636
98,959
167,346 90,779 76,567
50,584 37,183 13,401
12,470 7,674 4,796
4,195
4,195
t Figures shown under column 8 do not include number of houses occupied by Indian Nationals and their families in Indian Missions abroad. @Islands are treated as villages.
N.A. Stands for not availabl~.
T Stands for 'Total' R Stands for 'Rural' U Stand, for 'Urban'
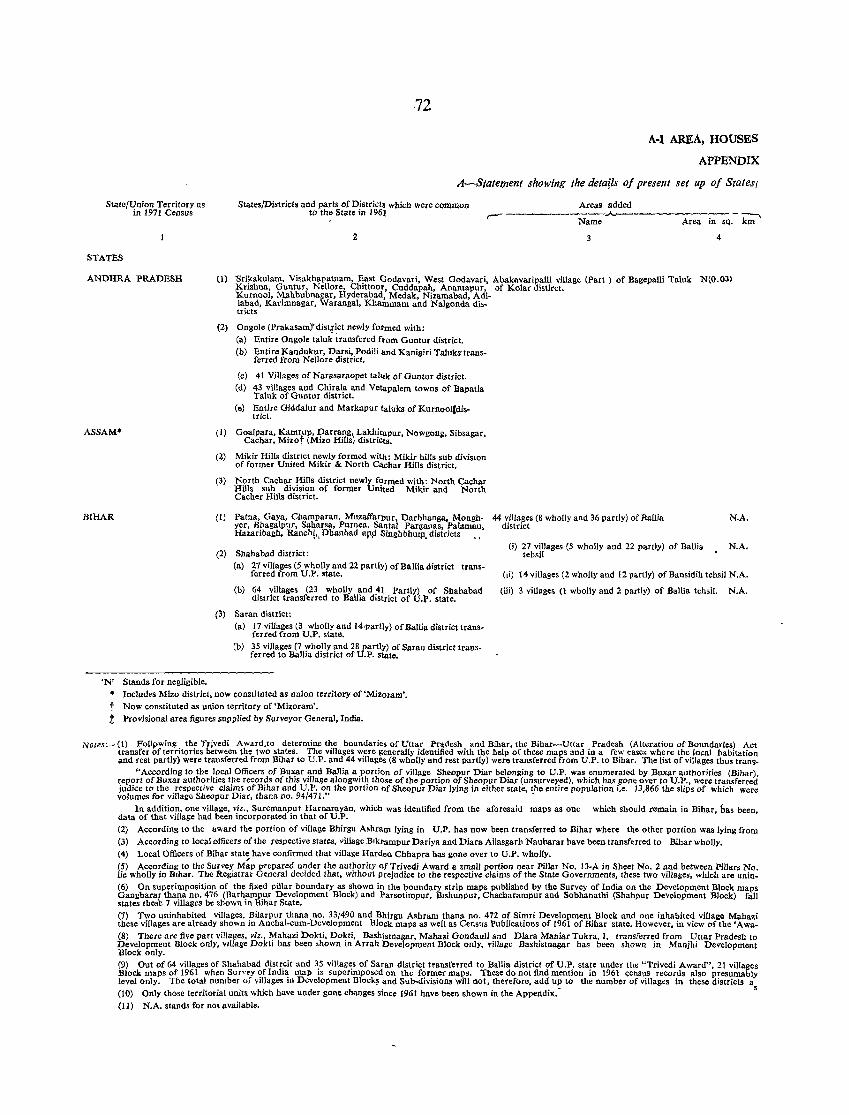
72
A-I AREA, HOUSES
APPENDIX
A-Statement showing the detatls of present set up of States I
State/Union Territory as in 1971 Census
States/Districts and parts of District~ which were common to the State in 1961
Areas added ,....- ----------.A.--- ------ - :---, Name Area in sq. km
2 4
STATES
ANDHRA PRADESH (1) 'Srikakulam, Visakhapatnam, East Codavari, West Godavari, Abakavaripalli village (Part) of BagepaUi Taluk N(O.Ol) :Krishna. Guntur. Nellore. Chittoor, Cnddapah. Anantapur. of :Kolar distirct. 'Kurnool, Mahbubnagar, Hyderabad. Medak. Nizamabad, Adi-Jabad, Rarimnagar, Warangal, Rhalnmam and Nalgonda dj;. tricts
(2) Ongole (Prakasam)' distfict newly formed with: (a) Entire Ongole taluk transfered from Guntur district. (b) Entire Randukur, Dars;, Podili and Ranigiri Taluks-trans
ferred from Nellore district.
(c) 41 Villages of Narasaraopet taluk of Guntur district. (d) 43 villages and Chirala 'llld Vetapalem towns of BapatJa
Taluk of Guntur district. (e) EI,1tire Giddalur and Markapur taluks of Kurnool[dis'
tnct.
ASSAM· (I) Goalpara.Ramrup. Darrang, LakhiIllpur, Nowgong. Sibsagar, Cachar, Mizot (Mizo Hills) districts.
BCHAR
(2) Mikir Hills district newly formed with: Mikir hills sub diviSIOn of fanner United Mikir & North Cachar Hills district.
(3) North Cuchar Hills district newly formed with: North Cachar Hi11s sub division of former United Mikir and North Cacher Hills district.
(J) Patna. Gaya. Champaran, Muzaffarl'ur, Darbhanga, Mongh- 44 villages (8 wholly and 36 partlyj ot Ballia yer, Bhagalpur. Saharsa. Purnea, Santa! Parganas. Pa1amau, district
N.A.
Hazaribagh. Ranchj"Dhanbad apfi Singhbhuljl, districts • ,
(2) Sbahabad district: (a) 21 villages (5 wholly and 22 partly) of BalUa district trans
ferred from U.P. state.
(b) 64 villages (23 wholly and 41 Partly) of Shahabad district transferred to Ballia district of U.p. state.
(3) Saran district: (a) 17 villages (3 wholly and 14.partly) of Ballia district trans
ferred from U.P. state. (b) 35 villages (7 wholly and 28 partly) of Saran district trans
ferred to Ballia district of U.P. Slate.
(i) 27 villages (5 wholly and 22 partly) of Ballia N.A. tehsil
(li) 14 villages (2 wholly and 12 partly) of Bansidih tehsil N.A.
(iii) 3 villages (1 wholly and 2: partly) of Ballia tehsii. N .A.
'N' Stands for negligible. • Includes Mizo district, now constitnted as union territory of'Mizoram'. t Now constituted as union territory of 'Mizoram'. t Provisional area figures snpplied by Surveyor General, India.
Notes:- (1) Follpwing the Trivedi AWArd,to determine the boundaries of Uttar Prlldesh and Bihar. the Bihar-Uttar Pradesh (Alteration of Boundaries) Act transfer of territories between the two states. The villages were generally identified with the help of these maps and in a rew cases where the local habitation and rest partly) were transferred from Bibar to U.P. and 44 viUages (8 wholly and rest partly) were transferred from U.P. to Bihar. The list of villages thus trans.
"According to the local Officers of Buxar and Ballia a portion of vlllage Sheopur Diar belonging to D.P. was enumerated by Boxar authorities (Bihar). report of Buxar authorities the records of this village alongwith those of the portion of Sheopur Diar (unsurveyed). which bas gone over to D.P., were transferred judice to the respective claims of Bihar and D.P. on the portion of Sheopur Diar lying in either state. the entire population i.e, 13,866 the slips of which were volumes for village Sbeapur Diar, thana no. 94/471." .
In addition, one village. viz., Suremanpur Harnafllyan. which was identified from the aforesaid maps as one which should rema.in in Bihar, has been, data of that village had been incorporated in that of U.P. (2) According to the award the portion of village Bhirgu Ashram lying in U.P. has now been transferred to Bihar where the other portion was lying from (3) According to local officers of the respective states, village B1krampur !Jadya and Diara Ailasgarh Nauoorar have been transferred to Bihar wholly. (4) Local Officers of Bihar state; have confirmed that village Hardeo Chhapra has gone over to U.P. wholly. (5) According to the Survey Map prepared under the authority Of Trivedi Award a smail portion near Pillar No. 13·A in Sheet No.2 and between Pillars No. lie wholly in BIhar. The Registrar General decided that. without Prejudice to the respective claims of the State Governments, these two villages, which are unin-(6) On superimposition of the fixed pillar boundary as shown in. the boundary striP maps published by the Survey of India on the Development Block maps Gangbarar thana no. 476 (Barhampur Development Block) and l>arsotimpur, Blshunpur, Chacharampur and Sobbanathi (Shahpur Development Block) fall states thesb 7 villages be shown in Bihar State. (1) Two uninhabited villages, BUarpur thana no. 33/490 and Bhirllu Ashram thana no. 472 of Simri Development Block and one inhabited village Mahazi tbese villages are already shown in Anchal-cum-Development Block maps as well as Census Publications of 1961 of Bibar state. However, in view or the 'Awa-(8) There are five part villages. viz .• Mahazi Dokti. Dokti. Bashistnagar, Mabazi Gondauli and Diara Maniar Tukra. I, transferred from Uttar Pradesh to Development Block only, vIllage Dokti has been shown in Arrah Development Block only. 'Image Bashistnagar has been shown in Manjhi Development Block only. (9) Out of 64 villages of Shahabad distrcit and 35 villages of Saran district transferred to DaJlia district of U.P. state under the "Trivedi Award". 21 villages Block maps of 1961 when Surv.y ofIndia map is superimposed on the former maps. These do not find mention in 1961 census records also presumably level only. The total number oj' villages in Development Block~ and Sub.divisions will not, therefore, add up to the number of villages in these districts a (10) Only those territorial units which have under gone changes since 1961 have been shown in the Appendix.- s (11) N.A. stands for not available.
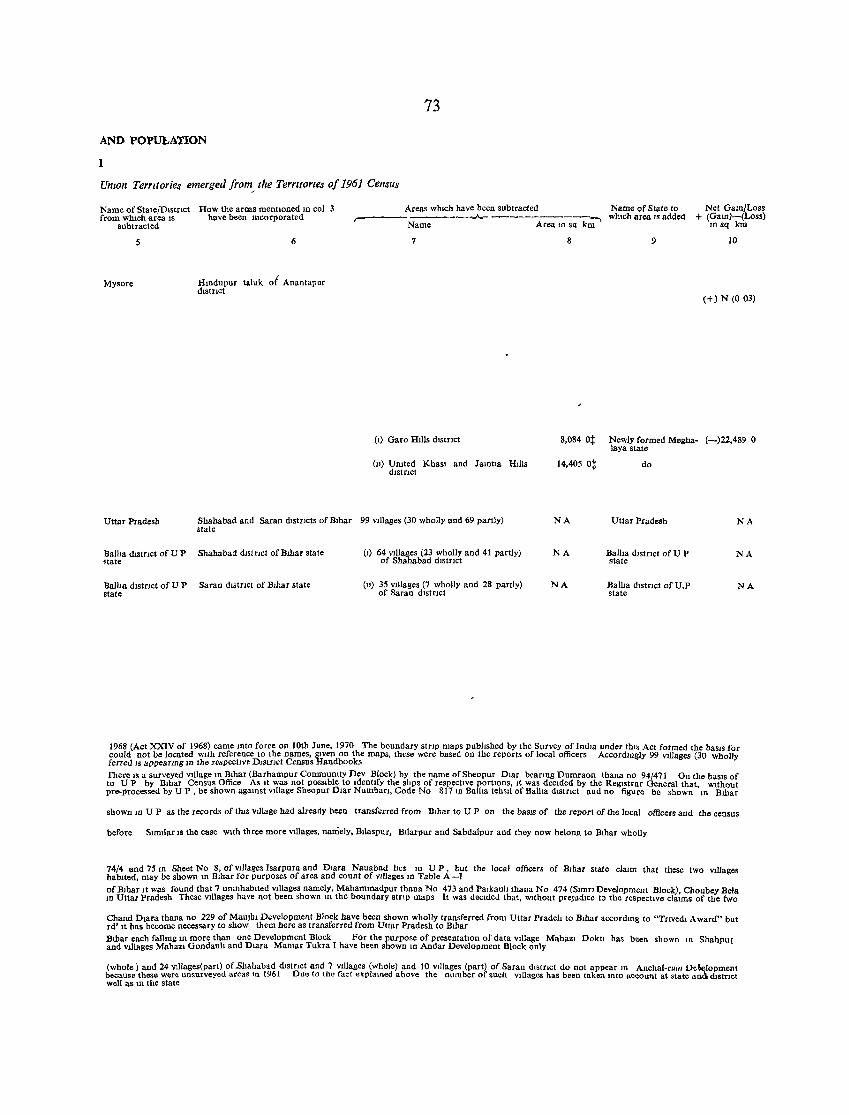
73
AND POPUbATION
1
Umon Temtories emerged from/ the Temtones of 1961 Census
Name of State/DIstrict How the areas menboned In col 3 from wluch area IS have been Incorporated
subtracted
5
Mysore
Uttar Pradesh
BaHIa dlstnct of U P state
Ballia d.stnct of U P state
6
Htndupur taluk of Anantapur dlstnct
Shahabad and Saran dlstncts of BIhar state
Shahabad d.s!nct of Bihar state
Saran d.stnct of B.har state
Areas whIch have been subtracted Name of State to Net Gam/Loss + (Gam)-(Loss)
10 sq kIn ,------ _____ -.A.r- -----------_, whIch area IS added
Name Area m SQ km
(I) Garo HIlls dIstrIct
(11) Uruted KhaS! aod Jumba Huls dlstnct
99 vIllages (30 wholly and 69 partly)
(.) 64 vIllages (23 whoHy and 41 partly) of Shahabad d.strlct
(ll) 3S vIllages (7 wholly and 28 partly) of Saran dIstrIct
8
8,084 ot
14,405 ot
NA
NA
NA
9 10
(+) N (003)
Newly formed Megha- (-)22,489 0 laya state
do
Uttar Pradesh Nt.
Balba d,stnct of U P NA state
Balba dlstnct of U.P NA state
1968 (Act XXIV of 1968) came mto force on 10th June, 1970 The boundary stTlP maps pubhshed by the Survey of IndIa under thIS Act formed the baSIS for could not be located WIth reference to the names, gIVen on the maps, these were based on the reports of local officers AccOrdID!lly 99 vIllages (30 wholly [erred IS appearIng m the respectwe DJSlrlCI Census Handbooks
rhere .s a surveyed VIllage 10 Blbar (Barhampur Commumty nev Block) by the name of Sheopur Dlar beanng Dumraon thana no 94/471 On the bas.s of to UP by BIhar Census Office As It waS not possIble to IdentIfy the shps of respectIVe portIOns, It was decIded by the RegIstrar General that, WIthout pre-processed by UP, be shown agamst VIllage Sheopur Dlar Numban, Code No 817.0 Balba tehsIl of BaUla dIstrIct and no figure be shown 10 Bihar
shown m U P as the records of tlus VIllage bad already been transferred from Blbar to UPon tbe bas.s of the report of the local officers and the census
before S.mllar.s tbe case WIth three more vlllages, namely, Buaspur, BlIarpur and Sabdalpur and tbey now belong to B.har wbolly
74/4 aud 75 10 Sheet No 8, of VIllages Isarpura and Dlara Nauabad hes m UP, but tbe local officers of BIhar state claIm that these two Villages hablted, may be shown 10 BIhar for purposes of area and count of VIllages In Table A -1
of Bihar It was found that 7 umnhab,ted villages namely, Mahamrnadpur thana No 473 and Palkauh thana No 474 (S.mTl Development Block), Choubey Bela In Uttar Pradesh These VIllages have not been shown 10 the boundary stnp maps It was deCIded that, WIthout prejudIce to the respectIVe claIms of the !'wo
Chand Dlara thana no 229 of Maulhi Development Block bave been shown wholly transferred from Uttar Pradeh to BIhar accordmg to "TrIvedI Award" but rd' It has become necessary to show them here as transferred from Uttar Pradesh to BIhar Bthar each faIlIng 10 more than one Development Block For the purpose of presentatIOn of data VIllage Mahazl Dokll has been shown tn Shahpur and VIllages MahaZl Gondauh and Dlara Mamar Tukra I have been shown 10 Andar Development Block only
(whole) and 24 villages(part) of Bhahabad dlstnct and 7 VIllages (whole) and 10 VIllages (part) of Saran district do not appear 10 Anchal-culIl D~\elopment because these were unsurveyed areas In 1961 Due to the fact explamed above the number of such Villages ha.s been taken Into account at state lln& dtstnct well as 10 the state
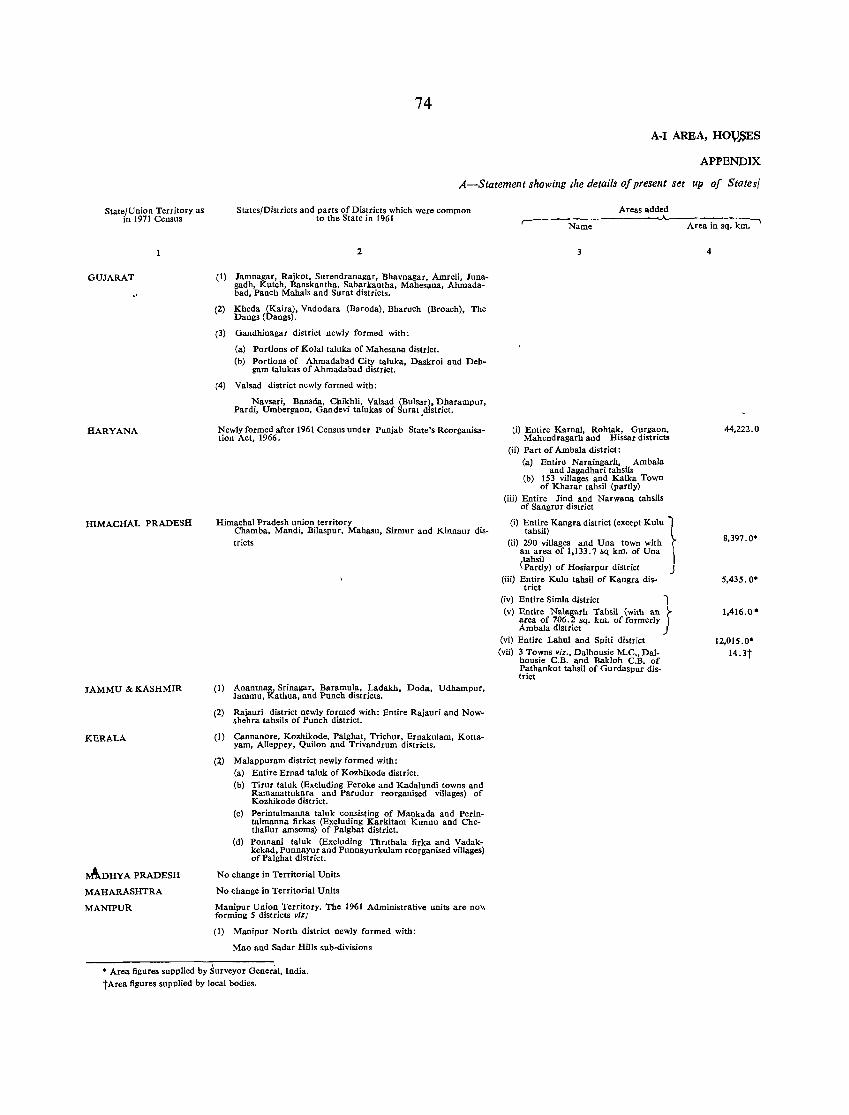
74
A·I AREA, HOV.,SES
APPENDIX
A-Statement showing the details of present set up of States!
State/Union Territory as in 1971 Census
GUJARAT
HARYANA
HIMAcHAL PRADESH
JAMMU & KASHMIR
KERALA
~DHYA PRADESH
MAHARASHTRA
MANIPUR
States/Districts and parts of Districts which were comlllon to the State in 1961
2
(I) Jamnagar, Rajkot, Surendranagar, Bhavnagar, Amreli, Junagadh, Kutch, Banskantha, Sabarkantha, Mahesana, Ahmadabad, Panch Mahals and Snrat districts,
(2) Kheda (Kaira), Vadodara (Baroda), Bharuch (Broach), The Dangs (Dangs).
(3) Gandhinagar district newly formed with:
(a) Portions of Kolal taluka of Mahesana district. (b) Portions of Ahmadabad City taluka, Daskroi and Deh
gam talukas of Ahmadabad district.
(4) Valsad district newly formed with:
Navsari, Bansda, Chikhli, Valsad (Bulsar), Dharampur, Pardi, Umbergaon, Gandevi talukas of Surat .district.
Newly formed after 1961 Census under Punjab State's Reorganisation Act, 1966.
Himachal Pradesh union territory Chamba, Mandi, B.iJaspur, Mahasu, Sirmur and Kinnaur dis-tricts
(I) Anantnag, Srinagar, Baramula, Ladakh, Doda, Udhampur, Jammu, Kathua, and Punch districts.
(2) Rajauri district newly formed with: Entire Rajanri and Nowshehra tahsils of Punch district.
(I) Cannanore, Kozhikode, Palghat, Trichur, Ernakulam, Kottayam, AIIeppey, Quilon and Trivandrnm districts.
(2) Malappuram district newly formed with: (a) Entire Ernad taluk of Kozhikode district. (b) Tirur talnk (Excluding Feroke and Kadalundi towns and
Ramanattukara and Parudur reorganised villages) of Kozhikode district.
(c) Perintalmanna taluk consisting of Mankada and Perintalmanna firkas (Excluding Karkitam Kunnu and Chethallur amsoms) of Palghat district.
(d) Ponnani taluk (Excluding Thnthala firka and Vadakkekad, Punnayur and Punnayurkulam reorganised villages) of Palghat district.
No change in Territorial Units
No change in Territorial Units
Manipur Union Territory. The 1961 Administrative units are no\\ forming 5 districts viz;
(I) Manipur North district newly formed with:
Mao and Sadar Hills sub·divisions
• Area figures supplied by Surveyor General, India. t Area figures supplied by local bodies.
Areas added r---
Name ..A---- ""'\
Area in sq. km.
(i) Entire Karnal, Rohtak, Gurgaon, Mahendragarh and Hissar districts
(ii) Part of Ambala district: (a) Entire Naraingarh, Ambala
and Jagadhari tahsils (b) 153 villages and Kalka Town
of Kharar tahsil (partly) (iii) Entire Jind and Narwana tahsils
of Sangrur district
(i) Entire Kangra district (except Kulu 1 tahsil) I
(ii) 290 villages and Una town with r an area of 1,133.7 sq km. of Una I tahsil
(Partly) of Hosiarpur district J (iii) Entire Kulu tahsil of Kangra dis
trict (iv) (v)
Entire Simla district ') Entire Nalagarh Tahsil (with an r area of 706.2 sq. km. of formerly I Ambala district J
(vi) Entire Lahul and Spiti district (vii) 3 Towns viz., Dalhousie M.C., Dal
housie C.B. and Bakloh C.B. of Pathankot tahsil of Gurdaspur district
4
44,222.0
8,397.0·
5,435.0·
1,416.0·
12,015.0· 14.3t
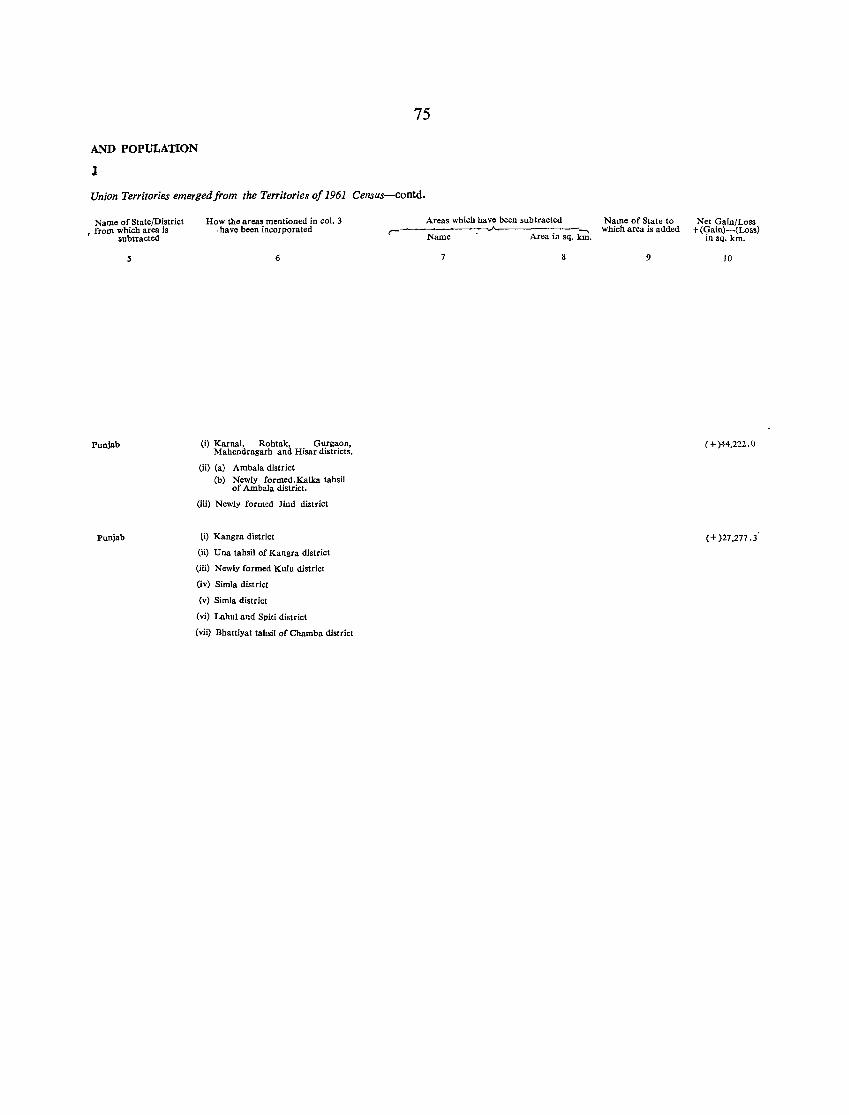
AND POPULATION
1
75
Union Territories emerged/rom the Territories 0/1961 Census-eoutd.
Name of State/District , from which area is
subtracted
5
Punjab
Punjab
How the areas mentioned in col. 3 ·have been incorporated
6
(i) Karnal, Rohtak, Gurgaon, Mahendragarh and Hisar districts.
(ii) (a) Ambala district (b) Newly formed,Kalka tahsil
of Ambala district.
(iii) Newly formed Jind district
ti) Kangra district
eii) Una tahsil of Kangra district
(iii) Newly formed Kulu district
(iv) Simla district
(v) Simla district
(vi) Lahul and Spiti district
(vii) Bhattiyat tahsil of Chamba district
Areas which have been subtracted ,----
Name Area in sq. bri.
8
Name of State to which area is added
9
Net Gain/Loss + (Gain)-(Loss)
in sq. km.
10
(+ )44.222.0
(+ )27,277 .3'
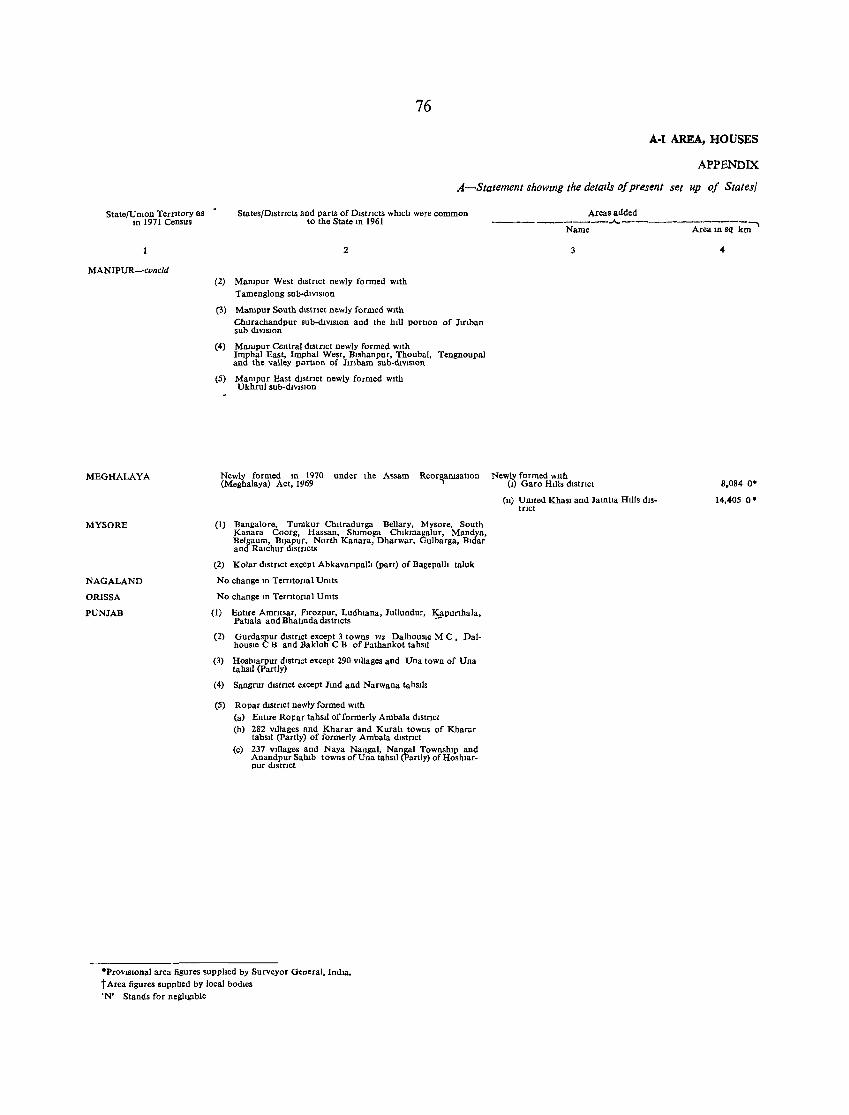
76
A-I AREA, HOUSES
APPENDIX
A-Statement showllIg the detalls of present set up of States/
State/Umon TerrItory as 10 1971 Census
MANIPUR-concId
MEGlIALAYA
MYSORE
NAGALAND
ORISSA
PUNJAB
States/Dlstncts and parts of Dlstncts which were common to the State 10 1961
2
(2) Mampur West dlstnct newly formed With Tamenglong sub·dlvlslOn
(3) Marupur South district newly formed WIth Churachandpur sub·dlvlslOn and the hill portIOn of Jmban sub divISIon
(4) Mampur Central dIstrIct newly formed WIth Imphal East, Imphal West, Blshanpur, Thoubal, Tengnoupal and the valley portIon of Jmbam sub·dlvlslon
(5) Mampur East distrIct newly formed With Ukhrul sub·divlSlon
Newly formed In 1970 under the Assam Reorl\amsatIon (Meghalaya) Act, 1969
(I) Bangalore, Tumkur Chltradurga Bellary, Mysore, South Kanara Coorg, Hassan, Sblmoga Chlkmagalur, Mandya, Belgaum, BIJapuf, North Kanara, Dharwar, Gulbarga, Bldar and Ralchur dIStrIcts
(2) Kolar dIstrict except AbkavarIpalh (part) of Bagepalh taluk
No change ill TerrItorIal Umts
No change In TerritorIal Umts
(1) Enhre Amntsar, flrozpur, Ludhlana, Jullundur, ~purthala, Pahala and BhatIllda distncts
(2) Gurdaspur dlstnct except 3 towns VIZ DalhOUSIe M C, Dal· housle C Band Bakloh C B of Pathankot tahSIl
(3) Hoshlarpur dlstnct except 290 VIllages and Una town of Una tahsil (Partly)
(4) Sangrur dlstnct except JlOd and Narwana tahslls
(5) Ropar distnct newly f"rmed WIth (a) Enhre ROJOar tahsil of formerly Ambala dIStrict (b) 282 VIllages and Kharar and Kurah towns of Kharar
tahSIl (partly) of formerly Ambala dlstnct (c) 237 VIllages and Naya Nangal, Nangal TownshIp and
Anandpur Salub towns of Una tahSIl (partly) of Hoshlar· pur dlstnct
·ProvlSIonal area figures supphed by Surveyor General, IndIa. t Area figures supplted by local bodIes 'N' Stands for nellhglble
Areas added -----________ .A. ____________ ......
Name Area 10 sq km
NewlY formed WIth (I) Garo Hills dlstnct
(11) Umted Khasl and JamtIa Hills diS· trIct
4
8,084 O·
14,405 O·
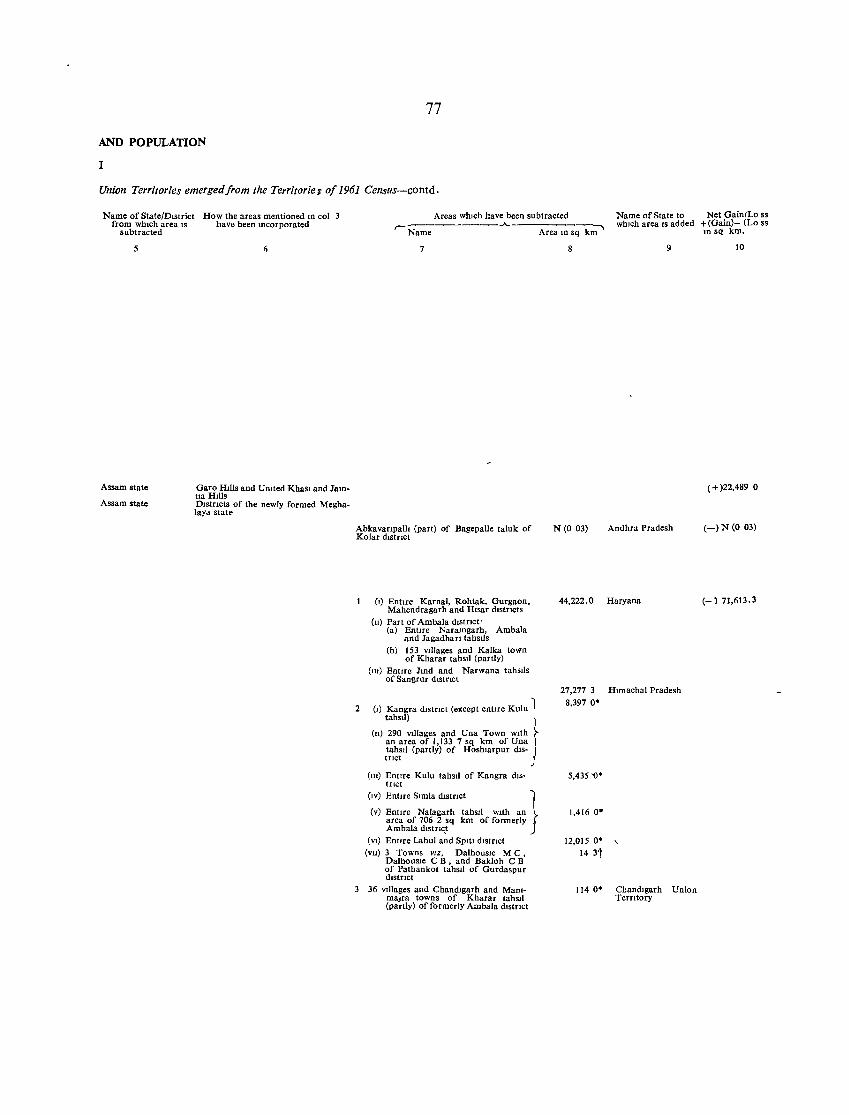
77
AND POPULATION
I
Union Territories emerged/rom the Territories 0/1961 Census-contd.
Name of State/DIstrict How the areas mentioned m col from whIch area IS have been mcorporated
subtracted
5
Assam state
Assam state
Garo HIlls and Umted Khasl and JamllaHIIls DIstncts of the newly formed Meghalaya stat~
Areas wluch have been subtracted Name of State to Net GainlLo ss whIch area IS added + (Gain)- (Lo S8
III sq km. ,.----------- ........ ---------., Name Area m sq km
7
Abkavarlpalh (part) of Bagepalle taluk of Kolar dIstrIct
(I) EntIre Kamal, Rohtak, Gurgaon, Mahendragarh and Hlsar dIstrIcts
(n) Part of Ambala dIstrIct· (a) Entire Naramgarh, Ambala
and Jagadharl tahsIls (b) 153 vIllages and Kalka town
of Kharar tahSIl (partly) (m) Entlfe Jmd and Narwana tahsiis
of Sangrur dlstnct
2 (I) Kangra dIstrIct (except entire Kulu 1 tahSIl) I
(n) 290 VIllages and Una Town wIth lan area of 1,133 7 sq km of Una I tahsd (partly) of Hoshlarpur dls- I tnct )
(m) Entire Kulu tahSIl of Kangra dIstrict
(IV) EntIre SImla dlstnct 1 (v) Entlfe Nalagarh tahSIl wIth an}
area of 706 2 sq km of formerly Ambala dlstnc,t
(VI) Entlfe Lahul and SPltl dlstnct (Vll) 3 Towns VIZ. DalhOUSIe M C ,
DalhOUSIe C B, and Bakloh C B of Pathankot tahsll of Gurdaspur dlstnct
36 vlllages and Chandlgarh and Mammalra towns of Kharar tahsll (partly) of formerly Ambala dlstnct
8 9
N (0 03) Andhra Pradesh
44,222.0 Haryana
27,277 3 HImachal Pradesh
8.397 0*
5,435 i)*
1,416 O'
12,015 O'
14 3t
114 O' Chandlgarh Union Terntory
10
(+)22,489 0
(-)N (003)
(-) 71,613.3
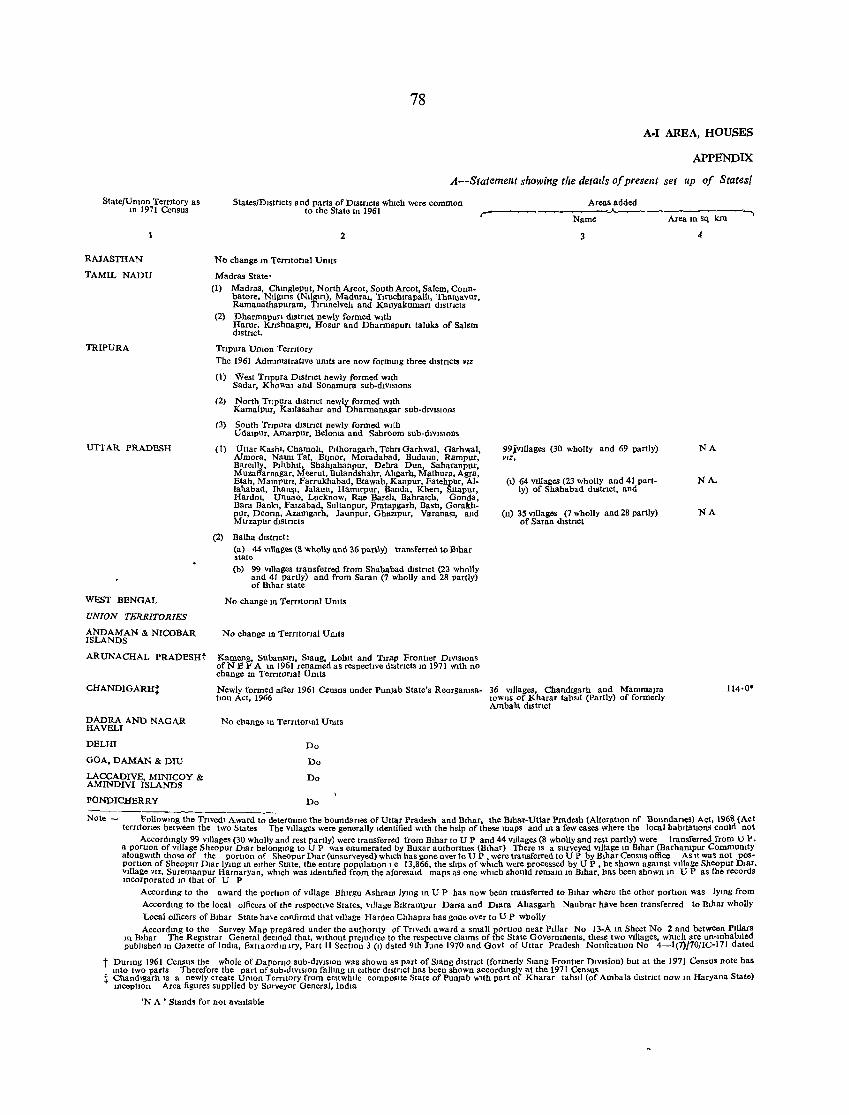
78
A.I AREA, HOUSES
APPENDIX
A-Statement showing the details of present set up of States{
State/Umon Terotory as In 1971 Census
RAJASTHAN
TAMIL NADU
TRIPURA
UITAR PRADESH
States/Districts and parts of Dlstncts which were common to the State In 1961
No change 10 Terntonal Unlls
Madras State'
2
(I) Madras, Chlngleput, North Arcot, South Arcot, Salem, Conn. batore, Nllglrls (Nllgm), Madura" Tlmchlrapalh, Thanlavur, Ramanathapuram, Tlrunelveh and Kanyakuma(l dlsttlcts
(2) Dhartnapun distrIct newly formed wIth Hamr, Knshnagm, Hosnr and Dharmapun talnks of Salem dlstnct.
TrIPura Unton TerrItory The 1961 Adml[llstratIve UUlts are now formmg three distrIcts VIZ
(I) West Tnpura DistrIct newly formed With Sadar, Khowal and Sonamura sub·dlVlslons
(2) North TrIpura dIStnct newly formed WIth Kamalpur, Katlasahar and Dharrnanagar sub·dlvISlOns
(3) South Tnpura district newly formed WIth Udaipur, Amarpur, Beloma and Sabroom sub·dlvIslOns
Uttar Kash., Chamo", Pithoragarh, Tehn Garhwal, Garhwal, Almora, Nalm Tal, B'jnor, Moradabad, Budaun, Rampur, BareIlly, PdIbhlt, Shahlahanpur, Debra Dun, Saharanpur, Muzaffarnagar, Meerut, Bulandshahr. Ahgarh, Mathura, Agra, Etah, Mampun, Farrukhabad, Etawah, Kanpur, Fatehpur, AI. lahabad, Jhan~I, Jalaun, Hannrpur, Banda, Khen, Sitapur, Hardol, Unnao, Lucknow, Rae Bareh, Babralch, Gonda, Bara Bankl, Falzabad, Sultanpnr, Pratapgarh, BastI, Gorakh· pur, Deona 1 Azamgarh, Jaunpur, GhaZlpuf, Varanasl, and Mlrzapur dtStncts
(2) Ballia distrIct: (a) 44 villages (8 wholly and 36 partly) tTan,ferred to BIhar state
(b) 99 villages transferred from Shahabad distrIct (23 wholly and 41 partly) and from Saran (7 wholly and 28 partly) of Bihar state
Areas added ___ ~OA---
Name
3
99 !vIllages (30 wholly and 69 partly) VIZ,
(I) 64 Villages (23 wholly and 41 part· Iy) of Shahabad dIstrIct, and
(11) 3S Villages (7 wholly and 28 partly) of Saran distnct
WEST BENGAL No change m TerrItonal UUlts
UNION TERRITORIES
ANDAMAN & NICOBAR ISLANDS
AR UNACHAL PRAPESHt
CHANDIGARHt
DADRA AND NAGAR HAVELI
DEL1f1
GOA, DAMAN & DIU
LACCADIVE, MINICOY & AMINDIVI ISLANDS
PONDICHERRY
No change 1D Terntortal Umts
Kameng, Subanslfl, Slang, Lohlt and TUlIp FrontIer D,VIsIOns orN E F A In 1961 renamed as respechve dIStrIcts 10 1971 With nO change In Terrttoflal U mts
Newly formed after 1961 Census under Punjab State's Reorgamsa. 36 VIllages, Chandtgarh and Mammalra !lon Act, 1966 towns of Kharar tahsil (partly) of formerly
No change 10 Terntonal Umts
Do
Do
Do
Do
Ambala dlstnct
Area In sq krn
4
NA
NA.
NA
114·0·
Note - Followmg the Tnvedl Award to determme the boundsrIes of Uttar Pradesh and BIhar, the Blhar·Uttar Pradesh (AlteratIOn of Boundanes) Act, 1968 (Acl temtones between the two States The VIllages were generally Identified WIth the help of these maps and 10 a rew cases where the local habitatIons could not
Accordmgly 99 VIllages (30 wholly and rest partly) were transferred from Bihar to U P and 44 Villages (8 wholly and rest partly) were transferred from UP. a portIon of vdlage Sheopur D.ar belongUll; to UP was enumerated by Buxar authontIes (BIhar) There IS a surveyed VIllage m Bihar (Barhampur Commumty alongw.th tho.e of the portIon of Sheopur D,ar (unsurveyed) WhiCh has gone over to UP, were transferred to U P by Bihar Census office As It was not pos· portion of Sheopur Dmr lymg III eIther State, the enUre populatIon Ie 13,866, the shps of whIch were processed by UP, be shown agamst vtllage Sheopur Dlar, VIllage VIZ, Suremanpur Harnaryan. whIch was Identtlied from the aforesaId maps as one Which shonld remam In BIhar, has been shown III UP as the records mcorporated m that of U P
Accordmg to the a ward the portIOn of Village Bhlfgu Ashram lymg 10 U P has now been transferred to BIhar where the other porbon was lymg from Accordmg to the local officers of the respechve States, vIllage Blkrampur Darla and Dlara Ahasgarh Naubrar have been transferred to Bihar wholly Local officers of BIhar State have confirmd that VIllage Hardeo Chhapra has gone over to U P wholly Accordmg to the Survey Map prepared under the authonty of Tnvedl award a small portIOn near P,llar No 13·A 10 Sheet No 2 and between Ptllars
In BIhar The Reg.strar General deCided that, WIthout prejudice to the respectlve claims of the State Governments, these two vtllages, which Me un-mhabIted pubhshed In Gazette of Ind.a, Bxt.aordmHY, Part II Sectlon 3 (,) dated 9th June 1970 and Govt of Uttar Pradesh Not.ficatlOn No 4-1(7)/10/IC·171 dated
t Dunng 1961 Census the whole of DaporI)o sub·d,vlsIOn was shown as part of Slang dIstrIct (formerly Slang Fronher D,VISion) but at the 1971 CensUS note has IOta two parts Therefore the part of sub·dlVlslon f.lhng 10 either dlStflct has been shown accordingly at the 1971 Census
t Chand.garh \S a newly create UnIOn Terntory from erstwh.le compoSlle State of Punjab With part of Kharar tahSil (of Ambala distrIct now 10 Haryana State) mceptlOn Area figures supplied by Su rveyor General, Ind.a
'N A ' Stands for not avaIlable
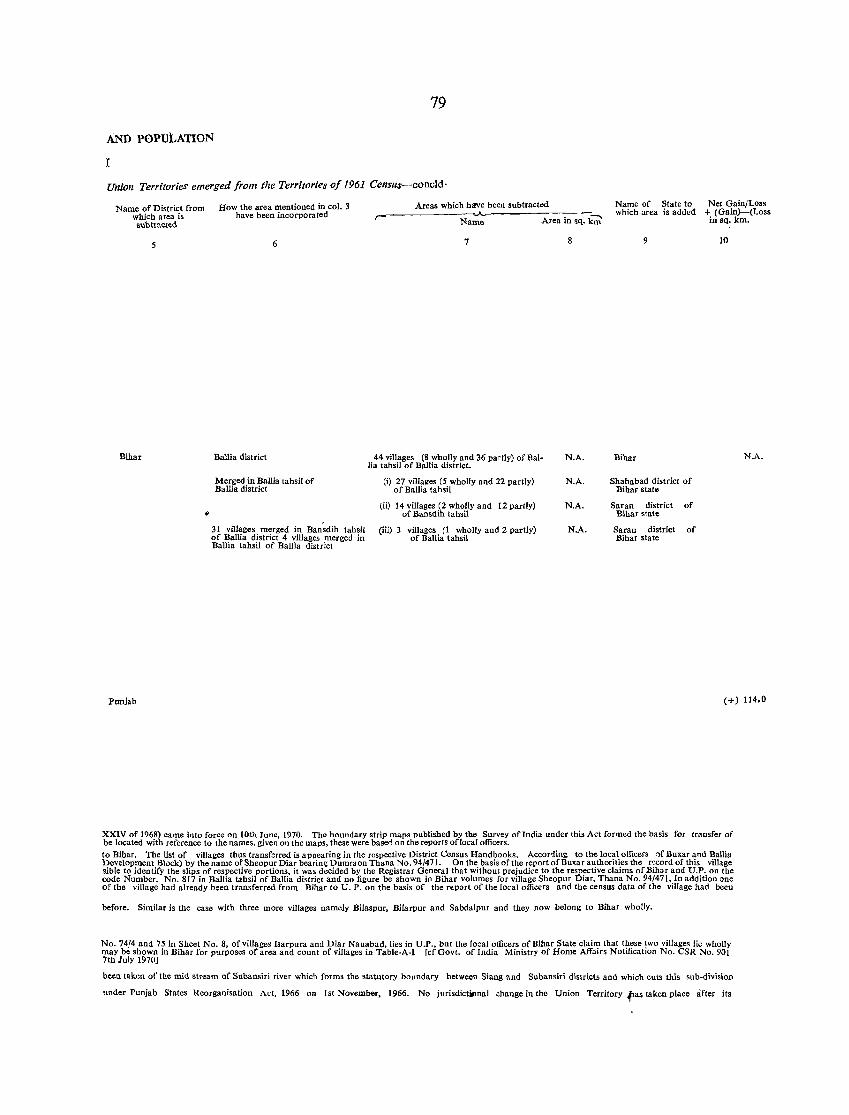
79
AND POPutATION
I
Union Territories emerged from the Territories of 1961 Census-concld·
Name of District from which area is subtracted
How the area mentioned in col. 3 have been incorporated
Areas which h1lVe been subtracted Name of State to Net Gain/Loss
Name Area in sq. G which area is added + (Gain)-(Loss
in sq. km.
5 6 7 8 9
Bihar Ballia district 44 villages (8 wholly and 36 partly) of Bal- N.A. Bihar N.A. lia tahsil of Ballia district.
Merged in Ballia tahsil of (i) 27 villages (5 wholly and 22 partly) N.A. Shahabad district of Ballia district of Ballia tahsil Bihar state
(ii) 14 villages (2 wholly and 12 partly) N.A. Saran district of ~ of Bansdih tahsil Bihar state
31 villages merged in Ban'sdih tahsil (iii) 3 villages (1 wholly and 2 partly) N.A. Saran district of of Ballia district 4 villages merged in of Ballia tahsil Bihar state Ballia tahsil of Ballia dist rict
Pnnj.b (+) 114.0
XXIV of 1968) came into force on 10th June, 1970. The boundary strip maps published by the Survey oflndia under this Act formed the basis for transfer of be located with reference to the names. given on the maps, these were basetl on the reports oflocal officers. to Bihar. The list of villages thus transf~rred is appearing in the respective District Census Handbooks. Accoding to the local officers "f Buxar and Ballia Development Block) by the name of Sheopur Diar bearing Dumraon Thana No. 941471. On the basis of the report of Buxar authorities the record of this village sible to identify the slips of respective portions, it was decided by the Registrar General that without prejudice to the respective claims of Bihar and U.P. on the code Number, No. 817 in Ballia tahsil of Ballia district and no figure be shown in Bihar volumes for village Sheopur Diar, Thana No. 94/471. In addition one orth. village bad already been transferred from Bihar to U. P. on the basis of the report of the local officers and the census data of the village had been
before. Similar is the case with three more villages namely Bilaspur, Bilarpur and Sabdalpur and they now belong to Bihar wholly.
No. 74/4 and 75 in Sheet No.8, of villages Isarpura and Diar Nauabad, lies in U.P., but the local officers of Bihar State claim that these two villages lie wholly may be shown in Bihar for purposes of area and count of villages in Table·A-l [cf Govt. of India Ministry of Home Affairs Notification No. CSR No. 901 7th July 1970)
been taklln of" the mid stream of Subansiri river which forms the statutory boundary between Siang and Subansiri districts and which cuts this sub-division
under Punjab States Reorganisation Act, 1966 on 1st November, 1966. No jurisdictional change in the Union Territory ftas taken place after its
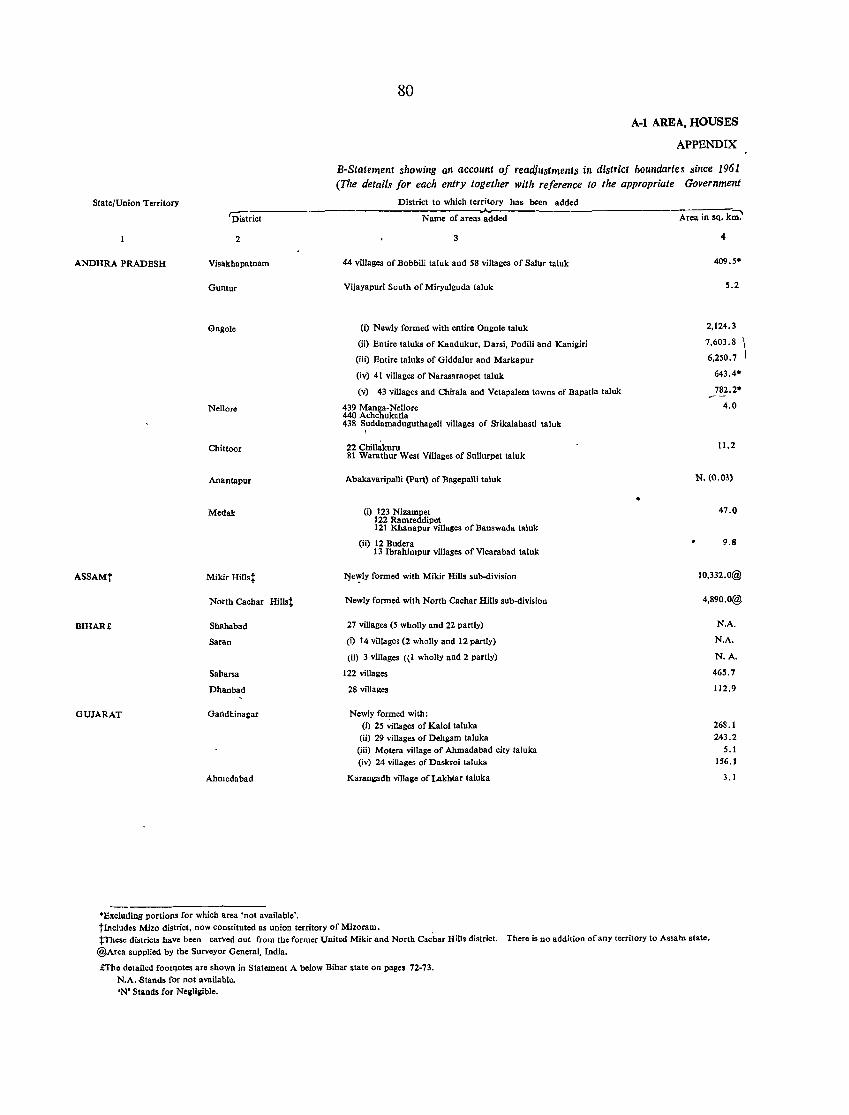
State/Union Territory
80
A-I AREA, HOUSES
APPENDIX
B-Statement showing an account of readjustments in district boundaries since 1961 (The details for each entry together with reference to the appropriate Government
District to which territory has been added
'District Name of areas~e-d-------------------Ar~i;;-;'k;;;:'
ANDHRA PRADESH
ASSAMt
BIHAR £
GUJARAT
2
Visakhapatnam
Guotur
0n20le
Nellore
Chittoor
Anantapur
Medak
Mikir Hills:::
North Cachar HiUst
Shahabad
Saran
Sabarsa
Dhanbad
Gandhinagar
Ahmedabad
*Eltclutllng portions for which area 'not available'.
3
44 villages of Bobbili taluk and 58 villages of Salllr taluk
Vijayapuri South of Miryalguda taluk
(i) Newly formed with entire Ongole taluk
(ii) Entire taluks of Kandukur. Darsi, Podili and Kanigiri
(iii) Entire taluks of Giddalur and Markapur
(iv) 41 villages of Narasaraopet taluk
(v) 43 villages and Chirala and Vetapalem towns of Bapatia taluk
439 Manga-Nellore 440 Achchukatla 438 Suddamaduguthageli villages of Srikalahasti taluk
I
22 Chi1lakuru 81 Warathur West Villages of Sullurpet taluk
Abakavaripalli (part) of Bagepalli taluk
(i) 123 Nizampet 122 Ramreddipet 121 Khanapur villages of Banswada taluk
(ii) 12 Budera 13 Ibrahimpur villages of Vicarabad taluk
1'fe~ly formed with Mikir Hilla sub-division
Newly formed with North Cachar Hills SUb-division
27 villages (5 wholly and 22 partly)
(i) 14 villages (2 wholly and 12 partly)
tii) 3 villages {( I wholly and 2 partly)
122 villages
28 villages
Newly formed with: (i) 2S villages of Kalol taluka (ii) 29 villages of Dehgam taluka
(iii) Motera village of Ahmadabad city taluka (iv) 24 villages of Daskroi taluka
Karangadh village of Lakhtar taluka
4
409.5·
5.2
2,124.3
7,603.8
6,250.7
643.4·
782.2·
4.0
11.2
N. (0.03)
.. 47.0
9.8
10,332.0@
4,890.0@
N.A.
N.A.
N.A.
465.7
112.9
268.1 243.2
5.1 156.1
3.1
tIncludes Mizo district, nOw constituted as union territory of Mizoram. tTh.s. districts have been carved out from the former United Mikir and North Cachar Hills district. There is no addition of any territory to Assaln stat~. @Area supplied by the Surveyor General, India.
£The detailed foo~otes are shown in Statement A below Bihar state on pages 72-73. N.A.Stands for not available. 'N' Stands for Nelilillible.
\
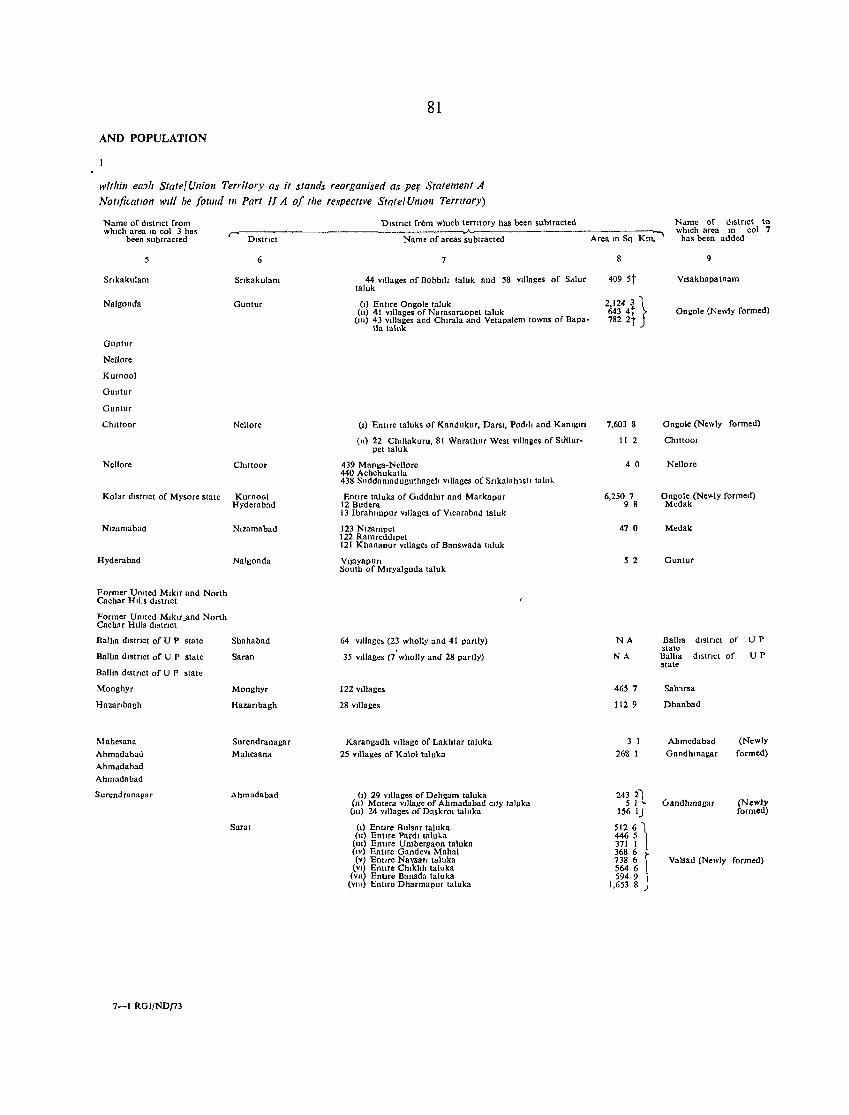
81
AND POPULATION
witltin eaJIz State! Union Territory as it stands reorganised as per Statement A Notlftc-atlon will be fOllnd 1/1 Part JJ A of the respective State! UIllOIl Terntory)
D,strict from whIch terntory has been subtracted Name of dIstrict from whIch area In col 3 has
been subtracted , D,stflct . __ ------- ~ .----------------
Name of d,strict to whIch area m col 7
has been added
5
Srlkakulam
Nalgonda
Guntur
Nellore
Kuroool
Guntur
Guntur
Chlttoor
6
Srlkakulam
Guntur
Nellore
Nellore Ch,ttoor
Kolar d,stflct of Mysore state Kurnoal Hyderabad
Nlzamabad Nlzamahad
Hyderabad Nalgonda
Former UOIted Mlklf and North Cachar HIlls d,stflct
Former UOIted Mlklr _and North Cachar Hills d,stnct
Balha dlstnct of U P sta te
Ballm d,str,ct of UPstate
Balha dlstnct of UPstate
Monghyr
Hazanhagh
~1ahe5ana
Ahmadabad
Ahmadabad
Ahmadabad
Surendranagar
7-1 RGlfND/73
Shahabad
Saran
Monghyr
Hazanbagh
Surendranagar
Mahesana
Ahmadabad
Surat
Name of areas subtracted
7
44 vIllages of BobbllI tal uk and 58 vIllages of Salur tal uk
(I) Entire Ongole tnIuk (II) 41 vIllages of Narnsaraopet taluk
(Ill) 43 vIllages and Ch,raln and Vetapalem towns of Bap.tla t.luk
(1) Entlfe t.luks of Kandukur, Darsl, Pod,l! and KaOlglfl
(II) 22 Chlilakuru, 81 Warathur West vJllalles of Stlllur-pet tal uk
439 Manga-Nellore 440 Achchukatla 438 Suddamaduguthageh vIllages of Srlkalahasll talul..
Entlfe taluks of Glddalur and Markapur 12 Budera 13 Ibrah,mpur villages of Vlcarabad tal uk
123 Nlzampet 122 Ramreddlpet 121 Khanapur villages of Banswada taluk
VIJayapun South of Mlfyalguda taluk
64 VIllages (23 wholly and 41 partly)
35 Villages 0' wholly and 28 partly)
122 Villages
28 Villages
Karangadh VIllage of Lakhtar taluka
25 Villages of Kalol taluka
(I) 29 VIllages of Dehgam taluka (II) Motera vdlage of Ahmadabad city taluka (III) 24 VIllages of DaskrOi taluka
(I) Entire Bulsar taluka (II) EntIre Pardi talu!"a
(III) Entire Umbersaon taluka (IV) Enllre (landevi Mahal (v) EntIre Navsaf) laluka
(VI) EntIre Chlkhh taluka (VIl) Entire Bansda taluka
(VIII) Entire Dharm"pur taluka
Area m Sq Km.
8
409 5t
2,124 3 j 643 4t r 782 2t J
7,603 8
11 2
4 0
6,250 7 9 8
47 0
5 2
NA
NA
465 7
112 9
3 I
268 1
2432") 51'>
156 IJ
5126,\ 4465 l 371 I
m~ 1",
564 6 5949 I
1,653 8 J
9
Visakhapatnam
Onl:ole (Newly formed)
Ongole (Newly formed)
Chlttoor
Nellore
Ongole (Ne,'ly formed) Medak
Medak
Guntur
Balha dlstflct of UP state Balha d,stnct of .tate
Sah"sa
Dhanbad
Ahmedabad
GandhlOagar
IJandhlOagar
UP
(Newly
formed)
(Newly formed)
Valsad (Newly formed)
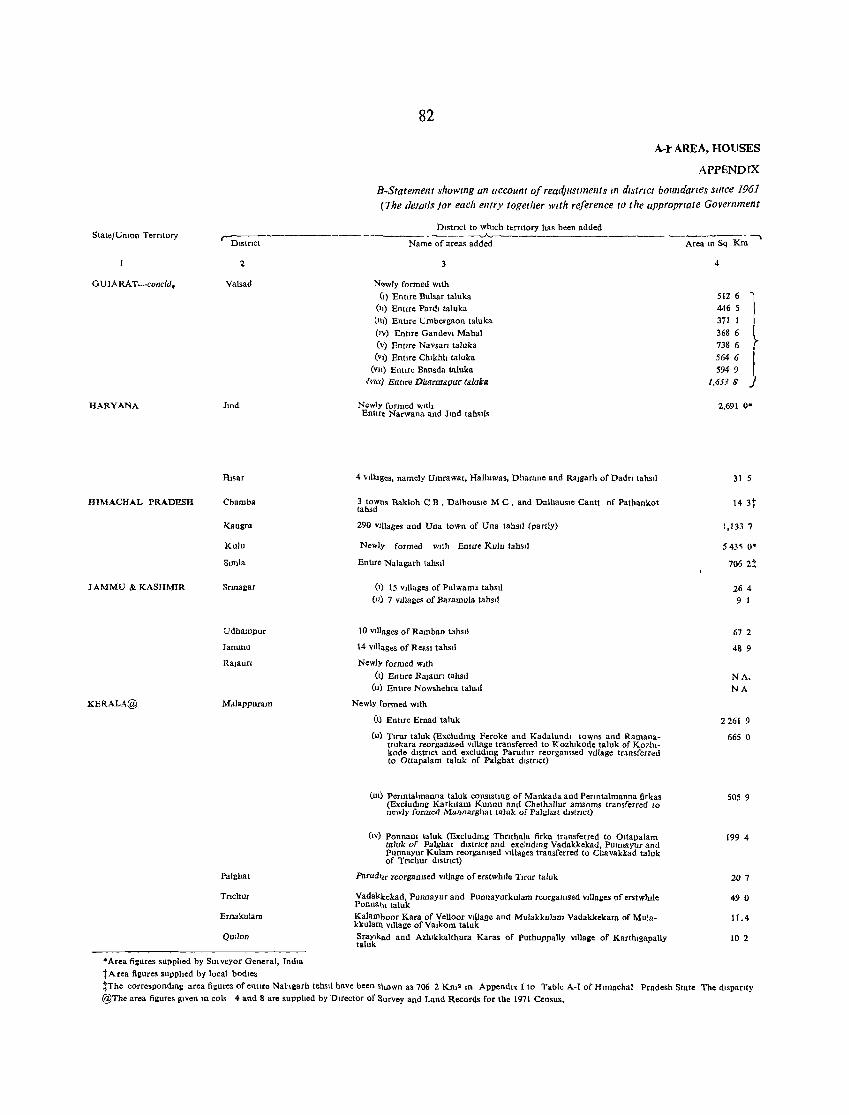
State/Umon Terntory I'});stnct
2
GUJARAT -coneld. Valsad
HARYANA lind
HIMACHAL PRADESH Charnba
Kangra
Kuln
JAMMU & KASHMIR Srmagar
Udhampur
Jarmnu
KERALA@ Mdlappnram
Palghat
Tnchur
Ernakulam
QUllon
* Area lieu res supplIed by SUI veyor General, India
t A rea lieures supplIed by local bodIes
82
A--t AREA, HOUSES
APPENDIX
B-Statemenl showrng an account ofreadjllslmellls 1I1 district boundartes Slllce 1961 (The de/ads jar each e11lry together with reference to the approprrate Government
DIstrIct to whIch temtory has been added
~ ---------------------------- Km -. Name of areas added
3
Newly formed wIth (I) Entire Bulsar taluka
(II) Entire PardI taluka (nl) EntIre Umbergaon taluka
('v) EntIre GandevI Mahal (v) Entlte Navsa" taluka
(V) Entire ChlkhlI talnka
(vn) Bnttre Bansda talnka (mt) Eatr,.e DIIIlrmapar ta/aka
Newly formed wIth Enttre Narwana and lmd tahsIls
4 vllla~es, namely Umrawat, Halluwas, Dharane and RaJ!:arh ofDadrt tahSIl
3 towns Rakloh C B , Dalhousie M C, and Dalhausle Cantt of Pathankot tabs II
290 vIllages and Una town of Una tahsil (partly)
Newly formed wIth En!Ire Kulu tabsll
Bnttre Nalagarh tahsIl
(1) 15 vJllages of Pulwama tahsil (11) 7 vIllages of Bararnula tahsil
10 VIllages of Ramban tabsll
14 vIllages of Reasl tahsIl
Newly formed wIth
(1) Entrre Ra}aun tahsil (n) Enttre Nowshehra tahsIl
Newly formed WIth
(I) EntIre Broad taluk
(n) TJrllf talnk (Excludmg Feroke and Kadalundl towns and Ramanattukara reorgamsed vlIlage transferred to Kozhlkode taluk of Kozhlkode dIstrict and exc1udmg Parudur reorgamsed vIllage transferred to Ottapalam taluk of Palghat dlstrJct)
(m) Permtalmanna taluk conslstmg of Mankada and Penn tal manna firkas (Excludmg Karkltam Kunnu and Chethallur amsoms transferred to newly formed Mannarghat !aluk of Palghat dI>tnct)
(IV) Ponnam taluk (ExcludIng Thnthala lirka transferred to Ottapalam taluk of Palghat dIstrIct and excludIng Vadakkekad, Punnayur and Punnayur Kulam reorgamsed VIllages transferred to Chavakkad taluk of Tnchur dIstrict)
Parud"'r reorganISed vIllage of erstwhrle Tlmr toluk
Vadakkekad, Punnayur and Punnayurkulam reorganrsed VIllages of erstwhIle Ponnal:u taluk Kalamboor Kara of Velloor vJllage and Mulakkulam Vadakkekara of MUlakkulall\ VIllage of Valkom taluk
~:l~kad and Azhlkkalthura Karas of Puthuppally VIllage of Karthlgapally
Area In Sq
4
512 6 "\ 4465
l 371 1
368 6 738 6 564 6 i 5949 ) 1,6538
2,691 O·
31 5
14 3t
1,133 7
5 43~ O·
7062:1:
26 4
9 1
672
48 9
NA. NA
2261 9
665 0
505 9
199 4
207
490
11.4
10 2
tThe correspondml: area lieures of enure Nahgarh tebsll have been s\wwn as 706 2 Km2 m Appendl" I to Table A-I of HImachal Pradesh State The d,sparity @The area figures gIven m cols 4 and 8 arc supplied by DIrector of Survey and Land Records for the 1971 Census.
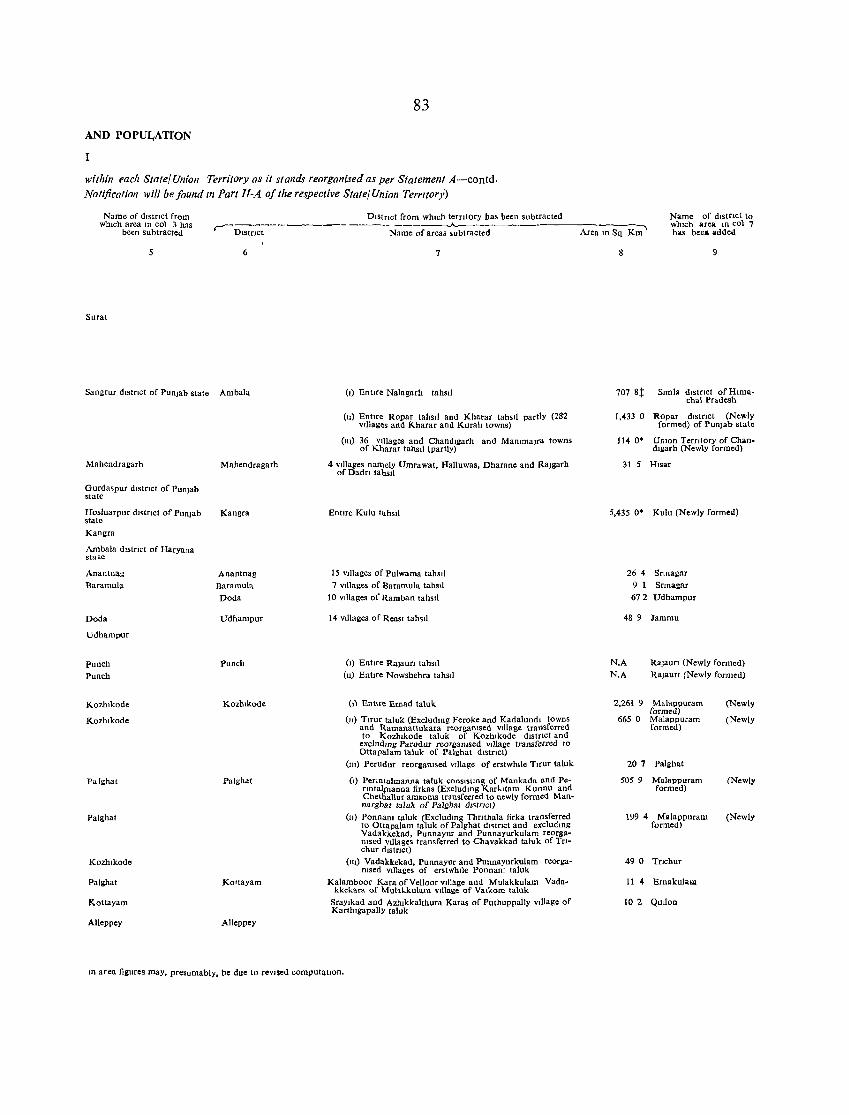
AND POPULATION
I
83
within each State/Union Territory as it stands reorganised as per Statement A-contd. Notification will be found In Part II-A of the respective State/ Union Territory)
DIStrIct from whIch territory has been subtracted Name of dIstrIct from whIch area In col 3 has
been subtracted .-----------_-- ---~_ --_-------Jo..---. ________________ ,
DIstrict Name of areas subtracted Area 10 Sq Km
Name of dlstrtct to wluch area III col 7 has bee. aaded
5 6
Sura!
Sangrur dls!f[c! of Punjab state Ambala
Mahendragarh
Gurda.pur dlstnct of Punjab state
Hoshlarpur d"(rIct of Punjab state
Kangra
Ambala dIstrIct of Haryana state
Anantnag
Baramula
Doda
Udhampur
Punch Punch
Kozhlkode
Kozhlkode
Palghat
Palghat
Kozhlkode
Palghat
Kottayam
Alleppey
Mahendr.garh
Kangra
Anantnag Baramula
Dada
Udhampur
Punch
Kozhlkode
Palghat
Koltayam
Alleppey
7
(I) EntlTe Nalagarh tahsil
(n) Enhre Ropar tahSIl and Kharar tahSIl partly (282 VIllages and Kharar and Kural! towns)
(111) 36 VIllages and Chandlgarh and Manlma)ra towns of Kharar tahSIl (partly)
4 VIllages namely Umrawat, Halluwas, Dharane and Rajgarh of Dadn tahs"
Entire Kulu tahSIl
15 VIllages of Pulwama tahs" 7 VIllages of aaramula tahSIl
10 VIllages of !tamban tahsIl
14 VIllages of Reasl tah,,1
(I) EntIre Rajauf[ tahSIl
(n) Enhre Nowshehra tahs"
{II EntIre Ernad taluk
(n) Tlrur taluk (Excludmg Feroke and Kadalundl towns and Ramanattukara reorgamsed VIllage transferred to Kozhlkode taluk of Kozhlkode dIstrict and
excludmg Parudur reorgamsed VIllage transferred to Ottapalam taluk of Palghat dIstrict)
(m) Perudur reorllamsed vrllage of erstwhIle Tlfur taluk
(1) Penntalmanna taluk conslStmg of Mankada and Permtalplanna firkas (Excludwg Kar1.ltam Kunnu and Chethallur amgoms transferred to newly formed Mannarghat talnk of Palgbat dlstnet)
(11) Ponnam taluk (Excluding Thnthala firka transferred to Oltapalam taluk of Palghat d"tnct and e"cludmg Vadakkekad, Punnayur and Punnayurkulam reorganIsed vIllages transferred to Cha vakkad taluk of Tnchur dlstnct)
(nl) Vadakkekad, Punnaynr and Punnayurkulam reorganISed VIllages of erstwhIle Ponnam talnk
Kalamboor Kara of Velloor VIllage and Mulakkulam Vadakkekara of Mulal..kulam village of Valkom lalul::
SraYlkad and Azhlkkalthura Karas of Puthuppally vlllage of Karthlgapally taluk
m area figures may, presumably, be due to revlSed compulahon.
9
707 8t SImla dlslrlct of HImachal Pradesh
1.433 0 Ropar dIstrIct (Newly formed) of Punjab state
114 O' Umon Temtory of Chandl~arh (Newly formed)
31 5 Hlsar
5,435 O' Kulu (Newly formed)
26 4 Srmagar 9 1 Snnal:llr 672 Udhampur
489 Jammu
N.A Rajaun (Newly formed)
N.A RaJaurI (Newly formed)
2,261 9 Malappuram formed)
(Newly
665 0 Malappuram (Newly formed)
207 Palghat
5059 Malappuram (Newly formed)
1994 Malappuram formed)
(Newly
490 Tnchur
11 4 Ernakulam
10 2 QUllon
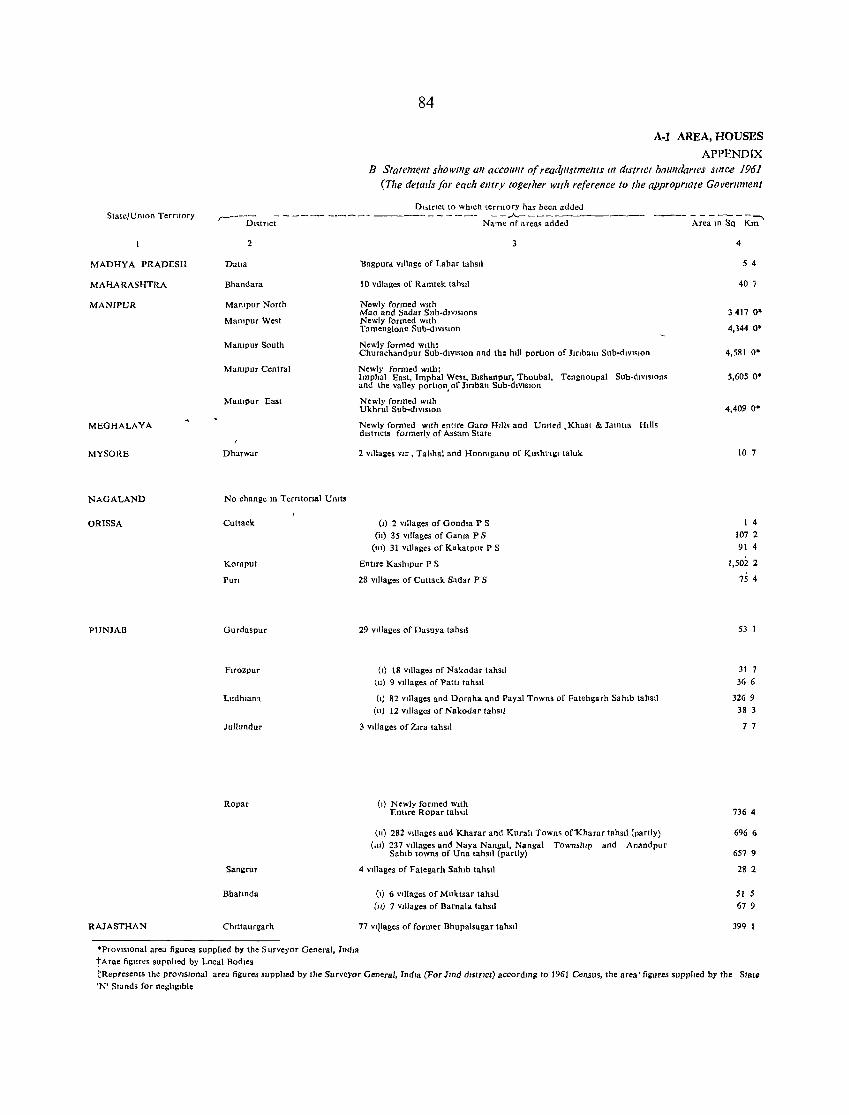
State/Umon Territory
MADHYA PRADESH
MAHARASHTRA
MANIPUR
MEGHALAYA
MYSORE
NAGALAND
ORISSA
PUNJAB
RAJASTHAN
84
A-I AREA, HOUSES
APPENDIX B Statement showmg an accollnt of readjustments lit district boundaries smce 1961
(The detmls for each el1try together w/{h reference to the approprtate Governmellf
DI,lrlct to whIch territory has been added
r---o;strlct - - - -- --- - - ------ - - - - -- N;';' ;r~r-;;'-~ded------ ---- A~a-m Sq- i(.;'
2
Datla
Bhandara
Mantpur North
Mampur West
Mampur South
Mampur Central
Mampur East
Dharwar
No change III TerTltoflal Umts
Cuttack
Koraput
Pun
Gurdaspur
FLrOZPUT
Ludhlanl
Jullunduf
Ropar
San!:rur
Bbatlllda
Chlttaurgarh
Bagpura vIllage of Lahar tahsIl
10 vIllages of Ramtek tahstl
Newly formed wIth Mao and Sadar Sub-d,vIsIons Newly formed with Tamenglonl! SUb-dIVIsIOn
Newly formed with:
3
Churachandpur Sub-dIVIsIon and the hIll portion of Jmbum Sub-dIVIsIOn
Newly formed Wlth: Imphal East, Imphal West, Blshanpur, Thoubal, Tengnoupal Sub-dIVIsIOns and the valley porhon, of Jmban Sub-dIVIsIOn
Newly formed WIth Ukhrul Sub-dlVlSLOll
Newly formed With entire Garo Hills and Umted _Khasl & JamtJa Hills dlstncts formerly of Assam State
2 villalles VIZ, Tahhal and Honmganu of Kusht~1:1 taluk
(I) 2 vIllages of Gondm P S (iJ) 35 vIllages of Ganm P S
(111) 31 vIllages of Kakatpur P S
Entlfe Kashlpur P S
28 vIllages of Cuttack Sadar P S
29 vIllages of Dasuya tahSIl
(I) 18 vIllages of Nakodar tahsil (11) 9 v1IIages of Patl! tahsIl
(I) 82 vLllages and Ooraha and Payal Towns of Fatehgarh SahIb tahsLI
(11) 12 vIllages of Nakodar tahs!]
3 Villages of ZLra tahSIl
(I) Newly formed WIth EntJre Ropar tah"l
(II) 282 vLllages and Kharar and Kuralt Towns of1(harar tahstl (partly) (m) 237 VIllages and Naya Nangal, Nanglll TownshIp and Anandpur
SahIb town. of Una tahSIl (partly)
4 Villages of Fategarh SahIb tahsll
(I) 6 VIllages of Muktsar tahSIl (11) 7 VIllages of Barnala tahsLi
77 vi/lages of former Bhupalsagar tahSil
4
54
40 "i
3417 O'
4,344 O'
4,581 0*
5,605 O'
4,409 O'
10 7
I 4
107 2 91 4
1,502 2 I
75 4
53 I
31 7 36 6
3269 38 3
7 7
7364
696 6
657 9
282
51 5 67 9
399 I
·PlOvlslonal area figures supphed by (he Surveyor General, IndIa tArae figures supplted by Local RodLes
tRepresents the provIsIonal area figures supplJed by the Surveyor General, Tnd'a (For Jmd d,slrlct) accordmg to 1961 Census, the area' figures supplied by the Stat" 'N' Stonds for negligIble
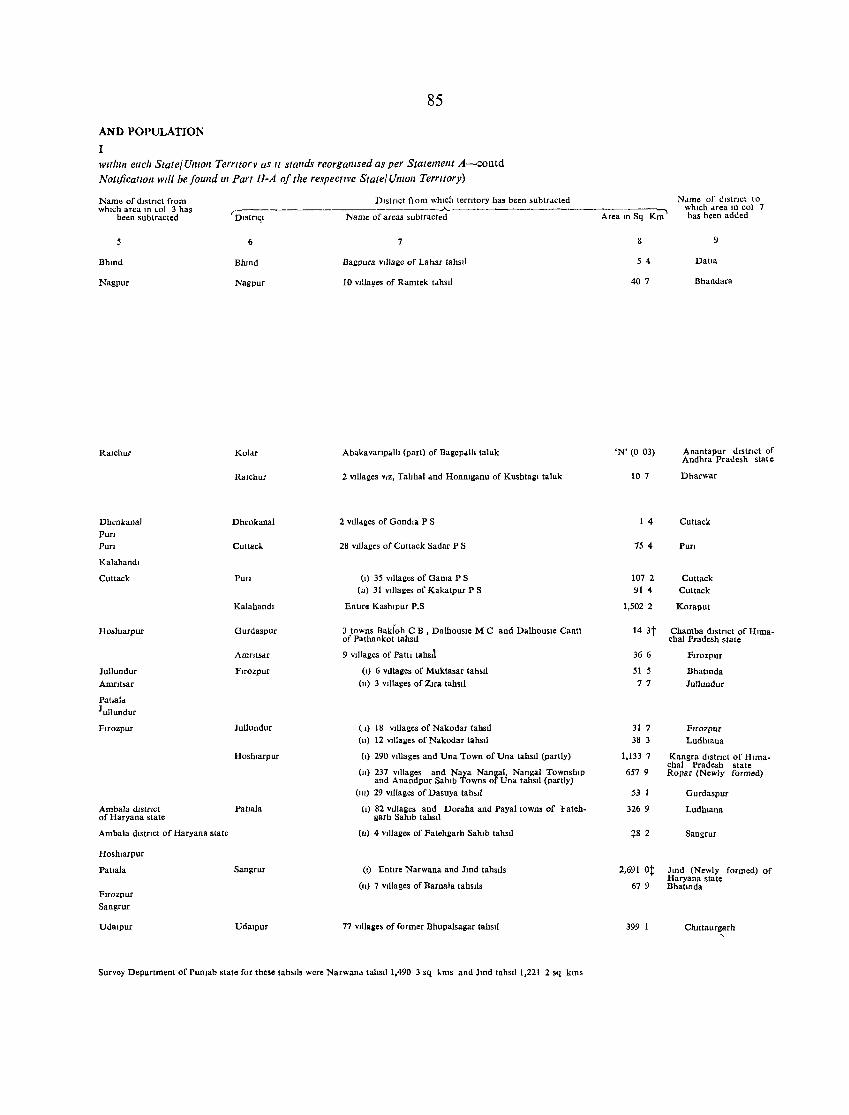
AND POPULATION
I
85
wallin eacl! StateJ Umoll Terntorv as II stands reorgalllsed as per Statement A-contd Notlficatloll will be foulld 1Il Part II-A of tIle respecllve State/ Ull/Oll Temtory)
Name of distrIct from which area In ~ol 3 has
been subtracted
5
Blund
Nagpur
Ralchur
Dhenkanal Pun Pun
Kalahandl
Cuttack
Hoshlarpur
Jullundur
Amntsar
Pahala Jullundur
Flrozpur
Ambala dIstrIct of Haryana state
Ambala distrIct of Haryana state
Hoshlarpur
Pallala
Flrozpur Sangrur
Udaipur
'Dlstrl'il
6
Bhmd
Nagpur
Koldr
Ralchur
Dhenkanal
Cuttack
Pun
Kalabandl
Gurdaspur
AmnlSdr
Flrozpur
Jullundur
Hoshlarpur
Pallala
Sangrur
Udaipur
Dlstnct fl0111 which temtory has been subtr .. cted .A.
Name of areas subtracted
7
Bagpura vIllage of Lahar tahsIl
10 vIllages of Ramtek tahsil
Abaka vanpalIt (part) of BagepollIt taluk
2 vlliages VIZ, Tahba1 and Honmganu of KUshtagl taluk
2 villages of Gondla P S
28 vIllages of Cultack Sadar P S
(I) 35 Villages of Gama P S (ll) 31 vlllalles of Kakatpur P S
EntIre Kashlpur P.S
3 towns Bakfoh C B , DalhousIe M C and DalhOUSIe Cantt of Pathankot tahsl!
9 Villages of Patti tahsIl
(I) 6 villalles of Muktasar tahsl! (Il) 3 VIllages of ZIra tahSIl
(I) 18 vllla1,les of Nakodar tahSIl (II) 12 Villages of Nakodar tahsIl
(I) 290 villalles and Una Town of Una tahsIl (partly)
(II) 237 Villages and Naya Nangal, Nangal TownshIp and Anandpur Sahib Towns of Una tahSil (partly)
(III) 29 vIllages of Dasuya tahsl!
(I) 82 Villages and Doraha and Payal towns of Fatehgarh Sahib tahsIl
(II) 4 Villages of Fatehgarh Sahib tahsl!
(I) Entlfe Narwana and Jmd tahslls
(II) 7 Villages of Barnala tahsiis
77 vlliaies of former Bhupalsagar tahSil
Survey Department of Punlab state for these tahslls were Narwan .. tahSil 1,490 3 sq kms and lmd tahsIl 1,221 2 sq killS
Ndme of dls!nc! to
K~ which drea In col 7
Area III Sq has been added
8 9
54 Datla
407 Bhandara
'N' (0 03) Anantapur dlstnct of Andhra Pradesh state
10 7 Dharwar
1 4 Cuttack
754 Pun
1072 Cutlack 91 4 Cultack
1,502 2 Koraput
14 3t Chamba dlslnct of Hima-chal Pradesh slate
366 FIrozpur
51 5 Bhatlnda 77 Jullundur
31 7 Flfozpur 38 3 LudhIana
1,133 7 Kangra distrIct of Hima-chal Pradesh slate
6579 Ropar (Newly formed)
53 1 Gurdaspur
326 9 Ludhlana
Z82 Sangrur
2,691 ot lmd (Newly formed) of Haryana state
679 BhatlOda
399 1 Chlttaurgarh ,
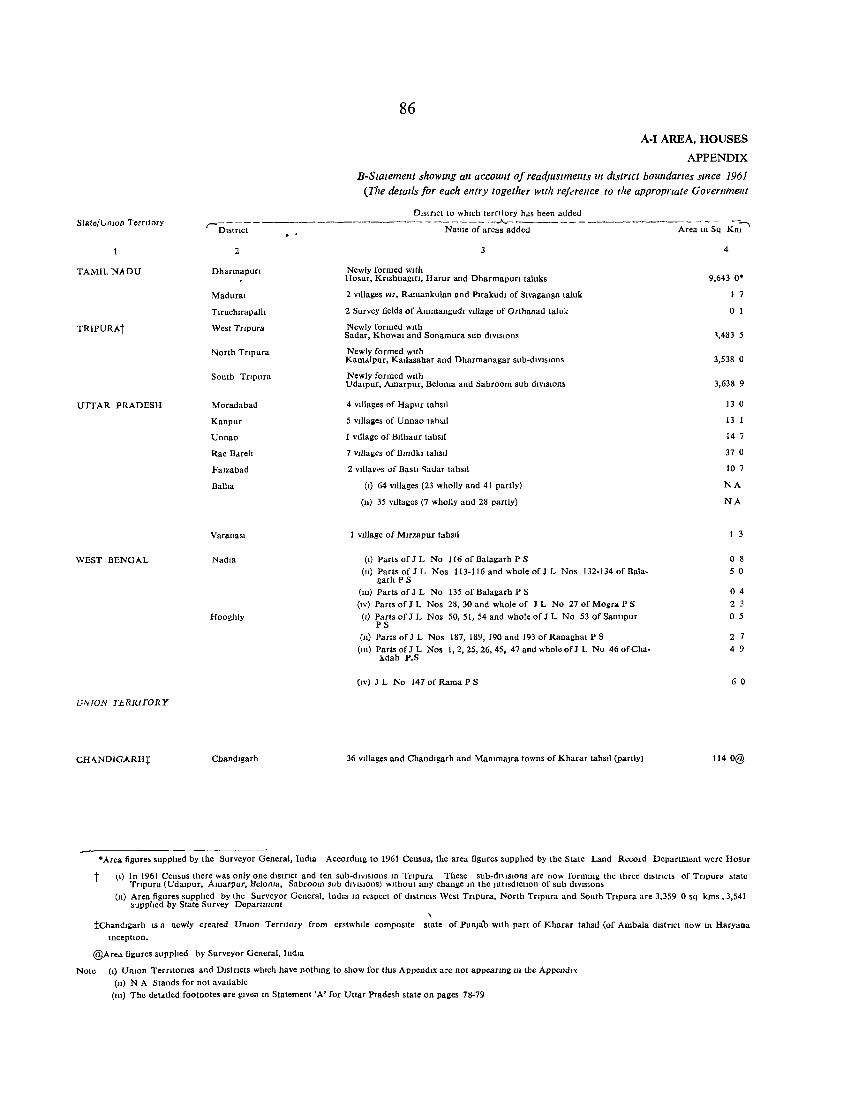
State/UflIon Tcrtltory
TAMILNADU
TRIPURAt
UTTAR PRADESH
WEST BENGAL
UNION TERRITORY
CH<\NDlGARH+
2
Dharmapun
Madural
T1ruchlfap .. ll,
West TrIpura
North Tnpura
South Tnpura
Moradabad
Kanpur
Unnao
Rae BMelI
FalZabad
BallI.
VaranaSl
NadIa
Hooghly
Chandlgarh
86
A-I AREA, HOUSES
APPENDIX
B-Statement showmg an account of read./ustmems III dIstrIct boundaYles slllce 1961 (The details for each entry together with rej.:rence to the approprtate Governmellf
3
Newly formed wIth Hosur, Knshnaglfl, Harur and Dharmapun taluks
2 vIllages VIZ, R.lmankulan and Puakudl of S,valtlanga taluk
2 Survey fields of Ammangud, vIllage of Orthanad taluk
Newly formed wIth Sadar, Khowal and Sonamura suo dIVISIOns
Newly formed WIth Kam.llpur, Kadasahar and Dharmanagar sub-dIVIsIOns
Newly formed WIth UdaIpur, Alllarpur, Beloma and Sabroom sub d,V,SIOns
4 VIllages of Hapur tahSIl
5 vdlalles of Unnao tahM!
1 VIllage of Bllhaur tahsIl
7 VIllages of Bmdkl tahSIl
2 vllla~~s of Bastl ~adar tahsIl
(I) 64 VIllages (23 wholly and 41 partly)
(II) 35 VIllages (7 wholly and 28 partly)
1 VIllage of MIr7.apur tahsIl
(I) Parts of J L No J J 6 of Balagarh P S
(II) Parts of J L Nos 113-116 and whole of J L Nos 132-134 of Balagarh P S
(III) Parts of J L No 135 of Balagarh P S
(IV) Parts of J L Nos 28, 30 and whole of J L No 27 of Mo~ra P S (I) Parts of J L Nos 50, 51, 54 and whole of] L No 53 of Sanupur
PS (II) Parts of J L Nos 187, 189, 190 and 193 of Ranaghat P S
(III) Parts ofJ L Nos 1,2,25,26,45, 47 and whole of] L No 46 ofChakdah P.S
(IV) ] L No 147 of Rama P S
36 VIllages and Chandlgarh and MammaJra towns of Kharar tahsIl (partly)
4
9,643 O'
1 7
o 1
1,483 5
3,538 0
3,638 9
13 0
13 1
14 7
37 0
10 7
NA
NA
1 3
o 8
50
04
2 3
o 5
2 7
4 9
6 0
1140@
• Area figures suppbed by the Surveyor General, IndIa Accordmg to 1961 Census, the area figures suppbed by the State Land Record Department were Hosur
t \1) In 1961 Census there was only one dlstncl and len sub-dIVIsIOns In Tnpura These sub-dl\lslOns are now formmg Ihe three dlstncts of Tnpur. slate Tnpura (UdaIpur, Amarpur, Beloma. Sabroom sub dl"sIOns) WIthout any change In the JurIsd,ctIon of sub dIVISIOns
(II) Area figures suppbed by the Surveyor General, IndIa In respect of dlstncls West Tnpura, North Tnpura and South Tnpura are 3,359 0 sq kms. 3,541 supplIed by State Survey Department
\
tChandllolarh IS a newly created UnIOn TerrItory from erstwhIle composIte state of Punjab WIth part of Kharar tahSIl (of Amb.lla dIstrIct now 10 Haryana
Incephon.
@Are.l figures supplIed by Surveyor General, IndIa
Note (I) UnIOn TerrItOrIes and D,stncts whICh have nothlllg to show for thIS AppendIX are not appearmg In the Appendl~
(II) N A Stands for not avaIlable (III) The det,uled footnotes are gIven In Slatement 'A' for Uttar Pradesh state on pages 78-79
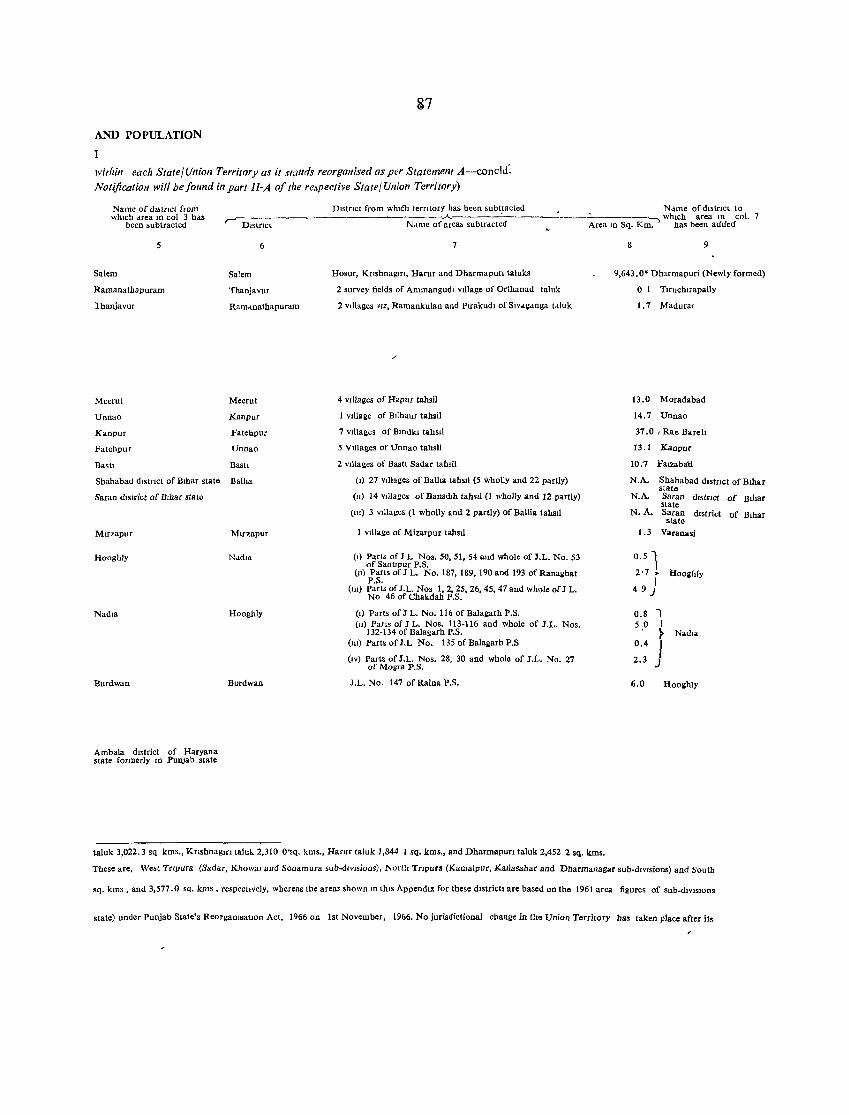
AND POPULATION
I
27
within each State/Union Territory as it stands reorganised as per Statement A-coneld: Notification will be found in part JI-A of the rejpective State/ Union Territory)
Name of dIstrict from whIch drea m col 3 has
been subtracted
District from whu,h temtory has been subtracted, N<lme of district to ~ _____________________ ",,-______ . --------_:_-------.." whIch area m col. 7
Dlstnct Ndme of area, subtracted ~ Area In Sq. Km. has been added
5
Salem
Ramanathapuram
lhanjavur
Meerut
Dnnao
Kanpur
Fatehpur
Baslt
Shahabad dlstnct of Bihar st. te
Saran district of Bihar state
Mlrzapur
Hooghly
Burdwan
Arubala district of Haryana state formerly m Punjab state
6
Salem
Thanjavur
Ramanathapuram
Meerut
Kanpur
Fatelo.pur
Dnnao
Bastl
Bal"_
Mlrzapur
Nddla
Hooghly
Burdwan
7
Hosur, Knshnagm, Harur and Dharmapun taluks
2 survey fields of Ammangudl vtllage of Orthanad taluk
2 VIllages VIZ, Ramankulan and Plrakudl of Slv"lOdnga t.luk
./
4 vtllages of Hapur tahsil
1 vtllage of Bllhaur tahsil
7 vtlla2es of Bmdkl tahSil
5 V tIlages of U nnaO tahsil
2 Villages of Bastl Sad .. r tahsil
(I) 27 VIllages of Ballia tahSil (5 wholly and 22 partly)
(11) 14 Villages of Bansdlh tahst! (1 wholly and 12 partly)
(Ill) 3 vtllages (1 wholly and 2 partly) of Ballia tahsil
1 Village of Mizarpur tahsil
(I) Parts of J L Nos. 50, 51, 54 and whole of J.L. No. 53 of SantI pur P.S.
(n) Parts of J L. No. 187, 189, 190 and 193 of Ranallhat P.S.
(Ill) Parts of J.L. Nos 1,2, 25, 26, 45. 47 and whole of J L. No 46 of Chakdah P.S.
(I) Parts of J L. No. 116 of Bala2arh P.S. (II) Parts of J L. Nos. 113·116 and whole of J.L. Nos.
132-134 of Balagarh P.S. (Ill) Parts of J.L No. 13S of Balallarh P.S
(IV) Parts of r.L. Nos. 28, 30 and whole of J.L. No. 27 of MOllra P.S.
J.L. No. 147 of Raina P.S.
taluk 3,022.3 sq kms., Knshnagm taIul.. 2,310 O'sq. kms., Hamr tal uk 1,844 1 sq. kms., and Dharmapurl taluk 2,452 2 sq. kin •.
8 9
9,643.0' Dharmapuri (Newly formed)
o 1 Tlruchlrapally
1.7 Madural
13.0 Moradabad
14.7 Unnao
37.0 I Rae Bareh
13.l Kanpur
10.7 Faluba'd
N.A. Shahabad dlstnct of Bmar state
N.A. Saran dlstnct of Bihar state
N.A. Saran district of Bihar state
1.3 Varanasi
0.5 l 2'7 ,. Hoollhly
49)
0.8 I S .0 I
~ NadIa 0.4 j 2.3
6.0 Hoollhly
These are, West Tflpura (Sadar, KhoW31 and Sonamura sub.dlVlsions), North Tnpura (KamaIpur, Kallasahar and Dharmanagar sub·dlVlsions) and South
sq. kms • and 3,577.0 sq. kms , respecllvely, whereas the areas shown III thiS AppendiX for these districts are based on the 1961 area figures of sub.dlvlslons
state) under Punjab State's Reorgalllsallon Act, 1966 on 1st November, 1966. No jurisdictional change in the Union Territory has taken place after its
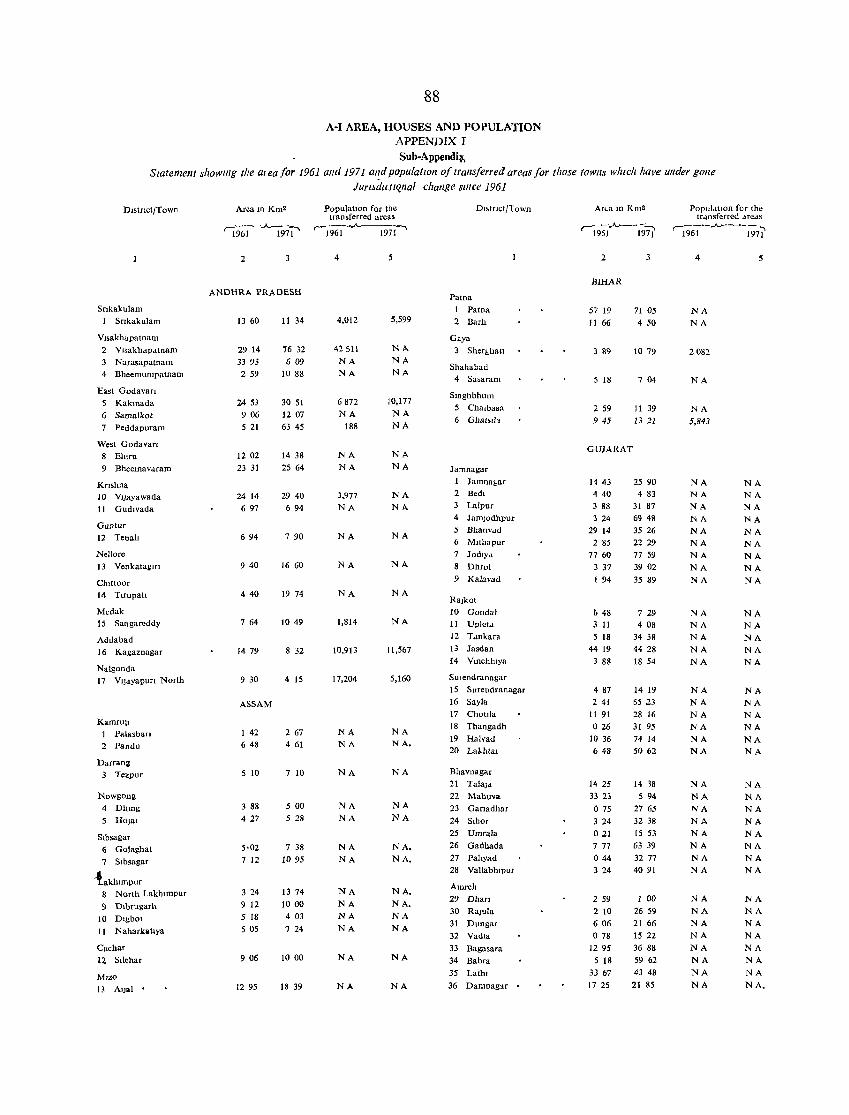
88
A-I AREA, HOUSES AND POPULATION APPENDIX I Sub-AppendiJ.
Swtement ShoWlllg tire meafor 1961 alld 1971 alld populatIOn of trallsferred areas for t/lOse fOWlls wlllch have under gOlle
JumdWuznal change slllce 1961
}),Slflct/Town
Snkaklliam
1 Snkakulam
V,sakhapatnam
2 Vlsakh"Pdtnam
3 Narasapatnam 4 Bheemumpatnam
East Godavan
5 Kakmada
6 Samalkot
7 Peddapuram
West Godavan
8 Eluru
9 Bheemav"ram
Knshna
10 VlJayawada
11 Glldlvada
Guntur
12 Tenall
Nellore
13 Venkatalllfl
Ch,ttoor
14 Tlrupatl
Medak 15 Sangareddy
Aduabad 16 Kagaznagar
Nalgonda
17 V'J"yapun North
KamrulJ 1 Palasban
2 Pandu
Darranll 3 Tezpur
Nowgonll
4 Dhmg
5 Ho)al
Slbsagar 6 Go\aghat
7 Slbsagar
lakhlmpur 8 North Lakh,mpur
9 Dlbrugarh
10 Dlgbo,
II Naharkatlya
Cachar
l2 Sllchar
M,zo
13 A'jal •
Ar.a In KOla PopulatlOn for the transferred areas
'1%-1---'-1971' 'l%i~-..
2 3
ANDHRA PRADESH
13 60 11 34
29 14
3393 259
24 53
906
5 21
1202
23 31
24 14
697
694
940
440
7 64
1479
76 32
609
1088
30 51
1207
63 45
14 38
25 64
29 40
694
7 90
16 60
19 74
1049
8 32
9 30 4 15
ASSAM
1 42 2 67 6 48 4 61
5 10 7 10
3 88 5 00
4 27 5 28
5·02 7 38
7 12 10 95
3 24 13 74
9 12 10 00
5 18 4 03
5 05 7 24
9 06 10 00
12 95 18 39
4
4,012
42511
NA
NA
6872
NA
188
NA
NA
3,977
NA
NA
NA
NA
1,814
10,913
17,204
NA
NA
NA
NA
NA
NA
NA
NA
NA
NA
NA
NA
NA
5,599
NA
NA NA
10,177 NA
NA
NA
NA
NA
NA
NA
NA
NA
NA
11,567
5,160
NA NA.
NA
NA
NA
NA.
NA.
NA. NA. NA
NA
NA
NA
D,,,lnct/Town
Patna
1 Patna
2 Barh
Gaya
3 Sherbhatl
Shahabad 4 Sasaram
S,nghbhum
5 ehalbasa
6 Ghat>!h
Jamnagar
1 Jamnabar 2 Bedl
3 Lalpur
4 Jamjodhpur
5 Bhanvdd
6 Mlthapur
7 Jod,y"
8 Dhro1
9 Kalavad
Rajkot
10 Gondal
11 Uplet"
12 T"nkara 13 Jasdan
14 Vmchhlya
SUlendranagar
15 Surendranagar
16 Suyla
17 Chollla
18 Thangadh
19 Halvad 20 Lal..hta,
Bhavnagar
21 TalaJ" 22 Mahuva
23 Gafladhar
24 S,hor
25 Vmrala
26 Gadhada
27 Pahyad 28 Vallabhlpur
Amre!J
29 Dhan
30 RaJula
31 Dungar
32 Vadla
33 Bagasara
34 Babra
35 Lathl
36 Damnagar
An"a In Km2
-..A.---r-t961 1971
2
BIHAR
57 19
11 66
389
5 18
259
945
71 05 4 50
10 79
704
11 39
132J
GUJARAT
1443
4 40 3 88
324
29 14
2 85
77 60
3 37
1 94
I; 48
3 11 5 18
44 19
3 88
4 87 2 41
11 91
026
1036 648
1425
33 23
075
324
021
7 77
044
324
259
2 10
606
078
12 95 5 18
33 67
17 25
25 90 4 83
31 87
69 48 3526
2229
77 59
39 02
35 89
729 4 08
34 38 4428
18 54
14 19
6523
28 16
31 95
74 14 5062
14 18
5 94
27 65
32 38
15 53
63 39
32 77
4091
1 00
2659
21 66
15 22
3688
59 62
43 48
21 85
Popul.,tlon for the tr d.llsferrcd areas
r----...A---- , 1961 1971
4
NA
NA
2082
NA
NA
5,843
NA
NA
NA
NA
NA
NA
NA
NA
NA
NA
NA
NA
NA
NA
NA
NA
NA
NA
NA
NA
NA
NA
NA
NA
NA
NA
NA
NA
NA
NA
NA
NA
NA
NA
NA
NA
5
NA NA
NA
NA
NA
NA
NA
NA
NA
NA NA
NA
NA
NA
NA
NA
NA
NA
NA NA
NA
NA
NA
NA
NA
NA
NA NA
NA
NA
NA
NA
NA
NA
NA
NA.
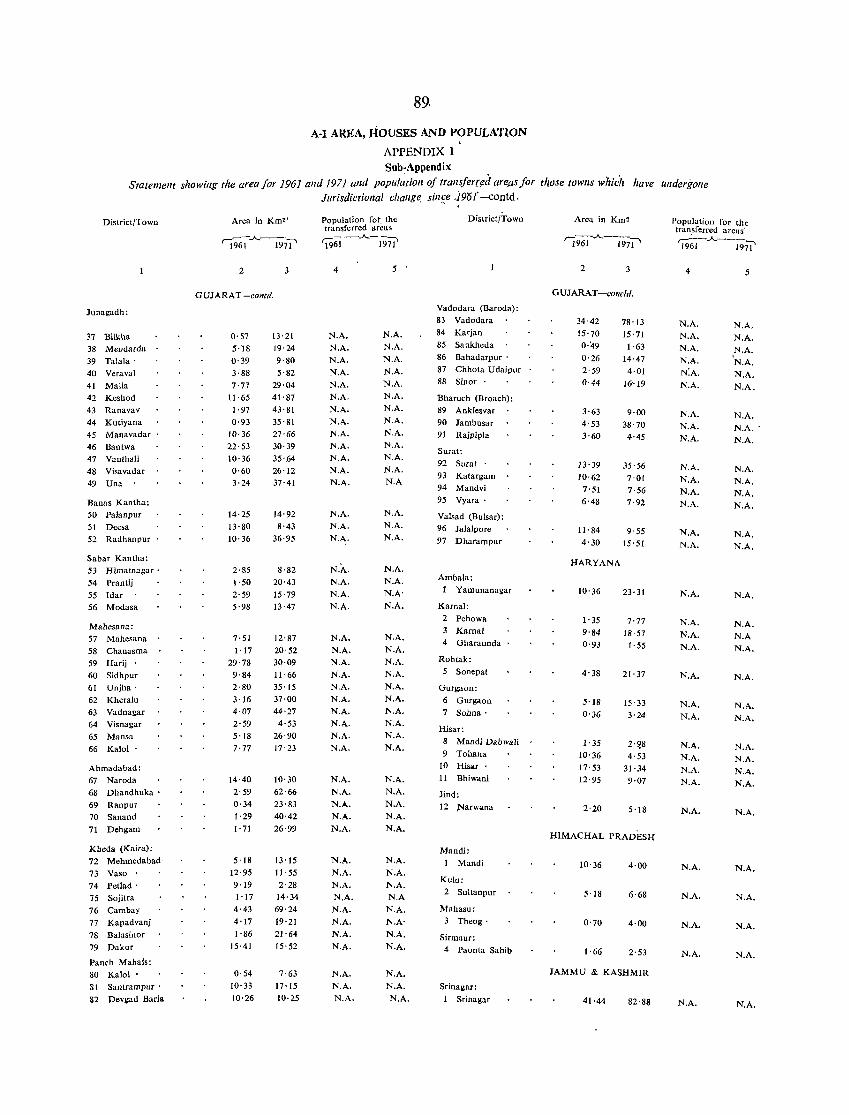
89.
A-I AREA, IiOUSES AND POPULATION . APPENDIX I Sub-Appendix
Statemellt showillg the area lor 1961 alld 1971 alld popul~tioll 0/ trans/err.ed arep,s for tI!ose towns whici, have undergone Jurisdictional challge, sil1~e J90t -contd.
District/Town
Junagadh:
37 Bilkha 38 Mendarda
39 Talala' 40 Veraval
41 Malia 42 Keshod 43 Ranavav
44 Kutiyana 45 Manavadar
46 Bantwa 47 Vanthali 48 Visavadar 49 Una
Banas Kantha: 50 Palanpur
51 Deesa 52 Radhanpur
Sabar Kantha: 53 Himatnagar' 54 l'rantij
55 Idar 56 Modasa
Mahesana: 57 Mahesana 58 Chanasma 59 Harij .
60 Sidhpur
61 Unjha' 62 Kheralu
63 Vadnagar 64 Visnagar 65 Mansa
66 Kalol'
Ahmadabad:
67 Naroda 68 Dhandhuka' 69 Ranpur
70 Sanand 71 Dehgam
Kheda (Kaifa):
72 Mehmedabad· 73 Vaso .
74 Petlad' 75 Sojitra
76 Cambay 77 Kapadvanj
78 Balasinor 79 Dakor
Panch Mahals: 80 Kalol .
81 Santrarnpur' 82 Devgad Baria
Area in Km2'
2 3
G UJARAT -eolltd.
0·57 5'-18
0·39
3·88
7'77 11·65
1·97
0·93 10·36
22·53
10·36 0·60 3·24
14'25
13·80 10·36
2·85 1·50
2·59 5·98
7'51 1·17
29·78 9·84
2·80
3'16 4·07
2·59
5'18 7·77
14·40
2'59 0·34
1'29
1·71
5'18 12·95
9'19
1'17 4·43
4·17
1'86 15·41
0'54 10·33
10·26
13'21 19'24
9'80 5'82
29'04 41'87
43'81
35'81
27'66 30·39
35'.64 26'12 37'41
14'92 8'43
36·95
8'82 20'43
15'79 13·47
12'87 20'52 30·09
11'66 35'15 37·00
44'27
4'53 26'90
17'23
10'30 62·66
23'83 40'42
26'99
13'15
11'55
2'28 14·34
69'24
19'21 21'64
15'52
7'63 17·15 10·25
Population fot. the transferred areaS
'l961 -.A..-i9'71'
4
N.A. N.A.
N.A. N.A.
N.A. N.A.
N.A. N.A. N.A. N.A. N.A.
N.A. N.A.
N.A. N.A. N.A.
N.A. N.A.
N.A. N.A.
N.A. N.A. N.A.
N.A. N.A.
N.A. N.A. N.A.
N.A. N.A.
N.A. N.A. N.A. N.A.
N.A.
N.A.
N.A. N.A. N.A. N.A.
N.A. N.A. N.A.
N.A. N.A. N.A.
5
N.A. N.A.
N.A.
N.A. N.A. N.A.
N.A. N.A. N.A.
N.A. N.A.
N.A. N.A
N.A.
N.A. N.A.
N.A.
N.A. N.A
N.A.
NA. N.A. N.A. N.A. N.A. N.A. N.A. N.A. N.A. N.A.
N.A.
N.A. N.A. N.A. N.A.
N.A. N.A.
N.A. N.A
N.A. N.A
N.A. N.A.
N.A. N.A.
N.A.
District/Town
Vadodara (Baroda): 83 Vadodara 84 Karjan
85 Sankheda
86 Bahadarpur' 87 Chhota Udaipur 88 Sinor .
Bharuch (Broach):
89 Anklesvar 90 Jambusar 91 Rajpipla
Surat: 92 Sural 93 Katargam 94 Mandvi
95 Vyara'
Valsad (Bulsar): 96 Jalalpofe
97 Dharampur
Arnbala:
1 Yamunana~ar
Karnal:
2 Pehowa 3 Kamal 4 Gharaunda
Rohtak:
5 Sonepat
Gurgaon:
6 Gurgaon
7 Sohna'
Hisar:
8 Mandi Dabwali 9 Tohana
10 Hisar .
II Bhiwani
Jind:
12 )'Iarwana
Mandi:
1 Mundi
Kulu:
2 Sultanpur
Mahasu:
3 Theog·
Sirmaur:
4 PaonIa Sahib
Srinagar:
1 Srinagar
Area in Km'
2 3
G UJARAT -colleld.
34'42 78'13 15'70 15'71 0'49 1'63
0'26 14·47 2'59 4·01
0'44 16"19
3'63 9·00
4'53 38'70 3'60 4·45
13'39 35'56 10'62 7·01
7'51 7·56 6'48 7·92
1l'84 9'55 4'30 15'51
HARYANA
10'36 23·31
1'35 7'77
9'84 18·57 0'93 1·55
4'38 21'37
5'18 15'33 0'36 3·24
1'35 2'~8
10'36 4·53
17'53 31·34
12'95 9·07
2'20 5'18
HIMACHAL PRADESH
10'36 4·00
5'18 6·68
0'70 4·00
1'66 2'53
JAMMU & KASHMIR
41·44 82·88
Population for the transferred arcas' r-:_-.A..---1961 19ii'
4
N.A.
N.A. N.A. N.A.
N:A. N.A.
N.A. N.A.
N.A.
N.A. N.A.
N.A. N.A.
N.A.
N.A.
N.A.
N.A. N.A. N.A.
N.A.
N.A. N.A.
N.A. N.A. N.A. N.A.
N.A.
N.A.
N.A.
N.A.
N.A.
N.A.
5
N.A.
N.A. N.A.
N.A.
N.A. N.A.
N.A. N.A ..
N.A.
N.A.
N.A. N.A. N.A.
N.A. N.A.
N.A.
N.A. N.A
N.A.
N.A.
N.A.
N.A.
N.A. N.A.
N.A. N.A.
N.A.
N.A.
N.A.
N.A.
N.A.
N.A.
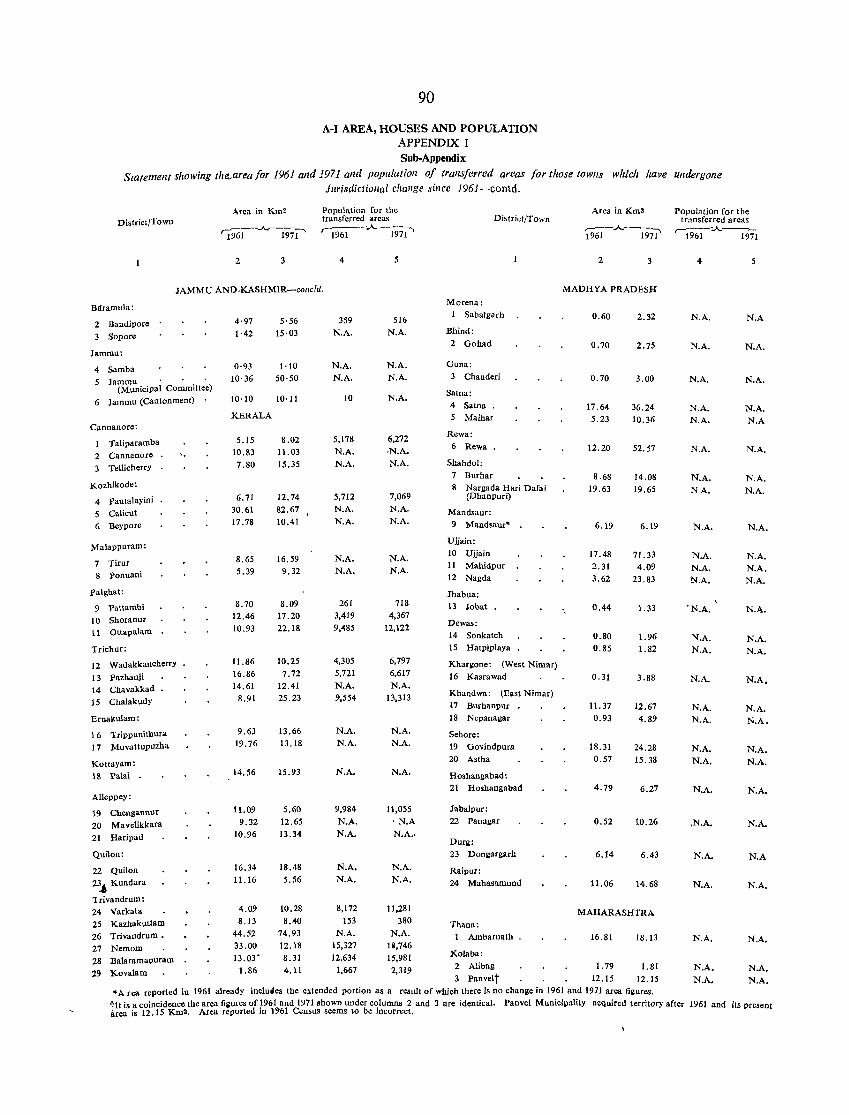
90
A-I AREA, HOUSES AND POPULATION APPENDIX I Sub-Appendix
Statement showing the...areafor 1961 and 1971 and population of transferred areas for those towns wlzich have undergone Jurisdictional citange since 1961-contd.
Area in Km2 Population for the transferred areas Dhtrict/Town
Area in Km2 POpulatiOn for the District/Town transferred areas
'1%-1-~1 ,.-~..A--mi' 'i96i--"---i97l' r-1961-..A-~97i
2 3
JAMMU AND.KASHMlR-coneld.
Bolramula:
2 Bandipore
3 Sopore
Jammu:
4 Samba Jammu . • .
(Municipal Committee)
6 Jammu (Cantonment)
Cannanore:
Taliparamba
2 Cannanore 3 Tellicherry
Kozhikode:
4 Pantalayini
5 Calicnt 6 Beypore
Malappuram:
7 Tirur 8 ponnani
Palghat:
9 Pattambi 10 Shoranur 11 Ottapalam
Tricbur:
12 Wadakkancherry
13 Pazhanji 14 Chavakkad 15 Chalakudy
Ernakulam:
16 'Irippunithura
17 Muvattupuzha
Kottayam: 18 Palai
Alleppey:
19 Chengannur 20 Mavelikkara
21 Haripad
Quilon:
22 Quilon
2~ Kundara
Trivandrum: 24 Varkala 25 Kazhakuttam
26 Trivandrum,
27 Nemom 28 Balaramapuram
29 Kovalam
4·97 1·42
0·93
10·36
10·10
KERALA
5.15 10.83 7.80
6.71 30.61
17.78
8.65 5.39
8.70 12.46 10.93
11.86 16.86
14.61 8.91
9.63
19.76
14.56
11.09
9.32 10.96
16.34
11.16
4.09
8.13
44.52 33.00
13.03' 1.86
5·56 15·03
1'10 50·50
10· 11
8.02 11.03
15.35
12.74 82.67 10.41
16.59 9.32
8.09 17.20 22.18
10.25
7.72 12.41 25.23
13.66 13.18
15.93
5.60
12.65 13.34
18.48
5.56
10.28 8.40
74.93 12.18
8.31 4.11
4
359 N.A.
N.A. N.A.
10
5,178
N.A. N.A.
5,712
N.A. N.A.
N.A. N.A.
261
3,419 9,485
4,305 5,721
N.A. 9,554
N.A. N.A.
N.A.
9,984
N.A. N.A.
N.A.
N.A.
8,172 153
N.A.
15,327 12,634
1,667
516 N.A.
N.A.
N.A.
N.A.
6,272
·N.A. N.A.
7,069
N.A. N.A.
N.A. N.A.
718 4,367
12,122
6,797
6,617
N.A. 13,313
N.A. N.A.
N.A.
11,055 ·N.A
N.A.·
N.A.
N.A.
11,281 380
N.A. 111,746 15,981
2,319
Morena: 1 Sabalgarh
Bhind:
2 Gohad
Guna:
3 Chanderi
Satna:
4 Satna . 5 Maihar
Rewa:
6 Rewa.
Shahdol: 7 Burhar
8 Nargada Had Darai (Dhanpuri)
Mandsaur: 9 Mandsaur*
Ujjain:
10 Vjjain
11 Mahidpur 12 Nagda
Jhabua: 13 Jobat
Dewas: 14 Sonkatch 15 Hatpiplaya
Kharllone: (West Nimar)
16 Kasrawad
Khandwa: (East Nimar) 17 Burhanpur 18 N epanagar
Sehore: 19 Govindpura
20 Astha
Hoshangabad: 21 Hoshangabad
Jabalpur: 22 Panagar
Durg:
23 Donllargarh
Raipur:
24 Mahasamund
Thana: I Ambarnath
Kolaba:
2
MADHYA PRADESH
0.60
0.70
0.70
17.64 5.23
12.20
8.68
19.63
6.19
17.48 2.31 3.62
0.44
0.80 0.85
0.31
11. 37
0.93
18.31 0.57
4.79
0.52
6.14
11.06
2.32
2.75
3.00
36.24
10.36
52.57
14.08
19.65
6.19
71.33 4.09
23.83
1. 33
1.96 1.82
3.88
12.67
4.89
24.28 15.38
6.27
10.26
6.43
14.68
MAHARASHTRA
16.81 18.13
2 Alibag 1. 79 1. 81
3 Panvelt 12.15 12.15
*A rea reported in 1961 already incluoles the extended portion as a result of which there is no chanlle in 1961 and 1971 area figures.
4
N.A.
N.A.
N.A.
N.A. N.A.
N.A.
N.A.
NA.
N.A.
N.A. N.A. N.A.
·N.A.
N.A.
N.A.
N.A.
N.A.
N.A.
N.A. N.A.
N.A.
.N.A.
N.A.
N.A.
N.A.
N.A.
N.A.
t It is a coincidence the area fillures of 1961 and 1971 shown under columns 2 and 3 are identical. Panvel Municipality acquired territory after 1961 and area is 12.15 Km0. Area reported in 1961 Census seems 10 be incorrect.
5
N.A
N.A.
N.A.
N.A. N.A
N.A.
N.A.
N.A.
N.A.
N.A. N.A. N.A.
N.A.
N.A. N.A.
N.A.
N.A. N.A.
N.A. N.A.
N.A.
N.A.
N.A
N.A.
N.A.
N.A.
N.A.
its present
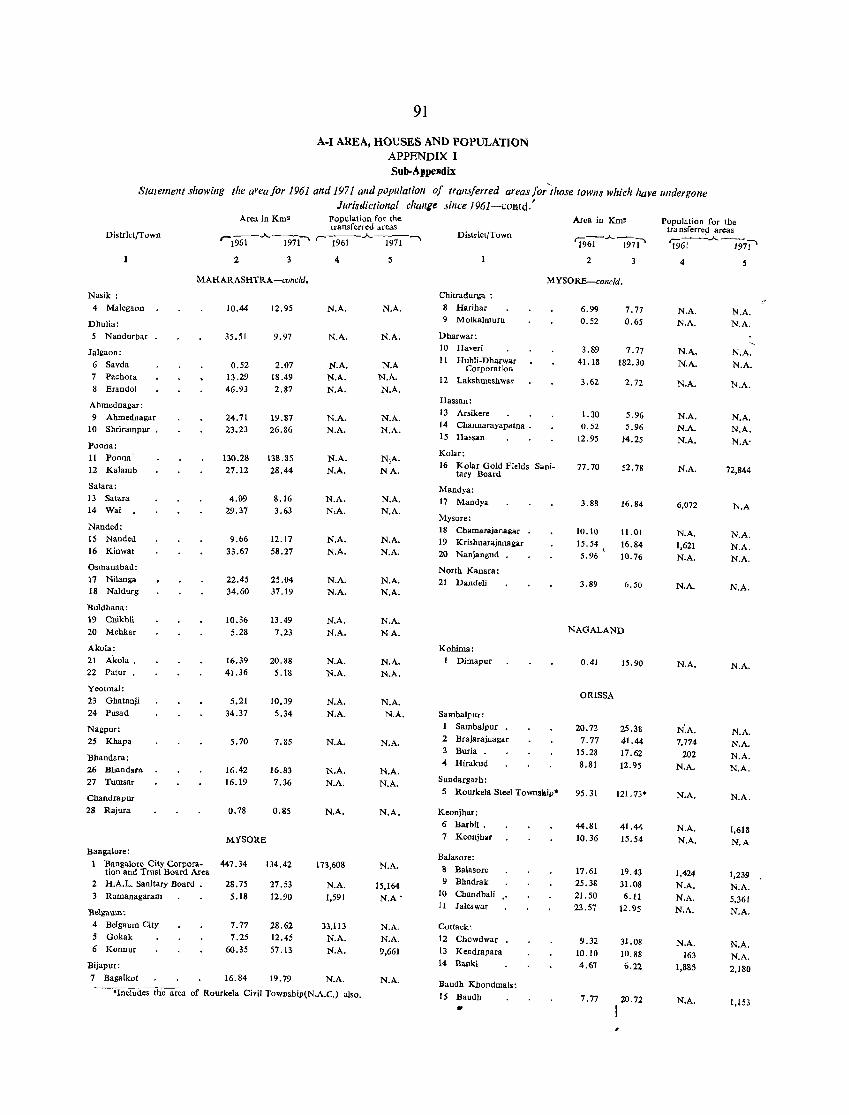
91
A-I AREA, HOUSES AND POPULATION APPENDIX I Suh-A,IPCJldix
Stazement showing the area for 1961 and 1971 alld po pula lion of trallsferred areaS for those towns which have ulldergone JurisJictional challile since J961-co.!ltd.'
Area in Km2 population for the transferred areas
DistrktJTown r-1%l-.A.-197i"' "1%1-"--1971--
2 3
MAHARASHTRA-ccnc1d,
Nasik: 4 Malegaon
Dhulia: 5 Nandurbar
Jalgaan: 6 Savda 7 Pachara 8 Erandol
Ahmednagar: 9 Ahmednagar
10 Shrirampur
Poona: II Paana'
12 Kalamb
Satara: 13 Satara 14 Wai
Nanded: 15 Nanded 16 Kinwat
Osmanabad: 17 Nilanga 18 Naldurg
Buldhana: 19 Chikhli 20 Mehkar
Akola: 21 Aimla. 22 Patur .
Yeotmal: 23 Ghatanji 24 Pusad
Nagpur: 25 Khapa
Bhandara: 26 Bhandara 27 Tumsar
Chandrapur 28 Rajura
10.44
35,51
0.52 13.29 46.93
24.71 23.23
130.28 27.12
4.09 29.37
9.66 33.67
22.45 34.60
10.36 5.28
16.39 41.36
5.21 34.37
5.70
16.42 16.19
0.78
12.95
9.97
2.07 18.49 2.87
19.87 26.86
138.85 28.44
8.16 3.63
12.17 58.27
25.04 37.19
13.49 7.23
20.88 5.18
10.39 5.34
7.85
16.83
7.36
MYSORE Bangalore:
1 Bangalore City Corpora- 447.34 tion and Trust Board Area
2 H.A.L. Sanitary Board 28.75 3 Ramanagaram 5.18
Belgaum: 4 Belgaum City 7.77 5 Gokak 7.25 6 Konnur 60.35
Bijapur: 7 Bagalkot 16.84
134.42
27.53
12.90
28.62 12.45 57.13
19.79
4
N.A.
N.A.
N.A. N.A. N.A.
N.A. N.A.
N.A. N.A.
N.A. N,A.
N.A. N.A.
N.A. N.A.
N.A. N.A.
N.A. N.A.
N.A. N.A.
N.A.
N.A. N.A.
N.A.
173,608
N.A. 1,591
33,113 N.A. N.A.
N.A.
'Includes the area of Rourkela Civil TOWDShip(N.A.C.) also.
5
N.A.
N.A.
N.A N.A. N.A.
N.A. N.A.
N.A. N.A.
N.A. N.A.
N.A. N.A.
N.A. NA.
N.A. N.A.
N.A. N.A.
N.A.
N.A. N.A.
N.A.
N.A.
15,164 N.A·
N.A. N.A. 9,661
N.A.
Area in Km' Population for the
District/Tawil tra nsferred arcas
'1961-"-1971' 't96-j---"----mi' 2 4 5
MYSORE-collcld.
Chitradurl:a : 8 Harihar 9 Molkalmuru
Dharwar: 10 Haveri I I Hubli-Dharwar
Corporation
12 Lakshmeshwar
Hassall: 13 Arsikere 14 Channarayapatna. 15 Hassan
Kolar:
16 Kolar Gold Fields Sani-tary Board
Mandya: 17 Mandy.
Mysore: 18 Chamarajanal:ar 19 Krisbnarajanagar 20 Nanjangud
North Kanara: 21 Dand.li
Kohima: 1 Dimapur
Sambalpur: 1 Sambalpur 2 Brajarajnagar 3 Burla . 4 Hirakud
Sundargarh:
5 Rourkela Steel Townsltip'
Keonjhar: 6 Barbil. 7 Keonjhar
Balasore:
II Balasare 9 Bhadrak
10 Chandbali " II Jaleswar
Cuttack: 12 Chowdwar 13 Kcndrapara 14 Banki
Baudh Kbondmals: 15 Baudh
•
6.99 0.52
3.89 41.18
3.62
1.30 0.52
12.95
77.70
3.88
10.10 15.54
5.96
3.89
7.77
0.65
7.77 182.30
2.72
5.96 5.96
14.25
52.78
16.84
11.01 16.84 10.76
6.50
NAGALAND
0.41
ORISSA
20.72 7.77
15.28 8.81
95.31
44.81 10.36
17.61 25.38
21.50 23.57
9.32 10.10
4.67
7.77
15.90
25.38 41.44 17.62 12.95
121.13*
I
41.44 15.54
19.43 31.08 6.11
12.95
31.08 10.88
6.22
20.72
N.A. N.A.
N.A. N.A.
N.A.
N.A. N.A. N.A.
N.A.
6,072
N.A. 1,621 N.A.
N.A.
N.A.
N:A. 7,774
202 N.A.
N.A.
N.A. N.A.
1,424
N.A. N.A. N.A.
N.A. 163
1,885
N.A.
N.A. N.A.
N.A. N.A.
N.A.
N.A. N.A. N.A-
72,844
N.A
N.A. N.A. N.A.
N.A.
N.A.
N.A. N.A. N.A. N.A.
N.A.
1,618 N.A
1,239
N.A. 5,361 N.A.
N.A. N.A. 2,180
1,153
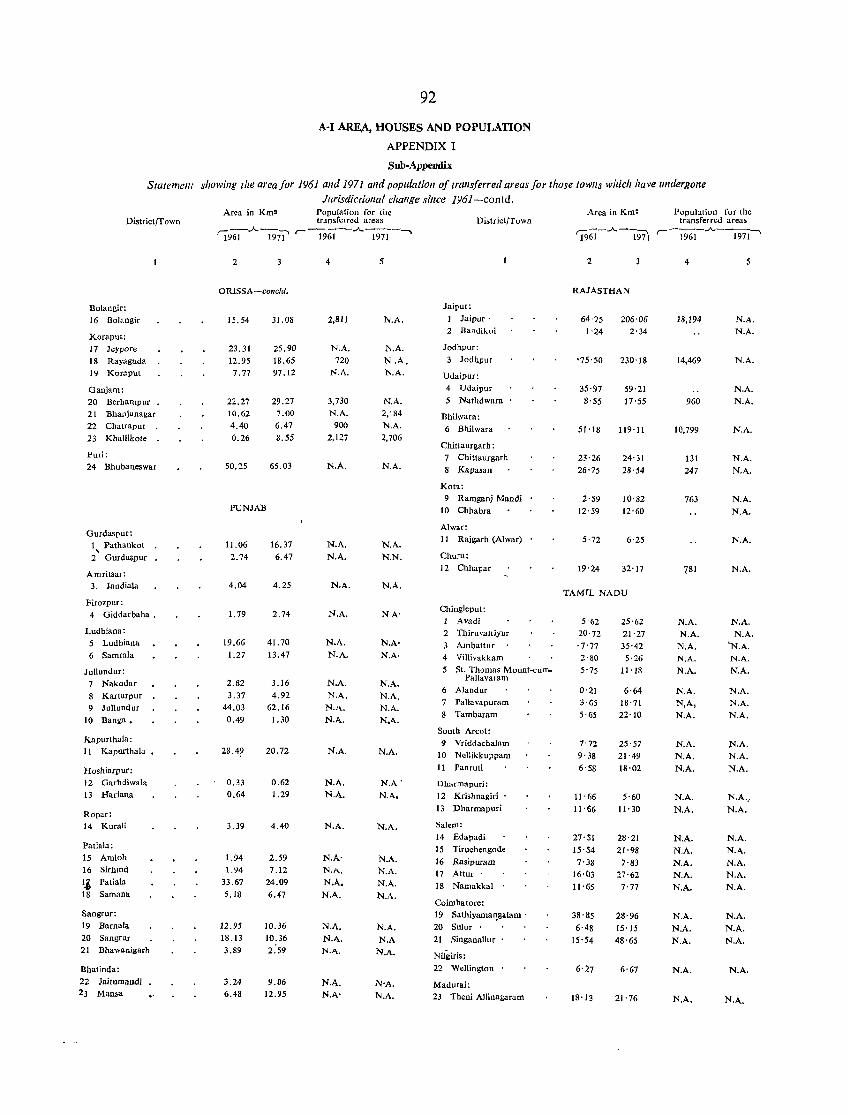
92
A-I AREA. HOUSES AND POPULATION
APPENDIX I
Sub-Appendix
Statemelll showing the area for 1961 and 197/ and population of transferred areas for those towns which have undergone Jurisdictional change since 196J-contd.
District/Town
Bolangir: 16 Bolangir
Koraput: 11 Jeypofe 18 Rayagada 19 Koruput
Ganjam: 20 Berhampur 21 Bhanjanagar 22 Chatrapur 23 Khallikote .
Puri:
24 Bhubaneswar
Gurdaspur: I Pathankot , 2 Gurda~pur
Amritsar: 3. Jandiala
Firozpur: 4 Giddarbaha.
Ludbiana: 5 Ludhiana 6 Samrala
Jullundur: 7 Nakodar 8 Kartarpur 9 Jullundur
10 Banga.
Kapurtbala: 11 Kapurthala
Hoshiafput: 12 Garhdiwala 13 Hariana
Ropar: 14 Kurali
Patiala: 15 Amloh 16 Sirbind
~ Patiala 18 Samana
Sangrur: 19 Barnala 20 Sangrur 21 Bhawanigarh
Bbatinda: 22 Jaitumnod; 23 Mama
Area in Km' Population for the transferred areas
'l961.A.-i9il' r-1961--..A.."Im-......
2
ORISSA-concld.
15.54
23.31
12.95 7.77
22.27 10.62 4.40
0.26
50.25
31.08
25.90 18.65 97.12
29.27 7.00 6.47 8.55
65.03
PUNJAB
11.06 2.74
4.04
I. 79
19.66 1.27
2.82 3.37
44.03
0.49
28.4?
0.33
0.64
3.39
1.94 1.94
33.67 5.18
12.95 18.13 3.89
3.24
6.48
16.37 6.47
4.25
2.74
41.70 13.47
3.16 4.92
62.16
1.30
20.72
0.62 1.29
4.40
2.59 7.12
24.09
6.47
10.36 10.36 2.59
9.06 12.95
4
2,811
N.A. 720
N.A.
3,730
N.A. 900
2,127
N.A.
N.A. N.A.
N.A.
N.A.
N.A. N.A.
N.A. N.A.
N.A. N.A.
N.A.
N.A. N.A.
N.A.
N.A· N.}\.
N.A. N.A.
N.A. N.A. N.A.
N.A. Nk
5
N.A.
N.A. N.A. N.A.
N.A. 2,184
N.A. 2,706
N.A.
N.A. N.N.
N.A.
N.A·
N.A·
N.A. N.A. N.A. N.A.
N.A.
N.A·
N.A.
N.A.
N.A. N.A. N.A. N.A.
N.A. N.A
N.A.
N·A. N.A.
District/Town
Jaipur: 1 Jaipur' 2 Bandikui
Jodhpur: 3 Jodhpur
Udaipur: 4 IJdaipur 5 Nathdwara
Bhilwara: 6 Bbilwara
Chittaurgarh: 7 Cbittaurgarh 8 Kapasan
Kota: 9 Ramganj Mandi
10 Chbabra
Alwar: II Rajgarh (AI war)
Churu: 12 Cbbapar
Chingleput: 1 Avadi 2 Thiruvattiyur 3 Ambattur 4 Villivakkam 5 St. Thomas Mount-cum-
Pallavaram 6 Alandur 7 Pallavapuram
8 Tambaram
South Arco!: 9 Vriddachalam
10 Nellikkuppam 11 Panruti
Dharmapuri: 12 Krishnagiri 13 Dharmapuri
Salem:
14 Edapadi 15 Tirucbengode 16 Rasipuram 17 Attur .
18 Namakkal
Coimbatore: 19 Sathiyamal\galam' 20 Sulur .
21 SinganaUur
Nilgiris: 22 Wellington
Madura;: 23 Thew Allinagaram
Area ill Km' Population for the transferred areas
'l96i-"""'--1971 ,---!%i-..A.-"'I97J ......
2
RAJASTHAN
64'75 1'24
'75'50
35·97
8'S5
51'18
23'26
26'75
2'$9
12'59
206'06
2'34
230'18
59'21
17'55
119'11
24'31 28'54
10'82
12'60
5'72 6'25
19'24 32'17
TAMfL NADU
5'62
20'72 -7'77 2'80 5'75
0'21 3'65
5'65
7'72 9'38
6'58
11'66
11'66
27'SI 15'S4 7·38
16·03
11'65
38'85
6·48 15'54
6'27
18'13
25-62
21·27
35'42 5·26
11'18 6'64
18'71
22'10
25'57 21'49
18'02
5'60
11'30
28'21
21'98 7'83
27'62 7'77
28'96
15' 15
48'65
6'67
21'76
4
18,194
14,469
960
10,799
131 247
763
781
N.A. N.A.
N.A. N.A. N.A.
N.A. N.A. N.A.
N.A. N.A.
N.A. N.A. N.A. N.A. N.A.
N.A. N.A. N.A.
N.A.
N.A.
N.A. N.A.
N.A.
N.A. N.A.
N.A.
N.A. N.A.
N.A. N.A.
N.A.
N.A.
N.A. N.A.
'N.A. N.A. N.A.
N.A. N.A. N.A.
N.A. N.A. N.A.
N.A., N.A.
N.A. N.A. N.A. N.A. N.A.
N.A. N.A. N.A.
N.A.
N.A.
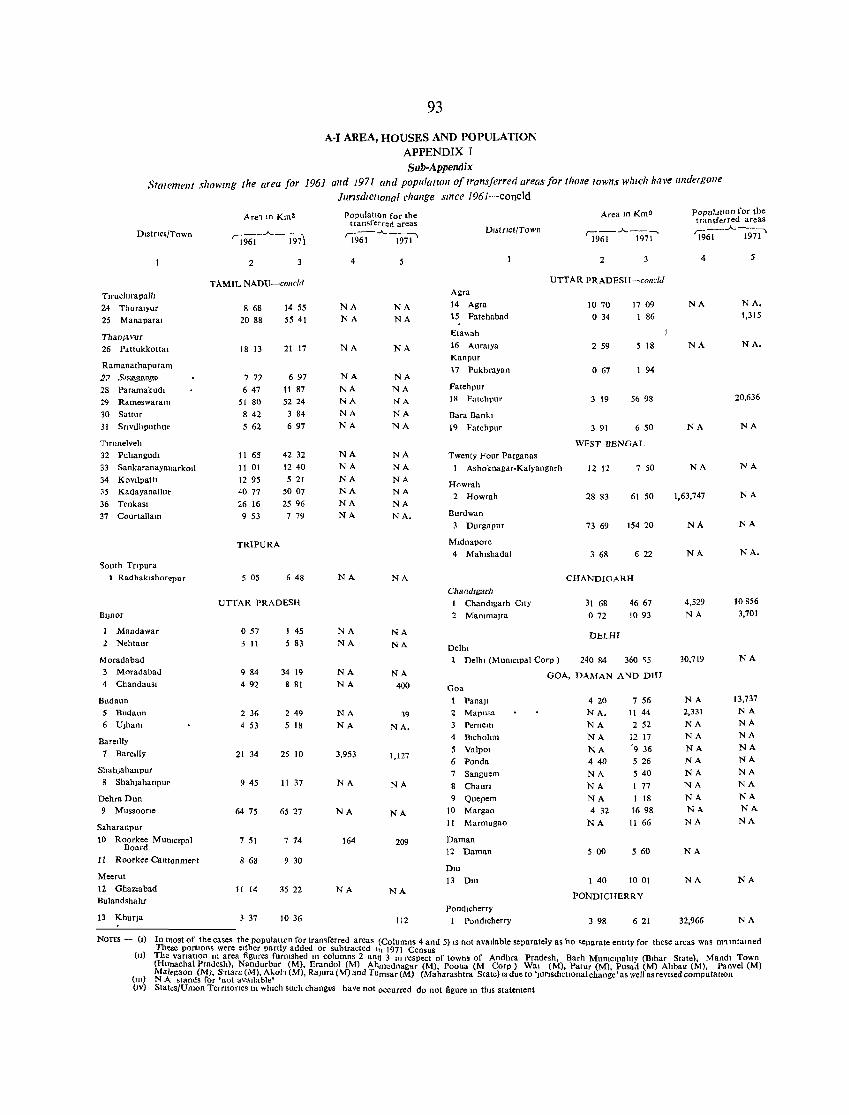
93
A-I AREA, HOUSES AND POPULATION APPENDIX r Sub-Appentlix
Statement showmg the area for 1961 alld 1971 and popu/atlOll of transferred areas far those towns whIch havf ulldergone JUrisdICtIonal change slllee 1961-concld
DistrIct/Town
T1ruclurapalh 24 Thuralyur 25 Manaparal
ThanJavur 26 Pdltukkottm
Ramanathapuram
:1, s..'~3.1'.Qg.~
28 Paramakudl 29 Rameswaram 30 Snttur 31 SnvIlhputhur
Tlrunelvell
32 Puhangudi
33 SankaranayanarkOlI 34 KovllpattI 35 Kadayanallur
36 Tenkasl 37 Courta1lam
South Tnpura \ RadhakIshorepur
Bijnor
Mandawar
2 Nehtaur
Moradabad 3 Moradabad
4 ChandauS!
Budaun Budaun
6 Ujham
Bareilly 7 BareIlly
Shahjahanpur
8 Shahjahanpur
Dehra Dun 9 Mussoone
SahaTanpur
10 Roorkee Munlclp31 Board
II Roorkee Cantonment
Meerut
12 Ghazmbad Bulandshahr
13 Khufja
Are'lln Km2 __ .A. __ --,
'1961 1971
2 3
TAMIL NADU-collc/If
8 68
20 88
18 13
7 77
647
51 80
842
5 62
11 65
11 01
1295 4077
26 16
9 53
14 S5
55 41
21 17
697
11 87
52 24 3 84
697
42 32
1240
5 21
5007
25 96 7 79
TRIPURA
5 OS 648
UTIAR PRADESH
057
3 11
9 84
492
2 36
4 53
21 34
94S
64 7S
7 51
8 68
If 14
3 37
I 45 5 83
34 19
8 81
249
5 lH
25 10
II 37
65 27
7 74
9 30
3522
1036
PopulatIon for the transferred areas
'1961""- -i9=ii\
4
NA NA
NA
NA
NA NA NA
NA
NA
NA NA NA
NA NA
NA
NA
NA
NA
NA
NA
NA
3,953
NA
NA
164
NA
NA NA
NA
NA
NA NA
NA
NA
NA
NA NA NA
NA NA,
NA
NA
NA
NA 400
39
NA,
1,127
NA
NA
209
NA
112
DJstflct/Town
Agra
14 Agra 15 Fatehabad
Eta\\ah
16 Auralya Kanpur
17 Pukhrayan
Fatehpur 18 Fatehpur
Bara Bankl 19 Fatehpnr
Twenty Four Parganas
Area IU Km 2
r---....J..---~ 1961 1971
2 3
UTTAR PRADESH-collcld
1070
o 34
2 59
o 67
3 19
3 91
17 09
1 86
5 18
I 94
56 98
6 50
WEST BENGAL
1 Ashoknagar-Kalyangarh 12 12 7 50
Howrah 2 Howrah
Burdwan
3 Durgapur
Mldnapore 4 Mahlshadal
Chandlgarh
1 Chandlgarh Clty
2 Mammajra
DeIhl
28 83 61 50
73 69 154 20
3 68 6 22
CHANDIGARH
31 68
072
DELHT
46 67
10 93
\ Deihl (Municipal Corp) 240 84 360 ,5
Goa
1 Pana]1
2 Mapus.
3 Pernem 4 Blchohm
5 VaipOJ 6 Ponda 7 Sanguem
8 Chann 9 Quepem
10 Margao 11 Marmugao
Daman 12 Daman
DIU
13 DIU
Pondlcherry 1 Pondlcherry
GOA, DAMAN A'ID DIU
4 20 NA. NA
NA
NA 440 NA
NA NA 4 32
NA
5 00
7 56 11 44
2 52 12 17 '9 36
5 26 5 40
I 77
1 18 1698
II 66
5 60
I 40 10 01
PONDICHERRY
3 98 6 21
PopulatIOn for the transferred areas __ ..A..--:-:. 'i961 1971
4
NA
NA
NA
NA
1,63,747
NA
NA
4,529
NA
30,719
NA 2,331
NA
NA
NA NA
NA
NA NA NA
NA
NA
NA
32,966
5
NA. 1,315
NA.
20,636
NA
NA
NA
NA
NA.
10856 3,701
NA
13,737 NA NA
NA NA NA
NA NA
NA NA
NA
NA
NA
NOTES - (i) In Illostot" the cases the populatJon fortran.ferred areas (Columns 4 and 5) IS not available separately asno separate entity for these areas was m'lmtaJOed These portIOns were either partly added or subtracted in 1971 Census
(n) The varIatIOn 10 area figures furnished 10 columns 2 an~ 3 In respect of towns of Andhra Pradesh, Barh Mumclpahty (BIhar State), Mandl Town (HImachal Pradesh), Nandurbar (M), Erandol (M) Ahmednagar (M), Poona (M Corp) Wal (M), Patur (M), Pusad (M) Ahball (M), Panvel (M) ~1e~s~~~d~~~~ ~;~~r;v~~!'bt~oh (M), RaJura (M) and TUmsar(M) (Maharashtro State) lS due to 'jul'lsdlctlOnalchange' as well as reVIsed computatlOn (m)
(IV) States/Umon TerntorIes 10 which such changes have not occurred do not figure m thls statement
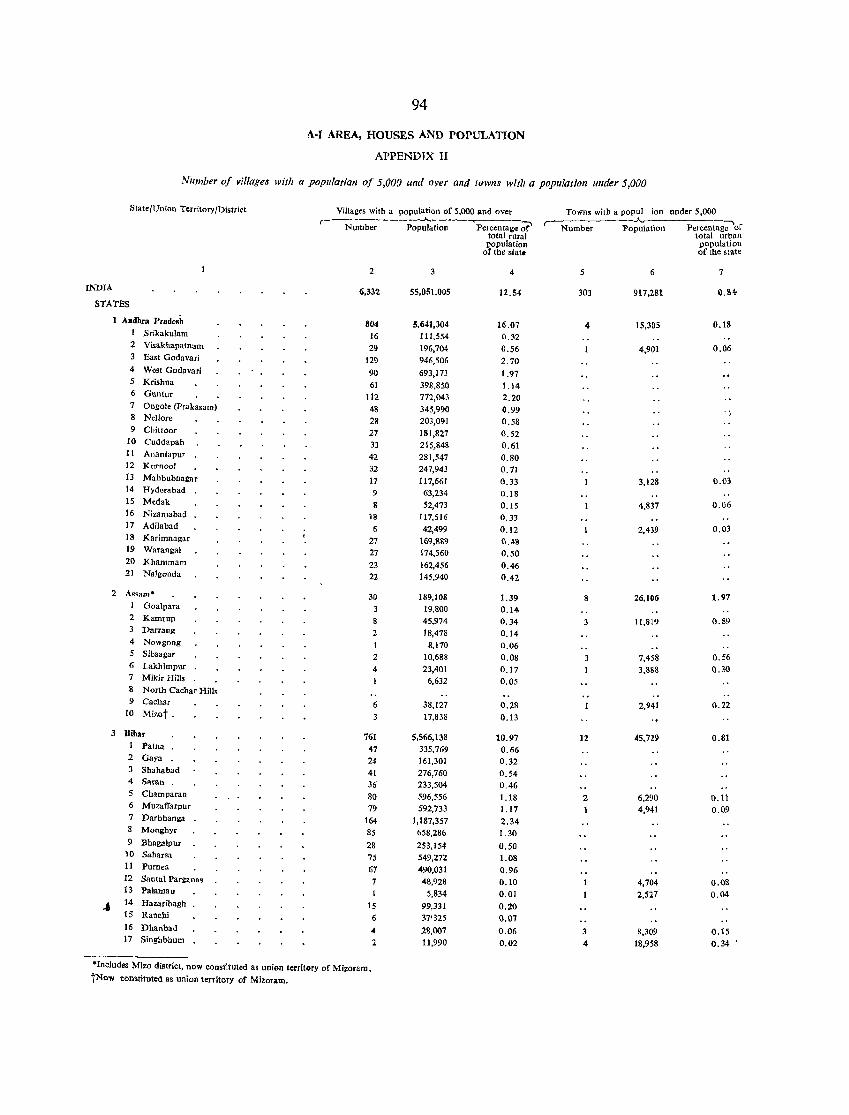
94
A-I AREA, HOUSES AND POPULATION
APPENDlX II
Number 0/ villages with a populatian of 5,000 and over and towns Willi a population under 5,000
State/Union Territory/District ViII'fleS with a population of 5,000 and over Towns with a popul ion under 5,000 r- Pop-;;;;'~Percentag. ;;?
Jv.--Percentag~of Number Number Population
total rural total urban population popUlation
of the state ofthe state
2 4 5 6 7
INDIA 6,332 55,051,005 12.54 303 917,281 O.M· STATES
1 A"dhra Pradesh 804 5,641,304 16.07 4 15,305 0.18 1 Srikakulam 16 111.554 0.32 2 Visakhapatnam 29 196,704 0.56 4,901 0.06 3 East Godavari 129 946,506 2.70 4 West Godavari 90 693,173 1.97 5 Krishna 61 398,850 1.14 6 Guntur 112 772,043 2.20 7 Ongol. (prakasam) 48 345,990 0.99 , 8 NeIlore 28 203,091 0.58 9 Chittoor 27 181,827 0.52
10 Cuddapah 33 215,848 0.61 11 Anantapur 42 281,547 0.80 12 Kurnool 32 247,943 0.71 13 Mahbubnagar 17 117,661 0.33 3,128 0.03 14 Hyderabad 9 63,234 0.18 15 Medak 8 52,473 0.15 4,837 0.06 16 Nizamabad 18 117,516 0.33 17 Adilabad 6 42,499 0.12 2,439 0.03 18 Karimnagar 27 169,8&9 \\.48 19 Warangal 27 174,560 0.50 20 Khammam 23 162,456 0.46 21 Nalgonda 22 145,940 0.42
2 Assam* 30 189,108 1.39 8 26,106 1.97 Goalpara 19,800 0.14
2 Kamrup 8 45,974 0.34 11,819 0.89 Darraug 2 18,478 0.14
4 Nowgong 8,170 0.06 5 Sibsagar 2 10,688 0.08 7,458 0.56 6 Lakhimpur 4 23,401 0.17 3,888 0.30 7 MikirHiIIs 6,632 0.05 8 North Cachar Hills 9 Cachar 6 38,127 0.28 2,941 0.22
10 Mizot· 17,838 o.b 3 Bihar 761 5,566,138 10.97 12 45,729 O.Sl
1 Patna 47 335,769 0.66 2 Gaya 24 161,301 0.32 3 Shahabad 41 276,760 0.54 4 Saran . 36 233,504 0.46 5 Charnparan 80 596,556 1. 18 2 6,290 0.11 6 Muzaffarpur 79 592,733 1.17 4,941 0.09 7 Darbhanga 164 1,187,357 2.34 8 Mongbyr 85 658,286 1.30 9 Bhagalpur 28 253,154 0.50
10 Saharsa 7S 549,272 1.08 11 Pumea 67 490,031 0.96 12 Santal Parganas 7 48,928 0.10 4,704 0.08 13 Palamau 5,834 0.01 2,527 0.04 .. 14 Hazaribagh IS 99,331 0.20 15 Ranchi 6 37'325 0.07 16 Dhanbad 04 28,007 0.06 3 8,309 0.15 17 Singhbhum 2 11,990 0.02 4 18,958 0.34
·Includes Mizo district, now constituted as union territory of Mizoram. tNow constituted as union territory of Mizoram.
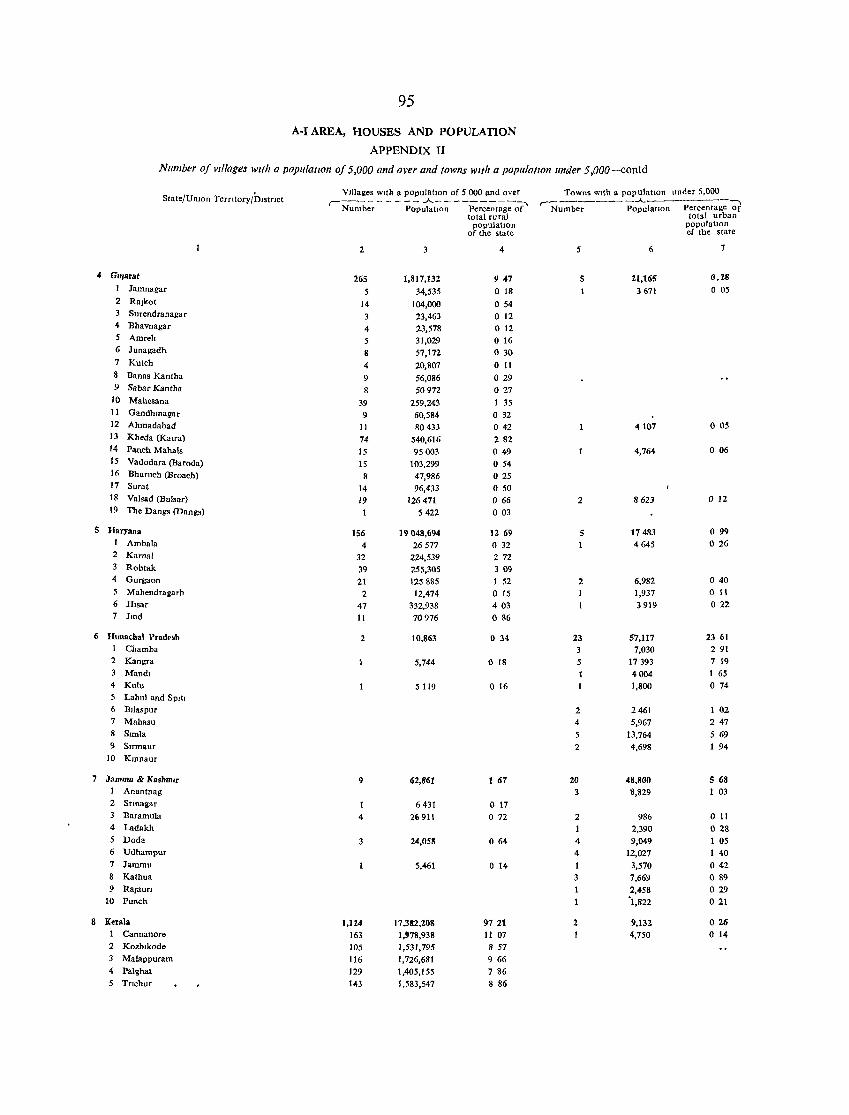
95
A·IAREA, HOUSES AND POPULATION
APPENDIX II
Number oj Villages with a populatIOn of 5,000 and over and 10Wlls wah a populatroll under 5,00D-contd
State/Umon TerrItory/Dlswct Villages wIth a populatIOn of 5000 and over Towns w,th a population under 5,000
r---- - - - - - .A.---_____ --:-,. ,---_ ______ --A...--------, Number PopulatIOn Percentage of Number Population Percentage of
total rural total urban populatIOn populatIOn
of the state ef the state
2 4 5 6 1
4 GUjarat 265 1,817,132 9 47 5 21,165 0.28 I Jamnagar 5 34,535 o 18 3671 o 05 2 RaJkot 14 104,000 054 3 Surendranagar 3 23,463 o 12 4 Bhavnagar 4 23,578 o 12 5 Amreh 5 31,029 o 16 6 Junagadh 8 57,172 030 7 Kutch 4 20,807 011 8 Banas Kantha 9 56,086 029 9 Sabar Kamha 8 50972 027
10 Mahesana 39 259,243 I 35 11 Gandhmagar 9 60,584 032 12 Ahmadabad 11 80433 042 4101 o 05 13 Kheda (Katra) 74 540,616 282 14 Panch Mahals 15 95003 049 4,764 o 06 15 Vadodara (Baroda) IS 103,299 054 16 Bharuch (Broach) 8 47,986 025 17 Sura! 14 96,433 o 50 18 Valsad (Bulsar) 19 126471 066 2 8623 012 19 The Dangs (Dangs) 5422 003
5 Haryana 156 19048,694 12 69 5 17483 o 99 1 Ambala 4 26577 032 4645 o 26 2 Kamal 32 224,539 272 3 Rohtak 39 255,305 3 09 4 Gurgaon 21 125885 I 52 2 6,982 040 5 Mahendragarh 2 12,474 o 15 1,937 o 11 6 Hlsar 47 332,938 403 3919 022 7 Jmd 11 70976 086
6 H,machal Pradesh 2 10,863 o 34 23 57,117 23 61 1 Chamba 7,030 291 2 Kangra 5,744 o 18 5 17 393 7 19 3 Mandl 1 4004 1 65 4 Kulu 5119 016 1 1,800 o 74 S Lahul and SPltl 6 Bllaspur 2 2461 1 02 7 Mahasu 4 5,967 247 8 SImla S 13,764 5 69 9 Sumaur 2 4,698 1 94
10 Kmnaur
7 Jammu & KashmIr 9 62,861 I 67 20 48,800 5 68 ! Anantnag 3 8,829 1 03 2 Srmagar 1 6431 o 17 3 Baramula 4 2lj911 072 2 986 011 4 Ladakh ! 2,390 028 5 Doda 3 24,058 064 4 9,049 ! 05 6 Udhampur 4 12,027 1 40 7 Jammu 5,461 o 14 I 3,570 042 8 Kathua 3 7,669 089 9 RaJ8uCl 2,458 029
10 Punch '1,822 021
8 Kerala 1,124 17,382,208 9721 2 9,132 026 1 Cannanore 163 1."8,938 II 07 4,750 o 14 2 Kozhlkode 105 1,531,795 857 3 Malappuram 116 1,726,681 966 4 Palghat 129 1,405,155 7 86 5 Trlchur 143 1,583,547 8 86
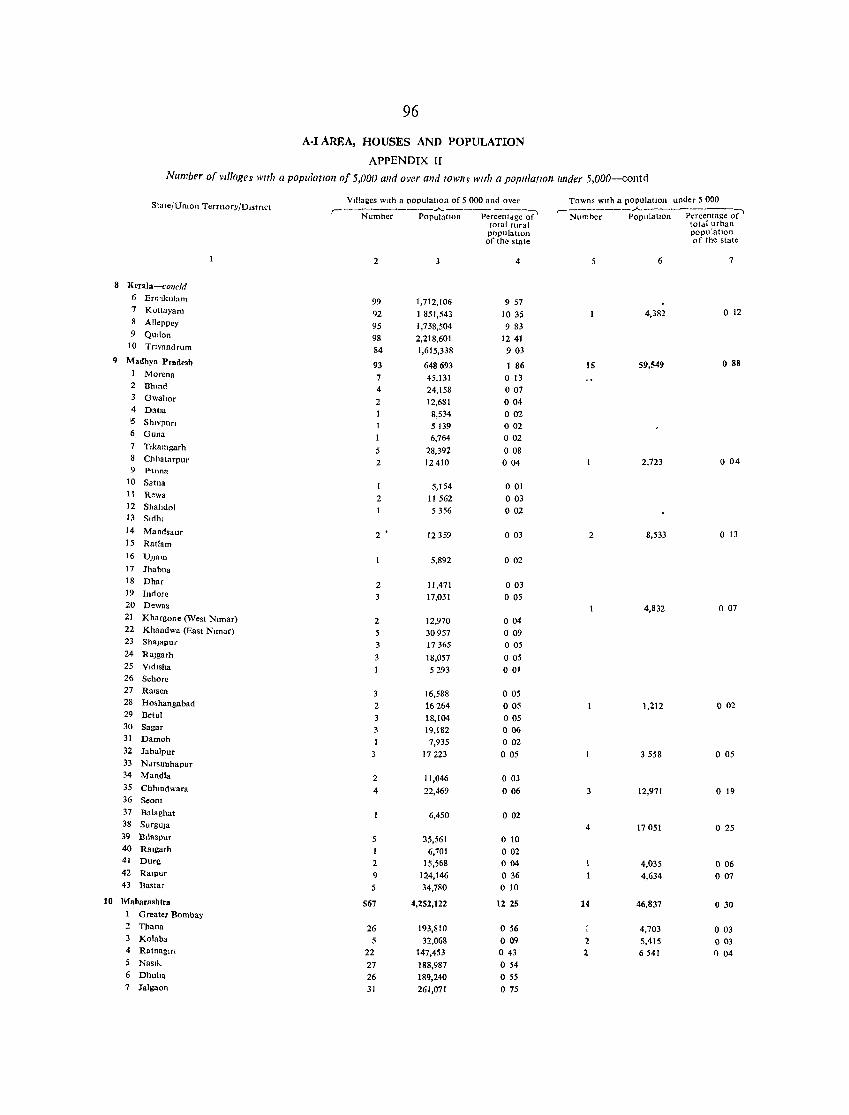
96
A·I AREA, HOUSES AND POPULATION
APPENDIX II
Number o( villages with a population of 5,000 alld over alld tOW/if with a popUlatlO1l IInder 5,000-contd
Villages With a population of 5 000 and Over Towns wtth a populatIOn under 5 000 State/Umon Terntory/D"trlet r- --------._---...A..----- -----:--., ~N~b~---~~~~-p~~~o~ Number POpulatlOn Percentdge of
total rural tot,,1 urban populatIOn populatIOn of the state of the slale
2 4 5 6 7
8 Kcrala-concld 6 Ern1kulam 99 1,712,106 9 57 7 Kottayam 92 1 851,543 1035 4,382 o 12 8 Alleppey 95 1,758,504 983 9 QUllon 98 2,218,601 1241
10 Tflvandrum 84 1,615,338 903 9 Madhya Pradesh 93 648693 1 86 15 59,549 o 88
1 Morena 7 45,131 o 13 2 Bhmd 4 24,158 007 3 Gwallor 2 12,681 004 4 Datla 8,534 002 !S ShlVPlln 5139 002 6 Guna 6,764 002 7 Tlkamgarh 28,392 008
Chhatarpur 2 12410 004 2,723 o 04 9 P'l.nna
10 Satna 5,154 001 11 Rewa 2 11562 003 12 Shahdol 5356 002 13 S,dhl
14 Mandsaur 2 12359 003 2 8,533 o 13 15 Ratl.m 16 UJJam 5,892 002 17 Jhabua 18 Dhar 2 11,471 003 19 Indore 17,031 005 20 Dewas 4,832 007 21 Khargone (West N,mar) 2 12,970 004 22 Khandwa (East Nlmar) 30957 009 23 Shajapur 3 17365 005 24 Rajgarh 3 18,057 005 25 Vld,sha 5293 001 26 Sehor. 27 Ralsen 3 16,588 005 28 Hoshangabad 2 16264 005 1,212 o 02 29 Betul 18,104 005 30 Sagar 3 19,182 006 31 Damoh 1 7,935 002 32 Jabalpur 3 17223 005 3558 o 05 33 Ndrslmhapur 34 Mandla 2 11,046 003 35 Chhmdwara 4 22,469 006 3 12,971 o 19 36 Seom 37 Balaghat 6,450 002 38 Surguja 4 17051 o 25 39 Bllaspur 35,561 o 10 40 Ralgarh 6,701 002 41 Durg 2 15,568 004 4,035 006 42 Ralpur 9 124,146 o 36 4,634 007 43 Bastar 5 34,780 o 10
10 Maharashtra 567 4,252,122 12 25 14 46,837 o 30 Greater Bombay
2 Thana 26 193,810 056 1 4,703 003 3 Kolaba 32,068 009 2 5,415 003 4 Ratnaglrl 22 147,453 043 2 6541 f) 04 5 NaSI!,. 27 188,987 o 54 6 Dhuha 26 189,240 o 55 7 Jalgaon 31 261,071 075
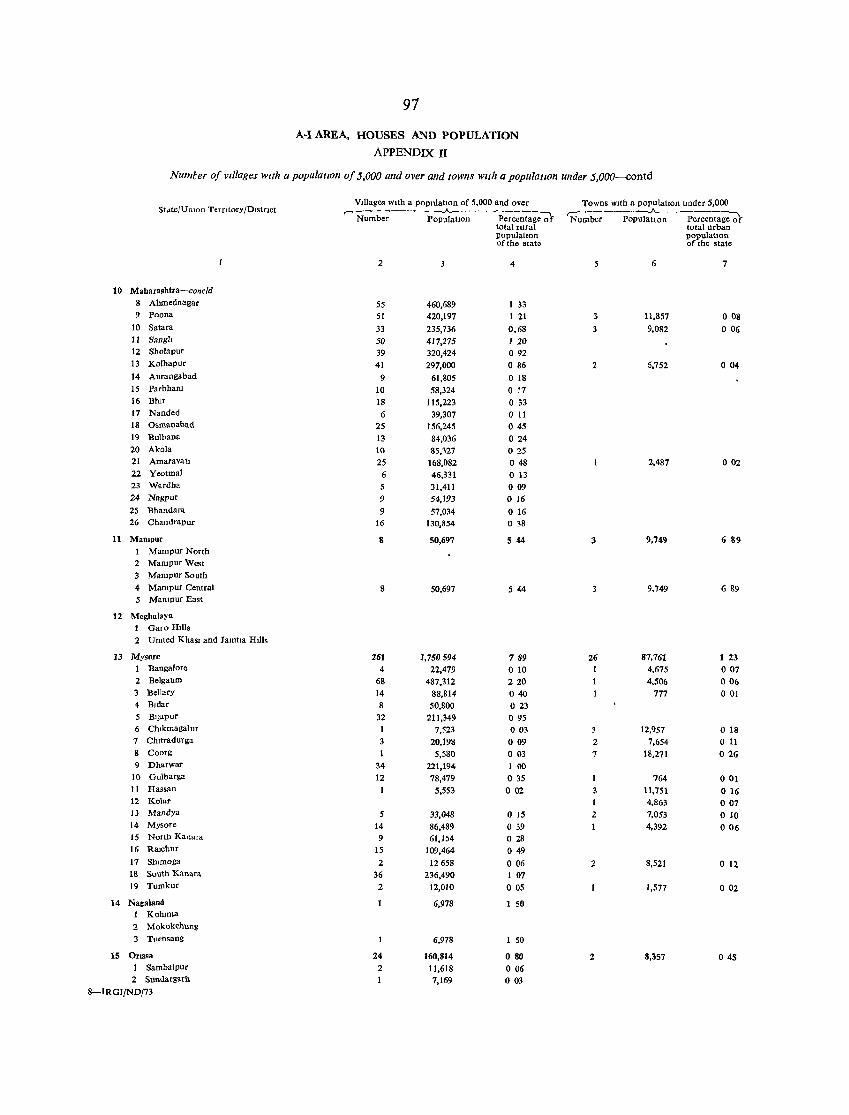
97
A-I AREA, HOUSES AND POPULATION
APPENDIx II
Numter of villages with a populatIOn of 5,000 and over and lowns with a population under 5,000---contd
SIAte/U man Terntory IDls!nct VIllages with a popnlatIOn of 5,000 and over Towns wIth a pOpulatIon under 5,000
r- Number -~--------, ,-: __ -----.A.-----------, Population Percentage 0 f Number PopulatIon Percentage of
total rural total urban populatIon populatIon of the statc orthe state
:2 4 6 7
10 Maharashtra-concld 8 Ahmednagar 55 460,689 1 33 9 Poona 51 420,197 1 21 :I 11,857 008
10 SataTa 33 235,736 0.68 3 9,082 006 11 Sangli 50 417,275 1 20 12 Sholapur 39 320,424 092 13 Kolhapur 41 297,000 086 2 6,752 004 14 Aurangabad 9 61,805 018 15 Parbham 10 58,324 o 17 16 Bhlr 18 115.223 o 33 17 Nanded 6 39,307 o 11 18 Osmanabad 25 156,245 045 19 Bulhana 13 84,036 024 20 Akola 10 85,327 025 21 Amaravah 25 168.082 048 2.487 002 22 Yeotmal 6 46,331 013 23 Wardba 5 31,411 009 24 Nagpur 9 54,193 016 25 Bhandara 9 57,034 o 16 26 Chandrapur 16 130,854 038
11 Mampur 8 50,697 5 44 9.749 6 89 Mampur North
2 MampurWest
3 Mampur South
4 Mantpur Central 8 50,697 544 9,749 689 5 Manlpur East
12 Meghalaya 1 Garo Hills
2 Untted KhaS! and Jamtla HIlls
13 Mys"re 261 1,750594 789 26 87.761 1 23 1 Bangalore 4 22,479 010 4,675 007 2 Belgaum 68 487.312 220 4,506 006 3 Bellary 14 88,814 040 777 001 4 Bldar 8 50,800 023 5 BI]apur 32 211,349 095 6 Chlkmagalur 1 7,523 003 12,957 o 18 7 Chltradurga 3 20,198 009 2 7,654 011 8 Coorg 5,580 003 7 18,271 026 9 Dharwar 34 221,194 100
10 Gulbarga 12 78,479 035 764 001 11 Hassan 5,553 002 3 11.751 016 12 Kolar I 4,863 007 13 Mandya 5 33,048 015 2 7,053 010 14 Mysore 14 86,489 o 39 4,392 006 15 North Kanara 9 61,154 028 16 Ralchur 15 109,464 049 17 Shlmoga 2 12658 006 2 8,521 012 18 South Kanara 36 236.490 I 07 19 Tomkur 2 12,010 005 1,577 002
14 Nagaland 6,978 1 50 1 Kohlma
2 Mokokchung
3 Tuensang 6,978 I 50
15 Orissa 24 160,814 080 2 8,357 045 I Sambalpur 2 11,618 006 2 Sundargarh 1 7,169 003
8-IRGJ/ND!73
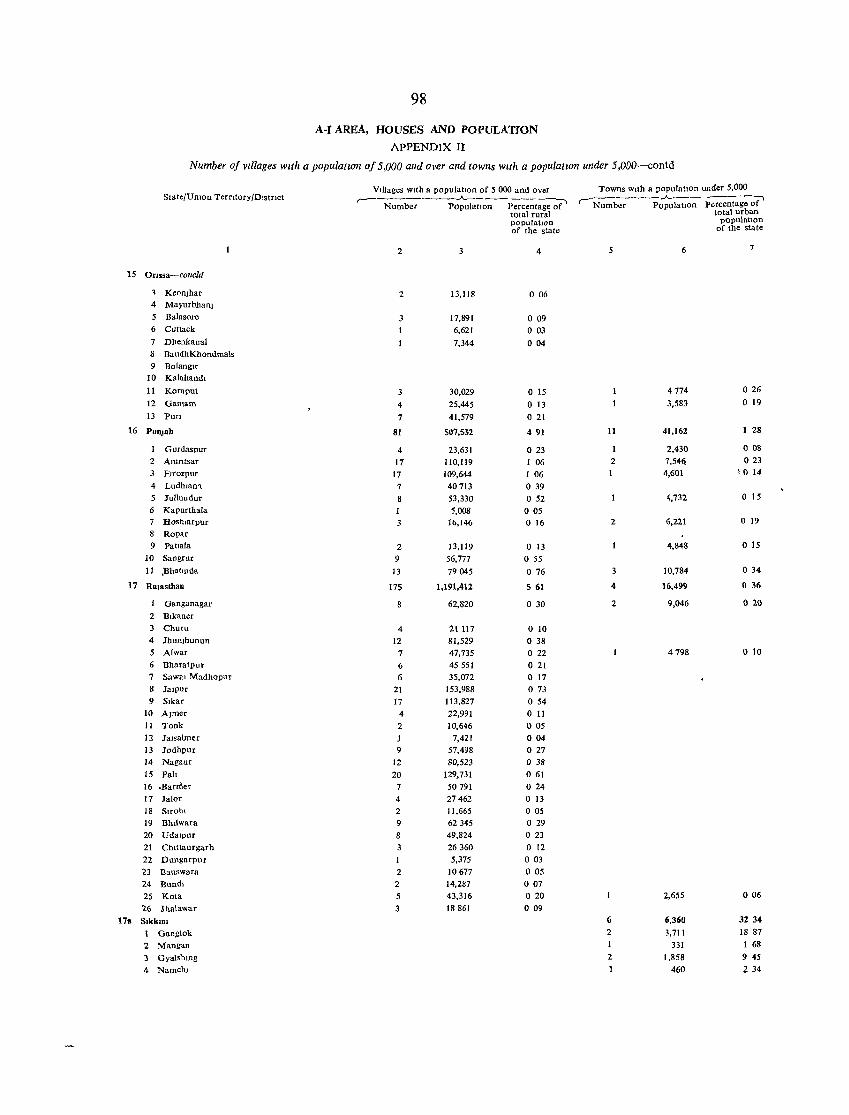
98
A-I AREA, HOUSES AND POPULATION
APPENDIX n Number of vIllages with a populatlon of 5,000 and over and towns with a populatzon under 5,ODO-contd
State/Umon Terntory/Dlstnct VIllages wIth a populatJon of 5 000 and over Towns wIth a populatIon under 5,000 ,---_______ .A.. ________ -:-, ______ .A.. _______ -:-.
Number PopulatIOn Percentage of ' Number PopulatIon Percentage of total rural total urban populatIOn populatIOn of the state of the state
2 3 4 5 6 7
15 Onssa-concld
1 Keonjhar 2 13,118 006 4 Mayurbhanj
5 Balasore 17,891 009 6 Cuttack 6,621 003 7 Dbenkanal 7,344 004 8 BaudhKhondmals
9 Bolan!:.r 10 Kalahand.
11 Koraput 30,029 o 15 4174 026
12 Ganlam 4 25,445 013 3,583 o 19
13 Pun 7 41,579 o 21
16 PUll)ab 81 507,532 491 11 41,162 1 28
1 Gurdaspur 4 23,631 023 2,430 008
2 An1ntsar 11 110,ll9 I 06 2 7,54(\ 023
3 Fltozpur 17 109,644 I 06 4,601 1014
4 Ludhtan't 7 40713 o 39 5 JuUundur 8 53,330 052 4,732 o 15
6 Kapurthala 5,008 005 7 Hoshlarpur 3 16,146 o 16 2 6,221 o 19
8 Ropar
9 Patmla 2 13,119 013 4,848 015
10 Sangrur 9 56,777 055 11 )3hattnda 13 79045 076 3 10,784 034
17 Rajasthan 175 1,191,412 561 4 16,499 o 36
1 Ganganagar 8 62,820 o 30 2 9,046 020
2 B.kaner
Churu 4 21 117 o 10 4 Jhunjhunun 12 81,529 o 38 5 Alwar 7 47,735 022 4198 010
6 Bharatpur 6 45551 o 21 7 Sawal Madhopur 6 35,072 o 17 8 Jalpur 21 153,988 o 73 9 Slkar 17 113,827 o 54
10 Ajlner 4 22,991 o 11 11 Tonk 2 10,646 005 12 Jalsalmer J 7,421 004 13 Jodhpur 9 57,498 o 27 14 Nagaur 12 80,523 038 15 Pall 20 129,731 061 16 .Barmer 7 50791 024 17 Jalor 4 27462 o 13 18 Slrohl 2 11,665 o 05 19 Biulwara 9 62345 o 29 20 Uda.pur 8 49,824 o 23 21 Cluttaurgarh 3 26360 o 12 22 Dungarpur 5,375 003 23 Banswara 2 10677 005 24 Bundl 2 14,287 007 25 Kola 5 43,316 o 20 2,655 006
26 Ihalawar 3 18861 009
17" Slkk,m 6 6,360 3234
1 Gangtok 2 3,711 18 87
2 Mangan 331 1 68
3 Gyalshmg 2 1,858 9 45
4 Namchl 1 460 234
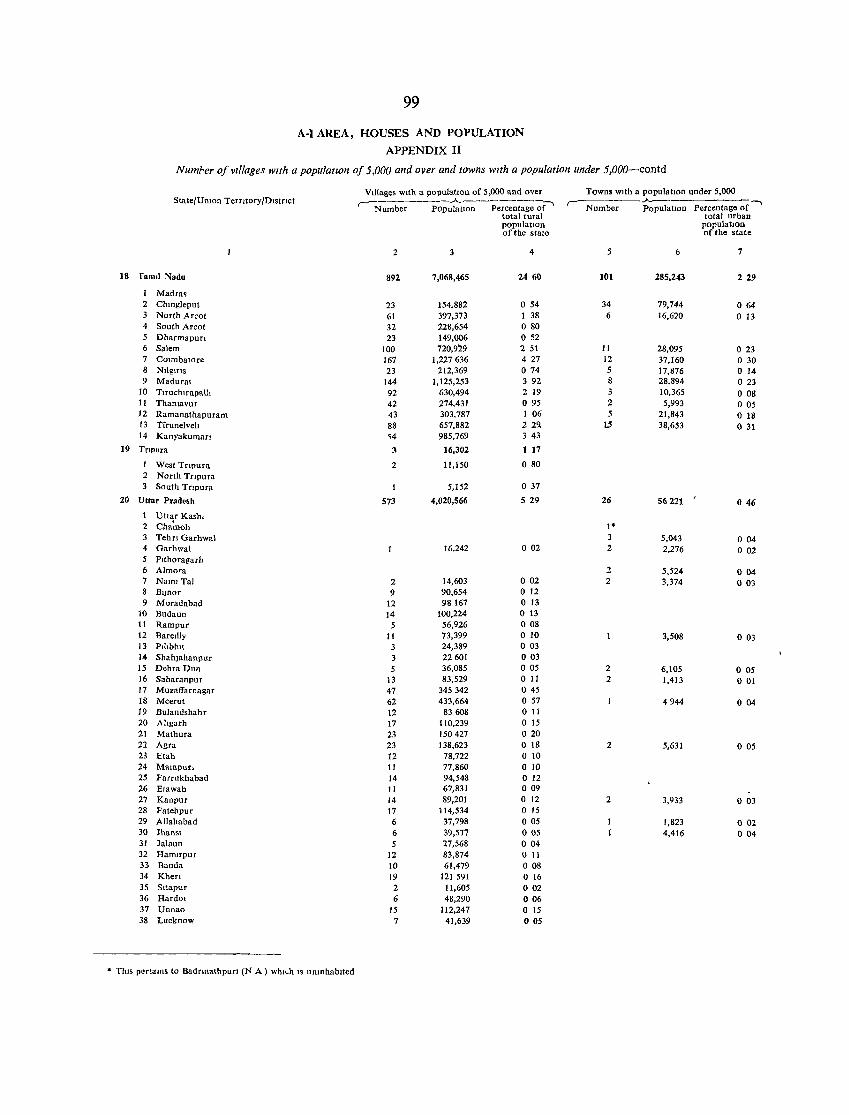
99
A-I AREA, HOUSES AND POPULATION
APPENDIX II
Numrer of vIllages with a populatIOn of 5,000 and over and towns with a population under 5,OOO-contd
V,llages wIth a populatlon of 5,000 and over Towns wIth a population under 5,000 State/Umon Termory/D,stnct ,----------.A.-~ _____ ::_'I ,-------.A.
Percentage of -.. Number POpulatlon Percentage of Nnmber PopulatIOn total rural total urban populatIOn population orthe state of the state
2 4 5 6 7
18 famd Nadu 892 7,068,465 24 60 101 285,243 2 29
Madra. 2 Chmgleput 23 154,882 o 54 34 79,744 064 3 North Arcot 61 397,373 I 38 6 16,620 013 4 South Arcot 32 228,654 o 80 5 Dharmapun 23 149,006 o 52 6 Salem 100 720,929 2 51 11 28,095 023 7 COlmbatore 167 1,227636 427 12 37,160 o 30 8 Nligms 23 212,369 074 5 17,876 o 14 9 Madural 144 1,125,253 392 8 28,894 023
10 Tlfuchlrapalll 92 630,494 2 19 3 10,365 008 II ThanJavur 42 274,431 095 2 5,993 005 12 Ramanathapuram 43 303,787 1 06 5 21,843 o 18 13 Tirunelvell 88 657,882 2 2~ 1.5 38,653 o 31 14 KanyakumaTl ~4 985,769 3 43
19 Trlpura 3 16,302 1 17
West Tflpura 2 11,150 o 80 2 North Tnpura 3 South TrIpura 5,152 o 37
20 Uttar Pradesh 573 4,020,566 529 26 56221 ,
046
Uttar Kasut 2 Cha~oh I" 3 Tehn Garhwal 3 5,043 o 04 4 Garhwal 16,242 002 2 2,276 002 5 PIthoragarh 6 Almora 2 5,524 004 7 Naml Tal 2 14,603 002 2 3,374 o 03 8 Bilnor 9 90,654 o 12 9 Moradabad 12 98167 o 13
10 Budaun 14 100,224 013 11 Rampur 5 56,926 008 12 Bareilly II 73,399 010 3,508 003 13 PIllbhl\ 3 24,389 003 14 Shahlahanpur 3 22601 003 15 DehraDun 5 36,085 005 2 6,105 o OS 16 Saharanpur 13 83,529 o 11 2 1,413 001 17 Muzaffarnagar 47 345342 045 18 Meerut 62 433,664 057 4944 004 19 Bulandshahr 12 83608 011 20 Aligarh 17 110,239 o 15 21 Mathura 23 150427 020 22 Agra 23 138,623 o 18 2 5,631 005 23 Elah 12 78,722 o 10 24 Malnpurl 11 77,860 o 10 25 Farrukhabad 14 94,548 o 12 26 Etawah II 67,831 009 27 Kanpur 14 89,201 o 12 2 3,933 o 03 28 Fatehpur 17 114,534 o 15 29 Allahabad 6 37,798 005 1,823 o 02 30 JhanSl 6 39,577 005 4,416 004 31 Jalaun 5 27,568 004 32 HamIrpur 12 83,874 011 33 Banda 10 61,479 008 34 Khefl 19 121591 o 16 35 Sitapur 2 11,605 002 36 HardOl 6 48,290 006 37 Unnao IS 112,247 o 15 38 Lucknow 7 41,639 005
• ThiS pertains to BadnnathpurI (N A ) which IS UnInhabited
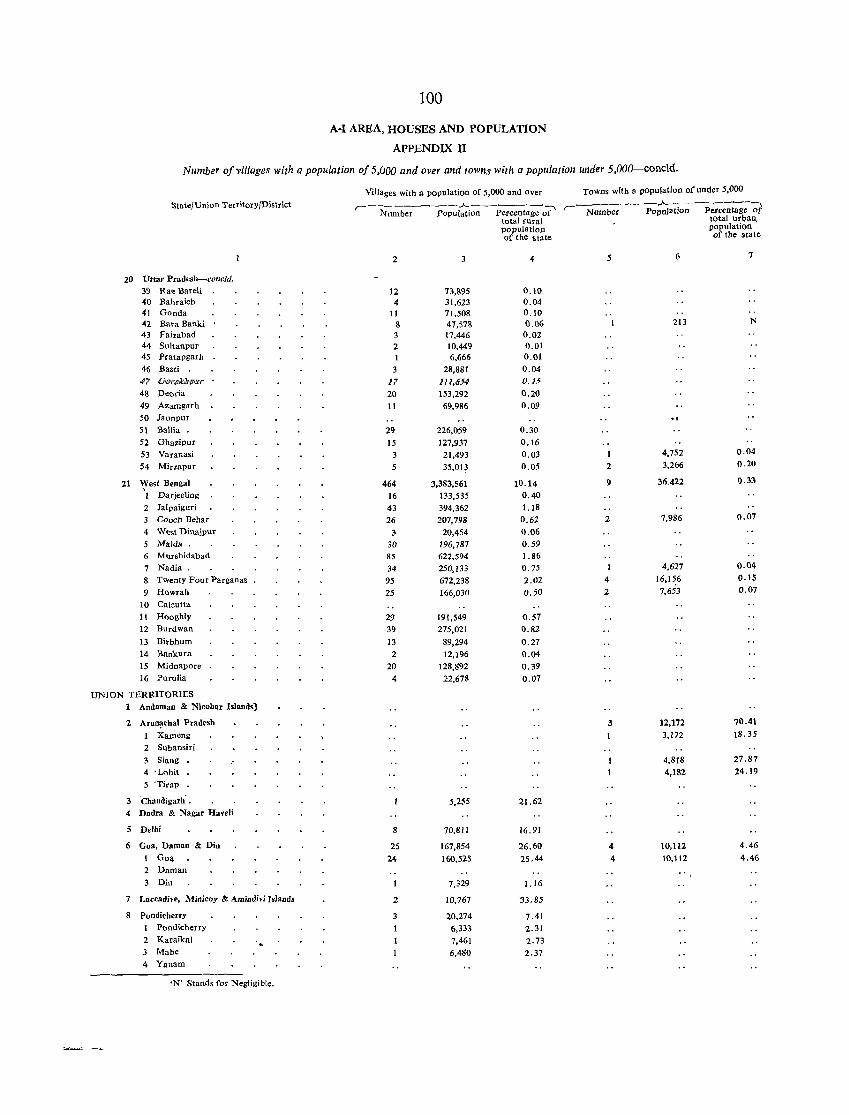
100
A·I AREA, HOUSES AND POPULATION
APPENDIX II
Number of villages with a population of 5,000 and over and lawns with a population under 5,OOO-concld.
Villages with a population of 5,000 and OVer Towns with" population of under 5,000
StatejUnion TerritoryjDistrict ,.~ ____ -_.A. ________ """:""\ ,. .A.----------,
Number Population Percentage of Number Population Percentage Of total rural total urban. population population of the state of the state
2 4 5 6 7
20 Uttar Pradesh-cone/d. 3') Rae Bareli 12 73,895 0.10 40 Bahraich 4 31,623 0.04 41 Gonda 11 71,508 0.10 42 Bata Banki 8 47,578 0.06 213 N
43 Faizabad 17,446 0.02 44 Suitanpur 2 10,449 0.01 45 Pratapgarh 6,666 0.01 46 Ba&ti 28,881 0.04 47 Gar-3kh{JUY' 17 111,6.54 D.15
48 Deoria 20 153,292 0.20 49 Azamgarh 11 69,986 0.09 50 Jaunpur
51 Ballia 29 226,059 0.30 52 Ghazipur 15 127,937 0.16 53 Varanasi 3 21,493 0.03 4,752 0.04
54 Mirzapur 5 35,OI~ 0.05 2 3,266 0.20
21 West Bengal \
464 3,383,561 10.14 9 36.422 0.33
1 Darjeeling 16 133,535 0.40 2 Jalpaiguri 43 394,362 1.18
Coach Behar 26 207,798 0.62 2 7,986 0.07
4 West Dinajpur 3 20,454 0.06 5 MaIda. 30 196,787 0.59 6 Murshidabad 85 622,594 l. 86 7 Nadia. 34 250,133 0.75 4,627 0.04
8 Twenty Four Parganas 95 672,238 2.02 4 16,15.6 O.IS
9 Howrah 25 166,030 0.50 2 7,653 0.07
10 Caloutta
11 Hooghly 29 191,549 0.57 12 Burdwan 39 275,021 0.82
13 Birbhum 13 89,294 0.27 14 Bankura 2 12,196 0.04 15 Midnapore 20 128,892 0.39 16 Purulia 4 22,678 0.07
UNION TERRITORIES 1 Andaman & Nicobar Islands)
2 Arun!'chal Pradesh 3 12,172 70.41
Kameng 3,172 18.35
2 Subansiri
Siang 4,818 27.87
4 'Lohit 4,182 24.19
5 'Tirap
3 Chandigarh' . 5,255 21.62 4 Dadra & Nagar lIaveli
5 Delhi 8 70,811 16.91
6 Goa, Daman & Diu 25 167,854 26.60 4 10,112 4.46
1 Go,! 24 160,525 25.44 4 10,112 4.46
2 Daman
3 Diu 7,329 1.16
7 I.accadive, Minicoy & Amindivi Islands 2 10,767 '33.85
8 Pondicherry 3 20,274 7.41 1 Pondicherry 6,333 2.31 2 Karaikal 7,461 2.73 3 Mahe 6,480 2.37 4 Yanam
'N' Stands for Negligible.
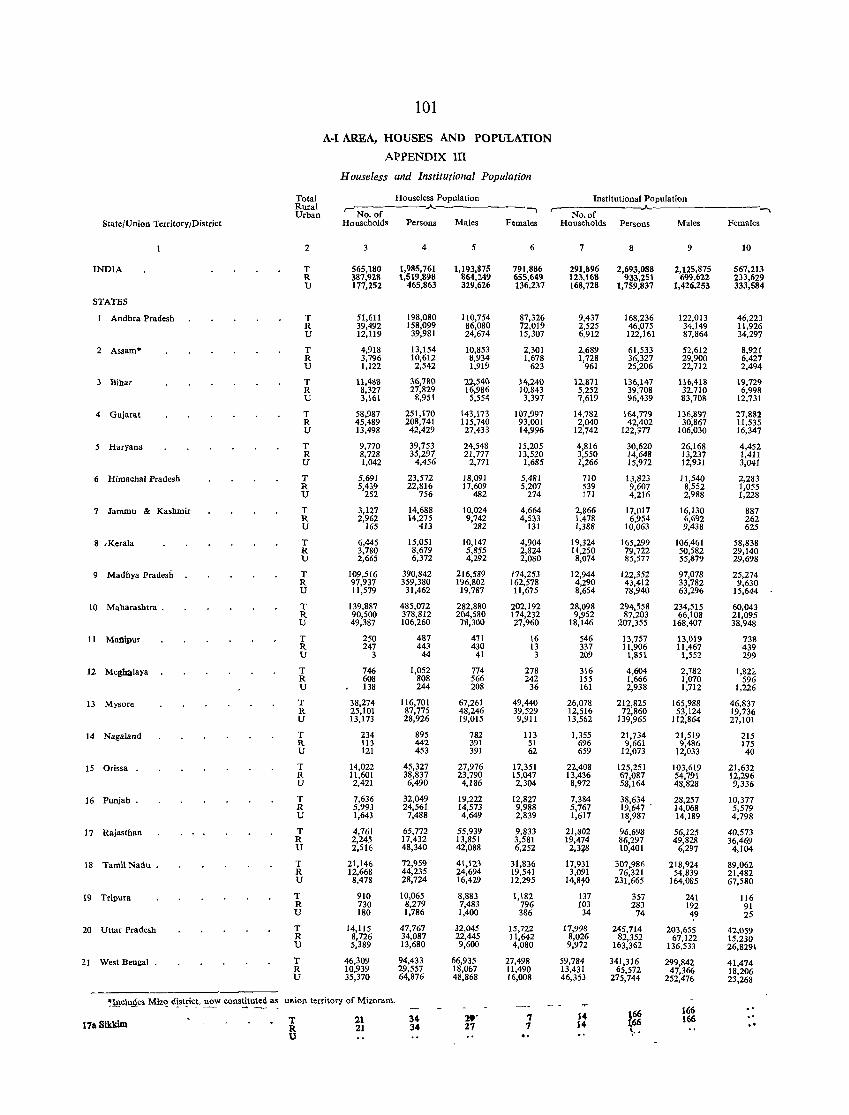
State/Union Territory/District
INDIA
STATES
1 Andhra Pradesh
2 Assam"
3 Bihar
4 Gujarat
5 Haryana
6 Himachal Pradesh
7 Jammu & Kashmir
8 JKerala
9 Madhya Pradesh
10 Maharashtra.
11 Manipur
12 Me~laya
13 Mysore
14 Nagaland
15 Orissa .
16 Punjab.
1 7 Rajasthan
18 Tamil Nadu .
19 Tripura
20 Uttar Pradesh
21 West Bengal •
Total Rural Urban
2
T R U
T R U
T R U
T R U
T R U
T R U
T R U
T R U
T R U
T R U
T R U
T R U
T R U
T R U
T R U
T R U
T R U
T R U
T R U
T R U
T R U
T R U
101
A-I AREA, HOUSES AND POPULATION
APPENDIX III
H ouseless and Institutional Population
Houseless Population (""""No. of ---oA.,
Households Persons Males
565,180 387,928 177,252
51,611 39,492 12,119
4,918 3,796 1,122
11,4113 8,327 3,161
58,987 45,489 13,498
9,770 8,728 1,042
5,691 5,439
252
3,127 2,962
165
6,445 3,780 2,665
109,516 97,937 11,579
139,887 90,500 49,387
250 247
3
746 608 138
38,274 25,101 13,173
234 113 121
14,022 11,601 2,421
7,636 5,993 1,643
4,761 2,245 2,516
21,146 12,668 8,478
910 730 180
14,115 8,726 5,389
46,309 10,939 35,370
4
1,985,761 1,519,898
465,863
198,080 158,099 39,981
13,154 10,612 2,542
36,"1&0 27,829
8,951
251,170 208,741 42,429
39,753 35,297
4,456
23,572 22,816
756
14,688 14,275
413
15,051 8,679 6,372
390,842 359,380
31,462
485,072 378,812 106,260
487 443 44
1,052 808 244
116,701 87,775 28,926
895 442 453
45,327 38,837 6,490
32,049 24,561 7,488
65,772 17,432 48,340
72,959 44,235 28,724
10,065 8,279 1,786
47,767 34,087 13,680
94,433 29,557 64,876
5
1,193,875 864,l49 329,626
110,754 86,080 24,674
10,853 8,934 1,919
22,540 16,986 5,554
143,173 115,740 27,433
24,548 21,777
2,771
18,091 17,609
482
10,024 9,742
282
10,147 5,855 4,292
216,589 196,802 19,787
282,880 204,580 78,300
471 430
41
774 566 208
67,261 48,246 19,015
782 391 391
27,976 23,790 4,186
19,222 14,573 4,649
55,939 13,851 42,088
41,123 24,694 16,429
8,883 7,483 1,400
32,045 22,445 9,600
66,935 18,067 48,868
...... Females
6
791,886 655,649 136,237
87,326 72,019 15,307
2,301 1,678
623
14,240 10,843 3,397
107,997 93,001 14,996
15,205 13,520
1,685
5,481 5,207
274
4,664 4,533
131
4,904 2,824 2,080
174,253 162,578 Il,675
202,192 174,232 27,960
16 13
3
278 242
36
49,440 39,529 9,911
113 51 62
17,351 15,047 2,304
12,827 9,988 2,839
9,833 3,581 6,252
31,836 19,541 12,295
1,182 796 386
15,722 JJ,642 4,080
27,498 1l,490 16,008
~:Wclu&es Miz~ d!st~ic_t, ~v cons~tu~ a~ u .. ion territory of Mizoram.
17a Sikkim T R U
21 21
34 34
19' 27
'1 7
Institutional Population
No. of Households Persons Males
7
291,&96 123,168 168,728
9,437 2,525 6,912
2,689 1,728
961
12,871 5,252 7,619
14,782 2,040
12,742
4,816 3,550 1,266
710 539 171
2,866 1,478 1,388
19,324 11,250 8,074
12,944 4,290 8,654
28,098 9,952
18,146
546 337 209
316 155 161
26,078 12,516 13,562
1,355 696 659
22,408 13,436 8,972
7,384 5,767 1,617
21,802 19,474 2,3+8
17,931 3,091
14,810
137 103
34
17,998 8,026 9,972
59,784 13,431 46,353
14 14
8
2,693,088 933,251
1,759,837
168,236 46,075 122,161
61,533 36,327 25,206
136,147 39,708 96,439
164,779 42,402
122,377
30,620 14,648 15,972
13,823 9,607 4,216
17,017 6,954
10,063
165,299 79,722 85,577
122,352 43,412 78,940
294,558 87,203
207,355
13,757 lI,906
1,851
4,604 1,666 2,938
212,825 72,860
139,965
21,734 9,661
12,073
125,251 67,087 58,J64
38,634 19,647 . 18,987
96,698 86,297 10,401
307,986 76,321
231,665
357 283 74
245,714 82,352
163,362
341,316 65,572
275,744
9
2,125,875 699,622
1,426,253
122,013 34,149 87,864
52,612 29,900 22,712
116,418 32,710 83,708
136,897 30,867
106,030
26,168 13,237 12,931
11,540 8,552 2,988
16,130 6,692 9,438
106,461 50,582 55,879
97,078 33,782 63,296
234,515 66,108
168,407
13,019 ll,467
1,552
2,782 1,070 1,712
165,988 53,124
112,864
21,519 9,486
12,033
103,619 54,791 48,828
28,257 14,068 14,189
56,125 49,828
6,297
218,924 54,839
164,085
241 192 49
203,655 67,122
136,533
299,842 47,366
252,476
166 166
...... Females
10
567,213 233,629 333,584
46,223 11,926 34,297
8,921 6,427 2,494
19,729 6,998
12,731
27,882 11,535 16,347
4,452 1,411 3,041
2,283 1,055 1,228
887 262 625
58,838 29,140 29,698
25,274 9,630
15,644
60,043 21,095 38,948
738 439 299
1,8T.< 596
1,226
46,837 19,736 27,101
215 175 40
21,632 12,296 9,336
10,377 5,579 4,798
40,573 36,469
4,104
89,062 21,482 67,580
116 91 25
42,059 15,230 26,8291
41,474 18,206 23,268
.'
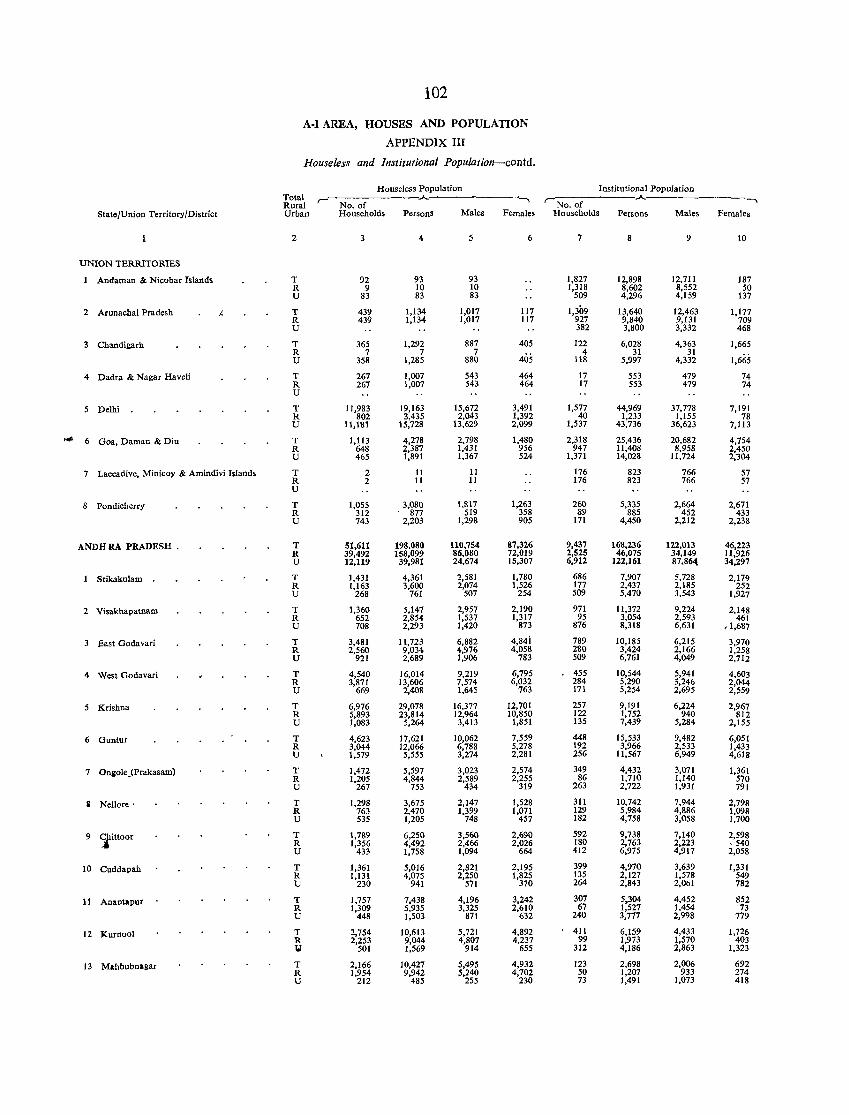
102
A-I AREA, HOUSES AND POPULATION
APPENDIX III
Houseless and Institutional Population-contd.
HouseJess Population Institutional Population Total r- '"'" --., r-'No. of ----'""'----------., Rural No. of
State/Union Territory/District Urban Households Persons Males Females Households Persons Males Females
2 3 4 6 7 8 9 10
UNION TERRITORIES
1 Andaman &. Nicobar Islands T 92 93 93 1,827 12,898 12,711 187 R 9 10 10 1,318 8,602 8,552 50 U 83 83 83 509 4,296 4,159 137
2 Arunachal Pradesh /. T 439 1,134 1,017 117 1,309 13,640 12,463 1,177 R 439 1,134 1,017 117 927 9,840 9,131 709 U 382 3,800 3,332 468
3 Chandigarh T 365 1,292 887 405 122 6,028 4,363 1,665 R 7 7 7
405 4 31 31
U 358 1,285 880 118 5,997 4,332 1,665
4 Dadra &. Nagar Hav.1i T 267 1,007 543 464 17 553 479 74 R 267 1,007 543 464 17 553 479 74 U
5 Delhi T 11,983 19,163 15,672 3,491 1,577 44,969 37,778 7,191 R 802 3,435 2,043 1,392 40 1,233 1,155 78 U 11,181 15,728 13,629 2,099 1,537 43,736 36,623 7,113
"'" 6 Goa, Daman & Diu T 1,113 4,278 2,798 1,480 2,318 25,436 20,682 4,754 R 648 2,387 1,431 956 947 11,408 8,958 2,450 U 465 1,891 1,367 524 1,371 14,028 11,724 2,'304
7 Laccadive, Minicoy &. Amindivi Islands T 2 11 11 176 823 766 57 R 2 11 II 176 823 766 57 U
8 Pondicherry T 1,055 3,080 1,817 1,263 260 5,335 2,664 2,671 R 312 877 519 358 89 885 452 433 U 743 2,203 1,298 905 171 4,450 2,212 2,238
ANDH RA PRADESH . T 51,611 198.080 110,754 87,326 9,437 168,236 122,013 46,223 R 39,492 158,099 86,080 72,019 2,525 46,075 34,149 11,926 U 12,119 39,981 24,674 15,307 6,912 122,161 87,86,\ 34,297
1 Srikakulam T 1,431 4,361 2,581 1,780 686 7,907 5,728 2,179 R 1,163 3,600 2,074 1,526 177 2,437 2,185 252 U 268 761 507 254 509 5,470 3,543 1,927
2 Visakhapatnam T 1,360 5,147 2,957 2,190 971 11,372 9,224 2,148 R 652 2,854 1,537 1,317 95 3,054 2,593 461 U 708 2,293 1,420 873 876 8,318 6,631 ,1,687
3 East Godavari T 3,481 11,723 6,882 4,841 789 10,185 6,215 3,970 R 2,560 9,034 4,976 4,058 280 3,424 2,166 1,258 U 921 2,689 1,906 783 509 6,761 4,049 2,712
4 West Godavari T 4,540 16,014 9,219 6,795 455 10,544 5,941 4,603 R 3,871 13,606 7,574 6,032 284 5,290 3,246 2,044 U 669 2,408 1,645 763 171 5,254 2,695 2,559
5 Krishna T 6,976 29,078 16,377 12,701 257 9,191 6,224 2,967 R 5,893 23,814 12,964 10,850 122 1,752 940 812 U 1,083 5,264 3,413 1,851 135 7,439 5,284 2,155
6 Guutur T 4,623 17,621 10,062 7,559 448 15,533 9,482 6,051 R 3,044 12,066 6,788 5,278 192 3,966 2,533 1,433 U 1,579 5,555 3,274 2,281 256 11,567 6,949 4,618
7 OnioleJPrakasam) T 1,472 5,597 3,023 2,574 349 4,432 3,071 1,361 R 1,205 4,844 2,589 2,255 86 1,710 1,140 570 U 267 753 434 319 263 2,722 1,931 791
a Nellore' T 1,298 3,675 2,147 1,528 311 10,742 7,944 2,798 R 763 2,470 1.399 1,071 129 5,984 4,886 1,098 U 535 1,205 748 457 182 4,758 3,058 1,700
9 ~ittoor T 1,789 6,250 3,560 2,690 592 9,738 7,140 2,598 R 1,356 4,492 2,466 2,026 180 2,763 2,223 ,540 U 433 1,758 1,094 664 412 6,975 4,917 2,058
10 Cuddapah T 1,361 5,016 2,821 2,195 399 4,970 3,639 1,331 R 1,131 4,075 2,250 1,825 135 2,127 1,578 549 U 230 941 571 370 264 2,843 2,Obl 782
11 Anantapur T 1,757 7,438 4,196 3,242 307 5,304 4,452 852 R 1,309 5,935 3,325 2,610 67 1,527 1,454 73 U 448 1,503 871 632 240 3,777 2,998 779
12 Kurnool T 2,754 10,613 5,721 4,892 411 6,159 4,433 1,726 R 2,253 9,044 4,807 4,237 99 1,973 1,570 403 Y 501 1,569 914 655 312 4,186 2,863 1,323
13 Mahbubnagar T 2,166 10,427 5,495 4,932 123 2,698 2,006 692 R 1,954 9,942 5,240 4,702 50 1,207 933 274 U 212 485 255 230 73 1,491 1,073 418
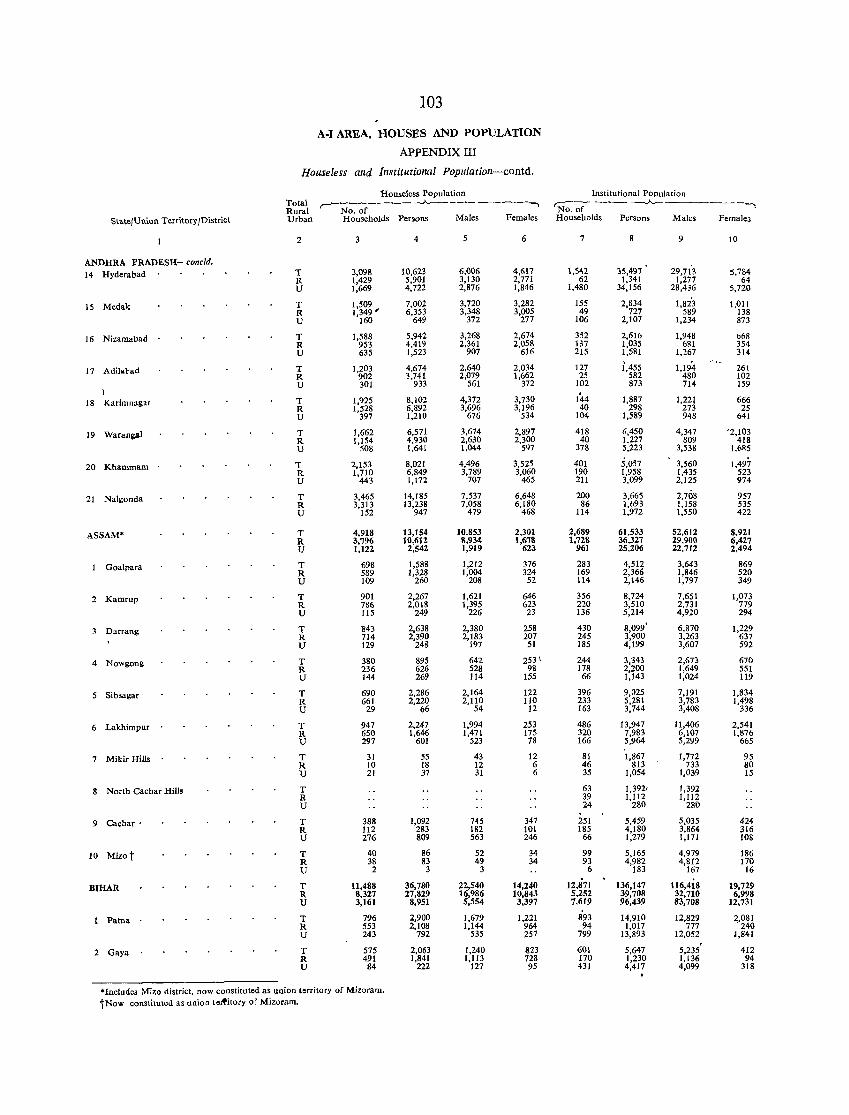
103
A-I AREA, HOUSES AND POPULATION
APPENDIX III
Houseless and Institutional Population-contd.
Houseless Population Institutional Popula tion Total ~---------~-----------, c:-- -- --A------____
Rural No. of No. of .
Stale/Union Territory/District Urban Households Persons Males Females Households Persons Males Females
2 3 4 5 6 7 8 9 10
ANDHRA PRADESH- concld.
14 Hyderabad T 3,098 10,623 6,006 4,617 1,542 35,497 29,713 5,784 R 1,429 5,901 3,130 2,771 62 1,341 1,277 64 U 1,669 4,722 2,876 1,846 1,480 34,156 28,436 5,720
15 Medak T 1,509 7,002 3,720 3,282 155 2,834 1,82'3 1,011 R 1,349 ' 6,353 3,348 3,005 49 727 589 138 U 160 649 372 277 106 2,107 1,234 873
16 Nizamabad T 1,588 5,942 3,268 2,674 352 2,616 1,948 668 R 953 4,419 2,361 2,058 137 1,035 6Rl 354 U 635 1,523 907 616 215 1,581 1,267 314
17 AdiJat-ad T 1,203 4,674 2,640 2.034 127 i,455 1,194 261 R 902 3,741 2,079 1,662 25 582 480 102 V 301 933 561 372 102 873 714 159
18 Karimnagar T 1,925 8,102 4,372 3,730 144 1,887 1,221 666 R 1,528 6,892 3,696 3,196 40 298 273 25 U 397 1,210 676 534 104 1,589 948 641
19 Warangal T 1,662 6,571 3,674 2,897 418 6,450 4,347 '2,103 R 1,154 4,930 2,630 2,300 40 1.227 809 418 V 508 1,641 1,044 597 378 5,223 3,538 1'6R5
20 Khamrnam T 2,153 8,021 4,496 3,525 401 5,057 3,560 1,497 R 1,710 6,849 3,789 3,060 190 1,958 1,435 523 V 443 1,172 707 465 211 3,099 2,125 974
21 Nalgonda T 3,465 14,185 7,537 6,648 200 3,665 2,708 957 R 3,313 13,238 7,058 6,180 86 1,693 1,158 535 V 152 947 479 468 114 1,972 1,550 422
ASSAM' T 4,918 13,154 10,853 2,301 2,689 61,533 52,612 8,921 R 3,796 10,612 8,934 1,6'18 1,728 36,327 29,900 6,427 V 1,122 2,542 1,919 623 961 25,206 22,712 2,494
I Goalpara T 698 1,588 1,212 376 283 4,512 3,643 869 R 589 1,328 1,004 324 169 2,366 1,846 520 V 109 260 208 52 114 2,146 1,797 349
2 Kamrup T 901 2,267 1,621 646 356 8,724 7,651 1,073 R 786 2,018 1,395 623 220 3,510 2,731 779 V 115 249 226 23 136 5,214 4,920 294
3 Darrang T 843 2,638 2,380 258 430 8,099' 6,870 1,229 R 714 2,390 2,183 207 245 3,900 3,263 637 U 129 248 197 51 185 4,199 3,607 592
4 Nowgon& T 380 895 642 253 \ 244 3,343 2,673 670 R 236 626 528 98 178 2,200 1,649 551 V 144 269 114 155 66 1,143 1,024 Jl9
5 Sib.agar T 690 2,286 2,164 122 396 9,025 7,191 1,834 R 661 2,220 2,110 110 233 5,281 3,783 1,498 U 29 66 54 12 163 3,144 3,408 336
6 Lakhimpur T 947 2,247 1,994 253 486 13,947 11,406 2,541 R 650 1,646 1,471 175 320 7,983 6,107 1,876 U 297 601 523 78 166 5,964 5,299 665
7 Mikir Hills T 31 55 43 12 81 1,867 1,772 95 R 10 18 12 6 46 813 733 80 U 21 37 31 6 35 1,054 1,039 15
S North Cachar Hills T 63 1,392' 1,392 R 39 1,112 1,112 U 24 280 281)
9 Cachar ' T 388 1,092 745 347 251 5,459 5,035 424 R 112 283 182 101 185 4,180 3,864 316 U 276 809 563 246 66 1,279 1,171 108
10 Mizot T 40 86 52 34 99 5,165 4,979 186 R 38 83 49 34 93 4,982 4,812 170 V 2 3 3 6 183 167 16
BIHAR T 11,488 36,780 22,540 14,240 12.871 136,147 1l6,4iS 19,729 R 8,327 27.829 16,986 10,843 5,252 39.708 32,710 6,998 U 3,161 8,951 5,554 3,397 7,619 96,439 83,708 12.731
1 Patna T 796 2,900 1,679 1,221 893 14,910 12,829 ~'~~6 R 553 2,108 1,144 964 94 1,017 777 U 243 792 535 257 799 13,893 12,052 1,841
, T 575 2,063 1.240 823 601 2 Gaya 5,647 5,235 412 R 491 1,841 1,113 728 170 1,230 1,136 94 V 84 222 127 95 431 4,417 4,099 318
"Includes Mizo district, now constituted as union territory of Mizoram. tNow constituted as union te .. itory of Mizoram,
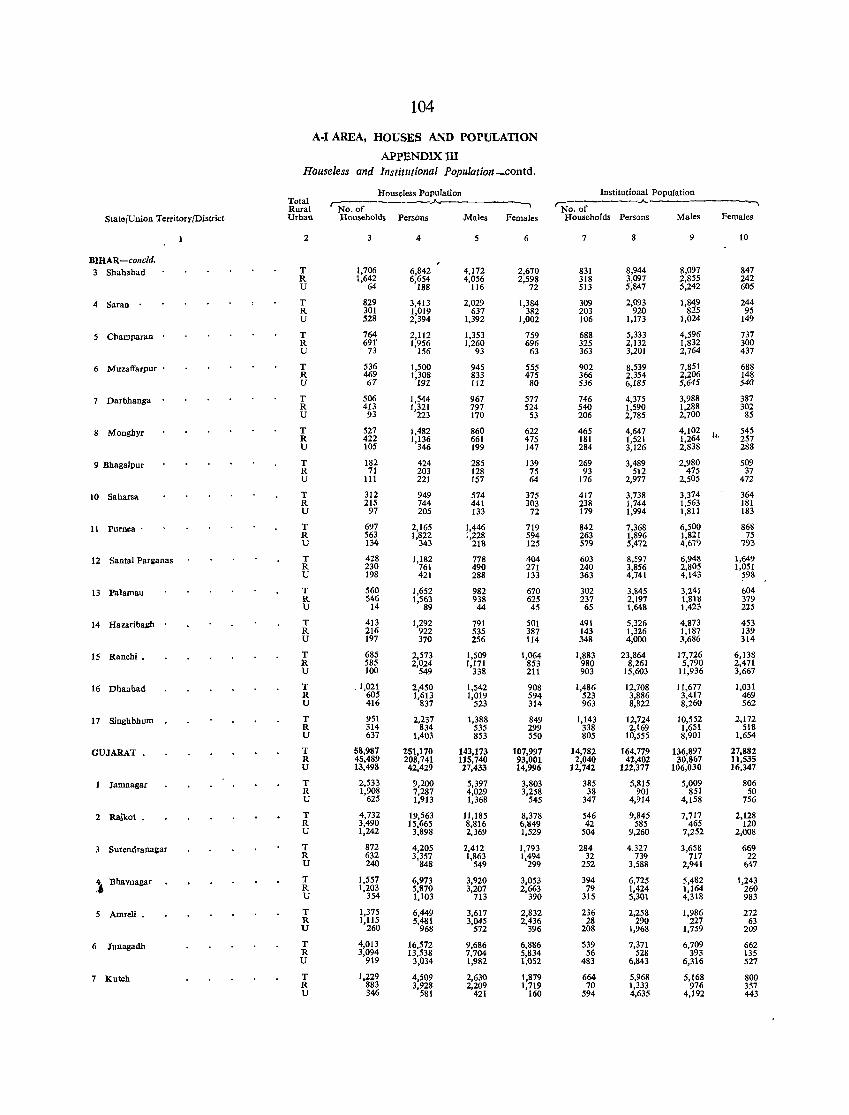
State/Union Territory/District
BIHAR-concld. 3 Shahabad
4 Saran .
5 Champaran .
6 Muzaffarpur'
7 Darbhanga
8 Monghyr
9 Bhallalpur
10 Saharsa
11 purnea'
12 Santal Pari,nas
13 Palamau
14 Hazaribagh .
IS Rauchi.
16 Dhanbad
17 Singhbhum
GUJARAT.
Jamnallar
2 Rajkot .
3 Surendranallar
~ Bhavnagar
5 Arnr.li.
6 Junagadh
7 Kutch
104
A-I AREA, HOUSES AND POPULATION
APPENDIX III Houseless and Institutional Population_contd.
Total Rural Urban
2
T R U
T R U
T R U
T R U
T R U
T R U
T R U
T R U
T R U
T R U
T R U
T R U
T R U
T R U
T R U
T R U
T R U
T R U
T R U
T R U
T R U
T R U
T R U
Frouseless Population
No. of Households Persons .Males
3
1,706 1,6~~
829 301 528
764 691'
73
536 469 67
506 413
93
527 422 105
182 71
111
312 215
97
697 563 134
428 230 198
560 546
14
413 216 197
685 585 100
,1,021 605 416
951 314 637
58,987 45,489 13,498
2,533 1,908
625
4,732 3,490 1,242
872 632 240
1,557 1,203
354
1,375 1,115
260
4,013 3,094
919
1,229 883 346
4
6,842 6,654
188
3,413 1,019 2,394
2,112 1,956
156
1,500 1,308
192
1,544 I,m 1,482 1,136
346
424 203 221
949 744 205
2,165
I'~i~ 1,182
761 421
1,652 1,563
89
1,292 922 370
2,573 2,024
549
2,450 1,613
837
2,237 834
1,403
251,170 208,741 42,429
9,200 7,287 1,913
19,563 15,665
3,898
4,205 3,357
848
6,973 5,870 1,103
6,449 5,481
968
16,572 13,538
3,034
4,509 3,928
581
5
4,172 4,056
116
2,029 637
1,392
1,353 1,260
93
945 833 112
967 797 170
860 661 199
285 128 157
574 441 133
1,446 1,228
218
778 490 288
982 938
44
791 535 256
1,509 1,171
338
1,542 1,019
523
1,388 535 853
143,173 115,740 27,433
5,397 4,029 1,368
11,185 8,816 2,369
2,412 1,863
549
3,920 3,207
713
3,617 3,045
572
9,686 7,704 1,982
2,630 2,209
421
-., Females
6
2,670 2,598
72
1,384 382
1,002
759 696
63
555 475 80
577 524
53
622 475 147
139 75 64
375 303 72
719 594 125
404 271 133
670 625 45
501 387 114
1,064 853 211
908 594 314
849 299 550
107,997 93,001 14,996
3,803 3,258
545
8,378 6,849 1,529
1,793 1,494
299
3,053 2,663
390
2,832 2,436
396
6,886 5,834 1,052
1,879 1,719
160
Institutional Population ------- ~ .------__ '"No. of -.,
Households Persons Males Females
7
831 318 513
309 203 106
688 325 363
902 366 536
746 540 206
465 181 284
269 93
176
417 238 179
842 263 579
603 240 363
302 237 65
491 143 348
1,883 980 903
1,486 523 963
1,143 338 805
14,782 2,040
12,742
385 38
347
546 42
504
284 32
252
394 79
315
236 28
208
539 56
483
664 70
594
8
8,944 3,097 5,847
2,093 920
1,173
5,333 2,132 3,201
8,539 2,354 6,185
4,375 1,590 2,785
4,647 1,521 3,126
3,489 512
2,977
3,738 1,744 1,994
7,368 1,896 5,472
8,597 3,856 4,741
3,845 2,197 1,648
5,326 1,326 4,000
23,864 8,261
15,603
12,708 3,886 8,822
12,724 2,169
10,555
164,779 42,402
122,377
5,815 901
4,914
9,845 585
9,260
4,327 739
3,588
6,725 1,424 5,301
2,258 290
1,968
7,371 528
6,843
5,968 1,333 4,635
9
8,097 2,855 5,242
I,m 1,024
4,596 1,832 2,764
7,851 2,206 5,645
3,988 1,288 2,700
4,102 1,264 2,838
2,980 475
2,505
3,374 1,563 1,811
6,500 1,821 4,619
6,948 2,805 4,143
3,241 1,818 1,423
4,873 1,187 3,686
17,126 5,790
11,936
11,677 3,417 8,260
10,552 1,651 8,901
136,897 30,867
106,030
5,009 851
4,158
7,717 465
7,252
3,658 717
2,941
5,482 1,164 4,318
1,986 227
1,759
6,709 393
6,316
5,168 976
4,192
10
847 242 605
244 95
149
737 300 437
688 148 540
387 302 85
545 257 288
509 37
472
364 181 183
868 75
793
1,649 1,051
598
b04 379 225
453 139 314
6,138 2,471 3,667
1,031 469 562
2,172 518
1,654
27,882 11,535 16,347
806 50
756
2,128 120
2,008
669 22
647
1,243 260 983
272 63
209
662 135 527
800 357 443
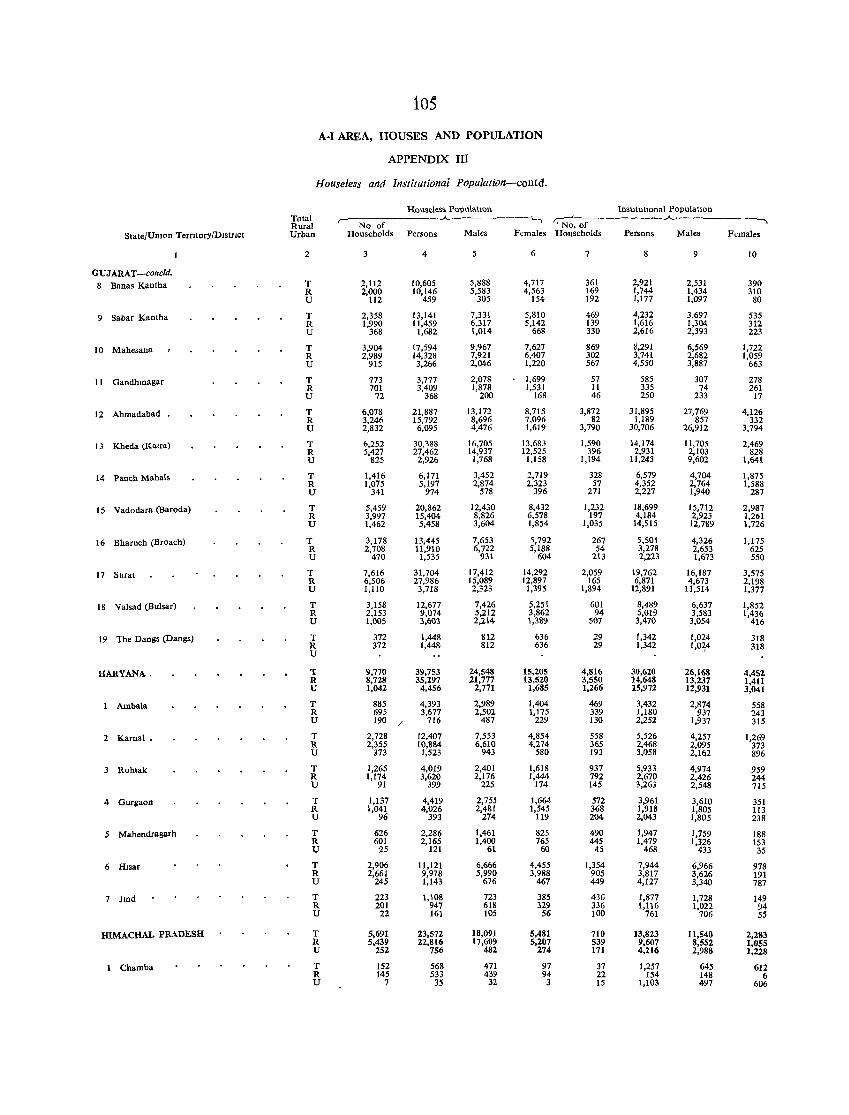
105
A·I AREA, HOUSES AND POPULATION
APPENDIX III
Houseless and Institutionai Population-contd.
Houseless Population InstItutlOnal PopulatIon Total
,.-~--___ .A. ________ --,
Rural r,:-'-'No. of
--.A.---___ --,
StatejUmon TerrItory/DistrIct Urban Households Persons Males Females Households Persons Males Females
2 3 4 6 7 8 9 10
GUJARAT -coneld. 8 Banas Kantha T 2,112 10,605 5,888 4,717 361 2,921 2,531 390
R 2,000 10,146 5,583 4,563 169 1,744 1,434 310 U 112 459 305 154 192 1,177 1,097 80
9 Sabar Kantha T 2,358 13,141 7,331 5,810 469 4,232 3,697 535 R 1,990 11,459 6,317 5,142 139 1,616 1,304 312 U 368 1,682 1,014 668 330 2,616 2,393 223
10 Mahesana T 3,904 17,594 9,967 7,627 869 8,291 6,569 1,722 R 2,989 14,328 7,921 6,407 302 3,741 2,682 1,059 U 915 3,266 2,046 1,220 567 4,550 3,887 663
11 GandhlOagar T 773 3,777 2,078 1,699 57 585 307 278 R 701 3,409 1,878 1,531 11 335 74 261 U 72 368 200 168 46 250 233 17
12 Ahmadabad. T 6,078 21,887 13,172 8,715 3,872 31,895 27,769 4,126 R 3,246 15,792 8,696 7,096 82 1,189 857 332 U 2,832 6,095 4,476 1,619 3,790 30,706 26,912 3,794
13 Khcda (Kalra) T 6,252 30,388 16,705 13,683 1,590 14,174 11,705 2,469 R 5,427 27,462 14,937 12,525 396 2,931 2,103 828 U 825 2,926 1,768 1,158 1,194 11,243 9,602 1,641
14 Panch Mahals T 1,416 6,171 3,452 2,719 328 6,579 4,704 1,875 R 1,075 5,197 2,874 2,323 57 4,352 2,764 1,588 LJ 341 974 578 396 271 2,227 1,940 287
15 Vadodara (Baroda) T 5,459 20,862 12,430 8,432 1,232 18,699 15,712 2,987 R 3,997 15,404 8,826 6,578 197 4,184 2,923 1,261 U 1,462 5,458 3,604 1,854 1,035 14,515 12,789 1,726
16 Bharuch (Broach) T 3,178 13,445 7,653 '1,792 267 5,501 4,326 1,175 R 2,708 11,910 6,722 5,188 54 3,278 2,653 625 U 470 1,535 931 604 21> 2,223 1,673 550
17 Surat T 7,616 31,704 17,412 14,292 2,059 19,762 16,187 3,575 R 6,506 27,986 15,089 12,897 165 6,871 4,673 2,198 U 1,110 3,718 2,323 1,395 1,894 12,891 11.514 1,377
18 Valsad (Bulsar) T 3)58 12,677 7,426 5,251 601 8,489 6,637 1,852 R 2,153 9,074 5,212 3,862 94 5,019 3,583 1,436 U 1,005 3,603 2,214 1,389 507 3,470 3,054 416
19 The Dangs (Dangs) T 372 1,448 812 636 29 1,342 1,024 318 R 372 1,448- 812 636 29 1,342 I,O~4 318 U
HARYANA. T 9,770 39,753 24,548 15,205 4,816 30,620 26,168 4,452 R 8,728 35,297 21,777 13,520 3,550 14,648 13,237 1,411 U 1,042 4,456 2,771 1,685 1,266 15,972 12,931 3,041
1 Ambala T 885 4,393 2,989 1,404 469 3,432 2,874 558 R 695 3,677 2,502 1,175 339 1,180 937 243 U 190 / 716 487 229 130 2,252 1,937 315
2 Karnal. T 2,728 12,407 7,553 4,854 558 5,526 4,257 1,269 R 2,355 10,884 6,610 4,274 365 2,468 2,095 373 U 373 1,523 943 580 193 3,058 2,Hj2 896
3 Rohtak T 1,265 4,019 2,401 1,618 937 5,933 4,974 959 R 1,174 3,620 2,176 1,444 792 2,670 2,426 244 U 91 399 225 174 145 3,263 2,548 715
4 Gurgaon T 1,137 4,419 2,755 1,664 572 3,961 3,610 351 R 1,041 4,026 2,481 1,545 368 1,918 1,805 113 U 96 393 274 119 204 2,043 1,805 238
5 Mahendragarh T 626 2,286 1,461 825 490 1,947 1,759 188 R 601 2,165 1,400 765 445 1,479 1,326 153 U 25 121 61 60 45 468 433 35
6 Hisar T 2,906 1l,121 6,666 4,455 1,354 7,944 6,966 978 R 2,661 9,978 5,990 3,988 905 3,817 3,626 191 U 245 1,143 676 467 449 4,127 3,340 787
7 JlOd T 223 1,108 723 385 436 1,877 1,728 149 R 201 947 618 329 336 1,116 1,022 94 U 22 161 105 56 100 761 706 55
HIMACHAL PRADESH T 5,691 23,572 18,091 5,481 710 13,823 11,540 2,283 R 5,439 22,816 17,609 5,207 539 9,607 8,552 1.055 U 252 756 482 274 171 4,216 2,988 1,228
I Chamba T 152 568 471 97 37 1,257 645 612 R 145 533 439 94 22 154 148 6 U 7 35 32 3 15 1,103 497 606
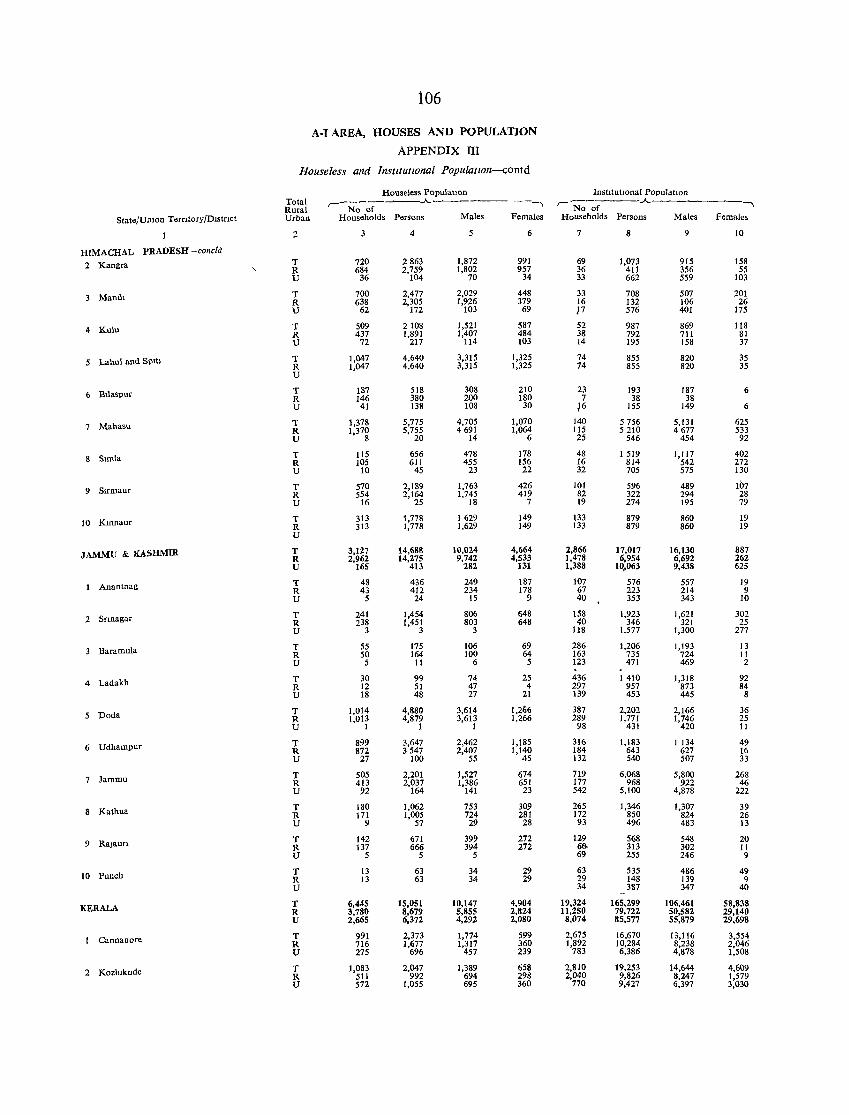
106
A-I AREA, HOUSES AND POPULATION
APPENDIX m Houseless and ins(ltu/lOnal PopulatlOn-contd
Houseless PopulatlOu InstItutlOnal PopulatlOn Total ,..-N;-ci=-----"----- ,
,.. No of -"---------, Rural
State/UOIon TerrItory/DIstrict Urban Households Persons Males Females Households Persons Males Females
2 4 5 6 7 8 9 10
mMACHAL PRADESH -concld
2 Kangra T 720 2863 1,872 991 69 1,073 915 158 , R 684 2,759 1,802 957 36 411 356 55 U 36 104 70 34 33 662 559 103
3 Mandl T 700 2,477 2,029 448 33 708 507 201 R 638 2,305 1,926 379 16 132 106 26 U 62 172 103 69 J7 576 401 175
4 Kulu T 509 2108 1,521 587 52 987 869 118 R 437 1,891 1,407 484 38 792 711 81 U 72 217 114 103 14 195 158 37
5 Lahul and SPltl T 1,047 4,640 3,315 1,325 74 855 820 35 R 1,047 4,640 3,315 1,325 74 855 820 35 U
6 Bllaspur T 187 518 308 210 23 193 187 6 R 146 380 200 180 7 38 38 U 41 138 108 30 16 155 149 6
7 Mahas\l T 1,378 5,775 4,705 1,070 140 5756 5,131 625 R 1,37~ 5,755 4691 1,064 115 5210 4677 533 U 20 14 6 25 546 454 92
8 Smlla T 115 656 478 178 48 1519 1,117 402 R 105 611 455 156 16 814 542 272 U 10 45 23 22 32 705 575 130
9 Sumaur T 570 2,189 1,763 426 101 596 489 107 R 554 2,164 1,745 419 82 322 294 28 U 16 25 18 7 19 274 195 79
10 Kmnaur T 313 1,778 1629 149 133 879 860 19 R 313 1,778 1,629 149 133 879 860 19 U
JAMMU & KASHMIR T 3,127 14,688 10,024 4,664 2,866 17,017 16,130 887 R 2,962 14,275 9,742 4,533 1,478 6,954 6,692 262 U 165 413 282 131 1,388 10,063 9,438 625
1 Anantnag T 48 436 249 187 107 576 557 19 R 43 412 234 178 67 223 214 9 U 5 24 15 9 40 353 343 10
2 Srmagar T 241 1,454 806 648 158 1,923 1,621 302 R 238 1,451 803 648 40 346 321 25 U 3 3 3 118 1,577 1,300 277
3 Baramula T 55 175 106 69 286 1,206 1,193 13 R 50 164 100 64 163 735 724 11 U 5 11 6 5 123 471 469 2
4 Ladakh T 30 99 74 25 436 1410 1,318 92 R 12 51 47 4 297 957 873 84 U 18 48 27 21 139 453 445 8
5 Doda T 1,014 4,880 3,614 1,2M 387 2,202 2,166 36 R 1,013 4,879 3,613 1,266 289 1,771 1,746 25 U I 1 1 98 431 420 II
6 Udhampur T 899 3,647 2,462 1,185 316 1,183 1134 49 R 872 3547 2,407 1,140 184 643 627 16 U 27 100 55 45 132 540 507 33
7 Jammu T 505 2,201 1,527 674 719 6,068 5,800 268 R 413 2,037 1,386 651 177 968 922 46 U 92 164 141 23 542 5,100 4,878 222
8 Kathua T 180 1,062 753 309 265 1,346 1,307 39 R 171 1,005 724 281 172 850 824 26 U 9 57 29 28 93 496 483 13
9 Rajaun T 142 671 399 272 129 568 548 20 R 137 666 394 272 68- 313 302 11 U 5 5 5 69 255 246 9
10 Punch T 13 63 34 29 63 535 486 49 R 13 63 34 29 29 148 139 9 U 34 387 347 40
KERALA T 6,445 15,051 10,147 4,904 19,324 165,299 106,461 58,838 R 3,780 8,679 5,855 2,824 ll,250 79,722 50,582 29,140 U 2,665 6,372 4,292 2,080 8,074 85,577 55,879 29,698
1 Cannanore T 991 2,373 1,774 599 2,675 16,670 13,116 3,554 R 716 1,677 1,317 360 1,892 10,284 8,238 2,046 U 275 696 457 239 783 6,386 4,878 1,508
2 Kozblkode T 1,083 2,047 1,389 658 2,810 19,253 14,644 4,609 R 511 992 694 298 2,040 9,826 8,247 1,579 U 572 1,055 695 360 770 9,427 6,397 3,030
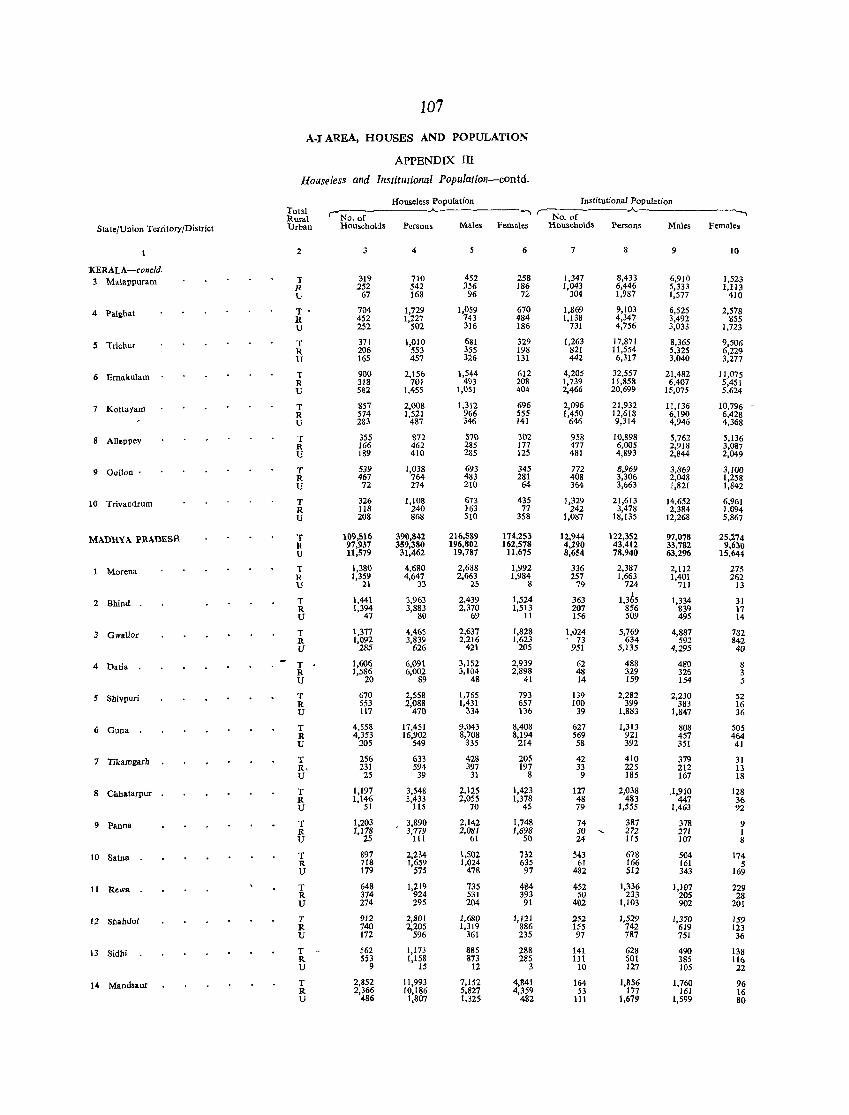
107
A-I AREA, HOUSES AND POPULATION
APPENDIX III
Houseless and Institlltional Population-con td.
Houseless Population Institutional Population Total 'No.of-----.A..-------.....,,- No.o-r----..A.. 1 Rural
State/Union Territory/District Urban Households Persons Males Females Households Persons Males Females
2 3 4 6 7 9 10
KERALA-concld. 3 Malappuram T 319 710 452 258 1,347 8,433 6,910 1,523
R 252 542 3~6 186 1,043 6,446 5,333 1,113 U 67 168 96 7"- 304 1,987 1,577 410
4 Palghat T 704 1,729 1,059 670 1,869 9,103 6,525 2,578 R 452 1,227 743 484 1,138 4,347 3,492 855 U 252 502 316 186 731 4,756 3,033 1,723
5 Trichur T 371 1,010 681 :>29 1,263 17,871 8,365 9,506 R 206 553 355 198 821 11,554 5,325 6,229 U 165 457 326 131 442 6,317 3,040 3,277
6 Ernakulam T 900 2,156 1,544 612 4,205 32,557 21,482 11,075 R 318 701 493 208 1,739 11,858 6,407 5,451 U 582 1,455 1,051 404 2,466 20,699 15,075 5,624
7 Kottayam T 857 2,008 1,312 696 2,096 21,932 11,136 10,796 -R 574 1,521 966 555 1,450 12,618 6,190 6,428 U 283 487 346 141 646 9,314 4,946 4,368
8 Alleppey T 355 872 570 302 958 10,898 5,762 5,136 R 166 462 285 177 477 6,005 2,918 3,087 U 189 410 285 125 481 4,893 2,844 2,049
9 Quilon T 539 1,038 693 345 772 6,969 3,869 3,100 R 467 764 483 281 408 3,306 2,048 1,258 U 72 274 210 64 364 3,663 1,821 1,842
10 Trivandrum T 326 1,108 673 435 1,329 21,613 14,652 6,961 R 118 240 163 77 242 3,478 2,384 J,094 U 208 868 510 358 1,087 18,135 12,268 5,867
MADHYA l'RADESR T 11}'9,516 390,842 216,589 174.253 12,944 122,352 97,078 25,274 R 97,937 359,380 196,802 162,578 4,290 43,412 33,782 9,630 U 11,579 31,462 19,787 11,675 8,654 7R,940 63,296 15,644
1 Morena T 1,380 4,680 2,688 1,992 336 2,387 2,112 275 R 1,359 4,647 2,663 1,984 257 1,663 1,401 262 U 21 33 25 8 79 724 711 13
2 Bhind T 1,441 3,963 2,439 1,524 363 1,365 1,334 31 R 1,394 3,883 2,370 1,513 207 856 839 17 U 47 80 69 JI 156 509 495 14
3 Gwalior T 1,377 4,465 2,637 1,828 1,024 5,769 4,887 782 R 1,092 3,839 2,216 1,623 73 634 592 842 U 285 626 421 205 951 5,135 4,295 40
4 Datia T 1,606 6,091 3,152 2,939 62 488 480 8 R 1,586 6,002 3,104 2,898 48 329 326 3 U 20 89 48 41 14 159 154 5
5 Shivpuri T 670 2,558 1,765 793 139 2,282 2,230 52 R 553 2,088 1,431 657 100 399 383 16 U 117 470 334 136 39 1,883 1,847 36
6 Guna T 4,558 17,451 9,043 8,408 627 1,313 808 505 R 4,353 16,902 8,708 8,194 569 921 457 464 U 205 549 335 214 58 392 351 41
7 Tikamgarh T 256 633 428 205 42 410 379 31 R. 231 594 397 197 33 225 212 13 U 25 39 31 8 9 185 167 18
8 Chhatarpur T 1,197 3,548 2,125 1,423 127 2,038 .1,910 128 R 1,146 3,433 2,055 1,378 48 483 447 36 U 51 115 70 45 79 1,555 1,463 92
9 Panna T 1,203 3,890 2,142 1,748 74 387 378 9 R 1,178 3,779 2,081 1,698 50 272 271 I U 25 111 61 50 24 lIS 107 8
10 Satna T 897 2,234 1,502 732 543 678 504 174 R 718 1,659 1,024 635 61 166 161 5 U 179 575 478 97 482 512 343 169
11 'Rewa T 648 1,219 735 484 452 1,336 1,107 229 R 374 924 531 393 50 233 205 28 U 274 295 204 91 402 1,103 902 201
12 Shabdoi T 912 2,801 1,680 1,121 252 1,529 1,370 159 R 740 2,205 1,319 886 155 742 619 123 U 172 596 361 235 97 787 751 36
13 Sidhi T 562 1,173 885 288 141 628 490 138 R 553 1,158 873 285 131 501 385 116 U 9 15 12 3 10 127 105 22
14 Mandsaur T 2,852 11,993 7,152 4,841 164 1,856 1,760 96 R 2,366 10,186 5,827 4,359 53 177 161 16 U 486 1,807 1,325 422 111 1,679 1,599 80
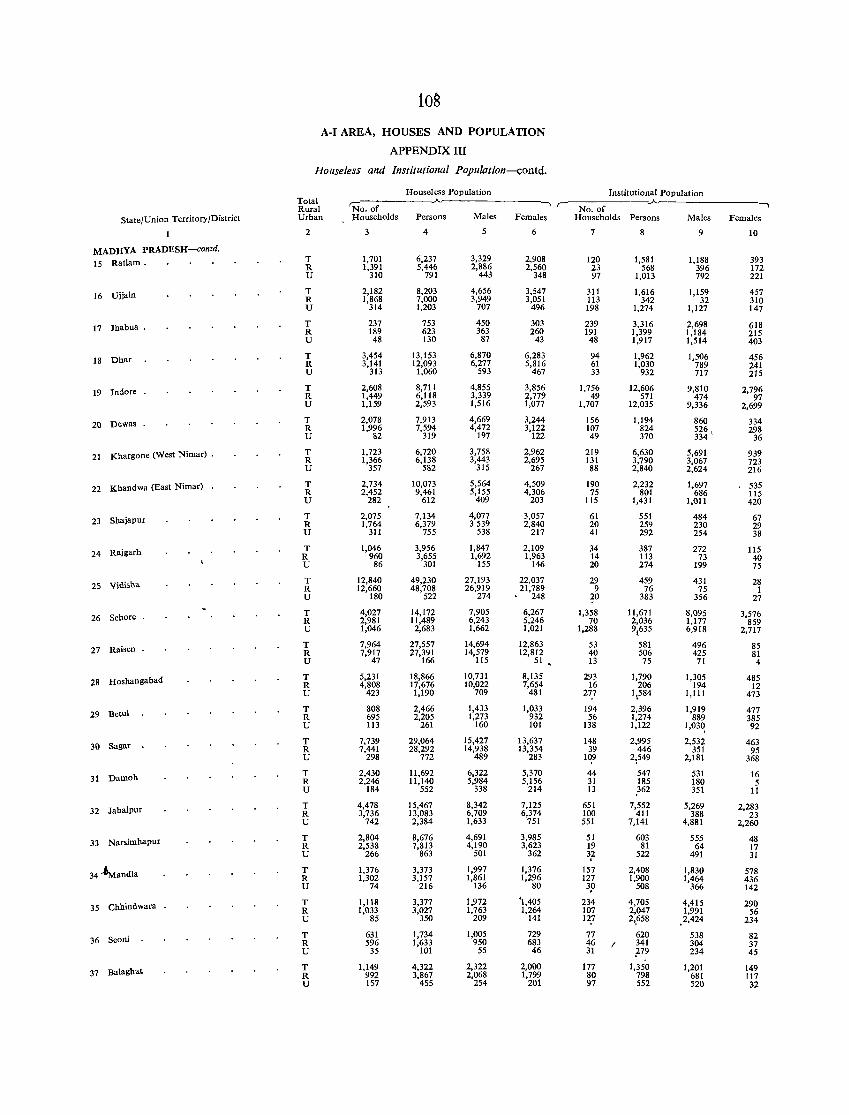
State/Union Territory/District
MADHYA PRADESH-contd.
15 Ratlam.
16 Vjjain
17 Jhabua.
18 Dhar
19 Indore .
20 Dewas .
21 Khargone (West Nimar) .
22 Khandwa (East Nimar)
23 Shajapur
24 Rajgarh
25 Vidisha
26 Sehore
27 Raisen .
28 Hoshangabad
29 Betul
30 Sagar .
31 Damoh
32 Jabalpur
33 Narsimhapur
34'~andla
35 Chhindwara
36 Seoni
37 Balaghat
loS
A-I AREA, HOUSES AND POPULATION
APPENDIX III
Houseless and Institutional Population-contd.
Housel ess Population Institutional Population Total Rural Urban
'N·-o.-o-r-- .A. .---------, "·-N-o.-O-r--.A. .-----..,
2
T R U
T R U
T R U
T R U
T R U
T R U
T R U
T R U
T R U
T R U
T R U
T R U
T R U
T R U
T R U
T R U
T R U
T R U
T R U
T R U
T R U
T R U
T R U
Households Persons Males Females Households Persons Males Females
1,701 1,391
310
2,182 1,868
314
237 189 48
3,454 3,141
313
2,608 1,449 1,159
2,078 1,996
82
1,723 1,366
357
2,734 2,452
282
2,075 1,764
311
1,046 960
86
12,840 12,660
180
4,027 2,981 1,046
7,964 7,917
47
5,231 4,808
423
808 695 113
7,739 7,441
298
2,430 2,246
184
4,478 3,736
742
2,804 2,538
266
1,376 1,302
74
1,118 1,033
85
631 596
35
1,149 992 157
4
6,237 5,446
791
8,203 7,000 1,203
753 623 130
13,153 12,093
1,060
8,711 6,118 2,593
7,913 7,594
319
6,720 6,138
582
10,073 9,461
612
7,134 6,379
755
3,956 3,655
301
49,230 48,708
522
14,172 11,489
2,683
27,557 27,391
166
18,866 17,676 1,190
2,466 2,205
261
29,064 28,292
772
11,692 11,140
552
15,467 13,083 2,384
8,676 7,813
863
3,373 3,157
216
3,377 3,027
350
1,734 1,633
101
4,322 3,867
455
5
3,329 2,886
443
4,656 3,949
707
450 363
87
6,870 6,277
593
4,855 3,339 1,516
4,669 4,472
197
3,758 3,443
315
5,564 5,155
409
4,077 3539
538
1,847 1,692
155
27,193 26,919
274
7,905 6,243 1,662
14,694 14,579
115
10,731 10,022
709
1,433 1,273
160
15,427 14,938
489
6,322 5,984
338
8,342 6,709 1,633
4,691 4,190
501
1,997 1,861
136
1,972 1,763
209
1,005 950
55
2,322 2,068
254
6
2,908 2,560
348
3,547 3,051
496
303 260
43
6,283 5,816
467
3,856 2,779 1,077
3,244 3,122
122
2,962 2,695
267
4,509 4,306
203
3,057 2,840
217
2,109 1,963
146
22,037 21,789
248
6,267 5,246 1,021
12,863 12,812
51
8,135 7,654
481
1,033 932 101
13,637 13,354
283
5,370 5,156
214
7,125 6,374
751
3,985 3,623
362
1,376 1,296
80
'1,405 1,264
141
729 683 46
2,000 1,799
201
7
120 23 97
311 113 198
239 191
48
94 61 33
1,756 49
1,707
156 107 49
219 131 88
190 75
115
61 20 41
34 14 20
29 9 ~O
1,358 70
1,288
53 40 13
293 16
277
194 56
138
148 39
109
44 31 13
651 100 551
51 19 3,2
157 127 39
234 107 127
77
jf ( 177 80 97
8
1,581 568
1,013
1,616 342
1,274
3,316 1,399 1,917
1,962 1,030
932
12,606 571
12,035
1,194 824 370
6,630 3,790 2,840
2,232 801
1,431
551 259 292
387 113 274
459 76
383
11,671 2,036 9:635
581 506 75
1,790 206
1\584
2,396 1,274 1,122
2,995 446
21549
547 185 362
7,552 411
7,141
603 81
522
2,408 1,900
508
4,705 2,047 2',658
620 341 1-79
1,350 798 552
9
1,188 396 792
1,159 32
1,127
2,698 1,184 1,514
1,506 789 717
9,810 474
9,336
860 m, 5,691 3,067 2,624
1,697 686
1,011
484 230 254
272 73
199
431 75
356
8,095 1,177 6,918
496 425 71
1,305 194
1,111
1,919 889
1,03q
2,532 351
2,181
531 180 351
5,269 388
4,881
555 64
491
1,830 1,464
366
4,415 1,991
,2,424
538 304 234
1,201 681 520
10
393 172 221
457 310 147
618 215 403
456 241 215
2,796 97
2,699
334 298
36
939 723 216
535 115 420
67 29 38
115 40 75
28 1
27
3,576 859
2,717
85 81 4
485 12
473
477 385 92
463 95
368
16 5
11
2,283 23
2,260
48 17 31
578 436 142
290 56
234
82 37 45
149 117 32
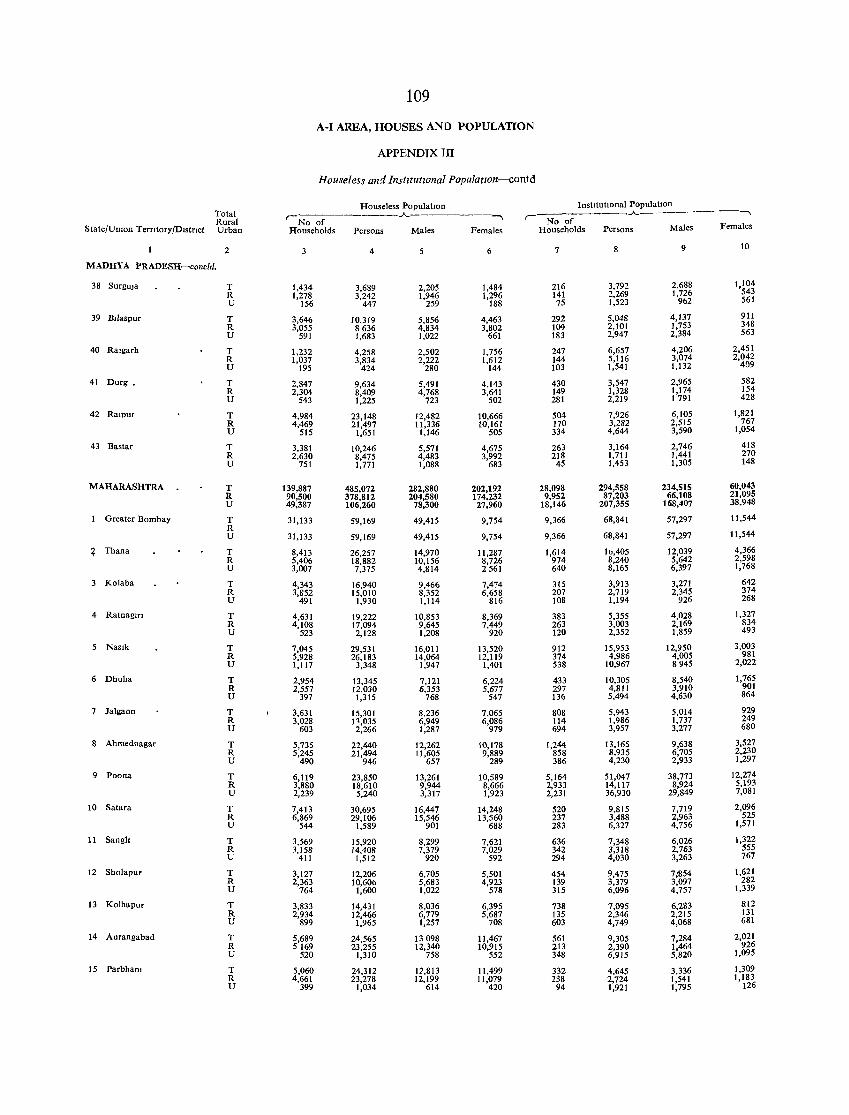
109
A-I AREA, HOUSES AND POPULATION
APPENDIX III
Houseless and InstllutlOnal PopulatlOn-contd
Houseless PopulatIon InstItutIonal PopulatIon Total ,..---------..A.-------_, ,..--N~---..A.---------, Rural No of
State/Umon Terntory!Dlstrlct Urban Households Persons Males Females Households Persons Males Females
2 4 6 7 8 9 10
MADHYA PRADESH-concld.
38 Surgu]a T 1,434 3,689 2,205 1,484 216 3,792 2,688 1104 R 1,278 3,242 1,946 1,296 141 2,269 1,726 '543
U 156 447 259 188 75 1,523 9b2 561
39 Bllaspur T 3,646 10,319 5,856 4,463 292 5,048 4,137 911 R 3,055 8636 4,834 3,802 109 2,101 1,753 348 U 591 1,683 1,022 661 183 2,947 2,384 563
40 Ralgarh T 1,232 4,258 2,502 1,756 247 6,657 4,206 2,451 R 1,037 3,834 2,222 1,612 144 5,116 3,074 2,042 U 195 424 280 144 103 1,541 1,132 409
41 Durg. T 2,847 9,634 5,491 4,143 430 3,547 2,965 582 R 2,304 8,409 4,768 3,641 149 1,328 1,174 154 U 543 1,225 723 502 281 2,219 1791 428
42 RalDur T 4,984 23,148 12,482 10,666 504 7,926 6,105 1,821 R 4,469 21,497 11,336 10,161 170 3,282 2,515 767 U 515 1,651 1,146 505 334 4,644 3,590 1,054
43 Bastar T 3,381 10,246 5,571 4,675 263 3,164 2,746 418 R 2,630 8,475 4,483 3,992 218 1,711 1,441 270 U 751 1,771 1,088 683 45 1,453 1,305 148
MAHARASHTRA T 139,887 485,072 282,880 202,192 28,098 294,558 234,515 60,043 R 90,500 378,812 204,580 174,232 9,952 87,203 66,108 21,095 U 49,387 106,260 78,300 27,960 18,146 207,355 168,407 38,948
Greater Bombay T 31,133 59,169 49,415 9,754 9,366 68,841 57,297 11,544 R U 31,133 59,169 49,415 9,754 9,366 68,841 57,297 11,544
f Thana T 8,413 26,257 14,970 11,287 1,614 Ib,405 12,039 4,366 R 5,406 18,882 10,156 8,726 974 8,240 5,642 2,598 U 3,007 7,375 4,814 2561 640 8,165 6,397 1,768
3 Kolaba T 4,343 16,940 9,466 7,474 315 3,913 3,271 642 R 3,852 15,010 8,352 6,658 207 2,719 2,345 374 U 491 1,930 1,114 816 108 1,194 926 268
4 Ratnagm T 4,631 19,222 10,853 8,369 383 5,355 4,028 1,327 R 4,108 17,094 9,645 7,449 263 3,003 2,169 834 U 523 2,128 1,208 920 120 2,352 1,859 493
5 Naslk T 7,045 29,531 16,011 13,520 912 15,953 12,950 3,003 R 5,928 26,183 14,064 12,119 374 4,986 4,005 981 U 1,117 3,348 1,947 1,401 538 10,967 8945 2,022
6 Dhuha T 2,954 13,345 7,121 6,224 433 10,305 8,540 1,765 R 2,557 12,030 6,353 5,677 297 4,811 3,910 901 U 397 1,315 768 547 136 5,494 4,630 864
7 Jalgaon T 3,631 15,301 8,236 7,065 808 5,943 5,014 929 R 3,028 11,035 6,949 6,086 114 1,986 1,737 249 U 603 2,266 1,287 979 694 3,957 3,277 680
Ahmednagar T 5,735 22,440 12,262 10,178 1,244 13,165 9,638 3,527 R 5,245 21,494 11,605 9,889 858 8,935 6,705 2,230 U 490 946 657 289 386 4,230 2,933 1,297
9 Poona T 6,119 23,850 13,261 10,589 5,164 51,047 38,773 12,274 R 3,880 18,610 9,944 8,666 2,933 14,117 8,924 5,193 U 2,239 5,240 3,317 1,923 2,231 36,930 29,849 7,081
10 Satara T 7,413 30,695 16,447 14,248 520 9,815 7,719 2,096 R 6,869 29,106 15,546 13,560 237 3,488 2,963 525 U 544 1,589 901 688 283 6,327 4,756 1,571
11 Sanglt T 3,569 15,920 8,299 7,621 636 7,348 6,026 1,322 R 3,158 14,408 7,379 7,029 342 3,318 2,763 555 U 411 1,512 920 592 294 4,030 3,263 767
12 Sholapur T 3,127 12,206 6,705 5,501 454 9,475 7;854 1,621 R 2,363 10,60b 5,683 4,923 139 3,379 3,097 282 U 764 1,600 1,022 578 315 6,096 4,757 1,339
13 Kolhapur T 3,833 14,431 8,036 6,395 738 7,095 6,283 812 R 2,934 12,466 6,779 5,687 135 2,346 2,215 131 U 899 1,965 1,257 708 603 4,749 4,068 681
14 Aurangabad T 5,689 24,565 13 098 11,467 561 9,305 7,284 2,021 R 5169 23,255 12,340 10,915 213 2,390 1,464 926 U 520 1,310 758 552 348 6,915 5,820 1,095
15 Parbhant T 5,060 24,312 17,813 11,499 332 4,645 3,336 1,309 R 4,661 23,278 12,199 11,079 238 2,724 1,541 1,183 U 399 1,034 614 420 94 1,921 1,795 126
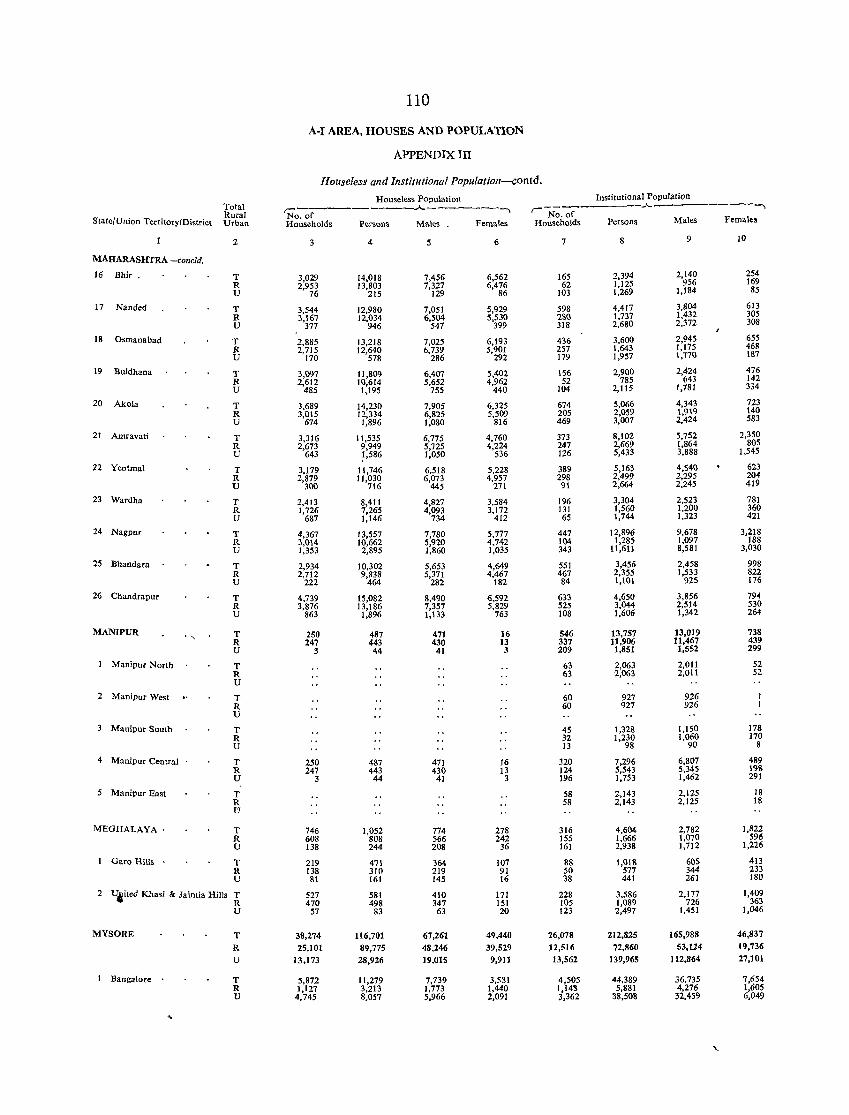
110
A·I AREA, HOUSES AND POPULATION
APPENDIX III
Houseless and Institutional Popu!ation-contd.
Houseless Population Institutional Population Total
'No. of .A.-------, ,..-- .A.---------,
Rural No. of State/Union Territory/District Urban Households Persons Males Females Households Persons Males Females
2 3 4 6 7 8 9 10
MAHARASHTRA -concld.
16 Bhir . T 3,029 14,018 7,456 6,562 165 2,394 2,140 254
R 2,953 13,803 7,327 6,476 62 1,125 956 169 U 76 215 129 86 103 1,269 1,184 85
17 Nanded T 3,544 12,980 7,051 5,929 598 4,417 3,804 613 R 3,167 12,034 6,504 5,530 2&0 1,737 1,432 305 U 377 946 547 399 318 2,680 2,372 308
18 Osmanabad T 2,885 13,218 7,025 6,193 436 3,600 2,945 655 R 2,715 12,640 6,739 5,901 257 1,643 1,175 468 U 170 578 286 292 179 1,957 1,710 187
19 Buldhana T 3,097 11,809 6,407 5,402 156 2,900 2,424 476 R 2,612 10,614 5,652 4,962 52 785 643 142 U 485 1,195 755 440 104 2,llS 1,181 334
20 Akola T 3,689 14,230 7,905 6,325 674 5,066 4,343 723 R 3,015 12,334 6,825 5,509 205 2,059 1,919 140 U 674 1,896 1,080 816 469 3,007 2,424 583
21 Amravati T 3,316 11,535 6,775 4,760 373 8,102 5,752 2,350 R 2,673 9,949 5,725 4,224 247 2,669 1,864 &05 U 643 1,586 1,050 536 126 5,433 3,888 1,545
12 YeotmaJ T 3,179 11,746 6,518 5,228 389 5,163 4,S40 623 R 2,879 11,030 6,073 4,957 298 2,499 2,295 204 U 300 716 445 271 91 2,664 2,245 419
23 Wardha T 2,413 8,411 4,827 3,584 196 3,304 2,523 781 R 1,726 7,265 4,093 3,172 131 1,560 1,200 360 U 687 1,146 734 412 65 1,744 1,323 421
24 Nagpur T 4,367 13,557 7,780 5,777 447 12,896 9,678 3,218 R 3,014 10,662 5,920 4,742 104 1,285 1,097 188 U 1,353 2,895 1,860 1,035 343 11,611 8,581 3,030
25 Bhandara T 2,934 10,302 5,653 4,649 551 3,456 2,458 998 R 2,712 9,838 5,371 4,467 467 2,355 1,533 822 U 222 464 282 182 84 1,101 925 176
26 Chaudrapur T 4,739 15,082 8,490 6,592 633 4,650 3,856 794 R 3,876 13,186 7,357 5,829 525 3,044 2,514 530 U 863 1,896 1,133 763 108 1,606 1,342 264
MANIPUR . "- T 250 487 471 16 546 13,757 13,019 738 R 247 443 430 13 337 11,906 11,467 439 U 3 44 41 3 209 1,851 1,552 ,299
Manlpur North T 63 2,063 2,011 52 R 63 2,063 2,011 52 U
2 Manipur West T 60 927 926 R 60 927 926 U
Manipur South T 45 1,328 1,150 178 R 32 1,230 1,060 170 U 13 98 90 8
4 Manipur Central T 250 4&7 471 16 320 7,296 6,807 489 R 247 443 430 13 124 5,543 5,345 198 U 3 44 41 3 196 1,753 1,462 291
5 Manipur East T 58 2,143 2,lZ5 18 R 58 2,143 2,125 18 IJ
MEGHALAYA· T 746 1,052 774 278 316 4,604 2,782 1,822 R 608 808 566 242 155 1,666 1,070 596 U 138 244 208 36 161 2,938 1,712 1,226
1 Garo Hills T 219 471 364 107 88 I ,illS 605 413 R 138 310 219 91 50 577 344 233 U 81 161 145 16 38 441 261 180
2 Ujited Khasi & laintia Hills T 527 581 410 171 228 3,586 2,177 1,409 R 470 498 347 151 lOS 1,089 726 363 U 57 83 63 20 123 2,497 1,451 1,046
MYSORE T 38,274 116,701 67,261 49,440 :26,078 212,825 165,988 46,837
R 25,101 89,775 48,246 39,529 12,516 72,860 53,U4 19,736
U 13,173 28,926 19,015 9,911 13,562 139,965 112,864 27,101
1 Bangalore T 5,872 11,279 7,739 3,S31 4,505 44,389 36,735 7,654 R 1,127 3,213 1,773 1,440 1,14S 5,881 4,276 1,605 U 4,745 8,057 5,966 2,091 3,362 38,508 32,459 6,049
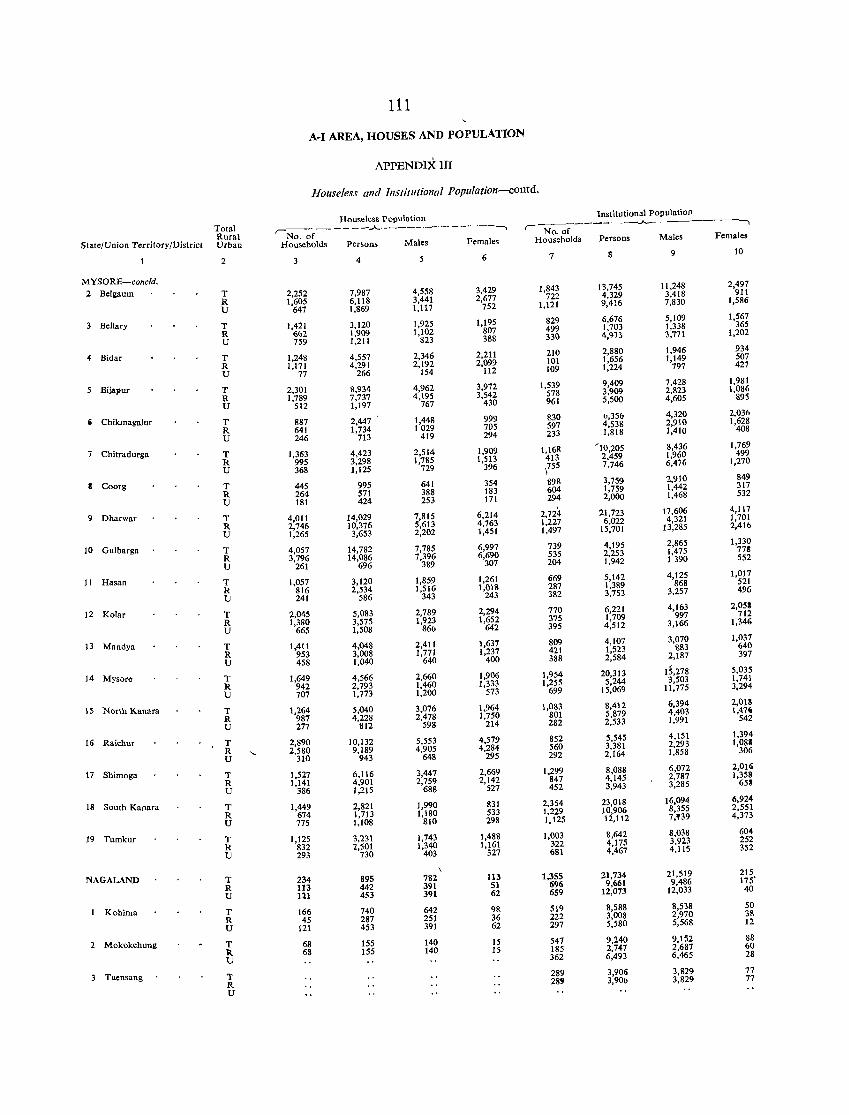
111
A-I AREA, HOUSES AND POPULATION
APPENDIX III
Houseless and Institutional population-contd.
Houseless Population Institutional Population
Total ,..-- - -- --..,).._.--~----- -----~ ,---- -...
State/Union Territory/District Rural No. of No. of
Urban Households Persons Males Females Households Persons Males Females
2 3 4 5 6 7 8 9 10
MYSORE-concld. 2 Belgaum T 2,252 7,987 4,558 3,429 1,843 13,745 11,248 2,497
R 1,605 6,118 3,441 2,677 722 4,329 3,418 911
U 647 1,869 1,117 752 1,121 9,416 7,830 1,586
Bellary T 1,421 3,120 1,925 1,195 829 6,676 5,109 1,567
R 6()2 1,909 1,102 807 499 1,703 1,338 365
U 759 1,2l! 823 388 330 4,913 3,771 1,202
4 Bidar T 1,248 4,557 2,346 2,211 210 2,880 1,946 934
R 1,171 4,291 2,192 2,099 101 1,656 1,149 507
U 77 266 154 112 109 1,224 797 427
5 Bijapuf T 2,301 8,934 4,962 3,972 1,539 9,409 7,428 1,981
R 1,789 7,737 4,195 3,542 578 3,909 2,823 1,086
U 512 1,197 767 430 961 5,500 4,605 895
• Chikmagalur T 887 2,447 1,448 999 830 0,356 4,320 2,036
R 641 1,734 1029 705 597 4,538 2,910 1,628
U 246 713 419 294 233 1,818 1,410 408
7 Chitradurga T 1,363 4,423 2,514 1,909 1,168 '10,205 8,436 1,769
R 995 3,298 1,785 1,513 413 2,459 1,960 499
U 368 1,125 729 396 \755 7,746 6,476 1,270
I Coorg T 445 995 641 354 898 3,759 2,910 849
R 264 571 388 183 604 1,759 1,442 317
U 181 424 253 171 294 2,000 1,468 532
9 Dharwar T 4,011 14,029 7,815 6,214 2,724 21,723 17,606 4,117
R 2,746 10,376 5,613 4,763 1,227 6,022 4,321 1,701
U 1,265 3,653 2,202 1,451 1,497 15,701 13,285 2,416
10 Gulbarga T 4,057 14,782 7,785 6,997 739 4,195 2,865 1,330
R 3,796 14,086 7,396 6,690 535 2,253 1,475 778
U 261 696 389 307 204 1,942 1390 552
11 Hasan T 1,057 3,120 1,859 1,261 669 5,142 4,125 1,017
R 816 2,534 1,516 1,018 287 1,389 868 521
U 241 586 343 243 382 3,753 3,257 496
12 Kolar T 2,045 5,083 2,789 2,294 770 6,221 4,163 2,051
R 1,380 3,575 1,923 1,652 375 1,709 997 712
U 665 1,508 86b 642 395 4,512 3,166 1,346
13 Mandya T 1,411 4,048 2,411 1,637 809 4,107 3,070 1,037
R 953 3,008 1,771 1,237 421 1,523 'jI'jI) 640
U 458 1,040 640 400 388 2,584 2,187 397
14 Mysore T 1,649 4,566 2,660 1,906 1,954 20,313 15,278 5,035
R 942 2,793 1,460 1,333 1,255 5,244 3,503 1,741
U 707 1,773 1,200 573 699 15,069 11,775 3,294
15 North Kanara T 1,264 5,040 3,076 1,964 1,083 8,412 6,394 2,013
R 987 4,228 2,478 1,750 801 5,879 4,403 1,47'
U 277 812 598 214 282 2,533 1,991 542
16 Raichur T 2,890 10,132 5,553 4,579 852 5,545 4,151 1,394
R " 2,580 9,189 4,905 4,284 560 3,381 2,293 1,081
U 310 943 648 295 292 2,164 1,858 306
17 Shimoga T 1,527 6,116 3,447 2,669 1,299 8,088 6,072 2,016
R 1,141 4,901 2,759 2,142 847 4,145 2,787 1,358
U 386 1,215 688 527 452 3,943 3,285 658
18 South Kanara T 1,449 2,821 1,990 831 2,354 23,018 16,094 6,924
R 674 1,713 1,180 533 1.229 10,906 8,355 2,551
U 775 1,108 810 298 1,125 12,112 7,'39 4,373
19 Tumkur T 1,125 3,231 1,743 1,488 1,003 8,642 8,038 604
R 832 2,501 1,340 1,161 322 4,175 3,923 252
U 293 730 403 327 681 4,467 4,115 352
NAGALAND \
T 234 895 782 113 1,355 21,734 21,519 215
R 113 442 391 51 696 9,661 9,486 175'
U 121 453 391 62 659 12,073 12,033 40
1 Kohima T 166 740 642 98 519 8,588 8,538 50
R 45 287 251 36 222 3,008 2,970 38
U 121 453 391 62 297 5,580 5,568 12
2 Mokokchung T 68 155 140 15 547 9,240 9,152 88
it 68 155 140 15 185 2,747 2,687 60
U 362 6,493 6,465 28
3 Tuensang T 289 3,906 3,829 77
R 28' 3,90b 3,829 77
U
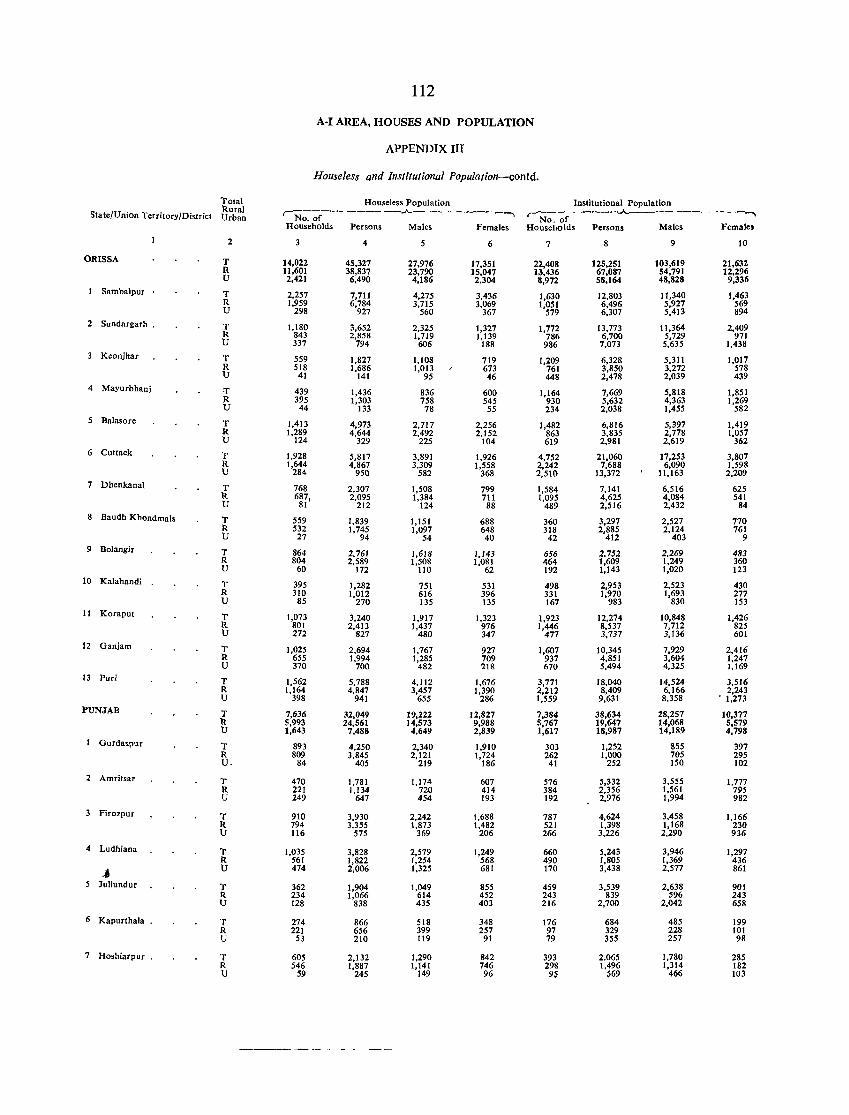
112
A-I AREA. HOUSES AND POPULATION
APPENDIX III
Houseless and Institutional Popu/ation-contd.
Total Houseless Population Institutional Population State/Union Territory/District
Rural ~------------~----------~ ~------.A.---- ------~ Urban No. of No. of Households Persons Males Females Households Persons Males Females
2 4 5 6 7 9 10
ORISSA T 14,022 45,327 27,976 17,351 22,408 125,251 103,619 21,632 R 11,601 38,837 23,790 15,047 13,436 67,087 54,791 12,296 U 2,421 6,490 4,186 2,304 8,972 58,164 48,828 9,336
Sambalpur T 2,257 7,711 4,275 3,436 1,630 12,803 11,340 1,463 R 1,959 6,784 3,715 3,069 1,051 6,496 5,927 569 U 298 927 560 367 579 6,307 5,413 894
2 Sundargarh . T 1,180 3,652 2,325 1,327 1,772 13,773 11,364 2,409 R 843 2,858 1,719 1,139 786 6,700 5,729 971 0 337 794 606 188 986 7,073 5,635 1,438
3 Keonjhar T 559 1,827 1,108 719 1,209 6,328 5,311 1,017 R 518 1,686 1,013 673 761 3,850 3,272 578 0 41 141 95 46 448 2,478 2,039 439
4 Mayurbbanj 'f 439 1,436 836 600 1,164 7,669 5,818 1,851 R 395 1,303 758 545 930 5,632 4,363 1,269 U 44 133 78 55 234 2,038 1,455 582
5 Balasore T 1,413 4,973 2,717 2,256 1,482 6,816 5,397 1,419 R 1,289 4,644 2,492 2,152 863 3,835 2,778 1,057 0 124 329 225 104 619 2,981 2,619 362
6 Cuttack T 1,928 5,817 3,891 1,926 4,752 21,060 17,253 3,807 R 1,644 4,867 3,309 1,558 2,242 7,688 6,090 1,598 0 284 950 582 368 2,510 13,372 11,163 2,209
7 Dhenkanal T 768 2,307 1,508 799 1,584 7,141 6,516 625 R 6~i' 2,095 1,384 711 1,095 4,625 4,084 541 0 212 124 88 489 2,516 2,432 84
8 Baudh Khondmals T 559 1,839 1,151 688 360 3,297 2,527 770 R 532 1,745 1,097 648 318 2,885 2,124 761 0 27 94 54 40 42 412 403 9
9 Bolangir T 864 2,761 1,618 1,143 656 2,752 2.269 483 R 804 2,589 1,508 1,081 464 1,609 1,249 360 0 60 172 110 62 192 1,143 1,020 123
10 Kalahandi T 395 1,282 751 531 498 2,953 2,523 430 R 310 1,012 616 396 331 1,970 1,~~~ 277 0 85 270 135 135 167 983 153
11 Koraput T 1,073 3,240 1,917 1,323 1,923 12,274 10,848 1,426 R 801 2,413 1,437 976 1,446 8,537 7,712 825 0 272 827 480 347 477 3,737 3,136 601
12 Ganjam T 1,025 2,694 1,767 927 1,607 10,345 7,929 2,416 R 655 1,994 1,285 709 937 4,851 3,604 1,247 0 370 700 482 218 670 5,494 4,325 1,169
13 Puri T 1,562 5,788 4,112 1,676 3,771 18,040 14,524 3,516 R 1,164 4,847 3,457 1,390 2,212 8,409 6,166 2,243 0 398 941 655 286 1,559 9,631 8,358 . 1,273
PUNJAB T 7,636 32,049 19,222 12,827 7,384 38,634 28,257 10,377 ll. 5,993 24,561 14,573 9,988 5,767 19,647 14,068 5,579 U 1,643 7,488 4,649 2,839 1,617 18,987 14,189 4,798
1 Gurdaspur T 893 4,250 2,340 1,910 303 1,252 855 397 R 809 3,845 2,121 1,724 262 1,000 705 295 o. 84 405 219 186 41 252 150 102
2 Amritsar T 470 1,781 1,174 607 576 5,332 3,555 1,777 R 221 1,134 720 414 384 2,356 1,561 795 0 249 647 454 193 192 2,976 1,994 982
3 Firozpur T 910 3,930 2,242 1,688 787 4,624 3,458 1,166 ll. 794 3,355 1,873 1,482 521 1,398 1,168 230 U 116 575 369 206 266 3,226 2,290 936
4 Ludhiana T 1,035 3,828 2,579 1,249 660 5,243 3,946 1,297 R 561 1,822 1,254 568 490 1,805 1,369 436
... U 474 2,006 1,325 681 170 3,438 2,577 861
5 Jullundur T 362 1,904 1,049 855 459 3,539 2,638 901 R. 234 1,066 614 452 243 839 596 243 U 128 838 435 403 216 2,700 2,042 658
6 Kapurthala . T 274 866 518 348 176 684 485 199 ll. 221 656 399 257 97 329 228 101 U 53 210 119 91 79 355 257 98
7 Hoshiarp ur . T 605 2,132 1,290 842 393 2.065 1,780 285 ll. 546 1,887 1,141 746 298 1,496 1,314 182 0 59 245 149 96 9S S69 466 103
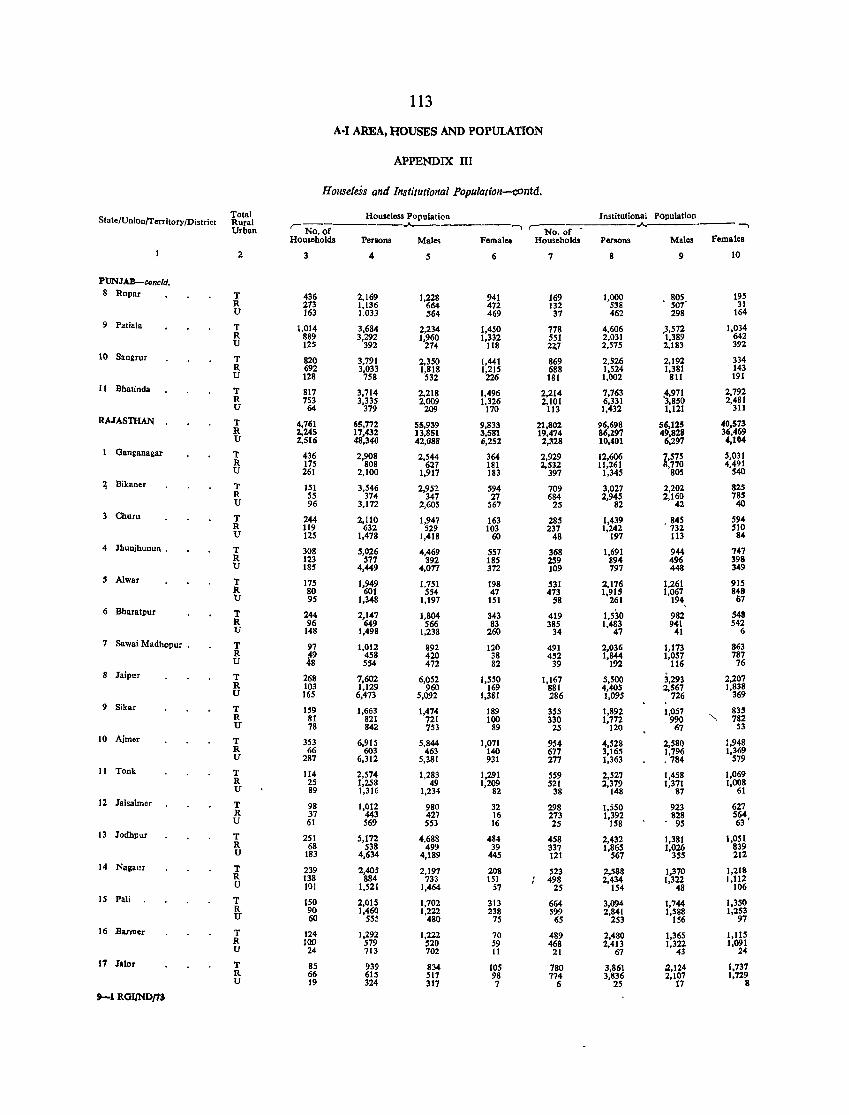
113
A·I AREA, HOUSES AND POPULATION
APPENDIX III
Houseless and Institutional Populotion-contd.
State/Union/Territory/District Total Houael.s! Population Institutional Population Rural ,----------.A.---------. ~or .A. -. Urban No. of
Females Households Persons Males Fernal .. Households Persons Males
2 3 4 S 6 7 8 9 10
PUNJAB-eoneid. S Ropar T 436 2,169 1,228 941 169 1,000 • 80S, 195
R 273 1,136 664 472 132 538 507 31 U 163 1.033 564 469 37 462 298 164
9 Patiala T 1.014 3,684 2,234 1,450 778 4,606 ),572 1'2l~ R 889 3,292 1,960 1,332 551 2,031 1,389 U 125 392 274 118 22,,7 2,575 2,183 392
10 Sangrur T 820 3,791 2,350 1,441 869 2,526 2,192 334 R 692 3,033 1,818 1,215 688 1,524 1,381 143 U 128 758 532 226 181 1,002 811 191
It Bhatinda T 817 3,714 2,218 1,496 2,214 7,763 4,971 2,792 R 753 3,335 2.009 1,326 2,101 6,331 ),850 2,481 U 64 379 209 170 113 1,432 1.121 311
RAJASmAN T 4,761 65,772 55,939 9,833 21,802 96,698 56,125 40,573 R 1,245 17,432 13,851 3,581 19,474 86,297 49,828 36.469 U 2,516 48,340 42,088 6,252 2,328 10,401 6,297 4,104
Ganganagar T 436 2,908 2,544 364 2,929 12,606 ~,57S 5,031 R 175 808 627 181 2,S32 11,261 ,770 4,m U 261 2,100 1,917 183 397 1,345 80S
~ Bikaner T lSI 3,546 2,952 594 709 3,027 2,202 825 R 55 374 347 27 684 2,945 2,160 7as U 96 3,172 2,605 567 25 82 42 40
3 Churu T 244 2,110 1,947 163 285 1.439 845 594 R 119 632 529 103 237 1,242 . 732 510 U 125 1,478 1,418 60 48 197 113 84
4 Jhunjhunun . T 308 5,026 4,469 SS7 368 1,691 944 747 R 123 577 392 185 259 894 496 398 U 185 4,0449 4,077 372 109 797 448 3<49
5 Alwar T 175 1,949 1,751 198 531 2,176 1,261 915 R 80 601 554 47 473 1,915 1,061 848 U 95 1,348 1,197 151 58 261 194 67
6 Bbaratpur T 244 2,147 1,804 343 419 1,530 982, 54! R 96 649 566 83 385 1,483 941 542 U 148 1,498 1.2,38 260 34 47 41 6
7 Sawai Madhopur • T 97 1,012 892 120 491 2,036 1,173 863 R ~9 458 420 38 452 1,844 1,057 787 U 48 554 472 82 39 192 116 76
8 laipur T 268 7,602 6,052 1.550 1,167 5,500 3,293 2,207 R 103 1,129 960 169 881 4,405 2,561 I,~~~ U 165 6,473 5,092 1.381 286 1,095 726
9 Sikar T 159 1,663 1,474 189 355 1,892 1,057 83' R 81 821 721 100 330 1,772 990 "- 782 U 78 842 753 89 25 120 67 53
10 Ajmer T 353 6,915 5,844 1,071 954 4,528 2,580 1,948 R 66 603 463 140 677 3,165 1,796 1,369 U 287 6,312 5.381 931 277 1,363 .784 579
11 Tonk T 114 2,574 1,283 1,291 559 2,527 1,458 1,069 R 25 1,258 49 1,~ 521 2,379 1,371 1,~~ U 89 1,316 1,234 38 148 87
12 laisahner T 98 1,012 980 32 298 1,550 923 627 R 37 443 427 16 273 1,392 828 564 U 61 569 553 16 25 158 95 63 '
13 Jodhpur T 251 5,172 4,688 484 458 2,432 1,381 l,g~~ R 68 538 499 39 337 1,865 1,026 U 183 4,634 4,189 445 121 567 35S 212
14 Nasaur T 239 2,405 2,197 208 523 2,588 1,370 1,218 R 138 884 733 151 498 2,434 1,322 1,112 U 101 1,521 1,464 57 25 154 48 106
15 Pali T ISO 2,015 1,702 313 664 3,094 1,744 1,350 R 90 1,460 1,222 238 599 2,841 1,588 1,253 U 60 555 480 75 65 253 156 97
16 Barmer T 124 1,292 1,222 70 489 2,480 1,365 1,115 R 100 579 520 S9 468 2,413 1,322 1,091 U 24 713 702 11 21 67 43 24
11 Idor T 85 939 834 105 780 3,861 .2,124 1,737 R 66 61S 517 98 774 3,836 2,107 1,729 U 19 324 317 7 6 25 17 8
9-1 ROI/ND/13
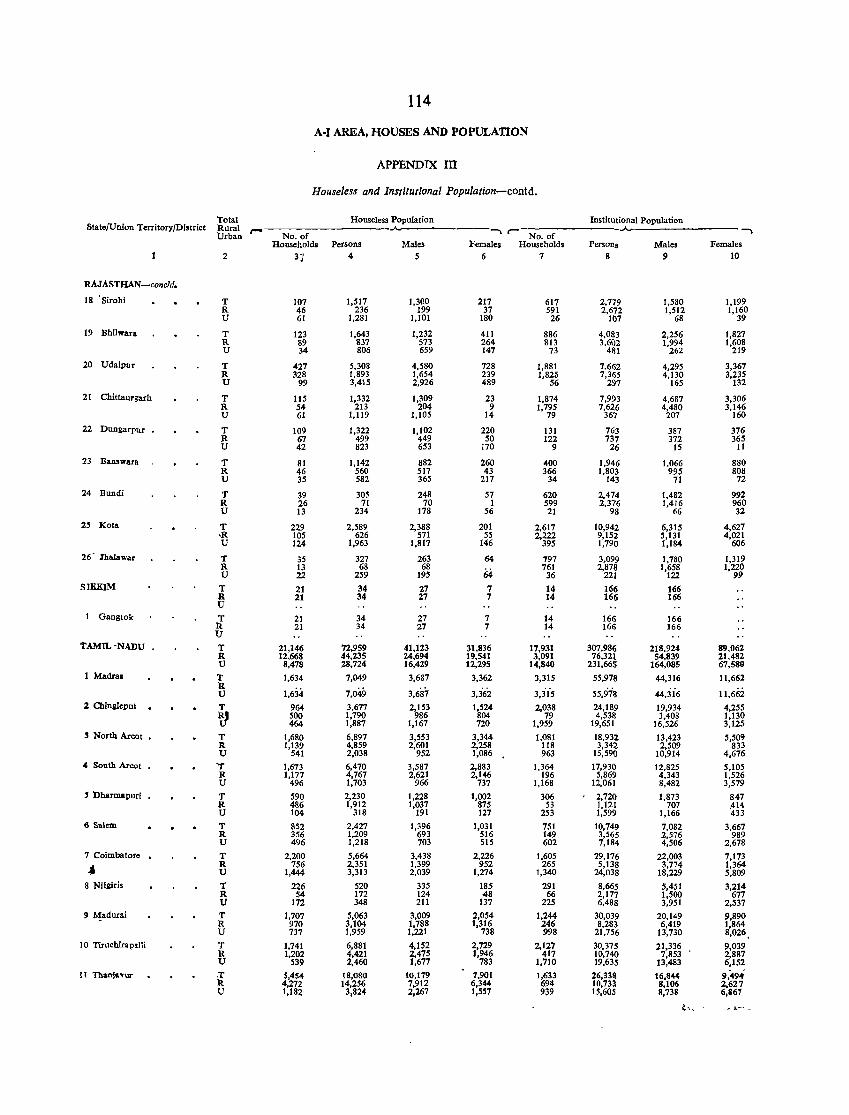
114
A-I AREA, HOUSES AND POPULATION
APPENDIX m
Houseless and Institutional Population-contd.
Total Houseless Population Institutional Population State/Union Territory/District Rural ,_ ...... r- ......
Urban No. of No. of Householda Persons Males Females Household. Persons Males Females
2 31 4 5 6 7 8 9 10
RAJASTHAN-concfd.
18 'Sirohi T 107 1,517 1,300 217 617 2,779 1,580 1,199 R 46 236 199 37 591 2,672 1,512 1,160 U 61 1,281 1,101 180 26 107 68 39
19 Bhilwara T 123 1,643 1,232 411 886 4,083 2,256 1,827 R 89 837 573 264 813 3,602 1,994 1,60S U 34 806 659 147 73 481 262 219
20 Udaipur T 427 5,308 4,580 728 1,881 7,662 4,295 3,367 R 328 1,893 1,654 239 I,S2~ 7,365 4,130 3,235 U 99 3,415 2,926 489 56 297 165 132
21 Chittaurgarh T 115 1,332 1,309 23 I,S74 7,993 4,687 3,306 R 54 213 204 9 1,795 7,626 4,480 3,146 U 61 1,119 1,105 14 79 36'7 207 160
22 Dungarpur T 109 1,322 1,102 220 131 763 387 376 R 67 499 449 50 122 737 372 365 U 42 823 653 170 9 26 15 II
23 Banswara T 81 1,142 882 260 400 1,946 1,066 880 R 46 560 517 43 366 1,803 995 808 U 35 582 365 217 34 143 71 72
24 Bondi T 39 30S 248 57 620 2,474 1,482 992 R 26 71 70 I 599 2,376 1,416 960 U 13 234 178 56 21 98 66 32
2' Kola T 229 2,589 2,388 201 2,617 10,942 6,315 4,627 ·R 105 626 571 55 2,222 9,152 5,131 4,021 U 124 1,963 1,817 146 395 1,790 1,184 606
26' 1halawar T 35 327 263 64 197 3,099 1,780 1,319 R 13 68 68 761 2,878 1,658 1,220 U 22 259 195 64 36 221 122 99
SIKKIM T 21 34 27 7 14 166 166 R 21 34 27 7 14 166 166 U
1 Gangtok T 21 34 27 7 14 166 166 It 21 34 27 7 14 166 166 U
TAMIL-NADU T 21,146 72,959 41,123 31,836 17,931 307,986 218.924 89.062 R 12,668 44,235 24,694 19,541 3,091 76,321 54,839 21,482 U 8,478 28,724 16,429 12,295 14,840 231,665 164,085 67,589
1 Madras 'f 1,634 7,049 3,687 3,362 3,315 55,978 44,316 11,662 R
1,634 7,049 3,687 3,362 3,31" 55,9i8 44ji6 11,66i U 2 ChineIeput T 964 3,617 2,153 1,524 2,038 24,189 19,934 4,255
~ 500 1,790 986 804 79 4,538 3,408 1,130 464 1,887 1,167 720 1,959 19,651 16,526 3,125
5 North Arcot • T 1,680 6,897 3,553 3,344 1,081 18,932 13,423 5,50~ It 1,139 4,859 2,601 2,258 118 3,342- 2,509 833 U 541 2,038 952 1,086 963 15,590 10,914 4,676
4 South Areat 'T 1,673 6,470 3,587 2,883 1,364 17,930 12,825 5,105 R 1,177 4,767 2,621 2,146 196 5,869 4,343 1,526 U 496 1,703 966 737 1,168 12,061 8,482 3,579
, Dharmapuri T 590 2,230 1.228 1,002 306 2,720 1,873 847 R 486 1,912 1,037 875 53 1,121 707 ,414 U 104 318 191 127 253 1,599 1,166 433
6 Salem T 852 2,427 1,396 1,031 751 10,749 7,082 3,667 R 356 1,209 693 516 149 3,565 2,576 989 V 496 1,218 703 515 602 7,184 4,506 2,678
7 Coimbatore T 2,200 5,664 3,438 2,226 1,605 29,176 22,003 7,173
-' R 756 2,351 1,399 952 265 5,138 3,774 1,364 U 1,444 3,313 2,039 1,274 1,340 24,038 18,229 5,809
8 NlIiiris T 226 520 335 185 291 8,665 5,451 3,214 R 54 172 124 48 66 2,177 1,500 677 U 172 348 211 137 225 6,488 3,951 2,537
9 1!adurai T 1,707 5,063 3,009 2,054 1,244 30,039 20,149 9,890 R 970 3,104 1,788 1,316 246 8,283 6,419 1,864 U 737 1,959 1,221 738 998 21,756 13,730 8,026.
10 Tiruchirapalli T 1,741 6,881 4,152 2,729 2,127 30,375 21,336 9,039 R 1,202 4,421 2,475 1,946 417 10,740 7,853 2,887 U 539 2,460 1,677 783 1,710 19,635 13,483 6,152
II ThanjavW' :1' 5,454 18,080 10,179 7,901 1,633 26,338 16,844 9,49,'-a 4,272 14,256 7,912 6,344 69" 10,733 8,106 2,621 U 1,182 3,824 2,267 1,557 939 15,605 8,738 6,&61
l". .. .,_--
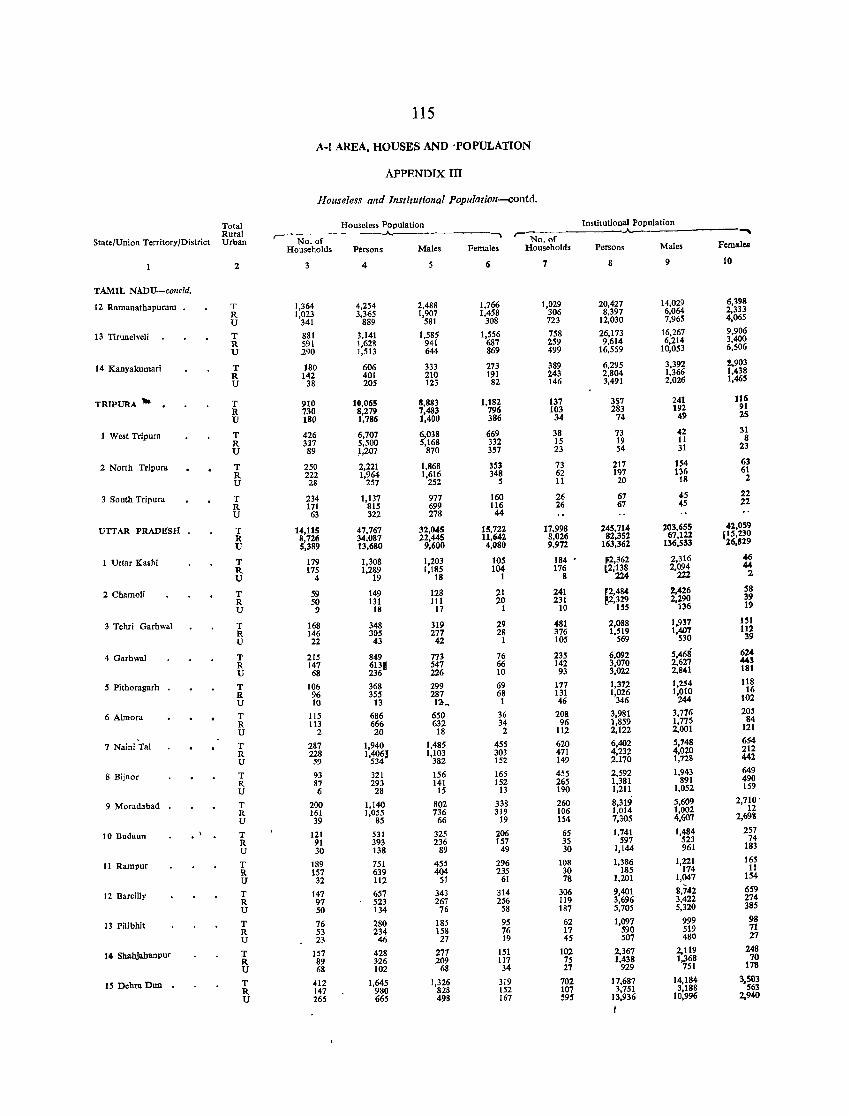
115
A-I AREA, HOUSES AND 'POPULATION
APPENDIX III
Houseless and Institutional population--<:,ontd.
Total Houseless Population Institutional Population Rural r- .....,
r- No. of """ State/Union Territory/District Urban No. of Households Persons Males Females Households Persons Males Females
2 3 4 6 7 8 51 10
TAMIL NADU-conc/d.
12 Ramanathapuram T 1,364 4,254 2,488 1,766 1,029 20,427 14,029 6,398
R 1,023 3,365 1,907 1,458 306 8,397 6,064 2,333
U 341 889 581 308 723 12,030 7,965 4,065
13 Tirunelveli T 881 3,141 1,585 1,556 758 26,173 16,267 9,906
R 591 1,628 941 687 259 9,614 6,214 3,400
U 290 1,513 644 869 499 16,559 10,053 6,506
14 Kanyakumari T 180 606 333 273 389 6,295 3,392 :2,903
R 142 401 210 191 243 2,804 1,366 1,438
U 38 205 123 82 146 3,491 2,026 1,465
TRIPURA "" T 910 10,065 8,883 1,182 137 357 241 116
R 730 8,279 7,483 796 103 283 192 91
U 180 1,786 1,400 386 34 74 49 2S
1 West Tripura T 426 6,707 6,038 669 38 73 <12 :n R 337 5,500 5,168 332 15 19 11 8
U 89 1,207 870 3~7 23 54 31 23
2 North Tripura T 250 2,221 1,868 353 73 217 1S4 63
R 222 1,964 1,616 348 62 197 136 61
U 28 257 252 S 11 20 18 2
3 South Tripura T 234 1,137 977 160 26 67 4S 22
R 171 81S 699 116 26 67 45 22
U 63 322 278 44
UTTAR PRADESH • T 14,115 47,767 32,045 IS,722 17.998 24!.714 203.655 41,059
R 8,726 34,087 22.445 11,642 8,026 82,351 67,1ll pS.230
U 5.389 13.680 9.600 4,080 9.972 163,362 136.533 16,819
1 Uttar Kashi T 179 1.308 1,203 105 184 F2,362 2,316 -46
R 175 1,289 1,185 104 176 [2;138 2,094 44
U 4 19 18 1 8 224 211 2
2 Chamoli T 59 149 128 21 241 F2,484 1,426 58
R 50 131 111 20 231 ~,2,329 2,290 39
U 9 18 17 1 10 B5 136 19
3 Tehri Garhwal T 168 348 319 19 481 2,088 1,937 131
R 146 305 277 28 376 I,S19 1,401 112
U 22 43 42 1 105 S69 530 39
4 Garhwal T 215 849 773 76 235 6,092 S,468 624 R 147 ~~~I 547 66 142 3,070 2,627 443
U 68 226 10 93 3,022 2,841 181
5 Pithoragarh T 106 368 299 69 177 1,372 1.254 U8
R 96 355 287 68 131 1.026 1,010 16
U 10 13 12-~ 1 46 346 244 102
6 Almora T 115 686 650 36 208 3,981 3,776 20' R 113 666 632 34 96 1,859 1,775 84
U 2 20 18 2 112 2,122 2.001 121
7 Naini Tal T 287 1,940 1,485 455 620 6,402 5,748 654
R 228 1,4063 1,103 303 471 4,232 4,010 212
U 59 534 382 152 149 2,170 1,728 442
8 Bijnor T 93 321 156 165 455 2,592 1,943 649
R 87 293 141 152 265 1,381 891 490
U 6 28 15 13 190 1,211 1,052 159
9 Moradabad T 200 1,140 802 338 260 8,319 5.609 2,710'
R 161 1,055 736 319 106 1,014 1,001 12
U 39 85 66 19 154 7,305 4,607 2,6911
10 Budaun T 121 531 325 206 65 1,741 1,484 257
R 91 393 236 157 35 597 523 74
U 30 138 89 49 30 1,144 961 183
11 Rampur T J89 751 455 296 108 1,386 1,221 165
R 157 639 404 235 30 185 174 11
U 32 112 51 61 78 1,201 1,047 154
12 Bareilly T 147 657 343 314 306 9,401 8,742 659
R 97 523 267 256 119 3,696 3,422 274
U 50 134 76 58 187 5.705 5,320 385
13 Pilibhit T 76 280 185 95 62 1,097 999 98
R 53 234 158 76 17 590 519 71
U 23 46 27 19 45 507 480 27
14 Shahjahanpur T 157 428 271 151 102 2,367 2,119 248
R 89 326 209 117 75 1.438 1,368 70
U 68 101 68 34 27 929 751 178
15 Debra Dun T 412 1,645 1,326 319 702 17.687 14,184 3.~~~ R 147 980 828 152 107 3.751 3,188 U 265 665 498 167 595 13,936 10,996 2,940
I
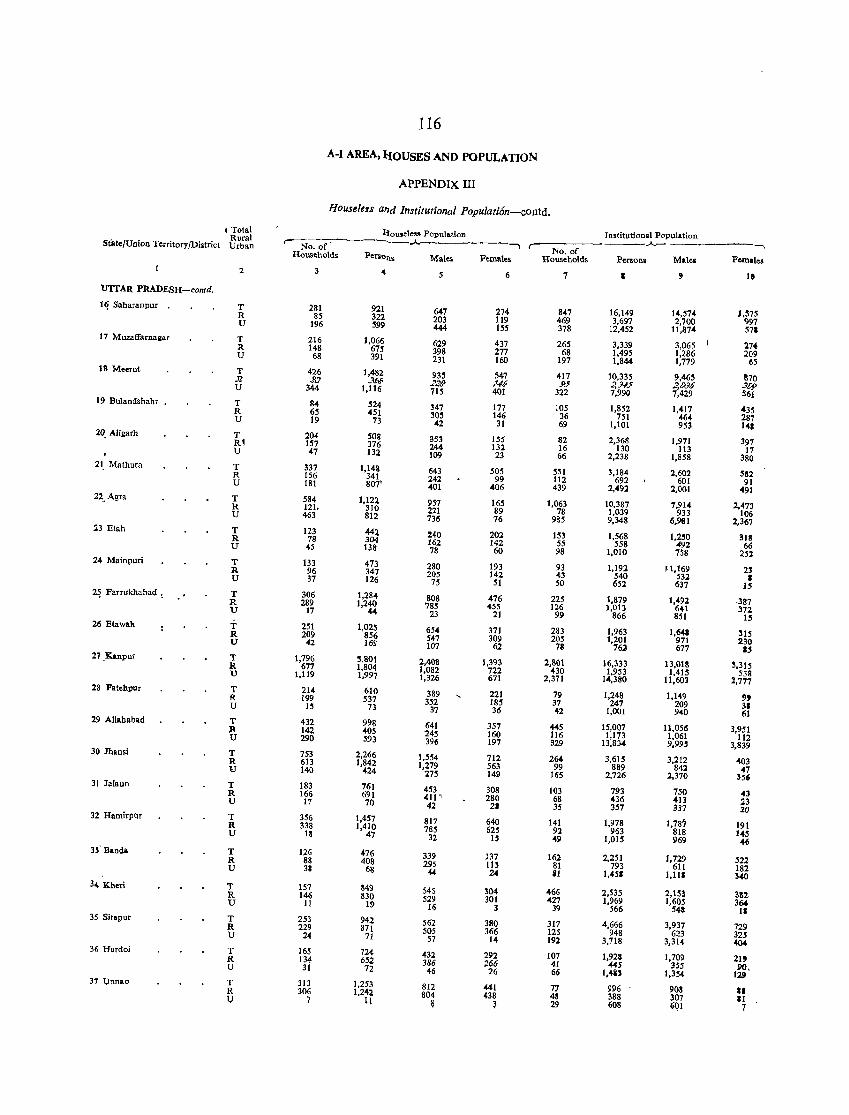
116
A-I AREA, lIOUSES AND POPULATION
APPENDIX III
Houuless afld Institutional Popu[ati6n-contd.
I Total llou.e!e., Population In.titutional Population Rural ~of' ------.A.---------..... -, State/Union Territory/District Urban
No. of Households PersOllS Male. Females Households Persona Mal ... PlIIllalea 2 3 4 5 6 7 I , 10
UTTAR PRADESH-con/d.
1<1 Saharanpur T 281 921 647 274 847 16,149 14,574 1,575 R 85 322 203 119 469 3,697 2,700 997 U 196 599 444 155 378 12,452 11,874 571 17 Muzaffarnallar T 216 1,066 629 437 265 3,339 3,065 274 R 148 6n 398 277 68 1,495 1,286 209 U 68 391 231 160 197 1,844 1,779 65 IS Meerut T 426 1,482 935 547 417 10,335 9,465 1170 .11 Jl7 _w 220 1# 1>5 2oJ4.! 2omO' :J[>p U 344 1,116 71S 401 322 7.990 7,429 S61
19 Bulandshahr . T 84 524 347 177 105 1,852 1.417 435 R 65 451 305 146 36 751 464 287 U 19 13 42 31 69 1.101 953 14. 20. Aiigarh T 204 50g 953 155 82 2.368 1.971 397 Rl 157 376 244 132 16 130 113 17 U 47 132 109 23 66 2.238 1.858 380 21. Mathur .. T 337 1,148 643 505 551 3.184 2.602 582 R 156 341 242 99 112 692 601 91 U 181 807' 401 406 439 2.492 2.001 491 22, Agra T 584 1.122 957 165 1.063 10.387 7.914 2.473 R 121. 310 221 89 78 1.039 933 106 U 463 812 736 76 985 9.348 6,961 2,367 23 Etah T 123 442 240 202 153 1.568 1.250 318 R 78 304 162 142 55 558 492 66 U 45 138 78 60 98 1,010 758 252 24 Mainpuri T 133 473 280 193 93 1.192 fl.169 23 R 96 347 205 142 43 540 532 I U 37 126 75 51 SO 652 637 15 2~ Farrukhabad , T 306 1.284 808 476 225 1.879 1,492 .387 R 289 1,240 785 455 126 1.013 MI 372 U 17 44 23 21 99 866 851 IS 26 Etawah T 251 1.02S 654 371 283 1.963 1.641 315 R 209 856 547 309 205 1.201 971 230 U 42 16S 107 62 78 762 677 'S 27 _K.npur T 1.796 3,801 2,408 1.393 2.801 16.333 13.018 5.315 R 677 1,804 1,082 722 430 1.953 1,415 538 U 1.119 1.997 1.326 671 2.371 14,380 11,603 '1..777 28 Patchpur T 214 610 389 221 79 1.248 1.149 " R 199 537 352 18S 37 247 209 3' U IS 73 37 36 '12 1.001 940 61 29 Allahabad T 432 998 641 357 445 15,007 11,056 3.951 R 142 405 245 160 116 1.173 1.061 112 U 290 593 396 197 329 13.834 9,99' 3.839 30 Jhans; T 753 2.266 1,554 712 264 3.615 3.212 '103 R 613 1,842 1,279 563 99 889 842 47 B 14() 424 275 149 165 2,726 2,370 356 31 Jalaun T 183 761 453 308 103 793 750 43 R 165 691 411' 280 68 436 413 23 U 17 70 42 21 35 357 337 20 32 Hamirpur T 356 1,457 817 640 141 1,978 1.787 191 R 338 1,410 785 625 92 963 818 145 U IS 47 32 15 49 1,015 969 46 3f Banda T 125 476 339 137 162 2,251 1,729 522 R 88 408 295 113 81 793 611 182 U 31 68 44 24 il 1 .... 5' 1,111 340 34 Khcri T 157 849 545 ~04 465 2.535 2.153 331 R 146 830 529 301 427 1.969 1.605 364 U II 19 16 3 39 566 54! II 35 Sitapur T 253 942 562 380 317 4.666 3,937 729 R 229 871 505 366 125 948 623 325 U 24 71 57 14 192 3.718 3,314 404 36 Hardoi T 165 724 432 292 107 1,928 1.709 21' R 134 652 386 266 41 445 355 90, U 31 72 46 26 66 1,4iJ 1.354 129 37 t.JnnRo T 313 1.253 812 441 7'1 996 90S II R 306 1.242 804 438 4S 388 307 11 U 7 II ~ ~ 29 608 6Q1 7
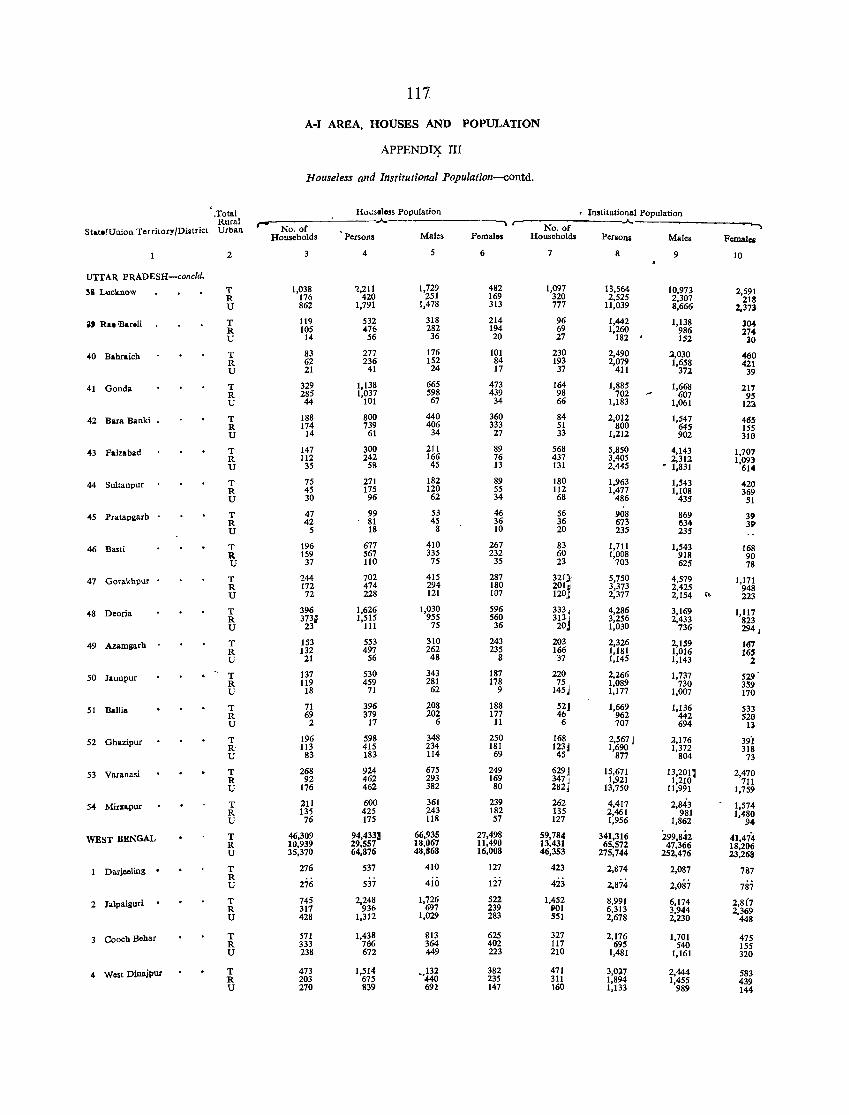
111
A-I AREA, HOUSES AND POPULATION
APPENDI'j: III
Houseless and Institutional Population-contd.
, Hous.less Population • Institutional Population .Total
Rural .A. .A.
St .. t./Uuion Territory/Diatrict Urban r- Na. of No. of
Households Persons Males Femalos Households Persons Mal .. Fcmal ..
2 4 6 7 8 9 10
UTTAR PRADESH-concld.
T 1,038 ~,21l 1,729 482 1,097 13,564 10,973 2,591 5& Lucknow R 176 420 251 169 320 2,525 2,307 218 U 862 1,791 1,478 313 777 11,039 8,666 2,373
T 119 532 318 214 96 1,442 1,138 l~ a, Rae ·Bar.1i R 105 476 282 194 69 1,260 986 274 U 14 56 36 20 27 182 . 152 30
T 83 277 176 101 230 2,490 2,030 460 40 Bahraich R 62 236 152 84 193 2,079 1,658 421 U 21 41 24 17 37 411 372 39
T 329 1,138 665 473 164 1,885 1,668 217 41 Gonda R 285 1,037 598 439 98 702 607 95 U 44 101 67 34 66 1,183 1,061 121
Bara Banki • T 188 800 440 360 84 2,012 1,547 465 42 174 739 406 333 51 800 645 155 R
14 61 34 27 33 1,212 902 310 U
T 147 300 211 89 568 5,850 4,143 1,701 43 Faizabad R 112 242 166 76 437 3,405 2,311 1,093 U 35 58 45 13 131 2,445 • 1,831 614
T 75 271 182 89 180 1,963 1,543 420 44 Sultanpur R 45 175 120 55 112 1,477 1,108 369 U 30 96 62 34 68 486 435 51
I
T 47 99 53 46 56 908 869 39 45 Pratapgarh R 42 81 4S 36 36 673 634 39 U 5 18 8 10 20 235 235
T 196 677 410 267 83 1,711 1,543 168 46 Basti R 159 567 335 232 60 1,008 918 90 U 37 110 75 35 23 703 625 78
T 244 702 415 287 321l- 5,750 4,579 1,171 47 Gorakhpur • R 172 474 294 180 201~ 3,373 2,425 948 U 72 228 121 107 120J 2,377 2,154 .. 223
T 396 1,626 1,030 596 333 J 4,286 3,169 1,117 48 Deoria R 373~ 1,515 955 560 313j 3,256 2,433 823 U 23 111 75 36 20 1,030 736 294 J
T 153 553 310 243 203 2,326 2,159 167 49 Azaml>"rh R 132 497 262 235 166 1,181 1,016 165 U 21 56 48 8 37 1,145 1,143 2
T 137 530 343 187 220 2,266 1,737 529 50 Jaunl?ur R 119 459 281 178 75, 1,089 730 359 U 18 71 62 9 145j 1,177 1,007 170
T 71 396 208 188 52J 1,669 1,136 533 51 Balli. R 69 379 202 177 4b 962 442 520 U 2 17 6 11 6 707 694 U
T 196 598 348 250 168 2,567 1 2,176 39'1 52 Ghazipur R' 113 415 234 181 1231 1,690 1,372 318 U 83 183 114 69 45 877 804 73
T 268 924 675 249 6291 15,671 13,2O ll 2,470 53 Varanasi R 92 462 293 169 347 J 1,921 1,210 711 U 176 462 382 80 282j 13,750 11,991 1,759
T 211 600 361 239 262 4,417 2,843 1,574 54 Mirnpur R 135 425 243 182 135 2,461 981 1,480 U 76 175 118 57 127 1,956 1,862 94
WEST BENGAL T 46,309 94,433.1 66,935 27,498 59,784 341,316 299,8.h 41,474 R 10,939 29,557 18,067 11,490 13,431 65,572 47,366 18,206 U 35,370 64,876 48,868 16,008 46,353 275,744 252,476 23,268
T 276 537 410 127 423 2,874 2,087 787 Darjeoling . R
537 4ii> 4ij 2,874 2,087 u 276 127 787
T 745 2,248 1,726 522 1,452 8,991 6,174 2,8(7 2 Jaipaiguri R 317 936 697 239 901 6,313 3,944 2,369 U 428 1,312 1,029 283 551 2,678 2,230 448
Coach Behar T 571 1,438 813 625 327 2,176 1,701 475 3 R 333 766 364 402 117 695 540 155 U 238 672 449 223 210 1,481 1,161 320
West Dinajpur T 473 1,514 ·'m 382 471 3,Ol7 2,444 583 4 R 203 675 235 311 1,894 1,455 439 U 270 839 692 147 \60 1,133 989 144
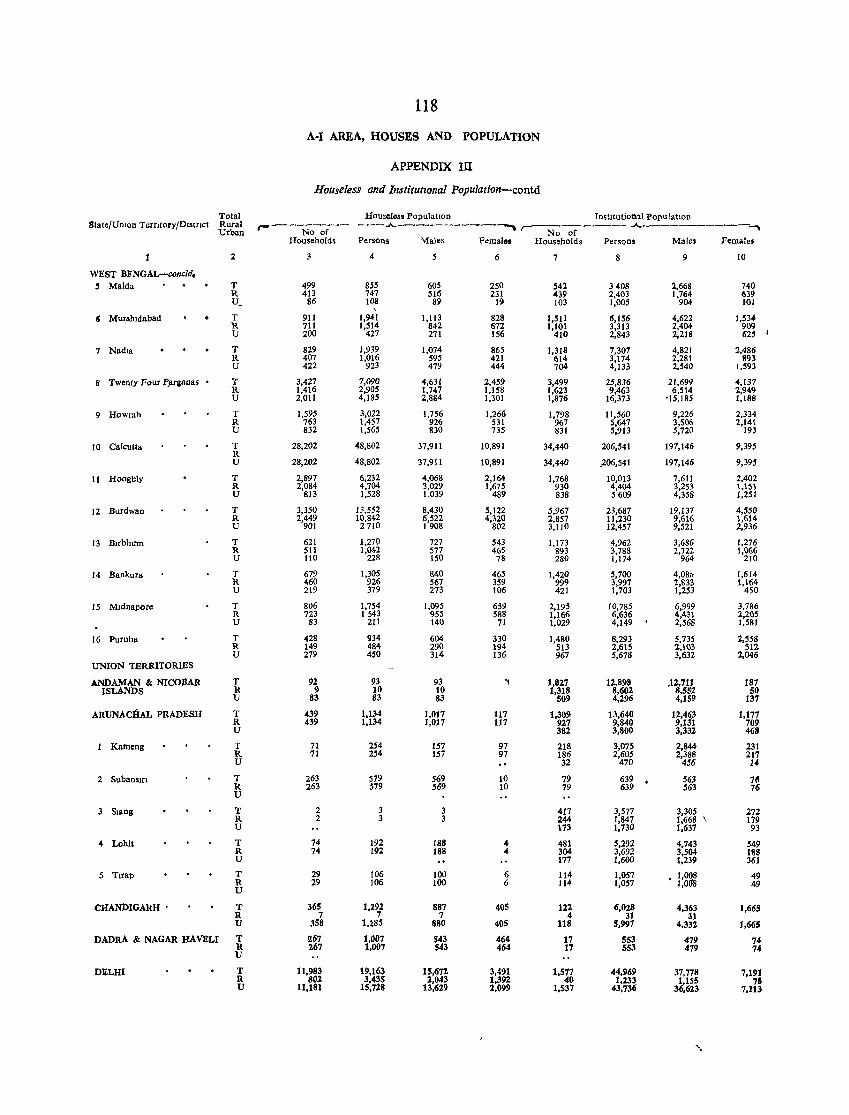
118
A·I AREA, HOUSES AND POPULATION
APPENDIX III
Houseless and Institutional Popu[ation-contd
Total Hou,closs PopulatIon Institution,,! Popu labon Stato/Umon TerrJtory/OlSlnct Rural r-------- ---.A.----~---~ ,.---------- .A..--------.......
Urban No of No of Housellold. Persons Males F~male. Households Persons Males Females
2 3 4 5 6 7 8 9 10
WEST BFNGAL-concld. , MaIda T 499 85' 605 250 542 3408 2,668 740 R 413 747 ~HI 231 439 2,403 1,764 639 u_ 86 108 89 19 103 1.005 904 101
\
6 Mursllidabad T 911 1,941 1,113 828 1.511 6.156 4,622 1,534 R 711 I,St4 842 672 1,IOt 3,313 2,404 909 U 200 427 271 156 410 2,843 2.218 625 J
7 Nadia T 829 1,939 1,074 865 1,318 7,307 4,821 2,486 R 407 1,016 595 421 614 3,174 2,281 893 U 422 923 479 444 704 4,133 2,540 1,'93
8 Twenty Four Pprganas • T 3,427 7,090 4,631 2,459 3,499 25,836 21,699 4,137 R 1,416 2.905 1,747 1,158 1,623 9,463 6,514 2,949 U 2,011 4,185 2.884 1,301 1,876 16.373 '15,185 l,t88
9 Howrah T 1,595 3,021 1,756 1,266 1,798 11,560 9,226 2,334 R 763 1,457 926 531 967 5,647 3,506 2,141 U 832 1,565 830 735 831 5,913 5,720 193
10 Calcutta T 28,202 48,802 R
37,911 10,891 34.440 206.541 197.146 9.395
U 28.202 48,802 37.911 10.891 34.440 ;206.541 197.146 9,395
11 Hoogh!y T 2,897 6,232 4,068 2,164 1,768 10.013 7,611 2,402 R 2,084 4,704 3,029 1,675 930 4,404 3,253 1.151 U 813 1,528 1,039 489 838 5609 4.358 1,251
12 Burdwan T 3,350 13,552 8,430 5,122 5,967 23.687 19,137 4,550 R 2,449 10,842 6,522 4,320 2,857 11,230 9,616 1.614 U 901 2710 1908 802 3,llO 12,457 9,521 2.936
13 Blrbhum T 621 1,270 727 543 1,173 4,962 3,686 1,276 R 511 1,042 577 465 893 3,788 2,722 1,066 U 110 228 150 78 280 1,174 964 210
14 Bankura T 679 1,305 840 465 1.420 5,700 4,080 1,614 R 460 926 567 359 999 3,997 2,833 1,164 U 219 379 273 106 421 1,703 1,253 450
15 Mldnallore T 806 1,754 1,095 659 2,195 10.785 6,999 3,786 R 723 1543 955 588 1,166 6,636 4,431 2,205 U 83 211 140 71 !,029 4,149 2,568 1,581
16 Puruha T 428 934 604 330 1.480 8.293 5,735 2.558 R 149 484 290 194 513 2,615 2,103 512 U 279 450 314 136 967 5,678 3.632 2,046
UNION TERRITORIES
ANDAMAN & NICOBAR T 92 93 93 ~ 1,827 12,898 ,l2,7~ 187 ISLANDS R 9 10 10 1,318 8,602 8,52 50
U 83 83 83 509 4,296 4,159 137
ARUNACHAL PRADESH T 439 1.134 1,017 117 1.309 13,640 12.4~3 1.177 R 439 1,134 1,017 117 927 9,840 9,1 1 709 U 382 3.800 3,332 468
Kameng T 71 254 157 97 218 3,075 2,844 231 R 71 254 157 97 186 2,605 2,388 217 U 32 470 456 14
2 Subansm T 263 579 569 10 79 639 563 76 R 263 579 569 10 79 639 563 76 U
3 Slang T 2 3 3 417 3,577 3,305 272 R 2 3 3 244 1,847 1.668 , 179 U 173 1.730 1.637 93
4 Lohll T 74 192 188 4 481 5.292 4.743 549 R 74 192 188 4 304 3.692 3.504 188 U 177 1,600 1.239 361
5 Trrap T 29 106 100 6 114 1.057 • 1,008 49 R 29 106 100 6 114 1,057 1.008 49 u
CHANDIGARH ' T 365 1.292 887 405 122 6.028 4.3~3 1.665 R 7 7 7 4 31 31 U 358 1,185 880 405 118 5,997 4.332 1.665
DADRA & NAGAR HA VELI T 267 1,007 543 464 17 553 479 74 R 267 1,007 543 464 17 553 479 74 U
DELm T 11.983 19,163 15,672 3,491 1.577 44.969 37,778 7.191 R 801 3,435 2.043 1.392 40 1,233 1,155 78 U 11.181 15,728 13,62.9 2,099 1.537 43.736 36.623 7.113
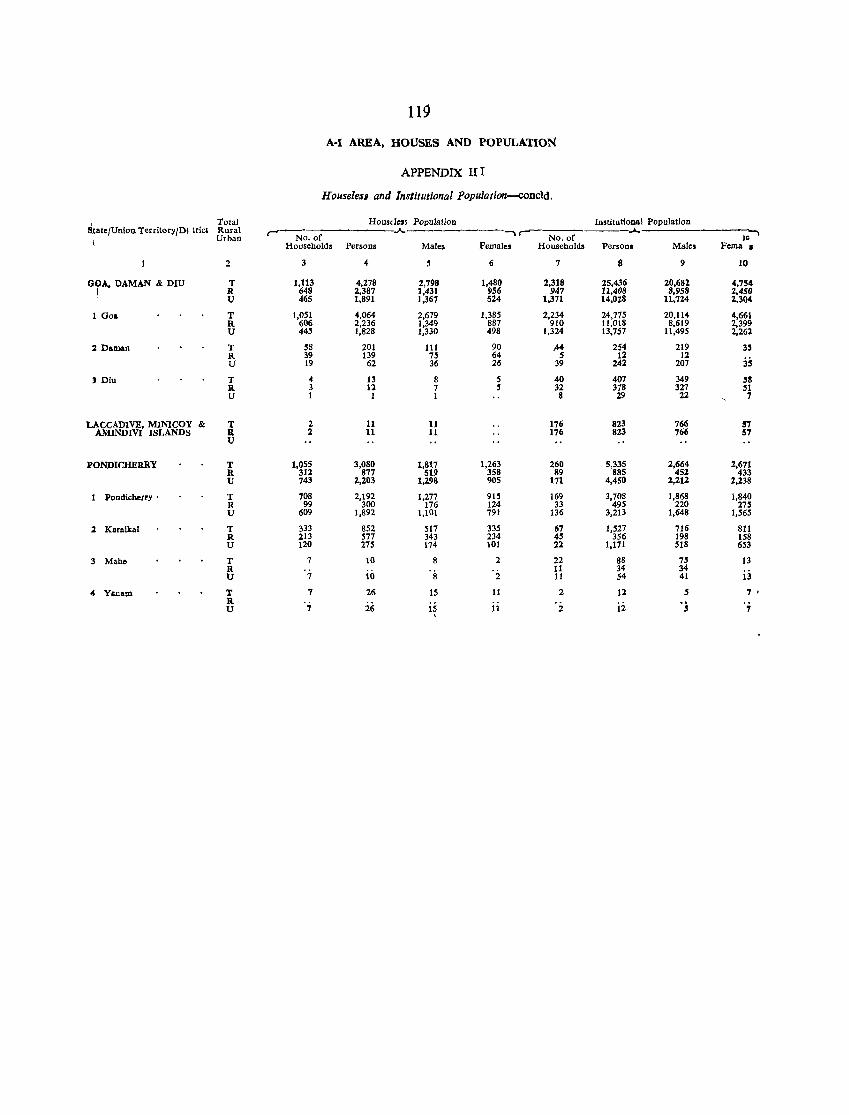
119
A-I AREA, HOUSES AND POPULATION
APPENDIX II I
Houselesl and Institutional Population-concld.
StatelUnlou 'l'erritory/Di tricl Total Houselel' Population ln8titutional Population Rural r .A.. -.r- .A. Urban No. of No. of lc
\ Households Persons Males Females Households Persons Males Fema I
2 3 4 5 6 7 8 9 10
GQA, DAMAN & DlU T 1,113 4,278 2,798 1,480 2,318 25,436 20,682 4,754 I R 648 2,387 1,431 956 947 l1,4Q8 8,958 2,450
U 465 1,891 1,367 524 1,371 14,OZS 11,724 2,304
1 Goa T 1,~g~ 4,064 2,679 1,385 2,234 24,715 20,114 4,661 R. 2,236 1,349 887 910 1l,018 8,619 2,399 U 445 1,828 1,330 498 1,324 13,757 11,495 2,261
:.I DSllJAn T ~8 201 111 90 ,44 254 219 3' R 39 139 7~ 64 S 12 12 3; u 19 62 36 26 39 242 207
3 Diu T 4 13 8 5 40 407 349 '8 R 3 11 7 ~ 32 378 327 ~H U 1 1 1 8 29 22 7
LACCADlVE, MINI COY & T 2 11 11 176 823 766 57 AMINDIVI ISLANDS R 2 11 11 176 8Z3 766 57
U
PONDICHERRY T 1,055 3,080 1,817 1,263 260 5,335 2,664 2,671 R 311 877 519 358 89 885 452 433 U 743 2,203 1,298 905 171 4,450 2,211 2,238
1 Pondicberry • T 708 2,192 1,277 915 169 3,708 1,868 1,840 R 99 300 176 124 33 495 220 27' U 609 1,892 1,101 791 136 3,213 1,648 1,565
:.I Karaikal T 333 852 517 335 67 1,527 716 811 R 213 577 343 234 4$ 356 198 158 U 120 275 174 101 22 1,171 518 653
3 Mahe T 7 10 8 2 22 88 " 13 R II 34 34
i3 U 7 10 8 2 11 S4 41
4 YAUAIn T 7 26 15 11 2 12 5 7 • R :iii is i:i '; u 7 11 2 7 ,

A-IT
DECADAL VARIATION IN POPULATION SINCE 1901
121

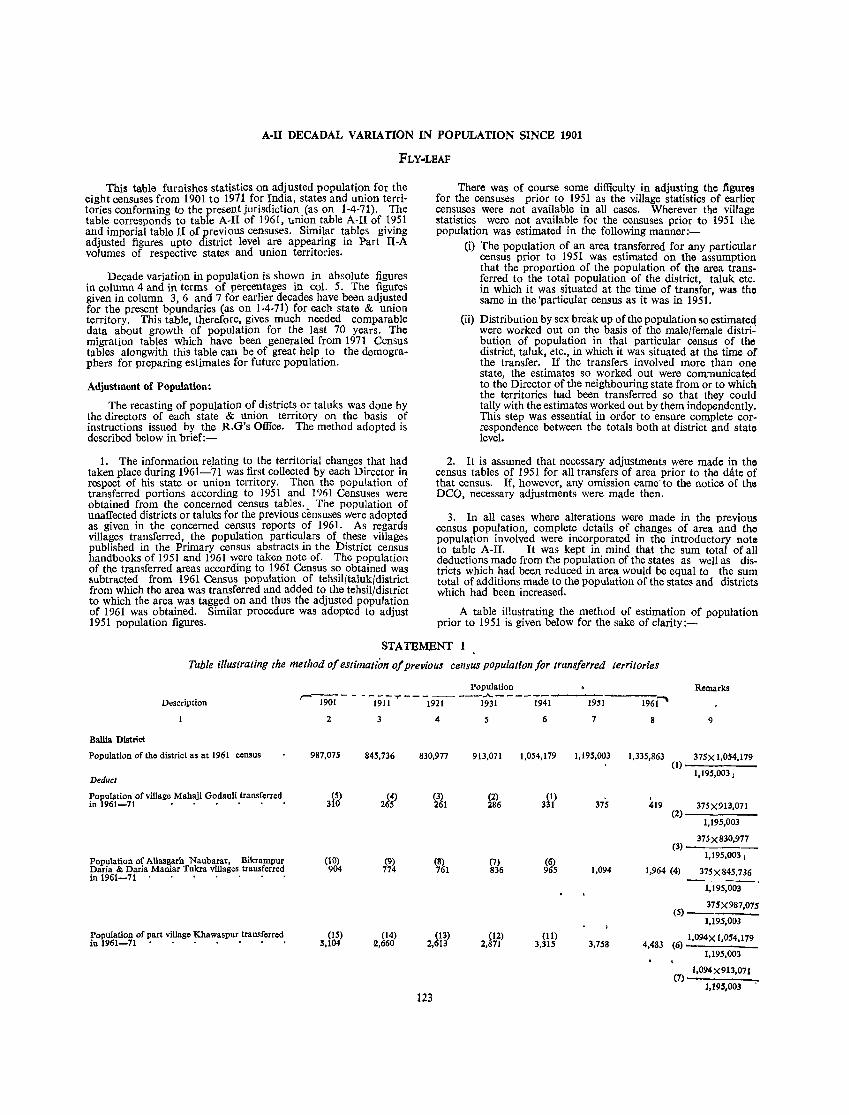
A-II DECADAL VARIATION IN POPULATION SINCE 1901
FLY-LEAF
This table furnishes statistics on adjusted population for the eight censuses from 1901 to 1971 for India, states and union territories conforming to the present jurisdiction (as on 1-4-71). The table corresponds to table A-II of 1961, lInion table A-II of 1951 and imperial table II of previous censuses. Similar tables giving adjusted figures upto district level are appearing in Part II-A volumes of respective states and union territories.
Decade variation in population is shown in absolute figures in column 4 and in terms of percentages in col. 5. The figures given in column 3, 6 and 7 for earlier decades have been adjusted for the present bpundaries (as on 1-4-71) for each state & union territory. This table therefore, gives much needed comparable data about growth 'of population for the last 70 years. The migration tables which have been generated from 1971 Census tables alongwith this table can be of great help to the demographers for pleparing estimates for future population.
Adjustment of Population:
The recasting of population of districts or taluks was done by the directors of each state & union territory on the basis of instructions issued by the R.G's Office. The method adopted is described below in brief:-
1. The information relating to the territorial changes that had taken place during 1961-71 was first collected by each Director in respect of his state or union territory. Then the population of transf<:rred portions according to 1951 and 1961 Censuses were obtained from the concerned census tables. The population of unaffected districts or taluks for the previous censuses were adopted as given in the concerned census reports of 1961. As regards villages transferred, the population particulars of these villages published in the Primary census abstracts in the bistrict census handbooks of 1951 and 1961 were taken note of. The population of the transferred areas according to 1961 Census so obtained was subtracted from 1961 Census population of tehsilftalukldistrict from which the area was transferred and added to the tehsil/district to which the area was tagged on and thus the adjusted population of 1961 was obtained. Similar procedure was adopted to adjust 1951 population figures.
There was ,of course some difficulty in adjusting the figures for the censuses prior to 1951 as the village statistics of earlier censuses were not available in all cases. Wherever the village statistics were not available for the censuses prior to 1951 the population was estimated in the following manner:-
(i) The population of an area transferred for any particular census prior to 1951 was estimated on the assumption that the proportion of the population of the area transferred to the total population of the district, taluk etc. in which it was situated at the time of transfer, was the same in the 'particular census as it was in 1951.
(ii) Distribution by sex break up of the population so estimateq were worked out on the basis of the male/female distribution of population in that particular census of the district, taluk, etc., in which it was situated at the time of the transfer. If the transfers involved more than one state, the estimates so worked out were communicated to the Director of the neighbouring state from or to which the territories had been transferred so that they could tally with the estimates worked out by them independently. This step was essential in order to ensure complete correspondence between the totals both at district and stato level.
2. It is assumed that necessary adjustments were made in the census tables of 1951 for all transfers of area prior to the date of that census. If, however, any omission came'to the notice of the DCO, necessary adjustments were made then.
3. In all cases where alterations were made in the previous census population, complete details of changes of area and the population involved were incorporated in the introductory note to table A-II. It was kept in mind that the sum total of all deductions made from the population of the states as well as districts which had been reduced in area would be equal to the sum total of additions made to the population of the state~ and districts which had been increased.
A table illustrating the method of estimation of population prior to 1951 is given below for the sake of clarity:-
STATEMENT 1
Table illustrating the method of estimation of previous census population for transferred territories
Population Remarks
Description ,....---- -- __ .,... ________ ...A... ______
1901 1911 1921 1931 1941 1931 1961"""
2 3 4 5 6 7 9
Ballia District
Population of tho district as at 1961 census 987,075 845,736 830,977 913,071 1,054,179 1,195,003 1,335,863 (I)
375X 1,054,179
Deduct 1,195,003 J
Population of village Mahaji Oodauli transferred (5) (4) (3) (2) (I) . in 1961-71 • • 31O 265 261 286 331 375 419 37'X913,071
(2) 1,195,003
(3) 375X830.977
Population of Ailasgarh Naubarar, Bikramllur (10) (9) (8) (7) (6) 1,195,003 J
Daria & Daria Maniar 1'ukra villages transferred 904 774 761 836 965 1,094 1,964 (4) 375 X 845,736 in 1961-71
1.195,003
(5) 375 X 987,07S
1,195.003
Population of part village Khawaspur transferred (15) ~14) ~13) (12) (11) 1,094X 1,054,179 in 1961-71' • . • • • • 3.104 2, 60 2, 13 2,871 3,315 3,758 4,483 (6) 1.195.003
(7) 1.094X913,071
1,195,003 123
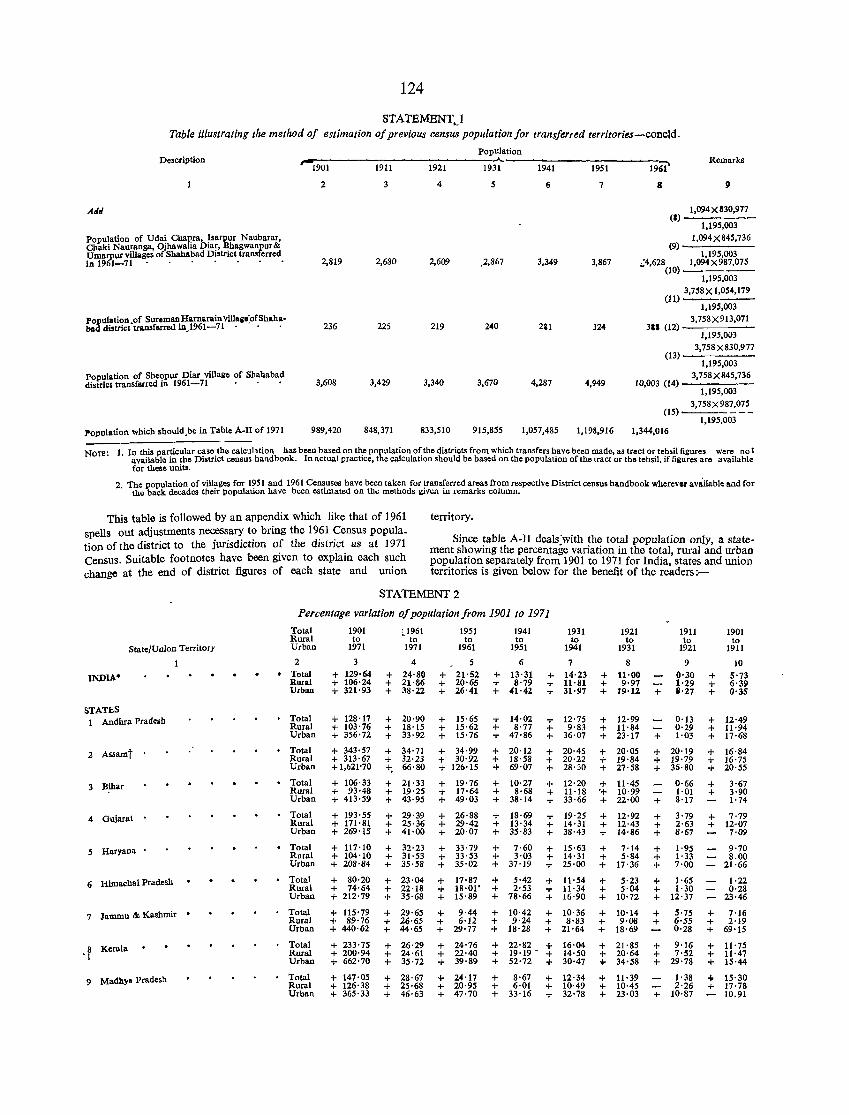
124
STATEMENT.) Table illustrating the method of estimation of previous census population for transferred territories-concld.
Description population
~1~9-0-1-------1-9-11-------19-2-1------1-9~----~19-4-1------1-95-1-------1-9~ Remarks
Alili
Population of Udai Chapra, Isarpur Naubarar, Chaki Nauranga, Oihawalia Diar, Bhagwanpur& Umarpur villages of Shahabad District transferred in 1961-71 ..•..
population .of SuremanHarnarain villa2.:ofShaha. bad district transf.rred 1n_1961-71· . •
2
2,819
236
3
2,680
225
4 5
2,609 .2,867
219 240
7
3,349 3,867
2&1 324
8
1,094 X 330,977 (1)----
1,195,003
(9) 1,094 X 845,736
1,195,003 ':4,628 1,094 X987,075
(10)-----1,195,003
3,7S8Xl,054,179 (11)------
1,195,003 3,758x913,071
311 (12) -----
(13)
1,19',003 3,758 X830,977
population of Sheopur Diar village of Shahabad district transferred in 1961-71 • . • 3,608 3,429 3,340 3,670 4,287 4,949 10,003 (14)
1,195,003 3,758X845,736
1,195,003 3,758x987,075
(IS) ---- - --1,195,003
Population which should.be in Table A-II of 1971 989,420 848,371 833,510 915,855 1,057,485 1,198,916 1,344,016
NOTE: 1. In this particular case the calcul.tion has been based on the population of the districts from which transfers have been made, as tract or teh.il figures were no t available In the District census handbook. In actual practice, the calculation should be based on the population of the tract or the tehsil. if fiaures are available for these nnits.
2 The population of villages for 1951 and 1961 Censuses have been taken for transferred areas from respective District census handbook wherevU' av~ilable and for . the back decades their population have been estimated on the methods given In remarks column.
This table is followed by an appendix which like that of 1961 spells out adjustments necessary to bring the 1961 Census popula_ tion of the district to the jurisdiction of the district as at 1971 Census. Suitable footnotes have been given to explain each such change at the end of district figures of each state and union
territory.
Since table A-II deals~with the total population only, a statement showing the percentage variation in the total, rural and urban population separately from 1901 to 1971 for India, states and union territories is given below for the benefit of the readers:-
STATEMENT 2
State/Union Territory
INDlA"
STATES Andhra Prade$h
2 Assamt
3 Bihar
4 Qujarat
5 Haryana •
6 Himachal Pradesh
7 Jammu &. Kashmir •
,¥ Kerala
9 Madhyft l'radesh
Percentage variation a/population/rom 1901 to 1971
Total Rural Urban
2
• Total Rural Urban
Total Rural Urban
Total Rural Urban
Total Rural Urban
• Total Rural Urban
• Total Rural Urban
Total Rural Urban
Total Rural Urban
Total Rural Urban
Total Rural Urban
1901 to
1971
3 + 129·64 + 106·24 + 321·93
+ 128·17 + 103·76 + 356·72
+ 343·57 + 313·67 + 1,(>21·70
+ 106·33 + 93·48 + 413·59
+ 193·55 + 171·81 + 269·15
+ 117·10 + 104·10 + 208'84
+ 80·20 + 74·64 + 212·79
+ 115·79 + 89·76 + 440·62
+ 233·75 + 200·94 + 662·70
+ 147·05 + 126·38 + 365·33
L1961 to
1971
4 + 24·80 + 21·86 + 38·22
+ 20·90 + 18·15 + 33·92
+ 34·71 + 32·23 +. 66·80
+ 21·33 + 19·25 + 43·95
+ 29·39 + 25·36 + 41·00
+ 32·23 + 31·53 + 35·58
+ 23·04 + 22·18 + 35·68
+ 29·65 + 26·65 + 44·65
+ 26·29 + 24·61 + 35·72
+ 28·67 + 25·68 + 46·63
1951 to
1961
5 + 21·52 + 20·65 + 26·41
+ 15·65 + 15·62 + 15·76
+ 34·99 + 30'92 + 126·15
+ 19·76 + 17·64 + 49·03
+ 26·88 + 29·42 + 20·07
+ 33·79 + 33·53 + 35·02
+ 17·87 + 18·01' + 15·89
+ 9·44 + 6·12 + 29·77
+ 24·76 + 22·40 + 39·89
+ 24·17 + 20·95 + 47·70
1941 to
1951
6 + 13·31 + 8·79 + <11·42
+ 14·02 + 8·77 + 47·86
+ 20·12 + 18·58 + 69·07
+ 10'27 + 8·68 + 38·14
+ 18·69 + 13·34 + 35·83
+ 7·60 + 3·03 + 37·19
+ 5·42 + 2·53 + 78·66
+ 10·42 + 9·24 + 18·28
1931 to
1941
7 + 14·23 + 11·81 + 31·97
+ 12·75 + 9'83 + 36·07
+ 20·45 + 20·22 + 28·30
+ 12·20 + 11·18 + 33·66
+ 19·25 + 14·31 + 38·43
+ 15·63 + 14· 31 + 25·00
+ 11·54 + 11·34 + 16·90
+ 10·36 + 8·S3 + 21·64
+ 22·82 + 16·04 + 19·19- + 14·50 + 52·n ... 30·47
+ 8·67 + 6·01 + 33·16
+ 12·34 + 10·49 + 32·78
1921 to
1931
8 + 11·00 + 9·97 + 19·11
+ 12·99 + 11·84 + 23·17
+ 20·05 ... 19·84 + 27·58
+ 11·45 .+ 10·99 + 22·00
+ 12·92 + 12·43 + 14·86
+ 7·14 + 5·84 + 17·36
+ 5·23 + 5·04 + 10·n
+ 10·14 + 9·08 + 18·69
+ 21·85 ... 20·64 "" 34·58
+ 11·39 + 10·45 + 23·03
...
+
1911 to
1921
9 0·30 1·29 8·27
0·13 0·29 1·03
+ 20·19 + 19·79 + 36·80
+ + + + + + +
0·66 1·01 8·17
3·79 2·63 8·67
1·95 1·33 7·00
+ 1·65 + 1·30 + 12·37
+ ... 5·75 6·55 0·28
+ 9·16 + 7·52 + 29·78
1·38 2·26
+ 10·87
1901 to
1911
10 + 5·73 + 6·39 + 0·35
+ 12·49 + 11·94 + 17·68
+ 16·84 + 16·75 + 20·55
+ +
3·67 3·90 1·74
+ 7·79 + 12-07
7·09
9·70 8.00
21·66
1·22 0·28
23·46
+ 7·16 + 2·19 + 69·15
+ 11·75 + 11·47 + 15·44
... 15·30 + 17·78
10.91
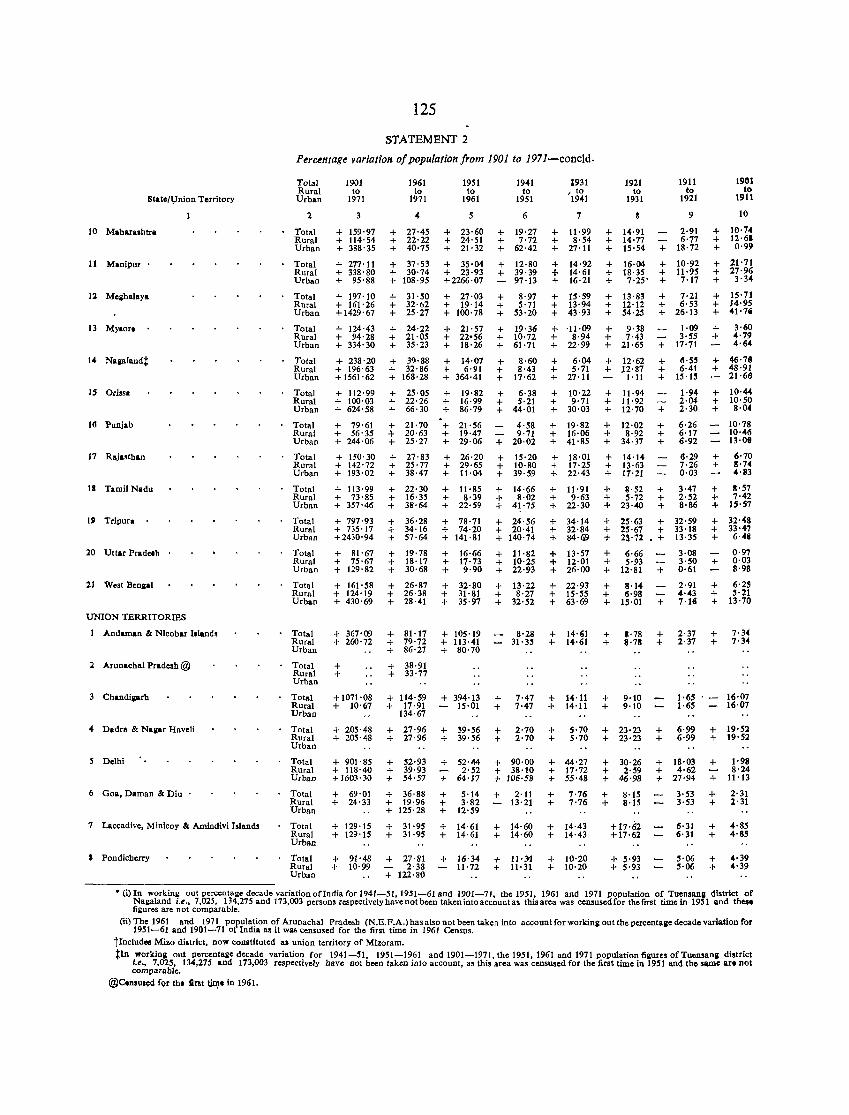
State/l,Jnion Territory
10 Maharaahtra
11 Manipur .
12 Meihalay&
13 MYlor.
IS Ori!sa
16 Punjab
17 Rajasthan
18 Tamil Nadu
19 Tripun
20 Uttar Pradeth .
21 West Benllal
UNION TERRITORIES
1 Andaman & Nlcobar bland.
:2 Arunachal Pradem @
3 Chandliarh
-4 Dadra & Nallar Haveli
5 Delhi
6 Goa, Daman & Diu •
7 Laccadive, Minicoy & Amlndivi Islandl
I Pondicherry
125
STATEMENT 2
Percentage variation of population from 1901 to 1971-concld.
Total Rural Urban
Total Rural Urhan
Total Rural Urhan
Total Rural Urban
Total Rural Urban
Total Rural Urban
Total Rural Urban
Total Rural Urban
Total Rural Urban
Total Rural Urban
Total Rural Urban
Total Rural Urban
Total Rural Urban
Total Rural Urban
1901 to
1971
3
+ 159'97 + 1l4'54 + 388'35
+ 277·11 + 338'80 + 95'88
+ 197'10 + 161'26 + 1429'67
+ 124·43 + 94'28 + 334'30
+ 238'20 + 196'63 + 1561'62
+ 1l2·99 + 100'03 + 624'58
+ 79·61 + 56' 35 + 244·06
+ 150'30 + 142'72 + 193'02
+ 113'99 + 73'85 + 357·46
+ 797·93 + 735'17 +2430'94
+ 81'67 + 75'67 + 129'82
+ 161'58 + 124'19 + 430'69
+ 367'09 + 260'72
Total + Rural + Urban
1961 to
1971
-4
+ 27·45 + 22·22 + 40'75
+ 37·53 + 30·74 + 108·95
+ 31·50 + 32·62 + 25'27
+ 24·22 + 21·05 + 35·23
+ 39·88 + 32·86 + 168·28
+ 25·05 + 22·26 + 66·30
+ 21·70 4- 20·63 + 25·27
+ 27·83 + 25·77 + 38·47
+ 22·30 + 16·35 + 38·64
+ 36·28 + 34·16 + 57·64
+ 19·78 + 18·17 + 30·68
+ 26·87 + 26·38 + 28·-41
+ 81'17 + 79·72 + 86·27
+ 38·91 + 33'77
1951 to
1961
5
+ 23·60 + 24'51 + 21·32
+ 35·04 + 23·93 +2266·07
+ 27·03 + 19·14 + 100'78
+ 21'57 + 22'56 + 18·26
+ 14·07 t 6·91 + 364·41
+ 19·82 + 16·99 + 86·79
+ 21·56 + 19·47 + 29·06
+ 26·20 + 29·65 + 11·04
+ 11·85 + 8·39 + 22'59
+ 78·71 + 74·20 + 141·81
+ 16·66 + 17'73 + 9·90
+ 32·80 + 31·81 + 35·97
+ 105'19 + 113·41 + 80'70
1941 to
1951
6
+ 19·27 + 7·72 + 62·42
+ 12'80 + 39·39
97'13
+ 8·97 + 5·71 + 53'20
+ 19·36 + 10·72 + 61·71
+ 8·60 + 8·43 + 17·62
+ 6·38 + 5·21 + 44·01
4·58 9·71
+ 20·02
+ 15·20 + 10·80 + 39·59
+ 14·66 + 8·02 + 41'75
+ 24'56 + 20·41 + 140·74
+ 11·82 + 10·25 + 22·93
+ 13·22 + 8·27 + 32·52
8'28 31'35
1931 , to 1941
7
+ 11·99 + 8'54 + 27·11
+ 14·92 + 14·61 + 16·21
+ 15·59 + 13·94 + 43·93
+ '11·09 + 8·94 + 22·99
+ 6·04 + 5·71 + 27·11
+ 10·22 + 9·71 + 30·03
+ 19·82 + 16·06 + 41'85
+ 18·01 + 17·25 + 22·43
+ 11·9\ + 9·63 + 22·30
+ 34·14 + 32·84 + 84·69
+ 13'57 + 12·01 + 26·00
+ 22·93 + 15'55 + 63·69
+ 14·Eil + 14·61
1921 to
1931
+ 1-4·91 + 14'77
1911 to
1921
+ IS·54 +
9
2·91 6·77
18·72
+ 16·04 + + 18·35 + + 7'25' +
10·92 11·95 7·17
+ 13·83 + 12·12 + 54·25
+ 9·38 + 7·43 + 21·65
+ 12·62 + 12'87
1 ·11
+ 11·94 + 11·92 + 12·70
+ 12·02 + 8·92 + 34·37
+ 14·14 + 13·63 + 17'21
+ 8·52 + 5·72 + 23·40
+ 7·21 + 6·53 + 26·13
1·09 3·55
+ 17·71
+ tS·SS + 6·41 + 15·15
1·94 2·04
+ 2·30
+ + +
+ + +
6·26 6·17 6·92
6·29 7·26 0·03
3·47 2·52 8·86
+ 25·63 + 32·59 + 25·67 + 33·18 + 2l·n. + 13·35
+ 6·66 + 5·93 + 12·81
+ 8·14 + 6·98 + IS·01
+ +
1'78 8'78
+
+
+ +
3'OS 3·50 0·61
2·91 4·-43 7·111
2·37 2·37
19tH to
1911
10
+ 10·7-4 + 12·61 + 0·99
+ 21·71 + 27·96 + 3·3-4
+ 15·71 + 14·95 + -41'7'
+ +
3·60 4·79 4·64
+ 46·78 + 48·91
21·66
+ 10·44 + 10·50 + S'04
+ +
10'78 10·-46 13·0t
6'70 8·74 -4·83
+ 8·57 + 7·42 + IS,S7
+ 32·-48 + 33·47 + 6·411
+ 0·97 0·03 8·98
+ 6·25 + 5·21 + 13·70
+ +
7·34 7·34
Total Rural Urban
+1071'08 + 114·59 + 394'13 + 7·47 + 14·11 + 9·10 + 10'67 + 17·91 15·01 + 7·47 + 14·11 + 9·10
1·65 1·65
16·07 16·07
134·67
Total Rural Urban
+ 205·48 + 27·96 + 39·56 + 2'70 + 5·70 + 23·23 + 6·99 + 19'5l + 205'48 + 27·96 + 39'56 + 2·70 + 5'70 + 23·23 + 6·99 + 19·51
Total Rural Urban
Total Rural Urban
+ 901'85 + 118·40 +1603'30
+ 69'01 + 24'33
+ 52·93 + 39·93 + 54·57
+ 36·88 + 19·96 + 125·28
+ 52·44 2·52
+ 64'17
+ 90·00 + 38·10 -I- 106·58
+ 5·14 + 2·11 + 3·82 13'21 + 12'59
+ 44·27 + 17·72 + 55·48
+ +
7·76 7·76
Total + 129'15 + 31·95 + 14·61 + 14·60 + 14·43 Rural + 129'15 + 31·95 + 14· 61 + 14·60 + 14·43 Urban
Total Rural Urban
+ 91'48 + 27'81 + 16·34 + 11·31 + 10·20 + 10'99 2· 38 11'72 + 11·31 + 10'20
+ 122'80
+ 30·26 + 2·59 + 46·98
+ +
8·15 8·15
+17·62 +17·62
+ 5·93 + 5·93
+ 18·03 + 4·62 + 27·94
3'53 3'53
+ 1·98 8·24
+ 11'13
+ +
2·31 2·31
5'06 + 4·39 5·06 + 4·39
• (i) In workin!: out percentage decade variation ofIndia for 1941-51, 1951-61 and 1901-71, the 1951, 1961 and 1971 Popnlation of Tuensan8 district of Nagaland i.e., 7,025, 134.275 and 173,003 persons respectively have not been taken into account as this area was censusedfor thelirst time in 1951 and these fi!:ures are not comparable.
(il) The 1961 and 1971 population of Arunachal Pradesh (N.E. F.A.) has also not been taken into account for workinll out the percenta!!e decade variation for 1951-61 and 1901-71 of India as it wa. censused for the first time in 1961 Census.
tlnc1ud ... Mizo district, now constituted .. I union territory of Mizoram.
tin "orkina out percentalle decade variation for 1941-51, 1951-1961 and 1901-1971, the 1951,1961 and 1971 population figures of Tuensana district I.e., 7,025, 134,275 and 173,003 respectively have Dot been taken into account, as this area was censused for the first time in 1951 lind thQ same art not comparable.
@Cemu1cd fQr the int t_in,ll in 1961.
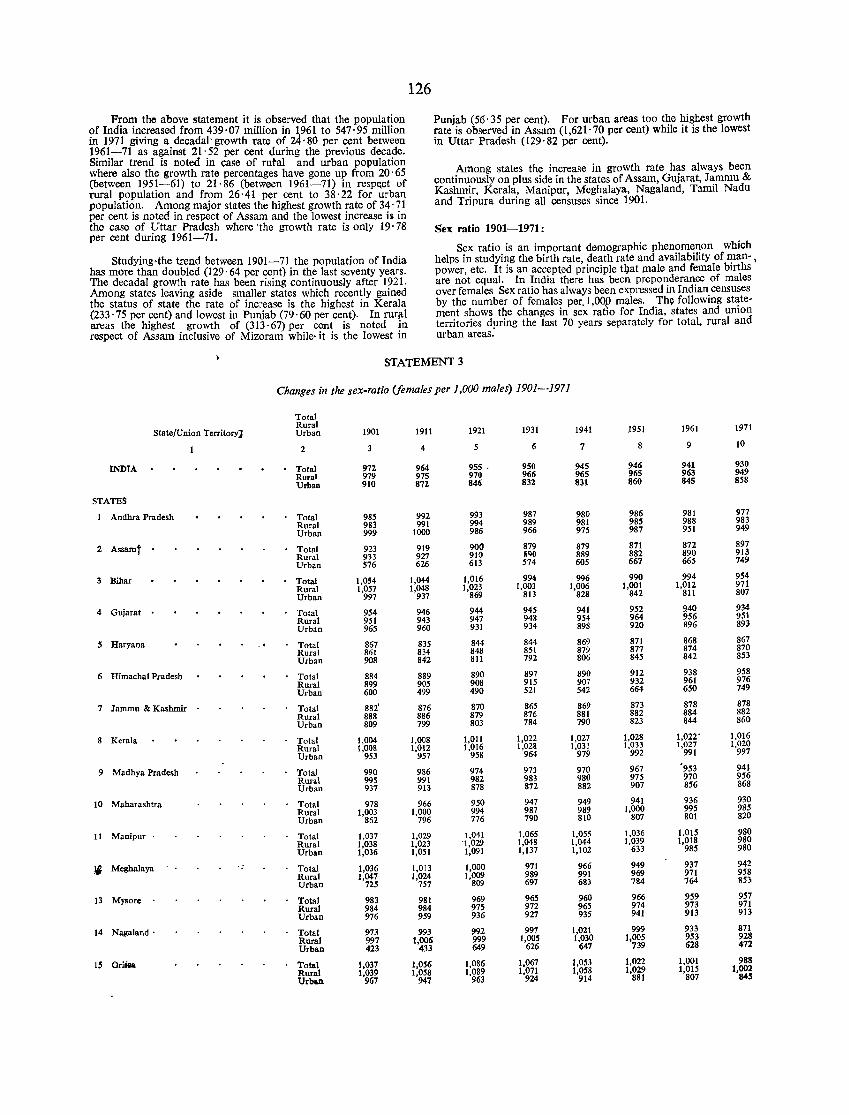
126
F~o~ the above statement it is observed that the population Punjab (56' 35 per cent). For urban areas too the highest growth of IndIa Increased from 439·07 million in t961 to 547·95 million rate is observed in Assam (1,621' 70 per cent) while it is the lowest in 1971 giving a decadal-growth rate of 24'80 per cent between in Uttar Pradesh (129, 82 per cent). 1?6~-71 as a~ainst 21'.52 per cent during the previous decade. SImIlar trend IS noted In case of rutal and urban population Among states the increase in growth rate has always been where also the growth rate percentages have gone up from 20·65 (between ]951-61) to 21· 86 (between 1961-71) in resp(\ct of continuously on plus side in the states of Assam, Gujarat, Jammu &
rural population and from 26'41 per cent to 38·22 for urban Kashmir, Kerala, Manipur, Meghalaya, Nagaland, Tamil Nadu
population. Among major states the highest growth rate of 34·71 and Tripura during all censuses since 1901. per cent is noted in respect of Assam and the lowest increase is in the case of Uttar Pradesh where 'the growth rate is only 19'78 Sex ratio 1901-1971: per cent during 1961-7l.
Studying',the trend between 1901-71 the population of India Sex ratio is an important demographic phenomenon which
helps in studying the birth rate, death rate and availability of man- • has more than doubled (129, 64 per cent) in the last seventy years. power, etc. It is an accepted principle tQat male and female births The decadal growth rate has been rising continuously after 1921. are not equal. In India there has been preponderance of males Among states leaving aside smaller states which recently gained over females Sex ratio has always been expressed in Indian censuses the status of state the rate of increase is the highest in Kerala by the number of females per,l,Oop m!J]es. The following state-(233·75 per ~ent) and lowest in Purijab (79, 60 per cent). In rurftl ment shows the changes in sex ratio for India, states and union areas the hIghest growth of (313, 67) per cent is noted in territories d}lring the last 70 years separately for total, rural and respect of Assam inclusive of Mizoram while' it is the lowest in urban areas.
STATEMENT 3
Changes in the sex-ratio ifemales per 1,000 males) 1901-1971
Total Rural
State/Union Territory) Urban 1901 1911 1921 1931 1941 1951 1961 1971
2 4 5 6 7 8 9 10
INDTA Total 972 964 955 . 950 945 946 941 930
Rural 979 975 970 966 965 965 963 949
Urban 910 872 846 832 831 860 845 858
STATES
I Andhra Pradesh Total 985 992 993 987 980 986 981 977
Rural 983 991 994 989 981 98S 988 983
Urban 999 1000 986 966 975 987 951 949
2 Assamt Total 923 919 900 879 879 871 872 897
Rural 933 927 910 fiQO 889 882 890 913
Urban 576 626 613 574 60S 667 665 749
3 Bihar Total 1,054 1,044 1,016 994 996 990 994 954
Rural 1,057 1,048 1,023 1.003 1,006 1,001 1,012 971
Urban 997 937 869 813 828 842 811 807
4 Gujarat Total 954 946 944 945 941 952 9.40 934
Rural 951 943 947 948 954 964 956 951
Urban 965 960 931 934 898 920 896 893
5 Haryana Total 867 835 844 844 869 871 868 867
Rural 861 834 848 851 879 877 874 870
Urban 908 842 811 792 806 845 842 853
6 Himachal Pradesh Total 884 889 890 897 890 912 938 958
Rural 899 905 908 915 907 932 961 976
Urban 600 499 490 521 542 664 650 749
7 Jammu & Kashmir Total 882' 876 870 865 869 873 878 878
Rural 888 886 879 876 881 882 884 882
Urban 809 799 803 784 790 823 844 860
8 Kerala Total 1,004 1,008 1,011 1,022 1,027 1,028 1,022' 1,016
Rural 1,008 1,012 1,016 1,028 1,033 1,033 1,027 1,020
Urban 953 957 958 964 979 992 991 997
9 Madhya Pradesh Total 990 986 974 973 970 967 953 941
Rural 995 991 982 983 980 975 970 956
Urban 937 913 878 872 882 907 856 868
10 Maharashtra Total 978 966 950 947 949 941 936 930
Rural 1,003 1,000 994 987 989 1,000 995 985
Urban 862 796 776 790 810 807 801 820
II Manipur . Total 1,037 1,029 1,041 1,065 1,055 1,036 1.015 980
Rural 1,038 1,023 '1,029 1,048 1,044 1,039 1,018 980
Urban 1,036 1,051 1,091 1,137 1,102 633 985 980
,Ii Meghalaya Total 1,036 1,013 1,000 971 966 949 937 942
Rural 1,047 1,024 1,009 989 991 969 971 958
Urban 725 757 809 697 683 784 764 853
13 Mysorc Total 983 981 969 965 960 966 959 9S7
Rural 984 984 975 972 965 974 973 971
Urban 976 959 936 927 935 941 913 913
14 Nagaland' Total 973 993 992 997 1,021 999 933 871
Rural 997 1,006 999 1,005 1,030 1,005 9S3 928
Urban 423 433 649 626 647 739 628 472
IS Or_ Total 1,037 1,056 1,086 1,067 1,053 1.022 1,001 988
Rural 1,039 1,058 1,089 1,071 1,OS8 1,029 1,01S 1,002
Urban 967 947 963 924 914 881 807 845
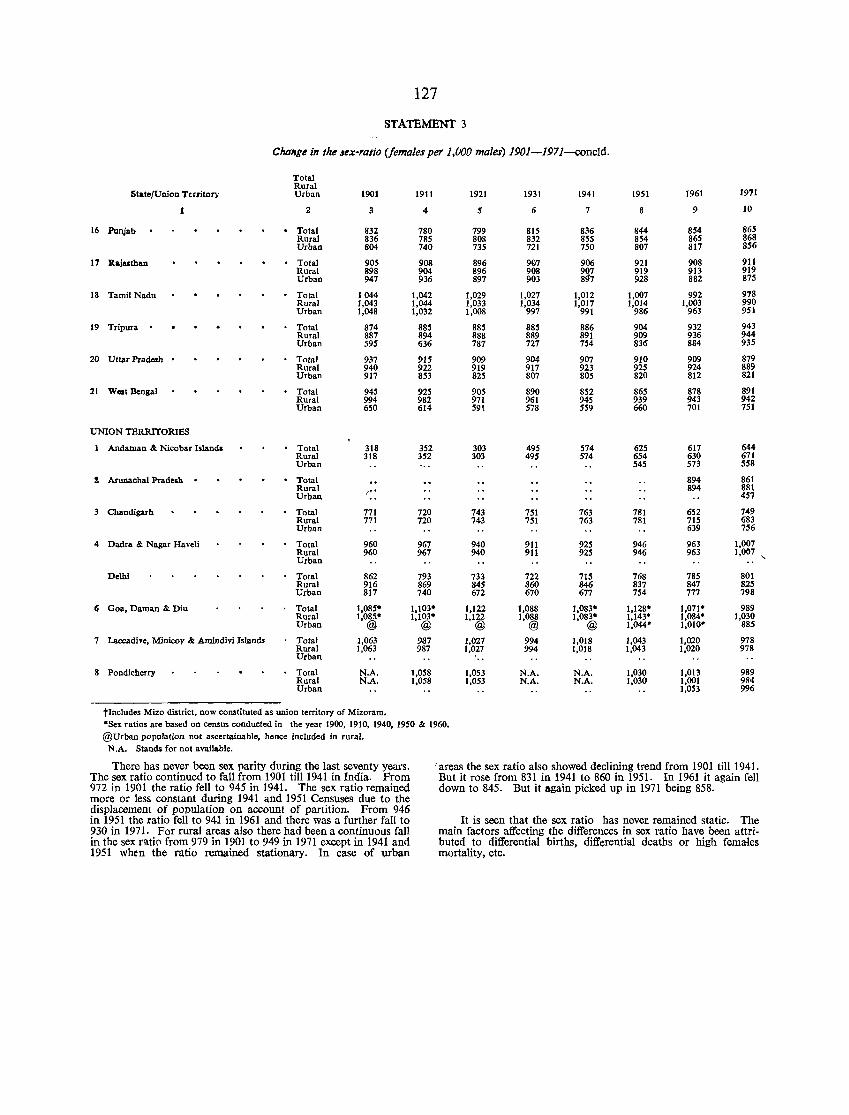
127
STATEMENT 3
Change in the lex-ratio (females per 1,UOO males) 1901-1971-concld.
Total Rural
1911 State/Union Territory Urban 1901 1911 1921 1931 1941 1951 1961
2 3 4 5 6 7 8 9 10
16 Funjab . Total 832 780 799 815 836 844 854 865 Rural 836 785 80S 832 855 854 865 868 Urban 804 740 735 721 750 807 817 856
17 Rajasthan Total 90S 908 896 907 906 921 908 911 Rural 898 904 896 908 907 919 913 919 Urban 947 936 897 903 8<17 928 882 875
18 Tamil Nadu Total 1044 1,042 1,029 1,027 1,012 1,007 992 978 Rural 1,043 1,044 1,033 1,034 1,017 1,014 1,003 990 Urban 1,048 1,032 1,008 997 991 986 963 951
19 Tripura . Total 874 885 885 885 886 904 932 943 Rural 887 894 888 889 891 909 936 944 Urban 595 636 787 727 754 8315 884 935
20 Uttar Pradesh Total 937 915 909 904 907 910 909 879 Rural 940 922 919 917 923 925 924 889 Urban 917 853 825 807 80S 820 812 821
21 W .. tBengal Total 945 925 90S 890 852 865 878 891 Rural 994 982 971 961 945 939 943 942 Urban 650 614 59t 578 559 660 701 751
UNION TERRITORIES
1 Andaman & Nicob .. r Islands Total 318 352 303 495 574 625 617 644 Rural 318 352 303 495 574 654 630 671 Urban 545 573 558
! Arunachal Pradesh . Total 894 861 Rural /' . 894 881 Urban 457
3 Chandigarh Total 771 720 743 751 763 781 652 749 Rural 771 720 743 751 763 781 715 683 Urban 639 756
4 Dadr .. & Nagar Haveli Total 960 967 940 911 925 946 963 1,007 Rural 960 967 940 911 925 946 963 1,007
" Urban
Delhi Total 862 793 733 722 715 768 785 801 Rural 916 869 845 860 846 837 847 825 Urban 817 740 672 670 677 754 777 798
(; Goa, Daman & Diu Total 1,085· 1,103" 1,122 1,088 1,083· 1,128' 1,071" 989 Rural 1,085' 1,103' 1,122 1,088 1,083' 1,143' 1,084' 1,030 Urban @ @ @ @ @ 1,044" 1,010' 885
7 Laccadive, Minicay & .Amindivi Islands Total 1,063 987 1,027 994 1,018 1,043 1,020 978 Rural 1,063 987 1,027 994 1,018 1,043 1,020 978 Urban
8 Pondicherry Total N.A. 1,058 1,053 N.A. N.A. 1,030 1,013 989 Rural N.A. 1,058 1,053 N.A. N.A. 1,030 1,001 984 Urban 1,053 996
tJncludes Mizo district, now constituted as union territory of Mizoram. 'Sex ratios are based on census conducted in the year 1900, 1910, 1940, 1950 & 1960. @Urban population not ascertainable, hence included in rural.
N.A. Stands for not available.
There has never been sex parity during the last seventy years. 'areas the sex ratio also showed declining trend from 1901 till 1941. The sex ratio continued to fall from 1901 till 1941 in India. From But it rose from 831 in 1941 to 860 in 1951. In 1961 it again fell 972 in 1901 the ratio fell to 945 in 1941. The sex ratio remained more or less constant during 1941 and 1951 Censuses due to the
down to 845. But it again picked up in 1971 being 858.
displacement of population on account of partition. From 946 in 1951 the ratio fell to 941 in 1961 and there was a further fall to It is seen that the sex ratio has never remained static. The 930 in 1971. For rural areas also there had been a continuous fall main factors affecting the differences in sex ratio have been attri-in the sex rlltiC'l from 979 in 1901 to 949 in 1971 except in 1941 and buted to differential births, differential deaths or high femrues 1951 when the ratio remained stationary. In case of urban mortality, etc.

A-n DECADAL VARIATION IN POPULATION SINCE 1901
NOTES FOR THE TABLE
1. The figures of Goa, Daman and Diu and Dadra and Nagar Haveli where a Census was taken as on 15th December, 1960 and 1 st March, 1962 respectively have not been adjusted as on 1st March, 1961. The population of these territories for 1901, 1911, 1941 and 1951 have been assumed to be the same as in 1900, 1910, 1940 and 1950 for working out the All-India totals. Similarly the population of Pondicherry as revealed at the Census in 1948 has been taken as of 1951 in this table.
2. The population of Jammu and Kashmir for 1951 has been taken to be the arithmetic mean of population in 1941 and 1961. The population of the state for 1941 and earlier Censuses have been adjusted with reference to the present censused area of the state which excludes territories currently under the illegal occupation of Pakistan and China.
3. Population of each state or union territory has been adjusted as close as practicable to its present set-up Le. as on 1st April, 1971.
4. (i) In working out 'decade variation' and 'percentage decade variation' for India for 1941-51 and 1951-61, the 1951 and 1961 popUlation of Tuensang district of Nagaland i.e. 7,025 and 134,275 respectively have not been taken into account as this area was censused for the first time in 1951 and these figures are not comparable.
(ii) The 1961 population of Arunachal Pradeqh (N.E.F.A.) has also not been taken into account for working out the decade variation and percentage decade variation for 1951-61 of India as it was censused for the first time in 1961 Census.
_ 5. The distribution of population of Pondicherry by sex for 1901 (246,354), ]931 (258,628) and 1941 (285,011) is not available. The figures 0'4ndia for tflese years are, therefore, exclusive of these population figures so far as distribution by sex is concerned.
129
10- 1 RGIfND/73

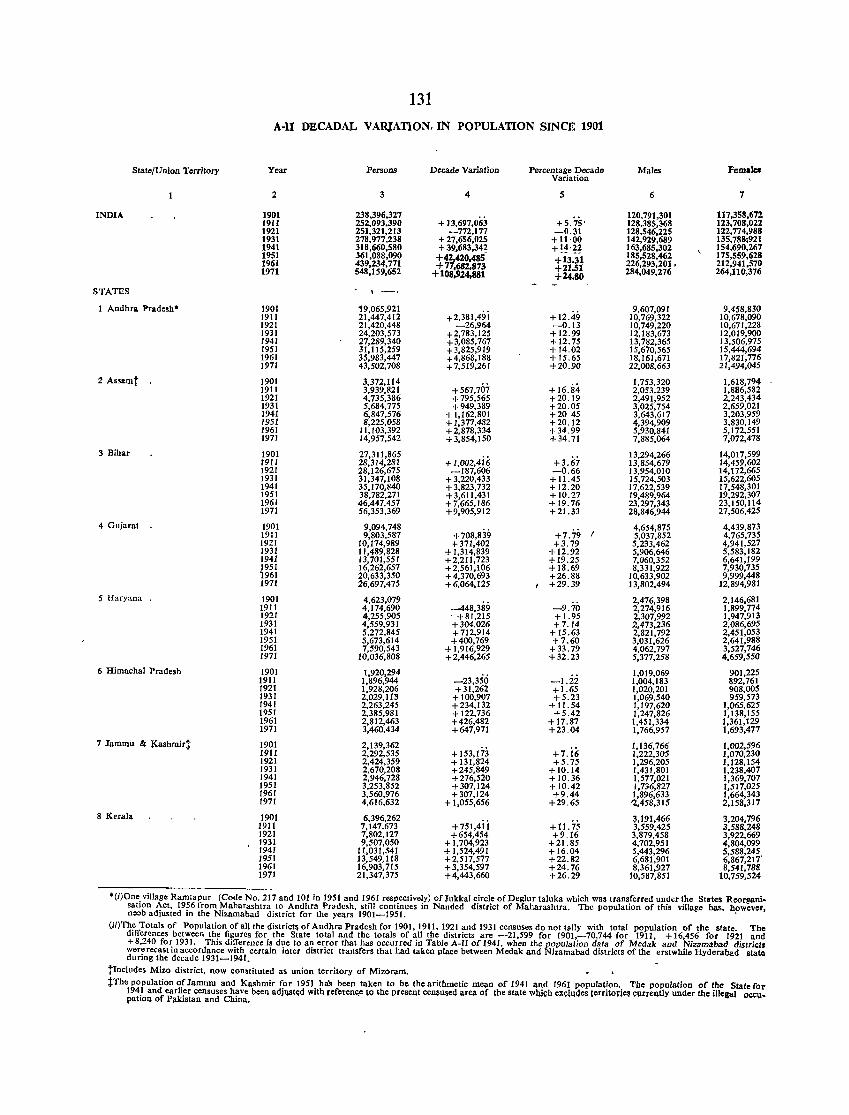
131
A-II DECADAL VARlATlON. IN POPULATION SINCE 1901
State/Union Territory Year Persons Decade Variation Percentage Decado Males Fem.let Variation
2 3 4 5 6 7
INDIA 1901 238,396,327 + 13,697,063 +5.75'
120,791,301 117,358,672 1911 252,093,390 128,385,368 123,708,022 1921 251,321,213 -772,177 -0.31 128,546,225 122,774,988 1931 278,977,238 + 27,656,025 +11·00 142,929,689 135,788;921 1941 318,660,580 + 39~683,34~ +!~.~~ 163,685,302 154,690,267 1951 361,088,090 +42,420,485 +13.31 185,528,462 175,559,628 1961 439,234,771 226,293,201 , 212,941,570 1971 548,159,652
+ 77,682,813 +21.51 284,049,276 264,11 0,376 + 108,924,881 +24.80
STATES , -. 1 Andhra Pradesh· 1901 19,065,921
+2,381,49i +12.49 9,607,091 9,458,830
1911 21,447,412 10,769,322 10,678,090 1921 21,420,448 -26,964 -0.13 10,749,220 10,671,228 1911 24,203,573 +2,783,125 +12.99 12,183,673 12,019,900 1941 27,289,340 +3,085,767 +12.75 13,782,365 13,506,975 1951 31,115,259 +3,825,919 +14.02 15,670,565 15,444,694 1961 35,983,447 +4,868,188 +15.65 18,161,671 17,821,776 1971 43,502,708 +7,519,261 +20.90 22,008,663 21,494,045
2 AS:!amt 1901 3,372,114 +567,707 +16.84
1,753,320 1,618,794 1911 3,939,821 2,053,239 1,886,582 1921 4,735,386 +795,565 +20.19 2,491,952 2,243,434 1931 5,684,775 +949,389 +20.05 3,025,754 2,659,021 1941 6,847,576 + 1,162,801 +2045 3,643,617 3,203,959 1951 8,225,058 +1,377,482 +20.12 4,394,909 3,830,149 1961 11,103,392 +2,878,334 +34.99 5,930,841 5,172,551 1971 14,957,542 +3,854,150 +34.71 7,885,064 7,072,478
3 Bihar 1901 27,311,865 +1,002,4ii; +3.67
13,294,266 14,017,599 1911 28,314,281 13,854,679 14,459,602 1921 28,126,675 -187,606 -0.66 13,954,010 14,172,665 1931 31,347,108 +3,220,433 + 11.45 15,724,503 15,622,605 1941 35,170,840 +3,823,732 +12.20 17,622,539 17,548,301 1951 38,782,271 + 3,611,431 +10.27 19,489,964 19,292,307 1961 46,447,457 +7,665,186 +19.76 23,297,343 23,150,114 1971 56,353,369 +9,905,912 +21.33 28,846,944 27,506,425
4 Gujarat 1901 9,094,748 +708,839 +7.79
4,654,875 4,439,873 1911 9,803,~87 I 5,037,852 4,765,735 1921 10,174,989 +371,402 +3.79 5,233,462 4.941,527 1931 11,489,828 + 1,314,839 +12.92 5,906,646 5,583,182 1941 13,701,551 +2,211,723 +19.25 7,060,352 6,641,199 {951 16,262,657 +2,561.f06 + 18.69 8,331,922 7,930,735
961 20,633,350 +4,370,693 +26.88 10,633,902 9,999,448 1971 26,697,475 +6,064,125 ( +29.39 13,802,494 12,894,981
5 Harynna 1901 4,623,079 -448,389 -9.70
2,476,398 2,146,681 1911 4,174,690 2,274,916 1,899,774 1921 4,255,905 . +81,215 + 1.95 2,307,992 1,947,913 1931 4,559,931 +304,026 +7.14 2,473,236 2,086,695 1941 5,272,845 +712,914 + 15.63 2,821,792 2,451,053 1951 5,673,614 +400,769 +7.60 3,031,626 2,641,988 1961 7,590,543 + 1,916,929 +33.79 4,062,797 3,527,746 1971 10,036,808 +2.446,265 +32.23 5,377,258 4,659,550
6 Himachal Pradesh 1901 1,920,294 -23,350 -1.22
1,019,069 901.225 1911 1,896,944 1,004,183 892,761 1921 1,928,206 +31,262 +1.65 1,020,201 908,005 1931 2,029,1[3 +100,907 +5.23 1,069,540 959,573 1941 2,263,245 +234,132 + 11.54 1,197,620 1,065,625 1951 2,385,981 + 122,736 +5.42 1,247,826 1,138,155 1961 2,812,463 +426,482 +17.87 1,451,334 1,361,129 1971 3,460,434 +647,971 +23.04 1,766,957 1,693,477
7 Jammu & lUshmirt 1901 2,139,362 + 153,173 +7.ii>
1,136,766 1,002,596 1911 2,292,535 1,222,305 1,070,230 1921 2,424,359 + 131,824 +5.75 1,296,205 1,128,154 1931 2,670,208 +245,849 +10.14 1,431,801 1,238,407 1941 2,946,728 +276,520 +10.36 1,577,021 1,369,707 1951 3,253,852 +307,124 + 10.42 1,736,827 1,517,025 1961 3,560,976 +307,124 +9.44 1,896,633 1,664,343 1971 4,616,632 + 1,055,656 +29.65 '2,458,315 2,158,317
8 Kerala 1901 6,396,262 +751,4ii
3,191,466 3,204,796 1911 7,147,673 + 11. 75 3,559,425 3,588,248 1921 7,802,127 +654,454 +9.16 3,879,458 3,922,669 1931 9,507,050 + 1,704,923 +21.85 4,702,951 4,804,099 1941 11,031,541 + 1,524,491 +16.04 5,443,296 5,588,245 1951 13.549,118 +2,517,577 +22.82 6,681,901 6,867,217' 1961 16,903,715 +3,354,597 +24.76 8,361,927 8,541,788 1971 21,347,375 +4,443,660 +26.29 10,587,851 10,759,524
·(i)One village Ramtapur (Code No. 217 and 101 in 1951 and 1961 respectively) of Jukkal circle of Deglur taluka which was transferred under the States Reorgani. sation Act, 1956 from Maharashtra to Andhra Pradesh, still continues in Nanded district of Maharashtra. The population of this village has, howevor, no,b adjusted in the Nizamabad district for the years 1901-1951. .
(Ii)The Totals of Population of aU the districts of Andhra Pradesh for 1901, 1911, 1921 and 1931 censuses do not tally with total population of the state. The differences between the figures for the State total and the totals of all the districts are -21,599 for 1901,-70,744 for 1911, +16,456 for 1921 and + 8,240 for 1931. This difference is due to an error that has occurred in Table A-ll of 1941, when the population data of Medak and Nizamabad distri<;ts were recast in accordance with certain inter district transfers that had taken place between Medak and Nizamabad districts of the erstwhile Hyderabad state during the decade 1931-1941.
tlncludes Mizo district, now constituted as union territory of Mizoram.
tTh. population of Jammu and Kashmir for 1951 hall been taken to be the arithmetic mean of 1941 and 1961 population. The population of the State for 1941 and earlier censuses have been adiusted with rcferen«e to the present censused area of the state which ellchldes territoTie~ c\lrrently under the illegal OCC\I_ patioI) of Pakistan and China.
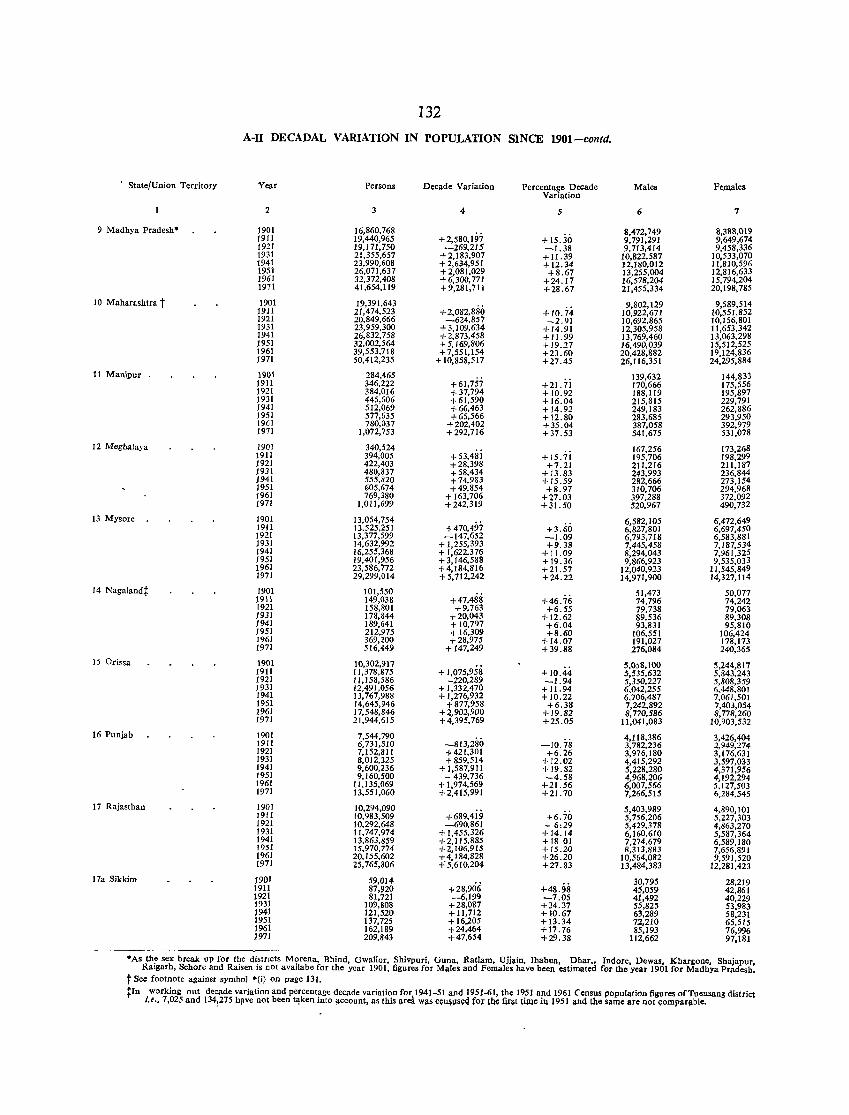
132 A-U DECADAL VARIATION IN POPULATION SiNCE 1901-contd.
State/Union Territory Year Persons Decade Variation Percentage Decade Males Female. Variation
2 3 4 5 6 7
9 Madhya Pradesh· 1901 16,860,768 +2,580,197 +15.30
8,472,749 8,388,019 1911 19,440,965 9,791,291 9,649,674 j921 19,171,750 -269,215 -1.38 9,713,414 9,458,336 1931 21,355,657 +2,183,907 + 11.39 10,822,587 10,533,070 1941 23,990,608 +2,634,951 +12.34 12,180,012 11,810,596 1951 26,071,637 +2,081,029 +8.67 13,255,004 12,816,633 1961 32,372,408 +6,300,771 +24.17 16,578,204 15,794,204 1971 41,654,119 + 9,281,711 +28.67 21,455,334 20,198,785
10 Maharashtra t 1901 19,391,643 +2,082,880 + 10.74
9,802,129 9,589,514 1911 21,474,523 10,922,671 10,551,852 1921 20,849,666 -624,857 -2.91 10,692,865 10,156,801 1931 23,959,300 + 3,109,634 +14.91 12,305,958 11,653,342 1941 26,832,758 +2,873,458 + 11.99 13,769,460 13,063,298 1951 32,002,564 +5,169,806 +19.27 16,490,039 15,512,525 1961 39,553,718 +7,551,154 +23.60 20,428,882 19,124,836 1971 50,412,235 + 10,858,517 +27.45 26,116,351 24,295,884
II Manipur . 1901 284,465 139,632 144,833 1911 346,222 +61,757 +21.71 170,666 175,556 1921 384,016 +37,794 + 10.92 188,119 195,897 )931 445,606 +61,590 +16.04 215,815 229,791 )941 512,069 +66,463 +14.92 249,183 262,886 )951 577,635 +65.566 +12.80 283,685 293,950 1961 780,037 +202,402 +35.04 387,058 392,979 1971 1,072,753 +292.716 +37.53 541,675 531,078
12 Megbalaya 1901 340,524 + 53.48i
167,256 173,268 1911 394,005 +15.71 195,706 198,299 1921 422,403 +28,398 +7.21 211,216 211.187 1931 480,837 +58,434 +13.83 243,993 236,844 j941 555,820 +74,983 +15.59 282,666 273,154 1951 (j05,674 +49,854 +8.97 310,706 294,968 1961 769,380 + 163,706 +27.03 397,288 372,092 J971 1,011,699 +242,319 +31.50 520,967 490,732
13 Mysore 1901 13,054,754 +470,497
6,582,105 6,472,649 1911 13,525,251 +3.60 6,827,801 6,697,450 1921 13,377,599 -147,652 -1.09 6,793,718 6,583,881 1931 14,632,992 + 1,255.393 +9.38 7,445,458 7,187,534 1941 16,255,368 + 1.622,376 +11.09 8,294,043 7,961,325 1951 19,401,956 + 3,146,588 + 19.36 9,866,923 9,535,033 1961 23,586,772 +4,184,816 +21.57 12,040,923 11,545,849 1971 29,299,014 +5,712,242 +24.22 14,971,900 14,327,114
14 NagaIand:j: 1901 101,550 +47,488 +46.76
51,473 50,077 1911 149,038 74,796 74,242 1921 158,801 +9,763 +6.55 79,738 79,063 )931 178.844 +20,043 +12.62 89,536 89,308 )941 189,641 + 10,797 +6.04 93,831 95,810 1951 212,975 + 16,309 +8.60 106,551 106,424 1961 369,200 +28,975 +14.07 191,027 178,173 1971 516,449 +147.249 +39.88 276.084 240,365
15 Orissa 1901 10,302,917 + 1,075,958 + 10.44
5,058,100 5,244,817 )911 11,378,875 5,535,632 5,843,243 1921 11,158,586 -220,289 -1.94 5,350,227 5,808,359 )931 12,491,056 + 1,332,470 +11.94 6,042,255 6,448,801 1941 13,767,988 + 1,276,932 +10.22 6,706,487 7,061,501 1951 14,645,946 +877,958 +6.38 7,242,892 7,403,054 1961 17,548,846 +2,902,900 +19.82 8,770,586 8,778,260 1971 21,944,615 +4,395,769 +25.05 11,041,083 10,903,532
16 Punjab 1901 7,544,790 -813,280
4,118,386 3,426,404 1911 6,731,510 -10.78 3,782,236 2,949.274 1921 7,152,811 +421.301 +6.26 3.976,180 3,176,631 1931 8,012,325 +859,514 +12.02 4,415,292 3,597,033 1941 9,600,236 + 1.587,911 +19.82 5,228,280 4,371,956 1951 9,160,500 - 439,736 -4.58 4,968,206 4,192,294 1961 11,135,069 + 1,974.569 +21.56 6,007,566 5,127,503 1971 13,551,060 +2.415,991 +21. 70 7,266.515 6,284,545
17 Rajasthan 1901 10,294,090 +689,4i9 +6.70
5,403,989 4,890,101 1911 10,983,509 5.756,206 5,227,303 1921 10,292.648 -690,861 - 6:29 5,429,378 4,863,270 1931 11,747,974 + 1,455,326 +14.14 6,160,610 5,587.364 1941 13,863,859 +2.115,885 +1801 7,274,679 6,589,180 1951 15,970,774 + 2,106.915 + 15.20 8,313,883 7,656,891 1961 20,155,602 +4,184,828 +26.20 10,564,082 9,591,520 1971 25,765,806 +' 5.61 0,204 +27.83 13,484,383 12,281,423
17a Sikkim 1901 59.014 +28,906 +48.98
30,795 28,219 1911 87,920 45,059 42,861 1921 81.721 -6.199 -7.05 41.492 40.229 1931 109,808 +28.087 +34.37 55,825 53,983 J941 121,520 +11,712 +10.67 63,289 58,231 1951 137,725 + 16,205 + 13.34 72.210 65,515 1961 162,189 +24,464 +17.76 85,193 76,996 1971 209,843 +47.654 +29.38 112.662 97.181
• As the sex break up for the districts Morena, Bhind, Gwalior. Shivpuri, Guna. Ratlam. Ujiain, Jhabua, Dhar" Indore. Dewas. Khargone, Shajapur. Raigarh, Schore and Raisen is not availabe for the year 1901. figures for Males and Females have been estimated for tbe year 1901 for Madhya Pradesb.
t See footnote against symbol '(i) on page 131.
fIn working out decade variation and percentage decade variation for 1941-51 and 1951-61, tbe 1951 and 1961 Census population figures of Tuensang district i.e., 7,025 and 134~275 h~ve not been t~ken into !lccount, as this 1m!. wllS c~~\Is~4 fOf 14 • .tlr~t lime ill 1951 lind the Same are not compar;lble.
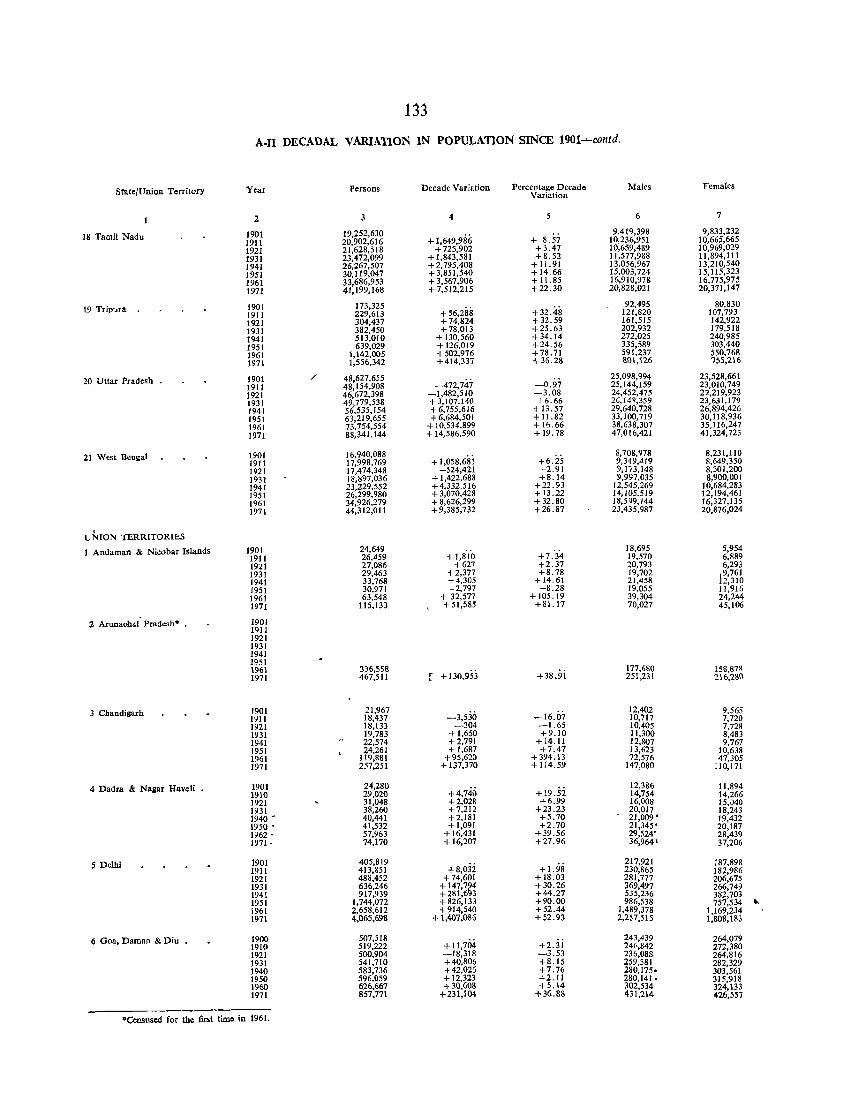
133
A-ll DECADAL VARIATION IN POPULATION SINCE 1901-'-contd.
State/Union Territory Year Persons Decade Variation Percentage Decade Males Females Variation
2 3 4 5 6 7
18 Tamil Nadu 1901 19,252,630 + 1,649,986 + 8.51
9,419,398 9,833,232 1911 20,902,616 10,236,951 10,665,665 1921 21,628,518 +725,902 +3.47 10,659,489 10,969,029 1931 23,472,099 + 1,843,581 +8.52 11,577,988 11,894,111 1941 26,267,507 +2,795,408 + 11.91 13,056,967 13,210,540 1951 30,Jl9,047 +3,851,540 +14.66 15,003,724 15,115,323 1961 33,686,953 +3,567,906 + 11.85 16,910,978 16,775,975 1971 41.199,168 +7,512,215 +22.30 20,828,021 20,371,147
19 Trip'"ra 1901 173,325 +32,48
92,495 80,830 19J1 229,613 +56,288 121,820 107,793 1921 304,437 +74,824 +32.59 161,515 142,922 1931 382,450 +78,013 +25.63 202,932 179,518 1941 513,DJ0 + 130,560 +34.14 272,025 240,985 1951 639,029 + 126,019 +24.56 335,589 303,440 1961 1,142,005 +502,976 +78.71 591,237 550,768 1971 1,556,342 +414,337 +36.28 801,126 755,216
20 Uttar Pradesh . 1901 / 48,627.655 -472,747 -0.97
25,098,994 23,528,661 1911 48,154,908 25,144,159 23,010,749 1921 46,672,398 -1,482,510 -3.08 24,452,475 22,219,923 1931 49,779,538 +3,107,140 +6.66 26,14Q,359 23,631,179 1941 56,535,154 +6,755,616 + 13.57 29,640,728 26,894,426 lQ51 63,219,655 +6,6S4,501 + 11.82 33,100,719 30,118,936 1961 73,754,554 + 10,534,899 +16.66 38,638,307 35,116,247 1971 88,341,144 + 14,586,590 +19.78 47,016,421 41,324,723
21 West Bengal 1901 16,9.40,088 8,708,978 8,231,110 1911 17,998,769 + 1,058,681 +6.25 9,349,"19 8,649,350 1921 17,474,348 -524,421 -2.91 9,173,148 8,301,200 1931 18,897,036 + 1,422,688 +8.14 9,997,035 8,900,001 1941 23,229,552 +4,332,516 +22.93 12,545,269 10,684,283 1951 26,299,980 +3,070,428 + 13.22 14,105,519 12,194,461 1961 34,926,279 +8,626,299 +32.80 18,599,144 16,327,135 1971 44,312,011 +9,385,732 +26.87 23,435,987 20,876,024
UNION TERRITORIES
1 Andaman & Nicobar Islands 1901 24,649 +1,8'10
18,695 5,954 1911 26,459 +7.34 19,570 6,889 1921 27,086 +627 +2.37 20,793 6,293 1931 29,463 +2,377 +8.78 19,702 19,761 1941 33,768 +4,305 +14.61 21,458 2,310 1951 30,971 -2,797 -8.28 19,055 11,916 1961 63,548 + 32,577 + 105.19 39,304 24,244 1971 115,133 + 51,585 +81.17 70,027 45,106
2 Arunaoha1 Pradesh· 1901 1911 1921 1931 1941 1951 1961 336,558
+ 130,953 +38.9i 177,680 158,878
1971 467,511 ~ 251,231 , 216,280
3 Chandisarh 1901 21.967 -3,530 -16.07
12,402 9.565 1911 18,437 10,717 7,720 1921 18,133 -304 -1.65 10.405 7.728 1931 19,783 + 1,650 +9.10 11,300 8,483 1941 22,574 +2,791 + 14.11 12,807 9,767 1951 24,261 + 1,687 +7.47 13,623 10,638 1961 119,881 +95,620 +394.13 72,576 47,305 1971 257,251 +137,370 + 114.59 147,080 110,171
4 Dadra & Nagar Haveli • 1901 24,280 +4,740 + 19.52,
12,386 11,894 1910 29,020 14,754 14,266 1921 31,048 +2,028 +6.99 16,008 15,040 1931 38,260 +7,212 +23.23 20,017 18,243 1940 • 40,441 +2,181 +5.70 21,009' 19,432 1950 • 41,532 +1,091 +2.70 21,345' 20,187 1962 • 57,963 + 16.431 +39.56 29,524' 28,439 1971· 74,170 + 16,207 +27.96 36,964' 37,206
5 Delhi 1901 405,819 + 8,03i +t.98
217,921 187,898 1911 413,851 230,865 182,986 1921 488,452 +74,601 +18.03 281,777 206,675 1931 636,246 + 147,794 +30.26 369,497 266,749 1941 917,939 +281,6!13 +44.27 535,236 382,703 1951 1,744,072 +826,133 +90.00 986,538 757,534 .. 1961 2,658,612 +914,540 +52.44 1,489,378 1,169,234 1971 4,065,698 + 1,407,086 +52,93 2,257,515 1,808,183
6 Goa, Daman & Diu , 1900 507,518 +2jj
243,439 264,079 1910 519,222 + 11,704 24~,842 272,380 1921 500,904 -18,318 -3.53 236,088 264,816 1931 541,710 +40,806 +8.15 259,381 282,329 1940 583,736 +42,026 +7.76 280,175_ 303,561 1950 596,059 + 12,323 +2.11 280,141. 315,918 1960 626,667 + 30,608 +5.14 302,534 324,133 1971 857,771 +231,104 +36.88 431,214 426,557
0Censused for the first tim. in 1961.
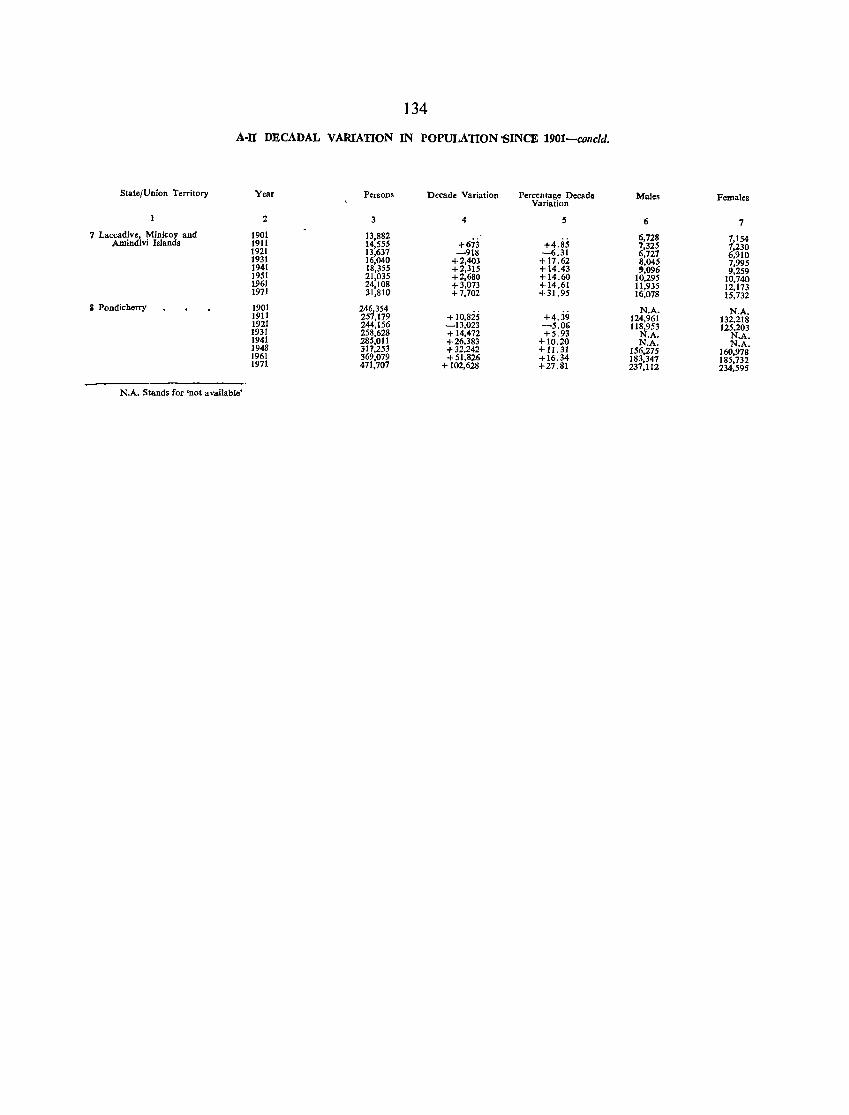
134
A-n DECADAL VARIATION IN POPULATION 'SINCE 1901-concld.
State/Union Territory Year Persons Decade Variation Percentage Decado Males Females Variation
Z 3 4 5 6 7 7 Laccadive, Minicoy and 1901 13,882
+673 +4.8.5 6,728 1,154 Amindivi Islands 1911 14,555 7,325 1,230 1921 13,631 -918 -6.31 6,127 6,910 1931 16,040 +2,403 + 17.62 8,045 7,995 1941 18,355 +2,315 +14.43 ',096 9,259 1951 21,035 +2,680 +14.60 10,295 10,740 1961 24,108 +3,073 +14.61 11,935 12,173 1971 31,810 +7,702 +31.95 16,078 15,732 II Pondicherry 1901 246,354
+10,825 +4.39 N.A. N.A. 1911 257,179 124,961 132,218 1921 244,156 -13,023 -5.06 118,953 125,203 1931 258,628 + 14,472 +5.93 N.A. N.A. 1941 285,011 +26,383 +10.20 N.A. N.A. 1948 311,253 +32,242 + 11. 31 156,275 160,978 1961 369,079 +51,826 +16.34 183,347 185,732 1971 471,707 +102,628 +27.81 237,112 234,595
N.A. Stands for 'not available'
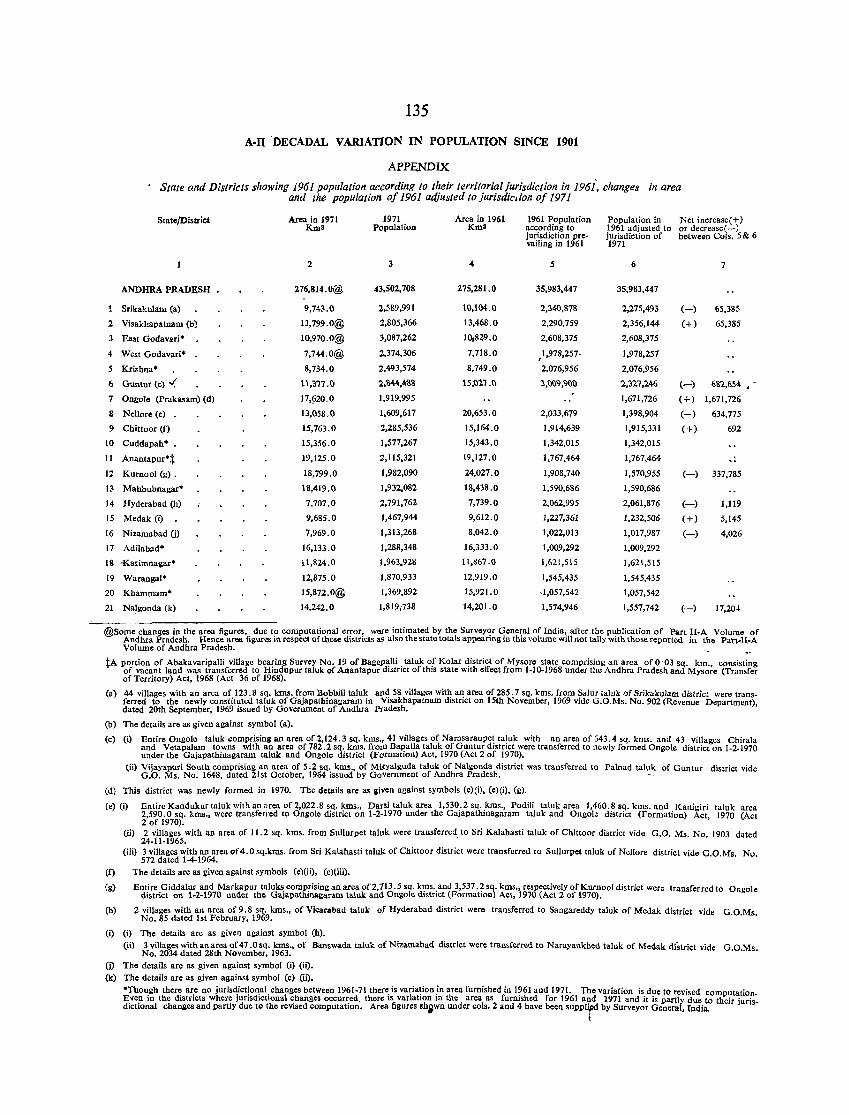
135
A-IT 'DECADAL V ARIATlON IN POPULATION SINCE 1901
APPENDIX
State and Districts showing 1961 population according to their territorial jurisdiction in 196i, changes in area and the population of 1961 adjusted to jurisdiction of 1971
State/Distriet Area in 1971 1971 Area in 1961 1961 Population Population in Net increase(+} Kma Population Km2 according to 1961 adjusted to or decrease ( - )
jurisdiction pre .. jurisdiction of between Cols. 5 & 6 vailing in 1961 1971
2 3 " 5 6 7
ANDHRA PRADESH 276,814.0@ 43,502,708 275,281.0 35,983,447 35,983,447
Srikakulam (a) 9,743.0 2,589,991 10,104.0 2,340,878 2,275,493 (-) 65,385
2 Visakhaplltnam (b) 13,799.0@ 2,805,366 13,468.0 2,290,759 2,356,144 (+) 65,385
3 Bast Godavari' 10,970.0@ 3,087,262 10,829.0 2,608,375 2,608,375
4 West Godavari' 7,744.0@ 2,374,306 7,718.0 ,1,978,257. 1,978,257
5 Krishna' 8,734.0 2,493,574 8,749.0 2.076,956 2,076,956
6 Guntur (c) ~ n,377.0 2,%44,488 15,021.0 3,009,900 2,32.7,2.46 (-) 6'82,654
7 Onllole (Prakasam) (d) 17,1'20.0 1,919,995 1,671,726 (+) 1,671,72(j
8 Nellore (e) 13,058.0 1,609,617 20,653.0 2,033,679 1,398,904 (-) 634,775
9 Chittoor (f) 15,763.0 2,285,536 15,164.0 1,914,639 1,915,331 (+) 692
10 Cuddapah* • 15,356.0 1,577,267 15,343.0 1,342,015 1,342,015
11 Anantapur* :j:. 19,125.0 2,115,321 19,127.0 1,767,464 1,767,464 .. 12 Knrnool (g) • 18,799.0 1,982,090 24,027.0 1,908,740 1,570,955 (-) 337,785
13 Mahbubnagar* 18,419.0 1,932,082 18,438.0 1,590,686 1,590,686
14 Hyderabad (b) 7,707.0 2,791,762 7,739.0 2,062,995 2,061,876 (-) 1,119
15 Medak (i) 9,685.0 1,467,944 9,612.0 1,227,361 1,232,506 (+) 5,145
16 Nizamabad Ul 7,969.0 1,313,268 8,042.0 1,022,013 1,017,987 (-) 4,026
17 Adilabad' 16,133.0 1,288,348 16,333.0 1,009,292 1,009,292
18 -Karimnalolar* i 1,824.0 1,963,928 11,867.0 1,621,515 1,621,515
19 Warangal' 12,875.0 1,870,933 12,919.0 1,545,435 1,545,435
20 Khammam* 15,872.0@ 1,369,892 15,921.0 ,1,057,542 1,057,542
21 Nalgonda (k) 14,242.0 1,819;738 14,201.0 1,574,946 1,557,742 (-) 17,204
@Some changes in the area fi£ures, due t? computational er:or, were intimated by the Survey,?r qene~al of India,. after.the Pl!blication of Part II·A Volume of Andhra Pradesh. Hence area figures 10 respect of these dlstncts as also the state totals appeanng m thiS volume Will not tally With those reported in the Part.U.A Volume of Andhra Pradesh.
tA portion of Abakavaripalli village bearing Survey No. 19 of Bagel'~l1i. taluk or Kolar district of Mysore state comprising an area of 0·03 sq. km., consisting of vacant land was transferred to Hindupur taluk of Anantapur dIstrIct of this state WIth effect from 1·10·1968 under the Andhra Pradesh and Mysore (Transfer of Territory) Act, 1968 (Act 36 of 1968).
(a) 44 villages with an area of 123.8 sq. kms. from Bobbili taluk artd 58 villages with an area of285.7 sq. kms. from Salur talnk "fSrikakularn district were trans. ferred to the newly constituted taluk of Gajapathinagaram in Yisakhapatnam district on 15th November, 1969 vide G.O.Ms. No. 902 (Revenue Department) dated 20th September, 1969 issued by Government of Andhra Pradesh. '
(b) The details are as given against symbol (a).
(c) (i) Entire Ongol. taluk comp~ising an area of 2,124.3 sq. kms., 41 villages of Narasaraope! taluk with an area of 543.4 sq. kms. and 43 viUages Chirala and Vetapalam towns Wlth an area of 782.2 sq. kms. from BapatJa talnk of Guntur dlstnct were transferred to newly formed Ongole district on 1.2.1970 under the Gajapathinagaram taluk and Ongole district (Formation) Act, 1970 (Act 2 of 1970).
eii) Vijayapuri South comprising an area of 5.2 sq. kms., of Mifyalguda taluk of Nal~onda district was transferred to Palnad taluk of Guntur district vide G.O. Ms. No. 1648, dated 21st October, 1964 issued by Government of Andhra Pradesh.
(d) This district was newly formed in 1970. The details are as gh'en against symbols (c) (i), (e) (i), (g).
ee) (i) Entire Kandukur taluk with an area of 2,022.8 sq. kms., Darsi taluk area 1,530.2 sq. kms., Podili taluk area 1,460.8 sq. kms. and Kanigiri taluk area 2,590.0 sq. kms., were transferred to Onllole district on 1·2·1970 under the Gajapathinagaram taluk and Ongole district (Formation) Act, 1970 (Act 2 of 1970).
tf)
(g)
(b)
(ii) 2 villages with an area of 11.2 sq. kms. from Sullurpet taluk were transferred, to Sri Kalahasti taluk of Chittoor district vide G.O. Ms. No. 1903 dated 24·11.1965.
(iii) 3 villages with an area of 4.0 sq.kms. from Sri Kalahasti talw. of Chittoor district were transferred to Sullurpet taluk of Nellore district vide G.O.Ms. No. 572 dated 1-4-1964.
The details are as given allainst symbols (e)(ii), (e)(iii).
Entire Giddalur and Markapur taluks comprising an area of 2,713.5 sq. kms. and 3,537.2 sq. kms., respectively of Kurnool district were transferred to Ongole district on 1·2·1970 under the Gajapathinagaram taluk and Ongole district (Formation) Act, 1970 (Act 2 of 1970).
2 villages with an area of 9.8 sq. kms., of Vicarabad taluk of Hyderabad district were transferred to Sangareddy taluk of Medak district vide G.O.Ms. No. 85 dated 1st February, 1969.
(i) (i) The details are as given against symbol (h).
(li) 3 villages with an area of 47.0 sq. kms., of Banswada taluk of Nizamabad district were tram.ferred to Narayankhed taluk of Medak district vide G 0 M No. 2034 dated 28th November, 1963. . • s.
(j) The details are as given against symbol (i) (ii). (k) The details are as given against symbol (c) (ii).
'Th0l!gh ther~ a~e no jurisdfct!oqal. changes between 1961-71 thero: is va~ia!ion _in area furnished in 1?61 and 1971. The variation is due to revised computation. E.ve!, 10 the dlstnct. where lunsdlcuonal "hanges occur~ed. there IS varIatIon 10 the area as furnIshed for 1961 a\,d 1971 and it is panly due to their jurisdictional chanloles and partly due til the reVIsed computatIon. Area figures Ihjwn under cols. 2 and 4 have been SUPPlf by Surveyor General. India.
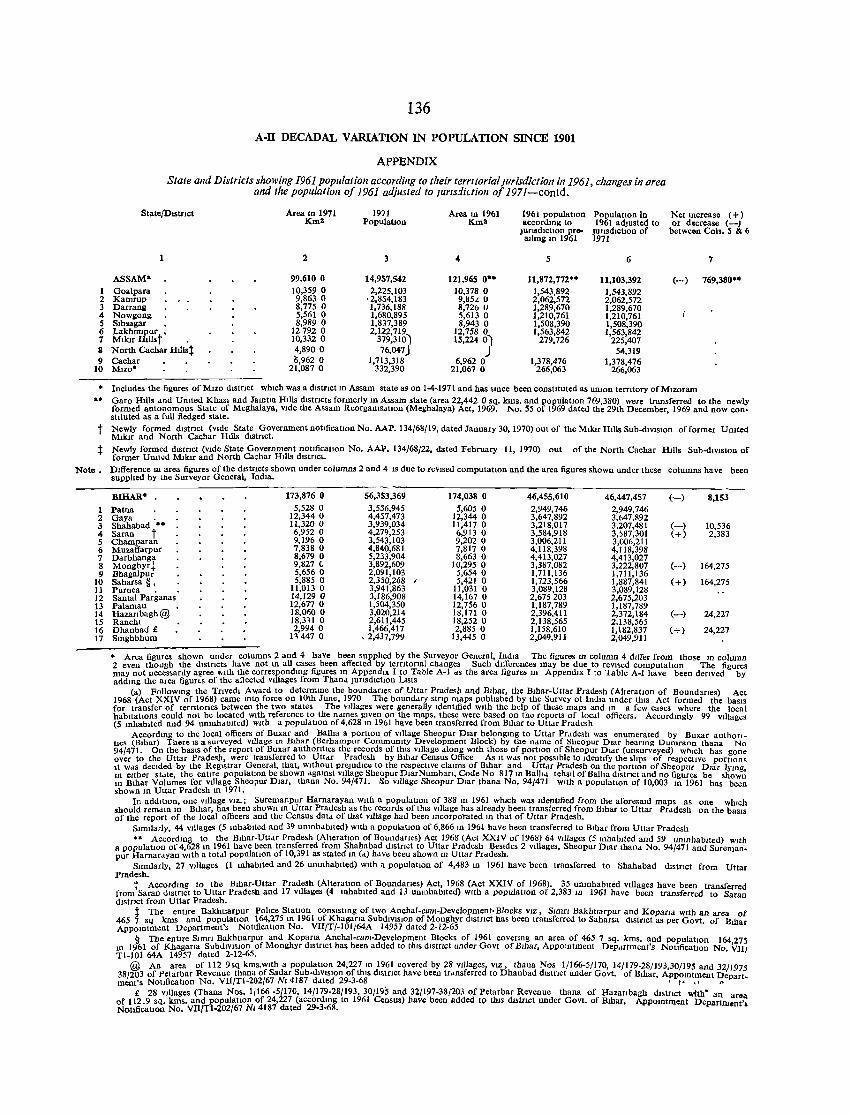
136
A-n DECADAL VARIATION IN POPULATION SINCE 1901
APPENDIX
State and Districts showing 1961 population according to their tern/orial Jurisdiction in 1961, changes in area and the population of 1961 adjusted to JUrISdiction of 1971-contd.
State/DistrIct Area In 1971 1971 Area 10 1961 1961 populatIon PopulatIon in Km2 PopulatIon Km2 according to 1961 adjusted to
JurISdictIOn pre- junsd,ctlon of allmg 1D 1961 1971
2 3 4 5 6
Net mcreas. (+) or decrease (-J
between Cob. 5 & 6
7
ASSAM" 1 Goalpara 2 Kamrup 3 Darranil 4 Nowgons
99.610 0 10,359 0 9,863 0 8,775 0 5,561 0 8,989 0
14,957,542 121,965 0·" 2,225,103 10,378 0
' 2,854,183 9,S5.l 0 1,736,188 8,7260 1,680,895 5,613 0
11,872,772·· 11,103,392 (-) 769,380·· 1,543.892 1,543,892 2,062,572 2,062,572 1,289,670 1,289,670 1,210,761 1,210,761
5 Sibsagar , 6 LakhlIDPur • 7 Mllur H!1lst
127920 10,332 0
1,837,389 2,122,719
379,310,
8,943 0 12,758 0 15,224 01
1,508,390 1,508,390 1,563,842 1,563,842
279,726 225,407 8 Nortb Cachar Hillst 9 Cachar
4,8900 '1;,962 0
76,047) 1,713,318
J 54,319 6,9620 1,378,476 1,378,476
10 M,zo· 21,087 0 332,390 21,067 0 266,063 266,063
• Includes the figures of M,zo dlstnct which was a district 10 Assam state as on 1-4-1971 and has smce been constItuted as umon terntory of M,zoram •• Garo Hills dnd Umted Khasl and Jamtla HlIls dlstncls formerly 10 Assam state (area 22,442 0 sq. kms. and populatlOn 769,380) were transferred to the newly
formed antonomous State of Meghalaya, Vide the Assam ReorgamsatlOn (Meghalaya) Act, 1969. No. 55 of 1969 dated the 29th December, 1969 and now constituted as a full fledged state.
t Newly formed d,stnct (Vide State Government notificatIOn No. AAP. 134/68/19. dated January 30,1970) out of the Mllor Hills Sub-dlVlslOn offormer United MIlor and Nortb Cachar Hills d,stnct.
t
Note.
1 2 3 4 5 6 7 8 9
10 11 12 13 14 15 16 17
Newly formed dlstnct (VIde State Government notmcatlOn No. AAl'. 134/68122, dated February 11, 1970) out of the North Cachar HlIls Sub-dlVlslOn of former Unlled Mlkrr and North Cachar Hllls dlslncl.
DIfference m area figures of the d,stncts shown under columns 2 and 4 15 due to revIsed computatIOn and the area figures shown under these supphed by Ibe Surveyor General, India.
columns have been
BIHAR' 173,876 0 56,353,369 174,038 0 46,455,610 46,447,457 (-) 8,153 Patna 5,528 0 3,556,945 5,605 0 2,949,746 2,949,746 Gaya • 12,344 0 4,457,473 12,344 0 3,647,892 3,647,892 Shahabad •• ll,320 0 3,939,034 11,417 0 3,218,017 3,207,481 (-) 10,536 Saran t 6,952 0 4,279,253 6,913 0 3,584,918 3,;87,301 (+) 2,383 Champaran 9,1960 3,543,103 9,202 0 3,006,211 3,006,211 Muzaffarpur 7,838 0 4,840,681 7,817 0 4,118,398 4,118,398 D.ubhanga 8,679 0 5,233,904 8,663 0 4,413,027 4,413,027 Monghyr~ 9,827 (, 3,892,609 10,295 0 3,387,082 3,222,807 (-) 164,275 Bhagalpur 5,656 0 2,091,103 5,654 0 1,711,136 1,711,136 Saharsa §. 5,885 0 2,350,268 I 5,421 0 1,723,566 1,887,841 (+) 164,275 Purnea • 11,013 0 3,941,863 11,031 0 3,089,128 3,089,128 Santal Parganas 14,1290 3,186,908 14,1670 2,675203 2,675,203 Palamau 12,677 0 1,504,350 12,756 0 1,187,789 1,187,789 Hazanbagh@ 18,060 0 3,O::W,214 18,171 0 2,396,411 2,372,184 (-) 24,227 Ranchl 18,HIO 2,611,445 18,252 0 2,138,565 2,138,565 Dhanbad £ 2,994 0 1,466,417 2,885 0 1,158,610 1,182,837 (+) 24,227 Smghbhum 1'4470 ,2,437,799 13,445 0 2,049,911 2,049,911
• Area figures shown under columns 2 and 4 have been supphed by the Surveyor General, India The figures Itt column 4 differ from those 10 column 2 even tbough the districts have not Itt all cases been affected by temtonal chdnges Such differences may be due to reVised computation The figures may not necessanly agree Mth the correspondmg figures m AppendIX I to Table A-I .. s the area figures 10 Appendix I to Table A-I have been denved by addmg the area figurLs of the aflected Villages from Than" JunsdlctlOn Lists
(a) Followmg the Tnvedl Award to determme the boundanes of Uttar Pradesh and BIhar, the BIhar-Uttar Pradesh (AlteratIOn of Boundanes) Act 1968 (Act XXIV of 1968) came mta force on 10th June, 1970 The bound .. ry stnp maps pubhshed by the Survey ot India under thiS Act formed the baSIS for transfer of terntones between the two states The Villages were generally Identdled With the help of these maps and III a few cases where the local habitatIOns could not be located WIth reference to the ndmes given on the maps, these were based on the reports of local officers. Accordmgly 99 vlllages (5 mhablted and 94 umnhablted) WIth a populatIOn of 4,628 III 1961 have been transferred from BIhar to Uttd( Pradesh
Accordmg to the local officers of Buxar and Balha a portIOn of Village Sheopur Dlar belongmg to Uttar Prddesh was enumerated by Buxar authontiCS (Bihar) There IS a surveyed v1llage In BIhar (Berhampur Communlty Development Block) by the name of Sheopur Dlar beanng Dumraon thana No 94/471. On the baSIS of the report of Buxar authonhes the records of thiS VIllage along With those of portIOn of Sheopur D,ar (unsurveyed) which has gone over to the Uttar Pradesh, were transferred to UU"r Pradesh by B,h .. r Census Office As It WdS not pOSSIble to ldenllfy the shps of respective portIOns It was deCided by the Registrar General, that, WIthout prejudice to the respective claims of Bihar and Uttar Pmdesh on the portIOn of Sheopur Dlar Iymg, lD eIther stdte, the entlfe populatIOn be shown aga1llst Village Sheopur DlarNumban, Code No 81710 BallI" tehsll of Balha dlstnct and no figures be shown 10 Bihar Volumes for Village Sheopur Dlar, thana No. 94/471. So VIllage Sheopur Dlar thana No. 94/471 wlth a populatlon of 10,003 10 1961 has been shown m Uttar Pradesh 10 1971.
In additIon, one Village VIZ.; Suremanpur Hamarayan wlth a populatIOn of 388 In 1961 which was ldentlfied from the aforesaId maps as one which should remdm 10 BIhar, has been shown In Uttar Pradesh as the records of this vlIlage has already been transferred from BIhar to Uttar Prddesh on the baSIS of the report of the local officers and the Census dat« of that village had been mcorpol'ated III that of Uttar Pradesh.
SImilarly, 44 Villages (5 mh .. b,ted and 39 umnhdblted) With a populatIOn of 6,86610 1961 have been transferred to Bihar from Uttar Pradesh •• Accordmg to the Bd,ar-UUM Pradesh (AlteratIOn of Bound.nes) Act 1968 (Act XXIV of 1968) 64 VIllages (5 mhablted and 59 unmhabItcd) WIth
a populatIon of 4,628 m 1961 have been transferred from Shahabad dlstrlct to Uttar Pradesh sesldes 2 Villages, Sheopur D,ar thana No. 94/471 and Suremanpur Hamar .. yan WIth a totdl populatIOn of 10,391 as stated 10 (<I) hdve been shown m Uttar Pr"desh.
Smulafly, 27 VIllages (1 mhablted and 26 umnhablted) With a populatIOn of 4,483 m 1961 have been transferred to Shahabad dlStrlct from Uttar Pradesh.
t Accordmg to the Bihar-Uttar Pradesh (Alterallon of Boundaries) Act, 1968 (Act XXIV of 1968). 35 unmhablted Villages have been transferred from'Saran dlstnct to Uttar Pradesh and 17 Villages (4 Inhabited and 13 umnhablted) With a populatIon of 2,383 III 1961 have been transferred to Saran dIStflct from Uttar Pradesh.
t The entIre Bakhtlarpur Pollee StatIOn conslstmg of two Anchal-cum-Development. Blocks VIZ, Slmn Bakhtmrpur and Kopana WIth an area of 465 7 sq kms and populatIOn 164,2751111961 of Khagana SubdlVlslOn of Monghyr dlstrlct has been transferred to Saharsa dIstnct as per Govt. of I3lhar Appomtment Department's NotlflcatlOn No. VII/T/-101/64A 14957 dated 2-12-65
9 The enUre SlUm Bakhuarpur and Kopana Anchal-cum-Development Blocks of 1961 covenng an area of 465 7 sq. kms. and populatIOn 164275 10 1961 of Khagana SUbulvlSlOn of Monghyr d,stnct has been added to thIS dlStflct under Govt of BIhar, AppOIntment Dep.rrtlnent's NOtlficatlOn No. VIII T1-101 64A 14957 dated 2-12-65.
@ An area of 112 9sq kms.wlth a population 24,227 III 1961 covered by 28 VIllages, VIZ, thana Nos 1/166-51170, 14/179-28/193,30/195 and 32/1975 38/203 of Petarbar Revenue thana of Sadar Sub-dlVlslOn of thIS d'stnct have been tr .. nsferred to Dhanbad d,strict under Govt. of BIhar, Appomtment Depart_ ment's NotlflcatlOn No. VU/Tl-202/67 NJ 4187 ddted 29-3-68 , I- " A
£ 28 VIllages (Thana Nos. 1/166 -5/170, 14/179-28/193, 30/19~ and 32/197-38/203 of Petarbar Revenue thana of Hazanbagh dlstnct wtth' an area of 112.9 sq. Ions. and populatIOn of 24,227 (accord 109 to 1961 Census) have been added to thIS dlStflct under Govt. of Bihar. Appomtment Departm.nt', Nollficatlon No. VIl(f1-2,02/67 N, 4187 dated 29-3-68.
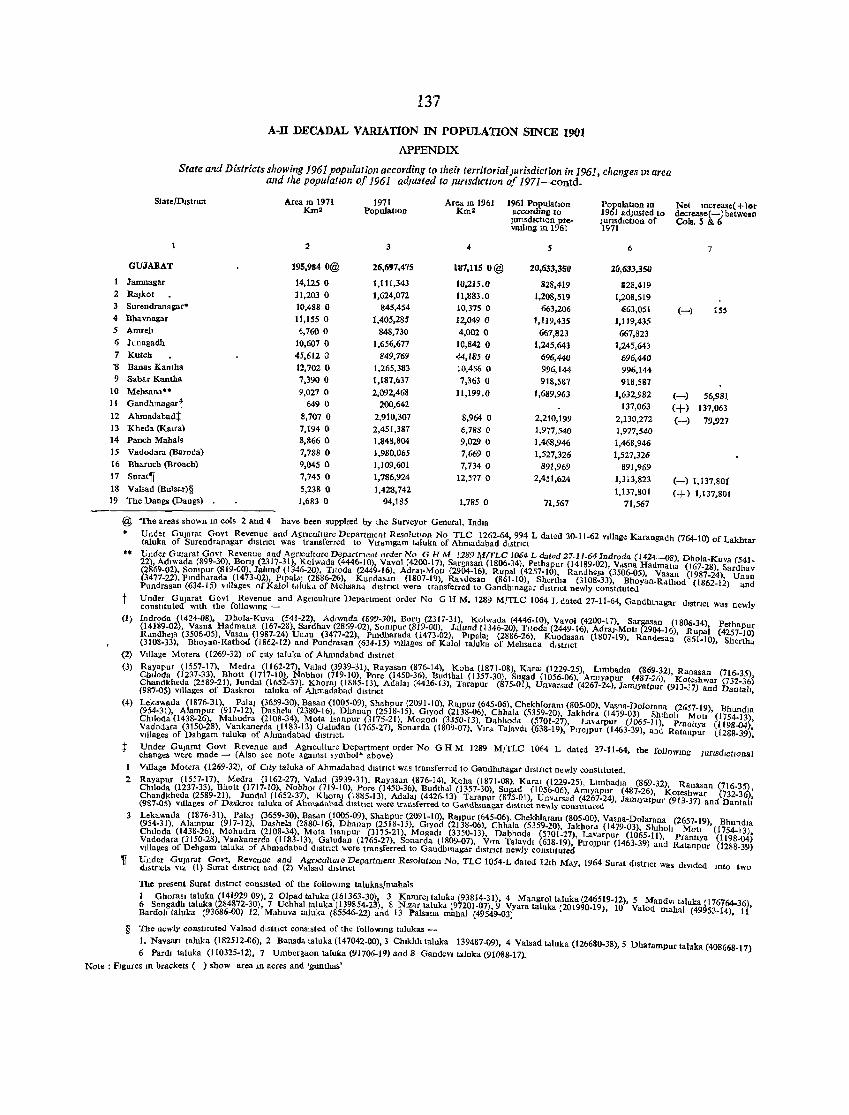
2
3
4
S 6 1
'8 9
10 11
12
13 14
15
16
11
18 19
137
A-lJ DECADAL VARIATION IN POPULATION SINCE 1901
APPENDIX
State and Districts showing 1961 population according to their territorial jurisdiction in 1961. changes !II area and the populatlOlI of 1961 adjusted to jurisdictIOn of 1971~ontd.
Area m 1971 1971 Area 1U 1961 Km2 PopulatIOn KID>!
2 3 4
GUJARAT 195,9840@ 26,697,475 187,1150@
Jamnagar 14,1250 1,111,343 10,215.0 RaJkot 11,203 0 1,624,072 11,883.0 Surendranallar· 10,488 0 845,454 10,375 0 :Bhavnagar 11,155 0 1,405,285 12,049 0 Amreh 6,760 0 848,730 4,002 0 Junagadh 10,607 0 1,656,671 10,842 0 Kutch 45,612 0 849,169 44,1850 :Banas Kantha 12,702 0 1,265,383 10,456 0 Sabar Kantha 7,390 0 1,187,637 7,363 0 Mehsana·· 9,027 0 2,092,468 11,199.0 Gandhmagart 6490 200,642 Ahmadabadt 8,707 0 2,910,307 8,964 0 Kheda (Kalra) 7,194 0 2,451,387 6,788 0 Panch Mahals 8,866 0 1,848,804 9,029 0 Vadodara (Baroda) 7,788 0 1,980,065 7,669 0 :Bharuch (Broach) 9,045 0 1,109,601 7,734 0 Sura!,\[ 7,745 0 1,786,924 12,577 0 Valsad (Bu1sar)§ 5,238 0 1,428,742 The Dangs (Dangs) J,683 0 94,185 1,1850
@ The areas shown In cols 2 and 4 have been supplIed by the Surveyor General, IndIa
1961 POl'ulatlOn accordlDg to JunsdlctIon pre-vaJlmlIml961
S
20,633,350
8.28,419
1,208,519 663,206
1,119,435
667,823 1,245,643
696,440 996,144
918,587
1,689,963
2,210,199 1,977,540
1,468,946
1,527,326 891,969
2,451,624
71,567
Population In 1961 adjusted to Junsdlctlon of 1971
6
20,633,3511
:28,419
1,208,519 (i63,051
1,119,435
667,823
1,245,643
696,440
996,144
918,581 1,632,982
137,063
2,130,272 1,977,540
1,468,946
1,527,326 891,969
1,313,823
1,137,801 71,567
Net Increase( + )f)r decrease( -) hetweln Cols.5 & 6
(-)
(-)
<+) (-)
7
155
56,981 131,063
79,921
(-) 1,137,80{
(+) 1,137,801
Under GUlarat Govt Revenue and AgrIculture Department ResolutlOn No TLC 1262.64,994 L dated 3()"11·62 Village Karangadh C764-1O) of Lakhtar taluka of Surendranagar dlStnct was transferred to Vlfamgam tdluka of Ahmadabad district
•• Under GUlarat Govt Revenue and Agriculture Department order No G H M 1289 ¥/TLC 1064 L dated 27-11-64 Indroda (1424-08), Dhola-Kuva (541-22), Adlwada (899·30), BonJ (2317-31), Kolw .. da (4446·10), Vavol (4200·17), Sargasan (1806·34), Pethapur (14189-02), Vasna Hadmatla (167.28), Sardhav (2869.02), Sompur (819·00), lalund (1346·20), Tlloda (2449-16), Adra1·Moll (2904·16), Rupal (4257·10), RandheJa (3506·05), Vasan (1987-24) Unau (3477-22), Pmdharada (1473·02), Plpaldl (2886.26), Kunda.an (1807.19), Ra\desan (861.10), Shertha (3108·33), Bhoyan·Rathod (1862.1:2) and Pundrasan (634.15) Villages of Kalal Idluk .. of Mehsan" dlstncl were transferred to Gandhmagar dlStnct newly constItuted
t Under GUlarat Govt Revenue and Agnculture Department order No G H M. 1289 MITLC 1064 L dated 27·11.64, Gandhlnagar d,stnct wa. newly conshtuted WIth tbe followlng-
(I) Indroda (1424-08), Dhola·Kuva (541·22), Adlwada (899·30), BonJ (2317·31), Kolwada (4446.10), Vavol (4200·17), Sargasan (1806.34) Pethapur (14189.02), Vasna Hadmaua (167·28), Sardhav (2869·02), SOlllpur (819-00), Jdlund (1346-20), Tltoda (2449·16), AdraJ-Mob (2904']6), Rupai (4257.10) R .. ndhela (3506·05), Vasan (1987.24) Uuau (3477-22), Pmdharada (1473.02), Plp.la] (2886·26), Kundasan (1807·19), Randesan (861-10), Shertha (3108·33), Bhoyan.Rathod (1862·12) and Pundrasan (634-15) Vlllages of Kalol talok. of Mehsana d,stnct
(2) VIllage Motera (1269-32) of city taluka of Ahmadabad dlstnct
(3) Rayapur (1557.17), Medra (1162·27), Valad (3939-31), Rayasan (876·14), Koba (1871·08), Karal (1229·25), Luubad .. (869·32) Ranasan (716-35) Ch!loda (1237·33), Bhott (1717-10), NobhOi (719.10), Pore (1450-36), Budthal (1357·30), Sugad (l()56.06), Anllyapur (487'26),' Kotesbwar (732-36i Chandkheda (2589·21), Jundal (1652·37), Khora) (1885·13), Adala] (4426.13), Tarapur (875·01), Unvarsad (4267.24), Januyatpur (913.37) and Dantall (987-05) Villages of Daskrol taluka of Ahmadabad dl.tnct ,
(4) Lekawada (1876-31), Palal (3659·30), :Basan (1005·09), Sbahpur (2091.10), RalPur (645·06), Chekhloram (805·00), Vasna·Dolorana (2657.19) Bhundla (954·31), Alampur (917·12), Dasbela (2380·16), Dbanap (2518-15), Glyod (2138-06), Chha!a (5359-20), Jakhdra (1479·03) Shlhol! MOh' (1754./3) Ch,loda (1438·26), Mahudra (2108·34), Mota Isanpur (3175·21), Mogodl (3350·13), Dabhoda (5701·27), La"drpur (1065-11), PranlIya (1198.04)' Vadodara (3150-28), Vankanerda (1183·13) Galudan (1765·27), Sonarda (1809·07), Vlrd Talavdl (638·19), PlfolPur (1463.39), and Ratanpur (1288.39)' VIllages of Dahgam taluka of Ahmadabad dlstnct. ,
t Under GU)aral Govt Revenue and Agtlculture Department order No G H M 1289 MJTLC 1064 L dated 27·11·64, the followlDg JUflsdlctlOnal changes were made - (Also see note agamst symbol' above)
Village Motera (1269·32), of City tal uk. of Ahmadabad dlstnct was transferred to Gandhmagar dlstnct newly eonshtuted.
2 Rayapur (1557·17), Medra (1162·27), Valad (3939·31), Rayasan (876·14), Koha (1871.08), Karal (1229·25), Llmbad13 (869·32), Ranasan (716.35) CJnloda (1237·33), Bhatt (17/7·10), NobhOl 1719·10), Pore (1450·36), Budthal (1357·30), Sugad (1056.06), Amlyapur (487·26), Kotesbwar (73236)' Chandkheda (2589·21), Jundal (1652·37), KhoraJ (1885·13), Adala) (4426·13) Tarapur C875-0l). Unvarsad (4267·24), Jamlyatpur (913-37) and na~tal: (98.7~05) VIllages of Daskro! taluka of Ahmadabad dls.trlct were transf-erred to Gdndhlnagar d~stnct newly COllstltuted
3 Lekawada (1876·31), Pdlal (3659·30), Ba,an (1005·09), Sbahpur (2091-10), RaJPur (645.06), Chekhlaram (805·00), Vasna·Dolarana (2657.19) Bhundla (954.31), Alampur (917-12), Dashela (2880-16), Dhanap (2518-15), Glyod (2138-06), Cbbala (5359·20), Jakhor .. (1479.03), Sblhoh Motl '(1754.13) Chdeda (1438-26), Mehudra (2108·34), Mota lsanpur (3175·21), Mogadl (3350.13), Dabhoda (5701.27), Lavarpur (l065·1I), Pranllya (1198-04) Vadodara (3150·28), Vankanerda (1183·13), Galudan (1765·27), Sonarda (1809·07), Vlra Talavdl (638.19), PlfolPur (1463-39) and Rdtanpur (1288.39) Villages of Dehgam taluka of Ahmadabad dIstrIct were transferred to Gandhmagar dIStrict newly constituted
~ Under GUJarat Govt, Revenue and Agriculture Department ResolutIon No. TLC IOS4·L dated 12th May, 1964 Surdt dlstflCI was diVided IDto two dlstrtcts VIZ (1) Sural district and (2) Valsad dlstnct
The present Sural dlslnct conSIsted of the followmg talukas/mahals
I Ghora'i taluka (14192909),:2 Olpad taluka (161363-30), 3 Karore) taluka (93814·31), 4 Mangrol taluka (246519·12), 5 MandvI (aluka 1176764-36) 6 Songadh tatoka (284872-30), 7 Uchhal taluka (139854.23), 8 Nlzar taluk .. (97201.07),9 Vyara taluka (201990.19), 10 Valod mahal (49953-14) 11' Bardoll taluka (93686.00) 12. Mahuva laluka (85546-22) and 13 Palsana mahal (49549-03) ,
§ The newly constituted Valsad dlstClct consisted of the foUowmg lalukas _
I. Navsan taluka (182512·06), 2 Bansda taluka (147042·00), 3 Chlkhh taluka 139487·09), 4 Valsad tdluka (126680-38),5 Dharampur taluka (408668.17) 6 PardI taluka (11032S·12), 7 Umbergaon taluka (91706·19) and 8 GandeVl taloka (91088.17).
Note : FIgures In brackets ( ) show area III acres and 'gunthas'
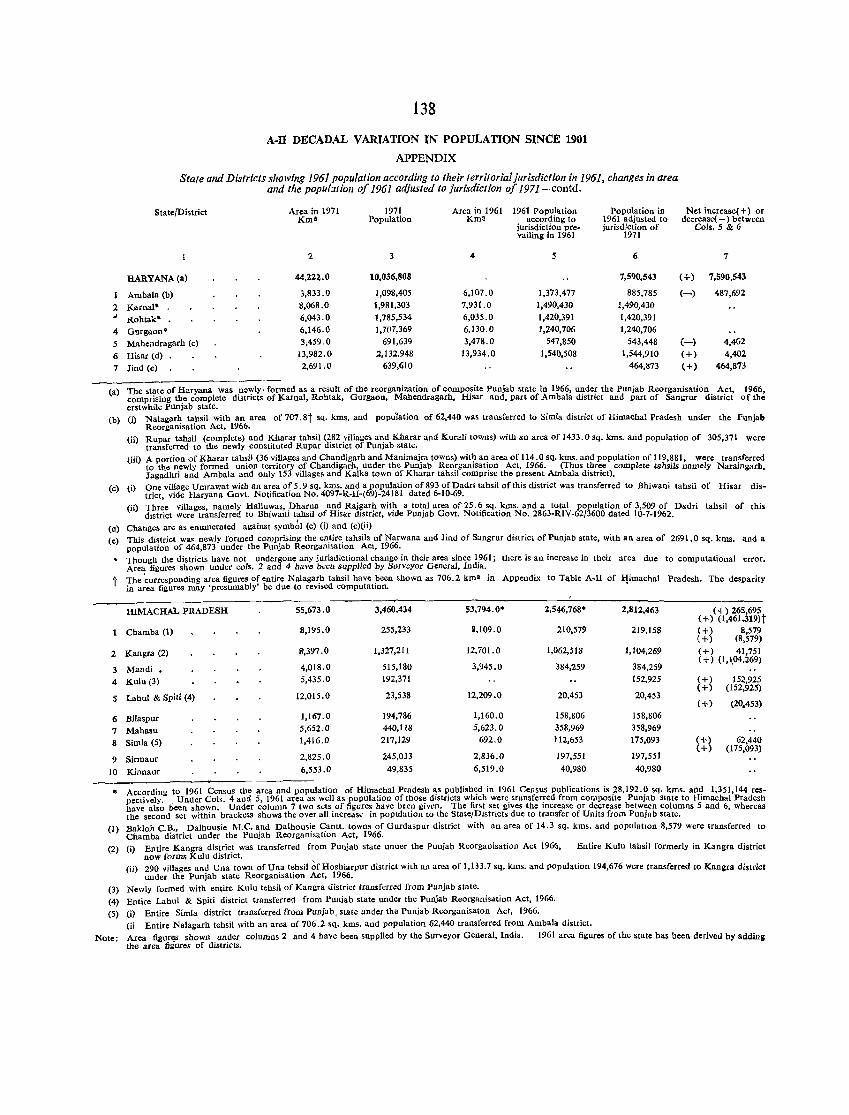
138
A-n DECADAL VARIATION IN POPULATION SINCE 1901
APPENDIX
State and Districts showing 1961 population according to their terriforialjurisdiction in 1961, changes in area and the population of 1961 adjusted to jun:~diction of 1971-contd.
State/District
HARYANA(a)
Ambala (b)
Area in 1971 Km2
2
44,222.0
3,833.0
1971 Area in 1961 Popnlation Km2
3 4
10,036,808
1,098,405 6,107.0
1961 population Population in according to 1961 adjusted to
jurisdiction pre .. jurisdiction of vailing in 1961 1971
5 6
7,590,543
1,373,477 885,785
Net increase( +) or decrease( - ) between
Cols.5 &. 6
7
(+) 7,590,54l
(-) 487,692
2 Karnal' . 8,068.0 1,981,303 7,931.0 1,490,430 1,490,430
J Rohtak* . 6,043.0 1,785,534 6,035.0 1,420,391 1,420,391
4 Gurgaon' 6,146.0 1,707,369 6,130.0 1,240,706 1,240,706
5 Mahendragarh (c) 6 Hisar (d)
3,459.0 13,982.0
691,639 3,478.0 2,132,948 13,934.0
547,850 543,448 (-) 4,4(i2
1,540,508 1,544,910 (+) 4,402
7 lind (e) 2,691.0 639,610 464,873 (+) 464,873
(a) The state of Haryana was newly· formed as a result of the reorganization of composite Punjab state in 1966, under the Puniab Reorganisation Act 1966 comprising the complete districts of Karnal, Rohtak, Gurgaon, Mahendragarh, Hisar and, part of Ambala district and part of Sangrur district of th~ erstwhile punjab state.
(b) (i) Nalagarh tahsil with an area of 707. 8t sq. lans. and population of 62,440 waS transferred to Simla district of Himachal Pradesh under the Punjab Reorganisation Act, 1966.
(ii) Rupar tahsil (complete) and Kharar tahsil (282 villages and Kharar and Kurali towns) with an area of 1433.0 sq. lans. and population of 305371 were transferred to the newly constituted Rupar district of Punjab state. '
(iii) A portion of Kharar tah~i1 (36 vi.!lages and Cha~digarh and Manimaj~a towns) wit~ a~ area of 114.0 sq. kms. and population of 119,881, were transferred to the newly formed unton terrItory of Chandlgarh, under the Punjab ReorganISatIOn Act, 1966. (Thus three complete tahsils namely Naraingarh Jagadhri and Arubala and only 153 villages and Kalka town of Kharar tahsil comprise the present Arnbala district). '
(c) (i) One village Umrawat with an area of 5.9 sq. lans. and a popnlation of 893 of Dadri tahsil of this district was transferred to Bhiwani tahsii of Risar district, vide Haryana Govt. Notification No. 4097-R-Il-(69)-24181 dated 6-10-69.
(ii) Three villages, namely Halluwas, Dharna and Rajgarh with a total area of 25.6 sq. lans. and a total population of 3,509 of Dadri tahsil of this district were transferred to Bhiwani tahsil of Hisar district, vide Punjab Govt. Notification No. 2863-RIV-62/3600 dated 10-7-1962.
(0) Changes are as enumerated against symbbl (c) (i) and (c)(ii) (0) This district was newly formed comprising the entire tahsils of Narwana and Jind of Sangrur district of Punjab state, with an area of 2691.0 sq. kms. and a
population of 464,873 under the Punjab Reorganisation Act, 1966. • Though the districts have not undergone any jurisdictional chang" in their area since 1961; there is an increase in their area due to computational error.
Area figures shown under cols. 2 and 4 have been supplied by Surveyor General, India. t The ~orresponding area figures of entire Na1agarh tahsil have been shown as 706.2 km2 in Appendix to Table A·II of ~imachal Pradesh. The desparity
in area figures may 'presumably' be due to revised computation.
RlMACHAL PRADESH 55,673.0 3,460,434 53,794.0' 2,546,768* 2,812,463 (+) 265,695 (+) (1,461.319)t
Chamba (1) 8,195.0 255,233 8,109.0 210,579 219,158 (+) 8,579 (+) (8,579)
2 Kangra (2) 8,397.0 1,327,211 12,701.0 1,062,518 1,104,269 (+) 41,751
3 Mandi • 4,018.0 515,180 3,945.0 384,259 384,259 (+) (1,\04,269)
4 Kulu(3) 5,435.0 192,371 152,925 (+) 152,925
Lahul & Spiti (4) 12,015.0 23,538 12,209.0 20,453 (+) (152,925)
s 20,453 (+) (20.453)
6 Bilaspur 1,167.0 194,786 1,160.0 158,806 158,806
7 Mahasu 5,652.0 440,118 5,623.0 358,969 358,969
8 Simla (5) 1,416.0 217,129 692.0 112,653 175,093 (+) 62,440
2,825.0 245,033 2,836.0 197,551 (+) (175,093)
9 Sirmaur 197,551
10 Kinnaur 6,553.0 49,835 6,519.0 40,980 40,980
* According to 1961 Census the area and population of Himachal Pradesh as published in 1961 Census publications is 28,192.0 sq. kms. and 1.351,144 respectively. Under Cols. 4 and 5, 1961 area as well as population of those districts which were transferred from composite Punjab state to Himachal Pradesh have also been shown. Under column 7 two sets of figures have been given. The first set gives the increase or decrease between columns 5 and 6 whereas the second set within brackets shows the over all increase in population to the Stale/Districts due to transfer of Units from Punjab state. '
(1) Bakloh C.B., Dalhousie M.C. and Dalhousie Cantt. towns of Gurdaspur district witb an area of 14.3 sq. kms. and populallon 8,579 were transferred to Chamba district under the Punjab Reorganisation Act, 1966.
(2) (i) Entire Kangra district was transferred from Punjab state unuer the Punjab Reorganisation Act 1966, Entire Kulu tahsil formerly in Kangra district now forms Kulu district.
(3)
(4)
(5)
Note:
Oi) 290 villages and Una town of Una tehsil ~f Hoshiarpur district wilh an area of 1,133.7 sq. kms. and population 194,676 were transferred to Kangra district under the Punjab state Reorganisation Act, 1966.
Newly formed with entire Kulu tehsil of Kangra district transferred from Punjab state. Entire Lahul & Spiti district transferred from Punjab state under the Punjab Reorganisation Act, 1966. (i) Entire Simla district transferred from Punjab, state under the Punjab Reorganisaton Act, 1966. (ii Entire Nalagarh tehsil with an area of 706.2 sq. kms. and population 62,440 transferred from Ambala district. Area figures shown under columns 2 and 4 have been supplied by the Surveyor General, India. 1961 area figures of the state has been derived by adding the area fiiures of districts.
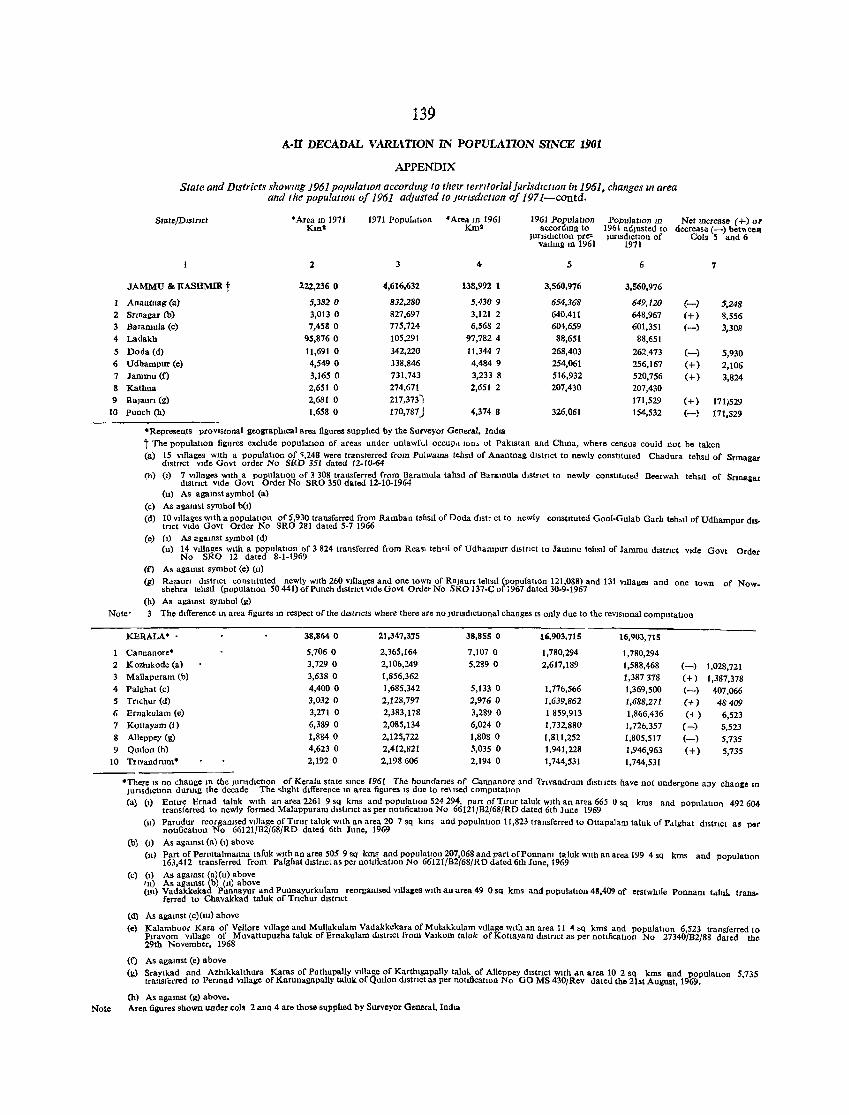
1 2 3 4
5 6 7 8 9
10
139
A·II DECADAL VARIATION IN POPULATION SINCE 1901
APPENDIX
State and Drstricts showlIlg 1961 populatIOn accordlllg to therr territorial jUrisdlCtlOJI in 1961, changes 1Il area and the populatlOll of 1961 adjusted to JUrISdiction of 1971-contd.
Stale/DJstTJCI • Area JD 1971 1971 POpuldlJOn • Area JD 1961 1961 PopulatIOn PopulatIOn m Net mcrease (+) oT l(ml Kml accordmg to 1961 adjusted to decrease (-) bet"lleen
JOTlsd[ct[on pre; jUrlsd[ctton of Cols 5 and 6 va[lmll In 1961 1971
2 3 4 5 6 7
JAMMU & KASHMIR t 2.22,236 0 4,616,632 138,992 1 3,560,976 3,560,976
Anantnag (a) 5,3820 832,280 5,4309 654,368 649,120 (-) 5,248 SrInagar (b) 3,0130 827,697 3,121 2 640,411 648,967 (+) 8,556 Baramula (c) 7,458 0 775,724 6,568 2 604,659 601,351 (-) 3,308 Ladakh 95,8760 105,291 97,782 4 88,651 88,651 Doda (d) 11,691 0 342,220 11,344 7 268,403 262,473 (-) 5,930 Udhampur (c) 4,549 0 338,846 4,484 9 254,061 256,167 (+) 2,106 Jammu (f) 3,1650 731,743 3,233 8 516,932 520,756 (+) 3,824 Kathua 2,651 0 274,671 2,651 2 207,430 207,430 RajaUIl (g) 2,6810 217,3731 171,529 (+) 171lS29 Punch (h) 1,658 0 170,787) 4,374 8 326,061 154,532 (-) 171,529
.Represents prOVIsional geoaraphlcal area figures supplted by the Surveyor General. India
t The populatton fiiures exclude population of areas under unlawft.1 oeeul''' Ion> 01 Pakistan and Chma, where census could not be taken (a) 15 vlIlages Wlth a populatlon of ',248 were transterred from Pulwama tebsll of Anantnag dlStnct to newly conslltuted Chadura tebsll of Srmagar
dlstrtct vide Gove order No SRD 351 dated 12-/0-64 (b) (,) 7 Villages With a populatlon of 3 308 transferred from Baramula tabsll of Baramula d[stnct to uewly conshtuted Beerwah tebsil of Snnasar
distrIct Vide Gove Order No SRO 350 dated 12-10-1964
(c) (d)
(e)
(f)
(g)
(h)
(11) As agamst symbol (a) As agamst symbol b(l) 10 villages Wlth a populatIOn of 5,930 transferred from Rambau tohs.1 of Doda d •• tr ct to newly consttt11ted Gool-Gulab Garh teh.lI of Udhampur dIStTlct vide Govt Order No SRO 281 dated 5-7 1966 (1) As agamst symbol (d) (11) 14 villages wIth a populatIOn of 3 824 transferred from Re"~l teh.li of Udhampur dIstrIct to Jammu tehsli of Jammu d.stnct vide Gove Order
No SRO 12 dated 8-1-1969 As agamst symbol <e) (11)
R.'laon d,strIct constItuted newly wIth 260 villages and one town of Rajaun tehsil (populahon 121,088) and 131 VIllages and one town of Nowshehra tebsll (populatIOn 50441) of Punch d[stncl vIde Govt Order No SRO 137-C of 1967 dated 30-9-1967 A.\ agamst symbol (g)
Note' 3 The dIfference In area figures m respect of the dIstrIcts where there are no Junsdlchonal changes IS only due to the revlslOnal computatIOn
2 3 4 5 Ii 7 8 9
10
KERALA' • 38,8640 21,347,3,5 38,855 0 16.903,715 16,903,715
Cannanore* 5,706 0 2,365,164 7,107 0 1,780,294 1,780,294 Kozlukode (a) 3,729 0 2,106,249 5,289 0 2,617,189 1,588,468 (-) 1,028,721 Mallapuram (b) 3,638 0 1,856,362 1,387378 (+) 1,387,378 Pa1ghat (c) 4,4000 1,685,342 5,133 0 1,776,566 1,369,500 (-) 407,066 Trtchur (d) 3,032 0 2,128,797 2,976 0 1,639,862 1,688,271 (+ ) 48409 Ernakulam (e) 3,271 0 2,383,178 3,289 0 1859,913 1,866,436 (+ ) 6,523 Kottayam (I) 6,389 0 2,085,134 6,024 0 1,732,880 1,726,357 (-) 6,523 Alleppey (g) 1,884 0 2,125,722 1,808 0 1,811,252 1,805,517 (-) 5,735 Qu[lon (h) 4,623 0 2,412,821 5,035 0 1,941,228 1,946,963 (+) 5,735 Tr[vandrum· 2,1920 2,198606 2,1940 1,744,531 1,744,531
.There IS no change 10 the junsdlc(lOn of Kerala state smce 1961 The bouodartes of Cannanore and TrIvandrum dlSttlcts have not undergone any chanle tn Jurisdiction durmg the decade The sltgltt difference 10 area figures IS due to re\1sed computatIOn (a) (I) Enllre Ernad tal uk With an area 2261 9 sq kms and populatIOn 524294. part of Tlrur taluk WIth an atea 665 0 sq kms and POpuldtlOn 492 604
transferred to newly formed Malappuram dIstinct as per nottiicatlOn No 66121fB2f68fRD dated 6th June 1969 (11) Parudur reorganISed VIllage of TIrur taluk WIth an area 20 7 sq kms and populatJOn 11,823 transferred to Ottapalam taluk of P"lghat dlstnct as par
nohficatlOn No 66121fB2f68fRD dated 6th June, 1969 (h) (I) As agamsl (a) (I) above
(ll) Part of Permtalmanna t,,('uk With an area 505 9 SQ kms and populat[on 207,068 and part ofPonnam taluk w.th an area 199 4 sq kms and populatIOn 163,412 transferred from Palghat dIStrict as per nolIficatIon No 6612IfB2{68{RD dated 6th June, 1969
(c) (l) As agamst (a)(il) above (11) As agamst (b) (n) above (lll) Vadakkekad Punnayur and Punnayurkulam reorganISed vIlla:es With an area 49 0 SQ kms and populatIOn 48,409 of erstwhIle Ponnarn tdlu!.. Irans
ferred to Chavakkad taluk of Tnchur dtstnct
(d) As agamst (C)(lll) above
(e) Kalamboor Kara of Vellore Village and Mullakulam Vadakkekara of Mulakkulam v.llage With an area I I 4 sq kms and populahon 6,523 transferred to PJravom VIllage of Muvattupuzha taluk of Ernakulam dIstnct from Valkom taluk of Kottayam dlstnct as per nottficatlOn No 27340jB2j88 dated the 29th November, 1968
(f) As agamst (e) above (g) Sray[kad and Azhlkkalthura Karas of Puthupally VIllage of Karthlgapally taluk of Alleppey d[strlct with O\n area 10 2 sq kms and populatIOn 5,735
transferred to Permad vlllage of Karunagapally taluk of QU1lon d.stnct as per nottficatlOn No GO MS 430/Rev dated the 21st Angust, 1969.
(h) As agamst (g) above. Note Area figures shown under eols 2 anQ 4 are those supphed by Surveyor General, India
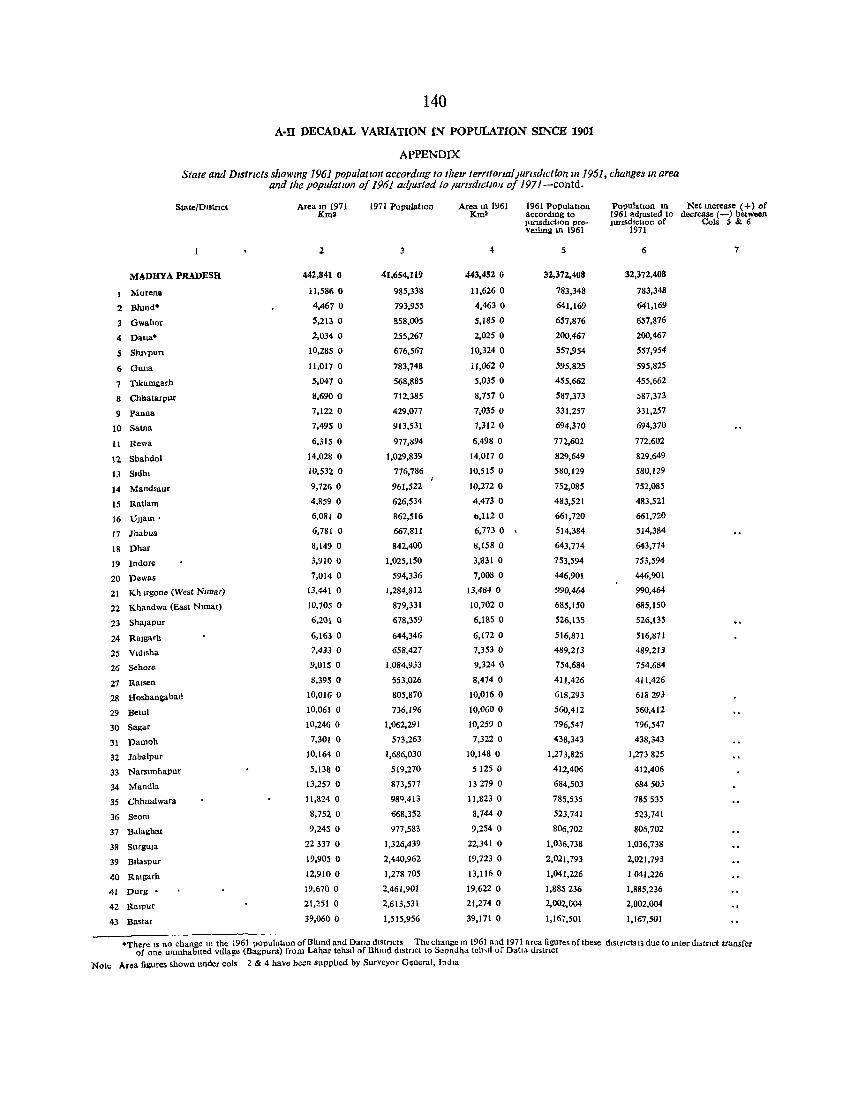
140
A·ll DECADAL VARIATION IN POPULATION SINCE 1901
APPENDIX
Slale and Dlstrzcts showing 1961 populatIOn accordlllg to their terntona/Jurlsdlction In 1961. changes In area and the population of 1961 ad.J/lsted to //lr/sdle/IM of 1971-contd.
StatejDlstnct
MADHYA PRADESH
I Morena
2 Bhmd·
3 Gwahor
4 Datta·
S Sh1\}lllfl
6 GUlla
7 Tlkumgarh
8 Chhatarput
9 Panna
10 Satnu
11 Rewa
12 Shahdol
13 Sldlu
14 Mandsaut
15 Ratlam
16 U))aln·
17 Jhabua
18 Dhar
19 Indore
20 Dewa.
21 Kh Lrgone (West Nunar)
22 Khandwa (Bast Nlmar)
23 Shajapur
24 Rajgarh
25 Vldtsha
26 Schore
27 Ralsen
28 lloshanllabad
29 Betnl
30 Sagar
31 Damoh
32 Jabalpur
33 Narslmhapur
34 Mandla
35 Chhllldwara
36 Seom
37 B .. laghat
38 Surguja
39 BllaSPur
40 Ihlgarh
41 Durg •
42 Ralpur
43 Bastar
Area In 1971 1Un2
442,841 0
11,586 0
4,467 0
5,213 0
2,034 0
10,285 0
11,017 0
5,047 0
8,690 0
7,122 0
7,495 0
6,31S 0
14,023 0
10,532 0
9,726 0
4,859 0
6,081 0
6,781 0
8,149 0
3,910 0
7,0140
13,441 0
10,705 0
6,201 0
6,163 0
7,433 0
9,01S 0
8,395 0
10,016 0
10,061 0
10,246 0
7,301 0
10,164 0
5,138 0
13,257 0
11,824 0
8,752 0
9,245 0
22337 0
19,905 0
12,910 0
19,670 0
21,251 0
39,060 0
1971 Populatton
3
41,654,119
985,338
793,955
858,005
255.267
676,567
783.748
568,885
712,385
429,077
913.531
977,894
1,029,839
776,786
961,522
626,534
862,516
667,811
842,400
1,025,150
594,336
1,284,812
879,331
678.359
644,346
658,427
1,084,933
553,026
805,870
736,196
1,062,291
573.263
1,686,030
519,270
873,577
980 ,413
668,352
977,583
1,326,439
2,440,962
1,278705
2,461,901
2,613,531
1,515,956
Area 1ll 1961 1961 Populatlon Kma accordtng to
JunsructIon pre· Vallmi In 1961
4
443,452 I)
11,626 0
4,463 0
5,1850
2,025 0
10,324 0
11,062 0
5,035 0
8,757 0
7,0350
7,312 0
6,498 0
14,017 0
10,5150
10,272 0
4,473 0
6,112 0
6,773 0 ,
8,1580
3,831 0
7,008 0
13,484 0
10,702 0
6,185 0
6,172 0
7,353 0
9,324 0
8,474 0
10,016 0
10,060 0
10,2590
7,322 0
10,148 0
51250
13 279 0
11,823 0
8,744 0
9,254 0
22,341 0
19,723 0
13,1160
19,622 0
21,274 0
39,171 0
5
32,372,408
783,348
641,169
657,876
200,467
557,954
595,825
455,662
587,373
331,257
694,370
772,602
829,649
580,129
752,085
483,521
661,720
514,384
643,774
753,594
446,901
990,464
685,150
526,135
516,871
489,213
754,684
411,426
618,293
560,412
796,547
438,343
1,273,825
412,406
684,503
785,535
523,741
806,702
1,036,738
2,021,793
1,041,226
1,885236
2,002,004
1,167,501
PopulatJon In Net Increase (+) of 1961 adjusted to decrease (-) between }lIl'lsdlctlOn of Cots 5 8< 6
1971
6
32,372,408
783,348
641,169
657,876
200,467
557,954
595,825
455,662
J87,373
331,257
694,370
772,602
829,649
580,129
752,085
483,521
661,720
514,384
643,774
753,594
446,901
990,464
685,150
526,135
516,871
489,213
754.684
411,426
618293
560,412
796,547
438,343
1,273825
412,406
684503
785535
523,741
806,702
1,036,738
2,021,793
1041,226
1,885,236
2,002,004
1,167,501
7
.There IS nO change 10 the 1961 populatIon of Bhmd and Datta dl'ITlcts The change 10 1961 and 1971 area figures or these dlstrletsls due to mter dtstrlct transfer of one unmhablted VIllage (Bagpura) from Lahar tehsll of Bhlnd rusttlct to Seondha teh,,1 of Dati .. dlstnct
Note Area fi&ures shown under cols 2 & 4 have been supplted by Surveyor General, IndIa
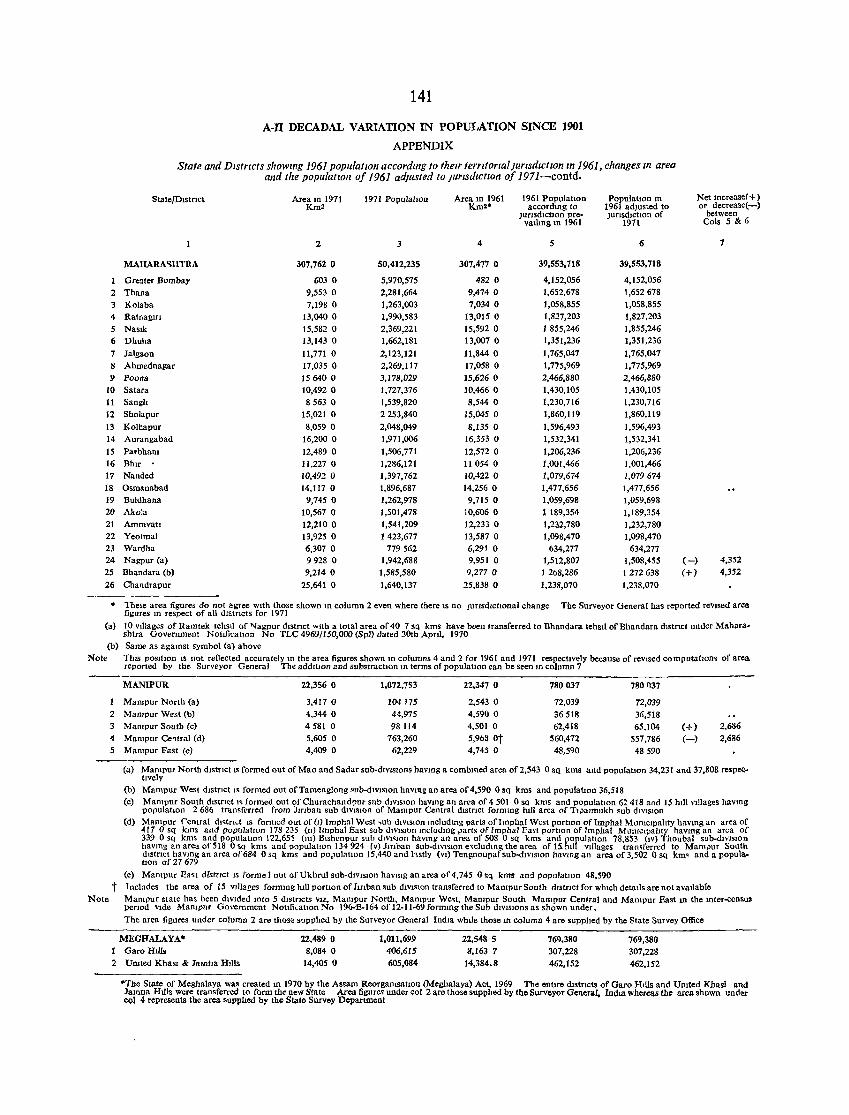
2 3 4 5 6 7 8 9
10 11 12 13 14 15 16 17 18 19 20 21 22 23 24 25 26
141
A-U DECADAL VARIATION IN POPULATION SINCE 1901
APPENDIX
Slale and Dlstrzcts showmg 1961 populatIOn accordmg to theIr lerntorzalJuYlsdlctlOn In 1961, changes IN area and the populatloll of 1961 adjusted to Junsdlctwn of 1971-contd.
Sta te/DIStrtct Area In 1971 1971 Populahon Area 10 1961 1961 PopulatlOn PopulatIOn 10 Km2 Km2· accord1Og to 1961 adjusted to
JUrISdlctlOn pre- JunsdlctlOn of valhng 10 1961 1971
2 3 4 5 6
MARARA '>HTRA 307,762 0 50,412,235 307,477 0 39,553,718 39,553,718
Greater Bombay 603 0 5,970,575 482 0 4,152,056 4,152,056 Thana 9,553 0 2,281,664 9,474 0 1,652,678 1,652678 Kolaba 7,198 0 1,263,003 7,034 0 1,058,855 1,058,855 Ratnagm 13,040 0 1,990,583 13,0150 1,827,203 1,827,203 Naslk 15,582 0 2,369,221 15,592 0 1855,246 1,855,246 Dhuha 13,143 0 1,662,181 13,007 0 1,351,236 1,351,236
Jalgaon 11,771 0 2,123,121 11,844 0 1,765,047 1,765,047 Ahrnednagar 17,035 0 2,269,117 17,058 0 1,775,969 1,775,969 Poona 15640 0 3,178,029 15,626 0 2,466,880 2,466,880 Satara 10,492 0 1,727,376 10,466 0 1,430,105 1,430,105 Sangh 8563 0 1,539,820 8,544 0 1,230,716 1,230,716 Sholapur 15,021 0 2253,840 15,045 0 1,860,119 1,860,119 Kolhapur 8,059 0 2,048,049 8,135 0 1,596,493 1,596,493 Aurangabad 16,200 0 1,971,006 16,353 0 1,532,341 1,532,341 Parbham 12,489 0 1,506,771 12,572 0 1,206,236 1,206,236 Bhlr 11,2270 1,286,121 11 054 0 1,001,466 1,001,466 Nanded 10,492 0 1,397,762 10,4220 1,079.674 1,079674 Osmanabad 14,117 0 1,896,687 14,256 0 1,477,656 1,477,656 Buldhana 9,745 0 1,262,978 9,7150 1,059,698 1,059,698 Akola 10,567 0 1,501,478 10,606 0 1189,354 1,189,354 Amravatl 12,210 0 1,541,209 12.233 0 1,232,780 1,232,780 Yeotmal 13,925 0 1423,677 13,587 0 1,098,470 1,098,470 Wardha 6,307 0 779562 6,291 0 634,277 634,277 Nagpur (a) 9928 0 1,942,688 9,951 0 1,512,807 1,508,455 Bhandara (b) 9,2140 1,585,580 9,277 ° 1268,286 1272 638 Chandrapur 25,641 0 1,640,137 25,838 0 1,238,070 1,238,070
Net lUcrease( + ) or decrease(-)
between Cols 5 &6
1
(-) 4,352 (+) 4,352
• These area figures do not agree WIth those shown m column 2 even where there IS no JuriSdlchonal change figures m respect of all distrIcts for 1971
The Surveyor General has reported reVIsed area
(a) 10 VIllages of Ramlek lehsll of ""agour d,str,ct With a total area of 40 7 sq kms have been transferred to Bhandara tehsil of Bhandara dlStnct under Mahora.shira Government NotIficatIOn No TLC 4969/150,000 (Spl) dated 30th AprIl, 1970
(b) Same as agamst symbol (a) above Note Th,s poslhon IS not reflected accurately m the area figures shown 10 columns 4 and 2 for 1961 and 1971 respectIVely because of reVised computatIon. of area
reported by the Surveyor General The addlhon aDd substTachon 10 terms of populatIon can be seen m column 7
2 3 4 5
MANIPUR 22,356 0 1,072,753 22,347 ° 780037 780037
Mampur North (a) 3,4110 104 175 2,543 0 72,039 72,039 Mampur West (b) 4,344 0 44,975 4,590 0 36518 36,518 Mampur South (c) 4581 0 98114 4,501 0 62,418 65,104 (+) 2,686 Mampur Ce~tral (d) 5,605 0 763,260 5,968 ot 560,472 557,786 (-) 2,686 Mampur Fast (e) 4,409 0 62,229 4,745 0 48,590 48590
(a) Mampur North dlstnct IS formed out of Mao and Sadar sub-d,VISlQnS havmg a comblOed area of 2,543 0 sq kms and populahon 34,231 and 37,808 re.pee:hvely
(b) Mampur West dlstnct IS formed out of Tamenglong sub-d,VISion haVlIl1> an area of 4,590 0 sq kms and populahon 36,518 (c) Mamour South d,stnct I~ formed out of Chura chand pur sub diVISJon havmg an area of 4501 0 sq kms and populatIon 62418 and 15 hill VIllages havmg
populatlOn 2686 transferred from 1mban sub diVISion of Mampur Central dlStnct formmg hill area of TI,>almukh sub diVISIOn (d) Mampur ('entral dl<tn.t IS fonned out of (I) Imphal West ,ub dlvlSlon Including parts ofImphal West portlOn oflrnphal Mumclpahty havtng an area of
411 0 sq kms and populatIOn 178235 (11) Tmphal East sub d,V,SIOn Includmg "arts oflmphal Fast portIOn of Imphal Mumclpahty haVIng an area of 339 0 sq kms and populatIOn 122,65~ (Ill) BIshenpur sub d,vI<IOn havmg an area of 508 0 sq kms and populallon 78,853 (IV) Thoubal sub-dIVISIOn havlOg an area of 518 0 sq kms and populatton 134924 (v) Jmban sub-dlvmon e~c1udlOg the area of 15 hill VIllages tran.ferred to Mam"ur South 1r~~r~~ ~~'6~§ an area of 684 0 sq kms and po,1UlatlOn 15,440 and hstly (VI) Tengnoupal sub-diVISIon havmg an area of 3,502 0 sq km- and a popula-
(e) Mampur Ea't drstrIct IS forme lout of Ukhrul sub-diVISIOn havmg an area of 4,745 0 sq kms and populatIOn 48,590 t Includes the area of 15 Villages formmg hill portlon ofJmban sub diVISIon transferred to MaOlpur South dIstrIct for Which details are not avatlable
Note Mampur state has been diVIded mto 5 dIstrICts VIZ, MaOlpur North, Mampur West, Mampur South Mampur Central and Mampur East In the mter-cenSus penod VIde Manlpur Government NotIfkatlOn No 196-£-164 of 12-11-69 formmg the Sub dIVISIons as shown under, The area figures under column 2 are those supplIed by the Surveyor General IndIa whtle those 10 column 4 are supphed by the State Survey Office
MEGHALAYA* 1 Garo Htlls 2 Untted Khasl & ]amtla HIlls
22,489 0 8,084 0
14,405 0
1,011,699 406,6J5 605,084
22,548 5 8,163 7
14,384.8
769,380 307,228 462,152
769,380 307,228 462,152
·The State of Meghalaya was created 10 1970 by the Assam ReorgaOisatlOu (MeghaJaya) Act, 1969 The entIre dIStrIcts of Oaro Hills and UntIed Khasi and Jamtla Htlls were transferred to form the neW State Area figures under col 2 are those supphed by the Surveyor General, IndIa wherells the area shown under col 4 represents the are;1 supphed by the State Survey Department
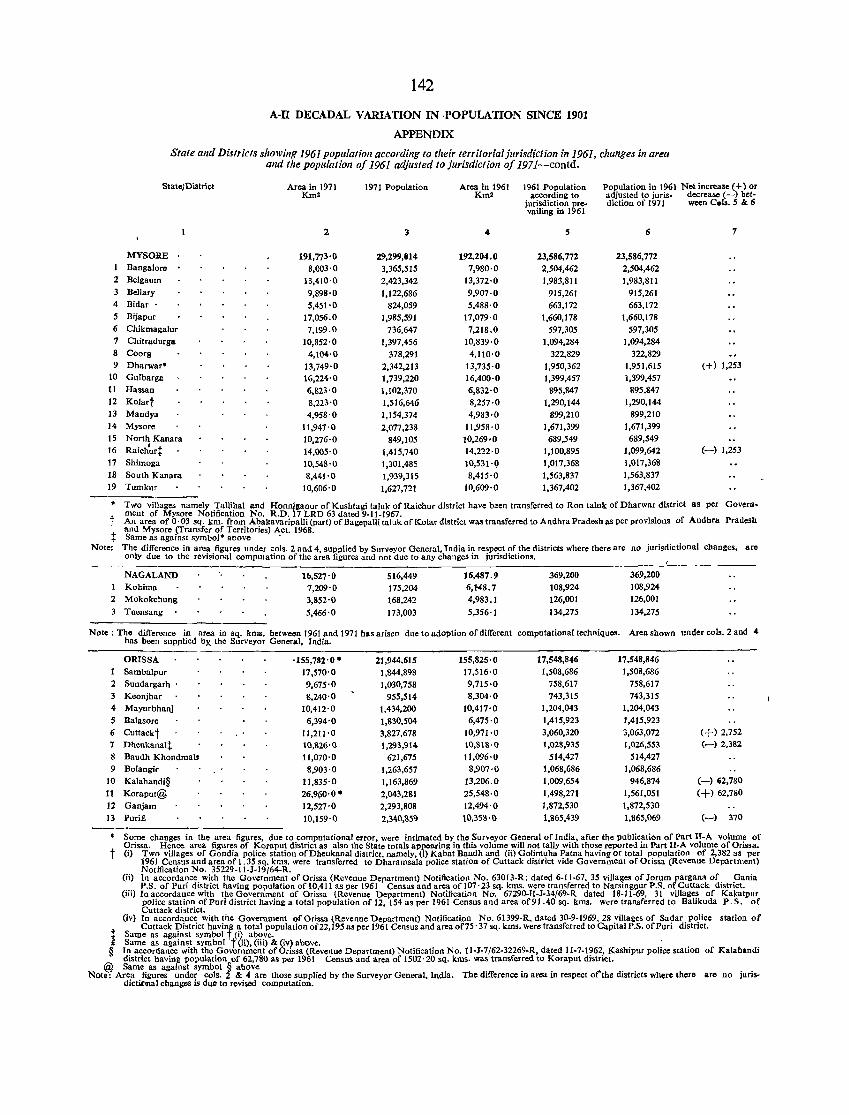
1 2 3 4 5 6 7 8 9
10 11 12 13
14 15 16 17
1.8 19
142
A-II DECADAL VARIATION IN ,POPULATION SINCE 1901
APPENDIX
State and Districts showing 1961 population according to their territoriaijurisdiction in 1961, changes in area and the population of 1961 adjusted to jurisdiction of 1971-contd.
State/District Area in 1971 1971 Population Km:
2 3
MYSORE 191,n3'0 29,299,'14 Bangalore 8,003'0 3,365,515 Be1gaum 13,410'0 2,423,342 Bellary 9,898'0 1,122,686 Bidar • 5,451'0 824,059 Bijapur 17,056.0 1,985,591 Chikmagalur 7,199.0 736,647 Chitradurga 10,852'0 1,397,456 Coorg 4,104·0 378,291 Dharwar· 13,749'0 2,342,213 Gulbarsa 16,224·0 1,739,220 Hassan 6,823'0 1,102,370 Kolart 8,223'0 1,516,646 Mandya 4,958'0 1,154,374 Mysore 11,941'0 2,077,238
10,276·0 849,105 14,005'0 1,415,740
North Kanara Raicb'urt Shimoga 10,548'0 1,301,485 South Kanara 8,441'0 1,939,315 Tumkur 10,606,0 1,627,721
Area in 1961 Km2
4
192,204.0 7,980·0
13,372'0 9,907'0 5,488·0
17,079'0 7,218.0
10,839·0 4,110,0
13,735'0 16,400·0 6,832'0 8,257·0 4,983·0
11,958·0 10,269'0 14,222·0 10,53H,) 8,415'0
10,609·0
1961 Population according to
jurisdiction pre-vailing in 1961
5
23,586,772 2,504,462 1,983,811
915,261 663,172
1,660,178 597,305
1,094,284 322,829
1,950,362 1,399,457
895,847 1,290,144
899,210 1,671,399
689,549 1,100,895 1,017,368 1,563,837 1,367,402
Population in 1961 Net increase (+) or adjusted to juris- decrease (--) bet-diction of 1971 ween C.ls. 5 & 6
6
23,586,772 2,504,462 1,983,811
915,261 663,172
1,660,178 597,305
1,094,284 322,829
1,951,615 1,399,457
895,847 1,290,144
899,210 1,671,399 689,549
1,099,642 1,017,368 1,563,837 1,367,402
7
(+) 1,253
(-) 1,253
,. Two villages namely Tallihal .. nd Honnl' ganur of Kushtagi taluk of Raichur district have been transferred to Ron ta1uk of Dharwar district as per Government of Mysore Notification No, R.D, 7 LRD 63 dated 9-1I-1967, t An area of 0,03 sq. km, from Abakavaripalli (part) of BagepaUi taltlk of Kolar district was transferred to Andhra Pradesh as per provisions of Andhra Pradesh and Mysore (Transfer of Territories) Act. 1968.
t Same as against symbol' aOOve ' Note: The difference in area figures under cols. 2 and 4, supplied by Surveyor General, India in respect of the districts where there are no jurisdictional changes, are
only due to the revisional computation of the area figures and not due to any changes in jurisdictions.
NAGALAND 16,527'0 516,449 16,487.9 369,200 369,200 1 Kohirna 7,209·0 175,204 6,M8.7 108,924 108,924 2 Mokokchung 3,852'0 168,242 4,983.1 126,001 126,001
3 Tuensang 5,466'0 173,003 5,356' 1 134,275 134,275
Nelte : The difference in area in sq. kms. between 1961 and 1971 has arisen due to adoption of different computational techniques. Area shown under cols. 2 and 4 has been supplied by" the Surveyor General, India.
ORISSA '155,782'0 .. 21,944,615 155,825·0 17,548,846 17,548,846 Sambalpur 17,570'0 1,844,898 17,516'0 1,508,686 1,508,686
2 Sundargarh • 9,675'0 1,030,758 9,715'0 758,617 758,617 3 Keonjhar 8,240'0 955,514 8,304·0 743,315 743,315 4 Mayurbhanj 10,412'0 1,434,200 10,417'0 1,204,043 1,204,043 5 Balasore 6,394'0 1,830,504 6,475·0 1,415,923 1,415,923 6 Cuttackt 11,211·0 3,827,678 10,971·0 3,060,320 3,063,072 C+) 2,752 7 Dhenkana1t 10,826'0 1,293,914 10,8\8'0 1,028,935 1,026,553 (-) 2,382
8 Baudh Khondmals 11,070'0 621,675 11,096'0 514,427 514,427 9 Bolangir 8,903'0 1,263,657 8,907·0 1,068,686 1,068,686
10 Kalahandi§ 11,835'0 1,163,869 13,206.0 1,009,654 946,874 (-) 62,780
It Koraput@ 26,9(i0'0 .. 2,043,281 25,548·0 1,498,271 1,561,051 C+) 62,780 12 Ganjam 12,527'0 2,293,808 12,494'0 1,872,530 1,872,530 13 Puri£ 10,159'0 2,340,859 10,353·0 1,865,439 1,865,069 (-) 370
* Some changes in the area figures, due to computational error, were intimated by th~ Surveyor General of India, after the publication of Part II-A volume of Orissa. Hence area figures of Koraput district as also the State totals appoaring in this volume will not tally with those reported in Part II-A volume of Oris.a.
t (i) Two villages of Gondia police station ofDhenkanal district, namely, (i) Kabat Bandh and (iil Golirnuha Patna having or total population of 2,382 as per 1961 Census and area of 1. 35 sq. kms. were transferred to Dharamsala police statiOn of Cuttack district vide Government of Orissa (Revenue Department) Notification No. 35229-II-l-19/64-R.
(ii) In accordance with the Government of Orissa (Revenue Department) Notificatiort No. 63013-R; dated 6-11-67, 35 villages of lorum pargana of Gania P.S. of Puri district having population of 10,41 I as per 1961 Census and area of 107·23 sq. kIttS. were transferred to Narsingllur P.S, of Cut tack district.
(iii) In accordance with the Government of Orissa (Revenue Department) Notification NO". 67290-U-]-34/69-R dated 18-11-69, 31 villages of Kakatpur police station ofPuri district having a total population of 12,154 as per 1961 Census and area of91.40 sq. kms, were transferred to Balikuda P.S. of Cuttack district.
(iv) In accordance with the Government of Orissa {Revenue Department) Notification No. 61399-R, dated 30-9-1969, 28 villages of Sadar police station of Cuttack District havinll a total population of22,195 as per 1961 Census and area of75· 37 sq. kms. were transferred to Capital P.S. ofPuri district,
t Same as against symbol T.(i) above. £ Same as against syrnbol t (ii), (iii) & (iv) above. .
§ Tn accordance with the Government of Orissa (Revenue Department) Notification No. 11-1-7/62-32269-R, dated 11-7-1962, l(ashipur police station of Kalahandi district having population of 62,780 as per 1961 Census and area of 1502·20 sq. kms, was transferred to Koraput district.
@ Same as against symbol § above Note: Area figures under cols. 2 & 4 are those supplied by the Surveyor General, India. The difference in area in respect orlbe districts where there arc no juris
dic\i(>nal changes is due to revised computation.
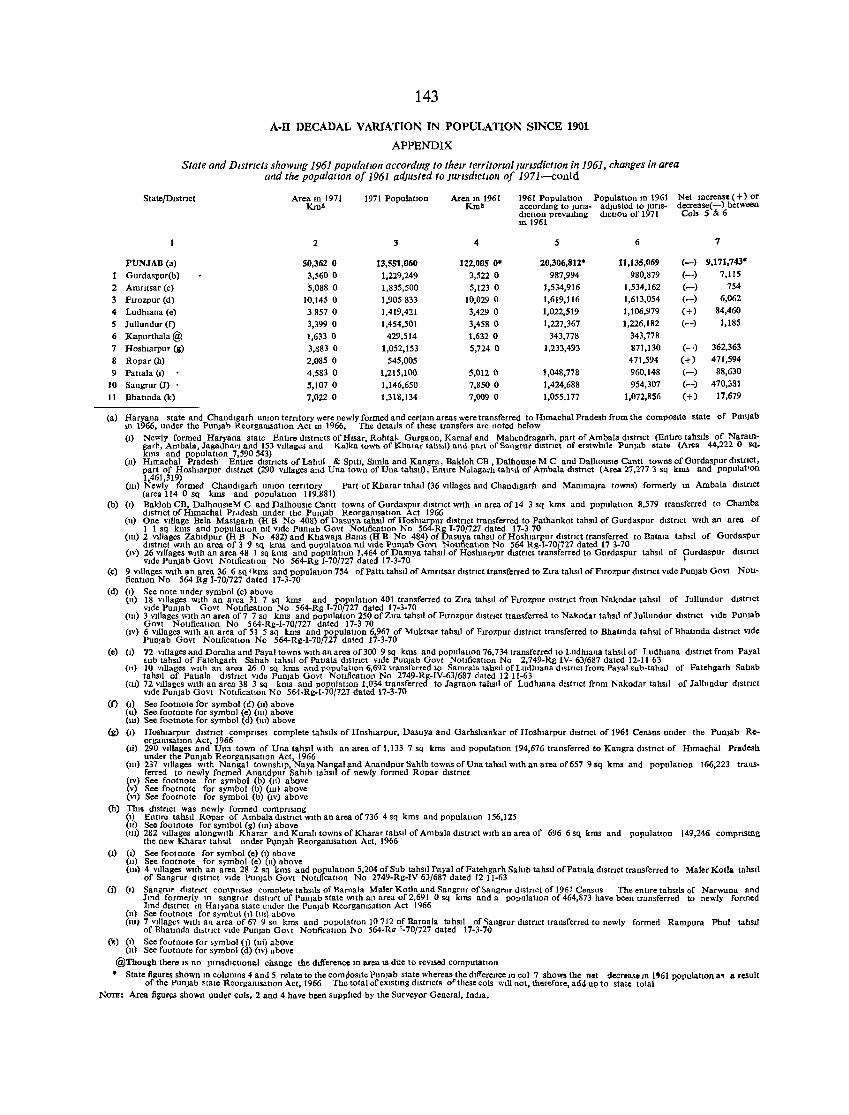
2 3 4
5 6 7
8 9
10 11
143
A-II DECADAL VARIATION IN POPULATION SINCE 1901
APPENDIX
State and Dlstncts showmg 1961 populatlOll accordlllg to tltelr ferritorral/uTisdicllOn in 1961, c!tanges in area and (h~ populatIOn of 1961 adjusted to JUrisdictIOn of 1971-contd
State/O,stncl Area 10 1971 Km2
1971 PopulatIOn Area in 1961 Km2
1961 PopulatlOn Population m 1961 Net mcrease ( + ) or accordmg to Juns- adjusted to Juns- decrease(-) between dlCllon prevailinlii dIctiOn of 1971 Cols 5 &6 In 1961
2 3 4 5 6 7
PUNJAB (a) 50,362 0 13,551,060 122,005 O· 20,306,812' 11,135,069 (-) 9,171,743·
Gurdaspur(b) 3,560 0 1,229,249 3,522 0 987,994 980,879 (-) 7,115
Amntsar (c) 5,088 0 1,835,500 5,123 0 1,534,916 1,534,162 (-) 754
F,rozpur (d) 10,145 0 1,905833 10,029 0 1,619,116 1,613,054 (-) 6,062
Ludhmna (e) 38570 1,419,421 3,429 0 1,022,519 1,106,979 (+) 84,460
Jullundur (f) 3,399 0 1,454,501 3,458 0 1,227,367 1,226,182 (-) 1,185
Kapurthala @ 1,633 0 429,514 1,6320 343,778 343,778
Hoshlarpur (8) 3,883 0 1,052,153 5,724 0 1,233,493 871,130 (-) 362,363
Ropar (b) 2,085 0 545,005 471,594 (+) 471,594
Pattala (I) 4,583 0 1,215,100 5,0120 1,048,778 960,148 (-) 88,630
Sangrur (J) 5,1070 1,146,650 7,850 0 1,424,688 954,307 (-) 470,381
Bhatmda (k) 7,022 0 1,318,134 7,009 0 1,055,177 1,072,856 (+) 17,679
(a) Haryana state and ChandIgarh unton terntory were newly formed and certam areas were transferred to Hlmachal Pradesh from the composite state of PnnJab ill 1966, under the Punjab Reorgamsatton Act 10 1966, The detaIls of these transfers are nated below (I) Newly farmed Haryana state Enltre dlstncts of Htsar, Rohtal. Gurgaon, Kamal and Mahendragarh, part of Ambala dlstnct (Enltre tahstls of Naralll
garh, Ambala, Jagadhan and 153 VIllages and Kalka town of Kharar tahSIl) and part of Saogrur d,stnct of erstwhIle Punjab state (Area 44,222 0 sq. kms and papulatIOn 7,590543)
(11) HImachal Pradesh Entire dIStricts of Lahul & SPltl, Simla and Kangra, Bakloh CB , DalhOUSIe M C and DalhOUSIe Cant! towns afGurdaspur dlstnct, part of Hoshlarpur dlstnct (290 VIllages and Una town of Una tahstl), Enllre Nalagarh tah'lI of Ambala dIStnct (Area 27,277 3 sq lans and populal'on 1,461,319)
(111) Newly formed Chandtgarh umOn terrItory Part of Kharar tahSIl (36 VIllages and Chandlgarh and MammaJra towns) formerly 10 Ambala dlslnct (area 114 0 sq kms and populatIOn 119,881)
(b) (I) Baklah CB, OalhousleM C and DalhOUSIe Cantt towns of Gurdaspur dIStrict WIth In area of 14 3 sq kms and papulalton 8,579 transferred ta Chamba dlstnct of Htmachal Prddesh under the Punjab Reorgamsahon Act 1966
(Il) One VIllage Bela Mastgarh (H B No 408) of Dasuya tahsIl of Hoshlarpur dIstrict transferred to Pathankot tahsil of Gurdaspur dIStrIct WIth an area of I I sq kms and populatIOn ml VIde Punjab Gavt NotIfication No 564-Rg 1-70/727 dated 17-370
(111) 2 VIllages Zahldpur (H B No 482) and KhawaJa Bams (H B No 484) of Oasuya tahsil of Hoshlarpur d,slnct transferred to Batala tahSIl of Gurdaspur dlstnct With an area of 3 9 sq kms and papulation nil Vide Punjab Govt Notlficatlon No 564 Rg-1-70/727 dated 17 3-70
(IV) 26 VIllages WIth an area 48 1 sq kms and populatIon 1,464 af Oasuya tahSIl of Hashtarpur dIstrict transferred to Gurda,pur tahstl of purdaspur dlsmet VIde Punjab Govt NoltficatIOn No 564-Rg 1-70/727 dated 17-3-70
(c) 9 VJ!lages WIth an area 36 6 sq 'kms and populatIOn 754 ofPat!1 tahstl of Amrltsar dIstrict transferred to Zlra tahsil afFlrozpur dIstrict VIde Punjab Govt NotificatIon No 564 Rg 1-70/727 dated 17-3-70
Cd) (I) See note under symbol (c) above (11) 18 VIllages WIth an area 31 7 sq kms and populatIOn 401 transferred 10 Zlra tahstl of Ftrozpur a'strlct from Nakodar tahSIl of Jullundur dIstrict
VIde Punjab Govt NotIficatIOn No 564-Rg 1-70/727 dated 17-3-70 (111) 3 VIllages WIth an area of 7 7 sq kms and populatIOn 250 of Zlra tahsIl of Ftrozpur dIstrict transferred to Nakodar tah,,! of lullundur dlstnct Vide Punjab
Gov! Nohficatton No 564-Rg-I-70/727 dated 17-3 70 (IV) 6 vtllages WIth an area of 51 5 sq lans and populatIOn 6,967 of Muktsar tahSil of Flrozpur district transferred to Bhat10da tahsil of Bbat10da dIstrict VIde
J'uDjab Govt Nattficallon Na 564-Rg-I-70/727 dated 17-3-70 (e) (I) n VIllages and Oaraha and Payal towns WIth an area of 300 9 sq lans and populatIOn 76,734 transferred ta Ludhtana tahsil of Ludhlana dtstrlct fram Payal
sub tahsil of Fatehgarh Sahab tahSIl of Patlala dIStrict VIde Punjab Govt NotIficatIOn Na 2,749-Rg IV- 63/687 dated 12-11 63 (11) 10 Vlllages WIth an area 26 0 sq kms and populatton 6,692 transferred to Samra!a tahstl of Ludhlana d,slrlct from Paya! sub-tahstl of Fatehgarh Sahab
tahsIl of Pahala dlstnct VIde Punjab Govt Notlficaltan Na 2749-Rg-IV-63/687 dated 12 11-63 (ill) 72 villages WIth an area 38 3 sq kms and populatIOn 1,034 transferred to Jagraon tahsIl af Ludhlana dIstrict from Nakadar tahstl of Jallundur dIstrtct
VIde Punjab Govt Noltficallon No 564-Rg-I-70/727 dated 17-3-70 (f) (I) See footnate for symbol (d) (11) above
(11) See footnote for symbol (e) (til) abave (m) See footnote for symbal (d) (Ill) abave
(g) (I) Hosluarpur distrIct comprtses complete tahslls of Hoshlarpur, Dasuya and Garhshankar of Hoshlarpur dlstflct of 1961 Census under the Punjab Reorgamsallon Act, 1966
(Il) 290 VIllages and Una town of Una tahsil "Ith an area af 1,133 7 sq kms and populatIOn 194,676 transferred to Kangra district of Hlmachal Pradesh under the Punjab ReargamsatlOn Act, 1966
(h)
(m) 237 VIllages WIth Nangal townshIp, Naya Nangal and Anandpur Sahib towns of Una tahsIl WIth an area of 657 9 sq kms and populatIOn l66,223 transferred to newly formed Anandpur SahIb tahsil of newly formed Ropar dIStrict
(IV) See foatnote for symbol (b) (n) above (v) See footnote for symbol (b) (lU) above (VI) See faotnote for symbol (b) (IV) above ThIS dtstflct was newly formed compnsmg (I) Entlre tahsIl Ropar of Ambala dIstrIct WIth an area of736 4 sq kms and populatIOn 156,125 (11) See footnote far symbol (g) (m) above (111) 282 VIllages alongwlth Kharar and Kural! towns of Kharar tahSIl af Ambala dIstrict wah an area of 696 6 sq kms and population 149,246 compnsmg
the new Kharar tahSIl under Punjab ReorgamsatlOn Act, 1966 (I) (I) See foal note far symbal (e) (1) above
(11) See faotnote for symbol <e) (n) above (lll) 4 VIllages WIth an area 28 2 sq kms and populalton 5,204 of Sub tahSIl Payal of Fatehgarh SahIb tahSIl afPatlala dIstrict transferred to Maler Kolla tahsIl
of Sangrur dlstnct VIde Punjab GoY! NatlficatlOn No 2749-Rg-IV 63/687 dated 12 11-63 (n (1) Sangrur dIstnct compnses complete tahstls of Barnala Maler Kotla and Sangrur ofSangrur dIstr1ct of 1961 Census The entIre tahstls of Narwana and
lInd farmerly III sangrur dIstrict of Punjab state WIth an area of 2,691 0 sq kms and a populallon of 464,873 have been transferred to newly formed Jlne dIStrict III Haryana state under the Punjab Reorgamsatlon Act 1966
(11) See footnote far symbol (1) (Ill) above (JIll 7 vIllage, with an area of 67 9 so kms and papulatIOn 10712 of Barnala tahsIl of'langrur dIstrIct transferred to newly formed Rampura Phul tahsil
af Bhatmda dl>tnct VIde Pun;atJ GO\l Nallficallon hio 564-Ro '-70/727 dated 17-3-71l (1<) (I) See footnote for ,ymbol (J) (IIi) above
(II) See footnote for symbal (d) (IV) above
@Thaugh there IS no JUrlsdlctlonal change the dtfferencc 10 area IS due to reVISed computatIOn
• State figures shown In columns 4 anJ 5 relatc to the com';oslte Punjab state whereas the dIfference IT) col 7 shows the net decrease III 1'61 populatIOn a' a result of the Punjab state ReorgamsatIOn Act, 1966 The total of eXIStIng dlstncts 0' these cols WIll not, therefore, add up to state total '
NOll!: Area fi¥Ur~s $ho,,'ll under ~o1s, 2 and 4 have been supplIed by the Surveyor General, IndIa,
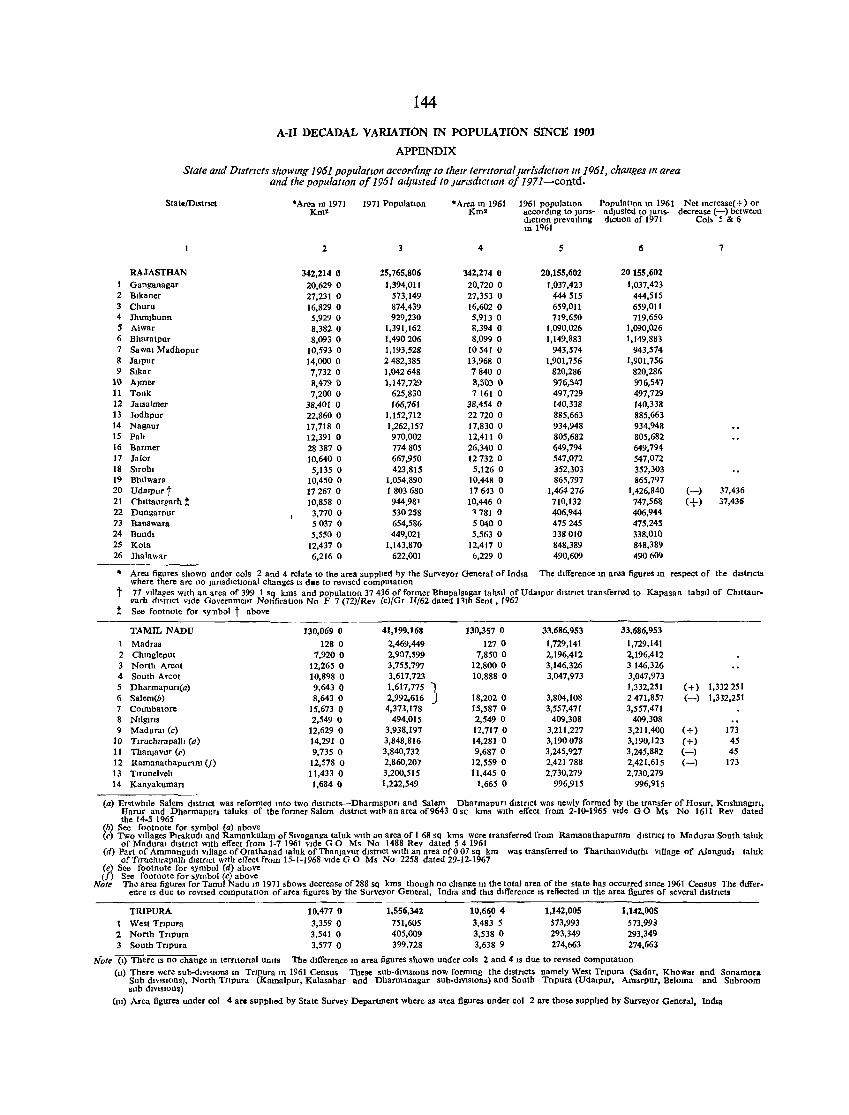
144
A-II DECADAL VARIATION IN POPULATION SINCE 1901
APPENDIX
State and Districts showlflg 1961 population accordlllg to their terntorial jurisdiction lit 1Q61, changes lfl area (lnd the populatIOn of 1961 adjusted to JUrISdICtIOn of 1971-contd.
State!DL,trict ·Area In 1971 1971 PopulatIon 'Area 10 1961 1961 populatIOn PopulatIon In 1961 Net Increase( +) or J(m2 Km2 accordmg to JUrIS- adjusted to Juns- decrease (-) between
dIctIon prev~lling <hctIon of 1971 Coi> 5 & G ill 1'161
2 3 4 5 (I 7
RAJASTHAN 342,214 0 :1.5,765,806 342,274 0 20,155,602 20155,602 1 Ganganagar 20,629 0 1,394,011 20,720 0 1,037,423 1,037,423 2 Blkaner 27,231 0 573,149 27,353 0 444 515 444,515 3 Churu 16,829 0 874,439 16,602 0 659,O!1 659,011 4 Jhunjhunn 5,929 0 929,230 5,913 0 719,650 719,650 5 Alwar 8,382 0 1,391,162 8,394 0 1,090,026 1,090,026 6 Bharatpur 8,093 0 1,490206 8,099 0 1,149,883 1,149,883 7 Sawal Madhopur 10,593 0 1,193,528 10541 0 943,S74 943,574 8 Jalpur 14,000 0 2482,385 13,968 0 1,901,756 1,901,756 9 S,kar 7,732 0 1,042648 78400 820,286 820,286
10 Almer 8,4790 1,147,729 8,5030 976,547 976,547 11 Tonk 7,200 0 625,830 7161 0 497,729 497,729 12 Jalsalmer 38,401 0 166,761 38,454 0 140,338 140,338 13 Jodhpur 22,860 0 1,152,712 22720 0 885,663 885,663 14 Nagaur 17,718 0 1,262,157 17,830 0 934,948 934,948 15 Pah 12,391 0 970,002 12,411 0 805,682 805,682 16 Banner 28387 0 774805 26,340 0 649,794 649,794 17 Jalor 10,640 0 667,950 12732 0 547,072 547,072 18 Sirolu 5,135 0 423,815 5,1260 352,303 351,303 19 Bhllwara 10,450 0 1,054,890 10,448 0 865,797 865,797 20 UdaIpur t 17267 0 1803680 17613 0 1,464276 1,426,840 (-) 37,436 21 Chlttaurgarb i 10,858 0 944,981 10,4460 710,132 747,56a (+) 37,436 22 Dungarl'ur 3,770 0 530258 ~ 781 0 406,944 406,944 73 Banswara. 5037 0 654,586 50400 475245 475,245 24 Bundl 5,550 0 449,021 5,563 0 338010 338,010 25 Kota 12,437 0 1,143,870 12,4170 848,389 848,389 26 Jhalav.ar 6,2160 622,001 b,229 0 490,609 49060?
* Area figures shown under cols 2 and 4 relate to the area supplied loy the Surveyor General of IndIa where there are no JurISd,ctIOnal changes IS dR. to reVIsed computatIon
The dIfference In area figures In respect of the dIStncts
t 77 VIllages WIth an area of 399 1 sq kms and populatIon 37 436 of former Bhupalsagar tahSil of Udaipur dIstrIct transferred to garh dl<tnct VIde Governme.,t NotlficatlOo No F 7 (72)/Rev (cJ/Gr IT/62 dated l~th Sent, 1962
Kapasan tahSIl of Ch,Uaur-
i See footnote for ,ymbol t ahove
TAMIL NAnU 130,069 0 41,199,168 130,357 0 33,686,953 33,686,953
Madras 128 0 2,469,449 1270 1,729,141 1,729,141 2 Chmgleput 7,920 0 2,907,599 7,850 0 2,196,412 2,196,412 3 North Arcot 12,265 0 3,755,797 12,800 0 3,146,326 3146,326 4 South Arcot 10,898 0 3,617,723 10,888 0 3,047,973 3,047,973 5 DharmapurI(a) 9,643 0 1,617,775 1 1,332,251 (+) 1,332251 6 Salem(b) 8,643 0 2,992,616 18,202 0 3,804,108 2471,857 (-) 1,332,251 7 Counbatore 15,673 0 4,373,178 15,5870 3,557,471 3,557,471 8 NIlgms 2,549 0 494,015 2,549 0 409,308 409,308 9 Madural (c) 12,629 0 3,938,197 12,717 0 3,211,227 3,211,400 (+) 173
10 TIruch,rapalll (d) 14,291 0 3,848,816 14,281 0 3,190078 3,190,123 (+) 45 11 Thanja vur (e) 9,735 0 3,840,732 9,687 0 3,245,927 3,245,882 (-) 45 12 Ramanathapur~m (f) 12,578 0 2,860,207 12,559 0 2,421788 2,421,615 (-) 173 13 TIrunelveh 11,433 0 3,200,515 11,445 0 2,730,279 2,730,279 14 KanyakumarI 1,6840 1,2l2.549 1,6650 996,915 996,915
(a) Erstwh.le Salem dIstrIct was reformed mto two distflcts-DharmapurI and Salem DharmapurI d,stnct was newly formed by the transfer of Hosur, KTlshnagm, Harur and Dhannapun talnks of the former Salem d.stTlct WIth an area of9643 0 SQ krns With effect from 2-10-1965 Vide GO Ms No 1611 Rev dated the 14-5 1965
(b) See footnote for symbol (a) above (c) Two v.llages P.rakudl and Ramankulam of Sivaganga taluk WIth an area of I 68 sq kms were transferred from Ramanathapuram d.strIct to Madura. South taluk
of Madural dlstnct WIth effect from 1-7 1961 VIde GO Ms No 1488 Rev dated 54 1961 (d) Part of Ammangud. VIllage of Orathanad (alnk of Thanjavur dlstnct WIth an area of 007 sq km was transferred to Tharthanvldutlu VIllage of AJangud, taluk
of TlTuch.rapalh dIstrIct WIth effect from 15-1-1968 VIde G 0 Ms No 2258 dated 29-12-1967 (e) See footnote for ,ymbol (d) above (f) See footnote for symhol (c) above
Note The area figures for TamIl Nadu 10 1971 shows decrease of288 sq kms though no change 10 the total area of the state has occurred smce 1961 Census The dIfference IS due to reVIsed computatIOn of area figures by the Surveyor General, Ind.a and th,S d.fference .s reflected tn the area figures of several dlstncts
TRIPURA West Trtpura
2 North Tnpura 3 South Tnpura
10,477 0 3,359 0 3,541 0 3,577 0
1,556,342 751,605 405,009 399,728
10,660 4 3,483 5 3,538 0 3,638 9
1,142,005 573,993 293,349 274,663
1,142,005 573,993 293,349 274,663
Note (1) There IS no change 10 terntoflal UnItS The difference 10 area ligures shown under cols 2 and 4 IS due to reVIsed computatIon (11) There were sub-dlvmons 10 Trtpura III 1961 Census These sub-dIVISIons now formmg the d'StflctS namely West Tnpura (Sadar, KhOwai and Sonamura
Suh dlVlSlOnS), North TrIpura (Kamalpur, Kalasahar and Dharmanagar suh-d,V,SIOns) and South Tnpura (UdaIpur, Amarpur, Beloma and Subroom sub dmslOns)
(m) Area figures under col 4 arc supphed by State Survey Departnlent where as area figures under col 2 are those supplIed by Surveyor General, IndIa
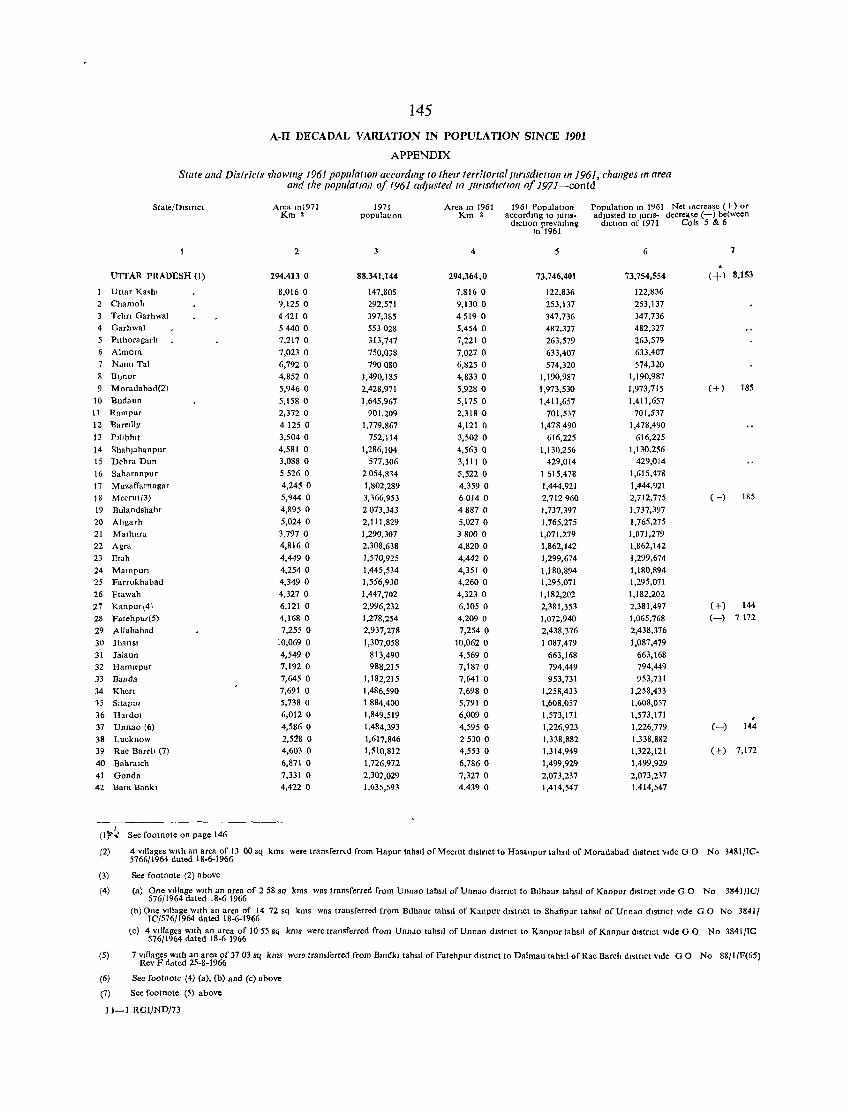
145
A-II DECADAL VARIATION IN POPULATlON SlNCE 19D1
APPENDIX
State and Districts ~howlllg 1961 populallOn accordmg 10 their territorial jllrlSd1C1101l1l11961, challges 111 area and rlie populatlOll of 1961 adjusted to JUTlSdlctlO/l of 1971-contd
State/DIstrIct Area 101971 1971 Area In 1961 1961 PopulatIon Populatlon in 1961 Net Hlcrease (+) or Km' populatIOn Km' accordIng to Juns .. adjusted to jUrIS- decrease (-) between
dICtion prevaIhng dIctIOn of 1971 Cols 5 & 6 'n 1961
2 4 5 6 7
UTTAR PRAD1:SH (I) 294,413 0 88,341,144 294,364,0 73,746,401 73,754,554 (+) 8,153
Uttar K •• h, 8,0160 147,805 7,8160 122,836 122,836 Chamoh 9,1250 292,571 9,1300 253,137 253,137 TehrI Garhwal 4421 0 397,385 45190 347,736 347,736
4 Garhwal 54400 553028 5,4540 482,327 482,327 PIthoragarh 7,2170 313,747 7,221 0 263,579 263,579 Almara 7,023 0 750,038 7,027 0 633,407 633,407 NaInI Tal 6,792 0 790080 6,825 0 574,320 574,320
8 BJ)nor 4,852 0 1,490,185 4,833 0 1,190,987 1,190,987
9 Moradabad(2) 5,946 0 2,428,971 5,928 0 1,973,530 1,973,715 (+) ISS
10 Budaun 5,158 0 1,645,967 5,175 0 1,411,657 1,411,657
11 Rampur 2,372 0 901,209 2,3180 701,537 701,537
12 BaTellly 41250 1,779,867 4,121 0 1,478490 1,478,490
13 PIIlbhlt 3,504 0 752,114 3,502 0 616,225 616,225
14 Shahjahanpur 4,581 0 1,286,104 4,563 0 1,130,256 1,130,256
15 Dehra Dun 3,088 0 577,306 3,111 0 429,014 429,014
16 Saharanpur 55260 2054,814 5,522 0 1 615,478 1,615,478
17 Muzaffarnagar 4,245 0 1,802,289 4,359 0 1,444,921 1,444,921
18 Meerul(3) 5,9440 3:166,953 60140 2,712960 2,712,775 (-) 185
19 Bulandshahr 4,895 0 2073,343 48870 1,737,397 1,737,397
20 AIIgarh 5,024 0 2,111,829 5,027 0 1,765,275 1,765,275 21 Mathnra 3,797 0 1,290,307 38000 1,071,279 1,071,279
22 Agra 4,8160 2,308,638 4,820 0 1,862,142 1,862,142
23 Etah 4,449 0 1,570,925 4,442 0 1,299,674 1,299,674
24 Mampurt 4,254 0 1,445,534 4,351 0 1,180,894 1,180,894
25 Farrukhabad 4,349 0 1,556,930 4,260 0 1,295,071 1,295,071
26 Etawah 4,327 0 1,447,702 4,323 0 1,182,202 1,182,202
27 Kanpur\4) 6,121 0 2,996,232 6,105 0 2,381,353 2,381,497 (+) 144
28 Fatehpur(5) 4,1680 1,278,254 4,209 0 1,072,940 1,065,768 (-) 7172
29 Allahahad 7,255 0 2,937,278 7,254 0 2,438,376 2,438,376
30 Jhansl 10,069 0 1,307,058 10,0620 1087,479 1,087,479
31 Jalaun 4,549 0 813,490 4,569 0 663,168 663,168
32 Hamlrpur 7,192 0 988,215 7,1870 794,449 794,449
33 Banda 7,645 0 1,182,215 7,641 0 953,731 953,731
34 Khen 7,691 0 1,486,590 7,698 0 1,258,433 1,258,433 15 SltapuT 5,738 0 1884,400 5,791 0 1,608,057 1,608,057
36 Hardol 6,0120 1,849,519 6,009 0 1,573,171 1,573,171 , 37 Unnao (6) 4,586 0 1.484,393 4,595 0 1,226,923 1,226,779 (-) 144
38 Lucknow 2,5211 0 1,617,846 25300 1,338,882 1,338,882
39 Rae Bareh (7) 4,603 0 1,510,812 4,553 0 1,314,949 1,322,121 (+) 7,172
40 Bahralch 6,871 0 1,726,972 6,7860 1,499,929 1,499,929
41 Gonda 7,331 0 2,302,029 7,327 0 2,073,237 2,073,237
42 Bara Bankt 4,422 0 1,635,593 4,439 0 1,414,547 1,414,547
(1l"~ See footnote on page 146
(2)
(3)
(4)
4 VIllages WlIh an area of 13 00 sq kms were transferred from Hapur tahSIl of Meerut dIStrIct to Hasanpur tahsIl of Moradabad dIstnct VIde G 0 No 3481/TC-5766/1964 dated 18-6-1966
See footnote (2) above
(a) One VIllage WIth an area of 2 58 sq kms was transferred from Unnao tahsIl of Unn.o d,strICt to BIlhaur tahsd of Kanpur dlStTlct VIde G 0 No 3841/IC/ 576/1964 dated 18-6 1966
(b) One VIllage WIth an area of 14 72 sq kms was transferred from Bllhaur tahSIl of Kanpur dIstrIct to Shdfipur tahSIl of Unnao d'StTlct VIde GO No 3841/ IC/576j1964 dated 18-6-1966
(c) 4 VIllages WIth an area of 10 55 sq kms were transferred from Unnao tahSIl of Unnao dIstTlct to Kanpur tahSIl of Kanpur dIstnct VIde G 0 No 3841/IC 576/1964 dated 18-6 1966
(5) 7 ~~~~sd:~!~ i~-8~!96t 3703 sq kms were transferred from Bmdk, tahsIl of Fatehpur d,strIct to Dalmau tahsIl of Rae Bareh dlSlflct VIde G 0 No 8S; t /F(65)
(6) See footnote (4) (a), (b) and (c) above
(7) See footnote (5) above
] 1-] RGl/ND/73
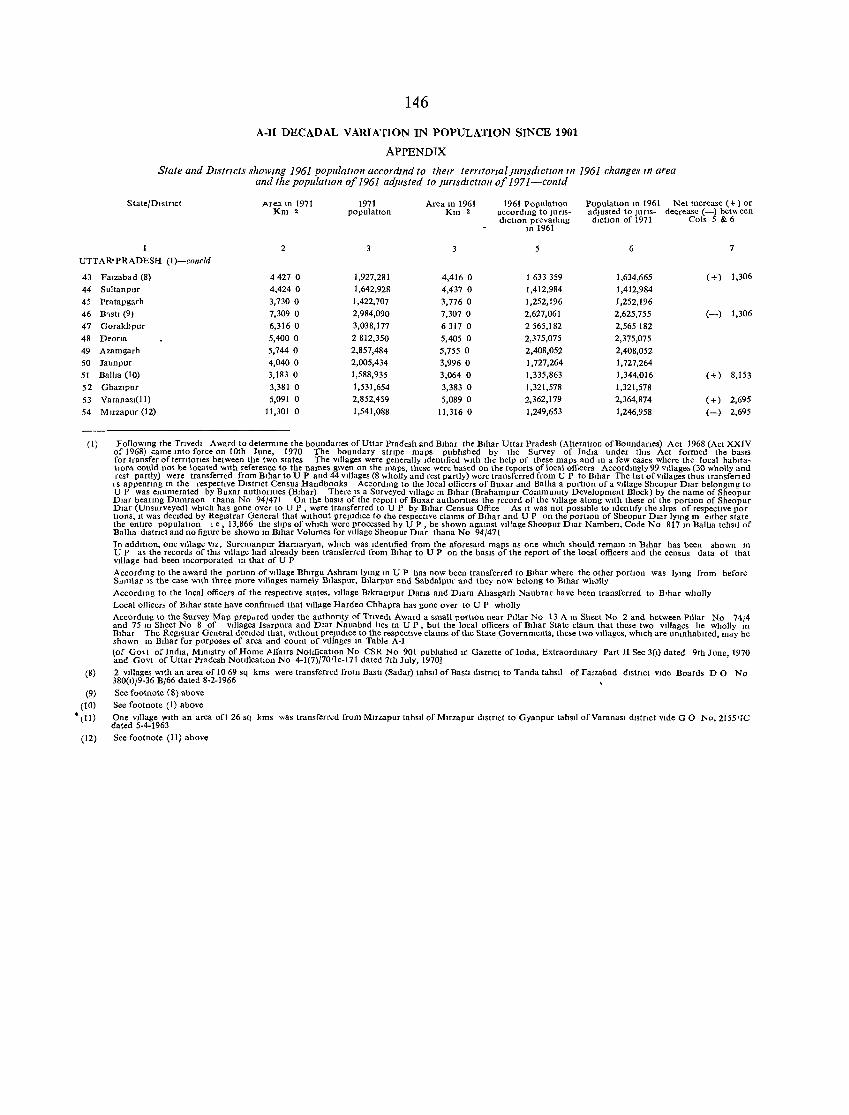
146
A-ll DECADAL VARIATION IN POPULATION SINCE 1901
APPENDIX
State and Dlstncts sholVmg 1961 populatIOn accordmd to their terri tonal j/lYlSdlctlOnlll 1961 changes In area and the populatIOn 0//961 adjusted to jUYlSdlctlO1I 0/1971-contd
State/DIstnct Area 1U 1971 Km 2
2
1971 populatIOn
Area In 1961 Km 2
1961 PopulatlOn accordmg to JUrIS~ dIctIon prevaIlmg
m 1961
PopulatIon m 1961 Net mcrease (+) or adjusted to Juns- decrease (-) bet" een dIctIon of 1971 Cols 5 & 6
6 7
UTTAR-PRADESH (I)-concld
43
44
45
46
47
48
49
50
51
52
53 54
(1)
(8)
(9)
(10)
• (11)
(12)
Falzabad (8)
Sultanpnr
Pralapgarh
B~stl (9)
Gorakhpur
Deana Azamgarh
Jaunpur Ballla (10)
Ghazlpur
Varanasl(ll)
M Ifzapur (12)
44270
4,424 0
3,730 0 7,309 0
6,3160
5,400 0
5,744 0
4,040 0
3,183 0
3,381 0
5,091 0
11,301 0
1,927,281
1,642,928
1,422,707
2,984,090
3,038,177
2812,350
2,857,484
2,005,434
1,588,935
1,531,654
2,852,459
1,541,088
4,4160 1 633 359
4,437 0 1,412,984
3,776 0 1,252,196
7,307 0 2,627,061
6317 0 2565,182
5,405 0 2,375,075
5,755 0 2,408,052
3,996 0 1,727,264
3,064 0 1,335,863
3,383 0 1,321,578
5,089 0 2,362,179
11,316 0 1,249,653
1,634,665
1,412,984
1,252,196
2,625,755
2,565182
2,375,075
2,408,052 1,727,264
1,344,016
1,321,578
2,364,874
1,246,958
(+) 1,306
(-) 1,306
(+) 8,153
(+) 2,695
(-) 2,695
Followmg the Tnvedl Award to determme the boundanes of Uttar Pradesh and BIhar the BIhar Uttar Pradesh (AlteratIOn ofBoundanes) Act 1968 (Act XXIV of 1968) came mto force on 10th June, 1970 The boundary slnpe maps publIshed by the Survey of IndIa under thIs Act formed the baSIS for transfer ofterntones between the two states The vIlla!:es were generally Identified wIth the help of these maps and III a few cases where the local habitatIOns could not be located WIth reference to the names gIven on the maps, these were based on the reports ofloeal officers AccordIngly 99 VIllages (30 wholly and rest partly) were transferred from Bihar to UP and 44 Villages (8 wholly and rest partly) were transferred from U P to BIhar The lIst of villages thns transfened
IS appearmg In the respective DIstnct Census Handbooks Accordmg to the local officers of Buxar dnd Ballm a portIOn of a vIllage Sheopuf Dmr be10ngmg to UP was enumerated by Buxar anthon tIes (BIhar) There IS a Surveyed VIllage In BIhar (Brahampur Commumty Development Block) by the name of Sheopur Dlar hearIng Dumraon thana No 94/471 On the baSIS of the report of Buxar authontles the record of the VIllage along WIth these of the portIOn of Sheopur DIar (Unsurveyed) whIch has gone over to UP, were transferred to UP by BIhar Census Office As It was not possIble to IdentIfy the shps of respectIve por tlOns, It was deCIded by RegIstrar General that WIthout prejudIce to the respective claIms of BIhar and UPon the portIOn of Sheopur Dmr Iymg In eIther state the entire populatIon Ie, 13,866 the slIps of whIch were processed by UP, be shown agams! vIllage Sheopur Dlar Namben, Code No 817 m Ballla tehsll of Ballla dlstnctandno figure be shown In BIhar Volumes for vIllage Sheopur Dmr thana No 94/471
In additIOn, one vlllage VIZ, Suremanpur HarnaryaI1, which was IdentIfied from the aforesaId maps as one which should remam III Bihar has been shown m UP as the records of thIS VIllage had already been transferred from BIhar to UPon the baSIS of the report of the local officers and the census data 01 that vIllage had been Incorporated In that of UP
Accordmg to the award the portIOn of vIllage Bhlrgu Ashram Iymg In U P has now been transferred to BIhar where the other portIOn was lYIng from before SImIlar IS the case WIth three more VIllages namely Bllaspur, BIlarpm and Sabdalpur and they now belong to BIhar Wholly
Accordmg to the local officers of the respective states, VIllage Blkrampur Dana and Dtara Ahasgarh Naubrar have been transferred to B'har wholly
Local officers of BIhar state have confirmed that vtllage Hardeo Chhapra has gone over to U P wholly
Accordmg to the Survey Map prep"red under the authonty of Tnvedl Award a small portIon near PIllar No 13 A m Sheet No 2 and between PIllar No 74/4 and 75 In Sheet No 8 of VIllages Isarpura and DIar Nauabad lIes In UP, but the local officers of BIhar State claIm that these two vIllages he wholly III BIhar The RegIStrar General deCIded that, WIthout prejudIce to the respectIve cJalms of the State Governments, these two VIllages, whIch are unmhablted, may be shown m BIhar for purposes of area and count of vtllages In Table A-I [Of GO\t of Indm, Mmlstry of Home "ffalrs NotIficatIOn No CSR No 901 pubhshed m Gazette of Ind,", Extraordmary Part II Sec 3(1) dated 9th June, 1970 and Govt of Uttar Pradesh NotIficatIOn No 4-1(7)/70 1Ic-171 dated 7th July, 1970]
2 VIllages WIth an area of 10 69 sq kms were transferred from BastI (Sadar) tahSIl of Bastl dlstnct to Tanda tahSIl of FalZabad dlstnct VIde Boards DONo 380(1)/9-36 B/66 dated 8-2-1966
See footnote (8) above
See footnote (1) above
One VIllage WIth an area ofl 26 sq kms was transferred from Mlrzapur tahSIl of Mlrzapur dlstnct to Gyanpur tahSIl of Va ran as I dlstnct VIde G 0 No_ 21551IC dated 5-4-1963
See footnote (11) above
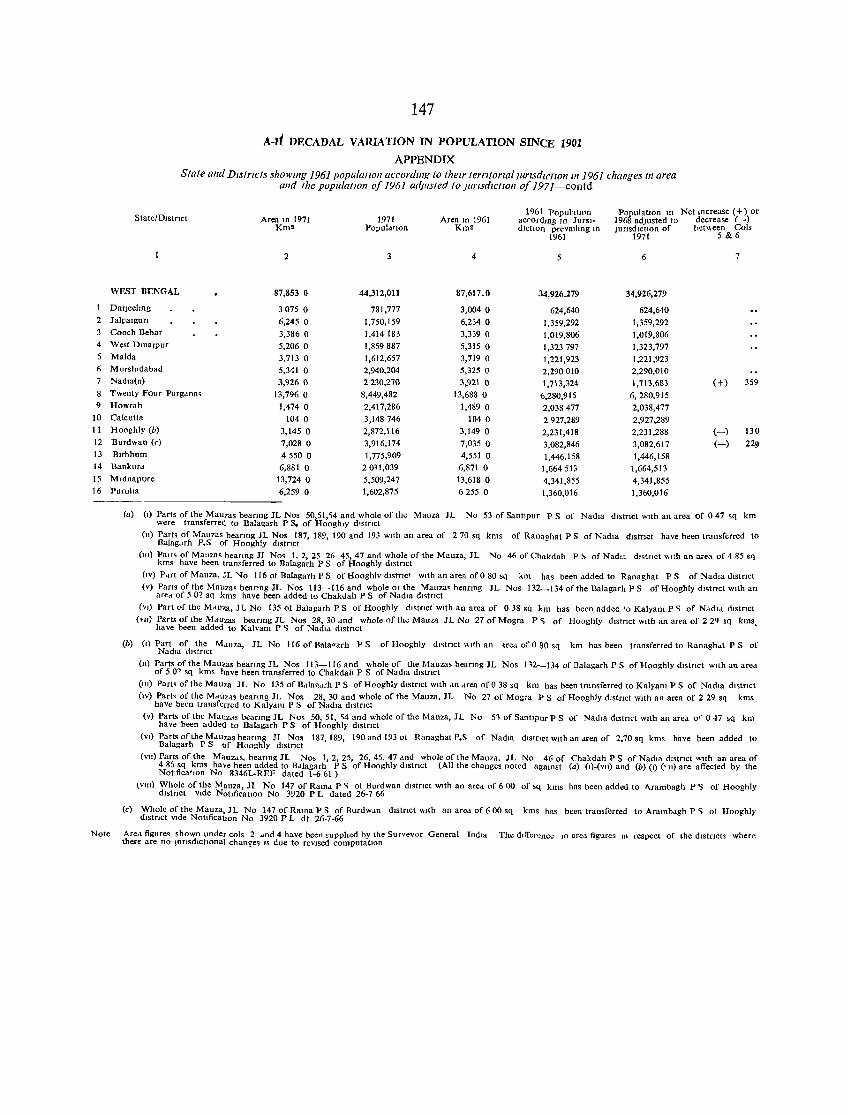
2
4
5 Ii
7
8 9
10
11 12
13 14
15 16
147
A-Ii DECADAL VARIATION IN POPULATION SINCE 1901
APPENDIX State and Dlstncts shawmg 1961 papulatLOIl accardmg to their terntarzal,urzsdictLOIllfl1961 changes 111 area
and the population of 1961 adJlIsted to JUYlsdlctlO/l of 1971-contd
StateJDlstnct 1961 PopuhtlOn PopulatIOn In Net mcrease (+) or
Area In 1971 1971 Area In 1961 ac("ord'mg to JurSJ~ 1968 adjusted to decrease (-) Km2 PO;JUldtlOn Km' dlctlot). prevaIling In JUrIsdlctlon of het\\een Cols
1961 1971 5 & 6
2 4 5 6 7
WEST BENGAL 87,853 0 44,312,011 87,617.0 34,926,279 34,926,279
Dar]eelmg 3075 0 781,777 3,004 0 624,640 624,640 Jalpalgun 6,245 0 1,750,159 6,234 0 1,359,292 1,359,292 Cooch Behar 3,386 0 1,414183 3,339 0 1,019,806 1,019,806 West DmalPur 5,206 0 1,859887 5,315 0 1,323797 1,323,797 MaIda 3,713 0 1,612,657 3,719 0 1,221,923 1,221,923 M lIrsh Idabad 5,341 0 2,940,204 5,325 0 2,290010 2,290,010 Nadm(al 3,926 0 2230,270 3,921 0 1,713,324 1,713,683 (+) 359 Twenty Four Pargana, 13,796 0 8,449,482 13,688 0 6,280,915 6,280,915 Howrah 1,474 0 2,417,286 1,489 0 2,038477 2,038,477 Calcutta 104 0 3,148746 1040 2927,289 2,927,289 Hooghly (b) 3,145 0 2,872,116 3,149 0 2,231,418 2,231,288 (-) 130 Burdwan (c) 7,028 0 3,916,174 7,035 0 3,082,846 3,082,617 (-) 22~ Blfbhum 45500 1,775,909 4,551 0 1,446,158 1,446,158 Bankurd. 6,881 0 2011,039 6,871 0 1,664513 1,664,513 Mldnapore 13,724 0 5,509,247 13,6180 4,341,855 4,341,855 Puruha 6,259 0 1,602,875 6255 0 1,360,016 1,360,016
(a) (I) Parts of the Mau?as beanng JL Nos 50,51, ~4 and whole of the Mauza JL No 53 of Santlpur P S of NadIa dIstrIct WIth an area of 047 sq km were transferre<l to Balagarb P S. of Hoogh,y d'stnct
(u) Parts of Mau?as beanng JL Nos 187,189,190 and 193 With an area of 270 sq kms of Ranaghat P S of NadIa dlstnct have been transferred to Bafag,trfi P.S of Hooghly dlstnct
(UI) Part. of Mauzas bearmg JJ No, I, 2, 25 26 45,47 and whole of the Mauza, JL No 46 of Chakdah P ~ of NadIa dlstnct ",th an area of 4 85 sq kms have been transferred to Balagarh P S of Hooghly dlstnct
(IV) Pdrt of Mauza, JL "10 116 of Halagarh P S of Hooghfv dlstnc' WIth an area of 0 80 sq km has been added to Ranaghat P S of Nadia ,itstnct
(v) Parts of the Mau7a, bearmg JL Nos 113-116 and whole otthe Mauza' bearIng JL Nos 132_134 orthe Balagarh P S of Hooghly dl'trrct WIth an ared of 5 02 sq Xms have been added to Chakdah P S of NadIa dl.tnct
(VI) Part of the Mdll~.a, JL No 135 01 Balagarh P S of Hooghly dIstrIct WIth an area of 038 sq km has been added '0 Kalyam P 'i of Nddld dlstnct
(vu) Parts of the Mduzas beanng JL Nos 18, 30 dnd whole of the Mauza JL No 27 of Mogra P'i of Hooghly dlstnct WIth an area of 2 2q sq kms, have been added to Kalvam P ') of Nadld dIstrIct
(b) (I) Part of the Mauza, JL No II 6 of Halaoarh P S of Hooghly d .. tnct \\ Ith an \fed of 0 80 sq km has been transferred to Ranaghat P S of Nadla (iI"itnct
(ll) Parts of the Mau""s bearmg JL Nos 113-116 and "hole of the Mallzas beanng JL Nos 1'12--134 of Balagarh P S of Hooghly dlStnct WIth an area of 5 0' sq kms have been transferred to Chakdah P S of NadIa dlstnct
(Ill) Parts of the Mallza JL No 135 of Bd1agurh P S of Hooghly dlStnct WIth ,to area of 0 38 sq km has been transferred to Kalyam P S of NadIa dl,tnct
(IV) Part, of the MdUZdS beanng JL Nos 28, 30 and whole of the Mauza, JL No 27 of Mogra l> S of Hooghly dIstnct WIth an area of 2 29 sq kms have been transferred to KalYdnI P S of NadIa dlstnct
(v) Parts of the Ma\lzds bearIng JL Nos 50, 51, ,4 and whole of the Mauza, JL No 51 of Santlj)llr P S of NadIa dlstnct WIth an ared 0' 047 sq km have been addeQ to Balagarh P S of Hooghly dlstflct
(VI) Parts oflhe M,LUzas bearmg JT Nos 187,189, 190 and 193 01 Ranaghat P.S of NadIa dIstnct WIth an drea of 2.70 sq kms have been added to Balagarh P S of Hooghly dlStTlct
(Vll) Parts of the M,LUzas, beaTIng JL No. 1,2, 25, 26,45,47 and whole of the Mau7a, JL No 46 of Chakdah P S of NadIa dlstnct WIth an area of 4 85 sq kms have been added to Bdiagarh P S of Hooghly dlstnct (All the changes noted allamst (a) (I)-(VU) and (b) (I) (, 11) are affected by the NotificatIOn No 8346L-REF dated 1-661 )
(VIII) Whole of the Mauza, Jl No 147 of Rama P ') 01 Burdwan dlstrrct WIth all are .. of 600 of sq kms has been added to 4rambagh P'l of Hooghly dlstnct vIde NollficatlOll No 3920 P L dated 26-7 66
(c) Whole of the Mauza, JL No 147 of Rama P S of Rurdwdll dlstnct "Itb an ared of 6 00 sq kms has been transferred to Aramb,gh P <; 01 Hooghly dIstrict vIde NotIficatIOn No 3920 P L dt 21)·7-66
Note Ared. figures shown under cols 2 and 4 have been supplied by the Surveyor General Indla The difference In area figures 10 respect of the dIstrIcts where there are no JUflsdictlOnal changes IS due to reVIsed computatIOn
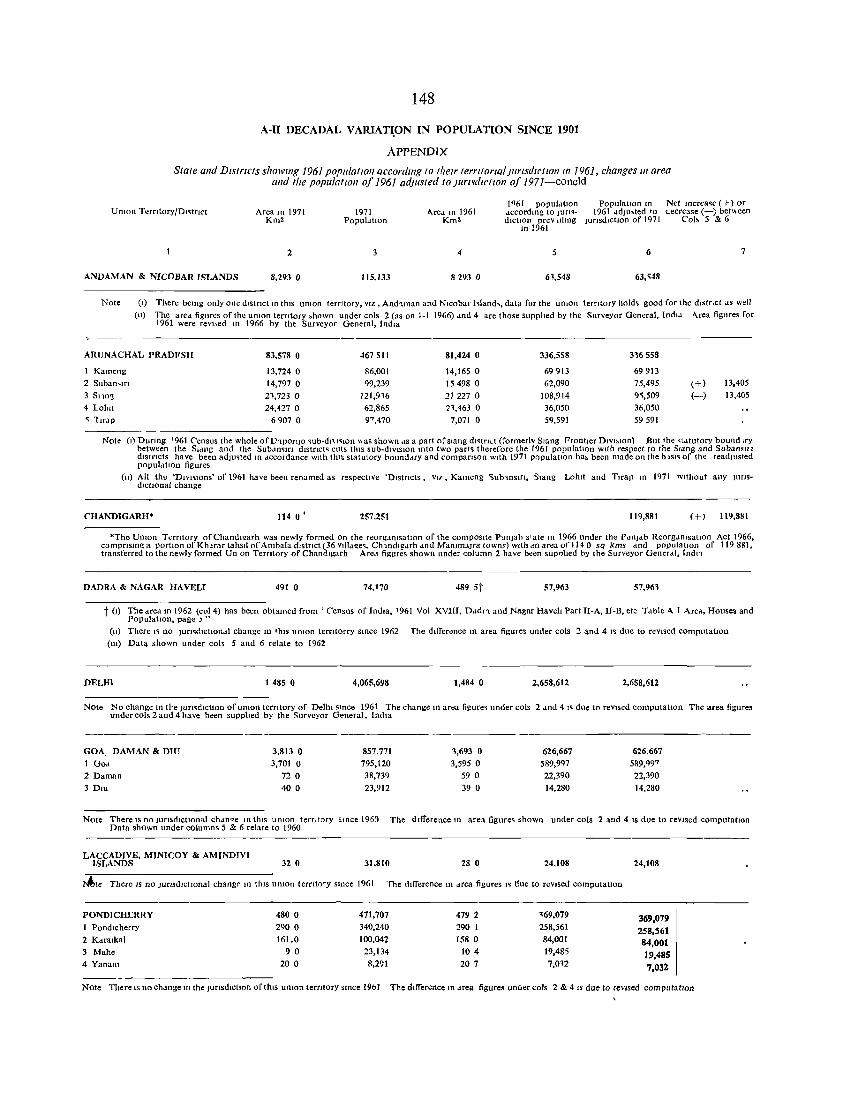
148
A-II DECADAL VARIAT~ON IN POPULATION SINCE 1901
APPENDIX
State and DistrIcts showing 1961 populatIOn accorrilllg to theIr ternlonal JUriSdictIOn 111 1961, changes III area and the populatIOn of 1961 adjusted to jumtilc/lOn of 1971-concld
Union Temtory/D"trlct
ANDAMAN & NICOBAR ISLANDS
Area In 1971 Km2
2
8,293 0
1971 PopulatIon
115,133
Area In 1961 Km2
4
8293 0
1<\61 populatIon PopulatIon In Net IOcrea •• (+) or c1ccordmg to Jurl~- 1961 "dju,ted to c.ecrease (-) bet"een dictIOn prey tIling JUrIsd,ctIon of 1971 Col' 5 & 6
In 1961
5 6
61,548 63,'i~8
Note (I) There bemg only one dIstrIct III th,s union teCCItolY, VIZ, And~man and Nlcobar hland" data for the unIOn terrItory hold, good for the d,str,ct as well
(II) The ared figures of the unIOn terntory ,hown under cols 2 (as on 1-1 1966) and 4 are those supphed by the Surveyor General, Indl.! "-rea figures for 1961 were revl,ed In 1966 by the Surveyor General, IndIa
ARUNACHAL PRADFSH 83,578 0 467511 81,424 0 336,558 3'6558
1 Kameng 13,724 0 86,001 14,1650 69913 69913
2 Suban"'ln 14,797 0 99,239 15498 0 62,090 75,495 (+) 13,405
3 Slm~ 21,723 0 121,916 21 227 0 108,914 9'\,509 (-) 13,405
4 Lohlt 24,427 0 62,865 21,463 0 36,050 36,050
<; 1 If"P 6 907 0 9~,470 7,071 0 59,591 59591
Note (I) Dunng '961 Census the whole ofD~ponjo <ub-d" ",on "as shown as a part of slang d"trIcI (formerlv Slang FrontIer D,vI>lon) ,But the .t .. tutory bound >ry between the Sldng and the Subdn~ln dlstnct", cuts thiS sub·dlvision mto two parts therefore the 1961 population With respect to the Slang and SubanSlll d,str,cts have been adju'ted In dccordance With thIS statutory hounddfY and comparIson WIth 1971 populatIon ha. been made on the b IS" of the readjusted populatIon figures
(II) All the 'Dlv",ons' of 1961 have been renamed as respectIve 'DIstrIctS, Vl7, Kameng '>ub,nsICI, S,ang Lohlt and TICap III 1971 WIthout any JurISdIctIonal change
CHANDIGARH* 114 0 I 257,251 119,881 (+) 119,881
·The UOIon Terntory ofChandlgarh was newly formed On the reorgaOlsatIon of the composIte Punjah state III 1966 under the P~njdb ReorgamsatIOn Act 1966, comprISIng a portIOn ofKhJrar tahSIl of Amhala d,strIct (36 vlllag .. , Ch,ndlgarh and Mamma)", towns) WIth dn area of 114 0 sq kms dnd populatIOn of 119881, transferred to the newly formed Un on TerrItory of Chandlgarh Ared figures shown under column 2 have been supohed by the Surveyor Generdl, lndl~
DADRA & NAGAR HAVELI 491 0 74,170 489 st 57,963 57,961
t (I) The area In 1962 (col 4) has been obtallled from' Census of Jndla, '961 Vol XVIII, Dddr, and Nagar Haveh Part II-A, II-B, etc Table "- I Area, Houses and PopulatIOn, page j "
(II) There I~ no JUrI,,;dlctlondl change III thiS umon terntorry since 1962 The drfference In area figures under cols 2 and 4 l~ due to reVised computation
(lU) Data shown under coh 5 and 6 relate to 1962
DELHI 1485 0 4,065,698 1,484 0 2,658,612 2,658,612
Note No change III tl'e jUrI<d,c(lon of umon terrItory of Deihl SInce 1961 The change III area fi~ur", under cols 2 and 4 " due to reVIsed computatIOn The area figures under cols 2 and 4 have been supplied by the Surveyor G~neral, IndIa
GOA, DANIAN & DIU I GOd
2 Daman
3 DIU
3,813 0
3,701 0
720
400
857,771
795,120 38,739
23,912
\693 0 3,595 0
59 0
39 0
----------------------------------626,667
589,9<)7
22,390
14,280
626,667 589,99~
22,390
14,280
Note There IS no JUrISd,ctIOnal chancre In th,s u mon temtory Slllce 196~ The dIfference In area figures shown under co Is 2 and 4 IS due to reVIsed computatIon Data shown under columns 5 & 6 relate to 1960
LACCADIVE, MJNICOY & AMINDIVI ISI,ANDS 320 31,810 28 0 24,108
~te There IS no jUCIsd,ctlOnal chang' III thIS umon ternto-y SInce 1961 The dIfference m drea figures,. tlue to reVIsed computatIon
PONDICHERRY 480 0 471,707 4792 ~69,079
1 Pondlcherry 2900 340,240 290 1 258,561
2 Karalkal 161,0 100,042 158 0 84,001
3 Mahe 9 0 23,134 104 19,485
4 Yanam 200 8,291 207 7,012
24,108
369.079 258,S61 84,001
19.485
7.032
Note There IS no chdnge m the JUrIsd,ctIon ofth,s unIOn temtory smce 1901 The dIfference In drea figures unc.er cols 2 & 4 IS due to reVIsed computatIon
A-III
VILLAGES CLASSIFIED BY POPULATION

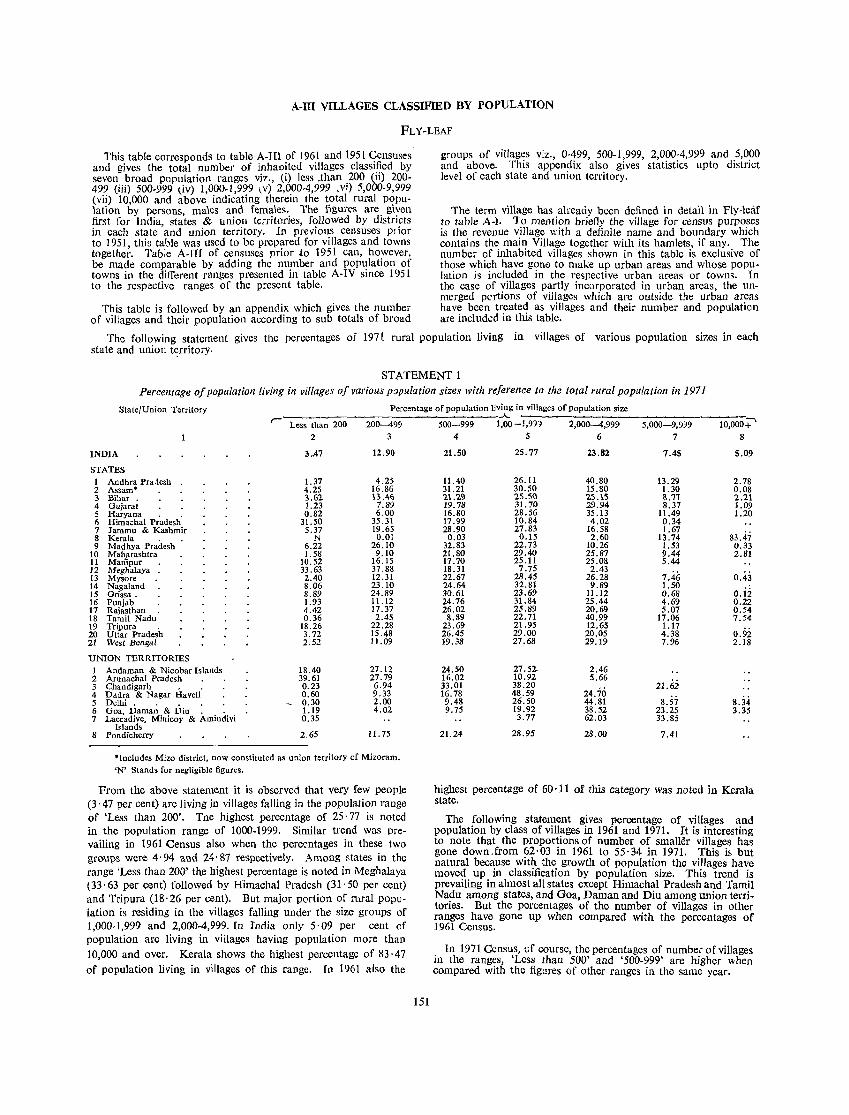
A-III VILLAGES CLASSIFIED BY POPULATION
FLY-LEAF
This table corresponds to table A-lIl of 1961 and 1951 Censuses and gives the total number of inhaoited villages classified by seven broad population ranges viz., {i) less .than .200 (ii) 200-499 (iii) 500-999 ~iv) 1,000-1,999 (v) 2,000-4,999 ,VI) 5,000-9,999 (vii) 10,000 and above indicating therein the total rural population by persons males and females. The figures are given first for India, sta'tes & union territories, followed by districts in each state and union territory. In previous censuses plior to 1951, this table was used to be prepared for villages and towns together. Table A-III of censuses prior to 1951 can, however, be made comparable by adding the number and population of towns in the different ranges presented in table A-IV since 1951 to the respective ranges of the present table.
This table is followed by an appendix which gives the number of villages and their population according to sub totals of broad
groups of villages viz., 0-499, 500-1,999, 2,000-4,999 and 5,000 and above. This appendix also gives statistics upto district level of each state and union territory.
The term village has already been defined in detail in Fly-leaf to table A-i. To mention briefly the village for census purposes is the revenue village with a definite name and boundary which contains the main Village together with its hamlets, if any. The number of inhabited villages shown in this table is exclusive of those which have gone to make up urban areas and whose population is included in the respective urban areas or towns. In the case of viIlages partly incorporated in urban areas, the unmerged p('rtions of villages which are outside the urban areas have been treated as villages and their number and population are included in this table.
The following statement gives the percentages of 1971 rural population living in villages of various population sizes in each state and union t~rritory.
STATEMENT 1 Percentage of population {iving in villages of various p:Jpulation sizes with reference to the total rural popUlation in 1971
State/Union Territory Percentage of popUlation living in villages of population size r- Less than 200 200---499
2 3
INDIA 3.A7 12.90
STATES 1 Andbra Pra.lesh 1. 37 4.25 2 Assam" 4.25 16.86 3 ~ihar • ,.62 B.4.6 4 Gujarat 1.23 7.89 5 Raryana . . 0.82 6.00 6 Rimachal Pradesh 31.50 35.31 7 Jammu & Kashmir 5.37 19.65 8 Kerala N 0.01 9 Madhya Pradesh 6.22 26.10
10 Maharashtra 1.58 9.10 11 Manipur 10.52 16.15 12 Meghalaya 33.63 37.88 13 Mysore 2.40 12.31 14 Nagaland 8.06 23.10 15 Orissa. 8.89 24.89 16 Punjab 1.93 11.12 17 Raiasthan 4.42 17.37 18 Tamil Nadu 0.36 2.45 19 Tripura . 18.26 22.28 20 Uttar Pradesh 3.72 15.48 21 West Bengal 2.52 11.09
UNION TERRITORIES 1 Andaman & Nicobar Islands 18.40 27.12 2 Arunachal Pradesh 39.61 27.79 3 Cbandigarh 0.23 6.94 4 Dadra & Nagar Haveli 0.60 9.33 5 Delhi. - 0.30 2.00 6 Goa, Dam"; & Diu: : 1.19 4.02 7 Laceadive, Minicoy & Amilldivi 0.35
Islands 8 Pondicherry 2.65 11.75
·Includes Mizo district, now constituted as union territory of Mizoram. 'N- Stands for negligible figures.
From the above statement it is observed that very few people (3' 47 per cent) are Jiving in villages falling in the population range of 'Less than 200'. Tne highest percentage of 25·77 is noted in the population range of 1000-1999. Similar trend was prevailing in 1961 Census also when the perce.ntages in these two groups were 4'94 and 24'87 respectively. Among r.tates in the range 'Less than 200' the highest percentage is noted in Meghalaya (33'63 per cent) followed by Himachal Pradesh (31'50 per cent) and Tripura (18, 26 per cent). But major portion of rural population is residing in the villages falling under the size groups of 1,000-1,999 and 2,000-4,999. In India only 5'09 per cent of population are living in viilages having population more than 10,000 and over. Kerala shows the highest percentage of 83'47 of population living in villages of this range. In 1961 also the
151
.A. - ____ 500-999 l,oo-l,9H 2,000--4,999 5,000-9,999 10,000+
4 5 6 7 8
21.50 25.77 23.82 7.45 5.09
11.40 26.11 40.80 13.29 2.78 31.21 30.50 15.80 1.30 0.08 2\.19 2S.SQ 15.15 '3.77 2.21 19.78 31.70 29.94 8.37 1.09 16.80 28.56 35.13 11.49 1.20 17.99 10.84 4.02 0.34 28.90 27.83 16.58 1.67 0.03 0.15 2.60 13.74 83.47
32.83 22.73 10.26 1.53 0.33 21.80 29.40 25.87 9.44 2.81 17.70 25.11 25.08 5.44 18.31 7.75 2.43
7.46 0.43 22.67 28.45 26.28 24.64 32.81 9.89 1.50 30.61 23.69 11.12 0.68 o.ii 24.76 31.84 25.44 4.69 0.22 26.02 25.89 20.69 5.07 0.54
8.89 22.71 40.99 17.06 7.54 23.69 21.95 12.65 1.17
0.9i 26.45 29.00 20.05 4.38 19.38 27.68 29.19 7.96 2.18
24.50 27.52- 2.46 16.02 10.92 5.66
21.6i 33.01 38.20 24.70 16.78 48.59
8.57 9.48 26.50 44.81 8.34 9.75 19.92 38.52 23.25 3.35
3.77 62.03 33.85
21.24 28.95 28.00 7.41
highest percentage of 60·11 of this category was noted in Kerala state.
The following statement gives percentage of villages and population by class of villages in 1961 and 1971. It is interesting to note that the proportions of number of smaller villages has gone down,from 62'03 in 1961 to 55·34 in 1971. This is but natural because with the growth of population the villages have moved up in classification by population size. This trend is prevailing in almost all states except Himachal Pradesh and Tamil Nadu among states, and Goa, Daman and Diu among union territories. But the percentages of the nUlIlber of villages in other ranges have gone up when compared with the percentages of 1961 Census.
In 1971 Census, of course, the percentages of number of villages in the ranges, 'Less than 500' and '500-999' are higher when compared with the figures of other ranges in the same year.
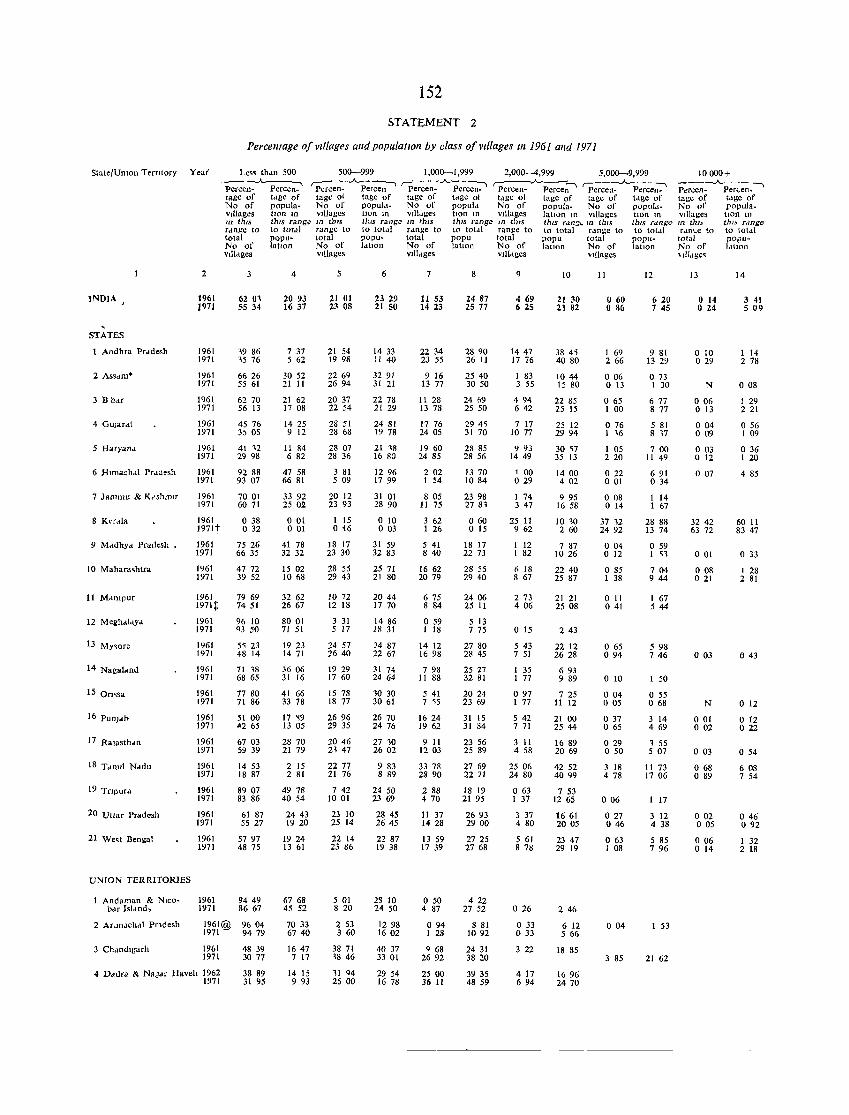
152
STATEMENT 2
Percentage of Villages alld populatlOll by class of villages III 1961 and 1971
State/Ullion Teffltory Year' Les. th,m 500 500-999 1,000-1,999 2,000-4,999 5,000--9,999 JO 000+
INDIA
STATES
I Andhra Pradesh
3 B hdr
5 Haryand
7 Jammu & KeshmJr
8 KUdla
9 MadhYd Pradesh
11 M"ntpur
14 Nagal .. ud
17 Rajasthan
18 Tamd N .. du
19 Tnpura
20 Uttar Pradesh
UNION TERRITORIES
1 Andaman & Ntcobar Isldnd,
2 Ar ~nJchdl Pr1desh
3 Chdndtgarh
~e~..A.. Perce~ Percen-~ rp;;~.A.p;c--;~ ~~;-, rp;;~-:-.A. Per;;;:' Pe;;:-.A..Pe;.; .. ~ ~~ ~~ ~~ ~~ _cl ~~ ~~ ~cl ~~ ~~ ~~ ~cl No of popula- No of populd- No uf popula No of popula- No of popul,,- No of papula-vdlages tlOn In vllJages tlOn tn vJl1..tges tlOn III villages latlOn III vIllages tIOn In vlllage~ Hon 10 In thlS thIS range m thlS tJus range m fhlS thJS range m thlS thls rdn:;~ m tillS lhls Tdngc {{1 thl'} thl:> rdngc rdnge to to total range to to totdl range to to totdl range to to total range to (0 total r,tn~e to to total total popu- total popu- total popu total popu total popu- total popu-No of latlOn No of IdtlOI1 No of latlon No of latlOn No of latlon No of latlOn villdges vIllages villdges vIllages villages \ dldgc~
2
1961 )971
1961 1971
1961 1971
1961 1971
1961 1971
1961 1971
1961 ]971
]961 1971
62 01 5534
19 86 15 76
6626 55 61
62 70 56 13
45 76 35 05
41 12 29 98
92 88 93 07
7001 6071
1961 0 38 1971t 0 32
1961 75 26 1971 66 35
1961 47 72 1971 39 52
1961 1971t
1961 1971
1961 1971
1961 1971
1961 1971
1961 1971
1961 1971
1961 1971
1961 1971
1961 1971
1961 1971
1961 1971
79 69 7451
96 10 q3 50
5~ 23 48 14
71 18 68 65
77 80 71 86
51 00 42 65
6703 59 39
14 53 18 87
89 07 83 86
61 87 55 27
5797 4875
9449 86 67
1961@ 9604 1971 94 79
1961 1971
48 39 3077
4
20 93 16 37
7 37 5 62
30 52 21 11
21 62 1708
1425 9 12
11 84 6 82
47 58 66 81
33 92 25 02
001 001
41 78 32 32
15 02 1068
3262 2667
8001 71 51
1923 14 71
36 06 31 16
41 66 33 78
17 ~9 13 05
28 70 21 79
2 15 2 81
49 78 40 54
2443 19 20
19 24 13 61
6768 45 52
70 33 6740
1647 7 17
21 01 23 OS
21 54 1998
22 69 2694
20 37 22 54
28 51 28 68
28 07 28 36
3 81 5 09
2012 23 93
1 15 016
18 17 23 30
28 55 29 43
10 72 12 18
3 31 5 17
24 57 2640
19 29 17 60
15 78 18 77
2696 29 35
2046 21 47
2277 21 76
742 1001
23 10 25 14
22 14 23 86
501 8 20
2 53 3 60
38 71 18 46
6
23 29 21 50
14 33 JI 40
32 91 31 21
22 78 21 29
24 81 19 78
21 18 16 80
1296 1799
31 01 28 90
o to o 03
31 59 32 83
2571 21 80
2044 17 70
14 86 IS 31
2487 22 67
31 74 24 64
10 30 30 61
2670 24 76
27 10 2602
9 83 8 89
24 50 23 69
2845 2645
22 87 19 38
2S 10 24 50
1298 1602
4037 33 01
7
11 53 14 23
22 34 23 55
9 16 13 77
II 28 13 78
17 76 2405
19 60 24 85
202 1 54
8 05 11 75
3 62 1 26
5 41 8 40
16 62 2079
675 8 84
059 I 18
14 12 1698
798 II 88
5 41 7 ';5
1624 1962
9 II 1203
33 78 28 90
288 470
11 37 1428
13 59 17 39
o 50 4 87
094 I 28
Q 68 2692
8
2487 2577
2890 26 11
2540 3050
24 69 25 50
294<; 31 70
2~ 85 28 56
13 70 1084
23 98 27 81
060 o 15
18 17 22 73
28 55 29 40
2406 25 11
513 7 75
27 80 28 45
25 27 32 81
2024 23 69
31 15 31 84
23 56 25 89
27 69 22 71
18 19 21 95
2693 2900
2725 2768
422 27 52
8 81 1092
2431 3820
4 69 625
1447 17 76
J 83 3 55
494 642
7 17 10 77
9 93 1449
1 00 029
J 74 347
25 11 9 62
J 12 1 82
6 18 8 67
2 73 4 06
o 15
5 43 7 51
1 35 177
097 1 77
5 42 7 71
3 11 4 58
25 06 2480
o 63 1 37
3 37 480
5 61 8 78
o 26
033 033
322
10
21 30 23 82
38 45 4080
1044 15 80
22 85 25 15
25 12 2994
30 ';7 35 13
1400 4 02
9 95 1658
10 10 2 60
7 87 10 26
22 40 25 87
21 21 25 08
243
22 12 2628
693 9 89
7 25 11 12
21 00 25 44
16 89 2069
42 52 4099
7 53 1265
16 61 2005
23 47 29 19
2 46
6 12 5 66
18 85
11
II 60 o R6
1 69 266
006 o 13
o 65 1 00
076 I 16
1 05 2 20
022 o 01
008 o 14
3712 2492
004 o 12
085 1 38
o II 041
065 094
o 10
o 04 005
037 o 65
029 o 50
3 18 478
006
027 046
063 I 08
004
3 85
12
620 7 45
9 81 13 29
073 1 30
677 8 77
5 81 8 17
7 00 11 49
691 o 34
I 14 I 67
28 88 13 74
o 59 1 <;1
7 04 9 44
1 67 544
598 746
I 50
055 068
3 14 4 69
1 55 5 07
11 73 1706
1 17
3 12 4 38
5 85 7 96
1 53
21 62
13
o 14 o 24
010 029
N
006 o 13
004 o 09
o 03 o 12
007
3242 63 72
001
008 021
003
N
001 002
o 03
068 089
002 005
006 o 14
14
3 41 5 09
1 14 278
008
1 29 221
056 1 09
036 1 20
4 85
60 11 83 47
o 33
I 28 2 81
043
o 12
o 12 022
o 54
608 7 54
046 092
1 32 2 18
4 Dadra & NaJdf Havelt 1962 1971
38 89 31 95
14 15 993
11 Q4 2500
29 54 16 78
25 00 36 11
3935 4859
4 17 694
1696 2470
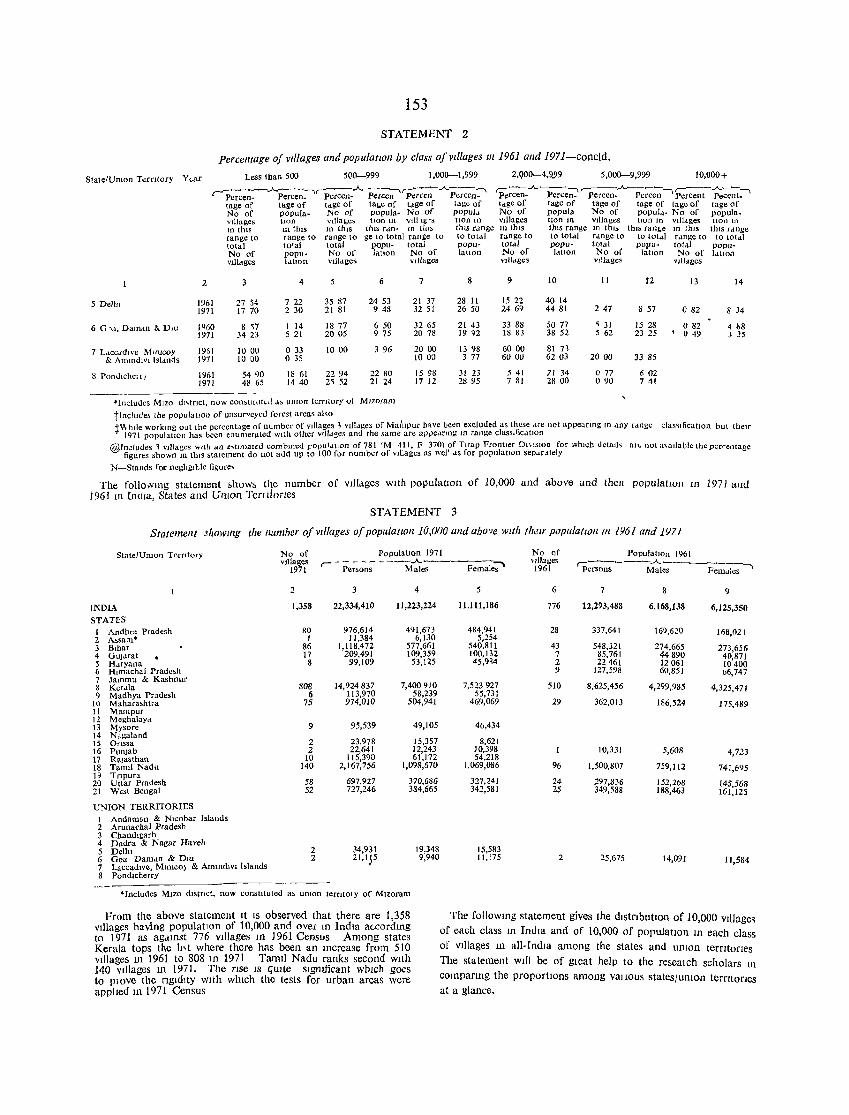
153
STATEMENT 2
Percelltage of villages alld population by class of vtllages III 1961 alld 1971-concld.
StatelUmon Terrttory Y ~ar Less tban 500 500-999 1,000-1,999 2,QOO-4,9..99 5,000-9,999 10,000+
r-~-. -..A.. Percen:--V-p;;;;...A. p~~rp;;;-~...A-p~;;-:.~ 'Per~;-_..A..---P;~~ rpercen-~ Perc;-~ Percent-~~~~ tage of tage of t"ge of tal.C of tdge of tage of tdge of tage of tage of tage of tage of tage of No of popula- No of popula- No of popul.. No of popula No of popul4- No of popula-vdlages tIon vtl!abcs Hon 111 VIH 19~5 tlOn In vIllages tIOn In vIllages tlon In vt1ldges Hon 111 10 thIS In thiS In this this fdn- In thl~ thIS fJnge In this this range 10 thIs thJl:lo rant:.e 1n this this range range to range to range to ge to total ranae to to tot"l range to to totdl rdnge to to totdl r"nge to to totdl total tO'al total popu- total popu- tOldl popu- total popu- lolal popu-No of popu- No of latlon No of latlon No of ldllon No of latlon No of ldlion villdges Idllon villdges VIllages vdldges VIllages vdldges
2 4 6 7 9 10 II f2 13 14
5 DelhI 1961 27 54 722 35 87 24 53 21 37 28 11 15 22 40 14 230 21 81 948 3251 2650 2469 4481 247 857 082 8 34 1971 17 70
6 G la, Damrtn &. DJu IQ60 8 ~7 1 14 1877 650 3265 21 43 33 88 5077 ~ 31 1528 082 4 h8 1971 3423 521 2005 9 75 20 78 1992 18 83 38 52 5 62 23 25 . 049 3 35
7 LiCCJdJve MInlcoy 1961 1000 033 1000 396 2000 13 98 6000 81 71 & Ammdivi Islands 1971 10 00 o 35 1000 3 77 6000 6203 2000 33 85
8 Pondlcherr I 1961 54,)0 18 61 2294 2280 1598 31 23 541 71 34 o 77 602 1971 48 65 1440 2~ 52 21 24 17 12 2895 7 81 2800 090 741
'Includes Mlzo dl'tnct1 now con~tlLlItl..d d~ UlHon tern tory of MJzoram ,
t1ncludes the populatIon of unsurveyed forest areas alo;;o ~\\ nile workmg out the percentdge of number of VIllages 'l Villages or Mat1lpur h:lve been excluded as these Me not appeanng m .. lIlY f.loge c1as"lficatJOll but their
1971 population has been enumerated WIth other v!lld~es and the same are api>earmg 1fl range cJass)lcJ.tJon @Includes '1 vllJages wlLh au c .. tullatcd combIned _l:Opu14tton of 781 (M 411. F 370) of Tlrap Frontter Dl\!SlOQ for WhICh detail., an. not Q\adablc the perrentage
figures shown In tbls statement do not add up to 100 for number of VIllages as weI' as for populallon sep .. rJfely
N-Stands for neghgltie figure>
The follo,vmg statement shows tIle number of vilidges With populatIOn of 10,000 and above and thclI populatIOll HI 197 J and 1961 III India, States and Umon Ten Itones
STATEMENT 3
Statement s/zowmg the /lumber of vilfages of population 10,000 alld above with thelY pOpUla(lOlIlfl 1961 alld 1971
StateJUruon Territory No of PopulatIon 1971 No of Populal!on 1961 VIllages ,---------J-
1971 Persons Males
2 3 4
INDIA 1,358 22,334,410 Il,223,224
STATES I Andhra Pradesb 80 976,614 491,673 2 Assam* 1 11,384 6,130 3 BIhar 86 1,118,472 577,661 4 GUJarat 17 209,491 109,359 5 Haryana 8 99,109 53,125 6 HImachal Pradesh 7 Jammu & KashmIr 8 Kerdla 808 14,924837 7,400910 9 Madbya Pradesb 6 113,970 58,239
10 Maharashtra 75 974,010 504,941 Jl Mampur 12 Meghalay" 13 Mysore 9 95,539 49,105 14 Ndgaland 15 OrIssa 2 23,978 15,357 16 Punjab 2 22,641 12,243 17 Rajasthan 10 115,390 61,172 18 TamIl Nadu 140 2,167,756 1,098,670 19 TrJpura 20 Uttar Pradesb 58 697,927 370,686 21 West Bengal 52 727,246 384,665
UNION TERRITORIES
I Andaman & Nlcobar Islands 2 Arunachal Pradesh 3 Cbandigarb 4 Dadra & Nagar Haveh 5 Delbi 2 34,931 19,348 6 Goa Damdn & Dzu 2 21,1J5 9,940 7 Laccadlve, MtnICO) & Ammdlvl Islands 8 Pondlcherry
*Includes MIZO dIstrIct, now constltuied as umon ternlOlY of ~{lzoram
From the above statement It IS observed that there are 1,358 VIllages having populatIOn of 10,000 and over III India accordmg to 1971 as ag,unst 776 Villages III 1961 Census Among states Kerala tops the It,t where there has been an lllcrease from 510 VIllages III 1961 to 808 In 1971 TamIl Nadu ranks second With 140 Villages In 1971. The nse IS qUite slgmficant which goes to plOve the ngIdlty with wluch the tests for urban areas wcre applied 111 1971 Census
Female';" vl11ages c--------.A. 1961 Persons Males Females
-,
5 6 7 9
11,111,186 776 12,293,488 6,168,138 6,125,350
484,941 28 5,254
337,641 169,620 168,021
540.811 43 548,321 274,665 273,656 100,132 7 85,761 44 890 40,871 45,984 2 22461 12061 10400
9 127,598 60,851 b6,747
7,523927 510 8,625,456 4,299,985 4,325,471 55,731
469,069 29 362,013 186,524 175,489
46,434
8,621 10,398 10,33J 5,608 4,723 54.218
1,069,086 96 1,500,807 759,112 741,695
327,241 24 297,836 1.52,208 145,568 342,581 25 349,588 188,463 161,125
15,583 11,175 2 25,675 14,091 11,584
The followmg statement gives the dlstnblltlOn of 1 0,000 v"Jage~ of cach class In IndIa and of 10,000 of population III each class of Villages III all-India among the states and umon terntones The statement Will be of glCat help to the resealch scholars In
companng the proportIOns among vallOUS states/lI01on temtones at a glance.
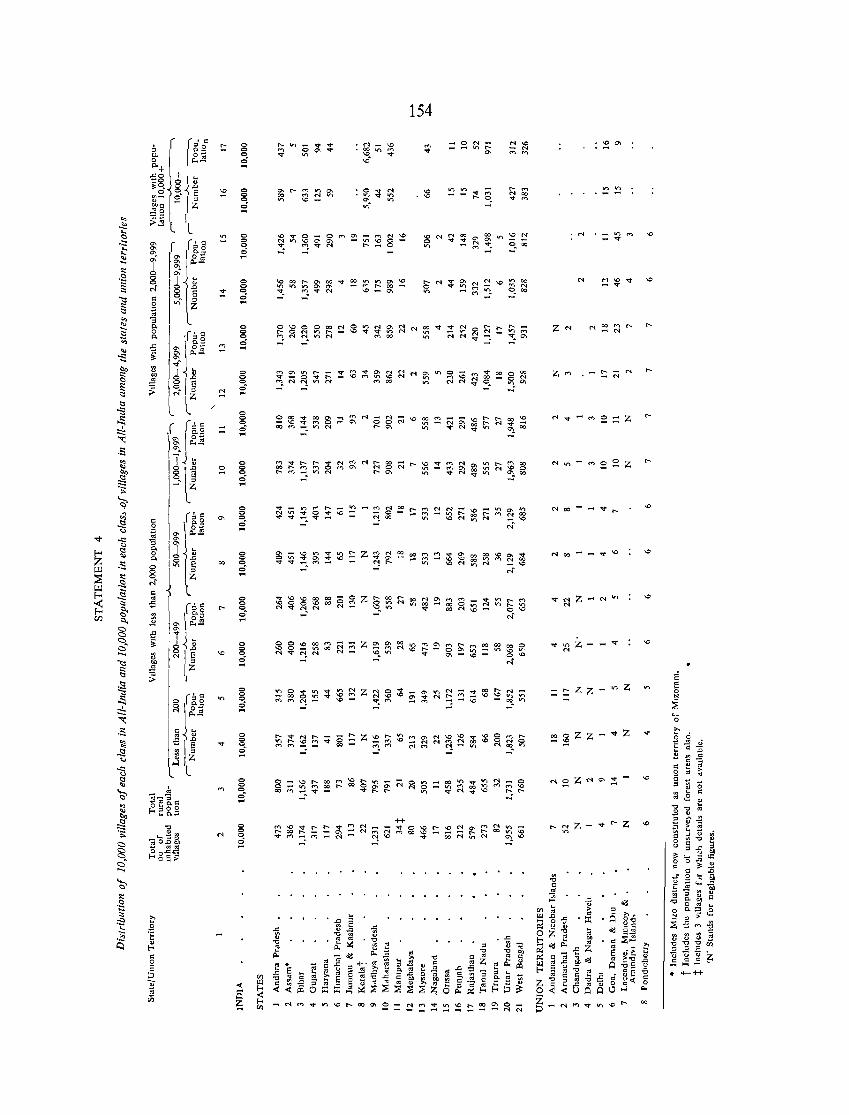
aaa-r o o N c:; .§ " '"3 0. o 0.
.;:: [i
00
....
"" o o g
o o o .,; -o o o d ... o o o .,; ....
o o o .,; ....
Q Q o g
g o .,; ....
o Q o .,; ....
o o Q
.,; ....
o Q Q
g
o o o .,; ....
o Q o .,; ....
o o o .,; ....
o Q Q
.,; ....
o g .,; ... o o o g
154
§~~~~~~~~~~~~ N
~~~~~~~~ ",'
~~~~~~:z~~~~~~~~~~~s~ - N
..
z'"
<t~Z __ <t
'"
'"
<... o
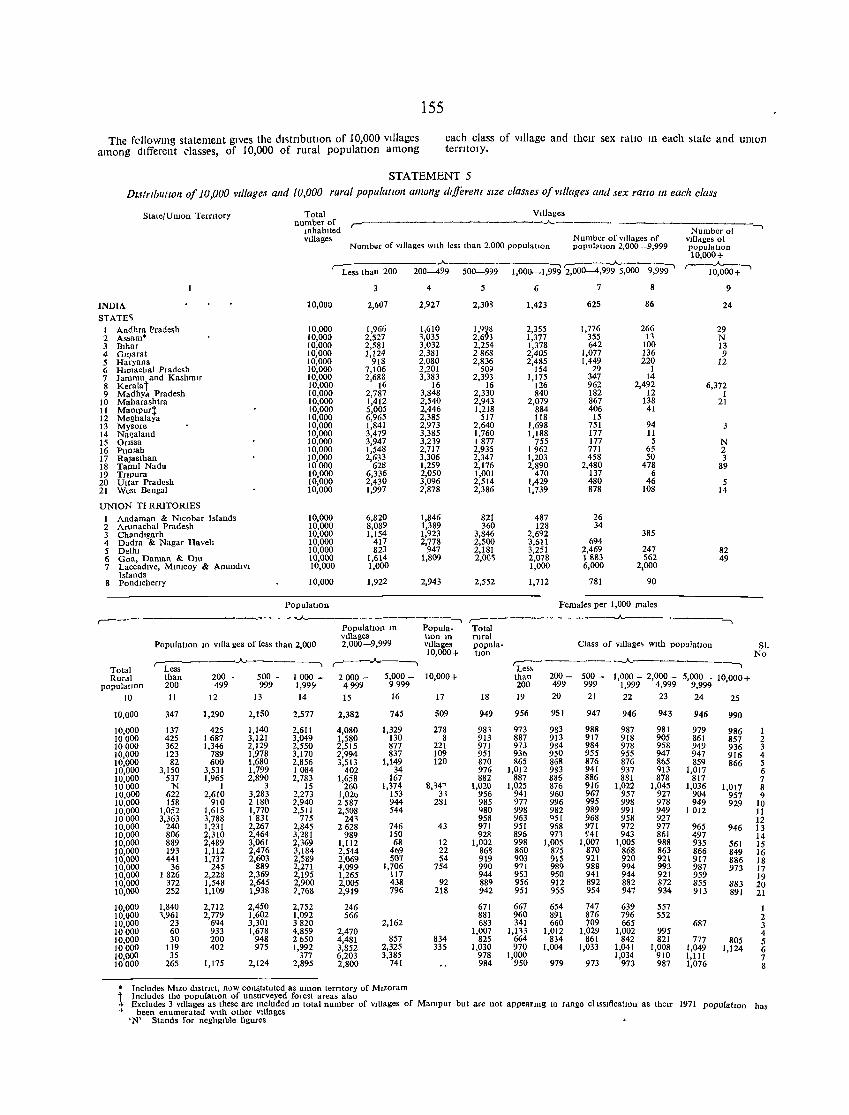
155
The fcllowmg statement gives the dlstnbutlOn of 10,000 villages each class of village and their sex ratio III each state and umon among different classes, of 10,000 of rural populatIOn among terntOlY·
STATEMENT 5
DU/rlbullan 0/10,000 Villages and 10,000 rural papu/altoll among different size classes a/villages and sex raoa lfl each class
Total VJllages Stater U mon Terntory number of r------------------.A.------------N";;;;;;;.:-;---.
mhablted vIllages
Nunlber of vIllage'> WIth less than 2,000 populatIOn N umber of vtllages of vIlldges 01 populotlOn 2,000 -9,999 popuJallon
10,000+
,-Less I han 200 .A-
200-499 500-999 -:"'I r-;::---.A.----
1,000-1,999 2,000-4,999 5,000 9,999' ,--~~
10,000+'
4 5 6 8 9
INDIA 10,000 2,607 2,927 2,308 1,423 625 86 24
STATE'> t Andhra Pradesh [0,000 1,966 1,610 1,9~8 2,355 1,776 266 29 2 Assam· to,OOO 2.527 1,035 2,6 3 1,377 355 n N 3 BIhar 10,000 2,581 3,032 2,254 1,378 642 100 13 4 GUjarat 10,000 1,124 2,381 2868 2,405 1,077 136 9 5 Haryana 10,000 918 2,080 2,836 2,485 1,449 220 12 6 Hunaclial Pradesh 10,000 7,106 2,201 509 154 29 1 7 Jammu and KashmIr 10,000 2,688 3,383 2,393 1,175 347 14 8 Keralat 10,000 16 16 16 126 962 2,492 6,372 9 MadhYd Pradesh 10,000 2,787 3,848 2,330 840 182 12 1
10 Maharashtra 10,000 1,4[2 2,540 2,943 2,079 867 138 21 [I MaOlpurt 10,000 5,005 2,446 1,218 884 406 41 12 Meghalaya 10,000 6,965 2,385 517 118 15 13 Mysore 10,000 1,841 2,973 2,640 1,698 751 94 3 14 Nagaland 10,000 3,479 3,385 1,760 1,188 177 11 15 Onssa 10,000 3,947 3,239 1877 755 177 5 N 16 Punlab 10,000 1,548 2,717 2,935 1962 771 65 2 17 Rajasthan 10,000 2,633 3,306 2,347 1,203 458 50 3 18 Tanul Nadu 10000 628 1,259 2,176 2,890 2,480 478 89 19 Tnpura 10,000 6,336 2,050 t,OOI 470 137 6 20 U ((ar Pra desh 10,000 2,430 3,096 2,514 1,429 480 46 5 21 West Bengal 10,000 1,997 1,878 2,386 1,739 878 108 14
UNION TI RRlTORIES
1 Andaman & Nlcobar Islands 10,000 6,820 1,846 821 487 26 2 Arunachal Pradesh 10,000 8,089 1,389 360 128 34 3 ChandIgarh 10,000 1,154 1,923 3,846 2,692 385 4 Dadra & Nagar Havel! 10,000 417 2,778 2,500 3,611 694 5 Deihl 10,000 823 947 2,181 3,251 2,469 247 82 6 Goa, Daman & DIU 10,000 1,614 1,809 2,00'; 2,078 1883 562 49 7 Laccadlve, Mmlcoy & AnundlvI 10,000 1,000 1,000 6,000 2,000
Islands 8 Pondlcherry 10,000 1,922 2,943 2,552 1,712 781 90
PopulatIOn Females per 1,000 males
,--_------------..,-----..A.----------------. PopulatIOn III Popula·
,--_____________ ..A---________ -,
Total vIllages bon In rural
PopulatIon m VItia ges of less than 2,000 2,000-9,999 vIllalles popula· Class of VIllage, wlIh populatIOn SI. 10,000+ tlon No r-:--------..A.-----, ,---..A.---, ~---------.A.----___ ----.,
Total Less Rurdl than 200 - 500 - 1000 - 2000 - 5,000 - 10,000+ than 200- 500 - 1,000- 2,000- 5,000- 10000+
populatIOn 200 499 999 1,999 4999 9999 200 499 999 1,999 4,999 9,999 '
10 11 12 13 14 15 16 17 18 19 20 21 22 23 24 25
10,000 347 1,290 2,150 2,577 2,382 745 509 949 956 951 947 946 943 946 990
10,000 137 425 1,140 2,611 4,080 1,329 278 98, 973 983 988 987 981 979 986 1 10 000 425 1687 3,121 3,049 1,580 130 8 913 887 913 917 918 905 861 857 2 10 000 362 1,346 2,129 2,550 2,515 877 22t 971 973 984 984 978 958 949 936 3 10,000 123 789 1,978 3,170 2,994 837 109 951 936 950 955 955 947 947 916 4 10,000 82 600 1,680 2,856 3,513 1,149 120 870 865 868 876 876 865 859 866 5 10,000 3,150 3,53t 1,799 1084 402 34 976 1,012 983 941 937 913 1,017 6 10,000 537 1,965 2,890 2,783 1,658 167 882 887 885 886 881 878 817 7 10000 N 1 3 15 260 1,374 S,3~~ 1,020 1,025 876 916 1,022 1,045 1,036 1,017 8 10,000 622 2,610 3,283 2,273 1,02b 153 956 941 960 967 957 927 904 957 9 10,000 158 910 2180 1,940 2587 944 281 985 977 996 995 998 978 949 929 10 10,000 1,052 1,615 1,770 2,511 2,508 544 980 998 982 989 99[ 949 1012 11 JOOOO 3,363 3,788 1831 775 241 958 963 Q5t 968 958 927 12 10,000 240 1,231 2,267 2,845 2628 746 43 971 951 968 971 972 977 965 946 13 10,000 806 2,310 2,464 3,281 989 150 928 896 971 941 943 861 497 14 10,000 889 2,489 3,061 2,369 1,112 68 12 1,002 998 1,005 1,007 1,005 988 935 561 15 10,000 193 1,112 2,476 3,184 2,544 469 22 868 860 875 870 868 863 866 849 16 10,000 441 1,737 2,603 2,589 2,069 507 54 919 903 915 921 920 921 917 886 18 10,000 36 245 889 2,271 4,099 1,706 754 990 971 989 988 994 993 987 973 17 10,000 1826 2,228 2,369 2,195 1,265 117 944 953 950 941 944 921 959 19 10,000 372 1,548 2,645 2,900 2,005 438 92 889 956 912 892 882 872 855 883 20 10,000 252 1,109 1,938 2,768 2,919 796 218 942 951 955 954 947 934 913 891 21
10,000 1,840 2,712 2,450 2,752 246 671 667 654 747 639 557 1 10,000 ',961 2,779 1,602 1,092 566 881 960 891 876 796 552 2 10,000 23 694 3,301 3820 2,162 683 341 660 709 665 687 3 10000 60 933 [,678 4,859 2,470 1,007 1,l'l3 1,012 1,029 1,002 995 4 10,000 30 200 948 2650 4,481 857 834 825 664 834 861 842 821 777 805 5 IO 000 119 402 975 1,992 3,852 2,325 335 1,030 970 1,004 1,033 1,041 1,008 1,049 1,124 6 10,000 35 377 6,203 3,385 978 1,000 1,034 910 1,111 7 10 000 265 1,175 2,124 2,895 2,800 741 984 950 979 973 973 987 1,076 8
* Includes MIZO dl~tnct. now con~t1tuted as umon terrItory of Mlzoram t Includes the populatIOn of unsurveyed forest areas also ... Excludes 3 vIllages as these are Included III total number of VIllages of Mlllllpur but are not appearmg In rdnge cl LSslficatlOn as theIr 1971 populatIOn has + been enumerated WIth other VIllages
'N' Stands for neglIgIble figures
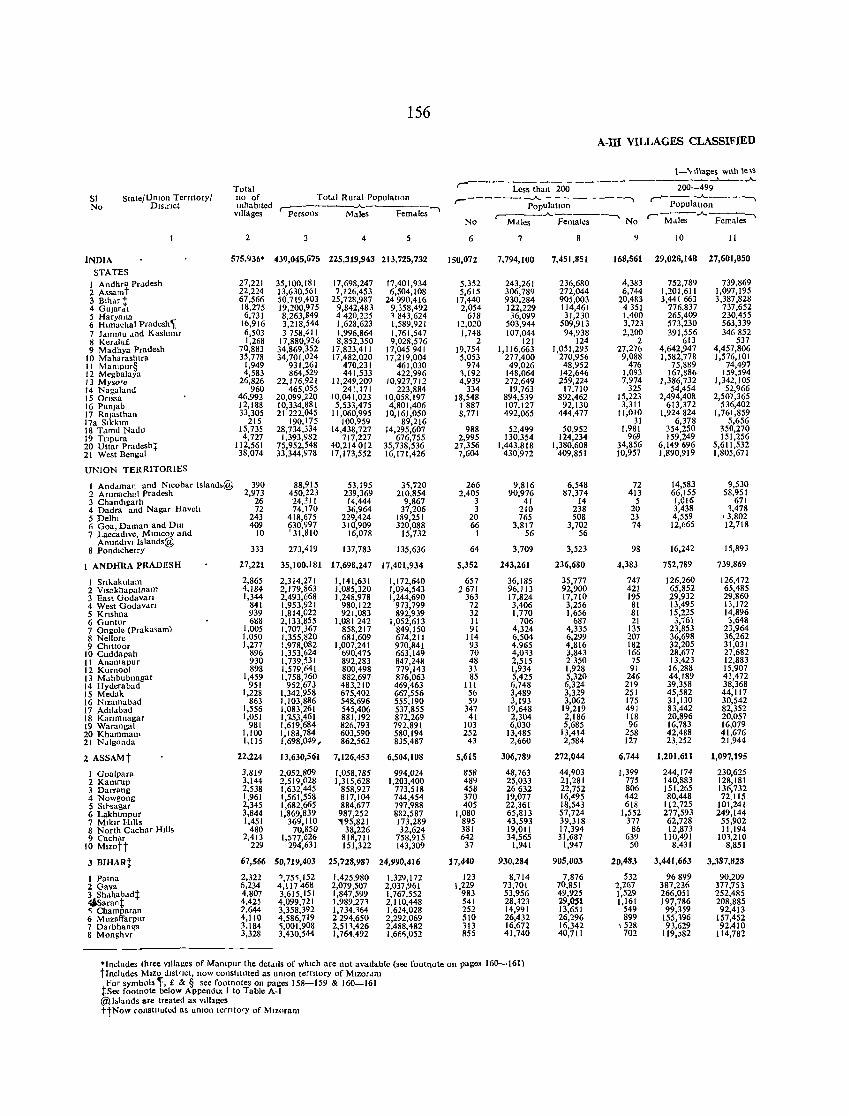
156
A-m VILLAGES CLASSIFIED
1-\ Illages with Ie"~ -------- ---- ------ ---------'------"-
Total r Less than 200 200-499 SI State/Unton Territory/ no of Totdl Rural PopulatIOn r-------.A. ---- -----, ,------.A. ____ --. No Dlstnct IOhnblted ~----.A.-------. populalton Population
Villages Persons Males Fern .. lcs ,---__ .A..-_____ --, ,-M~..A. Females--" No Mdles Females No
2 4 5 6 7 8 9 10 II
INDIA 575,936' 439,045,675 225,319,943 213,725,732 150,072 7,794,100 7,451,851 168,561 29,026,148 27,601,050
STATES I Andhra Pr .. desh 27,221 35,100,181 17,698,247 17,401,934 5,352 243,261 236,680 4,383 752,789 739,869 2 Assamt 22,224 13,630,561 7,126,453 6,504,108 5,615 306,789 272,044 6,744 1,201,611 1,097,195 3 Bihar t 67,566 50,719,403 25,728,987 24990,416 17,440 930,284 905,003 20,483 3,441663 3,387,828 4 GUJar .. t 18,275 19,200,975 9,842,483 9,358,492 2,054 122,229 114,461 4351 776,837 737,652 5 Haryana 6,731 8,263,849 4420,225 , 843,624 618 36,099 31,230 1.400 265,409 230,455 6 Himachal Pradesh'; 16,916 3,218,544 1,628,623 1,589,921 12,020 503,944 509,913 3,723 573.230 563,339 7 J .. mmu Jlld Kashmir 6,503 3758,41 I 1,996.864 1,761,547 1,748 107,044 94,938 2,200 391,556 346852 8 Kerdla£ 1,268 17,880,926 8,852.350 9,028,576 2 121 124 2 613 537 9 M adllyu Pradesh 70,883 34,869.352 17,823,411 17,045941 19,754 1,116,663 1,051,293 27,276 4.642,947 4,457,806
10 Maharashtra 35,778 34,701,024 17,482,020 17,219,004 5,053 277,400 270,956 9,088 1,582,778 1,576,101 I I ManIpur§ 1,949 931,261 470,231 461,030 974 49,026 48,952 476 75,889 74,497 12 Meghalaya 4,583 864,529 441,533 422,996 1,192 148,064 142,646 1,093 167,886 159,594 13 Myso'e 26.826 22,176,921 11,249,209 10,927,712 4,939 272,649 259,224 7,974 J,386,732 1,342,105 14 Nagaland 960 465,055 241,171 223,884 334 19,763 17,710 325 54,454 52,966 15 Onssa 46,992 20,099,220 10,041,023 10,058,197 18,548 894,539 892,462 15,223 2,494,408 2,507,365 16 Punjab 12,188 10,334,881 5,533,475 4,801,406 I 887 107,127 92,130 3,311 613,372 536,402 17 Rajasthan 33,305 21 222,045 11,060,995 10,161,050 8,771 492,065 444,477 11,010 1,924824 1,761,859 l7a Slkkml 215 190,175 100,959 89,216 31 6,378 5,656 18 Tdmll Nadu 15,735 28,734,334 14,438,727 14,295,607 988 52,499 50,952 1,981 354,250 350,270 19 Tnpura 4,727 1,393,982 717,227 676,755 2,995 130,354 124,234 969 159,249 151,256 20 Uttar Pradesh:;: 112,561 75,952,548 40,214012 35,738,536 27,356 1,443,818 1,380,608 34,856 6,149696 5,611,532 21 West Bengal 38,074 33,344,978 17,173,552 16,171,426 7,604 430,972 409,851 10,957 1,890,919 1,805,671
UNION TERRITORIES
I Anddman and Nlcobar Islandl.@ 390 88,915 53,195 3~,720 266 9.816 6,548 72 14,583 9,530 2 Arunachal Pradesh 2,973 450,223 239,369 210,854 2,405 90,976 87,374 413 66,155 58,951 3 Chandlgarh 26 24,31 I 14,444 9,867 3 41 14 5 1,016 671 4 Dadra and Nagar Havell 72 74,170 36,964 37,206 3 210 238 20 3,438 1,478 5 Deihl 243 418,675 229,424 189,251 20 765 508 23 4,559 , 3,802 6 Goa, Daman and DIU 409 630,997 310,909 320,088 66 3,817 3,702 74 12,665 12,718 7 Laccadlve, MIllICOY and 10 ' 31,810 16,078 15,732 1 56 56
AmlOdlvl Islands@ 333 273,419 137,783 135,636 64 3,709 3,523 98 16,242 15,893 8 Pondlcherry
1 ANDHRA PRADESH 27,221 35,100,181 17,698,247 17,401,934 5,352 243,261 236,680 4,383 752,789 739,869
1 Srll.akulam 2,865 2,314,271 1,141,631 1,172,640 657 36,185 35,777 747 126,260 126,472 2 V,sakhapatnam 4,184 2,179,863 1,085,320 1,094,543 2671 96,113 92,900 421 65,852 65,485 3 East Godavari 1,344 2,493,668 1,248,978 1,244,690 363 17,824 17,710 195 29,932 29,860 4 West Godav .. n 841 1,953,921 980,122 973,799 72 3,406 3,256 81 13,495 13,172 5 Knshna 939 1,814,022 921,083 892,939 32 1,770 1,656 81 15,225 14,896 6 Guntur 688 2,133,855 1,081242 1,052,613 11 706 687 21 3,761 3,648 7 Ongole (Praku'am) 1,005 1,707,367 858,217 849,150 91 4,324 4,335 135 23,853 23,964 8 Nellore 1,050 l,355,820 681,609 674,211 114 6,504 6,299 207 36,698 36,262 9 Cluttoor 1,277 1.978,082 1,007,241 970,841 93 4,965 4,816 182 32,205 31,031
10 Cuddapah 896 1,353,624 090,475 663,149 70 4,0,3 3,843 166 28,677 27,682 II Anantapur 930 1,739,531 892,283 847,248 48 2,515 2350 75 13,423 12,883 12 Kurnool 898 1,579,641 800,498 779,143 33 1,934 1,928 91 16,288 15,907 13 MJhbubnagar 1,459 1,758,760 882,697 876,063 85 5,425 5,320 246 44,189 43,472 14 Hyderabad 951 952,673 483,210 469,463 III 6,748 6,324 219 39,358 38,368 15 Medak 1,228 1,342,958 675,402 667,556 56 3,489 3,329 251 45,582 44,117 16 Nlzamabdd 863 1,103,886 548,696 555,190 59 3,193 3,062 175 31,130 30,542 17 AdJl .. bad 1,556 1,083,261 545,406 537,855 347 19,648 19,219 491 83,442 82,352 18 Kaflmnagar 1,051 1,J5.3,461 881,192 872,269 41 2,304 2,186 118 20,896 20,057 19 Warangal 981 1,619,684 826,793 792,891 103 6,030 5,685 96 16,783 16,079 20 Khammam 1,100 1,183,784 603,590 580,194 252 13,485 13,414 258 42,488 41,676 21 NJIgonda 1,115 1,698,049, 862,562 835,487 43 2,660 2,584 127 23,252 21,944
2 ASSAMt 22,224 13,630,561 7,126,453 6,504,108 5,615 306,789 272,044 6,744 1,201,6Il 1,097,195
I Goalpara 3,819 2,052,809 1,058.785 994,024 858 48,763 44,903 1,399 244,174 230,625 2 Kamrup 3,144 2,519,028 1,315,628 1,203,400 489 25,033 21,281 775 140,883 128,181 3 Darrang 2,538 1,632,445 858,927 773.518 458 26632 22,752 806 151,265 136,732 4 Nowgong 1,961 1,561,558 817,104 744,454 370 19,077 16,495 442 80,448 72,115 5 S,t-sagar 2,345 1,682,665 884,677 797,988 405 22,361 18,543 618 112,725 101,241 6 Lakhlmpur 3,844 1,869,839 987,252 882,587 1,080 65,813 57,724 1,552 277,593 249,144 7 MlkJf HIUs 1,451 369,110 '195,821 173,289 895 43,593 39,318 377 62,728 55,902 8 North Cachar Hdls 480 70,850 38,226 32,624 381 19,011 17,394 86 12,873 11,194 9 Cachar 2,413 1,577,626 818,71 I 758,915 642 34,565 31,687 639 110,491 101,210
10 M1zott 229 294,631 151,322 143,309 37 1,941 1,947 50 8,431 8,851
3 BlHARt 67,566 50,719,403 25,728,987 24,990,416 17,440 930,284 905,003 20,483 3,441,663 3,387,828
I Patna 2,322 ~,75~,152 1,425,980 1,329,172 123 8,714 7,876 532 96899 90,209 2 Gaya 6,234 4,117468 2,079,507 2,037,961 1,~~~ 73,701 70,851 2,267 387,236 377,753 3 Shdhabddt 4,807 3,615,151 1,847,599 1,767,552 53,956 49,925 1,529 266,051 252,485 4Sarant 4,425 4,099,721 1,989,271 2,110,448 541 28,423 29,051 1,161 197,786 208,885 ~ Charrparan 1,6M 3,358,392 1,734,,64 1,624,028 252 14,991 13,651 549 99,359 92,413 6 M lIZalfarplIr 4,110 4,586,719 2294,650 2,292,069 510 26,432 26,296 899 155,196 157,452 7 Darbhano:a 3.184 ~,OOI.908 2,511,426 2,488,482 113 16,672 16,342 \ 528 93,629 92,410 8 Monghvr 3,328 3,430,544 1,764,492 1,661\,052 855 41,740 40,711 702 119,~82 114,782
"Inclulles three VIllages of Manlpur the deldlls of which are not avallable <see footll0te Oll pages 160-161) tIncludes MIZO dIstrIct, now constituted as uOion terntory of Mlzordlll
For symbo1s~, £ & § see footnotes on pages 158-159 & 160-161 tSee footnote below AppendiX I to Table A-I @blunds are treated as Villages ttNolV constJtutcd as unJon tcrntory of Mlzoram
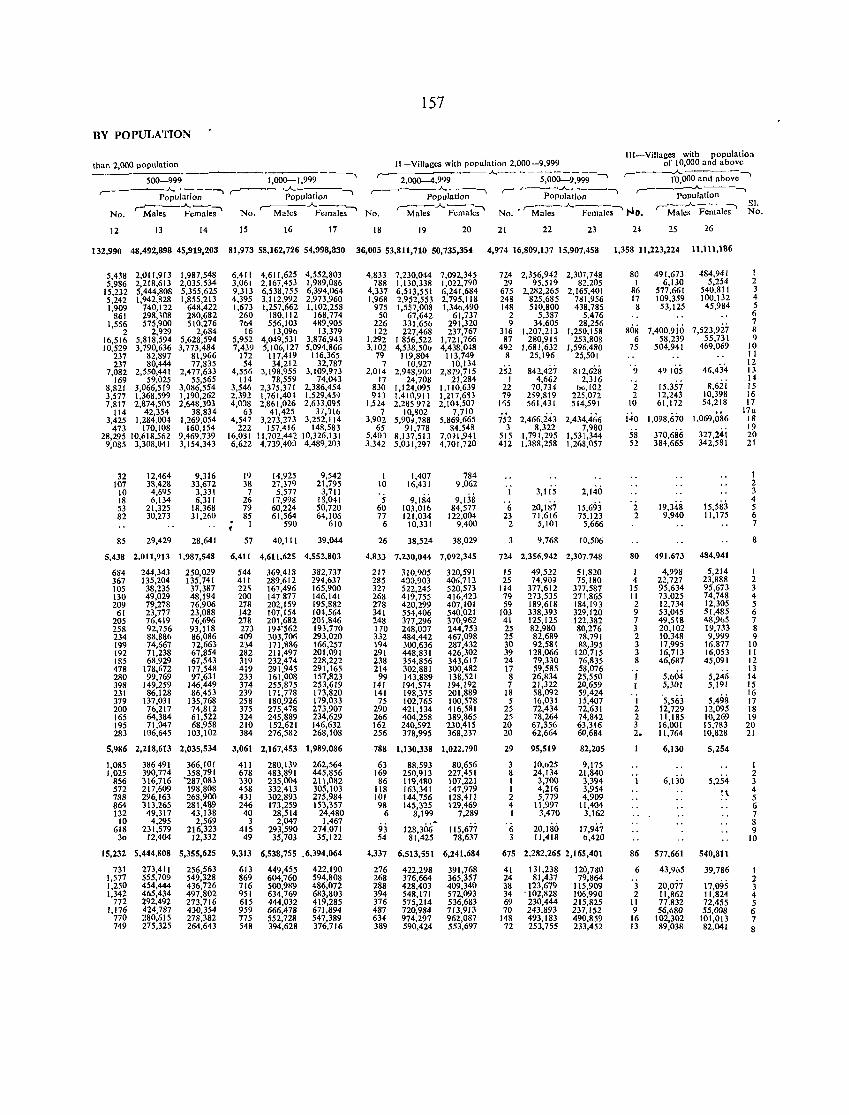
157
BY POPULATION
Ill-Villages with populatio~
than 2,000 population II-Villages with population 2,000-9,999 of 10,000 and above .A.- - -------- ---.A.-----..,
500-999 1,000--1,999 ..,
2,000-4,999 5,000-9,999 .., ,. m,ooO and above ,.- _--..A- - --'""1 ,.---to;;;w~..,
,---" __ ---.A. __ --., ,------ Pop~;;;;;;----"
,. __ ~.A.-. --.., Population Population Populallon
~.A._.., --'perna;''''
,---.A.----., ,-:--.A.----, ,.-_..A..--.., Sl. No. Males Females No. Males No. Males Females No.' Males Females 1'10. Males Females No.
12 13 14 IS 16 17 18 19 20 21 22 23 24 25 26
132,990 48,492,898 45,919,203 81,973 58,162,726 54,998,830 36,00553,811,710 50,735,354 4,974 16,809,137 15,907,458 J ,358 11,223,224 11,111,186
5,438 2,011,913 1,987,548 6,411 4,611,625 4,552,803 4,833 7,230,044 7,092,345 724 2,356,942 2,307,748 80 491,673 484,941 1 5,986 2,218,613 2,035,534 3,061 2,167,453 1,989,086 788 1,130,338 1,022,790 29 95,519 82,205 I 6,130 5,254 2
15,232 5,444,808 5,355,625 9,313 6,538,755 6,394,064 4,337 6,513,551 6,241,684 675 2,282,265 2,165,401 86 577,661 540,811 3 5,242 1,942,828 1,855,213 4,395 3,112,992 2,973,960 1,968 2,952,553 2,795,118 248 825,685 731,956 17 109,359 100,132 4 1,909 740,122 648,422 1,673 1,257,662 1,102,258 975 1,557,008 1,34b,490 148 510,800 438,785 8 53,125 45,984 5
861 298,308 280,682 260 180,112 168,774 50 67,642 61,737 2 5,387 5,476 6 1,556 575,900 510,276 704 556,103 489,905 226 331,656 291,320 9 34,605 28,256 7
2 2,929 2,684 16 13,096 13,379 122 227,468 237,767 316 (,207,213 1,250,158 80R 7,400.9io 7,523,927 8 16,516 5,818,594 5,628,594 5,952 4,049,531 3,876,943 1,292 1 856,522 1,721,766 87 280,915 253,808 6 58,239 55,731 9 10,529 3,790,636 3,773,484 7,439 5,106,127 5,094,866 3,102 4,538,50lJ 4,438,048 492 1,681,632 1,596,480 75 504,941 469,069 10
237 82,897 81,966 172 117,419 116,365 79 119.804 113,749 8 25,196 25,501 II 237 80,444 77,835 54 34,212 32,787 7 10,927 10,134
46,434 12
7,082 2,550,441 2,477,633 4,556 3,198,955 3,109,973 2,014 2,948,900 2,879,715 251 842,427 812,62S 9 49105 13 169 59,025 55,565 114 78,559 74,043 17 24,708 21,284 1 4,662 2,316
15,357 8,6ii 14
8,821 3,066,519 3,086,554 3,546 2,375,371 2,386,454 830 [,124,095 1,[ 10,639 22 70,734 60,[01 2 IS 3,577 1,368,599 1,190,262 2.392 1,761,40t 1.529,451 91) 1,410,911 1,217,6~3 79 259,819 225,072 2 12,243 10,398 16 7,817 2,874,505 2,648,303 4,OJ8 2,861,026 2,633.095 1,524 2,285972 2,IOU07 1~5 561,431 514,591 10 61,172 54,218 17
114 42,354 38,834 63 41,425 37,~16 7 IO,~02 7,710 2,466,:243 2,434,466 1,098,670 1,069,086
17a 3,425 1,284,004 1,269,054 4,547 3,273,273 3.252,114 3,902 5,90~,788 5,869,665 752 140 18
473 170,108 160,154 222 157,416 148,583 65 91,778 84.548 3 8,322 7,980 370,686
19 28,295 10,618,562 9,469,739 16,031 11,702,442 10,326,131 5,401 8,137,513 7,O~I,941 515 1,791,295 1,531,344 58 327,241 20 9,085 3,308,041 3,154,343 6,622 4,739,400 4,489,203 3.342 5,031,297 4,701,720 412 1,388,258 1,268,057 52 384,665 342,581 21
32 12,464 9,316 19 14,925 9,542 I 1,407 784 I 107 38,428 33,672 38 27,379 21,795 10 16,431 9,Q62
2,140 2
10 4,695 3,331 7 5,577 3,711 9,138
I 3,115 3 18 6,134 6,31 [ 26 [7,998 18,04[ 5 9,184
20,187 19,348 15,583 4
53 21,325 18,368 79 60,224 50,720 60 103,016 84,577 6 15,693 2 5 82 30,273 31,260 85 61,564 64,106 77 121,034 122,004 23 71,616 75,123 2 9,940 11,175 6 . 1 590 610 6 10,331 9,400 2 5,101 5,666 7
f
85 29,429 28,641 57 40,111 39,044 26 38,524 38,029 9,768 10,506
5,438 2,011,913 1,987,548 6,411 4,611,625 4,552,803 4,833 7,230,044 7,092,345 724 2,356,942 2,307,748 SO 491,673 484,941
684 244,343 250,029 544 369,418 382,737 217 310,905 320,591 15 49,522 51,820 I 4,998 5,214 I 367 135,204 135,741 411 289,612 294,637 285 400,903 405,712 25 74,90~ 75,180 4 22,727 23,888 2 105 38,235 37,387 22~ 167,496 165,900 327 522,245 520,573 114 377,612 377,587 15 95,634 95,673 3 130 49,029 48,194 200 147877 146,141 268 419,755 416,423 79 273,535 271,865 II 73.025 74,748 4 209 79,278 76,906 278 202,159 195,882 278 420,299 407,101 59 189,618 184,193 2 12,734 12,305 5
61 23,777 23,088 142 107,[54 104,564 341 554,406 540.021 103 338,393 329, [20 9 53,045 51,485 6 205 76,419 76,696 278 201,682 201,846 248 377,296 370,962 41 125,125 122,382 7 49,518 48,9b5 7 258 92,756 93,118 273 194'562 193,770 170 248,0:)7 244,753 25 82,980 80,276 3 20,102 19,733 8 234 88,886 86,086 409 303,701; 293,020 332 484,442 467,098 25 82,689 78,791 2 10,348 9,999 9 199 74,667 72,663 234 171,886 166,257 194 300,636 287,432 30 92,581 88,395 3 17,995 16,877 10 192 71,238 67,854 282 211,497 201,091 291 448,831 426,302 39 128,066 120,715 3 16,713 16,053 11 185 68,929 67,543 319 232,474 228,222 238 354,856 343,617 24 79,330 76,835 8 46,687 45,091 12 478 178,672 177,548 419 291,945 291,165 214 302,881 300,482 17 59,58, 58,076
5,604 5,246 13
280 99,769 97,631 233 161,008 157,823 99 143,889 138,521 8 26,834 25,550 1 14 398 149,259 146,449 374 255,875 253,619 141 194,574 194,192 7 21,322 20,659 I 5,301 5,191 15 231 86,128 86,453 239 171,778 173,820 141 198,375 201,889 18 58,092 59,424
5,563 5,498 16
379 137,031 135,768 258 180,926 179,033 75 102,765 100,578 5 16,031 15,407 I 17 200 76,217 74,812 375 275,478 273,907 290 421,134 416,581 25 72,434 72,631 2 12,729 12,095 18 165 64,384 61,522 324 245,889 234,629 266 404,258 389,865 25 78,264 74,842 2 11,185 10,269 19 195 71,047 68,958 210 152,621 146,632 162 240,592 230,415 20 67,356 63,316 3 16,001 15,783 20 283 106,645 103,102 384 276,582 268,108 256 378,995 368,217 20 62,664 60,684 2. 11,764 10,828 21
5,986 2,218,613 2,035,534 3,061 2,167,453 1,989,086 788 1,130,338 1,022,790 29 95,519 82,205 6,130 5,254
1,085 386491 366,101 411 280,139 262,564 63 88,593 80,656 3 10,b25 9,175 1 1,025 390,774 358,791 678 483,891 445,856 169 250,913 227,<151 8 24,134 21,840
6,130 5,254 2
856 316,7\6 ~87,083 330 235,004 211,082 86 119,480 107,221 I 3,700 3,394 I 3 572 217,609 198,808 458 332,413 305,103 118 163,341 147,979 1 4,216 3,954 :\ 4 788 296,163 268,900 431 302,893 275,984 101 144,756 128,41 [ 2 5,779 4,909 5 864 313,265 281,489 246 173,259 153,357 98 145,325 129,469 4 11,997 11,404 6 132 49,317 43,138 40 28,514 24,480 6 8,199 7,289 I 3,470 3,162 7
10 4,295 2,569 3 2,047 1,467 93 128,306 20,180 17,947
8 618 231,579 216,323 415 293,590 274,071 115,677 6 9
30 12,404 12,332 49 35,703 35,122 54 8[,425 78,637 3 11,418 b,420 10
15,232 5,444,808 5,355,625 9,313 6,538,755 .6,394,064 ~,337 6,513,551 6,241,684 675 2,282,265 2,165,401 86 577,661 540,811
731 273,411 256,563 613 449,455 422,190 276 422,298 391,768 41 131,238 120,780 6 43,905 39,786 I 1,577 555,709 549,328 869 604,760 594,808 268 376,664 365,357 24 81,437 79,864 . j
20,077 17,095 2
1,250 454,444 436,726 716 500,989 486,072 288 428,403 409,340 38 123,679 115,909 3 1,342 465,434 497,802 951 634,769 683,803 394 548,171 572,093 34 '102,828 106,990 2 11,862 11,824 4
772 292,492 273,716 615 444,032 419,285 376 575,214 536,683 69 230,444 215,825 11 77,832 72,455 5 1,176 424.787 430,354 959 666,478 671,894 487 720,984 713,913 70 243,893 237,152 9 56,680 55,008 6
770 280,615 278,382 775 552,728 547,389 634 974,297 962,087 148 493,183 490,859 16 102,302 101,013 7 749 275,325 264,643 548 394,628 376,716 389 590,424 553,697 72 253,755 233,452 13 89,038 82,041 8
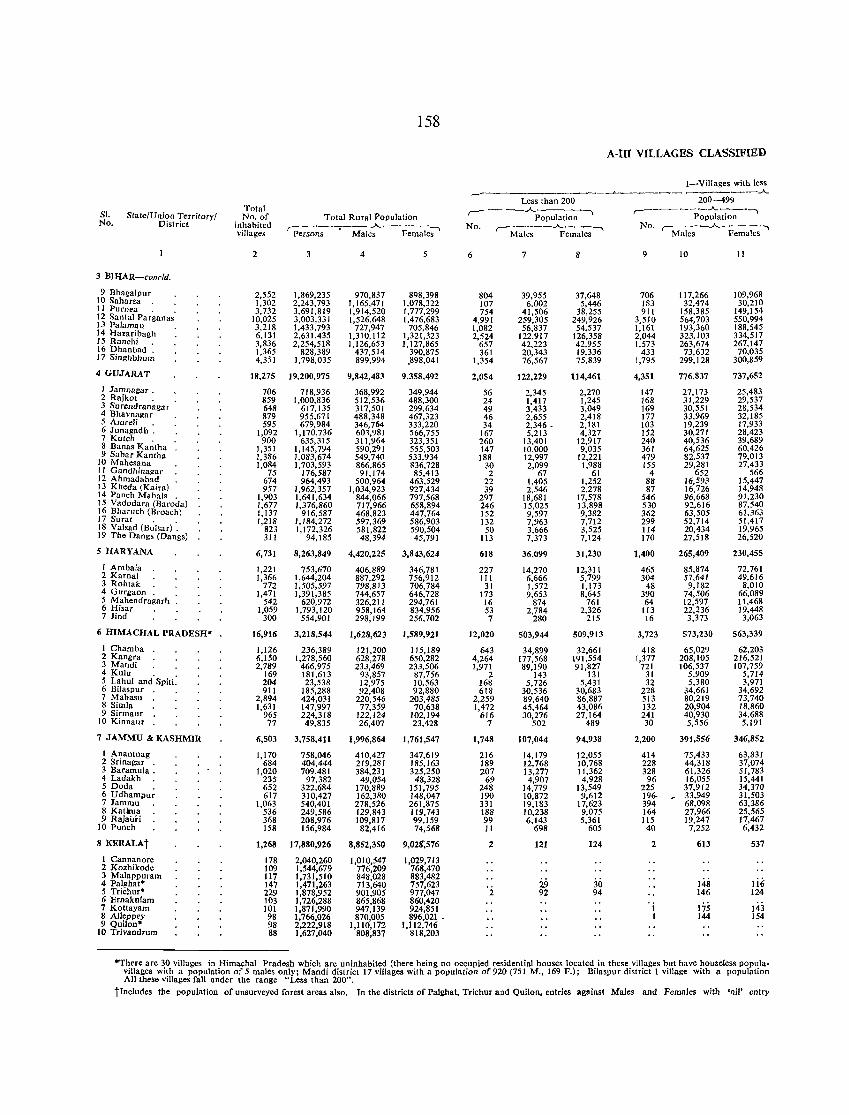
158
A-III VILLAGES CLASSIFIED
I-Villages with less ~ _____________ .A.
Less than 200 200-499
SI. Total
,..- -- --.A.;;;-pulation ...., -------"-------, State/Vnion Territory/ No. of Total Rural Population r- Population
No. District inhabited ~-_ .. __ .A.-----...., No. ~-_____ ..A... ___ ~ No. ,.--:- -_.A. ____ ---,
villages Persons MaJes Females Males Females Males Females
2 4 5 6 7 8 9 10 11
3 BIHAR-cone/d.
9 Bhagalpur 2,552 1,869,235 970,837 898,398 804 39,955 37,648 706 117,266 109,968 10 Sahar.. . 1,302 2,243,793 1,165,471 1,078,322 107 6,002 5,446 183 32,474 30,210 II Purnea 3,732 3,691,819 1,914,520 1,777,299 754 41,506 38,255 911 158,385 149,154 12 Santal Parganas' 10,025 3,003,331 1,526,648 1,476,683 4,991 259,305 249,926 3,510 564,703 550,994 13 Palamau . 3,218 1,433,793 727,947 705,846 1,082 56,837 54,537 1,161 193,360 188,545 14 Hazaribagh 6,131 2,631,435 1,310,112 1,321,323 2,524 122,917 126,358 2,))44 323,103 334,517 15 Ranchi . 3,836 2,254,518 1,126,653 1,127,865 657 42,223 42,955 1,573 263,674 267,147 16 Dhanbad . 1,365 828,389 437,514 390,875 361 20,343 19,336 433 73,6J2 70,035 17 Singhbhum 4,351 1,798,035 899,994 .898,041 1,354 76,567 75,839 1,795 299,128 300,859
4 GUJARAT 18,275 19,200,975 9,842,483 9,358,492 2,054 122,229 114,461 4,351 776,837 737,652
I Jamnagar. 706 718,936 368,992 349,944 56 2,345 2,270 147 27,173 25,483 2 Rajkot . 859 1,000,836 512,536 488,300 24 1,417 1,245 168 31,229 29,537 3 Surl!ndranagar 648 617,135 317,501 299,634 49 3,433 3,049 169 30,551 28,534 4 Bhavnagar 879 955,671 488,348 467,323 46 2,655 2,418 177 33,969 32,185 5 Amreli 595 679,984 346,764 333,220 34 2,346 - 2,181 103 19,239 17,933 6 Junagadh '. 1,092 1,170,736 601,981 566,755 167 5,213 4,327 152 30,271 28,423 7 Kutch . 900 635,315 311,964 323,351 260 13,401 12,917 240 40,536 39,689 8 Banas Kantha 1,351 1,145,794 590,291 555,503 147 10,000 9,035 361 64,625 60,426 9 Sabar Kantha 1,386 1,083,674 549,740 533,934 188 12,997 12,221 479 82,537 79,013
10 Mahesana 1,084 1,703,593 866,865 836,728 30 2,099 1,988 155 29,281 27,433 I I Gandhinagar 75 176,587 91,174 85,413 2 67 61 4 652 566 12 Ahmadabad 674 964,493 500,964 463,529 22 1,405 1,252 88 16,593 15,447 13 Kheda (Kaira) 957 1,962,357 1,034,923 927,434 39 2,546 2,278 87 16,726 14,948 14 Panch Mahals . 1,903 1,641,634 844,066 797,568 297 18,681 17,578 546 96,668 91,230 15 Vadodara (Baroda) 1,677 1,376,860 717,966 658,894 246 15,025 13,898 530 92,616 87,540 16 Bharuch (Broach) 1,137 916,587 468,823 447,764 152 9,597 9,382 362 63,505 61,363 17 Surat . . 1,218 1,184,272 597,369 586,903 132 7,963 7,712 299 52,714 51,417 18 Val sad (Bulsar) . 823 1,172,326 581,822 590,504 50 3,666 3,525 114 20,434 19,965 19 The Dangs (Dangs) 311 94,185 48,394 45,791 113 7,373 7,124 170 27,518 26,520
5 HARYANA 6,731 8,263,849 4,420,225 3,843,624 618 36,099 31,230 1,400 265,409 230,455
1 Ambala 1,221 753,670 406,889 346,781 227 14,270 12,311 465 85,874 72,761 2 Karoal 1,366 1,644,204 887,292 756,912 III 6,666 5,799 304 57,641 49,616 3 Rohfak 772 1,505,597 798,813 706,784 31 1,572 1,173 48 9,182 8,010 4 Gurgaon . 1,471 1,391,385 744,657 646,728 173 9,653 8,645 390 74,506 66,089 5 Mahendragarh 542 620,972 326,211 294,761 16 874 761 64 12,597 11 ,468 6 Hisar 1,059 1,793,120 958,164 834,956 53 2,784 2,326 113 22,236 19,448 7 Jind 300 554,901 298,199 256,702 7 280 215 16 3,373 3,063
6 HIMACHAL PRADESH' J6,916 3,218,544 1,628,623 1,589,921 12,020 503,944 509,913 3,723 573,230 563,339
1 Chamba 1,126 236,389 121,200 115,189 643 34,899 32,661 418 65,029 62,203 2 Kangra 6,150 1,278,560 628,278 650,282 4,264 177,568 191,554 1,377 208,105 216,521 3 Mandi 2,789 466,975 233,469 233,506 1,971 89,190 91,827 721 106,537 107,759 4 Kulu 169 181,613 93,857 87,756 2 143 131 31 5,909 5,714 5 Lahul and'Spit( 204 23,538 12,975 10,563 168 5,726 5,431 32 5,380 3,971 6 Bilaspur. . 911 185,288 92,408 92,880 618 30,536 30,683 228 34,661 34,692 7 Mahasu 2,894 424,031 220,546 203,485 2,259 89,640 86,887 513 80,219 73,740 8 Simla 1,631 147,997 77,359 70,638 1,472 45,464 43,086 132 20,904 18,860 9 Sirmaur 965 2~4,318 122,124 102,194 616 30,276 27,164 241 40,930 34,688
10 Kinnaur 77 49,835 26,407 23,428 7 502 489 30 5,556 5,191
7 JAMMU & KASHMIR 6,503 3,758,411 1,996,864 1,761,547 1,748 107,044 94,938 2,200 391,556 346,852
1 Anantnag 1,170 758,046 410,427 347,619 216 14,179 12,055 414 75,433 63,831 2 Srinagar . 684 404,444 219,281 185,163 189 12,768 10,768 228 44,318 37,074 3 Baramula. 1,020 709,481 384,231 325,250 207 13,277 11,362 328 61,326 51,783 4 Ladakh 235 97,382 49,054 48,328 69 4,907 4,928 96 16,055 15,441 5 Doda 652 322,684 170,889 151,795 248 14,779 13,549 225 37,912 34,370 6 Udhampu; 617 310,427 162,380 148,047 190 10,872 9,612 196· - 33,949 31,503 7 Jammu 1,063 540,401 278,526 261,875 331 19,183 17,623 394 68,098 63,386 8 Katlllua 536 249,586 129,843 119,743 188 10,238 9,075 164 27,966 25,565 9 RajaiJ.ri 368 208,976 109,817 99,159 99 6,143 5,361 115 19,247 17,467
10 Punch 158 156,984 82,416 74,568 11 698 605 40 7,252 6,432
8 KERALAt 1,268 17,880,926 8,852,350 9,028',576 2 121 124 2 613 537
1 Cannanore 178 2,040,260 1,010,547 1,029,713 2 Kozhikode 109 1,544,679 776,209 768,470 3 Malappuram 117 1,731,510 848,028 883,482
29 148 Iii; 4 Palghat' 147 1,471,263 713,640 757,623 30 5 Trichur' 229 1,878,952 901,905 977,047 2 92 94 146 124 6 Ernakulam 103 1,726,288 865,868 860,420
175 143 7 Kottayam 101 1,871,990 947,139 924,851 I 8 Alleppey 98 1,766,026 870,005 896,021 • 1 144 154 9 Quilono 98 2,222,918 1,110,172 1,112,746
10 Trivandrum 88 1,627,040 808,837 818,203
°There are 30 villages in Himachal Pradesh which are uninhabited (there being no occupied residential houses located in these villages but have houseless popula-villages with a population of 5 males only; Mandi district 17 villages with a population of 920 (751 M., 169 F.); Bilaspur district 1 viJIage with a population All these villages fall under the range "Less than 200".
t1ncludes the population of unsurveyed forest areas also. In the districts of Palghat, Trichur and Quilon, entries against Males and Females with 'nil' entry
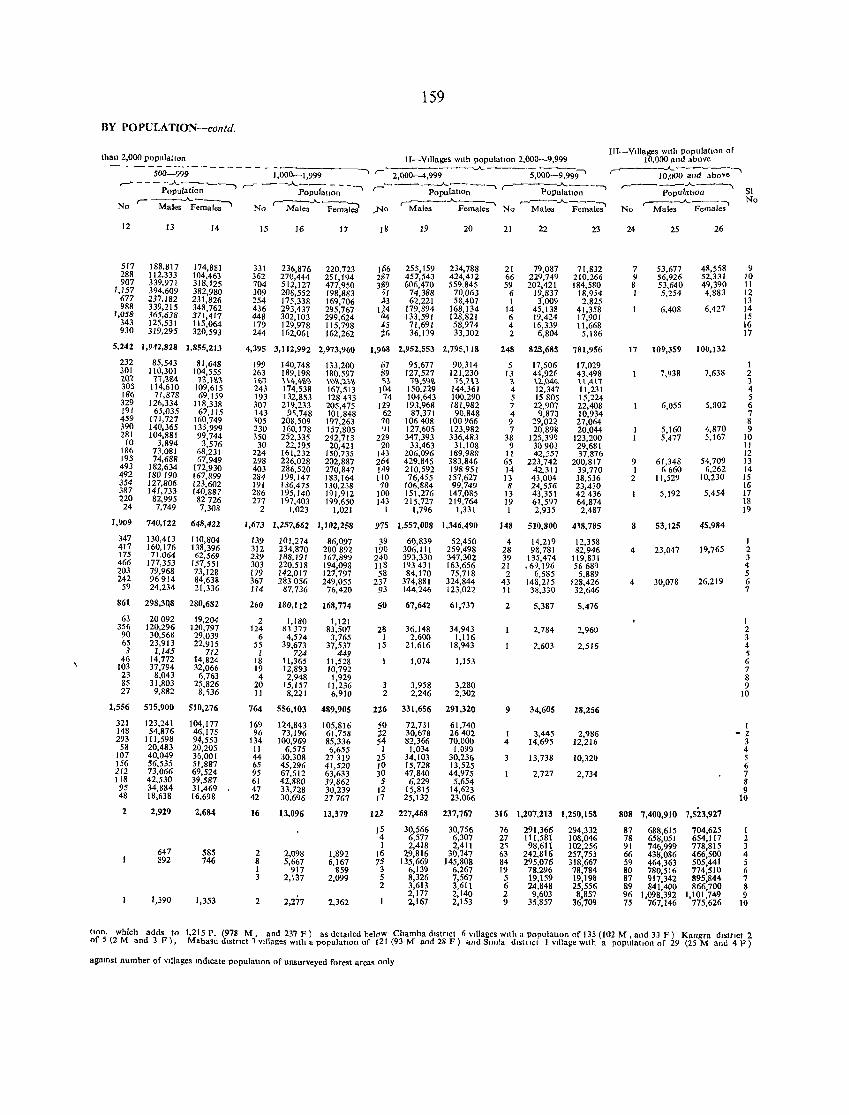
159
BY POPULATION-colltd.
than 2,000 populatIOn H-Villages with populatIOn 2,000-9,999 Ill-Villages WIth popuiallan of
10,000 and above ------ ..... _--------- _ ... ---, .--------------~ 5,000-9,999' r- -A. --------, 500-999 1,000-1,999 ' 2,000-4,999 IO,()(JO and above
r-" - -- --"--.------, ,_- ---A.--- - __ --, __ - -------.A. -- _---, r-..A.. __ ---, ,_-_ _ ~J.._-------..
Sl PopulatIOn Population r populatiOn PopulatIOn PopulatIon
r- Male.-"-F;males' r-~.A.--~ ~.A. __ ---, ,-----..A..-__ ---, ,..----_--~-- , No No No Male. Females ..No Males Females No Males Females No Males Females
12 13 14 15 16 17 18 19 20 21 22 23 24 25 26
517 188,817 174,881 331 236,876 220,723 166 255, 159 234,788 21 79,087 71,832 7 53,677 48,558 9 288 112,333 104,463 362 270,444 251,194 2$7 457,543 424,412 66 229,749 210,266 9 56,926 52,331 10 907 339,971 318,125 704 512,127 477,950 3~9 606,470 559,845 59 202,421 184,580 8 53,640 49,390 11
1,157 394,609 382,980 309 208,552 198,883 ';1 74,388 70,063 6 19,837 18,954 I 5,254 4,883 12 677 237,182 231,826 254 175,338 169,706 A3 62,221 58,407 1 3,009 2,825 13 988 339,215 348,762 436 293,437 295,767 124 179,894 168,134 14 45,138 41,358 6,408 6,427 14
1,058 365,638 371,417 448 302,103 299,624 <14 133,591 128,821 6 19,424 17,901 15 343 125,531 115,064 179 129,978 115,798 AS 71,691 58,974 4 16,339 lJ,668 16 930 319,295 320,593 244 162,061 162,262 % 36,139 33,302 2 6,804 5,186 17
5,242 1,942,828 1,855,213 4,395 3,112,992 2,973,960 1,968 2,952,553 2,795,118 248 825,685 781,956 17 109,359 100,132
232 85,543 81,648 199 140,748 133,200 P7 95,677 90,314 5 17,506 17,029 1 301 110,301 104,555 263 189,198 180,597 ~9 127,527 121,230 13 44,926 43,498 7,938 7,638 2 1m 71,,\>,4 n,ll'.>' If;.1 H"A'iI~ \\}II;nll s, 1~,S,!'iI 1S,lH " l'l.,(W;:. HA\1 3 305 114,610 109,615 243 174,538 167,513 104 150,229 144,361 4 12,347 11.231 4 186 71,878 69,159 193 132,853 128413 74 104,643 100,290 5 15805 15,224 5 329 126,334 118,338 307 219,233 205,475 129 193,968 181,982 7 22,907 22,408 6,055 5,802 6 191 65,035 67,115 143 9'.748 101,848 62 87.371 90,848 4 9.873 10,934 7 459 171,727 160,749 105 208,509 197,263 10 106408 100966 9 29,022 27,064 8 390 140,365 135,999 230 160,178 157,805 91 127,605 123,982 7 20,898 20,044 5,160 4,870 9 281 104,881 99,744 350 252,335 242,713 229 347,393 336,483 38 125,399 123,200 5,477 5,167 10
10 3,894 3,576 30 22,195 20,421 20 33,463 31,108 9 30903 29,681 II 181i 73,081 68,231 224 161,232 150,735 143 206,096 189,988 11 42,557 37,876 12 19S 74,688 67,949 298 226,028 202,887 264 429,845 383,846 65 223,742 200,817 9 61,348 54,709 13 493 182,634 172,930 403 286,520 270,847 149 210,592 198951 14 42,311 39,770 1 6660 6,262 14 492 180190 167,899 284 199,147 183,164 110 176,455 157,627 13 43,004 38,536 2 11,529 10,230 15 354 127,806 123,602 191 136,475 130,238 10 106,884 99,749 8 24,556 23,430 16 387 141,733 140,887 286 195,140 191,912 100 151,276 147,085 13 43,351 42436 5,192 5,454 17 220 82,995 82726 277 197,403 199,650 143 215,727 219,764 19 61,597 64,874 18 24 7,749 7,308 2 1,023 1,021 1 1,796 1,331 1 2,935 2,487 19
1,909 740,122 648,422 1,673 1,257,662 1,102,258 915 1,557,008 1,346,490 f48 510,800 418,785 53,125 45,984
347 130,413 110,804 139 101,274 86,097 39 60,839 52,450 4 14,219 12,358 I 417 160,176 138,396 312 234.870 200892 190 306,111 259,498 28 98,781 32,946 4 23,047 19,765 2 175 71,064 62,569 239 188,191 167,899 240 393,330 347.302 39 135,474 119,831 3 466 177,353 157,551 303 220.518 194,098 118 193431 163,656 21 ,69,196 56689 4 203 79,968 73,128 199 142,017 121,797 58 84,170 75,718 2 6,585 5.889 5 242 96914 84,638 367 283056 249.055 237 374,881 324,844 43 148,215 128,426 4 30,078 26,219 6
59 24,234 21,336 114 87.736 76,420 93 144,246 123,022 11 38,330 32,646 7
861 298,3Q8 280,682 260 180,lI2 168,774 ,,0 67,642 61,137 2 5,387 5,476
63 20092 19,204 2 1,180 1,121 I 356 120,296 120,797 124 81377 83,507 28 36,148 34,943 2,784 2,960 2 90 30,568 29,039 6 4,574 3,765 I 2,600 1,116 3 65 23,913 22,915 55 39,673 37,537 15 21,616 18,943 2,603 2,516 4 3 1,145 712 I 724 449 5
46 14,772 14,824 18 11,365 11 ,528 1,074 1,153 6 103 37,794 32,066 19 12,893 10,792 7 23 8,043 6,763 4 2,948 1,929 8 85 31,803 25,826 20 15,IS7 11,236 3 3,958 3,280 9 27 9,882 8, ~36 11 8,221 6,910 2 2,246 2,302 10
1,556 575,900 510,276 764 556,103 489,905 226 331,656 291,320 9 34,605 28,256
321 123,241 104,177 169 124,843 105,816 SO 72,731 61,740 1 148 54,876 46,175 96 73,196 61,758 ;12 30,678 26402 I 3,445 2,986 - 2 293 111,598 94,553 134 100,969 85,336 54 82,366 70,000 4 14,695 12,216 3 58 20,483 20,205 II 6,575 6,655 I 1,034 1,099 4
107 40,049 36,001 44 30,308 27319 25 34,103 30,236 13,738 10,320 5 156 56,535 51,887 65 45,296 41,520 10 15,728 13,525 6 212 73,066 69,524 95 67,612 63,633 30 47,840 44,975 2,727 2,734 7 ll8 42,530 39,587 61 42,ggO 39,862 5 6,229 5,654 8 95 34,884 31,469 47 33,728 30,239 12 15,815 14,623 9 48 18,638 16,698 42 30,696 27767 17 25,132 23,066 10
2 2,929 2,684 16 13,096 13,379 122 227,468 237,767 316 1,207,213 1,250,158 808 7,400,910 7,523,927
15 30,566 30,756 76 291,366 294,332 87 688,615 704,625 I 4 6,577 6,307 27 1l1,581 108,046 78 658,051 654,117 2 1 2,418 2,411 2~ 98,611 102,256 91 746,999 778,815 3
647 585 2 2,098 1,892 16 29,816 30,747 63 242,816 257,753 66 438,086 466,500 4 892 746 8 5,667 6,167 75 135,669 145,808 84 295,076 318,667 59 464,363 505,441 5
1 917 859 3 6,139 6,267 19 78,296 78,784 SO 780,516 774,510 6 3 2,137 2,099 5 8,326 7,567 5 19,159 19,198 87 917,342 895,844 7
2 3,613 3,611 6 24,848 25,556 89 841,400 866,700 8
2,217 2,177 2,140 2 9,603 8,857 96 1,098,392 1,101,749 9
1,390 1,353 2 2,362 2,167 2,153 9 35,857 36,709 75 767,146 775,626 10
tlOn, which adds to 1,215 P, (978 M, and 237 F) as detailed bel"w Chamba dIstrict 6 Villages With a population of 13S (102 M , and 33 F) Kangr. d,strict 2 of 5 (2 M and 3 P), Mahasu district 1 Villages wah a populatton of 121 (93 M and 23 F) and SImla dlstnct I Village wnh a populatIOn of 29 (25 M and 4 F)
agaInst number of Villages Indicate population of unsurveyed forest areas only
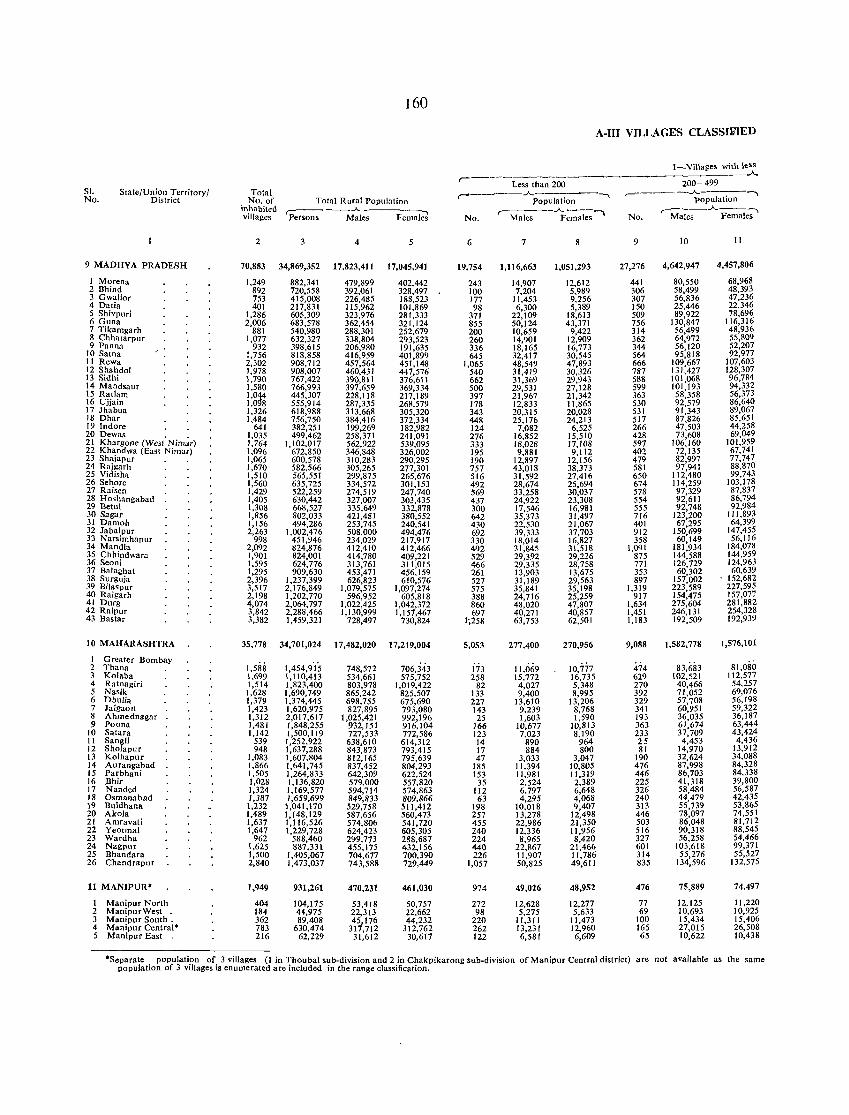
Sl, No,
State/Union Territory/ District
9 MADHYA PRADESH
I Morena 2 Bhind 3 Gwalior 4 Datia 5 Shivpuri 6 Guna 7 Tikamgarh 8 Chhatarpur 9 Panna
10 Satna II Rewa 12 Shah dol 13 Sidhi 14 Mandsaur 15 Rallam 16 Ujjain 17 Jhabua 18 Dhar 19 Indore 20 Dewas " 21 Khargone (West Nimar) 22 Khandwa (East Nimar) 23 Shajapur 24 Rajgarh 25 Vidisha 26 Sehore 27 Raisen 28 Ho<hangabad 29 Betu! 30 Sagar 31 Damoh 32 Jabalpur 33 Narsimhapur 34 Mandla 35 Chhindwarn 36 Seoni 37 Balaghat 38 Surguja 39 BiJaspur 40 Raigarh 41 Durg 42 Raipur 43 Bastar
10 MAHARASHTRA
1 Greater Bombay 2 Thana 3 Kolaba 4 Ratnagiri 5 Nasik 6 Dhulia 7 Jalgaon 8 Ahme dna gar 9 Poona
10 Satara II Sangli 12 Sholapur 13 Kolhapur 14 Aurangabad 15 Parbhani 16 ;Shir 17 Nanded 18 Osmanabad 19 Buldhana 20 Akola 21 Amravati 22 Yeotmal 23 Wardha 24 Nagpur 25 Bhandara 26 Chandrapur
11 MANIPUR*
1 Manipur North 2 ManipurWest , 3 Manipur South, 4 Manipur Central' 5 Manipur East
160
Total No, of Total Rural Population
inhabited c-----"------:--, villages Persons Males Females
2
70,883
1,249 892 753 401
1,286 2,006
881 1,077
932 1,756 2,302 1,978 1,790 1,580 1,044 I,Og8 1,326 1,484
64! 1,035 1,764 1,096 1,065 1,670 1,510 1,560 1,429 1,405 1,308 1,856 1,156 2,263
998 2,092 1,901 1,595 1,295 2,396 3,517 2,198 4,074 3,842 3,382
35,778
1,588 1,699 1,514 1,628 1,379 1,423 1,312 1,481 1,142
539 948
1,083 1,866 1,505 1,028 1,324 1,387
1,232 1,489 1,637 1,647
962 1,625 1,500 2,840
1,949
404 184 362 783 216
3
34,869,352
882,341 720,558 415,008 217,831 605,309 683,578 540,980 632,327 398,615 818,858 908,712 908,007 767,422 766,993 445,307 555,914 618,988 756,750 382,251 499,462
1,102,017 672,850 600,578 582,566 565,551 635,725 522,259 630,442 668,527 802,033 494,286
1,002,476 451,946 824,876 824,001 624,776 909,630
1,237,399 2,176,849 1,202,770 2,064,797 2,288,466 1,459,321
34,701,024
1,454,9'15 1,110,413 1,823,400 1,690,749 1,374,445 1,620,975 2,017,617 1,848,255 1,500,119 1,252,922 1,637,288 1,607,804 1,641,745 1,264,833 1,136,820 1,169,577 1,659,699
1,041,170 1,148,129 1,116,526 1,229,728
588,460 887,331
1,405,067 1,473,037
931,261
104,175 44,975 89,408
630,474 62,229
4
17,823,411
479,899 392,061 226,485 115,962 323,976 362,454 288,301 338,804 206,9~0 416,959 457,564 460,431 390,8\1 397,659 228,118 287,335 313,668 384,416 199,269 258,371 562,922 346,848 310,283 305,265 299,875 334,572 274,519 327,007 335,649 421,481 253,745 508,000 234,029 412,410 414,780 313,761 453,471 626,823
1,079,575 596,952
1,022,425 1,130,999
728,497
17,482,020
748,572 534,661 803,978 865,242 698,755 827,895
1,025,421 932,151 727,533 638,610 843,873 812,165 837,452 642,309 579,000 594,714 849,833 529,758 587,656 574,806 624,423 299,773 455,175 704,677 743,588
470,231
53,418 22,313 45,176
317,712 31,612
17,045,941
402,442 328,497 188,523 101,869 281,333 321,124 252,679 293,523 191,635 401,899 451,148 447,576 376,611 369,334 217,189 268,579 305,320 372,334 182,982 241,091 539,095 326,002 290,295 277,301 265,676 301,153 247,740 303,435 332,878 380,552 240,541 494,476 217,917 412,466 409,221 311,015 456,159 610,576
1,097,274 605,818
1,042,372 1,157,467
730,824
17,219,004
706j43 575,752
1,019,422 825,507 675,690 793,080 992,196 916,104 772,586 614,312 793,415 795,639 804,293 622,524 557,820 574,863 809,866 511,412 560,473 541,720 605,305 288,687 432,156 700,390 729,449
461,030
50,757 22,662 44,232
312,762 30,617
A-III VILLAGES CLASSIJi1ED
r----- Less than 200
,-------"-population """"""I
No, r- Mal-e-s---'pemal';;'
6
19,754
243 100 177 98
371 855 200 260 336 645
1,065 540 662 500 397 178 343 448 124 276 333 195 190 757 516 492 569 437 300 642 430 692 330 492 529 466 261 527 575 388 860 697
1',258
5,053
i73 258
82 133 227 143 25
166 123 14 17 47
185 153
35 112 63
198 257 455 240 224 440 226
1,057
974
272 98
220 262 122
7
1,116,663
14,907 7,204
11,453 6,300
22,109 50,124 10,659 14,901 18,165 32,417 48,549 31,419 31,369 29,531 21,967 12,833 20,315 25,176
7,082 16,852 18.028 9,881
12,897 43,018 31,592 28,674 33,258 24,922 17,546 35,373 22,530 39,333 18,014 31,845 29,392 29,335 13,903 31,189 35,841 24,716 48,020 40,271 63,753
277,400
11,069 15,772 4,027 9,400
13,610 9,239 1,603
10,677 7,023
890 884
3,033 11,394 11,981 2,524 6,797 4,295
10,018 13,278 22,986 12,336 8,965
22,867 11,907 50,825
49,026
12,628 5,275
11,311 13,231 6,581
1,051,293
12,612 5,989 9,256 5,389
18,613 43,371
9,422 12,909 16,773 30,545 47,893 30,326 29,943 27,128 21,342 11,865 20,028 24,213
6,525 15,510 17,108 9,112
12,156 38,373 27,416 25,694 30,037 23,308 16,981 31,497 21,067 37,703 16,827 31,518 29,226 28,758 13,1575 29,563 35,198 25,259 47,807 40,857 62,501
270,956
10,777 16,735 5,348 8,995
13,206 8,768 1,590
10,813 8,190
964 800
3,047 10,805 11,319 2,389 6,648 4,068 9,407
12,498 21,350 11,956 8,420
21,466 11,786 49,611
48,952
12,277 5,633
11,473 12,960 6,609
I-Villages with le~
200- 499
,..-------;;;;;;ulation -,
No. r-Male-s--"-p;;;je7'
9
27,276
441 306 307 150 509 756 314 362 344 564 666 787 588 599 363 530 531 517 266 428 597 402 479 581 650 674 578 554 555 716 401 912 358
1,091 875 771 353 897
1,319 917
1,634 1,451 1,183
9,088
474 629 270 392 329 341 193 363 233 25 81
190 476 446 225 326 240 313 446 503 516 327 601 314 835
476
77 69
100 165 65
10
4,642,947
80,550 58,499 56,836 25,446 89,922
130,847 56,499 64,972 56,120 95,818
109,667 131,427 101,068 101,193 58,358 92,579 91,343 87,826 47,503 73,608
106,160 72,135 82,997 97,941
112,480 114,259 97,329 92,611 92,748
123,200 67,295
150,699 60,149
181,934 144,588 126,729 60,302
157,002 223,589 154,475 275,604 246,131 192,509
1,582,778
83,iii!3 102,521
40,466 71,052 57,708 60,951 36,035 61,674 37,709 4,453
14,970 32,624 87,998 86,703 41,318 58,484 44,479 55,739 78,097 86,048 90,318 56,258
103,618 55,276
134,596
75,889
12,125 10,693 15,434 27,015 10,622
11
4,457,806
68,968 48,393 47,236 22,346 78,696
116,316 48,936 55,809 52,207 92,977
107,603 128,307 96,784 94,332 56,373 86,640 89,067 85,65 1 44,258 69,049
101,959 67,741 77,747 88,870 99,743
103,178 87,837 86,794 92,984
111,893 64,399
147,455 56,116
184,078 144,959 124,963 60,639
152,682 227,595 157,077 281,882 254,328 192,939
1,576,101
81,080 112,577
54,257 69,076 56,198 59,322 36,187 63,444 43,424 4,436
13,912 34,088 84,328 84,338 39,800 56,587 42,435 53,865 74,551 81,712 88,545 54,466 99,371 55,527
132,575
74,497
11,220 10,925 15,406 26,508 10,438
·Separate population of 3 villages (I in Thoubal sub-division and 2 in Chakpikarong sub-division of Manipur Central district) are not available as the same population of 3 villages is enumerated are included in the range classification.
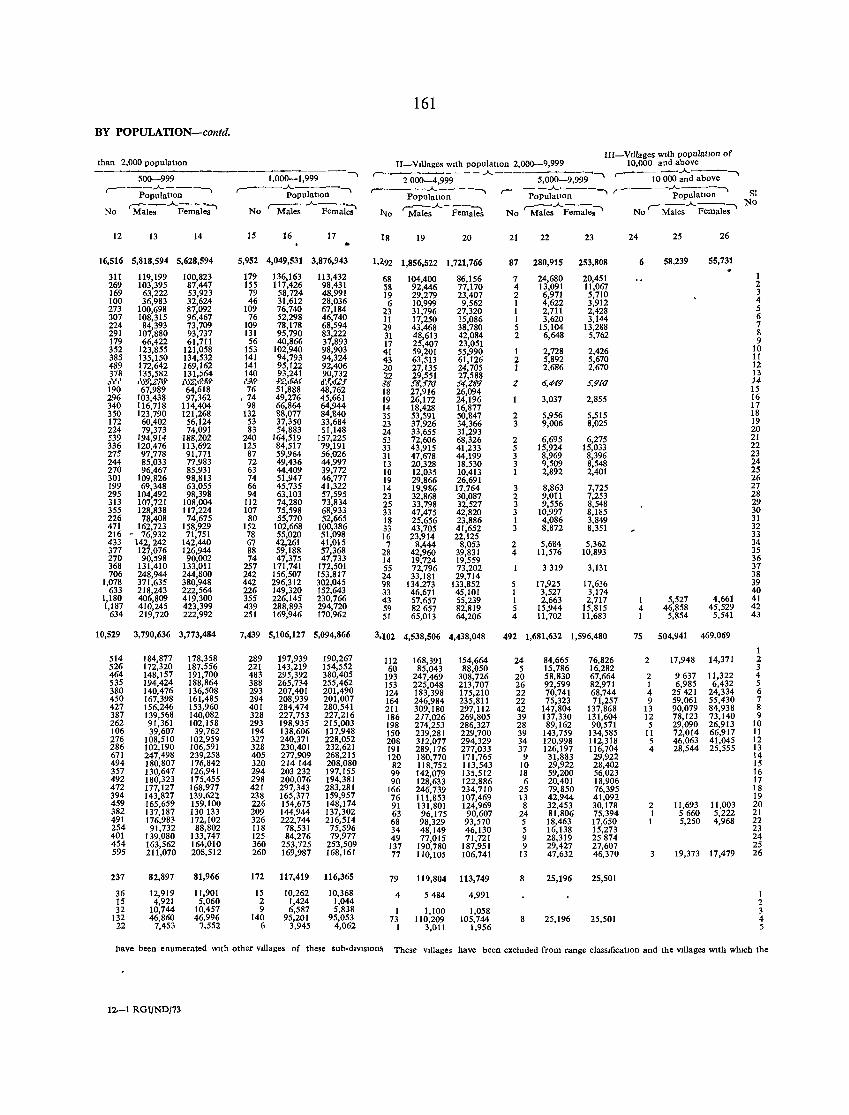
BY POPULATION-contd.
than 2,000 populatIon
500-999 ,------..A.. - --___,
Populatton
No 'Mal;'-..A.P;,;;-,Ye;--
12 13 14
16,516 5,818,594 5,628,594
311 269 169 100 273 307 224 291 179 352 385 489 378
;;"'1-11
190 296 340 350 172 224 539 336 275 244 270 301 199 295 313 355 226 471 216 433 377 270 368 706
1,078 633
1,180 1,187
634
119,199 103,395
63,222 36,983
100,698 108,315
84,393 107,880 66,422
123,855 135,150 172,642 135,582 1\w,2ilS' 67,989
103,438 116,718 123,790
60,402 79,373
194,914 120,476 97,778 85,033 96,467
109,826 69,348
104,492 107,721 128,838 78,408
162,723 - 76,932
142,242 127,076 90,598
131,410 248,944 371,635 218,243 406,809 410,245 219,720
100,823 87,447 53,923 32,624 87,092 96,467 73,709 93,737 61,711
121,058 134,532 169,162 131,564 ,w,6'Jil' 64,618 97,362
114,404 121,268
56,124 74,091
188,202 tt3,692 91,771 77,983 85,931 98,813 63,055 98,39l!
108,004 117,224 74,675
158,929 71,751
142,440 126,944
90,002 133,Oll 244,800 380,948 222,564 419,300 423,399 222,992
10,529 3,790,636 3,773,484
514 526 464 535 380 450 427 387 262 106 276 286 671 494 357 492 472 394 459 382 491 254 401 454 595
237
36 15 32
132 22
184,877 172,320 148,157 194,424 140,476 167,398 156,246 139,568 91,361 39,607
108,510 102,190 247,498 180,807 130,647 180,323 177,127 143,827 165,659 137,187 176,983
91,732 139,080 163,562 211,070
82,897
12,919 4,921
10,744 46,860
7,453
178,358 187,556 191,700 188,864 136,508 161,485 153,960 140,082 102,158
39,762 102,959 106,591 239,258 176,842 126,941 175,455 168,977 139,622 159,100 130133 172,102
88,802 133,747 164,010 208,512
81,966
11,901 5,060
10,457 46,996
7,552
1,000-1,999
,......,.------~opulatlOrt ----,
No Males..A.. Femal;'
15 16 17
5,952 4,049,531 3,876,943
179 155 79 46
109 76
109 131 56
153 141 141 140 ,'M' 76
, 74 98
132 53 83
240 125 87 72 63 74 66 94
112 107
80 152 78 67 88 74
257 242 442 226 355 439 251
136,163 117,426
58,724 31,612 76,740 52,298 78,178 95,790 40,866
102,940 94,793 95,122 93,241 :P~diM 51,888 49,276 66,864 88,077 37,350 54,883
164,519 84,517 59,964 49,436 44,409 51,947 45,735 63,103 74,280 75,598 55,770
102,668 55,020 42,261 59,188 47,375
171,741 156,507 296,312 149,320 226,145 288,893 169,946
113,432 98,431 48,991 28,036 67,184 46,740 68,594 83,222 37,893 98,903 94,324 92,406 90,732 6'J,<f2j 48,762 45,661 64,944 84,840 33,684 51,148
151,225 79,191 56,026 44,997 39,772 46,777 41,322 57,595 73,834 68,933 52,665
100,386 51,098 41,015 57,368 47,733
172,501 153,817 302,045 152,643 230,766 294,720 170,962
7,439 5,106,127 5,094,866
289 221 483 388 293 294 401 328 293 194 327 328 405 320 294 298 421 238 226 209 326 118 125 360 260
197,939 143,219 295,392 265,734 207,401 208,939 284,474 227,753 198,935 138,606 240,371 230,401 277,909 214144 203232 200,076 297,343 165,377 154,675 144,944 222,744
78,531 84,276
253,125 169,987
190,267 154,552 380,405 255,462 201,490 201,007 280,541 227,216 215,003 137,948 228,052 232,621 268,215 208,080 197,155 194,381 283,281 159,957 148,174 137,302 216,514
75,596 79,977
253,509 168,161
172 117,419 116,365
15 2 9
140 6
10,262 1,424 6,587
95,201 3,945
10,368 1,044 5,838
95,053 4,062
161
III-VIllages wIth populatIOn of II-VIllages WIth populatIOn 2,000-9,999 10,000 and above . ________ ..A..--------~___, ,---- __ ..A.. ___ ___,
r- 2000-4,999 5,000--9,999 10000 and above ,----...A-----, ,-___ ...A-___ , ,-___ ..A. ___ ___, Population Population Populatton
r:-~..A..- ---:-. ,---..A..--...... ,.--:-:-:-..A..--___, 1\[0 Males Females No Males Females No Males Females
18 19 20
1,292 1,856,522 1,721,766
68 58 19 6
~3 II ~9 31 17 41 43 20 22 38 18 19 14 35 23 24 53 33 31 13 10 19 14 23 25 33 18 33 16 7
28 14 55 24 \18 33 43 59 51
104,400 92,446 29,279 10,999 31,796 17,250 43,468 48,613 25,407 59,201 63,513 27,135 29,551 SS,STr] 27,916 26,172 18,428 53,591 37,926 33,655 72,606 43,915 47,678 20,328 12,035 29,866 19,986 32,868 33,798 47,475 25,656 43,705 23,914
8,444 42,960 19,724 72,796 33,181
134,273 46,671 57,657 82657 65,013
86,156 77,170 23,407
9,562 27,320 15,086 38,780 42,084 23,051 55,990 61,126 24,705 27,588 S4,ZtJ9 26,094 24,196 16,877 50,847 34,366 31,293 68,326 41,233 44,199 18,530 10,413 26,691 17,764 30,087 32,527 42,820 23,886 41,652 22,125
8,053 39,831 19,559 73,202 29,714
133,852 45,101 55,239 82,819 64,206
3,102 4,538,506 4,438,048
112 60
193 153 124 164 211 186 198 ISO 208 191 120
82 99 90
166 76 91 63 68 34 49 137 77
79
4
I 73
1
168,391 85,043
247,469 225,048 183,398 246,984 309,180 217,026 274,253 239,281 312,077 289,176 180,770 tt8,752 142,079 128,633 246,739 Ill,853 131,801 96,175 98,329 48,149 77,015
190,780 110,105
154,664 88,050
308,726 213,707 175,210 235,8ll 297,112 269,805 286,327 229,700 294,329 277,033 171,765 113,543 135,512 122,886 234,710 107,469 124,969
90,607 93,570 46,130 71,721
187,951 106,741
11 9,804 113,749
5484
1,100 110,209
3,011
4,991
1,058 105,744
1,956
21 22 23
87 280,915 253,808
7 4 2 1 1 1 5 2
1 2 1
Z
2 3
2 5 3 3 1
3 2 3 3 1 3
2 4
5 1 1 5 4
24,680 13,091 6,971 4,622 2,7tt 3,620
15,104 6,648
2,728 5,892 2,686
6,#9
3,037
5,956 9,006
6,695 15,924 8,969 9,509 2,892
8,863 9,Ott 9,556
10,997 4,086 8,872
5,684 11,576
3319
17,925 3,527 2,663
15,944 tl,702
20,451 tt,067 5,710 3,912 2,428 3,144
13,288 5,762
2,426 5,670 2,610
S,9l<J
2,855
5,515 8,025
6,275 15,033 8,396 8,548 2,401
7,725 7,253 8,548 8,185 3,849 8,351
5,362 10,893
3,131
17,636 3,174 2,717
15,815 11,683
492 1,681,632 1,596,480
24 5
20 26 22 22 42 39 28 39 34 37
9 10 18
6 25 13 8
24 5 5 9 9
13
8
8
84,665 15,786 58,830 92,599 70,741 75,323
147,804 137,330 89,162
143,759 120,998 126,197
31,883 29,922 59,200 20,401 79,850 42,944 32,453 81,806 18,463 16,138 28,319 29,427 47,632
25,196
25,196
76,826 16,282 67,664 82,971 68,744 71,257
137,868 131,604 90,571
134,585 112,318 116,704 29,922 28,402 56,023 18,906 76,395 41,092 30,178 75,394 17,650 15,273 25874 27,607 46,370
25,501
25,501
24
6
1 4 1
25
58,239
5,527 46,858
5,854
26
55,731
4,661 45,529
5,541
75 504,941 469,069
2
2 1 4 9
13 12 5
II 5 4
2 1 I
17,948
9637 6,985
25421 59,061 90,079 78,123 29,090 72,014 46,063 28,544
11,693 5660 5,250
14,371
tt,322 6,432
24,334 55,430 84,938 73,140 26,913 66,917 41,045 25,555
11,003 5,222 4,968
19,373 17,479
SI No
1 2 3 4 5 6 7 8 9
10 11 12 13 U 15 16 17 18 19 20 21 22 23 24 25 26 27 28 29 30 31 32 33 34 35 36 37 38 39 40 41 42 43
1 2 3 4 5 6 7 8 9
10 tt 12 13 14 15 16 17 18 19 20 21 22 23 24 25 26
I 2 3 4 5
have been enumerated WIth other VIllages of these sub-dIVISIons These VIllages have been excluded from range classificatIOn and the VIllages WIth whIch the
12--1 RO[/NDf73
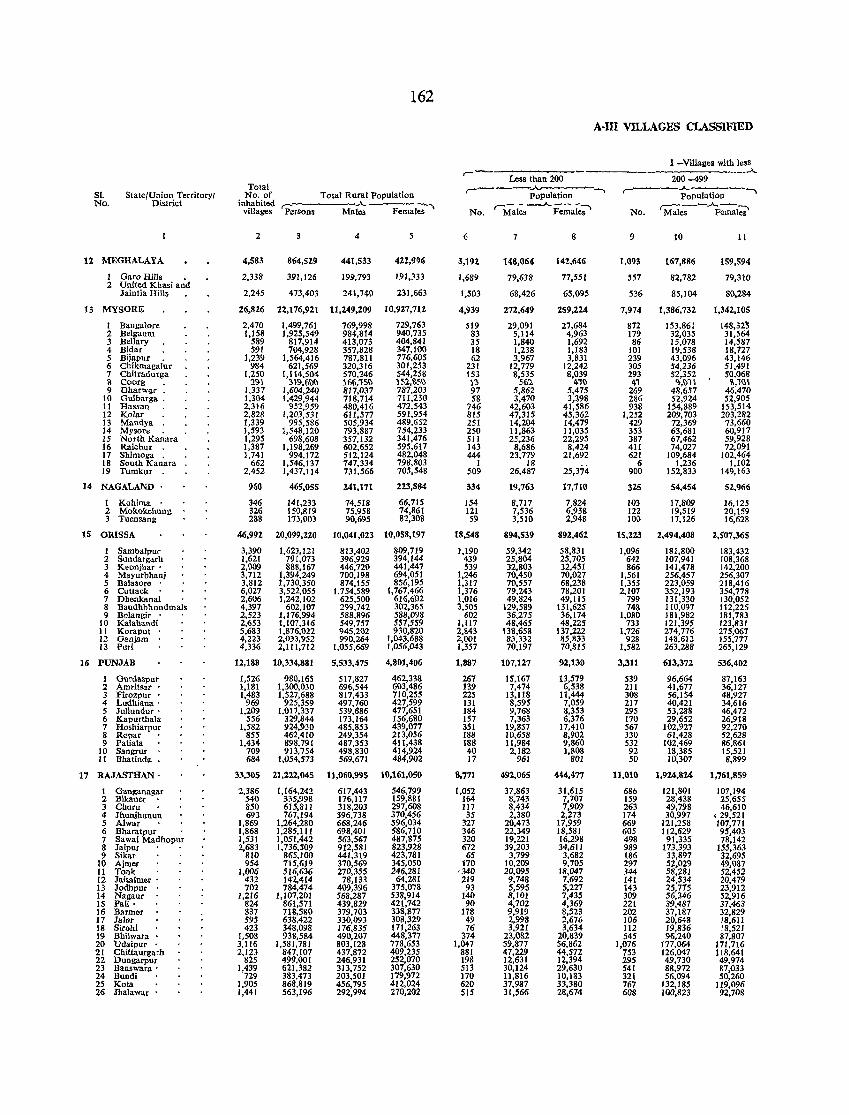
SI. No.
State/Union TerritorYI District
12 MEGHALAYA
1 GaroHiIIs • 2 United Khasi and
Jaintia Hills
13 MYSORE
I Bangalore 2 Belgaum 3 BelJary . 4 Bidar 5 Bijapur • 6 Cb.ikmagalur 7 Chitradurga 8 CooTg • 9 Dharwar .
10 Gulbarga. 11 Hassan 12 Kolar 13 Mandya 14 Mysore 15 North Kanara 16 Raichur 17 Shimoga . 18 South Kanara 19 Tumkur
14 NAGALAND .
1 Kohima 2 Mokokchung 3 Tuensang
15 ORISSA
1 Sambalpur 2 Sundargarh 3 Keonjhar' 4 Mayurbhanj 5 Balasore . 6 Cuttack 7 Dhenkanal 8 Baudhbhondmals 9 Balangir
10 Kalahandi II Korapu! 12 Ganjam 13 Puri
16 PUNJAB
I Gurdaspur 2 Amritsar • 3 Firozpur • 4 Ludhiana' 5 lullundur' 6 Kapuriliala 7 Hoshiarpur 8 Ropar 9 Patiala
10 Sangrur 11 Bhatinda.
17 RAJASTHAN·
I Ganganagar 2 Btkaner . 3 Churu 4 Jhunjhunun 5 Alwar 6 Bharatpur . 7 Sawai Madhopur 8 Jaipur 9 Sikar
10 Ajmer II Tonk 12 Jaisalmer' 13 Jodhpur 14 Nagaur 15 Pali· 16 Banner 17 Jalor 18 Sirohi 19 Bhilwara 20 Udaipur 21 Chittaurgarh 22 Dungarpur 23 Banswara' 24 Bundi 25 Kota 46 Ihalawar •
162
Total No. of Total Rural Population
inhabited ~ ____ ..A.. ------. villages Persons Males Females
2
4,583
2,338
2,245
26,826
2,470 1,158
589 591
1.239 984
1.250 291
1,337 1,304 2.316 2,828 1,339 1.593 1.295 1,387 1,741
662 2.452
960
346 326 288
46,992
3,390 1,621 2,009 3,712 3,812 6,027 2,606 4,397 2,523 2,653 5,683 4,223 4,336
12,188
1,526 1,181
I,~~~ 1,209
556 1,582
855 1,434
709 684
33,305
2,386 540 850 693
1,869 1,868 1,531
2'~n 954
1,006 432 702
1,216 824 837 595 423
1,508 3,116 2,123
825 1,439
729 1,905 1,441
864,529
391,126
473,403
22,176,921
1,499,761 1,925,549
817,914 704,928
1,564.416 621,569
1,114,504 319.600
1,604,240 1,429,944
952,959 1,203,531
995,586 1,548,120
698,608 1,198,269
994,172 1,546,137 1,437,114
465,055
141,233 150,819 173,003
20,099,220
1,623,121 791,013 888,167
1,394,249 1,730,350 3,522,055 1,242,102
602,107 1,176,994 1,107,316 1,876,G22 2,033,952 2,IlI,712
10,334,881
980,165 1,300,030 1,527,688
925,359 1,017,337
329,844 924,930 462,410 898,791 913,754
1,054,573
21,222,045
1,164,242 335,998 615,811 767,194
1,264,280 1,285,111 1,051,442 1,736,509
865,100 715,619 516,636 142,414 784,474
1,107,201 861,571 718,580 638,422 348,098 938,584
1,581,781 847,107 499,001 621,382 383,473 868,819 563,196
4
44t,533
199,793
241,740
11,249,209
769,998 984,814 413,073 357,828 787,811 320,316 570,246 1 66,15{) 817,037 718,714 480,416 611,577 505,934 793,887 357,132 602,652 512,124 747,334 731.566
241,171
74,518 75,958 90,695
10,041,023
813,402 396,929 446,720 700,198 874,155
1,754.589 625,500 299,742 588,896 549.757 945,202 990,264
1,055,669
5,533,475
517,827 696,544 817,433 497,760 539,686 173,164 485,853 249,354 487,353 498,830 569,671
11,059,995
617,443 176,117 318,203 396,738 668,246 698,401 563,5137 912,581 441,319 370,569 270,355
78,133 409,396 568,287 439,829 379,703 330,093 176,835 490,207 803,128 437.872 246,931 313,752 203,501 456,795 292,994
422,996
191,333
231,663
10,927,712
729,763 940,735 404,841 347,100 776,605 301,253 544,258 1 52,1I5{) 787,203 711,230 472,543 591,954 489,652 754,233 341,476 595,617 482,048 798,803 705,548
223,884
66,715 74,861 82,308
10,OS8,197
809,719 394,144 441,447 694,051 856,195
1,767,466 616,602 302,365 588,098 551,5S9 930,820
1,043,688 1,056,043
4,301,41)6
462,338 603,486 710,255 427,599 477,651 156,680 439.077 213,056 411,438 414,924 484,902
10,161,050
546,799 159,881 297,608 370,456 596,034 586,710 487,875 823,928 423,781 345,050 246,281
64,281 375,078 538,914 421,742 338,877 308,329 171,263 448,377 778,653 409,235 252,070 307,630 179,972 412,024 270,202
r- ---Le-ss-th-a-n~2-00-
No.
3,192
1,689
1,503
4,939
519 83 35 18 62
231 153 13 97 58
746 815 2S1 250 511 143 444
I 509
334
154 121 59
18,S48
1,190 439 539
1,246 1,317 1,376 1,016 3,505
602 1,117 2,843 2,001 1,357
l,BS7
267 139 225 131 184 157 351 188 188 40 17
8,771
1,052 164 117 35
327 346 320 672
65 170
'340 219 93
140 90
118 49 16
374 1,047
881 198 513 170 620 SIS
7
148,064
79,638
68,426
272,649
29,091 5,114 1,840 1,238 3,967
12,779 8,535
562 5,862 3,470
42,603 47,315 14,204 11,863 25,236
8,686 23,719
18 26,487
19,763
8,717 7,536 3,510
894,539
59,342 25,804 32,803 70,450 70,557 79,243 49,824
129,589 36,275 48,465
138,658 83,332 70,197
107,121
15,161 7,474
13,118 8,595 9,768 7,363
19.857 10,658 11,984 2,182
961
492,065
37,863 8,743 8,434 2,380
20,473 22,349 19,221 39,203
3,799 10,209 20,095 9,748 5,595 8,101 4,702 9,919 2,998 3,921
23,082 59,877 47,229 12,631 30,124 11,816 37,987 31,566
8
142,646
77,551
65,09.5
259,224
27,684 4.963 1,692 1,183 3.831
12,242 8,039
~'i{) 5,475 3,398
41,586 45,362 14,479 11,035 22,295
8,424 21,692
25,374-
17,710
7,824 6,938 2,948
892,462
58,831 25,705 32,451 70,027 68,238 78,201 49,115
131,625 36,174 48,225
137,222 85,833 70,815
92,130
13,579 6,538
11,444 7,059 8,353 6,376
17,410 8,902 9,860 1,808
801
444,477
31,615 7,707 7,909 2,273
17,959 18,581 16,298 34,611 3,682 9,705
18,047 7,692 5,227 7,435 4,369 8,523 2,676 3,634
20,839 56,862 44,572 12,394 29,630 10,183 33,380 28,674
A·ID VILLAGES CLASSIFIED
I -Villages with lesS , ______ ..A...
200-499 r-----;;,~--.,
No. ~e-;---'p~l~
9
1,093
557
536
7,974
872 179 86
101 239 305 293 ~'i
269 286 938
1,252 429 353 387 411 621
6 900
325
103 122 100
15,223
1,096 642 866
1,561 1,355 2,101
799 748
1,080 733
1,726 928
1,582
3,311
539 211 308 217 295 170 567 330 532 92 SO
11,010
68b 159 263 174 669 605 498 989 186 297 344 141 143 309 221 202 106 112 545
1,076 753 295 541 321 767 608
to
167,886
82,782
85,104
1,386,732
153,861 32,035 15,078 19,538 43,096 54,236 52,352
9,{)11 48,657 52,924
154,889 209,703
72,369 63,681 67,462 74,027
109,684 1,236
152.833
54,454
17,809 19,519 17,126
2,494,408
181,800 107,941 141,478 256,457 223,059 352,193 131,330 110,097 181,982 121,395 274,776 148,612 263,288
613,372
96,664 41,677 56,154 40,421 53,288 29,652
102,927 61,428
102,469 18,385 10,307
1,924,824
121,801 28,438 49,798 30,997
121,258 112,629
91,335 173,393
33,897 52,029 58,281 24,534 25,775 56,346 39,487 37,187 20,648 19,836 96,240
177,064 126,047 49,730 88,972 56,094
132,185 100,823
11
159,594
79,310
80,284
1,342,105
148,32!i 31,564 14,587 18,727 43.146 51,491 50,068 1I,1~1
46,470 52,905
153,514 203,282 73,660 60,917 59,928 72,091
102,464 1,102
149,163
52,966
16,125 20,159 16,628
2,507,365
183,432 108,368 142,200 256,307 218,416 354,778 130,052 112,225 181,783 123,831 275,067 155,777 265,129
536,402
87,163 36,127 48,927 34,616 46,472 26,918 92,270 52,628 86,861 15,521 8,899
1,761,859
107,194 25,655 46,610
,29,521 107,771 95,403 78,142
155,363 32,695 49,087 52,452 20,479 23.912 52,916 37,463 32,829 18,611 18,521 87,807
171,716 118,641 49,974 87,033 50,260
119,096 92,708
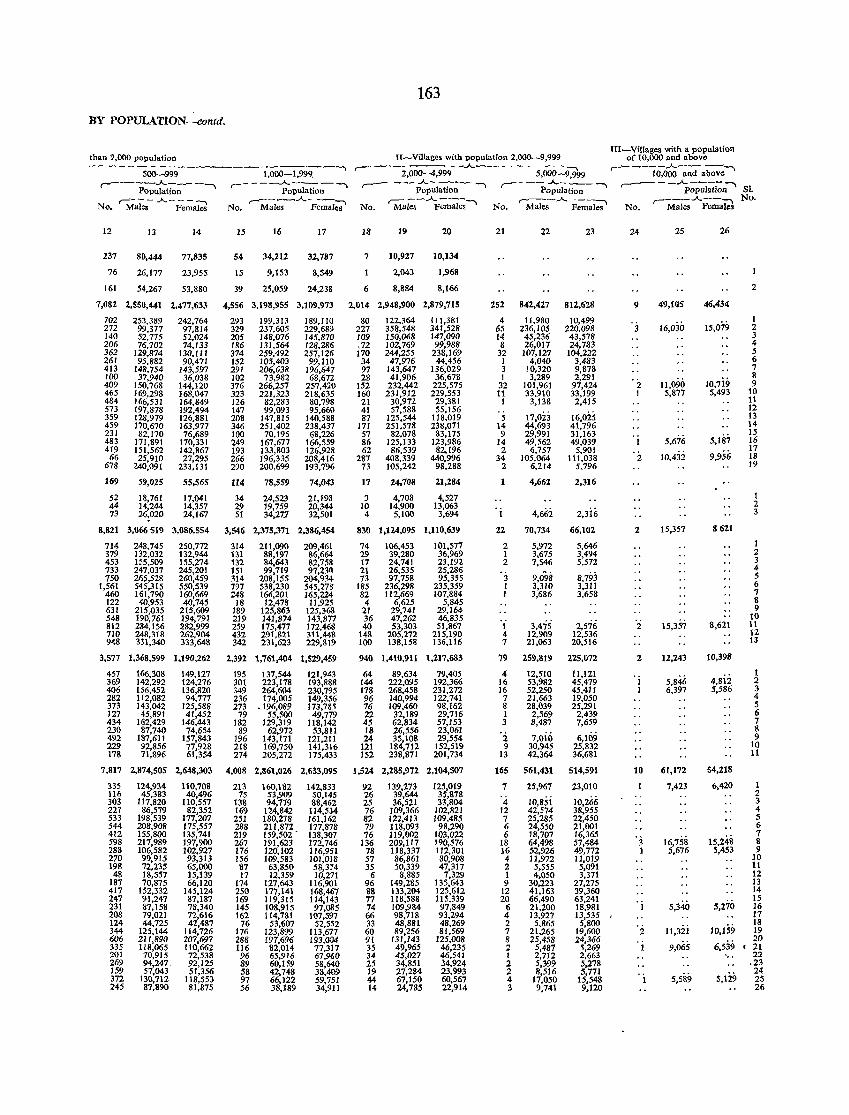
163
BY POPULATION-contd.
than 2,000 population II-Villages with population 2.000-9,999 III-Villages with a population
of 10,000 and above -------- ~ ,-- .A.
5,000-9:9'99 ,...-----A-- --,
500-999 1,000-1,999, 2,000-4,999 10,000 and above ,.....----.A.-__ , ,-----~~;;-, ,..- __ .A_- ___ ~ ,.--- .A. ___ , ,--- - _..A----,
Population Population Population population SI. ,.- - - .A..- - - -:-. ,---_.A.._ -, 'M~~-.A.F;males' r:-:-:---..A. ---~ ...-__ ..A.--~ No.
No. Males Females No. Males Females No. No. Males Females No. Males Females
12 13 14 15 16 17 18 19 20 21 22 23 24 25 26
237 80,444 77,835 54 34,212 32,787 7 10,927 10,134
76 26,177 23,955 15 9,153 8,549 2,043 1,968
161 54,267 53,880 39 25,059 24,238 6 8,884 8,166 2
7,082 2,550,441 2,477,633 4,556 3,198,955 3,109,973 2,014 2,948,900 2,879,715 252 842,427 812,628 9 49,f<15 46,434
102 253,389 242,764 293 199,313 189,110 80 122,364 111,381 4 11,980 10,499 16,030 15,079
1 272 99,317 91,814 329 237,605 229,689 227 358,548 341,528 65 236,105 220,098 3 2 140 52,775 52,024 205 148,076 145,870 109 150,068 147,090 14 45,236 43,578 3 206 76,702 74,133 186 131,564 128,286 ,72 102,769 99,988 8 26,017 24,783 4 362 129,874 130,111 374 259,492 257,126 170 244,255 238,169 32 107,127 104,222 5 261 95,882 90,471 152 105,403 99,110 34 47,976 44,456 1 4,040 3,483 6 413 148,754 143,597 291 206,638 196,647 97 143,647 136,029 .3 10,320 9,878 7 100 37,940 36,038 102 73,982 68,672 28 41,906 36,678 1 3,289 2,291
11,090 1O,7i9 8
409 150,768 144,120 376 266,257 257,420 152 232,442 225,575 32 101,961 97,424 ' 2. 9 465 169,298 168,047 323 221,323 218,635 160 231,912 229,553 11 33,910 33,199 I 5,877 5,493 10 484 166,531 164,849 126 82,283 80,798 21 30,972 29,381 1 3,138 2,415 11 573 197,878 192.494 147 99,093 95,660 41 57,588 55,156 12 359 128,979 126,881 208 147,815 140,588 87 125,544 118,019 5 17,023 16,025 13 459 170,670 163,977 346 251,402 238,437 171 251,578 238,071 14 44,693 41,796 14 231 82,170 76,689 100 70,195 68,226 57 82,078 83,175 9 29,991 31,163
5,676 5,187 15
483 171,891 170,331 249 167,677 166,559 86 125,133 123,986 14 49,562 49,039 16 419 151,562 142,867 193 133,803 126,928 62 86,539 82,196 2 6,757 5,901
10,4ii 9,956 17
66 25,910 27,295 266 196,335 208,416 281 408,339 440,996 34 105,064 111,038 2 18 678 240,091 233,131 290 200,699 193,796 73 105,242 98,288 2 6,214 5,796 19
169 59,025 55,565 114 78,559 74,043 17 24,708 21,284 4,662 2,316
52 18,761 17,041 34 24,523 21,198 3 4,708 4,527 1 44 14,244 14,357 29 19,759 20,344 10 14,900 13,063 2 73 26:020 24,167 51 34,277 32,501 4 5,100 3,694 ' i 4,662 2,3i6 3
8,821 3,066519 3,086,554 3,546 2,375,371 2,386,454 830 1,124,095 1,110,639 22 70,734 66,102 2 15,357 8621
714 248,745 250,772 314 211,090 209,461 74 106,453 101,577 2 5,972 5,646 1 379 132,032 132,944 131 88,197 86,664 29 39,280 36,969 1 3,675 3,494 2 453 155,509 155,274 132 84,643 82,758 17 24,741 23,192 2 1,546 5,572 3 733 247,037 245,201 lSI 99,719 97,230 21 26,535 25,286 4 750 265,528 260,459 314 208,155 204,934< 13 97,758 95,355 3 9,098 8,793 5
1,561 545,315 550,539 197 538,230 545,278 185 236,298 235,359 1 3,310 3,311 6 460 161,790 160,669 248 166,201 165,224 82 112,669 107,884 I 3,686 3,658 7 122 40,953 40,745 18 12,478 11,925 4 6,625 5,845 8 631 215,035 215,609 189 125,863 125,368 21 29,741 29,164 9 548 190,761 194,791 219 141,874 143,877 36 47,262 46,835
15,35; 10
812 284,156 282,999 259 175,477 172,468 40 53,303 51,867 1 3,475 2,576 2 8,621 11 710 248,318 262,904 432 291,821 311,448 148 205,272 215,190 4 12,909 12,536 12 948 331,340 333,648 342 231,623 229,819 100 138,158 136,116 7 21,063 20,516 13
3,577 1,368,599 1,190,262 2,392 1,761,404 1,529,459 940 1,410,911 1,217,683 79 259,819 225,072 2 12,243 10,398
457 166,308 149,127 195 137,544 121,943 64 89,634 79,405 4 12,510 It,121 5,846 4,8ii
t 369 142,292 124,276 301 223,178 193,888 144 222,095 192,366 16 53,982 45,479 1 2 406 156,452 136,820 349 264,604 230,795 178 268,458 231,272 16 52,250 45,411 I 6,397 5,586 3 282 1I2,082 94,777 236 174,005 149,356 96 140,994 122,741 7 21,663 19,050 4 373 143,042 125,588 273 .196,089 173,785 76 109,460 98,162 8 28,039 25,291 S 127 45,891 41,452 79 55,500 49,779 22 32,189 29,716 I 2,569 2,439 6 434 162,429 146,443 182 129,319 118,142 45 62,834 57,153 3 8,487 7,659 7 230 87,740 74,654 89 62,972 53,811 18 26,556 23,061 8 492 187,611 157,843 196 143,171 121,211 24 35,108 29,554 'i 7,()iO 6,109 9 229 92,856 77,928 218 169,750 141,316 121 184,712 152,519 9 30,945 25,832 10 178 71,896 61,354 274 205,272 175,433 152 238,871 201,734 13 42,364 36,681 11
7,817 2,874,505 2,648,303 4,008 2,861,026 2,633,095 1,524 2,285,972 2,104,507 165 561,431 514,591 10 61,172 54,218
335 124,934 110,708 213 160,182 142,833 92 139,273 125,019 1 25,967 23,010 7,423 6,42() I 116 45,383 40,496 75 53,909 50,145 26 39,644 35,818 2 303 117,820 ltO,557 138 94,179 88,462 25 36,521 33,804 4 1O,8Si 10,266 3 227 86,579 82,352 169 124,842 114,534 76 109,366 102,821 12 42,574 38,955 4 533 198,539 177,207 251 180,278 161,162 82 122,413 109,485 7 25,285 22,450 5 544 20S,908 175,557 288 211,872 177,878 79 118,093 98,290 6 24,550 21,001 6 412 155,800 135,741 219 159,502 - 138,307 76 119,002 103,022 6 18,707 16,365 'j 16,75& 15,24&
7 598 217,989 197,900 267 191,623 172,746 136 209,117 190,576 18 64,498 57,484 8 288 106,582 102,927 176 120,102 116,951 78 118,337 112,301 16 52,926 49,772 1 5,676 5,453 9 270 99,915 93,313 156 109,583 101,018 57 86,861 80,908 4 11,972 11,019 10 198 72,235 65,000 87 63,850 58,374 35 50,339 47,317 2 5,555 5,091 11
48 18,557 15,139 17 12,359 10,271 6 8,885 7,329 I 4,050 3,371 12 187 70,875 66,120 174 127,643 116,901 96 149,285 135,643 9 30,223 27,275 13 417 152,332 145,124 250 177,141 168,467 88 133,204 125,612 12 41,163 39,360 14 247 91,247 87,187 169 119,315 114,143 77 118,588 115,339 20 66,490 63,241 , i 5,340 5,270
15 231 87,158 78,340 145 108,915 97,085 74 109,984 97,849 6 21,200 18,981 16 208 79,021 72,616 162 114,781 107,597 66 98,718 93,294 4 13,927 13,535 / 17 124 44,725 42,487 76 53,607 52,552 33 48,881 48,269 2 5,865 5,800
10,159 18
344 125,144 114,726 176 123,899 113,677 60 89,256 81,569 7 21,265 19,600 'i 11,321 19 606 211,890 207,697 288 197,696 193,004 91 131,143 125,008 8 25,458 24,366
9,065 6,539 20
335 IIS,065 110,662 116 82,014 77,317 35 49,965 46,235 2 5,487 5,269 1 ' 21 201 70,915 72,538 96 65,916 67,960 34 45,027 46,541 1 2,712 2,663 '., 22 269 94,247, 92,125 89 60,159 58,640 25 34,851 34,924 2 5,399 5,278 ,23 159 57,043 51,356 58 42,748 38,409 19 27,284 23,993 2 8,516 5,771
5,589 5,129 24
372 130,712 118,553 97 66,122 59,751 44 67,150 60,567 4 17,050 15,548 1 2S 245 87,890 81,875 56 38,189 34,911 14 24,785 22,914 3 9,741 9,120 26
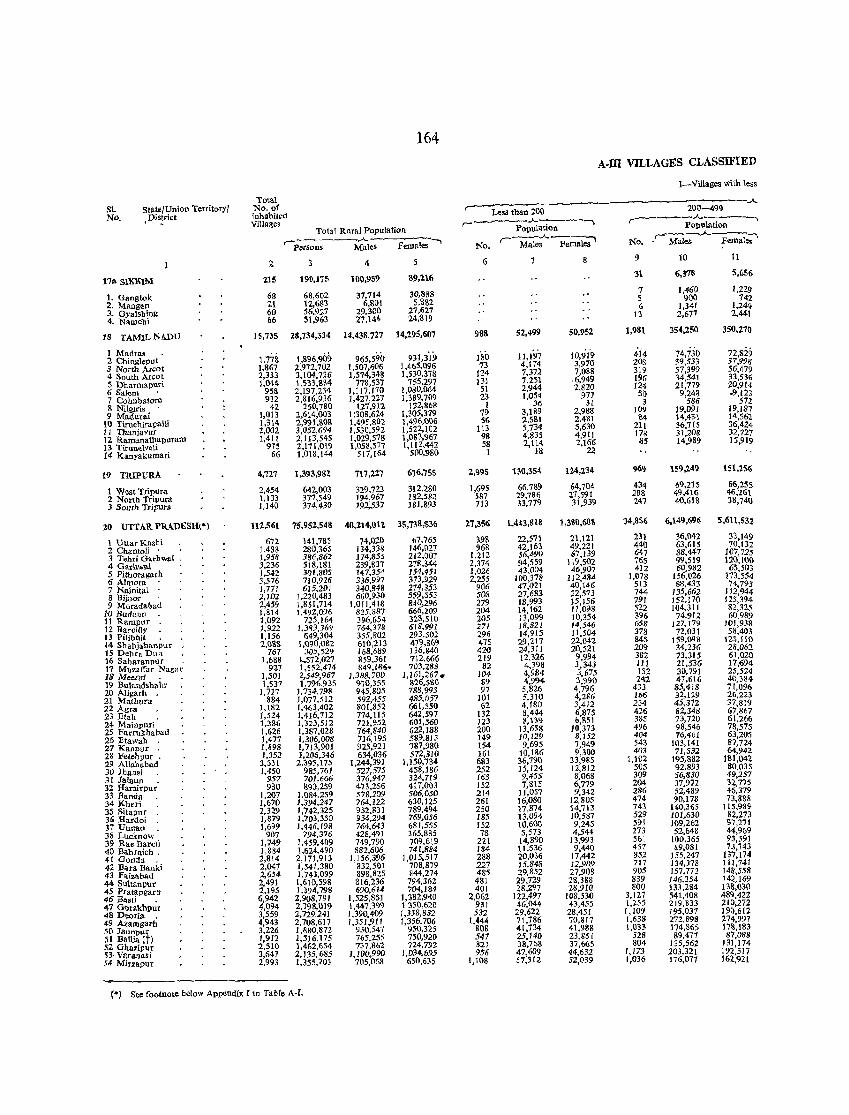
164
A.ill VILLAGES CLASSIFIED
I-Villages with less
Total ...A.. SI. State/Union Territor)', No. of ,--No. District inhabited Less tban ZOO 200-499
, - Villages r------"--.----...., ,--___ ..A..
Total RUTal Population Population Population
'-Persons ""- Females -.
,----'-Female;' No.
r-~----~-------'
Males No. Males . Mates Females
2 4 6 '1 8 9 10 II
17" slXKIM 215 190,175 100,959 89,216 31 6,378 5,656
1. Gangtok 68 68,602 37,714 30,888 7 1,460 1,229
2. Mangan 21 12,683 6,801 5,882 5 900 742
3. GyalshinS 60 56,927 29.300 21.627 G 1,341 1.244
4. Namchi 66 51,963 27.144 24,819 13 2,671 2,44-1
18 TAMILNADU 15,735 28,734,334 14,438,727 14,295,607 988 52,499 50,952 1,981 354,250 350,270
1 Madras 1,896,909 965,590 931,319 180 11,197 10,<h9 *1'4 74,730 72,829
2 Chingleput . 1,778 3 Nortb Areot 1,867 2,'n2,702 I,Sm,606 l,4~5,096 73 4,114 3,970 208 39,Sn 37,998
4 South Areol 2,333 3,104,726 1,574,348 1,530,378 124 7,372 7,088 319 57,399 56,479
5 Dharma pu:r\ 1,044 1,533,834 778,537 755,297 }31 7,251 .6,949 196 14,541 33,536
6 Salem 958 2,197,234 1,117,110 1,080,064 51 2,944 2,820 124 21,779 20,914
7 Coimbatore 932 2,816,936 1,427,227 1,389,709 2:\ 1,051 977 3Q 9,248 .9,123
8 Nilgn'''' 42 250,780 127,912 112,868 1 36 31 3 586 572
9 Madurai 1,013 2,614,003 1;108,624 1,305,379 79 3,189 2,988 Hi9 19,091 19,187
10 l"iruchirapalU 1,314 2,991,808 1,495,802 1,496,(){)6 56 2,511\ 2,481 \>>4 14,431 14,56:<
11 Tbanjavur 2,002 3,052,694 1,530,592 1,522,102 113 5,734 5,630 211 36,715 36,4204-
12 Ramanathapuram 1,411 2,113,545 1,029,578 1,083,967 98 4,835 4,911 178 31,208 32,727
13 Tirunelv.!i 975 2,171,019 1,058,577 1,112,442 58 2,114 2,166 as 14,989 IS,919
14 Kan)'akumari 66 1,018,144 51;,164 500,980 1 18 22
19 TRIPURA 4,727 1,393,gSZ 717,227 616,755 2,995 BO,354 124,234 969 159,149 151,256
1 West Tripura 2,454 642,003 329.723 312,:,180 ],695 66,789 64,704 434 69,215 66,255
2 North. Tripura 1,133 377,549 194,967 182,S82 587 29,786 27,591 268 49,416 46,261
3 Sam" Tr;purJl. 1,140 374,430 192,5.17 181,893 713 33,179 31,939 247 40,618 38,740
10 UTl'AR PR-W£SH\*) 112,561 75,952,548 40,114,011 35,738,S36 27,356 1,443,818 1,3S0,6011 34,856 6,149,696 5,611,532
1 Uttar :Kaobi 672 141,785 74,020 u7,765 398 22,5"11 21,121 231 36,042 3:\,149
2 Chamoli 1,488 280,365 134,338 146,027 968 42,163 49.221 440 63,615 70,132
3 Tehd Garhw.;1 . (,958 386,862 174,855 212,007 1,212 56,490 67,139 647 88,447 107,125
4 Garhwal 3,236 518,181 239,B37 27&,344 2,314 94,559 119,502 765 99,519 120,100
5 Pitboragarh 1,542 301,805 147,354 154,451 1,026 43,004 46,907 412 60,982 6S,503
6 Almara 3,576 710,926 336,997 313,l129 2,255 100,178 112,484 1,078 156,026 173,554
7 Nainital 1,771 615.20l 340,848 214.353 906 47.021 40,146 513 88,433 74,7%
8 Bijuor . ;/,102 ),220,483 660,930 559,553 508 27,683 22,573 744 135,662 112,944
9 M()radabad 2,459 1,851,714 1,0[l,418 840,296 279 18,993 15,156 791 152.170 125,394
I<J Budau!1 1,814 1,492,096 825,887 666,209 204 14,162 11,098 522 104,311 8~,325
11 Rampur 1,092 725,164 396,654 328,510 205 13,099 10,354 396 74,912 60,989
12 BareiUy 1.922 1,383,369 764,378 618.991 271 18,821 14,546 658 127,179 101,938
13 Pilibbil 1,156 649,304 355,802 293,502 296 14,915 11,504 378 72,031 58,403
14 Shahjahanpur 2,08& 1,090,082 610,213 419,869 475 29,217 22,042 84S 159,098 125,110
15 Dehra Dun 767 305,529 168,689 136,840 420 24,311 20,521 209 34,236 28,062
16 Saharanpur 1,688 1..S72,027 859,361 712,666 219 12,326 9,994 382 73,315 61,020
17 Muzaffar Nagar 927 1,552,474 849,18&. 703,288 82 4,3'>8 3,343 111 21,536 17,694
18 Meerut ' 1,501 2,549,967 1,388,700 1,16~267 • 104 4,984 3,675 152 30,791 25,524
19 BulaI>dShahr \,537 1,')96,935 910,355 82 ,SSO 89 4,994 :.\,990 242 47,616 40,384
20 Aligarh . 1,717 1,7}4,798 945,805 788,993 97 5,826 4,796 433 85,418 71,096
21 Mathura 884 1,0;7,512 592,455 485,057 101 5,3]0 4,286 166 32,129 26.223
22 Agra 1,182 1.463,402 801,852 661,550 62 4,180 3,412 234 45,372 37,819
23 Etab 1,524 1,416,712 774,115 642,597 132 8,444 6,875 426 82,348 67,867
24 Mainpuri' 1,386 1,323,512 72],952 601,560 123 8,139 6,851 385 73,720 61,266
25 FarrukhalJad 1,626 1,387,028 764,840 622,188 200 13,658 10,313 496 98,546 78,575
26 Etawah . 1,477 1,306,008 716,J95 589,813 149 10,129 8,152 404 76,461 63,205
27 Kanpur . 1,898 1,7J3,901 925,921 787.980 154 9,695 7,949 543 103,141 87,724
28 Feteh pur . 1,352 1,205,346 634,036 572,310 161 10,136 9,300 403 71,532 64,942
29 AIl"habad 3,531 2,'95,175 1,244,391 ],151),784 683 36,790 33,985 1,102 195,882 1lll,042
31} Jhans; 1,450 985,761 527,575 458,186 252 15,124 12,812 505 92,893 80,035
31 Jalaun • 957 '01,666 376,947 324,719 [63 9,455 8,068 309 56,830 49,231
32 Hamirpur 930 890,259 473,256 417,003 152 7,815 6,779 204 37,972 32,775
33 Banda . 1,207 1,084,259 578,209 506,050 214 !l,OS7 9,342 286 52,489 46,379
34 Kher; 1,670 1,394,247 764,122 630,125 261 16,080 12,805 474 90,178 73,888
35 Sitapur 2,329 1,742,325 952,831 789,494 250 17,874 14,713 743 140,365 115,98~
36 Hardoi 1,879 1,703,350 934,294 169,056 185 13,094 10,587 529 101,530 82,273
37 Unnao 1,699 1,446,198 764,643 681,555 152 10,600 9,245 591 109,262 97,271
38 Lucknow 907 794,376 428,491 365,885 78 5,573 4,544 273 52,648 44,969
39 Rae Bardi 1,749 1,459,409 749,790 709,619 221 14,890 13,993 561 100,365 95,591
40 Bahraich . 1,884 1,624.490 882,606 741,884 184 11.536 9,440 457 89,081 73,143
41 Gonda 2,814 2,171,913 1,156,396 ],015,517 288 20,036 17,442 852 155,247 131,174
42 Bara Banki 2,047 1,541,380 832,501 708,879 227 15,848 12,909 717 134,378 111,741
43 Faizabad 2,654 1,743,099 898,825 244,274 485 29,852 27,908 905 157,712 14S,558
44 Sultanpur 2,491 1,610,598 816,236 794,362 481 29,129 28,388 839 146,354 14~>169
45 Pratapgarh 2,195 1,394,798 690,614 704,184 40l 28,297 28,910 800 133,284 1 38,():lO
46 B&.ti . 6,942 2,908.791 1,525,851 1,382,940 2,062 122,497 108,530 3,127 541,408 489,422
47 G<:>rakhpur 4,094 2,198,019 1,447,3<)<) 1350,620 931 46,044 43,45~ 1,255 219,833 211),272
48 Deoria • 3,559 2,729,241 1,390,409 1,338,832 532 29,622 28,451 1,109 195,037 19Q,612
49 A~amgarh 4,943 2,708,617 1,351,911 1,356,706 1.444 71,786 70,817 1,638 272,898 274,997
503aunj>ur 3,226 1,~80,8n 930.547 950,325 808 41,734 41,988 1,033 114,865 17~,183
51 Bl\lIia ttl 1,912 1,516.175 765,255 750,920 547 25,140 23,851 528 89,477 87,088
52 Ghazipur 2.510 1,462,654 737,862 724,792 821 38,768 37,665 S()4 135,562 131,174
53· VaralJaSi 3,647 2,J35,685 1,100,990 1,1>34,695 956 41,609 44,632 1,173 203,321 192,517 S4 Mlrzapur 2,993 1,355,703 705,068 650,635 1,108 57.31~ 52,039 1,036 176,077 162,921
(~) See footnote below Append'lx r to Table A·C,
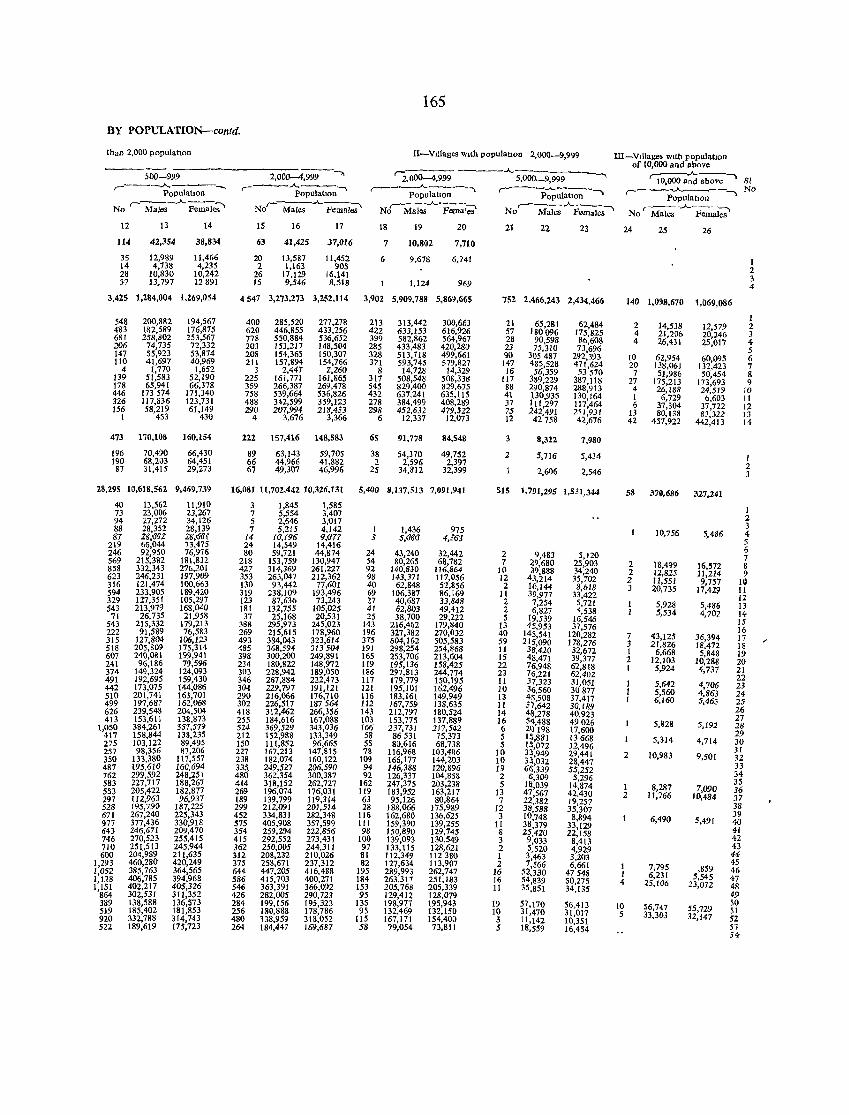
165
BY POPULATION-contd,
than 2,000 populatlOn II-Villages With populatIOn 2,000-9,999 III-Villages with populatIOn of 10.000 and above
500-999 2,000-4.999 -0 '2,000-4,999 ----A.. 5,000-9,999 ~ ~..A..--, Sl 10,000 and above ,.._---A---.._, ,---..A..----, ,--_..A.. __ -, r---"--A-- ,----.A----.--, No PopulatiOn PopulatiOn Population Popnlabon ... PopulatIOn
,-~---"-----, r----..A..--, ~..A.. __ ,.. No
..A.._, r----"-~-... No Males Females No Males Females No Males Fema'es Males Females No Males Females 12 13 14 IS 16 17 18 19 20 21 22 23 24 25 26
114 42,354 38,834 63 41,425 37,016 7 10,802 7,710
35 12,989 11,466 20 13,587 11,452 6 9,678 6,741 1 14 4,738 4,235 2 1,163 90S 2 28 10,830 10,242 26 17,129 16,141 3 37 13,797 12891 15 9,546 8,518 1,124 969 4
3,425 1,284,004 1,269,054 4547 3,273,273 3,252,114 3,902 5,909,788 5,869,665 752 2.466,243 2,434,466 140 1,098,670 1,069,086
1 548 200,882 194,567 400 285,520 277,278 213 313,442 300,663 21 65,281 62,484 2 14,538 12,579 2 483 182,589 176,875 620 446,855 433,256 422 633,153 616,926 57 180096 175,825 4 2),206 20,246 3 681 258,802 253,567 778 550,884 536,652 399 582,862 564,967 28 90,598 86,608 4 26,431 25,017 4 206 74,735 72,332 203 153,217 148,504 285 433,483 420,280 23 75,310 73,696 5 147 55,923 53,874 208 154,365 150,307 328 513,718 499,661 90 305487 292,393 10 62,954 60,095 6 110 41,697 40,969 211 157,894 154,766 371 593,745 579,827 147 485,528 471,624 20 138,061 132,423 7 4 1,770 1,652 3 2,447 2,260 8 14,728 14,329 16 56,359 53570 7 51,986 50,454 8 139 51,583 52, 190 225 161,771 161,865 317 508,548 508,338 117 389,229 387,118 27 175,213 173,693 9 178 65,941 66,378 359 266,387 269,478 545 829,400 829,675 88 290,874 288,913 4 26,188 24,519 10 446 173574 171,340 758 539,664 536,826 432 637,241 635,115 41 lJO,935 130,164 1 6,729 6,603 11 326 117,836 123,731 488 342,599 359,123 278 384,499 408,289 37 111,297 117,464 6 37,304 37,722 12 156 58,219 61,149 290 207,994 218,433 298 452,632 479,522 75 242,491 2'1,931 13 80,138 83,322 13 I 453 430 4 3,676 3,366 6 12,337 12,073 12 42758 42,676 42 457,922 442,413 14
473 170,108 160,154 222 157,416 148,583 65 91,778 84,548 3 8,322 7,980
196 70,490 66,430 89 63,143 59,705 38 54,370 49,752 2 5,716 5,434 I 190 68,203 64,451 66 44,966 41,882 2 2,596 2,397 2 87 31,415 29,273 67 49,307 46,996 2S 34,812 32,399 2,606 2,546 3
28,295 10,618,562 9,469,739 16,081 11,702,442 10,326,13{ 5,4110 8,137,513 7,091,941 515 1,791,295 1,531,344 58 370,686 327,241 40 13,562 11,910 3 1,845 1,585
1 73 23,006 23,267 7 5,554 3,407 2 94 27,272 34,126 5 2,646 3,017 3 88 28,352 28,139 7 5,215 4,142 1 1,436 975 10,756 5,486 4 gr U,(J'JZ U,6<Ji l4 [(J,l96 9,(J77 .; 5,(I8<J 4,363 5 219 66,044 73,475 24 14,549 14,416 6 246 92,950 76,976 80 59,721 44,874 24 43,240 32,411-2 2 9,483 5,120 7 569 215,382 181,832 218 153,759 130,947 54 80,265 68,782 7 ~9,680 25,903 2 18,499 16,572 8 858 332,343 276,201 427 314,369 261,227 92 140,830 116,864 10 39,888 34,240 2 12,825 11,214 9 623 246,231 197,909 353 263,047 212,362 98 143,371 117,056 12 43,214 35,702 2 11,551 9,757 10 316 121,474 100,663 130 93,442 77,601 40 62,848 52,856 2 10,144 8,618 3 20,735 17,429 11 594 233,905 189,420 319 238,109 193,496 69 106,387 86,169 11 39,977 33,422 12 329 127,351 105,297 123 87,636 73,243 27 40,687 33,848 2 7,254 5,721 5,928 5,486 13 543 213,979 168,040 181 132,755 105,025 41 62,803 49,412 2 6,827 "538 5,534 4,702 14 71 26,735 21,958 37 25,168 20,531 25 38,700 29,222 5 19,539 16,546 15 543 215,332 179,213 388 295,973 245,023 143 216,462 179,840 13 45,953 37,576 16 222 91,589 76,583 269 215,615 178,960 196 327,382 270,032 40 145,541 120,282 7 43,125 36,394 17 315 127,804 106,123 493 384,043 323,614 375 604,162 505,583 59 215,090 178,276 3 21,826 IS.472 18 518 205,009 175,314 485 368,594 313504 19) 298,254 254,868 11 38,420 32,672 1 6,668 5,848 19 607 240,081 199,941 398 300,200 249,891 165 253,706 213,604 15 48,471 39,377 2 12,103 10,288 20 241 96,186 79,596 234 180,822 148,972 119 195,136 158,425 22 76,948 62,818 I 5,924 4,737 21 374 149,324 124,093 303 228,942 189,050 186 297,813 244,774 23 76,221 62,402 22 491 192,695 159,430 346 267,884 222,473 117 179,779 150,195 11 37,323 31,051 5,642 4,706 23 442 173,075 144,086 304 229,797 191,121 121 195,101 162,496 10 36,560 30877 5,560 4,863 24 510 201,741 163,701 290 216,066 176,710 116 183,161 149,949 13 45,508 37,417 6,160 5,463 25 499 197,687 162,068 302 226,517 187564 112 167,759 138,635 II 37,642 30,189 26 626 239,548 204,504 418 312,462 266,356 143 212,797 180,524 14 4~,278 40,923 27 413 153,611 138,873 255 184,616 167,088 103 153,775 137,889 16 54,488 49026 5,828 5,192 28 1,050 384,261 357,579 524 369,529 343,036 166 237,731 217,542 6 20198 17,600 29 417 158,844 138,235 212 152,988 133,349 58 86531 75,373 5 IS,S81 13 668 5,314 4,714 30 275 103,122 89,495 150 111,852 96,665 55 80,616 68,738 5 !S,on 12,496 31 257 98,356 87,206 227 167,213 147,815 78 116,968 103,486 10 3l,949 29,441 2 10,983 9,501 32 350 133,380 117,557 238 182,074 160,122 109 166,177 144,203 10 H,032 28,447 33 487 195,610 160,694 ~~~ 249,527 206,590 94- 146,388 120,896 19 6/l,339 55,252 34 762 299,592 248,251 362,354 300,387 92 126,337 104,858 2 /l,309 5,296 35 583 227,717 188,267 414 318,152 262,727 162 247,375 203,238 5 18,039 14,874 I 8,287 7,090 36 553 205,422 182,877 269 196,074 176,031 119 183,952 163,217 13 47,567 42,430 2 11,766 10,484 37 297 112,963 96,937 189 139,799 119,314 63 95,126 80,864 7 22,382 19,257 38 528 195,790 187,225 299 212,091 201,514- 28 188,066 175,989 12 38,588 35,307 39 671 267,240 225,343 452 334,831 282,348 116 162,680 136,625 3 10,748 8,894 6,490 5,491 40 977 377,436 330,918 575 405,908 357,599 III 159,390 139,255 11 38,379 33,129 41 643 246,671 209,470 354 259,294 222,856 98 150,890 129,745 8 25,420 22,158
42 746 270,523 255,415 415 292,552 273,431 100 139,093 130,549 3 9,033 8,413 43 710 251,513 245,944 362 250,005 244,311 97 133,115 128,621 2 5,520 4,929 'U 600 204,989 211,635 312 208,232 210,026 81 112,349 112380 1 3,463 3,203 45 1,293 460,280 420,249 37S 258,671 237,312 82 127,634 113,907 2 7,566 6,661 1 7,795 ,859 46 1,052 385,763 364,565 644 447,205 416,488 195 289,993 262,747 16 52,330 47548 1 6,231 5,545 47 1,128 406,785 394,968 586 415,703 400,271 184 263,317 251,183 16 54,839 50,275 4 25,106 23,072 48 1,151 402,217 405,326 546 363,391 366,092 153 205,768 205,339 11 35,851 34,135
302,531 311,352 426 282,005 290,723 95 129,412 128,079 49 864 50 389 138,588 136,573 284 199,156 195,323 135 198,917 195,943 19 57,170 56,413 10 S6,747 55,729 51 519 185,402 181,853 256 180,888 178,786 95 132,469 132,150 10 31,470 31,017 5 33,303 32,147 52 920 332,788 314,743 480 138,959 318,052 115 167,171 154,400 3 11,142 IO,3S1
522 189,619 175,723 264 184,447 169,687 58 79.054 73,811 5 18.559 16,454 51 54
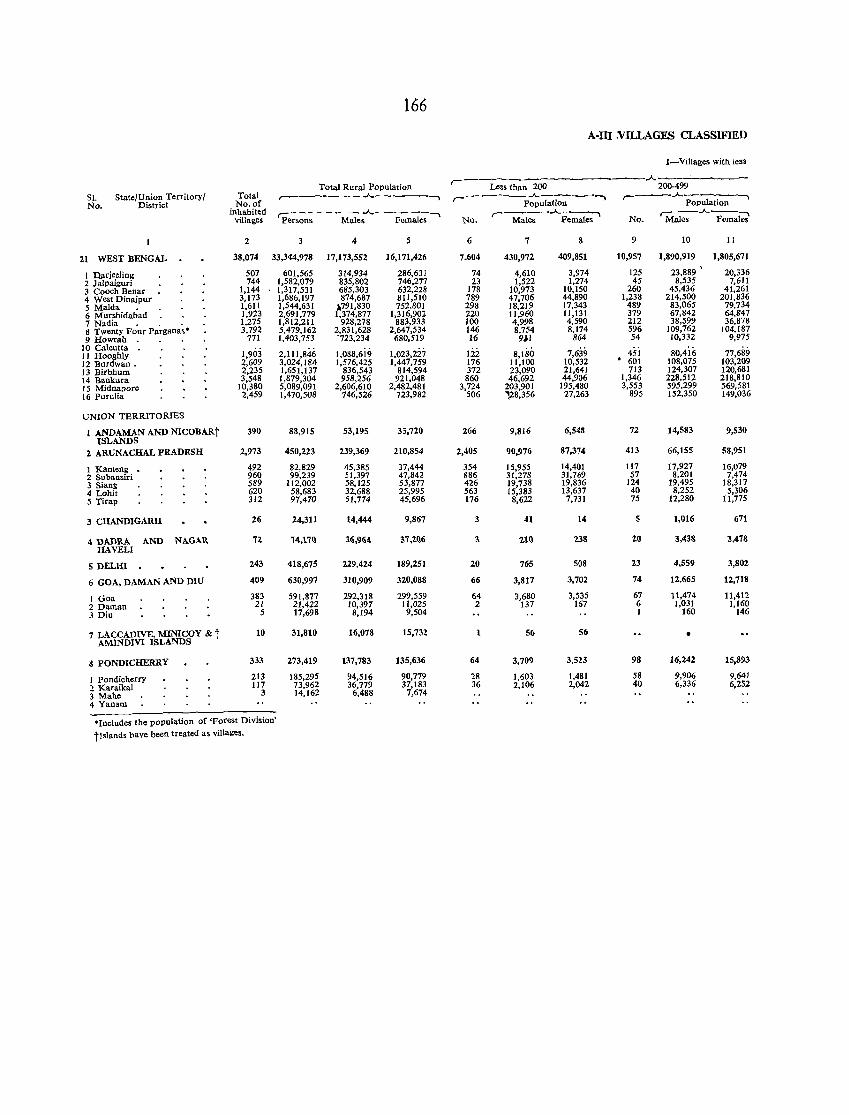
SI. No.
State/Union Territory! District
21 WEST BENGAL
I Pilrjeeling 2 Jalpaiguri 3 Cooch Behar 4 West Dinajpur 5 Maida . 6 Murshidabad 7 Nadia . . . 8 Twenty Four Parganas* 9 Howrah
10 Calcutta 11 Hooghly 12 Burdwan. 13 Birbbum 14 Bankura 15 Midnapore 16 purulia
UNION TERRITORIES
1 ANDAMAN AND NICOBARt ISLANDS
2 ARUNACHAL PRADESH
I Kameng • 2 Subansiri 3 Siang 4 Lobi! 5 Tirap
3 CHANDIGARH
1\ DADRA AND NAGAR HAVELI
5 DELHI
6 GOA, DAMAN AND DIU
I Goa 2 Daman 3 Diu
7 LACCADIVE, MINICOY & t AMINDIVI ISLANDS
8 PONDrCHERRY
I pondicherry 2 Karaikal 3 Mahe 4 Yanam
Total No. of
inhabited villages
2
38,074
507 744
1,144 3,173 1,611 1,923 1,275 3,792
771
1,903 2,609 2,235 3,548
10,380 2,459
390
2,973
492 960 589 620 312
26
72
243
409
383 21
5
10
333
213 117
3
166
Total Rural Population r----- --...A.- -----.
'Pe;s;;;'~ - - - Male;'-- &m:;;~-.
3
33,344,978
601,565 1,582,079 1,317,531 1,686,197 1,544,631 2,691.779 1,812,211 5,479,162 1,403,753
2,111,846 3,024,184 1,651,137 1,879,304 5,089,091 1,470,508
88,915
450,223
82,829 99,239
112,002 58.683 97,470
24,311
74,170
418,675
630,997
591,877 21,422 17,698
31,810
273,419
185,295 73,962 14,162
4
17,173,552
314,934 835,802 685,303 874,687
.10791,830 1,374,877
928,278 2,831,628 '723,234
1,088,6i9 1,576,425
836,543 958,256
2,606,610 746,526
53,195
239,369
45,385 51,397 58,125 32,688 51,774
14,444
36,964
229,424
310,909
292,318 10,397
8,194
16,078
137,783
94,516 36,779
6,488
5
16,171,426
286,631 746,277 632,228 811,510 752,801
1,316,902 883,933
2,647,534 680,519
1,023,227 1,447,759
814,594 921,048
2,482,481 723,982
35,720
210,854
37,444 47,842 53,877 25,995 45,696
9,867
37,2(16
189,251
320,088
299,559 H,025 9,504
15,732
135,636
90,779 37,183
7,674
*rncludes the population of 'Forest Division' tlslands have been treated as villages.
6
7.604
74 23
178 789 298 220 100 146 16
12i 176 372 860
3,724 506
266
2,0105
354 886 426 563 176
3
3
20
66
64 2
1
64
28 36
7
430,972
4,610 1,522
10,973 47,706 18,219 11,960 4,998 8,754 9~1
8,180 11,100 23,090 46,692
203,901 128,356
9,816
90,976
15,955 31,278 19,738 15,383 8,622
41
2.1(1
765
3,817
3,680 137
56
3,709
1,603 2,106
A-m .VILLAGES CLASSlFffin
409,851
3,974 1,274
10,150 44,890 17,343 11,131 4,590 8,174
864
7,639 10,532 21,641 44,906
195,480 27,263
6,548
87,374
14,401 31,769 19,836 13,637 7,731
14
23t1
508
3,702
3,535 167
56
3,523
1,481 2,042
I-Villages with leSS
..A.----.---~ 200-499
r----_A..~;;-~
~-.A..--:-"I No. Males Females
9
10,957
125 45
260 1,238
489 379 212 596 54
451 • 601
713 1,346 3,553
895
72
413
117 57
124 40 75
5
20
23
74
67 6 1
98
58 40
10
1,890,919
23,889 ' 8,535
45,436 214,500 83,065 67,842 38,599
109,762 10,332
80,4ii; 108,075 124,307 228,512 595,299 152,350
14,583
66,155
17,927 8,201
19,495 8,252
12,280
1,016
3,438
4,559
12,665
11,474 1,031
160
•
16,242
9,906 6,336
11
1,805,671
20,336 7,611
41,261 201,836
79,734 64,847 36,878
104,187 9,975
77,689 103,209 120,681 218,810 569,581 149,036
9,530
58,951
16,U79 7,474
18,317 5,306
11,775
671
3,478
3,802
12.718
11,412 1,160
146
15,893
9,641 6,252
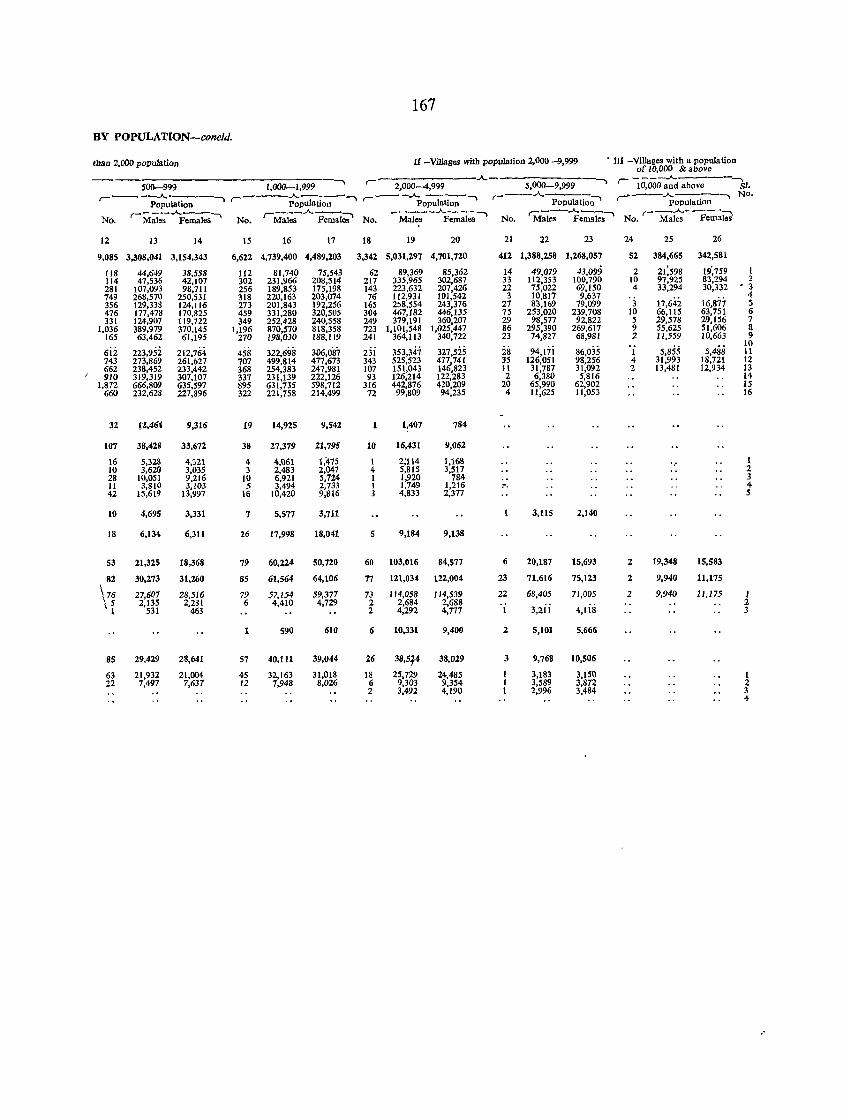
167
BY POPULATION-conc/d.
than 2,000 population II-Villages with population 2,000 -9,999 . III -Villages with a population of 10,000 & above
---., r- .A. , r- ____ ..A. _____ -, 500--999 1,000-1,999 2,000-4,999 5,000-9,999 10,000 and above Sl. r----.A.---. r----..A.------., r-~--..A. ---...... r---..A...---- ,---..A. , NO.
Population population population Populatio;;-' population
No. r----..A..----., r--_.A.--, ------"---,
No.
~ ___ .A. __ ---., r--..A..---:-'I
Males Females No. Males Females No. Males Females Males Fenules No. Males Females
12 13 14 15 16 17 18 19 20 21 22 23 24 25 26
9,085 3,308,041 3,154,343 6,622 4,739,400 4,489,203 3,342 5,031,297 4,701,720 412 1,388,258 1,268,057 52 384,665 342,581
118 44,649 38,558 112 81,740 75,543 62 89,369 85,362 14 49,079 43,099 2 21:598 19,759 1 114 47,536 42,107 302 231,966 208,514 217 335,965 302,687 33 112,353 100,790 10 97,925 83,294 2 281 107,093 98,711 256 189,853 175,198 143 223,632 207,426 22 75,022 69,150 4 33,294 30,332 • 3 749 268,570 250,531 318 220,163 203,074 76 112,931 101,542 3 10,817 9,637
17,64.2 16,877 4
356 129,338 124,116 273 201,843 192,256 165 258,554 243,376 27 83,169 79,099 3 5 476 177,478 170,825 459 331,280 320,505 304 467,182 446,1J5 75 253,020 239,708 10 66,115 63,751 6 331 124,907 119,722 349 252,428 240,558 249 379,191 360,207 29 98,577 92,822 5 29,578 29,156 7
1,036 389,979 370,145 1,196 870,570 818,358 723 1,101,548 1,025,447 86 295,390 269,617 9 55,625 51,606 8 165 63,462 61,195 270 198,030 188,119 241 364,113 340,722 23 74,827 68,981 2 11,559 10,663 9
223,9,Si 212,764 458 322,698 306,087 23i 353,347 327,525 2S 94,I7i 86,035 . i 5,855 5,488 10
612 11 743 273,869 261,627 707 499,814 477,673 343 525,523 477,741 35 126,051 98,256 4 31,993 18,721 12 662 238,452 233,442 368 254,383 247,981 107 151,043 146,823 11 31,787 31,092 2 13,481 12,934 13 910 319,319 307,107 337 231,139 222,126 93 126,214 122,283 2 6,380 5,816 14
1,872 666,809 635,597 895 631,735 598,712 316 442,876 420,209 20 65,990 62,902 15 660 232,628 227,896 322 221,758 214,499 72 99,809 94,235 4 11,625 11,053 16
32 ~Z,464 9,316 19 14,925 9,542 1 1~407 784
107 38,428 33,672 38 27,379 21,795 10 16,431 9,062
16 5,328 4,321 4 4,061 1,475 1 2;114 1,168 1 10 3,620 3,035 3 2,483 2,047 4 5,815 3,517 2 28 10,051 9,216 10 6,921 5,724 I 1,920 784 3 11 3,810 3,103 5 3,494 2,733 1 1,749 1,216 ~. 4 42 15,619 13,997 16 10,420 9,816 3 4,833 2,377 5
10 4,695 3,331 7 5,577 3,711 3,115 2,140
18 6,134 6,311 26 17,998 18,041 5 9,184 9,138
53 21,325 18,368 79 60,224 50,720 60 103,016 84,577 6 20,187 15,693 2 19,348 15,583
82 30,273 31,260 85 61,564 64,106 77 121,034 122,004 23 71,616 75,123 2 9,940 11,175
Vg 27,607 28,516 79 57,154 59,377 73 114,058 114,539 22 68,405 71,005 2 9,940 11,175 1 2,135 2,281 6 4,410 4,729 2 2,684 2,688 'i 3,2i i 4,1is
2 1 531 463 2 4,292 4,777 3
1 590 610 6 10,331 9,400 2 5,101 5,666
85 29,429 28,641 57 40,111 39,044 26 38,5~4 38,029 3 9,768 10,506
63 21,932 21,004 45 32,163 31,018 18 25,729 24,485 3,183 3,150 1 22 7,497 7,637 12 7,948 8,026 6 9,303 9,354 3,589 3,872 2
2 3,492 4,190 2,996 3,484 3 4
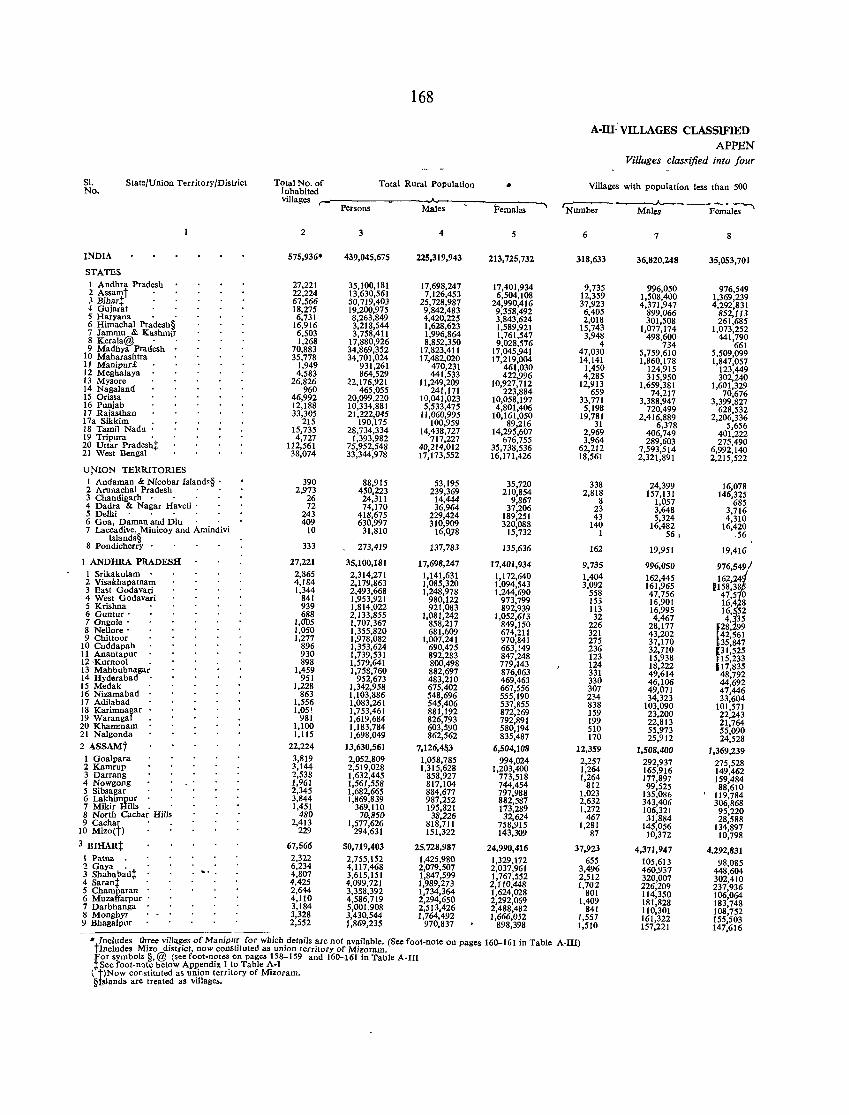
168
A-m:vILLAGES CLASSIFIED APPEN
Villages clas.<ijied into four
SI. State/Union Territory/District Total No. of No. inhabited
Total Rural Population • Villages with population less than 500
villages r- __.I ~
'Number Persons Males Females Males Females
2 3 4 5 6 7 8
INDIA 575,936· 439,045,675 225,319,943 213,725,732 318,633 36,820,248 35,053,701 STATES I Andhra Pradesh 27,221 35,100,181 17,698,247 17,401,934 9,735 996,050 976,549 2 Assamt 22,224 13,630,561 7,126,453 6,504,108 12,359 1,508,400 1,369,239 J Bihar.:t 67,566 50,719,403 25,728,987 24,990,416 37,923 4,371,947 4,292,831 4 Gujarat 18,275 19,200,975 9,842,483 9,358,492 6,405 899,066 852,113 5 Haryana . . 6,731 8,263,849 4,420,225 3,843,624 2,018 301,508 261,685 6 Himachal Pradesh § 16,916 3,218,544 1,628,623 1,589,921 15,743 1,077,174 1,073,252 7 Jammu & Kashmir 6,503 3,758,411 1,996,864 1,761,547 3,948 498,600 441,790 8 Kerala@ . 1,268 17,880,926 8,852,350 9,028,576 4 734 661 9 Madhya Pradesh 70,883 34,869,352 17,823,411 17,045,941 47,030 5,759,610 5,509,099 10 Maharashtra 35,778 34,701,024 17,482,020 17,219,004 14,141 1,860,178 1,847,057 II Manipur£ 1,949 931,261 470,231 461,030 1,450 124,915 123,449 12 Meghalaya 4,583 864,529 441,533 422,996 4,285 315,950 302,240 13 Mysore 26,826 22,176,921 11,249,209 10,927,712 12,913 1,659,381 1,601,329 14 Naga1and 960 465,055 241,171 223,884 659 74,217 70,676 15 Orissa 46,992 20,099,220 1(),041 ,023 10,058,197 33,771 3,388,947 3,399,827 16 Puniab 12,188 10,334,881 5,533,475 4,801,406 5,198 720,499 628,532 17 Raiasthan 33,305 21,222,045 11,060,995 10,161,050 19,781 2,416,889 2,206,336 17a Sikkim 215 190,175 100,959 89,216 31 6,378 5,656 18 Tamil Nadu 15,735 28,734,334 14,438,727 14,295,607 2,969 406,749 401,222 19 Tripura . 4,727 1,393,982 717,227 676,755 3,964 289,603 275,490 20 Uttar Pradesh~ 112,561 75,952,548 40,214,012 35,738,536 62,212 7,593,514 6,992,140 21 West Bengal 38,074 33,344,978 17,173,552 16,171,426 18,561 2,321,891 2,215,522
Ul"ION TERRITORIES 1 Andaman & Nicobar Islands§ • 390 88,915 53,195 35,720 338 24,399 16,078 2 Arunachal Pradesh 2,973 450,223 239,369 210,854 2,818 157,131 146,325 3 Chandigarh 26 24,311 14,444 9,867 8 1,057 685 4 Dadra & Nagar Haveli . 72 74,170 36,964 37,206 23 3,648 3,716 5 Delhi 243 418,675 229,424 189,251 43 5,324 4,310 6 Goa, Daman and Diu' . 409 630,997 310,909 320,088 140 16,482 16,420 7 Laccadive, Minicoy and Amindivi 10 31,810 16,0]8 15,732 1 56, ·56 Islands§
333 273,419 137,783 135,636 162 19,951 19,416 8 Pondicherry .
1 ANDHRA PRADESH 27,221 35,100,181 17,698,247 17,401,934 9,735 996,050 976,549 1 Srikakulam 2,865 2,314,271 1,141,631 1,172,640 1,404 162,445 162,24 2 Visakbapatnam 4,184 2,179,863 1,085,320 1,094,543 3,092 161,965 (158,3 3 East Godavari 1,344 2,493,668 1,248,978 1,244,690 558 47,756 47,5 0 4 West Godavari 841 1,953,921 980,122 973,799 153 16,901 16,48 5 Krishna 939 1,814,022 921,083 892,939 113 16,995 16, 52 6 Guntur . 688 2,133,855 1,081,242 1,052,613 32 4,467 4,~35 7 Ongoie . 1,0lJ5 1,707,367 858,217 849,150 226 28,177 {28, 99 8 Nellore' 1,050 1,355,820 681,609 674,211 321 43,202 42,561 9 Chittoor 1,277 1,978,082 1,007,241 970,841 275 37,170 35,847 10 Cnddapah 896 1,353,624 690,475 663,149 236 32,710 Pl,525 11 Anantapur 930 1,739,531 892,283 847,248 123 15,938 15,233 12 ·Kuruoo1 898 1,579,641 800,498 779,143 124 18,222 J17,835 13 Mahbubnagar 1,459 1,758,760 882,697 876,063 331 49,614 48,792 14 Hyderabad 951 952,673 483,210 469,463 330 46,106 44,692 15 Medak 1,228 1,342,958 675,402 667,556 307 49,071 47,446 16 Nizamabad 863 1,103,886 548,696 555,190 234 34,323 33,604 17 Adilabad 1,556 1,083,261 545,406 537,855 838 103,090 101,571 18 Karimnagar 1,05! 1,753,461 881,192 872,269 159 23,200 22,243 19 Warangal 981 1,619,684 826,793 792,891 199 22,813 21,764 20 Khammam 1,100 1,183,784 603,590 580,194 510 55,973 55,090 21 Nalgonda 1,115 1,698,049 862,562 835,487 170 25,912 24,528
2 ASSAMt 22,224 13,630,561 7,126,4~3 6,504,108 12,359 1,508,400 1,369,239 1 Goalpara 3,819 2,052,809 1,058,785 994,024 2,257 292,937 275,528 2 Kamrup 3,144 2,519,028 1,315,628 1,203,400 1,264 165,916 149,462 3 Darrang 2,538 1,632,445 858,927 773,518 1,264 177,897 159,484 4 Nowgong 1,961 1,561,558 817,104 744,454 812 99,525 88,610 5 Sibsagar 2,345 1,682,665 884,677 797,988 1,023 135,086 119,784 6 Lakhimpur 3,844 1,869,839 987,252 882,587 2,632 343,406 306,868 7 Mikir Hills 1,451 369,110 195,821 173,289 1,272 106,321 95,220 8 North Cachar Hills 480 70,850 38,226 32,624 467 31,884 28,588 9 Cachar 2,413 1,577,626 818,711 758,915 1,281 145,056 134,897 10 Mizo(t) 229 294,631 151,322 143,309 87 10,372 10,798
3 BIHAR~ 67,566 50,719,403 25,728,987 24,990,416 37,923 4,371,947 4,292,831 1 Patna 2,322 2,755,152 1,425,980 1,329,172 655 105,613 98,085 2 Gaya . 6,234 4,117,468 2,079,507 2,037,961 3,496 460,937 448,604 3 Shahabad~ ... 4,807 3,615,151 1,847,599 1,767,552 2,512 320,007 302,410 4 Saran~ 4,425 4,099,721 1,989,273 2,110,448 1,702 226,209 237,936 5 Champaran 2,644 3,358,392 1,734,364 1,624,028 801 114,350 106,064 6 Muzaffarpur . 4,110 4,586,719 2,294,650 2,292,069 1,409 181,828 183,748 7 Darbhanga 3,184 5,001,908 2,513,426 2,488,482 841 110,301 108,752 8 Monghyr 3,328 3,430,544 1,764,492 1,666,052 1,557 161,322 155,503 9 Bhagalpur 2,552 1,869,235 970,837 898,398 1,510 157,221 147,616
.. Includes three villages of Manipur for which details are not available. (See foot-note on pages 160-161 in Table A-III) tlncludes Mizo district, now constHuted as union territory of Mizoram. For symbols § @ (see foot-notes on pages 158-159 and 160-161 in Table A-III ~Seefoot-nQte'below Ap1'!endix 1.to Table ~-I
( t)Now constituted as umon territory of M,zoram. §Islands are treated as villages.
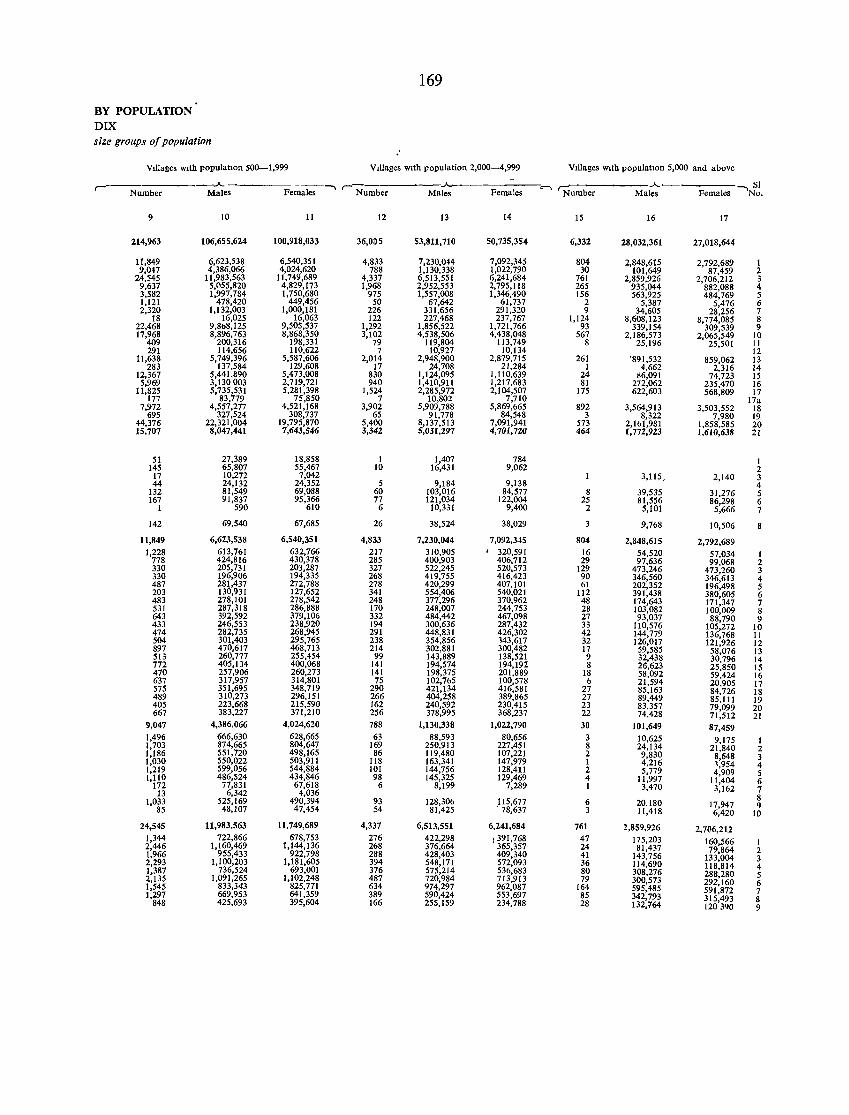
169
BY POPULATION DIX size groups of population
"
V,llages wIth populatIon 500-1,999 V,llages wIth population 2,000-4,999 V,llages wIth populatIon 5,000 and above
--.A. -.. r- Number
..A-----
'" ..A.. -.. SI r-
Number Males Females Males Females Number Males Females No,
9 10 11 12 13 14 15 16 17
214,963 106,655,624 100,918,033 36,005 53,811,710 50,735,354 6,332 28,032,361 27,018,644
11,849 6,623,538 6,540,351 4,833 7,230,044 7,092,345 804 2,848,615 2,792,689 1 9,047 4,386,066 4,024,620 788 1,130,338 1,022,790 30 101,649 87,459 2
24,545 11,983,563 11,749,689 4,337 6,513,551 6,241,684 761 2,859,926 2,706,212 3 9,637 5,055,820 4,829,173 1,968 2,952,553 2,795,118 265 935,044 882,088 4 3,582 1,997,784 1,750,680 975 1,557,008 1,346,490 156 563,925 484,769 5 1,121 478,420 449,456 50 67,642 61,737 2 5,387 5,476 6 2,320 1,132,003 1,000,181 226 331,656 291,320 9 34,605 28,256 7
18 16,025 16,063 122 227,468 237,767 1,124 8,608,123 8,774,085 8 22,468 9,8b8,125 9,505,537 1,292 1,856,522 1,721,766 93 339,154 309,539 9 17,968 8,896,763 8,868,350 3,102 4,538,506 4,438,048 567 2,186,573 2,065,549 10
409 200,316 198,331 79 119,804 113,749 8 25,196 25,501 II 291 114,656 110,622 7 10,927 10,134 12
11,638 5,749,396 5,587,606 2,014 2,948,900 2,879,715 261 '891,532 859,062 13 283 137,584 129,608 17 24,708 21,284 1 4,662 2,316 14
12,367 5,441,890 5,473,008 830 1,124,095 1,110,639 24 ~6,091 74,723 15 5,969 3,130003 2,719,721 940 1,410,911 1,217,683 81 272,062 235,470 16
11,825 5,735,531 5,281,398 1,524 2,285,972 2,104,507 175 622,603 568,809 17 177 83,779 75,850 7 10,802 7,710 17a
7,972 4,557,277 4,521,168 3,902 5,909,788 5,869,665 892 3,564,913 3,503,552 18 695 327,524 308,737 65 91,778 84,548 3 8,322 7,980 19
44,376 22,321,004 19,795,870 5,400 8,137,513 7,091,941 573 2,161,981 1,858,585 20 15,707 8,047,441 7,643,546 3,342 5,031,297 4,701,720 464 1,772,923 1,610,638 21
51 27,389 18,858 I 1,407 784 1 145 65,807 55,467 10 16,431 9,062 2
17 10,272 7,042 3,115, 2,140 3 44 24,132 24,352 5 9,184 9,138 4
132 81,549 69,088 60 103,016 84,577 8 39,535 31,276 5 167 91,837 95,366 77 121,034 122,004 25 81,556 86,298 6
I 590 610 6 10,331 9,400 2 5,101 5,666 7
142 69,540 67,685 26 38,524 38,029 9,768 10,506
11,849 6,623,538 6,540,351 4,833 7,230,044 7,092,3.l5 804 2,848,615 2,792,689 1,228 613,761 632,766 217 310,905 . 320,591 16 54,520 57,034 1
778 424,816 430,378 285 400,903 406,712 29 97,636 99,068 2 330 205,731 203,287 327 522,245 520,573 129 473,246 473,260 3 330 196,906 194,335 268 419,755 416,423 90 346,560 346,613 4 487 281,437 272,788 278 420,299 407,101 61 202,352 196,498 5 203 130,931 127,652 341 554,406 540,021 112 391,438 380,605 6 483 278,101 278,542 248 377,296 370,962 48 174,643 171,347 7 531 287,318 286,888 170 248,007 244,753 28 103,082 100,009 8 643 392,592 379,106 332 484,442 467,098 27 93,037 88,790 9 433 246,553 238,920 194 300,636 287,432 33 110,576 105,272 10 474 282,735 268,945 291 448,831 426,302 42 144,779 136,768 II 504 301,403 295,765 238 354,856 343,617 32 126,017 121,926 12 897 470,617 468,713 214 302,881 300,482 17 59,585 58,076 13 513 260,777 255,454 99 143,889 138,521 9 32,438 30,796 14 772 405,134 400,068 141 194,574 194,192 8 26,623 25,850 15 470 257,906 260,273 141 198,375 201,889 18 58,092 59,424 16 637 317,957 314,801 75 102,765 100,578 6 21,594 20,905 17 575 351,695 348,719 290 421,134 416,581 27 85,163 84,726 18 489 310,273 296,151 266 404,258 389,865 27 89,449 85,111 19 405 223,668 215,590 162 240,592 230,415 23 83,357 79,099 20 667 383,227 371,210 256 378,995 368,237 22 74,428 71,512 21
9,047 4,386,066 4,024,620 788 1,130,338 1,022,790 30 101,649 87,459 1,496 666,630 628,665 63 88,593 80,656 3 10,625 9,175 1 1,703 874,665 804,647 169 250,913 227,451 8 24,134 21,840 2 1,186 551,720 498,165 86 119,480 107,221 2 9,830 8,648 3 1,030 550,022 503,911 118 163,341 147,979 I 4,216 l,954 4 1,219 599,056 544,884 101 144,756 128,411 2 5,779 4,909 5 1,110 486,524 434,846 98 145,325 129,469 4 11,997 11,404 6 172 77,831 67,618 6 8,199 7,289 1 3,470 3,162 7 13 6,342 4,036 8 1,033 525,169 490,394 93 128,306 115,677 6 20,180 17,947 'I 85 48,107 47,454 54 81,425 • 78,637 3 1I,4J8 6,420 10
24,545 11,983,563 11,749,689 4,337 6,513,551 6,241,684 761 2,859,926 2,7Q6,212 1,344 722,866 678,753 276 422,298 t 391,768 47 175,203 160,566 1 2,446 1,160,469 1,144,136 268 376,664 365,357 24 81,437 79,864 2 1,966 955,433 922,798 288 428,403 409,340 41 143,756 133,004 3 2,293 1,100,203 1,181,605 394 548,171 572,093 36 114,690 118,814 4 1,387 736,524 693,001 376 575,214 536,683 80 308,276 288,280 5 2,135 1,091,265 1,102,248 487 720,984 713,913 79 300,573 292,160 6 1,545 833,343 825,771 634 974,297 962,087 164 595,485 591,872 7 1,297 669,953 641,359 389 590,424 553,697 85 342,793 315,493 8 848 425,693 395,604 166 255,159 234,788 28 132,.64 1203'10 9
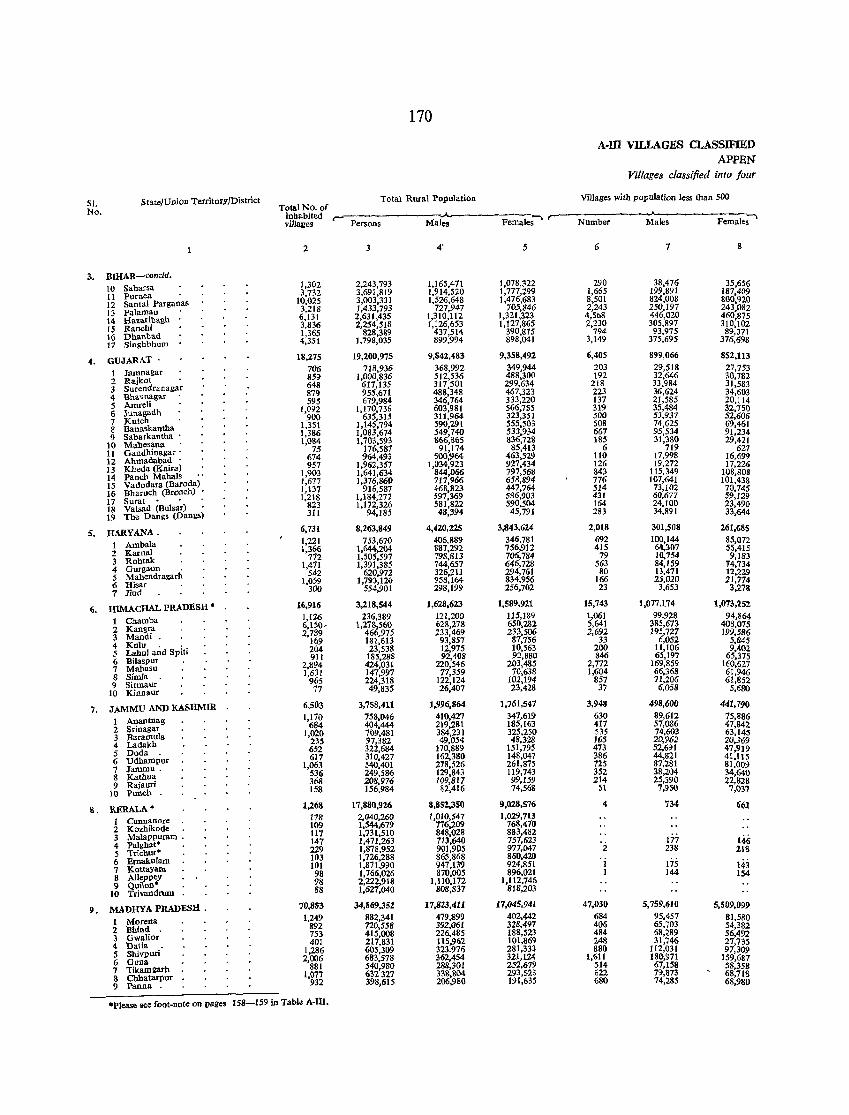
170
A-ill VILLAGES CLASSIFIED APPEN
Villages classified into four
Sl. State/Union TerritoryJDistrict Total No. of
Total Rural Population Villages with population less than 500
No. inhabited ...,____----...... ,..--Female;-' villages Persons Males Females Number Males
2 4' 5 6 7 8
3. BIHAR-concld.
10 Sahar.a 1,302 2,243,793 1,165,471 1,078,322 290 38,476 35,656
11 Purnea 3,732 3,691,819 1,914,520 1,177,299 1,665 199,891 187,409
12. San tal Parganas 10,025 3,003,331 1,526,648 1,476,683 8,501 824,008 800,910
13 Palamau 3,218 1,433,793 727,947 705,1146 2,243 250,19; 243,082
14 Hazaribagh 6,131 2,631,435 1,310,112 1,321,323 4,5b8 446,020 460,875
15 Ranchi 3,836 2,254,518 1,126,653 1,127,865 2,230 305,897 310,102
16 Dhaubad 1,365 828,389 437,514 390,875 794 93,975 89,371
17 Singhbhum 4,351 1,798,035 899,994 898,041 3,149 375,695 376,698
4. GUJARAT' 18,275 19,200,975 9,842,483 9,358,492 6,405 899,066 852..113
1 Jamnagar 706 718,936 368,992 349,944 203 29,518 27,753
2 Rajkot . 859 1,000,836 512,536 488,300 192 32,646 30,782
3 Surendranagar 648 617,135 317,501 299,634 218 33,984 31,583
4 Bhavuagar 879 955.611 488,348 467,323 223 36,624 34,603
5 Amreli 595 679.984 346,764 333,220 137 21,585 20,114
6 Junagadh 1,092 1,170,736 603,981 566,755 319 35,484 32,750
7 Kutch 900 635,315 311,964 323,351 500 53,937 52,606
8 Bauasi<anlba 1,351 1,145,794 590,291 555.503 508 74,625 69,461
9 Sabarkantha . 1,386 1,083,674 549,740 533,934 667 95,534 91,234
10 Mahesana 1,084 1,703,593 866,&65 836,728 185 31,380 29,421
11 Gandhinagar . 75 176,587 91,174 85,413 6 719 627
12 Ahmadabad . 674 964,493 500,964 463,529 110 17,998 16,699
13 Kheda (Kaira) 957 1,962,357 1,034,923 927,434 126 19,272 17,226
14 Panch Maltais 1,903 1,641,634 844,066 797,568 843 115,349 108,803
15 Vadodara (Baroda) 1,617 1,376,860 717,966 658,894 776 107,641 101,438
16 Bharuch (Broach) 1,137 916,581 468,823 447,764 514 73,102 70,745
17 Surat· • . 1,218 1,184,272 597,369 586,903 431 60,677 59,129
18 Valsad (Bulsar) . 823 1,172,326 581,822 590,504 164 24,100 23,490
19 The Dang. (Dangs) 311 94,185 48,394 45,791 283 34,891 33,644
5. HARYANA. 6,731 8,263,849 4,42(),22S 3,843,624 2,018 301,508 261,685
1 Ambala 1,221 753,670 406,889 346,781 692 100,144 85,072
2 Kamal 1,366 1,644.204 887,292 756,912 415 64,307 55,415
3 Rohtak 772 1,505,597 798.813 706,784 79 10,754 9,]83
4 Gurgaon . 1,471 1,391,385 744,657 646,728 563 84,159 '14,734
5 Mahendragarh 542 620,972 326,211 294,761 80 13,471 12,229
6 Risar 1,059 1,793,120 958,164 834,956 166 25,020 21,774
7 lind 300 554,901 298.199 256,702 23 3,653 3,278
6. lUMACHAL PRADESH • 16.916 3,218,544 1,628.623 1,589,921 15,743 1,077.174 1,073,252
1 Chamba 1,1:26 236,389 121,200 115,189 1,061 99,928 94,864
2 Kangra 6,150- 1,278,560 628,278 650,282 5,641 385,673 408,075
3 Mandi 2,789 466,915 233,469 233.506 2,692 195,727 199,586
4 Ku1u. . 169 181.613 93,857 87,756 33 6,052 5,845
5 Lahul and Spiti 204 23,538 12,975 10,563 200 11,106 9,402
6 Bilaspur 911 185,28S 92,408 92,880 846 65,197 65,375
7 Malta.u 2,894 424,031 220,546 203,485 2,772 169,859 160,627
8 Simla 1,631 147,997 77,359 70,638 1,604 66.368 61,946
9 Sirmaur 965 224,318 122,124 102,194 857 71,206 61,852
10 Kinnaur 77 49,835 26,407 23,428 37 6,058 5,680
7. JAMMU AND KASHMm 6,503 3,758,411 1,996,864 1,761,547 3,948 498,600 441,790
1 Anantnag 1,170 758,046 410,427 347,619 630 89,612 75,886
2 Srinagar 684 404,444 219.281 185,163 417 57,086 41.842
3 Bararoula 1,020 709,481 384,231 325.250 535 74,603 63,145
4 Ladakh 235 97,382 49,054 48,328 165 2D,962 20,369
5 Doda 6S2 322.684 170.889 151,795 473 52,691 41,919
6 Udhampur 617 310,427 162,380 148,047 386 44,821 41,115
7 Jammu. 1,063 540,401 278,526 261,875 725 87,281 81,009
8 Kathua 536 249.586 129.843 119,743 352 38,204 34,640
9 Rajauri 368 208,976 109,817 99,159 214 25,390 22,828
10 punch. IS8 156,984 82,416 74,568 51 7,950 7,037
8. KERALA* 1,268 17,880,926 8,852,350 9,028,576 4 734 661
I Cannanore 118 2,040,260 1,010,547 1,029,713
2 Kozhikode 109 1,544,679 776.209 768,470
3 Malappuram . 117 1,731,510 848,028 883,482
4 Palghat* . 147 1,471,263 713,640 757,623 171 146 5 Trichur' 229 1,878,952 901,905 977,047 2 238 218
6 Ernakulam 103 1,726,288 865.868 860,420
7 Kottayam 101 1,871,990 947,139 924,851 1 175 143 8 Alleppey 98 1,766,026 870.005 896,021 1 144 154
9 Quilou' 98 2,222,918 1,110,172 1,112,746
10 Trivaudrum 88 1,627,040 808,837 818,203
9. MADHYA PllADESH . 70,883 34,869,352 17,823,411 17,045,941 47,030 5,759,610 5,509,099
1 Morena 1,249 882,341 479,899 402,442 684 95,<157 81,580
2 llhind 892 720,558 392,061 328,497 406 65,703 54,382
3 Gwalior 753 415,008 226,485 188,523 484 68,289 56,492
4 Dalia 401 217,831 115,962 101,869 248 31,,46 27,735
5 Shivpuri 1,286 605,309 323.976 281.333 880 112,031 97,309
6 Gona 2,006 683,578 362,454 321,124 1,611 180.971 159,687
7 TikamBarh 881 540,980 288,301 252,679 514 67,158 58,358
8 Cbhatarpur 1,077 632 327 338,8(}4 293,52:; 622 79,a73 68,718
9 Panna 932 398,615 206,980 191,635 680 74,285 68,980
.Please see foot-note on pa!l;es 158-159 in Table A-m.
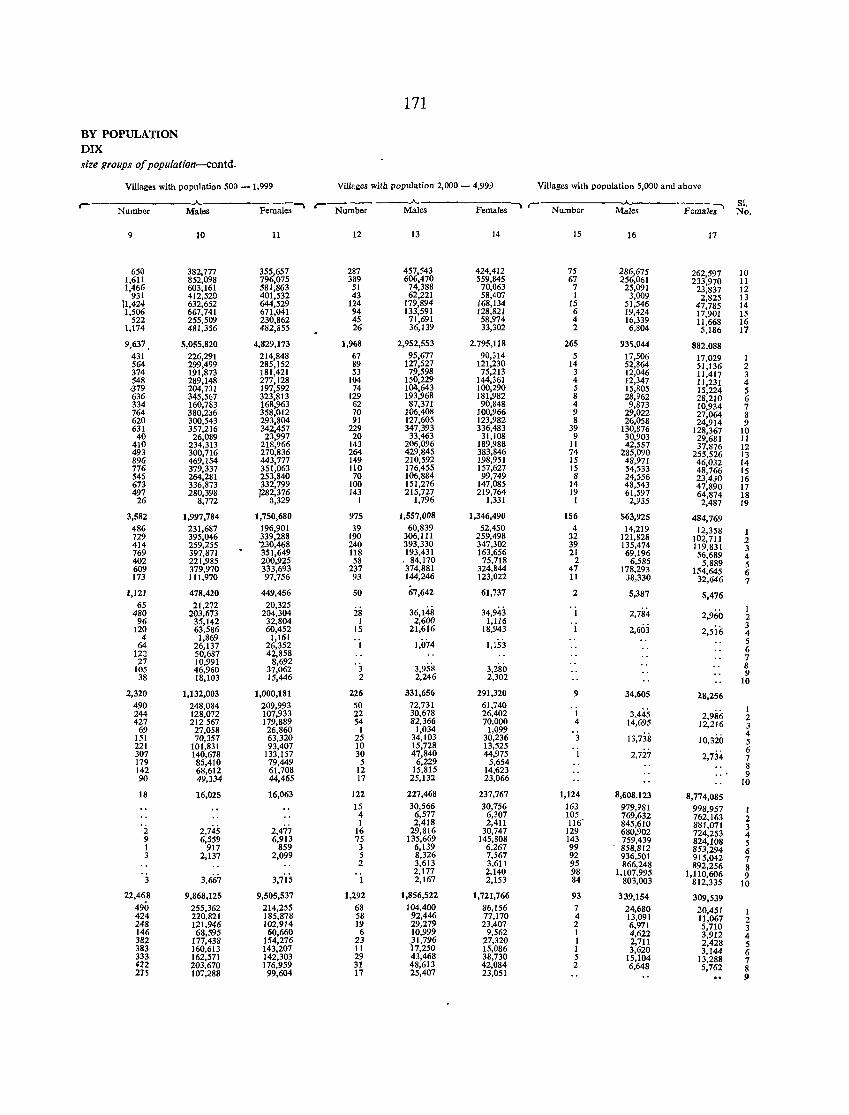
171
BY POPULATION DIX size groups of population-contd.
Villages with population 500 - 1,999 Villages with popnlation 2,000 - 4,999 Villages with population 5,000 and above
.A. ___ .A.
Sl. r-Number Males Females -'I r- Number Males Females' r- Number Males Female;' No.
9 10 11 12 13 14 15 16 17
650 382,777 355,657 287 457,543 424,412 75 286,675 262,597 10 1,6Il 852,098 796,075 389 606,470 559,845 67 256,061 233,970 11 1,466 603,161 581,863 51 74,388 70,063 7 25,091 23,837 12
931 412,520 401,532 43 62,221 58,407 1 3,009 2,825 13 11,424 632,652 644,529 124 179,894 168,134 15 51,546 47,785 14 1,506 667,741 671,041 94 133,591 128,821 6 19,424 17,901 15
522 255,509 230,862 45 71,691 58,974 4 16,339 11,668 16 1.174 481,356 482,855 26 36,139 33,302 2 6,804 5,186 17
9.637, 5,055,820 4,829,173 1,968 2,952,553 2,795,118 265 935,044 882,088 431 226,291 214,848 67 95,677 90,314 5 17,506 17,029 1 564 299,499 285,152 89 127,527 121,230 14 52,864 51,136 2 374 191,873 181,421 53 79,598 75,213 3 12,046 11,417 3 548 289,148 277,128 104 150,229 144,361 4 12,347 11,231 4 ,J79 204,731 197,592 74 IM,643 100,290 5 15,805 15,224 5 636 345,567 323,813 129 193,968 181,982 8 28,962 28,210 6 334 160,783 168,963 62 87,371 90,848 4 9,873 10,934 7 764 380,2:J6 358,012 70 106,408 100,966 9 29,022 27,064 8 620 300,543 293,804 91 127,605 123,982 8 26,058 24,914 9 631 357,216 342,457 229 347,393 336,483 39 130,876 128,367 10
40 26,089 23,997 20 33,463 31,108 9 30,903 29,681 11 410 234,313 218,966 143 206,096 189,988 II 42,557 37,876 12 493 300,716 270,836 264 429,845 383,846 74 285,090 255,526 13 896 469,154 443,777 149 210,592 198,951 15 48,971 46,032 14 776 379,337 351,063 llO 176,455 157,627 15 54,533 48,766 15 545 264,281 253,840 70 106,884 99,749 8 24,556 23,430 16 673 336,873 332,799 100 151,276 147,085 14 48,543 47,890 17 497 280,398 ]282,376 143 215,727 219,764 19 61,597 64,874 18
26 8,772 3,329 1 1,796 1,331 1 2,935 2,487 19
3,582 1,997,784 1,750,680 975 1,557,008 1,346,490 156 563,925 484,769 486 231,687 196,901 39 60,839 52,450 4 14,219 12,358 1 729 395,046 339,288 190 306,111 259,498 32 121,828 102,711 2 414 259,255 '230,468 240 393,330 347,302 39 135,474 119,831 3 769 397,871 351,649 lI8 193,431 163,656 21 69,196 56,689 4 402 221,985 200,925 58 84,170 75,718 2 6,585 5,889 5 609 379,970 333,693 237 374,881 324,844 47 178,293 154,645 6 173 111,970 91,756 93 144,246 123,022 11 38,330 32,646 7
1,121 478,420 449,456 50 67,642 61,737 2 5,387 5,476 65 21,272 20,325
36,148 34,943 2,784 1 480 203,673 204,304 28 1 2,960 2 96 35,142 32,804 1 2,600 1,116 2,603 3 120 63,586 60,452 15 21,616 18,943 1 2,5ii; 4 4 1,869 1,161 , i 1,074 1,153 5 64 26,137 26,352 6 122 50,687 42,858 7 27 10,991 8,692
3,958 3,280 8 105 46,960 37,062 3 9 38 18,103 15,446 2 2,246 2,302 10
2,320 1,132,003 1,000,181 226 331,656 291,320 9 34,605 28,256 490 248,084 209,993 50 72,731 61,740
3,445 1 244 128,072 107,933 22 30,678 26,402 1 2,986 2 427 212567 179,889 54 82,366 70,000 4 14,695 12,216 3 69 27,058 26,860 1 1,034 1,099
13,738 4 151 70,357 63,320 25 34,103 30,236 10,320 5 221 101,831 93,407 10 15,728 13,525
2,727 6 307 140,678 133,157 30 47,840 44,975 2,734 7 179 85,410 79,449 5 6,229 5,654 8 142 68,612 61,708 12 15,815 14,623 9 90 49,334 44,465 17 25,132 23,066 10
18 16,025 16,063 122 227,468 237,767 1,124 8,608,123 8,774,085 15 30,566 30,756 163 979,981 998,957 1 4 6,577 6,307 105 769,632 762,163 2
2,745 1 2,418 2,411 116' 845,610 881,071 3 2 2,477 16 29,816 30,747 129 680,902 724,253 4 9 6,559 6,913 75 135,669 145,808 143 759,439 824,108 5 1 917 859 3 6,139 6,267 99 858,812 853,294 6 3 2,137 2,099 5 8,326 7,567 92 936,501 915,042 7 2 3,613 3,611 95 866,248 892,256 8
3,667 3,7i5 2,177 2,140 98 1,107,995 1,110,606 9 3 1 2,167 2,153 84 803,003 812,335 10
22,468 9,868,125 9,505,537 1,292 1,856,522 1,721,766 93 339,154 309,539 490 255,362 214,255 68 104,400 86,156 7 24,680 20,451 1 424 220,821 185,878 58 92,446 77,170 4 13,091 11,067 2 248 121,946 102,914 19 29,279 23,407 2 6,971 5,710 3 146 68,595 60,660 6 10,999 9,562 1 4,622 3,912 4 382 177,438 154,276 23 31,796 27,320 1 2,711 2,428 5 383 160,613 143,207 11 )7,250 15,086 1 3,620 3,144 6 333 162,571 142,303 29 43,468 38,730 5 15,104 13,288 7 422 203,670 176,959 31 48,613 42,084 2 6,648 5,762 8 235 107,288 99,604 17 25,407 23,051 9
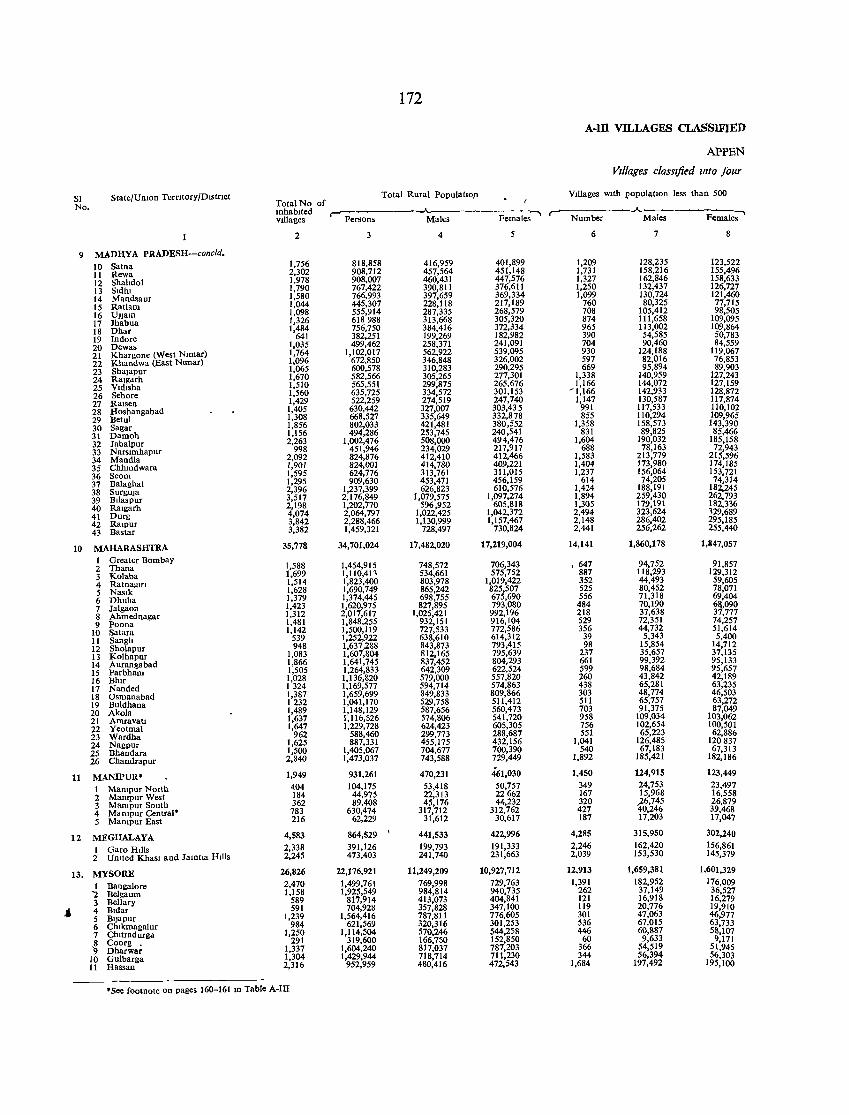
172
A-ill VILLAGES CLASSlFIED
APPEN
VIllages classified mto four
SI State/Umon Terntory/Dlstrlct Total No of
Total Rural Popu(aho)l Villages WIth 1?0pulatlOn less than 500
No. r
mhablted ~---------~ ..A. Female;' villages Persons Males Females Number Males
2 4 5 6 7 8
9 MADHYA PRADESH-concld.
10 Satna 1,756 818,858 416,959 401,899 1,209 128,235 123,522
11 Rewa 2,302 908,712 457,564 451,148 1,731 158,216 155,496
12 Shahdol 1,978 908,007 460,431 447,576 1,327 162,846 158,633
13 Sidlu 1,790 767,422 390,811 376,611 1,250 132,437 126,727
14 Mandsaur 1,580 766.993 397,659 369,334 1,099 130,724 121,460
15 RatIam 1,044 445,307 228,118 217,189 760 80,325 77,715
16 Ujjam 1,098 555,914 287,335 268,579 708 105,412 98,505
17 Jhabua 1,326 618988 313,668 305,320 874 111,658 109,095
18 Dhar 1,484 756,750 384,416 372,334 965 113,002 109,864
19 Indore 641 382,251 199,269 182,982 390 54,585 50,783
20 Dewas 1,035 499,462 258,371 241,091 704 90,460 84,559
21 Khargone (West Nlmar) 1,764 1,102,017 562,922 539,095 930 124,188 119,067
22 Khandwa (East Nunar) 1,096 672,850 346,848 326,002 597 82,016 76,853
23 Shajapur 1,065 600,578 310,283 290,295 669 95,894 89,903
24 Rajgdrh 1,670 582,566 305,265 277,301 1,338 140,959 127,243
25 Vldlsha 1,510 565,551 299,875 265,676 1,166 144,072 127,159
26 Sehore 1,560 635,725 334,572 301,153 -1,166 142,933 128,872
27 Ralsen 1,429 522,259 274,519 247,740 1,147 130,587 117,874
28 Hoshangabad 1,405 630,442 327,007 303,435 991 117,533 110,102
29 Belul 1,308 668,527 335,649 332,878 855 110,294 109,965
30 Sagar 1,856 802,033 421,481 380,552 1,358 158,573 143,390
31 Damoh 1,156 494,286 253,745 240,541 831 89,825 85,466
32 Jabalpur 2,263 1,002,476 508,000 494,476 1,604 190,032 185,158
33 Narslmhapur 998 451,946 234,029 217,917 688 78,163 72,943
34 Mandla 2,092 824,876 412,410 412,466 1,583 213,779 215,596
35 Chhmdwara 1,901 824,001 414,780 409,221 1,404 173,980 174,185
36 Seom 1,595 624,776 313,761 311,015 1,237 156,064 153,721
37 Balaghat 1,295 909,630 453,471 456,159 614 74,205 74,314
38 SurguJa 2,396 1,237,399 626,823 610,576 1,424 188,191 182,245
39 Bllaspur 3,517 2,176,849 1,079,575 1,097,274 1,894 259,430 262,793
40 Ralgarh 2,198 1,202,770 596,952 605,818 1,305 179,191 182,336
41 Durg 4,074 2,064,797 1,022,425 1,042,372 2,494 323,624 129,689
42 Ralpur 3,842 2,288,466 1,130,999 1,157,467 2,148 286,402 295,185
43 Bastar 3,382 1,459,321 728,497 730,824 2,441 256,262 255,440
10 MAHARASHTRA 35,778 34,701,024 17,482,020 17,219,004 14,141 1,860,178 1,847,057
1 Greater Bombay 2 Thana 1,588 1,454,915 748,572 706,343 \ 647 94,752 91,857
3 Kolaba 1,699 1,110,411 534,661 575,752 887 118,293 129,312
4 Ratnaglfl 1,514 1,823,400 803,978 1,019,422 352 44,493 59,605
5 Naslk 1,628 1,690,749 865,242 825,507 525 80,452 78,071
6 Dhuita 1,379 1,374,445 698,755 675,690 556 71,318 69,404
7 Jalgaon 1,423 1,620,975 827,895 793,080 484 70,190 6~,090
8 Alunednagar 1,312 2,017,617 1,025,421 992,196 218 37,638 37,777
9 Poona 1,481 1,848,255 932,151 916,104 529 72,351 74,257
10 Satara 1,142 1,5oo,1l9 727,533 772,586 356 44,732 51,614
11 Sangit 539 1,252,922 638,610 614,312 39 5,343 5,400
12 Sholapur 948 1,637,288 843,873 793,415 98 15,854 14,712
13 Kolhapur 1,083 1,607,804 812,165 795,639 237 35,657 37,135
14 Aurangabad 1,866 1,641,745 837,452 804,293 661 99,392 95,133
15 Parbham 1,505 1,264,833 642,309 622,524 599 98,684 95,657
16 Bhlr 1,028 1,136,820 579,000 557,820 260 43,842 42,189
17 Nanded 1324 1,169,577 594,714 574,863 438 65,281 63,235
18 Osmanabad 1,387 1,659,699 849,833 809,866 303 48,774 46,503
19 Buldhana 1232 1,041,170 529,758 511,412 511 65,757 63,272
20 Akola 1,489 1,148,129 587,656 560,473 703 91,375 87,049
21 Amravatl 1,637 1,116,526 574,806 541,720 958 109,034 103,062
22 Yeotmal 1,647 1,229,728 624,423 605,305 756 102,654 100,501
23 Wardha 962 588,460 299,773 288,687 551 65,223 62,886
24 Nagpur 1,625 887,331 455,175 432,156 1,041 126,485 120837
25 Bhandara 1,500 1,405,067 704,677 700,390 540 67,183 67,313
26 Chandrapur 2,840 1,473,037 743,588 729,449 1,892 185,421 182,186
11 MANIPUR" 1,949 931,261 470,231 461,030 1,450 124,915 123,449
1 Mampur North 404 104,175 53,418 50,757 349 24,753 23,497
2 Mampur West 184 44,975 22,313 22662 167 15,968 16,558
3 Mampur South 362 89,408 45,176 44,232 320 ,26,745 26,879
4 Mampur Central" 783 630,474 317,712 312,762 427 40,246 39,468
5 Mantpur East 216 62,229 31,612 30,617 187 17,203 17,047
12 MEGHALAYA 4,583 864,529 \ 441,533 422,996 4,285 315,950 302,240
1 Garo Hills 2,338 391,126 199,793 191,333 2,246 162,420 156,861
2 Untted Khasl and Jamtla Hills 2,245 473,403 241,740 231,663 2,039 153,530 145,379
13. MYSORE 26,826 22,176,921 11,249,209 10,927,712 12,913 1,659,381 1,601,329
1 Bangalore 2,470 1,499,761 769,998 729,763 1,391 182,952 176,009
'2 Belgaum 1,158 1,925,549 984,814 940,735 262 37,149 36,527
3 Bellary 589 817,914 413,073 404,841 121 16,918 16,279
J 4 Bldar 591 704,928 357,828 347,100 119 20,776 19,910
5 Bljapur 1,239 1,564,416 787,811 776,605 301 47,063 46,977
6 Chlkmagalur 984 621,569 320,316 301,253 536 67,015 63,733
7 ChJtradurga 1,250 1,114,504 570,246 544,258 446 60,887 58,107
~ Coorg • 291 319,600 166,750 152,850 60 9,633 9,171 Dharwar 1,337 1,604,240 817,037 787,203 366 54,519 51,945
10 Gulbarga 1,304 1,429,944 718,714 711,230 344 56,394 56,303
11 Hassan 2,316 952,959 480,416 472,543 1,684 197,492 195,100
.See footnote on pages 160-16110 Table A·III
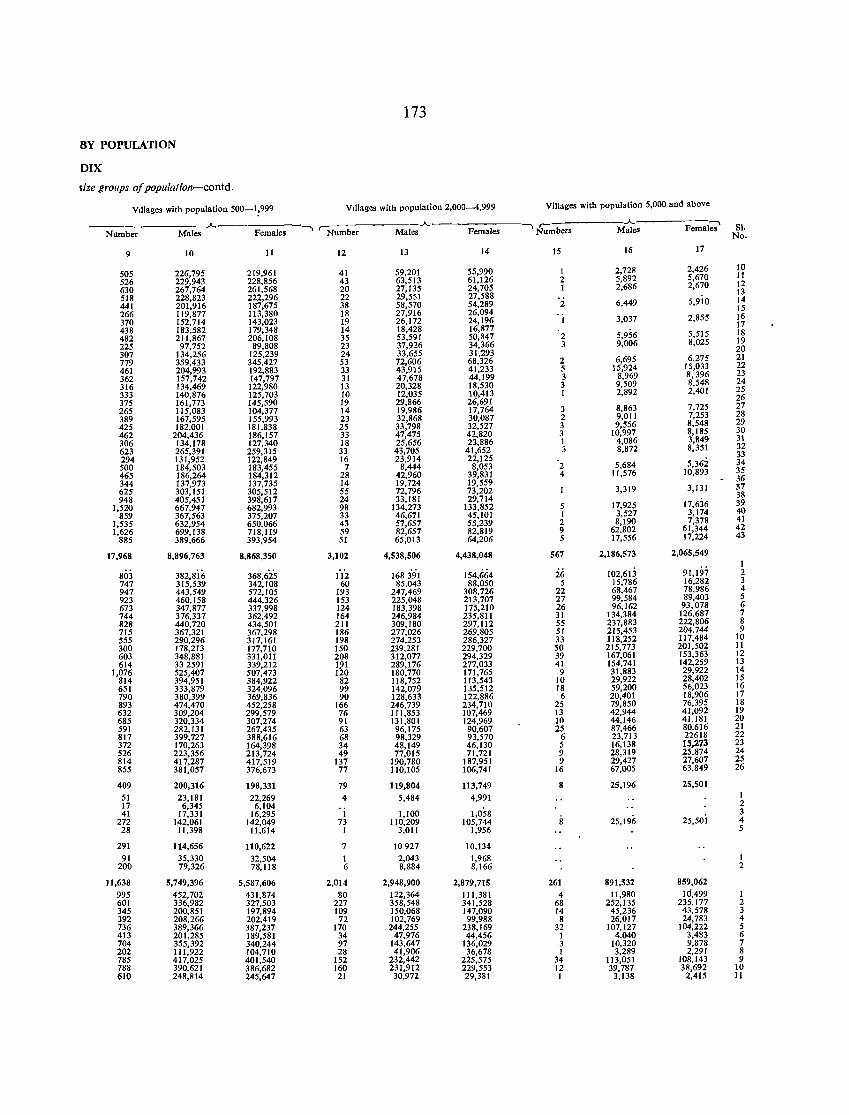
173
BY POPULATION
DIX
rize groups of populalion-contd.
Villages with population 500-1,999 Villages with population 2,000-4,999 Villages with population 5,000 and above
-"- ..A. "'Nwnbers
..A. Femal~
Number Males Females "' r-Number Males Females Males Sl. No.
9 10 II 12 13 14 15 16 17
505 226,795 219,961 41 59,201 55,990 1 2,728 2,426 10
526 229,943 228,856 43 63,513 61,126 2 5,892 5,670 II
630 267,764 261,568 20 27,135 24,705 1 2,686 2,670 12
518 228,823 222,296 22 29,551 27,588 13
441 201,916 187,675 38 58,570 54,289 2 6,449 5,910 14 15
266 119,877 113,380 18 27,916 26,094 2,855 16
370 152,714 143,023 19 26,172 24,196 3,037 438 183,582 179,348 14 18,428 16,877 17
482 211,867 206,108 35 53,591 50,847 2 5,956 5,515 18
225 97,752 89,808 23 37,926 34,366 3 9,006 8,025 19
307 134,256 125,239 24 33,655 31,293 20
779 359,433 345,427 53 72,606 68,326 2 6,695 6,275 21
461 204,993 192,883 33 43,915 41,233 5 15,924 15,033 22
362 157,742 147,797 31 47,678 44,199 3 8,969 8,396 23
316 134,469 122,980 13 20,328 18,530 3 9,509 8.548 24
333 140,876 125,703 10 12,035 10,413 1 2,892 2,401 25
375 161,773 145,590 19 29,866 26,691 26
265 115,083 104,377 14 19,986 17,764 3 8,863 7,725 27
389 167,595 155,993 23 32,868 30,087 2 9,011 7,253 28
425 182,001 181,838 25 33,798 32,527 3 9,556 8,548 29
462 204,436 186,157 33 47,475 42,820 3 10,997 8,185 30
306 134,178 127,340 18 25,656 23,886 1 4,086 3,849 31
623 265,391 259,315 33 43,705 41,652 8,872 8,351 32
294 131,952 122,849 16 23,914 22,125 5,362
33
500 184,503 183,455 7 8,444 8,053 2 5,684 34
465 186,264 184,312 28 42,960 39,831 4 11,576 10,893 35
344 137,973 137,735 14 19,724 19,559 36
625 303,151 305,512 55 72,796 73,202 3,319 3,131 37
948 405,451 398,617 24 33,181 29,714 38
1,520 667,947 682,993 98 134,273 133,852 5 17,925 17,636 39
859 367,563 375,207 33 46,671 45,101 I 3,527 3,174 40
1,535 632,954 650,066 43 57,657 55,239 2 8,190 7,378 41
1,626 699,138 718,119 59 82,657 82,819 9 62.802 61,344 42
885 389.666 393,954 51 65,013 64,206 5 17,556 17,224 43
17,968 8,896,763 8,868,350 3,102 4,538,506 4,438,048 567 2,186,573 2,065,549
91,197 1
803 382,816 368,625 112 168391 154,664 i6 102,613 2 747 315,539 342,108 60 85,043 88,050 5 15,786 16,282 3 947 443,549 572,105 193 247,469 308,726 22 68,467 78,986 4 923 460,158 444,326 153 225,048 213,707 27 99,584 89,403 5 673 347,877 337,998 124 183,398 175,210 26 96,162 93.078 6 744 376,337 362,492 164 246,984 235,811 31 134,384 126.687 7 828 440,720 434,501 211 309,180 297,112 55 237,883 222,806 8 715 367,321 367,298 186 277,026 269,805 51 215,453 204,744 9 555 290,296 317,161 198 274,253 286,327 33 118,252 117,484 10 300 178,213 177,710 150 239.281 229,700 50 215,773 201,502 11 603 348,881 331,011 208 312,077 294,329 39 167,061 153,363 12 614 332591 339,212 1.91 289,176 277,033 41 154,741 142,259 13
1,076 525,407 507,473 120 180,770 171,765 9 31,883 29,922 14 814 394,951 384,922 82 118,752 113,543 10 29,922 28,402 15 651 333,879 324,096 99 142,079 135,512 18 59,200 56,023 16 790 380,399 369,836 90 128,633 122,886 6 20,401 18,906 17 893 474,470 452,258 166 246,739 234,710 25 79,850 76,395 18 632 309,204 299,579 76 111,853 107,469 13 42,944 41,092 19 685 320.334 307,274 91 131,801 124,969 10 4.4,146 41,181 20 591 282,131 267,435 63 96,175 90,607 25 87,466 80,616 21 817 399,727 388,616 68 98,329 93,570 6 23,713 22618 22 372 170,263 164,398 34 48,149 46,130 5 16,138 1$,273 23 526 223,356 213,724 49 77,015 71,721 9 28,319 25,874 24 814 417,287 417,519 137 190,780 187,951 9 29,427 27,607 25 855 381,057 376,673 77 110,105 106,741 16 67,005 63,849 26
409 200,316 198,331 79 119,804 113,749 8 25,196 25,501
51 23,181 22,269 4 5,484 4,991 1 17 6,345 6,104 2 41 17,331 16,295 1 1,100 1,058
25,50i 3
272 142,061 142,049 73 110,209 IQ5,744 8 25,196 4 28 11,398 11,614 1 3,011 1,956 5
291 114,656 110,622 7 10927 10,134 91 35,330 32,504 1 2,043 1,968 1
200 79,326 78,118 6 8,884 8,166 2
11,638 5,749,396 5,587,606 2,014 2,948,900 2,879,715 261 891,532 859,062
995 452,702 431,874 80 122,364 111,381 4 11,980 ld,499 I 601 336,982 327,503 227 358,548 341,528 68 252,135 235,177 2 345 200,851 197,894 109 150,068 147,090 14 45,236 43,578 3 392 208,266 202,419 72 102,769 99,988 8 26,017 24,783 4 736 389,366 387,237 170 244,255 238,169 32 107,127 104,222 5 413 201,285 189,581 34 47,976 44,456 I 4,040 3,483 6 704 355,392 340,244 97 143,647 136,029 3 10,320 9,878 7 202 111,922 104,710 28 41,906 36,678 I 3,289 2,291 8 785 417,025 401,540 152 232,442 225,575 34 113,051 108,143 9 788 390,621 386,682 160 231,912 229,553 12 39,787 38,692 10 61Q 248,814 245,647 21 30,972 29,381 1 3,138 2,415 11
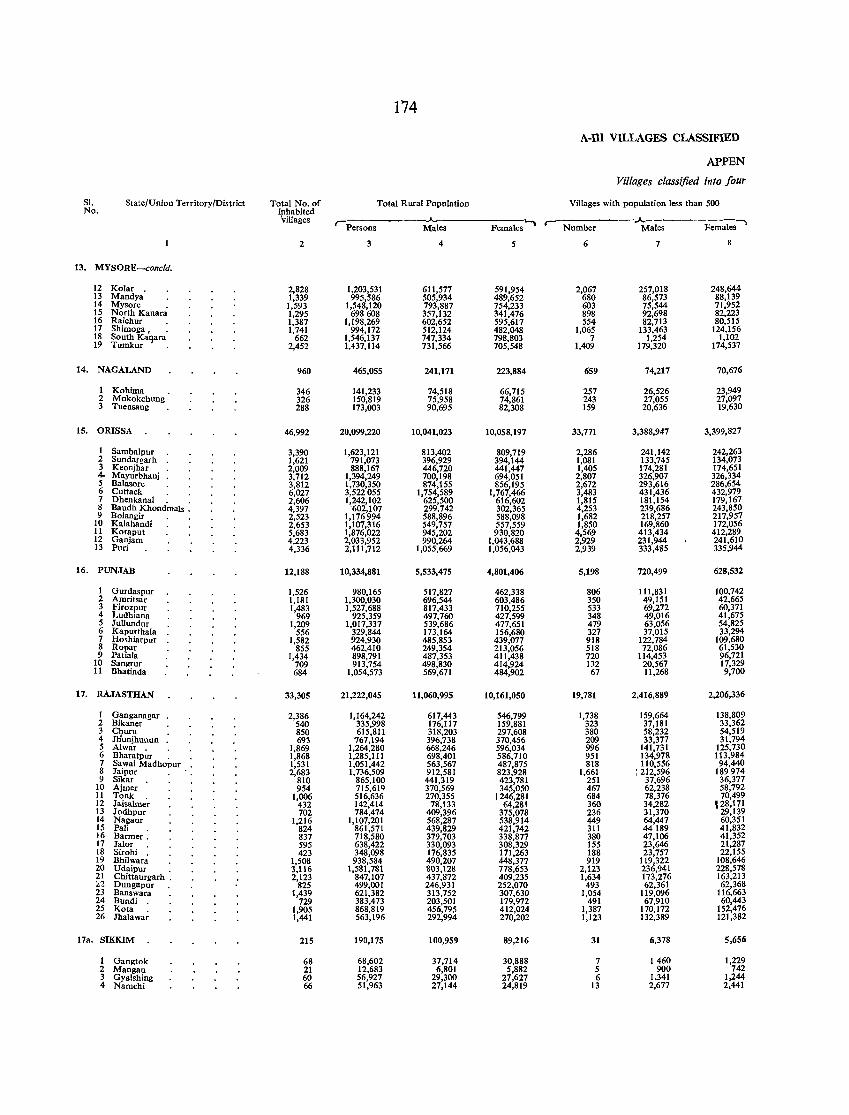
174
A-ill VILLAGES CLASSIFIED
APPEN
Villages classified illto four
SI. State/Union Territory/District Total No. of Total Rural Population Villages with population less than 500 No. iehabited
iIlages 'Persons
--J-.. Fe~ ,-
.A.-Females""" Males Number Males
2 3 4 5 6 7
13. MYSORE-concld.
12 Kolar 2,828 1,203,531 611,577 591,954 2,067 257,018 248,644 13 Mandya 1,339 995,586 505,934 489,652 680 86,573 88,139 14 Mysore 1,593 1,548,120 793,887 754,233 603 75,544 71,952 15 North Kanan': 1,295 698608 357,132 341,476 898 92,698 82,223 16 Raichur 1,387 1,198,269 602,652 595,617 554 82,713 80,515 17 Shimoga, : 1,741 994,172 512,124 482,048 1,065 133,463 124,156 18 ~~~~~a'lara 662 1,546,137 747,334 798,803 7 1,254 1,102 19 2,452 1,437,114 731,566 705,548 1,409 179,320 174,537
14. NAGALAND 960 465,055 241,171 223,884 659 74,217 70,676
I Kohima 346 141,233 74,518 66,715 257 26,526 23,949 2 Mokokchung 326 150,819 75,958 74,861 243 27,055 27,097 3 Tuensaog 288 173,003 90,695 82,308 159 20,636 19,630
15. ORISSA 46,992 20,099,220 10,041,023 10,058,197 33,771 3,388,947 3,399,827
1 Sarnbalpur 3,390 1,623,121 813,402 809,719 2,286 241,142 242,263 2 Suodargarh 1,621 791,073 396,929 394,144 1,081 133,745 134,073 3 Keoojhar 2,009 888,167 446,720 441,447 1,405 174,281 174,651 4- Mayurbhanj 3,712 1,394,249 700,198 694,051 2,807 326,907 326,334 5 Balasore 3,812 1,730,350 874,155 856,195 2,672 293,616 286,654 6 Cuttack 6,027 3,522055 1,754,589 1,767,466 3,483 431,436 432,979 7 Dhenkanal 2,606 1,242,102 625,500 616,602 1,815 181,154 179,167 8 Baudh Khond~als : 4,397 '602,107 299.742 302,365 4,253 239,686 243,850 9 Bolangir 2,523 1,176994 588,896 588,098 1,682 218,257 217,957
10 Kalahandi 2,653 1,107,316 549,757 557,559 1,850 169,860 172,056 11 Koraput 5,683 1,876,022 945,202 930,820 4,569 413,434 412,289 12 Ganjarn 4,223 2,033,952 990,264 1,043,688 2,929 231,944 241,610 13 Puri 4,336 2,111,712 1,055,669 1,056,043 2,939 333,485 335,944
16. PUNJAB 12,188 10,334,881 5,533,475 4,801,406 5,198 720,499 628,532
1 Gurdaspur 1,526 980,165 517,827 462,338 806 111,831 100,742 2 Arnritsar 1,181 1,300,030 696,544 603,486 350 49,151 42,665 3 Firozpur 1,483 1,527,688 817,433 710,255 533 69,272 60,371 4 Ludhiana 969 925,359 497,760 427,599 348 49,016 41,675 5 Julluodur 1,209 1,017,337 539,686 477,651 479 63,056 54,825 6 Kapurtha1a 556 329,844 173,164 156,680 327 37,015 33,294 7 Ho.hiarpur 1,582 924,930 485,853 439,077 918 122,784 109,680 8 Ropar 855 462,410 249,354 213,056 518 72,086 61,530 9 Patiala 1,434 898,791 487,353 411,438 720 114,453 96,721
10 SanjZrur 709 913,754 498,830 414,924 132 20,567 17,329 II Bhatinda 684 1,054,573 569,671 484,902 67 11,268 9,700
17. RAJASTHAN 33,305 21,222,045 11,060,995 10,161,050 19,781 2,416,889 2,206,336
1 Ganganagar 2,386 1,164,242 617,443 546,799 1,738 159,664 138,809 2 Bikaner 540 335,998 176,117 159,881 323 37,181 33,362 3 Churu 850 615,811 318,203 297,608 380 58,232 54,519 4 JIl'unjhuoun 693 767,194 396,738 370,456 209 33,377 31,794 5 Alwar . 1,869 1,264,280 668,246 596,034 996 141,731 125,730 6 Bharatpur : 1,868 1,285,111 698,401 586,710 951 134,978 113,984 7 Sawai Madhopur 1,531 1,051,442 563,567 487,875 818 110,556 94,440 8 Jaipur 2,683 1,736,509 912,581 823,928 1,661 ; 212,596 189974 9 Sikar 810 865,100 441,319 423,781 251 37,696 36,377
10 Aimer 954 715,61Q 370,569 345,050 467 62,238 58,792 11 Tonk 1,006 516,636 270,355 r 246,281 684 78,376 70,499 12 Jaisahne~ 432 142,414 78,133 64,281 360 34,282 128,171 13 Jodhpur 702 784,474 409,396 375,078 236 31,370 29,139 14 Nagaur 1,216 1,107,201 568,287 538,914 449 64,447 60,351 15 Pali 824 861,571 439,829 421,742 311 44189 41,832 16 Barmer: 837 718,580 379,703 338,877 380 47,106 41,352 17 Jalor 595 638,422 330,093 308,329 155 23,646 21,287 18 Sirohi 423 348,098 176,835 171,263 188 23,757 22,155 19 Bhilwar~ 1,508 938,584 490,207 448,377 919 119,322 108,646 20 Udaipur . 3,116 1,581,781 803,128 778,653 2,123 236,941 228,578 21 Chittaurgarh . 2,123 847,107 437,872 409,235 1,634 173,276 163,213 ~'2 Dungapur . 825 499,001 246,931 252,070 493 62,361 62,368 23 Banswara 1,439 621,382 313,752 307,630 1,054 119,096 116,663 24 Bundi 729 383,473 203,501 179,972 491 67,910 60,443 25 Kota 1,905 868,819 456,795 412,024 1,387 170,172 152,476 26 Jhalawa; 1,441 563,196 292,994 270,202 1,123 132,389 121,382
17a. SIKKIM 215 190,175 100,959 89,216 31 6,378 5,656
I Gangtok 68 68,602 37,714 30,888 7 1460 1,229 2 Mangan 21 12,683 6,801 5,882 5 900 742 3 Gyalshing 60 56,927 29,300 27,627 6 1.341 1,244 4 Namchi 66 51,963 27,144 24,819 13 2,677 2,441
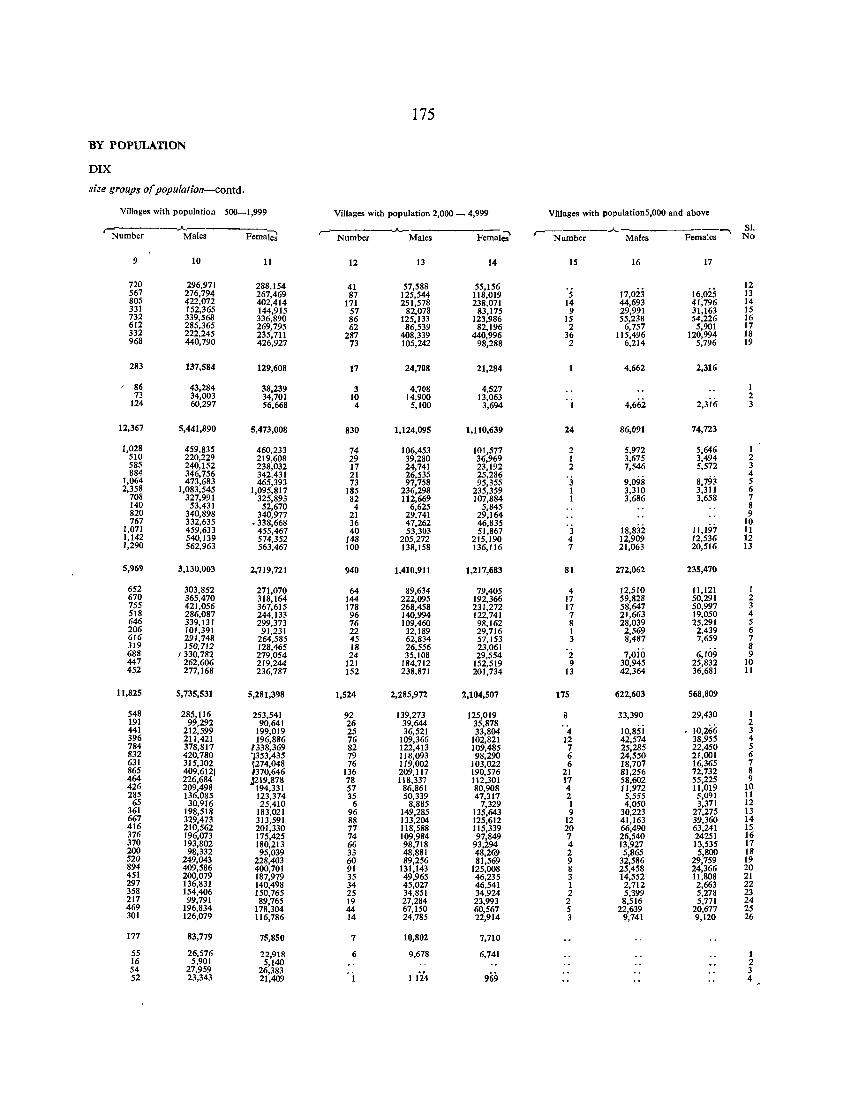
175
BY POPULATION
DIX
size groups of popularion-contd.
Villages with population 500-1,999 Villages with population 2,000 - 4,999 Villages with population5.000 and above
r-Number .A- .A.-
,.....,.---:-:: ___ .A. """'\ Sl.
Males FemaI;i Number Males Femal.;;' Number Males Females No
9 10 11 12 13 14 15 16 17
720 296,971 288,154 41 57,588 55,156 17,023 16,025
12 567 276,794 267,469 87 125,544 118,019 5 13 805 422,072 402,414 171 251,578 238,071 14 44,693 41,796 14 331 152,365 144,915 57 82,078 83,175 9 29,991 31,163 15 732 339,568 336,890 86 125,133 123,986 15 55,238 54,226 16 612 285,365 269,795 62 86,539 82,196 2 6,757 5,901 17 332 222,245 235.711 287 408,339 440,996 36 115,496 120,994 18 968 440,790 426,927 73 105,242 98,288 2 6,214 5,796 19
283 137,584 129,608 17 24,708 21,284 1 4,662 2,316
/ 86 43,284 38,239 3 4,708 4,527 1 73 34,003 34,701 10 14,900 13,063
2,3i6 2
124 60,297 56,668 4 5,100 3,694 1 4,662 3
12,367 5,441,890 5,473,008 830 1,124,095 1,110,639 24 86,091 74.723
1,028 459,835 460,233 74 106,453 101,577 2 5,972 5,646 1 510 220,229 219,608 29 39,280 36,969 1 3,675 3,494 2 585 240,152 238,032 17 24,741 23,192 2 7,546 5,572 3 884 346,756 342.431 21 26,535 25,286
8.793 4
1,064 473,683 465,393 73 97,758 95,355 'j 9,098 5 2,358 1,083,545 1,095,817 185 236,298 235,359 1 3,310 3,311 6
708 327,991 325,893 82 112,669 107,884 1 3,686 3,658 7 140 53,431 52,670 4 6,625 5,845 8 820 340,898 340,977 21 29.741 29,164 9 767 332,635 .338,668 36 47,262 46,835
11,197-10
1,071 459,633 455,467 40 53,303 51,867 3 18,832 11 1,142 540,139 574,352 148 205,272 215,190 4 12,909 12,536 12 1,290 562,963 563,467 100 138.158 136,116 7 21,063 20,516 13
5,969 3,130,003 2.719,721 940 1,410,911 1,217,683 81 272,062 235,470
652 303,852 271,070 64 89,634 79,405 4 12,510 11,121 1 670 365,470 318,164 144 222,095 192,366 17 59,828 50,291 2 755 421,056 367,615 178 268,458 231,272 17 58,647 50,997 3 518 286,087 244,133 96 140,994 122,741 7 21,663 19,050 4 646 339,131 299,373 76 109,460 98,162 8 28,039 25,291 5 206 101,391 91,231 22 32,189 29,716 1 2,569 2,439 6 616 291,748 264,585 45 62,834 57,153 3 8,487 7,659 7 319 150,712 128,465 18 26,556 23,061
6,109 8
688 1330,782 279,054 24 35,108 29,554 2 7,010 9 447 262,606 219,244 121 184,712 152,519 9 30,945 25,832 10 452 277,168 236,787 152 238,871 201,734 13 42,364 36,681 11
lJ,825 5,735,531 5,281,398 1,524 2.185.972 2.104,507 175 622,603 568,809
548 285,116 253,541 92 139,273 125,019 8 33,390 29,430 1 191 99,292 90,641 26 39,644 35,878
• 10,266 2
441 212,599 199,019 25 36,521 33,804 4 10,851 3 396 211,421 196,886 76 109,366 102,821 12 42,574 38,955 4 784 378,817 '338,369 82 122,413 109,485 7 25,285 22,450 5 832 420,780 1353,435 79 118,093 98,290 6 24,550 21,001 6 631 315,302 !274,048 76 119,002 103,022 6 18,707 16,365 7 865 409,6121 370,646 136 209,117 190,576 21 81,256 72,732 8 464 226,684 J219,878 78 118,337 112,301 17 58,602 55,225 9 426 209,498 194,331 57 86,861 80,908 4 11,972 11,019 10 285 136,085 123,374 35 50,339 47,317 2 5,555 5,091 11
65 30,916 25,410 6 8,885 7,329 1 4,050 3,371 12 361 198,518 183,021 96 149,285 135,643 9 30,223 27,275 13 667 329,473 313,591 88 133,204 125,612 12 41,163 39,360 14 416 210,562 201,330 77 118,588 115,339 20 66,490 63,241 15 376 196,073 175,425 74 109,984 97,849 7 26,540 24251 16 370 193,802 180,213 66 98,718 93,294 4 13,927 13,535 17 200 98,332 95,039 33 48,881 48,269 2 5,865 5,800 18 520 249,043 228,403 60 89,256 81,569 9 32,586 29,759 19 894 409,586 400,701 91 131,143 125,008 8 25,458 24,366 20 451 200,079 187,979 35 49,965 46,235 3 14,552 11,808 21 297 136,831 140,498 34 45,027 46,541 1 2,712 2,663 22 358 154,406 150,765 25 34,851 34,924 2 5,399 5,278 23 217 99,791 89,765 19 27,284 23,993 2 8,516 5,771 24 469 196,834 178,304 44 67,150 60,567 5 22,639 20,677 25 301 126,079 116,786 14 24,785 22,914 3 9,741 9,120 26
177 83,779 75,850 7 10,802 7,710
55 26,576 22,918 6 9,678 6,741 1 16 5,901 5,140 2 54 27,959 26,383 , i 1 t"i4 969
3 52 23,343 21,409 4
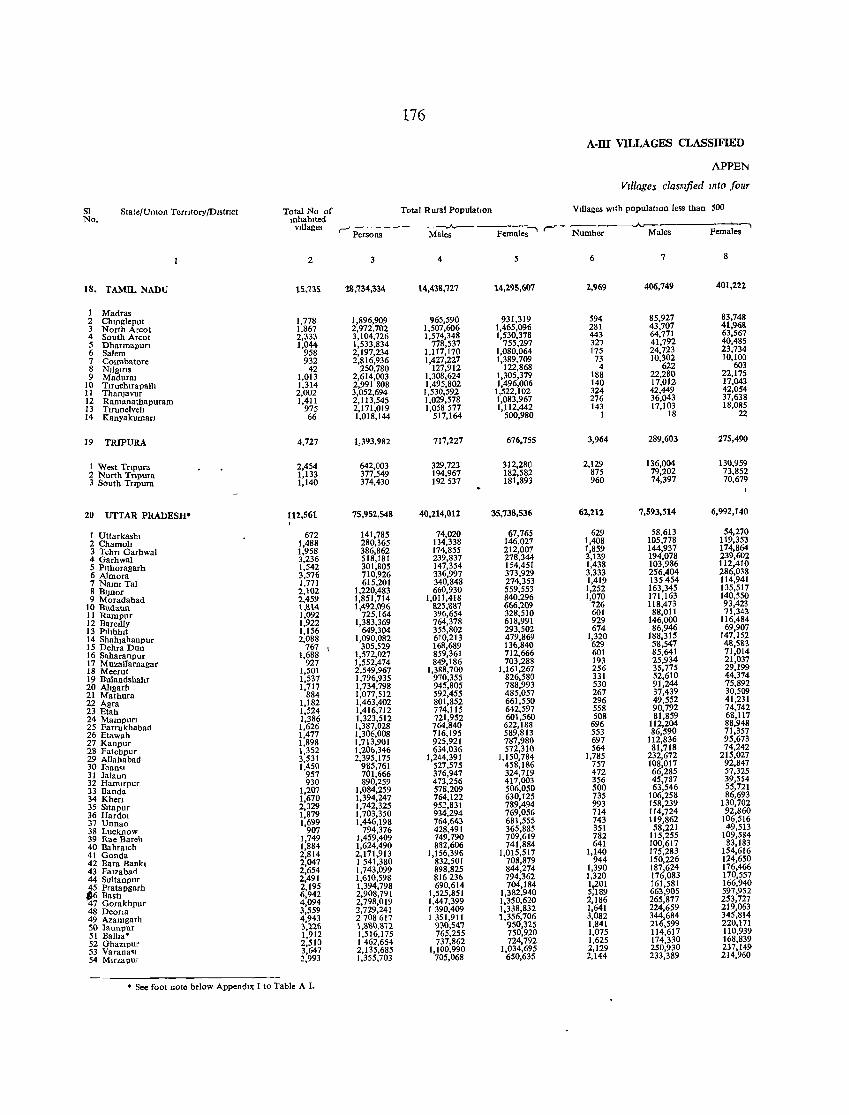
176
A-ill VILLAGES CLASSIFIED
APPE"N
Villages classified mto four
SI State/Umon Terntory/Dlstrlct Total No of Total Rural PopulatIon VIllages wIth populatIOn less than 500 No. mhablted
vIllages r- Per;;';;;' - --~e~ Females' r Number Males Females
2 3 4 5 6 7 8
18. TAMll.. NADU 15,735 28,734,3.4 14,43&,727 14,295,607 2,969 406,749 401,222
1 Madras 2 Chmgleput 1,778 1,896,909 965,590 931,319 594 85,927 83,748
3 North Arcot 1,867 2,972,702 1,507,606 1,465,096 281 43,707 41,96& 4 South Areot 2,333 3,104,726 1,574,348 1,530,378 443 64,771 63,567 5 Dharmapun 1,044 1,533,834 778,537 755,297 327 41,792 40,485 6 Salem 958 2,197,234 1,117,170 1,080,064 175 24,723 23,734
7 COImbatore 932 2,816,936 1,427,227 1,389,709 73 10,302 10,100
8 Nllgms 42 250,780 127,912 122,868 4 622 603 9 Madural 1,013 2,614,003 1,308,624 1,305,379 188 22,280 22,175
10 Tlruchlrapalh 1,314 2,991808 1,495,802 1,496,006 140 17,012- 17,043 II Thafljavur 2,002 3,052,694 1,530,592 1,522,102 324 42,449 42,054
12 Ramanathapuram 1,411 2,113,545 1,029,578 1,083,967 276 36,043 37,638 13 TIrunelveh 975 2,171,019 1,058577 1,112,442 143 17,103 18,085 14 Kanyakumarl 66 1,018,144 517,164 500,980 1 18 22
19 TRIPURA 4,727 1,393,982 717,227 676,755 3,964 289,603 275,490
I West Tnpura 2,454 642,003 329,723 312,280 2,129 136,004 130,959 2 North Tnpura 1,133 377,549 194,967 182,582 875 79,202 73,852 3 South Tnpura 1,140 374,430 192537 181,893 960 74,397 70,679
20 UTTAR PRADESH' 112,561 75,952,548 40,214,012 35,738,536 62,212 7,593,514 6,992,140
1 Uttarka.hl 672 141,785 74,020 67,765 629 58,613 54,270
2 Chamoh 1,488 280,365 134,338 146,027 1,408 105,778 119,353
3 Tehn Garhwal 1,958 386,862 174,855 212,007 1,859 144,937 174,864 4 Garhwal 3,236 518,181 239,837 278,344 3,139 194,078 239,602
5 PIthoragarh 1,542 301,805 147,354 154,451 1,438 103,986 112,410
6 Almora 3,576 710,926 336,997 373,929 3,333 256,404 286,038
7 Naml Tal 1,771 615,201 340,848 274,353 1,419 135454 114,941
8 Bllnor 2,102 1,220,483 660,930 559,553 1,252 163,345 135,517
9 Moradabad 2,459 1,851,714 1,011,418 840,296 1,070 171,163 140,550
10 Budauu 1,&14 1,492,096 825,887 666,209 726 118,473 93,423
11 Rampur 1,092 725,164 396,654 328,510 601 88,011 71,343
12 Barellly 1,922 1,383,369 764,378 618,991 929 146,000 116,484
13 Plhbhlt 1,156 649,304 355,802 293,502 674 86,946 69,907
14 Shahlahanpur 2,088 1,090,082 610,213 479,869 1,320 188,315 147,152
15 Dehra Dun 767 \ 305,529 168,689 136,840 629 58,547 4%,583 16 Saharanpur 1,688 1,572,027 859,361 712,666 601 85,641 71,014
17 Muzaffarnagar 927 1,552,474 849,186 703,288 193 25,934 21,037
18 Meerut 1,501 2,549,967 1,388,700 1,161,267 256 35,775 29,199
19 Bulandsbabr 1,537 1,796,935 970,355 826,580 331 52,610 44,374
20 Ahgarh 1,717 1,734,798 945,805 788,993 530 91,244 75,892
21 Mathura 884 1,077,512 592,455 485,057 267 37,439 30,509
22 Agra 1,182 1,463,402 801,852 661,550 296 49,552 41,231
23 Etah 1,524 1,416,712 774,115 642,597 558 90,792 74,742
24 Mampun 1,386 1,323,512 721,952 601,560 508 81,859 68,117 25 Farrukhabad 1,626 1,387,028 764,840 622,188 696 112,204 88,948
26 Etawah 1,477 1,306,008 716,195 589,813 553 86,590 71,357
27 Kanpur 1,898 1,713,901 925,921 787,980 697 112,836 95,673
28 Fatehpur 1,352 1,206,346 634,036 572,310 564 81,718 74,242
29 Allahabad 3,531 2,395,175 1,244,391 1,150,784 1,785 232,672 215,027
30 Jhau" 1,450 985,761 527,575 458,186 757 108,017 92,847
31 Jalaun 957 701,666 376,947 324,719 472 66,285 57,325
32 Hamlfpur 930 890,259 473,256 417,003 356 45,787 39,554
33 Banda 1,207 1,084,259 578,209 506,050 500 63,546 55,721
34 Khen 1,670 1,394,247 764,122 630,125 735 106,258 86,693
35 Sltapur 2,329 1,742,325 952,831 789,494 993 158,239 130,702
36 HardOl 1,879 1,703,350 934,294 769,056 714 114,724 92,860
37 Unnao 1,699 1,446,198 764,643 681,555 743 119,862 106,516
38 Lucknow 907 794,376 428,491 365,885 351 58,221 49,513
39 Rae Bareh 1,749 1,459,409 749,790 709,619 782 115,255 109,584
40 Bahralch 1,884 1,624,490 882,606 741,884 641 100,617 83,183
41 Gonda 2,814 2,171,913 1,156,396 1,015,517 1,140 175,283 154,616
42 Bara Bankl 2,047 1541,380 832,501 708,879 944 150,226 124,650
43 Falzabad 2,654 1,743,099 898,825 844,274 1,390 187,624 176,466
44 Sultanpur 2,491 1,610,598 816236 794,362 1,320 176,083 170,557
45 Pratapgarh 2,195 1,394,798 690,614 704,184 1\201 161,581 166,940 '6 Bash 6,942 2,908,791 1,525,851 1,382,940 5,189 663,905 597,952
47 Gorakhpur 4,094 2,798,019 1,447,399 1,350,620 2,186 265,877 253,727
48 Deana 3,559 2,729,241 I 390,409 1,338,832 1,641 224,659 219,063
49 Azamgarh 4,943 2708617 I 351,911 ',356,706 3,082 344,684 345,814
50 launpur >,226 \,8'i\O,'i\12 930,541 950,325 1,841 216,599 220,171
51 Balha> 1,912 1,516,175 765,255 750,920 1,075 114,617 110,939
52 GhaZipur 2,510 1462,654 737,862 724,792 1,625 174,330 168,839
53 Varana" 3,647 2,135,685 1,100,990 1,034,695 2,129 250,930 237,149
54 Mlrzapur 2,993 1,355,703 705,068 650,635 2,144 233,389 214,960
• Sec foot note below AppendIX I to Table A I.
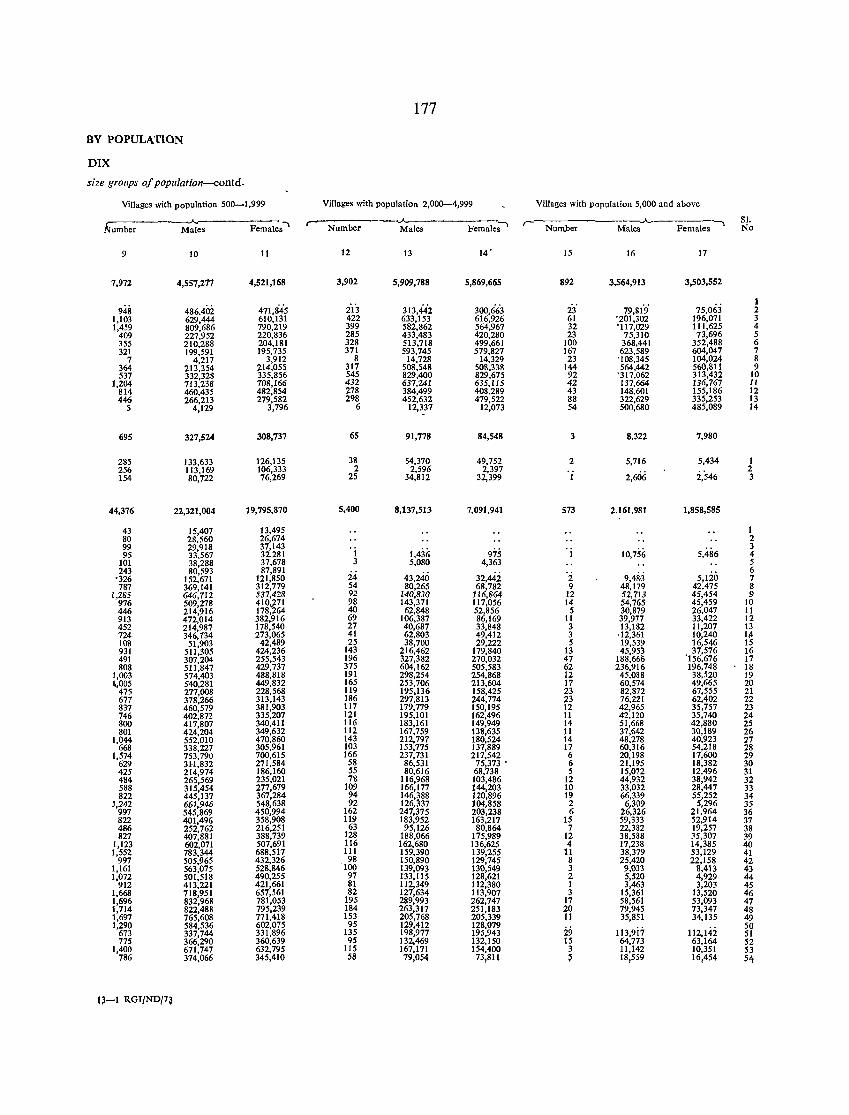
177
BY POPULATlON
DIX
size groups 0/ popu/afion-contd.
Villages with population 500-1,999 Villages with population 2,000-4,999 Villages with population 5,000 and above
_A...-----, SI. kumber Males Females ..... .--Number Males Female;'
r- Num.)Jer Males Females No
9 10 11 12 13 14' 15 16 17
7,972 4,557,277 4,521,168 3,902 5,909,788 5,869,665 892 3,564,913 3,503,552
948 486.40i 471,845 313,442 300,663 79,81!i 75,063 I
213 23 2 1,103 629,444 610,131 422 633,153 616,926 61 '201,302 196,071 3 1,459 809,686 790,219 399 582,862 564,967 32 '117,029 111,625 4
409 227,952 220,836 285 433,483 420,280 23 75,310 73,696 5 355 210,288 204,181 328 513,718 499,661 100 368,441 352,488 6 321 199,591 195,735 371 593,745 579,827 167 623,589 604,047 7
7 4,217 3,912 8 14,728 14,329 23 '108,345 104,024 8 364 213,354 214,055 317 508,548 508,338 144 564,442 560,811 9 537 332,328 335,856 545 829,400 829,675 92 '317,062 313,432 10
1,204 713,238 708,166 432 637,241 635,115 42 137,664 136,767 11 814 460,435 482,854 278 384,499 408,289 43 148,601 155,186 12 446 266,213 279,582 298 452,632 479,522 88 322,629 335,253 13
5 4.129 3,796 6 12.337 12,073 54 500,680 485.089 14
695 327,524 308,737 6S 91,778 84,548 3 8.322 7,980
285 133,633 126,135 38 54,370 49,752 2 5,716 5,434 1 256 113,169 106,333 2 2,596 2.397
2,546 2
154 80.722 76,269 25 34,812 32,399 1 2,606 3
44,376 22,321,004 19,795,870 5,400 8,137,513 7,091,941 573 2,161,981 1,858,585
43 15,407 13,495 1 80 28,560 26,674 2 99 29.918 37,143 'j 1,4ji; 975 . i 10,756 5,486
3 95 33,567 32,281 4
101 38,288 37,678 3 5,080 4,363 5 243 80,593 87,891
43,240 32,442 9,48.3 5,120 6
'326 152,671 121,850 24 2 7 787 369,141 312,779 54 80,265 68,782 9 48,179 42.475 8
1,285 646,712 537,428 92 140,830 116,864 12 52,713 45,454 9 976 509,278 410,271 98 143,371 117,056 14 54,765 45,459 10 446 214,916 178,264 40 62,848 52,856 5 30,879 26,047 11 913 472,014 382,916 69 106,387 86,169 II 39,977 33,422 12 452 214,987 178,540 27 40,687 33,848 3 13,182 11,207 13 724 346,734 273,065 41 62,803 49,412 3 ,12,361 10,240 1~ 108 51,903 42,489 25 38,700 29,222 5 19,539 16,546 15 931 511,305 424,236 143 216,462 179,840 13 45,953 37,576 16 491 307,204 255,543 196 327,382 270,032 47 188,665 '156.676 17 808 511,847 429,737 375 604,162 505,583 62 236,916 196,748 18
1,003 574,403 488,818 191 298,254 254,868 12 45,088 38,520 19 1,005 540,281 449,832 165 253,706 213,604 17 60,574 49.665 20
475 277,008 228,568 119 195,136 158,425 23 82,872 67.555 21 677 378,266 313,143 186 297,813 244,774 23 76,221 62,402 22 837 460,579 381,903 117 179,779 150,195 12 42,965 35,757 23 746 402,872 335,207 121 195,101 162,496 11 42,120 35,740 24 800 417,807 340,411 116 183,161 149,949 14 51,668 42,880 25 801 424.204 349,632 112 167,759 138,635 Ii 37,642 30,189 26
1,044 552,010 470,860 143 212.797 180,524 14 48,278 40,923 27 668 338,227 305,961 103 153,775 137,889 17 60,316 54,218 28
1,574 753,790 700,615 166 237,731 217,542 6 20,198 17,600 29 629 31-1,832 271,584 58 86,531 75,373 • 6 21,195 18,382 30 425 214,974 186,160 55 80.616 68,738 5 15,072 12,496 31 484 265.569 235,021 78 116,968 103,486 12 44,932 38,942 32 588 315,454 277,679 109 166,177 144,203 10 33,032 28,447 33 822 445,137 367,284 94 146,388 120,896 19 66,339 55,252 34
1,242 661,946 548,638 92 126,337 104,858 2 6,309 5,296 35 997 545,869 450,994 162 247,375 203,238 6 26,326 21,964 36 822 401,496 358,908 119 183,952 163,217 15 59,333 52,914 37 486 252,762 216,251 63 95,126 80,864 7 22,382 19,257 38 827 407,881 388,739 128 188,066 175,989 12 38,588 ~5,307 39
1,123 602,071 507,691 116 162,680 136,625 4 17,238 14,385 40 1,552 783,344 688,517 111 159,390 139,255 11 38,379 33,129 41
997 505,965 432,326 98 150,890 129,745 8 25,420 22,158 42 1,161 563,075 528,846 '100 139,093 130,549 3 9,033 8,413 43 1.072 501,518 490,255 97 133.115 128,621 2 5,520 4,929 44
912 413,221 421,661 81 112,349 112,380 1 3,463 3,203 45 1,668 718,951 657,561 82 127,634 113,907 3 15,361 13,520 46 1,696 832,968 781,053 195 289,993 262,747 17 58,561 53,093 47 1,714 822,488 795,239 184 263.317 251,183 20 79,945 73,347 48 1,697 765,608 771,418 153 205,768 205,339 11 35,851 34,135 49 1,290 584,536 602,075 95 129,412 128,079
21i 113,9i7 112,14i 50 673 337,744 331,896 135 198,977 195,943 51 775 366,290 360,639 95 132,469 132,150 15 64,773 63,164 52
1,400 671,747 632,795 115 167,171 154,400 3 11,142 10,351 53 786 374,066 345,410 58 79,054 73,811 ~ 18,559 16,454 54
t~-1 RGI/ND/7~
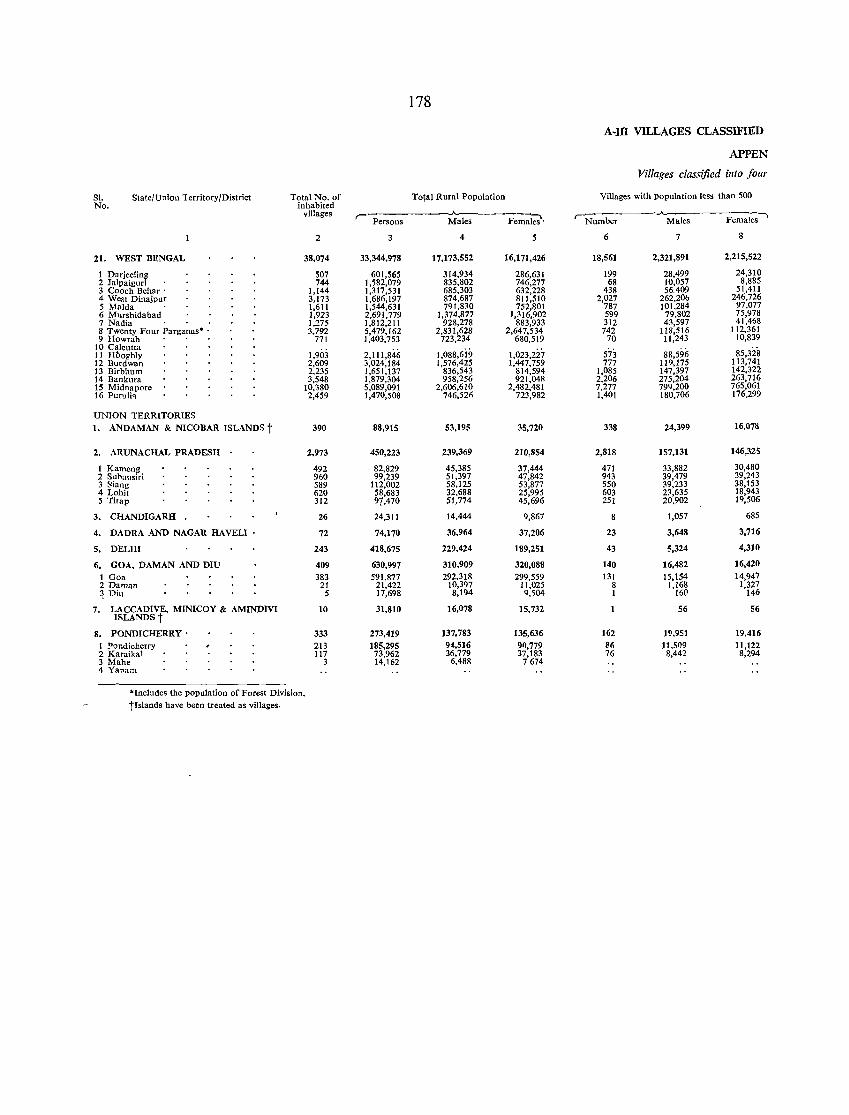
178
A-ID VILLAGES CLASSIFIED
APPEN
Villages classified into four
SI. State/Union Territory/District No.
Total No. of Tola) Rural Population Villages with population less than 500 inhabited
villages ,-----"---Femaks\ 'Number
..A_
Females' Persons Males Males
2 4 5 6 7 8
21. WEST BENGAL 38,074 33,344,978 17,173,552 16,171,426 18,561 2,321,891 2,215,522
I Darjeeling 507 601,565 314,934 286,631 199 28,499 24,310 2 Jalpaiguri 744 1,'582,079 835,802 746,277 68 10,057 8,885 3 Cooch Beha r . 1,144 1,317,531 685,303 632,228 438 56.409 51,411 4 West Dinajpur 3,173 1,686,197 874,687 811,510 2,027 262,206 246,726 5 MaIda 1,611 1,544,631 791,830 752,801 787 101,284 97,077 6 Murshidabad 1,923 2,691,779 1,374,877 1,316,902 599 79,802 75,978 7 Nadia 1,275 1,812,211 928,278 883,933 312 43,597 41,468 8 Twenty Four Parganas· . 3,792 5,479,162 2,831,628 2,647,534 742 118,516 112,361 9 Howrah 771 1,403,753 723,234 680,519 70 11,243 10,839
10 Calcutta 1,903 2,111,846 1,088,6i9 1,023,2i7 573 88,596 11 Hooghly 85,328
12 Burdwan 2,609 3,024,184 1,576,425 1,447,759 777 119,175 113,741 13 Birbhurn 2,235 1,651,137 836,543 814,594 1,085 147,397 142,322 14 Bankura 3,548 1,879,304 958,256 921,04R 2,206 275,204 263,716 15 Midnapore 10,380 5,089,091 2,606,610 2,482,481 7,217 79'1,200 765,061 16 Purulh 2,459 1,470,508 746,526 723,982 1,401 180,706 176,299
UNION TERRITORIES
1. ANDAMAN & NICOBAR ISLANDS t 390 88,915 53,195 35,720 338 24,399 16,078
2. ARUNACHAL PRADESH 2,973 450,223 239,369 210,854 2,818 157,131 146,325
1 Kameng 492 82,829 45,385 37,444 471 33,882 30,480 2 Sahansiri 960 99,239 51,397 47,842 943 39,479 39,243 3 Siang 589 112,002 58,125 53,877 550 39,233 38,153 4 Lohi! 620 58,683 32,688 25,995 603 23,635 18,943 5 Tirap 312 97,470 51,774 45,696 251 20,902 19,506
3. CHANDIGARH 26 24,311 14,444 '1,867 8 1,057 685
4. DADRA AND NAGAR HA VELl • 72 74,170 36,964 37,206 23 3,648 3,716
5. DELHI 243 418,675 229,424 189,251 43 S,324 4,310
6. GOA, DAMAN AND DIU 409 630,997 310,909 320,088 140 16,482 16,420
1 Goa 383 591,877 292,318 299,559 131 15,154 14,947 2 Daman 21 21,422 10,397 11,025 8 1,168 1,327 ~ Dill 5 17,698 8,194 9,504 1 16(> 146
7. LACCADIVE, MINICOY & AMINDM 10 31,810 16,078 15,732 56 56 ISLANDS t
8. PONDICHERRY . 333 273,419 137,783 135,636 162 19,951 19,416 I :!'ondicherry 213 185,295 94,516 90,779 86 11,509 11,122 2 Karaikal 117 73,962 36.779 37,183 76 8,442 8,294 3 Mahe 3 14,162 6,488 7674 4 Yaoam
'Includes the population of Forest Division. tlslands have been treated as villages.
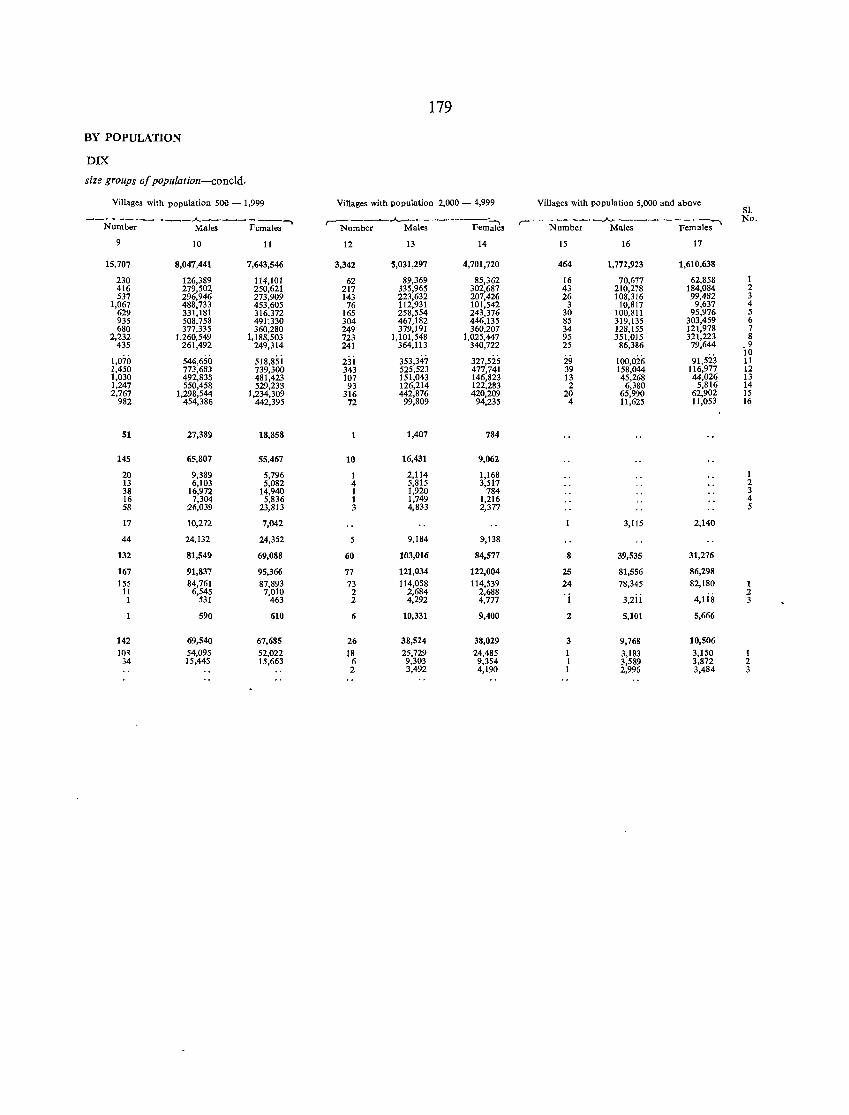
179
BY POPULATION
DIX
size groups of population-coneld.
Village. with population 500 - 1,999 ViJlages with population 2,000 - 4,999 Villages with population 5,000 and above SI.
----~------~---------~ ,..--:-----.....__-------, ,-- - - ---_.....__---- ----, No. Number Males Females Number Males Females Number Males Females
9 10 11 12 13 14 15 16 17
15,707 8,047.441 7,643,546 3,342 5,031,297 4,701,720 464 1,772,923 1,610,638
230 126,389 114,101 62 89,369 85,362 16 70,677 62,858 1 416 279,502 250,621 217 335,965 302,687 43 210,278 184,084 2 537 296,946 273,909 143 223,632 207,426 26 108,316 99,482 3
1,067 488,733 453,605 76 112,931 101,542 3 10,817 9,637 4 629 331,181 316,372 165 258,554 243,376 30 100,811 95,976 5 935 508,758 491;330 304 467,182 446,135 85 319,135 303,459 6 680 377,335 360,280 249 379,191 360,207 34 128,155 121,978 7
2,232 1,260,549 1,188,503 723 1,101,548 1,025,447 95 351,015 321,223 8 435 261,492 249,314 241 364,113 340,722 25 86,386 79,644 .9
1,070 546,650 5l8,85i 353,347 327,525 29 100,026 91,523 10
23i 11 1,450 773,683 739,300 343 525,523 477,741 39 158,044 116,977 12 1,030 492,835 481,423 107 151,043 146,823 13 45,268 44,026 13 1,247 550,458 529,233 93 126,214 122,283 2 6,380 5,816 14 2,767 1,298,544 1,234,309 316 442,876 420,209 20 65,990 62,902 15
982 454,386 442,395 72 99,809 94,235 4 11,625 11,053 16
51 27,389 18,858 1 1,407 784
145 65,807 55,467 10 16,431 9,062
20 9,389 5,796 1 2,114 1,168 1 13 6,103 5,082 4 5,815 3,517 2 38 16,972 14,940 1 1,920 784 3 16 7,304 5,836 1 1,749 1,216 4 58 26,039 23,813 3 4,833 2,377 5
17 10,272 7,042 3,115 2,140
44 24,132 24,352 5 9,184 9,138
132 81,549 69,088 60 103,016 84,577 8 39,535 31,276
167 91,837 95,366 77 121,034 122,004 25 81,556 86,298
155 84,761 87,893 73 114,058 114,539 24 78,345 82,180 1 11 6,545 7,010 2 2,684 2,688 'j 3,2ii 4,lis
2 1 531 463 2 4,292 4,777 3
590 610 6 10,331 9,400 2 5,101 5,666
142 69,540 67,685 26 38,524 38,029 3 9,768 10,506
10~ 54,095 52,022 18 25,729 24,485 1 3,183 3,150 1 34 15,445 15,663 6 9,303 9,354 1 3,589 3,872 2
2 3,492 4,190 1 2,996 3,484 3

A-IV
TOWNS AND URBAN AGGLOMERATIONS CLASSIFIED BY POPULATION IN 1971 WITH VARIATION SINCE 1901

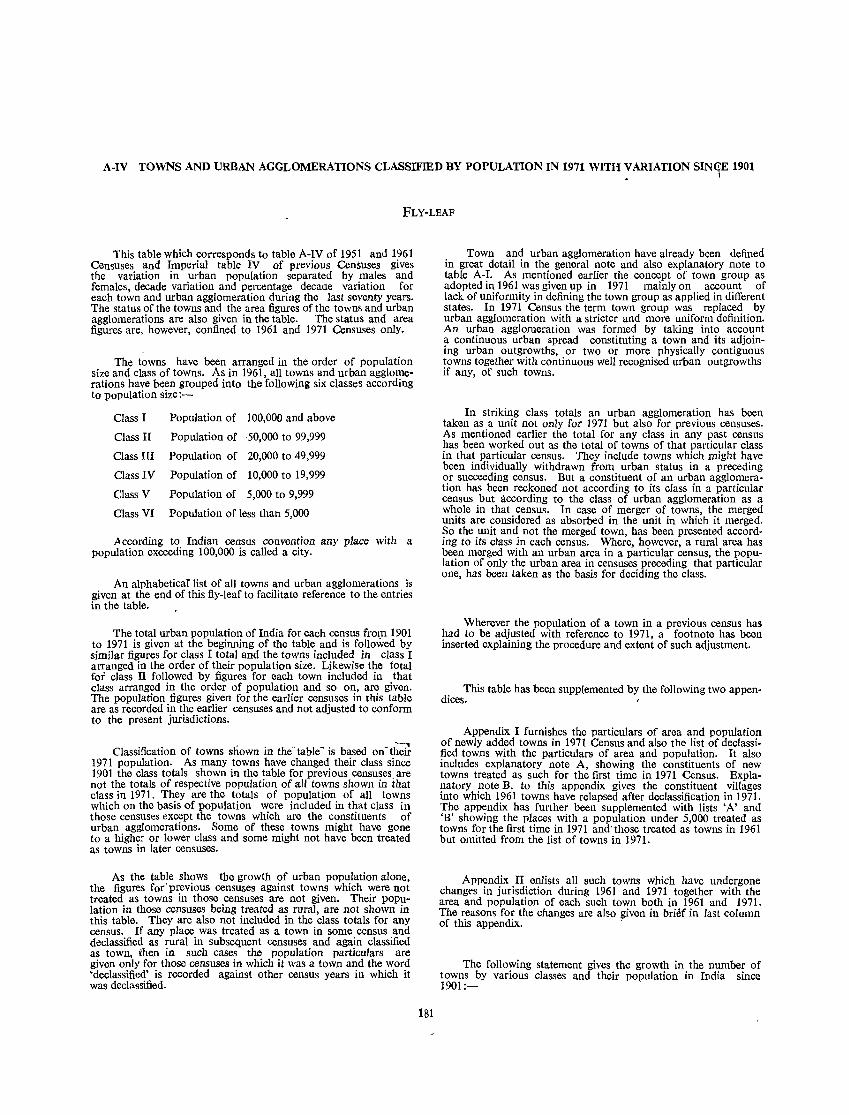
A-IV TOWNS AND URBAN AGGLOMERATIONS CLASSIFlED BY POPULATION IN 1971 WITH ~ARIATION SIN~E 1901
FLY-LEAF
This table which corresponds to table A-IV of 1951 and 1961 Censuses and Imperial table IV of previous Censuses gives the variation in urban population separated by males and females, decade variation and percentage decaae variation for each town and urban agglomeration during the last seventy years. The status of the towns and the area figures of the towns and urban agglomerations are also given in the table. The status and area figures are, however, confined to 1961 and 1971 Censuses only.
The towns have been arranged in the order of population size and class of towns. As in 1961, all towns and urban agglomerations have been grouped into the following six classes according to population size:-
Class I Population of 100,000 and above
Class II Population of '50,000 to 99,999
Class III Population of 20,000 to 49,999
Class IV Population of 10,000 to 19,999
Class V Population of 5,000 to 9,999
Class VI Population of less than 5,000
According to Indian census convention any place with a population exceeding 100,000 is called a city.
An alphabeticaf list of all towns and urban agglomerations is given at the end of this fiy-Ieaf to facilitate reference to the entries in the table.
The total urban population of India for each census fro1111901 to 1971 is given at the beginning of the table and is followed by similar figures for class I total and the towns included in class I arranged in the order of their population size. Likewise the total for class II followed by figures for each town included in that class arranged in the order of population and so on, are given. The population figures given for the earlier censuses in this table are as recorded in the earlier censuses and not adjusted to conform to the present jurisdictions.
Classification of towns shown in the-table- is based on-tl~ 1971 population. As many towns have changed their class since 1901 the class totals shown in the table for previous censuses. are not the totals of respective population of all towns shown in that class in 1971. They are the totals of population of all towns which on the basis of population were included in that class in those censuses except the towns which are the constituents of urban agglomerations. Some of these towns might have gone to a higher or lower class and some might not have been treated as towns in later censuses.
As the table shows the growth of urban population alone, the figures for' previous censuses against towns which were not treated as towns in those censuses are not given. Their population in those censuses being treated as rural, are not shown in this table. They are also not included in the class totals for any census. If any place was treated as a town in some census and declassified as rural in subsequent censuses and again classified as town, then in such cases the population particulars are given only for those censuses in which it was a town and the word 'declassified' is recorded against other census years in which it was declassified.
181
Town and urban agglomeration have already been defined in great detail in the general note and also explanatory note to table A-I. As mentioned earlier the concept of town group as adopted in 1961 was given up in 1971 mainly on account of lack of uniformity in defining the town group as applied in different states. In 1971 Census the term town group was replaced by urban agglomeration with a stricter and more uniform definition. An urban agglomeration was formed by taking into account a continuous urban spread constituting a town and its adjoining urban outgrowths, or two or more physically contiguous towns together with continuous well recognised urban outgrowths if any, of such towns.
In striking class totals an urban agglomeration has bcen taken as a unit not only for 1971 but also for previous censuses. As mentioned earlier the total for any class in any past census has been worked out as the total of towns of that particular class in that particular census. They include towns which might have been individually withdrawn from urban status in a preceding or succeeding census. But a constituent of an urban agglomeration has been reckoned not according to its class in a particular census but according to the class of urban agglomeration as a whole in that census. In case of merger of towns, the merged units are considered as absorbed in the unit in which it merged. So the unit and not the merged town, has been presented according to its class in each census. Where, however, a rural area has been merged with an urban area in a particular census, the population of only the urban area in censuses preceding that particular one, has been taken as the basis for deciding the class.
Wherever the population of a town in a previous census has had to be adjusted with reference to 1971, a footnote has been inserted explaining the procedure and extent of such adjustment.
This table has been supplemented by the following two appendices.
Appendix I furnishes the particulars of area and population of newly added towns in 1971 Census and also the list of declassified towns with the particulars of area and population. It also includes explanatory note A, showing the constituents of new towns treated as such for the first time in 1971 Census. Explanatory note B, to this appendix gives the constituent villages into which 1961 towns have relapsed after declassification in 1971. The appendix has further been supplemented with lists 'A' and 'B' showing the places with a population under 5,000 treated as towns for the first time in 1971 and"those treated as towns in 1961 but omitted from the list of towns in 1971.
Appendix II enlists all such towns which have undergone changes in jurisdiction during 1961 and 1971 together with the area and population of each such town both in 1961 and 1971. The reasons for the changes are also given in brier in last column of this appendix. .
The following statement gives the growth in the number of towns by various classes and their population in India since 1901:-
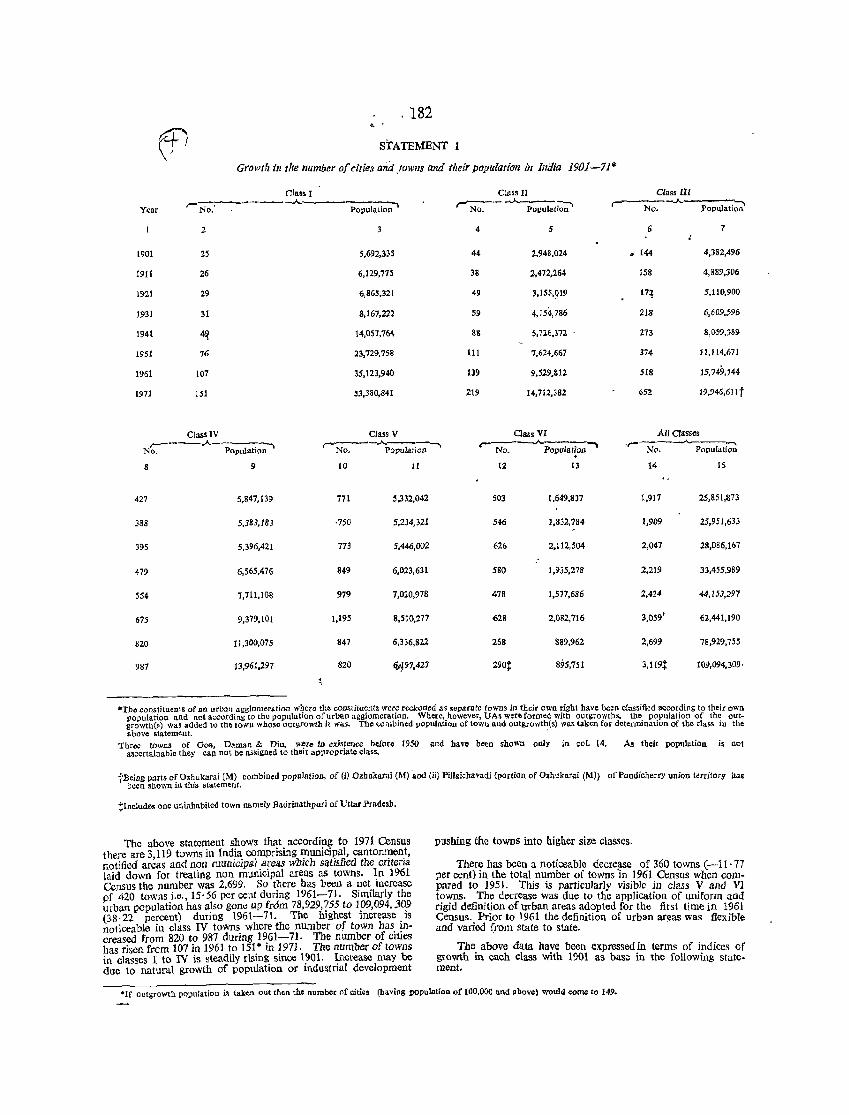
.182
STATEMENT 1
Growth in the number of cities and ,towns and their population in Inaia 1901-71*
Class I CM.ss II Class III
'-]'10: .A.
populali;;;" ,.....-;;--- -.A.--:--. r -"-
Popqlati;;-Year No. Popul"tion No.
2 " 5 G 7
1901 25 5.692,335 44 2,948,024 ~ 144 4,382,496
1911 26 6,129,775 38 2,472,264 158 4,889,306
In1 29 6,865,321 49 3,15S,~19 17~ S,1l0,900
1931 31 8,167,222 59 4,154,786 218 6,609,596
1941- 4~ 14,057,764 88 5,726,312 . 273 8,{}59,3S9
1951 76 23,729,758 111 7,624,667 374 11,114,671
1961 107 35,123,940 139 9,529,812 SIS 15,749,144
197J 151 .53,380,841 219 14,712,382 652 19,946,61l t
Class IV ClassV Class VI AnCJasses r-----.A----.--,
r""No. """ --. r-------"" ~ .~~ No. Population Population No. Populat!oll
8 9 (0 II 12 13 14 IS
427 5,847,139 771 5.332,042 503 1.649,837 1,917 2.5,851,873
388 5.383.183 ,750 5,234,321 546 1,832,784 1,909 25,951,633
395 5,396,421 773 5,446,On 626 2,112,504 2,047 28,086,167
479 6,565,476 849 6,023,631 580 1.935,278 2,219 33,455,989
554 7,711,108 979 7.020,918 478 1,577,686 2,424 44,153,297
675 9,379,101 1,195 8.510,277 ~2B 2.082,716 3,059' 62,441,190
820 11,300,075 847 6,336,822 268 889,962 2,699 78,929,755
987 13,961,297 820 q,:~97.427 290t 89S,751 3,119:1: 109,094,309·
.The constituents of an urban agglomeration where the con8tituents were reckoned as separate towns in their own right have been classified according to their own population lInd not according to the population of urban agglomeration. Where, however, VAs werefornled with outgrowths, the population of the outgrowth(s) waS added to the tOWl! whose ou~growth it was. The combined population oftown and outgrowth(s) was taken ror determination of the class in the above statement. ~
Three towns of Goa, Daman & Diu, were III existence before 1950 and havo been shown only in col. 14. As their population is not ascertainable they call not be aSSigned to their appropriate class.
tBeing parts of O.hukarai (1)1) combined population, of (i) Ozhukarai (M) -and {ii) Pillaicnavadi (portion of Ozltukarai (M» of Pondicherry uruon territory lms been shown in this statemont.
t1neludes onc uninhabited town namely BaurinAthpuri of Uttar Pradesh.
The above statement shows that according to 1971 Census there are 3 119 towns in India comprising municipal, cantonment, notified ar~as and non municipal 8l~1lS wIzicb satislied the criteria laid down for treating non municipal areas as towns. In 1961 Census the number was 2,699. So there bas been a net increase pf 420 towns i.e., 15·56 per cent during 1961-71. Similarly the urban population has also gone up from 78,929,?55 to Ip9,094 • .30_9 (3.8.22 percent) during 1961-71. The highest lllcrease .IS noticeable in class IV towns where the number of town bas mcreased from 820 to 987 during 1961-71. The number of cities has risen from 107 in 1961 to 151* in 1971. The number of towns in classes I to IV is ~teadUy rising since 1901. Increase may be d~e to natural growth of population or industrial development
pushing the towns into higher size classes.
There has been a noticeable decrease of 360 towns (-11·77 per cent) in the total number of towns 'in 1961 Census when compared to 1951. This is particularly visible in class V and VI towns. The decrease was due to the application of uniform aod rigid definition of urban areas adopted for the first time in 1961 Census. Prior to 1961 the definition of urban areas was flexible and varied ~rom state to state. .
The above data have been expressed in terms of indices of growth in each class with 1901 as base in the followin8 statement.
'If outgrowth population i~ taken out then tho number of cities (having population of 100,000 and ab<Jvel would come to 149.
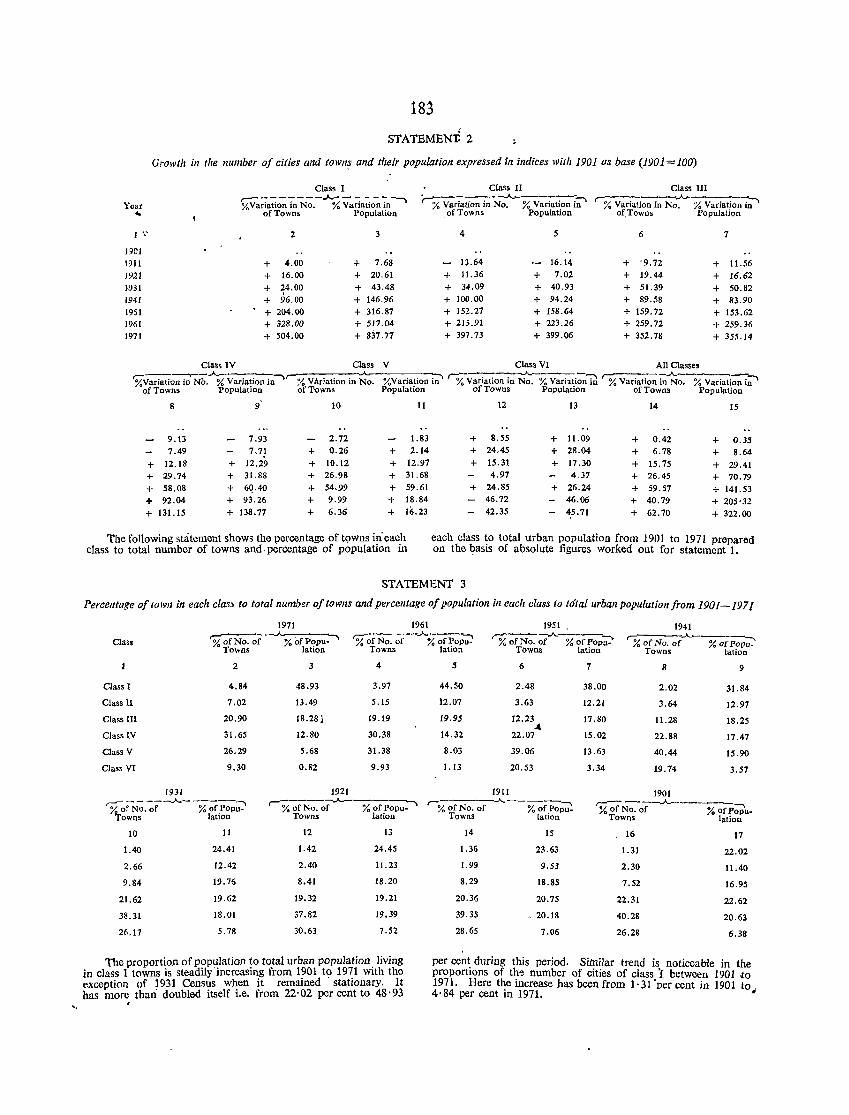
183
STATEMEm 2
Growth ill the number of cities alld fOWIIS and their population expressed in illdices with 1901 as base (1901=100)
Class I Class II Class III
Year ,.. ~-------~-------, %Yariation in No. % Variation in ~v;i;;';;;-N-;"- % Variation i;" '% Variation in N:'--% V;Jaijon ;;--
. of Towns Population of_Towns Population
I'"
1901 1911 1921 W31 1941 1951 1961 1971
of Towns Population
2
+ 4.00 + 16.00
+ ~4.00
+ 96.00 + 204.00 + 328.00 + 504.00
3
+ 7.68 + 20.61 + 43.48 + 146.96 + 316.87 + 517.04 + 837.77
4
13.64 + 11.36 + 34.09 + 100.00 + 152.27 + 215.91 + 397.73
5
16.14 + 7.02 + 40.93 + 94.24-+ 158.64 + 223.26 + 399.06
6
+ '9.72 + 19.44 + 51. 39 + 89.58 + 159.72 + 259.72 + 352.78
7
+ 11.56 + 16.62 + 50.82 + 83.90 + 153.62 + 259.36 + 355.14
Class IV Class V Class VI All Classes ,------.--.A,- 1 .___---~ r:----..A.------:"\ ~---..A. ~ %Variation in No. % Variation in ,-?~ VAriation in No. %Variation in % Variation in No. % Varhtion in % Variation in No. % Variation i;'
o of Towns Population of Towns Population of Towns Population of Towns Population
8
9.13 7.49
+ 12.18 + 29.74
+ 58.08 + 92.04 + 131.15
7.93 7.71
+ 12.29 + 31.88 + 6Q.40 + 93.26 + 138.77
10
2.72 + 0.26
+ 10.12 + 26.98
+ 54,99 + 9.99 + 6.36
11
1.83 + 2.14 + 12.97 + 31.68
+ 59.61 + 18.84 + 16.23
The following statement shows the percentage of towns in'each class to total number of towns and· percentage of popUlation in
12
+ 8.55 + 24.45 + 15.31
4.97
+ 24.85 46.72 42.35
13
+ 11.09 + 28.04
+ 17.30 4.37
+ 26.24 46.06
45.71
14
+ 0.42 + 6.78 + 15.75 + 26.45 + 59.57 + 40.79 + 62.70
15
+ 0.35 + 8.64
+ 29.41 + 70.79 + 141.53 + 205'32 + 322.00
each class to total urban population from 1901 to 1971 prepared on the basis of absolute figures worked out for statement 1.
STATEMENT 3
Percentage of lawn in each class to total number of towns and percelltage of population ill each class to to~al urban population from 1901-1971
Class
Class l
Class U
Class III
Class IV
Class V
Class VI
1931
1971 ,....... - ........A..-:-----.., % of No. of % of Popu·
Towns lation
2
4.84
7.02
20.90
31.65
26.29
9.30
3
48.93
13.49
18.28]
12.80
5.68
0.82
1921
sr;;fNo. of Towns
4
3.97
5.15
19.19
30.38
31. 38
9.93
1961
...... %ofP~ lation
5
44.50
12.07
19.95
14.32
8.03
1.13
1951 .
'% of No. of""'" % of Pop;:
190
Towns lation
6
2.48
3.63
12.23 .4
22.07
39.06
20.53
7
38.00
12.21
17.80
15.02
13.63
3.34
1941
'% of No-. -o-f.A.--%-o-o-f-P-o~p --'-u. Towns lation
8
2.02
3.64
11.28
22.88
40.44
19.14
1901
9
31.84
12.97
18.25
17.47
15.90
3.57
,,--- _____ ..A-________ -"-'\
% orNo. of % of.Popu. ,------"--------..
% of No. of % ofPopu· ~-----..A.-----
% orNo. of % of Po~ ,--- ---..A.--___ _ % of No. of % of p;;p\,.
Towns fatlon
10
1.40
2.66
9.84
21.62
38.31
26.17
11
24.41
12.42
19.76
19.62
18.01
5.78
Towns lation
12
1.42
2.40
8.41
19.32
37.82
30.63
13
24.45
11.23
18.20
19.21
19.39
7.52
The proportio,n of population to total urban population living in class I towns is steadily increasing from 1901 to 1971 with the exception of 1931 Census when it remained' stationary. It has more than doubled itself i.e. from 22·02 per cent to 48'93 .
Towns lation
14
1.36
1.99
8.29
20.36
39.35
28.65
IS
23.63
9.53
18.85
20.75
- 20.18
7.06
Towns lation
. 16
1.31
2.30
7.52
22.31
40.28
26.28
17
22.02
11.40
16.95
22.62
20.63
6.38
per cen~ during this period. Similar trend is noticeable in the proporttons of th~ number of cities of class 'I between 1901 to 1971. Here the increase has been from 1'31 'ver cent in 1901 to 4·84 per cent in 1971. "
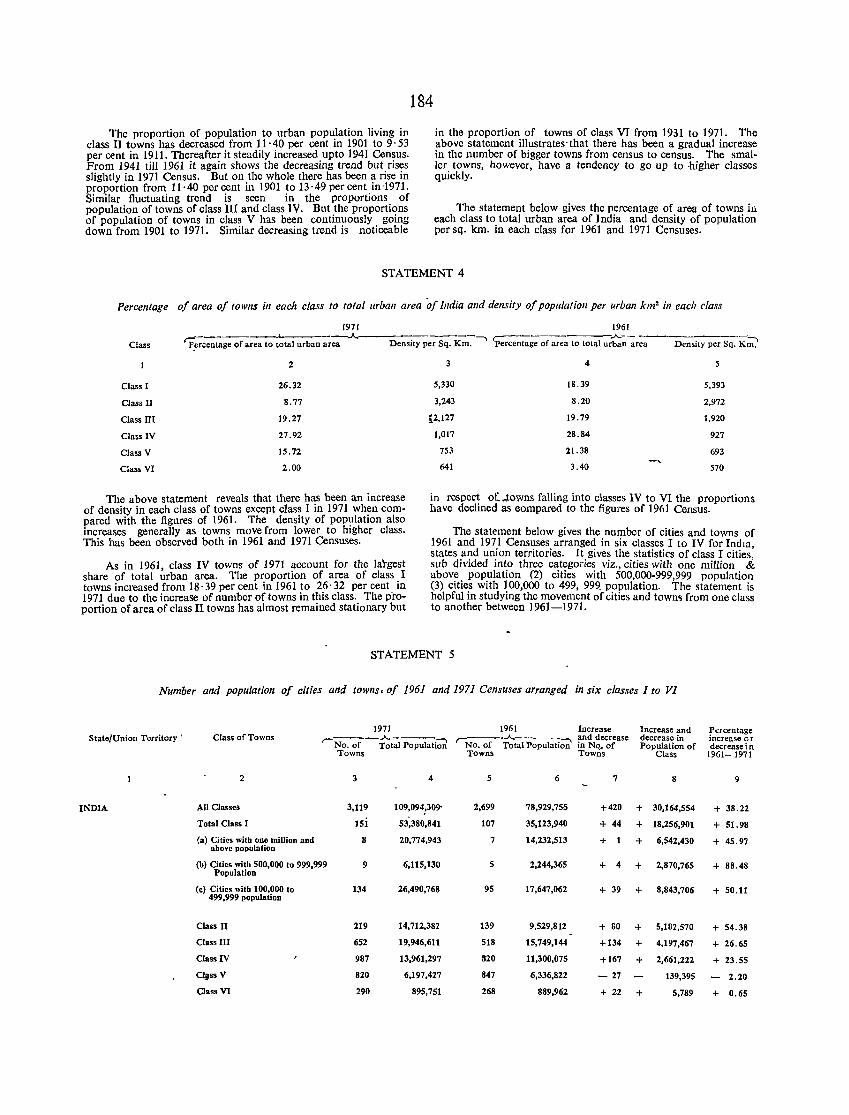
The proportion of population to urban population living in class II towns has decreased from 11·40 per cent in 1901 to 9·53 per cent in 1911. Thereafter it steadily increased upto 1941 Census. From 1941 till 1961 it again shows the decreasing trend but rises slightly in 1971 Census. But on the whole there has been a rise in proportion from 11·40 per cent in 1901 to 13 ·49 per cent in -1971. Similar fluctuating trend is seen in the proportions of population of towns of class III and class IV. But the proportions of population of towns in class V has been continuously going down from 1901 to 1971. Similar decreasing trend is noticeable
184
in the proportion of towns of class VI from 1931 to 1971. The above statement illustrates· that there has been a gradual increase in the number of bigger towns from census to census. The smal· ler towns, however, have a tendency to go up to ·higher classes quickly.
The statement below gives the percentage of area of towns in each class to total urban area of India and density of population per sq. km. in each class for 1961 and 1971 Censuses.
STATEMENT 4
Percentage 0/ area 0/ towns in each class to total urban area of India and density of popu/atioll per urban km2 in each class
Class
Class I
aass II
Class III
Class IV
Class V
Clas. VI
1971 1961 - ____ ----'-____ -.A. _________ -, .--- ;A.---
7ercentage of &rea to total urban area Density per Sq. Km. Percentage of area to total urban area
2 3 4
26.32 5,330 18.39
8.77 3,243 8.20
19.27 [2,127 19.79
27.92 1,017 28.84
15.72 753 21.38
2.00 641 3.40
Density per Sq. K;;>
5
5,393
2,972
1,920
927
693
570
The above statement reveals that there has been an increase of density in each class of towns except class I in 1971 when compared with the figures of 1961. The density of population also increases generally as towns move from lower to higher class. This has been observed both in 1961 and 1971 Censuses.
in respect oL.Jowns falling into classes IV to VI the proportions have declined as compared to the figures of 1961 Census.
The statement below gives the number of cities and towns of 1961 and 1971 Censuses arranged in six classes I to IV for Indw. states and union territories. It gives the statistics of class I cities' sub divided into three categories viz., cities with one million &. abov~. pop_ulation (2) cities with 500,090-999,999 population (3) cIties With 100,000 to 499, 999. populatIOn. The statement is helpful in studying the movement of cities and town5 from one class to another between 1961-1971.
As in 1961, class IV towns of 1971 account for the largest share of total urban area. The proportion of area of class I towns increased from 18·39 per cent in 1961 to 26·32 per cent in 1971 due to the increase of number of towns in this class. The proportion of area of class II towns has almost remained stationary but
STATEMENT 5
Number and population of cities and towns. of 1961 and 1971 Cellsuses arrallged in six classes I to VI
1971 1961 Increase Increase and State/Uuion Territory' Class of Towns
'-No. of .A.----"""\ '-No~-~~ Populati;;;;'
and decrease decrease in Total Population in Nq. of Population of
Towns Towns Towns Class
2 3 4 5 6 7 8
INDIA All Classes 3,119 109,094,309- 2,699 78,929,755 +420 + 30,164,554
Total Class I lsi 53,380,841 107 35,123,940 + 44 + 18,256,901
(a) Cities with one million and ahove population
8 20,774,943 7 14,232,513 + + 6,542,430
(b) Cities witb 500,000 to 999,999 9 6,115,130 5 2,244,365 + 4 + 2,870,765 Population
(c) Cities with 100,000 to 134 26,490,768 95 17,647,062 + 39 + 8,843,706 499,999 population
Class II 219 14,712,382 139 9,529,812 + GO + 5,182,570
Class III 652 19,946,611 518 15,749,144 +134 + 4,197,467
Class IV 987 13,961,297 820 11,300,075 +167 + 2,661,222
ClJss V 820 6,197,427 847 6,336,822 - 27 139,395
aass VI 290 895,751 268 889,962 + 22 + 5,789
rerceotage )llCreaSe or decreasein
1961- 1971
9
+ 38.22
+ 51.9H
+ 45.97
+ 88.48
+ 50.11
+ 54.38
+ 26.65
+ 23.55
2.20
+ 0.65
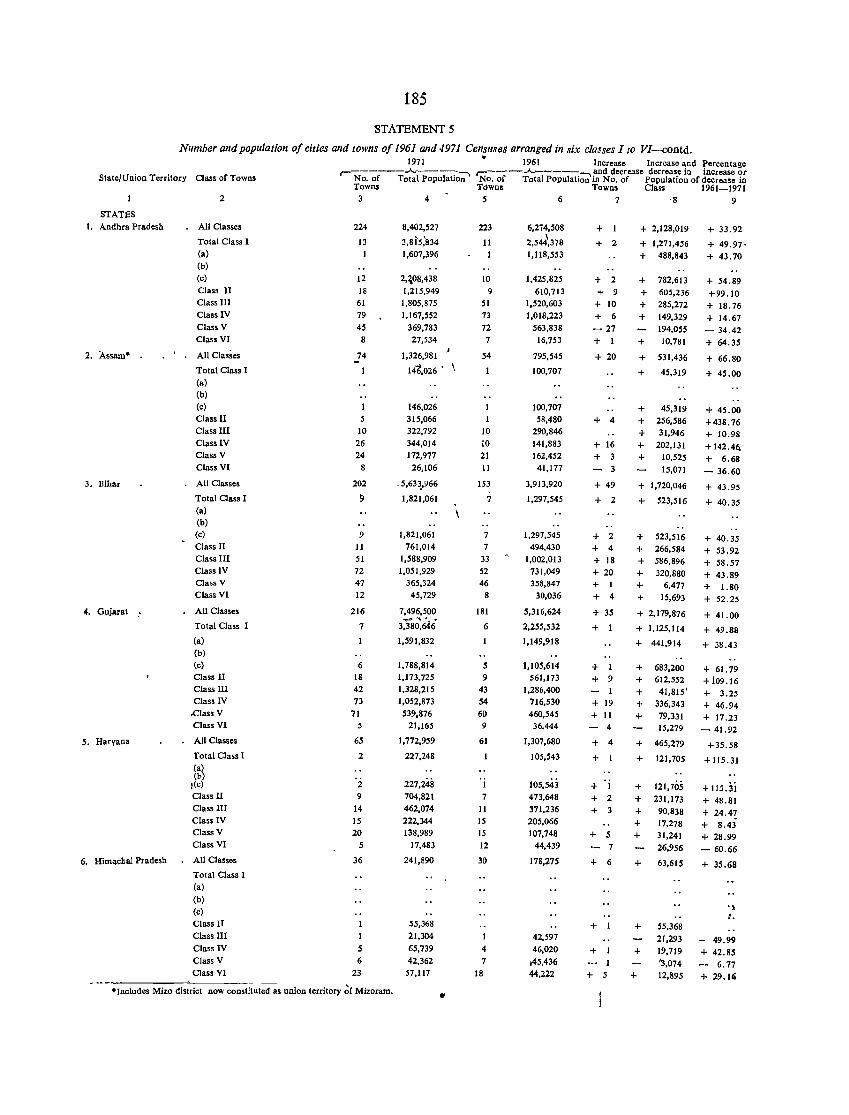
185
STATEMENTS
Number and population of cities and towns of 1961 and J971 Censuses arranged in six classes I 10 VI-contd. 1971 .. 1961 Increase Increase and fercentage
r--------"'-----~ L--.. --"-------.. and decrease decrease in Increase or State/Union Territory Class of Towns No. of Total Population No. of Total Population in No. of Population of decrease in
Towns T6wns Towns Class 1961-1971 2 3 4 6 7 '8 9
STATES I. Andhra Pradesh
2. Assam· .
3. Bihar
4. Guiarat
5. Haryana
6. Himachal Pradesh
All Classes
Total Class I (a)
(b) (c)
Class II Class III Class IV ClassV Class VI
All Classes
Total Class I (a)
(b)
(c)
Class II Class III Class IV Class V Class VI
All Classes
Total Class I (a) (b)
(c)
Class II Class III Class IV Class V Class VI
All Classes
Total Class I
(a)
(b)
(c) Class II Class III Class IV
.class V Class VI
All Classes
Total Class I (a) (b)
: (c) Class II Class III Class IV Class V Class VI
All Classes
Total Class I (a)
(b)
(c)
Class II Class III Class IV Class V Class VI
224
13 1
12 18 61 79 45 8
74
5 10
26 24
8
202
!I
9
II
51 72 47 12
216
7
6 18 42 73
71 5
65
2
2 9
14 15 20
5
36
5 6
23
.Includes Mizo district now constituted as union territory ~r Mizoram.
8,402,527
3,815)34 1,607,396
2,~08,438
1,215,949 1,805,875 1,167,552
369,783 27,534
1,326,981
146,026 '
146,026 315,066 322,792 344,014 172,977
26,106
.5,63~,966
1,821,061
1,821,061 761,014
1,588,909 1,051,929
365,324 45,729
7,496,500 ~ ...... ~ ..
3,380,646
1,591,832
1,788,814 1,173,725 1,328,215 1,052,873 539,876
21,165
1,772,959
227,248
227,248 704,821 462,074 222,344 138,989
17,483
241,890
55,368 21,304 65,739 42,362
57,117
•
223
11
10 9
51 73 72
7
54
1
10 10 21 11
153
7
7
7
33 52 46
8
181
6
I
5 9
43 54 60 9
61
1
1
7
11 15 15 12
30
4
7
18
6,274,508
2,54~,378 1,118,553
1,425,825 610,713
1,520,603 1,018,223
563,838 16,753
795,545
100,707
100,707 58,480
290,846 141,883 162,452
41,177
3,913,920
1,297,545
1,297,545 494,430
1,002,013 731,049 358,847
30,036
5,316,624
2,255,532
1,149,918
1,105,614 561,173
1,286,400 716,530 460,545 36.444
1,307,680
105,543
105,543
473,648 371,236 205,066 107,748
44,439
178,275
42,597 46,020
,45,436 44,222
+ + 2
+ 2 + 9
+ 10 + 6
- 27 + 1
+ 20
+ 4
+ 16 + 3
- 3
+ 49
+ 2
+ 2
+ 4 + 18 + 20 + I
+ 4
+ 35
+
+ + 9
+ 19
+ 11 4
+ 4
+ I
+ 1 + 2 + 3
+ 5 7
+ 6
+
+
+ 5
+ 2,128,019
+ 1,271,456 + 488,843
+ 782,613
+ 33.92
+ 49.97' + 43.70
+ 54.89 + 605,236 +99.10 + 285,272 + 18.76 + 149,329 + 14.67
194,055 - 34.42 -I- 10,781 + 64.35
+ 531,436
+ 45,319
+ 45,319 + 256,586 + 31,946 -I- 202,131 + 10,525
15,071
+ 1,720,046
+ 523,516
+ 523,516 -I- 266,584 + 586,896 + 320,880 + 6,477 + 15,693
+ 2,179,876
+ 1,125,114
+ 441,914
+ 683,200 + 612,552 + 41,815' + 336,343 + 79,331
15,279
+ 465,279
+ 121,705
+ 121,705 + 231,173 + 90,838 + 17,278 + 31,241
26.956
+ 63,615
+ 55,368
+ 66.80
+ 45.00
+ 45.00 +438.76 + 10.98
+142.4q + 6.68
- 36.60
+ 43.95
+ 40.35
+ 40.35 + 53.92 + 58.57 + 43.89 + 1.80 + 52.25
+ 41.00
+ 49.88
+ 38.43
+ 61.79 +109.16 + 3.25 + 46.94 + 17.23
- 41.92
+35.58
+ 115.31
+ 115,ji + 48.81 + 24.47 + 8.43 + 28.99
- 60.66
+ 35.68
21.293 - 49.99 + 19,719 + 42.85
'3,074 - 6.77 + 12,895 + 29. lei
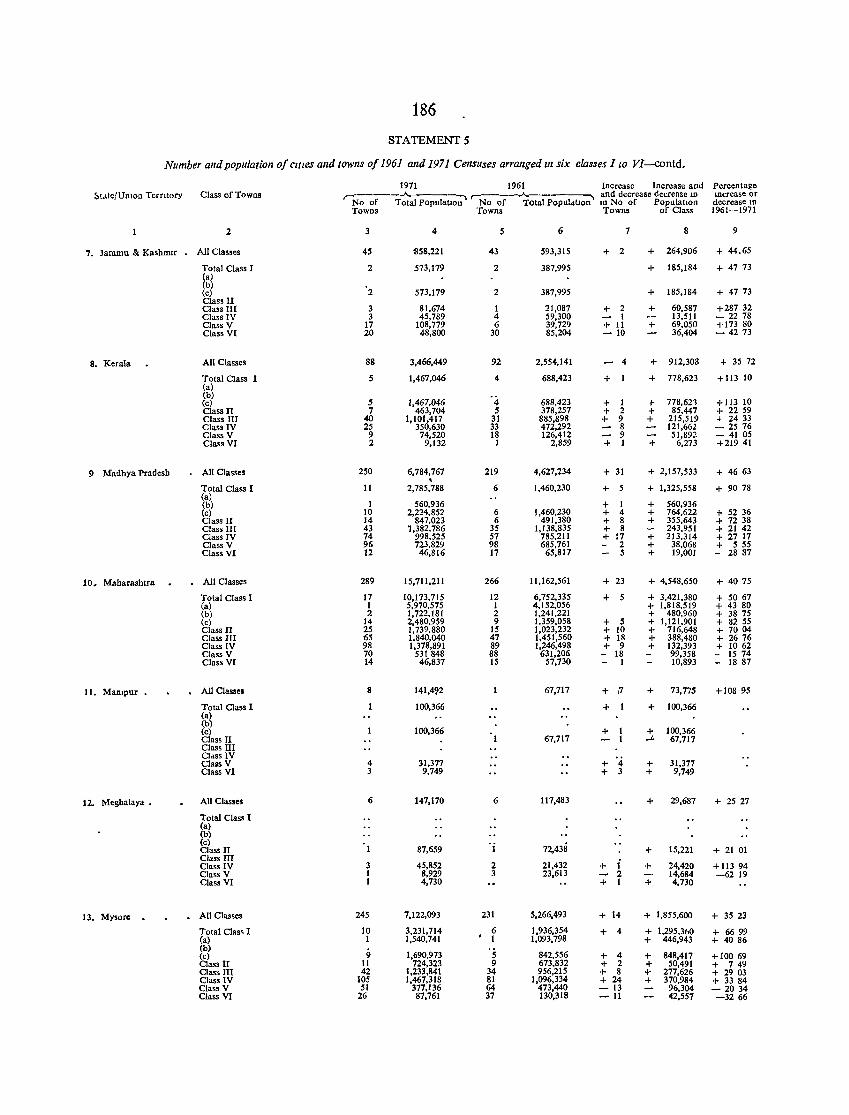
186
STATEMENTS
Number and population of elfles and towns of 1961 and 1971 Censuses arranged In six classes I to VI-contd.
1971 1961 Increase Increase and Percentage ~t,'tefUnlon Territory Class of Towns r:----..A..-----. r------"-----;----., and decrease decrease In JDcrease or
No of Total PopulatIon No of Total Popul4tlon In No of Population decrease In Towns Towns Towns of Class 1961-1971
2 3 4 S 6 7 8 9
7. Jammu & Kashmir All Classes 45 '858,221 43 593,315 + 2 + 264,906 + 44.65
Total Class I 2 573,179 2 387,995 + 185,184 + 4773 (a) (b) (c) 2 573,179 2 387,995 + 185,184 + 47 73 Class II Class III 3 81,674 I 21,087 + 2 + 60,581 +287 32 Class IV 3 45,789 4 59,300 - I 13,511 - 2278 Class V 17 108,779 6 39,729 + 11 + 69,050 + 173 80 Class VI 20 48,800 30 85,204 -10 36,404 - 42 13
8. Kerala All Classes 88 3,466,449 92 2,554,141 4 + 912,308 + 35 72
Total Class I 5 1,467,046 4 688,423 + + 718,623 + 113 10 (a) (b)
1,467,046 (c) 5 4 688,423 + 1 to 778,621 +11310 Class II 7 463,704 S 378,257 + 2 + 85,447 + 22 59 Class III 40 1,101,417 31 885,898 + 9 + 215,519 4 2433 Class IV 25 350,630 33 472,292 8 121,662 - 25 76 Class V 9 74,520 18 126,412 9 51,892 - 4105 Class VI 2 9,132 1 2,859 + 1 + 6,273 +219 41
9 Madhya Pradesh All Classes 250 6,184,761 219 4,621,234 + 31 + 2,157,533 + 46 63 , Total Class I 11 2,785,788 6 1,460,230 + 5 + 1,325,558 + 9078 (a) (b) 1 560,936 + 1 + 560,936 (c) 10 2,224.857 6 1,460,230 + 4 + 764,622 i- 52 36 Class II 14 847,023 6 491,380 + 8 + 355,643 + 72 38 Class III 43 1,382,786 35 1,138.835 + 8 243.951 + 21 42 Class IV 74 998.525 57 785,211 + 17 + 213,314 + 27 17 Class V 96 723.829 98 685,161 2 + 38,068 + 5 55 Class VI 12 46,816 17 65,817 5 + 19,001 - 28 87
10< Maharashtra Ail Classes 289 15,711,211 266 11,162,561 + 23 + 4,548,650 + 4075
Total Class 1 17 10,173,715 12 6,752,335 + 5 + 3,421.380 + 5067 (a) 1 5.970,575 1 4,152,056 + 1,818,519 + 43 80 (b) 2 1,722,181 2 1,241,221 + 480,960 + 38 75 (0) 14 2,480,959 9 1,359,058 + 5 + 1,121,901 + 8255 Class II 25 1,739,880 15 1,023,232 + 10 + 716,648 + 7004 Class III t;5 1.840,040 47 1,451,560 + IR + 388,480 + 2676 Class IV 98 1,378,891 89 1,246,498 + 9 + 132,393 + 1062 Class V 70 531 848 88 631,206 - 18 99,358 - 15 74 Class VI 14 46,837 IS 57,730 1 10,893 - 18 87
11. Mampur • All Classes 8 141,492 67,717 + .7 + 73,775 + 108 95
Total Class I 100,366 + + 100,366 (a) (b) (c) 100,366 + + 100,366 Class II 67,717 .J. 67,717 Class III CI4SS IV '4 Class V 4 31,377 + + 31,377 Class VI 3 9,749 + 3 + 9,749
12. Meghalaya. All Classes 6 147,170 6 117,483 + 29,687 + 2527
Total Class I (a) (b) (c) . i 72,438 Class II 87,659 + 15,221 + 21 01 Class III i Class IV 3 45,852 2 21,432 + + 24,420 + 113 94 Class V 1 8,929 3 23,613 2 14,684 -6219 Class VI 1 4,730 + 1 + 4,730
13. Mysore . All Classes 245 1,122,093 231 5,266,493 + 14 + 1,855,600 + 3523
Total Class I 10 3,231,714 . 6 1,936,354 + 4 + 1,295,360 + 6699 (a) 1 1,540,741 1 1,093,798 + 446,943 + 4086 (b) 9 1,690,973 842,556 (c) 5 + 4 + 848,417 + 100 69 Class II 11 724,323 9 673,832 + 2 + 50,491 + 749 Class III 42 1,233,841 34 956,215 + 8 + 277,626 + 2903 Class IV 105 1,467,318 81 1,096,334 + 24 + 370,984 + 33 84 Class V 51 377,136 64 473,440 -13 96,304 - 20 34 Class VI 26 87,761 37 130,318 -11 42,557 -3266
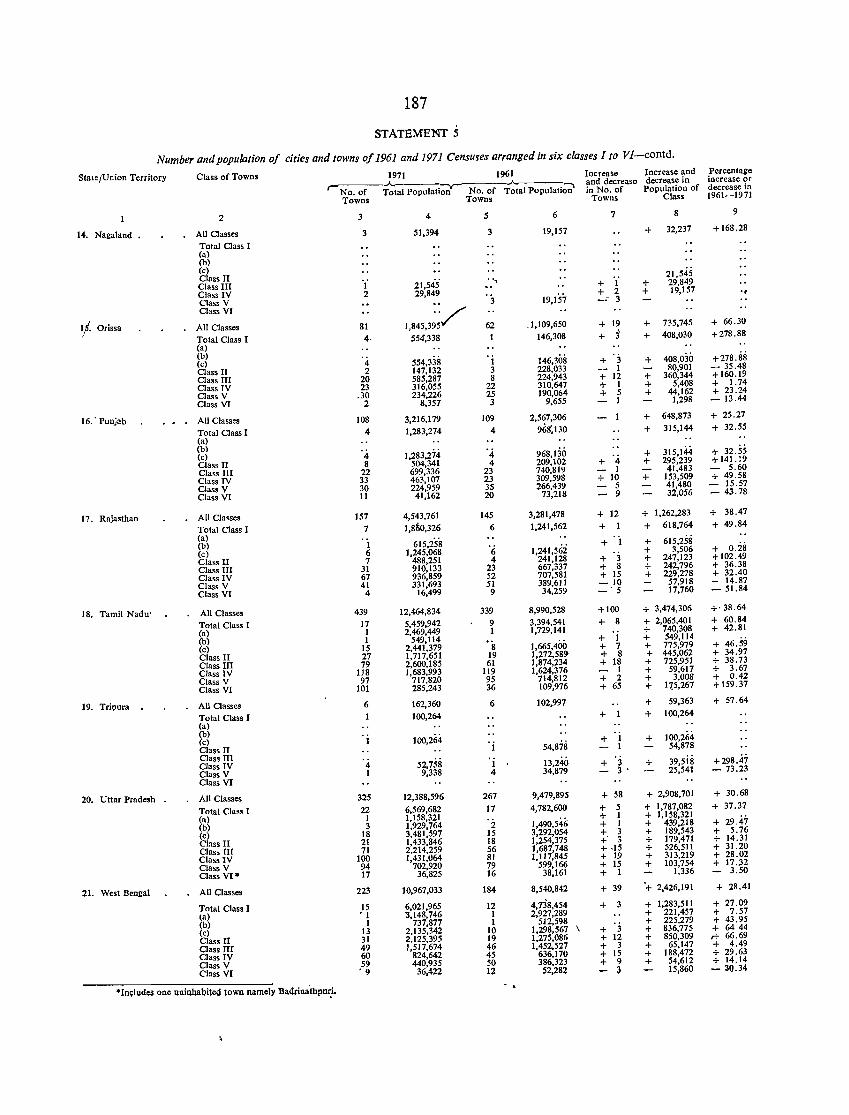
187
STATEMENT 5 Number and population of cities and lawns of 1961 and 1971 Censuses arranged in six classes I to VI-contd.
State/Union Territory Class of Towns 1971 1961 Increase Increase and Percentage
r- No. of Total populati~ No. of Total Populati~ and decrease decrease in increase or in No. of Population of decrease in
Towns Towns Towns Class 1961-1971
2 3 4 5 6 7 8 9
14. Nagaland All Classes 3 51,394 3 19,157 + 32,237 + 168.28
Total Class 1 (a) (b) (c) 21,545 Class II '1 21,545' ", Class III + 1 + 29,849
Class IV 2 29,849 '3 19,157 + 2 + 19,157 .,
Class V ::/ _- 3
Class VI
1/ Orissa All Classes 81 1,845,395 62 .1,109,650 + 19 + 735,745 + 66.30
Total Class I 4· 554',338 146,308 + 3 + 408,030 +278.88
(a) (b)
554,338 'j 146,308 408,030 +278.88 (c) 4 + 3 + Class IT 2 147,132 3 228,033
_ 1 80,901 _ 35.48
Class III 20 585,287 8 224,943 + 12 + 360,344 +160.19
Class IV 23 316,055 22 310,647 + 1 + 5,408 + 1.74
Class V .30 234,226 25 190,064 + 5 + 44,162 + 23.24
Class VI 2 8,357 3 9,655 I 1,298 - 13.44
16.' Punjab All Class"" 108 3,216,179 109 2,567,306 + 648,873 + 25.27
Total Class I 4 1,283,274 4 968',130 + 315,144 + 32.55
(a) (b) '4 1,283,274 '4 968,130 315,144 + 32.55 (c) + Class II 8 504,341 4 209,102 + 4 + 295,239 + 141 .!9
Class III 22 699,336 23 740,819 1 41,483 5.60
Class IV 33 463,107 23 309,598 + 10 + 153,509 + 49.58
Class V 30 224,959 35 266,439 - 5 41,480 _ 15.57
Class VI 11 41,162 20 73,218 - 9 32,056 - 43.78
17. Rajasthan All Classes 157 4,543,761 145 3,281,478 + 12 + 1,262,283 + 38.47
Total Class I 7 1,860,326 6 1,241,562 + 1 + 618,764 + 49.84
(a) . i 615,258 615,258 (b) '6 1,241,56i + 1 +
0.28 (c) 6 1,245,068 + 3,506 + Class II 7 488,251 4 241,128 + 3 + 247,123 + 102.49
Class III 31 910,133 23 667,337 + 8 + 242,796 + 36.38
Class IV 67 936,859 52 707,581 + 15 + 229,278 + 32.40
Class V 41 331,693 51 389,611 -10 57,918 - 14.87
Class VI 4 16,499 9 34,259 -' 5 17,760 - 51.84
18. Tamil Nadu' All Classes 439 12,464,834 339 8,990,528 +100 + 3,474,306 +. 38.64
Total Class I 17 5,459,942 9 3,394,541 + 8 + 2,065,401 + 60.84
(a) 1 2,469,449 1 1,729,141 + 740,308 + 42.81
(b) 1 549,114 ·s 1,665,400 + 1 + 549,114
+ 46.59 (c) 15 2,441.379 + 7 + 775,979 Class II 27 1,717,651 19 1,272,58') + 8 + 445,062 + 34.97
Classm 79 2,600,185 61 1,874,234 + 18 + 725,951 + 38.73
Class IV 118 ),683,993 119 1,624,376 - 1 + 59,617 + 3.67
Class V 97 717,820 95 714,812 + 2 + 3,008 + 0.42
Class VI 101 285,243 36 109,976 + 65 + 1'15,267 + 159.37
19. Tripura All Classes 6 162,360 6 102,997 + 59,363 + 57.64
Total Class J 100,264 + + 100,264 (a)
~? . i 100,264 . i 54,878 + . i + 100,264
Class II 1 54,878
Class III 52,758 . i 13,240 'j 39,5i8 +298.47
Class IV 4 + + Class V 1 9,338 4 34,879 3 . 25,541 - 73.23
Class VI
20. Uttar Pradesh All Classes 325 12,388,596 267 9,479,895 + 58 + 2,908,701 + 30.68
Total Class I 22 6,569,682 17 4,782,600 + 5 + 1,787,082 + 37.37
(a) 1 1,158,321 '2 1,490,546 + 1 + 1,158,321
+ 29.47 (b) 3 1,929,764 + 1 + 439,218 (c) 18 3,481,597 IS 3,292,054 + 3 + 189,543 + 5.76
Class II 21 1,433,846 18 1,254,375 + 3 + 179,471 + 14.31
Class III 71 2,214,259 56 1,687,748 + .15 + 526,511 + 31.20
Class IV 100 1,431,064 81 1,117,845 + 19 + 313,219 + 28.02
Class V 94 702,920 79 599,166 + 15 + 103,754 + 17.,'32
Class VI* 17 36,825 16 38,161 + 1 1.336 3.50
21. West Bengal All Classes 223 10,967,033 184 8,540,842 + 39 "+ 2.426,191 + 28.41
Total Class I 15 6,021,965 12 4,738,454 + + 1;283,511 + 27.09
ta) • 1 3,148,746 1 2,927,289 + 221,457 + 7.57
(b) 1 737,877 1 5J2,598 + 225,279 + 43.95
(c) 13 2,135,342 10 1,298,567 + 3 + 836,775 + 6444
Class II 31 2,125,395 19 1,275,086 + 12 + 850,309 .+ 66.69
Class III 49 1,517,674 46 1,452,527 + 3 + 65,147 + 4.49
Class IV 60 824,642 45 636,170 + 15 + 188,472 + 29.63
Class V 59 440,935 50 386,323 + 9 + 54,612 + 14.14
Class VI • 9 36,422 12 52,282 - 3 15,860 - 30.34
*ln~l\ldes one uninhabitei3 town namely Badrilllithpu~i. . .
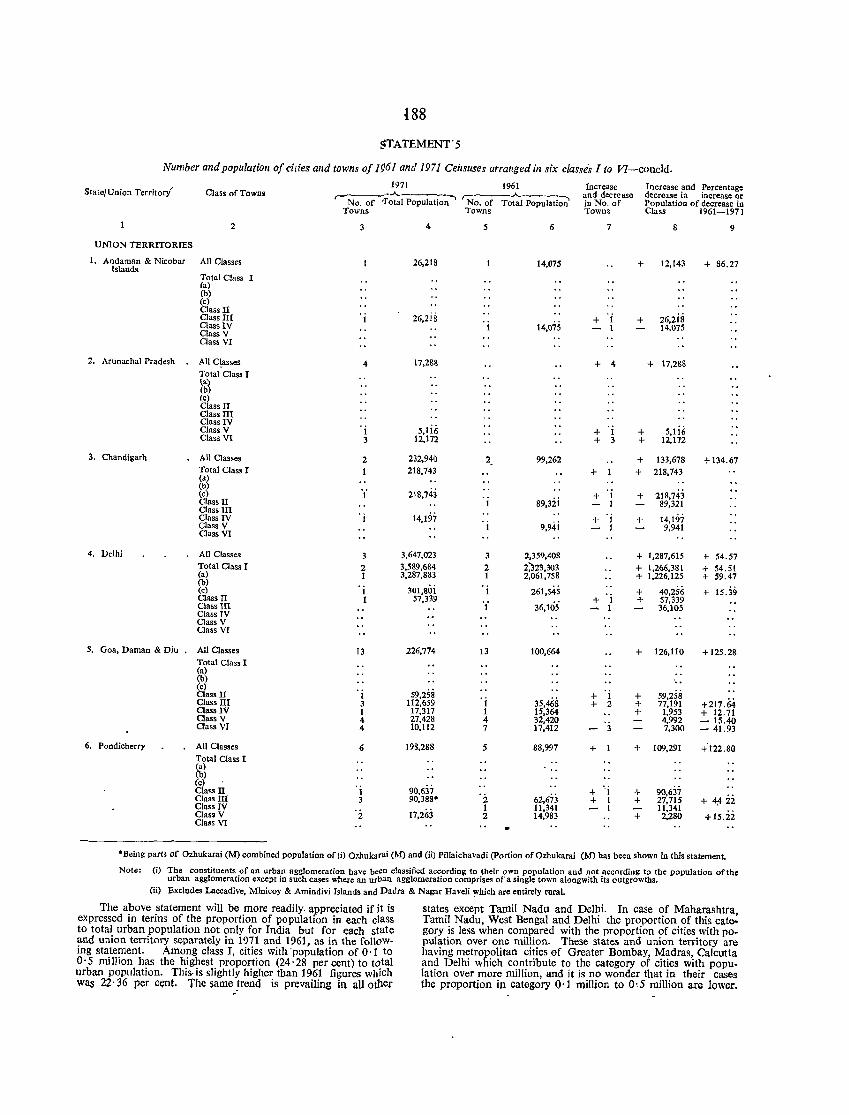
188
~TATEMENrs
Number and population of cides and towns of F)61 and 1971 Censuses arranged in six classes I to V1-concId.
State/Union Territor.! 1971 1961 Increase
and decrease in No. of Towns
Increase and ?ercentage decrease in mcrease or Population of decrease in Class 1961-1971
Class of Towns ,--:---_'--A..--~-l r::-.----.A..---, No. of 1"otal Population No. of Total Population
Towns Towns
2
UNION TERRITORIES
1. Andaman & Nicobar All Classes Islands
Total Clas. I ra) (b) (c) Class II Class III Class IV Class V Class VI
2. Arunachal Pradesh All C\asses
Total Class I \a)
3. Chandigarh
4. Delhi
(b) (c) Class II Class III Class IV Class V Class VI
All Classes Total Class J Ca) Cb) Cc) Class II Class III Class IV Class V Class VI
All Classes Total Class I Ca) (b) (c) Class II Class III Class IV Class V Class VI
S. Goa, Daman & Diu. All Classes
Total Class I (a)
6. Pondicherry
(b) (c) Class II Class III Class IV OassV Oass VI
All Clas.es Total Class I Ca) (b) (c) ClassTI Class ill Class IV Class V Class VI
3
4
I 3
2
'j
3
2 1
1 1
13
1 3 I 4 4
6
. j 3
2
4
26,218
26,2is
17,288
5,lii; 12,172
232,940
218,743
218,743
14,197
3,647,023
3,589,684 3,287,883
301,80i 57,339
226,774
59,258 112,659
17,317 27,428 10,112
198,288
90,637 90,388·
17,263
5
2.
3
2 I
1
'{
13
'j I 4 7
5
'2 1 2
6
14,075
14,075
99,262
89,3ij
9,94i
2,359,408
2)23,303 2,061,758
261,545
36,His
100,664
35,468 15,364 32,420 17,412
88,997
62,673 11,341 14,983
7
+ 1 I
+ 4
+ 'j + 3
+
+ 'j I
+ 'j I
+ I 1
+ 'j + 2
+
+ "j + 1
1
8
+ 12,143
+ 26,2is
+ +
14,075
+ 17,288
5,1i6 12,172
+ 133,678
+ 218,743
+ 218,743 89,321
+ 14,197 9,941
+ 1,287,615
+ 1,266,381 + 1,226,125
+ 40,256 + 57,339
36,105
+ 126,110
+ + +
59,258 77,191
1,953 4,992 7,300
+ 109,291
+ 90,637 + 27,715
11,341 + 2,280
9
+ 86.27
+ 134.67
+ 54.57
+ 54.51 + 59.47
+ 15.39
+ 125.28
+217.64 + 12.71 - 15.40 - 41.93
+'122.80
+ 4~ 22 + 15.2i
*Being parts of Omukarai (M) combined population of ti) Ozhukarai (M) and (ii) Pillaichavadi (portion of Ozhukarai (M) has been shown in this statement.
Note: (i) The constituents of an urban agglomeration have been classified according to their own population and not according to the population of tho urban agglomeration except in such cases where an urt>an agglomeration comprises of a single town alongwith its outgrowths.
(ii) Excludes Laccadive, Minicoy & Amindivi Islands and Dadra & Nagar Ha veli \.Vhich are entirely rural.
The above statement will be more readily. appreciated if it is expressed in terins of the proportion of popUlation in each class to total urban popUlation not only for India but for each state and union territory separately in 1971 and 1961, as in the follOWing statement. Among class T, cities with 'population of 0·1 to O' 5 million has the highest proportion (24' 28 per cent) to total urban population. This-is slightly higher than 1961 figures which was 22' 36 per cent. The same trend is prevailing in all otller
states except Tamil Nadu and Delhi. In case of Maharashtra, Tamil Nadu, West Bengal and Delhi the proportion of this category is less when compared with the proportion of cities with population over one million. These states and union territory are having metropolitan cities of Greater Bombay, Madras, Calcutta and Delhi which contribute to the category of cities with pOpUlation over more million, and it is no wonder that in their cases the proportion in category 0'1 million to O'S million are lower.
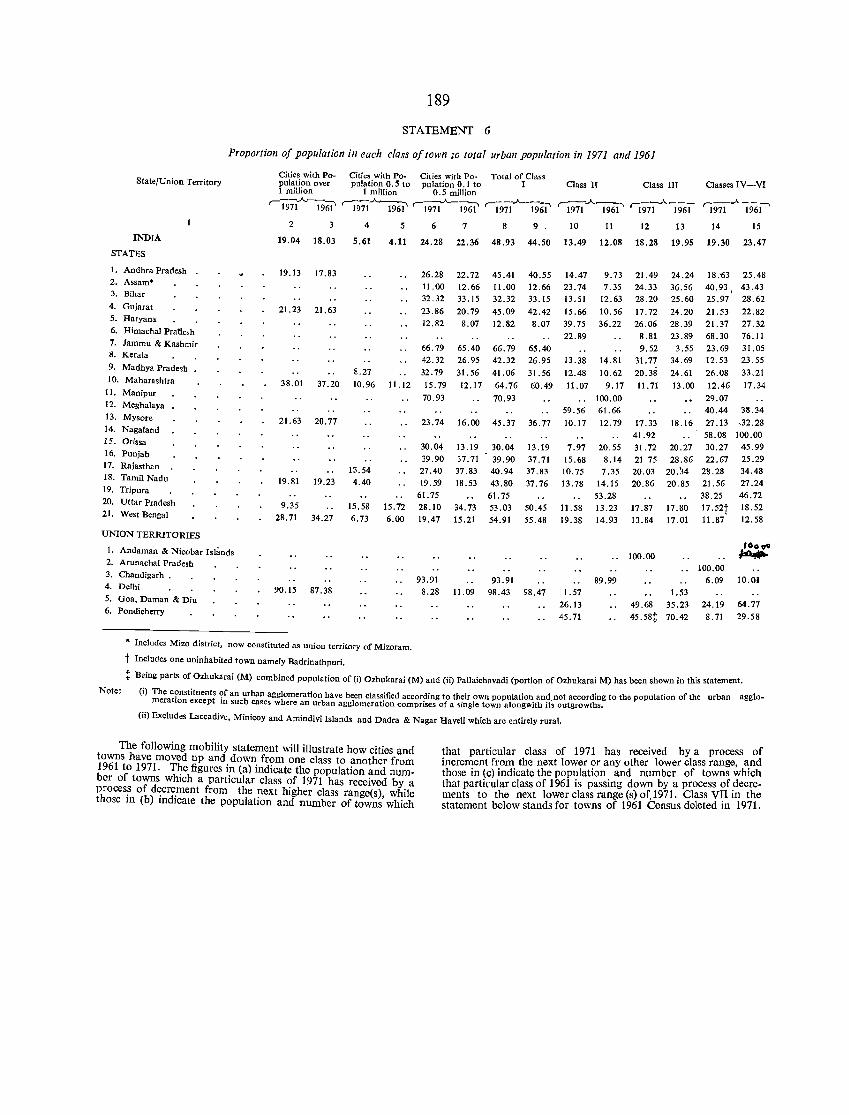
189
STATEMENT 6
Proportion oj population in each class oJtown 10 total urban population in 1971 alld 1961
State/Union Territory Cities with Po- Cities with Po. Cities with Po .. pulation over pulation 0.5 to pulation 0.1 to 1 million 1 million 0.5 million
,-1971.A.196i' '1971~ '-1971.A-i96i' 2 3 5 6 7
Total of Class I
8 9 .
Class II
10 11
Class III Classes IV-VI
12 13 14 15 INDIA
STATES
19.04 18.03
4
5.61 4.11 24.28 22.36 48.93 44.50 13.49 12.08 18.28 19.95 19.30 23.47
1. Andhra Pradesh 2. Assam. 3. Bihar
4. Gujarat 5. Haryana
6. Himachal Prallesh 7. Jammu & Kashmir 8. Kerala
9. Madhya Pradesh 10. Maharashtra
11. Manipur 12. Meghalaya 13. Mysore 14. Nagaland 15. Orissa 16. Punjab 17. Rajasthan 18. Tamil Nadu 19. Tripura
19.13 17.83
21.23 21.63
38.01 37.20
21.63 20.77
19.81 19.23
8.27
10.96
13.54 4.40
11.12
26.28 11.00 32.32
23.86 12.82
66.79 42.32
32.79
15.79
70.93
23.74
30.04 39.90 27.40 19.59
61.75
22.72 12.66 33.15
20.79 8.07
65.40 26.95
31.56
12.17
16.00
13.19 37.71 37.83
18.53
45.41 11.00 32.32
45.09
12.82
66.79 42.32
41.06
64.76
70.93
45.37
30.04
39.90 40.94 43.80
61.75
40.55 12.66 33.15
42.42
8.07
65.40 26.95
31.56
60.49
36.77
13.19 37.71 37.83
37.76
14.47
23.74 13.51
15.66 39.75
22.89
13.38
12.48
11.07
59.56
10.17
7.97 15.68 10.75 13.78
9.73 7.35
12.63
10.56 36.22
14.81
10.62
9.17
100.00 61.66
12.79
20.55 8.14
7.35 14.15
53.28
21.49 24.33 28.20
17.72 26.06
8.81
9.52 31. 77
20.38
11.71
17.33 41.92
31.72 21 75 20.03 20.86
24.24 36.56 25.60
24.20 28.39 23.89
3.55 34.69
24.61
13.00
18.16
20.27 28.86
20.34
20.85
18:63 25.48 40.93, 43.43 25.97 28.62
21.53 21.37 68.30
23.69 12.53
26.08
12.46
29.07
22.82 27.32 76.11 31.05 23.55
33.21
17.34
40.44 38.34
27.13 ,32.28 58.08 100.00
30.27 45.99 22.67 25.29
28.28 34.48 21. 56 27,24 38.25 46.72
20. Uttar Pradesh 9.35 21. West Bengal 28.71 34.27
15.58 6.73
15.72 28.10 6.00 19.47
34.73 53.03
15.21 54.91 50.45 55.48
11.58 13.23
19.38 14.93
17.87 13.84
17.80 17.52t 18.52 17.01 11.87 12,58
UNlON TERRITORIES
1. Andaman & Nicobar IslilOds 2. Arunachal Pradesh 3. Chandigarh . 4. Delhi 90.15 87.38 5. Goa, Daman & Diu 6. Pondicherry
., Includes Mizo district, now constituted as union territory of Mizoram.
t Includes one uninhabited town namely Badrinathpuri.
93.91 93.91 8.28 11.09 98.43 98.47 1.57
26.13 45.71
89.99
100.00
1.53
49.68 35.23
45.58:1: 70.42
100.00 6.09 10.01
24.19 64.77
8.71 29.58
:I: Being parts of Ozhukarai (M) combined population of (i) Ozhukarai (M) and (ii) Pallaichavadi (portion of Ozhukarai M) has been shown in this statement.
Note: (i) The c~nstituents ,?f an urban agglomeration have been classified according to their own population and. not according to the population of the urban agglo-meratIOn except In such cases where an urban agglomeration comprises of a single town alongwith its outgrowths.
(ii) Excludes Laccadive, Minicoy and Amindivi Islands and Dadra & Nagar Haveli which are entirely rural.
The following mobility statement will illustrate how cities and towns have moved up and down from one class to another from 1961 to 1971. The figures in (a) indicate the population and number of towns which a particular class of 1971 has received by a proces~ of d~cre.ment from the ~ext higher class range(s), while those m (b) mdlCate the populatIOn and number of towns which
that particular class of 1971 has received by a process of increment from the next lower or any other lower class range, and those in (c) indicate the population and number of towns which that particular class of 1961 is passing down by a process of decrements to the next lower class range (s) of,1971. Class VII in the statement below stands for towns of 1961 Census deleted in 1971.
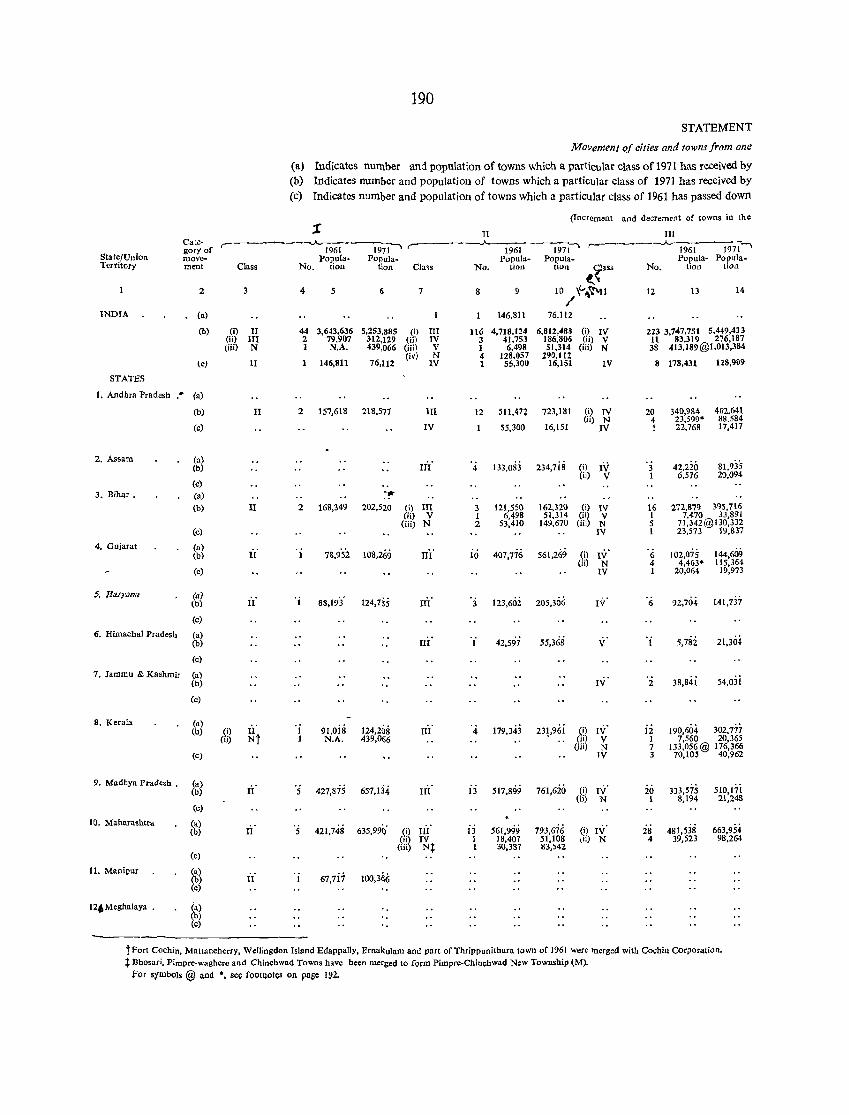
190
STATEMENT
Movement of cities and towns from one
(a) Indicates number and population of towns which a particular class of 1971 has received by (b) Indicates number and population of towns which a particular class of 1971 has received by (c) Indicates number and population of towns which a particular class of 1961 has passed down
(Increment and decrement of towns in the ;r TI III
Cate· ,--- '-" 1971---" r-oj
1971"' J.._
1971-' gory of 1961 1961 1961 State/Union move .. Popula· Popula- Popula- Popula- Popula· Popula-Territory ment Class No. tion tion CIa .. No. tion tion (~as:; No. tion tion
2 4 5 6 7 8 9 10 \(.,~~1 12 13 14
/ INDIA (a) 146,811 76.112
(b) (i) II 44 3,643,636 5,253,885 (i) HI 116 4.718,124 6,812,488 (i) IV 223 3,747,75t 5,449,433 (ii) HI 2 79,907 312,129 (ij) IV 3 41.753 186,806 (ill V 11 83,319 276,187 (iii) N 1 N.A. 439,066 (iii) V 1 6,498 51,314 (iii) N 38 413,189@t,013,384
(iv) N 4 128,057 290,112 ~c) 11 1 146,811 76,112 IV 1 55,300 16,151 IV 8 178,431 128,909
STATES
l. Andhra Pradesh .. (a)
(b) II 2 157,618 218,571 III 12 511,4n 723,181 (i) IV 20 340,984 462,641 (ii) N 4 23,599' 88,584
(c) IV 55,300 16,151 IV I 22,768 17,417
2. Assam (n) 133,OS3 234,7is IV 42,220 81,935 (b) III 4 (i) 3
(ii) V I 6,576 20,094 (c)
3. Bihar. (a) '. (b) II 2 168,349 202,520 (i) III 3 121,550 162,320 (i) IV 16 272,87Q 395,716 (ii) V 1 6,498 51,314 (ii) V 1 7,470 33,891
(iii) N 2 53.410 149,670 (iii) N 5 71,342@130,332 (cl IV 1 23,573 19,837
4. Gujaral (a) iI' , i 7&,95'2 108,269 ui' io 407,1'16 561,269 IV' '6 102,075 144.609 (b) (i) (ii) N 4 4,463· 115,364
(c) IV 1 20,064 19,973
5. HarJW/Ni (aJ Ii' 'j 88,193' 124,755 ni' 123,60i 205,306 92,70-i. 141,737 (b) 3 IV 6
(c)
6. Himachal Pradesh (a) III' 'j 42.597 55,368 y' 'j 5,782 21,304 (b)
(c)
7. Jammu & Kashmir (a) IY' 38,84i 54,oli (b) 2
(c)
8. Keral .. (a) iI' 'j 91,ois 124,208 IIi' '4 179,343 231,96i IV' ii 302,777 (b) (i) (i) 190,604 (ii) Nt 1 N.A. 439,OG6 (ii) V 1 7,560 20,365
(iii) N 7 lJ3,056@ 176,366 (c) IV 3 10,105 40,962
9. Madhya Pradesh. (a) Ii' '5 427,875 657,t34 ui' 517,899 761.6io IV' 333,575 510.17i (b) 13 (i) 20
(ii) N 1 8,194 21.248 (c)
to. Maharashtra (a) 421.748 635,99~' IIi' 561,999 793,676 481,538 663.954 (b) II 5 (i) 13 (i) IV 28
(ii) IV 1 18,407 51,108 ,ii) N 4 39.523 98.264 (iii) Nt 1 30.387 83,542
(c)
11. Manipur (a) (b) (c)
it' 'i 67,7ij 100,366
I~Meghalaya . ia) (b) (c)
tFort Cochin, Mattancherry, Wellingdon Island Edappally, Ernak;ulam and part of Thrippunithura town of 1961 Were lUerged with Cochin COrporation. t Dhosari, Pimpre·waghere and Chinchwad Towns have been merged to form Pimpre.Chinchwad New Township (M).
for symbOls @ and *. se~ footnotes on page 192.
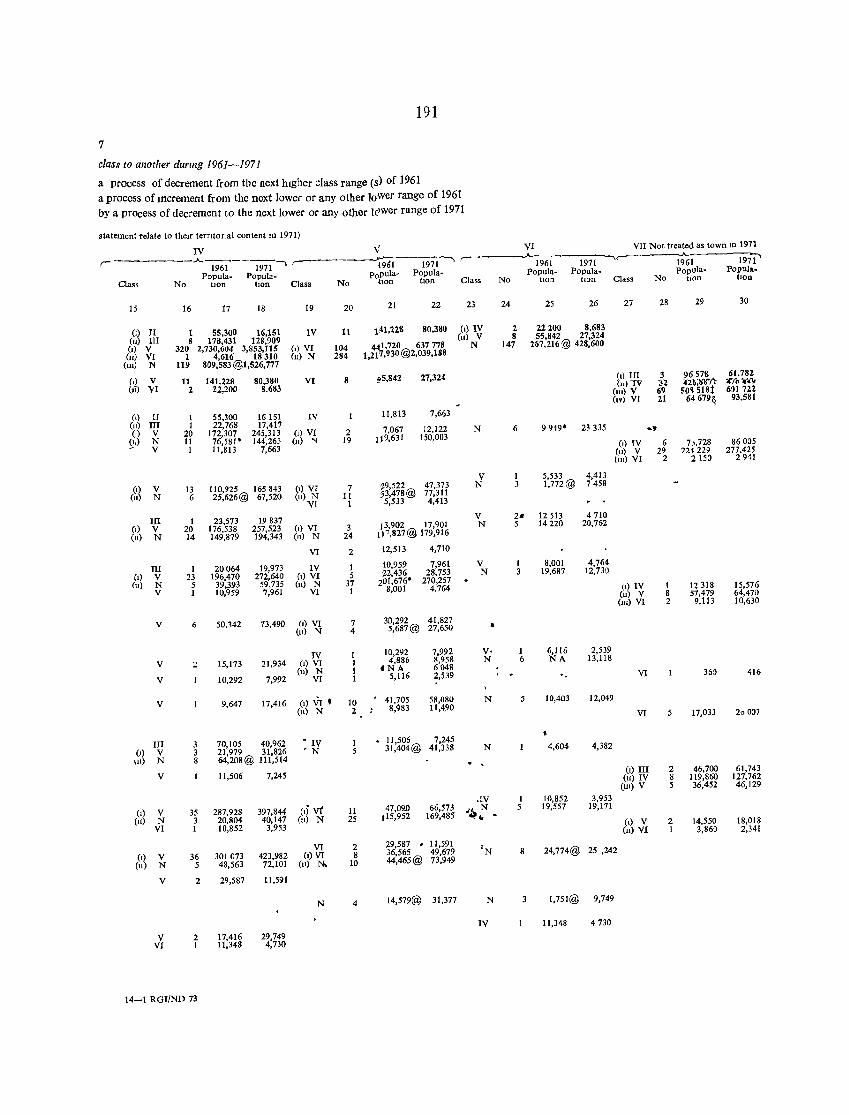
191
7
class to another durrng 1961-1971
a process of decrement from the next hIgher class range (s) of 1961 a process of Illcrement from the next lower or any other lo,wer range of 1961 by a process of decrement to the next lower or any other ]c)wer range of 1971
statement relate to thelt terntorlal content In 1971)
IV V VI VII Not treated as town m 1971
,--------"'-I%1--l971-, ,------------'~- 1971 -, r ..A..
1961 1971 1961 1971
Class Popula- Popula- popula- Popula- Popula- Popula- popula- Popul .. -
No tIOn bon Class No tlon tlon Class No hon tIOn Class No tlOn tlon
15 16 17 18 19 20 21 22 23 24 25 26 27 28 29 30
(l) JI 1 55,300 16.151 IV 11 1,41.228 80,380 (I) IV 2 22200 8.683
(II) III 8 178,431 128.909 (n) V 8 55,842 27,324
(.) V 320 2,730,604 3,853,115 (.) VI 104 4:'J.720 637778 N 147 267,216@ 428,600
(II) VI 1 4,616 18310 (u) N 284 1,21' ,930@2,039,188 (III) N 119 809,583@1,526,777
(.) v II 141,228 80,380 VI 8 ~5,842 27,324 (I) III 3 96578 61,782
(.i) "\'1 2 22,200 8,683 {u)TV -:n 42~;Wt'r ;('/0"'11'1
(III) V 69 503518t 601722 (IV) VI 21 64679q 93.581
(l) II I 55,300 16 lSI IV 11,813 7,663 (11) I1I I 22,168 17,417 (1) V 20 172,307 245,313 (1) VI 2 7,067 12,122 N 6 9949' 23335 , ..
Ql) N 11 76,581" 144,263 (11) '" 19 119,631 150,003 V I 11,813 7,663
(1) IV 6 7,,728 86005 (II) V 29 22~ 229 217,425 lUl) VI 2 2 15~ 2941
V 5,533 4,413
(I) V 13 110,925 165843 (.) VI 7 ~9,522 47,373 N 1,172@ 1458
(lI) N 6 25,626@ 61.520 (Il) N II J3,478@ 11.311 VI 1 5.533 4,413
III 1 23,573 19837 V 2_ 12513 4710
(1) V 20 116.538 251,523 (l) VI 3 j 3.902 17.90 I N 5 14220 20,162
(1I) N 14 149,879 194,343 (11) N 24 IP.827@ 179.916
VI 2 12,513 4.710
III 1 20064 19,973 IV 1 10,959 7,961 V 1 8,001 4,764
(.) V 23 196.470 272,640 (.) VI 5 )!2,436 28,753 N 3 19,687 12,730
(1I) N 5 39,393 59,735 (1I) N 37 201 ,676' 270,257 V 1 10,959 7.961 VI 1 8,001 4,764 (l) IV 1 12318 15,576
ell) V 8 57,479 64,410 (Ill) VI 2 9,113 10,630
V 6 50,342 73,490 (.) VI 7 30.292 41,827 • (1I) N 4 5,687@ 27.650
IV 10,292 7,992 V· 1 6,116 2,539
V 2 15,173 21,934 (.) VI 4,886 8,958 N 6 NA 13,118
(11) N CNA 6048
V 10,292 7,992 VI 5,116 2.539 VI 360 416
V 9.647 17,416 (l) VI • 10 . 41,705 58,080 N 5 10,403 12,049
(n) N 2 8,983 11,490 VI 5 17,033 20007
m 3 70,105 40,962 • IV • 11,506 7.245 e.) V 3 21,979 31.826 ' N 31,404@ 41,338 N 4,604 4,382
In) N 8 64,208@ 111.514 . ,
V 11,506 7,245 (.) III 2 46,700 61.743 (II) IV 8 119,860 127,762
(Ill) V 5 36,452 46.129
.IV I 10,852 3,953
(l) V 35 287,928 397,844 (1) vi II 47,09.0 66,573 Jl!t N 5 19,557 19,111
(II) N 3 20,804 40,147 (II) N 25 115,952 169,485 • • VI I 10,852 3,953
(l) V 2 14,550 18,018 (II) VI I 3,860 2,341
VI 2 29,581 • 11,591 'N e·) V 36 30] 073 423,982 (.) VI 8 36,565 49,679 8 24,774@ 25 .242
(ll) N 5 48,563 72,101 (II) N,. 10 44,465@ 73,949
V 2 29,587 11,591
N 4 14.579@ 31,377 N 3 1.751@ 9.749
IV 11,348 4730
V 2 17,416 29,749 VI I 11,348 4,730
14-1 RoIlND 73
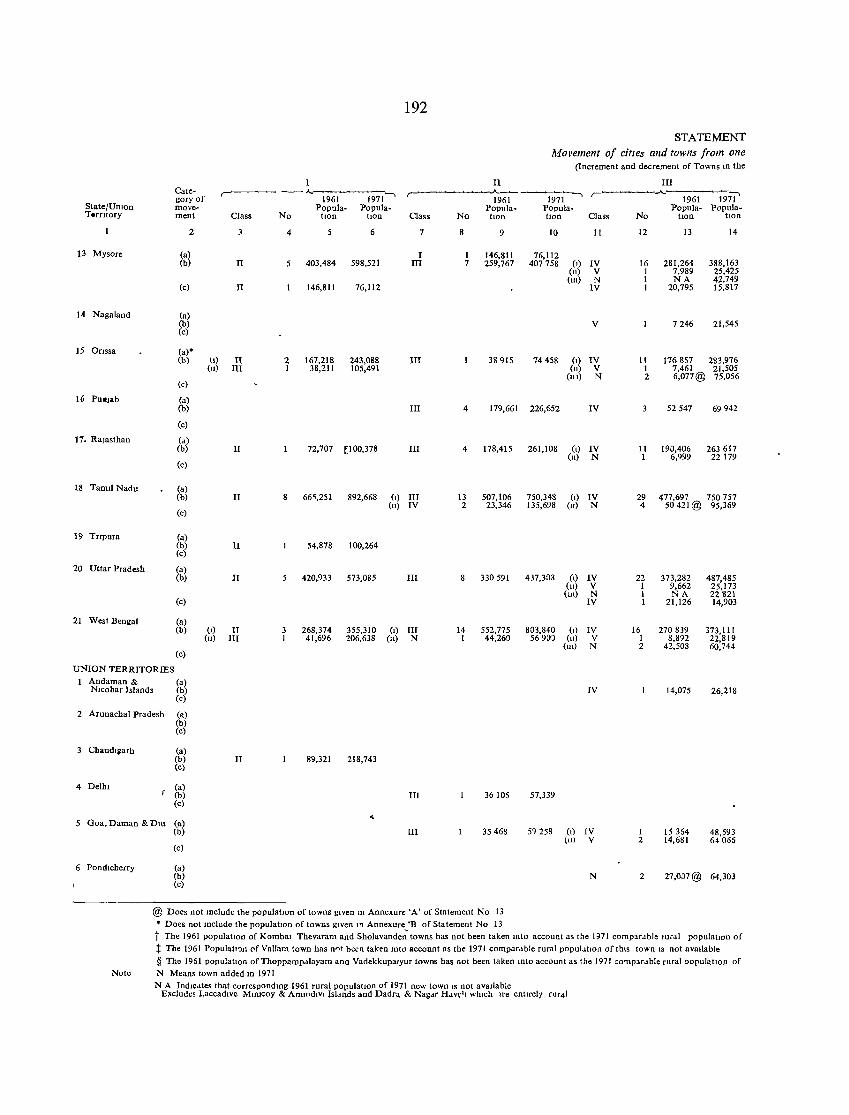
192
STATEMENT /\{ovement of cities and towns from one
(Increment and decrement of Towns In the
Category of move-ment
,.,.---- -- A.-1-9-61--~19-7~1-'
Popula- Popula-State/UOlon TerrItory Class No tlOn tlOn Class
13 Mysore
14 Nagaland
15 Onssa
2
(a) (b)
(c)
(a) (b) (c)
(a)"
II
II
(b) (,) II (Il) III
16 PU_Jab
11. Rajasthan
18 TamIl Nadu
19 Trrpura
20 Uttar Pradesh
21 West Bengal
(c)
(a) (b)
(c)
(a) (b)
(c)
(a) (b)
(c)
(a) (b) (c)
(a) (b)
(c)
(a) (b)
(c)
UNION TERRITORIES Andaman & Nlcobar Islands
(a) (b) (c)
2 Arunachal Pradesh (a)
3 Chandlilarh
4 DeIhl
(b) (c)
(a) (b) (c)
(a) (b) (c)
S Goa, Daman & DIU (a) (b)
6 Pondlcherry
(c)
(a) (b) (c)
II
II
II
II
(I) II (II) III
II
4 5 6
5 403,484 598,521
146,811 76,112
2 167,218 243,088 1 38,211 105,491
72,707 (100,378
7
I III
III
III
III
66~,251 892,668 (I) III (n) IV
54,878 100,264
5 420,933 573,085 III
3 268,374 355,310 (I) III 1 41,696 206,638 (n) N
89,321 218,743
III
III
No
8
II
1%I-~97t-, Popula- Popula-
tion tlon
9 10
Class
11
1 146,811 76,112 7 259,767 407 758 (I) IV
4
4
(Il) V (m) N
IV
V
38915 74458 (I) IV
179,661 226,652
(Il) V (III) N
IV
178,415 261,108 (I) IV (Il) N
13 507,106 750,348 (I) IV 2 23,346 135,698 (II) N
330591 437,303 (I) IV (II) V (m) N
IV
14 552,775 803,840 (I) IV 1 44,260 56 90) (II) V
(III) N
IV
36105 57,339
35468 59258 (1) IV (II) V
N
@ Does not !Dclude the populatIOn of towns gIven m Annexure 'A' of Statement No 13
• Does not mclude the populatIon of towns gIven In Annexure 'B of Statement No 13
No
12
16 1 1 1
III
1961 1971' Popula- Popula-
tIOn han
13
281,264 7,989 NA
20,795
7246
14
388,163 25,425 42,749 15,817
21,545
II 176857 283,976 1 7,461 21,505 2 6,077@ 75,056
52547 69942
11 190,406 263617 1 6,999 22 179
29 477,697 750757 4 SO 421 @ 95,369
22 I 1 I
373,282 9,662 NA
21,126
16 270839 I 8,892 2 42,503
I 2
14,075
15354 14,681
487,485 25,173 22821 14,903
373,111 22,819 60,744
26,218
48,593 64065
2 27,007 @ 64,303
t The 1961 populatIon of Kombal Thevaram and Sholavande; towns has not been taken mto account as the 1971 comparable rural populatIOn of
t The 1961 Populatl.,n orVallam town has nn' been taken Into account as the 1971 compardble rural populdtlon Oflhls town IS not avaIlable
§ The 1961 populatIon of Thoppampdlayam ana Vadekkupalyur towns has not been taken mto account as the 1971 cO'llp:1rdble rural populatIOn of
Note N Means town added In 1971
N A Indlcdtes that correspondIng 1961 rural populatIon of 1971 new town IS not available Excludes Laccadlve Mtnlcoy & AlUIOdlVI Isldnds and Dadra & Nagar Hav.'1 whIch Ire entIrely rolf<ll
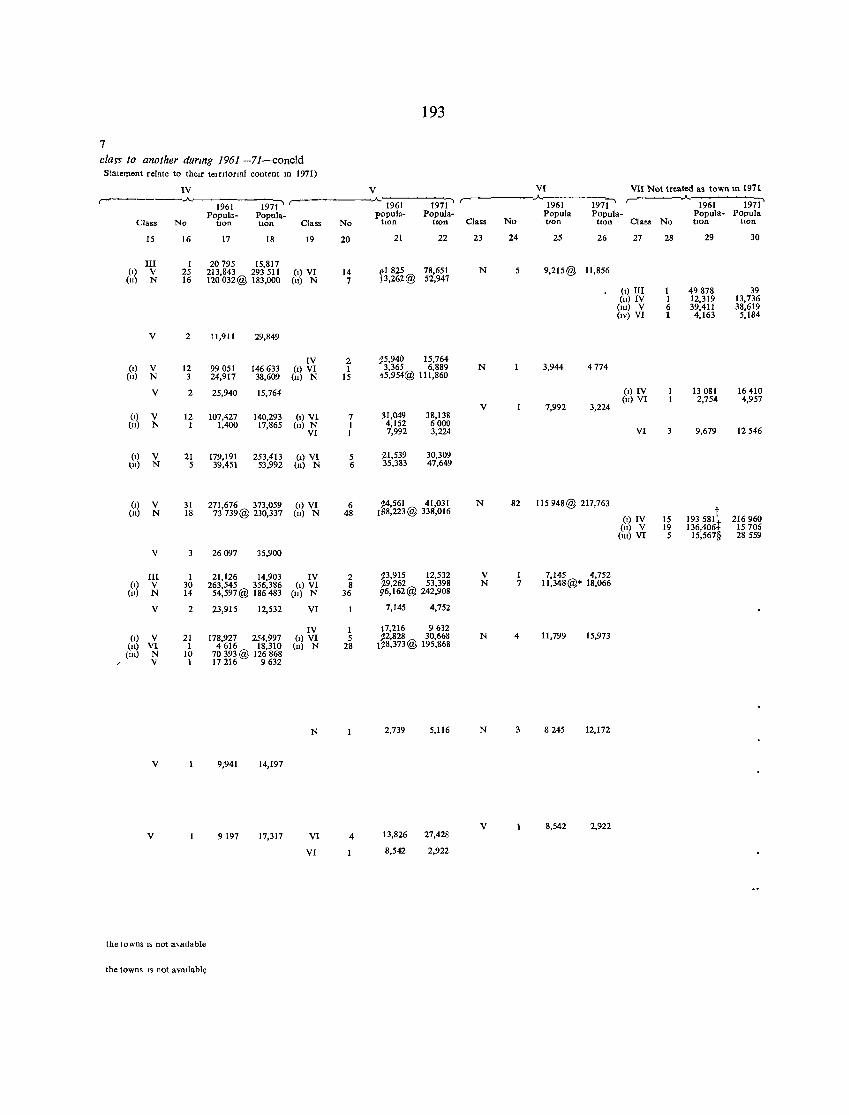
7 class to another durmg 1961 -71-concld Statement relate to theIr te1ntortal content 10 1971)
IV ,..---------.A.
Class No
15 16
III I (1) V 25
(n) N 16
V 2
(1) V 12 (ll) N 3
V 2
(1) V 12 (ll) N I
(1) V 21 (ll) N 5
(1) V 31 (n) N 18
V
III I (1) V 30
(ll) N 14
V 2
(1) V 21 ell} VI 1 (m) N 10
V I
V
V
the (owns IS not a\allable
the towns IS not avaIlable
1961 1971' Popula- Popula-
!Jon hon
17 18
20795 15,817 213,843 293 511 120032@ 183,000
1I,91l 29,849
99051 146633 24,917 38,609
25,940 15,764
107,427 140,293 1,400 17,865
179,191 253,413 39,451 53,992
271,676 373,059 73 739@ 230,337
26097 35,900
21,126 14,903 263,545 356,386
54,597@ 186483
23,915 12,532
178,927 254,997 4616 18,310
70 393 @ 126868 17216 9632
9;941 14,197
9197 17,317
Class
19
(1) VI (n) N
IV (1) VI
(ll) N
(1) VI (11) N
VI
(1) VI (ll) N
(1) VI (n) N
IV (1) VI
(ll) N
VI
IV (I) VI
(u) N
N
VI
VI
No
20
14 7
2 I
15
7 I I
5 6
6 48
2 8
36
I 5
28
4
193
V VI VII Not treated as town 10 1971 -"
1971' r- .A,
19ii' 1961 1971 1961 1961 popula- Popula- Popula Popula- Popula- Popula
hon tlOn Class No t!on tton CIIl •• No tJon tton
21 22 23 24 25 26 27 28 29 30
pI 825 78,651 N 5 9,215@ 11,856 13,262@ 52,947
(1) III I 49878 39 (ll) IV I 12,319 13,736
(m) V 6 39,41l 38,619 (IV) VI 1 4,163 5,184
;!5,940 15,764 3,365 6,889 N 3,944 4774
o5,954@ 111,860
(1) IV 13081 16410
V 7,992 (ll) VI 2,754 4,957
3,224 ~I,049 38,138 4,152 6000 7,992 3,224 VI 3 9,679 12546
21,539 30,309 35,383 47,649
~4,561 41,031 N 82 115 948@ 217,763 188,223@ 338,016
193581t
(1) IV 15 216960 (n) V 19 136,406+ 15705
(m) VI 5 15,567§ 28559
~3,915 12,532 V I 7,145 4,752 ~9,262 53,398 N 7 11,348@* 18,066 96,162@ 242,908
7,145 4,752
17,216 9632 ~2,828 30,668 N 4 11,799 15,973 1~8,373 @ 195,868
2,739 5,116 N 3 8245 12,172
V 8,542 2,922 13,826 27,428
8,542 2,922
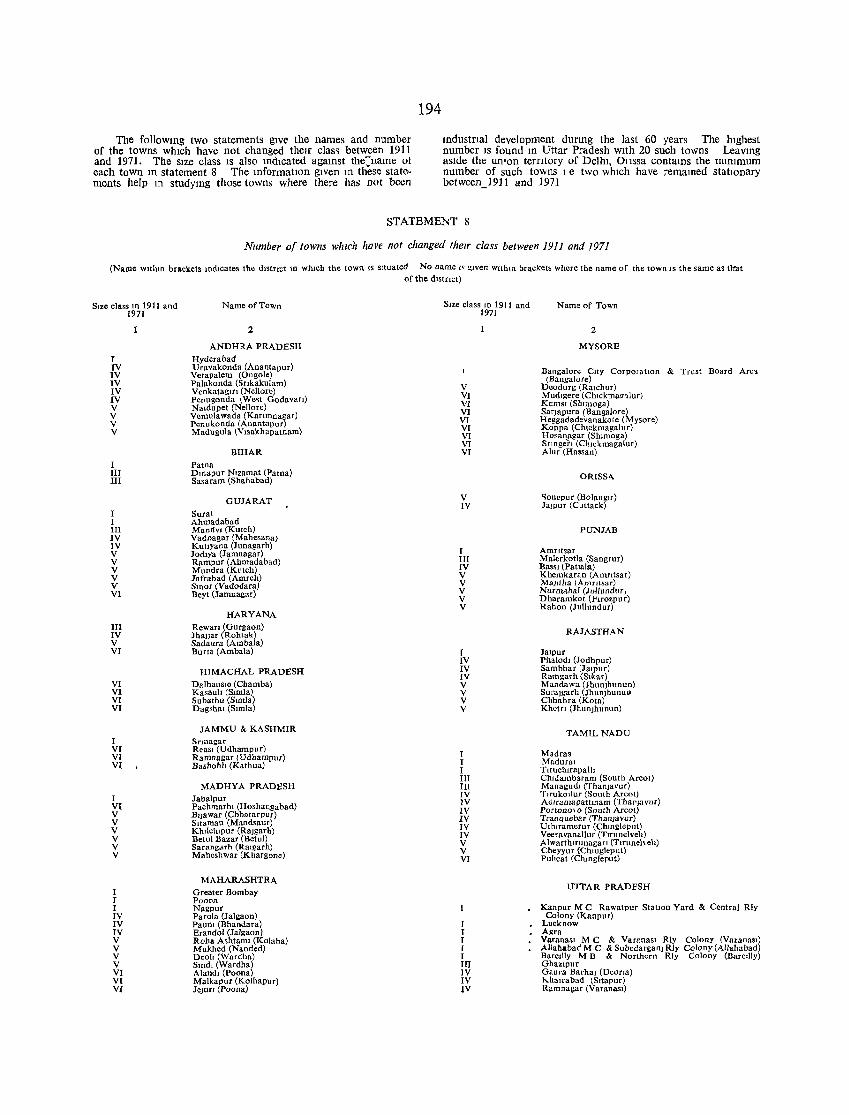
The folloWIng two statements gIVe the names and number of the towns which have not changed theIr clas~ between 1911 and 1971. The size class IS also IndICated agaInst the::name at each town III statement 8 The InformatIOn given m these state" ments help In studYIng those towns where there has not been
194
IndustrIal development dUrIng the last 60 years The highest number IS found III Uttar Pradesh With 20 such towns Leavmg aSide the un'on terrItory of Delhi, 0llssa contaInS the minImum number of such towns I e two which have remamed statIOnary between_1911 and 1971
STATEMENT 8
Number of towns which have not changed thew class between 1911 and 1971
(Name wltlun brackets lUdlcates the dIStrIct ID which the town IS sItuated No name I' ~Iven w!thln bracket, where the name of the town IS the same a< tltat of the dlstnct)
Size class In 1911 and 1971
I IV IV IV IV IV V V V V
I III III
1 I III IV IV V V V V V VI
III IV V VI
VI VI VI VI
I VI VI VI
I VI V V V V V V
I T I IV IV IV V V V V VI VI VI
Name of Town
2
ANDHRA PRADESH
Hyderabad Uravakonda (Anantapur) Vetapalem (Ongolo) Palakonda (Snkakulam) Venkatagm (Nellore) Penugonda [We.t Godavan) Naldupct (Nellore) Vemulawada (Kanmnagar) Penukonda (Anantapur) Madugula \Vlsakhapatnam)
BIHAR
Patna Dwapur Nlzamat (Patna) Sasaram (Shahabad)
GUJARAT
Sural Ahmadabad Mandv, (Kutch) Vadnagar (Mahesana) Kutlyana (Junagarh) Jodlya (Jamnagar) Rarnpur (Ahmadabad) Mundra (Kutch) Jafrabad (AmrelI) Smor (Vadodara) Beyt (Jamnagar)
HARYANA Rewan (Gurgaon) Jba])ar (Robtak) Sadaura (Ambala) Buna (Ambala)
HIMACHAL PRADESH
Dalhausle (Chamba) Kasault (Simla) Subatbu (Stmla) Dagshal (Simla)
JAMMU & KASHMIR Srmagar Reasl (Udhampur) Ramnagar (Udhampur) Bashohlt (Katbua)
MADHYA PRADESH Jabalpur Pachmarhl (Hoshangabad) Bljawar (Chhatarpur) Sltamau (Mandsaur) Khllchlpur (Rajgarh) Belul Bazar (Belul) Sarang"rh (Rmgarh) Mabeshwar (Khargone)
MAHARASHTRA Greater Bombay Poona Nagpur Parola (Jalgaon) Paunl (Bhandara) Erandol (Jalgaon) Roha Ashtaml (Kolaba) Mukhed (Nanded) Deoh (Wardha) Smdl (Wardha) Alandl (Poona) Malkapur (Kolhapur) leJurI (Poona)
Size class lU 1911 and 1971
V VI VI VI VI VI VI VI VI
V IV
I III IV V V V V V
I IV IV IV V V V V
I I I III III IV IV IV IV IV IV V V VI
I I I I I III IV IV IV
Name of Town
2
MYSORE
Bangalore CIty CorpOration & Trust Board Are'l (Bangalore)
Deodurg (Ralchur) Mudlgere (Chlckmau,lur) Kums! (ShInlOga) Sanapura (Bangalore) Heggadadevanakote (Mysore) Koppa (Chlckmagalur) Hosanagar (Shlmoga) Srmgerl (Chlckmagalur) AllIr (Hassan)
ORISS"-
'lonepur (Bolanglf) Jajpur (Cuttack)
PUNJAB
Amrltsar Malerkotla (Sangrur) BaSSI (Patlala) Khemkaran (Amntsar) Ma)llha (An1TJtsar) NurmahaI (Jullundur, Dharamkot (FHozpur) Rahon (Jullundur)
RAJASTHAN
Jalpur Phalodl (Jodhpur) Sambhar (JaIpur) Ramgarh (Slkar) Mandawa (Jhunjhunun) Surajgarh (JhunjhunuI> Chhabra (Kota) Khetri (Jhunjhunun)
TAMILNADU
Madras Madural Tl[uchITapalh Chhiambaram (South Areol) Managudl (ThanJavur) TlrukOilur (South Arcot) Ad.ramapatlmam (Thapjavur) Portono\O (South Areot) Tranquebar (Thaujavur) Uthlramerur (Chmgleput) Veeravanallur (Tlfunelveh) Alwarthlrunagan (TITuneh ell) Cheyyur (Chmgleput) PulIeat (Chmgleput)
UTTAR PRADFSH
Kanpur M C Rawatpur StatlOn Yard Colony (Kanpur)
Lucknow Agra
& Central Rly
Varanasl M C AllahabadMC BareJily M B Ghaz,pur
& Varanasl Rly Colony (Varanasl) & Subedarganj Rly Colony (Allahabad) & Northern Rly Colony (Baredly)
Gaura Barhaj (Deona) khalrabad (Sltapur) Ramnagar (Varanasl)
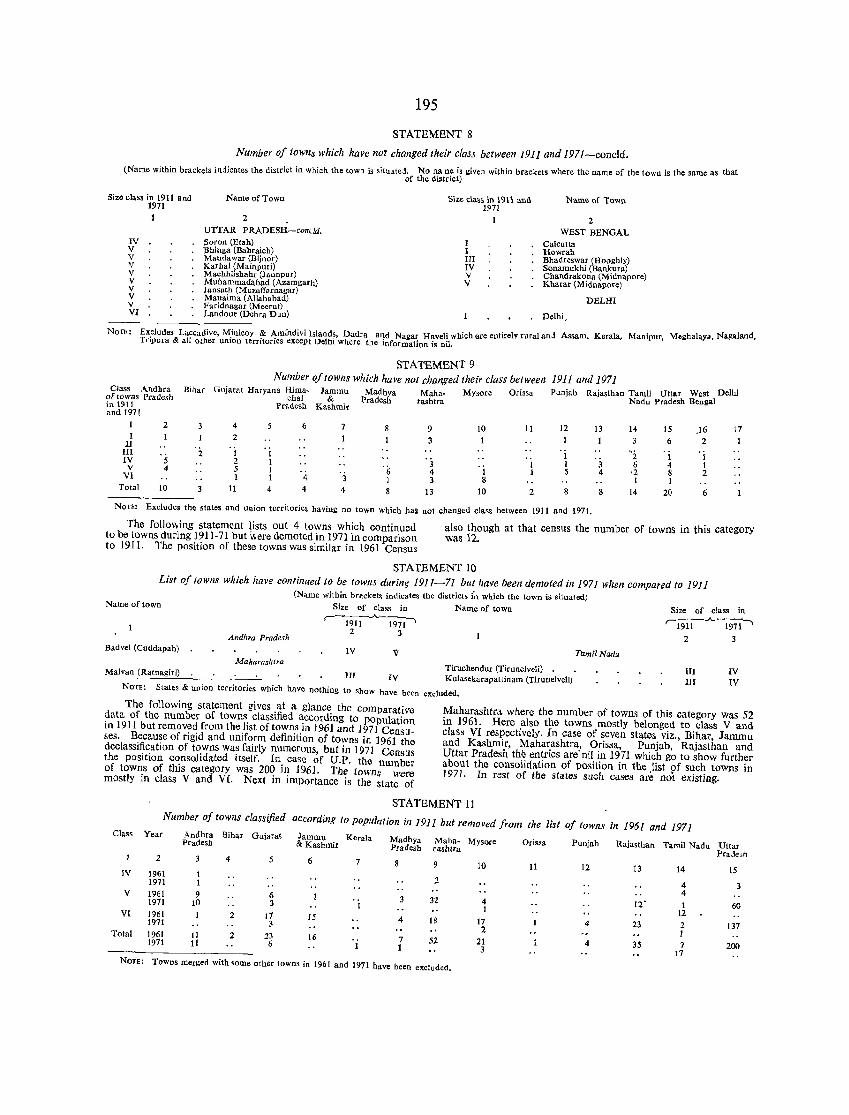
195
STATEMENT 8
Number of towns which have nor changed their class between 1911 and 197I-concId. (Name ithiu brack ts iujieates the district in which the tow~ is sitll.teJ. No n.a n~ is given within brackets where the name of the town is the same as that
w e of the dlStnct)
Size class in 1911 and 1971
IV V V V V V V V V VI
Name of Town
2
UTTAR PRADESH-condd. Soron (Etah) :Bhinga (Bahraich) Mandawar (Bijnor) Karhal (Mainpuri) Machhlishahr (Jaunpur) Muhammadabad (Azamga'h) Jansath (Mu.aff.rnagar) Mauaima (Allahabad) F~ridnagar (Meerut) Landour (Dehra Dun)
Size class in 1911 and 1971
I I III IV V V
1
Name of Town
2 WEST BENGAL
Calcutta Howrah Bhadreswar (Hooghly) Sonamukhi (Baokura) Chandrakona (Midnapore) Kharaf (Midnapore)
DELHI
, Delhi,
NOTE: Excludes Laceadive, Minicoy & Aminclivi Islands, Dadra and Nagar Haveli wbich are entirely rural .oJ Assam, Ketala, Manipur, Meghalay., Nagaland, Tdpura & all other union territories except Delhi where the information is nil.
Class Andhra of towns Pradesh in 1911 and 1971
I 2 I
II III IV
V VI
Total
S 4
10
STATEMENT 9 Number of towns which have not changed their class between
Bihar Gujarat Haryana Hima, Jammu Madhya Maha- Mysore Orissa chal & Pradesh rashtra
3 4 2
2 1 2 5 1
3 11 4
Pradesh Kashmir
6
4 4
3 4
';; 1
8
9 10 II 3 I
'3 'j 1
4 1 3 8
13 10 2
1911 and 1971 Punjab Rajasthan Tamil Uttar West
Nadu Pradesh Bengal
12 13 14 15 )6 1 6 2
1 "2 1 . i I 3 6 4 I S 4 '2 8 2
1 I 8 8 14 20 6
NOTE: Excludes the states and union territorie~ having no town Which has not changed class between 1911 and 1971.
Delhi
17
The follo'Wing statement lists out 4 towns which continued also though at that census the number of towns in this category to be towns during 1911-71 but v.ere demoted in 1971 in comparison was 12. to 1911. The position of these towns was similar in 1961 Census
STATEMENT 10 List of towns which have continued to be (owns during 1911-71 but have been demoted in 1971 when compared to 1911
Name of town (Name within bracket~ indicates the districts i~ which the town is situated)
Size of class in Name of town Size of class in
r-iiD-'--1971' r-l9i!".A.l97i'
Alldhra Pradesh 2 3
2 3 Badvel (Cuddapah) IV ThmilNadu
M aharaslz t ra Malvan (Ratnagiri) III IV
Tiruchendur (Tirunelveli) • Kulasekarapattinam (Tirunelveli)
NOTE: States & union territories which have nothing to show have been excluded.
III III
IV IV
The following statement gives at a glance the comparative data of the number of towns classified according to POtmlation in 1911 but removed from the list of towns in 1961 and 1971 Censuses. Because of rigid and uniform definition of towns in 1961 the declassification of towns was fairly numerous, but in 1971 Census the position consolidated itself. In cas", of U,P. the number of towns of this category was 200 in 1961. The towns were mostly in class V and Vi. Next in importance is the $tate of
Maharashtra where the number of tOWll~ of this category was 52 in 1961. Here also the towns mostly belonged to class V and class VI respectively, In case of seven states viz" Bihar, Jammu and Kashmir, Maharashtra, Orissa, Punjab, Rajasthan and Uttar Pradesh the entries are'nil in 1971 which go to show further about the consolidation of position in the list of such towns in 1971. In rest of the states such cases are not existing.
STATEMENT 11
Class Year
2
IV 1961 1971
Number of towns classified according to population in 1911 but removed from the list of towns in 196} and 1971 Andhra flihar Gujara! Jammu Ker.la Pradesh & Kashmir Madhya Maha- Mysore
Pradesh rashtra Orissa Punjab Rajasthan Tamil Nadu Uttar
PraJe3h
13 14 15
4 3
4 5
1 1
6 7 10 11 12
2
V 1961 1971
VI 1961 1971
Total 1961 1971
4 12' 1 60
12 23 2 137
1 3S 7 200
17
9 6 10 3
J 2 17 3
11 2 23 11 6
3 32 4 I
15 4 IS 17 4 2
16 7 52 21 4 I 3
NOTE: Towns merged with some other towns in 1961 and 1971 nave been excluded.
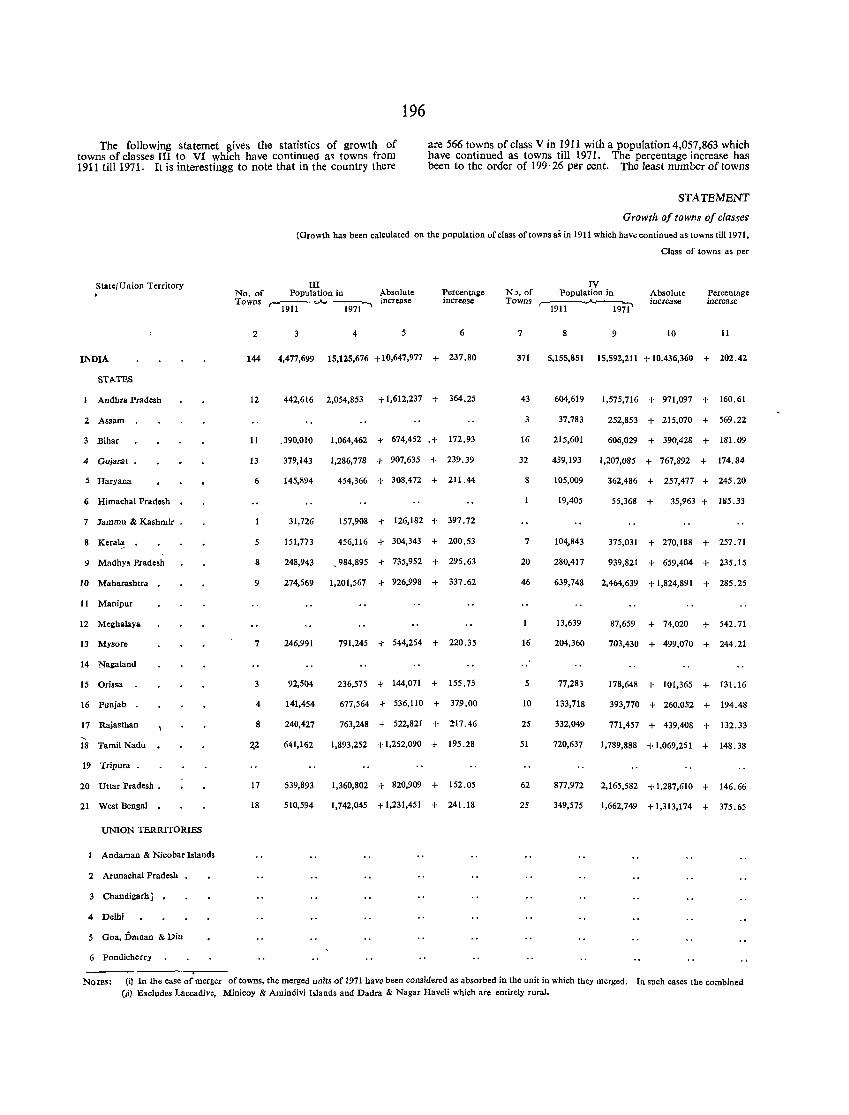
196
The following statemet gives the statistics of growth of towns of classes III to VI which have continUed a~ towns from 1911 till 1971. It is interestingg to note that in the country there
are 566 towns of class V in 1911 with a population 4,057,863 which have continued as towns till 1971. The percentage increase has been to the order of 199· 26 per cent. The least number of tOWl1S
State/Union Territory
INDIA
STATES
Andhra Pradesh
2 Assam
3 Bihar
4 Gujaral
S Haryana
6 Himachal Pradosh
7 Jammu & Kashmir
8 Keral,. •
9 Madhya Pradesh
10 Maharashtra
11 Manipur
12 Meliiha!aya
13 Mysorc
14 Na&aland
15 Orissa
16 Punjab
17 Rajasthan , 18 Tamil Nadu
19 Tripura •
20 Uttar Pradesh •
21 West Bengal •
UNION TERRITORIES
Andaman & Nicobar Islands
2 Arunachal Pradesh
Chandigarh J
4 Delhi
5 Goa, DIILnm & Diu
6 Pondicherry
STATEMENT
Growth of tOW1IS of classes
(Growth has been calculated on the population of class of towns as in 1911 which have continued as towns till 1971,
Class of towns as per
III IV No. of Population in Absolute
increase Percentage increase
NJ. of Population in Absolute increase
Percentage increase Towns r-~~ ____
2
144
12
11
13
6
5
8
9
7
4
8
17
18
4 5 6
4,477,699 15,125,676 + 10,647,977 + 237.80
442,616 2,054,853 ;-1,612,237 + 364.25
.390,010
379,143
145,894
31,126
151,773
248,943
1,064,462 + 674,452.+ 172.93
1,286,778 + 907,635 + 239.39
454,366 ;- 308,472 + 211.44
157,908 ;- 126,182 + 397.72
456,116 ;- 304,343 + 200.53
c984,895 ;- 735,952 + 295.63
274,569 1,201,567 ;- 926,998 + 337.62
246,991 791,245 ;- 544,254 + 220.35
92,504 236,575 + 144,071 + 155.75
141,454 677,564 + 536,110 + 379.00
240,427 763,248 + 522,821 + 2t 7.46
641,162 1,893,252 + 1,252,090 + 195.28
539,893
510,594
1,360,802 + 820,909 + 152.05
1,742,045 + 1,231,451 + 241.18
Towns -.A. _____ r-1911 1971'
7
371
43
3
16
32
7
20
46
16
5
10
25
51
62
25
8 9 10 II
5,155,851 15,592,211 + 10.436,360 + 202.42
604,619
37.783
215,601
439,193
105,009
19,405
104,843
280,417
639,748
13,639
204,360
77,283
1,575,716 + 971,097 + 160.61
252,853 + 215.070 + 569.22
606,029 + 390,428 + 181. 09
1,207,085 + 767,892 + 174.84
362,486 + 257,477 + 245.20
55,368 + 35,963 + 185.33
375,031 + 270,188 + 257.71
939,821 + 659,404 + 235.15
2,464,639 + 1,824,891 + 285.25
87,659 + 74,020 + 542.71
703,430 + 499,070 + 244.21
178,648 + 101,365 + 131.16
133,718 393,770 + 260.052 + 194.48
332,049 771,457 + 439,408 + 132.33
720,637 1,789,888 + 1.069,251 + 148.38
877,972
349,575
2,165,582 + 1,287,610 + 146.66
1,662,749 + 1,313,174 + 375.65
NorES: (iJ In the case of merger of towns, the merged units of 1971 have been considered as absorbed in the unit in which they merged. In such cases the combined (li) Excludes Laccadive, Minicoy & Amindivi Islands and Dadra & Nagar Haveli which are entirely rural.
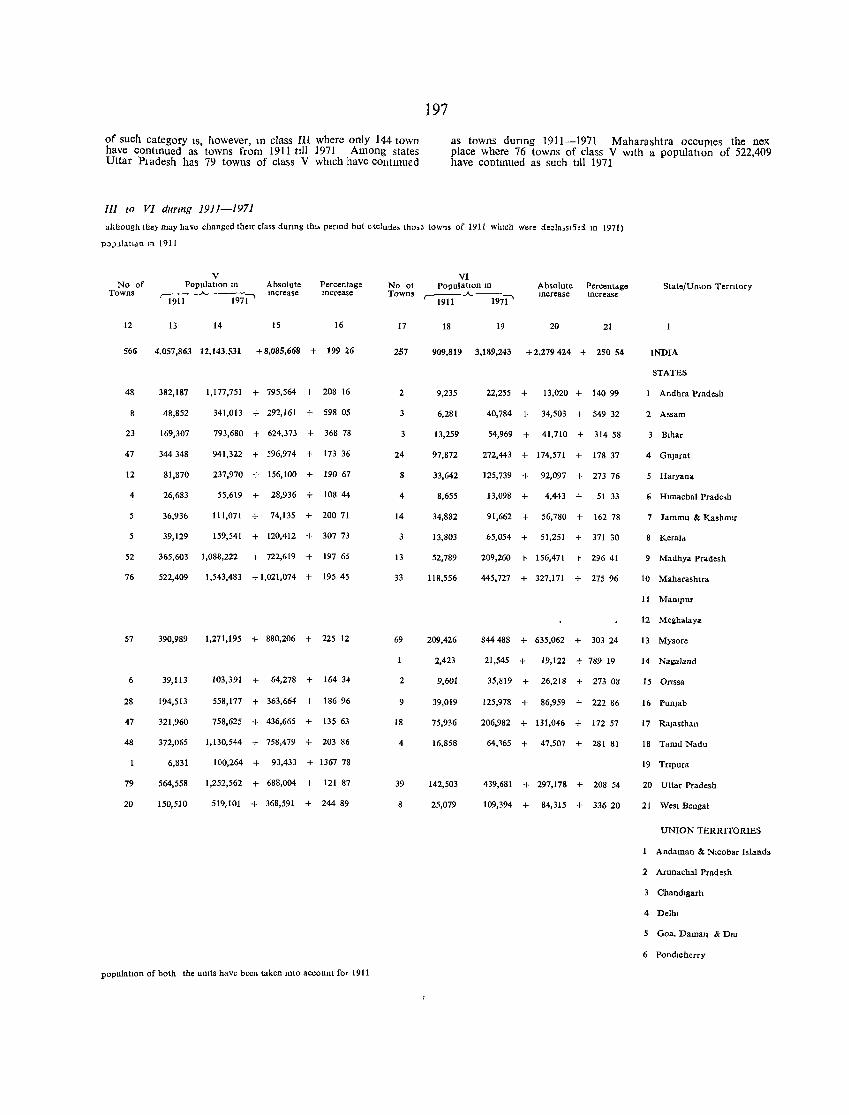
of such category IS, however, 111 class III where only 144 town have contmued as towns from 1911 ttll 1971 Amon~ states Uttar Pladesh has 79 towns of cla5s V which have Contlllued
III to VI durmg 1911-1971
197
as towns durmg 1911-1971 Maharashtra occupies the nex: place where 76 towns of class V with a populatIOn of 522,409 have contmued as such till 1971
although they may have changed their class dunng th'> penod but e<clui.> tho>. tow~s of 1911 which were decla>Sl5d m (971)
p~pllatldn 1'11911
No of Towns
12
566
48
23
47
12
4
5
52
76
57
6
28
47
48
79
20
V PopulatlOn m Absolute
Increase Percentage Increase 'l9il-.A..---I971'
13 14 15 16
4,057,863 12,143,531 + 8,085,668 + 199 26
382,187
48,852
169,307
344348
81,870
26,683
36,936
39,129
1,177,751 + 795,564 + 208 16
341,013 + 292,161 + 598 05
793,680 + 624,373 + 368 78
941,322 + 596,974 + 173 36
237,970 + 156,100 + 190 67
55,619 + 28,936 + 108 44
111,071 + 74,135 + 20071
159,541 + 120,412 + 307 73
365,603 1,088,222 + 722,619 + 197 65
522,409
390,989
39,113
194,513
321,960
372,065
6,831
564,558
150,510
1,543,483 + 1,021,074 + 195 45
1,271,195 + 880,206 + 225 12
103,391 + 64,278 + 164 34
558,177 + 363,664 + 186 96
758,625 + 436,665 + 135 63
1,130,544 + 758,479 + 203 86
100,264 + 93,433 + 1367 78
1,252,562 + 688,004 + 121 87
519,101 + 368,591 + 244 89
populatlOn of both the umts have been taken mto account for 1911
No 01 Towns
17
257
2
3
24
8
4
14
3
13
33
69
2
9
18
4
39
8
VI populatton m Absolute
mcrease Percentago Increase 'l9i1-"- ----;;'1'
18 19 20 21
909,819 3,189,243 + 2,279424 + 250 54
9,235
6,281
13,259
97,872
33,642
8,655
34,882
13,803
52,789
118,556
209,426
2,423
9,601
39,019
75,936
16,858
142,503
25,079
22,255 + 13,020 + 140 99
40,784 + 34,503 + 549 32
54,969 + 41,710 + 314 58
272,443 + 174,571 + 178 37
125,739 + 92,097 + 273 76
13,098 + 4,443 + 51 33
91,662 + 56,780 + 162 78
65,054 + 51,251 + 371 30
209,260 + 156,471 + 296 41
445,727 + 327,171 + 275 96
844 488 + 635,062 + 303 24
21,545 + 19,122 + 789 19
35,819 + 26,218 + 273 08
125,978 + 86,959 + 222 86
206,982 + 131,046 + 172 57
64,165 + 47,507 + 281 81
439,681 + 297,178 + 208 54
109,394 + 84,315 + 336 20
State/UnIOn Terrttory
INDIA
STATES
Andhra Pradesh
2 Assam
Bihar
4 Guprat
5 Haryana
7 Jammu &; Kashmir
8 Keral"
9 Madhya Pradesh
1 0 Maharashtra
11 Mampur
12 Me&halaya
13 Mysore
14 Nai:aland
15 Onssa
16 Punjab
17 Rajasthan
18 TanHI Nadu
19 TrIpura
20 Uttar Pradesh
21 West Bengal
UNION TERRITORIES
Andaman & Nlcobar Islands
2 Arunachal Pradesh
Chandlgarh
4 Delhi
5 Goa. Daman & DIU
6 Pondlcherry
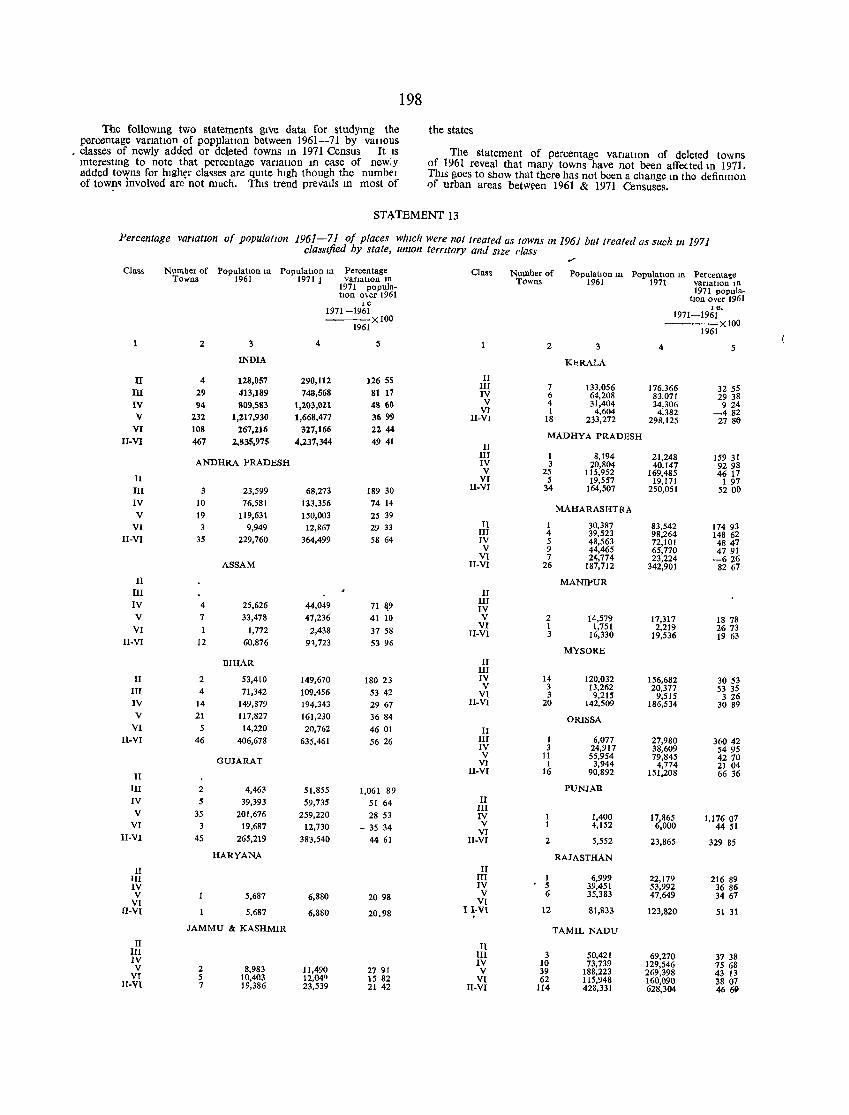
198
The followmg two statements gIve data for studymg the the states percentage vanatlOn of popplatlOn between 1961-71 by vallous
The statement of percentage vanatlOn of deleted towns • classes of newly added or deleted towns III 1971 Census It IS mterestlllg to note that percentage vanatlon In case of newly of 1961 reveal that many towns have not been affected III 1971. added towns for hIgher cla~ses are qUIte hIgh though the numhel ThiS goes to show that there has not been a change In the defimtloll of town~ involved are' not much. ThiS trend prevails m most of of urban areas betw~en 1961 & 1971 Censuses.
STATEMENT 13
Percentage VarlatlOn of populatIOn 1961-71 of places whIch were not treated as towns In 1961 but treated as such In 1971 classIfied by state, union terntory and sIze doss
.-'
Class Number of Populatton 1U PopulatlOn In Percentage Class Number of Population III Population III Percentage Towns 1961 1971 j vanatlon In Towns 1961 1971 varIa !ton m 1971 popula- 1971 popula-tion o\er 1961 han over 1961 Ie Ie. 1971-1961 1971-1961 ----x 100 ----x 100 1961 1961 2 3 4 5 2 3 4 5
INDIA KbRALA
IT 4 128,057 290,112 12655 II III 7 133,056 176,366 32 55 ill 29 413,189 748,568 81 17 IV 6 64,208 83,071 2938
IV 94 809,583 1,203,021 48 60 V 4 31,404 34,306 924 VI I 4,604 4,382 -482 V 232 1,217,930 1,668,477 36 99 II-VI 18 233,272 298,125 27 S6
VI 108 267,216 327,166 22 44 MADHYA PRADESH
II-VI 467 2,835,975 4,237,344 49 41 II
III 1 8,194 21,248 159 31 ANDHRA PRADESH IV 3 20,804 40,147 9298 V 25 115,952 169,485 46 17 II VI 5 19,557 19,171 1 97
III 3 23,599 68,273 189 30 H-VI 34 164,507 250,051 5200
IV 10 76,581 133,356 74 14 MAHARASHTRA
V 19 119.631 150,003 25 39 VI 3 9,949 12,867 29 33 II 1 30.387 83,542 17493
III 4 39,523 98,264 148 62 II-VI 35 229,760 364,499 58 64 IV 5 48,563 72,101 4847 V 9 44,465 65,770 4791
VI 7 24,774 23,224 -626 ASSAM II-VI 26 187,712 342,901 8267
II MANIPUR III II
III IV 4 25,626 44,049 71 ~ IV V 7 33,478 47,236 41 10 V 2 14,579 17,317 18 78
VI 1 1,751 2,219 2673 VI 1,772 2,438 37 58 II-VI 3 16,330 19,536 19 63 II-VI 12 60,876 91,723 53 96
MYSORE BIHAR II
III II 2 53,410 149,670 18023 IV 14 120,032 156,682 30 S3
V 3 13,262 20,377 53 35 III 4 71,342 109,456 53 42 VI 3 9,215 9,515 3 26 IV 14 149,879 194,343 29 67 II-VI 20 142,509 186,534 3089 V 21 117,827 161,230 36 84 ORISSA
VI 5 14,220 20,762 4601 II II-VI 46 406,678 635,461 5626 III 1 6,077 27,980 36042
IV 3 24,917 38,609 5495 V 11 55,954 79,845 4270 GUJARAT VI 1 3,944 4,774 21 04
II-VI 16 90,892 151,208 6636 II
III 2 4,463 51,855 1,061 89 PUNJAB
IV 5 39,393 59,735 51 64 II III
V 35 201,676 259,220 28 53 IV 1,400 17,865 1,17607 VI 3 19,687 12,730 - 35 34 V 4,152 6,000 4451
VI II-VI 45 265,219 383,540 44 61 II-VI 2 5,552 23,865 329 as
HARYANA RAJASTHAN
II II III 1 6,999 22,179 216 89 III IV 5 39,451 53,992 36 86 IV
V 5,687 6,880 2098 V 6 35,383 47,649 34 67 VI VI
I I-VI 12 81,833 123,820 51 31 L1-VI 5,687 6,880 20.98 . JAMMU & KASHMIR TAMIL NADU
II II III III 3 50,421 69,270 3738 N IV 10 73,739 129,546 75 68 V 2 8,983 11,490 27 91 V 39 188,223 269,398 43 13 VI 5 10,403 12,040 15 82 VI 62 115,948 160,090 3807 II-VI 7 19,386 23,539 21 42 II-VI 114 428,331 628,304 46 69
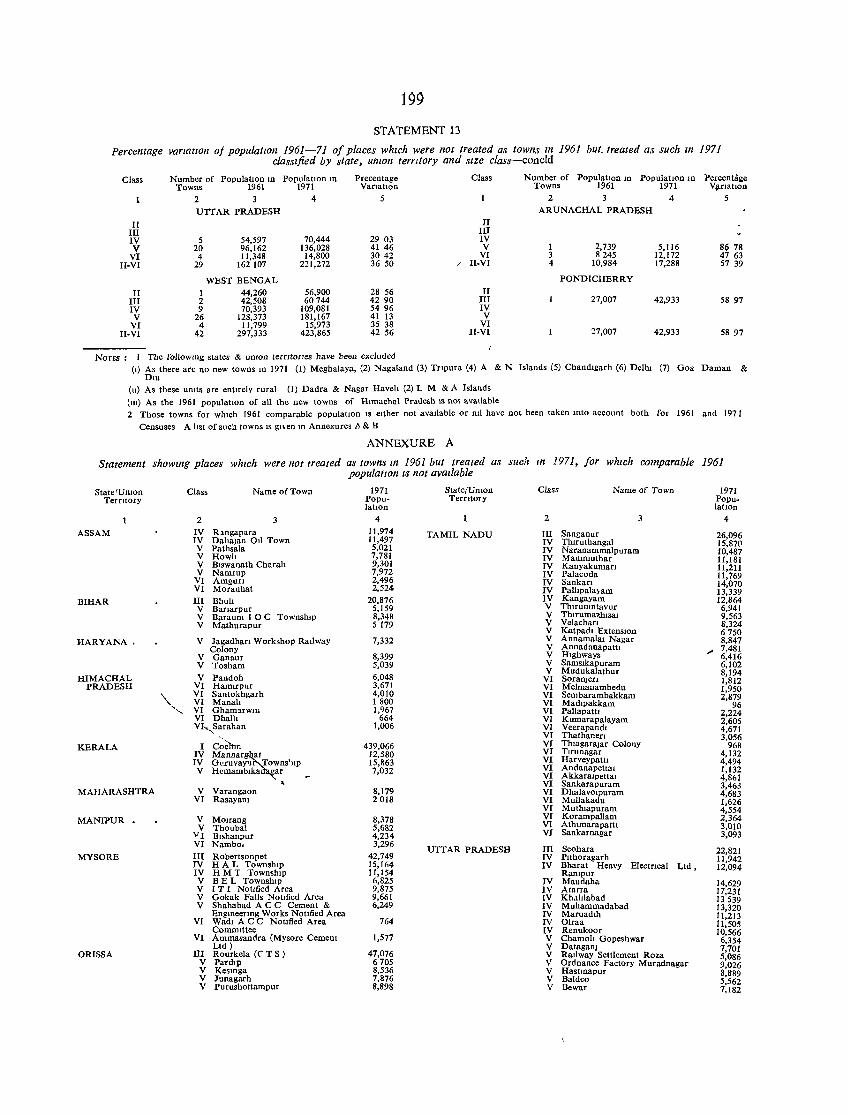
199
STATEMENT 13
Percentage variaTIon oj populatlOll 1961-71 of places which were llot treated as towns III 1961 but. treated as such III 1971 classified by state, union territory and size class-coneld
Class Number of Popuiattou 10 PopulatIOn III Precentage Class Number of PopulatIon m PopulatIOn III Percentage Towns 1961 1971 Vl'natlOn Towns 1961 1971 VarIatlon
2 4 5
UTTAR PRADESH
II III IV 5 54,597 70,444 29 03 V 20 96,162 136,028 41 46
vl 4 11,348 14,800 3042 II-VI 29 162107 221,272 36 50
WEST BENGAL
II 1 44,260 56,900 28 56 III 2 42,508 60744 42 90 IV 9 70,393 109,081 54 96 V 26 128,373 181,167 41 13
VI 4 11,799 15,973 35 38 II-VI 42 297,333 423,865 42 56
NorES : The followmg states & umon tern tones have been excluded
II III IV V
VI / II-VI
II III IV V
VI II-VI
2 3 4 5 ARUNACHAL PRADESH
1 3 4
2,739 8245
10,984
PONDICHERRY
27,007
27,007
5,116 12,172 17,288
42,933
42,933
86 78 47 63 57 39
58 97
5897
(I) As there are no new towns m 1971 (I) Meghalaya, (2) Nagaland (3) Tnpura (4) A & N Islands (5) Chandlgarh (6) DeIhl (7) Goa Daman & Dm
(11) As these umts are enurely rural (I) Dadra & Nagar Haveh (2) L M & A Islands
(111) As the 1961 populatIOn of all the new towns of Himachal Pradesh IS not avaIlable 2 Those towns for which 1961 comparable populatIOn IS either not avatlable or fill have not been taken mto account both for 1961 and 1971
Censuses A hst of such towns IS gl, en m Annexures " & B
ANNEXURE A
Statement showmg places which were not treated as towns III 1961 but treated as such III 1971, for which comparable 1961 populaflon IS not aVailable
StatefUnIOn Class Name of TowD 1971 Terntory Popu-
latIOn
2 3 4
ASSAM IV Rangapara 11,974 IV DahaJan Oil Town 11,497 V Pathsala 5,021 V Howh 7,781 V Blswanath Charah 9,301 V Namrup 7,972
VI Amgun 2,496 VI Moranhat 2.524
BIHAR III Bhuh 20,876 V Banarpur 5,159 V Baraum 10 C TownshIp 8,348 V Mathurapur 5179
HARYANA. V Jagadhan Workshop Radway 7,332 Colony
V Ganaur 8,399 V Tosham 5,039
HIMACHAL V Pandoh 6,048 PRADESH VI Hamlrpur 3,671
\. VI Santokhgarh 4,010 VI Manah 1800
",- VI Gham!lrWIO 1,967 VI Dhalll 664 V~Sarahan 1,006
KERALA I C~dt,n 439,066 IV Mannar at 12,580 IV GuruvaY1J Towns\llp 15,863 V Hemamblka ar 7,032
MAHARASHTRA V Varangaon 8,179 VI RasayaOl 2018
MANIPUR V MOlrang 8,378 V Thoubal 5,682
VI Blshanpur 4,234 VI Nambo, 3,296
MYSORE III Robertsonpet 42,749 IV HAL TownshIp 15,164 IV H M T Township 11,154 V BEL Township 6,825 V I T I Notllied Area 9,875 V Gokak Falls Notdied Area 9,661 V Shahabad A C C Cement & 6,249
EngmeerlOg Works Nohfied Area VI Wadi A C C NOhfied Area 764
CommIttee VI Ammasandra (My sore Cement 1,577
ORISSA III Ltd) Ronrkela «(" T S ) 47,076
V Pard.p 6705 V KeslOga 8,536 V Junagarh 7,876 V Purushottampur 8,898
State/Umon Terrttory
TAMIL NADU
UTTAR PRADESH
Class
2
III IV IV IV IV IV IV IV IV V V V V V V V V V
VI VI VI VI VI VI VI VI VI VI VI VI VI VI VI VI VI VI VI VI
III IV IV
IV IV IV IV IV IV IV V V V V V V V
Name of Town
3
Sanganur Thlruthangal Naranammalpuram Mammuthar Kanyakuman Palacoda Sankan Palhpala)am Kangayam ThtfUnmtavur Thlrumazh,sal Velacharl Katpadl ExtenSIOn Annamalat Nagar Annadanapattl Highways Sams!kapuram Mudukalathur SoranJen Melmanambedu Sem barambakkam Madlpakkam Pallapath Kumarapalayam Veerapanru Thathanen Thlagara]ar Colony Tlrunagar Harveypattl Andanapettm Akkaralpettal Sankarapuram DhalavOlpuram Mullakadu Mutluapuram Korampall!lm Athlmarapattl Sankarnagar
Seohara Pithoragarh Bharat Rampur
Heavy Electncal Ltd,
Maudaha Alarra Kh.lhlabad Muhammadabad Maruadlh 01raa Renukoor Chamoh Gopeshwar DataganJ Rallway Settlement Roza Ordnance Factory Muradnagar Hastmapur Baldeo Bewar
1971 Popu-lation
4
26,096 15,87(1 10,487 11,181 11,211 11,769 14,070 13,339 12,864 6,941 9,563 8,324 6750 8,847 ,. 7,481 6,416 6,102 8,194 1,812 1,950 2,879
96 2,224 2,605 4,671 3,056
968 4,132 4,494 1,132 4,861 3,463 4,683 1,626 4,554 2,364 3,010 3,093
22,821 11,942 12,094
14,629 17,231 13539 13,320 11,213 11,505 10,566 6,354 7,701 5,086 9,026 8,889 5,562 7,182
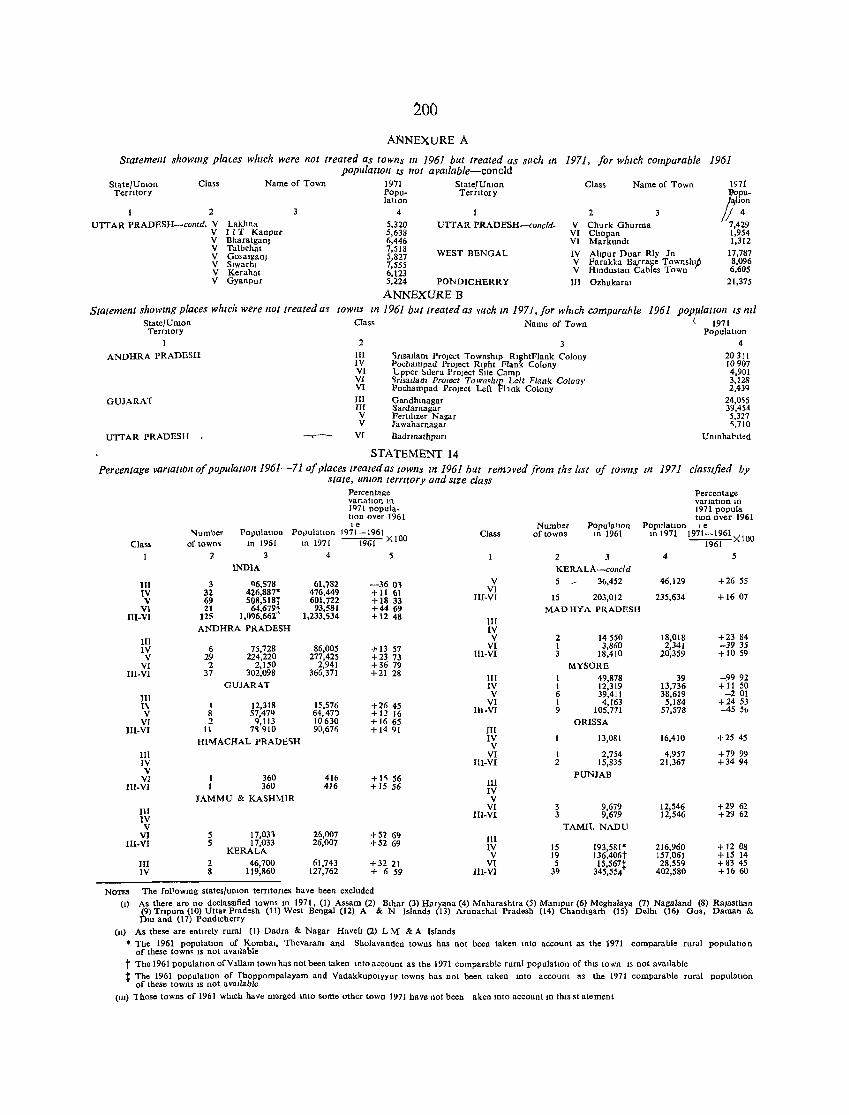
200
ANNEXURE A
STatement showmg plaus wlllch were not treated as towns III /961 but treated as such In populatIOn IS not avatlable-concld
1971, for wlllch comparable 1961
State/UnIOn Class Name of Town 1971 State/UnIOn Class Name of Town 1911 Territory Popu- Territory
lahon
2 UTTAR PRADESH-contd. V Lakhna
VII T Kanpur V Bharatgan] V Talbehat
4 5,320 5,638 6,446
UTTAR PRADESH-co/lcld-
WEST BENGAL
V VI VI IV
IlPu
-Ion
2 4
Churk Ghurma 7,429 Chopan 1,954 Markundl 1,312
17,787 V Gosalgan) V Slwarhl
7,518 5,827 7,555 V
V
Ahpur Duar Rly In Farakka Ba,rrage TownshIp 8,096 Hlndustan Cdbles Town 6,605 V Kerahat 6,123
V Gyanpur 5,:224 PONDICHERRY III Ozhukaral 21,375
ANNEXUREB Statement showmg places which were /lot treated as (OW/IS III /961 but treated as fuch In /971, for wlllch compara/rle 1961 pOPlllatlOn IS nzl
State/Uruon TerrItory
I
ANDHRA PRADESH
GUJARAT
UTTAR PRADESH
Class
2
III IV VI VI VI III nl V V
VI
Name of Town
'lnsallam Project TownshIp RlghtFlank Colony Pochampad Project RIFht Flank Colony Upper ::'I1eru Project SlIe Camp ~(millam Pro/eet Town<lllp LeU Flank Colony Pochampad Project Left Fhnk Colony Gandhmagar Sardarnagar FertIhzer Nagar Jawaharnagar IladrmathpuTl
STATEMENT 14
( 1971 POjlulatlOn
4
20311 10907 4,901 3,12!! 2,43Q
24,OS5 39,454 5,327 ~.710
Umnhat-Ited
Percentage VaYlatliJll of populatlOIl 1961-71 of places treated as fOWlls In 1961 but rem:JVed from the list of lawns ill 1971 classi./ied by state, UnIOIl terrttory and Size class
Percen!a~e Percentage VarIatIOn In variatIOn III 1 'I7l popula- 1971 popula tlOn over 1961 tIon over 1991 Ie Number Population PopulatIOn ] e
"'umber PopulatIOn POJJU13tlOn 1971-1961 Class of towns In 1961 In 1971 1971-1961 ><100 Class of town' In 1961 In 1971 1961 XI00 1961
I 2 3 4 2 3 4 5 INDIA KERALA-concl d
JIT 3 Q6,S78 61,782 -3601 V 5 ~ 36,452 46,129 +26 55 IV 32 426,887' 476,449 +11 61 VI V 69 S08,S18T 601,722 +1833 III-VI 15 203,012 235,634 +1607
VI 21 64,679:1: 93,581 +4469 MADHYA PRADESH ill-VI 125 1,096,662 1,233,534 +1248
III ANDHRA PRADESH IV
III V 2 14550 18,018 +23 84
IV 6 75,728 86,005 + 13 57 VI I 3,860 2,341 -3935
V 29 224,220 277,425 +23 73 III-VI 3 18,410 20,359 + 10 59
VI 2 2,150 2,941 +3679 MYSORE III-VI 37 302,098 366.371 +21 28
III 1 49,878 39 -9992 GUJAR4T IV I 12,319 13,736 +11 50
III V 6 39,411 38,619 -201
1\ 1 12,318 15.576 +2645 VI I 4,163 5,184 +2453 V 8 57,47'1 64,47:> +12 16 III-VI 9 105,771 57,578 -45 56
VT 2 9,113 10630 + 1665 ORISSA Ill-VI 11 7~ 910 90,671) +1491 III
HIlVIACHAL PRADE'>H IV 13,081 16,410 +2545 V
III VI I 2,754 4,957 +79 99 IV Ill-VI 2 15,835 21,367 +3494 V PUNJAB VI 360 41to +l~ 56
HI-VI 360 416 +1556 II1 IV
JAMMU & KASHMIR V
III VI 3 9,679 12,546 +29 62
IV III-VI 3 9,679 12,546 +29 62
V TAMIL NADU VI 5 17,031 26,007 +51 69 III III-VI 5 17,033 26,001 +52 69 IV 15 193,581" 216,960 + 1208 KERALA V 19 136,406t 157,061 +15 14 III 2 46,700 61,743 +3221 VI 5 IS,567t 28,559 +83 45 IV 8 119,860 121,762 + 659 IlI-VI 39 345,554 402,580 +1660
The fol'owmg states/umon temtones have been excluded NOTF.S (I) As there are no declasSIfied towns m 1971, (I) Assam (2) Bihar (3) Haryana (4) Maharashlra (5) Mampur (6) Meghalaya (1) Nagaland (8) RaJasthan
(9) Trlpura (10) Uttar Pradesh (11) West Bengal (12) A & 1'1 Islands (13) Arunachal Pradesh (14) Chandlgarh (15) DeIhl (16) Goa, Daman & Dm and (17) Pondlcherry
(11) As these are entIrely rural (I) Dadra & Nagar Havel! (2) L M & A Islands • The 1961 populatIOn of Kombal, Thevaram and Sholavanden towns has not been taken mto account as the 1971 comparable rural populatIon
of these town' IS not avaIlable t The 1961 populatlOn orV.11arn town has not been taken mto account as the 1971 comparable rural populatIon of thIs town IS not avaIlable t The 1961 populatIOn of fhoppompalayam and VadakkupOlyyur towns has not been taken mto account as the 1971 comparable rural population
of these towns ]s not avaIlable (Ill) lhose towns of 1961 whIch have merged mto some other town 1971 have not been aken mto account In tlus st atement
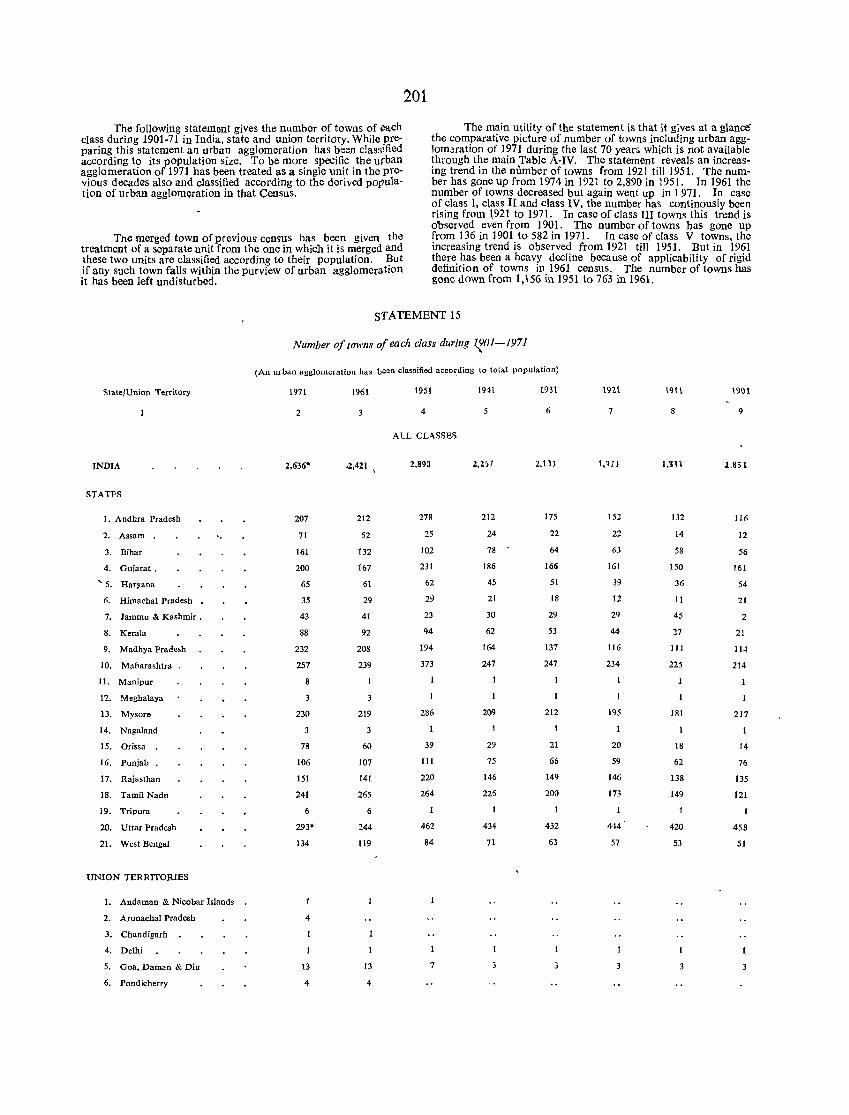
'rhe following statement gives the number of towns of ~ch class during 1901-71 in India, state and union territory. While preparing this statement an urban agglomeration has been classified according to its population size. To be more specific the urban agglomeration of 1971 has been treated as a single unit in the previous decades also and classified according to the derived population of urban agglomQration in that Census.
The merged town of previous census has been given the treatment of a separate unit from the one in which it is merged and these two units are classified according to their population. But if any such town falls within tho;) purview of urban agglomeration it has been left undisturbed.
201
The main utility of the statement is that it gives at a glancE! the comparative picture of number of towns including urban agglomeratIon of 1971 during the last 70 years which is not available through the main Table A-IV. The statement reveals an increasing trend in the number of towns from 1921 till 1951. The number has gone up from 1974 in 1921 to 2,890 in 1951. In 1961 the number of towns decreased but again went up in 1 971. In case of class I, class II and class IV, the number has continously been rising from 1921 to 1971. In case of class III towns this trend is o'bserved even from 1901. The number of towns has gone up from 136 in 1901 to 582 in 1971. In case of class V towns, the increasing trend is observed from 1921 tiII 1951. But in 1961 there has been a heavy decline because of applicability of rigid definition of towns in 1961 census. The number of towns has gone down from 1,156 in 1951 to 763 in 1961.
STATEMENT 15
State/Union Territory
INDIA
STATES
I. Andhra Pradesh
2. Assam
3. Bihar
4. Gujarat.
'- s. Haryana
6. Himachal Pradesh
7. Jammu & Kashmir.
8. Kerala
9. Madhya Pradesh
10. Maharashtra
II. Manipur
12. Meghalaya
13. Mysore
14. Nagaland
15. Orissa
16. Punjab
17. Rajasthan
18. Tamil Nadu
19. Tripura
20. Uttar Pradesh
21. West Bengal
UNION TERRITORIES
I. Andaman & Nicobar Islands
2. Arunachal Pradesh
3. Chandigarh
4. Delhi
5. Goa, Daman & Diu
6. Pondicherry
Number of towns of each class during ~Ol-1971
(An urban agglomeration has been classified acco~ding to total population)
1971
2
2,636'
207
71
161
200
65
35
43
88
232
257
8
230
78
106
151
241
6
293"
134
4
13
4
1961
3
.2,421 \
212
52
132
167
61
29
41
92
208
239
219
60
107
141
265
6
244
119
13
4
1951 1941 1931
4 5 6
ALL CLA.SSES
2,890 2,257 2,11)
278 212 175
25 24 22
102 78 M
231 186 166
62 45 51
29 21 18
23 30 29
94 62 53
194 164 137
373 247 247
286 2OO 212
39 29 21
III 75 66
220 146 149
264 226 200
462 434 432
84 71 63
7
Int 1911 1901
7 8 9
I,HI 1,831 .\,851
152 132 116
22 14 12
63 58 56
161 150 161
39 36 54
12 II 21
29 45 2
44 27 21
116 111 114
234 225 214
195 181 217
20 18 14
59 62 76
146 138 135
173 149 121
444 420 458
57 53 51
3 3
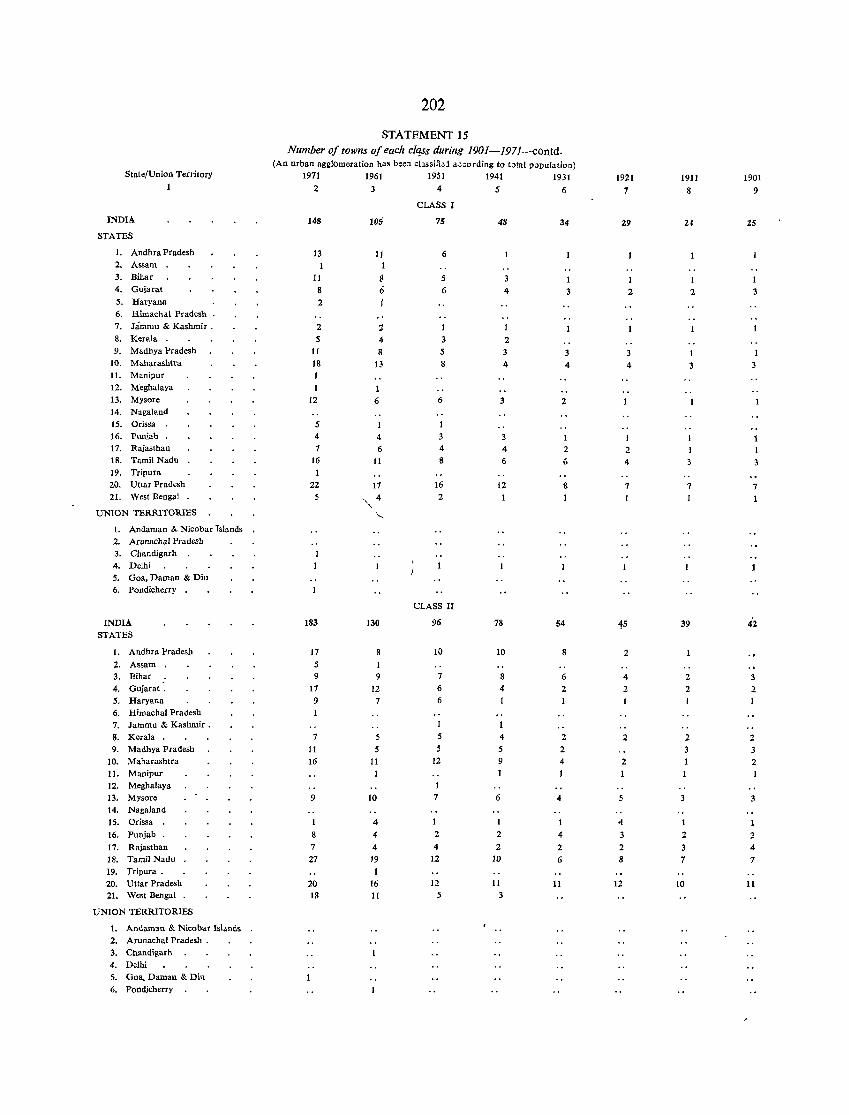
202
STATEMENT 15 Number of towns of each dqss during 1901-1971--contd.
(An urban agglomeration has bee:! clJssifid a~:ording to total pOllulation) State/Union Territory 1971 1961 1951 1941 1931 1921 1911 1901
1 2 3 4 5 6 7 8 9
CLASS I
INDIA 148 105 75 48 34 29 24 25 STATES
1. Andhra Pradesh 13 11 6 2. Assam 1 3. Bihar 11 8 5 1 I 4. Gujara! 8 6 6 4 3 2 2 3 5. Baryana 2 j
6. Himacha.l Pradesh .
7. Jammu & Kashmir. 2 i 1 8. Kerala S <I 3 2 9. Madhya Pradesh 11 8 5 3 3 3
10. Maharashtra 18 13 8 4 4 4 3 11. Manipur 1 12. Meghalaya
13. Mysore 12 6 6 3 2 14. Nagaland
15. Orissa 5 16. Punjab. 4 4 3 17. Rajasthan 7 6 4 4 2 2 18. Tamil Nadu 16 11 8 6 6 4 19. Tripura
20. Uttar Pradesh 22 17 16 12 8 7 7 7 21. West Bengal 5 ",4 2 1 1 1 1
UNION TERRITORIES
'" 1. Andaman & Nicobar Islands
2. Arunachal Pradesh
3. Chandigarh
4. Delhi S. Goa, Daman & Diu 6. Pondicherry
CLASS II
INDIA 183 130 96 78 54 4S 39 42 STATES
1. Andhra Pradesh 17 8 10 10 8 2 2. Assam 5 1 3. Bihar 9 9 7 8 6 4 2 3 4. Gujarat . 17 12 6 4 2 2 2 2 S. Haryana 9 7 6
6. Himachal Pradesh
7. Jammu & Kashmir. 1
8. Kerala 7 5 5 4 2 2 2 2 9. Madhya Pradesh 11 5 5 5 2 3
10. Maharashtra 16 11 12 9 4 2 2 11. Manipur 1 1 12. Meghalaya
13. Mysore 9 10 7 6 4 5 3 14. Nagaland
15. Orissa 1 4 1 ·1
16. Punjah . 8 4 2 2 4 3 2 2 17. Rajasthan 7 4 4 2 2 2 3 4 18. Tamil Nadu 27 19 12 10 6 8 7 7 19. Tripura . 1 20. Uttar Pradesh 20 16 12 11 11 12 10 11 21. West Bengal 18 11 5 3
UNION TERRITORIES
1. Andaman & Nicohar Islands
2. Arunachal Pradesh .
3. Chandigarh
4. Delhi
5. Goa, Daman & Diu
6. l'ondicherry
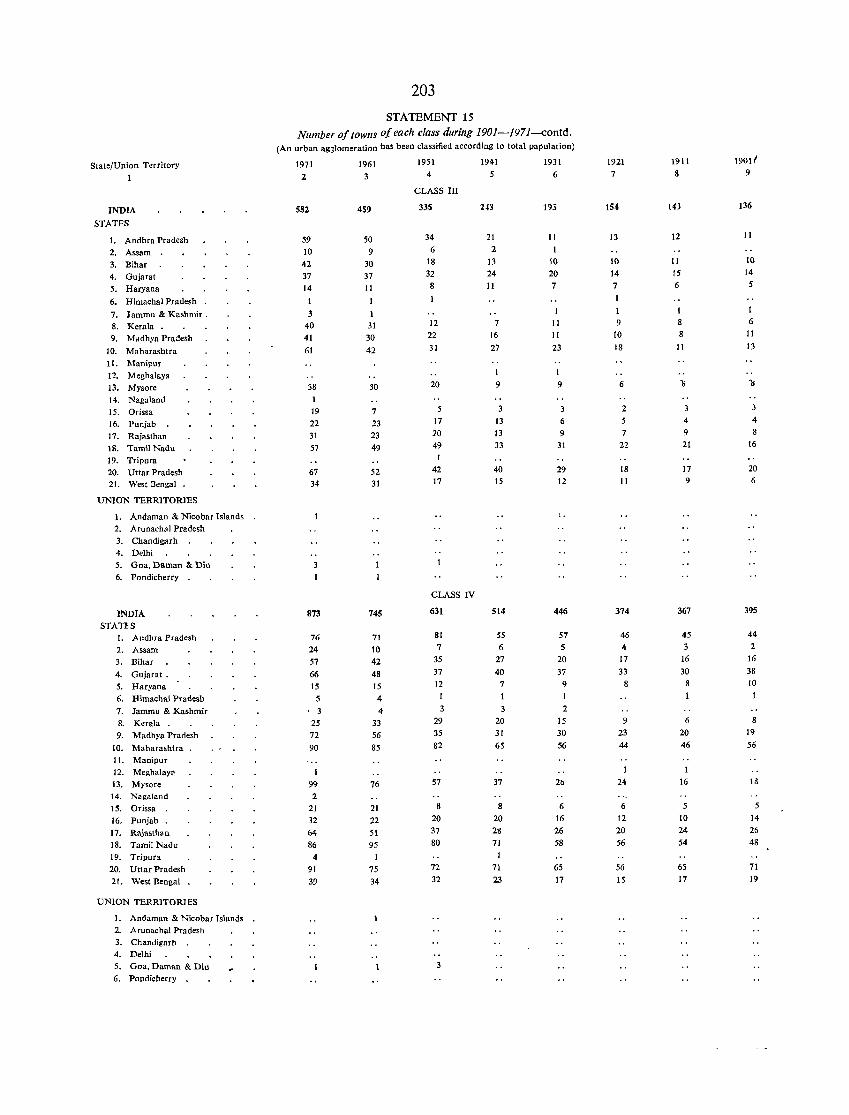
State/Union TerritOry
1
INDIA
STATES
1. Andhra Pradesh 2. Assam . 3. Bihar 4. Gujarat 5. Haryana
6. Himachal Pradesh
7. Jammu & Kashnlir . 8. Kerala . 9. Madhya Pradesh
10. Maharashtra 11. Manipur 12. M eghalaya
13. Mysore 14. Nagalaml
15. Orissa 16. Punjab . 17. Rajasthan 18. Tamil Nadu 19. Tripura 20. Uttar Pradesh 21. West Bengal .
UNION TERRlTORIES
1. Andaman & Nicobar Islands 2. Arunach81 Pradesh 3. Chandigarh . 4. Delhi 5. Goa, Daman & Diu 6. Pondicherry .
INDIA STAllS
1. Andhra Pradesh
2. Assam 3. Bihar
4. Gujara!. 5. Haryana
6. Himachal Pradesh
7. Jammu & Kashmir 8. Keral •. 9. Madhya Pradesh
10. Maharasblra . 11. Manipur 12. Meghalay~
13. Mysore 14. Nagaland 15. Orissa . 16. Punjab .
17. Rajasth. n 18. Tamil Nadu 19. Tripura 20. Uttar Pradesh
2 J. West Bengal .
UNION TERRITORIES
I. Andaman & Nicobar Islands 2. A run.chal Pradesh 3. Chandigarh . 4. Delhi
5. Goa, Daman & Diu 6. Pondicherry .
203
STATEMENT 15 Number of towns pi each class during 1901-1971-contd.
(An urban ag~lomeration has been classified according to total papulation)
1971 1961 1951 1941 1931
2 3 4 5 6
582
59
10 42
37
14
1
3 40
41
61
38 1 19
22
31
57
67 34
3
873
76
24 57
66
15 S
• 3
25
72
90
1
99 2
21 32 64
86
4
91 39
459
50
9 30
37
11
1
31 30
42
30
7
23 23
49
52
31
745
71
10 42
48
15
4
4 33
56
85
76
21
22
51 95
1
75
34
CLASS III
335
34
6 18
32
8
12
22
31
20
5 17
20 49
42 17
CLASS IV
631
81
7 35
37
12
I
3 29
35
82
57
8 20
37
80
72
32
21
2 13 24
11
7
16
27
I
9
13
13
33
40
15
514
55
6 27
40
7 1
3 20
31
65
37
8
20
28
71
1 71 23
193
11
I
10 20
7
11
II
23
I
9
6
9
31
29 12
..
446
57
5
20
37 q
I
2 15 30
56
2b
6
16
26
58
6S
17
1921
7
154
13
10
14 7
9
10
18
I>
2
5 7
22
18
11
374
46
4
17
33 8
9
23
44
24
6
12 20
56
56
15
1911 8
143
12
11
15 6
8 8
11
3
4 9 21
17 9
367
45
3 16
30
8
Ii
20
46
16
5 10 24
54
65
17
1901(
9
136
11
10 14 5
I 6
11
13
1s
:1
4
8
16
20
6
395
44
2
16
38
10 1
8 19
56
I~
14
26
48
71 19
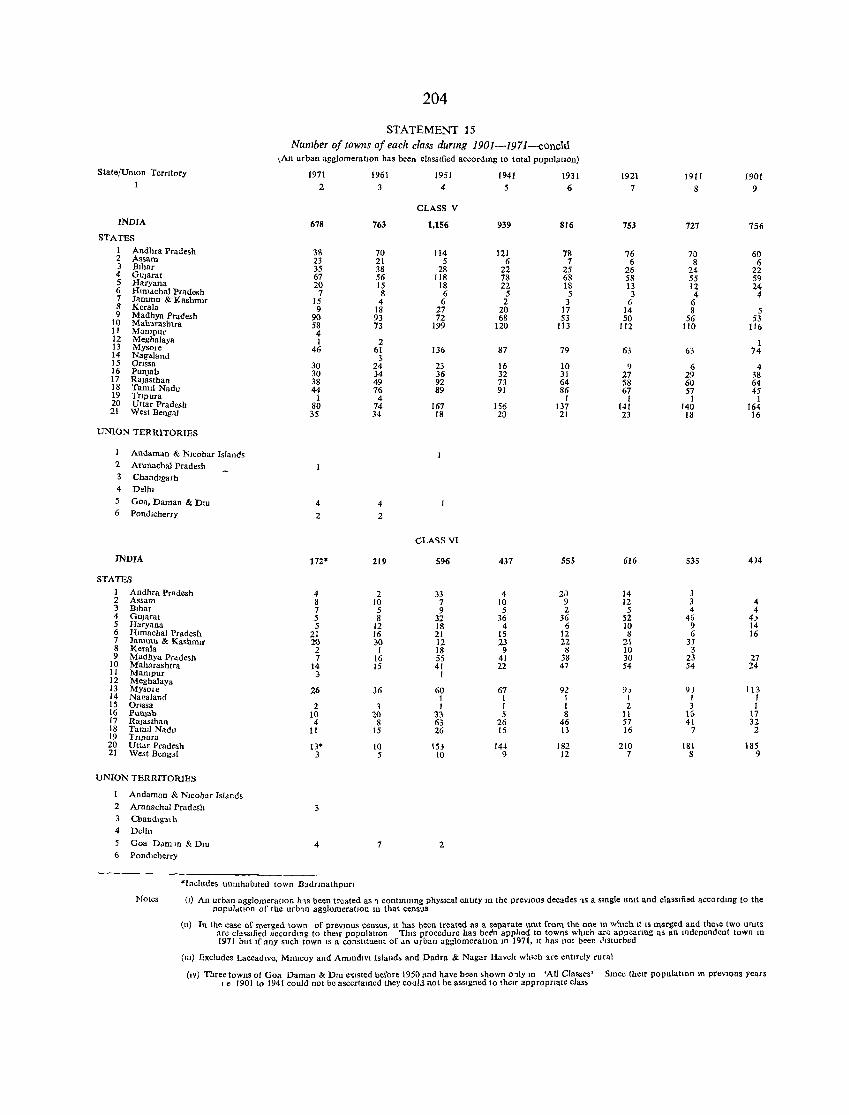
204
STATEMENT ] 5 Number of towns of each class durmg 1901-1971-concld
\An urban agglomerahon has been classified accordmg to total populatiOn)
State/Umon Territory 1971 1961 1951 1941 1931 1921 1911 1901 I 2 4 5 6 7 8 9
CLASS V
INDIA 678 763 1,156 939 816 753 727 756 STATES
1 Andhra Pradesh 38 70 114 121 78 76 70 60 2 Assam 23 21 5 6 7 6 8 6 3 BIhar 4 GUJarat
35 38 28 22 25 26 24 22 67 56 118 78 68 58 55 59 5 Haryana 20 15 18 22 18 13 12 24 6 HImachal Pradesh 7 8 6 5 5 3 4 4 7 Jammu & Kashmlf 15 4 6 2 3 6 6 S Kerala 9 18 27 20 17 14 8 5 9 Madhya Pradesh 90 93 72 68 53 50 56 53 10 Maharashtra 58 73 199 120 113 112 110 116 11 MaOlpur 4
12 Meghalaya I 2 I 13 Mysore 46 61 136 87 79 63 63 74 14 Nagaland 3 15 Onssa 30 24 23 16 10 9 6 4 16 Punjab 30 34 36 32 31 27 29 38 17 Rajasthan 38 49 92 73 64 58 60 64 18 TamIl Nadu 44 76 89 91 86 67 57 45 19 TTlpura I 4 1 I I I 20 Uttar Pradesh 80 74 167 156 137 141 140 164 21 West Bengal 3S 34 18 20 21 23 18 16
UNION TERRITORIES
Andaman & NJCobar Islands 2 Arunachal Pradesh 3 Cbandlgarh 4 DelhI 5 Goa, Daman & DIU 4 4 6 PonJlCherry 2 2
CLA'lS VI
INDIA 172" 219 596 437 555 616 535 4)4
STATES
1 Andhra Pradesh 4 2 33 4 20 14 3 2 Assam 8 10 7 10 9 12 3 4 3 BIhar 7 5 9 5 2 5 4 4 4 GUjarat 5 8 32 36 36 52 45 4) 5 Haryana 5 12 18 4 6 10 9 14 6 HImachal Pradesh 21 16 21 15 12 8 6 16 7 Jammu & KashmIr 21} 30 12 13 22 2! 37 8 Kerala 2 I 18 9 8 10 3 9 Madhya Pradesh 7 16 55 41 38 30 23 27
10 Maharasbtra 14 15 41 22 47 54 54 24 11 Manlpur 3 1 12 Meghalaya 13 Mysole 26 36 60 67 92 y, 9) 113 14 Naealand I 1 1 I 1 I 15 Orissa 2 3 1 I 1 2 3 I 16 Punjab 10 20 33 5 8 II 15 17 17 RaJastban 4 8 63 26 46 57 41 32 18 TamIl Nadu 11 15 26 15 13 16 7 2 19 Tnpura 20 Uttar Pradesh 13- 10 153 144 182 210 181 185 21 West Beng,,! 3 5 10 9 12 7 8 9
UNION TERRITORJES
Andaman & Nlcobar Islands 2 Arunachal Pradesh
Chandlgml1 4 Delhi
Goa Dam 10 & DIU 4 7 2 6 Pondlcherry
-Includes umnhablted town B,drmathpufl
Notes (I) An urban agglomeratIon h '\s been treated as 1 contmUlng phYSIcal entIty In tbe prevIous decades ~s a slosle umt and classIfied accordmg to tbe populatIOn of the urb1n agglomeratIOn 10 that census
(n) In the case of merged town of prevIous census, It has been treated as a separate nmt from the one m whIch It IS merged and the.e two unIts are cla"lfied accordmg to theu popu!~tlOn ThIS procedure has bee'n applted to towns whIch are appearIng as an mdependent town m 1971 but If any such town IS a constItuent of dn urban agglomeratIOn 10 1971, It has not been ,'lSturbed
(Ill) Excludes LaccadlVe, MlOlCOY and Ammdlvl Island. and Dadra & Nagar Haveh whIch are entirely rural
(IV) Three towns ot Goa Daman & DIU e'<!sted before 1950 jlnd have been shown o~ly In 'All Classes' Ie 1901 to 1941 could not be ascerlamed they coulJ not be aSSigned to theIr approprIate class
Smce theIr population m prevIOus years
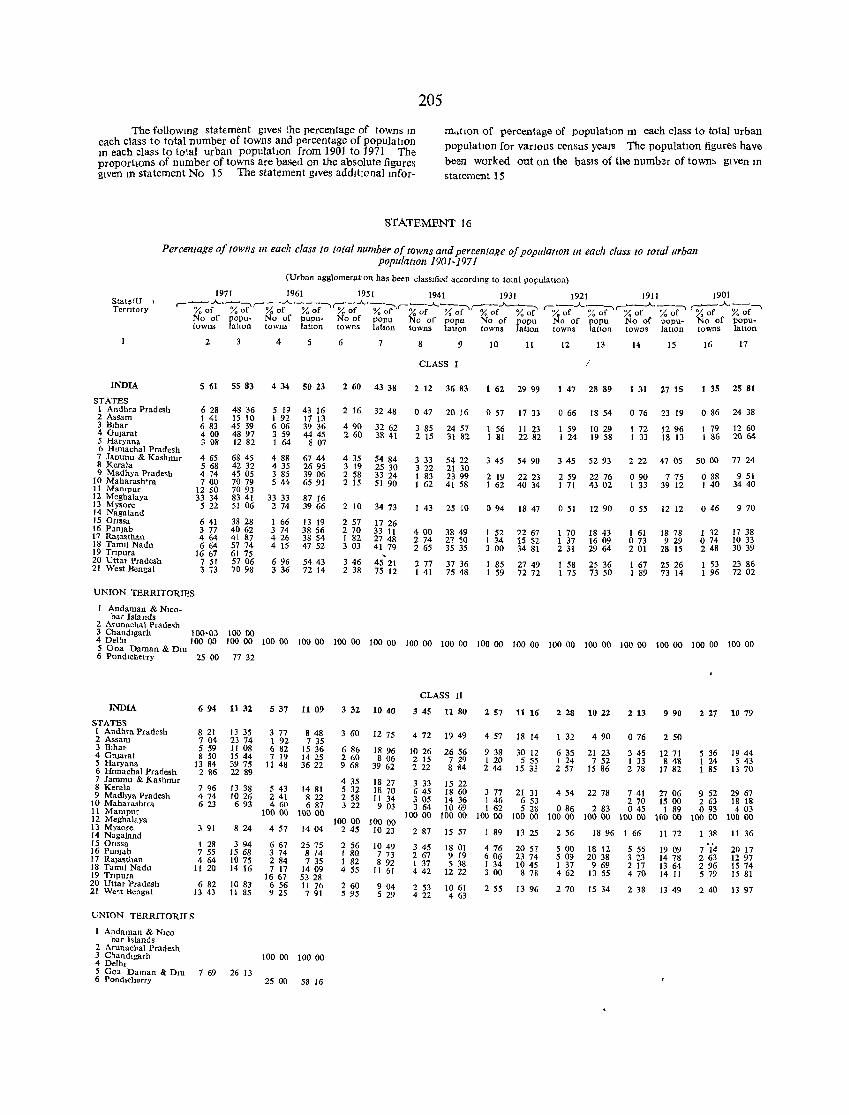
205
The followmg statement gIves the percentage of townS!D each class to total number of towns and percentage of populatIon III each class to total urban population from 1901 to 1971 The proportIons of number of towns are based on the absolute figures gIVen m statement No 15 The statement gives addltronal mfor-
m",tlon of percentage of popula1ion III each class to total urban populalton for vanous census years The population figures have been worked out on the baSIS of the number of towns given III statement 15
STATEMENT 16
Percentage 01 towns In each class to fatal number 01 towns and percentage 01 populaflon In each class to total urban populatIOn 1901-1971
(Urban agglomeratIOn has been cJasslfied accordmg to total populatlOn)
Stat~{U , TerrItory
1971 1961 1951 1941 1931 1921 1911 1901 --.A.----::'\.--:-:-.A.---,r::-:--.A,_~ --.A.~- r-:-.~ --.A.__ ,---:-:--:.A. __ -:-,\ ~.A.---,
r- % of % of % of % of % of %;r-r-% of % of' % of % of r-% of % uf' % of % of % of % of No of popu- No of pupu- No of popu No of popu No of popu No of popu No of popu- No of popu-towns latlOo towns latlon towns lation towns latlOfl towns latlOll towns latton towns latlOll towns latlOn
INDIA
STATES 1 Andhra Pradesh 2 Assam 3 BIhar 4 GUJarat 5 Haryana 6 HImachal Pradesh 7 Jammu & Kashnur 8 Kerala 9 Madhya Pradesh
10 Maharash'ra 11 Mampur 12 Meghalaya 13 Mysore 14 Nagaland 15 OrIssa 16 Punjab 17 Rajasthan 18 TamIl Nadu 19 Tnpura 20 Uttar Pradesh 21 West Bengal
UNION TERRITORIES
1 Andaman & Nlco-bar Islands
2 Arunachal Prade~h
2
5 61
628 1 41 683 4 00 3 08
4 65 5 68 474 700
12 50 33 34
5 22
641 3 77 464 664
1667 7 51 3 73
5583
48 36 15 10 45 39 48 97 1282
68 45 42 32 45 aS 7079 7093 83 41 51 06
38 28 4062 41 87 57 74 61 75 5706 7098
4
434
5 19 192 6 06 3 59 1 64
4 88 435 3 85 5 44
33 33 2 74
1 66 3 74 4 26 4 15
696 3 36
5
5023
43 16 17 13 39 36 4445
8 07
6744 2695 3906 6591
87 16 3966
13 19 38 56 38 54 47 52
5443 7214
6
260
2 16
490 260
4 35 3 19 2 $8 2 15
2 10
2 57 2 70 1 82 3 03
346 2 38
7
4338
3248
32 62 3841
5484 2S 30 33 24 51 90
3473
1726 33 11 2748 41 79
4521 75 12
8 9
CLASS
2 12
047
3 85 2 15
3 33 322 1 83 1 62
1 43
400 274 2 65
277 141
3683
20 16
24 57 31 82
5422 21 30 2399 41 58
25 10
38 49 27 50 35 35
37 36 7548
10
1 62
o 57
1 56 1 81
3 45
2 19 1 62
() 94
I 52 1 34 3 00
1 85 1 S9
11
2999
17 33
II 23 22 82
5490
2223 40 34
18 47
22 67 15 52 34 81
2749 7272
12
147
o 66
1 59 1 24
345
2 59 1 71
051
1 70 1 37 2 31
1 58 1 75
13
I
28 89
18 54
10 29 1958
52 93
22 76 4302
1290
18 43 1609 29 64
25 36 73 50
14
1 31
076
172 1 33
222
090 1 33
055
1 61 073 201
1 67 1 89
15
27 15
23 19
1296 18 13
47 05
775 39 12
12 12
18 78 929
28 15
25 26 73 14
16
I 35
o 86
1 79 1 86
5000
o 88 1 40
046
1 32 074 248
1 53 1 96
17
25 81
24 38
1260 2064
77 24
9 51 3440
970
17 38 1033 30 39
2386 72 02
3 Chandlgarh lOO'OJ 100 00 4 DeIhl 100 00 100 00 100 00 100 00 100 00 100 00 100 00 100 00 100 00 100 00 100 00 100 00 100 00 100 00 100 00 100 00 5 Goa Daman & DIU 6 Pondlcherry 25 00 77 32
INDIA
STATES 1 Andhra Pradesh 2 Assam 3 BIhar 4 GUjarat 5 Haryana 6 lfImachai Pradesh 7 Jammu & Kashnur 8 Kerala 9 Madhya Pradesh
10 Maharashlra 11 Mampur 12 Meghalaya 13 Mysore 14 NagaIand 15 OrIssa 16 Punjab 17 Rajasthan 18 TamIl Nadu 19 Tnpura 20 Uttar Pradesh 21 Weqt Bengal
UNION TERRITORII:S
I Andaman & NlCo bar Islands
2 Arunachal Pradesh
6941132
8 21 7 04 5 59 8 50
13 84 2 86
7 96 474 6 23
3 91
1 28 755 464
11 20
682 13 43
13 35 23 74 1I 08 15 44 39 75 22 89
13 38 1026 693
8 24
3 94 1568 1075 14 16
10 83 11 85
5 37 11 09
3 77 8 48 1 92 7 35 6 82 15 36 7 19 14 25
11 48 36 22
5 43 14 81 2 41 8 22 4 60 6 87
100 00 100 00
4 57 14 04
6 67 25 75 3 74 8 14 2 84 7 35 7 17 14 09
16 67 53 28 656 11 76 9 25 7 91
3 Chandlgarh 100 00 100 00 4 DelhI 5 Goa Daman & DIU 7 69 26 13 6 Pond,cherry 25 00 58 16
3 32 10 40
3 60 12 75
6 86 18 96 260 806 9683962
4 35 18 27 5 32 18 70 2 58 11 34 3 22 9 03
100 00 100 00 2 45 10 23
2 56 10 49 I 80 7 73 1 82 8 92 4 55 11 61
260 904 5 95 :; 29
CLASS II
3451180
472
1026 2 15 222
3 33 645 305 3 64
10000
287
3 45 2 67 137 4 42
2 53 4 22
1949
2656 7 29 8 84
15 22 18 60 14 36 10 69
10000
15 57
18 01 9 19 5 38
1222
1061 463
2 57 11 16
4 57 18 14
9 38 1 20 244
30 12 :; 55
15 33
2 28 10 22
132
635 1 24 257
490
21 23 7 52
15 86
2 13
076
3 45 I 33 2 78
9 90
250
1271 848
1782
2 27 10 79
5 36 124 1 85
1944 5 43
13 70
3 77 21 31 4 54 22 78 7 41 27 06 9 52 29 67 1 46 6 53 2 70 15 00 2 63 18 18 1 62 5 28 0 86 2 83 0 45 1 89 0 93 4 03
100 00 100 00 100 00 100 00 100 00 100 00 100 00 100 00
1 89 13 25
4 76 606 1 34 3 00
2 55
2057 23 74 1045 878
13 96
256
500 509 1 37 462
270
18 96 1 66
18 12 20 38
9 69 13 55
15 34
:; ss 3 23 2 17 470
238
1172
19 09 14 78 13 64 14 11
1349
1 38 11 36
7 'i4 263 296 5 79
240
20 17 12 97 IS 74 15 81
13 97
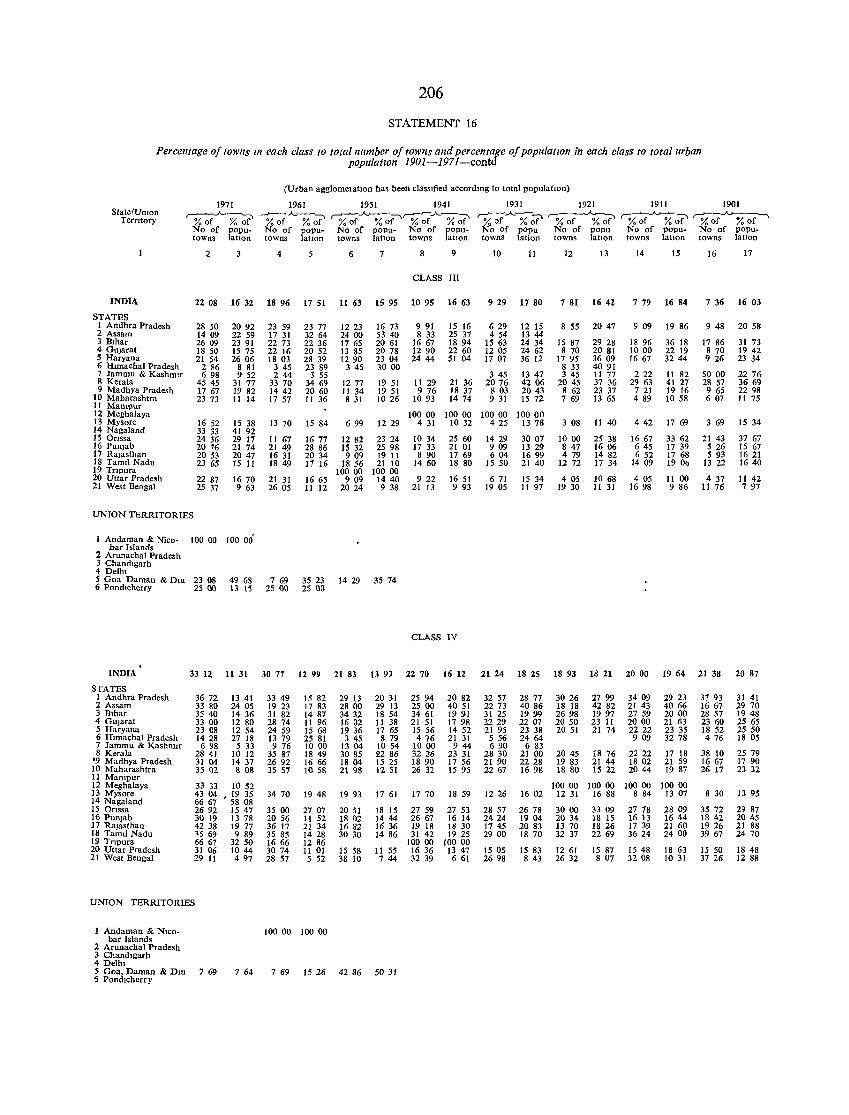
206
STATEMENT 16
Percentage of towns In each class to total number of towns and percentage of populatIOn in each class to total urban populatIOn 1901-1971-contd
(Urban agglomelatJon has been classIfied accordmg to total populatIOn)
StatelUmon TerrItory
INDIA
STATES 1 Andhra Pradesh 2 Assam 3 BIhar 4 GUjarat 5 Haryana 6 Hlll1achal Pradesh 7 Jammu & KashmIr 8 Kerala 9 Madhya Pradesh
10 Maharashtra 11 Mampur
1971 1961 1951 1941 r-:---..A..~ --r----A.---::-. ~..A..--:-.~-..A..---::-. %~ %~ %~ %~ %~ %~ %~ %~ No of popu- No of popu- No of popu- No of poputowns latton towns latlOn towns latlon towns labon
2 4 5 6 7 8 9
CLASS III
22 08 16 32 18 96 17 51 11 63 15 95 10 9S 16 63
28 50 1409 2609 18 50 21 54
286 698
45 45 17 67 23 73
2092 22 59 23 91 15 75 2606
8 81 9 52
31 77 1982 11 14
23 59 17 31 2273 22 16 18 03 345 244
33 70 1442 17 57
23 77 32 64 22 36 2052 28 39 23 89
3 55 3469 2060 II 36
12 23 2400 17 65 13 85 12 90
345
1277 II 34 8 31
1673 53 40 2061 2078 23 04 3000
19 51 19 51 1026
9 91 8 33
16 67 12 90 2444
11 29 9 76
1093
15 16 25 37 18 94 22 60 51 04
21 36 18 37 1474
1931 1921 ~..A..~ ---.A_..-
% of % ;;r- r-% of % ;;r-No of popu No of popu towns labon towns lallon
10 11
9 29 17 80
629 454
1563 1205 1707
345 2076 803 9 31
12 IS 13 44 24 34 2462 36 12
1347 4206 2043 15 72
12 13
7 81 16 42
8 55
15 87 8 70
1795 8 33 3 45
2045 8 62 7 69
2047
29 28 2081 3609 4091 II 77 37 36 23 37 13 65
12 Meghalaya 100 00 100 00 100 00 100 on 13 Mysore 14 Nagaland 15 Onssa 16 Punjab 17 Rajasthan 18 TamIl Nadu 19 Tnpura 20 Uttar Pradesh 21 West Bengal
UNION TERRITORIES
1652 33 33 2436 2076 20 53 23 65
2287 25 37
15 38 41 92 29 17 21 74 2047 15 11
1670 9 63
1 Andaman & Nico- 100 00 100 00' bar Islands
2 Arunachal Pradesh 3 Chandlgarh 4 Dellu
13 70
11 67 21 49 16 31 18 49
21 31 2605
15 84
1677 28 86 20 34 17 16
1665 11 12
699
1282 1532 909
1856 10000
909 2024
1229
23 24 2598 19 11 21 10
10000 1440 9 38
5 Goa Daman & DIU 23 08 49 6S 7 69 35 23 14 29 35 74 6 Pondlcherry 25 00 13 15 25 00 25 00
. INDIA 33 12 11 31 30 77 12 99 21 83 13 9)
STATES I Andhra Pradesh 3672 13 41 33 49 15 82 29 13 2031 2 Assam 33 80 2405 19 23 17 83 28 00 29 13 3 BIhar 35 40 14 36 31 82 1487 3432 18 54 4 GUjarat 33 00 12 80 28 74 11 96 1602 11 38 5 Haryana 23 08 1254 2459 15 68 19 36 17 65 6 Hrmacha1 Pradesh 1428 27 18 13 79 25 81 3 45 8 79 7 Jammu & KashmlT 6 98 5 33 9 76 10 00 13 04 10 54 8 Kerala 28 41 10 12 35 87 1849 3085 2286
'9 Madhya Pradesh 31 04 14 37 2692 16 66 18 04 15 25 10 Maharashtra 35 02 808 35 57 10 58 21 98 12 51 11 Mampur 12 Meghalaya 33 33 1052 13 Mysore 43 04 , 19 35 3470 1948 19 93 17 61 14 Naga1and 6667 58 08 15 Onssa 2692 15 47 35 00 27 07 20 51 18 15 16 Punjab 30 19 13 78 2056 II 52 1802 1444 17 Rajasthan 42 38 19 77 36 17 21 34 1682 1636 18 TamIl Nadu 15 69 9 89 35 85 1428 30 30 14 86 19 Tnpura 66 67 32 50 1666 12 86 20 Uttar Pradesh 31 06 1044 3074 II 01 15 58 11 55 21 West Bengal 29 11 497 28 57 5 52 38 10 744
UNION TERRITORIES
I Andaman & Nlco- 10000 10000 bar Islands
2 Arunachal Pradesh 3 Chandlgarh 4 Deihl 5 Goa, Daman & DIU 769 764 769 1526 4286 5031 5 Pondlcherry
4 31 10 32 4 25 13 78
10 34 17 33
8 90 1460
922 21 13
25 60 21 01 17 69 18 80
16 51 9 93
CLASS IV
22 70 16 12
2594 20 82 25 00 4051 3461 1991 21 51 17 98 15 56 14 52 476 21 31
!O 00 9 44 3226 23 31 1890 17 56 26 32 15 95
1770 18 59
27 59 27 53 2667 16 14 19 18 18 30 31 42 19 25
10000 10000 16 36 13 47 32 39 6 61
1429 909 604
1550
671 19 05
21 24
32 57 2273 31 25 2229 21 95 556 690
2830 21 90 2267
1226
2857 2424 1745 2900
1505 2698
3007 13 29 1699 21 40
15 34 11 97
18 2S
28 77 4086 1999 22 07 23 38 2464
6 83 21 00 2228 1698
1602
2678 1904 2083 18 70
15 83 8 43
3 08
1000 847 479
12 72
405 19 30
18 98
3026 18 18 2698 2050 20 51
2045 19 83 1880
10000 12 31
3000 2034 13 70 32 37
12 61 2632
11 40
25 38 1606 14 82 17 34
10 68 11 31
18 21
27 99 42 82 1997 23 11 21 74
18 76 21 44 15 22
10000 1688
33 09 18 15 18 26 2269
15 87 8 07
1911 1901
'%~..A.. % ~ r-%~.A. % of--' No of popu- No of poputowns latlOn towns lallon
14 15
7 79 16 84
9 09
18 96 1000 1667
2 22 29 63 721 4 89
442
16 67 645 6 52
1409
405 16 98
2000
3409 21 43 2759 2000 2222 909
2222 1802 2044
10000 8 84
2778 16 13 17 39 3624
1548 3208
19 86
36 18 22 19 3244
11 82 41 27 19 16 10 58
17 69
33 62 17 39 17 68 19 o~
11 00 9 86
19 64
29 23 40 66 20 00 21 63 23 35 3278
17 18 21 59 19 87
10000 13 07
28 09 1644 21 60 24 00
18 63 10 31
16 17
7 36 16 03
948
17 86 8 70 9 26
5000 28 57 9 65 6 07
3 69
21 43 526 5 93
13 22
4 37 11 76
21 38
37 93 16 67 28 57 23 60 18 52 476
38 10 16 67 26 17
8 30
35 72 18 42 1926 39 67
15 50 37 26
20 58
31 73 19 42 23 34
2276 3669 2298 11 75
15 34
37 67 15 67 1621 1640
11 42 797
20 87
31 41 29 70 1948 2565 25 50 18 05
25 79 1790 23 32
13 95
29 87 2045 21 88 24 70
18 48 12 88
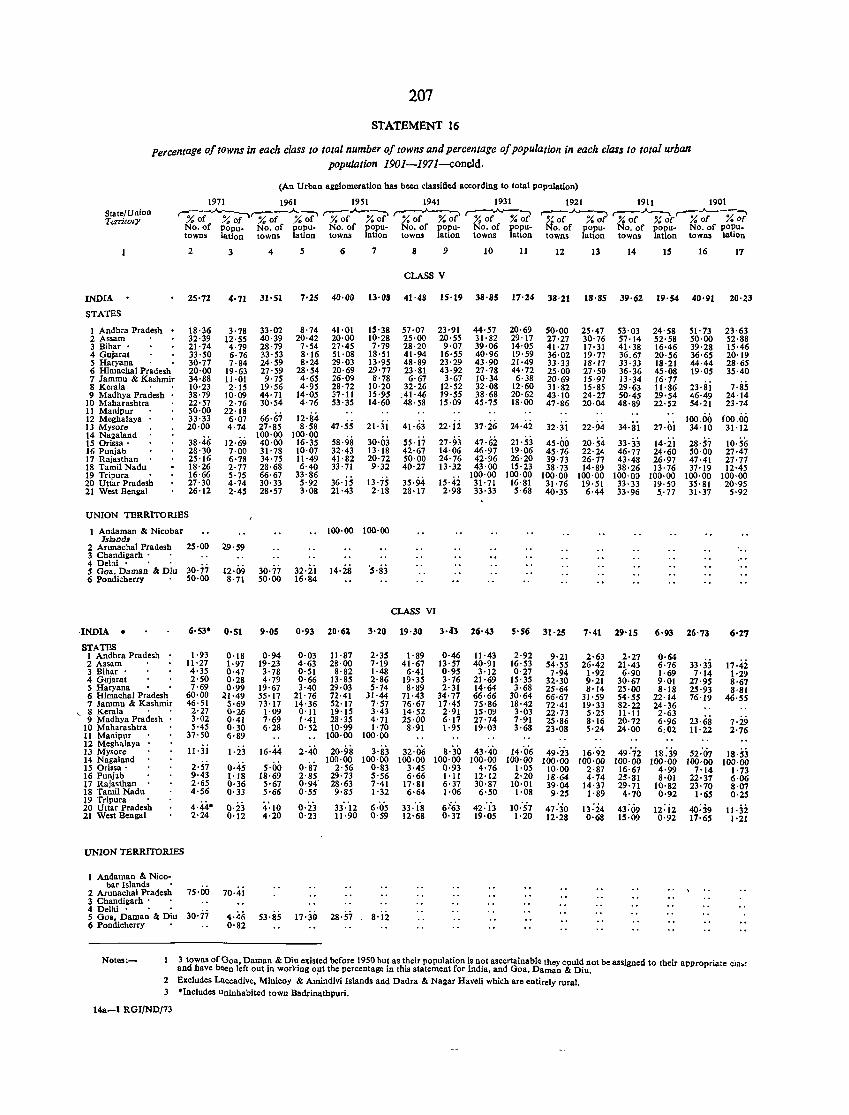
207
STATEMENT 16
Percentage of tOwns in each class to total number of towns and percentage of population in each class to total urban population 1901-1971-concld.
(An Urban agglomeration has been classified according to total population)
1971 1961 1951 1941 1931 1921 1911 1901 State/UnioD ---..A.-- .A- r::-:-.""'__~ r--'::7'~ --o.AJ-~ '% f ~ rx--"-X' 'Y.~-%7 T~'lTitt»"Y ,%of % ai" :Yo of :Yo -;(' % of % of ?i of % of' '% of % of " 0 • of III of Q of • 0 0 0
No. of Popu- No. of popu- No. of popu- o. of popu- No. of popu- No. of popu· No. of popu- No. of po~u_ towns lation towns laHon towns latlon towns latlon towns latlon towns latioD towns latioD towns latton
2 3 4 5 6 7 8 9 10 11 12 13 14 IS 16 17
CLASS V
INDIA 25·71, 4'71 31·51 7'25 4i)·OO 13'OB 41·48 15·19 38·85 17'24 38·21 18·85 39·62 19·54 40·91 20·23
STATES
1 Andhra Pradesh 18·36 3'78 33·02 8·74 41·01 15'38 57·07 23·91 44·57 20·69 50·00 25·47 53'03 24'58 51'73 23·63 2 Assam 32·39 12·55 40·39 20·42 20·00 10'28 25·00 20·55 31·82 29'17 27'27 30'76 57'14 52·58 50·00 52·88 3 Bihar· 21·74 4·79 28'79 7·54 27·45 7'79 28'20 9·07 39·06 14·05 41·27 17·31 41'38 16·46 39·28 15·46 4 Gujarat 33·50 6·76 33·53 8'16 51·08 18'51 41·94 16·55 40·96 19'59 36·02 19'77 36.67 20·56 36·65 20'19 5 Haryana 30·77 7·84 24·59 8'24 29·03 13·95 48·89 23·29 43·90 21·49 33·33 18·17 33·33 18·21 44·44 28·65 6 Himachal Pradesh 20·00 19·63 27·59 28'54 20·69 29'77 23·81 43·92 27·78 44·72 25·00 27'50 36·36 45·08 19·05 35·40 7 Jammu & Kashmir 34·88 11·01 9·75 4·65 26·09 8'78 6·67 3·67 10·34 6·38 20·69 15·97 13'34 16'77
23·si 7'SS 8 Kerala 10·23 2'15 19·56 4·95 28·72 10'20 32·26 12·52 32·08 12·60 31'82 15·85 29·63 11'86 9 Madhya Pradesh 38·79 10·09 44·71 14·05 37'11 15'95 Al·46 19·55 38·68 20·62 43·10 24·27 50·45 29'54 46·49 24·14
10 Maharashtra 22·57 2·76 30·54 4·76 53·35 14·60 48·58 15·09 45·75 18·00 47·86 20·04 48·89 22·52 54·21 23·74 11 Manipur 50·00 22'18
12'84 100.00 fOO.OO 12 Meghalaya 33·33 6·07 66·67 47'55 21·jj 41·63 22·ji 37·26 24·42 32'3i 22·94 34·si 27·oi 13 Mysore 20·00 4·74 27·85 8·58 34'10 31'12
14 Nagaland 38·46 12·69
100·00 100·00 58·98 30'03 27·93 47·62 21'53 45·00 20·54 33·33 14'2i 28'S7 10·5(; 15 Orissa· 40·00 16·35 55·17
16 Punjab 28'30 7·00 31·78 10·07 32·43 13'18 42·67 14·06 46·97 19·06 45'76 22'24 46'77 24·60 50·00 27·47 17 Rajasthan 25·16 6'78 34·75 11'49 41·82 20'72 50·00 24·76 42·96 26·20 39·73 26'71 43·48 26·97 47·41 21·77 18 Tamil Nadu 18·26 2·77 28·68 6·40 33'71 9'32 40·27 13·32 43·00 15·23 38·73 14·89 38'26 13'76 37'19 12·45 19 Tripura 16·66 5·75 66·67 33·86
36· is 13'75 35'94 15·42 100·00 100·00 100·00 100·00 100'00 100·00 100·00 100·00
20 Uttar Pradesh 27·30 4·74 30·33 5·92 31·71 16·81 31·76 19·51 33· 33 19·50 35'81 20·95 21 West Bengal 26·12 2·45 28·57 3·08 21·43 2'18 28·17 2·98 33·33 5·68 40·35 6·44 33'96 5.'77 31·37 5·92
UNION TERRITORIES
I Andaman & Nicobar 100·00 100·00 Island ..
2 Arunachal Pradesh 25·00 3 Chandigarh .
29'59 .. 4 Delhi·
30·77 12·09 30·77 32·ii 14·28 '5'83 5 Goa, Daman &: Diu 6 Pondkherry 50·00 8·71 50·00 16·84
CLASS VI
-INOlA 6·S3· 0'51 9·05 0·93 20·62 3'20 19·30 3·4) 26·43 5'56 31·25 7·41 29'15 6'93 26'73 6·2,
STATES 1 Andhra Pradesh 1·93 0·18 0·94 0·03 11·87 2'35 1·89 0·46 11·43 2·92 9·21 2·63 2·27 0·64
33-:H 2 Assam 11·27 1·97 19·23 4'63 28·00 7'19 41·67 13'57 40·91 16·53 54'55 26·42 21·43 6'76 17·42 3 Bihar' 4·35 0·47 3'78 0'51 8·82 1·48 6·41 0·95 3·12 0'27 7·94 1·92 6·90 1·69 7'14 1'29 4 Gujarst 2·50 0·28 4·79 0'66 13·85 2·86 19·35 3'76 21·69 15·35 32·30 9·21 30·67 9·01 27·95 8·67 5 Haryana 7·69 0·99 19·67 3'40 29·03 5'74 8'89 2·31 14·64 3·68 25·64 8'14 25·00 8'18 25·93 8·81 6 Himachal Pradesh 60·00 21·49 55·17 21'76 72·41 31'44 71·43 34'77 66·66 30·64 66·67 31'59 54'55 22·14 76·19 46·55 7 Jammu &: Kashmir 46·51 5·69 73'17 14'36 52·17 7'57 76·67 17·45 75·86 18·42 72·41 19· 33 82·22 24·36 8 Kerala 2·27 0'26 1·09 0'11 19'15 3'43 14·52 2'91 15·09 3·03 22·73 5·25 11'11 2·63 9 Madhya Pradesh 3·02 0·41 7·69 1'41 28·35 4'71 25·00 6·17 27'74 7·91 25·86 8·16 20·72 6'96 23·68 7'29 10 Maharashtra 5·45 0·30 6·28 0'52 10·99 1'70 8·91 1·95 19·03 3·68 23·08 5'24 24·00 6:02 11'22 2'76 11 Manipur 37·50 6·89 100·00 100·00
12 Meghalaya 11· 3i 1'23 16·44 2·40 20·98 3'83 8·30 43·4'0 14·'0'6 49:23 49:'72 18 :39 52:07 18'S3 13 Mysore 32·06 16·92
14 Nagaland 2'57 0·45 0'87
100·00 100·00 100·00 100·00 100·00 100·00 100·00 100·00 100·00 100·00 100'00 100·00 IS Orissa' 5·00 2·56 0·83 3·45 0·93 4'76 1·05 10·00 2·87 Hi·67 4·99 7'14 1·73 16 Puni'lb 9·43 t·18 18·69 2'85 29·73 5'56 6·66 I'll 12·12 2'20 18·64 4·74 25·81 8·01 22·37 6·06 17 Rajasthan 2·65 0·36 5·67 0'94' 28·63 7'41 17·81 6·37 30·87 10·01 39·04 14·37 29'71 10'82 23'70 S'07 18 Tamil Nadu 4'56 0·33 5'66 0'55 9·85 1·32 6·64 1·06 6·50 1·08 9'25 1'89 4'70 0·92 t '65 0·25 19 Tripura .
4·«· 0·23 4'·10 0·23 33':12 6·0'5 33:1'8 61'63 42:i3 10:57 47:30 13::i4 43:09 12:i2 40:39 lI·ii 20 Uttar Pradesh 21 West Bengal 2·24 0'12 4·20 0'23 11'90 0'59 12·68 0'31 19·05 1·20 12'28 0·68 15·09 0·92 17'65 1'21
UNION TERRITORIES
1 Andaman & Nico-bar Islands
75·00 70·4i 2 Arunachal Pradesh 3 Chandigarh • 4 Delhi·
30·77 4·46 53·85 17'30 28·57 8·i2 5 Goa, Daman &: Diu 6 Pondicherry 0'82
Notes:- 3 towns of Goa, Daman & Diu existed before 1959 but as their population is not ascertainablQ they could not be assigned to their appropriate Cia.' and have been left out in worb'ing out the percentage in this statement for India, and Goa. Daman & Diu. .
2 Excludes Laccadive, 1\1inicoy & Arindivi Islands and Dadra &: Nagar HaveU which are entirely rural. 3 *Includes uninhabited town Badrinatbpuri.
14a-l RGljND/13
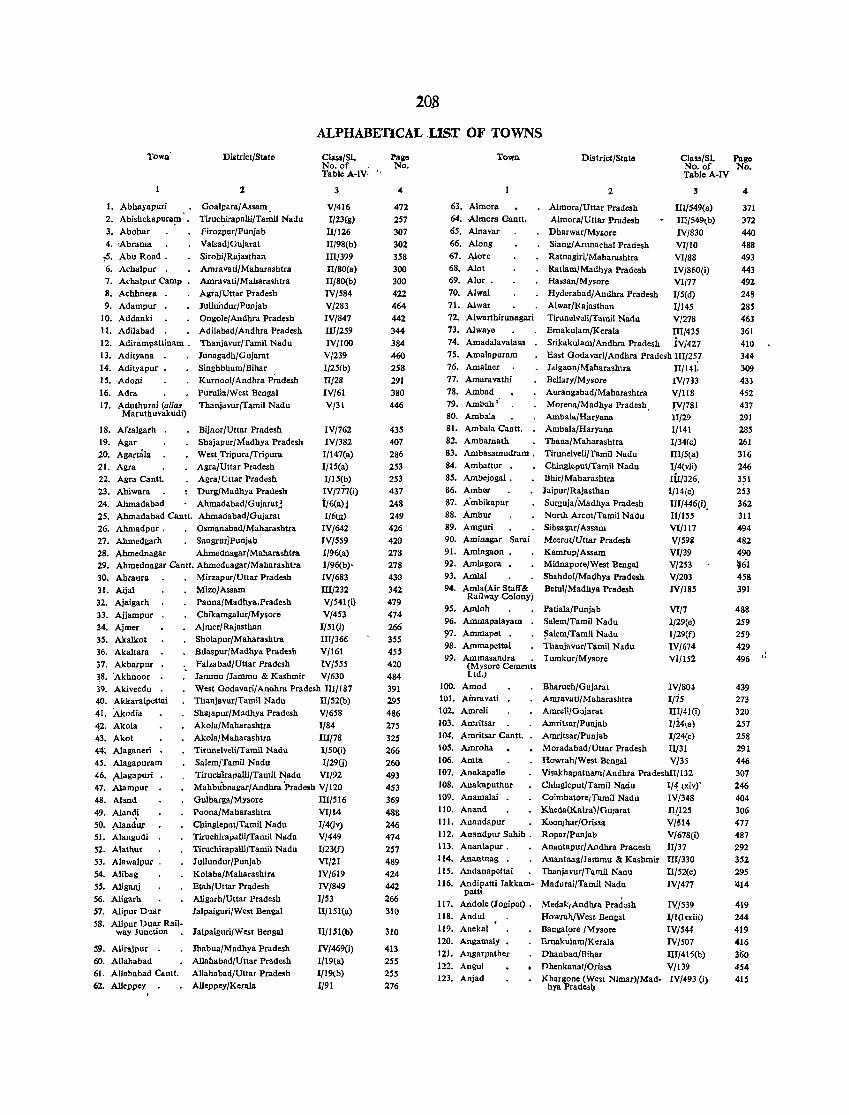
20.8
ALPHABETICAL .LIST OF TOWNS
District/State Class/SI. l'agc No. of . No.
1. Abhayapuri
2. Abishekapuro,m
3. Abohar 4. ~brama
,5. Abu Road • 6. Achalpur . 7. Achalpur Camp
8. AchhneJra
9. Adampur
10. Addanki
11. Adilabad 12. Adirampatlinam.
13. Adityana
14. Adityapur •
15. Adorn
16. Adra 17. Aduthurai (alias
Maruthuvakudi)
2
Goa!para/Assam
Tiruchirapalli/Tamil Nadu
i'irozpur/Punjab
ValsadlGujarat
Sirohi/Rajasthan
Arnravati/Maharashtra Amravati/Mahara.htra
Agra/Uttar Pradesh
1ulluhdur/Punjab
Ongole/ Andhra Pradesh
Adilabad/ Andhra Pradesh
Thanjavur/Tamil Nadu
1unagadh/Gujarat
Singhbhum/Bihar
Kurnool/Andhra P~adesh Purulia)West Bengal
Thanjavur/Tamil Nadu
Table A·IY· "
3
Y/416 I/23(g)
II/126
II/98(h)
1Il/399
II/80Ca) II/80(b)
lV/584
V/283 IV/847
III/259
IV/IOO
V/239 1/25(b)
II/28
IV/61
V/31
18. Afzalgarh Bijnor/Uttar Pradesh IV/762
19. Agar Shajapur/Madhya Pradesh IV/382
20. Agarmla West,Tripura/Tripura 1/147(a) 21. Agra Agra/Uttar Pradesh 1/15(a)
22. Agra Cantt. Agra/Ullar Pradesh 1/15(b) 23. Ahiwara Durg/Madhya Pradesh IV/777(i)
24. Ahmadabad Ahmadabad/GujaratJ 1/6(a)]
25. Ahmadabad C-antt. Ahmadabad/Gujarat 1/6~g)
26. Ahmadpur. Osmanabad/Mabarashtra IV/642 27. Ahmedgarh . Sangrur)Punjab IV/559 28. Ahmednagar Ahmednagar/Maharashtra 1/96(a)
29. Ahmednagar Cantt. Ahmedaagar/Maharashtra 1/96tb)' 30. Ahraura Mirzapur/Uttar Pradesh IV/683
31. Aijal Mizo/Assam lIIj232 32. Ajaigarh Panna/Madhya.Pradesh V/541 (i)
33. Ajjampur ChikamgalurjMysorc V/453
34. Ajmer Ajmer/Rajasthan 1/510)
35. Akalkot Sholapur/Maharashtra IIIj366
36. Akaltara BJ.laspurlMadhya Pradesh V/161 37. Akbarpur Faizahad/Uttar Pradesh lV/555
38. 'Akhnoor 1ammu /1ammu & Kashmir V/630
39. Akiveedu West Godavari/Aucihra Pradesh lII1I87 40. Akkaraipettai Thanjavur/Tamil Nadu 11/52(b)
41. Modia Shajapur/Madbya Pradesh V/658
4:2. Akola Akola/Maharashtra 1/84
43. Akot Akola/Maharashtra 1II/18 4>1: Alaganeri Tirunelveli/Tamil Nadu 1/50(i)
45. Alagapuram Salem/Tamil Nadu 1/29G)
46. AIagapuri Tiruchlrapalli/Tamil Nadu VI/92
47. Alampur Ma.hbu'bnagar/Andhra 'Pradesh V/120
48. Aland Gulbarga/Mysore llI/516
49. Alan,\! Poona/Maharashtra VI/14
50. Nandu,r Chingleput/TA1l1il Nadu 1/4(iv) 51. Alangudi Tiruchirap"IJi/Tamii Nadu V/449
52. Alathur TiruehirapalJi/Tamil Nadu 1/23(f) 53. Alawa!pur . Jullundur/punjab YI12!
54. Alibal! Kolaba/Maharashtr.. IV/619 55. AJiganj Etah/Uttar Pradesh IV/849
56. Aligarh AJigarh/Uttar Pradesh 1/53
57. Alipur Duar Jalpaiguri/West Bengal ll/151(a)
58. Alipur Duar Railway Junction
59. Alirajl'ur .
60. Allahabad 61. Allababad Cantt.
62. AUeppey
Jalpaiguri/West Bengal
Jhabua/Madhya Pradesh
Allahabad/Uttar Pradesh Allahabad/Uttar Pradesh
AUeppey/Kerala
II/151(b)
IV/469(i) 1/19(a)
I/19(b)
1/91
4
472
257
307
302 358
300 300 422
464 442
344
384
460
258
291
380 446
435 407
286
253 253 437
248
249 426
420
278 278
430 342
479
474
266
355 455
420
484
391 295
486
275
325
266
260 493
453 369
488 246 474
257 489
424 442
266
310
310
413
255 255
276
Town District/Stato Class/SL Pago No. of No.
63. Almora
64. ,Atmora Cantt. 65. Alnavar
66. Along
67. Alore 68. Alot 69. Alur •
70. Alwal
71. Alwar 72. Alwarthirunagari
73. Alwaye
74. Amadalavalasa
75. Amalapuram
76. Amalner 77. Amaravathi
78. Ambad
79. Ambah f
80. Ambala 81. Amba!a Cantt.
82. Ambarnath 83. Ambasamudram.
84. Ambattur •
85. Arnbejogai.
86. Amber 87. Ambikapur
88. Ambur 89. Amguri
90. Aminagar Sarai 91. Amingaon 92. Amlagora • 93. Amlai
94. ArnlfiCAir Staff&: Railway Colony)
95. Amloh
2
Almora/Uttar Pradesh
Alrnora/Utlar Pradesh Dharwar/Mysore
Siang/ Arnnachal Pradesh Ratnagiri/Maharashtra
Ratlam/Madhya Pradesh Hassan/Mysore
Hyderabad/Andhra Pradesh Alwar/Rajasthan
Tinmelveli/Tamil Nadu
Ernakulam/Kerala
Srikakulam/ Andhra Pradesh
Table A-IV
3
1ll/549(a)
1Il/549lb) IV/830
VI/tO
VI/88 IV/860(i) VI/77 I/S(d)
1/145
Vi278 IU/435 jV/427
East Godavari/Andhra Pradesh 111/257 J..Igaon/Maharashtra 11/141: Bellary/Mysore
Auranga bad/Maharashtra
Morena/Madhya Pradesh. Ambala/Haryana
Ambala/Haryana
Thana/Maharashtra
Tirunelveli/Tamil Nadu Chlngleput/Tamil Nadu
Bhir/Maharashtra Jaipnr/Rajasthan
Surgnja/Madhya Pradesh
North Areot/Tamil Nadu Sibsagar/ Assam
Meerut/Uttar Pradesh Kamrup/Assam Midnapore/West Bengal
Shahdol/Madhya Pradesh Betul/Madhya Pradesh
Patiala/Punjab
IV(733
V/1I8 IY/781 If/29 1/141 I/34(c)
III/Sta) 1/4{vii)
lir/326. 1/14(c)
1lI/446{i). II/ISS
VI/117 V!598 VI/39 V/253
V/203 IV/18S
96. Aromapalayam Salem/Tamil Nadu VI/7 1/29(e) 1/29(f)
IV/674
Yl/152
<;7. Aromapet . ~alem!Tamil Nadu
98. Ammapettai Thanjavur/Tamil N.du 99. Ammasandra . Tumkur/Mysore
(Mysore Cements Ltd.)
100. Amod 101. Ainravati
102. Amreli 103.
104.
105. 106.
Amritsar
Amritsar Canlt.
Amroha
Amta 107. Anakapall. 108. Anakaputhur
109. Anama!ai •
110. Anand 111. Anandapur 112. Anan'dpur Sahib.
113. Anantapur.
114. Anantnag •
115.
116.
117.
118.
Andanapettai Andipatti Takkam
patti
Andole (1ogipet) •
Andu!
119. Anekal 120. Angamaly
121. Angarpather
Bharuch/Gujarat IV/8()'~
Amravati/Maharashtra 1/15 Amreli/Gujarat III!4I(i)
Amritsar/Punjab 1124~a) Amritsar/Puoiab 1/24{c) Moradabad/Uttar Pradesh II/31
Howrah/West Bengal V/35
Yisakhapatnam! Andhra PradeshIl/!32
Chingleput/Tamil Nadu I/~ ~xivr
Coimbatore,Tamil Nadu lV!348
Kheda{Kaira)JGu:arat 1l1.125 Keon)har/OrisRa V/514 Ropar/Punjab V/678{i)
Aillmtapur/Andhra Prac:esh II/37 Anantnag/Jammn & Kashmir IIf/330
Thanjavur/Tamil Nanu 11/52(c)
Madurai/Tamil Nadu IV/477
Medak/Andhra Pradesh
Howrah/West Bengal
Bangal?re /Mysore
Ernakulam/Korala Dhanbaa/Hihar
122. Angul • flhenkanal/Orissa
1V/539 l/l(!xxiii)
IV/54·1
lV/507 1II/415(b)
V/139 IV/493 (i) 123. Anjad Khargone (West Nimar)/Mad
hya Prade.~
4
371
372
440 488
493 443 492
248
285 463
361 410
344
309 433
452 437 291
285 261
316 246
3?1 253
362
311 494
482 490
~61 45g
391
4g8
259
259 429
496
439 273
320
257 258
291 446
307 246
404
306 477 487
292 352
295 1I14
419
244
419
416
350
454
415
, "
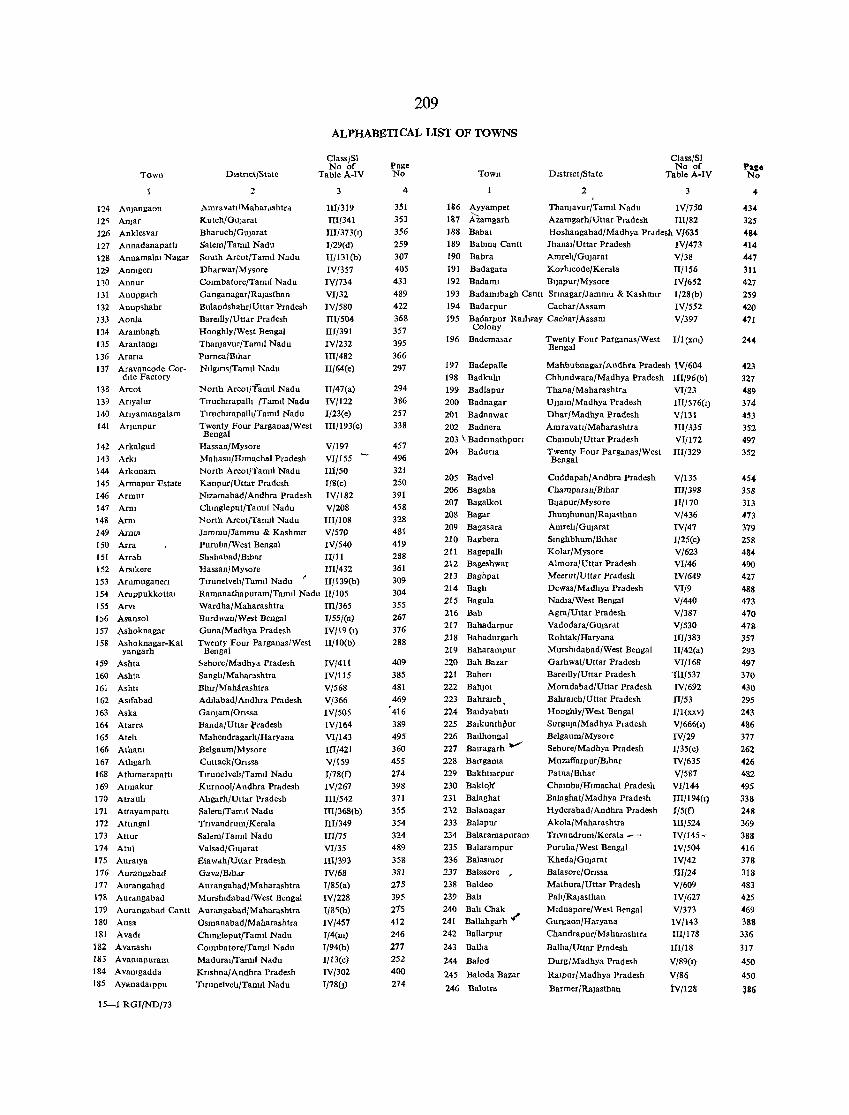
209
ALPHABETICAL LIST OF TOWNS
Town
124 An)aogaon
12' An)at 126 Anklesvat 127 AnnadanapattI 12S Annamalal Nagar 129 Anmgen 110 Annur 131 Anupgarh 132 Anup.hahr 133 Aonla 134 Arambagh 135 Arantangl
136 Arana 137 Aravancode Cor-
dite Factory
138 Arcot 139 Anyalur 140 Arlyamangalam 141 ArJunpur
142 Arkalgud 143 Arkl 144 Arkonam 145 Armapur Fstate 146 Armur 147 Arm 148 Arm 149 Arm. 150 Arra 151 Arrah 152 A rSlkere 153 Arumuganen 154 Aruppukkottal 155 ArVI 1~6 Asansol 157 Ashoknagar 158 Ashoknagar-Kal
yangarh 159 Ashta 160 Ashta 161 Ashtl 162 ASlfabad 163 Aska 164 Atarra 165 Ateh 166 Atham 167 Athgarh 168 Athlmarapattl 169 Atmakur 170 Atrault 171 Altayampaltl 172 Attmgal 173 Attur 174 Atul 175 Auralya 176 Aurangabad 177 Aurangabad 178 Aur,mgabad
Dlstnet/State
:2
Amravatl/1\1aharJshtrd Kutch/Gularat Bharuch/Gujarat Salem/Tamil Nadu South Areot/Tamll Nadu DhdrwarlMy,ore COImbatore/Tamll Nadu Ganganagar /Rajasthan Bulandshahr/Uttar Pradesh Baredly/Uttar Pradesh Hooghly/West Bengal Thaojavur/Tamll Nadu Purnea/Blhar NllglTl,/Tamti Nadu
North Arcot/Tamt! Nadu Tlruchlrapalh /Tamll Nadu Tlruchlrapalh/Tamll Nadu Twenty Four Parganas/West Bengal
HassanJMysore Mahasu/Hlmachal Pradesb North Areot/Tamll Nadu KanpurlUttar Pradesh Nlzamabad/Andhra Pradesh Chmgleput/Tamll Nadu North Areot/Tamll Nadu Jammu/Jammu & KashmIr Puruha/West Bengal Shahabad/Blhar Hassan/My,ore Tlrunelveh/Tamll Nadu
Class/SI No of
Table A-IV
3
III/319 Illl34t
JIJ/373(1)
I/29(d) II/13 1 (b)
IV/3S7 IV/734 VI/32 IV/S80 III/504 III/391 IV/232 III/482 II/64(e)
Il/47(a) IVI122 1/23(e) III/193(c)
V/197 VI/I 55 IIl/50 I{8(e)
IV/182 V/208 lIIfl08 V/570 IV/540 II/II III/432 II{139(b)
Ramanathapuram/Tamtl Nadu 11/105 Wardba/Mabarashtra III/365 Burdwan/West Bengal 1/55/(a) Guna/Madhya Pradesh IV/19 (I) Twenty Four Parganas/West II/IO(b)
Bengal ~ehore/MadhYd Pradesh Sangb/ Maharashtra Blur/Maharashtra Adllabad/Andhra Pradesh
GaujamlOn"a Banda/Uttar fradesh Mahendraga,h/Haryana Belgaum/Mysore CuttacklOnssa Tlrunelvell/Tamll N"du KurnooI/Andhra Pradesh Abgarh/Uttar Pradesb Salem/Tamil Nadu Tnvandrum/Kerala Salem/TamIl Nadu Valsad/Gularat EtawdhlUttar Pradesh Gava/Blhdr AurangabadlMaharashtra Murshldabad/West Beugal
IV/411 IV/llS V/568 V/366
179 Aurangabad Cantt Aurangabad/Maharashtra
IV/50S IV/164 VI/143 UI/42 I V/159 1/78(0 IV/267 I1I/542 III/368(b)
III/349 III/75 VI/35 II1139~
IV/68 I/85(a)
IV/228 T/8~(b)
IV/457 1/4(111)
1/94(b) 1/13(c) IV/302 I/78(J)
180 Ausa Osmanabad/Maharashtra 181 Avadl Chmllieput/Tamll Nadu 182 A vanashl 183 AvaUlapuram 184 A vamgadda
185 AyanadalPPu
15-1 RGIfNDf73
Counbatore/Talllll Nadu Madunu/Tamll Nddu KTlshna/ Andhra Pradesh Tlrunelveh/Tamll Nadu
Page No
4
351 353 356
259 307 405 433 489 422 368 357
395 366 297
294 386 257 338
457 496 321 2S0 391 458 328 481 419 288 361 309 304 355 267 376 288
409 385 481 469
·416
389 495 360 4SS
274
398
371
355 354 324 489
3S8
381
275 395 215 412
246 277 252 400 274
Town
186 Ayyampet 187 Azamgarh 188 Babal 189 Babma Cantt 190 Babra 191 Badagara 192 BadamI
DlstTlct/State
2 I
Thanjavur/Tamll Nadu
Class/SI No of
Table A-IV
3
IV/750 Azamgarh/Uttar Pradesh IIT/82 Hoshangabad/Madhya Pradesh V/63S Jhansl/Uttar Pradesh IV/473 Amreh/Gujarat V/38 K07hlcode/Kerala Bllapur/Mysore
193 Badamlbagh Cantt Srmagar/Jammu & KashmlT 194 Badarpur Cachar/Assam
II/156 IV/652 1/28(b) IV/552
V/397 195 Badarpur RaIlway Cachar/Assam Colony
196 Bademasat
197 Badepalle 198 Badkuhl 199 Badlapur 200 I1adnagar 201 Badnawar 202 Badnera 203 \ Badrmathpun 204 BaduTla
205 Badvel 206 Bagaha 207 I1agalkot 208 Bagar 209 I1agasara 210 Bagbera 211 Bagepallt 212 Bage.hwar 213 I1aghpat 214 Bagh 215 Bagula 216 Bah 217 Bahadarpur 218 Bahadurgarh 219 Baharampur 220 Bah Bazar 221 Bahen 222 Bahlol 223 Bahralch • 224 Baldyabatl 225 Balkunthpur 226 Batlhongdl 227 Balragarh--228 Balrgama 229 Bakhllarpur 230 Baklo)( 231 Balaghat 212 Balanagar 233 Balapur 234 Balaramapuram 235 Bdlarampur 236 Balasillor 237 Balasore 238 Baldeo 239 Bait 240 Bah Cbak
241 Ballabgarh '" 242 Ballarpur
243 Balha
244 Balod
245 Baloda Bazar
246 Balotra
Twenty Four Parganas/West 1/1 (XIII) Bengal
Mahbubnagar/Andhra Pradesh IV/604 Chlundwara/Madhya Pradesh lII/96(b} Thana/Maharashtra VI/23 Ujjam/Madbya Pradesh
Dhar/Madhya Pradesh Amravall/Maharashtra Chamoh/Uttar Pradesh Twenty Four Parganas/West Bengal
Cuddapah/ Andhra Pradesh Champaran/Blhar Bljapur/Mysore
Jhunlhunun/Rala'than AmreltlGuJarat Smghbhum/Blhar Kolar/Mysore Almora/Uttar Pradesh Meerut/Vttar Pradesh Dewas/Mddhya Pradesh NadIa/West Bengal Agra/Uttar Pradesh Vadodara/Gujarat Rohtak/Haryana Murshldabad/West Bengal Garhwal/Uttar Pradesh BaretilylUttar Pradesh Moradabad/Uttar Pradesh Bahratch/Uttar Pradesh Hooghly/We,t Bengal Surguja/MadhYd Pradesh Belgaum/Mysore Sehore/Madbya Pradesh Muzalfarpur/B.har Patna/Blhar Chamba/Hlmachal Pradesh Balaghat/Madhya Prade.h Hyderabad/ Andhra Pradesh Akola/Maharashtra
Tnvandrum/Kerala -Puruba/West Bengal Kheda/Gujarat Balasore/Onssa Mathura/Uttar Pradesh Palt/Rajasthan Mldnapore/Wesl Bengal GurgaonlHaryaua Chandrapur/Maharashtrd
Balba/Vttar Pradesh
Durg/Madhya Pradesh
RatpurlMadhya Pradesh
Barmer/Rajasthan
JII/576(1) V/131 IIl/335 VI/I72 IlI/329
VI135 1II/398
Il/170 V/436 IV/47 1/25(c)
V/623 VI/46 IVI649 VI/9 V/440 V/387 V/530 IIl/383 II/42(a) VI/I 68
1II/537 IV/692
II/53 J/I(xxv) VI666(1) rV/29 I/35(c) rV/635 V/587 VI/I44 IlI/194(1)
1/5(0 III/524 IV/145-rV/504 rV/42 IIT/24 V/609 IV/627 V/373 IV/143 III/I 78
Ill/IS
V/89(1)
V/8~
tvJl28
Paze No
4
434
325 484
414
447 311
427 259 420 471
244
423
327 489 374 453 352 497 352
454
358 313 473 379 258
484 490 427
488 473 470 478
357 293 497 370 430 295
243 486 377 262 426 482 495
338 248 369 388 416 378 318 483 425 469
388 336
317
450
450
~B(j
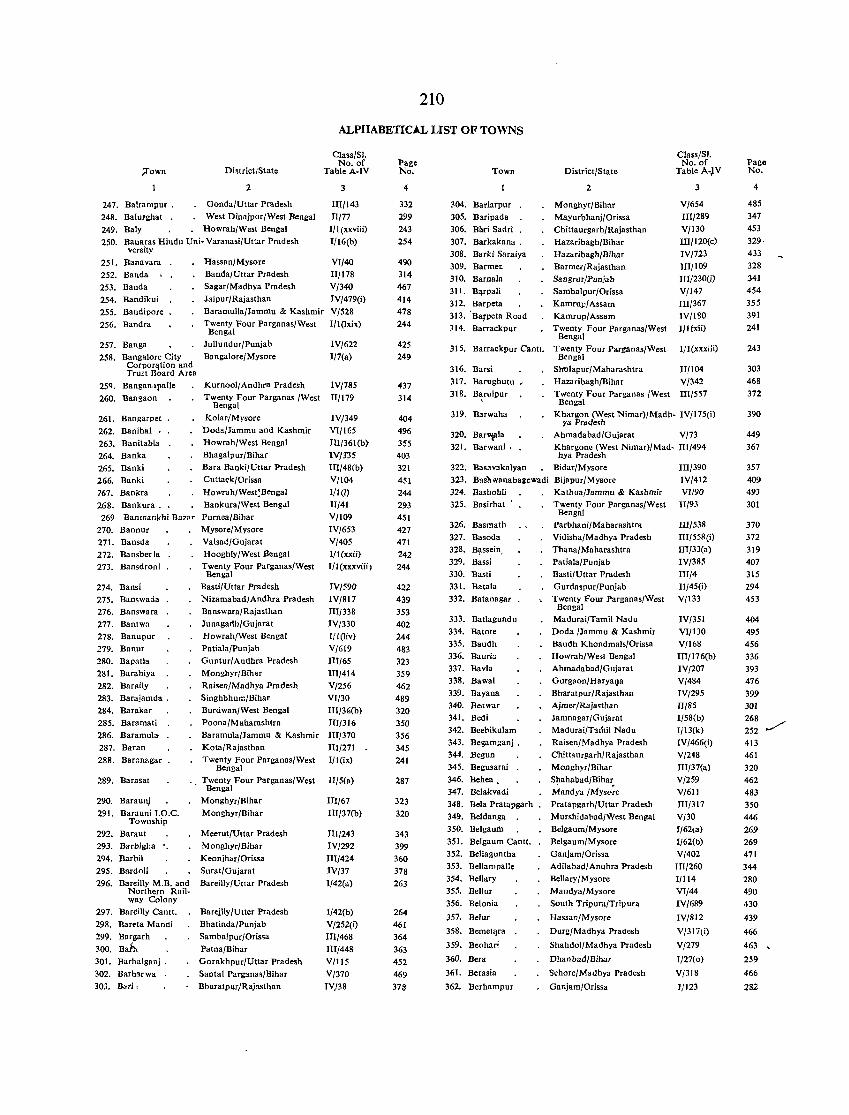
210
ALPHABETICAL LIST OF TOWNS
Class/SI.
;rown District/State No. of
Table A-IV
247. Balrampur. 248. Balu,ghat .
249. Baly
2
Gonda/Uttar Pradesh
West Dinajpur/West Ben!:al Howrah/West Bengal
250. Banaras Hindu Uni- Varanasi/Uttar Pradesh versity
251. Bann vara 252. Banda 253. Banda 254. Bandikui 255. Bandipore 256. Bandra
Hassanl Mysore Banda/Uttar Pradesh Sagar/Madhya Pradesh Jaipur/Rajasthan Baramulla/Jammu & Kashmir Twenty Four Parllanas/West Bengdl
257. Banga Jullundur/Punjab 258. Bangalore City Bangalore/Mysare
Corpor'ttion and Trust Board Area
259. Bangan,lpalle
260. Bangaon
261. Bangarpet 262. Banihal . 263. Banitabla 264. Banka 265. Banki 266. Banki 267. Bankra 268. Bankura.
Kurnool! Andhra Pradesh Twenty Four Parganas IWest
Bengal
Kolar/Mrsore Doda/Jammu and Kashmir Howrah/West Bengal Bhagalpur/Bihar Bara Banki/Utlar Pradesh Cuttack/Orissa
Howrah/West:Bengal Bankura/West Bengdl
269 Banmankhi Ba7", Purnea/Bihar
270. Bannur 271. Bansda 272. Bansber Ia 273. Bansdroni
274. Bansi 275. Ba.nswada 276. Banswara
277. Bantw" 278. Banupur 279. Banur 280. Bapatla 281. Barahiya 282. Baraily 283. Barajamda. 284. Barakar 285. Baramati 286. Baramula· 287. Baran 288. Baranagar
Mysore/Mysore Valsad/Gujarat Hooghly/West Bengal Twenty Four Parganas/West Bengal
Basti/Uttar Pradesh Nizamabad/Andhra Pradesb Banswara/Rajastban Junagadh/Gujarat Howrah/West Bengal Patiala/Punjab Gunturl Andhra Pradesh Monghyr/Bihar Raisen/Madhya Pradesh Singhbhnm/Bihar Burdwan/West Bengal Poona/Maharashtra Baramula/Jammu & Kashmir Kota/Rajasthan Twenty Four Parganas/West
Bengal
289. Barasa t . Twenty Four Parganas/West . Bengal
290. Baraunj 291. Barauni T.O.C.
Township
292. Baraut 293. Barbigha 294. Barbil 295. Bardoli 296. Bareilly M.B. and
Northern Railway Colony
297. Bareilly Cantt. 298. Bareta M andi 299. Bargarh 300. Bah,
301. Barhalganj. 302. Barbar wa 303. Ban,
Monghyr/Rihar Monghyr/Bihar
Meerut/Uttar Pradesh M onghyr /Bibar Keonjhar/Orissa Surat/Gujarat Bareilly/Uttar Pradesh
Bareilly/Utter Pradesh Bhatinda/Punjab Samba!pur/Oriss. Patna/Bihar Gorakhpur/Uttar Pradesh Santal l'arganas/Bihar Bharatpur/Rajasthan
3
III/143
1I/77 111 (xxviii) I/16(b)
VI/40
ll/178
V/340
IV/479(i)
V/528
I/1(hix)
IV/622
I/7(a)
IV/785
11/179
IV/349
VT/165 1II/361 (b)
IVm5 III/48fb) V/I04 1/1(1)
11/41
V/I09 IV/653 V/405 1/1 (xxii) f/I(xxxviii I
IV/590 IV/817 1II/338
IV/330 f/l(liv) V/619
ITT/65
ITI/414
V/256 VI/30 IlJ/3~(b)
II1/316 ITI/370 m/271
II I (ix)
II/5(a)
III/67 IlT/37(b)
lIJ/243
IV/292 1II/424
IV/37 1/42(a)
I/42(b) V/252(i)
III/468 lIJ/448
V/115
V/370
IV/38
Page No.
4
332 299
243 254
490 314 467 414 478 244
425 249
437
314
404 496 355 403
321 451 244 293 451
427 471
242 244
422
439 353 402 244
483 323 359 462 489 320 350 356 345 241
287
323 320
343
399
360 378
263
264 461 364
363 452 469
378
Town
,04. Bariarpnr 305. Baripada 306. Bari Sadri 307. Barkakana. 30S. Barki Saraiya 309. Barme~
310. Barnaia 311. B'Irpali 312. Barpeta 313. 'Barpeta Road 314. Barrackpur
District/State
2
Monghyr/Bibnr Mayurbhanj/Orissa Chittaurg.rb/Rajasthan Hazaribagh/Bihar Hazaribagb/Bihar Barmer/Rajasthan Sangrur /Punja b Sambalpur/Orissa Kamrup/Assam Kamrup/Assam Twenty Four Parganas/West
Bengal
Class/S!. No. of
Table A·1V
3
V/654
I1I/289
V/130 IlI/120(c)
IV/723 1JI/109 IlI/230(i)
V/147 III/367
lV/lSO II I (xii)
315. Barrackpur Cantt. Twenty Four Parganas/West Bengal
1/1 (xxxiii)
316. Barsi Slrolapurl Maharashtra Il!104 317. Barughutu ,
31S. B~ruipur
319. Barwaha
320. Bar""la 321. Barwani.
Hazaribagb/Bihar V 1342
Twenty Four Parganas IWest 111/557 Bengal
Khargon (West Nimar)/Madb. IV/175(i) ya Pradesh
Ahmadabad/Gujarat V/73 Khargone (West Nimar)/Mad- III/494 hya Pradesb
322. Bas.vakalyan Bidar/Mysore IIl/390 TV/412 VI/90
II/93
323. Basa.vanaballewadi Bijapur/Mysore 324. Basbohli Kathua/Jammu & Kashmir 325. Basirhat .
326. Basmath 327. Basoda 328. B\,ssein, 329. Bassi 330. Basti 331. Batala 332. Batanagar
333. Batlagundu 334. Batote 335. Baudh 336. Baurill 337. Bavla 338. Bawal 339. Bayana 340. Beawar 341. Bedi 342. Beebikulam 343. Begamganj . 344. Begun 345. Begusarai
346. Bebea, 347. Belakvadi 348. Bela Pratapgarh 349. Beldanga . 350. Belgaurtl 351. Belgaum Canlt. 352. Bellaguntha 353. Bellllmpalle 354. BeUary 355. Bellur 356. Belonia
357. Belur
358. Bemetqra
359. Beohar;
360. Bera
361. Berasia
362. Berhampur
Twenty Four Parganas/West Bengal
Parbhani/Maharashtra Vidisha/Madhya Pradesh Thana/Maharashtra Patiala/Puniab Basti/Uttar Pradesh Gurdaspur/Punjab Twenty Four Parganas/West
Bengal Madurai/Tamil Nadu Doda IJammn & Kashmir Baudb Khondmals/Orissa Howrah/West Bengal Ahmadabad/Gujarat GUTgaon/HaryaQa Bharatpur/Rajasthan Ajmer/Raja.than Jamnagar/Gujarat Madurai/Tamil Nadu Raisen/Madhya Pradesh ChittaurgarbJRajasthan Mongh~r/Bihar
Shahabad/Bihat; Mandya /Mysore Pratapgarh/Uttar Pradesh Murshidahad/West Bengal Belgaum/Mysore Belgaum/Mysore Ganjam/Orissa Adilabadl Anabra Pradesh BeUary I Mysore Mandya/Mysore South Tripura/Tripura
Hassan/Mysore
Durg!Madhya Pra<iesh
Shahdol/Madbya Pradesh
Dhaobad/Bihar
Sehore/MadhY3 Pradesh
G.njam/Orissa
III/538
III/55~(i)
m/33(a)
IV/385 III/4
Il/45(i)
V/133
IV/351
VT/130 V/168 III/176(b)
IV/207 V/484
IV/295
II/B5 I!58(b) IjI3(k) IV/466(i)
V/248
IlI/37(a)
V/259
V/611 III/317
V/30 1/62\a) I/62(b)
V/402 1II/260
1/114 VT/44 IV/6R9
IV/812
V/317(i)
V/279
1/27(0)
V!318
1/123
Page No.
4
485 347
453 329-433 328 341
454 355 391 241
243
303 468 372
390
449 367
357 4Q9
493
301
370 372
319 407 315 294
453
404 495 456 336 393 476
399
301
268 ./ 252 ......-
413
461
320
462 483
350 446
269
269 471 344 280 490 430
439
466
463 ,
259
466
282
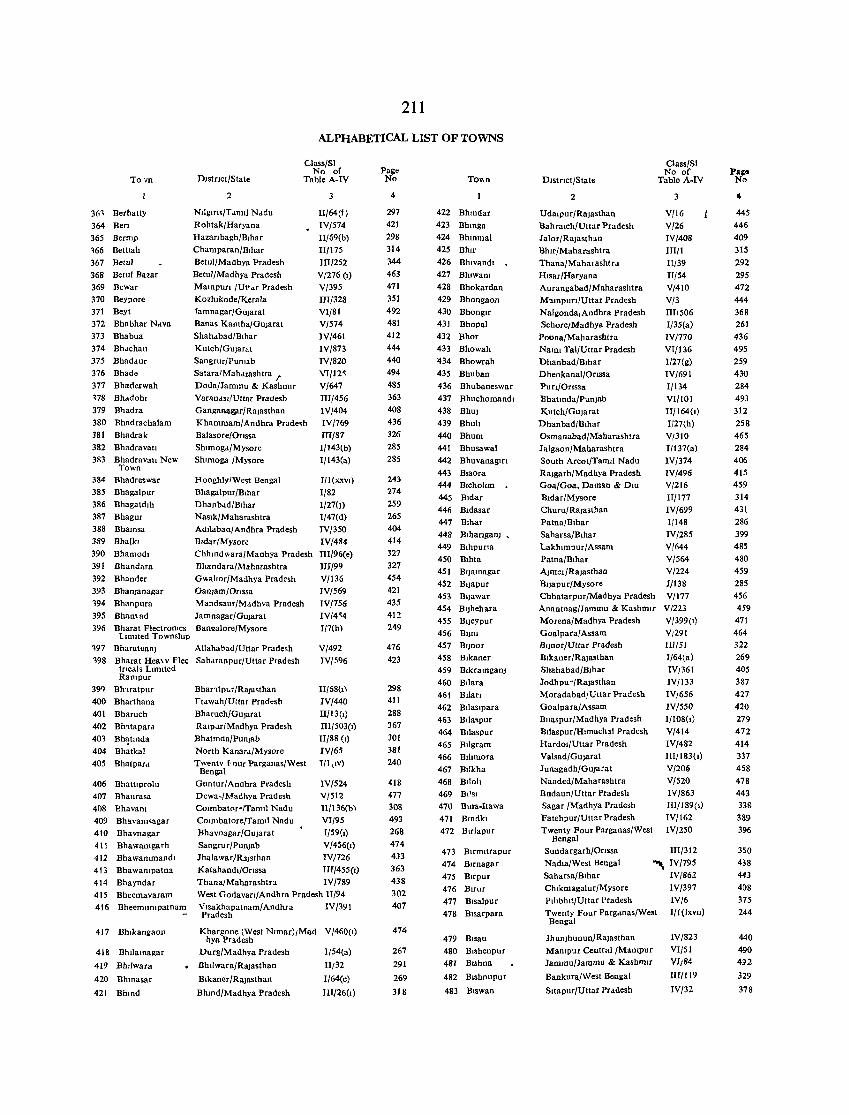
211
ALPHABETICAL LIST OF TOWNS
To vn
361 Berbatty
364 Ben 365 Bermp 166 BeWah 367 Bewl
368 Betul Bazar 369 Bewar 370 Beypore 371 Beyt 372 Bhabhar Ndva 373 Bhabua 374 Bholchau 375 Bhadaur 376 Bhade 377 Bhadetwab 178 Bhddohl 379 BI)adra
380 Rhadrachalam
381 Bhadra" 382 Bhadravatl 383 Bbadravatl New
Town 384 Bbadre~war
385 Bhagalpur 386 Bhagatdlh 387 Bhagur 388 Bhamsa 389 Bhalkl 390 Bhamodl 391 Bhandara 392 Bhander 393 BbanJanagar 194 Bhanpura 395 Bhamad
Dlstnct/State
Glass/SI No of
Table A-IV
2
Ntlglrl</Tamtl Nddu Rohtak/Haryana Hazanbagh/Blhar Champaran/Blhar Betul/Maahya Pradesh Betul/Madhya Pradesh Mampun /Ut'~r Pradesb K07hlkode/Kerala lamnagar/GuJarat Banas Kantha/GuJarat Shahdbad/Blhar Kutch/Gujarat Sangrur/PunJab
SataralMaharashtra .r Doda/Jammu & KashmIr Varandsl/Uttar Pradesh Gangallag,ar/RaJasthan Khammam/Andhra Prade.h Balasore/Onssa Shlmogd/MYsore Shlmoga /Mysore
HonghlylWest Bengal Bhagalpur/B,har Dhanbad/Blhar Naslk/Maharashlra Adllaban/Andhra Pradesh Bldar/Mysore
Chhmd"ara/Madhya Pradesh Bhandara/Maharashtra G ... hor/Madhya Pradesb Ganlam/Omsa Mandsaur/Madhva Pradesh Jamnagar/Gujarat
II/64(!) IV/574 II/69(b)
II/175 Ill/252 V/276 (1)
V/395 IIl/328 VI/81 V/574 lV/461 lV/873 IV/820 Vl/12~
V/647 IIl/456 lV/404 IV/769 III/S7 I/143lb) 1/143(a)
396 Bharat Flectron'cs Banaalore/Mysore LImIted Township
I/l(xxvl)
1/82 1/27(J) T/47(d)
IV/350 IV/484 II1/96(e) III/99
V/136 JV/569 TV/756 IV/4~4
I/7(h)
197 BbaratQanj Allaha1.'lad/Uttar Pradesh 198 Bharat He3\ V Flec Saharanpur/Uttar Pradesh
tTlcals LimIted
V/492 IV/596
RaOlpur
399 Bh'lratpur 400 Bharthana 401 Bharuch 402 Bh'ltapara 401 Bh~tInda
404 Bhatkal 405 Bhatpar d
406 BbattIprolu 407 Bhaurasa 408 BhavaOl 409 Bhavanl<agar 410 Bhavnagar 411 Bhawamgarb 412 Bhawammandl 413 Bhawampatna 414 Bhayndar
Bhar'ltpur/RaJa<than rtawah/Vttar Pradesh Bharuch/Gujarat Ralpur/Madhya Pradesh Bbatmda/Punjab North l<anard/Mysore Twentv fOllr Parganas/West
Bengal Guntur/ Anahra Pradesh Dewa,/Madhya Pradesh COImbat(lr-/Tamll Nadu
II/68(I)
IV/440 11/13(1) III/503(1) H/88 (I) TV/65 I/I,lv)
lV/524 V/512 Il/136(b)
COlmbatore/Tamil Nadu VI/95 Bhavnagar!Gujarat I/59(I) Sangrur/PunJab V/456(I) Jhalawar/R3Jsthan IV/726 Kalahandl/Onssa IH/455(1) Thana/Maharashtra IV/789
415 Bheemavararn 416 Bheemumpatnam
West GodavarI/Andhra Pradesh 1I/94 Vlsakhapatnam/Andhra IV/39 I
417 Bhlkangaon
418 Bhtlamagar
419 Bhllwara
420 Bhlllasar
421 Bhmd
Pradesh
Khargone (West Nlmar)/Mad V/460(1) hya Pradesh
Durg/Madhya Pradesh 1/54(a)
• Bhllwara/Rajasthan
Bikaner{Rajasthan
Bhmd/Madhya Pradesh
1I/32
1/64(c)
III/26(1)
Page No
4
297 421 298 314 344 463 471
351 492 481 412 444 440 494 485 363 408 436 326 285 285
243 274 259 265 404 414
327 327 454 421 435 412 249
476
423
298 411 288 367 301 381 240
418 477
308 493 268 474 433 363 438 302 407
474
267
291
269
318
422 Bhmdar 423 Bhmga 424 Bhmmal 425 Bhlr 426 BhlVandl 427 BhlwaOl
428 Bhokardan 429 Bhongaon 430 BhonglT 431 Bhopal 432 Bhor 433 Bhowah 434 Bhowrah 435 Bhuban
436 Bhubaneswar 437 Bbuchomandl 438 Bhuj 439 Bhuh 440 Bhum 441 Bhusawal 442 BhuvanaglTl 443 Blaora 444 Blchohm 445 Bldar 446 Bidasar 447 BIhar 448 Blhanganj 449 Blhpuna 450 BIhla 451 BIJamagar 452 Bljapur 453 Bljawar 454 BIJbehara 455 Bljeypur
456 BlJm 457 BIJnor 458 Bikaner 459 BlkramganJ 460 Bllara 461 Bllarl 462 Bilasipara 463 B,laspur 464 B,laspur
465 BIIgram 466 Blblllora 467 Bllkha 468 Blloh 469 BI'SI
470 Bma-nawa 471 Bmdkl 472 BlTlapur
473 Blrmltrapur 474 Blmagar 475 Blrpur
476 Blrur 477 Blsalpur 478 Blsarpara
479 Blsau 480 Blshenpur 481 Bishna
482 Bishnupur
483 Biswan
DlStnct/State
2
UdaIpur/Rajasthan Bahralch/Uttar Pradesh Jalor/RaJasthan Bhlr/Maharashtra Thana/Mahalashtra
Hlsar/Haryana Aurangabad/Maharashtra M"mpufl/Uttar Pradesh Nalgonda,Andhra Pradesh Sehore,Madhya Pradesh Poona/Maharashtra Naml Tal/Uttar Pradesh Dbanbad/Blhar Dhenkanal/Oflssa Pu ri/Oflssa BhatlOda/PunJab Kutch/Gujarat Dhanbad/Blhar Osmanabad/Mabarashtra J algaon/Maharashtra South Arcot/Tamll Nadu Rajgarh/Madhya Pradesh Goa/Goa, Daman & DIU Bldar/Mysore Churu/Rajasthan Patna/Blhar Saharsa/Blhar Lakhlmpur/Assam Patna/Blhar AJmel/RaJasthan BIJapur/Mysore Cbhatarpur/Madhya Pradesh Anantnag/Jammu & KashmIr Morena/Madhya Pradesh Goalpara/ Assam B'jnor/Uttar Pradesh Blkaner/Rajasthan Shahabad/BIhar Jodhpu -/Rajasthan Moradabad/Uttar Pradesh Goalpara/Assam Bllaspur/Madhya Pradesh Bllaspur/Hlmach~1 Pradesh HardOi/Uttar Pradesh
Valsad/Gujarat J unagadh/Gujarat Nanded/Mabarashtra Budaun/Uttar Pradesh Sagar /Madhya Pradesh Fatehpur/Uttar Pradesh Twenty Four Parganas/West
Bengal
Oass/SI No of
Table A-IV
V/16 V/26 IV/408 JIl/1
II/39 II/54 V/410 V/3 III/506 1/35(a)
IV/770 VI/136 I/27(g)
IV/691 1/134 VI/IOI IIfl64(1) 1/27(h)
Vi310 1/137(a)
IV/374 IV/496 V/216
II/I77 IV/699 1/148 IV/285 V/644 V/564 V/224
1/138 V/l77 V/223 V/399(1) V,291 Ill/51 1/64(a) IV/361 IV/l33 IV,656 IV/550 1/108(1)
V/414 IV/482 IlI/183(I)
V/20£> V/520 IV/863 III/189(1)
IV/162 IV/250
IlI/312 Sundargarh/OTIssa NadIa/West Bengal Saharsa/Blhar Chlkmagalur /Mysore PlbbhIt/Uttar Pradesh
" IV/795 IV/862 IV/397 IV/6
Twenty Four Parganas/We.t I/I(lxvu) Bengal
JbunJhunun/RaJasthan Mampur Central/ManIPur Jammu!Jammu & l<ashmlT
Bankura/West Bengal
Sltapur/Uttar Pradesh
rV/823
VI/51 Vl,84
III/I 19
IV/32
Pago No
4
445 446 409 315
292
295 472 444
368 261 436 495 259 430 284 493 312 258 465 284 406 415 459 314 431 286 399 485 480 459
285 456 459 471 464 322 269 405 387 427 420 279 472 414 337 458 478 443 338 389 396
350 438 443 408
375 244
440 490 492
329
378
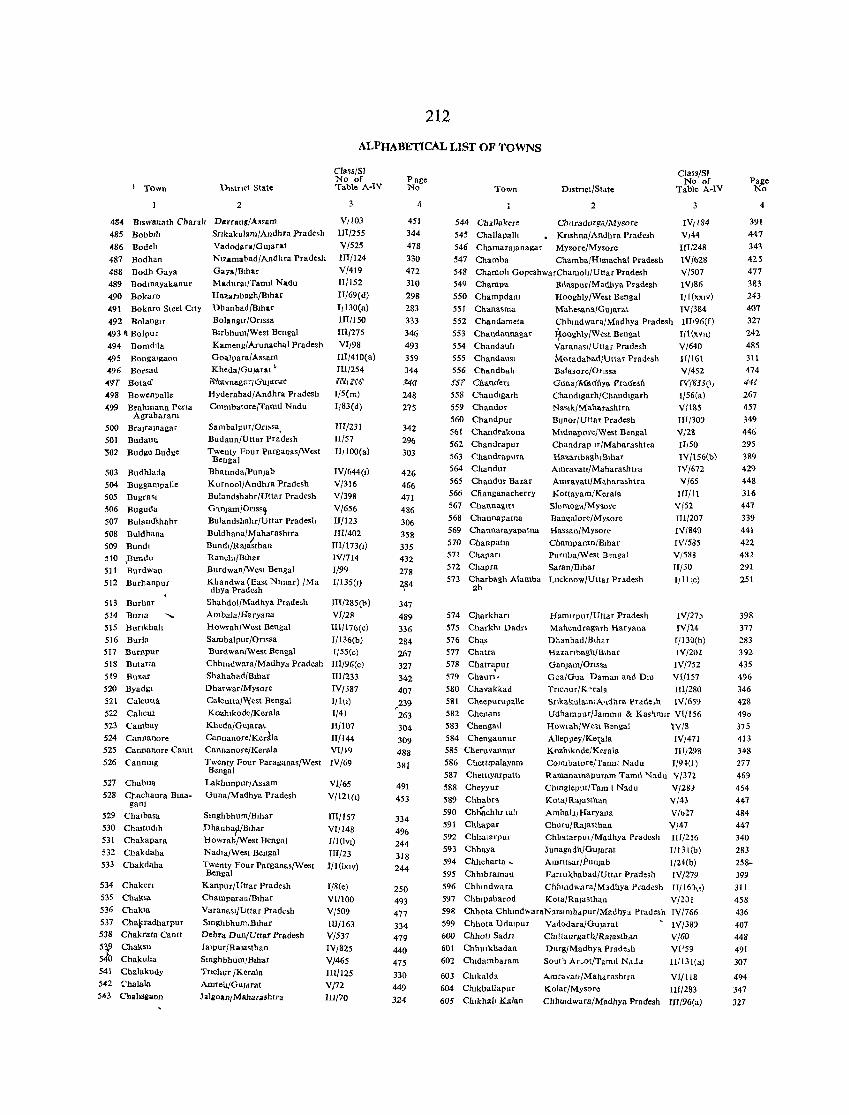
212
ALPHABETICAL LIST OF TOWNS
, Town D.st"ct State
2
ClasslSI No of Table A-IV
4~4 B,swanath Charalr Darnw!/As."", V/l03 JII/255
V/525
III/124
V/419 11/152
IT/69{d)
11130(a)
III/150
IIT/275 VI/98 III/410(a)
JU/254
485 Bobb'h Snkakulam/Andhra Pradesh
486 Bodel!
487 Bodhan
488 Bodh Gaya 489 Bodmayakanut
490 Bokam
VlIdodara/Gujurat NlZamabad/Andhra Pradesh
Gaya/Blhar
491 Bokaro Steel C,ty
492 Bolanglf
MlLdunu/Tamll Nadu Hazanbagh/Blhar
Dhanbad/Blhar Bol .. n~Jf/Onssa Blrbhum/West Bengal
Kameng/Arunachal Pradesh
Goalpara./ Assam Khoda/GuJarat'
B!ravno.garJGuJ"r.r( Hyderabad/ Andhra Pradesh
COlmbatore/Tannl Nadu
493 ~ Bolpur 494 BoOldlla
495 Bongalgaon 496 Borsad
4'J'T Rotaa 498 Bowenpalle
499 Brahmana Pena Agraharam
500 BraJraJnagar SOl Budaun
'502 Budge Budge
503 Budhlada 504 Buggarupai1e
505 BugraSJ 506 Buguda 507 Bulandshahr
508 Buldhana
509 Bundl 510 ,Bundu 511 Burdwan 512 Burhanpur
513 Burhar 514 BUfJll ......
515 Bunkhah 516 Burin 517 Burnpur 5J8 Butana
519 Buxar 520 Byadgl
521 Calcutta
522 Callcut 523 Cambay
524 Cannanore 525 Cannanore Cantt
526 Cannmg
527 Chabua
528 Chachaura Bma-gan]
529 Chalbasa
530 Chaltudlh 531 Chakapara 532 Chakdaha
533 Chakdaha
534 Chaken
535 Chak.a
536 Chakla
537 Cha!<radharpur 538 Chakrata Cantt
5~ Chaksu 540 Chakuha 541 Cllalakudy 542 (,halala
543 Chahsilaon
Sambalpur/On.sa. Budaun/Uttar Pradesh Twenty Four Parg"nas/West
Bengal Bhatmda/PunJab Kurnool/Andhra Pradesh Bulandshahr/Uttar Pradesh
G1n]am/Onss,;! Bulandshahr/Uttar Pradesb
Buldhana/~aharashtra
Bundl/Rajasthan Ranchl/Bthar BurdwanjWest Bengal
Khandwa (East Nlmar) 1M. dhYa Pradesh
Shahdol/Madhya Pradesh
Ambala/Haryana Howrah/West Bengal
Sambalpur/Onssa
1/5(m)
1J83(d)
HI/23 I II/57
fI;IOO(a)
IV/644(1)
V/316
V/398
V/656 II/123
III/402 III/173(1) IV/714
1/99
1/135(1)
1lI/285 (b) VI/28
III/176(c) I/I36(b)
Burctwan/West Bengal 1/55(c) Chhmdwara/Madhya Pradesh IIl/96(c)
Shahabad/Blhar III/233
Dharwar IMysore Calcutta/West Bengal
Kozhlkode/Kerala
Kheda/Gularat Cannanore/Kerdla CannanorelKerala
Twenty Four ParaganaslWest Bengal
Lakhlmpur/Assam Guna/Madhya Pradesh
Smghbhum/Blhar
Dhanbap/Blhar Howrah/West Bengal
NadIa/West Bengal
Twenty Four ParganaS/Wesl Bengal
Kanpur/Uttar Pradesh
Champaran/Blhar
VaranasljlJttar Pradesh
Smghbhum,Blhar Dehra Dun/Uttar Pradesh
Jalpur/RaJasthan
SmghbhurnlBlhar
Tnchur IKerala AmrehjGU]drat
Jallloan,Maharashtra
IV/387
1/1\1)
1/41
II/I07
III 144 VI}19
1V/69
VI/65
V/121(1)
III/157 V[;l48 1/1 (lVl)
lU/23
1/1 (lxJV)
I/8(e)
VI/IOO
V/509
1lI/163 V/537
IV/825 Vj465
m/125 VJ72
1l1/70
Page No
4
45J
344
478
330
472
310
298 283
333
346
493
359 344
34<J
248
275
342
296
303
426
466 471 486
306
358
335 432
278
'4,84
347
489
336
284 267
327
342
407
,239 263
304
309
488
381
491
453
334
496 244
318
244
250 493
477
334
479 440
475
330 449
324
Town Dlstnct/State
2
Class/SI No of
Table A-IV
544 Challakere ChItradvrga/Mysore
3
IV/lS4
V/44 III/248
IV/628
V/S07 lV/86 I/I(xxlv)
IV/384 IlII96(f)
1/1 (XVll)
V/640
II/IGI V/452 [,«(SH(l,
1/56(a)
V/18S
IH/3D?
V/28
545 Ch"Hapallt Krlshna/Andhra Pradesh 546 ChamaraJanagar Mysore/Mysore
547 Chamba Chamba/H1machal Pradesh
548 Chamoh GopeshwarChamoh/Uttar Pradesh 549 Charnpa Btlaspur/Madhya Pradesh 550 Champdam HooghlyjWest Bengal 551 Chanasma
552 Chandameta
553 Chandannagar
554 Chandauh 555 ChandauSl 556 Chandbah SST Cltana'en
558 Chandlgarh 559 Chandar
560 Chandpur
561 Chandrakona
562 Chandrapur 563 Chandrapura 564 Chandur
565 Chandur Bazar 566 Cliangllnacherry
567 Channagm
568 Channapatna 569 Channarayapatna
570 ChanpatJa 57l
572 573
Chapan Chapra
Charbagh Alamba gh
574 Charkhan 575 Charkhl Dadn
576 Chas 577 Chatra
578 Chatra,Pur 579 Chaun,
580 Chavakkad
581 Cheepurupalle 582 Chenam
583 Cheng"l 584 Chengannur 585 Cheruvannur
586 Chetttpalayam 587 Chetttyarpatt,
588 Cheyyur
589 Chhabra 590 Chhachhr lUI!
591 Chhapar 592 Chhatarpur
593 Chhaya
594 Chheharta ~
595 Chlubramau
596 Chlllndwara 597 Chhlpabarod
Mahesana/GuJatat Chhtndwara/Madhya Pradesh
¥ooghly/West Bengal
Varanasl/Uttar Pradesh
MoradabadlUttar Pradesh Balasorc/Orlssa
G'una(MaanYl\ {'raaesn Chandlgarh/Chandlgarh
Nas,k/Maharashtra
B'jnor/Uttar Pradesh M,dnapore/West Bengal
Chandrap If/Maharashtra HazanbaghlBlhar AmravaU/Maharashtra
Amravatt/Maharashtra Kottayam/Kerala
Shmloga/Mysore
Ban~alore/Mysore
Hassan/Mysore
Champaran/Blhar Purulla/West Bengal
Saran/BIhar Lucknow/Uttar Pradesh
If/50
IV/l 56(b) 1V/672
V/65
mIll V/52
HI/207 IV/841l
IV/S85
V/S8S II/30
I1II \e)
Hamtrpur/Uttar Pradesh Mahendragarh Har,ana
Dhanbad/Blhar Ha:z.anbagh/Blhar
GanJam/Onssa Goa/Goa Daman and Dm Tncnur/Ko rala
rVj27)
rV/14 I/130(b)
IV/21l2
IV/752
V£/IS7
III/280 SnkakulamlA'Idhra Prdde,h IV/65'} Udhampur/Jammll & Ka,'Imtr V[/156
Howlah/West Bengal IV/3
Alleppey/KeJ;ala rV/471 Kozhlkode/Kerala HI/298 COJmbatore/Tamll Nadu I/9~(l)
Rarnanatnapuram Tamil "Iadu V/372
Chmgleput/Tam I Nadll V/28J
Kola/Rajasthan VI43 Arubalal Haryana
Churu/RaJasthan Chhalarpllr/Mudhya Pradesh
Junagadh/GuJarat
Amnt»ar/PunJab Farrukhabad/UltM Pra'Iiesh
V/b27
V/47 IIf/216 I1131(b)
1/24(b)
rV/279 Chhllldwara/Madhya Pradesh JI!l6)\I)
Kota/Rajasthan V/201 598 Chhota ChhmdwaraN~rslmhdPur/Madhya Pradesh IV/766
599 Chhota UdaIpur Vddodara/GuJarat IV/38J 600 ChhotJ Sadn Chlttaurgarh/Ra]astb,m V!60
601 Chhulkhadan Durg/Madhya Prade,h Vl/59
602 Cbldambaram Sout, Ar_ot/Tamll NajJ 1lI131(a)
603 Ch'kalda Amravatl/Maharashtra VI/I18 604 ClukbaUapur Kolar/Mysore IH/283
605 ChlkhalJ Kalan Chhrndwara!Madhya Pradesh IIl/96(a)
Palle No
4
391
447 343
425
477
383 243
407 327 242
485
311 474 44{
267
457
349
446
295 389 429
448
316 447
339
441
422 482
291
251
398
377
283 392
435
496 346
428
490
375
413 348
277
469
454
H7 484
447
340
283
258-
399
311 458
436
407
448 491
307
494
347
327
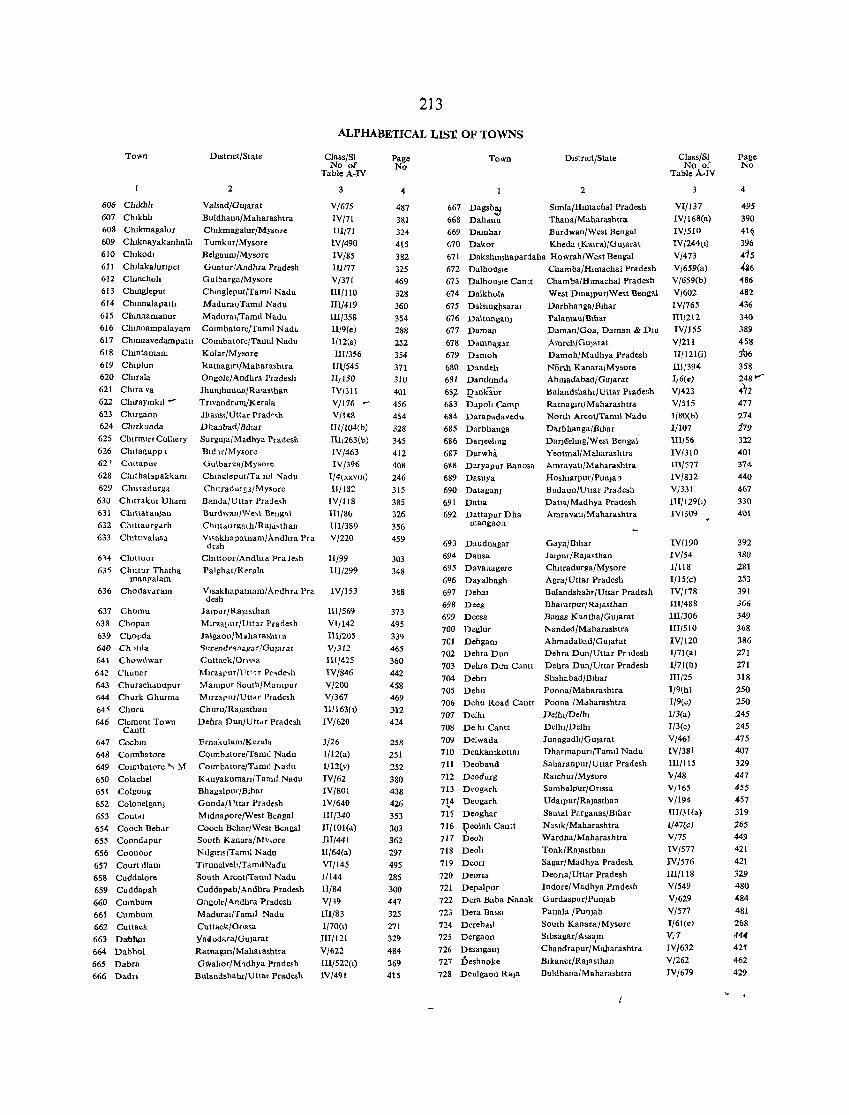
Town
606 Chlkhh
607 Chlkhh 608 Chtkmagalur
609 Chuwayakanhalh
610 Chlkodl
611 Chl)akaJunpet
612 Chtnchoh
613 Chmg]eput
614 ChmnalapattI
615 Chmnamanur
616 Chllluampalayam
DIstnct/State
2
Valsad/GuJarat
Buldhana/Maharashtra Chlkmagalur/Mysare
Tumkur/Mysore
Belgaum/Mysore
Guntur/Andhra Pradesh
Gulbarga/Mysore
Chmgleput/Tamll Nadu
Madural/Tamll Nadu
Madural/Tamll Nadu COlmbatore/Tamll Nadt.
617 Chmnavedampattl COlmbatore/Tamll Nadu
618 Chmtamam
619 Chlpluu
620 Chuala
621 Chlra va
622 ChU"aymkll-
623 ChlrgaOn
624 ChJfkllnda
625 Chlrmlrt Colliery
626 Chlta~upp 1
62'1 Cnltapur
628 Chlthalapaklcam
629 Ch.lradurga
630 ChItrakut Dham 631 Ch.ttaraU)arl
632 Chlttaurgdfh
633 Chlttlvalasa
614 ChJttoar
63'i Chlttur Thatha rnanralam
636 Chodavaram
637 Chamu
638 Chopan
639 Cl)ol'da
640 Ch 'ilia
641 Ch,'wdwar
642 Chunar
643 Churachannpur
644 Churk Ghurma
64< Churn
646 Clement Town Cantt
647 CochlO
648 COlmbatore
649 COlmbalore ..... M
650 Colaehel
651 Colgong
652 ColonelganJ
653 Conldl
654 Cooch Beh"r 655 Coondapur
656 Coonoor
657 Court 'llam 658 Cuddalore
659 Cuddapah
660 Cumbum
661 Cumbum
662 Cuttack
663 Dab"",
664 Dabhol
665 Dabra
666 Oadn
Kolar/Mysore
Ratnagtrl/Maharashtra
Ongole/Andhra Pladesh
JhunJhunun/RaJasthan
Tnvandrum/KeraJa Jhansl/Uttar Prade,h
Dhanbad/Blhar
SurguJa/Madhya Pradesh
Bid lr/Mysore
GulbargajMyscre
Chmgleput/Ta nIl "Iadu
Chllradu'ga;MY'ore
Banda/Ultar Pradesh Burdwan/We,t Beng'll
Clllttdurgal h/R ajd,than
Vl'akhap:;tnam/Andhra Pra dcsh
Chlltoor/Andhra Praje,h
Palghat/Kerala
V,sakhapatnam/Andhra Pra desh
J alpur / Ra lasthan
Mlrzavur/Uttar Pradesh
JalgaonjMahara,htra
fiiurendrg_naflarjGularat
Cutta~kjOn,'a
MlrZdrUT/Pllor P,"de,h
Mampur South/Mampur
Mtrzapur/Uttctr Pradesh
Churu/RaJasthan
Dehra Dun/Uttdr Pradesh
Frnakulam/Kerala
CQlmbdtore/Tamll Nadu
C'olmbatare/Tamll ]'.adu
I(,lllyakuman/Tarnil Nadu
Bhagalpur/Blhar
Gonda/Pllar Pradesh
MldnaporejWest Bengal
Cooch Behar/West Bengal South Kanara/Mv,ore
Nllgms/Tamll Nadu
TIrunelveh/T dmllNadu
South A.rcot/TamIl Nadu
Cuddapah/ Andhr. Pradesh
Ongole/ Andhra Pradesh
MaduraljTanlll Nadu
CuttackjOnssa
Yaliodara/Gu)arat
Ratnagln/Maharashtra
Gwabor/M~dhya Pradesh
Bulandshahr/Uttar Pradesh
213
ALPHABETICAL LIS'I OF TOWNS
Class/Sl No of
Table A-IV
3
V/675
IV/71 lIIj71
IV/490
IV/85 IUl77
V/371
II1/110
1II/419
lU/358
II/9(e) I/12(s)
III/356
III{545
1I,ISO
IV/311
V/176 V/148
IlI/104(b)
IlI/263(b)
IV/463 IV/396
1/4txxvlll)
1I/l82
IV/118
1Il/86
IIl/380
V/220
1l/99 1II/299
IV/153
1l\/569
VIi142
Ill/205 V,312
1lI/425
IV/846
V/200
V/367 II/163(J)
IV/620
1/26
1/12(a) 1/12(v)
IV/62 IV/801
IV/640
IIT/340
II/IOl(d)
III/44 I 1I/64(a)
VI/145
11144
11/84
Vf19
III/83 1/70(1)
III/121 V/622 III/522(l)
IV/491
Page No
4
487
381
324
415
382
325
469
328
360
354
288
252
354
311
310 4()1
456
454
328 345
412 4()8
246
315
385
326
356 459
303
348
388
373
495
339
465
360 442
458 469
312
424
258 251
252
380 438
426
353
303
362
297 495
285
300
447
325
271
329
484
369 415
Town
667 Dagsh~
668 Dah,iUu
DIstrIct/State
2
Simla/HImachal Pradesh
Thana/Maharashtra
669 Damhat Burdwan/West Bengal
670 Dakor Kheda (Kalra)/Gu)arat
671 Dakshm)hapardaha Howrah/WestBen!:al
672 Dalhollsle Chamba/Himaehal Pradesh
673 Dalhousie Cantt
674 Dalkhola
675 Dalslllgj1saral
676 Daltongan)
677 Daman
678 Damn'Ullf
679 Darnah
680 Dandeh
681 DamlImd ..
6S~ J;?anl<aur 683 DapoII Camp
684 Darapadavedu
685 Darbhanga
686 Daf)eelJUI:
687- Darwha 688 Daryapur Banasa
689 Dasuya
690 Dataganj
691 Datla
692 Dattapur Dha mangaon
693 Daudnagar 694 Dausa
695 Davanagere
696 Dayalbagh
697 Debal 698 Dceg
699 Deesa
700 Deglur
701 Dehgam 702 Dehra Dun
703 Dehra DtIn Cantt
704 DehrI
705 Dehu 706 Dehu Road Cantt
707 DelhI
708 Deihl Cantt
709 Delwada 710 Denkamkotlal
711 Deoband
712 Deodurg
713 Deogarh
7t4 Deogarh
715 Deoghar
716 ~eola!J Cantt 717 Deoh
718 Deoh
719 Dean
720 Deona
721 Depalpur
Chamba/Hlmachal Pradesh
West DlllaJPur/West Belll~al
Darbhanlla/Blhar
Palamau/B,har Daman/Goa, Daman & Dm
Amreh/Gu)arat
Darnah/Madhya Pradesh
NOrth KanaraiMysore
Ahmadabad/GuJarat
BlllandshahrJUttar Pradesh
Ratna~lfl/Maharashtra
North Arcot/Tam,l Nadu
Darbhanga/Blhar
Dar)€elmgIWest Bengal
Yeotmal/Maharashtra Amravatt/MlAharashtra
Hosh,arpur/Punjab
Budaun/Uttar Pradesh
DatJa/M«dhya Pranesh
AmravatJ/Maharashtra
Gaya/Blhar
Jalpur/RaJasthan
Ch,tradurga/Mysore
Agra/Uttar Pradesh
Bulandshahr/Uttar Pradesh
Bharatpur/Rajasthan
Banas Kantha/Gujarat
Nanded/Maharashtra
Ahmadabad/Gujatat
Dehra Dun/Uttar Pr ,desh
Dehra Dun/Uttar Pradesh
Shahabad/ BIhar
Poona/Mahura,hlra
Poona /Maharashtra
DelhI/Delhi
Deihl/Deihl
Junagadh/Gu]arat
DharmapurI/TamIl Nadu
Saharanpur/Uttar Pradesh
Ralchur/Mysore
Sambalpur/Onssa
Udalpur/Ralasthan
Santal Parganas/Blhar
NaSlk/Maharashtra Wardha/Maharashtra
Tonk/Rajasthan
Sagar/Madhya Pradesh
Deana/Ultar Pradesh
Indore/Madhya Pradesh
722 Dera Baba Nanak Gurdaspur/Punjab
723 Dera BaSSI
724 Dereball
725 Dergaon
726 Desalgan]
727 Deshnoke
728 Deulgaon Ra]a
Patlala /Pu'1Jab
South Kanara /Mysore
Slbsagar/ A.ssa,m
Chandrapnr/M$arashtr"
Blkaner/Ra)asthan
Buldhana/Maharashtra
Class/SI No of
Table A-IV
VI/137
IV/168(a)
IV/510
IV/244(l)
V/473
V/6S9(a)
V/659(b)
V/602 IV/765
1ll/212
IV/IS5
V/21l 1I/121(i)
1ll/394
1,6(e)
V/423
V/515 I/SO(b)
1/107
IIIIS' IV/310
UI/577
IV/832
V/331
III/129(1)
IVI309
IV/l90 IV/54 Ij1l8
1/IS(c)
IV/178
III/488
III/306
IIl/510
IV/120
1/71(a)
1/71(b)
III/2S 1/9(h) I/9(e)
1/3(a)
1/3(c)
V/461
IV/381
Ill/It 5
"/48 V/165 V/194
III/3 I (a)
1/47(c)
V/75
IV/577
IV/576
III/l1S V/549
V/629 V/S77
1/61(e)
VJ7
IVj632
V/262
IV/679
"
Page No
4
495
390 41q
396
415
4~6 486
482
436
340
389
458
3b6
358 248 .....
472
477
274
i79 322
401
374
440
467 330
401
392 380
281
253
391 366
349
368
386
271
271
318
250 250
245
245 475 407
329 447 455
457
319
265 449
421
421
329
480
484
481
268
44« 42;
462 429
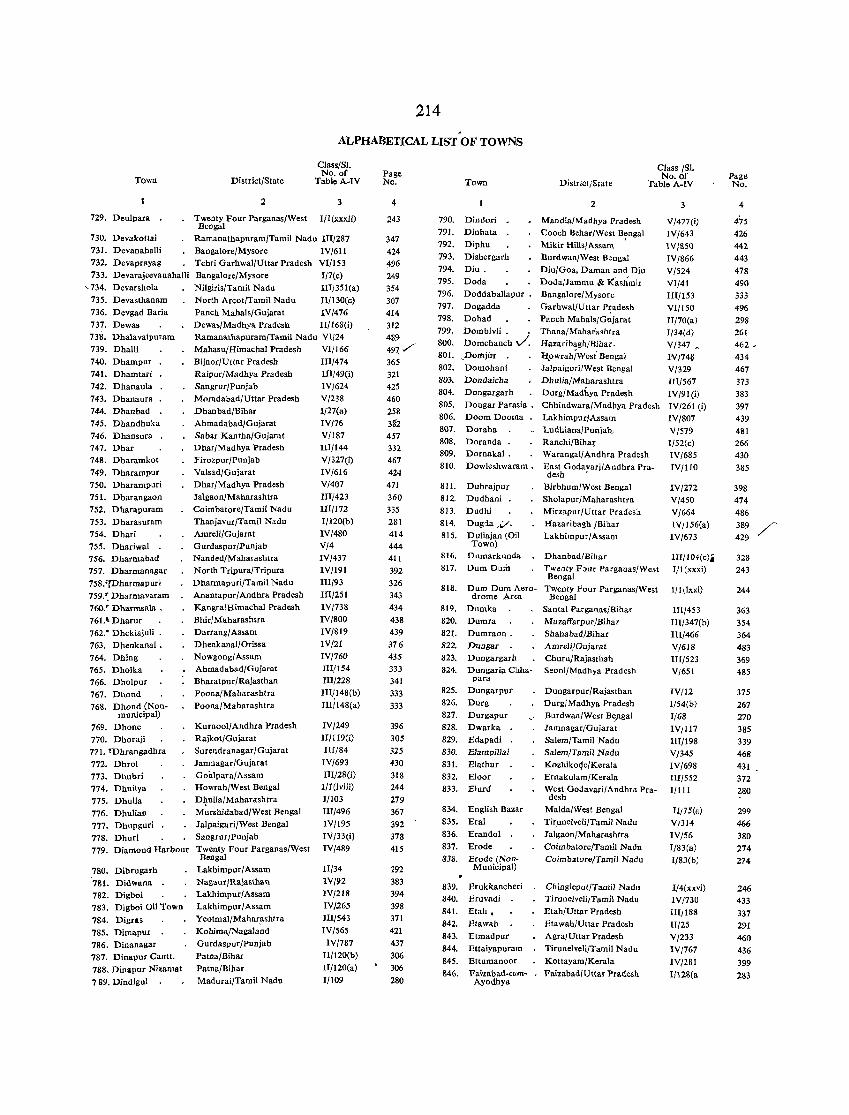
214
ALPHABETICAL LIST OF TOWNS
Town
729. Deulpara
730. Devakottai 731. Devanahalli 732. Devaprayag
District/State
2
Class/S!. No. of
Table A-IV
3
Twenty Four Parganas/West 1/1 (xxxii) Bengal
Ramanathapuram/Tamil Nadu 111/287
Bangalore/Mysore IV/611 Tehri Garhwal/Uttar Pradesh Vl/l53
733. Devarajeevanahalli Bangalore/Mysore I/7(c) IU/351(a)
II/l30(c)
IV/476 II/168(i)
'- 734. Devarshola
735. Devasthanam 736. Devgad Baria
737. Dewas
Nilgiris/Tamii Nadu
North Areol/Tamil Nadu Panch Mahals/Gujarat
Dewas/Madhya Pradesh 738. Dhalavaipuram Ramanathapuram/Tamil Nadu VI/24 739. Dhalli Mahasu/Himachal Pradesh VI/166
740. Dhampur
741. Dhamlari
742. Dhanaula
743. Dhanaura 744. Dhanbad
745. Dhandhuka 746. Dhansura .
747. Dhar 748. Dharamkot
749. Dharampur
750. Dharampuri 751. Dharangaon
752. Dharapuram
753. Dharasuram
754. Dhari 755. Dhariwal . 756. Dharmabad 757. Dharmanagar
758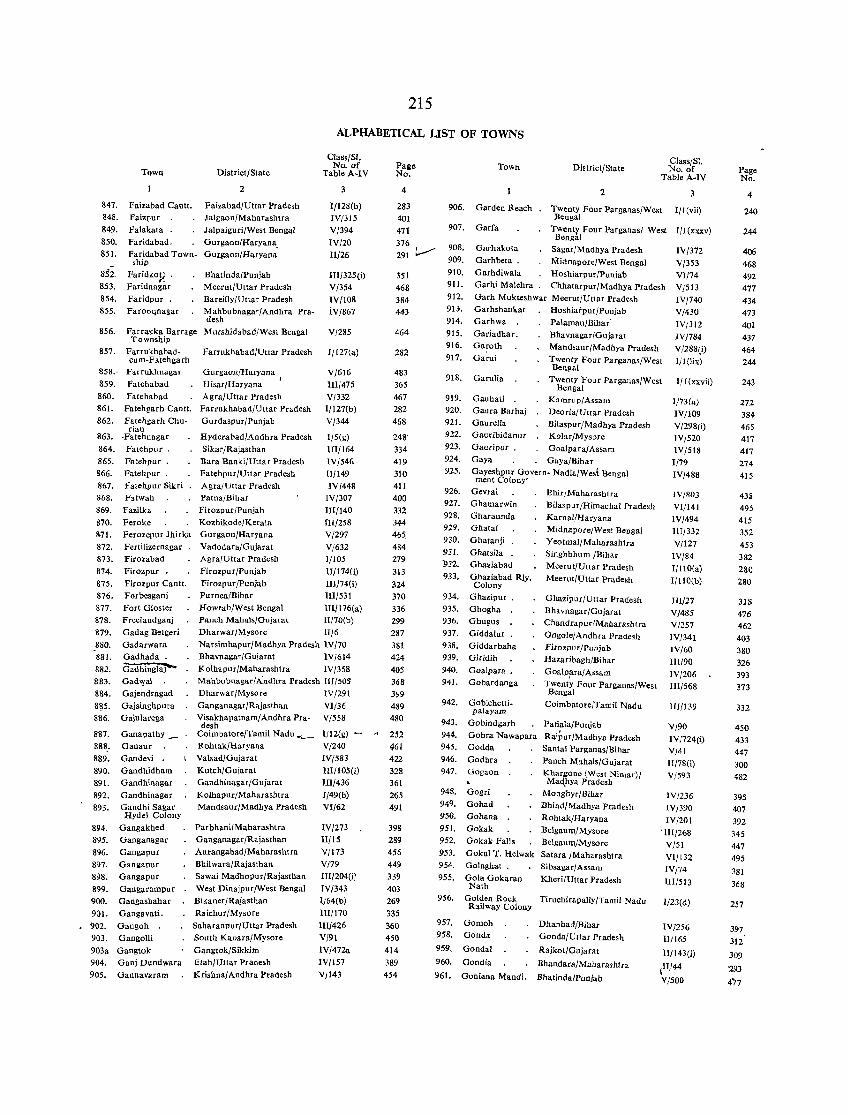
215
ALPHABETICAL LIST OF TOWNS
847. 848.
849.
850. 851.
852.
853.
854. 855.
856.
857.
Town
Faizabad Caott. Faizpur
Falakata . Faridabad. Faridabad Town. ship
Faridkot) • .Faridnagar
Faridpur . Farooqnagar
Farrakka Barrage Township
Farrukhabadcum.F~iehgarh
858.· Farrukhnasar
859. Fatehabad
860. Fatehabad
District/State
2
Faizabad/Uttar Pradesh Jalgaon/Maharashtra Jalpaiguri/West Bengal
Gurgaon/Haryana. Gu,rgaon/Haryana
BhatinJa/Punjab Meerut/Uttar Pradesh
Bareilly/Uttar Pradesh Mahbubnagar/Andhra Pradesh
Murshidabad/West Bengal
Farrukhabad/Uttar Pradesh
Gurgaon!Haryana
Hisar/Haryana
Agra/Uttar Pradesh 861. Fatehgarh Cant!. Farrukhabad/Uttar Pradesh 862. Fatehgarh Chu- Gurdaspur/Punjab
rian 863. .Fatehnagar Hyderabad/Andhra Pradesh
864. Fatehpur. Sikar/Rajasthan 865. Fatehpur. Bara Banki/Uttar Pradesh 866. Fatehpur. Fatehpur/Uttar Pradesh 867. Fatehpur Sikri. Agra/Uttar Pradesh
Class/Sl. No. of
TableA·IV
3
1/128(b) IV/315
V/394 IV/20 lIj26
1Il/325(i) V/354 IV/108 rV/867
V/285
1/127(a)
V/616
lIli475
V/332 I/127(b)
V/344
1/5(g)
1II/164 IV/546
1I/149 1V/448
868. Fatwah Patna/Bihar IV/307 869. Fazilka Firozpur/Punjab III/140
870. Feroke Kozhikode/Kerala III/258 ~7\' Ferozepur Jhirka Gurgaon/Haryana V/297
872. Fertilizernagar Vadodara/Gujarat Vj632 873. Firozabad Agra/Uttar Pradesh 1/105 874. Firozpur. Firozpur/Punjab U/174(i)
875. Firozpur Cantt, Firozpur/Punjab lIIj74(i) 876. Forbesganj Puruea/Bihar IIl/531 877. Fort Gloster Howrah/West Bengal IIlI176(a) 878. Freelandganj Panch Mahals/Gujarat III70(b) 879. Gadag Betgeri DharwarJMysore 1I/6
880. Gadarwara Narsimhapur/Madhya Pradesh IV/70 881. Gadhada. Bhavnagar/Gujarat IVi614
882. aaahingl~ Kolhapur/Maharashtra IV/358 883.
884.
8?5. 886.
Gad')'al Gajendragad Gajsinghpura
GajuJarega
Ganapathy _
Mahbubnagar/A-ndhra Pradesh III/50S
Dharwar/Mysore IVj291 Ganganagar /Rajasthan VI/36 Visakhapatnam/Andhra Pra· V/558 desh
887. Coimbatore/Tamil Nadu ... _ 1/12(g)
888. Ganaur Rohtak/liaryana 889. Gandevi Valsad/Gujarat
890. Gandhidham Kutch/Guiarat 891. Gandhinagar Gandhinagar /Gujarat
892. Gandhinagar Kolhapur/Maharashtra 893. Gandhi Sagar Mandsaur/Madhya Pradesh
Hydel Colony
894. Gangakhed Parbhani/Maharashtra
895. Ganganagar 896. Ganga pur 897. Gangapur
898. Gangapur
899. Gangarampur 900. Gangashahar
901. Gangavati.
902. Gangoh 903. Gangolli
903a Gangtok 904. Ganj Dundwara
905. Gannavaram
Ganganagar/Rajasthan
Aurangabad/Maharashtra
BhilwaraJRajasthan Sawa; Madhopur/Rajasthan
West Dinajpur/West Bengal Bikaner/Rajasthan
Raichur/Mysore
Saharanpur/Uttar Pradesh South Kanara/Mysore
Gangtok/Sikkim flah/Uttar Pradesh
Krishna/Andhra Pradesh
V/240 IV/583 HI/105(i)
III/436
I/49(b)
VI/62
IV/273
llfl5 V/173 V/79 1II/204(i)
IV/343 IJ64(b)
IIIJI70
1IIi426
V/91
IV/472a IV/157
VJI43
PallO No.
4
283 401 471
376
Town
906. Garden Reach
907. Garfa
DiHrict/State
2
Class,S!. No. of
TableA·IV
3
Twenty Four Parganas/West 1/1 (vii) Bengal
Twenty Four Parganas/ West 1/1 (xuv) Bengal
291 t.,...-r 908.
909.
910. 911.
912. 913. 914.
915. 916.
917.
Garhakota
Garhbeta . Garhdiwala Garhi Malehra
Sagar/Madhya Pradesh
l'YIiJnapore/West Bengal Hoshiarpur/Punjab Chhatarpur/Madhya Pradesh
IV/372
V/353 VI/74 V/513
IV/740 V/430
IV/312
IV/784 V/288(i)
1/1 (lix)
351 468
384 443
464
282
483
365 467 282
468
248'
334 419
310 411
400
332 344 465,
484
279
313
324 370
336 299 287
381 424
405
368
3~9
489 480
252
461 422
328
361
265
491
398 289
456
449
339 403
269
335
360 450
414
389 454
918.
919. 920.
n1. 922.
923. 924. 925.
926. 927.
928. 929.
930. 931. 932.
933.
934. 935. 936. 937.
938. 939. 940.
941.
942.
943.
94*. 945.
946. 947.
948. 949.
950.
951. 952.
953. 954.
955.
956.
Garh Mukteshwar Meerut/Uttar Pradesh Garhshankar
Garhwa .
Gariadhar. Garoth
Garui
Garulia
Gauhati Gaura Barhaj GaurelIa
Hoshiatpur/Punjab PaJamau/Bibar'
Bbavnagar/Gujarat
Mandsaur/Madhya Pradesh
Twenty Four Parganas/West Bengal
Twenty Four Parganas/West Bengal
Kamrllp/Assam
Deoria/Uttar Pradesh Bilaspur/Madhya Pradesh
Gauribidanur KOlar/Mysore
Gauripur . Goalpara/Assam Gaya Gaya/Bihar Gayeshpur Govern· Nadia/West Bengal ment Colony'
Gevrai
Gbamarwin
Gharaunda Ghatal
Ghatanji GhatsHa Ghaziabad
Ghaziabad RIy. Colony
Ghazipur . Ghogha Gbugus
Giddalur
Giddarbaha Giridih
Goalpara • Gobardanga
Gobichetti· palayam
Gobindgarh
Gobra Nawapara Godda
Godhra Gogaon
Bhit I Mabarashtra
Bilaspur /Himachal Pradesh Karnal/Haryana Midnapore/West Bengal
YeotmaljMaharashtra Singhbhum /Bibar
Meerut/Uttar Pradesh
Meerut/!Jttar Pradesh
Gbazipur/Uttar Pradesh Bhavnagar/Gujarat
Chandrapur/Maharashtra Ongole/Andhra Pradesh Firozpur/Punjab
Hazaribagh/Bihar
Goalp!,-ra/Assam
Twenty Four Parganas/West Bengal
Coimbatore/Tamil Nadu
Patiala/Punjab
RaillUr/MadhY2 Pradesh Santal Parganas/Bihar
Panch M01hals/Gujarat Kharp,one (West Nimar)/ Ma'\_hya Pradesh
1/1 (xxvii)
1/73 (a)
IV/I09 V/298(i) IVJ520 IV/SIS 1/79
IV/488
lV/803
VI/141 IV/494 IlI/332
V/127 lV/84
1/110(a) I/llO(b)
Illj27
V/485 V/257
IV/341 IV/60
III/90
IV/206 1II/568
1Il/139
V/90
IV/724(i) V/41
1l/78(i) V/593
lV/236 IV/390
IV/201
Gogri
Gohad
Gohana Gokak Gokak Falls
Monghyr/Bihar
BhiudjMadhya Pradesh RohtakjHaryana
Belgaum/Mysor.e Belgaum/Mysore
Gokul T. Helwak Satara /Maharashtra Golaghat .
Gola Gokaran Nath
Sibsagar/ Assam
Kheri/Uttar Pradesh
'1lI/268
V/51
VI/132 IV/74
1II/513
Golden Rock Tiruchirapally/Tamil Nadu Railway Colony l/23(d)
Gomoh DhanbaJ/Bihar
Gonda Gonda/Uttar Pradesh
Gondal Rajkot/Gujarat
Gondia Bhandara/Maharashtra
957.
958.
959.
960.
961. Goniana Mandi. Bhatinda/Punjab
IV/256
IIJI65
II/I 43(i)
{TJ/44
Vj500
Page No.
4
240
244
406
468 492 477
434 473
401 437
464
244
243
272
384 465 417
417 274 415
438 495 415 352
453 382
280
280
318 476 462
403 380
326 393
373
332
450
433 447
300 482
395 407
392
345
447 495
381
368
257
397 312'
309
293
4'77
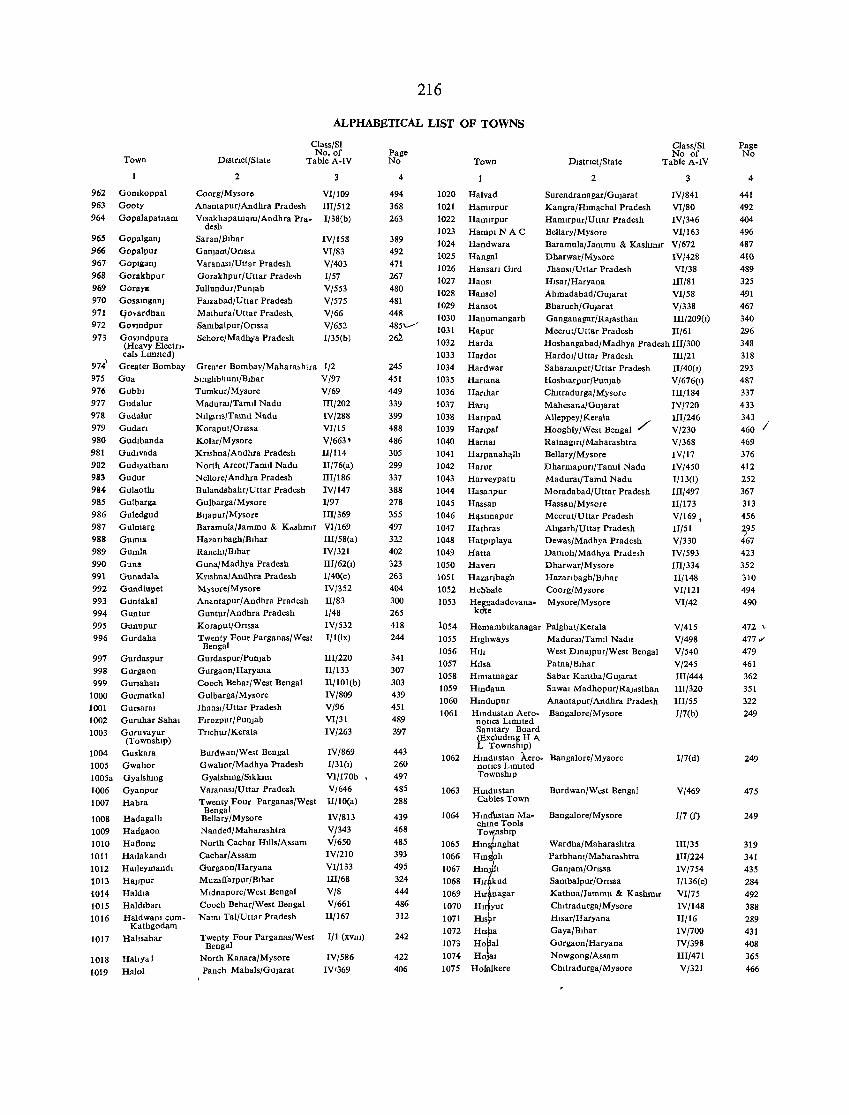
962 963
964
965
966
967
968
969 970
971 972
973
974\
975 976
977
978 979
980 981 982
983
9B4 985 986 987
988 989
990
991 992 993
994
Town
Gonlkoppal
Gooty
Gopalapatnam
Gopalganj
Gopalpur
Gopiganj
Gorakhpur
Goray. Go.amganj
qovardhan
Govmdpur Govmdpura (Heavy Electn-cals Limited)
Greater Bombay
Gua Gubbl Gudalur
Gudalur Gudart
Gudlbanda
Gudlvada Gudlyatham
Gudur
Gulaothl Gulbarga
Guledgud
Gulmarll Gumla Guml.
Gun.
Gunadala Gundl\1pet
Guntakal
Guntur 995 Gunupur
996 Gurdaha
997 Gurda.pur
998 Gurllaon 999 Gurlahal1
1000 Gurmatkal
1001 Gursaral 1002 Guruhar Sahal
1003 Guruvayur (TownshIp)
1004 Gu.kara
1005 GwallOr
1005a Gyalslung
1006 Gyanpur
1007
1008 1009
1010 1011
1012
1013
i014
1015
1016
1017
1018
1019
Habra
Hadagallt
Hadgaon Hafiong
Hallakandl Halleymandl
Hajlpur
Haldla
Haldlbart
Haldwam cum-Kathgodam
Haltsahar
Hallya]
Halol
216
ALPHABETICAL LIST OF TOWNS
Distfict/State
2
Coorg/Mysore
Class/SI No. of
Table A-IV
Anantapur/Andhra Pradesh
Vlsakbapatnam/Andhra Pradesh
3
VI/I09
I1I/512 I/38(b)
Saran/Blbar
Ganjam/Ortss" Varan"sl/Uttar Pradesh Gorakbpur/Uttar Prade,h
Jullundur/Pun)ab
Fatzabad/Uttar Pradesh
Malhura/Uttar Pradesh. Samba]pur/Onssa
Sehore/Madhfa Pradesh
IV/15S VI/83
V/403
1/57
V/553 V/575
V/66
V/652 1/35(b)
Greater Bombav/Mahara,htra 1/2
!>mghbltum/BIhar V/97 Turnkur/Mysore V/69
Madural/Tamtl Nadu
Nligms/Tamll Nadu
Koraput/Onssa
Kolar/My.ore Knshna/Andhra Pradesh
North Areot/Tamii Nadu N ellore/ Andhra Pradesh
Bulandshahr/Uttar Pradesh Gulbarga/Mysore
Bljapur/Mysore
Bar.mula/Jammu & K".hmtf Hazarlbagh/Blhar
Ranchl/Blbar
Guna/Madhya Pradesh Knshna/ Andhra Pradesh My,ore/Mysore
Anantapur/ Andhra Pradesh Guntur/ Andhra Pradesh
Koraput/Onssa Twenty Fout Parganas/West
Bengal
Gurdaspur/Punjab Gurgaon/Haryana
Cooeh Behar/West Bengal Gulbarga/Mysore
Jhansl/Uttar Pradesh
Flrozpur/Pllnjab Tnehllr/Kerala
Burdwan/West Bengal Gwallor/Madhya Pradesh
Gyalsbillg/Slkktm Varanasl/Uttar Pradesh Twenty Four Parganas/West
Bengal Beliary/Mysore
Nanded/Maharashtra North Cachar HIlls/Assam
Caehar/Assam Gurgaon/Haryana
Muzaffarpur/Blhat
MldnllPore/West Bengal Cooch Behar/West Bengal
NalUl Tal/Uttar Pradesh
Twenty Four Parganas/Wesl Bengal
North Kanara/Mysore
Paneh Mahals/Gujarat
TIl/202
IV/28S VI/15 V/663 ,
11/114 I1/76(a)
TIl/186 IV/147
1/97 1II/369
VI/169 III/58(a)
IV/321 1II/62(1) I/40(e)
IV/352
II/83 1/48 IV/532 I/l(1x)
1II/220
I1/133 II/IOI(b)
IV/809
V/96 VI/31
IV/263
IV/869 1/31(1)
VI/170b ,
V/646 II/I0(a)
IV/813
V/343 V/650
IV/210
VI/133
III/68
V/8 V/661
II/167
1/1 (xvm)
IV/586 IVI369
Page No
4
494
368 263
389 492 471 267
480 481
448 4851../"
262
245
451
449
339
399 488
486 305
299
337 388 278
355 497
322 402
323
263 404
300 265 418 244
341
307 303 439 451
489 397
443
260 497
485
288
439
468
485
393 495 324
444
486 312
242
422
406
1020
1021
1022 1023
1024
1025
1026
1027
1028 1029
1030 1031
1032
1033 1034
1035
1036
1037
1038 1039
1040 1041
1042
1043
1044
1045 1046
1047
1048 1049
1050 1051
1052
1053
1054
1055 1056
1057
1058
1059
1060 1061
1062
1063
1064
1065
1066
1067
1068
1069
1070
1071 1072
1073
1074
1075
Town
Halvad Hamlrpur
HamlTpur
HamplN AC
Handwara Hangal
Hansan GIrd
Hansl Hansol
Hansot Hanumangarh
Hapur
Harda
HardOl Hardwar
Hanana Hanhar
Hanj
Harlpad Hanpal
Hamal Harpanah'llh
Harur Harveypattt
Hasanpur Hassan H'Isttnapur
Hathras Hatplplaya
Halta
Haven Hazarlbagh
Hebbale Heggadadevana-
kelte
DIstrict/State
2
Surendranagar/Gujarat
Kangra/Hlmachal Pradesh
Class/SI No of
Table A-IV
3
IV/841
VI/80 Hamlrpur/Uttar Pradesh IV /346
Beliary/Mysore VI/163
Baramula/Jammu & Kashmir V/672 Dharwar/Mysore
Jhansl/Uttdr Pradesh IV/428
VI/38 HlsarjHaryana Ill/Sl
Abmadabad/Gujarat VI/58
Bharllch/Gujarat V/338 Ganganagar/Rajasthan III/209(l)
Meerut/Uttar Pradesh II/61
Hoshangabad/Madhya Pradesh Ill/300
HardOl/Uttar Pradesh III/21 Saharanpur/Uttar Pradesh
Hoshlarpur/l'unJab CIlItradurga/Mysore
Mahesand/GUjarat Alleppey/ Ketala
Hooghly/West Bengal /
Ratnagm/Maharashtra Bellary/Mysore
Dharmapun/Tamii Nadu
Madurai/Tamii Nadu
Moradabad/Uttar Pradesh Hassan/ Mysore Meerut/Uttar Pradesh
Ahgarh/Uttar Pradesb
Dewas/Madhya Pradesh Damoh/Madhya Pradesh
Dharwar/Mysore Hazanbagh/Blhar
Coorg/Mysore Mysore/Mysor.
II/40(l) V/676(1)
III/I 84 IV/720 1II/246
V/230 Vj36S
IV/17
IV/450 1/13(1)
1II/497 II/173
V/169 ,
II/51 V/330
IV/593 IU/334
1I/148 VI/121
VI/42
Hemamblkanagar Palghat/Kerala V/415 V/498
V/540
V/245
1II/444
III/320
III/55 If7(b)
Highways
Hilt
Hllsa Hlmatnagar Hmdaun Hmdupur
Hmdustan Aero-nottes Limited Samtary Board (Exeludmg H A L TownshIp)
Hmdustan A.eronotlcs LimIted Townslup
Hmdustan Cables Town
Hmel'ustan MachlOe Tools
TO~ShIP Hill nghat
Hm II
;::~~::ar HI yur
HIS r
::t:1 Ho)al
Holalkere
MaduraljTamIi Nadll
West Dmajpur/West Bengal Patna/Blhar
Sabar Kantha/GuJarat Sawal MadhopurjRajdsthan
Anantapllr/Andhra Pradesh Bangalore/Mysore
Bangaiore/Mysore
Burdwan/West Bengal
Bangalore/Mysore
Wardha/Maharashtra Parbham/Mahara,htra
Ganjam/Onssa
Sambalpur/Onssa
Kathua/Jammu & Kashmir Chltradurga/Mysore
Hlsar/Haryana
Gaya/Blhar
Gurgaon/Haryana
Nowgong/Assam
Chltradurga/Mysore
I/7(d)
V/469
1/7 (f)
IIIj35
III/224
IV/754 1/136(c)
VI/75 IV/148
II/16
IV/700
IV/398
1II/47 I
V/321
Page No
4
441
492 404
496 487 410
489
325 491 467
340
296 348 318
293 487 337 433
343
460 469
376 412
252 367
313 456
295 , 467 423
352
310 494
490
/
472 ,
477" 479
461
362
351 322
249
249
475
249
319
341
435
284
492
388
289 431
408 365
466
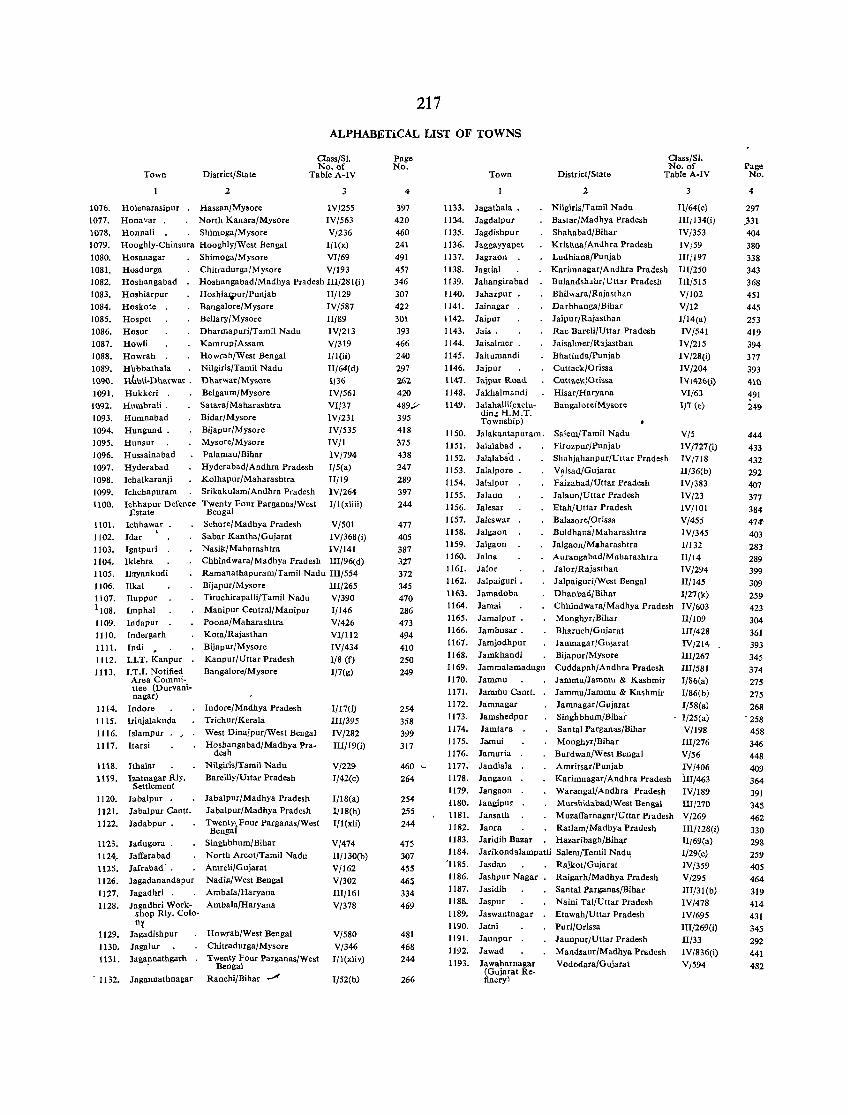
217
ALPHABETiCAL LIST OF TOWNS
Town District/Slate
2
Class/SI. No. of
Table A-IV
1076. Holenarasipur Hassan/My.ore IV/255 1077. 1078. 1079. 1080. 1081. 1082. 1083. 1084. 1085. 1086. 1087. 1088. 1089. lOgO.
1091. 1092. 1093. 1094. 1095. 1096. 1097. 1098. 1099. llOO.
1101. 1102. 1103. 1104. 1105. 1106. 1107. 1108.
1109. 1110. 1111. 1112. 1113.
1114. 1115. 1116. 1117.
1118. 1119.
1120.
1121. 1122.
1123. 1124,. 1125. 1126.
1127. 1128.
1129. 1130.
1131.
. 1132.
Honavar . Nortb Kanara/Mysore IV/563 HonnaH SlJimoga/Mysore V/236 Hooghly-Chinsura HooghlY/West Bengal 1/1(,,) Hosanagar Shimoga/Mysore VI/69 Hosdurga Chitradurga/Mysore V/193 Hoshangabad Hoshangabad/Madhya Pradesh III/281(i)
Hoshiarpur Hoshia"Pur/Punjab II/129 Hoskote Bangalore/Mysore IV /587 Hospet Bellary/Mysore II/89 Hosur Howli
Dharmapuri/Tamil Nadu Kamrup! Assam
Howrah Howrah/West Bengal Hhbbathala Nilgirls/Tamil Nadu H~bl\-Dharwar. DharwarlMysore Hukkeri .
Humbrali . Humnabad Hungund. Hunsur Hussainabad Hyderabad Ichaikaranji
Belgaum/Mysore Satara/Maharashtra Bidar/Mysore Bijapur/Mysore Mysore/Mysore Palamau/Bihar Hyderabad/ Andhra Pradesh Kolhapur/Maharashtra
lchchapuram Srikakulam/ Andhra Pradesh lehhapur Defence Twenty Four Parganas/West
Estate Bengal
IV/213 V/319 I/I(ii) Il/64{d)
11:>6 IV/561 VI/37 IV/231 IV/535
IV/I IV/794 I/5(a) Il/19 IV/264 I/l{xliii)
lehhawar . Idar Igatpuri Iklehra llayankudi
Ilkal Iluppur [mphal
Sehore/Madhya Pradesh V/501 Sabar Kantha/Gujarat IV/368(i) Nasik/Maharashtra IV/141 Chhindwara/Madhya Pradesh III/96(d) Ramanathapuram/Tamil Nadu III/554 Bijapur/Mysore III/265 Tiruehirapalli/Tamil Nadu V/390 Manipur Central/Manipur 1/146
[ndapur Poona/Maharashtra [ndergarh Kota/Rajasthan [ndi • Bijapur/Mysore I. LT. Kanpur Kanpur/Uttar Pradesh l.T.r. Notified Bangalore/Mysore
Area Commi-ttee (Durvani-nagar)
Indore Indore/Madhya Pradesh Irinjalakuda Triehur/Kerala Islampur West Dinajpur/West Bengal Itarsi Hoshangabad/Madhya Pra-
desh
Ithalar lzatnagar Rly.
Settlement Jabalpur • Jabalpur Cantt. Jadabpur
Jadugora Jaffarabad Jafrabad' . Jagadanandapur
Jagadhri . Jagadhri Work-
shop Rly. Colon¥
Iagadishpur
Iagalur Jaga;:lUathgarh
Iagannathna~ar
Nilgiris/Tamil Nadu Bareilly/Uttar Pradesh
Iabalpur/Madhya Pradesh IabaJpur/Madhya Pradesh TwentylFour Parganas/West Bengal
Singhbhum/Bihar North Arcot/Tamil Nadu Amreli/Gujarat Nadia/West Bengal Ambala/Haryana Ambala/Haryana
Howrah/West Bengal Chitradurga/Mysore Twenty Four Parganas/West
Bengal Ranchi/Bihar ..A
V/426 VI/112 IV/434 1/8 (f) 1/7(g)
1/17(i) III/395 IV/282 1II/19(i)
V/229 1/42(c)
I/18(a) 1/18(b) I/l(xli)
V/474 II/l30(b)
V/162 V/302 III/I 61 V/378
V/580 V/346 I/I{xliv)
I/52(b)
Page No.
4
397 420 460
241 491 457 346
307 422 301 393 466 240 297 262 420 489,./
395 418 375 438 247 289 397 244
477 405 387 327
372 345 470 286 473 494 410
250 249
254 358 399 317
460 ~
264
254
255
244
475 307 455
46!i 334 469
481 468 244
266
Town District/State
2
Class/SI. No. of
Table A-IV
1133. Jagathala. Nilgiris/Tamil Nadu Bastar/Madhya Pradesh Shahabad/Bihar Krishna/Andhra Pradesh Ludhiana/Punjab
3
1I/64(c)
lIIil34(i) IV/353 IV/59
1134. 1135. 1136. 1137. 1138. 1139. 1140. 1141. 1142. 1143. 1144. 1145. 1146. 1147. 1148. 1149.
1150. 1151. 1152. 1153. 1154. 1155. 1156. 1157. 1158. 1159. 1160. 1161. 1162. 1163. 1164. 1165. 1166. 1167. 1168. 1169. 1170. 1171. 1172. 1173. 1174. 1175. 1176. 1177. 1178. 1179. !l80. 1181. 1182. 1183. 1184.
'1185. 1186. 1187. 1188. 1189. 1190. 1191. 1192. 1193.
Jagdalpnr Iagdishpur Jaggayyapel Jagraon Iag!ial Jahangirabad Iahazpur Iainagar Jaipur Iais . laisalmer .
Jaitumandi Jajpur
I aiPllr Road Iakhalmandi lalahalli(exclu-
ding H.M.T. Township)
Jalakantapuram. Jalalabad . Jalalabad . Ialalpore Jalalpur Ialaun Ialesar Ialeswar Jalgaon Ialgaon Jalna Ialor Jalpaiguri .
lamadoba Jamai Iamalpur . Iambusar . Jamjodhpur
Iamkhandi Jammalamadugu Jammu Iammu Cantt. Jamnagar Jamshedpur Iamtara Jamui lamuria landiala Iangaon Iangaon Jangipur Iansath Iaora
Karimnagar/Andhra Pradesh Bulandshahr/Uttar Pradesh Bhilwara/Rajasthan Darbhanga/Bihar laipur/Rajasthan Rae Bareli/Uttar Pradesh JaisalmerjRajasthan Bhalinda/Punjab Cuttack/Orissa CuttacklOtissa Hisar /Raryana Bangalore/Mysore
Salem/Tamil Nadu Firozpur/Punjab Shahjahanpur/Uttar Pradesh
V~lsad/Gujarat
Faizabad/Uttar Pradesh Ialaun/Uttar Pradesh Etah/Uttar Pradesh Balasore/Orissa BUldhar.a/Maharashtra Ialgaon/Maharashlra Auranga bad/Maharashtra JalorjRajasthan Ialpaiguri/West Bengal DhanbadfBihar Chhindwara/Madhya Pradesh Monghyr/Bihar Bharuch/Gujarat Jamnagar/Gujarat Bijapur/Mysore Cuddapah/Andhra Pradesh Iammu/Jammu & Kashmir JammnjJammu & Kashmir Jamnagar/Gujarat Singnbhum/Bihar Santal Pargan'ls/Bihar Monghyr/Bihar Burdwan/West Bengal Amritsar/Punjab Karimnagar / Andhra Pradesh WarangaljAndhra Pradesh Murshidabad/West Bengal Muzaffarnagar/Uttar Pradesh Radam/Madhya Pradesh
laridih Bazar Hazaribagh/Bihllr Iarikondalampatti Salem/Tamil Nadq
Jasdan Raikot/Gujarat Iashpur Nagar Jasidih Iaspur Iaswantnagar Jatni Iaunpur . Iawad Jawaharnagar
(Guiarat Refinery)
RaigarhjMadhya Pradesh Santal Parganas/Bihar Naini Tal/Uttar Pradesh Etawah/Uttar Pradesh Puri/Orissa launpur/Uttar Pradesh
Mandsaur/Madhya Pradesh Vododara/Gujarat
lIIil97
IlIj250 IlIi515 V/I02 V/12 1/14(a) IV/541 IV/215 IV/28(i) IV/204 IVJ426(i)
VI/63 In (e)
Vj5
IV/727(i) IV/718 Il/36(b) IV/383 IV/23 IV/IOI V/455 IV/345 1/132 IIjl4
IV/294 11/145
1/27(k) IV/603 II/109 III/428 IV,214
1II/267 III/581 1/86(a) Ij86(b)
1/58 (a)
I/25(a) V/198
I1I/276 V/56 IV/406 IUj463
IV/I 89 IlI/270
V/269 III/128(i) II/69(a) I/29(c)
IV/359 V/295 IIIj31(b)
IV/478 IV/695 III/269(i) II/33
IV/836(i) V/594
Page No.
4
297 ,331 404 380 338 343 368 451 445
253 419 394 377
393 41\)
191 249
444 433 432
292 407 377
384 474'
403 283 289 399 309 259 423 304 361 393
345 374
275 275 268
• 258
458 346 448
409
364
391
345 462 330 298 259 405
464 319
414 431 345 292 441 482
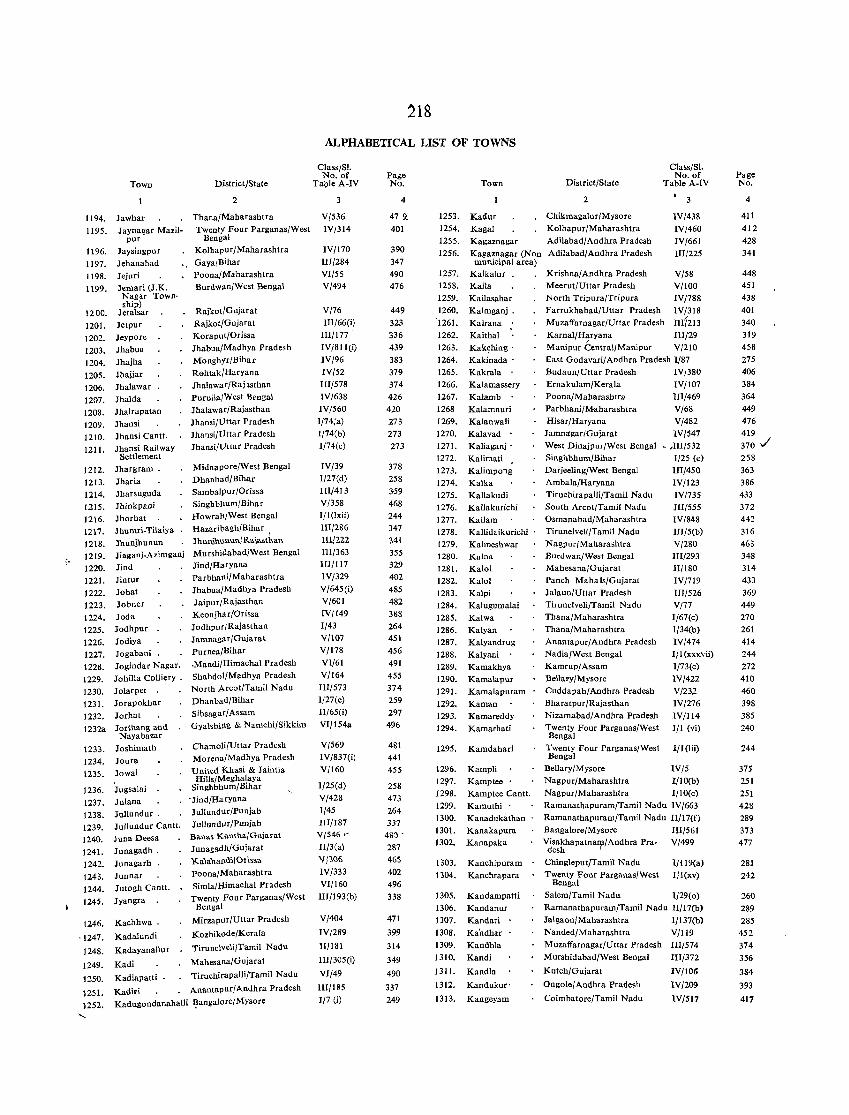
Town
1194. lawhar
1195.
1196.
1197.
1198.
1199.
1200.
1201.
1202.
1203. 1204.
1205.
1206. 1207.
1208.
1209. 1210.
1211.
1212.
1213.
1214.
1215. 1216.
1217. 1218. 1219.
1220. 1221.
1222.
1223. 1224.
1225.
1226. 1227.
1228.
1229.
Jaynagar Mazil-pur
Jaysingpur
Jehanabad Jejuri
lemar; (J.K. Nagar Town· ship)
letalsar
Jetpur
Jeypore
Jhabua
Jhajha lhajjar
Jhalawar lhalda lhalrapatan
Jhansi lhansi Cantt.
Jhansi Railway Settlement
Jhargram .
Jharia Jharsuguda
Jhinkpani
lhorhat lhumri-Tilaiya
lhunihunun Jiaganj .. Azimganj
Jind
Jintur
Jobat Jobner
Joda Jodhpur
Jodiya
Jogabani Jogindar Nagar. Johilla Colliery.
1230. Jolarpet . 1231. Jorapokhar
1232. Jorhat 1232a Jorthang and
Nayabazar
1233. Jo,himath
1234.
1235.
1236.
1237.
1238.
1239. 1240.
1241.
1242.
1243.
1244.
1245.
1246.
Joura
lowai
Jugsalai
Julana JuUundur . JuJlundur Cantt.
luna Deesa Junagadh .
Junagarh .
lunnar Jutogh Cantt.
Jyangra
Kachhwa.
Kadalundi
KadayanaUUI
Kadi
Kadiapatti .
District/State
2
Thana/Maharashtra Twenty Four Parganas/West
Bengal KolhapurjMaharashtra
GayalBihar Poona/Maharashlra BurdwanjWest Bengal
Rajkot/Gujarat Rajkot/Gujarat
Koraput/Orissa JhabuajMadhya Prades h
Monghrr/Bihar Rohtak/Haryana
Jhalawar/Raj lsthan Purulia/West Bengal JhalawarjRajasthan
Jhansijl)ttar Pradesh Jhansijl)ttar Pradesh
Jhansijl)ttar Pradesh
MidnaporejWest Bengal
DhanbadjBihar
Sambalpur IOrissa SinghblmmjBihar
Howrah/West Bengal
HazaribaghlBihar , Ihunihnuun/RaiMthan MurshidabadjWest Bengal
JindjHaryana ParbhaIlijMaharashtra JhabuajMadhya Pradesh
Jaipur/Rajasthan
Keonjhar/Orissa Jodhpur/ Rajasthan
Jamnagar/Gujarat
Purnea/Bihar .Mandi/Himachal Pradesh
ShahdoljMadhya Pradesh North ArcotjTamil Nadu
DhanbadjBihar SibsagarjAssam
Gyalshillg & NamchilSikkim
Chamoli/Uttar Pradesh Morena/Madhya Pradesh
United Khasi & Jaintia Hills/Meghalaya
Singhbhum/Bihar . JindjHaryana
Jullundor/Punjab JullundllrjPunjab Banas Kantha/Gujarat
JunagadhjGujarat
Ra1aband\jOrhsa PoonajMaharashtra
Simla/Himachal Pradesh Twenty Four ParganasjWest
Bengal
MirzaptlrjUttar Pradesh
Kozhikode/Kerala
TiruneIVelilTamil Nadu
MahesaoajGujarat
TiruchirapallijTamil Nadu
,1247.
1248.
1249.
1250.
1251.
1252 •
Kadiri Anantapur/AnJhra Pradesh
Kadu!londanahalli ~angalore/Mysore .....
218
ALPHABETICAL LIST OF TOWNS
ClassjSI. No. of
Taple A-IV
3
V/536 IVj314
IV/170 1Il/284
VI/55 VI494
V/76 IIlj66(i)
III/I77 .
IV/SII(i) IVj96
IV/52
III/578
IV/638 IVj560
1/74;a) Ij74(b)
1/74(c)
IVj39 Ij27(d)
I1I/413 V/358 1/1 (I xii)
llIj286
lU/222
1Il/363 IIIj II 7
IVjJ29
V/645 (i) Vj601
IV/149 Ij43
VII07 Vjl78
Vlj61 Vjl64
III/573 Ij27(e)
II/65(i)
VII154a
V/569
IV/837(i) Vjl60
1/25(d) Vj428
1/45
HI/187 V/546 ,...
II/3(a) Vj,Of,
IVj333
VI/160
1II/193(b)
V/404
IV/289
IljlSI
III/J05(i)
Vlj49
IIII185 Ij7 (i)
PaiSe No.
4
47 2. 401
390 347
490 476
449
323
336
439
383
379
374
426 420
273 273
273
378 258
3-59 468
244
347
341
355 329
402
485
482
388
264 451
456
491
455
374
259
297
496
481
441
455
258 473
264
337 48~ .
287
465
402
496
338
471
399
314
349
490
337
249
Town District/State
2
Cla,sjSI. No. of
Table A-IV
1253. Kadur ChikmagalurjMysore
Kolhapur/Maharashtra AdilabadjAndhra Pradesh
IVj438
IV/460
IV/661
IIl/225
1254. 1255.
1256.
1257. 1258. 1259.
1260. '1261.
1262. 1263.
1264.
1265. 1266.
1267. 1268
1269. 1270.
1271. 1272.
1273.
1274. 1275.
1276. 1277.
1278. 1279. 1280.
1281. 1282. 1283.
1284. 1285.
1286. 1287. 1288.
1289. 1290.
1291.
1292. 1293.
1294.
1295.
1296.
12\17. 1298. 1299.
1300.
1301. 1302.
1303.
1304.
1305.
1306.
1307.
1308.
1309. 1310.
1311.
1312.
1313.
Kagal Kagaznagar Kagaznagar (Non AdilabadjAndhra Pradesh
municipal area) Kaikalur . Krishna/Andhra Pradesh V/58
V/l00 Kaila Kailasahar Kaimgaoj.
Kairana .
Kaithal
Kak~hing .
Kakinada' Kakrala .
Kalamassery Kalamb .
Kalamnuri
Kalanwali Kalavad .
Kaliaganj'
Kalimati Kalimpong
Kalka Kallakudi
Kallakurichi
Kallam Kallid.ikurichi Kalmeshwar Kalna
Kalol Kalol Kalpi Kalugumalai
Kalwa Kalyan
Kalyandrug
Kalyani Kamakhya Kamalapur
Kamalapuram
Kaman Kamareddy
Kamarhati
Kamdahari
Kampli Kamptee
Kamptee Cantt. Kamuthi .
Kanadukathan
Kanak.pura Kanapaka
Kanchipuram
Kanchrapara
Kandampatti
Kandanur
Kandari
Kandhar Kandhla
Kandi
Kandla
Kandukur'
Kangeyam
Meerut/Uttar Pradesh
North Tripura/Tripura IV j788
FarrukhabadjUttar Pradesh IVj318
Muzaffarnagar/Uttar Pradesh III!213
Karnal/Haryana IIIj29
Manipur CentraljManipur Vj210 East Godavarij Andhra Pradesh Ij87
BudaunjUttar Pradesh lVj380 ErnakulamjKerala IVjl07
PoonajMaharashtra III/469
ParbhanijMaharashtra Vj68
HisarjHaryana V/482
Jammtgar/Gujarat lV/547 West Dinajpur/West Bengal SinghbhumlBihar
Darjeeling/West Bengal AmbalajHaryana
TiruchirapallijTamii Nadu South ArcotfTamil Nadu
Osmanabad/Maharashtra Tirunelveli/Tamil Nadu Nagpur/Maharashtra BurdwanjWest Bengal
MahesanalGujarat Panch Mahals/Gujarat JaJaunjU ttar Pradesh
Tirunelveli/Tamil Nadu ThanajMaharashtra
Thana/Maharashtra AnantapurjAndhra Pradesh
NadialWest Bengal KamrupjAssam BellarylMysore
Cuddapahj Andhra Pradesh BharatpurjRajasthan
NizamabadjAndhra Pradesh
Twenty Four Parganas/West Bengal
Twenty Four Parganas/West Bengal
BellaryjMysore
N agp ur jMaharashtra
- ,III/532 Ij25 (e)
IIIj450
IVjl23 IVj735
IIIj555
IVj8118 IIIj5(b)
Vl280 IIIj293
IIjl80
IV/719
III/526 Vj77
I/67(c) Ij34(b)
IVj474
1/1 (xxxvii)
Ij73(c)
IVj422
V/23]. IVj276
IV/114 1/1 (vi)
I/I(lii)
IV/5 IjlO(b)
NagpurjMaharashtra IjIO(c)
Ramanathapuram/Tamil Nadu IVj663 Ramanathapuram/Tamil Nadu II/17(f)
BangalorelMysore III/56 I
VJ~~~hapatna't'/Andhra Pra- Vj499
ChingleputjTamil Nadu
Twenty Four Parganas/West Bengal
Salem/Tamil Nadu
I/1I9(a) Ij I (xv)
1/29(0) RamanathapuramjTamil Nadu lIjI7(b)
Jalgaon/Maharashtra I/137(b)
Nanded/Maharashtra Vj119
MuzaffarnagarjUttar Pradesh IIIj574
MurshidabadjWest Bengal III/372
KutchjGujarat
Ongolel Andhra Pradesh
Coimbatore/Tamil Nadu
IVjlOG
IV/209
IVj517
Page No.
4
411
412
428
341
448
451
438
401
340 319 458
275
406 384
364 449
476
419
370 ../
258
363 386
433 372 442
316
463 348
314
433
369 449
270 261 414
244
272 410
460
398 385
240
244
375
251
251
428
289
373
477
281
242
260
289
285
452
374
356
384
393
417
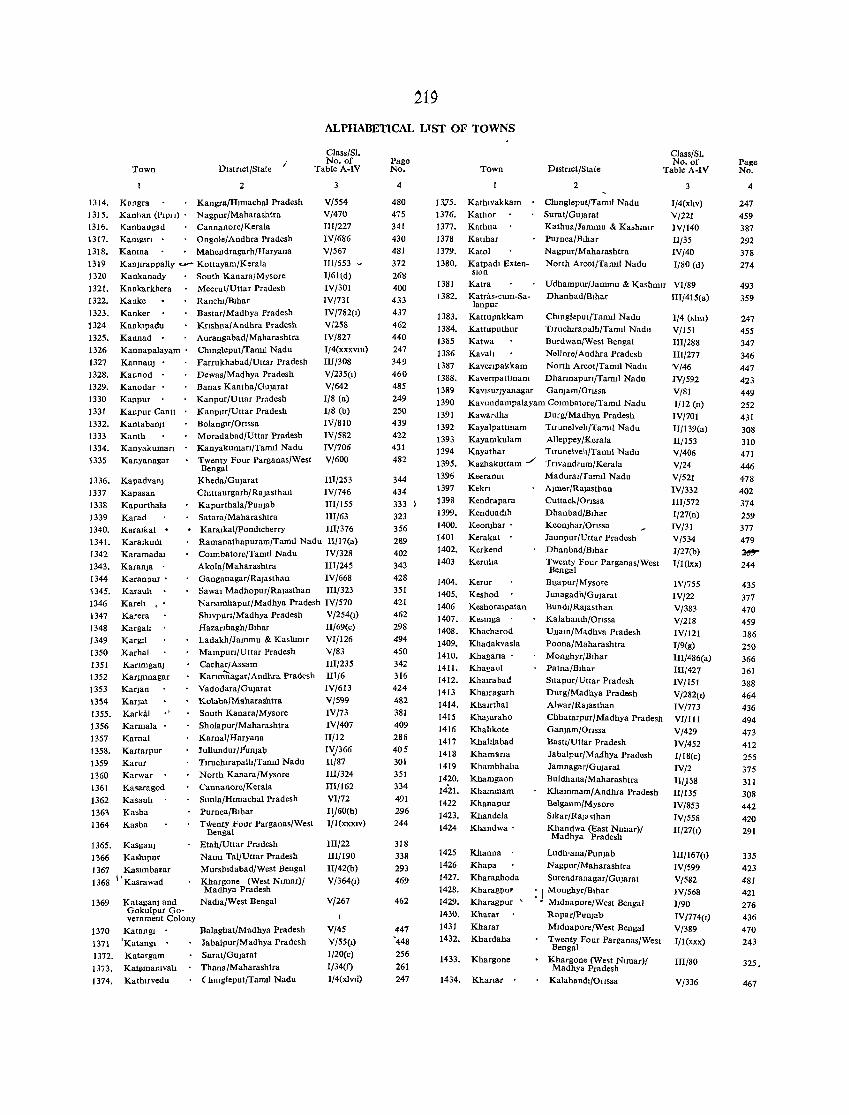
219
ALPHABETICAL LTST OF TOWNS
1314. 131 S. 1316.
1317. 1318.
1319 1320
1321. 1322.
1323.
1324 1325.
1326 1327
1328. 1329.
1330 1331 1332. 1333 1334.
1335
1336. 1337
1338
1339 1340. 1341. 1342
1343.
1344 1345.
1346 1347
1348 1349
1350
1351 1352
1353 1354
1355.
1356 1357
1358.
1359 1360
1361
1362 1361 1364
Town
Kengra Kanhan (Plpll) Kanbangad Kamglrl •
Dlstflct/State
2
Kangra/Hlmachal Pradesh
Nagpur/Maharashtra Cannanore/Kerala Ongole/Andhra Pradesh
Class/SI. No. of
Table A-IV
Kanma Mahendragarh/Haryana
V/554 V/470 JII/227
IV/686
V/567 II1/553 I/61(d)
IV/301 IV/731
IV/782(I)
V/258 IV/827 I/4(xxXVlll)
III/308 V/235(I)
V/642
Kanjlrappally ..._.. Kottayam/KeraJa
Kankanady South Kanara/Mysore
Ka nkarkhera
Kanke Kanker
KankIpadu Kannad •
Kannapalayam .
KannauJ
Kannod
Kanodar Kanpur Kanpur Cantt
Kantabanjl Kanth Kanyakumarl
Kanyanagar
Kapadvanj
Kapasan
Kapurthala Karad Ktlrmkal •
KaralkudI
Karamadal Karanja . Karanpur .
Karauh
Kareh • Karera Kargah KargIl
Karhal Karrmganj Karynnagar
Kanan Karlat Karkal .'
Karmala
Kamal Kaftarpur
Karur
Karwar Kasaragod
Kasauh
Kasba
Kasba
Meerut/Uttar Pradesh Ranclu/Blhar Bastar/Madhya Pradesh
Knshna/Andhra Pradesh Aurangabad/Maharashtra
Chmgleput/Tamll Nadu Farrukhabad/Uttar Pradesh
Dewas/Madhya Pradesh Banas Kantha/Oujarat
Kanpur/Uttar Pradesh Kanpur/Uttar Pradesh
Bolanglr/OrISsa Moradabad/Uttar Pradesh Kanyakuman/Tanul Nadu
Twenty Four Parganas/West Bengal
Kheda/Gularat ChIltaurgarh/ Rajasthan
Kapurthala/Punlab Satara/Maharashtra
1/8 (a)
1/8 (b)
IV/810
IV/582 IV/706 V/600
IIl/253
lV/746
IIl/l55 III/63
Kara,kal/Pond,cherry lII/376 Ramaoathapuram/Tam,l Nadu II(17(a)
COImbatore/TamIl Nadu IV/328 Akola(Maharashtra Ill/245 Ganganagar/Rajasthan IV/668
Sawa, Madhopur/Rajaslhan Ill/323 NarSIfnhapur/Madhya Pradesh IV/570 Sh,vpUrI/Madhya Pradesh V /254(1)
HazarIbagh/Blhar II/69(c) Ladakh/Jammu & KashmIr VI/126
MampurI/Uttar Pradesh V/83
Cachar/Assam Kanmrtagar/Andhra Pradesh
Vadodara/Gujarat
KolabalMaharashtra South Kanara/Mysore Sholapur/Maharashtra
Karnal/Haryana 1ulIundur/P'unjab Tuuchlrapalh/Tanul Nadu
North Kanara/Mysore
Cannanore/Kerala SImla/Hrmachal Pradesh
Purnea/Blhar TwentY Four Parganas/West
Bengal
III/235 Ill/6 IV/613 V(599
IV/73 IV/407
II/12
1'-:/366 II/87 III/324
III/162
Vl/72
11I60(b) 1/1 (XXXIV)
1365. Kasganj
1366 KashIpur
Etah/Uttar Pradesh NamI Tal/Uttar Pradesh
Mursludabad/West Beogal Khargone (West Nlmar)/ Madhya Pradesh
II1/22
III/I 90 II/42(h)
V/364(1) 1367 Kasrmbazar 1368 I 'Kasrawad
1369
1370
1371
1372.
1373.
1374.
Katagaoj and Gokulpur Government Colony
NadIa/West Bengal
Katangl' Balaghat/Madhya Pradesh 'Katang,· Jabalpur(Madhya Pradesh
Katargam Surat/Gujarat K.uemamvah Thana/Maharashtra Kathlrvedu (hlllgieput/Tamll Nadu
V/267
V/45
V/55(1) I/20(e)
I/34(f)
I/4(xlvti)
Page No.
4
480 475 341
430 481
372 268
400
433 437
462 440 247
349 460
485 249
250 439 422 431 482
344
434 333
323 356
289 402 343
428 351 421
462
298 494
450 342 316 424
482
381 409
288 405
301 351 334
491
296 244
318 338
293 469
462
447 -448
256
261
247
13.75. 1376. 1377. 1378
1379.
1380.
1381 1382.
1383. 1384.
1385 1386
1387 1388.
1389 1390
1391 1392
1393 1394 1395.
1396
1397 1398 1399. 1400. 1401
1402. 1403
1404.
1405. 1406
1407. 1408.
1409. 1410. 1411. 1412.
1413 1414.
1415 1416
1417
1418 1419
1420. 1421.
1422
1423. 1424
1425
1426
1427. 1428.
1429.
1430. 1431
1432.
1433.
1434.
Town
Kathlvakkam Kathor Kathua Kahhar
Katol Katpadl Exten
SIOn
D,strIct/State
2
Chmgleput/Tamll Nadu
Surat/GuJarat Kathua/Jamrou & KashmIr Purnea/Blhar
Nagpur/Maharashtra
North Areot/TamIl Nadu
Class/SI. No. of
Table A-IV
3
J/4(xhv)
V/221 IV/140
II/35 IV/40 1/80 (d)
Katra Katras-cum-Sa-
Udhampur/Jammu & KashmIr Vl/89
lanpur Dhanbad(Blhar III/415(a)
Kattupakkam Kattuputhnr
Katwa
Chmgleput/TamII Nadu
Tlruciurapalh/Tamll Nadu Burdwan/West Bengal
Kavah NelJore/Andhra Pradesh Kavenpakkam North Arcot/TamIl Nadu
Kavenpattmam DharmapurI/TamIl Nadu KaVISUrjyanagar Ganjam/Onssa
Kavundampalayam COImbatore/Tamii Nadu Kawardha Durg/Madhya Pradesh Kayalpattmam Kayamkulam Kayathar Kazhakuttam ./
Keeranur
Tuunelveh/Tam,l Nadu AlIeppey/KeraJa Tlrunelveh/Tamll Nadu Tnvandrum/KeraJa
MaduraI/TamIl Nadu Kekn Kendrapara
Kenduadlh KeonJhar .
Kerakat Kerkend
Keruha
Kerur Keshod Keshoralpatan Kesmga .
Khacharod
Khadakvasla
Khagana' KhagauI
Khauabad Khauagarh
Khauthal Khajuraho
KhalIkote KhalIlabad
Khamana
Khambhaha Khamgaon
Khammam Khanapur
Khandela
Khandwa'
Khanna .
Khapa
Kharaghoda Kharagpur
Kharagpur '
Kharar
Kharar
Khardaha
Khargone
Khanar
Ajmer/RaJasthan Cuttad./Onssa
Dhanbad/Blhar Keonjhar/Onssa
Jaunpur/Uttar Pradesh Dhanbad/B,har
Twenty Four Parganas/West Bengal
Bljapur/Mysore
J unagadh/GUlarat Bundl/Rajasthan
Kaiahandl/Onssa
Ujjam/Madhva Pradesh PooDa/Maharashtra Monghyr/Blhar Patna/Blhar
Sltapur/Uttar Pradesh Durg/Madhya Pradesh
Alwar/Rajasthan
Chhatarpur/Madhya Pradesh Ganjam/OrIssa
Basll/Uttar Pradesh
JabaJpur/Ma.dhya Pradesh Jamnagar/Gujarat
Buldhana(Maharashtra
Khammam/Andhra Pradesh Belgaum/Mysore
SIkar/RaJa'than Khandwa (East Nrmar)1 Madhya Pradesh
Ludh'ana/Punjab
Nagpur/Maharashtra
Surendranagar/Gujarat
'j Monghyr/B,har • Mldnapore/West Bengal
Ropar/Punjab
M,dnapore/West Bengal
Twenty Four Parganas/West Bengal
Khargone (We51 N,mar)/ Madhya Pradesh
KalahandI/OrISSa
1/4 (Xllll)
V/151
III/288 III/277 V/46
IY/592
V/81 J/12 (n)
1V/701
II/139(a) II/153 V/406
V/24
V/521 IV/332
lIJ/572 1/27(n)
IV/31 V(534
1/27(b)
1/I(1xx)
1\'/755
IV/22
V/383 V/2I8 IV/121 1/9(g)
1II/486(a) III/427
IV/151 V/282(I)
JV/773 VI/IJ 1
V/429
1V/452 I/18(c)
IV/2
II/.158 II/135 IV/853
IV/558 II/27(I)
1II/167(1)
IV/599
V/582 IV/568 1/90
1V/774(I) V/389 1/1 (xxx)
III/80
V/336
Page No.
4
247
459 387
292
378 274
493
359
247 455
347
346 447
423
449 252 431
308 310 471 446
478
402 374
259 377 479
3!I'r 244
435
377 470 459
386 250
366 361
388 464
436
494 473
412 255
375
311
308 442
420
291
335
423
481 421
276 436
470
243
325,
467
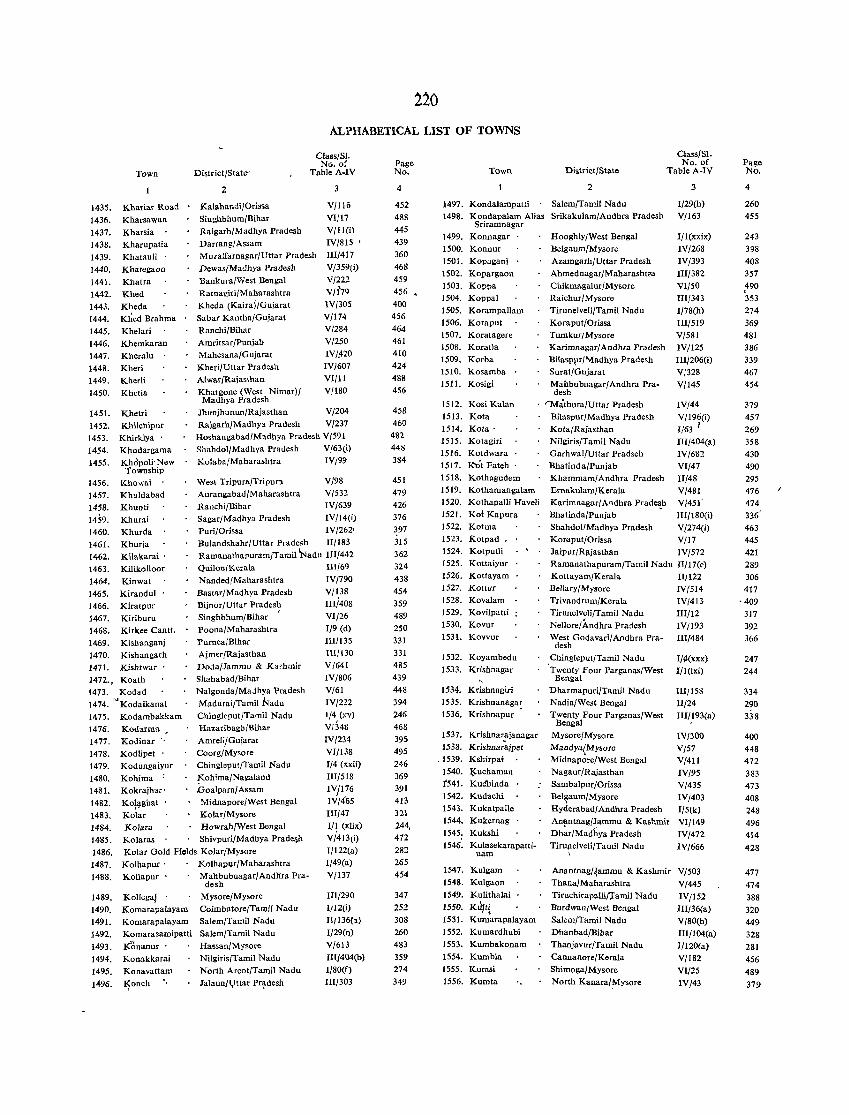
220
ALPHABETICAL LIST OF TOWNS
1435. 1436. 1437. 1438. 1439. 1440. 1441. 1442. 1443. 1444. 1445. 1446. 1447. 1448.
1449.
1450.
1451. 1452.
1453. 1454. 1455.
1456. 1457. 1458. 1459. 1460. 1461. 1462.
1463. 1464.
1465. 1466. 1467. 1468. 1469.
1470.
Town
Khariar Road Kharsawan Kharsia Kharupatia Khatauli . Khategaon
Khatra Khed Kheda Khed Brahma Khelari Khemkaran Kheralu Kheri Kherli Khetia
Khetri Khilchipur
Khirkiya .
Khodargama Khopoli' New Township
Khowai .
Khuldabad Khunti Khurai Khurda Khuria Kilakarai' Kilikalloar Kinwat Kirandul Kiratpur Kiriburu Kirkee Cant!. Kishanganj Kishangarh
1471. Kishtwar' 1472., Koath 1473. Kodad 1474. c"Kodaikanal
1475. Kodambakkam 1476. Kodarma
Kodinar '. Kodlipet . Kodungaiyur Kohima :
Kokraihar'
Kol~ghat
Kolar
District/State-
2
Kalahandi/Orissa Singhbhum/Bihar Raigarh/Madhya Pradesh Darrang/Assam
Class/Sl. NG. of
Table A-IV
3
V/116 VI/17 V/I1(i) IV/81S •
MUlaffarnagar/Uttar Pradesh Dewas/Madhya Pradesh
IlI/4J7 V/359(i)
V/222
VIl'79 IV/30S V/174 V/284 V/250 IV/fl20 IV/607
Vl/ll V/180
Bankura/West Bengal Ratna giri/M aharas htra Kheda (Kairai/Gujarat Sabar Kantha/Guiarat Ranchi/Bihar Amritsar/Punjab Mahesana/Gujarat Kheri/Uttar Pradesh Alwar/Rajasthan Khargone (West Nimar)/ Madhya Pradesh
Jhunjhun un /Raiasthan V/204
Rajgarh/Madhya Pradesh V /237 Hoshangabad/Madhya Pradesh V/591 Shahdol/Madhya Pradesh V/63 (i)
Kolaba/Maharashtra IV/99
West Tripura/Tripun Aurangabad/Maharashtra Ranchi/Bihar Sagar/Madhya Pradesh
V/98 V/532 IV/639 IV/14(i)
Puri/Orissa IV /262' Bulandshahr/Uttar Pradesh II/183 Ramanathapuram/Tamil Nadu III/442 Quilon/Kerala IIl/69
Nanded/Maharashtra 1V/790 Bastar/Madhya Pradesh V/138
Bijnor/Uttar Prades~ Iui408 Singhbhum/Bihar VI/26 Poona/Maharashtra 1/9 (d)
Purnea/Bihar Ajmer/Rajasthan Doda/Jammu & K.,hmir Shahabad/Bihar Nalgonda/MaJhya l'radesh MaduraijTamil Nadu Chingleput/Tamil Nadu HazaribagbJBihar Amrel;jGujarat Coorg/Mysore Chingiepul/Tamil Nadu
!<ohima/Nagaland .Goal para/ Assam Midnapore/West Bengal Kolar/Mysore
1477. 1478. 1479. 1480. 1481. 1482.
1483. 1484. 1485. 1486. 1487. 1488.
Kalara Hawrah/West Bengal
IlII135 IllJI30 V/641
IV/80G Vf61 IV/222 1/4 (xv)
V/348 IV/234 VI/l38 1/4 (xxii)
I1I/518
IVJI76 Iv/465 UIJ47
II! (xlix)
V/413(i) 1/122(a) 1/49(a) V/137
1489. 1490. 1491. 1492.
1493. 1494. 1495. 1496.
Kolaras Shivpuri/Madhya Prade&h Kolar Gold Fields Kolar/Mysore Kolliapur .
KoUapur
Kollega) Kornarapalayam Komarapalayam
Kolhapur/Maharashtra Mahbubnagar/AndHra Pra-
desh Mysore/Mysare CoirnbatorefTa!l}iJ Nadu
Salem/Tamil Nadu Komarasamipatti Salem/Tamil Nadu rC~nanur . Koaakkarai Konavattam ~onch ~.
Hassan/Mysore Nilgiris/Tamil Nadu North Arcot/Tamil Nadu
Jalaun/Vttar Pr~desh
lIIJ290
I/12(i)
II/136(1) I/29(n)
VJ613
m/404(b) I/80(f) III/303
Page No.
4
452 488 445 439
360 468 459 456
400 456 464 461 410 424 488 456
458 460
482 448
384
451 479 426 376 397 315 362 324 438 454
359 489 250 331
331 485
439 448
394 246
468 395 495
246 369 391 413
321 244, 472 282
265
454
347 252
308 260 483 359 274 349
Town District/State
2
1497. KondaJampatti Salem/Tamil Nadu
Class/SI. No. of
Table A-IV
1498. Kondapalam Alias Srikakulam/Andhra Pradesh Sriramnagar
3
I/29(h) V/163
1499. Konnagar Hooghly/West Bengal I/1(xxix) IVf268 IVf393 III/382 VI/50 m{343 I/78(b)
III/519 V/581 IV/125 Ill/206(i) V/328 V/145
1500. Konnur 1501. Kopaganj 1502. Kopargaon 1503. Koppa 1504. Koppal 1505. Korampallam 1506. Koraput 1507. Koratagere 1508. Koratla 1509. Korba 1510. Kosamba 1511. Kosigi
1512. Kosi Kalan 1513. Kota 1514. Kota' ISIS. Kotagiri 1516. Kotdwara 1517 . .K:Ot Fateh
Belgaum/Mysore Azamgarh/Uttar Pradesh Ahmednagar/Maharashtpa Chikmagalur/Mysore Raichur/Mysore Tirunelveli/Tamil Nadu Koraput/Orissa Tumkur/ Mysore Karimnagar/Andhra Pradesh Bilaspl;lr/Madhya Pradesh Surat/Gujarat Mahbubnagar/Andhra Pradesh
. "'Mathura/Uttar Pradesh Bilaspur/Madhya Pradesh Kota/Rajasthan Nilgiris/Tamil Nadu Garhwal/Uttar Pradseh Bhatinda/Punjab Khammam/Andhra Pradesh
IV/44 V/196(i) I{63 I
m/404(a) IV/682 VI/47 II/48 1518. Kothagndem
1519. Kothamangalam 1520. Kothapalli Haveli 1521. Ko! Kapura
Ernakulam/Kerala V/481 Karimnagar/Andhra Pradesh V/451 Bh.tinda/Punjab - IU/180(i)
1522. Kotrna 1523. Rotpad 1524. Kotputli 1525. Kottaiyur 1526. Kottayam 1527. Kottur 1528. Kovalam 1529. Kovilpatti 1530. Kovur 1531. Kovvur
1532. Koyambedu 1533. Krishnagar
1534. Krishnagiri 1535. Krishnanaga~
1536. Krishnapur
1537. Krishnarajanagar 1538. Krishnar'"ajpet
.1539. Kshirpai 1540. ~uchaman 1'541. Knchinda .
1542. Kudachi 1543. Kukatpalle 1544. Kukernag . 1545. Kuksbi 1546. Kulasekarapatti
narn
1547. Kulgam 1548. Kulgaon 1549. Kulithalai
1550. Kd/t! 1551. Kumarapalayam 1552. Kumardhubi 1553. Kumbakonam 1554. Kumbla 1555. Kums; 1556. Kumta "
ShahdollMadhya Pradesh V(274(i) Koraput/Orissa V/17 Jaipur/Rl'jasthan IV/572 Ramanathapuram/Tamil Nadn II/17(c) Kottayam/Kerala II/122 BellaryfMysore IV/514 Trivandrum/Kerala IV/413 Tirunelveli/Tamil Nadu Nellore/Andhra Pradesh West Godavari/Andhra Pra-
desh Chingleput/Tamil Nadu
'Twenty Four Parganas/West Bengal
Dharmapuri/Tamil Nadu Nadia/West Bengal Twenty Four Parganas/West
Bengal Mysore/Mysore Maadya/Mysare Midnap~re/West Bengal Nagaur/Rajasthan Sambalpur/Orissa Del.yaum/Mysore Hyderabad/Andhra Pradesh Anantnas/Jammu & Kashmir Dh~r/Madhya Pradesh Tiru,p.elveli/Tamil Nadu
\
Anantnag/{ammu & Kashmir Thana/Maharashtra Tiruchirapalli/'Jamil Nadu Burdwan/West Bengal Salem/Tamil Nadu Dhanbad/Bihar Thanjavur/Tamil Nadu Cannanore/Kerala Shimoga/Mysore North Kanara{Mysore
III/12 IV/193 III/484
I/(I(xxx)
1/1 (Ixi)
III/158 II/24 1II/193(a)
IV/300 V/57 V{411
IV/95 V/435 IV/403 I/5(k) VI/149 IV/472 IV/666
V/503 Vf445 IV/152 1II/36(a) V/80(b) IlIfl04(a) 1/120(a)
V/182 VI/25 IV/43
Page No.
4
260 455
243 398 408 357
~90 353 274
369 481 386 339 467 454
379 457 269 358 430 490 295 476 474 336'
463 445 421 289 306 417
'409 317
392
366
2.47 244
334
290
338
400 448 472 383 473
408
248
496 414
428
477
474
388 320 449 328 281 456
489
379
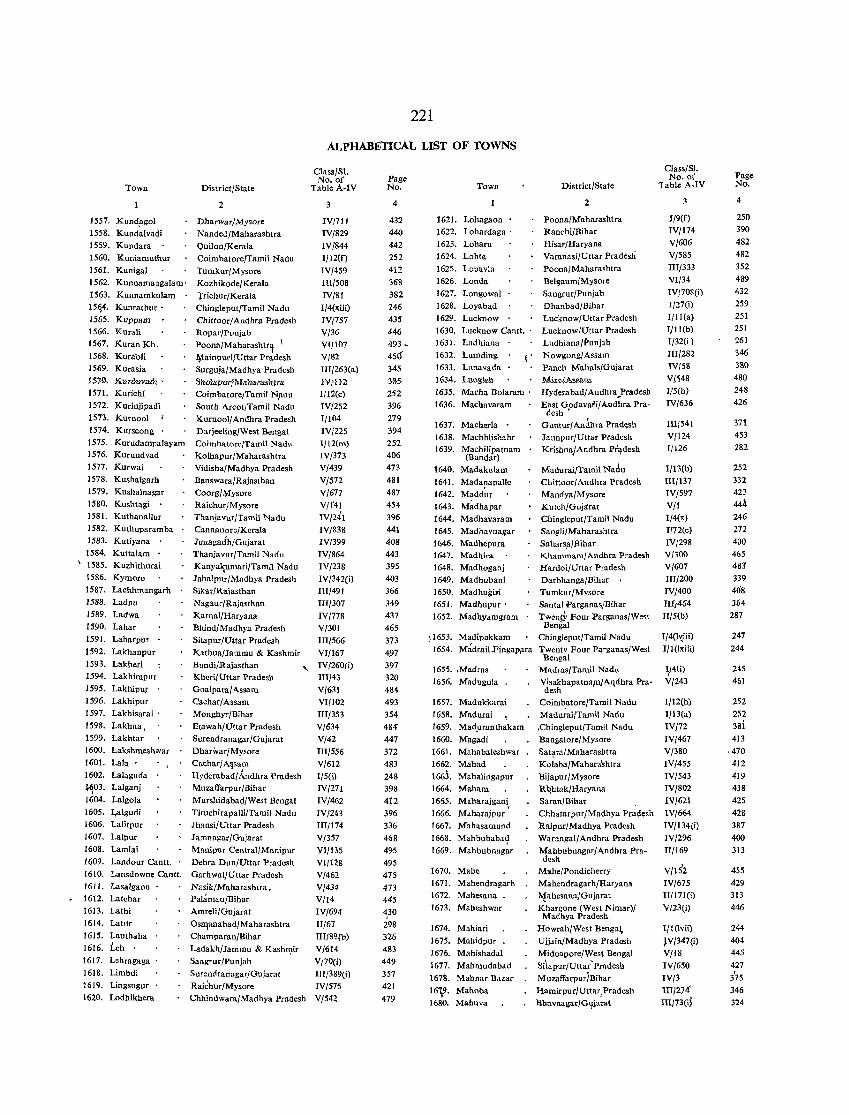
Town
1557. Kund!,l101
1558. Kundalvadi 1559. Kundara
1560. Kuniamuthur 1561. Kunigal
1562. Kunnamangalam'
1553. Kunnamkulam
151j4. Kunrathur' 1565. Kuppam 1566. Kurali
1567. Kuran Kh.
1568. Kuriioli
1569. Kurasia 1510. Kllnkmml-1571. Kurichi
1572. Kurinjipadi 1573. Kurnool 1574. Kurseong .
1575. Kurudampalayam 1576. Kurundvad 1577_ Kurwai
1578. Kushalgarh 1579. Kushalnagar 1580_ Kushtagi .
1581. Kutbanallur 1582. Kutbuparamba 1583. Kutiyana -1584. Kuttalam .
\ 1585. Kuzhithurai
1586. Kymnre
1587_ Lachhmangarh 1588. Ladnu
1589. Ladwa 1590_ Lahar
1591. Laharpur
1592. Lakhanpur 1593_ Lakheri 1594_ Lakhimpur
1595. Lakhipuf . 1596_ Lakhipur
1597_ Lakbisarai .
1598. Lakhna. 1599. Lakhtar
1600. Lakshmeshwar 1601. Lala .
1602. Lalaguda
~03. Lalganj 1604. Lalgola
1605. I.,algudi 1606. Lalitpur 1607_ Lalpur
1608. Lamlai
1609_ Landour Cantt. 1610. Lansdowne Cantt.
1611. Lasalgaon 1612_ Latehar
1613. Lathi
1614. Latur
1615. Lauthaha 1516. Leh .
1617. Lehragaga
1618. Limbdi 1619. Lingsugur
1620. Lodhikhera
221
ALPHABETICAL LIST OF TOWNS
District/State
2
Dharwar/Mysore
Nanded/Maharashtra
Quilon/Kerala Coimhatore/Tamil Nadu
Tumkur/Mysore
Kozhikode/Kerala
Trichur/Kerala Chingleput/Tamil Nadu
Chittoor/Andhra Pradesh Ropar/Punjab
Poona/Maharashtr~ I
¥ainpuri/Uttar Pradesh Surguja/Madhya Pradesh
Sh&~PU-ii~~f8ha-r~}rtr8
Coimbatore/Tamil N.adu Soutb Areot/Tamil Nadu
Kurnool/Andhra Pradesh
Darieeling/West Bengal Coimbatore/Tamil Nadu Kolhapur/Mabarashtra
Vidisha/Madhya Pradesh Banswara/Rajasthan
Coorg/Mysore
Raichur/Mysore
Thanjavur/Tamil Nadu Cannanore/Kerala
Class/SI. No. of
Table A-IV
IV/711
IV/829 IVJ844
T/12(f)
IV/4S9
III/50S
IV/81 I/4(xiii)
1VJ757
V/36
VI/107
V/S2 HI/263(a)
1/12(c)
IV/252 1(104
IV/225 I/12(m)
IV/373
V/439
V/572
V/617 V/f41
IV/241 IV/83&
IV/399 IV/864
1V/238 IV/342(i) ITI/49l
1II/307
IV/778 V/301
HI/566 VI/167
J unagadb/Gujarat Thanjavur/Tamil Nadu
Kanya~umari/Tamil Nadu JabaJpur/Madhya Pradesh Sikar/Rajasthan
Nagaur{Rajasthan
KarnaI/Haryana Bhind/Madhya Pradesh
Sitapur/Uttar Pradesh
Kathua/Jammu & Kashmir
Bundi/Rajasthan Kheri/Uttar Pradesh Goalpara/ Assam
Cachar/Assam Mongbyr/Bihar
Etawah{Uttar Pradesh
Surendranagar/Gujarat Dbarwar/Mysore
Cachar/A~sam
"' IV(2GO{i)
Hyderabad/ Andhra Pradesh Muzaffarpur/Bihar
Murshidabad/West Bengal Tiruchirapalli/Tami! Nadu
Jhansi/Uttar Pradesb
Jamnagar/Gujarat
Manipur Central/Manipur
Dehra Dun/Uttar Pradesh GarhwaljUttar Pradesh
Nasik(Maharashtra. Palamau/Bibar
Amreli/Gujarat
Osnpnabad/Maharashtra
Champaran/Bihar
Ladakh/Jammu & Kashqir Sangrur(Punjab
Surendranagar/Gujarat Rai~hur(Mysore Chhindwara/Madhya Pradesb
IIl/43
V/631 VI/l02
III/353 V/634
V/42
1II/556
V/612 I/5(i) IV/27 I
IV/462
1V/243
III/I 74 Vj357
Vl/B5
VI/128 V/462 V/434
V/14 1V/694
II/67 1II/89(b)
V/614
VOO(i) IlI/389(i)
IV/575
V/542
Page No.
4
432
440
442
252
412
368
382
246 435 446
493 -450
345
:l-35
252 396
279
394 252
406
473
481
487 454
396
441
408 443 395
403 366
349
437 465
373
497 397 320
484
493
354 484"
447 372
483
248 398 412
396 336
468
495
495
475
473 445
~30 298
326 483
449
357
421
479
Town
1621. Lnhagaon
1622. Lobardaga' 1623. Loharn
1624. Loh!a
1625. Lonav!a
1626. Londa 1627. Longowal
1628. Loyabad
1629. Lueknow
1630. Lucknow Cantt. 1631. Ludhiana 1632. Lumding
1633. Lunavada 16-34.. W2.-gk-h-
District/State
2
Poona/Mabarashtra
Ranehi/Bibar Hisar/Haryana
Varanasi/Uttar Pradesh
Poona/Mabarashtra Belgaum/Mysore
Sangrur/Punjab
Dhanbad/Bihar Lucknow/Uttar Pradesh Lucknow/Uttar Pradesb Ludhiana/Punjab
I' Nowgong/Assam Panch MahaIs/Gujarat
M!.:!2-!A£&~w .. 1635. Macha Bolaram .
1636. Machavaram
Hyderabad/ Andbra ~Pradesh
East Godavati/Andhra. Pra-
1637. Macherla •
1638. Machhlishabr 1639. Machilipatnam
(Bandar)
1640. Madakulam
1641. Mada?apalle 1642. Maddur
1643. Madhapar
1644. Madhavaram 1645. Madbavnagar 1646. M.dhepura 1647_ Madhira
1648. Madhoganj 1649. Madhubani 1650. Madhugipj
1651. Madhupur'
1652. Madhyamgram
desh'
Guntur/Andhra Prad~sh JaunpurjUttar Pradesh
KrisbnajAndhra Pr'>!desh
Madurai/Tamil Nadu Chittoor/ Andhra Pradesh
Mandya/Mysore Kutcb/Gujaeat Chiogleput/Tamil Nadu
SangJi/Maharashtra
Saharsil/Bihar Khammam/Andhra Pradesb Hardoi/Uttar Pradesh
Darbbanga/Bihar
Tumkur/Mysore SantaI Parganas/Bibar
TweT\~ Four Parganas/West Bengal
)1653. Madipakkam Chingleput/Tamil Nadu 1654. M;drailFingaPilra Twenty Four Parganas/West
Bengal 1655. ,Madras
1656. Madugula
1657. Madukkarai
1658. Madurai 1659. Mad_urantbakam
1660. Magadi
1661. Mahabaleshwar
1662. Mahad 1663. Mahalingapur 1664. Maham
1665. Maharajganj. 1666. Maharajpur
1667. Mabasamund
1668. Mabbubabaq
1669. Mahbubnagar
1670. Mahe
1671. Mahendragarh 1672. Mabesana .
1673. Maheshwar
1674. Mabiari
1675. Mahidpur
1676. Mabishadal
1677. Mahmudabad
1678. Mahnar Bazar
161;9. Mahoba 1680. Mahuva
Madla~/Tamil Nadu VisakbapatnanvA'ldhra Pra-
desb •
Coimbatore/Tamil Nadu
Madurai/Tamil Nadu
.Chiogleput/Tamil Nadu Bangalore/Mysore
Sat~ra/Mabarasbtra
Kolaba/Mabara'shtra Bijapur/Mysore
R~htak/Haryana
Saran/Bihar Chhatarpur/Madhya Pradesh
RaJpur/Madbya Pradesh
WarangaI/Andhra Pradesh
Mahbubnagar/Andhra Pradesh
Mahe/Pondicherry
Mahendragarh/Haryana l'1ahesana/Gujarat Khargone (West Nimar)/
Madhya Pradesh
B"owrab/West Benga~
Ujjdin/Madhya Pradesh
Midnapore/West Bengal Sitapur/Uttar'Pradesh
Muzaffarpur/Bihar
Hamirpur/Uttar, Pradesh
Bhavnagar/Gliiarat
Class/SI. No. of
1 able A.IV
3
I/9(f) 1V/174
V/606
V/585
III/333 VI/34 lV/70S(i)
1/27(i)
1/11 (a)
Ij 11 (b)
1/32(i)
III/282
IV/58 V!'i4& 1/5(h)
IV/636
III/541
V/I24 1/126
I/13(b)
III/137 IV/597
VII I/4(x) 1/72(c)
IV/298 V/300 V/607 III/200
IV/400 nI,464
U/5(b)
Ij4(h_;iii)
1/1 (Ixiii)
IJ4(i)
V/243
I/12(h)
I/13(a)
lVJ12
IV/467 V/380
IV/455
IV/543 IV/S02
IV/621 lVj664
IV/134(i)
1V/296
II/I 69
V/152
IVJ675
1I/171(i)
V/23 (i)
1/1 (lvii)
JV/347(j)
V/18
IV/650
IV/3
1II/274' IIl/73(;)
Page No.
4
250 390
482
482
352 489
432
259
251
251 261
346
380
480
248
426
371 453
282
252
332 423 444
246
272
400 465 483
339 408
364
287
247
244
245
461
252
252
38i
413 ,470
412
419 438
425
428
387 400
313
455
429 313
446
244
404 445
427 3'75
346 324
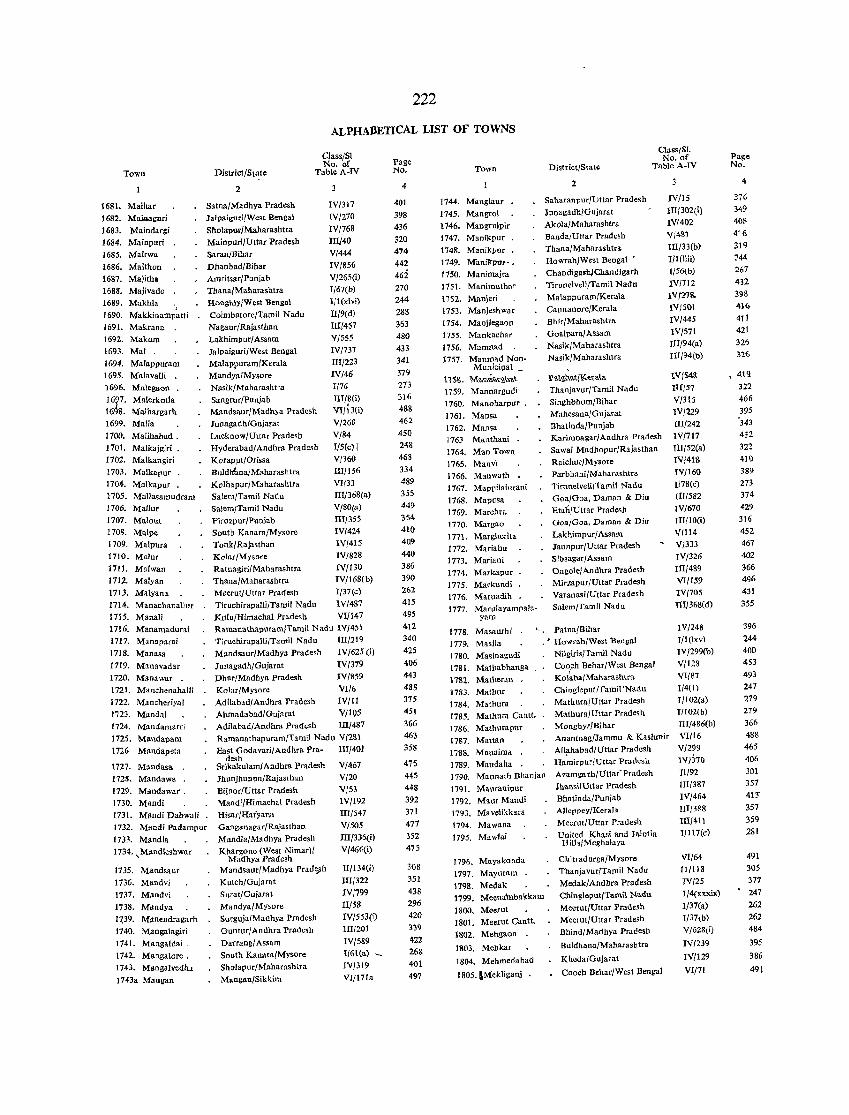
222
ALPJIABETICAL LIST OF TOWNS
Town
1681. Maihar 1682. Mainaguri
1683. Maindargi 1684. Mainpuri
1685. Mairwa 1686. Maithon
1687. Majitha 1688. Majivade 1689. Makhla
1690. Makkinam~~tti 1691. Makrana 1692. Makum 1693. Mal. 1694. Malappuram 1695. Malavalli . 1696. Malegaon .
16?7. Malerkotla 16~S. Malhargarh 1699. Malia 1700. Malihabad. 1701. Malkajgiri . 1702. Malkangiri 1703. Malkapur .
1704. Malkapur . 1705. Mallasamudram 1706. Mallur 1707. Malout 1708. Malpe 1709. Malpura 1710. Malur
1711. Malwan 1712. Malyan 1713. Malyana 1714. Manachanallur 1715. Manali 1716. Manamadurai 1717. Manaparai
1718. Manasa
1719. Manavadar 1720. Manawar . 1721. Manchenahalli 1722. Mancheriyal 1723. MandaI 1724. Mandam.rri 1725. Mandapam 1726 Mandapeta
t 727. Mlimdasa. . 1728. Mandawa . 1729. Mandawar. 1730. Mandi
District/State
Class/SI No. of
Table A-IV
2
Satna/Madhya Pradesh Jalpaiguri/West Bengal
SlIolapurlMaharashtra MainpurilUttar Pradesh SaranlBihar
Dhanbad/Bihar Amritsar/Punjab Thana/Maharashtra
. , HocghlylWest }lengal
Coimbatore/Tamil Nadu Nagaur/Rajasthan Lakhimpurl Assam JalpaigW'i/West Bengal Malappuram/Kerala Mandya/Mysore Nasik/Maharashtra Sangrur/Punjab Maudsaur/Madhya Pradesh Junagadh{Gujarat
Lucknow/Uttar Pradesh Hyderabad/ Andhra Pradesh Korappt/Orissa B uldif.,na/ Maharashtra
Kolhapur/Maharashtra Salem/Tamil Nadu Salem/Tamil Nadu Firozpur/Punjab South Kanara/Mysore Tonk/Rajasthan K<1lar/Mysore RatnagirilMaharashtra Thana/Maharasbtra Meerut/Uttar Pradesh Tiruehirapalli/Tamil Nadu Kl)lu/Himachal Pradesh
IV/317 IV/270 IV/76B
IIl/40 V/444
IV/856 V/265(i)
1/67(1))
Ijl(xlvi)
ll/9(d)
lU/457 V/555 IVj737
TIII223
IV/46 1/16 III/8(i) VI/i3(i)
V/268
V/84 I/5(e) I V/360 1lI1156
VII33 III/368(a) V/80(a)
1lI1355 IVI424 IV/415 IV/828
IV/130 IV/168(b) I/37(c)
IV/487 VI/147
RamanathapuramlTamil Nadl) IV/451 Ti!uchirap~l1ijTamiJ Nadu III/219 M~ndsaur/Madhya Pradesh IV/625 (il
]1l(1agadh/Gujarat IV/379 Dhar/Madhya Pradesh IV /859
Kolar/Mysore Vl/6 AdilabadlAndhra Pradesh IV/II Ahmadabad/Gujarat V/IQ5 Adilabad/Andhra Pradesh III/4B7
RamanathapuramlTamil Nadu Vl2Sl East Godavari/Audhra pra- III/401
desh SrikakulamlAndhra Pradesh V/467
V/20
1731. MtlUdi Dabwali 1732. Mandi Padampur
1733. Mandla
1hunjhunun/Rajasthan
Bijnor/Uttar Pradesh Mandi/Himachal Pradesh
HisarlHaiyana Ganganagar/Rajasthan Manella/Madhya Pradesh Khargone (West Nimar)(
VI53
IV/192 1ll/547 V/S05 1lI/336(i) V/466(i) 1734. ,Mllndleshwar
1735. Mandsaur 1736. Mandvi 1737. Mandvi
1738. Mandya 17.39. Manendragarh 1740. Mangalagiri 1741. Mangaldai.
1742. Mangalore. 1743. Mangal~edh,
1743a Mangan
Madhya Pradesh Mandsaur/Madhya Prade;h
Kutch/Gujarat Surat/Gujarat Mandya/ Mysore SurglljalMaahya Pradesh GunturJAmlhra Pradesh
Darraug/ Assam South Kanara/Mysore Sholapur/Maharashtra
Mansan/Sikkim
II/I 34(i)
1II/322
IV/799
ll/58 IV/553(i)
IIII201
IV/589 I(61(a) _
IVPl9
VI/171a
Page No.
4
401
398 436 320 474
442
462
270 244
288
363 480 433 341 379 273 316 488
462
450 248
468
334 489 355 449 354 410 409
440 386
390 262
415
495
412 340
425
406 443
488
375
451 366
463
35B
475 445
448
392
371
477 352
475
308 351 438 296
420 339
422 268
401 497
Town
1744. Manglaur
1745. Mangrol 1746. Mangrulpir 1747. Manikpur . 1748. Manikpur • 1749. Manikpu~·.
1750. Manimajra 1751. Manimuthar
1752. Manieri 1753. Manjeshwar 1754. Manjlegaon 1755. Mankachar
1756. Maumad 1757. Manmad Non-
Municipal _
t 15%. M. .. ",i""'6",,,,t
1759. Manna rgud; 1760. Manoharpllf •
1761. Mansa 1762. Mansa 176J Manthani
1764. Man Town
1765. Man"i 1766. Manwath • 1767. Mappilaiurani
1768. Mapusa 1769. Marehra 1770. Margao 1711. Margherita 1772. Mariahn 1773. Mariani 1774. Markapur
1775. Markundi 1'176. Maruadih 1777. Marulay.mpal.
yam
1778. Mas~urhi . 1779. Masil. 1780. Masinagudi 1781. Matha bhanga 1')82. Matheran 1783. Mathur
1784. Mathllra 1785. Mathura Cantt. 17B6. Mathurapur
1787. Mattan 178B. Mauaima . 1789. Maudaha .
District/State
CIass/SI. No. of
Table A-IV
2
Saharan pur/Uttar Pradesh
Junagadh/Gujarat Akola/Maharashtra Banda/Uttar Pradesh
ThanalMaharashtra Howrah/West Bengal • Chaudigasb)Chandigarh
TirunelveliJTamil Nadn Malappuram/Kerala
Cannanore/Kerala Bhir(Maharashtra
Goalparaj Assam Nasik/Maharashtra Nasik/Maharashtra
l1alg,h?tiK .. ~a\a Thanjavur/Tamil Nadu
Singhbhl)m/Bibar Mahesatla/Gujarat Bhalinda/Punjab Karimnagar/Andhra Pradesh
Sawai Madhopur/Rajasthan RaichurlMysore Parbhani/Maharashtra Tirunelvelil1'amil Nadu Goa/Goa, Daman & Diu Etah/Uttar Pradesh Goa/Goa, Daman & Diu Lakhirnpur/Assam Jaunpur(Uttar Pradesh
Slbsagar/Assam Ongole/ Andhra Pradesh Mirzapur/Uttar Pradesh Varanasi/Uttar Pradesh
Salem/Tamil Nadu
Patna/Bihar . I HowrahfWest Bengal
Nilgiris/Tamil Nadu Coo~h Behar/West Bengal Kol~ba/Maharashtra
IV/IS III/302(i) IVI402 V/4S1 Ill/33(b) I/I(liii)
1/56\b) 1V/7I2 IVms. IV/SOl IV/445 IV/571 II1/94(a) IU/94(b)
IV(54&
III/57 '1/315 IV/229
II1/242
IV/717 1IJ(52(a)
IVI418
IV/160
1/78(c) II1/582 TV/670 TIl/lOCi) Vl1l4 V/333 IV/326 ItI/489 VI/IS')
IV/70S TlI/368(d)
Chi nglepllt/Tamil'Nadu Matb.ura/Uttar Pradesh MathurajUttar Pradesh Monghyr/Bihar Anantnag/Jammu & Kashmir
Atlllhabad/Uttar Pradesh Hamirpur/Uttar Pradesh
1790. Maunath Bh.njan
1791. Mauranipur
Azamgarh/Uttar'Pradesh
Jhansi/Uttar Pradesh Bhatinda/Punjab AlIcppey/Kerala Meerut/Uttar Pradesh United Khasi and Jaintia
IV/248 T/I(lxv)
IV/299(b)
'11128 VIIS7 114(1) 1/102(3) I1102(b)
IH/486(b)
'11/16
V/299 IV}:i70
11/92 IlI/387 IV/464 III/3&8
1Il/411 1/117(0)
1792. Maur Maudi 1793. Mavelikkara 1794. Mawana
1795. Mawlai
1796. Mayakonda
1797. Mayuram .
1798. Medak 1799. Meeua\nbakkam
1800. Meerut 1801. Meerut Cantt. 1802. Mehgaon .
1803. Mehkar
1804. Mehmedabad
IB05. lMekliganj •
Hills/M eghalaya
Cbitradurga/Mysore Thanjavur/Tamil Nadu Medak/Andhra Pradesh Chingleput/Tamil Nadu
Meerut/Uttar Pradesh Meerut/Uttar Pradesh Bhind/ Madbya Pradesh
Buldhana/Maharashtra
Kheda/Gnjarat
Cooch Behar/West Bengal
VI/64 II/lIS IV/25 I/4(x,,)tjx)
1/37(a)
1/37\b) V/628(i)
IV/239
IV/129
VI/7I
Page No.
4
376 349
401' 4"6
319
244
267
432 398
41<.
4Jl 421
326
326
4t'l
322
466 395 '343
432 322 410 389 273 374 429 316 452 467 402
366
496
431
355
396
244
400 453 493 247 279
279 366 488 465 406
301
357 413'
357 359 281
491 305 377
247 262
262
484
395
386
491
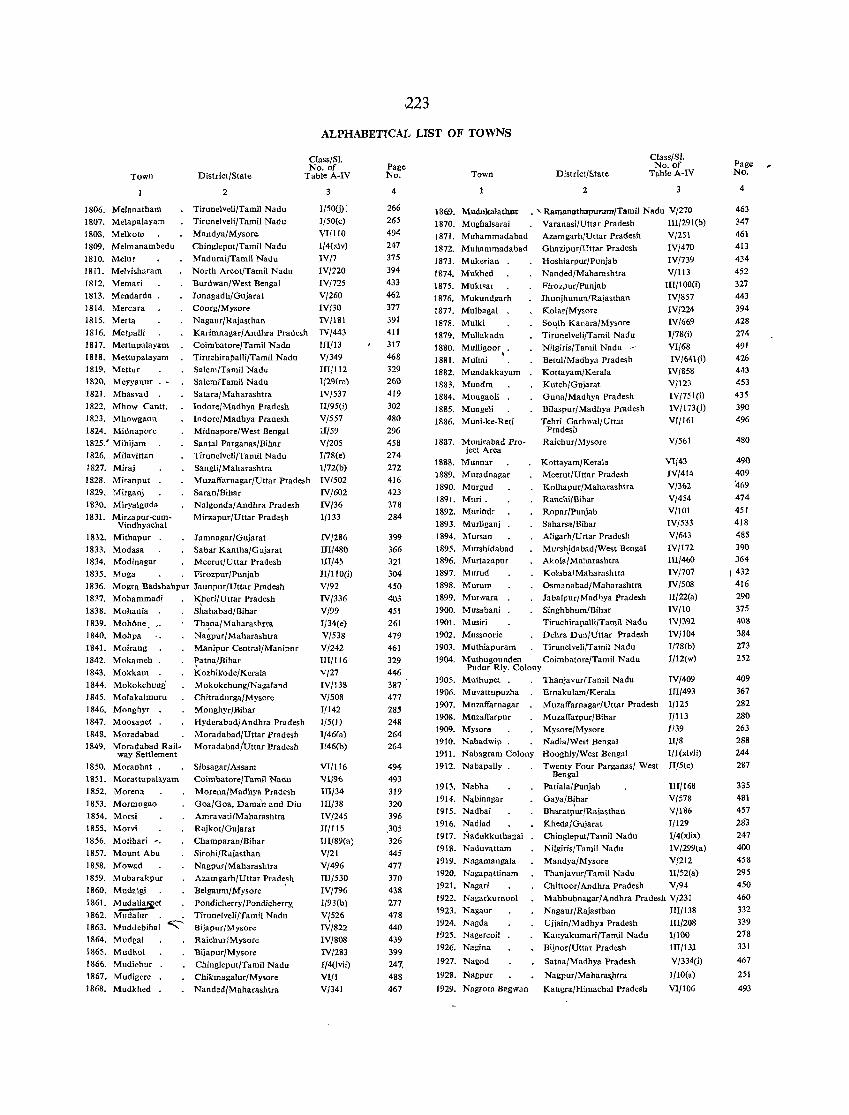
.223
ALPHABETICAL LIST OF TOWNS
Town District/State
Class/SI. No. of
Table A-IV
1806. Melanatham 1807. Melapalayam
1808. Melkole
1809. Melmanambedu
1810. Melur 1811. Melvisharam
1812. Memari 18! 3. Mendarda
1814. Mereara 1815. Merta
1816. Metpalli 1817. Mettupalayam
1818. Mettupalayam 1819. Mettur
1820. Meyyanur . -1821. Mhasvad
1822. Mhow Cantt. 1823. Mhowgaon 1824. Midnap('re
1825.' Mihijam
1826. Milavittan 1827. Miraj
1828. Miranpur 1829. Mirganj
1830. Miryalgud" 1831. Mirzapur-eum-
Vindhyachal
2
Tirunelveli/Tamil Nadu Tirunelveli/Tamil Nadu
Mandya/Mysor ..
Chingleput/Tamil Nadu
Madurai/Tamil Nadu
North Areot/Tamil Nadu
Burdwan/West Bengal Junagadh/Gujarat
Coorg/Mysore
Nagaur/Rajasthan
Karimnagar/Andhra Pradesh Coimbatore/Tamil Nadu
Tiruehirapalli/Tamil Nadu Salem/Tamil Nadu Salem/Tamil Nadu
Satara/Maharashtra Indore/Madhya Pradesh
Indore/Madhya Pradesh Midnapore/West Bengal
Santal Parganas/Bihar
Tirunelveli/Tamil Nadu Sangli/Maharashtra
Muzaffarnagar/Uttar Prade,h Saran/Bihar
Nalgonda/ Andhra Pradesh
Mirzapur/Uttar Pradesh
1832. Mithapur . Jamnagar/Gujarat 1833. Modasa Sabar Kantha/Glljarat 1834. Modinagar Meerut/Uttar Pradesh 1835. Moga Firozpur/Punjab
1836. Mogra Badshahpur Jaunpur/Uttar Pradesh 1837. Mohammadi
1838. Mohania 1839. MoMne_
1840. Mohpa 1841. Moirang
1842. Mokameh .
1843. Mokkam . 1844. Mokokchung
1845. Molakalmuru 1846. Monghyr •
1847. Moosapet .
1848. Moradabad 1849. Moradabad Rail-
way Settlement
1850. Maranhat . 1851. Morattupalayam
1852. Morena
1853. Mormugao 1854. Morsi
1855. Morvi
\ 856. Motihari '.
1857. Mount Abu 1858. Mowad
1859. Mubarakpur
1860. Mudalgi
1861. Mudalia!$!et
1862. Mudalur
1863. Muddebihal "" \864. Mudgal
1865. MudhDI 1866. Mudichur
\ 867 . M udigere
1868. Mudkhed
K,heri/Uttar Pradesh
Shahabad/ Bihar
Thapa/Maharashrm Nagpur/Maharashtra Manipur Central/Manipnr
ratna/Bihar Kozhikode/Kerala Mokokchung/Nagaland
Chitradurga/Mysore Monghyr/,Bihar
Hyderabad/Andhra Pradesh Moradabad/Uttar Pradesh Moradabad/Uttar Pradesh
Sibsagar/Assam
Coimbatore/Tamil Nadu
Morena/Madhya Pradesh
Goa/Goa. Daman and Diu Amravati/Maharashtra
Rajkot/Gujarat
Champaran/Bihar
Sirohi/Rajasthan Nagpur/Maharashtra
Azamgarh/Uttar Prade.sh Belgaum/Mysore
Pondicherry/Pondicherry,
Tirunelveli/Tamil Nadu Bijapur/Mysore
RaichurlMysore Bijapur/Mysore
Chingleput/Tamil Nadu
Chikmagalur/Mysore
Nanded/Maharashtra
3
I/50(j) ;
J/50(c)
VI/IIO 1/4(l<lv)
IV/1
IV/nO IV/725
V/260
IV/30 IV/181
I'i/443
III/I 3 V/349 IIlJl12 1/2'l(m)
IV/S37 II/95(i)
V/557
a/59 V/205 1/78(e)
I/72(b) IV/502
IV/602
JV/36 1/133
IV/286 IIl/480 III/45 II/II0(i)
V/92 IV/336
V/99 I/34(e)
V/538 V/242
III/1l6
V/27
IV/138 V/S08 1/142 T/5(1)
1/46(a) I146(b)
VI/lI6 Vf/'l6 Ill/34
JII/38
IV/245 II/lIS UI/89(a)
V/21 V/496
IIT/530 IV/796 I/93(b)
V(526 IV/822
IV/808
IV/283 T/4(lvii)
VI/l V/341
Page No.
4
266
265
494
247
375
394 433
462 377
391 411
317 468 329
260
419
302 480
296 458
274
272 416 423
378 284
399 366 321
304 450
403 451 261
479 461
329 446
387 477
285 248 264 264
494
493
319
320 396
.305 326
445
477 370
438
277
478 440
439 399
247. 488
467
Town District/State
2
Class/SI. No. of
Table A-IV
3
1869. Mud.ukalathur 1870. Mughalsarai
1871. Muhammadabad
1872. Muhammadabad
1873. Mukerian
. "Ramaoathapuram/Tamil Nadu V/270
1874. Mukhed
1875. Mukt.ar 1876. Mukundgarh
1877. Mulbagal .
1878. Mulki
1879. Mullakadu 1880. Mulligoor . • 1881. Multai 1882. Mundakkayam 1883. Mundra
1884. Mungaoli 1885. Mungeli
1886. Muni-ke-Reti
1887. Muoirabad Pro-ject Area
1888. Muonar 1889. Muradoagar
1890. Murgud
1891. Mllri.
1892. Murilldr 1893. Murliganj
1894. Mursan 1895. Murshidabad 1896. Murtalapur
1897. Mllrud 1898. Murum
1899. Murwara
1900. Musabani 1901. Musiri
Varanasi/Uttar Pradesh III/2.91(b)
Azamg'lrhlUttar Pradesh V/251
Ghazipur/Uttar Pradesh IV/470
Hoshiarpur/Punjab IV/739
Nanded/Maharashtra V/113 Firo,~ur/Pllnjab III/IOO(i)
Jhunjhuoun/Raiasthan IV/857
Kolar/Mysore IV/224
S04th Kanara/Mysore IV/669 Tirunelveli/Tamil Nadu 1/78(i)
Nilgiris/Tamil Nadu - VI/68 Betul/Madhya Pradesh IV/641 (i) Kottayam/K~rala IV/858
Kutch/Gujarat V /123 Guna/Madhya Pradesh IV/751(i)
Bilaspur/Madhya Pradesh IV/I 73(i)
Tehri Garhwal/Uttat VI/161 Pradesh
Raichur/Mysore V/561
Kottayam/Keraia
Meerut/Uttar Pradesh Kolhapm/Maharashtra
Ranchi/Bihar
Ropar/Punjab Saharsa/Bihar
Aligarh/Uttar Pradesh Mursh,idabad/West Bengal Akola/Maharashtra
KolabaiMaharashtra Osmanabad!Maharashtra
Jabalpur/Madl}ya Pradesh
Singhbhum/Bihar Tiruchirapalli/Tamil Nadu
1902. Mussoorie Dehra Dun/Uttar Pradesh
VI/43 IV/414
V/362
V/454 V/lOl
IV/533
V/643
IV/I 72 IIl/460
IV/707 IV/508 1I/22(a)
IV/lO lV}392
IV/I04 I/78(b)
I/12(w) 1903. Muthiapuram Tirunelveli/Tamil Nadu
1904. Muthugounden Coimbatore/Tamil Nadu Pudur Rly. Colony
1905. Muthupet . 1906. Muvattupuzha
1907. Muzaffarnagar
1908. Muzaffarpur 1909. Mysor. 1910. Nabadwip .
1911. Nabagram Colony 1912. Nabapally
1913. Nabha
1914. Nabinagar 1915. Nadbai
1916. Nadiad
1917. Nadukkuthagai
1918. Naduvattam 1919. Nagamangala
1920. Nagapattinam
1921. Nagari
1922. Nagarkurnool
1923. Nagaur
1924. Nagda 1925. Nagercoil
1926. Nagina
1927. Nagod
1928. Nagpur
ThanjavurlTamil Nadu
Ernakulam/Kerala Muzaffarnagar/Uttar Pradesh
Muzaffarpur/Bihar
Mysore/Mysore Nadia/West Bengal Hooghly/West Bengal
Twenty Four Parganas/ West Bengal
Patiala/Punjab
Gaya/Bihar I
Bharatpur/Rajasthan
Kheda/Gujarat Chingleput/Tamil Nadu
Nilgiris/Tamil Nadu
Mandya/Mysore
IV/409
IU/493
1/125
1/113 1/39
11/8 I/ICxlvii)
II/5(c)
IU/168
V/578
V/186
1/129 I/4(xlix)
IV/299ta)
V/212
Thanjavur/Tamil Nadu II/52(a)
Chittoor/Andhra Pradesh V/94
Mahbubnagar/Andhra Pradesh V/231
Nagaur/Rajasthan III/l38
Ujjain/Madhya Pradesh III/208 Kanyakumari/Tamil Nadu 1/100
Bijnor/Uttar Pradesh III/I3)
Satna/Madhya Pradesh V/334(i)
Nagpur/Mahara.$tra
1929. Nagrota B.swan Kangra/Himachal Pradesh
1/10(a)
VI/I06
Page No.
4
463 347
461
413
434
452
327 443
394
428 274
491 426 443
453
435
390 496
480
490 409 '469
474 451
418
485
390 364
t 432 416
290
375 40'3 384
273
252
409
367 282
280 263 288 244
287
335
481
457
28"3
247
400 458
295
450
460
332 339 278 331
467
251
493
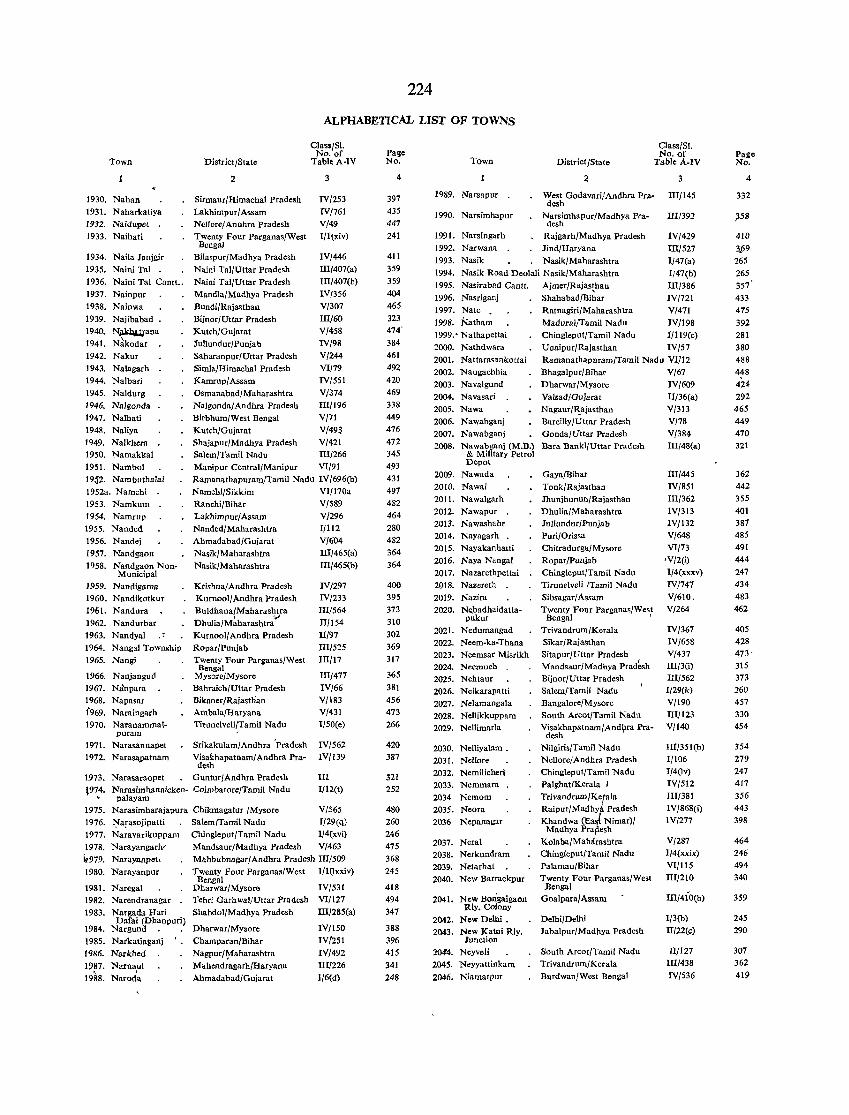
224
ALPHABETICAL LIST OF TOWNS
Town
1930. Nahan 1931. Naharkatiya 1932. Naidupet 1933. Naihati
1934. Naila Ianjgir 1935. Naini Tal . 1936. Naini Tal Cantt .. 1937. Nainpnr 1938. Nainwa 1939. Najibabad 1940. N;lkll;l.lpna 1941. N~kodar 1942. Naknr 1943. Nalagarh 1944. Nalbari 1945. Naldurg 1946. Nalgonda 1947. Nalhati 1948. Naliya 1949. Nalkhera 1950. Namakkal 1951. Nambol 19~2. Nambuthalai 1952a. Namehi 1953. Namkum 1954. Namrup 1955. Nanded 1956. Nandej 1957. Nandgaon 1958. Nandgaon Non-
Municipal 1959. Nandigama 1960. Nandikotkur 1961. Nandura 1962. Nandurbar 1963. Nandyal 1964. Nangal Township 1965. Nangj
1966. Nanjangnd 1967. Ninpara 1968. Napasar 1969. Naraingarh 1970. Naranammal-
puram 1971. Narasannapet 1972. Narasapatnam
District/State
2
Sirmaur/Himachal Pradesh Lakhimpur/ Assam Nell ore/ Anahra Pradesh Twenty Four Parganas/West Bengal
Bilaspur/Madhya Pradesh Naini Tal/Uttar Pradesh Naini Tal/Uttar Pradesh Mandla/Madhya Pradesh Bundi/Rajasthan Bijnor/Uttar Pradesh KutchjGujarat Jullundur/Punjab Saharanpur/Uttar Pradesh SimlajHimachal Pradesh Kamrup/Assam Osmanabad/Maharashtra Nalgonda/ Andhra Pradesh Birbhum/West Bengal Kutch/Gujarat
Class/SI. No. of Tabl~A-IV
3
IV/253 IV/76 I V/49 J/I\xiv)
IV/446 III/407(a) UI/407(b) IV/356 V/307 Ill/60 V/458 IV/98 V/244 VI}79
IV/551 V/374 m/196 V/71
V/493 Shajapur/Madhya Pradesh V/421 Salem/Tamil Nadu 1l/266 Manipur Central/Manipur VJ/91 Ramanathapuram/Tamil Nadu IV/696(b) NamchijSikkim VI/170a Ranchi/Bihar V/S89 Lakhimpur / Assam V 1'2.96 Nanded/Maharashtra 1/112 Ahmadabad/Guiarat Vf604 NasikfMaharashtra 1l/465(a) Nasik/Maharashtra JII/465(b)
Krishna/ Andhra Pradesh Kurnool/Andhra Pradesh Buldhana(Maharas~a
DhulialMaharashtra Knrnool/ Andhra Pradesh RoparfPunjab Twenty Four ParganasfWest
Bengal Mysore/Mysore Bahraich/Uttar Pradesh BikanerfRajastlian Arnbala/Haryana Titunelveli/Tamil Nadu
Srikakulam/ Andhra ·Pradesh Visakhapatnamf Andhra Pra
desh
IV/297 IV/233 IJI/564 11/154 11/97 1l/525 III/I 7
III/477 IV/66 V/183 V/431 1/50(e)
IV/562 IV/I39
1,973. Narasaraopet Guntur/Andhra Prade,h t9~4. Narasimhanaicken- Coimbatore/Tamil Nadu
• palayam
III I/I'2.(t)
1975. Narasimharajapura Chikmagalur /Mysore V/S65 1976. ~arasojjpatti Salem/Tamil Nadu I/29(q) 1977. Naravarikuppam Chingleput/Tamil Nadu I/4(xvi) 1978. NarayangariY Mandsaur/Madhya Pradesh V/463 ~979. Narayanpel< Mahbubnagar/Andhra Pradesh Ill/509 1980. Narayanpur Twenty Four Parganas/West I/IOxxiv)
1981. Naregal 1982. Narendranagar 1983. Nargada aari
Dafai (Dhanpuri) 1984. Nargund. . 1985. Narkatiaganj 1986. Narkhed 1987. Narnaul 1988. Naroda
Bengal Dharwar/M.Ysore Tehri Garhwal/Uttar Pradesh Shahdol/Madhya Pradesh
Dharwar/Mysore Champaran/Bihar Nagpur/'¥abarashtra Mahendragarh/Haryana Ahmadabad/Gujarat
lVf531 VI/127 1l/285(a)
IV/ISO IV(2S1 IV/492 1lI/226 I/6(d)
Page No.
4
397 435 447 241
411 359 359 404 465 323 474'
384 461 492 420 469 338 449 476 472 345 493 431 497
482 464 280 482 364 364
400 395 373 310 302 369 317
365 381 456 473 266
420 387
321 252
480 260 246 475 368 245
418 494 347
388 396 415 341 248
Town
1989. Narsapllr
DistrictfState
Class/SI. No. of
Table A.IV
3
West Godavari/Andhra Pra· IIIfl45 desh
1990. Narsimhapur NarsimhapurfMadhya Pra- IJI/392 desh
1991. Narsingarh Rajgarh/Madhya pradesh IV/429 1992. Narlvana Jind/Haryana ID/527 1993. Nasik NasikfMaharashtra I/47(a) 1994. Nasik Road Deolali Nasik/Maharashtra I/47(b) 1995. Nasirabad Cantt. Ajmer/Rajasthan Ill/386 1996. Nasriganj Shahabad/Ilihar IV/721 1997. Nate • Ratnagiri/Maharashtra V/471 1998. Natham Madurai/Tamil Nadu IV/198 1999.- Nathapettai Chingleput/Tamil Nadu I/119(c) 2000. Nathdwara Uoaipur/Rajasthan IVf57 2001. Nattarasankottai Ramanathapuram/Tamil Nadu VIl12 2002. Naugaehhia Bhagalpllr/Bihar V/67 2003. Navalgund 2004. Navasari 2005. Nawa 2006. Nawabganj 2007. Nawahgani
Dharwar/Mysore Valsad/Gujarat Nagaur/Rajasthan Bareilly/Uttar Pradesh Gonda/Uttar Pradesh
2008. Nawabganj (M.B.) Bara Banki/Uttar Pradesh & Military Petrol Depot
2009. Nawada 2010. Nawai 2011. Nawalgarh 2012. Nawapur . 2013. Nawashahr 2014. Nayagarh . 2015. Nayakanhatti 2016. Naya Nangal 2017. Nazarethpettai 2018. Nazereth • 2019. Nazira 2020. Nc:.badhaidatta-
pukur 2021. Nedumangad 2022. Neem-ka-Thana 2023. Neemsar Misrikh 2024. Neemucb . 2025. Nehtaur 2026. Neikarapatti 2027. NelamangaJa 2028. Nellikkuppam 2029. Nellimarla
2030. Nelliyalam. 2031. Nellore 2032. Nemilicheri 2033. Nemmara 2034 Nemom 2035. Neora 2036 Nepanagar
2037. Neral 2038. Nerkundram 2039. Netarhat 2040. New Barrackpur
2041. New Bongaigaon Rly. Colony
2042. New Delhi . 2043. New Katni Rly.
Junction
200. Neyveli 2045. Neyyattinkara 2046. Niamatpur
Gaya/Bihar Tonk/Rajasthan Jhunjhunun/Raiasthan Dhulia/Maharashtra Jullundur/Punjab Puri/Orissa Chitradurga/Mysore Ropar/punjab Chingleput/Tamil Nadu Tirunelveli fTamii Nadu Sibsagar/ Assam Twenty Four Parganas/Wes!
Bengal ' Trivandrum/Kerala Sikar/Raj""than Sitapur/Uttar Pradesh Mandsaur/Madhya Pract'esh Bijnor/Uttar Pradesh Salem/Tamil Na,du Bangalore/Mysore South ArcatfTamii Nadu Visakhapatnam/ And\lra Pra-
desh NilgirisfTarnil Nadu Nellore/Andhra Pradesh Chingleput/Tamil Nadu Palghat/Kerala j
Trivandrum/Ketala Raipur/M".Jhy,{ Pradesh Khandwa (E"'i.( Nimar)/
Madhya Praflesh Kolaba/MaMrashtra Chinglepllt/Tamil Nadu Palamau/Bihar Twenty Four Parganas/West Bengal
Goalpara/Assam
Delhi/Delhi Jabalpur/Madhya Pradesh
South Areot/Tamil Nadu TrivandrumfKerala Burdwan/West Bengal
IV/609 II/36(a) V/313 V/78 V/384 1JI/48(a)
llf445
IV/8S1 IlI/362 IV/313 IV/132 V/648 VIm
.v/2(i) I/4(xxxv) IV/747 V/610, V/264
IV/367 IV/658 V/437 IDf3Ci) III/562 I/29(k) V/190 III/I 23 V/140
HIf35 I (b) 1/106 I/40v) IVf512 JII/381 IV/868(i) IV/277
V/287 I/4(xxix) VIfl15 III/210
1l/410(b)
I/3(b) II122(c)
II/127 III/438 IV/536
Pa&e No.
4
332
)58
410
3.69 265 265 357 433 475 392 281 380 488 448 424 292 465 449 470 321
362 442 355 401 387 485 491 444 247 434 483 462
405 428 473' 315 373 260 457 330 454
354 279 247 417 356 443
398
464 246 494 340
359
245 290
307 362
419
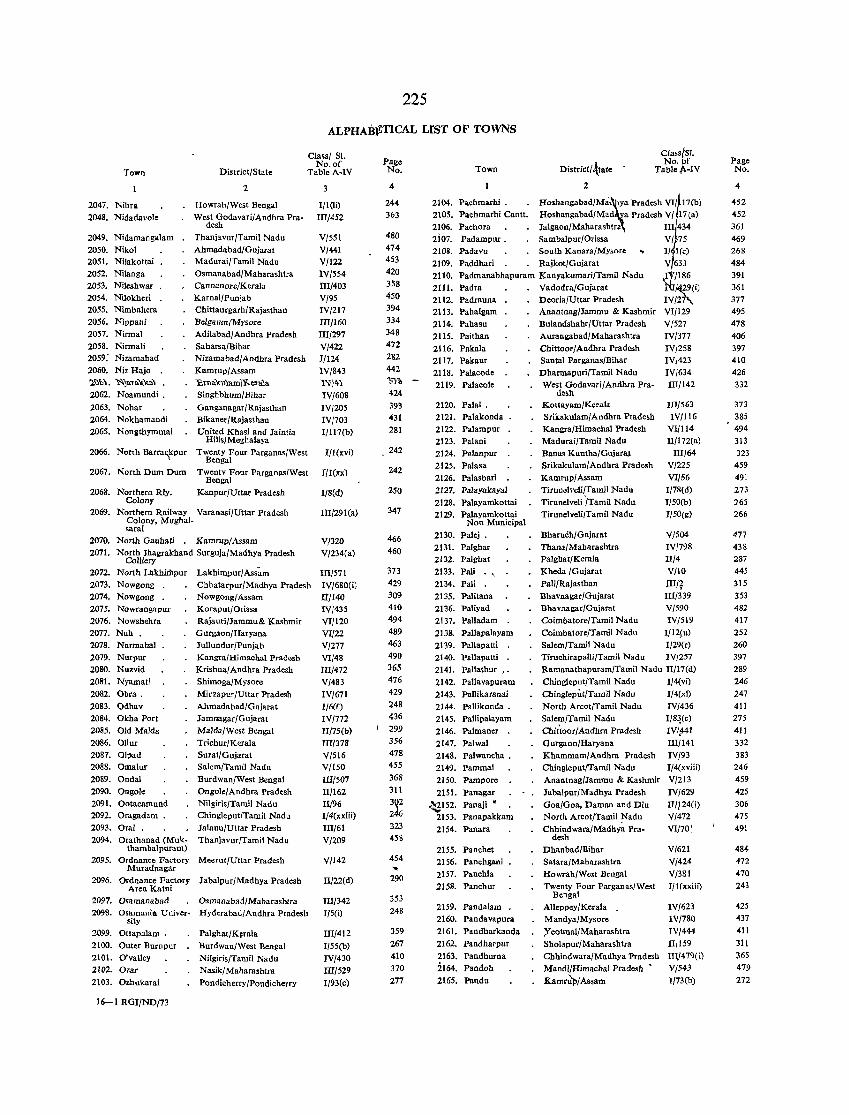
225
ALPHABeTICAL LIST OF TOWNS
Class/ SI.
Town District/State No. of
TaoleA-IV
2047. Nibra 2048. Nidada vole
2049. Nidamangalam 2050. Nikol 2051. Nilakottai 2052. Nilanga 2053. Nileshwar 2054. Nilokheri 2055. Nimbahera 2056. Nippani 2057. Nirmal 2058. Nirmali 2059: Nizamabad 2060. Niz Hajo . 'l'i}\)\. "i'I)ani'll"",\ . 2062. Noamundi.
2063. Nohar 2064. Nokhamandi 2065. Nonllthymmai
2066. Nortb Barracfpur
2067. North Dum Dum
2068. Northern Rly. Colony
2
Howrah/West Bengal West Godavari/Andhra Pra-
desh
Thanjavur/Tamil Nadu Ahmadaoad/Guiarat Madurai/Tamil Nadu Osmanaoad/Maharashtra Cannanore/KeraJa Karnal/Punjab Chittaurgarh/Rajasthan Belgaum/Mysore Adilabo.d/Andhra Pradesh Saharsa/Bihar Nizamabad/Andhra Pradesh Kamrup/Assam
1O.m"'''u\am)~e'a\a
Singhbhum/Bihar
Ganganagar/Rajasthan Bikaner/Rajasthan United Khasi and Jaintia
Hills/Meghalaya Twenty Four Parganas/West
Bengal
Twentv Four Parganas/West Bengal
Kanpur/Uttar Pradesh
2069. Northern Railway Varanasi/Uttar Pradesh Colony. Mughal-sarai
2070. North Gauhati . Kamrup/Assam 2071. North Jhagrakhand Surguja/MadhYa Pradesh
Colliery 2072. North Lakhimpur Lakhimpur/Ass;'m 2073. Nowgong . Chhatarpur/Madhya Pradesh 2074. Nowgong . 2075. Nowrangapur 2076. Nowshehra 2077. Nub . 2078. Nnrmahal 2079. Nurpur 2080. Nuzvid 2081. Nyamati 2082. Obra. 2083. Odhav 2084. Okha Port 2085. Old MaIda 2086. Ollur 2087. Olpad 2088. Omalul' 2089. Ondal 2090. Ongol" 2091. Ootacamulld 2092. Oragadam . 2093. Orai . 2094. Orathauad (Muk
thambalpuram)
Nowgong{ Assam Koraput/Orissa Rajanri/Jammu& Kashmir Gurgaon/Haryana Jnllundur/Punjab Kangra/Himachal Pradesh Krishna/ Andhra Pradesh Shimoga/Mysore Mirzapuc /Uttar Pradesh Ahmadabad/Guiarat Jamnagar/Gujarat MaIda/West Bengal Triehur/Kerala Surat/Gujarat SalemlTamil Nadu Burdwan/West Bengal Ongole/Andhra Pradesh Nilgiris/TamiJ Nadu Ching]eput/Tamil Nadu Jalaun/Uttar Pradesh Thanjavur/Tamil Nadu
2095. Ordnance Factory Meerut/Uttar Pradesh Muradnagar
2096. Ordnance Factory Jabalpur/Madhya Pradesh Area Katni
2097. Osamanaoad Osmanaoad/ Maharashlra 2098. Osamania Univer- Hyderabad/Andhra Pradesh
sity 2099. Ottapalam . 2100. Outer Burnpur 2101. O'valley 2102. Ozar 2103. Ozhukarai
16-1 RGI/ND/73
Palghat/K~rala
Bnrdwan/West Bengal Nilgiris/Tamil Nadu Nasik/Maharashlra Pondicherry/Pondieherry
I/IQi)
III/452
V/55 I V/441 V/122 IV/5S4 III/403 V/95 IV/217 III/160 III/297 V/422 1/124 IV/843 W)4' IV/608
IV/205 IV/703 I/117(b)
1/1 (xvi)
I/t(xx)
I/8ed)
III/29 I (a)
V/320 V/234(a)
III/57 I IV/680(i)
It!140 IV/435 VI/120 VI/22
V/277 VI/48
m/472 V/483 1V/671 1/6(f)
IV/712 II/75(o) III/378 V/516 V/150 III/507 II/162 II/96 I/4(xxiii)
III/61 V/209
V/142
II/22(d)
IIl/342 I/S(i)
ID/412 1/55(0)
IV/430
III/529 I/93(e)
Pae" No.
4
244 363
480 474 453
420 358 450 394 334 348 472 282 442 ,,;00 424
393 431 281
242
242
250
347
466 460
373 429 309 410 494 489 463 490
365 476 429
248 436
299 356 478 455 368 311
~~ 323 458
454 ... 290
353 248
359 267 410 370 277
Town District/·ttate
2
Class/SI_ No.pf
Taole,o.-IV
2104. Pachmarhi . HOShangabad/Ma:\~a Pradesh Vl/ 17(b) 2105. Pachmarhi Cant!. Hoshangaoad/Mad a Pradesh V/ 17(a) 2106. Pachora Jalgaon/Maharashtra III 434 2i07. Padarnpur. Samoalpur/Orissa V/ 75 2108. Padavu South Kanara/Mysore... 1/ 1 (c)
2109. Paddhari Rajkot/Gujarat V 633 2110. Padmanabhapuram Kanyakumari/Tamil Nadu ,1,,),/186 2111. Padra Vadodra/Gujarat "Nr~9(i) 2U2. Padrauna Deoria/Uttar Pradesh IV/2j\. 2U3. Paha1gam Anantnag/Jammu & Kashmir VI/129 2114. Pahasu Bulandshahr/Uttar Pradesh V/527 2115. Paithau Aurangabad/Maharashtra IV/377 2U6. Pakala Chittoor/Andhra Pradesh IV/258 2117. Pakaur Santal Parganas/Bihar IV/423 2118. Palaeode Dharmapuri/Tamil Nadu IV/634 2119. Palaeole West Godavari/Andhra Pra- III/142
2120. Palai . 2121. Palakonda 2122. Palampur 2123. Palani 2124. Palanpur 2125. Palasa 2126. Palasbari 2127. Palayakayal 2128. Palayamkottai 2129. Palayamkottai
Non Municipal 2130. Palej . 2131. Palghar 2132. Palghat 2133. Pali . \ 2134. Pali . 2135. Palitana 2136. Paliyad 2137. Palladam 2138. Pallapalayam 2139. Pallapatti . 2140. Pallapatti . 2141. Pallathur •• 2142. Pallavapuram 2143. Pallikaranai 2144. Pallikonda. 2145. Pallipalayam 2146. Palmaner . 2147. Palwal 2148. Palwaneha. 2149. Pammal 2150. Pamporc 2151. Panagar
~IS2. Panaji • 2153. Panapakkam 2154. Panara
2155. Panchet 2156. Panchgani 2157. Panehla 2J 58. Panehur
2159. Pandalam 2160. Pandavapura 2161. Pandharkaoda 2162. Pandharpur 2163. Pandhurna 2164. Pandoh 2165. Pandu
desh Kottayam/Kerala Srikakulam/Andhra Pradesh Kangra/Himachal Pradesh Madurai/Tamil Nadu Bana, Kantha/Guiara.t Srikakulam/Andhra Pradesh Kamrup/Assam TitUnelveli/Tamil Nadu Tirunelveli )Tamil Nadu Tirunelveli/Tamil Nadu
Bharu6h/Gujarat Thana/Maharashlra palghat/Kerala
Kheda /Gujarat Pali/Rajasthan Bhavnagar/Gujarat Bhavnagar/Gujarat Coimbatore/Tamil Nadu
Ill/563 IV/Jl6
VI/1l4 II/I 72(a)
IlI/64
V/225 VIj56
I/78(d) I/50(b) I/50(g)
V/504 IV/798 II/4
V/IO
IlI/t III/339 V/590 IV/519
Coimbatore/Tamil Nadu I/I2.(u) Salem/Tamil Nadu I/29(r) Tiruchirapalli/Tamil Nadu lV/257 Ramanathapnram/Tamil Nadu U/17(d) Chingleput/Tamil Nadu I/4(vi) ChingJeput/Tamil Nadu 1/4(xl) North Areot/Tamil Nadu IV/436 Salem/Tamil Nadu I/8~(c)
Chittoor/Aadhra Pradesh rv/tl41 aurgaon/Haryana ID/141 Khammam/Andhra Pradesh IV/93 Chingleput/Tamil Nadu I/4(xviii) Anantnag/Jammu & Kashmir V/213 Jabalpur/Madhya Pradesh IV/629 Goa/Goa. Daman and Diu III/24(i)
North Areot/Tamil ~adu V/472 Chhindwara/Madhya Pra- VI/70;
desh Dhanbad/Bihar Satara/Maharasbtra Howrah/West Bengal Twenty Four Parganas/West
Bengal Alleppey/Keraia . Mandya/Mysore
'YeotmalfMaharashtra Sholapur/Maharashtra Chhindwara/Madhya Pradesh Mandi/Himachal Pradesh •
Kamrrlp/Assam
V/621 V{424
V/381 J/l(xxiii)
IV/523
IV/780 IV/444 II/159 IIV479(i)
V/543 I/73(b)
Page No.
4
452 452 361 469 268 484 391 361 377 495 478 406 397 410 426 332
373 385 494 313 323
459 491 273 265 266
477 438 287 445 315 353 482
417 252 260 397 289 246 247 411 275 411 332 383 246 459
425
306 475
491
484 472
470
243
425 437
411 311 365 479
272
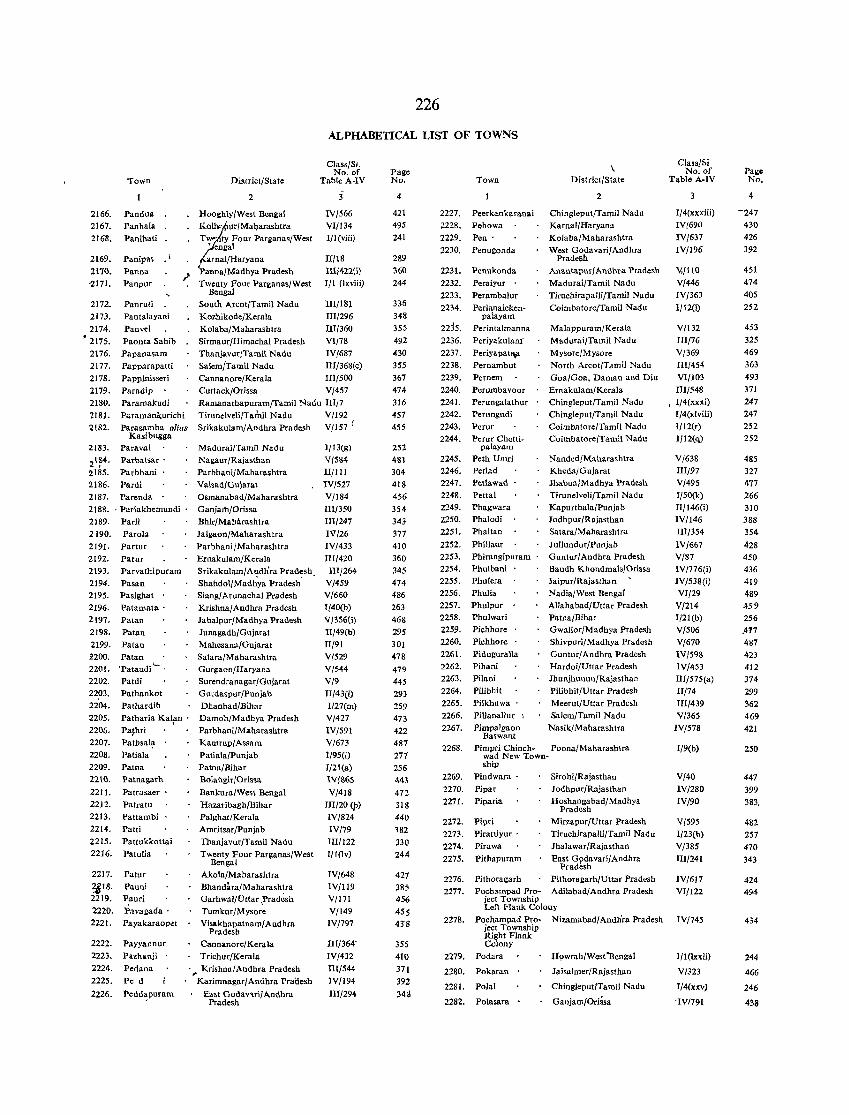
226
ALPHABETICAL LIST OF TOWNS
Town
2166. Pandua 2167. Panhala
2168. Panihati
District/State
2
Hoo~hly/West Bengal
Knill? ur/Ma~arashtra
Tw.· ty Four Parganas/West T engal
Class/SI. No. of
Table A-IV
j
IV/566 VIJl34
1/1 (viiiJ
2169. Panipat
2170. Panna '2171. Panpur ".
arnal/Haryana PannalMadhya Pradesh
Twenty Four ParganaslWest
II/18 IIIJ422(i)
1/1 (lxviii) "
2172. Panruti 2173. Pan talayani
2174.
• 2175. 2176. 2177.
2178.
2179. 2180.
'18t. 2182.
2183.
2\~J,· 2185.
Panvd Paonta Sahib
Papanasam Papparapatti
Pappinisseri Paradip
Paramakudi
Paramank,urichi
Parasamba alias Kasibugga
Paravai Parbatsar·
Parbhani 2186. Pardi
2187. Parenda 2188 .. Parlakhemundi .
2189. ParJi
2190. Parola
2191. 2192.
2193. 2194. 2195. 2196.
2\97.
2198. 2199. 11200. 2201.
2202.
22.03. 2204.
2205.
2206. 2207. 2208.
2209. 2210.
2211. 2212.
2213. 2214.
2215. 2216.
2217.
:?j18. 2219.
2220. 2221.
Partur
Parur Parvathipuram
Pasan Pasighat .
Patamata'
Palan Patan
Patan Patan >Pataudi'_ .
Patdi Pathankot
Pathardih Patharia Kalfn .
P"'thri
Pathsal\, Patiala Patna Patnagarh
Patrasaer .
Patratu
Pattambi
Patti Pattukkottai
PatuJia
Patur
Pauni Pauri Pavagada .
Payakaraop.t
2222. Payyannur
2223. Pazhanji
2224. Pedana
2225. Pe d
2226. Pedd~puram
Bengal
South ArentlTamil Nadu
Kozhikode/Kerala
Kolaba/Maharashtra
III/18}
III/296 IIII360
Sirmaur/Himachal Pradesh Vl178 ThanjavurlTamil Nadu IV/687 Salemtramil Nadu IlI/368(c)
Cannanore/Kerala Ill/500
Cuttack/Orissa V /457
Ram.anathapuram/Tamil Nadu IU/7 Tirunelveli/Taz'nil Nadu V/192 Srikakulam/ Andhra Pradesh V /157 (
Madurai/Tamil Nadu Nagaur/Rajasthan
ParbhanilMaharashtra Va\sadlGujarat
Osmanabad/Maharashtra
Ganjarh/Orissa Bhir/Maharashtra
Jalgaon/Maharashtra
Parbhani IMaharashtra
ErnakularnJKerala
SrikakulamlA~dtira Prad~sh. Shahdol/Madhya Pradesh Siang/Arunachal Pradesh
Krishna/Andhra Pradesh
Jabalpur/Madhya Pradesh Junagadh/Gujarat
Mahesana/Gujarat
Satara/Maharashtra Gurgaon/Haryana
Surendranagar/Gujarat Gurdaspur/Punjab
Dhanbad/Bihar Damoh/Madhya Pradesh
Parbhani/Maharashtra KamruplAssam
PatialalPunjab
Patna/Bihar BolahgirlOrissa
Bankura/West Bengal Hazaribagh/Bihar
PalghatlKerala
Amritsar/Punjab Thanjavur/Tamil Nadu
Twenty Four Parganas/West Bengal
Akola/Maharashtra
Bhandara/Maharashtra Garhwal/Uttar ,Prad~sh Tumkur/Mysore Visa.khapatnamlAndhra
Pradesh
Cannanore/Kerala Trichur/Kerala
• ,. Krishna/ Andhra Pradesh
Karimnagar/ Andhra Prall.sh
Ea.t Godav"lri/ Andhra Pradesh
1/13(g)
V/S&4
II/III IVI527 Vj184
IlI/350 IIII247
IV/26 IV/433
1lI1420
1II/264 V/459 V/660
I/40Cb) VI3S6(l) 1I/49(b)
II/91 VI529 V/544
V/9 U/43(i)
I/27(m)
VI427 lV/591
V/673 1/95(i)
1/2l(a)
WI&6S
V/418
III/20 ~b) IVI824
IV/79
III/122 1/1 (Iv)
IV/648
IV/1l9 V/171 V/149 IV/797
III/364'
IV/432
TII/544 IV/194
IITI294
Page No.
4
421 495
241
2&9
360 244
336
348
355
492 0130
355
367 474
316
457 455
251-481
304 418
456
354
343
377 410
360 345
474 486
263 468
295
301 478
479 445
293 259 473
422 487
277
256
443 472
318 440
182
330
444
427 385 456
455 43'8
355
410
371 392
34~
Town District/State
2
2227. Peerkankaranai 2228. Pehowa
Chingleput/Tamil Nadu KarnaJ/Haryana
Kolaba/Maharashtra West Godavari/Andhra
2229. Pen' 2230. Penugonda
Pradesh
2231. Pen ukonda 2232. Peraiyur .
2233. Perambalur
2234. Perianaicken-
Anantapur/Andhra Pradesh
MadurailTamii Nadu Tiruchirapalli/Tamil Nadu
Coimbatore/Tamii Nadu
2235.
2236.
2237. 2238.
2239. 2240.
2241. 2242.
2243. 2244.
2245. 2246. 2247. 2248. 2249. 2250.
2251.
2252. 2253. 2254. 2255. 2256. 2257. 2258. 2259.
2260.
2261. 2262.
2263.
2264. 2265.
2266. 2267.
2268.
2269.
2270.
2271.
2272.
2273.
2274.
2275.
2276. 2277.
2278.
2279.
2280.
2281.
2282.
palayam
Perintalmanna
Periyakulam
Periyapat¥ Pernambut Pernem
Perumbavoor
Perungalathur Perungudi
Perur
Perur Chetti· paJayam
Peth Umri Petlad Petlawad •
Pettai Phagwara Phalodi Phaltan
Phillaur Phirangipuram Phulbani Phulera
Phulia Phulpur
Phulwari Piehhore Pichhore
Piduguralla pjhani
Pilani PiIibhit
PiIkhuwa .
Pillanallur 1
Malappuram/Kerala
Madurai/Tamil Nadu
MysorelMysore North Areot/Tamil Nadu
Goa/Goa, Daman and Diu
Ernakulam/Kerala Chingleput/Tamil Nadu Chingleput/Tamil Nadu
Coimbatore/Tamil Nadu Coimbatore/Tamil Nadu
Nanded/Maharashtra Kheda/Gujarat JhabualMadhya Pradesh
Tirunelveli/Tamil Nadu KapurthalalPunjab JodhpurlRajasthan
Satara/Maharashtra
Jullundur/Punjab Guntur/ Andhra Pradesh Baudh Khondma\sjOrissa Jaipur/Rajasthan Nadia/West Bengal
Allahabad/Uttar Pradesh Patna/Bihar Gwalior/Madhya Pradesh Shivpuri/Madhya Pradesh
Guntur/Andhra Pradesh Hardoi/Uttar Pradesh
JhunjhurlUnlRajasthan Pilibhit/Uttar Pradesh
Meerut/Uttar Pradesh
Salem/Tamil Nadu Pimpalgaon Nasik/Maharnshtra
Baswant Pimpri Chinch- Poona/Maharashtra
wad New Town-ship
Pindwara .
Pipar Piparia
Pillri Pirattiyur .
Pirawa Pithapuram
Pithoragarh
Sirohi/Rajasthan Jodhpur/Rajasthan
Hoshanga bad/Madhya Pradesh
MirzapurlUttar Pradesh Tiruchirapalli/Tamil Nadu
Jhalawar/Rajasthan
East Gpdavari/Andhra Pradesh
PithoragarhlUttar Pradesh Pochampad Pro- Adilabad/ Andhra Pradesh
ject Township Left Flank Colony
Pochampad Pro- Nizamabad/Andhra Pradesh ject Township Right Flank Colony
Podara H\>wrah/West'Bengal
Pokaran Jaisalmer/Rajasthan
Polal ChingleputlTamil Nadu
Polasara Ganjam/Orissa
Class/Si No. of
Table A-IV
3
I/4(xxxiii)
IV/690 IVj637
IV/196
WHO
V/446
IV/363 1112(1)
V/132
III/76
V/369 III/4S4 VI/IO)
III/548 I/4(xxxi) I/4(ltlviii)
II 12(r) II 12(q)
VI638
IIl/97 VI495 I/50(k) Il/146(i)
IV/146
JII/354
IV/667
V/87 IV/776(i) IV/538(i)
VI/29 V/214 I/2ICb) V/506
V/670 IVI598 IV/453 III/575 (a)
1I/74 1II/439 V/365
IV/578
1/9(b)
V/40
IV/280 IV/90
V/595 I/23(h)
V/385
IU/241
IV/617 VI/12l
IV/74S
J/1(1xxij)
V/323
I/4(xxv)
'IV1791
Page No.
4
-247
430 426
392
451
474
405
252
453 325
469
363
493
371 247 247
252 252
485 327 477
266 310 388 354
~28 450 436
419 489 459
256
.477 487
423 412
374
299 362 469
421
250
447
399
383.
482
257 470
343
424 494
434
244
466
246
438
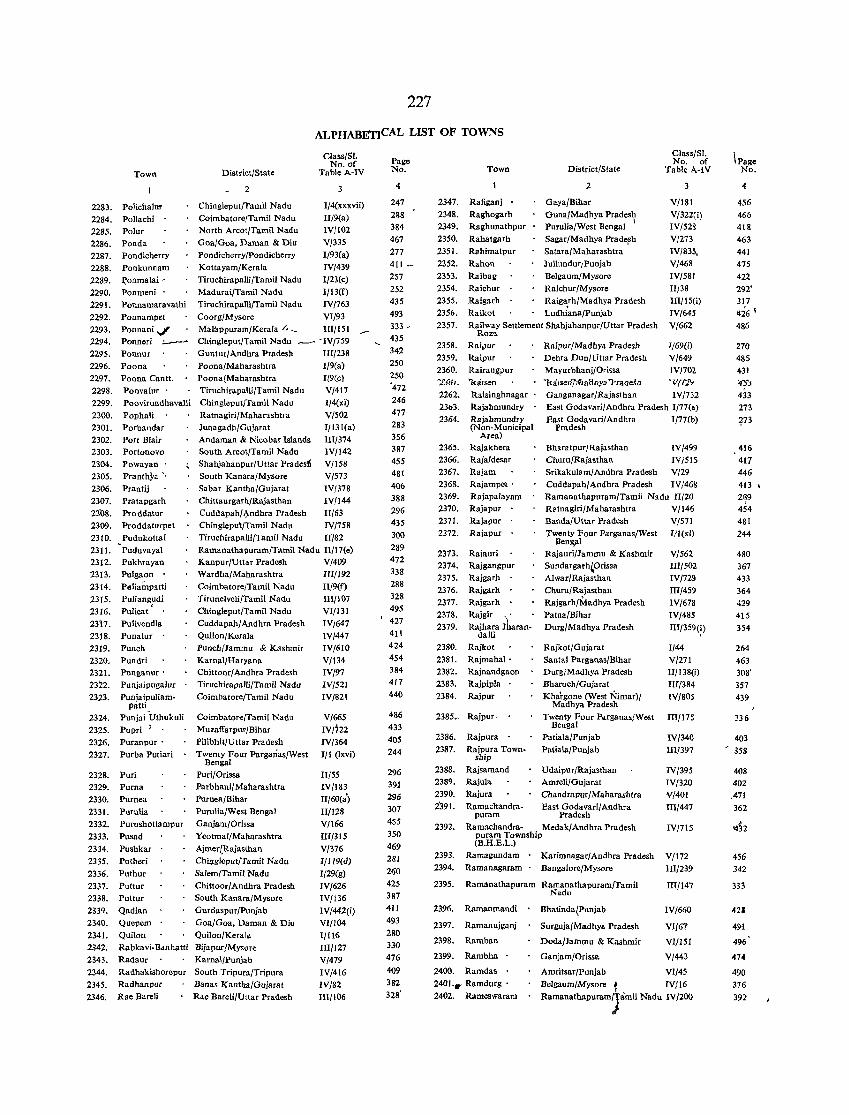
227
ALPHABETICAL LIST OF TOWNS
Town District/State
2
Class/SJ. No. of
Table A-IV
2283. Polichalu! Chingleput/Tamil Nadu 1/4(xxxvii)
II/9(a) IV/IOl
V/335 1/93(a)
IV/439 1/23(c)
1/I3(f)
IV/763
2284. Pollachi Coimbatore/Tamil Nadu 2285. Polur North Arcot/Tamil Nadu
2286. Ponda Goa/Goa. Daman & Din 2287. Pondicherry Pondieherry/Pondicherry
2288. Ponkunnam Kottayam/Kerala 2289. J;'onmalai' Tiruchirapalli/Tamil Nadu
2290. Ponmeni' Madurai/Tamil Nadu 2291. Ponnamaravathi Tiruchirapalli/Tamil Nadu
2292.
2293. 2294.
2295. 2296.
2297.
2298. 2299.
2300. 2301.
2302. 2303.
2304.
Ponnampet Coorg/Mysore VI/93 Ponnani../ Malappuram/Kerala /. ~ III/151 Ponneri ~ Chingleput/Tamil Nadu .,........- 'IVj759 Ponnur Guntur/Andhra Pradesh III/238
Poona Poona/Maharashtra 1/9(a)
Poona Cantt. Poona(Maharashlra 1(9(e) Poovalur . Tiruchirapalli/Tamil Nadu V/417
Poovirundhavalli Ching\eput}Tamii Nadu 1/4(xi)
Pophali Ratnagiri/Maharashtra V /502 Porbandar Junagadh/Gujaral 1/13 [(a)
Port Blair Andaman & Nieobar Islands III/374 Portonovo South Areot/Tamil Nadu IV/142 Powayan . Shahjahanpur/Uttar Pradesli V/l58
2305. PranthYa··
2306. Prantij
South Kanara/Mysore V/573
Sabar Kantha/Gujarat IV/378 2307. Pratapgarh
23'08. Proddatur 2309. Proddaturpet
2310. Pudukottai 2311. -Puduvayal
2312. Pukhrayan 2313. Pulgaon .
2314. Puliampatti
2315. 2316.
23\7.
2318. 2319. 2320. 2321.
2322.
2323.
2324.
2325. 2326.
2327.
Puliangudi , Pulieat
Pulivendla Punalur Punch
Pundri Punganur •
Punjaipugalur Punjaipnliam-
patti Punjai bthukuli Pupri )
Puranpur •
Purba Putiari
Puri Puma Purnea
Purulia Purushottampur
Pusad
Pushkar
Putheri Puthur
Puttur
Puttur Qadian Quepem
Quilon
Chittaurgarh/Rajasthan IV/l44
Cuddapah/~ndhra Pradesh II/63
Ching\eput/Tamil Nadu IV/758
TiruchirapaUi/Tamil Nadu U/82 Ramanathapuram/Tamil Nadu II/17(e) Kanpur/Uttar Pradesh V/409 WardhafMaharashtra
Coimbatore/Tamil Nadu Tirunelveli/Tamil Nadu Chingleput/Tamil Nadn
Cuddapah/Andhra Pradesh
Quilon/Kerala Punch/1ammu & Kashmir
Karnal/Haryana Chittoor/Andhra Pradesh Tiruchirapalli/Talllil Nadu
Coimbatore/Tamil Nadu
Coimbatore/Tamil Nadu
Muzaffarpur/Bihar PilibhitlUttar Pradesh
Twenty Four Parganas/West Bengal
Puri/Orissa Parbhani/Maharashtra Purnea/Bihar
Purulia/Wesl Bengal
Ganjam/Orissa
Yeotmal{Maharashtra
Ajmerl,Rajasthan Chi~gleput/Tamil Nadu
Salem/Tamil Nadu
Chittoor/ Andhra Pradesh South Kanara/Mysore
Gurdaspur/Punjab
Goa/Goa. Daman & Diu Quilon/Kerala
III/J92 Il/9(f)
IIII107
VI/131 IV/647 IV/447
IV/610
V/134 IV/97
IV/52l IV/821
V/665 IV/722
IV/364 1/1 (Ixvi)
2328. 2329.
2330.
2331.
2332. 2333.
2334.
2335.
2336.
2337. 2338.
2339. 2340.
2341. 2342.
2343.
2344.
2345.
2346.
Rabkavi-Bdnhatti Bijapur{Mysore Radaur Kamaltpunjab
II/55 IV/IS3 II/60(a)
H/128
V/166 III{3l5
V/316 1/JI9(d)
1/29(&)
IV/626 IV/136
1V/442(i)
VI/I 04
1/116
IIIIl27
V/479 IV/416
IV/82
III/I06
Radhakishorepur Radhanpur
Rae Bareli
South Tripura/Tripura
Banas Kantha/Gujarat Rae Bareli/Utla r Pradesh
Page No.
4
247
288 384
467
277 411 _
257
252
435 493
333 -435 342
250
250 '472
246
477
283 356 387 455 481
406
388
296 435
300
289 472
338
288 328
495 427
4Jl 424
454
384 417 440
486
433
405
244
296 391 296
307 455
350
469
281
260
425
387 4iJ 493
280
330
476
409 382
328'
Town
2347. Rafiganj
2348. Raghogarh 2349. Raghunathpur
2350. Rahatgarh
235 I. Rahimatpur
2352. Rahon 2353. Raibag
District/State
2
Gaya/Bthar GunajMadhya Pradesh Purulia/West Bengal I
Sagar/Madhya Prade,sh Salara/Maharashtra
Jullundur,Punjab Belgaum/Mysore
ClassjSl. No. of
Table A-IV
2354.
2355. 2356.
2357.
Raichur Raichur/Mysore
3
V/181 V/322(i) lV/52a V/273
IV/83S, V/468
IV/58 I
HI38 III/15(i)
IV/64S
V/662
Raigarh Raigarh/Madhya Pradesh
Raikot Ludhlana/Punjab Railway Settlement Shahjahanpur/Uttar Pradesh
Roza
2358. Rai"ur Raipur/Madhya Pradesh 1/69(i)
V/649 IVJ702
2359. Raipur
2360. Rairanzyur "ZJ'til. 'kwsen 2262. Raisinghnagar
2303. Rajahmundry 2364. Rajahmundry
(Non-Municipal Area)
2365. Rajakhera 2366. RajaJdesar 2367. Rajam
2368. Rajampet· 2369. Rajapalayam 2370. Raja pur
2371. Rajapur
2372.
2373. 2374. 2375.
2376.
2377. 2378. 2379.
2380. 2381.
23~2.
2383.
2384.
Rajapur
Rajauri Rajgangpur Rajgarh Rajgarh . Rajgarh • Rajgir . .
Rajhara Jharan-dalli
Rajkot
RajmahaI· Rajnandgaon Rajpipla
Rajpur
2385_ Rajpur,
2386. Rajpura
2387. Rajpura Township
2388. Rajsamand Raiula Rajura
Dehra Dun/Uttar Pradesh Mayurbhanj/Ori<sa
t<alsetiTmalinya 'haae!n -Vrr.!.Y Ganganagar/Rajasthan lV/732 East Godavari/Andhra Pradesh 1/77(.)
East Godavari/Andhra I/77(b) Pradesh
Bharatpnr/Rajasthan IV/499
Churu/Rajasthan IV/SIS Srikakulam/Andhra Pradesh V/29
Cuddapah/Andhra Pradesh IV/46B Ramanathapur\lm/Tamil N:ldu H/20 R2tnagiri/Maharashtra V/146
Banda/Uttar Pradesh V/571 Twenty Four Parganas/West
Bell!~al
Rajauri/Jammu & Kashmir
Sundargarh,Orissa Alwar/Rajasthan Churu/Rajasthan
RajgarhlMadhya Pradesh
Patna/Bihar Durg/Madhya Pradesh
Rajkot{Gujarat
Santal Parganas/Bihar Durg/Madhya Pradesh
Bharuch/Gujarat Khargone (West Nimar)/
Madhya Pradesh
Twenty Four Parganas{West Bengal
Patiala/punjab
Patiala/Punjab
Udaipur/Rajasthan Amreli/Gujarat
Chandrapur/Maharashtra
I/I(.:!)
V/562 III/502 IV/729
III/459 IV/678
IV/48S
III/3S9~)
1/44 V/27 I II/I 38(i) III{384
IV/80S
Ill/175
IV/340
III/397
2389.
2390.
2'391. Ramachandra- East Godavari/ Andhra
IV/395 JV/320
V/401
III/447
2392.
2393.
2394.
2395.
puram Pradesh
Ramachandra- Medak/Andhra Pradesh puram Township (B.H.E.L.)
Ramagundam
Rarnanagararn Karimnagar/Andhra Pradesh
Bangalore/Mysore
Ramanathapuram Ramanathapuram/Tami! Nadu
Bhatinda{Punjab
Surguja/Madhy& Pradesh
Doda/Jammu & Kashmir
Ganjam/Orissa
IV/71S
V/I72 II1/239
IIT/147
IV/660
VI/6T
VI/151
V/443
2396. Rarnanmandi
2397. Ramanujganj
2398. Ramban
2399. Rambha
2400. Ramdas
2401., Ramdurg .
2402. Rameswaram
Amritsar/Punjab Vl/45
Belgaum/Mysore It lV{16 RamanathaPUram;amii Nadu IV/2oo
\ Page No.
4
456
466
418
463 441 475
422 292'
317 1126 ~ 486
270 485 431
"73
433
273
f73
416
417 446
413
2~ 454
481
244
480 367 433
364
429 415
354
264
463 308'
357
439
336
403 358
408 402
,471
362
456
342
333
421
49>1
496'
474
490
376
392
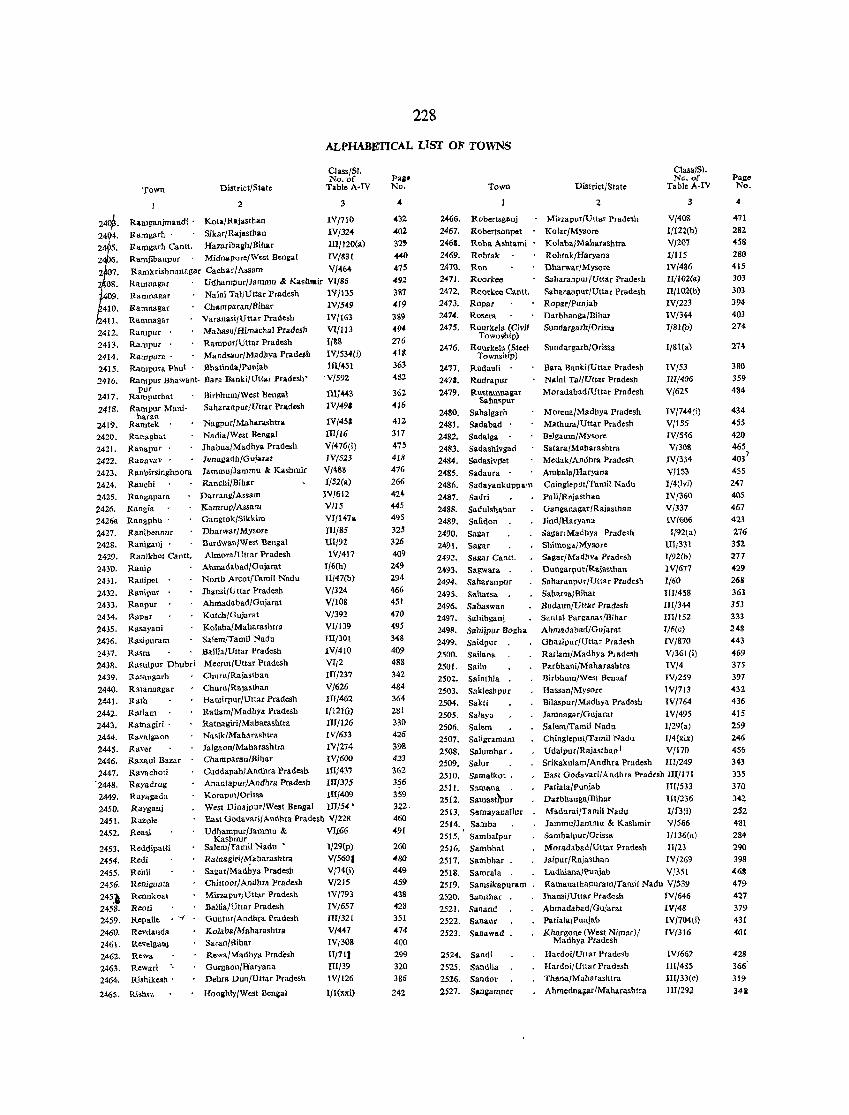
228
ALPHABETICAL L1ST OF TOWNS
2412. 2413.
2414. 2415.
2416.
2417.
2418.
2419. 2420.
2421. 2422. 2423.
2424.
Town Oistrict/State
2
Class/Sl. No.of
Table A·IV
3
Rilmganjmandi' Kota/Rajasthan IV/710 Ramgarh . Sikar/Rajastbau IV/324
Ramgarh Cantt. Hazarioal;h{llihar mI120(a) Rarnjibanpur Midnapore{West Bengal rV/S31
RaOlkrishoanagar Cachar/Assam V/~4 Ramnagar Udhampur/Jarnmu 8< Kash .. ir Vl/86 Rarn""gar Nairn Tal/Uttar Pradesh lVID5 Ramnllgar Champaran/8ihar IV/549
Ramnagar Varallasi/Uttar Pradesh JV/163 Rampur . Mahasu/Himachal Prade.ll VIlli 3 Rampur . Rampur/Uttar Pradesh 11&8 Rampura . Mandsaur/Madhya PradC$h IY/534(i)
Rampura Phul llhatinda/Puniab Ill/45 1 Rampur Bhawani • .Bara B.nki/Uttar Pradesh' 'V/592
pur Raltlpurhat Rampur Mani-
haran Raltltek Ranaghat Ranapur . Ranavav •
Ranbirsinghpora
Ranchi
Birbhum[West Bengal Saharanpur/lJttar Pradesh
Nal:pur/Maharashtra Nadia[West Ben2al Jhabua/Madhya. Pradesh
JunalladhfGujarM Jammu/Jammu k Kashmir
Ranchi/Bihar
lllJ4~3
IV/49'
2425. Rangapara 2426. Rangi. 2426a Rangphu'
Oarranll} Assam Kamrur/Assam Oangtok/Sikkim Oharwar/Mysore BurdwanjWest Bengal Almora!Uttar Pradesh
Ahmadabad/Gujarat
IV/45S
III/16 V/476(i) IV{523
VI-\SS I/S2(a)
IV}612
Y/15 VI/l .. 7 ..
In/8S llI/92 IV/417
2427. 2428.
2429. 2431).
2431. 2432.
2433. 2434. 2435. 2436. 2437.
2438. 2439.
2440. 2441. 2442. 2443.
2444.
2445. 2446. 2447.
'2448. 2449.
2450.
Ranioennur Raniganj . Ranikhet Cantt.
Ranip
R"nipet Raniput Ranpur
RnPar
Rasayani
North Arcot/Y"mil Nadu Jhansi/U ttar Pradesh Ahmadabad/Guiarat Kutch/Gujaea! KolabalMaharashtra
Rasipuram Salem/Tamil Nadu Rasra Ballia/Uttar Pradesh Rasulpur Ohubri Meerut/Uttar Pradesh
Ratangarb
Rllannagar Rilth Riltlam Ratnagiri . Ra.vaIgaon
Raver Raxaul Bazar Rayachoti R"yadrug RaYagada Rayganj
Chuw/Rajastban
Churu/RaJasthan Hamirpur/Uttar Pradesh Ra\lam/Madhya Pradesh Ratnagiri/Mabarashtra Naslk/Maharashtra Jalgaon/Maharashtra Chal11paran/Bibar Cuddapah/Andhra Pradesh Anantapur/Andhra Pradesh Koraput/Ori,sa West Dinajpur/Wesl Bengal
l/6(h) JI/47(b)
V/324 V/IOS V/392
VI/139 Ill/301 IV/4JO VI,2 III/237
V/626 ITI/462 1[121 (i)
UI/126 IV/633
IV/274
IY/600 IlIJ437 III/375 IlI/409 III/54 •
245!. Razo!e 2452. Reasi
East GodavlIrijAndhra Pradesh Vl2U
Udhampur/Jammu & VJJ66
2453. Reddipatti 2454. Red! 2455. RehH 2456. Renigunta
245.1 Rcnukoat 2458. Rooti 2459. Repalle .-!
2460. Revdanda 246 \. RevelgaUj
2462. 2463. 2464.
2465.
Rewa
Rewari Rlshikesll .
Risnm
Kashmir Salem/Tamil Nadu ' Ratnagiri/1'1aharashtra Sa~ar/Madhya Pradesh ChitlOOr/Andhra Pradesh MhzapurJ Utt"r Pradesh Ballia/Uttar Pradesh OunturlArtdltra Pr"desh Kolaba/Maharashtra Saran/Bihar Rewa/Madhy" Pradesh Gurgaon/Haryana Debra Dun/Ultar Pradesh
Haofi:hlylWest Ben~a!
1/29(p)
V/5601 VI74(i) Vf2lS IV/793
IlTI32l V/447 IV/308
IJI711 III/39 IV/126
I/I(xxi)
4
432
402
32' 440
475 492
387
419 389 494
276
4iS 363
482
362 4111
412
317
4i5 418 476 266
424 445 495
325 326
409
249 294
466 451
470 495 348
409 488
342
484 364
281
330 426
398 423
362
3?6 359
322· 460
491
260 480
449 459
438
428 351
474 400 299 320 386
242
Town
2"66. Robertsganj 2467. Rohertsonpct 2461. Roha Ashtami 2459. Rohtak 247{). Ron 2471. Roorkee
2472. Roorkee Cantt. 2473. Ropar 2474. Rosera 2475. Rourkelrt (Civil
Township)
2476. ROurkela (Steel Township)
2471. Rudauli . 247.. RudraplIr
2479. Rustamna~ar Sahaspur
2480. Sabalgarh 2481. Sadabad . 2482. Sadalga
2483. Sadashivgad 2484. SIldasiv]1et
2485. Sadaura . 2486. Sadayankupparrl 2487. Sadri
2488. Sadulshahar 2489. Safidon
2490. Sallar 2491. Sagar 2492. Sallar Cart!!. 2493. Sagwara • 2494. Saharanpur 2495. Sabatsa 2496. Sahaswan 2497. 5ahibganj 2498. SlIhijpur Bogh ..
2499. Saidpur 2500. Sailana 2501. Sailu 2502. Sainthia 2503. Sakleshpl1r 2504. Sakti 2505. Salaya 2506. Salem 2507. Saligramam
2508. Salumbar. 2509. Salur 2510. Sall1alkot.
2511. SlIolllana • 2512. samastl\>ur 2513. SamayanaJlur 2514. Samoa 251 S. Sambalpur
2516. Sambhal 2517. Sambhar. 2518. Samrala • 2519. Samsikapuram
2520. Samthar 2521. Sanand 2522. Sanaur 2523. Sanaw.d
2S2~.
2525.
2526.
2527.
Sandi
Sandila Sandor
S.ngarnner
Oistrict!State
2
Mirzapur/Ullar Pradesh
Kolar{Mysore KolabalMaharashtra Rohtak/Haryana Dharwar/Mysore Saharanpur/Utt&r Pradesh
Saharan9ur/Uttar Pradesh Ropar/punjab Darbhanga/Biha. SundargarblOrissa
Sundargarh/Oris&a
llara Banki/Uttat Pradesh N~ini Tal/Uttar Pradesh
Moradabad{Uttar Prad~sh
Morena/Madhya Pradesh Mathura/Uttar Pradesh Belgaum/Mysore Satara/Maharashtra Mcdak/Andhra Pradesh
Ambalaillaryana Cllinglepllt/Tamil Nadu Pali}Rfliasthan Gan~anag;ar{Raiasthan
JindJHaryana Sallar/Madhya Prade,h Shimoga}Mysore Sagar/Madh'la Pradesh
OungarpurlRaia~than
Saharanpur/Uttar Pradesh
Saharsa{Bihar BudaunfUttar Pradesh Santa! Parsana,{l3ihar
Anmadabad/Gujarat Ghazipur/Uttar Praje~h
Radam/Madbya P)adesh ParbhanijMaharashtra 13irbhum/Wesl Ben.al
Hassan/Mysore Bilaspur/Madhya Pradesh Jamnagar/Gujarat Salem{Tamil Nadu ChingleputjTamil Nadu
Udaipur/Rajasthan t Srikakulam/Andhra Pradesh
Class}Sl. No. of
Table A·IV
V/40S r{122(b)
Vl207 r/115
IV/486 II(102(a)
II{102(b)
IV/223
IV/344
1/81(0)
1/81(a)
IV/53 m1406 V/625
IV/744(i) V/156 IV/SS6
VI308 IV/334 V/IS) 1/4(1'1;)
IV/360 V/337
IV/W6
Ifnta) IllJ33l l/92(b)
IV/677
r{50
HI!458
Ul/344 IIl/152
T/~(c)
IV/870 V}361(i)
IV/4 JV/259
IV/7Il IV/164 IV/495
If29(a) l/4(xix)
V/170 IlI/249
Ea.t Godavari/Andhra Pradesh III/171
Patiala/Punjab IU/533 Darbhangal.Bihar III/236
Mlldurai/Tamil NadIJ Iff3(i) Jammu/Jammu & Kashmir V/566 Sambalpur/Orissa 11136(a)
Moradabad/Uttar Pradesh II/23 Jaipur{Raja'than IV/269 Ludhiana/Punjab VI351 RamanathapUram/Tamil Nadu V/539 Jhansi/Uuar Pra<ksl\ IV/646
Ahmadabad/Gujarat rv /48 PatialalPunjab IV/704(i)
Khargone (West Nimar)/ IV/316 Madbya Pradesh
HardoiJUttar Pradesh
HardoilUttar Pradesh Thana/Maharasbtra
Ahmedna~arIMabar'lshtra
IV/662
1lI/485 IIIJ33(c)
III/292
Pall" No.
4
471
282
458
280
415 303
303 394 403 274
274
380 359
484
434
455 420 465 4037
455 241
405
467 423
276 352
277
429 268
363
353
333
248
443
469 375 397
432 436
415
259 246
456 343
335
370 342
252
4~1
284
290 398 46&
479 427
379 431
401
428 366'
319
3411
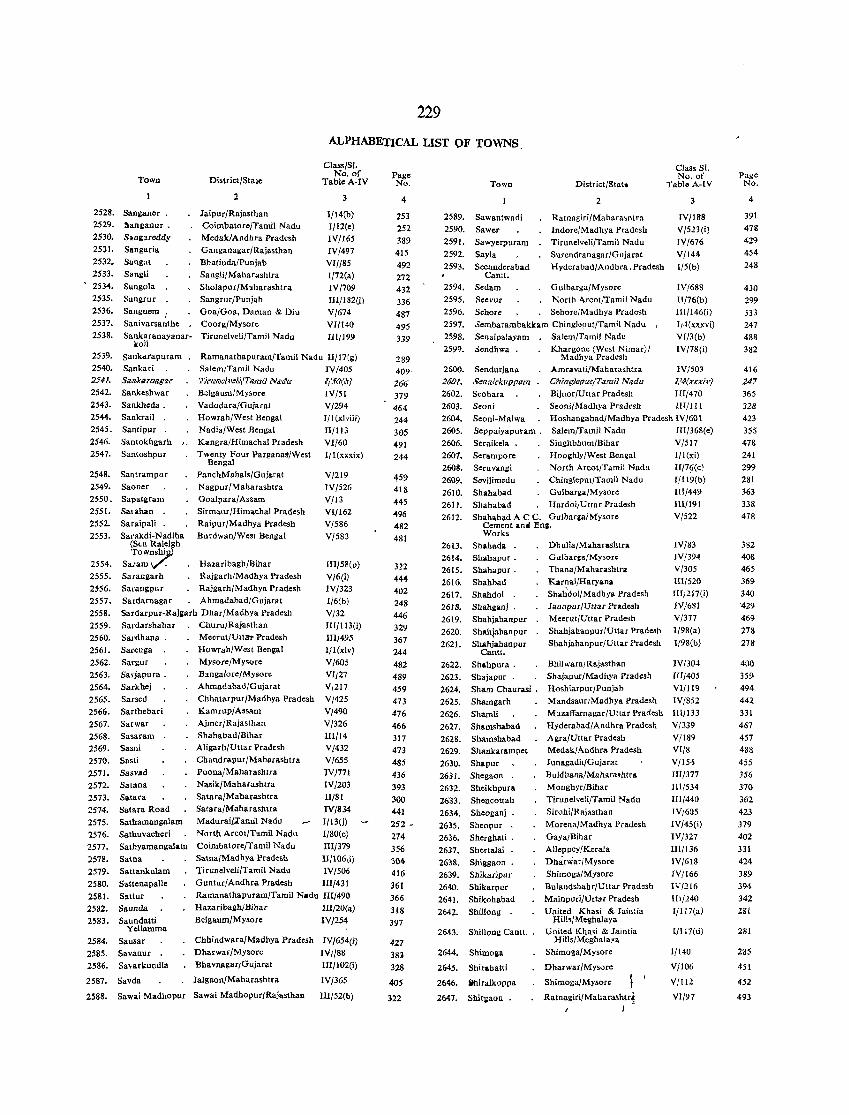
229
ALPHABETICAL LIST OF TOWNS.
Town
2528. Sanllaner l'Ianganur . S.nglfeddy Sangaria
Sanga! SangH
Sangola
Sungrur Sanguem
Sanivarsanthe
District/Stalc
2
Jaipur/Rajasthan Coimbatore/Tamil Nadu Medak/Andhra Pradesh
Ganganagar/Rajasthan Bhatinda/Punjab
SangIi/Maharashtra
Sholapur/M~harashtra
SangrurjPunjab
Goa/Goa. Daman & Diu Coorg/Mysore
Class/SI. No. of
Table A-IV
2529.
2530. 2531.
2532. 2533. 2534.
2535.
2536. 2537.
2538. Sankaranayanar- Tirunelveli/Tamil Nadu koil
3
I/14(b) 1/12(e)
IV/165
IV/497
VI//8S 1/72(a)
IV/709 III/I 82(i)
V/674 VI/140 IHj199
2539.
2540. :154 ....
sankMapuram . Sankari S<mJuU'.wl{;U
2542. Sankeshwar
2543. Sankheda.
2544. Sankrail . 2545. Santipur .
2546. Santo kbgarh 2547. Santosbpur
2548. Sao trampur 2549.
2550.
2551. 2552.
2553.
Saoner
Sapatgram Satah.n .
Saraipali . Sal'akdi-Nadiba
(S<n Raleigb TownshiJ;ll
Salam I./. Sa/anlolarh Sal'angpur
Ramanathapuram/Tamil Nadu II/17(g) Salem/Tamil Nadu IV/405
BelgaumlMysore IV/51 Vadodara/Gujarat V/294
Howrah/West Bengal I/l(xlviii) Nadia/West Bengal H/1l3 Kangra/Himacbal Pradesh VI/60
Twenty Four Pargana$/West I/I(xxxix) Bengal
PanchMahals/Guiarat V/219 Nagpur/Maharasbtra
Goalparal Assam Sirmaur/Himaebal Pradesh RaipurlMadbya Pradesh
BurdwanJWesl Benllal
Hazaribagh/Bihar Rajgarh/Madhya Pradesh
Rajgarh/Madhya Pradesh
IV!526
V/13 VII162
V/586 V/583
2554. 2555.
2556.
2557.
2558. 2559.
2560. 2561.
2562. 2563.
2564.
2565. 2566.
2567. 2568. 2569. 2570.
2571. 2572.
2573. 2514.
2575. '2576.
2577. 2578.
2579. 2580.
2581.
2582. 2583.
Sardarnagar Ahmadabad/Gujarat
IlI/58[b)
V/6(i) IV/323 I/6(b)
V/32 III/113(i)
IJI/495 I/l(xlv)
V/605 VI/27
V/217 VJ425 V/490 V/326
III/14 V/432
V/655 IV/771 IVj203
11/81 IV/834
11130) 1/80(e)
III/379 1I/106\i} IV/506
IlI/431
2584. 2585.
2586.
2587.
2588.
Sardarpur-Rajj;arb Dhar/Madhya Pradesh Sardarshahar Churu/Rajasthan
Sardhana . Sa,enga
Sargur Sarjapura.
Sarkhej
Sarscd Sarthebari
Sarwar
Sasaram Sasni
Sasti Sasvad
Satana
Satara Satara Road
Sathamangalam Sathuvacheri
MeerutJUUlrP Pradesh
Howrab/West Bengal Mysore/Mysure Bangalore/Mysore
Ahmadabad/Gujarat
Chhatarpur/Madhya Pradesh Kamrup/Assam AjmerjRajasthan
ShahalJad/Bibar AJigarh/Uttar Pradesb
Chandrapur/Maharashtra Poona/Maharashtra
Nasik/Maharashtra Satara/Maharasbtra
Satara/Maharashtra Madurai/;rarnil Nadu
North Areot/Tamil Nadu
Sathyamangalam Coimbatore/Tamil Nadu
Satna Satna/Madbya. Pradesh
Satlankulam Saltenapalle
Sattur Saunda Saundatti
YeJlamma
Sausar Savanur .
Sa\arkundla
Savda
Tirunelveli/Tamil Nadu Guntur/Andhra Pradesh
Ramanathapuram/Tamil Nadu llI/490 Hazaribagh/Bihar IlI/20(a)
Belgaum/Mysore IV/254
Chbindwara/Madhya Pradesh IV/654(i)
Dharwar/Mysore IV//88 Bhavnagaf/Gujarat IIIj102(i)
Jalgaon/Mabarasbtra
Sawai Madhopur Sawai Madhopur/Rajasthan
IV/365
1II/S2(b)
Page No.
4
253 2,2
389 415
492
272 432
336 487
495
339
289 409' 266
319 464 244
305 491
244
~59
418 445
496 482 481
322 444
402
248 446 329
367 244
482
489 459 473
476 466
317 473 485
436
393 300
441
252 -274
356 304 416
361
366
318
397
427 38}
328
405
322
Town
2589. Sawantwadi
2590. Sawer
2591. Sawyerpuram
2592. Sayla
2593. Seeunderabad Cantt.
Sedam
Seevur
District/Btat.
2
Ratnagiri/Mabara,ntra
Indore/Madbya Pradesh
Tirunelveli/Tamil Nadu Surendranagar/Gujarat
Hyderabad/Andhra. Pradesh
Gulbarga/Mysore
North Areot/Tamil Nadu
Class Sl. No. of
Table A-IV
IV/188 V/523(i)
IV/676 V/144
I/5(b)
2594.
2595.
2596.
2597.
2598. 2599.
Sehore Sebore/Madbya Pradesh
IV/688 1I/76(b)
III/146(i) I/4(xxxvi) VJ!3(b)
IV/7S(i)
Sembarambakkam Chingleput/Tamil Nadu I
Senaipalayam
:>endbwa .
Sendurjana SC{la.irkuppttm
Seobar.
Seoni Seoni-Malwa Seppaiyapuram .
Seraikel" . Serampore Seruvangi
Sevilimedu
Shababad Shababad
Salem/Tamil Nadu Kbargone (West Nimar)/
Madhya Pradesb Amravatl/Maharashtra
Clziogk:{7'1(ITamil Nudu
Bijnor/Uttar Pradesh
IV/50)
l(4(KKKiv)
III/470 Sconi/Madbya Pradesh IH/ll I Hosbangabad/Madhya Pradesh IV/601
Salem/Tamil Nadu IIl/368(e)
SinghbhumiBihar V/517 Hooghly/West Bengal l/l(xi) Nortb Areot/Tamil Nadu
Chingleput/Tamil Nadu
Gulbar~alMysore
Hardoi) Uttar Pradesb
2600. 261)/.
2602.
2603. 2604.
2605. 2606.
2607.
2608.
2609.
2610. 2611.
2612. Sbahabad A C C. Gulbar~alMysore Cement and Eng.
Il{7?(c)
11119(b)
IlII449 Jl[!191
V/522
Works
2613. Shabada . Dhulia/Mabarasbtra
2614. Shahapur. 2615. Shahapur.
2616.. Shabbad
2617. Shahdol 2613. Shahganj.
2619. Sbahjahanpur
2620. Sbah~ahanpur
2621. Shahjahanpur Cantt.
2622. Shahpura.
2623. Shajapur. 2624. Sham Chaurasi .
2625. Shamgarb
2626. Shamli 2621. Shamshabad
2628. Sbamshabad 2629. Shankarampet
2630. Shapur 2631. Sllegaon .
2632. Sheikhpura
2633. Sheneottah 2634. Sheoganj.
2635. Sheopur .
2636. Sherllhati. 2637. Shertalai .
2638. Shiggaon.
2639. Shikaripur 2640. Shikarpur
2641. Shikollabad
2642. Shillong .
2643. Sllillong Cantt.
2644. Shimo!:a
2645. Shirabatti
2646.
2647.
ihiralkop pa
Shirl1aon •
Gulbar,a/Mysore Thana/Mabar.shtra
Karnal/Haryana Shahdol/MadhY3 Pradesh
Jaunpur/Uttar Pradesh Meerut/Uttar Pradesh
Shabjahanpur/Uttar Pradesh
Shahjahanpur/Uttar Pradesh
Bhilwara/Rajasthan Shajapur/Madhya Pradesh
Hoshiarpur/Punjab
Mandsaur/MadbY3 Pradesh
Muzaffarnagar/Uttar Pradesb
Hyderabad/ Andhra Pradesh
Agra/Uttar Pradesh Medak/Andbra Pradesh
Junagadh/Gujarat
BuldlJana/MalJara!lJtra Moughyr/Bihar
Tirunelveli/Tamil Nadu
Sirohi/Rajasthan
Morena/Madhya Prauesh
Gaya/Bihar
Alleppey/Kerala
Dharwar/Mysore
Sbimoga/Mysore
Bulaudshahr/Uttar Pradesb
Mainpuri/Uttar Pradesh
United Khasi & Jaiu:ia Hil!,/Megbalaya
United Kbasi &. Jaintia Hills/Meghala .. "
Shimoga/Mysore
Dharwar/Mysore
Shimoga/Mysore
Ratnagiri/Maharashtra , '
IV/S3 IV/394
V/305 UII520 IlIJ217(i)
IV/681
V/377 1/98(a)
I{98(b)
IV/304
Irl/405
VI/119 IV/852
m/D3 V/339
V/189 VII8
V/l54
W/377 11[/534
1II/440
IV/60S IV/45(i)
IV/327
111/136 IV/618
IV/166
IV/216
1ll/240 1/1I7(a)
1/1l7(d)
1/140
V/106
V/112
VI/97
Page No.
4
391
478 429 454
248
430
299 333 247 488
382
416 247 365
328 423
355 478
241 299 281
363
338 478
382 408 465
369 340 '429
469
278
218
400
359 494
442 331
467 457
488
455
356 370
362 423
379 402
331 424
389 394
342
281
281
285
451
452
493
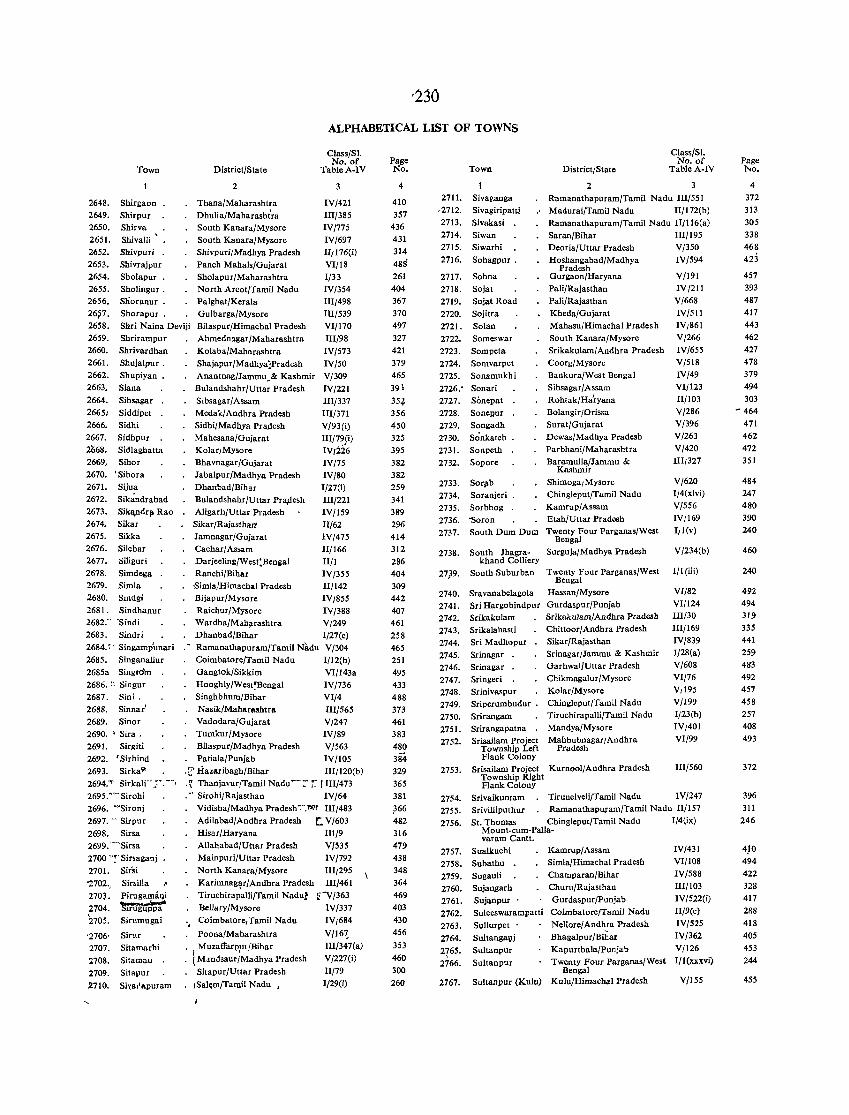
ALPHABETICAL LIST OF TOWNS
Town
Shirgaon Shirpur Shirva
Shivalli
Shivpuri . Shivrajpur
Sholapur . Sholingur.
Slioranur . Shorapur .
District/State
2
Thana/Maharashtra
Dhulia/Maharasht~a South Kanara/Mysore
South Kanara/Mysore
Shivpuri/Madhya Pradesh
Panch Mahals/Gujarat Sholapur/Maharashtra
North Arcot/Tamil Nadu Palghat/Kerala Gulbarga/Mysore
Class/SI. No. of
Table A-IV
2648.
2649. 2650.
2651.
2652. 2653.
2654. 2655. 2656,
26?7. 2658. 2659. 2660.
2661.
2662.
2663.
2664. 26651
2666.
2667. 2~8.
Shri Naina Deviji Bilaspur/Hirnachal Pradesh
3
IV/421 I1I/385
IV/775
IV/697 II,176(i)
VI/18
1/33 IV/354
I1IJ498 III/539 VI/170
I1I/98
IV/573
IV/50
V/309
IV/221
III/337
III/371 V/93 (i)
I1I/79(i) Ivri26
IVf75 IV/80 1/27(1)
Shrirampur Shri vardhan
Shnjalpur.
Shupiyan .
Siana
Sibsagar
Siddipet
Sidhi Sidhpur
Sidlaghatta
2669. Sihor 2670. • Sihora
2671. 2672. 2673.
2674.
2675. 2676.
2677.
2678. 2679. 2680.
Sijua
Sikandrabad
Si!Gtndrl' Rao Sikar
Sikka Silchar
Siliguri
Simdega Simla Sllldgi
2681. Sindhanur 2682:' "Sindi
2683. Sindri 2684. ~, Singampunari
2685. Singanallur
2685a Singto'm
2686. :: Singnr
2687. Sini. 2688. Sinnar'
2689. Sinor
2690. ' Sira . 2691. Sirlliti 2692. I Sirbind
2693. Sirka'" 2694."" Sirkali"' _::'. --,
2695.~··Sirohi
2696. -'Sironj 2697 ... Sirpur
2698. Sirsa 2699.-Sirsa
2700 ";' Sirsaganj 270 I. Sir'si
"2702., Sirsilla 270~. PirugamaQi
2704. 'm';'rrg'ii'tPa'" 2705.
'2706,
2707.
2708. 2;09.
2710.
Sirnmugai
SirtH
Sitamarhi
Sitamau . Sitapur
Si\'at'apuram
Ahmednagar/Maharashtra
Kolaba/Maharashtra Shajapur/Madhya:pradesh
Anantnag/Jammu .. & Kashmir Bulandshahr/Uttar Pradesh
Sibsagar/Assam
Medak/Andhra Pradesh SidhijMadhya Pra!lesh
MahesanafGnjarat Kolar,Mysore
Bhavnagar/Gujarat
Jabalpur{Madhya Pradesh
Dhanbad/Bihar
Bulandshahr/Uttar Pra,desh I1I/221
Aligarh/Uttar Pradesh IV/159 Sikar/Rajas!hart II/62
Jamnagar/Gujara! IV/475 Cachar/Assam II/166
Darjeeling/Wes(Benl:al 11/1 Ranchi/Bibar IV/355
-Simla/Himachal Pradesh II/142 BijapurfMysore IV/855
Raichur/Mysore IV/388
Wardha/M .. ~rashtra V/249 Dhanbad/Bihar I/27(c)
• Ramanathapuram/Tamil Nadu V/304
Coimbatore/Tamil Nadu I/12(b)
Gangtok/Sikkim VI/143a
Hooghly{Wes!!Bengal IV /736 Singhbhum/Bihar VI/4
Nasik/Maharashtra 1II/565 Vadodara/Gujarat V,247 TumkurfMysore IV/89
Bilaspur/Madhya Pradesh V/563
Patiala/Punjab IV/lOS
'1:' Hazaribagh/Bihar III,120(b) .~ Thanjavur/Tamil Nadu"-'~ r r 1II/473
." Sirohi/Rajasthan IV /64
Vidisha/Madhya Pradesh':'","I!"'r Ill/483
Adilabad/Andhra Pradesh C. V/603
Hisar/Haryana Ill/9
Allahabad/Uttar Pradesh V /535
MainpurijUttar Pradesh IV/792
North Kanara/Mysore III,295
Karimnag\,r/Andhra Pradesh III/461 Tiruchirapalli/Tamil Nadu! [i" "V /363
Bellary/Mysore IV 1337 " Coimbatore,Tamil Nadu
Poona/Maharashtra
MuzaffarpUl/Bihar
I MandsauriMadhya Pradesh i
Sitapur/Uttar Pradesh
I Salc;.m/Tatnil Nadu I
IV,684
V/167_ III/347(a)
V/227(i)
II/79
1/29(1)
Page No.
4
410
357 436 431
314
488 261
404 367
370 497
327
421
379 465
39\
35+ 356
450 325
395
382 382
259
341
389
296
414
312
286
404 309 442 407 461
258
465
251 495
433
488
373
461
383 480 384 329
365
381
~66
482
316
479 438
348 364
469
403 430
456
353
460
300
260
Town District, State
2
Class/SI. No. of
Table A-IV
3 ;m1.
.2712.
2713. 2714.
2715.
2716.
Sivaganga
Sivagiripatti
Sivakasi Siwan
Siwarhi
Sohagpur .
Ramana!hapuram/Tamil Nadu IIl/551
Madurai/Tamil Nadu II/I72(b)
Ramana!hapuram/Tamil Nadu II/116(a)
Saran/Bihar III/195 Deoria/Uttar Pradesh V /350
Hoshangabad/Madhya IV/594
2717.
2718.
2719.
2720.
2721. 2722.
2723.
2724.
2725.
Sohna
Soja! Sojat Road
Soji!ra
Solan
Someswar
Sompeta
Somvarpet
Sonamukhi
2726: Sonari 2727. Sonepat
2728. Sonellur 2729. Songadh
2730. S';nkatch
2731. Sonpeth
2732. Sopore
2733. Sorl'b 2734. Soranjeri
2735. Sorbhog .
2736. "Soron
Pradesh Gurgaon/Haryana Pali/Rajasthan
Pali/Rajasthan
Kheda/Gujarat Mahasu/Himachal Pradesh
South Kanara/Mysore
Srikakulam/Andhra Pradesh Coorg/Mysore
Bankura/West Bengal
Sibsagar/Assam
Rohtak/Hatyana Bolangir/Orissa
Surat/Gujarat
Dewas/Madhya Pradesh Parbhani/Maharashtra
Baramulla/Jammu & Kashmir
Shimoga, Mysore
Chingleput/Tamil Nadu Kamrup/Assam
Etah/Ut!ar Pradesh
V/191 IV /211
V/668
IV/511 IV,861
V/266
IV/655 V/518
IV/49
VI/123 Il/I03
V/286 V/396
V/263 V/420
IlI/327
V/620 I/4(xlvi)
V/556 IV,169
2737. South Dum Dum Twen!y Four Parganas/West I,l(v)
2738.
27~9.
2740.
2741. 2742. 2743.
2744 .
2745. 2746.
2747.
2748. 2749.
2750.
2751. 2752.
2753.
2754. 2755.
2756.
2757.
2758.
2759. 2760_
2761.
2762.
2763.
2764.
2765 . 2766.
2767.
Bengal
South Jhagra- Surguja/Madhya Pradesh khand Colliery
South Suburban Twenty Femr Parganas/West Bengal
Sravanabelagola Hassan/Mysore Sri Hargobindpur Gurdaspur/Punjab
Srikakulam Srikalahasti Sri Madhopur
Srinagar
Srinagar . Sringeri
Srinivaspur Sriperumbudur .
Srirangam Srirangapatna . Srisailam Project
Township Left Flank Colony
Srikakulam/Andhra Pradesh
Chittoor/Andhra Pradesh
Sikar /Rajasthan Srinagar/Jammu & Kashmir
Garhwal/Uttar Pradesh
Chikmagalur/Mysore
Kolar/Mysore Chingleput/Tamil Nadu Tiruchirapalli/Tamil Nadu
Mandya/Mysore
Mahbubnagar/Andhra Pradesh
Srisailam Project Kurnool/Andhra Pradesh Township Right Flank Colony
V/234(b)
1/1 (iii)
VI/82 VI/124
III/30 III/169
IV/839 I/28(a)
V/608
VI/76 V,195
V/199 I/23(b)
IV,401
VI/99
1II/560
Srivaikunlam Tirunelveli/Tamil Nadu IV /247
Srivilliputhur RamanathaPUJ'am/Tamil Nadu II/I 57 St. Thomas Chingleput/Tamil Nadu I/4{ix)
Mount-cum-Palla-varam Cantt.
SuaIkuchi Subathu •
Sugauli Sujangarh Sujanpur .
Kamrup/Assam Simla/Himachal Pradesb
Champaran/Bihar Churu/Rajasthan
Gurdaspur/Punjab
Suleeswarampatti Coimba!ore/Tamil Nadu Sullnrpet . Nellore/ Andhra Pradesh
Sultanglltlj Bhagalpur/B;tar
Sultanpur Kapurthala/Punjab
IV/43 I
VI/I08
IV/58B 1lI/l03
IV/522(i)
II/9(c)
IV/S25
IV/362
V/126
Sultanpur Twenty Four Parganas/West 1/1 (xxxvi) Bengal
Sultanpur (Kulu) Kulu/Himachal Pradesh Vfl55
Page 1:'<0.
4
372 313
305
338
468 423
457
393 487 417
443
462
427
478 379
494
303 ~ 464
471
462 472
351
484 247 480
390 240
460
240
492 494 319
335 441
259
483 492
457 458 257 408
493
372
396
311
246
4,10
494
422
328 417
2R8
418
405
453
244
455
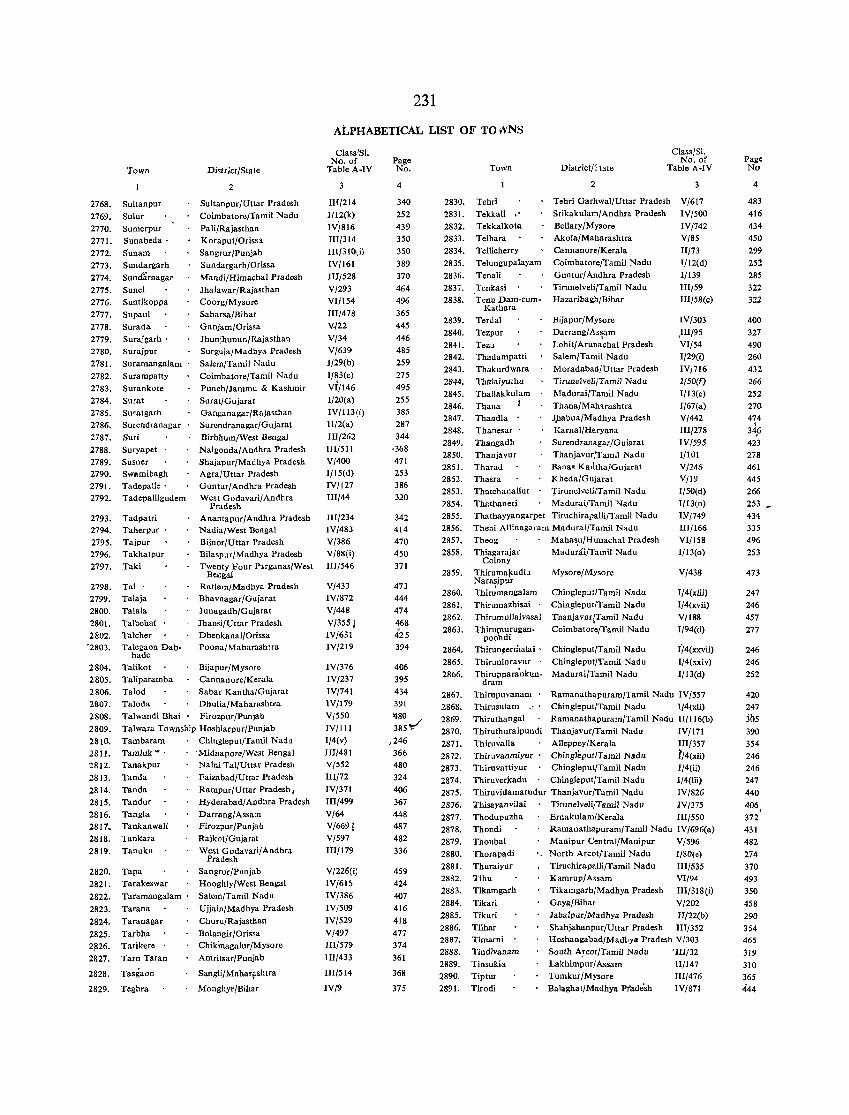
2768.
2769. 2770. 2771. 2772.
2773.
2774. 2775. 2776.
2777. 2778.
2779. 2780. 2781.
2782. 2783.
2784. 2785. 2786.
2787.
2788. 2789. 2790. 2791. 2792.
2793. 2794. 2795. 2796.
2797.
2798. 2799.
2800. 2801.
2802. '2803.
2804. 2805.
2806. 2807.
2808.
2809. 2810. 2811. 2812.
2813.
2814. 2815.
2816. 2817. 2818.
2819.
2820. 2821.
2822.
2823.
2824.
2825.
2~26.
2827.
2828.
2829.
Town
Sultanpur
Sulur
Sumerpur Sunabeda .
Sunam Sundargarh
Suncf1irnagar
Sunel Suntikoppa
Supaul
Surada Surajgarh .
Surajpur
Suramangalam Surampatty
Surankote
Surat Suratgarh
SUlendranagar
Suri Suryapet .
Susner Swamibagh Tad.palle· Tad.palligudem
Tadpatri Tah.rpur Tajpur Takhatpur Taki
Tal· Talaja Talala
Talbehat Talcher Talegaon Dab-
hade Talikot Taliparamba
Talod
DistrjCl/Slale
2
Sultanpur/Uttar Pradesh
Coimbatore/Tamil Nadu
Pali/Rajasthan Koraput/Orissl Sangrur/Puujab Sundargarh/Orissa
Mandi/Himachal Pradesh
Jhalawar/Rajasthan Coorg/Mysore
Saharsa/Bihar
Ganjam/Orissa Jhunjhunun/Rajasthan Surguja/Madhya Pradesh
Salem/Tamil Nadu
Coimbatore/Tamil Nadu
Punch/Jammu & Kashmir
Surat/Gujarat Ganganagar/Rajasthan Surendranagar/Gujarat
Birbhum/West Bengal Nalgouda/ Andhra Pradesh
Shajapur/Madhya Pradesh Agra/Uttar Pradesh Guutur/ Andhra Pradesh West Godavari/Andhra
Pradesh Anantapur/Andhra Pradesh Nadia/West Bengal
Bijnor/Uttar Pradesh Bilaspur/Madhya Pradesh Twenty Four Parganas/West
Beegal Ratlam/Madhya Pradesh Bhavnagar/Gujarat
Junagadh/Gujarat Jhansi/Uttar Pradesh
Dhenkanal/Orissa Poona/Maharashtra
Bijapur/Mysore
Cannanore/Kerala Sabar Kantha/Gujarat
Taloda Dhulia/Maharashtra Talwandi Bhai Firozpur/PunJab
Talwara Township Hoshiarpur/Punjab
Tambaram Chingleput/Tamil Nad', Tamluk * . 'Midnapore/West Bengal Tanakpur
Tanda
Tanda Tandur Tangla Tankanwali Tankara
Tanuku
Tapa Tarakeswar
Taramangalam
Tarana Taranagar
Tarbha Tarikere .
Tarn Taran
Tasgaon
Teghra
N aini TaIfU tlar Pradesh
Faizabad/Uttar Pradesh Rampur/Uttar Pradesh,
Hyderabad/ Andhra Pradesh
Darrang/ Assam Firozpur/Punjab
Rajkot/Gujarat West Godavari/Andhra
Pradesh
Sangrur/Punjab Hooghly/West Bengal
Salem/Tamil Nadu
Ujjain/Madhy'" Pradesh
Churu/Rajasthan Bolangir/Orissa Chikinagalur/Mysore
Amritsar/Punjab
Sangli/ Mahar~shtra
Monghyr!Bihar
231
ALPHABETICAL LIST OF TO vVNS
Class/SI. No. of
Table A-IV
IU/214 I/12(k)
IV/816 III/314 III/310\i)
IV/I6l
HI/528
V/293 VI/154
III/478
V-/22 V/34 V/639 I/29(b)
1/83(e)
VI/146 I/20(a)
IV/113(i) TI/2(a)
III/262
lII/511 V/400 I/15(d)
IV/127 III/44
III/234 IV/483
V/386 VI88(i) III/546
V/433 IV/872
V/448
V/355 1 IV/63l IV/219
IV/376 lV/237 IV/741 lV/179
V/550
IV/III 1/4(v)
III/48 I V/552
lII/72 IV/371
III/499
V/64 V/669j
V/597
III/179
V/226(i) IV/615
IV/386
IV/509 IV/529
VJ497
1lI/579
1II/433
IIl/514
IV/9
Page No.
4
340
252 439 350
350
389
370 464 496
365
445
446 485
259
275 495
255 385
287 344
'368 471 253 386 320
342 414 470
450 371
473 444
474 468
425 394
406
395 434 391
1180/ 385""
,246
366 480
324
406 367
448 487
482
336
459
424
407
416
418 477
374
361
368
375
2830.
2831. 2832. 2833.
2834.
2835. 2836.
2837. 2838.
2839. 2840.
2841. 2842. 2843.
2844. 2845.
2846. 2847.
2848. 2849.
2850. 2851. 2852.
2853. 2854.
2855. 2856.
2857. 2858.
2859.
2860.
2861. 2862.
2863.
2864.
2865.
2866.
2867. 2868. 2869.
2870.
2871. 2872. 2873. 2874.
2875. 2876.
2877. 2878. 2879.
2880. 2881. 2882.
2883.
2884.
2885.
2886. 2887. 2888.
2889. 2890.
2891.
Town District/: tate
2
Class/Sl. No. of
Table A-IV
Tehri Tehri Garhwal/Uttar Pradesh V/617
Tekkali " Tekkalkota Telhara Tellicherry
Telungupalayam
Tenali
Srikakulam/Andhra Pradesh lV/500
Bellary/Mysore IV/742 Akola/Maharashtr. V/85
Tenkasi Tenu Dam-cum
Kathara
Terdal
Tezpur
Tezu Thadampatti
Thakurdwara Thlrlaiyuthu
Thallakkulam I Tl:)ana
Thandla . Thanesar .
Thangadh Thanjavur Tharad Thasra Thatchanallur
Thathaneri
Cannanore/Kerala Coimbatore/Tamil Nadu
Guntnr/Andhra Pradesh
Tirunelveli/Tamil Nadu Hazaribagh/Bihar
Bijapur/Mysore
Darrang/ Assam
Lohit/ Aruna~hal Pradesh Salem/Tamil Nadu MoradabadjUttar Pradesh
Tirunelveli/Tamil Nadu
Madurai/Tamil N.du Thana/Maharashtra J)labua/Madhya Pradesh Kamal/Haryana
Surendranagar/Guiarat Thanjavur/Tamil Nadu Banas: Karltha/Gujarat
Kheda/Gujarat
Tirunelveli/Tamil Nadu Madurai/Tamil Nadu
Thathayyangarpet Tiruchirapalli/Tamil Nadu Theni Allinagaram Madurai/Tamil Nadu Theog Mahasu/Himachal Pradesh Thiagarajar Madu;ai/Tamii Nadu
Colony Thirumal<udLu Mysore/ Mysore Nar~ipur
Thir~mangalam Chinglcpul/Tamil Nadu Thirumazhisai . Chingleput/Tamil Nadu
Thirumullaivasal ThanjavuriTamii Nadu
Thirul"urugan- Coimbatore/Tamil Nadu paondi
Thirun,ermalai' Chingleput/Tamil Nlldu
Thiruninravur . Chingleput/Tamil Nadu Thirupparankun- Madurai/Tamil Nadu
dram
II/73 T/12(d)
1/139
III/59 III/58(e)
IV/303
,III/95 VI/54 1/29(i)
IVJ7I6 1150(f)
1/13(e) 1/67(a) V/442 1ll/278
IVl595
11101
V/246 V/19 I/50(d)
1/13(n)
IY/749 III/166
VI/158 1113(0)
V/438
I/4(xlii)
1/4(xvii)
V/188 I/94(d)
ri4(xxvii) I/4(xxiv)
I/I3(d)
Thirupuvanam' RamanathapuramjTamii Nadu IV/557
Thirusulam ." Chingleput/Tamil Nadn 1/4(xli)
Thiruthangal Ramanathapuram/Tamil Nadu III I 16(b) Thiruthuraipundi Thanjavnr/Tamil Nadu IV/171
Thiru;alla Alleppey/Kerala III/357 Thiruvanmiyur' Chingleput/Tamil Nadu t/4(xii)
Thirnvattiyur Chingleput/Tamil Nadu I/4(ij) Thiruverl<adu Chingieput/Tamil Nadu I/4(1ii)
Thiruvidamarudnr Thanjavur/Tamil Nadu IV/826 Thisayanvilai TirunelveU/Tamil Nadu IV/J75
Thodupuzha Ernakulam/Kera1a III/550 Thondi Ramanathapuram/Tamil Nadu IV/696(a)
Thoubal Manipur CentraliManipur V/596 Thorapadi
Thnraiyur Tihu Tikamgarh
Tikari Tikuri
Tilhar Timarni
Tindivanam
Tinsukia Tiptur
Tirodi
North Areat/Tamil Nadu
Tiruehirapalli/Tamil Nadu Kamrup/Assam
Tikamgarh/Madhya Pradesh
Gaya/Bihar
Jabalpur/Madhya Pradesh
1/80(e)
III/635 VI/94
III/318{i)
V/202 II/22(b)
Shahjahanpur/Uttar Pradesh JIT/352 Hoshangab.d/Madhya Pradesh V/303
South Arcot/Tamil Nadu <1Il/32
Lakhimpur/Assam II/l47 Tumkur/Mysore III/476
Bal"ghat/Madhya Pmdesh IV/87 I
Page No
4
483 416
434 450
299 252
285 322 322
400
327 490 260
432
266 252
270 474 , 34,6 423
278 461 445
266 253 434 335 496
253
473
247 246
457
277
246
246
252
420 247
:l05 390 354 246 246
247 440
406, 372 431 482
274
370 493
350
458
290
354 465
3J9 310
365 444
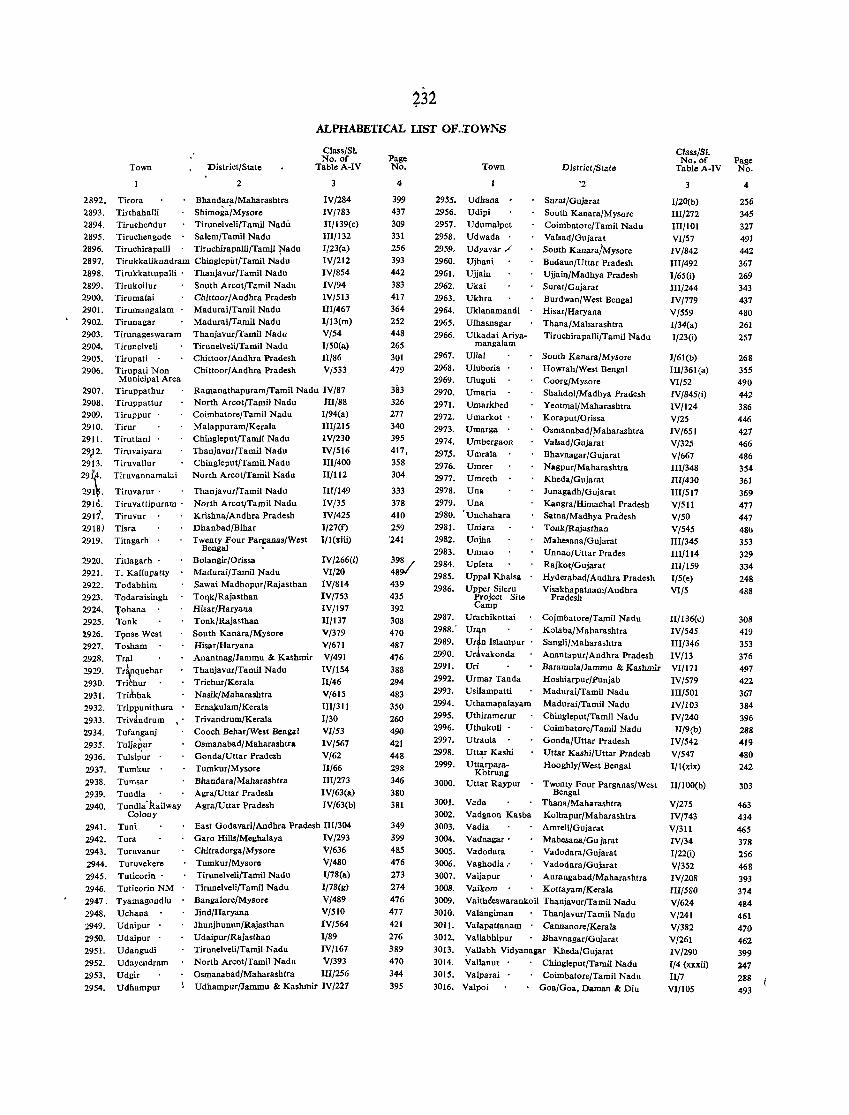
ALPHABETICAL LIST OF.,TOWNS
Town
Tirora
Tirthahalli Tiruchel1dur Tiruchengode
District/State
2
Bhandara/Maharashtra ShimogaiMysore Tirunelveli/Tamil Nadu
Salem/Tamil Nadu
Class/SI. No. of
Table A-IV
2892. 2893.
2894. 2895. 2896. 2897. 2898.
2899. 2900. 2901. 2902.
2903. 2904. 2905. 2906.
TiruchirapaJli Tiruchirapalli/Tamil {"adu
3
IV{284 lVj783
1l/139(e) IlIj132
1/23(a) IV{212
IV/854 IV{94 IVj513
1lI/467
Tirukkalikundram Chingleput/Tamil Nadu
2907. 2908. 2909.
2910. 2911.
29p. 2913.
29~4.
291~. 2916.
2917. 2918)
2919.
2920.
2921. 2922.
2923. 2924. 2925.
1926. 2927.
2928. 2929.
2930.
2931. 2932.
2933. 2934.
2935.
2936.
2937. 2938.
2939. 2940.
Tirukkattupalli .
Tirukoilur Tirumalai Tirumangalam Tirunagar
Tirunageswaram
Tirunelveli Tirupati .
Tirupati Non Municipal Area
Tiruppathur Tiruppattur Tiruppur
Tirur Tiruttani Tiruvaiyaru
Tiruvallur Tiruvannamalai
Tiruvarur· Tiruvattipuram .
Tiruvur
Tisra Titagarh ,
Titlagarh T. Kallupatty Todabhim Todaraisingh
Tohana Tonk
T9nse West Tosham Tr,,1
I Tr'V'quebar Tri~hur .
Tritbbak
TriPfunithura
Trivandrum " Tufanganj
Tuljapur
Tulsip'ur
Tumkur Tumsar
Tundla Tundla 'kailway
Colony
2941. Tuni
2942. Tura 2943. Turuvanur
2944. Turuvekere
2945. Tuticorin'
2946. Tuticorin NM 2947. Tyamagondlu
2948. Uchana 2949. Udaipur .
2950. Udaipur .
2951. Udangudi 2952. Udayendram
2953. Udgir 2954. UdhalIlpur
Thanjavur/Tamil Nadu
South Areot/Tamil Nadu Chittoor/ Andhra Pradesb Madurai/Tamil Nadu Madurai/Tamil Nadu Thanjavur/Tamil Nadu TirunelvelijTamii Nadu Chittoor/Andhra Pradesh Chittoor/Andhra Pradesh
11 13(m) Vj54
1/50(a)
Il/86 V/533
Ramanathapuram/Tamil Nadu IV/87 North Areot/Tamil Nadu 111/88 Coimbatore/Tamii Nadu 1/94(a) Malappuram/Kerala IIl/215 Chingleput/Tamil Nadu IV/230 Thanjavur/Tamil Nadu IV/516 Chingleput/Tamil, Nadu 11l/400 North Areot/Tamil Nadu II/1I2
Thanjavur/Tamil Nadu III/149
North Areot/Tamil Nadu IV/35 Krishna/Andhra Pradesh IV/425 Dhanbad/Bihar 1{27(f) Twenty Four Parl:anas/West 1/1 (xili)
Bengal
Bolangir/Orissa Madurai/Tamil Nadu Sawai Madhopur/Rajasthan To,\k/Rajasthan Hisar/Haryana Tonk/Rajasthan
South Kanara/Mysore Hisar /Haryana Anantnag/Jammu & Kashmir
Thanjavur/Tamil Nadu
Trichur/Kerala Nasik/Maharashtra
Erna,lmlam/Kerala Trivandrum/Kerala
Cooeh Behar/West Benl:al Osmanabad/Maharashtra
Gonda/Uttar Pradesh Tumkur/Mysore
Bhandara/Maharashtra Agra/Uttar Pradesh
Agra/Uttar Pradesh
IV/266(i) VI/20
IV/814
IV/7S3 IV/197
11/137
V/379 V/671
V/491 lV/1S4
It!46
V/615
1ll/311
1/30 VI/53
IV/567
V/62 II/66
lJI/273 IV/63(a) IV/63(b)
East Godavari/Andhra Pradesh 1II/304 Garo Hills/Meghalaya tV/293
Chitradurga/Mysorc V/636
Tumkur/Mysore V/480 Tirunelveli/Tamil Nadu 1/78(a)
Tirunelveli/TamiJ Nadu I/78(g)
Bangalore/Mysore V/489
Jind/Haryana V/S10
Jhunjhunun/Rajasthan IV/S64
Udaipur/Rajasthan 1/89 Tirunelveli/Tamil Nadu IV/167
North Arent/Tamil Nadu V/393
Osmanabad/Maharashtra lU/256
Udhampur/Jammu & Kashmir IV/227
Page No.
4
399 437
309 331 256 393 442
383 417 364 252 448
265 301 479
383 326 277 340 395 417, 358 304
333
378 410
259 '241
398/ 489<1' 439 435 392
308 470 487
476 388
294
483 350 260
490 421
448
298 346 380
381
349
399 485 476
273 274
476
477 421
276 389
470
344
395
2955. 2956.
2957.
2958. 2959.
2960. 2961.
2962. 2963.
2964. 2965.
2966.
2967. 2968. 2969.
2970. 2971.
2972.
2973. 2974. 297{>.
2976. 2977. 2978.
Town
Udhana Udipi
Udumalpet Udwada . Udyavar ,/
Ujhani
Ujjain
Ukai
Ukhra Uklanamandi
Ulhasnagar Ulkadai Ariya-
mangalam
Ullal
Uluberia Ululjluli Umaria
Umarkhed Umarkot . Umarga .
Umbergaon
Umrala Umrer
Umreth Una
2979. Una 2980. • Unehahara
2981.
2982.
2983. 2984.
2985. 2986.
2987. 2988.'
2989.
2990. 2991.
2992. 2993.
2994. 2995. 2996.
2997. 2998.
2999.
3000.
300).
3002. 3003.
3004.
3005. 3006.
3007.
Uniara Unjha
Unnao Upleta
Uppal Khalsa Upper Sileru
Project Site Camp
U raehikottai
Urllo Udn Islampur Urlvakonda
Uri Urmar Tanda Usilampatti
Uthamapalayam
Uthiramerur Uthukuli .
Utraula Uttar Kashi
Uttarpara-Kbtrung
Uttar Raypur
Vada
Vadgaon Kasba
Vadia Vadnagar'
Vadodara Vaghodia.· Vaijapur
District/State
'2
Surat/Gujarat
South Kanara/Mysore
Coimbatore/Tamil Nadu Valsad/Gujarat
South Kanara/Mysore
Budaun/Uttar Pradesh UjjaiujMadhya Pradesh Surat/Gujarat
Burdwan/West Bengal Hisar/Haryana
Thana/Maharashtra
Tiruchirapalli/Tamil Nadu
South Kanara/Mysore
Howrah/West Bengal Coors/Mysore
Shahdol/Madhya Pradesh
Yeotmal/Maharashtra Koraput/Orissa
Osmanabad/!'1aharashtra Vaisad/Gujarat Bhavnall:ar/Gujarat
Nagpur/Maharashtra Kheda/Gujara! JunagadhjGujarat
Kangra/Himachal Pradesh Satna/Madhya Pradesh Tonk/Rajasthan
Mahesana/Gujarat Unnao/Uttar Prades Rajkot/Gujarat
Hyderabadl Andhra Pradesh
Visakhapatnam/ Andhra Pradesh
Cojmbatore/Tamii Nadu
Kolaba/Maharashtra
Sangli/Maharashtra Anantapur/Andhra Pradesh
Baramula/Jammu & Kashmir Hoshiarpur/Punjab
Madurai/Tamil Nadu
Madurai/Tamii Nadu ChingleputjTamil Nadu CoimbatorejTamii Nadu
Gonda/Uttar Pradesh
Uttar Kashi/Uttar Pradesh Hooghly/West Bengal
Twenty Four Parganas/West Bengal
Thana/Maharashtra
Kolhapur/Maharashtra Amreli/Gujarat
MabesanafGu jarat
Vadodara/Gujarat Vadodara/Gujarat
Aurangabad/Maharashtra 3008. Vaikom Kottayam/Kerala 3009. Vaithe'eswarankoil Thanjavur/Tamil Nadu
3010. Valangiman Thanjavur/TamiJ Nadu 301). Valapattanam • Cannanore/Keraia
3012. Vallabhipur . Bhavnagar/Gujarat
3013. Vallabh Vidyanallar Kheda/Gujarat 3014.
3015.
3016.
Vallannr
Valparai Valpoi
Chingleput/Tamil Nadu
Coimbatore/Tamil Nadu Goa/Goa, Daman & Diu
Class/SI. No. of Page
Table A-IV No.
3
I/20(b)
III/272
IIIIlOI VI/57 IVj842
III/492 1/65 (i)
1II/244
IV/779
V/559 I/34(a) I/23(i)
1/61 (b)
1Il/36 1 (a)
VII52 IV/845(i) IV/124
V/25 IV/65 I V/325
V/667 1Il/348 III/430
1Il/517 V/511 V/50
V/54S
III/345
1II/1l4 III/I 59 I/5(e)
VI/5
II/136(e)
IV/545
1lI/346 IV/13 VI/I 71 IV/579
1lI/501 IV/103
IV/240 II/9(b)
IV/542
V/547
1/1 ("ix)
ll/lOO(b)
V/275
IV/743
V/311 IV/34 1/22(i)
V/352
IV/208 III/580 V/624 V/24 I
V/382 V/261
IV/290 114 (xxxii)
1I/7 VI/lOS
4
256
345
327 491
442
367
269 343 437
480 261
257
268 355
490 442
386 446
427 466
486 354
361
369 477
447 48(;
353
329 334
248 488
308 419 353
376
497 422
367 384
396 288 419
480 242
303
463 434
465 378 256
468
393 374
484 461
470
462
399 :147
288
493
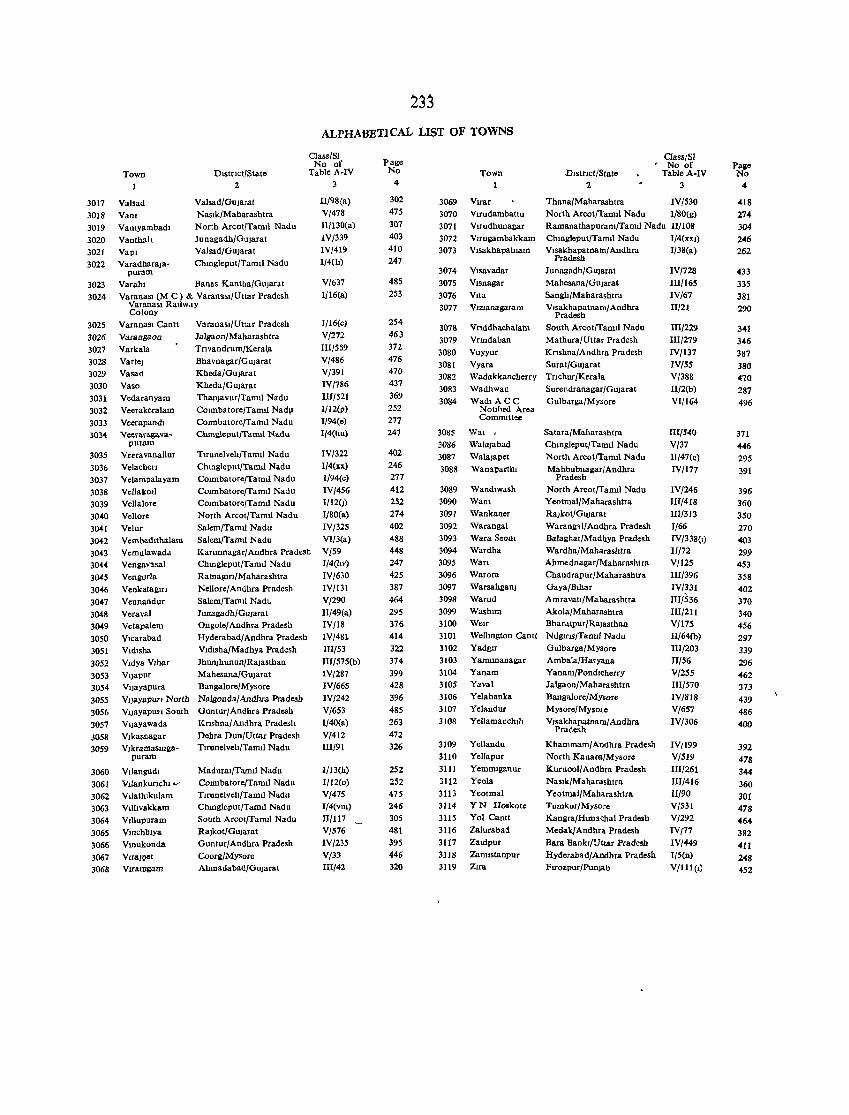
3017 3018 3019 3020 3021 3022
3023 3024
3025 3026
3027 3028
3029
3030 3031 3032 3033 3034
3035 3036 3037 3038 3039 3040 3041 3042 3043 3044 3045
3046 3047 3048 3049 3050 3051 3052 3053 3054 3055 3056 3057 3058 3059
3060 3061 3062 3063 3064 3065
3066 3067 306S
ALPHABETICAL LIST OF TOWNS
Town 1
Olstnct/State
Class/SI No of
Tab!e A-IV
Val sad Vam Vamyambadl Vanthah Yap! Varadharaja-
puram Varahl
2
Valsad/Gnjarat N aSlk/Maharashtra North Arcot/Taml! Nadu Junagadh/Gujarat Valsad/Gujarat Chmgleput/Tamll Nadu
Banas Kantha/Gujarat
Varanasl (M C) &. Varanasi/Uttar Pradesh VaranaSl Ratlw,IY Colony
VaranaSl Cantt Varangaon Varkal. Vartcj Vasad Vaso Vedaranyam Veerakeralam Veerapandl Veeraragava ..
puram VeeravanaUur Velachen Velampalayam VeUakoIl Vellalore
VeUore Velur Vembad,thalam Vemulawadd Venllavasal Vengurla Venkatalltrl Vennandur Veraval Velap.lem Vlcarabad Vldlsha Vldya Villar Vljapur
Varanasi/Uttar Pradesh Jalgaon/Maharashtra Tnvandrum/Kerala Bhavnagar/Gujarat Kheda/Gujarat Kheda/Gujarat Thanjavur/Tam,1 Nadu Co,mbatore/Tamll Nadl' ConnbatoreJTaml! Nadu Clungleput/Tanul Nadu
TlrunelveiI/Tamli Nadu ChlngJeput/Tanui Nadu COlmbatore/Tamll Nadu Cormbatore/Tamli Nadu Cotmbatoro/Taw! Nadu North ArcotJTaml! Nadu Salem/Tamil Nadu Salem/Tamil Nadu Karrmnagat/Andhra Pradesh ChmgJeput/Tamtl Nadu Ratoagm/Maharashlra NoUore/ Andhra Pradesh Salem/Tamil Nadu Junagadh/Gujarat Ongolo/ Andhra Pradesh Hyderabad/ Andhra Pradesh VldlSha/Madhya Pradesh Jhunjhunun/Rajasthan Mahesana/Gujarat
Vljayapura Bangalore/Mysore VljayapUrI North Nalgonda/Andbra Prad""h VljayaputJ South Guntur/Andhra Pradesh
Vljayawada Vlkasnagar Vlkramasmga-
puram
V,langudl Vdankurlchl ~ VIl&thikulam Vdbv&kk&m VIUupuram Vmchhlya Vmukonda Vlraj~t
Vmllngam
KrIShna/ Andhra Pradesh Dehea Dun/Uttar Pradesh TlrunelveiI/Tamtl Nadu
Madural/Tamtl Nadu Connbatore/Tamtl Nadu Tlrunelvelt/Tanul Nadu ClungJeput/Tamtl Nadu South Arcot/Tamll Nadu Rajkot/Gujarat Guntur/Andhra Pr&desh CoorgfMysore Alunadabad/Gujarat
3
II/98 (a) V/478 11/130(a) IV/339 IV/419 1/4(b)
V/637 1/16(a)
1/16(c)
V/272 III/559 V/486 V/391 IVj786 III/521 I/12(P) 1/94(e) 1/4(hu)
IV/322 I/4(xx) I/94(c) IV/456 I/12(J) 1/80(a)
IV/325 Vl/3(a)
V/59 I/4(lJv)
IV/630 IV/131 Vf290 II/49(a) IV/18 IV/48 1 III/53 1II/575(b)
IV/287 IV/66S IV/242 V/653 1/40(a)
V/412 IIl/91
I/13(h) 1/12(0) V/475 T/4(vwJ II/117 V/576 IVf235
V/33 IU/42
Page No
4
302 475
307
403 410 247
485 253
254 463 37).
476 470 437 369 252 277 247
402 246 277
412 252
274 402 488 448 247
425 387 464
295 376 414 322 374
399 428
396 485 263 472 326
252
252 475 246
305 481
395 446 320
3069 3070 3071 3072 3073
3074 3075 3076 3077
3078 3079 3080 3081 3082
3083 3084
3085 3086 3087 3088
3089 3090 3091 3092 3093 3094 3095 3096 3097 3098 3099 3100 3101 3102 3103 3104 3105 3106
3107
3108
3109 3110 3111 3112 3113
3114
3115 3116
3117
3118 3119
Class/Sl
Town 1
.DJstrlct/Slale • No of
TablcA-IV
Vlrar Vlrudambattu
2
Thana/Maharashtra North Arcot/Tamll Nadu
3
IV/530 1/80(g)
Vlrudhunagar Ramanathapuram/Tamtl Nadu II/108 Vlrugambakkam ChlOgleput/Tamtl Nadu 1/4(xxl) Vlsakhapatnam Vlsakhapatnatn/Andhra I/38(a)
Pradesh Vlsavadar Junagadh/Gujaral Vlsnagar Mahesana/GuJarat Vita SangJl/Maharashtra VlZlanagaram Vlsakhapatnatn/Andhra
Pradesh Vnddhaehalatn South Arcot/Tamtl Nadu Vrmdaban Vuyyur
Mathura/Uttar Pradesh Knshna/ Andhra Pradesh
Vyara Surat/Gularat Wadakkancherry Tnchur/Kerala Wadhwao WadlACC
Notified Area Committee
Wal t
Walajabad Walajapet Wanapartlu
Wandtwash WaDt Waukaner Warangal Wara Seonl Wardha Wan Warora Warsahganj Warud Washtm Weir Wellmgton Cantt Yadglf Yamnnanagar Yanam Yava! Yelahanka Yelandur YeUamanchdl
Yellandu Yellapur Yeffiffilganur Yeola Yeotmal YN Ho.kotc Yol Cantt Zahlrabad Zaldpur Zamlstanpur Zira
Surendranagar/Gularat Gulbdrga/Mysore
Satara/Maharashtra ChmgJeput/Tamll Nadu North Arcot/Tanul Nadu M&hbubnagar/Andhra
Pradesh North Areot/Taw! Nadu YeotmalfMaharashtra Rajkot/Gujarat Warang11/Andhra Pradesh Balaghat/Madhya Pradesh Wardha/Maharashtra Alune dnagar /Maharashtra Chandrapur/Maharashtr .. Gaya/Blhar AmravatJ/Maharashtra Akola/Maharashtra Bhardtpur/Rajasthan Ntlglrts/TaInlI Nadu Gulbarga/Mysore Ambala/Haryana Yanam/Pondlcherry J algaon/Maharashtra Bangalore/Mysore Mysore/Mysole Visakhapatnatn/ Andhra
Pradesh
Khammam/Andhra Pradesh North Kanara/Mysorc Kurnool/Andhra Pradesh Naslk/Maharashtra Yeotmal/Maharashtr& Tumkur/Mysore Kangra/Htmlchal Pradesh Medak/ Andhra Pradesh B&ra Bankl/!Jttar Pradesh Hyderabad/Andhra Pradesh Flfozpur/Punjab
IV/728 III/16S IV/67 II/2!
III/229 1lI/279
IV/137 IV/55 V/388 II/2(b) VI/I64
1II/S40 V/37 Ilf47(c) IV/177
IV/246 1II/418 III/3D 1/66
IVf338(1)
IJ/72 V/125
1lI/396
IV/331 IIIIS36 IIl/211 V/175
II/64(b)
III/203 II/56 V/255 III/570 IV/8IS V/6S7
IV/306
IV[199
V/519
III/261 III/416 II/gO
V/S3! V/292 IV/77 IVf449 I/S(n) V/llt(l)
Palle No
4
418 27-4 304
246 262
433
335 381 290
341 346
387
380 470
287
496
371
446 295 391
396 360 350
270
403 299 453 358
402 370
340 456 297
339
296
462 373 439
486 400
392
478
344
360
301 478
464 382
411 248
452
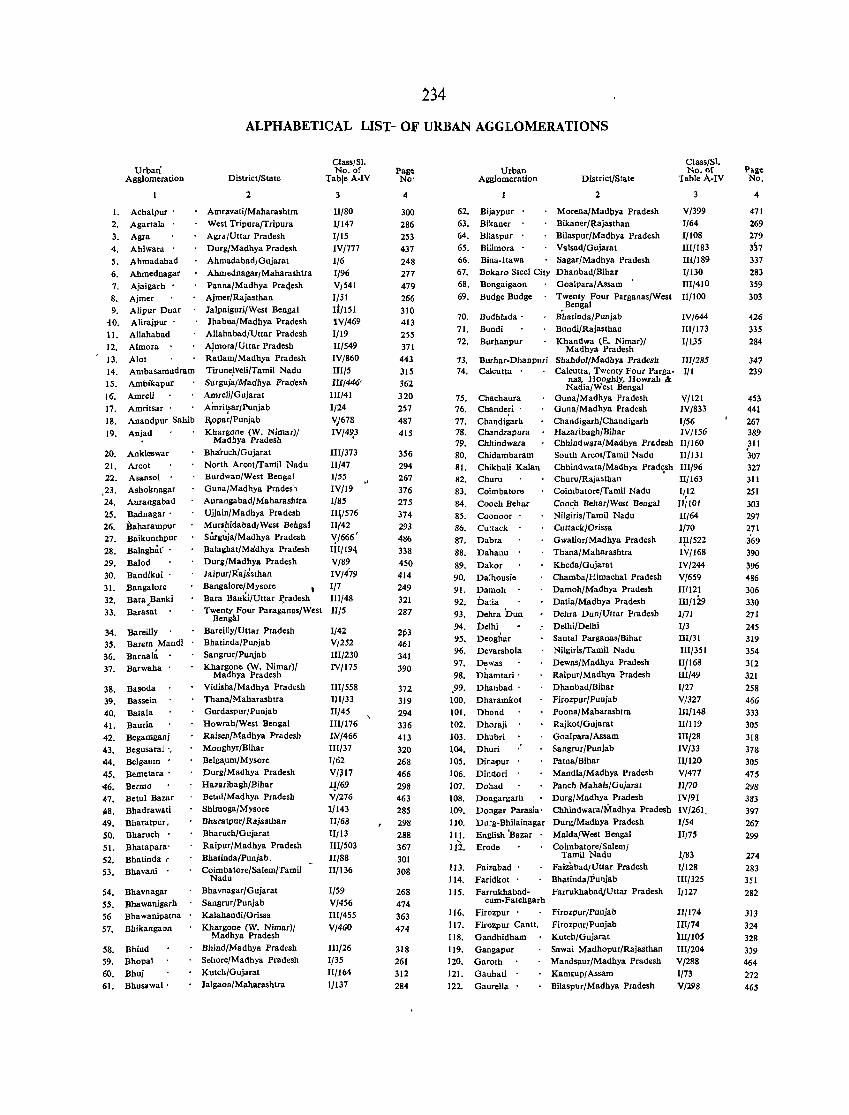
1. 2.
3.
4.
5. 6.
7.
8. 9.
fO.
11. 12.
13. 14. IS.
16. 17. 18.
19.
20. 21. 22.
.23. 24.
25.
26. 27.
28.
29. 30.
31.
32. 33.
34. 35.
36.
37.
38.
39. 40. 41. 42.
43.
44. 45.
46. 47.
~8.
49. 50.
5!. 52.
53.
54.
55. 56
51.
58. 59. 60. 6!.
Urban' Agglomeration
Achalpur Agarlala
Agra
Ahiwara
Ahmadabad Ahmednagar Ajaigarh .
Ajmer Alipur Duar Alirajpur .
Allahabad
Almora
Alot Ambasamudram
Amoikapur
Amreli Amritsar .
Anandpur Sahib
Anjad
Anklcswar Arcot Asansol .
Ashoknagar Aurangabad Badnagar' Baharampur Baikunthpur
Balaghaf
Balod Bandikui Bangalore
Bara,Banki Barasat
Bareilly Barela Mandl
Barnal~ Barwaha
Basoda Bassein Balala
Bauria Begamganj
Begusaral " Belgaum •
Bemetara'
Bermo Betul Bazar Bhadrawati Bharatpur, Bharuch •
Bhatapara'
Bhatinda " Bhavani .
Bhavnagar Bbawarugarh Bbawarupatna
Bbikangaon
Bhind Bhopal Bhuj
Bhusawal'
234
ALPHABETICAL LlST- OF URBAN AGGLOMER~TIONS
District/State
2
Amravati/Mabarashtra West TripurajTripura Agra/Uttar Pradesh
Durg/Madhya Pradesh
Ahmadabad/ Gujarat
Ahmednagar/Maharashtra Panna/Madhya Pra<jesb Ajmer/Rajasthan Jalpaiguri/West Bengal Jbabua/Madhya Pradesh Allahabad/Uttar Pradesh
A/mora/Uttar Pradesb RatJam/Madbya Pradesb Tirune,lveli/Tamii Nadu Surguja/Madbya Pradesli
Amreli/Gujarat
Alnrit,sar/Punjab R,opar/Punjab Khargone (W. Nimar)/
Madhya Pradesh
Bha'ruch/Gujarat North Arcot/Tamil Nadu Burdwan/West Bengal Guna/Madhya Pradesh Aurangabad/Maharashtra Ujjain/Madhya Pradesh Murshidabad/West Bengal SUrg~ja/Madhya Pradesh Balaghat/Mddhya Pradesh
Durs/Madhya Pradesh Jaipur/I{ajasthan
Banllalore/Mysore ~
Bara Banki/Uttar l!radesh Twenty Four Paraganas/West
Bengal
Bareilly/Uttar Pradesh Bbatinda/Punjab Sangrur /Punja b
Khargone (W. Nimar)/ Madhya Pradesh
Vidisba/Madhya Pradesh
Thana/Mabarasbtra Gurdaspur/Punjab Howrab/West Bengal
Raisen/Madbya Pradesh Monghyr/Bihar Belga,um/Mysore Durg/ Madhya Pradesh
Hazaribagh/Bihar Betul/Madhya Pradesh Shimoga/Mysore
Bharatpur/Rajasthan BbarucbjGujarat
Raipur/Madhya Pradesh Bhatinda/Punjab,
Coimbatore/Salem/Tamil Nadu
Bhavnagar/Gujarat Sangrur/Punjab
Kalahandi/Orissa Kbargone CW. Nimar}/
Madhya Pradesh
Bhind/Madhya Pradesh Sehore/Madhya Pradesh
Kutch/Gujarat Jalgaon/Maharashtra
Class/Sl. No. of
Table A·IV
3
II/80 1/147
1/15 IV/771
1/6
1/96 V/541
1/51 Iifl51 iV/469
1/19 II/549 IV/860
III/5 IrI{446<
IIJ/41 1/24
Vj678
IV/4~3
III/373
II/41 1/55 IV/19
1/85
II\l516 IJ{42
'{/666 '
JIl/194 V/89 IV/479
1/7 Ul/48 Il/5
1/42 V/252
III/230
IV/115
1lI/558 Ill/33 Il/45 1II/176 IlV/466
Ill/31
1/62 V/317
1[/69 V/276 1/143
II/6S II/13 III/503
II/88 IIfl36
1/59 V/456
III/455
V/460
IlI/26
1/35 II/I 64 1/131
Page No'
4
300 286
253
431
248
277 479 266
310 413
255
371
443 315 362
320 257
487
415
356
294 267
376 275 374 293 486 338 450
414
249 321
281
2p3
461
341
390
372 319
294 336 413 320
268 466
298 463
285 298
288 367
301 308
268 474
363
474
318
261
312
284
62.
63. 64. 65. 66. 67. 68.
69.
70.
7!. 72.
73. 74.
15. 76.
71. 18. 79. 80. 81. 82. 83.
84. 85. 86. 87.
88.
89. 90.
91. 92. 93.
94. 95.
96. 91.
98.
.99. 100.
101.
102.
103.
104. 105.
106. 101.
108.
109. 110.
lit. 112.
113. 114. 115.
116.
li7. Ii 8. 119. 120.
121.
122.
Urban Agglomeration
Bijaypur
Bikaner Bilaspur
Bilimora
District/State
2
Morena/Madbya Pradesh Bikaner/{tajasthan Bilaspur/Madhya Pradesh
V"lsad/Gujarat Bina-ltawa Sagar/Madhya Pradesh Bokaro Steel City Dhanhad/Bihar Bongaigaon Goalpara/ Assam •
Budge Budge Twenty Four Parganas/West
Budhlada' Bundi Burbanpur
Burhar-Dhanpuri Calcutta .
Chacbaura Chanderi .
Chandigarh Chandra!)ura Chhindwara Chidambaram Chikhali Kalan Churu Coimbatore
Coach Behar
Coonoor Cuttack
Dabra Dahanu
Dakor Dalhousie
Darnoh batia Dehra Dun
beIhi Deoshar Devarshola
Dewas
Dhamtari'
Dbanbad' Dharamkot
Dhond Dhoraji
Dbubri Dhuri :
Dinai'ur Dindori
Dohad
Bengal Bhatinda/Punjab
Bundi/Rajasthan
Kbandwa (E. Nimar)/ Madhya Pradesh
Sbabdol/Madhya Pradesb Calcutta, Twenty Four Parga
nas, Hooghly, Howrab & Nadia/West Bengal
GunafMadhya Pradesh Guna/Madhya Pradesh
Chandigarh/Chandigarh Hazaribagb/Bihar CbhindwlIra/Madbya Pradesh South Arcot/Tamil Nadu Chhindwara/Madhya Prad~sh Churu/Rajastban Coimbatore/Tamil Nadu
Cooc,h Behar/West Bengal Nilgiris/Tamil Nadu Cuttack/Orissa Gwali()r/Madbya Pradesh
Thana/Maharashtra
Kheda/Gujarat Chamba/P.imachal Pradesh Damoh/Madhya Pradesh Datia/Madhya Pradesh Dehra Dun/Uttar Pradesh
Delhi/Delhi Santal Parganas/Bibar
Nilgiris/Tamil Nadu Dewas/Madhya Pradesh
Raipur/Madhya Pradesh
Dhanbad/Bihar Firozpur/Puojab Poona/Maharashtra
Rajkot/Gujarat
Goalpara/Assam Saogrur/Punjab
Patna/ Bihar Mandla/Madbya Pradesh
Panch Mabals/Gujarat
Class/SI. ND.of
Table A·IV
V/399 1/64
1/108 III/183
IlI/189 1/130 1lI/410
11/100
IV/644
Ill/I 73
1/1.35
II11285 1/1
V/121 IV/833
1/56 IV/I 56 IIfl60 II/131 IIl/96 Il/163 1/12
II/IOI
II/54 1/70
11'/522
IV/168
IV/244 Vr659
II/121
III/lW 1/71 1/3 III/31
III/35 I
11/168 UI/49
1/27
V/327 III/148
II/1l9
m/28 IV/33
I1/120 V/417
11/70
Dongargarh Durs/Madhya Pradesh lV/91
Dongar Parasia' Chhindwara/Madhya Pradesh IV/261.
Durg-Bhilainagar Durg/Madhya Pradesh 1/54
English 'Bazar
Erode
FaiZllbad Faridkot .
Farrukhabad-cum-Fatebgarb
Firozpur •
Firozpur Cantt.
Gandbidbam
Gangapur Garotb Gauhati
Gaurella
Maida/West Bengal Coimbatore/Salem/
Tamil Nadu FaizJ.bad/Uttar Pradesh Bhatinda/punjab
Farrukhaba<1JUttar Pradesh
Firozpur/Punjab
Firozpur I Punjab
Kutch/Gujarat Sawai Madhopur/Rajasthan Mandsaur/Madhya Pradesh
Kamtup/Assam
Bilaspur/Madhya Pradesh
11/75
1/83 1/128
III/32S
1/127
II/I 74
III/14 :1II/l05 III/204
V/288
1/73 V/298
Palle No.
4
471 269 279
Jh 331
283
359
303
426
335
284
347 239
453 441
267 389 311 '307
327 311
2S1
303
297
271
369 390
~96 486
306
330
211
245
319 354
312
321
258
466 333 305
318
378 305
475
298 383
397
267
299
274
283
351
282
313
324
328
339
464
272 465
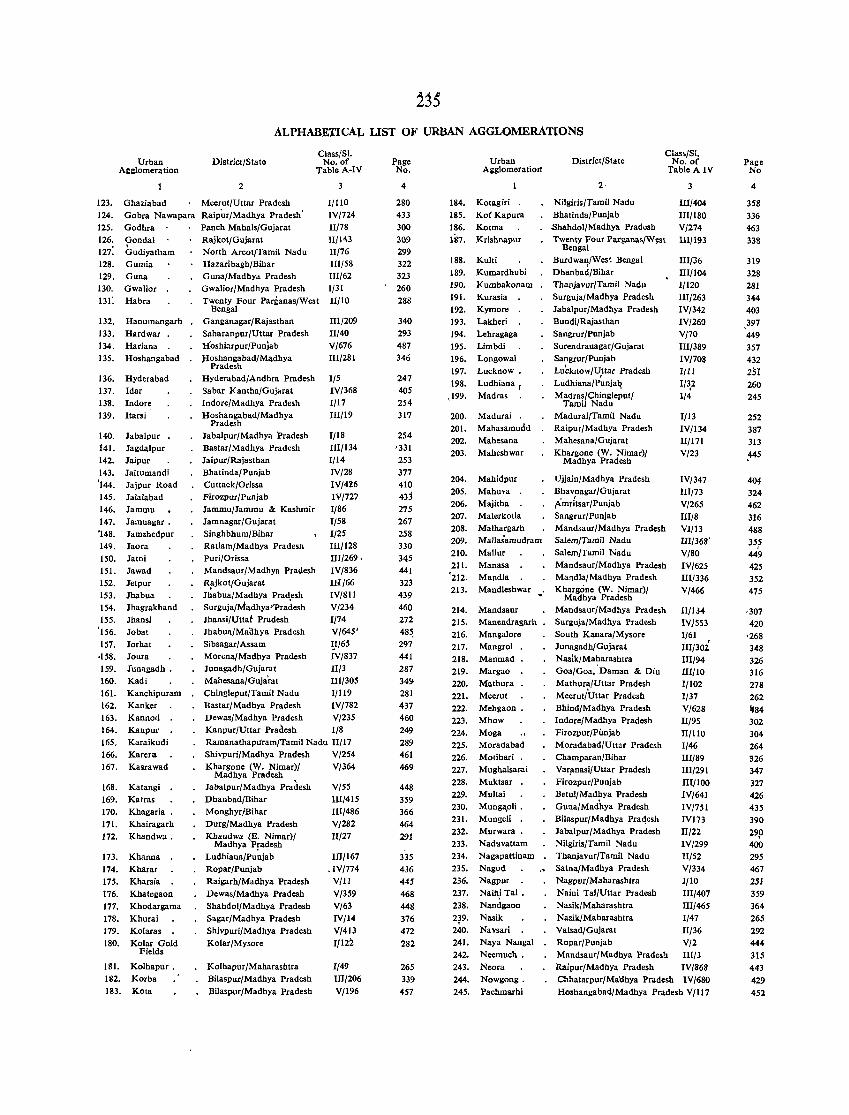
ALPHABETICAL LIST OF URBAN AGGLOMERATIONS
Class/SI. Urban
Alu:lomeration District/State No.of
Tabl.A-IV
123. 124. 125. 126. 127: 128. 129. 130.
13I:
132. 133.
134. 135.
136. 137.
138.
139.
140.
141. 142. 143. '144.
145.
146.
147.
'148.
149.
150. 151.
152.
153.
154.
155. '156.
157.
.158.
159.
160.
161.
162. 163. 164.
165.
166. 167.
168.
169.
170.
171.
172.
173.
174. 175.
li6. 177.
178.
179.
180.
181.
182.
183.
2
Ghaziabad Meernt/Uttar Pradesh
3
1/110 IV/724 lIj78 11/143 11/76 lJI/5S 1II/62
Gobra Nawapara Raip;'r/Madhya Pradesh' Godhra Panch Mahals/Gujarat Gondal Gudiyatham Gumia Guna Gwalior Habra
Hanum"ngarh Hardwar . Hariana . Hoshangabad
Hyderabad Idar
Indor~
ltarsi
Jabalpur Jagdalpur Jaipur Jaitumandi Jajpur Road Ialalabad Jammu Jamnagar. Jamshedpur Jaora Jatni Jawad Jetpur Jhabua Jhagrakhand Jhansi Jobat Jorhat Joura Junagadh . Kadi Kanchipuram Kanker Kannod . Kanpur Karaikudi Karera Kasrawad
Katangi Kalras Khagaria Khairagarh Kbandwa.
Khanna Kharar Kharsia Khategaon Khodargama Khurai Kolaras Kolar Gold
Fields
Kolhapur. Korba Kota
Rajkot/Gujarat North Arcot/Tamil Nadu Hazaribagh/Bihar Guna/Madhya Pradesh Gwalior/Madhya Pradesh Twenty Four Parganas/West
Bengal Ganganagar/Rajasthan Saharanpur/Uttar Pradesh Hoshiarpur/PunJab ):loshangabad,1 Madhya
Pradesh Hyderabad/Andbra Pradesh Sabar Kantha/Gujarat Indore/ Madhya Pradesh Hoshangabad/Madhya
Pradesh Jabalpur/Madbya Pradesh Bastar/Madhya Pradesh Jaipur/Rajasthan Bha tinda/ Punjab Cuttack/Orissa Firozpur/Punjab Jammu/Jammu & Kashmir Jamnagar/Gujarat Singhbhum/Bibar Ratlam/Madhya Pradesn Puri/Orissa Mandsaur/Madhya Pradesh Ri'jkot/Gujarat Jhabua/Madhya Pradesh Surguja/Madhya'·Pradesh Jhansi/ U ttat Pradesh Jhabua/Maahya Pradesh Sibsagar/Assam Morena/Madhya Pradesh Junagadh/Gujarat Mahesana/Gujarat Chingleput/Tamil Nadu Bastar/Madhya Pradesh Dewas/Madhya Pradesh Kanpur/Uttar Pradesh
1/31 II/IO
III/209 II/40
V/676 I1I/2S1
1/5 IV/368 1/17
III/I 9
1/18 III/134
1/14
IV/28 IV/416 IV/727 1/86 1/58 1/25 1II/I2S UI/269. IV/836 HI/66
IV/811 V/234 1/74
V/645'
!J/6S IV/S37 III3 UI/305
1/119 IVj782 V/235
1/8 Ramanathapl1ram/Tamil Nadu Il/17 Shivpuri/Madhya Pradesh V /254 Khargone (W. Nimar)/ V/364
Madhya Pradesh Jabalpur/Madhya Pradesh Dhanbad/Bihar MonghyrfBihar Durg/Madhya Pradesh Khandwa (E. Nimar)/
Madhya P!adesh Ludhiana/Punjah Ropar/Punjab Raigarh/Madhya Pradesh Dewas/Madhya Pradesh ShahdoljMadhya Pradesh Sagar/Madhya Pradesh Shivpuri/Madhya Pradesh Koiar/Mysore
Kolhapur/Maharashtra Bilaspur/ Madhya Pradesh Bilaspur/Madhya Pradesh
V/55 1lI/415
IIl/486 V/282 II/27
III/I 67
.IV/774 V/II
V/359 V/63
IV/14 V/413
1/122
1/49 III/206
V/196
Page No.
4
280 433
300
309
299 322 323
260 288
340
293 487 346
247
405 254 317
254 '331 253 377 410 43j
275
267 258
330
345
441
323 439
460
272
48~ 297
441 287
34!1 281
437
460 249
289 461
469
448 359 366
464 291
335
436
445
468
448 376 472 282
265
339
457
184. 185. 186. lin.
188. 189. 190.
191. 192. 193. 194. 195.
196.
197. 198.
,199.
200.
201. 202. 203.
204.
205. 206. 207. 208. 209.
210.
211. '212.
213.
214. 215. 216.
217.
218. 219. 220. 221.
222.
223. '224.
225. 226. 227. 228.
229.
230. 231. 232. 233. 234.
235.
236.
237.
238.
2~9.
240.
241. 242. 243.
244.
245.
Urban AJ:giomeratiorl
Kotagiri . KoCKapura Kotrna Krishnapur
Kulti Kumardhubi Kumbakonam Kurasia
Kymore . Lakheri Lehragaga Limbdi Longowal Lucknow. Ludhiana r Madras
Madurai Mahasamudd Mahesana Maheshwar
Mahidpur Mahuva . Majitha Malerkolla Malhargarh Mallasamudram Mallur
District/State Cla .. /Sl.
2·
Nilgiris/Tamil Nadu Bhatinda/Punjab
Shabdol/Madhya Praddsh Twenty Four Parganas/W~st
Bengal Burdwan/West Bengal Dhanbad/Bihar Thanjavur/Tamil Nadu Surguja/Madhya Pradesh Jabalpur/Madbya Pradesh Bundi/Rajasthan Sangrur/Punjah Surendranagar/Gujarat Sangrur/Punjab LuCknow/lJ,ttar Pradesh Ludhiana/Punjaq Madras/Chingleput/
Tamil Nadu MaduraijTamil Nadu Raipur/Madhya Pradesh Mahesana/Gujarat Khargone (W. Nimar)/
Madhya Pradesh
Ujjain/Madhya Pradesh Bhavnagar/Gujarat Amrltsar/Punjab Sangrur/Punjab Mandsaur/Madhya Pradesh Salem/Tamil Nadu Salem/Tamil Nadu Mandsaur/Madhya Pradesh Mandla/Madhya Pradesb
No. of Table A IV
3
III/404
III/I 80 V/274 lIIjl93
III/36
III/I04
1/120
III/263 IV/342 IV/260 Vj70
III/389 IVj70S Illl
I/~2 1/4
1/13
IV/134 II/I 71
V/23
Manasa Mandla Mandleshwar .' Khargone CW. Nimar)/
Madhya Pradesh
IV/347 IIIj73 V/265 1II/8 VI/13
IlI/368' V/80 IV/625 III/336 V/466
Mandsaur Manendragarh Mangalore Mangrol Manmad Margao Mathura Meerut Mehgaon. Mhow Moga Moradabad Motihari . Mughalsarai Muktsar . Multai Munga,oli . Mungeli . Murwara • Nadl!vattam Nagapattinam Nagod Nagpur NailliTal. Nandgaon Nasik Navsari Naya Nangal Neemuch. Neora Nowgong. Pachmarhi
Mandsaur/Madhya Pradesh Surguja/Madhya Pradesh South Kanara/Mysore Junagadh/Gujarat Nasik/Maharashtra Goa/Goa. 'Daman & Diu Mathura/Uttar Pradesh Meerut/Uttar Pradesh Bhind/Madhya Pradesh Indore/Madhya Pradesh Firozpur/Pimjab Moradabad/Uttar Pradesh Champaran/Bihar Varl'nasi/Uttar Pradesh Firozpur/Punjab Betul/ Madhya Pradesh Guna/Madhya Pradesh Bilaspur/Madhya Pra4esh Jabalpur/Madbya Pradesh Nilgiris/Tamii Nadu Thanjavur/Tamil Nadu Satoa/Madhya Pradesh Nagpur/Maharashtra Naiui Tal/Uttar Pradesh Nasik/Maharashtra Nasik/Maharashtra
II/1J4 IVj553
1/61 III/30i
III/94 III/IO 1/102 1/37
V/628 II/95
II/110 1/46
1II/89 IIl/29 I III/IOO
IV/641 IV/75t IV 173 II/22
IV/299
II/52
V/334 1/10
III/407 IIl/465
1/47 Valsad/Gujarat Il/36 Ropar/Punjab V/2 Mandsaur/Madhya Pradesh Ill/3 Raipur/Madhya Pradesh IV/868 Chhatarpur/Ma'dhya Pradesh IV/680 Hoshangabad/Madhya Pradesh V/1I7
Page No
4
358 336 463 338
319
328 281 344
403
,397 449
357 432
251 260 245
252
387 313
:U5
40'1 324 462 316
488
35~ 449 425 352
475
·307 420
'268 348 326 316
278 262 1184
302 304 264 326 347
327
426 435
390
291> 400
295
467
251
359
364
265
292
444
315
443
429
452
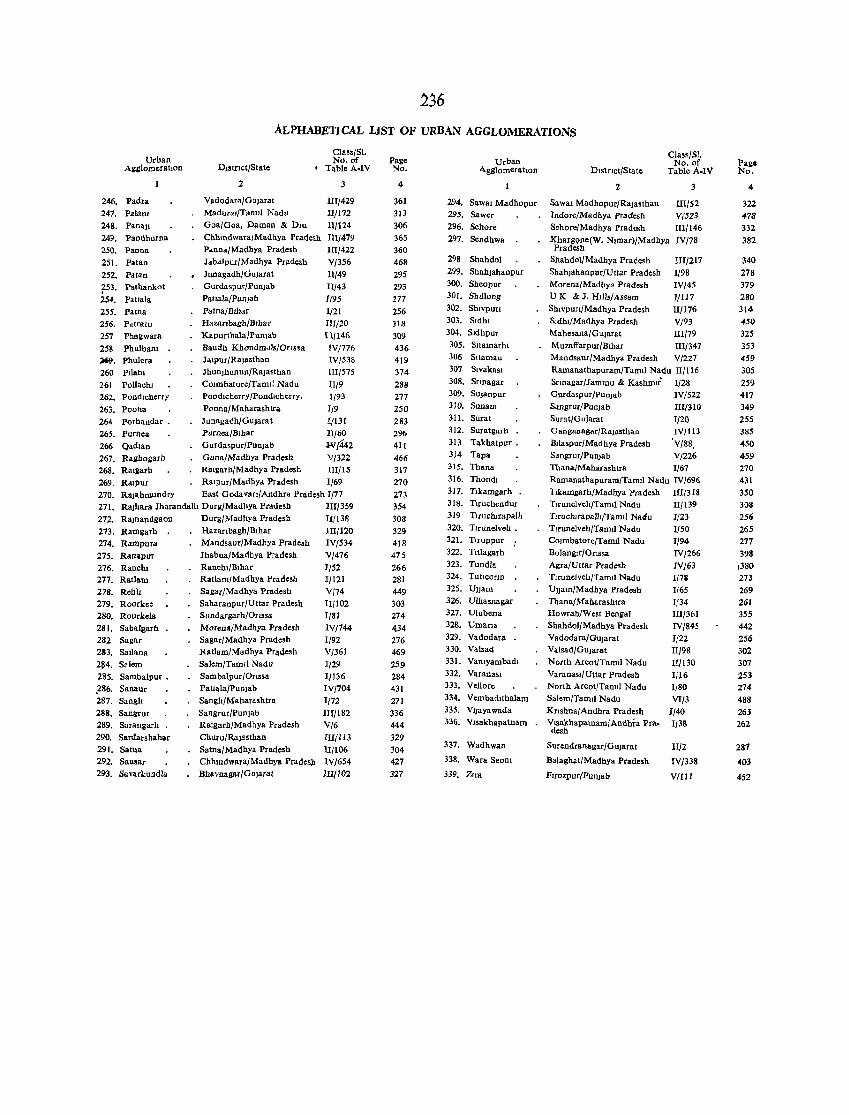
.236
ALPHABETICAL LIST OF URBAN AGGLOMERATIONS
Urban AIIl:lonleratJon
246. Padra 247. Palam
248. Panal' 249. Pandhurna 250. Panna 251. Patan 252. Patan ?-53. Path.nkat 254. Pauala 255. Palna 256. p"tratu 257 Phallwara 258 Phulbant li9. Phutors 260 PJlan. 261 Pollach.
Class/Sl. No. of
DlStnct/State
2
• Table A-IV
Vadodara/Gularat Madural/Tamll Nade Goa/Goa. Daman & D.u Chh'ndwara/Madhya Pradesh Panna/Madhya Pradesh J"b,1Ipur/Madhya Pradesh Junagadh/GuJarat Gurdaspur/Punjab
Pa! •• la/PunJab Palna/Blh.;r Hazarlbagb/Blbar Kapurlhala/Pun)ab Baudh Khondmdls/OrJs.a Ja1pur/Rajasthan Jhunjhunun/Ralasthan COlmbatore/Tam.l Nadu
3
1lI/429 11/172 1I/124 IlI/479 1IT/422 V/356
11/49 Il/43 1/95 1/21 HI/20 B/146 IV/776 IV/538 1II/575
U/9 262. Pondlcherry Pond.cherry/Pondlcherry. 1/93 263. poona Poona/Maharashlra I/9
264 porb.ndar. Junagadh/Gularat 1/131 265. Purnea Purne./Blbar 11/60 266 Qadlan Gurdaspur/Punjab W(442 267. Raghojarh Guna/Madhya Pradesh V/322 268. Ra.aarb Ra.garh/Madhya Pradesh III/IS 269. Rd.pur Ra,pur/MadhYd Pradesh 1/69 270. Ralahmundry East Godavan/Andhra Pradesh 1/77 271. Ralhara Jharandall. Durg/Madhya Pradesh 111/359 272. Ralnandgaon Durg/Madhya Pradesh 1I{138 273. Ramgarh Hazartbagh/B.har 111/120 274. Rampura Mandsaur/Madhya Pradesh IV/534 275. Ranapur Jhabua/Madhya Pradesh V/476 276. Ranch. Ranch./B.har J/52 277. Ratlatn Ratlam/Madhya Pradesh J/121 278. Reh" Sagar/Madhya Pradesh V/74 279. Roorke. Saharanpur/Uttar Pradesh III 102 280. Rourl:ela Sundargarh/Onssa J/8l 281. Sabalgarh Morena/Madhya Pradesh 1V/744 282 Sagar Sagar/Madhya Pradesh 1/92 283. Satlana Ratlam/Madhya Pradesh V/361 2~4. Solem Salern/TamJ! Nadu 1/29 285. Sa11lbalpur. Sambalpur/Or.ssa 1/136 .286. SaMur Pallala/Pun)ab IV/704 287. San!llt Sangh/ Maharashtra 1/72 288. Sanarur Sangrur/Punjab III/t82 289. Sarangarh Ra.&arh/Madhya Pradesh V/6 290. Sardarshahar Churu/Rajas!Itan III! 113 291. Salna Salna/Madhya Pradesh 1I/106 292. Sausar Chhmdwara/Madhya Prade$ IV/654 293. Savarkundla Bhavnagar/Gularat 111/102
Page No.
4
361 313 306 365 360 468 295 293 277
256 318 309 436 419 374 288 277 250 283 2% 411 466 317 270 273 354 30B
329 418 475 266 281 449 303 274 434 276 469
259 284 431 271
336 444
329
304 427 327
Urban Agglomerahon
294. Sawa! Madhopur 295. Sawer 296. Sehore 297. Sendhwa
298 Shahdol 299. Shahjahanpur 300. Sheopur 30 l. Shlllong 302. ShlVPUrt 303. S.dht 304. Sldhpur 305. S.tamarh! 306 SUamau 307 S.vakas. 308. Srmagar 309. SUjanpur 310. Sunam 311. Surat 312. Suratgarh 313 Takhatpur. 314 Tapa 31S. Thana 316. Thond. 317. Ttkamgarh • 318. Tlruchendur 319 Tlrucrurapalh 320. Tiruneivelt. 321. Tiruppur 322. T.tlagarh 323. Tundl. 324. Tut.conn 325. Uljam 326. Ulhasnagar 327. Ulubena 328. Umana 329. Vadodara 330. Valsad 331. Vamyambad. 332. Varanas. 333. Vellor.
334. Vembadlthalam 335. Vljayawad. 336. Vlsakhapatnam
337. Wadhwan
338. Wara Seont
339. Zrm
DlstflCt/State
2
Class/SI. No. of
Table A-IV
Sawa. Madhopur/Ralasthan Indarc(Madhya Pradesh Sehore/Madhya Pradesh RhargQne(W. N,mar)/Madhya Pradesh
3
III/52 VI523
III/146 IV/78
Shahdol/Madhya Pradesh Shahjahanpur/Uttar Pradesh Morena/Madhya Pradesh UK & J. Hllls/Assam Sh.vpun/Madhya Pradesh Stdh./Madhya Pradesh Mahesana/Gujarat Muzaffarpur/B.har
III/217 1/98 IV/4S
1/117 Il/176 V/93 111/79 111/347
Mandsaur/Madhya Pradesh V/227 Ramanathapuram/Tam.1 Nadu 11/116 Snnagar/Jammu & Kashm.r 1/28 Gurda,pur/Punjab IV/522 Sangrur/Punlab III/3l0 Sura!/Gujarat G anganagar/ Rajasthan BIla.pur/Madhya Pradesh Sangrur/PuuJab
1/20 IV/H3 'V/8S,
V/226 Thana/Maharashtra 1/67 Ramanathapuram/Tam.1 Nadu IV/696 TLkamgarh/Madhya Pradesh III/31S Ttrunelveh/Tamil Nadu Tlruchlfapall,/Taml! Nacu T,runelveh/Tam.l Nadu Co.mbatorejTam.1 Nadu Bolang.r/Onssa Agra/Utlar Pradesh TIrunelveh/Tam.l Nadu Ujlam/Madhya Pradesh Thana/Maharashtra Howrab/We.t Bengal Shahdol/Madhya Pradesh Vadodara/Gularat ValsadlGujarat North Areot/Tam.l Nadu Varanas./Uttar Pradesh North ArcotlTamtl Nadu Salem/Tam.l Nadu
Knshna/ Andhra Pradesh
Vd:~hapatnaml Andhra Pra-
Surendranagar/Gujarat
Balaghat/Madhya Pradesh
Flfozpur/PunJab
11/139
1/23 1/50 1/94
IV/266 IV/63 1/71 1/65 1{34 Ill/361 IV/845
1/22 JI/9S 11/130 1/16 1/80 VI/3
1/40 1/38
JI/2
IV/338
V/111
Paae No.
4
322 478 332 382
340 278 379 280 314 450 325 353 459
305 259 417 349 255 385 450
459 270 431 350 308 256 265 277 393
1380 273 269 261 355 442 256 302 307 251 274 488 261 262
287
401
452
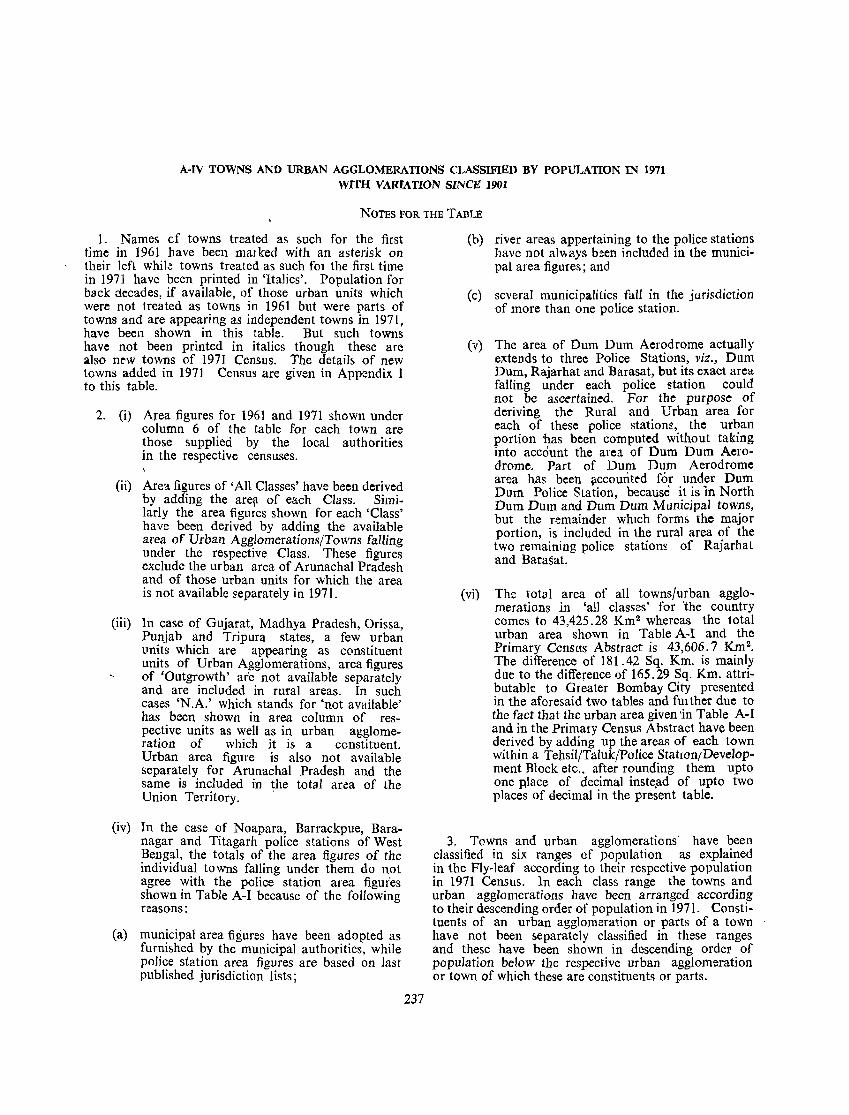
A-IV TOWNS AND URBAN AGGLOMERATIONS CLASSIFIED BY POPULATION IN 1971 WITH VARIATION SINCE 1901
NOTES FOR THE TABLE
1. Names cf towns treated as &uch for the first time in 1961 have been marked with an asterisk on their left while towns treated as such for the first time in 1971 have been printed in 'Italics'. Population for back decades, if available, of those urban units which were not treated as towns in 1961 but were parts of towns and are appearing as independent towns in 1971, have been shown in this table. But such towns have not been printed in italics though these are also new towns of 1971 Census. The detaih of new towns added in 1971 Census are given in Appendix I to this table.
2. (i) Area figures for 1961 and 1971 shown under column 6 of the table for each town are those supplied by the local authorities in the respective censuses.
(ii) Area figures of 'All Classes' have been derived by adding the are~ of each Class. Similarly the area figures shown for each 'Class' have been derived by adding the available area of Urban Agglomerations/Towns falling under the respective Class. These figures exclude the urban area of Arunachal Pradesh and of those urban units for which the area is not available ~eparately in 1971.
(iii)
(iv)
ln case of Gujarat, Madhya Pradesh, Orissa Punjab and Tripura states, a few urba~ units which are appearing as constituent units of Urban Agglomerations, area figures of 'Outgrowth' arb not available separately and are included in rural areas. In such cases 'N.A.' which stands for 'not available' has been shown in area column of respective units as well as in urban agglomeration of which it is a constituent. Urban area figure is also not available separately for Arunachal Pradesh and the same is included in the total area of the Union Territory. '
In the case of Noapara, Barrackpue, Baranagar and Titagarh police stations of West ~e~g~l. the totals of the area figures of the mdrvrdual towns falling under them do not agree ~ith the police station area figur'es shown In Table A-I because of the following reasons:
(a) municipal area figures have been adopted as furni&hed by the municipal authorities, while police station area figures are based on last published jurisdiction lists;
237
(b) river areas appertaining to the police stations have not al\\<ays been included in the municipal area figures; and
(c) several municipalities fall in the jurisdiction of more than one police station.
(v) The area of Dum Dum Aerodrome actually extends to three Police Stations, viz., Dum Dum, Rajarhat and Barasat, but its exact area falling under each police station could not be ascertained. For the purpose of deriving the Rural and Urban area for each of these police stations, the urban portion has been computed without taking into account the area of Dum Dum Aerodrome. Part of Dum Dum Aerodrome area has been fl,ccourited for under Dum Dum Police Station, because it is in North Dum Dum and Dum Dum Municipal towns, but the remainder WhICh forms the major portion, is included in the rural area of the two remaining police statiom of Rajarhat and Barasat.
(vi) The total area of all towns/urban agglomerations in 'all classes' for 'the country comes to 43,425.28 Km2 whereas the total urban area shown in Table A-I and the Primary Census Abstract is 43,606.7 Km2. The difference of 181.42 Sq. Km. is mainly due to the difference of 165.29 Sq. Km. attributable to Greater Bombay City presented in the aforesaid two tables and fm ther due to the fact that the urban area given 'in Table A-I and in the Primary Census Abstract have been derived by adding up the areas of each town within a Tehsil/Taluk/Police StatIOn/Development Block etc., after rounding them upto one nlace of decimal inste,ad of upto two places of decimal in the present table.
3. Towns and urban agglomerations' have been classified in six ranges of population as explained in the Fly-leaf according to their respective population in 1971 Census. ln each class range the towns and urban agglomerations have been arranged according to their descending order of population in 1971. Constituents of an urban agglomeration or parts of a town have not been separately classified in these ranges and these have been shown in descending order of population below the respective urban agglomeration or town of which these are constituents or parts.
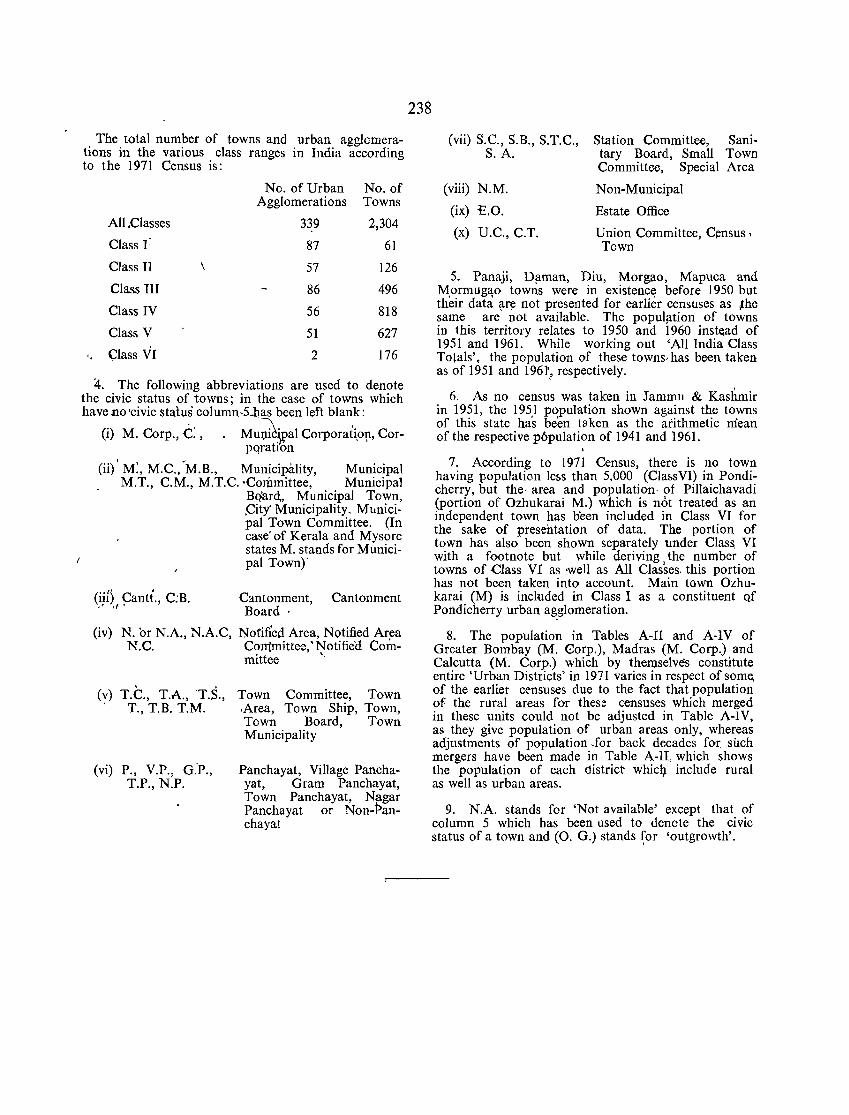
The total number of towns and urban agglomerations in the various class ranges in India according to the 1971 Census is:
No. of Urban No. of Agglomerations Towns
All ,Classes 339 2,304
Class I: 87 61
Class Il 57 126
Class III 86 496
Class IV 56 818
Class V 51 627
" ~lass VI 2 176
4. The following abbreviations are used to denote the civic status of towns; in the case of towns which haveno'ci\'ic status column,5..has been left blank:
"\ , (i) M. Corp., C: , Mu~i~wal Corporati.ol,l, Cor-
po,ratlOn
(ii) , M:, M.C., 'M.B., Municipality, Municipal M.T., C.M., M.T.C. 'Committee, Municipal
(iii) Canti., C:B. .'" If'
B<iard" Municipal Town, ,City' Municipality. Municipal Town Committee. (In case' of Kerala and Mysore states M. stands for Municipal Town)'
Cantonment, Cantonment Board·
(iv) N. or N.A., N.A.C, Nofified Area, Notified Area N.C. CO:rr(mittee;Notifiea Com-
mittee '.
(v) T.e., T.ot\., T.S., Town Committee, Town . T., T.B. T.M. ,Area, Town Ship, Town,
(vi) P., V.P., G'-P., T.P., N.P.
Town Board, Town Municipality
Panchayat, Village Panchayat, Gram Panchayat, Town Panchayat, Nagar Panchayat or Non-Panchayat
238
(vii) S.C., S.B., S.T.C., S. A.
(viii) N.M.
(ix) 'E.O.
(x) U.C., C.T.
Station Committee, Sani-tary Board, Small Town Committee, Special Area
Non-Municipal
Estate Office
Union Committee, Census, Town
5. Panaji, Dfl-man, Diu, Morgao, Mapuca and M.ormug~o towns were in existence: before 1950 but their data ~r!! not presented for earlier censuses as the same are {lot available. The populfltion of towns in this territory relates to 1950 and 1960 instead of 1951 and 1961. While working out 'All India Class Totals', the population of these towns, has been taken as of 1951 and 196r
l respectively.
6. As no census was taken in Jammu & Kashmir in 1951, the 1951 population shown against the towns of this state has been tllken as the arithmetic niean of the respective p6pulation of 1941 and 1961.
7. According to 1971 Census, there is no town having population le5s than 5,000 (Class VI) in Pond icherry, but the· area and population· of Pillaichavadi (portion of Ozhukarai M.) which is not treated as an independent town has been included in Class VI for the sake of presentation of data. The portion of town has also been shown separately under Clas~ VI with a footnote but while deriving the number of towns of .class VI as 'Well as All Classes. this portion has not been taken into account. Main town Ozhukarai (M) is included in Class I as a constituent Qf Pondicherry urban agglomeration.
8. The population in Tables A-II and A-IV of Greater Bombay (M. eorp.), Madras (M. Corp.) and Calcutta (M. Corp.) which by themselves constitute entire 'Urban Districts' in 1971 varies in re&pect of some. of the earlier censuses due to the fact that population of, the rural areas for these censuses which merged in these units could not be adjusted in Table A-IV, as they give population of urban areas only, whereas adjustments of population _for back decades for. such mergers have been made in Table A-It which shows the popUlation of each district' whicQ include rural as well as urban areas.
9. N.A. stands for 'Not available' except that of column 5 which has been used to dencte the civic status of a town and (0. G.) stands ~or 'outgrowth'.
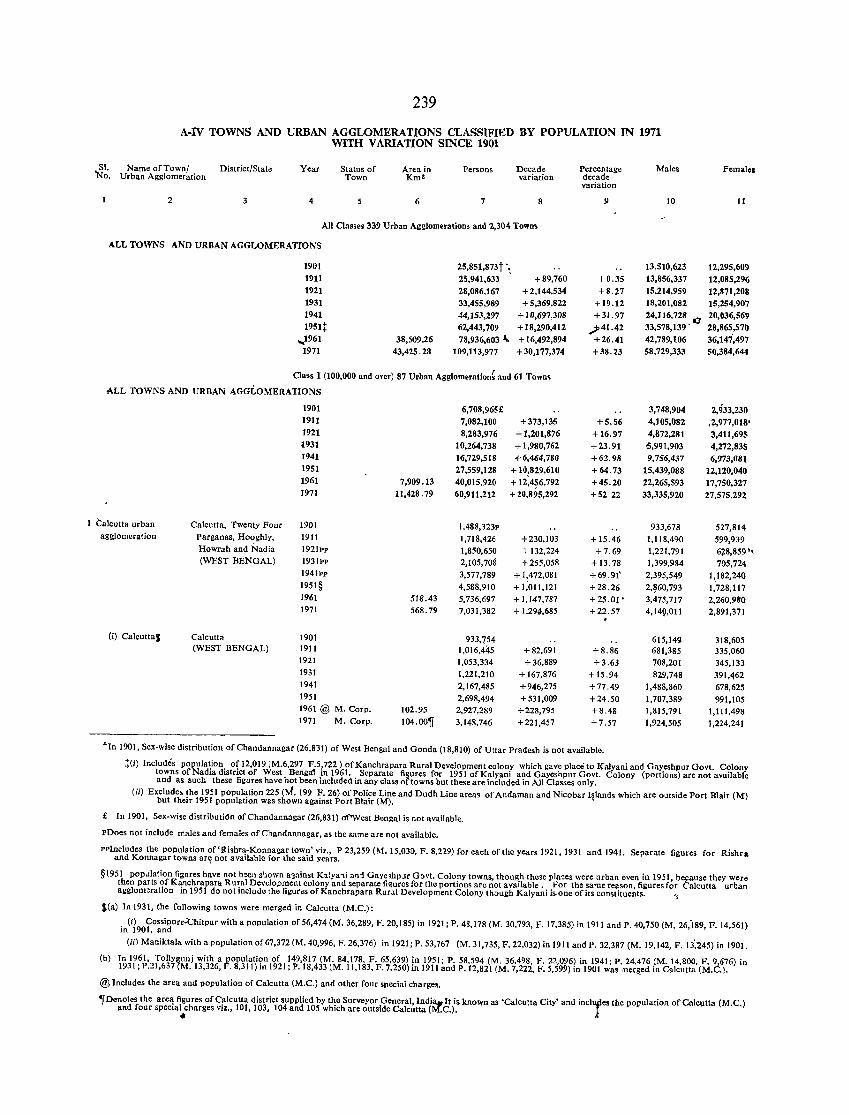
239
A·IV TOWNS AND URBAN AGGLOMERATIONS CLASSIFIED BY POPULATION IN 1971 WITH VARIATION SINCE 1901
.;;~. Name of Town/ District/State Year Status of Area in Persons Decade Percentage Males Urban Agglomeration Town Km2 variation decade
variation
2 3 4 6 7 8 9 10
All Classes 339 Urban Agglomerations and 2,304 Towns
ALL TOWNS AND URBAN AGGLOMERATIONS
1901 25,851,873t .~ 13,510,623 19I1 25,941,633 +89,760 +0.35 13,856,337 1921 28,086,167 +2,144,534 +8.27 15,214,959 1931 33,455,989 +5,369,822 +19.12 18,201,082 1941 44,153,297 + 10,697,3D8 +31.97 24,116,728 i1 1951t 62,443,709 + 18,290,412 741.42 33,578,139 .
... 1961 38,509.26 78,936,603 A. + 16,492,894 +26.41 42,789,106 1971 43,425.28 109,113,977 +30,177,374 +38.23 58,729,333
Class I (100,000 and over) 87 Urban Agglomeration' and 61 Town.
ALL TOWNS AND URBAN AGGLOMERATIONS
1901 6,708,965£ 3,748,904 1911 7,082,100 +373,135 +5.56 4,105,082 1921 8,283,976 +1,201,876 + 16.97 4,872,281 1931 10,264,738 + 1,980,762 +23.91 5,991,903 1941 16,729,518 +6,464,780 +62.98 9,756,437 1951 27,559,128 + 10,829,610 +64.73 15,439,088 1961 7,909.13 40,015,920 + 12;456,792 +45.20 22,265,593 1971 1l,428.79 60,911,212 + 20,895,292 +52.22 33,335,920
Calcutta urban Calcutta, Twenty Four 1901 1.488,323p 933,678 agglomeration Parganas, Rooghly, 1911 1,718,426 +230,103 + 15.46 1,08,490
Rowrah and Nadia 1921pp 1,850,650 + 132,224 +7.69 1,221,791 (WEST BENGAL) 1931pp 2,105,708 +255,058 +13.78 1,399,984
1941pp 3,577,789 + 11472,081 +69.91' 2,395,549 1951§ 4,588,910 + 1,01l,121 +28.26 2,~60,793 1961 518.43 5,736,697 + 1,147,787 +25.01' 3,475,717 1971 568.79 7,031,382 + 1.294,685 +22.57 4,14\),011
(i) Calcutta$ Calcutta 1901 933,754 615,149 (WEST BENGAL) 1911 1,016,445 + 82,691 +8.86 681,385
1921 1,053,334 +36,889 +3.63 708,201 1931 1,221,210 + 167,876 + 15.94 829,748 1941 2,167,485 +946,275 +77.49 1,488,860 1951 2,698,494 + 531,009 +24.50 1,707,389 1961 @ M. Corp. 102.95 2,927,289 +228,795 +8.48 1,815,791 1971 M. Corp. 104.00~ 3,148,746 +221,457 +7.57 1,924,505
tIn 1901, Sex-wise distribution of Chandan nagar (26,831) of West Bengal and Gonda (18,810) of Uttar Pradesh is not available.
Female.
11
12,295,609 12,085,296 12,871,203 15,254,907 20,036,569 28,865,570 36,141,497 50,384,64.
2,933,230 ,2,977,018" 3,411,695 4,272,835 6,973,081
12,120,040 17,750,327 27,575,292
527,814 599,939 6~8,859"
705,724 1,,182,240 1,728,117 2,260,980 2,891,371
318,605 335,060 345,133 391,462 678,625 991,105
1,111,498 1,224,241
t(i) Includes population of 12,019 (M.6,297 F.5,722) ofKanchrapara Rural Development colony which gave place to Kalyani and Gayeshpur Govt. Colony towns of Nadia district of West Benga' in 1961. Separate figures for 1951 of Kalyani and Gayeshpur Gov!. Colony (portions) are not available and as such these figures have hot been included in any class of towns but these are included in All Classes only.
(ii) Excludes the 1951 population 225 (lM. 199 F. 26) of Police Line and Dudh Line areas of Andaman and Nicobar Islands which are outside Port Blair (M) but their 1951 population was shown against Port Blair (M). '
£ In 1901, Sex-wise distributidn of Chandan nagar (26,831) of'West Bengal is not available.
pDoes not include males and females of Chandan nagar, as the same are not available.
ppIncludes the population of'Ri,bra-Konnagartown' vil., P 23,259 (M. 15,030, F. 8,229) for each of the years 1921, 1931 and 1941. Separate figures for Rishra and Konnagar towns ar~ not available for the said years.
§ 1951 population figures have not boon shown against Kalya"li ani Gaye,hpJr Govt. Colony towns, though these pla~es were urban even in 1951, bes;:ause they were then parts of Kancbrapara Rural Development colony and separate fi~ures for the portions are not available. For the sa'lle reason, figures for Calcutta urban agglomeration in 1951 do not include the figuros of Kanchrapara Rural Development Colony though Kalyani is.one of its constituents. "
Sea) Tn 1931, the following towns were merged in Calcutta (M.C.):
(i) Cossipore:Chitpur with a population of 56,474 (M. 36,289, F. 20,185) in 1921; P. 48,178 (M. 30,793, F. 17,385) in 1911 and P. 40,750 (M. 26:189, F. 14,561) in 1901, and
(Ii) Maniktala with a population of 67,372 (M. 40,996, F. 26,376) in 1921; P. 53,767 (M. 31,735, F. 22,032) in 1911 and P. 32,387 (M. 19,142, F. 13:'245) in 1901.
(b) Tn 1961, Tollygunj with a population of 149,817 (M. 84,178, F. 65.639) in 1951; P. 58,594 (M. 36,498, F. 22,096) in 1941; P. 24,476 (M. 14,800, F. 9,676) in 1931; P.21,637 (M. 13,326, F. 8,311) in 1921; P. 18,433 (M. 11,183, F. 7,250) in 1911 and P.12,821 (M. 7,222, F. 5,599) in 1901 was mer!ied in Calcutta (M.C.).
@ Includes the area and population of Calcutta (M.C.) and other four speciai charges.
~Denotes the area figures of Calcutta district supplied by the Surveyor General, IndilltrIt is known as 'Calcutta City' and inCITes tbe population of Calcutta (M.C.) and four special charges viz., 101, 103, 104 and 105 which are outside Calcutta (M.C.) . •
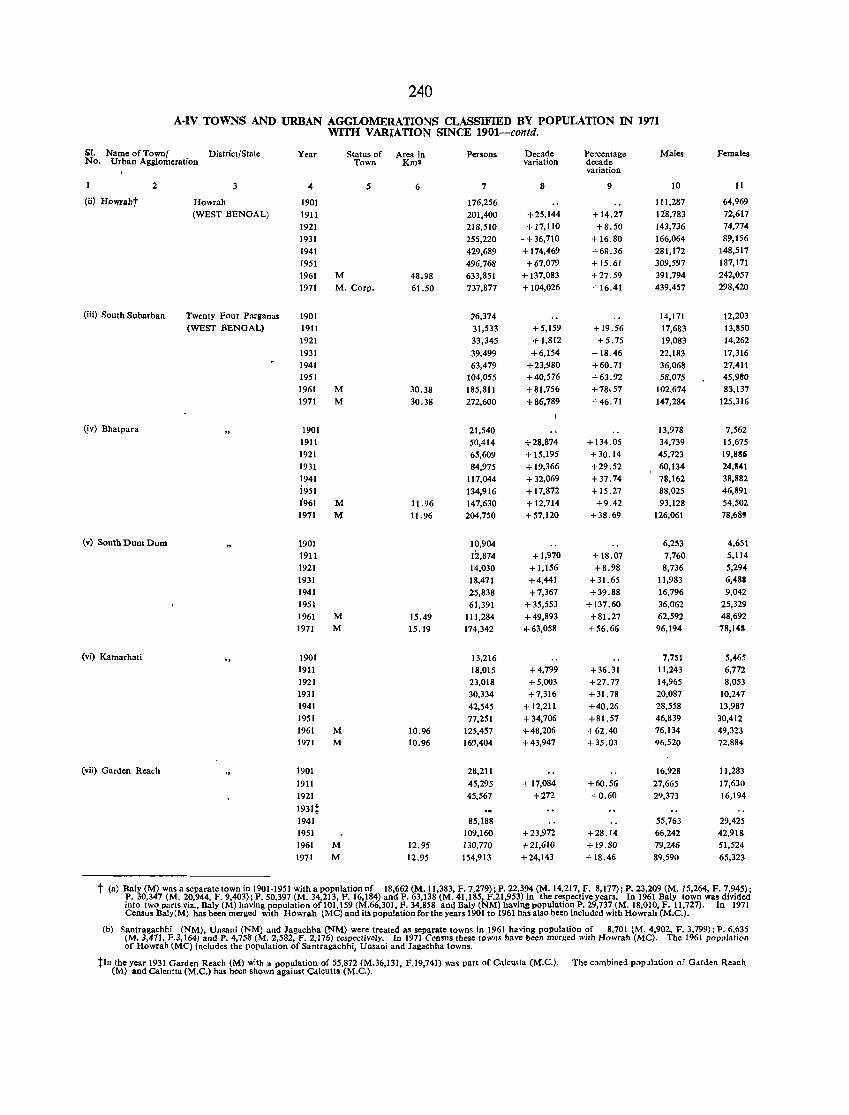
240
A·IV TOWNS AND URBAN AGGLOMERATIONS CLASSIFIED BY POPULATION IN 1971 WITH VARIATION SINCE 1901-contd.
SI. Name of Town/ District/State Year Status of Area in Persons Decade Percentage Males Females No. Urban Agl!iomeration Town KmS variation decade
variation
2 3 4 5 6 7 8 9 10 11
(ii) Howraht Howrah 1901 176,256 111,287 64,969 (WEST BENGAL) 1911 201,400 +25,144 + 14.27 12'8,783 72,617
1921 218,510 + 17,110 +8.50 143,736 74,774
1931 255,220 -+ 36,710 +16.80 166,064 89,156
1941 429,689 + 174,469 +68.36 281,172 148,517
1951 496,768 +67,079 + 15.61 309,597 187,171
1961 M 48.98 633,851 + 137,083 +27.59 391,794 242,057
1971 M. Corp. 61.50 737,877 + 104,026 +16.41 439,457 298,420
(iii) South Subarban Twenty Four Parllanas 1901 ?6,374 14,171 12,203 (WEST BENGAL) 1911 31,533 +5,159 + 19.56 17,683 13,850
1921 33,345 + 1,812 +5.75 19,083 14,262
1931 39,499 +6,154 + 18.46 22,183 17,316 1941 63,479 +23,980 +60.71 36,068 27,411 1951 104,055 +40,576 +63.92 58,075 45,980 1961 M 30.38 185,811 +81,756 +78,57 102,674 83,137 1971 M 30.38 272,600 +86,789 +46.71 147,284 125,316
I (!v) Bhatpara 1901 21,540 13,978 7,562
1911 50,414 +28,874 +134.05 34,739 15,675 1921 65,609 + 15,195 +30.14 45,723 19,88Ci 1931 84,975 + 19,366 +29.52 60,134 24,841 1941 117,044 + 32,069 +37.74 78,162 38,882 i951 134,916 + 17,872 + 15.27 88,025 46,891 (961 M 11.96 147,630 + 12,714 +9.42 93,128 54,502 1971 M 11.96 204,750 +57,120 +38.69 126,061 78,68'
(v) South Dum Dum 1901 10,904 6,253 4,651 1911 12,874 +1,970 + 18.07 7,760 5,114
1921 14,030 +1,156 +8.98 8,736 5,294 1931 18,471 +4,441 +31.65 11,983 6,481 1941 25,838 +7,367 +39.88 16,796 9,042 1951 61,391 +35,553 +137.60 36,062 25,329 1961 M 15.49 111,284 +49,893 + 81.27 62,592 48,692 1971 M 15.19 174,342 >1-63,058 +56.66 96,194 78,143
(vi) Kamarhati 1901 13.216 7,751 5,465 1911 18,015 +4,799 +36.31 11,243 6,772 1921 23,018 +5,003 +27.77 14,965 8,053 1931 30.334 +7,316 + 31. 78 20,087 10,247 1941 42,545 + 12,211 +40.26 28,558 13,987 1951 77,251 + 34,706 +81.57 46,839 30,412 1961 M 10.96 125,457 +48,206 +62.40 76,134 49,323 1971 M 10.96 16!',404 +43,947 +35.03 96,520 72.884
(vii) Garden Reach 1901 28,211 16,928 11,283
1911 45,295 + 17,084 +60.56 27,665 17,630 1921 45,567 +272 +0.60 29,373 16,194
1931t 1941 85,188 55,763 29,425 1951 109,160 +23,972 +28.14 66,242 42,918 1961 M 12.95 130,770 +21,610 +19.80 79,246 51,524 1971 M 12.95 154,913 +24,143 + 18.46 89,590 65,323
t (a) Baly (M) was a separate town in 1901·1951 with a population of 18,662 (M. 11,383, F. 7,279); P. 22,394 (M. 14,217, F. 8,177); P. 23,209 (M. 15,264, F. 7,945); P. 30,347 (M. 20,944, F. 9,403); P. 50,397 (M. 34,213, F. 16,184) and P. 63,138 (M. 41,185, F.21.953) in the respective years. In 1961 Baly town was divided into two parts viz., Baly (M) having population orlOI, 159 (M.66,301, F. 34,858 and Baly (NM) having population P. 29,737 (M. 18,010, F. 11,727). In 1971 Census llaly(M) has been merged with Howrah (Me) and its population forthe years 1901 to 1961 has also been included with Howrah (M.C.).
(b) Santragachhi (NM), Unsani (NM) and Jagachha (NM) were treated as separate towns in 1961 having population of 8,701 (M. 4,902, F. 3,799); P. 6,635 (M. 3,471, F.3,164) and P. 4,758 (M. 2,582, F. 2,176) respectively. In 1971 Census these towns have been merged with Howrah (MC). The 1961 population of Howrah (Me) includes the population of Santragachhi, Unsani and Jagachha towns.
tIn the year 1931 Garden Reach (M) with a population of 55,872 (M.36,131, F.19,741) wa' part of Calcutta (M.C.). (M) and Calcutta (M.C.) has been shown against C<\lcutta (M.C.).
The combined p"pubtion of Garden Reach
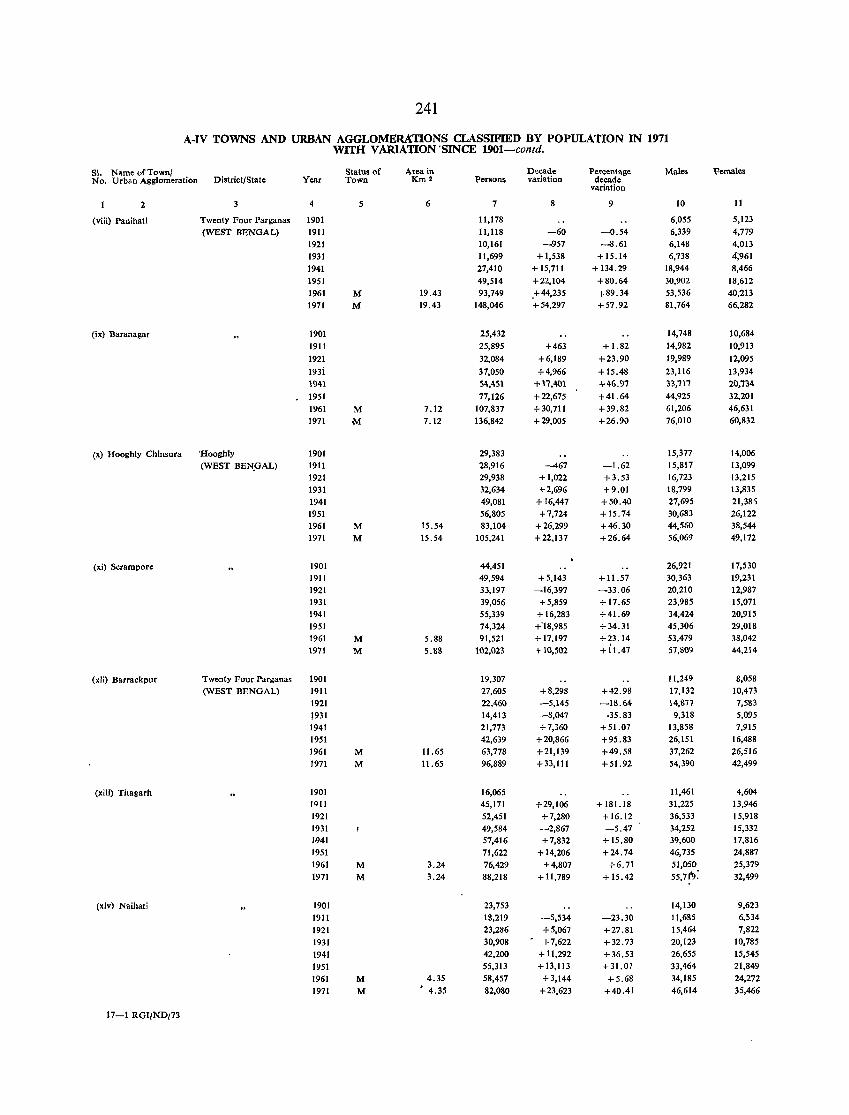
241
A-IV TOWNS AND URBAN AGGLOMERATIONS CLASSIFIED BY POPULATION IN 1971 WITH VARIATION'SINCE 1901-confd.
SI. Name of Townl Status of Area in Decade Percentage Male. Females No. Urban Agglomeration District/State Year Town Km2 Persons variation decade
variation
2 3 5 6 7 8 9 10 11
(viii) Panihati Twenty Four Parganas 1901 11,178 6,055 5,123
(WEST BENGAL) 1911 11,118 -60 -0.54 6,339 4,779
1921 10,161 -957 -8.61 6,148 4,013 1931 11,699 +1,538 +15.14 6,738 4,961 1941 27,410 + 15,711 + 134.29 18,944 8,466
1951 49,514 +22,104 +80.64 30,902 18,612 1961 M 19.43 93,749 ,+44,235 +89.34 53,536 40,213 1971 M 19.43 148,046 +54,297 +57.92 81,764 66,282
(ix) Baranagar 1901 25,432 14,748 10,684
1911 25,895 +463 + 1.82 14,982 10,913
1921 32,084 +6,189 +23.90 19,989 12,095
193i 37,050 +4,966 +15.48 23,116 13,934 1941 54,451 +17,401 +46.97 33,117 20,734
1951 77,126 +22,675 +41.64 44,925 32,201
1961 M 7.12 107,837 +30,711 +39.82 61,206 46,631 1971 M 7.12 136,842 +29,005 +26.90 76,010 60,832
(x) Hoogh1y Chinsura 'Hooghly 1901 29,383 15,377 14,006
(WEST BEN.GAL) 1911 28,916 -467 -1.62 15,817 13,099 1921 29,938 +1,022 +3.53 16,723 13,215 1931 32,634 +2,696 +9.01 18,799 13,835 1941 49,081 + 16,447 +50.40 27,695 21,38S 1951 56,805 +7,724 +15.74 30,683 26,122 1961 M 15.54 83,104 +26,299 +46.30 44,560 38,544 1971 M 15.54 105,241 +22,137 +26.64 56,069 49,172
(xi) Serampore 1901 44,451 26,921 17,530 1911 49,594 +5,143 +11.57 30,363 19,231 1921 33,197 -16,397 -33.06 20,210 12,987 1931 39,056 +5,859 + 17.65 23,985 15,071 1941 55,339 + 16,283 +41.69 34,424 20,915 1951 74,324 +'18,985 +34.31 45,306 29,018 1961 M 5.88 91,521 + 17.197 +23.14 53.479 38,042
1971 M 5.88 102,023 t 10,502 + i \.47 57,809 44,214
(xii) Barrackpur Twenty Four Parganas 1901 19,307 11,249 8,058 (WEST BENGAL) 1911 27,605 +8,298 +42.98 17,132 10,473
1921 22,460 -5,145 -18.64 14,877 7,583
1931 14,413 -8,047 -35.83 9,318 5,095 1941 21,773 +7,360 + 51.07 13,858 7,915 1951 42,639 +20,866 +95.83 26,151 16,488 1961 M 11.65 63,778 +21,139 +49.58 37,262 26,516 1971 M 11.65 96,889 + 33,111 +51.92 54,390 42,499
(xiii) Titagarh 1901 16,065 11,461 4,604
1911 45,171 +29,106 + 181.18 31,225 13,946 1921 52,451 +7,280 +16.12 36,533 15,918 1931 49,584 -2,867 -5.41 34,252 15,332 W41 57,416 +7,832 + 15.80 39,600 17,816 1951 71,622 +14,206 +24.74 46,735 24,887 1961 M 3.24 76,429 +4,807 +6.71 51,050 25,379 1971 M 3.24 88,218 + 11,789 +15.42 55,71'9: 32,499
(xiv) Naihati 1901 23,753 14,130 9,623 1911 18,219 -5,534 -23.30 11,685 6,534
1921 23,286 +5,067 +27.81 15,464 7,822
1931 30,908 +7,622 +32.73 20,123 10,185
1941 42,200 + 11,292 +36.53 26,655 15,545
1951 55,313 +13,113 +31.01 33,464 21,849
1961 M 4.35 58,457 +3,144 +5.68 34,185 24,272
1971 M • 4.35 82,080 +23,623 +40.41 46,614 35,466
17-1 RGIIND,73
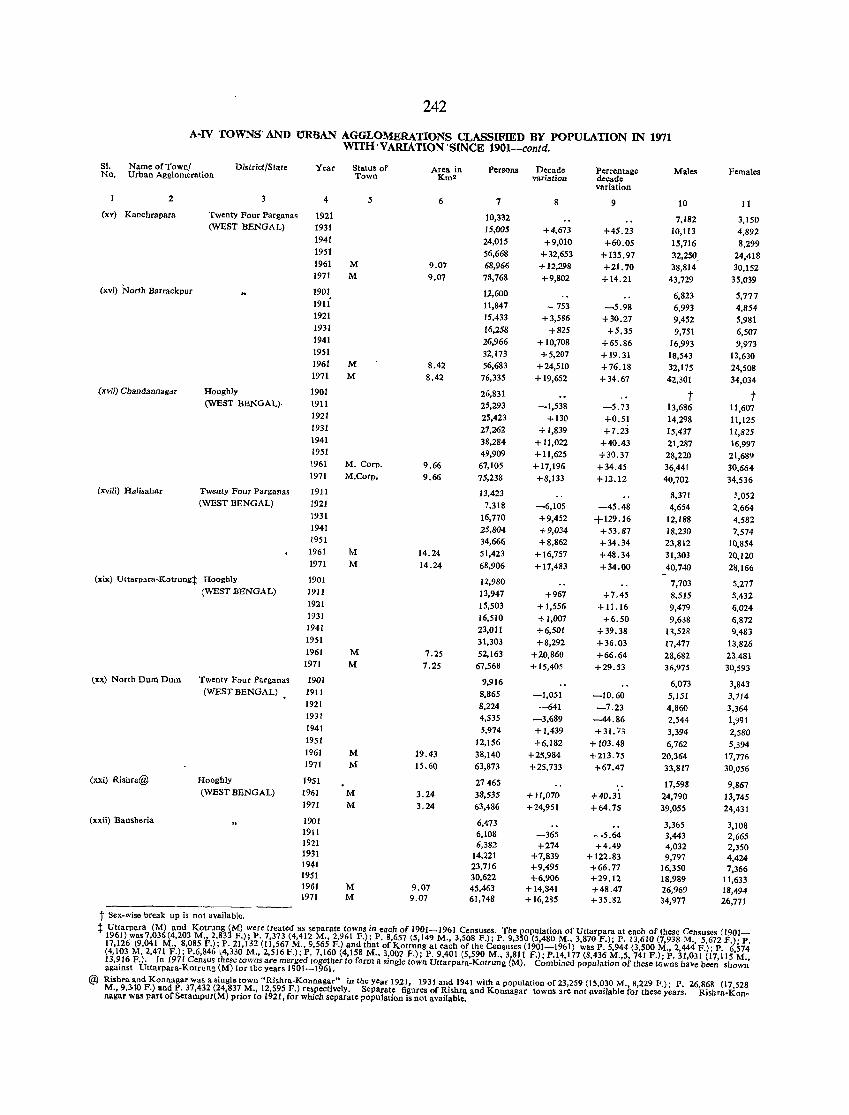
242
A·IV TOWNS' AND tJRBAN AGGLOMERATIONS CLASSIFffin BY POPULATION IN 1971 WITH'VARIATION'SINCE 1901-contd,
Sl. Name of Town{ District{State Year Status of Area in Persons Decade Percentage Males Females No. Urban Agglomeration Town Km2 variation decade variation
2 4 5 6 7 8 9 10 11 (xv) Kanchrapara Twenty Four Parganas 1921 10,332 7,182 3,150
(WEST BENGAL) 1931 15,005 +4,673 +45.23 10,113 4,892 1941 24,015 +9,010 +60.05 15,716 8,299 1951 56,668 +32,653 +135.97 32,250 24,418 1961 M 9.07 68,966 +12,298 +21.70 38,814 30,152 1971 M 9.01 78,768 +9,802 +14.21 43,729 35,039
(xvi) North Barrackpur 1901 12,600 6,823 5,777 1911 11,847 - 753 -5.98 6,993 4,854 1921 15.433 +3,586 +30.27 9,452 5,981 1931 16,258 +825 +5,35 9,751 6,507 1941 26,966 + 10,708 +65.86 16,993 9,973 1951 32,173 +5,207 +19.31 18,543 13,630 1961 M 8.42 56,683 +24,510 +76.18 32,175 24,508 1971 M 8.42 76,335 + 19,652 +34.67 42,301 34,034
(""ii) ChandannagdT Hooghly 1901 26,831 t t (WEST BENGAL)- 1911 25,293 -1,538 -5.73 13,686 11,607
1921 25,423 +130 +0.51 14,298 11,125 1931 27,262 + 1,839 +7.23 15,437 11,825 1941 38,284 + 11,022 +40.43 21,287 16,997 1951 49,909 + 11,625 +30.37 28,220 21,689 1961 M. Corp. 9.66 67,105 + 11,196 +34.45 36,441 30,664 1971 M.Corp. 9.66 75,238 +8,133 +12.12 40,702 34,536
(xviii) Halisahar Twenty Four Pacganas 1911 13,423 8,311 ~,052 (WEST BENGAL) 1921 7,318 -6,105 -45.48 4,654 2,664
1931 16,770 +9,452 +129.16 12,188 4,582 1941 25,804 +9,034 +53.87 18,230 7,574 1951 34,666 +8,862 +34.34 23,812 10,854 1961 M 14.24 51,423 + 16,757 +48.34 31,303 20,120 1971 M 14.24 68,906 + 17,483 +34.00 40,740 28,166
(xix) Uttarpara-Kotrungt Hooghly 1901 12,980 7,703 S,277 (WEST BENGAL) 1911 13,947 +967 +7.45 8,515 5,432
19:11 15,503 +1,556 + 11.16 9,479 6,024 1931 16,510 +1,007 +6.50 9,638 6,872 1941 23,011 +6,501 + 39.38 13,528 9,483 1951 31,303 +8,292 +36.03 17,477 13,826 1961 M 7.25 52,163 +20,860 +66.64 28,682 23,481
1971 M 7.25 67,568 +15,405 +29.53 36,915 30,593 lxx) North Dum Dum Twenty Four Parganas 1901 9,916 6,073 3,843
(WEST BENGAL) , 1911 8,865 -1,051 -10.60 5,151 3,714 1921 8,224 -641 -7.23 4,860 3,364 1931 4,535 -3,689 -44.86 2,544 1,991 1941 5,974 +1,439 + 31. 7J 3,394 2,580 1951 12,156 +6,182 +103.48 6,762 5,394 1961 M 19.43 38,140 +25,984 +213.75 20,364 17,776 1971 M 15.60 63,873 +25,733 +67.41 33,817 30,056
(xxi) Rishra@ Hooghly 1951 27465 17,598 9,867 (WEST BENGAL) 1961 M 3.24 38,535 +11,070 +40.3i 24,790 13,745
1971 M 3.24 63,486 +24,951 +64.75 39,055 24,431 (xxii) Bansberia 1901 6,473 3,365 3,108
1911 6,108 -365 -5.64 3,443 2,665 1921 6,382 +274 +4.49 4,032 2,350 1931 14,221 +7,839 + 122.83 9,797 4,424 1941 23,716 +9,495 +66.77 16,350 7,366 1951 30,622 +6,906 +29.12 18,989 11,633 1961 M 9.07 45,463 +14,841 +48.47 26,969 18,494 1971 M 9.01 61,748 + 16,285 +35.82 34,977 26,771
t Sex-wise break up is not available.
t Uttarpara (M) and Kotrung (M) were treated as separate towns in each of 1901-1961 Censuses. The popUlation of Uttarpara at each of these Censuses (1901-1961) was 7,036 (4,203 M" 2,833 F.); P. 7,373 (4,412 M., 2,961 F.); p. 8,657 (5,149 M., 3,508 F.); P. 9,350 (5,480 M., 3,870 F.); P. 13,610(7,938 M., 5,672 F.); P. 17,126 (9,041 M., 8,085 F.); P. 21,132 (11,567 M., 9,565 F.) and that of Kotrung at each ()f the Censuses (1901-1961) was P. 5,944 (3,500 M., 2,444 F.); P. 6,574 (4,103 M, 2,471 F.); P.6,846 \4,330 M., 2,516 F.); P. 7,160 (4,158 M., 3,001 F.); P. 9,401 (5,590 M., 3,811 F.); P.14,177 (8,436 M.,5, 741 F.); P. 31,031 (17,115 M., 13,916 F.). In 1971 Census these towns are merged together to form a single town Uttarpara-Kotrung (M). Combined population of these towns have been shown against Uttarpara-Kotrung (M) lor tbe years 1901-1961.
@ Rishra 811d Konnagar was a single town "Rishra-Konnagar" in the year 1921, 1931 and 1941 with a population of 23,259 (15,030 M., 8,229 F.); I'. 26,868 (17,528 M., 9,3010 F.) and P. 37,432 (24,837 M., 12,595 F.) respectively. SeplI.rate figures of Rishra and Konnagar towns ~re not available for these years. Rishra-Kon-nagar was part of Serampur(M) prior to 1921, for wbich separate pOPUlation is not available.
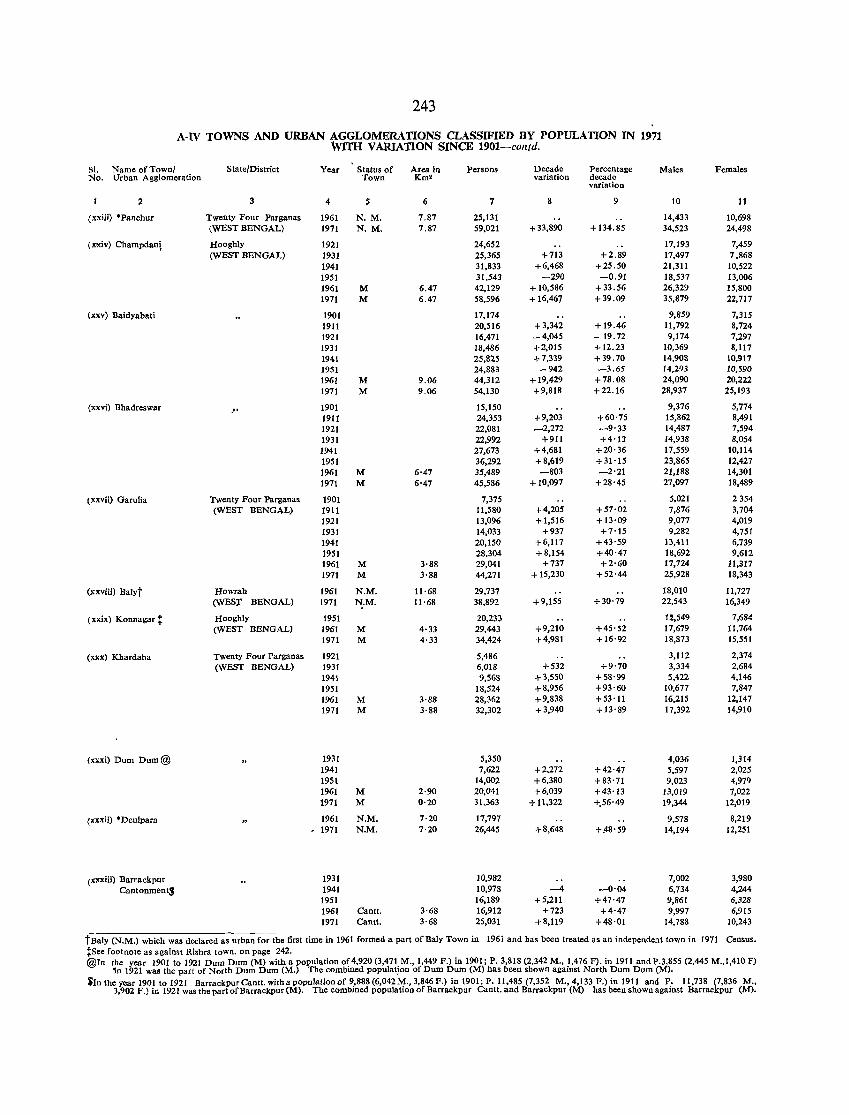
243
A-IV TOWNS AND URBAN AGGLOMERATIONS CLASSIFffiD BY POPULATION IN 1971 WITH VARIATION SINCE 1901-contd.
SI. Name of Townl State/District Year Status of Area in Persons Decade Percentage Males Females No. Urban Agglomeration Town Km' variation decade
variation
2 3 4 5 6 7 8 9 10 II
(xxiii) 'Panchur Twenty Four Parganas 1961 N.M. 7.87 25,131 14,433 10,698 (WEST BENGAL) 1971 N. M. 7.87 59,021 +33,890 + 134.85 34,523 24,498
(x'Xiv) Champdani, Hooghly 1921 24,652 17,193 7,459 (WEST BENGAL) 1931 25,365 +713 +2.89 17,497 7,868
1941 31,833 +6,468 +25.50 21,311 10,522 1951 31,543 -290 -0.91 18,537 13,006 1961 M 6.47 42,129 + 10,586 +33.56 26,329 15,800 1971 M 6.47 58,596 + 16,467 +39.09 35,879 22,717
(xxv) Baidyab"ti 1901 17,174 9,859 7,315 1911 20,516 +3,342 + 19.46 11,792 8,724 1921 16,471 -4,045 - 19.72 9,174 7,297 1931 18,486 +2,015 +12.23 10,369 8,117 1941 25,825 +7,339 +39.70 14,908 10,917 1951 24,883 -942 -3.65 14,293 10,590 1961 M 9.06 44,312 + 19,429 +78.08 24,090 20,222 1971 M 9.06 54,130 +9,818 +22.16 28,937 25,193
(xxvi) Bhadreswar ." 1901 15,150 9,376 5,774 19I1 24,353 +9,203 +60'75 15,862 8,491 1921 22,081 _2,272 -9'33 14,487 7,594 1931 22,992 +911 +4'13 14,938 8,054 1941 27,673 +4,681 +20'36 17,559 10,114 1951 36,292 +8,619 +31'15 23,865 12,427 1961 M 6'47 35,489 -803 -2'21 21,188 14,301 1971 M 6'47 45,586 + 10,097 +28'45 27,097 18,489
(xxvii) Garulia Twenty Four Parganas 1901 7,375 5,021 2354 (WEST BENGAL) 1911 11,580 H,205 +57·02 7,876 3,704
1921 13,096 + 1,516 + 13'09 9,077 4,019 1931 14,033 +937 +7'15 9,282 4,751 1941 20,150 +6,117 +43'59 13,411 6,739 1951 28,304 +8,154 +40·47 18,692 9,612 1961 M 3·88 29,041 +737 +2'60 17,724 11,317 1971 M 3·88 44,271 + 15,230 +52'44 25,928 18,343
(xxviii) Balyt Howrah 1961 N.M. 11·68 29,737 18,010 11,727 (WES)' BENGAL) 1971 N.M. 11·68 38,892 +9,155 +30'79 22,543 16,349
( xxix) Konnagar:l: Hooghly 1951 20,233 ll!,549 7,684 (WEST BENGAL) 1961 M 4·33 29,443 +9,210 +45'52 17,679 11,764
1971 M 4·33 34,424 +4,981 +16'92 18,873 15,551
(xxx) Khardaha Twenty Fonr Parganas 1921 5,486 3,112 2,374 (WEST BENGAL) 1931 6,018 +532 +9'70 3,334 2,684
1941 9,568 +3,550 +58'99 5,422 4,146 1951 18,524 +8,956 +93'60 10,677 7,847 1961 M 3·88 28,362 +9,838 +53'11 16,215 12,147 1971 M 3·88 32,302 +3,940 +13'89 17,392 14,910
(xxxi) Dum Dum @ 1931 5,350 4,036 1,314 1941 7,622 +2,272 +42'47 5,597 2,025 1951 14,002 +6,380 +83'71 9,023 4,979 1961 M 2·90 20,041 +6,039 +43'13 13,019 7,022 1971 M 0·20 31,363 + 11,322 +,56'49 19,344 12,019
(xxxii) °Deulpara 1961 N.M. 7·20 17,797 9,578 8,219 1971 N.M. 7·20 26,445 +8,648 +i18'S9 14,194 12,251
(xxxiii) Barrackpnr 1931 10,982 7,002 3,980 CantonmentS 1941 10,978 -4 -0·04 6,734 4,244
1951 16,189 +5,211 +47'47 9,861 6,328 1961 Cantt. 3·68 16,912 +723 +4'47 9,997 6,915 1971 Cantt. 3·68 25,031 +8,119 +48·01 14,788 10,243
tBaly (N.M.) which was declared as urban for the first time in 1961 formed a part of Baly Town io 1961 and has been treated as an independent town in 1971 Census. iSe. footnote as against Rishra town. on page 242. @In the year 1901 to 1921 Dum Dum (M) with a population of 4,920 (3,471 M., 1,449 F.) in 1901; P. 3,818 (2,342 M., 1,476 F). in 1911 and P.3,855 (2,445 M.,1,410 F)
1n 1921 was the part of North Dum Dum (M.) The combined population of Dum Dum (M) has been shown against North Dum Dum (M). SIn the year 1901 to 1921 BarrackpurCantt. with a population of 9,888 (6,042M., 3,846 F.) in 1901; P. 11,485 (7,352 M., 4,133 F.) in 1911 and P. 11,738 (7,836 M.,
3,902 P.) in 1921 was the part of Barrackpur (M). The combioed population of Barrackpur Cantt. and Barrackpur (M) has been shown against Barrackpur (M).
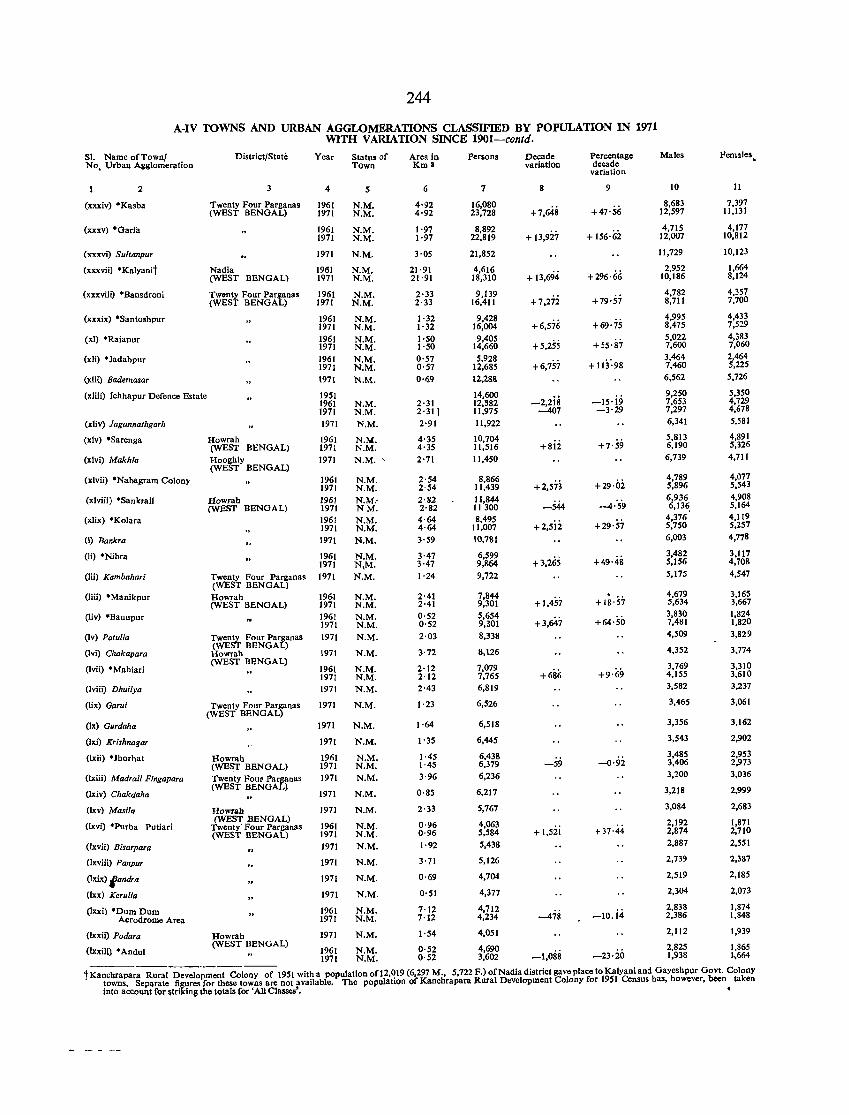
244
A-IV TOWNS AND URBAN AGGLOMERATIONS CLASSIFIED BY POPULATION IN 1971 WITH VARIATION SINCE 1901-contd.
SI. Name of Town/ District/State Year Status of Town No, Urban Agglomeration
2 3 4 S
N.M. N.M.
(xxxiv) ·Kasba Twenty Four Parganas 1961 (WEST BENGAL) 1971
(xxxv) ·Garfa
(xxxvi) Sultnnpur
(xxxvii) 'Kalyanit
(xxxviii) ·Bansdroni
(xxxix) ·Santoshpur
(xl) ·Rajapur
(xli) • Jadabpur
(xlii) Bademasar
Nadia (WEST BENGAL)
Twenty Four Parganas (WEST BENGAL)
(xliii) Ichhapur Defence Estate
(xliv) !agannathgarh
(xlv) ·Sarenga
(xlvi) Makhla
(xlvii) *Naba_gram Colony
(xlviii) ·Sankrail
(xlix) "Kolara
(I) Bankra
(Ii) *Nibra
(Iii) Kambaharl
(liii) • Manikpur
(liv) *Banupur
(Iv) Patulia
(lvi) Chakapara
(lvii) *M)lhiari
(I viii) Dhui/ya
(lix) Gami
(Ix) Gurdaha
(Ixi) Krishnagar
(lxii) ·Jhorhat
(Ixiii) Madrail Fingapara
(Ixiv) Chakdaha
(lxv) Masi/a
(Ixvi) ·Purha Putiari
(lxvii) Bisarpara
(Ixviii) Panpur
(Ixix) landra
(lxx) Kerulin
(Ixxi) ·Dum Dum Aerodrome Area
(Ixxii) Podara
(lxxiii) • Andu1
Howrah (WEST BENGAL) Hooghly (WEST BENGAL)
Howrah (WEST BENGAL)
Twenty Four Parganas (WEST BENGAL) Howrah (WEST BENGAL)
Twenty Four Parganas (WEST BENGAL) Howrah (WEST BENGAL)
Twenty Four Parganas (WEST BENGAL)
Howrah (WEST BENGAL) Twenty Four Parganas (WEST BENGAL)
Howrah (WEST BENGAL)
Twenty' Four Parganas (WEST BENGAL)
Howrah (WEST BENGAL)
1961 1971
1971
1961 1971
1961 1971
N.M. N.M.
N.M.
N.M. N.M.
N.M. N.M.
1961 N.M. 1971 N.M. 1961 N.M. 1971 N.M. 1961 N.M. 1971 N.M. 1971 N.M.
1951 1961 N.M. 1971 N.M. 1971 N.M.
1961 1971 1971
1961 1971 1961 1971 1961 1971 1971
1961 1971 1971
196.1 1971 1961 1971 1971
1971
1961 1971 1971
1971
1971
1971
N.lIl. N.M.
N.M. '
N.M. N.M. N.M, NM. N.M. N.M. N.M.
N.M. N,M. N.M.
N.M. N.M. N.M. N.M. N.M.
N.M.
N.M. N.M. N.M.
N.M.
N.M.
N.M.
1961 N.M. 1971 N.M. 1971 N.M.
1971 N.M.
1971 N.M.
1961 N.M. 1971 N.M. 1971 N.M.
1971
1971
1971
1961 1971
1971
1961 1971
N.M.
N.M.
N.M.
N.M. N.M.
N.M.
N.M. N.M.
Area in Km S
6
4·92 4·92
1'97 1·97
3·05
21·91 21·91
2·33 2·33
1·32 1·32 1·50 1'50 0'57 0·57 0·69
2·31 2'311 2·91
4'35 4'35 2'71
2'54 2,54 2,82 2'82 4,64 4·64 3'59
3·47 3·47 1·24
2·41 2·41 0'52 0'S2 2·03
3'72
2'12 2·12 2·43
1·23
1·64
1'35
1·45 1·45 3·96
0·85
2'33
0,96 0·96 1·92
3,71
0'69
0'51
7'12 7·12
1'54
0'52 0'52
Persons
7
16,080 23,728
8,892 22,819
21,852
4,616 18,310
9,139 16,411
9,428 16,004 9,405
14,660 5,928
12,685 12,288
14,600 12,S82 11,975 11,922
10,704 11,516 11,450
8,866 11,439 11,844 11300 8,495
11,007 10,781
6,599 9,864 9,722
7,844 9,301 5,654 9,301 8,338
8,126
7,079 7,765 6,819
6,526
6,518
6,445
6,438 6,379 6,236
6,217
5,767
4,063 5,584 5,438
5,126
4,704
4,377
4,712 4,234
4,051
4,690 3,602
Decade variation
8
+7,648
+ 13,927
+ 13,694
+7,272
+6,576
+5,255
+6,757
-2,2is -407
+812
+2,573
-544 +2,5ii
+3,265
+ 1,457
+3,647
-59
+I,5ii
-1,088
Percentage decade
variation
9
+47·56
+ 156·i;i
+296·66
+79'57
+69'75
+55'87
+ 113'·98
-15·i9 -3'29
+7'59
+29·02
-4:5'9
+29'57
+49·48
+18'57
+64'50
+9'69
-0·92
t37·44
-10.i4
-23·io
Males
10
8,683 12,597
4,715 12,007
11,729
2,952 10,186
4,782 8,711
4,995 8,475 5,022 7,600 3,464 7,460 6,562
9,250 7,653 7,297 6,341
5,813 6,190 6,739
4,789 5,896 6,936 6,13~
4,376 5,750 6,003
3,482 5,156 5,175
4,679 5,634 3,830 7,481 4,509
4,352
3,769 4,155 3,582
3,465
3,356
3,543
3,485 3,406 3,200
3,218
3,084
2,192 2,874 2,887
2,739
2,519
2,304
2,838 2,386
2,112
2,825 1,938
Females.
11
7,397 11,131
4,177 10,812
10,123
1,664 8,124
4,357 7,700
4,433 7,529 4,383 7,060 2,464 5,225 5,726
5,350 4,729 4,678 5,581
4,891 5,326 4,711
4.077 5,543 4,908 5,164 4,119 5,257 4,778
3,117 4,70& 4,547
3,165 3,667 1,824 1,820 3,829
3,774
3,310 3,610 3,237
3,061
3,162
2,902
2,953 2,973 3,036
2,999
2,683
1,871 2,710 2,551
2,387
2,185
2,073
1,874 1,848
1,939
1,865 1,664
tKanchrapara Rural Development Colony of 1951 with a population of12,019 (6,297 M., 5,722 F.) of Nadia district gave place to Kalyani and Gayeshpur GoYl. Colony towns, Separate figures for these towns are not available. The population of Kanchrapara Rural Development Colony for 1951 Census has, however, been taken into accoUllt for $trikinll the totals for' All Classes'. •
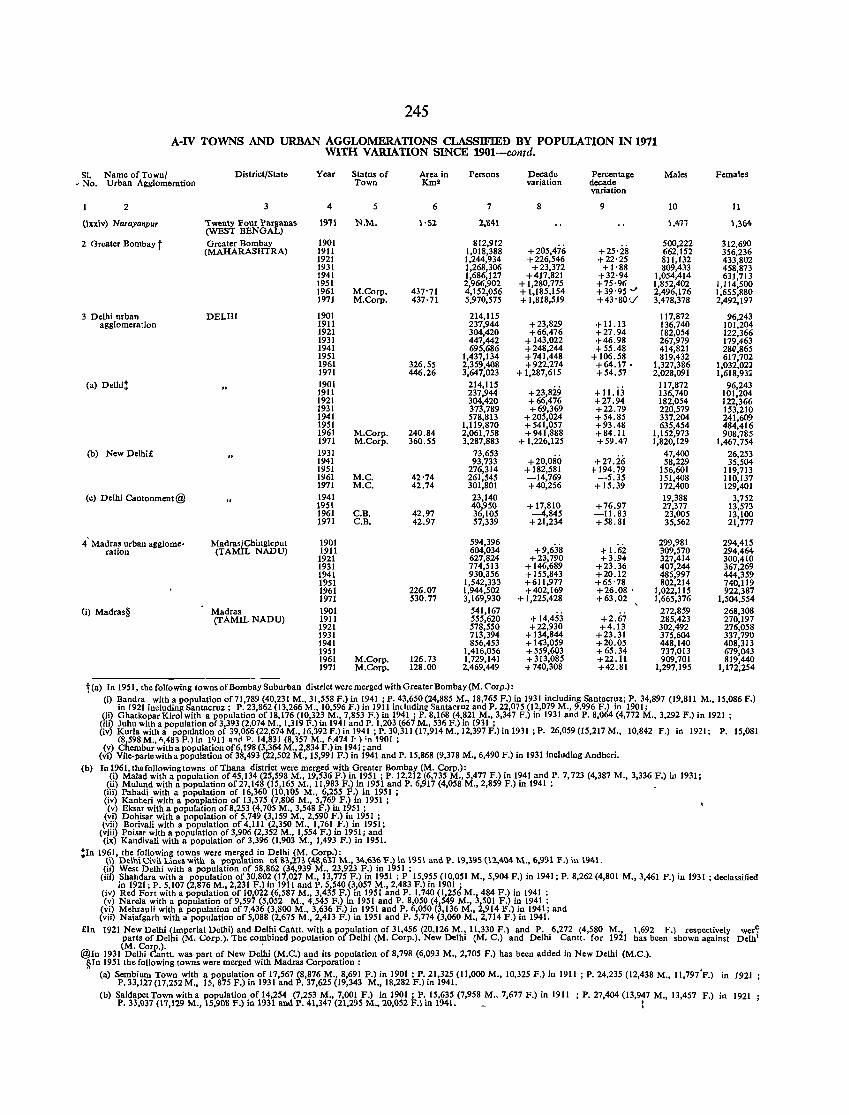
245
A-IV TOWNS AND URBAN AGGLOMERATIONS CLASSIFIED BY POPULATION IN 1971 Wlm VARIATION SINCE 1901-contd.
Sl. Name of Town/ • No. Urban Agglomeration
2
(lxxiv) Narayanpur
2 Greater Bombay t
3 Delhi urban agglomeration
(a) Delhit
(b) New Delhi£
(c) Delhi Cantonment@
4' Madras urban agglome. ration
(i) Madras§
District/State
3
lwent» Four Pa111anas (WEST BENGAL) Greater Bombay (MAHARASHTRA)
DELHI
Madras/Chingleput (TAMIL NADU)
Madras (TAMIL NADU)
Year
4
1911
1901 1911 1921 1931 1941 1951 1961 1971
1901 1911 1921 1931 1941 1951 1961 1971 1901 1911 1921 1931 1941 1951 1961 1971 1931 1941 1951 1961 1971 1941 1951 1961 1971
1901 1911 1921 1931 1941 1951 1961 1971 1901 1911 1921 1931 1941 1951 1961 1971
Status of Town
5
N.M.
M.Corp. M.Corp.
M.Corp. M.Corp.
M.C. M.C.
C.B. C.B.
M.Corp. M.Corp.
Area in Km2
6
1'52
437'71 437·71
326.55 446.26
240.84 360.55
42'74 42.74
42.97 42.97
226.07 530.77
126.73 128.00
Persons
7
2,841
812,912 1,018,388 1,244,934 1,268,306 1,686,127 2,966,902 4,152,056 5,970,575
214,115 237,944 304,420 447,442 695,686
1,437,134 2,359,408 3,647,023
214,115 237,944 304,420 373,789 578,813
1,119,870 2,061,758 3,287,883
73,653 93,733
276,314 261,545 301,801 23,140 40,950 36,105 57,339
594,396 604,034 627,824 774,513 930,356
1,542,333 1,944,502 3,169,930
541,167 555,620 578,550 713,394 856,453
1,416,056 1,729,141 2,469,449
t (a) In 1951, tb.e following towns of Bombay Suburban di,trict were merged with Greater Bombay (M. Corp.):
Decade Percentage Males variation decade
variation
8 9 10
1,417
+205,476 +25'28 500,222 662,152
+226,546 +22'25 811,132 +23,372 + 1'88 809,433
+417,821 +32'94 1,054,414 + 1,280,775 +75·96 1,852,402 + 1,185,154 + 39'95 oJ 2,496,176 + 1,818,519 +43'80\./ 3,478,378
117,872 +23,829 + 11.13 136,740 +66,476 +27.94 182,054
+ 143,022 +46.98 267,979 +248,244 +55.48 414,821 +741,448 + 106.58 819,432 +922,274 +64.17· 1,327,386
+ 1,287,615 +54.57 2,028,091
+23,829 +ll.i3 117,872 136,740
+66,476 +27.94 182,054 +69,369 +22.79 220,579
+205,024 + 54.85 337,204 +541,057 +93.48 635,454 +941,888 +84.11 1,152,973
+ 1.226,125 +59.47 1,820,129
+20,080 +27.i6 47,400 58,229
+ 182,581 + 194.79 156,601 -14,769 -5.35 151,408 +40,256 +15.39 172,400
19,388 + 17,810 +76.97 27,377 -4,845 -11.83 23,005
+21,234 +58.81 35,562
+9,638 +1.62 299,981 309,570
+23,790 +3.94 327,414 + 146,689 +23.36 407,244 + 155,843 +20.12 485,997 +611,977 +65 '78 802,214 +402,169 +26.08 • 1,022,115
+ 1,225,428 +63.02 1,665,376
+ 14,453 +2.67 272,859 285,423
+22,930 +4.13 302,492 + 134,844 +23.31 375,604 + 143,059 +20.05 448,140 +559,603 +65.34 737,013 +313,085 +22.11 909,701 + 740,308 +42.81 1,297,195
Females
11
1,364
312.690 356,236 433,802 458,873 631,713
1,114,500 1,655,880 2,492,197
96,243 101,204 122,366 179,463 28Q,865 617,702
1,032,02) 1,618,93:<
96,243 101,204 122,366 153,210 241,609 484,416 908,785
1,467,754 26,253 35,504
119,713 110,137 129,401
3,752 13,573 13,100 21,777
294,415 294,464 300,410 367,269 444,359 740,119 922,387
1,504,554 268,308 270,197 276,058 337,790 408,313 679,043 819,440
1,172,254
(i) Bandra with a population of 71,789 (40,231 M., 31,558 F.) in 1941 ; P. 43,650 (24,885 M., 18,765 F.) in 1931 including Santacruz; P. 34,897 (19,811 M., 15,086 F.) in 1921 including Santacruz; P. 23,862 (13,266 M., 10,596 F.) in 1911 induding Santacruz and P. 22,075 (12,079 M., 9,996 F.) in 1901;
(ii) GhatkoparKirol with a population of 18,176 (10,323 M., 7,853 F.) in 1941 ; P. 8,168 (4,821 M., 3,347 F.) in 1931 and P. 8,064 (4,772 M., 3,292 F.) in 1921 ; (iii) Juhu with a population of 3,393 (2,074 M., 1.319 F.) in 1941 and P. 1.203 (667 M., 536 F.) in 1911 ; (iv) Kurla with a population of 39,066 (22,674 M., 16,392 F.) in 1941 ; P. 30,311 (17,914 M., 12,397 F.) in 1931 ; P. 26,059 (15,217 M., 10,842 F.) in 1921; P. 15,081
(8,598 M., ",483 F.) in 1911 0·,(11). 14,831 (8,357 M., f.474 I-);n 1901 ; (v) Chembur with a population of 6, 198 (3,364 M., 2,834 F.) in 1941 ; and
(vi) Vile-parle with a population of 38,493 (22,502 M., 15,991 F.) in 1941 and P. 15,868 (9,378 M., 6,490 F.) in 1931 including Andheri. (b) Inl961,thcfollowingtowns of Thana district were merged with Greater Bombay (M. Corp.):
(i) Malad with a population of 45,134 (25,598 M., 19,536 F.) in 1951 ; P. 12,212 (6,735 M., 5,477 F.) in 1941 and P. 7,723 (4,387 M., 3,336 F.) in 1931; (ii) Mulund with a population of27,148 (15,165 M., 11,983 F.) in 1951 and P. 6,917 (4,058 M., 2,859 F.) in 1941 ;
(iii) Pahadi with a population of 16,360 (10,105 M., 6,255 F.) in 1951 ; (iv) Kanheri with a pouplation of 13,575 (7,806 M., 5,769 F.) in 1951 ; (v) Eksar with a population of 8,253 (4,705 M., 3,548 F.) in 1951 ;
(vi) Dohisar with a population of 5,749 (3,159 M., 2,590 F.) in 1951 ; (vii) Borivali with a population of 4,111 (2,350 M., 1,761 F.) in 1951;
(viii) Poisar with a population of 3,906 (2,352 M., 1,554 F.) in 1951; and (ix) Kandivali with a population of 3,396 (1,903 M., 1,493 F.) in 1951.
tin 1961, the following towns were merged in Delhi (M. Corp.): {i) Delhi Civil Line~with a population of 1'.~,273 (41'.,6~1 M., :>'4,6:>'6 F.) in \951 and P. \9,:>'95 (12,404 M., 6,991 P.) in 1941. (ii) West Delhi with a population of 58,862 (34,939 M., 23,923 F.) in 1951 ;
(iii) .Shahdara with a population of30,80~ (17,027 M., 13,775 F.) in 1951; P 15,9,55 (10,051 M., 5,904 F.) in 1941; P. 8,262 (4,801 M.,3,461 F.) in 1931 ; declassified In 1921; P. 5,107 (2,876 M., 2,231 F.) ID 1911 and P. 5,540 (3,057 M., 2,483 F.) m 1901 ;
(iv) Red Fort with a population of 10,022 (6,587 M., 3,435 F.) in 1951 and P. 1,740 (1,256 M., 484 F.) in 1941 ; (v) Narcla with a population of 9,597 (5,052 M., 4,545 F.) in 1951 and P. 8,050 (4,549 M., 3,501 F.) in 1941 ;
(vi) Mehrauli with a population of 7,436 (3,800 M., 3,636 F.) in 1951 and P. 6,050 (3,136 M., 2,914 F.) in 1941; and (vii) Naiafgarh with a population of 5,088 (2,675 M., 2,413 F.) in 1951 and P. 5,774 (3,060 M., 2,714 F.) in 1941.
£In 1921 New Delhi (Imperial Delhi) and Delhi CaMt. with a popUlation of 31,456 (20,126 M., 11,330 F.) and P. 6,272 (4,580 M., 1,692 F.) respectively wer'? parts of Delhi (M. Corp.). The combined population of Delhi (M. Corp.), New Delhi (M. C.) and Delhi Cantt. for 1921 has been shown against Delh' (M. Corp.). .
@In 1931 Delhi Cantt. was part of New Delhi (M.C.) and its popnlation of 8,798 (6,093 M., 2,705 F.) has been added in New Delhi (M.C.). ~In 1951 the following towns were merged with Madras Corporation:
(a) Sembium Town with a population of 17,567 (8,876 M., 8,691 F.) in 1901 ; P. 21,325 (11,000 M., 10,325 F.) in 1911 ; P. 24,235 (12,438 M., 11,797'F.) in 1921 ; P. 33,127 (17,252 M., 15,875 F.) in 1931 and P. 37,625 (19,343 M., 18,282 F.) in 1941.
(b) Saidapet Town with a population of 14,254 (7,253 M., 7,001 F.) in 1901 ; P. 15,635 (7,958 M., 7,677 F.) in 1911 ; P. 27,404 (13,947 M., 13,457 F.) in 1921 ; P. :>'3,037 (17,129 M., 15,908 F.) in 1931 and 1'. 41,347 (21,295 M .. 20,052 F.) in 1941. _ !
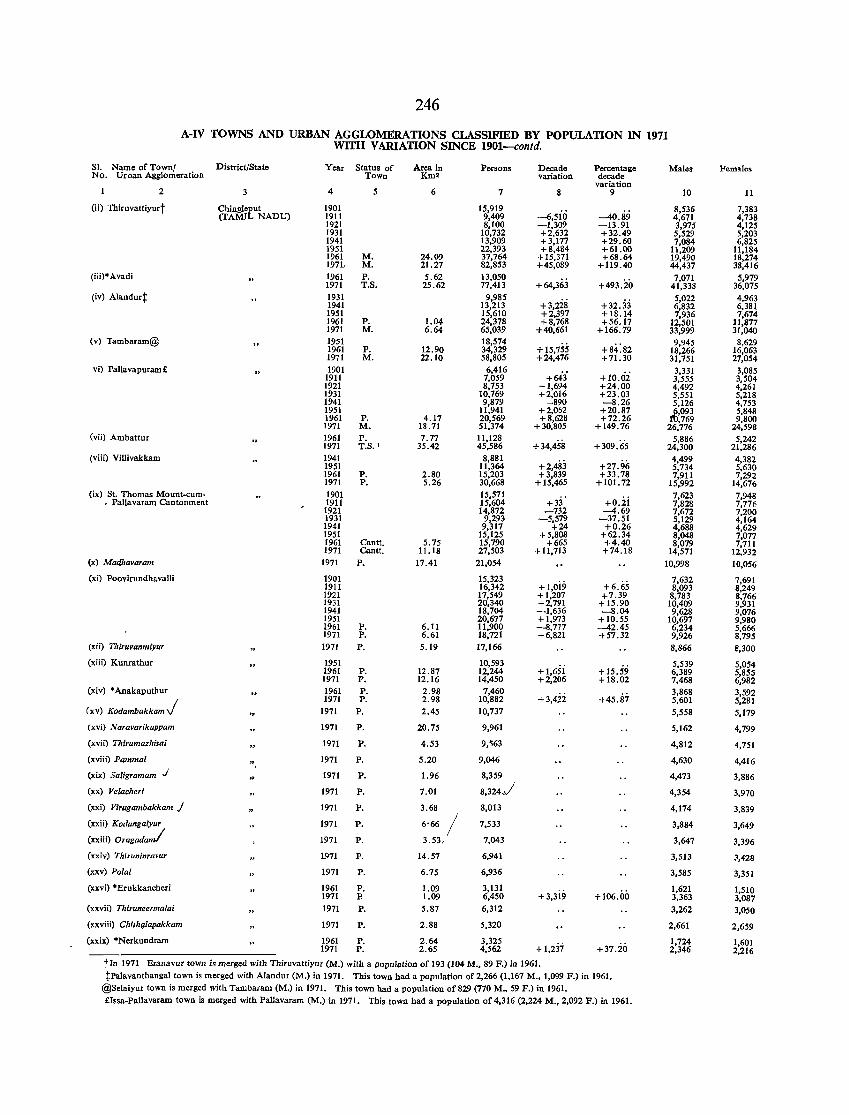
246
A-IV TOWNS AND URBAN AGGLOMERATIONS CLASSIFIED BY POPULATION IN 1971 WITH VARIATION SINCE 1901-contd.
SI. Name of Town! District/State Year Status of Area in Persons Decade Percentage Male. Females No. Uroan Agglomeration Town Km2 variation decade
variation 2 4 5 6 7 8 9 10 11
(ii) Thiruvattiyurt Chingleput 1901 15,919 -6,5iri -40.89 8,536 7,383
(TAMIL NADU) 1911 9,409 4,671 4,738 1921 8,100 -1,309 -13.91 3,975 4,125 1931 10,732 +2,632 +32.49 5,529 5,203 1941 13,909 +3,177 +29.60 7,084 6,825 1951 22,393 +8,484 +61.00 11,209 11,184 1961 M. 24.09 37,764 + 15,371 +68.64 19,490 18,274 197J.., M. 21.21 82,853 +45,089 +119.40 44,437 38,416
(iii)* Avadi 1961 P. 5.62 13,050 +64,363 +493.20
1,011 5,919 1971 T.S. 25.62 71,413 41,338 36,075
(iv) Alandur~ 1931 9,985 +3,228
5,022 4,963 1941 13,213 +32.33 6,832 6,381 1951 15,610 +2,397 + 18.14 1,936 1,614 1961 P. 1.04 24,378 +8,768 +56.17 12,501 11,877 1971 M. 6.64 65,039 +40,661 +166.79 33,999 31,040
(v) Tambaram@ 1951 18,574 + 15,755 +84:82
9,945 8,629 1961 P. 12.90 34,329 18,266 16,063 1971 M. 22.10 58,805 +24,476 +71.30 31,751 27,054
vi) Pallavapuram£ 1901 6,416 +lo.oi
3,331 3,085 1911 7,059 +643 3,555 3,504 1921 8,753 +1,694 +24.00 4,492 4,261 1931 10,769 +2,016 +23.03 5,551 5,218 1941 9879 -890 -8.26 5,126 4,753 1951 1(941 +2,062 +20.87 tt,093 5,848 1961 P. 4.11 20,569 +8,628 +72.26 ,769 9,800 1971 M. 18.71 51,374 +30,805 +149.76 26,776 24,598
(vii) Ambattur 1961 P. 7.77 11,128 +34,458 +309.65
5,886 5,242 1911 T.S. ' 35.42 45,586 24,300 21,286
(viii) Villivakkam 1941 8,881 +2,483 +27.96
4,499 4,382 1951 11,364 5,134 5,630 1961 P. 2.80 15,203 +3,839 +33.78 1,911 7,292 1971 P. 5.26 30,668 + 15,465 +101. 72 15,992 14,676
(ix) St. Thomas Mount-cum- 1901 15,571 +33 . +o.ii
7,623 7,948 • Pallavaram Cantonment 1911 15,604 7,828 7,776
1921 14,872 -132 -4.69 1,612 7,200 1931 9,293 -5,579 -31.51 5,129 4,164 1941 9,317 +24 +0.26 4,688 4,629 1951 15,125 +5,808 +62.34 8,048 7,017 1961 Cantt. 5.75 15,790 +665 +4.40 8,079 7,711 1971 Cantt. 11.18 27,503 + 11,713 +74.18 14,571 12,932
(x) Madhavaram 1971 P. 17.41 21,054 10,998 10,056
(xi) Poovirundhavalli 1901 15,323 +I,oi9 +6.65
7,632 7,691 1911 16,342 8,093 8,249 1921 17,549 +1,207 +7.39 8,783 8,766 1931 20,340 +2,791 + 15.90 10,409 9,931 1941 18,704 -1,636 -8.04 9,628 9,076 1951 20,677 +1,973 + 10.55 10,697 9,980 1961 P. 6.11 11,900 -8,771 -42.45 6,234 5,666 1971 P. 6.61 18,721 +6,821 +57.32 9,926 8,195
(~ii) Thiruvanmiyur 1971 P. 5.19 17,166 8,866 8,300
(xiii) Kunrathur 1951 10,593 + 1,6Si + 15.59
5,539 5,054 1961 P. 12.87 12,244 6,389 S,85S 1971 P. 12.16 14,450 +2,206 +18.02 7,468 6,982
(xiv) • Anakaputhur 1961 P. 2.98 7,460 +3,4ii
3,868 3,592
(xv) KodambakkamJ 1971 P. 2.98 10,882 +45.81 5,601 5,281
1971 P. 2.45 10,737 5,558 5,179
(xvi) Naravarikuppam 1971 P. 20.75 9,961 5,162 4,199
(xvii) Thirumazhisai 1971 P. 4.53 9,563 4,812 4,151
(xviii) Pammal 1971 P. 5.20 9,046 4,630 4,416
(xix) Saligramam J 1971 P. 1.96 8,359 4,473 3,886
(xx) Velacheri 1971 P. 7.01 8,324.J 4,354 3,970
(xxi) Virugambakkam J 1971 P. 3.68 8,013 4,174 3,839
(xxii) Kotiungaiyur 1971 P. 6'66 / 1,533 3,884 3,649
(xxiii) Oragadami /
1971 P. 3.53, 7,043 3,647 3,396
(xxiv) Thlruninravur 1971 P. 14.57 6,941 3,513 3,428
(xxv) Po/al 1971 P. 6.15 6,936 3,585 3,351
(xxvi) • Erukkancheri 1961 P. 1.09 3,131 +3,3i9 + 106.00
1,621 1,510 1971 P. 1.09 6,450 3,363 3,087
(xxvii) Thiruneermalai 1971 P. 5.87 6,312 3,262 3,050
(xxviii) Chith{llapakkam 1971 P. 2.88 5,320 2,661 2,659
(xxix) *Nerkundrarn 1961 P. 2.64 3,325 + 37.iO
1,124 1,601 1911 P. 2.65 4,562 + 1,237 2,346 2,216
tIn 1971 Eranavur town is merged with Thiruvattiyur (M.) with a population of 193 (104 M., 89 P.) in 1961. ~Pa1avanthanga1town is merged with A1andur (M.) in 1971. This town had a population of 2,266 (1,161 M., 1,099 P.) in 1961.
@SelaiyUI town is merged with Tambaram (M.) in 1971. This town had a population of 829 (770 M .. 59 P.) in 1961. £Issa-Pallavaram town is merged with Pallavaram (M.) in 1971. This town had a population of 4,316 (2,224 M., 2,092 P.) in 1961.
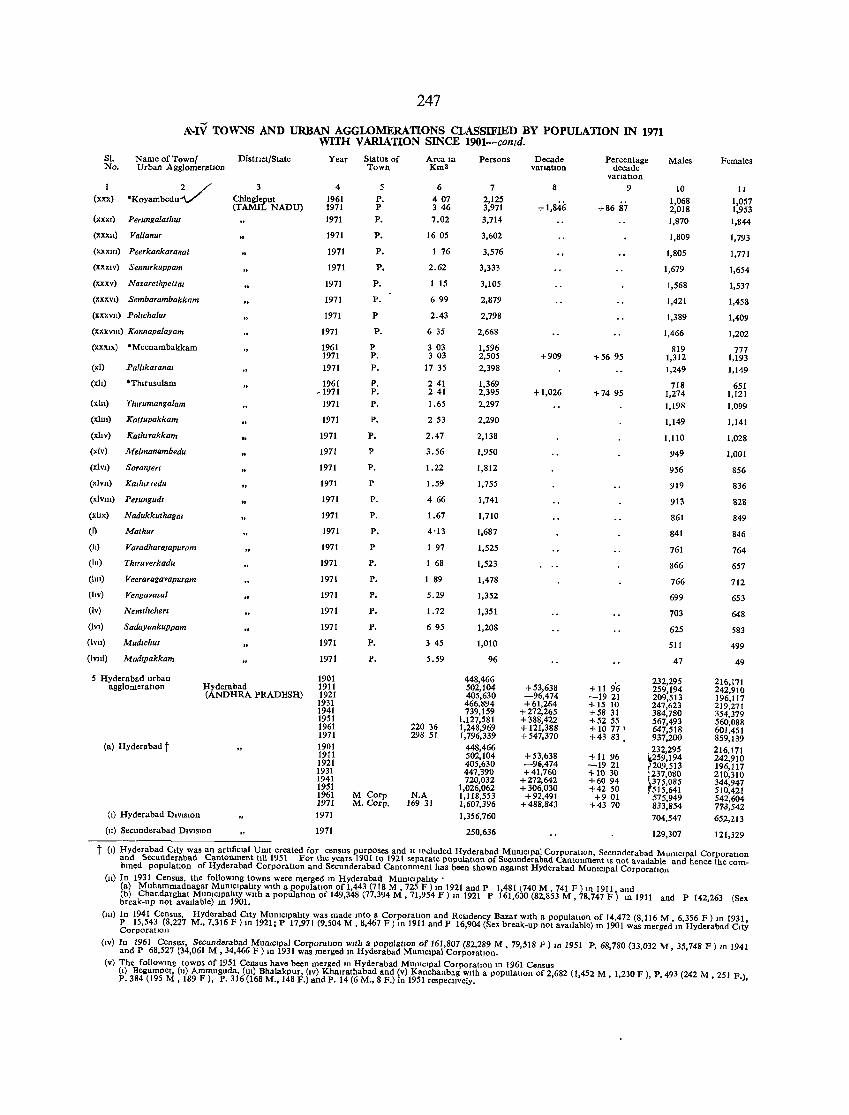
247
A\.rV TOWNS AND URBAN AGGLOMERATIONS CLASSIFIED BY POPULATION IN 1971 WITH V ARlATiON SINCE 1901-contd.
S1. No.
(xxx)
Name of Town/ Urban AgglomeratJon
'KOyambedUV'
(XXXI) Perungalathur
(xxxu) Val/anur
(xx Xlii) Peerkankaranai
(Xll'UV) Senmrkuppam
(xxxv) NazarethpeUQI
(XXXVI) Sembarambakkam
(xxxvn) Pollchalur
(XXXVlll) K allllapalayam
(XXXIX) *Meenambakkam
(d) Palbkarana!
(xh) *TJurusu1am
(x1n) Thlrumangalam
(xhn) Kattupakkam
(xhv) Kathlvakkam
(xlv) Melmanambedu
(xlVI) Soranjert
(xlvu) KalhlTvedu
(xlvm) Perungudl
(xhx) Nadukkuthagat
(I) Mathur
(Ii) Varadhartljapuram
(In) Thtruverkadu
(1m) Veeraragavapuram
(hv) Vengavasal
(Iv) Nemlltchert
(IVI) Sadayankuppam
(lVll) Mudlchur
(Ivni) Madlpakkam
DistrIct/State
3 Chingleput lTAMIL NADU)
5 Hyderabad urban agglomeratIon Hyderabad
(ANDHRA PRADESH)
(a) Hyderabad t
(1) Hyderabad DlVlSlon
(n) Secunderabad DIVISIon
Year
4
1961 1971 1971
1971
1971
1971
1971
1971
1971
1971
1961 1971
1971
1961 ,1971
1971
1971
1971
1971
1971
1971
1971
1971
1971
1971
1971
1971
1971
1971
1971
1971
1971
1901 1911 1921 1931 1941 1951 1961 1971 1901 1911 1921 1931 1941 1951 1961 1971 1971
1971
Status of Town
5 P. P P.
P.
P.
P.
P.
P.
P
P.
P P. P.
P. P. P.
P.
P.
p
P.
p
P.
P.
P.
p
P.
P.
P.
P.
P.
P.
P.
M Corp M. Corp.
Area In Km2
6 407 346 7.02
1605
1 76
2.62
1 15
699
2.43
635
303 3 03
17 35
241 241
1.65
253
2.47
3.56
1.22
1.59
466
1.67
4'13
1 97
1 68
1 89
5.29
1.72
695
3 45
5.59
22036 298 51
N.A 169 31
Persons
7 2,125 3,971 3,714
3,602
3,576
3,333
3,105
2,879
2,798
2,668
1,596 2,505 2,398
1,369 2,395 2,297
2,290
2,138
1,950
1,812
1,755
1,741
1,710
1,687
1,525
1,523
1,478
1,352
1,351
1,208
1,010
96
448,466 502,104 405,630 466.894 739,159
1,127,581 1,248,969 1,796,339
448,466 502,104 405,630 447,390 720,032
1,026,062 1,118.553 1,607,396 1,356,760
250,636
Decade vanatJon
8
+1,846
+909
+1,026
+53,638 -96,474 +61.264
+272,265 +388,422 + 121,388 +547,370
+ 53,b38 -9',474 +41,760
+272,642 +306.030
+92,491 +488,843
Percentage decade
varIatIOn
Males
9
+8687
+5695
+74 95
+11 96 -1921 +15 10 + 58 31 +52 55 +1077' +43 83 •
+ It 96 -1921 +1030 + 60 94 +42 50 +901
+4370
10 1,068 2,018 1,870
1,809
1,805
1,679
1,568
1,421
1.389
1,466
819 1,312
1.249
718 1,274
1.198
1,149
1,110
949
956
919
913
861
841
761
866
766
699
703
625
511
47
232,295 259,194 209.513 247,623 384.780 567,493 647,518 937,200
,232,295 ~59,194 (~09.513
}
237,080 37~,085 515.641 575,949 833,854 704,547
129,307
Females
11
1,057 1,953 1,844
1,793
1,771
1,654
1,537
1,458
1,409
1,202
777 1,193 1,149
651 1,121 1.099
1,141
1,028
1,001
856
836
828
849
846
764
657
712
653
648
583
499
49
216,171 242.910 196,117 219.271 354.379 560,088 601,451 859,139 216,171 242.910 196,117 210,310 344,947 510,421 542.604 71-3,542 652,213
121,329
t (1) Hyderabad City was an artIficIal Umt created for census purposes and It wcluded Hyderabad Mumclpal CorporatiOn. Secunderabad MUnICIpal CorporatIon and Secunderabad Cantonment tIll 1951 For the years 1901 to 1921 separate pOpulatIon of Secunderabad Cantonment IS not available and hence the combmed populatIon of Hyderabad CorporatIon and Secunderabad Cantonment has been shown agams! Hyderabad MUntclpal CorporatIon
(11) In 1931 Census, the followmg towns were merged m Hyderabad Mumclpahty' (a) Muhammadnagar MuntClpahty WIth a populatIon of 1,443 (718 M , 725 F ) III 1921 and P 1,481 l740 M • 741 F) In 1911. and (b) Chandarghat MUfllclpaltty WIth a populatIon of 149,348 (77,394 M , 71,954 F) In 1921 P 161,600 (82,853 M, 78,747 F) m 1911 and P 142.263 (Sex break-up not avatlable) m 1901.
(111) In 1941 Census, Hyderabad CIty MUnIclpahty was made mto a CorporatIon and ReSIdency Bazar WIth a populatIOn of 14.472 (8,116 M, 6,356 F) In 1931, P 15,543 (8,227 M., 7,316 F) In 1921; P 17,971 (9,504 M ,8,467 F) m 1911 and P 16,904 (Sex break-up not available) In 1901 was merged In Hyderabad City CorporatIon
(IV) In 1961 Cansus, Secunderabad Muntclp"1 CorporatIOn with a populatIOn of 161,807 (82.289 M, 79,518 F) In 1951 P. 68,780 (33,032 M, 35,748 F) III 1941 and P 68,527 (34,061 M, 34,466 F) In 1931 was merged m Hyderabad MUntclpal CorporatIOn.
(v) The follOWIng towns of 1951 Census have been merged In Hyderabad MUnICIpal CorporalIon m 1961 Census (1) Begumpet. (11) Ammuguda. (Ul) Bhalakpur. (IV) Khalrathabad and (v) Kanchanbag WIth a populatIon of 2,682 (1,452 M , 1,230 F ), P. 493 (242 M, 251 F) P. 384 (195 M, 189 F), P. 316 (168 M., 148 F.) and P. 14 (6 M., 8 F.) in 1951 respectIvely. • ,
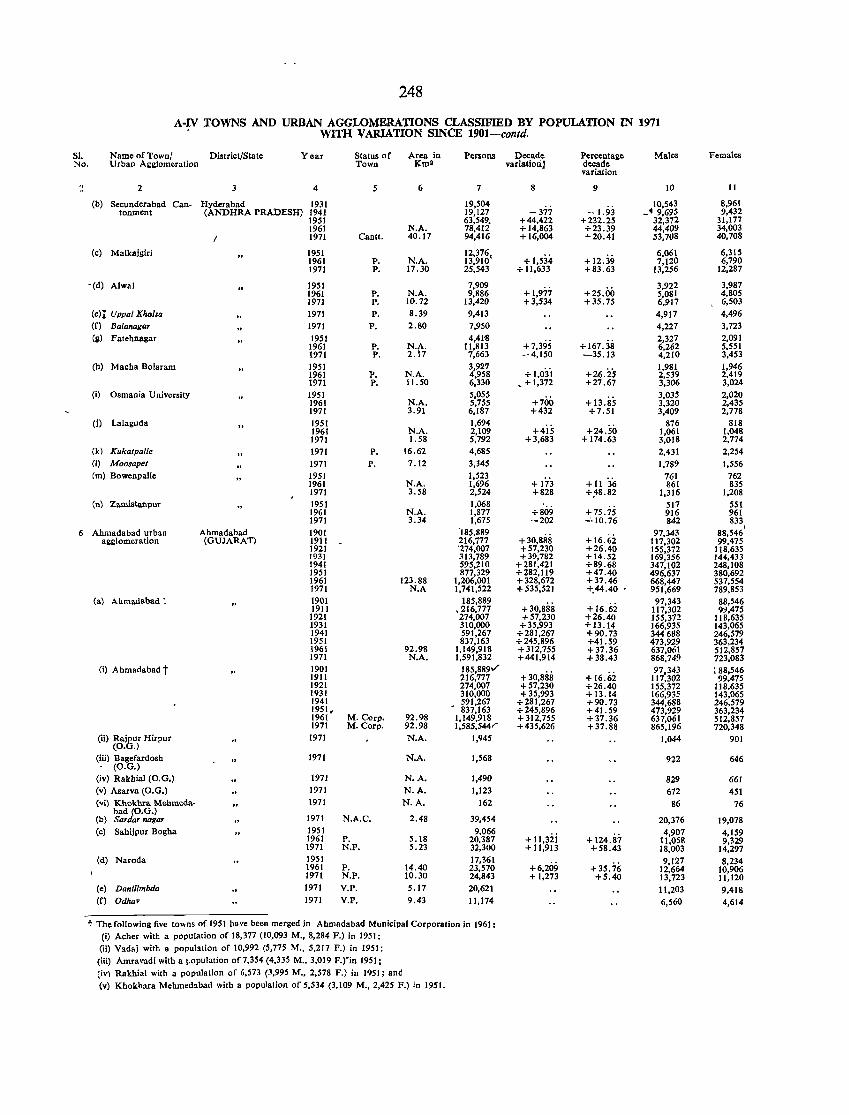
248
A-IV TOWNS AND URBAN AGGLOMERATIONS CLASSIFIED BY POPULATION IN 1971 WITH VARIATION SINCE 1901-contd.
SI. Name of Town: District/State Year Status of Area in Persons Decade Percentage Males Females No. Urban Agglomeration Town Km2 variation] decade
variation ., 2 4 5 6 7 8 9 10 11
(b) Secunderabad Can- Hyderabad 1931 19,504 - 1.93
10,543 8,961 toument (ANDHRA PRADESH) 1941 19,127 -377 _. 9,695 9,432
1951 63,549. +44,422 +232.25 32,312 31,177 1961 N.A. 78,412 + 14,863 +23.39 44,409 34,003 1971 Cantt. 40.17 94,416 + 16,004 +20.41 53,708 40,708
(c) Malkajgiri 1951 12,376, + 1,534 + 12.39
6,061 6,315 1961 P. N.A. 13,910 7,120 6,790 1971 P. 17.30 25,543 + 11,633 +83.63 13,256 12,287
-(d) A1wa1 1951 7,909 +1,977 +25.00
3,922 3,987 1961 P. N.A. 9,886 5,081 4,805 1971 P. 10.72 13,420 +3,534 +35.75 6,917 6,503
(e)i Uppal Khalsa 1971 P. 8.39 9,413 4,917 4,496 (f) Balanagar 1971 P. 2.80 7,950 4,227 3,723 (g) Fatehnagar 1951 4,41'8
+7,395 + 167.38 2,327 2,091
1961 P. N.A. 11,813 6,262 5,551 1971 P. 2.17 7,663 -4,150 -35.13 4,210 3,453
(h) Macha Bolaram 1951 3,927 +26.25
1,981 1,946 1961 P. N.A. 4,958 +1,031 2,539 2,419 1971 P. 11.50 6,330 _ + 1,372 +27.67 3,306 3,024
(i) Osmania University 1951 5,055 +13.85
3,035 2,020 1961 N.A. 5,755 +700 3,320 2,435 1971 3.91 6,187 +432 +7.51 3,409 2,778
(i) Lalaguda 1951 1,694 876 818 1961 N.A. 2,109 +415 +24.50 1,061 1,048 1971 1.58 5,792 +3,683 + 174.63 3,018 2,774
(k) Kukatpal/e 1971 P. 16.62 4,685 2,431 2,254 (I) Moosapel 1971 P. 7.12 3,345 1,789 1,556 1m) Bowenpalle 1951 1,523
+ 11 36 761 762
1961 N.A. 1,696 + 173 861 835 1971 3.58 2,524 +828 +;'18.82 1,316 1,208
(n) ZamistanpuT 1951 1,068 +75.75
517 551 1961 N.A. 1,877 +809 916 961 1971 3.34 1,675 -202 -='10.76 842 833
Ahmadabad urban Ahmadabad 1901 '185,889 97,343 88,546 \
6 +16.62 agglomeration (GUJARAT) 1911 - 216,777 +30,888 117,302 99,475
1921 '274,007 +57,230 +26.40 155,372 118,635 1931 313,789 +39,782 +14.52 169,356 144,433 1941 595,210 +281,421 +89.68 347,102 248,108 1951 877,329 +282,1l9 +47.40 496,637 380,692 1961 123.88 1,206,001 +328,672 +37.46 668,447 537,554 1971 N.A 1,741,522 +535,521 +.44.40 951,669 789,853
(a) Ahmadabad: 1901 185,889 +30,888 +16.62
97,343 88,546 1911 ,216,777 117,302 99,475
1921 274,007 +57,230 +26.40 155,372 118.635 1931 310,000 + 35,993 +13.14 166,935 143,065 1941 591,267 +281,267 +90.73 344688 246,579 1951 837,163 +245,896 +41.59 473.929 363.234 1961 92.98 1,149,918 +312,755 +37.36 637,061 512,857 1971 N.A. 1,591,832 +441,914 +38.43 868,749 723,083
(i) Ahmadabad t 1901 185,889,/' +30,888 +16.62
97,343 : 88,546 1911 216,777 117,302 99,475 1921 274,007 +57,230 +26.40 155,312 118,635 1931 310,000 +35,993 + 13.14 166,935 143,065 1941 591,267 +281,267 +90.73 344,688 246,579 1951" 837,163 +245,896 +41.59 473,929 363,234 1961 M. Corp. 92.98 1,149,918 +312,755 +37.36 637,061 512,857 1971 M. Corp. 92.98 1,585,544r +435,626 +37.88. 865,196 720,348
(ii) Rajpur Hirpur 1971 N.A. (O.G.)
1,945 1,044 901
(iii) Bagefardosh - (O.G.)
1971 N.A. 1,568 922 646
(iv) Rakhial (0. G.) 1971 N.A. 1,490 829 661 (v) Asarva (0. G.) 1971 N.A. 1,123 672 451 (vi) Khokhra Mehmeda- 1971 N.A. 162 86 76
(b) bad (O.G.)
1971 N.A.C. 2.48 39,454 Sardar nogar 20,376 19,078 (c) Sahijpur Bogha 1951 9,066
+ 11,3Zi 4,907 4,159
1961 P. 5.18 20,387 + 124.87 11,058 9,329 1971 N.P. 5.23 32,300 + 11,913 +58.43 18,003 14,297
(d) Naroda 1951 17,361 +6,209
9,127 8.234 1961 P. 14.40 23,570 + 35.76 12,664 10,906 1971 N.P. 10.30 24,843 +1,273 +5.40 13,723 11,120
(e) Danllimbda 1971 V.P. 5.17 20,621 11,203 9,418 (f) Odhav 1971 V.P. 9.43 11,174 6,560 4,614
t The following five to",ns of 1951 have been merged in Ahmadabad Municipal Corporation in 1961: (i) Acher with a population of 18,377 (10,093 M., 8,284 F.) in 1951;
(ii) Vadaj with a population of 10,992 (5,775 M., 5,217 1'.) in 1951:
(iii) Amravadi with a l-opu1ation of 7,354 (4,335 M .. 3,019 F.nn 1951; (iv) Rakhial with a population of 6,573 (3,995 M., 2,578 F.) in 1951; and
(v) Khokllara Mehmed3bad with a population of 5,534 (3,109 M., 2,425 F.) in 1951.
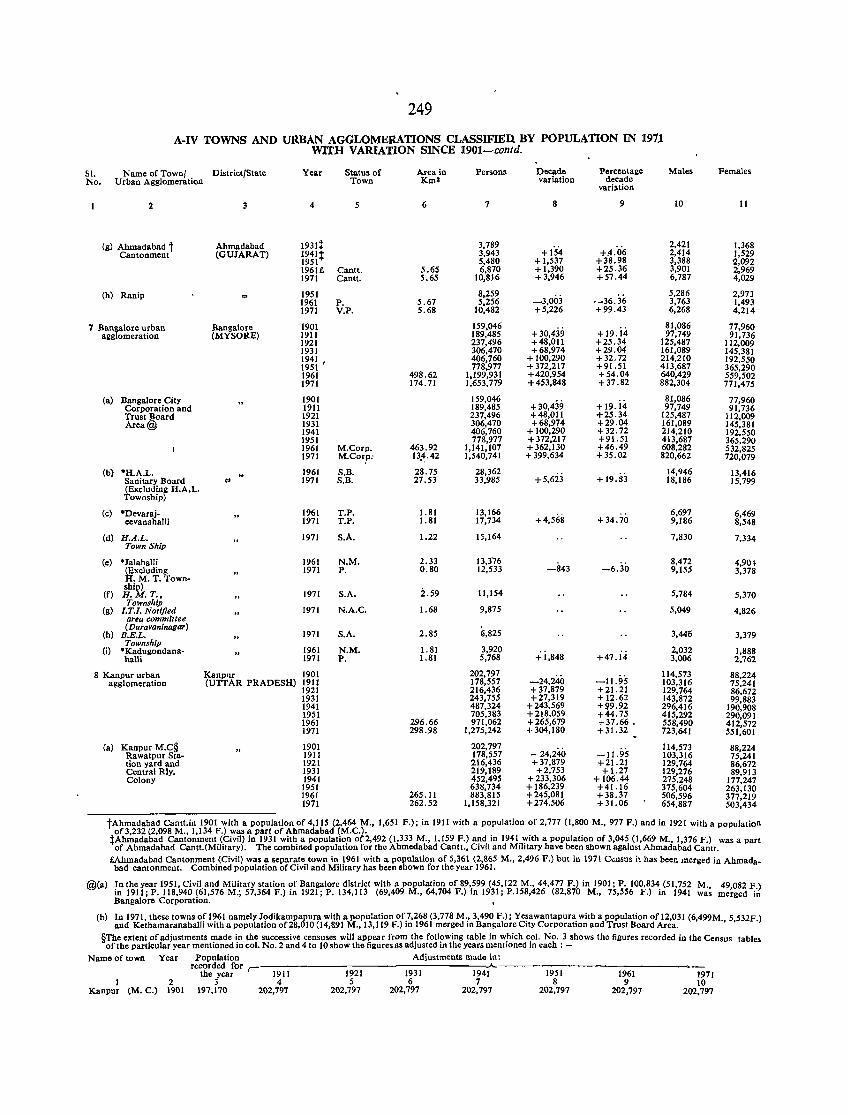
249
A-IV TOWNS AND URBAN AGGLOMERATIONS CLASSlFIEU BY POPULATION IN 197;1 WITH VARIATION SINCE 1901-contd.
SI. Name of Town/ District/State No. Urban Agglomeration
2
(g) Abmadabad t Cantonment
(h) Ranip
7 Bangalore urban agglomeration
(a) Bangalore City Corporation and Trust Board Area@
(b) ·H.A.L. Sanitary Board (Excluding H.A.L. Township)
(c) ·Devarajeevanahalli
(d) H.A.L. Town Ship
(e) ·Jalahalli (Excluding H. M. T. Township)
(f) H.M.T., Township
(g) I.T.I. Notified area committee (Duravaninagar)
(h) B.E.L. Township
(i) ·Kadugondana-halli
8 Kanpur urban agglomeration
(a) Kanpur M.C§ Rawatpur Station yard and Central Rly. Colony
3
Ahmadabad (GUJARAT)
Bangalore (MYSORE)
Kanp11r (UITAR PRADESH)
Year
4
1931~ tm t
Status of Town
1961£ Cantt. 1971 Cantt.
1951 1961 1971
1901 1911 1921 1931
~~~~ I
1961 1971
1901 1911 1921 1931 1941 1951 1961 1971
1961 1971
1961 1971
1971
1961 1971
1971
1971
1971
1961 1971
1901 1911 1921 1931 1941 1951 1961 1971
1901 1911 1921 1931 1941 1951 1961 1971
P. V.P.
M.Corp. M.Corp:
S.B. S.B.
T.P. T.P.
S.A.
N.M. P.
S.A.
N.A.C.
S.A.
N.M. P.
Area in Km2
6
5.65 5.65
5.67 5.68
498.62 174.71
463.92 13.~.42
28.75 27.53
1. 81 1.81
1.22
2.33 0.80
2.59
1.68
2.85
1. 81 1.81
296.66 298.98
265.11 262.52
Persons
7
3,789 3,943 5,480 6,870
10,816
8,259 5,256
10,482
159,046 189,485 237,496 306,470 406,760 778,977
1,199,931 1,653,779
159,046 189,485 237,496 306,470 406,760 778,977
1,141,107 1,540,741
28,362 33,985
13,166 17,734
15,164
13,376 12,533
11,154
9,875
g,825
3,920 5,768
202,797 178,557 216,436 243,755 487,324 705,383 971,062
1,275,242
202,797 178,557 216,436 219,189 452,495 638,734 883,815
1,158,321
Decade variation
8
+154 + 1,537 + 1,390 +3,946
-3,003 +5,226
+30,439 +48,011 +68,974
+ 100,290 + 372,217 +420,954 +453,848
+30,439 +48,011 +68,974
+ 100,290 +372,217 +362,130 +399,634
+ 5,6ij
+4,568
-843
+ i,848
-24,240 +37,879 +27,319
+243,569 +218,059 +265,679 + 304,180
- 24,240 +37,879
+2,753 +233,306 + 186,239 +245,081 +274,506
Percentage decade
variation
9
+.4:06 +38.98 +25.36 +57.44
-36.36 +99.43
+19.i4 +25.34 +29.()4 +32.72 +91.51 +54.04 + 37.82
+ 19-. i4 +25.34 +29.04 + 32.72 +91.51 +46.49 + 35.02
+ 19.83
+ 34.70
-6.30
+47. i-i
-11.95 +21.21 +12.62 +!l9.92 +44.75 +37.66. +31.32
-11.95 +21.21 +1.27
+ 106.44 +41.16 +38.37 +31.06
Males
10
2,421 2,414 3,388 3,901 6,787
5,286 3,763 6,268
81,086 97,749
125,487 161,089 214,210 413,687 640,429 882,304
81,086 97,749
125,487 161,089 214,210 413,687 608,282 820,662
14,946 18,186
6,697 9,186
7,830
8,472 9,155
5,784
5,049
3,440
2,032 3,006
114,573 103,316 129,764 143,872 296,416 415,292 558,490 723,641
114,573 103,316 129,764 129,276 275,248 375,604 506,596 654,887
Females
11
1,368 1,529 2,092 2,969 4,029
2,973 1,493 4,214
77,960 91,736
ll2,009 145,381 192,550 365,290 559,502 771,475
77,960 91,736
112,009 145,381 192,550 365,290 532,825 720,079
13,416 15,799
6,469 8,548
7,334
4,90~ 3,378
5,370
4,826
3,379
1,888 2,762
88,224 75,241 86,672 99,883
190,908 290,091 412,572 551,601
88,224 75,241 86,672 89,913
177,247 263,130 377,219 503,434
tAhmadabad Cantt.in 1901 with a population of 4,115 (2,464 M., 1,651 F.); in 1911 with a population of 2,777 (1,800 M., 977 F.) and in 1921 with a population of 3,232 (2,098 M., 1,134 F.) was a part of Ahmadabad (M.C.).
tAhmadabad Cantonment (Civil) in 1931 with a population of2,492 (1,333 M., 1,159 F.) and in 1941 with a population of 3,045 (1,669 M. 1376 F) was a part of Ahmadabad Cantt.(Military). The combined population for the Ahmedabad Cantt., Civil and Military have been shown against Ahmadabad Ca~tt.
£Ahmadabad Cantonment (Civil) was a separate town in 1961 with a population of 5,361 (2,865 M., 2,496 F.) but in 1971 Census it has been merged in Ahmada_ bad cantonment. Combined population of Civil and Military has been shown for the year 1961.
@(a) ~n the year 1951, Civil and Military station C?f Bangalore district with a population of 89,.599 (45,122 M., 44,477 F.) in 1901; P. 100,834. (51,752 M., 49,082 F.) 10 1911; P. 118,940 (61,576 M.; 57,364 F.) 10 1921; P. 134,113 (69,409 M., 64,704 F.) ID 1931; P.158,426 (82,870 M., 75,556 F.) 10 1941 was merged in Bangalore CorporatIOn.
(b) In 1971, these towns of 1961 namely Jodikampapura with a population of 7,268 (3,778 M., 3,490 F.); Yesawantapura with a population of 12,031 (6499M 5 532F ) and Kethamaranahalli with a population of28,Ol0 (14,891 M., 13,119 F.) in 1961 merged in Bangalore City Corporation and Trust Board Area. ' ." .
§The extent of adjustments made in the successive censuses will appear from the following table in which col. No.3 shows the figures recorded in the Census tables of the particular year mentioned in col. No.2 and 4 to 10 show the figures as adjusted in the years mentioned in each: -
Name of town Year Population Adjustments made in: recorded for r- ----------------.......
the year 1911 1921 1931 1941 1951 1961 1971 1 2 3 4 5 6 7 8 9 10
Kanpur (M. C.) 1901 197,170 202,797 202,797 202,797 202,797 202,797 202,797 202,797
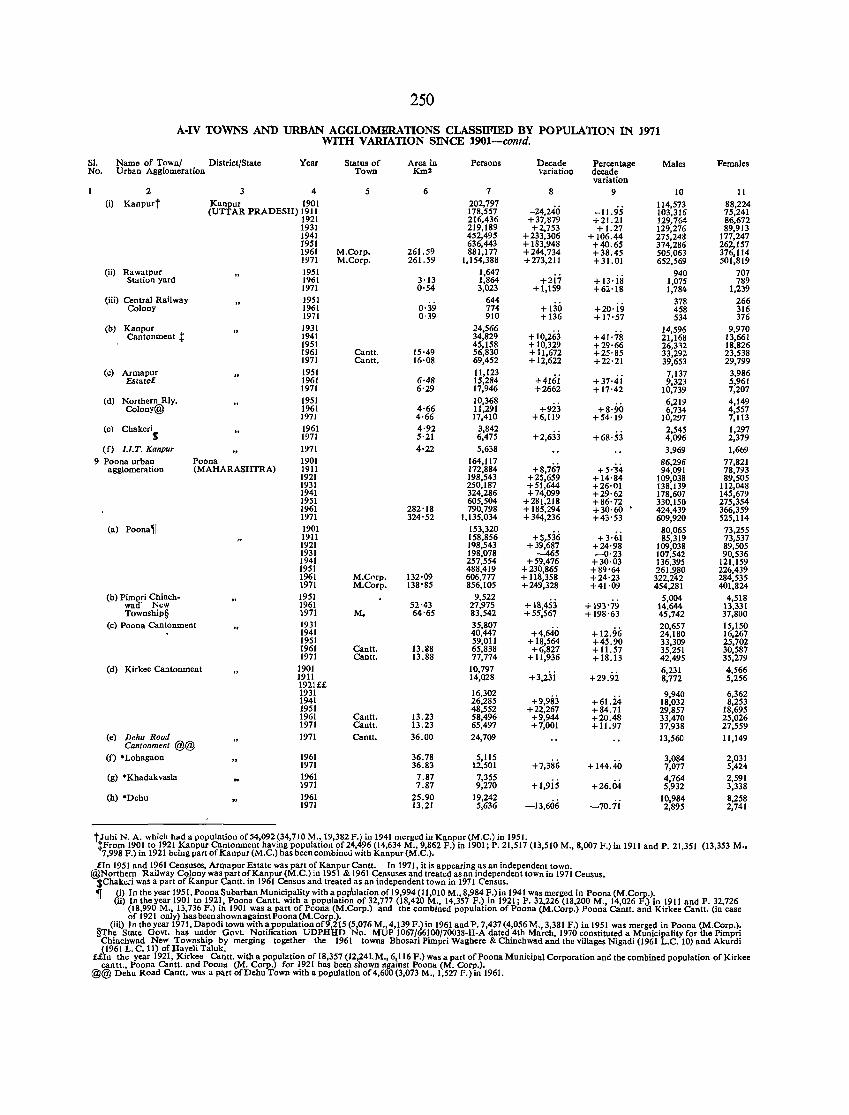
250
A-IV TOWNS AND URBAN AGGLOMERATIONS CLASSIFIED BY POPULATION IN 1971 WITH VARIATION SINCE 1901-contd.
SI. Name of Town/ District/State Year Status of Area in Persons Decade Percentage Males Females No. Urban Agglomeration Town Km2 variation decade
variation 2 3 4 5 6 7 8 9 10 11
(i) Kanpurt Kj'!fur 1901 202,797 -24,240 -11.95
114,573 88,224 (U AR PRADESH) 1911 178,557 103,316 75,241
1921 216,436 +37,879 +21.21 129,764 86,672 1931 219,189 +2,753 +1.27 129,276 89,913 1941 452,495 +233,306 +106.44 275,248 177,247 1951 636,443 + 183,948 +40.65 374,286 262,157 1961 M.Corp. 261.59 881,177 +244,734 +38.45 505,063 376,114 1971 M.Corp. 261.59 1,154,388 +273,211 +31.01 652,569 501,819
(ii) Rawatpur 1951 1,647 ;-2ii + 13·is
940 707 Station yard 1961 3'13 1,864 1,075 789
1971 0'54 3,023 + 1,159 +62'18 1,784 1,239 (iii) Central Railway 1951 644
+130 378 266
Colony 1961 0'39 774 +20·19 458 316 1971 0·39 910 +136 +17·57 534 376
(b) Kanpur 1931 24,566 +10,263 +41'78
14,596 9,970 Cantonment t 1941 34,829 21,168 13,661
1951 45,158 +10,329 +29·66 26,332 18,826 1961 Cantl. 15·49 56,830 +11,672 +25'85 33,292 23,538 1971 Cantl. 16·08 69,452 + 12,622 +22·21 39,653 29,799
(c) Armapur 1951 11,123 +416i
7,137 3,986 Estate£ 1961 6·48 15,284 +37·41 9,323 5,961
1971 6'29 17,946 +2662 +17·42 10,739 7,207 (d) Northern Rly. 1951 10,368
+9i3 +8·90 6,219 4,149
Colony@ 1961 4·66 11,291 6,734 4,557 1971 4·66 17,410 +6,119 +54'19 10,297 7,113
(el ChakeriS
1961 4·92 3,842 +2,633 +68'53
2,545 1,297 1971 5'21 6,475 4,096 2,379
(f) 1.l.T. Kanpur 1971 4'22 5,638 3,969 1,669 9 Poona urban Poona 1901 164,117
+8,767 +5·-34 86,296 77,821
agglomeration (MAHARASHTRA) 1911 172,884 94,091 78,793 1921 198,543 +25,659 +14'84 109,038 89,505 1931 250,187 +51,644 +26·01 138,139 112,048 1941 324,286 +74,099 +29'62 178,607 145,679 1951 605,504 +281,218 +86'72 330,150 275,354 1961 282'18 790,798 + 185,294 +30'60 424,439 366,359 1971 324'52 1,135,034 +344,236 +43'53 609,920 525,114
(a) Poona,r 1901 153,320 +5,536
80,065 73,255 1911 158,856 +3'61 85,319 73,537 1921 198,543 +39,687 +24·98 109,038 89,505 1931 198,078 -465 -0·23 107,542 90,536 1941 257,554 +59,476 +30·03 136,395 121,159 1951 488,419 +230,865 +89'64 261,!l,80 226,439 1961 M.Corp. 132·09 606,777 + 118,358 +24'23 322,2'12 284,535 1971 M.Corp. 138'85 856,105 +249,328 +41·09 454,281 401,824
(b) Pimpri Chinch- 1951 9,522 + Hl,4S3
5,004 4,518 wad' New 1961 52'43 27,975 +193'79 14,644 13,331 Township§ 1971 M. 64'65 83,542 +5S,567 + 198·63 45,742 37,800
(c) Poona Cantonment 1931 35,807 +4,640 +12.96
20,657 15,150 1941 40,447 24,180 16,267 1951 59,Oll + 18,564 +45.90 33,309 25,702 1961 Cantt. 13.28 65,838 +6,827 + 11.57 35,251 30,587 1971 Cantl. 13.88 77.774 +11,936 +18.13 42,495 35,279
(d) Kirkee Cantonment 1901 10,797 +3,23i +29.9i
6,231 4,566 1911 14,Q28 8,772 5,256 1921££ 1931 16,302
+9,983 +61.i4 9,940 6,362
1941 26,285 18,032 8,253 1951 48,552 +22,267 +84.71 29,857 18,695 1961 Cantl. 13.23 58,496 +9,944 +20.48 33,470 25,026 1971 Cantt. 13.23 65,497 +7,001 +11.97 37,938 27,559
(e) Dehu Road Cantonment @@
1971 Cantl. 36.00 24,709 13,560 11,149
(f) *Lohagaon 1961 36.78 5,115 +7,386
3,084 2,031 1971 36.83 12,501 + 144.40 7,077 5,424
(g) *Khadakyas1a 1961 7.87 7,355 + l,9is +26.04
4,764 2,591 1971 7.87 9,270 5,932 3,338
(h) ·Dehu 1961 25.90 19,242 -13,606 -70.ii
10,984 8,258 1971 13.21 5,636 2,895 2,741
t Juhi N. A. which had a population of 54,092 (34,710 M., 19,382 FJ in 1941 merged in Kanpur (M.C.) in 1951. tFrom 1901 to 1921 Kanpur Cantonment having population of 24, 96 (14,634 M., 9,862 F.) in 1901; P. 21,517 (13,510 M., 8,007 F.) in 1911 and P. 21,351 (13,353 M .• 7,998 F.) in 1921 being part of Kanpur (M.C.) has been combined with Kanpur (M.C.).
£In 1951 and 1961 Censuses, Art:l1apur Estate was part of Kanpur Cantt. In 1971, it is appearing as an independent town. @Northern Railway CQjony was part of Kanpur (M.C.) in 1951 & 1961 Censuses and treated as an independent town in 1971 Census.
sChakeri was apart of Kanpur Cantl. in 1961 Census and treated as an independent town in 1971 Census. 'I[ (i) In the year 1951, Poona Subarhan Municipality with a popUlation of 19,994 (11,010 M., 8,984 F.)in 1941 was merged in Poona (M.Corp.).
(ll) In the year 1901 to 1921, Poona Cantl. with a population of 32,777 (18,420 M., 14,357 F.) in 1921; P. 32,226 (18,200 M., 14,026 F.) in 1911 and P. 32,726 (18,990 M., 13,736 F.) in 1901 was a part of Poona (M.Corp.) and the combined population of Poona (M.Corp.) Poona Cantt. and Kirkee Cantl. (in case of 1921 only) has been shown against Poona (M.Corp.).
(iii) In the year 1971, Dapodi town witha/c0pulationof9,215 (5,076 M.,4,139 F.) in 1961 and P. 7,437 (4,056 M., 3,381 F.) in 1951 was merged in Poona (M.Corp.). §The State Govt. has under GOyt. Noti cation UDPHl;ID No. MUP 1067/66100/70038-II-A dated 4th March, 1970 constituted a Municipality for the Pimpri Chinchwad New Township by merging together the 1961 towns Bhosari Pimpri Waghere & Chinch wad and the villages Nigadi (1961 L.C. 10) and Akurdi ),1961 L. C. 11) of Bayeli Taluk.
££ n the year 1921, Kirkee Cantl. with a population of 18,357 (12,24lM., 6,116 F.) was a part ofPoona Municipal Corporation and the combined population of Kirkee cantt., Poona Cantt. and Poona (M. Corp.) for 1921 has been shown against Poona (M. Corp.).
@@ Dehu Road Cantl. was a part ofDehu Town with a population of 4,600 (3,073 M., 1,527 P.) in 1961.
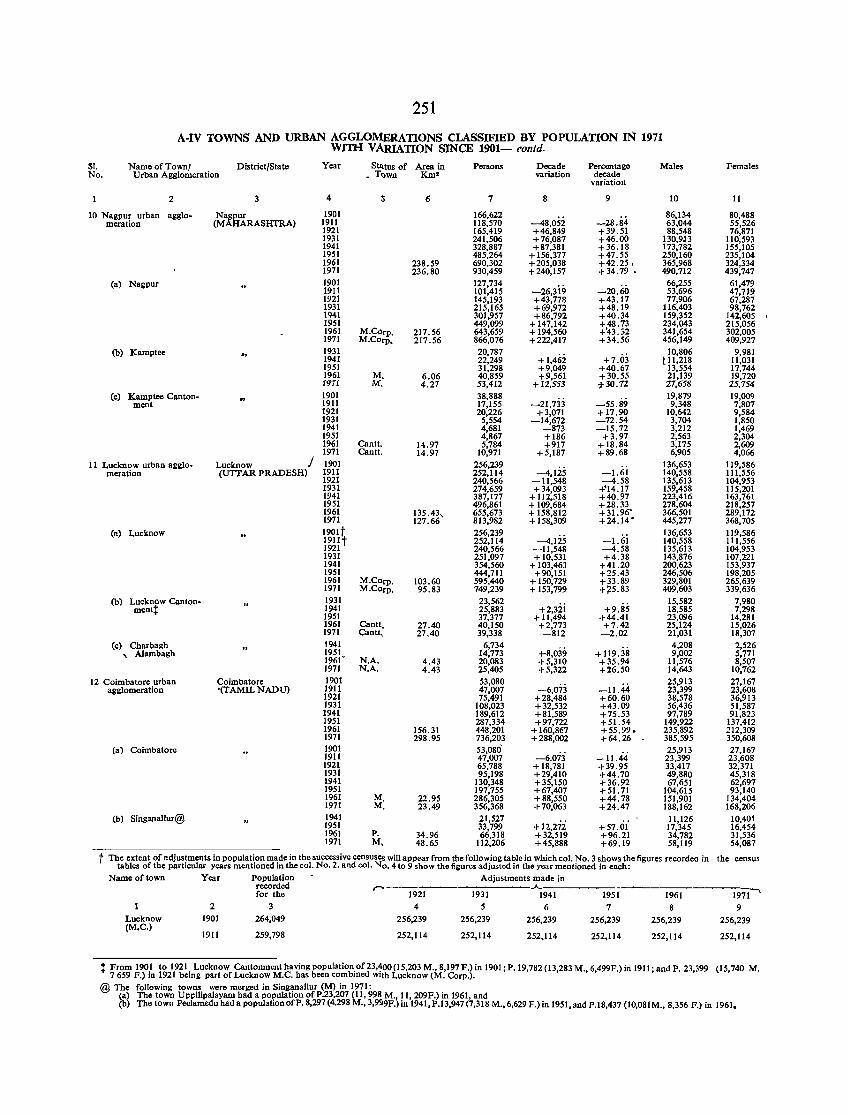
251
A-IV TOWNS AND URBAN AGGLOMERATIONS CLASSIFIED BY POPULATION IN 1971 WITH V ARlATION SINCE 1901- contd.
Sl. Name of Town/ District/State Year S~tus of Area in Persons Decade Percen~ge Males Females No. Urban Agglomeration _ Town Km2 variation decade
variation
2 3 4 S 6 7 8 9 10 11
10 Nagpur urban agglo- Nagpur 1901 166,622 -48,052 -2&.84
86,134 80,488 meration (MAHARASHrRA) 1911 118,570 63,044 55,526
1921 165,419 +46,849 +39.51 88,548 76,871 1931 241,506 +76,087 +46.00 130,9l3 110,593 1941 328,887 +87,381 +36.18 173,782 155,105 1951 485,264 + 156,377 +47.55 250,160 235,104 1961 238.59 690,302 +205,038 +42.25, 365,968 324,334 1971 236.80 930,459 +240,157 +34.79 , 490,712 439,747
(a) Nagpur 1901 127,734 -26,3i9 -20.60
66,255 61,479 1911 101,415 53,696 47,719 1921 145,193 +43,778 +43.17 77,906 67,287 1931 215,165 +69,972 +48.19 116,403 98,762 1941 301,957 +86,792 +40.34 159,352 142,605 \
1951 449,099 +147,142 +48.73 234,043 215,056 1961 M.Corp. 217.56 643,659 + 194,560 +'43.n 341,654 302,005 1971 M.Cotp, 217.56 866,076 +222,417 +34.56 456,149 409,927
(b) Kamptee ., 1931 20,787 +1,462 +7.03
10,806 9,981 1941 22,249 tl1,218 11,031 1951 31,298 +9,049 +40.67 13,554 17,744 1961 M. 6.06 40,859 +9,561 +30.55 21,139 19,720 rm M. 4.27 53,4[2 + 12,553 t 3O .12 27,658 25,754
(c) Kamptee Canton- 1901 38,888 -21,733 -55.89
19,879 19,009 ment 1911 17,155 9,348 7,807
1921 20,226 +3,071 +17.90 10,642 9,584 1931 5,554 -14,672 -72.54 3,704 1,850 1941 4,681 -873 -15.72 3,212 1,469 1951 4,867 +186 +3.97 2,563 2,304 1961 Cantt. 14.97 5,784 +917 + 18.84 3,175 2,609 1971 Cantt. 14.97 10,971 +5,187 +89.68 6,905 4,066
11 Lucknow urban agg1o- Lucknow j 1901 256,239 -4,125
136,653 119,586 meration (UTTAR PRADESH) 1911 252,114 -1.61 140,558 111,556
1921 240,566 -11,548 -4.58 135,613 104,953 1931 274,659 +34,093 +'14.17 159,458 115,201 1941 387,177 +112,518 +40.97 223,416 163,761 1951 496,861 + 109,684 +28.33 278,604 218.257 1961 135.43, 655,673 + 158,812 +31.96' 366,501 289,172 1971 127.66 813,982 +158.309 +24.14" 445,277 368,705
(a) Lucknow 1901t 256,239 -4,125 -1.6i
136,653 119,586
~mt 252,114 140,558 111,556 240,566 -11,548 -4.58 135,613 104,953
1931 251,097 +10,531 +4.38 143,876 107,221 1941 354,560 + 103,463 +41.20 200,623 153,937 1951 444,711 +90,151 +25.43 246,506 198,205 1961 M.Corp. 103.60 595.440 + 150,729 +33.89 329,801 265,639 1971 M.Corp. 95.83 749,239 + 153,799 +75.83 409,603 339,636
(b) Lucknow Canton- 1931 23,562 +2,32i +9.85
15,582 7,980 menlt 1941 25,883 18,585 7,298
1951 37.377 + 11.494 +44.41 23,096 14,281 1961 Cantt. 27.40 40,150 +2,773 +7.42 25,124 15,026 1971 Cantt, 27.40 39,338 -812 -2.02 21,031 18,307
(c) Charbagh 1941 6,734 +8,039 + 119.38
4,208 2,526 , Alambagh 1951 14,773 9,002 5,771
1961- N.A. 4.43 20,083 +5,310 +35.94 11,576 8,507 1971 N.A. 4.43 25,405 +5,322 +26.50 14,643 10,762
12 Coimbatore urban Coimbatore 1901 53,080 -6,073 -11.44
25,913 27,167 agglomeration '(TAMIL NADU) 1911 47,007 23,399 23,608
1921 75,491 +28,484 +60.60 38,578 36,913 1931 108,023 +32,532 +43.09 56,436 51,587 1941 189,612 +81,589 +75.53 97,789 91,823 1951 287,334 +97,722 +51.54 149,922 137,412 1961 156.31 448,201 + 160,867 +55.99, 235,892 212,309 1971 298.95 736,203 +288,002 +64.26 385,595 350,608
(a) Coimbatore 1901 53,080' -6.oij -11.44
25,913 27,167 1911 47,007 23,399 23,608 1921 65,788 + 18,781 +39.95 33,417 32,371 1931 95,198 +29,410 +44.70 49,880 45,318 1941 130,348 +35,150 +36.92 67,651 62,697 1951 197,755 +67,407 +51.71 104,615 93,140 1961 M. 22.95 286,305 +88,550 +44.78 151,901 134,404 1971 M. 23.49 356,368 +70,063 +24.47 188,162 168,206
(b) SinganaJlur@ 1941 21,527 11,126 10,401 1951 33,799 + 12,2ii +57.01 17,345 16,454 1961 P. 34.96 66,318 +32,519 +96.21 34,782 31,536 1971 M, 48.65 112,206 +45,888 +69.19 58,119 54,087
t The extent of adjustments in population made in the successive censuses will appear from the following table in which col. No.3 shows the figures recordea in tables of the particular years mentioned in the col. No.2. and col. No.4 to 9 show the figures adjusted in the year mentioned in each:
the census
Name of town Year Population Adjustments made in recorded ... ..A.. for the 1921 1931 1941 1951----1961----1971'
2 3 4 5 6 7 8 9 Lucknow 1901 264,049 256,239 256,239 256,239 256,239 256,239 256,239 (M.C.)
1911 259,798 252,114 252,114 252.114 252.114 252,114 252,114
t From 190.1 to 1921. Lucknow Cantonment having population.of23,100 (15,203 M., 8,197 F.) in 1901; P.19,782 (13,283 M., 6,499F.) in 1911; and P. 23,399 7659 F.) In 1921 bemg part of Lucknow M.C. has been combmed WIth Lucknow (M. Corp.).
(15,740 M.
@ The following towns were merged in Singanallur (M) in 1971: (a) The town Uppilipalayam had a population of P.23,207 (11,998 M., II, 209F.) in 1961, and (b) The town Peelamedu had apopulationofP. 8,297 (4.298 M., 3,999F.) in 1941,P.13,947 (7,318 M., 6,629 F.) in 1951, and P.18,437 (10,08IM., 8,356 F.) in 1961.
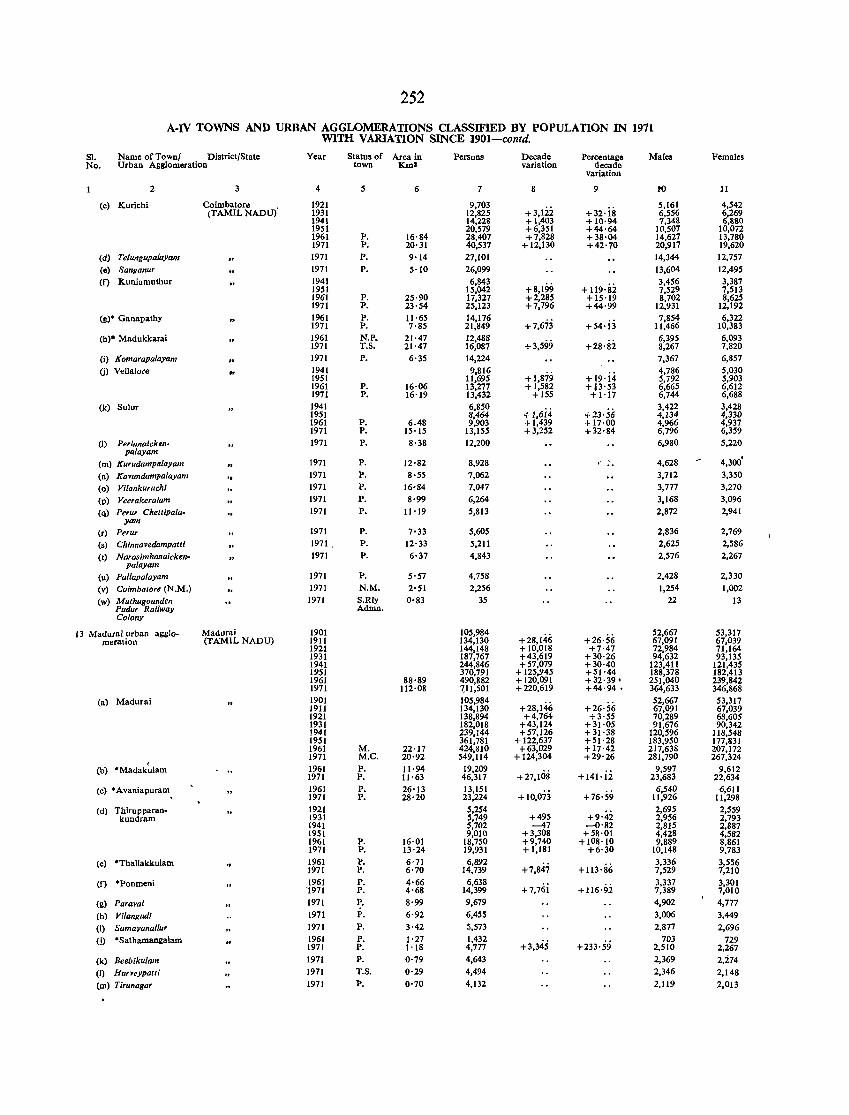
252
A-IV TOWNS AND URBAN AGGLOMERATIONS CLASSIFIED BY POPULATION IN 1971 WITH VARIATION SINCE 1901-contd.
SI. Name of Townl District/State Year Status of Area in Persons Decade Percentalle Males Females No. Urban Agglomeration town Km2 variation decade
variation
2 3 4 5 6 7 8 9 10 11
(c) Kurichi Coimbatore 1921 9,703 +3,122 +32·is
5,161 4,542 (TAMIL NADU) 1931 12,825 6,556 6,269
1941 14,228 +1,403 + 10·94 7,348 6,&80 1951 20,579 +6,351 +44·64 10,507 10,072 1961 P. 16·84 28,407 +7,828 + 38·04 14,627 13,780 1971 P. 20·31 40,537 + 12,130 +42'70 20,917 19,620
(d) TelungupaJaY{lJ1J 1971 P. 9'14 27,101 14,344 12,757
(e) Sanganur 1971 P. 5'10 26,099 13,604 12,495
(f) Kuniamuthur 1941 6,843 +8,199 + 119'S2
3,456 3,387 1951 15,042 7,529 7,513 1961 P. 25·90 17,327 +2,285 +15'19 8,702 8,625 1971 P. 23'54 25,123 +7,796 +44·99 12,931 12,192
(g)* Ganapathy 1961 P. 11·65 14,176 +7,673 +s4·i3
7,854 6,322 1971 P. 7·85 21,849 11,466 10,383
(b)* Madukkarai 1961 N.P. 21·47 12,488 +3,599 +28'S2
6,395 6,093 1971 T.S. 21·47 16,087 8,267 7,820
(i) Komarapalayam 1971 P. 6'35 14,224 7,367 6,857 (j) VeUalore 1941 9,816
+1,879 +19·j4 4,786 5,Q30
1951 11,695 5,792 5,903 1961 P. 16·06 13,277 +1,582 + P'53 6,665 6,612 1971 P. 16'19 13,432 +155 +1·17 6,744 6,688
(k) Sulur 1941 6,850 +J,6i4 +23'56
3,422 3,428 1951 8,464 4,134 4,330 1961 P. 6.48 9,903 +1,439 +17·00 4,966 4,937 1971 P. 15'15 13,155 +3,252 +32'84 6,796 6,359
(I) Pen'ana;cken· 1971 P. 8·38 12,200 6,980 5,220 palayam
(m) Kurudampalayam 1971 P. 12·82 8,928 .. 4,628 4,300'
(n) Kavundampalayam '. 1971 P. 8'55 7,062 3,712 3,350
(0) Vilankuruchi 1971 P. 16·84 7,047 3,777 3,270
(p) Veerakeralam 1971 P. 8·99 6,264 3,168 3,096
(q) Perur Chettipala- 1971 P. 11·19 5,813 2,872 2,941 yam
(r) Perur 1971 P. 7·33 5,605 2,836 2,769
(s) Chinnavedampatti 1971 P. 12'33 5,211 2,625 2,586
(I) Narasimhanaicken-palayam
1971 P. 6'37 4,843 2,576 2,267
(u) Pallapalayam 1971 P. 5'57 4,758 2,428 2,330
(v) Coimbatore (N.M.) 1971 N.M. 2'51 2,256 1,254 1,002
(w) Muthugounden 1971 S.Rly 0'83 35 22 13 Pudur Railway Admn. Colony
13 Madurai urban agglo- Madurai 1901 105,984 +28,146 +26·56
52,667 53,317 meration (TAMIL NADU) 1911 134,130 67,091 67,039
1921 144,148 +10,018 +7·47 72,984 71,164 1931 187,767 +43,619 + 30·26 94,632 93,135 1941 244,846 +57,079 +30·40 123,411 121,435 1951 370,791 + 125,945 +51'44 188,378 182,413 1961 88'89 490,882 + 120,091 +32'39' 251,040 239,842 1971 112·08 7)1,501 +220,619 +44·94 • 364,633 346,868
(al Madurai 1901 105,984 +28,146 +26·56
52,667 53,317 1911 134,130 67,091 67,039 1921 138,894 +4,764 +3'55 70,289 68.605 1931 182,018 +43,124 +31·05 91,676 90,342 1941 239,144 +57,126 +31·38 120,596 118,548 1951 361,781 + 122,637 +51'28 183,950 177,831 1961 M. 22·17 424,810 +63,029 + 17'42 217,638 207,172 1971 M.C. 20'92 549,114 + 124,304 +29'26 281,790 267,324
I 1961 P. 11·94 19,209 9,597 9,612 (b) 'Madakulam
+27,108 +141·ii 1971 P. 11·63 46,317 23,683 22,634
(c) *Avaniapuram 1961 P. 26'13 13,151 +10,073 +76'59
6,540 6,611 1971 P. 28·20 23,224 11,926 11,298
(d) Thirupparan- 1921 5,254 +9'42
2,695 2,559 kundram 1931 5,749 +495 2,956 2,793
1941 5,702 -47 -0'82 2,815 2,887 1951 9,010 +3,308 +58·01 4,428 4,582 1961 P. 16·01 18,750 +9,740 + 108'10 9,889 8,861 1971 P. 13'24 19,931 +1,181 +6·30 10,148 9,783
(e) *Thallakku1am 1961 P. 6·71 6,892 +7,847 + 113'86
3,336 3,556 1971 P. 6·70 14,739 7,529 7,210
(I) ·Ponmeni 1961 P. 4·66 6,638 +7,76i + 116·92
3,337 3,301 '1971 P. 4'68 14,399 7,389 7,010
(g) Paravai 1971 ~, 8·99 9,679 4,902 4,777
(h) Vllangudi 1971 P. 6·92 6,455 3,006 3,449
(i) Samavanallur 1971 P. 3·42 5,573 2,877 2,696
(j) 'SathamanKalam 1961 P. 1'27 1,432 +3,345 +233'59
703 729 1971 P. 1'18 4,777 2,510 2,267
(k) Beebikulam 1971 P. 0'79 4,643 2,369 2,274
(I) Harveypatti 1971 T.S. 0·29 4,494 2,346 2,148 (m) Tirunagar 1971 P. 0'70 4,132 2,119 2,013
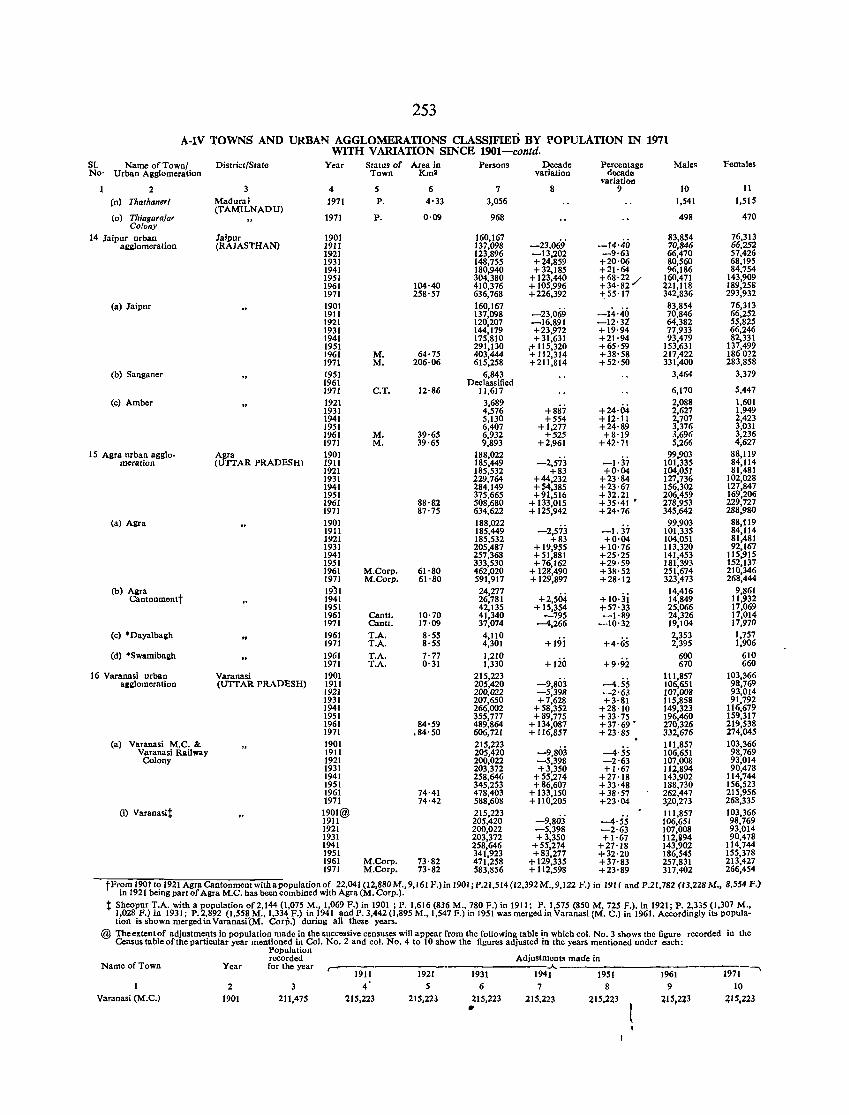
253
A-IV TOWNS AND URBAN AGGLOMERATIONS CLASSIFIED BY POPULATION IN 1971 WITH VARIATION SINCE 1901-contd.
SI. Name of Town/ District/State Year Status of Area in Persons Decade Percentage Males Females No· Urban Agglomeration Town Km2 variation decade
variation 2 3 4 5 6 7 8 9 10 II
(n) Thathaneri Madurai 1971 P. 4·33 3,056 1,541 1,515 (TAMILNADU)
0·09 968 498 470 (0) Thiagarajar 1971 P. Colony
14 Jaipur urban Jaipur 1901 160,167 -23,069· -14·40
83,854 76,313 aimlomeration (RAJASTHAN) 1911 137,098 70,846 66,252
1921 123,896 -13,202 -9·63 66,470 57,426 1931 148,755 +24,859 +20·06 80,560 68,195 1941 180,940 +32,185 +21·64 96,186 84,754 1951 304,380 + 123,440 t~n~/ 160,471 143,909 1961 104·40 410,376 + 105,996 221,118 189,258 1971 258·57 636,768 +226,392 -1;55·17 342,836 293,932
(a) Jaipur 1901 160,167 -23,069 -14·40
83,854 76,313 1911 137,098 70,846 66,252 1921 120,207 -16,891 -12·31 64,382 55,825 1931 144,179 +23,972 +19·94 77,933 66,246 1941 175,810 +31,631 +21·94 93,479 82,331 1951 291,130 ,+ 115,320 +65·59 153,631 137,499 1961 M. 64·75 403,444 + 1l2,314 +38'58 217,422 186022 1971 M. 206·06 615,258 +211,814 +52·50 331,400 283,858
(b) Sanganer 1951 6,843 3,464 3,379 1961 Declassified 1971 C.T. 12·86 11,617 6,170 5,447
(c) Amber 1921 3,689 +24·64
2,088 1,601 1931 4,576 +887 2,627 1,949 1941 5,130 +554 + 12·11 2,707 2,423 1951 6,407 +1,277 +24·89 3,376 3,031 1961 M. 39·65 6,932 +525 +8·19 3,696 3,236 1971 M. 39·65 9,893 +2,961 +42·71 5,266 4,627
15 Agra urban agglo- Agra 1901 188,022 -2,573 -1·37
99,903 88,tl9 meration (UTTAR PRADESH) 1911 185,449 101,335 84,114
1921 185,532 +83 +0·04 104,051 81,481 1931 229,764 +44,232 +23·84 127,736 102,028 1941 284,149 +54,385 +23·67 156,302 127,847 1951 375,665 +91,516 +32.21 206,459 169,206 1961 88·82 508,680 + 133,015 +35·41 ' 278,953 229,727 1971 87·75 634,622 + 125,942 +24·76 345,642 288,980
(a) Agra 1901 188,022 -2,573 -1.37
99,903 88,t19 1911 185,449 101,335 84,114 1921 185,532 +83 +0·04 104,051 81,481 1931 205,487 + 19,955 +10·76 113,320 92,167 1941 257,368 +51,881 +25·25 141,453 115,915 1951 333,530 +76,162 +29·59 181,393 152,137 1961 M.Corp. 61·80 462,020 + 128,490 +38·52 251,674 210,346 1971 M.Corp. 61·80 591,917 + 129,897 +28·12 323,473 268,444
(b) ,\ara 19'31 24,277 +2,564 +10·3i
14,416 9,861 Cantonmentt 1941 26,781 14,849 11,932
1951 42,135 + 15,354 +57·33 25,066 17,069 1961 Cantl. 10·70 41,340 -795 -1·89 24,326 17,014 1971 Canlt. 17·09 37,074 -4,266 -10·32 19,104 17,970
(c) ·Payalbagh 1961 T.A. 8·55 4,tlO +19i +4·65
2,353 1,757 1971 T.A. 8·55 4,301 2,395 1,906
(d) ·Swamibagh 1961 T.A. 7·77 1,210 +120 +9·9i
600 610 1971 T.A. 0·31 1,330 670 660
16 Varanasi urban Varanasi 1901 215,223 -9,803 -4.55
111,857 103,366 agKlomeration (UTTAR PRADESH) 1911 205,420 106,651 98,769
1921 200,022 -.5,398 -2·63 107,008 93,014 1931 207,650 +7,628 +3·81 115,858 91,792 1941 266,002 +58,352 +28·10 149,323 116,679 1951 355,777 +89,775 +33·75 196,460 159,317 1961 84·59 489,864 + 134,087 +37'69 • 270,326 219,538 1971 ,84·50 606,721 + 116,857 +23·85 332,676 274,045
(a) Varanasi M.C. & 1901 215,223 -9,803 -4·55
111,857 103,366 Varanasi Railway 1911 205,420 106,651 98,769
Colony 1921 200,022 -5,398 -2·63 107,008 93,014 1931 203,372 +3,350 +1·67 112,894 90,478 1941 258,646 +55,274 +27·18 143,902 114,744 1951 345,253 +86,607 +33·48 188,730 156,523 1961 74·41 478,403 + 133,150 +38·57 262,447 215,956 1971 74·42 588,608 + 110,205 +23·04 3':W,273 268,335
(i) Varanasit 1901@ 215,223 -9,803 -4·55
111,857 103,366 1911 205,420 106,651 98,769 1921 200,022 -5,398 -2·63 107,008 93,014 1931 203,372 +3,350 +1·67 112,894 90,478 1941 258,646 +55,274 +27·18 143,902 114,744 1951 341,923 +83,277 +32·20 186,545 155,378 1961 M.Corp. 73·82 471,258 + 129,335 +37·83 257,831 213,427 1971 M.Corp. 73·82 583,856 + 112,598 +23·89 317,402 266,454
tFrom 1901 to 1921 Agra Cantonment with a population of 22,041 (12,880M.,9,161 F.) in 1901; P.2I,514(12,392 M.,9,122 F.) in 1911 and P.21,782 (13,228 M., 8,554 F.) in 1921 being part of Agra M.C. has been combined with Agra (M. Corp.).
t Sheopur T.A. with a population of2,144 (1,075 M., 1,069 F.) in 1901 ; P. 1,616 (836 M., 780 F.) in 1911; P. 1,575 (850 M, 725 F.l. in 1921; P. 2,335 (1,307 M., 1,028 F.) in 1931; P.2,892 (1,558 M., 1,334 F.) in 1941 and P. 3,442 (1,895 M., 1,547 F.) in 1951 was merged in Varanasi (M. C.l in 1961. Accordingly its popula-tion is shown mergedinVaranasitM. Corp.) during all these years.
@ The extent of adjustments in population made in the successive censuses will appear from the following table in which col. No.3 shows the figure recorded in the Census table of the particular year mentioned in Col. No.2 and col. No.4 to 10 show the figures adjusted in the years mentioned under each:
Population recorded Adjustments made in
Name of Town Year for the year "----1911
..A.. ....., 1921 1931 1941 1951 1961 1971
2 3 4' 5 6 7 8 9 10 Varanasi (M.C.) 1901 211,475 215,223 215,223 215,223 215,223 215,223 215,2~3 215,223
•
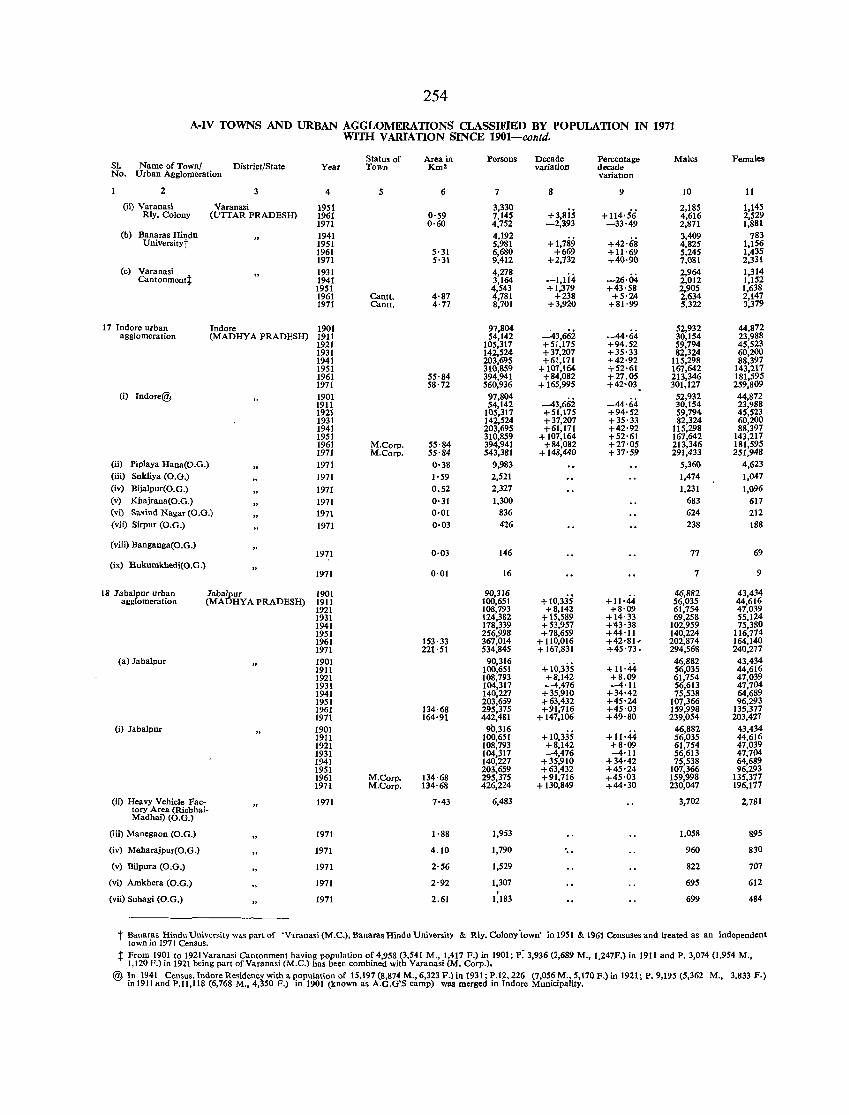
254
A-IV TOWNS AND URBAN AGGLOMERATIONS CLASSIFIED BY POPULATION IN 1971 WITH V ARIATlON SINCE 1901-contd.
Status of Area in Persons Decade Percentage Males Females SI, Name of Town/ District/State Year Town Km2 variation decade No. Urban Agglomeration variatIon
2 4 5 6 7 8 9 10 11
(ii) Varanasi Varanasi 1951 3,330 + 3,8is +114'5'6
2,185 1,145 Rly. Colony (UTTAR PRADESm 1961 0'59 7,145 4,616 2,529
1971 0·60 4,752 -2,393 -33·49 2,871 1,881 (b) Banaras Hindu 1941 4,192
+1,789 +42·68 3,409 783
U niversityt 1951 5,981 4,825 1,156 1961 5'31 6,680 +669 +11'69 5,245 1,435 1971 5·31 9,412 +2,732 +40'90 7,081 2,331
(c) Varanasi 1931 4,278 -I,li4 -26·04
2,964 1,314 Cantonmentt 1941 3,164 2,012 1,152
1951 4,543 +1,379 +43'58 2,905 1,638 1961 Cantt. 4'87 4,781 +238 +5·24 2,634 2,147 1971 Canlt. 4'77 8,701 +3,920 +81·99 5,322 3,379
17 Indore urban Indore 1901 97,804 ---43,662 -44'64
52,932 44,872 agglomeration (MADHYA PRADESm 1911 54,142 30,154 23,988
1921 105,317 +51,175 +94.52 59,794 45,523 1931 142,524 +37,207 +35'33 82,324 60,200 1941 203,695 +61,171 +42·92 115,298 88,397 1951 310,859 + 107,164 +52·61 167,642 143,217 1961 55·84 394,941 +84,082 +27.05 213,346 181,595 1971 58·72 560,936 + 165,995 +42'03 301,127 259,809
(i) Indore@ 1901 97,804 -43,662 -44·64
52,932 44,872 1911 54,142 30,154 23,988 1921 105,317 + 51,175 +94'52 59,794 45,523 1931 142,524 +37,207 +35·33 82,324 60,200 1941 203,695 +61,171 +42'92 115,298 88,397 1951 310,859 + 107,164 +52·61 167,642 143,217 1961 M.Corp. 55·84 394,941 +84,082 +27·05 213,346 181,595 1971 M.Corp. 55·84 543,381 + 148,440 +37'59 291,433 251,948
(ii) Piplaya Hana(O.G.) 1971 0·38 9,983 5,360 4,623 (iii) Sukliya (O.G.) 1971 1'59 2,521 1,474 1,047 (iv) Bijalpur(O.G.) 1971 0.52 2,327 1,231 1,096 (v) Khajrana(O.G.) 1971 0'31 1,300 683 617 (vi) Savind Nagar (O.G.) 1971 0·01 836 624 212 (vii) Sirpur (O.G.) 1971 0·03 426 238 188
(viii) Banganga(O.G.) 1971 0·03 146 77 69
(ix) Hukumkhedi(O.G.) 1971 0·01 16 7 9
18 Jabalpur urban Jabalpur 1901 90,316 + 10,33S + 11·44
46,882 43,434 agglomeration (MADHYA PRADESH) 1911 100,651 56,035 44,616
1921 108,793 +8,142 +8'09 61,754 47,039 1931 124,382 + 15,589 + 14'33 69,258 55,124 1941 178,339 +53,957 +~3'38 102,959 75,380 1951 256,998 +78,659 +44'11 140,224 116,774 1961 153·33 367,014 + 110,016 +42'81. 202,874 164,140 1971 221·51 534,845 + 167,831 +45'73, 294,568 240,277
(a) Jabalpur 1901 90,316 + 10,335 + 11·44
46,882 43,434 1911 100,651 56,035 44,616 1921 108,793 +8,142 +8.09 61,754 47,039 1931 104,317 -4,476 -4'11 56,613 47,704 1941 140,227 +35,910 +34'42 75,538 64,689 1951 203,659 +63,432 +45'24 107,366 96,293 1961 134'68 295,375 +91,716 +45'03 159,998 135,377 1971 164'91 442,481 + 147,106 +49·80 239,054 203,427
(i) Jabalpur 1901 90,316 +10,335 + 11'44
46,882 43,434 1911 100,651 56,035 44,616 1921 108,793 +8,142 +8'09 61,754 47,039 1931 104,317 -4,476 -4'11 56,613 47,704 1941 140,227 +35,910 +34·42 75,538 64,689 1951 203,659 +63,432 +45'24 107,366 96,293 1961 M.Corp. 134·68 295,375 +91,716 +45·03 159,998 135,377 1971 M.Corp. 134'68 426,224 + 130,849 +44'30 230,047 196,177
(ii) Heavy Vehicle Fac-tory Area (Richhai-
1971 7·43 6,483 3,702 2,781
Madhai) (O.G.)
(iii) Mauegaon (O.G.) 1971 1·88 1,953 1.058 895
(iv) Mabarajpur(O.G.) 1971 4.10 1,790 .. 960 830
(v) Bilpura (O.G.) 1971 2'56 1,529 822 707
(vi) Amkhera (O.G.) 1971 2·92 1,307 695 612 . (vii) Suhagi (O.G.) 1971 2.61 1,183 699 484
t Banaras Hindu University was part of 'Varanasi (M.C.), Banaras Hindu University & Rly. Colony town' in 1951 & 1961 Censuses and treated as an independont town in 1971 Census.
~ From 1901 to 1921Varanasi Cantonment having population of 4,958 (3,541 M., 1,417 F.) in 1901; p~ 3,936 (2,689 M., I 247F.) in 1911 and P. 3,074 (1,954 M., 1,120 F.) in 1921 being part ofVaranasi (M.C.) has been combined with Varanasi (M. Corp.). •
@ In 1941 Census, Indore Residency with a population of 15,197 (8,874 M., 6,323 F.) in 1931; P.12, 226 (7,056 M., 5,170 F.) in 1921; P. 9,195 (5,362 M., in 1911 and P.lI,ll~ (6,768 M., 4,350 F.) in 1901 (known as A.G.G'S camp) was merged in Indore Municipality.
3,833 }".)
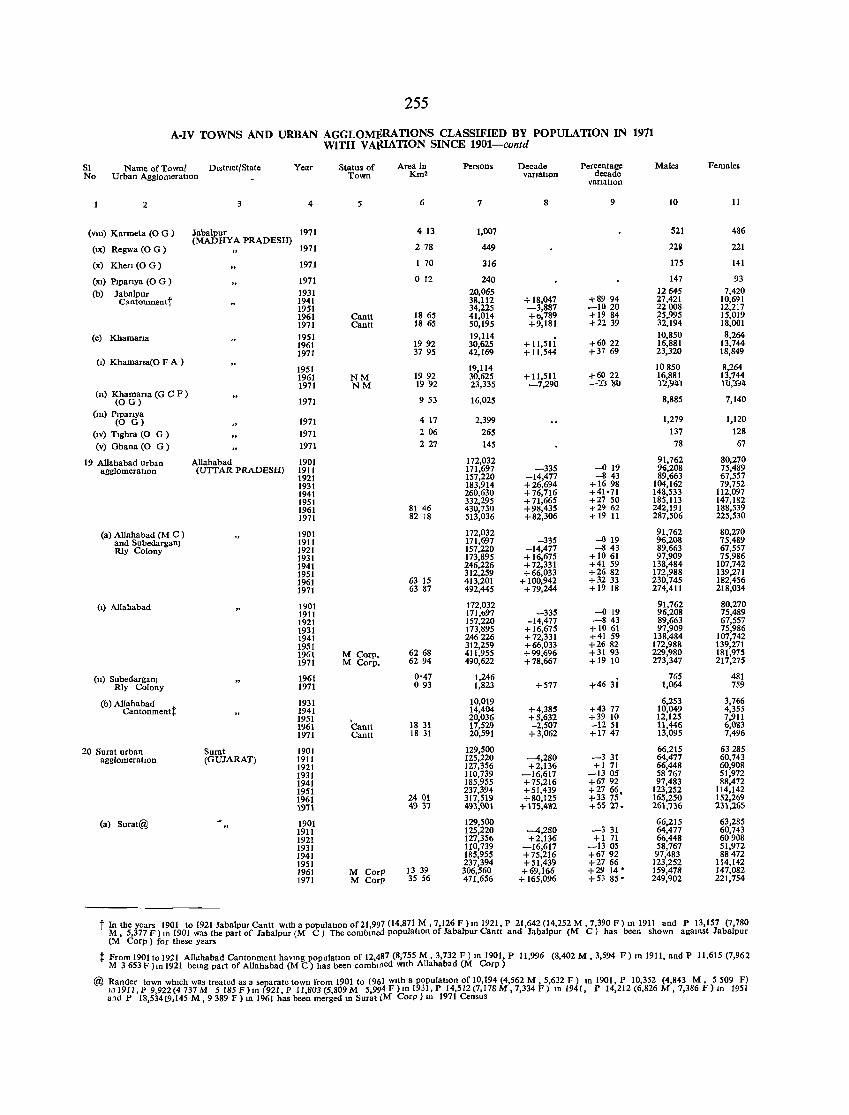
255
A-IV TOWNS AND URBAN AGGLOMICRATlONS CLASSIFIED BY POPULATION IN 1971 WlTH VAlUATION SINCE 1901-contd
Sl Name of Town{ D.strlct{State Year Status of Area in Persons Decade Percentage Males Females No Urban AgglomeratIOn Town Km' vanatlon decade
vanatlOn
2 3 4 5 6 7 8 9 10 II
(vm) Karmeta (0 G) Jabalpur 1971 4 13 1,007 521 486
(IX) Regwa (0 G ) (MADRY A PRADESH)
278 1971 449 22i 221
(x) Khen (0 G ) 1971 1 70 316 175 141
(XI) PIpanya (0 G ) 1971 o 12 240 147 93
(b) Jabalpur 1931 20,065 12645 7,420 Cantonmentt 1941 38.112 + 18,047 -\"89 94 27,421 10,691
1951 34,225 -3,887 -1020 22008 12,217 1961 Cantt 1865 41,014 +0,789 +1984 25,995 15,019 1971 Cant! 18 65 50,195 +9,181 +22 39 32,194 18,001
(c) Khamana 1951 19,114 10,850 8,264 1961 1992 30,625 + 11,511 +6022 16,881 13,744 1971 3795 42,169 + 11,544 +3769 23,320 18,849
(.) Khamana(O FA) 1951 19,114 10850 8,264 1961 NM 1992 30,625 + 11,511 -\"60 22 16,881 13,744 1971 NM 1992 23,335 -7,290 -21 1!U 12,""1 ro,:W"
(11) Khamana (G C F) (OG) 1971 953 16,025 8,885 7,140
(m) Plpanya (0 G) 1971 417 2,399 1,279 1,120
(IV) Tlghra (0 G) 1971 206 265 137 128
(v) Ghana (0 G) 1971 227 145 78 67
19 Allahabad nrban Allahabad 1901 172,032 91,762 80,270 agglomeratIOn (UTTAR PRADESH) 1911 171,697 -335 -019 96,208 75,489
1921 157,220 -14,471 -843 89,663 67,557 1931 183,914 +26,694 +1698 104,162 79,752 1941 260,630 +76,716 +41'71 148,533 112,097 1951 332,295 +71,665 +27 50 185,113 147,182 1961 81 46 430,730 +98,435 +29 62 242,191 188,539 1971 82 18 513,036 +82,306 + 19 11 287,506 225,530
(a) Allahabad (M C ) 1901 172,032 91,762 80,270 and Subedarganl 1911 171,697 -335 -0 19 96,208 75,489 Rly Colony 1921 157,220 -14,477 -843 89,663 67,557
1931 173,895 + 16,675 +1061 97,909 75,986 1941 246,226 +72,331 +4159 138,484 107,742 1951 312,259 +66,033 +2682 172,988 139,271 1961 63 15 413,201 +100,942 +3233 230,745 182,456 1971 63 87 492,445 +79,244 +1918 274,411 218,034
(1) Allahabad 1901 172,032 91,762 80,270 1911 171,097 -335 -019 96,208 75,489 1921 157,220 -14,477 -843 89,663 67,557 1931 173,895 + 16,675 +1061 97,909 75,986 1941 246226 +72,331 +41 59 138,484 107,742 1951 312,259 +66,033 +2682 172,988 139,271 1961 M Corp. 6268 411,955 +99,696 +31 93 229,980 181,975 1971 M Corp. 6294 490,622 +78,667 +19 10 273,347 217,275
(11) Subedargan) 1961 0'47 1,246 +46 3i
765 481 Rly Colony 1971 093 1,823 +577 1,064 759
(b) Allahabad 1931 10,019 6,253 3,766 Cantonmentt 1941 14,404 +4,385 +4377 10,049 4,355
1951 Cantt
20,036 +5,632 +39 10 12,125 7,911 1961 18 31 17,529 -2,507 -12 51 11,446 6,083 1971 Cant! 18 31 20,591 +3,062 +1747 13,095 7,496
20 Sura! urban Sura! 1901 129,500 66,215 63285 agglomeratIon (GUIARAT) 1911 125,220 -4,280 -331 64,477 60,743
1921 127,356 +2,136 +171 66,448 60,908 1931 110,739 -16,617 -1305 58767 51,972 1941 185,955 +75,216 +6792 97,483 88,472 1951 237,394 +51,439 tn ~~, 123,252 114,142 1961 2401 317,519 +80,125 165,250 152,269 1971 4937 4<)3,001 +1"15,4112 +552'1. 261,136 231,265
(a) Surat@ 1901 129,500 66,215 63,285 1911 125,220 -4,280 -331 64,477 60,743 1921 127,356 +2,136 +171 66,448 60908 1931 110,739 -16,617 _13 05 58,767 51,972 1941 185,955 +75,216 +6792 97,483 88472 1951 237,394 +51,439 +2766 123,252 114,142 1961 M Corp 13 39 306,560 +69,166 +29 14' 159,478 147,082 1971 M Corp 35 56 471,656 + 165,096 +53 85' 249,902 221,754
t In the years 1901 to 1921 Jabalpur Cant! With a populatIOn of21,997 (14,871 M , 7,126 F) tn 1921, P 21,642 (14,252 M ,7,390 F) m 1911 and P 13,157 (7,780 M, 5,377 F) In 1901 was the part of labalpur (M C) The combmed populatIOn of Jabalpur Cant! and Jabalpur (M C) has been shown agamst Jabalpur (M Corp) for these years
~ From 1901 to 1921 Allahabad Cantonment havmg populatIOn of 12,487 (8,755 M, 3,732 F) m 1901, P 11,996 (8,402 M, 3,594 F) m 1911, and P 11,615 (7,962 M 3 653F)m 1921 belOg part of Allahabad (M C) has been combloed With Allahabad (M Corp)
@ Rander town which was treated as a separate town from 1901 to 1961 WIth a populatIOn of 10,194 (4,562 M , 5,632 F) m 1901, P 10,352 (4,843 M, 5509 F) m 1911, P 9,922 (4737 M 5 185 F) m 1921, P 11,803 (5,809 M 5,994 F) m 1931, P 14,512 (7,178 M , 7,334 F) m 1941, P 14,212 (6,826 M , 7,386 F) In 1951 and P 18,534(9,145 M, 9 389 F) III 1961 has been merged III Sural (M Corp) m 1971 Census
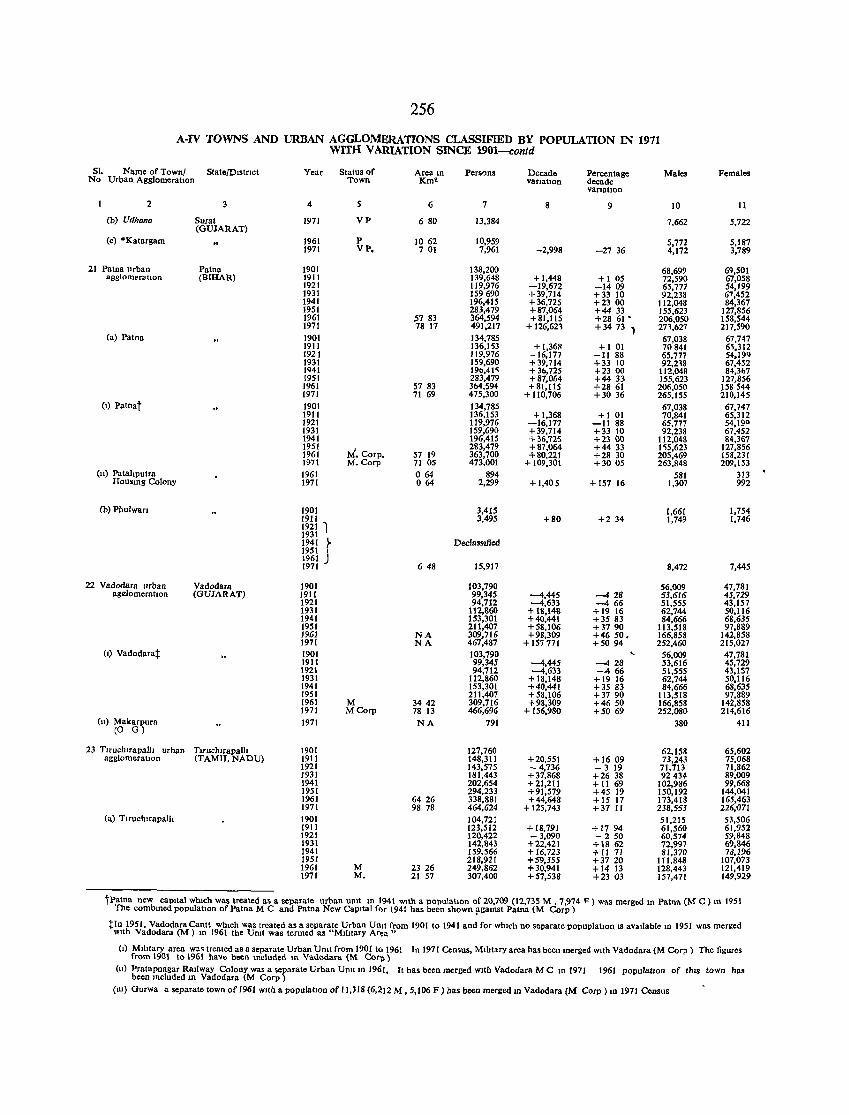
256
A-IV TOWNS AND URBAN AGGLOMERATIONS CLASSIFIED BY POPULATION IN 1971 WITl{ VARIATION SINCE 1901-contd
SI. Name of Town! State/Dlstnct Year Status of Area In Persons Decade Percentage Males Females No Urban Agglomeration Town Km2 vanatlon decade
vanatlon
2 3 4 6 7 8 9 10 11
(b) Udhana Surat 1971 VP 680 13,384 7,662 5,722 (GUJARAT)
(c) OKatargam 1961 P 1062 10,959 5,772 5,187 1971 VP. 701 7,961 -2,998 -27 36 4,172 3,789
21 Patna urban Patna 1901 138,200 68,699 69,501 agglomeration (BIHAR) 1911 139,648 +1,448 +105 72,590 67,058
1921 119,976 -19,672 -1409 65,777 54,199 1931 159690 +39,714 +33 10 92,238 67,452 1941 196,415 +36,725 +2300 112,048 84,367 1951 283,479 +87,064 +44 33 155,623 127,856 1961 ~7 83 364,594 +81,115 +2861 • 206,050 158,544 1971 78 17 491,217 + 126,62, + 34 73 1 27>,627 217,590
(a) Patna 1901 134,785 67,038 67,747 1911 136,153 +1,36~ +101 70841 6'\,312 1921 119,976 - 16,177 -11 88 65,777 54,199 1931 159,690 +39,714 +33 10 92,2,8 67,452 1Q41 19b,41~ +30,725 +23 00 112,04R 84,307 1951 283,479 +81,064 +44 33 155,623 127,856 1961 57 83 304.594 +81,115 +2861 206,050 )58544 1971 71 69 475,300 + 110,706 +3036 265,155 210,145
(I) Patnat 1901 134,785 67,038 61,747 1911 136,153 + 1,368 +101 70,841 65,312 1921 119,976 -16,177 -11 88 65,771 54,190
1931 159,690 +39,714 +33 10 92,238 61,452 1941 196,415 + 36,725 +2300 112,048 84,367 1951
M.Corp. 283,479 +87,064 +44 33 1~5,623 127,856
1961 57 19 363,700 +80,221 +28 30 205,469 158,231 1971 M. Corp 71 05 473.001 + 109,301 +3005 263,848 209,153
(11) Patahputra 1961 064 894 581 313 HOUSlOg Colony 1971 064 2,299 +1,405 + 157 16 1,307 992
(b) Phulwan 1901 3,415 1,661 1,754 1911 3,495 +80 +2 34 1,749 1,746 1921 I 1m ~ DeclassIfied
~m J 648 15,917 8,472 7,445 1971
22 Vadodara urban Vadodara 1901 103,790 56,009 47,781 aglZlomeration (GUIARAT) 1911 99,345 -4,445 -428 53,616 45,729
1921 94,712 -4,633 -466 51,555 43,157 1931 112,860 + 18,148 +19 16 62,744 50,116 1941 153,301 +40,441 +3583 84,666 68,635 1951 2tt,407 +58,106 +3790 tt3,51S 97,889 J96J NA 309,716 +98,309 +46 50. 166,858 142,858 1971 NA 467,487 + 157 771 +5094 252,460 215,021
(I) Vadodara:j: 1901 103,790 '- 56,009 47,781 1911 99,345 -4,445 -428 53,616 45,729 1921 94,712 -4,633 -466 51,555 43,157 1931 112,860 +IS,14S +1916 62,744 50,tt6 1941 153,301 +40,441 +3583 84,666 68,635 1951 211,401 +58,106 +37 90 113,518 91,889 1961 M 3442 309,716 +98,309 +4650 166,858 142,858 1971 MCorp 78 13 466,696 + 156,980 +5069 252,080 214,616
(11) Makarpura 1971 (0 G)
NA 791 380 411
23 Tlruch'rapall, urban Tlluclurapalll 1901 127,760 62,158 65,602 agglomeratIOn (TAMIL NADU) 1911 148,311 +20,551 +1609 73,243 75,068
1921 143,575 - 4,736 - 3 19 71,713 71,S62 1931 181,443 +37,868 +26 38 92434 89,009 1941 202,654 +2.1,211 + II 69 102,986 99,668 1951 294,233 +91,579 +45 19 150,192 144,041 1961 6426 338,881 +44,648 +15 17 173,418 165,463 1971 98 78 464,624 + 125,743 +37 II 238,553 226,071
(a) Tlruchlrapalh 1901 104,721 51,215 53,506 1911 123,512 +18,791 +1794 61,560 61,952 1921 120,422 ~ 3,090 - 250 60,574 59,848 1931 142,843 +22,421 +18 62 72,997 69,846 1941 159,566 + 16,723 +11 71 81,370 78,196 1951 218,921 +59,355 +3720 111,848 101,073 1961 M 23 26 249,862 +30,941 +1413 128,443 121,419 1971 M. 21 57 307,400 +57,538 +2303 157,471 149,929
tPatna new Cal)lta1 whtch was treated as a separate urban untt 10 1941 WIth a populatIon of 20,709 (12,735 M , 7,974 F) was merged 10 Patna eM C) 10 1951 The combined populalion of Patna M C and Patna New CapItal for 1941 has been shown !'gamst Patna (M Corp)
tlo 1951, Vadodara Cantt which was treated as a separate Urban Unit from 1901 to 1941 and for which no separate popuplatlOn IS aVailable 10 1951 was merged WIth Vadodara (M) In 1961 the UOlt was termed as "Mlhtary Area"
(I) Military area was treated as a separate Urban Umt from 1901 to 1961 from 1901 to 1961 have been mcluded 111 Vadooara eM Cor,,)
In 1971 Census, Mlhtary area has been merged wilh Vadodara (M Corp) The figures
(11) Pratapnagar Railway Colony was a separate Urban Umt In 1961, been Included 10 Vadodara (M Corp)
It has been merged With Vadodara M C In 1971 1961 popula!1on of thiS town has
(111) Gorwa a separate town of 1961 WIth a population of 11,318 (6,212 M , 5,106 F) has beeD merged ill Vadodara (M Corp) In 1971 Census
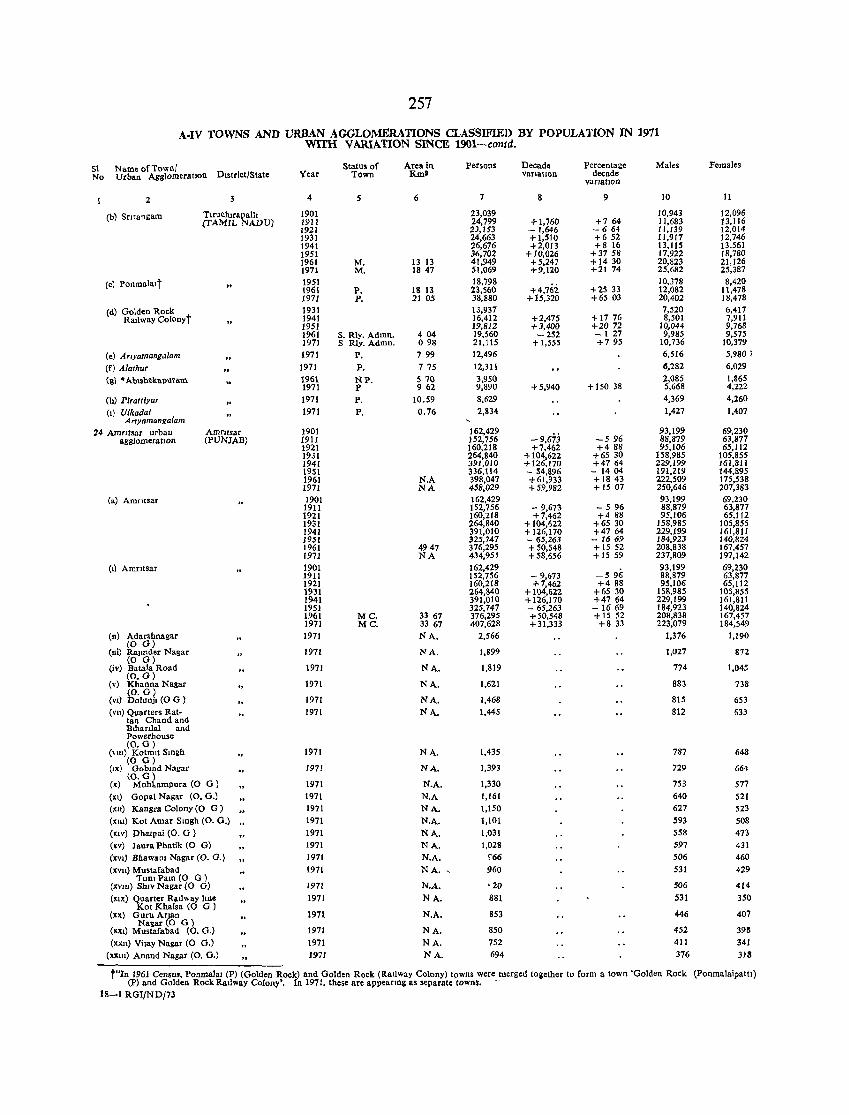
257
A-IV TOWNS AND URBAN AGGLOMERATIONS CLASSIFIED BY POPULATION IN 1971 WITH VARIATION SINCE 1901-contd.
51 Name of Townl Status of Area in Persons Decade Percentage Males Females
No Urban Agglomeration District/State Year Town Kma varIation decade varlatlOn
2 4 5 6 7 8 9 10 It
(b) Srtrangam TlCuchirapal11 1901 :23,039 10,943 12,096 (TAMIL NADU) 1911 24,799 +1,760 +764 11,683 13,116
1921 :23,153 -1,646 -664 11,139 12,014 1931 24,663 +1,510 +652 11,917 12,746 1941 :26,676 +2,013 +8 16 13,115 13,561 1951 36,702 + 10,026 +3758 17,922 18,780 1961 M. 13 13 41,949 +5,247 +1430 20,823 21,126 1971 M. 1847 51,069 +9,120 +2174 25,682 25,387
(c) Ponmala1t 1951 18,798 +4,762
10,378 8,420 1961 P. 18 13 23,560 +25 33 12,082 11,478 1971 P. 21 05 38,880 + 15,320 +6503 20,402 18,478
Cd) Golden Rock 1931 13,937 7,520 6,417 Railway Colonyt 1941 16,412 +2,475 +1776 8,501 7,911
1951 19,812 +3,400 +2072 10,044 9,768 1961 S. Rly. Admn. 404 19,560 -252 -127 9,985 9,575 1971 S Rly. Admn. 098 21,115 +1,555 +795 10,736 10,379
(e) Arlyamangillam 1971 P. 799 12,496 6,516 5,980 I
(f) Alarhur 1971 P. 775 12,311 6,282 6,029
(Q\ • Abuhe:ka1>>1ram 1961 NP. 57() 3,950 2,085 1,865 1971 P 962 9,890 +5,940 + 150 38 5,668 4,222
(h) Plrattiyu, 1971 P. 10.59 8,629 4,369 4,260
(I) Ulkadal 1971 P. 0.76 2,834 1,427 1,407 Arzyamangalam
24 AmtJIsar urban Amra.ar 1901 162,429 -9,673
93,199 69,230 agglomerallon (PUNJAB) 1911 152,756 -596 88,879 63,877
1921 160,218 +7,462 +488 95,106 65,112 1931 264,840 + 104,622 +6530 158,985 105,855 1941 391,010 +126,170 +4764 229,199 161,811 1951 336,114 - 54,896 - 1404 191,219 144,895 1961 N.A 398,047 +61,933 +1843 222,509 175,538 1971 NA 458,029 +59,982 +1507 250,646 207,383
(a) Amntsar 1901 162,429 93,199 69,230 1911 152,756 - 9,673 - 5 96 88,879 63,877 1921 160,218 +7,462 +488 95,106 65,ll2 1931 264,840 + 104,622 +65 30 158,985 105,855 1941 391,010 + 126,170 +47 64 229,199 161,811 1951 325,747 - 65,263 - 1669 184,923 140,824 1961 4947 376,295 +50,548 +15 52 208,838 167,457 1971 NA 434,951 +58,656 +1559 237,809 197,142
(1) Amrttsar 1901 162,429 93,199 69,230 1911 152,756 - 9,673 -s 96 88,879 63,877 1921 160,218 +7,462 +488 95,106 65,112 1931 264,840 + 1\)4,622 +65 3\) 158,985 105,855 1941 391,010 + 126,170 +4764 229,199 161,811 1951 325,747 - 65,263 - 1669 184,923 140,824 1961 MC. 33 67 376,295 +50,548 + 15 52 208,838 167,457 1971 Me. 33 67 407,628 + 31,333 +8 33 223,079 184,549
(11) Adarshnagar 1971 NA. 2,566 1,376 1,190 (0 G)
(IIi) RaJtnder Nagar 1971 NA. 1,899 1,027 872 (0 G)
(iv) Batala Road 1971 NA. 1,819 774 1,045 (O.G)
(v) Khanna Nagar 1971 NA. 1,621 883 738 (0. G)
1971 NA. 1,468 (VI) DolunJ' (0 G ) 815 653 (Vll) Quarters Rat- 1971 NA.
tan Chand and 1,445 812 633
Btbarlla1 and Powerhouse (O.G)
(, 111) Kotm.t S10gh 1971 NA. 1,435 787 648 (O G)
('x) Gobmd Nagar 1971 NA. 1,393 729 664 (O.G)
G) (x) Mohlampura {O 1971 N.A. 1,330 753 577
(XI) Gopal Nagar (0. G.) 1971 N.A 1,161 640 521 (Xli) Kangra Colony (O G) 1971 NA. 1,150 627 523 (XlU) Kot Amar Smgh (0. G.) .. 1971 N.A. 1,101 593 50S (XIV) Dhlllpai (0. G ) 1971 NA. 1,031 558 473 (xv) Jaurn Phatik (0 G) 1971 NA. 1,028 597 431
(XVI) BflawaOl Nagar (0. G.) 1971 N.A. <:66 506 460
(XVII) Mustafabad 1971 NA. , 960 531 429 Tunl Pam (0 G)
(XVIII) ShIV Nagar (0 G) 1971 N.A. '20 506 414
(XIX) Quarter Ral1"ay Imc 1971 NA. 881 531 350 Kot Khalsa (0 G)
(xx) Guru Arjan 1971 N.A. 853 446 407 Nasar (0 G)
(XXI) Mustafabad (0. G.) 1971 NA. 850 452 393
(XXII) Vilay Nagar (0 G.) 1971 NA. 752 411 341
(XXIll) Anand Nagar CO. G.) 1971 NA. 694 376 318
t"ln 1961 Census, P01lJllala. (P) (Golden Rock) and Golden Rock (Railway Colony) towns were merged tOiether to form a town 'Golden Rock (P) and Golden Rock Ra1lway Colony'. In 1971, these are appearms as separate towns. -
(Ponmalaipatt1 )
18-1 RGI/ND/73
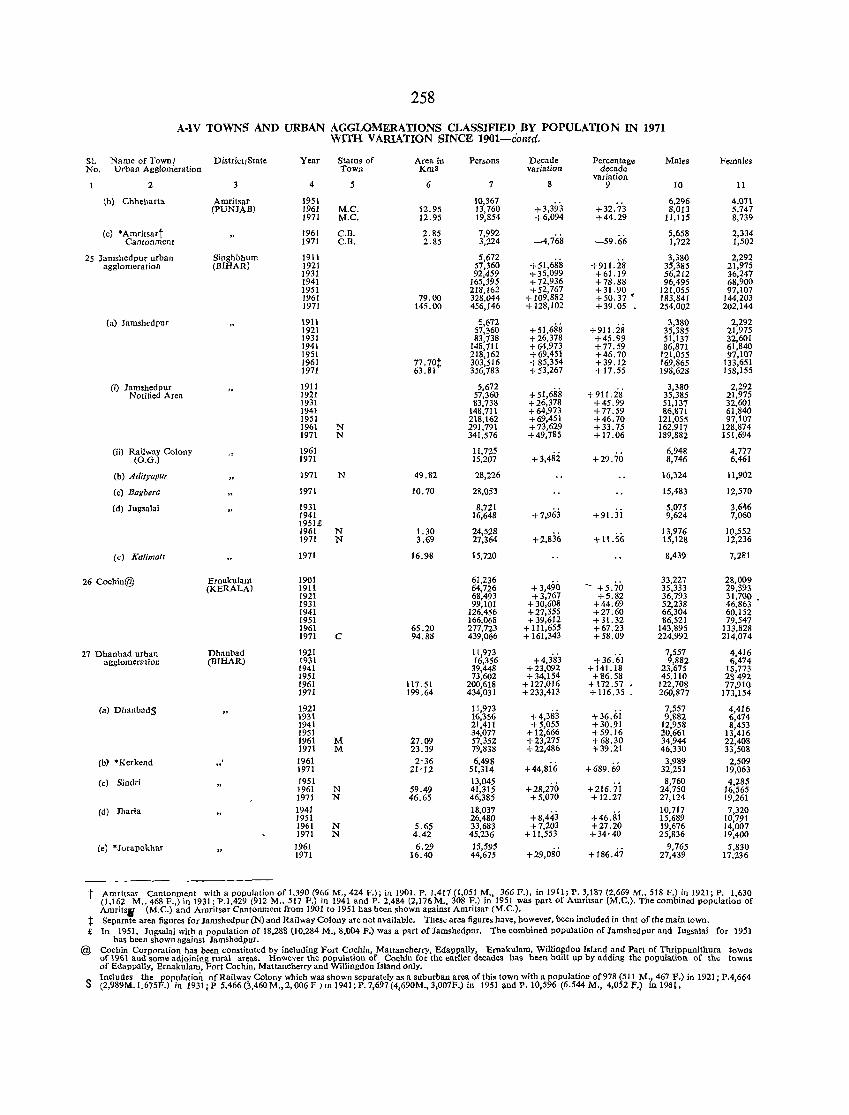
258
A-lV TOWNS AND URBAN AGGLOMERATIONS CLASSIFIED BY POPULATION IN 1971 WITH V ARlATION SINCE 1901-contd.
SI. Name of Town! DistrictJState Year Status of Area in Persons Decade Percentage Males Females No. Urban Agglomeration Town Km2 variation decade
variation 2 3 4 5 6 7 8 9 10 11
(b) Chheharta Amritsar 1951 10,367 +3,393 +32.73
6,296 4,071 (PUNJAB) 1961 M.C. 12.95 13,760 8,013 5,747
1971 M.C. 12.95 19,854 +6,094 +44.29 11,115 8,739
(c) • Amritsart 1961 C.B. 2.85 7,992 -4,768 -59.66
5,658 2,334 Cantonment 1971 C.B. 2.85 3,224 1,722 1,502
25 Jamshedpur urban Singhbhum 1911 5,672 +911.i8
3,380 2,292 agglomeration (BmAR) 1921 57,360 +51,688 35,385 21,975
1931 92,459 +35,099 + 61.19 56,212 36,247 1941 165,395 +72,936 +78.88 96,495 68,900 1951 218,162 +52,767 +31.90 121,055 97,107 1961 79.00 328,044 + 109,882 +50.37 • 183,841 144,203 1971 145.00 456,146 + 128,102 + 39.05 254,002 202,144
(a) Jamshedpur 1911 5.672 +51,688
3,380 2,292 1921 57,360 + 911.28 35,385 21,975 1931 83.738 +26,378 +45.99 51,137 32,601 1941 148,711 +64,973 +77.59 86,871 61,840 1951 218,162 +69,451 +46.70 121,055 97,107 1961 77.70:j: 303,516 +85,354 +39.12 169,865 133,651 1971 63.81 356,783 +53,267 + 17.55 198,628 158,155
(i) Jamshedpur 1911 5,672 +51,688 +911.28
3,380 2,292 Notified Area 1921 57,360 35,385 21,975
1931 83,738 +26,378 +45.99 51,137 32,601 1941 148,711 +64,973 +77.59 86,871 61,840 1951 218,162 +69,451 +46.70 121,055 97,107 1961 N 291,791 +73,629 +33.75 162,917 128,874 1971 N 341,576 +49,785 +17.06 189,882 151,694
Cii) Railway Colony 1961 11,725 +3,4Si +29.70
6,948 4,777 CO.G.) 1971 15,207 8,746 6,461
Cb) Adilyapur 1971 N 49.82 28,226 16,324 11,902
(c) Bagbera 1971 10.70 28,053 15,483 12,570
Cd) Jug.alai 1931 8,721 +7,963 +9J.3i
5,075 3,646 1941 16,648 9,624 7,060 1951£ 1961 N 1.30 24,528
+2,836 + 11.56 13,976 10,552
1971 N 3.69 27,364 15,128 12,236
(e) Kalimal. 1971 16.98 15,720 8,439 7,281
26 Cochin@ Ernakulam 1901 61,236 +3,490 - +5.70
33,227 28,009 (KERALA) 1911 64,726 35,333 29,393
1921 68,493 + 3,767 +5.82 36,793 31,700 • 1931 99,101 +30,608 +44.69 52,238 46,863 1941 126,456 +27,355 +27.60 66,304 60,152 1951 166,068 +39,612 + 31. 32 86,521 79,547 1961 65.20 277,723 + 111,655 +67.23 143,895 133,828 1971 C 94.88 439,066 + 161,343 +58.09 224,992 214,074
27 Dhanbad urban Dhanbad 1921 11,973 +4,3'8'3 +36:61
7,557 4,416 agglomeration (BIffAR) 1931 16,356 9,882 6,474
1941 39,448 +23,092 + 141.18 23,675 15,773 1951 73,602 + 34,154 +86.58 45,110 28492 1961 117.51 200,618 + 127,016 +172.57 , 122,708 77,910 1971 199.64 434,031 +233,413 + 116.35 260,877 173,154
(a) Dhanbad$ 1921 11,973 +4,383 +36.6i
7,557 4,416 1931 16,356 9,882 6,474 1941 21,411 +5,055 +30.91 12,958 8,453 1951 34,077 + 12,666 +59.16 20,661 13,416 1961 M 27.09 57,352 +23,275 +68.30 34,944 22,408 1971 M 23.39 79,838 +22,486 +39.21 46,330 33,508
(b} *Kerkend " . 1961 2'36 6,498
+ 44,sii; +689.69 3,989 2,509
1971 21'12 51,314 32,251 19,063
(c) Sindri 1951 13,045 +28,270 +216.7i
8,760 4,285 1961 N 59.49 41,315 24,750 16,565 1971 N 46.65 46,385 +5,070 +12.27 27,124 19,261
(d) Jharia 1941 18,031 +8,443 +46.si
10,717 7,320 1951 26,480 15,689 10,791 1961 N 5.65 33,683 +7,203 +27.20 19,676 14,007 1971 N 4.42 45,236 + 11,553 +34·40 25,836 19,400
Ce) *Jurapokhar 1961 6.29 15,595 +29,080 + 186.47
9,765 5,830 1971 16.40 44,675 27,439 17,236
t Amritsar Cantonment with a population of 1,390 (966 M., 424 F.); in 1901, P. 1,411 (1,051 M., 366 F.), in 1911; P. 3,187 (2,669 M., 518 F.) in 1921; P. 1,630 (1,162 M., 468 F.,l in 1931; P.l,429 (912 M., 517 F.) in 1941 and P. 2.484 (2,176M., 308 F.) in 1951 was part of Amritsar (M.e.). The combined population of Amritsf{ (M.C.) and Amritsar Cantonment from 1901 to 1951 has been shown against Amritsar (M.C.). .
:j: Separate area figures for Jamshedpur (N) and Railway Colony are not available. These area figures have, however, been mcluded in that of tbemain town. £ In 1951, Jugsalai with a population of 18,288 (10,284 M., 8,004 F.) Was a part of Jamshedpur.
has been shown against Jamshedpur. The combined population of Jamshedpur and Jugsalai for 1951
@ Cochin Corporation has been constituted by including Fort Cochin, Mattancherry, Edappally, Ernakulam, Willingdon Island and Part of ThripPunithura towns of 1961 and some adjoining rural area'. Howe';er the population of Cochin for the earlier decades has heen built up by adding the population of the towns of Edappally, Ernakulam, Fort Cochin, Mattancherry and Willingdon Island only.
$ Includes the population of Railway Colony which was shown separately as a suburban area of this town with a population of978 (511 M., 467 F.) in 1921; P.4.664 (2,989M.I.675F.) in 1931; P 5,466 (3,460 M., 2, 006 F ) m 1941; P. 7,697 (4, 690M., 3.007F.) in 1951 and P. 10,596 (6.544 M., 4,(152 F.) in 1961.
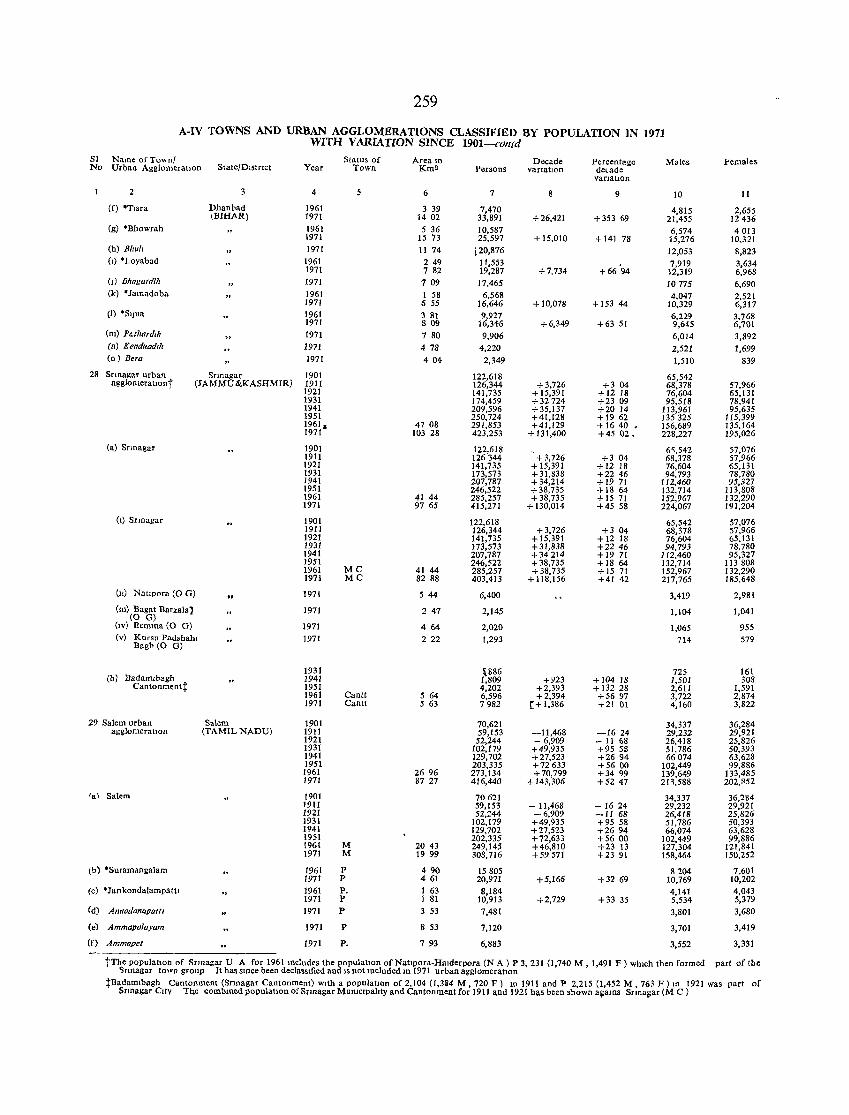
259
A-IV TOWNS AND URBAN AGGLOMERATlONS CLASSIFIED BY POPULATION IN 1971 WITH V ARlATlON SINCE 1901-cOlltd
SI Name ofTo\\n/ Status of Area In Decade Percentage Males Females No Urban Agglomerallon State/District Year Town Km2 Persons varIation delade
VarIatIon
2 4 5 6 7 9 10 11
(f) 'TlSra Dhanhad 1961 3 39 7,470 4,815 2,655 \BIHAR) 1971 14 02 33,891 +26,421 + 353 69 21,455 12436
(g) 'Bhowrab 1961 5 36 10,587 6,574 4013 1971 15 73 25,597 + 15,010 + 141 78 15,276 10,321
(b) Blzu/, 1971 11 74 [20,876 12,053 8,823 (I) 'Loyabad 1961 249 11,553
+66 '94 7,919 3,634
1971 7 82 19,287 +7,734 12,319 6,968 (1) Bhagatdih 1971 709 17,465 10 775 6,690 (k) 'Jamadoba 1961 I 58 6,568 4,047 2,521
1971 6 55 16,646 + 10,078 +15344 10,329 6,317 (1) 'S'jua 1961 3 81 9,927 6,229 3,768
1971 8 09 16,346 + 6,349 +63 51 9,645 6,701 (m) PllIhardlh 1971 7 80 9,906 6,014 3,892 (n) Kenduadlh 1971 4 78 4,220 2,521 1,699 (0) Bera 1971 404 2,349 1,510 839
28 Snnaga.r urban Sonagar 1901 122,618 65,542 aggiOt11eratlOnt (JAMMU &KASHMIR) 1911 126,344 +3,726 +304 68,378 57,966
1921 141,735 +15,391 +12 18 76,604 65,131 1931 174,459 +32724 +23 09 95,518 78,941 1941 209,596 +35,137 +20 14 113,961 95,635 1951 250,724 +41,128 +1962 135325 115,399 1961. 4708 291,853 +41,129 +1640 • 156,689 135,164 1971 103 28 423,253 + 131,400 +45 02. 228,227 195,026
(a) Srmagar 1901 122,618 6",542 57,076 1911 126344 +3,726 +304 68,378 57,966 1921 141,735 + 15,391 +12 18 76,604 65,131 1931 173,573 + 31,838 +2246 94,793 78,780 1941 207,787 +34,214 +1971 112,460 95,327 1951 246,522 +38,735 +1864 132,714 113,808 1961 41 44 285,257 + 38,735 +1571 152,967 132,290 1971 97 65 415,271 + 130,014 +45 58 224,067 191,204
(1) Srmagar 1901 122,618 65,542 57,076 1911 126,344 +3,726 +304 68,378 57,966 1921 141,735 +15,391 +12 18 76,604 65,131 1931 173,573 +31,838 +2246 94,793 78,780 1941 207,787 +34214 +1971 112,460 95,327 1951 246,522 +38,735 +1864 132,714 113808 1961 MC 41 44 285,257 +38,735 +1571 152,967 132,290 1971 MC 82 88 403,413 + 118,156 +41 42 217,765 185,648
(II) Natlpora (0 GJ 1971 5 44 6,400 3,419 2,981
(m) Bagat Barzala) 1971 2 47 2,145 1,104 1,041 (0 G)
('v) Demma (0 G) 1971 464 2,020 1,065 955 (v) Kursu Padshahl 1971 222 1,293 714 579
Bag}> (0 G)
1931 l886 725 161 (b) Badamlbagb 1941 1,809 +923 +104 18 1,501 308
Cantonmentt 1951 4,202 +2,393 + 132 28 2,611 1,591 1961 Cantt 564 6,596 +2,394 +56 97 3,722 2,874 1971 Cantt 5 63 7982 (+ 1,386 +2101 4,160 3,822
29 Salem urban Salem 1901 70,621 34,337 36,284 agglomeratIOn (TAMIL NADU) 1911 59,153 -11,468 -1624 29,232 29,921
1921 52,244 - 6,909 - 11 68 26,418 25,826 1931 102,179 +49,935 +95 52 51,786 50,393 1941 129,702 +27,523 +2694 66074 63,628 1951 203,335 +72 633 +5600 102,449 99,886 1961 2696 273,134 +70,799 +34 99 139,649 133,485 1971 8727 416,440 + 143,306 +5247 2n,588 202,~52
la\ Salem 1901 70621 34,337 36,284 1911 59,153 -11,468 - 1624 29,232 29,921 1921 52,244 -6,909 -11 68 26,418 25,826 1931 102,179 +49,935 +95 58 51,786 50,393 1941 129,702 +27,523 +2694 66,074 63,628 1951 202,335 +72,633 +5600 102,449 99,886 1961 M 2043 249,145 +46,810 +23 13 127,304 121,841 1971 M 1999 308,716 +59571 +23 91 158,464 150,252
(b) 'Suramangalam 1961 P 490 1580S 8204 7,601 1971 P 461 20,971 +5,166 +3269 10,769 10,202
(c) 'Jankonda1ampattl 1961 P. 1 63 8,184 4,141 4,043 1971 P 1 81 10,913 +2,729 +33 35 5,534 5,379
(d) Allnadanapattl 1971 P 3 53 7,481 3,801 3,680
<e) Ammapalayam 1971 P 8 53 7,120 3,701 3,419
(f) Ammapet 1971 P. 793 6,883 3,552 3,331
t The populabon of Srmagar U A for 1961 mcludcs the populatIOn of Nallpora·HaIderpora (N A) P 3, 231 (1,740 M , 1,491 F) WhICh then formed 'lrmagar town group It bas smce been declassIfied and IS not Included In 1971 urban agglomeration
part of the
tBadamlhagh Cantnnment (Snnagar Cantonment) WIth a populatIon of 2,104 (1,324 M, 720 F) In 1911 and P 2,215 (1,452 M, 763 F) In 1921 was part Srmagar cuy Tue combmed populatIOn of Srmagar MUnIcIpalIty and Cantonment for 1911 and 1921 haS been shown a¥alns Srma¥<lr eM C )
of
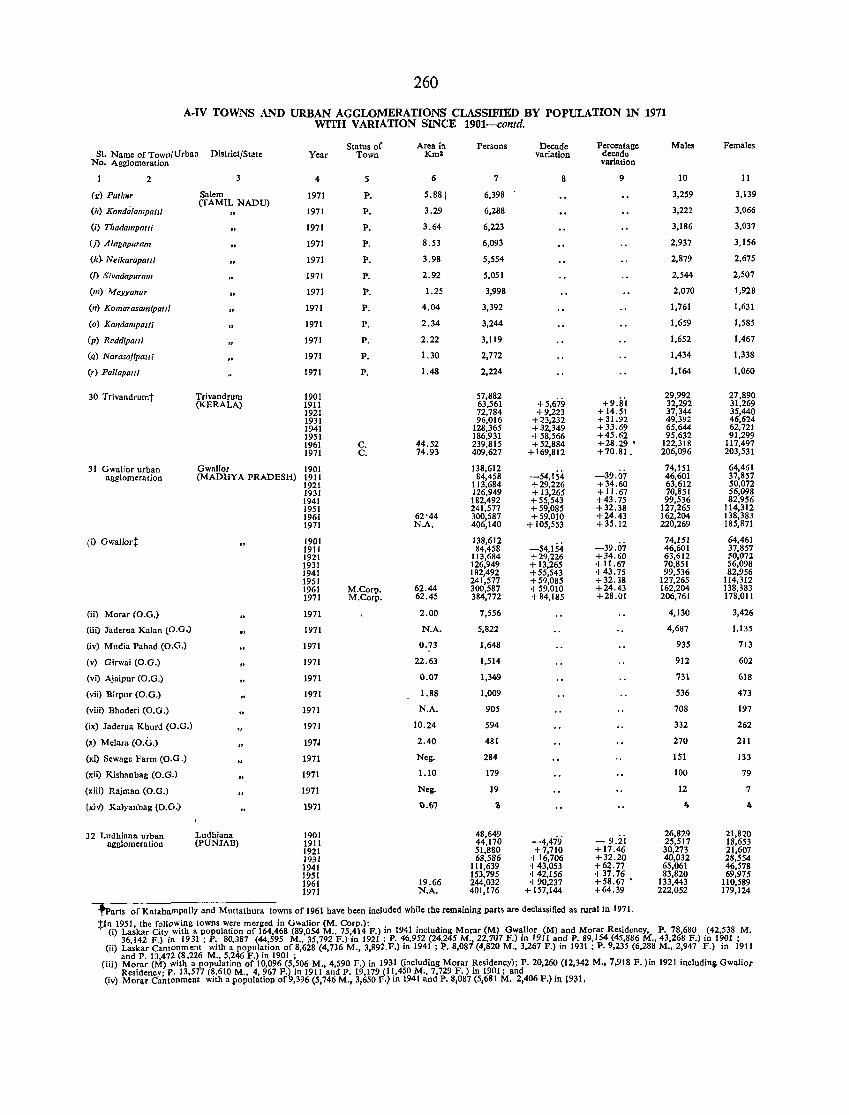
260
A·IV TOWNS AND URBAN AGGLOMERATIONS CLASSIFIED BY POPULATION IN 1971 WITH VARIATION SINCE 1901-contd.
Status of Area in Persons Decade Percentage Males Females SI. Name of TOWIl/Urban District/State Year Town Km2 variation decade
No. Agglomeration variation
2 4 5 6 7 8 9 10 11
(g) Puthlfr Salem 1971 P. 5.881 6,398 3,259 3,139
(h) Kondaiampalli (TAMIL NADU)
1971 P. 3.29 6,288 3,222 3,066
(i) Thadampatli 1971 P. 3.64 6,223 3,186 3,037
(j) Alagapuram 1971 P. 8.53 6,093 2,937 3,156
(k). Neikarapatli 1971 P. 3.98 5,554 2,879 2,675
(I) Sivadapuram 1971 P. 2.92 5,051 2,544 2,507
(m) Meyyanllr 1971 P. 1.25 3,998 2,070 1,928
(n) Komarasamipatl/ 1971 P. 4.04 3,392 1,761 1,631
(0) Kandampatli 1971 P. 2.34 3,244 1,659 1,585
(p) Reddipatli 1971 P. 2.22 3,119 1,652 1,467
(q) Nara,o}ipatli 1971 P. 1.30 2,772 1,434 1,338
(r) Pal/apatli 1971 P. 1.48 2,224 1,164 1,060
30 Trivandrurnt Trivandrum 1901 57,882 +5,679 +9.8'1
29,992 27,890 (KERALA) 1911 63,561 32,292 31,269
1921 72,784 +9,223 +14.51 37,344 35,440 1931 96,016 +23,232 + 31.92 49,392 46,624 1941 128,365 +32,349 +33.69 65,644 62,721 1951 186,931 + 58,566 +45.62 95,632 91,299 1961 C. 44.52 239,815 + 52,884 +28.29 • 122,318 117,497 1971 C. 74.93 409,627 + 169,812 +70.81. 206,096 203,531
31 Owalior urban Owalior 1901 138,612 -39.07
74,151 64,461 aglllomeration (MADHYA PRADESH) 1911 84,458 -54,154 46,601 37,857
1921 113,684 +29,226 +34.60 63,612 50.072 1931 126,949 + 13,265 +11.67 70,851 56,098 1941 182,492 +55,543 +43.75 99,536 82,956 1951 241,577 +59,085 +32.38 127,265 114,312 1961 62'44 300,587 +59,010 +24.43 162,204 138,383 1971 N.A. 406,140 + 105,553 +35.12 220,269 185,871
(i) Owaliort 1901 138,612 -54,154 -39.07
74,151 64,461 1911 84,458 46,601 37,857 1921 113,684 +29,226 + 34.60 63,612 50,072 1931 126,949 + 13,265 + 11.67 70,851 56,098 1941 182,492 +55,543 +43.75 99,536 82,956 1951 241,577 +59,085 +32.38 127,265 114,312 1961 M.Corp. 62.44 300,587 +59,010 +24.43 162,204 138,383 1971 M.Corp. 62.45 384,772 + 84,185 +28.01 206,761 178,011
(ii) Morar (0.0.) 1971 2.00 7,556 4,130 3,426
(iii) Jaderua Kalan (O.G.) 1971 N.A. 5,822 4,687 1,135
(iv) Mudia Pahad (0.0.) 1971 0.73 1,648 935 713
(v) Oirwai (0.0.) 1971 22.63 1,514 912 602
(vi) Ajaipur (0.0.) 1971 0.07 1,349 731 618
(vii) Birpur (0.0.) 1971 1.88 1,009 536 473
(viii) Bhoderi (O.G.) 1971 N.A. 905 708 197
(ix) Jaderua Khurd (0.0.) 1971 10.24 594 332 262
(x) Melara (O.G.) 1971 2.40 481 270 211
(xi) Sewage Farm (0.0.) 1971 Neg. 284 151 133
(xii) Kishanbag (0.0.) 1971 1.10 179 100 79
(xiii) Rajman (O.G.) 1971 Neg. 19 12 7
(x;v) Kalyanbag (D.O.) 1971 \).61 11 4 4
32 Ludhiana urban Ludhiana 1901 48,649 -4,479 - 9.ii
26,829 21,820 agglomeration (pUNJAB) 1911 44,170 25,517 18,653
1921 51,880 +7,710 +17.46 30,273 21,607 1931 68,586 + 16,706 +32.20 40,032 28,554 1941 111,639 +43,053 +62.77 65,061 46,578 1951 153,795 +42,156 + 37.76 83,820 69,975 1961 19.66 244,032 +90,237 +58.67 • 133,443 110,589 1971 N.A. 401,176 + 157,144 +64.39 222,052 179,124
"Parts of Katahampally and Muttathura towns of 1961 have been included While the remaining parts are declassified as rural in 1971.
tIn 1951, the following towns were merged in Owalior (M. Corp.): (i) Laskar City with a population of 164,468 (89,054 M., 75,414 F.) in 1941 including Morar (M) Owalior (M) and Morar Residency, P. 78,680 (42,538 M.
36,142 F.) in 1931 ; P. 80,387 (44,595 M., 35,792 F.hn 1921; P. 46,952 (24,245 M., 22,707 F.) in 1911 and P. 89,154 (4S,886 M., 43,268 F.) in 1901 ; (ii) Laskar Cantonment with a population of 8,628 (4,736 M., 3,892.F.) in 1941 ; P. 8,087 (4,820 M., 3,267 F.) in 1931 ; P. 9,235 (6,288 M., 2,947 F.) in 1911
and P. 13,472 (8,226 M., 5,246 F.) in 1901 ; (iii) Morar (M) with a population of 10,096 (5,506 M., 4,590 F.) in 1931 (including Morar Residency); P. 20,260 (12,342 M., 7,918 F._)in 1921 includini GwaJior
Residency' p. 13,577 (8,610 M., 4,967 F.) in 1911 and P. 19,179 (11,450 M., 7,729 F.) in 1901; and (iv) Morar Cantonment with a populatioll of9,396 (5,746 M., 3,650 f.) in 1941 and P. 8,087 (5,681 M. 2,406 F.) in 19~1,
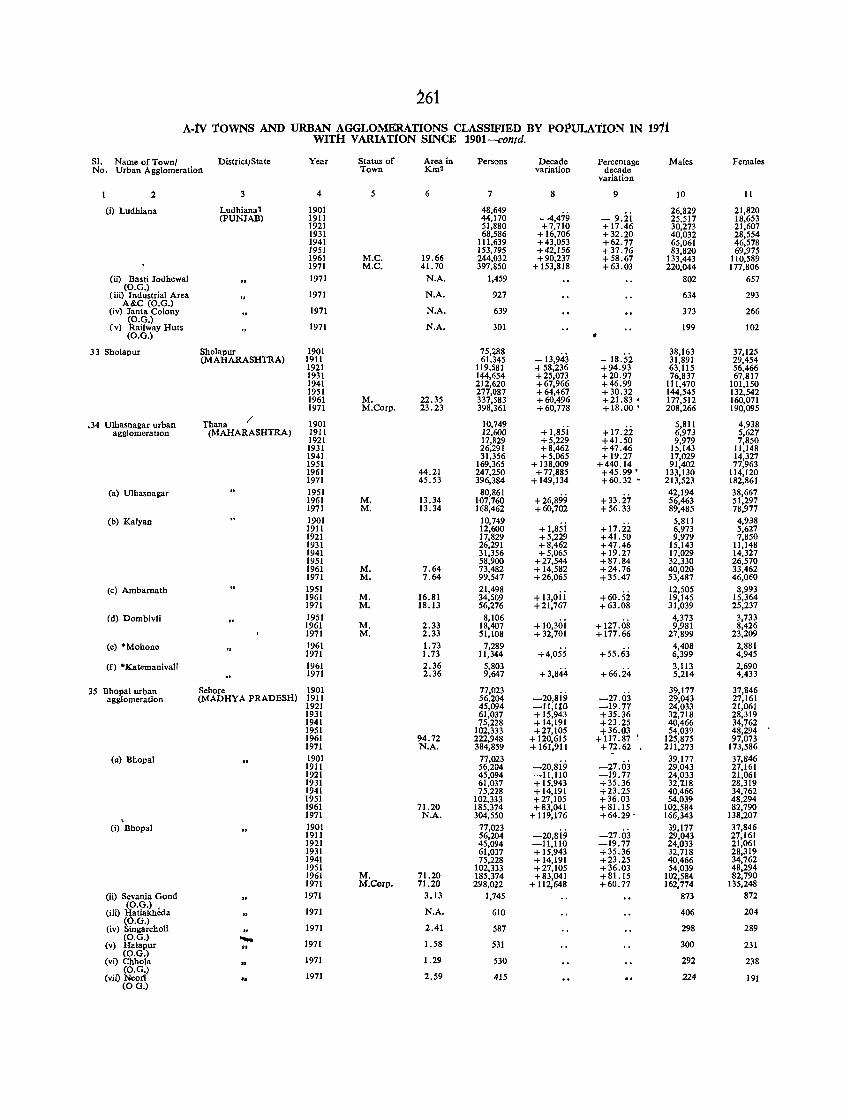
261
A-tv TOWNS AND URBAN AGGLOMERATIONS CLASSIFIED BY POPULATION IN 1911 WITH VARIATION SINCE 1901-contd.
SI. Name of Town/ District/State Year Status of Area in Persons Decade Percentage Males Females No. Urban Agglomeration Town Km2 variation decade
variation
2 4 5 6 7 8 9 10 11
(i) Ludhiana Ludhiana' 1901 48,649 -4,479 - 9.ii
26,829 21,820 (PUNJAB) 1911 44,170 25.517 18,653
1921 51,880 +7,710 +17.46 30,273 21,607 1931 68,586 + 16,706 +32.20 40,032 28,554 1941 111,639 +43,053 +62.77 65,061 46,578 1951 153,795 +42,156 +37.76 83,820 69,975 1961 M.C. 19.66 244,032 +90,237 +58.67 133,443 110,589 1971 M.C. 41. 70 397,850 + 153,818 + 63.03 220,044 177,806
(ii) Basti Jodhewal 1971 N.A. 1,459 802 657 (O.G.)
1971 N.A. (iii) Ind ustrial Area 927 634 293 A&C (O.G.)
(iv) Janta Colony 1971 N.A. 639 373 266 (O.G.)
(v) Railway Huts (O.G.)
1971 N.A. 301 199 102
33 Sho1apur Sholapur 1901 75,288 -13,943 - 18.52
38,163 37,125 (MAHARASHTRA) 1911 61,345 31,891 29,454
1921 119,581 + 58,236 +94.93 63,115 56,466 1931 144,654 +25,073 +20.97 76,837 67,817 1941 212,620 +67,966 +46.99 IlJ,470 101,150 1951 277,087 +64,467 +30.32 144,545 132,542 1961 M. 22.35 337,583 +60,496 +21.83 • 177,512 160,071 1971 M.Corp. 23.23 398,361 +60,778 + 18.00 ' 208,266 190,095
.34 Ulhasnagar urban Thana / 1901 10,749 5,811 4,938 agglomeratIOn (MAHARASHTRA) 1911 12,600 +I,85i +17.1i 6,973 5,627
1921 17,829 +5,229 +41.50 9,979 7,850 1931 26,291 +8,462 +47.46 15,143 11,148 1941 31,356 +5,065 +19.27 17,029 14,327 1951 169,365 + 138,009 +440.14 91,402 77,963 1961 44.21 247,250 +77,885 +45.99 ' 133,130 114,120 1971 45.53 396,384 + 149,134 +60.32 • 213,523 182,861
(a) Ulhasnagar 1951 80,861 +26,899 +33.i7
42,194 38,667 1961 M. 13.34 107,760 56,463 51,297 1971 M. 13.34 168,462 +60,702 +56.33 89,485 78,977
(b) Kalyan 1901 10,749 + 1,85i +17.ii
5,811 4,938 1911 12,600 6,973 5,627 1921 17,829 +5,229 +41.50 9,979 7,850 1931 26,291 + 8,462 +47.46 15,143 11,148 1941 31,356 +5,065 +19.27 17,029 14,327 1951 58,900 +27,544 +87.84 32,330 26,570 1961 M. 7.64 73,482 +14,582 +24.76 40,020 33,462 1971 M. 7.64 99,547 +26,065 +35.47 53,487 46,060
(c) Ambarnath 1951 21,498 +13,oii +60.5i
12,505 8,993 1961 M. 16.81 34,509 19,145 15,364 1971 M. 18.13 56,276 +21,767 +63.08 31,039 25,237
(d) Dombivli 1951 8,106 +10,30i + 127.08
4,373 3,733 1961 M. 2.33 18,407 9,981 8,426 1971 M. 2.33 51,108 +32,701 + 177 .66 27,899 23,209
(e) "Mohone 1961 I. 73 7,289 +4,055 +55.63
4,408 2,881 1971 1.73 11,344 6,399 4,945
(f) *Katemanivali 1961 2.36 5,803 +3,844 +66.24
3,113 2,690 1971 2.36 9,647 5,214 4,433
35 Bhopal urban Sehore 1901 77,023 -20,8i9 -27.03
39,177 37,846 agglomeration (MADHYA PRADESH) 1911 56,204 29,043 27,161
1921 45,094 -II,IlO -19.77 24,033 21,061 1931 61,037 + 15,943 + 35.36 32,718 28,319 1941 75,228 + 14,191 +23.25 40,466 34,762 1951 102,333 +27,105 +36.03 54,039 48,294 1961 94.72 222,948 + 120,615 +117.87 ' 125,875 97,073 1971 N.A. 384,859 + 161,911 +72.62 211,273 173,586
(a) Bhopal 1901 77,023 -20,8i9 -27.03
39,177 37,846 1911 56,204 29,043 27,161 1921 45,094 -11,110 -19.77 24,033 21,061 1931 61,037 + 15,943 +35.36 32,1.18 28,319 1941 75,228 +14,191 +23.25 40,466 34,762 1951 102,333 +27,105 +36.03 54,039 48,294 1961 71.20 185,374 +83,041 + 81.15 102,584 82,790 1971 N.A. 304,550 + 119,176 +64.29 . 166,343 138,207
\
(i) Bhopal 1901 77,023 -20,8i9 -27.03
39,177 37,846 1911 56,204 29,043 27,161 1921 45,094 -11,110 -19.77 24,033 21,061 1931 61,037 + 15,943 +35.36 32,718 28,319 1941 75,228 + 14,191 +23.25 40,466 34,762 1951 102,333 +27,105 +36.03 54,039 48,294 1961 M. 71.20 185,374 +83,041 + 81.15 102,584 82,790 1971 M.Corp. 71.20 298,022 + 112,648 +60.77 162,774 135,248
(ii) Sevania Gond 1971 3.13 1,745 873 872 (O.G.) •
1971 N.A. 406 204 (iii) Matiakheda 610 ( .G.)
1971 2.41 289 (iv) Singarcholi 587 298 (O.G.) ..... 1971 (v) Halapur 1.58 531 300 231 (O.G.)
1971 1.29 292 (vi) Chhola 530 238 (O.G.)
1971 2.59 415 224 (vii) Neol'i II 191 (0 G.)
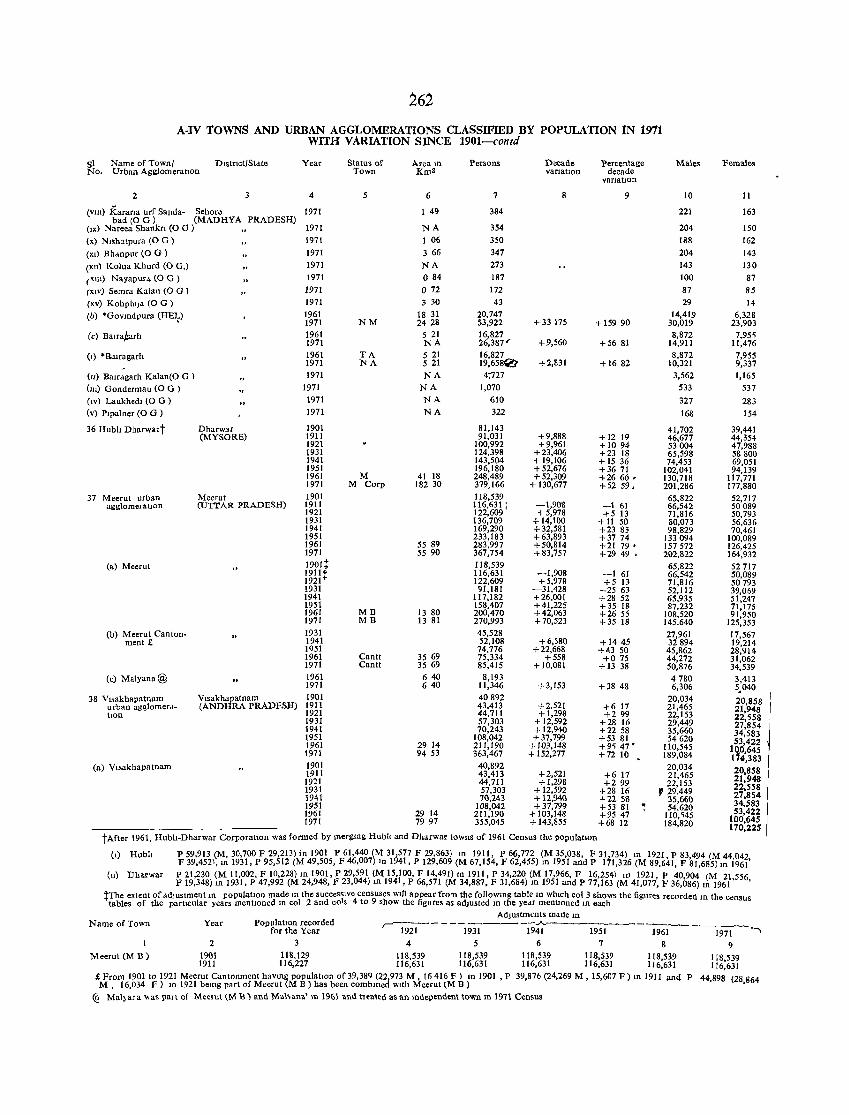
A·IV TOWNS AND URBAN AGGLOMERATIONS CLASSIFIED BY POPULATION 1N 1971 WITH VARIATION SINCE 1901-contd
Sl Name of Town/ DLStrIct/State No, Urban AgglomeratIOn
2
(VlII) Karana urf Sallda- Sehore bad (0 G) (MADHYA PRADESH)
(IX) Nareca Shank" (0 G )
(x) NIshatpura (0 G )
(XI) Bhdnpur (0 G )
(XII) Kolua Khurd (0 G,)
("111) Nayapur" (0 G ) (XIV) Semra Kalan (0 G )
(xv) KohphIJa (0 G )
(b) *GovlIIdpura (HEJ,)
(c) BaIra~arh
(I) 'Balfagarh
(11) BaIrdgarh KalantO G ) (Ill) Gondermau (0 G)
(IV) Laukhedl (0 G) (v) PIpalner (0 G)
36 HublI Dharwart
37 Meerut urban agglomeratlon
ta) Meerut
(b) Meerut Can ton· ment £
(c) Malyana @
38 VIsakhapatnam urban agglomerahon
(a) VIsakhapatnam
Dharwar (MYSORE)
Meerut (UTTAR PRADESH)
VIsakhapatnam (ANDHRA PRADESlI)
Year
4
1971
1971
1971
1971 1971
1971
1971 1971
1961 1971 1961 1971 1961 1971 1971
1971 1971 1971
1901 1911 1921 1931 1941 1951 1961 1971 1901 1911 1921 1931 1941 1951 1961 1971
1901t
:mt 1931 1941 1951 1961 1971 1931 1941 1951 1961 1971 1961 1971 1901 1911 1921 1931 1941 1951 1961 1971 1901 1911 1921 1931 1941 1951 1961 1971
Status of Town
5
NM
TA NA
M M Corp
MB MB
Canlt Cantt
Aream Km'
6
1 49
NA 106
3 66
NA 084
072 3 30
18 31 2428
521 NA 5 21 521 NA
NA NA NA
41 18 182 30
55 89 55 90
13 80 13 81
3569 35 69 640 640
29 14 9453
29 14 79 97
Persons
7
384
354
350 347
273 187
172
43
20,747 53,922 16,827 26,387" 16,827 19,6580 4-;727
1,070 610
322
81,143 91,031
100,992 124,398 143,504 196,180 248,489 379,166 118,539 116,631 I 122,609 136,709 169,290 233,183 283,997 367,754 118,539 116,631 122,609 91,181
117,182 158,407 200,470 270,993 45,528 52,108 74,776 75,334 85,415
8,193 11,346 40892 43,413 44,711 57,303 70,243
108,042 211,190 363,467
40,892 43,413 44,711 57,303 70,143
108,042 211,190 355,045
Decade vanatlOu
8
+ 33175
+9,560
+2,831
+9,888 +9,961
+23,406 + 19,106 +52,676 +52,309
+ 130,677
-I,9()S + 5,978
+ 14,1()0 +32,581 +63,893 +50,814 +83,757
--1,908 +5,978
-31,428 +26,001 +41,225 +42,063 +70,523
+ 6,580 +22,668
+558 +10,081
+3,153
+2,521 + 1,298
+ 12,592 + 12,940 +37,799
+103,148 + 152,277
+2,521 +1,298
+ 12,592 + 12,941\ +37,799
+ 103,148 + 143,855
Percentage decade
VariatIon
9
+ 159 90
+56 81
+1682
+ 12 19 +1094 +23 18 + 15 36 +3671 +26 66. +5259.
-161 +5 13
+11 50 +23 83 +3774 +2179 • +2949
-161 +5 13
-2563 +28 52 +35 18 +2655 +35 18
+1445 +43 50 +075
+13 38
+38 48
+617 +299
+28 16 +22 58 +53 81 +9, 47· +72 10
+617 +299
+28Ui +2258 +53 81 ': +9547 +68 12
tAfter 1961, Hubh-Dharwar CorporatlOn was formed by Inergmg Hub!! and Dharwar towns of 1961 Census the populatlon
Males
10
221
204
188
204 143
100
87 29
14,419 30,019 8,872
14,911 8,872
10,321 3,562
533
327
168
41,702 46,677 53004 65,598 74,453
102,041 130,718 201,286
65,822 66,542 71,816 80,073 98,829
133094 157572 202,822
65,822 66,542 71,816 52,112 65,935 87,232
108,520 145,640 27,961 32894 45,862 44,272 50,876 4780 6,306
20,034 21,465 22,153 29,449 35,660 54620
110,545 189,084 20,034 21,465 22,153
, 29,449 35,660 54,620
110, '45 184,820
Females
11
163
150
162
143 130
87
85 14
6,328 23,903
7,95' 11,476
7,955 9,337 1,165
537
283
154
39,441 44,354 47,988 58800 69,051 94,139
117,771 177,880
52,717 50 ()S9 50,793 56,636 70,461
100,089 126,425 164,932 52717 50,089 5() 793 39,069 51,247 71,175 91,950
125,353 17,567 19,214 28,914 31,062 34,539
3,413 5,040
20,858 21,948 22,558 27,854 34,583 53,422
lQ.O,645 114,383
20,858 21,948 22,558 27,854 34.583 53,422
100,645 170,225
(I) Hubh P 59,913 (M, 30,700 F 29,213) in 1901 P 61,440 (M 31,577 F 29,863) m 1911, P 66,772 (M 35,038, F 31,734) m 1921 P 83494 (M 44 042 F 39,452" m 1931, P 95,512 (M 49,505, F 46,007) In 1941, P 129,609 (M 67,154, F 62,455) m 1951 and P 171,326 (M 89,641, F 81,685) 1U 1961'
(11) Dharwar P 21,230 (M 11.002, F 10,228) III 1901, P 29,591 (M 15,100, F 14,491) m 1911, P 34,220 (M 17,966, F 16,254) III 1921 P 40904 (M 21556 F 19,348) III 1931, P 47,992 (M 24,948, l' 23,044) m 1941, P 66,571 (M 34,887, F 31,684) m 1951 and P 77,163 (M 41,077: F 36,086) m 1961' ,
tThe extent of adjustment m populatIon made m the succeSSive censuses wJ)1 appear from the follOWIng table m whIch col 3 shows the figures recorded m the census tables of the particular years mentIOned m col 2 and col, 4 to 9 sbow the figures as adjusted m the ye«r mentIoned m each
Adjustments made In
Name of Town Year
2
PopulatIon recorded for the Year
3
r------ - -- _______ ..A.. ----,
19~ 1~1 19~ 651 4 567
-l%1---mt-- ..... 9
Meerut lM B) 1901 118,129 118,539 118,539 118,539 118,539 118,539 1911 116,227 116,631 116,631 116,631 116,631 116,631
£ From 1901 to 1921 Meerut Cantonment havlUg populatIOn of 39,38Q (22,973 M, 16416 F) m 1901 , P 39,876 (24,269 M, 15,607 F) IU 1911 and M, 16,034 .f) IU 1921 bemg part of Meerut (M B) has been com bIlled WIth Meerut lM B)
<Q Mal)sra "as part of Meerut (M B) and Mahana' In 1961 ,md treated as an mdevemlent town In 1971 Census
118,539 116,631
P 44,898 (28,864
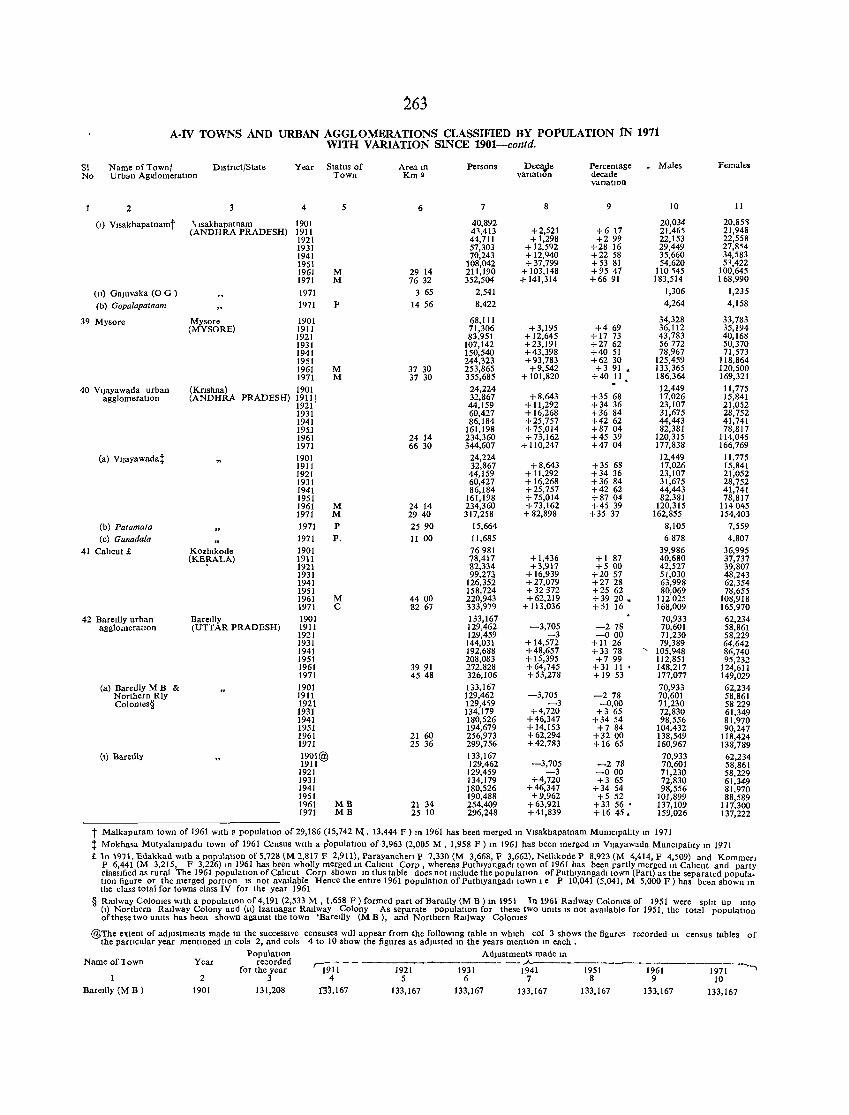
263
A.tv TOWNS AND URBAN AGGLOMERATIONS CLASSIFIED BY POPULATION 1N 1971 WITH V ARlATION SlNCE 1901-col1td.
SI Name of Town/ Dlstnct/State No Urban Ag~lomeratlOn
2
(,) Vlsakhapatnamt
(11) Gajuvaka (0 G )
(b) Gopalapatnam
39 Mysore
40 Vljayawada urban agglomeratIOn
Ca) VIJayawadat
(b) Patamata (c) G unadala
',lsakhapatnam (ANDHRA PRADESH)
Mysore (MYSORE)
(Knshna) (ANDHRA PRADESH)
41 Cahcut £ Kozhlkode (KE!U-LA)
42 Barellly urban Baretlly agglomeratIOn (UTTAR PRADESH)
(a) Baretily M B & Northern Rly COlontes§
ell Bareilly
Year Status of Town
4
1901 1911 1921 1931 1941 1951 1961 1971 1971 1971
1901 1911 1921 1931 1941 1951 1961 1971 1901 19111 1921 1931 1941 1951 1961 1971 1901 1911 1921 1931 1941 1951
5
M M
P
M M
1961 M 1971 M
1971 P 1971 P. 1901 1911 1921 1931 1941 1951 1961 M 1971 C 1901 1911 1921 1931 1941 1951 1961 1971 1901 1911 1921 1931 1941 1951 1961 1971 1901@ 1911 1921 1931 1941 1951 1961 MB 1971 MB
Area lfi Km2
6
29 14 76 32
3 65 14 56
37 30 37 30
24 14 66 30
24 14 2940 25 90 II 00
4400 8267
3991 4548
21 60 25 36
21 34 25 10
Persons
7
40,892 41,413 44,711 57,303 70,243
108,042 211,190 352,504
2,541 8,422
68,111 71,306 83,951
107,142 150,540 244,323 253,865 355,685
24,224 32,867 44,159 60,427 86,184
161,198 234,360 344,607
24,224 32,867 44,159 60,427 86,184
161,198 234,360 317,258
15,664 11,685 76981 78,417 82,334 99,273
126,352 158,724 220,943 333,979 133,167 129,462 129,459 144,031 192,688 208,083 272,828 326,106 133,167 129,462 129,4~9 134,179 180,526 194,679 256,973 299,756 133,167 129,462 129,459 134,179 180,526 190,488 254,409 296,248
Deca.de vanatulD
8
+2,521 + 1,298
+ 12,592 + 12,Q40 +37,799
+ 103,148 -I- 141,314
+3,195 + 12,645 +23,191 +43,398 +93,783 +9,542
+ 101,820
+8,643 +11,292 + 16,268 +25,757 +75,014 +73,162
+110,247
+8,643 +11,292 + 16,268 +25,757 +75,014 +73,162 +82,898
+1,436 +3,917
+ 16,939 +27,079 +32372 +62,219
+113,036
-3,705 -3
+ 14,572 +48,657 + 15,395 +64,745 +53,278
-3,705 -3
+4,720 +46,347 +14,153 +62,294 +42,783
-3,705 -3
+4,720 +46,347
+9,962 +63,921 +41,839
Percentage • Mdles decade varIation
9
+617 +299
+28 16 +22 58 +53 81 +9541 +6691
+469 + 17 73 +27 62 +40 51 +6230 +3 91 •
+40 11
+35 68 +34 36 +36 84 +4262 +87 04 +45 39 +47 04
+35 68 +34 36 +36 84 +42 62 +8704 +45 39
+35 37
+1 87 +500
+20 51 +2728 +25 62 +39 20. +51 16
-278 -000
+11 26 +33 78 +799
+31 11 ' +19 53
-278 -0,00
+3 65 +34 54 +784
+3200 +1665
-278 -000 +3 65
+34 54 +552
+33 56 ' +1645.
10
20,034 21,46~ 22,153 29,449 35,660 54,620
110 ~45 183,514
1,306 4,264
34,328 36,112 43,783 56772 78,967
125,459 133,365 186,364 12,449 17,026 23,107 31,675 44,443 82,381
120,315 177,838 12,449 17,026 23,107 31,675 44,443 82,381
120,315 162,855
8,105 6878
39,986 40,680 42,527 51,030 63,998 80,069
112025 168,009
70,933 70,601 71,230 79,389
" 105,948 112,851 148,217 177,077 70,933 70,601 71,230 72,830 98,556
104,432 138,549 160,967
70,933 70,601 71,230 72,830 98,556
101,899 137,109 159,026
t Malkapuram town of 1961 WIth ~ populatIOn of 29,186 (15,742 M:, 13,444 F) m 1961 has been merged III Vlsakhapatnam Muntclpahty III 1971
Females
11
20,85~ 21,948 22,558 27,8'4 34,583 5\422
100,645 168,990
1,235
4,158
33,783 35,194 40,168 50,370 71,573
118,864 120,500 169,321 11,775 15,841 21,052 28,752 41,741 78,817
114,045 166,769
11,775 15,841 21,052 28,752 41,741 78,817
114045 154,403
7,559 4,807
36,995 37,737 39,807 48,243 62,354 78,655
108,918 165,970
62,234 58,861 58,229 64,642 86,740 95,23~
124,611 149,029 62,234 58,861 58229 61,349 81,970 90,247
118,424 138,789
62,234 58,861 58,229 61,349 81,970 88,589
117,300 137,222
:j: Mokhasa Mutyalampadu town of 1961 Census WIth a populatIOn of 3,963 (2,005 M, 1,958 F) m 1961 has been merged m VIJayawada Munelpahty m 1971 £ In 19')1, Edakkad wlth a popu\aUon of 5,728 \M 2,817 F 2,911), Parayanchen P 7,330 (M 3,668, F 3,662), Nelhkode P 8,923 (M 4,414, F 4,509) and Kommen
P 6,441 (M 3,215, F 3,226) III 1961 has been wholly merged m Caheut Corp, whereas PuthlYJngadl town of 1961 has been partiy merged m Caheut and party classtfied as rural The 1961 populatIOn ofCaheut Corp shown m tlus table does not mclude the populatIOn of Puthlyangadl town (Part) as the separated popula. !Jon figure or the merged portIOn IS not avatlable Hence the enttre 1961 populatIOn of Puthlyangadl town I e P 10,041 (5,041, M 5,000 F) has been shown m the class total for towns class IV for the year 1961
§ Ratlway Colomes wllh a populauon of 4,191 (2,533 1\1: , 1,658 F ) formed part oeBarellly (M B ) m 1951 In 1961 Ratlway Colomes of 1951 were spltt up mto (1) Northern Ratlway Colony and (11) lzatnagar RaIlway Colony As separate populatIOn for these two Untts IS not avatlable for 1951, the total populatIOn of these two umts has been shown agamst the town 'Barellly (M B), and Northern Ratlway Colomes
@The extent of adjustments made m the succeSSlve censuses WIll appear from the folloWlllg table m whICh col 3 shows the figures the par!Jcular year mentIOned III cols 2, and cols 4 to 10 show the figures as adjusted m the years mentIOn m each.
Population Adjustments made 10 Name of 1 own Year recorded - -- ,.,.._
for the year 'i911 - - --~il" 1931--- -1941 1951 234 567 8
Barellly (M B) 1901 131,208 m,I67 133,167 133,167 133,167 133,167
recorded 10 census tables of
1961 9
133,167
1971 10
133,167
'.,
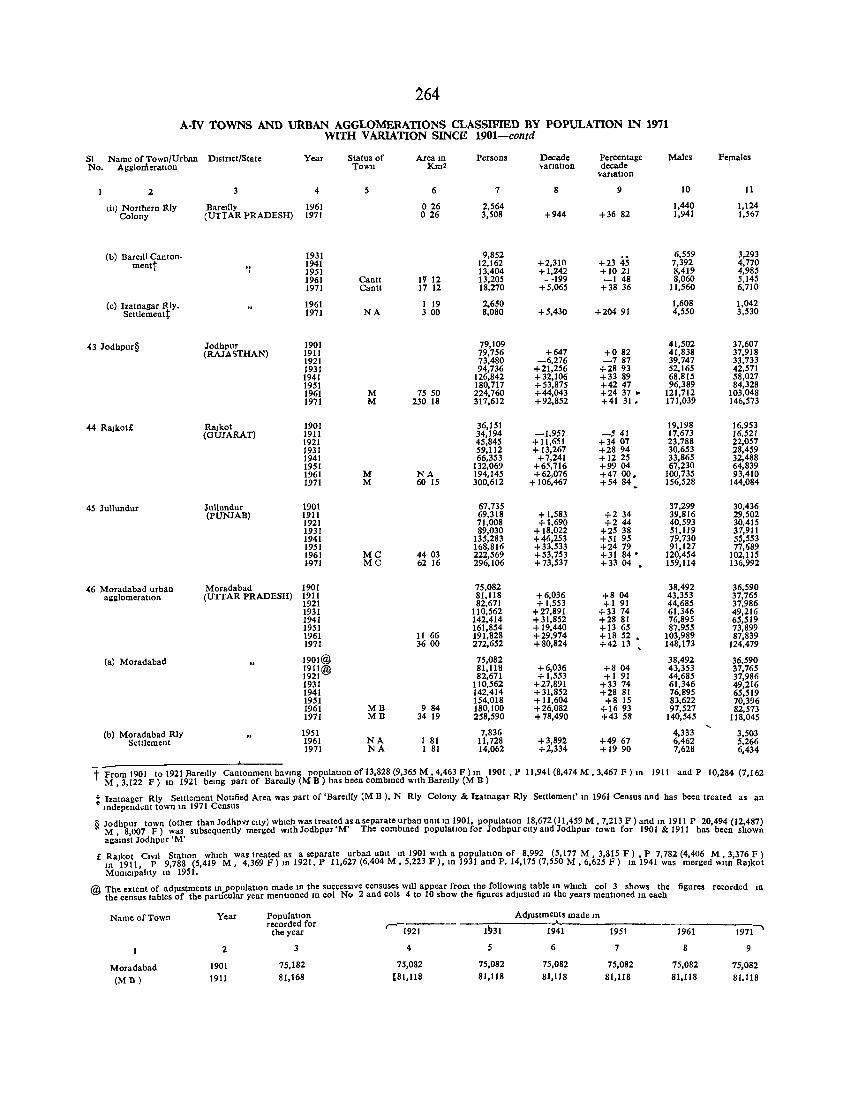
264
A-IV toWNS AND URBAN AGGLOMERATIONS CLASSIFIED BY POPULATION IN 1971 WITH VARIATION SINCE 1901-contd
51 Name of Town/Urban DIstrIct/State Year Status of Area 10 Persons Decade Percentage Males Females No. Agglomeration Town Km' "anatlon decade
vanatlon
2 3 4 5 6 7 8 9 10 11
\It) Northern Rly Barellly 1961 026 2,564 1,440 1,124 Colony (UTTAR PRADESH) 1971 026 3,508 +944 +36 82 1,941 1,567
(IJ) Barelll Canton· 1931 9,852 +23 45
6,559 3,293 menlt .. 1941 12,162 +2,310 7,392 4,770 , 1951 13,404 +1,242 +1021 8,419 4,985
1961 Cantt 1'112 13,205 -199 -148 8,060 5,145 1971 Cantt 17 12 18,270 +5,065 +38 36 11,560 6,710
(c) Izatnagar Rly. 1961 1 19 2,650 1,608 1,042 Settlementt 1971 NA 3 00 8,080 +5,430 +204 91 4,550 3,530
-43 Jodhpur§ Jodhpur 1901 79,109 41,502 37,607 (RAJA'iTHAN) 1911 79,756 +647 +082 41,838 37,918
1921 73,480 -6,276 -787 39,747 33,733 1931 94,736 +21,256 +28 93 52,165 42,571 1941 126,842 +32,106 +33 89 68,815 58,027 1951 180,717 +53,875 +4247 96,389 84,328 1961 M 75 50 224,760 +44,043 +24 37 .. 121,712 103,048 1971 M 230 18 317,612 +92,852 +41 31. 171,039 146,573
44 RaJkot£ RaJkot 1901 36,151 19,198 16,953 (GUJARAT) 1911 34,194 -1,957 -541 17,673 16,521
1921 45,845 + 11,651 +3407 23,788 22,057 1931 59,112 + 13,267 +2894 30,653 28,459 1941 66,353 +7,241 +1225 33,865 32,488 1951 132,069 +65,716 +9904 67,230 64,839 1961 M NA 194,145 +62,076 +47 00. 100,735 93,410 1971 M 60 15 300,612 + 106,467 +5484 156,528 144,084
45 lullundur lullundur 1901 67,735 37,299 30,436 (PUNJAB) 1911 69,318 + 1,583 +234 39,816 29,502
1921 71,008 +1,690 +244 40,593 30,415 1931 89,030 + 18,022 +25 38 51,119 37,911 1941 135,283 +46,253 +51 95 79,730 55,553 1951 168,816 +33,533 +2479 91,127 77,689 1961 MC 4403 222,569 +53,753 +31 84' 120,454 102,115 1971 MC 62 16 296,106 +73,537 +33 04 • 159,114 136,992
-46 Moradabad urban Moradabad 1901 75,082 38,492 36,590 alllllomeratJon (UTTAR PRADESH) 1911 81,118 +6,036 +804 43,353 37,765
1921 82,671 + 1,553 +1 91 44,685 37,986 1931 110,562 +27,891 +33 74 61,346 49,216 1941 142,414 +31,852 +2881 76,895 65,519 1951 161,854 +19,440 +13 65 87,955 73,899 1961 11 66 191,828 +29,974 +18 52 • 103,989 87,839 1971 3600 272,652 +80,824 +42 13 148,173 124,479
(a) Moradabad 1901@ 75,082 38,492 36,590
ml@ 81,118 +6,036 +804 43,353 37,765 82,671 + 1,553 +1 91 44,685 37,986
1931 110,562 +27,891 +3374 61,346 49,216 1941 142,414 +31,852 +28 81 76,895 65,519 1951 154,018 + 11,604 +8 15 83,622 70,396 1961 MB 9 84 180,100 +26,082 +1693 97,527 82,573 1971 MB 34 19 258,590 +78,490 +4358 140,545 118,045
(b) Moradabad Rly 1951 7,836 4,333 3,503 Settlement 1961 NA 1 81 11,728 +3,892 +4967 6,462 5,266
1971 NA 1 81 14,062 +2,334 +1990 7,628 6,434
t From 1901 to 1921 BareIlly Cantonment havmg populatIon of 13,828 (9,365 M , 4,463 F ) ID 1901, P 11,941 (8,474 M , 3,467 F ) m 1911 and P 10,284 (7,162 M , 3,122 F) In 1921 bemg part of BareIlly (M B ) has been combmed with Barellly (M B)
t Izatnager Rly Settlement Nollfied Area was part of 'Barellly (M B ), N Rly Colony & Izatnagar Rly Settlement' ID 1961 Census and has been treated as an mdependent town m 1971 Census
§ Jodhpur town (other than Jodhpvrclty) whIch was treated as a separate urban umt ID 1901, population 18,672 (11,459 M , 7,213 F ) and m 1911 P 20,494 (12,487) M, 8,007 F) was subsequently merged WIth Jodhpur 'M' The combmed populatIon for Jodhpur cIty and Jodhpur town for 1901 & 1911 has been shown agamst Jodhpur 'M'
£ RaJkot CIvil Stallon whIch was treated as a separate urban umt ID 1901 WIth a populatIon of 8,992 (5,177 M, 3,815 F) , P 7,782 (4,406 M, 3,376 F) ID 1911, P 9,788 (5,419 M, 4,369 F) ID 1921, P 11,627 (6,404 M, 5,223 F ),ID 1931 and P. 14,175 (7,550 M, 6,625 F) ID 1941 was merged with RaJkot MUDlclpahty 1D 1951.
@ The extent of adjustments m_populatlon made In the successive censuses will appear from the followmg table 10 which col 3 shows the the census tables of the partIcular year mentIOned ID col No 2 and cols 4 to 10 show the figures adjusted In the years mentioned In each
figures recorded 10
Name of Town Year PopulatIon Adjustments made lD
recorded for r- --"--the year 1921 1~31 1941 1951 1961 1971"1
2 3 4 5 6 7 8 9
Moradabad 1901 75,182 75,082 75,082 75,082 75,082 75,082 75,082
(MD) 1911 81,168 {81,118 81,118 81,118 81,118 81,118 81.118
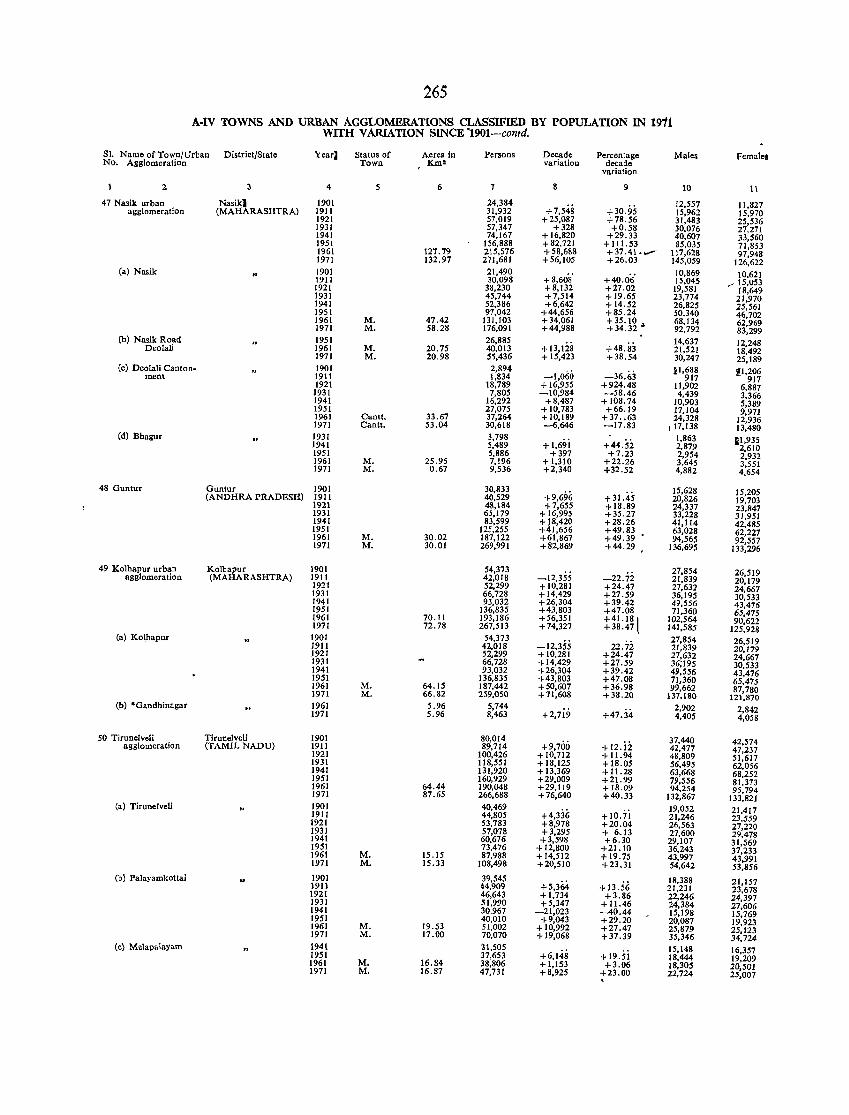
265 A-IV TOWNS AND URBAN AGGLOMERATIONS CLASSIFIED BY POPULATION IN 1911
WITH VARIATION SINCE -1901-contd.
SI. Name of Town/Urban District/State YearJ Status of Aerea in Persons Decade Percentage Males Females No. Agglomeration Town Km2 variation decade
variation
2 3 4 5 6 7 8 9 10 1\
47 Nasik urban NasikJ 1901 24,384 +7,548 +30.95
12,557 11,827 agglomeration (MAHARASHTRAl 1911 31,932 15,962 15,970
1921 57,019 +25,087 +78.56 31,483 25,536 1931 57,347 +328 +0.58 30,076 27,271 1941 74,167 + 16,820 +29,33 40,607 33,560 1951 156,888 +82,721 + 111.53 85,035 71,853 1961 127.79 215,576 +58,688 +37.41 • ....- 117,628 97,948 1971 132,97 271,681 +56,105 +26,03 145,059 126,622
(a) Nasik 1901 21,490 +40.06'
10,869 10.621 1911 30,098 + 8,608 15,045 r' 15,053 1921 38,230 +8,132 +27.02 19,581 18,649 1931 45,744 +7,514 +19.65 23,774 21,970 1941 52,386 +6,642 +14.52 26,825 25,561 1951 97,042 +44,656 +85.24 50,340 46,702 1961 M. 47.42 131,103 +34,061 t3Ug • 68,134 62,969 1971 M. 58.28 176,091 +44,988 92,792 83,299
(b) Nasik Road 1951 26,885 + 13,1iil +48.83
14,637 12,248 Deolali 1961 M. 20.75 40,013 21,521 18,492 1971 M. 20.98 55,436 + 15,423 +38.54 30,247 25,189
(c) Deolali Canton- 1901 2,894 -1,060 -36.63
11,688 11,206 ment 1911 1,834 917 917 1921 18,789 + 16,955 +924.48 11,902 6,887
1931 7,805 -10,984 -58.46 4,439 3,366 1941 16,292 +8,487 + 108.74 10,903 5,389 1951 27,075 + 10,783 +66.19 J7,104 9,971 1961 Cantt. 33.67 37,264 +10,189 +37 .• 63 24,328 12,936 1971 Cantt. 53.04 30,618 -6,646 -17.83 117,138 13,480
(d) Bhagur 1931 3,798 +I,69i +44.52
1,863 1il,935 1941 5,489 2,879 2,610 1951 5,886 +397 +7.23 2,954 2,932 1961 M. 25.95 7,!96 + 1,310 +22.26 3,645 3,551 1971 M. 0.67 9,536 +2,340 +32.52 4,882 4,654
48 Guntur Guntur 1901 30,833 +9,696 +31.45
15,628 15,205 (ANDHRA PRADESH) 1911 40,529 20,826 19,703 1921 48,184 +7,655 +18.89 24,337 23,847 1931 65,179 + 16,995 +35.27 33,228 31,951 1941 83,599 + 18,420 +28.26 41,114 42,485 1951 125,255 +41,656 +49.83 63,028 62,227 1961 M. 30.02 187,122 +61,867 +49.39 94,565 92,557 1971 M. 30.01 269,991 +82,869 +44.29 136,695 133,296
49 Kolbapur urban Ko11ltur 1901 54,373 -12,355 -22.72
27,854 26,519 agglomeration (M ARASHTRA) 1911 42,018 21,839 20,179 1921 52,299 + 10,281 +24.47 27,632 24,667 1931 66,728 + 14,429 +27.59 36,195 30,533 1941 93,032 +26,304 +39.42 49,556 43,476 1951 136,835 +43,803 +47.08 71,360 65,475 1961 70.11 193,186 +56,351 +41. 18 1 102,564 90,622 1971 72.78 267,513 +74,327 +38.47 141,585 125,928 (al Kol.hapur 1901 54.373
-12,355 27,854 26,519 1911 42,018 22.72 21,839 20,179 1921 52,299 +10,281 +24.47 27,632 24,667 1931 66,728 + 14,429 +27.59 36;195 30,533 1941 93,032 +26,304 +39.42 49,556 43,476 1951 136,835 +43,803 +47.08 71,360 65,475 1961 M. 64.15 187,442 +50,607 +36.98 99,662 87,780 1971 M. 66.82 259.050 +71,608 +38.20 137,180 121,870
(b) *Gandhinagar 1961 5.96 5,744 +2,7i9 +47.34
2,902 2,842 1971 5.96 8,463 4,405 4,058
50 Tirunelveli Tirunelveli 1901 80,014 +9,700 +12.ii
37.440 42,574 agglomeration (TAMIL NADU) 1911 89,714 42,477 47,237 1921 100,426 +10,712 + 11.94 48,809 51,617 1931 118,551 +18,125 +18.05 56,495 62,056 1941 131,920 +13,369 + 11.28 63,668 68,252 1951 160,929 +29,009 +21.99 79,556 81,373 1961 64.44 190,048 +29,119 +18.09 94,254 95,794 1971 87.65 266,688 +76,640 +40.33 132,867 133,821 (a) Tirunelveli 1901 40,469
+4,336 +10.7i 19,052 21,417 1911 44,805 21,246 23,559 1921 53,783 +8,978 +20.04 26,563 27,220 193J 57,078 +3,295 + 6.13 27,600 29,478 1941 60,676 +3,598 +6.30 29,107 31,569 1951 73,476 + 12,800 +21.10 36,243 37,233 1961 M. 15.15 87,988 +14,512 +19.75 43,997 43,991 1971 M. 15.33 108,498 +20,510 +23.31 54,642 53,856
(b) Palayamkottai 1901 39,545 +5,364 + 13.56
18,388 21,157 1911 44,909 21,231 23,678 1921 46,643 +1,734 +3.86 22,246 24,397 1931 51,990 +5,347 + 11.46 24,384 27,606 1941 30.967 -21,023 -40.44 15,198 15,769 1951 40,010 +9,043 +29.20 20,087 19,923 1961 M. 19.53 51,002 +10,992 +27.47 25,879 25,123 1971 M. 17.00 70,070 +19,068 +37.39 35,346 34,724 (c) Melapalayam 1941 31,505
+6,148 +19.i;i 15,148 16,357 1951 37,653 18,444 19,209 1961 M. 16.84 38,806 + 1,153 +3.06 18,305 20,501 1971 M. 16.87 47,731 +8,925 +23.00 22,724 25,007 .
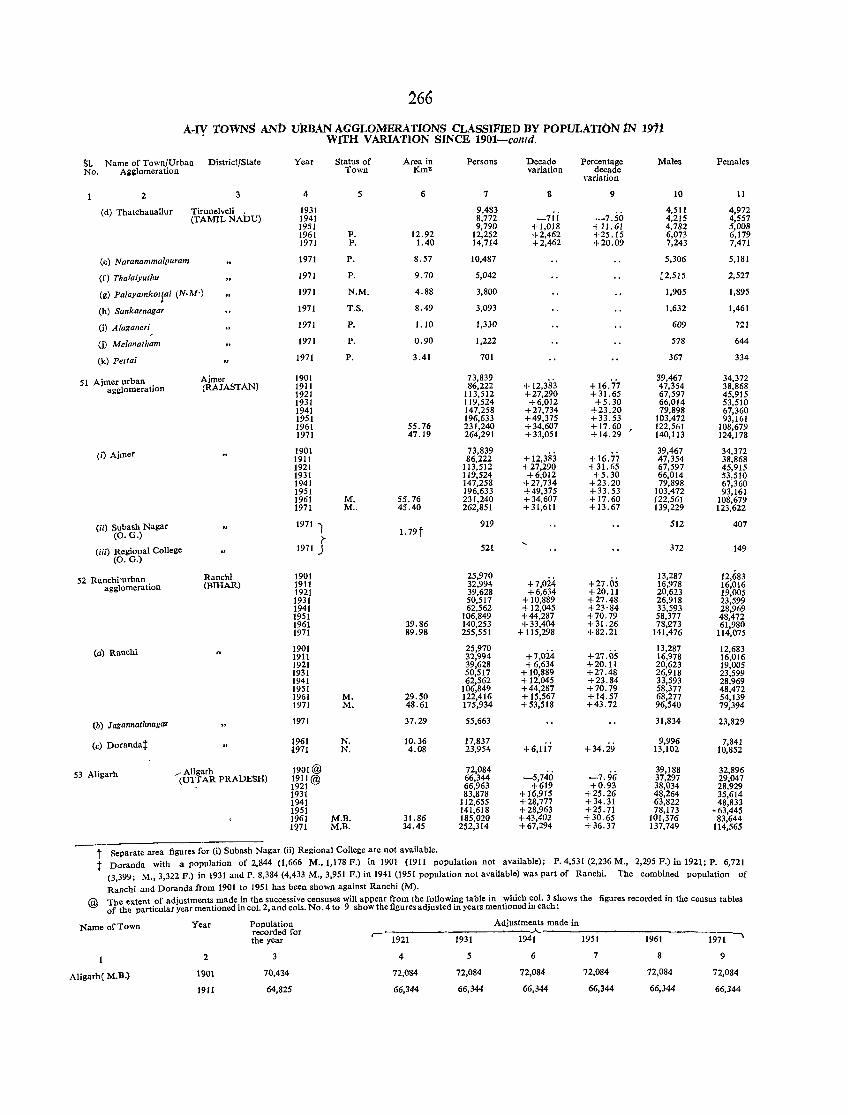
266 A-IV TOWNS AND uRBAN AGGLOMERATIONS CLASSIFIED BY POPULATION 1N 1911
. WITH VARIATION SINCE 1901-contd.
Sl. Name of Town/Urban District/State No. Agglomeration
2
(d) Thatchanallur
(e) Naranammalpuram
(f) Thalaiyuthu
3
Tirunelveli . (TAMIL NADU)
(g) Pa'ayamkotlai (N-M')
(h) Sankarnagar
(i) A/aganeri , (j) Me/analham
(k) Pettai
51 Ajmer urban . ag~lomeratIon
(i) Ajmer
(ii) Subash Nagar (0. G.)
Ajmer (RAJASTAN)
(iii) Regiol'al College (0. G.)
52. Ranchi'urban agglomeration
(a) Ranchi
(b) Jagannathnagar
(c) Dorandat
53 Aligarh
Ranchi (BIHAR)
_/ Aligarh (UTTAR PRADESH)
Year
4
1931 1941 1951 1961 1971
1971
1971
1971
1971
1971
1971
1971
1901 1911 1921 1931 1941 1951 1961 1971
1901 1911 1921 1931 1941 1951 1961 1971
1971 ')
{-1971 J
1901 1911 1921 1931 1941 1951 1961 1971
1901 1911 1921 1931 1941 1951 1961 1971
1971
1961 1971
1901@
ml@ 1931 1941 1951
Status of Town
5
P. P.
P.
P.
N.M.
T.S.
P.
P.
P.
M. MOo
M. M.
N. N.
1961 M.B. 19.71 M.B.
Area in Km2
6
12.92 1.40
8.57
9.70
4.88
8.49
1.10
0.90
3.41
55.76 47.19
55.76 45.40
1.79t
39.86 89.98
29.50 48.61
37.29
10.36 4.08
31.86 34.45
Persons
7
9,483 8,772 9,790
12,252 14,714
10,487
5,042
3,800
3,093
1,330
1,222
701
73,839 86,222
113,512 119,524 147,258 196,633 231,240 264,291
73,839 86,222
113,512 119,524 147,258 196,633 231,240 262,851
919
521
25,970 32,994 39,628 50,517 62,562
106,849 140,253 255,551
25,970 32,994 39,628 50,517 62,562
106,849 122,416 175,934
55,663
17,837 23,954
72,084 66,344 66,963 83,878
112,655 141,618 185,020 252,314
Decade variation
8
-711 +1,018 +2,462 +2,462
+ 12,383 +27,290 +6,012
+27,734 +49,375 +34,607 +33,051
+ 12.,383 +27,290 +6,012
+27,734 +49,375 +34,607 +31,611
+7,024 +6,634
+ 10,889 + 12,045 +44,287 + 33,404
+ 115,298
+7,024 +6,634
+ 10,889 + 12,045 +44,287 + 15,567 + 53,518
+6,lij
-5,740 +619
+16,915 +28,777 +28,963 +43,402 +67,294
Percentage decade
variation
9
-7.50 +11.61 +25.15 +20.09
+16.7'7 +31.65 +5.30
+23.20 +33.53 +17.60 +14.29
+16.77 +31.65 +5.30
+23.20 +33.53 +17.60 + 13. 67
+27.05 +2.0.11 +27.48 +23'84 +70.79 + 31. 26 +82.21
+27.0S +20.11 +27.48 +23.84 +70.79 +14.57 +43.72
+ 34.29
-7.96 +0.93
+25.26 +34.31 +25.71 + 30.65 + 36.37
Males
10
4,511 4,215 4,782 6,073 7,243
5,306
~2,515
1,905
1,632
609
578
367
39,467 47,354 67,597 66,014 79,898
103,472 122,561 140,113
39,467 47,354 67,597 66,014 79,898
103,472 122,561 139,229
512
372
13,287 16,978 20,623 26,918 33,593 58,377 78,!Z73
141,476
13,287 16,978 20,623 26,918 33,593 58,377 68,277 96,540
31,834
9,996 13,102
39,188 37,297 38,034 48,264 63,822 78,173
101,376 137,749
Females
11
4,972 4,557 5,008 6,179 7,471
5,181
2,527
1,895
1,461
721
644
334
34,372 38,868 45,915 53,510 67,360 93,161
108,679 124,178
34,372 38,868 45,915 53,510 67,360 93,161
108,679 123,622
407
149
12,683 16,016 19,005 23,599 28,969 48,472 61,980
114,075
12,683 16,016 19,005 23,599 28,969 48,472 54,139 79,394
23,829
7,841 10,852
32,896 29,047 28,929 35,614 48,833
-63,445 83,644
114,565
t Separate area figures for (i) Subash Nagar (ii) Regional College are not available. t Doranda with a population of 2,844 (1,666 M., 1,178 P.) in 1901 (1911 population not available); P. 4,531 (2,236 M., 2,295 P.) in 1921; P. 6,721
(3,399; M., 3,32.2. P.) in 1931 and P. 8,384 (4,433 M., 3,951 P.) in 1941 (1951 population not available) was part of Ranchi. The combined population of
Ranchi and Doranda from 1901 to 1951 has been shown against Ranchi (M). @ The extent of adjustments made in the successive censuses will appear from the following table in which col. 3 shows the figures recorded in the census tables
of the particular year mentioned in col. 2, and cols. No.4 to 9 show the figures adjusted in years mentioned in each:
Name of Town
Aligarh( M.B.)
Year
2
1901
1911
Population recorded for the year
3
70,434
64,825
Adjustments made in r- 1921 ----19-3-1--~' 19~----1-95-1----1-9-6'1-----19-7-1-'
4 5 6 7 8 9
72,084 72,084 72,084 72,084 72,084 72,084
66,344 66,344 66,344 66,344 66,344 66,344
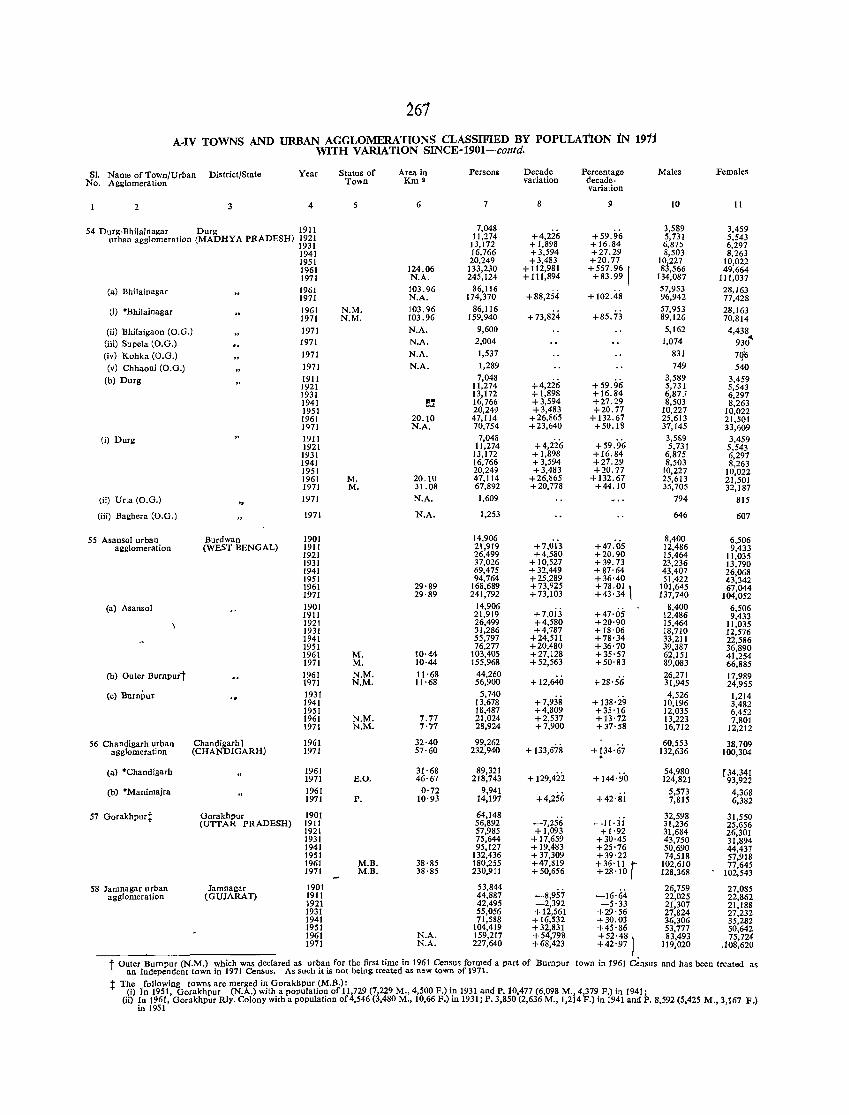
261 A.IV TOWNS AND URBAN AGGLOMERATIONS CLASSIFIED BY POPULATION iN 1911
WITH VARIATION SINCE-1901-contd.
81. Name of Town/Urban District/State Year Status of Area in Persons Decade Percentage Males Females No. Agglomeration Town Km 2 variation decade.
variation
2 3 4 6 7 8 9 10 11
54 Durg·Bhilaioagar Durg 1911 7,048 +4,226
3,589 3,459 urban agglomeration (MADHYA PRADESH) 1921 11,274 +59.96 5,731 5,543
1931 13,172 +1,898 +16.84 6,875 6,297 1941 16,766 +3,594 +27.29 8,503 8,263 1951 20,249 +3,483 +20.77 10,227 10,022 1961 124.06 133,230 + 112,981 +557.96 r 83,566 49.664 1971 N.A. 245,124 + 111,894 +83.99 134,087 111,037
(a) Bhi1aioagar 1961 103.96 86,116 57,953 28,163 1971 N.A. 174,370 +88,254 + 102.48 !l6,942 77,428
til *Bhilainagar 1961 N.M. 103.96 86,116 +85.73
57,953 28,163 1971 N.M. 103.96 159,940 +73,824 89,126 70,814
(ii) Bhilaigaon (O.G.) 1971 N.A. 9,600 5,162 4,438
(iii) Supe1a (O.G.) 1971 N.A. 2,004 1,074 930'"
(iv) Kohka (O.G.) 1971 N.A. 1,537 831 7q~ (v) Chhaoni (O.G.) 1971 N.A. 1,289 749 540
(b) Durg 1911 7,048 +4,226
3,589 3.459 1921 11,274 +59.96 5,731 5,543 1931 13,172 +1,898 +16.84 6,87-' 6,297 1941 !!!: 16,766 +3,594 +27.29 8,503 8,263 1951 20,249 +3,483 +20.77 10,227 10,022 1961 20.10 47,114 +26,865 + 132.67 25,613 21,501 1971 N.A. 70,754 +23,640 +50.IS 37,145 33,609
(i) Durg 1911 7,048 +4,226 +59.96
3,509 3,459 1921 11,274 5,731 5,543 1931 13,172 + 1,898 +16.84 6,875 6,297 1941 16,766 +3,594 +27.29 8,503 8,263 1951 20,249 +3,483 +20.77 10,227 10,022 1961 M. 20.10 47,114 +26,865 + 132.67 25,613 21,501 1971 M. 31.08 67,892 +20,778 +44.10 35,705 32,187
\ii) Urla (O.G.) "
1971 N.A. 1,609 794 815
(iii) Baghera (O.G.) 1971 N.A. 1,253 646 607
55 Asansol urban Burdwan 1901 14,906 +7,013
8,400 6,506 agglomeration (WEST BENGAL) 1911 21,919 +47.05 12,486 9,433
1921 26,499 +4,580 +20.90 15,464 11,035 1931 37,026 + 10,527 + 39.73 23,236 13,790 1941 69,475 + 32,449 +87'64 43,407 26,068 1951 94,764 +25,289 +36'40 51,422 43,342 1961 29'89 168,689 +73,925 +78.01 r 101,645 67,044 1971 29·89 241,792 +73,103 +43'34 137,740 104,052
(a) Asansol 1901 14,906 +7,oi3 +47·05
8,400 6,506 1911 21,919 12,486 9,433 1921 26,499 +4,580 +20'90 15,464 11,035 1931 31,286 +4,787 + 18·06 18,710 12,576 1941 55,797 +24,511 +78'34 33,211 22,586 1951 76,277 +20,480 +36'70 39,387 36,890 1961 M. 10·44 103,405 +27,128 +35'57 62,151 41,254 1971 M. 10·44 155,968 +52,563 +50'83 89,083 66,885
(b) Outer Burnpuri 1961 N.M. 11·68 44,260 + 12,640 +28'5'6
26,271 17,989 1971 N.M. 11'68 56,900 31,945 24,955
(c) Burnpur 1931 5,740 +7,938 + 138'29
4,526 1,214 1941 13,678 10,196 3,482 1951 18,487 +4,809 +35'16 12,035 6,452 1961 N.M. 7.77 21,024 +2,537 +13·72 13,223 7,801 1971 N.M. 7·77 28,924 +7,900 +37'58 16,712 12,212
56 Chandigarh urban Chandigarh 1 1961 32·40 99,262 + 133,678 + 134'67
60,553 38,709 agglomeration (CHANDIGARH) 1971 57·60 232,940 132,636 100,304 .
(a) ·Chandigarh 1961 31·68 89,321 + 129,422 +144'90
54,980 r 34,341 1971 E.O. 46'67 218,743 124,821 93,922
(b) ·Manimajra 1961 0'72 9,941 +4,256 +42·si
5,573 4,368 1971 P. 10·93 14,197 7,815 6,382
57 Gorakhpur~ Gorakhpur 1901 64,148 32,598 31,550 (UTTAR PRADESH) 1911 56,892 -7,256 -11·31 31,236 25,656
1921 57,985 +1,093 +1·92 31,684 26,301 1931 75,644 + 17,659 +30'45 43,750 31,894 1941 95,127 + 19,483 +25'76 50,690 44,437 1951 132,436 +37,309 +39'22 74,518 57,918 1961 M.B. 38·85 180,255 +47,819 +36'11 r 102,610 77,645 1971 M.B. 38·85 230,911 +50,656 +28'10 128,368 102,543
58 Jamnagar urban Jamnagar 1901 53,844 -8,957 -16·64
26,759 27,085 agglomeration (GUJARAT) 1911 44,887 22,025 22,862
1921 42,495 -2,392 -5'33 21,307 21,188 1931 55,056 +12,561 +29'56 27,824 27,232 1941 71,588 + 16,532 +30.03 36,306 35,282 1951 104,419 +32,831 +45·86 53,777 50,642 1961 N.A. 159,217 +54,798 +52'48 83,493 75,724 1971 N.A. 227,640 +68,423 +42'97 ) 119,020 .108,620
tOuter Burnpur (N.M.) which was declared as urban for the first time in 1961 Census formed a part of Burnpur an independent town in 1971 Census. As such it is not being treated as new town of 1971.
town in 1961 C~nsus and has been treated as
~ The following towns are merged in Gorakhpur (M.B.): (i) In 1951, Gorakhpur (N.A.) with a population of 11,729 (7,229 M., 4,500 F.) in 1931 and P. 10,477 (6,098 M., 4,379 F.) in 1941'
(ii) In 1961, Gorakhpur Rly. Colony with a population of4,546 (3,480 M., 10,66 F.) in 1931; P. 3,850 (2,636 M., 1,214 F.) in 1941 and P. 8592 (5 425 M. 3 167 F) in 1951 ' , " •
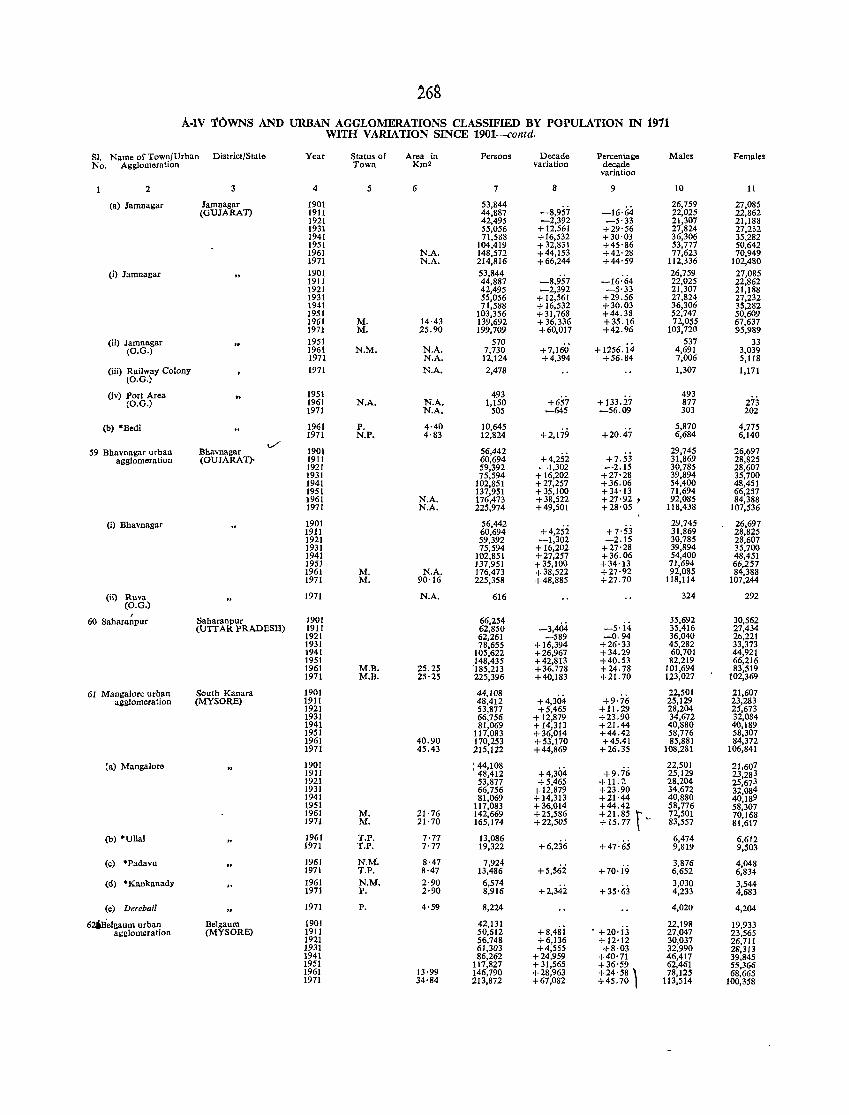
268
A-IV TOWNS AND URBAN AGGLOMERATIONS CLASSIFffiD BY POPULATION IN 1911 WITH VARIATION SINCE 1901-contd.
SI. Name of Town/Urban District/State Year Status of Area in Persons Decade Percentage Male. Females No. Agglomeration Town Km2 variation decade
variation
2 3 4 5 6 7 8 9 10 11
(a) Jamnagar Jamnagar 1901 53,844 -8,957 -16'64
26,759 27,085 (GUJARAT) 1911 44,887 22,025 22,862
1921 42,495 -2,392 -5'33 21,301 21,188 1931 55,056 + 12,561 +29'56 27,824 27,232 1941 71,588 +16,532 +30·03 36,306 35,282 1951 104,419 + 32,831 +45'86 53,771 50,642 1961 N.A. 148,572 +44,153 +42'28 77,623 70,949 1971 N.A. 214,816 +66,244 +44'59 112,336 102,480
0) ]amnagar 1901 53,844 -16:64
26,759 27,085 1911 44,887 -8,957 22,025 22,862 1921 42,495 -2,392 -5'33 21,307 21,188 1931 55,056 + 12,561 +29.56 27,824 27,232 1941 71,588 + 16,532 +30.03 36,306 35,282 1951 103,356 +31,768 +44.38 52,747 50,609 1961 M. 14·43 139,692 + 36,336 +35.16 72,055 67,637 1971 M. 25.90 199,709 +60,017 +42.96 103,720 95,989
(U) lamnagar 1951 570 +7,160' + 1256. i4
531 33 (O.G.) 1961 N.M. N.A. 7,730 4,691 3,039
1971 N.A. 12,124 +4,394 +56.84 7,006 5,118 (iii) Railway Colony 1971 N.A. 2,478 1,307 1,171
(O.G.)
(iv) Port Area 1951 493 +65;- +133.ij 493
(O.G.) 1961 N.A. N.A. 1,150 877 273 1971 N.A. 505 -645 -56.09 303 202
(b) *Bedi 1961 P. 4·40 10,645 +2,179
5,870 4,775 1971 N.P. 4·83 12,824 +20.47 6,684 6,140
V 1901 56,442 29,745 26,697 59 Bhavnagar urban Bhavnagar
+4,2Si +7.53 agglomeration (GUJARAT) 1911 60,694 31,869 28,825 1921 59,392 -1,302 -2.15 30,785 28,607 1931 75,594 + 16,202 +27·28 39,894 35,700 1941 102,851 +27,257 +36.06 54,400 48,451 1951 137,951 + 35,100 +34'13 71,694 66,257 1961 N.A. 176,473 +38,522 +27·92 , 92,085 84,388 1971 N.A. 225,974 +49,501 +28'05 118,438 107,536
(i) Bha vnagar 1901 56,442 +4,252 +7'53
29,745 26,697 1911 60,694 31,869 28,825 1921 59,392 -1,302 -2.15 30,785 28,607 1931 75,594 + 16,202 +27'28 39,894 35,700 1941 102,851 +27,257 +36.06 54,400 48,451 1951 137,951 +35,100 +34'13 71,694 66,257 1961 M. N.A. 176,473 + 38,522 +27'92 92,085 84,388 1971 M. 90·16 225,358 +48,885 +27.70 118,114 107,244
(ii) Ruva 1971 N.A. 616 324 292 (O.G.)
I Saharanpur 1901 66,254 35,692 30,562 60 Saharanpur (UTTAR PRADESH) 1911 62,850 -3,404 -5·i4 35,416 27,434
1921 62,261 -589 -0.94 36,040 26,221 1931 78,655 + 16,394 +26'33 45,282 33,373 1941 105,622 +26,967 +34.29 60,701 44,921 1951 148,435 +42,813 +40.53 82,219 66,216 1961 M.B. 25.25 '185,213 +36.778 +24.78 101,694 83,519 1971 M.B. 25·25 225,396 +40,183 +21. 70 123,027 102,369
61 Mangalore urban South Kanara 1901 44,108 +4,304 +9·76
22,501 21,607 agglomeration (MYSORE) 1911 48,412 25,129 23,283
1921 53,877 +5,465 + 1 1.29 28,204 25,673 1931 66,756 + 12,879 +23.90 34,672 32,084 1941 81,069 + 14,313 +21.44 40,880 40,189 1951 117,083 + 36,014 +44.42 58,776 58,307 1961 40.90 170,253 +53,170 +45.41 85,881 84,372 1971 45.43 215,122 +44,869 +26.35 108,281 106,841
(a) Mangaloro 1901 : 44,108 +4,304 +9.76
22,501 21,607 1911 48,412 25,129 23,283 1921 53,877 +5,465 +11.2 28,204 25,673 1931 66,756 + 12,879 +23.90 34,672 32,084 1941 81,069 +14,313 +21·44 40,880 40,189 1951 117,083 +36,014 +44.42 58,776 58,307 1961 M. 21·76 142,669 +25,586 +21.85 \ ~ 72,501 70,168 1971 M. 21·70 165,174 +22,505 + IS. 77 83,557 81,617
(b) 'Ullal 1961 T.P. 7·77 13,086 +6,236 +47'65
6,474 6,612 1971 T.P. 7·77 19,322 9,819 9,503
(c) ·Padavu 1961 N.M. 8·47 7,924 +5,562 +70, i9 3,876 4,048
1971 T.P. 8·47 13,486 6,652 6,834 (d) °Kankanady 1961 N.M. 2·90 6,574
+2,342 + 35'63 3,030 3,544
1971 P. 2·90 8,916 4,233 4,683
(e) Derebail 1971 P. 4'59 8,224 4,020 4,204
6~~lgaum urban Belgaum 1901 42,131 +8,4Si • +20·i3
22.198 19,933 agglomeration (MYSORE) 1911 50,612 27,047 23,565
1921 56,748 +6,136 +12'12 30,037 26,711 1931 61,303 +4,555 +8·03 32,990 28,313 1941 86,262 +24,959 +40'71 46,417 39,845 1951 117,827 +31,565 +36'59 62,461 55,366 1961 13·99 146,790 +28,963 +24'58 , 78,125 68,665 1971 34·84 213,872 +67,082 +45.70 113,514 100,358
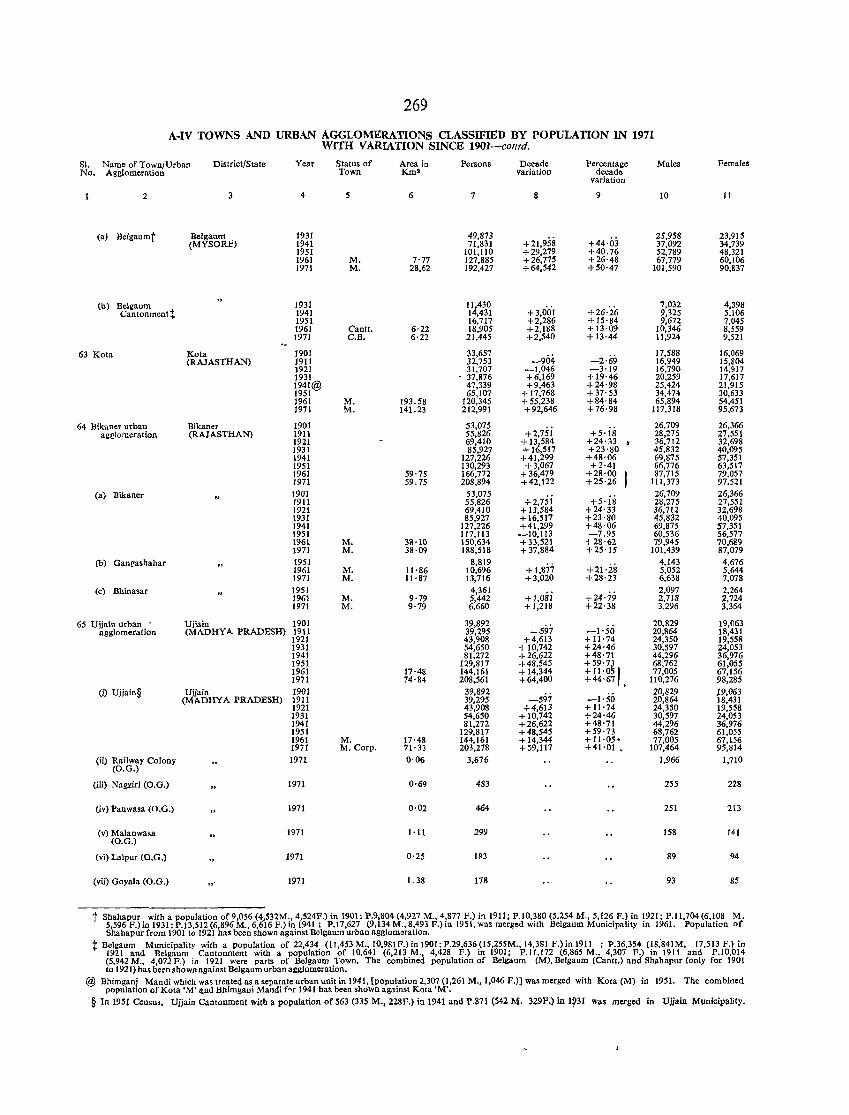
269
A-IV TOWNS AND URBAN AGGLOMERATIONS CLASSIFIED BY POPULATION IN 1971 WITH VARIATION SINCE 1901-contd.
SI. Name of Town/Urban District/State Year Status of Area in Persons Decade Percentage Males Females No. Agglomeration Town Kms variation decade
variation
2 3 4 5 6 7 8 9 10 II
(a) Belgaumt Helgau," 1931 49,873 +21,958 +44'03
25,958 23,915 (MYSORE) 1941 71,831 37,092 34,739
1951 101,110 +29,279 +40.76 52,789 48,321 1961 M. 7'77 127,885 +26,775 +26'48 67,779 60,106 1971 M. 28,62 192,427 +64.542 +50'47 101,590 90,837
(b) Belgaum 1931 1l,430 + 3,oeil +26'26
7,032 4,398 Cantonment t 1941 14,431 9,325 5,106
1951 16,717 +2,286 + 15'84 9,672 7,045 1961 Cantt. 6·22 18,905 +2,188 +13·09 10,346 8,559 1971 C.B. 6·22 21,445 +2,540 + 13·44 1l,924 9,521
63 Kola Kota 1901 33,657 -904 -2'69
17,588 16,069 (RAJASTHAN) 1911 32,753 16,949 15,804
1921 31,707 _1,046 -3'19 16,790 14,917 1931 37,876 +6,169 + 19·46 20,259 17,617 1941@ 47,339 +9,463 +24·98 25,424 21,915 1951 65,107 + 17,768 +37'53 34,474 30,633 1961 M. 193.58 120,345 +55,238 +84'84 65,894 54,451 1971 M. 141.23 212,991 +92,646 +76'98 117,318 95,673
64 Bikaner urban Bikaner 1901 53,075 +2,7Si +5·is
26,709 26,366 agglomeration (RAJASTHAN) 1911 55,826 28,275 27,551
1921 69,410 + 13,584 +24'33 • 36,712 32,698 1931 85,927 +16,517 +23'80 45,832 40,095 1941 127,226 +41,299 +48·06 69,875 57,351 1951 130,293 +3,067 +2·41 66,776 63,517 1961 59·75 166,172 +36,479 +28'00 87,715 79,057 1971 59.75 208,894 +42,122 +25·26 111,373 97,521
(a) Bikaner 1901 53,075 +2,75i +5·is
26,709 26,366 1911 55,826 28,275 27,551 1921 69,410 + 13,584 +24'33 36,712 32,698 1931 85,927 +16,517 +23'80 45,832 40,095 1941 127,226 +41,299 +48·06 69,875 57,351 1951 117,113 -10,113 -7.95 60,536 56,577 1961 M. 38·10 150,634 +33,521 +28'62 79,945 70,689 1971 M. 38·09 188,518 +37,884 +25'15 101,439 87,079
(b) Gangashahar 1951 8,819 + 1,877 +21'28
4,143 4,676 1961 M. 11'86 10,696 5,052 5,644 1971 M. 11·87 13,716 +3,020 +28'23 6,638 7,078
(c) Bhinasar 1951 4,361 +l,oili +24'79
2,097 2,264 1961 M. 9·79 5,442 2,718 2,724 1971 M. 9·79 6,660 +1,218 +22'38 3,296 3,364
65 Ujjaln urban • Ujjain 1901 39,892 -597 -1'50
20,829 19,063 agglomeration (MADRY A PRADESH) 1911 39,295 20,864 18,431
1921 43,908 +4,613 + 11 ,74 24,350 19,558 1931 54,650 + 10,742 +24'46 30,597 24,053 1941 81.272 +26,622 +48'71 44,296 36,976 1951 129,817 +48,545 +59'7~ 68,762 61,055 1961 17·48 144,161 + 14,344 +11,0 I 77,005 67,156 1971 74·84 208,561 +64,400 +44'67 • 110,276 98,285
(i) Ujjain§ Ujjain 1901 39,892 -1,50
20,829 )9,063 (MADRY A PRADESH) 1911 39,295 -597 20,864 18,431
1921 43,908 +4,613 + 11'74 24,350 19,558 1931 54,650 + 10,742 +24'46 30,597 24,053 1941 81,272 +26,622 +48'71 44,296 36,976 1951 129,817 +48,545 +59'73 68,762 61,055 1961 M. 17·48 144,161 + 14,344 + 1I·0S· 77,005 67,156 1971 M. Corp. 71·33 203,278 +59,117 +41·01 107,464 95,814
(ii) Railway Colony 1911 0·06 3,676 1,966 1,710 (O.G.)
(ill) Nagziri (O.G.) 1971 0·69 483 255 228
(iv) Panwasa (O.G.) 1971 0,02 464 251 213
(v) Malanwasa (O.G.)
1971 I'll 299 158 141
(vi) Lalpur (O.G.) 1971 0·25 183 89 94
(vii) Goyala (O.G.) n' 1971 1.38 178 93 85
t Shahapur with a population of 9,056 (4,S32M., 4,S24F.) in 1901; P.9,804 (4,927 M., 4,877 F.) in 1911; P.10,380 (5,254 M., 5,126 F.) in 1921; P.ll,704 (6,108 M. 5,596 F.) in 1931; P.13,512 (6,896 M., 6,616 F.) in 1941; P.17,627 (9,134 M., 8,493 F.) in 1951, was merged with Belgaum Municipality in 1961. Population of Shahapur from 1901 to 1921 has been shown against Be1ganm urban agglomeration.
t Belgaum Municipality with a population of 22,434 (11,453 M., 10,981 F.) in 1901; P.29,636 (l5,255M., 14,381 F.) in 1911 ; P.36.3S4 (18;84IM, 17,513 F.) in 1921 and Belgaum Cantonment with a population of 10,641 (6,213 M., 4,428 F.) in 1901; P.1I,I72 (6,865 M., 4,307 F.) in 1911 and P.10,014 (5,942M., 4,072F.) in 1921 were parts of Belgaum Town. The combined population of Belgaum (M), Belgaum (Cantt,) and Shahapur (only for 1901 to 1921) has be~n shown against Belgaum urban agglomeration.
@ Bhimganj Mandi which was treated as a separate urban unit in 1941, [population 2,307 (1,261 M., 1,046 F.)] was merged with Kota (M) in 1951. The combined popUlation of Kota 'M' I\.nd Bhimgani Ma~di f~r 1941 ha. been shown against Kora 'M',
§ In 1951 Census, Ujjain Cantonment with a population of 563 (335 M., 228F.) in 1941 and 1'.871 (542 M. 329F.) in 1~31 WIiS merged in Ujjain Municipality.
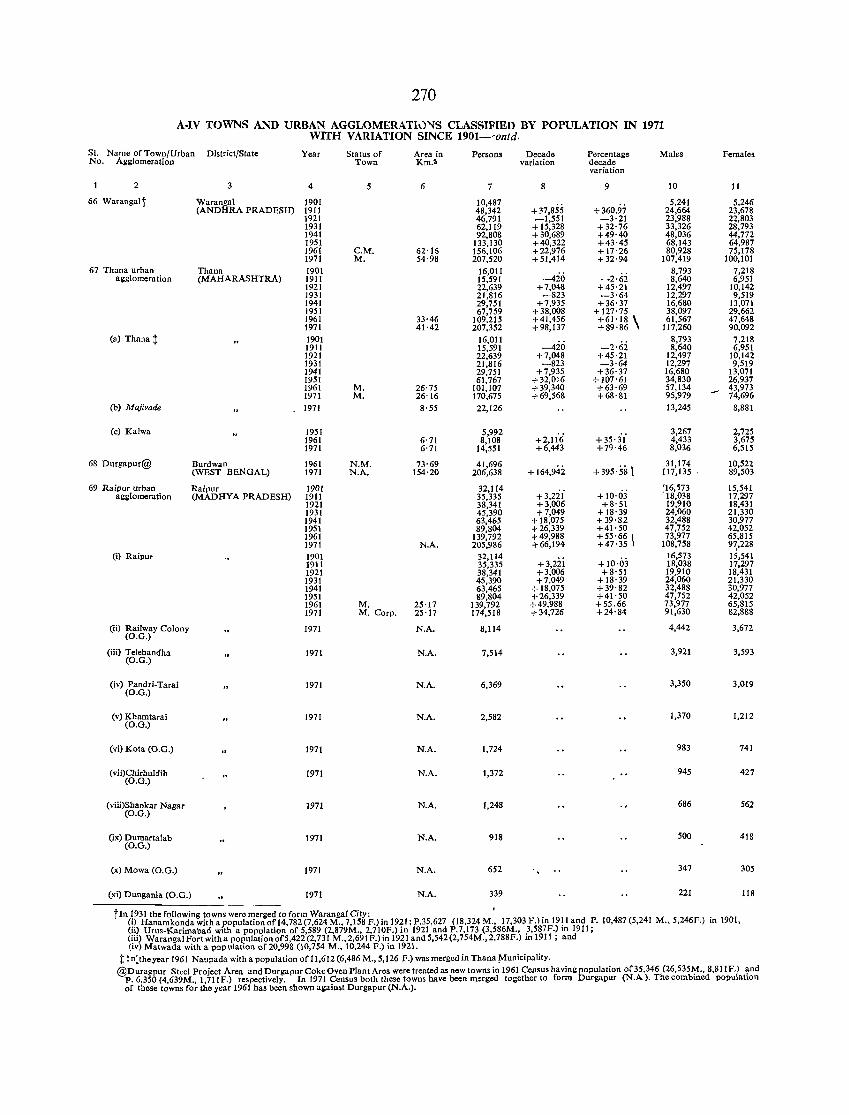
270
A-IV TOWNS AND URBAN AGGLOMERATI0~S CLASSIFillD BY POPULATION IN 1971 WITH VARIATION SINCE 1901-'ontd.
SI. Name of Town/Urban District/State Year Status of Area in Persons Decado Percentage Males Females No. Agglomeration Town Km.- variation decade
variation
2 3 4 5 6 7 8 9 10 11
66 Warangalt Warangal 1901 10,487 +360.97
5,241 5,246 (ANDHRA PRADESH) 1911 48,342 + 37,855 24,664 23,678
1921 46,791 -1,551 -3·21 23,988 22,803 1931 62,119 + 15,328 +32'76 33,326 28,793 1941 92,808 +30,689 +49·40 48,036 44,772 1951 133,130 +40,322 +43·45 68,143 64,987 1961 C.M. 62·16 156,106 +22,976 + 17'26 80,928 75,178 1971 M. 54·98 207,520 +51,414 +32'94 107,419 100,101
67 Thana urban Thana 1901 16,011 8,793 7,218 agglomeration (MAHARASHTRA) 1911 15,591 .~io -2·62 8,640 6,951
1921 22,639 +7,048 +45·21 12,497 10,142 1931 21,816 -823 -3·64 12,297 9,519 1941 29,751 +7,935 +36·37 16,680 13,071 1951 67,759 +38,008 + 127'75 38,097 29,662 1961 33'46 109,215 +41,456 +61'18 \ 61,567 47,648 1971 41·42 207,352 +98,137 +89·86 117,260 90,092
(a) Thana:j: 1901 16,011 8,793 7,218 1911 15,591 -420 -2·62 8,640 6,951 1921 22,639 +7,048 +45·21 12,497 10,142 1931 21,816 -823 -3·64 12,297 9,519 1941 29,751 + 7,935 +36'37 16,680 13,071 1951 61,767 +32,016 +107'61 34,830 26,937 1961 M. 26·75 101,107 + 39,340 +63'69 57,134 43,973 1971 M. 26'16 170,675 + 69,568 +68'81 95,979 74,696
(b) Majivade 1971 8·55 22,126 13,245 8,881
(c) Kalwa 1951 5,992 +2,11'6 +35·31
3,267 2,725 1961 6'71 8,108 4,433 3,675 1971 6'71 14,551 +6,443 +79·46 8,036 6,515
68 Durgapur@ Burdwan 1961 N.M. 73·69 41,696 + 164,942 +395'581
31,174 10,522 (WEST BENGAL) 1971 N.A. 154·20 206,638 117,135 89,503
69 Raipur urban Raipur 1901 32,114 +3,2il +10·03
'16,573 15,541 agglomeration (MADHYA PRADESH) 19I1 35,335 '18,038 17,297
1921 38,341 + 3,006 +8'51 19,910 18,431 1931 45,390 +7,049 + 18·39 24,060 21,330 1941 63,465 + 18,075 +39'82 32,488 30,977 1951 89,804 +26,339 +41'50 47,752 42,052 1961 139,792 +49,988 +55·66 \ 73,977 65,815 1971 N.A. 205,986 +66,194 +47·35 108,758 9~,228
(i) Raipur 1901 32,114 +3,zii +10·03
16,573 15,541 1911 35,335 18,038 17,297 1921 38,341 +3,006 +8'51 19,910 18,431 1931 45,390 +7,049 +18·39 24,060 21,330 1941 63,465 + 18,075 +39'82 32,488 30,977 1951 89,804 +26,339 +41'50 47,752 42,052 1961 M. 25·17 139,792 +49,988 +55.66 73,977 65,815 1971 M. Corp. 25·17 174,518 +34,726 +24'84 91,630 82,888
(ii) Railway Colony 1971 N.A. 8,114 4,442 3,672 (O.G.)
(iii) Telebandha (O.G.)
1971 N.A. 7,514 3,921 3,593
(iv) Pandri-Tarai (O.G.)
1971 N.A. 6,369 3,350 3,019
(v) Khamtarai (O.G.)
1971 N.A. 2,582 1,370 1,212
(vi) Kota (O.G.) 1971 N.A. 1,724 983 741
(vii)Chirhuldih (O.G.)
1971 N.A. 1,372 945 427
(vlii)Shankar Nagar (O.G.)
1971 N.A. 1,248 686 562
(ix) Dumartalab 1971 N.A. 918 500 418 (D. G.)
(x) Mowa (D. G.) 1971 NA. 652 347 305
(xi) Dungania (O.G.) 1971 N.A. 339 221 118
tIn 1931 the following towns were merged to form Warangal City: • (i) Hanamkonda witha population of 14,782 (7,624 M., 7,158 F.) in 1921; P.35,627 (18,324 M., 17,303 F.lin 19!1 and P. 10,487 (5,241 M.,5,Z46F.) in 1901, (ii) Uru.-Karimabad with a population of 5,589 (2,879M., 2.710F.) in 1921 and P.7,173 (3,586M., 3,587F.) 10 1911; (iii) Warangal Fort with a population of5,422 (2,731 M., 2,69IF.) in 1921 and 5,542 (2,754M., 2,788F.) in 1911 ; and (iv) Matwada with a population of 20,998 (10,754 M., 10,244 F.) in 1921.
:j: In)heyear 1961 Naupada with a population of 11,612 (6,486 M., 5,126 F.) was merged in Thana _Municipality. @Duragpur Steel Project Area and Durgapur Coke Oven Plant Area were treated as new towns in 1961 Census having population of35,346 (26,535¥., 8,81IF.) ~nd
P. 6,350 (4,639M., 1,711F.) respectively. In 1971 Census both these towns have been merged tOl;ether to form Durgapur (N.A). The combmed populatton of these towns for the year 1961 has been shown aiainst Durgapur (N.A.).
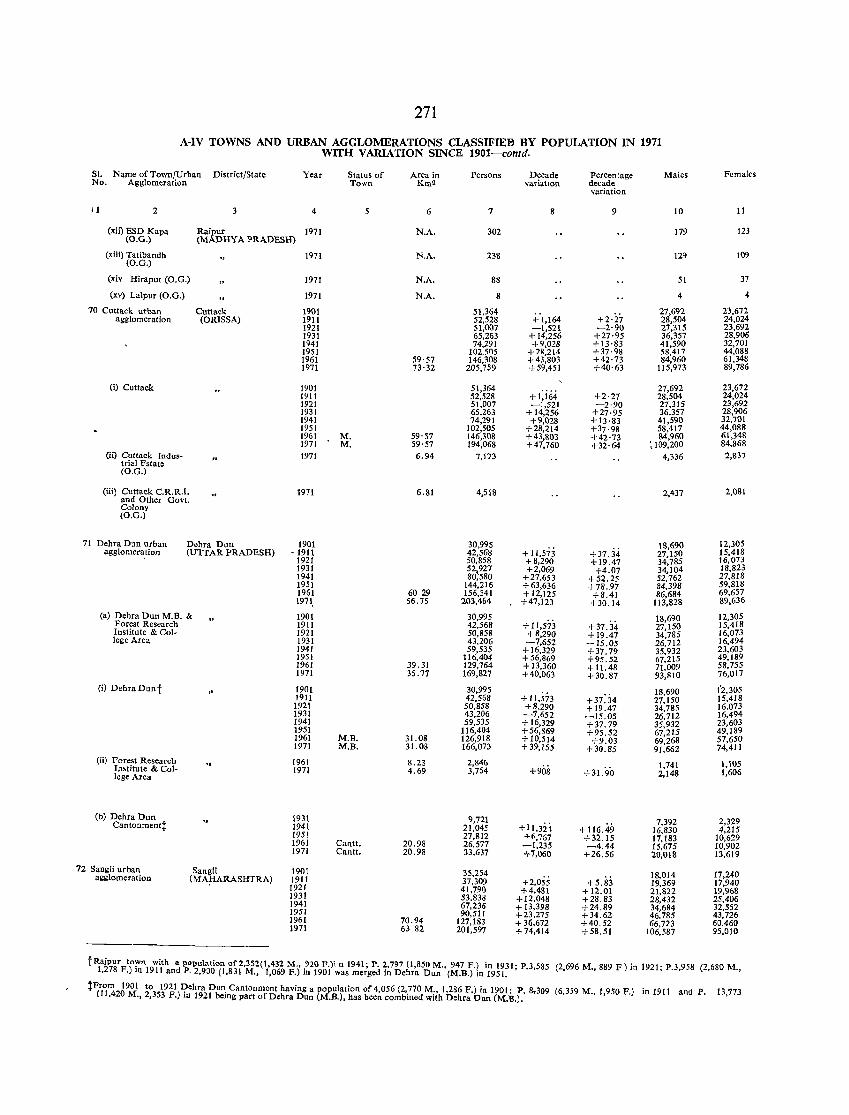
271
A-IV TOWNS AND URBAN AGGLOMERATIONS CLASSIFIEB BY POPULATION IN 1971 WITH VARIATION SINCE 1901-contd.
SI. Name of Town/Urban District/State Year Status of Area in Persons Decade Percentage Males Females No. Agglomeration Town Kmz variatlon decade
variation
j 1 2 3 4 6 7 8 9 10 II
(xii) ESD Kapa (O.G.)
Raipur 1971 (MADHYA PRADESH)
N.A. 302 179 123
(xiii) Tatibandh 1971 N.A. 238 129 109 (O.G.)
(xiv Hirapur (0.0.) 1971 N.A. 88 51 37
(xv) Lalpur (O.G.) 1971 N.A. 8 4 4
70 Cuttack urban Cuttack 1901 51,364 +'1,164 +2·27
27,692 23,672 agglomeration (ORISSA) 1911 52,528 28,504 24,024
1921 51,007 -1,521 -2·90 27,315 23,692 1931 65,263 + 14,256 +27·95 36,357 28,906 1941 74,291 +9,028 +13·83 41,590 32,701 1951 102,505 +28,214 +37·98 58,417 44,088 1961 59'57 146,308 +43,803 +42·73 ~4,960 61,348 1971 73'32 205,759 + 59,451 +40'63 115,973 89,786
(i) Cuttack 1901 51,364 +(i64
27,692 23,672 1911 52,528 +2·27 28,504 24,024 1921 51,007 -1,521 -2·90 27,315 23,692 1931 65,263 + 14,256 +27,95 36,357 28,906 1941 74,291 +9,028 +13·83 41,590 32,701 1951 102,505 +28,214 +37·98 58,417 44,088 1961 M. 59'57 146,308 +43,803 +42·73 84,960 61,348 1971 M. 59'57 194,068 +47,760 +32·64 ~109,200 84.868
(ii) Cuttack Indus- 1971 6.94 trial Fstate
7,173 4,336 2,837
(O.G.)
(iii) Cuttack C.R.R.I. 1971 6.81 and Other Govt.
4,518 2,437 2.081
Colony (O.G.)
71 Dehra Dun urban Dehra Dun 1901 30,995 + 11,5jj
18,690 12,305 agglomeration (UTTAR PRADESH) • 1911 42,568 +37j4 27,150 15,418
1921 50,858 +8,290 +19.47 34,785 16,073 1931 52\927 +2.069 +4.07 34,104 18,823 1941 80,580 +27,653 + 52.25 52,762 27.818 1951 144,216 +63,636 +78.97 84,398 59,818 1961 6029 156,341 +12,125 +8.41 86,684 69,657 1971, 56.75 203,464 +47,123 +30.14 113,828 89,636
(a) Dehra Dun M.B. & 1901 30,995 +11,573
18,690 12,305 Forest Research 1911 42,568 +37.34 27,150 15,418 Institute & Col- 1921 50,858 +8,290 + 19.47 34,785 16,073 lege Area 1931 43,206 -7,652 -15.05 26,712 16,494
1941 59,535 + 16,329 +37.79 35,932 23.603 1951 116,404 +56,869 +95.52 67,215 49,189 1961 39.31 129,764 + 13,360 + 11.48 71,009 58,755 1971 35.77 169,827 +40,063 +30.87 93,810 76,017
(i) Dehra Dun t 1901 30,995 + 11.573
18,690 1'2,305 1911 42,568 +37:34 27,150 15,418 1921 50,858 + 8,290 + 19.47 34,785 16.073 1931 43,206 -7,652 -15.05 26,712 16,494 1941 59,535 + 16,329 +37.79 35,932 23,603 1951 116,404 +56,869 +95.52 67,215 49,189 1961 M.B. 31.08 126,918 +10,514 +9.03 69,268 57,650 1971 M.B. 31.08 166,073 +39,155 +30.85 91,662 74.411
(ii) Forest Research 1961 8.23 2,846 +908
1,741 1,105 In,titute & Col- 1971 4.69 3,754 +31.90 2,148 1,606 lege Area
(b) Dehra Dun 1931 9,721 7,392 2,329 Cantonmentt 1941 21,045 +11,3ii +116.49 16,830 4,215 1951 27,812 +6,;67 +32.15 17,183 10,629 1961 Cantt. 20.98 26,577 -1.235 -4.44 15,675 10,902 1971 Cantt. 20.98 33.637 +7,060 +26.56 20,018 13,619
72 Sangli urban Sangli 1901 35,254 18,014 17,240 agglomeration (MA!IARASHTRA) 1911 37,309 +2,055 +5.83 19,369 17,940 1921 41,790 +4,481 +12.01 21,822 19,968 1931 53,838 +12,048 +28.83 28,432 25,406 1941 67,236 + 13,398 +24.89 34,684 32,552 1951 90,511 +23.275 +34.62 46,785 43,726 1961 70.94 127,183 + 36,672 +40.52 66,723 60,460 1971 63 82 201,597 +74,414 +58.51 106,587 95,010
tRajpur to!"n with a population of 2,352(1,432 M .. 920 F.)i n 1941; P. 2,797 (1,850 M., 947 F.) in 1931; P.3,585 1,278 F.) In 1911 and P. 2,900 (1,831 M., 1,069 F.) in 1901 was merged in Dehra Dun (M.B.) in 1951. (2,696 M., 889 F) in 1921; P.3,9S8 (2,680 M.,
t~~14 J901 to 1921 I?ehra Dun. Cantonment having a population of 4,056 (2,.770 M., 1,286 F.) in 1901; P. 8,309 ,2M., 2,353 F.) In 19Z1 belUg part of Dehra Dun (M.B.), has been combmed with Dehra Dun (M.B.).
(6,359 M., 1,950 F.) in 1911 and P. 13,773
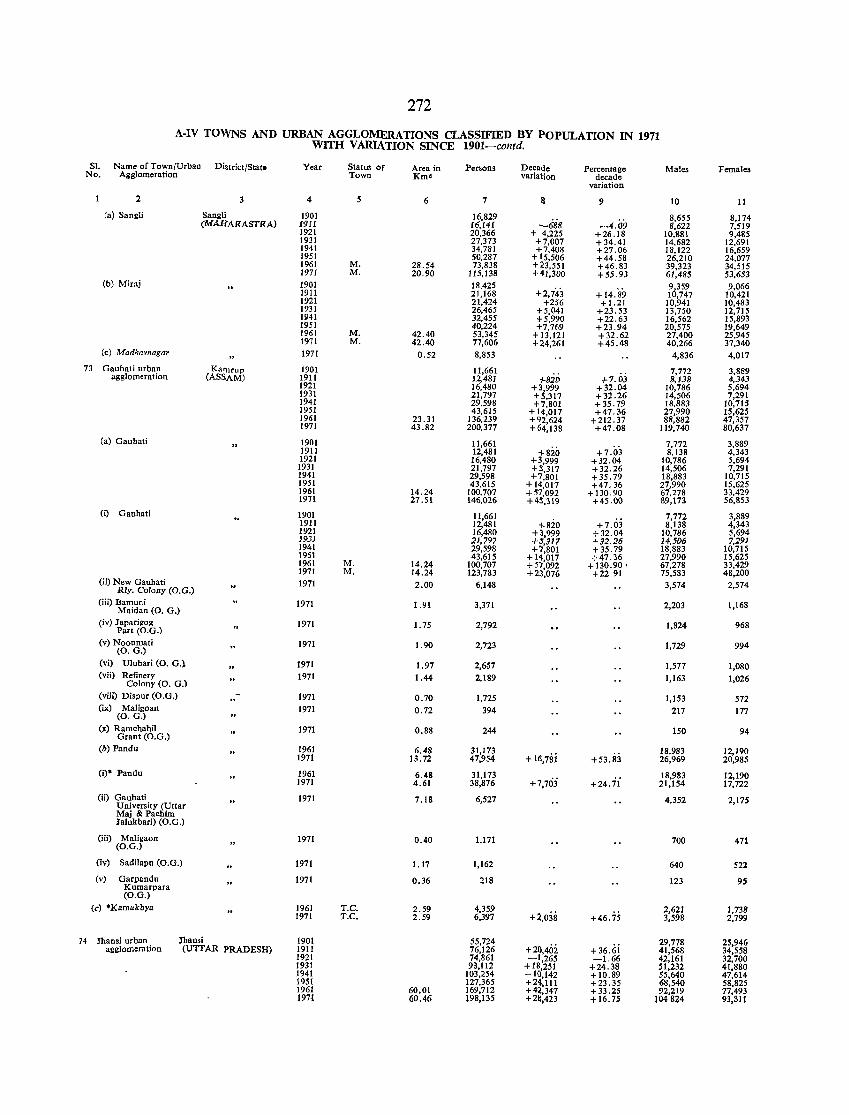
272
A-IV TOWNS AND URBAN AGGLOMERATIONS CLASSIFIED BY POPULATION IN 1971 WITH VARIATION SINCE 1901-contd.
SI. Name of Town/Urban District/Stat. Year Status of Area in Persons Decade Percentage Males Females No. Agglomeration Town Km2 variation decade
variation
2 3 4 5 6 7 !l 9 10 11
(a) Sangli Sangli 1901 16,829 8,655 8,174 (MAliARASTRA) 19I1 16,141 -688 -4.09 8,622 7,519
1921 20,366 + 4,225 +26.18 10,881 9,485 1931 27,373 +7,007 +34.41 14,682 12.691 1941 34.781 +7,408 +27.06 18,122 16,659 1951 50,287 + 15,506 +44.58 26,210 24,077 1961 M. 28.54 73,838 +23,551 +46.83 39,323 34,515 1971 M. 20.90 115,138 +41,300 +55.93 61,485 53,653
(b) Miraj 1901 18,425 +2,743
9,359 9,066 1911 21,168 + 14.89 10,747 10,421 1921 21,424 +256 +1.21 10,941 10,483 1931 26,465 +5,041 +23.53 13,750 12,715 1941 32,455 +5,990 +22.63 16,562 15,893 1951 40,224 +7,769 +23.94 20,575 19,649 1961 M. 42.40 53,345 + 13,121 +32.62 27,400 25,945 1971 M. 42.40 77,606 +2.4,261 +45.48 40,266 37,340
(c) Madhavnagar 1971 0.52 8,853 4,836 4,017
73 Gauhati urban Katnrup 1901 11,661 7,772 3,889 agglomeration (ASSAM) 1911 J2,48J -!-820 +-7.03 8,J38 4,343
1921 16,480 +3,999 +32.04 10,786 5,694 1931 21,797 +5,317 +32.26 14,506 7,291 1941 29,598 +7,801 +35.79 18,883 10,715 1951 43,615 +14,017 +47.36 27,990 15,625 1961 23.31 136,239 +92,624 +212.37 88,882 47,357 1971 43.82 200,377 +64,138 +47.08 119,740 80,637
(a) Gauhati 1901 11,661 -1-820
7,772 3,889 1911 12,481 +7.03 8,138 4,343 1921 16,480 +3,999 +32.04 10,786 5,694 1931 21,797 +S,317 +32.26 14,506 7,291 1941 29,598 +7,801 +35.79 18,883 10,715 1951 43,615 +14,017 +47.36 27,990 15,625 1961 14.24 100,707 +57,092 +130.90 67,278 33,429 1971 27.51 146,026 +45,319 +45.00 89,173 56,853
(i) Gauhati 1901 11,661 +7.03
7,772 3,889 1911 12,481 -!-820 8,138 4,343 1921 16,480 +3,999 +32.04 10,786 5,694 1931 21,797 +S,317 +32.26 14,506 7,291 1941 29,598 +7,801 +35.79 18,883 10,715 1951 43,615 +11,017 +47.36 27,990 15,625 1961 M. 14.24 100,707 +57,092 +130.90. 67,278 33,429 1971 M. 14.24 123,783 +23,076 +2291 75,583 48,200
Oi) New Gauhati 1971 2.00 6,148 3,574 2,574 Rly. Colony (O.G.)
(iii) Bamuni Maidan (0. G.)
1971 1.91 3,371 2,203 1,168
(iv) Japarigog Part (O.G.)
1971 1. 75 2,792 1,824 968
(v) Noonmati (0. G.)
1971 1.90 2,723 1,729 994
(vi) Ulubari (0. G.). 1971 1.97 2,6-57 1,577 1,080 (vii) Refinery 1971 1.44 2,189 1,163 1,026 Colony (0. G.) (viii) Dispur (O.G.) 1971 0.70 1,725 1,153 572 (ix) Maligoan
(0. G.) 1971 0.72 394 217 177
(x) Ramchahil 1971 0.88 244 150 94 Grant (O.G.) (b) Pandu 1961 6.48 31,173
+ 16,78i +53.83 18,983 12,190
1971 13.72 47,954 26,969 20,985
(i)* Pandu 1961 6.48 31,173 +7,703 +24.ii
18,983 12,190 1971 4.61 38,876 21,154 17,722
(ii) Gauhati 1971 7.18 6,527 4,352 2,175 University (Uttar Maj & Pacliim lalukbari) (O.G.)
(iii) Maligaon (O.G.)
1971 0.40 1,171 700 471
(iv) Sadilapu (O.G.) 1971 1.17 1,162 640 522
(v) Garpandu 1971 Kumarpara
0.36 218 123 95
(O.G.)
(c) *Kamakhya 1961 T.C. 2.59 4,359 H,038 +46.75
2,621 1,738 1971 T.C. 2.59 6,397 3,598 2,799
74 Jhansi urban Jhansi 1901 55,724 +20,402 + 36.6i
29,778 25,946 agglomeration (UTTAR PRADESH) 1911 76,126 41,568 34,558
1921 74,861 -1,265 -1.66 42,161 32,700 1931 93,112 +18,251 +24.38 51,232 41,880 1941 103,254 +10,142 +10.89 55,640 47,614 1951 127,365 +24,111 +23.35 68,540 58,825 1961 60.01 169,712 +44,347 +33.25 92,219 77,493 197t 60.46 198,135 +2S,423 + 16.75 104824 93,311

273
A-IV TOWNS AND URBAN AGGLOMERATIONS CLASSIFIED BY POPULATION IN 1971 WITH VARIATION SINCE 1901-contd.
SI. Name of Town/Urban DistrictlState Year Status of Area in Persons Decade Percentage Males Females No. Agglomeration Town Km2 variation decade
variation
2 ~ 4 5 6 7 8 9 10 11
(a) Jhansit Jhansi 1901 55,724 + 14,484 +25.99
29,778 25,946 UTTAR PRADESH 1911 70,208 38,323 31,185
1921 66,432 -3,776 -5.38 37,543 21,189 1931 64,591 -1,841 -2.77 33,908 30,683 1941 88,099 +23,508 +36.40 45,901 42,198 1951 106,333 + 18,234 +20.70 55,865 50,488 1961 M.B. 35.22 140,217 +33,884 +31.R7 73,959 66,258 1971 M.B. 35.22 173,292 + 33,075 +23.59 92,545 80,747
(b) Jhansi 1931 12,121 -8.iii
8,166 3,955 Cantonmentt 1941 11,132 -989 7,498 3,634
1951 16,075 +4,943 +44.40 9,920 6,155 1961 Cantt. 18.03 21,126 + 5,051 +31.42 13,441 7,635 1971 Cantt. 18.48 14,903 -6,223 -29.46 6,991 7,'12
(c) Jhansi lUy. 1941 4,023 +934 t23.22
2,241 1.782 Settlement 1951 4,957 2,755 2,202
1961 N.A. 6.76 8,369 +3,412 +68.83 4,819 3,550 1971 N.A. 6.76 9,940 + 1,571 + 18.77 5,288 4,652
75 Amravati@ Amravati 1901 39,511 +1,099
21,218 18.293 (MAHARASHTRA) 1911 40,610 +2.78 21,481 19,129
1921 45,469 +4,859 + 11.97 24,343 21,126 1931 57,100 + 11,631 +25.58 31,255 25,1145 1941 74,309 + 17,209 +30.14 39,538 34,771 1951 102,806 +28,497 +38.35 54,349 4&,457 1961 M. )0.34 137.875 +35,069 +34.11 74.427 63 .... 4& 1971 M. 36.34 193,800 +55,925 +40.56 103,217 90,583
76 Maleiaon Nasik 19,054 (MAHARASHTRA) 1901 +6 +0.03
9,915 9,139 1911 19,060 9,817 9,243 1921 23,505 +4,445 +23.32 12,052 11,453 1931 29,442 +5,937 +25.26 15,144 14,29B 1941 36,780 -+7,338 +24.92 18,986 17,794 19:;1 55,022 + 18,242 +49.60 28,179 21i.143 1961 M. 10.44 121,408 +66,386 + 120.65 64,128 57,210 1971 M. 12.95 191,847 +70,439 +58.02 99,444 n.403
77 Rajahmundry urban East Godavari 1901 36,408 +12,009 +32.98
17,779 11,'29 agglomeration (ANDHRA PRADESH) 1911 48,417 23,761 24,656 1921 53.791 +5,374 +1§.10 26,758 27,033 1931 63,526 +9,735 +1 .10 32,078 31,4411 1941 74,564 +11,038 +17.38 37,081 37,483 1951 105,276 +30,712 +41.19 52,016 53,260 1961 10.59 130,002 +24,726 +23.49 65,497 '64,505 1971 43.90 18S,805 +58,803 +45.23 95,895 92,.,10
(a) Raiahmundry 1901 36,408 + 12,009 +32.98
17,779 U,1i29 1911 48,417 23,761 24,656 1921 53,791 +5,374 + 11.10 26,758 27,033 1931 63,526 +9,735 +18.10 32,078 31,448 1941 74,564 +11,038 +17.38 37,081 37.483 1951 105,276 +30,712 +41.19 52,016 53,260 1961 M. 10.59 130,002 +24,726 +23.49 65,497 64.505 1971 M. 12.82 165,912 +35,910 +27.62 83,641 82,271
(b) RQjahmundry Non-Municipal Area
1971 P 31.08 22,893 12,254 10,639
.' 78 Tu tieorin urban Tirunelveli 1901 28,048 +12,cij +43.27
13,953 14,095 agglomerati()n (TAMIL NADU) 1911 40,185 20,320 19.865 1921 44,522 +4,337 +10.79 22,781 21,741 1931 60,395 + 15,873 + 35.65 30,497 29.398 1941 75,614 + 15,219 +25.20 38,262 37,352 1951 98,866 +23.252 + 30.75 49,819 49,047 1961 24.79 127,356 +28,490 +28.82 64,769 62,5S7 1971 )38.71 181,913 +54,557 +42.84 92,010 89,903
(a) Tllticodn 1901 28,048 + 12,137 +43.27
13,953 14.095 1911 40,185 20,320 19,365
1921 44,522 +4,337 + 10.79 22,781 21,741 1931 60,395 + 15,873 +35.65 30,497 29,39R 1941 75,614 + 15,219 +25.20 38,262 37,352 1951 98,856 +23,252 +30.75 49,819 49,047 1961 M. 13.47 124,230 +25,364 +25.65 63,188 61,042 1971 M. 13.38 155,310 +31,080 +25.02 78,436 76.374
(b) Muthiapuram 1971 P 18.88 4,554 2.356 2,19~
(c) Mappilaiurani 1971 P 8.71 4,530 2,375 2,155 (d) Palayakayal 1971 P 22.79 3,412 1,644 1,768
tGarhia Phatak (N. A.) with a population of 5,918 (3,245 M., 2,673 F.) in 1911; P. 8,429 (4,618 M., 3,811 P.) in 1921 and P. 16,400 (9.158 M., 7,242 F.) in 1931 was split up into (i) Jhansi (N.A.) and (ii) JhansiRly. Settlement (N.A.) in 1941. Thereafter, Jhansi (N.A.) was mergeJ in Jhansi (M.B.) in 1951 while Jhansi Rty. Set-tle!'lent (N.A.).is still in eXIstence. The br"a~up of 1941 popul~tion of Garhia Ph~tak (N.;\.) between the two split port!ons being not available, the whole popu-latIOn of Garhla Phatak from 1911 to 1931 IS Included 10 Jhansl urban ag~lomeratlOn and 10 1941 Jbnnsi N.A."s populatIOn 12525 (6579 M. 5946 F.) has been combined with Jhansi (M.B.). ' , , ,
tFrom 1901 to 1921 Jbansi Cantonment having a population of 7,843 (5,237 M., 2,606 F.) in 1901; 3,235 P.) in 1921 being part of Jhansi (M.B.) has been combined with Jhansi (M.B.).
P. 11,972 (8,180 M., 3,792 ~.)in 1911 and P. 12,047 (8,812 M.
@Amravati Camp with a population of 15,707 (8,127M., 7,580 F.) in 1951; P. 11,338 (6,523 M., 5,815 F.) in 1941; P. 10,268 (5,509 M., 4,759 f.) in 1931; P. 4775. (2,541 M. , 2,234 F.) in 1921; P 6,340 (3,334 M., 3,006 F.) in 19J1 and P. 5,295 (2,923 M., 2,372 F.) in 1901 was merged in Amravati Municipality in i961.
19-1 RGIIND/73
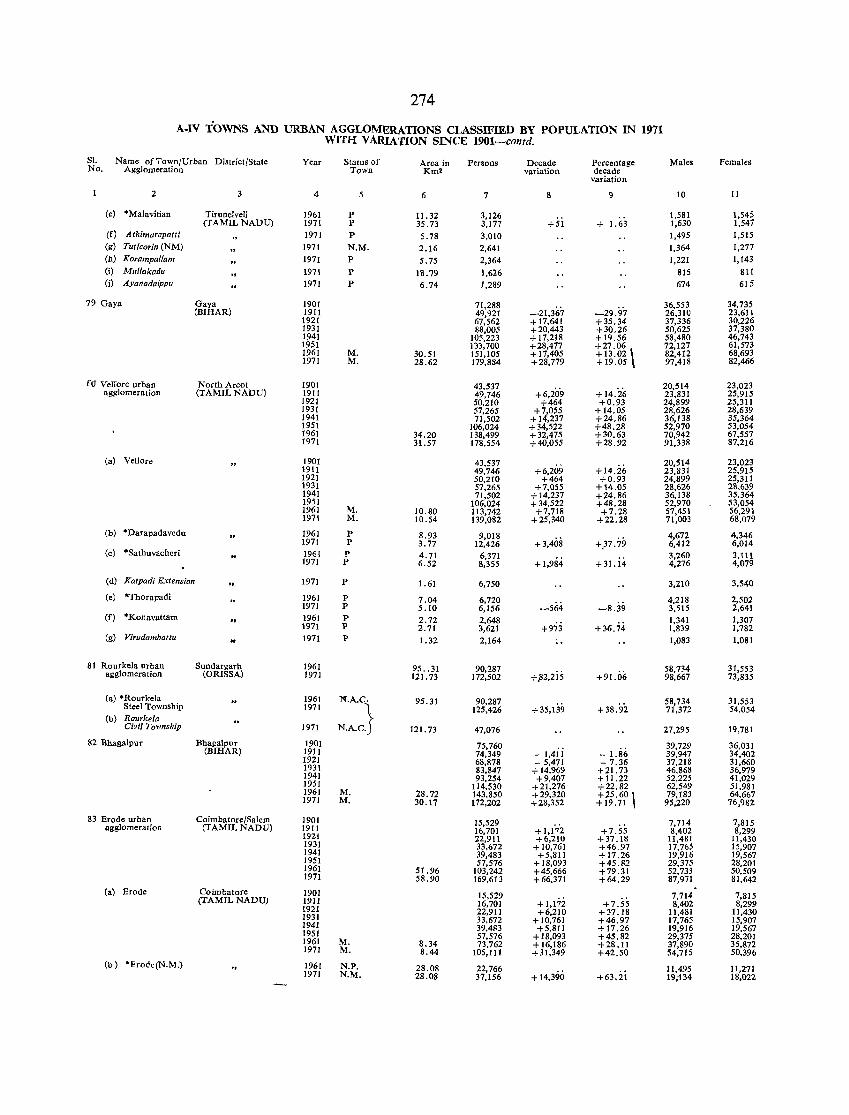
274
A·IV TOWNS AND URBAN AGGLOMERATIONS CLASSIFIED BY POPULATION IN 1971 WITH VARIATION SINCE 1901-contd.
Sl. Name of Town/Urban District/State Year Status of Area in Persons Decade Percentage Males Females No. Agglomeration Town Km2 variation decade
variation
2 3 4 6 7 8 9 10 11
(e) *Malavitian Tirnnelveli 1961 P 11. 32 3,126 1,581 1,545 (fA MIL NADU) 1971 P 35.73 3,177 +51 + 1.63 1,630 1,547
(C) Athimarapatti 1971 p 5.78 3,010 1,495 1,515 (II) Tuticorin (NM) 1971 N.M. 2.16 2,641 1,364 1,277 (h) Korampallam 1971 P 5.75 2,364 1,221 1,143 (i) Mullakadu 1971 p Ill. 79 1,626 815 811 (j) Ayanadaippu 1971 P 6.74 1,289 674 615
79 Gaya Gaya 1901 71,288 -21,367 -29.97
36,553 34,735 (BIHAR) 1911 49,921 26,310 23,611
1921 67,562 + 17,641 +35.34 37,336 30,226 1931 88,005 +20,443 +30.26 50,625 37,380 1941 105,223 + 17,218 +19.56 58,480 46,743 1951 133,700 +28,477 +27.06 \ 72,127 61,573 1961 M. 30.51 151,105 +17,405 + 13.02 82,412 68,693 1971 M. 28.62 179,884 +28,779 +19.05 97,418 82,466
flJ Verrore urban North Arcot 1901 43,537 +6,209 +14.26
20,514 23,023 agglomeration (TAMIL NADU) 1911 49,746 23,831 25,915
1921 50,210 +464 +0.93 24,899 25,311 1931 57,265 +7,055 +14.05 28,626 28,639 1941 71,502 +14,237 +24.86 36,138 35,364 1951 106,024 +34,522 +48.28 52,970 53,054 1961 34.20 138,499 +32,475 +30.63 70,942 67,557 1971 31.57 178,554 +40,055 +28.92 91,338 87,216
(a) Veil Ore 1901 43,537 + 14.26
20,514 23,023 1911 49,746 +6,209 23,831 25,915 1921 50,210 +464 +0.93 24,899 25,311 1931 57,265 +7,055 +14.05 28,626 28,639 1941 71,502 + 14,237 +24.86 36,138 35,364 1951 106,024 +34,522 +48.28 52,970 53,054 1961 M. 10.80 113,742 +7,718 +7.28 57,451 56,291 1971 M. 10.54 139,082 +25,340 +22.28 71,003 68,079
(b) *Darapadavedu 1961 p 8.93 9,018 +3,408 +}7.79
4,672 4,346 1971 P 3.77 12,426 6,412 6,014
(cl 'Sathuvacheri 1961 1> 4.71 6,371 3,260 3,111 1971 P 6.52 8,355 +1,984 + 31. i4 4,276 4,079
(d) Ka/padl Extension 1971 p 1.61 6,750 3,210 3,540
(e) 'Thorapadi 1961 p 7.04 6,720 -8.39
4,218 2,502 1971 P 5.10 6,156 -564 3,515 2,641
(f) *Konavattam 1961 P 2.72 2,648 +36.74
1,341 1,307 1971 P 2.71 3,621 +973 1,839 1,782
(g) Virudambatlu 1971 p 1.32 2,164 .. 1,083 1,081
81 Rourkela urban Sundargarh 1961 95 .. 31 90,287 +91.06
58,734 31,553 agglomeration (ORISSA) 1971 121. 73 172,502 +,82,2iS 98,667 73,835
(a) *Rourkela 1961 M.A.C. 95.31 90,287 +35,139 +38.92
58,734 31,553 Steel Township 1971 l 125,426 71,372 54,054 (b) RourkeTa
N.A.C.J Civil Township 1971 121. 73 47,076 27,295 19,781
82 Bhagalpur Bhagalpur 1901 75,760 - 1.86
39,729 36,031 (BIHAR) 1911 74,349 - 1,4ii 39,947 34,402
1921 68,878 - 5,471 - 7.36 37,218 31,660 1931 83,847 + 14,969 +21. 73 46,868 36,979 1941 93,254 +9,407 + 11.22 52,225 41,029 1951 114,530 +21,276 +22.82 62,549 51,981 1961 M. 28.72 143,850 +29,320 +25.60 \ 79,183 64,667 1971 M. 30.17 172,202 +28,352 +19.71 95,220 76,982
83 Erode urban Coimbatore/Salern 1901 15,529 7,714 7,815 agglomeration (TAMIL NADU) 1911 16,701 + l.t'i2 +7.55 8,402 8,299 1921 22,911 +6,210 +37.18 11,481 11,430 1931 33,672 +10,761 +46.97 17,765 15,907 1941 39,483 +5,811 +17.26 19,916 19,567 1951 57,576 + 18,093 +45.82 29,375 28,201 1961 51.96 103,242 +45,666 +79.31 52,733 50,509 1971 58.90 169,613 +66,371 +64.29 87,971 81,642
(a) Erode Coirnbatote 1901 15,529 7,714 7,815 (TAMIL NADU) 1911 16,701 + 1,1'72 +7.55 8,402 8,299 1921 22,911 +6,2)0 +37.18 11,481 11,430 1931 33,672 +10,761 +46.97 17,765 15,907 1941 39,483 +5,811 + 17.26 19,916 19,567 1951 57,576 + 18,093 +45.82 29,375 28,201 1961 M. 8.34 73,762 +16,186 +28.11 37,890 35,872 1971 M. 8.44 105,111 +31,349 +42.50 54,715 50,396
(b) *Erode(N.M.} 1961 N.P. 28.08 22,766 11,495 11,271 1971 N.M. 28.08 37,156 + 14,390 +63.ii 19;134 18,022
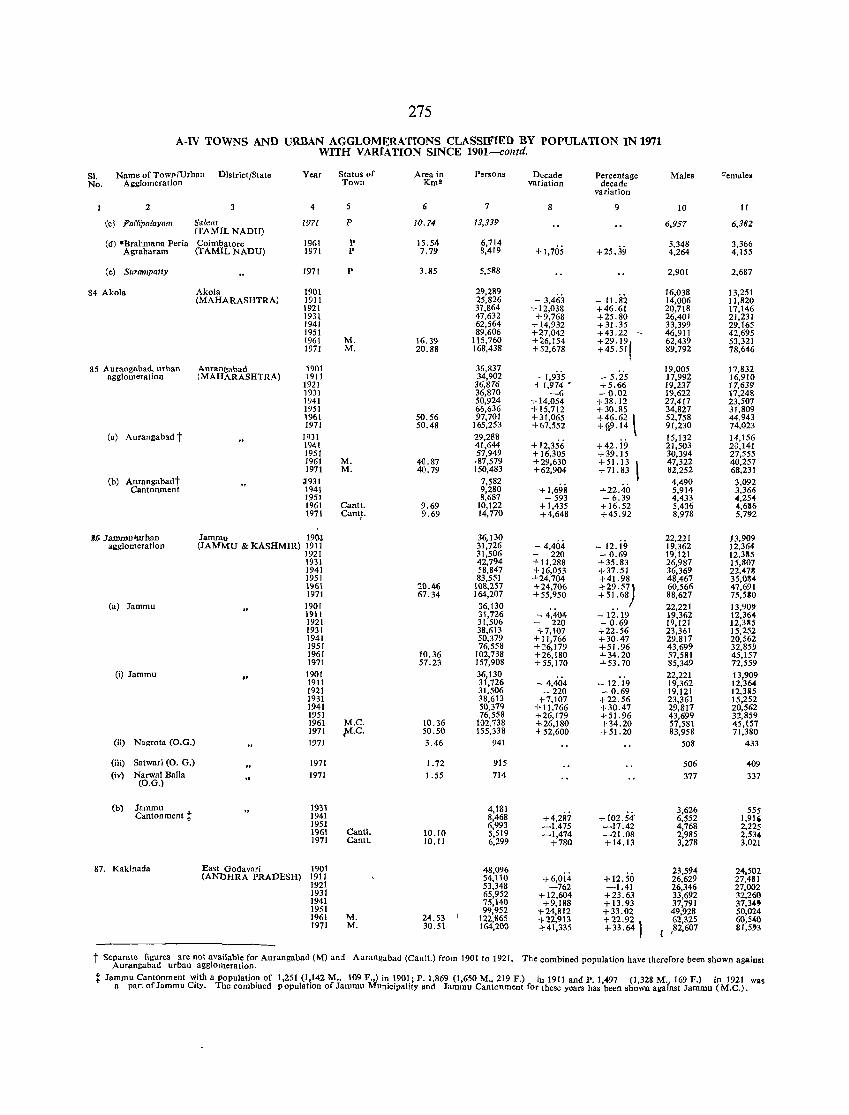
275
A-IV TOWNS AND URBAN AGGLOMERATIONS CLASSIFIED BY POPULATION IN 1971 WITH VARIATION SINCE 1901-contd.
81. Name of Tow!'I/Urban District/State Year Status of Area in Persons Decade Percentage Males Femalea No. Allglomeration Town Km' variation decade
variation
2 3 4 5 6 7 8 9 to 11
(c) Fa((ipm'ayam Sa lent 1971 P /0.74 13,339 6,957 6,382 (TAMIL NADU)
Cd) *Brahmana Peria Coimbatore 1961 P 15.54 6,714 + 1,705 +25,39
3.348 3,366 Agraharam (TAMIL NADU) 1971 p 7.79 8,419 4,264 4,155
(e) Surampatty 1971 P 3.85 5,588 2,901 2,687
84 Akola Akola 1901 29,289 - 3,463
16,038 13,251 (MAHARASHTRA) J9J I 25,826 - 11.82 14,006 11,820
1921 37,864 + 12,038 +46.61 20,718 17,146 1931 47,632 +9,768 +25.80 26,401 21,231 1941 62,564 +14,932 + 31. 35 33,399 29,165 1951 89,606 +27,042 +43.22 ~ 46,9 II 42,695 1961 M. 16.39 115,760 +26,154 +29.19
1 62,439 53,321
1971 M. 20.88 168,438 +52,678 +45.51 89,792 78,646
85 Aurangahad urban Aurangabad 1901 36,837 - 1,935
19,005 17,832 agglomeration (MAHARASHTRA) 1911 34,902 - 5.25 17,992 16,910
1921 36,816 + 1,974 • +5.66 19,231 11,639 1931 36,870 -6 - 0.02 19,622 17,248 1941 50,924 +14,054 +38.12 27,417 23,507 1951 66,636 +15,712 +30.85 34,827 31,809 1961 50.56 97,701 +31,065 +46.62 \ 52,758 44,943 1971 50.48 165,253 +67,552 +~,9. 14 91,230 74,023
(a) Aurangabad t 1931 29,288 + 12,356
15,132 14,156 1941 41,644 +42.19 21,503 20,141 1951 57,949 + 16,305 +39.15 30,394 27,555 1961 M. 40.87 ,87,579 +29,630 +51.13 47,322 40,257 1971 M. 40.79 150,483 +62,904 +71.83 82,252 68,231
(b) Aurangabadt ~931 7,582 +1,698 +22.40
4,490 3,092 Cantonment 1941 9,280 5,914 3,366
1951 8,687 - 593 - 6.39 4,433 4,254 1961 Cantt. 9.69 10,122 +1,435 +16.52 5,436 4,616 1971 Cant~. 9.69 14,170 +4,648 +45.92 8,978 5,792
J6 Jammulurba.n Jammu 19().J 36,130 - 4,404-
22,221 13,909 agglomeration (JAMMU & KASHMIR) 1911 31,726 - 12.19 19,362 12,364
1921 ,1,506 220 - 0.69 19,121 12.335 1931 42,794 + 11,288 +35.83 26,987 15,307 1941 58,847 + 16,053 +37.51 36,369 22,471 1951 83,551 +24,704 +41.98 48,467 35,034 196\ 20.46 108,257 +24,706 +29 .57) 60,566 47,691 1971 67.34 164,207 + 55,950 +51.68 88,627 75,510
(a) Jammu 1901 36,130 ~ 4,404
22,221 13,909 1911 31,726 - 12.19 19,362 12,364 1921 31,506 220 - 0.69 19,121 12,385 1931 38,613 +7,107 +22.56 23,361 15,252 1941 50,379 + 1],766 +30.47 29,817 20,562 1951 76,558 +26,179 +51.96 43,699 32,859 1961 10.36 102,738 +26,180 +34.20 57,581 45,157 1971 57.23 157,908 +55,170 +53.70 85,349 72,559
(i) Jammu "
1901 36,130 ~ 4,404
22,221 13,909 1911 31,726 - 12.19 19,362 12,364 1921 31,506 - 220 - 0.69 19,121 12,385 1931 38,613 +7,107 +22.56 23,361 15,252 1941 50,379 + 11,766 +30.47 29,817 20,562 1951 76,558 +26,179 +51.96 43,699 32,859 1961 M.C. 10.36 102,738 -+-26,180 +34.20 57,581 45,157 1971 ]'-t.C. 50.50 155,33& -+-52,600 +51.20 83,958 71,380
(ii) Nagrota (O.G.) 1971 3.46 941 508 433
(iii) 8atwari (0. G.) 1971 1.72 915 506 409 (iv) Narwal Balla
(O.G.) 1971 1.55 714 377 337
(b) Jammu 1931 4,181 +4,287 + 102.54'
3,626 555 Cantonment t 1941 8,468 6,552 1,91'
1951 6,993 -1,475 -17.42 4,768 2,225 1961 Cantl. 10.10 5,519 -1,474 -21.08 2,985 2,534 1971 Cantt. 10.11 6,299 +780 +14.13 3,278 3,021
87. Kakinada East Godavari 1901 48,096 +6,oi.i.
23,594 24,502 (ANl:>HRA PRADESH) 1911 54,110 +12.50 26,629 27,481
1921 53,348 -762 -1.41 26,346 27,002 1931 65,952 + 12,604 +23.63 33,692 32,260 1941 75,140 +9,188 +13.93 37,791 37,34' 1951 99,952 '1-24,812 +33.02 49,928 50,024 1961 M. 24.53 122,865 '1-22,913 +22.92
, 62,325 60,540
1971 M. 30.51 164,200 +41,335 + 33.64 ,82,607 81,5'3
t Separate figures are not available for Aurangabad (M) an:! Aurangabad urban agglomeration.
Aurangabad (Cantt.) from 1901 to 1921. The combined population have therefore been shown against
t Jammu Cantonment with a population of 1,251 (1,142 Moo 109 F.,) in 1901; P. 1,869 (1,650 M., 219 F.) in 1911 and P. 1497 (1328 M. 169 F.) in 1921 was a part of Jammu City. The combined population of Jammu MUnicipality and Jammu Cantonment for these years has'been sho'wn against Jammu (M.C.).
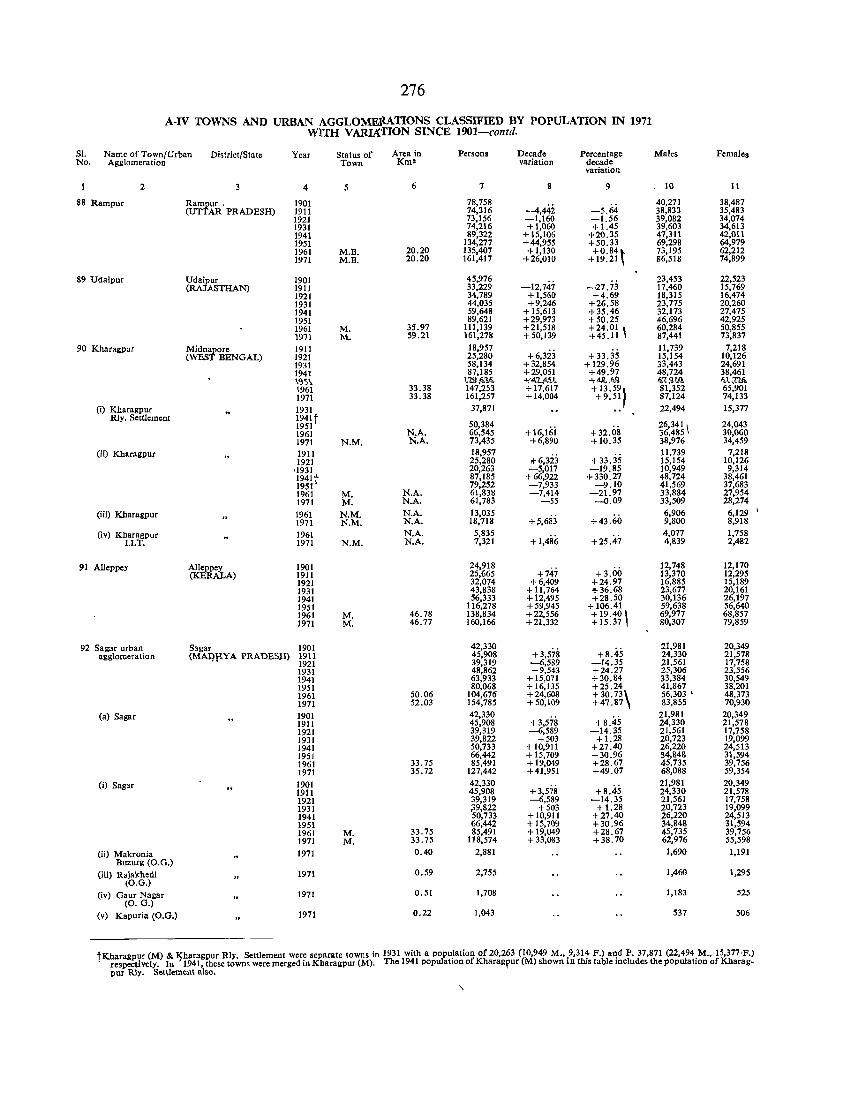
276
A-IV TOWNS AND URBAN AGGLOMEl~TIONS CLASSIFIED BY POPULATION IN 1971 WITH V ARM'rION SINCE 1901-contd.
51. Name of Town/Urban District/State Year Status of Area in Persons Decade Percentage Males Females No. Agglomeration Town Kms variation decade
variation
2 3 4 5 6 7 S 9 10 11
88 Rampur Rampur, 1901 78,758 -4,442 -5.64
40,271 38,487 (UTTAR PRADESH) 1911 74,316 38,833 35,483
1921 73,156 -1,160 -1.56 39,082 34,074 1931 74,216 + 1,060 +1.45 39,603 34,613 1941 89,322 +15,106 +20.35 47,311 42,011 1951 134,277 +44,955 +50.33 69,298 64,979 1961 M.B. 20.20 135,407 +1,130 +0.84\ 73,195 62,212 1971 M.B. 20.20 161,417 +26,010 +19.21 86,518 74,899
89 Udaipur Udaipur 1901 45,976 -12,747 -27.73
23,453 22,523 (RAJASTHAN) 1911 33,229 17,460 15,769
1921 34,789 + 1,560 +4.69 18,315 16,474 1931 44,035 +9,246 +26.58 23,775 20,260 1941 59,648 + 15,613 +35.46 32,173 27,475 1951 89,621 +29,973 +50.25 46,696 42,925 1961 M. 35.97 111,139 +21,518 ~i~:Yi \ 60,284 50,855 1971 M. 59.21 161,278 +50,139 87,441 73,837
90 Kharagpur Midnapore 1911 18,957 +6,32:i
11,739 7,218 (WEST BENGAL) 1921 25,280 +33.35 15,154 10,126
1931 58,134 +32,854 + 129.96 33,443 24,691 1941 87,185 +29,051 +49.97 48,724 38,461 \%\ t?.'!,iS.Yi. *>.4.'t,~~.1 .. ""dR..",,! ,,;~~W), ").~1J>. \96\ 33.38 147,253 +17,617 + 13.59, 81,352 65,901 1971 33.38 161,257 +14,004 +9.51 87,124 74,133
(i) Kharagpur 1931 37,871 22,494 15,377 Rly. Settlement 194\t
1951 50,384 + 16,16i
26,341 \ 24,043 1961 N.A. 66,545 +32.08 36,485 30,060 \971 N.M. N.A. 73,435 +6,890 + 10. 35 38,976 34,459
(H) Kharagpur 1911 18,957 H,32:i
11,739 7,218 1921 25,280 +33.35 15,154 10,126
'1931 20,263 -5,017 -19.85 10,949 9,314
l~~~t 87,185 +66,922 +330.27 48,724 38,461 79,252 -7,933 -9.10 41,569 37,683
\961 M. N.A. 61,838 -7,414 -21.97 33,884 27,954 1971 M. N.A, 61,783 -55 -0.09 33,509 28,274
(Hi) Kharagpur 1961 N.M. N.A. 13,035 6,906 6,129 \
1971 N.M. N.A. 18,718 +~,6S:i +43.60 9,800 8,918
(iv) Kharagpur 1961 N.A. 5,835 + 1,486 +25.47
4,077 1,758 I.I.T. 1971 N.M. N.A. 7,321 4,839 2,482
91 AIIeppey Alleppey 1901 24,918 +747 +3.00
12,748 12,170 (KERALA) 1911 25,665 13,370 12,295
1921 32,074 +6,409 +24.97 16,885 15,189 1931 43,838 + 11,764 +36.68 23,677 20,161 1941 56,333 +12,495 +28.50 30,136 26,197 1951 116,278 +59,945 + 106.41 59,638 56,640 1961 M. 46.78 138,834 +22,556 + 19.40, 69,977 68,857 1971 M. 46.77 160,166 +21,332 +15.37 80,307 79,859
92 Sagar urban Sagar 1901 42,330 +3,578 +8.45
21,981 20,349 agglomeration (MAJ}flYA PRADBSm 1911 45,908 24,330 21,578
1921 39,319 -6,589 -14.35 21,561 17,758 1931 48,862 +9,543 +24.27 25,306 23,556 1941 63,933 + 15,071 +30.84 33,384 30,549 1951 80,068 + 16,135 +25.24 41,867 38,201 1961 50.06 104,676 +24,608 +30.73\ 56,303 ' 48,373 1971 52.03 154,785 + 50,109 +47.87 83,855 70,930
(a) Sagar 1901 42,330 +3.578 +8.45
21,981 20,349 1911 45.908 24,330 21,578 1921 39,319 -6,589 -14.35 21,561 17,758 1931 39,822 +503 +1.28 20,723 19,099 1941 50,733 + 10,911 +27.40 26,220 24,513 1951 66,442 + 15,709 +30.96 34,848 31,594 1961 33.75 85,491 +19,049 +28.67 45,735 39,756 1971 35.72 127,442 +41,951 +49.07 68,088 59,354
(i) Sagar 1901 42,330 +3,578 +8.45
21,981 20,349 1911 45,908 24,330 21,578 1921 39,319 -6,589 -14.35 21,561 17,758 1931 ;39,822 +503 +1.28 20,723 19,099 1941 50,733 +10,911 +27.40 26,220 24,513 1951 66,442 + 15,709 +30.96 34,848 31,594 1961 M. 33.75 85,491 + 19,049 +28.67 45,735 39,756 1971 M. 33.75 118,574 +33,083 +38.70 62,976 55,598
(H) Makronia Buzurg (O.G.)
1971 0.40 2,881 1,690 1,191
(iii) Rajakhedi 1971 0.59 2,755 1,460 1,295 (O,G.)
(iv) Gaur Nagar 1971 0.51 1,708 1,183 525 (0. G.)
(v) Kapuria (O.G.) 1971 0.22 1,043 537 506
tKharagpur (M) & Kharagpur Rly. Settlement were separate towns in 1931 with a population of 20,263 (10,949 M., 9,314 P.) and P. 37,871 (22,494 M., 15,377 ,F.) respectively. In '1941, these towns were merged in Kharagpur (M). The 1941 population of Kharagfur (M) shown in this table includes the population of Kharag. pur Rly. Settlement also.
"
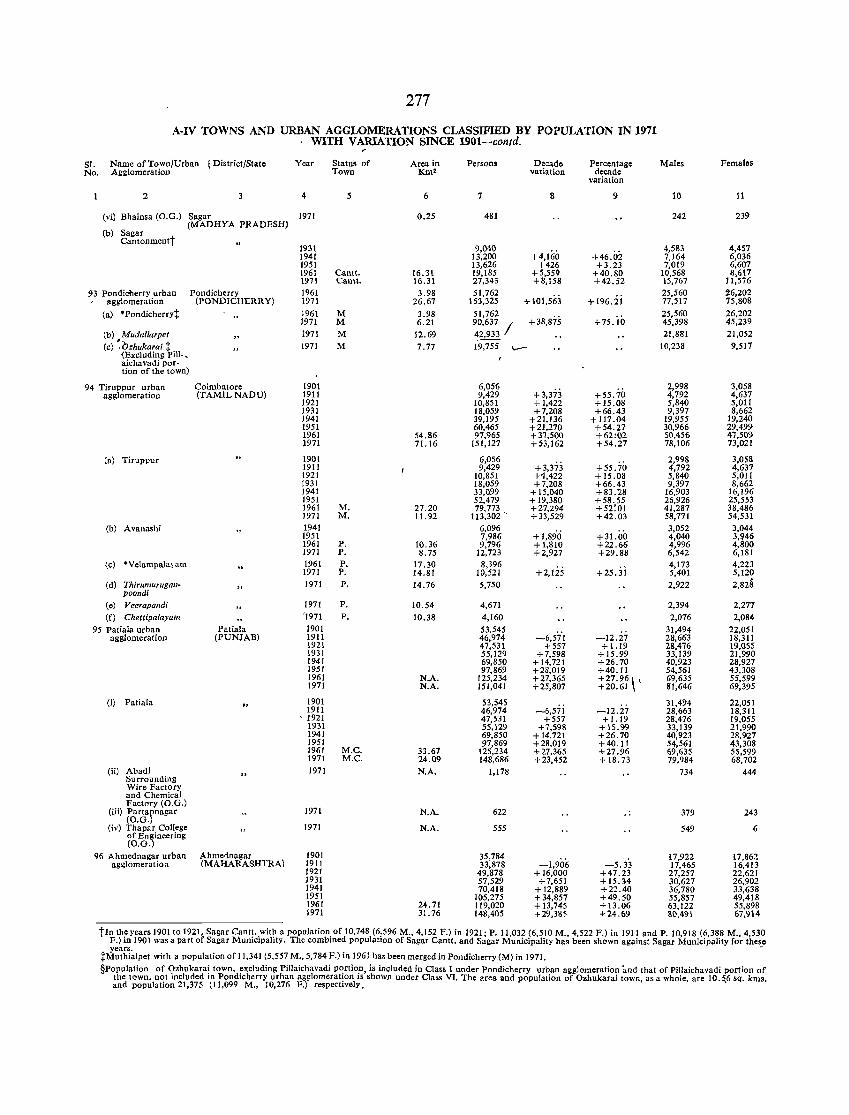
277
A·IV TOWNS AND URBAN AGGLOMERATIONS CLASSIFIED BY POPULATION IN 1971 WITH VARIATION SINCE 1901-contd.
SI. Name of Town/Urban t District/State Year Status of Area in Persons Decado Percentage Males Females No. Agglomeration Town Km2 variation decade
variation
2 4 5 6 7 8 9 10 11
(vi) Bhainsa (O.G.) Sagar 1971 0.25 481 242 239
(b) Sagar (MADHYA PRADESH)
Cantonmentt 1931 9,040 4,583 4,457 1941 13,200 +4,160 +46.02 7,164 6,036 1951 13,626 +426 +3.23 7,019 6,607 1961 Cantt. 16.31 19,185 +5,559 +40.80 10,568 8,617 1971 Cantt. 16.31 27,343 +8,158 +42.52 15,767 11,576
93 Pondicherry urban Pondicherry 1961 3.98 51,762 + 101,563
25,560 26,202 agglomeration (PONDICHERRY) 1971 26.67 153,325 +196.21 77,517 75,808
(a) ·Pondicherryt 1961 M 3.98 51,762 +38,875 +75. io 25,560 26,202
1971 M 6.21 90,637 I 45,398 45,239
(b) Mudaliarpet 1971 M 12.69 ~2,933 21,881 21,052
(c) ~ bzhukarai t 1971 M 7.77 19,755 ,__. 10,238 9,517 ,(Excluding Pill., aichavadi por-tion of the town)
94 Tiruppur urban Coimbatore 1901 6,056 +3,373 +55.70
2,998 3,058 agglomeration (TAMIL NADU) 1911 9,429 4,792 4,637
1921 10,851 +1,422 +15.08 5,840 5,011 1931 18,059 +7,208 +66.43 9,397 8,662 1941 39,195 +21,136 +117.04 19,955 19,240 1951 60,465 +21,270 +54.27 30,966 29,499 1961 54.86 97,965 +31,500 +62102 50,456 47,509 ~971 71.16 151,127 +53,162 +54.27 78,106 73,021
(a) Tiruppur 1901 6,056 +3,373 +55.70
2,998 3,058 1911 9,429 4,792 4,637 1921 10,851 +1,422 +15.08 5,840 5,Oll 1931 18,059 +7,208 +66.43 9,397 8,662 1941 33,099 + 15,040 +83.28 16,903 16,196 1951 52,479 + 19,380 +58.55 26,926 25,553 1961 M. 27.20 79,773 +27,294 +52~01 41,287 38,486 1971 M. 11.92 113,302 ' +33,529 +42.03 58,771 54,531
(b) Avanashi 1941 6,096 +1,890 +31.00
3,052 3,044 1951 7,986 4,040 3,!l46 1961 P. 10.36 9,796 +1,810 +22.66 4,996 4,800 1971 P. 8.75 12,723 +2,927 +29.88 6,542 6,181
te) 'VelampaJa) am 1961 P, 17.30 8,396 +2,125
4,173 4,223 1971 P. 14.81 10,521 +25.31 5,401 5,120
(d) Thirumurugon- 1971 P. 14.76 5,750 2,922 2,828 poondi
(e) Veerapandi 1971 P. 10.54 4,671 2,394 2,277 (f) Cltettipaiayam '1971 P, 10.38 4,160 2,076 2,084
95 Patiala urban Patiala 1901 53.545 -6,57'1 -12.27
31,494 22,051 agglomeration (PUNJAB) 1911 46,974 28,663 18,311
192\ 47,531 +557 + 1.19 28,476 19,()55 1931 55,129 +7,598 +15.99 33,139 21,990 1941 69,850 +14,721 +26.70 40,923 28,927 1951 97,869 +28,019 +40.11 54,561 43,308 1961 N.A, 125,234 +27,365 +27,96 \ \ 69,635 55,599 1971 N,A. 151,041 +25,807 +20.61 81,646 69,395
(i) Patiala 1901 53,545 -6,57i
31,494 22,051 1911 46,974 -12.27 28,663 18,311
, 1921 47,531 +557 +1.19 28,476 19,055 1931 55,129 +7,598 +15.99 33,139 21,990 1941 69,850 +14,721 +26.70 40,923 28,927 1951 97,869 +28,019 +40.11 54,561 43,308 1961 M.e. 33.67 125,234 +27,365 +27.96 69,635 55,599 1971 M.C. 24.09 148,686 +23,452 + 18.73 79,984 68,702
(ii) Abadi Surrounding
1971 N.A. 1,178 734 444
Wire Factory and Chemical Factory (O.G.)
1971 (iii) Parta1nagar N.A. 622 .. 379 243 (O.G.
(iv) Thapar College 1971 N.A. 555 549 6 of Engineering (O.G.)
96 Ahmednagar urban Ahmednagar 1901 35,784 -1,906 -5.33
17,922 17,862 agglomeration (MAHARASHTRAl 1911 33,878 17,465 16,413
1921 49,878 + 16,000 +47.23 27,257 22,621 1931 57,529 +7,651 +15.34 30,627 26,902 1941 70,418 + 12,889 +22.40 36,780 33,638 1951 105,275 +34,857 +49.50 55,857 49,418 1961 24.71 119,020 + 13,745 +13.06 63,122 55,898 1971 31. 76 148,405 +29,385 +24.69 81),491 67,914
tIn th!'years 1901 to 1921, Sagar Cant! .. wit\I a population. of 10,748 (6,596 M., 4,152 F.) in 1921; P. 11,032 (6,510 M., 4,522 F.) in 1911 and P. 10,918 (6,388 M., 4,530 F.) ID 1901 was a part of Sagar MUUIc'pahty. The combmed populatton of Sagar Cantt. and Sagar Municipality has been shown against Sagar Municipality for thes_e years.
tMuthialpet with a popnlation of 11,341 (5.557 M., 5,784 F.) in 1961 has been merged in Pondicherry (M) in 1971.
§Population of qzhukara! town, ~xcluding Pillaichavadi p,?rtio?, is included in Class T under Pondicherry urban agglomeration :~nd that of Pillaichavadi portion of the town, not ,neluded 10 Pond,cherry urban agglomerat~on ,s shown under Class VI. The area and population of Ozhukarai town, as a whole, are 10.!\6 sq. kms. and population 21,375 (11,099 M., 10,276 F.) respec!Jvely.
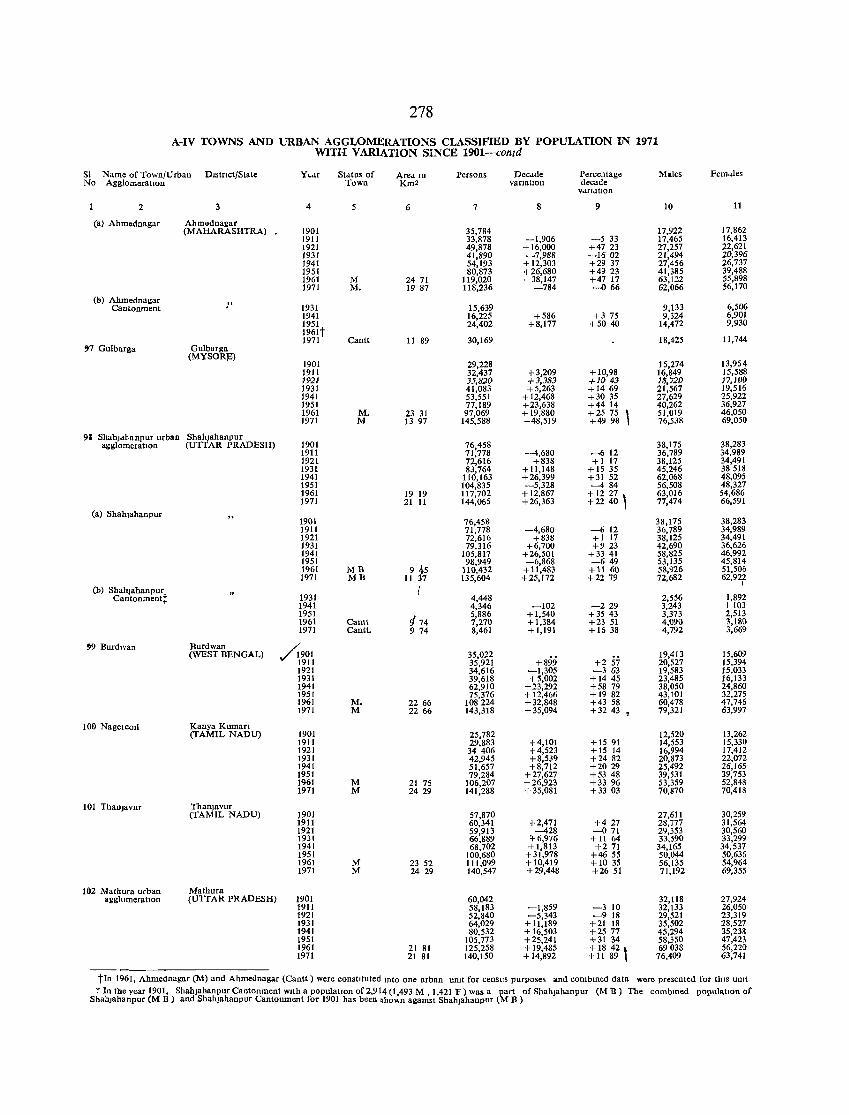
278
A-IV TOWNS AND URBAN AGGLOMERATIONS CLASSIFIED BY POPULATION IN 1971 WITH V ARlATlON SINCE 1901-contd
Sl Name of Town/Urban DIstrict/Slate Year SlulUs of Aced. III Persons Decade Percentage Males Fern"les No AgglomeratIOn Town Km' vanatlon decade
VdrIdtlon
2 4 5 6 7 8 9 10 11
(a) Ahmodnagar Ahrnodnagar 17,862 (MAHARASHTRA) 1901 35,784 17,922
1911 33,878 -1,906 -533 17,465 16,413 1921 49,878 +16,000 +4723 27,257 22,621 1931 41,890 -7,988 -1602 21,494 20,396 1941 54,193 + 12,303 +29 37 27,456 26,737 1951 80,873 +26,680 +4923 41,385 39,488 1961 M 24 71 119,020 +38,147 +4717 63,122 55,898 1971 M. 19 87 118,236 -784 --066 62,066 56,170
(b) Ahmednagar .. 9,133 6,506 Cantonment 1931 15,639
1941 16,225 +586 +3 75 9,324 6,901 1951 24,402 +8,177 +5040 14,472 9,930 1961t 1971 Cant! 11 89 30,169 18,425 11,744
'7 Gulbarga Gulbarga (MYSORf,)
1901 29,228 15,274 13,954 1911 32,437 +3,209 +10,98 16,849 15,588 1921 35,820 +3,383 +10 43 13,720 17,100 1931 41,083 +5,263 +1469 21,567 19,516 1941 53,551 + 12,468 +3035 27,629 25,922 1951 77,189 +23,638 +4414 40,262 36,927 1961 M. 23 31 97,069 + 19,880 +25 75 51,019 46,050 1971 M 13 97 145,588 +48,519 +49 98 76,538 69,050
91 ShahJdbanpur urban Shahjahanpur agglomelatlOn (UTTAR PRADESH) 1901 76,458 38,175 38,283
1911 71,778 -4,680 -612 36,789 34,989 1921 72,616 +838 +1 17 38,125 34,491 1931 83,764 + 11,148 + IS 35 45,246 38518 1941 110,163 +26,399 +31 52 62,068 48,095 1951 104,835 -5,328 -484 56,508 48,327 1961 19 19 117,702 + 12,867 + 12 27 , 63,016 54,686 1971 21 11 144,065 +26,363 +2240 77,474 66,591
(a) Shah,ahanpur 1901 38,175 38,283 76,458 1911 71,778 -4,680 -612 36,789 34,989 1921 72,616 +838 +1 17 38,125 34,491 1931 79,316 +6,700 +923 42,690 36,626 1941 105,817 +26,501 +33 41 58,825 46,992 1951 98,949 -6,868 -649 53,135 45,814 1961 MB 9 f.5 110,432 + 11,483 +11 60 58,926 51,506 1971 MB 11 7 135,604 +25,172 +2279 72,682 62,922
I (b) Shahjahanpur l 1,892 Cantonmentt 1931 4,448 2,556
1941 4,346 -102 -229 3,243 1 103 1951
if 74 5,886 +1,540 +3543 3,373 2,513
1961 Cantt 7,270 +1,384 +23 51 4,090 3,180 1971 Cantt, 9 74 8,461 +1,191 + 1638 4,792 3,669
'9 Burdwan Burdwan ~901 (WEST BENGAL) 35,022 +899 +2 57
19,413 15,609 1911 35,921 20,527 15,394 1921 34,616 -1,305 -363 19,583 15,033 1931 39,618 + 5,002 +1445 23,485 16,133 1941 62,910 +23,292 +58 79 38,050 24,860 1951 75,376 +12,466 +1982 43,101 32,275 1961 M. 2266 108224 +32,848 +43 58 60,478 47,746 1971 M 22 66 143,318 +35,094 +3243 79,321 63,997
100 NagelcOli Kanya Kuman (TAMIL NADU) 1901 25,782 12,520 13,262
1911 29,883 +4,101 + 15 91 14,553 15,330 1921 34406 +4,523 +15 14 16,994 17,412 1931 42,945 +8,539 +2482 20,873 22,072 1941 51,657 +8,712 +2029 25,492 26,165 1951 79,284 +27,627 +53 48 39,531 39,753 1961 M 21 75 106,207 +26,923 +3396 53,359 52,848 1971 M 2429 141,288 +35,081 +33 03 70,870 70,418
101 ThauJavur Thanjavur (TAMIL NADU) )901 57,870 27,611 30,259
1911 60,341 +2,471 +427 28,777 31,564 1921 59,913 --428 -071 29,353 30,560 1931 66,889 '1-6,976 + 11 64 33,590 33,299 1941 68,702 + 1,813 +271 34,165 34,537 1951 100,680 + 31,978 +4655 50,044 50,636 1961 M 23 52 111,099 +10,419 + 10 35 56,135 54,964 1971 M 24 29 140,547 +29,448 +26 51 71,192 69,355
Itt2 Mathura urban Mathura agglnmeratlOn (UTTAR PRADESH) 1901 60,042 32,118 27,924
1911 58,183 -1,859 -310 32,133 26,050 1921 52,840 -5,343 -918 29,521 23,319 1931 64,029 +11,189 +21 18 35,502 28,527 1941 80,532 + 16,503 +25 77 45,294 35,238 1951 105,773 +25,241 +31 34 58,350 47,423 1961 21 81 125,258 + 19,485 + 18 42, 69038 56,220 1971 21 81 140,150 + 14,892 + II 89 76,409 63,741
tIn 1961, Ahmednagar (M) and Ahmednagar (Cantt) were constLtuted mto one urban umt for census purposes and combmed data were presented for thLS Unit
T In the year 1901, Shahjahanpur Cantonment wIth a populatIOn of2,914 (1,493 M , 1,421 F) was a part of Shahjahanpur Shabjananpur (M B) and ShahJahanpur Cantonment for 1901 has been &ho"n agamst Shahjahanpur (M B)
(M B) The combmed populalLon of
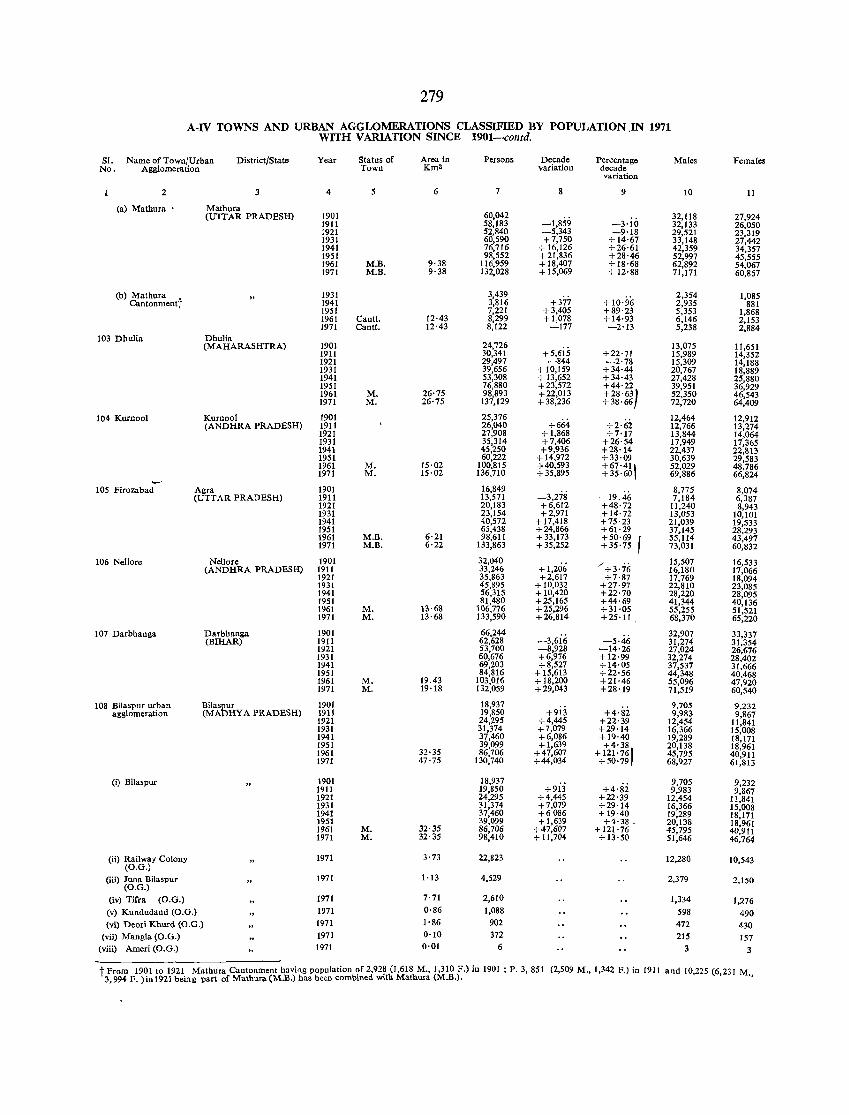
279
A-IV TOWNS AND URBAN AGGLOMERATIONS CLASSIFIED BY POPULATION ,IN 1971 WITH V ARlATION SINCE 1901-contd.
SI. Name of Town/Urban District/State Year Status of Area in Persons Decade Percentage Males Females No. Agglomeration Town Km2 variation decade
variation
2 3 4 5 6 7 9 10 11
(a) Mathura • Mathura (UTTAR PRADESH) [901 60,042
-1,859 32,118 27,924
1911 58,183 -3·10 32,133 26,050 1921 52,840 -5,343 -9·18 29,521 23,319 [931 60,590 +7,750 + 14'67 33,148 27,442 [941 76,716 +16,126 +26·61 42,359 34,357 1951 98,552 +21,836 +28·46 52,997 45,555 1961 M.B. 9'38 116,959 + 18,407 +18·68 62,892 54,067 1971 M.B. 9·38 132,028 + 15,069 + 12'88 71,171 60,857
(b) ~~i~~entt 1931 3,439 +377 +10·96
2,354 1,085 1941 3,816 2,935 881 1951 7,221 +3,405 +89'23 5,353 1,868 1961 Cantt. 12·43 8,299 +1,078 + 14·93 6,146 2,153 1971 Cantt. 12·43 8,122 -177 -2'13 5,238 2,884
103 Dhulia Dhulia (MAHARASHTRA) 1901 24,726 13,075 11,651
1911 30,341 +5,615 +22'71 15,989 14,352 1921 29,497 -844 -2,78 15,309 14,188 1931 39,656 + 10,159 +34·44 20,767 18,889 1941 53,308 + 13,652 +34·43 27,428 25,880 1951 76,880 +23,572 +44'22 39,951 36,929 1961 M. 26'75 98,893 +22,013 +28·63 } 52,350 46,543 1971 M. 26·75 137,129 +38,236 +38·66 72,720 64,409
104 Kurnool Kurnool 1901 25,376 +664 +2·62
12,464 12,912 (ANDHRA PRADESH) 1911 26,040 12,766 13,274
1921 27,908 + 1,868 +7'17 13,844 14,064 1931 35,314 +7,406 +26'54 17,949 17,365 1941 45,250 +9,936 +28'14 22,437 22,813 1951 60,222 + 14,972 +33·09 30,639 29,583 1961 M. 15·02 100.815 +40,593 +67' 41 1 52,029 48,786 1971 M. 15·02 136,710 +35,895 +35·60 69,886 66,824
105 Firozabad Agra 1901 16,849 -3,278 -19.46
8,775 8,074 (UTTAR PRADESH) 1911 13,571 7,184 6,387
1921 20,183 +6,612 +48'72 11,240 8,943 1931 23,154 +2,971 +14·72 13,053 10,101 1941 40,572 +17,418 +75·23 21,039 19,533 1951 65,438 +24,866 +61'29 37,145 28,293 1961 M.B. 6'21 98,611 +33,173 +50·69 55,114 43,497 1971 M.B. 6·22 133,863 +35,252 +35'75 73,031 60,832
106 Nellore Nellore 1901 32,040 + 1,206 / + 3'76
15,507 16,533 (ANDHRA PRADESH) 1911 33,246 16,180 17,066
1921 35,863 +2,617 +7·87 17,769 18,094 1931 45,895 + 10,032 +27·97 22,810 23,085 1941 56,315 + 10,420 +22·70 28,220 28,095 1951 81,480 +25,165 +44·69 41,344 40,136 1961 M. 13·68 106,776 +25,296 +31·05 55,255 51,521 1971 M. 13·68 133,590 +26,814 +25'11 68,370 65,220
107 Darbhanga Darbhanga 1901 66,244 -3,6i6 -5·46
32,907 33,337 (BIHAR) 1911 62,628 31,274 31,354
1921 53,700 -8,928 -14'26 27,024 26,676 1931 60,676 +6,976 +12·99 32,274 28,402 1941 69,203 +8,527 +14'05 37,537 31,666 1951 84,816 + 15,613 +22'56 44,348 40,468 1961 M. 19.43 103,016 + 18,200 +21·46 55,096 47,920 1971 M. 19'18 132,059 +29,043 +28'19 71,519 60,540
108 Bilaspur urban Bilaspur 1901 18,937 +9i3 +4·si
9,705 9,232 agglomeration (MADHYA PRADESH) 1911 19,850 9,983 9,867
1921 24,295 +4,445 +22·39 12,454 11,841 1931 31,374 +7,079 +29'14 16,366 15,008 1941 37,460 +6,086 + 19'40 19,289 18,171 1951 39,099 + 1,639 +4·38 20,138 18,961 1961 32·35 86,706 +47,607 +121'76) 45,795 40,911 1971 47·75 130,740 +44,034 +50'79 68,927 61,813
(i) Bilaspur 1901 18,937 Hij +4'82
9,705 9,232 1911 19,850 9,983 9,867 1921 24,295 +4,445 +22'39 12,454 11,841 1931 31,374 +7,079 +29'14 16,366 15,008 1941 37,460 +6086 + 19'40 19,289 18,171 1951 39,099 +1,639 +4·38. 20,138 18,961 1961 M. 32·35 86,706 +47,607 +121'76 45,795 40,911 1971 M. 32·35 98,410 + 11,704 + 13'50 51,646 46,764
(ii) Railway Colony 1971 3'73 (0.0.)
22,823 12,280 10,543
(iii) Juna Bilaspur (0.0.)
1971 1·13 4,529 2,379 2,150
(iv) Tifra (0.0.) 1971 7'71 2,610 1,334 1,276 (v) Kundudand (O.G.) 1971 0'86 1,088 598 490 (vi) Deori Khurd (0.0.) 1971 1'86 902 472 1\30
(vii) Mangla ~O.G.) 1971 0'10 372 215 157 (viii) Arneri (O.G.) 1971 0·01 6 3 3
t From 1901 to 1921 Mathura Cantonment having population ,?f 2,92~ (1,618 M., 1,310 F.) in 1901 ; P. 3, 851 3,994 F. )in1921 being part of Mathura(M.B.) has been combmed wtth Mathura (M.B.).
(2,509 M., 1,342 F.) in 1911 and 10,225 (6,231 M.,
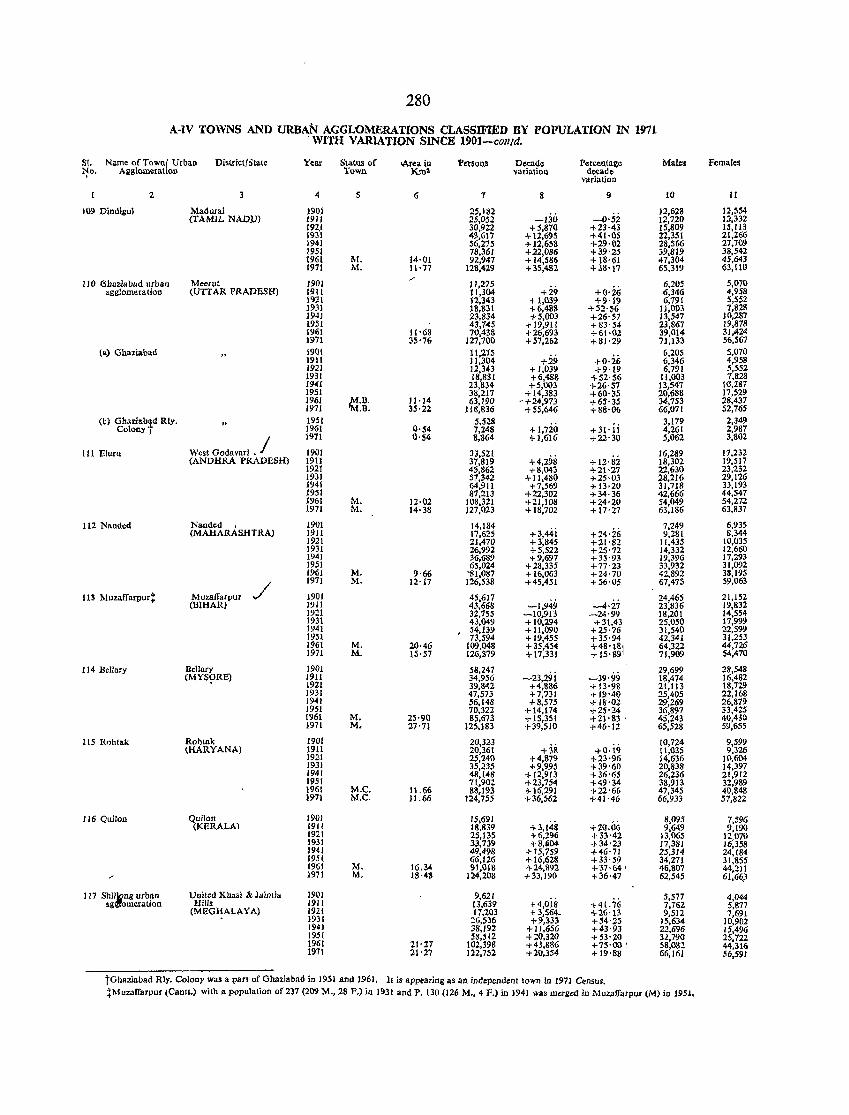
280
A-IV TOWNS AND URBAN AGGL'OMERATIONS CLASSIFIED BY POPULATION IN 1971 . WITH VARIATION SINCE 1901-collld.
SI. Name of Town{ Urban District/:ita(e Y~ar Status of \(\fea. in Pasons Decaue Percentage Malea Females ~o. Agglomeration Town l(m2 variation del:ado
variation
2 3 4 S 6 7 8 9 10 11
109 Dindigul Madurai 1901 25,132 -130 -O'Sl
12,628 12,554 (TAMIL NADlJ) 1911 25,052 12,720 l2,332
192J 30,922 +5,870 +23·43 15,809 15,113 1931 43,617 +12,695 +41·05 22,351 21,266 1941 56,275 +12,658 +29'()2 28,566 27.709 1951 78,361 +22,086 +39'25 39,819 38.542 1961 M. 14·01 92947 + 14,S86 + 18'61 47,304 45,643 1971 M. 11·71 128;4:29 +35,482 +38·}7 65,319 63,110
11 0 6bazla bad urban Meerut 1901 11,275 +29 +0'26
6,205 5,070 agglomeration (UTI AR PRADESH) 1911 11,304 6,346 4,958
1921 12,343 +1,039 +9'19 6,791 5,S52 1931 18,831 +6,488 +52'$6 11,003 7,828 1941 23,834 +5,003 +26'57 J3,547 10,287 1951 43,745 + 19,911 + 83'54 23,867 19,878 1961 Jl'68 70,438 +26,693 +61,0:2 39,014 31,424 1971 35'76 127,700 +57,262 +81·29 71,133 56,567
(a) Ghaziabad 1901 11,215 +29 +0.26
6,205 S,07() 1911 11,304 6.346 4,958 1921 12,343 +1,039 +9·(9 6,791 5,552 1931 18,831 +6,488 +52'56 11,003 7,828 1941 23,834 +5,003 +26'57 13,541 10,287 1951 38,217 +14,383 +60'35 20,688 17,529 1961 ~.D. 11'14 63,190 ~+24,973 +6S'35 34,753 28,437 1971 .n. 35'22 118,636 +55,646 +88·06 66,071 52,765
(b) Gh~riab~d Rly. 1951 5,528 +1,720 +31·ji
3,179 2,349 Colony t 1961 0'54 7,248 4,261 2,987
W~st Godavari .1 1971 0'54 8,864 +1,616 +22'30 5,062 3,802
III Bluru 1901 33,521 +4,298 +1:;1'82
16,289 17.232 (ANDHRA PRADESH) 1911 37,819 18,302 19,517
1921 45,862 +8,043 +21'27 22,630 23,232 1931 57,342 +11,480 +25·03 28,216 29,125 1941 64,911 +7,569 + 13·20 31,718 33,193 1951 87,213 +22,302 +34·36 42,666 44,547 1961 M, 12·0:2 108,321 +21,108 +24'20 54,049 54,27.2 1971 M. 14·38 127,023 + 18,702 + 17-:~7 63,186 63,837
112 Nanded Nauded 1901 14,184 +3,44i +24·:i6
7,249 6,935 (MAHARASHTRA) 1911 17,625 9,281 8,344
1921 21.470 +3,845 +21'S2 11,435 10,035 1931 26,992 +5,522 +25'72 14,332 12,660 1941 36,689 +9,697 +3S'9J 19,396 17,293 1951 65,024 +28.335 +77'23 33,932 31,092 1961 M. 9'66 '81,087 + 16,063 +24'70 42,892 33,195
/ 1971 M. 12'17 126,538 +45,451 +56'05 67,475 59,063
113 Muzaffarpur; Muzaffarpur 1901 45,617 -1.949 ..,..4,27
24,465 21,152 (BIHAR) 1911 43,668 23,836 19,832
1921 32,755 -10,913 -24'99 18,201 14,554 1931 43,049 +10,294 +31,43 25,050 17,999 1941 , 54,139 + 11,090 +25·76 31,540 22,599 19~1 73,594 + 19,455 +35'94 42,341 31,253 1961 M. 20'46 109,048 +35,454 +48' 18 1 64.322 44.726 1971 M. lS'S7 126,379 + 17,331 i-lS'S9 71,909 54,470
114 Bellary Boilary 1901 58,247 -23,29i ~39'99
29,699 28,548 (MYS~RE) 1911 34,956 18,474 16,482
1921 39,842 +4,886 +13'98 21,113 18,729 1931 47,57;; +7,731 +19·40 25,405 22,168 1941 56,148 +8,575 +18·02 29,269 26,87!) 1951 70,322 +14,174 +25'24 36,897 33,425 1961 M. 25'90 85,673 +15,351 +21'83 . 45,243 40,430 1971 M. 27'71 125,183 +:>9,510 +46'12 65,528 59,655
([5 Rflhtak Rohtnk 1901 20,323 +38 +o·i<i
LO,724 9,599 (HARYANA) 1911 20,361 1l,03S 9,326
1921 25,240 +4,879 +23'96 14,636 10.604 1931 35,235 +9,995 +39'60 20,838 14,397 1941 48,[48 + 12,913 + 36'!iS 26.236 21.912 1951 71,902 +23,154 +49'34 38,913 32,989 1961 M.e. 11.66 88,193 +16,291 +22'66 47,345 40,848 1971 M.e. 11.66 124,755 +36,562 +41'46 66,933 57,822
116 Quilon QuiJon 1901 15,69J +3,148 +20.06
8,095 7,596 (KERALA) 1911 18,839 9,649 9,190
1911 25,135 +6,296 + 33'42 13,065 12.070 1931 33,739 +8,'04 +34'23 17,381 16,358 1941 49,498 + 15,759 +46·71 25,314 24,184 t951 66,126 + 16,628 + 33'59 34,271 31,855 1961 M. 16.34 91,018 +24,892 +37·64 ' 46,807 44,:m 1971 M. 18·43 124,208 +33,190 +36'47 62,545 61,66,3
117 Sh1t'g urb~n United Kbasi & J~inlja 1901 9,621 +4,ois +4[. 76
5,577 4,044 ag merallon Hllls 1911 13,639 7,762 5,871
(MEGHALAYA) 1921 17,203 +3,564_ +26'13 9,512 7,691 1931 16,536 +9,333 i"!)4'25 15,634 10,902 1941 38,192 +11,656 +43'9J 22,696 15,496 Ill.51 58,512 +ZO,320 +53'20 3l,790 25,721. 196t 21'27 102,398 +43,886 +75'00 ' 58,082 44,316 1971 21':27 122,752 +20,354 +19'811 66,161 56,591
tGhaziabad Rly. Colony was a parI of GlUlziabad in 1951 and 1961. 11 is appearing as an independent lown in 1911 Census. tMuzaffarpur (Cantl.) with a population of 237 (209 M., 28 P.) in 1!l31 and P. 130 (126 M., 4 F.) in 1941 was merged in MUZillJarpur (M) in 1951.
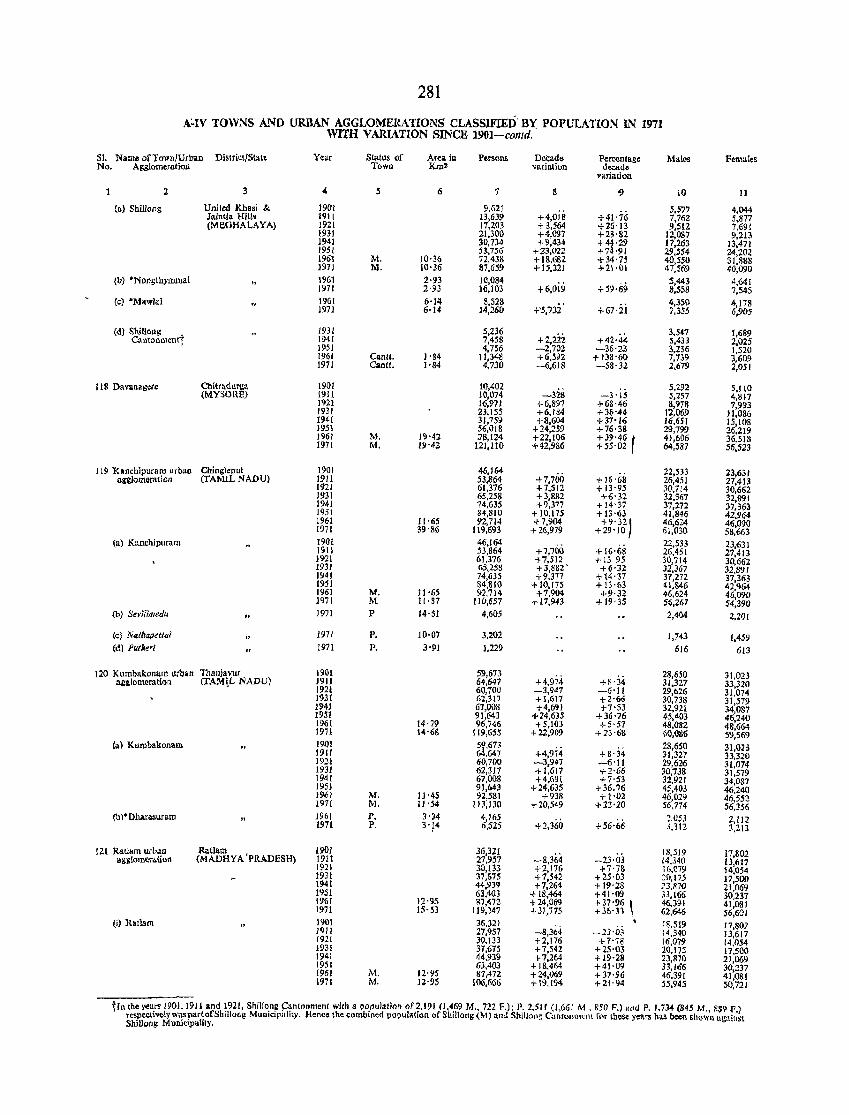
281
A~IV TOWNS AND URBAN AGGLOMERATIONS CLASSIFIED' BY POPULATION IN 1971 WITH VARIATION SINCE 1901-comd.·
SI. Name of Town/Urban District/Slale Ye~r Status of Arn it! PUSQ!lS DeCade Percentage Males Fen\ates No. Agglomeration Town Kill' variation decade
variation
2 3 4 5 6 7 S 09 10 11
(al Shillons United Khasi &. 1901 9,621 :',577 4,044 laintia Hilts 19lt 13,639 +4,018 +41'76 7,762 5,877 (MBGHALA YA} 1921 1',Z<l3 + 3,564 +26'13 9,512 ?59!
1931 21.300 +4,097 +23·82 12,087 9.213 }94) 30,734 -1-9,434 +4p9 17,263 13,471 t9S1 53,756 +23,022 +7 ·91 29,5S4 24,202-1961 M. 10'36 72,438 + 18,G8Z + 34'75 40,550 31,888 1911 M. 10'36 87,659 +15,221 +21·01 41,569 40,090
(b) *Nongthymmai 1961 2'93 10,084 -I-6,Oi9 +59'69
5,443 4,641 1971 2-93 16,103 8,558 7,545
(c) 'Mawlai 1961 6'14 8,518 +'5,73i' +67,:ii
4,350 4,178 J971 6'14 14,260 7,355 6,905
(d) Shinollg . 1931 5,236 +2,2ii +42-44
.,,5(7 1,689 CantonmentT 1941 7,458 5,433 2,025
1951 4,756 -2,702 -36'23 3,236 1,52<l 1961 Canlt. HI4 11,348 +6,592 + 138'60 7,n9 3,609 1971 Cantt. 1'84 4,730 -6,6J8 -58,32 2,679 2,051
118 Da vanaj,'ere Chitradurg", 1901 10,402 -32S -3·is
5,292 5,(10 (MYSORE) 1911 10,074 5,257 4,817
1921 J6,97J -1-6,897 +68,46 8,978 7,993 1931 23.155 +6,184 +36'44 12,069 11,086 1941 31,759 +8,604 +37'16 16,651 15,108 J951 56,018 +24,259 +76·38 29,799 26.219 J961 M. J9·42 :78,124 +22,1()6 +39'46 r 41,606 35,518 1971 M. 19-4Z 121,110 +42,936 +55-02 64,587 56,523
119 Kanchipuram urban Chinsleput 1901 46,164 +7,700
22,533 23,631 agl:iomeratioll (TAMIL NADU) 1911 53,864 + 16-68 26,45J 27,413
1921 61,376 +7,512 + 13'95 30,714 30,662 1931 65,258 +3,882 +6-32 32,367 32,89! 1941 74,635 +9,377 +14'37 37,272 37,363 Iq5! 84,810 +10,175 + 13'63 41,846 42,964 1961 11'65 92,714 +7,904 +9' 321 46,624 46,090 1971 39'&6 119,693 + 26,919 +29'10 6J,030 58,663
(a) Kanchipuram 1901 46,164 + 7,700 +16-68
22,533 23,63J 1911 .53,864 26,451 27,413 1921 61,376 +7,.512 + 1395 :10,714 30,662 1931 5.5,258 + 3,882' +6'32 32,367 32,891 1941 74,635 +9,377 + 14,37 37,272 37,363 1951 84,810 + 10,175 +0'1)3 41,846 42,964 1961 M_ 11'65 92,714 +1,904 +9·32 16,624 46,Q9() 1971 M 11-37 110,657 + 17,943 +19'35 5<$,Z67 $4,390
(b} Se}-Ilhnedu J971 P 14·51 4,605 2,404 2,201
(c) Nalhapetlai 1971 P. 10·07 3,202 1,743 1,459 (dl Putlwi 1971 P. 3'91 1,229 616 613
120 Kumbllkonam urban Thanjavuf 1901 59,673 H,974 H'34
23,650 31.023 allilomeration (TAM~L NADU) 1911 64,647 31,327 33,320
1921 60,700 -3,947 -6'11 29,626 31.074 1931 62,~17 + 1,6!7 +Z·m; 30,738 31,5711 1941 67,008 +4,69J +7'53 32,921 34,087 1951 91,643 +24,635 +36'76 45,4.03 46,240 196! 14'79 96,146 +5,103 +5'57 48,082 48,664 1971 14'6S 119,655 + 22,909 +n·68 60,086 5'.1,569
(a) Kumbakonam 190J 5l,673 +4,974 28,650 31,013 1911 6 ,647 +8'34 31,327 33,320 1921 60,700 -3,947 -6'11 29426 31,074 1931 62,317 +1,617 +2·66 >0,38 31,579 1941 67,008 +4,691 +7·53 32,921 34,087 1951 91,643 +24,635 +~6.76 45,4(13 46,240 1%1 M. 11-45 512,581 +938 +1'02 46,029 46.552 1911 M. 11'54 113,130 +20,549 +22'20 56,774 56,356
(b)' DlJarasuram " 1961 P. 3·)4 4,165 ::.053 2,112 1971 p- 3'14 6,525 +2,160 +56'66 .1,312 3,213
121 Rat!1I1n urban Ra.tllull. 1901 36,321 -8,364 18.519 17,802
alliliomeration (MADHYA 'PRADESH) 1911 27,957 -23·03 J4,340 13,617 1921 30,133 +2,176 +')'78 IG,079 14,054 1931 37,575 +7,542 +2H>3 ;0,175 17,500 1941 44,939 +7,264 + 19'28 73,870 21,069 1951 63,403 + 111,464 +41-09 33,166 30,237 196! 12'95 87,472 + 14,()69 + 37'96 \ 46,391 41,081 19/1 15, 53 119,;47 +31,775 + J6'31 62,646 56,601
0) RatJalll 1901 36,321 -8,364 -2J'Oj
IS,519 17,$07 )911 27,957 Id,340 13,617 1921 3Q,I33 +2,176 +7'78 16,079 14.054 1931 37,675 + 7,542 +15,03 20,175 17,500 1941 44,939 +7,264 +19·28 23,870 21,069 195! 63,403 + 18,464 +41·09 33,166 30,237 1961 M, 12-95 87,472 +24,1)69 +37'% 46.391 41.081 1971 Me !Z·9.5 106,666 +19,194 +21'94 55,945 50,721
tIn the yeat'S 1901, J911 and 1921, Shillong '::anlonmenr wilh a po~u'ation of2,191 (1,469 M .• 722 F.l; P. 2.511 (1,661 M .• 850 F.) "lid p, 1.734- (845 M., :lSI> P.) respeclivelywaspartofShillons Municipality. Hence the combined populalion of Shiltol1g (M) 1\11& Shillong CanloJl!ll~nt !i>r these years has been shown Ilg'linst ShiUoDY; Munltipalit)'. '
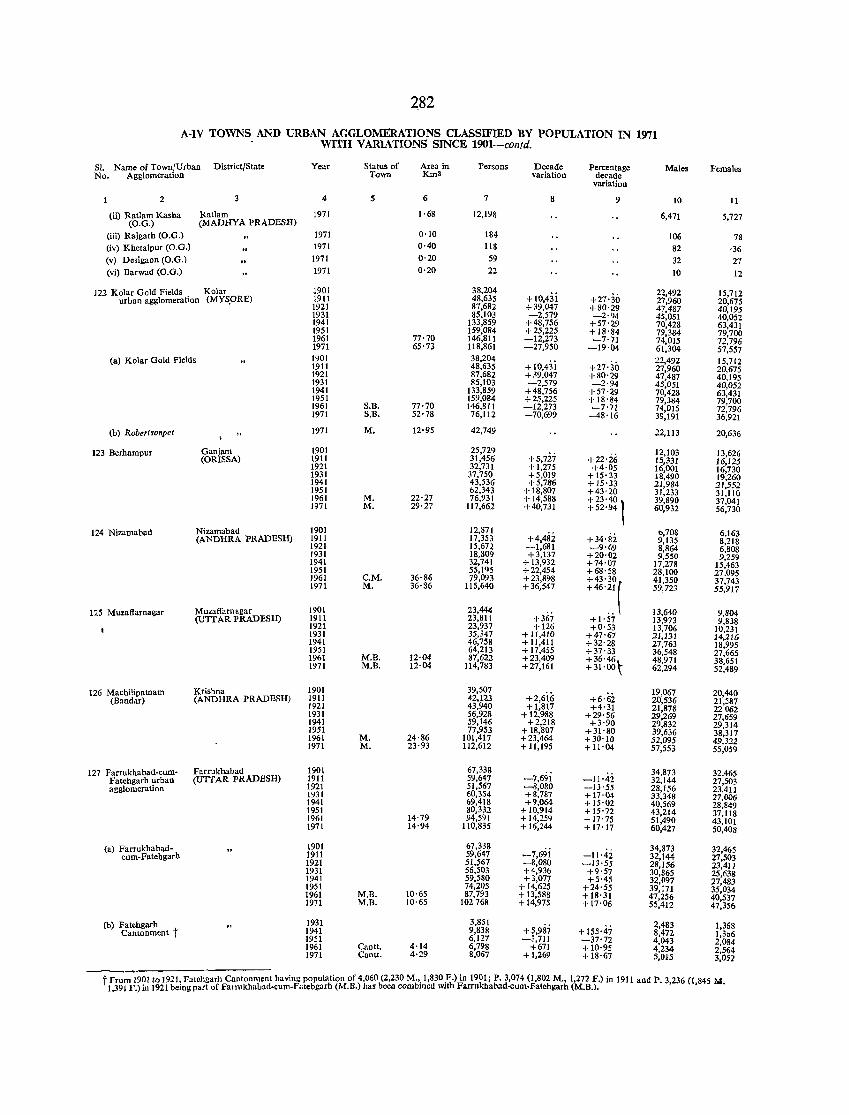
282
A-IV TOWNS AND URBAN AGGLOMERATIONS CLASSIFIED BY POPULATION IN 1971 WITH VARlATIONS SINCE 1901-co/ltd.
S1. Name of Town/Urban District/State Year Status of Area in Persons Decade Percentage Males Females No. Agglomeration Town Km2 variation decade
variation
2 4 5 6 7 8 9 10 11
(ii) Ratlam Kasba Ratlam 1971 1·68 12,198 6,471 5,727 (O.G.) (MADHYA PRADESH)
(iii) Rajgarh (O.G.) 1971 0·10 184 106 78 (iv) Khetalpur (O.G.) 1971 0·40 118 82 ·36 (v) Desigaon (O.G.) 1971 0·20 59 32 27 (vi) Barwad (O.G.) 1971 0·20 22 10 12
12? Kolar Gold Fields Kolar 1901 38,204 +10,43i +27'30
22,492 15,712 - urban agglomeration (MYS.ORE) 1911 48,635 27,960 20,675
1921 87,682 +39,047 +80'29 47,487 40,195 1931 85,103 -2,579 -2·94 45,051 40,052 1941 133,859 +48,756 +57'29 70,428 63,431 1951 159,084 +25,225 +18'84 79,384 79,700 1961 77·70 146,811 -12,273 -7'71 74,015 72,796 1971 65'73 118,861 -27,950 -19'04 61,304 57,557
Cal Kolar Gold Fields 1901 38,204 + I 0,43 i +27'30
22,492 15,712 1911 48,635 27,960 20,675 1921 87,682 + 39,047 +80'29 47,487 40,195 1931 85,103 -2,579 -2·94 45,051 40,052 1941 133,859 +48,756 +57'29 70,428 63,431 1951 159,084 +25,225 +18'84 79,384 79,700 1961 S,B. 77·70 146,811 -12,273 -7'71 74,015 72,796 1971 S.B. 52·78 76,112 -70,699 -48'16 39,191 36,921
(b) Robertsonpet 1971 M, 12'95 42,749 22,113 20,636
123 Berhampur ~RiSSA) 1901 25,729
+5,7i7 +22'26 12,103 13,626
1911 31,456 15,331 16,125 1921 32,731 + 1,275 +4·05 16,001 16,730 1931 37,750 +5,019 + 15'33 18,490 19,260 1941 43,536 +5,786 +15'33 21,984 21,552 1951 62,343 + 18,807 +43'20 31,233 31,110 1961 M. 22·27 76,931 + 14,588 +23'40 39,890 37,041 1971 M. 29·27 117,662 +40,731 +52'94 1 60,932 56,730
124 Nizamabad Nizamabad 1901 12,871 +4,482 +34'82
b,708 6,163 (ANDHRA PRADESH) 1911 17,353 9,135 8,218 1921 15,672 -1,681 -9'69 8,864 6,808
1931 18,809 +3,137 +20·02 9,550 9,259 1941 32,741 + 13,932 +74·07 17,278 15,463 1951 55,195 +22,454 +68'58 28,100 27.095 1961 C.M. 36'86 79,093 +23,898 +43·30 41,350 37,743 1971 M. 36·86 115,640 +36,547 +46'~~ ( 59,723 55,917
125 Muzafiarnagar Muzaifarnagar 1901 23,444 +367
13,640 9,804 (UTT AR PRADESH) 1911 23,811 +1·57 13,973 9,838 1921 23,937 +126 +0'53 13,706 10,231 1931 35,347 +11,410 +47'07 21,131 14,216
1941 46,758 + 11,411 +32'28 27,763 18,995 1951 64,213 + 17,455 +37·33 36,548 27.665 1961 M.B. 12·04 87,622 +23,409 +36'46 48,971 38,651 1971 M.B. 12·04 114,783 +27,161 +31'00\' 62,294 52,489
126 Machilipatnam Krishna 1901 39,507 +2,6iii +6'62
19,067 20,440 (Bandar) (ANDHRA PRADESH) 1911 42,123 20,536 21,587 1921 43,940 +1,817 +4·31 21,878 22062 1931 56,928 +12,988 +29'56 29,269 27,659 1941 59,146 +2,218 +3'90 29,832 29,314 1951 77,953 + 18,807 +31'80 39,636 38,317 1961 M. 24·86 101,417 +23,464 +30'10 52,095 49,322
1971 M. 23·93 112,612 + 11,195 +11·04 57,553 55,059
127 Farrukhabad-cum· Farrukhabad 1901 67,338 -7,69i
34,873 32,465 Fatehgarh urban (UTTAR PRADESH) 1911 59,647 -11'42 32,144 27,503 agglomeration 1921 51,567 -8,080 -13'55 28,156 23,411 1931 60,354 +8,787 +17·04 33,348 27,006
1941 69,418 +9,064 + 15·02 40,569 28,849 1951 80,332 +10,914 +15·72 43,214 37,118 1961 14'79 94,591 + 14,259 + 17'75 51,490 43,101 1971 14'94 110,835 + 16,244 +17'17 60,427 50,408
(a) Farrukhabad- 1901 67,338 -7,69i -11·42
34,873 32,465 cum·Fatehgarh 1911 59,647 32,144 27,503
1921 51,$67 -8,080 -13'55 28,156 23,411 1931 56,503 +4,936 +9'57 30,865 25,638 1941 59,580 +3,077 +5'45 32,097 27,483 1951 74,205 +14,625 +24·55 39,171 35,034 1961 M.B. 10·65 87,793 + 13,588 + 18·31 47,256 40,537 1971 M.B. 10·65 102768 + 14,975 + 17·06 55,412 47,356
(b) Fatehgarh t 1931 3,851 +5,987 + 155'47 2,483 1,368
Cantonment 1941 9,8311 8,472 1,306 1951 6,127 -3,711 -37'72 4,043 2,084 1961 Cantt. 4·14 6,798 +671 + 10·95 4,234 2,564 1971 Cantt. 4·29 8,067 +1,269 + 18'67 5,015 3,05]
~m 1901 to 1921, Fatehgarh Cantonment having population of 4,060 (2.230 M.,.1,830 .F.) in 1901; P. 3,074 (1,802 M., 1,272 F.) in 1911 and P. 3,236 (1,845 M. 1.3911'.) in 1921 being part of Farrukhabad-cum·Fatehgarh (M.B.) has heen combmed WIth Farrukbabad-cum·Fatehgarh (M.B').
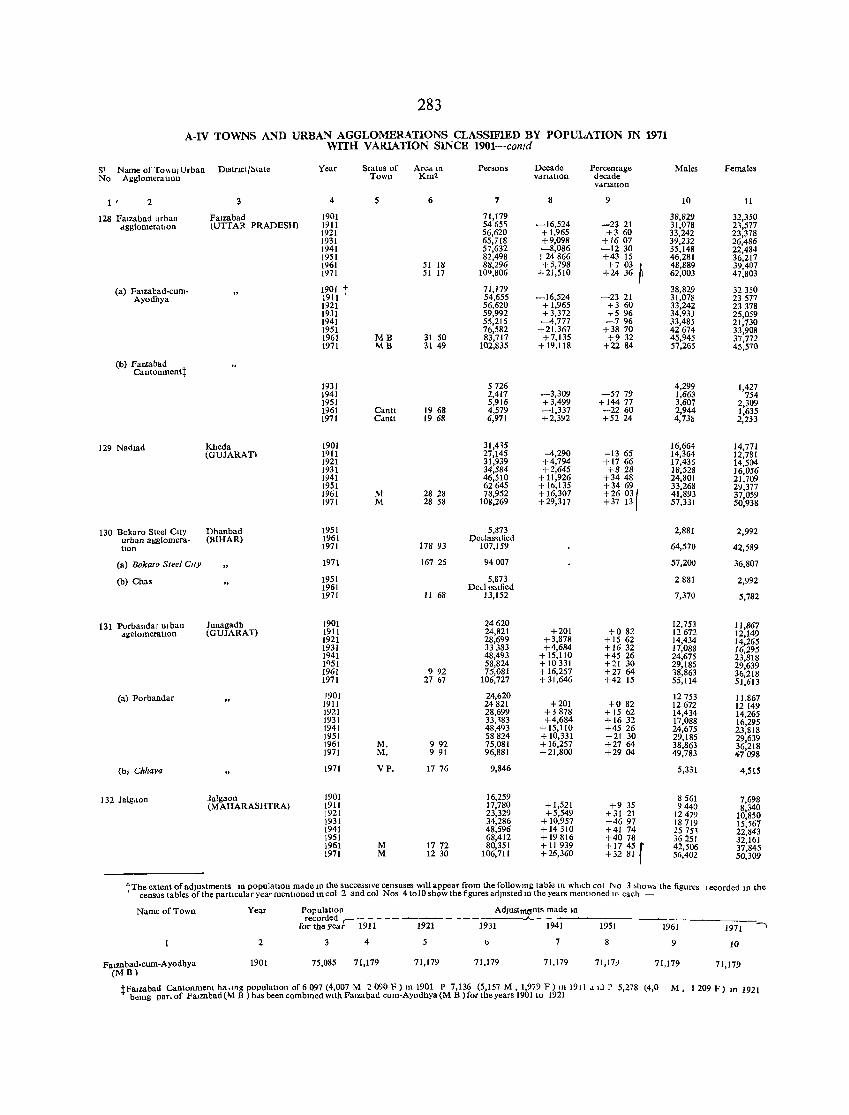
283
A-IV TOWNS AND URBAN AGGLOMERATIONS CLASSIFIED BY POPULATION IN 1971 WITH VARIATION SINCE 1901-contd
81 Name of TO\\Il/Urban Dlstflct/Mate Year Status of Ared. In Persons Decade Percentage Males Females No Agglomeration Town Km2 Vdn~tlOn dxade
Vdrlauon
1 ' 2 4 5 6 7 8 9 10 11
128 FalZabad urban FalZabad 1901 71,179 38,829 32,350 dgglomeratJon (UTTAR PRADESH) 1911 54 65~ -16,524 -2321 31,078 2\517
1921 56,620 +1,965 +3 60 33,242 23,378 1931 65,718 +9,098 +1607 39,232 26,486 1941 57,632 -8,086 -1230 35,148 22,484 1951 82,498 +24866 +43 15 46,281 36,217 1961 51 18 88,296 +5,798 +7 03
~ 48,889 39,407
1971 51 17 100 ,806 +21,510 +2436 62,003 47,803
(a) Fatzabad-cum- 1901 t 71,179 38,829 32350 Ayodhya 1911 54,655 -16,524 -2321 31,078 23517
1921 56,620 + 1,965 +3 60 33,242 23318 1931 59,992 +3,372 +5 96 34,933 25,059 1941 55,215 -4,777 -796 33,485 21,730 1951 76,582 +21,367 +38 70 42674 33,908 1961 MB 31 50 83,117 +1,135 +9 32 45,945 37,772 1971 I\1B 31 49 102,835 +19,118 +2284 57,265 45,510
(b) Falzabad Cantonmentt
1931 5726 4,299 1,427 1941 2,417 -3,309 -5779 1,663 754 1951 5,916 +3,499 + 144 77 3,607 2,309 1961 Cantt 19 68 4,579 -1,337 -2260 2,944 1,635 1971 Cdntt 1968 6,971 +2,392 +5224 4,738 2,233
129 Nadlad Kheda 1901 3l,4~5 16,664 14,771 (GUJARATI IQU 27,145 -4,290 -13 65 14,364 12,781
1921 31,939 +4,794 +1766 17,435 14,504 1931 34,584 +2,645 +828 18,528 16,056 1941 46,510 + 11,926 +3448 24,801 21,709 1951 62645 +16,135 +34 69 33,268 29,377 1961 M 2828 78,952 + 16,307 +26 03( 41,893 37,059 1971 M 28 58 108,269 +29,317 +37 13 57,331 50,938
130 Bokaro Steel City Dhanbad 1951 5,873 2,881 2,992 urban agglomera- (BIHAR) 1961 OedaS<lfied hon 1971 178 93 107,159 64,570 42,589
(a) Bokaro Steel Cay 1971 167 25 94007 57,200 36,807
(b) Chas 1951 5,873 2881 2,992 1961 Dedts>1fied 1971 11 68 13,152 7,370 5,782
131 Porbandar Ul ban Junagadh 1901 24620 12,753 11,867 "gelomeratiOn (GUJARAT) 1911 24,821 +201 +082 12672 12,149
1921 28,699 +3,878 + 15 62 14,434 14,265 1931 33383 +4,684 +1632 17,088 16,295 1941 48,493 + 15,110 +4526 24,675 23,818 10 51 58,824 + 10 331 +21 30 29,185 29,639 1961 992 75,G8! + 16,257 +27 64 18,863 36,218 1971 27 67 106,727 + 31,646 +42 15 55,114 51,613
(al Porbandar 1901 24,620 12753 11,867 1911 24821 +201 +0 82 12672 12149 1921 28,699 +3878 + 15 62 14,434 14,265 1931 33,l83 +4,684 + 1632 17,088 16,295 1941 48,493 +15,110 +4526 24,675 23,818 1951 58824 + 10,331 +21 30 29,185 29,639 1961 M, 992 75,081 + 16,257 +2764 38,863 36,218 1971 M. 9 91 96,881 +21,800 +2904 49,783 47098
(bl Chilava 1971 VP, 1776 9,846 5,331 4,515
132 Jalgdon Jalgaon 1901 16,259 8561 7,698 (MAHARASHTRA) 1911 17,780 +1,521 +9 35 9440 8,340
1921 23,329 +5,549 +31 21 12419 10,850 1931 34,286 + 10,957 +4697 18719 15,567 1941 48,596 + 14310 +41 74 25 75~ 22,843 1951 68,412 + 19 816 +4078 36251 32,161 1961 M 1772 80,351 + 11 939 + 17 45 r 42,506 37,845 1971 M 1230 106,7ll +26,360 +32 81 51),402 50,309
tTbe extent of adJustments In population made In the successive censuses Will appear from the follo\\lIlg table 111 whlch col 1'<0 3 ,how, the figures census tables of the particular year mentIOned lIlcoi 2 and col Nos 4to10 show the figures adjusted III the years mentIOned III each -
I ecorded In the
Name of Town Year PopulatIon Adjustments made In recorded r- - - - -------- ,.A..- -
for the year 1911 1921 1931 1941 1951 1961 1971 -,
2 4 5 " 7 9 10
Falzabad-cum-Ayodhya 1901 75,085 71,179 71,179 71,179 71,179 71,IH 71,179 71,179 (MBI
tFalzabad Cantonment ha.mg populatIOn of 6 097 (4,007 M 2090 F) 111 1901 P 7,136 (5,157 M, 1,979 F) In 1911 .t lJ l' 5,278 bemg par,of Falzabad(1\1 B ) h<ls been combmed With Falzabad cum-Ayodhya(M B) for the years 1901 to 1921
(4,0 M, I 209 F) In 1921
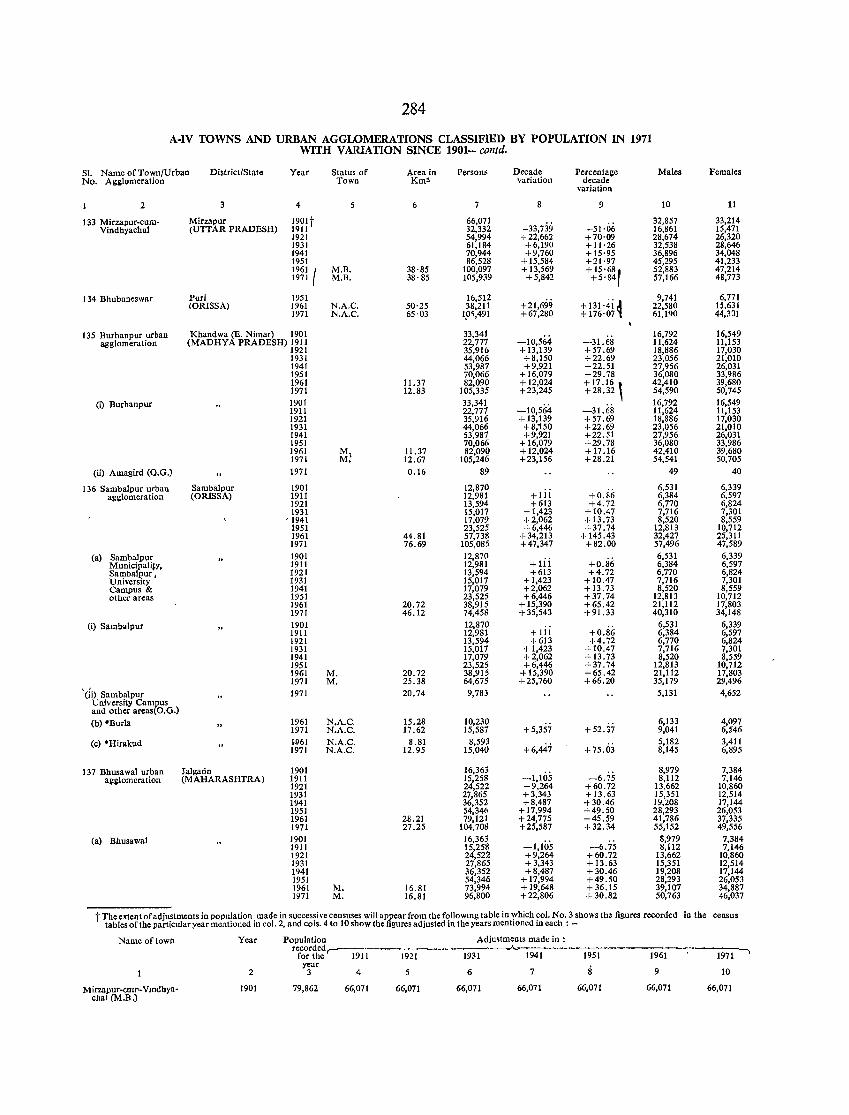
284
A-IV TOWNS AND URBAN AGGLOMERATIONS CLASSIFIED BY POPULATION IN 1971 WITH VARIATION SINCE 1901-contd.
SI. Name of Town/Urban District/State Year Status of Area in Persons Decade Percentage Males Females No. Agiliomcration Town Km2 variation decade
variation
2 4 6 7 8 9 10 11
133 Mirzapur-cum· Mirzapur 1901t 66,071 -33,7:i9
32,857 33,214 Vindhyachal (UTTAR PRADESH) 1911 32,332 -51·06 16,861 15,471
1921 54,994 +22,662 +70·09 28,674 26,320 1931 61,184 +6,190 + 11·26 32,538 28,646 1941 70,944 +9,760 +15·95 36,896 34,048 1951 86,528 + 15,584 +21·97 45,295 41,233 1961 ( M.B. 38·85 100,097 + 13,569 +15' 68 1 52,883 47,214 1971 M.B. 38' 85 105,939 +5,842 +5'84 57,166 48,773
134 Bhub"neswar Purl 1951 16,512 +21,699 +131'4i 1 9,741 6.771
(ORISSA) 1961 N.A.C. 50·25 38,211 22,580 15,631 1971 N.A.C. 65·03 1~~,491 + 67,280 + 176·07 61.190 44,331
135 Burhanpur urban Khandwa (E. Nimar) 1901 33,341 -10,564 -31.68
16,792 16,549 agglomeration (MADHYA PRADESH) 1911 22,771 11,624 11,153
1921 35,916 + 13,139 +57.69 18,886 17,030 1931 44,066 +8,150 +22.69 23,056 21,010 1941 53,981 +9,921 +22.51 27,956 26,031 1951 70,066 + 16,079 +29.78 36,080 33,986 1961 11.37 82,090 + 12,024 + 17.16, 42,410 39,680 1971 12.83 105,33.5 +23,245 +28.32 54,590 50,745
(i) Burhanpur 1901 33,341 16,792 16,549 1911 22,771 -10,564 -31.68 11,624 11,153 1921 35,916 + 13,139 +57.69 18,886 17,030 1931 44,066 +8,'150 +22.69 23,056 21,010 1941 53,987 +9,921 +22.51 27,956 26,031 1951 70,066 + 16,079 +29.78 36,080 33,986 1961 M\ 11.37 82,090 + 12,024 +17.16 42,410 39,680 1971 M. 12.67 105,246 +23,156 +28.21 54,541 50,705
(ti) Amagird (G. G.) 1971 0.16 89 49 40
136 Sambalpur urban Sambalpur 1901 12,870 +lii
6,531 6,339 ag!J;lomeration (ORISSA) 1911 12,981 +0.86 6,384 6,597
1921 13,594 +613 +4.72 6,770 6,824 1931 15,011 + 1,423 +10.47 7,716 7,301
, 1941 17,079 +2,062 + 13.73 8,520 8,559 1951 23,525 +6,446 +37.74 12,813 10,712 1961 44.81 57,738 +34,213 + 145.43 32,427 25,311 1971 76.69 105,085 +47,347 +82.00 57,496 47,589
(a) Sambalpur 1901 12,870 + Iii +0.86
6,531 6,339 Municipa1~y, 1911 12,981 6,384 6,597 Sambalpur , 1921 13,594 +613 +4.72 6,770 6,824 University 1931 15,017 +1,423 + 10.47 7,716 7,301 Campus & 1941 17,079 +2,062 + 13.73 8,520 8,559 other areas 1951 23,525 +6,446 +37.74 12,813 10,712
1961 20.72 38,915 + 15,390 +65.42 21,112 17,803 1971 46.12 74,458 +35,543 +91.33 40,310 34,148
(i) Sambalpur 1901 12,870 6,531 6,339 1911 12,981 +111 +0.86 6,384 6,597 1921 13,594 +613 +4.72 6,770 6,824 1931 15,017 + 1,423 +10.47 7,716 7,301 1941 17,079 +2,062 + 13.73 8,520 8,559 1951 23,525 +6,446 +37.74 12,813 10,712 1961 M. 20.72 38,915 + 15,390 +65.42 21,112 17,803 1971 M. 25.38 64,675 +25,760 +66.20 35,179 29,496
'(ii) Sambalpur 1971 20.74 9,783 5,131 4,652 University Campus and other areas(O.G.)
(b) "Burla 1961 N.A.C. 15.28 10,230 +5,357 + 52j7
6,133 4,097 1971 N.A.C. 17.62 15,581 9,041 6,546
(c) *Hirakud W61 N.A.C. 8.81 8,593 +6,447 +75.03
5,182 3,411 1971 N.A.C. 12.95 15,040 8,145 6,895
137 Bhusawal urban Jalgaon 1901 16,363 -1,105
8,979 7,384 agillomeration (MAHARASHTRA) 1911 15,258 -6.75 8,112 7,146
1921 24,522 +9,264 +60.72 13,662 10,860 1931 27,865 +3,343 + 13.63 15,351 12,514 1941 ~~:m +8,487 + 30.46 19,208 17,144 1951 + 17,994 +49.50 28,293 26,053 1961 28.21 79,121 +24,775 +45.59 41,786 37,335 1971 27.25 104,708 +25,587 +32.34 55,152 49,556
(a) Bhusawal 1901 16,363 -1,105
8,979 7,384 1911 15,258 -6.75 8,112 7,146 1921 24,522 +9,264 +60.72 13,662 10,860 1931 27,865 +3,343 + 13.63 15,351 12,514 1941 36,352 +8,487 +30.46 19,208 17,144 1951 54,346 + 17,994 +49.50 28,293 26,053 1961 M. 16.81 73,994 + 19,648 +36.15 39,107 34,887 1971 M. 16.81 96,800 +22,806 + 30.82 50,763 46,037
t The extent of adjustments in population made in successive censuses will appear from the folloWlOg table in which col. No.3 shows the figures recorded in the census tables of the particular year mentioned in col. 2, and co is. 4 to 10 show the figures adjusted in the years mentioned in each: -
Name of town Year Population Adju.tments made in : recorded,..-----: ------"-
1971 -. for the 1911 1921 1931 1941 1951 1961 year
2 3 4 6 7 Ii 9 10
Mirzapur-cllIr-Vmdhyn-chal (M.B.)
1901 79,862 66,071 66,071 66,071 66,071 66,071 66,071 66,071
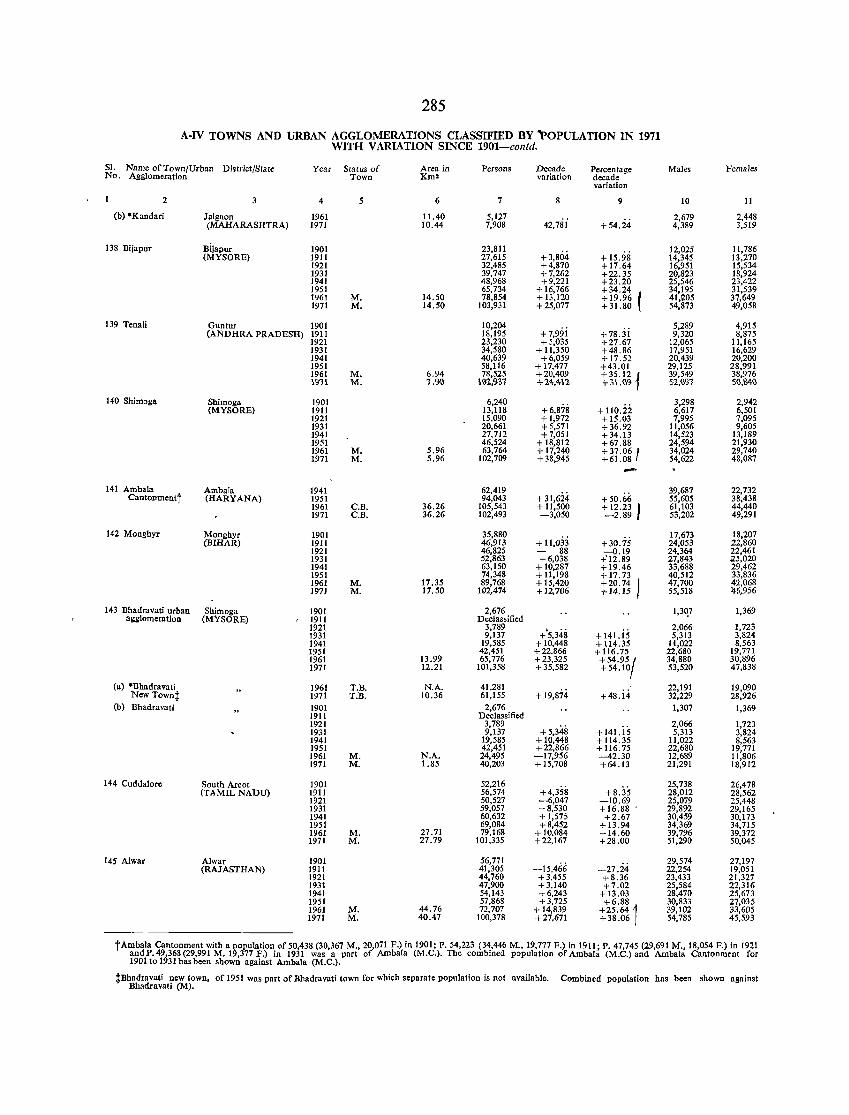
285
A-IV TOWNS AND URBAN AGGLOMERATIONS CLASSIFIED BY 'POPULATION IN 1971 WITH VARIATiON SINCE 1901-contd.
51. Name of Town/Vrban District/State Year Status of Area in Persons Decade Percentage Males Females No. Agglomeration Town Km2 variation decade
variation
2 4 5 6 7 9 10 11
(b) "Kandari Jalgaon 1961 11.40 5,127 42,7Si +54.24
2,679 2,448 (MAHARASHTRA) 1971 10.44 7,908 4,389 3,519
138 Bijapur Bljapur 1901 23,811 +3,804 +15.98
12,025 11,786 (MYSORE) 1911 27,615 14,345 13,270
1921 32,485 +4,870 +17.64 16,951 15,534 1931 39,747 +7,262 +22.35 20,823 18,924 1941 48,968 +9,221 +23.20 25,546 23,422 1951 65,734 + 16,766 + 34.24 34,195 31,539 1961 M. 14.50 78,854 + 13,120 + 19.96 41,205 37,649 1971 M. 14.50 103,931 +25,077 +31.80 54,873 49,058
139 Tenali Guntur 1901 10,204 +7,99i
5,289 4,915 (ANDHRA PRADESH) 1911 18,195 +78ji 9,320 8,875
1921 23,230 + 5,035 +27.67 12,065 11,165 1931 34,580 + 11,350 +48.86 17,951 16,629 1941 40,639 +6,059 + 17.52 20,439 20,200 1951 58,116 + 17,477 +43.01 29,125 28,991 1961 M. 6.94 78,525 +20,409 +35. 12 J 39,549 38,976 19'1\ M. '1.91} 1~1,937 +14,412 ""31.119 S1,iY37 ~,M~
140 Shimoga Shimoga 1901 6,240 +6,878 + 110.22
3,298 2,942 (MYSORE) 1911 13,118 6,617 6,501
1921 15,090 +1,972 + 15.03 7,995 7,095 1931 20,661 +5,571 +36.92 11,056 9,605 1941 27,712 +7,051 +34.13 14,523 13,189 1951 46,524 + 18,812 +67.88 24,594 21,930 1961 M. 5.96 63,764 + 17,240 +37. 06 1 34,024 29,740 1971 M. 5.96 102,709 +38,945 +61.08 54,622 48,087 -
141 Amba!. AmbaJa 194! 62,419 +31,624
39,687 22,732 Cantonmentt (HARYANA) 1951 94,043 + 50.66 55,605 38,438
1961 C.B. 36.26 105,543 + 11,500 + 12.23 I 61,103 44,440 1971 C.B. 36.26 102,493 -3,050 -2.89 53,202 49,291
142 Monghyr Monghyr 1901 35,880 + 11,033 + 30.75
17,673 18,207 (BIHAR) 1911 46,913 24,053 22,860
1921 46,825 88 -0.19 24,364 22,461 1931 52,863 +6,038 +'12.89 27,843 125,020 1941 63,150 + 10,287 +19.46 33,688 29,462 1951 74,348 + 11,198 + 17.73 40,512 33,836 1961 M. 17.35 89,768 + 15,420 +20.74 47,700 42,068 1971 M. 17.50 102,474 +12,706 +14.J5 55,518 lj6,956
143 Bhadravati urban Shimoga 1901 2,676 1,3q7 1,369 agglomeration (MYSORE) 1911 Declassified
1921 3,789 +'5,348 + 141. is
2,066 1,723 1931 9,137 5,313 3,824 1941 19,585 + 10,448 + 114.35 11,022 8,563 1951 42,451 +22,866 + 116.75 22,680 19,771 1961 13.99 65,776 +23,325 +54.95 { 34,880 30,896 1971 12.21 101,358 +35,582 +54.10 53,520 47,838
(a) *Bhadravati 1961 T.B. N.A. 41,281 + 19,874 +48.i4
22,191 19,090 New Townt 1971 T.B. 10.36 61,155 32,229 28,926
(b) Bhadravati 1901 2,676 1,307 1,369 1911 Declassified 1921 3,789
+5,348 + 141. is 2,066 1,723 1931 9,137 5,313 3,824 1941 19,585 + 10,448 + 114.35 11,022 8,563 1951 42,451 +22,866 + 116.75 22,680 19,771 1961 M. N.A. 24,495 -17,956 -42.30 12,689 11,806 1971 M. 1.85 40,203 + 15,708 +64.13 21,291 18,912
144 Cuddalore South Areot 1901 52,216 +4,358 +8.3S
25,738 26,478 (TAMIL NADV) 1911 56,574 28,012 28,562
1921 50,527 -6,047 -10.69 25,079 25,448 1931 59,057 +8,530 + 16.88 . 29,892 29,165 1941 60,632 + 1,575 +2.67 30,459 30,173 1951 69,084 +8,452 + 13.94 34,369 34,715 1961 M. 27.71 79,168 + 10,084 +14.60 39,796 39,372 1971 M. 27.79 101,335 +22,167 +28.00 51,290 50,045
145 Alwar Alwar 1901 56,771 -15,466 -27.24
29,574 27,197 (RAJASTHAN) 1911 41,305 22,254 19,051
1921 44,760 +3,455 +8.36 23,433 21,327 1931 47,900 +3,140 +7.02 25,584 22,316 1941 54,143 +6,243 + 13.03 28,470 25,673 1951 57,868 +3,725 +6.88 30,833 27,035 1961 M. 44.76 72,707 + 14,839 +25. 64 1 39,102 33,605 1971 M. 40.47 100,378 +27,671 +38.06 54,785 45,593
tAmbala Cantonment with a population of 50,438 (30,367 M., 20,071 F.) in 1901; P. 54,223 (34,446 M., 19,777 F.) in 1911; P. 47,745 (29,691 M., 18,054 F.) in 1921 andP. 49,368 {29,99 I M. 19,377 F.) in 1931 was a part of Arubala (M.C.). The combined population of Ambala (M.C.) and Ambala Cantonment for 1901 to 1931 has been shown against Ambala (M.C.).
tBhadravati new town, of 1951 was part of Bhadravati town for which separate population is not available. Bhadravati (M).
Combined population has been shown against
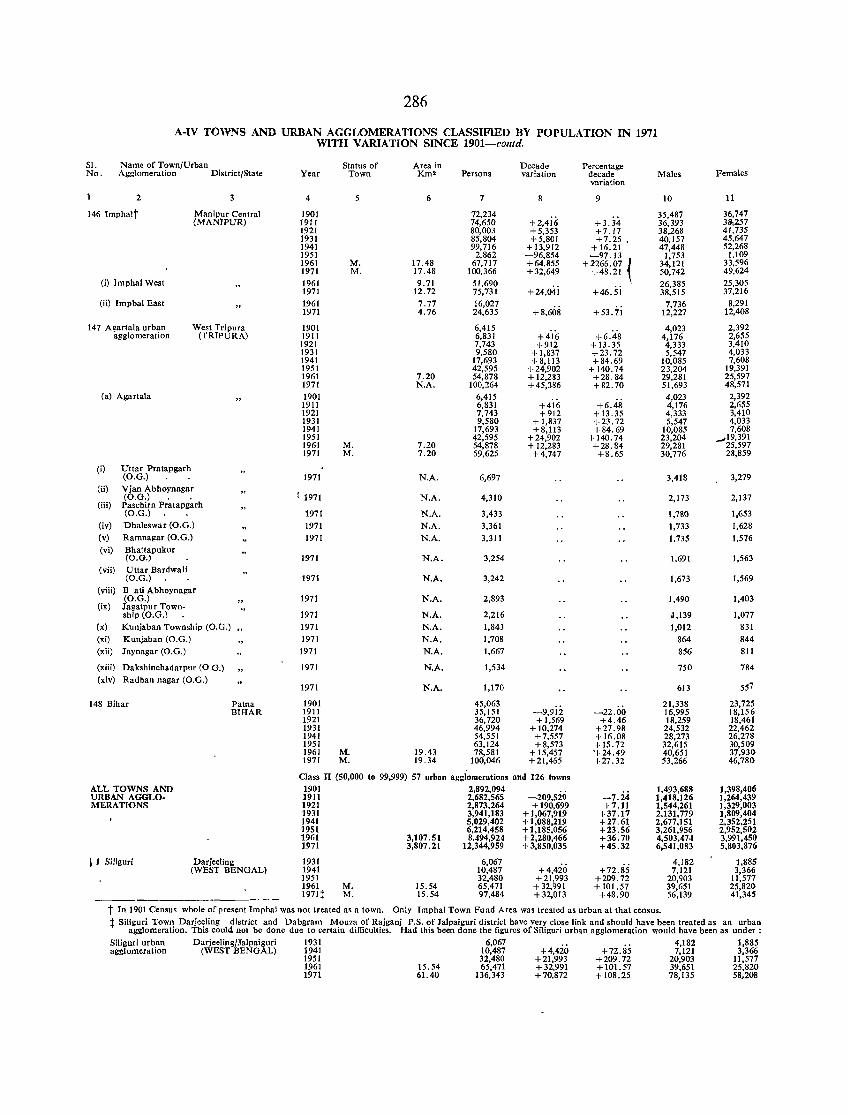
286
A-IV TOWNS AND URBAN AGGLOMERATIONS CLASSIFlED BY POPULATION IN 1971 WITH VARIATION SINCE 1901-contd.
SI. Name of Town/Urban Status of Area in Decade Percentage No. Agglomeration District/State Year Town Km2 Persons variation decade Males Females
variation
2 3 4 5 6 7 8 9 10 11
146 Imphalt Manipur Central 1901 72,234 +2,4ii; +3.34
35,487 36,747 (MANlPUR) 1911 74,650 36,393 38,257
1921 80,003 +5,353 +7.17 38,268 41,735 1931 85,804 +5,801 +7.25 , 40,157 45,647 1941 99,716 + 13,912 +16.21 47,448 52,268 1951 2,862 -96,854 -97.13 1,753 1,109 1961 M. 17.48 67,717 +64,855 +2266.07 { 34,121 33,596 1971 M. 17.48 100,366 +32,649 +48.21 50,742 49.624
(i) Imphal West 1961 9.71 51,690 + 24,04 i +46.5i
26,385 25,305 1971 12.72 75,731 38,515 37,216
(ii) Impbal East 1961 7.77 16,027 +8,608
7,736 8,291 1971 4.76 24,635 +53.71 12,227 12,408
147 Agartala urban West Tripura 1901 6,415 +6.4'8
4,023 2,392 agglomeration (TRTPURA) 1911 6,831 +416 4,176 2,655
1921 7,743 +912 + 13.35 4,333 3,410 1931 9,580 + 1,837 +23.72 5,547 4,033 1941 17,693 +8,113 + 84.69 10,085 7,608 1951 42,595 +24,902 +140.74 23,204 19,391 1961 7.20 54,878 + 12,283 +28.84 29,281 25,597 1971 N.A. 100,264 +45,386 + 82.70 51,693 48,571
(a) Agartala 1901 6,415 +6.48
4,023 2,392 1911 6,831 +416 4,176 2,655 1921 7,743 +912 + 13.35 4,333 3,410 1931 9,580 +1,837 +23.72 5,547 4,033 1941 17,693 +8,113 + 84.69 10,085 7,608 1951 42,595 +24,902 +140.74 23,204 ~19,391 1961 M. 7.20 54,878 + 12,283 +28.84 29,281 25,597 1971 M. 7.20 59,625 +4,747 +8.65 30,776 28,859
(i) Uttar Pratapgarh (O.G.) 1971 N.A. 6,697 3,418 3,279
(ii) Vjan Abhoynagar (O.G.) 1971 N.A. 4,310 2,173 2,137
(iii) Paschirn Pratapgarh (O.G.) 1971 N.A. 3,433 1,780 1,653
(iv) Dhaleswar (O.G.) 1971 N.A. 3,361 1,733 1,628 (v) Ramnagar (O.G.) 1971 N.A. 3,311 1.735 1,576 (vi) Bhattapukur
(O.G.) 1971 N.A. 3,254 1.691 1,563 (vii) Uttar Bardwali
(O.G.) 1971 N.A. 3,242 1,673 1,569 (viii) B ati Abhoynagar
(O.G.) 1971 N.A. 2,893 1,490 1,403 (ix) Jagatpur Town-
ship (O.G.) 1971 N.A. 2,216 J,139 1,077 (x) Kunjaban Township (O.G.) .. 1971 N.A. 1,843 1,012 831 (xi) Kunjaban (O.G.) 1971 N.A. 1,708 864 844 (xii) Jaynagar (O.G.) 1971 N.A. 1,667 856 811
(xiii) Dakshinchadarpur (0 G.) 1971 N.A. 1,534 750 784 (xiv) Radhan nagar (O.G.)
557 1971 N.A. 1,170 613
148 Bihar Patna 1901 45,063 -9,9ii
21,338 23,725 BIHAR 1911 35,151 -22.00 16,995 18,156
1921 36,720 +1,569 +4.46 18,259 18,461 1931 46,994 + 10,274 +27.98 24,532 22,462 1941 54,551 +7,557 +16.08 28,273 26,278 1951 63,124 +8,573 +15.72 32,615 30,509 1961 M. 19.43 78,581 + 15,457 '+24.49 40,651 37,930 1971 M. 19.34 100,046 +21,465 +27.32 53,266 46,780
aass IT (50,000 to 99,999) 57 urban agglomerations and 126 towns ALL TOWNS AND 1901 2,892,094
-209,529 -7.24 1.493.688 1,398,406
URBAN AGGLO- 1911 2,682,565 1,418,126 1,264,439 MERATIONS 1921 2,873,264 +190,699 +7.11 1,544,261 1,329,003
1931 3,941,183 +1,067,919 +37.17 2,131,779 1,809,404 1941 5,029,402 +1,088,219 +27.61 2,677,151 2,352,251 1951 6.214,458 +1,185,056 +23.56 3,261,956 2,952,502 1961 3,107.51 8.494,924 +2,280,466 +36.70 4,503,474 3,991,450 1971 3,807.21 12,344,959 +3,850,035 +45.32 6,541,083 5,803,876
~ I Siliguri Darjeeling 1931 6,067 +4,420
4,182 1,885 (WEST BENGAL) 1941 10,487 +72.85 7,121 3,366
1951 32,480 +21,993 +209.72 20,903 11,577 1961 M. 15.54 65,471 + 32,991 +101.57 39,651 25,820 1971t M. 15.54 97,484 +32,013 +48.90 56,139 41,345 --------------. --
t In 1901 Census whole of present Imphal was not treated as a town. Only Imphal Town Fund Area was tre:lted as urban at that census. t Siliguri Town Darjeeling district and Dahgram Mou?a of Rajganj P.S. of Jalpaiguri district have very close link and should have been treated as an urban
agglomeration. This could nol be done due to certain difficulties. Had this been done the figures of Siliguri urban agglomeration would have been as under:
Siliguri urban Darjeeling/Ja1paiguri 1931 6,067 +4,420
4,182 1,885 agglomeration (WEST BENGAL) 1941 10,487 +72.85 7,121 3,366
1951 32,480 +21,993 +209.72 20,903 11,577 1961 15.54 65,471 +32,991 + 101.57 39,651 25,820 1971 61.40 136,343 +70,872 + 108.25 78,135 58.208
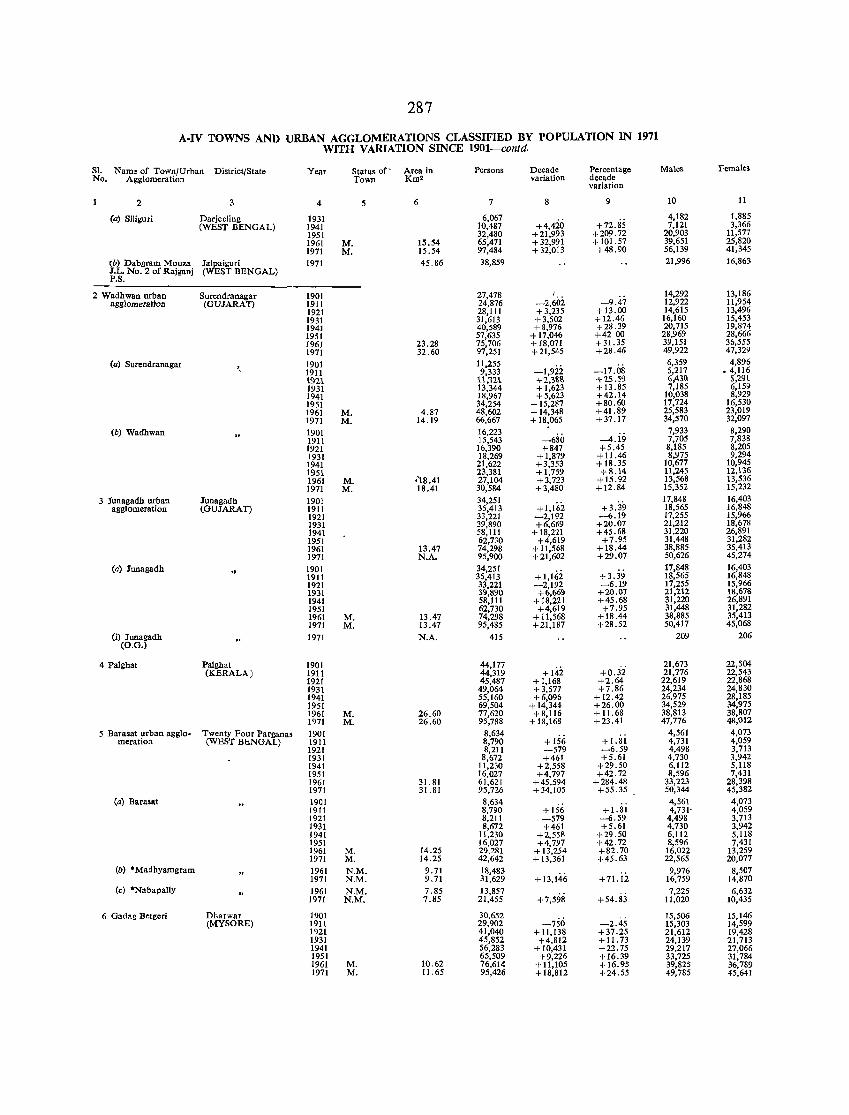
287
A-IV TOWNS AND URBAN AGGLOMERATIONS CLASSIFIED BY POPULATION IN 1971 WITH VARIATION SINCE 1901-contd.
S1. Name of Town/Urban District/State Year Status of- Area in Persons Decade Percentage Males Females No. Agglomeration Town Km2 variation decade
varjation
2 3 4 5 6 7 8 9 10 11
(a) Siliguri Darieeling 1931 6,067 +4,420
4,182 1,885 (WEST BENGAL) 1941 10,487 +72.85 7,121 3,366
1951 32,480 +21,993 +209.72 20,903 11,577 1961 M. 15.54 65,471 +32,991 + 101.57 39,651 25,820 1971 M. 15.54 97,484 + 32,013 +48.90 56,139 41,345
(b) Dabgram Mouza Jalpaiguri 1971 45.86 38,859 21,996 16,863 J.L. No.2 of Rajganj (WEST BENGAL) P.S.
2 Wadhwan nrban Surendranagar 1901 27,478 I
-9.47 14,292 13,186
agglomeration (GUJARAn 1911 24,876 -2,602 12,922 11,954 1921 28,111 +3,235 + 13.00 14,615 13,496 1931 31,613 +3,502 + 12.46 16,160 15,453 1941 40,589 +8,976 +28.39 20,715 19,874 1951 57,635 + 17,046 +4200 28,969 28,666 1961 23.28 75,706 + 18,071 + 31.35 39,151 36,555 1971 32.60 97,251 +21,545 +28.46 49,922 47,329
(a) Surendranagar 1901 11,255 -1,922 -17.08
6,359 4,896 1911 9,333 5,217 .4,116 1<}21 \\,111 +1,,%8 +'1.5.59 6,410 5,291 1931 13,344 +1,623 +13.85 7,185 6,159 1941 18,967 +5,623 +42.14 10,038 8,929 1951 34,254 + 15,287 +80.60 17,724 16,530 1961 M. 4.87 48,602 + 14,348 +41.89 25,583 23,019 1971 M. 14.19 66,667 + 18,065 +37.17 34,570 32,097
(b) Wadhwan 1901 16,223 -680 --4. i9
7,933 8,290 1911 15,543 7,705 7,838 1921 16,390 +847 +5.45 8,185 8,205 1931 18,269 + 1,879 +11.46 8,975 9,294 1941 21,622 +3,353 +18.35 10,677 10,945 1951 23,381 +1,759 +8.14 11,245 12,136 1961 M. .18.41 27,104 +3,723 +15.92 13,568 13,536 1971 M. 18.41 30,584 +3,480 +12.84 15,352 15,232
3 Junagadh nrban Junagadh 1901 34,251 +1,16i.
17,848 16,403 agglomeration (GUJARAT) 1911 35,413 +3.39 18,565 16,848
1921 33,221 -2,192 -6.19 17,255 15,966 1931 39,890 +6,669 +20.07 21,212 18,678 1941 58,111 +18,221 +45.68 31,220 26,891 1951 62,730 +4,619 +7.95 31,448 31,282 1961 13.47 74,298 + 1l,568 +18.44 38,885 35,413 1971 N.A. 95,900 +21,602 +29.07 50,626 45,274
(a) Junagadh 1901 34,251 +1,162
17,848 16,403 1911 35,413 +3.39 18,565 16,848 1921 33,221 -2,192 -6.19 17,255 15,966 1931 39,890 +6,669 +20.07 21,212 18,678 1941 58,111 +18,221 +45.68 31,220 26,891 1951 62,730 +4,619 +7.95 31,448 31,282 1961 M. 13.47 74,298 + 11,568 + 18.44 38,885 35,413 1971 M. 13.47 95,485 +21,187 +28.52 50,417 45,068
(i) Jnnagadh 1971 N.A. 415 209 206 (O.G.)
4 Palgha! Palghat 1901 44,177 +142
21,673 22,504 (KERALA) 1911 44,319 +0.32 21,776 22,543
1921 45,487 + 1,168 +2.64 22,619 22,868 1931 49,064 + 3,577 +7.86 24,234 24,830 1941 55,160 +6,096 + 12.42 26,975 28,185 1951 69,504 + 14,344 +26.00 34,529 34,975 1961 M. 26.60 77,620 +8,116 + 11.68 38,813 38,807 1971 M. 26.60 95,788 +18,168 +23.41 47,776 48,012
5 Barasat urban agglo- Twenty Four Parganas 1901 8,634 4,561 4,073 meration (WEST BENGAL) 1911 8,790 +156 + 1.81 4,731 4,059
1921 8,211 -579 -6.59 4,498 3,713 1931 8,672 +461 +5.61 4,730 3,942 1941 11,230 +2,558 +29.50 6,112 5,118 1951 16,027 +4,797 +42.72 8,596 7,431 1961 31. 81 61,621 +45,594 +284.48 33,223 28,398 1971 31.81 95,726 +34,105 +55.35 50,344 45,382
(al Barasat 1901 8,634 + 156
4,561 4,073 1911 8,790 +1.81 4,731' 4,059 1921 8,211 -579 -6.59 4,498 3,713 1931 8,672 +461 +5.61 4,730 3,942 1941 11,230 +2,558 +29.50 6,112 5,118 1951 16,027 +4,797 +42.72 8,596 7,431 1961 M. 14.25 29.281 + 13,254 +82.70 16,022 13,259 1971 M. 14.25 42,642 + 13,361 +45.63 22,565 20,077
(b) 'Madhyamgram 1961 N.M. 9.71 18,483 + 13,146
9,976 8,507 1971 N.M. 9.71 31,629 +71.12 16,759 14,870
(cl *NabapaJly 1961 N.M. 7.85 13,857 7,225 6,632 1971 N.M. 7.85 21,455 +7,598 +54.83 11,020 10,435
6 Gadag Bet!:eri Dharwar 1901 30.652 15,506 15,146 (MYSORE) 1911 29,902 -750 -2.45 15,303 14,599
1921 41,040 + 11,138 +37.25 21,612 19,428 1931 45,852 +4,812 + 11. 73 24,139 21,713 1941 56,283 + 10,431 +22.75 29,217 27,066 1951 65,509 +9,226 +16.39 33,725 31,784 1961 M. 10.62 76,614 + 11,105 +16.95 39,825 36,789 1971 M. 11.65 95,426 +18,812 +24.55 49,785 45,641
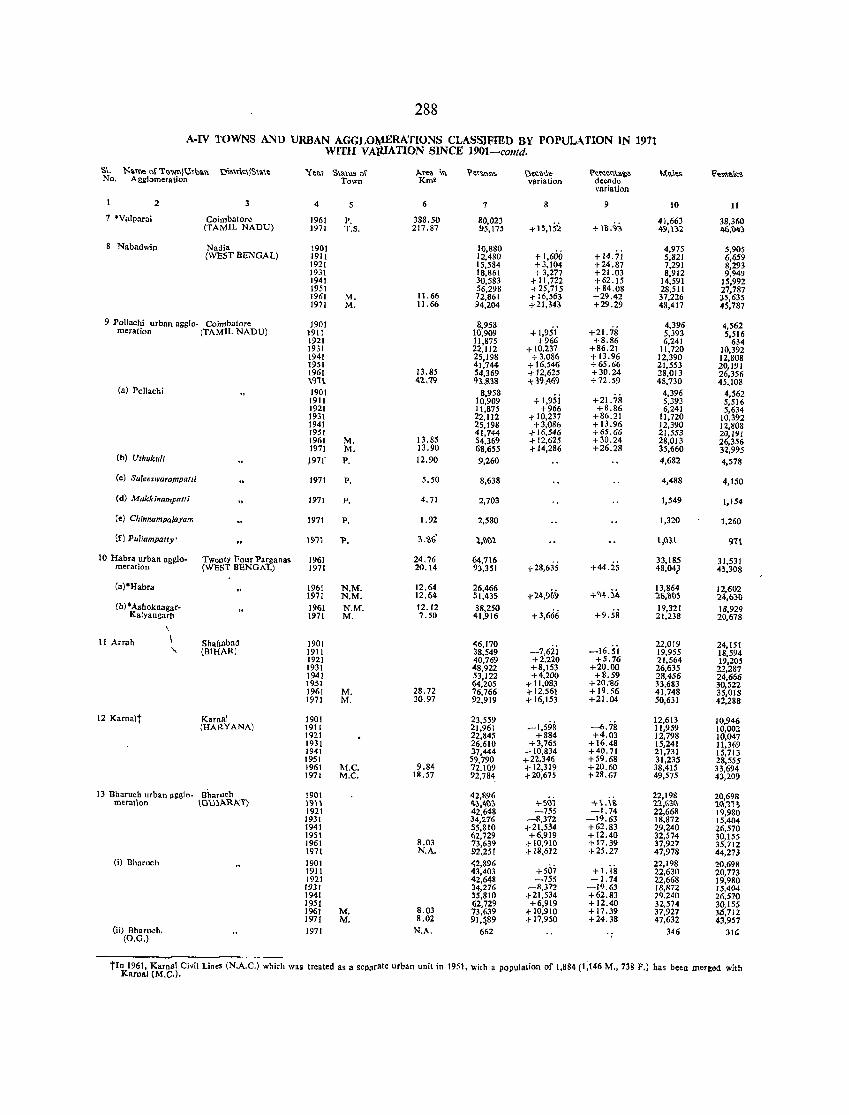
288
A-IV TOWNS AND URBAN AGGLo.M~ERATIONS CLASSIFIED BY POPULATION IN 1971 WITH VAlUATION SlNCE 1901-contd.
SI. N~me of'I)'Ol"IU,\)v." Di~\I\~\IS\v.\e Year Statu. of lI.,e'A i" \'e,~o"" \)""'A"'~ \'e'~"""\ .. "e Males Fema\e. No. Agglomeration Town Km2 variation decade variation
2 3 4 6 7 9 10 11
7 'Valparai Coimbatore 1961 P. 388.50 80,023 -t15,152 +111."3
41,663 38,360 (TAMIL NADU) 197J T.S. 217.87 95,175 4'9,1:12 46,'il4:\
8 Nabadwip Nadia 1901 10,880 4,975 5,905 (WEST BENGAl) 1911 12,480 + 1,600 + 14.7i 5,821 6,659
1921 15,584 +3,104 +24.87 7,291 8,293 1931 18,861 + 3,277 +21.03 8,912 9,949 1941 30,583 +11,722 +62.15 14,591 15,992 1951 56,298 +25,715 +84.08 28,51l 27,787 1961 M. 11.66 72,861 -r 16,563 +29.42 37,226 35,635 1971 M. 11.66 94.204 -t21,343 +29.29 48,417 45,787
9 PoUachi urban aggJo· Coimbatore 1901 8,958 +1,951 +21. 78 4,396 4,562
meratioo (TAMIL NADU) 1911 10,909 5,393 5,516 1921 It ,875 +966 +8.86 6,241 634 1931 22,112 + 10,237 +86.21 11,720 10,392 1941 25,198 +3,086 + 13.96 12,390 12,808 1951 41,744 -t 16,546 +65.66 21,553 20,191 1961 13.85 54,369 -t 12,625 +30.24 28,013 26,356 \'11t 42,79 n,!!.lll *39,469 +72.59 48 .. 730 45 •. 108
(a) Pollachi 1901 8,958 + 1,9Si +2J.78
4,396 4,562 1911 10,909 5,393 5,516 1921 11,875 +966 +8.86 6,241 5,634 1931 22,1l2 -t 10,237 +86.21 11,720 10,392 1941 25,198 +3,086 + 13.96 12,390 12,808 1951 41,744 +16,546 +65.66 21,553 2a,I91 1961 M. 13.85 54,369 + 12,625 +30.24 28,013 26,356 1971 M. 13.90 68,655 +14,286 +26.28 35,660 32,995
(b) Ulhukllli )971' P. 12.90 9,260 4,682 4,578
(c) SuleeslVararnpatli 1971 P. 5.50 8,638 4,488 4,150
(d) Makkinampatti 1971 P. 4.71 2,703 1,549 1.154
(e) Chinnampa!ayam 1971 P. 1.92 2,580 1,320 1,260
tfl Puliampalty' lnl 1'. ?'.%~' l,~~l l,Qll 911
10 Habra urbao agglo. Twenty Four Parganas 1961 24.76 64,716 ;-28,635 +44.25
33,185 31,531 meration (WEST BENGAL) 1971 20.14 93,351 48,04} 45,308
(a) "Habra 1961 N.M. 12.64 26,466 -I-2o\,96iJ +<)d4 13,864 12,602
1971 N.M. 12.64 51,435 26,%\'6 24,6)1) (b)"Asboknagar. 1961 N.M. 12.12 38,250
+3,666 +9.58 19,321 18,929
Kalyang;uh 1971 M. 7.50 41,916 21,238 20,678 \
II Arrah \ Shababad 1901 46,170 22,019 24,1S1 "- (BIHAR) 1911 38,549 -7,62i -16.5i 19,955 18,594
1921 40,769 +2.220 +5.76 21,564 19,205 1931 48,922 +8,153 +20.00 26,635 22,287 1941 53,122 +4,200 +8.59 28,456 24,666 1951 64,205 ;-11,083 +20."'06 33,683 30,522 1961 M. 28.72 76,766 -1-12,561 +19.56 41,748 35,018 1971 M. 30.97 92,919 -1-16,153 +21.04 50,631 42,288
12 Karnalt Kamal 1901 23,559 ~1,598 -6.78
12,613 10,946 ~HAR.YANA) 1911 21,961 11,959 10,002
1921 22,845 +884 +4.03 12,798 10,047 1931 26,610 +3,765 +16.48 15,241 lI,369 1941 37,444 -t 10,834 +40.71 21,731 15,713 1951 59,790 +22,346 +59.68 31,235 28,555 1961 M.C. 9.84 72,109 ;-12,319 +20.60 38,415 33,694 1971 M.e. 18.57 92,784 -t 2O,675 +28.67 49,575 43,209
13 Bharuch urban (lgglo. B~aruch 1901 42,896 'r-SI); +\.\~
22,198 20,698 merafion \GUlARA.1') 19)1 4~,4~' 'l.l,~m 1~,1n
1921 42,648 -755 -1.74 22,668 19,980 1931 34,276 -8,372 -19.63 18,872 15,404 1941 55,810 +21,534 +62.83 29,240 26,570 1951 62,729 +6,919 +12.40 32,574 30,155 1961 8.03 73,639 +10,910 +17.39 37,927 35,712 1971 N.A. 92,251 + 18,612 +25.27 47,978 44,273
(i) Bharllch 1901 42,896 +507 + 1. is 22,198 20,698
1911 43,403 22,630 20,773 1921 42,648 -755 -1.74 22,668 19,980 1931 34,276 -8,372 -19.63 18,872 15,404 1941 SS,810 +21,534 +62.83 ?9.240 26.570 J951 62,729 +6,919 +12.40 32,574 30,155 J961 M. 8.03 73,639 01- 10,910 +17.39 37,927 3iS,712 1971 M. 8.02 9q89 + 17,950 +24.38 47,632 43,957
(ii) Bharu"h. 1971 N.A. (0.0.)
662 346 31G
tIn 1961, Karnlll Civil Lines (N.A.C.) which was treated as a separate urban unit in 1951, with a population of 1,884 (1;146 M., 738 F.) bas been merted with Karnal (M.e.).
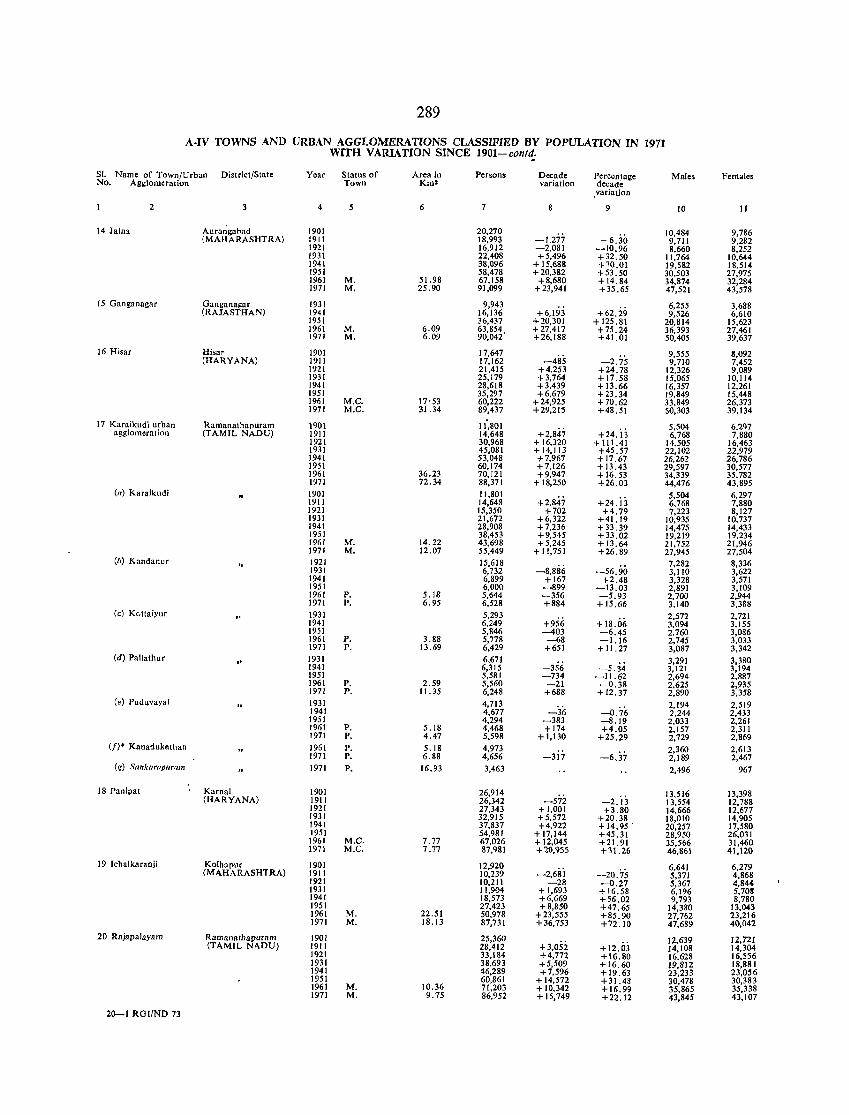
289
A-IV TOWNS AND URBAN AGGLOMERATIONS CLASSIFIED BY POPULATION IN 1971 WITH VARIATION SINCE 1901-cont~
SI. Name of Town/Urban District/State Year Status of Area in Persons Decade Percentall:e Males Females No. Agglomeration Town Km2 variation decade
variation
2 4 5 6 7 9 10 11
14 Jalm Aura~gabad 1901 20,270 - 6.30
10,484 9,786 (MAHARASHTRA) 1911 18,993 -1.277 9,711 9,282
1921 16,912 -2,081 -10.96 8,660 8,252 1931 22,408 +5,496 +32.50 11,764 10,644 1941 38,096 + 15,688 +70.01 19,582 18,514 1951 58,478 +20.382 +53.50 30,503 27,975 1961 M. 51.98 67,158 +8,680 +14.84 34,874 32,284 1971 M. 25.90 91,099 +23,941 +35.65 47,521 43,578
15 Ganganagar Gangan.gar 1931 9,943 +6,193 +62.29
6,255 3,688 (RAJASTHAN) 1941 16,136 9,526 6,610
1951 36,437 +20.301 +125.81 20,814 15,623 1961 M. 6.09 63,854. +27,417 +75.24 36,393 27,461 1971 M. 6.09 90,042 +26,188 +41.01 50,405 39,637
16 Hisar Hisar 1901 17,647 -2.75
9,555 8,092 (HARYANA) 1911 17,162 -485 9,710 7,452
1921 21,415 + 4,253 +24.78 12,326 9,089 1931 25,179 +3,764 + 17.58 15,065 10,114 1941 28,618 +3.439 + 13.66 16,357 12,261 1951 35,297 +6,679 +23.34 19,849 15,448 1961 M.e. 17'53 60,222 +24,925 + 70.62 33,849 26,373 1971 M.e. 31.34 89,437 +29,21:5 +48.51 50,303 39,134
17 Karaikudi urban Ramanathapuram 1901 I {,SOl +2,847 +24. ij
5,504 6,297 agglomeration (TAMIL NADU) 1911 14,648 6,768 7,880
1921 30,968 + 16,320 + 111.41 14,505 16,463 1931 45,081 + 14,113 +45.57 22,102 22,979 1941 53,048 +7,967 +17.67 26,262 26,786 1951 60,174 +7.126 + 13.43 29,597 30,577 1961 36.23 70.121 +9,947 +16.53 34,339 35.782 1971 72.34 88,371 + 18,250 +26.03 44,476 43,895
(n) Karaikudi 1901 11,801 +2,847 +24.i)
5,504 6,297 1911 14,648 6,768 7,880 1921 15,350 +702 +4.79 7,223 8,127 1931 21,671 +6,322 +41.19 10,935 10,737 1941 28.908 + 7,236 + 33.39 14,475 14,433 1951 38,453 +9.545 +33.02 19,219 19.234 1961 M. 14.22 43,698 +5,245 + 13.64 21.752 21,946 1971 M. 12.07 55.449 +11,751 +26.89 27,945 27,504
(h) Kandanur 1921 15,618 -8,886 -56.90
7,282 8,336 1931 6,732 3,110 3,622 1941 6,899 + 167 +2.48 3,328 3,571 1951 6,000 -899 -13.03 2,891 3.109 1961 P. 5.18 5,644 -356 -5.93 2,700 2,944 1971 P. 6.95 6,528 +884 +15.66 3,140 3,388
(c) Kottaiyur 1931 5,293 +18.06
2,572 2,721 1941 6,249 +956 3.094 3,155 1951 5,846 -403 -6.45 2.760 3,086 1961 P. 3.88 5,778 -68 -1.16 2,745 3,033 1971 P. 13.69 6,429 +651 + 11.27 3,087 3,342
(d) Pallathur "
1931 6,671 -5.34
3,291 3,380 1941 6,315 ~356 3,121 3,194 1951 5,581 -734 -11.62 2,694 2.887 1961 P. 2.59 5,560 -21 -0.38 2.625 2,935 1971 P. 11. 35 6,248 +688 + 12.37 2,890 3,358
(e) Puduvayal 1931 4,713 -0.76
2,194 2,519 1941 4,677 -36 2.244 2,433 1951 4,294 -383 ~8.19 2.033 2,261 1961 P. 5.18 4,468 +174 +4.05 2,157 2,311 1971 P. 4.47 5,598 + 1,130 +25.29 2,729 2,869
(f)' Kana1ukathan 1961 P. 5.18 4,973 -3i7 -6.37
2,360 2,613 1971 P. 6.88 4,656 2,189 2,467
(g) Sank{lrapur.,m 1971 P. 16.93 3,463 2,496 967
18 Panipat Karnal 1901 26.914 -2.ij
13.516 13,398 (HARYANA) 1911 26,342 -572 13,554 12,788
1921 27,343 +1,001 +3.80 14,666 12,677 1931 32.915 +5,572 +20.38 18,010 14,905 1941 37,837 +4,922 +14.95 . 20,257 17,580 1951 54,981 + 17,144 +45.31 28,950 26.031 1961 M.e. 7.77 67.026 + 12,045 +21.91 35,566 31,460 1971 M.e. 7.77 87.981 +20,955 +31.26 46,861 41,120
19 [Chalkaranji Kolhapur 1901 12,920 -2,6Si --20.75
6.641 6.279 (MAHARASHTRA) 1911 10,239 5,371 4,868
1921 10,211 -28 -0.27 5,367 4,844 1931 11,904 +1,693 + 16.58 6,196 5,708 1941 18,573 +6.669 +56.02 9,793 8,780 1951 27,423 +8,850 +47.65 14,380 13,043 1961 M. 22.51 50.978 +23,555 +85.90 27,762 23,216 1971 M. 18.13 87,731 +36,753 +72.10 47,689 40,042
20 Rajapalayam Ramanathapuram 1901 25,360 +3,o.si +12.03
12,639 12,721 (TAMIL NADU) 1911 28,412 14,108 14,304
1'l21 33,184 +4,772 +\6.80 16,628 16,556 193\ 38,693 +5,509 +16.60 19,812 18,881 1941 46,289 +7,596 +19.63 23,233 23,056 1951 60,861 + 14.572 +31.48 30,478 30,383 1961 M. 10.36 71.203 + 10.342 +16.99 35,865 35,338 1971 M. 9.75 86,952 + 15,749 +22.12 43,845 43,107
2a-1 RGI/ND 73
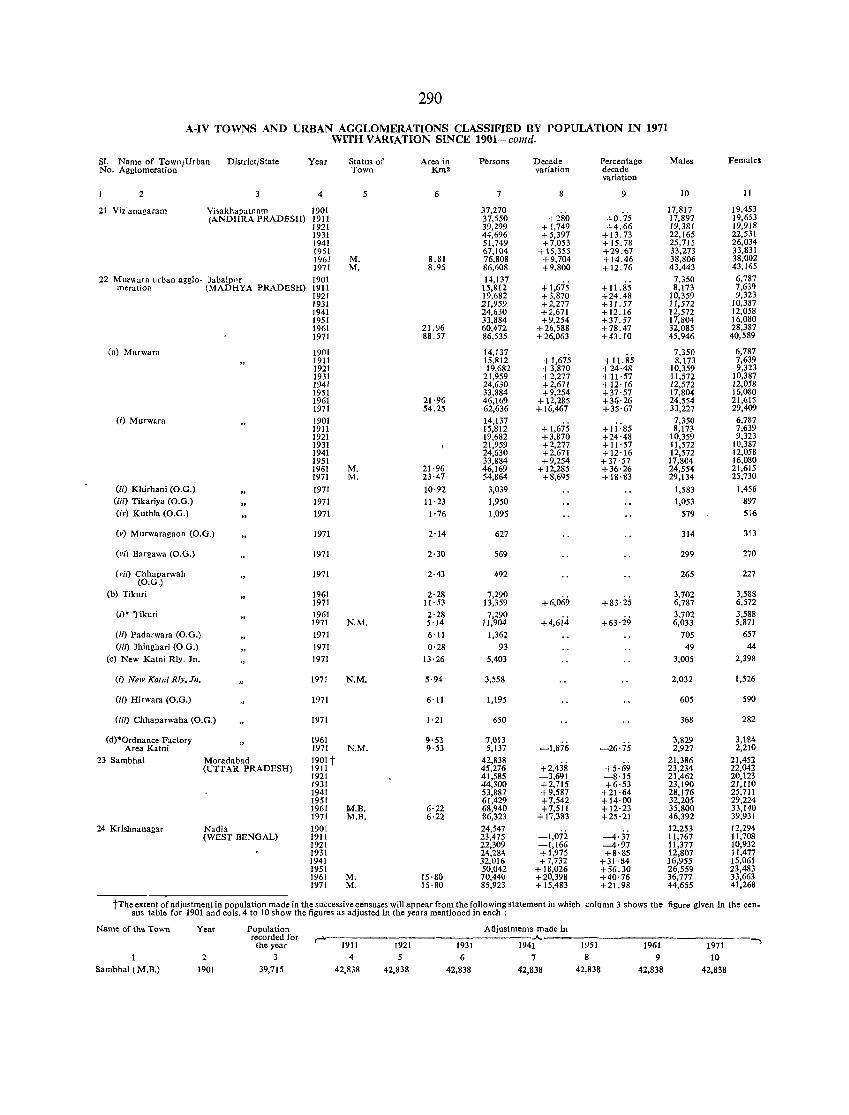
290
A-IV TOWNS A.ND URBAN AGGLOMERATIONS CLASSIFIED BY POPULATlON IN 1971 WITH VARIATION SINCE 1901-- contd.
SI. Name of Town/Urban District;State Year Status of Area in Persons Decade Percentage Males Females No. Agglomeration Town Km2 variation d<cade
variation
2 4 5 6 7 9 10 II
21 Vizianagaram Yhakhapatna'11 1901 37,270 17,817 19,453 (ANDHRA PRADFSH) 1911 37,550 +280 +0.75 17,897 19,653
1921 39,299 + 1,749 +4.66 19,381 19.918 1931 44,696 +5,397 +13.73 22,165 22,531 1941 51,749 +7,053 +15.78 25,715 26,034 1951 67,104 + 15,355 +29.67 33,273 33,831 1961 M. 8.81 76,808 +9,704 + 14.46 38,806 38,002 1971 M. 8.95 86,608 +9,800 +12.76 43,443 43,165
22 Murwa,a urban agglo· Jabalp,'r 1901 14,137 + 1,675 + lui5
7,350 6,787 meration (MADHYA PRADESH) 1911 15,812 8,173 7,639
1921 19,682 +3,870 +24.48 10,359 9,323 1931 21,959 +2,277 + 11.57 11,572 10,387 1941 24,630 +2,671 +12.16 12,572 12,058 1951 33,884 +9,254 +37.57 17,804 16,080 1961 21.96 60,472 +26,588 +78.47 32,085 28,387 1971 88.57 86,535 +26,063 +43.10 45,946 40,589
(a) Murwara 1901 14,137 + 1,675 + 11. 85
7,350 6,787 1911 15,812 8,173 7,639 1921 19,682 + 3,870 +24·48 10,359 9,323 1931 21,959 +2,277 +11·57 11,572 10,387 1941 24,630 +2,671 +12·16 12,572 12,058 1951 33,884 +9,~54 +37·57 17,804 15,080 1961 2·1·96 46,169 + 12,285 +36·26 24,554 21,615 1971 54.25 62,636 + 16,467 +35·67 33,227 29,409
(i) Murw.ra 1901 14,137 + 1,675 +1 j:85
7,350 6,787 1911 15,812 8,173 7,639 1921 19,682 +3,870 +24·48 10,359 9,323 1931 21,959 +2,277 + 11·57 11,572 10,387 1941 24,630 +2,671 +12·16 12,572 12,058 1951 33,884 +9,254 +37·57 17,804 16,080 1961 M. 21·96 46,169 + 12,285 +36·26 24,554 21,615 1971 M. 23·47 54,864 +8,695 +18·83 29,134 25,730
(ii) Khirhani (O.G.) 1971 10·92 3,039 1,583 1,456
(iii) Tikariya (0.0.) 1971 11·23 1,950 1,053 897
(iv) Kuthla (0.0.) 1971 1·76 1,095 579 516
(v) Murwaragaon (0.0.) 1971 2·14 627 314 313
(vi) Bargawa (O.G.) 1971 2·30 569 299 270
(vii) Chhaparwah 1971 2·43 492 265 227 (O.G.)
(b) Tikuri 1961 2·28 7,290 +6,069 +83·25
3,702 3,588 1971 11·53 13,359 6,787 6,572
(i)* Tikuri 1961 2·28 7,290 +4,6i.i +63·29
3,702 3,588 1971 N.M. 5·14 1l,904 6,033 5,871
(ii) Padarwara (O.G.) 1971 6'11 1,362 705 657
(iii) Jhinghari (O.G.) 1971 0·28 93 49 44
(c) New Katni Rly. In. 1971 13·26 5,403 3,005 2,398
(i) New Katni Riy. In. 1971 N.M. 5·94 3,558 2,032 1,526
(ii) Hirwara (O.G.) 1971 6,]] 1,195 605 590
(iii) Chhaparwaha (O.G.) 1971 1·21 650 368 282
(d)' Ordnance Factory 1961 9·53 7,013 3,829 3,184 Area Katni 1971 N.M. 9·53 5,137 -1,876 -26·75 2,927 2,210
23 Sambhal Moradabad 1901 t 42,838 +2,438 +5·69
21,386 21,452 (UTTAR PRADESH) 1911 45,276 23,234 22.042
1921 41,585 -3,691 -8·15 21,462 20,123 1931 44,300 +2,715 +6·53 23,190 21,110 1941 53,887 +9,587 +21·64 28,176 25,711 1951 61,429 +7,542 +14·00 32,205 29,224 1961 M.B. 6·22 68,940 +7,511 +12·23 35,800 33,140 1971 M.B. 6·22 86,323 + 17,383 +25·21 46,392 39,931
24 Krishnanagar Nadia 1901 24,547 -1,072
12,253 12,294 (WEST BENGAL) 1911 23,475 --4·37 11,767 11,708
1921 22,309 -1,166 --4·97 11,377 10,932 1931 24,284 +1,975 +8·85 12,807 11,477 1941 32,016 +7,732 +31·84 16,955 15,061 1951 50,042 + 18,026 +56.30 26,559 23,483 1961 M. 15·80 70,440 +20,398 +40·76 36,777 33,663 1971 M. 15·80 85,923 + 15,483 +21.98 44,655 41,268
tThe extent of adjustment in population made in the successive censuses will appear from the following statement in which column 3 shows the figure given in the cen_ sus table for 1901 and cols_ 4 to 10 show the figures as adjusted in the years mentioned in each:
Name of the Town Year Population A6justments made in recorded for ,.. .A.. -,
the year 1911 1921 1931 1941 1951 1961 1971
2 3 4 5 6 7 8 9 10 Sambhal (M.B.) 1901 39,715 42,838 42,838 42,838 42,838 42,838 42,838 42,838
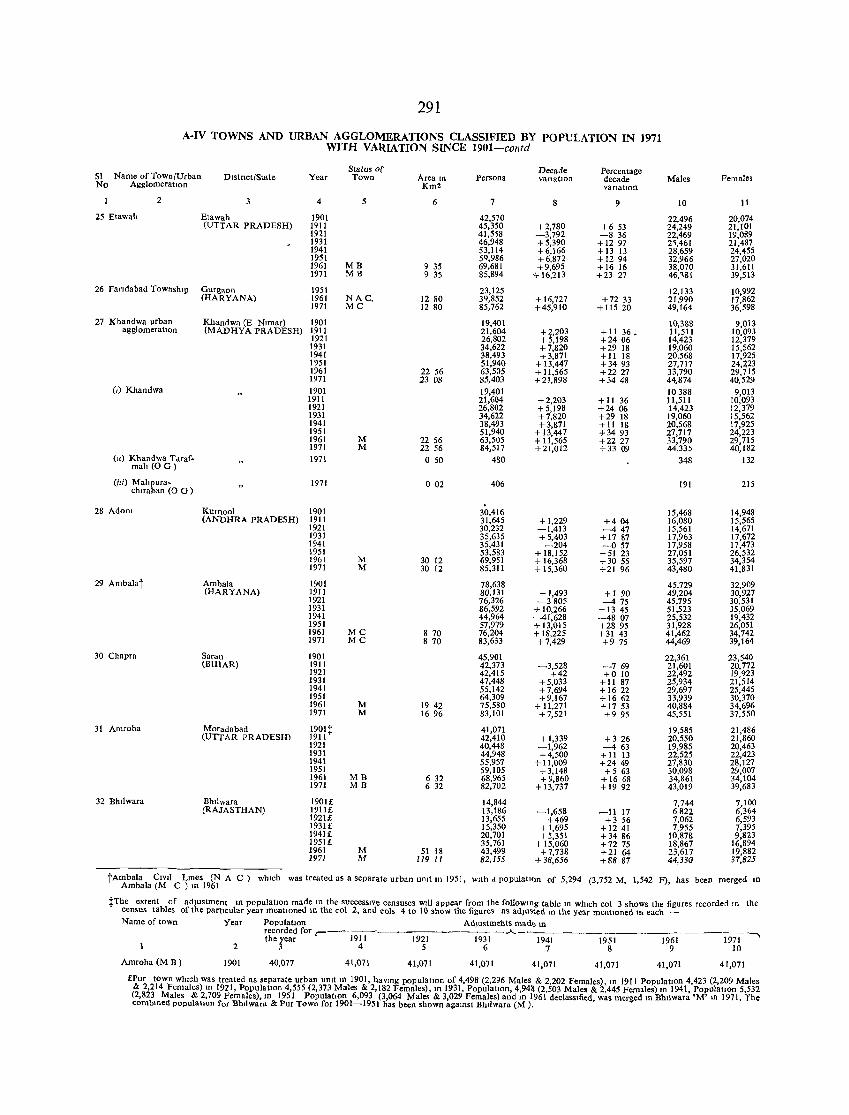
291
A-IV TOWNS AND URBAN AGGLOMERATIONS CLASSIFIED BY POPULATION IN 1971 WITH VAlUATION SINCE 1901-conld
Status Of Decade Percentage SI Name of Town/Urban District/State Year Town Area m Persons variatIon decade Males Females No AgglomeratIOn Km2 varIatIOn
2 4 6 7 9 10 11 25 Etawalt Etawah 1901 42,570 22,496 20.074
(UTTAR PRADESH) 1911 45,350 + 2,780 +653 24,249 21,101 1921 41,558 -3,792 -836 22,469 19,089 1931 46,948 +5,390 +1297 2'i,461 21,487 1941 53,114 +6,166 +13 13 28,659 24,455 1951 5'1,986 +6,872 +1294 32,966 27,020 1961 MB 9 35 69,681 +9,695 +1616 38,070 31,611 1971 MB 935 85,894 +16,213 +23 27 46,~81 39,513
26 Fandabad Township Gurgaon 1951 23,125 12,133 10,992 (HARYANA) 1961 NAC. 12 80 3'1,852 + 16,727 +72 33 21,990 17.862
1971 MC 1280 85,762 +45,910 + lIS 20 49,164 36,598
27 Khandwa urban Khandwa (E Nlmar) 1901 19,401 10,388 9,013 agglomeration (MADHYA PRADESH) 1911 21,604 +~,203 + 11 36. 11,511 10,09.1
1921 26,802 + ,198 +2406 14,423 12,379 1931 34,622 +7,820 +29 18 19,060 15,562 1941 38,493 +3,871 +11 18 20,568 17,925 1951 51,940 + 13,447 +3493 27,717 24,223 1961 2256 63,505 + 11,565 +2227 33,790 29,715 1971 23 08 85,403 +2J,898 +3448 44,874 40,529
(,) Khandwa 1901 19,401 10388 9,013 1911 21,604 +2,203 +11 36 11,511 10,093 1921 26,802 +5,198 +2406 14,423 12,379 1931 34,622 +7,820 +29 18 19,060 15,562 1941 38,493 +3,871 +11 18 20,568 17,925 1951 51,940 + 13,447 +3493 27,717 24,223 1961 M 22 56 63,505 + 11,565 +2227 33,790 29,715 1971 M 22 56 84,517 +21,012 +33 09 44,335 40,182
(II) Khandwa T araf· 1971 o 50 480 348 132 mah (00)
(IIi) Mahpura- 1971 o 02 406 191 215 chlrahan (0 0 ) .
28 AdoOl Kurnool 1901 30,416 15,468 14,948 (ANbHRA PRADESH) 1911 31,645 + 1,229 +404 16,080 15,565
1921 30,232 -1,413 -447 15,561 14,671 1931 35,635 + 5,403 + 17 87 17,963 17,672 1941 35,431 -204 -057 17,958 17,473 1951 53,583 + 18,152 +51 23 27,051 26,532 1961 M 30 12 69,951 + 16,368 +30 55 35,597 34,354 1971 M 30 12 85,311 + 15,360 +21 96 43,480 41,831
29 Ambalat Ambala 1901 78,638 45,729 32,909 (HARYANA) 1911 80,131 +1,493 +1 90 49,204 30,927
1921 76,326 -3805 -475 45,795 30,531 1931 86,592 + 10,266 +13 45 51,523 35,069 1941 44,964 ~41,628 -4807 25,532 19,432 1951 57,919 + 13,015 +2895 31,928 26,051 1961 MC 8 70 76,204 + 18,225 +31 43 41,462 34,742 1971 MC 8 70 83,633 +7,429 +9 75 44,469 39,164
30 Chapra Saran 1901 45,901 22,361 23,540 (BIHAR) 1911 42,373 -3,528 -769 21,601 20,772
1921 42,415 +42 +0 10 22,492 19,923 1931 47,448 +5,033 +11 87 25,934 21,514 1941 55,142 +7,694 +1622 29,697 25,445 1951 64,309 +9,167 +1662 33,939 30,370 1961 M 1942 75,580 + 11,271 + 1753 40,884 34,696 1971 M 1696 83,101 +7,521 +9 95 45,551 37,550
31 Amroha Moradabad 1901t 41,071 19,585 21,486 CUTT AR PRADESH) 1911 42,410 + 1,339 +326 20,550 21,860
1921 40,448 -1,962 -463 19,985 20,463 1931 44,948 +4,500 + II 13 22,525 22,423 1941 55,957 +11,009 +2449 27,830 28,127 1951 59,105 +3,148 +5 63 30,098 29,007 1961 MB 6 32 68,965 +9,860 +1668 34,861 34,104 1971 MB 632 82,702 + 13,737 + 19 92 43,019 39,683
32 Bhllwara Bhliwara 1901£ 14,844 7,744 7,100 (RAJASTHAN) 1911£ 13,186 -1,658 -11 17 6822 6,364
1921£ 13,655 +469 +3 56 7,062 6,593 1931£ 15,350 + 1,695 +1241 7,955 7,395 1941£ 20,701 + 5,351 +3486 10,878 9,823 1951£ 35,761 + 15,060 +72 75 18,867 16,894 1961 M 51 18 43,499 +7,738 +21 64 23,617 19,882 1971 M 119 11 82,155 +38,656 +8887 44,330 37,825
tAmbala Cml Lmes (N A C ) Ambala (M C) III 1961
WhICh was treated as a separate urban UOlt In 1951, WIth d populatIOn of 5,294 (3,752 M, 1,542 F), has been merged III
tThe extent of adjustment In populatIOn made m the successIVe censuses WIll appear from the follOWing table m which col 3 shows the figures recorded In census tables of the parbcular year mentIOned III the col 2, and cols 4 to 10 show the figures as adjUSted m the year mentIOned In each _
the
Name of town Year PopulatIOn AdJustmehts made III recorded for r- ..A. --. the year 1911 1921 1931 1941 1951 1961 1971
2 3 4 5 6 7 8 9 10
Amroha (MB) 1901 40,077 41,071 41,071 41,071 41,071 41,071 41,071 41,071
£Pur town whICh was treated as separate urban UOlt m 1901, havmg populatIOn of 4,498 (2,296 Males & 2,202 Females), m 1911 Popula(lon 4,423 (2,209 Males & 2,214 Females) m 1921, Populauon 4,555 (2,373 Males & 2,182 Females), III 1931, PopulatIOn, 4,948 (2,503 Males & 2,445 Females) III 1941, PopulatIOn 5,532 (2,823 Males & 2,709 Females),!U 1951 PopulatIOn 6,093 (3,064 Males & 3,029 Females) and III 1961 declassified was merged In Bhllwara 'M' 'n 1911. The combIned population for Bhllwara & Pur Town for 1901-1951 has been shown agamst Bhllwara (M). '
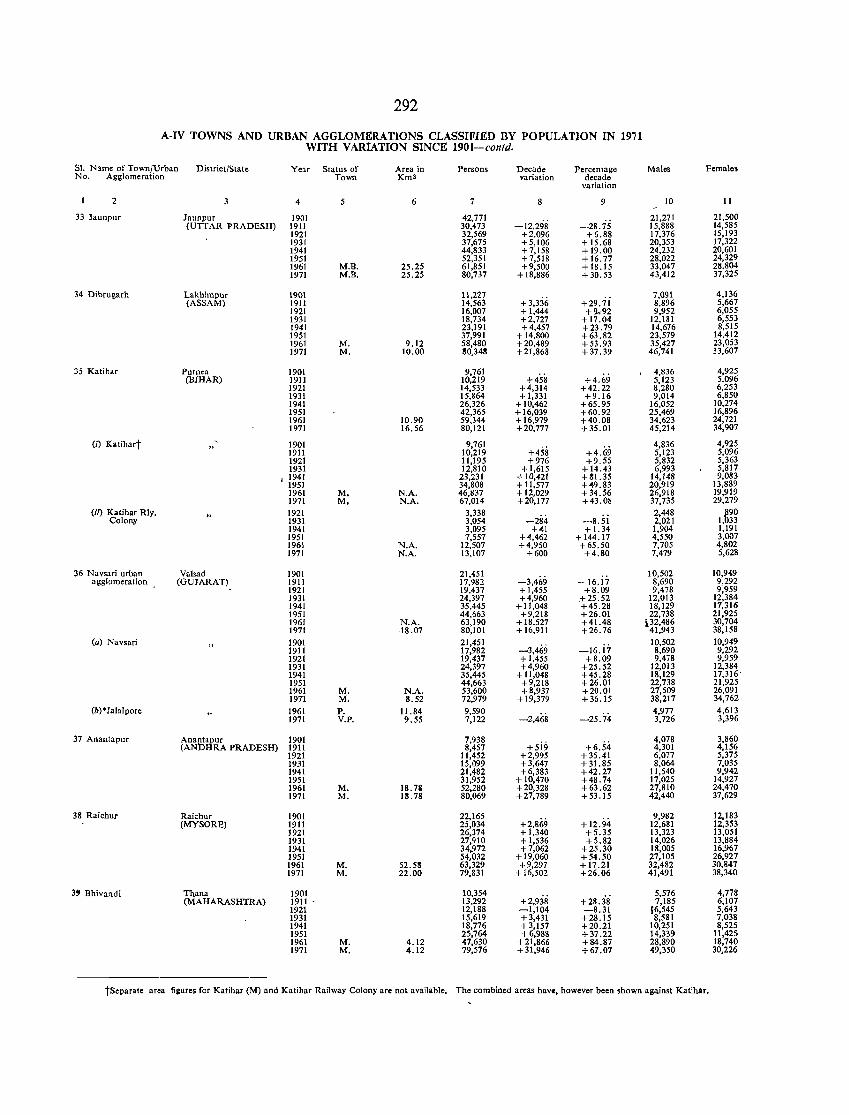
292
A-IV TOWNS AND URBAN AGGLOMERATlONS CLASSIFI£D BY POPULATION IN 19;1 WITH VARIATION SINCE 1901-contd.
81. Name of TownJUrban DistrictJState Year Status of Area in Persons Decade Percentage Male, Females No. Agglomeration Town Km2 variation decade
variation
2 4 6 7 8 9 10 11
33 Jaunpur Jaunpur 1901 42,771 -12,298
21,271 21,500 (UTTAR PRADESH) 1911 30,473 -28.75 15,888 14,585
1921 32,569 +2,096 +6.88 17,376 15,193 1931 37,675 +5,106 + 15.68 20,353 17,322 1941 44,833 +7,158 +19.00 24,232 20,601 1951 52,351 +7,518 + 16.77 28,022 24,329 1961 M.B. 25.25 61,851 +9,500 + 18.15 33,047 28.804 1971 M.B. 25.25 80,737 + 18,886 +30.53 43,412 37,325
34 Dibrugarh Lakhimpur 190\ 11,227 +3,336 +29.7i
7,091 4,136 (ASSAM) 1911 14,563 8,896 5,667
1921 16,007 +1,444 +'k92 9,952 6,055 1931 18,734 +2,727 +17.04 12,181 6,553 1941 23,191 +4,457 +23.79 14,676 8,515 1951 37,991 + 14,800 +63.82 23,579 14,412 1961 M. 9.12 58,480 +20,489 +53.93 35,427 23,053 1971 M. 10.00 80.34S +21,868 + 37.39 46,741 33,607
35 Katihar Purnea 1901 9,761 4,836 4,925 (BIHAR) 1911 10,219 +458 +4.69 5,123 5,096
1921 14,533 +4,314 +42.22 8,280 6,253 1931 15,864 + 1,331 +9.16 9,014 6,850 1941 26,326 + 10,462 +65.95 16,052 10,274 1951 42,365 + 16,039 +60.92 25,469 16,896 1961 10.90 59,344 + 16,979 +40.08 34,623 24,721 1971 16.56 80,121 +20,777 +35.01 45,214 34,907
0) Katihart 1901 9,761 +4.69
4,836 4,925 1911 10,219 +458 5,123 5,096 1921 11,195 +976 +9.55 5,832 5,363 1931 12,810 + 1,615 + 14.43 6,993 5,817
, 1941 23,231 + 10,421 +111.35 14,148 9,083 1951 34,808 +11,577 +49.83 20,919 13,889 1961 M. N.A. 46,837 + 12,029 + 34.56 26,918 19,919 1971 M. N.A. 67,014 +20,177 +43.08 37,735 29,279
Oi) Katihar Rly. 1921 3,338 -284
2,448 g90 O)lony 1931 3,054 -8.51 2,021 I, 33
1941 3,095 +41 + 1.34 1,904 1,191 1951 7,557 +4,462 + 144.17 4,550 3,007 1961 N.A. 12,507 +4,950 + 65.50 7,705 4,802 1971 N.A. 13,107 +600 +4.80 7,479 5,628
36 Navsari urban Valsad 1901 21,451 -3,469
10,502 10,949 agglomeration (GUJARAT) 1911 17,982 -16.17 8,690 9,292
1921 19,437 + 1,455 +8.09 9,478 9,959 1931 24,397 +4,960 +25.52 12,013 12,384 1941 35,445 + 1l,048 +45.28 18,129 17,316 1951 44,663 +9,218 +26.01 22,738 21,925 196[ N.A. 63,190 + 18,527 +41.48 1.32,486 30,704 1971 ·[8.07 80,10[ +16,911 +26.76 41,943 38,158
(a) Navsari 1901 21,451 -3,469
10,502 10,949 1911 17,982 -16.17 8,690 9,292 1921 19,437 + 1,455 +8.09 9,478 9,959 1931 24,397 +4,960 +25.52 12,013 12,384 194[ 35,445 + 11,048 +45.28 18,129 17,316' 1951 44,663 +9,218 +26.01 22,738 21,925 1961 M. N.A. 53,600 +8,937 +20.01 27,509 26,091 1971 M. 3.52 72,979 + 19,379 +36.15 38,217 34,762
(h)*Ja[a[pore 1961 P. 11.84 9,590 -2,468 -25.74
4,977 4,613 1971 V.P. 9.55 7,122 3,726 3,396
37 Anantapur Anaptapur 1901 7,938 +5iil +6,54
4,078 3,860 (ANDHRA PRADESH) 1911 8,457 4,301 4,156
1921 11,452 +2,995 + 35.41 6,077 5,375 1931 15,099 +3,647 + 31.85 8,064 7,035 1941 21,482 +6,383 +42.27 11,540 9,942 1951 31,952 + 10,470 +48.74 17,025 14,927 1961 M. 18.72 52,280 +20,328 +63.62 27,810 24,470 1971 M. 18.78 80,069 +27,789 +53.15 42,440 37,629
38 Raichur Raichur 1901 22,165 +2,869 +12.94
9,982 12,183 (MYSORE) 1911 25,034 12,681 12,353
1921 26,374 +1,340 +5.35 13,323 13,051 1931 27,910 + 1,536 +5.82 14,026 13,884 1941 34,972 +7,062 +25.30 18,005 16,967 1951 54,032 +19,060 +54.50 27,105 26,927 1961 M. 52.5S 63,329 +9,297 +17.21 32,482 30,847 1971 M. 22.00 79,831 + 16,502 +26.06 41,491 38,340
3' Bhivandi Thana 1901 10,354 +2,938 +28.38
5,576 4,778 (MAHARASHTRA) 1911 . 13,292 7,185 6,107
1921 12,188 -1,104 -8.31 16,545 5,643 1931 15,619 +3,431 +28.15 8,581 7,038 1941 18,776 +3,157 +20.21 10,251 8,525 1951 25,764 +6,988 +37.22 14,339 11,425 1961 M. 4.12 47,630 +21,866 +84.87 28,890 18,740 1971 M. 4.12 79,576 +31,946 +67.07 49,350 30,226
tSeparate area fieure, for Katihar (M) and Katihar Railway Colony are not available. The combined areas hav., however been shown against Katihar.
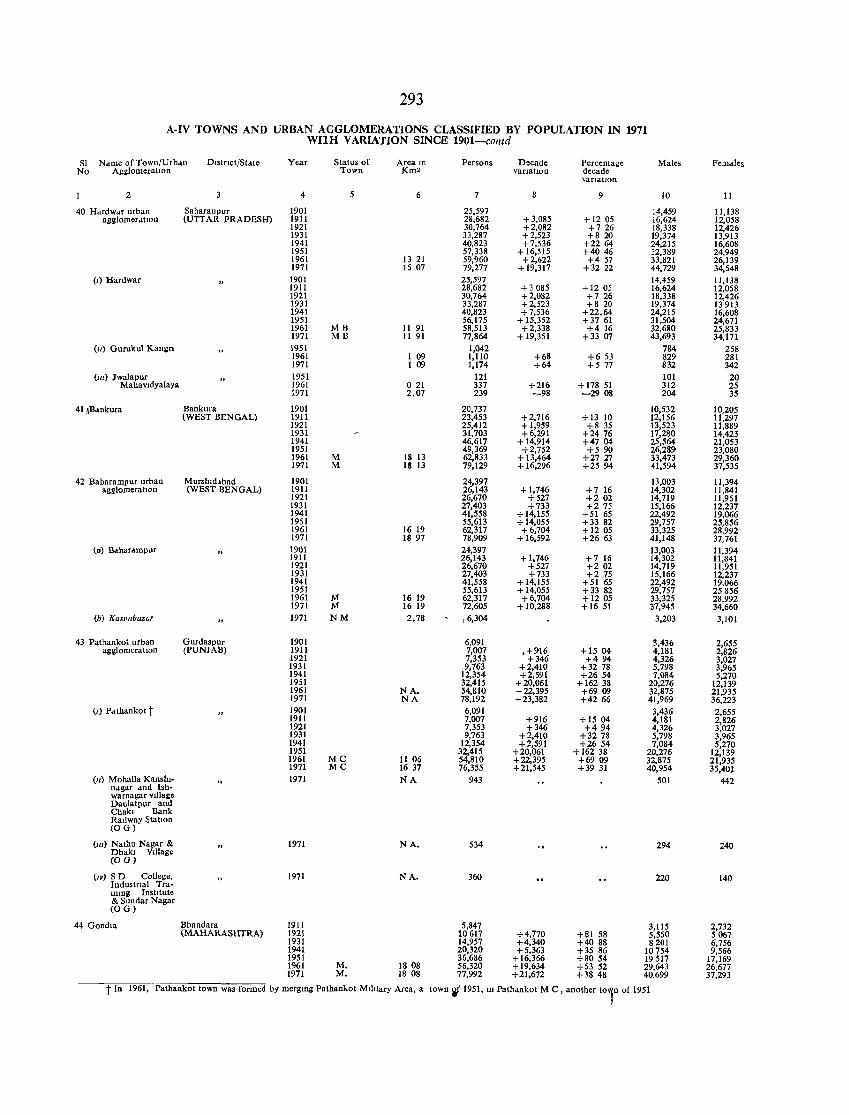
293
A-IV TOWNS AND URBAN AGGLOMERATIONS CLASSIFIED BY POPULATION iN 1971 WnH VARIATION SINCE 1901-cotltd
SI Ndme of Town/Urbdn Distfict/Stdte Year Status of Area In Persons Decade Percentage Males Femdles No Agglomeration Town Km2 vanatlOu decade
VanatlOll
2 4 5 6 7 8 9 10 11
40 HdCdw"r urban Saharan pur 1901 25,597 14,459 11,138 agglomerdtlon (UTTAR PRADESH) 1911 28,682 +3,085 + 1205 16,624 12,058
1921 30,764 +2,082 +7 26 18,338 12,426 1931 33,287 + 2,523 +820 19,374 13,913 1941 40,823 +7,536 +2264 24,215 16,608 1951 57,338 + 16,515 +4046 32,389 24,949 1961 13 21 59,960 +2,622 +4 57 33,821 26,139 1971 15 07 79,277 +19,317 +3222 44,729 34,548
(I) Hardwar 1901 25,597 14,459 11,138 1911 28,682 +3085 + 1205 16,624 12,058 1921 30,764 +2,082 +726 18,338 12,426 1931 33,287 +2,523 +820 19,374 13913 1941 40,823 +7,536 +22.64 24,215 16,608 1951 56,175 + 15,352 +3761 31,504 24,671 1961 MH II 91 58,513 +2,338 +416 32,680 25,833 1971 MB 11 91 77,864 + 19,351 +33 07 43,693 34,171
(11) Guru\ml Kanlin 1951 1,042 784 258 1961 1 09 1,110 +68 +653 829 281 1971 1 09 1,174 +64 +577 832 342
(Ill) Jwalapur 1951 121 101 20 Mahavldyalaya 1961 021 337 +216 + 178 51 312 25
1971 2.07 239 -98 -2908 204 35
41 JBdnkura Bankura 1901 20,737 10,532 10,205 (WEST BENGAL) 1911 23,453 +2,716 + 13 10 12,156 11,297
1921 25,412 + 1,959 +8 35 13,523 11,889 1931 31,703 +6,291 +2476 17,280 14,423 1941 46,617 +14,914 +4704 25,564 21,053 1951 49,369 +2,752 +590 26,289 23,080 1961 M 18 13 62,833 + 13,464 +2727 33,473 29,360 1971 M 18 13 79,129 +16,296 +25 94 41,594 37,535
42 Baharampur urban Murshldabad 1901 24,397 13,003 11,394 ag£lomeratIon (WEST BENGAL) 1911 26,143 + 1,746 +7 16 14,302 11,841
1921 26,670 +521 +202 14,719 11,951 1931 27,403 +733 +275 15,166 12,231 1941 41,558 +14,155 +51 65 22,492 19,066 1951 55,613 + 14,055 +33 82 29,757 25,856 1961 16 19 62,317 +6,704 +1205 33,325 28,992 1971 18 97 78,909 + 16,592 +2663 41,148 37,761
(a) Bahar"mpllr 1901 24,397 13,003 11,394 1911 26,143 +1,746 +7 16 14,302 11,841 1921 26,670 +521 +202 14,719 11,951 1931 27,403 +733 +275 15,166 12,237 1941 41,558 + 14,155 +51 65 22,492 19,066 1951 55,613 + 14,055 +33 82 29,757 25856 1961 M 16 19 62,311 +6,704 +1205 33,325 28,992 1971 M 16 19 72,605 + 10,288 +1651 37,945 34,660
(b) KaslIllbazar 1971 NM 2.78 ,6,304 3,203 3,101
43 Pathankot urban Gurdaspur 1901 6,091 3,436 2,655 agiloeneratlOn (PUNJAB) 1911 7,007 ,+916 +15 04 4,181 2,826
1921 7,353 +346 +494 4,326 3,027 1931 9,763 +2,410 +3278 5,798 3,965 1941 12,354 +2,591 +2654 7,084 5,270 1951 32,415 +20,061 + 162 38 20,276 12,139 1961 NA. 54,810 +22,395 +6909 32,875 21,935 1971 NA 78,192 +23,382 +4266 41,969 36,223
(,) Pdthankot t 1901 6,091 3,436 2,655 1911 7,007 +916 +1504 4,181 2,826 1921 7,353 +346 +494 4,326 3,027 1931 9,763 +2,410 +3278 5,798 3,965 1941 12,354 +2,591 +2654 7,084 5,270 1951 32,415 +20,061 + 162 38 20,276 12,139 1961 MC 11 06 54,810 +22,395 +6909 32,875 21,935 1971 MC 16 37 76,355 +21,545 +39 31 40,954 35,401
(II) Mohalla Kansh,- 1971 NA 943 501 442 ndgar dnd Ish-warnagar VIllage Daulatpur and Chakl Bank Railway StatIOn (00)
(Ill) Nathu Nagar & 1971 NA. 534 294 240 Dhakl V,llage (00)
(,v) SD College, 1971 NA. 360 220 140 Industflal Tra-Inmg Institute & Sundar Nagar (OG)
44 Gondla Bhandara 1911 5,847 3,115 2,732 (MAHARASHTRA) 1921 10617 +4,770 +81 58 5,550 5067
1931 14,957 +4,340 +40 88 8201 6,756 1941 20,320 +5,363 +35 86 10754 9,566 1951 36,686 + 16,366 +8054 19517 17,169 1961 M. 1808 56,320 + 19,634 +53 52 29,643 26,677 1971 M. 18 08 77,992 +21,672 +3848 40,699 37,293
tin 1961, Pathankot town was formed by merging Pathankot MIlItary Area, a town '1/1951, In Pathdnkot M C , another t01n of 1951
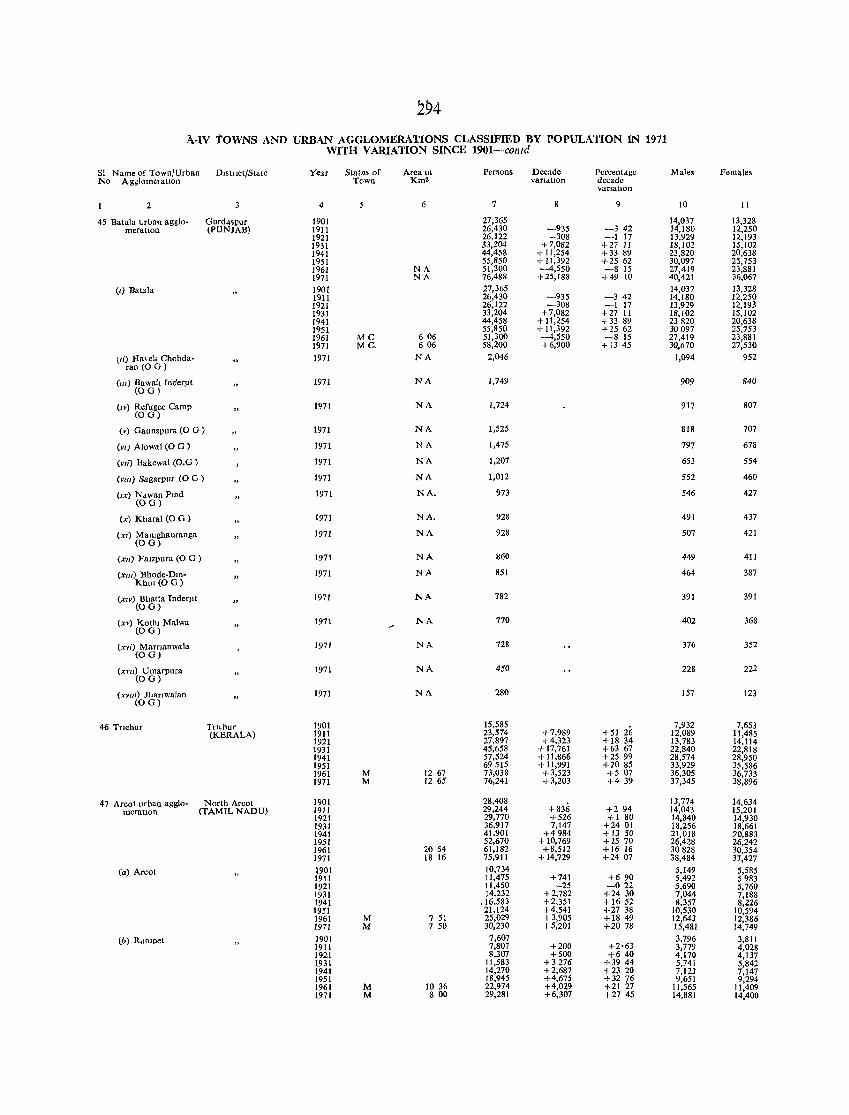
294 A-IV tOWNS AND URBAN AGGLOMERATIONS CLASSIFIED BY POPULATION IN 1971
WITH VARIATION SINCE 1901-contd
SI Name of Town/Urban Dlstnct/State Year Status of Area In Persons Decade Percentage Males Females No AgglomeratIon Town Km2 vandtlon decade
varIatIon
2 4 6 7 9 10 11
45 Batala .. rban agglo- Gurda,pur 1901 27,365 14,037 13,328 merauon (PUNJAB) 1911 26,430 -935 -342 14,180 12,250
1921 26,122 -308 -117 13,929 12,193 1931 33,204 +7,082 +27 11 18,102 15,102 1941 44,458 + 11,254 + 33 89 23,820 20,638 1951 55,850 + 11,392 +25 62 30,097 25,753 1961 NA 51,300 -4,550 -8 15 27,419 23,881 1971 NA 76,488 +25,188 +49 10 40,421 36,067
(I) Batala 1901 27,365 14,037 13,328 1911 26,430 -935 -342 14,180 12,250 1921 26,122 -308 -117 13,929 12,193 1931 33,204 +7,082 +27 11 18,102 15,102 1941 44,458 + 11,254 +33 89 23820 20,638 1951 55,850 + 11,392 +25 62 30097 25,753 1961 MC 606 51,300 -4,550 -815 27,419 23,881 1971 MC. 606 58,200 +6,900 + 1345 30.670 27,530
tlil Ha\ell Chohda- 1971 NA 2,046 1,094 952 ran (0 G)
(1lI) Bawah Inderjlt 1971 NA 1,749 909 840 (OG)
(IV) Refugee Camp 1971 NA 1,724 917 807 (OG)
(v) Gaunspura (0 G ) 1971 NA 1,525 818 707
(VI) Alowal (0 G) 1971 NA 1,475 797 678
(VIi) Bakewal (O.G ) 1971 NA 1,207 653 554
(VIll) Sagarpur (0 G ) 1971 NA 1,012 552 460
(IX) Ndwan Pmd 1971 NA. 973 546 427 (0 G)
(x) Kharal (0 G ) 1971 NA. 928 491 437
(XI) Mamghauranga (0 G)
1971 NA 928 507 421
(xu) F31zpura (0 0 ) 1971 NA 860 449 411
(XIII) Bhode-Dm-Khm(O G)
1971 NA 851 464 387
(XIV) Bhatta IndefJlt (OG)
1971 NA 782 391 391
(xv) Kothl Malwa (OG)
1971 NA 770 402 368
(xvi) Mamanwala (OG)
1971 NA 728 376 352
(XVII) Umarpura (OG)
1971 NA 450 228 222
(XVlll) JharJwaJan (00)
1971 NA 280 157 123
46 Tnehur Tn~hur 1901 15,585 +51 26
7,932 7,653 (KERALA) 1911 23,574 +7,989 12,089 11,485
1921 27,897 +4,323 +18 34 13,783 14,114 1931 45,658 + 17,761 +63 67 22,840 22,818 1941 57,524 + 11,666 +25 99 28,574 28,950 1951 69515 +11,991 +1085 33,929 35,586 1961 M 1267 73,038 +3,523 +5 07 36,305 36,733 1971 M 1265 76,241 +3,203 +4 39 37,345 38,896
47 Areol urban agglo- North Areol 1901 28,408 +836
13,774 14,634 meratlon (TAMIL NADU) 1911 29,244 +294 14,043 15,201
1921 29,770 +526 +1 80 14,840 14,930 1931 36,917 7,147 +24 01 18,256 18,661 1941 41,901 +4984 + 13 50 21,018 20,883 1951 52,670 + 10,769 + l5 70 26,428 26,242 1961 20 54 61,182 +8,512 +1616 30828 30,354 1971 18 16 75,911 + 14,729 +2407 38,484 37,427
(a) Areo! 1901 10,734 5,149 5,585 1911 11,475 +741 +690 5,492 5983 1921 11,450 -25 -022 5,690 5,760 1931 14,232 +2,782 +24 30 7,044 7,188 1941 .16,583 +2,351 + 1652 8,357 8,226 1951 21,124 +4,541 +27 38 10,530 10,594 1961 M 7 51 25,029 + 3,905 +18 49 12,643 12,386 1971 M 7 50 30,230 +5,201 +2078 15,481 14,749
(b) R.!OlOet 1901 7,607 3.796 3,811 1911 7,807 +200 +2'63 3,779 4,028 1921 8,307 +500 +640 4,170 4,137 1931 11 ,583 +3276 +3944 5,741 5,842 1941 14,270 +2,687 +23 20 7,123 7,147 1951 18,945 +4,675 +32 76 9,651 9,294 1961 M 10 36 22,974 +4,029 +21 27 11,565 11,409 1971 M 8 00 29,281 +6,307 +27 45 14,881 14,400
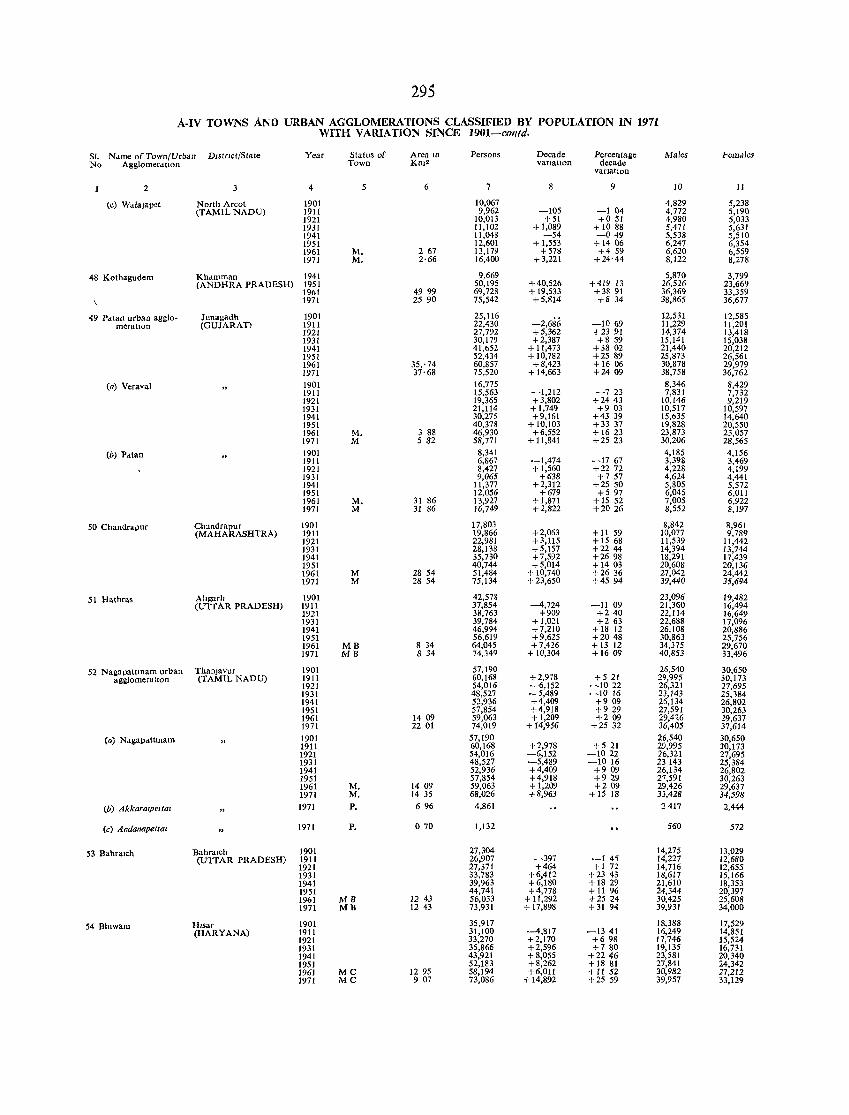
295
A-IV TOWNS AND URBAN AGGLOMERATIONS CLASSIFIED BY POPULATION IN 1971 WITH VARIATION SINCE 1901-contd.
51. Ndme of Town/Urban DJstncl/State Year Status of Area w Persons Decade Percental:o Males l-ellldles No Agglomerdllon Town Km2 vanatlon decade
VarIatIOn
2 3 4 6 7 9 !O II
(c) WalaJapet North Arcot 1901 10,067 4,829 5,238 (TAMIL NADU) 1911 9,962 -105 -104 4,772 5,190
1921 10,013 +51 +051 4,980 5,033 1931 11,102 + 1,089 + 1088 5,471 5,631 1941 11,048 -54 -049 5,538 5,510 1951 12,601 + 1,553 + 1406 6,247 6,354 1961 M. 2 67 13,179 +578 +4 59 6,620 6,559 1971 M. 2·66 16,400 +3,221 +24'44 8,122 8,278
48 Kothagudem Khdmman 1941 9,669 5,870 3,799 (ANDHRA PRADESH) 1951 50,195 +40,526 +419 13 26,526 23,669
1901 49 99 69,728 + 19,533 +38 91 36,369 33,359 1971 2590 75,542 +5,814 +834 38,865 36,677
49 Pdtan urban agglo· Junagadh 1901 25,116 -2,686
12,531 12,585 meratlOn (GUJARAT) 1911 22,430 -1069 11,229 11,201
1921 27,792 +5,362 +2391 14,374 13,418 1931 30,179 +2,387 +8 59 15,141 15,038 1941 41,652 + 11,473 +38 02 21,440 20,212 1951 52,434 + 10,782 +25 89 25,873 26,561 1961 35,'74 60,857 +8,423 +1606 30,878 29,979 1971 37·68 75,520 + 14,663 +24 09 38,758 36,762
(a) Veraval 1901 16,775 8,346 8,429 1911 15,563 -1,212 -723 7,831 7,732 1921 19,365 +3,802 +2443 10,146 9,219 1931 21,114 +1,749 +9 03 10,517 10,597 1941 30,275 +9,161 +43 39 15,635 14,640 1951 40,378 + 10,103 +33 37 19,828 20,550 1961 M. 3 88 46,930 +6,552 + 1623 23,873 23,057 1971 M 5 82 58,771 + 11,841 +2523 30,206 28,565
(b) Palan 1901 8,341 4,185 4,156 1911 6,867 -1,474 -1767 3,392 3,469 1921 8,427 + 1,560 +22 72 4,228 4,199 1931 9,065 +638 +7 57 4,624 4,441 1941 11,377 +2,312 +25 50 5,805 5,572 1951 12,056 +679 +5 97 6,045 6,011 1961 M. 31 86 13,927 + 1,871 + 15 52 7,005 6,922 1971 M 31 86 16,749 +2,822 +2026 8,552 8,197
50 Chandra"ur Ch:tndrapur 1901 17,803 8,842 8,961 (MAHARASHTRA) 1911 19,866 +2,063 + II 59 10,077 9,789
1921 22,981 + 3,115 + 15 68 11,539 11,442 1931 28,138 +5,157 +2244 14,394 13,744 1941 35,730 +7,592 +2698 18,291 17,439 1951 40,744 +5,014 + 1403 20,608 20,136 1961 M 28 54 51,484 + 10,740 +26 36 27,042 24,442 1971 M 28 54 75,134 +23,650 +4594 39,440 35,694
51 Hathras Ahgarh 1901 42,578 23,096 19,482 (UTTAR PRADESH) 1911 37,854 --4,724 -11 09 21,360 16,494
1921 38,763 +909 +240 22,114 16,649 1931 39,784 + 1,021 +263 22,688 17,096 1941 46,994 +7,210 + 18 12 26,108 20,886 1951 56,619 +9,625 +2048 30,863 25,756 1961 MB 8 34 64,045 +7,426 +13 12 34,375 29,670 1971 MB 8 34 74,34Q + 10,304 +1609 40,853 33,496
52 Nagallattmam urban ThanJavur 1901 57,190 26,540 30,650 agglomera tlOn (TAMIL NADU) 1911 60,168 +2,978 +521 29,995 30,173
1921 54,016 -6,152 -1022 26,321 27,695 1931 48,527 -5,489 -1016 23,143 25,184 1941 52,936 +4,409 +909 26,134 26,802 1951 57,854 +4,918 +929 27,591 30,263 1961 14 09 59,063 + 1,209 +209 29,4,6 29,637 1971 2201 74,019 + 14,956 +2532 36,405 37,614
(,,) N.gapdttmam 1901 57,190 26,540 30,650 1911 60,168 +2,978 +5 21 29,995 30,173 1921 54,016 -6,152 -1022 16,321 27,695 1931 48,527 -5,489 -1016 23143 25,384 1941 52,936 +4,409 +909 26,134 26,802 1951 57,854 +4,918 +929 27 ,591 30,263 1961 M. 14 09 59,063 +1,209 +209 29,426 29,637 1971 M. 1435 68,026 +8,963 +1518 33,428 34,598
(0) Akkarlllpeltal 1971 P. 696 4,861 2417 2,444
(c) AndanapeltOl 1971 P. 070 1,132 550 572
53 Bahralch Bahralch 1901 27,304 14,275 13,029 (UTTAR PRADESH) 1911 26,907 -397 -14<; 14,227 12,680
1921 27,371 +464 +1 72 14,716 12,655 1931 33,783 +6,412 +2343 18,617 15,166 1941 39,963 +6,180 + 1829 21,610 18,353 1951 44,741 +4,778 + II 96 24,344 20,397 1961 MB 1243 56,033 +11,292 +2524 30,425 25,608 1971 MB 12 43 73,931 + 17,898 +31 94 39,931 34,000
54 Bhlwam Hlsar 1901 35,917 18,388 17,529 (HARYANA) 1911 31,100 --4,817 -1341 16,249 14,851
1921 33,270 +2,170 +698 17,746 15,524 1931 35,866 + 2,596 +7 80 19,135 16,731 1941 43,921 + 8,055 +2246 23,581 20,340 1951 52,183 +8,262 + 18 81 27,841 24,342 1961 MC 12 95 58,194 +6,011 +1152 30,982 27,212 1971 MC 9 07 73,086 + 14,892 +2559 39,957 33,129
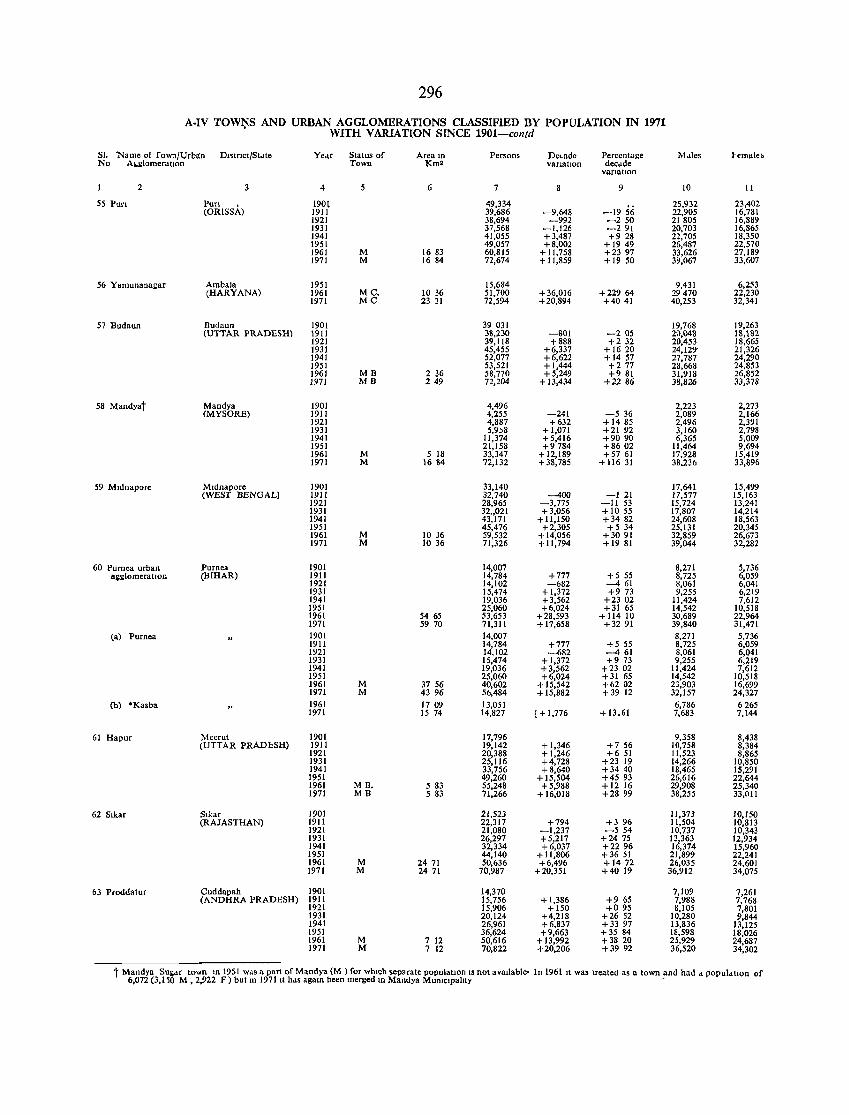
296
A-IV TOW~S AND URBAN AGGLOMERATIONS CLASSIFIED BY POPULATION IN 1971 WITH VARIATION SINCE 1901-colltd
SI. 'Name of [own/Urb<tn DJ~tnct/St"te No Alo.lIlomeratlOn
YeM Status of Town
Area III Km2
Persons Decade vanatlon
Percentage dec"de
varIatIOn
2
55 Pun
56 Yamunana~ar
57 Budaun
58 Mandyat
59 Mu.lnapore
60 Purnea urban alll:lomeratlOD
(a) Purnea
(b) *Kasba
61 Hapur
62 Slkar
63 Proddatur
3
Purl ;; (ORISSA)
Ambala (HARYANA)
Budaun (UTTAR PRADESH)
Mandya (MYSORE)
Mldnapore (WEST BENGAL)
Purnea (BIHAR)
Meerut (UTTAR PRADESH)
Slkar (RAJASTHAN)
Cuddapah (ANDHRA PRADESH)
4
1901 1911 1921 1931 1941 1951 1961 1971
1951 1961 1971
1901 1911 1921 1931 1941 1951 1961 1971
1901 1911 1921 1931 1941 1951 1961 1971
1901 1911 1921 1931 1941 1951 1961 1971
1901 1911 1921 1931 1941 1951 1961 1971 1901 1911 1921 1931 1941 1951 1961 1971 1961 1971
1901 1911 1921 1931 1941 1951 1961 1971
1901 1911 1921 1931 1941 1951 1961 1971
1901 1911 1921 1931 1941 1951 1961 1971
5
M M
MC. MC
MB MB
M M
M M
M M
MB. MD
M M
M M
6
16 83 16 84
1036 23 31
2 36 249
5 18 16 84
10 36 1036
54 65 59 70
37 56 43 96 1709 15 74
5 83 5 83
2471 2471
7 12 7 12
7
49,334 39,686 38,694 37,568 41,055 49,057 60,815 72,674
15,684 51,700 72,594
39 031 38,230 39,118 45,455 52,077 53,521 58,770 72,204
4,496 4,255 4,887 5,9~8
11,374 21,158 33,347 72,132
33,140 32,740 28,965 32,,021 43,171 45,476 59,532 71,326
14,007 14,784 14,102 15,474 19,036 25,060 53,653 71,311 14,007 14,784 14,102 15,474 19,036 25,060 40,602 56,484 13,051 14,827
17,796 19,142 20,388 25,116 33,756 49,260 55,248 71,266
21,523 22,317 21,080 26,297 32,334 44,140 50,636
70,987
14,370 15,756 15,906 20,124 26,961 36,624 50,616 70,822
-9,648 -992
-1,126 +3,487 +8,002
+ 11,758 + 11,859
+36,016 +20,894
-801 +888
+6,337 +6,622 + 1,444 +5,249
+ 13,434
-241 +632
+ 1,071 +5,416 +9784
+ 12,189 +38,785
-400 -3,775 +3,056
+ 11,150 +2,305
+ 14,056 + 11,794
+777 -682
+ 1,372 +3,562 +6,024
+28,593 + 17,658
+777 -682
+1,372 + 3,562 +6,024
+ 15,542 + 15,882
[+ 1,776
+1,346 + 1,246 +4,728 +8,640
+15,504 +5,988
+16,018
+794 -1,237 +5,217 +6,037
+ 11,806 +6,496
+20,351
+ 1,386 +150
+4,218 +6,837 +9,663
+ 13,992 +20,206
9
-1956 -250 -291 +9 28
+1949 +2397 +1950
+22964 +4041
-205 +232
+ 1620 + 1457 +277 +981
+2286
-536 +1485 +2192 +9090 +8602 +5761
+ 116 31
-121 -11 53 + 1055 +3482 +5 34
+3091 +19 81
+5 55 --461 +9 73
+2302 +31 65
+ 114 10 +3291
+5 55 --461 +9 73
+23 02 +31 65 +6202 +39 12
+ 13.61
+756 +6 51
+23 19 +3440 +45 93 +1216 +28 99
+3 96 -554
+2475 +2296 +36 51 +1472 +4019
+9 65 +095
+26 52 +3397 +35 84 +3820 +39 92
M"les
10
25,932 22,905 21805 20,703 22,705 26,487 33,626 39,067
9,431 29470 40,253
19,768 20,048 20,453 24,129-27,787 28,668 31,918 38,826
2,223 2,089 2,496 3,160 6,365
11,464 17,928 38.236
17,641 17,577 15,724 17,807 24,608 25,131 32,859 39,044
8,271 8,725 8,061 9,255
11,424 14,542 30,689 39,840 8,271 8,725 8,061 9,255
11,424 14,542 23,903 32,157 6,786 7,683
9,358 10,758 11,523 14,266 18,465 26,616 29,908 38,255
11,373 11,504 10,737 13,363 16,374 21,899 26,035 36,912
7,109 7,988 8,105
10,280 13,836 18,598 25,929 36,520
II
23,402 16,781 16,889 16,865 18,350 22,570 27,189 33,607
6,253 22,230 32,341
19,263 18,182 18,665 21,326 24,290 24,853 26,852 33,378
2,273 2,166 2,391 2,798 5,009 9,694
15,419 33,896
15,499 15,163 13,241 14,214 18,563 20,345 26,673 32,282
5,736 6,059 6,041 6,219 7,612
10,518 22,964 31,471 5,736 6,059 6,041 6,219 7,612
10,518 16,699 24,327 6265 7,144
8,438 8,384 8,865
10,850 15,291 22,644 25,340 33,011
10,150 10,813 10,343 12,934 15,960 22,241 24,601 34,075
7,261 7,768 7,801 9,844
13,125 18,026 24,687 34,302
t Mandya SU1l"T town 10 1951 w"s a part of Mandya (M) for whIch separate population IS not avallable· In 1961 It was treated as a town and had d populdtlon of 6,072 (3,1 'i0 M, 2,922 F) but III 1971 It hds agam been merged 1O Mandya MUlllclpahty -
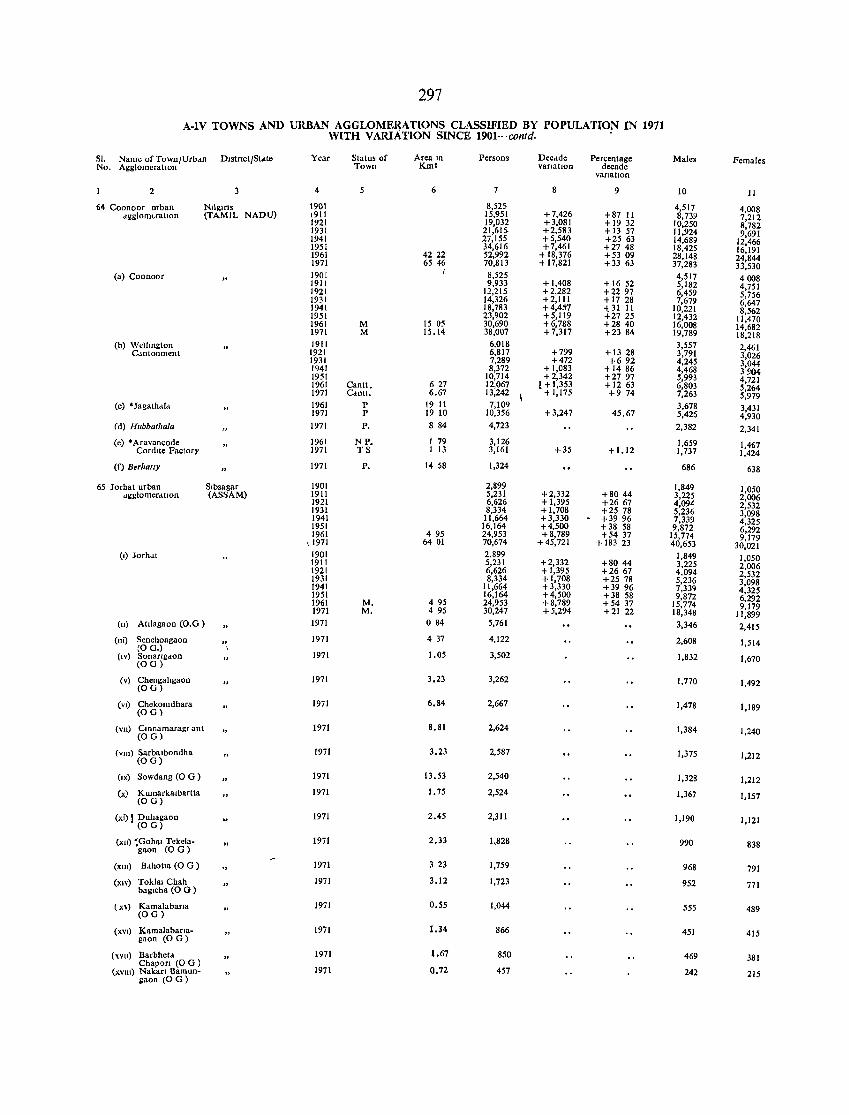
297
A-IV TOWNS AND URBAN AGGLOME~ATIONS CLASSIFIED BY POPULATION IN 1971 WITH V ARIATlON SINCE 1901-contd.
SI. Name of Town/Urban DlstrIct/St,He Year Statns of Area 111 Persons Decadc Percentage Males Females No. Agglomerallon Town Km2 vanatlon decade
vanatlon
2 4 6 8 9 10 II
64 Coonoor orban NIIglflS 1901 8,525 4,517 4,008 dg!llom~catIon (TAMIL NADU) 1911 15,951 + 7,426 +87 II 8,739 7,212
1921 19,032 +3,081 + 19 32 10,250 8,782 1931 21,615- +2,583 + 13 57 11,924 9,691 1941 27,155 +5,540 +25 63 14,689 12,466 1951 34,616 +7,461 +27 48 18,425 16,191 1961 4222 52,992 + 18,376 +53 09 28,148 24,844 1971 65 46 70,813 +17,821 +33 63 37,283 33,530
(a) Coonoor 1901 8,525 4,517 4008 1911 9,933 + 1,408 + 1652 5,182 4,751 1921 12,215 +2,282 +2297 6,459 5,756 1931 14,326 +2,111 + 1728 7,679 6,647 1941 18,783 +4,4Y7 *31 11 10,221 8,562 1951 23,902 + 5,119 +2725 12,432 11,470 1961 M 15 05 30,690 +6,788 +2840 16,008 14,682 1971 M 15.14 38,007 +7,317 +23 84 19,789 18,218
(b) WellIngton 1911 6,018 3,557 2,461 Cantonment 1921 6,817 +799 + 13 28 3,791 3,026 1931 7,289 +472 +692 4,245 3,044 1941 8,372 + 1,083 +1486 4,468 3904 1951 10,714 + 2,342 +2797 5,993 4,721 1961 Cantt. 627 12,067 [ + 1,353 + 1263 6,803 5,264 1971 Cantt. 6.67 13,242 +1,175 +974 7,263 5,979
(c) *Jagalh,dd 1961 P 19 11 7,109 3,678 3,431 1971 P 19 10 10,356 +3,247 45.67 5,426 4,930
(d) Hubbathala 1971 P. 8 84 4,723 2,382 2,341
(e) * Aravaneode 1961 NP. 1 79 3,126 1,659 1,467 CordIte Factory 1971 TS 1 13 3,161 +35 +1.12 1,737 1,424
(f) Berhatly 1971 P. 14 58 1,324 686 638
65 Jochat urban Slbsagar 1901 2,899 1,849 1,050 dggiomerdtJOll (ASSAM) 1911 5,231 +2,332 +8044 3,225 2,006 1921 6,626 + 1,395 +2667 4,094 2,532 1931 8,334 + 1,708 +25 78 5,236 3,098 1941 11,664 +3,330 - +3996 7,339 4,325 1951 16,164 +4,500 +38 58 9,872 6,292 1961 495 24,953 +8,789 +5437 15,774 9,179 11971 6401 70,674 +45,721 + 183 23 40,653 30,021
(,) Jorhal 1901 2,899 1,849 1,050 1911 5,231 +2,332 +8044 3,225 2,006 1921 6,626 + 1,395 +2667 4,094 2,532 1931 8,334 +1,708 +25 78 5,236 3,098 1941 11,664 +3,330 +3996 7,339 4,325 1951 16,164 +4,500 +38 58 9,872 6,292 1961 M. 4 95 24,953 +8,789 +54 37 15,774 9,179 1971 M. 4 95 30,247 +5,294 +21 22 18,348 11,899 (11) Atllagaon (O.G ) 1971 o 84 5,761 3,346 2,415
(ui) Senchoagaon .. 1971 4 37 4,122 2,608 1,514 (0 G.) \
(IV) Sonarlgdoll 1971 1.05 3,502 1,832 1,670 (0 G)
(v) Chengahgaon (OG)
1971 3.23 3,262 1,770 1,492
(VI) Chekomdhara (OG)
1971 6.84 2,667 1,478 1,189
(vu) Clnnamaragr ant 1971 8.81 2,624 1,384 1,240 (0 G)
(Vlll) Sarbalbondha 1971 3.23 2,587 1,375 1,212 (0 G)
('x) Sowdang (0 G ) 1971 13.53 2,540 1,328 1,212
(x) Kumarkalbartta 1971 1. 75 2,524 1,367 1,157 (0 GJ
(xi) ! Duhagaon 1971 2.45 2,311 1,190 1,121 (0 G)
(XII) :Gohal Tekela- 1971 2.33 gaon (0 G)
1,828 990 838
(Xlll) Bdhotla (0 G ) 1971 3 23 1,759 968 791
(XIV) Toklal Chah 1971 baglcha (0 G )
3.12 1,723 952 771
( xv) Kamalabatla (0 G)
1971 0.55 1,044 555 489
(XVI) Kamalabatla- 1971 gaon (0 G)
1.34 866 451 415
(XVll) Barbhet .. 1971 1.67 850 469 381 Chapotl (0 GJ
(XVlll) Nakan Bamun- 1971 0.72 457 242 215 gaon (0 G)
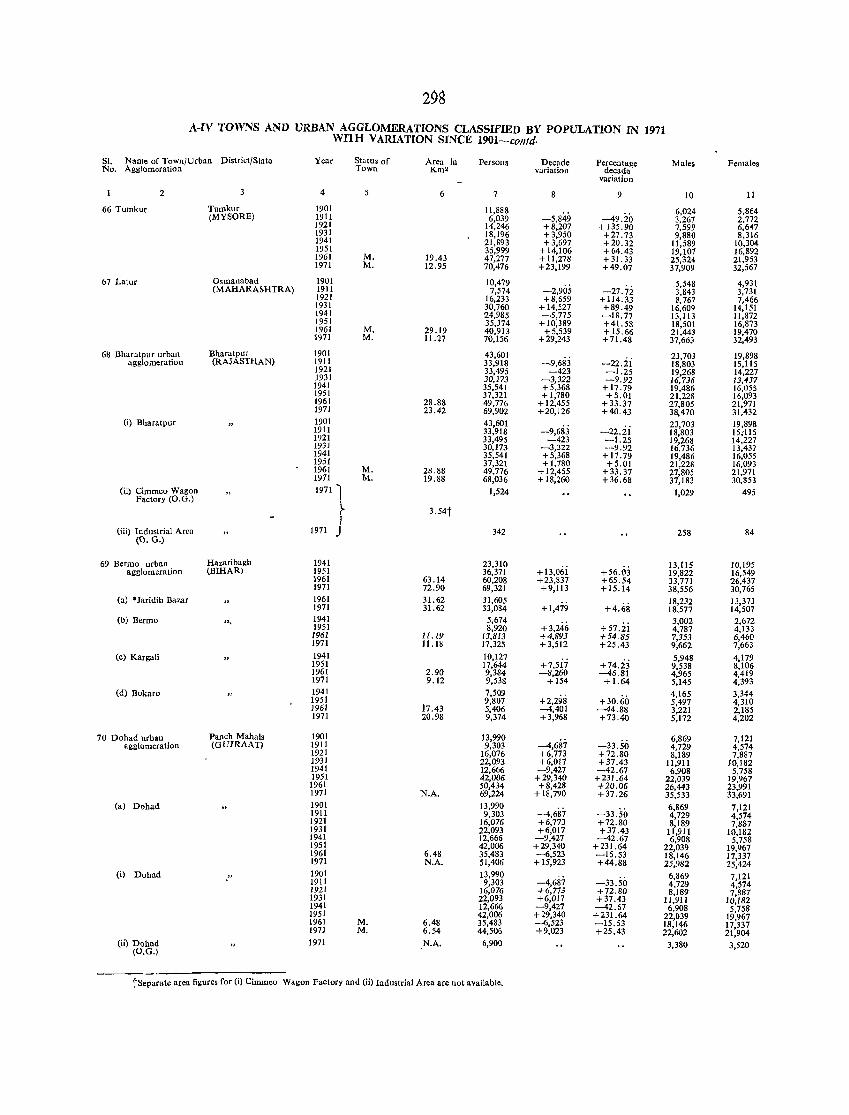
298 A-IV TOWNS AND URBAN AGGLOMERATIONS CLASSIFIED BY POPULATION IN 1971
WIlH VARIATION SINCE 1901-collld.
!:!l. Name of TownjUrban DistrictjState Year Status of Area in Persons Decade Percentage Males Females No. Agglomeration Town Km2 variation decade
variation
2 4 6 7 8 9 10 11
66 Tumkur TU01kur 1901 11,888 6,024 5,864 (MYSORE) 1911 6,039 -5.849 -49.20 3,267 2,772
1921 14,246 +8,207 + 135.90 7,599 6,647 1931 18,196 + 3,950 +27.73 9,880 8,316 1941 21,893 +3,697 +20.32 11,589 10,304 1951 35,999 + 14,106 +64.43 19,107 16,892 1961 M. 19.43 47,277 + 1l,278 + 31.33 25,324 21,953 1971 M. 12.95 70,476 +23,199 +49.07 37,909 32,567
67 Latur Osmanabad 1901 10,479 -2,905 -27.72
5,548 4,931 (MAHARASHTRA) 1911 7,574 3,843 3,731
1921 16,233 +8,659 +114.33 8,767 7,466 1931 30,760 + 14,527 +89.49 16,609 14,151 1941 24,985 -5,775 -18.77 13,113 11,872 1951 35,374 + 10,389 +41.58 18,501 16,873 1961 M. 29.19 40,913 +5,539 + 15.66 21,443 19,470 1911 M. 11.27 70,156 +29,243 +71.48 37,663 32,493
68 Bharatpur urban Bharatpur 1901 43,601 -9,683 -22.ii
23,703 19,898 agglomeration (RAJASTllAN) 1911 33,918 18,803 15,115
1921 33,495 -423 -1.25 19,268 14,227 1931 30,173 -3,322 -9.92 16,736 13,437 1941 35,541 + 5,368 + 17.79 19,486 16,055 1951 37,321 + 1,780 +5.01 21,228 16,093 1961 28.88 49,776 +12,455 +33.37 27,805 21,971 1971 23.42 69,902 +20,126 +40.43 38,470 31,432
(i) Bbaratpur 1901 43,601 -9,683 -22.ii 23,703 19,898
1911 33,918 18,803 15;115 1921 33,495 -423 -1.25 19,268 14,227 1931 30,173 -3,322 -9.92 16,736 13,437 1941 35,541 +5,368 + 17.79 19,486 16,055 1951 37,321 +1,780 +5.01 21,228 16,093 1961 M. 28.88 49,776 + 12,455 +33.37 27,805 21,971 1971 M. 19.88 68,036 + 18,260 +36.68 37,183 30,853
(U) Cimmco Wagon 1971 1 1,524 1,029 495 Factory (O.G.)
~ 3.54t f
(iii) Industrial Area 1971 J (0. G.)
342 258 84
69 Bermo urban Hazaribagh 1941 23,310 +13,06i +56.03
13,115 10,195 agglomeration (BIHAR) 1951 36,371 19,822 16,549
1961 63.14 60,208 +23,837 +65.54 33,771 26,437 1971 72.90 69,321 +9,113 +15.14 38,556 30,765
(a) *Jaridih Bazar 1961 31.62 31,605 + 1,479 +4.68
18,232 13,373 1971 31.62 33,084 18,577 14,507
(b) Bermo ". 1941 5,674 +3,246 + 57 .ii 3,002 2,672
1951 8,920 4,787 4,133 1961 11.19 13,813 +4,893 +54.85 7,353 6,460 1971 11.18 17,325 +3,512 +25.43 9,662 7,663
(c) Kargali 1941 10,127 +74.23
5,948 4,179 1951 17,644 +7,517 9,538 8,106 1961 2.90 9,384 --8,260 --46.81 4,965 4,419 1971 9.12 9,538 +154 + 1.64 5,145 4,393
(d) Bokaro 1941 7,509 +2,298 +30.60
4,165 3,344 1951 9,807 5,497 4,310 1961 17.43 5,406 -4,401 -44.88 3,221 2,185 1971 20.98 9,374 +3,968 +73.40 5,172 4,202
70 Dohad urban Pancb Mahals 1901 13,990 -4,687 -33.50
6,869 7,121 agglomeration (GUIRAAT) 1911 9,303 4,729 4,574
1921 16,076 +6,773 +72.80 8,189 7,887 1931 22,093 +6,017 +37.43 11,911 10,182 1941 12,666 -9,427 -42.67 6,908 5,758 1951 42,006 +29,340 +231.64 22,039 19,967 1961 50,434 +8,428 +20.06 26,443 23,991 1971 N.A. 69,224 + 18,790 +37.26 35,533 33,691
(a) Dohad 1901 13,990 -33.50
6,869 7,121 1911 9,303 -4,687 4,729 4,574 1921 16,076 +6,773 +72.80 8,189 7,887 1931 22,093 +6,017 +37.43 JI,911 10,182 1941 12,665 -9,427 --42.67 6,908 5,758 1951 42,006 +29,340 +231.64 22,039 19,967 1961 6.48 35,483 -6,523 -15.53 18,146 17,337 1971 N.A. 51,406 + 15,923 +44.88 25,982 25,424
(i) Dohad " 1901 13,990
-4,687 -33.50 6,869 7,121
1911 9,303 4,729 4,574 1921 16,076 +6,773 +72.80 8,189 7,887 1931 22,093 +6,017 +37.43 11,911 10,182 1941 12,666 -9,427 -42.67 6,908 5,758 1951 42,006 +29,340 +231.64 22,039 19,967 1961 M. 6.48 35,483 -6,523 -15.53 18,146 17,337 1971 M. 6.54 44,506 +9,023 +25.43 22,602 21,904
(ii) Dohad 1971 N.A. (O.G.)
6,900 3,380 3,520
tSeparate area figures for (i) Cimmco Wagon Factory and (ii) Industrial Area are not available.
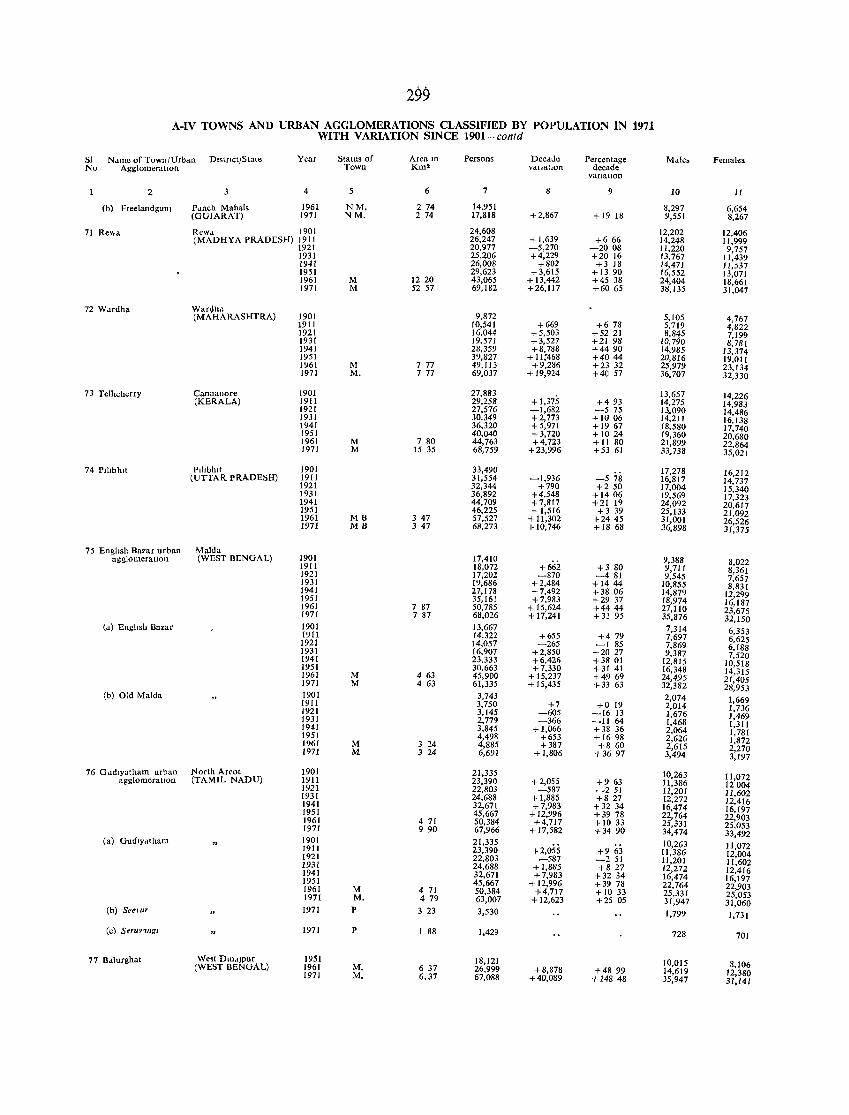
299 A-IV TOWNS AND URBAl~ AGGLOMERATIONS CLASSIFIED BY POPULATION IN 1971
WITH V ARlATION SINCE 1901-conld
SI Name of Town/Urban DlstnctjState Year Status of Area lU Persons Decade Percentage Mule. Females No AgglomeratIOn Town Km2 VdfJatlOn decade
varlaLIon
2 4 5 6 7 8 9 10 11
(b) FreelandgunJ Punch Mahals 1961 NM. 2 74 14,951 8,297 6,654 (GUJARAT) 1971 NM, 274 17,818 +2,867 + 19 18 9,551 8,267
71 Rev. a Rewd 1901 24,608 12,202 12,406 (MADHYA PRADI:SH) 1911 26,247 + 1,639 +666 14,248 11,999
1921 20,977 -5,270 -2008 11,220 9,757 1931 25,206 +4,229 +20 16 13,767 11,439 1941 26,008 +802 +318 14,471 11,537 1951 29,623 +3,615 + 13 90 16,552 13,071 1961 M 1220 43,065 + 13,442 +45 38 24,404 18,661 1971 M 52 57 69,182 +26,117 +60 65 38,135 31,047
72 W .. rdha Warllhd 9,872 5,105 (MAHARASHTRA) 1901 4,767
1911 10,541 +669 +678 5,719 4,822 1921 16,044 +5,503 +5221 8,845 7,199 1931 19,571 +3,527 +21 98 10,790 8,781 1941 28,359 +8,788 +4490 14,985 13,374 1951 39,827 + 1l~468 +4044 20,816 19,OIJ 1961 M 7 77 49,113 +9,286 +23 32 25,979 23,134 1971 M, 7 77 69,037 + 19,924 +40 57 36,707 32,330
73 Telhcherry Cannanore 1901 27,883 + 1,375
13,657 14,226 (KERALA) 1911 29,258 +493 14,275 14,983 1921 27,576 -1,682 -575 13~090 14,486
1931 30,349 +2,773 +1006 14,211 16,138 1941 36,320 +5,971 +1967 18,580 17,740 1951 40,040 +3,720 +1024 19,360 20,680 1961 M 7 80 44,763 +4,723 +11 80 21,899 22,864 1971 M 15 35 68,759 +23,996 +53 61 33,738 35,021
74 Plllbhlt Plltblu' 1901 33,490 17,278 16,212 (UTTAR PRADESI;l) 1911 31,554 -1,936 -578 16,817 14,737 1921 32,344 +790 +250 17,004 15,340 1931 36,892 +4,548 +1406 19,569 17,323 1941 44,709 +7,817 +21 19 24,092 20,617 1951 46,225 +1,516 +3 39 25,133 21,092 1961 MB 3 47 57,527 +11,302 +2445 31,001 26,526 1971 MB 347 68,273 + 10,746 +18 68 36,898 31,375
75 Engltsh Banr urban MaIda agglomeratton (WEST BENGAL) 1901 17,410 9,388 8,022 1911 18,072 +662 +3 80 9,711 8,361 1921 17,202 -870 -481 9,545 7,657 1931 19,686 +2,484 +1444 10,855 8,831 1941 27,178 +7,492 +38 06 14,879 12,299 1951 35,161 +7,983 +29 37 18,974 16,187 1961 7 87 50,785 + 15,624 +4444 27,110 23,675 1971 7 87 68,026 +17,241 +33 95 35,876 32,150
(d) Engltsh Bazar 1901 13,667 7,314 6,353 1911 14,322 +655 +479 7,697 6,625 1921 14,057 -265 -185 7,869 6,188 1931 16,907 +2,850 +2027 9,387 7,520 1941 23,333 +6,426 +38 01 12,815 10,518 1951 30,663 +7,330 +31 41 16,348 14,315 1961 M 4 63 45,900 + 15,237 +4969 24,495 21,405 1971 M 4 63 61,335 + 15,435 +33 63 32,382 28,953 (b) Old MaIda 1901 3,743 2,074 1,669 1911 3,750 +7 +0 19 2,014 1,736 1921 3,145 -605 -1613 1,676 1,469 1931 2,779 -366 -1164 1,468 1,311 1941 3,845 +1,066 +38 36 2,064 1,781 1951 4,498 +653 +1698 2,626 1,872 1961 M 3 24 4,885 +387 +8 60 2,615 2,270 1971 M 3 24 6,691 +1,806 +3697 3,494 3,191
76 Gudlyatham urban North Areot 1901 21,335 10,263 11,072 agglomeratIon (TAMIL NADU) 1911 23,390 +2,055 +963 11,386 12004 1921 22,80J -587 -251 11,201 11,602 1931 24,688 + 1,885 +827 12,272 12,416 1941 32,671 +7,983 +32 34 16,474 16,197 1951 45,667 + 12,996 +39 78 22,764 22,903 1961 4 71 50,384 +4,717 + 10 33 25,331 25,053 1911 9 90 67,966 + 17,582 +3490 34,414 33,492 (a) GUdlYdtham 1901 21,335
+2,055 10,263 11,072 1911 23,390 +9 63 11,386 12,004 1921 22,803 -587 -251 11,201 11,602 1931 24,688 + 1,885 +827 12,272 12,416 1941 32,671 +7,983 +32 34 16,474 16,197 1951 45,667 + 12,996 +39 78 22,764 22,903 1961 M 4 71 50,384 +4,717 + 10 33 25,331 25,053 1971 M, 4 79 63,007 + 12,623 +25 05 31,947 31,060
(b) SeelUr 1971 P 3 23 3,530 1,799 1,731
(c) SuuV'"gl 1971 P I 88 1,429 728 701
77 Bdlurghat West Dm.IJPur 1951 18,121 10,015 8,106 (WEST BENGAL) 1961 M. 6 37 26,999 +8,878 +48 99 14,619 12,380 1971 M. 6.37 67,088 +40,089 +14848 35,947 31,141
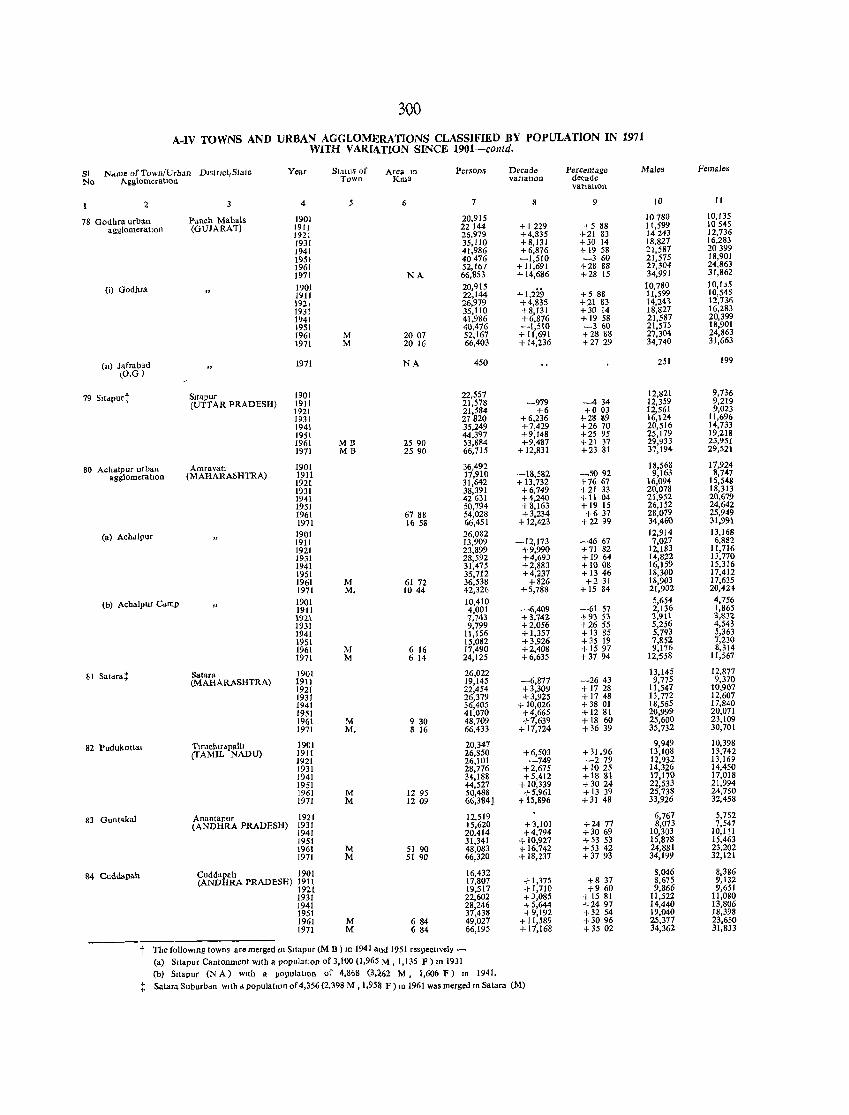
300
A-IV TOWNS AND URBAN AGGLOMERATIONS CLASSIFIED BY POPULATION IN 1971 WITH VARIATION SINCE 1901-contd.
SI N .. Ule of Town/Urban DlslIlct,State Year Status of Area in Persons Decade Percentage Males Females
No AgglomeratIon Town Km2 varJatlon decade vat'latlon
2 4 6 7 8 9 JO 11
78 Godhra urban Panch Mahals 1901 20,9J5 10780 IO,J35
agglomeratIon (GUJARAT) 1911 22144 + 1229 +5 88 11,599 10545 1921 26,979 +4,835 +21 83 14243 12,736 J931 35,110 +8,131 +30 14 J8,827 16,283 1941 41,986 +6,876 + 19 58 21,,87 20399 1951 40476 -1,510 -360 21,575 18,901 1961 52,167 +11,691 +28 88 27.304 24,863 1971 NA 66,853 + 14,686 +28 15 34,991 31,862
(i) Godhra 1901 20,915 +1,229
10,780 10,US 1911 22,144 +5 88 11,599 10,545 Inl 26,979 +4,835 +21 &3 14,24> 12,136 1931 35,110 +8,131 +30 14 18,827 16,283 1941 41,986 +6,876 + 19 58 21,587 20,399 1951 40,476 -1,510 -360 21,575 18,901 1961 M 2007 52,167 +11,691 +2888 27,304 24,863 1971 M 20 16 66,403 + 14,236 +2729 34,740 31,663
(II) Jafrabad 1971 Nil. 450 251 199
(O.G)
79 Sltdpurt Sltapur 1901 22,557 12,821 9,736 (UTTAR PRADESH) 1911 21,578 -979 ---4 34 12,359 9,219
1921 21,584 +6 +003 12,561 9,023 1931 27820 +6,236 +28 89 16,124 11,696 1941 35,249 +7,429 +2670 20,516 14,733 1951 44,397 +9,148 +2595 25,179 19,218 1961 MB 2590 53,884 +9,487 +21 37 29,933 23,951 1971 MB 2590 66,715 + 12,831 +23 81 37,194 29,521
80 Achalpur urban Amravatl 1901 36,492 18,568 17,924
agglomeratIOn (MAHARA~HTRA) 1911 17,910 -18,582 -5092 9,163 8,747 1921 31,642 + 13,732 +7667 16,094 15,548 1931 38,391 +6,749 +21 33 20,078 18,313 1941 42631 +4,240 +11 04 21,952 20,619 1951 50,794 +8,163 + 19 15 26,152 24,642 1961 6788 54,028 +3,234 +6 37 28,079 25,949 1971 16 53 66,451 + 12,423 +2299 34,.1,60 31,991
Ca) Achdlpllr 1901 26,082 12,914 13,168 1911 13,909 -12,173 -4667 7,027 6,882 1921 23,899 +9,990 +71 82 12,183 11,716 1931 28,592 +4,693 + 1964 14,822 13,770 1941 31,475 +2,883 + 1008 16,159 15,316 1951 35,712 +4,237 + 13 46 18,300 17,412 1961 M 61 72 36,538 +826 +2 31 18,903 17,635 1971 M. 1044 42,326 +5,788 + 15 84 21,902 20,.424
(b) Achalpur Camp 1901 10,410 5,654 4,756 1911 4,001 -6,409 -61 57 2,136 1,865 \921 7,743 + 3,742 +93 S3 3,9!l 3,832 1931 9,799 +2,05tJ +2655 5,256 4,543 1941 11,156 +1,357 + 13 85 5,793 5,363 1951 15,082 +3,926 +35 19 7,852 7,230 1961 M 6 16 17,490 +2,408 + 1597 9,176 8,314 1971 M 6 14 24,125 +6,635 +3794 12,558 11,567
81 Safdra+ Satara 1901 26,022 13,145 12,877 (MAHARASHTRA) 1911 19,145 -6,877 -2643 9,775 9,370
1921 22,454 +3,309 + 1728 11,547 10,907 1931 26,379 +3,925 +1748 13,772 12,607 1941 36,405 + 10,026 +38 01 18,565 17,840 1951 41,070 +4,665 +1281 20,999 20,071 1961 M 930 48,709 +7,639 +18 60 25,600 23,109 1971 M. 8 16 66,433 + 17,724 +36 39 35,732 30,701
82 Pudukottal T,ruchlrapalh 1901 20,347 9,949 10,398 (TAMIL NADU) 1911 26,850 +6,503 +31.96 13,108 13,742
1921 26,101 -749 -279 12,932 13,169 1931 28,776 +2,675 +1025 14,326 14,450 1941 34,188 +5,412 +1881 17,170 17,018 1951 44,527 + 10,339 +3024 22,533 21,994 1961 M 1295 50,488 +5,961 + 13 39 25,738 24,750 1971 M 1209 66,384J + 15,896 +31 48 33,926 32,458
83 Guntakal Ananfapur 1921 12,519 6,767 5,752 (ANDHRA PRADESH) 1931 15,620 +3,101 +2477 8,073 7,547
1941 20,414 +4,794 +3069 10,303 10,111 1951 31,341 + 10,927 +53 53 15,878 15,463 1961 M 51 90 48,083 + 16,742 +5342 24,881 23,202 1971 M 51 90 66,320 + 18.237 +3793 34,199 32,121
84 Cuddapah Cuddapeh 1901 16,432 8,046 8,386 (ANDIIRA PRADESH) 1911 17,807 +1,375 +8 37 8,675 9,132
1921 19,517 +1,710 +960 9,866 9,651 1931 22,602 +3,085 +1581 11,522 11,080 1941 28,246 +5,644 +2497 14,440 13,806 1951 37,438 +9,192 +32 54 19,040 18,398 1961 M 6 84 49,027 + 11,589 +3096 25,371 23,650 1971 M 6&4 66,195 + 17,168 +3502 34,362 31,833
t The foUowtOg towns are merged to Sltapur (M B ) In 1941 and 1951 respectIvely -
Ca) Sltapur Cantonment WIth a populatlOn of 3,100 (1,965 M, 1,135 F) III 1931
(b) Sltapur (N A) wllh a populatIOn of 4,868 C3,~62 M, 1,606 F) In 1941.
t Satara Suburbdn with d populatIOn of 4,356 (2,398 M , 1,95~ F) In 1961 was merged tn Salara (M)
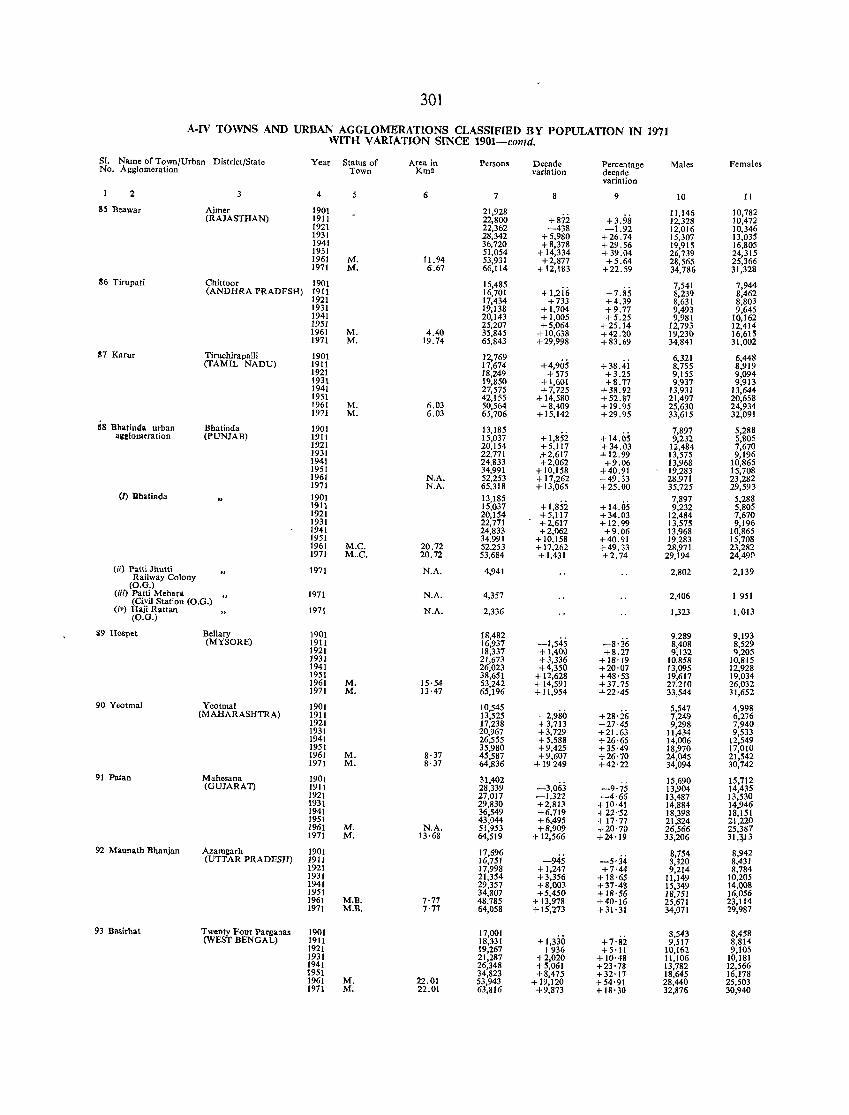
301
A-IV TOWNS AND URBAN AGGLOMERATlONS CLASSIFrED BY POPULATION IN 1971 WITH VARIATION SINCE 1901-contd.
51. Name of Town/Urban District/State Year Status of Area in Persons Decade Percentage Males Females No. Agglomeration Town Km' variation decade
variation
2 4 5 6 7 9 10 II
85 Beawar Ajmer 1901 21,928 +87i +3.98
11,146 10,782 (RAJASTHAN) 1911 22.800 12.328 10.472
1921 22.362 -438 -1.92 12,016 10.346 1931 28.342 +5,980 +26.74 15,307 13.035 1941 36.720 +8.378 +29.56 19,915 16,805 1951 51,054 + 14.334 + 39.04 26,739 24.315 1961 M. 11.94 53.931 +2,877 +5.64 28,565 25,366 1971 M. 6.67 66,114 +12.183 +22.59 34,786 31.328
86 Tirupati Chittoor 1901 15,485 +I,2i6
7,541 7,944 (ANDHRA PRADESH) 1911 16,701 +7.85 8.239 8,462
1921 17.434 +733 +4.39 8,631 8,803 1931 19,138 +1,704 +9.77 9,493 9,645 1941 20,143 +1,005 +5.25 9,981 10,162 1951 25,207 +5,064 +25.14 12.793 12,414 1961 M. 4.40 35,845 +10,638 +42.20 19,230 16.615 1971 M. 19.74 65,843 +29,998 +83.69 34,841 31,002
87 Karur Tiruchirapalli 1901 12.769 +4,905 +38.4i
6.321 6.448 (TAMIL NADU) 1911 17,674 8.755 8,919
1921 18,249 +575 +3.25 9,155 9,094 1931 19,850 +1,601 +8.77 9,937 9,913 1941 27,575 +7,725 +38.92 13,931 13.644 1951 42,155 .r 14.580 +52.87 21.497 20.658 1961 M. 6.03 50.564 +8,409 + 19.95 25,630 24.934 1971 M. 6.03 65.706 + 15.142 +29.95 33,615 32,091
88 Bbatinda urban Bhatinda 1901 13,185 + \,852 + 14.05
7.897 5.288 al:clomerlltion (pUNJAB) 1911 15.037 9.232 5,805
1921 20,154 +5,117 +34.03 12,484 7.670 1931 22,771 .+2,617 +12.99 13.575 9.196 194\ 24,833 +2,062 +9.06 13.968 10.865 1951 34,991 +10,158 +40.91 19,283 15,708 1961 N.A. 52,253 + 17.262 +49.33 28,971 23,282 1971 N.A. 65,318 + 13,065 +25.00 35,725 29.593
(1) Bhatinda 1901 13,185 + 1,852 + 14.05
7,897 5,288 1911 15,037 9,232 5,805 1921 20,154 +5.117 +34.03 12,484 7.670 1931 22,771 +2,617 +12.99 13,575 9.196 1941 24,833 +2,062 +9.06 13,968 10,865 1951 34,991 + 10,158 +40.91 19,283 15,708 1961 M.C. 20.72 52,253 + 17.262 +49.33 28,971 23,282 1971 M .. C. 20.72 53,684 +1,431 +2.74 29,194 24.490
(ii) Patti Jhutt; 1971 N.A. 4,941 2,802 2,139 Railway Colony
(O.G.) 1951 (iii) Patti Mehara 1971 N.A. 4,357 2.406 (Civil Station (O.G.)
1.323 1,013 (iv) Haji Rattan 1971 N.A. 2,336 (O.G.)
&9 Hospet Bellary 1901 18,482 -1.545 -8·36
9,289 9.193 (MYSORE) 1911 16.937 8,408 8.529
1921 18,337 + 1,400 +8.21 9.132 9,205 1931 21,673 +3,336 +18'19 10,858 10,815 1941 26,023 +4,350 +20·07 13,095 12,928 1951 38,651 + 12.628 +48'53 19,617 19,034 1961 M. 15·54 53,242 + 14,591 +37.75 27.210 26,032 1971 M. 13·47 65.196 +11.954 +22·45 33,544 31.652
90 Yeotmal Yeotmal 1901 10,545 +2,980 +28·26
5.547 4.998 (MAHARASHTRA) 1911 13.525 7,249 6,276
1921 17,238 +3,713 +27·45 9,298 7.940 1931 20.967 +3,729 +21.63 1l.434 9,533 1941 26.555 +5,588 +26·65 14,006 12.549 1951 35.980 +9,425 +35·49 18,970 17.010 1961 M. 8·37 45.587 +9,607 +26·70 24,045 21.542 1971 M. 8·37 64.836 + 19 249 +42'22 34,094 30,742
91 Patan Mahesana 1901 31.402 -3,063 -9'75
15,690 15,712 (GUJARA'l) 1911 28,339 13,904 14.435
1921 27,017 -1,322 -4·66 13.487 13,530 1931 29,830 +2,8lJ +10·41 14,884 14.946 1941 36,549 +6,719 +22"52 18,398 18,151 1951 43,044 +6,495 + 11'17 21,824 21.220 1961 M. N.A. 51.953 +8.909 +20'70 26.566 25.387 1971 M. 13·68 64.519 + 12.566 +24'19 33.206 31,:}l3
92 Maunath Bhanjan Azamgarh 1901 17,696 -945 -5'34
8.754 8.942 (UTTAR PRADESH) 1911 16.751 8,320 8,431
1921 17.998 +1.247 +7·44 9,214 8.784 1931 21,354 +3.356 +18·65 11,149 10,205 1941 29.357 +8,003 +37'48 15,349 14,Q08 1951 34.807 +5,450 +18'56 18.751 16,056 1961 M.B. 7·77 48.785 + 13,978 +40'16 25.671 23.114 1971 M.B. 7·77 64.058 + 15,273 +31·31 34.071 29.987
93 Basirbat Twenty Four Parllanas 1901 17,001 +1,330 +7·si
8.543 8.458 (WEST BENGAL) 1911 18,331 9,517 8,814
1921 19,267 +936 +5'1! 10.162 9,105 1931 21.287 +2,020 + 10·48 11,106 10,181 1941 26.348 +5.061 +23'78 13.782 12.566 1951 34,823 +8.475 +32'17 18.645 16.178 1961 M. 22.01 53,943 +19.120 +54·91 28.440 25.503 1971 M. 22.01 63,816 +9,873 +18'30 32,876 30.940
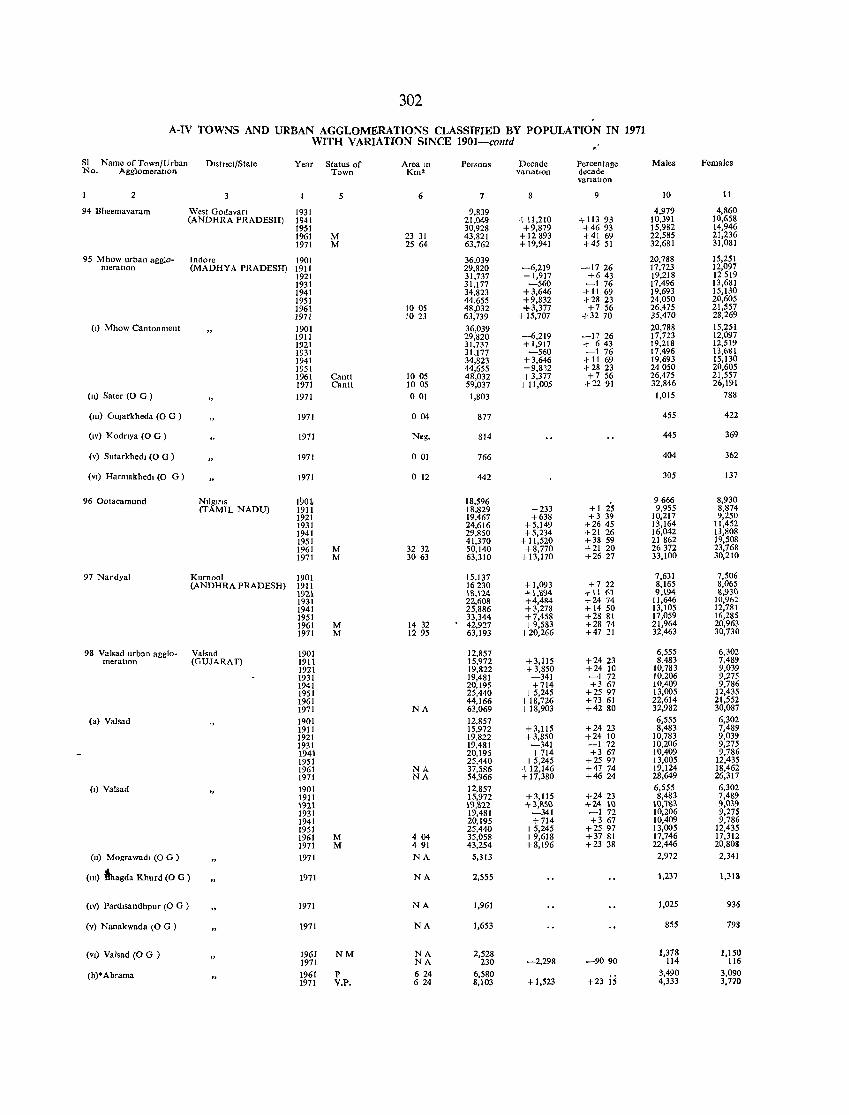
302
A-IV TOWNS AND URBAN AGGLOMERATIONS CLASSIFIED BY POPULATlON IN 1971 WITH VARIATION SINCE 1901-contd
~
SI Name of Town/Urban DlStrtct/State Year Status of Area In Persons Decade Percentage Males Females No. AgglomeratIOn Town Km' vanatlon decade
vanatIOn
2 4 5 6 7 8 9 10 11
94 Bheemavaram West Godavart 1931 9,839 4,979 4,860 (ANDHRA PRADESH) 1941 21,049 +11,210 + 113 93 10,391 10,658
1951 30,928 +9,879 +4693 15,982 14,946 1961 M 23 31 43,821 + 12 893 +41 69 22,585 21,236 1971 M 25 64 63,762 +19,941 +45 51 32,681 31,081
95 Mhow urban agglo- Indore 1901 36,039 20,788 15,251 meratlOn (MADHYA PRADESH) 1911 29,820 -6,219 -1726 17,723 12,097
1921 31,737 +1,917 +643 19,218 12519 1931 31,177 -560 -176 17,496 13,681 1941 34,823 + 3,646 + 11 69 19,693 15,130 1951 44,655 +9,832 +28 23 24,050 20,605 1961 10 05 48,032 +3,377 +7 56 26,475 21,557 1971 1023 63,739 + 15,707 +32 70 35,470 28,269
(I) Mhow Cantonment 1901 36,039 20,788 15,251 1911 29,820 -6,219 -17 26 17,723 12,097 1921 31,737 + 1,917 + 643 19,218 12,519 1931 31,177 -560 -176 17,496 13,681 1941 34,823 +3,646 + 11 69 19,693 15,130 1951 44,655 +9,812 +28 23 24050 20,605 1961 Cantt 1005 48,032 +3,377 +7 56 26,475 21,557 1971 Cantt 1005 59,037 +11,005 +2291 32,846 26,191
(II) Sater (0 G ) 1971 001 1,803 1,015 788
(III) OUJarkheda (0 G) 1971 004 877 455 422
(IV) Kodnya (0 G) 1971 Neg. 814 445 369
(v) Sutarkhedl (0 G ) 1971 001 766 404 362
(VI) Hnrmakhedl (0 0) 1971 o 12 442 305 137
96 Ootacamund Nllglrts 11)0. 18,596 +1 i5
9666 8,930 (TAMIL NADU) 1911 18,829 +233 9,955 8,874
1921 19,467 +638 +3 39 10,217 9,250 1931 24,616 +5,149 +2645 13,164 11,452 1941 29,850 +5,234 +21 26 16,042 13,808 1951 41,370 + 11,520 +38 59 21862 19,508 1961 M 32 32 50,140 +8,770 +21 20 26372 23,768 1971 M 30 63 63,310 + 13,170 +2627 33,100 30,210
97 Nandyal Kumool 1901 15,137 7,631 7,506 (ANDHRA PRADESH) 1911 16230 + 1,093 +7 22 8,165 8,065
192\ \\1,124 +1,894 +1\ 61 9,194 &,9:'Q 1931 22,608 +4,484 +2474 11,646 10,962 1941 25,886 +3,278 + 14 50 13,105 12,781 1951 33,344 + 7,458 +28 81 17,059 16,285 1961 M 14 32 42,927 +9,583 +28 74 21,964 20,963 1971 M 1295 63,193 +20,266 +4721 32,463 30,730
98 Valsad urban agglo- Valsad 1901 12,857 6,555 6,302 meratlOn (GUJARAT) 1911 15,972 +3,115 +2423 8,483 7,489
1921 19,822 +3,850 +24 10 10,783 9,039 1931 19,481 -341 -172 10,206 9,275 1941 20,195 +714 +3 67 10,409 9,786 1951 25,440 +5,245 +25 97 13,005 12,435 1961 44,166 + 18,726 +73 61 22,614 21,552 1971 NA 63,069 +18,903 +4280 32,982 30,087
(a) Valsad 1901 12,857 6,555 6,302 1911 15,972 +3,115 +2423 8,483 7,489 1921 19,822 +3,850 +24 10 10,783 9,039 1931 19,481 -341 -172 10,206 9,275 1941 20,195 +714 +3 67 10,409 9,786 1951 25,440 +5,245 +25 97 13,005 12,435 1961 NA 37,586 +12,146 +47 74 19,124 18,462 1971 NA 54,966 + 17,380 +4624 28,649 26,317
(I) Valsad 1901 12,857 6,555 6,302 1911 15,972 + 3,115 +24 23 8,483 7,489 1921 1'},S22 +3,&50 +24 \0 \O,n:. 9,(»9 1931 19,481 -341 -172 10,206 9,275 1941 20,195 +714 +3 67 10,409 9,786 1951 25,440 +5,245 +25 97 13,005 12,435 1961 M 404 35,058 +9,618 +37 81 17,746 17,312 1971 M 491 43,254 +8,196 +23 38 22,446 20,808
(11) Mograwadl (0 G ) 1971 NA 5,313 2,972 2,341
(m) ~agda Khurd (0 G ) 1971 NA 2,555 1,237 1,318
(IV) Pardlsandhpur (0 G ) 1971 NA 1,961 1,025 936
(v) Nanakwada (0 G ) 1971 NA 1,653 855 798
(VI) Valsad (0 G ) 1961 NM NA 2,528 1,378 1,150 1971 NA 230 -2,298 -9090 114 116
(b)'Abrama 1961 P 624 6,580 +23 i5
3,490 3,090 1971 V.P. 624 8,103 +1,523 4,333 3,770
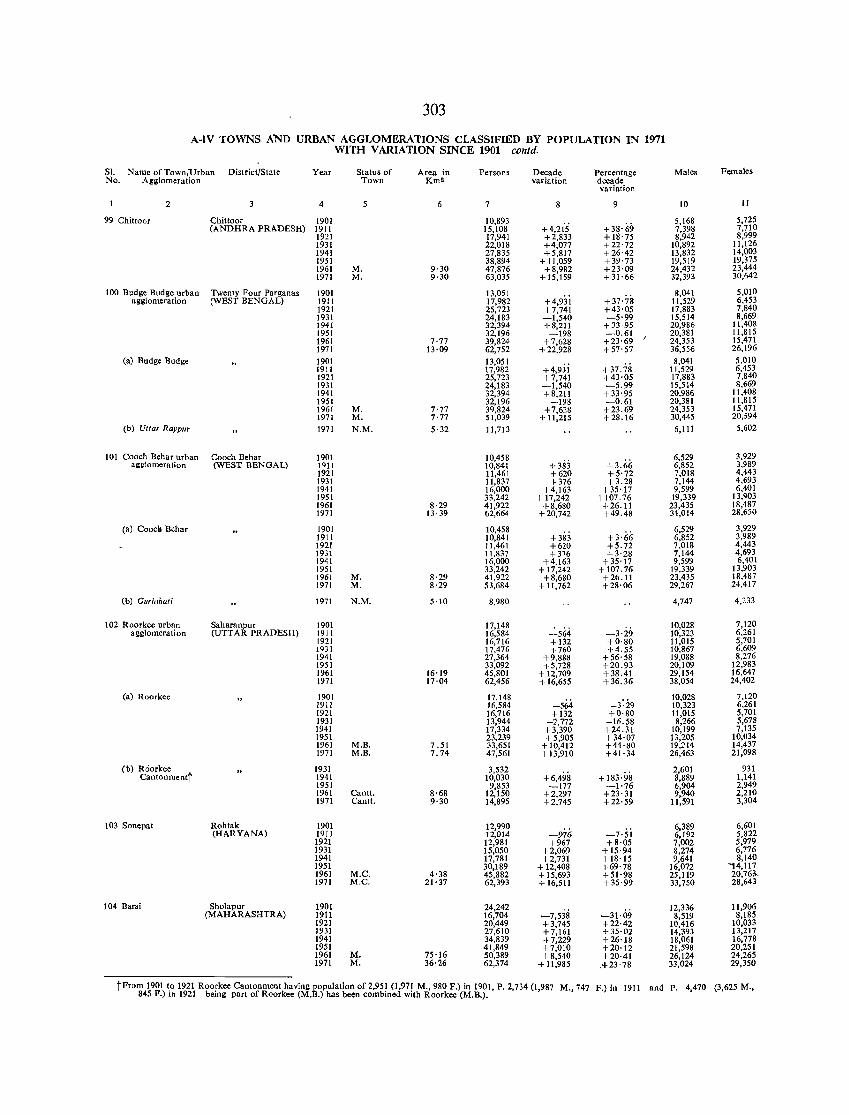
303
A-IV TOWNS AND URBAN AGGLOMERATIONS CLASSIFIED BY POPULATION IN 1971 WITH VARIATION SINCE 1901-contd.
S1. Name of Town/Urban District/State Year Status of Area in Persons Decade Percentage Males Females No. Ar;l:lomeralion Town Km2 variation decade
variation
2 4 5 7 8 9 10 11
99 Chiltoor Chittoor 1901 10,893 +4,21'5
5,168 5,725 (ANDHRA PRADESH) 1911 15,108 + 38' 69 7,398 7,710
1921 17,941 +2,833 + 18'75 8,942 8,999 1931 22,018 +4,077 +22'72 10,892 11,126 1941 27,835 +5,817 +26'42 13,832 14,003 1951 38,894 + 11,059 +39'73 19,519 19,375 1961 M. 9·30 47,876 +8,982 +23·09 24,432 23,444 1971 M. 9·30 63,035 + 15,159 +31·66 32,393 30,642
100 Budge Budge urban Twenty Four Parganas 1901 13,051 +4,93i +37'78
8,041 5,010 agglomeration (WEST BENGAL) 1911 17,982 11,529 6,453
1921 25,723 +7,741 +43·05 17,883 7,840 1931 24,183 -1,540 -5'99 15,514 8,669 1941 32,394 +8,211 +33·95 20,986 11,408 1951 32,196 -198 -0.61 20,381 11,815 1961 7·77 39,824 +7,628 +23'69 24,353 15,471 1971 13·09 62,752 +22,928 +57'57 36,556 26,196
(a) Budg. Budge 1901 13,051 +4,9:ij + 37.78
8,041 5,010 1911 17,982 11,529 6,453 1921 25,723 +7,741 +43'05 17,883 7,840 1931 24,183 -1,540 -5.99 15,514 8,669 1941 32,394 +8,211 + 33'95 20,986 11,408 1951 32,196 -198 -0.61 20,381 11,815 1961 M. 7'77 39,824 +7,628 +23.69 24,353 15,471 1971 M, 7·77 51,039 + 11,215 +28.16 30,445 20,594
(b) Uttar Raypur 1971 N.M. 5·32 11,713 6,111 5,602
101 Cooch Behar urban Cooch Behar 1901 10,458 +38:i +3.66
6,529 3,929 agglomeration (WEST BENGAL) 1<)11 10,841 6,852 3,989
1921 11,461 +620 +5'72 7,018 4,443 1931 11,837 +376 +3.28 7,144 4,693 1941 16,000 +4,163 +35'17 9,599 6,401 1951 33,242 + 17,242 +107.76 19,339 13,903 1961 8·29 41,922 +8,680 +26.11 23,435 18,487 1971 13·39 62,664 +20,742 +49.48 34,014 28,650
(al Coocb Behar 1901 10,458 +3'66
6,529 3,929 1911 10,841 +383 6,852 3,989 1921 11,461 +620 +5.72 7,018 4,443 1931 11,837 +376 +3'28 7,144 4,693 1941 16,000 +4,163 +35'17 9,599 6,401 1951 33,242 + 17,242 +107.76 19,339 13,903 1961 M. 8·29 41,922 +8,680 +26.11 23,435 18,487 1971 M. 8·29 53,684 + 11,762 +28'06 29,267 24,417
(b) GlIri"hafi 1971 N.M. 5·10 8,980 4,747 4,233
102 Roorkee urban Saharanpur 1901 17,148 -3'29
10,Q28 7.120 a~glomeration (UTTAR PRADESH) 191 I 16,584 -564 10,323 6,261
1921 16,716 + 132 +0'80 11,015 ~,701 1931 17,476 +760 +4.55 10,867 ,609 1941 27,364 +9,888 +56'58 19,088 8,276 1951 33,092 +5,728 +20.93 20,109 12,983 1961 16'19 45,801 + 12,709 +38.41 29,154 16,647 1971 17·04 62,456 + 16,655 +36.36 38,054 24,402
<al Roorkee 1901 17,148 -3:29
10,028 7.120 1911 16,584 -564 10,323 6,261 1921 16,716 +132 +0·80 11,015 5,701 1931 13,944 -2,772 -16.58 8,266 5,678 1941 17,334 +3,390 +24.31 10,199 7,135 1951 23.239 +5,905 +34·07 13,205 10,034 1961 M.B. 7.51 33,651 +10,412 +44'80 19,214 14,437 1971 M.B. 7.74 47,561 + 13,910 +41·34 26,463 21,098
(b) Roorkee 1931 3,532 + 183·98
2,601 931 Cantonmentt 1941 10,030 +6,498 8,889 1,141
1951 9,853 -177 -1·76 6,904 2,949 1961 Cantt. 8·68 12,150 +2,297 +23·31 9,940 2,210 1971 Cantt. 9·30 14,895 +2,745 +22'59 11,591 3,304
103 Sonepat Rohtak 1901 12,990 6,389 6,601 <HARYANA) 1911 12,014 -976 -7·51 6,192 5,822
1921 12,981 +967 +8·05 7,002 5,979 1931 15,050 +2,069 + 15·94 8,274 6,776 1941 17,781 +2,731 + 18·15 9,641 8,140 1951 30,189 + 12,408 +69·78 16,072 '14,117 1961 M.C. 4·38 45,882 + 15,693 +51·98 25,119 20,76;_ 1971 M.C. 21'37 62,393 + 16,511 + 35·99 33,750 28,643
104 Barsi Sholapur 1901 24,242 -7,538 -3Hi9
12,336 11,906 (MAHARASHTRA) 1911 16,704 8,519 8,185
1921 20,449 +3,745 +22·42 10,416 10,033 1931 27,610 +7,161 +35·02 14,393 13,217 1941 34,839 +7,229 +26'18 18,061 16,778 1951 41,849 +7,010 +20'12 21,598 20,251 1961 M. 75'16 50,389 +8,540 +20·41 26,124 24,265 1971 M. 36·26 62,374 + 11,985 .+23'78 33,024 29,350
tFrom 1901 to 1921 Roorkee Cantonment having population of 2,951 (1,971 M., 980 F.) in 1901, P. 2,734 (1987 M. 747 8~5 1".) in 1921 bein~ part of Roorkee (M.B.) has been combined with Roorkee (M.B.). "
F.) in 1911 and P. 4,470 (3,625 M.,
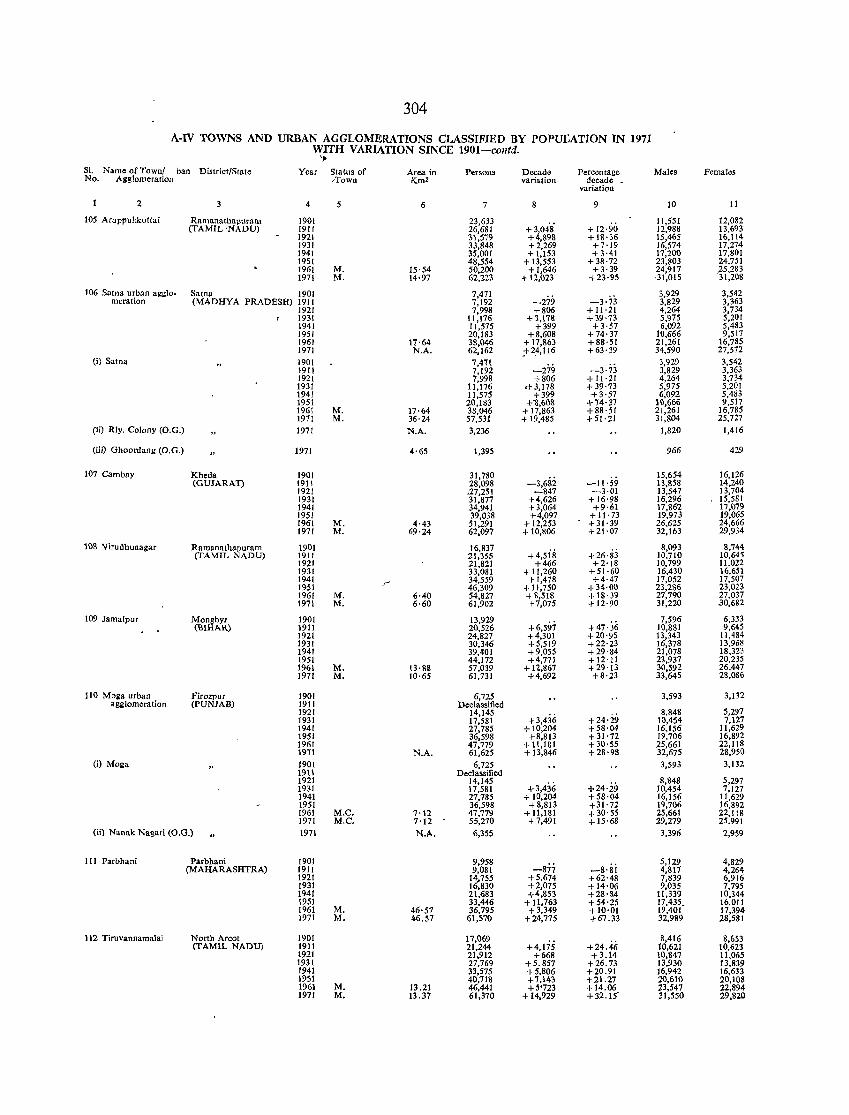
304
A-IV TOWNS AND URBAN AGGLOMERATIONS CLASSIFIED BY POPULATION IN 1971 WITH VARIATION SINCE 1901-contd.
'I' SI. Name of Town/ ban District/Stute Year Status of Area in Persons Decade Percentage Males Females No. AIl81omeratioll /Town Km2 variation decade
variation
2 3 4 5 6 7 9 10 11
105 Aruppukkottai Ramanathapuram 1901 23,633 +3,04'8' + 12·90
11,551 12,082 (TAMIL 'NADU) 1911 26,681 12,988 13,693
1921 3\,519 +4,898 + 18·36 15,465 16,1\4 1931 33,848 +2,269 +7·19 16,574 17,274 1941 35,001 + 1,153 +3·41 17,200 17,801 1951 48,554 + 13,553 +38·72 23,803 24,751 1961 M. 15'54 50,200 +1,646 +3·39 24,917 ,25,283 1971 M. 14·97 62,223 + 12,023 +23·95 ·31,015 31,208
106 Satoa urban agglo- Satna 1901 7,471 -279
3,929 3,542 meration (MADHYA PRADESH) 1911 7,192 -3·73 3,829 3,363
1921 7,998 +806 +11·21 4,264 3,734 1931 11,176 + 3,178 +39·73 5,975 5,201 1941 11,575 +399 +3·57 6,092 5,483 1951 20,183 +8,608 +74·37 10,666 9,517 1961 17·64 38,046 + 17,863 +88·51 21,261 16,785 1971 N.A. 62,162 f2~,116 +63·39 34,590 27,572
(i) Salna 1901 7,471 -3·13
3,929 3,542 1911 7,192 -279 3,829 3,363 1921 7,998 +806 + 11·21 4,264 3,734 1931 11,176 0+3,178 + 39·73 5,975 5,201 1941 11,575 +399 +3'57 6,092 5,483 1951 20,183 +1l,608 +74'37 10,666 9,517 1961 M. 17·64 38,046 + 17,863 +88·51 21,261 16,785 1971 M. 36·24 57,531 + 19,485 +51·21 31,804 25,727
(ii) Rly. Colony (O.G.) 1971 N.A. 3,236 1,820 1,416
(iii) Ghoordang (O.G.) 1971 4·65 1,395 966 429
107 Cambay Kheda 1901 31,780 -3,682 -11·59
15,654 16,126 (GUJARAn 1911 28,098 13,858 14,240
1921 .27,251 -847 -3·01 13,547 13,704 1931 31,877 +4,626 + 16·98 16,296 15,581 1941 34,941 +3,064 +9·61 17,862 17 ,079 1951 39,038 +4,097 +11·73 19,973 19,065 1961 M. 4·43 51,291 + 12,253 +31·39 26,625 24,666 1971 M. 69·24 62,097 + 10,806 +21·07 32,163 29,934
108 Virudhunagar Ramanathapuram 1901 16,837 +4,5is +26·gj
8,093 8,744 (TAMIL NADU) 1911 21,355 10,710 10,645
1921 21,821 +466 +2'18 10,799 11,022 1931 33,081 +11,260 +51·60 16,430 16,651 1941 f 34,559 + 1,478 +4·47 17,052 17,507 1951 46,309 + 11,750 +34·00 23,286 23,023 1961 M. 6·40 54,827 +8,518 +18·39 27,790 27,037 1971 M. 6·60 61,902 +7,075 + 12'90 31,220 .30,(;82
109 Jamalpur Monghyr 1901 13,929 +6,597 +47·36
7,596 6,333 (BIHAR) 1911 20,526 10,881 9,645
1921 24,827 +4,301 +20'95 13,343 11,484 1931 30,346 +5,519 +22'23 16,378 13,968 1941 39,401 +9,055 +29'84 21,078 18,323 1951 44,172 +4,771 +12·11 23,937 20,235 1961 M. 13·82 57,039 + 12,867 +29'13 30,592 26,447 1971 M. 10·65 61,731 +4,692 +8'23 33,645 28,086
110 Mo!:a urban Firozpur 1901 6,725 3,593 3,132 ag&lomeration (PUNJAB) 1911 Declassified
1921 14,145 +3,4ji; +24'29
8,848 5,297 1931 17,581 10,454 7,127 1941 27,785 + 10,204 +58·04 16,156 11,629 1951 36,598 +8,813 +31·72 19,706 16,892 1961 47,779 + 11,181 +30'55 25,661 22,118 1971 N.A. 61,625 + 13,846 +28'98 32,675 28,950
(i) Mo!:a 1901 6,725 3,593 3,132 1911 Declassified 1921 14,145
+3,436 +24'29 8,848 5,297
1931 17,581 10,454 7,127 1941 27,785 + 10,204 +58'04 16,156 11,629 1951 36,598 +8,813 +31'72 19,706 16,892 1961 M.C. 7'12 47,779 + 11,181 +30' 55 25,661 22,118 1971 M.C. 7'12 55,270 +7,491 +15'68 29,279 25.991
(ii) Nanak Nagari (O.G.) 1971 N.A. 6,355 3,396 2,959
111 Parbhani Parbhani 1901 9,958 -877 -8·lii
5,129 4,829 (MAHARASHTRA) 1911 9,081 4,817 4,264
1921 14.755 +5,674 +62'48 7,839 6,916 1931 16,830 +2,075 +14·06 9,035 7,795 1941 21,683 +4,853 +28'84 11,339 10,344 1951 33,446 + 1l,763 +54·25 17,435. 16,011 1961 M. 46'57 36,795 +3,349 +10·01 19,401 17,394 1971 M. 46.57 61,570 +24,775 +67.33 32,989 28,581
112 Tiruvannamalai North Aroot 1901 17,069 +4,1'75 +24.46
8,416 8,653 (TAMIL NADD) 1911 21,244 10,621 10,623
1921 21,912 +668 +3.14 10,847 11,065 1931 27,769 +5.857 +26.73 13,930 13,839 1941 33,575 +5,806 +20.91 16,942 16,633 1951 40,718 +7,143 +21.27 :20,6\0 20,108 1961 M. 13.21 46,441 +5'723 +14.06 :23,541 22,894 1971 M. 13.31 61,370 + 14,929 +32.15' 31,550 29,820
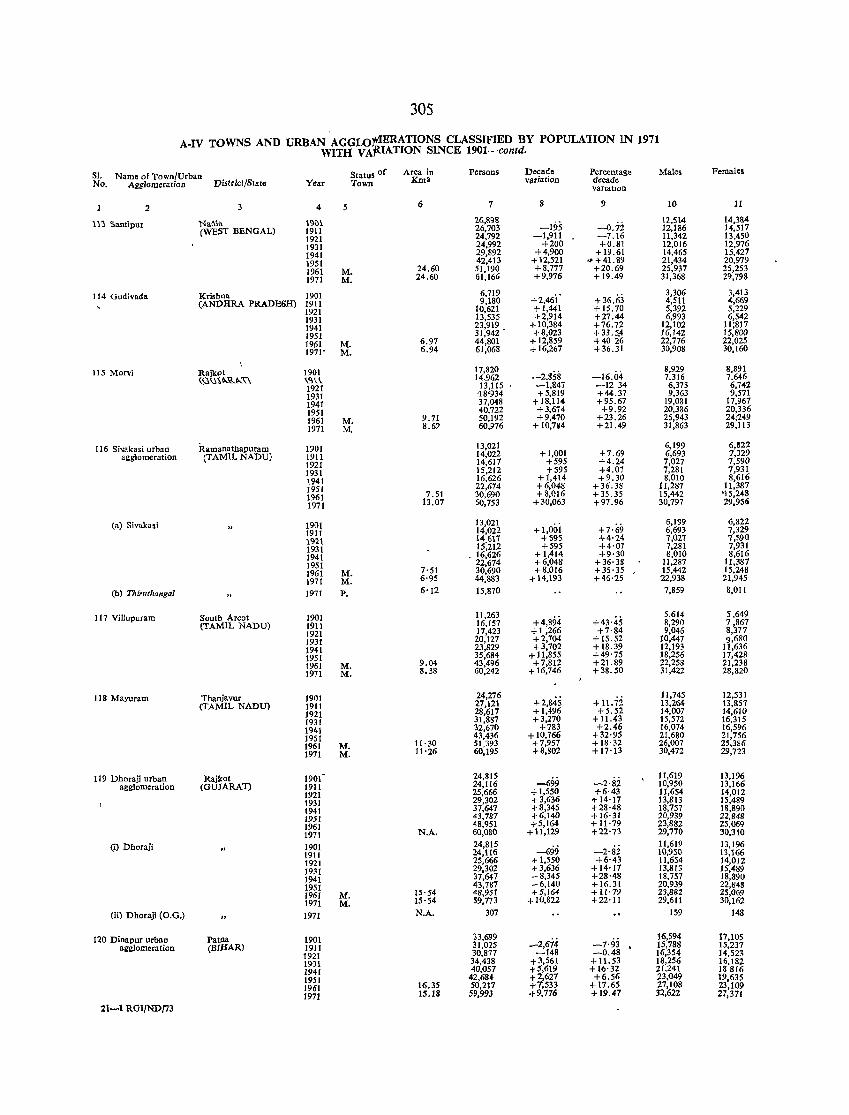
305
A-IV TOWNS AND URBAN AGGLOMERATIONS CLASSIFIED BY POPULAlION IN 1971 WITH VAfUATION SINCE 1901-contd.
S1. Name of Town/Urban Status of Area in Persons Decade Percentage Males Peroales
No. Agglomeration District/State Year Town Kma vllriation decade variation
2 3 4 5 6 7 8 9 10 11
11> Santipur NaMa 191)1 26,&9& -195 -0.7.2
12,514 14,1&4 (WEST BENGAL) 1911 26,703 12,186 14,517
1921 24,792 -1,911 -7.16 11,342 13,450 1931 24,992 +200 +0.81 12,016 12,976 1941 29,892 +4,900 +19.61 14,465 15,427 1951 42,413 + 12,521 !~ +41.89 21,434 20,979 1961 M. 24.60 51,190 +8,777 +20.69 25,937 25,253 1971 M. 24.60 61,166 +9,976 + 19.49 31,368 29,798
114 Gudivada Krishna 1901 6,719 +2,46i' +36.63
3,306 3,413 (ANPHRA PRADESH) 1911 9,180 4,511 4,669
1921 10,621 +1,441 +15.70 5,392 5,229 1931 13,535 +2,914 +27.44 6,993 6,542 1941 23,919 + 10,384 +76.72 12,102 11;817 1951 31,942 • +8,023 +33.5,4 16,142 15,800 1961 M. 6.97 44,801 + 12,859 +4026 22,776 22,025 1971' M. 6.94 61,068 + 16,267 +36.31 30,908 30,160
\ 115 Morvl Rajkot 1901 17,820
-2.gS8 -16.04 8,929 8,891
~<'>U\~\U-..."C\ \''1\'\' 14,962 7.316 7.646 1921 I3,1l5 -1,847 -1234 6,373 6,742 1931 '18'934 +5,819 +44.37 9,363 9,571 1941 37,048 + 18,114 +95.67 19,081 17,967 1951 40,722 +3,674 +9.92 20,386 20,336 1961 M. 9.71 50,192 +9,470 +23.26 25,943 241249 1971 M 8.67 60,976 + 10,7S4 + 21.49 31,863 29,113
116 Si~akasi urban Ramanathapuram 1901 13,021 6,199 6,822 agglomeration (TAMIL NADU) 1911 14,022 +1,001 +7.69 6,693 7,329
1921 14,617 +595 +4.24 7,027 7,590 1931 15,212 +595 +4.07 7,281 7,931 1941 16,626 +1,414 +9.30 8,010 8,616 1951 22,674 +6,048 +36.38 11,287 11,387 1961 7.51 30,690 +8,016 +35.35 15,442 '15,248 1971 13.07 50,753 +30,063 +97.96 30,797 29,956
(al Sivakasi 1901 13,021 +I,ooi +7·69
6,199 6,822 1911 14,022 6,693 7,329 1921 14617 +595 +4·24 7,027 7,590 1931 15;212 +595 +4·07 7,281 7,931 1941 . 16,626 + 1,414 +9'30 8,010 8,616 1951 22,674 +6,048 +36'38 11,281 11,387 1961 M. 7'51 30,690 +8,016 +35·35 , 15,442 15,248 1971 M. 6'95 44,883 + 14,193 +46·25 22,938 21,945
(b) Thiruthangal 1971 P. 6'12 15,870 7,859 8,011
117 Villupuram South Areot 1901 11,263 +4,894 +43'45
5,614 5,649 (TAMIL NADU) 1911 16,157 8,290 7,867
1921 17,423 +1,266 +7·84 9,046 8,377 1931 20,127 +2,704 + 15.52 10,441 9,680 1941 23,829 +3,702 + 18.39 12,193 11,636 1951 35,684 + 11,855 +49'75 18,256 17,428 1961 M. 9.04 43,496 +7,812 +21.89 22,258 21,238 1971 M. 8.38 60,242 + 16,746 +38.50 31,422 28,820
118 MayUram Tbanjavur 1901 24,276 +2,&45 + 1l.7i
11,745 12,531 (TAMIL NADU) 1911 27,121 13,264 13,857
1921 28,617 +1,496 +5.52 14,007 J4,610 1931 31,887 +3,270 + 11.43 15,572 16,315 1941 32,670 +783 +2.46 16,074 16,596 1951 43,436 +10,766 +32·95 21,680 21,756 1961 M. 11'30 51,393 +7,957 +18·32 26,007 25,386 1971 M. 11'26 60,195 +8,802 + 17'13 30,472 29,723
119 Dhoraji urban Rajkot 1901 24,815 --699 -2'8.2
11,619 13,196 agglomeration (GU]ARA1) 1911 24,116 10,950 13,166
1921 25,666 + 1,550 +6·43 11,654 14,012 1931 29,302 +3,636 +14'17 13,813 15,489 1941 37,647 +8,345 +28'48 18,757 18,890 1951 43,787 +6,140 +16·31 20,939 22,848 1961 48,951 +5,164 + 11'79 23,882 25,069 1971 N.A. 60,080 +11,129 +22'73 29,770 30,310
(i) Dhoraji " 1901 24,815 --699 -2·ii
11,619 13,196 1911 24,116 10,950 13,166 1921 25,666 +1,550 +6·43 11,654 14,012 1931 29,302 +3,636 +14'17 13,813 15,489 1941 37,647 +8,345 +28·48 18,757 18,890 1951 43,787 +6,140 +16.31 20,939 22,848 1961 M. 15'54 48,951 +5,164 + 11'79 23,882 25,069 1971 M. 15'54 59,773 +10,822 +22·11 29,611 30,162
(ii) Dhoraji (O.G.) " 1971 N.A. 307 159 148
120 Dinapur urban Patl1a 1901 33,699 _2,674 -7·93
16,594 17,105 agglomeration (BrHAR) 1911 31,025 . 15,788 15,231
1921 30,877 -148 -0.48 16,354 14,523 1931 34,438 +3,561 + 11.53 18,256 16,182 1941 40,057 +5,619 +16'32 21,241 18816 1951 42,684 +2,627 +6.56 23,049 19,635 1961 16.35 50,217 +7,533 +17.65 27,108 23,109 1971 IS.18 59,993 +9,776 + 19.47 32,622 27,371
21-1 RGI/NP/73

" 306
A-IV TOWNS AND URBAN AGGLOMERATIONS CLASSIFIED BY POPULATION IN 1971 WITH VARIATION SINCE 1901-contd.
SI. Name of Town/Urban District/State, Year Status of Area in Persons Decade Percentage Males Females No. Agglomeration Town Km.' variation decade
variation
2 3 4 5 6 7 8 9 10 11
(a) Dinapur Patna 1901 33,699 -2,674
16,594 17,105 Nizatnat (BIHAR) 1911 31,025 -7.93 15,788 15,237
1921 30,877 -148 -0.48 16,354 14,523 1931 24,221 -6,656 -21.56 12,347 11,874 1941 30,321 +6,100 +25.18 15,784 14,537 1951 42,684 + 12,363 +40.77 23,049 19,635 1961 M. 12'85 35,159 -7·525 -17.63 18,502 16,657 1971 M. 11.76 42,694 +7,535 +21.43 22,881 19,813
(b) Dinapur Cantonmentt 1931 10,217 -4'7i
5,909 4,308 1941 9,736 -481 5,457 4,279 1951 1961 Cantt. 3.50 15,058
+2,24i + 14.88 8,606 6,452
1971 Cantt. 3'42 17,299 9,741 7,558
121 Damoh urban Damoh 1901 13,355 +3,687 +27·i;i
6,746 6,609 agglorneration (MADHYA PRADESH) 1911 17,042 8,732 8,310
1921 15,296 -1,746 -10'25 7,993 7,303 1931 20,728 +5,432 +35'51 10,726 10,002 1941 26,795 +6,067 -1-29'27 13,754 13,041 1951 36,964 +10,169 + 37'95 19,002 17,962 1961 15'51 46,656 +9,692 +26'22 24,46.9 22,187 1971 16·07 59,983 + 13,327 +28·56 31,619 28,364
(i) Damoh 1901 13,355 +3,687 +27·i;i
6,746 6,609 1911 17,042 8,732 8,310 1921 15,296 -1,746 -10'25 7,993 7,303 1931 20,728 +5,432 +35'51 10,726 10,002 1941 26,795 +6,067 +29'27 13,754 13,041
'" 1951 36,964 + 10,169 + 37·95 19,002 17,962 1961 M. 15'51 46,656 +9,692 +26'22 24,469 22,187 1971 M. 15'51 59,489 + 12,833 +27'51 31,353 28,136
(ii) Hirdepur (O.G.) 1971 0·40 455 244 211
(!ii) Chopra Ryt.(O.G.) 1971 0·16 39 22 17
122 Kottayarn Kottayam 1901 17,552 -2,4ii -13.74
9,147 8,405 (KERALA) 1911 15,141 7,863 7,278
1921 18,833 +3,692 +24·38 9,855 8,978 1931 25,236 +6,403 +34-00 13,280 11,956 1941 33,364 +8,128 +32'21 f,380 15,984 1951 44,204 +10,840 +32.49 2,549 21,655 1961 M. 15'54 52,685 + 8,481 +19'19 26,850 25,835 1971 M. 15·55 59,714 +7,029 + 13.34 30,075 29,639
123 Bulandshabr Bulandshahr 1901 18,959 +2.24
10,326 8,633 (UTTAR PRADESH) 1911 19,383 +424 10,679 8,704
1921 19,509 +126 +0.65 11,056 8,453 1931 24,898 +5,389 +27.62 14,248 10,650 1941 29,701 +4,803 +19.29 16,800 12,901 1951 37,496 + 7,795 +26.24 20,709 16,787 1961 M.B. 3.24 44,163 +6,667 +17.78 24,125 20,038 1971 M.B. 3.29 59,505 + 15,342 +34'74 32,165 27,340
124 Panaji urban Goa 1950 31,950 + 3,5 is' + 11.0i
15,942 16,008 agglomeration (GOA, DAMAN & DIU) 1960 4:20 35,468 17,948 17,520
1971 37.00 59,258 +23,790 +67.07 30,948 28,310
(i) Panajit 1950 31,950 +3,5is + 11. Iii
15,942 16,008
~O M. 4.20 35,468 17,948 17,520 1 M. 7.56 34,9]3 -SIS -1.45 18,577 16,376
(ii) Talcigao (O,G.) 1971 6.2,3. 6,851 3,518 3,339
(iii) Calapor (O.G.) 1971 7.65 6,663 3,334 3,329
(iv) Chirnbel (O.G.) 1971 3.07 3,847 1,953 1,894
(V) Murda (O.G.) 1971 1.88 3,048 1,529 1,519
(vi) Morornbi-o- 1971 1.97 1,254 664 590 Pequeno (O.G.) (Merees)
(vii) Morombi-o-Grande (O.G.)
(Merees)
1971 5.88 1,188 601 587
(viii) Gujira (D.G·) 1971 1.68 776 396 380
(ix) Panelim (O.G.) 1971 1.08 672 376 296
125 Anand Kheda 1901 10,010 +129
5,482 4,523 (GUJARAT) 1911 10,139 + 1.29 5,595 4,544
1921 11,054 +915 +9.02 6,173 4,881 1931 11,660 +606 +5.48 6,517 5,143 1941 17,154 +5,494 +47.12 9,260 7,894 1951 25,767 +8,613 + 50.21 14,091 11,676 1961 M. 21.26 40,458 +14,691 +57.01 22,369 18,089 1971 M. 21.13 59,155 + 18,697 +46.21 32,171 26,984
tDinapur Cantonment with a population of 10,841. (5,939 M., 4,902 P.) in ,1901 P.9,95,9 (5,655. M., 4,304 F)4t 19.11; P. 9,21.0 (5,373 M., 3,837 P.) in 1921; P. 13,514 (8,068 M. 5,446 P,) in 1951 was a part of Dmapur (M). The combmed population of Dlllapur MunIcIpality and Dmapur Cantonment for 1901,1911, 1921 and 1951 bas been shown against Dinapur Municipality. In 1931 & 1941 Dinapur Cantonment was treated as a separate urban unit.
tPanaji was a town ill 1900, 1910, 1921, 1931 a1)1I1940 but its popUlation is not lIvaila1;>le for these years,
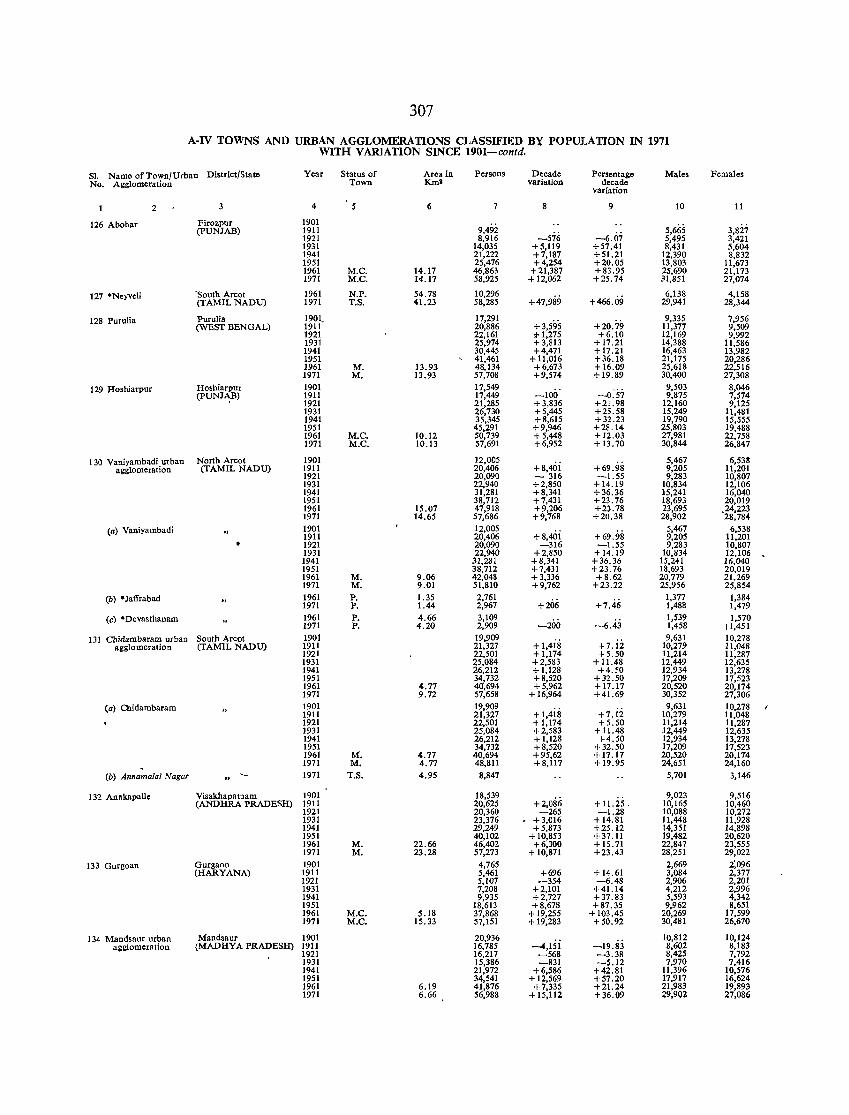
307
A-IV TOWNS AND URBAN AGGLOMERATIONS CLASSIFIED BY POPULATION IN 1971 WITH VARJATlON SINCE 1901-contd.
SI. Name of Town/U rban District/State Year Status of Area in Persons Decade Persentage Males Females No. Agglomeration Town Krnl variation decade
variation
2 4 6 7 8 9 10 11
126 Abohar Firozpur 1901 9,492 5,665 3,827 (pUNJAB) 1911
-576 -6.07 1921 8,916 5,495 3,421 1931 14,035 +5,119 +57.41 8,431 5,604 1941 21,222 +7,187 +51.21 12,390 8,832 1951 25,476 +4,254 +20.05 13,803 11,673 1961 M.C. 14.17 46,863 +21,387 +83.95 25,690 21,173 1971 M.C. 14.17 58,925 +12,062 +25.74 31,851 27,074
127 °Neyveli 'South Arcot 1961 N.P. 54.78 10,296 +47,989 +466.09
6,138 4,158 (TAMIL NADU) 1971 T.S. 41.23 58,285 29,941 28,344
128 Purulia Purulia 1901 17,291 +3,595
9,335 7,956 (WEST BENGAL) 1911 20,886 +20.79 11,377 9,509
1921 22,161 01-1,275 +6.10 12,169 9,992 1931 25,974 +3,813 +17.21 14,388 11,586 1941 30,445 +4,471 +17.21 16,463 13,982 1951 41,461 + 11,016 +36.18 21,175 20,286 1961 M. 13.93 48,134 +6,673 + 16.09 25,618 22,516 1971 M. 13.93 57,708 +9,574 +19.89 30,400 27,308
129 Hoshiarpur Hoshiarpur 1901 17,549 -100' -0:57
9,503 8,046 (PUNJ~) 1911 17,449 9,875 7,574
1921 21,285 +3,836 +21.98 12,160 9,125 1931 26,730 +5,445 +25.58 15,249 11,481 1941 35,345 +8,615 +32.23 19,790 15,555 1951 45,291 +9,946 +28.14 25,803 19,488 1961 M.C. 10.12 50,739 +5,448 + 12.03 27,981 22,758 1971 M.C. 10.13 57,691 +6,952 + 13.70 30,844 26,847
130 Vaniyambadi urban North Arcot 1901 12,005 +8,40i +69.98
5,467 6,538 agglomeration (TAMIL NADU) 1911 20,406 9,205 11,201
1921 20,090 - 316 -1.55 9,283 10,807 1931 22,940 +2,850 +14.19 10,834 12,106 1941 31,281 +8,341 +36.36 15,241 16,040 1951 38,712 +7,431 +23.76 18,693 20,019 1961 15.07 47,918 +9,206 +23.78 23,695 .24,223 1971 14.65 57,686 +9,768 +20.38 28,902 28,784
(a) Vaniyambadi 1901 12,005 +8,40i
5,467 6,538 1911 20,406 +69.98 9,205 11,201 1921 20,090 -316 -1.55 9,283 10,807 1931 22,940 +2,850 +14.19 10,834 12,106 . 1941 31,281 +8,341 +36.36 15,241 16,040 1951 38,712 +7,431 +23.76 18,693 20,019 1961 M. 9.06 42,048 +3,336 +8.62 20,779 21,269 1971 M. 9.01 51,810 +9,762 +23.22 25,956 25,854
(b) °Jaffrabad 1961 P. 1.35 2,761 +206 +7.46
1,377 1,384 1971 P. 1.44 2,967 1,488 1,479
(c) *Devasthanam 1961 P. 4.66 3,109 -6.43
1,539 1,570 1971 P. 4.20 2,909 -200 1,458 11,451
131 Chidambaram urban South Areot 1901 19,909 9,631 10,278 agglomeration (TAMIL NADU) 1911 21,327 +1,418 +7.12 10,279 11,048
1921 22,501 +1,174 +5.50 11,214 11,287 1931 Z5,084 +2,583 + 11.48 12,449 12,635 1941 26,212 +1,128 +4.50 12,934 13,278 1951 34,732 +8,520 +32.50 17,209 17,523 1961 4.77 4a,694 +5,962 +17.17 20,520 20,174 1971 9.72 57,658 + 16,964 +41.69 30,352 27,306
(a) Chidambaram 1901 19,909 9,631 10,278 1911 21,327 +1,418 +7.12 10,279 11,048 1921 22,501 +1,174 +5.50 11,214 11,287 1931 25,084 +2,583 + 11.48 12,449 12,635 1941 26,212 +1,128 +4.50 12,934 13,278 1951 34,732 +8,520 +32.50 17,209 17,523 1961 M. 4.77 40,694 +95,62 + 17.17 20,520 20,174 1971 M. 4.77 48,811 +8,117 +19.95 24,651 24,160
(b) Annamalai Nagar 1971 T.S. 4.95 8,847 5,701 3,146
132 Anakapalle Visakhapatnam 1901 18,539 +2,086
9,023 9,516 (ANDHRA PRADESH) 1911 20,625 +11.25. 10,165 10,460
1921 20,360 -265 -1.28 10,088 10,272 1931 23,376 +3,016 +14.81 11,448 11,928 1941 29,249 +5,873 +25.12 14,351 14,898 1951 40,102 + 10,853 +37.11 19,482 20,620 1961 M. 22.66 46,402 +6,300 +15.71 22,847 23,555 1971 M. 23.28 57,273 + 10,871 +23.43 28,251 29,022
133 Gurgoan Gurgaon 1901 4,765 2,669 2;096 (HARYANA) 1911 5,461 +696 +14.61 3,084 2,377
1921 5,107 -354 -6.48 2,906 2,201 1931 7,208 +2,101 +41.14 4,212 2,996 1941 9,935 +2,727 +37.83 5,593 4,342 1951 18,613 +8,678 +87.35 9,962 8,651 1961 M.C. 5.18 37,868 + 19,255 + 103.45 20,269 17,599 1971 M.C. 15.33 57,151 + 19,283 + 50.92 30,481 26,670
134 Mandsaur urban Mandsaur 1901 20,936 -",lsi -19.83
10,812 10,124 aggiomeration (MADHYA PRADESH) 1911 16,785 8,602 8,183
1921 16,217 -568 -3.38 8,425 7,792 1931 15,386 -831 -5.12 7,970 7,416 1941 21,972 +6,586 +42.81 11,396 10,576 1951 34,541 + 12,569 +57.20 17,917 16,624 1961 6.19 41,876 +7,335 +21.24 21,983 19,893 1971 6.66 56,988 + 15,112 +36.09 29,902 27,086
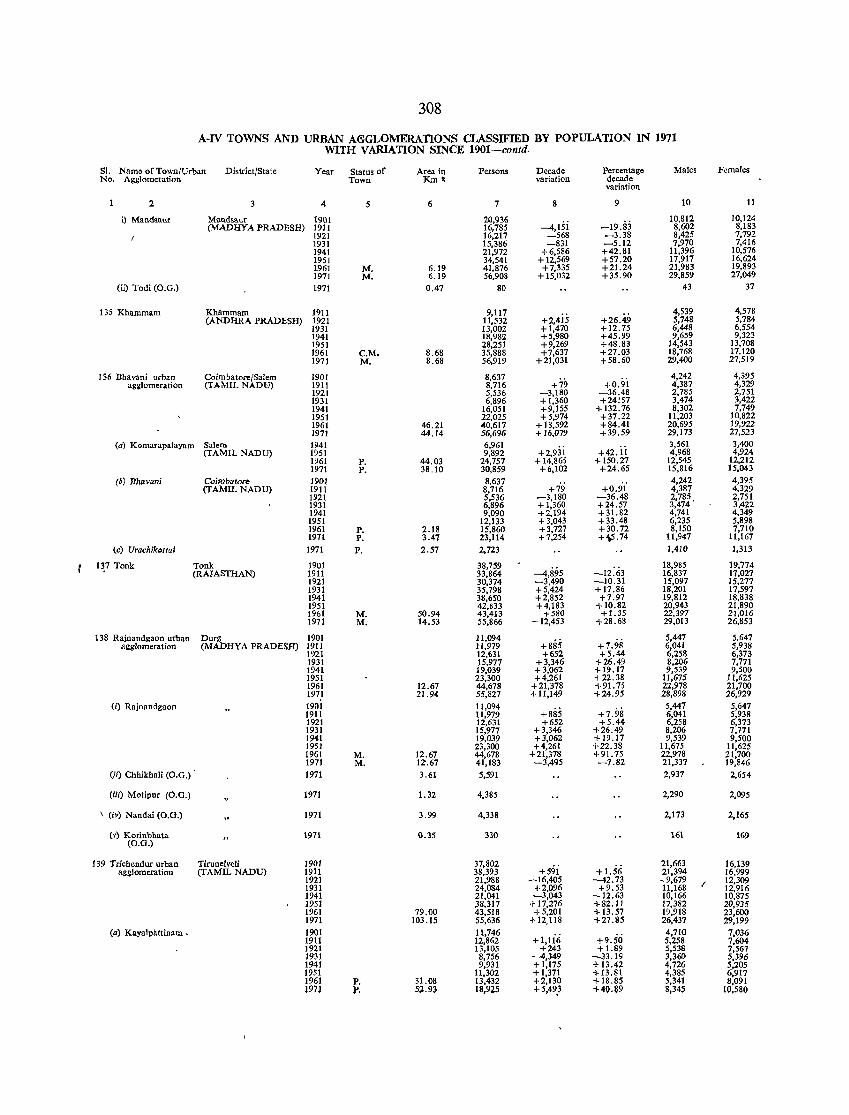
308
A-IV TOWNS AND URBAN A~GLOMERATIONS CLASSIFIED BY POPULATION IN 1971 WITH VARlATION SINCE 1901·-contd.
SI. Name of Town/Urban District/State Year Status of Area in Persons Decade Percentage Males Females No. Agglomeration Town Km2 variation decade
variation
2 4 5 6 7 8 9 10 11
i) Mand.aut MaQdoaur 1901 20,936 -4,di -19.83
10,812 10,124 (MADHYA PRADESH) 1911 16,785 8,602 8,183
1921 16,217 -568 -3.38 8,425 7,792 1931 15,386 -831 -5.12 7,970 7,416 1941 21,972 +6,586 +42.81 11,396 10,576 1951 34,541 + 12,569 +57.20 17,917 16,624 1961 M. 6.19 41,876 +7,335 +21.24 21,983 19,893 1971 M. 6.19 56,908 + 15,032 +35.90 29,859 27,049
(ii) Tadi (O.G.) 1971 0.47 80 43 37
135 Khammam Khammam 1911 9,117 +2,4is +26.49
4,539 4,578 (ANDHRA PRADESH) 1921 11,532 5,748 5,784
1931 13,002 +1,470 +12.75 6,448 6,554 1941 18,982 +5,980 +45.99 9,659 9,323 1951 28,251 +9,269 +48.83 14,543 13,708 1961 C.M. 8.68 35,888 +7,637 +27.03 18,768 17,120 1971 M. 8.68 56,919 +21,031 +58.60 29,400 27,519
136 Bhavani urban Coimbatore/Sa1em 1901 8,637 +79 +oji
4,242 4,395 ag~lomer"tion (TAMIL NADB) 1911 8,716 4,387 4,329
1921 5,536 -3,180 -36.48 2,785 2,751 1931 6,896 +1,360 +24:57 3,474 3,422 1941 16,051 +9,155 + 132.76 8,302 7,749 1951 22,025 +5,974 +37.22 11,203 10,822 1961 46.21 ,(0,617 + 18,592 +84.41 20,695 19,922 1971 44.14 56,696 + 16,079 +39.59 29,173 27,523
(a) Komarapalayam Salem 1941 6,961 +2,93i +42.ii
3,561 3,400 (TAMIL NADU) 1951 9,892 4,968 4,924
1961 P. 44.03 24,757 + 14,865 + 150.27 12,545 12,212 1971 P. 38.10 30,859 +6,102 +24.65 15,816 15,043
(b) Dhav.ani Coimbatore 1901 8,637 +i9 +0.91
4,242 4,395 (TAMIL NADU) 1911 8,716 4,387 4,329
1921 5,536 -3,180 -36.48 2,785. 2,751 1931 6,896 + 1,360 +24.57 3,474 3,422 1941 9,090 +2,194 + 31.82 4,741 4,349 1951 12,133 + 3,043 +33.48 6,235 5,898 1961 P. 2.18 15,860 +3,727 +30.72 8,150 7,710 1971 1'. 3.47 2:>,1l4 +7,254 +~.74 11,947 11,167
(e) Uraehibltai 1971 P. 2.57 2,723 1,410 1,313
q7 Tonk Tonk 1901 38,759 -4,895
18,985 19,774 (RAJASTHAN) 1911 33,864 -12.63 16,837 17,027
1921 30,374 -3,490 -10.31 15,097 15,277 1931 35,798 +5,424 +17.86 18,201 17,597 1941 38,650 +2,852 +7.97 19,812 18,838 1951 42,833 +4,183 + 10.82 20,943 21,890 1961 M. 50.94 43,413 +580 +1.35 22,397 21,016 1971 M. 14.53 55,866 + 12,453 +28.68 29,013 26,853
138 Rajnandgaon urban Durg 1901 11,094 +885 +7.98
5,447 5,647 agglomeration (MADHYA PRADESH) 1911 11,979 6,041 5,938
1921 12,631 +652 +5.44 6,258 6,373 1931 15,977 +3,346 +26.49 8,206 7,771 1941 19,039 +3,062 +19.17 9,539 9,500 1951 23,300 +4,261 +22.38 11,675 11,625 1961 12.67 44,678 +21,378 +91. 75 22,978 21,700 1971 21.94 55,827 + 11,149 +24.95 28,898 26,929
(i) Rajnandgaan 1901 11,094 +885 +7.98
5,447 5,647 1911 11,979 6,041 5,938 1921 12,631 +652 +5.44 6,258 6,~73 1931 15,917 +3,346 +26.49 8,206 7,771 1941 19,039 +3,062 +19.17 9,539 9,500 1951 23,300 +4,261 +22.38 11,675 11,625 1961 M. 12.67 44,678 +21,378 +91. 75 22,978 21,700 1971 M. 12".67 41,183 -3,495 -7.82 21,337 19,846
(ii) Chhikhali (O.G.) 1971 3.61 5,591 2,937 2,654
(iii) Motipur (O.G.) 1971 1.32 4,385 2,290 2,095
\ (it,) Nandai (O.G.) 1971 3.99 4,338 2,173 2,165
(,.) Korinbhata (O.G.)
1971 0.35 330 161 169
139 Trichendur urban Tirunelveli 1901 37,802 +59i +1.56
21,663 16,139 agg!omera tion (TAMIL NADU) 1911 38,393 21,394 16,999
1921 21,988 -16,405 -42.73 - 9,679 I 12,309 1931 24,084 +2,096 +9.53 11,168 12,916 1941 21,041 -3,043 -12.63 10,166 10,875 1951 )8,317 + 17,276 +82.11 17,382 20,935 1961 79.00 43,518 + 5,201 + 13.57 19,918 23,600 1971 103.15 55,636 +12.118 +27.85 26,437 29,199
(a) Kayalpkttinam , 1901 11,746 +I,li6 +9.50
4,710 7,036 1911 12,862 5,258 7,604 1921 13,105 +243 + 1.89 5,538 7,567 1931 8,756 -4,349 -33.19 3,360 5,396 1941 9,931 +1,175 + 13.42 4,726 5,205 1951 11,302 +1,371 +13.81 4,385 6,917 1961 P. 31.08 13,432 +2,130 + 18.85 5,341 8,091 1m P. 52.9~ (8,n5 +5,49.3 +40.89 8,34S 10,580
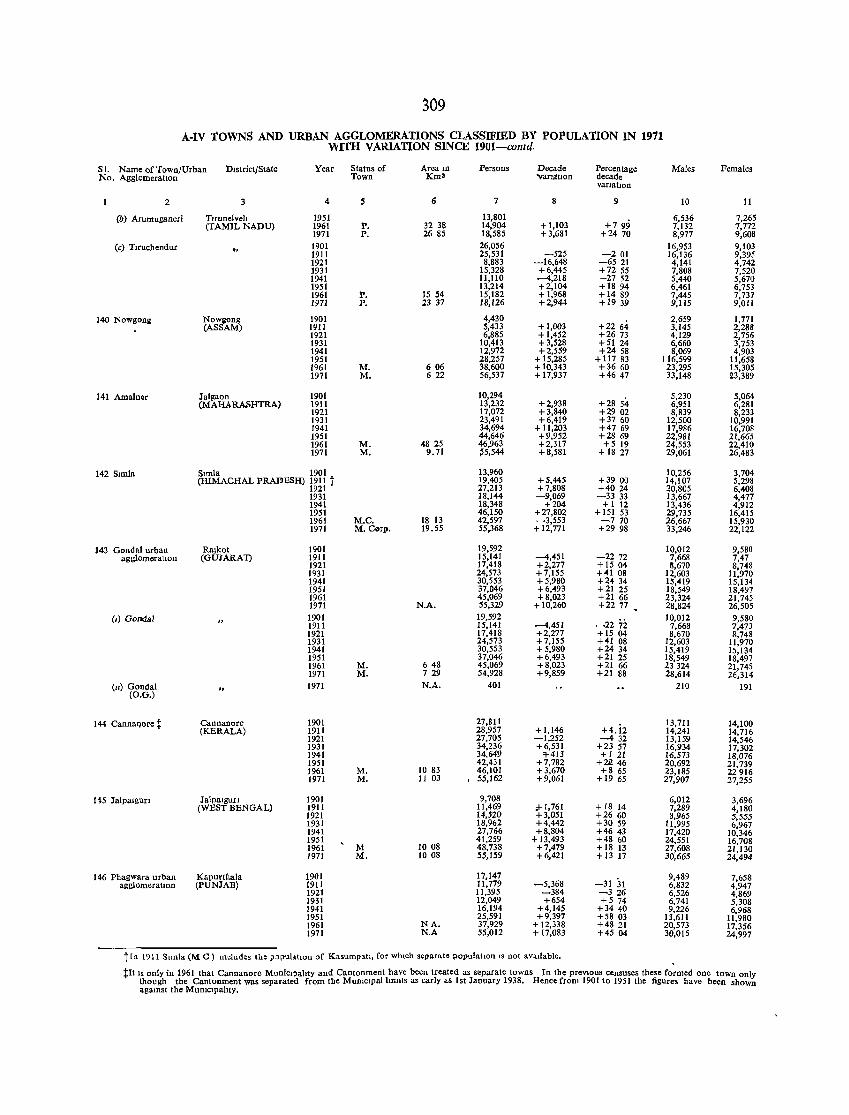
309
A·tv TOWNS AND URBAN AGGLOMERATIONS CLASSIFIED BY POPULATION IN 1911 WITH V ARlATION SINCE 1901-comd.
SI. Name of Town/Urban DIstrict/State Year Status of Area Ifi Persons Decade Percentage Males Females No. AgglomeratIOn Town Km' 'VamttlOn decade
VarIatIOn
2 3 4 5 6 7 8 9 10 11
(b) Arumuganeri T.runelveh 1951 13,801 +799
6,536 7,265 (TAMIL NADU) 1961 P. 32 38 14,904 +1,103 7,132 7,772
1971 P. 2685 18,585 + 3,681 +2470 8,977 9,608
(c) Tlruchendur 1901 26,056 16,953 9,103 1911 25,531 -525 -201 16,136 9,395 1921 8,883 -16,648 -6521 4,141 4,742 1931 15,328 +6,445 +72 55 7,808 7,520 1941 11,110 -4,218 -27 52 5,440 5,670 1951 13,214 +2,104 +1894 6,461 6,753 1961 P. 15 54 15,182 +1,968 + 1489 7,445 7,737 1971 P. 2337 18,126 +2,944 +1939 9,115 9,Oll
140 Nowgong Nowlolong 1901 4,430 +2264
2,659 1,771 (ASSAM) 1911 5,433 +1,003 3,145 2,288
1921 6,885 +1,452 +2673 4,129 2,756 1931 10,413 +3,528 +5124 6,660 3,753 1941 12,972 +2,559 +24 58 8,069 4,903 1951 28,257 + 15,285 + 117 83 116,599 11,658 1961 M. 606 38,600 + 10,343 +36 60 23,295 15,305 1971 M. 622 56,537 + 17,937 +4647 33,148 23,389
141 Amaln.r Ja1gaon 1901 10,294 +2854
5,230 5,064 (MAHARASHTRA) 1911 13,232 +2,938 6,951 6,281
1921 17,072 +3,840 +29 02 8,839 8,233 1931 23,491 +6,419 +37 60 12,500 10,991 1941 34,694 + 11,203 +47 69 17,986 16,708 1951 44,646 +9,952 +2869 22,981 21,665 1961 M. 4825 46,963 +2,317 +5 19 24,553 22,410 1971 M. 9.71 :;5,544 +8,581 + 1827 29,061 26,483
142 SImla SImla 1901 13,960 10,256 3,704 (HIMACHAL PRADESH) 1911 t 19,405 +5,445 +39 00 14,107 5,298
1921 27,213 +7,808 +4024 20,805 6,408 1931 18,144 -9,069 -3333 13,667 4,477 1941 18,348 +204 +1 12 13,436 4,912 1951 46,150 +27,802 + 151 53 29,735 16,415 1961 M.C. 18 13 42,597 -3,553 -770 26,667 15,930 1971 M. Corp. 19.55 55,368 + 12,771 +2998 33,246 22,122
143 Gondal urban Ra]kot 1901 19,592 10,012 9,580 agglomeratlOu (GUJARAT) 1911 15,141 -4,451 -2272 7,668 7,47
1921 17,418 +2,277 + 1504 8,670 8,748 1931 24,573 +7,155 +41 08 12,603 11,970 1941 30,553 +5,980 +2434 15,419 15,134 1951 37,046 +6,493 +2125 18,549 18,497 1961 45,069 +8,023 +21 66 23,324 21,745 1971 N.A. 55,329 + 10,260 +2277 28,824 26,505
(I) Gondal 1901 19,592 -2272
10,012 9,580 1911 15,141 -4,451 7,668 7,473 1921 17,418 +2,277 +1504 8,670 8,748 1931 24,573 +7,155 +41 08 12,603 11,970 1941 30,553 +5,980 +24 34 15,419 15,134 1951 37,046 +6,493 +2125 18,549 18,497 1961 M. 648 45,069 +8,023 +21 66 23324 21,745 1971 M. 729 54,928 +9,859 +21 88 28.614 26,314
(ll) Gondal 1971 N.A. 401 210 191 (O.G.)
144 Cannaijore t Cannanore 1901 27,811 +4.i2
13,711 14,100 (KERALA) 1911 28,957 +1,146 14,241 14,716
1921 27,705 -1,252 -432 13,159 14,546 1931 34,236 +6,531 +23 57 16,934 17,302 1941 34,649 '1-413 +1 21 16,573 18,076 1951 42,431 +7,782 +22 46 20,692 21,739 1961 M. 10 83 46,101 +3,670 +8 65 23,185 22916 1971 M. 11 03 , 55,162 +9,061 +1965 27,907 27,255
145 Jalpalgun Jalpalgun 1901 9,708 6,012 3,696 (WEST BENGAL) 1911 11,469 ;f- 1,761 +18 14 7,289 4,180
1921 14,520 +3,051 +2660 8,965 5,555 1931 18,962 +4,442 +3059 11,995 6,967 1941 27,766 +8,804 +4643 17,420 10,346 1951 41,259 + 13,493 +48 60 24,551 16,708 1961 M 10 08 48,738 +7,479 +1813 27,608 21,130 1971 M. 1008 55,159 +6,421 +J3 17 30,665 24,494
146 Phagwara urban Kapurthala 1901 17,147 -31 31
9,489 7,658 agglomeratIOn (PUNJAB) 1911 11,779 -5,368 6,832 4,947
1921 11,395 -384 -326 6.526 4,869 1931 12,049 +654 +5 74 6,741 5,308 1941 16,194 +4,145 +3440 9,226 6,968 1951 25,591 +9,397 +58 03 13,611 11,980 1961 NA. 37,929 + 12,338 +4821 20,573 17,356 1971 N.A 55,012 + 17,083 +45 04 30,015 24,997
t [11 1911 SImla eM C) Incllldes the p~;>ulatlOn of Kasumpatl, for whIch separate populahon IS not avaIlable.
tIt IS only in 1961 that Cannanore Municlpailty and Cantonment have been treated as separate towns In the prevIOUS censuses these formed one town only though the Cantonment was separated from the MUnICIpal hmlls as early as 1st January 1938. Hence from 1901 to 1951 the figures have been shown agaInst the MUnIclpahty.
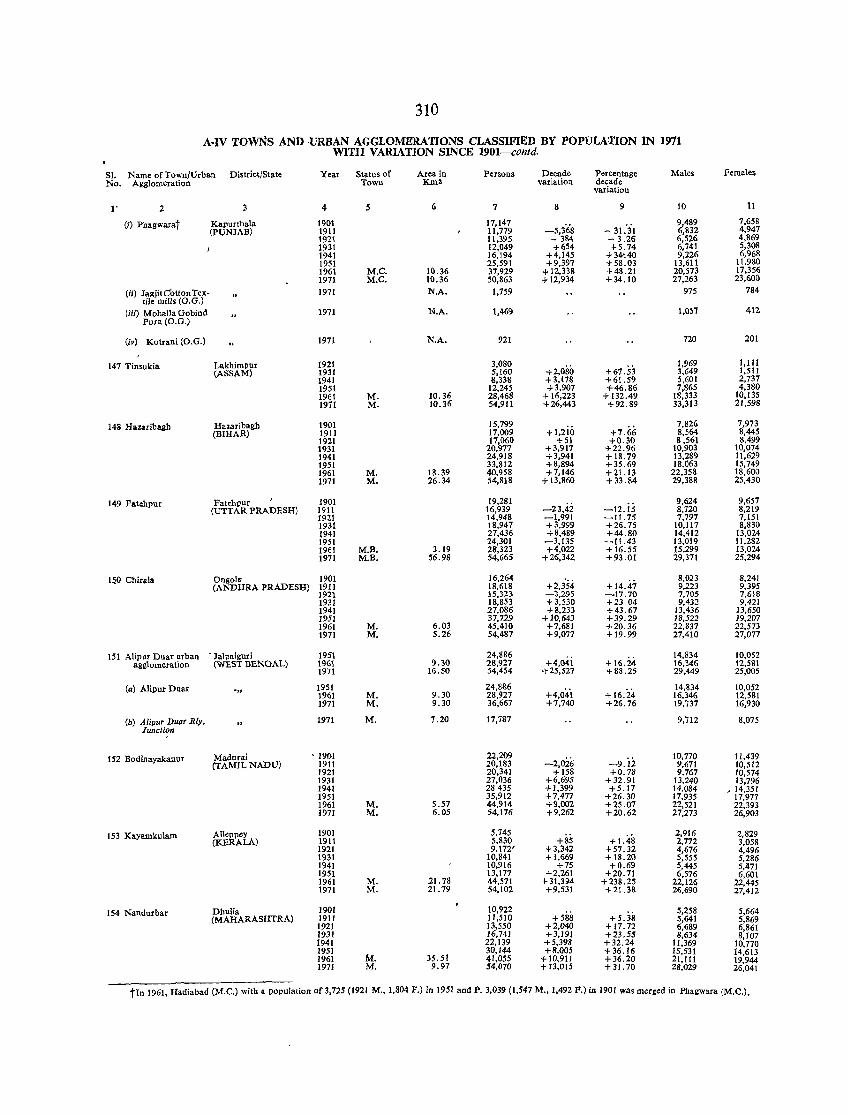
310
A-IV TOWNS AND ·URBAN AGGLOMERATIONS CLASSIFIED BY POPULATION IN 1911 WITH VARIATION SINCE 1901-contd.
SI. Name of Town/Urban District/State Year Status of Area in Persons Decade Percentage Males Females No. Agglomeration Town l(m2 variation decade
variation
l' 2 4 5 6 7 8 9 10 11
(i) Phagwarat Kapurthala 1901 17,147 -5,3'68 - 31 :31
9,489 7,658 (PUNJAB) 1911 11,779 6,832 4,947
1921 11,395 -384 - 3.26 6,526 4,869 1931 12,049 +654 +5.74 6,741 5,308 1941 16,194 +4,145 +34~40 9,226 6,968 1951 25,591 +9,397 +58.03 13,611 11,980 1961 M.C. HU6 37,929 + 12,338 +48.21 20,573 17,356 1971 M.C. 10.36 50,863 +12,934 +34.10 27,263 23,600
(ii) JagjitCbttonTex- 1971 N.A. 1,759 975 784 tile mills (O.G.)
(iii) Mohalla Oobind Pura (0.0.)
1971 N.A. 1,469 1,057 412
(iv) Kotrani (0.0.) 1971 N.A. 921 720 201
147 Tinsukia Lakhimpur 1921 3,080 '1'2,000 +67.53
1,969 1,Ill (ASSAM) 1931 5,160 3,649 1,511
1941 8,338 +3,178 +61.59 5,601 2,737 1951 12,245 +3,907 +46.86 7,865 4,380 1961 M. 10.36 28,468 + 16,223 + 132.49 18,333 10,135 1971 M. 10.36 54,911 +26,443 +92.89 33,313 21,598
148 Hazaribagh Hazarihagh 1901 15,799 +I,2iil
7,826 7,973 (BIHAR) 1911 17,009 +7.66 8,564 8,445
1921 17,060 +51 +0.30 8,561 8,499 1931 20,977 +3,917 +22.96 10,903 10,074 1941 24,918 +3.941 +18.79 13,289 11,629 1951 33,812 +8,894 +35.69 18,063 15,749 1961 M. 18.39 40,958 +7,146 +21.13 22,358 18,600 1971 M. 26.34 54,818 + 13,860 +33.84 29,388 25,430
149 Fatehpur Fatehpur ,
1901 19,281 9,624 9,657 (UTTAR PRADESH) 1911 16,939 -23,42 -12.15 8,720 8,219
1921 14,948 -1,991 -1 J. 75 7,797 7,151 1931 18,947 +3,999 +26.75 10,117 8,830 1941 27,436 +8,489 +44.80 14,412 13,024 1951 24,301 -3,135 -11.43 13,019 11,282 1961 M.B. 3.19 28,323 +4,022 + 16.55 15,299 13,024 1971 M.B. 56.98 54,665 +26,342 +93.01 29,371 25,294
15.0 Chirala Ongole 1901 16,264 +2,354
8,023 8,241 (ANDHRA PRADESH) 1911 18,618 +14.47 9,223 9,395
1921 15,323 -3,295 -17.70 7,705 7,618 1931 18,853 +3,530 +2304 9,432 9,421 1941 27,086 +8,233 +43.67 13,436 13,650 1951 37,729 +10,643 +39.29 18,522 19,207 1961 M. 6.03 45,410 +7,681 +20.36 22,837 22,573 1971 M. 5.26 54,487 +9,077 +19.99 27,410 27,077
151 Alipur Duar urban . Jalpaiguri 1951 24,886 +4,04i
14,834 10,052 agglomeration (WEST BENGAL) 1961 9.30 28,927 +16.24 16,346 12,581
1971 16.:50 54,454 +25,527 +88.25 29,449 25,005
(a) Alipur Duar '" 1951 24,886
+4,04i + 16.24 14,834 10,052
1961 M. 9.30 28,927 16,346 12,581 1971 M. 9.30 36,667 +7,740 +26.76 19,737 16,930
(b) Alipur Dllaf 1I.1y. 1971 M. 7.20 17,787 9,712 8,075 Junction
152 Bodinayakanur Madurai • 1901 22,209 -2,026 -9.i2
10,770 11,439 (TAMIL NADV) 1911 20,183 9,671 10,512
1921 20,341 +158 +0.78 9,767 10,574 1931 27,036 +6,695 +32.91 13,240 13,796 1941 28435 +1,399 +5.17 14,084 , 14,351 1951 35,912 +7,477 +26.30 17,935 17,977 1961 M. 5.57 44,914 +9,002 +25.07 22,521 22,393 1971 M. 6.05 54,176 +9.262 +20.62 27,273 26,903
153 Kayamkularn Alleppey 1901 5,745 + 1.48
2,916 2,829 (KERALA) 1911 5,830 +85 2,772 3,058
1921 9,172' +3,342 +57.32 4,676 4,496 1931 10,841 +1,669 +18.20 5,555 5,286 1941 10,916 +75 +0.69 5,445 5,471 1951 13,177 +2,261 +20.71 6,576 6,601 1961 M. 21.78 44,571 + 31,394 +238.25 22,126 22,445 1971 M. 21.79 54,102 +9,531 +21.38 26,690 27,412
154 Nandurbar Dhulia 1901 10,922 +588 +5.38
5,258 5,664 (MAHARASHTRA) 1911 11,510 5,641 5,869
1921 13,550 +2,040 +17.72 6,689 6,861 1931 16,741 +3,191 +23.55 8,634 8,107 1941 22,139 +5,398 +32.24 11,369 10,770 1951
M. 30,144 +8,005 +36.16 15,531 14,613
1961 35.51 41,055 + 10,911 +36.20 21,111 19,944 1971 M. 9.97 54,070 '1'13,015 +31.70 28,029 26,041
tIn 1961, ftadiabad (M.C.) with a population of 3,725 (1921 M., 1,804 F.) in 1951 and P. 3,039 (1,547 M., 1,492 P.) in 1901 was merged in Phagwara (M.e.).
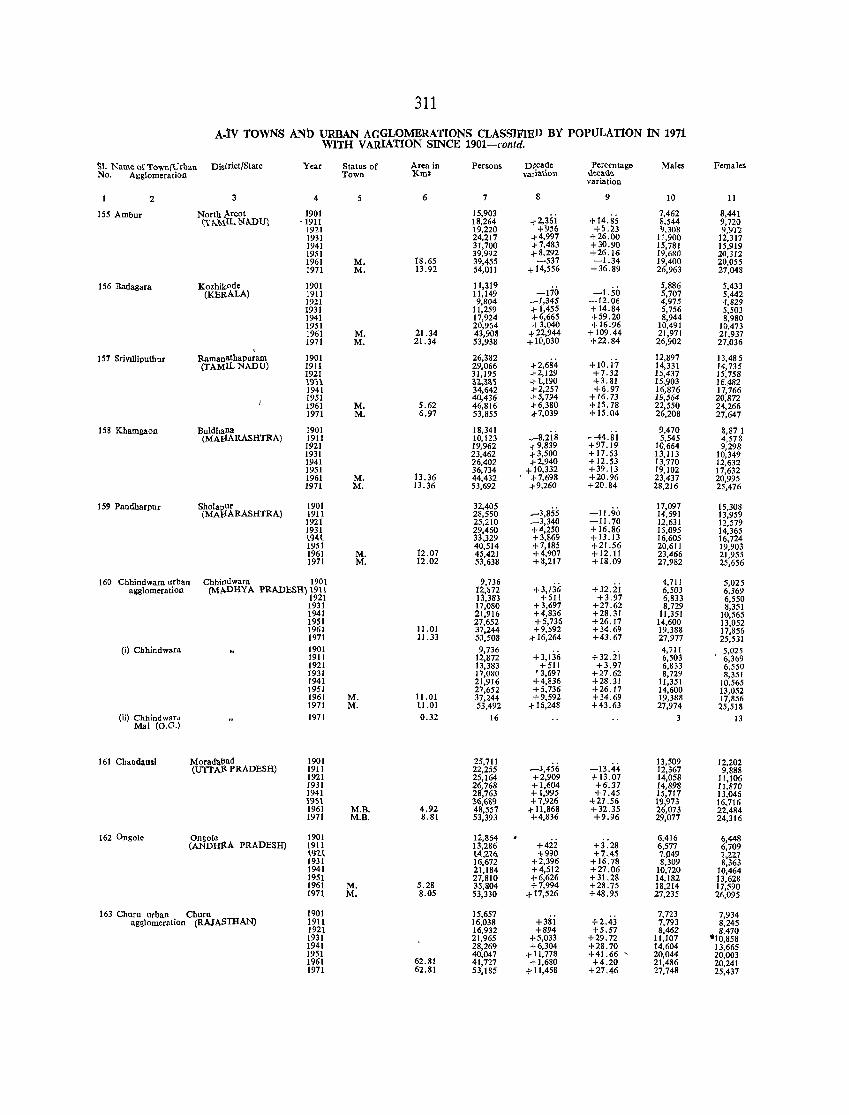
311
A-tv TOWNS ANt> URBAN AGGLOMERATIONS CLASSlFlED BY POPULATION IN 1971 WITH VARIATION SINCE 1901-contd.
!il. NameofTown{Vrban Disirict/State Year Status of Area in Persons D~cade Percentage Males Females No. Agglomeration Town Km. vatiation \lecau."
variation
2 3 4 6 7 9 10 11
155 Ambur North ,\rcot 1901 15,903 ,-2,36i +14.85
7,462 8,441 <:r .... M.£L NillUl • 1911 18,264 8,544 9,720
1921 19,220 +950 +5.:n 9,308 9,912 1931 24,217 -/"4,997 +26.00 11,900 12,317 1941 31,700 -1-7,483 +30.90 15,781 15,919 1951 39,992 -/"8,292 +26.16 19,680 20,312 1961 M. 18.65 39,455 -537 -1.34 19,400 20,055 1971 M. 13.92 54,011 + 14,556 +36.89 26,963 27,048
156 Badagara Kozhikode 1901 11,319 -1"70 -1.50
5,886 5,433 (KERALA) 1911 11,149 5,707 5,442
1921 9,804 ~1,345 -12.06 4,975 4,829 1931 11,259 -1-1,455 + 14.84 5,756 5,503 1941 17,924 -1-6,665 +59.20 8,944 8,980 1951 20,964 +3,040 +16.96 10,491 10,473 1961 M. 21.34 43,908 +22,944 + 109.44 21,971 21,937 1971 M. 21.34 53,938 + Ill,030 +22.84 26,902 27,036 ,
157 SrivllIiputhur Ramanathapuram 1901 26,382 -1-2,684- +lo.i;
12,897 13,485 (TAMIL NADU) 1911 29,066 14,331 14,735
1921 31,195 -/"2,129 +1.32 15,437 15,758 \911 32,3&5 -r 1,190 +3.81 15,903 16,482 1941 34,642 -1-2,257 +6.97 16,876 17,766 1951 40,436 -1-5,794 +16.73 19,564 20,872 1961 M. 5,62 46,816 -1-6,380 +15.78 22,550 24,266 1971 M. 6,97 53,855 -1-7,039 +15.04 26,208 27,647
158 Khamgaon Buldhana 1901 18,341 -44.i;i
9,470 8,871 (MAE!ARASHTRA) 1911 10,123 ~8,218 5,545 4,578
1921 19,962 -1- 9,839 +97.19 10,664 9,298 1931 23,462 -1- 3,500 +17.53 13,113 10,349 1941 26,402 -1-2,940 +12.53 13,770 12,632 1951 36,734 + 10,332 +39.13 19,102 17,632 1961 M. 13.36 44,432 -1-7,698 +20.96 23,437 20,995 1971 M. 13.36 53,692 -j-9,260 +20.84 28,216 25,476
159 Pandharpur Sholapur 1901 32,405 ..-3,855 -11.90
17,097 15,308 (MAIlARASHTRA) 1911 28,550 14,591 13,959
1921 25,210 ..-3,340 -11.70 12,631 12,579 1931 29,460 +4,250 +16.86 15,095 14,365 t94.t 33,329 +3,869 +13.13 16,605 16,724 1951 40,514 +7,185 +21.56 20,611 19,903 1961 M. 12.07 45,421 +4,907 + 12.11 23,466 21,955 1971 M. 12.02 53,638 +8,217 +18.09 27,982 25,656
160 Chhindwara urban ChhirJdwara 1901 9,736 +3,Jji; +32.2i
4,711 5,025 agglomeration (Mp.DHYA PRADESH) }:~} 12,872 6,503 6,369
13,383 +511 +3.97 6,833 6,550 1931 17,080 +3,697 +27.62 8,729 8,351 1941 21,916 +4,836 +28.31 11,351 10,565 1951 27,652 +5,736 +26.17 1.,600 13,052 1961 11.01 37,244 +9,592 +34.69 19,388 17,856 1971 11.33 53,508 -/"16,264 +43.67 27,977 25,531
(i) Chhindw .. ra 1901 9,736 +3,136 +32.ii
4,711 5,025 1911 12,872 6,503 ' 6,369 1921 13,383 +511 +3.97 6,833 6,550 1931 17,080 ' 3,697 +27.62 8,729 8,351 1941 21,916 +4,836 +28.31 11,351 10,565 1951 27,652 +5,736 +26.17 14,600 13,052 1961 M. 11.01 37,244 +9,592 +34.69 19,388 17,856 1971 M. 11.01 53,492 .j-16,248 +43.63 27,974 25,518
(iil Chhindward Mal (OJ}.)
1971 0.32 16 3 13
161 Chandansi Moradll.bad 1901 25,711 ~3,456 -13.44
13,509 12.202 (UTTAlt PRADESH) 1911 22,255 12,367 9,888
1921 25,164 +2,909 +13.07 14,058 11,106 1931 26,768 +1,604 +6.37 14,898 11,870 1941 28,763 + 1,995 +7.45 15,717 13,046 1951 36,6~9 +7,926 +27.56 19,973 16,7t6 1961 M.B. 4.92 48,557 -/" 11,868 +32.35 26,073 22,484 1971 M.B. 8.81 53,393 +4,836 +9.96 29,077 24,316
162 Ongole Ongole 1901 12,864 6,416 6,448 (ANDHRA PRADESH) 1911 13,286 +422 +3.28 6,577 6,709
\'1"l_\ t4,'2.76 +99Q +7A5 7.Jl49 7,227 1931 16,672 +2,396 +16.78 8,309 8,363 1941 21,184 +4,512 +27.06 10,720 10,464 1951 27,810 +6,626 + 31.28 14,182 13,628 1961 M. 5.28 35,804 +7,994 +28.75 18,214 17,590 1971 M. 8.05 53,330 + 17,526 +48.95 27,235 26,095
163 Churu urban Churu 1901 15,657 +38i +2.43
7,723 7,934 agglomeration (RAJASTHAN) 1911 16,038 7,793 8,245
1921 16,932 +894 +5,57 8,462 8,470 1931 21,965 -1-5,033 +29,72 11,107 ·10,858 1941 28,269 -1-6,304 +28.70 14,604 13,665 1951 40,047 + 11,778 +41.66 ' 20,044 20,003 1961 62.81 41,727 +1,680 +4.20 21,486 20,241 1971 62.81 53,185 +11,458 +27.46 27,748 25,437
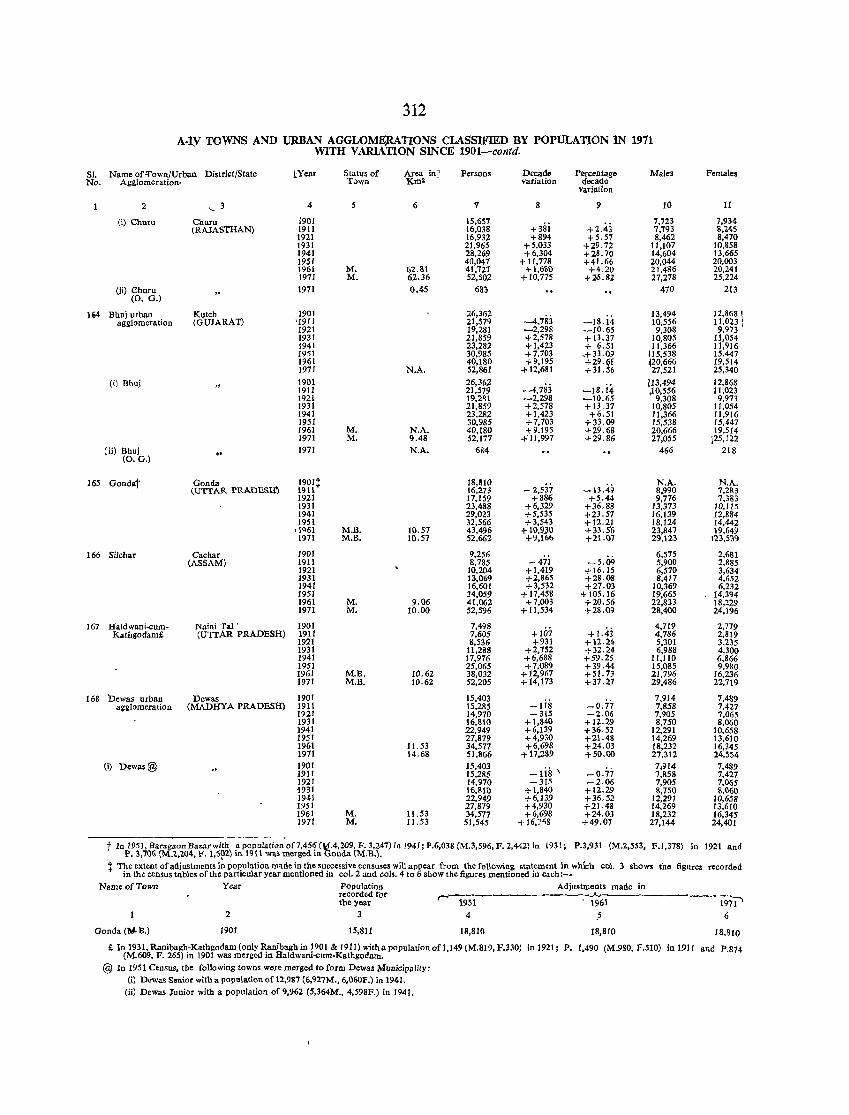
312
A·IY TOWNS AND URBAN AGGLOME;R,ATIONS CLASSIFIED BY POPULATION IN 1971 WITH V ARlATION SINCE 1901-contd.
SI. Name of!fown/Urban District/State I:Year Status of Mel.! in~ Persons Decade Percentage Males Females No. Agglomeration· Town Km~ variation decade
variation
2 '- 3 4 5 6 ., 8 9 10 11
(i) Churn Churn 1901 15,657 +3si +2.43
7,723 1,934 (RAJASTHAN) 1911 16,038 7,793 8,245
1921 16,932 +894 +5.57 8,462 8,470 1931 21,965 +5,033 +29.72 11,107 10,858 1941 28,269 +6,304 +28.70 14,604 13,665 1951 40,047 + 11,778 +41.66 20,044 20,003 1961 M. 62.81 41,727 +1,680 +4.20 21,486 20,241 1971 M. 62.36 52,502 + 10,775 +26.82 27,278 25,224
(ii) Churu 1971 0,45 683 470 213 (0. G.)
1M Bhuj urban Kutch 190) 26,362 --4,783 -18.i4
13,494 12,868 1 agglomeration (GUJARAT) '1911 21,579 10,556 11,023 1
1921 19,281 -2,298 -10.65 9,308 9,973 1931 21,859 +2,578 + 13.37 10,805 11,054 1941 23,282 +1,423 + 6.51 11,366 11,916 1951 30,985 +7,703 ,+33.09 115,538 15,447 1961 40,180 +9,195 +29.(ig ~20,666 19,514 1971 N.A. 52,861 + 12,681 +31.56 27,521 25,340
(i) Bhuj 1901 26,362 -4.7S3 -18.i4
113,494 12,868 1911 21,579 ,10,556 11.023 1921 19,281 -2,298 -10.65 9,308 9,973 1931 21,859 +2,578 + 13.37 10,805 1l,054 1941 23,282 +1,423 +6.51 11,366 ll,916 1951 30,985 +7,703 +33.09 15,538 15,447 1961 M. N.A. 40,180 +9.195 +29.68 20,666 19,514 1971 M. 9.48 52,177 of 11,997 +29.86 27,055 125,122
Cii) Bhuj 1971 N.A. 684 466 218 (0. G.)
165 Gondat Gonda 1901t 18,810 -13.49
N.A. N.A. (UTTAR PRADESH') 1911 16,273 _ 2,537 8,990 7,283
1921 17,159 +886 +5.44 9,776 7,383 1931 23,488 +6,329 +36.88 13,373 10,115 1941 29,023 +5,535 +23.57 16,139 12,884 1951 32,566 +3,543 +12.2) 18,124 14,442
'1%1 M.B. 10.57 43,4<}6 +IO,VO +33.56 23,847 19,649 1971 M.B. 10.57 52,662 +9,166 +21.()7 29,123 12.3,539
166 Silchar Cachar 1901 9,256 -5.09
6,575 2,681 (ASSAM) 1911 8,785 -471 5,900 2,885
1921 10,204 +1,419 +16.15 6,570 3,634' 1931 13,069 +2,865 +28.08 8,417 4,652 1941 16,601 +3,532 +27.03 10,369 6,232 1951 34,059 + 17,458 +105.16 19,665 , 14,394 1961 M. 9.06 41,062 +7,003 +20.56 22,833 18,229 1971 M. 10.00 52,596 + 11,534 +28.09 28,400 24,196
167 Haldwani-cwn- Naini Tal' 1901 7,498 +107 +1.4.i
4,719 2,779 Kathgodam£ (UTTAR PRADESH) 1911 7,605 4,786 2,819
1921 8,536 +931 +12.24 5,301 3,235 1931 11,288 +2,752 +32.24 6,988 4,300 1941 11,976 +6,688 +59.25 11,110 6,866 1951 25,065 +7,089 +39.44 15,085 9,980 1961 M.B. 10.62 38,032 +12,967 +51. 73 21,796 16,236 1971 M.B. 10.62 52,205 + 14,173 +37.21 29,486 22,719
168 Dewas urban Dewas 1901 15,403 -lis
7,914 7,489 agi1omeration (MADHYA PRADESfI) 1911 15,285 -0.77 7,858 7.427
1921 14,970 -315 -2.06 7,905 7,065 1931 16,810 +1,840 +12.29 8,750 8,060 1941 22,949 +6,139 +36.52 12,291 10,658 1951 27,879 +4,930 +21.48 14,269 13,610 1961 11. 53 34,577 +6,698 +24.03 18,232 16,345 1971 14,68 51,866 + 17,289 +50.00 27.312 24,554
(i) Dewas@ 1901 15,403 -lis' -0.71 7,914 7,489
1911 15,285 7,858 7,427 1921 14,970 -315 -2.06 7,905 7,065 i931 16,810 +1,840 +12.29 8,750 8,(\61l 1941 22,949 +6,139 +36.52 12,291 10,658 1951 27,879 +4,930 +21.48 14,269 13,610 1961 M. 11.53 34,577 +6,698 +24.03 18,232 16,345 1971 M. 11.53 51,545 +16,?'iS +49.01 27,144 24,401
t In 1951, BaragaonBazarwith a population of 7,456 (~.4,209, F. 3,247) in 1941; P.6,038 (M.3,596, F. 2,442) in 1931; P. 3,706 (M.2,l04, F. I,S~2) in 1911 was merged in onda (M.B.),
P.3,931 (M.2,553, F.I,378) in 1921 and
t The extent of adjustments in population made in tbe successive censuses will appear from the following statement in which col. 3 shows in the census tables of the particular year mentioned in col. 2 and cois. 4 to 6 show the figures mentioned in eacb:-
the figures recorded
Name of Town Year Population Adjustments made in recorded for .-1951---------:-1%1 the year 1971'
2 3 4 .5 6
Gonda (1\1, R) 1901 15,811 18,810 18,810 18,810
£ In 1931, Ranibagh-Kathgodam (only Ranibagh in 1901 & 1911) with a population of l,149lM.819, F.330) (M.609, F. 265) in 1901 was merged in Haldwani-cum-Kathgodatn.
in 1921; P. 1.490 (M.9S0, F.510) in 1911 and P.874
@ In 1951 Census. tbe following towns were merged to form Dewas :t.{unicipality: (il Dewas Senior with a population of 12,987 (6,927M., 6,060F.) in 1941.
(ii) Dewas Junior with a population of 9,962 (5,364:M., 4,598F.) in 1941.
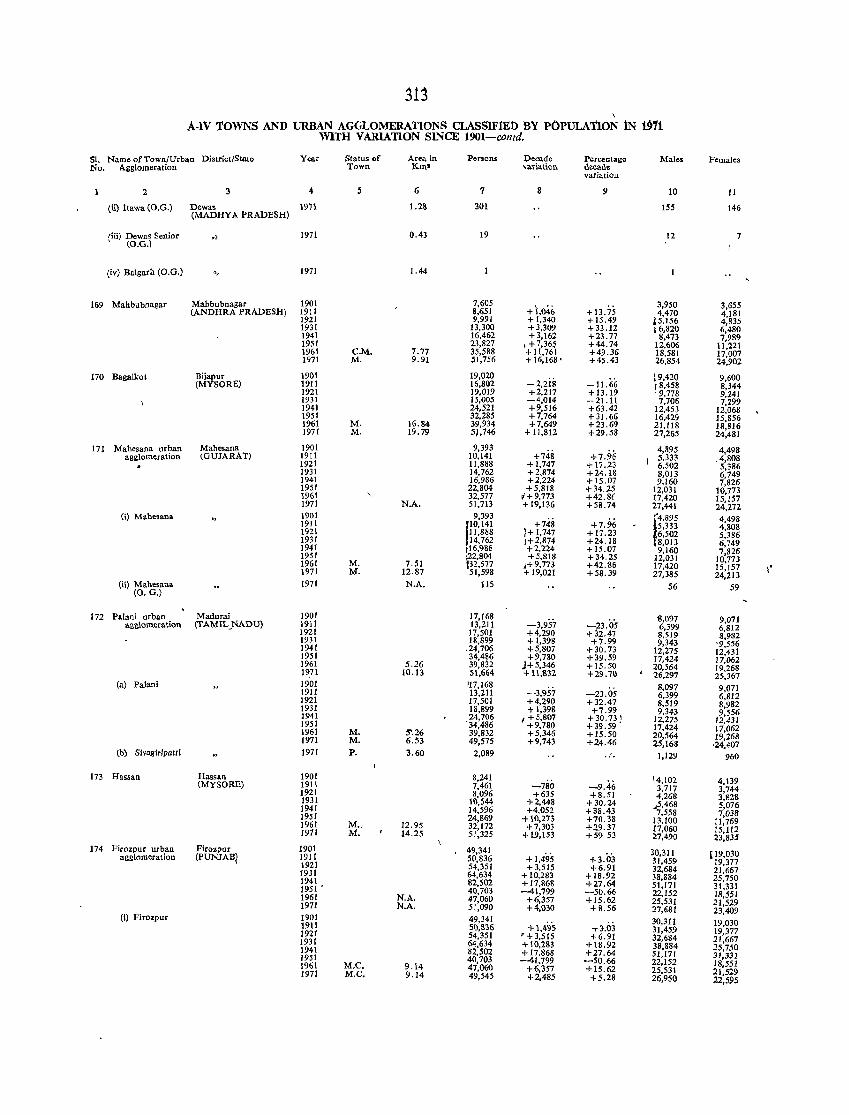
313 \
A-1V TOWNS AND URBAN AGGLOMERATIONS CLASSIFIED BY p()pULAnON iN 1§11 WITH V ARlATlON SINCE 1901-contd.
SI, Name of Town/Urban DistrictiState Year Status of Area in Persons Oecade Percentage Males Females No. Agglomeration Town Km' ~a.ria.tion decade
va.riation
2 3 4 5 6 7 9 10 11
(ii) Itawa (O.G.) Dewas 1971 1.2& 301 155 146 (MADHYA PRADESH)
riii) Dewas Senior ., 1971 0.43 19 12 7 , (O.G.)
(iv) Balgarh (O.G.) 0, 1971 1.44
169 Mahbubnagar Mabbubnagar 1901 7,605 + 1.046
3,950 3,655 (ANDHRA PRADESH) 1911 8,651 + 13.75 4,470 4,181
1921 9,991 + 1,340 +15.49 15,156 4,835 1931 13,300 +3,309 +33.12 16,820 6,480 1941 16,462 +3,162 +23.77 8,473 7,989 1951 23,827 , +7,36~ +44.74 12,606 11,221 1961 C.M. 7.77 35,588 + 11,761 +49.36 18,581 17,007 1971 M. 9.91 51,756 + 16,168' +45.43 26,854 24,902
170 Bagalkol Bijapur 1901 19,020 -2,2is -11.66
\9,420 9,600 (MYSORE) 1911 16,802 18,458 8,344
1921 19,019 +2,217 +13.19 . 9,778 9,241 1931 15,005 -4,014 - 21.11 7,706 7,299 1941 24,521 +9,516 +63.42 12,453 12,068 1951 32,285 +7,764 +31.66 16,429 15,856 1961 M. 16.84 39,934 +7,649 +23.69 21,118 18,816 1971 M. 19.79 51,746 +11,812 +29.58 27,265 24,481
171 Mahesana urban Mahesana 1901 9,393 +7.96
4,395 4,498 agglomeration (GUJARAT) 1911 10,141 +748 5,333 .4,808
1921 11,888 +1,747 + 17 .23 6,502 5,386 1931 14,762 +2,874 +24.18 8,013 6,749 1941 16,986 +2,224 +15.07 9,160 7,826 1951 22,804 +5,818 +34.25 12,031 10,773 1961 32,577 ~+9,773 +42.8( 17,420 15,157 1971 N.A. 51,713 + 19.136 +58.74 27,441 24,272
(i) Malle.ana 1901 9,393 +7048 +7.96
(4,895 4,498 1911 110,141 5,333 4.808 1921 r,888 J+I,747 + 17.23 f6,502 5,386 1931 14,762 1+ 2,874 +24.18 8,013 6,749 1941 16,986 +2,224 +15.07 9,160 7,826 1951 :22,804 +5,818 +34.25 12,031 10,773 1961 M. 7.51 132,577 ,+9,773 +42.86 17,420 15,157 t' 1971 M. 12.87 51,598 +19.021 +58.39 27,385 24,213 (ii) Mahesaua
(0. G.) 1911 N.A, 115 56 59
172 Palani urban Madurai 1901 11,168 -3,9S1 -23.05
iI,097 9,071 agglomeration (TAMIL_NADU) 1911 13,211 6,399 6,812 1921 17,501 +4,290 +~2.47 8,519 8,982 1931 18,899 +1.398 +7.99 9.343 '9,556 1941 ,24,706 +5,807 +30.73 12,275 12,431 1951 34,4~6 +9,780 + 39. 59 17,424 17.062 1961 5.26 39,82 J+5,346 +15.50 20,564 19,268 1~71 10.13 SI.664 + 11,1132 +29.71) ,
26,297 25,367 (a) Palaui 1901 117,168
-3,957 8,097 9,071 19t1 13,211 -23.05 6,399 6,812 1921 17,501 +4,290 +32.47 8,519 8,982 1931 18,899 +1,398 +7.99 9,343 9,556 1941 .24,706 1+ 5,807 +30.731 12,275 12,431 1951 34,486 +9,180 +39.59 . 17,424 17,062 1961 M. 5'.26 39,832 +5,346 +15.50 20,564 19,268 1971 M. 6.53 49,575 +9,743 +24.46 25.168 '24,407
(b) Sivagiripatti 1971 P. 3.60 2,089 ... 1,129 960
173 Hassan Hassan 1901 8,241 -180 -9.46
14,102 4.139 (MYSORE) 1911 7,461 3,717 3,744 1921 8,096 +635 +8.51 4,268 3,828 1931 11),544 +2,448 +30.24 ... 5,468 5,076 1941 14,596 +4,052 +38.43 7,558 7,038 1951 24,869 +10.273 +70.38 13,100 11,769 1961 M., 12.95 32,172 +7,303 +29.37 17,060 15,112 1971 M. 14.25 51,325 + 19,153 +59 53 27,490 23.835 174 Firozpur urban Firozpur 1901 49,341
+1,495 +3.03 30,311 (19,030 agglomeration (PUNJAB) 1911 50,836 31,459 19.377 1921 54,351 +3,515 +6.91 32,684 21,667 1931 64,634 + 10,283 + 18.92 38,884 25.750 1941 82.502 + 17,868 +27.64 51,171 31,331 1951 . 40,703 -41,799 -50.66 22,152 18,551 1961 N.A. 47,060 +6,351 +15.62 25,531 21,529 1971 N.A. SI,090 +4,030 +8.56 27.681 23,409
(i) Firozpur 1901 49,341 30,311 19,030 1911 50,836 + 1,4~is +3.03 31,459 19,377 1921 54,351 ' +3,515 +6.91 32,684 21,667 1931 64,634 + 10,283 +18.92 38,884 25,750 1941 82.502 + 17,868 +27.64 51,171 31,331 1951 40,703 -41,799 -50.66 22,152 18.551 1961 M.e. 9.14 47,060 +6,351 + 15.62 25,531 1971 M.e. 9.14 21.529 49,545 +2,485 +5.28 26.950 22,595
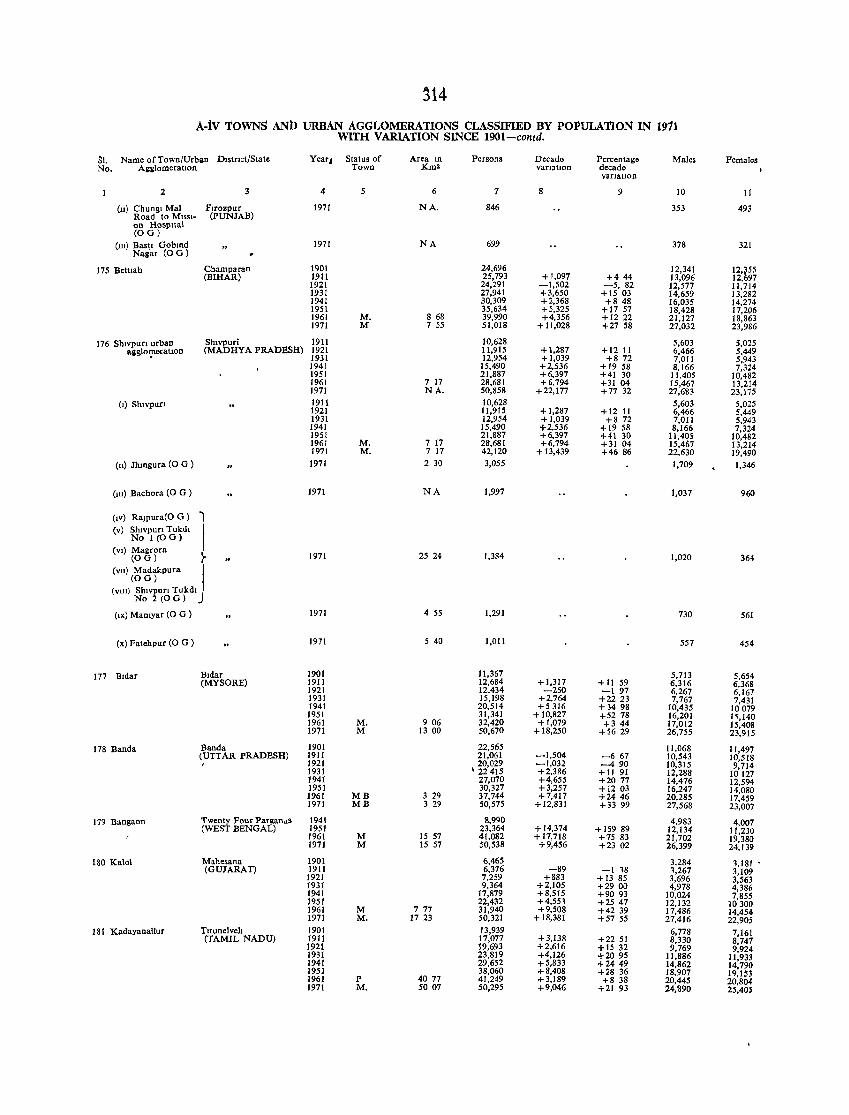
~14
A-tv TOWNS ANb URBAN AGGLOMERATIONS CLASSIFIED BY POPULAnON IN 1911 WITH VARIATION SINCE 1901-contd.
Sl. Name of Town/Urban DistrIct/State Year~ Statns of Area III Persons Decade Percentage Males Females No. AllglomeratlOn Town Km' vartatlOn decade
varIatIon
2 3 4 5 6 1 8 9 10 11
(n) Chungl Mal Flrozpur 1971 NA. 846 353 493 Road to MISSI- (PUNJAB) on Hospital (OG)
(111) Bastt Goblnd 1971 NA 699 378 321 Na!:ar (0 G)
175 Bettlah Champa ran 1901 24,696 12,341 12,~S5 (BIHAR) 1911 25,793 +1,097 +444 13,096 12, 97
1921 24,291 -1,502 -5,82 12,577 11,714 1931 27,941 +3,650 +15 03 14,659 13,282 1941 30,309 +2,368 +8 48 16,035 14,274 1951 35,634 +5,325 +17 57 18,428 17,206 1961 M. 8 68 39,990 +4,356 +1222 21,127 18,863 1971 M 7 55 51,018 + 11,028 +27 58 27,032 23,986
176 ShtvpuCi urban Shtvpuri 1911 10,628 5,603 5,025 agglot;'eratlon (MADHYA PRADESH) 1921 11,915 + 1,287 +12 11 6,466 5,449
1931 12,954 +1,039 +872 7,011 5,943 1941 15,490 +2,536 +19 58 8,166 7,324 1951 21,887 +6,397 +41 30 11,405 10,482 1961 7 17 28,681 +6,794 +31 04 15,467 13,214 1971 NA. 50,858 +22,177 +77 32 27,683 23,175
(I) Shlvpun 1911 10,628 5,603 5,025 1921 11,915 +1,287 +12 11 6,466 5,449 1931 12,954 +1,039 +872 7,011 5,943 1941 15,490 +2,536 +19 58 8,166 7,324 1951 21,887 +6,397 +41 30 11,405 10,482 1961 M. 7 17 28,681 +6,794 +31 04 15,467 13,214 1971 M. 7 17 42,120 + 13,439 +46 86 22,630 19,490
(II) Jhmgura (0 G ) 1971 230 3,055 1,709 1,346
(lIl) Bachora (0 G ) 1971 NA 1,997 1,037 960
(IV) Ra1Pura(0 G ) l (v) ShlvpurI Tukdl I No 1 (0 G) (VI) Magrora
(OG) ~ 1971 2524 1,384 1,020 364
(VII) Madakpura I (OG)
(VlIl) ShlvpurI Tukdl J No 2 (OG)
(.x) Mamyar (0 G ) 1971 4 55 1,291 730 561
(x) Fatehpur (0 G ) 1971 5 40 1,011 557 454
177 Bldar Bldar 1901 11,367 5,713 5,654 (MYSORE) 1911 12,684 + 1,317 +11 59 6,316 6,368
1921 12,434 -250 -197 6,267 6,167 1931 15,198 +2,764 +2223 7,767 7,431 1941 20,514 +5316 + 3498 10,435 10079 1951 31,341 + 10,827 +52 78 16,201 1~,140 1961 M. 906 32,420 +1,079 +3 44 17,012 15,408 1971 M 13 00 50,670 + 18,250 +5629 26,755 23,915
178 Banda Banda 1901 22,565 11,068 11,497 (UTTAR PRADESH) 1911 21,061 -1,504 -667 10,543 10,518
1921 20,029 -1,032 -490 10,315 9,714 1931 "22415 +2,386 +1191 12,288 10127 1941 27,070 +4,655 +2077 14,476 12,594 1951 30,327 +3,257 +1203 16,247 14,080 1961 MB 3 29 37,744 +7,417 +2446 20,285 17,459 1971 MB 3 29 50,575 +12,831 +33 99 27,568 23,007
179 Bangaon Twenty Four PargandS 1941 8,990 4,983 4,007 (WEST BENGAL) 1951 23,364 + 14,374 + 159 89 12,134 11,230
1961 M 15 57 41,082 +17,718 +75 83 21,702 19,380 1971 M 15 57 50,538 +9,456 +23 02 26,399 24,139
180 Kalal Mahesana 1901 6,465 3,284 1,181 ' (GUJARAT) 1911 6,376 -89 -1 18 1,267 3,109
1921 7,259 +883 + 13 85 3,696 3,563 1931 9,364 +2,105 +2900 4,978 4,386 1941 17,879 +8,515 +9093 10,024 7,855 1951 22,432 +4,553 +2547 12,132 10300 1961 M 777 31,940 +9,508 +42 39 17,486 14,454 1971 M. 1723 50,321 +18,381 +57 55 27,416 22,905
181 Kadayanallur TIrunelvelI 1901 13,939 6,778 7,161 (TAMIL NADU) 1911 17,077 +3,138 +2251 8,330 8,747
1921 19,693 +2,616 +15 32 9,769 9,924 1931 23,819 +4,126 +2095 11,886 11,933 1941 29,652 +5,833 +2449 14,862 14,790 1951 38,060 +8,408 +28 36 18,907 19,153 1961 P 4077 41,249 +3,189 +8 38 20,445 20,804 1971 M. 5007 50,295 +9,046 +2193 24,890 25,40$
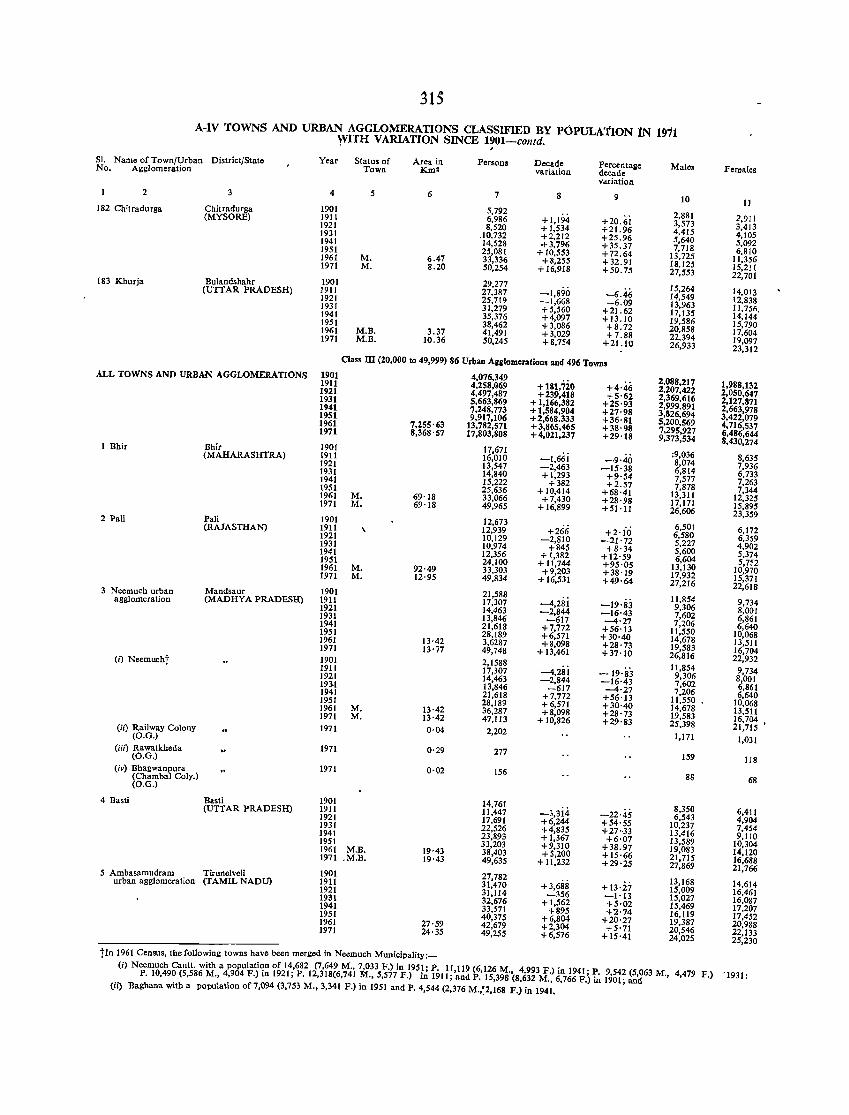
j15
A-tv TOWNS AND URBAN AGGLOMERATIONS CLASSIFIED BY POPULATION IN 1911 WITH VARIATION SINCE 1901-contd.
SI. Name of Town/Urban District/State Year Status of Area in Persons Decade Perc.ntalle Male. Females No. Agglomeration Town KmS variation decade variation
2 3 4 5 6 7 8 9 10 II 182 Chitradurga Chitradurga 1901 5,792
+1,194 +20.i;i 2,881 2.911 (MYSORE) 1911 6,986 3,573 3,413 1921 8.520 +1,534 +21.96 4.415 4.105 1931 .10.732 +2.212 +25.96 5,640 5.092 1941 14,528 -+3.796 +35.37 7.718 6,810 1951 25,081 + 10.553 +72.64 13.725 11.356 1961 M. 6.47 33,336 +8,255 +32.91 18.125 15,211 1971 M. 8.20 50.254 +16.918 +50.75 27,553 22,701
183 Khurja Bulandshahr 1901 29,277 -1.890 -6.46
15.264 14.013 (UTTAR PRADESH) 1911 27,387 14.549 12,838 1921 25.719 -1,668 -6.09 13,963 11.756. 1931 31.279 +5,560 +21.62 17,135 14,144 1941 35,376 +4,097 +13.10 19.586 15,790 1951 38,462 +3,086 +8.72 20,858 17.604 1961 M.B. 3.37 41.491 +3,029 +7.88 22.394 19,097 1971 M.B. 10.36 50.245 +8.754 +21.10 26,933 23.312 Class m (20,000 to 49,999) 86 Urban Aeelomerations and 496 Towns
ALL TOWNS AND URBAN AGGLOMERATIONS 1901 4,076,349 +181,720 +4'46
2,088,217 1,988,132 1911 4.258.069 2,207,422 2,050.647 1921 4,497,487 +239.418 +5'62 2,369,616 2,127,871 1931 5,663,869 +1,166,382 +25'93 2,999,891 2,663,978 1941 7,248,773 +1,584,904 +27'98 3,826,694 3.422,079 1951 9,917,106 +2,668.333 +36'81 5,200,569 4,716,537 1961 7,255,63 13,782,571 +3,865,465 +38'98 7,295,927 6,486,644 1971 8,368'57 17,803,808 +4,021,237 +29'18 9,373,534 8,430,274 1 Bhir Bhir 1901 17,671 -1,66i -9'40
:9,036 8,635 (MAHARASHTRA) 1911 16,010 8,074 7,936 1921 13,547 -2,463 -15'38 6.814 6,733 1931 14,840 +1,293 +9'54 7.577 7,263 1941 15,222 +382 +2.57 7,878 7,344 1951 25,636 +10,414 +68'41 13.311 12,325 1961 M. 69·18 33,066 +7,430 +28·98 17,171 15,895 1971 M. 69'18 49,965 + 16,899 +51'11 26,606 23,359 2 Pali Pali 1901 12,673 +266 +2'10
6,501 6,172 (RAJASTHAN) 1911 12,939 6,580 6,359 1921 10.129 -2,810 -21'72 5,227 4,902 1931 10,974 +845 +8'34 5,600 5.374 1941 12,356 + 1,382 +12'59 6.604 5,752 1951 24,100 + 11,744 +95·05 13,130 10,970 1961 M. 92·49 33,303 +9.203 +38'19 17,932 15,371 1971 M. 12'95 49,834 + 16,531 +49'64 27,216 22,618 3 Neemuch urban Mandsaur 1901 21,588
-4,28i -19'83 11,854 9,734 agglomeration (MADHYA PRADESH) 1911 17,307 9,306 8.001 1921 14.463 -2,844 -16'43 7,602 6,861 1931 13,846 -617 -4'27 7,206 6.640 1941 21,618 +7.772 +56'13 11,550 10,068 1951 28,189 +6,571 +30'40 14,678 13,511 1961 13·42 3,6287 +8,098 +28'73 19.583 16,704 1971 13'77 49,748 + 13,461 +37'10 26,816 22,932 (i) Neemucht 1901 2,1588
-4,2Si -19'83 11.854 9,734 1911 17,307 9,306 8,001 1921 14,463 -2,844 -16'43 7,602 6,861 193-1 13,846 -617 -4'27 7,206 6,640 1941 21,618 +7,772 +56'13 11,550 10,068 1951 28,189 + 6,571 +30'40 14,678 13.SI1 1961 M. 13·42 36,287 +8,098 +28'73 19,583 16,704 1971 M. 13·42 47.113 + 10,826 +29'83 25.398 21,715 ' (in Railway Colony 1971 0·04 2,202 1,171 1,031 (O.G.)
(/ii) Rawatkheda 1971 0'29 277 IS9 118 (O.G.)
(iv) Bhagwanpura 1971 0·02 156 88 68 (Chamba1 Coly.)
(O.G.)
4 Basti Basti 1901 14,761 -3,3i4 8,350 6,411 (UTTAR PRADESH) 1911 11,447 -22'45 6,543 4,904 1921 17,691 +6,244 +54'55 10,237 7,454 1931 22.526 +4,835 +27'·33 13,416 9,110 1941 23,893 +1,367 +6'07 13,589 10,304 1951 33,203 +9,310 +38.97 19,083 14,120 1961 M.B. 19·43 38,403 +5,200 +15·66 21,715 16,688 1971 .M.B. 19'43 49,635 + 11,232 +29'25 27,869 21,766 5 Ambasamudram Tirune1veli 1901 27,782 +3,688 13,168 14.614 urban agglomeration (TAMIL NADU) 1911 31,470 + 13'27 15,009 16,461 1921 31,114 -356 -1'13 15,027 16,087 1931 32,676 +1,562 +5'02 15,469 17,207 1941 33,571 +895 +'2'74 16,119 17,452 1951 40,375 +6,804 +20'27 19,387 20.988 1961 27·59 42,679 +2,304 +5'71 20,546 22,133 1971 24·35 49,255 +6,576 +15'41 24,025 25,230
tIn 1961 Census, the following towns have been merged in Neemuch Municipality:-
(i) Neemuch Cantt. with a population of 14,682 (7.649 M., 7,033 F.) in 1951; P. 11,119 (6,126 M., 4.993 F.) in 1941; P. 9,542 (5,063 M., 4,479 F) '1931 : P. 10,490 (5,586 M., 4,904 F.) in 1921; P. 12,318(6,741 M., 5,577 F.) in 1911; and P. 15,398 (8.632 M., 6,766 F.) in 1901; and .
(ii) Baghana with a population of 7,094 (3,753 M., 3,341 F.) in 1951 and P. 4,544 (2,376 M.,~2,168 F.) in 1941.
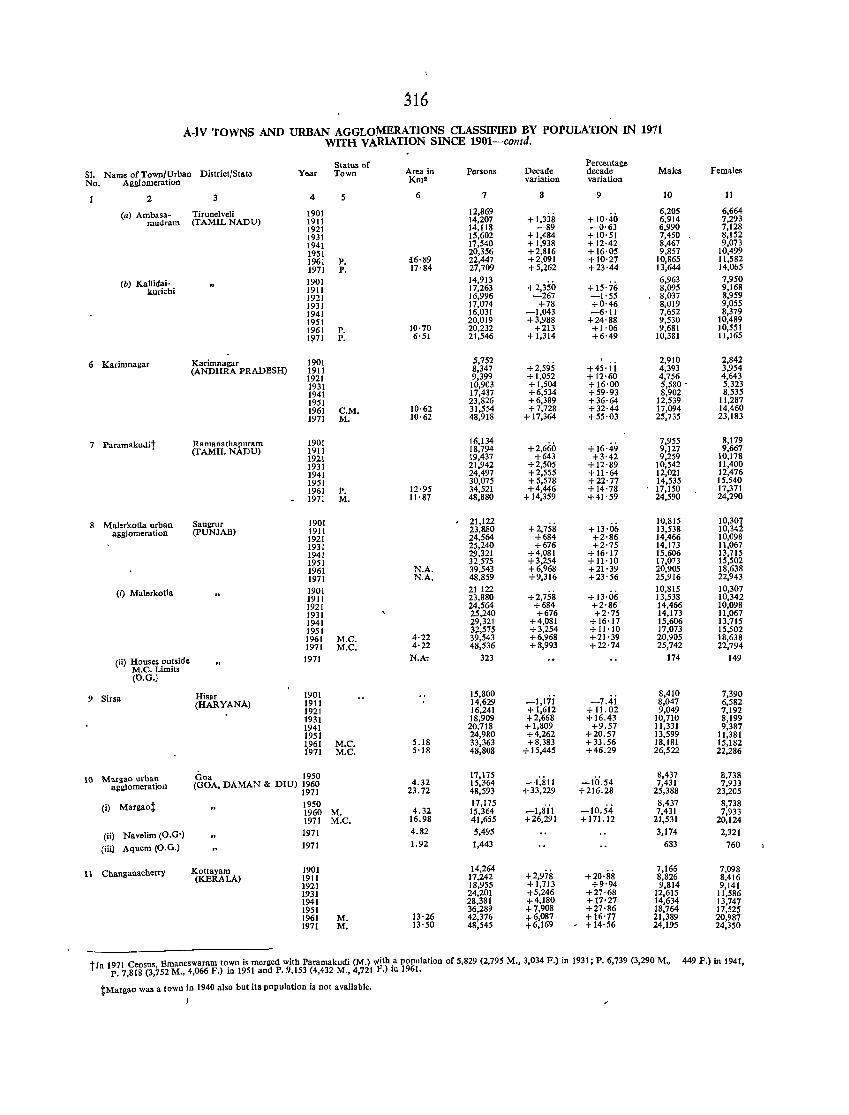
316
A-tv TOWNS AND URBAN AGGLo:MERATIONS CLASSIFIED BY POPULATION IN 1911 WITH VARIATION SINCE 1901-contd.
Status of Percentage SI. Name of Town/Urban District/Stat. Year Town Area in Persons Decade decade Males Females No. Agglomeration Km! variation variation
2 3 4 5 6 7 8 9 10 11
(a) Ambasa- Tirunelveli 1901 12,869 + 1,338 +10'40
6,205 6,664 mudram (TAMIL NADU) 1911 14,207 6,914 7.293
1921 14,118 -89 --0·63 6,990 7,128 1931 15,602 + 1,484 + 10'51 7,450 8,152 1941 17,540 + 1,938 +12·42 8,467 9,073 1951 20,356 +2,816 + 16·05 9,857 10,499 1961 P. ~6'89 22,447 +2,091 +10'27 10,865 11,582 1971 P. 17'84 27,709 +5,262 +23'44 13,644 14,065
(b) Kallidai- 1901 14,913 +2,350 +15'76
6,963 7,950 kuricbi 1911 ]7,263 8,095 9,168
1921 16,996 -267 -1'55 8,037 8,959 1931 17,074 +78 +0'46 8,019 9,055 1941 16,031 -1,043 -6'11 7,652 8,379 1951 20,019 +3,988 +24'88 9,530 10,489 196] P. 10'70 20,232 +213 +1·06 9,681 10,551 1~71 P. 6'51 21,546 + 1,314 +6'49 10,381 11,165
6 Karimnagar Karimnagar 1901 5,752 +2,595 +45·jj
2,910 2,842 (ANDHRA PRADI!SH) 1911 8,347 4,393 3,954
1921 9,399 +1,052 +12·60 4,756 4,643 1931 10,903 +1,504 +16·00 5,580 • 5,323 1941 17,437 +6,534 +59·93 8,902 8,535 195] 23,826 +6,389 +36'64 12,539 11,287 1961 C.M. 10·62 31,554 +7,728 +32·44 17,094 14,460 1971 M. 10·62 48,918 + 17,364 +55'03 25,735 23,183
7 Paramakudit Ramanathapuram 190] 16,134 +2,660 +16·49
7,955 8,179 (TAMIL NADU) 1911 18,794 9,127 9,667
1921 19,437 +643 +3·42 9,259 10,178 1931 21,942 +2,505 +12'89 10,542 11,400 1941 24,497 +2,555 + 11·64 12,021 12,476 1951 30,075 +5,578 +22'77 14,535 15,540 1961 P. 12·95 34,521 +4,446 +14'78 17,150 17,371 1971 M. 11'87 48,880 + 14,359 +41'59 24,590 24,290
Mal.rkotla urban Sangrur 1901 21,122 +2,758 +13·06
10,8]5 10,301 agglomeration (pUNJAB) 1911 23,880 13,538 10,34
1921 24,564 +684 +2'86 14,466 10,098 1931 25,240 +676 +2'75 14,173 11,067 1941 29,321 +4,081 +16'17 15,606 1),715 1951 32.575 +3,254 + 11'10 17,073 15,502 1961 N.A. 39,543 +6,968 +21'39 20,905 18,638 1971 N.A. 48,859 +9,316 +23·56 25,916 22,943
(i) Malerkotla 1901 21 122 +13·06
10,815 10,307 1911 23,880 +2,758 13,538 10,342 1921 24,564 +684 +2'86 14,466 10,098 1931 25,240 +676 +2'75 14,173 11,067 1941 29,321 +4,081 +16'17 15,606 13,715 1951 32,575 +3,254 + 11·10 17,073 15,502 1961 M.C. 4·22 39,543 +6,968 +21'39 20,905 18,638 1971 M.C. 4'22 48,536 +8,993 +22'74 25,742 22,794
(ii) Houses outside 1971 N.k 323 174 149 M.C.Limits (O.G.)
9 Sirsa Hisar 1901 15,800 -1,1'7i -7 . .jj
8,410 7,390 (HARYANA) 19J I 14,629 8,047 6,582
J921 16,241 +1,612 + II. 02 9,049 7,192 1931 18,909 +2,668 +J6.43 10,710 8,199 1941 20,718 + 1,809 +9.57 11,331 9,387 1951 24,980 +4,262 +20.57 13,599 11,381 1961 M.C. 5.18 33,363 +8,383 +33.56 18,J81 15,182 1'971 M.C. 5'18 48,808 + 15,445 +46.29 26,522 22,286
10 Margao urban Goa J950 17,175 -1',811 -10.54
8,437 8,738 a£l:lomeration (GOA, DAMAN & DIU) J960 4.32 15,364 7,431 7,933
1971 23.72 48,593 +33,229 +216.28 25,388 23,205
(i) Margaot J950 J7,175 -I,ail -JO.54
8,437 8,738 1960 M. 4.32 15,364 7,431 7,933 1971 M.C. 16.98 41,655 +26,291 +171.12 21,531 20,124
(ii) Navelim (O.G·) 1971 4.82 5,495 3,174 2,321
(iii) Aquem (O.G.) 1971 1.92 1,443 683 760
II Changanacherry Kottayam J901 J4,264 +2,978 +20'88
7,166 7,098 (KERALA) 1911 17,242 8,826 8,416
1921 18,955 +1,713 +9'94 9,8J4 9,141 1931 24,201 +5,246 +27'68 t2,615 11,586 1941 28,381 +4,180 +17'27 14,634 13,747 1951 36,289 +7,908 +27'86 18,764 17,525 1961 M. 13·26 42,376 +6,087 + 16'77 21,389 20,987 1971 M. 13'50 48,545 +6,169 - + 14·56 24,195 24,350
tIn 1971 Census, Emaneswaram to.wn is merged with Paramakudi (M.) \~ith.a population nf 5,829 (2,795 M., 3,034 F.) in 1931; P. 6,739 (3,290 M., P. 7,818 (3,752 M., 4,066 F.) In 1951 and P. 9,153 (4,432 M., 4,721 F.) 10 1961.
449 F.> in 1941,
tMargao was a lown in 1940 also but its population is not available.
I
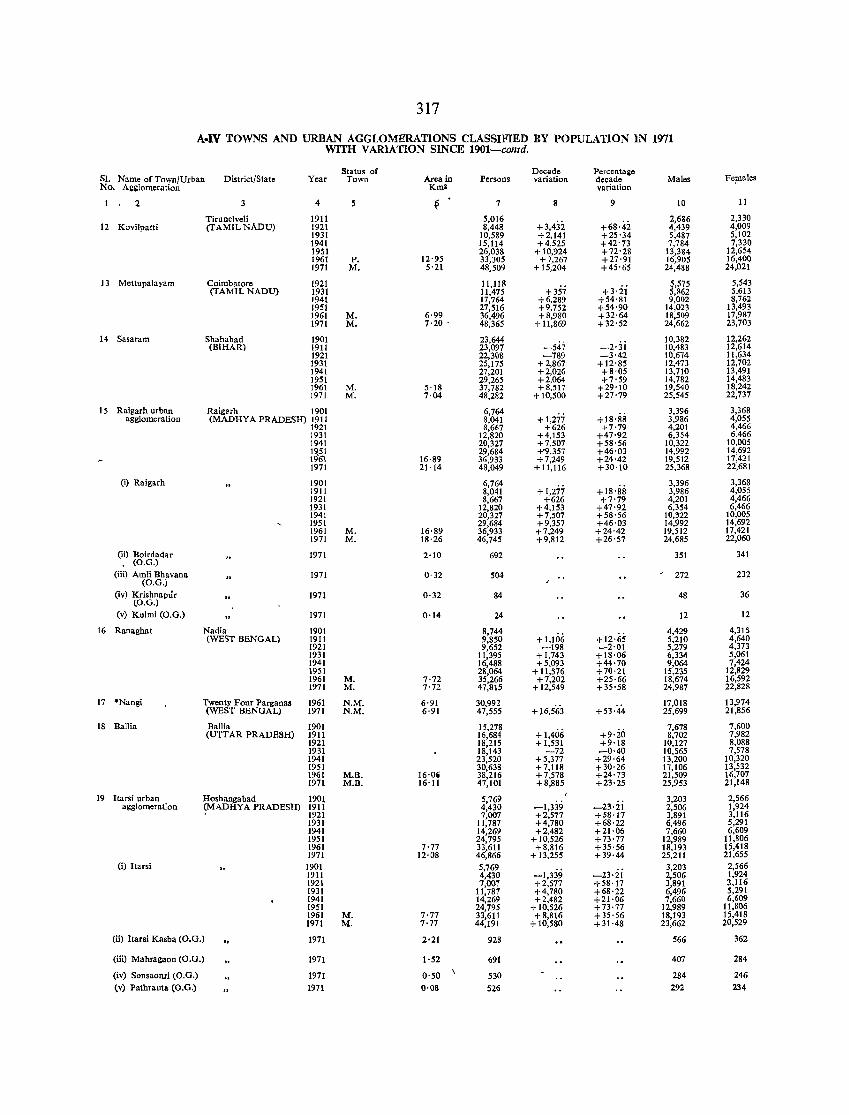
317
A.IV TOWNS AND URBAN AGGLOMERATIONS CLASSIFIED BY POPULATION m 1971 WITH V ARlATION SINCE 1901-comd.
Status of Decade Percentaec SI. Name of Town/Urban District/State Year Town Area in Persons variation decade Males Fe1"ales No. Agglomeration KmO variation
I . 2 4 ~ 7 8 9 10 11
Tirunelveli 1911 5,016 +3,432 +68'42
2,686 2,330 12 Kovilpatti (TAMIL NADU) 1921 8,448 4,439 4,009
1931 10,589 +2,141 +25'34 5,487 5,102 1941 15,114 +4,525 +42'73 7,184 7,330 1951 26,038 +10,924 +72'28 13,384 12,654 1961 P. 12'95 33,305 +7,267 +27'91 16,905 16,400 1971 M. 5'21 48,509 + 15,204 +45'65 24,488 24,021
13 Mettupalayam Coimbatore 1921 11,118 +357 +3·ii
~,575 5,543 (TAMIL NADU) 1931 11,475 5,862 5,613
1941 17,764 +6,289 +54'81 9,002 8,762 1951 27,516 +9,752 +54'90 14,023 13,493 1961 M. 6·99 36,496 +8,980 +32'64 18,509 17,987 1971 M. 7'20 . 48,365 + 11,869 +32'52 24,662 23,703
14 Sasaram Shahabad 1901 23,644 -547 -2·:ii
10.382 12.262 (BIHAR) 1911 23,097 10,483 12,614
1921 22,308 -789 -3'42 10,674 11,634 1931 25,175 +2,867 +12'85 12,473 12,702 1941 27,201 +2,026 +8'05 13,710 13,491 1951 29,265 +2,064 +7'59 14,782 14,483 1961 M. 5'18 37,782 +8,517 +29'10 19,540 18,242 1971 M. 7·04 48,282 + 10,500 +27'79 25,545 22,737
15 Raigarh urban Raig"rh 1901 6,764 +1,277 +18'88
3,396 3,368 agglomeration (MADHYA PRADESH) 1911 8,041 3,986 4,055
1921 8,667 +626 +7·79 4,201 4,466 1931 12,820 +4,153 +47'92 6,354 6,466 1941 20,327 +7,507 +58'56 10,322 10,005 1951 29,684 +'9.357 +46'03 14,992 14,692 !<}6'l. 16·89 36,933 +7,249 +24'42 19,512 17,421 1971 21'14 48,049 +11,116 +30'10 25,368 22,681
(i) Raigarh 1901 6,764 +1,277 + 18'88
3,396 3,368 1911 8,041 3,986 4,055 1921 8,667 +626 +7'79 4,201 4,466 1931 12,820 +4,153 +47'92 6,354 6,466 1941 20,327 +7,507 +58'56 10,322 10,005 1951 29,684 +9,357 +46'03 14,992 14,692 1961 M. 16·89 36,933 +7,249 +24'42 19,512 17,421 1971 M. 18·26 46,745 +9,812 +26'57 24,685 22,060
(ii) Boirdadar 1971 2·10 692 351 341 (O.G.)
(iii) Amli Bhavana 1971 0·32 504 - 272 232 (O.G.)
(iv) Krishna pur 1971 0'32 84 48 36 (O.G.)
(v) Kulmi (O.G.) 1971 0·14 24 12 12
16 Ranaghat Nadia 1901 8,744 + WiG +12·65
4,429 4,315 (WEST BENGAL) 1911 9,850 5,210 4,640
1921 9,652 -198 -2'01 5,279 4,373 1931 11,395 +1,743 +18·06 6,334 5,061 1941 16,488 +5,093 +44'70 9,064 7,424 1951 28,064 + 11,576 +70'21 15,235 12,829 1961 M. 7·72 35,266 +7,202 +25·66 18,674 16,592 1971 M. 7'72 47,815 + 12,549 +35'58 24,987 22,828
17 ·Nangi Twenty Four Parganas 1961 N.M. 6·91 30,992 +)6,5(53 +53·44
17,018 13,974 (WEST BENGAL) 1971 N.M. 6·91 47,555 25,699 21,8.56
18 Ballia Ballia 1901 15,278 + 1,406 +9'20
7,678 7,600 (UTTAR PRADESH) 1911 16,684 8,702 7,982
1921 18,215 + 1,531 +9'18 10,127 8,088 1931 18,143 -72 -0'40 10,565 7,578 1941 23,520 +5,377 +29·64 13,200 10,320 1951 30,638 + 7,118 +30·26 17,106 13,532 1961 M.B. 16·0. 38,216 +7,578 +24'73 21,509 16,707 1971 M.B. 16·11 47,101 +8,885 +23·25 25,953 21,148
19 Itarsi urban Hoshangabad 1901 5,769 -1,339 -21·2i
3,203 2,566 agglomeration (MADHYA PRADESH) 1911 4,43() 2,506 1,924
1921 7,007 +2,577 +58'17 3,891 3,116 1931 11,787 +4,780 +68·22 6,496 5,291 1941 14,26'1 +2,482 +21·06 7,660 6,609 1951 24,795 + 10,526 +73'77 12,989 11,806 1961 7·77 33,611 +8,816 +35·56 18,193 15,418 1971 12·08 46,866 + 13,255 +39·44 25,211 21,655
(i) Itarsi 1901 5,769 -1,339 -23·ii
3,203 2,566 1911 4,43() 2,506 1,924 1921 7,007 +2,577 +58'17 3,891 3,116 1931 11,787 +4,780 +68·22 6,496 5,291 1941 14,269 +2,482 +21·06 7,660 6,609 1951 24,795 + 10,526 +73·77 12,989 11,806 1'161 M. 7'77 33,611 +8,816 + 35·56 18,193 15,418 1971 M. 7·77 44,191 + 10,580 +31·48 23,662 20,529
(ii) Itarsi Kasba (O.G.) 1971 2'21 928 566 362
(iii) Mahragaon (O.G.) 1971 1·52 691 407 284
(iv) Sonsaonri (O.G.) 1971 0'50 530 284 246 (v) Pathrauta (O.G,) 1971 0·08 526 292 234
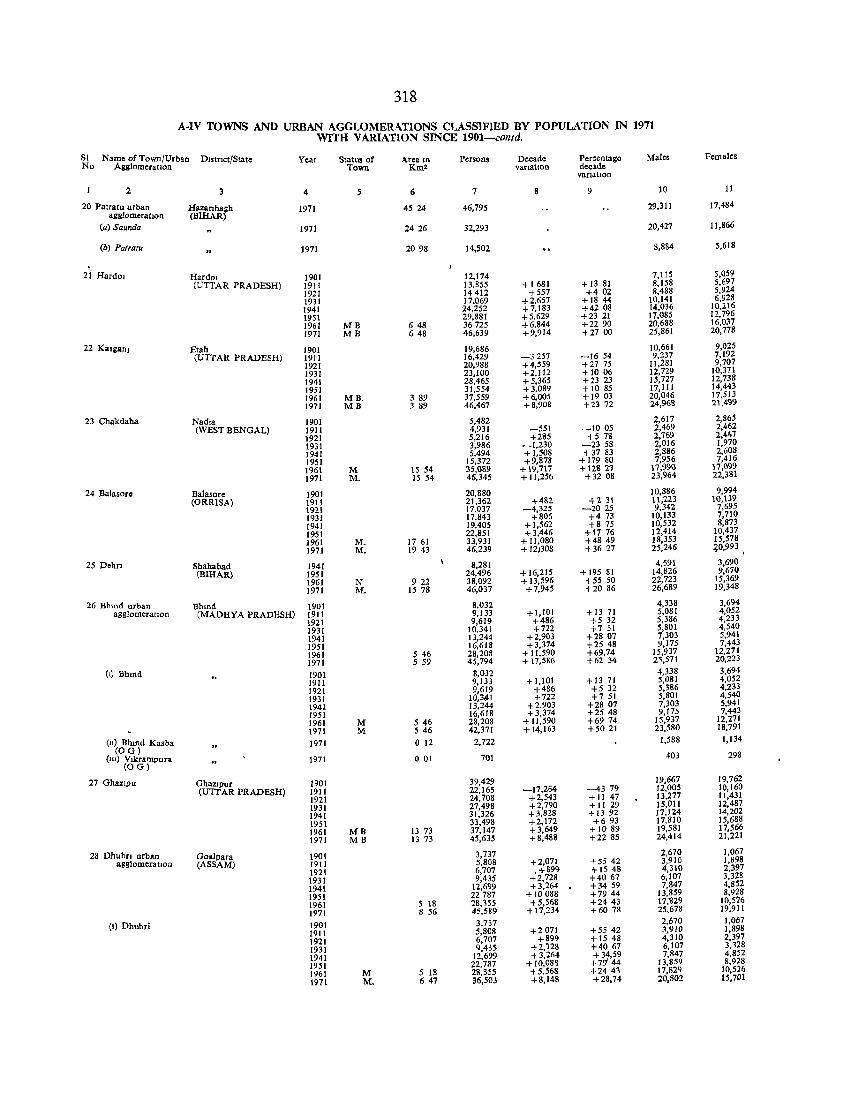
318
A·IV TOWNS AND URBAN AGGLOMER,\TIONS CLASSIFIED BY POPULATION IN 1971 WITH VARIATlO~ SINCE 1901-contd.
SI Name of Town/Urban D,stnct{State Year Status of Area In Persons Decade Percentage Males Females No AgglomeratIOn Town Km2 vanatlon decade
vanatIOn
2 3 4 6 7 8 9 10 11
20 Patratu urban Hazanbagh 1971 4524 46,795 29,311 17,484 agglomeratIOn (BIHAR)
(a) Saunda 1971 2426 32,293 20,427 11,866
(b) PatralU 1971 2098 14,502 8,884 5,618
21 Hardol HardOl 1901 12,174 7,115 5,059 (UTTAR PRADESH) 1911 13,855 + 1681 +13 81 8,158 5,697
1921 14412 +557 ... 402 8,488 5,924 1931 17.069 +2,657 +1844 10,141 6,928 1941 24,252 +7,183 +4208 14,036 10,216 1951 29,881 +5,629 +23 21 17,085 12,796 1961 MB 648 36725 +6,844 +2290 20,688 16,037 1971 MB 648 46,639 +9,914 +2700 25,861 20,778
22 KasllanJ Blah 1901 19,686 10,661 9,025 (UTTAR PRADESH) 1911 16,429 -3257 -1654 9,237 7,192
1921 20,988 +4,559 +2775 11,281 9,707 1931 23,100 +2,112 + 10 06 12,729 10,371 1941 28,465 +5,365 +23 23 15,727 12,738 1951 31,554 +3,089 + 10 85 17,111 14,443 1961 MB. 3 89 37,559 +6,005 +19 03 20,046 17,513 1971 MB 3 89 46,467 +8,908 +23 72 24,968 21,499
23 Chakdaha NadIa 1901 5,482 2,617 2,865 (WEST BENGAL) 1911 4,931 -551 -1005 2,469 2,462
1921 5,216 +285 +578 2,169 2,441
1931 3,986 _1,230 -2358 2,016 1,970 1941 5,494 +1,508 +3783 2,886 2,608 1951 15,372 +9,878 + 179 80 7,956 7,416 1961 M 15 54 35,089 + 19,717 + 12S 21 17,991) 11,099 1971 M. 15 54 46,345 + 11,256 +32 08 23,964 22,381
24 Balasorc Balasore 1901 20,880 10,886 9,994 (ORRISA) 19J1 21.362 +482 +231 11,223 10,139
1921 17,037 -4,325 -2025 9,342 7,695 1931 17,843 +806 +4 73 10,133 7,710 1941 19,405 +1,562 +8 75 10,532 8,873 1951 22,851 + 3,446 +17 76 12,414 10,437 J961 M. 1761 33,931 + 11,080 +4849 18,353 15,578 1971 M. 1943 46,239 + 12)308 +3627 25,246 ~O,993
\
25 Dehn Shahabad 1941 8,281 4,591 3,690 (BIHAR) 1951 24,496 +16,215 + 195 81 14,B26 9,670
1961 N 922 38,092 + 13,596 +55 50 22,723 15,369
1971 M. 15 78 46,037 +7,945 +20 86 26,689 19,348
26 Bhtnd urban 'Bhtnd 1901 8,032 4,338 3,694 agglomeratIOn (MADHYA PRADESH) 1911 9,133 +1,101 +13 71 5,081 4,052
1921 9,619 +486 +5 32 5,386 4,233
1931 10,341 +722 +7 51 5,801 4,540
1941 13,244 +2,903 +2807 7,303 5,941
1951 16,618 +3,374 +25 48 9,175 7,443
1961 546 28,208 + 11,590 +69,74 15,937 12,271
1971 559 45,794 + 17,586 +62 34 2',571 20,223
(I) BhlOd 1901 8,032 4,338 3,694
1911 9,133 +1,101 +13 71 5,081 4,052
1921 9,619 +486 +532 5,386 4,233
1931 10,341 +722 +751 5,801 4,540
1941 13,244 +2,903 +2807 7,303 5,941 1951 16,618 +3,374 +2548 9,175 7,443
1961 M 546 28,208 +11,590 +6974 15,937 12,271
1911 M S 46 42,371 +14,163 +5021 23,580 18,791
(u) Blund Kasba 1971 o 12 2,722 1,588 1,134 (OG)
(Ill) V,krampura (OG)
1971 001 701 403 298
27 Ghazlpu GhazlPUr 1901 39,429 19,667 19,762
(UTI AR PRADESH) 1911 22,165 -17,264 -4379 12,005 10,160
1921 24,708 +2,543 + II 47 13,277 11,431
1931 27,498 +2,790 + II 29 15,011 12,487 1941 31,326 +3,828 + 1392 17,124 14,202
1951 33,498 +2,172 +693 17,810 15,688
1961 MB 13 73 37,147 +3,649 + 1089 19,581 17,566
1971 MB 13 73 45,635 +8,488 +2285 24,414 21,221
28 Dhubfl urban Goalpara 1901 3,737 2,670 1,067 agglomeratIOn (ASSAM) 1911 5,808 +2,071 +5542 3,910 1,898
1921 6,707 ,+899 +1548 4,310 2,397
1931 9,435 +2,728 +4067 6,107 3,328
1941 12,699 +3,264 +3459 7.847 4,852
1951 22787 + 10 088 +7944 13,859 8,928
1961 5 18 28,155 +5,568 +2443 17,1129 10,526
1971 8 56 45,589 + 17,234 +6078 25,678 19,911
(1) Dhubri 1901 3,737 2,670 1,067
1911 5,808 +2071 +5542 3,910 1,898
1921 6,707 +899 +1548 4,310 2,397
1931 '1,435 +2,728 +4067 6,107 3,128
1941 12,699 +3,264 +34,59 7,847 4,8~2
1951 22,787 + IO,08~ +79' 44 13,859 8,928
1961 M 5 IS 28,355 +5,568 +2441 17,82Q 10,526
1971 M, 647 36,503 +8,148 +28,74 20,802 15,701

319
A-IV TOWNS AND ~AN AGGLOMERATIONS CLASSlFlED BY POPULATION IN 1971 WITH VARlATION SINCE 1901--contd.
SI. Name of Town!Urban District/State Year Status of Area in PersonS Decade Percentage Males Females No. AgglomeratIon Town Km2 variation decade
variation
2 3 4 S 6 7 8 9 10 11
(ii) Bidyapara Goalpara 1971 2.09 9,086 4,876 4,210 (0. G.) (ASSAM)
29 Kaithalt Karoal 1901 14,408 -1,496
7,250 7,158 (HARYANA) 1911 12,912 -10.38 6,552 6,360
1921 15,477 +2,565 +19.87 8,113 7,364 1931 19,418 +3,941 +25.46 10,745 8,673 1941 22,325 +2,907 +14.97 12,160 10,165 1951 28,422 +6,097 +27.31 15,088 13,334 1961 M.C. 5.44 34,890 +6,468 +22.76 18,657 16,233 1971 M.C. 7.90 45,199 + 10,309 +29.55 24,359 20,840
30 Srikakulam Srikakulam 1901 18,196 -344
8,403 9,793 (ANDHRA PRADESH) 1911 17,852 -1.89 8,246 9,606
1921 16,298 -1,554 -8.70 7,695 8,603 1931 16,588 +290 +1.78 8,030 8,558 1941 22,249 +5,661 +34.13 9,776 12,473
" 1951 24,212 +1,963 +8.82 11,924 12,288 1961 M. 13.60 35,071 + 10,859 +44.85 17,704 17,367 1971 M. 11.34 45,179 +10,108. +28.82 22,977 22,202
31 Deoghar urban Santal Parganas 1901 8,838 4,897 3,941 agglomeration (BIHAR) 1911 11,394 +2,556 +28.92 6,282 5,112
1921 12,355 +961 +8.43 6,888 5,467 1931 14,217 +1,862 +15.07 8,117 6.100 1941 19,792 +5,575 +39.21 10,941 8,851 1951 25,510 +5,718 +28.89 14,117 11,393 1961 31.83 35,105 +9,595 +37.61 19,432 15,673 1971 23.86 45,060 +9,955 +28.36 25,162 19,898
(a) Deoghar 1901 8,838 4,897 3,941 19I1 11,394 +2,556 +28.92 6,282 5,112 1921 12,355 +961 +8.43 6,888 5,467 1931 14,217 +1,862 +15.07 8,117 6,100 1941 19,792 +5,575 +39.21 10,941 8,851 1951 25,510 +5,718 +28.89 14,117 11,393 1961 M. 16.29 30,813 +5,303 +20.79 17,172 13,641 1971 M. 16.29 40,356 +9,543 +30.97 22,645 17,711
(b) .Jasidih 1961 N. 15.54 4,292 Hii +9.60
2,260 2,032 1971 N. 7.57 4,704 2,517 2,187
32 Tindivanam South Areot 1901 11,373 5,685 56,88 (TAMIL NADU) 1911 13,804 +2,431 +21.38 6,923 6,881
1921 15,177 +1,373 +9.95 7,674 7,503 1931 18,856 +3,679 +24.24 9,745 9,111 1941 18,177 -679 -3.60 9,323 8,854 1951 29,651 + 11,474 +63.12 .15,402 14,249 1961 M. 22.40 34,342 +4,691 +15.82 17,468 16,874 1971 M. 22.38 45,058 +10,716 +31.20 23,296 21,762
33 Bassein urban Thana 1901 10,702 -10.32
5,452 5,250 gglomeration (MAHARASHTRA) 1911 9,598 -1104 4,866 4,732
1921 10,366 +768 +8.00 5,318 5,048 1931 12,689 +2,323 +22.41 6,640 6,049 1941 13,969 +1,280 +10.09 7,295 6,674 1951 19,640 +5,671 +40.60 10,344 9,296 1961 13.00 28,238 +8,598 +43.78 14,628 13,610 1971 17.02 44,909 + 16,671 +59.04 23,355 21,554
(a) Bassein 1901 10,702 -I,ui.i -10.'32
5,452 5,250 1911 9,598 4,866 4,732 :921 10,366 +768 +8.00 5,318 5,048 1931 12,689 +2,323 +22.41 6,640 6,049 1941 13,969 + 1,280 +10.09 7,295 6,674 1951 19,640 +5,671 +40.60 10,344 9,296 1961 M. 8.13 22,598 +2,958 + 15.06 11,811 10,787 1971 M. 8.00 30,594 +7,996 +35.38 15,830 14,764
(b) Manikpur 1971 4.15' 7,610 4,091 3,519 (c) 'Sandor 1961 4.87 5,640
+ 18.88 2,817 2,823
1971 4.87 6,705 +1,065 3,434 3,271 34 Morena Morena 1911 2,690 1,461 1,229
(MADHYA PRADESH) 1921 4,783 +2,093 +77.8'1' 2,785 1,998 1931 7,240 +2,457 +51.37 4,126 3,114 1941 12,527 +5,287 +73.02 6,952 5,575 1951 18,124 +5,591 +44.68 9,827 8,297 1961 M. 6.73 28,331 +10,213 +56.35 15,761 12,576 1971 M. 12.00 44,901 + 16,564 +58.45 24,859 20,042
35 Hinganghat Wardha 1901 12,662 +18.oi
6,486 6,176 (MAHARASHTRA) 1911 14,943 +2,2Si 7,690 7,253
1921 17,200 +2,251 +15.10 8,887 8,313 1931 22601 +5,401 + 31.40 11,812 10,789 1941 28,040 +5,439 +24.07 14,298 13,742 1951 32,868 +4,828 +17.22 16,523 16,345 1961 M. 6.42 36,890 +4,022 +12.24 18,943 17,947 1971 M. 6.42 44,349 +7,459 +20.22 23,091 21,258
36 Kulti urban Burdwan 1931 11,574 7,180 4,394 agglomeration (WEST BENGAL) 1941 29,194 + 17,620 + 152.24 17,762 11,432 1951 41,803 +12,609 +43.19 24,637 17,166 1961 11.14 48,454 +6,651 +15.91 28,147 20,307 1971 11.14 44,289 --4,165 -8.60 24,802 19,487
tIn 1961, Kaitha1 Mandi (N.A.C.) which wa. treated as a separate urban unit in 1951, with II population of 2,690 (1,536 M., 1,154 F.) was merged in Kaithal (M.C.).
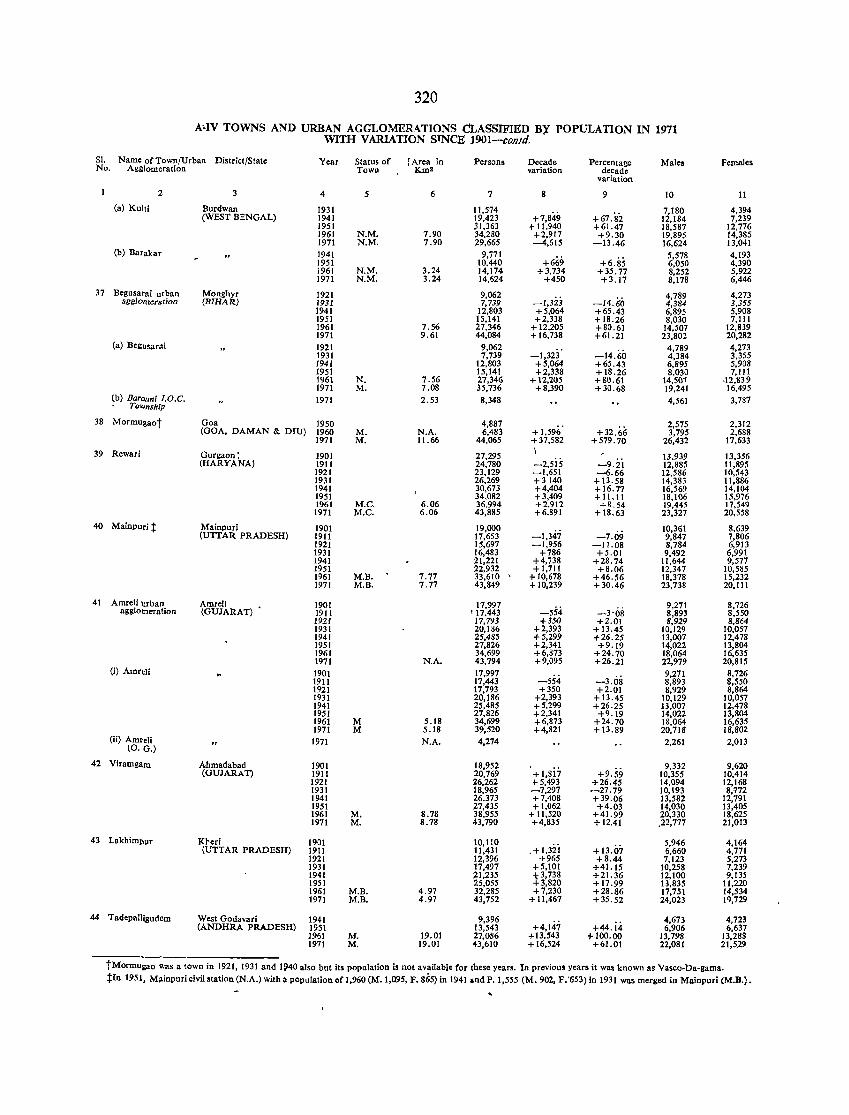
320
A~IV TOWNS AND URBAN AGGI_OMERATIONS CLASSIFIED BY POPULATION IN 1971 WITH VARIATION SINCE 1901-conld.
SI. Name of Town/Urban District/State Year Status of fArea in Persons Decade Percentage Males Females No. Agglomeration TOWll Km2 variation decade
vadation
2 3 4 5 6 7 8 9 10 11
(a) Kulti Burdwan 1931 11,574 +7,849 +67.82
7,180 4,394 (WEST BENGAL) 1941 19,423 12,184 7,239
1951 31,363 + 11,940 +61.47 18,587 12,776 1961 N.M. 7.90 34,280 +2,917 +9.30 19,895 14,385 1971 N.M. 7.90 29,665 -4,615 -13.46 16,624 13,041
(b) Barakar 1941 9,771 +669 +6.85
5,578 4,193 1951 10,440 6,050 4,390 1961 N.M. 3.24 14,174 +3,734 +35.77 8,252 5,922 1971 N.M. 3.24 14,624 +450 +3.17 8,178 6,446
37 Begusatai urban Monghyr 1921 9,062 4,789 4,273 acgJomeration (BIHAR) 1931 7,739 -I,3ij -14.60 4,384 3,355
1941 12,803 +5,064 +65.43 6,895 5,908 1951 15,141 +2,338 +18.26 8,030 7,111 1961 7.56 27,346 +12,205 +80.61 14,507 12,839 1971 9.61 44,084 + 16,738 +61.21 23,802 20,282
(a) Besusarai 1921 9,062 -1,323' -14.60
4,789 4,273 1931 7,739 4,384 3,355 1941 12,803 +5,064 +65.43 6,895 5,908 1951 15,141 +2,338 +18.26 8,030 7,111 1961 N. 7.56 27,346 + 12,205 +80.61 14,507 .12,839 1971 M. 7.08 35,736 +8,390 +30.68 19,241 16,495
(b) BarcllIni I.O.C. 1971 2.53 8,348 4,561 3,787 Township
38 Mormugaot Goa 1950 4,887 2,575 2,312 (GOA, DAMAN & DIU) 1960 M. N.A. 6,483 + 1,596 +32.66 3,795 2,688
1971 M. 11.66 44,065 +37,582 +579.70 26,432 17,633
39 Rewari Gurgaon: 1901 27,195 \ 13,939 13,356 (HARYANAl 1911 24,780 -2,5i5 -9.2i 12,885 11,895
1921 23,129 -1,651 -6.66 12,586 10,543 1931 26,269 +3140 +13.58 14,383 11,886 1941 30,673 +4,404 +16.77 16,569 14,104 1951 34,082 +3,409 +11.11 18,106 15,976 1961 M.e. 6.06 36,994 +2.912 +8.54 19,445 17,549 1971 M.e. 6.06 43,885 +6.891 + 18.63 23,327 20,558
40 Mainpuri t Mainpuri 1901 19,000 10,361 8,639 (UTTAR PRADESH) 1911 17,653 -1,347 -7.09 9,847 7,806
1921 15,697 -1,956 -11.08 8,784 6,913 1931 16,483 +786 +5.01 9,492 6,991 1941 21,221 +4,738 +28.74 11,644 9,577 1951 22,932 +1,711 +8.06 12,347 10,585 1961 M.B. 7.77 33,610 , + 10,678 +46.56 18,378 15,232 1971 M.B. 7.77 43,849 + 10,239 +30.46 23,738 20,111
41 Amreli Ilrban Amreli 1901 17,997 9,271 8,726 agglotneration (GUJARAT) 1911 ' 17.443 -554 -3'08 8,893 8,550
1921 11,793 +350 +2.01 8,929 8,864 1931 20,186 +2,393 + 13.45 10,JZ9 10,057 1941 25,485 +5,299 +26.25 13,007 12,478 1951 27,826 +2,341 +9.19 14,022 13,804 1961 34,699 +6,873 +24.70 18,064 16,635 1971 N.A. 43,794 +9,095 +26.21 22,979 20,815
(i) Amreli 1901 17,997 -554 -3.08
9,271 8,726 1911 17,443 8,893 8,550 1921 17,793 +350 +2.01 8,929 8,864 1931 20,186 +2,393 + 13.45 10,129 10,057 1941 25,485 +5,299 +26.25 13,007 12,478 1951 27,826 +2,341 +9.19 14,022 13,804 1961 M 5.18 34,699 +6,873 +24.70 18,064 16,635 1971 M 5.18 39,520 +4,821 + 13.89 20,718 18,802
(ii) Amreli 1971 N.A. 4,274 2,261 2,013 (0. G.)
42 Viramgam Ahmadabad 1901 18,952 9,332 9,620 (GUJARAT) 1911 20,769 +1,817 +9.59 10,355 10,414
1921 26,262 +5,493 +26.45 14,094 12,168 1931 18,965 -7,297 -27.79 10,193 8,'172 1941 26.373 +7,408 +39.06 13,582 12,791 1951 27,435 +1,062 +4.03 14,030 13,405 1961 M. 8.78 38,955 + 11,520 +41.99 20,330 18,625 1971 M. 8.78 43,790 +4,835 +12.41 .22,777 21,013
43 Lakhimpur Kreri 1901 10,110 .+I,32i
5,946 4,164 (UTTAR PRADESH) 1911 11,431 +13.07 6,660 4,771
1921 12,396 +965 +8.44 7,123 5,273 1931 17,497 +5,101 +41.15 10,258 7,239 1941 21,235 'p,738 +21.36 12,100 9,135 1951 25,055 +3,820 +17.99 13,835 11,220 1961 M.B. 4.97 32,285 +7,230 +28.86 17,751 14,534 1971 M.B. 4.97 43,752 + 11,467 +35.52 24,023 19,729
44 Tadepalligudem West Godavari 1941 9,396 +4,147
4,673 4,723 (ANDHRA PRADESH) 1951 13,543 +44,i4 6,906 6,637
1961 M. 19.01 27,086 +13.543 +100.00 13,798 13,288 1971 M. 19.01 43.610 + 16,524 +61.01 22,081 21,529
tMormugao was a town in 1921, 1931 and 1~40 also but its population is not available for these years. In previous years it wa~ known as Vasco-Oa-gama. tIn 1951, Mjlinpuricivil station (N.A.) with a Population of 1,960 (M. 1,095, F. 865) in 1941 and P. 1,555 (M. 902, F.'653) in 1931 was merged in Mainpuri (M.B.}.
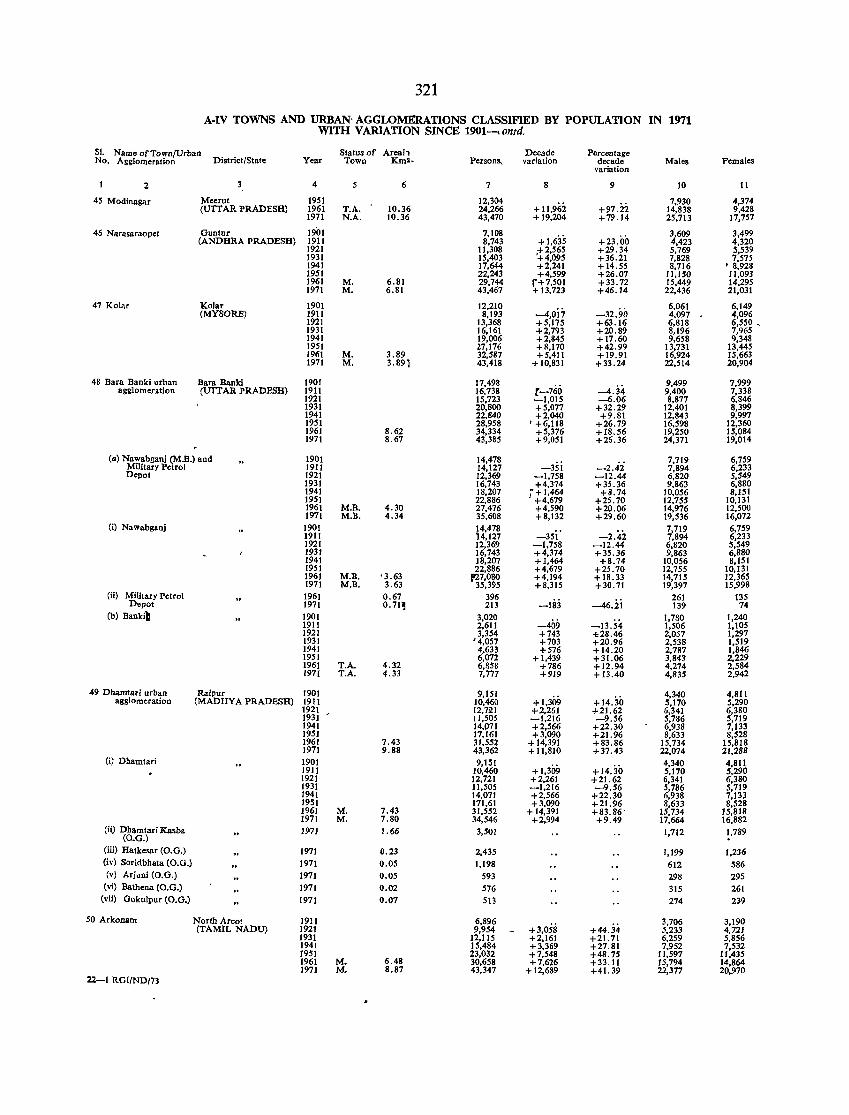
321
A·IV TOWNS AND URBAN' AGGLOMERATIONS CLASSlFlED BY POPULATION IN 1971 WITH VARlATION SINCE 1901_ontd.
SI. Name of Town/Urban Status of Area;' Decade Percentage No, Agglomeration District/State Year Town Km2. Person" variation decade Males Pemales
variation
2 4 6 7 8 9 10 11
45 Modinagar Meerut 1951 12,304 + 11,962 +97.22
7,930 4,374 (UTI AR PRADESH) 1961 T.A. 10.36 24,266 14,838 9,428
1971 N.A. 10.36 43,470 + 19,204 +79.14 25,713 17,757
46 Narasaraopet OuntDr 1901 7,108 +1,635 +23.00
3,609 3,499 (ANDHRA PRADESH) 1911 8,743 4,423 4,320
1921 11,308 +2,565 +29.34 5,769 5,539 1931 15,403 '+4,095 +36.21 7,828 7,575 1941 17,644 +2,241 +14.55 8,716 , 8,928 1951 22,243 +4,599 +26.07 11,150 11,093 1961 M. 6.81 29,744 r+7,501 +33.72 15,449 14,295 1971 M. 6.81 43,467 + 13,723 +46.14 22,436 21,031
47 Kolar Kolar 1901 12,210 -4,Oi7 -32.90
6,061 6,149 (MYSORE) 1911 8,193 4,097 4,096
1921 13,368 +5,175 +63.16 6,818 6,550 _ 1931 16,161 +2,793 +20.89 8,196 7,965 1941 19,006 +2,845 +17.60 9,658 9,348 1951 27,176 +8,170 +42.99 13,731 13,445 1961 M. 3.89 32,587 +5,411 +19.91 16,924 15,663 1971 M. 3.891 43,418 +10,831 +33.24 22,514 20,904
48 Bara Banki urban Bara Banki 1901 17,498 (-760 -4.34
9,499 7,999 agglomeration (UTI AR PRADESH) 1911 16,738 9,400 7,338
1921 15,723 -1,015 -6.06 8,877 6,846 1931 20,800 +5,077 +32.29 12,401 8,399 1941 22,840 +2,040 +9.81 12,843 9,997 1951 28,958 ' +6,118 +26.79 16,598 12,360 1961 8.62 34,334 +5,376 +18.56 19,250 15,084 1971 8.67 43,385 +9,051 +26.36 24,371 19,014
(a) Nawabganj (M.B.) and 1901 14,478 -3si
7,719 6,759 Military Petrol 1911 14,127 -2.42 7,894 6,233 Depot 1921 12,369 -1,758 -12.44 6,820 5,549
1931 16,743 +4,374 +35.36 9,863 6,880 1941 18,207 ;""+1,464 +8.74 10,056 8,151 1951 22,886 . +4,679 +25.70 12,755 10,131 1961 M.B. 4.30 27,476 +4,590 +20.06 14,976 12,500 1971 M.B. 4.34 35,608 +8,132 +29.60 19,536 16,072
(i) Nawabganj 1901 l4,478 -35i' -2.42
7,719 6,759 1911 4,127 7,894 6,233 1921 12,369 -1,758 -12.44 6,820 5,549 1931 16,743 +4,374 +35.36 9,863 6,880 1941 18,207 +1,464 +8.74 10,056 8,151 1951 22,886 +4,679 +25.70 12.755 10,131 1961 M.B. '3.63 P27,080 +4,194 + 18.33 14,715 12,365 1971 M.B. 3.63 35,395 +8,315 +30.71 19,397 15,998
(ii) Military Petrol 1961 0.67 396 -183 -46.2i
261 135 Depot 1971 0.71~ 213 139 74
(b) Bankib 1901 3,020 -409
1,780 1,240 1911 2,611 -13.54 1,506 1,105 1921 3,354 +743 -1028.46 2,057 1,297 1931 r 4,057 +703 +20.96 2,538 1,519 1941 4,633 +576 +14.20 2,787 1,846 1951 6,072 +1,439 + 31.06 3,843 2,229 1961 T.A. 4.32 6,858 +786 +12.94 4,274 2,584 1971 T.A. 4.33 7,777 +919 + 13.40 4,835 2,942
49 Dhamtati urban Raipur 1901 9,151 +1,309 +14.30
4,340 4,811 agglomeration (MADHYA PRADESH) 1911 10,460 5,170 5,290
1921 12,721 +2,261 +21.62 6,341 6,380 1931 11,505 -1,216 -9.56 5,786 5,719 1941 14,P71 +2,566 +22.30 6,938 7,133 1951 17,161 +3,090 +21.96 8,633 8,528 1961 7.43 31,552 +14,391 +83.86 15,734 15,818 1971 9.88 43,362 +11,810 +37.43 22,074 21,288
(i) Dhamtari 1901 9,151 +1,309 +14.30
4,340 4,811 191I 10,460 5,170 5,290 1921 12,721 +2,261 +21.62 6,341 6,380 1931 11,505 -1,216 -9.56 5,786 5,719 1941 14,071 +2,566 +22.30 6,938 7,13~ 1951 171,61 +3,090 +21.96 8,633 8,528 1961 M. 7.43 31,552 +14,391 +83.86' 15,734 15,818 1971 M. 7.80 34,546 +2,994 +9.49 17,664 16,882
(ii) Dhamtari Kasba 197J 1.66 3,501 1,712 1,789 (o.G.)
(iii) Hatkesar (0.0.) 1971 0.23 2,435 1,199 1,236 (iv) Soridbhata (O.G.) 1971 0.05 1,198 612 586 (v) Ariuni (0.0.) 1971 0.05 593 298 295
(vi) Bathena (0.0.) 1971 0.02 576 315 261 (vii) G()kulpur (O.G.) 1971 0.07 513 274 239
50 Arkonam North Arcot 1911 6,896 +3,058 +44.34
3,706 3,190 (TAMIL NADU) 1921 9,954 5,233 4,721
1931 12,115 +2,161 +21.71 6,259 5,856 1941 15,484 +3,369 +27.81 7,952 7,532 1951 23,032 +7,548 +48.75 11,597 11,435 1961 M. 6.48 30,658 +7,626 +33.11 15,794 14,864 1971 M. 8.87 43,347 +12,689 +41. 39 22,377 20,970
22--1 RGI/NDm
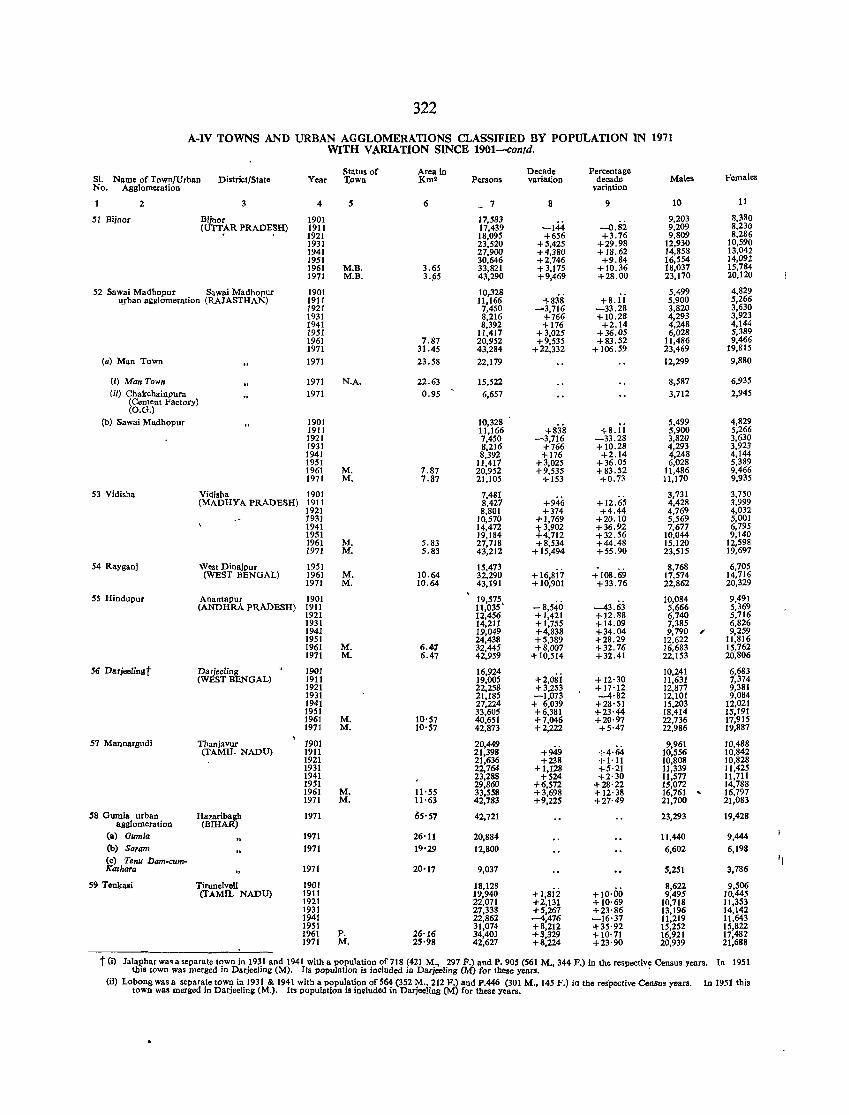
322
A-IV TOWNS AND URBAN AGGLOMERATIONS CLASSIFIED BY POPULATION IN 1971 WITH VARIATION SINCE 1901-conrd.
Status of Area in Decade Percentage Females SI. Name of Town/Urban District/State Year Tpwn l{m2 Persons variation decade Males
No. Agglomeration variation
2 3 4 S 6 7 8 9 10 11
51 Bijnor Bijnor 1901 17,583 -144 -o.si
9,203 8,380 (UTTf-R PRADESH) 1911 17,439 9,209 8,230
1921 18,095 +656 +3.76 9,809 8,286 1931 23,520 +5,425 +29.98 12,930 10,590 1941 27,900 +4,380 +18.62 14,858 13,042 1951 30,646 +2,746 +9.84 16,554 14,092 1961 M.B. 3.65 33,821 +3,175 +10.36 18,037 15,784 1971 M.B. 3·ti5 43,290 +9,469 +28.00 23,170 20,120
52 Sawai Madbopur Sawai Madhopur 1901 10,328 +838 +8. ii
5,499 4,829 u_rban agglomeration (RAJASTHAN) 1911 11,166 5,900 5,266
1921 7,450 -3,716 -33.28 3,820 3,630 1931 8,216 +766 +10.28 4,293 3,923 1941 8,392 +176 +2.14 4,248 4,144 1951 11,417 +3,025 +36.05 6,028 5,389 1961 7.87 20,952 +9,535 +83.52 11,486 9,466 1971 31.45 43,284 +22,332 + 106.59 23,469 19,815
(a) Man Town 1971 23.58 22,179 12,299 9,880
(I) Man Town 1971 N.A. 22.63 15,522 8,587 6,935
(ii) Chakcbainpura 1971 0.95 6,657 3,712 2,945 (Cement Factory) (O.G.)
(b) Sawai Madhopur 1901 10,328 +838 +8.ii
5,499 4,829 1911 11,166 5,900 5,266 1921 7,450 -3,716 -33.28 3,820 3,630 1931 8,216 +766 + 10.28 4,293 3,923 1941 8,392 +176 +2.14 4,248 4,144 1951 11,417 +3,025 + 36.05 6,028 5,389 1961 M. 7.87 20,952 +9,535 +83.52 11,486 9,466 1971 M. 7.87 21,105 +153 +0.73 11,170 9,935
53 Vidisha Vidisha 1901 7,481 +946
3,731 3,750 (MADHYA PRADESH) 1911 8,421 +12.65 4,428 3,999
1921 8,801 +374 +4.44 4,769 4,032 1931 10,570 +1,769 +20.10 5,569 5,001 1941 14,472 t 3,902 +36.92 7,677 6,795 1951 19,184 4,712 +32.56 10,044 9,140 1961 M. 5.83 27,718 +8,534 +44.48 15,120 12,598 1971 M. 5.83 43,212 +15,494 +55.90 23,515 19,697
54 Rayganj West Dinajpur 1951 15,473 + 16,8i7
8,768 6,705 (WEST BENGAL) 1961 M. 10.64 32,290 +108.69 17,574 14,716
1971 M. 10.64 43,191 +10,901 +33.76 22,862 20,329
55 Hindupur Anantapur 1901 19,575 - 8,540
10,084 9,491 (ANDHRA PRADESH) 1911 11,035' -43.63 5,666 5,369
1921 12,456 +1,421 +12.88 6,740 5,716 1931 14,211 +1,755 +14.09 7,385 6,826 1941 19,049 +4,838 +34.04 9,790 , 9,259 1951 24,438 +5,389 +28.29 12,622 11,816 1961 M. 6.41 32,445 +8,007 +32.76 16,683 15,762 1971 M. 6.47 42,959 + 10,514 +32.41 22,153 20,806
56 Darjeeling! Darjeeljng 1901 16,924 +2,osi
10,241 6,683 (WEST BENGAL) 1911 19,005 + 12·30 11,631 7,374
1921 22,258 +3,253 +17·12 12,877 9,381 1931 21,185 -1,073 -4·82 12,101 9,084 1941 27,224 + 6,039 +28·51 15,203 12,021 1951 33,605 +6,381 +23·44 18,414 15,191 1961 M. 10'57 40,651 +7,046 +20·97 22,736 17,915 1971 M. 10'57 42,873 +2,222 +5·47 22,986 19,887
57 Mannargudi Thanjavur 1901 20,449 +949
9,961 10,488 (TAMIL NADU) 1911 21,398 +4·64 10,556 10,842
1921 21,636 +238 +1·11 10,808 10,828 1931 22,764 +1,128 +5·21 11,339 11,425 1941 23,288 +524 +2·30 11,577 11,711 1951 29,860 +6,572 +28·22 15,072 14,788 1961 M. 11'55 33,558 +3,698 +12·38 16,761 , 16,797 1971 M. 11'63 42,783 +9,225 +27·49 21,700 21,083
58 Gumia urban Hazaribagh 1971 a8g1orneration (BIHAR)
65'57 42,721 23,293 19,428
(a) Gumia 1971 26'11 20,884 11,440 9,444 (b) Saram 1971 19'29 12,800 6,602 6,198 (c) Tenu Dam-cum- 'I Karhara 1971 20'17 9,031 5.251 3,786
59 Tenkaii Tirunelvell 1901 18,128 +1,sii +10·00
8,622 9,506 (TAMIL NADU) 1911 19,940 9,495 10,445
1921 22,071 +2,131 +10·69 10,718 11,353 1931 27,338 +5,267 +23·86 13,196 14,142 1941 22,862 -4,476 -16·37 11,219 11,643 1951 31,074 +8,212 +35·92 15,252 15,S22 1961 P. 26-16 34,403 +3,329 +10·71 16,921 17,482 1971 M. 25'98 42,621 +8,224 +23·90 20,939 21,688
t (i) Jalal?harwa. a separate town in 1931 and 1941 with a population of 718 (421 M., 297 P.) and P. 905 (561 M., 344 F.) in the respective Census years. thIS town was merged in Darjeeling (M). Its population is included in Darjeeling (M) for these years. .
In 1951
(il) Lobona was a separate town in 1931 & 1941 with a population of 564 (352 M., 212 F.) and P.446 (301 M., 145 F.) in the respective Census years. town was merged in Darjeeling (M.). Its population is ine1uded in Darjeeling (M) for these years.
In 1951 this
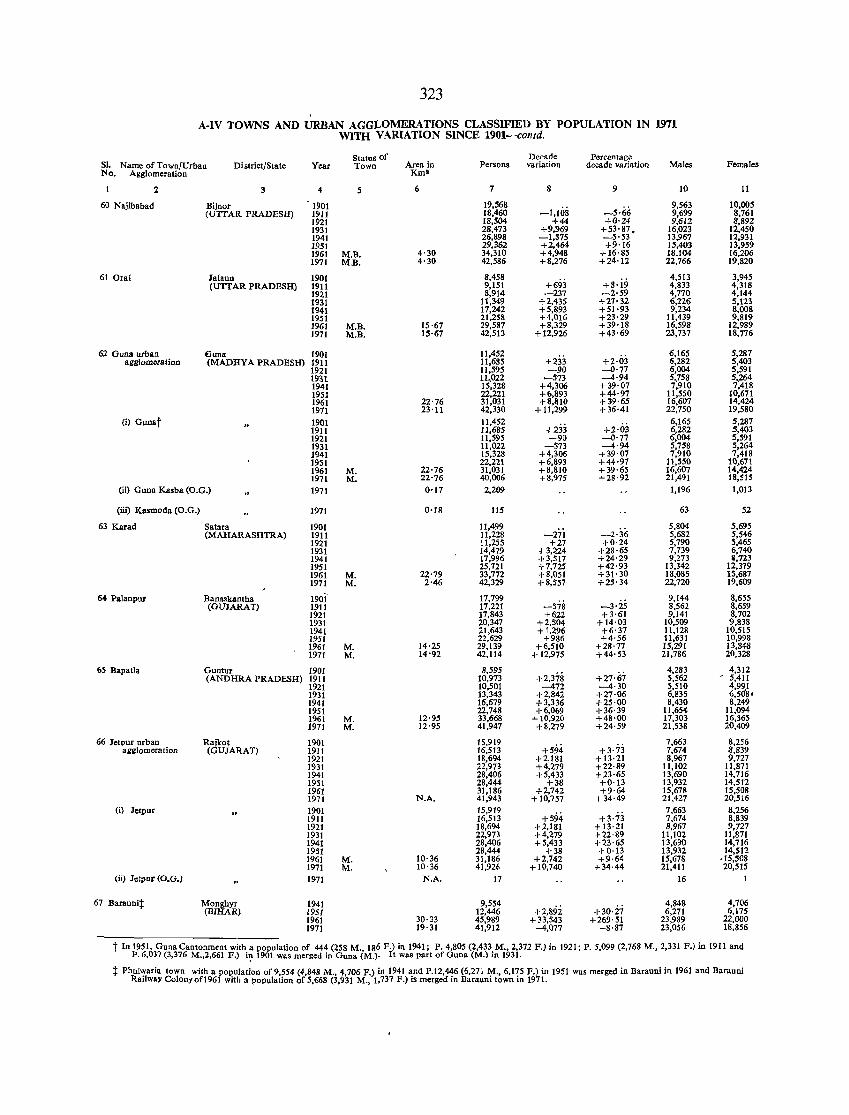
323
A-IV TOWNS AND URBAN AGG!.OMERATIONS CLASSIFIED BY POPULATION IN 1971 WITH VARIATION SINCE 1901-contd.
Status of Decade Percentage SI. Name of Town/Urban District/State Year Town Are. in Persons variation decade variation Males Females No. Agglomeration Km2
2 3 4 5 6 7 8 9 10 11
60 Najibabad Bijnor 1901 19,568 -I,His
9,563 10,005 (UTTAR PRADESH) 1911 18,460 -5·66 9,699 8,761
1921 18,504 +44 +0·24 9,612 8,892 1931 28,473 +9,969 +53·87. 16,023 12,450 1941 26,898 -I,S75 -5·53 13,967 12,931 1951 29,362 +2,464 +9'16 15,403 13,959 1961 M.B. 4·30 34,310 +4,948 +16'85 18,104 16,206 1971 M.B. 4'30 42,586 +8,276 +24·12 22,766 19,820
610r.i J.laun 1901 8,458 +693 +S·i9
4,513 3,945 (UTTAR PRADESH) 1911 9,151 4,833 4,318
1921 8,914 -237 -2'59 4,770 4,144 1931 11,349 +2,435 +27'32 6,226 5,123 1941 17,242 +5,893 +51·93 9,234 8,008 1951 21,258 +4,016 +23·29 11,439 9,819 1961 M.B. 15·67 29,587 +8,329 +39'18 16,598 12,989 1971 M.B. 15'67 42,513 + 12,926 +43·69 23,737 18,776
62 Gun. urban auna 1901 11,452 +233 +2·03
6,165 5,287 agglomeration (MADHYA PRADESH) 1911 11,685 6,282 5,403
1921 11,595 -90 -0·77 6,004 5,591 1931 11,022 -573 -4·94 5,758 5-264 1941 15,328 +4,306 +39·07 7,910 7,418 1951 22,221 +6,893 +44·97 11,550 10,671 1961 22'76 31,031 +8,810 +39·65 16,607 14,424 1971 23'11 42,330 + 11,299 +36·41 22,750 19,580
(i) Gunat 1901 11,452 +233 +2·03
6,165 5,287 1911 11,685 6,282 5,403 1921 11,595 -90 -0'77 6,004 5,591 1931 11,022 -573 -4·94 5,758 5,264 1941 15,328 +4,306 +39·07 7,910 7,418 1951 22,221 +6,893 +44·97 11,550 H),671 1961 M. 22'76 31,031 +8,810 +39·65 16,607 14,424 1971 M. 22·76 40,006 +8,975 +28-92 21,491 18,S15
(ii) Guna Kasba (O.G.) 1971 0'17 2,209 1,196 1,013
(iii) Rasmoda (O.G.) 1971 0·18 115 63 52
63 Karad Salara 1901 11,499 -27i -2'36
5,804 5,695 (MAHARASHTRA) 1911 11,228 5,682 5,546
1921 11,255 +27 +0·24 5,790 5,465 1931 14,479 +3,224 +28·65 7,739 6,740 1941 17,996 +3,517 +24'29 9,273 a,723 1951 25,721 +7,725 +42·93 13,342 12,379 1961 M. 22'79 33,772 +8,051 +31·30 18,085 15,687 1971 M. 2'46 42,329 +8,557 +25·34 22,720 19,609
64 Palanpur Banaskantha 1901 17,799 -S78 -3'2S
9,144 8,655 (GUJARAT) 1911 17,221 8,562 8,659
1921 17.843 +622 +3·61 9,141 8.702 1931 20,347 +2,504 +14·03 10,509 9,838 1941 21,643 +1,296 +6·37 11,128 10,515 19S1 22,629 +986 +4·56 11,631 10,998 1961 M. 14·25 29,139 +6,510 +28·77 15,291 13,848 1971 M. 14'92 42,114 + 12,975 +44·53 21,786 20,328
65 BapaUa Guntnr 1901 8,595 +2,378 +27·67
4,283 4,312 (ANDHRA PRADESH) 1911 10,973 5,562 ~ 5,411
1921 10,501 -472 -4·30 5,510 4,991 1931 13,343 +2,842 +27·06 6,835 6,50'8. 1941 16,679 +3,336 +25·00 8,430 8,249 1951 22,748 +6,069 +36·39 11,654 11,094 1961 M. 12·95 33,668 +10,920 +48·00 17,303 16,365 1911 M. 12·95 41,947 +8,279 +24·59 21,538 20,409
66 Jetpur urban Rajkot 1901 15,919 +594 +3·73
7,663 8,256 agglomeration (GUJARAT) 1911 16,513 7,674 8,839
1921 18,694 +2,181 +13·21 8,967 9,727 1931 22,973 +4,279 +22·89 11,102 11,871 1941 28,406 +5,433 +23·65 13,690 14,716 1951 28,444 +38 +0·13 13,932 14,512 1961 31,186 +2,742 +9·64 15,678 15,508 1971 N.A. 41,943 + 10,757 +34·49 21,427 20,516
(i) Jetpur 1901 15,919 +594 +3·73
7,663 8,256 1911 16,513 7,674 8,839 1921 18,694 +2,181 +13·21 8,967 9,727 1931 22,973 +4,279 +22·89 11,102 11,871 1941 28,406 +5,433 +23·65 13,690 14,716 1951 28,444 +38 +0·13 13,932 14,512 1961 M. 10·36 31,186 +2,742 +9·64 15,678 <15,508 1971 M. 10·36 41,926 +10,740 +34·44 21,411 20,515
(ii) Jetpur (O.G.) 1971 N.A. 17 16
67 Baraunit Mongbyr 1941 9,554 +2,892 +30·27
4,848 4,706 (BIHAR) 1951 11,446 6,271 6,175
1961 30·33 45,989 +33,543 +269·51 23,989 22,000 1971 19· 31 41,912 -4,077 -8·87 23,056 18,856
t In 1951, Guna Cantonment with a population of 444 (258 M. 186 P.) in 1941; P. 4,805 (2,433 M., 2,372 F.) in 1921; P. 5,099 (2,768 M., 2,331 F.) in 1911 and 1>.6,037 (3,376 M.,2,661 P.) i,:, 1901 was merged in Guna (M.). It was part of Guna (M.) in 1931.
t Phulwaria town with a population 0[9,554 (4,848 M., 4 706 P.) in 1941 and P.12,446 (6,271 M., 6,175 F.) in 1951 was merged in Barauni in 1961 and Barauni Railway Colonjof1961 with a population of 5,668 (3,931 M., 1,737 F.) is merged in Barauni town in 1971.
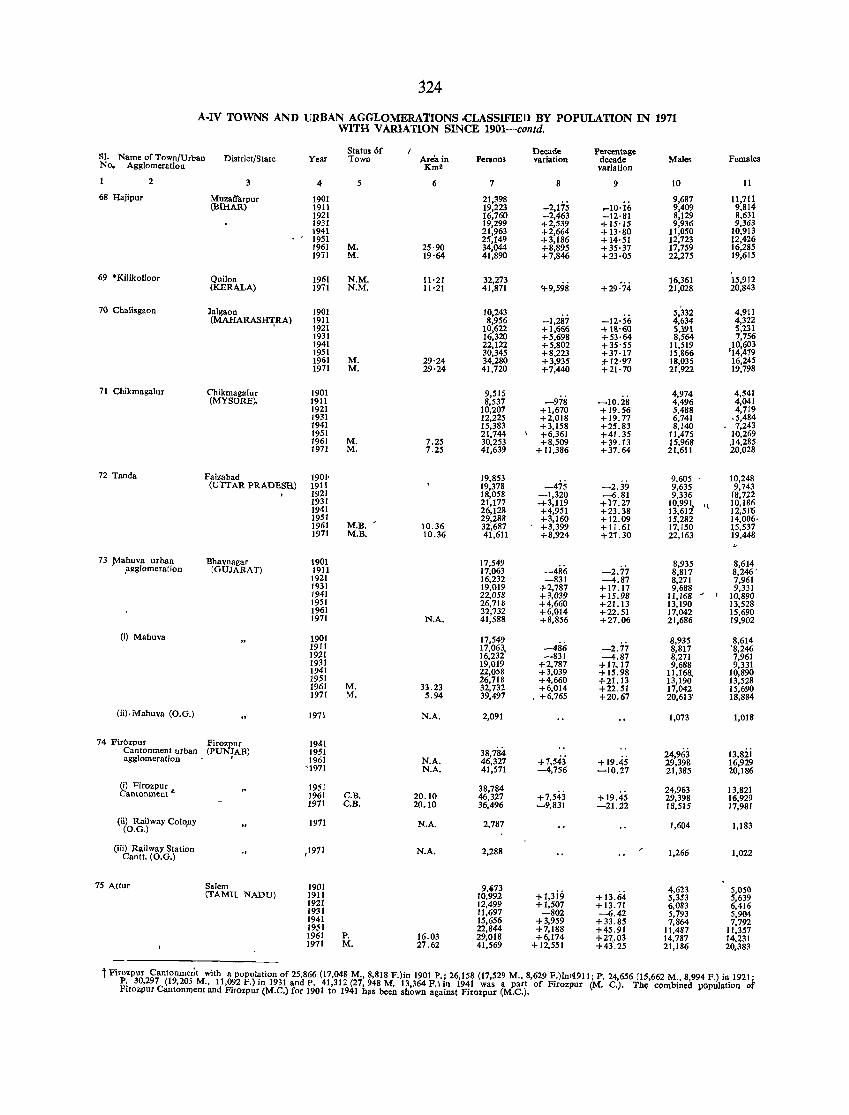
324
A-IV TOWNS AND URBAN AGGLOMERATIONS .cLASSIFIED BY POPULATION IN 1971 WITH V ARlATlON SINCE 1901-contd.
Status br Decade Percentage Females 51. Name of Town/Urbao District/State Yelll" Town Areja in Persons variation decade Males
No. Agglomeration Km2 varjation
2 3 4 5 6 7 8 9 10 11
68 Hajipur Muzaff'arpur 1901 21,398 -2,175 ,..IO·j6
9,687 11,711 (BIHAR) 1911 19,223 9,409 9,814
1921 16,760 -2,463 -12·81 8,129 8,631 1931 19,299 +2,539 +15·15 9,936 9,363 1941 21,963 +2,664 +13·80 11,050 10,913 1951 25,149 +3,186 + 14·51 12,723 12,426 1961 M. 25·90 34,044 +8,895 +35·37 17,759 16,285 1971 M. 19·64 41,890 +7,846 +23·05 22,275 19,615
69 °Ki1ikolloor Quilon 1961 N.M. 11'21 32,273 4-9,598
16,361 '15,912 (KERALA) 1971 N.M. 11'21 41,871 +29·74 21,028 20,843
70 Chalisgaon Ja1gaon 1901 10,243 -1,287 -12·56
5:332 4,911 (MAHARASHI;RA) 1911 8,956 4,634 4,322
1921 10,622 + 1,666 + 1&·60 5,391 5,231 1931 16,320 +5,698 +53·64 8,564 7,756 1941 22,122 +5,802 +35'55 11,519 10,603 1951 30,345 +8,223 +37·17 15,866 '14,479 1961 M. 29·24 34,280 +3,935 ;1-12·97 18,035 16,245 1971 M. 29'24 41,720 +7,440 +21·70 21,922 19,798
71 Chikmaga1ur Chikmaga1ur 1901 9,515 -978 -10.28
4,974 4,541 (MYSORE~ 1911 8,537 4,496 4,041
1921 10,207 +1,670 +19.56 5,488 4,719 1931 12,225 +2,018 +19.77 6,741 ,5,484 1941 15,383 +3,158 +25.83 8,140 7,243 1951 21,744 +6,361 +41.35 11,475 10,269 1961 M. 7.25 30,253 +8,509 +39.13 15,968 ..t4.285 1971 M. 7.25 41,639 + 11.386 +37.64 21,611 20,028
72 Tanda Faizabad 1901, 19,853 -2.39
9.605 10,248 (Urr AR PRADESH) 1911 19,378 -475 9,635 9,743
1921 18,058 -1,320 -6.81 9.336 f8,722 1931 21,177 .+3,119 +17.27 10.99} '( 10,186 1941 26,128 +4,951 +23.38 13,61 12,510 1951 29,288 +3,160 +12.09 15,282 14,006. 1961 M.B. 10.36 32,687 +3,399 + 11.61 17,150 ~5,537 1971 M.B, 10.36 41,611 +8,924 +27.30 22,163 19,448
73 _Mahuva urban Bhavnagar 1901 17,549 8,935 8,614 ~agglomeration (GUJARAT) 1911 17,063 -486 -2.77 8,817 8,246'
1921 16,232 -831 -4.87 8,271 7,961 1931 19,019 +2,787 +17.17 9,688
~ 9,331
1941 22,058 +3,039 +15,98 11,168 , 10,890 1951 26,718 +4,660 +21.13 13,190 13,528 1961 32,732 +6,014 +22,51 17,042 15,690 1971 N,A, 41,588 +8,856 +27.06 21,686 19,902
(i) Mahuva 1901 17,549 -2,77
8,935 8,614 1911 17,063, -486 8,817 '8,246 1921 16,232 -831 -4,87 8,271 7,961 1931 19,019 +2,787 +17.17 9,688 9,331 1941 22,058 +3,039 +15.98 11,168, 10,890 1951 26,718 +4,660 +21.13 13,190 13,528 1961 M. 33.23 32,732 +6,014 +22,51 17,042 15,690 1971 M, 5,94 39,497 • +6,765 +20.67 20,613' 18,884
(ii). Mahuva (O,G,) 1971 N,A. 2,091 1,073 1,018
74 Fir6zpur Firozpur 1941 24,963 13,8:ii Cantonment t>rban (PUN!AB) 1951 38,784
+7,543 +19.45 agglomeration 1961 N.A, 46,327 29,398 16,929 '1971 N.A. 41,571 -4,756 -10,27 21,385 20,186
(i) Firozpur 1951 38,784 +7,543 +19.45
24,963 13,821 Cantonment t 1961 C.B. 20,10 46,327 29,398 16,929 1911 C.B. 20.10 36,496 -9,831 -21.22 18,515 17,981
(il) Railway Colopy (O,G,)
1971 N.A, 2,787 1,604 1,183
(iii) Railway Station Cantt, (O,G.)
,1971 N,A. 2,288 1,266 1,022
75 Attur Salem 1901 9,"3 +I,3i!i
4,623 5,050 (TAMIL NADU) 1911 10,992 +13.64 5,353 5,639 1921 12,499 +1,507 +13.71 6,083 6,416 1931 11,697 -802 -6.42 5,793 5,904 1941 15,656 +3,959 +33.85 7,864 7,792 19S1 22,844 +7,188 +45.91 11,487 11,357 1961 p, 16,03 29,018 +6,174 +27,,03 14,787 14,231 1971 M. 27.62 41,569 +12,551 +43.25 21,186 20,383
t Firozpur Cantonment with a population of 25,866 (17,048 M., 8,818 F.lin 1901 P.; 26,158 (17,529 M., 8,629 F.)ln,f911; p, 24,656 (15,662 M., 8,994 F.) in 1921; p, 30,297 (19,205 M., 11,092 F.) in 1931 and p, 41,312 ~27, 948 M, 13,364 F.) in 1941 was a part of Firozpur (M. C,). The> combined populatioQ of Firozpur cantonment and Firozpur (M.C,) for 1901 to 19 1 haS been shown against Firozpur (M.C.).
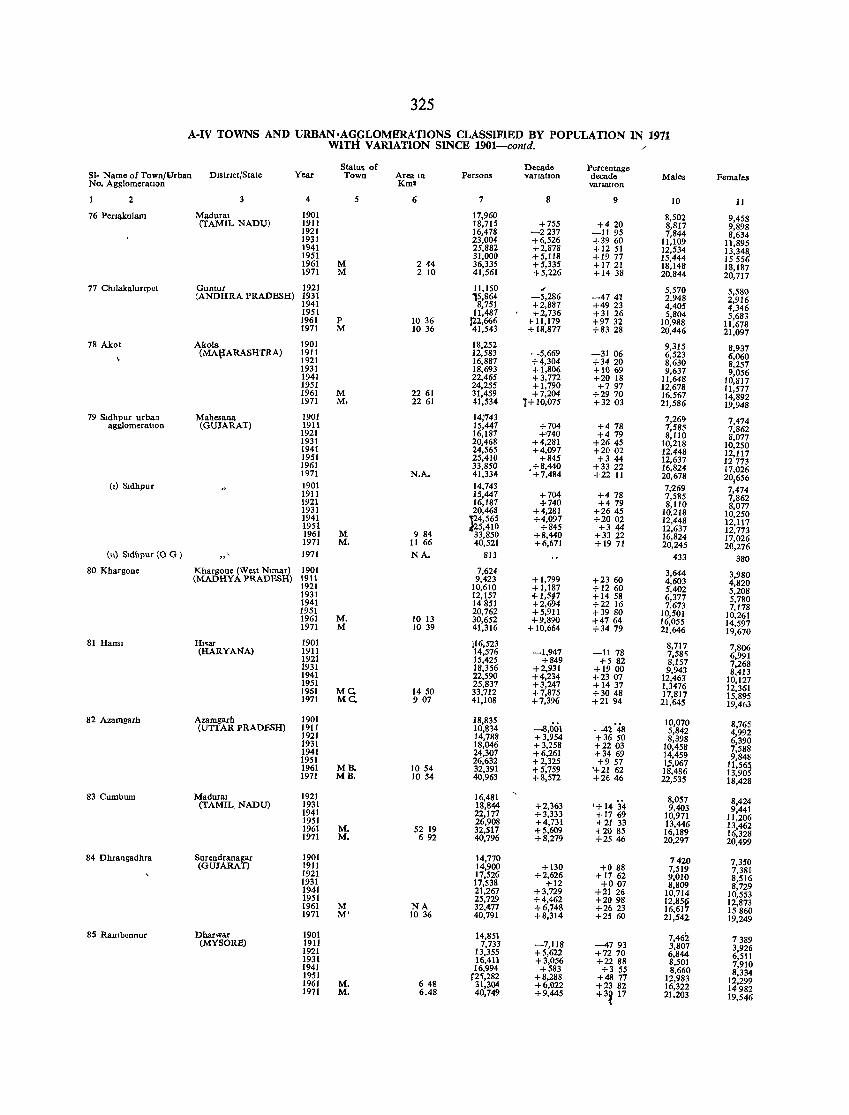
325
A-IV TOWNS AND URBAN ,AGGLOMERATIONS CLASSlFlED BY POPULATION IN 1911 WlTH VARIATION SINCE 1901-contd. /
Status of Decade Percentage SI- Name of Town/Urban DIstnct/State Year Town Aream Persons varIation decade Males Females No. Agglomeration Km2 VaflatIon
2 4 5 6 7 8 9 10 11
76 PerIlIkulam Madural 1901 17,960 8,502 9,458 (TAMIL NADU) 1911 18,715 +755 +420 8,817 9,898 1921 16,478 -2237 -11 95 7,844 8,634 1931 23,004 +6,526 +39 60 11,109 11,895 1941 25,882 +2,878 +1251 12,534 13,348, 1951 31,000 +5,118 +1977 15,444 15556 1961 M 244 36,335 +5,335 +1721 18,148 18,187 1971 M 2 10 41,561 +5,226 +14 38 20,844 20,717
77 ChIlakaluflpet Guntur 1921 11,150 .- 5,570 5,580 (ANDHRA PRADESH) 1931 ,5,864 -5,286 -4741 2,948 2,916 1941 8,751 +2,887 +4923 4,405 4,346 1951 11,487 +2,736 +3126 5,804 5,683 1961 P 10 36 ]22,666 ~ 11,179 +97 32 10,988 11,678 1971 M 10 36 41,543 + 18,877 +83 28 20,446 21,097 78 Akot Akola 1901 18,252 9,315 8,937 (MA{IARASHTRA) 1911 12,583 -5,669 -3106 6,523 6,060 1921 16,887 +4,304 +3420 8,630 8,257 1931 18,693 +1,806 +1069 9,637 9,056 1941 22,465 +3,772 +2018 11,648 10,817 1951 24,255 +1,790 +797 12,678 11,577 1961 M 22 61 31,459 +7,204 +2970 16,567 14,892 1971 M. 2261 41,534 1+ 10,075 +32 Q3 21,586 19,948 79 Sldhpur urban Mahesana 1901 14,'743 7,269 7,474 agglomeration (GUJARAT) 1911 15,447 +704 +478 7,585 7,862 1921 16,187 +,740 +479 8,110 8,077 1931 20,468 +4,281 +2645 10,218 10,250 1941 24,565 +4,097 +2002 12,448 12,117 1951 25,410 +845 +344 12,637 12773 1961 33,850 .+8,440 +33 22 16,824 17,026 1971 N.A. 41,334 +7,484 +22 11 20,678 201656
(I) Sldhpur 1901 14,743 7,269 7,474 1911 15,447 +704 +4 78 7,585 7,862 1921 16,187 +740 +479 8,110 8,077 1931 20,468 +4,281 +2645 10,218 10,250 1941 R4,565 +4,097 +2002 12,448 12,117 1951 5,410 +845 +344 12,637 12,773 1961 M 9 84 33,850 +8,440 +33 22 16,824 17,026 1971 M. II 66 40,521 +6,671 +19 71 20,245 20,276 (n) Sldhpur (0 G ) 1971 NA. 813 433 380
80 Khargone Khargone (West Nlmar) 1901 7,624 3,644 3,980 (MADHYA PRADESH) 1911 9,423 +1,799 +23 60 4,603 4,820 1921 10,610 +1,187 +1260 5,402 5,208 1931 12,157 +1,5§' +1458 6,377 5,780 1941 14851 +2,64 +2216 7,673 7,178 1951 20,762 +5,911 +39 80 10,501 10,261 1961 M. 10 13 30,652 +9,890 +4764 16,055 14,597 1971 M 10 39 41,316 + 10,664 +3479 21,646 19,670 81 Hansl H .. ar 1901 j16,523 8,717 7,806 (HARYANA) 1911 14,576 -1,947 -1178 7,58~ 6,991 1921 15,425 +849 +582 8,157 7,268 1931 18,356 +2,931 +1900 9,943 8,413 1941 22,590 +4,234 +2307 12,463 10,127 1951 25,837 +3,247 +1437 1,3476 12,361 1961 Me. 1450 33,712 +7,875 +3048 17,817 15,895 1971 Me. 907 41,108 +7,396 +2194 21,645 19,463
82 Azamgarh Azamgarh 1901 18,835 -8,001 -42 '48
10,070 8,765 (UTTAR PRADESH) 1911 10,834 5,842 4,992 1921 14,788 +3,954 +3650 8,398 6,390 1931 18,046 +3,258 +2203 10,458 7,588 1941 24,307 +6,261 +3469 14,459 9,848 1951 26,632 +2,325 +9 57 1..5,067 11,56~ 1961 MR. 1054 32,391 +5,759 '+21 62 18,486 13,90 1971 MB. 1054 40,963 +8,572 +2646 22,535 18,428
83 Cumburn Madural 1921 16,481 '+1434
8,057 8,424 (TAMIl. NADU) 1931 18,844 +2,363 9,403 9,441 1941 22,177 +3,333 + 17 69 10,971 11,206 1951 26,908 +4,731 +21 33 13,446 13,462 1961 M. 52 19 32,517 +5,609 + 2085 16,189 16,328 1971 M. 692 40,796 +8,279 +2546 20,297 20,499
84 Dhrangadhra Surendranagar 1901 14,770 7420 7,350 (GUJARAT) 1911 14,900 +130 +088 7,519 7,381 1921 17,526 +2,626 + 17 62 9,010 8,516 1931 17,538 +12 +007 8,809 8,729 1941 21,267 +3,729 +21 26 10,714 10,553 1951 25,729 +4,462 +2098 12.85~ 12,873 1961 M NA 32,477 +6,748 +2623 16,61 15860 1971 M' 10 36 40,791 +8,314 +2560 21,542 19,249
85 Rambennur Dharwar 1901 14,851 7,452 7389 (MYSORE) 1911 7,733 -7,118 --47 93 3,807 3,926 1921 13,355 +5,622 +72 70 6,844 6,511 1931 16,411 +3,056 +22 88 8,501 7,910 1941 16,994 +583 +3 55 8,660 8,334 1951 (2~,282 +8,288 +4877 12,983 12,299 1961 M. 648 31,304 +6,022 +2382 16,322 14982 1971 M. 6.48 40,749 +9,445 +3¥ 17 21,203 19,546
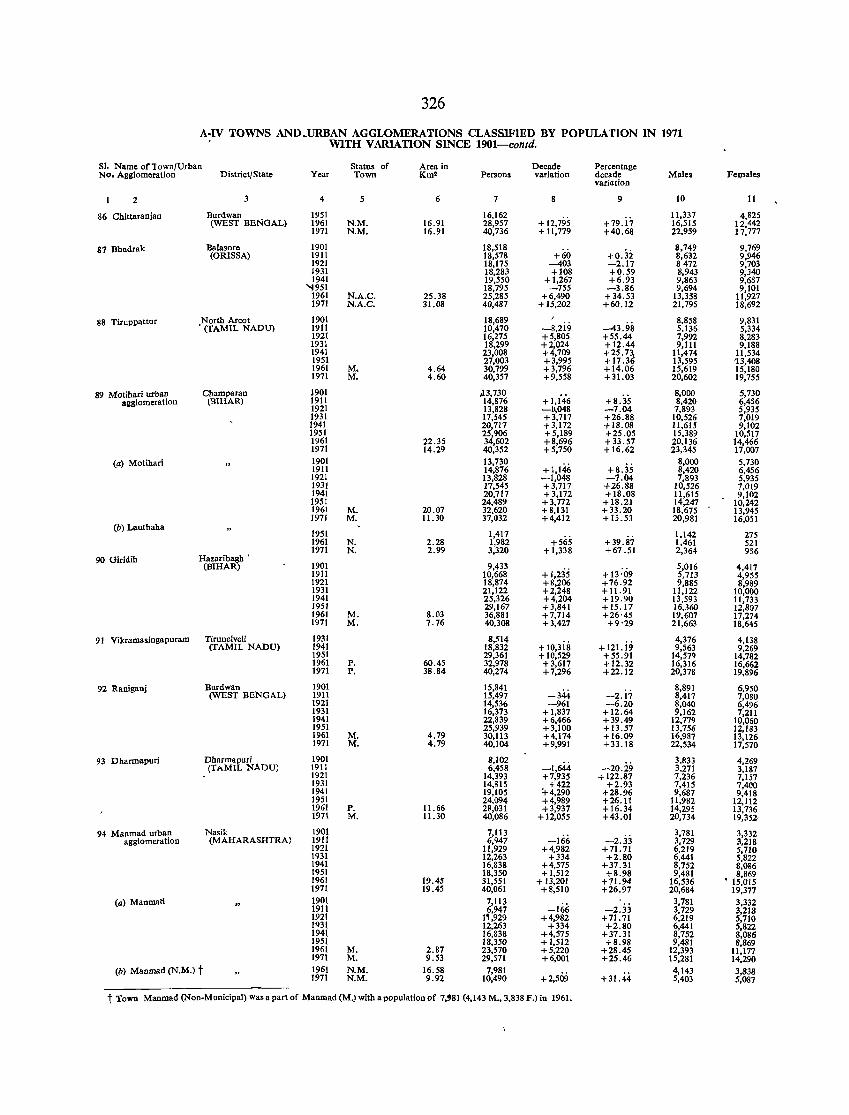
326
A·IV TOWNS AND.URBAN AGGLOMERATIONS CLASSIFIED BY POPULATION IN 1971 WITH VARIATION SINCE 1901-contd.
SI. Name of Town/Urban Status of Area in Decade Percentage NO. Agglomeration District/State Year Town Km2 Persons variation decade Males Females
variation
2 3 4 5 6 7 8 9 10 11
86 Chittaranjan Burdwan 1951 16,162 + 12,795 +79.i7
ll,337 4,825 (WEST BENGAL) 1961 N.M. 16.91 28,957 16,515 12,442
1971 N.M. 16.91 40,736 + 11,779 +40.68 22,959 17,777
87 Bhadral< Ba1asore 1901 18,518 +oji
8,749 9,769 (ORISSA) 1911 18,578 +60 8,632 9,946
1921 18,175 -403 -2.17 8472 9,703 J931 18,283 +108 +0.59 8,943 9,340 1941 19,550 +1,267 +6.93 9,863 9,687
'i951 18,795 -755 -3.86 9,694 9,101 1961 N.A.C. 25.38 25,285 +6,490 + 34. 53 13,358 11,927 1971 N.A.C. 31.08 40,487 +15,202 +60.12 21,795 18,692
88 Tiruppattur North Areot 1901 18,689 I 8,858 9,831 • (TAMIL NADD) 1911 10,470 -8,2i9 -43.98 5,136 5,334
1921 16,275 +5,805 +55.44 7,992 8,283 1931 18,299 +2,024 + 12.44 9,111 9,188 1941 23,008 +4,709 +25.7~ 11,474 11,534 1951 27,003 +3,995 +17.3 13,595 13,408 1961 M. 4.64 30,799 +3,796 +14.06 15,619 15,180 1971 M. 4.60 40,357 +9,558 +31.03 20,602 19,755
89 Motihari urban Cbamparan 1901 ,13,730 +I,i46
8,000 5,730 agglomeration (BIHAR) 1911 14,876 +8.35 8,420 6,456
1921 13,828 -1\048 -7.04 7,893 5,935 1931 17,545 +3,717 +26.88 10,526 7,019 1941 20,717 + 3,172 +18.08 11,615 9,102 1951 25,906 +5,189 +25.05 15,389 10,517 1961 22.35 34,602 +8,696 + 33.57 20,136 14,466 1971 14.29 40,352 +5,750 +16.62 23,345 17,007
(a) Motihari 1901 13,730 +1,146 +8,35
8,000 5,730 1911 14,876 8,420 6,456 1921 13,828 -1,048 -7.04 7,893 5,935 1931 17,545 +3,717 +26.88 10,526 7,019 1941 20,717 +3,172 + 18.08 11,615 9,102 1951 24,489 +3,772 +18.21 14,247 10,242 1961 M. 20.07 32,620 + 8,131 +33.20 18,675 13,945 1971 M. 11.30 37,032 +4,412 + 13.53 20,981 16,051
(b) Lautbaha 1951 1,417 1,142 275 1961 N. 2.28 1,982 +565 +39.87 1,461 521 1971 N. 2.99 3,320 + 1,338 +67.51 2,364 956
90 Giridib Hazaribagb , 1901 9,433 5,016 (BIHAR)
+1,235 +13:09 4,417
1911 10,668 5,713 4,955 1921 18,874 +8,206 +76.92 9,885 8,989 1931 21,122 +2,248 + 11. 91 11,122 10,000 1941 25,326 +4,204 +19.90 13,593 11,733 1951 29,167 +3,841 +15.17 16,360 12,807 1961 M. 8.03 36,881 +7,714 +26'45 19,607 17,274 1971 M. 7.76 40,308 +3,427 +9'29 21,663 18,645
91 Vikramasingapuram Tirunelveli 1931 8,514 + 10,3is + 121.i9
4,376 4,138 (TAMIL NADD) 1941 18,832 9,563 9,269
1951 29,361 + 10,529 +55.91 14,579 14,782 1961 P. 60.45 32,978 +3,617 +12.32 16,316 16,662 1971 P. 38.84 40,274 +7,296 +22.12 20,378 19,896
92 Raniganj Burdwan 1901 15,841 8,891 6,950 (WEST BENGAL) 1911 15,497 -344 -2.17 8,417 7,080
1921 14,536 -961 -6.20 8,040 6,496 1931 16,373 +1,837 +12.64 9,162 7,211 1941 22,839 +6,466 +39.49 12,779 10,060 1951 25,939 +3,100 +13.57 13,756 12,183 1961 M. 4.79 30,113 +4,174 + 16.09 16,987 13,126 1971 M. 4.79 40,104 +9,991 +33.18 22,534 17,570
93 Dharmapuri Dharmapuri 1901 8,102 -1,644 -20.29
3,833 4,269 (TAMIL NADU) 1911 6,458 3,271 3,187
1921 14,393 +7,935 +122.87 7,236 7,157 1931 14,815 +422 +2.93 7,415 7,400 1941 19,105 +4,290 -1-28.96 9,687 9,418 1951 24,094 +4,989 +26.11 11,982 12,112 1961 P. 11.66 28,031 +3,937 +16.34 14,295 13,736 1971 M. 11.30 40,086 + 12,055 +43.01 20,734 19,352'
94 Manmad urban Nasil< 1901 7,113 -166
3,781 3,332 agglomeration (MAHARASHTRA) 191( 6,947 -2.33 3,729 3,218
1921 11,929 +4,982 +71. 71 6,219 5,710 1931 12,263 +334 +2.80 6,441 5,822 1941 16,838 +4,575 +37.31 8,752 8,086 1951 18,350 +1,512 +8.98 9,481 8,869 1961 19.45 31,551 + 13,201 +71.94 16,536 • 15,015 1971 19.45 40,061 +8,510 +26.97 20,684 19,377
(a) Manmatl 1901 7,113 -Iii;; -2.33
3,781 3,332 1911 6,947 3,729 3,218 1921 1',929 +4,982 +71. 71 6,219 5,710 1931 12,263 +334 +2.80 6,441 5,822 1941 16,838 +4,575 +37.31 8,752 8,086 1951 18,350 +1,512 +8.98 9,481 8,869 1961 M. 2.87 23,570 +5,220 +28.45 12,393 11,177 1971 M. 9.53 29,571 +6,001 +25.46 15,281 14,290
(b) Manmad (N.M.) t 1961 N.M. 16.58 7,981 +2,509 +31.44
4,143 3,838 1971 N.M. 9.92 10,490 5,403 5,087
t Town Manmad (Non.Municipal) was a part of Ma011\ad (M.) with a population of 7,'81 (4,143 M., 3,838 F.) in 1961.
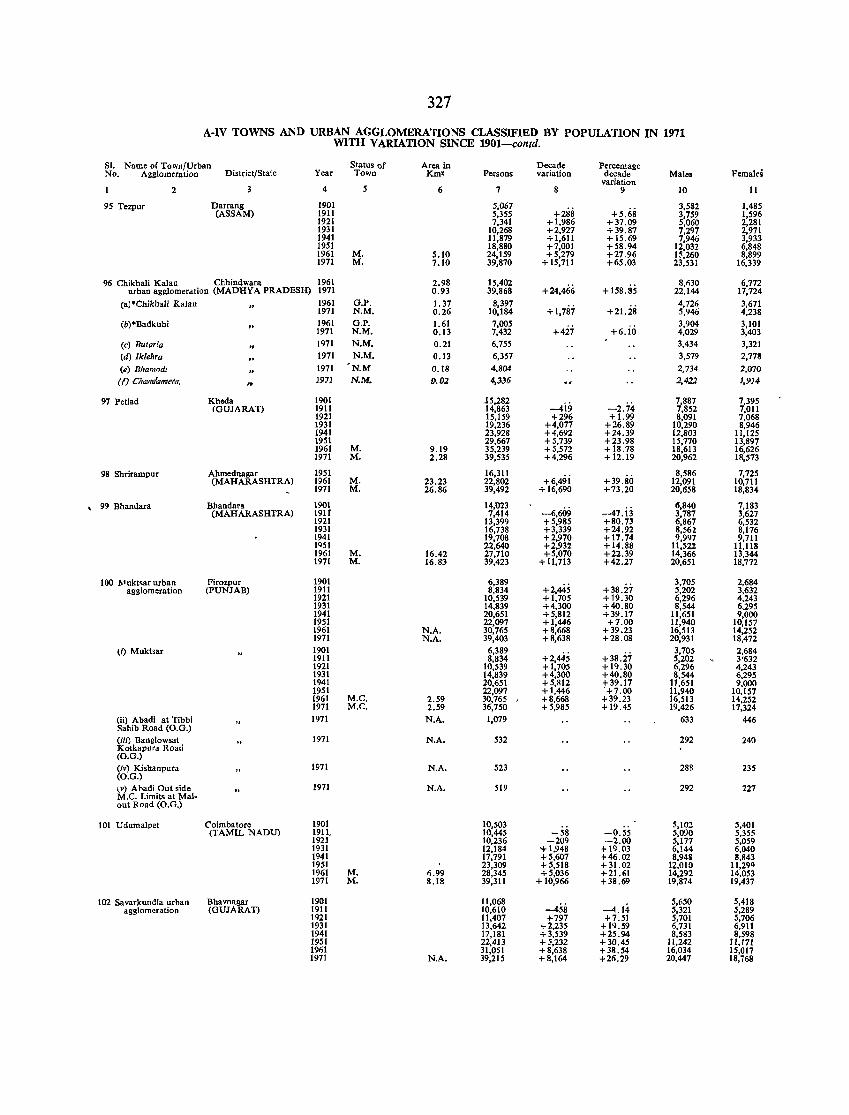
327
A-lV TOWNS AND URBAN AGGLOMERATIONS CLASSIFIED BY POPULATION IN 1971 WITH VARIATION SINCE 1901-contd.
SI. Name of Town/Urban Status ()f Area in Decade Percentage No. Agglomeration District/State Year Town Kmll Persons variation decade Males Femald
variation 2 4 5 6 7 9 10 11
95 Tezpur Darrang 1901 5,067 +288 +5.68
3,5B2 1,485 (ASSAM) 1911 5,355 3,759 1,596
1921 7,341 +1,986 +37.09 5,060 2,281 1931 10,268 +2,927 +39.87 7,297 2,971 1941 11,879 +1,611 +15.69 7,946 3,933 1951 18,880 +7,001 +58.94 12,032 6,848 1961 M. 5.10 24,159 +5,279 +27.96 15,260 8,899 1971 M. 7.10 39,870 + 15,711 +65.03 23,531 16,339
96 Chikhali Kalan Chhindwara 1961 2.98 15,402 +24,46;; + 158.85
8,1130 6,772 urban agglomerdtion (MADHYA PRADESH) 1971 0.93 39,868 22,144 17,724
(a)·Chikhali Kalan 1961 G.P. 1.37 8,397 +1,787 +21.28
4,726 3,671 1971 N.M. 0.26 10,184 5,946 4,238
(b)·Badkuhl 1961 G.P. 1.61 7,005 +427 +6.i<i
3,904 3,101 1971 N.M. 0.13 7,432 4,029 3,403
Ccl Butar!a 1971 N.M. 0.21 6,755 3,434 3,321 (d) Iklehra 1971 N.M. 0.13 6,357 3,579 2,778 eel BhamfJd, 1971 N.M 0.18 4,804 2,734 2,070 (f) Cka.Mzll'U't<l. J9'J N.M. 0.02 4,336 2,422 J,914
97 Petlad Kheda 1901 15,282 --4iil -2.74
7,887 7,395 (GUJARAT) 1911 14,863 7,852 7,011
1921 15,159 +296 +1.99 8,091 7,068 1931 19,236 +4,077 +26.89 10,290 8,946 1941 23,928 +4,692 +24.39 12,803 11,125 1951 29,667 +5,739 +23.98 15,770 13,897 1961 M. 9.19 35,239 +5,572 +18.78 18,613 16,626 1971 M. 2.28 39,535 +4,296 +12.19 20,962 18,573
98 Shrirampur Abmednagar 1951 16,311 +6,49i +39.80
8,586 7,725 (MAHARASHTRAl 1961 M. 23.23 22,802 12,091 10,711
1971 M. 26.86 39,492 +16,690 +73.20 20,658 18,834
, 99 Bhandara Bhandara 1901 14,'023 -6,609 --47.ij
6,840 7,183 (MAHARASHTRA) 1911' 7,414 3,787 3,627
1921 13,399 +5,985 +80.73 6,867 6,532 1931 16,738 +3,339 +24.92 8,56l 8,176 1941 19,708 +2,970 +17.74 9,997 9,711 1951 22,640 +2,932 + 14.88 11,522 11,118 1961 M. 16.42 27,710 +5,070 +22.39 14,366 13,344 1971 M. 16.83 39,423 + 11,713 +42.27 20,651 18,772
1 00 ~f ukt,ar urban Firozpur 1901 6,389 +2,445 +38.27
3,705 2,684 agglomeration (PUNJAB) 1911 8,834 5,202 3,632
1921 10,539 +1,705 + 19.30 6,296 4,243 1931 14,839 +4,300 +40.80 8,544 6,295 1941 20,651 +5,812 +39.17 11,651 9,000 1951 22,097 +1,446 +7.00 11,940 10,157 1961 N.A. 30,765 +8,668 +39.23 16,513 14,252 1971 N.A. 39,403 +8,638 +28.08 20,931 18,472
ti) Muktsar 1901 6,389 +2,445 +38.27
3,705 2,684 1911 8,834 5,202 3'632 1921 10,539 + 1,705 +19.30 6,296 4,243 1931 14,839 +4,300 +40.80 8,544 6,295 1941 20,651 +5,812 f39.17 11,651 9,000 1951 22,097 +1,446 +7.00 11,940 10,157 1961 M.e. 2.59 30,765 +8,668 +39.23 16,513 14,252 1971 M.e. 2.59 36,750 +5,985 + 19.45 19,426 17,324
(ii) Abadi at Tibbi Sahib Road (O.G.)
1971 N.A. 1,079 633 446
(iii) Banglowsat Kotkapura Road
1971 N.A. 532 292 240
(O.G.) (iv) Kishanpura 1971 N.A. 523 283 235 (O.G.) (v) Abadi Out side M.e. Limits at Mal-
1971 N.A. 519 292 227
out Road (O.G.)
101 Udumalpet Coimbatore 1901 10,503 -0.55
5,102 5,401 (TAMIL NADU) 1911. 10,445 -58 5,090 5,355
1921 10,236 -209 -2.00 5,177 5,059 1931 12,184 '+ 1,948 + 19.03 6,144 6,040 1941 17,791 +5,607 +46.02 8,9411 8,843 1951 23,309 +5,518 +31.02 12,010 ll,29Q 1961 M. 6.99 28,345 +5,036 +2Uil 14,292 14,053 1971 M. 8.18 39,311 + 10,966 +38.69 19,874 19,437
102 Savarkund1a urban Bhavnagar 1901 11,068 -458 --4.14
5,650 5,418 agglomeration (GUJARAT) 1911 10,610 5,321 5,289
1921 11,407 +797 +7.51 5,701 5,706 1931 13,642 +2,235 + 1').59 6,731 6,911 1941 17,181 + 3,539 +2S.94 8,583 8,598 1951 22,413 +5,232 +30.45 11,242 11,171 1961 31,051 +8,638 +38.54 16,034 15,017 1971 N.A. 39,215 +8,164 +26.29 20,447 18,768
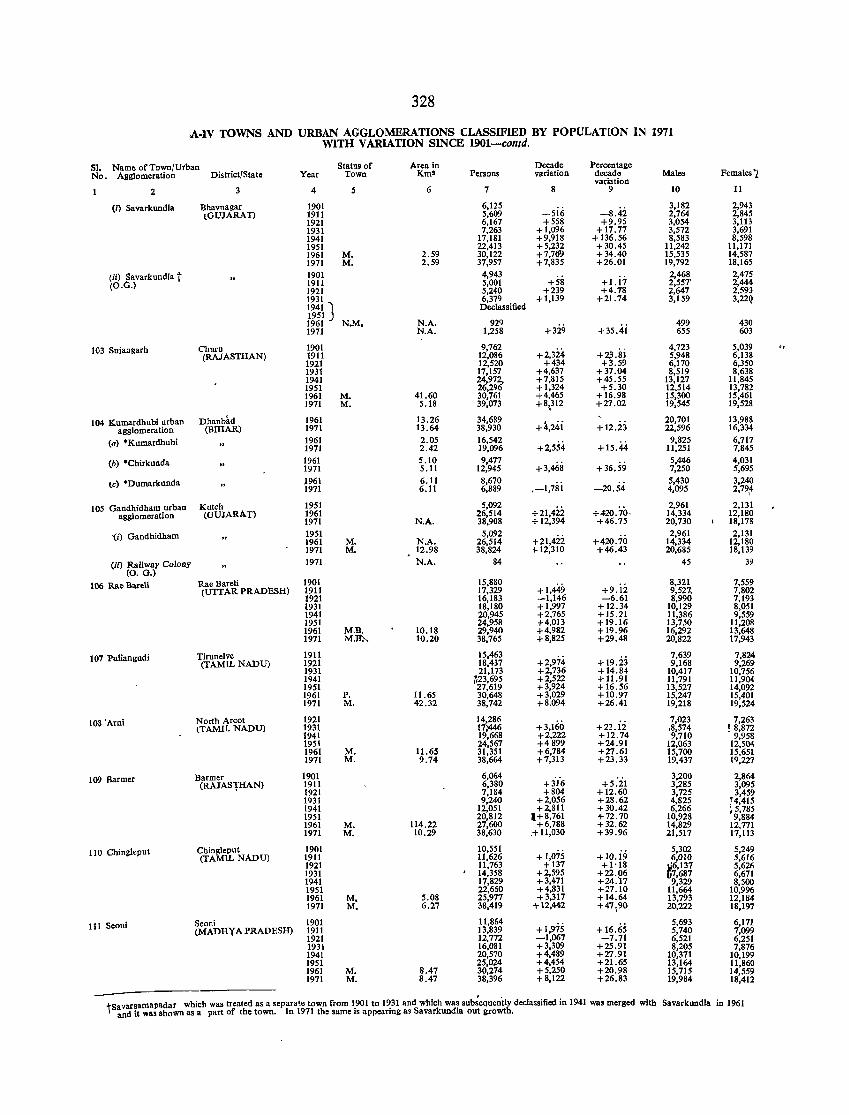
328
A.lV TOWNS AND URBAN AGGLOMERATIONS CLASSIFIED BY POPULATION IN 1971 WlTH V ARlATION SlNCE 1901-contd.
SI. Name of Town/Urban Statns of Area in Decade Percentage No. Agglomeration District/Stato Year Town K.m2 Persons variation decado Males Females!
variation 2 3 4 5 6 7 8 9 10 11
(I) Savarkundla Bhavnagar 1901 6,125 .-5i6
3,182 2,943 tGUJARAl) 1911 5,609 -8.42 2,764 2,845
1921 6,167 +558 +9.95 3,054 3,113 1931 7,263 +1,096 +17.77 3,572 3,691 1941 17,181 +9,918 + 136.56 8,583 8,598 1951 22,413 +5,232 +30.45 11,242 11,171 1961 M. 2.59 30,122 +7,769 +34.40 15,535 14,587 1971 M. 2.59 37,957 +7,835 +26.01 19,792 18,165
(ii) Savarkundla t 1901 4,943 +58 +1.i7
2,468 2,475 (O.G.) 1911 5,001 2,557' 2,444
1921 5,240 +239 +4.78 2,647 2,593 1931 6,379 + 1,139 +21.74 3,159 3,22Q 1941 J Declassified 1951 1961 N.M. N.A. 929
+329 +35.4i 499 430
1971 N.A. 1,258 655 603
103 Sujangarh Churu 1901 9,762 +23.8i
4,723 5,039 ., (RAJASTHAN) 1911 12,086 +2,324 5,948 6,138
1921 12,520 +434 +3.59 6,170 6,350 1931 17,157 +4,637 +37.04 8,519 8,638 1941 24,972, +7,815 +45.55 13,127 11,845 1951 26,296 + 1,324 +5.30 12.514 13,782 1961 M. 41.60 30,761 +4,465 + 16.98 15,300 15,461 1971 M. 5.18 39,073 +8,,312 +27.02 19,545 19,52.~
104 Kumardhubi urban Dhanbad 1961 13.26 34,689 +4,z.ii +12.23
20,701 13,988 agglomeration (BIHAR) 1971 13.64 38,930 22,596 16,334
Cn) oKumardhubi 1961 2.05 16,542 +15.44
9,825 6,717 1971 2.42 19,096 +2,554 11,251 7,845
(b) °Chirkunda 1961 5.10 9,477 +3,468 + 36.59
5,446 4,031 1971 5.11 12,945 7,250 5,695
te) 'Dumarkunda 1961 6.11 8,670 ,-1,78i -20.54
5,430 3,240 1971 6.11 6,889 4,095 2,79,4
105 Gandhidham urban Kutch 1951 5,092 +21,422 +420.70,
2,961 2,131 agglomeration lGUJARAT) 1961 26,514 14,334 12,180
1971 N.A. 38,908 + 12,394 +46.75 20,730 18,178
'(i) Gandhidham 1951 5,092 +21,422 +420.70
2,961 2,131 1961 M. N.A. 26,514 14,334 12,180 1971 M. 12.98 38,824 + 12,310 +46.43 20,685 18,139
(if) Railway Colony 1971 N.A. 84 45 39 (0. G.)
106 Rae Barel! Rae Bareli 1901 15,880 +1,449 +9.ii
8,321 7,559 (UTTAR PRADESH) 1911 17,329 9,527, 7,802
1921 16,183 -1,146 -6.61 8,990 7,193 1931 18,180 +1,997 +12.34 10,129 8,051 1941 20,945 +2,765 +15.21 11,386 9,559 1951 24,958 +4,013 +19.16 13,750 11,208 1961 M.B. 10.18 29,940 +4,982 +19.96 16,292 13,648 1971 M.JJ>,. 10.20 38,765 +8,825 +29.48 20,822 17,943
107 Puliangudi Tirunelve 1911 15,463 +2,974 +19.23
7,639 7,824 (TAMIL NADU) 1921 18,437 9,168 9,269
1931 21,173 +2,736 +14.84 10,417 10,756 1941 (123,695 +2,522 +11.91 11,791 11,904 1951 27,619 +3,924 +16.56 13,527 14,092 1961 P. 11.65 30,648 +3,029 +10.97 15,247 15,401 1971 M. 42.32 38,742 +8.094 +26.41 19,218 19,524
lOS 'Arni North Arcot 1921 14,286 +3,160 +22.ii
7,023 7,263 (TAMIL NADU) 1931 17;446 \8,574 ! 8,872
1941 19,668 +2,222 +12.74 9,710 9,958 1951 24,567 +4899 +24.91 12,063 12,504 1961 M. 11.65 31,351 +6,784 +27.61 15,700 15,651 1971 M. 9.74 38,664 +7,313 +23.33 19,437 19,227
109 Harmer Barmer 1901 6,064 +316 +5:21
3,200 2,864 (RAJASTHAN) 1911 6,380 3,285 3,095
1921 7,184 +804 +12.60 3,725 3,459 1931 9,240 +2,056 +28.62 4,825 f4,415 1941 12,051 +2,811 +30.42 6,266 ;5,785 1951 20,812 1+8,761 '1-72.70 10,928 9,884 1961 M. 114.22 27,600 +6,788 +32.62 14,829 12,771 1971 M. 10.29 38,630 .+ 11,030 +39.96 21,517 17,113
11 0 Chingleput Cbingleput 1901 10,551 +1,075 + 10.i9
5,302 5,249 (TAMIL NADU) 1911 11,626 6,010 5,616
1921 11,763 +137 +1'18 t,137 5,62fi 1931 14,358 +2,595 +22.06 7,687 6,671 1941 17,829 +3,471 +24.'17 9,329 8,500 1951 22,660 +4,831 +27.10 11,664 10,996 1961 M. 5.08 25,977 +3,317 +14.64 13,793 12,184 1971 M. 6.27 38,419 +12,442 +47;90 20,222 18,197
111 Seoni Seoni 1901 11,864 +1,975 +16.65
5,693 6,171 lMADHYA PRADESH) 1911 13,839 5,740 7,099
1921 12,772 -1,067 -7.71 6,521 6,251 1931 16,081 +3,309 +25.91 8,205 7,876 1941 20,570 +4,489 +27.91 10,371 10,199 1951 25,024 +4,454 +21.65 13,164 11,860 1961 M. 8.47 30,274 +5,250 +20.98 15,715 14,559 1971 M. 8.47 38,396 +8,122 +26.83 19,984 18,412
tSa'{arsamapadar which was treated as a separate town from 1901 to 1931 and which wa., sub;eQuen'tly declassified in 1941 was merged with Savarkundla in 1961 and it VIas shown as a part of the town. In 1971 the same is appearing as Savarkundla out growtb.
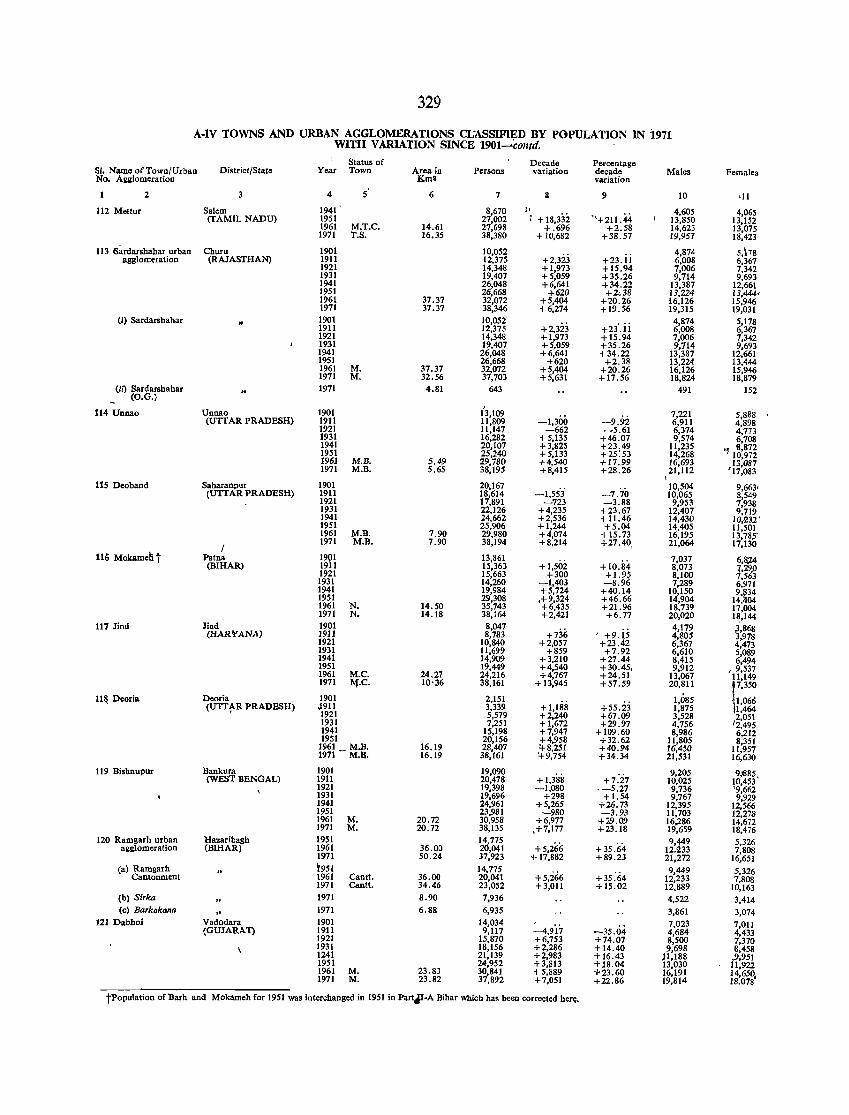
329
A-IV TOWNS AND URBAN AGGLOMERATIONS CLASSIFIED BY POPULATION IN 1971 WiTH VARIATION SINCE 1901-,contd. .
Status of Decade Percentage SI. Name of Town/Urban District/State Year Town Area in Persons variation decade Males Females No. Agglomeration KOla variation
2 4 5 6 7 i 9 10 ·11
112 Mettur Salem 1941 8,670 11 4,605 4,065 (TAMIl. NADU) 1951 27,002 1 + 18,332 "+211.44 13,850 13,152
1961 M.T.C. 14.61 27,698 + .696 +2.58 14,623 13,075 1971 T.S. 16.35 38,380 + 10,682 +38.57 19,957 18,423
113 6iudarshahar urban Churu 1901 10,052 +2,323 +23.ii
4,874 5,178 agglomeration (RAJASTHAN) 1911 12,375 6,008 6,367
1921 14,348 +1,973 +15.94 7,006 7,342 1931 19,407 +5,059 +35.26 9,714 9,693 1941 26,048 +6,641 +34.22 13,387 12,661 1951 26,668 +620 +2,,38 13,224 13,444, 1961 37.37 ,32,072 +5,404 +20.26 16,126 15,946 1971 37.37 38,346 +6,274 +19.56 19,315 19,031
(i) Sardarshahar 1901 10,052 +2,323 +23.ii
4,874 5,178 1911 12,375 6,008 6,367 1921 14,348 + 1,973 +15.94 7,006 7,342 1931 19,407 +5,059 +35.26 9,714 9,693 1941 26,048 +6,641 +34.22 13,387 12,661 1951 26,668 +620 +2.38 13,224 13,444 1961 M. 37.37 32,072 +5,404 +20.26 16,126 15,946 1971 M. 32.56 37,703 + 5,631 +17.56 18,824 18,879
(ii) Sardarshahar (0.0.)
1971 4.81 643 491 152
114 Unuao Unnao 1901 {3,lO9 -1,300
7,221 5,888 , (UTTAR PRADESH) 1911 l1,B09 -9.92 6,911 4,89B
1921 11,147 -662 _5.61 6,374 4,773 1931 16,282 +5,135 +46.07 9,574 6,708 1941 20,107 +3,825 +23.49 11,235 'I 8,872 1951 25,240 +5,133 +25:53 14,268 10,972 1961 M.B. 5A9 29,780 +4,540 + 17.99 16,693 13,087 1971 M.B. 5.65 38,195 +8,415 +28.26 21,112 '17,083 ,
115 Deoband Saharanpur 1901 20,167 -1,55'3
10,504 9,663' (UTTAR PRADESH) 1911 18,614 -7.70 10,065 8,549
1921 17,891 -723 -3.B8 9,953 7,938 1931 22,126 +4,235 +23.67 12,407 9,719 1941 24,662 +2,536 +11.46 14,430 10,1.132' 1951 25,906 +1,244 +5.04 14,405 11,501 1961 M.B. 7.90 29,9BO +4,074 +15.73 16,195 13,78:;' 1971 M.B. 7.90 38,194 +8,214 +27.40 , 21,064 17,130 /
116 Mokameli t Patna 1901 13,861 +10.84
7,037 6,8).4 (BIHAR) 1911 15,363 + 1,502 8,073 J,2~ 1921 15,663 +300 +1.95 8,100 ,53
1931 14,260 -1,403 -8.96 7,289 6,971 1941 19,984 +5,724 +40.14 10,150 9,g34 1951 29,308 ,+9,324 +46.66 14,904 14, 04 1961 N. 14.50 35,743 +6,435 +21.96 18,739 17,004 1971 N. 14.18 38,164 +2,421 +6.77 20,020 1~,144
117 lind Jind 1901 8,047 +736 ' +9i
4,179 ,3,868 (HARVANA) 1911 8,783 4,805 3,978
1921 10,840 +2,057 +23. 2 6,367 4,473 1931 11,699 +859 +7.92 6,610 5,089 1941 14,909 +3,210 +27.44 B,415 6,494 1951 19,449 +4,540 +30.45, 9,912 • 9,537 1961 M.C. 24.27 24,216 +4,767 +24.51 13,067 11,149 1971 ~.C. 10'36 38,161 + 13,945 +57.59 20,811
r-35O
11& Deoria Deoria 1901 2,151 1,085 1,066 (UTT~R PRADESH) .1911 3,339 + 1,188 +55.23 1,875 1,464
1921 5,579 +2,240 +67.09 3,528 2,051 1931 7,251 + 1,672 +29.97 4,756 '2,495 1941 15,198 +7,947 + 109.60 8,9B6 6,212 1951 20,156 +4,958 +32.62 11,805 8,351 1961 _ M.B. 16.19 28,407 !J..8,251 +40.94 16,450 11,957
1971 M.a. 16.19 38,161 '+9,754 +34.34 21,531 16,630
119 Bishnupur Bankura 1901 19,090 + 1,388 +7:27
9,205 9i885, (WEST BENGAL) 1911 20,478 10,025 10,453 1921 19,398 -1,080 .-5.27 9,736 '9,662 1931 19,696 +298 +1.54 9,767 9,929 1941 24,961 +5,265 +26.73 12,395 12,566 1951 23,981 -980 -3.93 11,703 12,278 1961 M. 20.72 30,958 +6,977 +29.09 16,286 14,672 1971 M. 20.72 38,135 ,+7,177 +23.18 19,659 18,476
120 Ramgarh urban Hazaribagh 1951 14,775 +5,266 + 35.64
9,449 5,326 agglomeration (BIHAR) 1961 36,00 20,041 12.233 7,80B
1971 50.24 37,923 + 17,882 +89.23 21,272 16,651 (al Ramgarh ~951 14,775
+5,266 9,449 5,326
Cantonment 1961 Cantt. 36.00 20,041 +35.64 12,233 7,808 1971 Cantt. 34.46 23,052 +3,011 + 15.02 12,889 10,163
(b) Sirka 1971 8.90 7,936 4,522 3,414 (c) Barkakana 1971 6.88 6,935 3,861 3,074
121 Dabhoi Vadodara 1901 14,034 -4,9i7 -35.04
7,023 7,011 (OUJARA.T) 1911 9,117 4,684 4,433
1921 15,870 +6,753 +74.07 8,500 7,370 1931 18,156 +2,286 + 14.40 9,698 8,458 1241 21,139 +2,983 + 16.43 JI,IB8 i9,951 1951 24,952 +3,813 +)8.04 13,030 1,922 1961 M. 23.B3 30,841 +5,889 +23.60 16,191 14,650, 1971 M. 23.82 37,892 +7,051 +22.86 19,814 18.078
tPopulation of Barh and Mokarneh for 1951 was interchanged in 1951 in PartJI-A Bihar which has been corrected her~.
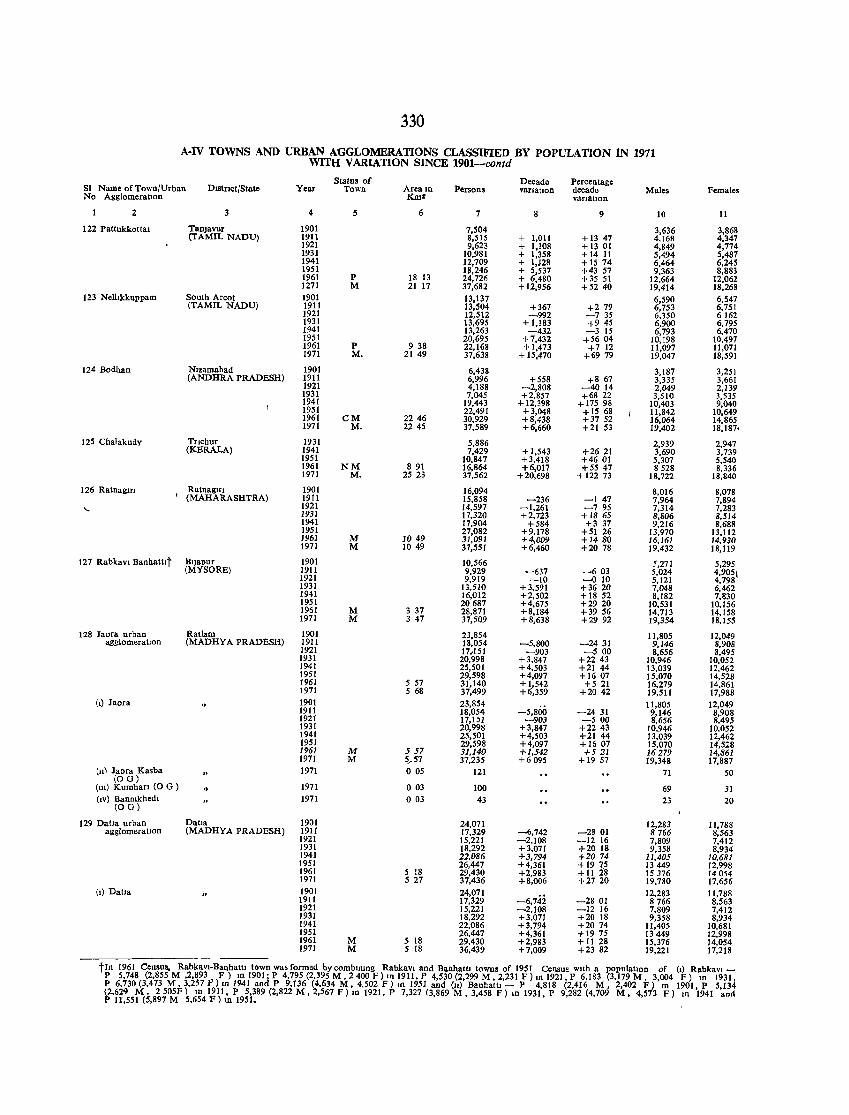
jjO
A-IV TOWNS AND URBAN AGGLOMERATIONS CLASSIFIED BY POPULATION IN 1971 WITH V ARlATlON SINCE 1901-contd
Status of Decade Percentage Sl Name of Town/Urban Dlstnct/State Year Town Area III Persons varIatIon decade Males Females No AgglomeratIOn KmS varIatIon
2 3 4 5 6 7 8 9 10 11
122 Pattukkottal TanJavur 1901 7,504 3,636 3,868 (TAMIL NADU) 1911 8,515 + 1,011 + 13 47 4,168 4,347
1921 9,623 + 1,108 + 13 01 4,849 4,774 1931 10,981 + 1,358 +14 It 5,494 5,487 1941 12,709 + I,J28 +15 74 6,464 6,245 1951 1~,246 + 5,537 +43 57 9,363 8,883 1961 P 18 13 24,726 + 6,480 +35 51 12,664 12,062 1271 M 21 17 37,682 + 12,956 +5240 19,414 18,268
123 Nelhkkuppam South Arcot 1901 13,137 6,590 6,547 (TAMIL NADU) 1911 13,504 +367 +279 6,753 6,751
1921 12,512 -992 -735 6,350 6162 1931 13,695 + 1,183 +945 6,900 6,795 1941 13,263 -432 -315 6,793 6,410 1951 20,695 +1,432 +5604 10,198 10,497 1961 P 938 22,168 +1,413 +7 12 11,097 11,071 1971 M. 2149 37,638 + 15,470 +6919 19,047 18,591
124 Bodhan Nlzamabad 1901 6,438 3,187 3,251 (ANDHRA PRADESH) 1911 6,996 +558 +8 67 3,335 3,661
1921 4,188 -2,808 -4014 2,049 2,139 1931 7,045 +2,857 +68 22 3,510 3,535 1941 19,443 + 12,398 +175 98 10,403 9,040 1951 22,491 +3,048 +15 68 11,842 10,649 1961 CM 2246 30,929 +8,438 +3752 16,064 14,865 1971 M. 2245 37,589 +6,660 +21 53 19,402 18,187.
125 Chalakudy Tflchur 1931 5,886 2,939 2,947 (KERALA) 1941 7,429 +1,543 +2621 3,690 3,739
1951 10,847 +3,418 +4601 5,307 5,540 1961 NM 891 16,864 +6,017 +5547 8528 8,336 1971 M. 2523 37,562 +20,698 + 122 73 18,722 18,840
126 Ratnagm I
RatnaglrJ 1901 16,094 8,016 8,078 (MAHARASHTRA) 1911 15,858 -236 -147 7,964 7,894
'- 1921 14,597 -1,261 -795 7,314 7,283 1931 17,320 +2,723 +1865 8,806 8,514 1941 17,904 +584 +3 37 9,216 8,688 1951 27,082 +9,178 +51 26 13,970 13,112 1961 M 1049 31,091 +4,009 +1480 16,161 14,930 1971 M 1049 37,551 +6,460 +2078 19,432 18,119
127 Rabkavi Banhattlt Bllapur 1901 10,566 5,271 5,295 (MYSORE) 1911 9,929 -637 -603 5,024 4,9051 1921 9,919 -10 --0 10 5,121 4,798
1931 13,510 +3,591 +3620 7,048 6,462 1941 16,012 +2,502 +18 52 8,182 7,830 1951 20687 +4,675 +2920 10,531 10,156 1961 M 3 37 28,871 +8,184 +39 56 14,713 14,158 1971 M 3 47 37,509 +8,638 +2992 19,354 18,155
128 Jaora urban Ratlam 1901 23,854 lI,805 12,049 agglomeration (MADHYA PRADESH) 1911 18,054 -5,800 -2431 9,146 8,908
1921 17,151 -903 -500 8,656 8,495 1931 20,998 +3,847 +2243 10,946 10,052 1941 25,501 +4,503 +21 44 13,039 12,462 1951 29,598 +4,097 +1607 15,070 14,528 1961 5 57 31,140 + 1,542 +5 21 16,279 14,861 1971 5 68 37,499 +6,359 +2042 19,511 17,988
(I) Jaora 1901 23,854 -5,800
11,805 12,049 1911 18,054 -2431 9,146 8,908 1921 17,151 -903 -500 8,656 8,495 1931 20,998 +3,847 +2243 10,946 10,052 1941 25,501 +4,503 +21 44 13,039 12,462 1951 29,598 +4,097 +1607 15,070 14,528 1961 M 557 31,140 +1,542 +521 16279 14,861 1971 M 5/57 37,235 +6095 + 19 57 19,348 17,887
(11\ Jaora Kasba 1971 005 121 71 50 (OG)
(111) Kumhafl (0 G ) ,. 1971 003 100 69 31 (IV) llanmkhedl
(OG) 1971 003 43 23 20
129 Datla urban Daha 1901 24,071 12,283 11,788 agglomeratIon (MADHYA PRADESH) 191t 17,329 -6,742 -2801 8766 8,563
1921 15,221 -2,108 -1216 7,809 7,412 1931 18,292 +3,071 +2018 9,358 8,934 1941 22,086 +3,794 +2074 11,405 10,681 1951 26,447 +4,361 +19 ~ 13 449 12,998 1961 5 18 29,430 +2,983 +11 2 15376 14054 1971 5 27 37,436 +8,006 +27 20 19,780 17,656
(I) Dalla 1901 24,071 -6,742
12,283 It ,788 1911 17,329 -2801 8766 8,563 1921 15,221 -2,108 -1216 7,809 7,412 1931 18,292 +3,071 +20 18 9,358 8,934 1941 22,086 +3,794 +2074 It ,405 10,681 1951 26,447 +4,361 +1975 13449 12,998 1961 M 5 18 29,430 +2,983 +11 28 15,376 14,054 1971 M 5 18 36,439 +7,009 +23 82 19,221 17,218
tIn 1961 Census, RabkavI-Banhattl town was formed by combinIng Rabkavi and BanhattJ towns of 1951 Censue WIth a populatIon of (I) RabkavI-P 5,748 (2,855 M ,2,893 F) 10 1901; P 4,795 (2,395 M, 2 400 F) 10 19tt, P 4,530 (2,299 M, 2,231 F) In 1921, P 6,183 (3,179 M, 3,004 F) In 1931, P 6,130 (3,473 M, 3,257 F) In 1941 and P 9,136 (4,634 M, 4,502 F) In 1951 and (11) BanhattJ - P 4,818 (2,416 M, 2,402 F) In 1901, P 5,134 (2,629 M, 2 505F) In 19lt, P 5,389 (2,822 M, 2,567 F) In 1921, P 7,327 (3,869 M, 3,458 F) In 1931, P 9,282 (4,709 M, 4,573 F) III 1941 and P If,S51 (5,897 M 5,654 F) III 1951.
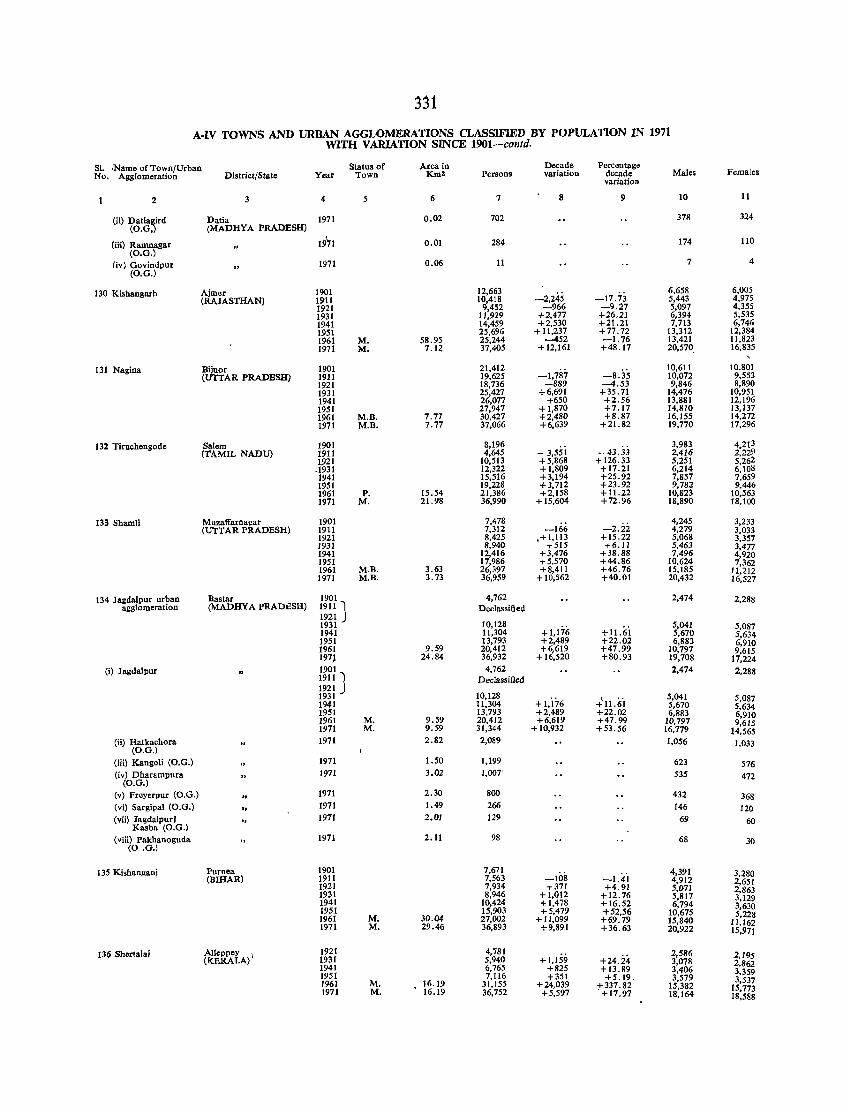
331
A-IV TOWNS AND URBAN AGGLOMERATIONS CLASSIFIED BY POPULATION IN 1971 WITH VARIATION SINCE 1901-contd.
SI. ,Name of Town/Urban Status of Area in Decade Percentage No. Agglomeration District/State Year Town Kro2 Persons variation decade Males Females
variation
2 3 4 5 6 7 8 9 10 11
(ii) Datiagird Datia 1971 0.02 702 378 324 (O.G,) (MADHYA PRADESH)
(iii) Ramnagar 19~1 0.01 284 174 110 (O.G.)
(iv) Govindpur 1971 0.06 11 7 4 (O.G.)
130 Kishangarh Aimer 1901 12,663 -2,245 -17.73
6,658 6,005 (RAJASTHAN) 1911 10,418 5,443 4,975
1921 9,452 -966 -9.27 5,097 4,355 1931 11,929 +2,477 +26.21 6,394 5,535 1941 14,459 +2,530 +21.21 7,713 6,746 1951 25,696 + 11,237 +77.72 13,312 12,384 1961 M. 58.95 25,244 -452 -1.76 13,421 11,823 1971 M. 7.12 37,405 +12,161 +48.17 20,570. 16,835
131 Nagina Bijnor 1901 21,412 -8.35
10,611 10,801 (UTTAR PRADESH) 1911 19,625 -1,787 10,072 9,553
1921 18,736 -889 -4.53 9,846 8,890 1931 25,427 +6,691 +35.71 14,476 10,951 1941 26,071 +650 +2.56 13,881 12,196 1951 27,947 + 1,870 +7.17 14,810 13,137 1961 M.B. 7.77 30,427 +2,480 +8.87 16,155 14,272 1971 M.B. 7.77 37,066 +6,639 +21.82 19,770 17,296
132 Tiruchengode Salem 1901 8,196 - 3,55i - 43.33
3,983 4,213 (TAMIL NADU) 1911 4,645 2,416 2,229
1,921 10,513 +5,868 + 126. 33 5,251 5,262 .1931 12,322 +1,809 +17.21 6,214 6,108 1941 15,516 +3,194 +25.92 7,857 7,659 1951 19,228 +3,712 +23.92 9,782 9,446 1961 P. 15.54 21,386 +2,158 + 11.22 10,823 10,563 1971 M. 21.98 36,990 + 15,604 +72.96 18,890 18,100
133 Shamli Muzaffarnagar 1901 7,478 -2.ii
4,245 3,233 (UTTAR PRADESH) 1911 7,312 -166 4,279 3,033
1921 8,425 ,+1,113 +15.22 5,068 3,357 1931 8,940 +515 +6.11 5,463 3,477 1941 12,416 +3,476 +38.88 7,496 4,920 1951 17,986 +5,570 +44.86 10,624 7,362 1961 M.B. 3.63 26,397 +8,411 +46.76 15,185 11,212 1971 M.B. 3.73 36,959 + 10,562 +40.01 20,432 16,527
134 Jagda1pur urban Bastar 1901 4,762 2,474 2,288 agglomeration (MADHYA PRADESH) 1911 } Declassified
1921 1931 10,128
+1,176 +11.6i 5,041 5,087
1941 11,304 5,670 5,634 1951 13,793 +2,489 +22.02 6,883 6,910 1961 9.59 20,412 +6,619 +47.99 10,797 9,615 197, 24.84 36,932 + 16,520 +80.93 19,708 17,224
(i) Jagdaipur 1901 J 4,762 2,474 2,288 1911 nedassified 1921 1931 10,128
+I,i76 \ .. 5,041 5,087
1941 11,304 +11.61 5,670 5,634 1951 13,793 +2,489 +22.02 6,883 6,910 1961 M. 9.59 20,412 +6,619 +47.99 10,797 9,615 1971 M. 9.59 31,344 + 10,932 +53.56 16,779 14,565
(ii) Hatkachora 1971 2.82 2,089 1,056 1,033 (O.G.)
(iii) Kanlloli (O.G.) 1971 1.50 1,199 623 576 (iv~ Dharampura .. 1971 3.02 1,007' 535 472
O.G.) (v) Freyerpuf (O.G.) .. 1971 2.30 800 432 368 (vi) Sargipal (O.G.) .. 1971 1.49 266 146 120 (vii) Jagdalpurl 1971 2.01 129 69 60
Kasba (O.G.) (viii) Pakhanoguda 1971 2.11 98 68 30
(O.G.)
135 Kishanganj Purnea 1901 7,671 4,391 3,280 (BIHAR) 1911 7,563 -108 -1.4i
1921 7,934 +371 +4.91 4,912 2,651
1931 8,946 +1,012 +12.76 5,071 2,863
1941 10,424 +1,478 +16.52 5,817 3,129
1951 15,903 +5,479 +52,56 6,794 3,630
10,675 5,228 1961 M. 30.04 27,002 +11,099 +69.79 15,840 11,162 1971 M. 29.46 36,893 +9,891 +36.63 20,922 15,971
136 Sherta1ai Alleppey \ 1921 4,781 +1,159
2,586 2,195 (T<ERALA) 1931 5,940 +24.24 3,078 2,862 1941 6,765 +825 +13.89 3,406 3,359 1951 7,116 +351 +5.19_ 3,579
1961 M. 16.19 31,155 +24,039 :1"337.82 3,537
1971 M. 16.19 36,752 +5,597 15,382 15,773
+17.97 18,164 18,588
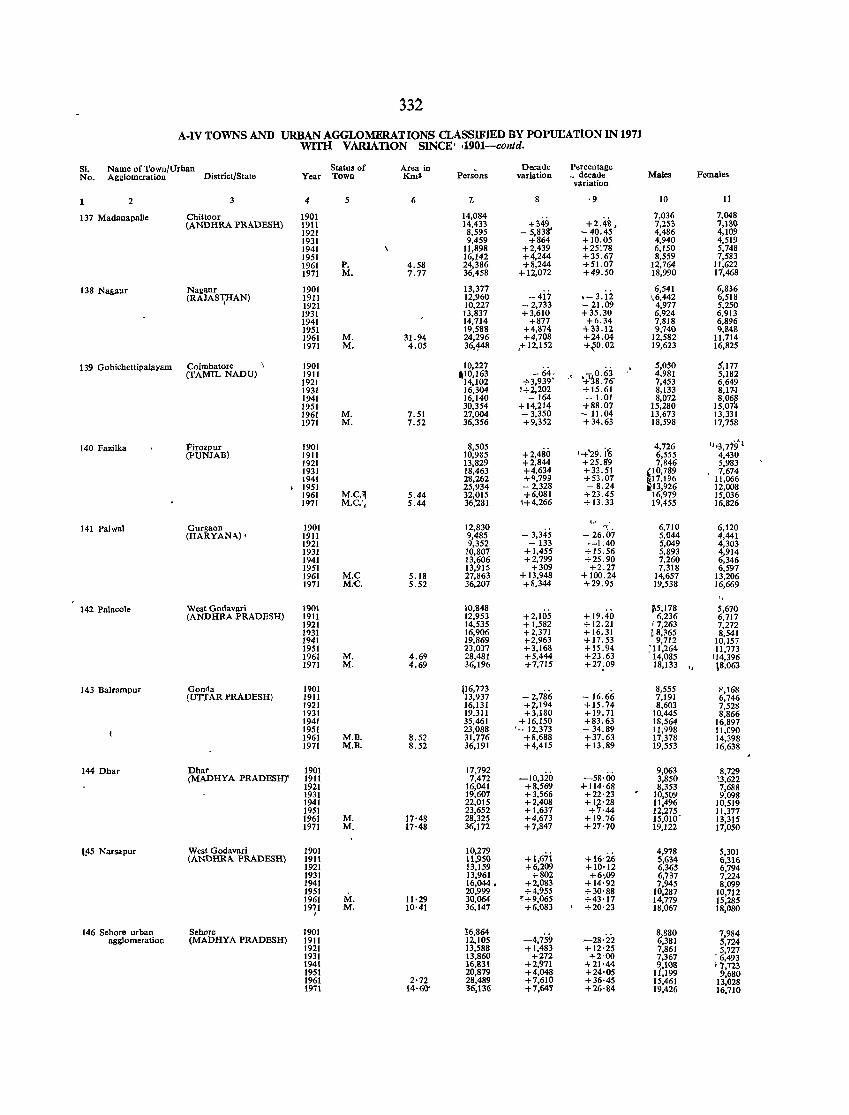
332
A-IV TOWNS AND URBAN AGGLOMERATIONS CLASSIFIED BY POPlJEATlON IN 1971 WITH VARIATION SINCE' ,1901-contd.
SI. Name of Town/Urban Status of Area in Persons
DtlCade Percentage No. Agglomeration District/State Year Town KIDS variation " decade Males Females
variation
2 3 4 5 6 7. '9 10 11
137 Madanapalle Chiltoor 1901 14,084 +2.48.
7,036 7,048 (ANDHRA l'RADESH) 1911 14,433 +349 7,253 7,lS0
1921 8,595 - 5,838' - 40.45 4,486 4,109 1931 9,459 +864 +10.05 4,940 4,519 1941 11,898 +2,439 +25:78 6,150 5,748 1951 16,142 +4,244 +35.6~ 8,559 7,583 1961 P. 4.58 24,386 +8,244 +51.0 12,764 11,622 1971 M. 7.77 36,458 +12,072 +49.50 18,990 17,468
138 Nagaur Nagaur 1901 13,377 ,- 3.ii
6,541 6,836 (RAJAS~HAN) 1911 12,960 - 417 \6,442 6,518
1921 10,227 - 2,733 - 21.09 4,977 5,250 1931 13,837 +3,610 +35.30 6,924 6,913 1941 14,714 +877 +6.34 7,818 6,896 1951 19,588 +4,874 +33.12 9,740 9,848 1961 M. 31.94 24,296 +4,708 +24.04 12,582 11,714 1971 M. 4.05 36.148 ,+12,152 +<0.02 19,623 16,825
139 Gobichettipa]J1yam CoiInbatore \ 1901 10,227 . 5,050 5,177 (TAMIL NADU) 1911 .10,163 -64. .' '+'3~:~} 4,981 5,182
1921 14,102 -1'3,939' 7,453 6,649 1931 16,304 1+2,202 +15.61 8,133 8,17·1 1941 16,140 -164 - 1.01 8,072 8,06~ 1951 30,354 +14,214 +88.07 15,280 15,07'1 1961 M. 7.51 27,004 _ 3,350 - 11.04 13,673 13,331 1971 M. 7.52 36,356 +9,352 +34.63 18,598 17,758
140 Fazilka Firozpur 1901 8,505 +2,480 t+·2~.i'6
4,726 1J'3,71"9! (PUNJAB) 1911 10,985 6,555 4,430
1921 13,829 +2,844 +25.8'9 7,846 5,983 1931 18,463 +4,634 +33.51 ,10,789 7,674 1941 28,262 +Q,799 +53.07 ~17,196 11,066
• 1951 25,934 - 2,328 - 8.24 r 13,926 12,008 1961 M.C.ij 5.44 32,015 +6,081 +23.45 16,979 15,036 1971 M.C:, 5.44 36,'281 1+4,266 +13.33 19,455 16,826
1901 12,830 to' _.,
141 Palwal Gurgaon 6,710 6,120 (HARYANA), 1911 9,485 _ 3,345 - 26.07 5,044 4,441
1921 9,352 - 133 -1.40 5,049 4,303 1931 10,807 +1,455 +15.56 5,893 4,914 1941 13,606 +2,799 +25.90 7,260 6,346 1951 13,915 +309 +2.27 7,318 6,597 1961 M.C 5.18 27,863 + 13,948 + 100.24 14,657 13,206 1971 M.e. 5.52 36,207 +8,344 +29.95 19,538 16,669
'. 142 Palaeole West Godavari 1901 10,848 ~5,178 5,670
(ANDHRA PRADESH) 1911 12,953 +2,105 +19.40 6,236 6,717 1921 14,535 +1,582 +12.21 17,263 7,272 1931 16,906 +2,371 +16.31 18,365 8,541 1941 19,869 +2,963 +17.53 9,712 10,157 1951 23,037 +3,168 +15.94 ':11,264 11,773 1961 M. 4.69 28,481 +5,444 +23.63 14,085 114,396 1971 M. 4.69 36,196 +7,715 +27;09 18,133
" \8,063
143 Ba1rampur Gonrla 1901 l16,n3 _ 2,786
8,555 ~,168 (UTTAR PRADESH) 1911 13,937 -16.66 7,191 6,746
1921 16,131 +S,194 +15.74 8,603 7,528 1931 19.311 + ,180 +19.71 10,445 8,866 1941 35,461 +16,150 +83.63 18,564 16,897 1951 23,088 '_ 12,373 _ 34.89 11,998 11,090 1961 M.B. 8.52 31,776 +8,688 +37.63 17,378 14,398 1971 M.B. 8.52 36,191 +4,415 + 13.89 19,553 16,638
144 Dbar Dbar 1901 17,792 -10,320 -58·00
9,063 8,729 (MADHYA PRADESH)' 1911 7,472 3,850 ~3,622
1921 16,041 +8,569 + 114·68 8,353 7,688 1931 19,607 +3,566 +22·23 10,509 9,098 1941 22,015 +2,408 +lj}'28 11,496 10,519 1951 23,652 + 1,637 + ·44 12,275 11,377 1961 M. 17·48 28,325 +4,673 +19.76 15,010' 13,315 1971 M. 17·48 36,172 +7,847 +27'70 19,122 17,050
l~5 Narsapur West Godavari 1901 10,279 + 1,67i + 16·i6
4,978 5,301 (ANDHRA PRADESH) 1911 11,950 5,634 6,316
1921 13,159 +6,209 + 10'12 6,365 6,794 1931 13,961 +802 +6.,09 6,737 7,224 1941 16,044 • +2,083 +14·92 7,945 8,099 1951 M, 20,999 +4,955 +30'88 10,287 10,712 1961 11·29 30,064 ~ +9,065 +43'17 14,779 15,285 1971 M, 10·41 36,147 +6,083 +20·23 18,067 18,080
I
146 Sehore urban Sehore 1901 16,864 8,880 7,984 agglomeration (MADHYA PRADESH) 1911 12,105 --4,759 -28'22 6,381 5,724
1921 13,588 +1,483 + 12·25 7,861 5,727 1931 13,860 +272 +2·00 7,367 . 6,493 1941 16,831 +2,971 +21'44 9108 , 7,723 1951 20,879 +4,048 +24·05 11.199 9,680 1961 2'72 28,489 +7,610 +36'45 15,461 13,028 1971 14'60- 36,136 +7,647 +26·84 19,426 16,710
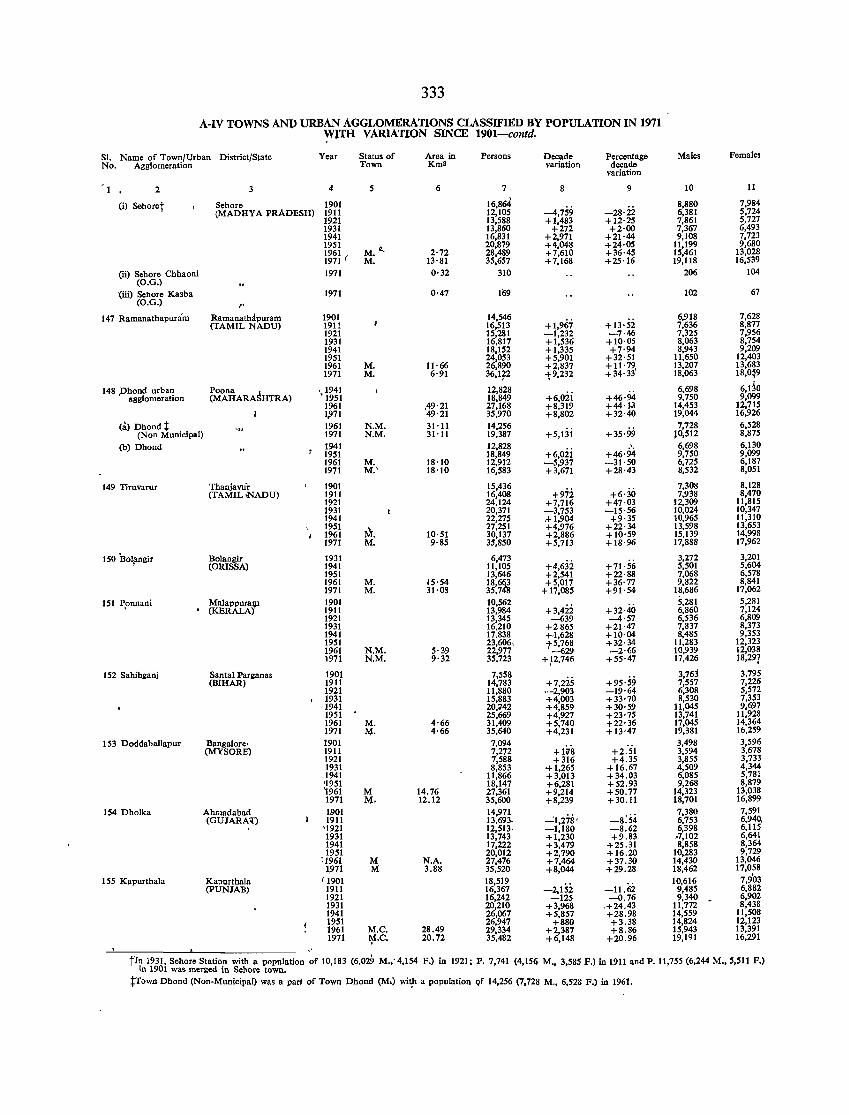
333
A-IV TOWNS AND URBAN AGGLOMERATIONS CLASSIFIED BY POPULATION IN 1971 WITH VARIATION SINCE 1901-contd.
Sl. Name of Town/Urban District/State Year Status of Area in Persons Decade Percentage Males Females No. Agglomeration Town Km2 variation decade
variation
2 4 5 6 7 8 9 10 11
(i) Sehoret Sehor. 1901 16,864 -4,759 -28·22
8,880 7,984 (MADHYA PRADESH) 1911 12,105 6,381 5,724
1921 13,588 +1,483 +12·25 7,861 5,727 1931 13,860 +272 +2·00 7,367 6,493 1941 16,831 +2,971 +21·44 9,108 7,723 1951
M."-20,879 +4,048 +24·05 11,199 9,680
1~~1 ( 2'72 28,489 +7,610 +36·45 15,461 13,028 M. 13'81 35,657 +7,168 +25·16 19,118 16,539
(ii) Sehore ehhaoni (O.G.)
1971 0'32 310 206 104
'(iii) Sehor. Kasba 1971 0·47 1li9 102 67 (O.G.)
I'
147 Ramanathapuram Ramanathapuram 1901 14,546 +1,967
6,918 7,628 (TAMIL NADU) 191! 16,513 +13·52 7,636 8,877
1921 15,281 -1,232 -7·46 7,325 7,956 1931 16,817 +1,536 +10·05 8,063 8,754 1941 18,152 +1,335 +7·94 8,943 9,209 1951 24,053 +5,901 +32·51 11,650 12,403 1961 M. 11·66 26,890 +2,837 +11'79, 13,207 13,683 1971 M. 6·91 36,1~2 ;;9,232 +34·33 18,063 18,O~9
148 phond urban Poona S \'ml 12,828 +6,02i +46·94
6,698 6,do agglomeration (MAHARA HTRA) 18,849 9,750 9,099
1961 ,49, 21 27,168 +8,319 +44·13 14,453 12,715 J.971 49·21 35,970 +8,802 +32·40 19,044 16,926
(a) Dhond t 1961 N.M. 31·11 14,256 +5,13i +35·99
7,728 6,528 (Non Municipal) 1971 N.M. 31'11 19,387 }0,512 8,875
(b) Dhond 1941 12,828 +6,oii +46·9~
6,698 6,130 1951 18,849 9,750 9,099 1961 M. 18'10 12,912 -5,937 -31·50 6,725 6,187 1971 M.' 18'10 16,583 +3,671 +28·43 8,532 8,051
149 Tirnvarnr Thanjavul- 1901 15,436 +972 +6·30
7,308 8,128 (TAMIL NADU) 1911 16,408 7,938 8,470
1921 24,124 +7,716 +47·03 12,309 11,815 1931 20,371 -3,753 -15·56 10,024 10,347 1941 22,275 ,+1,904 +9·35 10,965 11,310 1951 1\\. 27,251 +4,976 +22·34 13,598 13,653 1961 10·51 30,137 +2,886 +10'59 15,139 14,998 1971 M. 9'85 35,850 +5,713 +18·96 17,888 17,962
150 Bo1/lngir Bolangir 1931 6,473 +4,63i +71·56
3,272 3,201 (ORISSA) 1941 11,105 5,501 5,604
1951 13,646 +2,541 +22·88 7,068 6,578 1961 M. 15'54 18,6~ +5,017 +36·77 9,822 8,841 1971 M. 31·08 35,7 + 17,085 +91·54 18,686 17,062
151 P,onnani Malappuram 1901 10,562 +3,42i +32·40
5,281 5,281 (KERALAj' 1911 13,984 6,860 7,124
1921 13,345 -639 -4·57 6,536 6,809 1931 16,210 +2865 +21·47 7,837 8,373 1941 17.838 +.t,628 +10·04 8,485 9,353 1951 23,606, t~~g +32·34 11,283 12,323 1961 N.M. 5·39 22,977 -2·66 10,939 12,038 1971 N.M. 9·32 35.723 + ,2,746 +55·47 17,426 18,297
152 Sahibganj Santal Parganas 1901 7,558 +95'59
3,763 3,795 (BIHAR) 1911 14,783 +7,225 7,557 7,226
1921 11,880 -2,903 -19·64 6,308 5,572 1931 15,883 +4,003 +33'70 8,530 7,353
·1941 20,442 +4,859 +30·59 11,045 9,697 1951 25,669 +4,927 +23'75 13,741 11,928 1961 M. 4·66 31,409 +5,740 +22·36 17,045 14,364 1971 1\:1. 4·66 35,640 +4,231 +13·47 19,381 16,259
153 Doddaballapur Bangalore, 1901 7,094 +2:51
3,498 3,596 (MYSORE) 1911 7,272 +1078 3,594 3,678
1921 7,588 +316 +4.35 3,855 3,733 1931 8,853 +1,265 +16.67 4,509 4,344 1941 11,866 +3,013 +34.03 6,085 5,781 '1951 18,147 +6,281 +52.93 9,268 8,879 '1961 M 14.76 27,361 +9,214 +50.77 14,323 13,038 1971 M, 12.12 35,600 +8,239 + 30.11 18,701 16,899
154 Dholka Ahmadabad 1901 14,971 "":1,278' -8:54
7,380 7,591 (GUJARA'f) 1911 13,693. 6,753 6,940,
'1921 12,513. -1,180 -8.62 6,398 6,115 1931 13,743 +1,230 +9.83 ,7,102 6,641 1941 17,222 +3,479 +25.31 8,858 8,364 1951 20,012 +2,790 +16.20 10,283 9,729
:1961 M N.A. 27,476 +7,464 +37.30 14,430 13,046 l,971 M 3.88 35,520 +8,044 +29.28 18,462 17,058
155 Kapurthala Kapurthala 11901 18,519 -2,152- -1t.iii
10,616 7,9()3 (PUNJAB) 1911 16,367 9,485 6,882
1921 16,242 -125 -0.76 9,340 - 6,902 1931 20,210 +3,968 .+24.43 11,772 8,438 1941 26,067 +5,857 +28.98 14,559 11,508 1951 26,947 +880 +3.38 14,824 12,123 1961 M.C. 28.49 29,334 +2,387 +8.86 15,943 13,391 1971 ~f.C. 20.72 35,482 +6,148 +20.96 19,191 16,291 . "
tln 1931, Sehor. Station with a population of 10,183 (6,029 M.; 4,154 F.) in 1921; P. 7,741 (4,156 M., 3,585 F.) in 1911 and P. 11,755 (6,244 M., 5,511 F.) in 1901 was merged in Sehore town.
:j:Town Dhond (Non-Municipal) was a part of Town Dhond (M.) wi~ a population Qf 14,256 (7,728 M., 6,528 F.) in 1961.
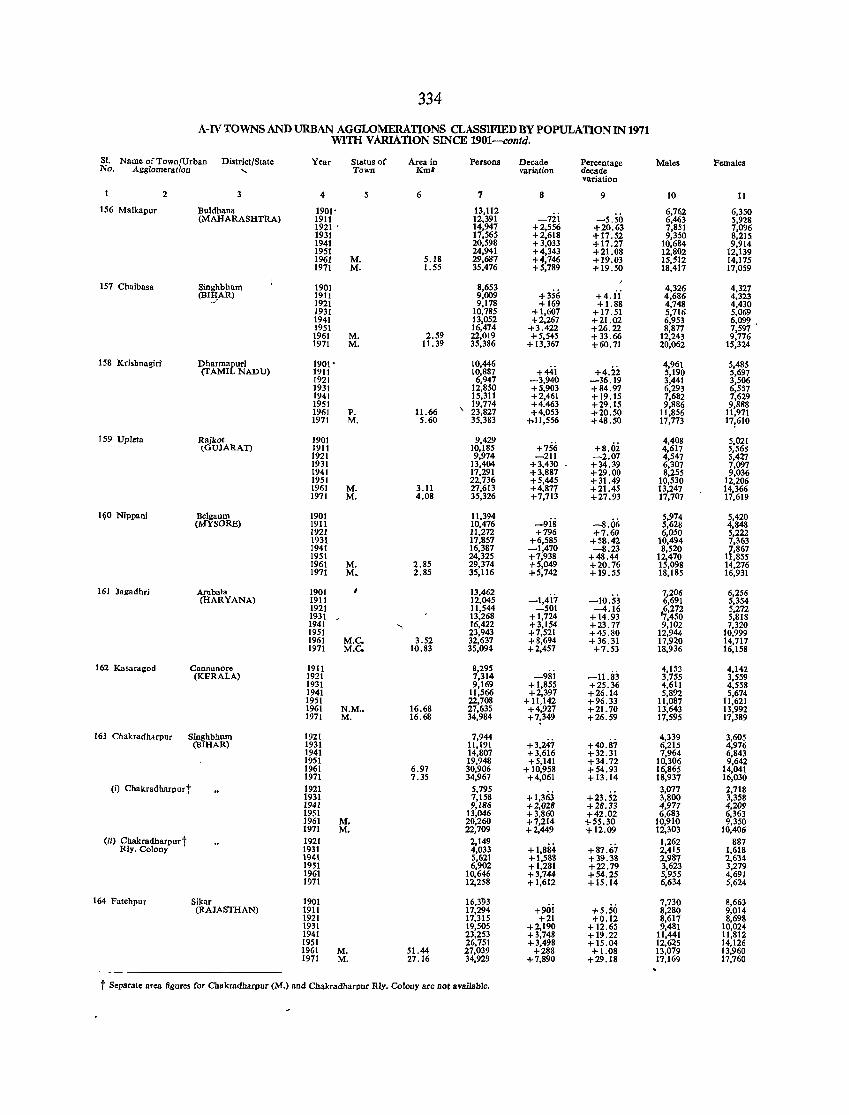
334
A-N TOWNS AND URBAN AGGLOMERATIONS CLASSlFlED BY POPULATION IN 1971 WITH VARIATION SINCE 1901-contd.
SI. Name of Town/Urban District/State Year Status of Area in Persons Decade Percentage Males Females No. Agglomeration "- Town Km' variation decade
variation
2 4 5 6 7 8 9 10 11
156 Malkapur Buldhana 1901' 13,112 -7ii
6,762 6,350 (MAHARASHTRA) 1911 12,391 -5.50 6,463 5,928
1921 ' 14,947 +2,556 +20.63 7,851 7,096 1931 17,565 +2,618 +17.52 9,350 8,215 1941 20,598 +3,033 +17.27 10,684 9,914 1951 24,941 +4,343 +21.08 12,802 12,139 1961 M. 5.18 29,687 +4,746 +19.03 15,512 14,175 1971 M. 1.55 35,476 +5,789 +19.50 18,417 17,059
157 Chaibasa Singhbhum 1901 8,653 +4.ii
4,326 4,327 (BIHAR) 1911 9,009 +356 4,686 4,323 ..r 1921 9,178 +169 +1.88 4,748 4,430
1931 10,785 +1,607 +17.51 5,716 5,069 1941 13,052 +2,267 +21.02 6,953 6,099. 1951 16,474 +3.422 +26.22 8,877 7,597 1961 M. 2.59 22,019 +5,545 +33.66 12,243 9,776 1971 M. 11.39 35,386 + 13,367 +60.71 20,062 15,324
158 Krishnagirt Dharmapuri 1901' 10,446 +44i
4,961 5,485 (TAMIL NADU) 1911 10,887 +4.22 5,190 5,697
1921 6,947 -3,940 -36.19 3,441 3,506 1931 12,850 +5,903 +84.97 6,293 6,557 1941 15,311 +2,461 +19.15 7,682 7,629 1951 , 19,774 +4.463 +29.15 9,886 9,888 1961 P. 11.66 23,827 +4,053 +20.50 11,856 11,971 1971 M. 5.60 35,383 -/.11,556 +48.50 17,773 17:610
159 Upleta Rajkot 1901 9,429 4,408 5,021 (OUJARAT) 1911 10,185 +756 +8.02 4,617 5,568
1921 9,974 -211 -2.07 4,547 5,427 1931 13,404 +3,430 +34.39 6,307 7,097 1941 17,291 +3,887 +29.00 8,255 9,036 1951 22,736 +5,445 + 31.49 10,530 12,206 1961 M. 3.11 27,613 +4.877 +21.45 13,247 14,366 1971 M. 4.08 35,326 +7,713 +27.93 17,707 17,619
If/O Nippani Belgaurn 1901 11,394 -9ig -8.66
5,974 5,420 (MYSORE) 1911 10,476 5,628 4,848
1921 11,272 +796 +7.60 6,050 5,222 1931 17,857 +6,585 +58.42 10,494 7,363 1941 16,387 -1,470 -8.23 8,520 ?,867 1951 24,325 +7,938 +48.44 12,470 1 ,855 1961 M. 2.85 29,374 +5,049 +20.76 15,098 14,276 1971 M, 2.85 35,116 +5,742 +19.55 18,185 16,931
161 Jagadhr; AmbaJa 1901 13,462 -I,4i7 -10.53
7,206 6,256 (HARYANA) 1911 12,045 6,691 5,354
1921 11,544 -501 --4.16 4,272 5,272 1931 13,268 +1,724 + 14.93 ,450 5,818 1941 " 16,422 +3,154 +23.77 9,102 7,320 1951 23,943 +7,521 +45.80 12,944 10,999 1961 M.e. 3.52 32,637 +8,694 +36.31 17,920 14,717 1971 M.e. 10.83 35,094 +2,457 +7.53 18,936 16,158
162 Kasaragod Cannaoore 1911 8,295 -98i -11.83
4,153 4,142 (KERALA) 1921 7,314 3,755 3,559
1931 9,169 +1,855 +25.36 4,611 4,558 1941 11,566 +2,397 +26.14 5,892 5,674 1951 22,708 + 11,142 +96.33 11,087 11,621 1961 N.M .. 16.68 27,635 +4,927 +21.70 13,643 13,992 1971 M. 16.68 34,984 +7:349 +26.59 17,595 17,389
163 Chakradharpur Singhbhum 1921 7,944 +3,247 +40.81
4,339 3,605 (BIHAR) 1931 11,191 6,215 4,976
1941 14,807 +3,616 + 32.31 7,964 6,843 1951 19,948 +5,141 +34.72 10,306 9,642 1961 6.97 30,906 + 10,958 +54.93 16,865 14,041 1971 7.35 34,967 +4,061 + 13.14 18,937 16,030
(i) Chakradharpur t 1921 5,795 +1,363 + 23.5i
3,017 2,718 1931 7,158 3,800 3,358 1941 9,186 +2,028 +28.33 4,977 4,209 1951 13,046 +3.860 +42.02 6,683 6,363 1961 M. 20,260 +7,214 +55.30 10,910 9,350 1971 M. 22,709 +2,449 +12.09 12,303 10,406
(ii) Chakradharpur t 1921 2,149 +1,884 +87.67
1,262 887 Rly. Colony 1931 4,033 2,415 1,618
1941 5,621 +1,588 +39.38 2,987 2,634 1951 6,902 +1,281 +22.79 3,623 3,279 1961 10,646 +3,744 +54.25 5,955 4,691 1971 12,258 +1,612 + 15.14 6.634 5,624
164 Fatehpur Sikar 1901 16,3~3 +90i
7,730 8,663 (RAJASTHAN) 1911 17,294 +5.50 8,280 9,014
1921 17,315 +21 +0.12 8,617 8,698 1931 19,505 +2,190 +12.65 9,481 10,024 1941 23,253 +3,748 + 19.22 11,441 11,812 1951 26,751 +3,498 + 15.04 12,625 14,126 1961 M. 51.44 27,039 +288 +1.08 13,079 13,960 1971 M. 27.16 34,929 +7,890 +29.18 17,169 17,760
t Separate area figures for Chakradharpur (M.) and Chakradharpur Rly. Colony are not available.
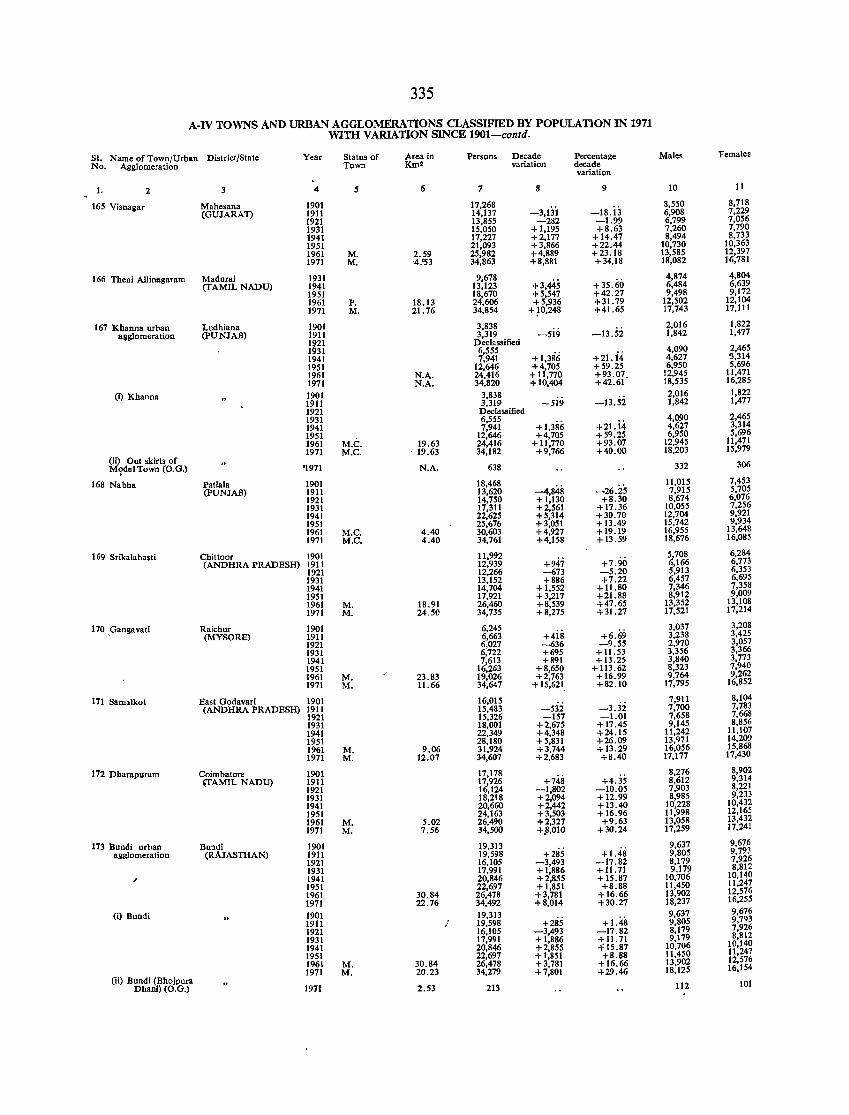
335
A-IV TOWNS AND URBAN AGGLOMERATIONS CLASSIFIED BY POPULATION IN 1971 WITH VARIATION SINCE 1901-comd.
Sl. Name of Town/Urban District/State Year Status of Area in Persons Decade Percentage Males Females No. Agglomeration Town Km2 variation decade
variation
t. 2 3 4 5 6 7 8 9 10 11
165 Visnagar Mahesana 1901 17,268 -3,13i -18.i3
8,550 8,718 (GUJARAT) 1911 14,137 6,908 7,229
1921 13,855 -282 -1.99 6,799 7,056 1931 15,050 +1,195 +8.63 7,260 7,790 1941 17,227 +2,177 + 14.47 8,494 8,733 1951 21,093 +3,866 +22.44 10,730 10,363 1961 M. 2.59 25,982 +4,889 +23.18 13,585 12,397 1971 M. '4.'53 34,863 +8,881 +34,18 18,082 16,781
166 Theni Allinagararn Madurai 1931 9,678 +3,445 +35,60
4,874 4,804 (TAMIL NADD) 1941 13,123 6,484 6,639
1951 18,670 +5,547 +42.27 9,498 9,172 1961 P. 18.13 24,606 +5,936 +31.79 12,502 12,104 1971 M. 21.76 34,854 + !0,248 +41.65 17,7113 17,111
167 Khanna urban Ludhiana 1901 3,838 -5i9 -13.52
2,016 1,822 agglomeration (pUNJAB) 1911 3,319 1,842 1,477
1§21 Declassified 1 31 6,555
+I,3fi6 +21. i4 4,090 2,465
1941 7,941 4,627 S,314 1951 12,646 +4,705 +59.25 6,950 5,696 1961 N.A. 24,416 +11,770 +93.07. 12,945 11,471 1971 N.A. 34,820 + 10,404 +42.61 18,535 16,285
(i) Khanna 1901 3,838 -si9 -13052
2,016 1,822 1911 3,319 1,842 1,477 1921 Declassified 1931 6,555
+ 1,386 +21. i4 4,090 2,465
1941 7,941 4,627 3,314 1951 12,646 +4,705 +59.25 6,950 5,696 1961 M.C. 19.63 24,416 + 11,770 +93.07 12,945 11,471 1971 M.e. . 19.63 34,182 +9,766 +40.00 18,203 15,979
(iI) Out skirts of M,?de1 Town (O.G.) '1971 N.A. 638 332 306
168 Nabba Patiola 1901 18,468 -4,848 -26.25
11,015 7,453 (pUNJAB) 1911 13,620 7,915 5,705
1921 14,750 +1,130 +8.30 8,674 6,076 1931 17,311 +2,561 +17.36 10,055 7,256 1941 22,625 +5,314 +30.70 12,704 9,921 1951 25,676 +3,051 + 13.49 15,742 9,934 1961 M.C. 4.40 30,603 +4,927 +19.19 16,955 13,648 1971 M.C. 4.40 34,761 +4,158 + 13.59 18,676 16,085
169 Srikalahasti Chittoor 1901 11,992 +947 +7.90
5,708 6,284 (ANDHRA PRADESH) 1911 12,939 6,166 6,773
1921 12,266 -673 -5.20 5,913 6,353 1931 13,152 +886 +7.22 6,457 6,695 1941 14,704 + 1,552 + 11.80 7,346 7,358 1951 17,921 +3,217 +21.88 8,912 9,009 1961 M. 18.91 26,460 +8,539 +47.65 13,352 13,108 1971 M. 24.50 34,735 +8,275 + 31.27 17,521 17,214
170 ,Gangavati Raichur 1901 6,245 His +6.69
3,037 3,208 (MYSORE) 1911 6,663 3,238 3,425
1921 6,027 -636 -9.55 2,970 3,057 1931 6,722 +695 + 11.53 3,356 3,366 1941 7,613 +891 + 13.25 3,840 3,773 1951 16,263 +8,650 + 113.62 8,323 7,940 1961 M. 23.83 19,026 +2,763 +16.99 9,764 9,262 1971 M. 11.66 34,647 + 15,621 +82.10 17,795 16,852
171 Samalkot East Godavari 1901 16,015 -532 -3.32
7,911 8,104 (ANDHRA PRADESH) 1911 15,483 7,700 7,783
1921 15,326 -157 -1.01 7,658 7,668 1931 18,001 +2,675 + 17.45 9,145 8,856 1941 22,349 +4,348 +24.15 11,242 11,107 1951 28,180 +5,831 +26.09 13,971 14,209 1961 M. 9.06 31,924 +3,744 +13.29 16,056 15,868 1971 M. 12.07 34,607 +2,683 +8.40 17,177 17,430
172 Dharapuram Coirnbatore 1901 17,178 +748 +4.35
8,276 8,902 \TAMIL NADD) 1911 17,926 8,612 9,314
1921 16,124 -1,802 -10.05 7,903 8,221 1931 18,218 +2,094 +12.99 8,985 9,233 1941 20,660 +2,442 +.J3.40 10,228 10,432 1951 24,163 +3,503 +16.96 11,998 12,165 1961 M. 5.02 26,490 +2,327 +9.63 13,058 13,432 1971 M. 7.56 34,500 +,8,010 +30.24 17,259 17,241
173 Bundi urban Bundi 1901 19,313 +285 +1.48
9,637 9,676 agglomeration (RAJASTHAN) 1911 19,598 9,805 9,793
1921 16,105 -3,493 -17.82 8,179 7,926 1931 17,991 +1,886 +11.71 9,179 8,812
/ 1941 20,846 +2,855 +15.87 10,706 10,140 1951 22,697 +1,851 +8.88 11,450 11,247 1961 30.84 26,478 +3,781 +16.66 13,902 12,576 1971 22.76 34,492 +8,014 +30.27 18,237 16,255
(i) Bundi 1901 19,313 9,637 9,676 1911 ; 19,598 +285 +1.48 9,805 9,793 1921 16,105 -3,493 -17.82 8,179 7,926 1931 17,991 + 1,886 + 11. 71 9,179 8,812
1941 20,846 +2,855 .f15.87 10,706 10,140
1951 22,697 +1,851 +8.88 11,450 11,247 1961 M. 30.84 26,478 +3,781 +16.66 13,902 12,576
1971 M. 20.23 34,279 +7,801 +29.46 18,125 16,154
(ii) Bundi (Bhojpura Dhani) (O.G.) 1971 2.53 213 112 101
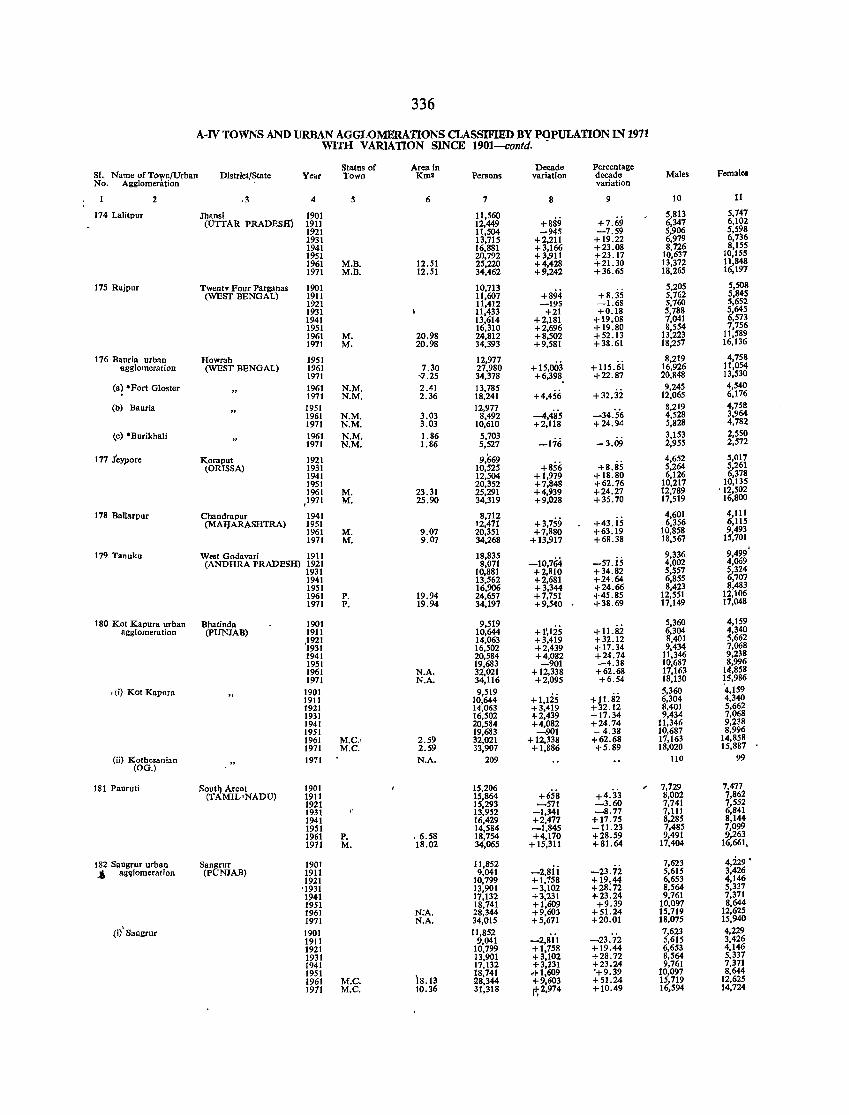
336
A-IV TOWNS AND URBAN AGGLOMERATIONS CLASSIFIED BY POPULATION IN 1971 WITH VARIATION SINCE 1901-contd. -
SI. Name of TO'fl)/Urban Statns of Area in Decade Percentage
District/State Year Town Km2 Persons variation decade Males Females No. Agglomeration variation
2 ,3 4 5 6 7 8 9 10 11
174 Lalitpur Jhansi 1901 11,560 +889 +7.69
5,813 5,747 (UTTAR PRADESH) 1911 12,449 6,347 6,102
1921 11,504 -945 -7.59 5,906 5,598 1931 13,715 +2,211 +19.22 6,979 6,736 1941 16,881 +3,166 +23.08 8,726 8,155 1951 20,792 +3,911 7-23.11 10,637 10,15S 1961 M.B. 12.51 25,220 +4,428 +21.30 13,372 11,848 1971 M.B. 12.51 34,462 +9,242 +36.65 18,265 16,197
175 Rajpur Twentv Four Parganas 1901 10,713 +894 +8.35
5,205 5,508 (WEST BENGAL) 1911 11,607 5,762 5,845
1921 11,412 -195 -1.68 5,760 5,652 1931 11,433 +21 +0.18 5,788 5645 1941 13,614 +2,181 + 19.08 7,041 6,573 1951 16,310 +2,696 + 19.80 8554 7,756 1961 M. 20.98 24,812 +8,502 +52.13 13:223 11,589 1971 M. 20.98 34,393 +9,581 +38.61 18,257 16,136
176 Bauria urban Howrah 1951 12,977 + 15,003 + 115.i;i
8,219 4,758 1lgg1omeration (WEST BENGAL) 1961 7.30 27,980 16,926 11,054
1971 '1.25 34,378 +6,398 +22.87 20,848 13,530
(a~ 'Fort Gloster 1961 N.M. 2.41 13,785 +4,456 + 32.3i
9,245 4,540 1971 N.M. 2.36 18,241 12,065 6,176
(b) Bauria 1951 12,977 --4,4ii5 -34:5'6
8,219 4,758 1961 N.M. 3.03 8.492 4,528 3,964 1971 N.M. 3.03 10,610 +2,118 +24.94 5,828 4,782
~c) °Burikhali 1961 N.M. 1.86 5,703 -176 -3.09
3,153 2,550 1971 N.M. 1.86 5,527 2,955 2,572
177 ieypore Koraput 1921 9,669 +856 +8.85
4,652 5,017 (ORISSA) 1931 10.525 5,264 5.261
1941 12,504 + 1,979 +18.80 6,126 6,378 1951 20,352 +7,848 +62.76 10,217 10,135 1961 M. 23.31 25,291 +4,939 +24.27 12,789 '12,502
,1971 M. 25.90 34,319 +9,028 +35.70 17,519 16,800
178 Ballarpur Chandrapur 1941 8,712 +3,759 +43.i5
4,601 4,111 (MAIJARASHTRA) 1951 12,471 6,356 6,115
1961 M. 9.07 20,351 +7,880 +63.19 10,S58 9,493 1971 M. 9.07 34,268 + 13,917 +68.38 IS,567 15,701
, 179 Tanuku 9,499 West Godavari 1911 18,835
-57.i5 9,336
(ANDHRA PRADESH) 1921 8,071 -10,764 4,002 4,069 1931 10,881 +2,810 +34.82 5,557 5,324 1941 13,562 +2,681 +24.64 6,855 6,707 1951 16,906 +3,344 +24.66 8,423 8,483 1961 P. 19.94 24,657 +7,751 +45.85 12,551 12,106 1971 P. 19.94 34,197 +9,540 +3S.69 17,149 17,048
180 Kot Kapura urban Bhatinda 1901 9,519 +1',125 +11.82
5,360 4,159 agglomeration (pUNJAB) 1911 10,644 6,304 4,340
,1921 14,063 +3,419 +32.12 S,401 5,662 1931 16,502 +2,439 + 17.34 9,434 7,068 1941 20,584 +4,082 +24.74 11.346 9,238 1951 19,683 -901 -4.38 10,687 8,996 1961 N.A. 32,021 + 12,338 +62.68 17,163 14,858 1971 N.A. 34,116 +2,095 +6.54 18,130 15,986
,(i) Kot Kapura 1901 9,519 +1,125 +~1.8i
5,360 '4,159 1911 10,644 6,304 4,340 1921 14,063 +3,419 + 2.12 8,401 5.662 1931 16,502 +2,439 +17.34 9,434 7,068 1941 20,584 +4,082 +24.74 11.346 9,238 1951 19,683 -901 - 4.38 10,687 8,996 1961 M.C.' 2.59 32,021 +12,338 +62.68 17,163 14,858 1971 M.C. 2.59 33,907 +1,886 +5.89 18,020 15,887
(ii) Kothesanian (OG.)
1971 N.A. 209 110 99
181 Pauruti Soutlj Arcot 1901 15,206 +658 +4.3'3
7,729 7,477 (TAMIL'NADU) 1911 15,864 8.002 7,862
1921 15,293 ~571 -3.60 7,741 7,552 1931 13,952 -1,341 -8.77 7,111 6,841 1941 16,429 +2,477 +17.75 8,285 8,144 1951 14,5S4 -1,845 -11.23 7,485 7,099 1961 P. .6.58 18,754 +4,170 +28.59 9,491 9,263 1971 M. 18.02 34,065 + 15,311 +81.64 17,404 16,661,
f 82 Sangrur urban Sangrur 1901 11,852 -2,sii -23.7i
7.623 4,:229 • .. agt;lomeration (PUNJAB) 1911 9,041 5,615 3.426 1921 10,799 +1,758 +19,44 6,653 4,146
'1931 13,901 +3,102 +28.72 8,564 5,337 1.941 17,132 +3,231 +23.24 9,761 7,371 1951 18,741 +1,609 +9.39 10,097 8,644 1961 N:A. 28,344 +9,603 +51.24 15,719 12,625 1971 N.A. 34.015 +5,671 +20.01 18,075 15,940
(i)' Sangrur 1901 11,852 -2,81'1 -23:72
7,623 4,229 1911 9,041 5,615 3,426 1921 10,799 +1.758 + 19.44 6,653 4,146 1931 13,901 +3,102 +28.72 8,564 5,337 1941 17,H2 +3,231 +23.24 9,761 7,371 1951
lS.13 18,741 .... 1.609 '+9.39 10,097 8,644
1961 M.C. 28,344 +9,603 +51.24 15,719 12,625 1971 M.C. 10.36 31,318 &,2,974 +10.49 16,594 14,724
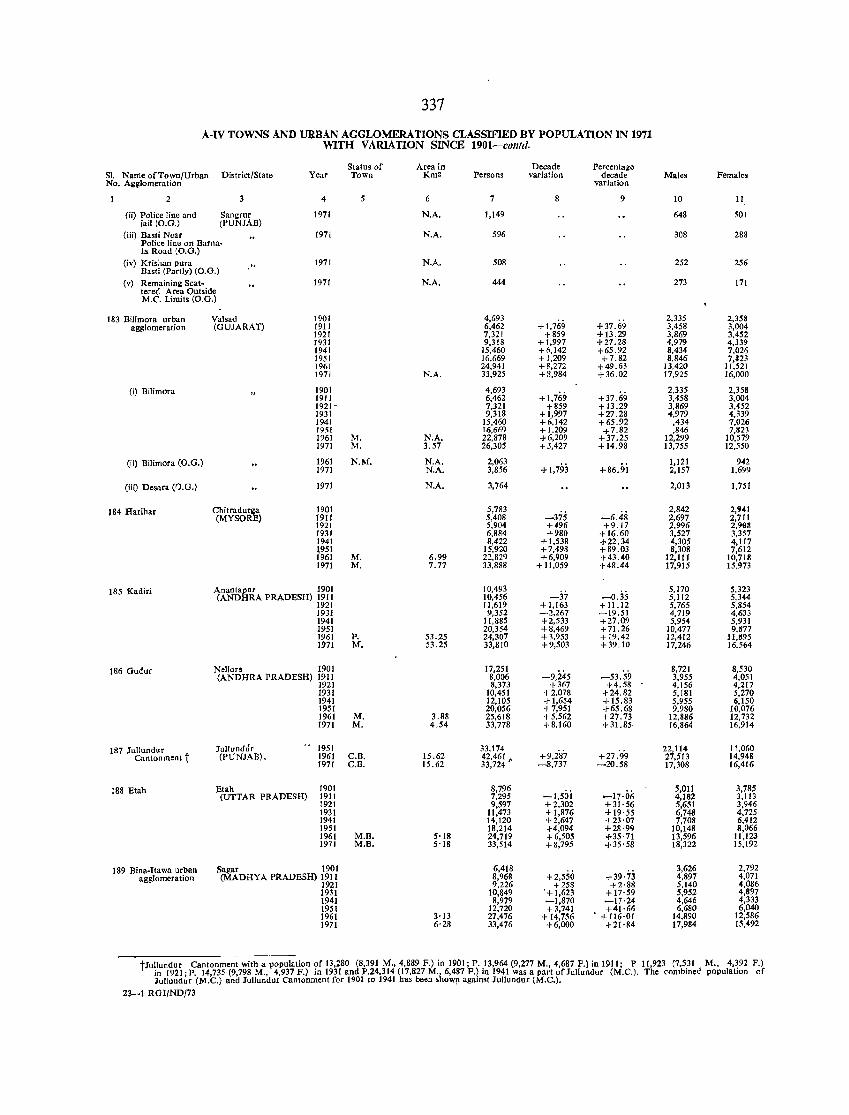
337
A-IV TOWNS AND URBAN AGGLOMERATIONS CLASSIFIED BY POPULATION IN 1971 WITH VARIATION SINCE 1901-colltd.
Status of Area in Decade Percentage SI. Name of Town/Urban District/State Year Town Km2 Persons variation decade Males Females No. Agglomeration variation
2 4 5 6 7 9 10 11
(ii) Police line and Sangrur 1971 N.A. 1,149 648 501 jail (0.0.) (PUNJAB)
(iii) Basti Near Police line on Barna-
1971 N.A. 596 308 288
la Road (0.0.) (iv) Krishnn pura
Basti (Partly) (0.0.) .. 1971 N.A. 508 252 256
(v) Remaining Scat-teree! Area Outside
1971 N.A. 444 273 171
M.e. Limits (0.0.)
183 Bilimora urban Val.ad 1901 4,693 + 1,769
2.335 2,358 agglomeration (GUJARAT) 1911 6,462 +37.69 3,458 3,004
1921 7,321 +859 + 13.29 3,869 3.452 1931 9,318 +1,997 +27.28 4,979 4,339 1941 15,460 +6,142 +65.92 8,434 7,026 1951 16,669 + 1,209 +7.82 8,846 7,123 1961 24,941 +g,272 +49.63 13,420 11,521 1971 N.A. 33,925 +8,984 +36.02 17,925 16,000
(i) Bilimorn 1901 4,693 +1,769 +37.69
2,335 2,358 1911 6.462 3,458 3,004 1921- 7.321 +859 +13.29 3,869 3.452 1931 9,318 +1,997 +27.28 4,979 4.339 1941 15,460 +6,142 +65.92 ,434 7,026 1951 16,669 + 1.209 +7.82 ,846 7.823 1961 M. N.A. 22,878 +6,209 +37.25 12,299 10,579 1971 M. 3.57 26,305 +3,427 + 14.98 13,755 12,550
(li) Bilimora (0.0.) 1961 N.M. N.A. 2,063 + 1,793 +86.9i
1,121 942 1971 N.A. 3,856 2,157 1,6~9
(iii) Desara (0.G.) 1971 N.A. 3,764 2,013 1,751
IS4 Harihar Chitraduw 1901 5,783 -375 -6.48
2,842 2,lj41 (MYSO ) 1911 5,408 2,697 2,711
1921 5,904 +496 +9.17 2,996 2,9GB 1931 6,884 +980 +16.60 3,527 3,357 1941 8,422 +1,538 +22.34 4,305 4,117 \951 15,920 +7,498 +89.03 8,308 7,612 1961 M. 6.99 22,S29 +6,909 +43.40 12, l! I 10,713 1971 M. 7.77 33,888 + 11,059 +48.44 17,915 15.!'?3
185 Kndiri Anantapur 1901 10,493 -37 -0.35
5,170 5,323 (ANDHRA PRADESH) 1911 10,456 5,112 5,344
1921 11,619 +1,163 + 11.12 5,765 5,S54 1931 9,352 -2,267 -19.51 4,719 4,633 1941 11,885 +2,533 +27.09 5,954 5,931 1951 20,354 +8,469 + 71.26 10,477 9,877 1961 P. 53.25 24,307 + 3,953 +19.42 12,412 11,395 1971 M. 53.25 33,810 +9,503 +39.10 17,246 16,564
186 Gudur Nellore 1901 17,251 -9,245 _53.59
8,721 8,530 (ANDHRA PRADESH) 1911 8,006 3,955 4,051
1921 8,373 +367 +4.58 4,156 4,217 1931 10,451 +2,078 +24.82 5,181 5,270 1941 12,105 + 1,654 +15.83 5,955 6,150 1951 20,056 +7,951 +65.68 9,980 10,076 1961 M. 3.88 25,618 +5,562 +27.73 12,886 12,732 1971 M. 4.54 33,778 +8,160 +31.85, 16,864 16.914
187 Jullundur JuUunddr 1951 33.174 +27.99
22,114 1l.060 Cantonment t (PUNJAB). 1961 C.B. 15.62 42,461" +9,287 27,513 14,948
1971 C.B. 15.62 33,724 -8,737 -20.58 17,308 16,416
188 Etah Elah 1901 8,796 -I,50i -17·06
5,011 3,785 (UTTAR PRADESH) 1911 7,295 4,182 3,113
1921 9,597 + 2,302 +31·56 5,651 3,946 1931 11,473 + 1,876 + 19'55 6,748 4,725 1941 14,120 +2,647 +23'07 7,708 6,412 1951 IS,214 +4,094 +28·99 10,148 8,066 1961 M.B. 5'IS 24,719 +6,505 +35·71 13,596 11,123 1971 M.B. 5'18 33,514 +8,795 +35'58 18,322 15,192
189 Bina-Itawa urban Sagar 1901 6,418 +2,550 +39·73
3,626 2,792 agglomeration (MADHYA PRADESH) 1911 8,968 4,897 4,071
1921 9,226 +258 +2·88 5,140 4,086 1931 10,849 .+ 1,623 +17·59 5,952 4,897 1941 8,979 -1,870 -17·24 4,646 4,333 1951 12,720 +3,741 +41·66 6,680 6,040 1961 3'13 27,476 + 14,756 • + 116·01 14,890 12,586 1971 6·28 33,476 +6,000 +21·84 17,984 15,492
tJullundur Cantonment with a population of 13,280 (8,391 M., 4,889 F.) in 1901; P. 13,964 (9,277 M., 4,687 F.) in 1911; P 11,923 (7,531 M., 4,392 F.) in 1921; P. 14,735 (9,798 M., 4,937 F.) in 1931 and P.24,314 (17,827 M., 6,487 F.) in 1941 was a part of JuJlundur (M.C.). The combined population of Jullundur (M.C.) and lullundur Cantonment for 1901 to 1941 has beeu show!1 against Jullundur (M.C.).
23-1 RGI/NO/73
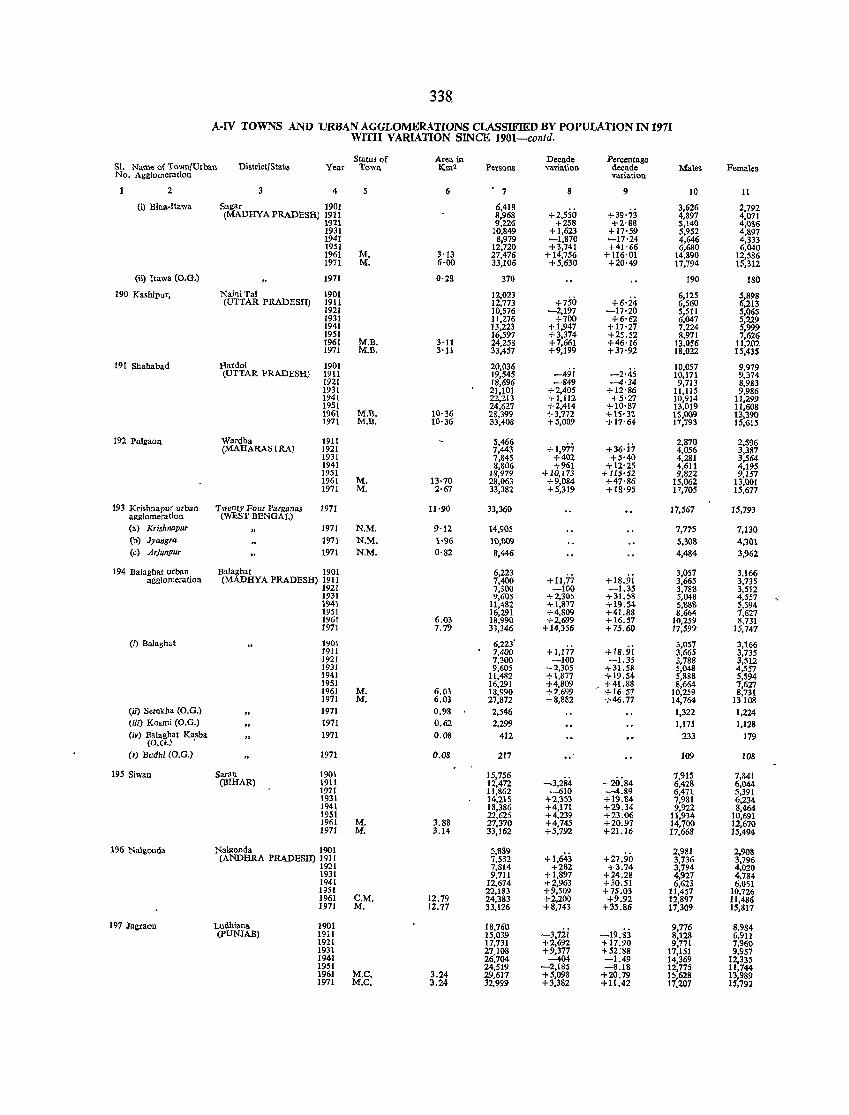
338.
A-IV TOWNS AND URBAN AGGLOMERATIONS CLASSIFIED BY POPULATION IN 1971 WITH VARIATION SINCE 1901-contd.
Status of Area in Decade Percentage S1. Name or TownlUrban DistrictlState Year Town Kma Persons variation decade Males Females No. Agglomeration variation
2 3 4 6 7 8 9 10 11
(i) Bin~-Itawa Sagar 1901 6,418 +2,550 +39'73
3,626 2,792 (MADHYA PRADESH) 1911 8,968 4,897 4,071
192\ 9,226 +258 +2'88 5,14(\ 4,0116 1931 10,849 +1,623 +17'S9 5,952 4,897 1941 8,979 -1,870 ~17'24 4,646 4,333 1951 12,720 +3,741 +41'66 6,6S0 6,040 1961 M. 3'13 21,476 + 14,7S6 + 116'01 14,890 12,586 1971 M. 6·00 33,106 +5,630 +20·49 17,794 1~,312
(ii) Itawa (O.G.) 1971 0·28 370 190 180
190 Kasbipur, NainiTal 1901 12,023 +750 +6·i.i
6,125 5,898 (UTTAR PRADESH) 1911 12,773 6,560 6,213
1921 10,576 -2,197 -17'20 5,511 5,065 1931 11,276 +700 +6·62 6,047 5,229 1941 13,223 +1,947 +17'27 7,224 5,999 1951 16,597 +3,374 +25.52 8,971 7,626 1961 M.B. 3'11 24,258 +7,661 +46'16 13,056 11,202 1971 M.B. :Hl 33,457 +9,199 +37'92 18,022 15,435
191 Shahabad Bardoi 1901 20,036 -49i
10,OS7 9,979 (UTTAR PRADESH) 1911 19,545 -2'45 10,171 9,374
192! 18,696 -849 -4'34 9,713 B,983 193! 21,101 +2,405 +12'S6 II,IIS 9,986 1941 22,213 +1,112 +5'27 10,914 11,299 1951 24,627 +2,414 +10'87 13,019 11,608 1961 M.B. 10'36 28,399 +3,772 + 15'32 15,009 13,390 1971 M.B. 10'36 33,408 +5,009 +17'64 17,793 15,615
192 Pulgaon Wardha 1911 5,466 + 1,977 + 36·j1
2,870 2,596 (MARARASTRA) 1921 7,443 4,056 3,387
1931 7,845 +402 +5'40 4,281 3,S64 1941 8,806 +961 +12'25 4,611 4,19S 1951 IIi,979 +10,173 + 115'52 9,822 9,157 1961 M. 13'70 28,063 +9,084 +47'86 15,062 13,001 1971 M. 2·67 33,382 +5,319 +IS·95 17,705 IS,677
193 Krishnapu~ urban Twenty Four Parganas 1971 11'90 33,360 17,567 15,793 agglomeration (WEST BENGAL) (a) Krishnapur 1971 N.M. 9'12 14,90S 7,715 7,130 (b) Jyangra 1971 N.M. \'96 10,(1)9 5,308 4,1()1 (c) Arjunpur 1971 N.M. 0'82 8,446 4,484 3,962
194 Balaghat urban Balaghat 1901 6,223 + 11,77 +18.!ii
3,057 3,166 agglomeration (MADRY A PRADESH) 1911 7,400 3,665 3,735
1921 7,300 -100 -1.35 3,788 3,512 1931 9,605 +2,305 +31.58 5,048 4,557 1941 11,482 +1,877 +19.54 5,888 5,594 1951 16,291 +4,809 +41.88 S,664 7,627 1961 6.03 18,990 +2,699 +16.57 10,259 8.731 1971 7.79 33,346 +14,356 +75.60 17,S99 15,747
(i) BaJaghat 1901 6,223' +1,177 +IB.!ii
3,057 3,166 1911 7,400 3,665 3,735 1921 7,300 -100 -1.35 3,788 3,512 1931 9,605 +2,305 +31.58 5,048 4,S57 1941 11,482 + 1,877 +19.54- 5,888 5,594 1951 16,291 +4,809 _ +41.S8 8,664 7,627 1961 M. 6.0~ 18,990 +2.699 +16.57 10,259 8,731 1971 M. 6.03 27,872 +8,882 +46.77 14,764 13108
(ii) Sere1<ha (O.G.) 1971 0.98 2,546 1,322 1.224 (iii) Ko,llli (O.G.) 1971 0.62 2.299 1,171 1,128 (iv) Balagha! Kasba 1971 0.08 412 233 179
(O.G.) •
M Budbi (O.G.) 1971 0.08 217 109 lOS
19.5 Siwan Saran 1901 15,756 ~3,284 -20:84
7,915 7,841 (llIHAR) 1911 12,472 6,428 6,044
1921 11,862 -610 -4.89 6,471 5,391 1931 14,215 +2,353 +19.84 7,981 6,234 1941 18,386 +4,171 +29.34 9,922 8.464 1951 22,625 +4,239 +23.06 11,934 10,691 1961 M. 3.88 27,370 +4,745 +20.97 14,700 12,670 1971 M. 3.14 33,162 +5,792 +21.16 17,668 15,494
196 Nalgonda Nalgonda 1901 5,889 +1,643 +27.90
2,981 2,90& (ANDHRA PRADESH) 1911 7,532 3,736 3,796
1921 7,S14 +282 +3.74 3,794 4,020 1931 9,711 +1,S97 +24.28 4,927 4,784-1'141 12,674 +2,963 +30.S1 6,623 6,051 1951 22,183 +9,509 +75.03 11,457 10,726 1961 C.M. 12.79 24,383 +2,200 +9.92 12,S97 11,486 1971 M. 12.77 33,126 +8,743 +35.86 17,309 IS,S17
197 lagraon Ludhiana 1901 IS,760 -3.72i -19.83
9,776 8,984 (pUNJAB) 1911 15,039 8,128 6,911
1921 17,731 +2,692 +17.90 9,771 7,960 1931 27.108 +9,377 +S2:88 17,1S1 9,957 1941 26,704 -404 -1.49 14,369 12,335 1951 24,519 -2,185 -S.IS 12,775 11,744 1961 M.e. 3.24 29,617 +5,09& +20.79 15,628 13,989 1971 M.C. 3.24 32,999 +3,382 +11.42 17.207 15,792
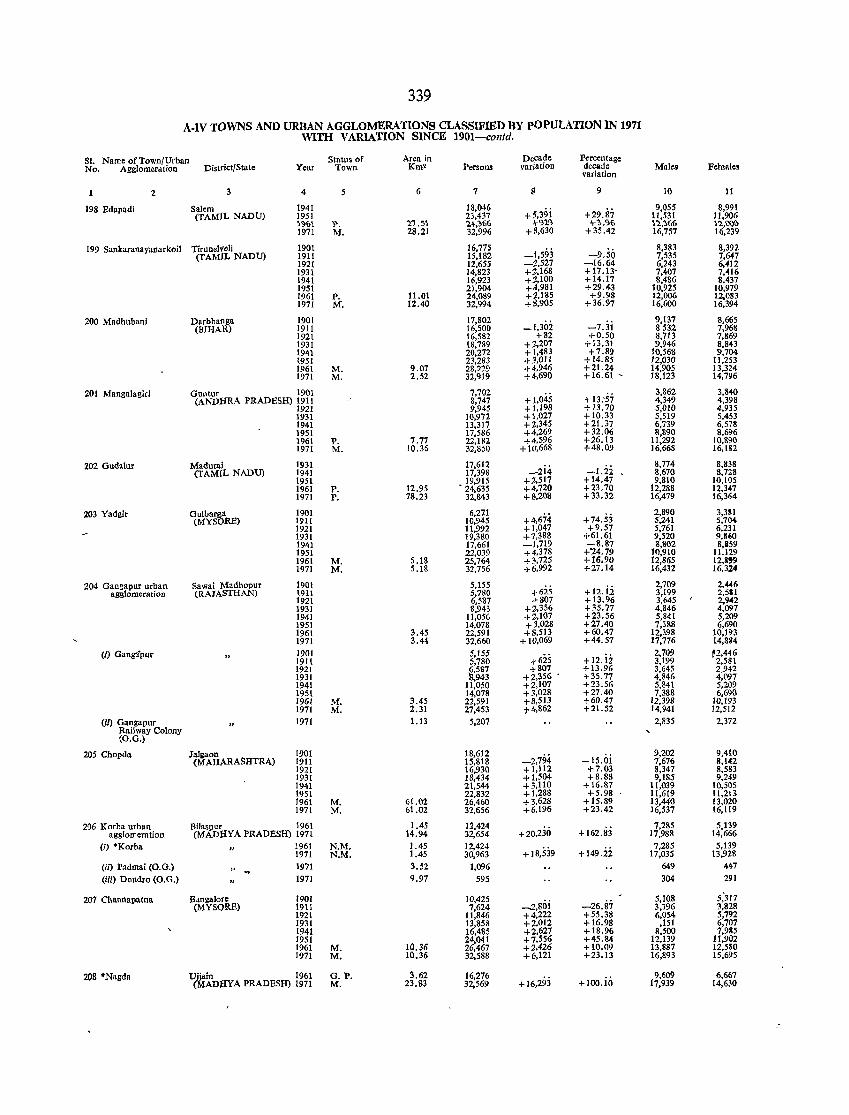
339
A.IV TOWNS AND URBAN AGGLOMERATIONS CLASSIFIED BY pOPULATION IN 1971 WITH VARIATION SINCE 1901-contd.
81. Name of Town/Urban Status of Area in Decade Percentage No. Agglomeration District/Stato Year Town Km2 Persons variation decade Males Female!
variation
2 3 4 5 6 7 g 9 10 11
198 Edapadi Salem 1941 18.046 +5.39i +29.87-
9.055 8,991 (TAMrL NADU) 1951 23,437 11.531 11,906
1%\ 1'. 21.51 24.%6 -'r~1.~ 'r'?.% 12.166 n.\)\)\) 1971 M. 28.21 32,996 +8.630 +35.42 16.757 16.239
199 Sankaranayanarkoil Tirunelveli 1901 16.775 _1.593 -9.50
8,383 8.392 (TAWL NADU) 1911 15.182 7.535 7.647
1921 12.655 _].,527 -16.64 6,243 6,412 1931 14,823 +:1.168 +17.13' 7.407 7,416 1941 16,923 +:1,100 +14.17 8,486 8,437 1951 21.904 +J.981 +29.43 10,925 10,979 1961 P. 11.01 24,089 +:;1,185 +9.98 12,006 12,083 1971 M. 12.40 32,994 +8,905 +36.97 16,600 16,394
200 Madhubani Darbhanga 1901 11,802 _1.30i -7,Ji
9,137 8,665 (BIHAR) 1911 16,500 8532 7,968
1921 16,582 +82 +0.50 8.713 7,869 1931 18,789 +:t.207 +13.31 9.946 8.843 1941 20,272 +1,483 +7.89 10,568 9,704 1951 23,283 +J,OI1 +14.85 1:2,030 11,253 1961 M. 9.07 28,2:29 +J.946 +21.24 14.905 13,324 1971 M. 2.52 32,919 +4-,690 +16.61 - 18,123 14,796
201 Mangalagiri Guntur 1901 7,702 +1,045 + 13:57
3,862 3,840 (ANDJIRA PRADESH) 1911 8,747 4,349 4,398
1921 9,945 +1,198 +13.70 5.010 4,935 1931 10,972 + 1,027 +10.33 5.519 5,453 1941 13,317 +2,345 +21.37 6,739 6,578 1951 17,586 +4,269 +32.06 8,890 8,696 1961 P. 7.77 22,182 +4.596 +26.13 11,292 10,890 1971 M. 10.36 32,850 + llJ,668 +48.09 16,668 16.lg2
202 Gudalur Madural 1931 17,612 _2i4 --l.ii
8,774 8,838 (TAMl'L NADU) 1941 17.398 8,670 8,728
1951 19,915 +2,517 +14.47 9.810 10,105 1961 P. 12.95 ' 24,635 +4,720 +23.70 12,288 12,347 1971 P. 78.23 32,843 +8,208 +33.32 16,479 16,364
203 Yadgir Gulbarga 1901 6,27.1 +4,674 +74.53
2,890 3,381 (MYSORE) 1911 10.945 5,241 5.704
1921 11.992 +1,047 +9.51 5.761 6,231 1931 19,380 +1,388 +61.61 9,520 9,8.0 1941 17,661 _1,719 -8.87 8,802 8,359 1951 22,039 +4.378 +"24.79 10,910 11.129 1961 M. S.18 25,764 +3,725 +16.90 12,865 12,8" 1971 M. 5.18 32,756 +6,992 +27.14 16,432 16,324
204 Gangapur urban Sawai ]l.l:adhopur 1901 5,155 -1'625 +12.ii
2,709 2,#6 agglomeration (RAJASTHAN) 1911 5,780 3,199 2,5S1
1921 6,587 -1'807 + 13.96 3,645 2,9042 1931 8,943 +2.356 +35.77 4,846 4,097 1941 11,050 +2,107 +23.56 5,841 5,209 1951 14,078 +3.028 +27.40 7.388 6.690 196\ 3.45 22,591 +8,513 + 60.47 12,198 10,193 1971 3.44 32,660 + 10,069 +44.57 17.776 14,8B4
(l) Ganga'pur 1901 5,155 +625 +12.i2
2.709 ,2,446 1911 5,780 3.199 2.581 1921 ~,587 +807 +13.96 3,645 2.942 1931 ,943 +2,356 • +35.77 4,846 4,(197 1941 11,050 +2,107 +23.56 5,841 5,209 1951 14,078 +3,028 +27.40 7,388 6.69(\ 1961 M. 3.45 22.591 +8,513 +60.47 12,398 10.193 1971 M. 2.31 27.453 ';'4,862 +21.52 14,941 12,512
(ii) Gangapur 1971 1.13 5,207 2,835 2,372 Railway Colony (O.G.)
205 Chopda JaJllaon 1901 18.612 -2,794 -15.oi 9,202 9,410
(MAHARASHTRA) 1911 15.818 7,676 8.142 1921 16,930 + 1,112 +7.03 8,347 8,583 1931 18,434 +1,504 +8.88 9,185 9,249 1941 21,544 +3,110 + 16.87 ll,039 10,505 1951 22,832 +1,288 +5.98 11,619 11.213 1961 M. 6t.02 26,460 +3,628 +15.89 13,440 f3,020 1971 M. 61.02 32,656 +6,196 +23.42 16,537 16,119
206 Korba urban Bilaspur 196\ 1.45 12,424 +20,230 + 162.83
7,285 5,139 agglomeration (MAD:tIY A PRADESH) 1971 14.94 32,654 17,988 14,666
(l) *Korba 1961 N.M. 1.45 12,424 + 18,539 +149.i2
7,285 5,139 1971 N.M. 1.45 30.963 17,035 13,928
(ii) Padmni (0. G.) 1971 3.52 1,096 649 447
(iii) Dondro (O.G.) 1971 9.97 595 304 291
207 Channapatna Bangalofe 1901 10.425 .....2,80i -26.87 5. lOS 5,'317
(MYSQRE) 1911 7,624 3,796 3,828 1921 11,846 +4.222 +55.38 6,054 5,792 1931 13,858 +2,012 +16.98 .151 6,707 1941 16,485 +2,627 + 18.96 8.500 7,985 1951 24,041 +7,556 +45.84 12,139 11,902 1961 M. 10.36 26,467 +2,426 + 10.09 13,887 12,530 1971 M. 10.36 32,588 +6,121 +23.13 16,893 15,695
208 ·Nagda ~jdin 1961 O. P. 3.62 16,276 + 16,293 + 100.iO
9,609 6,667 MADJlYA PRADESH) 1971 M. 23.83 32.569 17,939 14.630
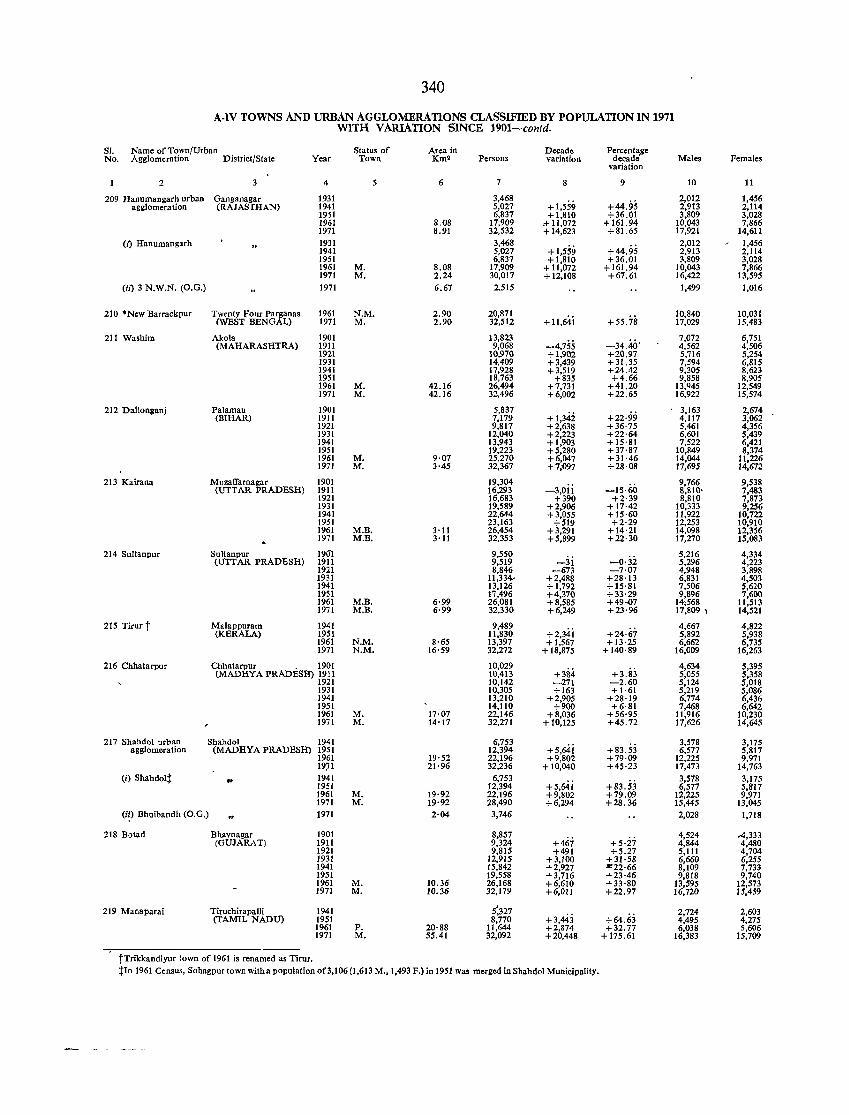
340
A-lV TOWNS AND URBAN AGGLOMERATIONS CLASSIFIED BY POPULATION IN 1971 WITH VARIATION SINCE 1901-contd.
SI. Name of Town/Urban Status of Area in Decade Percenta)!e No. Agglomeration District/State Year Town Km2 Persons variation decado Males Females
variation
2 4 5 6 7 8 9 10 11
209 Hanumangarh urban Ganganagar 1931 3,468 +1,559 +44.95
2,012 1,456 agillomera lion (RAJASTHAN) 1941 5,027 2,913 2,114
1951 6,837 + 1,810 +36.01 3,809 3,028 1961 S.08 17,909 &11,072 + 161.94 10,043 7,866 1971 8.91 32,532 + 14,623 +81.65 17,921 14,611
(f) Hanumangarh 1931 3,468 +1,559 +44.95
2,012 1,456 1941 5,027 2,913 2,114 1951 6,837 +1,810 +36.01 3,809 3,028 1961 M. 8.08 17,909 + 11,072 + 161.94 10,043 7,866 1971 M. 2.24 30,O!7 +12,108 +67.61 16,422 13,595
(it) 3 N.W.N. (O.G.) 1971 6.67 2.515 1,499 1,016
210 "New Barrackpur Twenty FOllr Parganas 1961 N.M. 2.90 20,871 + 1I,64i +55.78
10,840 10,031 (WEST BENGAL) 1971 M. 2.90 32,512 17,029 15.483
211 Washim Ako1a 1901 13,823 -4,755 -34.40'
7,072 6,751 (MAHARASHTRA) 1911 9,068 4,562 4,506
1921 10,970 +1,902 +20.97 5,716 5,254 1931 14,409 +3,439 +31.35 7,594 6,815 1941 17,928 +3,519 +24.42 9,305 8,623 1951 18,763 +835 +4.66 9,858 8,905 1961 M. 42.16 26,494 +7,731 +41.20 13,Q45 12,549 1971 M. 42.16 32,496 +6,002 +22.65 16,922 15,574
212 Daltonganj Palamau 1901 5,837 +1,342 +22·99
3,163 2,674 (BIHAR) 1911 7,179 4,117 3,062
1921 9,817 +2,638 +36·75 5,461 4,356 1931 12,040 +2,223 +22·64 6,601 5,439 1941 13,943 +1,903 +15·81 7,522 6,421 1951 19,223 +5,280 +37·87 10,849 8,374 1961 M. 9·07 25,270 +6,047 +31·46 14,044 11,226 1971 M. 3·45 32,367 +7;097 +28·08 17,695 14,672
213 Kalrana Muzaifarnagar 1901 19,304 -3,oii
9,766 9,538 (UTTAR PRADESH) 1911 16,293 -IS·60 8,810' 7,483
1921 16,683 +390 +2·39 8,810 7,873 1931 19,589 +2,906 +17·42 10,333 9,256 1941 22,644 +3,055 +15·60 11,922 10,722 1951 23,163 +519 +2·29 12,253 10,910 1961 M.B. 3'11 26,454 +3,291 +14·21 14,098 12,356 1971 M.B. 3'1l 32,353 +5,899 +22·30 17,270 15,083
214 Su1tanpur Sultanpur 190'1 9,550 -:ii -0·32
5,216 4,334 (UTTAR PRADESH) 1911 9,519 5,296 4,223
1921 8,846 -673 -7·07 4,948 3.898 1931 11,334- +2,488 +28·13 6,831 4,503 1941 13,126 +1,792 +15·81 7,506 5,620 1951 17,496 +4,370 +33·29 9,896 7,600 1961 M.B. 6·99 26,081 +8,585 + 49''()7 14;568 11,513 1971 M.B. 6·99 32,330 +6,249 +23·96 17,809 \ 14,521
215 Tirur t Malappuram 1941 9,489 +2,34i +24'(;;
4,667 4,822 (KERALA) 1951 11,830 5,892 5,938
1961 N.M. 8·65 13,397 + 1,567 + 13·25 6,662 6,735 1971 N.M. 16·59 32,272 + 18,875 + 140·89 16,009 16,263
216 Chhatarpur Chhatarpur . 1901 10,029 +384 +3.83
4,634 5,395 (MADHYA PRADESH) 1911 10,413 5,055 5,358
1921 10,142 -271 -2.60 5,124 5,018 1931 10,305 +163 +1·61 5,219 5,086 1941 13,210 +2,905 +28·19 6,774 6,436 1951 14,110 +900 +6·81 7,468 6,642 1961 M. 17·07 22,146 +8,036 +56·95 11,916 10,230 1971 M. 14'17 32,271 + 10,125 +45.72 17,626 14,645
217 Shahdo1 urban Shahdo1 1941 6,753 +5,64i +83.53
3,578 3,175 agglomeration (MADHYA PRADESH) 1951 12,394 6,577 5,817
1961 19·52 22,196 +9,802 +79·09 12.225 9,971 1971 21·96 32,236 + 10,040 +45·23 17,473 14,763
(i) Shahdo1t 1941 6,753 +5,64i +83.53
3,578 3,175 1951 12,394 6,577 5,817 1961 M. 19·92 22,196 +9,802 +79.09 12,225 9,971 1971 M. 19·92 28,490 +6,294 +28.36 15,445 13,045
(i!) Bhuibandh (O.G.) 1971 2·04 3,746 2,028 1,718
218 Botad Bhavnagar 1901 8,857 +467
4,524 4.333 (GUJAl~AT) 1911 9,324 +5·27 4,844 4,480
1921 9,815 +491 +5.27 5,111 4,704 1931 12,915 +3,100 + 31·58 6,660 6,255 1941 15,842 +2,927 'F'22·66 8,109 7,733 1951 19,558 +3,716 +23·46 9,818 9,740 1961 M. 10.36 26,168 +6,610 +33·80 13,595 12,573 1971 M. 10.36 32,179 +6,011 +22.97 16,720 15,459
219 Manaparai Tiruchlrapalli 1941 5:327 +3,«3 +64.63
2,724 2,603 (TAMIL NADU) 1951 8,770 4,495 4,275
1961 P. 20·88 11,644 +2,874 +32.77 6,038 5,606 1971 M. 55.41 32,092 +20,448 + 175.61 16,383 15,709
tTrikkandiyur town of 1961 is renamed as Tirur.
tIn 1961 Census, Sohagpur town with a population of3,106 (1,613 M., 1,493 F.) in 1951 was merged in Shahdol Municipality.
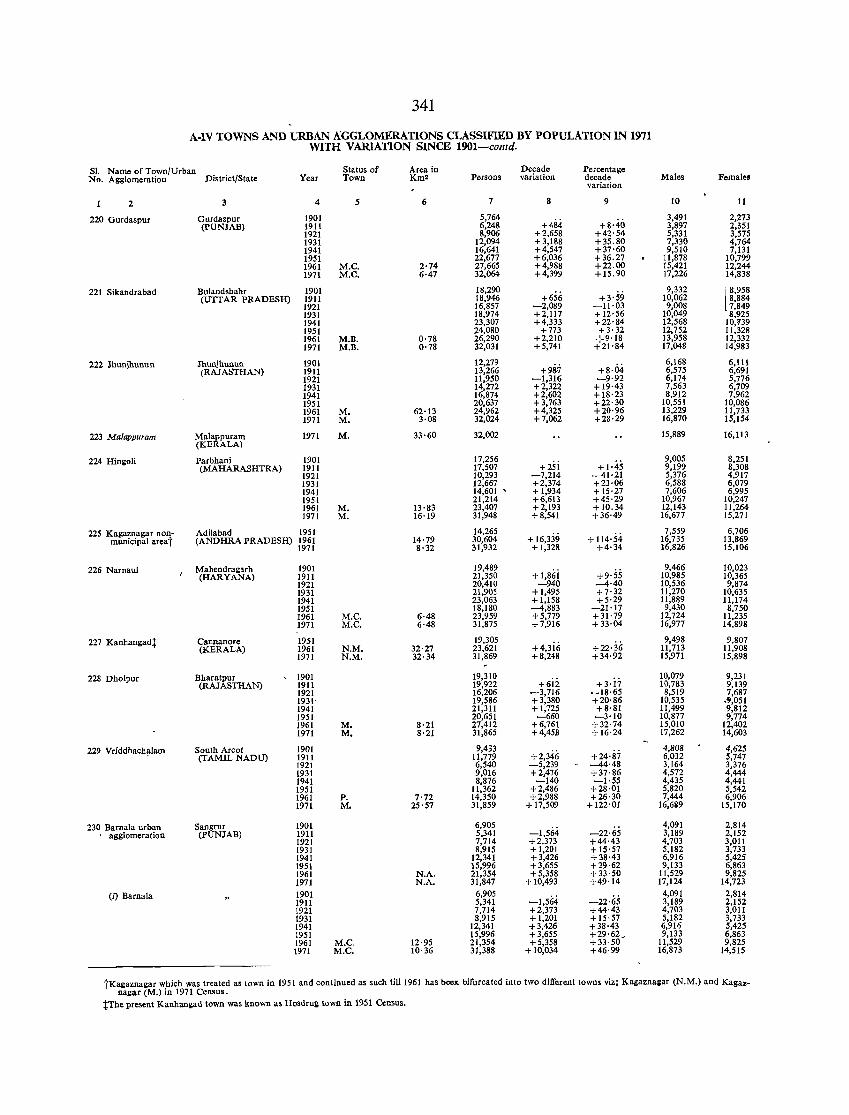
341
A-IV TOWNS AND URBAN AGGLOMERATIONS CLASSlFlED BY POPULATION IN 1971 WITH VARIATION SINCE 1901-conrd.
SI. Name of Town/Urban Status of Area in Decade Percentage No. Agglomeration District/State Year Town Km2 Persons variation decade Males Females
variation
2 3 4 5 6 7 8 9 10 11
220 Gurdaspur Gurdaspur 1901 5,764 +484 +8·40
3,491 2,273 (PUNlAB) 1911 6,248 3,897 2,351
1921 8,906 +2,658 +42'54 5,331 3,575 1931 12,094 +3,188 +35.80 7,330 4,764 1941 16,641 +4,547 +37'60 9,510 7,131 1951 22,677 +6,036 +36.27 11,878 10,799 1961 M.e. 2'74 27,665 +4,988 +22.00 15,421 12,244 1971 M.e. 6·47 32,064 +4,399 +15.90 17,226 14,838
221 Sikandrabad Bulandshahr 1901 18,290 +656
9,332 [8,958 (UTTAR PRADESH) 1911 18,946 +3'59 10,062 8,884
1921 16,857 -2,089 -11·03 9,008 7,849 1931 18,974 +2,117 +12'56 10,049 8,925 1941 23,307 +4,333 +22'84 12,568 10,'739 1951 24,080 +773 +3·32 12,752 11,328 1961 M.B. 0'78 26,290 +2,210 +9·18 13,958 12,332 1971 M.B. 0'78 32,031 +5,741 +21,84 17,048 14,983
222 lhunjhunun lhunjhunun 1901 12,279 +98-7 +8·04
6,168 6,111 (RAJASTHAN) 1911 13,266 6,575 6,691
1921 11,950 -1,316 -9·92 6,174 5,776 1931 14,272 +2,322 +19·43 7,563 6,709 1941 16,874 +2,602 + 18·23 8,912 7.962 1951 20,637 +3,763 +22·30 10,551 10,086 1961 M. 62·13 24,962 +4,325 +20·96 13,229 11,733 1971 M. 3·08 32,024 +7,062 +28·29 16,870 15,154
223 Malappuram Malappuram 1971 M. 33·60 32,002 15,889 16,113 (KERALA)
224 Hingoli Parbhani 1901 17,256 +2si
9,005 8,251 (MAHARASHTRA) 1911 17,507 +1·45 9,199 8,308
1921 10,293 -7,214 --41·21 5,376 4,917 1931 12,667 +2,374 +23·06 6,588 6,079 1941 14,601 ' + 1,934 + 15·27 7,606 6,995 1951 21,214 +6,613 +45·29 10,967 10,247 1961 M. )3'83 23,407 +2,193 +10.34 12,143 !I,264 1971 M. 16·19 31,948 +8,541 +36·49 16,677 15,271
225 Kagamagar non- Adilabad 1951 14,265 + 16,339 + 114'54
7,559 6,706 municipal areat (ANDHRA PRADESH) 1961 14'79 30,604 16,735 13,869
1971 8·32 31,932 + 1,328 +4·34 16,826 15,106
226 Narnaul Mahendragarh 1901 19,489 9,466 10,023 (HARYANA) 1911 21,350 +1,861 +9·55 10,985 10,365
1921 20,410 -940 --4·40 10,536 9,874 1931 21,905 + 1,495 +7·32 11,270 10,635 1941 23,063 +1,158 +5·29 11,889 11,174 1951 18,180 --4,883 -21·17 9,430 8,750 1961 M.e. 6·48 23,959 +5,779 +31·79 12,724 11,235 1971 M.e. 6·48 31,875 +7,916 + 33·04 16,977 14,898
227 Kanhangadi Cannanore 1951 19,305 +4,3i6 +22·36
9,498 9,807 (KERALA) 1961 N.M. 32'27 23,621 11,713 11,908
1971 N.M. 32·34 31,869 +8,248 +34·92 15,971 15,898
228 Dholpur Bharatpur 1901 19,310 +3·i-j
10,079 9,231 (RAJASTHAN) 1911 19,922 +612 10,783 9,139
1921 16,206 -3,716 -18·65 8,519 7,687 1931- 19,586 +3,380 +20·86 10,535 ",051 1941 21,311 +1,725 +8·81 11,499 9,812 1951 20,651 -660 -3·10 10,877 9,774 1961 M. 8'21 27,412 +6,761 +32-74 15,010 12,402 1971 M. 8'21 31,865 +4,45$ +16·24 17,262 14,603
229 Vriddhach~Iam South Arcot 1901 9,433 +2,346
4,808 4,625 (TAMIL NADU) 1911 11,779 +24·87 6,032 5,747
1921 6,540 -5,239 - --44·48 3,164 3,376 1931 9,016 +2,476 +37·86 4,572 4,444 1941 8,876 -140 -1·55 4,435 4,441 1951 11,362 +2,486 +28·01 5,820 5,542 1961 p- 7'72 14,350 +2,988 +26·30 7,444 6,906 1971 M. 25'57 31,859 + 17,509 +122'01 16,6119 15,170
230 Barnala urban Sangrur 1901 6,905 -1,564
4,091 2,814 agglomeration (pUNJAB) 1911 5,341 -22-65 3,189 2,152
1921 7,714 +2,373 +44·43 4,703 3,011 1931 8,915 +1,201 +15·57 5,182 3,733 1941 12,341 +3,426 +38·43 6,916 5,425 1951 15,996 +3,655 +29·62 9,133 6,863 1961 N.A. 21,354 +5,358 +33·50 11,529 9,825 1971 N.A. 31,847 + 10,493 +49·14 17,124 14,723
(I) Barnala 1901 6,905 -1,564
4,091 2,814 1911 5,341 -22·65 3,189 2,152 1921 7,714 +2,313 +44·43 4,703 3,011 1931 8,915 + 1,201 +15·57 5,182 3,733 1941 12,341 +3,426 +38-43 6,916 5,425 1951 15,996 +3,655 +29·62~ 9,133 6,863 1961 M.e. 12-95 21,354 +5,358 +33·50 11,529 9,825 1971 M.e. 10'36 31,388 + 10,034 +46·99 16,873 14,515
tKagaznagar which was treated as town in 1951 and continued as such ti1l1961 has beem bifurcated into two different town. viz; Kagazna;ar (N.M.) and Kagaz-nagar (M.) in 1971 Census.
tThe present Kanhangad town was known as Hosdrug tDwn in 1951 Census.
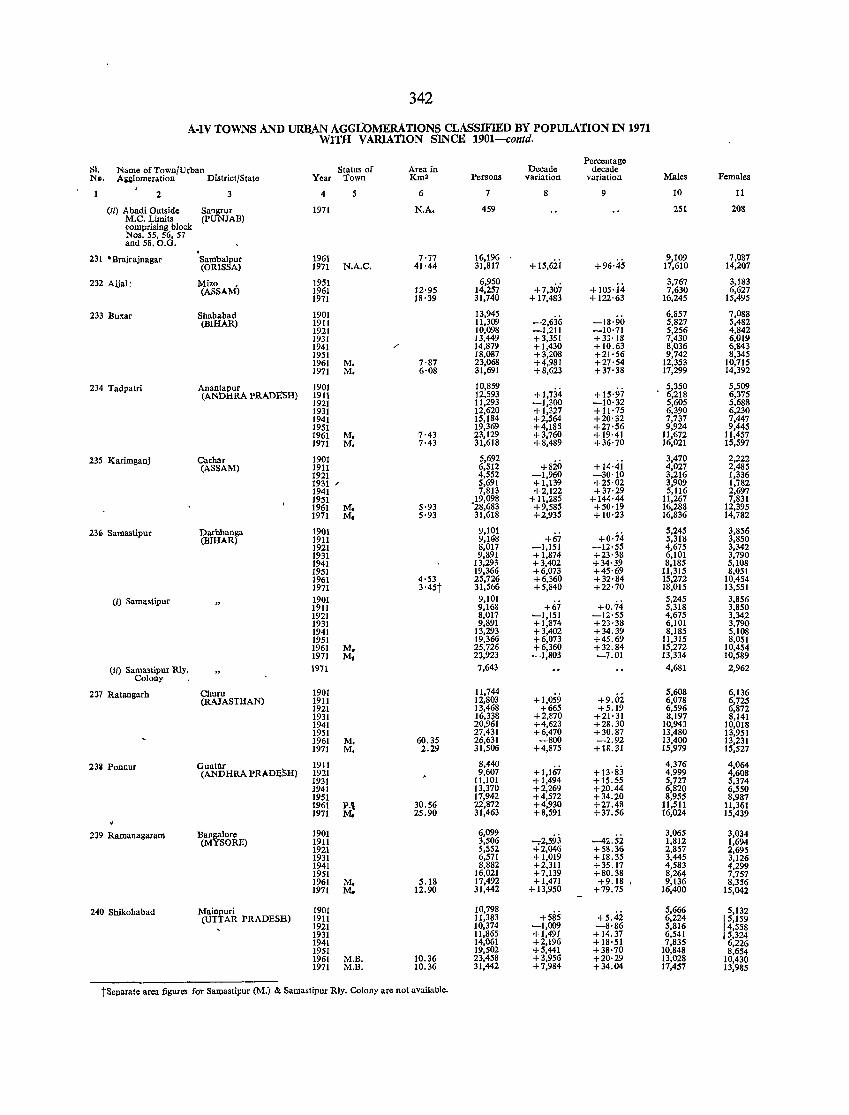
342
A·IV TOWNS AND URBAN AGGLOMERATIONS CLASSIFIED BY POPULATION IN 1971 W1TH VARIATION SINCE 1901-comd.
Percentage SI. Name of Town/Urban Status of Area in Decade decade Ne. Agglomeration District/State Year Town Km2 Persons variation variation :Males Females
2 3 4 6 7 8 9 10 11
(li) Abadi Outside Sangrur 1971 N.A. 459 251 208 M.C. Limits (PUNJAB) comprising block Nos. 55. 56. 57 and 58.0.G.
231 • Brajrajnagar Sambal£ur 1961 7'77 16.196 + 15.6ii +96·45
9.109 7.087 (ORIS A) 1971 N.A.C. 41'44 31.817 17.610 14,207
232 Aijal; Mizo 1951 6.950 +7.307 +10S·j4
3.767 3.183 (ASSAM) 1961 12·95 14.257 7.630 6.627
1971 18·39 31,740 + 17.483 + 122·63 16,245 15,495
233 Bultar Shahabad 1901 13.945 -2.636 -18-90
6.857 7.088 (BlHAR) 1911 11.309 5.827 5.482
1921 10.098 -1.211 -10·71 5.256 4.842 1931 13.449 +3.351 + 33·18 7.430 6.019 1941 /' 14.879 + 1.430 +10.63 8.036 6.843 1951 18.087 +3.208 +21·56 9.742 8.345 1961 M. 7'87 23.068 +4.981 +27'54 12.353 10.715 1971 M. 6·08 31,691 +8.623 +37'38 17.299 14.392
234 Tadpatri Anantapur 1901 10.859 +1.734- + 15·97
5.350 5.509 (ANDHRA PRADIlSH) 1911 12.593 6.218 6.375
1921 11.293 -1.300 -10·32 5.605 5.688 1931 12.620 + 1.327 + 11·75 6.390 6.230 1941 15,184 +2.564 +20·32 7.737 7.447 1951 19.369 +4,185 +27'56 9.924 9.445 1961 M. 7·43 23,129 +3,760 + 19·41 11.672 11.457 1971 M. 7·43 31.618 +8.489 +36·70 16.021 15.597
235 Karimganj Cachar 1901 5.692 +B20 +14·,ji
3.470 2.222 (ASSAM) 1911 6.512 4.027 2.485
1921 4.552 -1.960 -30·10 3.216 1.336 1931 , 5.691 + 1.139 +25·02 3.909 1.782 1941 7.813 +2.122 +37'29 5.116 2.697 1951 19.098 + 11.285 +144·44 11.267 7.831 1961 M. 5·93 -28.683 +9.585 +50·19 16.288 12.395 1971 M. 5'93 31.618 +2,935 + 10·23 16.836 14,782
236 Samastipur Darbhanga 1901 9.101 +0·74
5.245 3.856 (BIHAR) 1911 9.168 +67 5.318 3.850
1921 8.017 -1.151 -12·55 4,675 3,342 1931 9.891 +1.874 +23·38 6.101 3.790 1941 13.293 +3.402 +34'39 8,185 5.108 1951 19,366 +6.073 +45·69 11.315 8.051 1961 4·53 25.726 +6,360 +32·84 15.272 10,454 1971 3'45t 31.566 +5,840 +22'70 18.015 13,551
(i) Samastipur 1901 9,101 +67 +0.74
5,245 3.856 1911 9,168 5.318 3,850 1921 8.017 -1,151 -12'55 4.675 3.342 1931 9,891 + 1.874 +23'38 6.101 3.790 1941 13,293 +3.402 +34.39 8,185 5.108 1951 19.366 +6.073 +45.69 11.315 8.0S1 1961 M. 25.726 +6,360 +32.84 15.272 10.454 1971 M. 23.923 -1,803 -7.01 13,334 10.589
(ii) Samastipur illy. Colony
1971 7,643 4.681 2,962
237 Ratangarh Churu 1901 11.744 +1.059 +9.02
5.608 6.136 (RAJASTHAN) 1911 12.803 6.078 6,725
1921 13.468 +665 +5.19 6.596 6.872 1931 16.338 +2.870 +21·31 8.197 8,141 1941 20.961 +4.623 +28.30 10.943 10,Q18 1951 27.431 +6.470 +30.87 13.480 13.9S1 1961 M. 60.35 26.631 -800 -2.92 13.400 13,231 1971 M. 2.29 31.506 +4.875 +18.31 15.979 15.527
233 Ponnur Gunt(lr 1911 8.440 +1.167
4.376 4.064 (ANDHRA PRADE'SH) 1921 9.607 +13·83 4.999 4.608
1931 11.101 +1.494 +15.55 5.727 5,374 1941 13.370 +2.269 +20.44 6.820 6.550 1951 17.942 +4.572 +34.20 8.955 8.987 1961 P., 30.56 22,872 +4.930 +27.48 11,511 11.361 1971 M'. 25.90 31.463 +8.591 +37.56 16,024 15.439
239 Ramanagaram Bangalore 1901 6.099 .... 2.593 -42.si
3.065 3.034 (MYSORE) 1911 3.506 1.812 1.694
1921 5.552 +2.046 +58.36 2.857 2.695 1931 6.571 +1,019 + 18.35 3,445 3.126 1941 8.882 +2.311 +35.17 4.583 4.299 1951 16.021 +7.139 +80.38 8.264 7,757 1961 M. 5.18 17,492 + 1.471 +9.18 , 9.136 8.356 1971 Me 12.90 31,442 + 13,950 +79.75 16,400 15.042
240 Shikohabad Mainpuri 1901 10.798 +5.42
5,666 5.132 (UTTAR PRADESH) 1911 11.383 +585 6.224
15
•159
1921 10.374 -1.009 -8·86 5.816 4.558 1931 11.865 +1.491 + 14.37 6.541 5,324 1941 14.061 +2.196 + IS'51 7,835 6,226 1951 19,502 +5.441 +38·70 10.848 8.654 1961 M.B. 10.36 23,458 +3.956 +20·29 13.028 10.430 1971 M.B. 10.36 31.442 +7,984 +34.04 17.457 13,985
tSeparate area figures for Salllastipur eM.) & Samastipur Rly. Colony are not available.
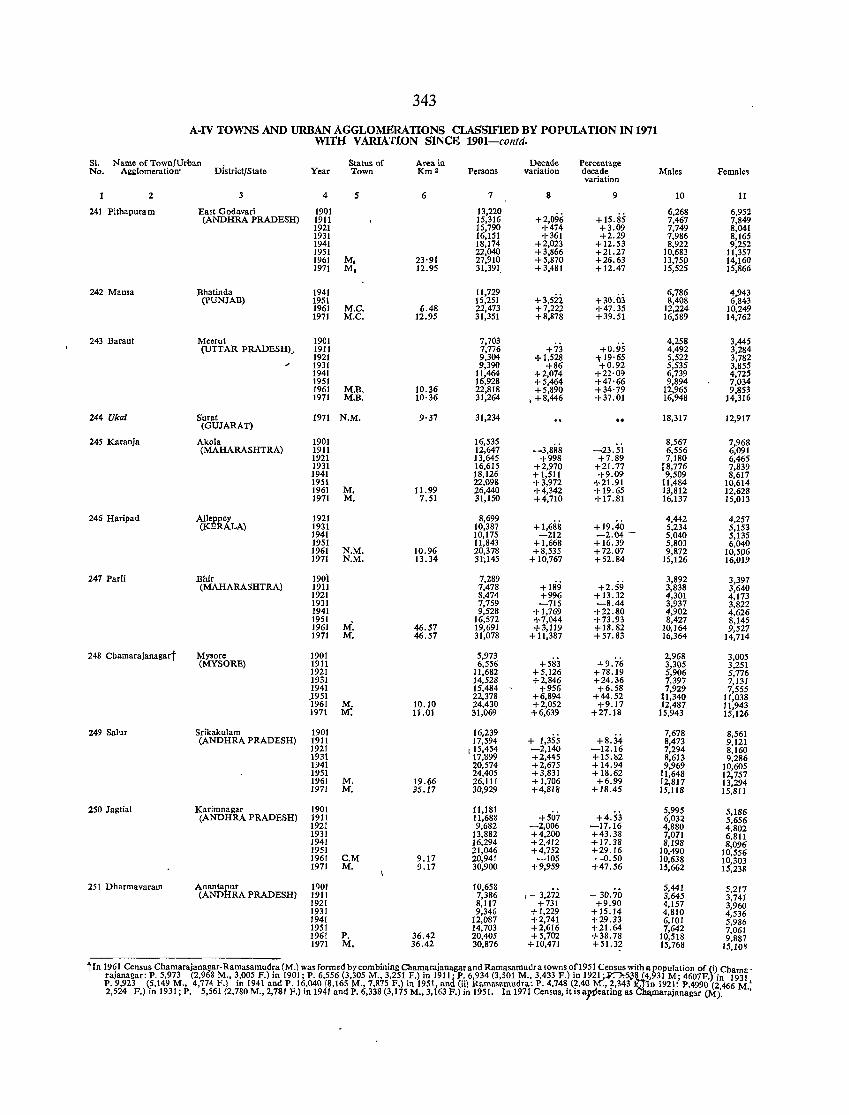
343
A-IV TOWNS AND URBAN AGGLOMERATIONS CLASSIFIED BY POPULATION IN 1971 WITH VARIATION SINCE 1901-contd.
Sl. Name of TownlUrban District/State
Status of Area in Decade Percentage No. Agglomeration' Year Town Km 2 Persons variation decade Males Females
variation
2 3 4 5 6 7 8 9 10 11
241 Pithapuram East Godavari 1901 13,220 +2,096 + 15.85
6,268 6,952 (ANDHRA PRADESH) 1911 15,316 7,467 7,849
1921 15,790 +474 +3.09 7,749 8,041 1931 16,151 +361 +2.29 7,986 8,165 1941 18,174 +2,023 +12.53 8,922 9,252 1951 22,040 +3,866 +21.27 10,683 11,357 1961 M. 23'91 27,910 +5,870 +26.63 13,75P 14,160 1971 M. 12.95 31,391. +3,481 + 12.47 15,525 15,866
242 Mansa Bhatinda 1941 11,729 +3,5ii +30.03
6,786 4,943 (PUNJAB) 1951 15,251 8,408 6,843
1961 M.C. 6.48 22,473 +7,222 +47.35 12,224 10,249 1971 M.C. 12.95 31,351 +8,878 +39.51 16,589 14,762
243 Baraut Meerut 1901 7,703 +0.95
4,258 3.445 (UTTAR PRADESHt 1911 7,776 +73 4,492 3,284
1921 9,304 + 1,528 t 19·65 5,522 3,782 1931 9,390 +86 +0.92 5,535 3,855 1941 11,464 +2,074 +22·09 6,739 4,725 1951 16,928 +5,464 +47'66 9,894 7,034 1961 M.B. 10.36 22,818 +5,890 +34'79 12,965 9,853 1971 M.B. 10·36 31,264 • +8,446 +37.01 16,948 14,316
244 Ukai Surat 1971 N.M. (GUJARAT)
9'37 31,234 18,317 12,911
245 Karanja Akola 1901 16,535 -3,888
8,567 7,968 (MAHARASHTRA) 1911 12,647 -23.51 6,556 6,091
1921 13,645 +998 +7.89 7,180 6,465 1931 16,615 +2,970 +21. 77 18,776 7,839 1941 18,126 +1,511 +9.09 9,509 8,617 1951 22,098 +3,972 +21.91 11,484 10,614 1961 M. 11.99 26,440 +4,342 +19.65 13,812 12,628 1971 M. 7.51 31,150 +4,710 +17.81 16.137 15,013
246 Haripad Alleppey 1921 8,699 +1,688 + 19.40
4,442 4,251 (KERALA) 1931 10,387 5,234 5,153
1941 10,175 -212 -2.04 - 5,040 5,135 1951 11,843 +1,668 +16.39 5,803 6,040 1961 N.M. 10.96 20,378 +8,535 +72.07 9,872 10,506 1971 N.M. 13.34 31',145 +10,767 +52.84 15,126 16,019
247 Parli Bhir 1901 7,289 +189 +2.59
3,892 3,397 (MAHARASHTRA) 1911 7,478 3,838 3,640
1921 8,474 +996 +13.32 4,301 4,173 1931 7,759 -715 -8.44 3,937 3,822 1941 9,528 +1,769 +22.80 4,902 4,626 1951
M: 16,572 +7,044 +73.93 8,427 8,145
1961 46.57 19,691 +.3,119 +18.82 10,164 9,527 1971 M. 46.57 31,078 +11,387 +57.83 16,364 14,714
248 Chamarajanagart Mysore 1901 5,973 +583 +9.76
2,968 3,005 (MYSORE) 1911 6,556 3,305 3,251
1921 11,682 +5,126 +78.19 5,906 5,776 1931 14,528 +2,846 +24.36 7,397 7,131 1941 15,484 +956 +6.58 7,929 7,555 J951 22,378 +6,894 +44.52 11,340 11,038 1961 M. 10.10 24,430 +2,052 +9.17 12,487 11,943 1971 M: 11.01 31,069 +6,639 +27.18 15,943 15,126
249 Salur Srikakulam 1901 16,239 + 1,355 +8,34
7,678 8,561 (ANDHRA PRADESH) 1911 17,594 8,473 9,121
1921 115,454 -2,140 -12.16 7,294 8,160 1931 17,899 +2,445 +15.82 8,613 9,286 1941 ZO,574 +2,675 +14.94 9,969 10,605 1951 24,405 +3,831 +18.62 11,648 12,757 1961 M. 19.66 26,111 +1,706 +6.99 12,817 13,294 1971 M. 35.17 30,929 +4,818 +18.45 15,118 15,811
250 Jagtial Karimnagar 1901 11,181 +507 +4.53
5,995 5,186 (ANDHRA PRADESH) 1911 11,688 6,032 5,656
1921 9,682 -2,006 -17.16 4,880 4,802 1931 13,882 +4,200 +43.38 7,071 6,811 1941 16,294 +2,412 +17.38 8,198 8,096 1951 21,046 +4,752 +29.16 10,490 10,556 1961 C.M 9.17 20,941 -105 -0.50 10,638 10,303 1971 M. 9.17 30,900 +9,959 +47.56 15,662 15,238
251 Dharmavaram Anantapur 1901 10,658 1- 3,27i - 30.70
5,441 5,217 (ANDHRA PRADESH) 1911 7,386 3,645 .3,741
1921 8,117 +731 +9.90 4,157 3,960 1931 9,346 +1,229 +15.14 4,810 4,536 1941 12,087 +2,741 +29.33 6,101 5,986 1951 14,703 +2,616 +21.64 7,642 7,061 1961 P. 36.42 20,405 +5,702 +38.78 10,518 9,881 1971 M. 36.42 30,876 +10,471 +51.32 15,768 15,10~
tIn 19~1 Census Chamarajanagar-Ramasamud~a (M.) was formed by combining Cham,arajanagarand Ramasarnudra towns o.fl95 I Census with a population of (i) Chama' raJanagar: P. 5,973 (2,968 M., 3,005 F.) In 1901; P. 6,556 (3,305 M., 3,251 F.) In 1911; P. 6,934 (3,501 M., 3,433 F.) In 19~.r.:";-5J~,931 M; 4607F.) in 1931 P.9,923 (5,149 M., 4,774 F.) in 1941 and P. 16,040 (8,165 M., 7,875 F.) in 1951, and (ii) Ramasamudra: P. 4,748 (2,40 •. ,2,343 . n 1921: P.4990 (2466 M' 2,524 F.) in 1931; P. 5,561 (2,780 M., 2,781 F.) in 1941 and P. 6,338 (3,175 M., 3,163 F.) in 1951. In 1971 Census, it is apearing as ~rnarajanagar (M). .,
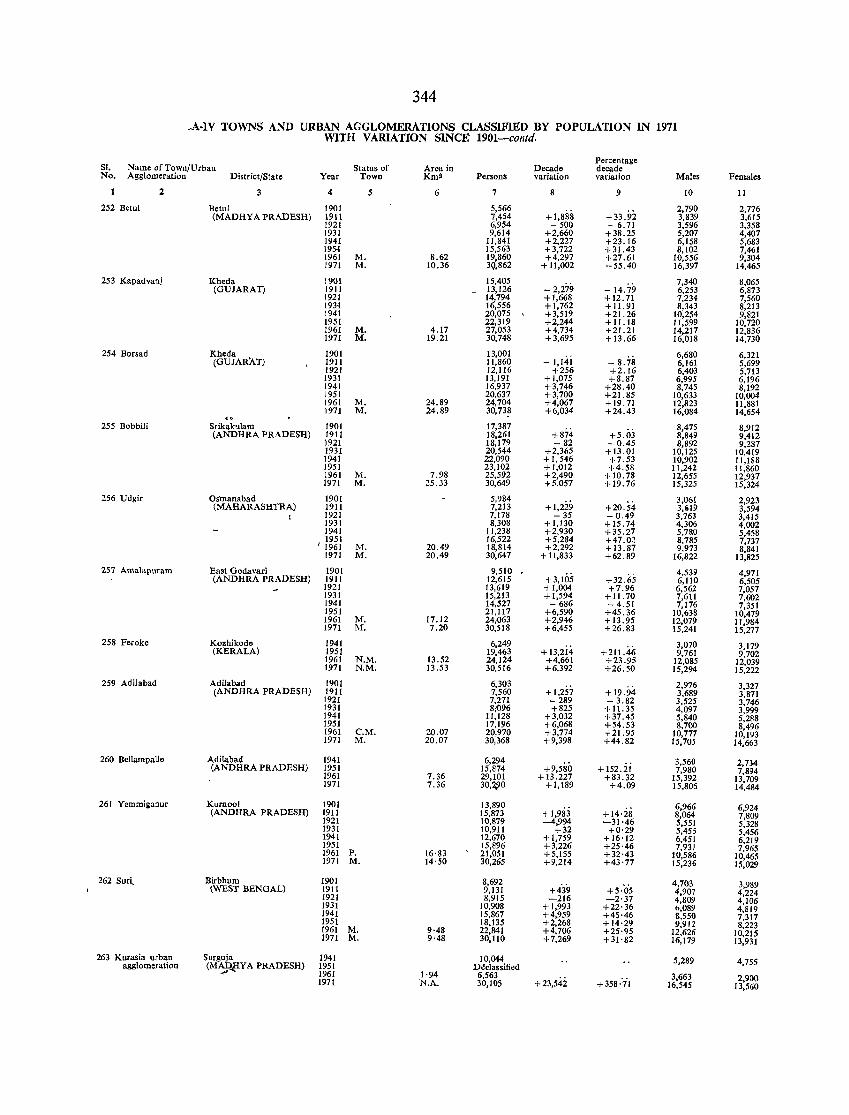
344
~A·IV TOWNS A~D URBAN AGGLOMERATIONS CLASSIFIED BY POPULATION IN 1971 WITH VARIATION SINCE' 1901-contd.
SI. Name of Town/Urban Status of Area in llercentage
Decade decade No. Agglomeration District/State Year Town Kru2 Persons variation variation Males Females
2 3 4 5 6 7 8 9 10 11
252 Betul lletul 1901 5,566 +1,888
2,790 2,776 (MADRY A PRADESH) 1911 7,454 +33.92 3,839 3,615
1921 6,954 - 500 - 6.71 3,596 3,358 1931 9,614 +2,660 +38.25 5,207 4,407 1941 1l,841 +2,227 +23.16 6,158 5,683 19Si 15,563 +3,722 + 31.43 8,102 7,461 1961 M. 8.62 19,860 +4,297 +27.61 10,556 9,304 1971 M. 10.36 3Q.862 + 11,002 +55.40 16,397 14,465
253 Kapadvanj Kheda 1901 15,405 - 2,279 - 14.79
7,340 8,065 (GUJARAT) 1911 - 13,126 6,253 6,873
1921 14,794 +1,668 + 12.71 7,234 7,560 193~ 16,556 +1,762 + 11.91 8,343 8,213 1941 20,075 \ +3,519 +21.26 10,254 9,821 1951 22,319 +2,244 + 11.18 11,599 10,720 1961 M. 4.17 27,053 +4,734 +21.21 14,217 12,836 1971 M. 19.21 30,748 +3,695 + 13.66 16,018 14,730
254 Borsad Kheda 1901 13,001 -1,14i
6,680 6,321 (GUJARAT) 1911 11,860 - 8.78 6,161 5,699
1921 12,116 +256 +2.16 6,403 5,713 1931 13,191 +1,075 +8.87 6,995 6,196 1941 16,937 +3,746 +28.40 8,745 8,192 1951 20,637 +3,700 +21.85 10,633 10,004 1961 M. 24.89 24,704 +4,067 +19.71 12,823 11,881 1971 M. 24.89 30,738 +6,034 +24.43 16,084 14,654 ••
255 Bobbili Srikak'Jlam 1901 17,387 +874
8,475 8,912 (ANDRRA PRADESH) 1911 18,261 +5.03 8,849 9,412
1921 18,179 - 82 - 0.45 8,892 9,287 1931 20,544 +2,365 +13.01 10,125 10,419 1941 22,090 + 1,546 +7.53 10,902 11,188 1951 23,102 +1,012 +4.58 11,242 11,860 1961 M. 7.98 25,592 +2,490 + 10.78 12,655 12,937 1971 M. 25.33 30,649 +5.057 +19.76 15,325 15,324
256 Udgir Osmanabad 1901 5,984 +1,229
3,061 2,923 (MAHARASHTRA) 1911 7,213 +20.54 3,1019 3,594
1921 7,178 - 35 - 0.49 3,763 3,415 1931 8,308 +1,130 +15.74 4,306 4,002 1941 11,238 +2,930 +35.27 5,780 5,458 1951 16,522 +5,284 +47.02 8,785 7,737
I 1961 M. 20.49 18,814 +2,292 + 13.87 9,973 8,841 1971 M. 20.49 30,647 + 11,833 +62.89 16,822 13,825
257 Amalapuram East Godavari 1901 9,510 +3,105 +32.65
4,539 4,971 (ANDHRA PRADESH) 1911 12,615 6,110 6,505
1921 13,619 +1,004 +7.96 6,562 7,057 1931 15,213 +1,594 + II. 70 7,6\1 7,602 1941 14,527 - 686 - 4.51 7,176 7,351 1951 21,117 +6,590 +45.36 10,638 10,479 1961 M. 17.12 24,063 +2,946 + 13.95 12,079 11,984 1971 M. 7.20 30,518 +6,455 +26.83 15,241 15,277
258 Feroke Kozhikode 1941 6,249 + 13,2i4 +211.46
3,070 3,179 (KERALA) 1951 19,463 9,761 9,702
1961 N.M. 13.52 24,124 +4,661 +23.95 12,085 12,039 1971 N.M. 13.53 30,516 +6,392 +26.50 15,294 15,222
259 Adilabad Adilabad 1901 6,303 +1,257 + 19.94
2,976 3,327 (ANDHRA PRADESH) 1911 7,560 3,689 3,871
1921 7,271 - 289 - 3.82 3,525 3,746 1931 8:096 +825 + 11.35 4,097 3,999 ]941 11,128 +3,032 +37.45 5,840 5,288 1951 17,196 +6,068 +54.53 8,700 8,496 1961 C.M. 20.07 20,970 +3,774 +21.95 10,777 10,193 1971 M. 20.07 30,368 +9,398 +44.82 15,705 14,663
260 Bellampalle Adilabad 1941 6,294 +9,580 + 152.ii
3,560 2,734 (ANDHRA PRADESH) 1951 15,874 7,980 7,894 1961 7.36 29,101 + 13.227 +83.32 15,392 13,709 1971 7.36 30,2,90 +1,189 +4.09 15,806 14,484
261 Yemmiganur Kuroool 1901 13,890 +1,983 +14'28
6,966 6,924 (ANDHRA PRADESH) 1911 15,873 8,064 7,809 1921 10,879 -4,994 -31'46 5,551 5,328 1931 10,911 +32 +0'29 5,455 5,456 1941 12,670 +1,759 +16'12 6,451 6,219 1951 ]5,896 +3,226 +25·46 7,931 7.965 1961 P. 16'83 21,051 +5,155 +32·43 10,586 10,465 1971 M. 14'50 30,265 +9,214 +43'77 15,23. 15,029
262 Suri.. Birbhum 1901 8,692 +4'39 +5·'0'5
4,703 3,989 (WEST BENGAL) 1911 9,131 4,907 4,224 1921 8,915 -216 -2'37 4,809 4,106 1931 ]0,908 +],993 +22·36 6,089 4,819 1941 15,867 +4,959 +45'46 8,550 7,317 1951 18,135 +2,268 +14·29 9,912 8,223 1961 M. 9'48 22,841 +4,706 +25·95 12,626 10,215 1971 M. 9·48 30,110 +7,269 +31'82 16,179 13,931
263 Kurasia urban Surguja 1941 10,044 5,289 4,755 agglomeration (M~..{lYA PRADESH) 1951 Declassified 1961 1·94 6,563 3,663 2,900 1971 N.A. 30,105 + 23,54i + 358 :7'1 16,545 13,560
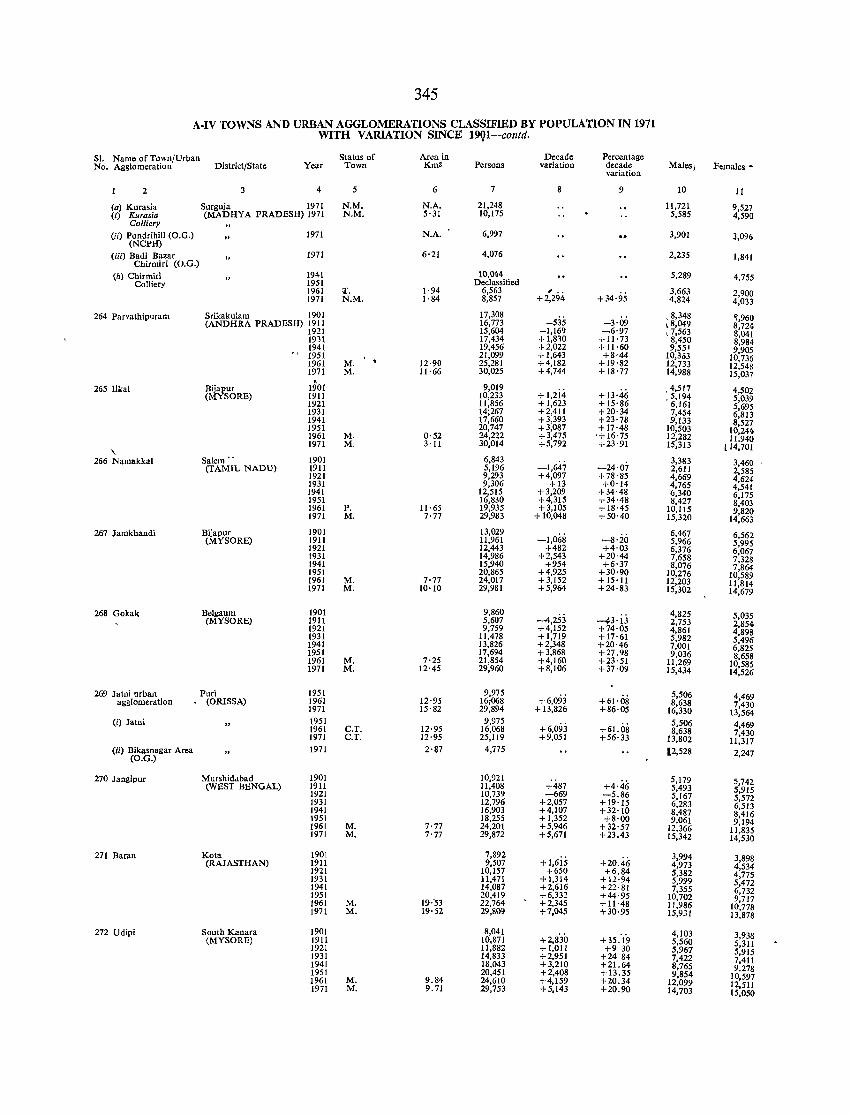
345
A-IV TOWNS AND URBAN AGGLOMERATIONS CLASSIFIED BY POPULATION IN 1971 WITH VARIATION SINCE 19Q1-contd.
SI. Name of Town/Urban No. Agglomeration District/State
Status of Year Town
2 3 4
(a) Kurasi~ Surguja 1971 (i) Kurasia (MADHYA PRADESH) 1971
N.M. N.M.
Colliery (ii) Pondrihill (O.G.) 1971
(NCPH) (iii) Badi Bazar
Chirmiri (O.G.)
(b) Chirmiri Colliery
264 Parvathipuram
265 I1kal
" 266 Namakkal
267 Jamkhandi
268 Gokak
269 Jatni urban agglomeration
(;) Jalni
(ii) Bikasnagar Area (O.G.)
270 Jangipur
271 Baran
272 Udipi
1971
1941 1951 1961 'l'. 1971 N.M.
Srikakulam 1901 (ANDHRA PRADESH) }g11
Bijapur (MYSORE)
Salem ., (TAMIL NADU)
Bijapur (MYSORE)
Belgaum (MYSORE)
Puri (ORISSA)
Murshid.lbad (WEST BENGAL)
Kota (RAJASTHAN)
South Kanara (MYSORE)
1931 1941
" 1951 1961 M. 1971 M.
1901 1911 1921 1931 1941 1951 1961 M. 1971 M.
1901 1911 1921 1931 1941 1951 1961 P. 1971 M.
1901 1911 1921 1931 1941 1951 1961 M. 1971 M.
1901 1911 1921 1931 1941 1951 1961 M. 1971 M.
1951 1961 1971 1951 1961 1971 1971
1901 1911 1921 1931 1941 1951 1961 1971
1901 1911 1921 1931 1941 1951 1961 1971
1901 1911 1921 1931 1941 1951 1961 1971
C.T. C.T.
M. M.
M. M.
M. M.
Area in Kmz
6
N.A. 5·31
N.A.
.6'21
1·94 1'84
12·90 11·66
0'52 3'11
11·65 7'77
7'77 10'10
7'25 12'45
12·95 15'82
12·95 12·95
2'87
7'77 7'77
19'-53 19'52
9.84 9.71
Persons
7
21,248 10,175
6,997
4,076
10,044 Declassified
6,563 8,857
17,308 16,773 15,604 17,434 19,456 21,099 25,281 30,025
9,019 10,233 11,856 14;267 17,660 20,747 24,222 30,014
6,843 5,196 9,293 9,306
12,515 16,830 19,935 29,983
13,029 11,961 12,443 14,986 15,940 20,865 24,017 29,981
9,860 5,607 9,759
11,478 13,826 17,694 21,854 29,960
9,975 16;668 29,894
9,975 16,068 25,119
4,775
10,921 11,408 10,739 12,796 16,903 18,255 24,201 29,872
7,892 9,507
10,157 11,471 14,087 20,419 22,764 29,809
8,041 10,871 11,882 14,833 18,043 20,451 24,610 29,753
Decade variation
8
, .. +2,294
-535 -1,169 +1,810 +2,022 +1,643 +4,182 +4,744
+I,2i4 +1,623 +2,411 +3,393 +3,087 +3,475 +5,792
-1,647 +4,097
+13 +3,209 +4,315 +3,105
+ 10,048
-1,068 +482
+2,543 +954
+4,925 +3,152 +5,964
-4,253 +4,152 +1,719 +2,348 + 3,868 +4,160 +8,106
+6,093 + 13,826
+6,093 +9,051
+487 -669
+2,057 +4,107 +1,352 +5,946 +5,671
+I,6i5 +650
+1,314 +2,616 +6,332 +2,345 +7,045
+2,830 +1,011 +2,951 +3,210 +2,408 +4,159 +5,143
Percentage decade variation
9
+34'95
-3·09 -6·97 + 11'73 +11'60 +8·44
+19'82 + 18'77
+13'46 + 15'86 +20'34 +23'78 +17'48
'+16'75 +23'91
-24·07 +78'85 +0'14
+34'48 +34'48 +18·45 +50·40
-s·io +4'03
+20'44 +6·37
+30'90 +15'11 +24'83
---lI3· ij +74'05 +17'61 +20'46 +27.98 +23'51 +37'09
+61'08 +86'05
+61.08 +56·33
+4·46 -5.86
+19'15 +32'10 +8·00
+32'57 +23.43
+20.46 +6.84
+1l·94 +22'81 +44'95 + 11'48 +30'95
+ 35:19 +9 30
+2484 +21.64 +13.35 +20.34 +20.90
Males j Females •
10
11,721 5,585
3,901
2,235
5,289
3.663 4,824
,8,348 1 8,049 \ 7,563 8,450 9,55 1
10,363 12,733 14,988
.4,517
.5,194 6,161 7,454 9,133
10,503 12,282 15,313
3,383 2,611 4,669 4,765 6,340 8,427
10,115 15,320
6,467 5,966 6,376 7,658 8,076
10,276 12,203 15,302
4,825 2,753 4,861 5,982 7,001 9,036
11,269 15,434
5,506 8,638
16,330 5,506 8,638
13,802
12,528
5,179 5,493 5,167 6,283 8,487 9,061
12,366 15,342
3,994 4,973 5,382 5,999 7,355
10,702 11,986 15,931
4,103 5,560 5,967 7,422 8.765 9,854
12,099 14,703
11
9,527 4,590
3,096
1,841
4,755
2,900 4,033
~,960 8,724 8,041 8,984 9,905
10,736 12,548 15,037
4,502 5,039 5,695 6,813 8,527
10,244 11.940
l14,701
3,460 2,585 4,624 4,541 6,175 8,403 9,820
14,663
6,562 5,995 6,067 7,328 7,864
10,589 11,814 14,679
5,035 2,854 4,898 5,496 6,825 8,658
10,585 14,526
4,469 7,430
13,564 4,469 7,430
11,317 2,247
5,742 5,915 5,572 6,513 8,416 9,194
11,835 14,530
3,898 4,534 4,775 5,472 6,732 9,717
10,778 13,878
3,938 5,311 5,915 7,411 9,278
10,597 12,511 15,050
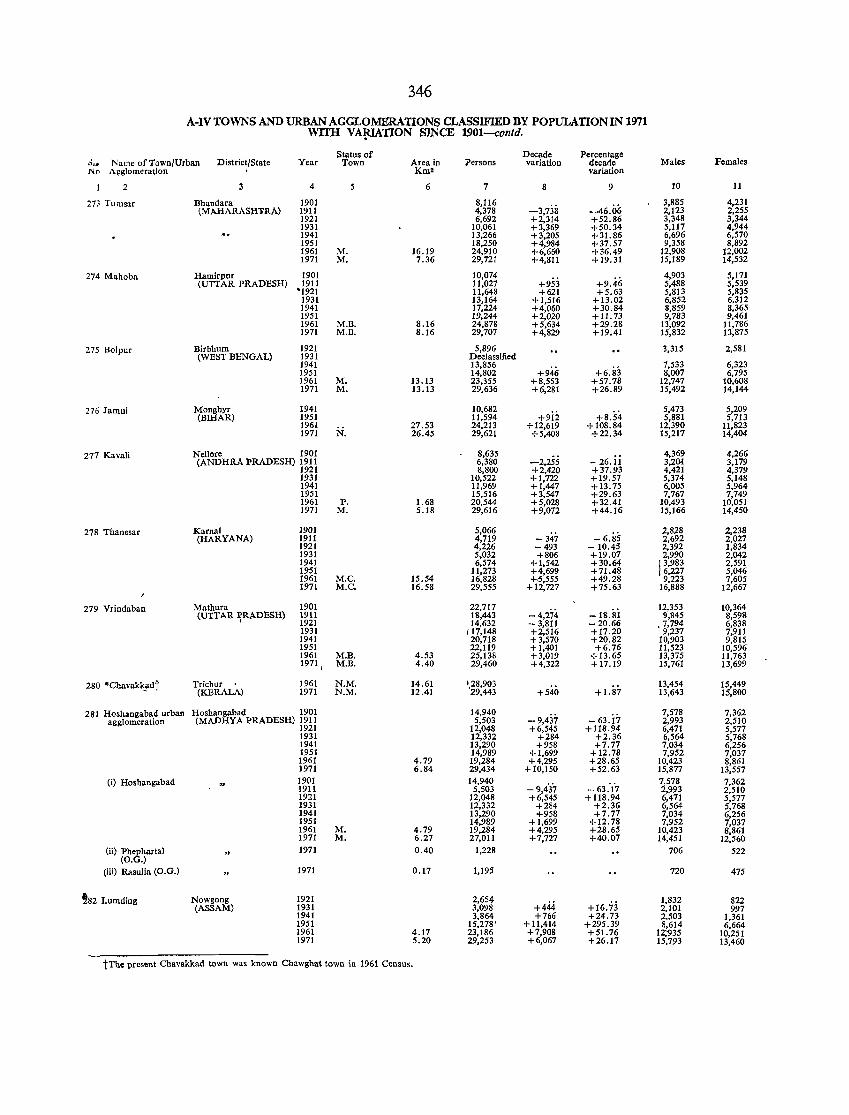
346
A·IV TOWNS AND URBAN AGGLOMERATIONS CLASSIFIED BY POPULATION IN 1971 WITH VA¥IATION SINCE 1901-contd.
Status of Decade Percentage ,:; .. l"ame of Town/Urban District/State Year Town Area in Persons variation decade Males Females No Agglomeration Km2 variation
2 4 5 6 7 8 9 10 11
273 Tumsar Bhandara 1901 8,116 -3,738 -46.06
3,885 4,231 (MAHARASH'RA) 1911 4,378 2,123 2,255
1921 6,692 +2,314 +52.86 3,348 3,344 1931 10,061 +3,369 +50.34 5,117 4,944 1941 13,266 +3,205 +31.86 6,696 6,570 1951 18,250 +4,984 +37.57 9,358 8,892 1961 M. 16.19 24,910 +6,660 +36.49 12,908 12,002 1971 M. 7.36 29,721 +4,811 +19.31 15,189 14,532
274 Mahoba Hamirpnr 1901 10,074 +9.46
4,903 5,171 (UTTAR PRADESH) 1911 11,027 +953 5,488 5,539
'1921 11,648 +621 +5.63 5,813 5,835 J931 13,164 +1,516 +13.02 6,852 6,312 1941 17,224 +4,060 +30.84 8,859 8,365 1951 19,244 +2,020 +11.73 9,783 9,461 1961 M.B. 8.16 24,878 +5,634 +29.28 13,092 11,786 1971 M.B. 8.16 29,707 +4,829 +19.41 15,832 13,875
275 Bolpur Birbhum 1921 5,896 3,315 2,581 (WEST BENGAL) 1931 Declassified
1941 13,856 +946 +6.83
7,533 6,323 1951 14,802 8,007 6,795 1961 M. 13.13 23,355 +8,553 +57.78 12,747 10,608 1971 M. 13.13 29,636 +6,281 +26.89 15,492 14,144
275 Jamui Monghyr 1941 10,682 +9ii +8.54
5,473 5,209 (BIHAR) 1951 11,594 5,881 5,713
1961 27.53 24,213 +12,619 + 108.84 12,390 11,823 1971 N. 26.45 29,621 +5,408 +22.34 15,217 14,404
277 Kavali Nellore 1901 8,635 -2,255 - 26.ii
4,369 4,266 (ANDHRA PRADESH) 1911 6,380 3,2Q.1. 3,179
1921 8,800 +2,420 +37.93 4,421 4,379 1931 10,522 +1,722 +19.57 5,374 5,148 1941 11,969 +1,447 + 13.75 6,005 5,964 1951 15,516 +3,547 +29.63 7,767 7,749 1961 P. 1.68 20,544 +5,028 +32.41 10,493 10,051 1971 M. 5.18 29,616 +9,072 +44.16 15,166 14,450
278 Thanesar Karnal 1901 5,066 -347
2,828 2,238 (HARYANA) 1911 4,719 - 6.85 2,692 2,027
1921 4,226 -493 - 10.45 2,392 1,834 1931 5,032 +806 + 19.07 2,990 2,042 1941 6,574 +1,542 +30.64 13,983 2,591 1951 11,273 +4,699 +71.48 16,227 5,046 1961 M.C. 15.54 16,828 +0,555 +49.28 9,223 7,605 1971 M.C. 16.58 29,555 +12,727 +75.63 16,888 12,667
279 Vrindaban Mathura 1901 22,717 -4,274 - 18.si
12,353 10,364 (UTTAR ~RADESH) 1911 18,443 9,845 8,598
1921 14,632 - 3,811 - 20.66 .7,794 6,838 1931 117,148 +2,516 +17.20 9,237 7,911 1941 20,718 +3,570 +20.82 10,903 9,815 1951 22,119 +1,401 +6.76 11,523 10,596 1961 M.B. 4.53 25,138 +3,019 + 13.65 13,375 11,763 1971, M.B. 4.40 29,460 +4,322 +17.19 15,761 13,699
280 ·Chavakk~dt Trichur 1961 N.M. 14.61 '.28,903 +1.87
13,454 15,449 (KERALA) 1971 N.M. 12.41 29,443 +540 13,643 15,800
281 Hoshangabad urban Hosbangabad 1901 14,940 -9,437 - 63. i7
7,578 7,362 agglomeration (MADHYA PRADESH) 1911 5,503 2,993 2,510
1921 12,048 +6,545 + 118.94 6,471 5,577 1931 12,332 +284 +2.36 6,564 5,768 1941 13,290 +958 +7.77 7,034 6,256 1951 14,989 +1,699 +12.78 7,952 7,037 1961 4.79 19,284 +4,295 +28.65 10,423 8,861 1971 6.84 29,434 +10,150 +52.63 15,877 13,557
(i) Hosbangabad 1901 14,940 -9,4'37
7,578 7,362 1911 5,503 -63.17 2,993 2,510 1921 12,048 +6,545 + l1S.94 6,471 5,577 1931 12,332 +284 +2.36 6,564 5,768 1941 13,290 +958 +7.77 7,034 6,256 1951 14,989 +1,699 +12.78 7,952 7,037 1961 M. 4.79 19,284 +4,295 +28.65 10,423 8,861 1971 M. 6.27 27,011 +7,727 +40.07 14,451 12,560
(ii) Phepbartal (O.G.)
1971 0.40 1,228 706 522
(iii) Rasulia (O.G.) 1971 0.17 1,195 720 475
!S2 Lumding Nowgong 1921 2,654 +16.73
1,832 822 (ASSAM) 1931 3,098 +444 2,101 997
1941 3,864 +766 +24.73 2,503 1,361 1951 15,278' + 11,414 +295.39 8,614 6,664 1961 4.17 23,186 +7,908 +51.76 12;935 10,251 1971 5.20 29,253 +6,067 +26.17 15,793 13,460
tThc present Chavakkad town was known Chawghat town ;n 1961 Census.
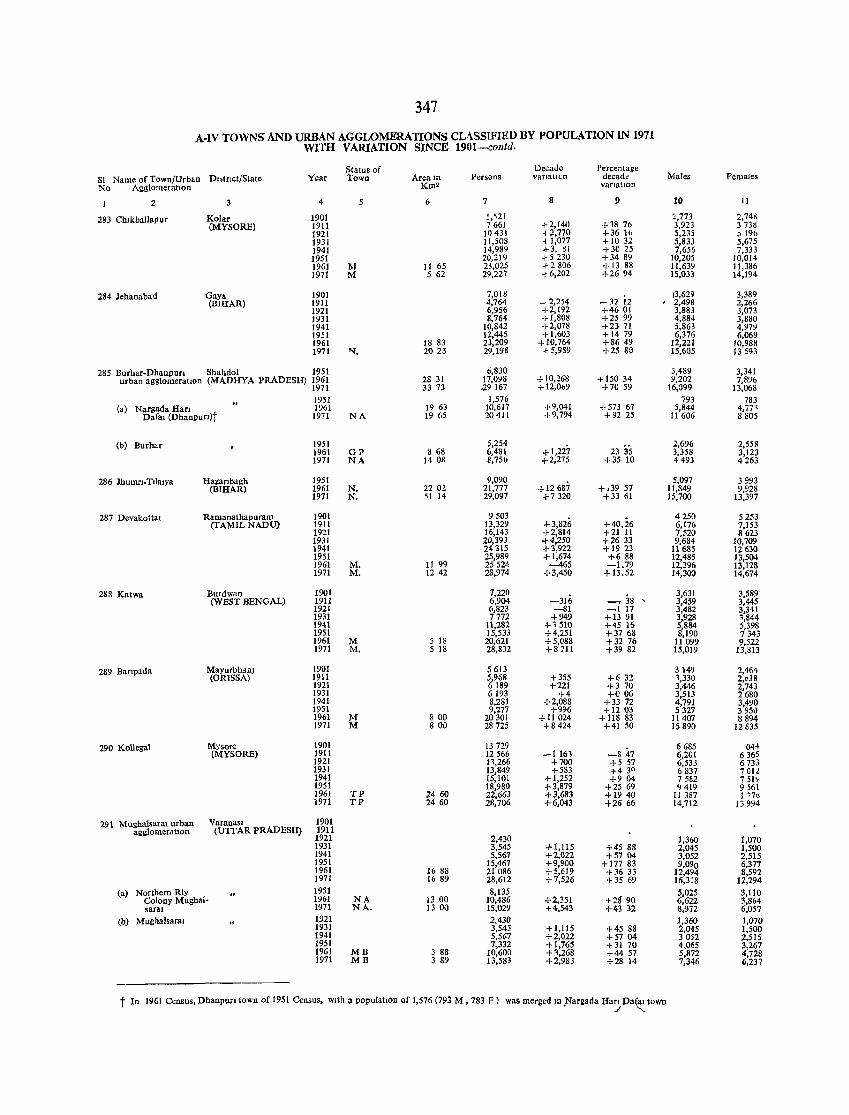
347
A-IV TOWNS AND URBAN AGGLOMERATIONS CLi\SSIFIIW BY POPULATION IN 1971 WITH VARIATION SINCE 1901-contd.
Status of Decade Percentage SI Name of Town/Urban DbtrJct/State Year Town Areatn Persons vanallen decade Males Females No AgglomeratIon Km2 variatIon
2 3 4 6 7 8 9 10 11
283 CbJkbaJlaPur Kolar 1901 5,"21 2,773 2,74~
(MYSORE) 1911 7661 +2,140 +38 70 3,923 3 73~ 1921 10431 +2,770 +36 10 5,235 ) 1% 1931 11,508 +1,077 +1032 5,833 5,675 1941 14,989 +3, 81 +30 25 7,656 7,333 1951 20,219 +5230 +34 89 10,205 10,014 1961 M 11 65 23,025 +2806 + 13 88 11,639 11,386 1971 M 562 29,227 +6,202 +2694 15,033 14,194
284 Jebanabad Gaya 1901 7,018 - 32 i2
13,629 3,389 (BIHAR) 1911 4,764 - 2,254 2,498 2,266
1921 6,956 +2,192 +4601 3,883 3,073 1931 8,764 +1,808 +25 99 4,884 3,880 1941 10,842 +2,078 +23 71 5,863 4,979 1951 12,445 +1,603 +1479 6,376 6,069 1961 18 83 23,209 +10,764 +8649 12,221 10,988 1971 "'. 2023 29,198 +5,989 +25 80 15,605 13593
285 Burhar-DhanpurI Shahdol 1951 6,830 3,489 3,341 urban agglomeratIOn (MADHYA PRADESH) 1961 28 31 17,098 + 10,268 + 150 34 9,202 7,896
1971 33 73 :;.9167 +12,069 +7059 16,099 13,068 1951 1,576 793 783
(a) Nargada Han 1961 1963 10,617 +9,041 +573 67 5,844 4,77 1
Dafal (Dhaupun}t 1971 NA 1965 20411 +9,794 +92 25 11 606 8805
(b) Burhar 1951 5,254 2335
2,696 2,558 1961 GP 868 6,481 4-1,227 3,358 3,123 1971 NA 14 OR ~,75b ,.2,275 +35 10 4493 4263
286 Jbumn-Tilalya Ha~tJbagh 1951 9,090 + 12 687
5,097 3993 (BIHAR) 1961 N. 2202 21,771 + ,39 57 11,849 9,928
1971 N. "I 14 29,091 +7320 +33 61 15,700 13,397
287 Devakottal Ramanathapuram 1901 9503 4-3,826 +40.26
4250 5253 (TAMIL NADU) 1911 13,329 6,176 7,153
1921 16,143 +2,814 +21 11 7,520 8623 1931 20,393 +4,250 +2633 9,684 10,709 1941 24315 +3,922 +19 23 11685 \2630 1951 25,989 4-1,674 +688 12,485 13,504 1961 M. 11 99 25524 -465 -1.79 12,396 13,128 1971 M. 1242 28,974 +3,450 +13.52 14,300 14,674
288 Katwa Burdwan 1901 7,220 -316 -,38
3,631 3,589 (WEST BENGAL) 1911 6,904 , 3,459 3,445
1921 6,823 -81 -117 3,482 3,341 1931 7772 +949 +13 91 3,928 ~,844 1941 11,282 +1510 +45 16 5,884 5,398 1951 15,533 +4,251 +3768 8,190 7343 1961 M 5 18 20,621 +5,088 +32 76 II 099 9,522 1971 M. 5 18 28,832 +8111 +39 82 15,019 13,813
289 Banpada MayurbhdnJ 1901 5613 3149 2,464 (ORISSA) 1911 5,968 +355 +632 1,330 2,038
1921 6189 +221 +370 3,446 2,743 1931 6193 +4 +006 3,513 2680 1941 8,281 +2,088 +33 72 4,791 3,490 1951 9,277 +996 +1203 5327 3950 1961 M 800 20301 +11 024 + 118 83 11407 8894 1971 M 800 28725 +8424 +4150 IS 890 12835
290 Kollegal MYsore 1901 13729 6685 04~ (MYSORE) 1911 12566 -1161 -847 6,201 6365
1921 11,266 +700 +5 57 6,533 6733 1931 13,849 +583 +430 6837 7 Oil 1941 15,101 +1,252 +904 7582 7 51~ 1951 18,980 +3,879 +25 69 '1419 956l 1961 TP 24 60 22,663 +3,683 +1940 11 387 ! '7" 1971 TP 2460 28,706 +6,043 +2666 14,712 13994
291 Mughalsaral urban Varanasl 1901 agglomerdtlon (U'ITAR PRADESH) 1911
1921 2,430 1,360 1,070 1931 3,545 +1,115 +4588 2,045 1,500 1941 5,567 +2,022 +5704 3,052 2,515 1951 15,467 +9,900 + 177 83 9,090 6,377 1961 16 88 21086 +5,619 +3633 12,494 8,592 1971 16 89 28,612 +7,526 +35 69 16,318 12,294
Ca) Northern Rly 1951 8,135 5,025 3,110 Colony Mughal- 1961 NA 13 00 10,486 +2,351 +2890 6,622 3,864 saral 1971 NA- 1300 15,029 +4,543 +43 32 8,972 6,057
(b) Mugbalsara. 1921 2,430 1,360 1,070 1931 3,545 +1,115 +45 88 2,045 1,500 1941 5,567 +2,022 +5704 3052 2,515 1951 7,332 +1,765 +31 70 4,065 3,267 1961 MB 3 88 10,600 +~,268 +4457 5,872 4,728 1971 MB 3 89 13,583 +2,983 +28 14 7,346 6,237
t In 1961 Census, Dhanpurl town of 1951 Census, WJth a populatIon of 1,576 (793 M , 783 F) was merged 10 Nargada Harl Pa~ town , J
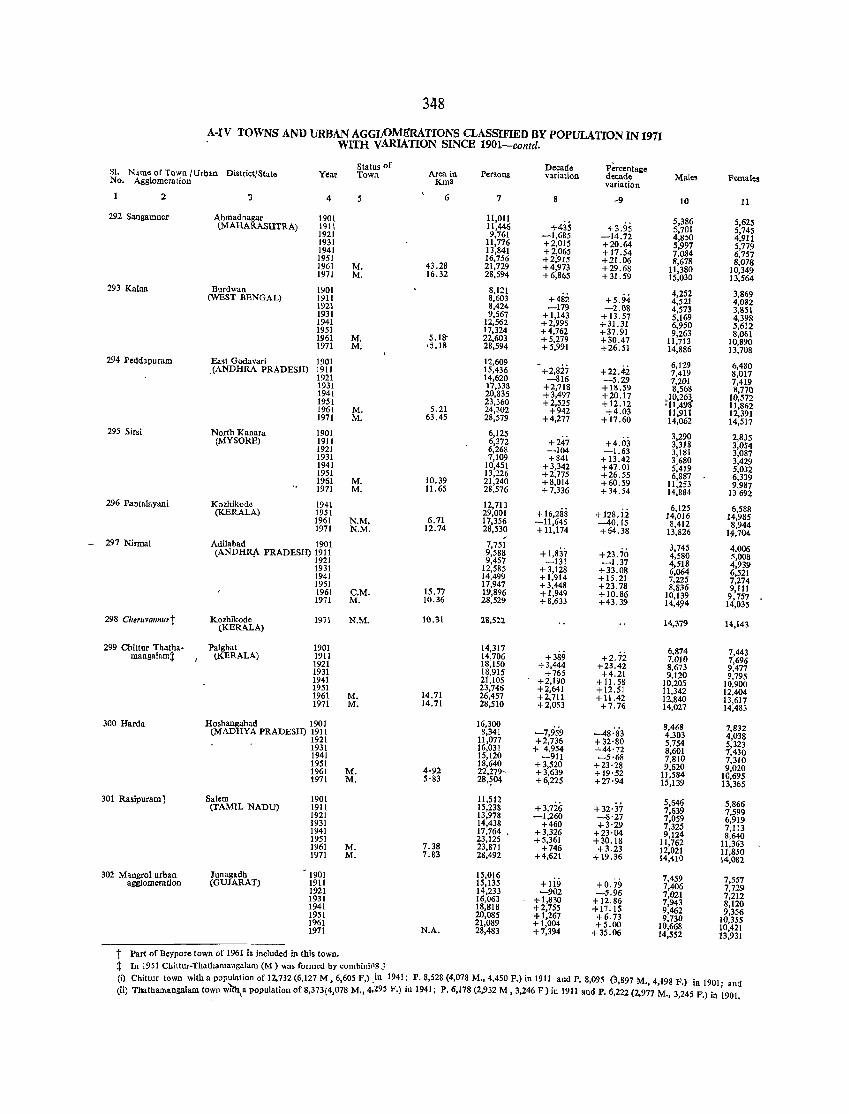
348
A-IV TOWNS AND URBAN AGGl·OMERATIONS CLASSIFIED BY POPULATION IN 1911 WITH VARIATION SINCE 1901-contd.
Status of Decade Percentage SI. Name of Town tUrban District/State Year Town Area in Persons variation decade Male. Females No. Agglomeration Km2 variation
2 '3 4 5 6 7 -9 10 11
292 Sangamner Ahmadnagar 1901 11,011 +435 +3.95
5,386 5,625 (MAHARASHTRA) \91\ ll,446 5,701 5,745 1921 9,761 -1,685 -14.72 4,850 4,911 1931 11,776 +2,015 +20.64 5,997 5,779 1941 l3,841 +2,065 + 17.54 7,084 6,757 1951 16,756 +2,915 +21.06 8,678 8,078 1961 M. 43.28 21,729 +4,973 +29.68 11,380 10,349 1971 M. 16.32 28,594 +6,865 + 31.59 15,030 13,564 293 Kalna Burdwan 1901 8,121
+482 +5.94 4,252 3,869 (WEST BENGAL) 1911 8,603 4,521 4,082 1921 8,424 -179 -2.08 4,573 3,851 1931 9,567 +1,143 + 13.57 5,169 4,398 1941 12,562 +2,995 +31.31 6,950 5,612 1951 17,324 +4,762 +37.91 9,263 8,061 1961 M. 5.18- 22,603 +5.279 +30.47 11,713 10,890 1971 M. '5.18 28,594 +5,991 +26.51 14,886 13,70S
294 Peddapuram East Godavari 1901 12,609 +2,827 +22.42
6,129 6,480 .(ANDHRA PRADESH) 1911 15,436 7,419 8,017 1921 14,620 -816 -5.29 7,201 7,419 1931 17,338 +2,718 +18.59 8,568 8,770 1941 20,835 +3,497 +20.17 ,10,263 10,572 1951 23,360 +2,525 +12.12 'll,49s' 11,862 1961 M. 5.21 24,302 +942 +4.03 11,911 12,391 1971 M. 63.45 28,579 +4,277 + 17.60 14,062 14,517 295 Sirsi North Kanara 1901 6,125
+247 +4.03 3,290 2,835 (MYSORE) 1911 6,372 3,318 3,054 1921 6,268 -104 -1.63 3,181 3,087 1931 7,109 +841 + 13.42 3.680 3,429 1941 10,451 +3,342 +47.01 5,419 5,032 1951 13,226 +2,775 +26.55 6,887 6,339 1961 M. 10.39 21,240 +8,014 +60.59 11,253 9,987 1971 M. 11.65 28.576 +7,336 +34.54 14,884 13692
296 Pantalayani Kozhikode 1941 12,713 + 16,288 +128.ii
6,125 6,588 (KERALA) 1951 29,001 14,016 14,985 1961 N.M. 6.71 17,356 -ll,645 -40.15 8,412 8,944 1971 N.M. 12.74 28,530 + 11,174 +64.38 13,826 If,704 - 297 Nirmal Adilabad 1901 7,751
+1,837 3,745 4.006 (ANDHRA PRADESH) 1911 9,588 +23.70 4,580 5,008 • 1921 9,457 -131 -1.37 4,518 4,939 1931 12,585 +3,128 +33.0S 6,064 6,521 1941 14,499 + 1,914 +15.21 7,225 7,274 1951 17,947 +3,448 +23.78 8,836 9,111 1961 C.M. 15.77 19,896 +1,949 +10.86 10,139 9.757 1971 M. 10.36 28,529 +8,633 +43.39 14,4~4 14,035
298 Cherllvannu,t Kozhikode 1971 N.M. 10.31 28,522 14,379 14,14, (KERALA)
299 Chittur Thatha. Palghat 1901 14,317 +389 +2.72
6,874 7,443 mangal.mt (KERALA) 1911 14,706 7,010 7,696 1921 18,150 + 3,444 +23.42 8,673 9,477 1931 18,915 +765 +4.21 9,120 9,795 1941 21,105 +2,190 + 11.58 10.205 10,900 1951 23,746 +2,641 +12.51 11,342 12,404 1961 M. 14.71 26,457 +2,711 + 11.42 12,840 13,617 1971 M. 14.71 28,510 +2,053 +7.76 14,027 14,483
300 Harda Hoshangabad 1901 16,300 -7,959 -4S:83
8,468 7,832 (MADHYA PRADESH) 1911 8,341 4,303 4,038 • 1921 11,077 +2,736 +32'80 5,754 5,323 1931 16,031 + 4,954 +44'72 8,601 7,430 1941 15,120 -911 -5,68 7,810 7,310 1951 18,640 +3,520 +23·28 9,620 9,020 1961 M. 4·92 22,279' +3,639 +19'52 11,584 10,695 1971 M. 5'83 28,?04 +6,225 +27'94 15,139 13,365
30 I Rasipuram 1 Salem 1901 11,512 +3,726 + 32·37
5.646 5,866 (TAMIL NADU) 1911 15,238 7,639 7,599 1921 13,978 -1,260 -8'27 7,059 6,919 1931 14,438 +460 +3'29 7,325 7,113 1941 17,764 +3,326 +23·04 9,124 8,640 1951 23,125 +5,361 +30.18 11,762 11,363 1961 M. 7.38 23,871 +746 +3.23 12,021 11,850 1971 M. 7.83 28,492 +4,621 + 19.36 14,410 14,0112
302 Mangrol urban Junagadh 1901 15,016 +Ii!i +0.79
7,459 7,557 agglomeration (GUJARAT) 1911 15,135 7,406 7,729 1921 14,233 -902 -5.96 7,021 7,212 1931 16,063 +1,830 + 12.86 7,943 8,120 1941 18,81S +2,755 +17.15 9,462 9,356 1951 20,085 +1,267 +6.73 9,730 10,355 1961 21,089 +1,004 +5.00 10,668 10,421 1971 N.A. 28,483 +7,394 +35.06 14,552 13,931
t Part of Beypore town of 1961 is included in this town.
:j: In 1951 Chittur-Thathamangalam (M) was formed by comhinil1g ~
(i) Chittur town with a popUlation of 12,732 (6,127 M. 6,605 F,) _in 1941; P. 8,528 (4,078 M., 4,450 P.) in 1911 and P. 8,095 (3,897 M., 4,198 P.) in 1901; and
(ii) Tbatharr.angalam town w't!h,a population of 8,373(4,078 M., 4,295 F.) in 1941; P. 6,178 (2,932 M, 3,246 F) in 1911 and P. 6,222 (2,977 M., 3,245 P.) in 1901.
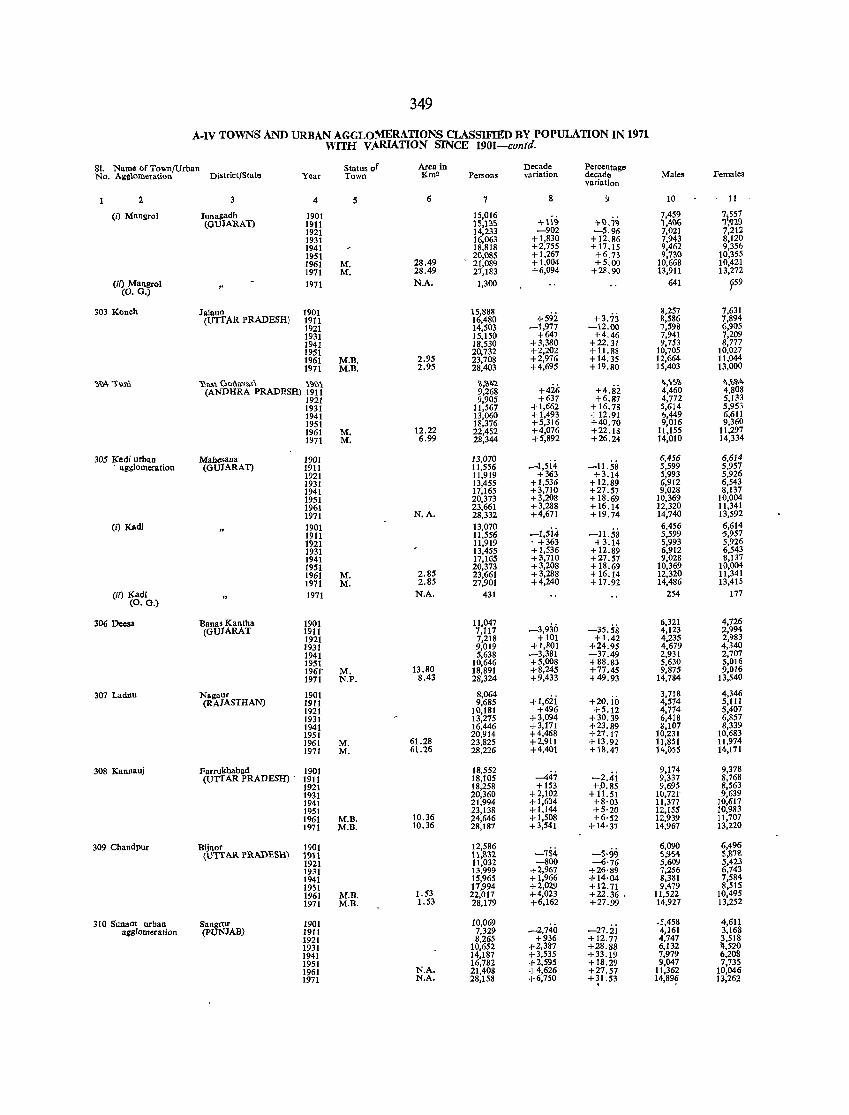
349
A-IV TOWNS AND URBAN AGGLOJ\{ERATIONS CLASSIFIED BY POPULATION IN 1971 WITH Vft.RIATION SINCE 1901-contd.
SI. Name of Town/Urban Status of Area in Decade Percentage No. Agglomeration District/State Year Town Km' Persons v~riation decade Males Females
variation
2 4 5 6 7 9 10 11
(11 Mangro1 Junagadh 1901 15,016 +li~ +().i9
7,459 7:557 (QUlARAT) 1~11 15,135 1,4()6 1,q1.9
1921 14,233 -902 -5.96 7,021 7,212 1931 16,063 +1,830 + 12.86 7,943 8,120 1941 18,818 +2,755 + 17.15 9,462 9,356 1951 20,085 +1,267 +6.73 9,730 10,355 1961 M. 28.49 21,089 +1,004 +5.00 10,668 10,421 1971 M. 28.49 27,183 +6,094 +28.90 13,911 13,272
(ii) Mangro1 (0. G.)
1971 N.A. 1,300 641 y59
303 Konch JalauD 1901 15,888 +592
8,257 7,631 (UTTAR PRADESH) 1911 16,480 +3.73 8,586 7,894
1921 14,503 _1,977 -12.00 7,598 6,905 1931 15,150 +647 +4.46 7,941 7,209 1941 18,530 +3,380 +22.31 9,753 8,777 1951 20,732 +2,202 + 11. 88 10,705 10,027 1961 M.B. 2.95 23,708 +2,976 +14.35 12,664 11,044 1971 M.B. 2.95 28,403 +4,695 +19.80 15,403 13,000
,\}'. 'tun; 10,,"\ O<>&".,an \~I'I\ '11,'11"1:. +426 +4.82 ","":>'0 ",b"lo"
(ANDHRA PRADESH) 1911 9,268 4,460 4,808 1921 9,905 +637 +6.87 4,772 5,133 1931 11,567 +1,662 +16.78 5,614 5,953 1941 13,060 +1,493 +12.91 6,449 6,611 1951 18,376 +5,316 +40.70 9,016 9,360 1961 M. 12.22 22,452 +4,076 +22.18 11,155 11,297 1971 M. 6.99 28,344 +5,892 +26.24 14,010 14,334
305 Kadi urban Mahesana 1901 13,070 _I,5i<i -11.58
6,456 6,614 . agglomeration (QUIARAT) 1911 11,556 5,599 5,957
1921 11,919 +363 +3.14 5,993 5,926 1931 13,455 +1,536 +12.89 6,912 6,543 1941 17,165 +3,710 +27.57 9,028 8,137 1951 20,373 +3,208 +18.69 10,369 10,004 1961 23,661 +3,288 +16.14 12,320 11,341 1971 N.A. 28,332 +4,671 + 19.74 14,740 13,592
(i) Kadi 1901 13,070 _1,5i<i -11.58
6,456 6,614 1911 11,556 5,599 5,957 1921 11,919 • +363 +3.14 5,993 5,926 1931 13,455 +1,536 + 12.89 6,912 6,543 1941 17,165 +3,710 +27.57 9,028 8,137 1951 20,373 +3,208 + 18.69 10,369 10,004 1961 M. 2.85 23;661 +3,288 +16.14 12,320 11,341 1911 M. 2.85 27,901 +4,240 + 17.92 14,486 13,415
(iIJ Kadi (0. G.)
1971 N.A. 431 254 177
306 Decsa Banas Kantha 1901 11,047 ~3,9:iO -35.58
6,321 4,726 (QUIARAT 1911 7,117 4,123 2,994
1921 7,218 +101 +1.42 4,235 2,983 1931 9,019 +1,801 +24.95 4,679 4,340 1941 5,638 ~3,381 -37.49 2,931 2,707 1951 10,646 +5,008 +88.83 5,630 5,016 1961' M. 13.80 18,891 +8,245 +77.45 9,875 9,016 1911 N.P. 8.43 28,324 +9,433 +49.93 14,784 13,540
307 Ladnu Nagaur 1901 8,064 +I,6ii +20. io 3,718 4,346
(RAJASTHAN) 1911 9,685 4,574 5,111 1921 10,181 +496 +5.12 4,774 5,407 1931 13,275 +3,094 + 30.39 6,418 6,857 1941 16,446 +3,171 +23.89 8,107 8,339 1951 20,914 +4,468 +27.17 10,231 10,683 1961 M. 61.28 23,825 +2,911 + 13.92 11,851 11,974 1971 M. 61.26 28,226 +4,401 + 18.47 14,055 14,171
308 Kal1Jlauj Farrukhabad 1901 18,552 -447 -2.4i 9,174 9,378
(UTTAR PRADESH) • 1911 18,105 9,337 8,768 1921 18,258 + 153 +.0.85 9,695 8,563 1931 20,360 +2,102 + 11. 51 10,721- 9,639 1941 21,994 +1,634 +8'03 11,377 10,617 1951 23,138 + 1,144 +5'20 12,155 10,983 1961 M.B. 10.36 24,646 +1,508 +6'52 12,939 11,707 1911 M.B. 10.36 28,187 +3,541 +14'37 14,967 13,220
309 Chandpur Bijnor 1901 12,586 -154 -5·<)<) 6,090 6,496
(UTI'AR PRADESH) 1911 11,1132 5,954 5,%n 1921 11,032 -800 -6'76 5,609 5,423 1931 13,999 +2,967 +26'89 7,256 6,743 1941 15,965 + 1,966 +14'04 8,381 7,584 1951 17,994 +2,029 +12.71 9,479 8,515 1961 M.B. I. S3 22,017 +4,023 +22.36 . 11,522 10,495 1971 M.B. 1.53 28,179 +6,162 +27.99 14,927 13,252
310 Sunam urban sa'mf 1901 10,069 _2,740 -27.ii
.5,458 4,611 agglomeration (P JAB) 1911 7,329 4,161 3,168
1921 8.265 +936 +12.77 4,747 3,518 1931 10,652 +2,387 +28.88 6,132 11,520 1941 14,187 +3,535 +33.19 7,979 6,208 1951
N.A. 16,782 +2,595 +18.29 9,047 7,735
1961 21,408 +4,626 +27.57 11,362 10,046 1971 N.A. 28,158 +6,750 +31.53 14,89? 13,262 ,
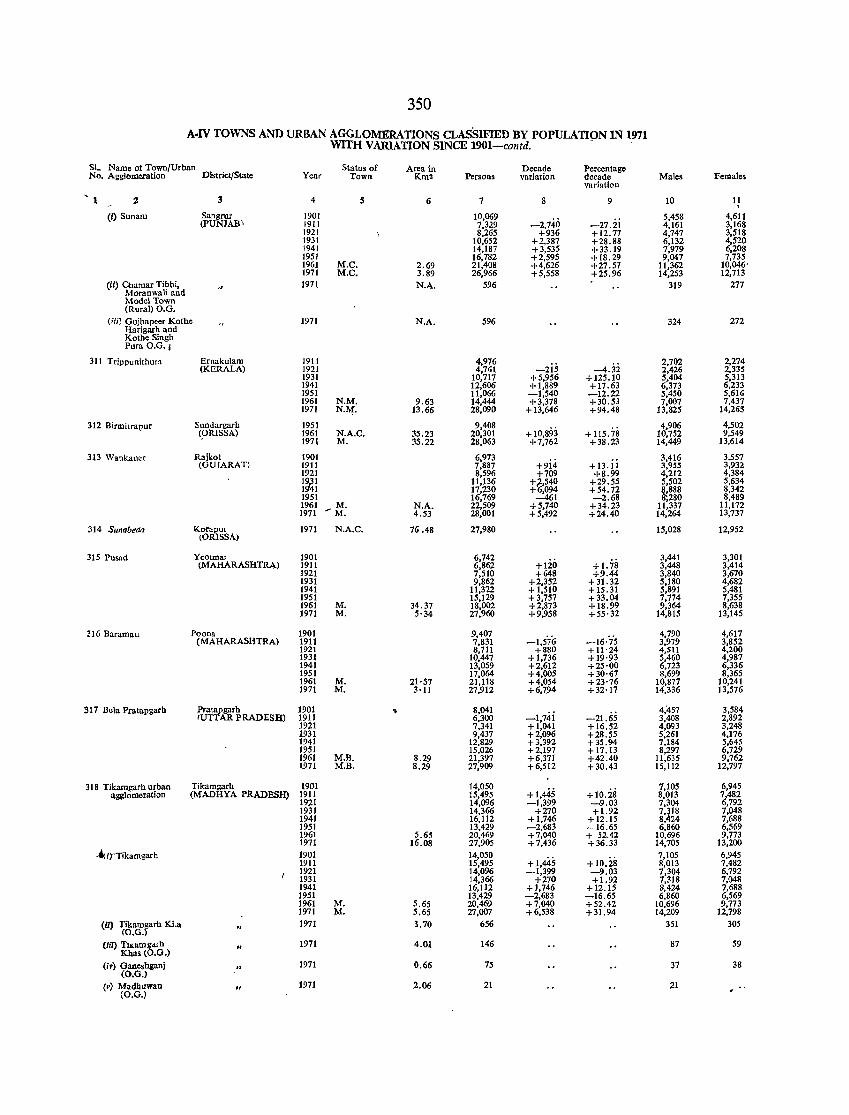
350
A·IV TOWNS AND URBAN AGGLOMERATIONS CLASSIFIED BY POPULATION IN 1971 WITH VARIATION SINCE 1901-contd.
51_ Name at Town/Urban Status of Area in Decade Percentage No, Agglomeration District/State Year Town Km2 Persons variation decade Males Females
variation , 1 2 3 4 5 6 7 8 9 10 11 ,
(I) Sunam Sangrur 1901 10,069 -2,740
5,458 4,611 (PUNJAB; 1911 7,329 -27.21 4,161 3,168
1921 8,265 +936 +12.77 4,747 3,518 1931 10,652 +2,387 +28.88 6,132 4,520 1941 14,187 +3,535 +33.19 7,979 6,208 1951 16,782 +2,595 +18.29 9,047 7,735 1961 M.C. 2.69 21,408 +4,626 +27.57 11,362 10,046' 1971 M.C. 3.89 26,966 +5,558 +25.96 14,253 12,713
(ii) Chamar Tibbi, 1971 N.A. 596 319 277 Moranwali and Model Town (Rural) O.G.
(iii) Gujhapeer Kothe 1971 N.A. 596 324 272 Rarigarh and Kothe Singh Pura O.O.j
311 Ttippunithura Ernakulam 1911 4,976 -2is
2,702 2,274 (KERALA) 1921 4,761 -4.32 2,426 2,335
1931 10,717 +5,956 + 125.10 5,404 5,313 1941 12,606 +1,889 +17.63 6,373 6,233 1951 11,066 -1,540 -12.22 5,450 5,616 1961 N.M. 9.63 14,444 +3,378 +30.53 7,007 7,437 1971 N.~. 13.66 28,090 + 13,646 +94.48 13,825 14,265
312 Birmilrapur Sundargarb 1951 9,408 + 10,893 + 115.78
4,906 4,502 (_ORISSA) 1961 N.A.C. 35.23 20.301 10,752 9,549
1971 M. 35.22 28,063 +7,762 +38.23 14,449 13,614
313 Wankaner Rajkot 1901 6,973 +9i4
3,416 3,557 (GUJARAT) 1911 7,887 +13.11 3,955 3,932
1921 8,596 +709 +8.99 4,212 4,384 1~1 11,136 +~,540 +29.55 5,502 5,634 1 41 17,230 + ,094 +54.72 ~888 8,342 1951 16,769 -461 -2.68 ,280 8,489 1961 M. N.A. 22,509 +5,740 +34.23 11,337 11,172 1971 ~M. 4.53 28,001 +5,492 +24.40 14,264 13,737
314 SunabeM KorIliuL (0 SSA)
1971 N.A.C. 76.48 27,980 15,028 12,952
315 Pusad Yeotma! 1901 6,742 +120 +1.78
3,441 3,301 (MAHARASRTRA) 1911 6,862 3,448 3,414
1921 7,510 +648 +9.44 3,840 3,670 1931 9,862 +2,352 +31.32 5,180 4,682 1941 11,372 +1,510 +15.31 5,891 5,481 1951 15,129 +3,757 +33.04 7,774 7,355 1961 M. 34.37 18,002 +2,873 +18.99 9,364 8,638 1971 M. 5'34 27,960 +9,958 +55·32 14,815 13,145
316 Barama" Poona 1901 9,407 -1,576 -16'7'5
4,790 4,617 (MAHARASHTRA) 1911 7,831 3,979 3,852
1921 8,711 +880 + 11·24 4,511 4,200 1931 10,447 + 1,736 +19·93 5,460 4,987 1941 13,059 +2,612 +25·00 6,723 6,336 1951 17,064 +4,005 +30·67 8,699 8,365 1961 M. 21·57 21,118 +4,054 +23'76 10,877 10,241 1971 M. 3'11 27,912 +6,794 +32·17 14,336 13,576
917 Bela Pratapgarh Pratapgarh 1901 ~ 8,041 -1,74i -2t.65
4,457 3,584 (UTTAR PRADESH) 1911 6,300 3,408 2,892
1921 7,341 + 1,041 +16.52 4,093 3,248 1931 9,437 +2,096 +28.55 5,261 4,176 1941 12,829 +3.392 +35.94 7,184 5,645 1951 15,026 +2,197 +17.13 8,297 6,729 1961 M.B. 8.29 21,397 +6,371 +42.40 11,635 9,762 1971 M.B. 8.29 27,909 +6,512 +30.43 15,112 12,797
318 Tikamgarh urban Tikamgarh 1901 14,050 +1,445 + 10.28
7,105 6,945 agglomeration (MADHYA PRADESH) 1911 15,495 8,013 7,482
1921 14,096 -1,399 -9.03 7,304 6,792 1931 14,366 +270 +1.92 7'118 7,048 1941 16,112 +1,746 +12.15 8, 24 7,688 1951 13,429 -2,683 -·16.65 6,860 6,569 1961 5.65 20,469 +7,040 + 52.42 10,696 9,773 1971 16.08 27,905 +7,436 +36.33 14,705 13,200
.• (i/Tikamgarh 1901 14,050 +1,445 + 10.28
7,105 6,945 1911 15,495 8,013 7,482 1921 14,096 -1,399 -9.03 7,304 6,792 1931 14,366 +270 +1.92 7,318 7,048 1941 16,112 +1,746 +12.15 8,424 7,688 1951 13,429 -2,683 -16.65 6,860 6,569 1961 M. 5.65 20,469 +7,040 +52.42 10,696 9,773 1971 M. 5.65 27,007 +6,538 +31.94 14,209 12,798
(Il) Tikarngarn Ki.a 1971 3.70 656 351 305 (0.0.)
(Ii£) fu~Ol g4i h 1971 4.01 146 87 59 Khas (O.G.)
(iv) Ganesh&;anj (O.G.)
1971 0.66 75 37 38
(V) Madhuwan 1971 2.06 21 21 (0.0.)
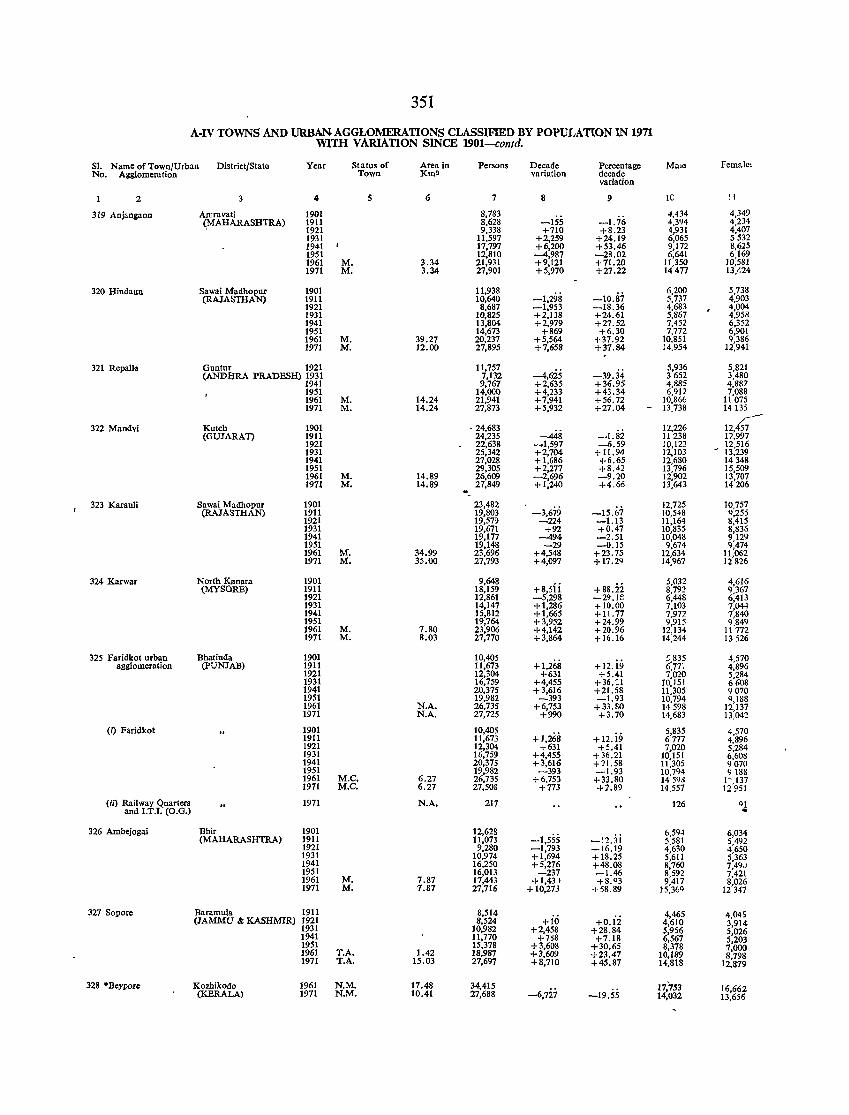
351
A·IV TOWNS AND URBAN AGGLOMERATIONS CLASSIFIED BY POPULATION IN 1971 WITH VARIATION SINCE 1901---contd.
SI. Name of Town/Urban District/State Year Status of Area in Persons Decade Percentage MalO Female, No. A~glomeration Town J{m2 variation decade
variation
2 4 5 6 7 8 9 Ie 11
319 Anjangaon Aroravati 1901 8,783 -1.76
4,434 4,349 ~MAHARASHTRA) 1911 8,628 -155 4,394 ::~6j 1921 9,338 +710 +8.23 4,931
1931 11,597 +2,259 +24.19 6,065 5532 1941 17,797 +6,200 +53.46 9,172 8,625 1951 12,810 --4,987 -28.02 6,641 IgJ~~ 1961 M. 3.34 21,931 +9,121 +71.20 11)50 1971 M. 3.34 27,901 +5,970 +27.22 14477 13,'-24
320 Hindaun Sawai Madhopur 1901 11,938 -1,298 -10.87
6,200 5,738 (RAJASTHAN) 1911 10,640 5,737 4,903
1921 8,687 -1,953 -18.36 4,683 4,004 1931 10,825 +2,138 +24.61 5,867 4,958 1941 13,804 +2,979 +27.52 7,452 6,352 1951 14,673 +869 +6.30 7,772 6,901 1961 M. 39.27 20,237 +5,564 +37.92 10,851 9,386 1971 M. 12.00 27,895 +7,658 +37.84 14.954 12,941
321 RepaUe Guntur 1921 11,757 --4,62S -39.34-
5,936 5,821 (ANlDIlRA PRADESH) 1931 7,132 3652 3,480
1941 9,761 +2,635 +36.95 4,885 4,882 1951 14,000 +4,233 +43.34 6,912 7,088 1961 M. 14.24 21,941 +7,941 +56.72 10,866 It 075 1971 M. 14.24 27,873 +5,932 +27.04 - 13.738 14135
322 Mandvi Kutch 1901 ·24,683 -1.82
12,226 12,,6-(GUJARAT) 1911 24,235 -448 11238 17,997
1921 22,638 -.1,597 --6.59 10,122 12,516 1931 25,342 +2,704 + 11.94 12,103 ~ 13,239 1941 27,028 + 1,686 +6.65 12,680 14348 1951 29,305 +2,277 +8.42 13.196 15,509 1961 M. 14.89 26,609 -2,696 -9.20 12,902 13,707 1971 M. 14.89 27,849 +1,240 +4.66 13,643 14206 -_
323 Karau1i Sawai Madhopur 1901 23,482 -3,679 -15.(,7
12,725 Ig;m (RAJASTHAN) 1911 19,803 JO,548 1921 19,579 -224 -1.13 11,164 8,415 1931 19,671 +92 +0.47 10,835 8,836 1941 19,177 --494 -2.51 10,048 9129 1951 19,148 -29 -0.15 9,674 9;474 1961 M. 34.99 23,696 +4,548 +23.75 12,634 11,062 1971 M. 35.00 27,793 +4,097 +17.29 14,967 12826
324 Karwar North Kanara 1901 9,648 +8,5ii +88.22
5,032 4,616 (MYSORE) 1911 18,159 8,792 ~:m 1921 12,861 -5,298 -29.18 6.448
1931 14,147 +1,286 +10.00 7,103 7,04-1 1941 15,812 +1,665 + 11. 77 7,972 7,840 1951 19,764 +3,952 +24.99 9,915 9.849 1961 M. 7.80 23,906 +4,142 +20.96 12,134 11772 1971 M. 8.03 27,770 +3,864 +16.16 14,244 13 526
325 Faridkot urban Bhatinda 1901 10,405 +1,268 +12.i9
r 835 4,570 agglomeration (pUNJAB) 1911 11,673 6)1', 4,896
1921 12,304 +631 +5.41 7,020 5,284 1931 16,759 +4,455 +36.:1 10,151 6608 1941 20,375 +3,616 +21.58 11,305 9070 1951 19,982 -393 -1.93 10,794 9,188 1961 N.A. 26.735 +6,753 +33.80 14598 12,137 1971 N.A. 27,725 +990 +3.70 14,683 13,042
(I) Faridkot 1901 10,405 +1,268 +12.i9
5,835 4,570 1911 11,673 6777 4,896 1921 12,304 +631 +5.41 7020 5,284 1931 16,759 +4,455 +36.21 10,151 6,608 1941 20,375 +3,616 +21.58 11,305 9070 1951 19,982 -393 -1.93 10,794 9188 1961 M.C. 6.27 26,735 +6,753 +33.80 1459.i 1',137 1971 M.C. 6.21 27,508 +173 +2.89 14,557 11951
(if) Rail wa y Quarters 1971 N.A. 217 126 91 and I.T.I. (O.G,) ..
326 Ambejogai Bhir 1901 12,628 -.1,555 ~)2.3i
6,594 6,034 (MAHARASHTRA) 1911 11,073 5.581 5,492
1921 9,280 -1,793 -16.19 4,630 4,650 1931 10,974 +1,694 +18.25 5,611 5,363 1941 16,250 +5,276 +48.08 8,760 7,49J 1951 16,013 -237 -1.46 8,592 7,421 1961 M. 7.87 17,443 +1,43 ) +8. Q 3 9,417 8,026 1971 M. 1.87 27,716 + 10,273 +58.89 15,369 12 347
327 Sopor. Baramula 1911 8,514 +io
4,465 4,045 (JAMMU & KASHMIR) 1921 8,524 +O.i2 4,610 3,914
1931 10,982 +2,458 +28.84 5,956 5,026 1941 11,770 +788 +1.18 6,567 5,203 1951 15,378 +3,608 +30.65 8,378 7,000 1961 T.A. 1.42 18,987 +3,609 +23.47 10,189 11,798 1971 T.A. 15.03 27,697 +8,710 +45.87 14,818 12,879
328 °Beypore Kozhikode 1961 N.M. 11.48 34,415 -6,727
17,753 16,662 (KERALA) 1971 N.M. 10.41 27,688 -19.55 14,032 13,656
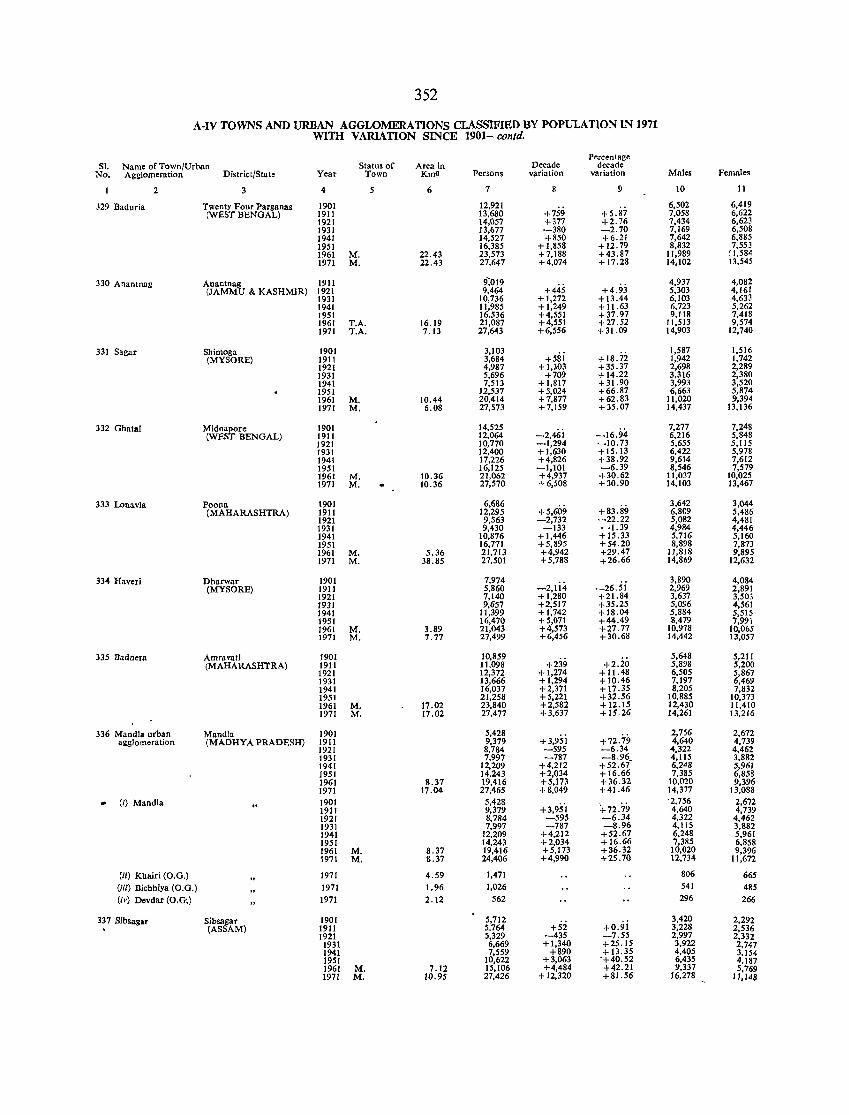
352
A-IV TOWNS AND URBAN AGGLOMERATIONS CLASSIFIED BY POPULATION IN ]971 WITH VARIATION SINCE 1901--contd.
Percentage Name of Town/Urban S1. Statu. of Area in Decade decade
No. Agglomeration District/State Year Town Km<I Persons variation variation Males Females
2 3 4 5 6 7 9 10 11
329 Baduria Twenty Four Parganas 1901 12,921 +759 +5.87
6,502 6,419 (WEST BENGAL) 1911 13,680 7,058 6,622
1921 14,057 +377 +2.76 7,434 6,623 1931 13,677 ·-380 -2.70 7,169 6,508 1941 14,527 +850 +6.21 7,642 6,885 1951 16,385 +1,858 +12.79 8,832 7,553 1961 M. 22.43 23,573 +7,188 +43.87 11,989 11,584 1971 M. 22.43 27,647 +4,074 + 17.28 14,102 13,545
330 Anantnag Anantnag 1911 9~019 His +4.93
4,937 4,082 (JAMMU & KASHMIR) 1921 9,464 5,303 4,161
1931 10,736 + 1,272 +13.44 6,103 4,633 1941 11,985 +1,249 + 11.63 6,723 5,262 1951 16,536 +4,551 +37.97 9,118 7,418 1961 T.A. 16.19 21,087 +4,551 +27.52 11,513 9,574 1971 T.A. 7.13 27,643 +6,556 + 31.09 14,903 12,740
331 Sagar Shimoga 1901 3,103 + 18.72
1,587 1,516 (MYSORE) 1911 3,684 +581 1,942 1,742
1921 4,987 + 1,303 +35.37 2,698 2,289 1931 5,696 +709 + 14.22 3,316 2,380 1941 7,513 + 1,817 +31.90 3,993 3,520 1951 12,537 +5,024 +66.87 6,663 5,874 1961 M. 10.44 20,414 +7,877 +62.83 11,020 9,394 1971 M. 6.08 27,573 +7,159 +35.07 14,437 13,136
332 Ghatal Midnapore 1901 14,525 -16.94
7,277 7,248 (WEST BENGAL) 1911 12,064 -2,461 6,216 5,848
1921 10,770 -1,294 -10.73 5,655 5,115 1931 12,400 + 1,630 +15.13 6,422 5,978 1941 17,226 +4,826 +38.92 9,614 7,612 1951 16,125 -1,101 -6.39 8,546 7,579 1961 M. 10.36 21,062 +4,937 +30.62 11,037 10,025 1971 M. 10.36 27,570 +6,508 +30.90 14,103 13,467
333 Lonavla Poooa 1901 6,686 +5,609 +83.89
3,642 3,044 (MAHARASHTRA) 1911 12,295 6,809 5,486
1921 9,563 -2,732 -22.22 5,082 4,481 1931 9,430 -133 -1.39 4,984 4,446 1941 10,876 +1,446 +15.33 5.716 5,160 1951 16,771 +5,895 +54.20 8,898 7,873 1961 M. 5.36 21,713 +4,942 +29.47 11,818 9,895 1971 M. 38.85 27,501 +5,788 +26.66 14,869 12,632
334 Haveri Dharwar 1901 7,974 -2,li4
3,890 4,084 (MYSORE) 1911 5,860 -26.51 2,969 2,891
1921 7,140 + 1,280 +21.84 3,637 3,503 1931 9,657 +2,517 +35.25 5,096 4,561 1941 11,399 +1,742 +18.04 5,884 5,515 1951 16,470 +5,071 +44.49 8,479 7,991 1961 M. 3.89 21,043 +4,573 +27.77 10,978 10,065 1971 M. 7.77 27,499 +6,456 +30.68 14,442 13,057
335 Badnera Amravati 1901 10,859 +2.20
5,648 5,211 (MAHARASHTRA) 1911 11,098 +239 5,898 5,200
1921 12,372 +1,274 +11.48 6,505 5,867 1931 13,666 +1,294 +10.46 7,197 6,469 1941 16,037 +2,371 +17.35 8,205 7,832 1951 21,258 +5,221 +32.56 10,885 10,373 1961 M. 17.02 23,840 +2,582 +12.15 12,430 11,410 1971 M. 17.02 27,477 +3,637 +15.26 14,261 13,216
336 Mandla urban Mandla 1901 5,428 +3,9Si +72.79
2,756 2,672 agglomeration (MADHYA PRADESH) 1911 9,379 4,640 4,739
1921 8,784 -595 -6.34 -4,322 4,462 1931 7,997 -787 -8.96_ 4,115 3,882 1941 12,209 +4,212 +52.67 6,248 5,961 1951 14,243 +2,034 +16.66 7,385 6,858 1961 8.37 19,416 +5,173 +36.32 10,020 9,396 1971 17.04 27,465 +8,049 +41.46 14,377 13,088
(i) Mandla 1901 5,428 + 3,9Si +72.79
'2,756 2,672 1911 9,379 4,640 4,739 1921 8,784 -595 _6.34 4,322 4,462 1931 7,997 -787 -8.96 4,115 3,882 1941 12,209 +4,212 +52.67 6,248 5,961 1951 14,243 +2,034 +16.66 7,385 6,858 1961 M. 8.37 19,416 +5,173 +36.32 10,020 9,396 1971 M. 8.37 24,406 +4,990 +25.70 12,734 11,672
(ii) Khairi (O.G.) 1971 4.59 1,471 806 665 (iii) Bichhiya (O.G.) 1971 1.96 1,026 541 485
(iv) Devdar (0.0:) 1971 2.12 562 296 266
337 Sibsagar Sibsagar 1901 5,712 +52 +0.9i
3,420 2,292 (ASSAM) 1911 5,764 3,228 2,536
1921 5,329 -435 -7.55 2,997 2,332 1931 6,669 +1,340 +25.15 3,922 2,747 1941 7,559 +890 +13.35 4,405 3,154 1951 10,622 +3,063 '+40.52 6,435 4,187 1961 M. 7.12 15,106 +4,484 +42.21 9,337 5,769 1971 M. 10.95 27,426 + 12,320 +81.56 16,278 11,148
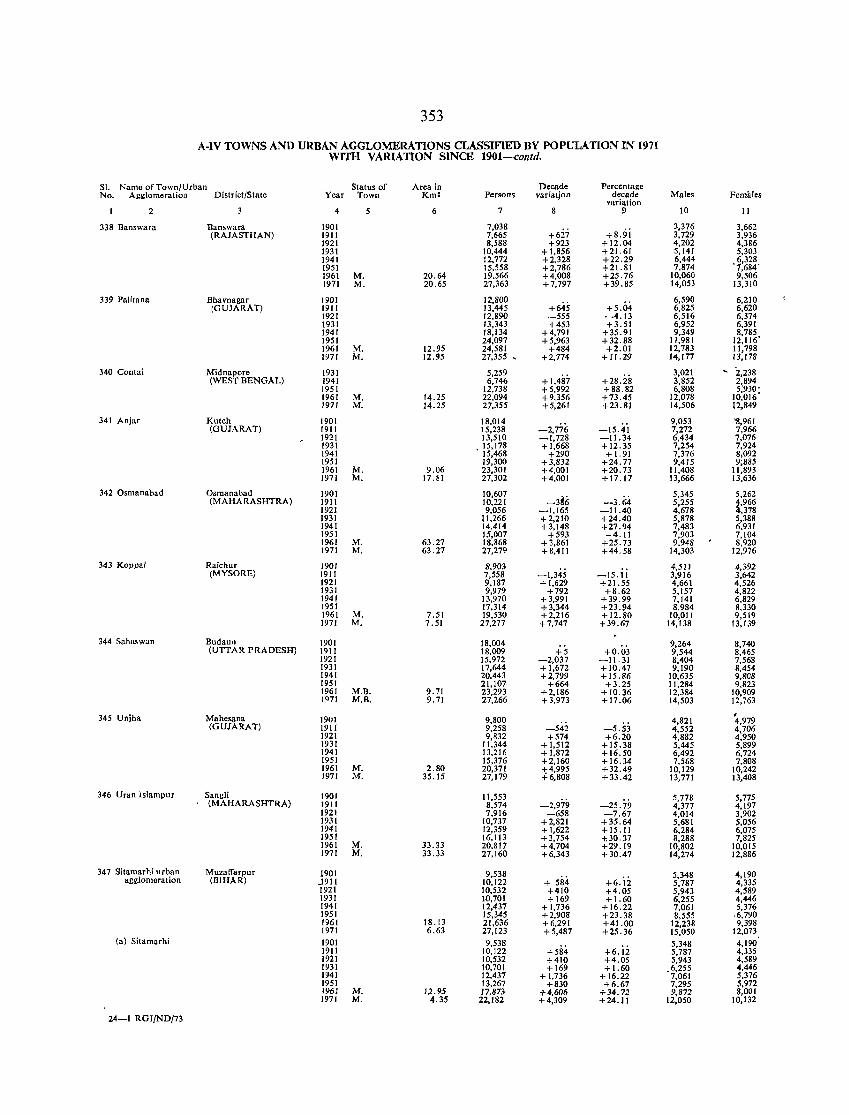
353
A-IV TOWNS AND URBAN AGGLOMERATIONS CLASSIFIED BY POPULATION IN 1971 WITH VARIATION SINCE 1901-contd.
S1. Name of Town/Urban Status of Area in Decade Percentage No. Ag~lomeration District/State Year Town Km2 Persons variation decade Males Females
variation 2 4 5 6 7 9 10 11
338 Banswara Banswara 1901 7,038 +8.9i
3,376 3,662 (RAJASTHAN) 1911 7,665 +627 3,729 3,936
1921 8,588 +923 +12.04 4,202 4,386 1931 10,444 + 1,856 +21.61 5,141 5,303 1941 12,772 +2,328 +22.29 6,444 6,328 1951 15,558 +2,786 +21.81 7,874 '1,684' 1961 M. 20.64 19.566 +4.008 +25.76 10,060 9,506 1971 M. 20.65 27,363 +7,797 +39.85 14,053 13,310
339 Palitana Bhavnagar 1901 12,800 +5.04
6,590 6,210 (GUJARAT) 1911 13,445 +645 6,825 6,620
1921 12,890 -555 -4.13 6,516 6,374 1931 13,343 +453 +3.51 6,952 6,391 1941 18,134 +4,791 +35.91 9,349 8,785 1951 24,097 +5,963 +32.88 11,981 12,116' 1961 M. 12.95 24,581 +484 +2.01 12,783 11,798 1971 M. 12.'5 27,355 , +2,774 +1(,29 14,177 13,178
340 Contai Midnapore 1931 5,259 3,021 , 2,238 (WEST BENGAL) 1941 6,746 +1,487 +28.is 3,852 2,894
1951 12,738 +5,992 +88.82 6,808 5,930; 1961 M. 14.25 22,094 +9,356 +73.45 12,078 10,016 1971 M. 14.25 27,355 +5,261 +23.81 14,506 12,849
341 Anjar Kutch 1901 18,014 -2,776
9,053 '8,961 (GUJARAT) 1911 15,238 -15.41 7,272 7,966
1921 13,510 -1,728 -11.34 6,434 7,076 1931 .15,178 + 1,668 +12.35 7,254 7,924 1941 15,468 +290 +1.91 7,376 8,092 1951 19,300 +3,832 +24.77 9,415 9;885 1961 M. 9.06 23,301 +4,001 +20.73 11,408 11,893 1971 M. 17.81 27,302 +4,001 +17.17 13,666 13,636
342 Osmanahad Osmanabad 1901 10,607 -3~6
5,345 5,262 (MAHARASHTRA) 1911 10,221 -3.64 5,255 4,966
1921 9,056 -1,165 -11.40 4,678 .!I,37S 1931 11,266 +2,210 +24.40 5,878 5,388 1941 14,414 +3,148 +27.94 7,483 6,931 1951 15,007 +593 +4.11 7,903 7,104 1961 M. 63.27 18.868 +3,861 +25.73 9.948 8,920 1971 M. 63.27 27,279 +8,411 +44.58 14,303 12,976
343 Koppal Raichur 1901 8,903 4,5l! 4,392 (MYSORE) 1911 7,558 -1,345 -15.11 3,916 3,642
1921 9,187 +1,629 +21.55 4,661 4,526 1931 9,979 +792 +8.62 5,157 4,822 1941 13,970 +3,991 +39.99 7,141 6,829 1951 17,314 +3,344 +23.94 8,984 8,330 1961 M. 7.51 19,530 +2,216 +12.80 10,011 9,519 1971 M, 7.51 27,277 + 7,747 +39.67 14,138 13,139
344 Saha,wan Budaun 1901 18,004 9.264 8,740 (UTTAR PRADESH) 1911 18,009 +5 +0.03 9,544 8,465
1921 15,972 -2,037 -11.31 8,404 7,568 1931 17,644 + 1,672 +10.47 9,190 8,454 1941 20,443 +2,799 +15.86 10,635 9,808 1951 21,107 +664 +3.25 11,284 9,823 1961 M.B, 9.71 23,293 +2,186 +10.36 12,384 10,909 1971 M.B. 9.71 27,266 + 3,973 +17.06 14,503 12,763
345 Unjha Mahesana 1901 9,800 ,
4,821 4,979 (GUJARATJ 1911 9,258 -542 -5.53 4,552 4,706
1921 9,832 +574 +6,20 4,882 4,950 1931 11,344 +1,512 +15.38 5,445 5,899 1941 13,216 + 1,872 +16.50 6,492 6,724 1951 15,376 +2,160 +16.34 7.568 7,808 1961 M. 2.80 20,371 +4,995 +32.49 10,129 10,242 1971 M, 35.15 27,179 +6,808 +33.42 13,771 13,408
346 Uran lslampur Sangli 1901 11,553 -2,979
5,778 5,775 (MAHARASHTRA) 1911 8,574 -25.79 4,377 4,197
1921 7,916 -658 -7.67 4,014 3,902 1931 10,737 +2,821 +35.64 5,681 5,056 1941 12,359 + 1,622 +15.11 6,284 6,075 1951 16,113 +3,754 +.30.37 8,288 7,825 1961 M, 33.33 20,817 +4,704 +29.19 10,802 10,015 1971 M. 33.33 27,160 +6,343 +30.47 14,274 12,886
347 Sitamarhi urban Muzafl'arpur 1901 9,538 5,348 4,190 agglomeration (BIHAR) .1911 10,122 + 584 +6. ii 5,787 4,335
1921 10,532 +410 +4.05 5,943 4,589 1931 1-0,701 +169 + 1.60 6,255 4,446 1941 12,437 + 1,736 +16.22 7,061 5,376 1951 15,345 +2,908 +23.38 8,555 .6,790 1961 18.13 21,636 +6,291 +41.00 12,238 9,398 1971 6.63 27,123 +5,487 +25.36 15,050 12,073
Ca) Sitamarhi 1901 9,538 5,348 4,190 1911 10,122 +584 +6.i:i 5,787 4,335 1921 10,532 +410 +4.05 5,943 4,589 1931 10,701 +169 + 1.60 .6,255 4,446 1941 12,437 + 1,736 + 16.22 7,061 5,376 1951 13,267 +830 +6.67 7,295 5,972 196: M. 12.95 17.873 +4,606 +34.72 9,872 8,001 1971 M. 4.35 22,182 +4,309 +24.11 12,050 10,132
24-1 RGr/ND/73
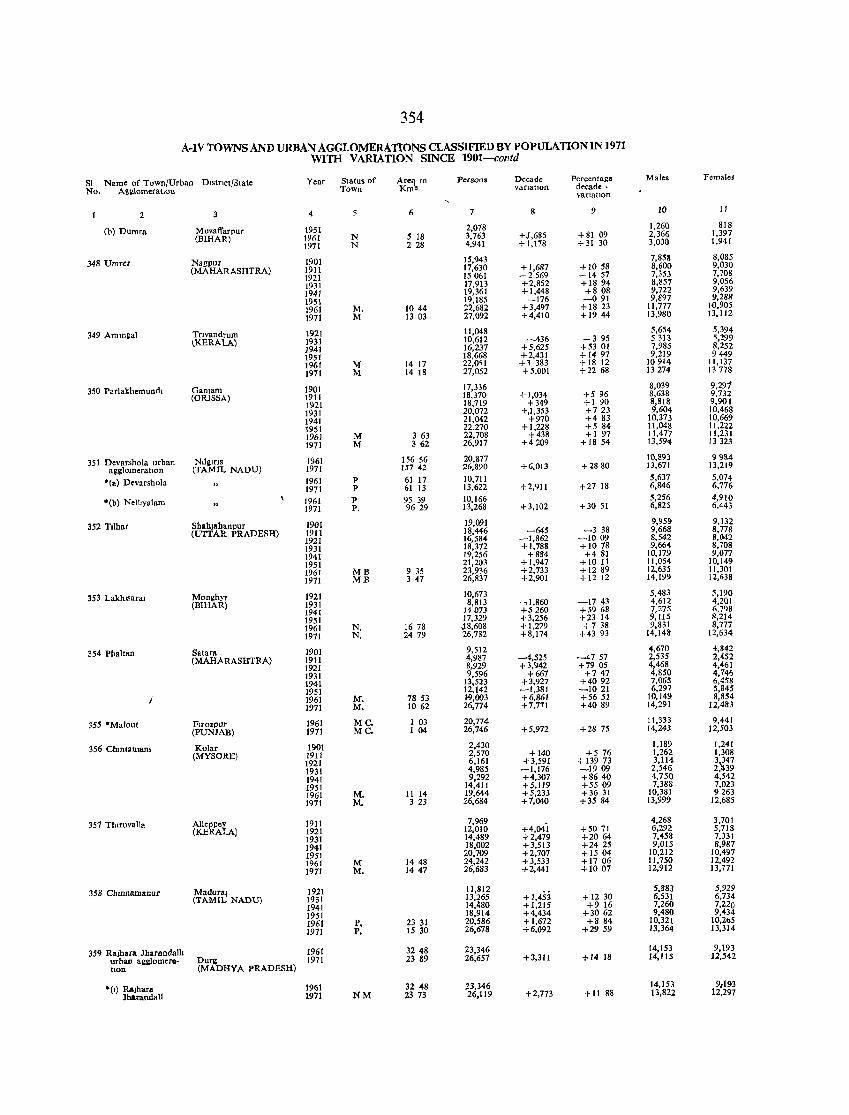
354
A.IV TOWNS AND URBAN AGGLOMERA nONS CLASSIFIED BY POPULA nON IN 1971 WITH VARIATION SINCE 1901-contd
SI Name of Town/Urban DIstTlct/State Year Status of 1<~\m Persons Decade Percentage Male~ Females
No. AgglomeratIOn Town vanatlOn decade. vanatlon
2 3 4 6 7 8 9 10 II
(b) Dumra Muzafl'arpur 1951 2,078 1,260 818
(BIHAR) 1961 N 5 18 3,763 +J,685 +81 09 2,366 1,397
1971 N 228 4,941 + 1,178 +31 30 3,000 1,941
348 Umrer NagpuT 1901 15,943 7,858 8,085
(MAHARASHTRA) 1911 17,630 +1,687 +1058 8,600 9,030
1921 15061 -2569 -1457 7,353 7,708
1931 17.913 +2.852 +1894 8,857 9,056
1941 19,361 +1,448 +808 9,722 9,639
1951 19,185 -176 -091 9,897 9,288
1961 M. 1044 22,682 +3,497 +1823 11,777 H),905
1971 M 13 03 27,092 +4,410 +1944 13,980 13,112
349 Amm~al TTlvandrum 1921 1l,048 5,654 5,394
\KERALA) 1931 10,612 ~436 -395 5313 <,199
1941 16,237 +5,625 +5301 7,985 8,252 1951 18,668 +2,431 +1497 9,219 9449 1961 1\1" 14 17 22,0<1 + 1 383 +18 12 10914 11,137
1971 M 14 18 27,052 +5,001 +2268 13 274 13778
350 Parlakhemundt Ganjam 1901 17,336 8,039 9,291
(ORlSSA) 1911 18,370 +1,034 +5 96 8,638 9,732 1'i21 18,719 +349 +1 90 8,818 9,901
1931 20,072 +,1,353 +723 9,604 10,468 1941 21,042 +970 +483 10,373 10,669 1951 22,270 +1,228 +5 84 11,048 11,222 1961 M 363 22,708 +438 +197 J 1,477 11,231
1971 M 362 26,917 +4209 + 1854 13,594 13323
351 Devarshola urban NIllllTlS 1961 156 56 20,877 10,893 9984
agglomeratIOn (TAMIL NADU) 1971 15742 26,890 +6,013 +2880 13,671 13,219
*(a) Devarshola 1961 P 61 17 10,711 5,637 5,074 1971 P 61 13 13,622 +2,911 +27 18 6,846 6,776
*(b) Nelhyalam 1961 P 95 39 10,166 5,256 4,910 1971 P. 9629 13,268 +3,102 +3051 6,825 6,443
352 TIIhar ShahJahanpur 1901 19,091 9,959 9,132
(UTTAR PRADESH) 1911 18,446 -645 -338 9,668 8,778 1921 16,584 -1,862 -1009 8,542 8,042
1931 18,372 +1,788 +1078 9,664 8,708 1941 19,256 +884 +481 10,179 9,077
1951 21,203 +1,947 +10 11 11,054 10,149 1961 ME 9 35 23,936 +2,733 + 1289 12,635 11,301 1971 MB 347 26,837 +2,901 +1212 14,199 12,638
353 Lakhlsaral MonghYr 1921 10,673 5,483 5,190
(BIHAR) 1931 8,813 ~1,860 -1743 4,612 4,201 1941 14073 +5260 +5968 7,275 6,798
1951 17,329 +3,256 +2314 9,115 8,214 1961 N. 1678 J8,608 +1,279 +7 38 9,831 8,777 1971 N, 2479 26,782 +8,174 +43 93 14,148 12,634
354 Phaltan Satara 1901 9,512 4,670 4,842
(MAHARASHTRA) 1911 4,987 -4,525 -4757 2,535 2,452 1921 8,929 +3,942 +7905 4,468 4,461 1931 9,596 +667 +747 4,850 4,746 1941 13,523 +3,927 +4092 7,065 6,458 1951 12,142 -1,381 ~IO 21 6,297 5,845 1961 M. 7853 19,003 +6,861 +5651 10,149 8,854 1971 M. 1062 26,774 +7,771 +4089 14,291 12,483
355 ·Malon! Flrozpur 1961 MC. 1 03 20,774 11,333 9,441
(PUNJAB) 1971 Me. I 04 26,746 +5,972 +28 75 14,243 12,503
356 Chmtamam Kolar 1901 2,430 1,189 1,241 (MYSORE) 1911 2,570 +140 +576 1,262 1,308
1921 6,161 +3,591 + 139 73 3,114 3~47 1931 4,985 -1,176 -1909 2,546 2, 39 1941 9,292 +4,307 +8640 4,750 4,542 1951 14,411 +5,119 +5509 7,388 7,023 1961 M. 11 14 19,644 +5,233 +3631 10,381 9263 1971 M. 3 23 26,684 +7,040 +3584 13,999 12,685
357 TblTUvalla Alleppey 1911 7,969 +4,04i
4,268 3,701 (KERALA) 1921 12,010 +5071 6,292 5,718
1931 14,489 +2,479 +2064 7,458 7,031 1941 18,002 +3,513 +2425 9,015 8,987 1951 20,709 +2,707 +1504 10,212 10,497 1961 M 1448 24,242 +3,533 +1706 11,750 12,492 1971 M. 1447 26,683 +2,441 +1007 12,912 13,771
358 Chmnarnanur Madural 1921 11,812 5,883 5,929
(TAMIL NADU) 1931 13,265 +1,453 +12 30 6,531 6,734 1941 14,480 +1,215 +916 7,260 7,220 1951 18,914 +4,434 +3062 9,480 9,434 1961 P. 23 31 20,586 +1,672 +884 10,321 10,205
1971 P. 1530 26,678 +6,092 +2959 13,364 13,314
359 RIIJhllta Jharandalli 1961 3248 23,346 14,153 9,193
urban aggJomera- Durg 1971 23 89 26,657 + 3,311 +1418 14,IIS 12,542
bon (MADHYA PRADESH)
·(1) RaJhara 1961 32 48 23,346 14,153 9,193
lbl.rand"U 1971 NM 23 73 26,119 +2,773 +11 88 13,822 12,297
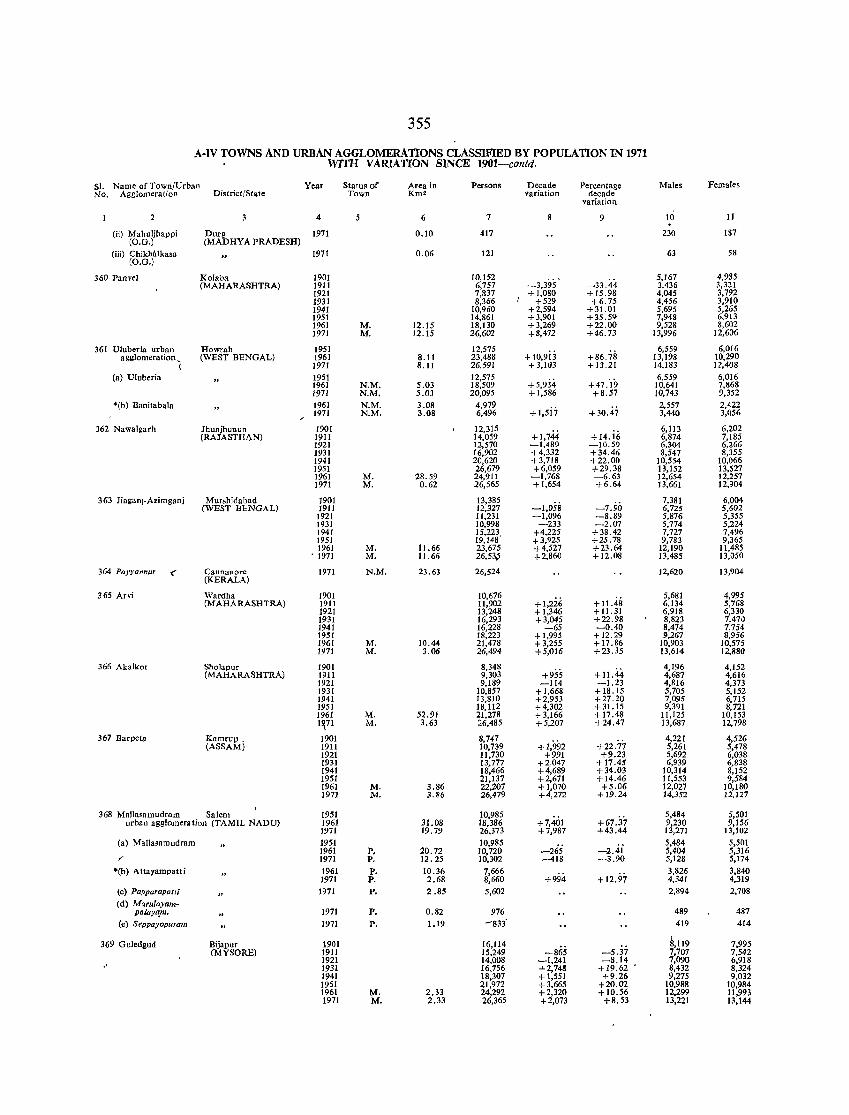
355
A-IV TOWNS AND URBAN AGGLOMERATIONS CLASSIFIED BY POPULA nON IN 1971 \\TI'H VARIATION SINCE 1901-contd.
SI. Name of Town/Urban Year Status of Area in Persons Decade Percentage Males Females No. Agglomeration District/State Town Km2 variation decade
variation
2 4 5 6 7 9 10 J1
(ii) Mahuljhappi (O.G.)
Durg (MADHYA PRADESH)
1971 0.10 417 230 187
(iii) Chikhltlkasa 1971 0.06 121 63 58 (O.G.)
360 Pan vel Kolaba 1901 10,152 ~3,395'
5,167 4,985 (MAHARASHTRA) 1911 6,757 -33.44 3,436 3,321
1921 7,837 +1.080 +15.98 4,045 3,792 1931 8,366 +529 +6.75 4,456 3,910 1941 10,960 +2,594 +31.01 5,695 5,265 1951 14,861 +3,901 +35.59 7,948 6,913 1961 M. 12.15 18,130 +3,269 +22.00 9,528 8,602 1971 M. 12.15 26,602 +8,472 +46.73 13,996 12,606
361 Uluberia urban Howrah 1951 12,575 + 10,9ij +86.78
6,559 6,016 agglomeration ~ (WEST BENGAL) 1961 8.11 23,488 13,198 10,290
( 1971 8.11 26,591 +3,103 + 13.21 14,183 12,408
(a) Uluberia 1951 12,575 +5,934 +47.'19
6,559 6,016 1961 N.M. 5.03 18,509 10,641 7,868 1971 N.M. 5.03 20,095 +1,586 +8.57 10,743 9,352
*(b) Banitabala 1961 N.M. 3.08 4,979 +I,5i7 +30.47
2,557 2,422 1971 N.M. 3.08 6,496 3,440 3,056
362 Nawalgarh Jhunjhunun 1901 12,315 +1,744
6,113 6,202 (RAJASTHAN) 1911 14,059 +14.16 6,874 7,185
1921 12,570 -1,489 -10.59 6,304 6,266 1931 16,902 +4,332 +34.46 8,547 8,355 1941 20,620 +3,718 +22.00 10,554 10,066 1951 26,679 +6,059 +29.38 13,152 13,527 1961 M. 28.59 24,911 -1.768 -6.63 12,654 12,257 1971 M. 0.62 26,565 +1,654 +6.64 13,661 12,904
363 JiaganJ-Azimganj MUfbhidabad 1901 13,385 -1,058 -7.90
7,381 6,004 (WEST BENGAL) 1911 12,327 6,725 5,602
1921 11,231 -1,096 -8.89 5,876 5,355 1931 10,998 -233 -2.07 5,774 5,224 1941 15,223. +4,225 +38.42 7,727 7,496 1951 19,148 +3,925 +25.78 9,783 9,365 1961 M. 11.66 23,675 +4,527 +23.64 12,190 11,485
. 1971 M. 11.66 26,53,5 +2,860 + 12.08 13,485 13,050
364 Pay)'annur < Cannan ore 1971 (KERALA)
N.M. 23.63 26,524 12,620 13,904
365 Arvi Wardha 1901 10,676 + 1,226
5.681 4,995 (MAHARASHTRA) 1911 11,902 + 11.48 6,134 5.768
1921 13,248 + 1.346 +11.31 6,918 6,330 1931 16,293 +3,045 +22.98 8,823 7,470 1941 16,228 -65 -0.40 8,474 7,754 1951 18,223 + 1,995 +12.29 9,267 8,956 1961 M. 10.44 21,478 +3,255 +17.86 10,903 10,575 1971 M. 3.06 26,494 +5,016 +23.35 13,614 12,880
366 Akalkot Sholapur 1901 8,348 +955 + 11.44
4,196 4,152 (MAHARASHTRA) 1911 9,303 4,687 4,616
1921 9,189 -114 -1.23 4,816 4,373 1931 10.857 +1,668 +18.15 5,705 5,152 1941 13,810 +2,953 +27.20 7,095 6,715 1951 18,112 +4,302 +31.15 9,391 8,721 1961 M. 52.91 21.278 +3,166 +17.48 11,125 10,153 1~71 M. 3.63 26,485 +5,207 +24.47 13,687 12,798
367 Barpeta Kamrup. 1901 8,747 +1,992
4,221 4,526 (ASSAM) 1911 10,739 +22.77 5,261 5,478
1921 11,730 +991 +9.23 5,692 6,038 1931 13,777 +2,047 + 17.45 6,939 6,838 1941 18,466 +4,689 +34.03 10,314 8,152 1951 21,137 +2.671 +14.46 11,553 9,584 1961 M. 3.86 22.207 +1,070 +5.06 12,027 10.180 1971 M. 3.86 26,479 +4,272 +19.24 14,352 12,127
368 MaUasamudram Salem 1951 10.985 +7,401 +67.37
5.484 5,501 urban agglomeration (TAMIL NADU) 1961 31.08 18,386 9,230 9,156
1971 19.79 26.373 +7,987 +43.44 13,271 13,102
(a) Mallasamudram 1951 10,985 5.484 5,501 1961 P. 20.72 10,720 -265 -2.41 5,404 5,316 ,,- 1971 P. 12.25 10,302 -418 -3.90 5,128 5,174
·Cb) 1\ ttayampatti 1961 P. 10.36 7,666 +994 + 12.97
3,826 3,840 1971 P. 2.68 8,660 4,341 4,319
(c) Papparapatti 1971 P. 2.85 5,602 2,894 2,708
(d) Marula),am-palaya.m• 1971 P. 0.82 976 489 487
(e) Seppayopuram 1971 P. 1.19 -833' 419 414
369 Guledgud Bijapur 1901 16,114 -5.37
8,119 7.995 (MYSORE) 1911 15.249 -865 7,707 7,542
1921 14.008 -1,241 -8.14 7,091) 6,918 1931 16,756 +2,74S +19.62 8,432 8,324 1941 18,307 + 1,551 +9.26 9,275 9,032 1951 21,972 +3,665 +20.02 10,988 10,984 1961 M. 2.33 24,292 +2,320 +10.56 12,299 11,993 1971 M. 2.33 26,365 +2,073 +8.53 13,221 13,144
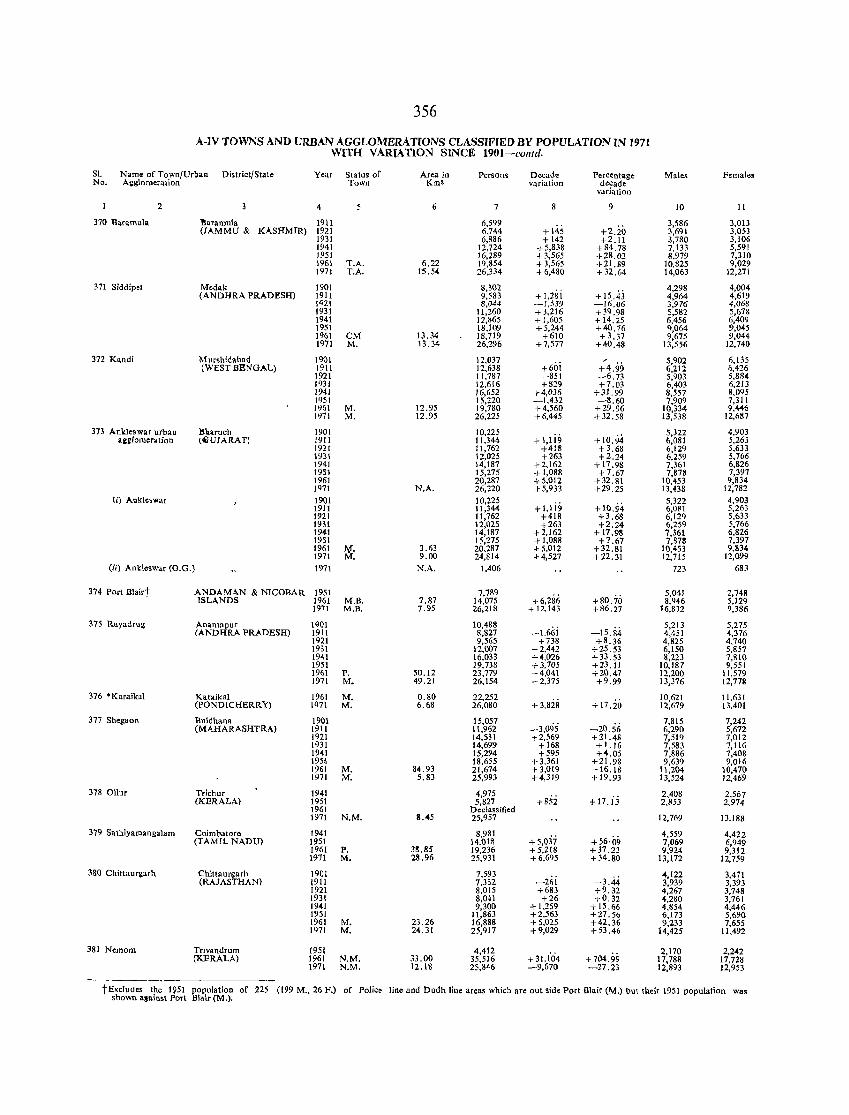
356
A-IV TOWNS AND URBAN AGGLOMERA TrONS CLASSIFIED BY POPULATlON IN 1971 WITH VARTATIO~ SINCE 1901-colltd.
S1. Name of Town/Urban District/State Year Status of Area in Persons Decade Percentage Males Femal •• No. Aj,\glomeration Town Km2 variation decade
variation
2 4 6 7 8 9 10 II
370 Baramula ~.ramula 1911 6,599 + 145 +2.20
3,586 3,013 (JAMMU & KASHMIR) 1921 6,744 3,691 3,053
1931 6,886 + 142 +2.11 3,780 3,106 1941 12,724 +5,838 +84.78 7,133 5,591 1951 16,289 +3,565 +28.02 8,979 7,310 1961 T.A. 6.22 19,854 +3,565 +21.89 10,825 9,029 1971 T.A. 1'5.54 26.334 +6,480 +32.64 14,063 12,271
371 Siddipet Medak 1901 8,302 + 1,2Si + 15.43
4,298 4,004 (ANDHRA PRADESH) 1911 9,583 4,964 4,619
!qZ! 8,044 -1,539 -16.06 3,976 4,068 1931 11,260 +3,216 +:!Q.98 5,582 5,61& 1941 12,865 +1,605 + 14.25 6,456 6,409 1951 18,109 + 5,244 +40.16 9,064 9,045 1961 eM 13.34 18,719 +610 +3.37 9,675 9,044 1971 M. 13.34 26,296 +7,577 +40.48 13,556 12,740
372 Kandi Murshidabad 1901 12,037 +6oi +4.99
5,902 6,135 (WEST BENGAL) 1911 12,638 6,212 6,426
1921 11,787 -851 -6.73 5,903 5,884 1931 12,616 +829 +1.03 6,403 6,213 1941 16,652 +4,036 +31.99 8,557 8,095 I'lSI 15,220 -1,432 -8.60 7,909 7,31l 1961 M. 12.95 19,780 +4,560 +29.96 10,334 9,446 1971 M. 12.95 26,225 +6,445 +32.58 13,538 12,687
373 Ankleswar urban ~b.aruch 1901 10,225 +I,lici +10.94
5,322 4,903 allltlolller~tion tlitUJARAT) 1911 11,344 6,081 5,263
1921 11,762 +418 +3.68 6,129 5,633 1931 12,025 +263 +2.24 6,259 5,766 1941 14,187 +2,162 + 17 .98 7,361 6,826 1951 15,275 + 1,088 +7.67 7,878 7,391 1%1 20,287 +5,012 +32.81 10,453 9,834 1971 N.A. 26,220 + 5,933 +29.25 13,438 12,782
(i) Ankleswar 1901 10,225 +I,li9 + 10.94
5,322 4,903 1911 11,344 6,081 5,263 1921 11,762 +418 +3.68 6,129 5,633 1931 12,025 +263 +2.24 6,259 5,766 1941 14,187 +2,162 +17.98 7,361 6,826 1951 15,275 + 1,088 +7.67 7,87! 7,397 1961 !\f. 3.63 20,287 + 5,012 +32.81 10,453 9,834 1971 M. 9.00 24,814 +4,527 +22.31 12,715 12,099
eii) Ankleswar (O.G.) 1971 :-<.A. ].406 723 683
374 Port Blairt ANDAMAN & NICOBAR 1%1 7,71',9 -;-6,2S6 +80.70
5,041 2,748 ISLANDS 1961 M.B. 7.87 14.075 8,946 5,129
1971 M.B. 7.95 26,218 + 12,143 +86.27 16,832 9,386
375 Rayadrult Anantapur 1901 10,488 -1,66i -15.84
5,213 5,275 (ANDHRA PRADESH) 1911 8,827 4,451 4,376
1921 9,565 +738 +8.36 4,825 4,740 1931 12,007 +2,442 +25.53 6,150 5,851 1941 16,033 +4,026 +33.53 8,223 7,810 1951 19,738 +3,705 +23.11 10,187 9,551 1961 P. 50.12 23,779 +4,041 +20.47 n,200 11,579 1971 M. 49.21 26,154 +2,375 +9.99 13,376 12,771
376 *Karaikal Karaikal 1961 M. 0.80 22,252 +3,82S + 17.20
10,621 11,631 (pONo[CHERRy) 1<l71 M. 6.68 26,080 12,679 13,401
377 Shegaon lluldhana 1901 15,057 -3,095 -20.56
7,815 1,242 (MAHARASHTRA) 1911 11,962 6,290 5,672
1921 14,531 +2,569 +21.48 7,511} 7,012 1931 14,699 +168 +1.16 7,583 7,116 1941 15,294 +595 +4.05 7,886 1,408 195~ 18,655 +3,361 +21.98 9,639 9,016 1961 M. 84.93 21,674 + 3,019 +16.18 11,204 10,470 1971 M. 5.83 25,993 +4,319 +19.93 13,524 12,469
378 Ollur Trichur 1941 4,975 +852 +17.ij
2.408 2,567 (KERALA) 1951 5,827 2,853 2,974
1961 Declassified 1971 N.M. 8.45 25,957 12,769 13,188
379 SathiyaIllangalam Coimbatore 1941 8,981 +5,037 +56'09
4,559 4,422 (TAM!L NADU) 1951 14.018 7,069 6,949
1961 P. 3~.85 19,236 +5,218 +37.22 9,924 9,312 \971 M. 28.96 25,931 +6,695 +34.80 13,\72 12,159
3&0 Chittaurgarh Chittauritarh 1901 7,593 -26i -3.44
<1,122 3,471 (RAJASTHAN) 1911 7,332 3,939 3,393
1921 8,015 +683 +9.32 4,267 3,748 1931 8,041 +26 +0.32 4,280 3,761 19<11 9,300 + 1,259 + 15.66 4,854 4,446 1951 11,863 +2,563 +27.56 6,173 5,690 1961 M. 23.26 16,888 + 5,025 +42.36 9,233 7,655 1971 M. 24.31 25,917 +9,029 +53.46 14,425 11,492
381 Nemom TtJvandrum 1951 4,412 +31.104 + 704.99
2,170 2,242 (KERALA) 1961 N.M. 33.00 35,516 17,788 17,728
1971 N.M. 12.18 25,846 --9,670 -27.23 12,893 12,953
t Excludes the 1951 population of 225 (199 M., 26 F.) of Polic. line and Dudh line areas which are out side Port Blair (M,) but their 1951 population was shown aaainst Port Blair (M.).
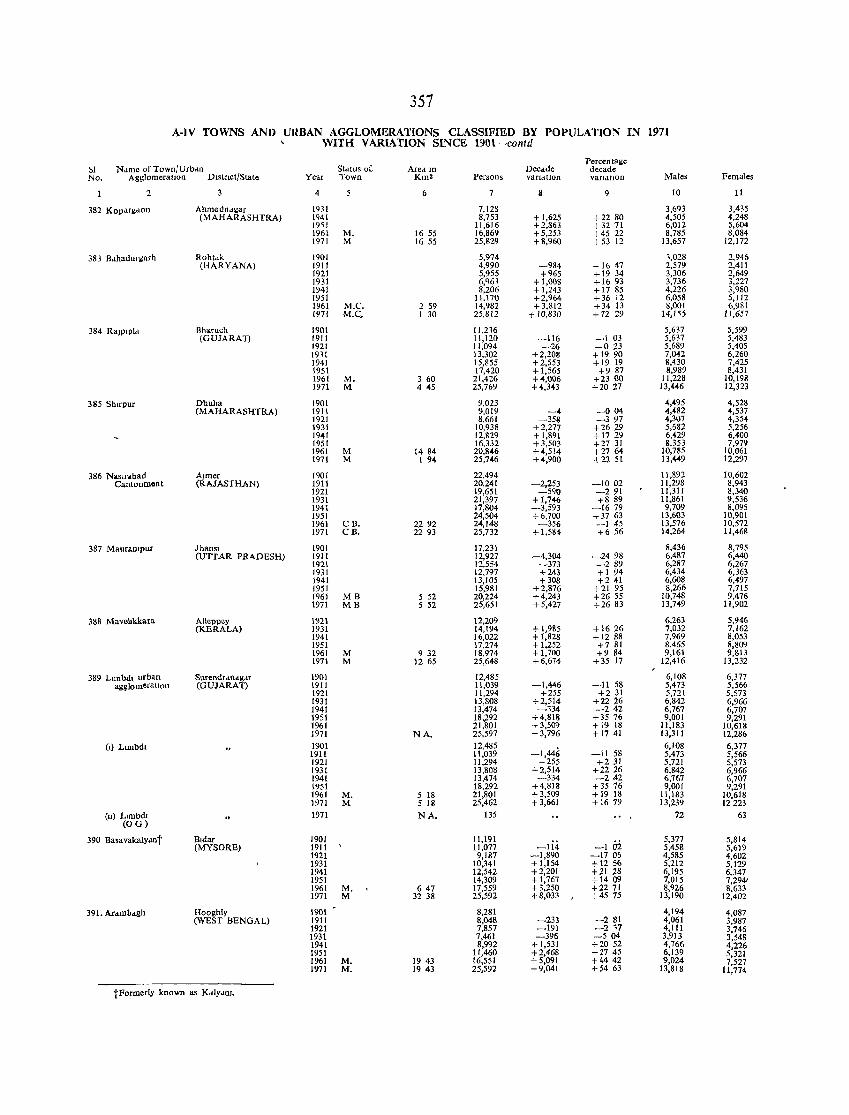
357
A-1V TOWNS AND URBAN AGGLOMERATIONS CLASSIFIED BY POPULATION IN 1971 WITH VARIATION SINCE 1901-contd
Name ofTown/Urbdn Percentage
M Status oC Area In Dec."ie decade No. AgglomeratIOn Dlslnct/State Year Town Kill" Persons VafJdtlOn vandtlon Males Females
2 3 6 7 2 9 10 11
382 KOpdrgdon Ahmedl1.lgar 1931 7,128 3,693 3,435 (MAHARASHTRA) 1941 8,753 + 1,625 +22 SO 4,505 4,248
]9,] 1l,616 + 2,863 +3271 6,012 5,604 1961 M. 16 55 16,869 +5,253 +45 22 8,785 8,084 1971 M 16 55 25,82'1 +8,960 +53 12 13,657 12,172
383 Bdhauurgarh Rohtdk 1901 5,974 1,028 2,946 (HARYANA) 1911 4,990 -984 -16 47 2,579 2,411
1921 5,955 +965 +19 34 3,306 2,649 1931 6,961 + 1,008 +1693 3,736 3,227 1941 8,206 + 1,243 + 17 85 4,226 3,980 1951 11,170 +2,964 +36 12 6,058 5,112 1961 M.e. 2 59 14,982 +3.812 +34 13 8,001 6,981 1971 M.e.. 1 30 25,812 + 10,830 +72 29 14,115 11,657
384 RaJPlpld Bh .. ruch 1901 11,216 5,637 5,599 (G UJA RAT) 1911 11,120 -116 -103 5,637 5,483
1921 11,094 -26 -023 5,689 5,405 1911 13,302 +2,208 +1990 7,042 6,260 1941 15,855 +2,553 + 19 19 8,430 7,425 1951 17,420 + 1,565 +9 87 8,989 8,431 1961 M. 3 60 21,426 +4,006 +2300 11,228 10,198 1971 M 4 045 25.769 +4,3043 +201-7 13,4046 12,323
385 Shlfpur Dhulta 1901 9,023 4,495 4,528 (MAHARASHTRA) 1911 9,019 -4 -004 4,481- 4,537
1921 8,661 -358 -397 4,307 4,354 1931 10,938 +2,277 +2629 5,682 5,256 1941 12,S29 +1,891 +17 29 6,429 6,400 1951 16,332 +3,503 +27 31 8.353 7,979 1961 M 1484 20,846 +4,514 +2764 10,785 10,661 1971 M 1 94 25,7046 +4,900 +23 SI 13,«9 12,297
386 NaSlr.bad Ajmer 190r 22,494 11,892 10,602 Cantonnlent (RAJASTHAN) 1911 20,241 -2,253 -1002 11,298 8,943
1921 19,651 -590 -291 11,311 8,340 1931 21,397 +1,746 +8 89 11,861 9,536 1941 17,804 -3,593 -1679 9,709 8,095 1951 24,504 +6,700 +37 63 13,603 10,901 1961 CB. 2292 24,148 -356 -145 13,576 10,572 1971 CB. 2293 25,732 +1,584 +6 56 14,264 11,468
387 Mauralllpur Jhansl 1901 17,231 8,436 8,795 (UTTAR PR'\DESH) 1911 12,927 -4,304 -2498 6,487 6,440
1921 12,554 -373 -289 6,287 6,267 1931 12,797 +243 +1 94 6,434 6,363 1941 13,105 +308 +241 6,608 6,497 1951 15,981 +2,876 +21 95 8,266 7,715 1961 MB 5 52 20,224 +4,243 +2655 10,748 9,476 1971 MB 5 52 25,651 +5,427 +2683 13,749 11,902
388 Mavehkkara AUeppey Inl 12,209 6,263 5,946 (KERALA) 1931 14,194 + 1,985 +1626 7,032 7,162
1941 16,022 +1,828 +1288 7,969 8,053 1951 17,274 +1,252 +781 8,465 8,809 1961 M 9 32 18,974 +1,700 +9 84 9,161 9,813 1971 M 12 65 25,648 +6,674 +35 17 12,416 13,232
389 Llmbdl urban Surendr dflclg.iT 1901 12,485 6,108 6,377 agglomeratIon (GUJARAT) 1911 11,039 -1,446 -1158 5,473 5,566
1921 11,294 +255 +2 31 5,721 5,573 1931 13,808 +2,514 +2226 6,842 6,966 1941 13,474 -134 -242 6,767 6,707 1951 18,,292 +4,818 +3516 9,001 9,291 1961 21,801 + 3,509 +1918 11,183 10,618 1971 NA. 25,597 +3,196 + 1741 13,311 12,286
el} Llmbdl 1901 12,485 -1,446
6,108 6,377 1911 11,039 -1158 5,473 5,566 1921 11,294 +255 +2 JI 5.721 5,573 1931 13,808 +2,514 +2226 6,842 6,966 1941 13,474 -334 -242 6.767 6,707 1951 18,292 +4,818 +35 16 9,001 9,291 1961 M. 5 18 21,801 + 3,509 +1918 11,183 10,618 1971 M 5 18 25,462 +3,661 +1619 13,239 12223
(n) Llmbdl (OG)
1971 NA. 135 .. , 72 63
390 BasavakalY.lnt Bldar 1901 11,191 -li4 -102
5,377 5,814 (MYSORE) 1911 11,077 5,458 5,619
1921 9,187 -1,890 -1706 4,585 4,602 1931 10,341 + 1,154 +1256 5,212 5,129 1941 12,542 +2,201 +21 28 6,195 6,347 1951 14,309 + 1,767 +1409 7,015 7,2941 1961 M. 647 11,559 +3,250 +2211 8,926 8,633 1971 M 32 38 25,592 +8,033 +45 75 13,190 12,402
391. Aumbdgh Hooghly \901 8,281 4,194 4,087 (WEST BENGAL) 1911 8,048 -233 -281 4,061 3,987
1921 7,857 -191 _217 4,111 3,746 1931 7,461 -396 -504 3.913 3,548 1941 8,992 + 1,531 +2052 4,766 4,226 1951 11,460 +2,468 +2745 6,139 5,321 1961 M. 1943 16.551 + 5,091 +44 42 9,024 7,527 1971 M. 1943 25,592 +9,041 +54 63 13,818 11,774
tFormerly known as KdlYdlll.
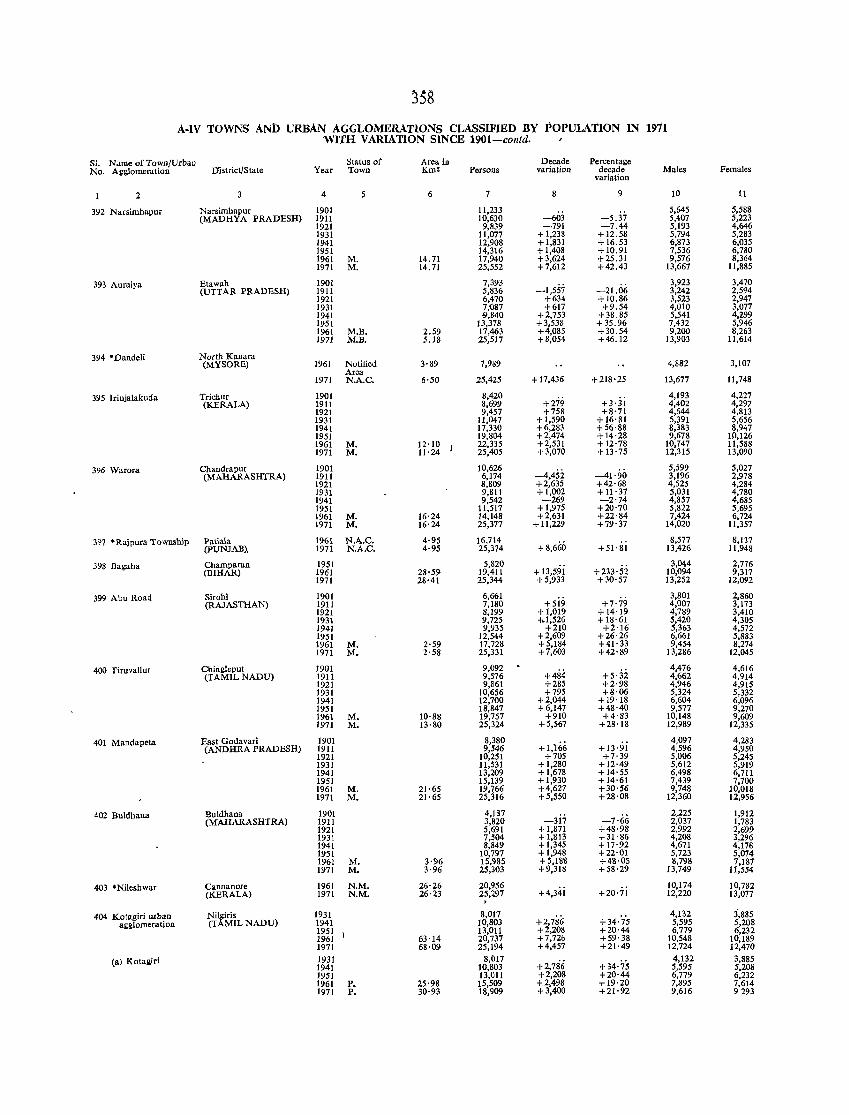
j58
A-IV TOWNS ANb URBAN AGGI,OMERATlONS CLASSIFIED BY POPULATION IN 1911 WITH VARIATION SINCE 1901-colltd.
S1. N"me of Town/Urban Status of Area in Decade Percentage No. Agglomeration District/State Year Town KmZ Persons variation decade Males Females
variation
2 4 5 6 7 8 9 10 11
392 N arsimhapur Narsimbapur 1901 11,233 5,645 5,588 (MADHYA PRADESH) 1911 10,630 -603 -5.37 5,407 5,223
1921 9,839 -791 -7.44 5,193 4,646 1931 11,077 + 1,238 + 12.58 5,794 5,283 1941 12,908 +1,831 + 16.53 6,873 6,035 1951 14,316 + 1,408 +10.91 7,536 6,780 1961 M. 14.71 17,940 + 3,624 +25.31 9,576 8,364 1971 M. 14.71 25,552 +7,612 +42.43 13,667 11,885
393 Auraiya Etawab 1901 7,393 -1,5,S7 -21.06
3,923 3,470 (UTTAR PRADESH) 1911 5,836 3,242 2,594
1921 6,470 +634 + 10.86 3,523 2,947 1931 7,'087 +617 +9.54 4,010 3,077 1941 -9,840 +2,753 + 38.85 5,541 4,:£99 1951 13,378 +3,538 +35.96 7,432 5,946 1961 M.B. 2.59 17,463 +4,085 + 30.54 9,200 8,263 1971 M.B. 5.18 25,517 +8,054 +46.12 13,903 11,614
394 * Dandeli North Kanara (MYSORE) 1961 Notified 3·89 7,989 4,882 3,107
Area 1971 N.A.C. 6,50 25,425 +17,436 +218'25 13,677 11,748
395 Irinjalakuda Trichur 1901 8,420 +279
4,193 4,227 (KERALA) 1911 8,699 +3'31 4,402 4,297
1921 9,457 +758 +8'71 4,644 4,813 1931 11,047 +1,590 +16'IH 5,391 5,656 1941 17,330 +6,283 +56·88 8,383 8,947 1951 19,804 +2,474 +14·28 9,678 10,126 1961 M. 12·10 22,335 +2,531 +12'78 10,747 11,588 1971 M. 11·24 25,405 +3,070 + 13'75 12,315 13,090
396 Warora Cbandrapur 1901 10,626 -4,452 -41'90
5,599 5,027 (MAHARASHTRA) 1911 6,174 3,196 2,978
1921 8,809 +2,635 +42,68 4,525 4,284 1931 9,811 + 1,002 + 11·37 5,031 4,780 1941 9,542 -269 -2'74 4,857 4,685 1951 11,517 + 1,975 +20'70 5,822 5,695 1961 M. 16'24 14,148 +2,631 +22'84 7,424 6,724 1971 M. 16·24 25,377 +11,229 +79·37 14,020 11,357
397 *Rajpura Township Patiala 1961 N.A.C. 4·95 16,714 +8,660
8,577 8,137 (pUNJAB), 1971 N.A.C. 4·95 25,374 +51'81 13,426 11,948
398 Bagaba Cbamparan 1951 5,820 +13,59i +233''si
3,044 2,776 (BIHAR) 1961 28·59 19,411 10,094 9,317
1971 28·41 25,344 +5,933 +30,57 13,252 12,092
399 Abu Road Sirobi 1901 6,661 +5i9 +7·79
3,801 2,860 (RAJASTHAN) 1911 7,180 4,007 3,173
1921 8,199 +1,019 +14'19 4,789 3,410 1931 9,725 ",1,526 +18·61 5,420 4,305 1941 9,935 +210 +2·16 5,363 4,572 1951 12,544 +2,609 +26·26 6,661 5,883 1961 M. 2·59 17,728 +5,184 +41·33 9,454 8,274 1971 M. 2·58 25,331 +7,603 +42·89 13,286 12,045
400 Tiruvallur Cbingleput 1901 9,092 +484 +5·32
4,476 4,616 (TAMIL NADU) 1911 9,576 4,662 4,914
1921 9,861 +285 +2·98 4,946 4,915 1931 10,656 +795 +8·06 5,324 5,332 1941 12,700 +2,044 +19'18 6,604 6,096 1951 18,847 +6,147 +48·40 9,577 9,270 1961 M. 10'88 19,757 +910 +4,83 10,148 9,609 1971 M. 13'80 25,324 +5,567 +28'18 12,989 12,335
401 Mandapeta East Godavari 1901 8,380 +1,166
4,097 4,283 (ANDHRA PRADESH) 1911 9,546 +13·91 4,596 4,950
1921 10,251 +705 +7·39 5,006 5,245 1931 11,531 + 1,280 +12·49 5,612 5,919 1941 13,209 + 1,678 +14'55 6,498 6,711 1951 15,139 + 1,930 + 14·61 7,439 7,700 1961 M. 21·65 19,766 +4,627 +30·56 9,748 10,018 1971 M. 21·65 25,316 +5,550 +28·08 12,360 12,956
402 Buldbana Buldhana 1901 4,137 2,225 1,912 (MAHARASHTRA) 1911 3,820 -317 -7·66 2,037 1,783
1921 5,691 + 1,871 +48·98 2,992 2,699 1931 7,504 + 1,813 +31'86 4,208 3,296 1941 8,849 +1,345 +17·92 4,671 4,178 1951 10,797 +1,948 +22·01 5,723 5,074 1961 M. 3·96 15,985 +5,188 +48·05 8,798 7,187 1971 M. 3·96 25,303 +9,318 +58·29 13,749 11,554
403 °Nilesbwar Cannanore 1961 N.M. 26·26 20,956 +4,34i +20·ii
10,174 10,782 (KERALA) 1971 N.M. 26·23 25,297 12,220 13,077
404 Kotagiri wban Nilgiris 1931 8,017 +2,786 +34'75
4,132 3,885 agglomeration (TAMIL NADU) 1941 10,803 5,595 5,208
1951 13,011 +2,208 +20·44 6,779 6,232 1961 63'14 20,737 +7,720 +59·38 10,548 10,189 1971 68·09 25,194 +4,457 +21·49 12,724 12,470
(a) Kotasiri 1931 8,017 +2,786 +34'75
4,132 3,885 1941 10,803 5,595 5,208 1951 13,011 +2,208 +20·44 6,779 6,232 1961 P. 25·98 15,509 +2,498 +19·20 7,895 7,614 1971 P. 30·93 18,909 +3,400 +21'92 9,616 9293
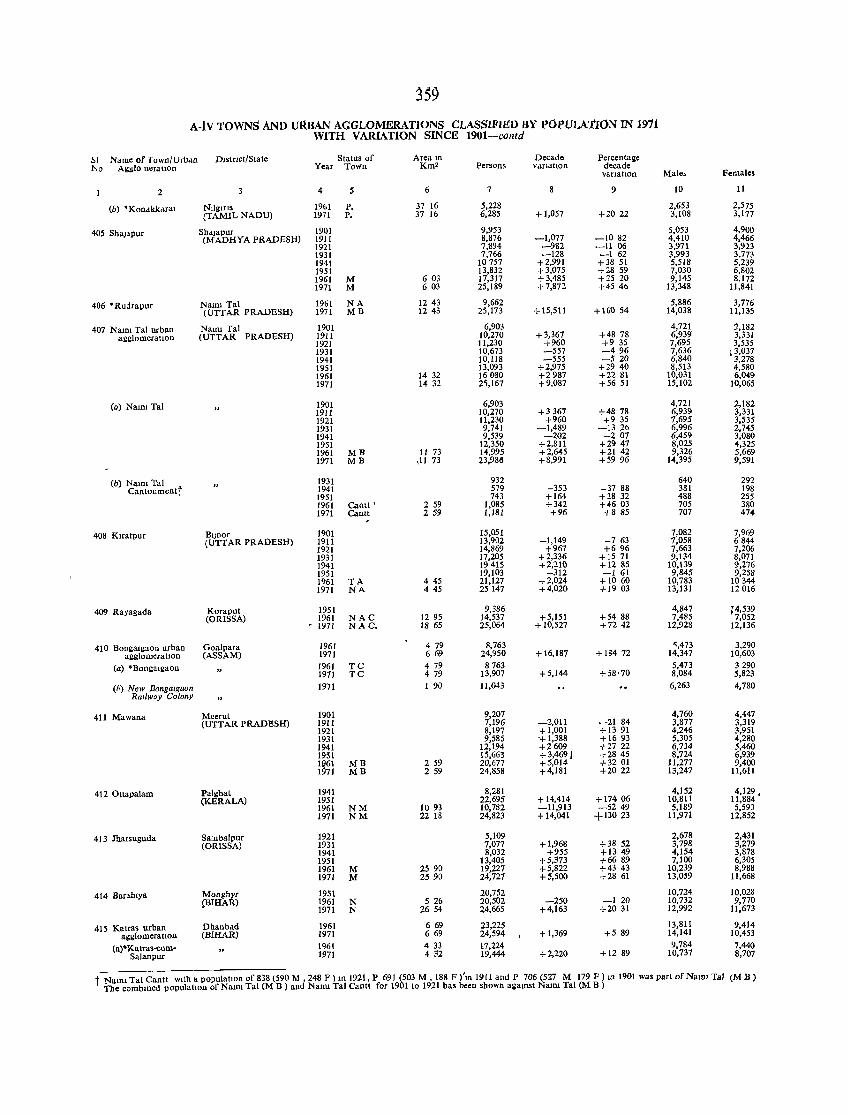
359
A-tv TOWNS AND URBAN AGGLOMERATIONS CLASSIFIED BY POPULATION IN 1911 WITH VARIATION SINCE 1901-contd
51 Name of Town/Urb<ln Dlstrlct/Sta te Status of Area In Decade Percenta!:. r-.o Agglo neratlOn Year Town Km' Persons Vdrlatlon decade
VarIatlOn Male, Fernale~
2 4 5 6 7 8 9 10 11
(b) *KonakkMal N,lgms 1961 P. 37 16 5,228 2,653 2,575 (TAMIL NADU) 1971 P. 37 16 6,285 +1,057 +2022 3,108 3,177
405 ShaJapur ShdjapUr 1901 9,953 5,053 4,900 (MADHYA PRADESH) 1911 8,876 -1,077 -1082 4,410 4,466
1921 7,894 -982 -11 06 3,971 3,92:) 1931 7,766 -128 -162 3.993 3,773 1941 10757 +2,991 +38 51 5,518 5,239 1951 13,832 +3,075 +28 59 7,030 6.802 1961 M 603 17,317 +3,485 +2520 9,145 8,172 1971 M 603 25,189 +7,872 +45 4b 13,348 11,841
406 'Rudrapur Naml Tal 1961 NA 1243 9,662 5,886 3,776 (UTTAR PRADESH) 1971 MB 1243 25,173 +15,511 + 160 54 14,038 11,135
407 Naml Tal urban Naml Tal 1901 6,903 4,721 2,182 agglomeratlon (UTTAR PRADESH) 1911 10,270 + 3,367 +48 78 6,939 3,331
1921 11,230 +960 +9 35 7,695 3,535 1931 10,673 -557 -496 7,636 .3,037 1941 10,118 -555 -520 6,840 3,278 1951 13,093 +2,975 +29 40 8,513 4,580 1961 14 32 16080 +2987 +2281 10,031 6,049 1971 14 32 2~,167 +9,087 +56 51 15,102 10,065
(a) Naml Tal 1901 6,903 4,721 2,182 1911 10,270 +3367 +48 78 6,939 3,331 1921 11,230 +960 +9 35 7,695 3,535 1931 9,741 -1,489 -1320 6,996 2,745 1941 9,539 -202 -207 6,459 3,080 1951 12,350 +2,811 +2947 8,025 04,325 1961 MB 11 73 14,995 +2,645 +2142 9,326 5,669 1971 MB ,11 73 23,986 +8,991 +5996 14,395 9,591
(b) NalOl Tal 1931 932 640 292 Cantonmentt 1941 579 -353 -37 88 381 198
1951 743 +164 +28 32 488 255 1961 Cantt ' 2 59 1,085 +342 +4603 705 380 1971 Cantt 259 1,181 +96 +8 85 707 474
408 Klratpur BljnOr 1901 15,051 7,082 7,969 (UTTAR PRADESH) 1911 13,902 -1,149 -7 63 7,058 6844
1921 14,869 +967 +696 7,663 7,206 1931 17,205 +2,336 + 15 71 9,134 8,071 1941 19415 +2,210 + 1285 10,139 9,276 1951 19,103 -312 -161 9,845 9,258 1%1 TA 445 21,127 +2,024 + 1060 10,783 10344 1971 NA 445 25147 +4.020 +19 03 13,131 12016
409 Rayagada Koraput 1951 9,386 4,847 ;4,539 (ORISSA) 1961 NAC 1295 14,537 +5.151 +5488 7,485 7,052
1971 NAC. 18 65 25,064 + 10,527 +72 42 12,928 12,136
410 BODgalgaon urban Goalpara 1961 4 79 1',763 ',473 3,290 agglomeration (ASSAM) 1971 6 69 24,950 + 16,187 + 184 72 14,347 10,603
(a) 'Bongalgaon 1961 TC 4 79 8763 5,473 3290 1971 TC 479 13,907 +5,144 +58·70 8,084 5,823
(h) New Bongalgaon 1971 1 90 ll,043 6,263 4,780 Rallw,y Colony
411 Mawana Meerut 1901 9,207 4,760 4,447 (UTTAR PRADI!:SH) 1911 7,196 -2,011 -2184 3,877 3,319
1921 8,197 +1,001 +1391 4,246 3,951 1931 9,585 't 1,388 +1693 5,305 4,280 1941 12,194 +2609 +2722 6,734 5,460 1951 15,663 +3,469 j +2845 8,724 6,939 1~61 MB 259 20,677 +5,014 +3201 11,277 9,400 171 MB 259 24,858 +4,181 +2022 13,247 11,611
412 Ottapalam Palghat 1941 8,281 4,152 4,129, (KERALA) 1951 22,695 + 14,414 + 174 06 10,811 11,884
1961 NM 10 93 10,782 -11,913 -5249 5,189 5,593 1971 NM 22 18 24,823 + 14,041 +13023 11,971 12,852
413 Jharsugl1da Salubalpur 1921 5,109 2,678 2,431 (ORISSA) 1931 7,077 + 1,968 +38 52 3,798 3,279
1941 8,032 +955 +1349 4,154 3,878 1951 13,405 +5,373 +6689 7,100 6,305 1961 M 25 90 19,227 +5,822 +4343 10,239 8,988 1971 M 2590 24,727 +5,500 +28 61 13,059 11,668
414 Barablya Monghyr 1951 20,752 10,124 10,028 !J3IHAR) 1961 N 526 20,502 -250 -120 10,732 9,770
1971 N 2654 24,665 +4,163 +2031 12,992 11,673
415 Katras urban Dbanbad 1961 669 23,225 13,811 9,414 agglomeratIon (BIHAR) 1971 669 24,594 +1,369 +5 89 14,141 10,453
(a)*Katras·cnm- 1961 4 33 11,224 9,784 7,440 Salanpur 1971 432 19,444 +2,220 +1289 10,737 8,707
t Nallll Tal Cantt WIth a populatIOn of 838 (590 M , 248 F) m 1921, P 691 (503 M, 188 F )'m 1911 and P 706 (527 M 179 F) ill 1901 was part of NalUI Tal The combllled populahon of Naml Tal (M B ) and Nalru Tal Canlt for 1901 to 1921 bas been shown agamst Nalru Tal (M B )
(MB)
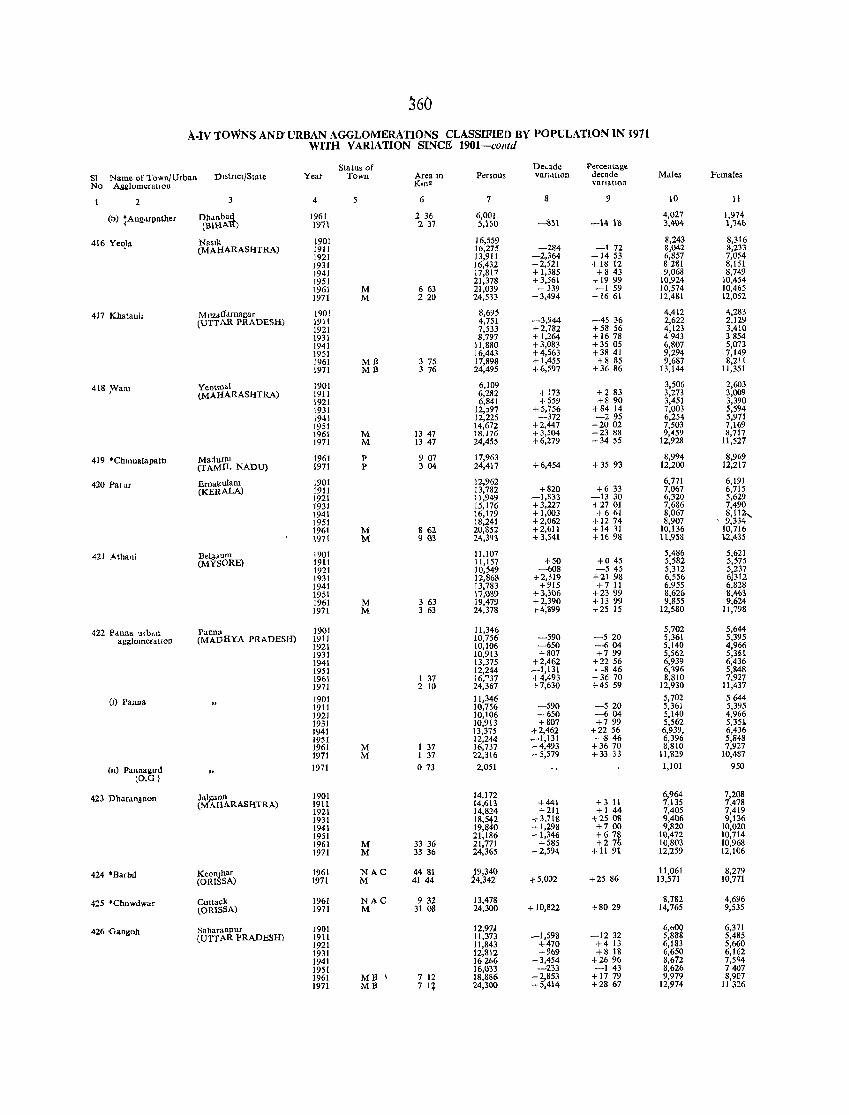
~60
A.tv tOWNS AND' URBAN AGGLOMERATIONS CLASSIFIED BY POPULATION IN 1911 WITH VARIATION SINCE 1901-cO/ltd
Status of De~ade Percentage SI Name of Town/Urban Dlstnct/Stale Year Town Area JO Persons varlatIOll decade Mdles Females No Ag~JomeratJon Km2 variation
2 3 4 5 6 7 8 9 10 11
(b) ~AngdfPather Dhdnba~ 1961 2 36 6,001 4,021 1,974 (SlHA 1971 :2 37 5,lS0 -%51 -\4 \% J,404 1,146
416 Yeo}a NaSIk 1901 16,559 8,243 8,316 (MAtfARASHTRA) J911 16,275 -284 -172 8,042 8,233
1921 13,911 -2,364 -1453 6,857 7,054 1931 16,432 +2,521 +18 12 8281 8,151 1941 17,817 + 1,385 +8 43 9,068 8,749 1951 21,378 +3,561 + 19 99 10,924 10,454 1961 M 6 63 21,039 - 339 -159 10,574 10,465 1971 M 220 24,513 +3,494 + 1661 12,481 12,052
417 Khataull Mu",tfdrnagar 1901 8,695 4,412 4,283 (UTTAR PRADESH) 1911 4,751 -3,944 -4536 2,622 2,129
1921 7,533 +2,182 +58 56 4,123 3,410 1931 8,797 + 1,264 + 1678 4943 3854 1941 11,880 +3,083 +35 OS 6,807 5,073 1951 16,443 +4,563 +3841 9,294 7,149 1961 Mil 3 75 17,898 + 1,455 +8 85 9,681 8,211 1971 MIl 3 76 24,495 +6,597 +3686 13,144 11,351
418 ~aOl Yeotll1al 1901 6,109 3,506 2,603 (MAtfARASHTRA) 1911 6,282 + 173 +2 83 3,273 3,009
1921 6,841 +559 +8 90 3,451 3,390 1931 12,J97 + 5,756 +84 14 7,003 5,594 1941 12,225 -372 -295 6,254 5,971 1951 14,672 +2,447 +2002 7,503 7,169 1961 M 13 47 18,176 + 3,504 +23 88 9,~59 8,717 1971 M 13 47 24,455 +6,279 +3455 12,928 11,527
419 'Chlllnalapatll Madural 1961 P 907 17,963 8,994 8,969 (TAMIL NADD) 1971 P 304 24,417 +6,454 +35 93 12,200 12,217
420 Parur Ernakulam 1901 12,962 6,771 6,191 (KERALA) 1911 13,782 +820 +6 33 7,067 6,715
1921 11,949 _1,833 -1330 6,320 5,629 1931 15,176 +3,227 +2701 7,686 7,490 1941 16,179 +1,003 +661 8,067 8,112, 1951 18,241 +2,062 +1274 8,907 - 9,334 1961 M 8 62 20,852 +2,611 +14 11 10,136 10,716 1971 M 903 24,3Q3 + 3,541 +1698 1l,958 ll,415
421 Athanl Belgaum 1901 11.107 5,486 5,621 (MYSORE) 1911 11,157 +50 +045 5,582 5,575
1921 10,549 -608 -545 5,312 ~lm 1931 12,868 +2,319 +21 98 6,556 1941 13,783 +915 +7 11 6,955 6,828 1951 11,0%9 -1-3,306 +2399 8,626 8,463 1961 M 3 63 19,479 +2,390 + 13 99 9,855 9,624 1971 M 3 63 24,378 +4,899 +25 15 12,580 11,798
422 P.mna urbdn Panna 1901 11,346 5,702 5,644 agglomeratIon (MADHYA PRADESH) 1911 10,756 -590 -520 5,361 5,395
1921 10,106 -650 -604 5,140 4,966 1931 10,913 +807 +799 5,562 5,351 1941 13,375 +2,462 +22 56 6,939 6,436 1951 12,244 _1,131 -846 6,196 5,848 1961 I 37 16,~37 +4,493 +36 70 8.810 7,927 1971 2 10 24,367 +7,630 +45 59 12,930 11,437
(I) Panna 1901 11,346 5,702 5644 1911 10,756 -590 -520 5,361 5,395 1921 10,106 -650 -604 5,140 4,966 1931 10,913 +807 +799 5,562 5,351 1941 13,375 +2,462 +2256 6,939, 6,436 1951 12,244 _1,131 -846 6,396 5,848 1961 M 1 37 16,737 +4,493 +3670 ~,810 7,927 1971 M I 37 22,316 + 5,579 +33 33 11,829 10,487
(II) Pannallord 1971 o 73 2,051 1,101 950 (O.G)
423 Dharanaaon J~aon 1901 14,172 6,964 7,208 ( AUARASHTRA) 1911 14.613 +441 +3 11 7,135 7,478
1921 14,824 +211 +144 7,405 7,419 1931 18,542 +3,718 +2508 9,406 9,136 1941 19,840 +1,298 +700 9,820 10,020 1951 21,186 + 1,346 + 67i 10,472 10,714 1961 M 33 36 21,771 +585 +27 10,803 10,968 1971 M 33 36 24,365 +2,594 + 11 91 12,259 12,106
424 °llar",1 Keonlhar 1961 NAC 44 81 19,340 11,061 8,279 (ORISSA) 1971 M 41 44 24,342 +5,002 +2586 13,571 10,771
425 'Chowdwar Cuttack 1961 NAC 9 32 13,478 8,782 4,696 (ORISSA) 1971 M 31 08 24,300 +10,822 +8029 14,765 9,535
426 GaDgoh Saharanpur 1901 12,9U 6,,,0~ 6,371 (UTTAR PRADESH) 1911 11,373 _1,598 -1232 5,88 5,485
1921 11,843 +470 +4 13 6,183 5,660 1931 12,812 +969 +8 18 6,650 6,162 1941 16266 +3,454 +2696 8,672 7,5Q4 1951 16,033 -233 -143 8,626 7407 1961 Mill 7 12 18,886 +2,853 +1779 9,979 8,907 1971 Mil 7q. 24,300 +5,414 +2867 12,974 11 316
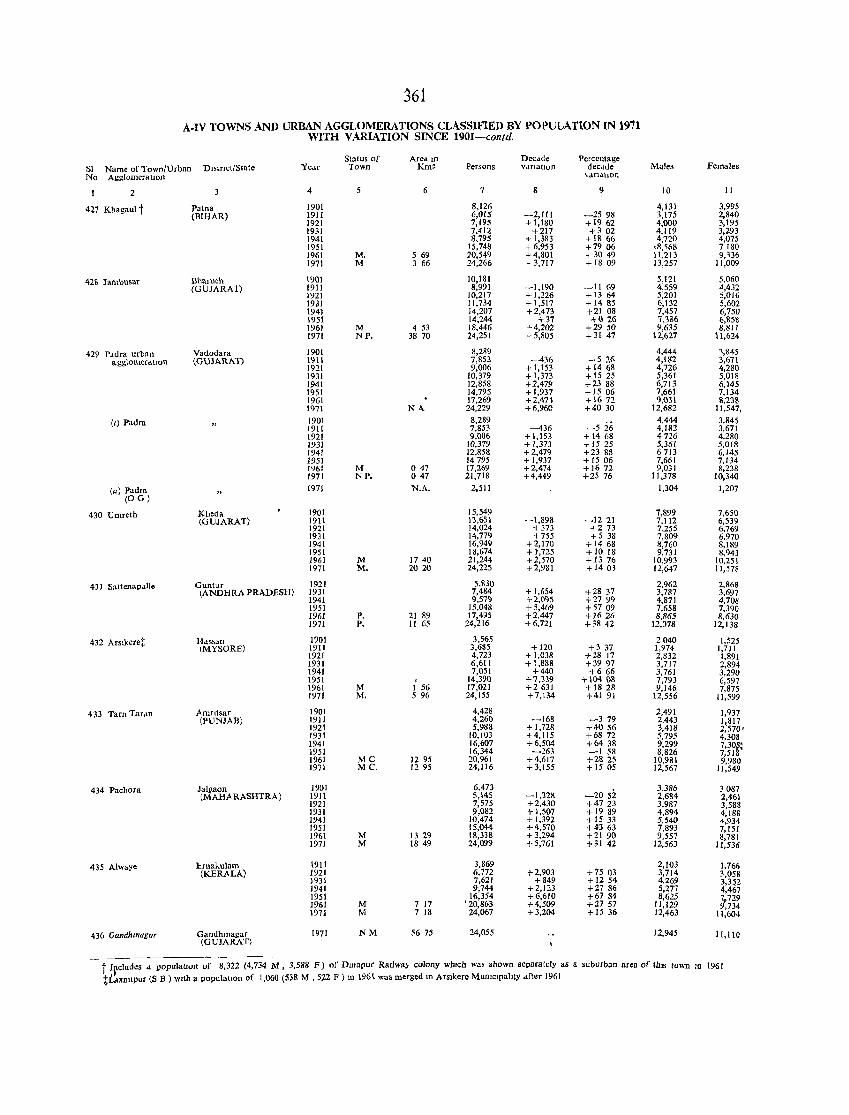
j61
A-IV TOWNS AND URBAN AGGLOMERATIONS CLASSIFIED BY POPULATION IN 1971 WITH VARIATION SINCE 1901-contd.
Status of AreoilO Decade Percentage SI Name of Town/Urban DI>lnct/State YeM Town Km' Persons vanatlon dec,lde Males Females No Agglomerallon v.lflithon
2 4 7 8 9 10 II
427 Khagaul t Palna 1901 8,126 4,131 3,995 (BIHAR) 1911 6,015 -2,111 -2598 3,175 2,840
1921 7,195 +1,180 +1962 4,000 3,195 1931 7,412 +217 +302 4,119 3,293 1941 8,795 .,.1,383 + 1866 4,720 4,075 1951 15,748 + 6.953 +7906 o8,'i68 7180 1961 M. 5 69 10,549 +4,801 -13049 11,213 9,136 1971 M 3 66 24,266 +3,717 + 1809 13,257 Il,009
42S lambusar Btarueh 1901 10,181 5,121 5,060 CGUJARAT) 1911 8,991 -1,190 -1169 4,559 4,432
1921 10,217 + 1,226 + 13 64 5,201 5,016 Inl 11,734 + 1,517 + 1485 6,132 5,602 1941 14,207 +2,473 +21 08 7,457 6,750 1951 14,244 +37 +(126 7,386 6,858 1961 M 4 53 18,446 +4,202 +2950 9,635 8,81 I 1971 NP. 38 70 24,251 + 5,805 + 31 47 12,627 11,624
429 Padra urban Vadodara 1901 8,2R9 4,444 1,845 agglmuerdtlon (OUlARAT) 1911 7,853 --436 -526 4,182 3,671
1921 9,006 + 1,153 + 1468 4,726 4,280 1931 10,379 + 1,373 + 15 25 5,361 5,018 1941 12,858 +2,479 +2388 6,713 6,145 1951 14,795 +1,937 + 1506 7,661 7,134 1961 17,269 +2,474 +1672 9,(l3t 3,23% 1971 N<\ 24,229 +6,960 +4030 12,682 11,547,
(,) Padra 1901 8,289 -526
4,444 3,845 1911 7,853 --436 4,182 3,671 1921 9.(106 + 1,153 + 1468 4726 4,280 1931 10,379 + 1,373 + 1525 5,361 5,018 1941 12,858 +2,479 +2388 6713 6,145 1951 14795 + 1,937 + 1506 7,661 7,134 1961 M 047 17,269 +2,474 +1672 9,031 8,238 1971 NP. 047 21,718 +4,449 +25 76 II ,378 1(\340
(u) Padra 1971 N.A. 2,511 1,304 1,207 (OG)
430 Umreth Kheda 1901 15,549 7,899 7,650 (GUJARAT) 1911 13,651 -1,898 -1221 7,112 6,539
1921 14,024 +373 +273 7,255 6,769 1931 14,779 +755 +5 38 7,809 6,970 1941 16,949 +2,170 + 1468 8,760 8,189 1951 18,674 + t,725 +1018 9,731 8,943 1961 M 1740 21,244 +2,570 + 1376 10,993 10,251 1971 M. 2020 24,225 +2,981 + 1403 12,647 11,578
431 Sattcl1apdlle Guntur 1921 5,830 2,962 2,868 (ANDI-lRA PRADESH) 1931 7,484 + 1,654 +28 37 3,787 3.697
1941 9,57<) +2,095 +2799 4,871 4,708 1951 15,048 +5,469 +5709 7,658 7,390 1961 P. 21 89 17,495 +2,447 +1626 8,865 8,630 1971 P. II 65 24,216 +6,721 +3842 12,078 12,138
432 Arslkeret 1-Idssan 1901 3,565 2040 1,525 (MYSORE) 1911 3,685 +120 +3 37 1,974 1,711
1921 4,723 + 1,038 +28 17 2,832 1,891 1931 6,611 + 1,888 +3997 3,717 2,894 1941 7,051 +440 +666 3,761 3,290 1951 I 14,39Q +7,3?'9 +104 D8 7,793 6,597 1961 M 1 56 17,021 +2631 + 1828 9,146 7,875 1971 M. 596 24,155 +7,134 +4191 12,556 11,599
433 Tarn Tar~n Amntsar 1901 4,428 2,491 1,937 (PUNJAB) 1911 4,260 -168 -379 2,443 1,817
1921 5,988 +1,728 +4056 3,418 2,570' 1931 10,103 +4,115 +6872 5,795 4,308 1941 16,607 +6,504 +64 38 9,299 7,30~: 1951 16,344 -263 -158 8,826 7,51 1961 Me 1295 20,961 +4,617 +2825 10,981 9.980 1971 Me. 1295 24,116 +3,155 +1505 12,567 11,549
434 Pachora Jalgaon 1901 6,473 -20si
3,386 3087 (MAHARASHTRA) 19!1 5,145 -1,328 2,684 2,461
1921 7,575 +2,430 +4723 3,987 3,588 1931 9,082 +1,507 +19 89 4,894 4,188 1941 10,474 + 1,392 +1533 5,540 4,934 1951 15,044 +4,570 +4363 7,893 7,151 1961 M 13 29 18,338 + 3,294 +2190 9,557 8,781 1971 M 18 49 24,099 +5,761 +31 42 12,563 11,536
435 Alwaye Ernak.ulam 1911 3,869 2,103 1,766 (KERALA) 1921 6,772 +2,903 +7503 3,714 3,058
1931 7,621 +849 +1254 4,269 3,3~2 1941 9,744 +2,123 +2786 5,277 4,467 1951 16,354 +6,610 +6784 8,625 7J.729 1961 M 7 17 ' 20,863 +4,509 +2757 11,129 ,734 1971 M 7 18 24,067 +3,204 +15 36 12,463 It,604
436 Gandhtnagar Gandhlflagar (GUJARAT)
1971 NM 56 75 24,055 12,945 11,110
t ~cludes d populatIOn of 8,322 /4,734 M, 3,588 F) of Dmapur Radwa~ colony wblcb was shown separately as a suburban area of tblS to"n 10 1961 :t.t.txDllPur (5 B ) wllb a populatIon of 1,060 (538 M , 522 F ) m 1961 waS merged III Arslkere Mumclpahty .tfter 1961
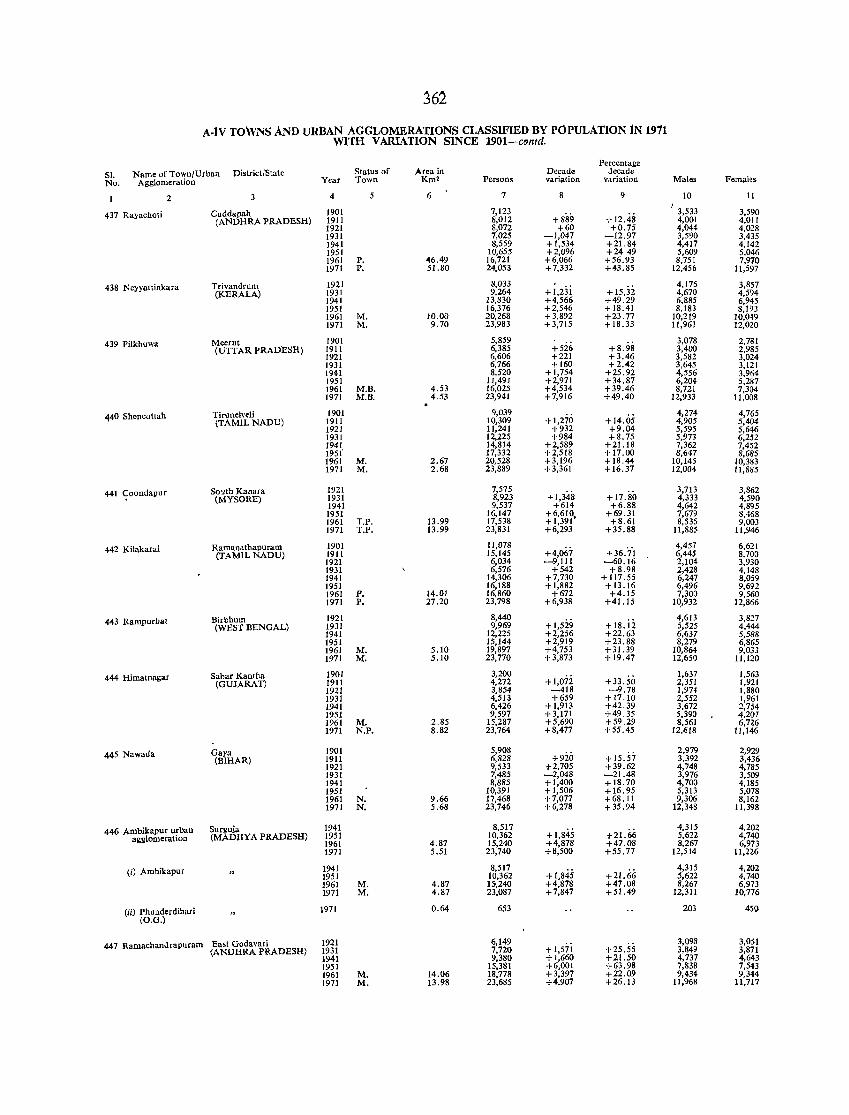
j62
A.tV TOWNS AND URBAN AGGLOMERATIONS CI,ASSlFIED BY POPULATION IN 1911 WITH VARIATION SINCE 1901-clJntd.
Percentage Status of Area in 51. Name of Town/Urban District;State Decade decade
No. Agglomeration Year Town Km2 Persons variation variation Males Females
2 3 4 5 6 7 9 10 It
437 Rayachoti Cuddapah 1901 7,123 +889 + 12.48
I 3,533 3,590 (ANDHRA PRADESH) 1911 8,012 4,001 4,011
1921 8,072 +60 +0,75 4,044 4,028 1931 7,025 -1,047 -12.97 3,590 3,435 1941 8,559 +1,534 +21.84 4,417 4,142 1951 10,655 +2,096 +2449 5,609 5,046 1961 P, -46.49 16,721 +6,066 +56.93 8,751 7,970 1971 P. 51.80 24,053 +7,332 +43.85 12,456 1t,597
438 Neyyatlinkara Trivandrunl 1921 8,033 +1,23i + 15,3i
4,176 3,857 (KERALA) 1931 9,264 4,670 4,594
1941 13,830 +4,566 +49.29 6,885 6,945 1951 16,376 +2,546 +18.41 8,183 8,193 1961 M. 10,00 20,268 +3,892 +23.77 10,219 10,OW 1971 M. 9.70 23,983 +3,715 + 18.33 11,963 12,020
439 Pilkhuwa Meerut 1901 5,859 3,078 2,781 (UTTAR PRADESH) 1911 6,385 +526 +8.98 3,400 2,985
1921 6,606 +221 +3.46 3,582 3,024 1931 6,766 +160 +2.42 3,645 3,121 1941 8,520 +1,754 +25.92 4,556 3,964 1951 11,491 +2,971 + 34. 87 6,204 5,287 1961 M.B. 4.53 16,025 +4,534 +39.46 8,721 7,304 1971 M.B. 4.53 23,941 +7,916 +49.40 12,933 11,008
440 Shencottah Tirunelveli 1901 9,039 +1,270 +14.05
4,274 4,765 (TAMIL NADU) 1911 10,309 4,905 5,404
1921 11,241 +932 +9.04 5,595 5,646 1931 12,225 +984 +8.75 5,973 6,252 1941 14,814 +2,589 +21.18 7,362 7,452 1951' 17,332 +2,518 +17.00 8,647 8,685 1961 M. 2.67 20,528 +3,196 +18,44 10,145 10,383 1971 M. 2.68 23,889 +3,361 +16.37 12,004 11,885
441 <;:oondapur SO:tth Kanara 1921 7,575 +1,348 +17.80
3,713 3,862 (MYSORE) 1931 8,923 4,333 4,590
1941 9,537 +614 +6.88 4,642 4,895 1951 16,147 +6,610, +69.31 7,679 8,468 1961 T.P. 13.99 17,538 +1,391 +8.61 8,535 9,003 1971 T.P. 13.99 23,831 +6,293 +35.88 11,885 11,946
442 Kilakarai Ramanathapuram 1901 11,078 +4,067 +36.7'1
4,457 6,621 (TAMIL NADU) 1911 15,145 6,445 8,700
1921 6,034 -9,111 -60.16 2,104 3,930 1931 6,576 +542 +8.98 2,428 4,148 1941 14,306 +7,730 + 117.55 6,247 8,059 1951 16,188 +1,882 + 13.16 6,496 9,692 1961 P. 14.01 16,860 +672 +4.15 7,300 9,560 1971 P. 27.20 23,798 +6,938 +41.15 10,932 12,866
443 Rampurhal Birbhum 1921 8,440 +1,529
4,613 3,827 (WEST BENGAL) 1931 9,969 + 18.12 5,525 4,444
1941 12,225 +2,256 +22.63 6,637 5,588 1951 15,144 +2,919 +23.88 8,279 6,865 1961 M. 5.10 19,897 +4,753 + 31. 39 10,864 9,033 1971 M. 5.10 23,770 +3,873 +19.47 12,650 11,120
444 Himatnagar Sabar Kantha 1901 3,200 +1,072 +33.50
1,637 1,563 (GUJARAT) 1911 4,272 2,351 1,921
1921 3,854 -418 -9.78 1,974 1,880 1931 4,513 +659 + 17.10 2,552 1,961 1941 6,426 +1,913 +42.39 3,672 2,754 1951 9,597 +3,171 +49.35 5,390 4,207 1961 M. 2.85 15,287 +5,690 +59.29 8,561 6,726 1971 N.P. 8.82 23,764 +8,477 +55.45 12,618 lI,I46
44S Nawada Gaya 1901 5,908 2,979 2,929 (BIHAR) 1911 6,828 +920 +15.57 3,392 3,436
1921 9,533 +2,705 +39.62 4,748 4,785 1931 7,485 -2,048 -21.48 3,976 3,509 1941 8,885 +1,400 + 18.70 4,700 4,185 1951 10,391 +1,506 +16.95 5,313 5,078 1961 N. 9.66 17,468 +7,077 +68.11 9,306 8,162 1971 N. 5.68 23,746 +6,278 + 35.94 12,348 11,398
446 Ambikapur urban Surguja 1941 8,517 +1,845 +21.66
4,315 4,202 agglomeration (MADHYA PRADESH) 1951 10,362 5,622 4,740
1961 4.87 15,240 +4,878 +47.08 8,267 6,973 1971 5.51 23,740 +8,500 +55.77 12,514 11,226
(il Ambikapur 1941 8,517 +1,845 +21.66
4,315 4,202 1951 10,362 5,622 4,740 1961 M. 4.87 15,240 +4,878 +47.08 8,267 6,973 1971 M. 4.87 23,087 +7,847 + 51.49 12,311 10,776
(iil Phunderdihari 1971 0.64 653 203 4S()
(O.G.)
447 RamachanJrapuram East Godavari 1921 6,149 3,098 3,051 (ANDHRA PRADESH) 1931 7,720 +1,571 +25.55 3,849 3,871
1941 9,380 +1,660 +21.50 4,737 4,643 1951 15,381 +6,001 +63.98 7,838 7,543 1961 M. 14.06 18,778 +3,397 +22.09 9,434 9,344 1971 M. 13.98 23,685 +4.907 +26.13 11,968 11,717
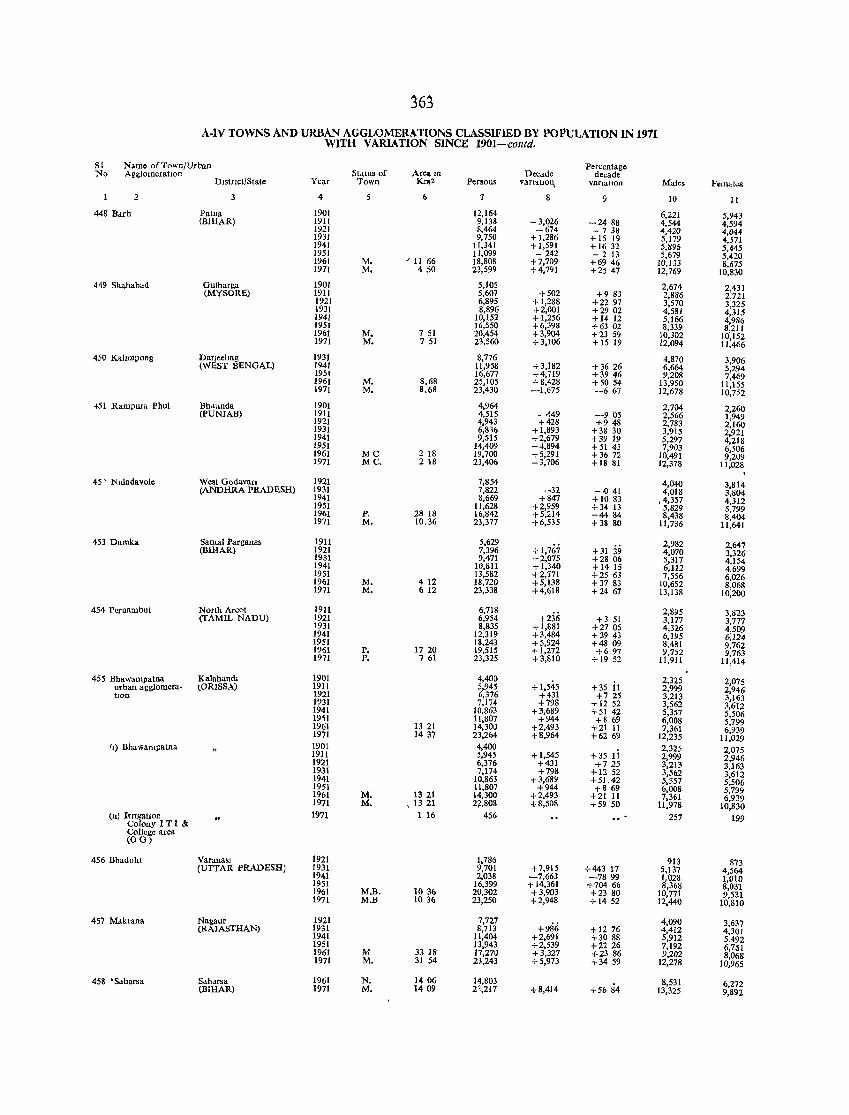
363
A-IV TOWNS AND URBAN AGGLOMERATIONS CLASSIFIED BY POPULATION IN 1911 WITH VARIATION SINCE 1901-contd.
SI Name ofTown/Url>an Percentage No A gglolUeratlOn Stdtus of Are. In Decade decade
D1str1c(/State Year Town KIlO' Persons VartatlOll, vafIatlon Male. Females
2 3 4 6 8 10 II
448 Barh PalUa 1901 12,164 6,221 5,943 (BIHAR) 1911 9,138 - 3,026 -2488 4,544 4,594
1921 8,464 -674 - 738 4,420 4,044 1931 9,750 + 1,286 + 15 19 5,179 4,571 1941 11,341 + 1,591 + 1632 5,896 5,445 1951 11,099 - 242 - 2 13 5,679 5,420 1961 M. / II 66 18,808 +7,709 +69 46 10,133 8,675 1971 M. 450 23,599 +4,791 +25 47 12,769 10,830
449 Shahabad Gulbarga 1901 5,105 2,674 2,431 (MYSORE) 1911 5,607 +502 +983 2,886 2,721 1921 6,895 + 1,288 +2297 3,570 3,325 1931 8,896 +2,001 +2902 4,581 4,315
1941 10,152 +1,256 +14 12 5,166 4,986 1951 16,550 +6,398 +6302 8,339 8,211 1961 M. 7 51 20,454 + 3,904 +23 59 10,302 10,152 1971 M. 751 23,560 +3,106 + 15 19 12,094 11.466
450 Kahmpong Darjee1mg 1931 8,776 4,870 3,906 (WEST BENGAL) 1941 11,958 +3,182 +3626 6,664 5,294 1951 16,677 +4,719 +3946 9,208 7,469 1961 M. 8.68 25,105 +8,428 +5054 13,950 11,155 1971 M. 8.68 23,430 -1,675 -667 12,678 10,752
+51 Rampura Phu\ Bhdtmda 1901 4,964 2,704 2,260 (PUNJAB) 1911 4,515 -449 -905 2,566 1,949
1921 4,943 +428 +948 2,783 2,160 1931 6,816 + 1,893 +38 30 3,915 2,921 1941 9,515 +2,679 +39 19 5,297 4,218 1951 14,409 +4,894 +51 43 7,903 6,506 1961 MC 2 18 19,700 +5,291 +3672 10,491 9,209 1971 MC. 2 18 23,406 + 3,706 +18 81 12,378 li,028
45) Nldadavol. West Godavan 1921 7,854 4,040 3,814 (ANDHRA PRADESH) 1931 7,822 -32 -041 4,018 3,804 1941 8,669 +847 + 10 83 ,4,357 4,312 1951 11,628 +2,959 +34 13 5,829 5,799 1961 P. 28 18 16,842 +5,214 +44 84 8,438 8,404 1971 M. 10.36 23,377 + 6,535 +38 80 11,736 11,641
453 Dumka Santal Parganas 1911 5,629 +1,767 +31 39 2,982 2,647 (BlBAR) 1921 7,396 4,070 3,326 1931 9,471 +2,075 +28 06 5,317 4,154 1941 10,811 +1,340 +1415 6,112 4,699 1951 13,582 +2,771 +2563 7,556 6,026 1961 M. 412 18,720 +5,138 +3783 10,652 8,068 1971 M. 612 23,338 +4,618 +2467 13,138 10,200
454 Pernambut North Arcot 1911 6,718 2,895 3,823 (TAMIL NADU) 1921 6,954 +236 +351 3,177 3,777 1931 8,835 +1,881 +2705 4,326 4,509 1941 12,319 +3,484 +3943 6,195 6,124 1951 18,243 +5,924 +48 09 8,481 9,762 1961 P. 1720 19,515 +1,272 +697 9,752 9,763 1971 P. 7 61 23,325 +3,810 + 19 52 11,911 11,414
455 Bhawampatna KIlIahand1 1901 4,400 + 1,545
2,325 2,075 urban agglomera- {ORISSA) 1911 5,945 + 35 li 2,999 2,946 tlOn 1921 6,376 +431 +725 3,213 3,163 1931 7,174 +798 + 12 52 3.562 3,612 1941 10,863 +3,689 +51 42 5,357 5,506
19~1 11,807 +944 +8 69 6,008 5,799 1961 13 21 14,300 +2,493 +21 11 7,361 6,939 1971 14 37 23,264 +8,964 +6269 12,235 ll,029 (1) Bhawampatna 1901 4,400
+35 Ii 2,325 2,075 1911 5,945 + 1,545 2,999 2,946 1921 6,376 +431 +725 3,213 3,163 1931 7,174 +798 +12 52 3,562 3,612 1941 10,863 +3,689 +51.42 5,357 5,506 1951 11,807 +944 +8 69 6,008 5,799 1961 M. 13 21 14,300 +2,493 +21 11 7,361 6,939 1971 M. , 13 21 2+,808 +8,508 +59 50 11,978 10,830
(ll) Ieng.tlon 1971 1 16 456 257 199 Colony I TI & College area (OG)
456 Bhadohl Varanasl 1921 1,786 913 873 (UTTAR PRADESH) 1931 9,701 +7,915 +443 17 5,137 4,564 1941 2,038 ~7,663 -7899 1,028 1,010 1951 16,399 +14,361 +7()4 66 8,368 8,031 1961 M.B. 1036 20,302 +3,903 +23 80 10,771 9,531
1971 M.B 1036 23,250 +2,948 + 14 52 12,440 10,810
457 Makrana Nagaur 1921 7,727 +986
4,090 3,637 (RAJASTHAN) 1931 8,713 +1276 4,412 4,301
1941 11,404 +2,691 +3088 5,912 5,492 1951 13,943 +2,539 +22 26 7,192 6,751 1961 M 33 18 17,270 +3,327 +23 86 9,202 8,068 1971 M. 31 54 23,243 +5,973 +3459 12,278 10,965
458 'Saharsa Sdhdrsa 1961 N. 1406 14,803 +56 84
8,531 6,272 (BIHAR) 1971 M. 1409 21,217 +8,414 13,325 9,892
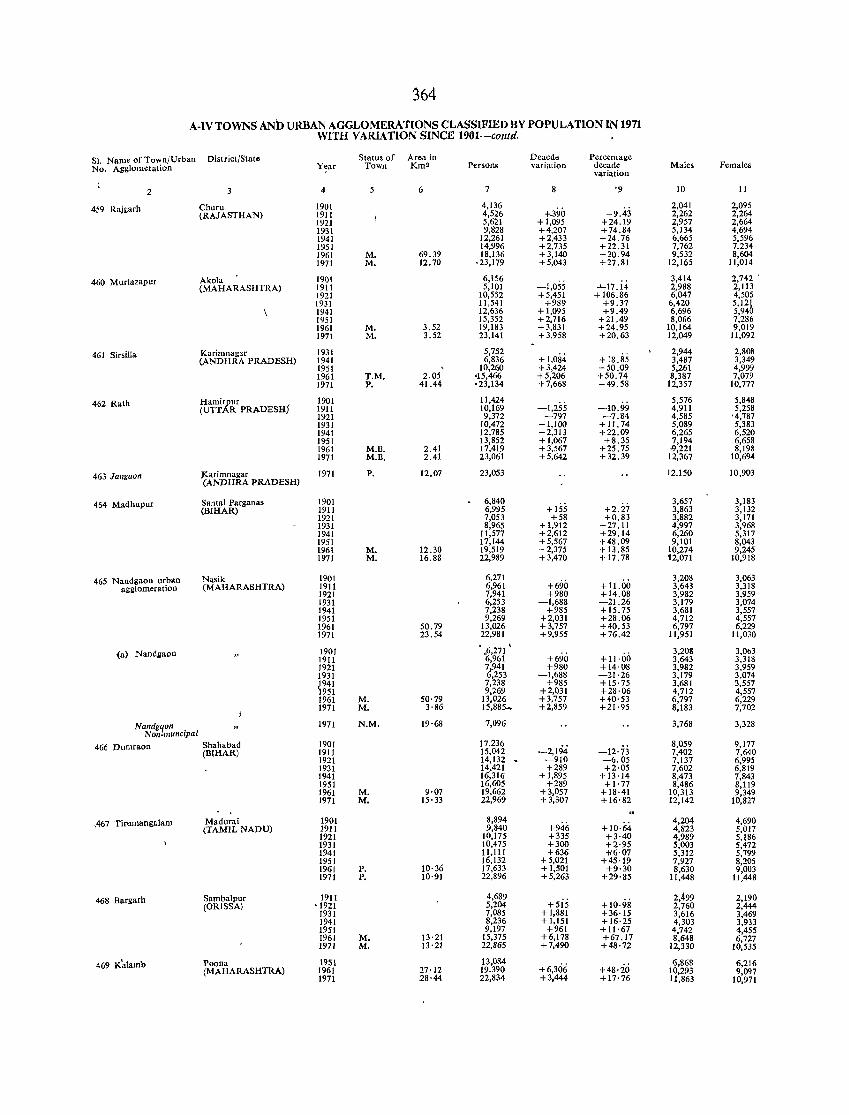
364
A-IV TOWNS AND URBAN AGGLOMERATIONS CLASSIFIED BY POPULATION IN 1971 WITH VARIATION SINCE 1901-contd.
S1. Name of Town/Urban District/Slate Status of Area in Deacde Percentage No. Agglomeration Year Town Km2 Persons variation decade Males Pemales
variation
2 3 4 5 6 7 8 '9 10 II
459 Ruj£arh Churu 1901 4,136 +-390 +9.43
2,041 2,095 (RAJASTHAN) 1911 4,526 2,262 2,264
1921 5,621 + 1,095 +24.19 2,957 2,664 1931 9,828 +4,207 +74.84 5,134 4,694 1941 12,261 +2,433 +24.76 6,665 5,596 1951 14,996 +2,735 +22.31 7,762 7,234 1961 M. 69.39 18,136 +3,140 +20.94 9,532 8,604 1971 M. 12.70 ,23,179 +5,043 +27.81 12,165 11,014
460 Murlazapur Akola 1901 6,156 -1,055
3,414 2,742 ' (MAHARASHTRA) 1911 5,101 -'-17.14 2,988 2,113
1921 10,552 +5,451 + 106.86 6,047 4,505 1931 11,541 +989 +9.37 6,420 5,12& 1941 12,636 + 1,095 +9.49 6,696 5,94 1951 15,352 +2,716 +21.49 8,066 7,286 1961 M. 3.52 19,183 +3,831 +24.95 10,164 9,019 1971 M. 3.52 23,141 +3,958 +20.63 12,049 11,092
461 Sirsilla Karimnagar 1931 5,752 + 1,084 + 18.85
2,944 2,808 (ANDHRA PRADESH) 1941 6,836 3,487 3,349
1951 10,260 +3,424 +50.09 5,261 4,999 1961 T.M. 2.05 '15,466 +5,206 +50.74 8,387 7,079 1971 P. 41.44 '23,134 +7,668 +49.58 12,357 10,777
462 Rath Hamirpur ( 1901 11,424 -1,255 -10.99
5,576 5,848 (UTTAR PRADESH) 1911 10,169 4,911 5,258
1921 9,372 -797 -7.84 4,585 '4,787 1931 10,472 +1,100 + 11. 74 5,089 5,383 1941 12,785 +2,313 +22.09 6,265 6,520 1951 13,852 + 1,067 +8.35 7,194 6,658 1961 M.B. 2.41 17,419 +3,567 +25.75 -9,221 8,198 1971 M.B. 2.41 23,061 +5,642 +32.39 12,367 10,694
463 Jangaon ,Karimnagar 1971 P. 12.07 23,053 12.150 10,903 (ANDHRA PRADESH)
464 Madhupur Santa1 Parganas 1901 6,840 3,657 3,183 (BIHAR) 1911 6,995 +155 +2.27 3,863 3,132
1921 7,053 +58 +0.83 3,882 3,171 1931 8,965 +1,912 +27.11 4,997 3,968 1941 11,577 +2,612 +29.14 6,260 5,317 1951 17,144 +5,567 +48.09 9,101 8,043 1961 M. 12.30 19,519 +2,375 + 13.85 10,274 9,245 1971 M. 16.88 22,989 + 3,470 + 17.78 12,071 10,918
465 Nandgaon urban Nasik 1901 6,271 +11.00
3,208 3,063 agglomeration (MAHARASHTRA) 1911 6,961 +690 3,643 3,318
1921 7,941 +980 +14.08 3,982 3.959 1931 6,253 -1,688 -21.26 3,179 3,074 1941 7,238 +985 +15.75 3,681 3,557 1951 9,269 +2,031 +28.06 4,712 4,557 1961 50.79 13,026 +3,757 +40.53 6,797 6,229 1971 23.54 22,981 +9,955 +76.42 11,951 11,030 . .
{a) Nandllapn 1901 ,6,271 + 11·00
3,208 3,003 1911 6,961 +690 3,643 3,318 1921 7,941 +980 +14·08 3,982 3,959 1931 6,253 -1,688 -21·26 3,179 3,074 {941 7,238 +985 + 15·75 3,681 9,557
951 9,269 +2,031 +28·06 4,712 4,557 1961 M. 50'79 13,026 +3,757 +40·53 6,797 6,229 1971 M. 3·86 15,8851 +2,859 +21·95 8,183 7,702
Nandgqon 1971 N.M. 19·68 7,096 3,768 3,328 Non-muncipal
466 Dumraon Shahabad 1901 17,236 -2,194 -12·73
8,059 9,177 (BIHAR) 1911 15,042 7,402 7,640
1921 14,132 . -910 -6.05 7,137 6,995 1931 14,421 +289 +2·05 7,602 6,819 1941 16,316 + 1,895 +13·14 8,473 7,843 1951 16,605 +289 +1·77 8,486 8,119 1961 M. 9·07 19,662 +3,057 +18·41 10,313 9,349 1971 M. 15'33 22,969 +3,307 +16·82 12,142 10,827
.467 Tirumangalam Madurai 1901 8,894 +946 +10·64
4,204 4,690 (TAMIL NADD) 1911 9,840 4,823 5,017
1921 10,175 +335 +3·40 4,989 5,186 1931 10,475 +300 +2·95 5,003 5,472 1941 ll,l11 +636 -116·07 5,312 5,799 1951 16,132 +5,021 +45·19 7,927 8,205 1961 P. 10·36 17,633 +1,501 +9·30 8,630 9,003 1971 P. 10·91 22,896 +5,263 +29·85 11,448 11,448
468 Bargarh Sarnbalpur 1911 4,689 +5is +10·98
2,499 2,190 (ORISSA) '1921 5,204 2,760 2,444
1931 7,085 + 1,881 +36·15 3,616 3,469 1941 8,236 + 1,151 +16·25 4,303 3,933 1951 9,197 +961 + 11·67 4,742 4,455 1961 M. 13·21 15,375 +6,178 +67.17 8,648 6,727 1971 M. 13·21 22,865 +7,490 +48·72 12,330 10,535
469 K'alamb Poona 1951 13,0&4 +6,306 +48·20
6,868 6,216 (MAHARASHTRA) 1961 27·12 19.390 10,293 9,097
1971 28·44 22,834 +3,444 +17·76 1l,863 10,971
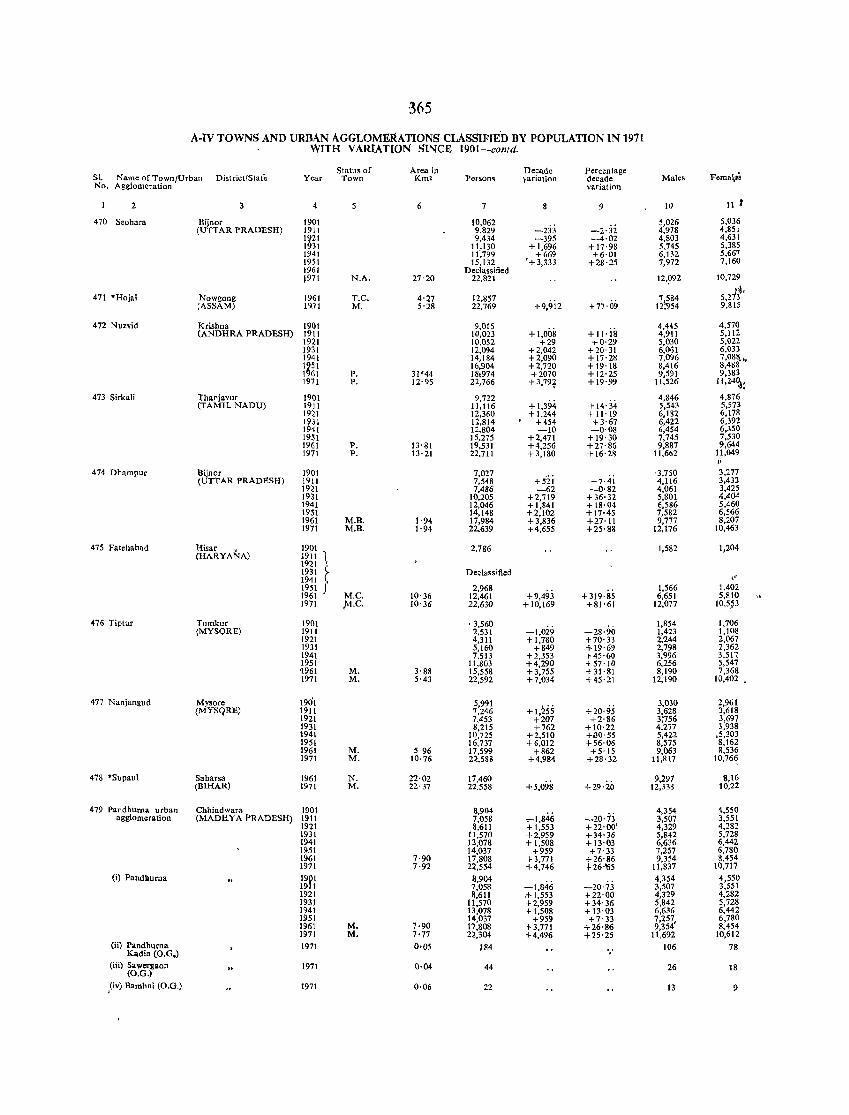
365
A-IV TOWNS AND URBAN AGGLOMERATIONS CLASSIFIED BY POPULATION IN 1971 WITH VARIATlON SINCE 1901-contd.
Status of Area in Decade Percentage Fema~ S1. Name of Town/Urban District/State Y04r Town Km. Persons variation decade Males
No. Agglomeration variation
2 4 6 7 9 10 11 1
470 Seobara Bijnor 1901 10,062 5,026 5,036 (UTTAR PRADESH) 1911 9,829 -233 -2·32 4,978 4,851
1§21 9,434 -395 -4·02 4,803 4,631 I 31 11,130 +1,696 + 17·98 5,745 5,385 1941 11,799 +669 +6·01 6,132 5,667 1951 15,132 '+ 3,333 +28·25 7,972 7,160 1961 Declassified ,971 N.A. 27·20 22,821 12,?92 10,729
in. 471 'Hojai Nowgong 1961 T.e. 4'27 12,857 +9.9i2
7584 5,2 3 (ASSAM) 1~71 M. 5'28 22,769 +77·09 12!954 9,815
472 Nuzvid Krishna 1901 9,015 4.445 4.570 (ANDHRA PRADESH) 19\1 10,023 +1,008 + 11·18 4,911 5,112
1921 10,052 +29 +0·29 5,030 5,022 1931 12,094 +2,042 +20·31 6,061 6,033 1941 14,184 +2,090 +17'28 7,096 ~:~~}" I~SI 16,904 +2,720 +19·18 8,416 I 61 P. 31'44 181974 +2070 +12·25 9,591 9,383 1971 P. 12·95 22,766 + 3,79t +19'99 11,526 1I,24~~
473 Sirkali Thanjavur 1901 9,722 +1,394
4,846 4,876 (TAMIL NADtJ) 1911 11,116 + 14·34 5,543 5,573
1921 12,360 +1,244 +11'19 6,182 6,178 1931 12,814 +454 +3·67 6,422 6,392 1941 12,804 -10 -0-08 6,454 6,350 1951 15,275 +2,471 +19·30 7,745 7,530 1961 P. 13'81 19,531 +4,256 +27·86 9,887 9,644 1971 P. 13-21 22,711 +3,180 +16·28 11,602 11,049
I'
474 Dhampur Bijnor 1901 7,027 +izi +7·4i
'3,750 3,277 (UTTAR PRADESH) 1911 7,548 4,lJ6 3,432
1nl 7,486 -62 -0·82 4,061 3,425 1931 10,205 +2,719 +36·32 5,801 4,404 1941 12,046 +1,841 + 18·04 6,586 5,460 1951 14,148 +2,102 +17·45 7,582 6,566 1961 M.B. 1'94 17,984 +3,836 +27'11 9,777 8,207 1971 M.B. 1'94 22,639 +4,655 +25·88 12,176 10,463
475 Fatehabad Hisar l~n J 2,786 1,582 1,204 (HARYANA)
1921 : 1931 )0- Declassified ", 1941 " 1951 ) 2,968
+9,493 + 319'85 1,566 1,402
1961 M.C. 10· 36 12,461 6,651 5,810 ., 1971 ,M.C. 10'36 22.630 +10,169 +81·61 12,077 10.5~3
476 Tiptur Tumkur 1901 , 3,560 -28·90
1,854 1,706 (MYSQRE) 1911 2,531 -1,029 1,423 1,108
1921 4.311 + 1,780 +70·33 2,244 2,067 1931 5,160 +849 +19·69 2,798 2,362 1941 7,513 +2,353 +45·60 3,996 3,517; 1951 11,803 +4,290 +57·10 6,256 5,547 '1961 M. 3'88 15,558 +3,755 +31·81 8,190 7,368 1971 M. 5'43 22,592 +7,034 +45·21 12,190 10,402
477 Nanjangud Mysore 1901 5,991 +1,255 +20·95
3,030 2,961 (MYSQRE) 1911 7,246 3,628 3,618
1921 7,453 +207 +2·86 3;756 3,697 1931 8,215 +762 +10·22 4,'277 3,938 1941 10.725 +2,510 +80'55 5,422 ,5,303 1951 16,737 +6,012 +56·06 8,575 8,162 1961 M. 5'96 17.599 +862 +5·15 9,063 8,536 1971 M. 10·76 22,58~ +4,984 +28·32 11,817 10,76~
478 'Supaul Saharsa 1961 N. 22'02 17,460 +5,098
9,297 8,16 (BIHAR) 1971 M, 22'37 22.558 +29·20 12,338 10,22
479 Pandburna urban Chhindwara 1901 8,904 .,-.1,846 -20'73
4,354 4,550 agglomeration (MADHYA PRADESH) 1911 7,058 3,507 3,551
1921 8,611 +1,553 +22'00' 4,329 4,282 1931 11,570 +2,959 +34·36 5,842 5,728 1941 13,078 + 1,508 +13'03 6,636 6,442 1951 14,037 +959 +7'33 7.257 6,780 1961 7·90 17,808 +3,771 +26·86 9,354 8,454 1971 7·92 22,554 +4,746 +26·'65 11,837 10,717
(i) PandlllUrna 19p1 8,904 -1,846 -20·73
4,354 4,550 19 1 7,058 3,S07 3,551 1921 8,611 '+1,553 +22·00 4,329 4,282 1931 11,570 +2,959 +34'36 5,842 5,728 1941 13,078 +1,508 +13·03 6,636 6,442 1951 14,037 +959 +7'33 7,257, 6,780 1961 M, 7·90 17,808 +3,771 +26·86 9,354 8,454 1971 M. 7'77 22,304 +4,496 +25'25 11,692 10,612
(ii) Pandhurna 1971 0·05 184 106 78 Kadia (O.G.)
(iii) Sawergaon (G.G.)
1971 0·04 44 26 18
, (iv) Bamhni (G.G.) 1971 0·06 22 13 9
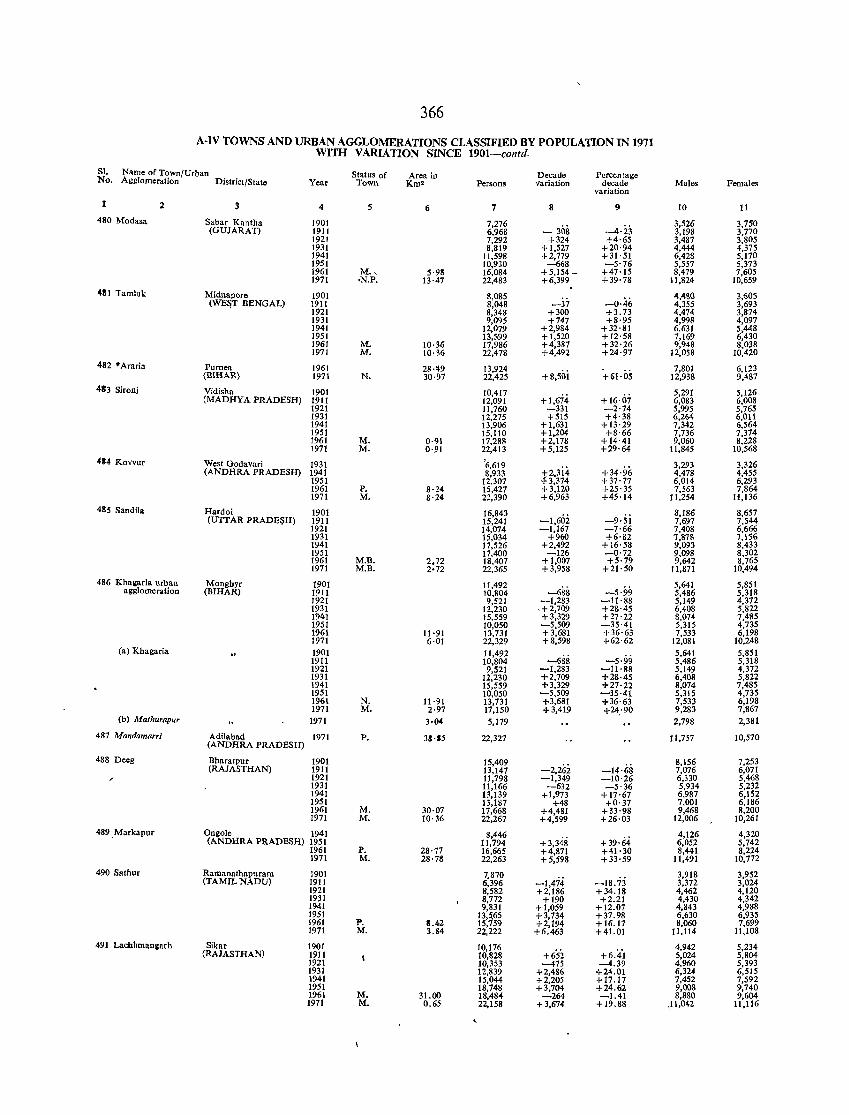
366
A-IV TOWNS AND URBAN AGGLOMERATIONS CLASSIFIED BY POPULATION IN 1971 WITH VARIATION SINCE 1901-cOfltd.
SI. Name of Town/Urban Status of Area iu Decade Percentage No. Agglomeration District/State Year Town Km" Persons variation decade Males Females
variation
1 2 3 4 5 6 7 8 9 10 11
480 Modasa Sabar Kantha 1901 7,276 - 308 -4·23
3,526 3,750 (OUJARAT) 1911 6,968 3,198 3,770
1921 7,292 +324 +4·65 3,487 3,805 1931 8,819 + 1,527 +20·94 4,444 4,375 1941 11,598 +2,779 +31·51 6,428 5,170 1951 10,930 -668 -5'76 5,557 5,373 1961 M" 5·98 16,084 +5,154_ +47·15 8,479 7,605 1971 ·N.P. 13·47 22,483 +6,399 + 39'78 11,824 10,659
481 Tamluk Midnapore 1901 8,085 -0·46
4,480 3,605 (WE~T BENGAL) 1911 8,048 -37 4,355 3,693
1921 8,348 +300 +3.73 4,474 3,874 1931 9,095 +747 +8·95 4,998 4,097 1941 12,079 +2,984 +32·81 6,631 5,448 1951 13,599 +1,520 +12·58 7,169 6,430 1961 M. 10·36 17,986 +4,387 +32'26 9,948 8,038 1971 M. 10·36 22,478 +4,492 +24·97 12,058 10,420
482 0Araria Purnea 1961 28·149 13,924 +8,50i +61·05
7,801 6,123 (BIHAR) 1971 N. 30·97 22,425 12,938 9,487
4113 Sironj Vidisha 1901 10,411 +1,674 +16·07
5,291 5,126 (MADHYA PRADESH) 1911 12,091 6,083 6,008
1921 11,160 -331 -2·74 5,995 5,765 1931 12,275 +515 +4·38 6,264 6,011 1941 13,906 +1,631 +13·29 7,342 6,564 1951 15,110 +1,204 +8·66 7,736 7,374 1961 M. 0·91 17,288 +2,178 +14·41 9,060 8,228 1971 M. 0·91 22,413 +5,125 +29·64 11,845 10,568
484 Kovvur West Godavari 1931 '6,619 +34·96
3,293 3,326 (ANDHRA PRADESH) 1941 8,933 +2,3i4 4,478 4,455
1951 12,307 f3,374 +37·77 6,014 6,293 1961 P. 8·24 15,427 +3,120 +25·35 7,563 7,864 1971 M. 8·24 22,390 +6,963 +45'14 11,254 11,136
485 Sandila Hardoi 1901 16,843 -1,602 -9·si
8,186 8,657 (UTTAR PRADE$H) 1911 15,241 7,697 7,544
1921 14,074 -1,167 -7·66 7,408 6,666 1931 15,034 +960 +6'82 7,878 1,156 1941 17,526 +2,492 +16·58 9,093 8,433 1951 17.400 -126 -0·72 9,098 8,302 1961 M.B. 2.72 18,407 +1,007 +5·79 9,642 8,765 1971 M.B. 2·72 22,365 +3,958 +21·50 1l,871 10,494
486 Kha&aria urban Monghyr 1901 11,492 -688 -5·99
5,641 5,851 agglomeration (BIHAR) 1911 10,804 5,486 5,318
1921 9,521 -1,283 -11·88 5,149 4,372 1931 12,230 .+2,709 +28·45 6,408 5,822 1941 15,559 +3,329 +27·22 8,074 7,485 1951 10,050 -5,509 -35·41 5,315 4,735 1961 11·91 13,731 +3,681 +36·63 7,533 6,198 1971 6·01 22,329 +8,598 +62·62 12,081 10,248
(a) Khagaria 1901 11,492 -688 -5·99
5,641 5,851 1911 10,804 5,486 5,318 1921 9,521 -1,283 -11'88 5,149 4,372 1931 12,230 +2,709 +28·45 6,408 5,822 1941 15,559 +3,329 +27'22 8,074 7,485 1951 10,050 -5,509 -35·41 5,315 4,735 1961 N. 11·91 13,731 +3,681 +36'63 7,533 6,198 1971 M. 2·97 17,150 +3,419 +24:90 9,283 7,867
(b) Mafhurapur 1971 3·04 5,179 2,798 2,381
487 Mandamarri Adilabad 1971 P. 33·15 22,327 11,757 10,570 (ANDHRA PRADESH)
488 De.g Bharatpur 1901 15,409 -2,262 -14·68
8,156 7,253 (RAJASTHAN) 1911 13,147 7,076 6,071
1921 11,798 -1,349 -10·26 6,330 5,468 1931 11,166 -632 -5·36 5,934 5,232 1941 13,139 +1,973 +17·67 6,987 6,152 1951 13,187 +48 +0'37 7,001 6,186 1961 M. 30·07 17,668 +4,481 +33·98 9,468 8,200 1971 M. 10·36 22,267 +4,599 +26·03 12,006 10,261
489.Markapur Ongole 1941 8,446 + 3,348 +39·64
4,126 4,320 (ANDHRA PRADESH) 1951 11,794 6,052 5,742
1961 P. 28·77 16,665 +4,871 +41·30 8,441 8,224 1971 M. 28·78 22,263 +5,598 +33·59 11,491 10,772
490 Sathur Ramanathapuram 1901 7,870 3,918 3,952 (TAMIL NADU) 1911 6,396 -1,474 -18.73 3,372 3,024
1921 8,582 +2,186 +34.18 4,462 4,120 1931 8,772 +190 +2.21 4,430 4,342 1941 9,831 +1,059 +12.07 4,843 4,988 1951 13,~65 +3,734 +37.98 6,630 6,935 1961 P. &.42 15, 59 +2,194 +16.17 8,060 7,699 1971 M. 3.84 22,222 +6.463 +41.01 11,114 11,108
491 Lachhman~arh Sikar 1901 10,176 +6.4'1
4,942 5,234 (RAJASTHAN) 19J1 10,828 +652 5,024 5,804
1921 10,353 -475 -4.39 4,960 5,393 1931 12,839 +2,486 +24.01 6,324 6,515 1941 15,044 +2,205 +17.17 7,452 7,592 1951 18,748 +3,704 +24.62 9,008 9,740 1961 M. 31.00 18,484 -264 -1.41 8,880 9,604 1971 M. 0.65 22,158 +3,614 + 19.88 ,11,042 11,116

367
A·IV TOWNS AND URBAN AGGLOMERATIONS CLASSIFIED BY POPULATION IN 1971 WlTH VARIATION SINCE 1901-contd.
SI Name of Town/Urban DIstnct/State Ye:u Status of Area In Persons D.~ade Percentage Ma1es Fema.les 1'<0 Agll10meratlOn Town Km2 vanatlon decade
varIat10n
2 3 4 ~ fj 7 8 9 10 11
492 Ujhanl Budaun 1901 7,917 4,182 37;5 (UTTAR PRADESH) 1911 8,274 +351 +451 4,543 3731
1921 11,186 +2,912 +35 19 6,609 4,577 1931 12,178 +992 +887 6,733 5445 1941 11,955 -223 -183 6,539 5,416 1951 14,163 +2,208 + 1847 7,611 6,552 1961 MB. 453 17,542 +3,379 +23 86 9396 8146 1971 MB. 5 IS 22,140 +4,598 +2621 11,835 10,305
493 Muvattupuzha cTnakulam 1921 4,517 +1,109
2,431 2,086 \KERALA) 1931 5,626 +24 55 2,991 2,635
1941 9,079 +3,453 +61 38 4,663 4,416 1951 10,159 +1,080 + 11 90 5,155 5004 1961 M 1976 22,900 + 12,741 + 125 42 11,837 11,063 1971 M. 13 18 22,137 -763 -333 11,396 10,741
494 BarwaOl Khargone (W Nlmar) 1901 6,277 3,030 3,247 (MADHYA PRADESH) 1911 7,279 +1,002 + 15 96 3,540 3,739
1921 8,395 +1,116 +1533 4,119 4,276/ 1931 8,949 +554 + 6 60 4,454 4,495 1941 12569 +3,620 +4045 6,271 6298 1951 13,896 +1,327 + 10 56 7,119 6,777 1961 M 1 76 17,446 +1550 +25 55 9,171 8275 1971 M. 1 76 22,099 +4,653 +26 67 11,685 10,414
495 Sardba oa Meerut 1901 12,46' -3,225 -2587
6,486 ~,9~1 (UT"I;AR PRAPESH) 1911 9,242 4,850 4,392
1921 9,524 +282 +305 5,060 4,464 1931 10,265 +741 +778 5,53R 4,727 1941 12,607 +2,342 +22 82 6993 5614 1951 12,556 -51 -040 '7,071 5,483 1961 NA. o 34 16,563 +4,007 +3191 R,863 7,700 1971 NA o 34 27,083 +5,<20 +33 13 11,799 10,284
496 Dhulian MUlShldabad 19lt 8,298 4,016 4,282 (WEST BENGAL) 1921 8,435 +137 +1 65 4,091 4,344
1931 9,767 + 1,332 +15 7Q 4,703 5,064 1941 12,613 +2,846 +2914 6,415 6,198 1951 15,935 +3,322 +2634 8,208 7,727 1961 M 777 17,220 + 1,285 +806 8,859 8,361 1971 M 7 77 27,068 +4,848 +28 15 11,203 10,865
497 Hasanpur Moradabad 1901 9,579 4,825 4754 (UTTAR PRADESH) 1911 10,682 + 1,103 +11 51 5457 5,225
1921 9,946 -736 -689 5,216 4,730 1931 11,276 +1,330 +13 37 6008 5268' 1941 4,249 -7,027 -6232 2,269 1,980 1951 14.777 + 10,528 +247 78 7,810 6,967 1961 MR, 971 17,731 +2,954 +1999 9,335 8,396 1971 MB 971 22,063 +4,332 +2443 11 ,770 10,293
498 SboraGlur P.llgnat 1941 8,587 +35 04
4,231 4,356 (KERALA) 1951 11,596 +3,009 5,694 5,902
1961 NM, 1246 14,307 +2,711 +23 38 7,132 7,175 1971 NM 17 20 22,038 +7,731 +5404 10,988 11,050
499 Tandur Hyderabad 1901 5,930 3,146 2,784 (ANDHRA PRADESH) 1911 6,504 +574 +968 3,344 3160
1921 7,436 +932 +1433 3,872 3,564 1931 8,462 + 1,026 +13 80 4,265 4,197 1941 9,280 +818 +9 67 4,704 4,576 1951 15,480 +6,200 +6681 7,740 7,740 1961 CM. 603 16,736 +1,256 +8 11 8,541 8,195 1971 M 582 22,008 +5,272 +31 50 11,225 10,783
500 'PapPulIssen Cannanore 1961 NM. 1930 16,420 8,200 8,220 (KERALA) 1971 NM, 1524 21,952 +5,532 +33 69 11,039 10,913
501 UsIlampat(J Madura! 1931 8,705 4,400 4,305 (TAMILNADU) 1941 11,745 +3,040 -.-34 92 5,879 5,866
1951 14,047 +2,302 +1960 6,997 7,050 1961 P 2072 15,781 +1,734 +1234 7,865 7,916 1971 p, 13 84 21,887 +6,106 +38 69 10,927 10,960
502 'RaJgangpur Sundargarh 1961 NAC. 2616 13,843 7,833 6,010 (ORISSA) 1971 M, 26 16 21,876 +8,033 +5803 11,753 10,123
503 Bhatapara urban Ralpur 1921 4,714 2,364 2,350 agglomeratIOn (MADHYA PRADESH) 1931 7,974 +3,260 +69 16 4,271 3,703
1941 9,974 +2,000 +2508 4,961 5,013 1951 12,262 +2,288 +2294 6,316 5,946 1961 6'58 16,930 +4,668 +38 07 8,578 8,352 1971 973 21,859 +4,929 +29 11 11,041 10,818
(I) Bhatap~ra 1921 4,714 2,364 2,350 1931 7,974 +3,260 +69 16 4,271 3,703 1941 9,974 +2,000 +25,08 4,961 5,013 1951 12,262 +2,288 +22 94 6,316 5,946 1961 M. 65a 16,930 +4,668 +38 07 8,578 8,352 1971 M. 651 20,980 +4,050 +2392 10,587 10,393
(u) Pat par COG) 1971 3 15 879 454 425
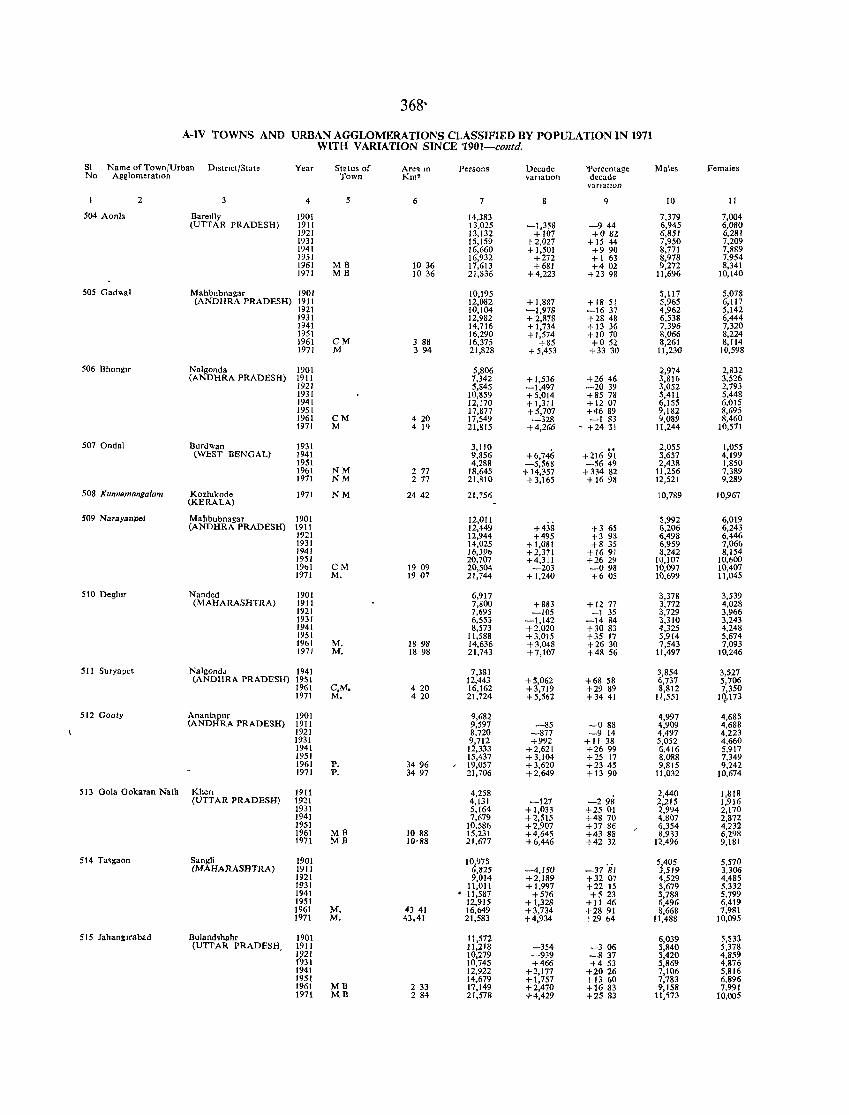
368'
A-IV TOWNS AND URBAN AGGLOMERATIONS CLASSIFIED BY POPULATION IN 1971 WITH VARIATION SINCE'1901-contd.
Sl Name of TownfUrban D,stflctfState Year Status of Are'llfl Persons Decade 1lercentage Males Females No AgglomeratIOn Town Km2 variatIOn decade
Vanatron
2 4 6 7 9 10 11
504 Aonla Barellly 1901 14.383 7,379 7,004 (UIT AR PRADESH) 1911 13,025 -1,358 -944 6,945 6,080
1921 13,132 + 107 +082 6,851 6,281 1931 15,159 + 2,027 + 15 44 7,950 7,209 1941 16,660 + 1,501 +9 90 8,771 7,889 1951 16,932 +272 + 1 63 8,978 7,954 1961 MB 10 36 17,613 +681 +402 9,272 8,341 1971 MB 1036 21,836 +4,223 +23 98 11,696 10,140
505 Gad"al Mahbubnagar 1901 10,195 5,117 5,078 (ANDHRA PRADESH) 1911 12,082 + 1,887 + 18 51 5,965 6,117
1921 10,104 -1,978 -1637 4,962 5,142 1931 12,982 + 2,878 +28 48 6,538 6,444 1941 14,716 + 1,734 +13 36 7,396 7,320 1951 16,290 +1,574 +1070 8,066 8,224 1961 CM 3 88 16,375 +85 +052 8,261 8,114 1971 M 3 94 21,828 +5,453 +33 30 11,230 10,598
506 Bhonglf Nalgonda 1901 5,806 2,974 2,832 (ANDHRA PRADESH) 1911 7,342 +1,536 +2646 3,816 3,526
1921 5,845 -1,497 -2039 3,052 2,793 1931 10,859 +5,014 +85 78 5,411 5,448 1941 12,170 +1,311 +1207 6,155 6,015 1951 17,877 +5,707 +4689 9,182 8,695 1961 CM 4 20 17,549 -328 -I 83 9,089 8,460 1971 M 4 19 21,815 +4,266 - +24 31 11,244 10,571
507 Ondal Burdwan 1931 3,110 +6,746 +216 9i
2,055 1,055 (WEST BENGAL) 1941 9,856 5,657 4,199
1951 4,288 -5,568 -5649 2,438 1,850 1961 NM 2 77 18,645 + 14,}57 + 334 82 11,256 7,389 1971 NM 277 21,810 +3,165 + 16 98 12,521 9,289
508 KlInnomllngalam Kozhlkode 1971 NM 2442 21,756 10,789 10,967 (KERALA)
509 Narayanpel Mahbubnagar 1901 12,011 +438
5,992 6,019 (ANDHRA PRADESH) 1911 12,449 +3 65 6,206 6,243
1921 12,944 +495 +3 98 6,498 6,446 1931 14,025 + 1,081 +8 35 6,959 7,066 1941 16,391> +2,371 + 1691 8,242 8,154 1951 20,707 +4,311 +2629 10,107 10,600 19b1 CM 19 09 20,504 -203 -098 10,097 10,407 1971 M. 19 07 21,744 +1,240 +6 05 10,699 11,045
510 Deglur Nanded 1901 6,917 3,378 3,539 (MAHARASHTRA) 1911 7,800 +883 + 12 77 3,772 4,028
1921 7,695 -105 -I 35 3,729 3,966 1931 6,553 -1,142 -1484 3.310 3,243 1941 8,573 +2,020 +30 83 4,325 4,248 1951 11,588 +3,015 +35 17 5,914 5,674 1%1 M. 1898 14,636 +3,048 +26 30 7,543 7,093 1971 M. 18 98 21,743 +7,107 +48 56 11,497 10,246
511 Suryapet NalgondJ 1941 7,381 3,854 3,527 (ANDHRA PRADESH) 1951 12,443 +5,062 +68 58 6,737 5,706
1961 C,M. 420 16,162 +3,719 +29 89 8,812 7,350 1971 M, 420 21,724 +5,562 +3441 11,551 IQ,173
512 Gooty Anantapur 1901 9,682 4,997 4,685 (ANDHRA PRADESH) 1911 9,597 -85 -088 4,909 4,688
1921 8,nO -877 -914 4,497 4,223 1931 9,712 +992 +11 38 5,052 4,660 1941 12,333 +2,621 +2699 6,416 5,917 1951 15,437 +3,104 +25 17 8,088 7,349 1961 P. 3496 , 19,057 + 3,620 +23 45 9,815 9,242 1971 P. 3497 21,706 +2,649 + 13 90 11.032 10,674
513 Gola Gokaran Natb Khen 1911 4,258 2,440 1,818 (UTTAR PRADESH) 1921 4,131 -127 -298 2,215 1,9J6
1931 5,164 +1,033 +2501 2,994 2,170 1941 7,679 +2,515 +48 70 4,807 2,872 1951 10,586 +2,907 +37 86 6,354 4,232 1961 ME 1088 15,231 +4,645 +43 88 8,933 6,298 1971 MB 10'88 21,677 +6,446 +42 32 12,496 9,181
514 Ta'gaon Sangli 1901 10,975 -37'81
5:l405 5.570 (MAHARASHTRA) 1911 6,825 -4,150 ,519 3,306
1921 9,014 +2,189 +32 07 4,529 4,485 1931 11,011 +1,997 +22 15 5,679 5,332 1941 • 11,587 +576 +S 23 5,788 5,799 1951 12,915 + 1,328 +11 46 6,496 6,419 1961 M. 43 41 16,649 +3,734 +2891 8,668 7.981 1971 M. 43.41 21,583 +4,934 +29 b4 11,488 10,095
515 Jahanglrabad Buland,hahr 1901 11,572 5,039 5,533 (UTTAR PRADESH, 1911 11,218 -354 -306 5,840 5,378 WI 10,279 -939 -837 5,420 4,859
31 10,745 +466 +4 53 5,869 4,876 1941 12,922 +2,177 +2026 7,106 5,816 1951 14,679 + 1,757 +13 60 7,783 6,896 1961 MB 2 33 17,149 +2,470 +1683 9,158 7.991 1971 MB 2 84 21,578 +4,429 +2583 11,~73 10,005
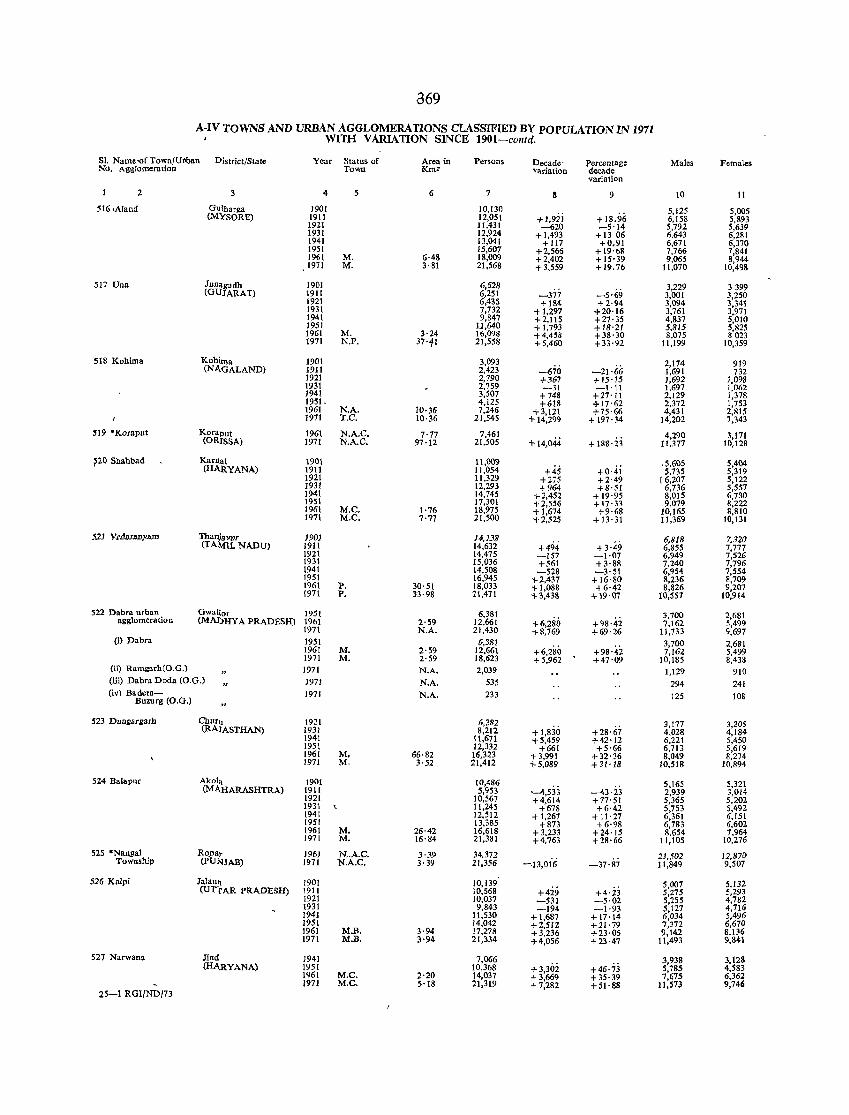
369
A-IV TOWNS AND URBAN AGGLOMERATIONS CLASSIFIED BY PO PULA TION IN 1971 WITH VARIATION SINCE 1901-contd.
SI. Name'()fTownfU~ban District/State Year Status of Area in Persons Decade' Percentage Males Females No. Agglomeration Town Km' variation decade
variation
2 4 5 6 7 3 9 10 11
516 ,Aland Gulbarga 1901 10,130 +l,92i + 18.96
5,125 5,005 (MY-SORE) 1911 12,051 6,158 5,893
1921 11,431 -620 -5'14 5,792 5,639 1931 12,924 +1,493 +13 06 6.643 6,2Rl 1941 13,041 + 117 +0.91 6,671 6,370 1951 15,607 +2,566 + 19'03 7,766 7,841 1961 M. 6·48 18,009 +2,402 +15'39 9,065 8,944 1971 M. 3· 81 21,568 + 3,559 +19.7b 11,070 10,498
517 Una Junngadh 1901 6,628 -377
3,229 3399 (GUJARAT) 1911 6,251 -5,69 3,001 3,250
1921 6,435 +184 +2·94 3,094 3,341 1931 7,732 +1,297 +20·16 3,761 3,971 1941 9,847 +2,115 +27·35 4,837 5,010 1951 lJ,640 +1,793 +18·21 5,815 5,825 1961 M. 3·24 16,098 +4,458 +38'30 8,075 8023 1971 N.P. 37'11 21,558 +5,460 +33·92 11,199 10,359
518 Kohima Kohitna 1901 3,093 -670 -21·66
2,174 919 (NA.GALAND) 1911 2,423 1,691 732
1921 2,790 +367 +15·15 1,692 1,098 1931 2,759 -31 -1·11 1,697 1,062 1941 3,507 +748 +27'11 2,129 1,378 1951. 4,125 +618 +17'62 2,372 1,753 1961 N.A. 10·36 7,246 -\-3,121 +75·66 4,431 2,815 1971 T.C. 10·36 21,545 -\-14,299 + 197' 34 14,202 7,343
519 ·Koraput KoraJ)ut 1961 N.A.C. 7·77 7,461 + 14,044 + 188·ij
4,290 3,171 (ORISSA) 1971 N.A.C. 97·12 21,505 11,377 10,128
~2() Shahbad Kamal 1901 11,009 +0'4i
.5,605 5,4()~ (HARYANA) 1911 1l,054 +45 5,735 5,319
1921 11,329 +275 +2'49 r 6,207 5,122 1931 12,293 +964 +8'51 6,736 5,557 1941 14,745 +2,452 + 19·95 8,015 6,730 1951 17,301 '\- 2,556 + 17'33 9,079 8,222 1961 M.C. 1·76 18,975 + 1,674 +9·68 10,165 3,&10 1971 M.e. 7·77 21,500 +2,525 +13·31 11,369 10,131
521 'V.eDa.r=y.aro ThanJavn.r 1901 14,138 +494 +3·49
6,818 7,32() (TA},fIL NADU) 1911 14,632 6,855 7,777
1921 14,475 -157 -1·07 6,949 7,526 1931 15,036 +561 +3·8& 7,240 7,796 1941 14,508 -528 -3'51 6,954 7,554 1951 16,945 '\-2,437 +16'80 8,236 8,709 1961 P. 30·51 18,033 '\-1,088 +6'42 8,826 9,207 1971 P. 33·98 21,471 +3,438 +19·07 10,551 10,914
522 Dabrs urban Gwallor 1951 6,3&1 +6,280 +98·42
3,700 2,681 agglomeration (MAl)HY A PRADESH) 19b! 2·59 12,661 7,162 5,499 1971 N.A.. 21,430 '\- 8,769 +69·26 11,733 9,697
(i) Dabra 1951 6,381 +6,280
3,700 2,681 1961 M. 2·59 12,661 +98·42 7,162 5,499 1971 M. 2·59 18,623 +5,962 +47·09 10,1&5 8,438
(til Ramgarh(O.G.l 1971 N.A. 2,039 1,129 910 (iii) Dabra Doda (O.G.) 1971 N.A. 535 294 241 (iv) Badera-
Buzurg (O.G.) 1971 N.A. 233 125 108
523 Dungargarh Churq 1921 6,382 +I,8jO +28·67
3,177 3,205 (RAl'ASTHAN) 1931 8,212 4,028 4,184
1941 11,671 +3,459 +42'12 6,221 5,45() 1951 12,332 +661 +5·66 6,713 5,619 1961 M. 66·82 16,323 '1-3,991 +32'36 8,049 8,274 1971 M. 3·52 21,412 '1-5,089 +31'18 10,518 10,894
524 Balapur Akola 1901 10,486 '-4,533
5,165 5,321 (MAHARASHTRA) 1911 5,953 -43·23 2,939 3,014
1921 10,567 +4,614 +77'51 5,365 5,202 1931 11,245 +678 +6·42 5,753 5,492 1941 12,512 + 1,267 + 11·27 6,361 6,151 1951 13,385 +873 +6·98 6,783 6,6()2 1961 M. 26·42 16,618 + 3.233 +24'15 8,654 7,964 1971 M. 16·84 21,381 +4,763 + 28· 66 11,105 10,276
525 ·Nacyal Ro.oar J96J N .. A.C. 3·39 34,372 "'"'13,OiG
21,502 12,870 Township (PUNJAB) 1971 N.A.C. 3·39 21,356 -37·87 11,849 9,507
526 Kalpi ]alau~ 1901 10,139 +429
5,001 5,132 <un-AR PRA.DESH) 1911 10,568 +4·23 5,275 5,293 1921 10,037 -531 -5·02 5,255 4,782 1931 9,843 -194 -1·93 5,127 4,716 1941 11,530 +1,687 + 17'14 6,034 5,496 1951 14,042 +2,512 +21·79 7,372 6,670 1961 M.B. 3·94 17,278 +3,23b +23·05 9,142 8,136 1971 M.B. 3·94 21,334 +4,056 +23·47 11,493 9,841
527 Narwana Jind 1941 7,066 +3,302 +46·73
3,938 3,128 (HARYANA) 1951 10,3b8 5,785 4,583
1961 M.e. 2'20 14,037 + 3,669 + 35· 39 7,675 6,362 1971 M.C. 5·18 21.319 +7,282 +51'88 11,573 9,746
25-1 RGI/ND/73
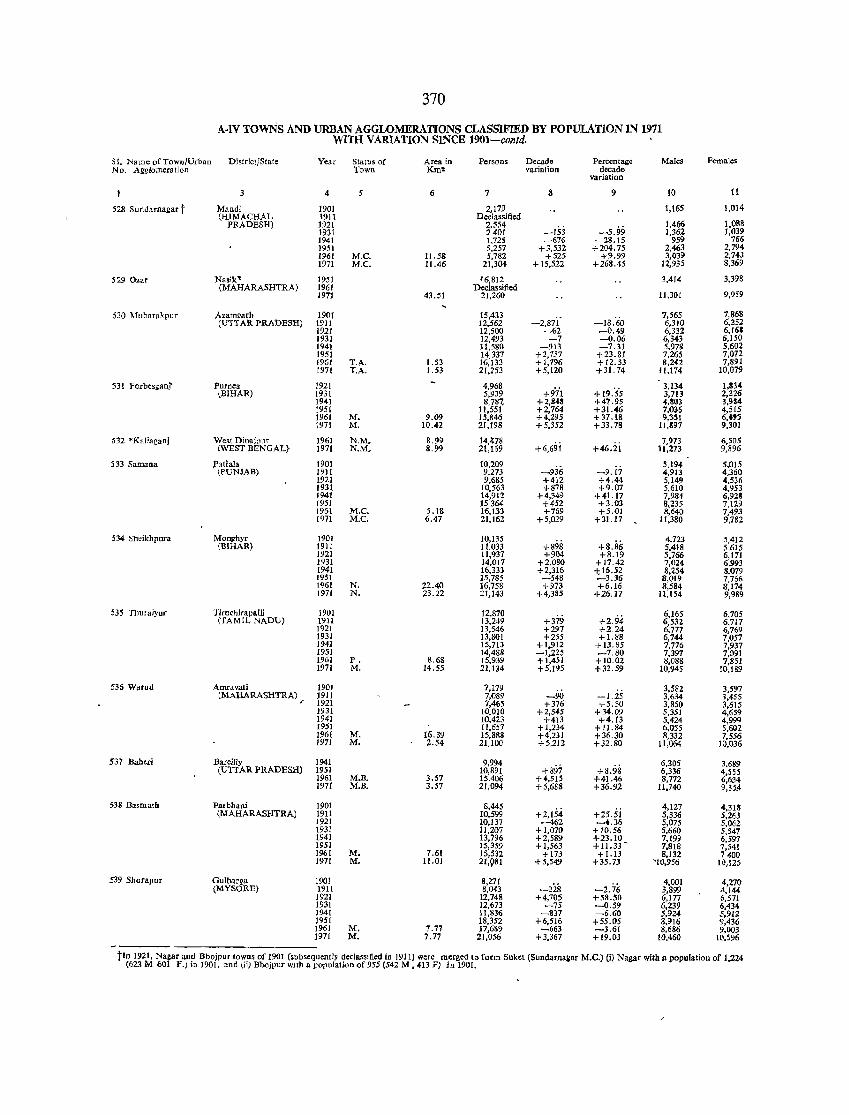
370
A·IV TOwNs AND URBAN AGGWMERATIONS CLASSIFIED BY POPULATION IN 1971 WITH VARIATION SINCE 1901-confd,
s 1. Name of Town/Urban Di5trictjState Year Status of Area in Persons Decade Percentage Males Females No. Aggiomeration Town Km! variation decade
variation
3 4 6 7 8 9 10 11
528 Sundarnagar t Mandi 1901 2,179 1,165 1,014 (IDMACHAL 1911 Declassified
1,088 PRADESH) 1921 2,554 -15:i -5.99
1,466 1931 2401 1,362 1,039 1941 1,725 -676 -28.15 !>59 766 1951 5,257 +3,532 +204.75 2,463 2,794 1961 M.e. 11.58 5,782 +525 +9.99 3,039 2,743 1971 M.C. 11.46 21,304 + 15,522 +268.45 12,935 8,369
529 Ozar Nasik" 1951 '6,812 3,414 3,398 (MAHARASHTRA) 1961 Declassified
9,959 1971 43.51 21,260 11,301
530 Mubarakpur Azamgarh 1901 15,433 -2,87i' -18.'60
7,565 7,868 (UTTAR PRADESH) 1911 12,562 6,310 6,252
1921 12,500 -62 -0.49 6,332 6,161 1931 12,493 -7 -0.06 6,343 6,150 1941 ll,580 -913 -7.31 5,978 5,602 1951 14,337 +2,157 +23.81 7,265 7,072 1961 T.A. 1.53 16,133 +1,196 +12.53 8,242 7,891 1971 T.A. 1.53 21,253 +5,120 +31. 74 11,174 10,079
531 Forbesganj' Purnea 1921 4,968 +9'71 +19:55
3,134 1,&;lo4 lBIHAR) 1931 5,939 3,713 2,226
1941 8,78~ +2,843 +47.95 4,S03 3,9$4 1951
9.09 11,551 +2,164 +31.46 7,036 4,515
1961 M. 15,846 +4,295 +37.18 9,351 6,4'S 1971 M. 10.42 21,198 +5,352 +33.78 11,1197 9,301
H2 *Kaliaganj West Dinajpur 1961 N.M. 8.99 14.'1.78 +6,69i +46.ii
7,973 6,505 (WEST BENGALr 1971 N.M. 8.99 21,169 11,273 9,896
533 Samana Patiala 1901 10,209 -936
5,194 5,015 (PUNJAB) 1911 9,273 -9.17 4,913 4.360
1921 9,685 +412 +4.44 5,149 4,536 1931 10,563 +878 +9.07 5,610 4,953 1941 14,912 +4,349 +41.17 7,984 6,928 1951 15364 +452 +3.03 8,235 7,129 1961 M.e. S.18 16,133 +769 +5.01 8,640 7,493 1971 M.C. 6.47 21,162 +5,029 +31.17 11,380 9,782
534 Sheikhpura Monghyr 1901 10,135 +898 +8.86
4,723 5,412 (BIHAR) 1911 11.033 5,418 5.615
1921 11,937 +904 +8.19 5,766 6,171 1931 14,011 +2,080 +17.42 7,024 6,993 1941 16,333 +2,316 +.16.52 8,254 8,079 1951 15,785 -548 -3.36 8,019 7,766 1961 N, 22.40 16,758 +973 +6.16 8,584 8,174 1971 N. 23.22 21,143 +4,385 +26.17 11,154 9,989
535 Thuraiyur Tiruchirapalli 1901 12,870 +379 +2.94
6,165 6,705 (TAMIL NADU) 1911 13,249 6,532 6,717
1921 13,546 +297 +2.24 6,777 6,769 1931 13,801 +255 + 1.88 6,744 7,057 1941 15,713 +1,912 + 13.85 7,776 7,937 1951 14,488 -1,225 -7.80 7,397 7,091 1961 P. 8.68 15,939 +1,451 +10.02 8,088 7,851 1971 M. 14.55 21,134 +5,195 +32.59 10,945 W,189
536 Warua Anuavali 1901 7,179 3,582 3,597 (MAHARASHTRA) 1911 7,089 -90 -1.25 3,634 3,455
~ 1921 7,465 +376 +5.30 3,850 3,615 1931 10.010 +2,545 +34.09 5,351 4,659 1941 10,423 +4[3 +4.13 5,424 4,999 1951 11,651 +1,234 + 11.84 6,055 5,602 1961 M. 16.39 15,888 +4,231 +36.30 8,332 7,556 1971 M. 2.54 21,100 +5,212 +32.80 11,064 10,036
537 Baheri Bareilly 1941 9,994 +897 +8.98
6,305 3,68<) (UTTAR PRADESH) 1951 10,891 6,336 4,555
1961 M.B. 3.57 15,406 +4,515 +41,46 8,772 6,634 1971 M.B. 3.57 21,094 +5,688 +36.92 II ,740 9,~54
538 Basmath Parbb.ni 1901 6,445 +2,154 +25.5i
4,127 4,318 lMAHARASIlTRA) 1911 10,599 5,336 5,263
1921 10,137 -462 -4.36 5,075 5,062 1931 II,207 +1,070 +10.56 5,660 5,547 1941 13,796 +2,589 +23.10 7,199 6,597 1951 15,359 +1,563 +11.33 - 7,818 7,541 1961 M. 7.61 15,532 +173 +1.13 8,132 7400 1971 M. 11.01 21,981 +5,549 +35.73 '10,956 10,125
539 Shorapur Gulbar~a 1901 8,271 -228
4,001 4,270 (MYSORE) 1911 8,043 -2.76 3,899 4,144
1921 12,748 +4,705 +58.50 6,177 6,571 1931 12,673 -75 -0.59 6,239 6,434 1941 11,836 -837 -6.60 5,924 5,912 1951 18,352 +6,516 +55.05 8,916 9,436 1961 M, 7.71 17,639 -663 -3.61 8,686 9,003 1971 M. 7.77 21,056 +3,367 +19.03 lO,46O 10,596
tin 1921, Nagar and Bbojpur towns of 1901 (subsequently declassified in 1911) were merged to form Suko! (Sundarnasar M.e.) (il Nasar with a population of 1,224 (623 M 601 F.) in 1901, and Iii) Bhojpur WJth a population of 955 (542 M , 413 F) in 1901.
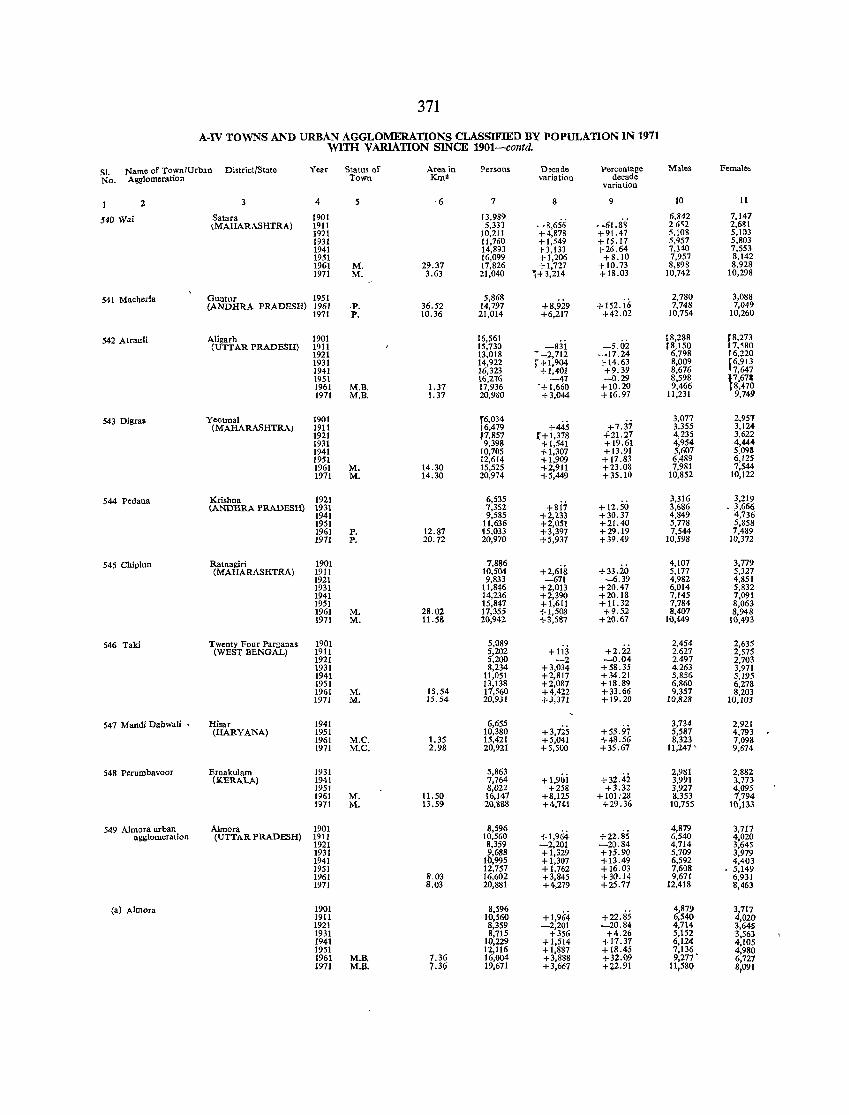
371
A-IV TOWNS AND URBAN AGGLOMERATIONS CLASSIFIED BY POPULATION IN 1971 WITH V ARlATION SINCE 1901-contd.
51. Name of Town/Urban Di~trict/St3te Year Status of Area in Persons Docade Percentage Males Females No. Agglomeration Town Km2 variation decade
variation
2 3 4 S ,6 7 8 9 10 11
540 Wai Satara 1901 13,989 -8,656 -61.8'8'
6.842 7,147 \MAHARASHTRA) 1911 5,333 2652 2,681
1921 10,211 +4,878 +91.47 5,108 5,103 1931 11,760 +1,549 +15.17 5,957 5,803 1941 14,893 +3,133 +26.64 7,HO 7,553 1951 16,099 +1,206 +8.10 7,957 8,142 1961 M. 29.37 17,826 +1,727 +10.73 8,898 8,928 1971 M. 3.63 21,040 i+ 3,214 +18.03 10,742 10,298
541 Macherla Gunlur 1951 5,868 +152.ii;
2,780 3,088 (ANDHRA PRADESH) 1961 ,Po 36.52 14,797 +8,929 7,748 7,049
1971 P. 10.36 21,014 +6,217 +42.02 10,754 10,260
542 Atrauli Aligarh 1901 16,561 -5.02
:8,288 {8,273 (UTTAR PRADESH) 1911 15,730 -831 f8,150 7.580
1921 13,018 ~ -2,712 -17.24 6,798 '6,220 1931 14,922 rtl:~gt +14.63 8,009 (6,913 1941 16,323 +9.39 8,676 7,647 1951 16,276 -41 -0.29 8,598 r·671 1961 M.B. 1. 37 17,936 • + 1,660 +10.20 9,466 8,470 1971 M.B. \. 37 20,980 +3,044 +16.97 11,231 9,749
543 Digras Yeotmal 1901 f6,034 +445
3,077 2,951 (MAHARASHTRA) 1911 6,479 +7.37 3,355 3,124
1921 17,857 {+1,378 +21.27 4,235 3,622 1931 9,398 +1,541 +19.61 4,954 4,444 1941 10,705 +1,307 +13.91 5,607 5.093 1951 12,614 +1,909 +17.83 6,489 6,125 1961 M. 14.30 15,525 +2,911 +23.08 7,981 7,544 1971 M. 14.30 20,974 +5,449 +35.10 10,852 10,122
544 Pedana Krishna 1921 6,535 +&i7
3,316 3,219 (ANDHRA PRADESH) 1931 7,352 + 12.50 3,686 _ ~,666
1941 9,585 +2,233 +30.37 4,849 4,736 1951 11,636 +2,051 +21.40 5,778 5,858 1961 P. 12.87 15,033 +3,397 +29.19 7,544 7,489 1971 P. 20.72 20,970 +5,937 +39.49 10,598 10,372
545 Chiplun Ratnagiri 1901 7,886 +2,6ii! +33.iO
4,107 3,779 (MAHARASHTRA) 1911 10,504 5,177 5,327
1921 9,833 -671 -6.39 4,982 4,851 1931 11,846 +2,013 +20.47 6,014 5,832 1941 14,236 +2,390 +20.18 7,145 7,091 1951 15,847 +1,611 + 11.32 7,784 8,063 1961 M. 28.02 17,355 +1,508 +9.52 8,407 8,948 1971 M. 11.58 20,942 +3,587 +20.67 10,449 10,493
546 Taki Twenty Four Parganas 1901 5,089 +lij +2.ii
2,454 2,635 (WEST BENGAL) 1911 5,202 2,627 2,575
1921 5,200 -2 -0.04 2,497 2,703 1931 8,234 +3,034 +58.35 4,263 3,971 1941 11,051 +2,817 +34.21 5,856 .5,195 1951 13,138 +2,087 +18.89 6,860 6,278 1961 M. 15.54 17,560 +4,422 +33.66 9,357 8,203 1971 M. 15.54 20,931 +3,371 +19.20 10,828 10,103
547 Mandl Dabwali • Hisar 1941 6,655 + 3,725 +55.97
3,734 2,921 (HARYANA) 1951 10,380 5,587 4,793
1961 M.e. 1.35 15,421 +5,041 +48.56 8,323 7,098 1971 M.e. 2.98 20,921 +5,500 +35.67 11,247 ' 9,674
548 Perumbavoor Ernakulam 1931 5,863 + 1,90i +32.42
2,981 2,882 (KERALA) 1941 7,764 3,991 3,773
1951 8,022 +258 +3.32 3,927 4,095 1961 M. 11.50 16,147 +8,125 + 101:28 8,353 7,794 1971 M. 13.59 20,888 +4,741 +29.36 10,755 10,133
549 Alxnora urban Almora 1901 8,596 +1,964 +22.85
4,879 3,717 agglomeration (UTTAR PRADESH) 191J 10,560 6,540 4,020
1921 8,359 -2,201 -20.84 4,714 3,645 1931 9,688 +1,329 +15.90 5,709 3,979 1941 10,995 + 1,307 +13.49 6,592 4,403 1951 12,757 +1,762 +16.03 7,608 5,149 1961 8.03 16,602 +3,845 +30.14 9,671 6,931 1971 8.03 20,881 +4,279 +25.77 12,418 8,463
(a) Almora 1901 8,596 +1,964
4,879 3,717 1911 10,560 +22.85 6,540 4,020 1921 8,359 -2,201 -20.84 4,714 3,645 1931 8,715 +356 +4.26 5,152 3,563 1941 10,229 +1,514 +17.37 6,124 4,105 1951 12,1l6 + 1,887 +18.45 7,136 4,980 1961 M.B. 7.36 16,004 +3,888 +32.09 9,277- 6,727 1971 M.B. 7.36 19,671 +3,667 +~2.91 lI,58\) 8,091
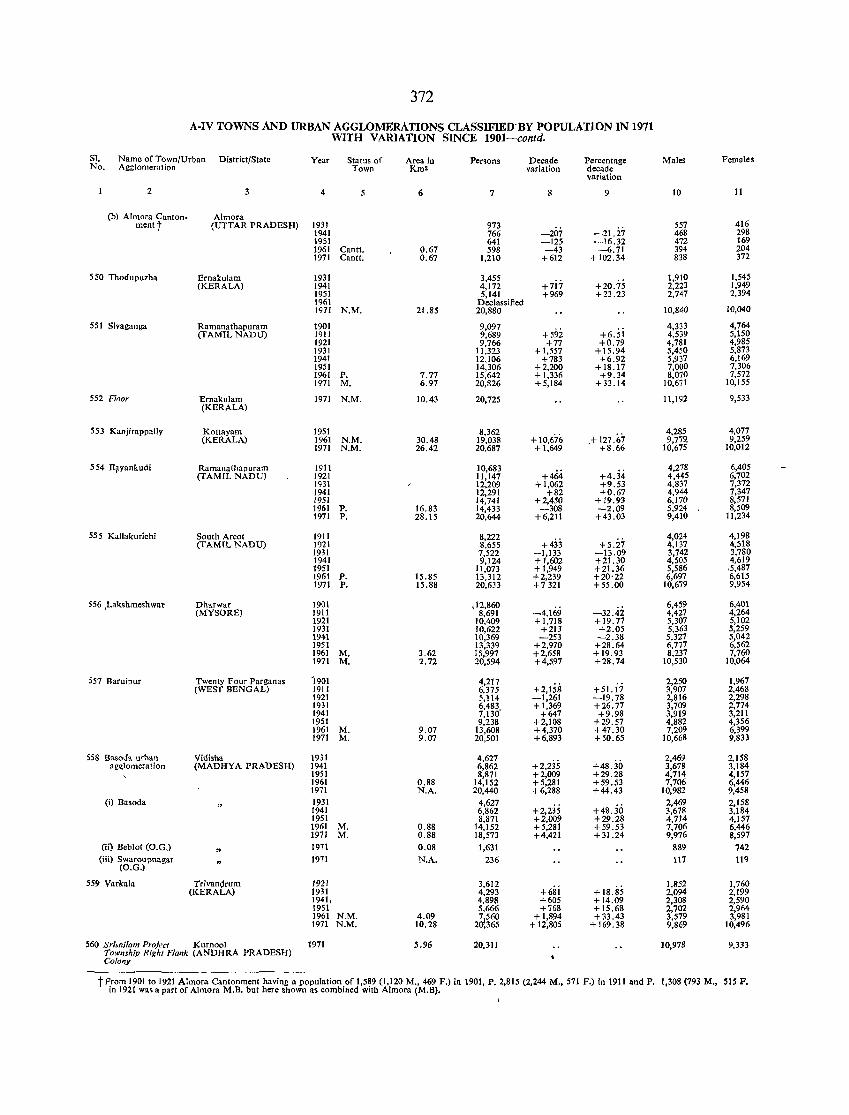
372
A-IV TOWNS AND URBAN AGGLOMERATIONS CLASSIFIED' BY POPULATION IN 1971 WITH VARIATION SINCE 1901-contd.
SI. Name of Town/Urban District/State Year Stat!!s of Area in Penons Decade Percentage Males Females No. Agglomeration Town Km2 variation decade
variation
2 3 4 5 6 7 g 9 10 11
(b) Almora Canton- Almora mentt (UTTAR PRADESH) 1931 973
-21.27 557 416
1941 766 -207 468 298 1951 641 -125 -16.32 472 169 1961 Cantt. 0.67 598 -43 -6.71 394 204 1971 Cantt. 0.67 1,210 +612 + 102.34 838 372
550 Thodupuzha Ernakulam 1931 3,455 +7ii +20.75
1,910 1,545 (KERALA) 1941 4,172 2,223 1,949
1951 5,141 +969 +23.23 2,747 2,394 1961 Declassified 1971 N.M. 21.85 20,880 10,840 10,040
551 Sivaganga Ramanathapuram 1901 9,097 +592 +6,Si
4,333 4,764 (TAMIL NADU) 1911 9,689 4,539 5,150
1921 9,766 +77 +0.79 4,781 4,985 1931 11,323 + 1,557 +15.94 5,450 5,873 1941 12,106 +783 +6.92 5,937 6,169 1951 14,306 +2,200 +18.17 7,000 7,306 1961 P. 7.77 15,642 + 1,336 +9.34 8,070 7,572 1971 M. 6.97 20,326 +5,184 +33.14 10,671 10,155
552 Floor Ernakulam 1971 N.M. (KERALA)
10.43 20,725 11,192 9,533
553 Kanjirappally Kottayam 1951 8,362 + 10,676 .+127.67
4,285 4,077 (KERALA) 1961 N.M. 30.48 19,038 9,779. 9,259
1971 N.M. 26.42 20,687 +1,649 +8.66 10,675 10,012
5 54 n~yankudi Ramanathapuram 1911 10,683 +464 +4.34
4,278 6,405 (TAMIL NADU) 1921 11,147 4,445 6,702
1<)31 12,209 +1,062 +9.53 4,837 7,372 1941 12,291 +82 +0.67 4,944 7,347 1951 14,741 +2,450 +19.93 6,170 8,571 1961 P. 16.83 14,433 -308 -2.09 5,924 8,509 1971 P. 28.15 20,644 + 6,211 +43.03 9,410 11,234
555 Kallakurichi South Arcot 1911 8,222 +433
4,024 4,198 (TAMIL NADD) 1921 8,655 +5.27 4,137 4,518
1931 7,522 -1,133 -13.09 3,742 3,780 1941 9,124 + 1,602 +21.30 4,505 4,619 1951 11,073 +1,949 +21.36 5,586 ,5,487 1961 P. 15.85 13,312 +2,239 +20'22 6,697 6,615 1971 P. 15.88 20,633 +7321 +55.00 10,679 9,954
556 ,Lakshmeshwar Dharwar 1901 i 12,860 -4,169 -32.42
6,459 6,401 (MYSORE) 1911 8,691 4,427 4,264
1921 10,409 +1,718 + 19.77 5,307 5,102 1931 10,622 +213 +2.05 5,363 5,259 1941 10,369 -253 -2.38 5,327 5,042 1951 13,339 +2,970 +28.64 6,777 6,562 1961 M. 3.62 15,997 +2,658 +19.93 8,237 7,760 1971 M. 2.72 20,594 +4,597 +28.74 10,530 10,064
557 Baruipur Twenty Four Parganas '1901 4,217 +2,158 +5l.ij
2,250 1,967 (WEST BENGAL) 1911 6,375 3,907 2,468
1921 5,114 -1,261 -19.78 2,816 2,298 1931 6,483 + 1,369 +26.77 3,709 2,774 1941 7,130' +647 +9.98 3,919 3,211 1951 9,238 +2,108 +29.57 4,882 4,356 1961 M. 9.07 13,608 +4,370 +47.30 7,209 6,399 1971 M. 9.07 20,501 +6,893 +50.65 10,668 9,833
S5S Basoda urhan Vidisha 1931 4,627 +2,235 +48.30
2,469 2,158 ag~lomeration (MADHYA PRADESH) 1941 6,862 3,678 3,184
1951 8,871 +2,009 +29.28 4,714 4,157 1961 0.88 14,152 +5,281 +59.53 7,706 6,446 1971 N.A. 20,440 +6,288 +44.43 10,982 9,458
(i) Basoda 1931 4,627 +2,235 +48.30
2,469 2,158 1941 6,862 3,678 3,184 1951 8,871 +2,009 +29.28 4,714 4,157 1961 M. 0.88 14,152 +5,281 + 59.53 7,706 6,446 1971 M. 0.88 18,573 +4,421 + 31.24 9,976 8,597
(ii) Behlot (O.G.) 1971 0.08 1,631 889 742 (iii) Swaroopnagar 1971 N.A. 236 117 119
(O.G.)
559 Varkala Trivanllrum 1921 3,612 +6si +18.85
1,852 1,760 (KERALA) 1931 4,293 2,094 2~199
19411 4,898 +605 +14.09 2,308 2,590 1951 5,666 +768 +15.68 2,702 2,964 1961 N.M. 4.09 7560 + 1,894 +33.43 3,579 3,981 1971 N.M. 10.28 2ii!365 + 12,805 + 169.38 9,869 10,496
560 Sri.ailam Project Kurno,,1 Township Right Flank (ANDHRA PRADESH) Colony
1971 5.96 20,31l 10,918 9,333
t From 1901 to 1921 Almora Cantonment having a population of 1,589 (1,120 M., 469 P.) in 1901, P. 2,815 (2,244 M., 571 F.) in 1911 and P. in lnl wa~ a part of A.lmora M.B. but here $hown as combined with Almora (M.B).
1,308 (793 M" 515 F.
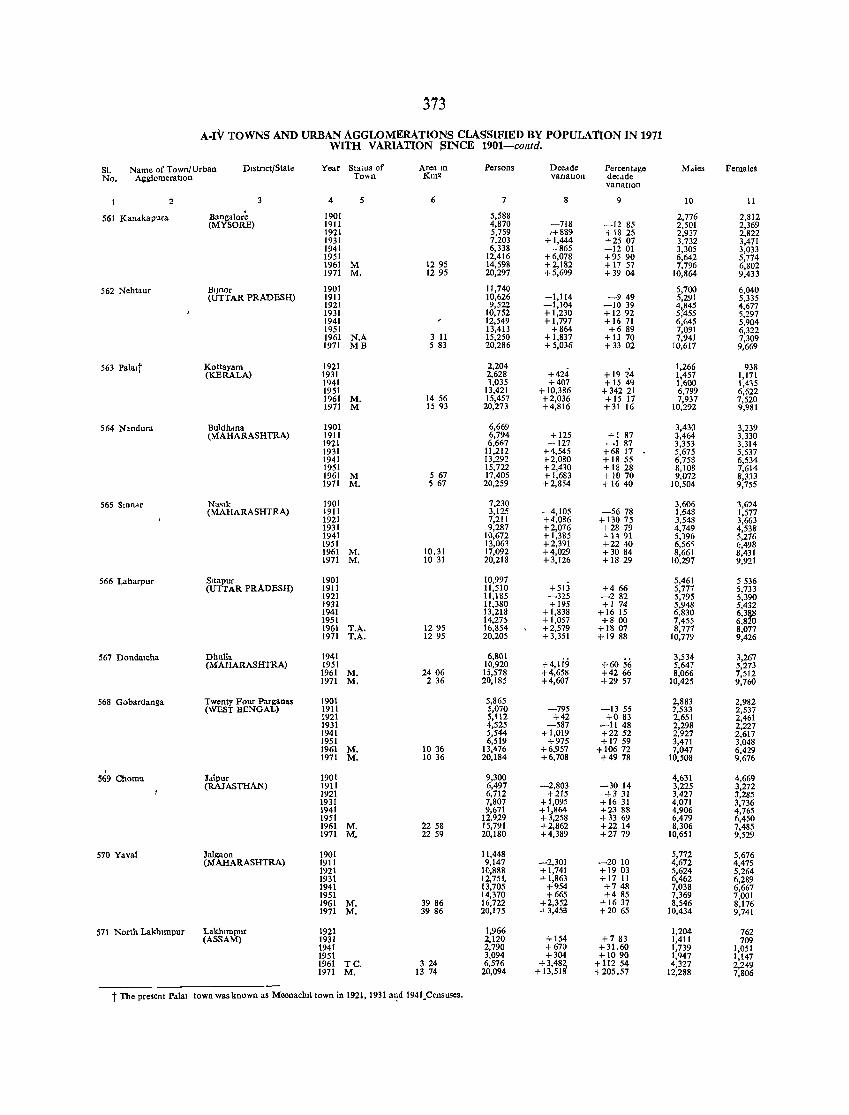
373
A-tv TOWNS AND URBAN AGGLOMERATIONS CLASSIFIED BY POPULATION IN 1911 WITH V ARlATION I'lNCE 1901-contd.
Sl. Name of Town/Urban Dlslnct/State Year Status of Area ill Persons Decade Percentdge M.les Female' No. AgglomeratIon To"n Km2 vanatlon deco1de
vanatlOn
2 4 5 6 7 8 9 10 II
561 Kandkapura Bangalore 1901 5,588 2,776 2,812 (MYSORE) 19I1 4,870 -718 -1285 2,501 2,369
1921 5,759 1+889 + 18 25 2,937 2,822 1931 7,203 +1,444 -1-25 07 3,732 3,471 1941 6,338 -865 -1201 3,305 3,033 1951 12,416 +6,078 +95 90 6,642 5,774 1961 M 12 95 14,598 +2,182 + 17 57 7,796 6,802 1971 M, 1295 20,297 'r5,699 +39 04 10,864 9,433
562 Neht.ur Bllnor 1901 11,740 5,700 6,040 (UTTAR PRADESH) 1911 10,626 -1,114 -949 5,29: 5,335
1921 9,522 -1,104 -1039 4,845 4,677 1931 10,752 +1,230 +1292 5;455 5,297 1941 12,549 + 1,797 + 1671 6,645 5,904 1951 13,413 +864 +6 89 7,091 6,322 1961 N.A 3 11 15,250 + 1,837 + 13 70 7,941 7,309 1971 MB 5 83 20,286 + 5,036 +33 02 10,617 9,669
563 Palalt Kottayam 1921 2,204 +19 £4
1,266 938 (KERALA) 1931 2,628 +424 1,457 1,171
1941 1,035 +407 + 15 4q 1,600 1,4,5 1951 13,421 + 10,386 + 342 21 6,799 6,622 1961 M. 1456 15,457 +2,036 + 15 17 7,937 7,520 1971 M 1593 20,273 +4,816 +31 16 10,292 9,981
564 Nandura Buldhdna 1901 6,669 3,430 3,239 (MAHARASHTRA) 1911 6,794 + 125 +! 87 3,464 3,330
1921 6,667 -127 -187 3,353 3,314 1931 11,212 +4,545 +68 17 5,675 5,537 1941 13,292 +2,080 +18 55 6,758 6,534 1951 15,722 + 2,410 + 18 28 8,108 7,614 1961 M 567 17,405 +1,683 +1070 9,072 8,333 1971 M. 5 67 20,259 + 2,854 + 16 40 10,504 9,755
565 SlOndr Na'ltk 1901 7,230 3,606 3,624 (MAHARASHTRA) 1911 3,125 -4,105 -5678 1,648 1,577
1921 7,211 +4,086 + 130 75 3,548 3,663 1931 9,287 +2,076 +28 79 4,749 4,538 1941 10,672 +1,385 "H 91 5,196 5,276 1951 13,061 +2,391 +2240 6,56' 6,498 1961 M. 10.31 17,092 +4,029 +3084 8,661 8,431 1971 M. 1031 20,218 +3,126 +1829 10,297 9,921
566 Laharpur Sltapur 1901 10,997 5,461 5536 (UTTAR PRADESH) 1911 11,510 +513 +466 5,777 5,733
1921 11,185 -325 -282 5,795 5,390 1931 11.380 +195 +1 74 5,948 5,432 1941 13,218 +1,838 + 16 15 6,830 6,3fo 1951 14,275 + 1,057 +8 00 7,455 6,80 1961 T.A. 1295 16,854 +2,579 + 1807 8,777 8,077 1971 T.A. 1295 20.205 +3,351 +1988 10,779 9,426
567 Dondalcha Dhulia 1941 6,801 +4,ti9 +6056
3,534 3,267 (MAHARASHTRA) 1951 10,920 5,641 5,273
1961 M. 2406 15,578 +4,658 +4266 8,066 7,512 1971 M. 236 20,185 +4,607 +2957 10,425 9,760
568 Gobardanga Twenty Four Parganas 1901 5,865 2,883 2,982 (WEST BENGAL) 1911 5,070 -795 -1355 1,533 2,537
1921 5,112 +42 +083 2,651 2,461 1931 4,525 -587 -11 48 2,298 2,227 1941 5,544 +1,019 +2252 2,927 2,617 1951 6,519 +975 +1759 3,471 3,048 1961 M. 10 36 13,476 +6,957 + 106 72 7,047 6,429 1971 M. 1036 20,184 +6,708 +4978 10,508 9,676
569 Chomu Jdipur 1901 9,300 4,631 4,669 (RAJASTHAN) 1911 6,497 -2,803 -3014 3,225 3,272
1921 6,712 +215 +331 3,427 3,285 1931 7,807 +1,095 + 1631 4,071 3,736 1941 9,671 +1,864 +2388 4,906 4,765 1951 12,929 + 3,258 +33 69 6,479 6,450 1961 M. 2258 15,791 +2,862 +2214 8,306 7,485 1971 M. 2259 20,180 +4,389 +2779 10,651 9,529
570 Yava! Jalgaon 1901 11,448 5,772 5,676 (MAHARASHTRA) 1911 9,147 -2,301 -2010 4,672 4,475
1921 10,888 +1,741 +1903 5,624 5.264 1931 12,751.. + 1,863 +17 11 6,462 6,289 1941 13,705 +954 +748 7,038 6,667 1951 14,370 +665 +485 7,369 7,001 1961 M. 3986 16,722 +2,352 + 1637 8,546 8,176 1971 M. 3986 20,175 +3,453 +2065 10,434 9,741
571 North Lakhlmpur Lakhlmpur 1921 1,966 1,204 762 (ASSAM) 1931 2,120 +154 +783 1,411 709
1941 2,790 +670 + 31.60 1,739 1,051 1951 3,094 +304 +1090 I,Q47 1,147 1961 TC. 324 6,576 +3,481, + 112 54 4,327 2,249 1971 M. 13 74 20,094 + 13,518 +205.57 12,288 7,806
t The present Palal town was known as Meenaclu1 town in 1921, 1931 a~d 1941.Censuses.
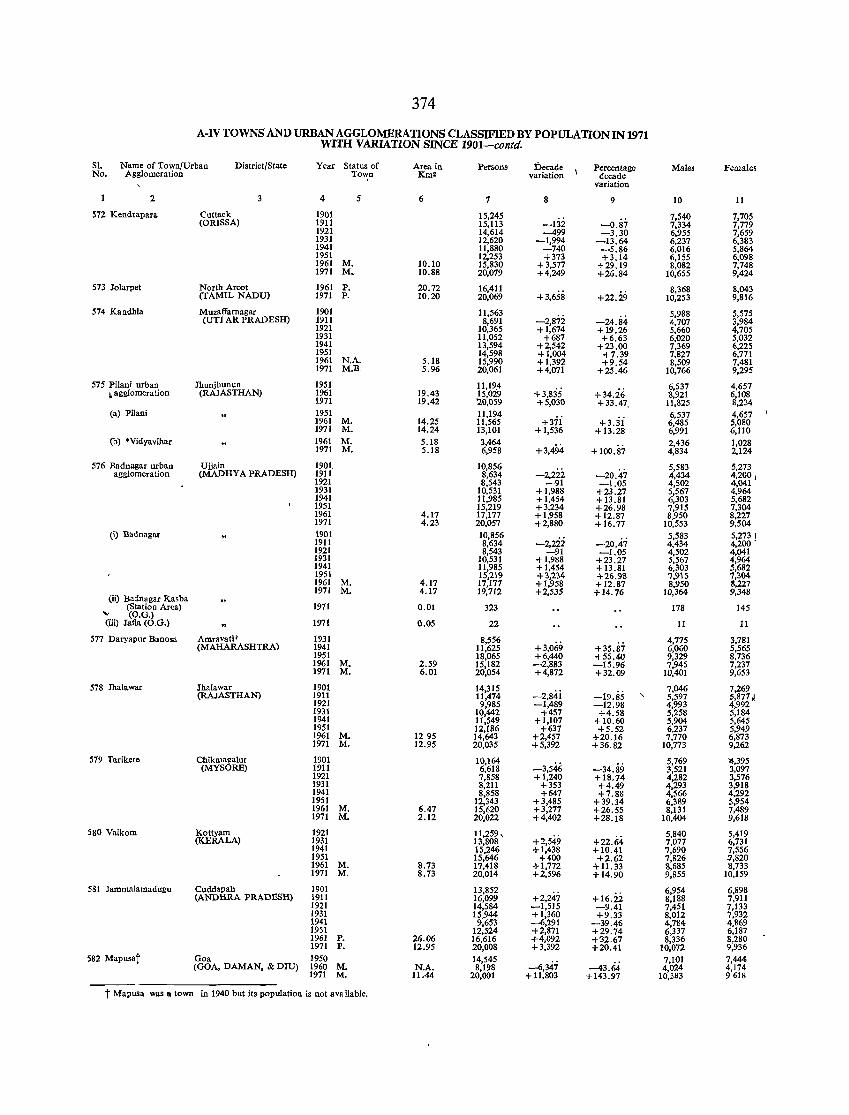
374
A-IV TOWNS AND URBAN AGGLOMERATIONS CLASSIFIED BY POPULATIONlN 1971 WITH VARIATION SINCE 1901-contd.
SI. Name of Town/Urban District/State Year Status of Area in Persons Decade Percentage Males Females No. Agglomeration Town Km2 variation decade
variation
2 3 4 5 6 7 9 10 11
572 Kendrapara Cuttack 1901 15,245 ~0.87
7,540 7,705 (ORISSA) 1911 15,113 -132 7,334 7,779
1921 14,614 -499 -3.30 6,955 7,659 1931 12,620 -1,994 -13.64 6,237 6,383 1941 11,880 -740 -5.86 6,016 5,864 1951 12,253 +373 +3.14 6,155 6,098 1961 M. 10.10 15,830 +3,577 +29.19 8,082 7,748 1971 M. 10.88 20,079 +4,249 +26.84 10,655 9,424
573 Jolarpet North Arcot 1961 P. 20.72 16,411 +3,658 +22.29
8,368 8,043 (TAMIL NADU) 1971 P. 10.20 20,069 10,253 9,816
574 Kandhla M uzaifarnagar 1901 11,563 -2,872 -24.84
5,988 5,575 (Un AR PRADESH) 1911 8,691 4,707 3,984
1921 10,365 + 1,674 +19.26 5,660 4,705 1931 11,052 +687 +6.63 6,020 5,032 1941 13,594 +2,542 +23.00 7,369 6,225 1951 14,598 +1,004 +7.39 7,827 6,771 1961 N.A. 5.18 15,990 +1,392 +9.54 8,509 7,481 1971 M.B. 5.96 20,061 +4,071 +25.46 10,766 9,295
575 Pilani urban 1hunjhunun 1951 11,19.4 +3,835 +34.26
6,537 4,657 L agglomeration (RAJASTHAN) 1961 19.43 15,029 8,921 6,108
1971 19.42 '20,059 +5,030 +33.47. 11,825 8,234 (a) Pilani 1951 11,194
+3"ii +3.3j 6,537 4,657
1961 M. 14.25 11,565 6,485 5,080 1971 M. 14.24 13,101 + 1,536 +13.28 6,991 6,110
(b) *Vidyavihar 1961 M. 5.18 3,464 +3,494 + 100.87
2,436 1,028 1971 M. 5.18 6,958 4,834 2,124
576 Badnagar urban Ujjain 1901. 10,856 -2,222 -20.47
5,583 5,273 agglomeration (MADHYA PRADESH) 1911 8,~34 4,434 4,200 I
1921 8,543 -91 -1.05 4,502 4,041 1931 10,531 +1,988 +23.27 5,567 4,964 1941 11,985 +1,454 +13.81 6,303 5,682 1951 15,219 +3,234 +26.98 7,915 7,304 1961 4.17 17,177 + 1,958 + 12.87 8,950 8,227 1971 4.23 20,057 +2,880 + 16.71 10,553 9,504
(i) Badnagar 1901 10,856 -2,2ii -20.47
5,583 5,2731 1911 8,634 4,434 4,200 -1921 8,543 -91 -1.05 4,502 4,041 1931 10,531 +1,988 +23.27 5,567 4,964 1941 11,985 +1,454 +13.81 6,303 5,682 1951 15,219 +3,234 +26.93 7,915 7,304 1961 M. 4.17 17,177 +1,958 +12.81 8,950 8,227 1971 M. 4.17 19,712 +2,535 +14.16 10,364 9,348
(ii) Badnagar Kasba 1971 0.01 323 178 145 (Station Area)
.... (O.G.) (iii) Jafia (O.G.) 1971 0.05 22 11 11
577 Daryapur Banosa Amravati' 1931 8,556 +3,069 + 35.87
4,775 3,781 (MAHARASHTRA) 1941 11,625 6,060 5,565
1951 18,065 +6,440 +55.40 9,329 8,736 1961 M. 2.59 15,182 -2,883 -15.96 7,945 1,237 1971 M. 6.01 20,054 +4,872 +32.09 10,401 9,653
578 1halawar rhalawar 1901 14,315 -2,84i -19.85
7,046 7,269 (RAJASTHAN) 1911 11,474 , 5,597 S,877j
1921 9,985 -1,489 -12.98 4,993 4,992 1931 10,442 +451 +4.58 5,258 5,184 1941 11,549 +1,101 +10.60 5,904 5,645 1951 12,186 +631 +5.52 6,237 5,949 1961 M. 1295 14,643 +2,457 +20.16 7,770 6,873 1971 M. 12.95 20,035 +5,392 +36.82 10,773 9,262
579 Tarikere Chikmagalur 1901 10,164 -3,546 -34.89
5,769 '4,395 (MYSORE) 1911 6,618 3,521 3,097
1921 7,858 + 1,240 +18.14 4,282 3,576 1931 8,211 +353 +4.49 4,293 3,918 1941 8,858 +641 +7.88 4,566 4,292 1951 12,343 +3,485 + 39.34 6,389 5,954 1961 M. 6.47 15,620 +3,277 +26.55 8,131 7,489 1971 M. 2.12 20,022 +4,402 +28.18 10,404 9,618
580 Vaikom Kottyam 1921 11,259, +2,549 +22.64
5,840 5,419 (KERALA) 1931 13,303 1,077 6,731
1941 15,246 + 1,438 +10.41 7,690 7,556 1951 15,646 +400 +2.62 1,826 -1,820 1961 M. 8.73 17,418 +1,772 + 11.33 8,685 8,733 1971 M. 8.73 20,014 +2,596 + 14.90 9,855 10,159
581 Jammalamadugu Cuddapah 1901 13,852 +2,247 +16.22
6,954 6,898 (ANDHRA PRADESH) 1911 16,099 8,188 7,911
1921 14,584 -1,515 -9.41 7,451 7,133 1931 15,944 +1,360 +9.33 8,012 7,932 1941 9,653 -6,291 -39.46 4,784 4,869 1951 12,524 +2,871 +29.74 6,337 6,187 1961 P. 26.06 16,616 +4,092 +'32.67 8,336 8,280 1971 P. 12.95 20,008 +3,392 +20.41 10,072 9,936
582 Mapusat Goa 1950 14,545 -6,347 --43.64
7,101 7,444 (GOA, DAMAN, & DIU) 1960 M. N.A. 8,198 4,024 4,174
1971 M. 11M 20,001 +11,803 +143.97 10,383 9618
t Mapusa was a town in 1940 but its population is not ava ilable.
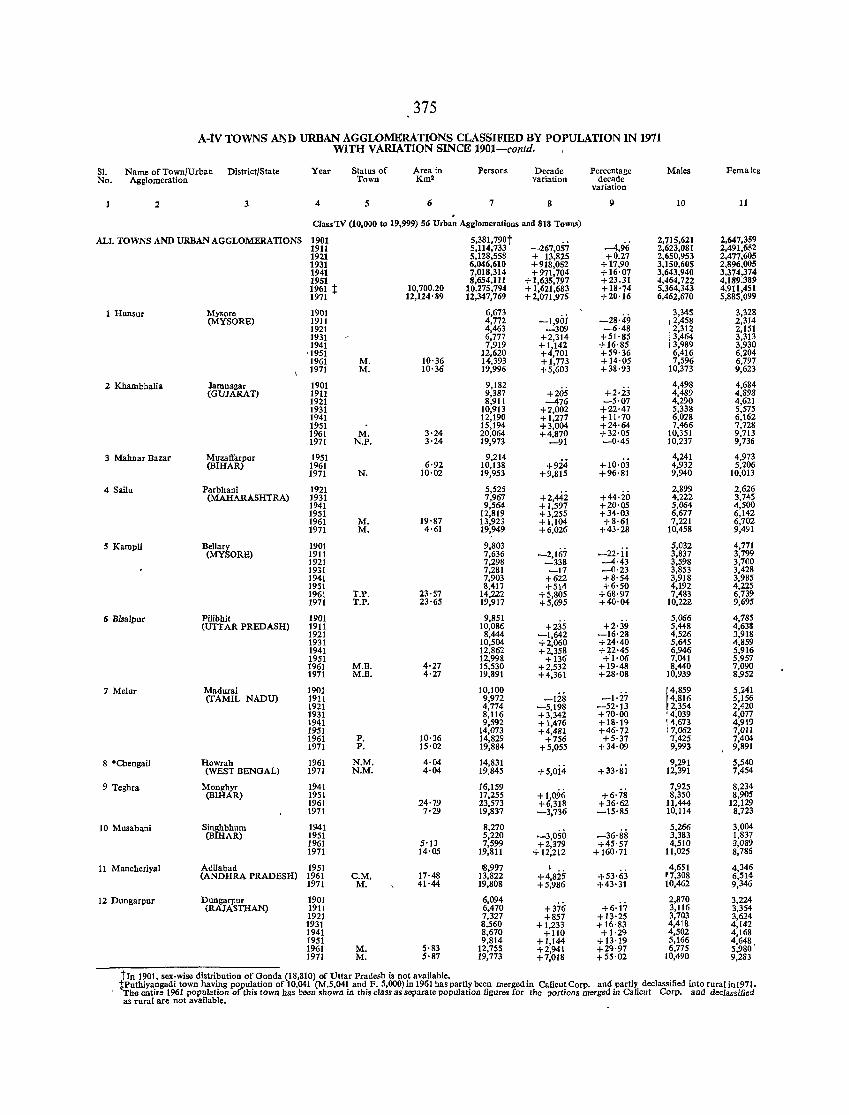
375
A-tv TOWNS MlD URBAN AGGLOMERATIONS CLASSIFIED BY POPULATION IN 1971 WITH VARIATION SINCE 1901-contd.
81. Name of TownTUrbao District[State Year Status of Area in Persons Decade Percentage Males Females No. Agglomeration Town Km2 variation decade
variation
2 3 4 5 6 7 8 9 10 11
C1ass'IV (10,000 to 19,999) 56 Urban Agglomeralions and 818 Towns)
ALL TOWNS AND URBAN AGGLOMERATIoNS 1901 5,381,790t -267,057 --4,96
2,715,621 2,647,359 1911 5,114,733 2,623,081 2,491,652 1921 5,128,558 + 13,825 +0.27 2,650,953 2,477,605 1931 6,046,610 +918,052 +17,90 3,150,605 2,896,005 1941 7,018,314 +971,704 +16·07 3,643,940 3,374,374 1951 8,654,111 +1,635,797 +23.31 4,464,722 4,189.389 1961 t 10,700.20 10.275,794 +1,621,683 +18'74 5,364,343 4,911,451 1971 12,124'89 12,347,769 +2,071,975 +20·16 6,462,670 5,885,099
1 Huosur Mysore 1901 6,6n -1,90i -28·49
3,345 3,328 (MYSORB) 1911 4,772 12,458 2,314
1921 4,463 -309 -6·48 2,312 2,151 1931 6,777 +2,314 +51'85 [ 3,464 3,313 1941 7,919 +1,142 +16'85 ! 3,989 3,930
'1951 12,620 +4,701 +59·36 6,416 6,204 1961 M. 10·36 14,393 +1,773 +14·05 7,596 6,797 1971 M. 10·36 19,996 +5,603 +38·93 10,373 9,623
2 Kbambhalia Iamnagar 1901 9,182 +205 +2·i3
4,498 4,684 (GUJARAT) 1911 9,387 4,489 4,898
1921 8,911 --476 -5·07 4,290 4,621 1931 10,913 +2,002 +22·47 5,338 5,575 1941 12,190 +1,277 + 11·70 6,028 6,162 1951 15,194 +3,004 +24·64 7,466 7,728 1961 M. 3'24 20,064 +4,870 +32·05 10,351 9,713 1971 N.P. 3'24 19,973 -91 -0·45 10,237 9,736
3 Mahnar Bazar Muzaffarpur 1951 9,214 +9i4 + 10'03
4,241 4,973 (BIHAR) 1961 6·92 10,138 4,932 5,206
1971 N. 10·02 19,953 +9,815 +96'81 9,940 10,013
4 Sailu Parbhani 1921 5,525 +2,44i +44·io
2,899 2,626 (MAHARASHTRA) 1931 7,967 4,222 3,745
1941 9,564 +1,597 +20·05 5,064 4,500 1951 12,819 +3,255 +34·03 6,677 6,142 1961 M. 19'87 13,923 +1,104 +8'61 7,221 6,702 1971 M. 4·61 19,949 +6,026 +43·28 10,458 9,491
5 Karopli Bellary 1901 9,803 -2,167 -22·ii
5,032 4,771 (MYSORB) 1911 7,636 3,837 3,799
1921 7,298 -338 --4·43 3,598 3,700 1931 7,281 -17 -0'23 3,853 3,428 1941 7,903 +622 +8'54 3,918 3,985 1951 8,411 +514 +6'50 4,192 4,225 1961 T.P. 23'57 14,222 +5,805 +68·97 7,483 6,739 1971 T.P. 23·65 19,917 +5,695 +40·04 10,222 9,695
6 Bisalpur Pilibhit 1901 9,851 +235 +2·39
5,066 4,785 (UTTAR PREDASH) 1911 10,086 5,448 4,638
1921 8,444 -1,642 -16'28 4,526 3,918 1931 10,504 +2,060 +24·40 5,645 4,859 1941 12,862 +2,358 +22·45 6,946 5,916 1951 12,998 +136 +-1'06 7,041 5,957 1961 M.B. 4·27 ]5,530 +2,532 +19·48 8,440 7,090 1971 M.B. 4'27 19,891 +4,361 +28·08 10,939 8,952
7 Melur Madurai 1901 10,100 -128 -1·27
r4,859 5,241 (TAMIL NADU) 1911 9,972 14,816 5,156
1921 4,774 -5,198 -52·13 2,354 2,420 1931 8,116 +3,342 +70·00 '4,039 4,077 1941 9,592 +1,476 + 18'19 i 4,673 4,919 1951 14,073 +4,481 +46·72 17,062 7,011 1961 P. 10·36 14,829 +756 +5·37 7,425 7,404 1971 P. 15·02 19,884 +5,055 +34·09 9,993 9,891
8 *Chengail Howrah 1961 N.M. 4·04 14,831 +5,oi4 +33'8i
9,291 5,540 (WEST BENGAL) 1971 N.M. 4·04 19,845 12,391 7,454
9 Teghra Monghyr 1941 16,159 +1,096 +6·78
7,925 8,234 (BIHAR) 1951 17,255 8,350 8,905
196] 24'79 23,573 +6,318 +36·62 11,444 12,129 1971 7·29 19,837 -3,736 -15·85 10,114 8,723
10 Musabani Singhbhum 1941 8,270 -3,050
5,266 3,004 (BIHAR) 1951 5,220 -36·88 3,383 1,837
1961 5'13 7,599 +2,379 +45·57 4,510 3,089 1971 14·05 19,811 + 12,212 + 160'71 11,025 8,786
11 Mancheriyal Adilabad 1951 8,997 I 4,651 4,346 (ANDHRA PRADESH) 1961 C.M, 17·48 13,822 +4,825 +53·63 ",308 6,514
1971 M. 41·44 19,808 +5,986 +43'31 10,462 9,346
12 Dungarpur Dungarpur 1901 6,094 +3'76 +6·i7
2,870 3,224 (RAJASTHAN) 1911 6,470 3,116 3,354
1921 7,327 +857 +1;1'25 3,703 3,624 1931 8,560 + 1,233 +16·83 4,4]8 4,142 1941 8,670 +110 +1·29 4,502 4,168 1951 9,814 +1,144 +13'19 5,166 4,648. 1961 M. 5·83 12,755 +2,941 +29·97 6,775 5,980 1971 M. 5'87 19,773 +7,018 +55·02 10,490 9,283
tIn 1901, sex-wise distribution of Gonda (18,810) of Uttar Pradesh is not available. ~Puthiyangadi town having population of 10,041 (M.5,041 and F. 5,000) in 1961 has partly been merged in Calicut Corp. and partly declassified into rural in1971. The entire 1961 popUlation of this town has been shown in this class as separate population figures for the portions merged in Calicn! Corp. and declassified as rural are not available.
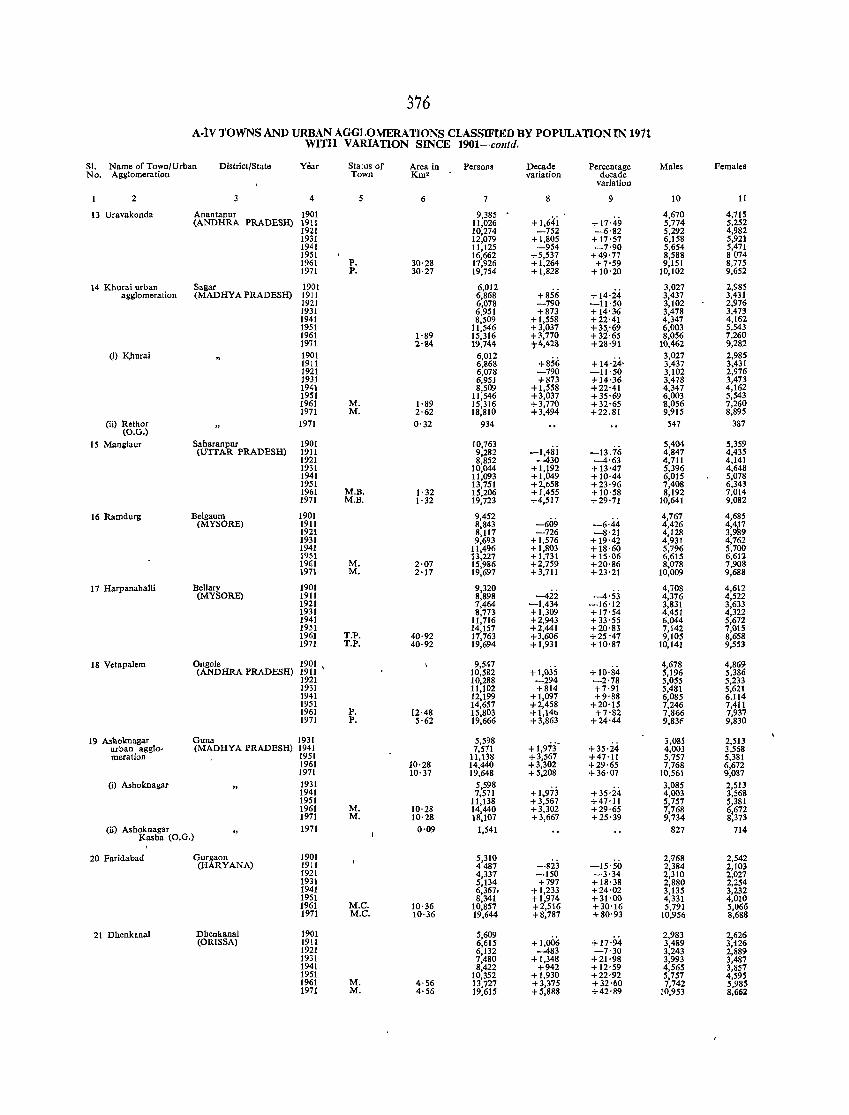
376
A·tv TOWNS AND URBAN AGGLOMERATIONS CLASSIFIED BY POPULATION IN 1911 WITH VARIATION SINCE 1901-contd.
SI. Name of Town/Urban District/State Year Status of Area in Persons Decade Percentage Males Females No. Agglomeration Town Km" variation decade
variation
2 4 5 6 7 8 9 10 11
13 Uravakonda Anantapur 1901 9,385 +I,64i +17·49
4,670 4,715 (ANDHRA PRADESH) 1911 11,026 5,774 5,252
1921 10,274 -752 -6'82 5,292 4,982 1931 12,079 +1,805 +17'57 6,158 5,921 1941 11,125 ·-954 -7·90 5,654 5,471 1951 16,662 +5,537 +49'77 8,588 8074 1961 P. 30·28 17,926 +1,264 +7·59 9,151 8,775 1971 P. 30·27 19,754 +1,828 +10'20 10,102 9,652
14 Khurai urban Sagar 1901 6,012 +856 +14'24
3,027 2,985 agglomeration (MADHYA PRADESH) 1911 6,868 3,437 3,431
1921 6,078 -790 -11'50 3,102 2,976 1931 6,951 +873 +14'36 3,478 3,473 1941 8,509 +1,558 +22·41 4,347 4,162 1951 11,546 +3,037 !~l~~ 6,003 5,543 1961 1·89 15,316 +3,770 8,056 7,260 1971 2·84 19,744 t 4,428 +28·91 10,462 9,282
0) K,hurai 1901 6,012 +856
3,027 2,985 1911 6,868 + 14·24' 3,437 3,431 1921 6,078 -790 -11'50 3,102 2,976 193J 6,951 +873 +14·36 3,478 3,473 1941 8,509 +1,558 +22·41 4,347 4,162 1951 11,546 +3,037 +35·69 6,003 5,543 1961 M. 1·89 15,316 +3,770 +32'65 8,056 7,260 1971 M. 2·62 18,810 +3,494 +22.81 9,915 8.895
(ii) Rethor (O.G.)
1971 0'32 934 547 387
15 Maoilaur Saharanpur 1901 10,763 -1,4Si -13.;6
5,404 5,359 (UTTAR PRADESH) 1911 9,282 4,847 4,435
1921 8,852 -430 -4·63 4,711 4,141 1931 10,044 +1,192 + 13·47 5,396 4,648 1941 11,093 +1,049 +10·44 6,015 5,078 1951 13,751 +2,658 +23·96 7,408 6,343 1961 M.B. 1·32 15,206 +1,455 + 10'58 8,192 7,014 1971 M.B. 1'32 19,723 +4,517 +29'71 10,641 9,082
16 Ramdurg Belgaum 1901 9,452 -609 -6·44
4,767 4,685 (MYSORE) 1911 8,843 4,426 4,4f 1921 8,117 -726 -8·21 4,128 3,99
1931 9,693 +1,576 +19·42 4,931 4,762 1941 11,496 +1,803 +18·60 5,796 5,700 1951 13,227 +1,731 + 15·06 6,615 6,612 1961 M. 2·07 15,986 +2,759 +20·86 8,078 7,908 1971 M. 2·17 19,697 +3,711 +23'21 10,009 9,688
17 Harpaoahalli Bellary 1901 9,320 4,708 4,612 (MYSORE) 1911 8,898 -422 -4·53 4,376 4,522
1921 7,464 -1,434 -16·12 3,831 3,633 1931 8,773 +1,309 +17·54 4,451 4,322 1941 11,716 +2,943 + 33'55 6,044 5,672 1951 14,157 +2,441 +20·83 7,142 7,01S 1961 T.P. 40·92 17,763 +3,606 +25 '47 9,105 8,658 1971 T.P. 40·92 19,694 +1,931 + 10'87 10,141 9,553
18 Vetapalem Ongole 1m' 9,547 +1,035
4,678 4,869 (ANDHRA PRADESH) 10,582 +10·84 5,196 5,386
1921 10,288 -294 -2·78 5,055 5,233 1931 11,102 +814 +7·91 5,481 5,621 1941 12,199 +1,097 +9·88 6,085 6,114 1951 14,657 +2,458 +20'15 7,246 7,411 1961 P. 12·48 15,803 +I,14b +7'82 7,866 7,937 1971 P. 5·62 19,666 +3,863 +24·44 9,831' 9,830
19 Ashokoagar Guna 1931 5,598 + 1,97j-
j,08~ 2,513 urban agglo- (MADHYA PRADESH) 1941 7,511 +35·24 4,003 3,568 meration 1951 11,138 +3,567 +47·11 5,757 5,381
1961 10'28 14,440 +3,302 +29·65 7,768 6,672 1971 10'37 19,648 +5,208 + 36·07 10,561 9,081
(i) Ashoknagar 1931 5,598 + 1,973
3,085 2,513 1941 7,571 + 35'24 4,003 3,568 1951 11,138 +3,567 +47'11 5,757 5,381 1961 M. 10·28 14,440 +3,302 +29'65 7,768 6,672 1971 M. 10·28 18,107 +3,667 +25'39 9,734 8,373
(ii) Ashoknagar 1971 0'09 1,541 827 714 Kasha (O.G.)
20 Faridabad Gurgaon 1901 5,310 -823 -15'50
2,'768 2,542 (HARYANA) 1911 4487 2,384 2,103
1921 4,337 -150 -3·34 2,310 2,027 1931 5,134 +797 +18·38 2,880 2,254 1941 6,367. +1,233 +24·02 3,135 3,232 1951 8,341 +1,974 +31·00 4,331 4,010 1961 M.C. 10·36 10,857 +2,516 +30'16 5,791 5,066 1971 M.C. 10·36 19,644 +8,787 +80'93 10,956 8,688
21 Dheokaoal Dheokanal 1901 5,609 +1,006
2,983 2,626 (ORISSA) 1911 6,615 +17'94 3,489 3,126
1921 6,132 -483 -7'30 3,243 2,889 1931 7,480 +1,348 +21·98 3,993 3,487 1941 8,422 +942 +12'59 4,565 3,851 1951 10,352 +1,930 +22·92 5,757 4,595 1961 M. 4·56 13.727 +3,375 +32'60 7,742 5,985 1971 M. 4'56 19,615 +5,888 +42'89 10,953 8,661
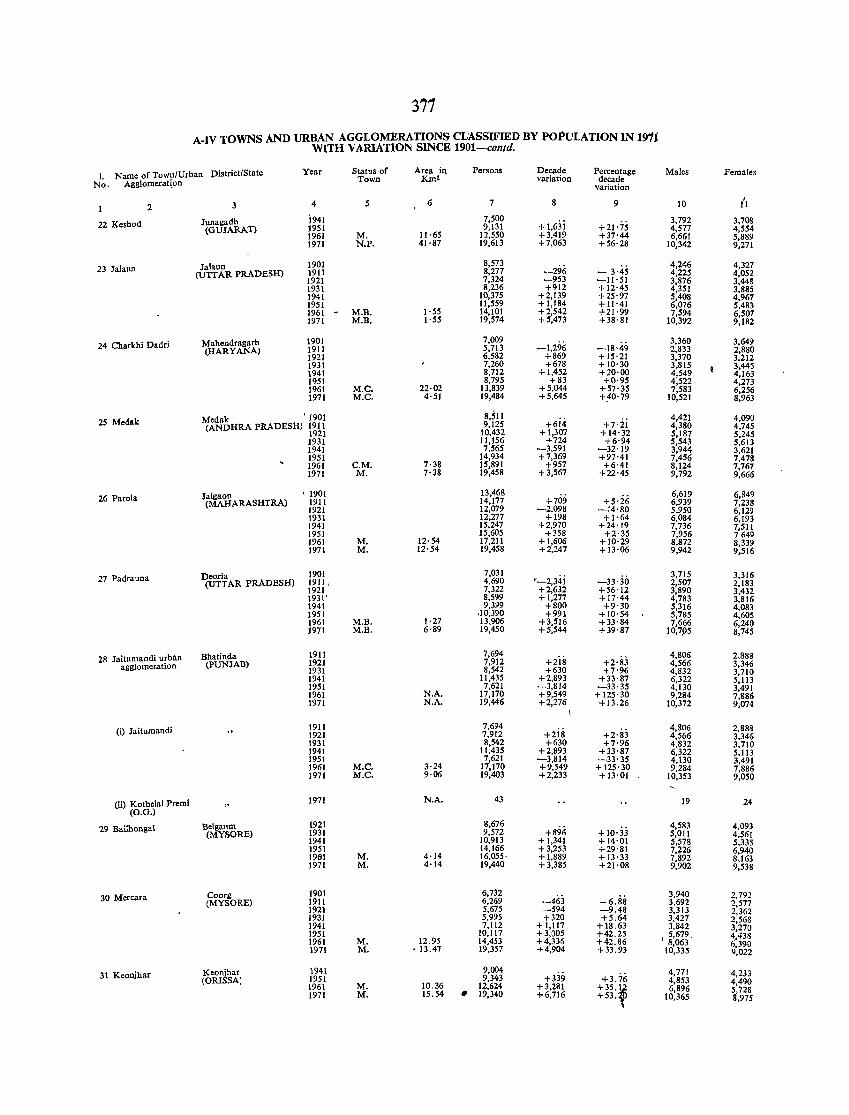
371 A-IV TOWNS AND URBAN AGGLOMERATIONS CL:4.SSIFIED BY POPULATION IN 1911
WITH VARIATION SINCE 1901-contd.
1. Name of Town/Urban Pistrict/State Year Status of Area in Persons Decade Percentage Males Females Town KIn2 variation decade
No. Agglomeratipn variation
4 5 6 7 9 10 ,
2 11
22 Keshod Junagadh 1941 7,500 +1,63i +21'75
3,792 3,708 (GUJARAT) 1951 9,131 4,577 4,554
1961 M. 11·65 12,550 +3,419 +37·44 6,661 5,889 1971 N.P. 41·87 19,613 +7,063 +56'28 10,342 9,271
23 Jalaun Jalaun 1901 8,573 - 3·45
4,246 4,327 (UTTAR PRADESH) 1911 8,277 -296 4,225 4,052
1921 7,324 -953 -11'51 3,876 3,448 1931 8,236 +912 +12'45 4,351 3,885 1941 10,375 +2,139 +25·97 5,408 4,967 1951 11,559 +1,184 +11'41 6,076 5,483 1961 - M.B. 1·55 14,101 +2,542 +21·99 7,594 6,507 1971 M.B. 1·55 19,574 +5,473 +38'81 10,392 9,182
24 Charkhi Dadri Mahendragarh 1901 7,009 -1,296 -18·49
3,360 3,649 (HARYANA) 1911 5,713 2,833 2,880
1921 6,582 +869 +15'21 3,370 3,212 1931 7,260 +678 + 10'30 3,815 3,445 1941 8,712 +1,452 + 20·00 4,549 4,163 1951 8,795 +83 +0·95 4,522 4,273 1961 M.C. 22·02 13,839 +5,044 + 57·35 7,583 6,256 1971 M.C. 4·51 19,484 +5,645 +.40'79 10,521 8,963
25 Medak Medak ' 1901 8,S1l +6i4 +7·ii
4,421 4,090 (ANDHRA PRADESH) m~ 9,125 4,380 4,745
10,432 +1,307 +14'32 5,187 5,245 1931 11,156 +724 +6·94 5,543 5,613 1941 7,565 -3,591 -32'19 3,944 3,621 1951 14,934 +7,369 +97'41 7,456 7,478 1961 C.M. 7·38 15,891 +957 +6·41 8,124 7,767 1971 M. 7·38 19,458 +3,567 +22'45 9,792 9,666
26 Parola Jalgaon \ 1901 13,468 6,619 6,849 (MAHARASHTRA) 1911 14,177 +709 +5'26 6,939 7,238
1921 12,079 -2,098 -14'80 5,950 6,129 1931 12,277 +198 +1'64 6,084 6,193 1941 15,247 +2,970 +24'19 7,736 7,511 1951 15,605 +358 +2'35 7,956 7649 1961 M. 12·54 17,211 +1,606 +10·29 8,872 8,339 1971 M. 12·54 19,458 +2,247 + 13·06 9,942 9,516
27 Padrauna Deoria 1901 7,031 3,715 3,316 (UTTAR PRADESH) 1911, 4,690 '-2,341 -33,30 2,507 2,183
1921 7,322 +2,632 +56'12 3,890 3,432 1931' 8,599 +1,277 +17·44 4,783 3,816 1941 9,399 +800 +9'30 5,316 4,083 1951 ,10,390 +991 +10'54 5,785 4,605 1961 M.B. 1·27 13,906 +3,516 +33'84 7,666 6,240 1971 M.B. 6·89 19,450 +5,544 +39'87 10,7,05 8,745
28 Jaitumandi urban Bhatinda 1911 7,694 +2is
4,806 2,888 (PUNJAB) 1921 7,912 +2'83 4,566 3,346 agglomeration 1931 8,542 +630 +7'96 4,832 3,710
1941 11,435 +2,893 +33·87 6,322 5,113 1951 7,621 -3,814 -33'35 4,130 3,491 1961 N.A. 17,170 +9,549 + 125·30 9,284 7,886 1971 N.A. 19.446 +2,276 +13.26 10,372 9,074
\
(i) Jaitumandi 1911 7,694 +2'83
4,806 2,888 1921 7,912 +218 4,566 3,346 1931 8,542 +630 +7·96 4,832 3,710 1941 11,435 +2,893 +33'87 6,322 5,113 1951 7,621 -3,814 -33'35 4.130 3,491 1961 M.C. 3·24 17,170 +9,549 + 125·30 9,284 7,886 1971 M.C, 9·06 19,403 +2,233 +13·01 10,353 9,050
(ii) Kothelal Premi 1971 N.A. 43 19 24 (O.G.)
29 Bailhongal Belgaum 1921 8,676 +896
4,583 4,093 (MYSORE) 1931 9,572 + 10'33 5,011 4,561
1941 10,913 +1,341 +14·01 5,578 5,335 1951 14,166 +3,253 +29'81 7,226 6,940 1961 M. 4·14 16,055· + 1,889 + 13'33 7,892 8,163 1971 M. 4·14 19,440 +3,385 +21'08 9,902 9,538
30 Mercara Coorg 1901 6,732 3,940 2,792 (MYSORE) 1911 6,269 -463 -6.88 3,692 2,577
1921 5,675 -594 -9.48 3,313 2,362 1931 5,995 +320 +5.64 3,427 2,568 1941 7,112 + 1,117 +18.63 3,842 3,270 1951 10,117 +3,005 +42.25 \ 5,679. 4, .. 38 1961 M .• 12.95 14,453 +4,336 +42.86 8,063 6,390 1971 M. . 13.47 19,357 +4,904 +33.93 10,335 9,022
31 Keonjhar Keonjhar 1941 9,004 +339 +3.76
4,771 4,233 (ORISSA) 1951 9,343 4,853 4,490
1961 M. 10.36 12,624 +3,281 +35., 6,896 5,728 1971 M. 15.54 • 19,340 +6,716 +53. 10,365 8,975
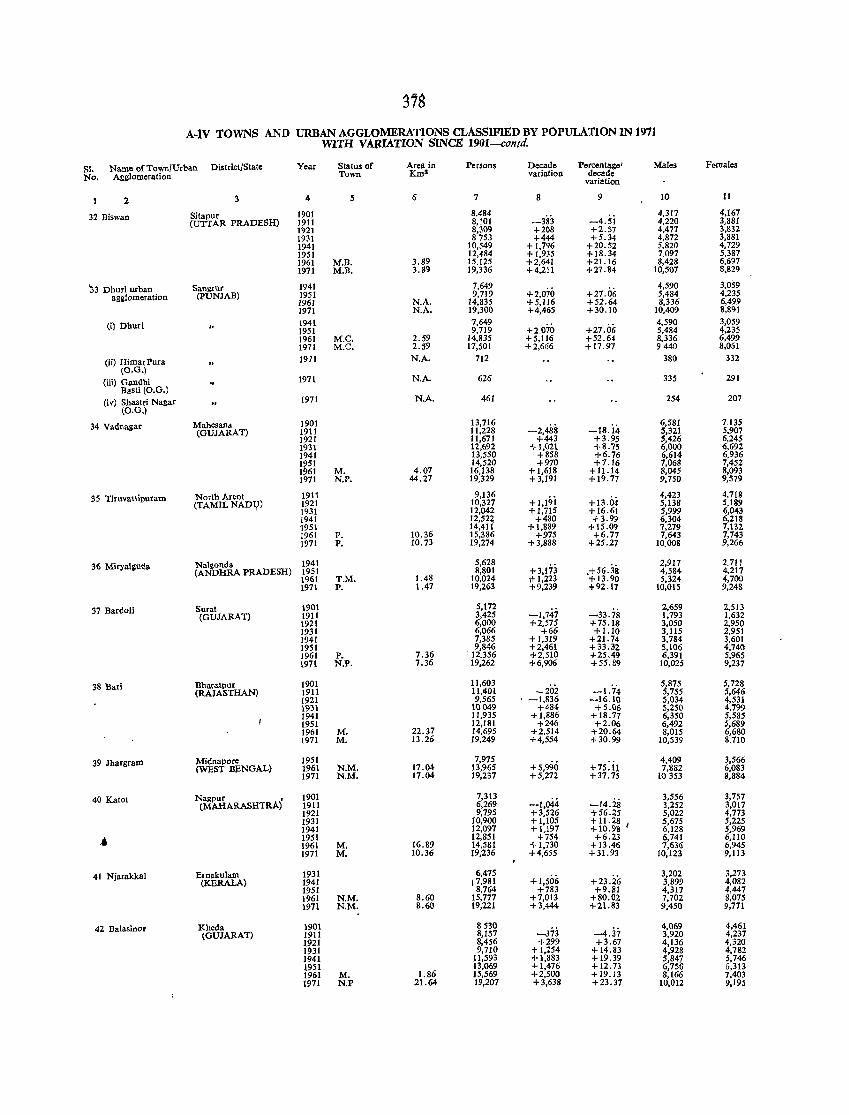
~7S
A-tv toWNS AND URBAN AGGLOMERATIONS CLASSIFIED BY POPULATION IN 1971 WITH VAlUATION SINCE 1901-contd.
SI. Name of Town/Urban District/State Year Status of Area in Persons Decade Percentage' Males Females
No. Agglomeration Town Km2 variation decade variation
2 3 4 5 6 7 8 9 10 11
32 Biswan Sitapur 1901 8.484 -4.5i
4,317 4,167 (UTTAR PRADESH) 1911 8,101 -383 4,220 3,881
1921 8,309 +208 +2.57 4,477 3,832 1931 8753 +444 +5.34 4,872 3,881 1941 10,549 +1,796 +20.52 5,820 4,729 1951 12,484 +1,935 +18.34 7.097 5,387 1961 M.B. 3.89 15.125 +2,641 +21.16 8,428 6,697 1971 M.B. 3.89 19,336 +4,211 +27.84 10,507 8,829
'33 Dhuri urban Sangrur 1941 7,649 +2,070 +27.06
4,590 3,059 agglomeration (PUNJAB) 1951 9,719 5,484 4,235
1961 N.A. 14,835 +5,116 +52.64 8,336 6,499 1971 N.A. 19,300 +4,465 +30.10 10,409 8,891
(i) Dburi 1941 7,649 +2,070 +27.06
4,590 3,059 1951 9,719 5,484 4,235 1961 M.C. 2.59 14,835 +5,116 +52.64 8,336 6,499 1971 M.C. 2.59 17,501 +2,666 +17.97 9440 8,061
(ii) HimatPura 1971 N.A. 712 380 332 (O.G.)
(iii) Gandhi 1971 N.A. 626 335 291 Basti (O.G.)
(i v) Shastri Nagar 1971 N.A. 461 254 207 (O.G.)
34 Vaduallar Mahesana 1901 13,716 -2,488 -18.i4
6,581 7.135 (GUJARAT) 1911 11,228 5,321 5,907
1921 11,671 +443 +3.95 5,426 6,245 1931 11,692 +1,021 +8.75 6,000 {i,692 1941 13,550 +858 +6.76 6,614 6,936 1§51 14,520 +970 +7.16 7,06S 7,452 1 61 M. 4.07 16,138 +1,618 +11.14 8,045 8,093 1971 N.P. 44.27 19,329 +3,191 +19.77 9,750 9,579
35 Tiruvattipuram North Areot 1911 9,136 +1,19i + 13.04
4,423 4,718 (TAMIL NADT,J) 1921 10,327 5,138 5.189
1931 12,042 +1,715 +16.61 5,999 6,0.3 1941 12,522 +480 +3.99 6,304 6,218 1951 14,4!l + 1.889 +15.09 7,279 7,132 1961 P. 10.36 15,386 +975 +6.77 7,643 7,743 1971 P. 10.73 19,274 +3,888 +25.27 10.008 9,266
36 Miryailluda Nalgonda 1941 5,628 +3,f73 ,+56.38
2,917 2.71! (ANDHRA PRADESH) 1951 8,801 4,584 4,217
1961 T.M. 1.48 10,024 )1-1,223 ,,13.90 5,324 4,700 1971 P. 1.47 19,263 +9,239 +92.17 10,015 9,248
37 Bardoli Surat 1901 5,172 -1,747 -33.78
2,659 2,513 (GUIARAT) 1911 3.425 1,793 1,632
1921 6,000 +2,575 +75.18 3,050 2.950 1931 6,066 +66 +1.10 J,1l5 2,951 1941 7,385 +1,319 +21. 74 3,784 3,601 1951 9,846 +2,461 +33.32 5,106 4.740 1961 P. 7.36 [ 12,356 +2,510 +25.49 6,391 5,965 1971 N.P. 7.36 19,262 +6,906 +55.89 10,025 9,237
38 Bari Bharatpur 1901 11,603 -202 -1.74
5,875 5,728 (RAJASTHAN) 1911 11,401 5,755 5,646
1921 9,565 -1,836 -16.10 5,034 4,531 1931 10049 +484 +5.06 5,250 4,799 1941 11,935 + 1,886 +18.77 6,350 5,585 1951 12,181 +246 +2.06 6,492 5,689 1961 M. 22.37 14,695 +2.514 +20.64 8,015 6,680 1971 M. 13.26 19,249 +4,554 +30.99 10,539 8.710
39 Jhargral11 Midnapore 1951 7,975 4,409 3,566 (WEST BpNGAL) 1961 N.M. 17.04 13,965 +5,990 +75.11 7,882 6,083
1971 N.M. 17.04 19,237 +5,272 +37.75 to 353 8,884
40 Katol Nagpur • 1901 7,313 -1,044 -14.28
3,556 3,757 (MAHARASHTRA) 1911 6,269 3,252 3,017
1921 9,795 +3,526 +56.25 5,022 4,773 1931 10,900 +1,105 +11.28 5.675 5,225 1941 12,097 +1,197 +10.98 6,128 5,969
•• 1951 12,851 +754 +6.23 6,741 6,1l0 1961 M. 16.89 14,581 + 1,730 + 13.46 7,636 6,945 1971 M. 10.36 19,236 +4,655 +31.93 10,123 9,113
41 Njarakkal Ernakulam 1931 6,475 +1,506 +23.26
3,202 3,273 (KERALA) 1941 ,7,981 3,899 4,082
1951 8,764 +783 +9.81 4,317 4,447 1961 N.M. 8.60 15,777 +7,013 +80.02 7,702 8,075 1971 N.M. 8.60 19,221 +3,444 +21.83 9,450 9,711
42 Balasinor Kheda 1901 8530 -373 -4.37
4,069 4,461 lGUIARAT) 1911 8,157 3,920 4,237
1921 8,456 +299 +3.67 4,136 4,320 1931 9,710 +1,254 +14.83 4,928 4,782 1941 11,593 +1,883 +19.39 5,847 5,746 1951 13,069 +1,476 +12.73 6,75~ 6,313 1961 M. 1.86 15,569 +2,500 +19.13 8,166 7,403 1971 N,P 21.64 19,207 +3,638 +23.37 10,012 9,19$
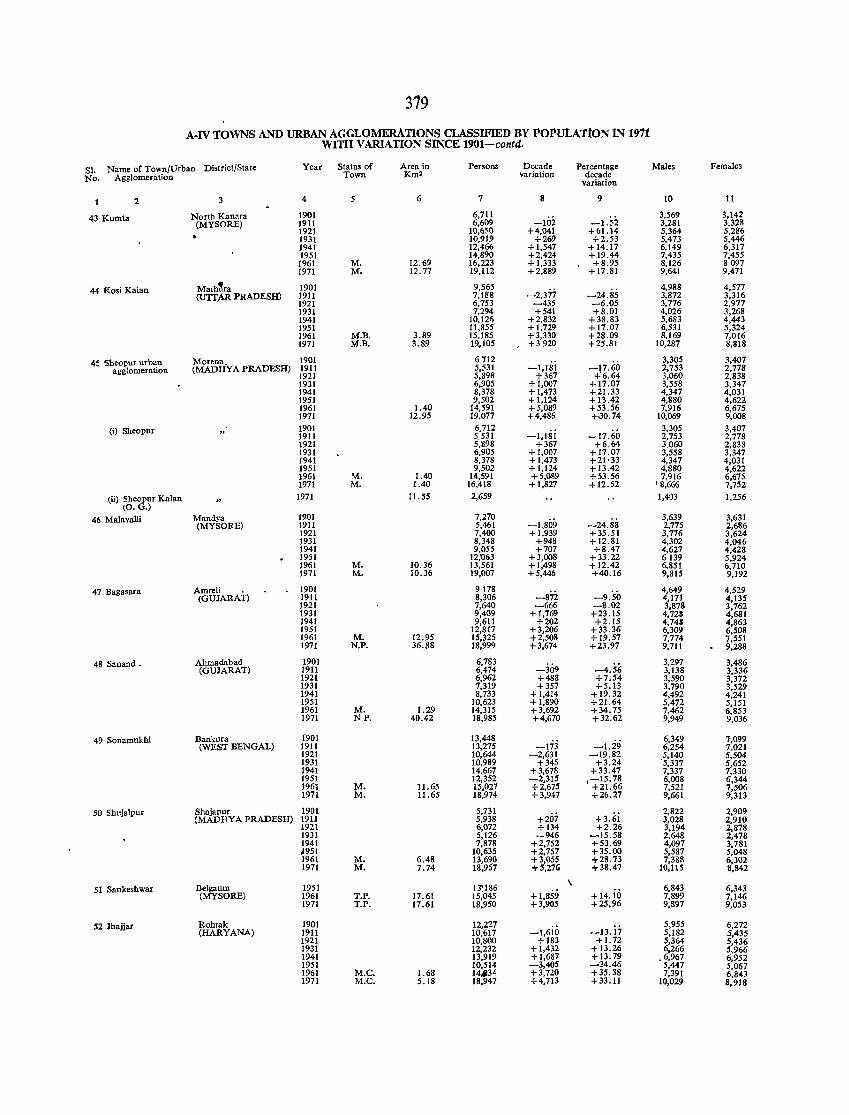
379
A-IV tOWNS AND URBAN AGGLOMERATIONS CLASSIFIED BY POPU'LATtON IN 1911 WITH VARIATION SINCE 1901-contd.
S). Name of Town/Urban Districl/State Year Status of Town
Area in Km2
Persons Decade variation
Percentage decade
variation No. Agglomeration
2
43 l(umta
44 Kosi Kalan
45 Sheopur urban agglomeration
(i) Sheopur
(ii) Sheopur Kalan {O.G.)
46 Malavalli
47 Bagasara
48 Sanand.
49 Sonamukhi
50 Shujalpur
51 Saukeshwar
52 Jhajjar
3
North Kanara (MYSORE)
Matht'lra (UTTAR-PRADESH)
Morena. (MADHYA PRADESH)
Mandya (MYSORE)
Arnreli . (GUJARAT)
Ahmadabad (GUJARAT)
Bankura (WEST BENGAL)
Shajapur (MADHYA PRADESH)
Belgaum (MYSORE)
Rohtak (HARYANA)
4
1901 1911 1921 1931 1941 1951
1961 1971
190) 1911 1921 1931 1941 1951 1961 1971
1901 1911 1921 1931 1941 1951 1961 1971 1901 1911 1921 1931 1941 1951 1961 1971 1971
1901 1911 1921 1931 1941 1951 1961 1971
1901 1911 1921 1931 1941 1951 1961 1971
1901 1911 1921 1931 1941 1951 1961 1971
[901 1911 1921 1931 1941 1951 1961 1971
1901 1911 1921 1931 1941 J951 1961 1971
1951 1961 1971
1901 1911 1921 1931 1941 1951 1961 1971
5
M. M.
M.B. M.B.
M. M.
M. M.
M. N.P.
M. NP.
M. M.
M. M.
T.P. T.P.
M.C. M.C.
6
12.69 12.77
3.89 3.89
1.40 12.95
1.40 1.40
11.55
10.36 10.36
12.95 36.88
1.29 40.42
11.65 11.65
6.48 7.74
17.61 17.61
1.68 5.18
7
6,711 6,609
10,650 10,919 12,466 14,890 16,223 19,112
9,565 7,188 6,753 7,294
10,121i 11,855 15,185 19,105
6712 5,531 5,898 6,905 8,378 9,502
14,591 19.077
6,712 5531 5:898 6,905 8,378 9,502
14,591 16,418 2,659
7.270 5,461 7,400 8,348 9,055
12,'063 13,561 19,007
9178 8,306 7,640 9,409 9,611
12,817 15,325 18,999
6,783 6,474 6,962 7,319 8,733
10,623 14,315 18,985
13,448 13,275 10,644 10,989 14,667 12,352 15,027 18,974
5,731
~:g~~ 5,126 7,878
10,635 13,690 18,957
13~186 15,045 18,950
12,227 10,617 10,800 12,232 13,919 10,514 14,.34 18,947
8
-102 +4,041
+269 +1,547 +2,424 +1,333 +2,889
-2,377 -435 +541
+2,832 + 1,729 +3,330 +3920
-I,lIij +367
+1,007 +1,473 + 1,124 +5,089 +4,486
-I,Hii +367
+1,007 +1,473 +1.124 +5,089 + 1,827
-1,809 +1,939
+948 +707
+3,008 +1,498 +5,446
-872 -666
+1,769 +202
+3,206 +2,508 +3,674
-309 +488 +357
+1,414 +1,890 +3,692 +4,670
-63 -2,631
+345 +3,678 -2,315 +2,675 +3,947
+207 +134 -946
+2,752 +2,757 +3,055 +5,276
+ 1,859 +3,905
-1,6io +183
+1,432 +1,687 -3,405 +3,720 +4,713
\
9
-1.52 +61.14 +2.53
+ 14.17 +19.44 +8.95
+17.81
-24.85 -6.05 +8.01
+38.83 +17.07 +28.09 +25.81
-F·60 +6.64
+17.07 +21.33 +13.42 +53.56 +JO.74
-17.60 +6.64
+17.07 +21'33 + 13.42 +53.56 + 12.52
-24.88 +35.51 + 12.81 +8.47
+33.22 + 12.42 +40.16
-9.50 -8.02
+23.15 +2.15
+33.36 +19.57 +23.97
-4.56 +7.54 +5.13
+19.32 +21.64 +34.75 +32.62
-J.i!i -19.82
+3.24 +33.47
.-15.78
. +21.66 +26.27
+3.i;i +2.26
-15.58 +53.69 +35.00 +28.73 +38.47
+14.10 +25,96
-13.17 + I. 72
+13.26 +13.79 -24.46 +35.38 +33.11
Males
10
3,569 3,281 5,364 5,473 6,149 7,435 8,126 9,641
4,988 3,872 3,776 4,026 5,683 6,531 8,169
10,287
3,305 2,753 3,060 3,558 4,347 4,880 7,916
10,069 3,305 2,753 3,060 3,558 4,347 4,880 7,916
18,666
1,403
3,639 2,775 3,776 4,302 4,627 6139 6,851 9,815
4,649 4,171 3,878 4,728 4,74. 6,309 7,774 9,711
3,297 3,138 3,590 3,790 4,492 5,472 7,462 9,949
6,349 6,254
.~:~j~ 7,337 6,008 7,521 9,661
2,822 3,028 3,194 2,648 4,097 5,587 7,388
10,115
6,843 7,899 9,897
5,955 5,182 5,364 6,266
,6,967 5,447 7,391
10,029
Females
11
3,142 3,328 5,286 5,446 6,317 7,455 8097 9,471
4,577 3,316 2,977 3,268 4,443 5,324 7,016 8,818
3,407 2,778 2,838 3,347 4,031 4,622 6,675 9,008 3,407 2,778 2,838 3,347 4,031 4,622 6,675 7,752 1,256
3,631 2,686 3,624 4,046 4,428 5,924 6,710 9,192
4,529 4,135 3,762 4,681 4,863 6,508 7,551 9,288
3,486 3,336 3,372 3,529 4,241 5,151 6,853 9,036
7,099 7,021 5,504 5,652 7,330 6,344 7,506 9,313
2,909 2,910 2,878 2,478 3,781 5,048 6,302 8,842
6,343 7,146 9,053
6,272 5,435 5,436 5,966 6,952 5,067 6,843 B,918
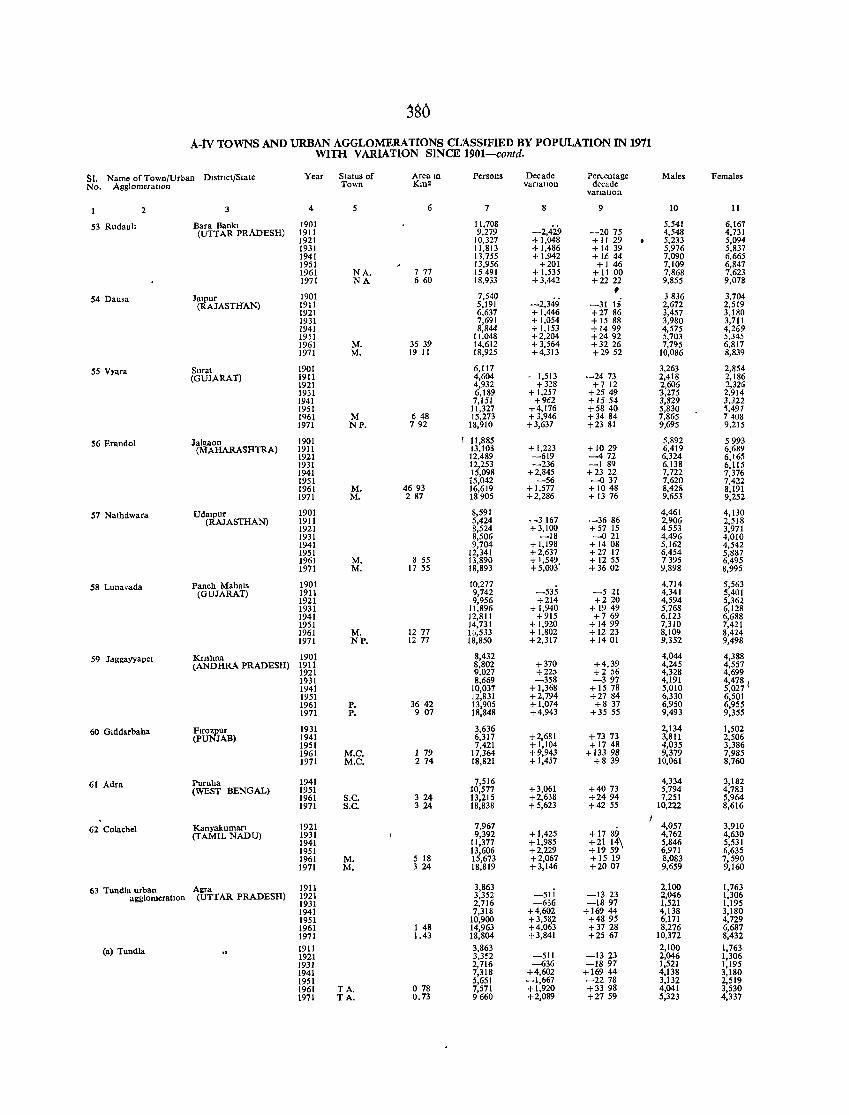
3S0
A-tv 'tOWNS AND URBAN AGGLOMERATIONS CLASSJFIED BY POPULATION IN 1911 WITH VARIATION SINCE 1901-contd.
Sl. Name of Town/Urban Dlstflct/State Year Status of Area 10 Persons Decade Pertentage Males Females No. AgglomeratIOn Town Km2 vartallon decade
vanatlon
2 4 5 6 7 8 9 10 11
53 Rudauh Bara Bankl 1901 11.708 -2,429
5,541 6,167 (UTI AR PRADESH) 1911 9,279 -2075 4,548 4,731
1921 10,327 + 1,048 +11 29 5,233 5,094 1931 11,813 + 1,486 + 14 39 5,976 5,837 1941 11,755 + 1,942 + 1.6 44 7,090 6,665 1951 13,956 +201 + 146 7,109 6,847 1961 NA. 7 77 15491 + 1,535 + 11 00 7,868 7,623 1971 NA 660 18,933 +3,442 +2222 9,855 9,078
1901 7,540 ,
54 Dausa Jalpur -2,349
3836 3.704 (RAJASTHAN) 1911 5,191 -31 IS 2,672 2,519
1921 6,637 +1,446 +2786 3,457 3,180 1931 7,691 + 1,054 + 1588 3,980 3,711 1941 8,844 + 1.153 +1499 4,575 4,269 1951 11,048 +2,204 +2492 5,703 5,345 1961 M. 36 39 14,612 +3,564 +3226 7,795 6,817 1971 M. 19 11 18,925 +4,313 +2952 10,086 8,839
55 Vyara Surat 1901 6,117 3,263 2,854 (GUJARAT) 1911 4,604 - 1,513 -2473 2,418 2,186
1921 4,932 +328 +712 2,606 2,326 1931 6,189 + 1,257 +2549 '3,275 2.914 1941 7,151 +962 + 1554 3,829 3,322 1951 11,327 .,.4,176 +5840 5,830 ~.497 1'161 M 648 15,273 +3,946 +3484 7,865 7408 1971 NP, 792 18,910 +3,637 +23 81 9,695 9,215
56 Erando1 Jaigaon 1901 I 11,885 5,892 5993 (MAHARASHTRA) 1911 13,108 + 1,223 + 10 29 6,419 6,689
1921 12,489 -619 -472 6,324 6,165 1931 12,253 -236 -189 6,138 6,115 1941 15,098 +2,845 +23 22 7,722 7,376 1951 ;5,042 -56 -037 7,620 7,422 1961 M. 4693 16,619 + 1,577 +1048 8,428 8,191 1971 M. 287 18905 +2,286 + 1376 9,653 9,252
57 Nathdwara UdaIpur 1901 8,591 4,461 4,130 (RAJASTHAN) 1911 5,424 -3167 -3686 2,906 2,518
1921 8,524 +3,100 +57 15 4553 3,971 1931 8,506 -18 -021 4,496 4,010 1941 9,704 + 1,198 +1408 5,162 4,542 1951 12,341 +2,637 +2717 6,454 5,887 1961 M. 8 55 13,890 t~:~~· +1255 7395 6,495 1971 M. 17 55 18,893 +3602 9,898 8,995
58 Lunavada Panch Mahals 1901 10,277 4,714 5,563 (GUJARAT) 1911 9,742 -535 -521 4,341 5,401
1921 9,956 +214 +220 4,594 5,362 1931 11,896 + 1,940 + 1949 5,768 6,128 1941 12,811 +915 +769 6,123 6,688 1951 14,731 +1,920 +1499 7,310 7,421 1961 M. 1277 10,533 + 1,802 + 1223 8,109 8,424 1971 NP. 1277 18,850 +2,317 +1401 9,352 9,498
59 Jdggayyapet Knshna 1901 8,432 4,044 4,388 (ANDHRA PRADESH) 1911 8,802 +370 +4.39 4,245 4,557
1921 9.027 +225 +256 4,328 4,699 1931 8,669 -358 -397 4,191 4,478 ( 1941 10,037 +1,368 +1578 5,010 5,027 1951 12,831 +2,794 +2784 6,330 6,501 1961 P. 36 42 13,905 + 1,074 +837 6,950 6,955 1971 P. 9 07 18,848 +4,943 +35 55 9,493 9,355
60 Glddarbaha Ftrozpur 1931 3,636 2,134 1,502 (PUNJAB) 1941 6,317 +2,681 +73 73 3,811 2,506
1951 7,421 +1,104 +1748 4,035 3,386 1961 M.C. 1 79 17,364 +9,943 + 133 98 9,379 7,985 1971 M.C. 274 18,821 +1,457 +8 39 10,061 8,760
61 Adra Purulla 1941 7,516 4,334 3,182 (WEST BENGAL) 1951 10,577 +3,061 +4073 5,794 4,783
1961 S.C. 324 13,215 +2,638 +2494 7,251 5,964 1971 S.C, 324 18,838 + 5,623 +4255 10,222 8,616
62 Co1achet Kanyakuman 1921 7,967 + 1789
4,057 3,910 (TAMIL NADU) 1931 9,392 + 1,425 4,762 4,630
1941 11,377 + 1,985 +21 14\ 5,846 5,531 1951 13,606 +2,229 +1959 6,971 6,635 1961 M. 5 18 15,673 +2,067 +1519 8,083 7,590 1971 M. 324 18,819 +3,146 +2007 9,659 9,160
63 Tundla urban Agra 1911 3,863 -sJi
2,100 1,763 agglomeratIon (UTTAR PRADESH) 1921 3,352 -1323 2,046 1,306
1931 2,716 -636 -1897 1,521 1,195 1941 7,318 +4,602 + 169 44 4,138 3,180 1951 10,900 +3,582 +4895 6,171 4,729 1961 1 48 14,963 +4,063 +3728 8,276 6,687 1971 1.43 18,804 +3,841 +2567 10,372 8,432
(a) Tundla 1911 3,863 2,100 1,763 1921 3,352 -511 -13 23 2,046 1,306 1931 2,716 -636 -1897 1,521 1,195 1941 7,318 +4,602 +169 44 4,138 3,180 1951 5,651 -1,667 -2278 3,132 2,519 1961 TA. 078 7,571 +1,920 +3398 4,041 3,530 1971 TA. 0.73 9660 +2,089 +27 59 5,323 4,337
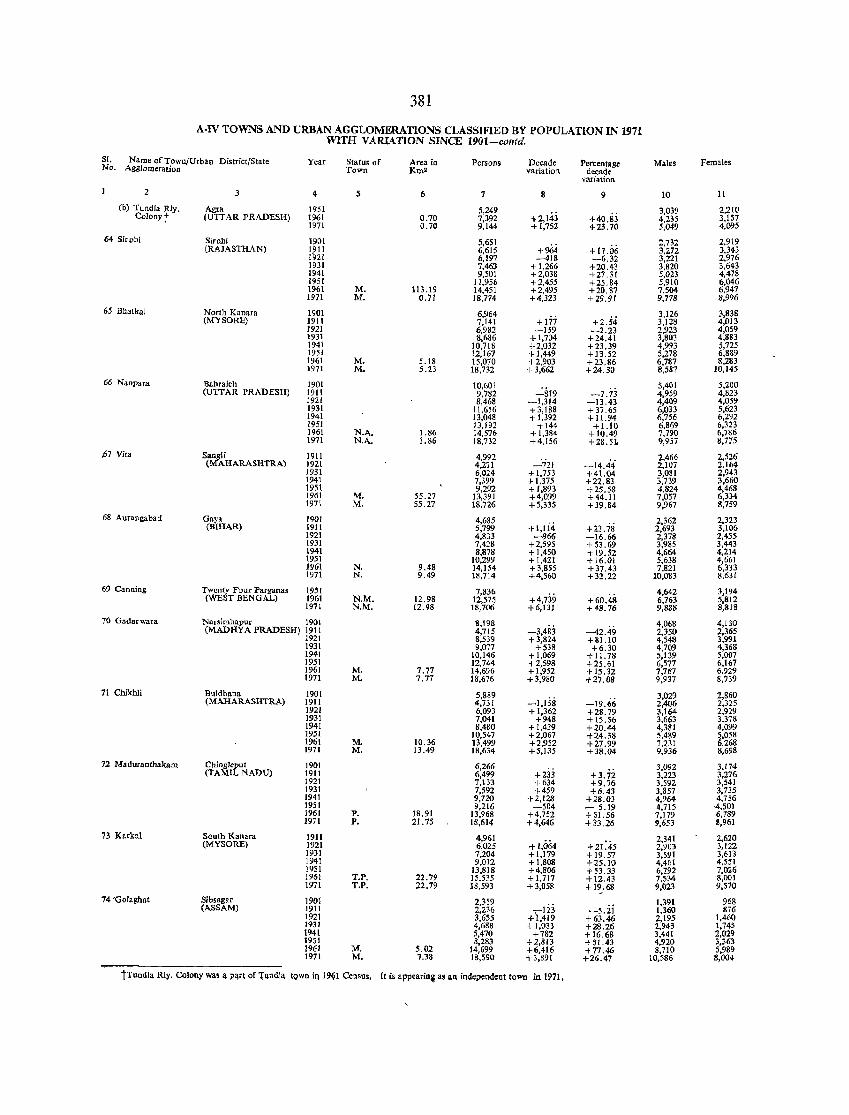
381
A·IV TOWNS AND URBAN AGGLOMERATIONS CLASSIFIED BY POPULATION IN 1971 WITH VARIATION SINCE 1901-contd.
SI. Name of Town/Urbao DistrictfState Year Status of Area in Persons Decade ".rcent,ge Males Females No. Agglomeration Town Km2 variation decade
varia1ion
2 3 4 5 6 7 8 9 10 II
(b) Tundla RJy. Agra 1951 5,249 +2,143 +40.83
3,039 2,210 Colonyt (UTTAR PRADESH) 1961 0.70 7,392 4,235 3,IS7
1971 0.70 9,144 + 1,752 +23.70 5,049 4,095
64 Sirohi Sironi 1901 5,651 +%4 + 17.06
2,732 2,919 (RAJASTHAN) m: 6,615 3,272 3,343
6,197 -418 -6.32 3,221 2,976 1931 7,463 + 1,266 +20.43 3,820 3,643 1941 9,501 +2,038 +27.31 5,023 4,478 1951 11,956 +2,455 +25.84 5.910 6,046 1961 M. 113.19 14,451 + 2,495 +20.87 7,504 6,947 1971 M. 0.71 18,774 +4,323 +29.91 9,778 8,996
65 Bhatkal North Kanara 1901 6,964 +177 +2,54
3,126 3,838 (MYSORE) 1911 7,141 3,128 4,013
1921 6,982 -159 -2.23 2,923 4,059 1931 8,686 +1,704 +24.41 3,803 4,883 1941 10,718 +2,032 +23.39 4,993 5,725 1951 12,167 +1,449 + 13.52 5,278 6,889 1961 M. 5.18 15,070 +2,903 +23.86 6,787 8,283 1971 M, 5.23 18,732 + 3,662 +24.30 8,587 10,145
66 Nanpara lIahraich 1901 10,601 _:S19 -7.73
5,401 5,200 (UTTAR PRADESH) 1911 9,782 4,959 4,823
1921 8,468 -1,314 -13.43 4,409 4,059 1931 11,656 +3,188 +37.65 6,033 5,623 1941 13,048 + 1,392 + 11.94 6,756 6,292 1951 13,192 +144 +1.10 6,869 6,323 1961 N.A. 1.86 14,576 +1,384 +10.49 7,790 6,786 1971 N.A, 1.86 18,732 +4,156 +28.5L 9,957 8,775
p7 Vita Sangli 1911 4,992 _:i21 -14.44
2,466 2,526 (MAHARASHTRA) 1921 4,271 2,107 2,164
1931 6,024 +1,753 +41.04 3,081 2,943 1941 7,399 +1,375 +22.83 :;,739 3,660 1951 9,292 +1,893 + 25.58 4,824 4,468 1961 M. 55.27 13,391 +4,099 +44.11 7,057 6,334 1971 M. 55.27 18,726 +5,335 +39.84 9,967 8,759
68 Aurangabad Gay. 1901 4,685 +1,li4 +23.78
2,362 2,323 (BIHAR) 1911 5,799 2,693 3,106
1921 4,833 -966 -16.66 2,378 2,455 1931 7,428 +2,595 + 53.69 3,985 3,443 1941 8,878 +1,450 +19.52 4,664 4,214 1951 10,299 +1,421 + 16.01 5,638 4,661 1961 N. 9.48 14,154 +3,855 + 37.43 7,821 6,333 1971 N. 9.49 18,714 +4,560 +32.22 10,083 8,631
69 Canning Twenty Four Pargana. 1951 7,836 +4,739 +60.48
4,642 3,194 (WEST BENGAL) 1961 N.M. 12.98 12,575 6,763 5,812
1971 N.M. 12.98 IS,706 +6,131 + 48.76 9,888 8,818
70 Gadar war .. Narsimhapur 1901 8,198 -3,483 -42.49
4,068 4,130 (MADHYA PRADESH) 1911 4,715 2,350 2,365
1921 8,539 +3,824 + 81.10 4,548 3,991 1931 9,077 +538 +6.30 4,709 4,368 1941 10,146 +1,069 + 11. 78 5,139 5,007 1951 12,744 +2,598 +25.61 6,577 6,167 1961 M. 7.77 14,696 +1,952 +15.32 7,767 6.929 1971 M. 7.77 18,676 +3,980 +27.08 9,937 8,739
71 Chikbli Buldhana 1901 5,889 -1,158
3,029 2,860 (MAHARASHTRA) 1911 4,73£ -]9.66 2,406 2.325
1921 6,093 + 1,362 +28.79 3,164 2,929 1931 7,041 +948 +15.56 3,663 3,378 1941 8,480 +1,439 +20.44 4,381 4,099 1951 10,547 +2,067 +24.38 5,489 5,058 1961 M. 10.36 13,499 +2,952 +27.99 7,231 6,268 1971 M. 13.49 18,634 +5,135 +38.04 9,936 8,698
72 Maduranthakam Chinglepul 1901 6,266 +zj3 +3.72
3,092 3,174 (TAMIL NADU) 1911 6,499 3,223 3,276
1921 7,133 +634 +9.76 3,592 3,541 1931 7,592 +459 +6.43 3,857 3,735 1941 9,720 +2,128 +28.03 4,964 4,756 1951 9,216 -504 - 5.19 4,715 -4,501 1961 P. 18.91 13,968 +4,752 +S1.56 7,179 6,789 1971 p, 21.75 18,614 +4,646 + 33.26 9,653 5,961
73 Karkal South Kallara 1911 4,961 +1,064 +21:45
2,W 2,620 (MYSORE) 1921 6,025 2,903 3,122
1931 7,204 +1,179 + 19.57 3,591 3,613 1941 9,012 +1,808 +25.10 4,461 4,551 1951 13,818 +4,806 +53.33 6,292 7,026 1961 T.P. 22.79 15.535 +1,717 +12.43 7,~34 8,001 1971 T.P. 22.79 18,593 + 3,058 + 19.68 9,023 9,570
74 'Golaghat Sibsagar 1901 2,359 ,Iij
1,391 968 (ASSAM) 1911 2,236 -s.ii 1,360 876
1921 3,655 +1,419 + 63.46 2,195 1,460 1931 4,688 + 1,033 +28.26 2,943 1,745 1941 5,470 +782 +16.68 3,441 2,029 19S1 8,283 +2,813 +51.43 4,920 3,363 1961 M. 5.02 14,6'19 +6,416 + 77.46 8,710 5,989 1971 M. 7.38 18,590 +3,891 +26.47 10,586 8,004
tTundla Rly. Colony was a Part of TundJa town iq 1961 Census. [t is appearin~ as an independent town in 1971,
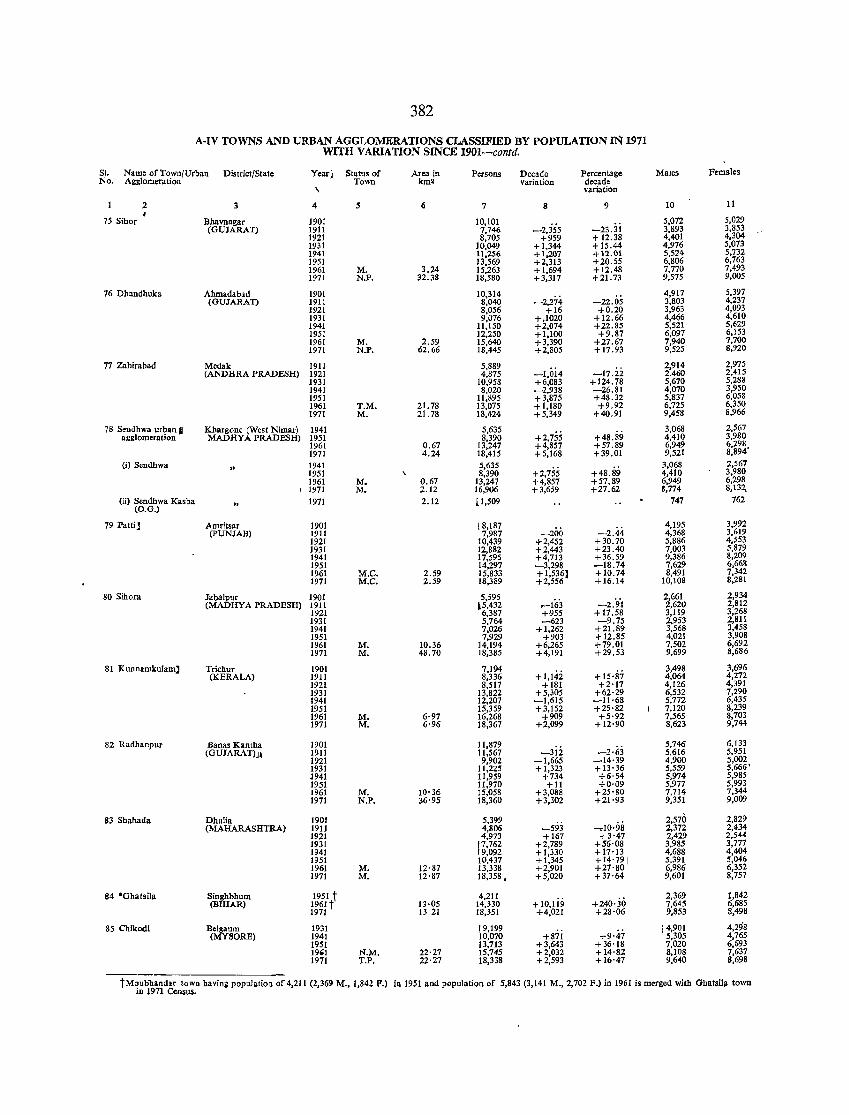
382
A-IV TOWNS AND URBAN AGGLOMERATIONS CLASSIFIED BY POPULATION IN 1971 WITH VARIATION SINCE 1901-contd.
SI. Name of Town/Urban District/State Yearj Status of Area in Persons Decade Percentage Males Females No. Agglomeration Town kJn2 variation decade
\ variation
2 3 4 5 6 7 8 9 10 11
75 Sihor Bhavnagar 1901 10,101 -2.355
5,072 5,029 (GUJARAT) 1911 7,746 -23.31 3,893 3,853
1921 8,705 +959 + 12.38 4,401 4,304 1931 10,049 +1,344 + 15.44 4,976 5,073 1941 11,256 + 1,207 + 12.01 5,524 5,732 1951 13,569 +2,313 +20.55 6,806 6,763 1961 M. 3.24 15,263 +1,694 +12.48 7,770 7,493 1971 N.P. 32.38 18,580 + 3,317 +21. 73 9,575 9,005
76 Dhandhuka Ahmadabad 1901 10,314 -2,274
4,917 5,397 (GUJARAT) 1911 8,040 -22.05 3,803 4,237
1921 8,056 +16 +0.20 3,963 4,093 1931 9,076 +,1020 +12.66 4,466 4,610 1941 11,150 +2,074 +22.85 5,521 5,629 1951 12,250 +1,100 +9.87 6,097 6,153 1961 M. 2.59 15,640 +3,390 +27.67 7,940 7,700 1971 N.P. 62.66 18,445 +2,805 +17.93 9,525 8,920
77 Zahirabad Medak 1911 5,889 -I,oi4
2,914 2,975 (ANDHRA PRADESH) 1921 4,875 -17.22 2.460 2,415
1931 10,958 +6,083 + 124.78 5,670 5,288 1941 8,020 -2,938 -26.81 4,070 3,950 1951 11,895 +3,875 +48.32 5,837 6,058 1961 T.M. 21. 78 13,075 +1,180 +9.92 6,725 6,350 1971 M. 21.78 18,424 +5,349 +40.91 9,458 8,966
78 Sendhwa urban, Khargone (West Nimar) 1941 5,635 +2,755 +48.89
3,068 2,567 agglomeration MADHYA PRADESH) 1951 8,390 4,410 3,980
1961 0.67 13,247 +4,857 +57.89 6,949 6,298 1971 4.24 18,415 +5,168 +39.01 9,521 8,894'
(i) Sendhwa .. 1941 5,635 +2,755 +48.89
3,068 2,567 1951 8,390 4,410 3,980 1961 M. 0.67 13,247 +4,857 +57.89 6,949 6,298
, 1971 M. 2.12 16,906 +3,659 +27.62 3,774 8,13~
(ii) Sendhwa Kasba 1971 2.12 l1,509 747 762 (O.G.)
79 Patti] Arnritsar 1901 18,187 -200
4,195 3,992 (pUNJAB) 1911 7,987 -2.44 4,368 3,619
1921 10,439 +2,452 +30.70 5,886 4,553 1931 12,882 +2,443 +23.40 7,003 5,879 1941 17,595 +4,713 +36.59 9,386 8,209 1951 14,297 -3,298 -18.74 7,629 6,668 1961 M.C. 2.59 15,833 + 1,536) + 10.74 8,491 7,342 1971 M.C. 2.59 18,389 +2,556 +16.14 10,108 8,281
80 Sihora Jabalpur 1901 5,595 ,.-163 -2.9'1
2,661 2,934 (MADHYA PRADESH) 1911 15,432 2,620 2,812
1921 6,387 +-955 + 17.58 3,119 3,268 1931 5,764 -623 -9.75 2,953 2,811 1941 7,026 +1,262 +21.89 3,568 3,458 1951 7,929 +903 +12.85 4,021 3,908 1961 M. 10.36 14,194 +6,265 +79.01 7,502 6,692 1971 M. 48.70 18,385 +4,191 +29.53 9,699 8,686
81 Kunnarnkulam] Trichur 1901 7,194 +1,142 +15·87
3,498 3,696 (KERALA) 1911 8,336 4,064 4,272
1921 8,517 +181 +2'17 4,126 4,391 1931 13,822 +5,305 +62·29 6,532 7,290 1941 12,207 -1,615 -11·68 5,772 6,435 1951 15,359 +3,152 +25·82 7,120 8,239 1961 M. 6·97 16,268 +909 +5·92 7,565 8,703 1971 M. 6·96 18,367 +2,099 + 12·90 8,623 9,744
82 Radbanpur Banas Kantba 1901 11,879 -3i2 -2·63
5,746 6,133 (GUJARAT)j~ 1911 11,567 5,616 5,951
1921 9,902 -1,665 -14·39 4,900 5,002 1931 11,225 +1,323 + 13'36 5,559 5,666' 1941 11,959 +734 +6·54 5,974 5,985 1951 11,970 +11 +0·09 5,977 5,993 1961 M. 10'36 15,058 +3,088 +25'80 7,714 7,344 1971 N.P. 36·95 18,360 +3,302 +21'93 9,351 9,009
83 Shahada Dbulia 1901 5,399 ...,.10·98
2,570 2,829 (MAHARASHTRA) 1911 4,806 -593 2,372 2,434
1921 4,973 +167 +3·47 2,429 2,544 1931 !',762 +2,789 +56'08 3,985 3,777 1941 9,092 +1,330 +17'13 4,688 4,404 1951 10,437 +1,345 + 14'79 1 5,391 5,046 1961 M. 12·87 13,338 +2,901 +27'80 6,9.'16 6,352 1971 M. 12·87 18,358. +5,020 +37·64 9,601 8,757
84 ·Ghatsi!a Singhbhum 1951 t 4,211 +10,li9 +240'30
2,369 1,842 (BIHAR) 1961 t 13·05 14,330 7,645 6,685
1971 1321 18,351 +4,021 +28·06 9,853 8,498
85 Chikodi Be1gaum 1931 19,199 +87i +9·47
i 4,901 4,298 (MYSORE) 1941 10,070 5,305 4,765
1951 13,713 +3,643 +36'18 7,020 6,693 19'1 N.M. 22·27 15,745 +2,032 + 14'82 8,108 7,637 1971 T.P. 22·27 18,338 +2,593 +16'47 9,640 8,698
t Moubllandar town havinl: population of 4,211 (2,36' M., 1,842 P.) ill 1971 Census.
in 19$1 and popUlation of 5,843 (3,141 M., 2,702 F.) in 1961 is merged with Ghatsilll town
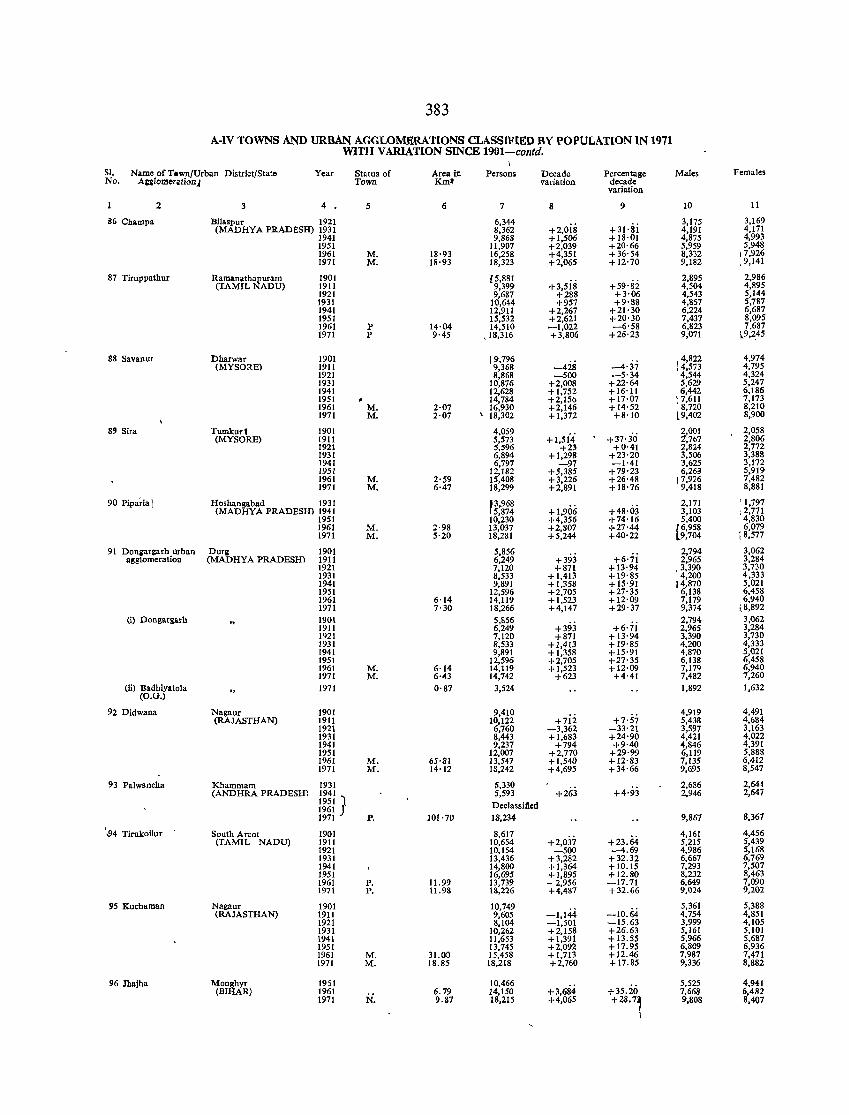
383
A-IV TOWNS AND URBAN AGGLOMERATIONS CLASSIFIED BY POPULATION IN 1971 WITH VARIATION SINCE 1901-contd.
SI. Name of Town/Urban District/State Year Status of Area in Persons Decade Percentage Males Females No. AgglomerationJ Town 1(m2 variation decade
variation
2 3 4 5 6 7 8 9 10 11
86 Champa Bilaspur 1921 6,344 +2,ois +31·si
3,175 3,169 (MADHYA PRADESH) 1931 8,362 4,191 4,171
1941 9,868 +1,506 +18·01 4,875 4,993 1951 11,907 +2,039 +20·66 5,959 \ 5,948 1961 M. 18·93 16,258 +4,351 +36'54 8,332 7,926 1971 M. 18'93 18,323 +2,065 + 12·70 9,182 ,9,141
87 Tiruppathur Ramanathapuram 1901 f 5,881 +3,5is +59'82
2,895 2,986 (TAMIL NADU) 1911 9,399 4,504 4,895
1921 9,687 +288 +3·06 4,543 5,144 1931 10,644 +957 +9'88 4,857 5,787 1941 12,911 +2,267 +21·30 6,224 6,687 1951 15,532 +2,621 +20·30 7,437 8,095 1961 P 14·04 14,510 -1.022 -6'58 6,823 7.687 1971 P 9·45 ,18,316 +3.806 +26'23 9,071 1.9,245
88 Savanttr Dharwar 1901 19,796 -42S -4·37
4,822 4,974 (MYSORE) 1911 9,368 14.573 4,795
1921 8,868 -500 -5·34 4,544 4,324 1931 10,876 +2,008 +22·64 5,629 5,247 1941 12,628 +1,752 +16'11 6,442 6,186 1951 14,784 +2,156 +17·07
t ~:~~& 7,173 1961 M. 2·07 16,930 +2,146 + 14·52 8,210 1971 M. 2·07 \ 18,302 +1,372 +8'10 [9,402 8,900
8" Sira Tumkur' 1901 4,059 +1,5i4 +37·30
2,001 2,058 (MYSORE) 1911 5,573 1.,767 2,806
1921 5,596 +23 +0'41 2,824 2,772 1931 6,894 +1,298 +23·20 3,506 3,388 1941 6,797 -97 -1·41 3,625 3,172 1951 12,182 +5,385 +79·23 6,26<1 5,919 1961 M. 2·59 15,408 +3,226 +26·48 17,926 7,482 1971 M. 6·47 18,299 +2,891 +18'76 9,418 8,881
90 Pipa~ia 1 Hoshangabad 1931 p,968 +1,906 +48·03
2,171 ' 1,797 (MADHYA PRADESH) 1941 5,874 3,103 :2,771
1951 10,230 +4,356 +74'16 5,400 4,830 1961 M_ 2·98 13,037 +2,807 +27·44 [6,958 6,079 1971 M. 5'20 18,281 +5,244 +40'22 9,704 ,8,577
91 Dongargarh urban Durg 1901 5,856 +393 +6·ii
2,794 3,062 a!!,;glomeratioD (MADHYA PRADESH) 1911 6,249 2,965 3,284
1921 7,120 +871 +13'94 ,3,390 3,730 1931 8,533 +1,413 +19·85 4,200 4,333 1941 9,891 +1,358 +15'91 14,870 5,021 1951 12,596 +2,705 +27'35 6,138 6,458 1961 6·14 14,119 +1,523 + 12·09 7,179 6,940 1971 7·30 18,266 +4,147 +29·37 9,374 ,8,892
(i) Dongargarh 1901 5,856 +393 +6·ii
2,794 3,062 1911 6,249 2,965 3,284 1921 7,120 +871 +13'94 3,390 3,730 1931 8,533 +1,413 +19·85 4,200 4,333 1941 9,891 +1,358 +15·91 4,870 5,021 1951 12,596 +2,705 +27'35 6,138 6,458 1961 M. 6·14 14,119 +1,523 +12·09 7,179 6,940 1971 M. 6·43 14,742 +623 +4·41 7,482 7,260
(ii) Badhiyatola 1971 0·87 (O.G.)
3,524 1,892 1,632
92 Didwana Nagaur 1901 9,410 +7ii +7·57
4,919 4,491 (RAJASTHAN) 1911 10,122 5,438 4,684
1921 6,760 -3,362 -33·21 3,597 3,163 1931 8,443 +1,683 +24'90 4,421 4,022 1941 9,237 +794 +9·40 4,846 4,391 1951 12,007 +2,770 +29·99 6,119 5,888 1961 M. 65·81 13,547 +1,540 +12'83 7,135 6,412 1971 M. 14'12 18,242 +4,695 +34·66 9,695 8,547
93 Palwancha Khammam 1931 5,330 +263 +4·93
2,686 2,644 (ANDHRA PRADESH) :m) 5,593 2,946 2,647
1961 J Declassified 1971 P. 101'70 18,234 9,867 8,367
\94 Tirukoilur South Arcot 1901 8,617 +2,Oj7 +23.64
4,161 4,456 (TAMIL NADU) 1911 10,654 5,215 5,439
1921 10,154 -500 --4.69 4,986 5,168 1931 13,436 +3,282 +32.32 6,667 6,769 1941 14,800 +1,364 +10.15 7,293 7,507 1951 16,695 +1,895 +12.80 8,232 8,463 1961 P. 11.99 13,739 - 2,956 -17.71 6,649 7,090 1971 P. 11.98 18,226 +4,487 +32.66 9,024 9,202
95 Kuchaman Nagaur 1901 10,749 -1,144 -10.64
5,361 5,388 (RAJASTHAN) 1911 9,605 4,754 4,851
1921 8,104 -1,501 -15.63 3,999 4,105 1931 10,262 +2,158 +26.63 5,161 5,101 1941 11,653 +1,391 + 13.55 5,966 5,687 1951 13,745 +2,092 +17.95 6,809 6,936 1961 M. 31.00 15,458 +1,713 +12.46 7,987 7,471 1971 M. 18.85 18,218 +2,760 + 17.85 9,336 8,882
96 Jhajha Monghyr 1951 10,466 +3,684 +35.20
5,525 4,941 (BIHAR) 1961
N. 6.79 14,150 7,668 6,482
1971 9.87 18,215 +4,065 +28.7, 9,808 8,407
1
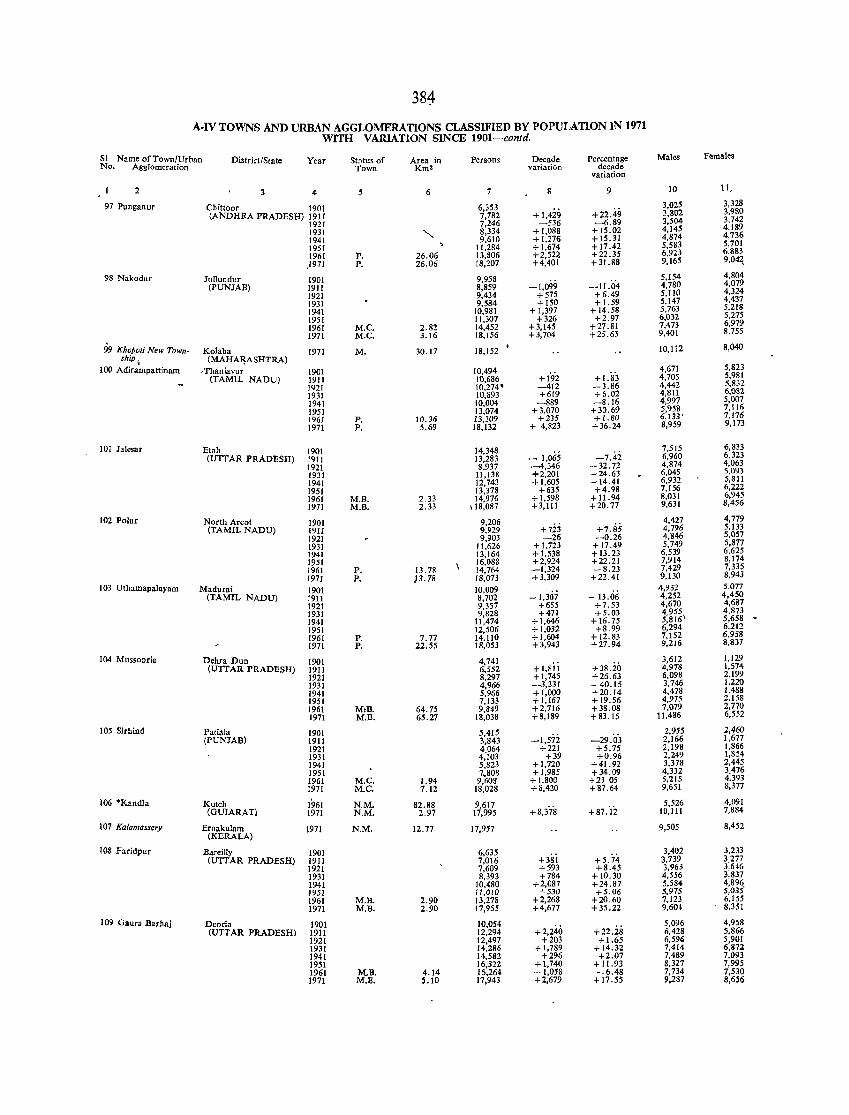
384
A-IV TOWNS AND URBAN AGGLOMERATIONS CLASSIFIED BY POPULATION IN 1971 WITH VARIATION SINCE 1901--contd.
SI Name of Town/Urban District/Scate Year Stntu, of Area in Persons Decade Percentage Males Females No. Agglomeration Town Km2 variation decade
variation
2 3 4 5 6 7 9 10 11,
97 Punganur Chiltoor 1901 6,353 3,025 3,328
(ANDHRA PRADESH) 1911 7,782 +1,429 +22.49 3,802 3.980
1921 7,246 -536 -6.89 3,504 3.742
1931
"'" 8,334 +1,088 + 15.02 4,145 4,189
1941 9.610 +1.276 + 15.31 4,874 4.736
1951 11.284 +1,674 + 17.42 5,583 5.701
1961 P. 26.06 13,806 +2,5n +22.35 6.923 6.883
.I971 P. 26.06 18,207 +4,401 + 31.88 9,165 9,04~
98 Nakodar Jllllundur 1901 9,958 5,154 4.804 (PUNJAB) 1911 8,859 -1.099 -11.04 4,780 4,079
1921 9,434 +575 +6.49 5,110 4,324
1931 9,584 + 150 + 1.59 5,147 4,437
1941 10,981 + 1,397 + 14.58 5,763 5,218
1951 11,307 +326 +2.97 6,032 5,275
1961 M.C. 2.82 14,452 +3,145 +27.81 7,473 6,979
1971 M.C. 3.16 18,156 +3,704 +25.63 9,401 8,755
99 Khopoli N,w Town- Kolaba 1971 M. 30.17 18,152 10,112 8,040 ship, (MAHA~SHTRA)
100 Adirampaltinam .Thanjavur 1901 10,494 4,671 5,823 (TAMIL NADU) 1911 10,686 +1'9'2 + 1.83 4,705 5,981
1921 10.274' -412 -3.86 4,442 5,832
J931 10,893 +619 +6.02 4,811 6.082
1941 10.004 -889 -8.J6 4,997 5,007
1951 13,074 +3,070 +30.69 5,958 7,116
1961 P. 10.36 13,309 +235 + 1.80 6,133' 7,176
1971 P. 5.69 18,132 + 4,823 +36.24 8,959 9,173
101 Jalesar Etah 1901 14,348 7,515 6,833 (UTTAR PRADESH) 1911 13,283 - 1,065 -7.42 6,960 6,323
1921 8.937 -4,346 - 32.72 4,874 4,063
1931 11,138 +2,201 +24.63 6,045 5,093
1941 12,743 +1,605 + 14.41 6,932 5,811
1951 J3.378 +635 +4.98 7,156 6,222 1961 M.B. 2,33 14,976 +1.598 + 11.94 8,031 6,945 1971 M.B. 2.33 \ 18,087 +3,111 +20.77 9,631 8,456
102 Polur North Arcot 1901 9,206 4,427 4,779 (TAMIL NADU) 1911 9,929 +723 +7.85 4.796 5.133
J921 9,903 -26 -0.26 4,846 5,057
1931 11,626 +1,723 + 17.49 5,749 5,877 1941 13,164 +1,538 + 13.23 6,539 6,625 1951 16,088 +2,924 +22.21 7,914 8,174 1961 P. 13,78 J4,764 -1,324 -8.23 7,429 7,335
1971 P. )3.78 18,073 +3,309 +22.41 9,130 8,943
103 Uthamapalayam Madurai J901 10.009 -1,307
4,932 5,077 (TAMIL NADU) 1911 8.702 - 13.06 4,252 4,450
1921 9.357 +655 +7.53 4,670 4,687 1931 9,828 +471 +5.03 4955 4,873 1941 11,474 +1,646 + 16.75 5;816\ 5,658 -1951 12,506 +1,032 +8.99 6,294 6,212 1961 P. 7.77 14.110 +1,604 + 12.83 7,152 6,958 1971 P. 22.55 18,053 +3,943 +27.94 9,216 8,837
104 Mussoorie Dehra Dun 1901 4,741 3,612 1,129 (UTTAR PRADESH) 1911 6,552 +1,sii + 38.20 4,978 1,574
1921 8,297 +1,745 +26.63 6,098 2,199 1931 4,966 -3,331 - 40.15 3,746 1,220 1941 5.966 +1,000 +20.14 4,478 1.488 1951 7,133 +1,167 + 19.56 4,975 2,158 1961 M,B. 64.75 9,849 +2,716 +38.08 7,079 2,770 1971 M.B. 65.27 18,038 +8,189 +83.15 11,486 6,552
lOS Sirhind Patiala 1901 5,415 2,955 2,460 (PUNJAB) 1911 3,843 -1,572 -29.03 2,166 1,677
1921 4.064 +221 +5.75 2,198 1,866 1931 4,103 +39 +0.96 2,249 1,854 1941 5,823 +1,720 +41.92 3,378 2,445 1951 7.808 +1,985 +34.09 4,332 3.476 1961 M.C. 1.94 9,603 +1.800 +23 OS 5,215 4,393 1971 M.e. 7.12 18,028 +8,420 +87.64 9,651 8,377
106 *Kandla Kutch 1961 N.M. 82.88 9.617 5,526 4,091 (GUJARAT) J971 N.M. 2,97 17,995 +8,378 +87.'t2 10,111 7,884
107 Kalamassery Ernakulam 1971 N.M. 12.77 17,957 9,505 8,452 (KERALA)
lOS faridpllr Bareilly 1901 6.635 3,402 3,233 (UTTAR PRADESH) 1911 7,016 +3si +5.74 3,739 3,277
1921 7,609 +593 +8.45 3,963 3,646 1931 8,393 +784 + 10.30 4,556 3,837 1941 10,480 +2,087 +24.87 5,584 4,896 J951 II ,010 +530 +5.06 5,975 5,035 1961 M.B. 2.90 J3,278 +2,268 +20.60 7,123 6,155 1971 M.B. 2.90 17,955 +4,677 +35.22 9,604 8,351
109 Gnura Barhai Deoria 1901 10,054 +2,240
5,096 4,958 (UTTAR PRADESH) 1911 12,294 +22.28 6,428 5,866
1921 12,497 +203 +1.65 6,59' 5,901 1931 14,286 + 1,789 +14.32 7,414 6,872 1941 14,582 +296 +2.07 7,489 7,093 1951 16,322 + 1,740 + J 1.93 8,327 7,995 1961 M.B. 4.14 15,264 -1,058 -6.48 7,734 7,530 1971 M.B. 5.10 17,943 +2,679 +17.55 9,287 8,656
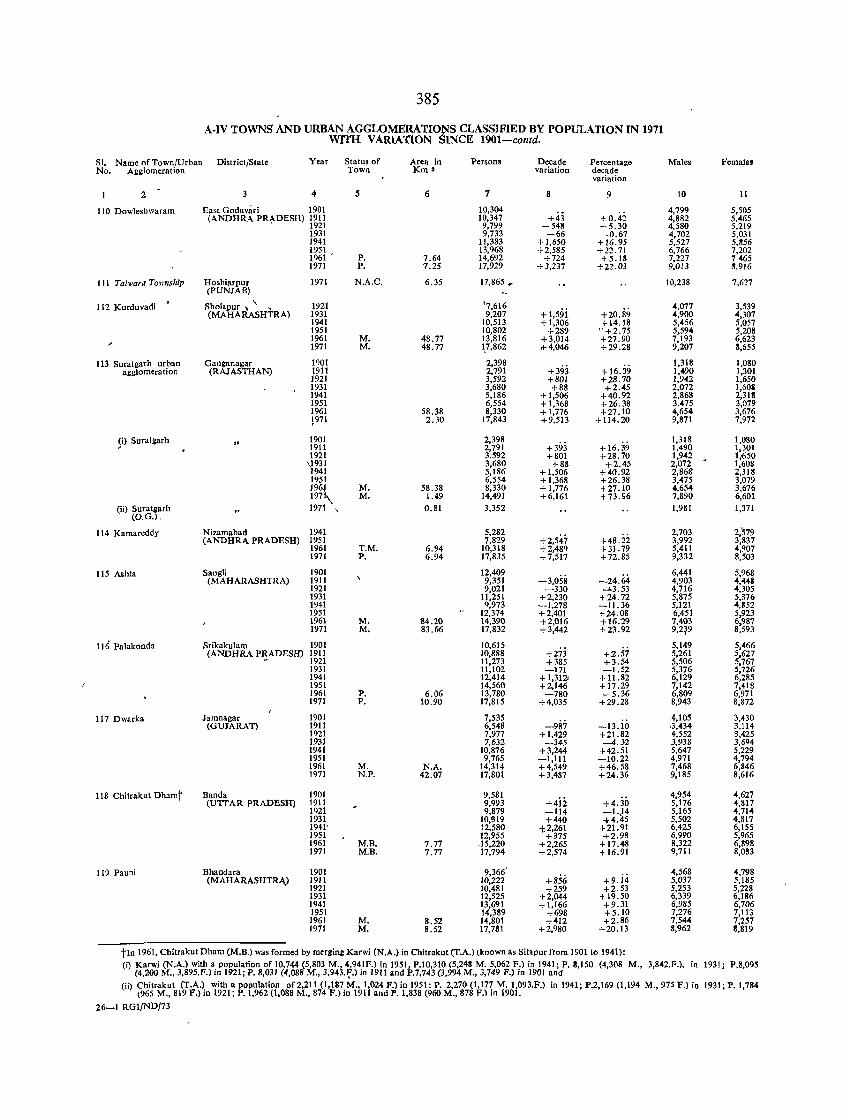
385
A·IV TOWNS AND URBAN AGGLOMERA TIOJiS CLASSJFIED BY POPULATION IN 1971 WITH VARlATION lNCE 1901-contd.
SI. Name of Town/Urban District/State Year Status of Area in Persons Decade Percentage Males Females No. Agglomeration Town Km' variation decade
variation
2 3 4 5 6 7 8 9 10 11
110 Dowleshwaram East Godavari 1901 10,304 +43
4,799 5,505 (ANDHRA PRADESH) 1911 10,347 +0.42 4,882 5,465
. 1921 9,799 -54S -5.30 4,580 5,219 1931 9,733 -66 -0.67 4,702 5,031 1941 11,383 +1,650 +16.95 5,527 5,856 (951 13,968 +2,585 +22.71 6,766 7,202 1961 - P. 7.64 14,692 +724 +5.18 7,227 7465 1971 P. 7.25 17,929 +3,237 +22.03 9,013 3,916
111 Talwara Township Hoshiarpur (PUNJAB)
1971 N.A.C. 6.35 17,865 ~ 10,238 7,627
112 Kurduvadi . \ 1921 '7,616 4,077 3,539 Sholapur , ,
+ 1,59i (MAHARASHTRA) 1931 9,207 +20.89 .01,900 .01,307 1941 10,513 +1,306 1-14.18 5,456 5,057 1951 10,802 +289 "+2.75 5,59.01 5,208 1961 M. 48.77 13,816 +3,014 +27.90 7,193 6,623 1971 M. 48.77 1?,862 .-1-4,046 +29.28 9,207 3,655
113 Suratgarh urban Ganganagar lqOl 2,398 Ui) +16.39
1,313 1,080 a~glomeration (RAJASTHAN) 1911 2,791 1,.0190 1,301
1921 3,592 +801 +28.70 1,942 1,650 1931 3,680 +88 +2.45 2,072 1,60& 1941 5,186 + 1,506 +40.92 2,868 2,31S 1951 6,554 +1,368 +26.38 3,475 3,079 1961 58.38 8,330 +1,776 +27.10 4,654 3,676 ~971 2.30 17,843 +9,513 +114.20 9,871 7,972
(i) Suratgarh 1901 2,398 +393 + 16.39
1,318 1,080
" 1911 2,791 1,490 1,301 1921 3,592 +801 +28.70 1,942 1,.650
'f931 3,680 +88 +2.45 2,072 1,608 941 5,186 + 1,506 +40.92 2,868 2,313
1951 6,554 +1,368 +26.38 3,475 3,079 196J M. 58.38 8,330 +1,776 +27.10 4,654 3,676 197\ M. 1.49 14,491 +6,161 +73.96 7,890 6,601
(ii) Surat&arh 1971 " 0.81 3,352 1,981 1,371 (O.G.),
114 Kamareddy Nizamabad 1941 5,282 +2,547
2,703 2,579 (ANDHRA PRADESH) 1951 7,829 +48.22 3,992 3,837
1961 T.M. 6.94 10,318 +2,489 + 31. 79 5,411 4,907 1971 P. 6.94 17,835 +7,517 +72.85 9,332 8,503
115 Ashta Sangli 1901 12,409 -3,058 -24.64
6,441 5,968 (MAHARASHTRA) 1911 9,351 4,903 4,441l
1921 9,021 -330 -'-3.53 4,716 4,305 1931 11,251 +2,230 +24.72 5,875 5,376 1941 Q,973 -1,278 -11.36 5,121 4,852 1951 12,374 +2,401 +24.08 6,451 5,923 1961 M. 84.20 14,390 +2,016 + 16:29 7,403 6,987 1971 M. 83.66 17,832 +3,442 +23.92 9,2~9 8,593
116 Palakonda Srikakulam 1901 10,615 +2.57
5,149 5,466 (ANDHRA P~ADESH) 1911 10,888 +273 5,261 5,627
1921 11,273 +385 +3.54 5,506 5,767 1931 11,102 -171 -1.5Z 5,376 5,726 1941 12,414 + 1,31Z, +11.82 6,129 6,285 1951 14,560 +2,146 +17.29 7,142 7,418 1961 P. 6.06 13,780 -780 -5.36 6,809 6,971 1971 P. 10.90 17,815 +4,035 +29.28 8,943 8,872
117 Dwarka Jamnagar 1901 7,535 -987
4,105 3,430 (GUJARAn 1911 6,548 -13.10 ,3,434 3,114
1921 7,977 +1,429 +21.82 4,552 3,425 1931 7,632 -345 -4.32 3,938 3,694 1941 10,876 +3,244 +42.51 5,647 5,229 1951 9,765 -1,111 -10.22 4,971 4,794 1961 M. N.A. 14,314 +4,549 +46.58 7,468 6,846 1971 N.P. 42.07 17,801 +3,487 +24.36 9,185 8,616
118 Chitrakut Dhamt Banda 1901 9,581 +4ii
4,954 4,627 (UTTAR PRADESH) 1911 9,993 +4.30 5,176 4,817
1921 9,879 -114 -1 .• 14 5,165 4,71.01 1931 10,S19 +440 -1-4.45 5,502 4,817 1941' 12,580 t2,261 +21.91 6,425 6,155 1951 12,955 +375 +2.98 6,990 5,965 1961 M.B. 7.77 ,15,220 +2,265 +17.48 8,322 6,898 1971 M.B. 7.77 17,794 +2,574 +16.91 9,711 8,083
119 Pauni Bhandara 1901 9,366' +856 +9.i4
4,568 4,798 (MAHARASHTR.v 1911 10,222 5,037 5,185
1921 10,481 +259 +2.53 5,253 5,228 1931 12,525 +2,044 + 19.50 6,339 6,186 1941 13,691 +1,166 +9.31 6,985 6,706 1951 14,389 +698 +5.10 7,276 7,113 1961 M. 8.52 14,801 +412 +2.86 7,544 7,257 1971 M. 8.52 17,781 +2,980 +20.13 8,962 8,819
tIn 1961, Chitrakut Dham (M.B.) was formed by merging KarlVi (N.A.) in Chitrakut (T.A.) lknown as Sitapur from 1901 to 1941): (i) Karwi (N.A..) with a. population of 10,744 (5,803 M., 4,94.1F.) in 1951, P.I0,310 (5,248 M. 5,062 F) in 1941; P. 8,150 (4,3(18 M.,
(4,200 M., 3,895.F.) In 1921; P. 8,031 (4,088 M., 3,943. f.) In 1911 and P.7,743 (3,994 M., 3,749 F.) 10 1901 and 3,842.F.), in 1931; P.8,095
(ii) Chitrakut (T.A.). with a population of2,211 (l,117.M., 1,024 F.) in 1951; P. 2,270 (1,17? M. 1,093.F.) in 1941; P.2,169 (1,194 M., 975 F.) in t965 M., 819 F.) 10 1921; P. 1,962 (1,088 M., 874 F.) III 1911 and P. 1,838 (960 M., 878 F.) III 1901.
1931; P. 1,784
26-1 RGI/ND/73
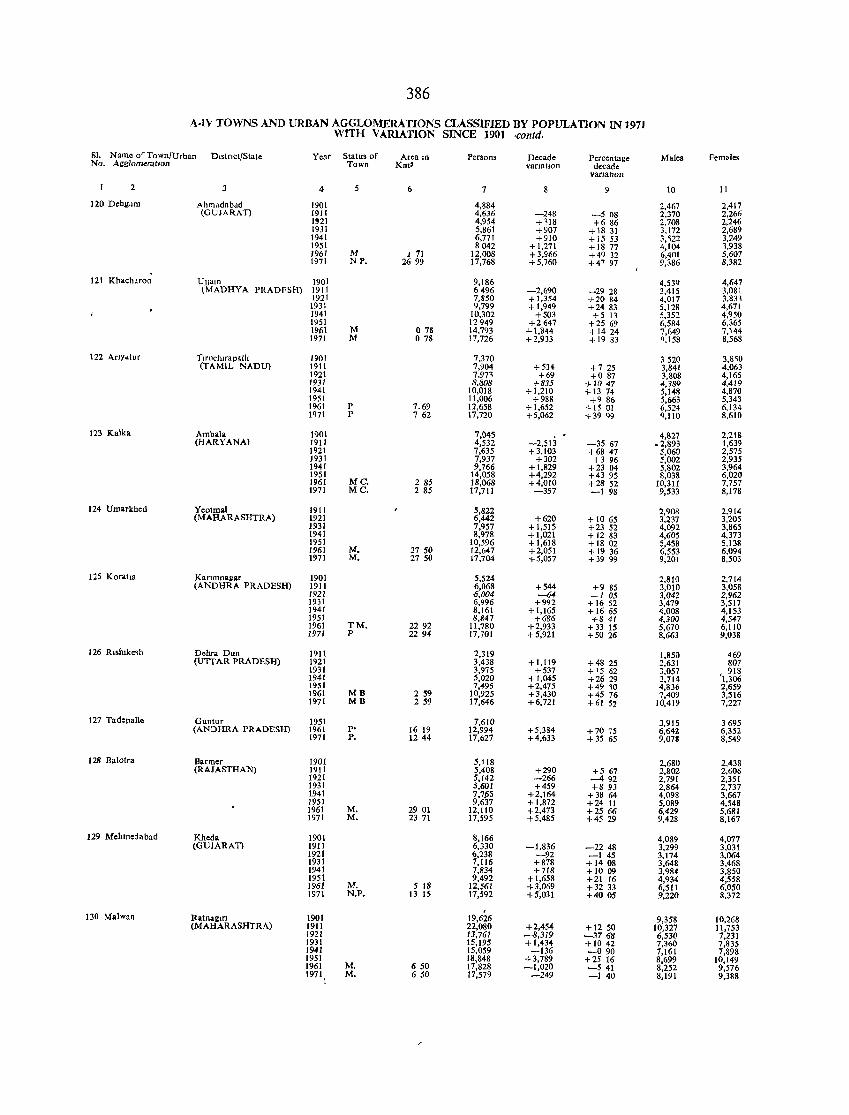
386
A·tV TOWNS AND URBAN AGGLOMERATIOl'>S CLASSIFIED BY POPULATION IN 1971 WITH VARlATION SINCE 1901-contd.
SI. Name Dr Town/Urban District/State Year Status of Area m Persons Decade Percentage Males Fem.les Na. Aj;glomcratlOn Town Km9 variatIOn decade
vafJatlOll
2 3 4 5 6 7 9 10 11
120 Dehgdm Ahmadabad 1901 4,884 2,467 2,417 (GUJARA'I) 1911 4,636 -248 -508 2,370 2,266
1'21 4,954 +118 +686 2,708 2,246 1931 5,861 +907 + 18 31 3,172 2,689 1941 6,771 +910 +15 53 3, )22 3,249 1951 8042 + 1,271 + 18 77 4,104 1,938 1961 M 1 71 12.008 + 3,966 +49 32 6,401 5,607 1971 NP. 2699 17,768 + 5,760 +4~ 97 9,386 8,382
121 Khach,roa Ullam 1901 9,186 4,539 4,647 (MADHYA PRADPSH) 1911 6496 -2,690 -29 28 3,415 3,081
1921 7,850 +1,354 +2084 4,017 3,831 1931 9,799 +1,949 +2483 5,128 4,671 1941 10,302 +503 +5 II 5.352 4.950 1951 12949 +2647 +25 69 6,584 6,365 1961 M o 7S 14,793 -!-1,844 + 1424 7,649 7,144 1971 M 078 17,726 +2,933 + 19 83 Q,I58 8.568
122 Arlyqlur TlfIlch.rapalh 1901 7,370 3520 3,8'iO (TAMIL NADU) 1911 7,904 +534 +725 3,841 4,063
1921 7,971 +69 +0 87 3,808 4,165 1931 8,808 +835 +1047 4,389 4,419 1941 10,018 +1,210 + 1374 5,148 4,870 1951 11,006 +988 +9 86 5,663 5,343 1961 P 7.69 12,658 +1,652 +1501 6,524 6,134 IQ71 P 762 17,720 +5,062 +39 <)9 'l,110 8,610
123 Kalka Ambala 1901 7,045 4,827 2,218 (HARYANA) 1911 4,532 -2,513 -3567 .2,893 1,639
1921 7,635 +3,103 +68 47 5,060 2,575 1931 7,937 +302 +3 96 5,002 2,935 1941 9,766 +1,829 +23 04 5,802 3,964 1951 14,058 +4,292 +43 95 8,038 6,020 1961 MC. 285 18,068 +4,010 +28 52 10,311 7,757 1971 MC, 2 85 17,111 -357 -198 9,533 8,178
124 Umarkhed Yeolmal 1911 5,822 2,908 2,914 (MAHARASHTRA) 1921 6,442 +620 + 1065 3,237 3,205
1931 7,957 + 1,515 +23 52 4,092 3,865 1941 8,978 +1,021 + 12 83 4,605 4,313 1951 10,596 +1,618 + 18 02 5,458 5,138 1961 M. 27 50 12,647 +2,051 + 19 36 6,553 6,094 1971 M. 27 50 17,704 +5,057 +39 99 9,201 8,503
125 Koralla Kanmna&:ar 1901 5,524 2,810 2,714 (ANDHRA PRADESH) 1911 6,068 +544 +985 3,010 3,058
1921 6,004 --64 -105 3,042 2,962 1931 6,996 +992 + 16 52 3,479 3,517 1941 8,161 +1,165 + 1665 4,008 4,153 1951 8,847 +686 +841 4,300 4,547 1961 TM. 2292 11,780 +2,933 +33 15 5,670 6,110 1971 P 2294 17,701 +5,921 +5026 8,663 9,038
126 Rlshlke.h Dehra Dun 1911 2,319 1,850 469 (UTTAR PRADESH) 1921 3,438 +I,1l9 +48 25 2,631 807
1931 3,975 +537 + 15 62 3,057 918 1941 5,020 +1,045 +26 29 3,714 '1,306 1951 7,495 +2,475 +49 ,0 4,836 2,659 1961 MB 2 59 10,925 +3,430 +45 76 7,409 3,516 1971 MB 259 17,646 +6,721 +61 52 10,419 7,227
127 Tad.palle Guntur 1951 7,610 3,915 3695 (ANDHRA PRADESH) 1961 P' 16 19 12,994 +5.384 +7075 6,642 6,352
1971 P. 1244 17,627 +4,633 +35 65 9,071 8,549
128 Balotra Jlarmer 1901 5,118 2,680 2,438 (RAJASTHAN) 1911 5,408 +290 +5 67 2,802 2,606
1921 5,142 -266 -492 2,791 2,351 1931 5,601 +459 +893 2,864 2,737 1.941 7,7p5 +2,164 +38 64 4,098 3,667 1951 9,637 +1,872 +24 11 5,089 4,548 1961 M. 2901 12,110 +2,473 +25 66 6,429 5,681 1971 M. 2371 17,595 +5,485 +45 29 9,428 8,167
129 Mehtnedabad Kheda 1901 8,166 4,089 4,077 (GUJARA'I) 1911 6,330 -1,836 -2248 3,299 3,031
1921 6,238 -92 -145 3,174 3,064 1931 7,116 +878 + 1408 3,648 3,468 1941 7,834 +718 +1009 3,984 3,850 1951 9,492 +1,658 +21 16 4,934 4,558 1961 M. 5 18 12,561 +3,069 +32 33 6,511 6.050 1971 N.P. 13 15 17,592 +5,031 +40 05 9,220 8.372
130 Malwan Ratna~," 1901 19,626 9,358 10.268 (MAHARASHTRA) 1911 22,080 +2,454 + 12 50 10,327 11,753
1921 13,761 -8,319 -3768 6,530 7.231 1931 15,195 + 1,434 +1042 7,360 7,835 1941 15,059 -136 --090 7,161 7,898 1951 18,848 +3,789 +25 16 8,699 10,149 1961 M. 650 17,828 -1,020 -541 8,252 9,576 1971\ M. 650 17,579 -249 -140 8,191 9,388
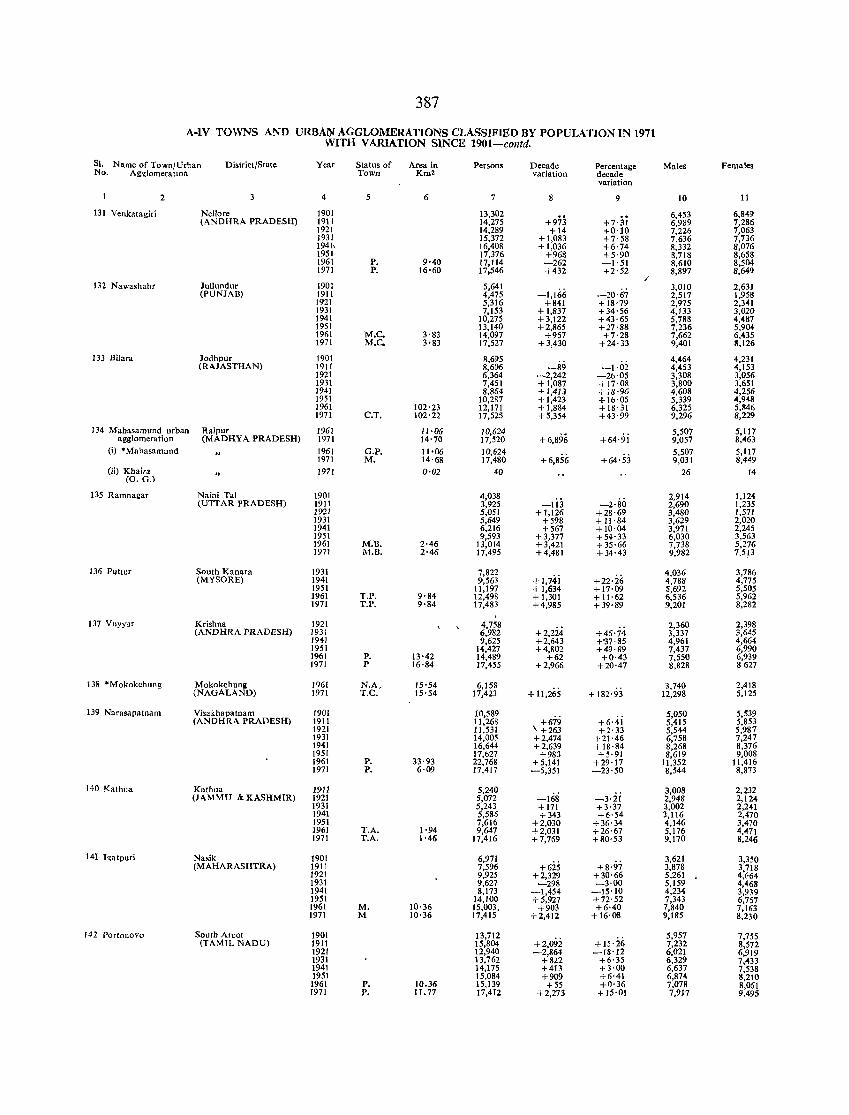
387
A-IV TOWNS AND URBA~ AGGLOMERATIONS CLASSIFIED BY POPULA nON IN 1971 WITH VARIATION SLNCE 1901-colltd.
SI. Name of Town/Urban District/State Year Status of Area in Persons Decade Percentage Males Females No. Agglomeratlon Town Km2 variation decade
variation
2 4 5 6 7 8 9 10 11
131 Venkatagiri Nellore 1901 13,302 +973 +7'3i
6,453 6,849 (ANDHRA PRADESH) 1911 14,275 6,989 7,286
1921 14,289 +14 +0·10 7,226 7,063 1931 15,372 +1,083 +7'58 7,636 7,736 194h 16,408 + 1,036 +6·74 8,332 8,076 1951 17,376 +968 +5·90 8,718 8,658 1961 P. 9'40 17,114 -262 -1·51 8,610 8,504 1971 P. 16'60 17,546 +432 +2·52 8,897 8,649
I 132 Nawashahr Jullundur 1901 5,641
-1,16(; -2(}·6i 3,010 2,631
(PUNJAB) 1911 4,475 2,517 1,958 1921 5,316 +841 + 18·79 2,975 2,341 1931 7,153 +1,837 +34·56 4,133 3,020 1941 10,275 +3,122 +43·65 5,788 4,487 1951 13,140 +2,865 +27·88 7,236 5,904 1961 M.e. 3'83 14,097 +957 +7·28 7,662 6,435 1971 M.e. 3'83 17,527 +3,430 +24·33 9,401 ~,126
133 Bilara Jodhpur 1901 8,695 -1·02
4,464 4,231 (RAJASTHAN) 1911 8,606 -89 4,453 4,153
1921 6,364 -2,242 -20·05 3,308 3,056 1931 7,451 + 1,087 +17·08 3,800 3,651 1941 8,864 +1,413 +18·96 4.608 4,256 1951 10,287 +1,423 +10·05 5,339 4,948 1961 102'23 12,171 + 1,884 + 18·31 6.325 5,S46 1971 C.T. 102'22 17,525 +5,354 +43'99 9,296 8,229
134 Mahasamund urban Raipur 1961 11·06 10,624 +6,896 +64'9i
5,507 5,117 agglomeration (MADHYA PRADESH) 1971 14'70 17,520 9,057 8,463
(i) *Mahasamund 1961 G.P. 11·06 10,624 +6,856 +64'53
5,507 5,117 1971 M. 14'68 17,480 9,031 8,449
(ii) Khaira 1971 0'02 40 26 14 (0. G.)
135 Ramn.gar Naini Tal 1901 4,038 -2·80
2,914 1,124 (UTTAR PRADESH) 1911 3,925 -113 2,690 1,235
1921 5,051 + 1,126 +28·69 3,480 1,571 1931 5,649 +598 + 1l·84 3,629 2,020 1941 6,216 +567 +10·04 3,971 2,245 1951 9,593 + 3,377 + 54· 33 6,030 3,563 1961 M.B. 2·46 13,014 +3,421 + 35·66 7,738 5,276 1971 M.B. 2'46 17,495 +4,481 +34·43 9,982 7.513
136 PutlUr South Kanara 1931 7,822 +1,74i +22·26
4,036 3,786 (MYSORE) 1941 9,563 4,788 4,775
1951 11,197 + 1,634 +17·09 5,692 5,505 1961 T.P. 9·84 12,498 +1,301 + 11·62 6,536 5,962 1971 T.P. 9·84 17,483 +4,985 +39·89 9,201 8,282
137 Vuyyur Krishna 1921 4,758 +2,224 +46'74
2,360 2,398 (ANDHRA PRADESH) 1931 6,982 3,337 3,645
1941 9,625 +2,643 +"37·85 4,961 4,664 1951 14,427 +4,802 +49·89 7,437 6,990 1961 P. 13·42 14,489 +62 +0·43 7,550 6,939 1971 P 16·84 17,455 +2,966 +20·47 8,828 8627
138 *Mokokchung Mokokchunlt 1961 N.A. 15'54 6,158 +11,265
3,740 2,418 (NAGALAND) 1971 T.e. 15·54 17,423 + 182·93 12,298 5,125
139 Narasapatnam Visakhapatnam 1901 10,589 5,050 5,539 (ANDHRA PRADESH) 1911 11,268 +679 +6·41 5,415 5,853
1921 11,531 , +263 +2·33 5,544 5,987 1931 14,005 +2,474 +21·46 6,758 7,247 1941 16,644 +2,639 +18·84 8,268 8,376 1951 17,021 +983 +5·91 8,619 9,008 1961 p. 33·93 22,768 +5,141 +29'17 11,352 11,416 1971 P. 6·09 17,417 -5,351 -23·50 8,544 8,873
140 Kathua Kathua 1911 5,240 -1I;1i -3·ii
3,008 2,232 (JAMMU &KASHMIR) 1921 5,072 2,948 2,124
1931 5,243 +171 +3·37 3,002 2,241 1941 5,586 +343 +6·54 3,116 2,470 1951 7,616 +2,030 +36·34 4,146 3,470 1961 T.A. 1'94 9,647 +2,031 +26·67 5,176 4,471 1971 T.A. 1·46 17,416 +7,769 +80·53 9,170 8,246
141 hatpuri Nasik 1901 6,971 +8·97
3,621 3,350 (MAHARASHTRA) 1911 7,596 +625 3,878 3.718
1921 9,925 +2,329 +30·66 5,261 4,664 1931 9,627 -298 -3·00 5,159 4,468 1941 8,173 -1,454 -15'10 4,234 3,939 1951 14,100 +5,927 +72·52 7,343 6,757 1961 M. 10·36 15,003, +903 +6·40 7,840 7,163 1971 M 10·36 17,415 +2,412 +16·08 9,185 8,230
142 Portanova South Areot 1901 13,712 +2,092 +15·26
5,957 7,755 (TAMIL NADU) 1911 15,804 7,232 8,572
1921 12,940 -2,864 -18'12 6,021 6,919 1931 13,762 +8.t2 +6'35 6,329 7,433 1941 14,175 +413 +3'00 6,637 7,538 1951 15,084 +909 +6·41 6,874 8,210 1961 P. 10.36 15,139 +55 +0·36 7,078 8,061 1971 P. 11.77 17,412 +2,273 +15·01 7,917 9.49:5
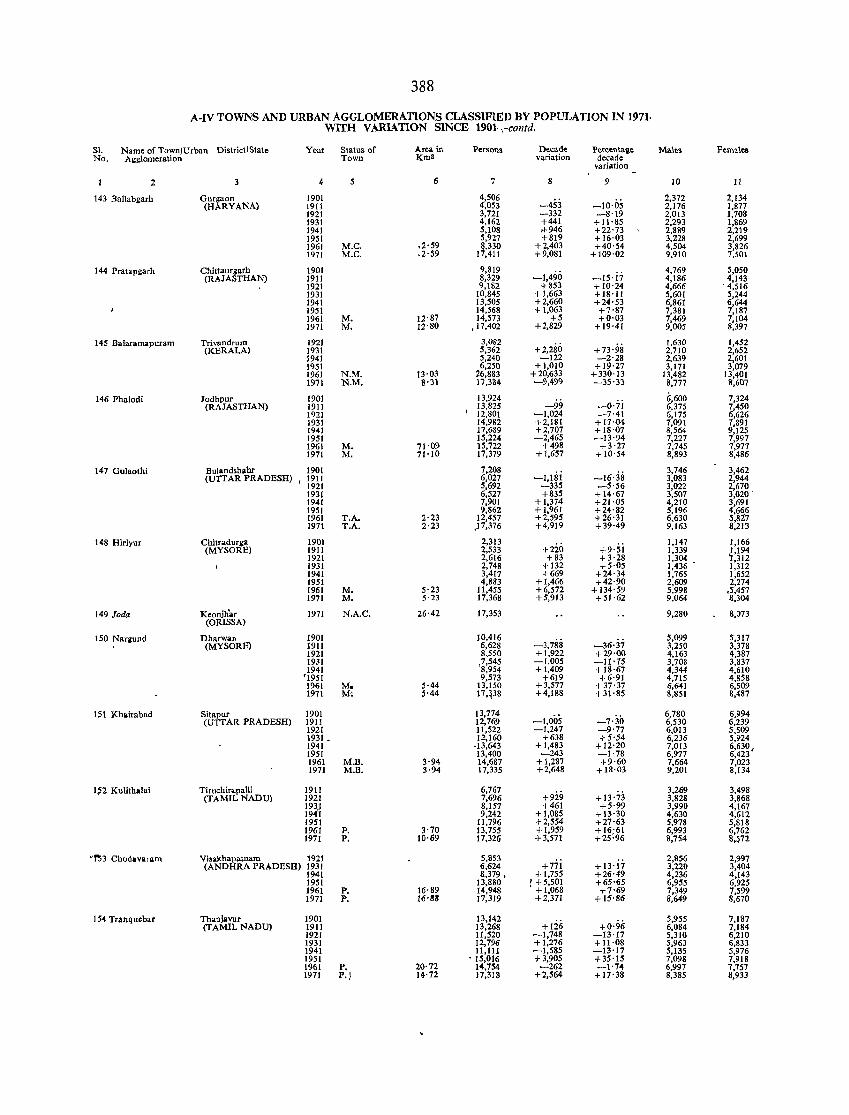
388
A-IV TOWNS AND URBAN AGGLOMERATIONS CLASSIFIED BY POPULATION IN 1971· WITH VARIATION SINCE 1901-,---contd.
SI. Name of TownlUrban DistrictlState Year Status of Area in Persons Decade Percenta&e Males Female& No. Al:giomeration Town Km2 variation decade
variation
2 4 5 6 7 8 9 10 II
143 BaUabg;arh Gurgaon 1901 }506 -453 -10·05 2,372 2,134
(HARYANA) 1911 ,053 2,176 1,877 1921 3,721 -332 -8·19 2,013 1,708 1931 4,162 +441 +11'85 2,293 1,869 1941 5,108 0+946 +22'73 2,889 2,219 1951 5,927 +819 + 16·03 3,228 2,699 1961 M.C. ,2'59 8,330 +2,403 +40'54 4,504 3,826 1971 M.C. ,2'59 17,411 +9,081 +109·02 9,910 7,501
144 Pratapllarh Chittaurgarh 1901 9,819 -1,490 -15·i7
4,769 5,050 (RAJASTHAN) 1911 8,329 4,186 4,143
1921 9,182 +85; + 10'24 4,666 . 4,516 1931 10,845 +1,663 +18'11 5,601 5,244 1941 13,505 +2,660 +24'53 6,861 6,644 1951 14,568 +1,063 +7'87 7,381 7,187 1961 M. 12'87 14,573 +5 +0·03 7,469 7,104 1971 M. 12'80 ,17,402 +2,829 +19·41 9,005 8,397
145 Balaramapuram Trivandrurn 1921 3,082 +2,280 +73·98
1,630 1,452 (KERALA) 1931 5,362 2,710 2,652
1941 5,240 -122 -2'28 2,639 2,601 1951 6,250 +1,010 +19'27 3,171 3,079 1961 N.M. 13'03 26,883 +20,633 +330'13 13,482 13,401 1971 N.M. 8·31 17,334 -9,49'} -35'33 8,777 8,607
146 Phalodi Jodhpur 1901 13,924 -99 -Q'7i
6,600 7,324 (RAJASTHAN) 1911 13,825 6.375 7,450
1921 I 12,801 -1,024 -7·41 6,175 6,626 1931 14,982 .... 2,181 +17·04 7,091 7,891 1941 17,689 +2,707 +18'07 8,564 9,125 1951 15,224 -2,465 -13·94 7,227 7,997 1961 M. 71·09 15,722 +498 +3'27 7,745 7,977 1971 M. 71'10 17,379 + 1,657 +10'54 8,893 8,486
147 Gulaothi Bulandshllhr 1901 7,208 -I,lsi -16·38
3,746 3,462 (UIT AR PRADESH) f 1911 6,027 3,083 2,944
1921 5,692 -335 -5'56 3,022 2,670 1931 6,527 +835 + 14·67 3,507 3,020 . 1941 7,901 +1.374 +21·05 4,210 3,691 1951 9,862 +1,961 +24'82 5.196 4.6~6 1961 T.A. 2'23 12,457 +2,595 +26'31 6,630 5,8 7 1971 T.A. 2'23 ,17,376 +4,919 + 39'49 9,163 8,213
148 Hiriyur Chitradurl:a 1901 2,313 +220 +9·si
1,147 1,166 (MYSORE) 1911 2,533 1,339 1,194
1921 2,616 +83 +3·28 1,304 '1.312 1931 2,748 +132 +5·05 1,436 1,312 1941 3,417 +669 +24'34 1,765 1,652 1951 4,883 +1,466 +42·90 2,609 2,274 1961 M. 5'23 11,455 +6,572 + 134·59 5,998 ,5,457 1971 M. 5·23 17,368 +5,913 +51 ·62 9,064 8,304
149 Jada Keonjhar 1971 N.A.C. 26·42 17,353 9,280 8,073 (ORISSA)
150 Nar&und Dharwarf 1901 10,416 -3,788 -36·37
5,099 5,317 (MYSORE) 1911 6,628 3,250 3,378
1921 8,550 +1,922 +29·00 4,163 4,387 1931 ,7,545 -1,005 -lp5 3,708 3,837 1941 8,954 +1,409 +1 ·67 4,344 4,610
'1951 9,573 +619 +6'91 4,715 4,858 1961 M. 5'44 13,150 +3,577 +37·37 6,641 6,509 1971 M. 5'44 17 ,~38 +4,188 + 31'85 8,851 8,487
151 Khairabad Silapur 1901 13,774 -1,005 -7·30
6,780 6,994 (UTTAR PRADESH) 1911 12,769 6,530 6,239
1921 11,522 -1,247 -9'77 6,013 5,509 1931 _ 12,160 +638 +5'54 6,236 5,924 1941 ·13,643 +1,483 +12'20 7,013 6,630, 1951 13,400 -243 -1'78 6,977 6,423 1961 M.B. 3·94 14,687 +1,287 +9'60 7,664 7,023 1971 M.B. 3·94 17,335 +2,648 +18·03 9,201 8,134
1~2 KuUthalai Tiruchirapam 1911 6,767 +929 + 13·':'3
3,269 3,498 (TAMIL NADU) 1921 7,696 3,828 3,868
m: 8,157 +461 +5·99 3,990 4,167 9,242 + 1,085 + \3'30 4,630 4,612
1951 11,796 +2,554 +27·63 5,978 5,818 1961 P. 3'70 13,755 +1,959 +16;61 6,993 6,762 1971 P. 10·69 17,326 +3,571 +25·96 8,754 8,~72
'-r.i3 Chodavaram Visakhapatnam 1921 5,853 + 13·ii
2,856 2,997 (ANDHRA PRADESH) 1931 6,624 +771 3,220 3,404
1941 8,379, + 1,755 +26·49 4,236 4,143 1951 13,880
! t~:g~~ +65'65 6,955 6,925 1961 P. 16·89 14,948 +7·69 7,349 7,599 1971 P. 16'88 17,319 +2,371 +15·86 8,649 8,670
154 Tranqu4bar Thaojavur 1901 13,142 +126 +0'96
5,955 7,187 (TAMIL NADU) 1911 13,268 6,084 7,184
1921 1l,520 -1,748 -13'17 5,310 6,210 1931 12,796 +1,276 + 1t·08 5,963 6,833 1941 II ,Ill -1,685 -13'17 5,135 5,976 1951 • 15,016 + 3,905 +35'15 7,098 7,918 1961 P. 20·72 14,754 -262 -\·74 6,997 7,757 1971 P.) 14·72 17,318 +2,564 +17'38 8,385 8,933
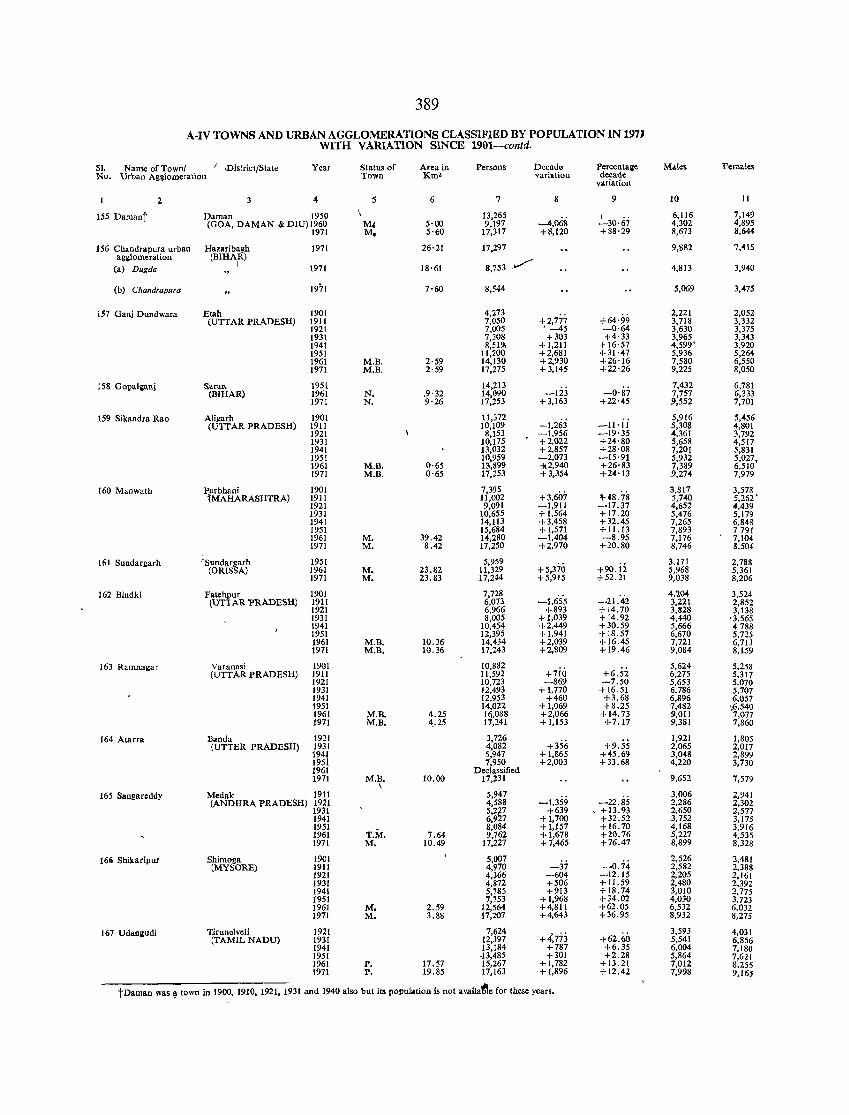
389
A-IV TOWNS AND URBAN AGGLOMERATIONS CLASSIFIED BY POPULATION IN 197J WiTH VARIATION SINCE 1901-colltd.
SI. Name of Town/ I ,District/State Year No. Urban Anlomeration
2
155 Damant
156 Chandrapura urban ag&lomeration
Ca) Dugda
Cb) Chandrapura
157 Gani Dundwara
158 Gopal~nj
159 Sikandra Rao
160 Manwath
161 Sundargarh
162 Bindki
163 Ramnagar
164 Atarra
165 Sangarcddy
161> Shikaripur
167 Udangudi
3 4
Daman 1950 (GOA, DAMAN & OlU) 1960
1971
Hazaribagh (BIHAR) ,
Etah (UTTAR PRADESH)
Saran CBIHAR)
Aligarh (UTTAR PRADESH)
Parbhani tMAHARASHTRA)
iSundargarh (ORISSA)
Fatehpur (UTI AR 'pRADESH)
Varanas! (UTTAR PRADESH)
Banda (UTTER PRADESH)
1971
1971
1901 1911 1921 1931 1941 1951 1961 1971
1951 1961 1971
1901 1911 1921 1931 1941 1951 1961 1971
1901 1911 1921 1931 1941 1951 1961 1971
1951 1961 1971
1901 1911 1921 1931 1941 1951 1961 1971
1901 1911 1921 1931 1941 1951 1961 1971
1921 1931 1941 1951 1961 1971
Medak 1911 (ANDHRA PRADESH) ml
Shimoga (MYSORE)
TjrunelvcIi (TAMIL NADU)
1941 1951 1961 1971
1901 1911 1921 1931 1941 1951 1961 1911
1921 1931 1941 1951 1961 1971
Status of Town
5
M.B. M.B.
N. N.
M.B. M.B.
M. M.
M. M.
M.B. M.B.
M.B. M.B.
M.B. \
T.M. M.
M. M.
P. P.
Area in Kma
6
5·00 5'60
26'21
18'61
1'60
2'59 2'59
,9'32 9'26
0·65 0'65
39.42 8.42
23.82 23.83
10.36 10.36
4.25 4 .. 25
10.00
7.64 10.49
2.59 3.88
11.51 19.85
Persons
7
13,265 9,191
17,311
17,291
8,753
8,544
4,273 7,050 1,005 7,308 8,519,
11,200 14,130 17,275
14,213 14,090 11,253
11,372 10,109
8,153 10,175 13,032 10,959 13,899 17,253
7,395 11,002 9,091
10,655 14,113 15,684 14,280 11,250
5,959 ll,329 17,244
1,728 6,073 6,966 8,005
10,454 12,395 14,434 11,243
10,882 1l,592 10,723 12,493 12,953 14,022 16,088 17,241
3,726 4,082 5,947 7,950
Declassified 17,231
5,947 4,588 5,2').1 6,9'21 8,084 9,762
17,227
5,001 4,970 4,366 4,872 5,785 7,753
12,564 11,207
1,624 12,397 13,184
.13,485 15,261 17,163
Decade variation
8
-4,068 +8,120
+2,177 , -45 +303
+1,211 +2,681 +2,930 +3,145
-123 +3,163
-1,263 -1,956 +2,022 +2,857 -2,073 -112,940 +3,354
+3,607 -1,911 + 1,564 +3,458 +1,571 -1.404 +2,910
+5,310 +5,915
-1,6'5'5 +893
+1,039 +2,449 +1.941 +2,039 +2,809
+1iQ -869
+1.710 +460
+ 1,069 +2,066 +1,153
+356 + 1,865 +2,003
-1,359 +639
+1,700 +1,151 +1,678 +7,465
-31 -604 +506 +913
+1,968 +4,811 +4,643
+ 4',1'13 +787 +301
+1,182 + 1,896
tDaman was ~ town in 1900, 1910, 1921, 1931 and 1940 also but its population is not availatle for these yean.
Percentalle decade
variation
9
I .. -30'67 +88'29
+64'99 -0·64 +4·33
+ 16'51 + 31·41 +26'16 +22·26
-0'87 +22'45
-11, ii -19'35 +24'80 +28'08 -15·91 +26'83 +24'13
H8.78 -11.37 + 11.20 +32.45 + 11.13 -8.95
+20.80
+90.ii +52.21
-21.'42 +14.10 +14.92 +30.59 +18.57 +16.45 +19.46
+6.52 -1.50
+16.51 +3.68 +8.25
+14.73 +7.17
+9.55 +45.69 +33.68
-22.85 , +13.93
+32.52 +16.10 +20.76 +76.41
-0.74 -12.15 + 11.59 +18.14 +34.02 +62.05 +36.95
+62.60 +6.35 +2.28
+ 13.21 + 12.42
Molles
10
6,116 4,302 8,6,13
9,882
4,813
5,069
2,221 3,718 3,630 3,965 4,599' 5,936 7,580 9,225
7,432 7,757 9,552
5,916 5,30$ 4,361 5,658 7,201 5,932 7,389 9,214
3,817 5,140 4,652 5,416 7,265 1,893 7,176 8,746
3,171 5,968 9,038
4,204 3,221 3,828 4,440 5,666 6,670 1,721 9,084
5,624 6,215 5,653 6,786 6,896 7,482 9,011 9,381
1,921 2,065 3,048 4,220
9,652
3,006 2,286 2,650 3,752 4,168 5,227 8,899
2,526 2,582 2,205 2,480 3,010 4,030 6,532 8,932
3,593 5,541 6,004 5,864 7,012 7,998
Females
11
7,149 4,895 8,644
7,415
3,940
3,475
2,052 3,332 3,375 3,343 3,920 5,264 6,550 8,050
6,181 6,333 7,701
5,456 4,801 3,792 4,517 5,831 5,027, 6,510 7,919
3,578 5,262 • 4,439 5,179 6,848 1791 7,104 8,504
2,788 5,361 8,206
3,524 2,852 3,138
'3,565 4188 5,725 6,713 8,159
5,258 5,317 5,010 5,107 6,057
\6,540 7,077 7,860
1,805 2,017 2,899 3,730
7,579
2,941 2,302 2,517 3,115 3,916 4,535 8,328
2,481 2,388 2,161 2,392 2.775 3,123 6,032 8,275
4,031 6,856 7,180 7,621 8,255 9,165
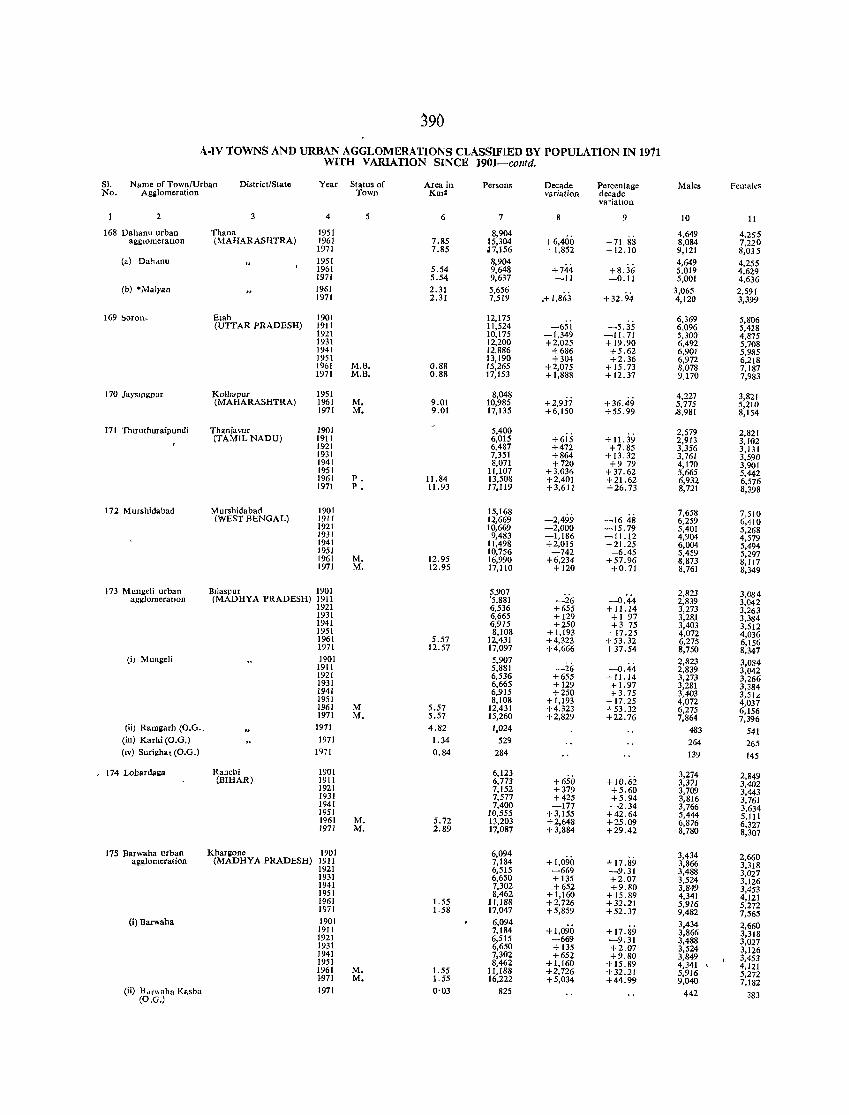
390
..\·IV TOWNS AND URBAN AGGLOMERATIONS CLASSIFIED BY POPULATION IN 1971 WITH VARIATION SINCE 1901-contd.
SI. Name of Town/Urban District/State Year Status or Area in Persons Decade Percentage Males Females No. Agglomeration Town Km' variation decade
variatIon
2 4 5 6 7 8 9 10 II
168 Dahanu urban Thana 1951 8,904 +6,400
4,649 4,255 agglOmeratIOn (MAHARASHTRA) 1961 7.85 15,304 +71 88 8,084 7,220
1971 7.85 n,156 +1,852 + 12. 10 9,121 8,035 (a) Dahanu 1951 8,904
+8.36 4,649 4,255
1961 5.54 9,648 +744 5,019 4,629 1971 5.54 9,637 -11 -0.11 5,001 4,636
(b) 'Molyan 1961 2.31 5,656 .+1,863
3,065 2,591 1971 2.31 7,519 +32.94 4,120 3,399
169 l>or011_ Etah 1901 12,175 -65i
6,369 5,806 (UTTAR PRADESH) 1911 11,524 -5.35 6,096 5,428
1921 10,175 -1,349 -II. 71 5.300 4,875 1931 12,200 +2,025 +19.90 6,492 5,708 1941 12,886 -+ 686 +5.62 6,901 5,985 1951 13,190 +304 +2.36 6,972 6,218 1961 M.B. 0.88 15,265 +2,075 + 15.73 8,078 7,187 1971 M.B. 0.88 17,153 +1,888 + 12.37 9.170 7,983
170 JaYSl[lgpur Kolbapur 1951 8,048 +2,9ji +36.49
4,227 3,821 (MAHARASHTRA) 1961 M. 9.01 10,985 5,775 5,210
1971 M. 9.01 17,135 +6,150 +55.99 .8,981 8,154
171 Thlruthuraipundi Thaniavur 1901 5,400 2,579 2,821 (TAMIL NADU) 1911 6,015 +615 + 11.39 2,913 3,102 ]921 6,487 +472 +7.85 3,356 3,131
1931 7,351 +864 + 13.32 3,761 3,590 1941 8,071 +720 +9 79 4,170 3,901 1951 11,107 +3,036 +37.62 5,665 5,442 1961 P. 11.84 13,508 +2,401 +21.62 6,932 6,576 1971 P. 11.93 17,119 +3,611 +26.73 8,721 8,398
172 Murshidabad M urshidabad 1901 15,168 -2,499
7,658 7,510 (WEST BENGAL) 1911 12,669 -1648 6,259 6,410 1921 10,669 -2,000 -15.79 5,401 5,268 1931 9,483 -1,186 -11.12 4,904 4,579 1941 11,498 +2,015 + 21.25 6,004 5,494 1951 10,756 -742 -6.45 5,459 5,297 1961 M. 12.95 16,990 +6,234 +57.96 8,873 8,117 1971 M, 12.95 17,110 + 120 +0.71 8,761 8,349
173 Mungeli urban Btlaspur 1901 5,907 "":'26 -0.44
2,823 3,084 aggJomerauon (MADHYA PRADESH) 1911 '5,881 2,839 3,042 1921 6,536 +655 +11.14 3,273 3,263 1931 6,665 +129 +1 97 3,281 3,384 1941 6,915 +250 +3 75 3,403 3,512 1951 8,108 + 1,193 + 17.25 4,072 4,036 1961 5.57 12,431 +4,323 +53.32 6,275 6,156 1971 12.57 17,097 +4,666 +37.54 8,750 8,347 (i) MungcH 1901 5,907
-0.44 2,823 3,084 1911 5,881 -26 2,839 3,042 1921 6,536 +655 +11.14 3,273 3,266 1931 6,665 + 129 + 1.97 3,281 3,384 1941 6,915 +250 +3.75 3,403 3,51" 1951 8,108 +1,193 + 17.25 4,072 4,037 1961 M 5.57 12,431 +4,323 +53.32 6,275 6,156 1971 M. 5.57 15,260 +2,829 +22.76 7,864 7,396
(ii) Ramgarh (O.G •. 1971 4.82 1,024 483 541 (ill) Karhi (O.G.) 1971 1.34 529 264 265 (IV) Surighat (O.G.) 1971 0.84 284 139 145
174 LobardallR Ranchi 1901 6,123 + 10.62
3,274 2,849 (BIHAR) 1911 6,773 +650 3,371 3,402 1921 7,152 +379 +5.60 3,709 3,443 1931 7,577 +425 +5.94 3,816 3,761 1941 7,400 -177 -2.34 3,766 3,634 1951 10,555 +3,155 +42.64 5,444 5,111 1961 M. 5.72 13,203 +2,648 +25.09 6,876 6,327 1971 M. 2.89 17,087 +3,884 +29.42 8,780 8,307
175 Barwaha urban Kbarllone 1901 6,094 +1,090
3,434 2,660 agglomeralion (MADHYA PRADESH) 1911 7,184 + 17.89 3,866 3,318 1921 6,515 -669 -9.31 3,488 3,027 1931 6,650 + 135 +2.07 3,524 3,126 1941 7,302 +652 +9.80 3,849 3,453 1951 8,462 +1,160 + 15.89 4,341 4,121 1961 1.55 11,188 +2,726 +32.21 5,916 5,272 1971 1.58 17,047 +5,859 +52.37 9,482 7,565 (i) Barwaha 1901 6,094 3,434 2,660 ]91 I 7,184 +1,090 +17.89 3,866 3,318 1921 6,515 -669 -9.31 3,488 3,027 1931 6,650 + 135 +2.07 3,524 3,126 1941 7,302 +652 +9.80 3,849 3,453 1951 8,462 +1,160 +15.89 4,341 4,121 1961 M. 1.55 11.188 +2,726 +32.21 5,916 5,272 1.lJ71 M. 1.55 16,222 +5,034 +44.99 9,040 7,182
(ii) B"f" aha Kasba 1971 0'03 825 442 383 (O.G.)
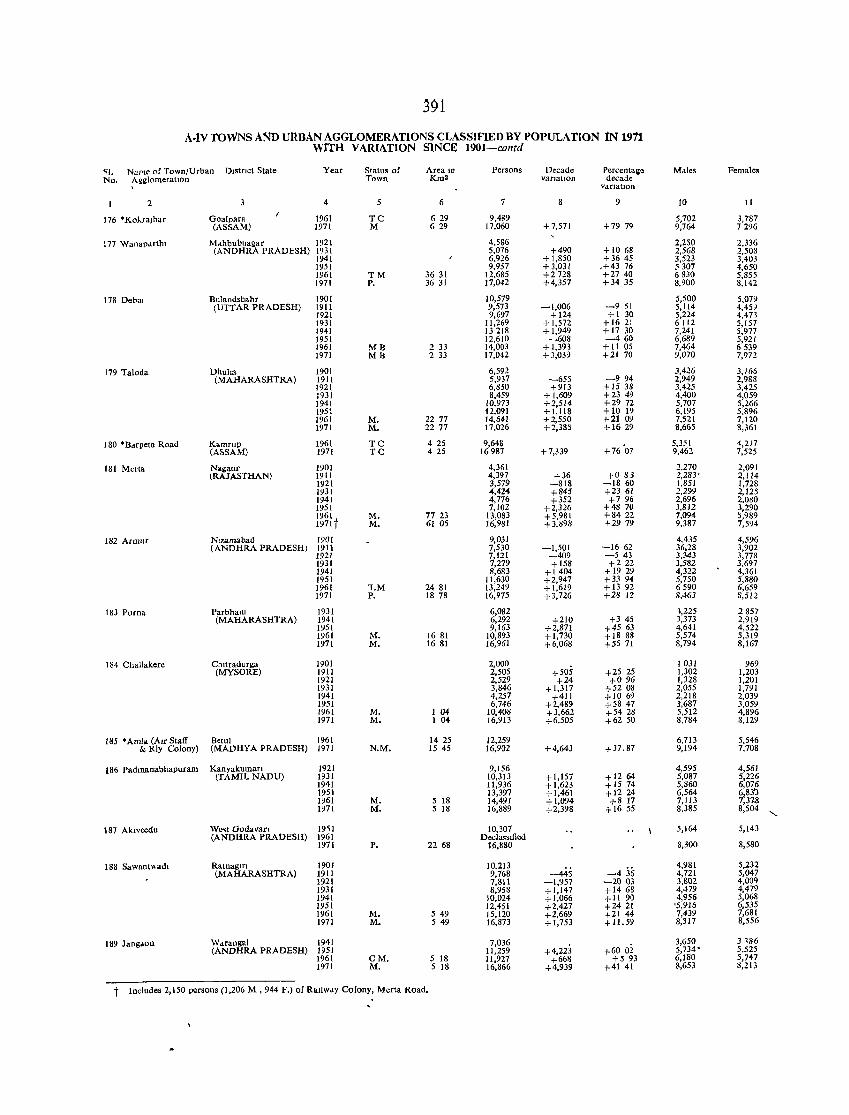
391
A·tv TOWNS AND URBAN AGGLOMERATIONS CLASSIFIED BY POPULATION tN 1911 WITH VARIATION SINCE 1901-contd
<;1. Name of Town/Urban DistrIct State Year Status of Area 10 Persons Decade Percentaf;e Males Females No. Agglomeration Town Km2 varJatlOn decade
VartatlOn
2 4 6 7 8 9 10 11
176 ·Ko)..raJhar Go.lpar. 1961 TC 629 9.489 5,702 3,787 (ASSAM) 1971 M 629 17,060 +7,571 +79 79 9,764 7296
177 Wanaparthl Mahbubnagar 1921 4,586 2,250 2,336 (ANDHRA PRADESH) 1931 5,076 +490 + 1068 2,568 2,508
1941 6,926 + 1,850 +3645 3,523 3,403 1951 9,957 +3,031 .+43 76 5307 4,650 1961 ™ 36 31 12,685 +2728 +27 40 6830 5,855 1971 P. 36 31 17,042 +4,357 +3435 8,900 8,142
178 DebUl Bul.ndsbahr 1901 10,579 5,500 5,079 (UTTAR PRADESH) 1911 9,573 -1,006 -951 5,114 4,4H
1921 9,697 +124 +1 30 5,224 4,471 1931 11,269 + 1,572 + 16 21 6112 5,157 1941 13 218 +1,949 + 17 30 7,241 5,977 1951 12,610 -608 -460 6,689 5,921 1961 MB 2 33 14,003 + 1,393 + 11 05 7,464 6539 1971 MB 2 33 17,OU +3,0)) +21 70 9,070 7,972
179 Taloda Dhuha 1901 6,592 3,426 3,165 (MAHARASHTRA) 1911 5,937 -655 -994 2,949 2,988
1921 6,850 +9lJ +15 38 3,425 3,425 1931 8,459 +1,609 +23 49 4,400 4,059 1941 10,973 +2,514 +29 72 5,707 5,266 1951 12,091 +1,118 +10 19 6,195 5.896 1961 M. 22 77 14,641 +2,550 +21 09 7,521 7,120 1971 M. 2277 17,026 +2,385 +1629 8,665 8,361
) 80 *Barpeta Road Kamrup 1961 TC 425 9,648 +76 '07
5,351 4,2)7 (Af>SAM) 1971 TC 425 16987 +7,339 9,462 7,525
181 Merta Naiaur 1901 4,361 2,270 2,091 (RAJASTHAN) 1911 4,397 +36 +083 2,283' 2,114
1921 3,579 -818 -1860 1,851 1,728 1931 4,42'1 +845 +23 61 2,299 2,125 1941 4,776 +352 +796 2,696 2.080 1951 7,102 +2,326 +48 70 3.812 3,290 1961 M. 77 23 13,083 +5,981 +8422 7,094 5,989 1971t M. 61 05 16,981 +3,898 +29 79 9,387 7,594
182 Armur N.zamabad 1901 9,031 4,435 4,596 (ANDHRA PRADESH) 1911 7,530 -1,501 -1662 36,28 3,902
1921 7,121 -409 -543 3,343 3,778 1931 7,279 +158 +222 3,582 3,697 1941 8,683 +1404 + 1929 4,322 4,361 1951 11,630 +2,947 +3394 5,750 5,880 1961 "T.M 2481 13,249 +1,619 +13 92 6590 6,659 1971 P. 18 78 16,975 +3,726 +28 12 8,463 8,512
183 Puma Parbham 1931 6,082 1,225 2857 (MAHARASHTRA) 1941 6,292 +210 +3 45 3,373 2,919
1951 9,163 +2,871 +4563 4,641 4,522 1961 M. 1681 10,893 +1,730 +18 88 5,574 5,319 1971 M. 1681 16,961 +6,068 +5571 8,794 8,167
184 Ch.llakere Chltradurga 1901 2,000 +505
1031 969 (MYSORE) 1911 2,505 +25 25 1,302 1,203
1921 2,529 +24 +096 1,328 1,201 1931 3,846 +1,317 +5208 2,055 1,791 1941 4,257 +411 +1069 2,218 2,039 1951 6,746 +2,489 +5847 3,687 3,059 1961 M. 104 10,408 +3,662 +54 28 5,512 4,896 1971 M. I 04 16,913 +6,505 +6250 8,784 8,129
185 ·Aml .. (AlrS!aff Betul 1961 14 25 12,259 6,713 5,546 & Rly Colony) (MADHYA PRADESH) 1971 N.M. 1545 16,901 +4,643 +37.87 9,194 7,708
186 Padrnanabhapuram Kanyakuman 1921 9,156 4,595 4,561 (TAMIL NADU) 1931 10,313 +1,157 +1264 5,087 5,226
1941 11,936 +1,623 +1574 5,860 6,076 1951 13,397 +1,461 +1224 6,564 ~83'3 1961 M. 5 18 14,491 +1,094 +8 17 7,113 ,378 1971 M. 5 18 16,889 +2,398 + 16 55 8,385 8,504
"-187 Aklveedu We,! Godavaro 19~1 10,307 5,164 5,143
(ANDHRA PRADESH) 1961 Declassified 1971 P. 22 68 1p,880 8,300 8,580
188 Sawant"adl Ratnaglfl 1901 10,213 -436
4,981 5,232 (MAHARASHTRA) 1911 9,768 -445 4,721 5,047
1921 7,811 -1,957 -2003 3,802 4,009 1931 8,958 +1,147 + 1468 4,479 4,479 1941 10,024 +1,066 +11 90 4,956 5,068 1951 12,451 +2,427 +2421 '5,916 6,535 1961 M. 5 49 15,120 +2,669 +21 44 7,439 7,681 1971 M. 5 49 16,873 +1,753 + 11.59 8,317 8,556
189 langdon Wdrangal 1941 7,036 +4,223 +600i
3,650 3186 (ANDHRA PRADESH) 1951 11,259 5,734' 5,525
1961 CM. 5 18 11,927 +668 +5 93 6,180 5,747 1971 M. 5 18 16,866 +4,939 +4141 8,653 8,213
t Includes 2,150 persons (I,206 M, 944 F.) of Ra,lwdY Colony, Merta Road.
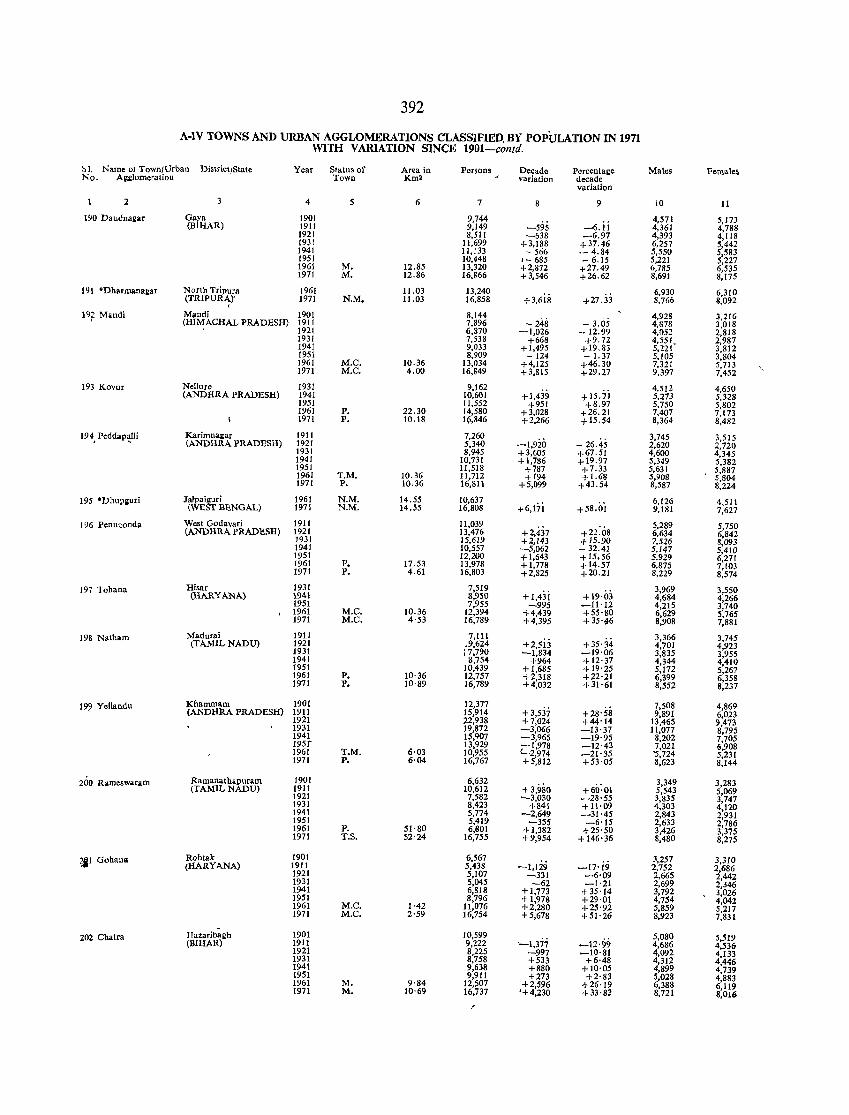
392
A-IV TOWNS AND URBAN AGGLOMERATIONS CLASSIFIED. BY POPULATION IN 1971 WITH VARIATION SINCE 1901-contd.
~l. Name ot Town/Urban District/State Year Status of Area in Persons Decade Percentage Males Female~ No. Ag~Jomeration Town Km' variation decade
variation
2 3 4 5 6 7 9 10 11
190 Daudnagar Gaya 1901 9,744 -595 -6.ii
4,571 5,173 (BIHAR) 1911 9,149 4,361 4,788
1921 8,511 -638 -6.97 4,393 4,118 1931 11,699 +3,188 +37.46 6,257 5,442 1941 11,133 - 566 .- 4.84 5,550 5,583 1951 10,448 1- 685 - 6.15 5,221 5,227 1961 M. 12.85 13,320 +2,872 +27.49 6,785 6,535 1971 M. 12.86 16,866 +3,546 +26.62 8,691 8,175
191 ·Dharmanallar North Tripura 1961 11.03 13,240 +3,6ili +27.3.3
6,930 6,310 (TRIPU~)' 1971 N.M. 11.03 16,858 8,766 8,092
19f! Mandi Mandi 1901 8,144 - 248
4.928 3,216 (HIMACHAL PRADESH) 1911 7,896 - 3.05 4,878 3.018
1921 6,870 -1,026 - 12.99 4,052 2,818 1931 7,538 +668 +9.72 tm· 2,987 1941 9,033 +1,495 + 19.83 3,812 1951 8,909 - 124 - 1.37 5,105 3,804 1961 M.C. 10.36 13,034 +4,125 +46.30 7,321 5,713 1971 M.C. 4.00 16,849 +3,815 +29.27 9,397 7,452
193 Kovur Nellore 1931 9,162 +1,439 +15.;i
4,512 4,650 (ANDHRA PRADESH) 1941 10,601 5,273 5,328
1951 11,552 +951 +8.97 5,750 5,802 1961 P. 22.30 14,580 +3,028 +26.21 7,407 7,173 1971 P. 10.18 1(>,846 +2,266 +15.54 8,364 8,482
194, Peddap~lli Karimnallar 1911 7,260 -1,920 - 26.45
3,745 3,515 (ANDHRA PRADESH) 1921 5,340 2,620 2,720
1931 8,945 +3,605 +67.51 4,600 4,345 1941 10,731 +1,786 +19.97 5,349 5,382 1951 11,518 +787 + 7.33 5,631 5,887 1961 T.M. 10.36 11,712 +194 + 1.68 5,908 5,804 1971 P. 10.36 16,811 +5,099 +43.54 8,587 8,224
195 oDhuPl:uri Jalpaiguri 1961 N.M. 14.55 10,637 +6,i7i +58.oi
6,126 4,511 (WEST BENGAL) 1971 N.M. 14.55 16,808 9,181 7,627
196 Penuoonda West Godavari 1911 11,039 +2,4j7 +22:08
5,289 5,750 (ANDHRA PRADESH) 1921 13,476 6,634 6,842 1931 J5,619 +2,143 +15.90 7,526 8,093
1941 10,557 -5,062 - 32.41 5,147 5,410 1951 12,200 +1,643 +15.56 5,929 6,271 1961 P. 17.5.1 13,978 +1,778 +14.57 6,875 7,103 1971 P. 4.61 16,803 +2,825 +20.21 8,229 8,574
197 Tohana Hisar 1931 7,519 +1,43i + 19'03
3,969 3,550 (HARYANA) 1941 8,950 4,684 4,266
1951 7,955 -995 -11'12 4,215 3,740 1961 M.C. 10.36 12,394 +4,439 + 55'80 6,629 5,765 1971 M.C. 4'53 16,789 +4,395 +35'16 8,908 7,881
198 Natham Madurai 1911 7,11l +2,5ij +35'34
3,366 3,745 (TAMIL NADU) 1921 ,9,624 4,701 4,923
J931 ,7,790 -1,834 -19'06 3,835 3,955 1941 8,754 +964 +12'37 4,344 4,410 1951 10,439 +1,685 +19'25 5,172 5,267 1961 P. 10·36 12,757 +2,318 +22'21 6,399 6,358 1971 P. 10'89 16,789 +4,032 +31'61 8,552 8,237
19~ Yellandu Khammam 1901 12,377 +3,sj7 +28'58
7,508 4,869 (ANDHRA PRADESH) 1911 15,914 9,891 6,023
1921 22,938 +7,024 +44'14 13,465 9,473 1931 19,872 -3,066 -13'37 11,077 8,795 1941 IS,907 -3,965 -19'95 8,202 7,705 195f 13,929 ;-1,978 -12·43 7,021 6,908 1961 T.M. 6'03 10,955 -2,974 -21'35 '5,724 5,231 1971 P. 6·04 16,767 +5,812 +53·05 8,623 8,144
200 Rameswaram Ramanathapuram 1901 6,632 +3,980 +60'·01
3,349 3,283 (TAMIL NADU) 1911 10,612 5,543 5,069 1921 7,582 -3,030 -28'55 3,835 3,747 1931 8,423 +841 + 11'09 4,303 4,120 1941 5,774 -2,649 -31·45 2,843 2,931
1951 5,419 -355 -6'15 2,633 2,786 1961 P. 51'80 6,801 +1,382 +25'50 3,426 3,375 1971 T.S. 52'24 16,755 +9,954 + 146'36 8,480 8,275
?jt Gohan .. Rohtak 1901 6,567 -1,li'; -17·i9
3,257 3,310 (HARYANA) 1911 5,438 2,752 2,686 1921 5,107 -331 -6'09 2,665 2,442
1931 5,045 -62 -1'21 2,699 2,346 1941 6,818 + 1,773 +35'14 3,792 3,026 1951 8,796 + 1,978 +29·01 4,754 4,042 1961 M.C. 1·42 11,076 +2,280 +25'92 5,859 5,217 1971 M.e, 2·59 16,754 +5,678 +51·26 8,923 7,831
202 Chatra Hazaribagh 1901 10,599 '-1,377 -12'99
5,080 5,519 (BIHAR) 1911 9,222 4,686 4,536
1921 8,225 -997 -10'81 4,092 4,133 1931 8,758 +533 +6·48 4,312 4,446 1941 9,638 +880 + 10'05 4,899 4,739 1951 9,911 +273 +2'83 5,028 4,883 1961 M. 9'84 12,507 +2,596 +26'19 6,388 6,119 1971 M. 10'69 16,737 '+4,230 +33'82 8,721 8,016
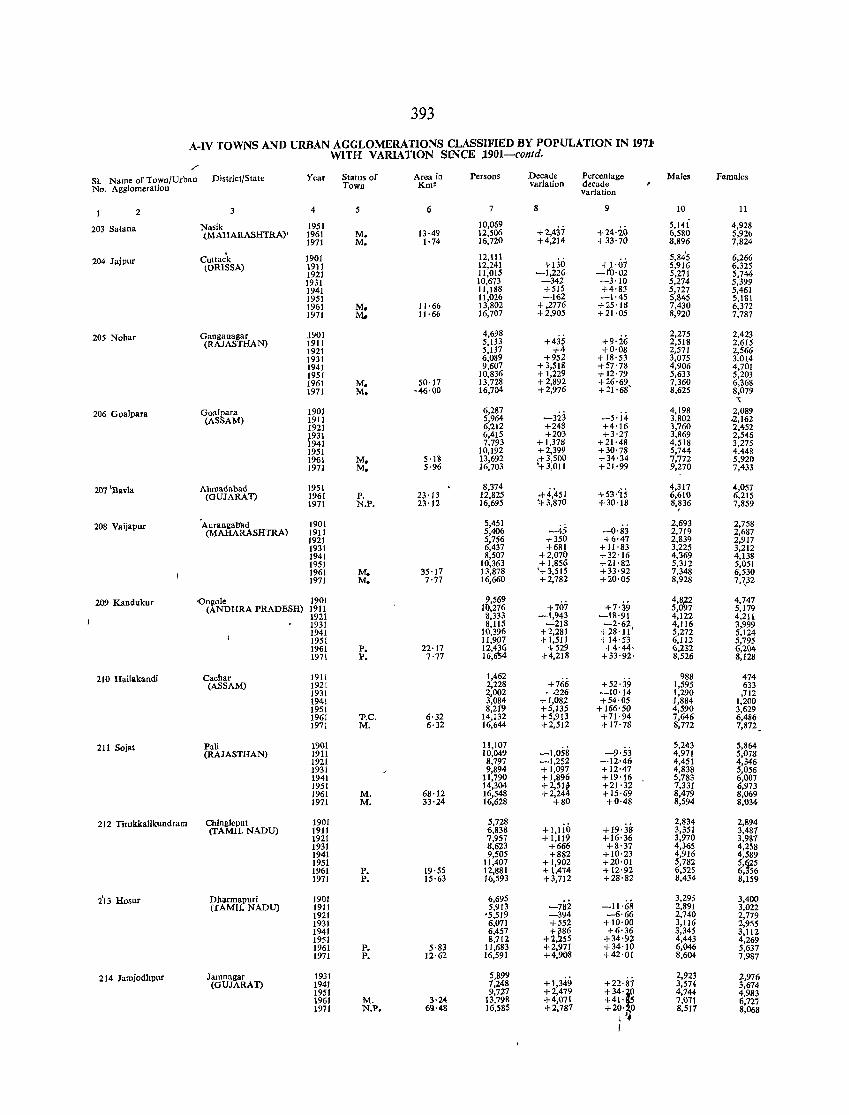
393
A-IV TOWNS AND URBAN AGGLOMERATIONS CLASSIFIED BY POPULATION IN 1971' WITH VARIATION SINCE ,1901-contd.
/'
SI. Name of Town/Urban District/State Year Status of Area in Persons Decade Percentage Males Females No. Agglomeration Town Km2 variation d~cade
variation
2 3 4 5 6 7 8 9 10 II
203 Sahina Nasik 1951 10,069 +2,437 +24·2.0
5,14i 4,928 {MAHARASHTRA)' 1961 M. 13·49 12,506 6,580 5,921>
1971 M. 1·74 16,720 +4,214 +33'70 8,896 7,824
204 Jajpur Cuttack 1901 12,111 +130 +Hii
5,845 6,266 (ORISSA) 1911 12,241 5,916 6,325
1921 11,015 -1,226 -1'0·02 5,271 5,744 1931 10,673 -342 -3'10 5,274 5,399 1941 11,188 +515 +4'83 5,727 5,461 1951 11,026 -162 -1'45 5,845 5,181 1961 M. 11·66 13,802 +,2776 +25'18 7,430 6,372 1971 .1\1. 11·66 16,707 +2,905 +21·05 8,920 7,787
205 Nohar Gaoganagar J901 4,698
+~i +9·i6 2,275 2,423
(RAJASTHAN) 1911 5,133 2,518 2,615 1921 5,137 +0'08 2,571 2,566 1931 6,089 +952 + 18·53 3,075 3,014 1941 9,607 +3,518 +57'78 4,906 4,701 1951 10,836 + 1,229 +12'79 5,633 5,203 1961 M. 50·17 13,728 +2,892 +26'69, 7,360 6,368 1971 M. ,46·00 16,704 +2,976 +21'68 8,625 8,079
'\
206 Goalpara Goalpara 1901 6,287 ~3i3 -5·i.j.
4,198 2,089 (ASSAM) 1911 5,964 3,802 .2,162
1921 6,212 +248 +4'16 1,760 2,452
t931 6,415 +203 +3'27 3,869 2,546 941 7,793 +1,378 +21'48 4,518 3,275
1951 10,192 +2,399 +30'78 5,744 4.448 1961 M. 5·18 13,692 1+ 3,500 +34·34 7,772 5,920 1971 M. 5·96 16,703 +3,011 +21'99 9,270 7,433
207 'Bavla Ahmadabad 1951 8,374 .+4,451 +53'~5
4,317 ,",,057 (GUJARAT) 1961 P. 23·13 12,825 6,610 6,215
1971 N.P. 23'12 16,695 '+ 3,870 +30'18 8,~36 7,859
208 Vaija pur 'Auranl:;abad 1901 5,451 -45 -0·g3
2,693 2,758 (MAHARASHTRA) 1911 5,406 2,719 2,687
1921 5,756 +350 +6·41 2,839 2,917 1931 6,437 +681 + 11'83 3,225 3,212 1941 8,507 +2,070 +32'16 4,369 4,138 1951 10,363 + 1,856 +21'82 5,312 5,051 1961 M. 35'17 13,878 '+3,515 +33'92 7,348 6,530 1971 M. 7·77 16,660 +2,782 +20'05 8,928 7,7,$2
209 Kandukur ()ngole 1901 9,569 +707
4,8~2 4,747 (ANDHRA PRADESH) 1911 Ill,276 +7'39 5,0 7 5,179
1921 8,333 -1,943 -18·91 4,122 4,211 1931 8,115 -218 -2'62 4,116 3,999 1941 10,396 +2,281 +28'11' 5,272 5.124 1951 11,9P7 +I,5J1 +14'53 6,112 5,795 1961 P. 22·17 12,~(i +529 +4,44, 6,232 6,21)4 1971 P. 7·77 16, 4 +4,218 +33'92' 8,526 8,128
210 Hailakandi Cachar 1911 1,462 +766 +52'39
988 474 (ASSAM) 1921 2,228 1,595 633
1931 2,002 -226 -10'14 1,290 .712 1941 3,084 +1,082 +54'05 1,884 1,200 1951 8,2f9 +5,135 + 166'50 4,590 3,629 1961 1'.C. 6·32 14,132 +5,913 +71'94- 7,646 6,486 1971 M. 6·32 16,644 +2,512 +17'78 8,772 7,872
211 Sojat Pali 1901 11,107 -1,058 -9'53
5,243 5,864 (RAJASTHAN) 1911 10,049 4,971 5,078
1921 8,797 -1,252 -12'46 4,451 4,346 1931 9,894 +1,097 +12'47 4,838 5,056 1941 11,790 + 1,896 +19'16 5,783 6,007 1951 14,304 +2,51;1- +21'32 7,331 6,973 1961 M. 68·12 16,548 +2,244 +15'69 8,479 8,069 1971 M. 33·24 16,628 +80 +0·48 8,594 8,034-
212 Tirukkalikundram Chingleput 1901 5,728 +l,lio +19·38
2.834 2,894 (TAMIL NADU) 1911 6,838 3,351 3,487
Inl 7,957 +1,119 +16'36 3,970 3,981 1931 8,623 +666 +8'37 4,365 4,258 1941 9,505 +882 +10'23 4,916 4,589 1951 11,407 +1,902 +20'01 5,782
5'fs5 1961 P. 19·55 12,881 + 1,474 + 12·92 6,525 6, 56 1971 P. 15·63 16,593 +3,712 +28'82 8,434 8,159
i13 Hosur DhilImapuri 1901 6,695 ~78Z -11'68
3,295 3,400 (TAMIL NADU) 1911 5,913 2,891 3,022
1921 '5,519 -394 -6'66 2,740 2,779 1931 6,071 +552 + 10·00 3,116 2,955 1941 6,457 +~86 +6'36 3,345 3,112 1951 8,712 +2, 55 +34'92 4,443 4,269 1961 P. 5·83 11,683 +2,971 +34·10 6,046 5,637 1971 P. 12·62 16,591 +4,908 +42'01 8,604 7,987
214 JamjodllPur Jamnngar 1931 5,899 +1,349 +22'81
2,923 2,976 (GUJARAT) 1941 7,248 3,574 3,674
1951 9,727 +2,479 +34'~ 4,744 4,983 1961 M. 3·24 13,798 +4,071 +41' 7,071 6,727 1971 N.P. 6<;1-48 16,585 +2,787 +20, 0 8,511 8,068
I J~
I
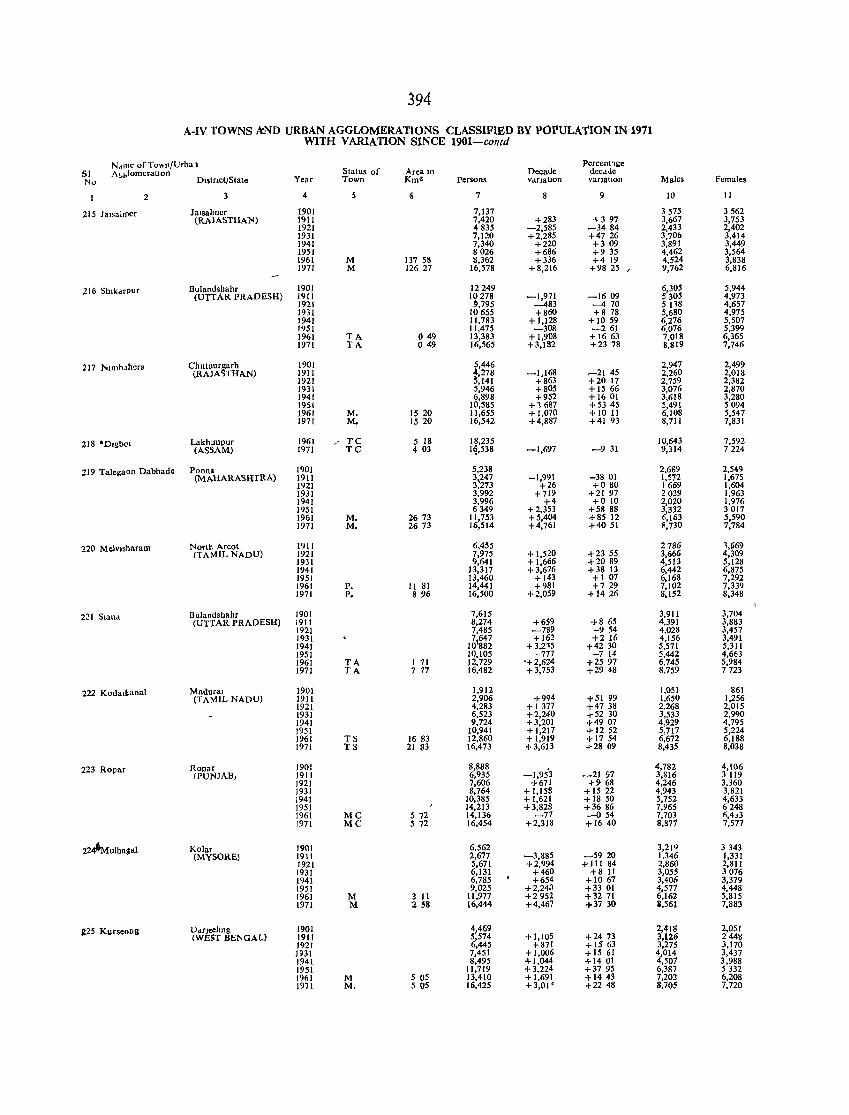
394
A-IV TOWNS kND URBAN AGGLOMERATIONS CLASSIFIED BY POPULATION IN 1971 WITH VARIATION SINCE 1901-contd
Name of Town/Urba 1 Percent1ge SI A~l>lomeratlOn Status of Area In Decade decdJe No Dlstnct/State Year Town Km~ Persons VdfJatJOD vanatlOn Males Females
2 3 4 ~ 7 9 10 II
215 Jalsalmcr Jalsahncr 1901 7,137 3575 3562 (RAJASTHAN) 1911 7,420 +283 +397 3,667 3,753
1921 4835 -2,585 -3484 2,433 2,402 1931 7,120 +2,285 +47 26 3,706 3,414 1941 7,340 +220 +309 3,891 3,449 1951 8026 +686 +9 35 4,462 3,564 1961 M 137 55 8,362 +336 +419 4,524 3,838 1971 M 12627 16,578 +8,216 +98 25 / 9,762 6,816
21 c> Sblk"rPur Bulandsbabr 1901 12249 6,305 5,944 (UTTAR PRADESH) 1911 10278 -1,971 -1609 5305 4,973
1921 ~,795 --483 --4 70 5118 4,657 1931 10655 +860 +878 5,680 4,975 1941 11,783 +1,128 + 1059 6,276 5,507 1951 11,475 -308 -261 6,076 5,399 J961 TA 049 13,383 + J,908 +J663 7,018 6,365 1971 TA 049 J6,565 +3,182 +2378 8,819 7,746
ZI7 NuubJhora Chlttnurgarh 1901 5,446 2,947 2,499 (RAJA')THAN) 1911 04.,278 -1,168 _2145 2,260 2,018
1921 5,141 +863 +2017 2,759 2,382 1931 5,946 +805 + 15 66 3,076 2,870 1941 6,898 +952 +1601 3,618 3,280 1951 10,585 +1687 +5345 5,491 5094 1961 M. 1520 11,655 +1,070 + 1011 6,108 5,547 1971 M. 15 20 16,542 +4,887 +4193 8,711 7,831
218 *Dlgbol Lakhlmpur 1961 / TC 5 18 18,235 10,643 7,592 (ASSAM) 1971 TC 4 03 1~,538 -1,697 -931 9,314 7224
219 Talegaon Dabhad. Poona 1901 5,238 2,689 2,504'} (MAHARASHTRA) 1911 3,247 -1,991 -3801 1,512 1,675
1921 3,273 +26 +080 1669 1,604 1931 3,992 +719 +2197 2029 1,963 1941 3,996 +4 +010 2,020 1,976 1951 6349 +2,353 +58 88 3,332 3017 1961 M. 2673 11,753 +5,404 +85 12 6,163 5,590 1971 M. 2673 16,514 +4,761 +4051 8,730 7,784
220 Melvlsllaram North Areol 1911 6,455 2786 l,li69 (TAMIL NADU) 1921 7,975 + 1,520 +23 55 3,666 4,309
1931 9,641 + 1,666 +2089 4,513 5,128 1941 13,317 +3,676 +38 13 6,442 6,875 1951 13,460 + 143 +107 6,168 7,292 1961 P. II 81 14,441 +981 +729 7,102 7,339 1971 P. 8 96 16,500 +2,059 +1426 8,152 8,348
2"1 Sland Bulandshahr 1901 7,615 3,9J1 3,704 (UTTAR PRADESH) 1911 8,274 +659 +8 65 4,391 3,883
1921 7,485 -789 -9 54 4,028 3,457 1931
1&lfsi + 162 +216 4,156 3,491
1941 +3,215 +42 30 5,571 5,311 1951 10,105 -777 -7 14 5,442 4,663 1961 TA 1 11 12,729 '+2,624 +2597 6,745 5,984 1971 TA 7 17 16,482 + 3,753 +29 48 8,759 7723
222 Kodalkanal Madural 1901 1,912 1,051 861 (TAMIL NADU) 1911 2,906 +994 +51 99 1,650 1,256
1921 4,283 + 1377 -t-47 38 2,268 2,015 1931 6,523 +2,240 +52 30 3,533 2,990 1941 9,724 +3.201 +49 07 4,929 4,795 )951 10,941 +1,217 + 1252 5,717 5,224 1961 TS 1683 12,860 +1,919 +1754 6,672 6,188 1971 TS 21 83 16,473 +3,613 +28 09 8,435 8,038
223 Ropar Ropar 1901 8,888 -1,95'3
4,782 4,106 (PUNJAB, 1911 6,935 -2197 3,816 3119
1921 7,606 +671 +968 4,246 3,360 1931 8,764 + 1,158 +1522 4,943 3,821 1941 10,385 +1,621 +1850 5,752 4,633 1951 14,213 +3,828 +3686 7,965 6248 )961 MC 572 14,136 -77 -054 7,703 6,4,3 )971 MC 5 72 16,454 +2,318 +1640 8,871 7,577
22hulba~al Kolar 1901 6,562 3,21Q 3343 (MYSORE) 1911 2,677 -3,885 -5920 1,346 1,331
1921 5,671 +2,994 +01 84 2,860 2,811 1931 6,131 +460 +8 II 3,055 3076 1941 6,785 +654 +1067 3,406 3,379 )951 9,025 +2,240 +33 01 4,577 4,448 1961 M 3 II 11,977 +2952 +3271 6,162 5,815 1971 M 258 16,444 +4,467 +37 30 i,561 7,883
l!25 Kurseong OdrJee1mg 1901 4,469 2,418 2,051 (WEST BENGAL) 1911 5,574 + 1,105 +2473 3,126 2448
1921 6,445 +871 +15 63 3,275 3,170 1931 7,451 +1,006 +15 61 4,014 3,437 1941 8,495 +1,044 +1401 4,501 3,988 1951 11,719 +3,224 +3795 6,387 5332 1961 M 505 13,410 +1,691 +1443 7,202 6,208 1971 M. 5 05 16,425 +3,01' +2248 8,705 7,720
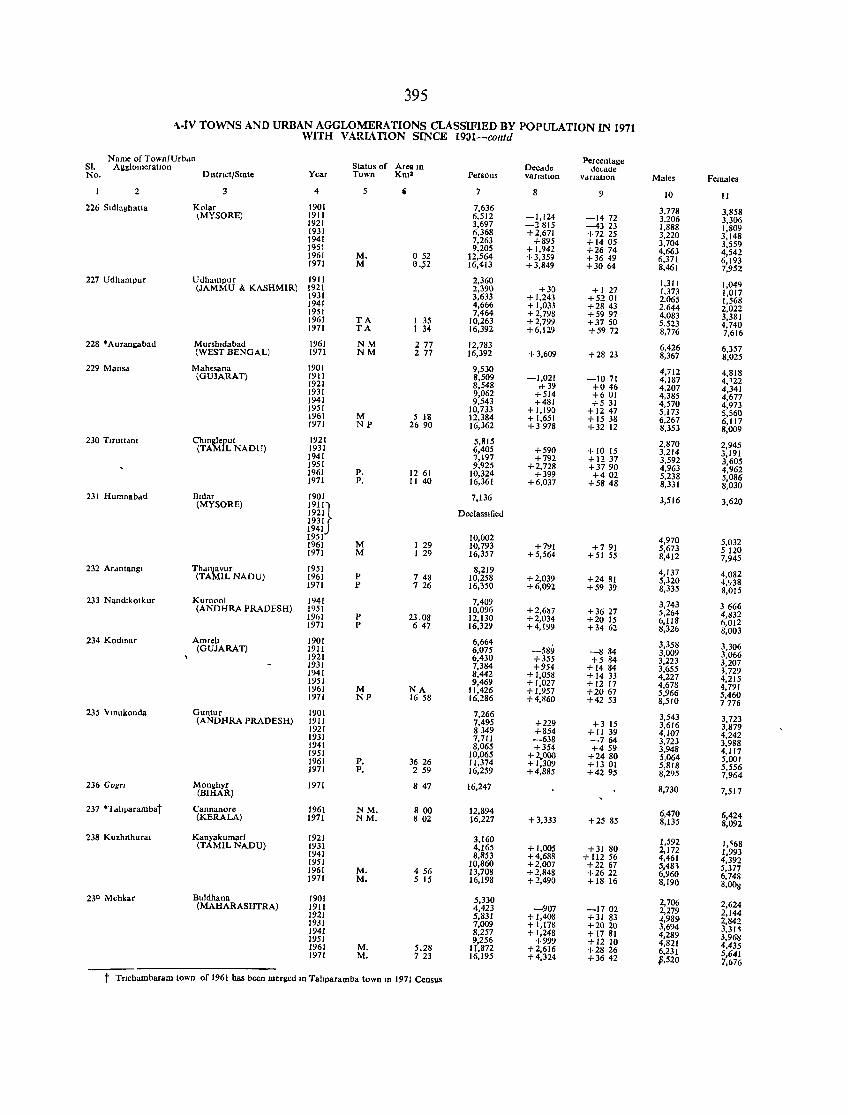
395
>\.IV TOWNS AND URBAN AGGLOMERATIONS CLASSIFIED BY POPULATION IN 1971 WITH VARIATION SINCE 1901-coflfd
Name of Town/Urb,," Area III Dec .. de
Percentage SI. AgglomeratIon Status of JeeR"e No. DlstIlet/State Year Town Kmz Persons variation Variation Males Females
2 4 5 , 7 8 9 10 II
226 Sidlaghalta Kolar 1901 7,636 3,778 3.858 \MYSORE) 1911 6,512 -1,124 -1472 3,206 3,306 1921 3,697 -2815 -4323 1,888 1,809 1931 6,368 +2,671 +72 25 3,220 3,148 1941 7,263 +895 + 1405 3.704 3,559 1951 9,205 + 1,942 +2674 4,663 4,542 1961 M. 052 12,564 +3,359 +3649 6,371 6,193 1971 M 0.,52 16,413 +3,849 +3064 8,461 7,952 227 Udhampur Udhampur 1911 2,360 1,311 1,049 (JAMMU & KASHMIR) 1921 2,390 +30 +1 27 1,373 1,017 1931 3,633 + 1,243 +5201 2,065 1,568 1941 4,666 + 1,033 +2843 2,644 2,022 1951 7,464 +2,798 +5997 4,083 3,381 1961 TA I 35 10,263 +2,799 +3750 5,523 4,740 1971 TA I 3<4 16,392 +6,129 +5972 8,776 7,616 228 • Aurangabad Murshldabad 1961 NM 277 12,783 6,426 6,357 (WEST BENGAL) 1971 NM 2 77 16,392 + 3,609 +2823 8,367 8,025 229 Mans .. Mahesana 1901 9,530 4,712 4,818 (GUJARAT) 1911 8,509 -1,021 -1071 4,187 4,122 1921 8,548 0+ 39 +046 4,207 4,341 1931 9,062 +514 +601 4,385 4,677 J941 9,543 +481 +531 4,570 4,973 J951 10,733 +1,190 +1247 5,173 5,560 J961 M 5 18 12,384 + 1,651 + 1538 6,267 6,117 1971 NP 2690 16,362 +3978 +32 12 8,353 8,009 230 Tuultdm Chmsleput 1921 5,815 2,870 2,945 (TAMIL NADU) 1931 6,405 +590 + 1015 3,214 3,191 1941 7,197 +792 +12 37 3,592 3,605 J951 9,925 +2,728 +3790 4,963 4,962 1961 P. 12 61 10,324 +399 +402 5,238 5,086 J971 P. II 40 16,361 +6,037 +5848 8,331 8,030 231 Humnab .. d Bldar 1901 7,136 3,516 3,620 (MYSORE) J9JI,
Declassified J92lj J931 1941 1951 10,002 4,970 5,032 1961 M I 29 10,793 +791 +791 5,673 5 J20 1971 M 1 29 16,357 +5,564 +51 55 8,412 7,945
232 Aranlangl Thdl1!:iwr 195J 8,2J9 4,137 4,082 (TA ILNADU) 196J P 748 10,258 +2,039 +24 8J 5,320 4,~38 1971 P 7 26 16,350 +6,092 +59 39 8,335 8,015 233 Nandikotkur Kurnool 1'141 7,409 3,743 3666 (ANDHRA PRADESH) J951 10,096 +2,687 +3627 5,264 4,832 J961 P 23.08 12,130 +2,034 +2015 6,118 6,012 1971 P 647 16,329 +4,199 +3462 8,326 8,003 234 Kodlflar ArnrelJ J90J 6,664 3,358 3,306 (GUJARAT) 1911 6,075 -589 -884 3,009 3,066 1921 6,430 +355 +5 84 3,223 3,207 1931 7,384 +954 +1484 3,655 3,729 1941 8,442 + 1,058 + 14 33 4,227 4,215 J951 9,469 + 1,027 +J217 4,678 4,791 J96J M NA 11,426 + 1,957 +2067 5,966 5,460 J97J NP 1658 16,286 +4,R60 +42 53 8,510 7776 235 'Vmukonda GUl1tur 1901 7,266 3,543 3,723 (ANDHRA PRADESH) 19JJ 7,495 +229 +3 J5 3,616 3,879 1921 8349 +854 +1139 4,107 4,242 J93J 7,711 -638 -764 3,723 3,988 1941 8,065 +354 +459 3,948 4,117 195J 10,065 +2,,000 +2480 5,064 5,001 1961 P. 3626 11,374 +1,309 +13 01 5,818 5,556 1971 P. 2 59 16,259 +4,885 +4295 8,295 7,964 236 GogrJ Monghyr 1971
(BIHAR) 847 16,247 8,730 7,5J 7
237 ·T .. hparambat Cannanore 1961 NM. 800 12,894 6,470 6,424 (KERALA) 1971 NM. 802 16,227 +3,333 +2585 8,135 8,092
238 Kuzhlthurm Kanyakumarl J921 3,160 1,592 I, <68 (TAMIL NADU) J931 4,165 + 1,005 +31 80 2,172 1,993 J941 8,853 +4,688 + 112 56 4,461 4,392 J951 10,860 +2.007 +22 67 5,481 5,377 1961 M. 456 13,708 +2,848 +2622 6,960 6,748 )971 M. 5 15 16,198 +2,490 +1816 8,190 8,008
23Q Mehkar Buldhana 1901 5,330 2,706 2,624 (MAHARASHTRA) 1911 4,423 -907 -1702 2,279 2,144 J92J 5,831 +1,408 +31 83 2,989 2,842 1931 7,009 + J,178 +2020 3,694 3,31~ 1941 8,257 +1,248 +1781 4,289 3,968 195J 9,256 +999 +1210 4,821 4,435 1961 M. 5.28 11,872 +2,616 +2826 6,231 5,641 J971 M. 723 16,195 +4,324 +3642 ,p,520 7,676
t Tflehambaram town of 1961 has been merged ID Tahparamba town ID 1971 Census
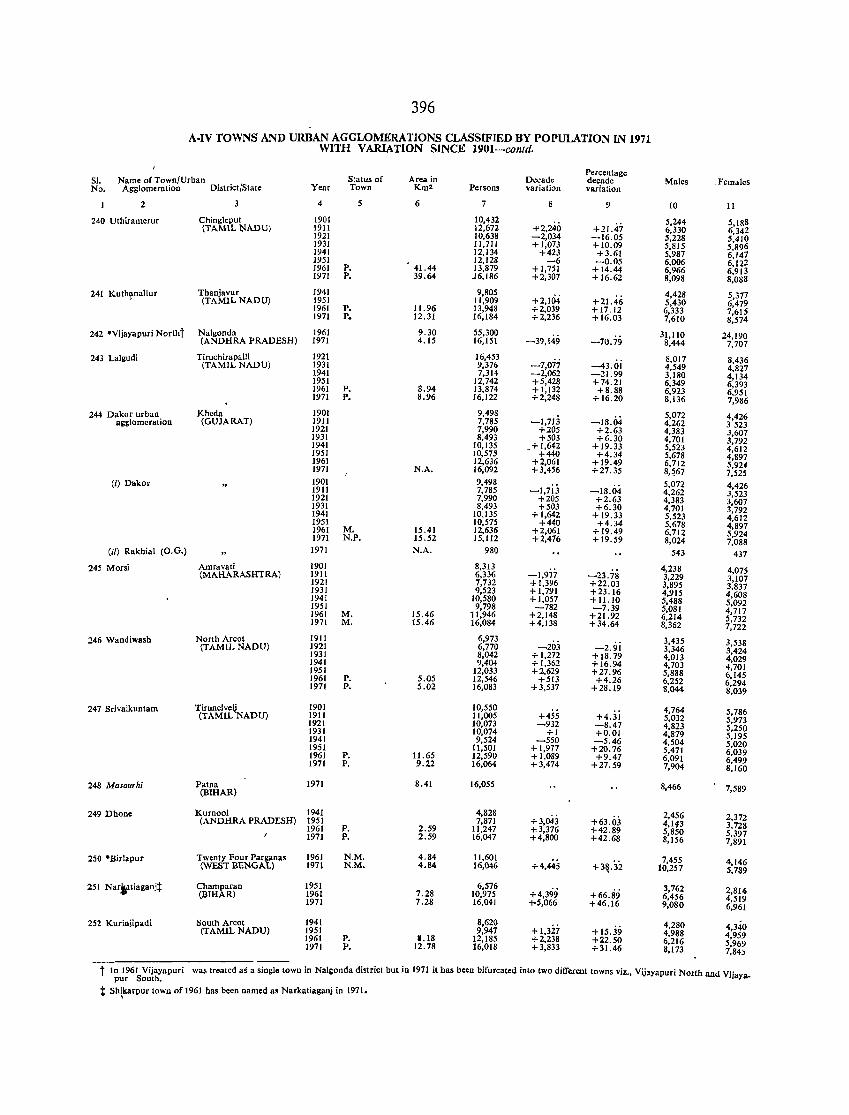
396
A-IV TOWNS AND URBAN AGGLOMERATIONS CLASSlFrED BY POPULATION IN 1971 WITH VARIATION SINCE 1901-conld.
Area in Percentage
51. Name of Town/Urban Status of Decade decade Males . Females No. Agglomeration District/State Year Town Km2 Persons variation variation
2 4 5 6 7 9 10 11
240 Uthiramcrur Chinglcput 1901 10,432 -1'2.240 +21.47
5,244 5.[88 (TAMlL J:lADU) 1911 12,672 6,330 6,342
1921 10,638 -2,034 -[6.05 5,228 5,410 1931 11,711 +1,073 + 10.09 5,815 5,896 1941 ]2,134 +423 +3.61 5,987 6,147 1951 12,128 -6 -0.05 6,006 6,122 1961 P. 41.44 13,879 + [,751 +14.44 6,966 6.913 1971 P. 39.64 J6,[86 +2,307 + 16.62 8,098 8,088
241 Kuth~nallur Thanjavur 1941 9,805 +2,104 + 21.46
4,428 5,377 (TAMIL NADU) 1951 11,909 5,430 6,479 1961 P. 11.96 13,948 +2.039 +17.12 6,333 7,615 1971 P. 12.31 16,184 +2,236 + 16.03 7,610 8,574
242 *Vijayapuri Northt Nalgonda 1961 9.30 55,300 -39,149 --70.79
31,110 24.190 (ANDHRA PRADESH) 1971 4.15 16,151 8,444 7,707
243 Lalgudi Tiruchirapalli 1921 16,453 -7,077 -43.oi
8.017 8,436 (TAMIL NADU) 1931 9,376 4,549 4,827 1941 7,314 -2,062 -21.99 3,180 4,134 1951 12,742 +5,428 +74.21 6,349 6,393 1961 P. 8.94 13,874 +1,132 +8.88 6,923 6,951 1971 P. 8.96 16,122 +2,248 +16.20 8,136 7,986
244 Dako r urban Khcda 1901 9,498 -I,7jj -18.04
5,072 4.426 agglomeration (GUJARAT) 1911 7,785 4,262 3523 1921 7,990 +205 +2.63 4,383 3,607 1931 8,493 +503 +6.30 4,701 3,792 1941 10,135 _ + 1,642 +19.33 5,523 4,612 1951 10,57' +440 +4.34 5,678 4,897 1961 12,636 +2,061 +19.49 6,712 5,924 1971 N.A. 16,092 +3,456 +27.35 8,~67 7,525
(i) Dakar ]901 9,498 -l,7j3 -18.04
5,072 4,426 1911 7,785 4,262 3,523 1921 7,990 +205 +2.63 4,383 3,607 1931 8,493 +503 +6.30 4,701 3,792 1941 10,135 +1,642 + 19.33 5,523 4,6]2 1951 10,575 +440 +4.34 5,678 4,897 1961 M. 15.41 12,636 +2,061 +19.49 6,712 5,924 1971 N.P. 15.52 15,lI2 +2,476 +19.59 8,024 7,088 (ii) Rakbia1 (O.G.) 1971 N.A. 980 543 437
245 MOTsi Arnravati 1901 8,313 -1,977 -23.78
4,238 4,075 (MAHARASHTRA) 1911 6,336 3,229 3,107 1921 7,732 + 1,396 +22.03 3,895 3,837 1931 9,523 +1,791 +23.16 4,915 4,608 1941 10,580 +1,057 +11.10 5,488 5,092 1951 9,798 -782 -7.39 5,081 4,717 1961 M. 15.46 11,946 +2,148 +21.92 6,214 5,732 1971 M. 15.46 16,084 +4,138 +34.64 8,362 7,722
2.016 Wandiwash North Areot 1911 6,973 -2.9i
3,435 3,538 (TAMIL NADU) 1921 6,770 -203 3,346 3,424 1931 8,042 +1,272 + 18.79 4,013 4,029 1941 9,404 + 1,362 +16.94 4,703 4,701 1951 12,033 +2,629 +27.96 5,888 6,145 19.61 P. 5.05 12,546 +513 +4.26 6,252 6,294 1971 P. 5.02 16,083 +3,537 +28.19 8,044 8,039
247 Srivaikuntam TirunelveU 1901 10,550 +455 +4.3j 4,764 5,786 (TAMIL NADU) 1911 11,005 5,032 5,973 1921 10,073 -932 -8.47 4,823 5,250 1931 10,074 +1 +0.01 4,879 5,195 1941 9,524 -550 -5.46 4,504 5,020 1951 11,501 +1,917 +20.76 5,471 6,039 1961 P. 11.65 12,590 +1,089 +9.47 6,091 6,499 1971 P. 9.22 16,064 +3,474 +27.59 7,904 8.160
248 Masaurhi Patna 1971 (BIHAR)
8.41 16,055 8,466 7,589
249 Dhone Kurnoo1 1941 4,828 +3,043 +63.03
2,456 2,372 (ANDHRA PRAD:r.:SH) 1951 7,871 4,1~3 3,728 1961 P. 2.59 1I.247 +. 3,376 +42.89 5,850 5,397 1971 P. 2.59 16,047 +4,800 +42.68 8,156 7,891
250 • I3irlapur Twenty Four Pars.nas 1961 N.M. 4.84 1I,601 +4,445 +3~.3i
7,455 4,146 (WEST BENGAL) 1971 N.M. 4.84 16,046 10,257 5,789
251 Nariatiaganit Champaran 1951 6,576 +4,399 +66.89
3,762 2,814 (BIHAR) 1961 7.28 10,975 6,456 4,519 1971 7.28 16,041 -115,066 +46.16 9,080 6,961
252 Kurinjip .. di South Areot 1941 S,620 + 1,3.27 +15.3ej
4,280 4,340 (TAMIL NADU) 1951 9,947 4,988 4,959 1961 P. '.IS 12,185 +2,238 +22.50 6,216 5,969 1971 P. 12.78 16,018 +3,833 +31.46 8,173 7,84)
t In 1961 Vijayapuri pur South.
was treated as a single town in Na11londa district but in 1971 it has been bifurcated into two different towns viz., Vijayapuri North and Vijaya.
t Shlkarpur town of 1961 has been named as Narkatiaganj in 1971.
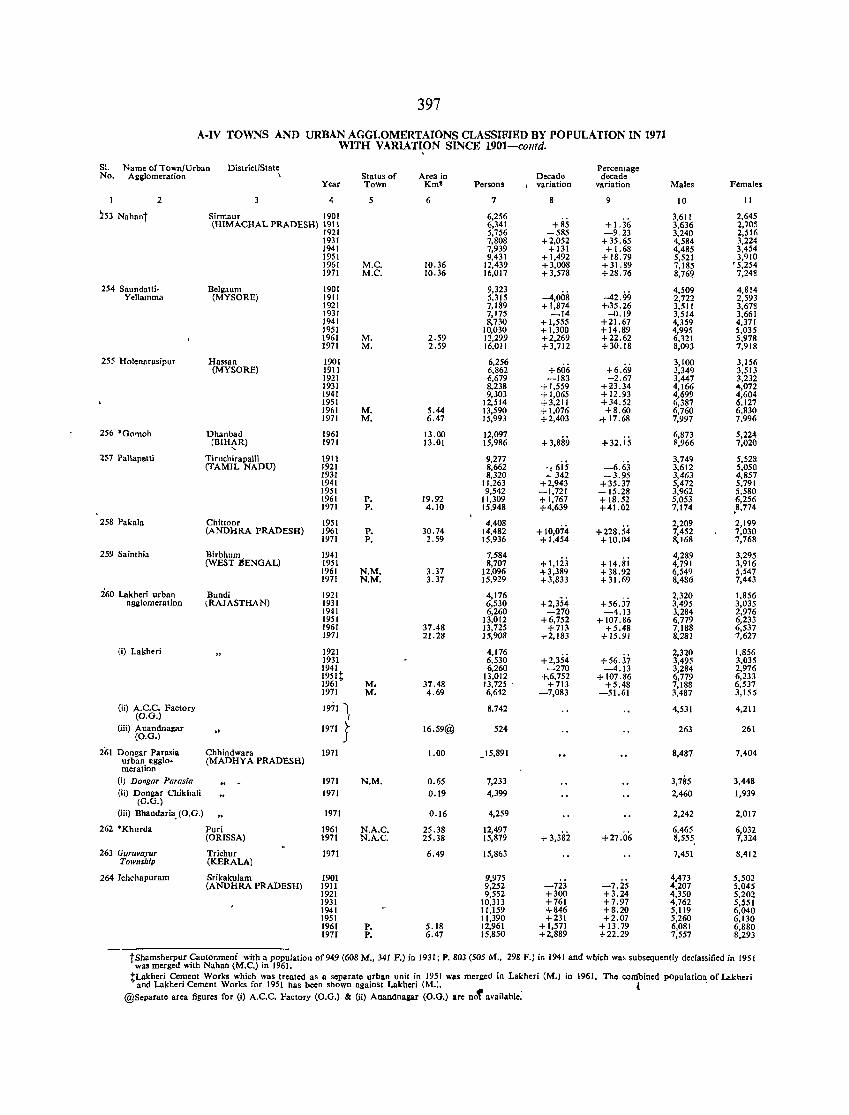
397
A-IV TOWNS AND URBAN AGGLOMERTAIONS CLASSIFIED BY POPULATION IN 1971 WITH VARIATION SINCE 1901-contd. ,
SI. Name of Town/Urban District/State Percentage No. Agglomeration \ Status of Area in Decade decade
Year Town Km! Persons I variation variation Males Females
2 4 5 6 7 8 9 10 11
253 Nahant Sirmaur 1901 6,256 +1.36
3,611 2,645 (HIMACHAL PRADESH) 1911 6,341 +85 3,636 2,705
1921 5,756 -585 -9.23 3,240 2,516 1931 7,808 +2,052 +35.65 4,584 3,224 1941 7,939 +131 + 1.68 4,485 3,454 1951 9,431 + 1,492 + 18.79 5,521 3,'110 1961 M.C. 10.36 12,439 +3,008 +31.89 7,185 '5,254 1971 M.e. 10.36 16,017 +3,578 +28.76 B,76~ 7,248
254 Saundatti- Belgaum 1901 9,323 -4,008
4,509 4,814 Yellamma (MYSORE) 1911 5,3r -42.99 2,722 2,593
1921 7,1 9 + 1,874 +,35.26 3,511 3,678 1931 7,175 -14 -0.19 3,514 3,661 1941 8,730 +1,555 +21.67 4,359 4,371 1951 10,030 + 1.300 +14.89 4,995 5,035 1961 M. 2.59 12,299 +2,269 +22.62 6,321 5,978 1971 M. 2.59 16,011 +3,712 +30.18 8,093 7,918
255 Holenarasipur Hassan 1901 6,256 +6.69
3,100 3,156 (MYSORE) 1911 6,862 +606 3,349 3,513
1921 6,679 -183 -2.67 3,447 3,232 1931 8,238 + 1,559 +23.34 4,166 4,072 1941 9,303 + 1,065 + 12.93 4,699 4,604 1951 12,514 +3,211 +34.52 6,387 6,127 1961 M. 5.44 13,590 +1,076 +8.60 6,760 6,830 1971 M. 6.47 15,993 +2,403 -+ 17.68 7,997 7,996
256 *Gomoh Dhanbad 1961 13.00 12,097 +3,889 +32.is
6,873 5,224 (BIHAR) 1971 13.01 15,986 8,966 7,020
" 257 Pallapalti Tiruchirapalli 1911 9,277 .., 6is -6.63
3,749 5,528 (TAMIL NADU) 1921 8,662 3,612 5,050
1931 8,320 - 342 -3.95 3,463 4,857 1941 11,263 +2,943 +35.37 5,472 5,791 1951 9,542 -1.721 -15.28 3,962 5,580 1961 P. 19.92 11,309 + 1,767 + 18.52 5,053 6,256 1971 P. 4.10 15,948 +4,639 +41.02 7,174 ,8,774
258 Pakaln Chitloor 1951 4,408 + 10,074 +228.54
2,209 2,199 (ANDHRA PRADESH) 1961 P. 30.74 14,482 7,452 7,030
1971 P. 2.59 15,936 +1,454 +10.04 8,168 7,768
259 Sainlhia Birbhum 1941 7,584 + l,lii
4,289 3.295 (WEST BENGAL) 1951 8,707 +14.81 4,791 3.916
1961 N.M. 3.37 12,096 +3,389 +38.92 6,549 5,547 1971 N.M. 3.37 15,929 +3,833 +31.69 8,486 7,443
260 Lakheri urban Bundi 1921 4,176 +2,354 +56j7
2,320 1.856 agJ:lomeration (RAJASTHAN) 1931 6,530 3,495 3,035
1941 6,260 -270 -4.13 3,284 2,976 1951 13,012 +6,752 + 107.86 6,779 6,233 1961 37.48 13,725 +713 +5.48 7,188 6.537 1971 21.28 15,908 +2,183 +15.91 8,281 7,627
(i) Lakheri 1921 4,176 +2,354
2,320 1,856 1931 6,530 +56.37 3,495 3,035 1941 6,260 -270 -4.13 3,284 2,976 1951t 13,012 +..6,752 +107.86 6,779 6,233 1961 M. 37.48 13,725 . +713 +5.48 7,188 6,537 1971 M. 4.69 6,642 -7,083 -51.61 3,487 3,155
(ii) A.C.C. Factory 1971 ') 8.742 4,531 4,211 (D.G.) I
(iii) Anandnagar "
1971 r 16.59@ 524 263 261 (D.G.) J
261 Dongar Parasin Chhindwara 1971 1.00 _15,891 8,487 7,404 urban agglo- (MADHYA PRADESH) meration
(i) Do"gar Parosio 1971 N.M. 0.65 7,233 3,785 3,448 (ii) Dongar Chikhali
(O.G.) 1971 0.19 4,399 2,460 1,939
(iii) Bhandaria. (O.G.) 1971 0.16 4,259 2,242 2.017
262 *Khurda Puri 1961 N.A.C. 25.38 12,497 + 3,382 +27.06
6,465 6,032 (ORISSA) 1971 N.A.C. 25.38 15,879 8,555 7,324
263 Gurul'o)'ur Trichur 1971 6.49 15,863 7,451 8,412 Townsilip (KERALA)
264 Ichchapuram Srikakulam 1901 9,975 -7.2S
4,473 5,502 (ANDHRA PRADESH) 1911 9,252 -723 4,207 5.045
1921 9,552 +300 +3.24 4,350 5.202 1931 10.313 +761 +7.97 4,762 5,551 1941 11,159 +846 +8.20 5,119 6,040 1951 11,390 +231 +2.07 5,260 6,130 1961 P. 5.18 12,961 +1,571 +13.79 6,081 6,880 1971 P. 6.47 15,850 +2,889 +22.29 7,557 8,293
tShamsherpur Cantonment with a population of949 (608 M., 341 F.) in 1931; P. 803 (505 M., 298 F.) in 1941 and which wa' subsequently declassified in 1951 was merged with Nahan (M.C.) in 1961.
tLakheri Cement Works which was treated as a separate urban unit in 1951 was merged in Lakheri (M.) in 1961. The com'bined pOpulation of Lakheri and Lakheri Cement Works for 1951 has been shown against Lakheri (M.). t·
@Separate area figures for (i) A.C.C. Factory (O.G.) & (ii) Anandnagar (O.G.) are nof available:
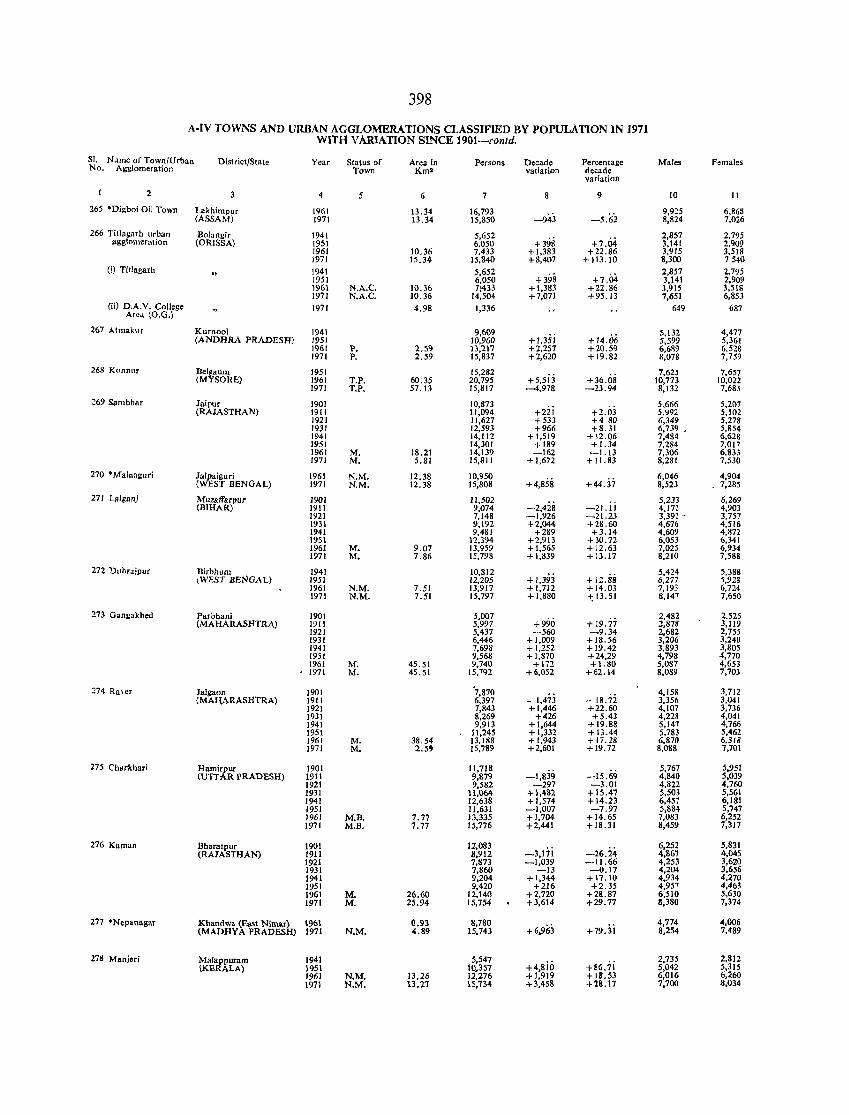
398
A-IV TOWNS AND URBAN AGGLOMERATIONS CLASSIFIED BY POPULATION lN 1971 WITH VARIATION SINCE 1901-contd.
SI. N~me of Town/Urban District/State Year Status of Area in Persons Decade Percentage Males Females No. Agglomeration Town Km2 vatiation decade
variation
2 4 5 6 7 8 9 10 II
265 'Digboi Oil Town Lnkhimpur 1961 13.34 16,793 -943 -5.62
9,925 6,868 (ASSAM) 1971 13.34 15,850 8,824 7,026
266 Titlagarh urban Bolangir 1941 5,652 His +7.04
2,857 2,795 agglomeration (ORISSA) 1951 6,050 3,141 2.909
1961 10.36 7.433 +1,383 +22.86 3,915 3,518 1971 15.34 15,840 t-S,407 + 113.10 8,300 7540
(i) Titlagarh 1941 5,652 +398 +7.04
2,857 1.,795 1951 6,050 3,141 2,909 1961 N.A.C. 10.36 7:433 +1,383 +22.86 3.915 3,518 J971 N.A.C. 10.36 14,504 +7,071 +95.13 7,651 6,853
(ii) D.A.V. College Are .. (O.G.)
1971 4.98 1,336 649 687
267 Atmakllr Kurnool 1941 9,609 5,132 4,477 (ANDHRA PRADESH) 1951 10,960 +1,35; +14.06 5,599 5,361
1961 1'. 2.59 13,217 +2,251 +20.59 6,689 6.528 1971 P. 2.59 15,837 +2,620 + 19.82 8,078 7,759
268 Konnllr Delgaum J951 J5,282 7,625 7,657 (MYSORE) J96J T.P. 60.35 20,795 +5.5ij +36.08 10,773 10,022
1971 T.P. 57.13 J5,817 -4,978 -23.94 8,132 7,685
~69 Sambhar Jaipur 1901 10,873 5,666 5,207 (RAJASTHAN) 1911 11,094 +2zi +2.03 5il92 5,102
1921 11,627 +533 +480 6,349 5,278 1931 12,593 +966 +8.31 6,739 . 5,854 1941 14,112 +1,519 +12.06 7,484 6,628 1951 14,301 + 189 + 1.34 7,284 7,017 1961 M. 18.21 14,139 -162 -1.13 7,306 6,833 1971 M. 5.81 15,811 +1,672 + 11. 83 8,281 7,530
270 'Mainaguri Jalpaiguri 1961 N.M. 12.38 10,950 +4,858
6,046 4,904 (WEST BENGAL) 1971 N.M. 12.38 15,808 +44.37 8,523 7,285
271 Lalganj Muzaffarpur 1901 11,502 -2,428
5,233 6,269 (BIHAR) 1911 9,074 -21.11 4,171 4,903
1921 7,148 -1,926 -21.23 3,391 - 3,757 1931 9,192 +2,044 +28.60 4,676 4,516 1941 9,481 +289 +3.14 4,609 4,872 195\ 12,394 +2,913 +30.72 6,053 6,341 1961 M. 9.07 13,959 +1,565 + 12.63 7,025 6,934 1971 M. 7.86 15,798 +1,839 +13.17 8,210 7,588
272 Dubraipur Dirbhum 1941 10,812 +I,39j
5,424 5,388 (WEST BENGAL) 1951 12,205 +12.88 6,277 5,928
1961 N.M. 7.51 13,917 +1,712 +14.03 7,193 6,724 1971 N.M, 7.51 15,797 +1,880 -t; 13.51 8,147 7,650
273 Gangakhed Parbhani 1901 5,007 +990 + 19.77
2,482 2.525 (MAHARASHTRA) 1911 5,997 2,878 3,119
1921 5,437 -560 -9.34 2,682 2,755 1931 6,446 +1,009 + 18.56 3,206 3,240 1941 7,698 + 1,252 +19.42 3,893 3,805 1951 9,568 +1,870 +24,29 4,798 4,770 1961 M. 45.51 9,740 +172 +1.80 5,087 4,653
, 1971 M. 45.51 15,792 +6,052 +62.14 8,089 7,703
274 Ra\er Jalgaon 190J 7,870 - 1,473
4,158 3,712 (MAHA-RASHTRA) 1911 6,397 - 18.72 3,356 3,041
1921 7,843 +1,446 +22.60 4.107 3,736 1931 8,269 +426 +5.43 4,228 4,041 1941 9,913 +1,644 +19.88 5,147 4,766 1951 11,245 +1,332 +13.44 5,783 5,462 1961 M. 38.54 13,188 +1,943 + 17.28 6,870 6,318 1971 M. 2.5' 15,789 +2,601 +19.72 8,088 7,701
275 Charkhari Hamirpur 1901 11,718 -1,839
5,767 5,951 (UTTAR PRADESH) 1911 9,879 -15.69 4,840 5,039
1921 9,582 -297 -3.01 4,822 4,760 1931 11,064 +1,482 +\5.47 5,503 5,561 1941 12,638 + 1,574 +14.23 6,451 6,181 1951 !J,63! -1,007 -7.97 5,884 5,747 1961 M.D. 7.77 13,335 +1,704 +14.65 7,083 6,252 1971 M.B. 7.77 15,776 +2,441 +18.31 8,459 7,311
276 Kaman Bharatpur 1901 12,083 -3,17i
6,252 5,831 (RAJASTHAN) 19J1 B.912 -26.24 4,867 4,045
1921 7,873 -1,039 -11.66 4,253 3,620 1931 7,860 -13 -0.17 4,204 3,656 1941 9,204 + 1,344 +17.10 4,934 4,270 1951 9,420 +216 +2.35 4,951 4,463 1961 M. 26.60 12,140 +2,720 +28.87 6,510 5,630 1971 M. 25.94 15,754 +3,614 +29.77 8,380 7,374
277 'Nepanagar Khandwa (Ea~t Nimar) 1961 0.93 8,780 +6,963 + 79.3i
4,774 4,006 (MADHYA PRADESH) 1971 N.M. 4.89 15,743 8,254 7,489
278 Manjeri Malappuram 1941 5,547 +4,8io +8G.7i
2,735 2,812 \KERALA) 1951 10.357 5,042 5,315
1961 N.M. 13.26 12,276 +I,9J9 +18.53 6,016 6,260 1971 N,M, 13.27 15,734 +3,458 +28.17 7,700 8.034
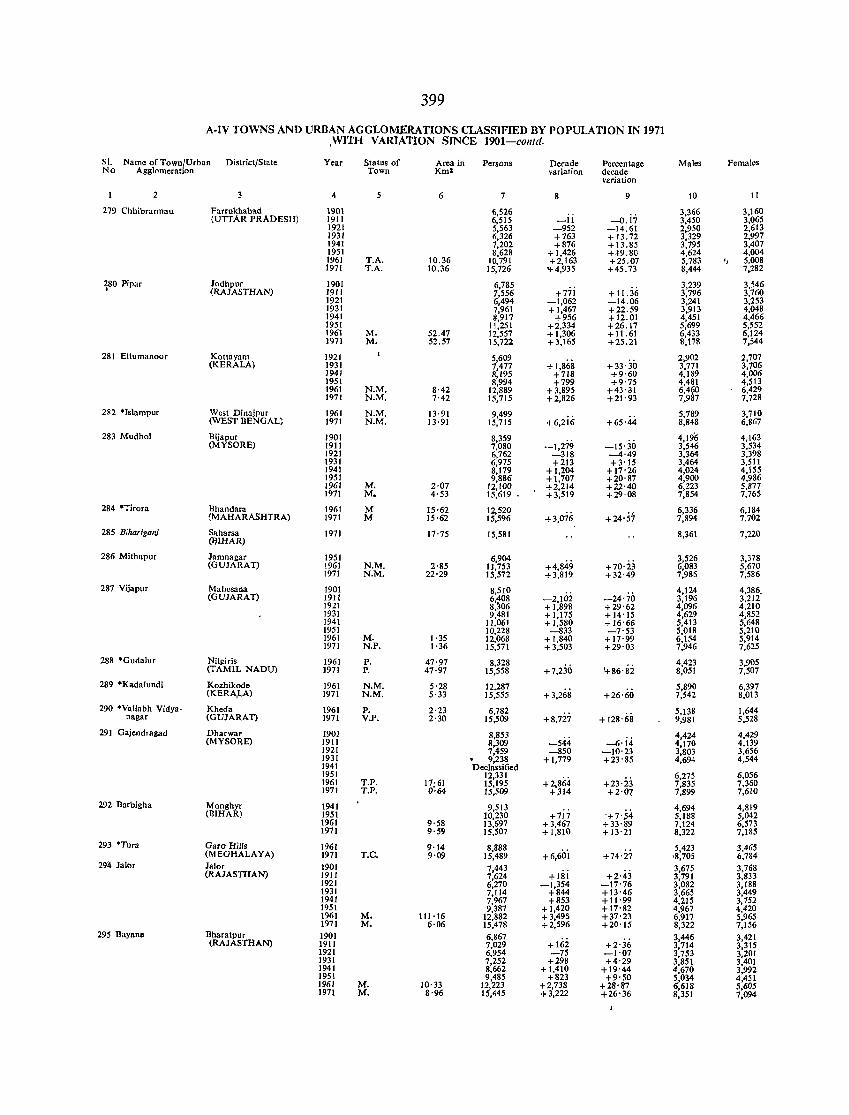
399
A-IV TOWNS AND URBAN AGGLOMERATIONS CLASffiFIED BY POPULATION IN 1971 ,WITH VARIATION SINCE I901-collld.
SI. Name of Town/Urban District/State Year Status of Area in Persons Decade Percentage Males Females No Agglomeration Town Km2 variation decade
variation
2 4 5 6 7 8 9 10 11
279 Chhibrarmau Farrukhabad 190\ 6,526 -o.b
3,366 3,160 (UTTAR PRADESH) 1911 6,515 _11 3,450 3,065
1921 5,563 -952 -14.61 2,950 2,613 1931 6,326 +763 + 13.72 3,329 2,997 1941 7,202 +S76 + 13.85 3,795 3,407 1951 8,628 + 1,426 +19.80 4,624 4,004 1961 T.A. 10.36 10,791 +2,163 +25.07 5,783 'J 5,008 1971 T.A. 10.36 15,726 ,+4,935 +45.73 8,444 7,282
i80 Pipar Jodhpur 1901 6,785 +7ii
3,239 3,546 (RAJASTHAN) 1911 1,556 + 11.36 3,796 3,760
1921 6,494 -1,062 -14.06 3,241 3,253 1931 7,961 +1,467 +22.59 3,913 4,048 1941 8,917 +956 +12.01 4,451 4,466 1951 11,251 +2,334 +26.17 5,699 5,552 1961 M. 52.47 12,557 +1,306 + 11.61 6,433 6,124 )971 M. 52.57 15,722 +3,165 +25.21 8,178 7,544
281 Ettumanoor Kottayam 1921 5,609 + 1,868
2,902 2,707 (KERALA) 1931 7,477 + 33'30 3,771 3,706
1941 8,195 +718 +9'60 4,189 4,006 1951 8,994 +799 +9·75 4,481 4,513 1961 N.M. 8·42 12,889 + 3,895 +43'31 6,460 6.429 1971 N.M. 7·42 15,715 +2,826 +21'93 7,9S7 7,728
282 oIslampur West Dinajpur 1961 N.M. 13·91 9,499 +6,2i6 +65·44
5,789 3,710 (WEST BENGAL; 1971 N.M. 13·91 15,715 8,848 6,867
283 Mndho1 Bijapur 1901 8,359 .-1,279 -15'30
4,196 4,163 (MYSORE) 1911 7,OSO 3,546 3,534
1921 6.762 -318 -4·49 3.364 3,398 1931 6,975 +213 +3'15 3,464 3,511 1941 8,179 +1,204 +17'26 4,024 4,155 1951 9,886 +1,707 +20'87 4,900 4,986 1961 M. 2·07 12,100 , +2,214 +22'40 6,223 5,877 1971 M. 4·53 15,619 +3,519 +29·08 7,854 7,765
284 °Tirora Bhandara 1961 M 15·62 12,520 +3,076 +24'57
6,336 6,184 (MAHARASHTRA) 1971 M 15·62 15,596 7,S94 7,702
285 Bihar igalli Saharsa 1971 reIHAR)
17'75 15,581 8,361 7,220
286 Mithapur Jamnagar 1951 6,904 +4,849
3,526 3,378 (GUJARAT) 1961 N.M. 2·85 11,753 +70'23 6,083 5,670
1971 N.M. 22'29 15,572 +3,819 + 32'49 7,985 7,586
287 Vijapur Mahesana 1901 8,510 4,124 4,386. (GUJARAT) 1911 6,408 -2,102 -24'70 3,195 3,2t2
1921 8,~06 +1,898 +29'62 4,096 4,210 1931 9,481 +1,175 +14'15 4,629 4,S52 1941 11,061 +1,580 + 16'66 5,413 5,648 1951 10,228 -833 -7'53 5,018 5,210 1961 M. 1·35 12,068 +1,840 + 17'99 6,154 5,914 1971 N.P. 1·36 15,571 +3,503 +29'03 7,946 7,625
288 ·Guda1ur NiI!(iris 1961 P. 47·97 8,328 +7,230 4-86'82
4,423 3,905 (TAMIL NADU) 1971 P. 47·97 15,558 8,051 7,507
289 °Kada1undi Kozhikode 1961 N.M. 5'28 12,287 + 3,268 +26'60
5,890 6,397 (KERA,LA) 1971 N.M. 5·33 15,555 7,542 8,013
290 *Vallabh Vidya- Kheda 1961 P. 2·23 6,782 5,138 1,644 nagar (GUJARAT) 1971 V.P. 2·30 15,509 +8,727 + 128·68 9,981 5,528
291 Gajendragad Dharwar 1901 8,853 -544 --6' i4
4,424 4,429 (MYSORE) 1911 8,309 4,170 4,139
1921 7,459 -850 -10'23 3,803 3,656 1931 • 9,238 + 1,779 +23'85 4,694 4,544 1941 Declassified 1951 12,331 6,275 6,056 1961 T.P. Ih:~ 15,195 +2,864 +23'23 7,835 7,360 1971 T.P. 15,509 +.314 +2'07 7,899 7,610
292 Barbigha Monghyr 1941 9,513 +7i-j '+7'$4
4,694 4,819 (BIHAR) 1951 10,230 5,188 5,042
1961 9'5S 13,697 + 3,467 +33'89 7,124 6,573 1971 9'59 15,507 +1,810 +13'21 8,322 7,185
293 ·Tura Garo Hills 1961 9·14 8,888 5,423 3,465 (M EGHALA Y A) 1971 T.e. 9·09 15,489 +6,60i +74'27 18,705 6,784
29:t Jator Ja10r 1901 7,443 3,675 3,768 (RAJASTHAN) 1911 7,624 +181 +2'4j 3,791 3,833
1921 6,270 -1,354 -17'76 3,082 3,188 1931 7,114 +844 +13'46 3,665 3,449 1941 7,967 +853 +11'99 4,215 3,752 1951 9,387 +1,420 +17'82 4,967 4,420 1961 M. 111'16 12,882 +3,495 +37'23 6,917 5,965 1971 M. 6·06 15,478 +2,596 +20'15 8,322 7,156
295 Bayana Bharatpur 1901 6,867 +162
3,446 3,421 (RAJASTHAN) 1911 7,029 +2'36 3,714 3,315
1921 6,954 -75 -1'07 3,753 3,201 1931 7,252 +298 +4'29 3,851 3,401 1941 8,662 +1,410 +19'44 4,670 3,992 1951 9,485 +823 +9'50 5,034 4,451 1961 M. 10·33 12,223 +2,738 +28'87 6,618 5,605 1971 M. 8·96 15,445 +3,222 +26'36 8,351 7,094
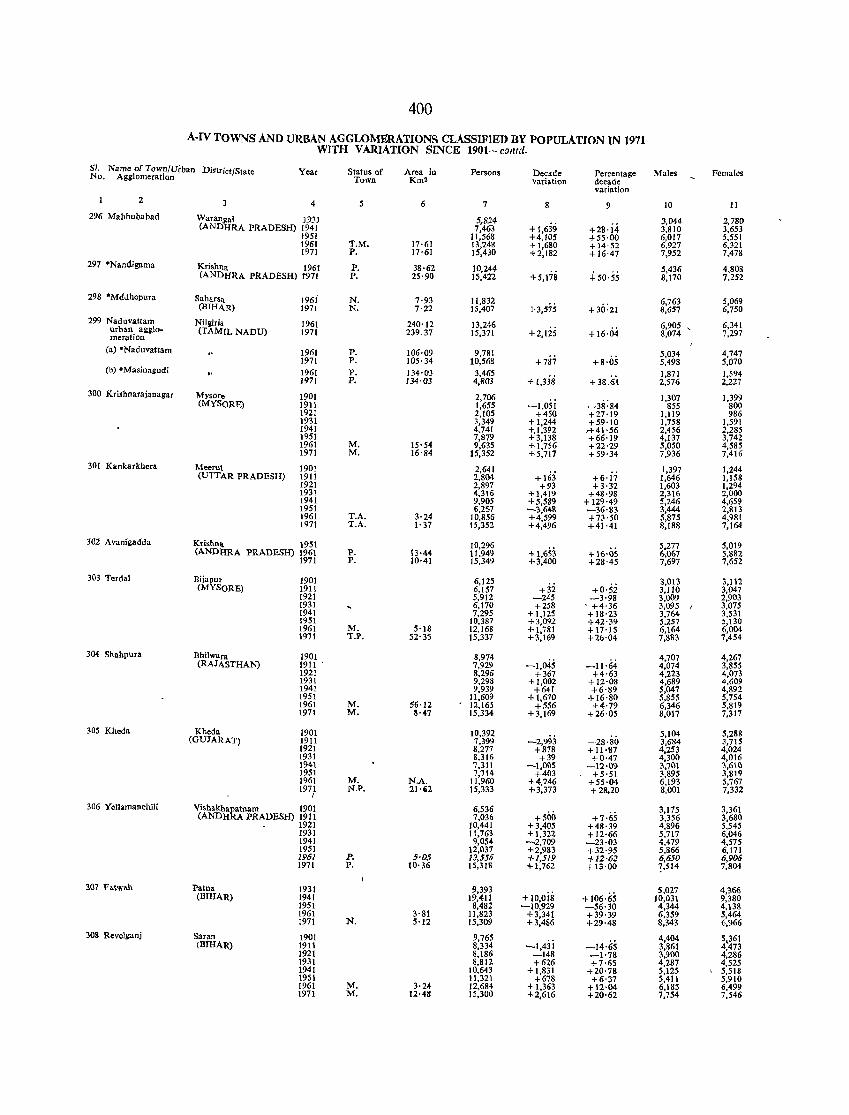
400
A-IV TOWNS AND URBAN AGGLOMERATIONS CLASSIFIED BY POPULATION IN 1971 WITH VARIATION SINCE 1901- contd.
SI. Name of Town/Ui'ban District/State Year Status of Area in Persons Decade Percentage Males Females No. Agglomeration Town Km2 variation decade variation
2 4 5 6 7 8 9 10 11 296 Mahbubabad Warangal J.93J 5,824 3,044 2,780
(ANDHRA PRADESH) 1941 7,463 + 1,639 +28·i.i 3,810 3,653 1951 11,568 +4,105 +55·00 6,017 5,551 1961 T.M. 17·61 13,248 +1,680 + 14·52 6,927 6,321 [971 P. 17·61 15,430 +2,182 + 16·47 7,952 7,478
297 .Nandigama Krishna 1961 P. 38·62 10,244 5,436 4,808 (ANDHRA PRADESH) 1'971 P. 25·90 15,422 +5,1'78 +50·55 8,170 7,252
298 ·MdJhepura Saharsa 1961 N. 7·93 11,832 6,763 5,069 (BIHAR) 1971 N. 7·22 15,407 +3,575 +30:21 8,657 6,750
299 Naduvattam Niliiris [96[ 240'[2 13,246 6,905 , 6,341 urban a1l210- (TAMIL NADD) 1971 239.37 15,371 +2,125 +16·04 8,074 7,297 mcration (n) *Naduvattam 1961 P. 106·09 9,781 5,034 4,747
1971 P. 105'34 10,568 +787 +8'05 5,498 5,070 (b) *MasinaBudi 1961 P. 134'03 3,465
+ {,g38 + 38. iii 1,871 1,594
1971 P. 134'(}3 4,8()3 2,576 2,227 300 Krishnarajanagar Mysore 1901 2,706
-1,05i -3S:84 1,307 1,399
(MYSORE) 1911 1,655 855 800 1921 2,105 +450 +27'19 1,119 986 1931 3,349 +1,244 +59'10 1,758 1,591 1941 4,741 +,1,392 ,+41·56 2,456 2,285 1951 7,879 +3,138 +66·19 4,137 3,742 1961 M. IS-54 9,635 +1,756 +22·29 5,050 4,585 1971 M. 16'84 15,352 +5,717 +59·34 7,936 7,416
301 Kllnkarkhera Meerut 1901 2,641 1,397 1,244 (UTTAR PRADESH) 1911 2,804 +163 +6·i"; 1,646 1,158
1921 2,897 +93 +3·32 1,603 1,294 1931 4,316 +1,419 +48·98 2,316 2,000 1941 9,905 +5,589 +129·49 5,246 4,659 1951 6,257 -3,648 -36·&3 3,444 2,813 1961 T.A. 3'24 10,856 +4,599 +7}'50 5,875 4,98l 1971 T.A. 1·37 15,352 +4,496 +41·41 8,188 7,164
:HJ2 Avanfgaaaa Krishna 1951 10,296 + 1,653 + 16·05
5,277 5,019 (ANDlIRA PRADESH) 1961 P. 13·« 11,949 6,067 5,882
1971 P. 10'41 15,349 +3,400 +28·45 7,697 7,652
303 Terdal Bijapur 1901 6,125 +32
3,013 3,112 (MYSORE) 1911 6,157 +0·52 3,110 3,047
1921 5,912 -245 -3,98 3,G09 2,903 1931 6,170 +258 - +4·36 3,095 I 3.075 1941 7,295 +1,125 + 18·23 3,764 3,531 1951 10,387 +3,092 +42'39 5,257 5,130 1961 M. 5'18 12,168 +1,781 + 17·15 6,164 6,004 19')1 T.P. 52'35 15,337 +3,169 +2b-04 7,883 7,454
304 Shahpura Bhilwara 1901 8,974 -1,045 -11·64
4,707 4,267 (RAJASTHAN) 1911 . 7,929 4,074 3,855
1921 8,296 +367 +4·63 4,223 4,073 1931 9,298 +1,002 +12-08 4,689 4,609 1941 9,939 +641 +6·89 5,047 4,892 1951 ll,609 +1,670 +16·80 5,855 5,754 1961 M. 56'12 12,165 +556 +4'79 6,346 5,819 1971 M. 8·47 15,334 +3,169 +26·05 8,017 7,317
305 Kheda Kheda 1901 10,392 -2,993
5,104 5,288 (OUJAkAT) 1911 7,39'l -28·80 3,684 3,715
1921 8,277 +878 + 11''87 4,253 4,024 1931 8,316 +39 +0·47 4,300 4,016 1941 7,311 -1,005 -12·09 3,')01 3,610 1951 7,714 +403 +5·51 3,895 3,819 1961 M. N.A. 11,960 +4,246 +55·04 6,193 5,767 1971 N.P. 21,'2 15,333 +3,373 +28.20 8,001 7,332
I 306 Yellamanchili Vishakbapatnam 1901 6,536
+500 +7·65 3,175 3,361
(ANDHRA PRADESH) 1911 7,036 3,356 3,680 1921 10,441 +3,405 +48·39 4,896 5,545 1931 11,763 +1,322 +12·66 5,717 6,046 1941 9,054 "+~:~~ -23·03 4,479 4,575 1951 12,037 +32·95 5,866 6,171 1961 P. 5'()5 13,556 -1-1,519 +12·62 6,65() 6,9()6 1971 P. 10·36 15,318 +1,762 +13·00 ?,514 7,804
:\07 Fatwah Patna 1931 9,393 +lo,ois +106·65
5,027 4,%6 (BIHA.R) 1941 19,411 10,031 9,380
1951 8,482 -10,929 -56·30 4,344 4,138 1961 3·81 11,823 +3,341 +39'39 6,359 5,464 1971 N. 5'12 15,309 +3,486 +29·48 8,343 6,966
308 Revelj;anj Saran 1901 9,765 -I,4ji -14·65
4,404 5,361 (BIHA.R) 1911 8,334 3,861 4,473
1921 8,186 -148 -1·78 3,900 4,286 1931 8,812 +626 +7·65 4,287 4,525 1941 10,643 +1,831 +20·78 5,125 \ 5,518 1951 11,321 +678 +6·37 5,411 5,910 1961 M. 3·24 12,684 +1,363 +12'04 6,185 6,499 1971 M. 12'48 15,300 +2,616 +20·62 7,754 7,546
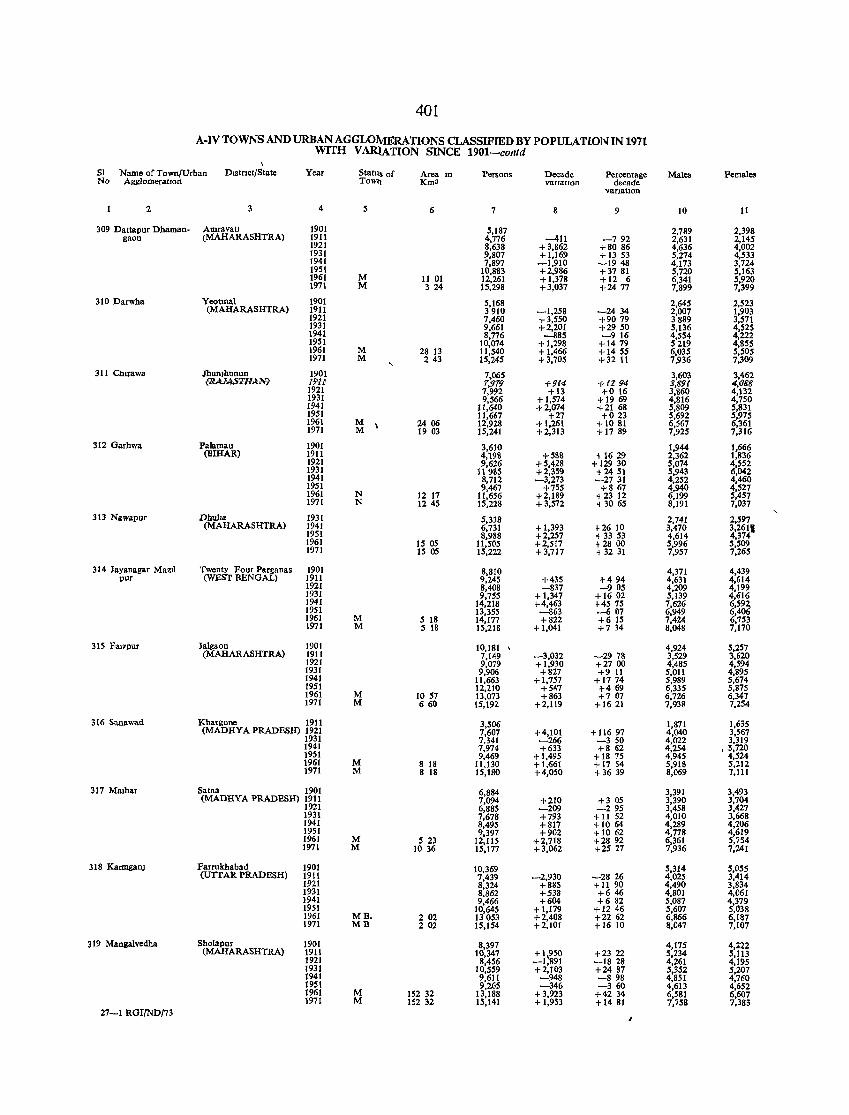
401
A-IV TOWNS AND URBAN AGGLOMERATIONS CLASSIFIED BY POPULATION IN 1971 WITH V ARlATION SINCE 1901-contd
\
SI Name of Town/Urban Dlstnct/State Year Statu; of Area m Persons De<:ade Percentage Male. Female. No AggiomeratlOn ToWl) Km' VartatIon d""ade
vanatlon
2 3 4 5 6 7 9 10 11
309 Dattapur Dhaman- Amravatl 1901 5,187 2,789 2,398 gaon (MAHARASHTRA) 1911 4,776 -411 -792 2,631 2,145
1921 8,638 +3,862 +8086 4,636 4,002 1931 9,807 +1,169 +1353 5,274 4,533 1941 7,897 -1,910 -1948 4,173 3,724 1951 10,883 +2,986 +3781 5,720 5,163 1961 M 11 01 12,261 + 1,378 +12 6 6,341 5,920 1971 M 324 15,298 +3,037 +24 77 7,899 7,399
310 Darwha Yeotmal 1901 5,168 2,645 2,523 (MAHARASHTRA) 1911 3910 -1,258 -24 34 2,007 1,903
1921 7,460 +3,550 +9079 3889 3,571 1931 9,661 +2,201 +2950 5,136 4,525 1941 8,776 -B85 -916 4,554 4,222 1951 10,074 + 1,298 +1479 S 219 4,855 1961 M 28 13 11,540 +1,466 +14 S5 6,035 5,505 1971 M 243 15,245 +3,705 +32 11 7,936 7,309
311 Clnrawa Jhun)hunun 1901 7,065 3,603 3,462 (1UUASTHAN; 1911 7,979 +9l4 +12 94 3,g9l -I,(J88
1921 7,992 +13 +0 16 3,860 4,132 1931 9,566 +1,574 +1969 4,816 4,750 1941 11,640 +2,074 +2168 5,809 5,831 1951 11,667 +27 +023 5,692 5,975 1961 M 24 06 12,928 + 1,261 +1081 6,567 6,361 1971 M 1903 15,241 +2,313 +1789 7,925 7,316
312 Garhwa Palamau 1901 3{IO 1,944 1,666 (BIHAR) 1911 4,98 +588 t 16 29 2,362 1,836
1921 9,626 +5,428 + 12930 5,074 4,552 1931 11985 +2,359 t 2451 5,943 (1,042 1941 8,712 -3,273 --27 31 4,252 4,460 1951 9,467 +755 +867 4,940 4,527 1961 N 12 17 11,656 +2,189 -123 12 6,199 5,457 1971 N 1245 15,228 +3,572 oj 30 65 8,191 7,037
" 313 Nawapur Dhwill 1931 5,338 2,741 2,597 (MAHARASHTRA) 1941 6,731 +1,393 +2610 3,470 3,2611
1951 8.988 +2,257 -I 33 53 4,614 4,374 1961 15 05 11,505 +2,517 of 28 00 5,996 5,509 1971 15 05 15,222 +3,717 -I 32 31 7,957 7,265
314 Jayanagar MaZ11 Twenty Four Pllrganas 1901 8,810 4,371 4,439 pur (WEST BENGAL) 1911 9,245 +435 +494 4,631 4,614
1921 8,408 -837 -9 OS 4,209 4,199 1931 9,755 + 1,347 +1602 5,139 4,616 1941 14,218 +4,463 +4575 7,626 6,592, 1951 13,355 -863 -607 6,949 6,401i 1961 M 5 18 14,177 +822 +615 7,424 6,153 1971 M 5 18 15,218 + 1,041 +7 34 8,048 7,170
315 Fal7pur Jalgaon 1901 10,181 , 4,924 5,257 (MAHARASHTRA) 1911 7,149 -3,032 -2978 3,529 3,620
1921 9,079 +1,930 +2700 4,485 4,594 1931 9,906 +827 +9 11 5,011 4,895 1941 11,663 + 1,757 +1774 5,989 5,674 1951 12,210 +547 +469 6,335 5,875 1961 M 1057 13,073 +863 +707 6,726 6,347 1971 M 660 15,192 +2,119 +1621 7,938 7,254
316 Sanawad Khargone 1911 3,506 1,871 1,635 (MADHYA PRADESm 1921 7,607 +4,101 + 116 97 4,040 3,567
1931 7,341 -266 -350 4,022 3,319 1941 7,974 +633 +862 4,254 .3,720 1951 9,469 + 1,495 +18 75 4,945 4,524 1961 M 8 18 11,130 +1,661 +17 S4 5,918 5,212 1971 M 8 18 15.180 +4,050 +36 39 8,069 7.111
317 MaJhar Satna 1901 6,884 3,391 3,493 (MADHYA PRADESH) 1911 7,094 +210 +305 3,390 3.704
1921 6,885 -209 -295 3,458 3,427 1931 7,678 +793 +11 52 4,010 3,668 1941 8,495 +817 + 1064 4,289 4,206 1951 9,397 +902 +1062 4,778 4,619 1961 M 5 23 12,115 +2,718 +2892 6,361 5,754 1971 M 1036 15,177 +3,062 +25 27 7,936 7,241
318 KaungaoJ Farrnkhabad 1901 10,369 5,314 5.055 (UTTAR PRADESH) 1911 7,439 -2,930 ~28 26 4,025 3,414
1921 8,324 +885 + 11 90 4,490 3,834 1931 8,862 +538 +646 4,801 4.061 1941 9,466 +604 +682 5,087 4,379 1951 10,645 +1,179 +1246 5,607 5,038 1961 MB. 2 02 13053 +2,408 +2262 6,866 6,187 1971 MB 202 15,154 +2,101 +1610 8,047 7,Hl7
319 ManaaIvedba Sholapur 1901 8,397 4,175 4,222 (MAHARASHTRA) 1911 10,347 +1~50 +2322 5,234 5,113
1921 8.456 -1,91 -1828 4,261 4,195 1931 10,559 +2,103 +24 87 5.352 5,207 1941 9,611 -948 -898 4,851 4,760 1951 9,2.65 -346 -360 4,613 4,652 1961 M 152 32 13,188 +3,923 +42 34 6,581 6,607 1971 M 152 32 15,141 + 1,953 +1481 7,758 7,383
27-1 RGI/ND/73
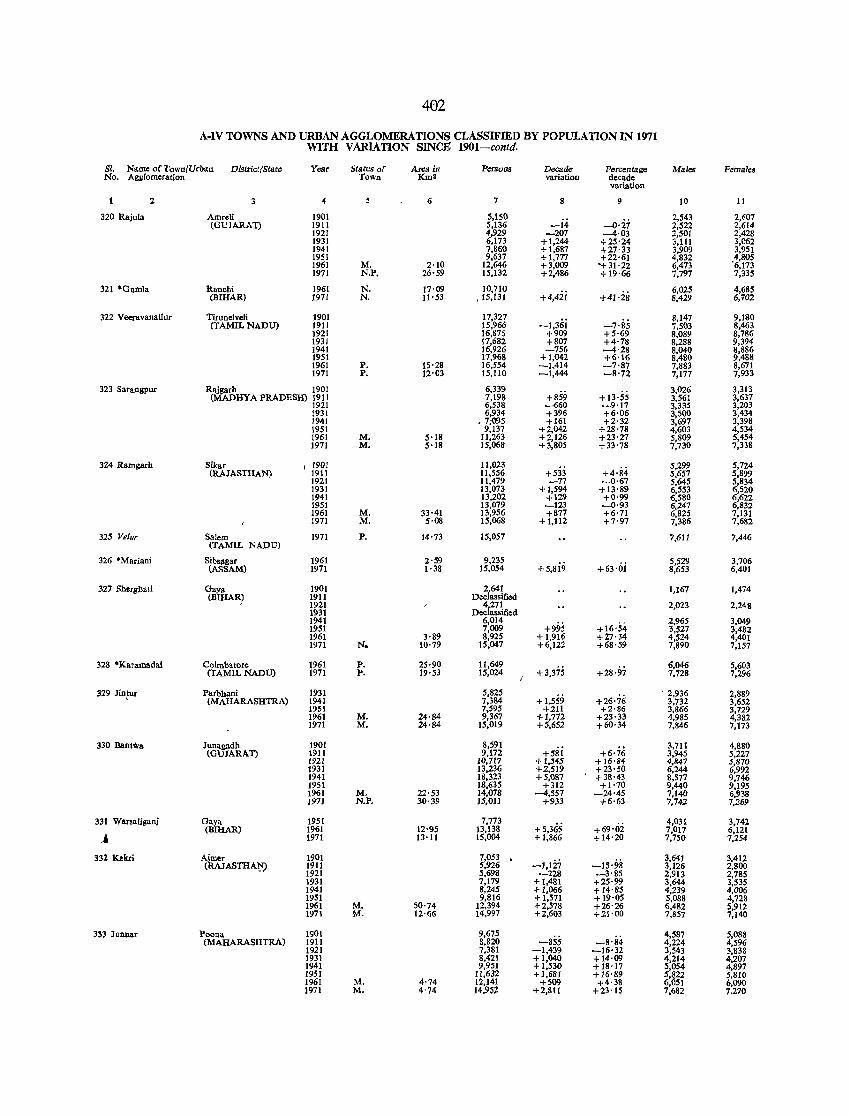
402
A-IV TOWNS AND URBAN AGGLOMERATIONS CLASSIFIED BY POPULATION IN 1971 WITH VARIATION SINCE 1901-contd.
51. Name of Town/Urban District/StD.te Year Status of Area in Persons Decade Percentage Males Females No. AgilomeratJon Town Km2 variation decade
variation
2 3 4 5 6 7 8 9 10 11
320 Rajula Amreli 1901 5,150 -i4 -0'27
2,543 2,607 (GUIARAT) 1911 5,[36 2,522 2,614
1921 4,929 -207 -4·03 2,501 2,428 1931 6,173 +1,244 +25'24 3,111 3,062 1941 7,860 +1,687 +27·33 3,909 3,951 1951 9,637 +1,777 +22·61 4,832 4,805 1961 M. 2'10 12,646 +3,009 "+31·22 6,473 '6,173 1971 N.P. 26'59 15,132 +2,486 +19·66 7,797 7,335
321 'Gumla Ranchi 1961 N. 17'09 10,710 +4,42i +41'28
6,025 4,685 (BIHAR) 1971 N. ll'S3 ,15,131 8,429 6,702
322 Veeravanallur Tirunelveli 1901 17,327 ~I,36i -7·85
8,147 9,180 (TAMIL NADU) 1911 15,966 7,503 8,463
1921 16,875 +909 +5·69 8,089 8,786 1931 17,682 +807 +4·78 8,288 9,394 1941 16,926 -756 -4·28 8,040 8,886 1951 17,968 +1,042 +6·16 8,480 9,488 1961 P. 15·28 16,554 -1,414 -7·87 7,883 8,671 1971 P. 12'03 15,110 _1,444 -8·72 7,177 7,933
323 Sarallgpur Rajgarh 1901 6,339 +13·55
3,026 3,313 (MADHYA PRADESH) 1911 7,198 +859 3,561 3,637
1921 6,538 -660 -9'17 3,335 3,203 1931 6,934 +396 +6·06 3,500 3.434 1941 • 7;@5 +161 +2·32 3,697 3,398 1951 9,137 +2,042 +28·78 4,603 4,534 1961 M. 5·18 11,263 +2,126 +23·27 5,809 5,454 1971 M. 5'18 15,068 +3,805 +33·78 7.730 7,338
324 Ramgarh Sikar I 1901 11,023 +533 +4'84
5,299 5,724 (RAJASTHAN) 1911 11,556 5,657 5,899
1921 11,479 _77 -0·67 5,645 5,834 1931 13,073 +1,594 +13'89 6,553 6,520 1941 13,202 +129 +0·99 6,580 6,622 1951 13,079 -123 -0·93 6,247 6.832 1961 M. 33·41 13,956 +877 +6'71 6,825 7,131 1971 M. 5·08 15,068 + 1,112 +7'97 7,386 7,682
325 Vel", Salem 1971 P. 14'73 15,057 7,611 7,446 (TAMIL NADU)
326 'Mariani Sibsagar 1961 2'59 9,23$ +S,Si9 + 63 ·oi
5,529 3,706 (AsSAM) 1971 1·38 15,054 8,653 6.401
327 Sher,gllati Gaya 1901 2,641 1.167 1.474 <BIHAR} 1911 Declassified
1921 4,271 2,023 2.248 1931 Declassified 1941 6,014
+995 +16'54 2,965 3,049
1951 7,009 3,527 3,482 1961 3·89 8,925 + 1,916 +27'34 4,524 4,401 1971 N. 10·79 15,047 +6.122 +68'59 7,890 7,157
328 °Karamadai Coimbatore 1961 P. 25·90 11,649 +3,375 +28·97
6,046 5,603 (TAMIL NADU) 1971 P. 19'53 15,024 7.728 7,296
329 Jin~ur Parbhani 1931 5,825 + 1,559 +26·76
' 2,936 2,889 (MAHARASHTRA) 1941 7,384 3,732 3,652
1951 7,595 +211 +2·86 3,866 3,729 1961 M. 24·84 9,367 +1,772 +23·33 4,985 4,382 1971 M. 24·84 15,019 +5,652 +60·34 7,846 7,173
330 Bantwa Junagadh 1901 8,591 +5si +6·76
3,711 4,880 (GU1ARAT) 1911 9,172 3,945 5,227
1921 10,717 + 1,545 +16'84 4,847 5,870 1931 13,236 +2,519 +23·50 6,244 6,992 1941 18,323 +5,087 +38·43 8,577 9,746 1951 18,635 +312 +1'70 9,440 9,195 1961 M. 22'53 14,078 -4,557 -24·45 7,140 6,!l38 1971 N.P. 30·39 15,011 +933 +6·63 7,742 7,269
331 Waraaliganj Gaya 1951 7,773 +5,365 +69'02
4.031 3,742 (BlllAR.) 1961 12·95 13,138 7,017 6,121
•• 1971 D·ll 15,004 +1,866 +14'20 7,750 7,254
332 Kckri Aimer 1901 7,053 . -I,li7 -15·98
3,641 3,412 (RAJASTHAJ:!) 1911 5,926 3,126 2,800
1921 5,698 -228 -3'85 2,913 2,785 1931 7,179 +1,481 +25'99 3,644 3,535 1941 8,245 +1,066 + 14'85 4,239 4,006 1951 9,816 + 1,571 +19·05 5,088 4,728 1961 M. 50'74 12,394 +2,578 +26'26 6,482 5,912 1971 M. 12'G6 14,997 +2,603 +21'00 7,8S7 7,140
33~ Junnar Poona 1901 9,675 -855 4,587 5,088
(MAHARASHTRA) 1911 8,820 -8'84 4,224 4,596 1921 7,381 -1,439 -16'32 3,543 3,838 1931 8,421 +1,040 + 14·09 4,214 4,207 1941 9,951 + 1,530 +18'17 5,054 4,897 1951 11,632 +1,681 +16·89 5,822 5,810 1961 M. 4'74 12,141 +509 +4·38 6,051 6,090 1971 M. 4'74 14,951- +2,811 +23'15 7,682 7,270
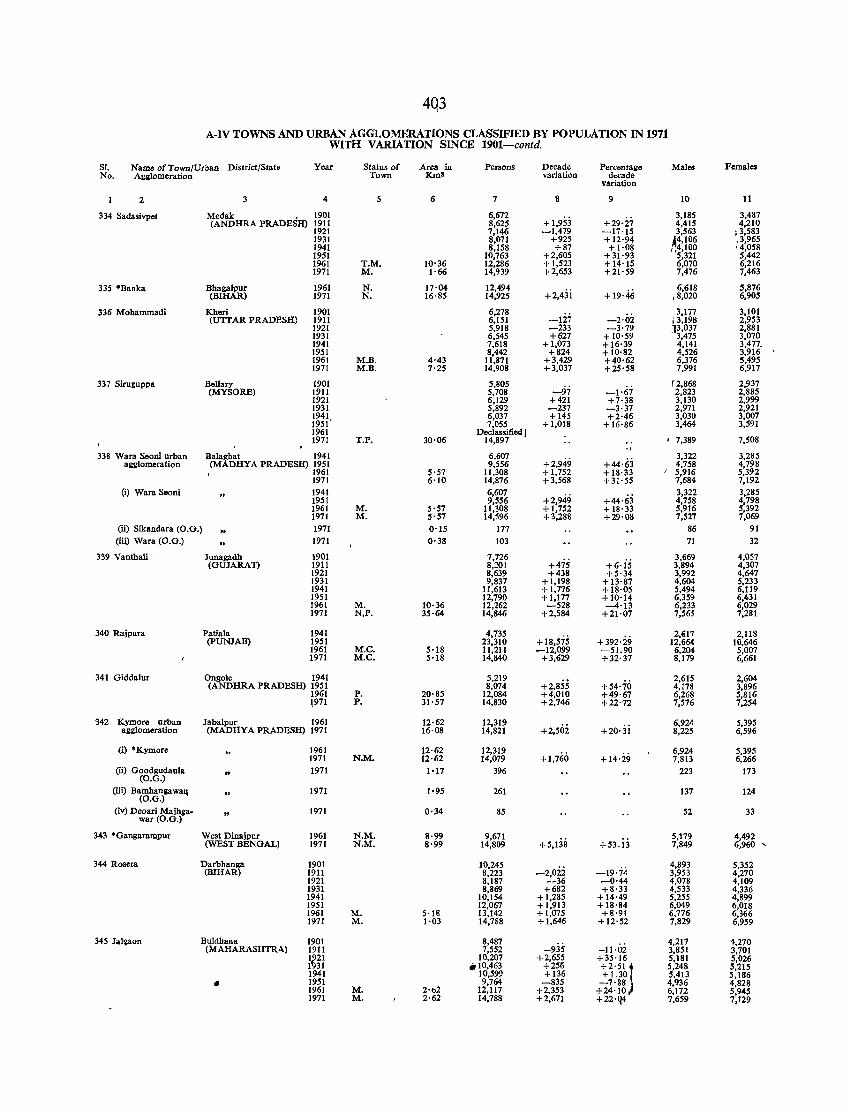
4Q3
A-IV TOWNS AND URBAN AGGLOMERATIONS CLASSIFIED BY POPULATION IN 1971 WITH VARIATION SINCE 1901-contd.
SI. Name of Town/Urban District/State Year Status of Area in Persons Decade Percentage Males Females No. Agglomeration Town :r<m! variation deCade
variation
2 3 4 5 6 7 8 9 10 11
334 Sadasivpet Medak 1901 6,672 + 1,9S3 +29'27
3,185 3,487 (ANDHRA PRADESH) 1911 8,625 4,415 4,210
1921 7,146 -1,479 -17'15 3,563 ; 3,583 1931 8,071 +925 + 12'94 44,106 ,3,965 1941 8,158 +87 +1·08 1.4,100 i 4,058 1951 10,763 +2,605 +31·93 5,321 5,442 1961 T.M. 10'36 12,286 +1,523 +14'15 6,070 6,216 1971 M. 1'66 14,939 +2,653 +21'59 7,476 7,463
335 .Banka Bhaga1pur 1961 N. 17·04 12,494 +2,4:ij +19·46
6,618 5,876 (BIHAR) 1971 N. 16·85 14,925 ,8,020 6,905
336 Mohammadi Kheri 1901 6,278 3,177 3,101 (UTfAR PRADESH) 1911 6,151 -127 -2·02 i 3,198 2,953
1921 5,918 -233 -3'79 ]3,037 2,881 1931 6,545 +627 +10'59 3,475 3,070 1941 7,618 + 1,073 +16'39 4,141 3,477. 1951 8,442 +824 +10·82 4,526 3,916 1961 M.B. 4·43 11,871 +3,429 +40·62 6,376 5,495 1971 M.B. 7·25 14,908 +3,037 +25'58 7,991 6,917
337 Siruguppa Bellary 1901 5,805 -97 -1·67
r2,868 2,937 (MYSORE) 1911 5,708 2,823 2,885
1921 6,129 +421 +7·38 3,130 2,999 1931 5,892 -237 -3·37 2,971 2,921 1941 6,037 +145 +2·46 3,030 3,007 1951' 7,055 +1,018 +16'86 3,464 3,591 1961 Declassified I 1971 T.P. 30·06 14,897 ' 7,389 7,508
338 Wara Seoni urban Balaghat 1941 6,607 +2,949 +44'63
3,322 3,285 agglomeration (MADHYA PRADESH) 1951 9,556 4,758 4,798
1961 5'57 11,308 + 1,752 + 18·33 I 5,916 5,392 1971 6·10 14,876 +3,568 +31'55 7,684 7,192
(i) Wara Seoni 1941 6,607 +2,949 +44'63
3,322 3,285 1951 9,556 4,758 4,798 1961 M. 5'57 11,308 +1,752 + 18·33 5,916 5,392 1971 M. 5'57 14,596 +3,288 +29·08 7,527 7,069
(li) Sikandara (0.0.) 1971 0'15 177 86 91 (iii) Wara (0.0.) 1971 0·38 103 71 32
339 Vanthali Junagadh 1901 7,726 +47S +6. is 3,669 4,057
(OUJARAT) 1911 8,201 3,894 4,307 1921 8,639 +438 +5'34 3,992 4,647 1931 9,837 +1,198 +13'87 4,604 5,233 1941 11,613 +1,776 +18·05 5,494 6,119 1951 12,790 + 1,177 +10'14 6,359 6,431 1961 M. 10·36 12,262 -528 --4·13 6,233 6,029 1971 N,P. 35·64 14,846 +2,584 +21·07 7,565 7,281
340 Rajpura Patiala 1941 4,735 +392·29
2,617 2,118 (PUNJAB) 1951 23,310 + 18,575 12,664 10,646
1961 M.C. 5·18 11,211 -12,099 -51.90 6,204 5,007 1971 M.C. 5·18 14,840 +3,629 +32·37 8,179 6,661
341 Oiddalur Ongole 1941 5,219 +2,855 +54'70
2,615 2,604 (ANDHRA PRADESH) 1951 8,074 4,178 3,896
1961 P. 20·85 12,084 +4,010 +49'67 6,268 5,816 1971 P. 31·57 14,830 +2,746 +22'72 7,576 7,254
342 Kymore urban Jaba1pur 1961 12·62 12,319 +2,502 +20'3i
6,924 5,395 agglomeration (MADHYA PRADESH) 1971 16·08 14,821 8,225 6,596
(i) *Kymore 1961 12·62 12,319 +1,760 +14'29
6,924 5,395 1971 N.M. 12·62 14,079 7,813 6,266
(ii) Goodgudau1a (O.G.)
1971 1'17 396 223 173
(iii) Bamhaoia waq 1971 1·95 261 137 124 (O.G.)
(iv) Deoari Majhga- 1971 0·34 85 52 33 war (O.G.)
343 *Oangarampur West Dinajpur 1961 N.M. 8·99 9,671 +5,138
5,179 4,492 (WEST BENGAL) 1971 N.M. 8·99 14,809 +53.13 7,849 6,960 "-
344 Rosera Darbhanga 1901 10,245 -2,022 -19·74
4,893 5,352 (BIHAR) 1911 8,223 3,953 4,270
1921 8,187 -36 -0·44 4,078 4,109 1931 8,869 +682 +8·33 4,533 4,336 1941 10,154 +1,285 + 14·49 5,255 4,899 1951 12,067 +1,913 +18'84 6,049 6,018 1961 M. 5'18 13,142 +1,075 +8'91 6,776 6,366 1971 M. 1'03 14,788 +1,646 +12'52 7,829 6,959
345 Jal~aon Bu1dhana 1901 8,487 -935
4,217 4,270 (MAHARASHTRA) 1911 7,552 -11·02 3,851 3,701
1€21 10,207 +2,655 +35'16 5,181 5,026 1 31 .. 10,463 +255 +2'51j 5,248 5,215 1941 10,595.' +136 + 1.30 5,413 5,186
• 1951 9,764 -835 -7'88 4,936 4,828 196] M. 2'1>2 12,117 +2,353 +24'10 6,172 5,945 1971 M. 2'62 14,788 +2,671 +22'Q4 7,659 7,129
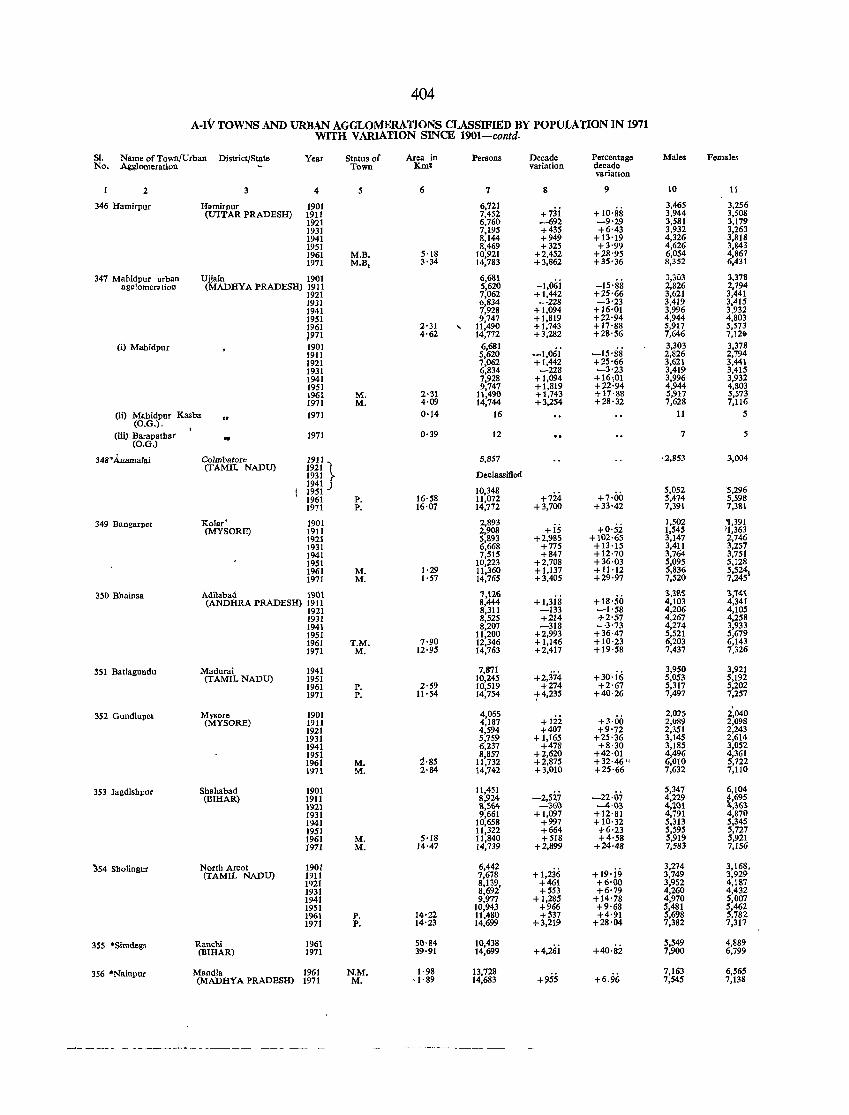
404
A-IV TOWNS AND URBAN AGGLoMERATIONS CLASSIFIED BY POPULATION IN 1971 WITH V ARIATlON SINCE 1901-contd.
SI. Name of Town/Urban District/State Year Status of Area in Persons Decade Percentage Males Females No. Agglomeration Town Km2 variation decade
variation
2 4 5 6 7 8 9 10 11
346 Hamirpur Hamirpur 1901 6,721 +73i + 10'88
3,465 3,256 (U1TAR PRADESH) 1911 7,452 3,944 3,508
1921 6,760 -692 -9'29 3,581 3,179 1931 7,19S +435 +6'43 3,932 3,263 1941 8,144 +949 +13'19 4,326 3,818 1951 8,469 +325 +3'99 4,626 3,843 1961 M.B. S'18 10,921 +2,452 +28'95 6,054 4,867 1971 M.B, 3·34 14,783 +3,862 +35'36 8,352 6,431
347 Ma11idpur urban Ujjain 1901 6,681 -I,oi;i -15'88
J,303 3,378 ag2'lomer~tion (MADHYA PRADESH) 1911 5,620 2,826 2,794
1921 7,062 +1,442 +25'66 3,621 3,441 1931 6,834 -228 -3'23 3,419 3,415 1941 7,928 + 1,094 +16'01 3,996 3.932 1951 9,747 +1,819 +22'94 4,944 4,803 1961 2·31 , 11,490 +1,743 +17'88 5,917 5,573 1971 4·62 14,772 +3,282 +2S'56 7,646 7,126
(i) Mabidpur 1901 6,681 -I,06i -15'88
3,303 3,378 1911 5,620 2,826 2,794 1921 7,062 + 1,442 +25'66 3,621 3,441 1931 6,834 -228 -3'23 3,419 3,415 1941 7.928 + 1,094 + 16·m 3,996 3,932 1951 9,747 +1,819 +22·94 4,944 4,803 1961 M. 2'31 11,490 +1,743 +17'88 5,917 5,573 1971 M. 4·09 14,744 +3,254 +28'32 7,628 7,116
(ii) Mahidpur Kasba (O.G.).
1971 0·14 16 11 5
(iii) Barapatbar (O.G.) •• 1971 0·39 12 7 5
348~Anamalai Colmbatore J9JJ~ 5,857 ·2,853 3,004 (TAMIL NADU) 1921
1931 Declassified
l~~l ) 10,348 +724 +7'00
5,052 5,296 1961 P. 16·58 11,072 5,474 5,598 1971 P. 16·07 14,772 +3,700 +33'42 7,391 7,381
349 Bangarpct Kolar 1901 2,893 +is +o·si
1,502 '1,391 (MYSORE) 1911 2,908 1,545 11,363
1921 5,893 +2,985 +102'65 3,147 2,746 1931 6,668 +775 + 13'15 3,411 3,257 1941 7,515 +847 +12'70 3,764 3,751 1951 10,223 +2,708 +36'03 5,095 5,128 1961 M. 1·29 11,360 + 1,137 +11'12 5,836 5,524, 1971 M. 1'57 14,765 +3,405 +29·97 7,520 7,245
350 Bbainsa Adilabad 1901 1,126 + 1,3is + 18 '50
~,'f.$ ~,""1 (ANDHRA PRADESH) 1911 8,444 4,103 4,341
1921 8,311 -133 -1'58 4,206 4,105 1931 8,525 +214 +2'57 4,267 4,258 1941 8,207 -318 -3'73 4,274 3,933 1951 11,200 +2,993 +36·47 5,521 5,679 1961 T.M. 7·90 12,346 +1,146 +10'23 6,203 6,143 1971 M. 12·95 14,763 +2,417 +19'58 7,437 7,326
351 Batlagundu Madurai 1941 7,871 +2,374 +30·i6
3,950 3,921 (TAMIL NADU) 1951 10,245 5,053 5,192
1961 P. 2'59 10,519 +274 +2'67 5,317 5,202 1971 P. 11·54 14,754 t 4,235 +40·26 7,497 7,257 .
352 Gundlupet Mysore 1901 4,065 +3'00
2,025 2,040 (MYSORE) 1911 4,187 +122 2,089 2,098
1921 4,594 +407 +9'72 2,351 2,243 1931 5,759 + 1,165 +25'36 3,145 2,614 1941 6,237 +478 +8·30 3,185 3,052 1951
i'85 8,857 +2,620 +42·01 4,496 4,361
1961 M. 11,732 +2,875 +32'46" 6,010 5,722 1971 M. 2·84 14,742 +3,010 +25'66 7,632 7,110
353 Jagdisbpur Sbababad 1901 11,451 ~2,si7 -22·07
5,347 6,104 (BIHAR) 1911 8,924 4,229 t 695
1921 8,564 -3W -4·03 4,201 ,363 1931 9,661 +1,097 +12'81 4,791 4,870 1941 10,658 +997 +10·32 5,313 5,345 1951 11,322 +664 +6'23 5,595 5,727 1961 M. 5·18 11,840 +518 +4·58 5,919 5,921 1971 M. 14·47 14,739 +2,899 +24·48 7,583 7,156
~54 Sbo1ingur North Arcot 1901 6,442 +1,236 +19·i9
3,274 3,168, (TAMIL NADU) 1911 7,678 3,749 3,929
1921 8,139, +461 +6'00 3,952 4,187 1931 8,692 +553 +6'79 4,260 4,432 1941 9,977 + 1,285 +14'78 4,970 5,007 1951 10,94,3 +966 +9'68 5,481 5,462 1961 P. 14·22 11,480 +537 +4'91 5,698 5,782 1971 P. 14'23 14,699 +3,219 +28'04 7,382 7,317
355 'Simdegll Ranchi 1961 50·84 10,438 +4,2i;i +40'82
5,549 4,889 (BIHAR) 1971 39·91 14,699 7,900 6,799
356 'Nainpur Mandla 1961 N.M. 1·98 13,728 +955 +6.96
7,163 6,565 (MADHYA PRADESH) 1971 M. ' 1'89 14,683 7,545 7.138
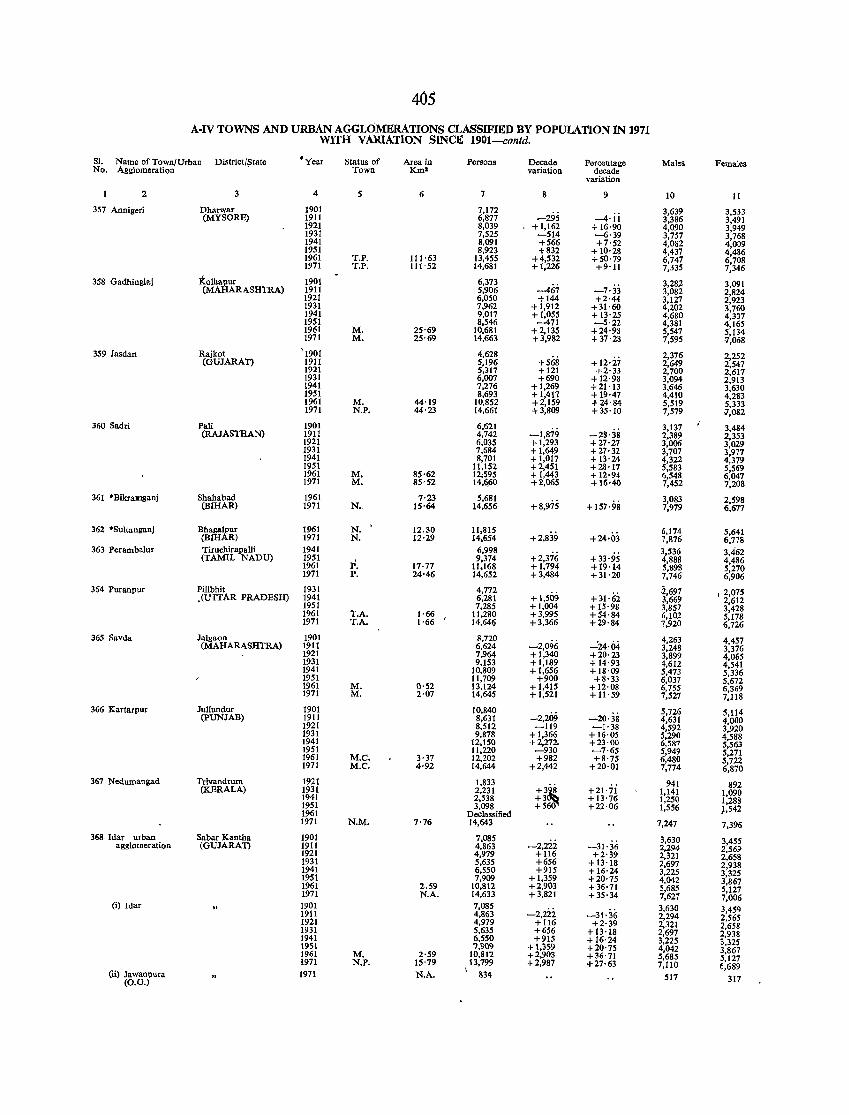
405
A-IV TOWNS AND URBAN AGGLOMERATIONS CLASSIFIED BY POPULATION 1N 1971 WITH VARIATION SINCE 1901-contd.
SI. Name of Town/Urban District/State • Year Status of Area in Persons Decade Percentage Males Females No. Agglomeration Town Km2 variation decade
,'ariation
2 3 4 5 6 7 8 9 10 11 357 Annigeti Dharwar 1901 7.172
-4.jj 3.639 3.533
(MYSORE) 1911 6.877 -295 3,386 3,491 1921 8.039 +1.162 +16·90 4,090 3,949 1931 7,525 -514 -6·39 3.757 3.768 1941 8,091 +566 +7'52 4,082 4,009 1951 8,923 +832 + 10'28 4,437 4,486 1961 T.P. 111·63 13,455 +4,532 +50'79 6,747 6,708 1971 T.P. 111'52 14,681 +1.226 +9'11 7,335 7,346
358 GadhingJaj KOlhapur 1901 6,373 -467 -7'33
3,282 3,091 (MAHARASHTRA) 1911 5.906 3,082 2,824
1921 6,050 +144 +2'44 3,127 2,923 1931 7,962 + 1,912 +31·60 4,202 3,760 1941 9,017 +1,055 + 13'25 4,680 4,337 1951 8,546 -471 -5'22 4,381 4,165 1961 M. 25'69 10.681 +2,135 +24·98 5.547 5.134 1971 M. 25'69 14.663 +3.982 +37·28 7.595 '7.068
359 Jasdan Rajkot '1901 4.628 +568 + 12·ii
2.376 2.252 (GUJARAT) 1911 5.196 2.649 2.547
1921 5.317 +121 +2·33 2.700 2,617 1931 6,007 +690 + 12'98 3.094 2,913 1941 7,276 + 1,269 +21'13 3,646 3,630 1951 8,693 + 1,417 + 19·41 4,410 4,283 1961 M. 44·19 10,852 +2,159 + 24·84 5.519 5,333 1971 N.P. 44·23 14,661 +3,809 +35'10 7,579 :7,082
36Q Sadri Pali 1901 6.621 -1,879 -28'38
3,137 3,484 (RAJASTHAN) 1911 4,742 2,389 2.353
1921 6.035 t 1,293 + 27·27 3.006 3,029 1931 7.684 +1,649 + 27·32 3.701 3.977 1941 8.701 +1,017 + 13'24 4.322 4,379 1951 11,152 +2,451 +28'17 5,583 5.569 1961 M. 85·62 12,595 + 1,443 + 12·94 6.548 6.047 1971 M. 85'52 14.6.60 +2,065 + 16·40 7,452 7.208
361 ·Bikralll8anj Shahabad 1961 7·23 5,681 +8,975 + 157·98
3.083 2.598 (BIHAR) 1971 N" 15'64 14.656 7,979 6,617
362 ·Sultanganj Bhasalpur 1961 N. 12.30 11.815 +2,839 +24'03
6.174 5.641 (BIHAR) 1971 N. 12'29 14,654 7.876 6,778
363 Perambalur TiruchirapaUi 1941 6.998 +2.376 +33·95
3,536 3,462 (TAMIL NADU) 1951
P. 9.374 4.888 4.486 1961 17·77 11,168 + 1,794 + 19·14 5,898 5,270 1971 P. 24·46 14,652 +3,484 +31'20 7,746 6.906
364 Puranpur Pilibhit 1931 4.772 +1,509
a.697 ,2,075 .(UTTAR PRADESH) 1941 6.281 +31·62 3.669 2.612 1951 7.285 +1.004 + H·98 3.857 3,428 1961 T.A. 1·66 11,280 +3,995 +54'84 6.102 5.178 1971 T.A. 1·66 14,646 +3.366 +29'84 7,920 6,726
365 Savda Ja1gaon 1901 8,720 -2,096 ":24'04
4,263 4,457 (MAHARASHTRA) 1911 6.624 3.248 3,376 1921 7,964 + 1,340 +20'23 3,899 4,065 1931 9,153 +1,189 + 14·93 4.612 4,541 1941 10.809 + 1,656 + 18·09 5,473 5.336 1951 11.709 +900 +8·33 6.037 5,672 1961 M. 0·52 13,124 +1,415 +12·08 6,755 6,369 1971 M. 2·07 14,645 + 1,521 + 11'59 7,527 7.118
366 Kartarpur lullundur 1901 10.840 -2,209 -20'38
5.726 5.114 (pUNJAB) 1911 8,631 4,631 4,000 1921 8.512 -119 -1·38 4,592 3,920 1931 9,878 + 1.366 + 16·05 5,290 4.588 1941 12,150 +2.272. +23·00 6,587 5.563 1951 11,220 -930 -7·65 5,949 5.271 1961 M.e. 3'37 12,202 +982 +8·75 6.480 5.722 1971 M.e. 4·92 14.644 +2,442 +20'Q1 7.774 6,870
367 Nedumangad Trivandrum 1921 1.833 +3~ +21·ii
941 892 (KERALA) 1931 2,231 1.141 1,090 1941 2,538 +3 + 13'76 1.250 1,288 1951 3,098 +560 +22·06 1,556 }.542 1961 Declassified 1971 N.M. 7·76 14.643 7,247 7,396
368 Idar uIban Sabar Kantha 1901 7,085 -2,22i -31·36
3.630 3.455 agglomeration (GUIARAT) 1911 4,863 2.294 2,569 1921 4,979 +116 +2'39 2.321 2,658 1931 5,635 +656 + 13'18 2,697 2,938 1941 6,550 +915 +16·24 3,225 3.325 1951 7.909 + 1,359 +20'75 4,042 3,867 1961 2.59 10.812 +2.903 +36'71 5.685 5.127 1971 N.A. 14,633 +3,821 +35·34 7.627 7,006 (i) Idar 1901 7.085
-2.2ii -31·36 3.630 3.459 1911 4,863 2.294 2,565 1921 4,979 +116 +2'39 2,321 2,658 1931 5.635 +656 + 13'18 2,697 2.938 1941 6,550 +915 +16'24 3,225 3,325 1951 7,909 + 1.359 +20'75 4,042 3,867 1961 M. 2·59 10.812 +2,903 +36'71 5,685 5,127 1971 N.P. 15'79 13.799 +2.987 +27'63 7.110 6,689 I (ii) Jawanpura 1971 N.A. 834 517 317 (O.G.)
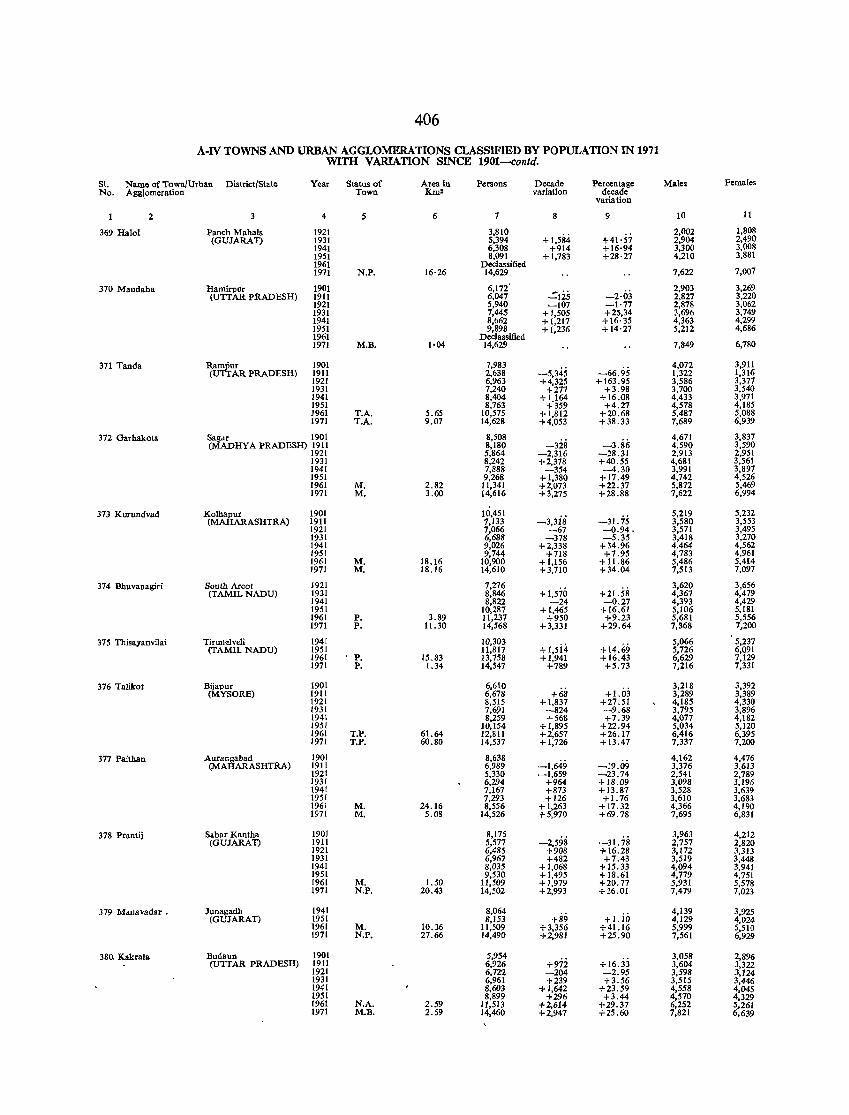
406
A-IV TOWNS AND URBAN AGGLOMERATIONS CLASSIFIED BY POPULATION IN 1971 WITH VARIATION SINCE 1901-contd.
SI. Name of Town/Urban District/State Year Status of Area in Persons Decade Percentage Males Females No. AgB\omeration Town Km' variation decade
variation
2 3 4 5 6 7 8 9 10 11
369 Halol Panch Mahals 1921 3,810 +1,584 +41·57
2,002 1,808 (GUJARAT) 1931 5,394 2,904 2,490
1941 6,308 +914 +16·94 3,300 3,008 1951 8,091 + 1,783 +28·27 4,210 3,881 1961 Declassified 1971 N.P. 16·26 14,629 7,622 7,007
370 Maudaha Hamirpur 1901 6,172" "'::125 -2·03
2,903 3,269 (UTTAR PRADESH) 1911 6,047 2,827 3,220
1921 5,940 -107 -1·77 2,878 3,062 1931 7,445 +1,505 +25,34 3,696 3,749 1941 8,662 + 1,217 +16·35 4,363 4,299 1951 9,898 +1,236 +14'27 5,212 4,686 1961 Declassified 1971 M.B. 1·04 14,629 7,849 6,780
371 Tanda Rampur 1901 7,983 -5,345 -66.95
4,072 3,911 (UTTAR PRADESH) 1911 2,638 1,322 1,316
1921 6,963 +4,325 +163.95 3,586 3,377 1931 7,240 +277 +3.98 3.700 3,540 1941 8,404 + 1.164 +16.08 4,433 3,971 1951 8,763 +359 +4.27 4,578 4,185 1961 T.A. 5.65 10,575 +1,812 +20.68 5,487 5,088 1971 T.A. 9.07 14,628 +4,053 +38.33 7,689 6,939
372 Garhakota Sagdr 1901 8,508 -3.86
4,671 3,837 (MADHYA PRADESH) 1911 8,180 -328 4,590 3,590
1921 5,864 -2,316 -28.31 2,913 2,951 1931 8,242 +2,378 +40.55 4,681 3,561 1941 7,888 -354 -4.30 3,991 3,897 1951 9,268 +1,380 +17.49 4,742 4,526 1961 M. 2.82 11,341 +2,073 +22.37 5,872 5,469 1971 M. 3.00 14,616 +3,275 +28.88 7,622 6,994
373 Kurundvad Kolhapur 1901 !(),451 -3,3is -31.75
5,219 5,232 (MAHARASHTRA) 1911 7,133 3,580 3,553
1921 7,066 -67 -0.94. 3,571 3,495 1931 6,688 -378 -5.35 3,418 3,270 1941 9,026 +2,338 +34.96 4,464 4,562 1951 9,744 +718 +7.95 4,783 4,961 1961 M. 18.16 10,900 +1,156 + 11.86 5,486 5,4l4 1971 M. 18.16 14,610 +3,710 +34.04 7,513 7,097
374 Bhuvanagiri South Areot 1921 7,276 +1,570 +21.58
3,620 3,656 (TAMIL NADU) 1931 8,846 4,367 4,479
1941 8,822 -24 -0.27 4,393 4,429 1951 10,281 + 1,465 +16.61 5,106 5,181 1961 P. 3.89 11,237 +950 +9.23 5,681 5,556 1971 P. 11. 30 14,568 +3,331 +29.64 7,368 7,200
375 Thisayanvilai Tirunelveli 1941 10,303 +1,5i4 +[4.69
5,066 5,231 (TAMIL NADU) 1951 11,817 5,726 6,091
1961 P. 15.83 13,758 +1,941 +16.43 6,629 7,129 1971 P. 1.34 14,547 +789 +5.73 7,216 7,331
376 Talikot Bijapur 1901 6,610 +68 +1.03
3,218 3,392 (MYSORE) 1911 6,678 3,289 3,389
1921 8,515 + 1,837 +27.51 4,185 4,330 1931 7,691 -824 -9.68 3,795 3,896 1941 8,259 +568 +7.39 4,077 4,182 1951 10,154 + 1,895 +22.94 5,034 5,120 1961 T.P. 61.64 12,811 +2,657 +26.17 6,416 6,395 1971 T.P. 60.80 14,537 +1,726 +13.47 7,337 7,200
377 Paithan Allrangabad 1901 8,638 -1,649 -19.09
4,162 4,476 (MAHARASHTRA) 1911 6,989 3,376 3,613
1921 5,330 -1,659 -23.74 2,541 2,789 1931 6,294 +964 +18.09 3,098 3,196 1941 7,167 +813 + 13.87 3,528 3,639 1951 7,293 +126 +1. 76 3,610 3,683 1961 M. 24.16 8,556 +1,263 +17.32 4.366 4,190 1971 M. 5.08 14,526 +5,970 +69.78 7,695 6,831
378 Prantij Sabar Kantha 1901 8,175 -2,598 -31.78
3,963 4,212 (GUJARAT) 1911 5,577 2,757 2,820
1921 6,485 +908 +16.28 3,172 3,313 1931 6,967 +482 +7.43 3,519 3,448 1941 8,035 +1,068 +15.33 4,094 3,941 1951 9,530 +1,495 +18.61 4,779 4,751 1961 M. 1.50 11,509 +1,979 +20.77 5,931 5,578 1971 N.P. 20.43 14,502 +2,993 +26.01 7,479 7,023
379 Manavadar . Junagadh 1941 8,064 +89 +1.io
4,139 3,925 (GUJARAT) 1951 8,153 4,129 4,024
1961 M. 10.36 11,509 +3,356 +41.16 5,999 5,510 1971 N.P. 27.66 14,490 +2,981 +25.90 7,561 6,929
380. Kakrala Budaun 1901 5,954 +972 +16,33
3,058 2,896 (UTTAR PRADESH) 1911 6,926 3,604 3,322
1921 6,71:2 -204 -2.95 3,598 3,124 1931 6,961 +239 +3.56 3,515 3,446 1941 8,603 +1,642 +23.59 4,558 4,045 1951 8,899 +296 +3.44 4,570 4,329 1961 N.A. 2.59 11,513 +2,614 +29.37 6,252 5,261 1971 M.B. 2.59 14,460 +2,947 +25.60 7,821 6,639
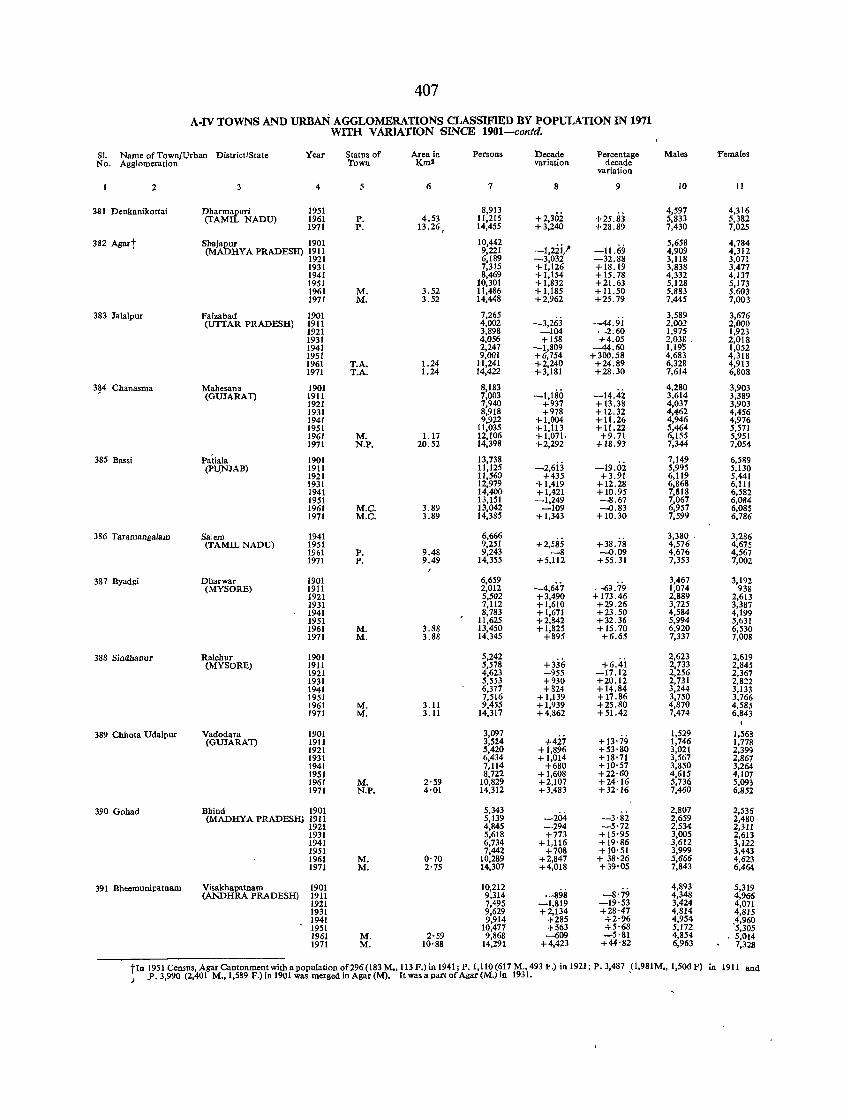
407
A-IV TOWNS AND URBAN AGGLOMERATIONS CLASSIFIED BY POPULATION IN 1971 WITH VARIATION SINCE 1901-contd.
Sl. Name of Town/Urban District/State Year Status of Area in Persons becade Percentage Males Females No. Agglomeration Town Km! variation decade
variation
2 4 5 6 7 8 9 10 11
3& 1 Denkanikottai Dharmapuri 1951 8,913 +2,302
4,597 4,316 (TAMIL NADU) 1961 P. 4.53 11,215 +25.83 5,833 5,382
1971 P. 13.26, 14,455 +3,240 +28.89 7,430 7,025
382 Agart Shajab'r 1901 10,442 -I,22i/ -11.69
5,658 4,784 (MA HY A PRADESH) 1911 9,221 4,909 4,312
1921 6,189 -3,032 -32.88 3,118 3,071 1931 7,315 +1,126 +18.19 3,838 3,477 1941 8,469 +1,154 + 15.78 4,332 4,137 1951 10,301 +1,832 +21.63 5,128 5,173 1961 M. 3.52 11,486 +1,185 + 11.50 5,883 5,603 1971 M. 3.52 14,448 +2,962 +25.79 7,445 7,003
383 Jalalpul Faizabad 1901 7,265 -3,263
3,589 3,676 (UTTAR PRADESH) 1911 4,002 --44.91 2,002 2,000
1921 3,898 -104 -2.60 1,975 1,923 1931 4,056 +158 +4.05 2,038. 2,018 1941 2,247 -1,809 --44.60 1,195 1,052 1951 9,001 +6,754 +300.58 4,683 4,318 1961 T.A. 1.24 11,241 +2,240 +24.89 6,328 4,913 1971 T.A. 1.24 14,422 +3,181 +28.30 7,614 6,808
384 Chanasma Mahesana 1901 8,183 -1,180 -14.42
4,280 3,903 (GUJARAT) 1911 7,003 3,614 3,389
1921 7,940 +937 + 13.38 4,037 3,903 1931 8,918 +978 + 12.32 4,462 4,456 1941 9,922 +1,004 + 11.26 4,946 4,976 1951 11,035 +I,lJ3 + 11.22 5,464 5,571 1961 M. 1.17 12,106 +1,071. +9.71 6,155 5,951 1971 N.P. 20.52 14,398 +2,292 +18.93 7,344 7,054
385 Bassi Patiala 1901 13,738 -2,6i3 -19.02
7,149 6,589 (PLlNJAB) 1911 11,125 5,995 5,130
1921 11,560 +435 +3.91 6,119 5,441 1931 12,979 +1,419 +12.28 6,868 6,111 1941 14,400 +1,421 +10.95 7,818 6,582 1951 13,151 -1,249 -8.67 7,067 6,084 1961 M.C. 3.89 13,042 -109 -0.83 6,957 6,085 1971 M.C. 3.89 14,385 + 1,343 + 10.30 7,599 6,786
386 Taramangalam Salem 1941 6,666 +2,585 +38.78
3,380 . 3,286 (TAMIL NADU) 1951 9,251 4,576 4,675
1961 P. 9.48 9,243 -8 -0.09 4,676 4,567 1971 P. 9.49 14,355 +5,112 +55.31 7,353 7,002
387 Byadgi Dharwar 1901 6,659 -4,647
3,467 3,191 (MYSORE) 1911 2,012 -69.79 1,074 938
1921 5,502 +3,490 +173.46 2,889 2,613 1931 7,112 +1,610 +29.26 3,725 3,387 1941 8,783 +1,671 +23.50 4,584 4,199 1951 11,625 +2,842 +32.36 5,994 5,631 1961 M. 3.88 13,450 + 1,825 + 15.70 6,920 6,530 1971 M. 3.88 14.345 +895 +6.65 7,337 7,008
388 Sindhanur Raichur 1901 5,242 +336 +6.4i
2,623 2,619 (MYSORE) 1911 5,578 2,733 2,845
1921 4,623 -955 -17.12 2,256 2,367 1931 5,553 +930 +20.12 2,731 2,822 1941 6,377 +824 +14.84 3,244 3,133 1951 7,516 +1,139 +17.86 3,750 3,766 1961 M. 3.11 9,455 +1,939 +25.80 4,870 4,585 1971 M. 3.11 14,317 +4,862 + 51.42 7,474 6,843
389 Cbhota Udaipur Vadodara 1901 3,097 1,529 1,568 (GUJARAT) 1911 3,524 +427 + 13·79 1,746 1,778
1921 5,420 + 1,896 +53'80 3,021 2,399 1931 6,434 +1,014 + 18·71 3,567 2,867 1941 7,114 +680 +10'57 3,850 3,264 1951 8,722 +1,608 +22'60 4,615 4,107 1961 M. 2'59 10,829 +2,107 +24'16 5,736 5,093 1971 N.P. 4'01 14,312 + 3,483 + 32'16 7,460 6,852
390 Gohad Bhind 1901 5,343 -204
2,807 2,536 (MADHYA PRADESH) 1911 5,139 -3'82 2,659 2,480
1921 4,845 -294 -5·72 2,534 2,311 1931 5,618 +773 +15·95 3,005 2,613 1941 6,734 + 1,116 +19'86 3,612 3,122 1951 7,442 +708 + 10'51 3,999 3,443 1961 M. 0'70 10,289 +2,847 + 38'26 5,666 4,623 1971 M. 2·75 14,307 +4,018 +39·05 7,843 6,464
391 Bheemunipatnam Visakhapatnam 1901 10,212 -898 -8'79
4,893 5,319 (ANDHRA PRADESH) 1911 9,314 4,348 4,966
1921 7,495 -1,819 -19'53 3,424 4,071 1931 9,629 +2,134 +28·47 4,814 4,815 1941 9,914 +285 +2'96 4,954 ,4,960 1951 10,477 +563 +5'68 5,172 5,305 1961 M. 2'59 9,868 -609 -5'81 4,854 . 5,014 1971 M. 10'88 14,291 +4,423 +44'82 6,963 7,328
tIn 1951 Census, Agar Cantonment withapopuiation of296 (183 M., 113 P.) in 1941; P. 1,110 (617 M., 4931'.) in 1921; P. 3,487 (1,981M .. 1,506 P) ) .P. 3,990 (2,401 M., 1,589 F.) in 1901 was merged in Agar (M). It was a part of Agar (M.) in 1931. .
in 1911 and
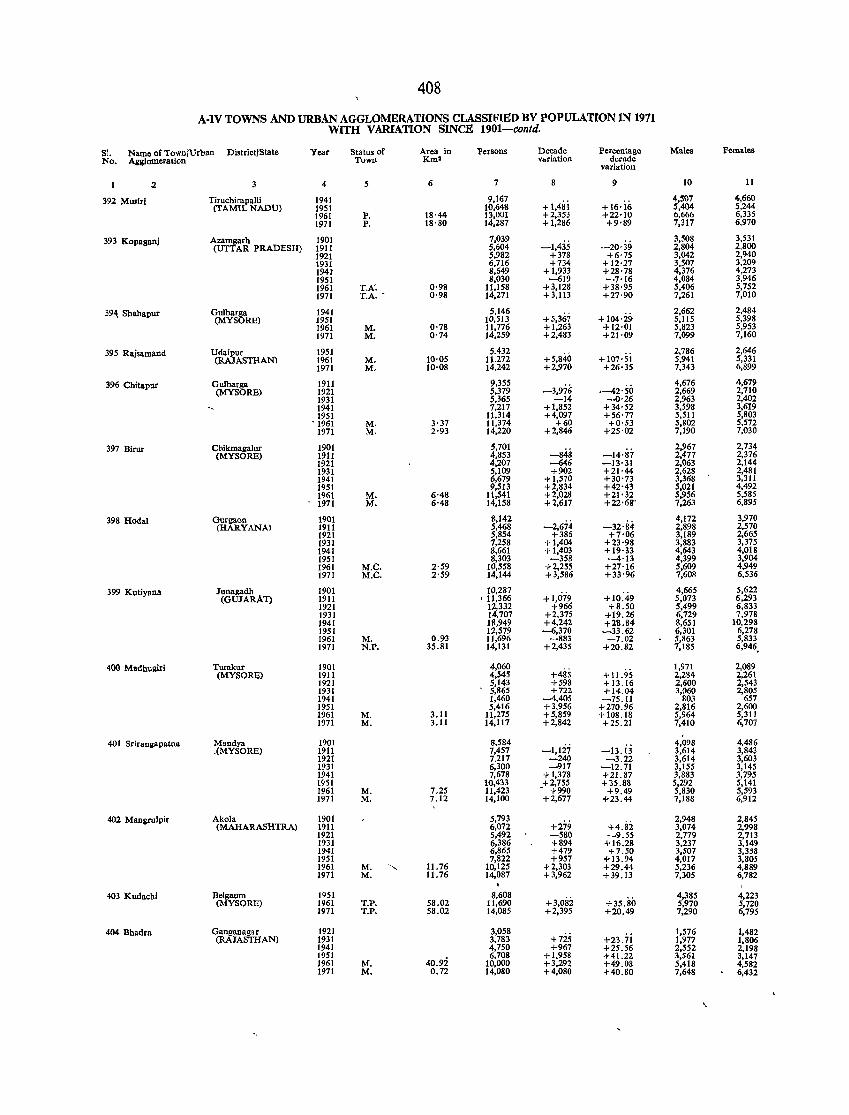
408
A.IV TOWNS AND URBAN AGGLOMERATIONS CLASSIFIED BY POPULATION IN 1971 WITH VARIATION SINCE 1901-contd.
51. Name of Town/Urban District/State Year Status of Area in "Persons Decade Percentage MalC1l Females No. Agglomeration Town Km' y"riation decade
variation
2 3 4 5 6 7 9 10 11
392 Muslri Tiruchirapalli 1941 9,161 + 1,4Si
4,507 4,660 (fAMlL NADU) 1951 10,648 +16'16 5,404 5,244
1961 P. 18'44 13,001 +2,353 +22·10 6,666 6,335 1971 P. 18'80 14,287 + 1,286 +9'89 7,317 6,970
393 Kopaganj Azamgarh 1901 1,039 -1,435 -20·39
3,508 3,531 (UTTAR PRADESH) 1911 5,604 2,804 2,800
1921 5,982 +378 +6·75 3,042 2,940 1931 6,716 +734 +12·27 3,507 3.209 194r 8,649 +1,933 +28'78 4,376 4,273 1951 8,030 -619 -7'16 4,084 3,946 1961 TX 0·98 11,158 + 3,128 +38·95 5,406 5,752 1971 T.A. - 0'98 14,271 +3,113 +27'90 7,261 7,010
39~ Shahapur Gulbarga 1941 5,146 +5,367 + 104'29
2,662 2,484 (MYSORE) 1951 10,S13 5,115 5,398
1961 M. 0·78 1l,776 +1,263 +12·01 5,823 5,953 1971 M. 0·74 14,259 +2,483 +21'09 7,099 7,160
395 Raisamand Udaipur 1951 5.432 +5,840 + 107·si
2,786 2,646 (RAJASTHAN) 1961 M. 10'05 11.272 5,941 5,331
1971 M. 10·08 14,242 +2,970 +26·35 7,343 6,899
396 Chitapur Gulbarga 1911 9,355 -3,976 ,-42'50
4,676 4,679 (MYSORE) 1921 5,379 2,669 2,710
1931 5,365 -14 -0·26 2,963 2,402 1941 1,217 +1,852 +34·52 3,598 3,619 1951 1l,314 +4,097 +56·77 5,511 5,803
. 1961 M. 3·37 11,374 +60 +0·53 5,802 5,572 1971 M. 2'93 14,220 +2,846 +25·02 7,190 7,030
397 Birur Chikmagalur 1901 5,701 -848
2;J67 2,734 (MYSORE) 1911 4,853 -14'87 2,477 2,376
1921 4,207 -646 -13'31 2,063 2,144 1931 5,109 +902 +21·44 2,628 2,481 1941 6,679 +1,'70 +30'73 3,368 3,311 1951 9,513 +2,834 +42'43 5,021 4,492 1961 M. 6'48 11,541 +2,028 +21'32 5,956 5,585 1971 M. 6·48 14,158 +2,617 +22'68' 1,263 6,895
398 Hodal Gurgaon 1901 8,142 -2,674 -32'84
4,172 3,970 (HARYANAI 1911 5.468 2.898 2,570
1921 5,854 +386 +7·06 3,189 2,665 1931 7,258 +1,404 +23'98 3,883 3,375 1941 8,661 +1,403 +19'33 4,643 4,018 1951 8,303 -358 -4'13 4,399 3,904 1961 M.C. 2'59 10,558 +2,255 +27'16 5,609 4,949 1971 M.e. 2'59 14,144 +3,586 +33'96 1,60~ 6.536
399 Kntiyana Junagadh 1901 10,287 +1,079 +10:49
4,665 5,622 (GUJARAT) 1911 I It,366 5,073 6,293
1921 12,332 +966 +8.50 5,499 6,833 1931 14,707 +2,375 +19.26 6,729 7,978 1941 18,949 +4,242 +28.84 8,651 10,298 1951 12,579 -6,370 -33.62 6,301 6,278 1961 M. 0.93 11,696 -883 -7.02 5,863 5,833 1971 N.P. 35.81 14.131 +2,435 +20.82 7,185 6,946,
400 Madhugiri Tumkur 1901 4,060 + 11.95
1,971 2,089 (MYSORE) 1911 4,545 +485 2,284 2,261
1921 5,143 +598 +13.16 2,600 2,543 1931 5,865 +722 +14.04 3,060 2,805 1941 1,460 -4.405 -75.11 803 657 1951 5,416 +3,956 +270.96 2,816 2,600 1961 M. 3.11 11,275 +5,859 +108.18 5,964 5,311 1971 M. 3.11 14,117 +2,842 +25.21 7,410 6,707
401 Srirangapatna Mandya 1901 8,584 -1,12i -13.ij
4,098 4,486 .(MYSORE) 1911 7,457 3,614 3,843
1921 7.217 -240 -3.22 3,614 3,603 1931 6,300 -917 -12.71 3,155 3,145 1941 1,678 +1,378 +21.87 3,883 3,795 1951 10,433 +2,755 +35.88 5,292 5.141 1961 M. 1.25 11,423 - +990 +9.49 5,830 5,593 1971 M. 7.12 14,100 +2,677 +23.44 7,188 6,912
402 Mangrulpir Akola 1901 5,793 +279
2,948 2,845 (MAHARASHTRA) 1911 6,072 +4.82 3,074 2,998
1921 5.492 -580 -9.55 2,779 2,713 1931 6,386 +894 +16.28 3,237 3,149 1941 6,865 +479 +7.50 3,507 3,358 1951 7,822 +957 +13.94 4,011 3,805 1961 M. '" 11.76 10,125 +2,303 +29.44 5,236 4,889 1971 M. 11.76 14,087 +3,962 +39.13 7,305 6,782
403 Kudachi Belgaum 1951 8,608 +3,082
4,385 4,223 (MYSORE) 1961 T.P. 58.02 11,690 +35.80 5,970 5,720
1971 T.P. 58.02 14,085 +2,395 +20.49 7,290 6,795
404 Bhadra Ganganagar 1921 3,058 1,576 1,482 (RAJASTHAN) 1931 3,783 +725 +23.7i 1,977 1,806
1941 4,750 +967 +25.56 2,552 2,198 1951
40.9i 6,708 +1,958 +41.22 3,561 3,147
1961 M. 10,000 +3,292 +49.08 5,418 4,582 1971 M. 0.72 14,080 +4,080 +40.80 7,648 6,432
,
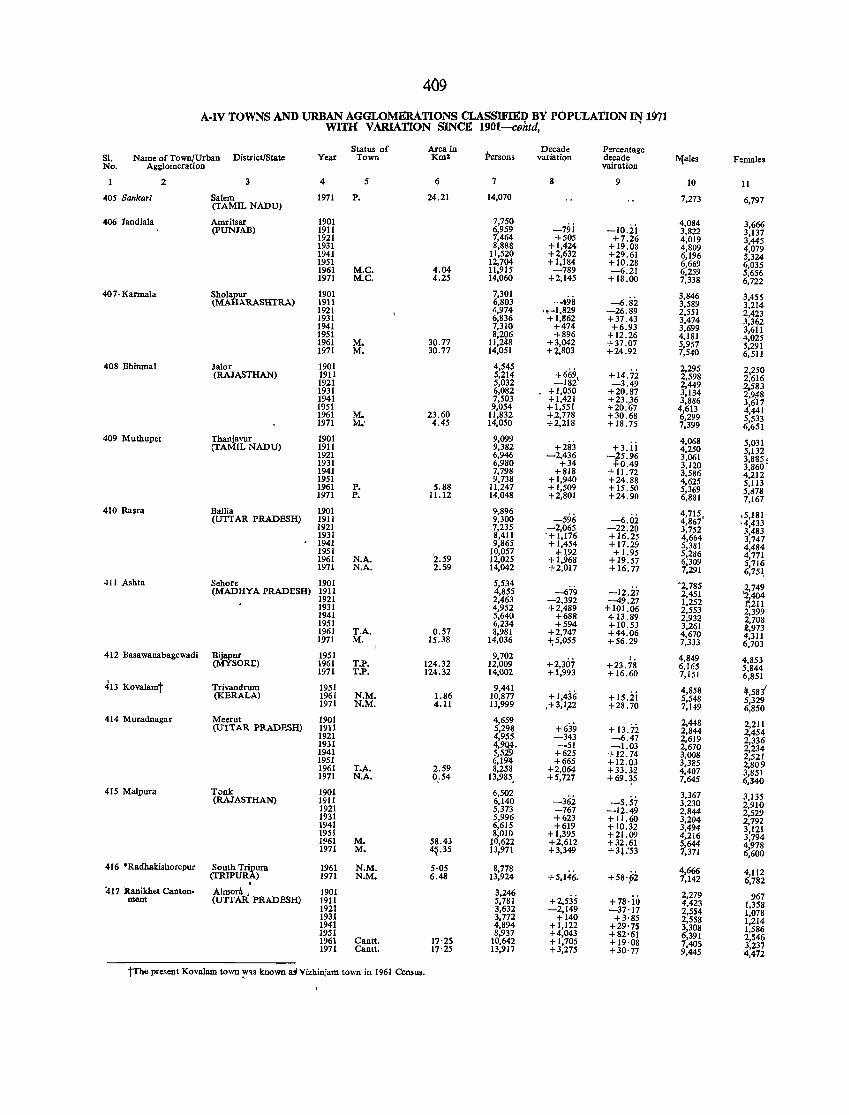
409
A-IV TOWNS AND URBAN AGGLOMERATIONS CLASSIFIED BY POPULATION ~ 1971 WITH VARIATION SINCE 1901-contd,
Status of Area in Persons
Decade Percentage SI. Name of Town/Urban District/State Year Town Km2 variation decade l\i{ales Females No. Agglomeration vairation
2 3 4 5 6 7 8 9 10 11
405 Sankari Salem 1971 P. 24.21 14,070 7,273 6,797 (TAMIL NADU)
406 randiala Amritsar 1901 7,750 -79i -10.2i
4,084 3,666 (pUNJAB) 1911 6,959 3,822 3,137 1921 7,464 +505 +7.26 4,019 3,445 1931 8,888 +1,424 +19.08 4,809 4,079 1941 11,520 +2,632 +29.61 6,196 5,324
1951 12,704 +1,184 +10.28 6,669 6,035 1961 M.C. 4.04 11,915 -789 -6.21 6,259 5,656 1971 M.C. 4.25 14,060 +2,145 +18.00 7,338 6,722
407-Karmala Sholapur 1901 7,301 -498 -6.82
3,846 3,455 lMAHARASHTRA) 1911 6,803 3,589 3,214 1921 4,974 ,.-1,829 -26.89 2,551 2,423 1931 6,836 +1,862 +37.43 3,474 3,362 1941 7,310 +474 +6.93 3,699 3,611 1951 8,296 +896 +12.26 4,181 4,025 1961 M. 30.77 11,248 +3,042 +37.07 5,957 5,291 1971 M. 30.77 14,051 ++,803 +24.92 7,540 6,511
408 Bhinmal Jalor 1901 4,545 +669, +14.7i 2,295 2,250 (RAJASTHAN) 1911 5,214 2,598 2,616 1921 5,032 -182 -3.49 2,449 2.583 1931 6,082 + 1,050 +20.87 3,134 2,948 1941 7,503 +1,421 +23.,36 3,886 3,617 1951 9,054 +1,551 +20.67 4,613 4,441 1961 M. 23.60 11,832 +2,778 +30.68 6,299 5,533 1971 M.· 4.45 14,050 +2,218 +18.75 7,399 6,651
409 Muthupet Thanjavur 1901 9,099 +283 +3.ii
4,068 5,031 (TAMIL NADU) 1911 9,382 4,250 5,132 1921 6,946 -2,436 '15.96 3,061 3,885 1 1931 6,980 +34 0.49 3,120 3,860 1941 7,798 +818 +11.12 3,586 4,212 1951 9,738 +1,940 +24.88 4,625 5,113 1961 P. 5.88 11,247 +1,509 + 15.50 5,369 5,078 1971 P. 11.12 14,048 +2,801 +24.90 6,881 7,167 410 Rasra Ballia 1901 9>,896
-596 -6.oi 4,715, .5,181 (UTTAR PRADESH) 1911 9,300 4,867 '4,433 1921 7,235 -2,065 -22.20 3,752 3,483 1931 8,411 '+1,176 +16.25 4,664 3,747 1941 9,865 +1,454 +17.29 5,381 4,484 1951 2.59
10,057 ... \92 +1.95 5,286 4,771 1961 N.A. 12,025 + 1,968 +19.57 6;309 5,716 1971 N.A. 2.59 14,042 +2.017 + 16.77 7,291 6,751, 411 Ashta Sehore 1901 5,534
-12.27 '2,785 2,749 (MADHYA PRADESH) 1911 4,855 -679 2,451 '2,404 1921 2,463 -2,392 -49.27 1,252 1:21l 1931 4,952 +2,489 + 101.06 2,553 2,399 1941 5,640 +688 + 13 .89 2,932 2,708 1951 6,234 +594 +10.53 3,261 .2,973 1961 T.A. 0.57 8,981 +2,747 +44.06 4,670 4,311 1971 M. 15.38 14,036 -1;5,055 +56.29 7,333 6,703
412 Basawanabagewadi Bijapur 1951 9,702 +2,307
1. 4,849 4,853 (MYSORE) 1961 T.P. 124.32 12,009 +23.78 6,165 5,844 1971 T.P. 124.32 14,002 +1,993 +16.60 7,151 6,851 413 Kovalamt Trivandrum 1951 9,441
+1,436 +15.ii 4,858 4,581 (KERALA) 1961 N.M. 1.86 10,877 5,548 5,329 1971 N.M. 4.11 13,999 ,+3,1,22 +28.70 7,149 6,850
414 Muradnagar Meerut 1901 4,659 +639 + 13.72
2,448 2,211 (U'ITAR PRADESH) 1911 5,298 2,844 2,454 1921 4,955 -343 -6.47 2,619 2,336 1931 4,9~, -51 -1.03 2,670 2,234 1941 5,5 +625 + 12.74 3,008 2,521 1951 6,194 +665 +12.03 3,385 2,809 1961 T.A. 2.59 8,258 +2,064 +33.32 4,407 3,851 1971 N.A. 0,54 13,985. +5,727 +69.35 7,645 6,340 415 Malpura Tonk 1901 6,502 3,367 3,135 (RAJASTHAN) 1911 6,140 -362 -5.57 3,230 2,910 1921 5,373 -767 -12.49 2,844 2,529 1931 5,996 +623 +11.60 3,204 2,792 1941 6,615 +619 + 10.32 3,494 3,121 1951 8,010 + 1,395 +21.09 4,216 3,794 1961 M. 58.43 10,622 +2,612 +32.61 5,644 4,978 1971 M. 4~.35 13,971 +3,349 + 3l :53 7,371 6,600
416 ·Radhakishorepur South Tripura 1961 N.M. 5·05 8,778 +58'~2
4,666 4,112 (TRIPURA) 1971 N.M. 6.48 13,924 +5,146, 7,142 6,782 . 417 Ranikhet Canton- Almora, 1901 3,246
+7s·io 2,279 967 ment (UTTAR PRADESH) 1911 5,781 +2,535 4,423 1,358 1921 3,632 -2,149 -37'17 2,554 1,078 1931 3,772 +140 +3'85 2,558 1,214 1941 4,894 +1,122 +29'75 3,308 1,586 1951 8,937 +4,043 +82·61 6,391 2,546 1961 Cantt. 17'25 10,642 + 1,705 + 19·08 7,405 3,237 1971 Cantt. 17·25 13,917 +3,275 +30'77 9,445 '4,472
tThe present Kovalam town ~ns known uVizhinjam town in 1961 Census.
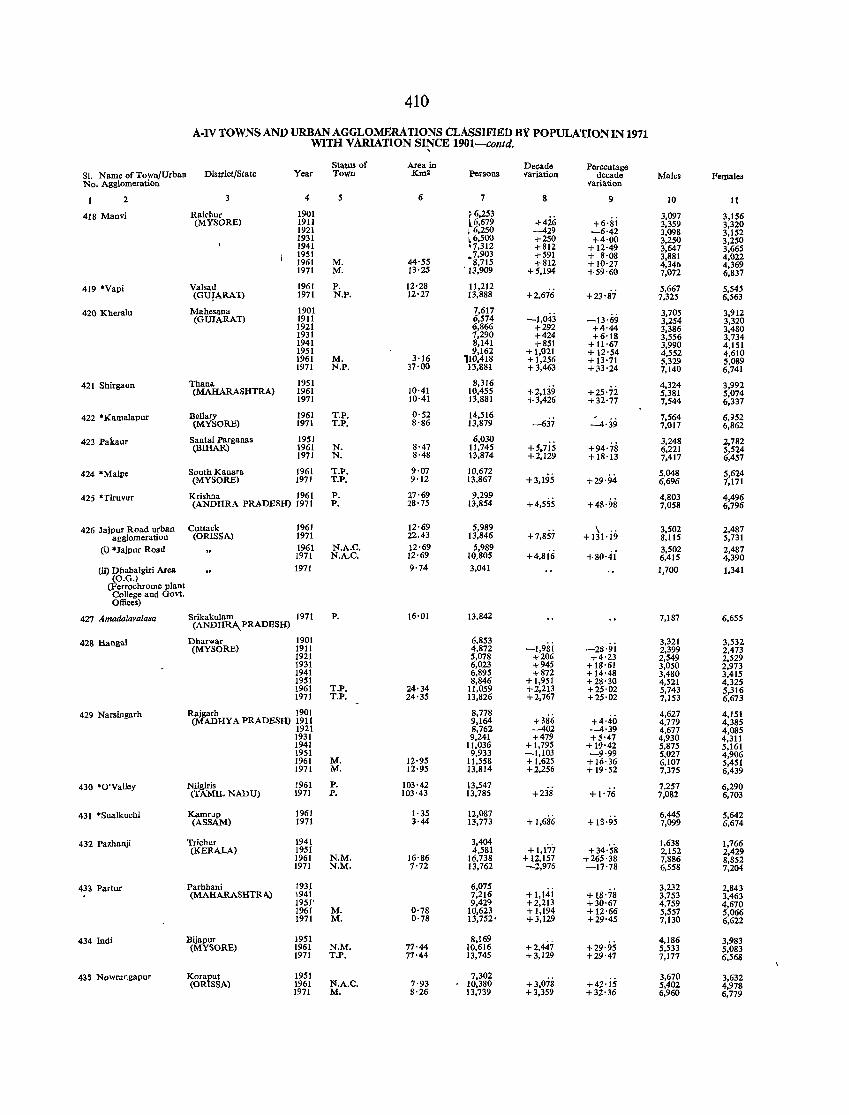
410
A-IV tOWNS AND URBAN AGGLOMERATIONS CLASSIFIED BY POPULATION IN 1971 WITH VARIATION S~CE 1901-contd.
SI. Name of Town/Urban No. Agglomeration
District/State Year Status of Town
2
418 Manvi
419 'Vapi
420 Kberalu
421 Sbirgaon
422 'Kamalapur
423 Pakaur
424 'Malpe
425 *Tiruvur
3
Raichur (MYSORE)
Valsad (GU!ARAT)
Mabesana (GUJARAT)
Thana (MAHARASHTRA)
Bellary (MYSORE)
Santal Parganas (BIHAR)
South Kanara (MYSORE)
4
1901 1911 1921 1931 1941 1951 1961 1971
1961 1971
1901 1911 1921 1931 1941 1951 1961 1971
1951 1961 1971
5
M. M.
P. N.P.
M. N.P.
1961 T.P. 1971 T.P.
1951 1961 N. 1971 N.
1961 T.P. 1971 T.P.
Krishna 1961 P. (ANDHRA PRADESH) 1971 P.
426 Jajpur Road urban Cuttack agglomeratiou (ORISSA)
1961 1971
(i) • J ajpur Road
(ti) Dhabalgiri Area (O.G.)
(Ferrochrome plant College and GoVl. Offices)
427 Amadalavalasa
428 Hangal
429 Narsingarh
430 'O'Valley
431 'Sualkucbi
432 Pamanji
433 Partur
434 Indi
435 Nowrangapur
1961 N.A.C. 1971 N.A.C.
1971
Srikakulam 1971 P. (ANDHRl\PRADBSH)
Dharwar (MYSORB)
1901 1911 1921 1931 1941 1951 1961 T.P. 1971 T.P.
Rajgarh 1901 (MADHYA PRADBSH) ml
Nilgiris (TAMIL NADU)
Kamrup (ASSAM)
Trichur (KERALA)
Parbhani (MAHARASHTRA)
Bijapur (MYSORE)
Koraput (ORISSA)
1931 1941 1951 1961 M. 1971 M.
1961 P. 1971 P.
1961 1971
1941 1951 1961 N.M. 1971 N.M.
1931 1941 1951' 1961 M. 1971 M.
1951 1961 N.M. 1971 T.P.
1951 1961 N.A.C. 1971 M.
Area in Km2
6
44'55 13·25
12'28 12'27
3'16 37·00
10·41 10·41
0'52 8'86
8·47 8·48
9·07 9'12
27·69 28'75
12·69 22.43 12·69 12·69 9·74
16'01
24·34 24'35
12'95 12·95
103'42 103'43
1'35 3·44
16·86 7'72
0'78 0'78
77·44 77·44
7'93 8'26
Persons
7
r 6,253 l6,679 i 6,250 ,6,500 '1,312 .1,903
S,715 '13,909
11,212 13,888
7,617 6,574 6,866 1,290 8,141 9,162
110,418 13,881
8,316 10,455 13,881
14,516 13,879
6,030 11,745 1~,874
10,672 13,867
9,299 13,854
5,989 13,846
5,989 10,805 3,041
13,842
6,853 4,872 5,078 6,023 6,895 8,846
11,059 13,826
8,778 9,164 8,762 9,241
11,036 9,933
11,558 13,814
13,547 13,785
12,087 13,773
3,404 4,581
16,738 13,762
6,075 7,216 9,429
10,623 13,752'
8,169 10,616 13,745
7,302 10,380 13,739
Decade variation
8
+426 ~29 +250 +812 +591 +812
+5,194
+2,676
-1,043 +292 +424 +851
+1,021 + 1,256 +3,463
+2,139 +3,426
+5.7i5 +2,129
+3,195
+4,555
+7,857
+4,8i6
-1,98i +206 +945 +872
+1,951 +2,213 +2,767
+386 -402 +479
+ 1,795 -1,103 + 1,625 +2,256
+ 1,686
+1,177 + 12,157 -2,976
+I,14i +2,213 +1,194 +3,129
+2,447 +3,129
+3,078 +3,359
Percentage decade
variation
9
+6·gi -6'42 +4'00
+12'49 + 8'08 +10'27 +59'60
+23'87
-13'69 +4·44 +6'18
+ U'67 + 12'54 + 13'71 +33'24
+25'72 +32'77
+94'78 +18'13
+29'94
+48'98
\ ., +131'19
+80·.ji
-2S'9i +4'23
+ 18'61 +14'48 +28'30 +25·02 +25·02
+4'40 -4'39 +5'47
+ 19'42 -9,99 +16'36 + 19'52
+1'76
+ 13'95
+34'58 +265'38 -17'78
+ ls·is +30'67 + 12·66 +29·45
+29·95 +29'47
+42·is +32'36
Males
10
3,097 3,359 3,098 3,250 3,647 3,881 4,346 7,072
5,667 7,325
3,705 3,254 3,386 3,556 3,990 4,552 5,329 7,140
4,324 5,381 7,544
7,564 7,017
3,248 6,221 7,417
5,048 6,696
4,803 7,058
3,502 8,115 3,502 6,415 1,700
7,187
3,321 2,399 2,549 3,050 3,480 4,521 5,743 7,153
4,627 4,779 4,677 4,930 5,875 5,027 6,107 7,375
7,257 7,082
6,445 7,099
1,638 2,152 7,886 6,558
3,232 3,753 4,759 5,557 7,130
4,186 5,533 7,177
3,670 5,402 6,960
Females
II
3,156 3,320 3,152 3,250 3,665 4,022 4,369 6,837
5,545 6,563
3,912 3,320 3,480 3,734 4,151 4,610 5,089 6,741
3,992 5,074 6,337
6,952 6,862
2,782 5,524 6,457
5,624 7,171
4,496 6,796
2,487 5,731 2,487 4,390 1.341
6,655
3,532 2,473 2,529 2,973 3,415 4,325 5,316 6.673
4,151 4,385 4,085 4,311 5,161 4,906 5,451 6,439
6,290 6,703
5,642 6,674
1,766 2,429 8,852 7,204
2,843 3,463 4,670 5,066 6,622
3,983 5,083 6,568
3,632 4,978 6,779
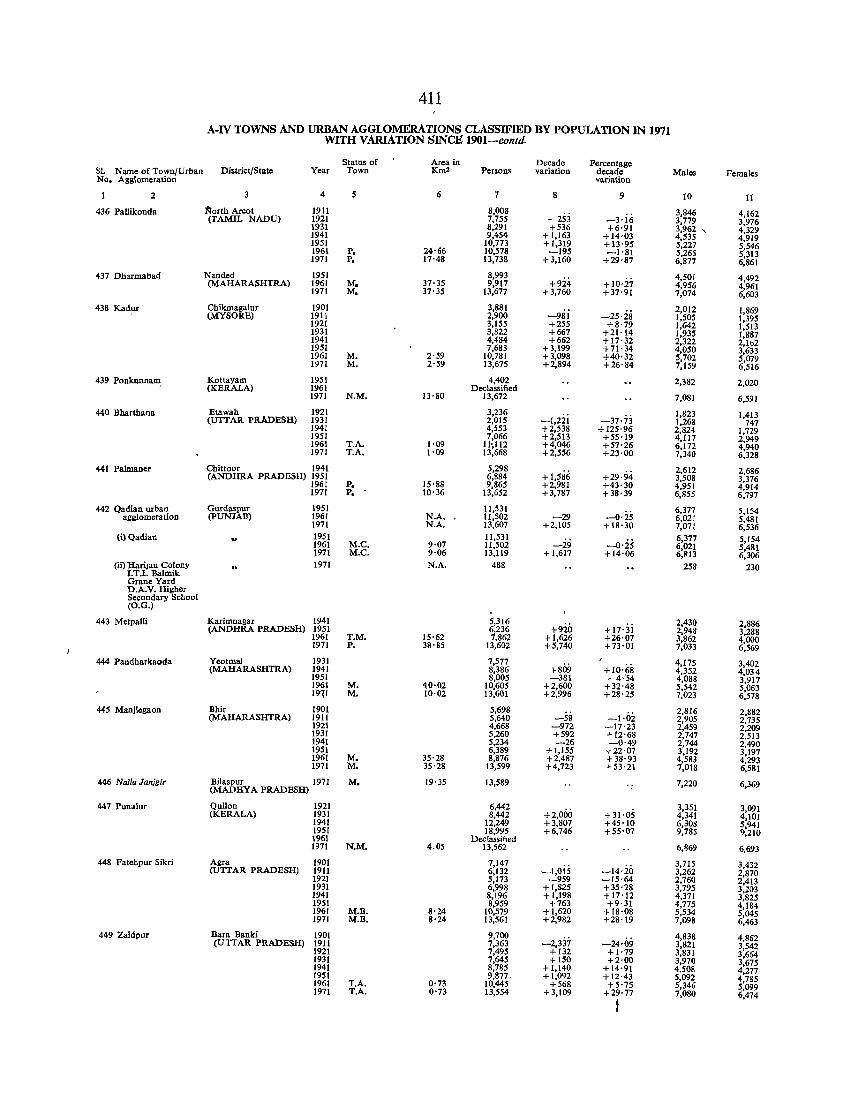
411
A·IV TOWNS AND URBAN AGGLOMERATIONS CLASSIFIED BY POPULATION IN 1971 WITH VARIATION SINCE 1901-contd. .
Status of Area in Decade Percentage SI. Name of Town/Urban District/State Year Town Km2 Persons variation decade Males Females No. Agglomeration variation
2 3 4 5 6 7 8 9 10 11
436 Pallikonda ~orth Arcot 1911 8,008 -253 -3·i6
3,846 4,162 (TAMIL NADU) 1921 7,755 3,779 3,976
1931 8,291 +536 +6·91 3,962 "- 4,329 1941 9,454 +1,163 +14'03 4,535 4,919 1951 10,773 + 1,319 + 13·95 5,227 5,546 1961 P. 24·66 10,578 -195 -1'81 5,265 5,313 1971 p. 17'48 13,738 +3,160 +29'87 6,877 6,861
437 Dharmabad Nanded 1951 8,993 +9i4 +lo·i7
4,501 4,492 (MAHARASHTRA) 1961 M. 37'35 9,917 4,956 4,961
1971 M. 37'35 13,u77 +3,760 +37·91 7,074 6,603
438 Kadur Chikmagalur 1901 3,881 -9si -25·is 2,012 1,869 (MYSORB) 1911 2,900 1,505 1,395
1921 3,155 +255 +8'79 1,642 1,513 1931 3,822 +667 +21'14 1,935 1,887 1941 4,484 +662 +17'32 2,322 2,1b2 1951 7,683 +3,199 +71·34 4,050 3,633 1961 M. 2'59 10,781 +3,098 +40'32 5,702 5,079 1971 M. 2'59 13,675 +2,894 +26'84 7,159 6,516
439 Ponkunna~ Kottayam 1951 4,402 2,382 2,020 (KERALA) 1961 Declassified 1971 N.M. 13'80 13,672 7,081 6,591
440 Bharthana Etawah 1921 3,236 -I,2ii -37'73
1,823 1,413 (UTTAR PRADESH) 1931 2,015 1,268 747
1941 4,553 +2,538 +125·96 2,824 1,729 1951 7,066 +2,513 +55'19 4,117 2,949 1961 T.A. 1·09 1l~112 +4,046 +57'26 6,172 4,940 1971 T.A. 1'09 13,668 +2,556 +23·00 7,340 6,328
441 PaJmaner Chiltoor 1941 5,298 +1,586 +29·94
2,612 2,686 (ANDHRA PRADESH) 1951 6,884 3,508 3,376
1961 p. 15'88 9,865 +2,981 +43·30 4,951 4,914 1971 P. 10'36 13,652 +3,787 +38·39 6,855 6,797
442 Qadian urban Gurdaspur 1951 11,531 6,377 5,154 agglomera tion (pUNJAB) 1961 N.A. 11,502 -29 -0'25 6,021 5,481
1971 N.A. 13,607 +2,105 +18'30 7,071 6,536 (i) Qadian 1951 11,531
-a·is 6,377 5,154 1961 M.e. 9·07 11,502 -29 6,021 5,481 1971 M.C. 9'06 13,119 +1,617 +14'06 6,813 6,306
(ii) Hanlan Colony 1971 N.A. LT.I. Balmik
488 258 230
Grane Yard D.A.V. Higher Secondary School (O.G.)
443 Metpalli Karimnagar 1941 5,316 +9ii> + 17'3i
2,430 2,886 (ANDHRA PRADESH) 1951 6,236 2,948 3,288
1961 T.M. 15'62 7,862 +1,626 +26'07 3,862 4,000 1971 P. 38'85 13,602 +5,740 +73'01 7,033 6,569
444 Pandharkaoda Yeotmal 1931 7,577 +809 +10'68
4,175 3,402 (MAHARASHTRA) 1941 8,386 4,352 4,034
1951 8,005 -381 -4"54 4,088 3,917 1961 M. 10'02 10,605 +2,600 +32'48 5,542 5,063 197.1 M. 10·02 13,601 +2,996 +28'25 7,023 6,578
445 Manjlegaon Bhir 1901 5,698 -I·oi
2,816 2,882 (MAHARASHTRA) 1911 5,640 -58 2,905 2,735
1921 4,668 -972 -17'23 2,459 2,209 1931 5,260 +592 +12'68 2,747 2,513 1941 5,234 -26 -0·49 2,744 2,490 1951 6,389 +1,155 +22·07 3,192 3,197 1961 M. 35'28 8,876 +2,487 +38'93 4,583 4,293 1971 M. 35'28 13,599 +4,723 ,,53'21 7,018 6,581
446 Naila lanJgir Bitaspur 1971 M. 19'35 13,589 7,220 6,369 (MADHYA PRADESH)
447 Punalnr Quilon 1921 6,442 +2,000 +31'05
3,351 3,091 (KERALA) 1931 8,442 4,341 4,101
1941 12,249 +3,807 +45'10 6,308 5,941 1951 18,995 +6,746 +55'07 9,785 9,210 1961 Dec lassi ~ed 1971 N.M. 4,05 13,562 6,869 6,693
448 Fatehpur Sikri Alll"a 1901 7,147 -I,ois
3,715 3,432 (UTTAR PRADESH) 1911 6,132 -14·20 3,262 2,870
1921 5,173 -959 -15·64 2,760 2,413 1931 6,998 +1,825 +35'28 3,795 3,203 1941 8,196 +1,198 +17'12 4,371 3,825 1951 8,959 +763 +9·31 4,775 4,184 1961 M.B. 8'24 10,579 +1,620 +18'08 5,534 5,045 1971 M.B. 8'24 13,561 +2,982 +28'19 7,098 6,463
449 Zaidpur Bara Banki 1901 9,700 -2,337 -24·09
4,838 4,862 (UTTAR PRADESH) 1911 7,363 3,821 3,542 1921 7,495 +132 +1'79 3,831 3,664 1931 7,645 +150 +2·00 3,970 3,675 1941 8,785 +1,140 +14'91 4.508 4,277 1951 9,877. +1,092 +12·43 5,092 4,785 1961 T.A. 0'73 10,445 +568 +5'75 5,346 5,099 1971 T.A. 0'73 13,554 +3,109 +29'77 7,080 6,474
f
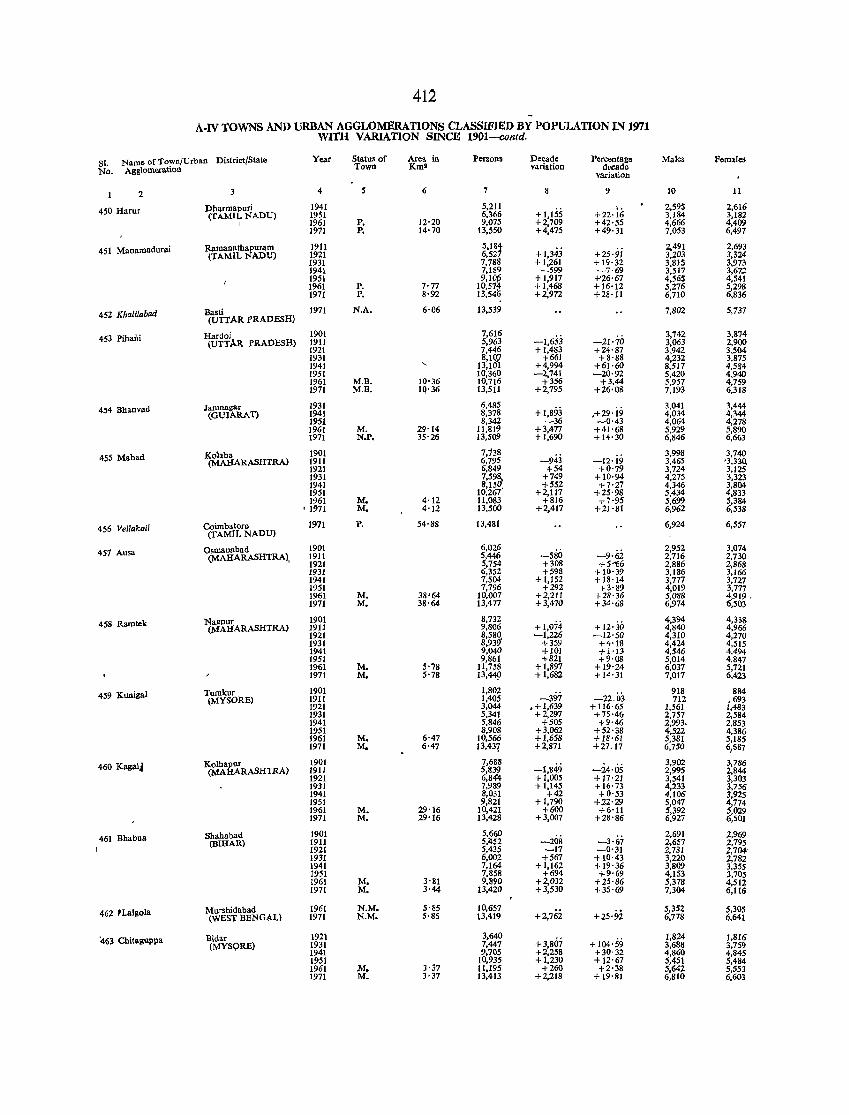
412
A-IV toWNS AND URBAN AGGLOMERATIONS CLASSIFIED BY POPULATION IN 1971 WITH VARIATION SINCE 1901--COlltd.
st. Namo of Town/Urban District/State Year Status of Area in Persons Decade Percentage Males Females No. Agglomeration Town KmS variation decade
variation
2 3 4 5 6 9 10 11
450 Harur Dbarmapuri 1941 5,211 L 2,595 2,616 (TAMIL NADU) 1951 6,366 + 1,155 +22·16 3,184 3,182
I 1961 P. 12·20 9,075 +2,709 +42'55 4,666 4,409 1971 P. 14·70 13,550 +4,475 +49·31 7,053 6,497
451 Manamadurai Ramanatbapuram 1911 5,181 +1,343 +25'9i 2,491 2,693
(TAMIL NADU) 1921 6,52 3,203 3,324 1931 7,78S +1,261 + 19·32 3,815 3,973 1941 7,189 -599 ~7·69 3,517 3,67.2 1951 9,10~ + 1,917 +'26·67 4,565 4,541 1961 P. 7·77 10,51~ + 1,468 +16·12 5,276 5,298 1971 P. 8'92 13,546 +2,972 +28·11 6,710 6,836
452 Khalilabad Basti 1971 N.A, 6'06 13,539 7,802 5,737 (UTTAR PRADESH)
453 PibaDi Hardoi 1901 7,616 -1,653 -21'70
3,742 3,874 (UTTAR PRADESH) 1911 5,963 3,063 2,9Q0
1921 7,446 +1,483 +24'87 3,942 3,504 1931 8,lgj +661 +8'88 4,232 3,875 1941 " 13,1 I +4,994 +61·60 8,517 4,584 1951 10,360 -2,741 -20'92 5,420 4,940 1961 M.B. 10'36 10,716 +356 +3.44 5,957 4,759 1971 M.B. 1Q'36 13,511 +2,795 +26'08 7,193 6,318
454 Bhanvad Jamnagar 1931 6,485 + 1,893 ,+29, i9
3,041 3,444 (GUJARAT) 1941 8,378 4,034 4,344
1951 8,342 -36 -0'43 4,064 4,278 1961 M. 29'14 11,819 +3,477 +41'68 5,929 5,890 1971 N.P. 35'26 13,509 +1,690 +14'30 6,846 6,663
455 Mahad Ko1aba 1901 7,138 -943 -12·i9
3,998 3,740 (MAIlARASHTRA) 1911 6,795 3,465 '3,330.
1921 6,849 +54 +0'79 3,724 3,125 1931 7,59~ +749 +10'94 4,275 3,323 1941 8,15 +552 +7'27 4,346 3,804 1951 10,261 +2,117 +25'98 5,434 4,833 1961 M. 4'12 11,083 +816 +7'95 5,699 5,384
, 1971 M. 4'12 13,500 +2,417 +21'81 6,962 6,538
456 Vellakoil Coimbatore 1971 P. 54'88 13,481 6,924 6,551 (TAMIL NADlJ)
457 Ausa Osman"bad 1901 6,026 -580 -9·i;i
2,952 3,074 (MAHARASHTRA), 1911 5,446 2,716 2,730
1921 5,754 +308 +5'156 2,886 2,868 1931 6,352 +598 +10'39 3,186 3,166 1941 7,504 +1,152 +18'14 3,777 3,721 1951 7,796 +292 +3'89 4,019 3,777 1961 M. 38'64 10,007 +2,211 +28·36 5,088 4,919. 1971 M. 38'64 13,471 +3,470 +34'68 6,974 6,503
458 Ramtek Nagpur 1901 8,732 +1,074 +12'30
4,394 4,338 (MAHARASHTRA) 1911 9,806 4,840 4,966
1921 8,580. -1,226 -12'50 4,310 4,270 1931 8,939 +359 +4'18 4,424 4,515 1941 9,040 +101 +1·13 4,546 4,494 1951 9,861 +821 +9·08 5,014 4,847 1961 M. 5'78 11,758 +1,897 +19'24 6,037 5,721 1971 M. 5'78 13,449 + 1,682 +14'31 7,017 6.423
459 Kunigal Tumkur 1901 1,802 -397 -22.03
918 884 (MYSORE) 1911 1,405 712 ,693
1921 3,044 • + 1,639 + 116·65 1,561 1,483 1931 5,341 +2,297 +75'46 2,757 2,584 1941 5,846 +505 +9'46 2,993. 2,853 1951 8,908 +3,062 +52'38 4,522 4,386 1961 M. 6'47 10,566 +1,658 +18·61 5,381 5,185 1971 M. 6·47 13,437 +2,871 +27.17 6,750 6/,87
460 Kagal~ Kolh~ 1901 7,688 -1,849 -24·05
3,902 3,786 (MA RASHTRA) 1911 5,839 2,995 2,844
1921 6,84'4 +1,005 + 17'21 3,541 3,303 1931 7,989 + 1,145 + 16·73 4,233 3,756 1941 8,031 +42 +0'53 4,106 3,925 1951 9,821 +1,790 +22'29 5,047 4,774 1961 M. 29'16 10,421 +600 +6'11 5,392 5,029 1971 M. 29'16 13,428 +3,007 +28'86 6,927 6,501
461 Bbabua Shahabad 1901 5,660 -208 -3·67
2,691 2,969 (BIHAR) 1911 5,1I52 2,657 2,795
1921 5,435 ~17 -0'31 2,731 2,704' 1931 6,002 +567 + 10·43 3,220 2,782 1941 7,164 +1,162 + 19· 36 3,809 3,355 1951 7,858 +694 +9'69 4,153 3,705 1961 M. 3'81 9,890 +2,032 +25·86 5,378 4,512 1971 M. 3'44 13,420 +3,530 +35'69 7,304 6,116
462 , Lalgola Mursbidabad 1961 N.M. 5'85 10,657 +2,76i +25'92
5,352 5,305 (WEST BENGAL) 1971 N.M. 5'85 13,419 6,778 6,641
463 Cbitaguppa Bidar 1921 3,640 + 3,807 + 104'59
1,824 1,816 (MYSQRE) 1931 7,447 3,688 3,759
1941 9,705 +2,258 +30'32 4,860 4,845 19'1 10,935 + 1,230 + 12'67 5,451 5,484 1961 M. 3·37 11,195 +260 +2'38 5,642 5,553 1971 M. 3'37 13,413 +2,218 +19'81 6,810 6,603
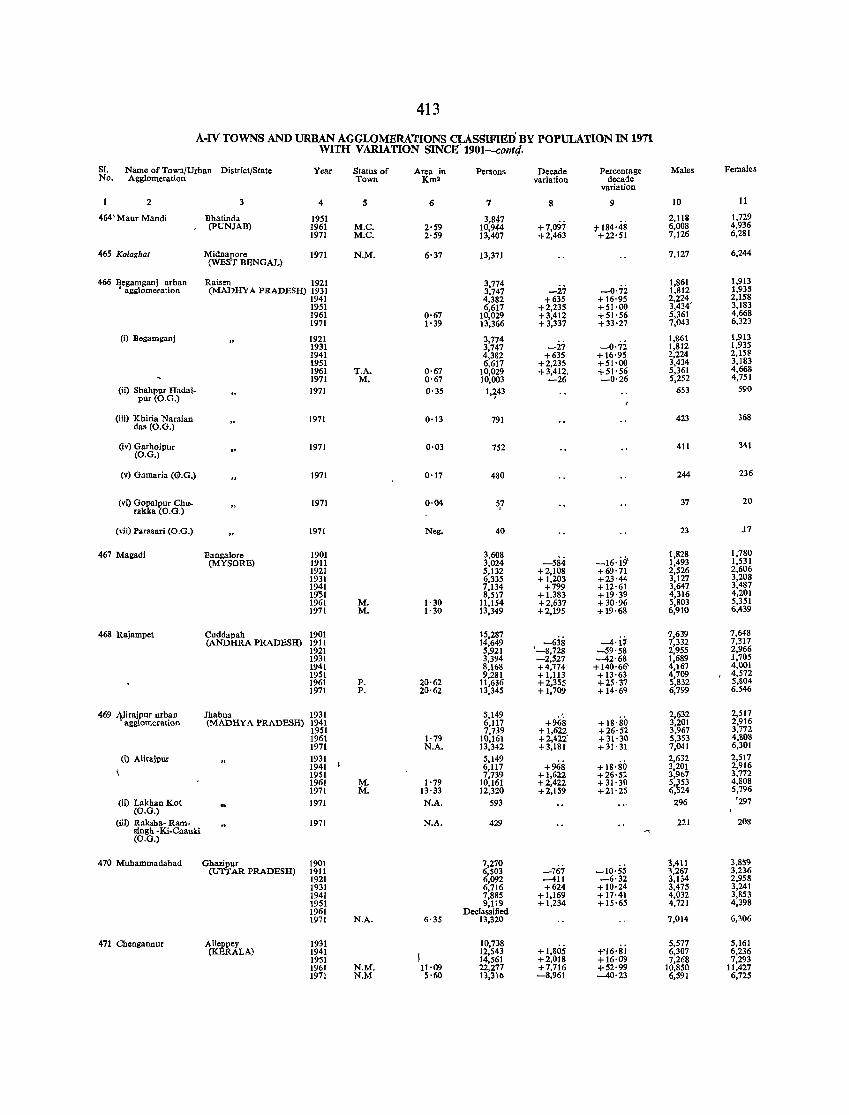
413
A-IV TOWNS AND URBAN AGGLOMERA'TIONS CLASSIFIED BY POPULATION IN 1971 WITH V ARlATION SlNCE'1901-col1tq.
SI. Name of Town/Urban District/State Year Status of Area in Persons Decade Percentage Males Females No. Agglomeration Town Km' variation decade
variation
2 3 4 S 6 7 8 9 10 11
464'Manr Mandi Bhatinda 1951 3,847 +7,097 :1-184·48
2,118 1,729 (PUNJAB) 1961 M.C. 2,59 10,944 6,008 4,936
1971 M.C. 2,59 13,407 +2,463 +22,51 7,126 6,281
465 Kolaghat Midnapore (WEST BENGAL)
1971 N.M. 6,37 13,371 7,127 6,244
466 Begamganj urban Raisen 1921 3,774 -27 -0'72
1,861 1,913 , agglomeration (MADHYA PRADESH) 1931 3.747 1,812 1.935
1941 4.382 +635 + 16·95 2,224 2,158 1951 6.617 +2,235 +51·00 3,434' 3,183 1961 0·67 10.029 +3.412 +51'56 5,361 4,668 1971 1,39 13.366 +3,337 + 33'27 7,043 6,323
(i) Begamganj 1921 3.714 1.861 1,913 1931 3,747 -27 -0·72 1,812 1,935 1941 4,382 +635 +1()'95 2,224 2,15S 1951 6,617 +2,235 +51·00 3,434 3,183 1961 T.A, 0,67 10,029 +3,412, +51,56 5,361 4,668 1971 M, 0,67 10,003 -26 -0,26 5,252 4,751
(ii) Shahpur Hadai· pur (O.G.)
1971 0,35 1,,43 653 590
(iii) Khiria Naraian das (O.G.)
1971 0·13 791 423 368
(iv) Garhoipur (O.G.) .' 1971 0'03 752 411 341
(v) Gamaria (@.G.) 1971 0,17 480 244 236
(vi) Gopa1pur Chu- 1971 0·04 5,1 37 20 rakka (0.0,)
(vii) Parasari (O,G.) 1971 Neg. 40 23 J7
467 Magadi Bangalore 1901 3,608 -584 -16·i9'
1,828 1,780 (MYSORE) 1911 3,024 1,493 1,531
1921 5,132 +2,108 +69,71 2,526 2,606 1931 6,335 + 1,203 +23·44 3,127 3,208 1941 7,134 +799 +12·61 3,647 3,487 19'51 8,517 +1.383 + 19,39 4,316 4,201 1961 M. 1·30 11,154 +2,637 +30·96 5,803 5,351 1971 M. 1,30 13,349 +2,195 + 19·68 6,910 6,439
468 Rajampet Cuddapah 1901 15,287 -638 -4·i:7
7,639 7,648 (ANDHRA PRADESH) 1911 14,649 7,332 7,317
1921 5,921 '-8,728 -59'58 2,955 2,966 1931 3,394 -2,527 -42·68 1,689 ,1,705 1941 8,168 +4,774 + 140·66' 4,167 4,001 1951 9,281 + 1,113 +13,63 4,709 4,572 1961 P. 20·62 11,636 +2,355 +25·37 5,832 5,~04
1971 P. 20,62 13,345 +1,709 +14'69 6,799 6.546
469 Alirajpur urban Jhabua 1931 5,149 +968 +18·80
2,632 2,517 , allglomeration (MADHYA PRADESH) 1941 6,117 3,201 2,916
1951 7,739 +1,622 +26·52 3,967 3,772 1961 1'79 10,161 +2,422' +31,30 5,353 4,808 1971 N.A. 13,342 +3,181 +31·31 7,041 6,301
(i) Alirajpur 1931 5,149 +968 +18,80
2,632 2,517 1941 6,117 3,201 2,916 1951 7,739 +1,622 +26·52 3,967 3,172 1961 M. 1,79 10,161 +2,422 +31,30 5,~53 4,808 1971 M. 13·33 12,320 +2,159 +21'25 6,24 5,796
(ii) Lakhan Kot (O.G.)
1971 N.A. 593 296 '297
(iii) Raksha- Ram- 1971 N.A. 429 221 2Q8 singh -Ki·Chauki (O.G.)
470 Muhammadabad Ghazipur 1901 7,270 -10·55
3,411 3,859 (UTTAR PRADESH) 1911 6,503 -767 3,267 3,236
1921 6,092 -411 -6·32 3,134 2,958 1931 6,716 +624 +10·24 3,475 3,241 1941 7,885 +1,169 +17·41 4,032 3,853 1951 9,119 +1,234 +15·65 4,721 4,398 1961 Declassified 1971 N,A. 6·35 13,320 7,014 6,306
471 Chensannur Alleppey 1931 10,738 + 1,805 +'16·si
5,577 5,161 (KERALA) 1941
~ 12,543 6,307 6,236
1951 14,561 +2,018 + 16·09 7,268 7,293 1961 N.M. 11·09 22,277 +7,716 +52·99 10,850 11,427 1971 N.M 5'60 13,316 -8,961 -40·23 6,591 6,725
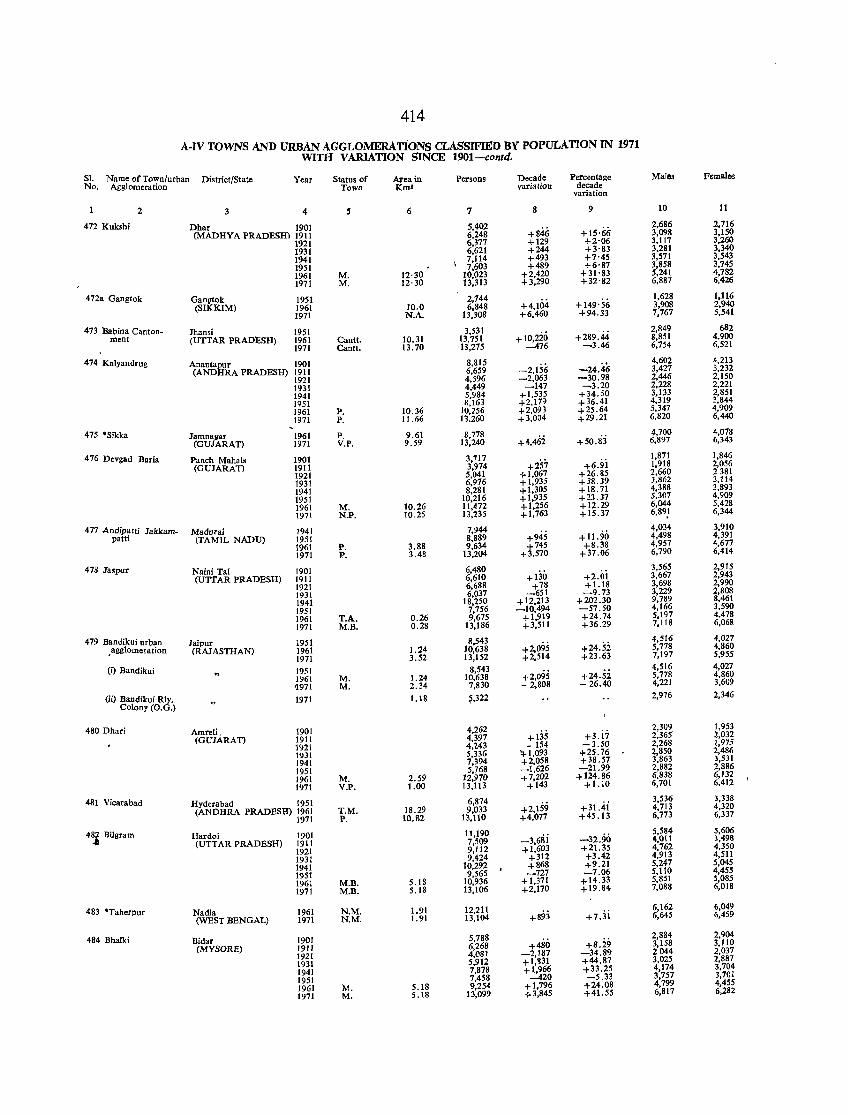
414
A-IV TOWNS AND URBAN AGGLOMERAtiONS CLASSIFIED BY POPULATION IN 1971 WITH VARIATION SINCE 1901-contd.
S1. Name of Town/urban District/State Year Status of Area in Persons Decade Percentage Males Females No. Agglomeration Town Km' variation decade
variation
2 3 4 5 6 7 8 9 10 11
472 Kuksbi Dbar 1901 5,402 2,686 2,716 (MADHYA PRADESm 1911 6,248 +846 +ls·i;6 3,098 3,150
1921 6,377 +129 +2'06 3,117 3,260 1931 6,621 +244 +3'83 3,281 3,340 1941 \
7,114 +493 +7·45 3,571 3,543 1951 7,603 +489 +6'87 3,858 3,745 1961 M. 12·30 10,023 +2,420 +31'83 5,241 4,782 1971 M. 12·30 13,313 +3,290 +32'82 6,887 6,426
472a Gangtok Gangtok 1951 2,744 +4,104
1,628 1,116 (SIKKIM) 1961 10.0 6,848 +149'56 3,908 2,940
1971 N.A. 13,308 +6,460 +94.33 7,767 5,541
473 Babina Canton- Jhansi 1951 3,531 2,849 682 ment (UTTAR PRADl::SH) 1961 Cantt. 10.31 13,751 +10,220 +289.44 8,851 4,900
1971 Cantt. 13.70 13,275 ----476 -3.46 6,754 6,521
474 Kalyandrng Anantapnr 1901 8,815 -2,156 -24.46
4,602 4,213 (ANDHRA PRADESH) 1911 6,659 3,427 3,232
1921 4,596 -2,063 -30.98 2,446 2,150 1931 4,449 -147 _3.20 2,228 2,221 1941 5,984 +1.535 +34.50 3,133 2,851 1951 8,163 +2,179 +36.41 4.319 3,844 1961 P. 10.36 10.256 +2,093 +25.64 5.347 4,909 1971 P. 11.66 13.260 +3,004 +29.21 6,820 6,440
475 ·Sikka lamnagar 1961 P. 9.61 8.778 4,700 4,078 (GUIARAn 1971 V.P. 9.59 13,240 +4.46i +50.83 6,897 6,343
476 Devgad Baria Panch Mahals 1901 3,717 1,871 1,846
(GUJARAn 1911 3,974 +257 +6.9i 1,918 2,056 1921 5,041 +1.067 +26.85 2,660 2381 1931 6,976 +1,935 +38.39 3,862 3,114
1941 8,281 +1,305 +18.71 4,388 3,893
1951 10,216 +1,935 +23.37 5,307 4,909
1961 M. 10.26 11,472 + 1,256 +12.29 6,044 5,428 1971 N.P. 10.25 13,235 +1,763 +15.37 6,89,1 6,344
477 Andipatti Jakkam- Madurai 1941 7,944 +945
4,034 3,910 patti (TAMIL NADU) 1951 8,889 +11.90 4,498 4,391
1961 P. 3.88 9,634 +745 +8.38 4,957 4,677 1971 P. 3.48 13,204 +3,570 +37.06 6,790 6,414
478 laspur Naini Tal 1901 6,480 +130
3,565 2,915
(UTTAR PRADESH) 1911 6,610 +2.ili 3,667 2,943
1921 6,688 + 78 +1.18 3,698 2,990 1931 6,037 -651 -9.73 3,229 2,808 1941 18,250 +12,213 +202.30 9,789 8,461
1951 7,756 -10,494 -57.50 4,166 3,590
1961 T.A. 0.26 9,675 +1,919 +24.74 5,197 4,478
1971 M.B. 0.28 13,186 +3,511 +36.29 7,118 6,068
479 Bandikui urban Jaipur 1951 8,543 +2,095
4,516 4,027 • agglometation (RAJASTHAN) 1961 1.24 10,638 + 24,Si 5,778 4,860
1971 3.52 13,152 +2,514 +23.63 7,197 5,955
(i) Bandikui 1951 8,543 +2,095 +24.52
4,516 4,027
1961 M. 1.24 10,638 5,778 4,860
1971 M. 2.34 7,830 - 2,808 - 26.40 4,221 3,609
(ii) Bandikui Rly. 1971 1.18 Colony (0. G.)
~,322 2,976 2,346
480 Dhari Amreli. 1901 4,262 2,309 1,953
(GUJARAn 1911 4,397 +135 +3.i7 2,365 2,032
1921 4,243 - 154 -3.50 2,268 1,975
1931 5,336 !!-I,093 +25.76 2,850 2,486
1941 7,394 +2,058 +38.57 3,863 3,531
1951 5,768 -1,626 -21.99 2,882 2,886
1961 M. 2.59 12,970 +7,202 +124.86 6,838 6,132
1971 V.P. 1.00 13,113 +143 +1.10 6,701 6,412
481 Vicarabad Hyderabad 1951 6,874 +2,159 +31.4i
3,536 3,338
(ANDHRA PRADESH) 1961 T.M. 18.29 9,033 4,713 4,320
1971 P. 10.82 13,110 +4,077 +45.13 6,773 6,337
4~ Bilgram Hardoi 1901 11,190 -3,6Si -32.90
5,584 5,606
(UTTAR pRADESH) 1911 7,509 4,Oll 3,498
1921 9,112 +1,603 +21.35 4,762 4,350
1931 9,424 +312 +3.42 4,913 4,511
1941 10,292 +868 +9.21 5,247 5,045
1951 9,565 -727 _7.06 5,110 4,455
1961 M.B. 5.IS 10,936 +1,371 +14.33 5,851 5,085
1971 M.B. 5.18 13,106 +2,170 +19.84 7,088 6,018
483 ·Taherpnr Nadia 1961 N.M. 1.91 12,211 +893 +7ji
6,162 6,049
(WEST BENGAL) 1971 N.M. 1.91 13,104 6,645 6,459
484 Bhalki Bidar 1901 5,788 +480 +8.29
2,884 2,904
(MYSORE) 1911 6,268 3,158 3,110
1921 4,081 -2,187 -34.89 2044 2,037
1931 5.912 +1,~31 +44.87 3,025 2,887
1941 7,878 + 1,966 +33.25 4,174 3,704
1951 7,458 -420 -5.33 3,757 3,701
1961 M. 5.18 9,254 +1,796 +24.08 4,799 4,455
1971 M. 5.18 13,099 +3,845 +41.55 6,817 6,282
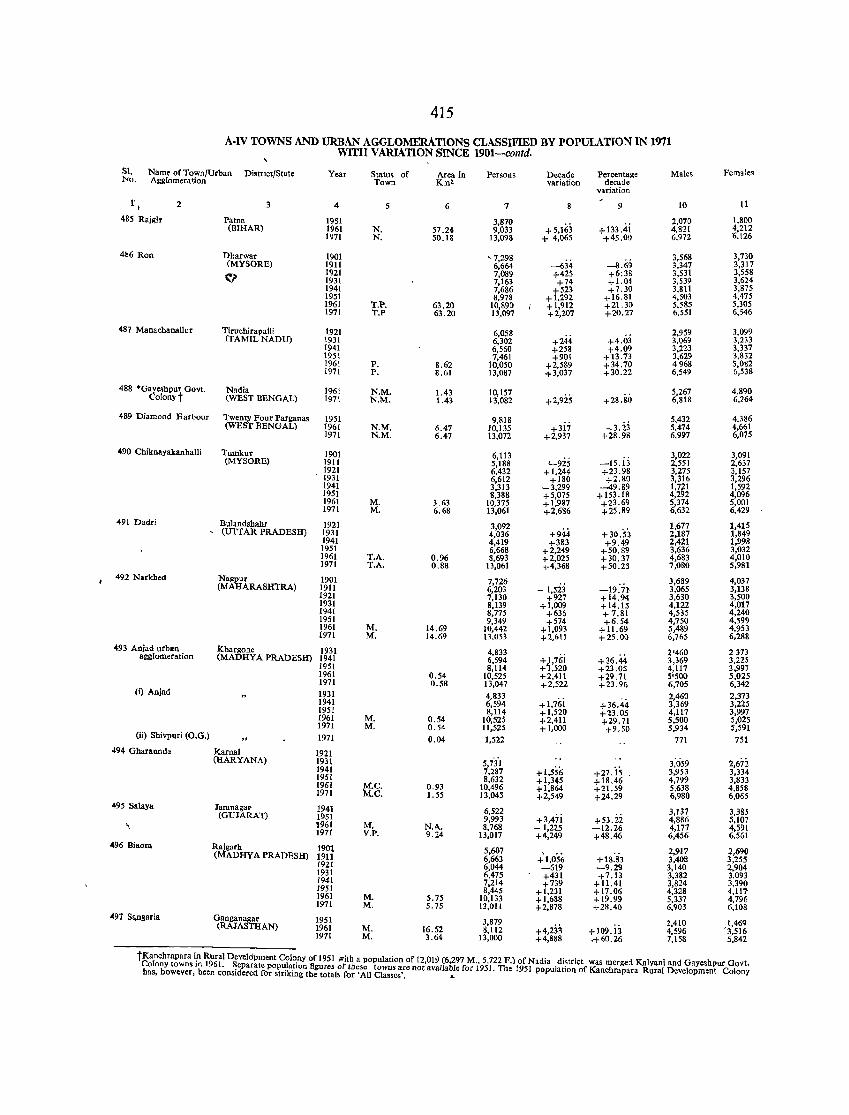
415
A·IV TOWNS AND URBAN AGGLOMERATIONS CLASSIFIED BY POPULATION IN 1971 WITH VARIATION SINCE 1901-contd.
SI. Name of Town/Urban Distnct/State Year Statu. of Area in Persons Decade Percentage Males Pemales NO. Agg1omera(ion Town Km' variation decade
variation
l' I 2 3 4 5 6 7 9 10 11
485 Rajgir Patna 1951 3,B70 +133.4i
2,070 1,800 (BIHAR) 1961 N. 57.24 9,033 +5,163 4,821 4,212
1971 N. 50.18 13,098 + 4,065 +45.00 6,972 6.126
4~6 Ron Dbarwar 1901 , 7,298 3,568 3,730 (MYSORE) 1911 6,664 -634 -8.69 3,347 3,317
~ 1921 7,089 +425 +6:38 3,531 3,558 1931 7,163 +74 +1.04 3,539 3,624 1941 7,686 +523 +7.30 3,811 3,875 1951 8,978 +1,292 +16.81 4,503 4,475 1961 T.P. 63.20 10,890 +1,912 +21.30 5,585 5,305 1971 T.P 63.20 13,097 +2,207 +20.27 6,551 6,546
487 ManachanaUur Tiruchirapalli 1921 6,058 +244 +4.03
2,959 3,099 (fAMIL NADUj 1931 6,302 3,069 3,233
1941 6,560 +258 +4.09 3,223 3,337 1951 7,461 +901 + 13.73 3,629 3.832 1961 P. 8.62 10,050 +2,589 +34.70 4968 5,082 1971 P. 8.61 13,087 +3,037 +30.22 6,549 6,538
488 ·Gaveshpur Govt. Nadia 1961 N.M. 1.43 10,157 +2,925 +28.80
5,267 4,890 Colonyt (WEST BENGAL) 1971 N.M. 1.43 13,082 6,818 6,264
489 Diamond Harbour Twenty Four Parganas 1951 9,818 +3i'i +3.23
5,432 4,386 (WEST BENGAL) 1961 N.M. 6.47 10,135 5,474 4,661
1971 N.M. 6.47 13,072 +2,937 +28.98 6,997 6,075
490 Chiknay.k.nh.1li Tumkur 1901 6,113 L-9iS
3,022 3,091 (MYSORE) 1911 5,188 -15.13 2,551 2,637
1921 6,432 +1,244 +23.98 3,275 3,157 1931 6,612 +180 +2.80 3,316 3,296 1941 3,313 -3,299 --49.89 1,7~1 1,592 1951 8,388 +5,075 +153.18 4,22 4,096 1961 M. 3.63 10,375 + 1,987 +23.69 ~374 5,001 1971 M. 6.68 13,061 +2,686 +25.89 ,632 6,429
491 Dadri Bnlandshahr 1921 3,092 1,677 1,415 , (UTIAR PRADESH) 1931 4,036 +944 +30.5'3 2,187 1,849 1941 4,419 +383 +9.49 2,421 1,998 1951 6,668 +2,249 +50.89 3,636 3,032 1961 T.A. 0.96 8,693 +2,025 +30.37 4,683 4,010 1971 T.A. 0.88 13,061 +4,368 +50.25 7,080 5,981
492 Narkhod Na~pur 1901 7,726 3,689 4,037 (MAHARASHTRA) 1911 6,203 -I,5i:i -19:it- 3,065 3,138
1921 7,130 +927 +14.94 3,630 3,500 1931 8,139 +1,009 +14.15 4,122 4,017 1941 8,775 +635 +7.81 4,535 4,240 1951 9,349 +574 +6.54 4,750 4,599 1961 M. 14.69 10,442 +1,093 +11.69 5,489 4,953 1971 M. 14.69 13.053 +2,611 +25.00 6,765 6,288
493 Aniad urblln Khargone 1931 4,833 +p6i +36.44
2'460 2373 agglomeration (MADHYA PRADESH) 1941 6,594 3,369 3,225 1951 8,114 + ,520 +23.05 4,117 3,997 1961 0.54 10,525 +2,411 +29.71 5'500 5,025 1971 0.58 13,047 +2,522 +23.96 6,705 6,342
(i) Anjad 1931 4,833 +36.44
2,460 2,373 1941 6,594 +1,761 3,369 3,225 1951 8,114 +1,520 +23.05 4,117 3,997 1961 M. 0.54 10,525 +2,411 +29.71 5,500 5,025 1971 M. 0.54 11,525 + 1,000 +9.50 5,934 5,591
(ii) Shivpnri (O.G.) 1971 0.04 1,522 771 751 494 Gharaunda Karna1 1921
(HARYANA) 1931 5,731 3;059 2,672 1941 7,287 +1,556 +27. is 3,953 3,334 1951 8,632 +1,345 +18.46 4,799 3,833 1961 M.e. 0.93 10,496 +1,864 +21.59 5,638 4,858 1971 'M.C. 1.55 13,045 +2,549 +24.29 6,980 6,065
495 Salaya Jamnaga'l' 1941 6,522 3,137 3,385 (GUJARAT) 1951 9,993 +3,4ii +53.ii 4,886 5,107 \ 1961 M. N.A. 8,768 -1,225 -12.26 4,177 4,591 1971 V.P. 9.24 13,017 +4,249 +48.46 6,456 6.561
496 Biaora Rajgarh 1901 5,607 2,917 2,690 (MADHYA PRADESH) 1911 6,663 +1,056 + 18.83 3,408 3,255 1921 6,044 -619 -9.29 3,140 2,904 1931 6,475 +431 +7.13 3,382 3,093 1941 7,214 +739 +11.41 3,824 3,390 1951 8,445 +1,231 +17.06 4,328 4,117' 1961 M. 5.75 10,133 +1,688 + 19.99 5,337 4,796 1971 M. 5.75 13,011 +2,878 +28.40 6,903 6,108
497 SlIlllaria Ganganagar 1951 3,879 2,410 1,469 (RAJASTHAN) 1961 M. 16.52 8,112 +4,233 +109. ij 4,596 -3,516 1971 M. 3.64 13,000 +4,888 .-+60.26 7,158 5.842
tKanchrapara i.n Rural Develdpment Colo.ny of 1951 witb a population of 12,019.(6,297 M., 5,722 P.) of Nadia district was merged Kalyani .nd Gayeshpur GOyt. Colony towns In 1951. ~eparate pop~la.tJOn figures of these tOWDS are not avallable for 1951. The 1951 population of Kanchrapara Rural Development Colony has, however, been conSIdered for strlkmg the total. for 'All Classes'. ..
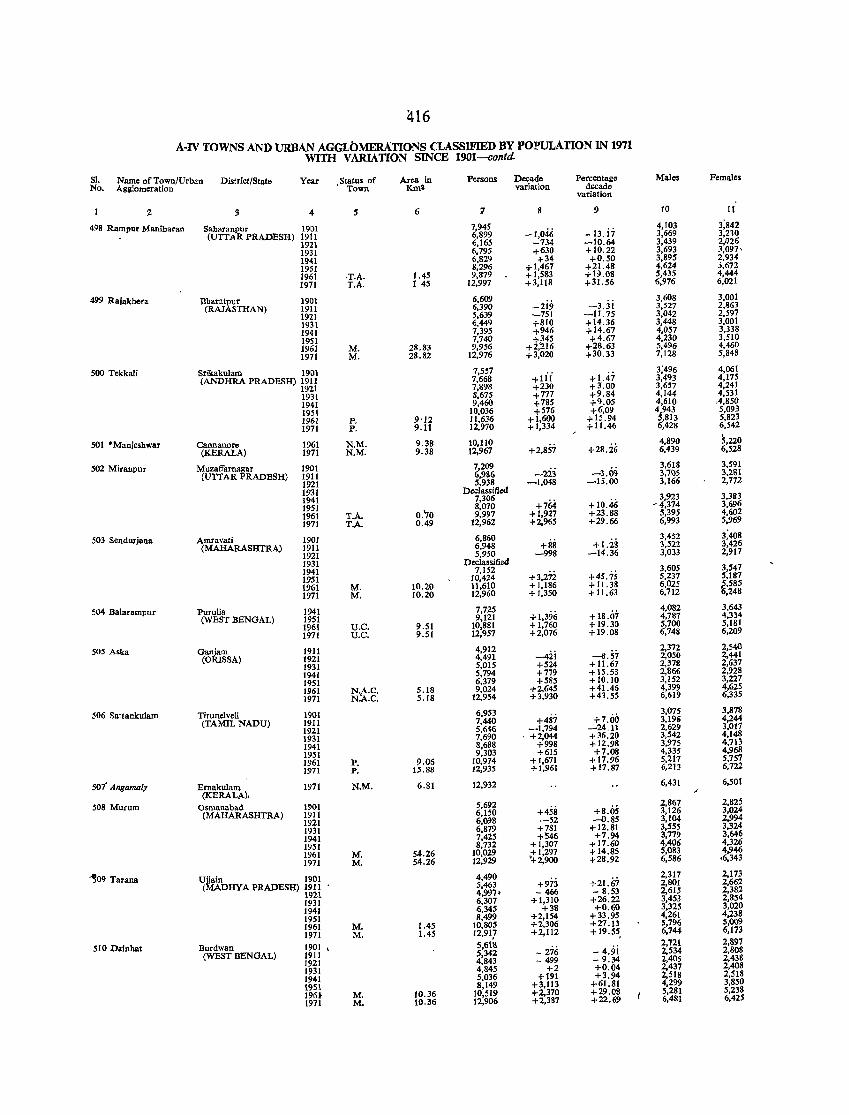
416
A-IV TOWNS AND URBAN AGGLOMERATIONS CLASSIFIED BY POPULATION IN 1971 WITH VARIATION SINCE 1901-contd.
SI. Name of Town/Urban District/State Year Status of Area in Persons Decade Percentage Males Females No. Allillomeration Town KmB variation decade
variation
Z 3 4 5 6 7 9 10 11
498 Rampur Maniharan Saharanl'ur 1901 7.945 -1,046
4.103 3:842 (UTTAR PRADESH) 1911 6,899 - 13.i7 3,669 3,210
1921 6,165 -734 -10.64 3,439 2,126 1931 6.795 +630 +10.22 3,693 3,097. 1941 6,829 +34 +0.50 3.895 2,934 1951 8,296 ;1-1.467 +21.48 4,624 3,672 1961 'T.A. 1.45 9,879 + 1,583 +H.08 5,435 4,444 1971 T.A. 145 12,997 +3,118 +31.56 6,976 6,021
499 Rajakhera Bharatpur 1901 6,609 -2i9 -3ji
3,608 3.001 (RAJASTHAN) 1911 6.390 3,527 2,863
1921 5,639 -751 -11.75 3,042 2,597 1931 6,449 +810 +14.36 3,448 3,001 1941 7,395 +946 +14.67 4,057 3,338 1951 7,740 +345 +4.67 4,230 3,510 J961 M. 28.83 9,956 +-2,~I6 +28.63 5,496 4,460 1971 M. 28.82 12,976 +3,020 +30.33 7,128 5,848
500 Tekkali Srikakulaltl 1901 7,557 +lii +1.47
3;496 4,061 (ANDHRA PRADESH) 1911 7,668 3,493 4,175
1921 7,898 +230 +3'.00 3,657 4,241 1931 8,675 +777 +9.84 4.144 4.531 1941 9.460 +785 +<).05 4,610 .4.850 1951 10.036 +576 +6.09 4,943 5,093 1961 P. 9'12 11,636 +1.600 +15.94 5.813 5.823 1971 P. 9.11 12.970 +-1.334 +11.46 6.428 6.542
501 *Manieshwar Cannanorc 1961 N.M. 9.38 10.110 +2.857 +28,26
4,890 5,220
(KERALA) 1971 N.M. 9.38 12.967 6.439 6.528
502 Miranpur Muzaffarnagar 1901 7.209 -223 -3.0<}
3,618 3,591
(UTTAR PRADESH) 1911 6,986 3,705 3.281 1921 5,938 -1,048 -15.00 3,166 2.712 1931 Declassified 1941 7,306
+764 + 10.46 3,923 3,3S3
1951 8.070 -1,374 3.696 1961 T.A. 0.70 9.997 +1,927 +23.88 ,395 4.602
1971 T.A. 0.49 12.962 +2.965 +29.66 6,993 5,969
503 Sendlll'jana Amravati 1901 6.860 + 1.2S
3,452 3:408
(MAHARASHTRA) 1911 6,948 +88 3,522 3.426 1921 5,950 -998 -14.36 3,033 2,917 1931 Declassified 1941 7.152
+3.272 +45.75 3,605 3.547
1951 10.424 5.237 5.187
1961 M. 10.20 11.610 +1.186 + 11.38 6,025 %,585 1971 M. 10.20 12.960 +1,350 +11.63 6,712 .248
504 Balarampur Purulia 1941 7.725 +1.396 +18.07
4,082 3.643 (WEST BENGAL) 1951 9.121 4,787 4.334
1961 U.C. 9.51 10.881 +1.760 + 19.30 5,700 5.181
1971 U.C. 9.51 12,957 +2.076 +19.08 6,748 6.209
sOS Aska Ganjam 1911 4.912 -8.57
2,372 2,540
(ORISSA) 1921 4.491 _:ii 2,050 2,441
1931 5.015 +524 + 11.67 2,378 2.637
1941 5,794 +779 +15.53 2,866 2,928
1951 6.379 +585 +10.10 3,152 3.227 1961 N-A..C. 5.18 9,024 +2,645 +41.46 4,399 4.625 1971 N.A.C. 5.18 12,954 +3,930 +43.55 6,619 6,335
506 Sattankulam Tirunelveli 1901 6.953 +487 +7.00
3.075 3.878
(TAMIL NADU) 1911 7.440 3,1% 4.244 1921 5,646 -1.794 -24.11 2,629 3.017 1931 7,690 . +2.044 +36.20 3,542 4.148
1941 8.688 +998 +12.98 3,975 4,713
1951 9.303 +615 +7.08 4,335 4,968
1961 P. 9.06 10.974 +1.671 +17.96 5,217 5,757
1971 P. 1.5.88 12,935 +1.961 +17.87 6,213 6,722
507' Angamaly Ernakulam 1971 N.M. 6.81 12.932 6,431 6,501
(KERALA). " 508 Murum Osmanabad 1!101 5.692
+458 +8.05 2,867 2.825
(MAHARASHTRA) 1911 6.150 3,126 3.024
1921 6.098 -52 -0.85 3,104 2.994
1931 6.879 +781 +12.81 3,S55 3.324
1941 7,425 +'546 +7.94 3.779 3.646
1951 8.732 +1.307 +17.60 4,406 4.326
1961 M. 54.26 10.029 +1.297 + 14.85 5.083 4.946
1971 M. 54.26 12.929 ~2.900 +28.92 6,586 .6.343
'~09 Tarana Ujjain 1901 4,490 +973 +21.67
2,317 2.173
(MADHYA PRADESH) 1911 5.463 2,801 2,662
1921 4.997. - 466 - 8.53 2,615 2,382
1931 6,307 +1.310 +26.22 3.453 2.854
1941 6.345 +38 +0.60 3.325 3.020
1951 8,499 +2.154 +33.95 4,261 4,238
1961 M. 1.45 ]0.805 +2.306 +27.13 5,796 5.009
1971 M. 1.45 12.917 +2.112 +19.55, 6.744 6.173
slO Dainhat Burdwan 1901 , 5.618 - 276 - 4.9i
2.721 2,897
(WEST BENGAL) 1911 5.342 2.534 2,808
1921 4.843 - 499 - 9.34 2,405 2,438
1931 4.845 +2 +0.04 2,437 2,408
1941 5.036 +191 +3.94 2.518 2.518
1951 8,149 +3.113 +61.81 4.299 3.850
196} M. 10.36 10.519 +2,370 +29.08 5.281 5,238
1971 M. 10.36 12.906 +-2,3S7 +22.69 6.481 6,425
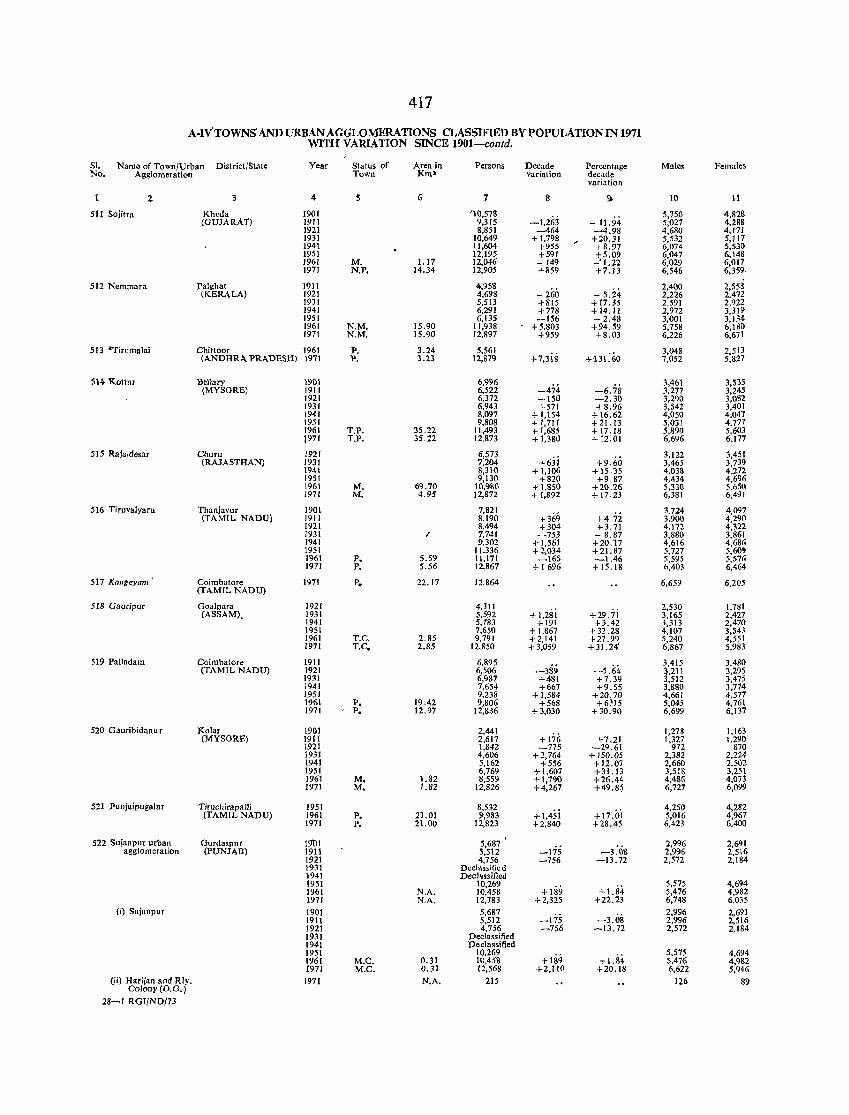
417
A·IVTOWNS AND URBAN AGGLOMERATIONS CLASSIFIED BY POPULATION IN 1971 WITH VARIATION SINCE 1901-col1ld.
SI. Name of Town/Urban District/State Year Status of Area in Persons Decade Percentage Males Females No. Agglomeration Town Km2 variation decade
variation
2 3 4 S 6 7 II ~ 10 11
511 Sojitra Kheda 1901 /10,578 -1,263 _ 11.94 5,750 4,828
(GUIARAT) 1911 9,315 5,027 4,288 1921 8,851 -464 ~4.98 4,680 4,171 1931 10,649 +1,798 +20.31 5,532 5,117 1941 11,604 +955 +8.97 6,074 5,530 1951 12,195 +591 +5.09 6,047 6,148 1961 M. 1.17 12,046 - 149 _' 1.22 6,029 6,017 1971 N.P. 14.34 12,905 +859 +7.13 6,546 6,359.
512 Nemmara Palgbat 1911 4,958 _ 260 _ 5.24
2.400 2,558 (KERA.LA) 1921 4,698 2,226 2,472
1931 5,513 +815 + 17.35 2.591 2.922 1941 6,291 +778 +14.11 2,972 3,319 1951 6,135 -156 _ 2.48 3,001 3,134 1961 N.M. 15.90 11,938 +5.803 +94.59 5,758 6,180 1971 N.M. 15.90 12,897 +959 +8.03 6,226 6,671
513 "Tirumalai Cbittoor 1961 P. 3.24 5,561 + 7,3is +131:60
3,048 2,513 (ANDHRA PRADESH) 1971 P. 3.23 12,879 7,052 5,827
514 Kottnr 'Bellary 1901 6,996 -474- -6.78
3,461 3,535 (MYSORE) 1911 6,522 3,277 3,245
1921 6,372 -150 -2.30 3,290 3,082 1931 6,943 +571 +8.96 3,542 3,401 1941 8,097 + 1,154 +16.62 4,050 4,047 1951 9,808 +1,711 +21.13 5,031 4,777 1961 T.P. 35.22 11,493 + 1,685 + 17.18 5,890 5,603 1971 T.P. 35.22 12,873 + 1,380 +12.01 6,696 6,177
515 Rajaldesar Churu 1921 6,573 +6jj
3,122 3,451 (RAJASTHAN) 1931 7,204 +9.60 3,465 3,739
1941 8,310 + 1,106 + 15.35 4,0:>8 4,272 1951 9,130 .+820 +9.87 4,434 4,696 1961 M. 69.70 10.980 +1,850 +20.26 5,330 5,650 1971 M. 4.95 12.872 + 1,892 + 17.23 6,381 6,491
516 Tiruvaiyaru Thanjavur 1901 7,821 +369 +4.72
3.724 4,097 (TAM[L NADU) 1911 8,190 3,900 4,290
[921 8,494 +304 +3.71 4,172 4,322 1931 I 7,741 -753 _ 8.87 3.880 3,861 1941 9,302 +1,561 +20.17 4,616 4,686 1951 11,336 +2,034 +11.87 5,727 5,60' 1961 P. 5.59 11,171 -165 -1.46 5,595 5,576 1971 P. 5.56 12,867 +1696 +15.18 0,403 6,464
517 Kallgeyam Coimbatore (fAMIL NAOU)
1971 p. 22.17 12,864 6,659 6.205
518 Gauripur Goalpara 1921 4,311 + 1,28i
2,530 1,781 (ASSAM), 1931 5,592 +29.71 3,[65 2,427
1941 5.783 +191 +3.42 3,313 2,470 1951 7,650 + 1,867 + 32.28 4,107 3,543 1961 T.C, 2.85 9,791 +2,141 +27.99 5,240 4,551 1971 T.C. 2.85 12,850 +3,059 + 31.24' 6,867 5,983
519 Palladam Coimbatore 1911 6,895 -389 -5.64
3,4[5 3,480 (TAMIL NADU) 1921 6,506 p!1 3,295
1931 6,987 +481 +7.39 ,512 3,475 1941 7,654 +667 +9.55 3,880 3,774 1951 9.238 + 1,584 +20.70 4,661 4,577 1961 P. 19.42 9,806 +568 +6~15 5,045 4.761 1971 P. 12.97 12,836 +3,030 +30.90 6,699 6,137
520 Gauribidanu r Kolar 1901 2,441 +176
1,278 1,163 (MYSORE) 1911 2,617 +7.21 1,327 1,290
1921 1,842 -775 -29.61 972 870 1931 4,606 +2,764 +150.05 2,382 2,224 1941 5,162 +556 +12.07 2,66D 2,502 1951 6,769 +1,607 +31.13 3,518 3,251 1961 M. 1.82 8,559 +1,790 +26.44 4.486 4,073 1971 M. 1.82 12,826 +4,267 +49.8~ 6,727 6,099
521 Punjaipugalur TiruchirapaUi 1951 8,532 +1.45i +17.oi
4,250 4,282 (TAMIL NADU) 1961 P. 21.01 9,983 5,016 4,967
[971 P. 21.00 12,823 +2.840 +28.45 6,423 6,400
522 Sujanpur urban Gurdaspur l<ml 5,687 -175 -3:08
2,996 2,691 agglomeration (PUNJAB) 1911 5,512 2.996 2,516
1921 4,756 -756 -13.72 2,572 2,184 1931 Decla"i fie d 1941 Dechssified 1951 10,269
+189 +d4 5,575 4,694
1961 N.A. 10,458 5,476 4,982 1971 N.A, 12,783 +2,325 +22.23 6,748 6.035
(i) Sujanpur 1901 5,687 -175 -3.0i!
2,996 2,691 1911 5,512 2,996 2,516 1921 4,756 -756 -13.72 2,572 2.184 1931 Declassified 1941 Declassified 1951 10,269
-1-189 + 1.84 5,575 4,694
1961 M.e. 0.31 10,458 5,476 4,982 1971 M.e. 0.31 12,568 + 2,110 +20.18 6,622 5,946
(ii) Harijan and R1y. Colony (O.G.)
1971 N.A. 215 126 89
28-1 RGI/ND/73
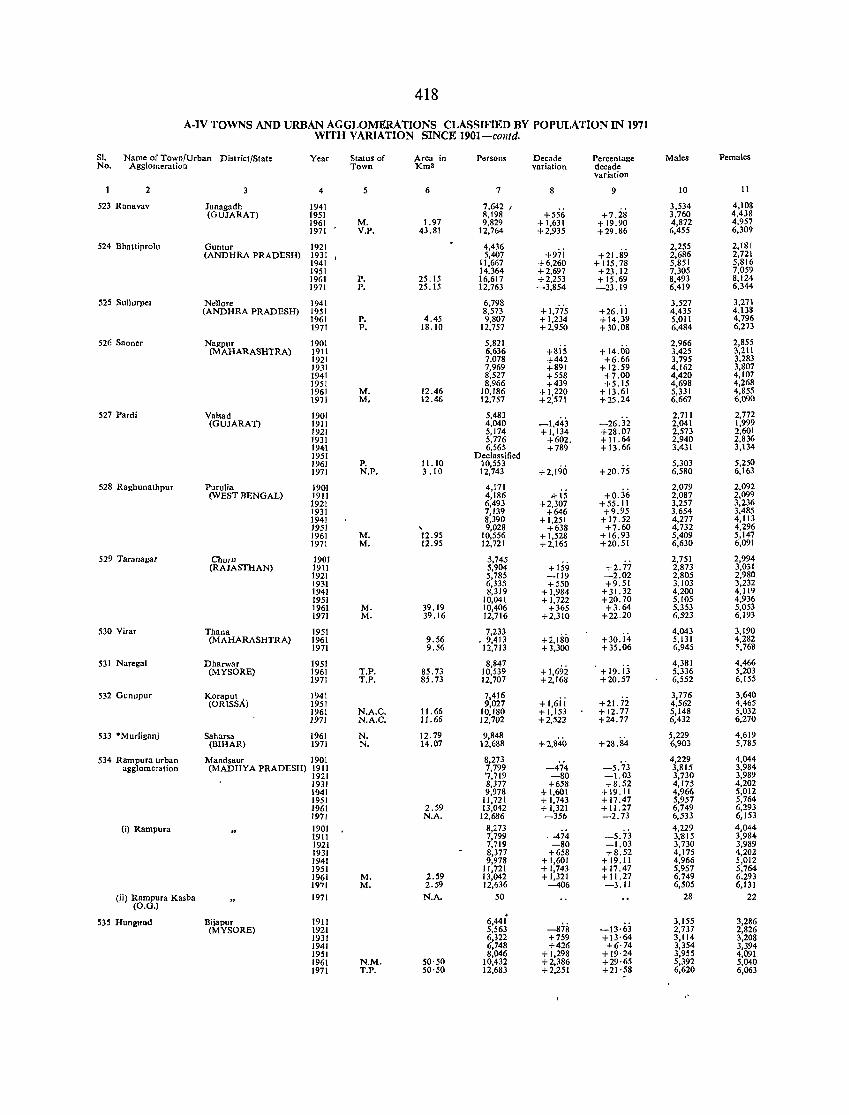
418
A-IV TOWNS AND URBAN AGGLOMERATIONS CLASSIFIED BY POPULATION IN 1971 WITH VARIATION SINCE 1901-colltd.
SI. Name or Town/Urban District/State Year Status of Area in Persons Decade Percentage Males Females No. Agglomeration Town Km2 variation decade
variation
2 3 4 5 6 7 9 10 11
523 Ranavav Junagadh 1941 7,642 I +556 +7.28
3,534 4,108 (GUJARAn 1951 R,198 3,760 4,438
1961 M. 1.97 9,829 + 1,631 + 19.90 4,872 4,957 1971 V.P. 43.81 12,764 +2,935 +29.86 6,455 6,309
524 Bhalliprolu Guntur 1921 4,436 +97i +21.89
2,255 2,18! (ANDHRA PRADESH) 1931 5,407 2,686 2,721
1941 11,667 +6,260 +115.78 5,851 5,816 1951 14,364 +2.697 +23.12 7,305 7,059 1961 p, 25.15 16,617 +2,253 + 15.69 ~493 8,124 1971 P. 25. IS 12,763 -3,854 -23.19 ,419 6,344
525 Sullurpel Nellore 1941 6,798 +1,775 +26.ii
3,527 3,271 (ANDHRA PRADESH) 1951 8,573 4,435 4,138
1961 P. 4.45 9,807 + 1,234 + 14.39 5,011 4.796 1971 P. 18.10 12,757 +2,950 +30.08 6,484 6,273
52E Saoner Nagpur 1901 5,821 +8is
2,966 2,855 (MAHARASHTRA) 1911 6,636 +14.00 3,425 3,2\1
1921 7,078 +442 +6.66 3,795 3,283 1931 7,969 +891 + 12.59 4,162 3,807 1941 8,527 +558 +7.00 4,420 4,107 1951 8,966 +439 +5.15 4,698 4,268 1961 M. 12.46 10,186 +1,220 + 13.61 5,331 4,855 1971 M. 12.46 12,757 +2,571 +25.24 6,667 6,090
527 Pardi Valsad 1901 5,483 -26.32
2,711 2,772 (GUJARAn 1911 4,040 -1,443 2,041 1,999
192! 5,174 +1,134 +28.07 2,573 2,601 1931 5,776 +602. +11.64 2,940 2,836 1941 6,565 +789 + 13.66 3,431 3,\34 1951 Declass itied 1961 P. 11.10 10,553
+2,190 5,303 5.250
1971 N.P. 3.10 12,743 +20.75 6,580 6,163
528 Raghunathpur PuruHa 1901 4,171 +Oj6
2,079 2,092 (WEST BENGAL) 1911 4,186 ,j-15 2,087 2,099
1921 6,493 +2,307 +55.11 3,257 3,236 1931 7,139 +646 +9.95 3,654 3,485 1941 8,390 +1,251 + 17 .52 4,277 4,113 1951 , 9,028 +638 +7.60 4,732 4,296 1961 M. 12.95 10,556 + 1,528 + 16.93 5,409 5,147 1971 M. 12.95 12,721 +2,165 +20.51 6,630 6,091
529 Taranagar Churu 1901 5,745 + IS9
2,751 2,994 (RAJASTHAN) 1911 5,904 +2.77 2,873 3,031
1921 5,785 -119 -2.02 2,805 2,980 1931 6,33S +550 +9.51 3,103 3,232 1941 8,319 +1,984 +31.32 4,200 4,119 1951 10,O4! +1,722 +20.70 5,105 4,936 1961 M. 39.19 10,406 +365 +3.64 5,353 5,053 1971 M. 39.16 12,716 +2,310 +22.20 6,523 6,193
530 Virar Thana 1951 7,233 +30.i4
4,043 3,190 (MAHARASHTRA) 1961 9.56 • 9,413 +2,180 5,131 4,282
1971 9.56 12,713 + 3,300 +35.06 6,945 ~,768
531 Naregal Dharwar 1951 8,847 + 1,69i +19. jj
4,381 4,466 (MYSORE) 1961 T.P. 85.73 10,539 5,336 5,203
1971 T.P. 85.73 12,707 +2,168 +20.57 6,552 6,155
532 Gunupur Koraput , 1941 7,416 +1,6ii
3,776 3,640 (ORISSA) 1951 9,027 +21. 72 4,562 4,465
1961 N.A.C. 11.66 10,180 + 1,153 + 12.77 5,148 5,032 1971 N.A.C. 11.66 12,702 +2,522 +24.77 6,432 6,270
533 °Murliganj Saharsa 1961 N. 12.79 9,848 +2,840 +28.84
5,229 4,619 (BIHAR) 1971 N. 14.07 12,688 6,903 5,785
534 Rampura urban Mandsaur 1901 8,273 4,229 4,044 agglomeration (MADHYA PRADESH) 1911 7,799 -474 -5.73 3,815 3,984
1921 7,719 -80 -1.03 3,730 3,989 1931 8,377 +658 +8.52 4,175 4.202 1941 9,978 +1,601 +19.11 4,966 5,012 1951 1I,72! + 1,743 +17.47 5,957 5,764 1961 2.59 13,042 +1,321 + 11.27 6,749 6,293 1971 N.A. 12,686 -356 -2.73 6,533 6,153
([) Rampura 1901 8,273 -5.73
4,229 4,044 1911 7,799 ---474 3,'815 3,984 Inl 7,719 -80 -1.03 3,730 3,989 1931 8,377 +658 +8.52 4,175 4,202 1941 9,978 +1,601 +19.11 4,966 5,012 1951 11,721 + 1,743 + 17.47 5,957 5,764 1961 M. 2.59 13,042 +1,321 + 11.27 6,749 6.293 1971 M. 2.59 12,636 -406 -3.11 6,505 6,131
(ii) Rampura Kasba 1971 N.A. 50 28 22 (O.G.)
535 Hunllllnd Bijapur 19tJ 6,44i -878 -13·63
3,155 3,286 (MYSORE) 1921 5,563 2,737 2,826
1931 6,322 +759 +13·64 3,114 3,208 1941 6,748 +426 +6·74 3,354 3,394 1951 8,046 + 1,298 +19·24 3,955 4,091 1961 N.M. 50·50 10,432 +2,386 +29·65 5,392 5,040 1971 T.P. 50'50 12,683 +2,251 +21·58 6,620 6,063
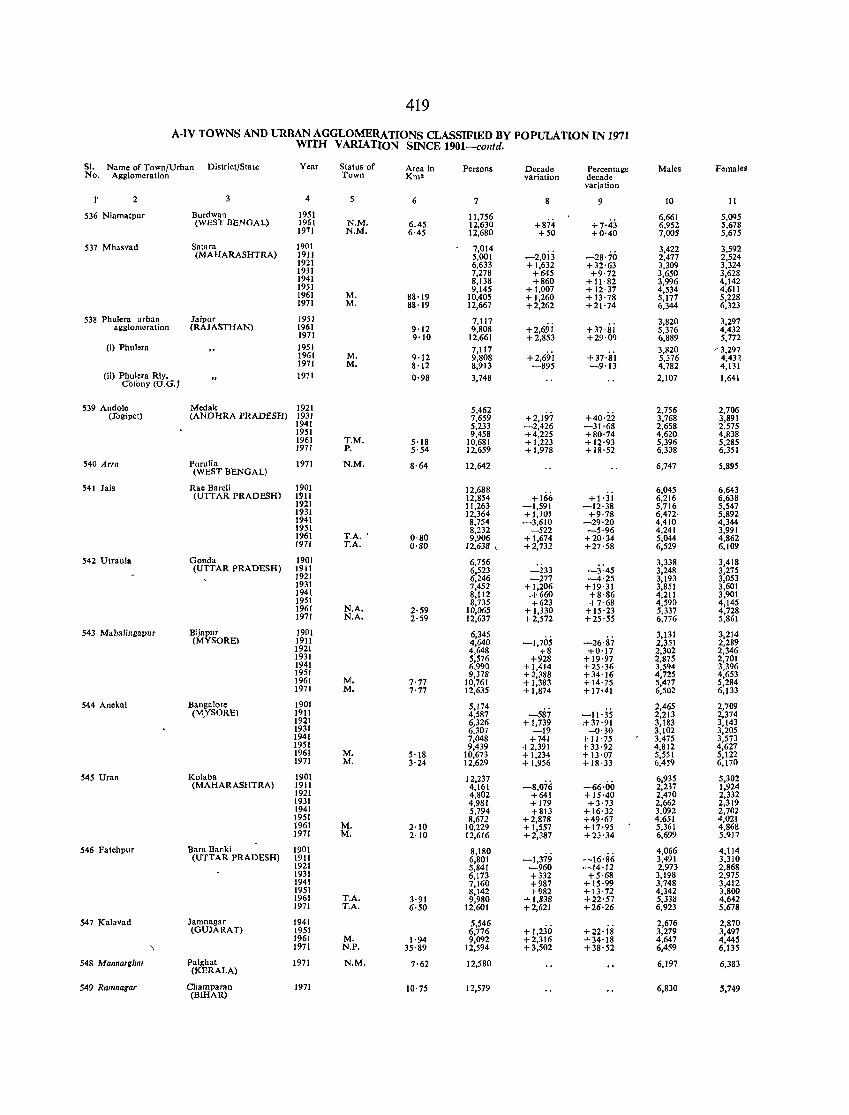
419
A-IV TOWNS AND URBAN AGGLOMEIUTIONS CLASSIFIED BY POPULATION IN 1971 WITH VARIATtON SINCE 1901-contd.
SI. Name of Town/Urban District/State Year Status of Area in Persons Decade Percentage Males Females No. Agglomoration Town Km2 variation decade
variation
l' 2 4 6 7 9 10 II
536 Niam.tpur Burdwan 1951 11,756 6.661 5,0Cl5 (WEST BENGAL) 1961 N.M. 6.45 12,630 +874 +7,43 6,952 5,678
1971 N.M. 6'45 12,680 +50 +0·40 7,005 5,675
537 Mhasvad Satara 1901 7,014 3,422 3,592 (MAHARASHTRA) 19J1 5,001 -2,oij -28'70 2,477 2,524
1921 6,633 + 1,632 +32·63 3,309 3,324 1931 7,278 +645 +9·72 3,650 3,628 1941 8,138 +860 + 11 ·82 3,996 4,142 1951 9,145 + 1,007 + 12·37 4,534 4,611 1961 M. 88'19 10,405 + 1,260 + 13'78 5,177 5,228 1971 M. 88'19 12,667 +2,262 +21'74 6,344 6,323
538 Phu1era urban Jaipur 1951 7,117 3,820 3,297 agglomeration (RAJASTHAN) 1961 9·12 9,808 +2,691 +37·lii 5,376 4.432
1971 9'10 12,661 +2,853 +29·09 6,889 5.772 (i) PhuJera 1951 7,117
+2,69i + 37·si 3,R20 ~ 3.297
1961 M. 9'12 9,808 5,376 4,43~ 1971 M. 8'12 8,913 -895 -9·13 4,782 4,131
(ii) PhuJera Rly. COlony (O.G.f
1971 0·98 3,748 2,107 1,641
539 Andole Medak 1921 5,462 +2,197
2,756 2,706 (Togipet) (ANDHRA PRADESH) 1931 7,659 +40'22 3,768 3,891
1941 5,233 -2,426 -31·68 2,658 2,575 1951 9,458 +4,225 +80·74 4.620 4.838 1961 T.M. 5'18 10,681 + 1,223 +12·93 5,396 5,285 1971 P. 5'54 12,659 +1,978 + 18·52 6,308 6,351
540 Arra Purulia 1971 N.M. 8·64 12,642 6,747 5,895 (WEST BENGAL)
541 Jais Rae Bar.1i 1901 12,688 +166
6,045 6.643 (UTI AR PRADESH) 1911 12,854 +1·31 6,216 6,638
1921 11,263 -1,591 -12·38 5.716 5,547 1931 12,364 +1,101 +9·78 6,472- 5,892 1941 8,754 -3,610 -29·20 4,410 4,344 1951 8,232 -522 -5·96 4,241 3,991 1961 T.A .. 0·80 9,906 + 1,674 +20·34 5.044 4,862 1971 T.A. 0·80 12,638 I +2,732 +27·58 6,529 6,109
542 Utr.ula Gonda 1901 6,756 "":'i33 -3:45
3,338 3,418 (UTIAR PRADESH) 1911 6,523 3,248 3,275
1921 6,246 -277 -4·25 3,193 3,053 1931 7,452 +1,206 +19·31 3,851 3,601 1941 8,112 .+660 +8·86 4,211 3,901 1951 8,735 +623 +7·68 4,590 4,145 1961 N.A. 2·59 10,065 +1,330 +15·23 5,337 4,728 1971 N.A. 2·59 12,637 +2,572 +25·55 6,776 5,861
543 Mahalingapur Bijapur 1901 6,345 -1,705
3,131 3,214 (MYSOREI 1911 4,640 -26·87 2,351 2,289
1921 4,648 +8 +0·17 2,302 2,346 1931 5,576 +928 + 19·97 2,875 2,701 1941 6,990 +1,414 +25·36 3,594 3,396 1951 9,378 +2,388 +34'16 4,725 4,653 1961 M. 7·77 10,761 + 1,383 + 14'75 5,477 5,284 1971 M. 7'77 12,635 + 1,874 +17·41 6,502 6,133
544 Anekal Bangalore 1901 5,174 2,465 2,709 (M'ySOREI 1911 4,587 -587 -11·35 2,213 2,374
1921 6,326 + 1,739 .+37·91 3,183 3,143 1931 6,307 -19 -0·30 3,102 3,205 1941 7,048 +741 +11'75 3.475 3,573 1951 9,439 +2,391 + 33·92 4,812 4,627 1961 M. 5'18 10,673 + 1,234 + 13·07 5,551 5,122 1971 M. 3·24 12.629 + 1,956 + 18·33 6,459 6,170
545 Uran Kolaba 1901 12,237 -8,076 -66·00
6,935 5,302 (MAHARASHTRA) 1911 4,161 2,237 1,924
1921 4,802 +641 +15'40 2,470 2,332 1931 4,981 + 179 +3·73 2,662 2,319 1941 5,794 +813 + 16·32 3.092 2,70] 1951 8,672 +2,878 +49·67 4,651 4,021 1961 M. 2·10 10,229 +1,557 + 17·95 5.361 4.868 1971 M. 2'10 12,616 +2,387 +23·34 6,699 5.917
546 Fatehpur Bara Banki 1901 8,180 -1,379 -16'86
4,066 4,114 (UTTAR PRADESH) 1911 6,801 3,491 3,310
1921 5,841 -960 -14'12 2,973 2,868 1931 6,173 +332 +5·68 3,198 2,975 1941 7,160 +987 + 15·99 3,748 3,412 1951 8,142 +982 + 13·72 4,342 3,800 1961 T.A. 3·91 9,980 + 1,838 +22'57 5,338 4,642 1971 T.A, 6·50 12,601 +2,621 +26'26 6,923 5,678
547 Kalavad Jamnagar 1941 5,546 + 1,2jO +22·is
2,676 2,870 (GUJARATI 1951 6,776 3,279 3,497
1961 M. 1·94 9,092 +2,316 +34'18 4,647 4,445 \ 1971 N.P. 35·89 12,594 + 3,502 + 38'52 6,459 6,135
548 Mannarghat Palghat (KERALA)
1971 N.M. 7·62 12,580 6,197 6,383
549 Ramnagar Champaran 1971 10'75 12,579 6,830 5,749 (BIHAR)
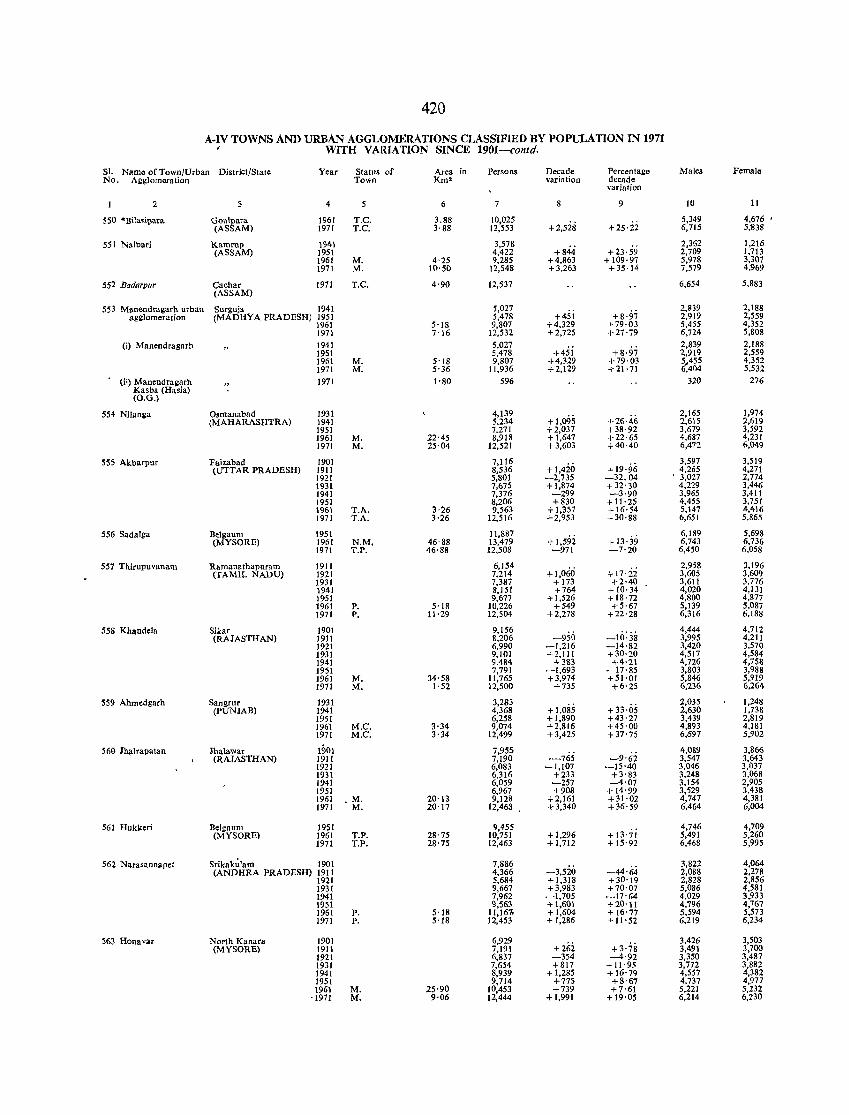
420
A-IV TOWNS AND URBAN AGGLOMERATIONS CLASSIFlED BY POPULATION IN 1971 , WITH V;'\RlATION SINCE 1901-contd.
SI. Name of Town/Urban District/State Year Status of Area in Persons Decade Percentage Males Female No. Agglomeration Town Km2 variation decade
variatjon
2 3 4 5 6 7 8 9 10 11
550 ·Bila,ipara Goalpara 1961 T.e. 3.88 10,025 +2,528 +z5·zi
5,349 4,676 ' (ASSAM) 1971 T.e. 3'88 12,553 6,715 5,838
551 Nlilbari Kamrup 1941 3,578 +844 +23·59
2,362 1,216 (ASSAM) 1951 4,422 2,709 1,713
1961 M. 4'25 9,285 +4,863 + 109·97 5,978 3,301 1971 M. 10'50 12,548 + 3,263 +35·14 7,579 4.969
552 Badarpur Cachar (ASSAM)
1971 T.e. 4'90 12,537 6,654 5,883
553 Manendragarh urban Surguja 1941 5,027 2,839 2,188 agglomeration (MADHYA PRADESH) 1951 5,478 +451 +8·97 2,919 2,559
1961 5'18 9,807 +4.329 +79·03 5,455 4,352 1971 7'16 12,532 +2,725 +27·79 6,124 5,808
(i) Manendragarh 1941 5,027 +45i +8·97
2,839 2,188 1951 5,478 '2.,919 2,559 1961 M. 5'18 9,807 +4,329 +79·03 ?455 4,352 1971 M. 5'36 11,936 +2,129 +21·71 ,404 5,532
(ii) Manendragarh 1971 1'80 596 320 276 Kasba (Hasia) (O.G.)
554 Nilania Osmanabad 1931 4,139 + 1,095 +26·46
2,165 1,974 (MAHARASHTRA) 1941 5.234 2,615 2,619
1951 7,271 +2,037 + 38·92 3.679 3,592 1961 M. 22'45 8,918 + 1,647 +22·65 4,687 4,231 1971 M. 25'04 12,521 + 3,603 +40·40 6,472 6,049
555 Akbarpur Faizabad 1901 7,116 + l,4iO + 19·96
3,597 3,519 (UTTAR PRADESH) 1911 8,536 4,265 4,271
1921 5,801 -2,735 -32.04 . 3,027 2,774 1931 7,675 + 1,874 + 32'30 4,229 3,446 1941 7,376 -299 -3'90 3,965 3,411 1951 8,206 +830 +11'25 4,455 3,751 196\ T.A. 3·26 9,563 + 1,357 + 16'54 5,147 4,416 1971 T.A. 3·26 12,516 +2,953 +30'88 6,651 5,865
556 Sadalga Belgaum 1951 11,887 + 1,59i + 13·39
6,189 5,698 (MYSORE) 1961 N.M. 46·88 13,479 6,743 6,736
1971 T.P. 46·88 12,508 -971 -7'20 6,450 6,058
557 Thirupuvanam Ramanathapuram 1911 6,154 +1,060 + 17'22
2,958 3,196 (TAMIL NADU) 1921 7,214 3,605 3,609
1931 7,387 +173 +2'40 3,611 3,776 1941 8,151 +764 +10'34 4,020 4,131 1951 9,677 +1,526 + 18·72 4,800 4,877 1961 P. 5·18 10,226 +549 +5'67 5,139 5,087 1971 P. 11·29 12,504 +2,278 +22'28 6,316 6,188
558 Khandela Sikar 1901 9,156 -950 -10:38
4,444 4,712 (RAJASTHAN) 1911 8,206 3,995 4,211
1921 6,990 -1,216 -14'82 3,420 3,570 1931 9,101 +2,111 +30'20 4,517 4,584 1941 9,484 +383 +4'2\ 4,726 4,758 1951 7,791 -1,693 -17'85 3,803 3,988 1961 M. 34·58 11,765 +3,974 +51'01 5,846 5,919 1971 M. 1·52 12,500 +735 +6'25 6,236 6,264
559 Ahmedgarh Sangrur 1931 3,283 + 1,085 + 33'05
2,035 1,248 (PUNJAB) 1941 4,368 2,630 1,73&
1951 6,258 +1,890 +43'27 3,439 2,819 1961 M.e. 3·34 9,074 +2,816 +45'00 4,893 4,181 1971 M.e. 3·34 12,499 +3,425 +37'75 6,597 5,902
560 Jh.lrapatan lhalawar 190\ 7,955 -9'62
4,089 3,866 (RAJASTHAN) 1911 7,190 ·-765 3,547 3,643
1921 6,083 -1,107 -15'40 3,046 3,037 1931 6,316 +233 +3'83 3,248 3,068 1941 6,059 -257 -4'07 3,154 2,905 1951 6,967 +908 +14'99 3,529 3,438 1961 .M. 20·\3 9,128 +2,161 +31'02 4,747 4,381 1971 M. 20'17 12,468 + 3,340 +36'59 6,464 6,004
561 Hukkeri Belgaum 1951 9,455 + 13·ji
4,746 4,709 (MYSORE) 1961 T.P. 28'75 10,751 +1,296 5,491 5,260
1971 T.P. 28'75 12,463 +1,712 +15'92 6,468 5,995
562 N'lrasannapet Srikakulam 1901 7,886 -3,5io -44'64
3,822 4,064 (ANDHRA PRADESH) 1911 4,366 2,088 2,278
1921 5,684 + 1,318 +30'19 2,828 2,856 1931 9,667 +3,983 +70'07 5,086 4,581 1941 7,962 -1,705 -17'64 4,029 3,933 1951 9,563 + 1,601 +20'11 4,796 4,767 1961 P. 5'18 11,16], +1,604 + 16'77 5,594 5,573 1971 P. 5'18 12,453 + 1,286 + 11'52 6,219 6,234
~63 Honavar North Kanara 1901 6,929 +26i +3'78
3,426 3,503 (MYSORE) 1911 7,191 3,491 3,700
1921 6,837 -354 -4'92 3,350 3,487 1931 7,654 +817 + 11'95 3,772 3,882 1941 8,939 + 1,285 + 16'79 4,557 4,382 1951 9,714 +775 +8'67 4.737 4,977 1961 M. 25·90 10,453 +739 +7'61 5,221 5,232
'1971 M. 9·06 12,444 +1,991 + 19·05 6,214 6,230
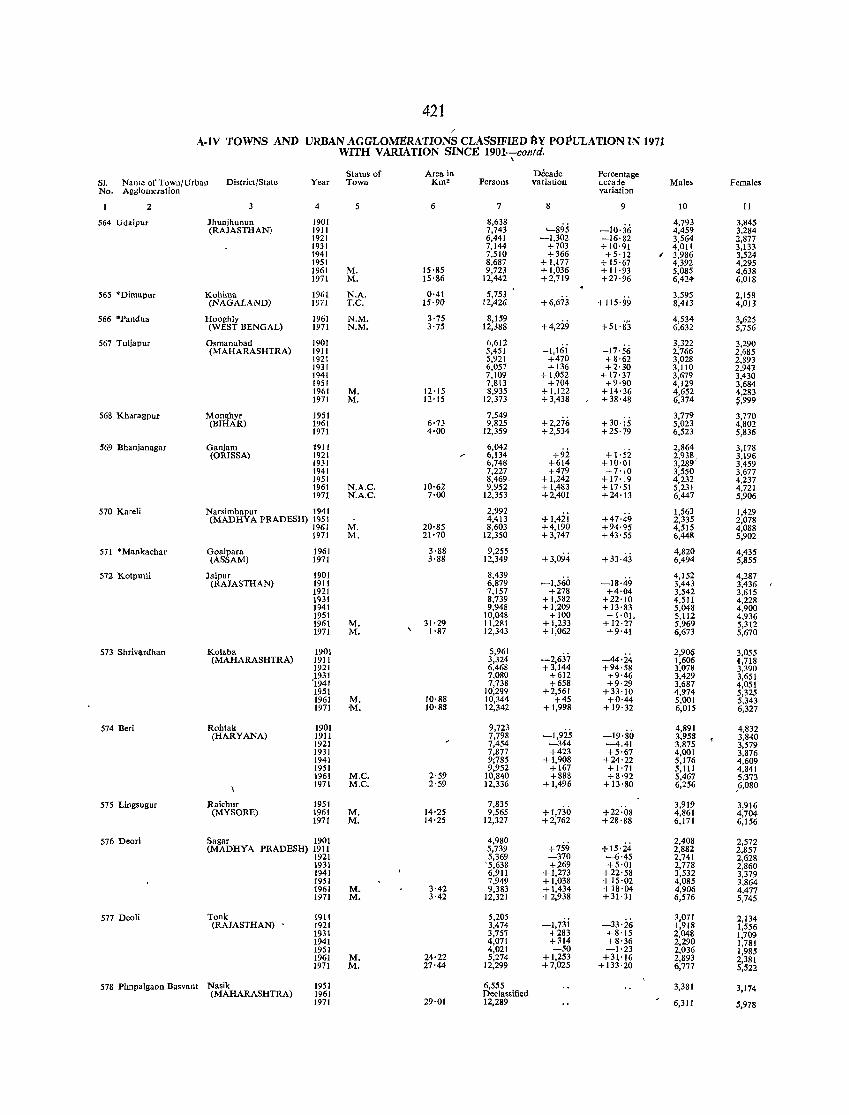
421 /
A·IV TOWNS AND URBAN AGGLOMERATIONS CLASSlFIED BY POPULATION IN 1971 WITH VARIATION SINCE 1901-contd.
\
Status of Area in Decade Percentage SI. Nam.ofTown/Urban District/State Year Town Km' Persons variation decade Males Females No. Agglomeration variation
2 4 5 6 7 8 9 10 II
564 Udaipur Jhunjhunun 1901 8,638 q95 -10,36 4,793 3,845
(RAJASTIlAN) 1911 7,743 4,459 3.284 1921 6,441 -1,302 -16'82 3,564 2,877 1931 7,144 +703 + 10'91 4,011 3,133 1941 7,510 +366 +5'12 , 3,986 3,524 1951 8,687 +1,n7 + 15·67 4,392 4,295 1961 M. 15'85 9,723 +1,036 + 11'93 5,085 4,638 1971 M. 15'86 12,442 +2,719 +27'96 6,424- 6,018
565 'Dimapur Kohima 1961 N.A. 0'41 5,753 + 115'99
3,595 2,158 (NAG ALAND) 1971 T.C. 15·90 12,426 +6,673 8,413 4,013
566 'Pandua Hooghly 1961 N.M. 3'75 8,159 +4,229 +51'8'3
4,534 3,625 (WEST BENGAL) 1971 N.M. 3·75 12,388 6,632 5,756
567 Tuljapur Osmanabad 1901 6,612 -17'56
3,322 3,290 (MAHARASHTRA) 1911 5,451 -1,161 2,766 2,685
1921 5,921 +470 +8'62 3,028 2,893 1931 6,057 +136 +2'30 3,110 2,947i 1941 7,109 + 1,052 + 17'37 3,679 3,430 1951 7,813 +704 +9·90 4,129 3,684 1961 M. 12'15 8,935 +1,122 +14·36 4,652 4,283 1971 M. 12'15 12,373 +3,438 +38'48 6,374 ~,999
568 Kharagpur Monghyr 1951 7,549 +30, is 3,779 3,770
(BIHAR) 1961 6'73 9,825 +2,276 5,023 4,802 1971 4·00 12,359 +2,534 +25'79 6,523 5,836
569 Bhanjanagar Ganjam 1911 6,042 +92 +1'52
2,864 3,178 (ORISSA) 1921 6,134 2,938 3,196
1931 6,748 +614 +10'01 3,289" 3,459 1941 7,227 +479 +7·10 3,550 3,677 1951 8,469· +1,242 +17'19 4,232 4,237 1961 N_.A.C. 10·62 9,952 + 1,483 + 17'51 5,231 4,721 1971 N.A.C. 7·00 12,353 +2,401 +24'13 6,447 5,906
570 KareH Narsimhapur 1941 2,992 +1,4ii +47,49
1,563 1,429 (MADHYA PRADESH) 1951 4,413 2,335 2,078
1961 M. 20·85 8,603 +4,190 +94'95 4,515 4,088 1971 M. 21'70 12,350 + 3,747 +43'55 6,448 5,902
571 "Mankachar Goalpara 1961 3'88 9,255 +3,094 +33'43
4,820 4,435 (ASSAM) 1971 3'88 12,349 6,494 5,855
572 Kolputli Jaipur 1901 8,439 -1,560 -18·49
4,152 4,287 (RAJASTHAN) 1911 6,879 3,443 3,436
1921 7,157 +278 +4·04 3,542 3,615 1931 8,739 + 1,582 +22'10 4,511 4,228 1941 9,948 + 1,209 + 13'83 5,048 4,900 1951 10,048 +100 +1'01, 5,112 4,936 1961 M. 31'29 11,281 + 1,233 +12·27 5,969 5,312 1971 M. 1'87 12,343 +1,062 +9·41 6,673 5,670
573 Shriv~rdhan Kolaba 1901 5,961 -2,637 -44·i4
2,906 3,055 (MAHARASHTRA) 1911 3,324 1,606 t,718
1921 6,468 +3,144 +94'58 3,078 3,390 1931 7,080 +612 +9·46 3,429 3,651 '1941 7,738 +658 +9·29 3,687 4,051 1951 10,299 +2,561 +33'10 4,974 5,325 1961 M. 10'88 10,344 +45 +0·44 5,001 5,343 1971 ·M. 10'88 12,342 +1,998 +19'32 6,015 6,327
574 Beri Rohtak 1901 9,723 -I,9is -19'80
4,891 4,832 (HARYANA) 1911 7,798 3,958 3,840
1921 7,454 -344 -4.41 3,875 3,579 1931 7,877 +423 +5'67 4,001 3,876 1941 9;785 + 1,908 +24'22 5,176 4,609 1951 9,952 + 167 +1'71 5,111 4,841 1961 M.C. 2'59 10,840 +888 +8·92 5,467 5,373 1971 M.C. 2'59 12,336 + 1,496 +13'80 6,256 ,6,080
575 Lingsugur Raichur 1951 7,835 +22:08
3,919 3,916 (MYSORE) 1961 M. 14'25 9,565 +1,730 4,861 4,704
1971 M. 14'25 12,327 +2,762 +28'88 6,171 6,156
576 Deori Sagar 1901 4,980 +15·i4
2,408 2,572 (MADHYA PRADESH) 1911 5,739 +759 2,882 2,857
1921 5,369 -370 -6'45 2,741 2,628 1931 '5,638 +269 +5·01 2,778 2,860 1941 6,91J + 1,273 +22'58 3,532 3,379 1951 7,949 + 1,038 +15·02 4,085 3,864 1961 M. 3·42 9,383 +1,434 +18'04 4,906 4,477 1971 M. 3'42 12,321 +2,938 +31'31 6,576 5,745
577 Deoli Tonk 1911 5,205 -1,73i -33·ii;
3,071 2,134 (RAJASTHAN) 1921 3,474 1,918 1,556
1931 3,757 +283 +8'15 2,048 1,709 1941 4,071 +314 +8'36 2,290 1,781 1951 4,021 -50 -1·23 2,036 1,985 1961 M. 24'22 5,274 + 1,253 +31'16 2,893 2,381 1971 M. 27·44 12,299 +7,025 + 133·20 6,777 5,522
578 Pirnpalgaon Basvant Nasik 1951 6,555 3,381 3,174 (MAHARASHTRA) 1901 Declassified
1971 29·01 12,289 6,31J 5,978
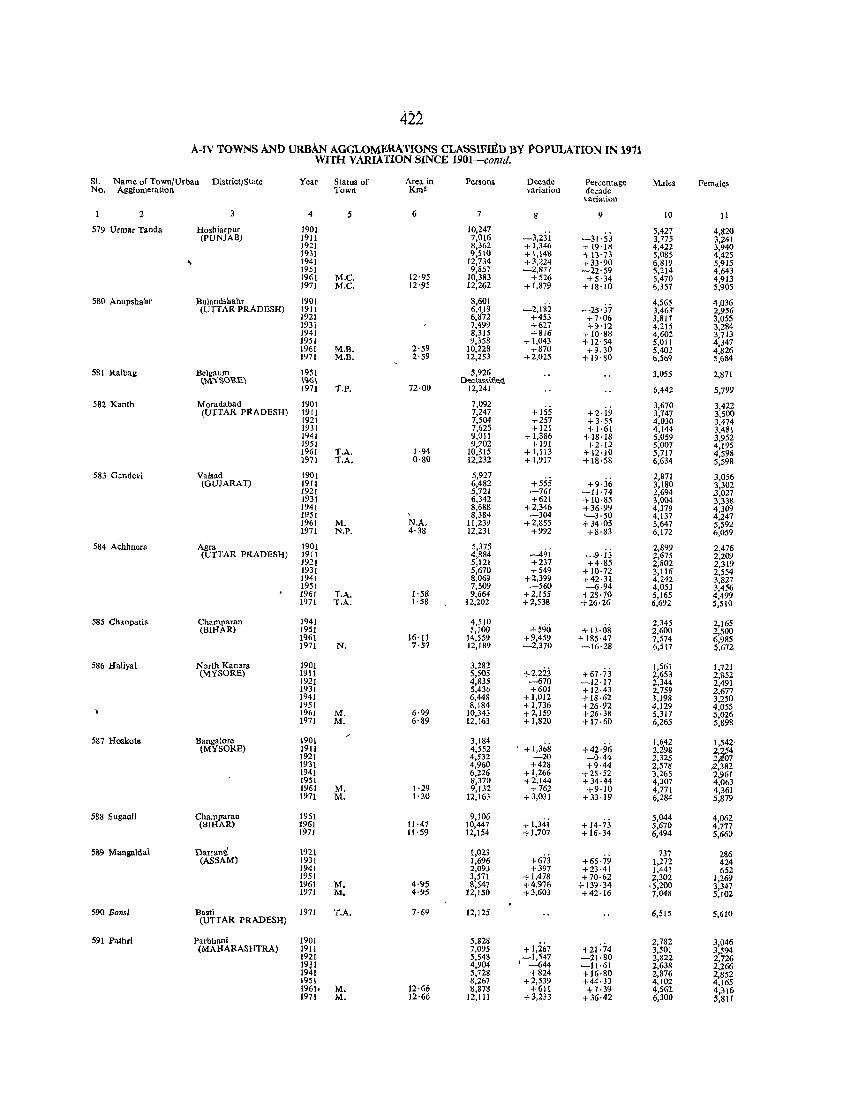
422
A-IV TOWNS AND URBAN AGGLOMERATIONS CLASS1FUtD BY POPULATION IN 1911 WITH VARIATION SINCE 1901-contd.
Sl. Name of Town/Urban District/State Year Status of Area in Persons Decode Percentage Males Femal"s No. Agglomeration 'Town Km~ variation decade
\ariation
2 3 4 5 6 7 8 9 10 11
579 Urmar Tanda Hoshiarpur 1901 10,247 -3,23j -31'53
5,427 4,820 (PUNJAB) 1911 7,016 3,775 3,241
1921 8,362 + 1,346 + 19'18 4,422 3,940 1931 9,510 +1,14& +n'73 5,085 4,425 , 1941 12,734 +3,224 +33'90 6,819 5,915 1951 9,857 -2,877 -22'59 5,214 4.643 1961 M.C. 12'95 10,383 +526 +5'34 5,470 4,913 1971 M.C. 12'95 12,262 + 1,879 +18·10 6,351 5.905
580 Anupshaltr Bulandshahr 1901 8,601 _2,182 -25·37
4,565 4,036 (UTTAR PRADESH) 1911 6,4)9 3,463' 2,956
1921 6,872 +453 +7·06 3,817 3,055 1931 7,499 +627 +9'12 4,215 3,284 1941 8,315 +816 + 10'88 4,602 3,713 1951 9,358 + 1,043 + 12'54 5,011 4,347 1961 M.B. 2'59 10,228 +870 +9.30 5,402 4,826 1971 M.B. 2'59 12,253 +2,025 + 19·80 6,56Q 5,684
581 Raibag Belgaum 1951 5,926 3,055 2,871 \M.'(S()~) \%\ D..cto. .. ,l~
1971 T.P. 72'00 12,241 6,442 5,799
582 Kanth Moradabad 1901 7,092 +2·i9
3,670 3,422 (UTTAR PRADESH) 1911 7,247 +155 3,747 3,500
1921 7,504 +257 +3·55 4,030 3,474 1931 7,625 + 121 +1,61 4,144 3,481 1941 9,011 +1,386 + 18·18 5,059 3,952 1951 9,202 +191 +2,12 5,007 4,195 1961 TA 1'94 10,315 + 1,113 + 12·10 5,717 4,598 1971 'T.A. 0'80 12,232 +1,917 + 18·58 6,634 5,598
583 Gandevi Valsad 1901 5,927 +9·j6
2,871 3,056 (GUJARAT) 1911 6,482 +555 3,180 3,302
1921 5,721 -761 -11·74 2,694 3,027 1931 6,342 +621 + 10·85 3,004 3,33& 1941 &,688 +2,346 +36·99 4,379 4,309 1951 8,384 -304 "-3·50 4,137 4,247 1961 M. N.A. 11,239 + 2,855 +34·05 5,647 5,592 1971 N.P. 4·38 12,231 +992 +8·83 6,172 6,059
584 Achbnera Agra 1901 5,375 2,899 2,476 (VTT AR PRADESH) 1911 4,884 -491 -9·13 2,675 2,209
1921 5,121 +237 +4·85 2,802 2,319 1931 5,670 +549 +10·72 3,116 2,554 1941 8,069 +2,399 +42·31 4,242 3,827 1951 7,509 -560 -6·94 4,053 3,456 1961 T.A. J'58 9,664 +2,155 +28·70 5,165 4,499 1971 T.A. I'SS 12,202 +2,538 +26·26 6,692 5,510
585 Chanpatia. Champaran 1941 4,510 +590 + 13·08
2,345 2,165 (BIHAR) 1951 5,100 2,600 2,500
1961 16·11 14,559 +9,459 + 185·47 7,574 6,985 1971 N. 7·51 12,189 -2,370 -16·28 6,517 ~,672
586 Haliyal North Kanara 1901 3,282 +2,223 +67·73
1,561 1,721 (MYSORE) 1911 5,505 2,653 2,852
1921 4,835 -670 -12·17 2,344 2,491 1931 5,430 +601 + 12·43 2,759 2,677 1941 6,448 +1,012 + 18·62 3,198 3,250 1951 8,184 +1.736 +26·92 4,129 4,055 1961 M. 6·99 10,343 +2,159 +26·38 5,317 5,026 1971 M. 6·89 12,163 + 1,820 +17·60 6,265 5,898
587 Hoskote Bangalore 1901 3,184 . + 1,368 +42·96
1,642 1,542 (MYSORE) 1911 4,552 2,t98
2704
1921 4,532 -20 -0·44 2,325 2 07 1931 4,960 +428 +9·44 2,578 ,2,382 1941 6,226 + 1,266 +25·52 3,265 2.961 1951 8,370 +2,144 +34·44 4,307 4,003 1961 M. 1·29 9,132 +762 +9·10 4,771 4,361 1971 M. 1·30 12,163 +3,031 +33·19 6,284 5,879
588 Sugauli Chall1paran 1951 9,106 +1,34i
5,044 4,062 (BUIAR) 1961 11·41 10,441 +14·73 5,670 4,777
1971 11·59 12,154 +1.707 +16·34 6,494 5,660
SS9 Mangaldai Darrang 1911 1,023 +673
737 286 (ASSAM) 1931 1,696 +65·79 1,272 424
1941 2,093 +397 +23·41 1,441 652 1951 3,571 +1,478 +70·62 2,302 1,269 1961 M. 4·95 8;547 +4,976 + 139·34 ,5,200 3,347 1971 M. 4·95 12,150 +3,603 +42·16 7,048 5,102
590 Bansi Basti 1971 T.A. 7'69 12,125 6,515 5,610 (UTTAR PRADESH)
591 Pathrl Parbhani 1901 5,828 + 1,267 +21:74
2,782 3,046 (MAHARASIiTRA) 1911 7,095 3,501 3,594
1921 5,548 _1,547 -21·80 2,822 2,726 19J1 4,904 I -{i44 -11·61 2,638 2,266 1941 5,728 +824 +16·80 2,876 2,852 1951 8,267 +2,539 +44·33 4,102 4,165 1%1. M, 12·66 8,878 +611 +7·39 4,561 4,316 1971 M. 12'66 12,111 +3,233 +36·42 6,300 5,811
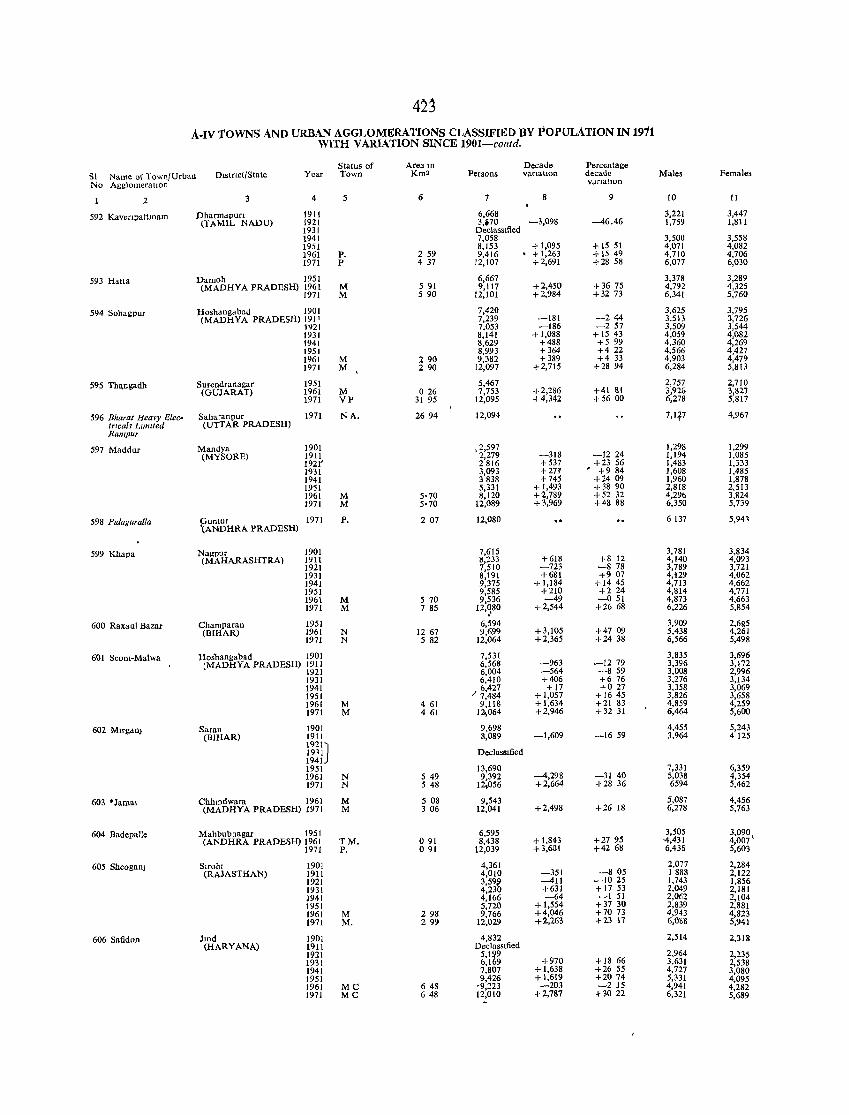
42j A-IV TOWNS AND URBAN AGGLOMERATIONS CLASSIFIED BY POPULATION IN 1911
WiTH VARIATION SINCE 1901-contd.
Status of Aream Decade Percentage SI Name "fTown/Urban DIstnct/State Year Town Km2 Persons VartatlOu decade Males Females No AgglomeratIOn Vdr1allOn
2 3 4 5 6 7 8 9 10 II
592 Kavenpattmam Dharmdpun 1911 6,668 3,221 3,447 (TAMIL NADU) 1921 3,.70 -3,098 -46.46 1,759 1,811
1931 Declassified 1941 7,058 3,500 3,558 1951 8,153 + 1,095 + 15 51 4,071 4,082 1961 P. 259 9,416 • + 1,263 + 15 49 4,710 4,706 1971 P 437 12,107 +2,691 +28 58 6,077 6,030
593 Hatta Damoh 1951 6,667 3,378 3,289 (MADHYA PRADESH) 1961 M 591 9,117 +2,450 +3675 4,792 4,325
1971 M 590 12,101 +2,984 +3273 6,341 5,760
594 Sohagpur Hoshangdbad 1901 7,420 3,625 3,795 (MADHYA PRADESH) 191' 7,239 -181 -244 3,513 3,726
1921 7.053 -186 -257 3,509 3,544 1931 8,141 + 1,088 + 1543 4,059 4,082 194\ 8,629 +488 +5 99 4,360 4,269 1951 8,993 +364 +422 4,566 4,427 196\ M 290 9,382 +389 +4 33 4,903 4,479 1971 M 290 12,097 +2,715 +28 94 6,284 5,813
595 Tha,ngadh Surendranagar 1951 5,467 2,757 2,710 (GUJARAT) 1961 M 026 7,753 +2,286 +41 81 3,926 3,827
1971 VP 31 95 12,095 +4,342 +5600 6,278 5,817
596 Bharat Heavy Elec· Saharanpur 1971 NA. 2694 12,094 7,If7 4,967 trleals LlInlted (UTTAR PRADESH) Rampur
597 Maddur Mandya 1901 ,2,597 1,298 1,299 (MYSORE) 1911 2,279 -318 -1224 1,194 1,085
1921' 2816 +537 +23 56 1,483 1,333 1931 3,093 +277 . +984 1,608 1,485 1941 3838 +745 +2409 1,960 1,878 1951 5,331 + 1,493 +3890 2,818 2,513 1961 M 5'70 8,120 +2,789 +52 32 4,296 3,824 1971 M 5'70 12,089 +3,969 +48 88 6,350 5,739
598 Plduguralla Guntur 1971 P. 207 12,080 6137 5,94~
'(ANDHRA PRADESH)
599 Khapa Nagpur 1901 7,615 3,781 3,834 (MAHARASHTRA) 1911 8,233 +618 +8 12 4,140 4,093
1921 7,510 -723 -878 3,789 3,721 1931 8,191 +681 +907 4,129 4,062 1941 9,375 +1,184 +1445 4,713 4,662 1951 9,585 +210 +224 4,814 4,771 1961 M 570 9,536 -49 -051 4,873 4,663 1971 M 785 12,g80 +2,544 +26 68 6,226 5,854
600 Raxaul Bazar Champaran 1951 6,594 3,909 2,685 (BIHAR) 1961 N 1267 9,699 +3,105 +47 09 5,438 4,261
1971 N 582 12,064 +2,365 +24 38 6,566 5,498
601 SeoOl-Malwa Hosbangabad 1901 7,531 3,835 3,696 (MADHYA PRADESH) 1911 6,568 -963 -1279 3,396 3,172
1921 6,004 -564 -859 3,008 2,996 1931 6,410 +406 +6 76 3,276 3,134 1941 ;' 6,427 +17 +027 3,358 3,069 1951 7,484 + 1,057 +1645 3,826 3,658 1961 M 461 9,118 +1,634 +21 83 4,859 4,259 1971 M 4 61 12,064 +2,946 +3231 6,464 5,600
602 Mirg<ln) Saran 1901 9,698 4,455 5,243 (BIHAR) 1911 8,089 -1,609 -1659 3,964 4125
1921J 19 1 1 DeclassIfied 1941 1951 13,690 7,331 6,359 1961 N 549 9,392 -4,298 -3140 5,038 4,354 1971 N 5 48 12,056 +2,664 +28 36 6594 5,462
603 ·Jamal ChhlOdwara 1961 M 5 08 9,543 5.087 4,456 (MADHYA PRADESH) 1971 M 3 06 12,041 +2,498 +26 18 6,278 5,763
604 Badepalle Mahbubnagar 1951 6,595 3,505 3,090 (ANDHRA PRADESH) 1961 TM. 091 8,438 +1,843 +2795 -4,431 4,007'
1971 P. o 91 12,039 +3,601 +4268 6,436 5,603
605 Sheogan) Slrohl 1901 4,361 2,077 2,284 (RAJASTHAN) 1911 4,010 -351 -805 1888 2,122
1921 3,59t -411 -1025 1,743 1,856 1931 4,23 +631 + 17 53 2,049 2,181 1941 4,166 -64 -151 2,062 2,104 1951 5,720 + 1,554 +37 30 2,839 2,881 1961 M 298 9,766 +4,046 +7073 4,943 4,823 1971 M. 299 12,029 +2,263 +23 17 6,OE8 5,941
606 Safidon Jllld 1901 4,832 2,514 2,318 (HARYANA) 1911 DeclassIfied
1921 5,1~9 2,964 2,235 1931 6,1 9 +970 + 18 66 3,631 2,538 1941 7,807 + 1,638 +2655 4,727 3,080 1951 9,426 +1.619 +2074 5,331 4.095 1961 MC 648 '9,223 -203 -215 4,941 4,282 1971 MC 648 12,010 +2,787 +3022 6,321 5,689
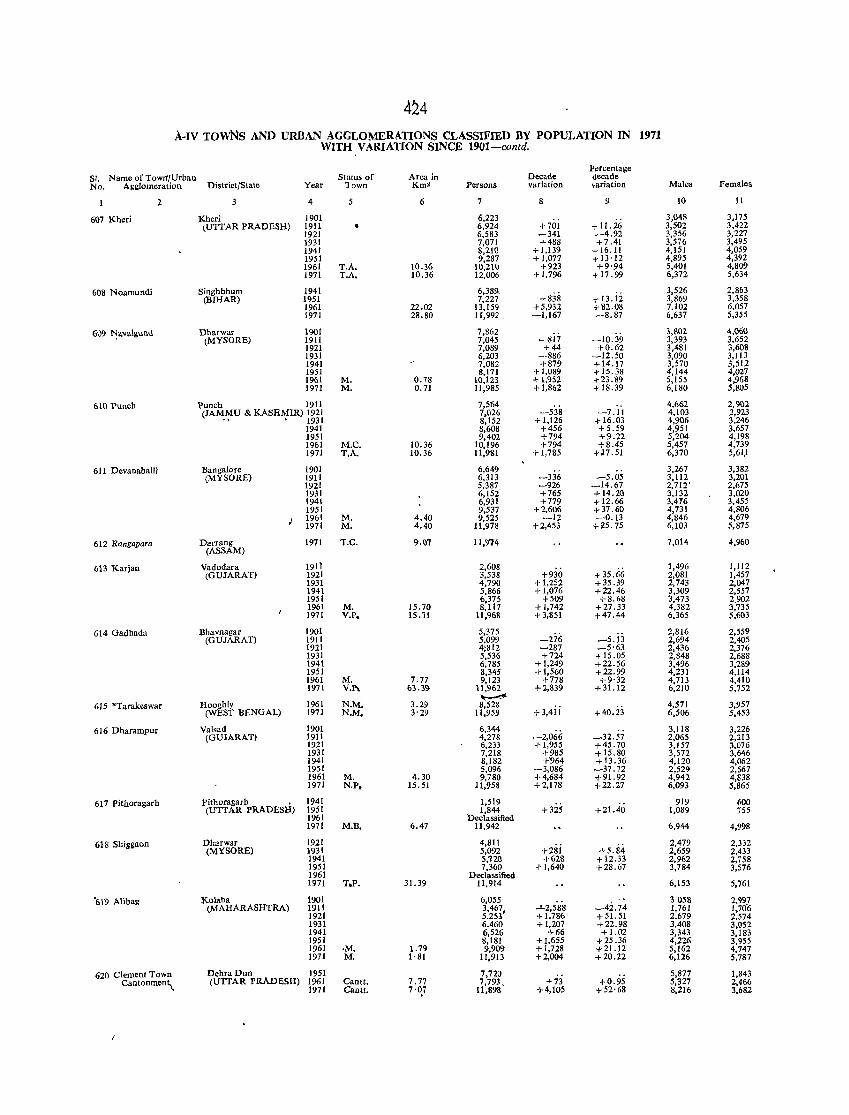
4~4
A-IV TOwNs AND URBAN AGGLOMERATIONS CLASSIFIED BY POPULATION IN 1971 WITH VARIATION SINCE 1901-contd.
Percentage SI. Name of Towlt/Urban Status of Area in Decade decade No. Agglomeration DistrictjStale Year 'I own Km2 Persons variation variation Males Females
2 4 6 7 8 9 10 11
607 Kheri Kheri 1901 6,223 3,048 3,175 (UTTAR PRADESH) 1911 6,924 +701 + 11. 26 3,502 3,422
1921 6,583 -341 -4.92 3,356 3,227 1931 7,071 +488 +7.41 3,576 3,495 1941 8,210 +1,139 + 16.11 4,151 4,059 1951 9,287 +1,077 +13·12 4,895 4,392 1961 T.A. 10.36 10,210 +923 +9'94 5,401 4,809 1971 T.A. 10.36 12,006 +1,796 + 17 .99 6,312 5,634
608 Noamundi Singhbhum 1941 6,389, + 13.ii
3,526 2,863 (BIHAR) 1951 7,227 +838 3,869 3,358
1961 22.02 13,159 +5,932 -1'82.08 7.102 6,057 1971 28.80 11,992 -1,167 --8.87 6,637 5,355
609 ~a"a\gund Dharwar 1901 7,862 3,802 4,%0 (MYSORE) 1911 7,045 -817 -10.39 3,393 3,652
1921 7,089 +44 +0.62 3,481 3,608 1931 6,203 -886 -12.50 3,090 3,113 1941 7,082 +879 + 14.17 3,570 3,512 1951 8,171 +1,089 -t- 15. 38 4,144 4,027 1961 M. 0.78 10,l2) + 1,952 -t-23.89 5,155 4,968 1971 M. 0.71 11,985 +1,862 + 18.39 6,180 5,805
610 Punch Punch 19J1 7,564 4,662 2,902 (JAMMU & KASHMIR) 1921 7.026 -538 -7.11 4,103 2.923
.. , 1931 8,152 +1,126 -\'16.03 4,906 3,246 1941 8,608 +456 +5.59 4,951 3,657 1951 9,402 +794 +9.22 5,204 4,198 1961 M.e. 10.36 10.196 +794 +8.45 5,457 4,739 1971 T,A. 10.36 11.981 + 1,785 +J7.51 6,370 5.6l,1
611 Devanahalli Bangaiore 1901 6,649 -3:i6
3,267 3,382 (MYSORE) 1911 6,313 -5.05 3.112 3,201
1921 5,387 -926 -14.67 2.712' 2,675 1931 6,152 +765 +14.20 3,132 3,020 1941 6,931 +779 +12.66 3,476 3.455 1951 9,537 +2,606 +37.60 4,731 4,806 1961 M. 4.40 9,525 -12 -0.13 4,846 4,679 1971 M. 4.40 11.978 +2,453 +25.75 6,103 5,875
612 Rangapara Darrang 1971 T.C. 9.()7 11.914 7,014 4,960 (ASSAM)
613 Karjan Vadodara 1911 2,608 +35.66
1,496 1,112 (GUJARAT) 1921 3,538 +930 2,081 1,457
1931 4,790 + 1,252 +35.39 2,743 2,047 1941 5,866 +1,076 +22.46 3,309 2,557 1951 6.375 +509 +8.68 3,473 2,902 1961 M. 15.70 8,117 +1,742 +27.33 4,382 3,735 1971 Vop. IS .71 11,968 +3,851 +47.44 6,365 5,603
614 Gadhada Bhavnagar 1901 5,375 -276
2,816 2,559 (GUJARAT) 1911 5.099 -5.13 2,694 2,405
1921 4:812 -287 _5'63 2,436 2,376 1931 5,536 +724 +15.05 2,848 2,688 1941 6,785 +1,249 +22.56 3,496 3,289 1951 8,345 +1,560 +22.99 4,231 4,114 1961 M. 7.77 9.123 +778 +9'32 4,713 4,410 1971 Vo? 63.39 11,962 +2,839 +31.12 6,210 5,752
Hooghly 1961 NoM. ",,_...,..
615 *Tarakeswar 3.29 8,528 +40.23
4,571 3,957 (WEST BENGAL) 1971 N.M. 3'29 11.959 + 3,431 6,506 5,453
616 Dharampur Valsad 1901 6,344 -2,066
3,118 3,226 (GUJARAT) 1911 4,278 -32.57 2,065 2,213
1921 6,233 +1,955 +45.70 3,157 3,076 1931 7.218 +985 + 15.80 3,572 3,646 1941 8,182 +'964 +13.36 4,120 4,062 1951 5,096 -3,086 -37.72 2,529 2,567 1961 M. 4.30 9,780 +4,684 +91.92 4,942 4,838 1971 N.P, 15.51 11.958 +2,178 +22.27 6,093 5.865
617 Pithoragarh pithoragarh , 1941 1,519 919 600 (UTTAR PRADESH) 1951 1,844 +325 +21.40 1,089 755
1961 Declassified 1971 M.B. 6047 11,942 6,944 4,998
618 ShilOgaon Dharwar 1921 4,811 2,479 2,332 (MYSORE) 1931 5.092 +281 +5.84 2,659 2.433
1941 5,720 +628 +12.33 2,962 2,758 1951 7,360 +1,640 +28.67 3,784 3,576 1961 Declassified 1971 T.P. 31.39 11.914 6,153 5.761
'619 Alibag Kolaba 1901 6,055 -42.74
3058 2,99; (MAHARASHTRA) 1911 N~j, ..J...2,588 1,761 1,706
1921 + 1.786 -I' 51. 51 2.679 2.574 1931 6.460 +1,207 +22.98 3.408 3.052 1941 6,526 +66 +1.02 3,343 3,183 1951 8,181 +1,655 + 25 .36 4,226 3,955 1961 ·M. 1.79 9,909 +1,728 +21.12 5,162 4,747 1971 M. 1'81 11,913 +2,004 +20.22 6,126 5,787
620 Clement Town DehraDun 1951 7,720 5,877 1,843 Cantonment., (UTTAR PRADESH) 1961 Cantt. 7.77 7,793, +73 +0.95 5,327 2,466
\ 1971 Cantt. 7'Q7 11.898 +4,105 +52·68 8,216 3,682
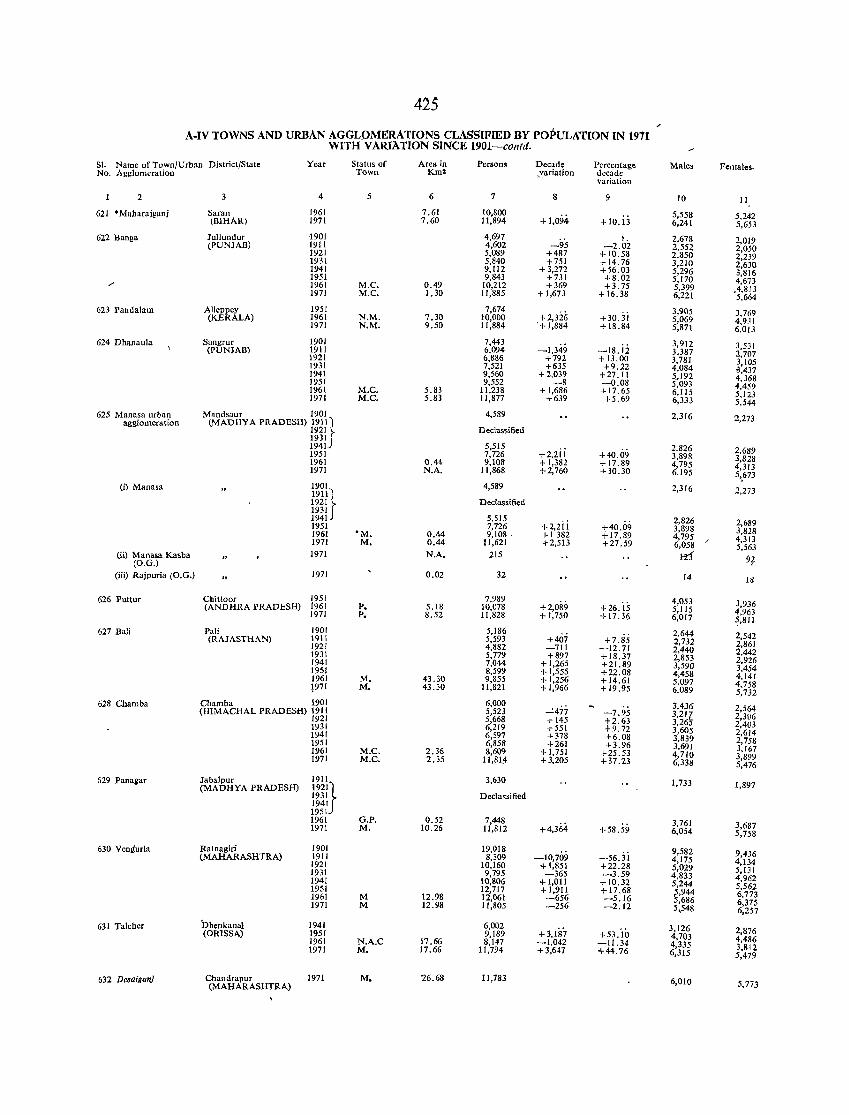
425
A-IV TOWNS AND URBAN AGGLOMERATlONS CLASSIFffiO BY POPULATION IN 1971 WITH VARli\TION SINCE 1901-confd.
SI. Name of Town/Urban District/State Year Status of Area in Persons Decade Percentage Male. Females· No. Agglomeration Town Km' ~variation decade
variation
2 3 4 5 6 7 8 9 10 11
621 *Mabarajganj Saran 1961 7.61 10,800 +1,094 + 10. jj
5,558 5,242 (BIHAR) 1971 7.60 11,894 6,241 5,653
622 Banga Jullundur ·1901 4,697 2,678 2,019 (PUNJAB) 1911 4,602 -95 -2.02 2,552 2,050 1921 5,089 +487 + 10.58 2.850 2,239 1931 5,840 +751 +14.76 3,210 2,630 1941 9,112 +3,272 +56.03 5,296 3,816 1951 9,843 +731 +8.02 5,170 4,673 ,/ 1961 M.e. 0.49 10.?!:2 +369 +3.75 5,399 .4,813 1971 M.C. 1.30 11,8 5 + 1,673 + 16.38 6,221 5,664
623 Pandalam Alleppey 1951 7,674 +2,326
3,905 3,769 (KERA1A) 1961 N.M. 7.30 10,000 +30.31 5,069 4,931 1971 N.M. 9.50 11,884 '+ 1,884 +18.84 5,871 6,013
624 Dbanaula Sangrur 1901 7,443 -1,349 -18.ii
3,912 3,531 (PUNJAB) 1911 6,094 3.387 2,707 1921 6,886 +792 + 13.00 3,781 3,105 1931 7,521 +635 +9.22 4,084 3,437 1941 9,560 +2,039 +27.11 5,192 4,368 1951 9,552 -8 -0.08 5,093 4,459 1961 M.C. 5.83 11,238 + 1,686 + 17.65 6,115 5,123 1971 M.C. 5.83 11,877 +639 +5.69 6,333 5,544 625 M anasa urban Mandsaur 1901 4,589 2,316 2,273 agglomeration (MADHYA PRADESH) 19111
1921 ~ Declassified
l§llJ 5,515 +2,2ii +40.09
2,826 2,689 1951 7,726 3,898 3,828 1961 0.44 9,108 + 1,382 + 17.89 4,795 4,313 1971 N.A. 11,868 +2,760 + 30.30 6,195 5,,673 (i) Manasa
190,} 4,589 2,316 2,273 1911
1921 Declassified 1931 1941 5,515
+2,2ii +40.09 2,826 2,689 1951 7,726 3,898 3,828 1961 ·M. 0.44 9,108. + 1382 +17.89 4,795 4,313 1971 M. 0.44 11,621 +2,513 +27.59 6,058 5,563
(ii) Manasa Kasba 1971 N.A. 215 1-rl 9f (O.G.)
(iii) Rajpuria (O.G.) 1971 0.02 32 14 18
626 Puttur Chiltoor 1951 7,989 +2,089 +26. is 4,053 3,936 (ANDHRA PRADESH) i961 P. 5.18 10,078 5,115 4,963 1971 P. 8.52 11,828 + 1,750 + 17.36 6,017 5,811
627 Bali Puli 1901 5,186 +7.85
2,644 2,542 (RAJASTHAN) 1911 5,593 +407 2,732 2,861 1921 4,882 -711 -12.71 2,440 2,442 1931 5,779 +897 +18.37 2,853 2,926 1941 7,044 + 1,265 +21.89 3,590 3,454 1951 8,599 + 1,555 +22.08 4,458 4,141 1961 M. 43.30 9,855 +1,256 +14.61 5,097 4,758 !971 M. 43.30 11,821 +1,966 +19.95 6,089 5,732 628 Cbamba Chamba 1901 6,000
,__!477 -7.95 3,436 2,564 (HIMACHAL PRADESH) 1911 5,523 3,21~ 2,306 1921 5,668 + 145 F·63 3,26 2,403 1931 6,219 +551 9.72
1941 6,597 +378 +6.08 3,605 2,614
1951 6,858 +261 +3.96 3,839 2,758 3,691 3,167 1961 M.C. 2.36 8,609 +1,751 +25.53 4,710 3,899 1971 M.C. 2.35 11,81;4 +3,205 +37.23 6,338 5,476
629 Panagar Jabalpur 1911} 3,630 1,733 1,897 (MADHYA PRADESH) 1921 1931 Declassified 1941 1951 1961 G.P. 0.52 7,448
+4,364 +58.59 3,761 3,687 1971 M. 10.26 11,812 6,054 5,758
630 Vengurla Ratnagiri 1901 19,018 -10,709 -5di
9,582 9,436 (MAHARI\SHTRA) 1911 8,309 4,175 4,134 1921 10,160 +1,851 +22.28 5,029 5,131 1931 9,795 -365 -3.59 4,833 4,962 1941 10,806 +1,011 + 10.32 5,244 5,562 1951 12,717 +1,911 +17.68 .5,944 6,773 1961 M 12.98 12,061 -656 -5.16 5,686 6,315 1971 M 12.98 11,805 -256 -2.12 5,548 6,257
631 Talcber Dhenkal1al 1941 6,002 +3,187
3,126 2,876 (OR1SSA) 1951 9,189 +53.10 4,703 1961 N.A.C 17.66 8,147 -1,042 -11.34 4,335 4,486
1971 M. 17.66 11,794 +3,647 +44.76 6,315 3,812 5,479
632 Desaiga1li Chandrapur 1971 M. 26.68 11,783 6,010 5,773 (MAHARASHTRA)
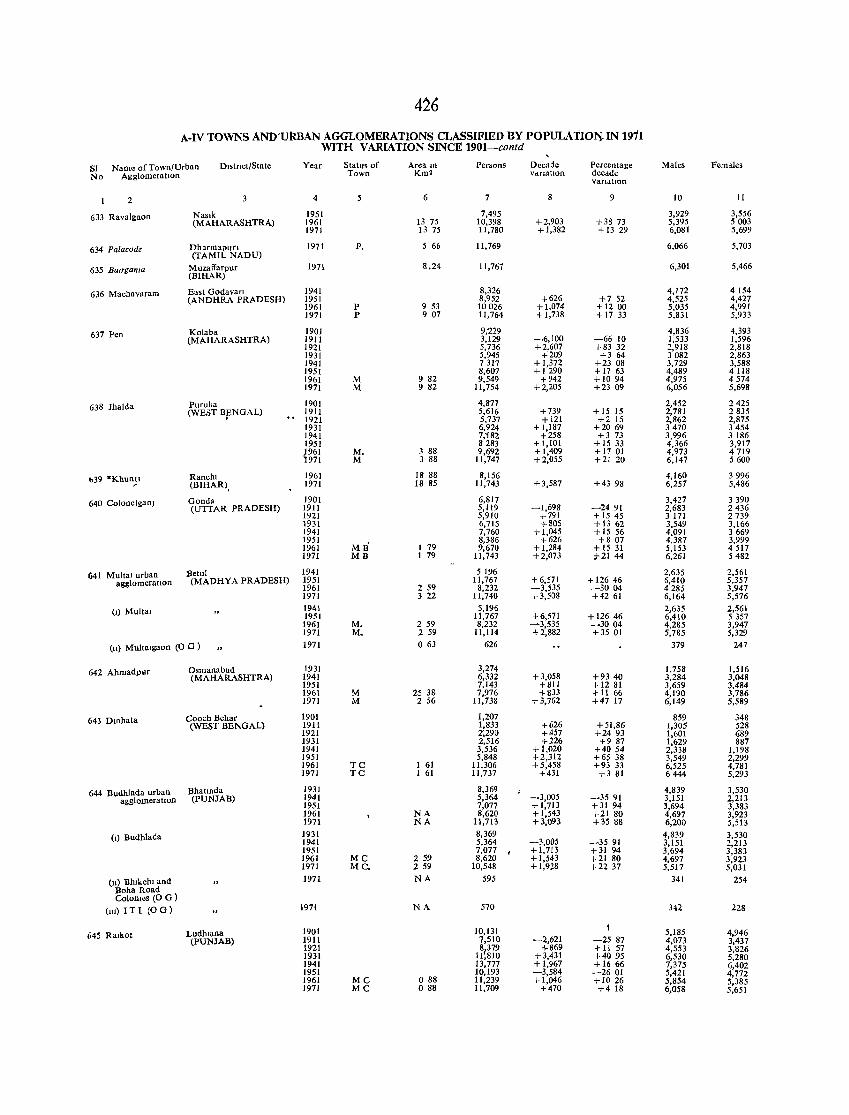
416 A-IV TOWNS AND'URBAN AGGLOMERATIONS CLASSIFIED BY POPULATIOl'i- IN 1911
WITH VARIATION SINCE 1901-contd
SI Name of Town/Urban DIstnct/State Year Status of Area In Persons Decaae Percentage Males Females No AgglomeratIOn Town Km2 VdrlatlOn decdde
Vand..tlon
2 4 5 6 7 8 9 10 II
633 Ravalgaon Naslk 1951 7,495 3,929 3,556 (MAHARASHTRA) 1961 13 75 10,398 +2,903 +3873 5,395 5003
1971 13 75 11,780 + 1,382 + 13 29 6,081 5,699
634 Palacode Dharrnapurt (TAMIL NADU)
1971 P. 5 66 11,769 6,066 5,703
635 BalYgama Muzaffarpur (BIHAR)
1971 8.24 11,767 6,301 5,466
636 Machavaram East Godavari 1941 8,326 4,172 4154 (ANDHRA PRADESH) 1951 8,952 +626 +7 52 4,525 4,427
1961 P 9 53 10026 +1,074 +1200 5,035 4,991 1971 P 9 07 11,764 + 1,738 + 17 33 5,831 5,933
637 Pen Kolaba 1901 9,'229 4,836 4,393 (MAHARASHTRA) 1911 3,129 ~6,IOO ~66 10 1,533 1,596
1921 5,736 +2,607 +83 32 2,918 2,818 1931 5,945 +209 +3 64 3082 2,863 1941 7317 + 1,372 +23 08 3,729 3,588 1951 8,607 + 1290 + 17 63 4,489 4118 1961 M 9 82 9,549 +942 +1094 4,975 4574 1971 M 9 82 1l,754 +2,205 +23 09 6,056 5,698
638 Jhalda Purulla 1901 4,877 2,452 2425 (WEST BENGAL) 1911 5,616 +739 + 15 15 2,781 2835
• 1921 5,737 +121 +2 15 2,862 2,875 1931 6,924 + 1,187 +2069 3470 3454 1941 7,182 +258 +3 73 3,996 3186 1951 8283 + 1,101 + 15 33 4,366 3,917 {961 M. 3 88 9,692 +1,409 +1701 4,973 4719
971 M 3 88 11,747 +2,055 +21 20 6,147 5600
1>39 *Khuny Ranchl 1961 18 88 8,156 4,160 3996 (BIHAR), 1971 18 85 11,743 + 3,587 +43 98 6,257 5,486
640 ColonelganJ Gonda 1901 6,817 3,427 3390 (UTTAR PRADESH) 1911 5,119 -1,698 -2491 2,683 2436
1921 5,910 +191 +1545 3171 2739 1931 6,715 +805 + 13 62 3,549 3,166 1941 7,760 +1,045 +15 56 4,091 3669 1951
MB 8,386 +626 +8 07 4,387 3,999
1961 1 79 9,670 + 1,284 + 15 31 5,153 4517 1971 MB 1 79 11,743 +2,073 ;1-21 44 6,261 5482
641 Multal urban Betul 1941 5 196 2,635 2,561 agglomeratIOn (MADHYA PRADESH) 1951 11,767 +6,571 + 12646 6,410 5,357
1961 2 59 8,232 -3,535 -3004 4285 3,947 1971 3 22 11,740 +3,508 +4261 6,164 5,576
(I) Multal 1941 5,196 2,635 2,561 1951 11,767 +6,571 + 126 46 6,410 5357 1961 M. 2 59 8,232 -'03,535 -3004 4,285 3,947 1971 M. 2 59 1l,114 +2,882 +35 01 5,785 5,329
(11) Muitalgaon (0 G ) 1971 o 63 626 379 247
642 Ahmadp1<lr Osmanabad 1931 3,274 1,758 1,516 (MAHARASHTRA) 1941 6,332 + 3,058 +9340 3,284 3,048
1951 7,143 +811 +12 81 3,659 3,484 196\ M 25 38 7,976 +833 + 11 66 4,190 3,786 1971 M 2 56 11,738 +3,762 +47 17 6,149 5,589
643 Dtnhata Cooch Behar 1901 1,207 859 348 (WEST BENGAL) 1911 1,833 +626 +51,86 1,305 528
1921 2;290 +457 +2493 1,601 689 1931 2,516 +226 +9 87 1,629 887 1941 3,536 +1,020 +4054 2,338 1,198 1951 5,848 +2,312 +65 38 3,549 2,299 1961 TC 1 61 11,306 +5,458 +93 33 6,525 4,781 1971 TC 1 61 11,737 +431 +3 81 6444 5,293
644 Budh1ada urban Bhattnda 1931 8,369 4,839 3,530 agglomeratIon (PUNJAB) 1941 5,364 -3,005 -3591 3,151 2,213
1951 7,077 +1,713 +31 94 3,694 3,383 1961 NA 8,620 + 1,543 +2180 4,697 3,923 1971 NA 11,713 +3,093 +35 88 6,200 5,513
(I) Budh1ada 1931 8,369 4,839 3,530 1941 5,364 -3,005 -3591 3,151 2,213 1951 7,077 • +1,7J3 +3194 3,694 3,383 1961 MC 259 8,620 + 1,543 +2180 4,697 3,923 1971 MC. 259 10,548 + lm8 +2237 5,517 5,031
(11) Bhlkehl and 1971 NA 595 341 254 Boha Road ColonIes (0 G )
(111) I T I (0 G ) 197i NA 570 342 228
645 Ralkot Ludhlana 1901 10,131 5,185 4,946 (PUNJAB) 1911 7,510 -2,621 -2587 4,073 3,437
1921 8379 +869 + II 57 4,553 3,826 1931 11:810 +3,431 +4095 6,530 5,280 1941 13,777 + 1,967 +16 66 7,375 6,402 1951 10,193 ~3,584 -2601 5,421 4,772 1961 MC o 88 11,239 +1,046 +1026 5,854 5,385 1971 MC 088 ll,709 +470 +4 18 6,058 5,651
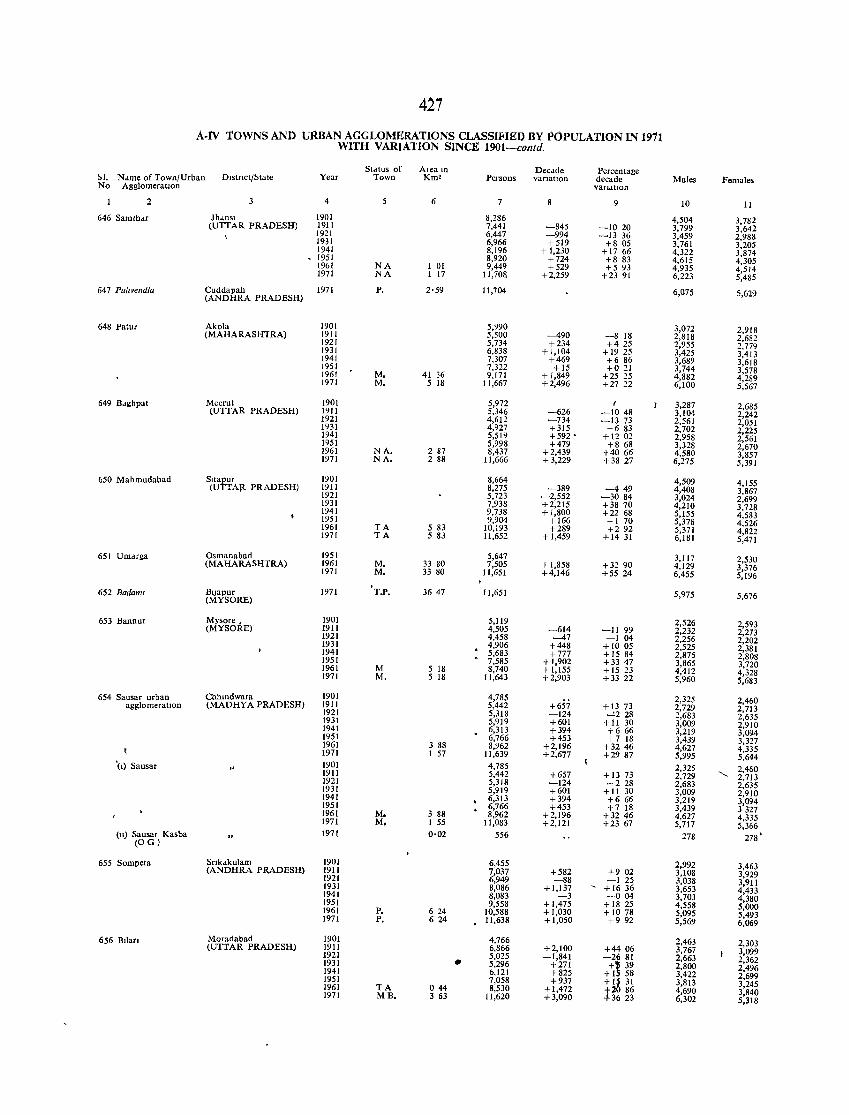
427
A-IV TOWNS AND URBAN AGGLOMERATIONS CLASSIHED BY POPULATION IN 1911 WITH VARIATION SINCE 1901-contd.
StdtuS of Alealu Decdde Percentage 1>1. Ndme of Town/Urban Dlstflct/5tate Year Town Km' Persons VarIatIOn decade Males Females No AgglomeratIOn vafldtlOn
2 3 4 5 6 7 9 10 11
646 Samthdr Jhdnsl 1901 8,286 4,504 3,782 (UTTAR PRADESH) 1911 7,441 -845 -1020 3,799 3,642 1921 6,447 -994 -1336 3,459 2,988 1931 6,966 +519 +8 05 3,761 3,205 1941 8,196 + 1,230 +1766 4,322 3,874 - 1951 8,920 +724 +8 83 4,615 4,305 1961 NA 1 01 9,449 +529 +5 93 4,935 4,514 1971 NA 1 17 11,708. +2,259 +23 91 6,223 5,485
647 Pulivendla Cuddapah 1971 P. (ANDHRA PRADESH)
2'59 11,704 6,075 5,619
648 Patur Akola 1901 5,990 3,072 2,918 (MAHARASHTRA) 1911 5,500 -490 -818 2,818 2,682 1921 5,734 +234 +425 2,955 2,779 1931 6,838 +1,104 + 19 25 3,425 3,413 1941 7,307 +469 +6 86 3,689 3,618 1951 7,322 +15 +021 3,744 3,578 1961 M. 41 36 9,171 + 1,849 +25 25 4,882 4,289 1971 M. 5 18 11,667 +2,496 +27 22 6,100 5,567
649 Bdgbpat Meerut 1901 5,972 I 3,287 2,685 (UTTAR PRADESH) 1911 5,346 -626 -1048 3,104 2,242 1921 4,612 -734 -13 73 2,561 2,051 1931 4,927 +315 +683 2,702 2,225 1941 5,519 +592 • +12 02 2,958 2,561 1951 5,998 +479 +8 68 3,328 2,670 1961 NA. 2 87 8,437 +2,439 +4066 4,580 3,857 1971 NA. 2 88 11,666 + 3,229 +3827 6,275 5,391
650 Mahmudabad Sltapur 1901 8,664 4,509 4,155 (UTTAR PRADESH) 1911 8,275 -389 -449 4,408 3,867 1921 5,723 -2,552 -3084 3,024 2,699 1931 7,938 +2,215 +38 70 4,210 3,728 1941 9,738 +1,800 +2268 5,155 4,583 1951 9,904 + 166 + 1 70 5,378 4,526 1961 TA 5 83 10,193 +289 +292 5,371 4,822 1971 TA 5 83 11,652 +1,459 +14 31 6,181 5,471
651 UmMga Osmanabad 1951 5,647 3,117 2,530 (MAHARASHTRA) 1961 M. 33 80 7,505 + 1,858 +32 90 4,129 3,376 1971 M. 33 80 11,651 +4,146 +55 24 6,455 5,196 ,
1971 T.P. 36 47 11,651 652 BadamI B'japUr 5,975 5,676 (MYSORE)
653 Bannur Mysore, 1901 5,119 2,526 2,593 (MYSORE) 1911 4,505 -614 -1199 2,232 2,273 1921 4,458 -47 -104 2,256 2,202 1931 · 4,906 +448 + 1005 2,525 2,381 1941 5,683 +777 + 15 84 2,875 2,808 1951 · 7,585 + 1,902 +33 47 3,865 3,720 1961 M 5 18 8,740 + 1,155 + 15 23 4,412 4,328 1971 M. 5 18 11,643 +2,903 +33 22 5,960 5,683
654 Sausar urban ChhlOdwara 1901 4,785 2,325 2,460 agglomeratIOn (MADHYA PRADESH) 1911 5,442 +657 +13 73 2,729 2,713 1921 5,318 -124 -'-2 28 2,683 2,635 1931 5,919 +601 +11 30 3,009 2,910 1941 6,313 +394 +666 3,219 3,094 1951 6,766 +453 +7 18 3,439 3,327 1961 3 88 8,962 +2,196 +3246 4,627 4,335 1971 1 57 11,639 +2,677 +2987 5,995 5,644 '(1) Sausar 1901 4,785 2,325 2,460 1911 5,442 +657 + 13 73 2,729 ""- 2,713 1921 5,318 -124 -228 2,683 2,635 1931 5,919 +601 + 11 30 3,009 2,910 1941 6,313 +394 +6 66 3,219 3,094 1951 · 6,766 +453 +7 18 3,439 3327 1961 M. 3 88 8,962 +2,196 +3246 4,627 4,335 1971 M. 1 55 11,083 +2,121 +23 67 5,717 5,366 (11) Sausar Kasba 1971 0·02 556 278 278' (OG)
655 Sompeta Snkdkulam 1901 6,455 2,992 3,463 (ANDHRA PRADESH) 1911 7,037 +582 +902 3,108 3,929 1921 6,949 -88 -125 3,038 3,911 1931 8,086 +1,137 - + 16 36 3,653 4,433 1941 8,083 -3 -004 3,703 4,380 1951 9,558 + 1,475 + 1825 4,558 5,000 1961 P. 624 10,588 + 1,030 + 1078 5,095 5,493 1971 P. 6 24 11,638 +1,050 +992 5,569 6,069
656 Bllan Moradabad 1901 4,766 2,463 2,303 (UTTAR PRADESH) 1911 6,866 +2,100 +4406 3,767 3,099 1921 5,025 -1,841 -2i 81 2,663 2,362 1931 • 5,296 +271 + 39 2,800 2,496 1941 b.121 +825 +1 58 3,422 2,699 1951 7,058 +937 +lg 31 3,813 3,245 1961 TA 044 8,530 +1,472 t:2 86 4,690 3,840 1971 MB. 3 63 11,620 +3,090 3623 6,302 5,318
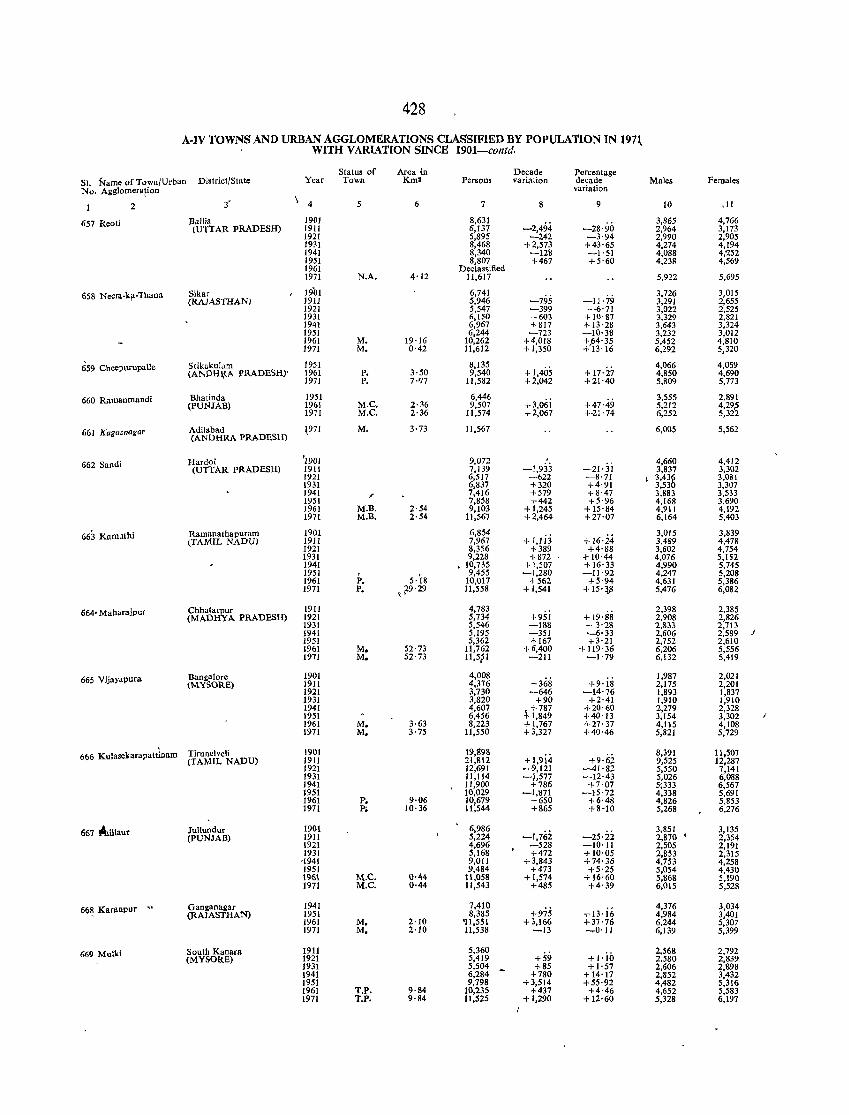
428
A-IV TOWNS AND URBAN AGGLOMERATIONS CLASSIFIED BY POPULATION IN 1971. . WITH VARIATION SINCE 1901-contd.
Status of Area in Decade Percentage SI. Name of Town/Urban District/State Year Town Km2 Persons variation decade Males Females No. Agglomerafion variation
2 3" ~ 4 5 6 7 8 9 10 ,11
657 Reoti llallia J901 8,631 -2,494
3,865 4,766 (UTTAR PRADESH) 1911 6,137 -28·90 2,964 3,173
1921 5,895 -242 -3'94 2,990 2,905 1931 8,468 +2,573 +43'65 4,274 4,194 1941 8,340 -128 -1'51 4,088 4,'252 1951 8,807 +467 +5'60 4,238 4,569 1961 Declassified 1971 N.A. 4·12 11,617 5,922 5,695
658 Necm-lq\-Thana Sikar 19b1 6,741 -11-'79
3,726 3,015 (RAJASTHAN) 1911 5,946 -795 3,291 2,655
1921 5,547 -399 -6'71 3,022 2,525 1931 6,150 +603 + 10·87 3,329 2,821 1941 6,967 +817 + 13'28 3,643 3,324 1951 6,244 -723 -10'38 3,232 3,012 1961 M. 19·16 10,262 +4,018 t'fn~ 5,452 4,810 1971 M. 0·42 11,612 + 1,350 6,292 5,320
659 Chcepurupalle Srikaku[,tm 1951 8,135 +1,405
4,066 4,069 (ANPHI;tA PRADESH)' 1961 P. 3·50 9,540 + 17'27 4,850 4,690
1971 P. 7''77 11,582 +2,042 +21·40 5,809 5,773
660 Ramanmandi Bhatinda 1951 6,446 +3,06i
3,555 2,891 (pUNJAll) 1961 M.C. 2·36 9,507 +47·49 5,212 4,29,5
1971 M.e, 2·36 11,574 +2,067 +<21'74 6,252 5,322
661 Kagalnagar Adila.bad \971 M. (ANDHRA PRADESH)
3·73 11,567 6,005 5,562
662 Sandi Bardoi '1901 9,072 , 4,660 4,412 (UTTAR PRADESH) 1911 7,139 -1,933 -21·31 3,837 3,302
1921 6,517 -622 -8·71 I 3,43g 3,081 1931 6,837 +320 +4'91 3,53 3,307 1941 / 7,416 +579 +8'47 3,883 3,533 1951 7,858 +442 +5'96 4,168 3,690 1961 M.B. 2·54 9,103 +1,245 +15·84 4,911 4,192 1971 M.B. 2·54 11,567 +2,464 +27'07 6,164 5,403
663 Kamulhi Ramanathapuram 1901 6,854 +l,lij +16'24
3,015 3,839 (TAMIL NADU) 1911 7,967 3,489 4,478
1921 8,356 +389 +4·88 3,602 4,754 1931 9,228 +872 +10·44 4,076 5,152 1941 10,735 +1,507 +16·33 4,990 5,745 1951 P. 5.'1&
9,455 -1,280 -Jl·92 4,247 5,208 1961 10,017 +562 +5'94 4,631 5,386 1971 P. 29·29 11,558 +1,541 +15-:\11 5,476 6,082 ;,.
664' Mabarajpuf Chbatarpur 1911 4,783 +95i + 19'88
2,398 2,385 (MADHYA PRADESH) 1921 5,734 2,908 2,826
1931 5,546 -188 -3'28 2,833 2,713 1941 5,195 -351 --6'33 2,606 2,589 )
1951 5,362 +167 +3'21 2,752 2,610 1961 M. 52·7:\ 11,762 +6,400 + 119· 36 6,206 5,556 1971 M. 52·73 lI,5t l -211 -1'79 6,132 5,419
665 Vijayapura Bangalore 1901 4,008 +368 +9·is
1,987 2,021 (MYSORE) 1911 4,376 2,175 2,201
1921 3,730 -646 -14'76 1,893 1,837 1931 3,820 +90 +2·41 1,910 1,910 1941 4,607 , +787 +20'60 2,279 2,328 1951 6,456 +1,849 +40'13 3,154 3,302 / 1961 M. 3·63 8,223 +1,767 +27· 37 4,115 4,108 1971 M. 3·75 11,550 +3,327_ +40·46 5,821 5,729 .
Tirunelveli 1901 19,898 8,391 11,507 666 Kulasekarapattinam (TAMIL NADU) 1911 21,812 +l,9i4 +9'62 9,525 12,287
1921 12,691 -9,121 -41'82 5,550 7,141 1931 11,114 -1,577 -12·43 5,026 6,088 1941 11,900 +786 +7·07 5;333 6,567 1951 10,029 -1,871 -15·72 4,338 5,691 1961 P. 9·06 10,679 +650 +6·48 4,826 5,853 1971 p. 10·36 11,544 +865 +8-10 5,268 6,276
667 tlhUlaut Julluudur 1901 6,986 -1,762 -25'22
3,851 3,135 (PUNJAB) 1911 5,224 2,870 • 2,354
1921 4,696 -528 -10'11 2,505 2,191 1931 5,168 +472 +10·05 2,853 2,315
'1941 9,011 +3,843 +74'36 4,753 4,258 1951 9,484 +473 +5·25 5,054 4,430 1961 M.e. 0·44 11,058 +1,574 + 16·60 5,868 5,190 1971 M.C. 0·44 11,543 +485 +4'39 6,015 5,528
66~ Karanpur " Ganganagar 1941 7,410 +13·i6
4,376 3,034 (RAJASTHAN) 1951 8,385 +975 4,984 3,401
1961 M. 2·10 '11,551 +3,166 +37'76 6,244 5,307 1971 M. 2·10 11,538 ~13 ...,..O·ll 6,139 5,399
669 Mulki South Kanara 1911 5,360 +59 +1·io
2,568 2,792 (MYSORE) 1921 5,419 2.580 2,839
1931 5,504 . +85 +1'57 2,606 2,898 1941 6,284 +780 + 14'17 2,852 3,432 1951 9,798 +3,514 +55·92 4,482 5,316 1961 T.P. 9·84 10,235 +437 +4'46 4,652 5,583 1971 T.P. 9·84 11,525 +1,290 +12·60 5,328 6,197
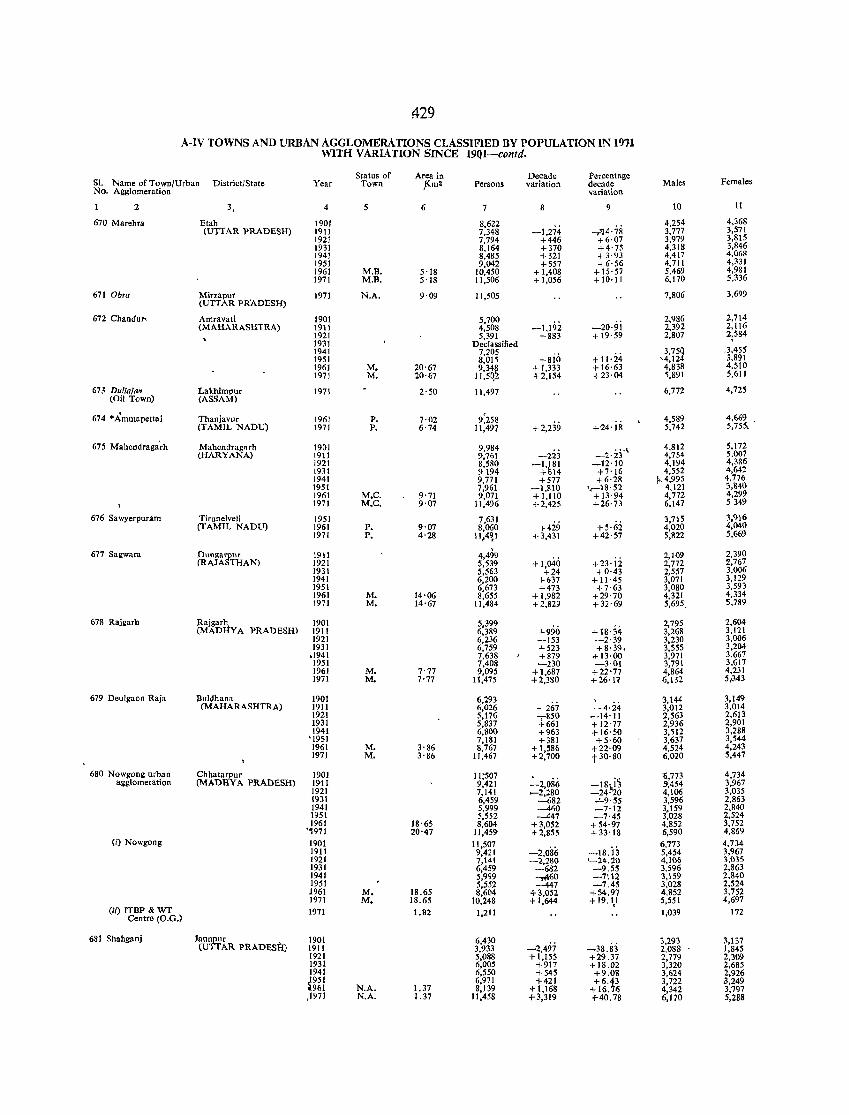
~29
A-IV TOWNS AND URBAN AGGLOMERATIONS CLASSIFIED BY POPULATION IN 19"11 WITH VARIATION SINCE 19Q1-contd.
Status of Area in Decade Percentage Females SI. Name of Town/Urban District/State Year Town ,Km2 Persons variation decade Males
No. Agglomeration variation
2 3, 4 5 6 7 8 9 10 11
670 Mareh .. a Etah 1901 8,622 -,.."14'78
4,254 4,368 (UTTAR PRADESH) 1911 7,348 -1,274 3,777 3,571
1921 7,794 +446 +6·07 3,979 3,815 1931 8,164 +370 +4·75 4,318 3,846 1941 8,485 +321 +3'93 4,417 4,068 1951 9,042 +557 +6·56 4,711 4,331 1961 M.B. 5'18 10,450 + 1,408 + 15·57 5,469 4,981 1971 M.B. 5'18 11,506 + 1,056 + 10·11 6,170 5.336
671 Ob,a Mirzapur (UTTAR PRADESH)
1971 N.A. 9·09 11,505 7,806 3,699
672 Chandul' Amravati 1901 5,700 -1,19i
2,986 2,714 (MAHARASHTRA) 1911 4,508 -20·91 2,392 2,116
1921 5,391 +883 + 19·59 2,807 2;584 1931 Declassified
,3,455 1941 7,205 +8io +11·24
3,75~ 1951 8,015 '412 3,891 1961 M. 20'67 9,34~ + 1,333 + 16·63 4;838 4.510 1971 M. 20'67 11,5Q_ 4-2,154 + 23·04 5,891 5.611
673 Dulin;". Lakhimpur 1971 2'50 11,497 6,772 4,725 (Oil Town) (ASSAM)
674 ·Ammapettai Thanjavur 1961 P. 7·02 9:258 +2,239 +24·is
4,589 4,669 • (TAMIL NADD) 1971 P. 6'74 11,497 5,742 5,755,
675 Mahendraga'rh Mahendrag"rh 1901 9,984 -223
... ~ 4,812 5,172 (HARYANA) 1911 9,761 -2·:13 4,754 5,007
1921 8,580 -I,~81 ~12'10 4,194 4,386 1931 9194 + 14 +7'16 4,552 4,642 1941 9,771 +577 +6'28 ~, 4,995 4,176 1951 7,961 -1,810 ,.-18'52 4.121 3,840 1961 M.e, 9'71 9,071 + 1,110 + 13·94 4,772 4,299 1971 M.C. 9'07 11,496 +2,425 +26·73 6.147 5349
676 Sawyerpuram Tirunelveli 1951 7,631 +429 +5·62
3,715 3,916 (TAMIL NADD) 1961 P. 9'07 8,060 4,020 4,040
1971 P. 4'28 I\f4~1 +3,431 +42'57 5,822 5,669
677 Sagwal'a Dungarpur 1911 4,499 +1,040 +23·ii
2,109 2,390 (RAJASTHAN) 1921 5,539 2,772 2,767
1931 5,563 +24 +0·43 2,557 3,006 1941 6,200 +637 +11·45 3,071 3,129 1951 6,673 +473 +7,63 3,080 3,593 1961 M. 14'06 8,655 + 1,982 +29·70 4,321 4,334 1971 M. 14'67 11,484 +2,829 + 32,69 5,695, 5,789
678 Rajgarh Rajgar~ 1901 5,399 +990 + 18·34
2,795 2,604 (MAD Y A PRADESH) 1911 6,389 3,268 3,121
1921 6,236 -153 -2·39 3,230 3,006 1931 6,759 +523 +8139. 3,555 3,204
.1941 7,638 +879 .1-13,00 3,971 3,667 1951 7,408 -230 -3,01 3,791 3,617 1961 M. 7'77 9,095 +1,687 +22'77 4,864 4,231 1971 M. 7'77 11,475 +2,380 +26'11 6,132 5;343
679 Deulgaon Raja Buldhan" 1901 6,293 3,144 3,149 (MAHARASHTRA) 1911 6,026 -267 -4·24 3,012 3,014
1921 5,176 -:r~~? -14'11 2,563 2,613 1931 5,837 + 12·77 2,936 2,901 1941 6,800 +963 + 16·50 3,';12 3,288
'1951 7,181 +381 +5·60 3,637 3,544 1961 M. 3'86 8,767 +1,586 +22,09 4,524 4,243 1971 M. 3'86 11,467 +2,700 t 30· 80 6,020 5,447
680 Nowgong urban Chhatarpur 1901 11:507 -2,086 -18~~
'6,773 4,734 agglomeration (MADHYA PRADESH) 1911 9,421 5>,454 3,967
1921 7,141 _2,280 -24·0 4,106 3,035 1931 6,459 -682 -'-9· 55 3,596 2,863 1941 5,999 -460 -7·12 3,159 2,840 1951 5,552 -447 -7·45 3,028 2,524 1961 18'65 8,604 +3,052 +54·97 4,852 3,752
"971 20'47 11,459 +2,855 +33,18 6,590 4,869 (i) Nowgong 1901 11,507
-18.i3 6,773 4,734
1911 9,421 -2,086 5,454 3,967 1921 7,141 -2,280 '-24.20 4,106 3,035 1931 6,459 -682 -9,55 3,596 2,863 1941 5,999 ~O -7'.12 3,159 2,840 1951 5,552 -447 -7.45 3,028 2,524 1961 M. 18.65 8,604 +3,052 +54.97 4,852 3,752 1971 M. 18,65 10,248 + 1,644 +19.1,1 5,551 4,697
(U) rrBP & WT 1971 1.82 1,211 1,039 172 Centre (O,G.)
68 t Shahganj Jaunpur 1901 6,430 3,293 3,137 (UTTAR PRADESH) 1911 3,933 -2,497 -38.83 2,088 1,845
1921 5,088 + 1,155 +29.37 2,779 2,309 1931 6,005 +917 + 18.02 3,320 2,685 1941 6,550 +545 +9.08 3,624 2,926 ~951 6,971 +421 +6,~3 3,722 .1,249
961 N.A. 1.37 8,139 + 1,168 +16.6 4,342 3,797 ,1971 N,A. 1.37 11,458 +3,319 +40.78 6,170 5,288
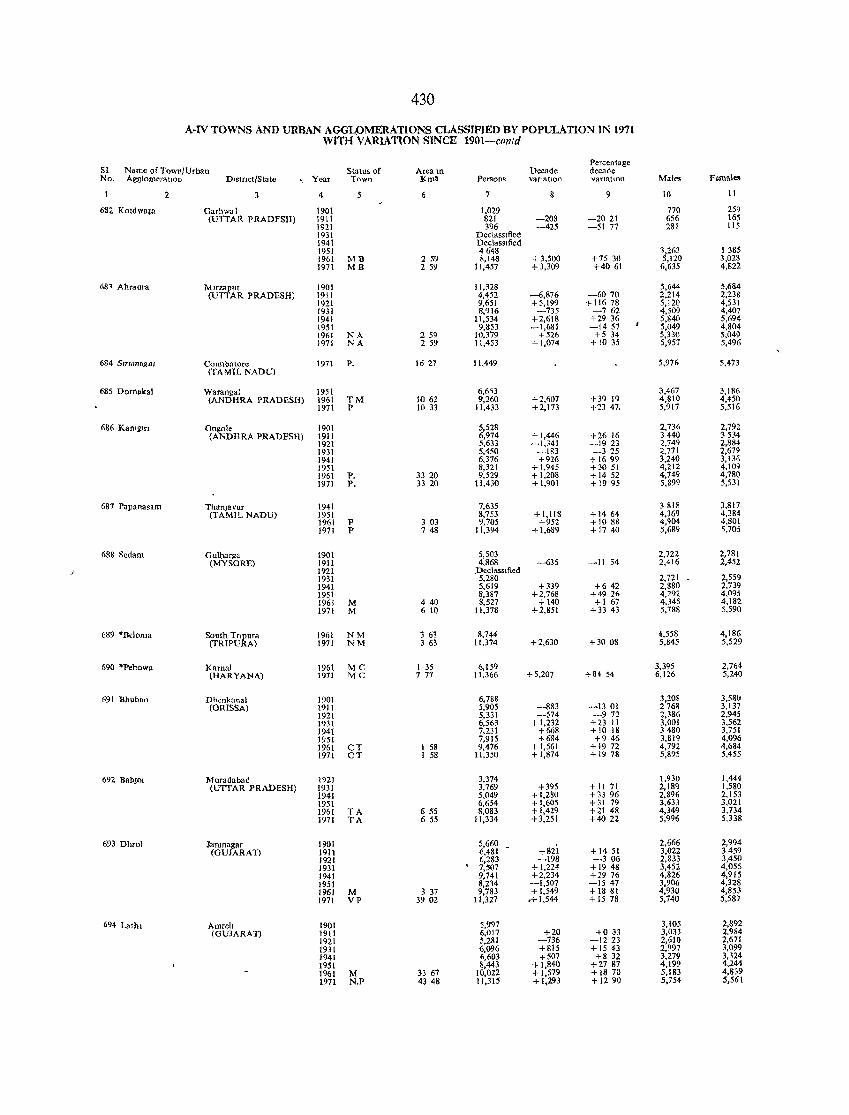
430
A·IV TOWNS AND URBAN AGGLOMERATIONS CLASSIFIED BY POPULATION IN 1971 WITH VARIATION SINCE 1901-conld
SI Name of TownJUrban Percentage
Status of Aream Decade decade No. Agglomeration DlstnctJState , Year Town Km~ Persons variation vanatlon Males Females
2 3 4 5 7 9 10 11
682 Kotdwafa Garhwal 1901 1,029 770 259 (UTTAR PRADFSH) 1911 821 -208 -2021 656 165
1921 396 -425 -51 77 281 115 1931 DeclassIfied 1941 DeclasSIfied 1951 4648 1,263 1385 1961 Mll 2 59 8,148 + 3,500 +75 30 5,120 3,028 1971 MB 259 11,457 + 3,309 +4061 6,635 4,822
681 Ahraura Mlrzapur 1901 11,328 5,644 5,684 (UTTAR PRADESH) 1911 4,452 -6,876 -6070 2,214 2,238
1921 9,651 +5,199 + 1 1678 5,120 4,531 1931 8,916 -735 -762 4,509 4,407 1941 11 ,534 +2,618 +29 36 5,840 5,694 1951 9,853 -1,681 -1457 5,049 4,804 1961 NA 259 10,379 +526 +534 5,330 5,049 1971 NA 259 11,453 +1,074 +1035 5,957 5,496
684 SlnmlllgGl COimbatore 1971 p, 16 27 11,449 5,976 5,473 (TAMIL NADU)
685 Dornakal Watanga1 1951 6,6~3 3,467 3,186 (ANDHRA PRADESH) 1961 ™ 1062 9,260 +2,607 +39 19 4,810 4,450
1971 P 10 33 11,433 +2,173 +23 47. 5,917 5,516
686 Kantg:1rl Ongole 1901 5,528 2,736 2,792 (ANDHRA PRADESH) 1911 6,974 +1,446 +26 16 :3 440 :3 534
1921 5,633 -1,341 -1923 2,749 2,884 1931 5,450 -183 -325 2,771 2,679 1941 6,376 +926 + 1699 3,240 3,136 1951 8,321 +1,945 +3051 4,212 4,109 1961 p, 3320 9,529 +1,208 + 1452 4,749 4,780 1971 P. 3320 11,430 +1,901 + 1995 5,899 5,531
687 Papanasam ThanJavur 1941 7,635 3818 3,817 (TAM1L NADU) 1951 8,753 +1,118 + 1464 4,369 4,384
1961 P 303 9,705 +952 + 1088 4,904 4,801 1971 P 748 11,394 +1,689 + 1740 5,689 'i,7QS
688 Sedam Gulbarga 1901 5,503 2,722 2,781 (MY SORE) 1911 4,868 -635 -11 54 2,416 2,452
1921 ;DeclaSSIfied 1931 5,280 2,721 - 2,559 1941 5,619 +339 +642 2,880 2,739 1951 8,387 +2,768 +4926 4,292 4,095 1961 M 440 8,527 + 140 + 1 67 4,345 4,182 1971 M 6 10 11,378 +1,851 + 33 43 5,788 5,590
689 ·Beloma South Tnpura 1961 NM 3 63 8,744 4,558 4,186 (TRIPURA) 1971 NM 363 11,374 +2,630 +3008 5,845 5,529
690 'Pehowa Kamal 1961 MC I 35 6,159 3,395 2,764 (HARYANA) 1971 Me 777 11,366 +5,207 +84 54 6,126 5,240
691 Bhuban Dhcnkanal 1901 6,788 3,208 3,58(1 (ORISSA) 1911 5,905 -883 -1301 2768 3,137
1921 5,331 -574 -972 2,386 2,945 1931 6,563 +1,232 +23 11 3,001 3,562 1941 7,231 +668 + 10 18 3480 3,751 1951 7,915 +684 +946 3,819 4,096 1961 CT 1 58 9,476 + 1,561 + 1972 4,792 4,684 1971 CT I 58 11,350 +1,874 + 19 78 5,895 5,455
692 Bah)ol Moradabad 1921 3,374 1,930 1,444 (UTTAR PRADESH) 1931 3,769 +395 + 11 71 2,189 1,580
J941 5,049 + 1,280 +33 96 2,896 2,153 1951 6,654 +1,605 +31 79 3,633 3,021 1961 TA 655 8,083 + 1,429 +21 48 4,349 3,734 ]971 TA 6 55 11,334 +3,251 +4022 5,996 5,338
693 Dhrol Jamnagar 1901 5,660 +82i
2,666 2,994 (GUJARAT) 1911 6,481 +1451 3,022 3459
1921 6,283 -198 -306 2,833 3,450 ]931 . 7,507 +1,224 + 1948 3,452 4,055 1941 9,741 +2,234 +2976 4,826 4,915 1951 8,214 -1,507 -1547 3,906 4,328 1961 M 3 37 9,783 + 1,549 +1881 4,930 4,853 1971 VP 3902 11,327 .+1,544 + 15 78 5,740 5,587
694 Lathl Amreh 1901 5,997 3,105 2,892 (GUJARAT) 1911 6,017 +20 +033 3,033 2,984
1921 5,281 -736 -1223 2,610 2,671 1931 6,096 +815 + IS 43 2,997 3,099 1941 6,603 +507 +832 3,279 3,324 1951 8,443 +1,840 +2787 4,199 4,244 1961 M 33 67 10,022 + 1,579 +1870 5,183 4,839 1971 N.P 4348 11,315 +1.293 + 1290 5,754 5,561
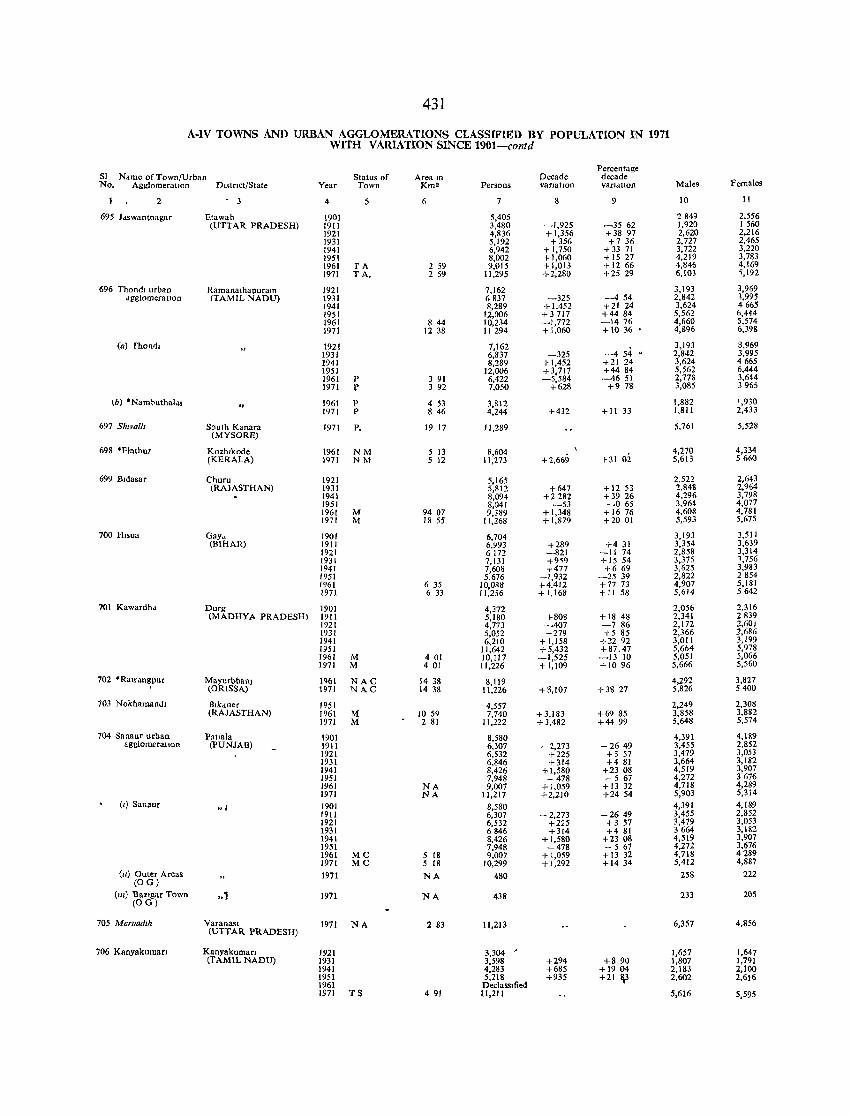
431
A-IV TOWNS AND URBAN AGGLOMERATlONS CLASSIFlED BY POPULATION IN 1971 WITH VARIATION SINCE 1901-contd
Percentage SI Name of Town/Urban Status of Area In Decade decade No. AgglomeratIOn DistrIct/State Year Town Km2 Persons varIatIOn varJdtIon Males Females
2 3 4 5 6 7 8 9 10 II
695 J"swantnagar Etawah 1901 5,405 2849 2,556 (UTTAR PRADESH) 1911 3,480 -1,925 -3562 1,920 1560
1921 4,836 +1,356 +38 97 2,620 2,216 1931 5,192 +356 +7 36 2,727 2,465 1941 6,942 + 1,750 +33 71 3,722 3,220 1951 8,002 +1,060 +15 27 4,219 3,783 1961 TA 2 59 9,015 + 1,013 +12 66 4,846 4,169 1971 TA. 2 59 11,295 +2,280 +25 29 6,103 <;,192
696 Thondl urban Ramanathapuram 1921 7,162 3,193 3,969 dgglomerauon (TAMIL NADU) 1931 6837 -325 -454 2,842 1,995
1941 8,289 +1,452 +21 24 3,624 4665 1951 12,006 +3717 +44 84 5,562 6,444 1961 844 10,234 -1,772 -1476 4,660 5,574 1971 12 38 11294 +1,060 +10 36 4,896 6,398
(a) [homb 1921 7,162 3,193 3,969 1931 6,837 -325 -454 " 2,842 3,995 1941 8,289 +1,452 +21 24 3,624 4665 1951 12,006 +3,717 +44 84 5,562 6,444 1961 P 3 91 6,422 -5,584 -4651 2,778 3,644 1971 f 392 7,050 +628 +978 3,085 3965
(h) ·Naml>uthaldl 1961 p 4 53 3,812 1,882 ',930 1971 P 846 4,244 +432 +11 33 1,811 2,433
697 Shlvalll South Kanara 1971 P. 19 17 11,289 5,761 5,528 (MYSORE)
698 *Flnthur Kozhlkode 1961 NM 5 13 ~,604 +2,66<) +31 02
4,270 4,334 (KERALA) 1971 NM 5 12 11,273 5,613 5660
699 Bldasar Churu 1921 5,165 2,522 2,643 (RAJASTHAN) 1931 5,812 +647 +12 53 2,848 2,964
1941 8,094 +2282 +39 26 4,296 3,798 1951 8,041 -53 -065 3,964 4,077 1961 M 94 07 9,389 + 1,348 + 16 76 4,608 4,781 1971 M 18 55 11,268 + 1,879 +20 01 5,593 5,675
700 HlSua Gay" 1901 6,704 3,193 3,511 (BIHAR) 1911 6,993 +289 +431 3,354 3,639
1921 6172 -821 -11 74 2,858 3,314 1931 7,131 +9,9 + 15 54 3,375 1,756 1941 7,608 +477 +669 3,625 3,983 1951 5,676 -1,932 -2539 2,822 2854 1961 6 35 10,088 +4,412 +77 73 4,907 5,181 1971 6 33 11,256 + 1,168 +11 58 5,614 5642
7()1 Kawardhd Durg 1901 4,372 2,056 2,316 (MADHYA PRADESH) 1911 5,180 +808 +18 48 2,341 2839
1921 4,773 -407 -786 2,172 2,601 1931 5,052 +279 +5 85 2,366 1,686 1941 6,210 + 1,158 +2292 3,011 3,199 1951 11,642 +5,432 +87.47 5,664 5,978 1961 M 401 10,117 -1,525 -13 10 5,051 5,066 1971 M 401 11,226 +1,109 + 1096 5,666 5,560
702 * Ralf dngpur MayurbhanJ 1961 NAC 14 38 8,119 4,292 3,827 (OR[SSA) 1971 NAC 14 38 11,226 +3,107 +38 27 5,826 5400
703 Nokhamandl Blkdner 1951 4,557 2,249 2,308 (RAJASTHAN) 1961 M 10 59 7,740 +3,183 +69 85 3,858 3,882
1971 M 2 81 11,222 + 3,482 +44 99 5,648 5,574
704 Sanaur urban PatlRla 1901 8,580 4,391 4,189 agglomeratlOn (PUNJAB) 1911 6,307 - 2,273 - 2649 3,455 2,852
1921 6,532 +225 +3 57 3,479 3,053 1931 6,846 +314 +481 3,664 3,182 1941 8,426 +1,580 +2308 4,519 3,907 1951 7,948 - 478 - 567 4,272 3676 1961 NA 9,007 + 1,059 +13 32 4,718 4,289 1971 NA 11,217 +2,210 +24 54 5,903 5,314
(I) San.ur "I 1901 8,580 4,391 4,189
1911 6,307 - 2,273 -2649 3,455 2,852 1921 6,532 +225 +3 57 3,479 3,053 1931 6846 +314 +481 3664 3,182 1941 8,426 +1,580 +2308 4,519 3,907 1951 7,948 -478 - 5 67 4,272 3,676 1961 MC 5 18 9,007 + 1,059 +1332 4,718 4289 1971 MC 5 18 10,299 +1,292 +1434 5,412 4,887
(II) Outer Areas (OG)
1971 NA 480 258 222
(Ill) Bazlgar Town (OG)
.. 1 1971 NA 438 233 205
70S Marllad,h Varanasl 1971 NA (UTTAR PRADESH)
2 83 11,213 6,357 4,856
706 Kanyakuman Kanyakuman 1921 3,304 J 1,657 1,647 (TAMIL NADU) 1931 3,598 +294 +890 1,807 1,791
1941 4,283 +685 +1904 2,183 2,100 1951 5,218 +935 +21 1\3 2,602 2,616 1961 DeclassIfied 1971 TS 491 11,211 5,616 5,595
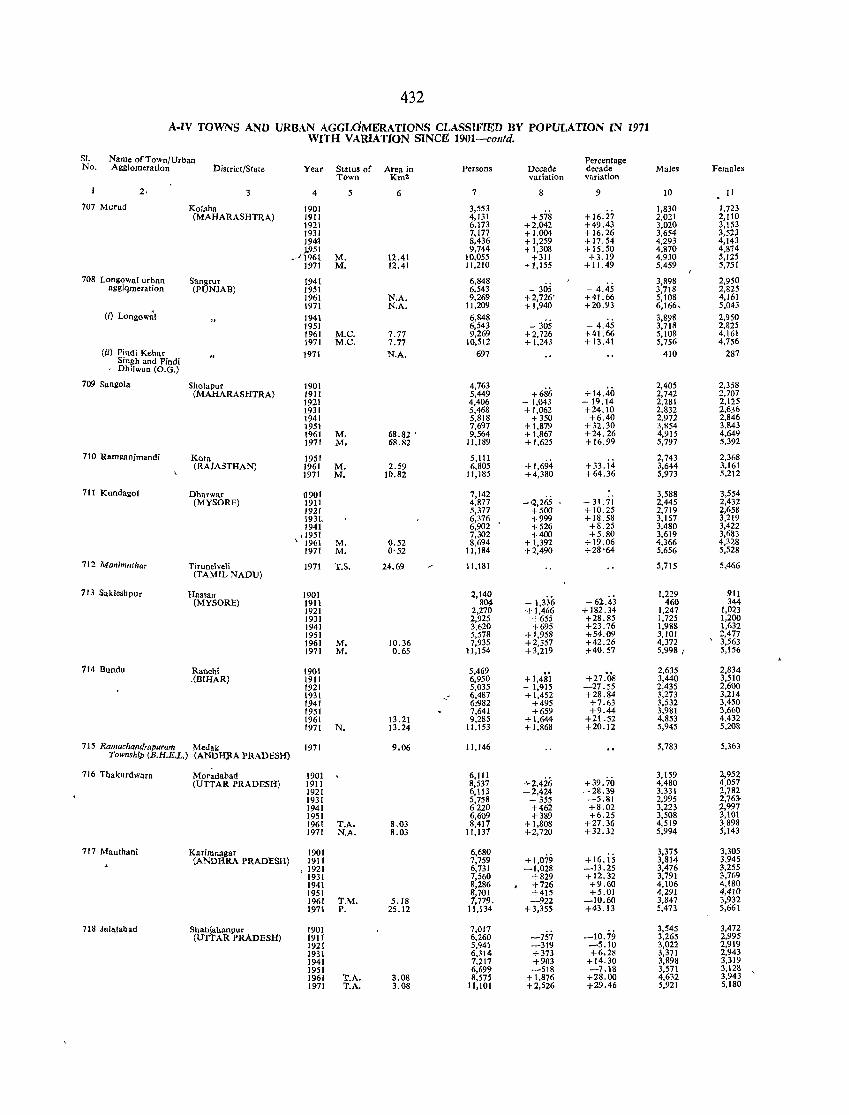
432
A-IV TOWNS AND URBAN AGGLdMERATIONS CLASSIFlED BY POPULATION eN 1971 WITH VARIATION'SINCE 1901--cOlltd.
SI. Name of Town/Urban Percentage No. Agglomeration District/State Year Status of Area in Person. Decade decade Males Females
Town Km' variation variation
2. 3 4 5 6 7 8 9 10 11
707 Murud Kolaba 1901 3,553 1,830 1,723 (MAHARASHTRA) 19lJ 4,131 +578 + 16.27 2,021 2,110
1921 6,173 +2,042 +49.43 3,020 3,153 1931 7,177 +1,004 +16.26 3,654 3,523 1941 8,436 + 1,259 +17.54 4,293 4,143 ).951 9,744 +1,308 +15.50 4,870 4,874
.,J 1<161 M. 12.41 10,055 +311 +3.19 4,930 5,125 1971 M. 12.41 11,210 +1,155 +11.49 5,459 5,751
708 LongoWal urban Sangrur 1941 6,848 - 4.45
3,898 2,950 agglqmeration (PUNJAB) 1951 6,543 - 305 3,718 2,825
1961 N,A, 9,269 +2,726' +41.66 5,108 4,161 1971 N.A. 11,209 + 1,940 +20.93 6,166, 5,043
(0 Longow~1 1941 6,848 3,898 2,950 1951 6,543 - 305 - 4.45 3,718 2,825 1961 M.C. 7.77 9,269 +2,726 +41.66 5,108 4,161 1971 M.C. 7.77 10,512 +1,243 +13.41 5,756 4,756
(Ii) Pindi Kehar 1971 N.A. 697 410 287 Singh and Pindi
. Dhilwan (O.G.)
709 Sanllola Sholapur 1901 4,763 +686
2,405 2,358 (MAHARASHTRA) 1911 5,449 + 14.40 2,742 2,707
1921 4,406 - 1,043 -19.14 2,'281 2,125 1931 5,468 + 1,062 +24.10 2,832 2,636 1941 5,818 +350 +6.40 2,972 2,846 1951 7,697 + 1.879 +32.30 3,854 3,843 1961 M. 68.82 . 9,564 + 1,867 +24.26 4,915 4,649 1971 M. 68.82 11,189 +1,625 +16.99 5,797 5,392
710 Ram~anjmandi Kota 1951 5,111 + 1,694 +33. j4
2,743 2,368 (RAJASTHAN) 1961 M. 2.59 6,805 3,644 3,161
1971 M. J().82 ll,185 +4,380 +64 .. 36 5,973 5,212
711 Kunda!:ol Dharwar 11901 7,142 -,2265 -31.7i
3,588 3,554 (MYSORE) 1911 4.877 2.445 2,432
1921 5,377 +500 + 10.25 2,719 2,658 1931. 6,376 +999 + 18.58 3,157 3,219 1941 6,902 +526 +8.25 3,480 3,422
11951 7,302 +400 +5.80 3,619 3,683 , 1961 M. 0.52 8,694 + 1,392 +19.06 4,366 4,328
1971 M. 0'52 11,184 +2,490 +28'64 5,656 5,528
712 Manimllthar Tirunelveli 1971 1'.S. 24.69 11,181 5,715 5,466 (TAMIL NADU)
713 Sakleshpur Hassan 1901 2,140 -1,336 - 62.43
1,229 911 (MYSORE) 1911 8~ 460 344
1921 2,270 +1,466 + 182.34 1,247 1,023 1931 2,925 +655 +28.85 1,725 1,200 1941 3,620 +695 +23.76 1,988 1,632 1951 5,578 +1,958 -1>54.09 3.101 2,477 1961 M. 10.36 7,935 +2,357 +42.26 4,372
, 3,563 1971 M. 0.65 11,154 +3,219 ;1-40.57 5,998 I 5,156
714 Bundu Ranchi 1901 5,469 + 1,4Si +27.'08
2,635 2,834 ,(BIHAR) 1911 6,950 3,440 3,510
1921 5,035 - 1,915 -27.55 2,435 2,600 1931 ,- 6,487 + 1,452 +28.84 3,273 3,214 1941 6;982 +495 +7.63 3,532 3,450 1951 7,641 +659 +9.44 3,981 3,660 1961 13.21 9,285 +1,644 +21.52 4,853 4,432 1971 N. 13.24 11,153 +1,868 +20.12 5,945 5,208
715 Ramachandrapuram Medak Township (B.H.E.L.) (ANDH)tA PRADESH)
1971 9.06 11,146 5,783 5,363
716 Thakurdwara Moradabad 1901 6,111 +2,426 +39.70
3,159 2,952 (UTTAR PRADESH) 1911 8,537 4,480 4.057
1921 6,113 -2,424 -28.39 3,331 2,782 1931 5,758 -355 -5.81 2,995 2,763-1941 6220 +462 +8.02 3,223 2,997 1951 6,609 +389 +6.25 3,508 3,101 1961 T.A. 8.03 8,417 + 1,808 +27.36 4,519 3.898 1971 N.A. 8.03 11,137 +2,720 +32.32 5,994 5,143
717 Manthani Karimnagar 1901 6,680 +1,079 +16. is
3,375 3,305 (ANDllRA PRADESH) 1911 7,759 3,814 3,945
I 1921 6,731 -1,028 -13.25 3,476 3,255 1931 7,560 +829 +12.32 3,791 3,769 1941 8,286 +726 +9.60 4,106 4,180 1951 8,701 +415 +5.01 4,291 4,410 1961 T.M. 5.18 7,779. -922 -10.60 3.847 3,932 1971 P. 25.12 11,134 +3,355 +43.13 5,473 5,661
7[8 Jalalabad Shahjahanpur 1901 7,017 -757 -10.79
3,545 3,472 (UTTAR PRADESH) 1911 6.260 3,265 2,995
1921 5,941 -319 -5.10 3,022 2,9[9 1931 6,314 +373 +6.28 3,371 2,943 1941 7,217 +903 +14.30 3,898 3,319 1951 6,699 -518 -7.18 3,571 3,128 1961 T.A. 3.08 8,575 +1,876 +28.00 4,632 3,943 1971 T.A. 3,08 11,101 +2,526 +29.46 5,921 5,180
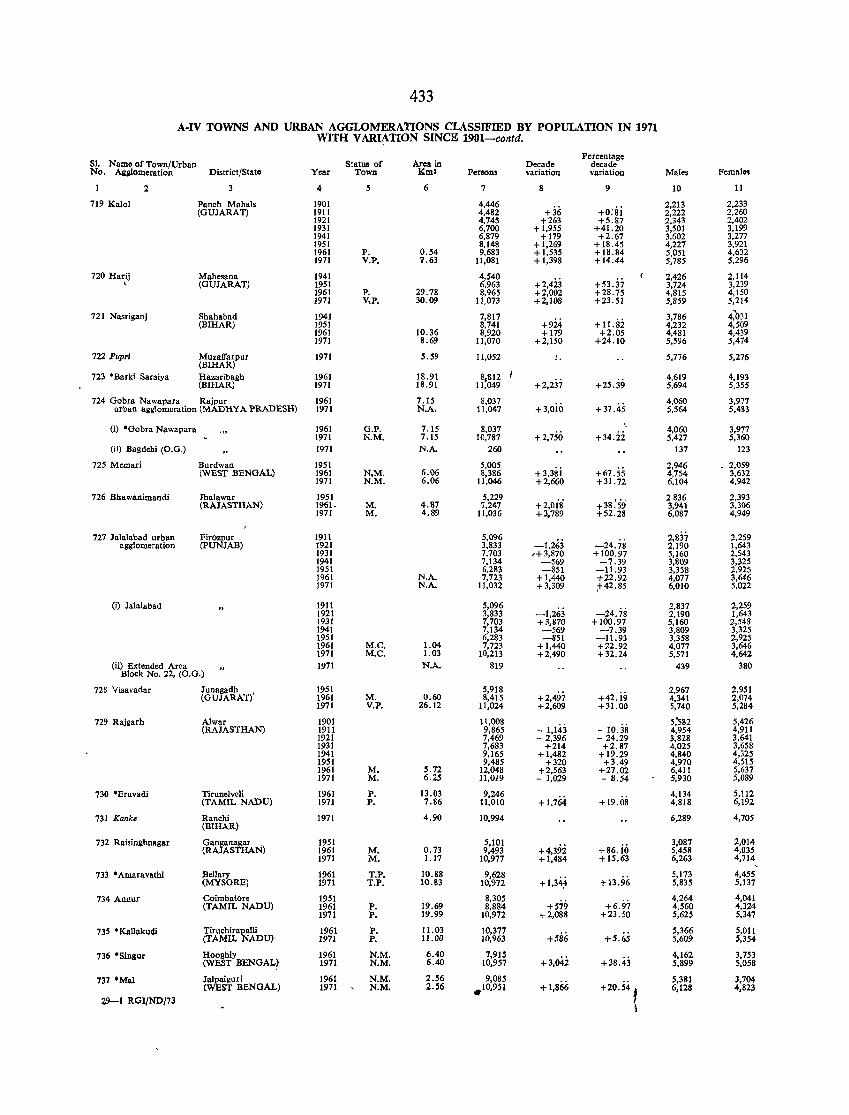
433
A-IV TOWNS AND URBAN AGGLOMERATIONS CLASSIFIED BY POPULATION IN 1911 WITH VARIATION SINCE 1901-contd.
51. Name of Town/Urban S~atu. of Area in Decade Percentage
decade No. Agglomeration District/State Year Town Kml Penons variation variation Males Females
2 3 4 S 6 7 8 9 10 11
719 Kalol Panch Mahals 1901 4,446 +36 +o:si
2,213 2,233 (GUJARAT) 1911 4,482 2,222 2,260
1921 4,745 +263 +5.87 :2,343 2,402 1931 6,700 +1,955 +41.20 3,501 3,199 1941 6,879 +179 +2,67 3.602 3,277 1951 8,148 + 1,269 +18.45 4,227 3,921 1961 P. 0.54 9,683 + 1,535 +18.84 5,051 4,632 1971 V.P. ".63 11,081 +1,398 +14.44 5,785 5,296
720 Harij Mahesana 1941 4,540 +2,4i3 +53.37
2,426 2,114 , (GUJARAT) 1951 6,963 3,724 3,239 1961 P. 29.78 8,965 +2,002 +28.75 4,815 4,150 1971 V,P. 30.09 11,073 +2,108 +23.51 5,859 5,214
721 Na.'Tiganj Shahabad 1941 7,817 +924 + 11.82
3,786 4;'031 (BIHAR) 1951 8,741 4,232 4,509
1961 10.36 8,920 +179 +2.05 4,481 4,439 1971 8.69 11,070 +2,150 +24.10 5,596 5,474
722 Pupri Muzaffarpur 1971 5.59 11,052 , 5,776 5,276 (BIHAR)
723 • Barki Saraiya Hazaribagh 1961 18.91 8,812 +2,237 +25,39
4,619 4,193 (BIHAR) 1971 18.91 11,049 5,694 5.355
724 Gobra Nawapara Rajpur 1961 7.15 8,037 +3,oio +37.45
4,060 3,977 urban agglomeration (MADHYA PRADESH) 1971 N.A. 11,047 5,564 5,483
(i) ·Oobra Nawapara 1961 G.P. 7.1S 8,037 +2,750 + 34.2i
4,060 3,977 1971 N.M. 7.15 10,787 5,427 5,360
(ii) Bagdehi (O.G.) 1971 N.A, 260 137 123
725 Memari Burdwan 1951 5,005 +3,3Si +67.55
2,946 _ 2,059 (WEST BENGAL) 1961 N.M. 6.06 8,386 4,754 3,632
1971 N.M. 6.06 11,046 +2,660 + 31. 72 6,104 4,942
726 Bhawanimandi lhalawar 1951 5,229 +2,018 +38:59
2836 2,393 (RAJASTHAN) 1961. M. 4.87 7,247 3,941 3,306
1971 M. 4.89 11,036 +3,789 + 52.28 6,087 4,949
727 lalalabad urban Firezpur 1911 5,096 -1,263 -24.78
2,83; 2,259 agglomeration (PUNJAB) 1921 3,833 2,190 1,643
1931 7,703 ,+3,870 + 100.97 5,160 2,543 1941 7,134 -569 -7.39 3,809 3,325 1951 6,283 -851 -11.93 3,358 2,925 1961 N.A. 7,723 +1,440 +22.92 4,077 3,646 1971 N.A. 11,032 +3,309 ;1-42.85 6,010 5,022
(i) J a1alabad 1911 5,096 -1,263 -24.78
2,837 2,259 1921 3,833 2,190 1,643 1931 7,703 +3,870 +100.97 5,160 2,543 1941 7,134 -569 -7.39 3,809 3,325 1951 6,283 -851 -11.93 3,358 2,925 1961 M.C. 1.04 7,723 +1,440 +22.92 4,077 3,646 1971 M.C. 1.03 10,213 +2,490 +32.24 5,571 4,642
(ii) Extended Area 1971 N.A. 819 439 380 Block No. 22, (O.G.)
728 Visavadar Junagadh 1951 5,918 +2,497 +42. i9
2,967 2,951 (GUJARAT)' 1961 M. 0.60 8,415 4,341 2,074
1971 V.P. 26.12 tl,024 +2,609 + 31.00 5,740 5,284
729 Rajgarh Alwar 1901 11,008 - 1,143 - 10.38
5:582 5,426 (RAJASTHAN) 1911 9,865 4,954 4,911
1921 7,469 - 2,396 - 24.29 3,828 3,641 1931 7,683 +214 +2.87 4,025 3,658 1941 9,165 +1,482 +19.29 4,840 4,325 1951 9,485 +320 +3.49 4,970 4,515 1961 M. 5.72 12,048 +2,563 +27.02 6,411 5,637 1971 M. 6.25 11,019 - 1,029 - 8.54 5,930 5,089
730 ·Eruvadi Tirunelveli 1961 P. 13.03 9,246 + 1,764 +19.08
4,134 5,112 (TAMIL NADU) 1971 P. 7.86 tl,010 4,818 6,192
731 Kanke Ranchi 1971 (BIHAR)
4.90 10,994 6,289 4,705
732 RaisiJli)magar Ganganagar 1951 5,101 +4,392 + 86. io 3,087 2,014
(RAJASTHAN) 1961 M. 0.73 9,493 5,458 4,035 1971 M. 1.17 10,977 +1,484 +15.63 6,263 4,714 ,
733 • Amaravathi Bellary 1961 T.P. 10.88 9,628 +1,34~ +13.96
5,173 4,455 (MYSORE) 1971 T.P. 10.83 10,972 5,835 5,137
734 Annur Coimbatore 1951 8,305 +579 +6.97
4,264 4,041 (TAMIL NADU) 1961 P. 19.69 8,884 4,560 4,324
1971 P. 19.99 10,972 +2,088 +23.50 5,625 5,347
735 • KalIakudi Tiruchirapalli 1961 P. 11.03 10,377 +586 +5.65
5,366 5,011 (TAMIL NADU) 1971 P. 11.00 10,963 5,609 5,354
736 ·Singur Hooghly 1961 N.M. 6.40 7,915 +3,042 +38.43
4,162 3,753 (WEST BENGAL~ 1971 N.M. 6.40 10,957 5,899 5,058
737 ·Mal Jaipaiguri 1961 N.M. 2.56 9,085 +1,866 +20..54 t 5,381 3,704
(WEST BENGAL) 1971 N.M. .2.56 .10,951 6,128 4,823
29-1 RGI/ND/73
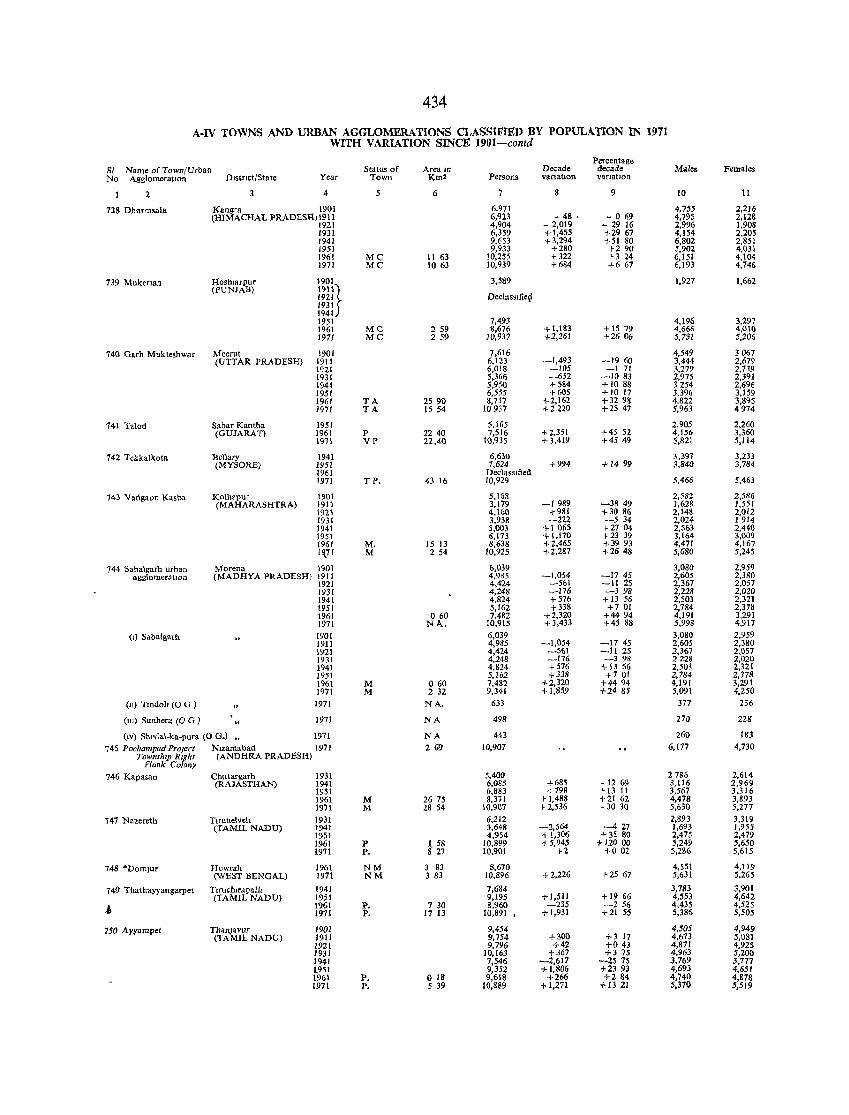
434
A-IV TOWNS AND URBAN AGGLOMERATIONS CLASSIFIED BY POPULATION IN 1971 WITH VARIATION SINCE 1901-contd
Percentage Sl Name of Town/U(oan Status of Area In Decade decade Males Females No AgglomeratIOn D.str.ct/State Y.ar Town Km2 Persons variation varlatJOn
2 4 5 6 7 8 9 10 11
738 Dharmsala Kangra 1901 6.971 4,755 2,216 (HIMACHAL PRADESH)1911 6,923 - 48 • - 0 69 4,795 2,128
Inl 4,904 - 2,019 - 29 16 2,996 1,908 1931 6,359 +1.455 +2967 4,154 2,205 1941 9.653 +3.294 +51 80 6.802 2,851 1951 9.933 +280 +290 5.902 4,031 1961 MC 11 63 10,255 +322 +3 24 6,151 4,104 1971 MC 1063 10,939 +684 +667 6,193 4,746
739 Mukermn Hosh.arpur 1901 3,589 1,927 1,662 (I'UNJAB) 19\\)
Oeclassltieg 1921 r mlJ 1951 7,493 4,196 3,297 1961 Me 259 8,676 + 1,1&3 +15 79 4,666 4,<lI() 1971 MC 259 10,937 +2,261 +2606 5,731 5,206
740 Garh Mukteshwar Meerut 1901 7,616 4,549 3067 (UTTAR PRADESH) 1911 6,123 -1,493 -1960 3,444 2,679
1921 6,018 -105 -171 3,279 2,139 1931 5,366 -652 -10 83 2,975 2,391 1941 5,950 +584 + 10 88 3254 2,696 1951 6,555 +605 + 10 17 3,396 3,159 1961 TA 2590 8,717 +2,162 +3298 4,822 3,895 1971 TA 15 54 10937 +2220 +25 47 5,963 4974
141 Talod Sa.bar Kantha 1951 5,165 2,905 2,260 (GUJARAT) 1961 p 2240 7,516 +2,351 +45 52 4,156 3,360
1971 VP 22.40 10,935 +3,419 +4549 5.821 5.114
742 Tekkalkota 13ellary 1941 6,630 3,397 3,233 (MYSORE) 1951 7,624 +994 +1499 3,840 3,784
1961 DeclassIfied 1971 TP. 43 16 10.929 5,466 5,463
743 Vadgaon Kasba Kolhapur 1901 5.168 2,582 2,586 (MAHARASHTRA) 1911 3,179 -1989 -3849 J,628 1,551
\921 4,160 -t 981 +3086 2,148 2,012 1931 3,938 -222 -534 2,024 1914 1941 5,003 +1065 +2704 2,563 2,440 1951 6,173 +1.170 +23 39 3,164 3,009 1961 M, 15 13 8,638 +2,465 +3993 4,471 4,167 1'{71 M 254 10,925 +2.287 +2648 5,680 5,245
744 Sabalgarh urban Morena 1901 6,039 3,080 2,959 agglomeration (MADHYA PRADESH) 1911 4,985 _1,054 -1745 2,605 2,380
1921 4,424 -561 -11 25 2,367 2,OS7 1931 4,248 -176 -398 2,228 2,020 1941 4,824 +576 +13 56 2,503 2,321 1951 5,162 -t 338 +701 2,784 2,378 1961 060 7,482 +2,320 +44 94 4,191 3,291 1971 N 1\. 10,915 +3,433 +45 88 5,998 4,917
(I) Sabalgarh 1901 6,039 3,080 2,959 19J1 4,985 -1,054 -1745 2,605 2,380 1921 4,424 _561 -11 25 2,367 2,057 1931 4,248 -176 -398 2228 2,020 1941 4,824 +576 + 13 56 2,503 2,321 1951 5,162 +338 +701 2,784 2,378 1961 M 060 7,482 +2,320 +4494 4,191 3,291 1971 M 232 9,341 +1,859 +24 85 5,091 4,250
(u) Tmdoll (0 G ) 1971 NA. 633 377 256
(lU) Sunhera (0 G ) 1971 NA 498 270 228'
(IV) Shwlal-ka-pura (0 G.) .. 1971 NA 443 260 183
745 Pochampad PrOject NlZamaoad 1971 269 10,907 6,177 4,730 Township Right lANDHRA PRADESH)
Flunk Colony 746 Kapasan Ch,ttargarh 1931 5,400 2785 2,614
(RAJASTHAN) 1941 6,085 +685 + 12 69 3.116 2,969 1951 6,883 +798 + 13 II 3,567 3,316 1961 M 26 75 8,3'l1 + 1,488 +2162 4,478 3,893 1971 M 28 54 10,907 + 2,536 +30 30 5,630 5,277
'47 Nazereth Tlrunetveh 1931 6,212 2,893 3,319 (TAMIL NADU) 1941 3,648 -2,564 --427 1,693 1,955
1951 4,954 + 1,306 ... 35 80 2,475 2,479 1961 P 1, 58 10,899 +5,945 +J20 00 5,249 5,650 1971 P. 8 27 10,901 +2 +002 5,286 5,615
748 *l)oIDJur Howrah 1961 NM 3 83 8,670 4,551 4,119 (WEST BENGAL) 1971 NM 3 83 10,896 +2.226 +25 67 5,631 5,265
749 Thathayyangarpet TIru,hlrapaUI 1941 7,684 3,783 3,901 (TAMIL NADU) 1951 9,195 + 1,511 +1966 4,553 4,642 .. 1961 P . 7 30 8,960 -235 -256 4,435 4,525
1911 P. 17 13 10,891 , +1,931 +21 55 5,386 5,505
150 Ayyampet ThanJavur 1901 9,454 4,505 4,949 (TAMIL NADU) 1911 9,754 +300 +3 17 4,613 5,081
1921 9,796 +42 +043 4,811 4.925 1931 10,163 +367 +375 4,963 5,200 1941 7,546 -2,617 -2515 3,769 3,777 1951 9,352 +1,806 +2393 4,693 4,651 1961 P. o 18 9,6J8 +266 +284 4,740 4,878 1971 P. 539 10.889 +1,271 +1321 5,370 5,519
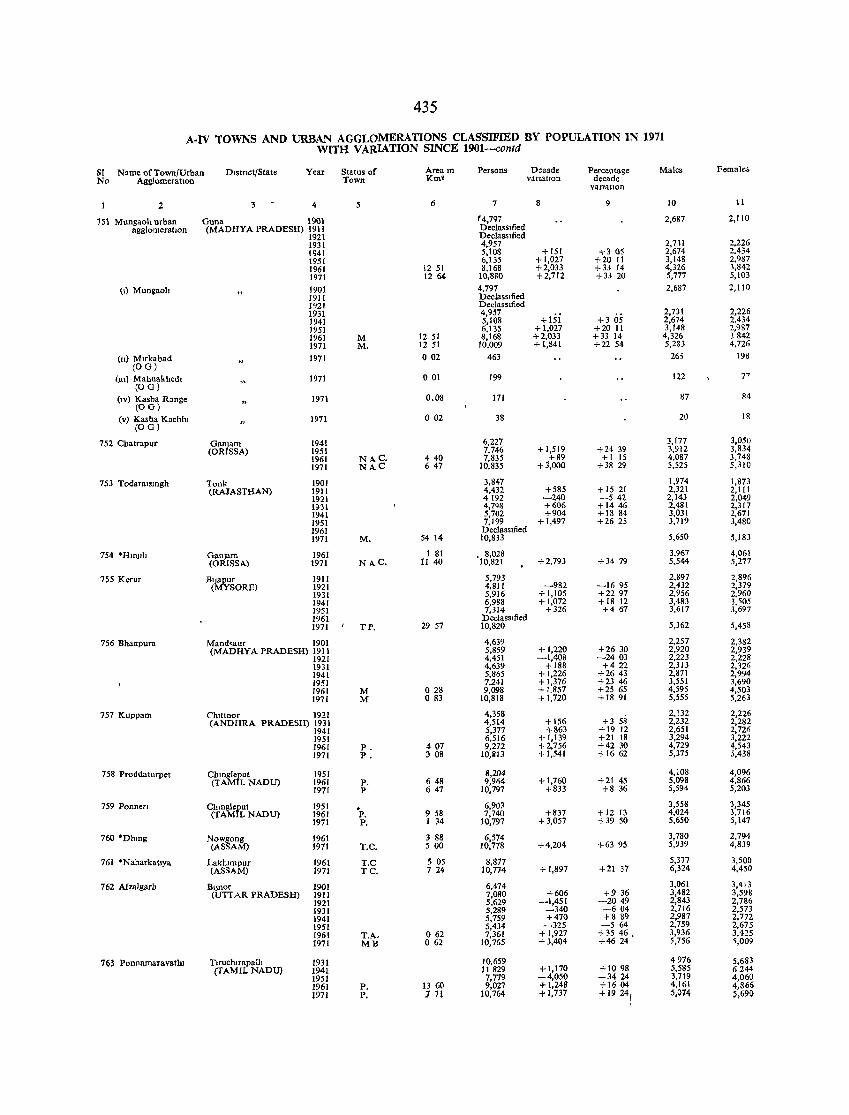
435
A.IV TOWNS AND URBAN AGGLOMERATIONS CLASSIFIED BY POPULATION IN 1971 WITH VARIATION SINCE 1901-contd
SI Name of Town/Urban Dlsttlct/State Year Status o( Artam Persons Dceade Percentage Males Females No Agglomeration Town KmS varJatJon decade
varmtlon
2 3 4 5 6 7 8 9 10 11
751 Mungaoh urban Guna 1901 '4,797 2,687 2,1l0 agglomeratIOn (MADHYA PRADESH) 1911 Declasstfied
1921 Declassified 1931 4,957 2,7H 2,226 1941 5,108 +151 +305 2,674 2,434 1951 6,135 +1,027 +20 II 3,148 2,987 1961 1251 8,168 +2,033 +33 14 4,326 1,842 1971 1264 10,880 +2,712 +33 20 5,777 5,103
(1) Mungaoh 1901 4,797 2,687 2,110 1911 DeclaSSified 1921 DeclaSSIfied 1931 4,957
+Isi 2,731 2,226
1941 5,108 +3 05 2,674 2,434 1951 6,135 + 1,027 +20 11 3,148 2,987 1961 M 1251 8,168 +2,033 +33 14 4,326 3842 1971 M, 1251 10,009 +1,841 +22 54 5,283 4,726
(ll) Mlrkabad (OG)
1971 002 463 265 198
(ml Mahuakhedl 1971 001 199 122 F (OG)
(IV) Kasba Range (00)
1971 0,08 171 87 84
(v) Kasba Kachhl 1971 002 38 20 18 (OG)
752 Chatrapur Ganjam 1941 6,227 3,177 3,050 (ORISSA) 1951 7,746 +1,519 +24 39 3,912 3,834
1961 NAC, 440 7,835 +89 + I 15 4,087 3,748 1971 NAC 647 10,835 +3,000 +38 29 5,525 ~,310
753 Todarmsmgh Tonk 190! 3,847 1,974 1,873 (RAIASTHAN) 1911 4,432 +585 +1521 2,321 2,111
1921 4192 -240 -542 2,143 2,049 1931 4,798 +606 +1446 2,481 2,317 1941 5,702 +904 +18 84 3,031 2,671 1951 7,199 +1,497 +2625 3,719 3,480 1961 DeclaSSIfied 1971 M, 54 14 10,833 5,650 5,183
754 °HlDjlh Ganjam 1961 1 81 , 8,028 3,967 4,061 (ORISSA) 1971 NAC, 11 40 10,821 +2.793 +34 79 5,544 5,277
755 Kernr BljapUr 1911 5,793 2,897 2,896 (MYSORE) 1921 4,811 -982 -1695 2,432 2,379
1931 5,916 + 1,105 +2297 2,956 2,960 1941 6,988 +1,072 +18 12 3,483 3, "05 1951 7,314 +326 +467 3,617 3,697 1961 DeclaSSified 1971 TP, 29 57 10,820 5,362 5,458
756 Bhanpura Mand'llur 1901 4,639 2,257 2,382 (MADHYA PRADESH) 1911 5,859 +1,220 +2630 2,920 2,939
1921 4,451 -1,408 -2403 2,223 2,228 1931 4,639 +188 +422 2,313 2,326 1941 5,865 +1,226 +2643 2,871 2,994 1951 7,241 + 1,376 +2346 3,551 3,690 1961 M 028 9,098 + 1,857 +25 65 4,595 4,503 1971 M 083 10,818 +1,720 +1891 5,555 5,263
757 Kuppam Chtttoor 1921 4,358 +3 58
2,132 2,226 (ANDHRA PRADESH) 1931 4,514 +156 2,232 2,282
1941 5,377 +863 +1912 2,651 2,726 1951 6,516 +1,139 +21 18 3,294 3,222 1961 P. 407 9,272 +2,756 +4230 4,729 4,543 1971 p, 3 08 10,1113 +1,541 +1662 5,375 5,438
758 Proddaturpet Chmg1epnt 1951 8,204 4,108 4,096 (TAMIL NADD) 1961 p, 648 9,964 +1,760 +2145 5,098 4,866
197I P 647 10,797 +833 +8 36 5,594 5,203
759 Ponnen Chmglepul 1951 .p, 6,903 3,558 3,345
(TAMIL NADD) 1961 9 58 7,740 +837 +12 13 4,024 3,716 1971 p. 1 34 10,797 +3,057 +39 50 5,650 5,147
760 "Dhmg Nowgong 1961 3 88 6,574 3,780 2,794 (ASSAM) 1971 T.e. 500 10,778 +4,204 +6395 5,939 4,839
761 *Naharkatlya Lakhlmpur 1961 T,C 505 8,877 5,377 3,500 (ASSAM) 1971 TC, 724 10,714 +1,897 +21 37 6,324 4,450
762 Mzalgarh B'jnOr 1901 6,474 3,061 3,413 (UTTAR PRADESH) 1911 7,080 +606 +9 36 3,482 3,598
1921 5,629 -1,451 -2049 2,843 2,786 1931 5,289 -340 -604 2,716 2,573 1941 5,759 +470 +8 89 2,987 2,772 1951 5,434 -325 -564 2,759 2,675 1961 T,A. o 62 7,361 + 1,927 +35 46 , 3,936 3,425 1971 MB o 62 10,765 +3,404 +4624 5,756 ,,009
763 PonnamaTavathl Tlruchlrapalh 1931 10,659 4976 5,683 (TAMIL NADD) 1941 11829 +1,170 +1098 5,585 6244
1951 7,779 -4,050 -3424 3,719 4,060 1961 p, 1360 9,027 +1,248 +1604 4,161 4,866 1971 P. ;7 71 10,764 +1,737 +1924
1 5,074 ~,690
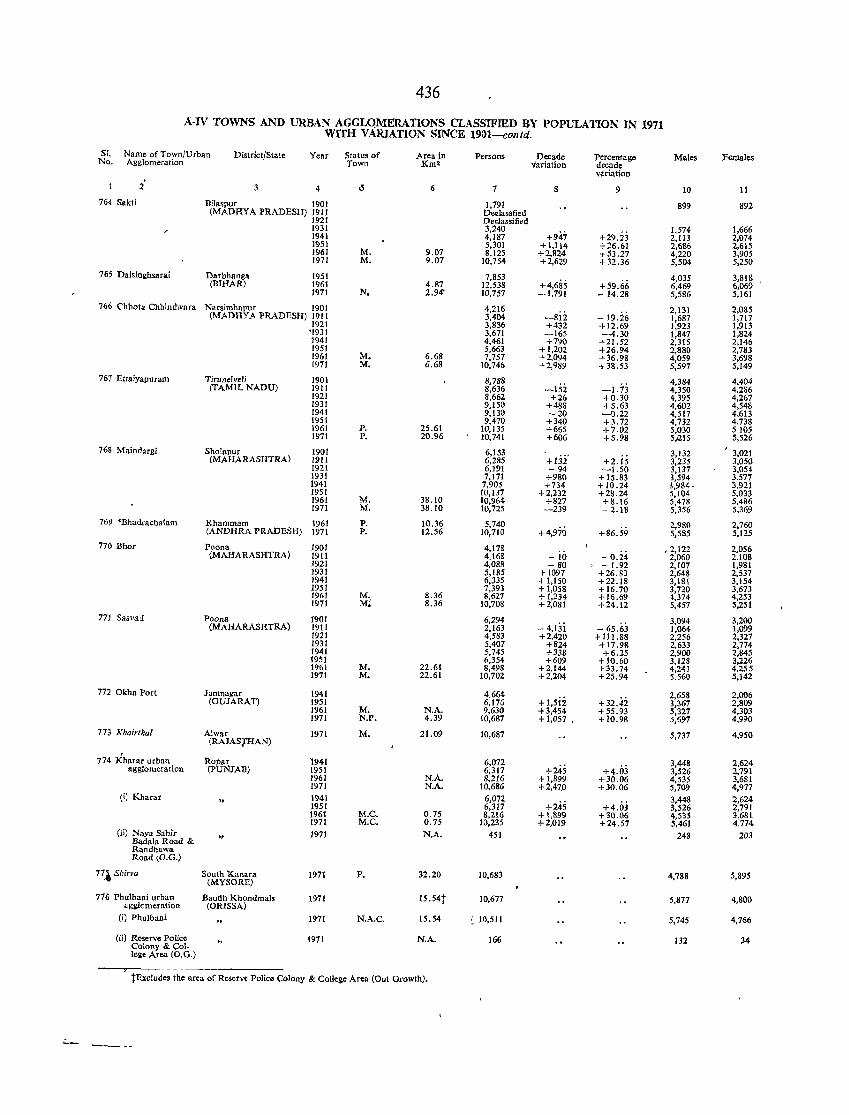
436
A·IV TOWNS AND URBAN AGGLQMERATIONS CLASSIFffiD BY POPULATION IN 1971 WITH VARIATION SINCE 19111-contd.
S1. Name of Town/Urban District/State Year Status of Area in Persons Decade Percentage Males Females No. Agglomeration Town Km2 variation decade variation
2 3 4 .s 6 7 8 9 10 11 764 Sakli Bilaspur 1901 1,791 899 892
(MADHYA PRADESH) 1911 Declassfied 1921 Declassified 1931 3,240
+947 +29,i3 1,574 1,666
1941 4,187 2,113 2,074 1951 5,301 +1,114 +26.61 2,686 2,615 1961 M. 9.07 8,125 +2,824 +53.27 4,220 3,905 1971 M. 9.07 10,754 +2,629 +32.36 5,504 5,250
765 Dalsin&hsarai Darbhanga 1951 7,853 +4,685 +59.66
4,035 3,818 (BIHAR) 1961 4.87 12,538 6,469 6,069
1971 N. 2.94' 10,757 -1,791 - 14.28 5,586 5,161
766 Chhota Chhindwara Narsimhapur 1901 4,216 -8ii - 19.26
2,131 2,085 (MADHYA PRADESH) 1911 3,404 1,687 1,717
1921 3,836 +432 +12.69 1,923 1,913 '1931 3,671 -165 -4.30 1,847 1,824 1941 4,461 +790 +21.52 2,315 2.146 1951 5,663 +1,202 +26.94 2,880 2,783 1961 M. 6.68 7,757 +2,094 +36.98 4,059 3,698 1971 M. 6.68 10,746 +2,989 +38.53 5,597 5,149
767 Etlaiyapuram Tirunelvdi 1901 8,788 -IS2 -1.7j
4,384 4,404 (TAMIL NADU) ]911 8,636 4,350 4,286
1921 8,662 +26 +0.30 4,395 4,267 1931 9,]5G +488 +5.63 4,602 4,548 1941 9,130 -20 -0.22 4,517 4,613 195] 9.470 +340 +3.72 4,732 4,738 1961 P. 25.61 10,]35 +665 +7.02 5,030 5105 1971 P. 20.96 10,741 +606 +5.98 5~15 5,526
768 Maindargj Sholtlpur 1901 6,153 +tii' +2.i5
3,132 ' 3,021 (MAHARASHTRA) 1911 6,285 3,235 3,050
1921 6,191 - 94 -1.50 3,]37 3,054 1931 7,171 +980 +15.83 3,594 3.577 1941 7,905 +734 +10.24 3,984· 3,921 1951 10,137 +2,232 +28.24 5,104 5,033 1961 M. 38.10 10,964 +827 +8.16 5,478 5,486 1971 M. 38.10 10,725 -239 - 2.18 5,356 5,369
769 *Bhadrachalam Khammam 1961 P. 10.36 5,74G +4,970 + 86.59
2,980 2,760 (ANDHRA PRADESH) 1971 P. 12.56 IO,71G 5,585 5,125
770 llhor Poona 1901 4,17& - 0.24
,2,122 2,G56 (MAHARASHTRA) 1911 4.168 - 10 2,060 2.108
1921 4,088 - 80 -1.92 2,107 1,981 1931 5,185 + 1097 +26.83 2,648 2,537 1941 6,335 +1,150 +22.18 3,181 3,154 1951 7,393 +1,058 +16.70 3,720 3,673 1961 M. 8.36 8,627 +1,234 + 16.69 4,374 4,253 1971 Mi 8.36 10,708 +2,081 +24.12 5,457 5,251
771 Sasvael Poona 1901 6,294 - 4,13i - 65.63
3,094 3,200 (MAHARASHTRA) 1911 2,163 1,064 1,099
1921 4,583 +2,420 + 111.88 2,256 2,327 1931 5,407 +824 + 17.98 2,633 2,774 1941 5,745 +338 +6.25 2,900 2,845 1951 6,354 +609 +10.60 3,128 3,226 1961 M. 22.61 8,498 +2,144 +33.74 4,243 4,255 1971 M. 22.61 10,702 +2,204 +25.94 5.560 5,142
772 Okha Fort Jamnagar 1941 4.664 +I,sii +32.42
2,658 2,006 (GUJARAT) 1951 6,176 3,367 2,809
1961 M. N.A. 9,630 +3,454 +55.93 5,327 4,303 1971 N.P. 4.39 10,687 + 1,057 +10.98 5,697 4,990
773 Khairthal Alwar 1971 M. 21.09 10,687 5,737 4,950 (RAJAS/HAN)
774 Kharar urban Ropar 1941 6,072 +245 +4.03
3,448 2,624 agglomeration (PUNJAB) 1951 6,317 3,526 2,791
1961 N.A. 8,216 +1,899 +30.06 4,535 3,681 1971 N.A. 10,686 +2,47.0 +30.06 5,709 4,977
(il Kharar 1941 6,072 +245
3,448 2,624 1951 6,317 +4.03 3,526 2,791 1961 M.C. 0.75 8,216 +1,899 +30.06 4,535 3,68t 1971 M.C. 0.75 10,235 +2,019 +24.57 5,461 4,774
(ii) Naya Sahir Badala Road &
1971 N.A. 451 248 203
Randhawa Road \O.G.)
7~. Shirva South Kanara 1971 P. 32.20 10,683 4,788 5,895 (MYSORE)
776 Phulbani urban Baudh Khondmals 1971 15.54t 10,677 5,877 4,800 agilomeration (ORISSA)
(i) Phulbani 1971 N.A.C. 15.54 10,511 5,745 4,766
(ii) Reserve Police 1971 N.A. 166 132 ;14 Colony & Col-lege Area (O.G.)
tExcludes the area of Reserve Police Colony & Colles:c Area (Out Growth).
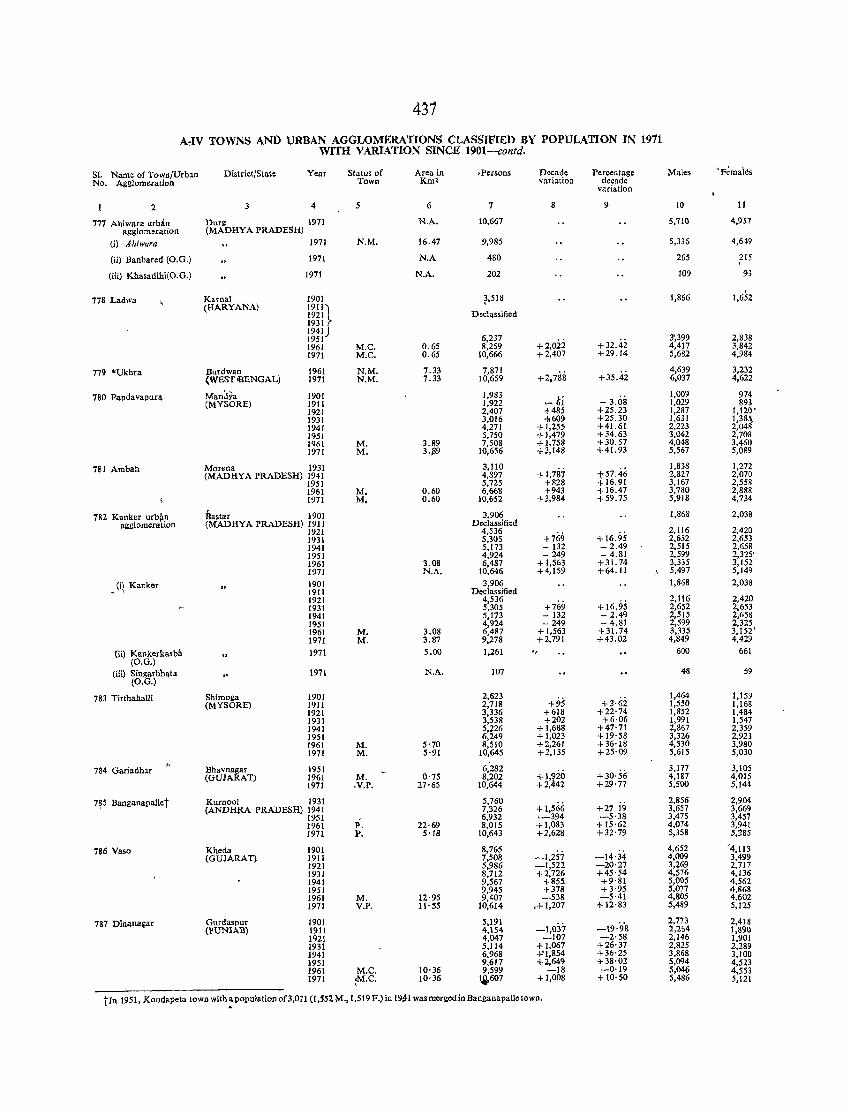
431 ArlV TOWNS ANi> URBAN AGGLOMERATIONS CLASSIFIED BY POPULATION IN 1911
WITH V ARIATIO~ SINCE 1901-confd.
SI. Name of Town/Urban District/State Year Status of Area in ,Persons Decade Percentage Males 'Females No. Agglomeration Town KIn2 variation decade
variation
2 4 5 6 7 8 9 10 11
777 Ahiwara ur~;ln agglomeration
Durs (MADHYA PRADESH)
1971 N.A. 10,667 5,710 4,957
(i) Ahiwara 1971 N.M. 16.47 9,985 5,336 4,649
(ii) Banbared (O.G.) 1971 N.A 480 265 215
(Hi) Khasadihi(O.G.) 1971 N.A. 202 109 93
778 Ladwa Kamal 1901 ],S18 1,866 1,652 (HARYANA) 1911,
Declassified mlr 1941)
6,237 3~399 2.838 1951 +2,022 +32.42 1961 M.C. 0.65 8,259 4,417 3.842
1971 M.e. 0.65 10,666 +2,407 +29.14 5,682 4,984
779 ·Ukhra Bnrdwan 1961 N.M. 7.33 7,871 +2.788 +35.42
4,639 3,232 (WEST .BENGAL) 1971 N.M. 7.33 10,659 6,037 4,622
780 Pandavapura Mandya 1901 1,983 .- /;j - 3.08
1,009 974 (MYSORE) 1911 1,922 1,029 893
1921 2,407 +485 +25.23 1,287 1,120' 1931 3,016 -lt609 +25.30 1,631 1,385, 1941 4,271 +1,255 +41. 61 2,223 2,048 1951 5,750 +1,479 +34.63 3,042 2,708 1961 M. 3.89 7,508 +1,758 +30.57 4,048 3,460 1971 M. 3.$9 10,656 +3,148 +41.93 5,567 5,089
781 Ambah Morena 1931 3,110 + 1,787 +57.46
1,838 1,272 (MADHYA PRADESH) 1941 4,897 2,827 2,070
1951 5,725 +828 +16.91 3,167 2,558 1961 M. 0.60 6,668 +943 +16.47 3,780 2,888 1971 M. 0.60 10,652 +3,984 +59.75 5,918 4,734
782 Kanker urb~n Bastar 1901 3,906 1,868 2,038 agglomeration (MAlJHYA PRADESH) 1911 Declassified
1921 4,536 +769 + 16.95
2,116 2.420 1931 5,305 2,652 2,653 1941 5,173 - 132 - 2.49 2,515 2,658 1951 4,924 - 249 - 4.81 2,599 2,325' 1961 3.08 6,487 + 1,563 + 31. 74 3,335 3,152 1971 N.A. 10,646 +4,159 +64.11 5,497 5,149
(i) Kanker 1901 3,906 1,868 2,038 . , 1911 Declassified 1921 4,536
+ 16.95 2,116 2,420
1931 5.305 +769 2,652 2,653 1941 5,173 - 132 - 2.49 2,515 2,658 1951 4,924 - 249 - 4.81 2,599 2,325 1961 M. 3.08 6,487 + 1,563 +31.74 3,335 3,152' 1971 M. 3.87 9,278 +2,791 +43.02 4,849 4,429
(ii) Kankerkasba 1971 5.00 1,261 " 600 661 (O.G.)
(iii) Singarbhata 1971 N.A. 107 48 59 (O.G.)
783 Tirtbahalli Shimoga 1901 2,623 +3'6i
1,464 1,159 (MYSORE) 1911 2,718 +95 1,550 1,168
1921 3,336 +618 +22'74 1,852 1,484 1931 3,538 +202 +6·06 1,991 1,547 1941 5,~26 + 1,688 +47·71 2,867 2,359 1951 6,49 +1,023 + 19'58 3,326 2,923 1961 M. S'70 8,510 +2,261 +36'18 4,530 3,980 1971 M. 5·91 10,645 +2,135 +25'09 5,615 5,030
784 Gariadhar " Bhavnagar 1951 6;282 3,177 3,105 (GUJARAT) 1961 M. 0'75 8,202 +1,~io +30·56 4,187 4,015
1971 .V.P. 27'65 10,644 +2,42 +29'77 5,500 5,144
7~5 Banganapallet Kuroool 1931 5,760 + 1,566 +27 i9
2,856 2,904 (ANDHRA PRADESH) 1941 7,326 3,657 3,669
1951 6,932 .-394 -5,38 3,475 3,457 1961 P. 22'69 8,015 +1,083 + 15·62 4,074 3,941 1971 P. S'18 10,643 +2,628 +32'79 5,358 5,285
786 Vaso Rheda 1901 8,765 -1,257
4,652 '4,113 (GUJARAT) 1911 7,508 -14·34 4,009 3,499
1921 5,986 -1,522 -20'27 3,269 2,717 1931 8,712 +2,726 +45'54 4,576 4,136 1941 9,567 +855- +9'81 5,005 4,562 1951 9,945 +378 +3·95 5.077 4.868 1961 M. 12·95 9,407 -538 -5·41 4,805 4.602 1971 V.P. 11'55 10,614 ,,+1,207 +12·83 5,489 5,125
787 Dinanagar Gurdasllur 1901 5,191 -1,037 -19'9'S
2,773 2,418 (PUNJAB) 1911 4,154 2,264 1,890
1921 4,047 -107 -2·58 2,146 1,901 1931 5,114 +1,067 +26·37 2,825 2,289 1941 6,968 +'1,854 +36·25 3,868 3,100 1951 9,617 +2,649 +38·02 5,094 4,523 1961 M.C. 10'36 9,599 -18 -0·19 5,046 4,553 1971 :M.e. 10'36 Ji607 +1,008 + 10·50 5,486 5,121
tIn 1951, Kondapeta town with_: population of3,071 (1,552 M.,1,519 F.) in 19~1 was merged in Banganapalle town.
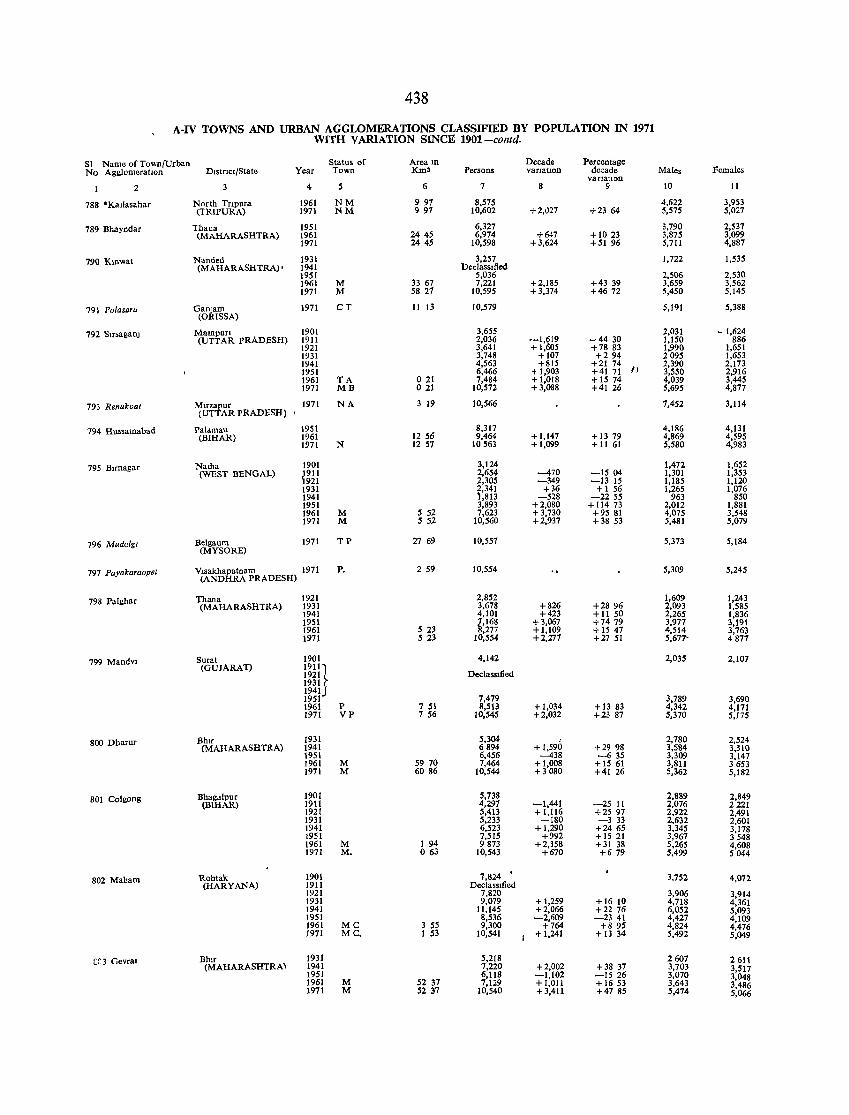
438
A-IV TOWNS AND URBAN AGGLOMERATIONS CLASSIFIED BY POPULATION IN 1911 WITH V ARlATION SINCE 1901-contd.
SI Name of Town/Urban Status of Aream Decade Percentage No AgglomeratlOn Dlstnct/State Year Town Km2 Persons VarIatIOn decade Males Females
vanatlOn 2 4 5 6 7 8 9 10 11
788 *Kmlasahar North Tnpura 1961 NM 997 8,575 4,622 3,953 (TRIPURA) 1971 NM 991 10,602 +2,\127 +2364 5,575 5,027
789 Bbayodar Thana 1951 6,327 3,790 2,537 (MAHARASHTRA) 1961 2445 6,974 +647 +1023 3,875 3,099
1971 2445 10,598 +3,624 +5196 5,711 4,887
790 KlOwat Nanded 1931 3,257 1,722 1,535 (MAHARASHTRA) • 1941 Declassified
1951 5,036 2,506 2,530 1961 M 33 67 7,221 +2,185 +43 39 3,659 3,562 1971 M 5821 10,595 +3,374 +4672 5,450 5,145
791 Polasara GanJam 1971 CT 11 13 10,579 5,191 5,388 (ORISSA)
792 SlrsaganJ MalOpun 1901 3,655 2,031 ~ 1,624 (UTTAR PRADESH) 1911 2,036 -1,619 ---44 30 1,150 886
1921 3,641 + 1,605 +7883 1,990 1,651 1931 3,748 +107 +294 2095 1,653 1941 4,563 +815 +21 74
Il 2,390 2,173
1951 6,466 -+ 1,903 +41 71 3,550 2,916 1961 TA 021 7,484 +1,018 + IS 74 4,039 3,445 1971 MB 021 10,572 + 3,088 +4126 5,695 4,877
793 Renukoat Mlfzapur 1971 NA 3 19 10,566 7,452 3,114 (UTTAR PRADESH)
794 Hussamabad Paldmau 1951 8,317 4,186 4,131 (BIHAR) 1961 12 56 9,464 +1,147 + 1379 4,869 4,595
1971 N 12 57 10563 + 1,099 + 11 61 5,580 4,983
795 Blrnagar NadIa 1901 3,124 1,472 1,652 (WEST BENGAL) ~91l 2,654 ---470 -1504 1,301 1,353
921 2,305 -349 -13 IS 1,185 1,120 1931 2,341 +36 +1 56 1,265 1,076 1941 ',813 -528 -2255 963 850 1951 3,893 +2,080 + 114 73 2,012 1,881 1961 M 5 52 7,623 + 3,730 +95 81 4,075 3,548 1971 M 5 52 10,560 +2,937 +38 53 5,481 5,079
796 Mudalgl Belgaum (MYSORE)
1971 TP 27 69 10,557 5,373 5,184
797 Payakaraopet Vlsakhapatnam 1971 P. 259 10,554 5,309 5,245 (ANDHRA PRADESH)
798 Palghar Thana 1921 2,852 1,609 1,243 (MAHARASHTRA) 1931 3,678 +826 +2896 2,093 1,585
1941 4,101 +423 + 11 50 2,265 1,836 1951 k,I68 +3,067 +7479 3,977 3,191 1961 523 ,277 + 1,109 +15 47 4,514 3,763 1971 5 23 10,554 +2,277 +2751 5,677- 4877
799 Mandvl Sura! 1901 4,142 2,035 2,107 (GUJARAT) 1911l
~m~ DeclassIfied
1941J 7,479 1951 3,789 3,690
1961 P 7 51 8,513 + 1,034 +13 83 4,342 4,171 1971 VP 7 56 10,545 +2,032 +23 87 5,370 5,175
800 Dbarur Bblr 1931 5,304 + 1,590
2,780 2,524 (MAHARASHTRA) 1941 6894 +29 98 3,584 3,310
1951 6,456 -438 -635 3,309 3,147 1961 M 59 70 7,464 + 1,008 +1561 3,811 3653 1971 M 6086 10,544 +3080 +41 26 5,362 5,182
801 Colgong BbagdJpur 1901 5,738 2,889 2,849 (BIHAR) 1911 4,297 -1,441 -2511 2,076 2221
1921 5,413 + 1,116 +2597 2,922 2,491 1931 5,233 -180 -333 2,632 2,601 1941 6,523 + 1.290 +2465 3,345 3,178 1951 7,515 +992 +1521 3,967 3548 1961 M 1 94 9873 +2,358 +31 38 5,265 4,608 1971 M. 063 10,543 +670 +679 5,499 5044
802 Maham Robtak 1901 7,824 3,752 4,072 (HARYANA) 1911 DeclassIfied
1921 7,820 3,906 3,914 1931 9,079 + 1,259 +1610 4,718 4,361 1941 11,145 +2,066 +2276 6,052 5,093 1951 8,536 -2,609 -2341 4,427 4,109 1961 MC 3 55 9,300 +764 +895 4,824 4,476 1971 MC. 1 53 10,541 f + 1,241 + 13 34 5,492 5,049
(C3 GevraJ Bhrr 1931 5,218 2607 2611 (MAHARASHTRA) 1941 7,220 +2,002 +38 37 3,703 3,517
1951 6,118 -1,102 -1526 3,070 3,048 1961 M 52 37 7,129 + 1,011 +1653 3,643 3,486 1971 M 5237 10,540 +3,411 +4785 5,474 5,066
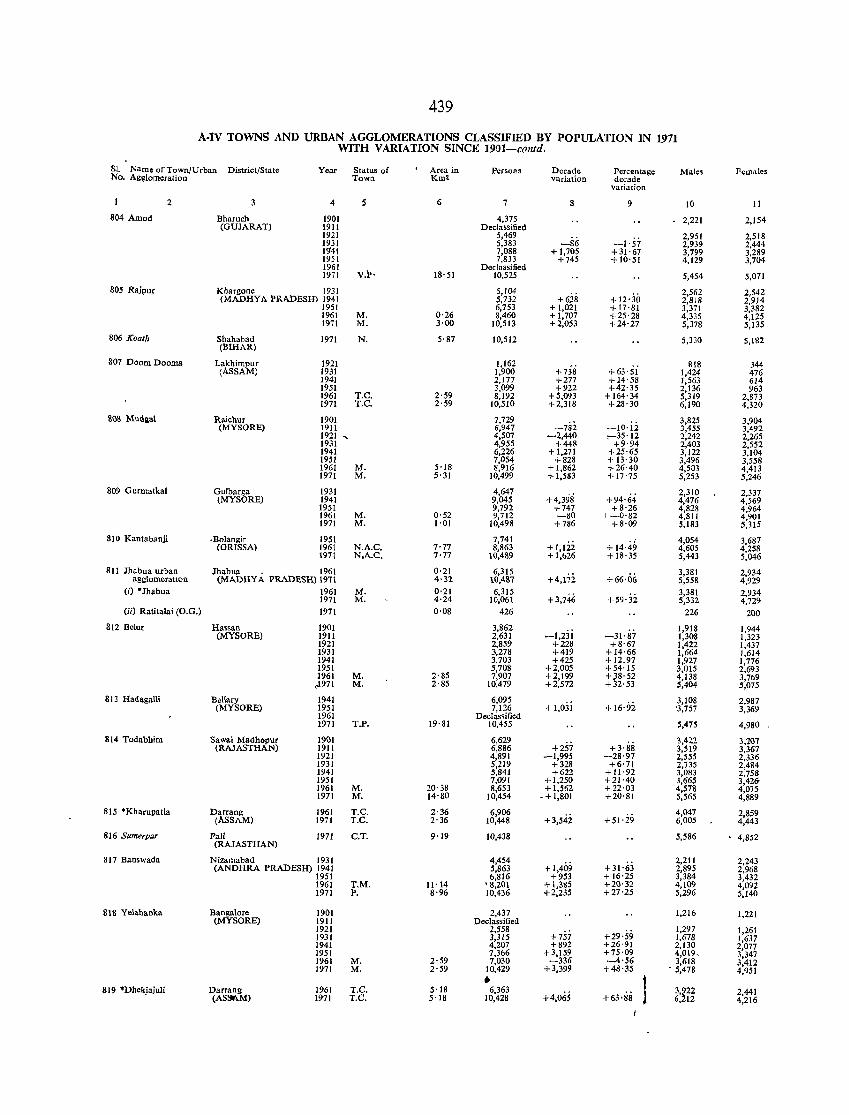
439
A-IV TOWNS AND URBAN AGGLOMERATIONS CLASSIFIED BY POPULATION IN 1971 WITH VARIATION SINCE 1901-contd.
S1. Name of Town/Urban District/State Year Status of Area in Persons Decade Percentage Males Females No. Ag~lomeration TOWll Kma variation decade
variation
2 3 4 5 6 7 8 9 10 !1
804 Amod Bharuch 1901 4,375 2,221 2,154 (GUJARAT) 1911 Declassified
1921 5,469 -1'57
2,951 2,518 1931 5,383 -86 2,939 2,444 1941 7,088 + 1,705 +31'67 3,799 3.289 1951 7,833 +745 + 10'51 4,129 3,704 1961
V.p· Declassified
1971 18· 51 10,525 5,454 5,071
80S Rajpur Khargone 1931 5,104 +12'30
2,562 2,542 (MADHYA PRADESH) 1941 5,732 +628 2,818 2,914
1951 6,753 +1,021 + 17'81 3,371 3,382 1961 M. 0·26 8,460 + 1,707 +25'28 4,335 4,125 1971 M. 3·00 10,513 +2,053 +24'27 5,378 5,135
806 Koalh Shahabad 1971 N. 5'87 10,512 5,330 5,182 (BIHAR)
807 Doom Dooma Lakhimpur 1921 1,162 +738 +63·si
818 344 (ASSAM) 1931 1,900 1,424 476
1941 2,177 +277 +14'58 1,563 614 1951 3,099 +922 +42'35 2,136 963 1961 T.C. 2·59 8,192 +5,093 + 164'34 5,319 2,873 1971 T.C. 2'59 10,510 +2,318 +28·30 6,190 4,320
808 Mud"al Raichur 1901 7,729 3,825 3,904 (MYSORE) 1911 6,947 -782 -10·12 3,455 3,492
1921 "- 4,507 -2,440 :-35'12 2,242 2,265 1931 4,955 +44R +9'94 2,403 2,552 1941 6,226 + 1,271 +25'65 3,122 3,104 1951 7,054 +828 + 13'30 3,496 3,558 1961 M. 5'18 8,916 +1,862 +26'40 4,533 4,413 1971 M. 5·31 10,499 + 1,583 +17'75 5,253 5,246
809 Gurmatkal Gulbarga 1931 4,647 +4,398 +94'64
2,310 2,337 (MYSORE) 1941 9,045 4,476 4,569
1951 9,792 +747 +8'26 4,828 4,964 1961 M. 0'52 9,712 -80 1-0'82 4,811 4,901 1971 M. 1'01 10,498 +786 +8'09 5,183 5,315
810 Kantabanji -Bolangir 1951 7,741 + 1,122 +14·49
4,054 3,687 (ORISSA) 1961 N.A.C. 7'77 8,863 4,605 4,258
1971 N.A..C. 7'77 10,489 +1,b26 + 18·35 5,443 5,046
811 Jhabua urban Jhabua 1961 0'21 6,315 +4,l'ii +66·06
3,381 2,934 aggiomeratlOn (MADHY i.. PRADESH) 197\ 4'32 1(),487 5,558 4,929
(0 "Jhabua 1961 M. 0·21 6,315 +3,746
3,381 2,934 1971 M. 4·24 10,061 +59·32 5,332 4,729
(Ii) Ratitalai (O.G.) 1971 0·08 426 226 200
812 Belur Hassan 1901 3,862 -1,23i
1,918 1,944 (MYSORE) 1911 2,631 -31'87 1,308 1,323
1921 2,859 +228 +8·67 1,422 1,437 1931 3,278 +419 +14'66 1,664 1,614 1941 3,703 +425 + 12.97 1,927 1,776 1951 5,708 +2,005 +54'15 3,015 2,693 1961 M. 2'85 7,907 +2,199 +J8'52 4,138 3,769
,,1971 M. 2'85 10,479 +2,572 +32·53 5,404 5,075
813 Hadagalli Bellary 1941 6,095 + 1,03i +16·92
3,108 2,987 (MYSORE) 1951 7,126 '3,757 3,369
1961 Declas.ified 1971 T.P. 19'81 10,455 5,475 4,980
814 Todabhim Sawai Madhopur 1901 6,629 +257 +3·88
3,422 3,201 (RAJASTHAN) 1911 6,886 3,519 3,367
1921 4,891 -1,995 -28·97 2,555 2,336 1931 5,219 +328 +6'71 2,735 2,484 1941 5,841 +622 + 11 '92 3,083 2,758 1951 7,091 +1,250 +21·40 3,665 3,426-1961 M. 20'38 8,653 + 1,5fi2 +22'03 4,578 4,075 1971 M. 14'80 10,454 .+1,801 +20'81 5,565 4,889
815 *Kharupatia Darrang 1961 T.C. 2·36 6,906 +3,542 +51'29
4,047 2,859 (ASSAM) 1971 T.C. 2'36 10,448 6,005 4,443
816 Sllmerpur Pali 1971 C.T. 9'19 10,438 5,586 4,852 (RAJASTHAN)
817 Banswada Nizamabad 1931 4,454 +1,409
2,211 2,243 (ANDHRA PRADESH) 1941 5,863 +31'63 2,895 2,968
1951 6,816 +953 + 16·25 3,384 3,432 1961 T.M. 11'14 ' 8,201 + 1,385 +20·32 4,109 4,092 1971 P. 8'96 10,436 +2,235 +27·25 5,296 5,140
818 Yelahanka Banga\ore 1901 2,437 1,216 1,221 (MYSORE) 1911 Declassified
1921 2,558 +757 +29·59
1,297 1,261 1931 3,315 1,678 1,637 1941 4,207 +892 +26'91 2,130 2,077 1951 7,366 +3,159 +75·09 4,019. 3,347 1961 M. 2·59 7,030 -336 -4'56 3,618 3,412 1971 M. 2'59 10,429 +3,399 +48·35 . 5,478 4,951 • 819 *Dhekjajuli Darrang 1961 T.C. 5·18 6,363
+4,065 +63'88 3,~22 2,441
(ASst\M) 1971 T.C. 5'18 10,428 6, 12 4,216
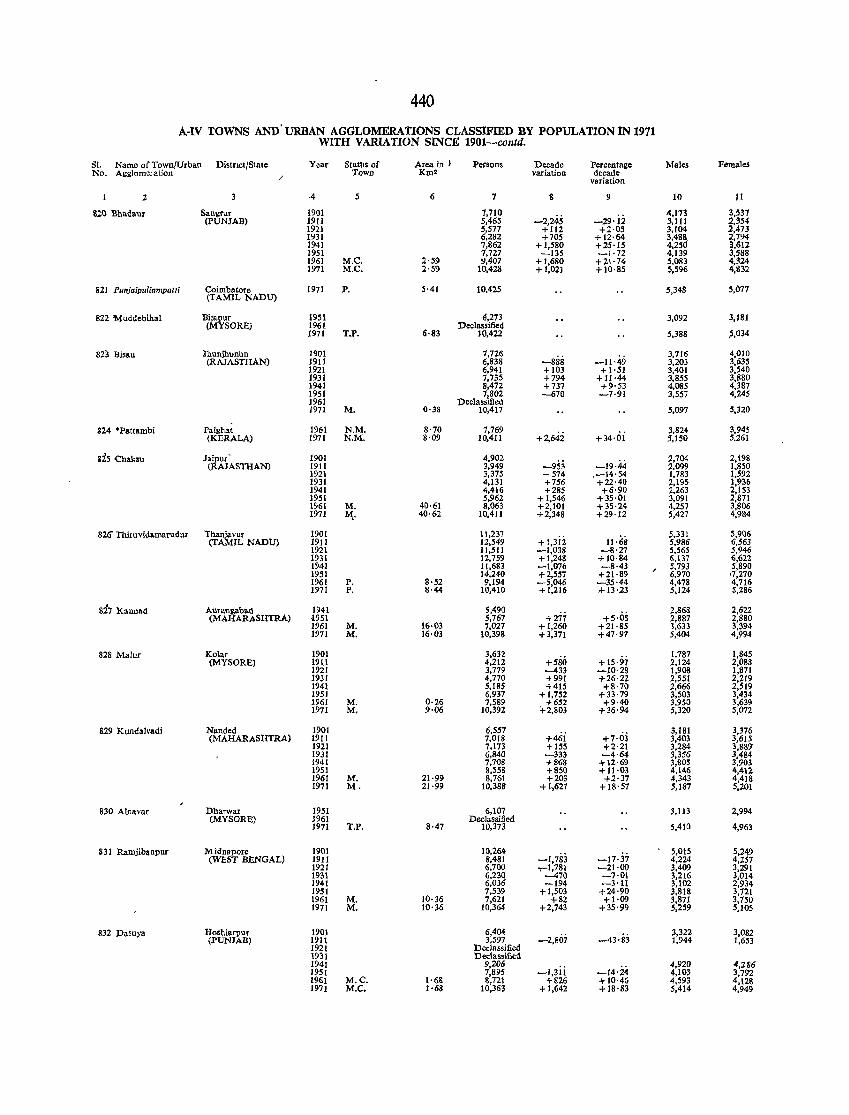
440 A-IV TOWNS AND' URBAN AGGLOMERATIONS CLASSIFmn BY POPULATION IN 1911
WITH VARIATION SINCE 1901-contd.
SI. Name of Town/Urban Distnct/State Year Stat1Js of Area in) Persons Decade Percentage Males Felllllles No. AggJome! ation
/ Town Km! variation decade
variation
2 3 ·4 5 6 7 8 9 10 11
SlO Bhadaur Sangrur 1901 7,710 -2,245 -29·ji
4,173 3,S37 (pUNJAB) 1911 5,465 3,111 2,354
1921 :5,577 +112 +2·05 3,104 2,473 1931 6,282 +705 +12·64 3,48~ 2,794 1941 7,862 + 1,580 +25·15 4,25 3,612 1951 7.727 -135 -1·72 4,139 3,588 1961 M.C. 2·59 9.407 +1,680 +21·74 5,083 4,324 1971 M.C. 2'59 10,428 + 1,021 +10·85 5,596 4,1'132
821 Punjaipuliampatti Coimbatore 1971 P. 5·41 10,425 5,348 5,077 (TAMIL NADD)
822 Muddebihal Bijapur 1951 6,273 3,092 3,181 (MYSORE) 1961 Declassified
1971 T.P. 6·83 10,422 5,388 ;;,034
823 Bisau Jhunjhuniln 1901 1,726 -888 -11·49
3,716 4,010 (RAJASTHAN) 19I1 6,838 3,203 3,635
1921 6,941 + 103 +1·51 3,401 3,540 1931 7,735 +794 +11·44 3,855 3,880 1941 8,472 +737 +9·53 4,085 4,387 1951 7,802 -670 -7·91 3,557 4,245 1961 Declassified 1971 M. 0'38 10,417 5,097 5,310
~24 ·Pattambi Palghat 1961 N.M. 8'70 7,769 +2,64:.i +34·oi
3,824 3,945 (KERALA) 1971 N.M. 8·09 10,411 5,150 5.261
gZ5 <::haksu Jaipur 1901 4,902 -953 -19·44
2,704 2,198 (RAJASTIlAN) 1911 3,949 2,099 1,850
1921 3,375 -574 .-14·54 1,783 1,592 1931 4,131 +756 +22·40 2,195 1,9:>6 1941 4,416 +285 +6·90 2,263 2,1S3 1951 5,962 +1,546 +35·01 3,091 2,871 1961 M. 40·61 8,063 +2,101 +35·24 4,257 3,806 1971 M,. 40·62 10,411 +2,348 +29·12 5,427 4,984
826' Thiruvida.marudur Tbanjavur 1901 11,231 +I,3i:i U·68
5.331 5,906 (TAMIL NADD) 1911 12,549 5,986 6,563
1921 11,511 -1.038 -S·27 5,565 5,946 1931 12,759 +1,248 +10·84 6,137 6,622 1941 11,683 -1,076 -8·43 5,793 5,890 1951 14.240 +2,557 +21·89 6,970 .7,270 1961 P. 8·52 9,194 -5,046 -35·44 4.478 4,116 1971 P. 8·44 10,410 +1,216 ..r 13·23 5,124 5,286
827 Kannad Aurangaball 1941 5,490 +271 +5·05
2,868 2,622 (MAHARASHTRA) 4951 5,767 2,887 2,880
1961 M. 16·03 1,027 +1,260 +21·85 1,633 3,394 1971 M. 16·03 10,398 +3,371 +47·97 5,404 4,994
828 Malur Kolar 1901 3,632 +580 + 15·97
1,787 1,845 (MYSORE) 1911 4,212 2,124 2,088
1921 3,779 -433 -10·28 1,908 1,871 1931 4,770 +991 +26·22 2,551 2,219 1941 5,185 +415 +8·70 2,666 2,519 1951 6,937 +1,752 +33·79 3,503 3,434 1961 M. 0·26 7,589 +652 +9·40 3,950 3,639 1971 M. 9·06 10,392 +2,803 +36·94 5,320 5,072
829 Kundalvadi Nanded 1901 6,557 +46i +7·03
3,181 3,376 (MAHARASHTRA) 1911 7,018 3,403 3,615
1921 7,173 +155 +2·21 3,284 3,889" 1931 6,840 -333 -4·64 3,356 3,484 1941 7,708 +868 +12·69 3,805 3,903 1951 8,5S8 +850 + Il·03 4,146 4,412 1961 M. 21·99 8,761 +203 +2·37 4,343 4,418 1971 M. 21·99 10,388 + 1,627 +18·57 5,187 5,201
830 Alnavar Dharwar 1951 6,107 3,113 2,994 (MYSORE) J961 Declassified
1971 T.P. 8·47 10,373 S,41() 4,963
331 Ramjibanpur 111 idnapore 1901 10,264 -1,783 -17·37
5,015 5,249 (WEST BENGAL) 1911 8,481 4,224 4,257
1921 6,700 .,...1,781 -21·00 3,409 3,291 1931 6,230 -470 -7·01 3,216 3,014 1941 6,036 -194 -3'U 3,102 2,934 1951 7,539 +1,503 +24·90 3,818 3,121 1961 M. 10·36 7,621 +82 +1·09 3,871 3,750 1971 M. 10·36 10,364 +2,743 +35·99 5,259 5,105
832 Dasuya Hoshiarpur 1901 6,404 -2,807 -43·S3
3,322 3,082 (PUNJAB) 1911 3,597 1,944 1,653
1921 Declassified 1931 Declassified 1941 9,206
-I,3ii -14·24 4,920 4,286
1951 7,895 4,103 3,792 1961 M.e. 1'6& 8,721 +826 +10·46 4,593 4,128 1971 M.e. 1'68 10,363 +1,642 +18·83 5,414 4,949
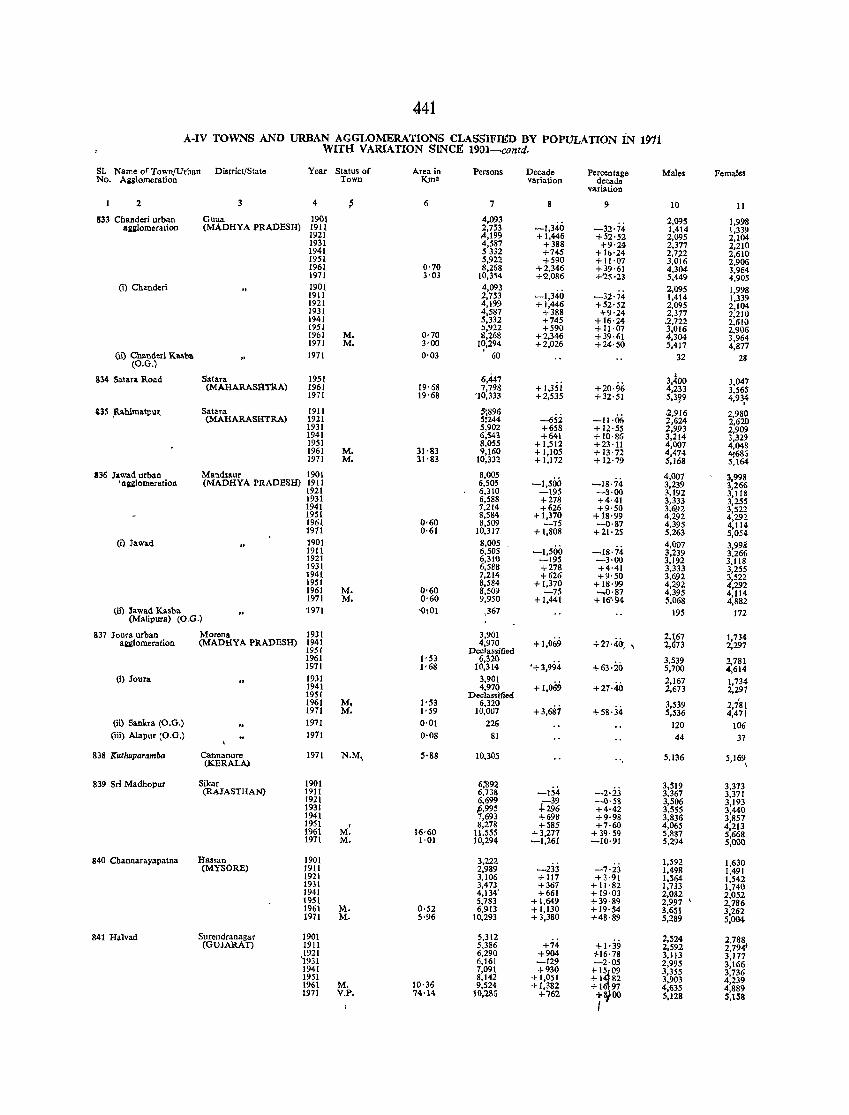
441
A-tv TOWNS AND URBAN AGGLOMERATIONS CLASSlFmD BY POPULATION iN 1911 WITII VARlATION SINCE 19D1-contd.
SI. Name of Town/Urban District/State Year Status of Area in Persons Decade Percentage Males Females No. A"lomeration Town Kmz variation decada
variation
2 3 4 ~ 6 7 9 10 11
833 Chanderi urban Guna 1901 4,093 -1,340 -32·74
2,095 1,998 aailollleration (MADHYA PRADESH) 1911 2,753 1,414 1,339
1921 A,199 + 1,446 +52'52 2,095 2,104 1931 4,587 +388 +9'24 2,317 2,210 1941 5332 +745 +lb'24 2,722 2,610 1951 5,922 +590 + 11'07 3,016 2,905 1961 0'70 8,268 +2,346 +39'61 4,304 3,964 1971 3'03 10,354 +2,086 +'25-23 5,449 4,905
(i) Chanderi 1901 4,093 -1,340 -32·74
2,095 1,998 1911 2,753 1,414 1,339 1921 4,199 +1,446 +52·52 2,095 2,104 1931 4,587 +388 +9·24 2,377 Z,210 1941 5,332 +745 +16·24 ,2,722 2,610 1951 5,922 +590 + 11·07 3,016 2,906 1961 M. 0'70 8,268 +2,346 +39·61 4,304 3,964 1971 M. 3'00 10,294 +2,026 +24'50 5,417 4,877
(il) Chanderi Ka~'oa 1971 0'03 • 60 32 28 (O.G.)
1951 6,447 ,
834 Satara Road Satara +I,3Si +20·96
3,400 3,047 (MAHARASIrrRA) 1961 19'68 7,798 4,233 3,565
1971 19'68 '10,333 +2,535 +32'51 5,1~9 4,93,4
&35 f.ahimatpu~ SataTa 1911 5;896 -65i. -11'06
·2,916 2,980 (MAHARASHTRA) 1921 5:244 2,624 2,620
1931 5,902 +658 +12·55 2,993 2,909 1941 6,543 +641 + 10·86 3,214 3,329 1951 8,055 + 1,512 +23'11 4,007 4,048 1961 M. 31'83 9,160 +1,105 + 13·72 4,474 4:686 1971 M. 31'83 10,332 +1,172 +12'79 5,168 5,164
136 lawad urban Mandsaur 1901 8,005 -1,500 -18·74
4,007 3,998 , 4"lollleration (MADHYA PRADESH) 1911 6,505 3,239 3,266
1921 6,310 -195 -3·00 3,192 3,118 1931 6,588 +278 +4·41 3,333 3,255 1941 7,214 +626 +9·50 3,692 3,522 1951 8,584 + 1,370 + 18·99 4,292 4,292 1961 0·60 8,509 -75 -0·87 4,395 4,lI~ 1971 0'61 10,317 + 1,808 +21'25 5,263 5,054
(i) Jawad 1901 8,005 I
~1,500 -18·74 4,007 3,998'
1911 6,505 3,239 3.266 1921 6,310 -195 -3·00 3,192 3,118 1931 6,588 +278 +4·41 3,333 3,255 1941 7,214 +626 +9·50 3,692 3,522 1951 8,584 +1,370 +18·99 4,292 4,292 1961 M. 0'60 8,509 -75 ....,.0·87 4,395 4,114 1971 M. 0'60 9,950 + 1,441 + 16"~4 5,068 4,8S~
(il) lawad Kasba (Malipura) (O.G.)
'1971 '(l101 ,367 195 172
837 Joura urban Morena 1931 3,901 +1,069 +27'40-, ,
2,~67 1,734 agglomeration (MADHYA PRADESH) 1941 4,970 2, 73 2,297 1951 Declassified
1961 1'53 6,320 '+3,994 +63,20
3,539 2,781 1971 1'68 10,314 5,700 4,614
(i) loura 1931 3,901 + 1,069 +27·40
2,167 1,734 1941 4,970 2,673 2,297 1951 Declassified
2.7SI 1961 M. 1'53 6,320 + 3,687 +58·34
3,539 1971 M. 1'59 10,007 5,S36 4,471
(ii) Sankra (O.G.) 1971 0'01 226 120 106 (iii) Alapur [O.G.) 1971 0·08 81 44 37
838 Kuthuparamba Cannanore (KERAl.A)
1971 N.M) 5'88 10,305 .. 5,136 5,169\
839 Sri Madhopur Sikar 1901 6;'892 -2·i3
3,519 3,373 (RAJASTHAN) 1911 6,738 -154 3,367 3,311
1921 6,699 -39 -0'58 3,506 3,193 1931 p,99S +296 +4·42 3,555 3,440 1941 7,693 +698 +9·98 3,836 3,857 1951 , 8,278 +585 +7·60 4,065 4,213 1961 M, 16,60 11,555 + 1,277 + 39· 59 5,887 S,66g 1971 M, 1·01 10,294 ~I,261 -10·91 5,294 5,000
840 Cbannarayapatna Hassan 1901 3,22~ -233
1,592 1,630 (MYSORE) 1911 2,989 -7·23 1,498 1,491
1921 3,106 + 117 +3·91 1,564 1,542 1931 3,473 +367 + 11·82 1,733 1,740 1941 4,134' +661 + 19·03 2,082 2,052 1951 5,783 + 1,649 +39'89 2,997 ' 2,786 1961 M. 0·52 6,913 + 1,130 + 19'54 3,651 3,262 1971 M. 5·96 10,293 +3,380 +48·89 5,289 5,004
841 Halvad Surendranagar 1901 5,312 +74
2,524 2,788 (GUJARAT) 1911 5,386 +1·39 2,592 2,794'
1921 6,290 +904 +16·78 3,113 3,177 '1931 6,161 -129 -2·05 2,995 3,166 1941 7,091 +930
i-
Ir9 3,355 3,736 1951 8,142 +1,051 +1 82 3,903 4,239 1961 M. 10·36 9,524 +1,382 +1 97 4,635 4,889 1971 V.P. 74·14 10,286 +762 + 00 5,128 5,158 f
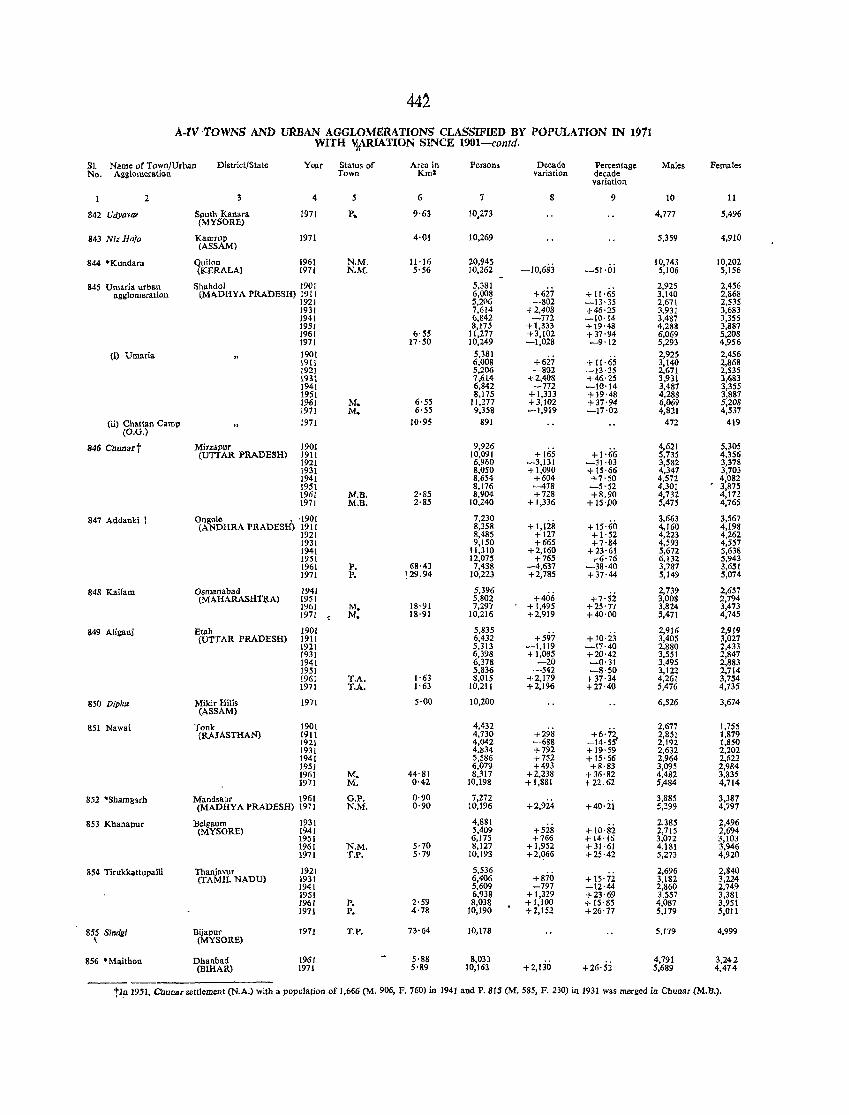
441 A-lV ·TOWNS AND UnBAN AGGLOMERATIONS CLASSIFIED BY POPULATION IN 1911
WITH 'f~RIATION SINCE 1901-contd.
SJ. Name of TownJUrban District/State Year Status of Area in Persons Decade Percentage Males Females No. Agglomeration Town Km2 variation decade
variation
2 3 4 5 7 8 9 10 11
842 Udyovar Sputh Kanara (MYSORE)
1971 p. 9·63 10,273 4,777 5,496
843 Niz Hajo Kamrup 1971 (ASSAM)
4·01 10,269 5,359 4,910
844 ·Kundara Quilon 1961 N.M. 11·16 20,945 -10,683 -51·oi
10,743 10,202 (KERALAJ 1971 N.M. 5·56 10,262 5,106 5,156
845 Umaria urban Shahdol 1901 5,381 +627
2,925 2,456 agglomeration (MADHYA PRADESH) 1911 6,008 + 11'65 3,140 2,868
1921 5,21'6 -802 -13·35 2,671 2,535 1931 7,614 +2,408 +46·25 3,931 3,683 1941 C,,842 -772 -10'14 3,487 3,355 1951 8,175 +1,333 +19·48 4,288 3,887 1961 6·55 11,277 +3,102 +37·94 6,069 5,208 1971 17'50 10,249 -1,028 -9'12 5,293 4,956
(i) Umaria 1901 5,381 +6:11 + 11·65
2,925 2,456 1911 6,008 3,140 2,868 1921 5,206 -802 -13·35 2,671 2,535 193\ 7#4 +2,408 +46'25 3,911 3,6&3 1941 6,842 -772 -10'14 3,487 3,355 1951 8,175 + 1,333 +19·48 4,288 3,887 1961 M. 6·55 11,277 +3,102 +37·94 6,069 5,208 1971 M. 6·55 9,358 -1,919 -17·02 4,821 4,537
(ii) Chattan Camp 1971 10·95 891 472 419 (0.0.)
846 Chunart Mir:zapur 1901 9,926 +165 +1'66
4,621 5,305 (Urr AR PRADESH) 1911 10,091 5,735 4,356
1921 6,900 -3,131 -31·03 3,582 3,378 ]93] 8,050 .;- 1,090 + IS·66 4,347 3,703 1941 8,654 +604 +7'50 4,572 4,082 1951 8,176 -478 -5'52 4,301 3,875 1961 M.B. 2-85 8,904 +128 +8.90 4,732 4,172 1971 M.B, 2·85 10,240 +1,336 +15·pO 5,475 4,765
847 Addanki 1 Ongole , ·190! 7,230 +1,128 + 15·60
3,663 3,567 (ANDHRA PRADESH) 1911 8,358 4,160 4,198
1921 8,485 +127 +1'52 4,223 4,262 193! 9,!50 +665 +7·84 4,593 4,557 1941 11,310 +2,160 +23·61 5,672 5,638 19S! 12,075 +765 +6'76 6,132 5,943 1961 P. 68·43 7,438 -4,637 -38·40 3,787 3,651 1971 P. !29.94 10,223 +2,785 +37·44 5,14~ 5,074
848 Kallam Osmanabad 1941 5,396 +406
2,739 2,657 (MAHARASHTRA) 1951 5,802 +7'52 3,008 2,794
1961 M. 18'91 7,297 + 1,495 +25'77 3,824 3,473 1971 M. 18·91 10,216 +2,919 +40'00 5,471 4,145
849 Aliganj Etab 1901 5,835 +597 + 10·23
2,916 2,919 (UTTAR PRADESH) 1911 6,432 3,405 3,027
1921 5,313 -1,119 -17·40 2,880 2,433 1931 6,398 +1,085 +20·42 3,551 2,847 1941 6,378 -20 ......0·31 3,495 2,883 1951 5,836 -542 -8·50 3,122 2,714 1961 T.A. 1·63 8,015 +2,179 +37·34 4,261 3,754 1971 T.A. 1·63 10,211 +2,196 +27·40 5,476 4,735
850 Diphu MikirHills 1971 5·00 10,200 6,526 3,674 (ASSAM)
851 Nawai Tonk 1901 4,432 +298 +6,72, 2,677 1,755
(RAJASTHAN) 1911 4,730 2,851 1,879 1921 4,042 -688 -14·55 2,192 1,850 1931 4,834 +792 +19'59 2,632 2,202 1941 5,586 +752 + 15'56 2,964 2,622 1951 6,079 +493 +8·83 3,095 2,984 1961 M. 44,SI 8,317 +2,238 +36'82 4,482 3,835 1971 M, 0·42 10,198 + 1,881 +22.62 5,484 4,714
852 ·Sbamgarb Mandsaur 1961 G.P. 0·90 7,272 +2,924 +40·ii
3,885 3,387 (MADHYA PRADESH) 1971 N.M. 0·90 10,196 5,!99 4,797
853 Kbanapur Belgaum 1931 4,881 + 10'82
2,385 2,496 (MYSORE) 1941 5,409 +528 2,715 2,694
1951 6,175 +766 + 14·16 3,072 3,103 1961 N.M. 5·70 8,127 +1,952 +31·61 4.181 3,946 1971 T.P. 5·79 10,193 +2.~66 +25·42 5,273 4,920
854 Tirukkattupalli Thanjavur 1921 5,536 +810 + 15'72
2,696 2,840 (TAMIL NADU) 1931 6,406 3,182 3,224
1941 5,609 -797 -12·44 2,860 2,749 1951 6,938 +1,329 +23·69 3,557 3,381 1961 P. 2'59 8,038 +1,100 + 15·85 4,081 3,951 1971 P. 4'78 10,190 +2,152 +26'17 5,179 5,011
855 Sindgl \
Bijapur (MYSORE)
1971 T.P. 73·64 10,178 5,179 4,999
856 • Maithon Dhanbad 1961 5·88 8,033 +2,130
4,791 3,242 (BIHAR) 1971 5·89 10,163 +26·52 5,689 4,474
tl!l 1951, Chullarselliement (N.A.) witb a population of 1,666 (M. 906, F.160) in 1941 and P. SIS (M. 585, F. 230) in 1931 was merged in ChUlIM (M.D.).
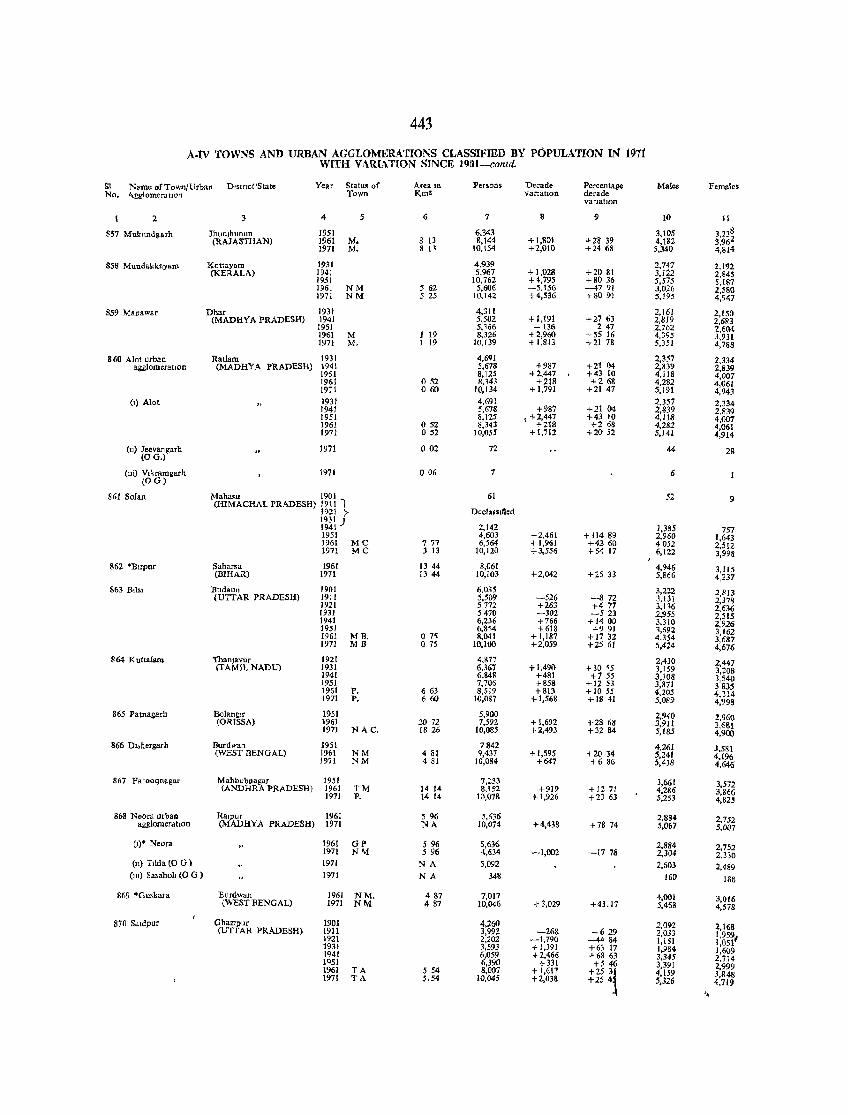
443
A.tV TOWNS AND URBAN AGGLOMERATIONS CLASSIFIED BY POPULATION IN 1')71 W[TH VAR[ATION SINCE 19IH-contd.
SI Name of Town/l1rban D·.trlellStat. Year Status of Area In Persons Decade Percentage Males Females No. AgglomeratlOn Town Kmz vanatlOn decade
var13tJon
2 3 4 5 6 7 8 9 10 11
S57 Mukltnd~arh Jhun,hunun 1951 6.343 3,105 3,23~ (RAJASTHAN) 1961 M. 8 13 8,144 +1,801 +2839 4,182 3,96
1971 M. 8 [1 10,154 +2,010 +2468 5,340 4,814
858 Mundakkayam Kottayam 1931 4,939 2,747 2,192 (KERALA) 1941 5.967 +1,028 +2081 3.122 2,845
1951 10,762 +4,795 +8036 5,575 5.187 1961 NM ;5 62 5.606 -5,156 --47 91 3,026 2,580 1971 NM 525 10.142 +4,536 +80 ~1 5,195 4,947
859 Manawar Dhar 1931 4,311 2,161 2,150 (MADHYA PRADESH) 1941 5,502 +1,191 +2763 2,8J9 2.683
1951 5,166 -136 247 2,762 2,604 1961 M 19 8,326 +2,960 +55 16 4,395 3,931 1971 M. 19 10,139 + 1,813 +21 78 5,351 4,788
860 Alot urban Ratlam 1931 4,691 2,357 2,334 agglomeratIon (MADHYA PRADESH) 1941 5,678 +987 +21 04 2,839 2,839
1951 8,125 +2,447 +43 10 4,118 4.007 1961 052 S,343 +218 +268 4,282 4,061 1971 060 10,134 + 1,791 +2141 5,191 4,943
(I) Alot 1931 4,691 2,357 2,334 1941 5,678 +987 +21 04 2,839 2,839 1951 8,125 , +2,447 +43 10 4.118 4,007 1961 052 8,343 +218 +268 4,282 4,061 1971 052 10,055 +1,712 +2052 5,141 4,914
(Il) Jeevangarh (OG,)
1971 002 72 44 28
(ui) V.kramgarh (OG)
1971 006 7 6
861 Solan Mahasll 1901 61 52 9 (HIMACHAL PRADESH) 1911 I 1921 ?- Decla~stfied mp 2,142 1,385 757 1951 4,603 +2,461 + 114 89 2,960 1,643 1961 MC 777 6.564 +1,961 +4260 4052 2,512 1971 MC 3 13 10,120 +3,556 +54 17 6,122 3,998
862 'BlIl'ur Saharsa 1961 13 44 8,061 4,946 3,115 (BIHAR) 1971 1344 10,103 +2,042 +2533 5,866 4,237
863 B.ls, lJudaun 1901 6,035 3,222 2,813 (UTTAR PRADESH) 1911 ,5,509 -526 -872 3,131 2,378 1921 5772 +263 +477 3,116 2,636 1931 :5470 -302 -523 2,955 2,515 1941 6,236 +766 +1400 3.310 2,926 1951 6.3~4 +618 +991 1,692 3,162 1961 MB. o 7~ 8,041 +1,187 +1732 4,354 3,687 1971 MB 015 10,100 +2,059 +2561 5,424 4,676
864 J(uttalam ThanJavur 1921 4,877 2,43() 2,447 (TAMll NADU) 1931 6,361 +1.490 + 30 <5 3,159 3,208 1941 6,848 +481 +755 3,308 3,540 1951 7,706 +858 +1253 3,871 3835 1961 P. 663 8,519 +813 +1055 4,205 4,314 1971 P. 660 10,087 +1,568 +1841 5,089 4,998
865 Palnagarh Bolanglf 1951 5,900 2,940 2,960 (ORISSA) 1961 2072 7,592 +1.692 +2868 3,911 3,681 1971 NAC. 1826 10,085 +2,493 +3284 5,185 4,900 866 DJ.hergarb Burdwatl 195! 7842 4,261 3,581 (WEST BENGAL) 1961 NM 4 81 9,437 + 1,595 +2034 5,241 4,196 1971 NM 4 81 10,084 +647 +686 5,438 4,646
867 Farooqnagar Mahbubnagar 1951 7,233 3,661 3,572 (ANDHRA PRADESH) 1961 ™ 14 14 8,152 +919 + 1271 4,286 3,866 1971 p, 14 14 10,078 + 1,926 +23 63 5,253 4,825
868 Neora urban Ralpur 1961 596 5,636 2,884 2,752 agglomefdllon (MADHYA PRADESH) 1971 NA 10,074 +4,438 +7874 5.067 5,007
(I)' Neara 1961 GP 5 96 5,636 2.884 2,752 1971 N'I1 596 4,634 -1,002 -1778 2,304 2,330 (n) Ttlda (0 G ) 1971 NA 5,092 2.603 2,489
(Ill) Sasahoh (0 G ) 1971 NA 348 160 188
869 *Guskara Burdwan 1961 NM. 487 7,017 4,001 3,016 (WEST BENGAL) 1971 NM 487 10.046 + 3,029 +43.17 5,468 4,578
870 Sd,dpur GhaZlpur 1901 4,260 2,092 2,168 (UTTAR PRADESH) 1911 3,992 ~26& -629 2,033 1,959; 1921 2,202 -1,790 --44 84 1,151 I,05J 1931 3,593 + 1,391 +63 17 1,984 1,609 1941 6,059 +2,466 +68 63 3,345 2,714 IQ51 6,390 +331 +546 3,391 2,999 1961 TA 5 54 8,001 + 1,617 +25 31 4.159 3,848 1971 TA 5.54 10,045 +2,038 +254 5,326 4,719
'.
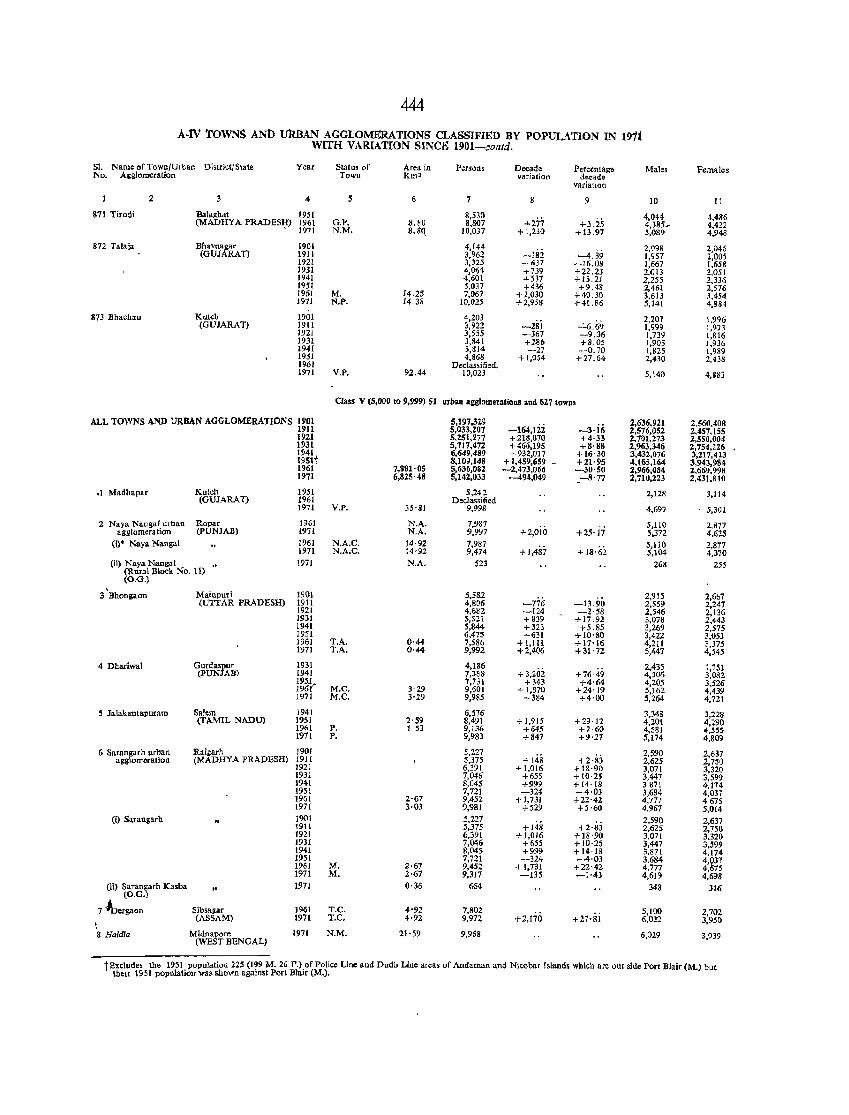
444
A-tv TOWNS AND URBAN AGGLOMERATIONS CLASSIFIED BY POPULATION IN 1911 WITH VARIATION SINCE 1901-~nld.
S1. Name of TownfUrba" Di'tri~tfState Year Status of Area in Persons De<:ade Percentage Males Females No. Agglomeration Town Km' variation decade
variation
2 4 6 7 9 10 I[
871 Tirodi Baiaghdt 1951 8.530 +277 +3.25
4,044 4,486 (MADHYA PRADESli) 196[ G.P. 8.80 8,807 4,385, 4,422
1971 N.M. 8.Se{ 10,037 + 1,230 +13.97 5,089 4,948
872 Talaja Bhavnagar 1901 4,[44 -lS2 2,098 2,046
(GUJARAD 1911 3,962 -~.39 1,957 2,005 1921 J,325 --6J7 --16.08 1,667 [,658 1931 4,0154 +739 +22.23 2.013 2.051 1941 4,601 +537 +13.21 2,255 2,336 1951 5,037 +436 +9.4~ 2,461 2,576 1961 M. 14.25 7,067 + 2,030 +40.3() 3,613 .1,454 1971 N.P. 14.38 10,025 + 2,958 + .. 1.86 5,141 4,884
873 Bbachau Kutcb 1901 4,203 -2si -:'6.69
2,207 \,996 (GUJARAT) 1911 3,922 1.999 1,913
1921 3,555 -367 -9.36 1,739 1,816 1931 3,841 +2M +8.05 1.905 1,936 1941 3,814 -27 --0.70 1,825 1,989 1951 4,868 + 1,054 +27.64 2,430 2,438 1961 Declas;ified. 1971 V.P. 92.44 10,023 5,140 4,883
Class V (5,000 to 9,999) 51 urban agglomerations and 627 towns
ALL TOWNS AND URBAN AGGLOMERATIONS 1901 5,197,329 -164,12i -3·16
2,636.921 2,560.40R 1911 5,033,207 2,576,052 2,457,155 1921 5.251.277 +218,070 +4·33 2,701,273 2,550,004 1931 5,717,472 +466,195 +8·88 2,963,346 2,754,126 1941 6,649,489 +932,017 + 16· 30 3,432,076 3,217.413 1951t 8,109,148 + 1.459,659 _ +21·95 4,165,164 3,943,984 1961 7,881'05 5,636,082 -2,473,066 -30·50 2,966.084 2,659,998 1971 6,825'48 5,142,033 -494,049 _-8'77 2.710,223 2,431.810
.1 Madbapar Kutch 1951 5,242 2,128 3,114 (GUJARA1) 1961 Declassified
1971 V.P, 35·81 9,998 4,697 5.301
2 Naya Nanga! urban Ropar 1961 N.A. 7,987 +2,oio +25, ii 5,110 2,877
agglomeration (pUNJAB) 1971 N.A. 9,997 5,372 4,625 (i)' Nay;; Nangal 1961 N.A.C. 14·92 7,987
+1,487 5,110 2,877
1971 N.A.C. 14'92 9,474 + 18'62 5,104 4.370 (il) Naya Nanga! " 1971 N.A. 523 268 255
(Rural Block No. 11) (0.0.)
3 'Bhongaon Mainpuri 1901 5,582 2,915 2,6b7 (UTTAR PRADESH) 1911 4.806 -776 -13.90 2,559 2,247
1921 4,682 -124 -2'58 2,546 2.136 1931 5,521 +83:; +17.92 3,078 2,443 1941 5,844 +323 +5.85 3,269 2,575 1951 6,475 +631 +10'80 3,422 3,053 1961 T.A. 0,44 7.586 + 1,111 + ]7'16 4,211 3,375 1971 T.A, 0'44 9,992 +2,406 +31'72 5,447 4,545
4 Dhariwal Gurdaspur 1931 4,186 + 3,202 +7649
2,435 1,751 (PUNJAB) 1941 7,388 4,306 3,082
l~~ 7,731 +343 +4'64 4,205 3.526 M.e. 3·29 9,601 +1,870 +24'19 5,162 4,439
1971 M.C, 3'29 9,985 +384 +4·00 5,264 4,721
5 Ja!akantal'nram Salem 1941 6,576 3,348 3,228 (TAMIL NADU) 1951 2'59 8,491 +1,915 +29·12 4,201 4,290
1961 P. 1· 53 9,136 +645 +7·60 4.581 4,555 1971 P. 9,983 +847 +9·27 5,174 4,809
6 Saranfolrh ur'f!lln Raigarh 1901 5,227 + 148 +2·gj
2,590 2,637 agg omeratlOn (MADHYA PRADESH) 1911 5,375 2,625 2,750
1921 6.391 +1,016 +18·9() 3,071 3,320 1931 7,046 +655 +10·25 3,447 3,599 1941 8,()45 +999 +14·18 3,871 4,174 1951 7,721 -324 -4-03 3,684 4,037 1961 2'67 9.452 +1,731 +22-42 4,777 4675 1971 3,03 9,981 +529 +5·60 4,967 5,014
(i) Sarangarh 1901 5,227 2,590 2,637 1911 5,375 +148 +2'83 2.625 2,750 1921 6,391 + 1.016 +18·90 3,071 3,320 1931 7,046 +655 +10·25 3,447 3,599 1941 8,045 +99<) +14·18 3,871 4,174 1951 7,721 -324 -4'()3 3,684 4,g37 1961 M. 2·67 9,452 + 1,731 +22·42 4,777 4, 15 1971 M. 2·67 9,317 -135 -1·43 4,619 4,698
(il) Sarangarh Kasba 1971 0·36 664 348 316 (O.G.)
1 ~ergaon Sibsa~ar 1961 T.e. 4'92 1,a02 +2,170 +27·si
5,100 2,702 (ASSAM) 1971 T.C, 4·92 9,972 6,022 3,950 ,
8 Haldia Midnapore (WEST BENGAL)
1971 N.M. 21·59 9,968 6,029 3,939
tExclnde, the 1951 population 225 (199 M. 26 P.) of Polic~ Line and Dudb Line areas of Andaman and Nicobar Island, which are out 'ide PorI Blair (M.) but theu 1951 population was shown against Port Blair (M.J.
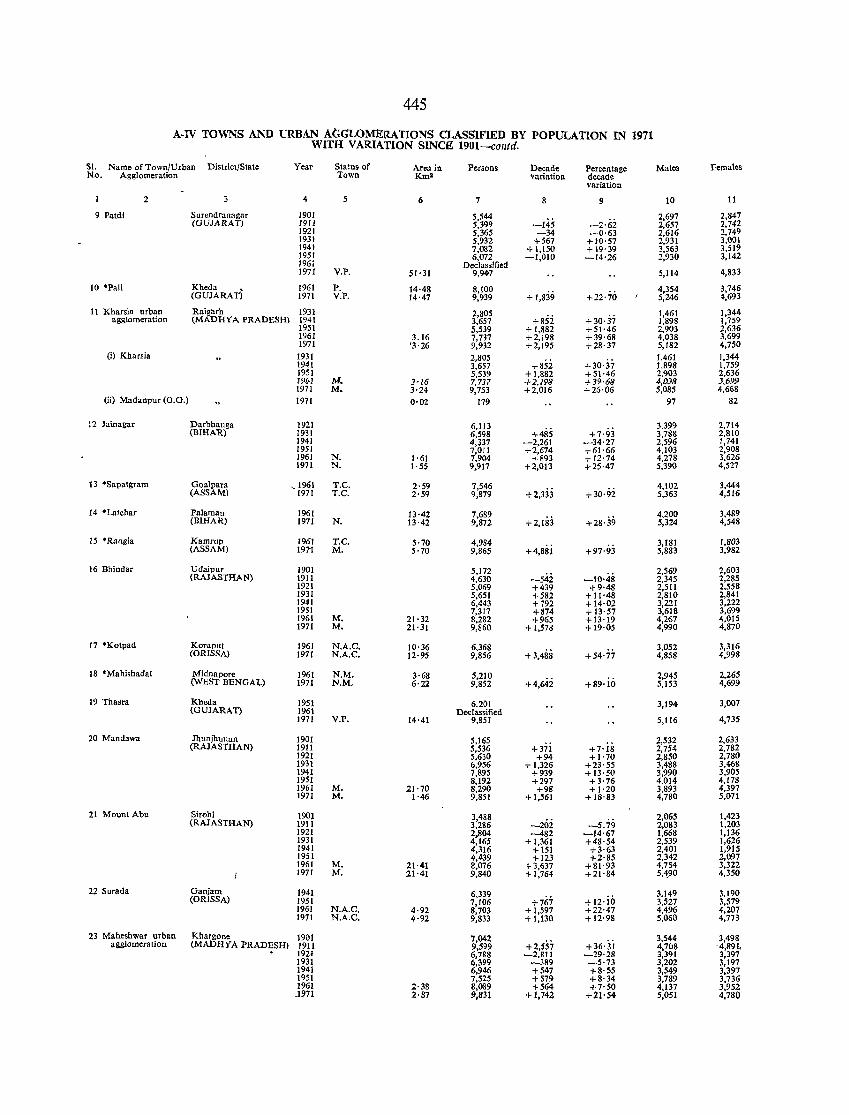
445
A·IV TOWNS AND URBAN AGGLOMll:RATIONS CLASSlFIED BY POPULATION IN 1971 WITH V ARIATlON SINCE 1901-contd.
51. Name of Town/Urban District/State Year Status of Area in Persons Decade Percentage Males Females No. Agglomeration Town Kml variatioa decade
variation
2 4 5 6 7 8 9 10 11
9 Patdi Surendranagnr 1901 5.544 -145 -2·i>i
2,697 2,847 (GUJARAT) 1911 5,399 2,657 2,742
1921 5,365 -34 -0'63 2,616 2,749 1931 5,932 +561 +10'57 2,931 3,001 1941 7,082 +1,150 + 19'39 3,563 3,519 1951 6,072 -1,010 -14'26 2,930 3,142 1961 Declassified
4,833 1971 V.P. 51·31 9,9407 5,114
10 "Pali Kheda 1961 P. 14·48 8,100 4,354 3,146 (GUJARAT) 1971 V.P. 14·41 9,939 + 1,839 +22'70 5,246 4,693
11 Kharsi. urban Raigarh 1931 2,805 +852 +30·37
1,461 1,344 agglomeration (MADHYA PRADESH) 1941 3,651 1,898 1,759
1951 5,539 + 1,882 +51·46 2,903 2,636 1961 3.16 7,737 +2,198 +39·68 4,038 3.699 1971 '3'26 9,932 +2,195 +28·37 5,182 4,750
(i) Kharsia 1931 2,805 +8si +30·37
1,461 1,344 1941 3.657 1,898 1,759 1951 5,539 +1,882 +51·46 2,903 2,636 1961 M. 3·/6 7,737 +2,/98 +39·68 4,038 3.699 1971 M. 3'24 9,753 +2,016 +26·06 5,085 4,668
(ii) Madanpur (0.0.) 1971 0·02 179 97 82
12 Juinagar Darbhanga 1921 6,113 +7·93
3,399 2,714 (BIHAR) 1931 6,598 +485 3,788 2,810
1941 4,337 -2,261 -34·27 2,596 1,741 1951 7,011 +2,674 +61·66 4,103 2,908 1961 N. 1'61 7,904 +893 +12'74 4,278 3,626 1971 N. 1·55 9,911 +2,013 +25'47 5,390 4,527
13 ·Sapalgram Goalpara ~ 1961 T.C. 2'59 7,546 +2,3JJ +30'92
4,102 3,444 (ASSAM) 1971 T.C. 2'59 9,879 5,363 4,516
14 ·Lalehar Palamau 1961 13'42 7.689 +2,183 +28·39
4,200 3,489 (BIHAR) 1971 N. 13·42 9,872 5,324 4,548
15 "Rangia Kamrup 1961 T.C. 5·70 4,984 +4,88i +97·93
3,181 1,803 (ASSAM) 197'1 M. 5·70 9,865 5,883 3,982
16 Bhindar Udaipur 1901 5,172 -542 -10'48
2,569 2,603 (RAJASTHAN) 1911 4,630 2,345 2,285
192\ 5,069 +439 +9·48 2,511 2,558 1931 5,651 +582 + 11·48 2,810 2,841 1941 6,443 +792 +14·02 3,221 3,222 1951 7,317 +874 +13'57 3,618 3,699 196\ M. 21·32 8,282 +965 + 13'19 4,267 4,015 1971 M. 21·31 9,860 + 1,578 + 19·05 4,990 4,870
17 "Kotpad Koraput 1961 N.A.C. 10·36 6,368 +3,488 +54'77
3,052 3,316 (ORISSA) 1971 N.A.C. 12·95 9,856 4,858 4,998
18 *Mahishadal Midnapore 1961 N.M. 3·68 5,210 +4,642 +89·ii>
2,945 2,265 (WEST BENGAL) 1971 N.M. 6'22 9,852 5,153 4,699
19 Thasra Kheda 1951 6.201 3,194 3,007 (GUJARAT) 1961 Declassified
1971 V.P. 14'41 9,851 5,Jl6 4,735
20 Mandawa Jhunjhunun 1901 5,165 +7·is
2,532 2,633 (RAJASTHAN) 1911 5,536 +371 2,754 2,782
1921 5,630 +94 +1'70 2,850 2,780 1931 6,956 +1,326 +23'55 3,488 3,468 1941 7,895 +939 + 13· 50 3,990 3,905 1951 8,192 +297 +3'76 4,014 4,178 1961 M. 21·70 8,290 +98 +1·20 3,893 4,397 1971 M. 1'46 9,851 + 1,561 +18·83 4,780 5,071
21 Mount Abu Sirohi 1901 3,488 -202 -5.79
2,065 1,423 (RAJASTHAN) 1911 3,286 2.083 1,203
1921 2,804 -482 -14·67 1,668 1,136 1931 4,165 + 1,361 +48'54 2,539 1,626 1941 4,316 +151 +3'63 2,401 1,915 1951 4,439 +123 +2'85 2,342 2,097 1961 M. 21·<41 8,076 + 3,637 +81·93 4,754 3,322 1971 M. 21·41 9,840 +1,764 +21'84 5,490 4,350
22 Surada Ganjam 1941 6,339 +12·iil
3,149 3,190 (ORISSA) 1951 7,106 +767 3,527 3,579
1961 N.A.C. 4·92 8,703 + 1,597 +22·47 4,496 4,207 1971 N.A.C. 4·92 9,833 +1,130 +12·98 5,060 4,713
23 Maheshwar urban Khargone 1901 7,042 +2,557 +36·ji
3,544 3,498 agglomera lion (MADHYA PRADESH) 1911 9,599 4,7(J8 '4,89L
1921 6,788 -2,811 -29·28 3,391 3,397 1931 6,399 -389 -5·73 3,202 3,197 1941 6,946 +547 +8'55 3,549 3,397 1951 7,525 +579 +8·34 3,789 3,736 1961 2·38 8,089 +564 +7·50 4,137 3,952 .1971 2·87 9,831 +1,742 +21'54 5,051 4,780
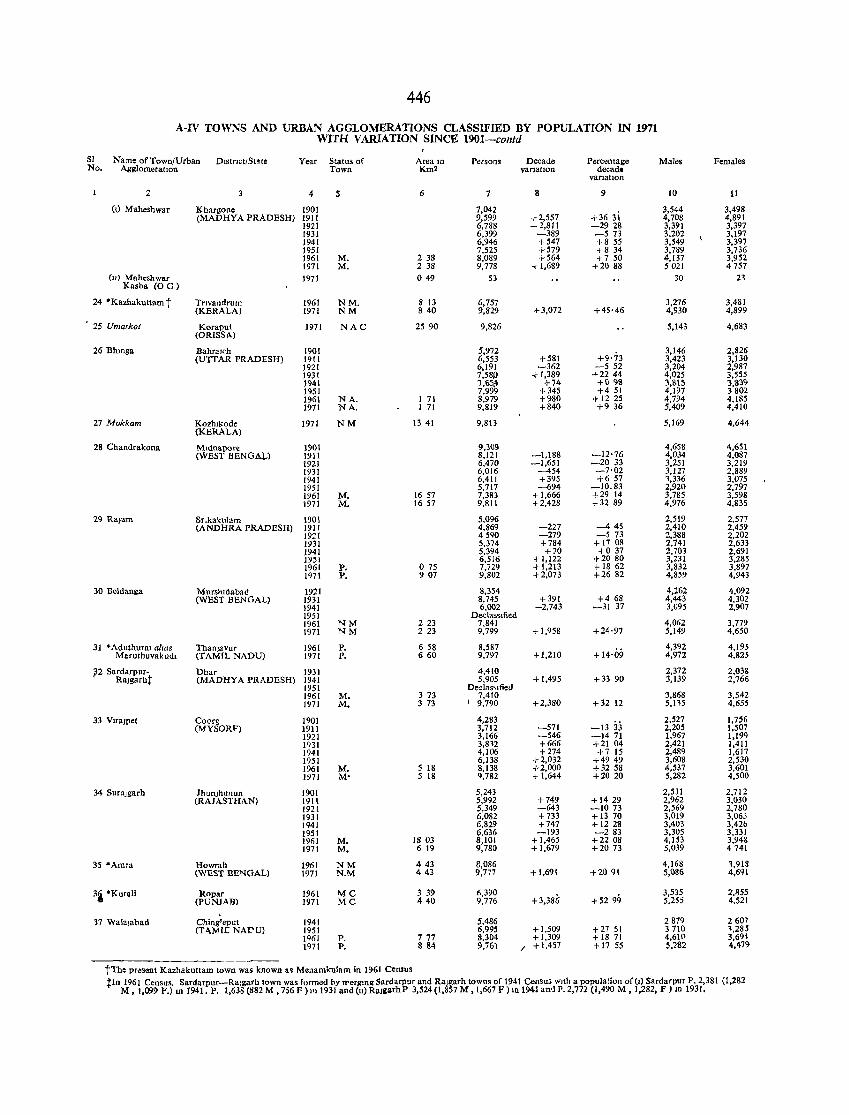
446
A-IV TOWNS AND URBAN AGGLOMERATIONS CLASSIFIED BY POPULATION IN 1971 WITH VAR.!ATlON SINCE 1901-contd
SI Name of Town/Urban D,strlct/St.te Year Status of Aream Persons Decade Percentage MaJes FemaJes No. AgglomeratIon Town Km2 varlatl0n decad.
vanatton
2 4 S 6 7 8 9 10 11
(1) Maheshwar Khargone 1901 7,042 +363i
3,544 3,498 (MADHYA PRADESH) 1911 9,599 +2,557 4,708 4,891
1921 6,788 -2,811 -2928 3,391 3,397 1931 6,399 -389 -573 3,202 3.197 1941 6,946 +547 +8 55 3,549 3,397 1951 7.525 +579 +8 34 3,789 3,736 1961 M. 238 8,089 +564 +7 50 4,137 3,952 1971 M. 238 9,778 + 1,689 +2088 5021 4757
(It) Maheshwar 1971 049 53 30 23 Kasha (0 G)
24 °Kazhakuttam t Trlvandrum 1961 NM. 8 13 6,757 3.276 3,481 (KERALA) 1971 NM 840 9,829 +3,072 +45'46 4,930 4,899
25 Umarkot Korapul (ORISSA)
1971 NAC 2590 9,826 5,143 4,683
26 Bhmga BahralCh 1901 5,972 +9'73
3,146 2,826 (UTTAR PRADESH) 1911 6,553 +581 3,423 3,130
1921 6,191 -362 -552 3,204 2,987 1931 7,58/) + 1,389 +2244 4,025 3,555 1<)41 1,65,4 +74 +098 3,%15 3,%3<) 1951 7,999 +345 +451 4,197 3802 1961 NA. 1 71 8,979 +980 + 12 25 4,794 4.185 1971 NA. 1 71 9,819 +840 +936 5,409 4,410
27 Mokkam Kozblkode 1971 NM 13 41 9,813 5,169 4,644 (KERALA)
28 Cbandrakona Mldnallore 1901 9,3G9 4,658 4,651 (WEST BENGAL) 1911 8,121 -1,188 -12'76 4,034 4,087
1921 6,470 -1,651 -2033 3,251 3,219 1931 6,016 -454 -7·02 3,127 2,889 1941 6,411 +395 +6 57 1,336 3,075 1951 5,717 -694 -10.83 2,920 2,797 1961 M. 1657 7,383 +1,666 +29 14 3,785 3,598 J971 M. 1657 9,811 +2,428 +32 89 4,976 4,835
29 Ra)am Sr.kakulam 1901 5,096 2,519 2,577 (ANDHRA PRADESH) 1911 4,869 -227 -445 2,410 2,459
1921 4590 -279 -573 2,388 2,202 1931 5,374 +784 + 17 OS 2,741 2,633 1941 5,394 +10 +037 2,703 2,691 1951 6,516 +1,122 +2080 3,231 3,285 1961 P. 075 7,729 +1,213 +1862 3,832 3,897 1971 P. 907 9,802 +2,073 +2682 4,859 4,943
30 Beldanga Murshldabad 1921 8,354 4,262 4,092 (WEST BENGAL) 1931 8,745 +391 +468 4,443 4,302
1941 6,002 -2,743 -31 37 3,095 2,907 1951 Declas"fied 1961 NM 223 7,841 4,062 3,779 1971 NM 223 9,799 + 1,958 +24'97 5,149 4,650
31 • Ad uthural aliaS ThanJavur 1961 P. 658 8,587 +14'09
4,392 4,195 Maruthuvakudl (TAMIL NADU) 1971 P. 660 9,797 +1,210 4,972 4.825
il2 Sardarpuro Dhar 1931 4,410 2,372 2,038 Ralgarht (MADHYA PRADESH) 1941 5,905 +1,495 +33 90 3,139 2,766
1951 Dedas\lfied 1961 M. 373 7,410 3,868 3,542 1971 M. 373 I 9,790 +2,380 +32 12 5,115 4,655
33 Vlralpe( Co('rg 1901 4,283 -133j
2,527 1,756 (MYSORF) 1911 3,712 -571 2,205 1,507
1921 3,166 -546 -1471 1,967 1,199 1931 3,812 +666 +2104 2,421 1,411 1941 4,106 +274 +7 15 2,489 1,617 1951 6,138 +2,032 +4949 3,608 2,530 1961 M. 5 18 8,138 +2,000 +32 58 4,537 3,601 1971 M' 5 18 '1,782 +1,644 +2020 5,282 4,500
34 Suralgarh Jhunlhunun 1901 5,243 2,531 2,712 (RAJASTHAN) 1911 5,992 +749 +1429 2,962 3,030
1921 5,349 -643 -1073 2,569 2,780 1931 6,082 +733 + 13 70 3,019 3,063 1941 6,829 +747 + 1228 3,403 3,426 1951 6,636 -193 -283 3,305 3,331 1961 M. 1803 }.101 +1,465 +2208 4,153 3,948 1971 M. 6 19 ,780 +1,679 +2073 5,039 4741
35 "Amra Howrah 1961 NM 443 8,086 4,168 ,,918 (WEST BENGAL) 1971 N.M 443 9,777 +1,691 +2091 5,086 4,691
3i "J{ur.li Ropar 1961 MC 339 ~,390 +3,386 +5299
3,535 2.~55 (PUNJAB) 1971 MC 440 9,776 5,255 4,521 .
37 Wala]abad Ching'eput 1941 5.486 2879 2607 IT O\MII: NAr'U) 1951 6,995 +1.509 +27 51 3710 1,285
1961 P. 777 8,304 +1,309 + 18 71 4,61(\ 3,694 1971 P. 884 9,761 / +1,457 +17 55 S,?82 4,479
tThe pr,,"sent Kazhakuttam town was known a. Menamkulam in 1961 Census trn 1961 Census, Sardarpur-RaJgarh town was formed by rrergIn!! Sardarpur and RaJgarh towns of 1941 Censu. Wltb a population of (1) Sardarpur P. 2,381 (1,282
M, 1,099 F.) m 1941. P. 1,638 (882 M ,756 F) l',1931 and (u) Ral&arhP 3,524 (1, 57 M ,1,667 F) In 1941 and P. 2,772 (1,490 M, 1,282, F) lD 1931.
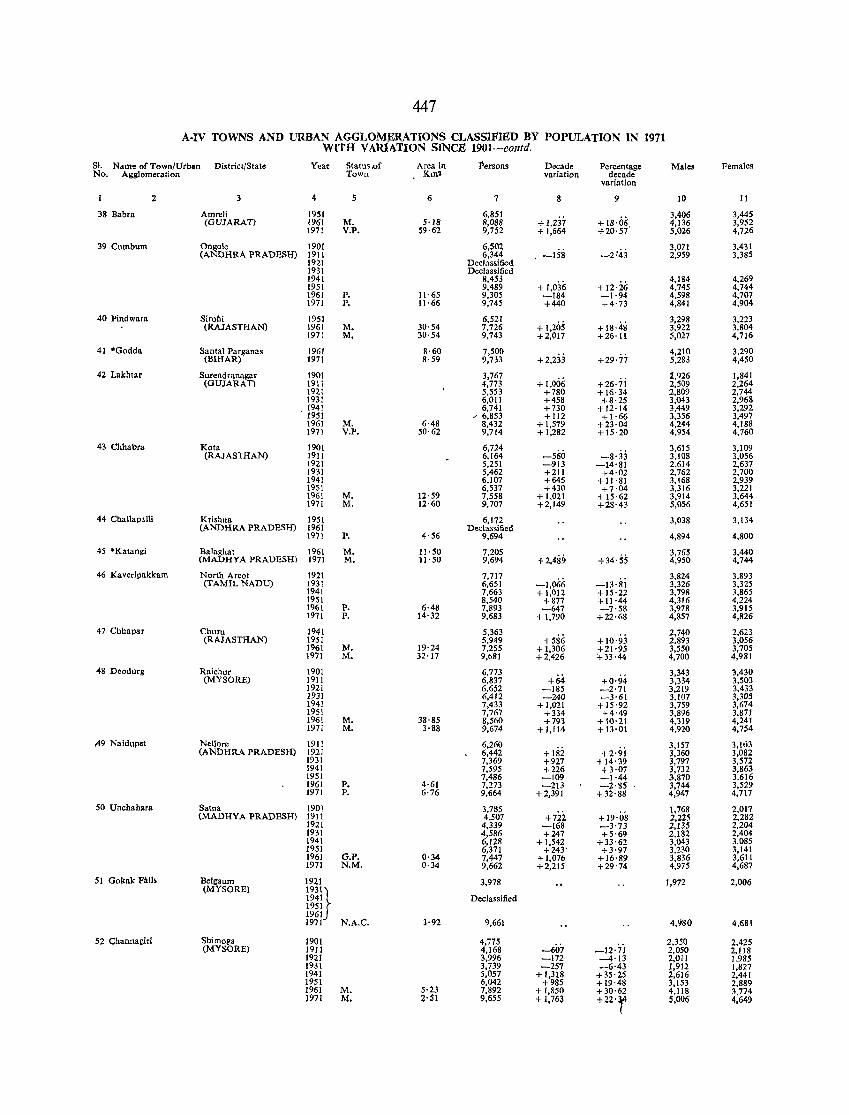
447
A·IV TOWNS AND URBAN AGGLOMJ):RATIONS CLASSIFIED BY POPULATION IN 1971 WITH VARIATION SINCE 1901--contd.
SI. Name of Town/Urban District/State Year Slatu'.of Area in :Persons Decade Percentage Males Females No_ Agglomeration Town Km2 variation decade
variation
2 3 4 5 6 7 8 9 10 II
38 Babra Amreli 1951 6,851 +1,237 +18·06
3,406 3,445 (GUJARAT) 1961 M_ 5-18 8,088 4,136 3,952
1971 V_P, 59·62 9,752 +1,664 +20-57' 5,026 4,726
39 Cumbum Ongole 1901 6,502 . -158 -2:43
3,011 3,431 (ANDHRA PRADESH) 1911 6,344 2,959 3,385
1921 Declassified 1931 Declassified 1941 8,453
+1,036 +12·26 4,184 4,269
1951 9,489 4,745 4,744 1961 P. 11·65 9,305 -184 -1·94 4,598 4,707 1971 P. 11·66 9,745 +440 +4-73 4,841 4,904
40 Pindwara Sirohi 1951 6,521 +1,205 +18-48
3,298 3.223 (RAJASTHAN) 1961 M. 30·54 7,726 3,922 3,804
1971 M. 30'54 9,743 +2,017 +26'11 5,027 4,716
41 *Godda Santal Parganas 1961 8·60 7,500 +2,233 +29'77
4,210 3,290 (BIHAR) 1971 8·59 9,733 5,283 4,450
42 Lakhtar Surendranagar 1901 3,767 + 1,006 +26'7i
1,926 1,841 (GUJARAn 1911 4,773 2,509 2,264
1921 5,553 +780 +16·34 2,809 2,744 1931 6,011 +458 +8·25 3,043 2,968
. l~~l 6,741 +730 +12-14 3,449 3,292 / 6,853 + 112 +1'66 3,356 3,497
1961 M_ 6·48 8,432 + 1,579 +23-04 4,244 4,188 1971 V_P. 50·62 9,714 + 1,282 +15-20 4,954 4,760
43 Chhabra Kola 1901 6,724 -560
3,615 3,109 (RAJASTHAN) 1911 6,164 -8,33 3,108 3,056
1921 5,251 -913 -14·81 2,614 2,637 1931 5,462 +211 +4-02 2,762 2,700 1941 6,107 +645 +11·81 3,168 2,939 1951 6,537 +430 +7·04 3,316 3,221 1961 M_ 12·59 7,558 +1.021 +15·62 3,914 3,644 1971 M_ 12·60 9,707 +2,149 +28-43 5,056 4,651
44 Challapalti Krishna 1951 6,172 3,038 3,134 (ANDHRA PRADESH) 1961 Declassified
1971 P. 4-56 9,694 4,894 4,800
45 *Katangi Balagha1 1961 M_ 11 ·50 7,205 +2,489 +34'55
3,765 3,440 (MADHYA PRADESH) 1971 M. 11'50 9,694 4,950 4,744
46 Ka veripakkam North Areot 1921 7,717 -1,066
3,824 3,893 (TAMIL NADU) 1931 6,651 -13'81 3,326 3,325
1941 7,663 +1,012 +15·22 3,798 3,865 1951 8,540 +877 +11-44 4,316 4,224 1961 P. 6·48 7,893 -647 -7-58 3,978 3,915 1971 P. 14·32 9,683 +1,790 +22·68 4,857 4,826
47 Chhapar Churu 1941 5,363 +586 +10'93
2,7~0 2,623 (RAJASTHAN) 1951 5,949 2.83 3,056
1961 M. 19-24 7,255 +1,306 +21-95 3,550 3,705 1971 M. 32·17 9,b81 +2,426 +33-44 4,700 4,981
48 Deodurg Raichur 190! 6,773 +64 +0·94
3,343 3,430 (MYSORE) 1911 6,837 3,334 3,503
1921 6,652 -185 -2-71 3,219 3,433 1931 6,412 -240 -3·61 3,107 3,305 1941 7,433 +1,021 +15·92 3,759 3,674 1951 7,767 +334 +4'49 3,896 3.811 1961 M_ 38·85 8,560 +793 +10·21 4.319 4,241 1971 M. 3·88 9,674 + 1,114 +13·01 4,920 4,754
49 Naidupet Nellore 1911 6,260 +182 +2'9i
3,157 3,1113 (ANDHRA PRADESH) 1921 6,442 3,360 3,082
1931 7,369 +927 +14'39 3,797 3,572 1941 7,595 +226 +3-07 3,732 3,863 1951 7,486 -109 -1-44 3.870 3.616 1961 P. 4·61 7,273 -213 -2·85 3,744 3,529 1971 P- 6·76 9,664 +2,391 +32-88 4,947 4,717
50 Unchahara Satna 1901 3,785 +722 +19-08
1,768 2,017 (MADHYA PRADESH) 1911 4,507 2,225 2,282
192! 4,339 -168 -3·73 2,135 2,204 1931 4,586 +247 +5-69 2.182 2,404 1941 6,128 +1,542 +33-62 3,043 3,085 1951 6,311 +243' +3-97 3,230 3,141 1961 G_P_ 0·34 7,447 +1,076 +16·89 3,836 3,611 1971 N_M. 0-34 9,662 +2,215 +29'74 4,975 4,687
51 Gokak FaIl. Be1gaum 1921 3,978 1,972 2,006 (MYSORE) 1931 )
1941
j Declassified
1951 1961 1971 N.A.C_ 3-92 9,661 4,980 4,681
52 Channagiri Shimop:a 1901 4,775 -607 -12·7i
2,350 2,425 (MYSORE) 1911 4,168 2,050 2,118
1921 3,996 -172 -4'13 2,011 1.985 1931 3,739 -257 -6·43 1,912 1,827 1941 5,057 + 1,318 +35·25 2,616 2,441 1951 6,042 +985 + 19·48 3,153 2.889 19G1 M. 5-23 7,892 + 1,850 +30·62 4,118 3_774 1971 M. 2·51 9,655 + 1,763 +22'r 5,006 4,649
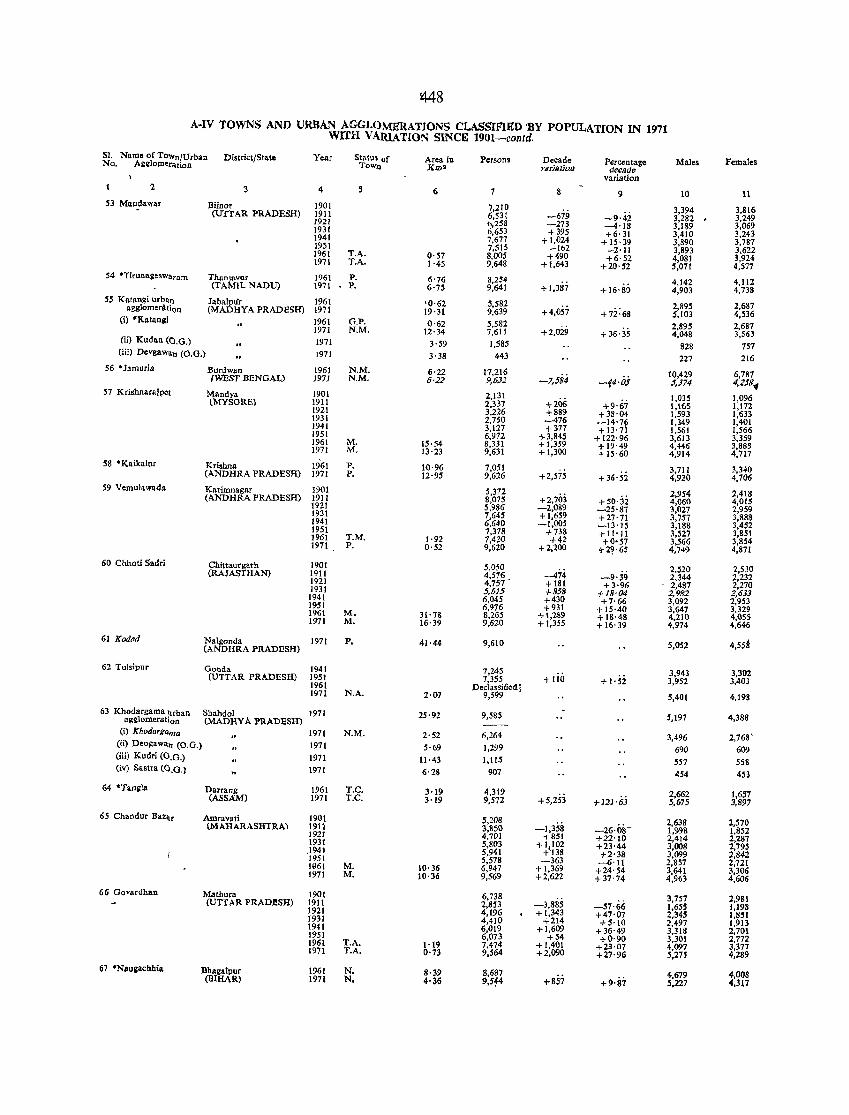
~48
A·IV TOWNS AND URBAN AGGLOMERATIONS CLASSIFIED 'BY POPULATION IN 1971 WITH VAlUATION SINCE 1901-contd.
SI. Name of TOWn/Urban District/State Year Status of Area in Persons Decade Percentage Males Females No. Agglomeration ToWll Km> varlavoJJ decade variation
2 3 4 S 6 7 8 9 10 II 53 Mandawar Biinor 1901 7,210
-679 3,394 3,816 (UTTAR PRADESH) 1911 6,S31 -9·42 3,282 . 3,249 1921 b,258 -273 --4'18 3,189 3,069 1931 6,653 +395 +6·31 3,410 3,243 1941 7,677 +1,024 + 15·39 3,890 3,787 1951 7,S15 -lb2 -2·11 3,893 3,622 1961 T.A. 0'57 8,005 +490 +6·52 4,081 3,924 1971 T.A. 1'45 9,648 +1,643 +21)'52 5,071 4,577 54 *Tirunageswaram ThanJ8vur 1961 P. 6'76 8,254
+1,387 4,142 4,112 (TAMIL NADD) 1971 P. 6·75 9,641 +16·80 4,903 4,738
55 Katangi urban Jabalpu'r 1961 '0·62 .~,582 +4,057 +7i:68
2,895 2,687 agglomerAtion (MADHYA PRADESH) 1971 19'31 9,639 5,103 4,536 (i) "Katanaj 1961 G.P. 0·62 5,582
+2,029 2,895 2,681 1971 N.M. 12·34 7,611 + 36· 35 4,048 3,563
(ii) Kudan (Cl.G.) 1971 3'59 1,585 828 751 (iii) Devgawan (O.G.) 1971 3'38 443 227 216
56 ·Jamuria Burdwan 1961 N.M. 6·22 17,216 -7,584
10,429 6,787 (WEST BENGAL) J97J N,M, 6,22 9,6)2 -14•05 5,374 4,2581( 57 Krishnarajpet Mandya 1901 2,131
+206 1,035 1,096 (MYSQRE) 1911 2.337 +9'67 1,165 1,172 1921 3,226 +889 +38·04 1,593 1,633 \931 2,750 --476 -14'7f 1,349 1,401 1941 3,127 +377 +13·7 1,561 1,566 1951 6,972 +3,845 + 122·96 3,613 3,359 1961 M. 15·54 8,331 +1,359 +19·49 4,446 3,885 1971 M. 13'23 9,631 + 1,300 + 15·60 4,914 4,717
58 ·Kaikalur Krishna 1961 P. 10·96 7,051 +2,575
3,711 3,340 (ANDHRA PRADESH) 1971 P. 12·95 9,626 +36'52 4,920 4,706 59 Vemulawada Karimnagar 1901 5,372
+2,703 +50·32 2,954 2,418 (ANDHRA PRADESH) 1911 8,075 4,060 4,015 1921 5,986 -2,089 -25'87 3,027 2,959 1931 7,645 +1,659 +27'71 3,757 3,888 1941 6,640 -1,005 -13'15 3,188 3,452 1951 7,378 +738 + 11'11 3,527 3,851 1961 T.M. 1·92 7,420 +42 +0'57 3,566 3,854 1971 P. 0'52 9,6:20 +2,200 +2~'65 4,749 4,871
60 Chhoti Sadri Chittaurgarh 1901 5,050 -9'39
2,520 2,5.10 (RAJASTHAN) 1911 4,516 --474 2,344 2,232 1921 4,7S7 . + 181 +3·96 2,487 2,270 1931 5,6)5 +858 +18·04 2,982 2,631 1941 6,045 +430 +7·66 3,092 2,953 1951 6,976 +931 +15·40 3,647 3,329 1961 M. 31'78 8,265 +1,289 +18·48 4,210 4,055 1971 M. 16·39 9,6:20 +1,355 +16'39 4,974 4,646
61 Kodad Nalgonda (ANDHRA PRADESH)
1971 P. 41·44 9,610 5,052 4,55A
62 Tulsipur Gonda 1941 7,245 + lio +1·si
3,943 3,302 (UTTAR PRADESH) 1951 7,355 3,952 3,403 1961 Declassified 1 1971 N.A. 2·07 9,599 5,401 4,198
63 Khodargama Ilrban Shahdol 1971 25·92 9,585 5,197 4,388 agglomeration (MADHYA PRADESH) (il Khodarg"ma 1971 N.M. 2'52 6,264 3,496 2,768'
(iil Deogawan (O.G.) 1971 5'69 1,299 690 609 (iii) Kudri (O.G.) 1971 11'43 1,115 557 558 (iv) Sastra (O.G.) 1971 6'28 901 454 453
64 "Tanilia Darrang 1961 T.C. 3·19 4,319 +5,253
2,662 1,657 (ASSAM) 1971 T.C. 3 '19 9,572 70121'6j 5,675 3,897
6S Chandur Baz\r Amravati 1901 5,208 -1,358 -26·08-
2,638 2,570 (MAHARASHTRA) 1911 3,850 1,998 1,852 1921 4,701 +851 +22'10 2,414 2,287 1931 5,803 +1~102 +23'44 3,008 2,795 .1941 5,941 + 138 702'38 3,099 2,842 1951 5,518 -363 --6'11 2,857 2,121 HI61 M. 10·36 6,947 + 1,369 +24'54 3,641 3,306 1971 M. 10·36 9,569 +2,622 + 37'14 4,963 4,606
66 Govardhan Mlltbura 1901 6,738 -57'66
3,757 2,981 (UTTAR PRADESH) 1911 2,853 -3,885 1,655 1,198 1921 4,196 + 1,343 +47'07 2,345 J,8~1 1931 4,410 +214 +5'10 2,491 1,913 1941 6,019 +1,609 +36'49 3,318 2,701 1951 6,073 +54 +0'90 3,301 2,772 1961 T.A. 1'19 7.474 +1,401 +23·07 4,091 3,377 1971 T.A. 0·73 9,564 +2,090 +27'96 5,27$ 4,289
67 ·Nau;acllhia Bhagalpur 1961 N. 8·39 8,687 +857
4,679 4,008 (BIHAR) 1971 N. 4'36 9,514 +9'81 5,221 4,317
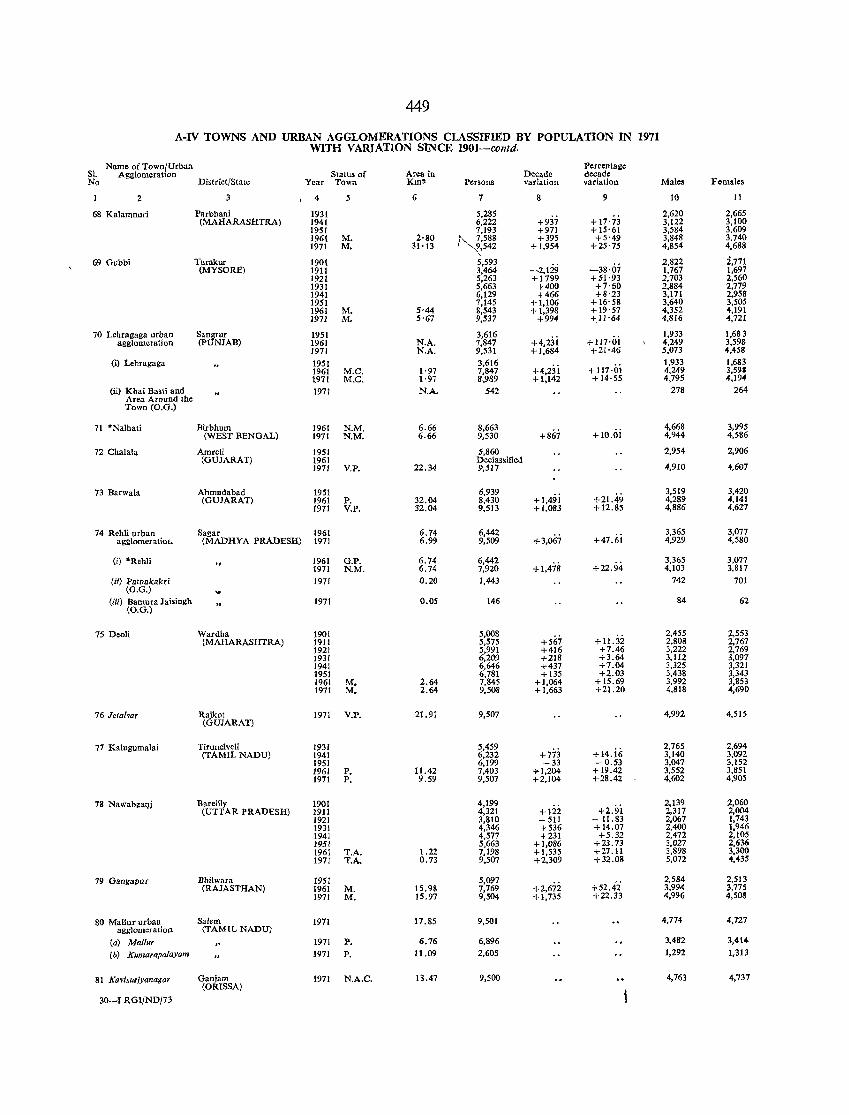
449
A-IV TOWNS AND URBAN AGGLOMERATIONS CLASSIFIED BY POPULATION IN 1971 WITH VARIATION SINCE 1901-contd.
SI. Name of Town/Urban Percentage
Agglomeration Status of Area in Decade decade No District/State Year Town Km: Persons variation variation Males Females
2 4 5 6 7 8 9 10 11
68 Kalamnuri Parbhani 1931 5,285 + 17'73
2,620 2,665 (MAHARASHTRA) 1941 6,222 +937 3,122 3,100
1951 7,193 +971 +15'61 3,584 3,609 1961 M. 2'80 ~588 +395 +5'49 3,848 3.740 1971 M. 31'13 ,542 +1,954 +25'75 4,854 4,688
69 Gubbi Tumkur 1901 5,593 -2,129 -38·07
2,822 :i,771 (MYSORE) 1911 3,464 1,767 1,697
1921 5,263 +1799 +51'93 2,703 2,560 1931 5,663 +400 +7'60 2,884 2,779 1941 6,129 +466 +8'23 3,171 2,958 1951 7,145 +1,106 + 16'58 3,640 3,505 1961 M. 5'44 8,543 + 1,398 +19'57 4,352 4,191 1971 M. 5'67 9,537 +994 +.11'64 4,816 4,721
70 Lebragaga urban Sangrur 1951 3,616 +4,23i + 117·oi
1,933 1,683 agglomeration (PUNJAB) 1961 N.A. 7,847 4,249 3,598
1971 N.A. 9,531 +1,684 +21'46 5,073 4,458
(i) Lehragaga 1951 3,616 +4,23i
1,933 1,683 1961 M.e. 1'97 7,847 + 117 ·01 4,249 3,591 1971 M.C, 1·97 8,989 + 1,142 +14·55 4,795 4,194
(li) Kbai Bast; and 1971 N.A. 542 278 264 Area Around tbe Town (O.G.)
71 'N~lbati Birbhum 1961 N.M. 6.66 8,663 +867 +lo.<ii
4,668 3,995 (WEST BENGAL) 1971 N.M. 6.66 9,530 4,944 4,586
72 Cbalala Amreli 1951 5,860 2,954 2,906 (GUJARAT) 1961
1971 V,P. 22.34 Declassified 9,517 4,910 4,607
73 Barwala Ahmadabad 1951 6,939 +1,49i +21.49
3,519 3,420 (GUJARAT) 1961 P. 32.04 8,430 4,289 4,141
1971 V.P. 32.04 9,513 +1,083 +12.85 4,886 4,627
74 Rebli urban Sagar 1961 6.74 6,442 +3,067 +47.i;i
3,365 3,077 agglomeratioh (MADHYA PRADESH) 1971 6.99 9,509 4,929 4,580
(i) tRehli 1961 G.P. 6.74 6,442 +1,478 +22.94
3,365 3,077 1971 N.M. 6.74 7,920 4,103 3,817
(ii) Patnakakri (O.G.)
1971 0.20 1,443 742 701
(iii) Barnura Jaisingh 1971 0.05 146 84 62 (O.G.)
75 Deoli Wardha 1901 5,008 +567 + 11.32
2,455 2,553 (MAHARASHTRA) 1911 5,575 2,808 2,767
1921 5,991 +416 +7.46 3,222 2,769 1931 6,209 +218 +3.64 3,HZ 3,097 1941 6,646 +437 +7.04 3,325 3,321 1951 6,781 +135 +2.03 3,438 3,343 1961 M. 2.64 7,845 +1,064 +15.69 3,992 3,853 1971 M. 2.64 9,508 +1,663 +21.20 4,818 4,690
76 Jetal,ar Rajkot 1971 V.P. 21.91 9,507 4,992 4,515 (GUJARAT)
77 Kalugumalai Tirunelveli 1931 5,459 +773 +14.ii;
2,765 2,694 (TAMIL NADU) 1941 6,232 3,140 3,092
1951 6,199 -33 -0.53 3,047 3,152 1961 P. 11.42 7,403 ,..1,204 + 19.42 3,552 3,851 1971 P. 9.59 9,507 +2,104 +28.42 4,602 4,905
78 Nawabgal}j Bareilly 1901 4,199 +2.9i
2,139 2,060 (UTTAR PRADESH) 1911 4,321 +122 2,317 2,004
1921 3,810 -511 - U.83 2,067 1,743 1931 4,346 +536 +14.07 2,400 1,946 1941 4,577 +231 +5.32 2,472 2,105 1951 5,663 +1,086 +23.73 3,027 2,636 1961 T.A. 1.22 7,198 +1,535 +27.11 3,898 3,300 1971 T.A. 0.73 9,507 +2,309 +32.08 5,072 04,435
79 Gallgapur Bhilwara 1951 5,097 +2,672 +52.42
2,584- 2,513 (RAJASTHAN) 1961 M. 15.98 7,769 3,994 3,775
1971 M. 15.97 9,504 +1,735 +22.33 4,996 4,508
80 Mallur urban Salem 1971 17.85 9,501 4,774 4,727 agglomeratiO(1 (TAMIL NADU)
(a) MalluT 1911 P. 6.76 6,896 3,482 3,414
(h) Kumarapalayam 1971 P. 11.09 2,605 1,292 1,313
81 Kavisur;ya1lagor Ganjam (ORISSA)
1911 N.A.C. 13.47 9,500 4,763 4,737
30-1 RGJ/ND/7)
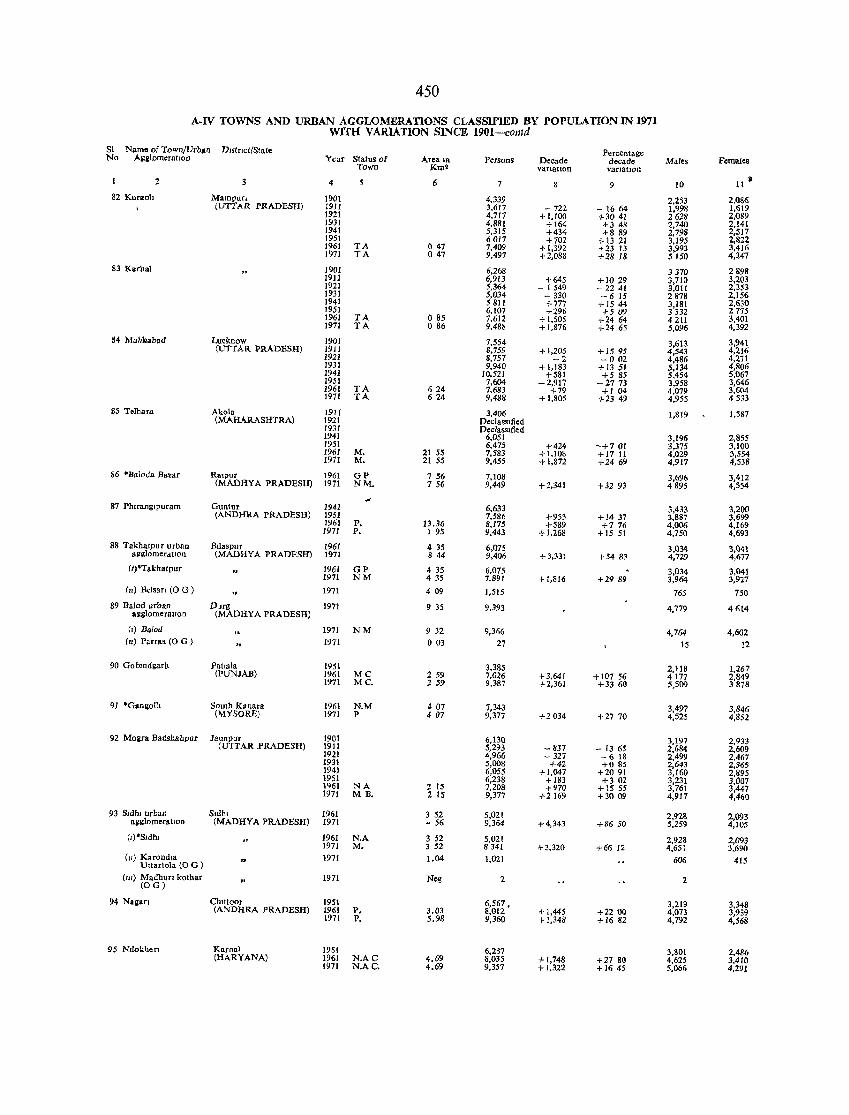
450
A·IV TOWNS AND URBAN AGGLOMERATIONS CLASSIFIED BY POPULATION IN 1971 WITH VARlATlON SINCE 1901-contd
SI Name of Town/Urb.cn D,stTlct{State Percentage No AglllomeratlOn Year Status of Area 1D Persons Decade decade Males Females Town Kmt variatIon varmtlOn
2 4 6 7 8 9 10 It ..
82 Kurlloh MalOl'un 1901 4,339 2,253 2,086 (UTTAR PRADESH) 1911 3,617 -722 - 16 64 1,998 1,619
1921 4,717 +1,100 +3041 2628 2,0$9 1931 4,881 +164 +348 2,740 2,141 1941 5,315 +434 +889 2,798 2,517 1951 6 017 +702 +1321 3,195 2,822 1961 TA 047 7,409 +1,392 +23 13 3,993 3,416 1971 TA 047 9,497 +2,088 +2818 5 ISO 4,347
83 Karhal 1901 6,268 3370 2898 1911 6,913 +645 +10 29 3,710 3,203 1921 5,364 - 1 549 - 2241 3,0 II 2,353 1931 5,034 - 330 -615 2878 2,156 1941 5811 +777 +1544 3,181 2,630 1951 6,107 +296 +509 3332 277S 1961 TA 085 7,612 + 1,505 +2464 4211 3,401 1971 TA 086 9,488 +1,876 +2465 5,096 4.392
84 Mal,l:Iabad Lucknow 1901 7,554 3,613 3,941 (UTTAR PRADESH) 1911 8.759 +1,205 +1595 4,543 4,216
1921 8,757 -2 -002 4,486 4,271 1931 9,940 +1,183 +1351 5,134 4,806 1941 10,521 +581 +S 85 5,454 5,067 1951 7,604 -2,917 -2773 3,958 3,646 1961 TA 624 7,683 +79 +104 4,079 3,604 1971 TA 624 9,488 +1,805 +2349 4,955 4533
85 Telhara Akolo 1911 3,406 1,819 1,587 (MABARASHTRA) 1921 DeclasSIfied
1931 DeclassIfied 1941 6,051 3,196 2,855 1951 6,475 +424 -+701 3,375 3,100 1961 M. 21 55 7,583 +1,108 +17 11 4,029 3.554 1971 M. 21 55 9,455 +1,872 +2469 4,917 4,538
86 ·Baloda Bazar Ralpur 1961 OP 7 56 7,108 3,696 3,412 (MADHYA PRADESH) 1971 NM. 756 9,449 +2,341 +3293 4895 4,554
87 Phltangl puram Guntur 1941 6,633 3,433 3,200 (ANDHRA PRADESH) 1951 7,586 +953 +1437 3,887 3,699
1961 P. 13.36 8,175 +589 +776 4,006 4,169 1971 P. 1 95 9,443 +1,268 +1551 4,750 4,693
88 Takhatpur urban Bdaspur 1961 4 35 6,075 3,034 3,041 agglomerdtlOn (MADHYA PRADESH) 1971 844 9,406 +3,331 +5483 4,729 4,677 (i)'Taldtatpur 1961 OP 435 6,075 3,034 3,041
1971 NM 435 7,891 +1,816 +2989 3,964 3,927 (II) BelsaTl (0 G) 1971 409 1,515 765 750
89 Balod urhlUl DJrg 1971 a2111omeratlOn (MADHYA PRADESH)
9 35 9,393 4,779 4614
(,) Balod 1971 NM 932 9,366 4,764 4,602 (II) Parras (0 G ) 1971 003 27 15 12
90 Gobmdgarh Pahala 1951 3,385 2,118 1,267 (PUNJAB) 1961 MC ;I 59 7,026 +3,641 + 107 56 4177 2,849 1971 MC. 1 59 9,387 +2,361 +3360 5,509 3878
91 *G.cn201h South {{,mara 1961 N.M 407 7.343 3,497 3,846 (MYSOREJ 1971 P " 07 9,377 +2034 +2770 4,525 4,852
92 MOllra Badshahpur Jaunpur 1901 6.130 3,197 2,933 (UTTA.R ,PRADESH) 1911 5,293 - 837 - 13 65 2,684 2,609 1921 4,966 - 327 - 618 2,499 2,467 1931 5,008 +42 +085 2,643 2,365 1941 6,055 +1,047 +2091 3,160 2,895 1951 6,238 +183 +302 3,231 3,007 1<)61 NA 2 15 7,2D8 +970 + IS 55 3,761 3,447 1971 MB. 1 15 9,377 +2169 +3009 4,917 4,460
93 S,dhl urban Sldhl 1961 3 52 5,021 2,92& 2,093 agglomeration (MADHYA PRADESH) 1971 ... 56 9,364 +4,343 +8650 S,2S9 4,105
(,)'Sldhl 1961 N.A 3 52 5,021 2,928 2,093 1971 M. 3 52 8341 +3,320 +6612 4,651 3,690 (II) Karond'a 1971 1.04 1,021 606 415 Uttartola (0 G)
(III) Madhufl kothar (OG)
1971 Neg 2 2
94 Naian Chlttoor 1951 6,567. 3,219 3,348 (ANDHRA PRADESH) 1961 p, 3.03 8,012 +1,445 +22 00 4,073 3,939 1971 P. 5.98 9,360 +1,348 +1682 4,792 4,568
95 Nlloi<befl Karnal 1951 6.287 3,801 2,486 (HARYANA) 1961 N.AC 4.69 8,035 +1,748 +2780 4,625 3,410
1971 N.AC. 4.69 9,357 +1,322 +11) 45 5,066 4,291
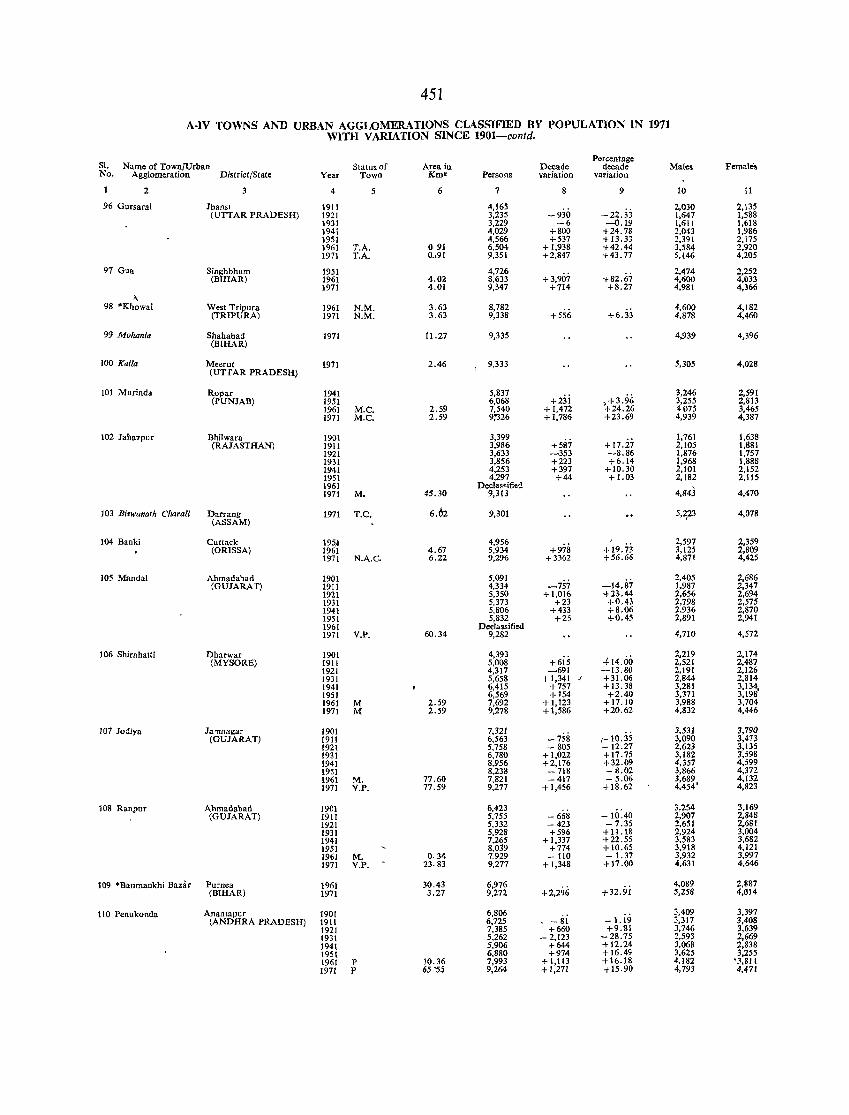
451
A-lV TOWNS AND URBAN AGGLOMERATIONS CLASSIFIED BY POPULATION IN 1971 WITH VARIATION SINCE 1901-colltd.
SI. Name of Town/Urban Area in Percentage
Status of Decade decade Males Femal~ No. Agglomeration District(State Year Town Km' Persons variation variation
2 3 4 6 7 9 10 11
96 Gursarai Jhans. 1911 4,165 -930 -22.33
2,030 2,135 (UTTAR PRADESH) 1921 3,235 1,647 1,588
1931 3,229 -6 -0.19 1,611 1,618 1941 4,029 +800 +24.78 2,043 1,986 1951 4,566 +537 +13.33 2,391 2,175 1961 T.A. 091 6,504 +1,938 +42.44 3,584 2,920 1971 T.A. 0..91 9,351 +2,847 +43.77 5,146 4,205
97 Gua Singhbhum 1951 4,726 +3,907
2,474 2,252 (BIHAR) 1961 4.02 8,633 -t-82.67 4,600 4,033
1971 4.01 9,347 +714 +8.27 4,981 4,366
"-98 ·Khowai West Tripura 1961 N.M. 3.63 8,782 +556 +6.33
4,600 4,182 (TRIPURA) 1971 N.M. 3.63 9,338 4,878 4,460
99 Mohania Shahabad 1971 (BIHAR)
11.27 9,335 4,939 4,396
100 Kaila Meerut 1971 2.46 9,333 5,305 4,028 (UTTAR PRADESH)
101 Murinda Ropar 1941 5,837 +23i ,+3.96
3,246 2,591 (PUNJAB) 1951 6,068 3,255 2,813
1961 M.C. 2.59 7,540 +1,472 +24.26 4075 3,465 1971 M.C. 2.59 9;'326 +1,786 +23.69 4,939 4,387
102 Jaha7pur Bhilwara 1901 3,399 +17.27
1,761 1,638 (RAJASTHAN) 1911 3,986 +587 2,105 1,881
1921 3,633 -353 -8.86 1,876 1,757 1931 3,856 +223 +6.14 1,968 1,888 1941 4,253 +397 +10.30 2,101 2,152 1951 4,297 +44 +1.03 2,182 2,115 1961 Dec1a"ifie~
4,843 1971 M. 45.30 9,313 4,470
103 Biswanafh Charali Darrang 1971 T.C. 6.02 9,301 5,2,23 4,078 (ASSAM)
104 Banki Cuttack 195,1. 4,956 +978 +19.73
2,597 2,359 (ORISSA) 1961 4.67 5,934 3,125 2,809
1971 N.A.C. 6.22 9,296 +3362 +56.66 4,871 4,425
lOS MandaI Ahmadabad 1901 5,091 2,405 2,686 (GUJARAT) 1911 4,334 -757 -14.87 1,987 2,347
1921 5,350 + 1,016 +23.44 2,656 2,694 1931 5,373 +23 +0.43 2,798 2,575 1941 5,806 +433 +8.06 2,936 2,870 1951 5,832 +25 +0.45 2,891 2,941 1961 Declassified 1971 V.P. 60.34 9,282 4,710 4,572
106 Shirahalti Dharwar 1901 4,393 His +14.00
2,219 2,174 (MYSORE) 1911 5,008 2,521 2,487
1921 4,317 -691 -13.80 2,191 2,126 1931 5,658 +1,341 , +31.06 2,844 2,814 1941 6,415 +757 +13.38 3,2&1 3,134, 1951 6,569 +154 +2.40 3,371 3,198 1961 M 2.59 7,692 +1,123 +17.10 3,988 3,704 1971 M 2.59 9,278 +1,586 +20.62 4,832 4,446
107 Jodlya Ja'11nagar 1901 7,321 ,- 10.35
3,531 3,790 (GUJARAT) 1911 6,563 -758 3,090 3,473
1921 5,758 - 805 -12.27 2,623 3,135 1931 6,780 + 1,022 + 17 .75 3,182 3,598 1941 8,956 +2,176 +32.09 4,357 4,599 1951 8,238 -718 - 8.02 3,866 4,372 1961 M. 77.60 7,821 -417 - 5.06 3,689 4,132 1971 V.P. 77.59 9,277 +1,456 +18.62 4,454' 4,823
108 Ranpur Ahmadabad 1901 6,423 -10:40
3,254 3,169 (GUIARAT) 1911 5,755 - 668 2,907 2,848
1921 5,332 - 423 -7.35 2,651 2.681 1931 5,928 +596 + 11.18 2,924 3,004 1941 7,265 + 1,337 +22.55 3,583 3,682 1951 8,039 +774 + 10.65 3,918 4,121 1961 M. 0·34 7.929 - 110 - 1.37 3,932 3,997 1971 V.P. 23.83 9,277 +1,34& +17.00 4,631 4,646
109 ·Banmankhi Bazar Purnea 1961 30.43 6,976 +2,296 +32.9i
4,089 2,887 (BIHAR) 1971 3.27 9,272 5,258 4,014
110 Penukonda Annntapur 1901 6,806 3,409 3,397 (ANDHRA PRADESH) 1911 6,725 , - 81 - 1.19 3,317 3,408
1921 7,385 +660 +9.81 3,746 3,639 1931 5.262 - 2,123 -28.75 2,593 2,669 1941 5,906 +644 +12.24 3,068 2,838 1951 6,880 +974 +16.49 3,625 3,255 1961 P 10.36 7,993 +I,1l3 +16.18 4,182 '3,811 1971 P 65 '55 9,264 +1,271 +15.90 4,793 4,471
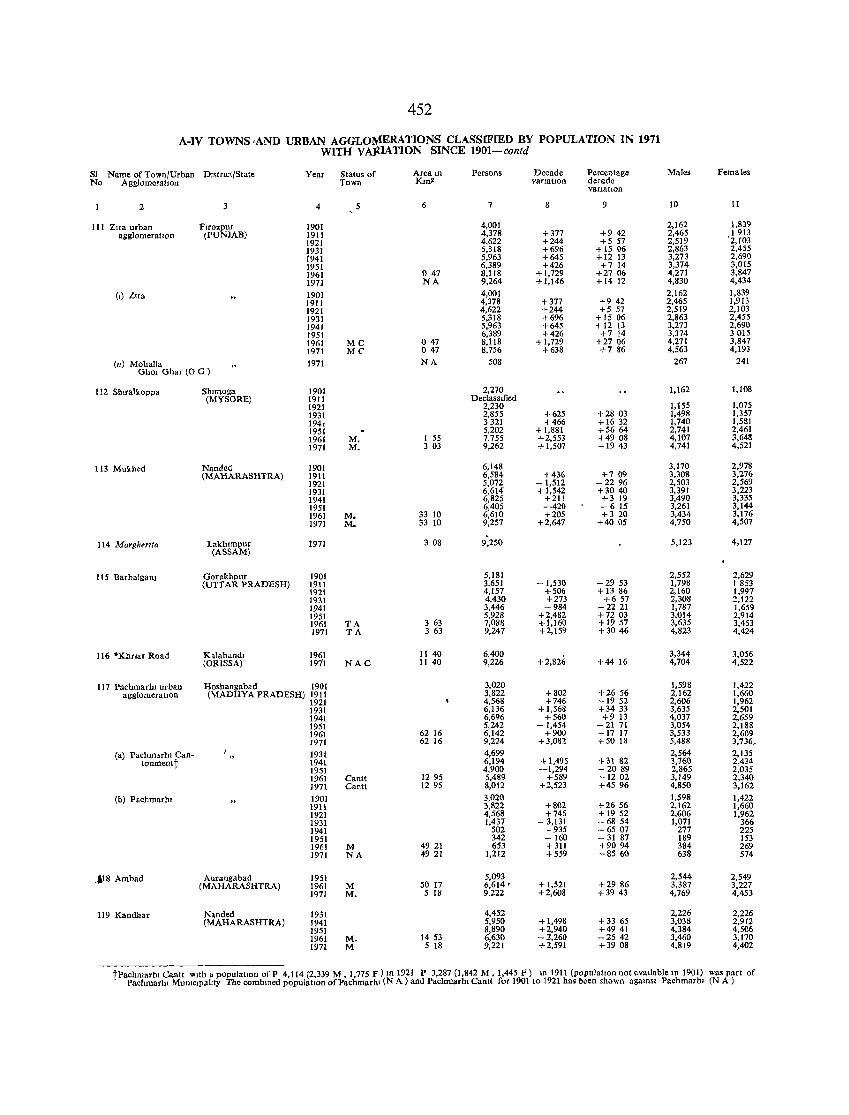
452
A-IV TOWNS .AND URBAN AGGLOlVlERATIONS CLASSIFIED BY POPULATION IN 1971 WITH VAJUATION SINCE 1901-contd
SI Name of Town/Urban Dlstnct/State Year Status of Aream Persons Decade Percentage Males Females No Agglomeration Town Km2 vanatIOn derade
vanatIDn
2 4 5 6 7 8 9 10 11
111 Z"a urban Flrozpur 1901 4,001 2,162 1,839 agglomeratIOn (PUNJAB) 1911 4,378 +377 +942 2,465 1913
1921 4,622 +244 +5 57 2,519 '2,103 1931 5,318 +696 + 1506 2,863 2,455 1941 5,963 +645 +12 13 3,273 2,690 1951 6,389 +426 +714 3,374 3,015 1961 l) 47 8,118 +1,729 +2706 4,271 3,847 1971 NA 9,264 +1,146 +1412 4,830 4,434
(I) bra 1901 4,001 2,162 1,839 1911 4,378 +377 +942 2,465 1,913 1921 4,622 +244 +5 57 2,519 2,103 1931 5,318 +696 + 1506 2,863 2,455 1941 5,963 +645 +1213 3,273 2,690 1951 6,389 +426 +714 3,374 3015 1961 Me 047 S,1I8 +1,729 +2706 4,271 3,847 1971 MC' 047 8.756 +638 +786 4,563 4,193
(11) Mohalla 1971 NA 508 267 241 Ghar Ghar (0 G )
112 Shlralkappa Shlmoga 1901 2,270 1,162 1,108 (MYSORE) 1911 Declassified
1921 2,230 1,155 1,075 1931 2,855 +625 +2803 1,498 1,357 194, 3321 +466 +1632 1,740 1,581 1951 5,202 +1,881 +5664 2,741 2,461 1961 M. I 55 7,755 +2,553 +4908 4,107 3,648 1971 M. 3 03 9,262 +1,507 + 1943 4,741 4,521
113 Mukhed Nanded 1901 6,148 3,170 2,978 (MAHARASHTRA) 1911 6,584 +436 +709 3,308 3,276
1921 5,072 -1,512 - 2296 2,503 2,569 1931 6,614 +1,542 +3040 3,391 3,223 194! 6,825 +211 +319 3,490 3,335 1951 6,405 -420 -615 3,261 3,144 1961 M. 33 10 6,610 +205 +320 3,434 3,176 1971 M. 33 10 9,257 +2,647 +4005 4,750 4,507
114 Marghenla Lakh,mpur 1971 3 08 9,250 5,123 4,127 (ASSAM)
115 BarhalganJ Gorakhpur 1901 5,181 2,552 2,629 (UTTAR PRADESH) 1911 3,651 -1,530 -2953 1,798 1853
1921 4,157 +506 + 13 86 2,160 1,997 1931 4,430 +273 +657 2,308 ::!,I22 1941 3,446 -984 -2221 1,787 1,659 1951 5,928 +2,482 +72 03 3,014 2,914 1961 TA 3 63 7,088 +1,160 +1957 3,635 3,453 1971 TA 363 9,247 +2,159 +3046 4,823 4,424
116 *Khnar Road Kalahandl 1961 11 40 6,400 +2,826
3,344 3,056 (ORISSA) 1911 NAC 11 40 9,226 +4416 4,704 4,522
117 Pachmarhl urban Hosbangabad 1901 3,020 1,598 1,422 agglomeration (MADHYA PRADESH) 1911 3,822 +802 +2656 2,162 1,660
1921 4,568 +746 + 1952 2,606 1,962 193! 6,136 +1,568 +3433 3,635 2,501 194! 6,696 +560 +913 4,037 2,659 1951 5,242 -1,454 - 21 71 3,054 2,188 1961 62 16 6,142 +900 + 1717 3,533 2,609 1971 62 16 9,224 +3,082 +5018 5,488 3,736,
(a) Pacbmarlu Can- 1931 4,699 2,564 2,135 tonmentt 1941 6,194 + 1,495 +31 82 3,760 2,434
1951 4,900 -1,294 -2089 2,865 2,035 1961 Cantt 1295 5,489 +589 +1202 3,149 2,340 1971 Cantt 1295 8,012 +2,523 +4596 4,850 3,162
(b) Pachmarhl 1901 3,020 1,598 1,422 1911 3,822 +802 +2656 2,162 1,660 1921 4,568 +746 +1952 2,606 1,962 1931 1,437 - 3,131 - 6854 1,071 366 1941 502 - 935 -6507 277 225 1951 342 -160 - 31 87 189 153 1961 M 4921 653 +311 +9094 384 269 1971 NA 4921 1,212 +559 +8560 638 574
.lI8 Ambad Aurangabad 1951 5,093 2,544 2,549 (MAHARASHTRA) 1961 M 5017 6,614 ' +1,521 +2986 3,387 3,227
1971 M. 5 18 9.222 +2,608 +3943 4,769 4,453
119 Kandhar Nanded 1931 4,452 2,226 2,226 (MAHARASHTRA) 1941 5,950 +1,498 +3365 3,038 2,912
1951 8,890 +2,940 +4941 4,384 4,506 1961 M. 1453 6,630 -2,260 -2542 3,460 3,170 1971 M 5 18 9,221 +2,591 +3908 4,819 4,402
tPachmarhl Gantt With a populatIOn of P 4,114 (2,339 M , 1,775 F) In 1921 P 3,287 (1,842 M, 1,445 F) in 1911 (population not available In 1901) was part of Pachmarhl Mumclpallty The combmed papulatJon ofPachmarhl (N A) and Pachmarhl Cantt for 1901 to 1921 has been shown agamst Pachmarhl (N A)
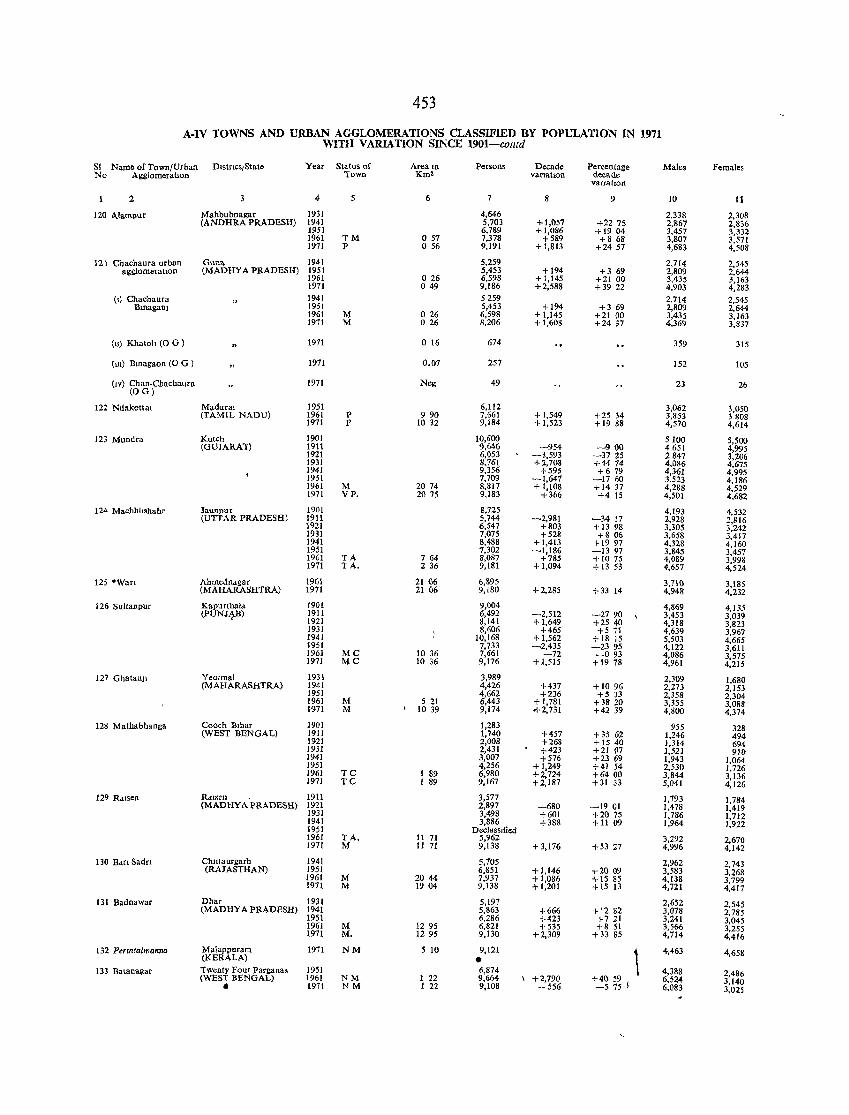
453
A-IV TOWNS AND URBAN AGGLOMERATIONS CLASSIFIED BY POPULATION IN 1971 WITH VARIATION SINCE 1901-contd
SI Name of Town/Urban DIstnct/State Year Status of Area 10 Persons Decade Percentage Males Females No Agglomerahon Town Kmt varJatlon decade
varJahon
2 3 4 5 6 8 9 10 11
120 Alamllur Mahbubnagar 1931 4,646 2,338 2.308 (ANDHRA PRADESH) 1941 5,703 +1,057 +2275 2,867 2,836
1951 6,789 +1,086 +1904 3,457 3,332 1961 ™ o 57 7,378 +589 +868 3,807 3,571 1971 P 056 9,191 +1,813 +2457 4,683 4,508
121 Chachaura urban Guna 1941 5,259 2.714 2,545 agglomeration (MADHY A PRADESH) 1951 5,453 +194 +369 2,809 2,644
1961 026 6,598 +1,145 +2100 3,435 3,163 1971 049 9,186 +2,588 +3922 4,903 4,283
(I) Chachaura 1941 5259 2,714 2,545 Bmagan] 1951 5,453 +194 +369 2,809 2,644
1961 M 026 6,598 +1,145 +21 00 3,435 3,163 1971 M 026 8,206 +1,608 +24 37 4,369 3,837
(11) Khatoh (0 G ) 1971 o 16 674 359 315
(111) Btnagaon (0 G) 1971 0.07 257 152 105
(IV) Chan-Chachaura 1971 Neg (OG)
49 23 26
122 Nllakottal Madural 1951 6,112 3,062 3,050 (TAMIL NADU) 1961 p 990 7,661 + 1,549 +25 34 3,853 3808
1911 P 1032 9,184 + 1,523 +19 88 4,570 4,614
123 Mundra Kutch 1901 10,600 5100 5,500 (GUIARAT) 1911 9,646 -954 -900 4651 4,995
1921 6,053 -3,593 -3725 2847 3,206 1931 8,761 +2,708 +4414 4,086 4,675 1941 9,356 +595 +619 4,361 4,995 1951 7,709 -1,647 -1760 3,523 4,186 19M M 2074 8,817 + 1,108 +1437 4,288 4,529 1971 VP. 2075 9,183 +366 +4 15 4,501 4,682
124 Machhhshahr Jaunpur 1901 8,725 4,193 4,532 (UTTAR PRADESH) 1911 5,744 -2,981 -3417 2,928 2,816
1921 6,547 +803 +13 98 3,305 3,242 1931 7,075 +528 +806 3,658 3,417 1941 8,488 +1,413 +1997 4,328 4,160 1951 7,302 -1,186 -13 97 3,845 3,457 1961 TA 7 64 8,087 +785 + 1075 4,089 3,998 1971 TA. 236 9,181 +1,094 + 13 S3 4,657 4,524
125 ·Wan Ahrnednaga r 1961 21 <l6 6,895 3,71<l 3,185 (MAHARASHTRA) 1971 21 06 9,180 +2,285 +33 14 4,948 4,232
126 Su1tanpur Kapurthala 1901 9,004 4,869 4,135 (PUNJ4B) 1911 6,492 -2,512 -2790 3,453 3,039
1921 8,141 +1,649 +2540 4,318 3,823 1931 8,606 +465 +571 4,639 3,967 1941 10,168 + 1,562 +18 15 5,503 4,665 1951 7,733 -2,435 -2395 4,122 3,611 1961 Me 1036 7,661 -72 -093 4,086 3,575 1971 MC 1036 9,176 +1,515 +1918 4,961 4,215
127 Ghatan)l Yeotrnal 1931 3,989 2,309 1,680 (MAHARASHTRA) 1941 4,426 +437 +1096 2,273 2,153 1951 4,662 +236 +5 33 2,358 2,304
1961 M 5 21 6,443 +1,781 +3820 3,355 3,088 1971 M 1039 9,174 rl-2,731 +42 39 4,800 4,374
128 Mathabh.nga Coach BIhar 1901 1,283 955 328 (WEST BENGAL) 1911 1,740 +457 +35 62 1,246 494 1921 2,008 +268 +1540 1,314 694 1931 2,431 +423 +21 07 1.521 910 1941 3,007 +576 +23 69 1,943 1,064 1951 4,236 +1,249 +41 54 2,530 1,726 1961 TC I 89 6,980 +2,724 +6400 3,844 3,136 1971 TC I 89 9,167 +2,187 +31 33 5,041 4,126
129 Ralsen Rdlsen 1911 3,577 1.193 1,784 (MADHYA PRADESH) 1921 2,897 -680 -1901 1,478 1,419
1931 3,498 +601 +2015 1,786 1,712 1941 3,886 +388 +11 09 1,964 1,922 1951 DeclassIfied 1961 TA. 1171 5,962 3,292 2,670 1971 M 1I7l 9,138 +3,176 +5327 4,996 4,142
130 B~nSadn Chlttaurgarh 1941 5,705 2,962 2,743 (RAJASTHAN) 1951 6,851 +1,146 +2009 3,583 3,268
1961 M 2044 7,937 +1,086 +15 85 4.138 3,799 1971 M 1904 9,138 +1,201 +15 13 4,721 4,417
131 Badnawar Dhar 1931 5,197 2,652 2,545 (MADHYA PRADESH) 1941 5,863 +666 +12 82 3,078 2,785
1951 6,286 +423 +721 3,241 3,045 1961 M 1295 6,821 +535 +8 51 3,566 3,255 1971 M. 1295 9,130 +2,309 +33 85 4,714 4,416
132 Perm/a/manna Malappuram 1971 NM 5 10 9,121 , 4,463 4,658 (KERALA) • 133 Batanagar Twenty Four Parganas 1951 6.874 4,388 2,486 (WEST BENGAL) 1961 NM 1 22 9,664 \ +2,790 +40 59 6,524 3,140 • 1971 NM I 22 9,108 -556 -515 I 6,083 3,025
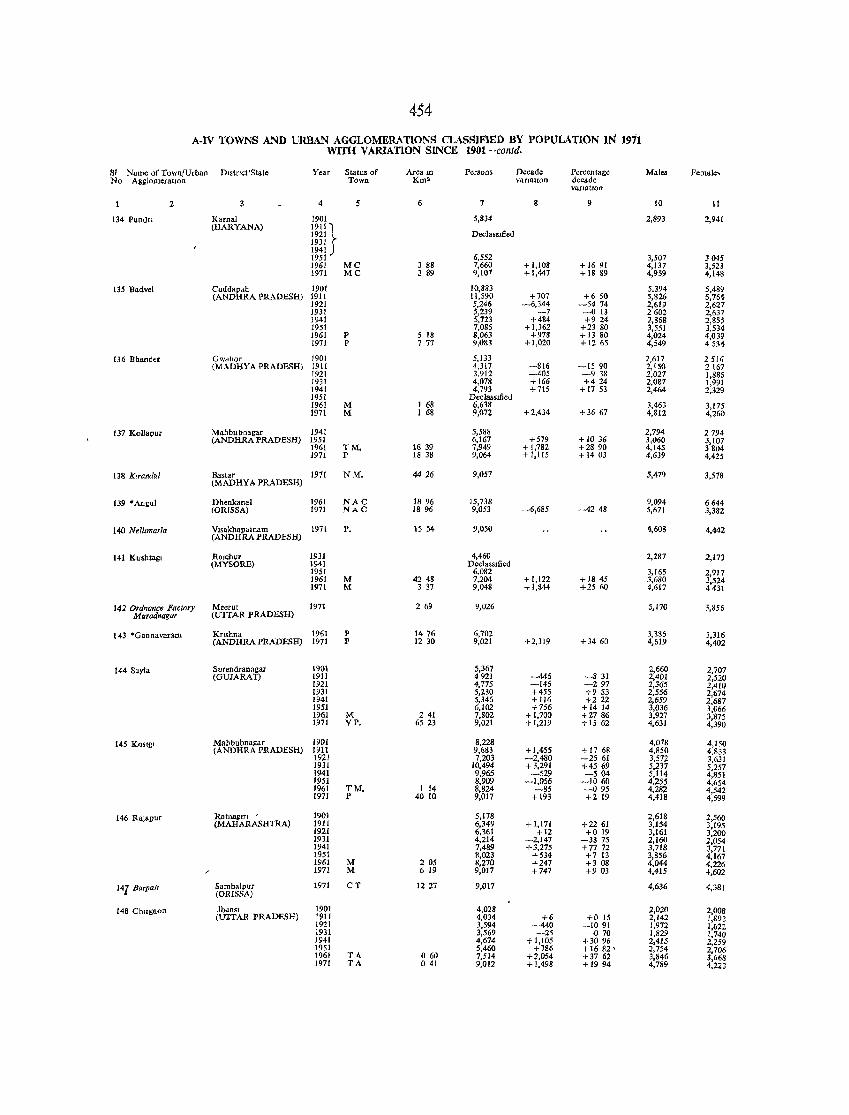
454
A-IV TOWNS AND URBAN AGGLOMERATIONS CLASSlFlED BY POPULATION IN 1911 WITH VARIATlON SINCE 1901-contd.
SI Name of Town/Urban DlStnct'Stato Year Status of Arcam Persons necado Percentage Males Female, No Ai&lomeratIou Town Km' vanatton decade
V8natJOn
2 4 S 6 7 8 9 10 11
134 Pund" Karnal 1901 5,834 2,893 2,941 (HARYANA) 191 11 Declassllied 1921 ~
ml) 6,552 3,507 3045 1951
1961 MC 3 88 7,660 + 1,108 +1691 4,137 3,523 1971 MC 3 89 9,101 +1,447 +1889 4,959 4,148
135 Badvcl CUddal'I.ili 1901 10,883 5,394 5,489 (AND RA PRADESH) 1911 11,590 +707 +650 5,826 5,764
1921 5,246 -6,344 -5474 2,619 2,627 1931 5,239 -7 -013 2602 2,637 1941 5,723 +484 +924 2,868 2,855 1951 7,085 + 1,362 +2380 3,551 3,534 1961 P 5 18 8,063 +978 +13 80 4,024 4,039 1971 p 777 9,083 + 1,020 + 1265 4,549 4534
136 Bhander GWdllor 1901 5,133 2,617 251" (MADHYA PRADESH) 1911 ~,317 -816 -1590 2,150 2167
1921 3,912 -405 -938 2,021 1,885 1931 4,078 +166 +424 2,087 1,991 1941 4,793 +715 + 17 53 2,464 2,329 1951 Declassdied 1961 M I 68 6,638 3,463 3,175 1971 M 1 68 9,072 + 2,434 +3667 4,812 4,260
137 Kollapur Mahbubnagar 1941 5,588 2,794 2794 (ANDHRA PRADESH) 1951 6,167 +579 +10 36 3,060 3,107
1961 TM. 18 39 7,949 +1,782 +2890 4,145 3804 1971 P 18 38 9,064 +1,115 +1403 4,639 4,425
138 Klrandul Bastar (MADHYA PRADESH)
1971 NM. 4426 9,057 5,479 3,578
139 "Angu! Dhenkana1 1961 NAC 1896 !5,738 9,094 6644 (ORISSA) 1971 NAC 18 96 9,053 -6,685 -4248 5,611 3,332
140 Ndltmarla VIsakhapatnam 1971 P. (ANDHRA PRADESH)
15 54 9,050 4,608 4,442
141 Kuwtagl Ralchur 1931 4,460 2,287 2,173 (MYSORE) 1941 Declassified
1951 6,082 3,165 2,917 1961 M 4248 7,204 +1,122 +1845 3,680 3,524 1971 M 3 37 9,048 + 1,844 +2560 4,617 4431
142 Ordnance Factory Meerut 1971 269 9,026 5,170 3,856 Murad-agar (UTTAR PRADESH)
143 'Gannavatam Krishna 1961 P 1476 6,702 3,386 3,316 (ANDHRA PRADESH) 1971 P 1230 9,021 +2,319 +3460 4,619 4,402
144 Sayla Surendranagar 1901 5,367 2,660 2,707 (GUJARAT) 1911 4921 -446 -831 2,401 2,520
1921 4,775 -146 -297 2,365 2,410 1931 5,230 +455 +9 53 2,556 2,674 1941 5,346 +116 +222 2,659 2,687 1951 6,102 +756 +1414 3,036 3,066 1961 M 241 7,802 +1,700 +2786 3,927 3,875 1971 VP. 65 23 9,021 +1,219 +15 62 4,631 4,390
145 KOSlgl Mahbubnagar 1901 8,228 4,078 4,150 (ANDHRA PRADESH) 1911 9,683 +1,455 +17 68 4,850 4,833
1921 7,203 -2,480 -2561 3,572 3,63l 1931 10,494 +3,291 +4569 5,237 5,257 1941 9,965 -529 -504 5,114 4,851 1951 8,909 -1,056 -10 60 4,255 4,654 1961 TM. I 14 8,824 -85 -095 4,282 4,542 1971 P 40 10 9,017 + 193 +219 4,418 4,599
146 RaJapur Ratnap:JTl ( 1901 5,178 2,618 2,560 (MAHARASHTRA) 1911 6,349 +1,111 +2261 3,154 3,195
1921 6,361 +12 +019 3,161 3,200 1931 4,214 -2,147 -33 75 2,160 2,054 1941 7,489 +3,275 +7772 3,718 3,771 1951 ~,023 +534 +7 13 3,856 4,167 1961 M 205 8,270 +247 +308 4,044 4,226 1971 M 6 19 9,017 +747 +903 4,415 -1,602
141 Barpal, Samba!pur 1971 CT (ORISSA)
1227 9,017 4,636 4,381
148 Chltgaon Jhansl 1901 4,028 2,020 2,008 (UTTAR PRADESH) 1911 4,034 +6 +0 15 2,142 1,892
1921 3,594 -440 -1091 1,972 1,622 1931 3,569 -2, -070 1,829 1,740 1941 4,674 +1,105 +3096 2,415 2,259 1951 5,460 +786 +1682 ' 2,754 2,706 1961 T4. 060 7,514 +2,054 +3762 3,846 3,668 1971 TA 041 9,012 +1,498 +1994 4,789 4.223
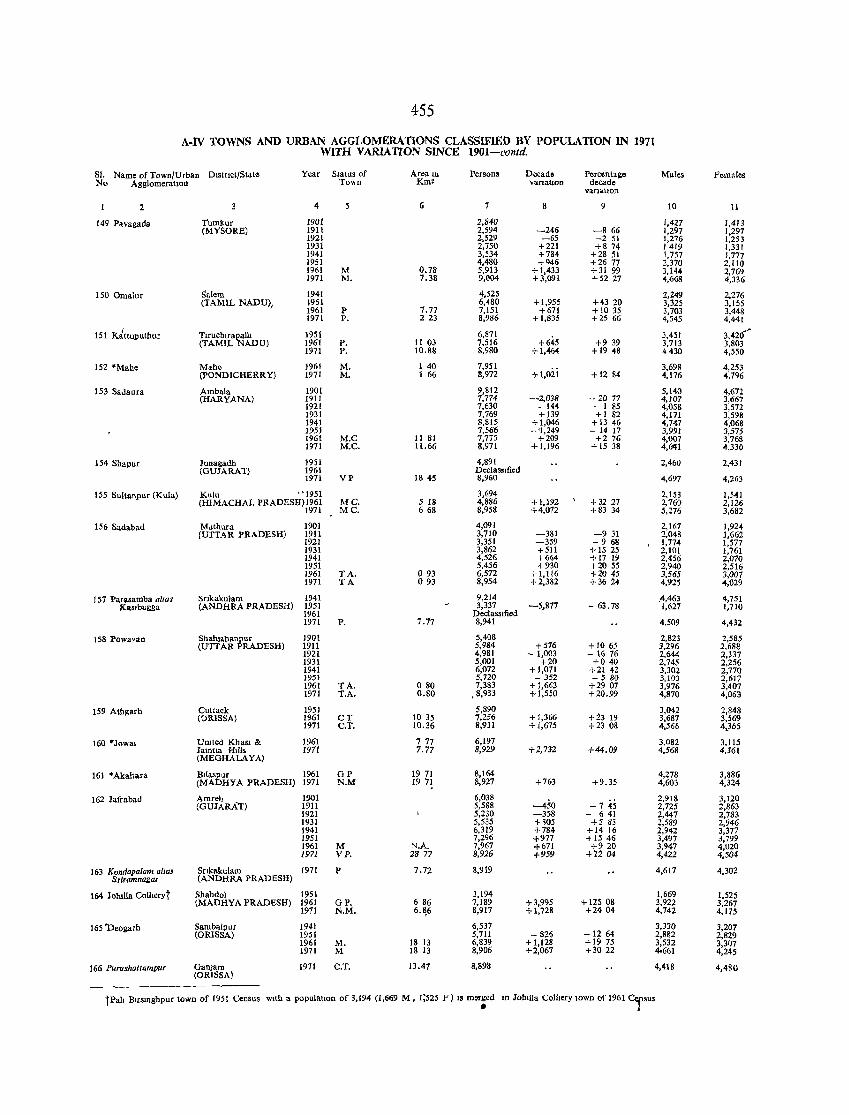
455
A·IV TOWNS AND URBAN AGGLOMERATlONS CLASSIFIED BY POPULATION IN 1971 WITH VARIATION SINCE 1901-contd.
SI. Name of Town/Urban D1strIct/State Year Status of Area 1n Persons Decade Percentalle Males Females No Agglomerauon To"n Km2 \'anattOD decade
vanatlon
2 3 4 6 7 8 9 10 11
149 Pa vagada Tumkur 190{ 2,840 1,421 1,413 (MYSORE) 1911 2,594 -246 -866 1,297 1,297
1921 2,529 -65 -251 1,276 1.253 1931 2,750 +221 +874 1419 1,331 1941 3,534 +784 +28 51 1,757 1,777 1951 4,480 +Q46 +26 77 2,370 2,110 1961 M 0.78 5,913 +1,433 +31 99 3,144 2,769 1971 M. 7.38 9,004 +3,091 +5227 4,668 4,336
1500malur Salem 1941 4,525 2,249 2,276 (TAMIL NADU); 1951 6,480 +1,955 +4320 3,325 3,155
1961 P 7.77 7,151 +671 + 10 35 3,703 3,448 1971 P. 223 8,986 +1,835 +25 66 4,545 4,441
151 K~((uputhur T.ruch,rapaU, 1951 6,871 +645
3,451 3,420 (TAMIL NADU) 1961 P. 11 03 7,516 +9 39 3,713 3,803
1971 P. 10.88 8,980 +1,464 +1948 4430 4.550
152 *Mahe Mahe 1961 M. 1 40 7,951 3,698 4,253 (PONDICHERR Y) 1971 M. 1 66 8,972 +1,021 +1284 4,176 4,796
153 SaJaura Ambala 1901 9,812 5,140 4,672 (HARYANA) 1911 7,774 -2,038 - 2077 4,107 3,667
1921 7,630 - 144 - 1 85 4,058 3,572 1931 7,769 + 139 +1 82 4,171 3,598 1941 8,815 + 1,046 +13 46 4,747 4,068 1951 7,566 -'1,249 -1417 3,991 3,575 1961 M.C 11 81 7,775 +209 +276 4,007 3,768 1971 M.e. 11.66 8,971 +1,196 + 1538 4,641 4,330
154 Shapur Junagadh 1951 4,891 2,460 2,431 (GUJARAT) 1961 Declass.fied
1971 VP 18 45 8,960 4,697 4,263
155 Sultanpur (Kulu) Kulu ' '1951 3,694 2,153 1,541 (IDMACHAL PRADESH)1961 MG. 5 18 4,886 +1,192 +3227 2,760 2,126
1971 MC. 668 8,958 +4,072 +83 34 5,276 3,682
156 Sadabad M~thllra 1901 4,091 2,167 1,924 (UTTAR PRADESH) 1911 3,710 -381 -931 2,048 1,662
1921 3,351 -359 - 9 68 1,774 1,577 1931 3,862 +511 + 1525 2,101 1,761 1941 4,526 +664 + 17 19 2,456 2,070 1951 5,456 +930 +20 55 2,940 2,516 1961 TA. 093 6,572 +1,116 +2045 3,565 3,007 1971 'fA 093 8,954 +2,382 +3624 4,925 4,029
157 Parasamba alcas Sr.tkakulam 1941 9,214 ,4,463 4,751 Kaslbugga (ANDHRA PRADESH) 1951 3,337 -5,877 - 63.7& 1,627 1,710
1961 Declassllled 1971 P. 7.77 8,941 4,509 4,432
158 Powavan Shahlahanpur 1901 5,408 2,823 2,585 (UTTAR PRADESH) 1911 5,984 +576 + 1065 3,296 2,688
1921 4,981 - 1,003 - 16 76 2,644 2,337 1931 5,001 +20 +040 2,745 2,256 1941 6,072 +1,071 +2142 3,302 2,770 1951 5,720 - 352 - 580 3,103 2,617 1961 TA. 080 7,383 +1,663 +2907 3,976 3,407 1971 T.A. 0.80 ,8,933 +1,550 +20.99 4,870 4,063
159 Athgarh Cuttack 1951 5,890 3,042 2,848 (~RISSA) 1961 CT 10 35 7,256 +1,366 +23 19 3,687 3,569
1971 C.T. 10.36 8,931 +1,675 +23 08 4,566 4.365
160 ·Jowal Uruted Khas1 & 1961 777 6,197 3,082 3,115 J alnUa H.lls 1971 7.77 8,929 +2,732 +44.09 4,568 4,361 (MEGHALAYA)
161 *Akaltara Bl1aspur 1961 GP 19 71 8,164 4,278 3,886 (MADHYA PRADESH) 1971 N.M 19 7t 8,927 +763 +9.35 4,603 4,324
162 Jafrabad Amreh 1901 6,038 -450 - 745
2,918 3,120 (GUJARAT) 1911 5,588 2,725 2,863
1921 5,230 -358 - 641 2,447 2,783 1931 5,535 +,05 +583 2,589 2,946 1941 6,319 +784 +1416 2,942 3,377 1951 7,296 +977 + 1546 3,497 3,799 1961 M N.A. 7,967 +671 +920 3,947 4,020 1971 VP. 2877 8,926 +959 +1204 4,422 4,5CJ4
163 Kondapalam a/.DS Srtkakulam [971 P 7.72 8,919 4,617 4,302 Sriramnagar (ANDHRA PRADESH)
164 Johllla Collteryt Shahdol 1951 3,194 1,669 1,525 (MADHYA PRADESH) 1961 GP. 686 7,189 +3,995 + 125 08 3,922 3,267
1971 N.M. 6.~6 8,917 +1,728 +2404 4,742 4,175
165 'Deogarh SambaJpur 1941 6,537 3,330 3,207 (ORISSA) 1951 5,711 - 826 -1264 2,882 2,829
1961 M. 18 13 6,839 + 1,128 + 1975 3,532 3,307 1971 M 18 13 8,906 +2,067 +3022 40661 4,245
166 P"rusholtampur Gan)am 1971 C.T. 13.47 8,898 4,418 4,480 (ORISSA)
tPab BlfsJOghpur town of 1951 Census WIth a populatIon of 3,194 (1,669 M, 1;525 F) 18 merged 1D JobllJa Colhery lown of 1961 c.rsus
•
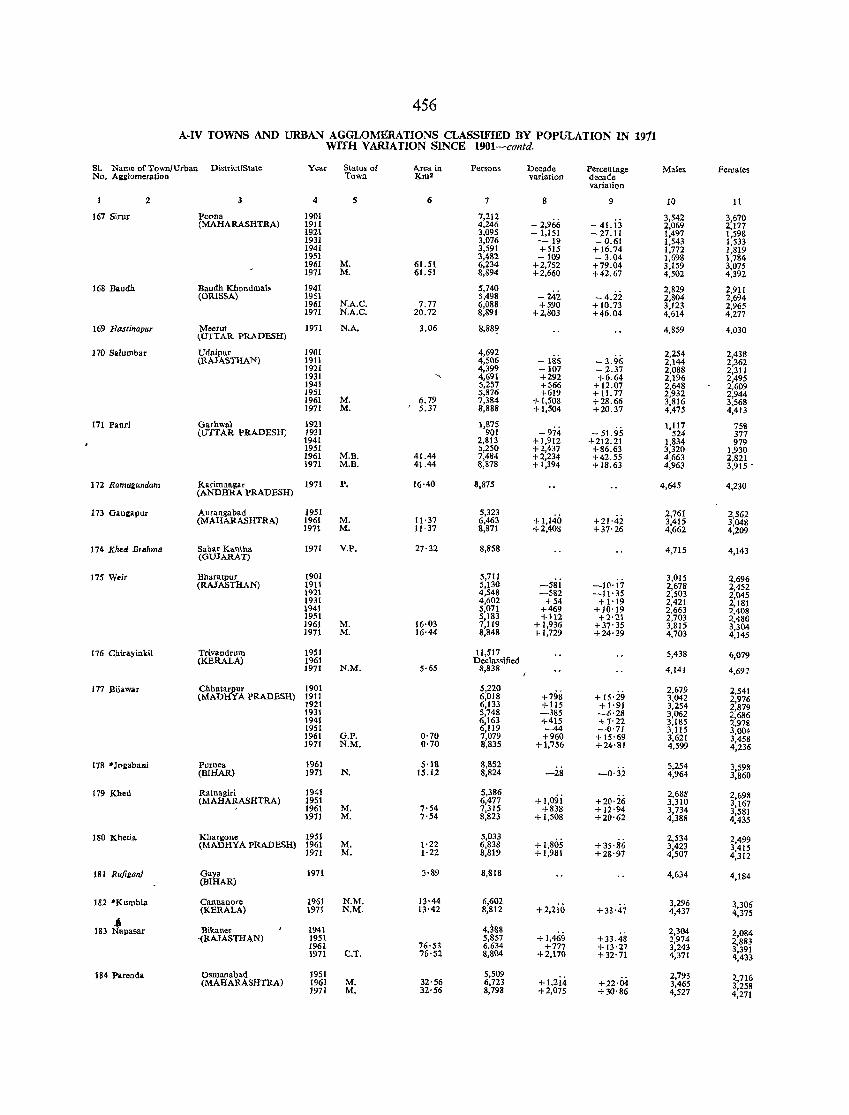
456
A-IV TOWNS AND URBAN AGGLOMERATIONS CLASSIFIED BY POPULATION IN 1911 WITH V ARIATlON SlNCE 1901-contd.
81. Name of Town/Urban Di,trictfState Year Status of Area in Persons Decade Percentage Males Females No. Aaalomeration Town J{m2 variation decade
variation
2 3 4 S 6 7 8 9 10 11
167 Sirur Poona 1901 7,212 - 2,966 - 41. ij
3,542 3,670 (MAHARASHTRA) 1911 4,246 2,069 2,177
1921 3,095 - 1,151 - 27.11 1,497 1,598 1931 3,076 -19 -0.61 1,543 1,533 1941 3,591 +515 +16.74 1,772 1,819 1951 3,482 -109 - 3.04 1,698 1,784 1961 M. 61.51 6,234 +2,752 +79.04 3,159 3,075 1971 M. 61.51 8,894 +2,660 +42.67 4,502 4,392
168 Baudh Baudh Kbondmals 1941 5,740 - 24i -4.ii
2,829 2,911 (ORISSA) 1951 S,498 2,804 2,694
1961 N.A.C. 7.77 6,088 +590 + 10.73 3,123 2,965 1971 N.A.C. 20.72 8,891 +2,803 +46.04 4,614 4,277
169 liaslinapur Meerut 1971 N.A, 3,06 8,88~ 4,859 4,030 ~UTTAR PRADESH)
170 Sdnmbar Udaipur 1901 4,692 -186 - 3.96
2,254 2,438 (RAJASTHAN) 1911 4,506 2,144 2,362
1921 4,399 -107 -2.37 2,088 2,311 1931 "- 4,691 +292 +6.64 2,196 2,495 1941 5,257 +566 +12.07 2,648 2,609 1951 5,876 +619 + 11. 77 2,932 2,944 1961 M. 6.79 7,384 + 1,508 +28.66 3,816 3,568 1971 M. I 5.37 8,888 +1,504 +20.37 4,475 4,413
171 Panr; Garhwal 1921 I,B75 -974
1,117 758 (UTTAR PRADESH) 1931 901 - 51.95 524 377
1941 2,813 +1,912 +212.21 1.834 979 1951 5,250 +2,437 +86.63 3,320 1,930 1961 M.B. 41.44 7,484 +2,234 +42.55 4,663 2,821 1971 M.B. 41.44 8,878 + 1,394 + 18.63 4,963 3,915 •
172 Ramazundam Karimtlagar (ANDHRA PRADESH)
1971 p, 16·40 8,875 4,645 4,230
173 Gaoaapur Aurangabad 1951 5,323 +1,140 +21'42
2,761 2,562 (MAHARASHTRA) 1961 M. 11·37 6,463 3,415 3,048
1971 M. 11·37 8,871 +2,408 +37'26 4,662 4,209
174 Khed Brahms Sabar Kantha (GUIARAT)
1971 V.P. 27·32 8,858 4,715 4,143
175 Weir Bharatpur 1901 5,711 3,015 2,696 (RAJASTHAN) 1911 5,130 -581 -10·17 2,678 2,452
1921 4,548 -582 -H·35 2,503 2,045 1931 4,602 +54 +1'19 2,421 2,181 1941 5,071 +469 +10'19 2,663 2,408 1951 5,183 +112 +2·21 2,703 2,480 1961 M. 16·03 7,119 +1,936 +37·35 3,815 3,304 1971 M. 16·44 8,848 +1,729 +24·29 4,703 4,145
176 Cnirayinkil Trivandrnm 1951 11,517 5,438 6,079 (KERALA) 1961 Declas.ified
1971 N.M. 5·65 8,838 4,141 4,69i
177 Bijawar Cbhatarpur 1901 5,220 +798
2,679 2.541 (MADHYA PRADESH) 1911 6,018 + 15'29 3,042 2,976
1921 6,133 +115 +1'91 3,254 2,879 1931 5,748 -385 -6·28 3,062 2,686 1941 6,163 +415 +7'22 3,185 2,978 1951 6,119 --44 -0'71 3,115 3,004 1961 G.P. 0·70 7,079 +960 + 15·69 3,621 3,458 1971 N.M. 0·70 8,835 +1,756 +24'81 4,599 4,236
178 *Jogabaai Purnea 1961 5·18 8,852 -0'3i
5,254 3,598 (BIHAR) 1971 N. 15.12 8,824 -28 4,964 3,860
179 Khed Ratn.giri 1941 5,386 +I,09i
2,688 2,698 (MAHARASHTRA) 1951 6,477 +20'26 3,310 3,167
1961 M. 7·54 7,315 +838 +12·94 3,734 3,581 1971 M. 7'54 8,823 + 1,508 +20'62 4,388 4,435
180 Khetia Khargone 1951 5,033 +1,805 +35·86
2,534 2,499 (MADHYA PRADESH) 1961 M. 1·22 6,838 3,423 3,415
1971 M. 1·22 8,819 +1,981 +28'97 4,507 4,312
181 Rafizon/ Gay. (BIHAR)
1971 3·89 8,818 4,634 4,184
182 *Kumbla Cannanore 1961 N.M. 13·44 6,602 +2,zio
3,296 3,306 (KBRALA) 1971 N.M. 13'42 8,812 +33'47 4,437 4,375 .. Bikaner 1941 4,~88 2,304 183 Napasar
+ 1,469 2,084 -(RAJASTHAN) 1951 5,857 +33.48 2,974 2,883 1961 76·53 6.634 +777 + 13·27 3,243 3,391 1971 C.T. 76'52 8,804 +2,170 +32'71 4,371 4,433
184 Pareada Osmanabad 1951 5,509 +1,2i4
Z,793 2,716 (MAHARASHTRA) 1961 M. 32'56 6,723 +22·04 3,465 3,258 1971 M. 32'56 8,798 +2,075 +30·86 4,527 4,271
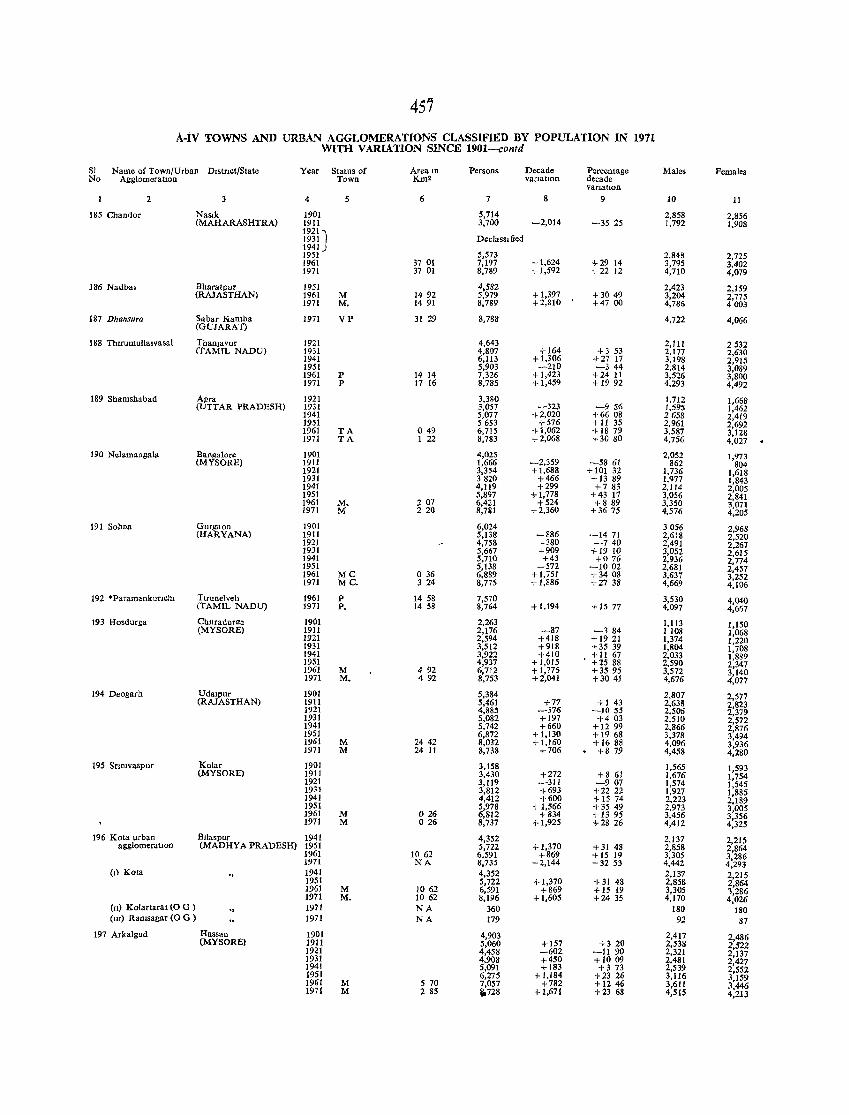
457
A-iV TOWNS AND URBAN AGGLOMERATIONS CLASSIFIED BY POPULATION IN 1971 WITH VARIATION SINCE 1901-contd
SI Name of Town/Urban Dlstnct/State Year Status of Aream Persons Decade Percentage Males Females No AgglomeratIOn Town ]{m2 vanatlOu decade
varIation
2 3 4 5 6 7 8 9 10 11
185 Chandor Naslk 1901 5,714 2,858 2,856 (MAHARASHTRA) 1911 3,700 -2,014 -3525 1,792 1,908
1921, Declassliied 1m)
1951 5,573 2,848 2,725 1961 3701 7,197 + 1,624 +29 14 3,795 3,402 1971 37 01 8,789 + 1,592 +22 12 4,710 4,019
186 Nadbal Bharatpur 1951 4,582 2,423 2,159 (RAJASTHAN) 1961 M 1492 5,919 + 1,397 +3049 3,204 2,715
1971 M, 1491 8,789 +2,810 \ +47 00 4,786 4003
187 Dhansura Sabar N.antba 1971 VP (GUJARAT)
31 29 8,788 4,722 4,066
188 Thlfumullalvasal ThanJavur 1921 4,643 2,111 2532 (TAMIL NADU) 1931 4,807 +164 +3 53 2,177 2,630
1941 6,113 + 1,306 +27 17 3,198 2,915 1951 5,903 -210 -344 2,814 3,089 1961 P 14 14 7,326 + 1,423 +24 11 3,526 3,800 1971 P 17 16 8,785 + 1,459 + 1992 4,293 4,492
189 Shamshabad Al'ra 1921 3,380 1,712 1,668 (UTTAR PRADESH) 1931 3,057 -323 -956 1,595 1,462
1941 5,077 +2,020 +66 08 2658 2,419 1951 5653 +576 + 11 35 2,961 2,692 1961 TA 049 6,715 +1,062 + 18 79 3,587 3,128 1971 TA 1 22 8,783 + 2,068 +3080 4,756 4,027
190 Nelamangala Bangalore 1901 4,025 2,052 1,973 (MYSORE) 1911 1,666 -2,359 -5861 862 804
1921 3,354 +1,688 +101 32 1,736 1,618 1931 3820 +466 +13 89 1,977 1,843 1941 4,119 +299 +783 2,114 2,005 1951 5,897 + 1,778 +43 17 3,056 2,841 1961 M. 2 07 6,421 +524 +889 3,350 3,071 1971 M 220 8,7U +2,360 +367S 4,576 4,205
191 Sohna Gurgaon 1901 6,024 3056 2,968 (HARYANA) 1911 5,138 -886 -1471 2,618 2,520
1921 4,758 -380 -740 2,491 2,267 1931 5,667 +909 +1910 3,052 2,615 1941 5,710 +43 +076 2,936 2,774 1951 5,138 -572 -1002 2,681 2,457 1961 MC o 36 6,889 + 1,751 +3408 3,637 3,252 1971 MC. 324 8,775 + 1,886 +27 38 4,669 4,106
192 'Paramankunchl Tlrunelveh 1961 P 14 58 7,570 3,530 4,040 (TAMIL NADU) 1971 p, 14 58 8,764 +1,194 + 15 77 4,097 4,667
193 Hosdurga ChltradurI!' 1901 2,263 1,113 1,150 (MYSORE) 1911 2,176 -87 -184 1108 1,068
1921 2,594 +418 + 1921 1,374 1,220 1931 3,512 +918 +3539 1,804 1,708 1941 3,922 +410 + II 67 2,033 1,889 1951 4,937 +1,015 +2588 2,590 2,347 1961 M 492 6,712 + 1,775 +3595 3,572 3,140 1971 M. 492 8,753 +2,041 +3041 4,676 4,077
194 Deogarh Udaipur 1901 5,384 2,807 2,577 (RAJASTHAN) 1911 5,461 +77 +1 43 2,638 2,S23
1921 4,885 -576 -1055 2,506 2,379 1931 5,082 +197 +403 2,510 2,572 1941 5,742 +660 +1299 2,866 2,876 1951 6,872 + 1,130 + 1968 3,378 3,494 1961 M 2442 8,032 +1,160 + 1688 4,096 3,936 1971 M 2411 8,738 +706 +8 79 4,458 4,280
195 Snmvaspur Kolar 1901 3,158 1,565 1,593 (MYSOREl 1911 3,430 +272 +8 61 1,676 1,754 1921 3,1l9 -311 -907 1,574 1,545 1931 3,812 +693 +2222 1,927 1,885 1941 4,412 +600 +1574 2,223 2,189 1951 5,918 +1,566 +3549 2,973 3,005 1961 M 026 6,812 +834 + 13 95 3,456 3,356 1971 M 026 8,737 +1,925 +2826 4,412 4,325
196 Kota urban Btlaspur 1941 4,352 2,137 2,215 agglomeratIOo (MADHYA PRADESH) 1951 5,722 + 1,370 +31 48 2,858 2,864 1961 10 62 6,591 +869 +15 19 3,305 3,286 1971 NA 8,735 +2,144 +32 53 4,442 4,293
(I) Kota 1941 4,352 2,137 2,215 1951 5,722 +1,370 +31 48 2,858 2,864 1961 M 1062 6,591 +869 +15 19 3,305 l,286 1971 M. 1062 8,196 +1,605 +24 35 4,170 4,026
(ll) Kolartarat (0 G ) 1971 NA 360 180 180 (lll) Ramsagar (0 G ) 1971 NA 179 92 87
197 Arkalgud Hassan 1901 4,903 2,417 2,486 (MYSORE) 1911 5,060 +157 +320 2,538 2,522 1921 4,458 -602 -11 90 2,321 2,137 1931 4,908 +450 +1009 2,481 2,427 1941 5,091 +183 +373 2,539 2,552 1951 6,275 +1,184 +23 26 3,116 3,159 1961 M 570 7,057 +782 +1246 3,611 3,44(; 1911 M 285 io72S + 1,671 +23 68 4,515 4,213
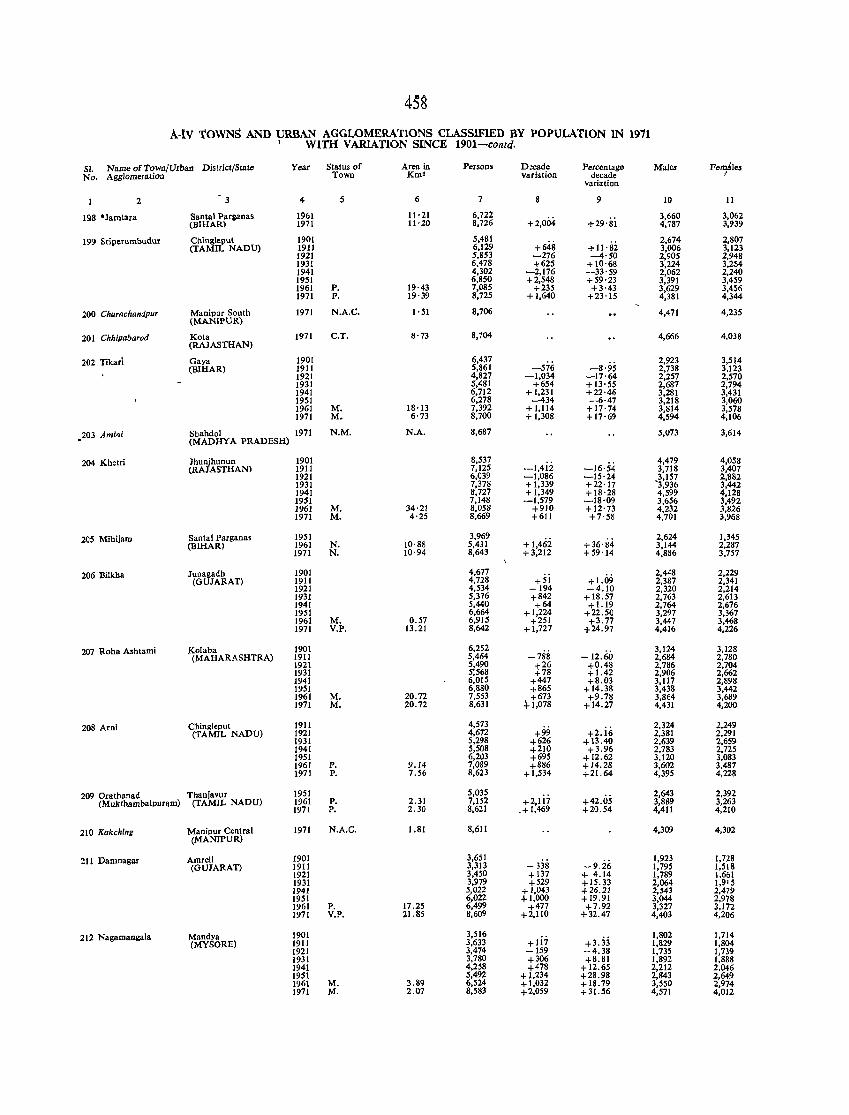
458
A-tv TOWNS AND URBAN AGGLOMERATIONS CLASSIFIED BY POPULATION IN 1911 I WITH VARIATION SINCE 1901-contd.
51. Name of Town/Urban District/State Year Status of Area in Persons D:cade Percentage Males Fero'!les No. Agglomeration Town Kro2 variation decade " variation
2 3 4 5 6 7 9 10 II
198 'Jamtara Santal Parganas 1961 11'21 6,722 +2,004 +29·ili
3,660 3,062 (BIHAR) 1971 H'20 8,726 4,787 3,939
199 Sriperumbudur Cb.ingleput 1901 5,481 +648 +1I·i!i
2,674 2,807 (TAMIL NADU) 1911 6,129 3,006 3,123
1921 5,853 -276 --4'50 2,905 2,948 1931 6,478 +625 +10·68 3,224 3,254 1941 4,302 -2,176 -33'59 2,062 2,240 1951 6,850 +2,548 +59'23 3,391 3,459 1961 P. 19·43 7,085 +235 +3'43 3,629 3,456 1971 P. 19'39 8,725 +1,640 +23·15 4,381 4,344
200 Churachandpur Manipur South (MANIPUR)
1971 N.A.C. I' 51 8,706 4,471 4,235
201 Chhipabarod Kota 1971 C.T. 8'73 8,704 4,666 4.038 (RAJASTHAN)
202 Tikarl Gaya 1901 6,437 -576 -8'95
2,923 3,514 (BIHAR) 1911 5,861 2,738 3,123
1921 4,827 -1,034 -17·64 2,257 2,570 1931 5,481 +654 +13'55 2,687 2,794 1941 6,712 +1,231 +22'46 3,281 3,431 1951 6,278 --434 -6·47 3,218 3,060 1961 M. 18'13 7,392 + 1,114 +17'74 3,814 3,578 1971 M. 6'73 8,700 + 1,308 +17'69 4,594 4,106
203 Amlqi Shahdol 1971 N.M. N.A. 8,687 5,073 3,614 . (MADHYA PRADESH)
204 Khetri Jhunjhunun 1901 8,537 -I,4ii -16·.54
4,479 4,058 (RAJASTHAN) 1911 7,125 3.718 3,407
1921 6,039 -1,086 -15·24 3,157 2,882 1931 7,378 +1,339 +22'17 '3,936 3,442 1941 8,727 + 1,349 +18'28 4,599 4,128 1951 7,148 -1,579 -18·09 3,656 3,492 1961 M. 34'21 8,058 +910 +12'73 4,232 3,826 1971 M. 4'25 8,669 +611 +7·58 4,701 3,968
20S Mihijam Santal Parganas 1951 3,969 +I,46i + 36'84
2,624 1,345 (BIHAR) 1961 N. 10·88 5,431 3,144 2,287
1971 N. 10·94 8,643 +3,212 +59'14 4,886 3,757
206 Bilkha Junagadb 1901 4,677 +1.09
2,448 2,229 (GUJARAT) 1911 4,728 +51 2,387 2,341
1921 4,534 -194 -4.10 2,320 2,214 1931 5,376 +842 +18.57 2,763 2,613 1941 5,440 +64 +1.19 2,764 2,676 1951 6,664 +1,224 +22.50 3,297 3,367 1961 M. 0.57 6,915 +251 +3.77 3,447 3,468 1971 V.P. 13.21 8,642 +1,727 +24.97 4,416 4,226
207 Roha Ashtami Kolaba 1901 6,252 3,124 3,128 (MAHARASHTRA) 1911 5,464 -788 -12.60 2,684 2,780
1921 5,490 t 26 +0.48 2,786 2,704 1931 5;568 +78 +1.42 2,906 2,662 1941 6,015 +447 +8.03 3,117 2,898 1951 6,880 +865 +14.38 3,438 3,442 1961 M. 20.72 7,553 +673 +9.78 3,864 3,689 1971 M. 20.72 8,631 +1,078 +14.27 4,431 4,200
208 Arni Chingleput 1911 4,573 +99 +2.ii>
2,324 2,249 (TAMIL NADU) 1921 4,672 2,381 2,291
1931 5,298 +626 + 13.40 2,639 2,659 1941 5,508 +210 +3.96 2,783 2,725 1951 6,203 +695 +12.62 3,120 3,083 1961 P. 9.14 7,089 +886 +14.28 3,602 3,487 1971 P. 7.56 8,623 + 1,534 +21.64 4,395 4,228
209 Oratbanad Thanjavur 1951 5,035 +42.05
2,643 2,392 (Mukfhambalpuram) (TAMIL NADU) 1961 P. 2.31 7,152 +2,117 3,889 3,263
1971 P. 2.30 8,621 _+1,469 +20.54 4,411 4,210
210 Kakching Manipur Central (MANIPUR)
1971 N.A.C. 1.81 8,611 4,309 4,302
:!11 Damnagar Amreli 1901 3,651 - 338 -9.i6
1,923 1,728 (GUJARAT) 1911 3,313 1,795 1,518
1921 3,450 +137 + 4.14 1,789 1,661 1931 3,979 +529 +15.33 2,064 1,915 1941 5,022 +1,043 +26.21 2,543 2,479 1951 6,022 +1,000 +19.91 3,044 2,978 1961 P. 17.25 6,499 +477 +7.92 3,327 3,172 1971 V.P. 21.85 8,609 +2,110 +32.47 4,403 4,206
212 Nagamaogala Mandya 1901 3,516 +li7 +3.33
1,802 1,714 (MYSORE) 1911 3,633 1,829 1,804
1921 3,474 -159 -4.38 1,735 1,739 1931 3,780 +306 +8.81 1,892 1,888 1941 4,258 +478 +12.65 2,212 2,046 1951 5,492 + 1,234 +28.98 2,843 2,649 1961 M. 3.89 6,524 +1,032 +18.79 3,550 2,974 1971 M. 2.07 8,583 +2,059 + 31.56 4,571 4,012
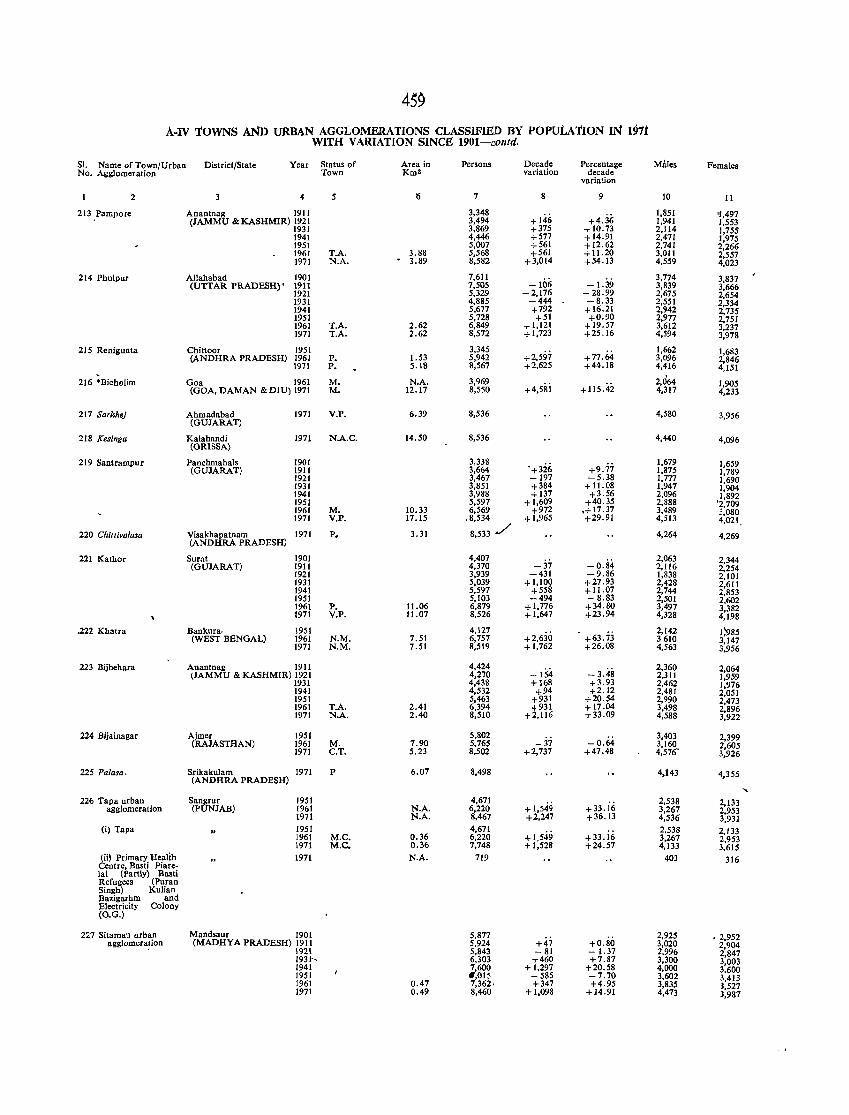
459 A-IV TOWNS AND URBAN AGGLOMERATIONS CLASSIFIED BY POPULATION IN 1911
WITH VARIATION SINCE 1901-contd.
SI. Name of Town/Urban District/State Year Status of Area in Persons Decade Percentage Males Females No. Agglomeration Town Km2 variation decade
variation
2 3 4 5 6 7 8 9 10 11
213.Pampore Anantnag 1911 3,348 +146 +4ji;
1,851 '1,497 (JAMMU & KASHMIR) 1921 3,494 1,941 1,553
1931 3,869 +375 +10.73 2,1l4 1,755 1941 4,446 +577 +14.91 2,471 1,975 1951 5,007 +561 +12.62 2,741 2,266 1961 T.A. 3.88 5,568 +561 + 11.20 3,011 2,557 1971 N.A. 3.89 8,582 +3,014 +54.13 4,559 4,023
214 Phulpur Allahabad 1901 7,611 -1.39
3,774 3,837 (UTTAR PRADESH)' 1911 7,505 -106 3,839 3,666
1921 5,329 -2,176 - 28.99 2,675 2,654 1931 4,885 -444 -8.33 2,551 2,334 1941 5,677 +792 +16.21 2,942 2,735 1951 5,728 +51 +0.90 2,977 2,751 1961 T.A. 2.62 6,849 +1,121 +19.57 3,612 3,237 1971 T.A. 2.62 8,572 +1,723 +25.16 4,594 3,978
215 Renigunla ChiUoor 1951 3,345 +2,597
1,662 1,683 (ANDHRA PRADESH) 1961 P. 1.53 5,942 + 77.64 3,096 2,846
1971 P. 5.18 8,567 +2,625 +44.18 4,416 4,151
216 *Bicholim Goa 1961 M. N.A. 3,969 +4,5Si +115.42
2,064 1,905 (GOA. DAMAN & DIUlI971 M. 12.17 8,550 4,317 4,233
217 Sarkhej Ahmadabad 1971 V.P. 6.39 8,536 4,580 3,956 (GUJARAT)
218 K.singa Kalahandi (ORISSA)
1971 N.A.C. 14.50 8,536 4,440 4,096
219 Santrampur Panchmahals 1901 3,338 +3i6 +9.77
1,679 1,659 (GUJARAT) 1911 3,664 1,875 1,789
1921 3,467 -197 -5.38 1,777 1,690 1931 3,851 +384 + 11.08 1,947 1,904 1941 3,988 +137 +3.56 2,096 1,892 1951 5,597 +1,609 +40.35 2,888 '2,709 1961 M. 10.33 6,569 +972 .+ 17.37 3,489 3,080 1971 V.P. 17.15 ,8,534 +1,965 +29.91 4,513 4,021.
220 Chittivolasa Visakhapatnam 1971 P. 3.31 8,533'/ 4,264 4,269 (ANDHRA PRADESH)
221 Kathor Surat 1901 4,407 -0.84
2,063 2,344 (GUJARAT) 1911 4,370 -37 2,116 2,254
1921 3,939 -431 -9.36 1,838 2,101 1931 5,039 +1,100 +27.93 2,428 2,611 1941 5,597 +558 + 11.07 2,744 2,853 1951 5,L03 -494 - 8.83 2,501 2,602 1961 p, 11.06 6,879 + 1,776 +34.80 3,497 3,382 1971 V.P. 11.07 8,526 +1,647 +23.94 4,328 4,198
,222 Khatra Bankura· 1951 4,127 +2,6jO +63.7j
2,142 J;985 (WEST BENGAL) 1961 N.M. 7.51 6,757 3610 3,147
1971 N.M. 7.51 8,519 +1,762 +26.08 4,563 3,956
223 Bijbehara Anantnag 1911 4,424 -154 -3.48
2,360 2,064 (JAMMU & KASHMIR) 1921 4,270 2,311 1,959
1931 4,438 +168 +3.93 2,462 1,976 1941 4,532 +94 +2.12 2,481 2,051 1951 5,463 +931 +20.54 2,990 2,473 1961 T.A. 2.41 6,394 +931 +17.04 3,498 2,896 1971 N.A. 2.40 8,510 +2,116 +33.09 4,588 3,922
224 Bijainagar Ajmer 1951 5,802 3,403 2,399 (RAJASTHAN) 1961 M. 7.90 5,765 - 37 -0.64 3,160 2,605
1971 C.T. 5.23 8,502 +2,737 +47.48 4,576' 3,926
225 Palasa. Srikakulam 1971 P (ANDHRA PRADESH)
6.07 8,498 4.143 4,355
.... 226 Tapa urban Sangrur 1951 4,671
+1,549 +33. i6 2,538 2,133
agglomeration (PUNJAB) 1961 N.A. 6,220 3,267 2.953 1971 N.A. 8,467 +2,247 +36.13 4,536 3,931
(i) Tapa 1951 4,671 +1.549 +33.i6
2,538 2,133 1961 M.e. 0.36 6,220 3,261 2,953 1971 M.e. 0.36 7,748 +1,528 +24.57 4,133 3,615
(ii, Primary Health 1971 N.A. 719 403 316 Centre, Basti Piare-lal (Partly) Basti Refugees (Puran Singh) Kulian Bazigarhm and Electricity Colony (O.G.)
227 Sitamau urban Mandsaur 1901 5,877 +4; +0.80
2,925 .2,952 agglomera!ion (MADHYA PRADESH) 1911 5.924 3,020 2,904
1921 5,843 -81 - 1.37 2.996 2,847 1931~ 6,303 +460 +7.87 3,300 3,003 1941 7,600 +1,297 +20.58 4,000 3,600 1951 .,015 -585 -7.70 3,602 3,413 1961 0.47 7,362. +347 +4.95 3,835 3,527 1971 0.49 8,460 +1,098 +14.91 4,473 3,987
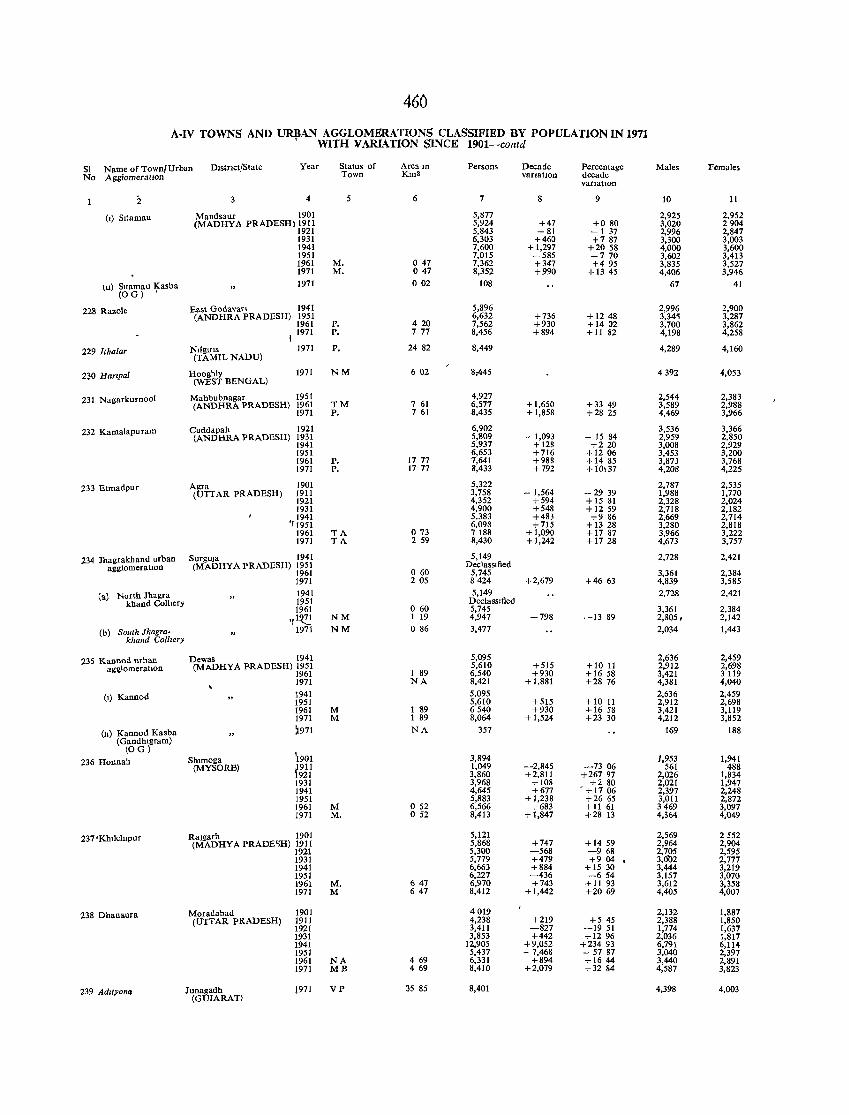
460
A-IV TOWNS AND URBAN AGGLOMERATIONS CLASSIFIED BY POPULATION IN 1971 I WITH VARIATION ~INCE 1901-contd
SI Name of Town/Urban DIstrict/State Year Status of Area In Persons Decade Percentage Males Females No AgglomeratIOn Town Km2 vanatlon decade
vanatton
"2 4 5 6 7 8 9 10 11
(I) Sltamau Mandsaur 1901 5,877 2,925 2,951 (MADHYA PRADESH) 1911 5,924 +47 +080 3,020 2904
1921 5,843 -81 -I 37 2,996 2,847 1931 6,303 +460 +787 3,300 3,003 1941 7,600 +1,297 +2058 4,000 3,600 1951 7,015 -585 -770 3,602 3,413 1961 M. 047 7,362 +347 +495 3,835 3,527 1971 M. 047 8,352 +990 + 1345 4,406 3,946
(11) Sllamall Kasba 1971 002 108 67 41 (OG) •
228 Razole East Godavari 1941 5,896 2,996 2,900 (ANDHRA PRADESH) 1951 6,632 +736 +1248 3,345 3,287
1961 P. 420 7,562 +930 +1402 3,700 3,862 I 1971 P. 777 8,456 +894 +11 82 4,198 4,258
229 [thalar NJlgms 1971 P. 24 82 8,449 4,289 4,160 (TAMIL NADU)
2~0 Hartpal Hooghly 1971 NM 602 8;445 4392 4,053 (WEST BENGAL)
231 Nagarkurnool Mahbubnagar 1951 4,927 2,544 2,383 (ANDHRA PRADESH) 1961 ™ 7 61 6,577 +1,650 +33 49 3,589 2,988
1971 P. 761 8,435 +1,858 +28 25 4,469 3,966
232 Kamalapuram Cuddapah 1921 6,902 3,536 3,366 (ANDHRA PRADESH) 1931 5,809 - 1,093 - 15 84 2,95~ 2,850
1941 5,937 + 128 +220 3,008 2,929 1951 6,653 +716 +1206 3,453 3,200 1961 P. 1777 7,641 +988 +1485 3,873 3,768 1971 P. 1777 8,433 +792 +10,37 4,208 4,225
233 Etmadpur Agra 1901 5,322 2,787 2,535 (UTTAR PRADESH) 1911 3,758 - 1,564 -2939 1,988 1,7.70
1921 4,352 +594 + 15 81 2,328 2,024 1931 4,900 +548 +1259 2,718 2,182 1941 5,383 +483 +9 86 2,669 2,714
'11951 6,098 +715 + 1328 3,280 2,818 1961 TA 073 7188 +1,090 +17 87 3,966 3,222 1971 TA 259 8,430 +1,242 +17 28 4,673 3,757
234 Jhagrakhand urban SurguJa 1941 5,149 2,728 2,421 agglomeratIOn (MADHYA PRADESH) 1951 Declassllled
1961 o 60 5,745 3,361 2,384 1971 205 8424 +2,679 +4663 4,839 3,585
(a) North Jhagra 1941 5,149 2,728 2,421 khand Co1hery 1951 DeclassIfied
1961 060 5,745 3,361 2,384 'r1~ NM 1 19 4,947 -798 -1389 2,805, 2,142
(b) South Jhagra- 1971 NM 086 3,477 2,034 1,443 khand Coll,ery
235 Kannod urban Dewas 1941 5,095 2,636 2,459 ag~lomeratlOn (MADHYA PRADESH) 1951 5,610 +515 +10 II 2,912 2,698
1961 I 89 6,540 +930 +1658 3,421 3119 1971 NA 8,421 + 1,881 +28 76 4,381 4,040
(I) Kannod 1941 5,095 2,636 2,459 1951 5,610 +515 +1011 2,912 2,698 1961 M I 89 6540 +930 +16 58 3,421 3,119 1971 M 1 89 8,064 + 1,524 +23 30 4,212 3,852
(II) Kannod Kasba ~971 NA 357 169 188 (Gandhlgram)
(OG) '1901 236 Honnah Shlmoga 3,894 1,953 1,941
(MYSORB) t911 1,049 -2,845 -7306 561 488 921 3,860 +2,811 +267 97 2,026 1,834
1931 3,968 +108 +280 2,021 1,947 1941 4,645 +677 - + 17 06 2,397 2,248 1951 5,883 +1,238 +26 65 3,011 2,872 1961 M 052 6,566 +683 +11 61 3469 3,097 1971 M. 052 8,413 + 1,847 +28 13 4,364 4,049
237 'K1n!c1llpur Ra]garh 1901 5,121 2,569 2552 (MADHYA PRADE,)H) 1911 5,868 +747 +1459 2,964 2,904
1921 5,300 -568 -968 2,705 2,595 1931 5,779 +479 +9 04 . 3,01:>2 2,777 1941 6,663 +884 +15 30 3,444 3,219 1951 6,227 -436 -654 3,157 3,070 1961 M. 647 6,970 +743 +11 93 3,612 3,358 1971 M 647 8,412 +1,442 +2069 4,405 4,007
238 Dhanaura Moradabad 1901 4019 2,132 1,887 (UTTAR PRADESH) 1911 4,238 +219 +5 45 2,388 1,850
1921 3,411 -827 -1951 1,774 1,637 1931 3,853 +442 +1296 2,036 1,817 1941 12,905 +9,052 +23493 6,791 6,114 1951 5,437 - 7,468 - 5787 3,040 2,397 1961 NA 469 6,331 +894 +1644 3,440 2,891 1971 MB 469 8,410 +2,079 +3284 4,587 3,823
239 Ad,tyana Junagadh J971 VP 35 85 8,401 4,398 4,003 (GUJARAT)
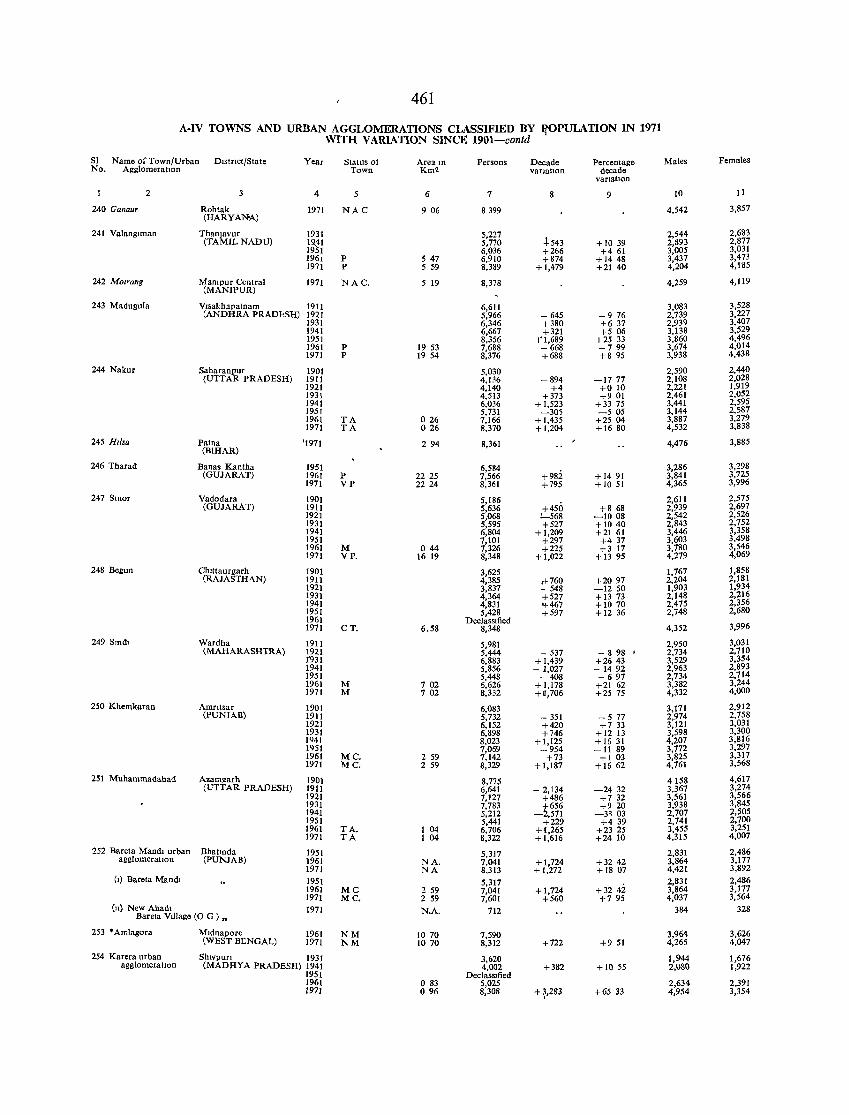
461
A-IV TOWNS AND URBAN AGGLOMERATIONS CLASSIFIED BY llOPULATlON IN 1971 WITH VARIATION SINCE 1901-contd
SI Name of Town/Urban DIstrIct/State Year Statns of Area In Persons Decade Percentage Males Females No. AgglomeratIon Town Km' vanatl0n decade
variatIOn
2 4 5 6 7 9 10 11
240 Ganaur Rohtak 1971 NAC 906 8399 4,542 3,857 (HARYANA)
241 Valanglman ThanJavur 1931 5,227 +543
2,544 2,683 (TAMIL NADU) I~I 5,770 + 1039 2,893 2,877
19 I 6,036 +266 +461 3,005 3,031 196, P 547 6,910 +874 + 1448 3,437 3,473 1971 P 5 59 8,389 +1,479 +21 40 4,204 4,185
242 MOlrang Mampur Central 1971 NAC. (MANIPUR)
5 19 8,378 4,259 4,119
243 Madugula Vlsakhapatnam 1911 6,611 3,083 3,528 (ANDHRA PRADbSH) 1921 5,966 - 645 - 976 2,739 3,227
1931 6,346 +380 +6 37 2,939 3.407 1941 6,667 +321 +5 06 3,138 3,529 1951 8.356 -¥1,689 +25 33 3,860 4,496 1961 P 19 53 7,688 - 668 -799 3,674 4,014 1971 P 19 54 8,376 +688 +895 3,938 4,438
244 Nakur Saharanpur 1901 5,030 2,590 2,440 (UTTAR PRADESH) 1911 4,136 -894 -1777 2,108 2,028
1921 4,140 +4 +010 2,221 1,919 1931 4,513 +373 +901 2,461 2,052 1941 6,036 +1,523 +33 75 3,441 2,595 1951 5,731 -305 -505 3,144 2,587 1961 TA 026 7,166 +1,435 +2504 3,887 3,279 1971 TA 026 8,370 +1,204 +1680 4,532 3,838
245 HI/sa Patna '1971 294 8,361 4,476 3,885 (BIHAR)
246 Tharad Banas Kantha 1951 6,584 3,286 3,298 (GUJARAT) 1961 P 2225 7,566 +982 +1491 3,841 3,725
1971 VP 2224 8,361 +795 +1051 4,365 3,996
247 Smor Vadodara 1901 5,186 2,611 2.575 (GUJARAT) 1911 5,636 +450 +8 68 2,939 2,697
1921 5,068 !-568 -1008 2,542 2,526 1931 5,595 +527 +1040 2,843 2,752 1941 6,804 + 1,209 +21 61 3,446 3,358 1951 7,101 +297 +437 3,603 3,498 1961 M 044 7,326 +225 +3 17 3,780 3,546 1971 VP. 16 19 8,348 +1,022 + 1395 4,279 4,069
248 Begun Chtttaurgarh 1901 3,625 1,767 1,858 (RAJASTHI\N) 1911 4,385 &760 +2097 2,204 2,181
1921 3,837 - 548 -1250 1,903 1,934 1931 4,364 +527 +13 73 2,148 2,216 1941 4,831 't467 +1070 2,475 2,356 1951 5,428 +597 + 12 36 2,748 2,680 1961 DeclaSSIfied
3,996 1971 CT. 6.58 8,348 4,352
249 Smd. Wardha 191I 5,981 2,950 3,031 tMAHARASHTRA) 1921 5,444 - 537 - 898 . 2,734 2,710
1'931 6,883 +1,439 +2643 3,529 3,354 1941 5,856 - 1,027 - 14 92 2,963 2,893 1951 5,448 - 408 - 697 2,734 2,714 1961 M 702 6,626 +1,178 +21 62 3,382 3,244 1971 M 702 8,332 +a,706 +25 75 4,332 4,000
250 Khemkaran Amntsar 1901 6,083 3,171 2,912 (PUNJAB) 1911 5,732 - 351 - 577 2,974 2,758
1921 6,152 +420 +7 33 3,121 3,031 1931 6,898 +746 +12 13 3,598 3,300 1941 8,023 +1,125 +1631 4,207 3,816 1951 7,069 -954 -11 89 3,772 3,297 1961 MC. 2 59 7,142 +73 +103 3,825 3,317 1971 MC. 2 59 8,329 + 1,187 +1662 4,761 3,568
251 Muhammadabad Azamgarh 19()1 8,775 4158 4,617 (UTTAR PRADESH) 1911 6,641 - 2,134 -2432 3,367 3,274
1921 7,127 +486 +7 32 3,561 3,566 1931 7,783 !656 +920 3,938 3,845 1941 5,212 - ,571 -3103 2,707 2,505 1951 5,441 +229 +439 2,741 2,700 1961 TA. 1 04 6,706 +(,265 +2325 3,455 3,251 1971 TA 104 8,322 + 1,616 +24 10 4,315 4,007
252 Bareta Mandl urban Bhatmda 1951 5,317 2,831 2,486 agglomeratIon (PUNJAB) 1961 NA. 7,041 +1,724 +3242 3,864 3,177
1971 NA 8,313 +1,272 + 1807 4,421 3,892 (1) Bareta Mandl 1951 5,317 2,831 2,486
1961 MC 2 59 7,041 +1,724 +3242 3,864 3,177 1971 Me. 2 59 7,601 +560 +795 4,037 3,564
(11) New Ahad\ 1971 N.A. 712 384 328 Bareta VIllage (0 G ) n
253 • Amlagora lVhdnapore 1961 NM 1070 7,590 3,964 3,626 (WEST BI:NGAL) 1971 NM 1070 8,312 +722 +951 4,265 4,047
254 Karera urban Sh,VPUrI 1931 3,620 1,944 1,676 agglomeratIon (MADHYA PRADESH) 1941 4,002 +382 +1055 2,080 1,922
1951 DeclassIfied 1961 o 83 5,025 2,634 2,391 1971 096 8,308 +~,283 +6533 4,954 3,354
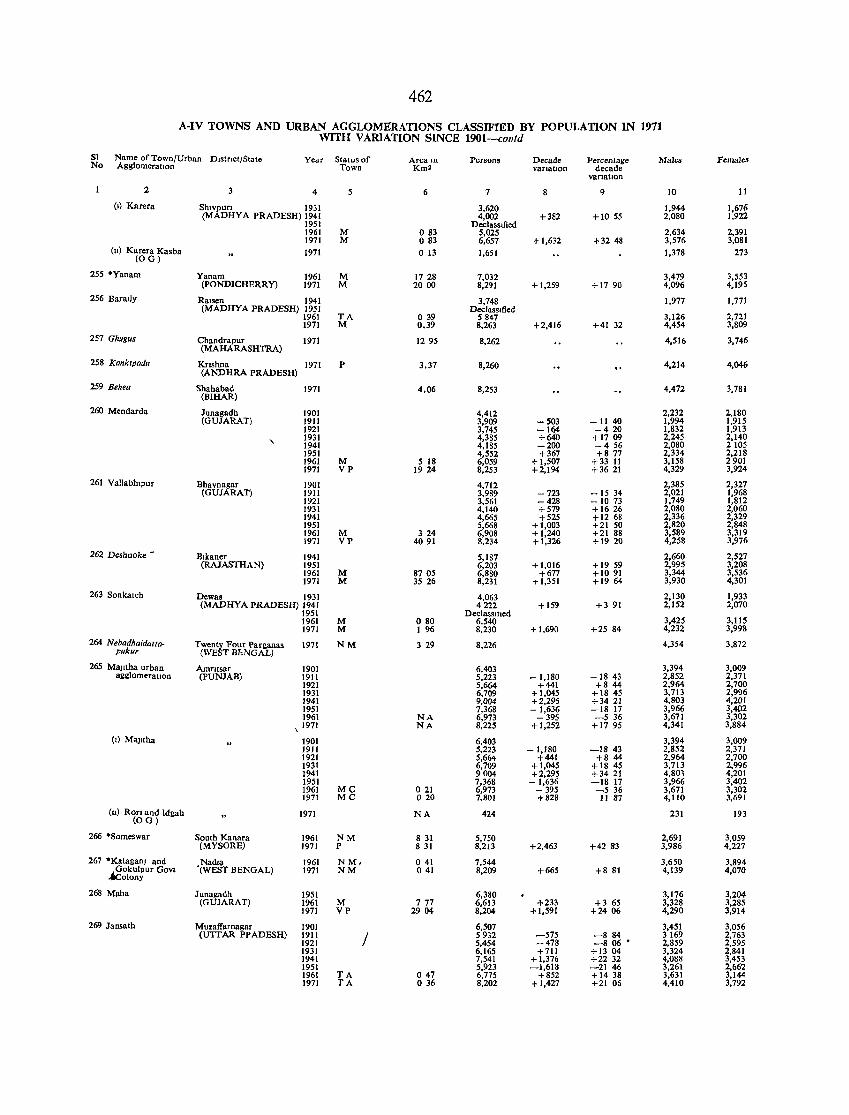
462
A-IV TOWNS AND URBAN AGGLOMERATIONS CLASSIFIED BY POPULATION IN 1971 WITH VARIATION SINCE 1901-contd
SI Name of Town/Urban DIStrict/State Year Status of Area JD Persons Decade Percentage Males Female. No AgglomeratIon Town Km 2 variatIon decade
vanatJOn
2 3 4 5 6 7 8 9 10 11
(I) Karera ShlVpun 1931 3,620 1,944 1,676 (MADHYA PRADESH) 1941 4,002 +382 +1055 2,080 1,922
1951 DeclassIfied 1961 M 083 5,025 2,634 2,391 1971 M 083 6,657 +1,632 +32 48 3,576 3,081
(II) Karera Kasba 1971 o 13 1,651 1,378 273 (OG)
255 *Yanam Yanam 1961 M 1728 7,032 3,479 3,553 (PONDICHERRy) 1971 M 2000 8,291 + 1,259 +1790 4,096 4,195
256 Baral)y Ra,sen 1941 3,748 1,977 1,771 (MADHYA PRADESH) 1951 DeclassIfied
1961 TA 039 5847 3,126 2,721 1971 M 0.39 8,263 +2,416 +41 32 4,454 3,809
257 Ghugus Chandrapur 1971 (MAHARASHTRA)
1295 8,262 4,516 3,746
258 Kank,pariu Knshna 1971 P (ANDHRA PRADESH)
3.37 8,260 4,214 4,046
259 Behea Shahabad 1971 (BIHAR)
4.06 8,253 4,472 3,781
260 Mendarda Junagadh 1901 4,412 2,232 2,180 (GUJARAT) 1911 3,909 - 503 -1140 1,994 1,915
1921 3,745 -1~ -420 1,832 1,913
" 1931 4,385 +64 +1709 2,245 2,140 1941 4,185 -200 - 4 56 2,080 2105 1951 4,552 +367 +877 2,334 2,218 1961 M 5 18 6,059 + 1,507 +33 11 3,158 2901 1971 VP 1924 8,253 +2,194 +3621 4,329 3,924
261 Vallabh,pur Bhavnagar 1901 4,712 2,385 2,327 (GUJARAT) 1911 3,989 -723 -1534 2,021 1,968
1921 3,561 -428 -1073 1,749 1,812 1931 4,140 +579 +1626 2,080 2,060 1941 4,665 +525 +12 68 2,336 2,329 1951 5,668 +1,003 +21 50 2,820 2,848 1961 M 324 6,908 +1,240 +21 88 3,589 3,319 1911 VP 4091 8,234 + 1,326 +1920 4,258 3,976
262 Deshnoke - B,kaner 1941 5,187 2,660 2,527 (RAJASTHAN) 1951 6,203 +1,016 +19 59 2,995 3,208
1961 M 8705 6,880 +677 +1091 3,344 3,536 1971 M 3526 8,231 + 1,351 +1964 3,930 4,301
263 Sonkatch Dewas 1931 4,063 2,130 1,933 (MADHYA PRADESH) 1941 4222 +159 +391 2,152 2,070
1951 Dec1assmed 1961 M 080 6,540 3,425 3,115 1971 M 1 96 8,230 +1,690 +25 84 4,232 3,998
264 Neharihaldalta- Twenty Four Parganas 1971 NM 329 8,226 4,354 3,872 pukur (WEST BeNGAL)
263 MllJltha urban Amrltsar 1901 6,403 3,394 3,009 agglomeration (pUNJAB) 1911 5,223 -1,180 -1843 2,852 2,371
1921 5,664 +441 +8 44 2,964 2,700 1931 6,709 +1,045 +18 45 3,713 2,996 1941 9,004 +2,295 +3421 4,803 4,201 1951 7,368 - 1,636 -1817 3,966 3,4P2 1961 NA 6,973 -395 -536 3,671 3,302
\ 1971 NA 8,225 +1,252 +17 95 4,341 3,884
(11 MaJltha 1901 6,403 3,394 3,009 1911 5,223 -1,180 -1843 2,852 2,371 1921 5,664 +441 +844 2,964 2,700 1931 6,709 +1,045 +18 45 3,713 2,996 1941 9004 +2,295 +3421 4,801 4,201 1951 7,368 -1,636 -18 17 3,966 3,402 1961 MC 021 6,973 - 395 -536 3,671 3,302 1971 Me 020 7,801 +828 II 87 4,110 3,691
(u) Ron and Idgah (OG)
1971 NA 424 231 193
266 *Someswar South Kanara 1961 NM 8 31 5,750 2,691 3,059 (MYSORE) 1971 P 831 8,213 +2,463 +42 83 3,986 4,227
267 *Katagan) and NadllJ 1961 NM, 041 7,544 3,650 3,894 ~okulpur Govt '(WEST BENGAL) 1971 NM 041 8,209 +665 +8 81 4,139 4,070
olony
268 Malta Junagadh 1951 6,380 3,176 3,204 (GUJARAT) 1961 M 777 6,613 +233 +3 65 3,328 3,285
1971 VP 2904 8,204 +1,591 +2406 4,290 3,914
269 Jansath Muzaffarnagar 1901 6,507 3,451 3,056 (U'ITAR PPADESH) 1911 I 5932 -575 -884 3169 2,763
1921 5,454 -478 -806' 2,859 2,595 1931 6,165 +711 +1304 3,324 2,841 1941 7,541 +1,376 +22 32 4,088 3,453 1951 5,923 -1,618 -2146 3,261 2,662 1961 TA 047 6,775 +852 +14 38 3,631 3,144 1971 TA 036 8,202 + 1,427 +21 06 4,410 3,792
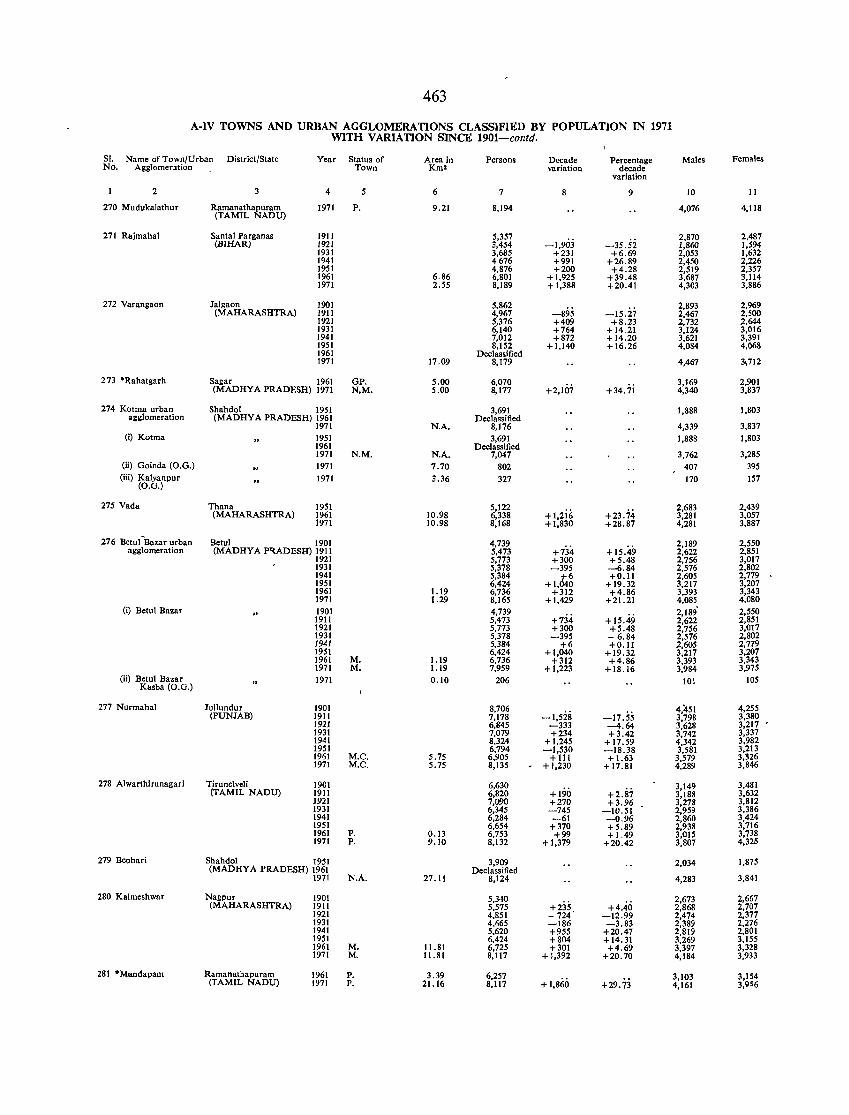
463
A-IV TOWNS AND URBAN AGGLOMERATIONS CLASSIFIED BY POPULATION IN 1971 WITH VARIATION SINCE 1901-colltd.
SI. Name of Town/Urban District/State Year Status of Area in Persons Decade Percentage Males Females No. Agglomention Town Km2 variation decade
variation
2 3 4 5 6 7 8 9 10 11
270 Mudukalathur Ramanathapuram (TAMIL NADU)
1971 P. 9.21 8,194 4,076 4,118
271 Rajmahal Santa1 Parganas 1911 5,357 -1,W:i
2,870 2.487 (BIHAR) 1921 3,454 -35.52 1,86Q 1,594
1931 3,685 +231 +6.69 2,053 1,632 1941 4676 +991 +26.89 2,450 2,226 1951 4,876 +200 +4.28 2,519 2,357 1961 6.86 6,801 +1,925 +39.48 3,687 3,114 1971 2.55 8,189 +1,388 +20.41 4,303 3,886
272 Var,ngaon Jalgaon 1901 5,862 2,893 2,969 (MAHARASHTRA) 1911 4,967 -895 -15.27 2,467 2,500
1921 5,376 +409 +8.23 2,732 2,644 1931 6,140 +764 +14.21 3,124 3,016 1941 7,012 +872 +14.20 3,621 3,391 1951 8,152 +1,140 +16.26 4,084 4,068 1961 Declassified 1971 17.09 8,179 4,467 3\712
273 ·Rahatgarh Sagar 1961 GP. 5.00 6.070 +2,107 +34.7i
3,169 2,901 (MADHYA PRADESH) 1971 N,M. 5.00 8,177 4,340 3,837
274 Kotroa urban Shahdol 1951 3,691 1,888 1,803 agglomeration (MADHYA PRADESH) 1961 Declassified
1971 N.A. 8,176 4,339 3.837 (I) Kotma 1951 3,691 1,888 1,803
1961 Declassified 1971 N.M. N.A. 7,047 3,762 3,285
(ii) Goinda (O.G.) 1971 7.70 802 407 395 (iii) Kalyanpur
(O.G.) 1971 3,36 327 170 157
275 Vada Thana 1951 5,122 +I,2i6 +23.74
2,683 2,439 (MAHARASHTRA) 1961 10.98 6,338 3,281 3,057
1971 10.98 8,Hi8 +1,830 +28.87 4,281 3,887
276 Betul Bazar urban Betul 1901 4,739 +15.49
2,189 2,550 agglomeration (MADHYA P~ADESH) 1911 5,473 +734 2,622 2,851
1921 5,773 +300 +5.48 2,756 3,017 1931 5,378 -395 -6.84 2,576 2,802 1941 5,384 +6 +0.11 2,605 2,779 1951 6,424 +1,640 +19.32 3,217 3,207 1961 1.19 6,736 +312 +4.86 3,393 3,343 1971 1.29 8,165 +1,429 +21.21 4,085 4,080
(i) Belul Bazar 1901 4,739 +734
2,189' 2,550 1911 5,473 + 15.49 2,622 2,851 1921 5,773 +300 +5.48 2,756 3,017 1931 5,378 -395 - 6.84 2,576 2,802 1941 5,384 +6 +0.11 2,605 2,779 1951 6,424 +1,040 +19.32 3,217 3,207 1961 M. 1.19 6,736 +312 +4.86 3,393 3,343 1971 M. 1.19 7,959 +1,223 +18.16 3,984 3,975
(ii) Betul Bazar Kasba (O.G.)
1971 0.10 206 101 105
277 Nurmahal Jullundur 1901 8,706 -I,52S
4,451 4,255 (PUNJAB) 1911 7,178 -17.55 3,798 3,380
1921 6,845 -333 -4.64 3,628 3,217 1931 7,079 +234 +3.42 3,742 3,337 1941 8,324 +1,245 + 17.59 4,342 3,982 1951 6,794 -1,530 -18.38 3,581 3,213 1961 M.C. 5.75 6,905 + III + 1.63 3,579 3,326 1971 M.C. 5.75 8,135 - + 1,230 + 17.81 4,289 3,846
278 Alwarthirunagari Tirunelveli 1901 6,630 +190
3,149 3,481 (TAMIL NADU) 1911 6,820 +2.87 3,188 3,632
1921 7,090 +270 +3.96 3,278 3,812 1931 6,345 -745 -10.51 2,959 3,386 1941 6,284 -61 -0.96 2,860 3,424 1951 6,654 +370 +5.89 2,938 3,716 1961 P. 0.13 6,753 +99 + 1.49 3,015 3,738 1971 P. 9.10 8,132 +1,379 +20.42 3,807 4,32.5
279 Beohari Shahdol 1951 3,909 2,034 1,875 (MADRY A PRADESH) 1961 Declassified
1971 N.A. 27.11 8,124 4,283 3,841
280 Kalmeshwar Nagpur 1901 5,340 2,673 2,667 (MAHARASHTRA) 1911 5,575 +235 +4.40 2,868 2,707
1921 4,851 - 724 -12.99 2,474 2,377 1931 4,665 -186 -3.83 2,389 2,276 1941 5,620 +955 +20.47 2,819 2,801 1951 6,424 +804 +14.31 3,269 3,155 1961 M. 11.81 6,725 +301 +4.69 3,397 3,328 1971 M. 11.81 8,117 +1,392 +20.70 4,184 3,933
281 ·Mandapam Ramanathapuram 1961 P. 3.39 6,257 +1,860 +29.73
3,103 3,154 (TAMIL NADU) 1971 P. 21.16 8,117 4,161 3,956
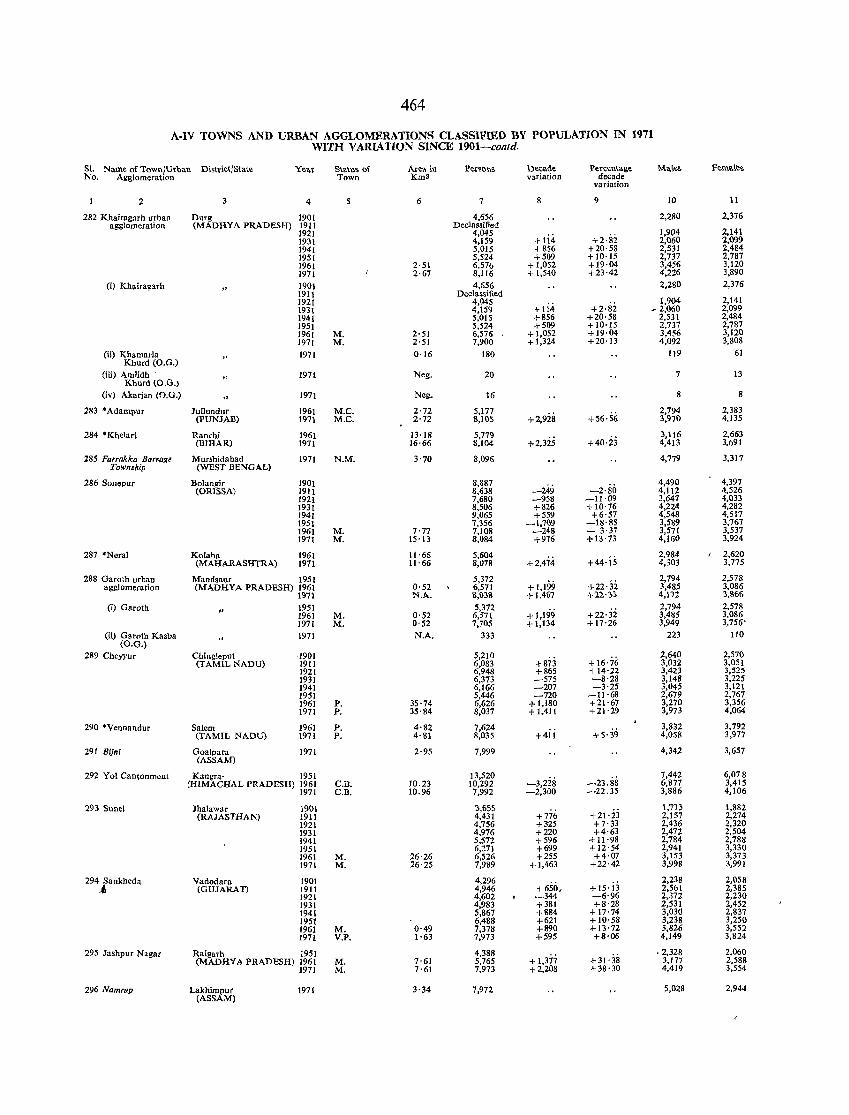
464
A·lV TOWNS AND URBAN AGGLOMERATIONS CLASSIFIED BY POPULATION IN 1971 WITH VARIATION SINCE 1901-conrd.
SI. Name of TOWllfUtban DistrictfState Year Status of Are.a -in PetsOM Decade Percentage Ma\es Fema\ts No. Agglomeration Town Kmz variation decade
variation
2 3 4 6 7 8 9 10 11
282 Khairagarh urban Durg 1901 4,656 2,280 2,376 agglomeration (MADIlY A PRADESH) 1911 Declassified
1921 4,045 +2·82
1,904 2,141 1931 4,159 +114 2,060 2,099 1941 5,015 +856 +20·58 2,531 2,484-1951 5,524 +509 +10·15 2,737 2,787 1961 2·51 6,57() + 1,052 +19·04 3,456 3,120 1971 2·67 8,116 + 1,540 +23·42 4,226 3,890
(i) Khairaprh 1901 4,656 2,280 2,376 1911 Declassified 1921 4,045
+1i4 1,904 2,141
1931 4,159 +2·82 _ 2,060 2,099 1941 5,015 +856 +20·58 2,531 2,484 1951 5,524 +509 + 10·15 2,737 2,787 1961 M. 2'51 6,576 +1,052 +19·04 3,456 3,120 1971 M. 2·51 7,900 + 1,324 +20·13 4,092 3,808
(ii) Khamaria Khurd (O.G.)
1971 0·16 180 119 61
(iii) Arnlidh ' 1971 Neg. 20 7 13 Khurd (O.G.)
(iv) Akarjan (O.G.) 1971 Neg. 16 8 8
283 * Adampur Jullundnr 1961 M.C. 2·72 5,177 +2,928
2,794 2,383 (pUNJAB) 1971 M.C. 2'72 8,105 +56·56 3,970 4,135
284 *Khelari Ranchi 1961 13'18 5,779 +2,325 +4o·ij
3,116 2,663 (BIHAR) 1971 16·66 8,104 4,413 3.691
285 Farrakka Barrage Murshidabad 1971 N.M. 3'70 8,096 4,779 3,317 Township (WEST BENGAL)
286 Sonepur Bolangir 1901 8,887 -249 -2·80
4,490 4,397 (ORISSA) 1911 8,638 4,1l2 4,526
1921 7,680 -958 ~11·09 3,647 4,033 1931 8,506 +826 + 10·76 4,224 4,282 1941 9,065 +559 +6·57 4,548 4,517 1951 7,356 -1,709 -18·85 3,589 3,767 1961 M. 7'77 7,108 -248 - 3·37 3,571 3,537 1971 M. 15'13 8,084 +976 +13'73 4,160 3,924
287 *Neral Kolaba 1961 1!·66 5,604 +2,474 +44·jS
2,984 2,620 (MAHARASHTRA) 1971 11'66 8,078 4,303 3,775
288 Garoth urban Mandsaur 1951 5,372 +1,199 +22·32
2,794 2,578 agglomeration (MADHYA PRADESH) 1961 0'52 6,571 3,485 3,086
1911 N.A. 8,038 + 1,467 +22'3, 4,112 3,866
(i) Garoth 1951 5,372 +1,199 +22·ji
2,794 2,578 1961 M. 0·52 6,571 3,485 3,086 1971 M. 0'52 7,705 + 1,134 + 17'26 3,949 3,756'
(ii) Garoth Kasba 1971 N.A. 333 223 110 (O.G.)
289 Cheyyur Ching!eput -1901 5,210 +873 + 16·76
2,640 2,570 (TAMIL NADU) 1911 6,083 3,032 3,051
1921 6,948 +865 +14'22 3,423 3,525 1931 6,373 -575 -8'28 3,148 3,225 1941 6,166 -207 -3·25 3,045 3,121 1951 5,446 -720 -11·68 2,679 2,767 1961 P. 35'74 6,li26 +1,180 +21·67 3,270 3,356 1971 P. 35·84 8,037 + 1,411 +21·29 3,973 4,064
290 ·Vennandur Salem 1961 P. 4·82 7,624 +4ii +5'39
3,832 3,792 (TAMIL NADU) 1971 P. 4'81 8,035 4,058 3,977
291 Bijni Goalpara 1971 2'95 7,999 4,342 3,657 (ASSAM)
292 Y 01 Cantonment Kangra' 1951 13,520 -3,228 -23.88
7,442 6,078 (HIMACHAL PRADESH) 1961 C.B. 10.23 10,292 6,877 3,415
1971 C.B. 10.96 7,992 -2,300 -22.35 3,886 4,106
293 Sunel )halawar 19tH 3,655 +21·:ij
1,113 1,882 (RAJASTHAN) 1911 4,431 +776 2,151 2,274
1921 4,756 +325 +7'33 2,436 2,320 1931 4,976 +220 +4·63 2,472 2,504 1941 5,572 +596 + 11'98 2,784 2,788 1951 6,271 +699 + 12·54 2,941 3,330 1961 M. 26'26 6,526 +255 +4'07 3,153 3,373 1971 M. 26'25 7,989 +1,463 +22·42 3,998 3,991
294 Sankheda Vadodara 1901 4,296 +15·j3
2,238 2,058 ., (GUlAR-AD 1911 4,946 +650, 2,561 2,385 1921 4,602 -344 -6·96 2,372 2,230 1931 4,983 +381 +8'28 2,531 2,452 1941 5,867 +884 + 17'74 3,030 2,837 1951 6,488 +621 +10'58 3,238 3,250 1961 M. 0·49 7,378 +890 + 13'72 3,826 3,552 1971 V.P. 1'63 7.973 +595 +8'06 4,149 3,824
295 Jashpur Nagar Raigarh 1951 4,388 + 1,377 +31'38
,2,328 2,060 (MADHYA PRADESH) 1961 M. 7'61 5,765 3,177 2,588
1971 M. 7'61 7,973 +2,208 +38'30 4,419 3,554
296 NamrllP Lakhimpur (ASSAM)
1971 3·34 7,972 5,028 2,944
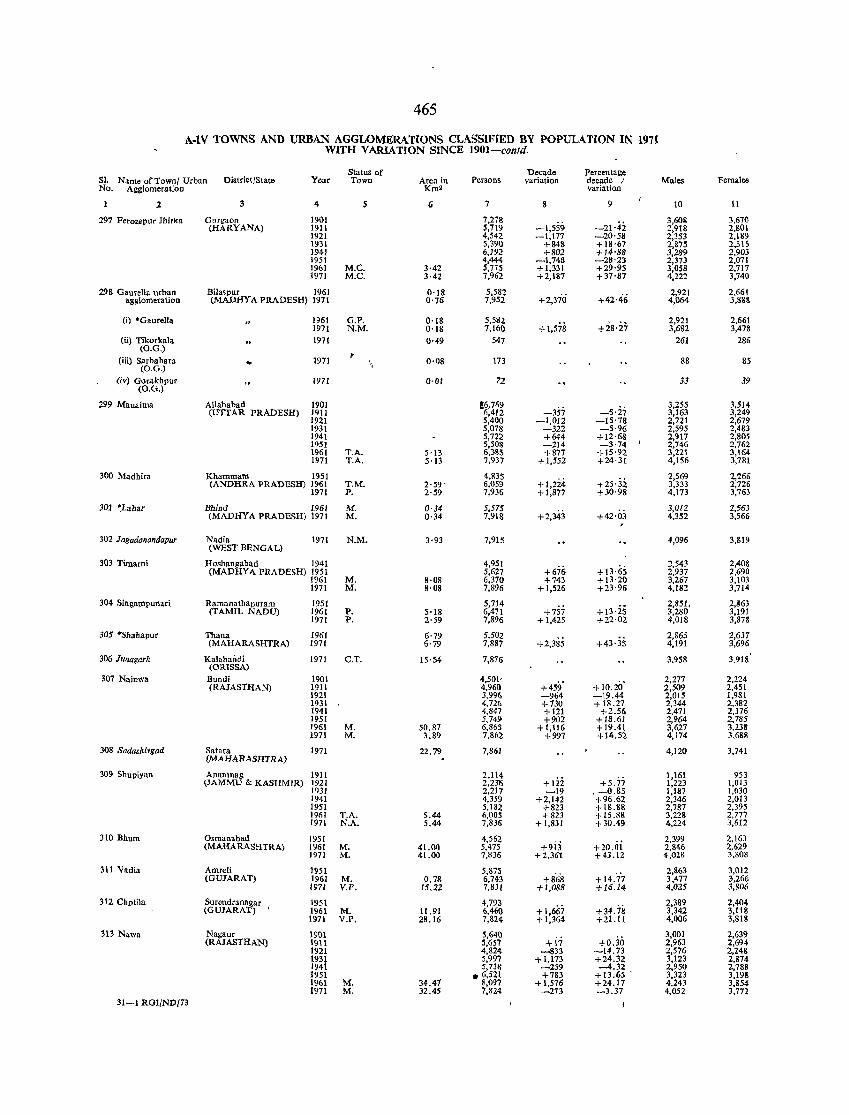
465
A-lV TOWNS AND URBAN AGGLOMERATl.ONS CLASSIFIED BY POPULATION IN 1971 WITH VARIATION SINCE 1901-comd.
Status of Decade Percentage 51. Name of Town/ Urban District/State Year Town Area in Persons variation decade / Males Females No. A~glomeratioD Km2 variation
2 3 4 5 6 7 8 9 10 11
291 Feroz"pur Jhirka Gurgaon 1901 7,21& -1,559 -21·42
3,60i 3,670 (HARYANA) 1911 5,719 2,918 2,801
1921 4,542 -1,177 -20·58 2,353 2,189 1931 5,390 +848 +18·67 2,875 2,515 1941 6,192 +802 +14·88 3,289 2,903 1951 4,444 -1,748 -28·23 2,373 2,071 1961 M.C. 3·42 5,715 +1,331 +29·95 3,058 2,717 1971 M.C. 3·42 7,962 +2,187 +37'87 4,222 3,740
298 Gaurella urban Bila<pur 1961 0'18 5,582 +2,370 +42'46
2,921 2,661 agglomeration (MADHYA PRADESH) 1971 0'76 7,952 4,064 3,888
(i) "Gaurella 1961 G.P. 0·18 5,582 + 1,578 +28'27
2,921 2,661 1971 N.M. 0·18 7,160 3,682 3,478
(ii) Tikorka1a 1971 0'49 547 261 286 (O.G.)
(iii) Sarbabara 1971 t
173 88 85 " 0·08
(O.G.)
(iv) GoraklIpur 1971 0'01 72 33 39 (O.G.)
299 Mauaima Allahabad 1901 £6,769 -357 -5·27
3,255 3,514 (UTTAR PRADESH) 1911 6,412 3,163 3,249
1921 5,400 -1,012 -15'713 2,721 2,679 1931 5,078 -322 -5·96 2,595 2,483 1941 5,722 +644 + 12·68 2,917 2,805 1951 5,508 -214 -3·74 2,746 2,762 1961 T.A. 5·13 6,385 +877 + 15·92 3,221 3,164 1971 T.A. 5·13 7,937 +1,552 +24·31 4,156 3,781
300 Madbira Khammam 1951 4,835 +1,224 +25·32
2,569 2,266 (ANDHRA PRADESH) 1961 T.M. 2'59' 6,059 3,333 2,726
1971 P. 2·59 7,936 +1,877 +30·98 4,173 3,763
301 *Labar Bhind 1961 M. 0·34 5,575 +2,343 +42·03
3,0[2 2,563 (MADHYA PRADESH) 971 M. 0·34 7,918 4,352 3,566
302 J ul1adanandapur Nadia 1971 N.M. (WEST BENGAL)
3·93 7,915 4,096 3,819
303 Timarni Hosbangabad 1941 4,951 +676 +13·65
2,543 2,408 (MADHYA PRADESH) 1951 5,627 2,937 2,690
196\ M. 8·08 6,370 +743 +13'20 3,267 3,103 1971 M. g'OB 7,896 +1,526 +23·96 4,IB2 3,71"
304 Singampunari Ramanathapuram 1951 5,714 +13·25
2,851, 2,363 (TAMIL NADU) 1961 P. 5·18 6,471 +757 3,280 3,191
1971 P. 2·59 7,896 +1,425 +22·02 4,018 3,878
305 "Shahapur Thana 1961 6'79 5,502 +2,385 +43'35
2,865 2,631 (MAHARASHTRA) 1971 6·79 7,887 4,191 3,696
306 Junagarh Kalahandi (ORISSA)
1971 C.T. 15·54 7,876 3.958 3,918
307 Nainwa Bundi 1901 4,501< +459' +10.20'
2,277 2,224 (RAJASTFIAN) 1911 4,960 2,509 2,451
1921 3,996 -964 -19.44 2,015 1,981 1931 4,726 +730 + 18.27 2,344 2,382 1941 4,841 +121 +2.56 2,471 2,376 1951 5,749 +902 +18.61 2,964 2,785 1961 M. 50.87 6.865 +1,116 +19.41 3,627 3,238 1971 M. 3.89 7,86:! +997 +14.n 4,174 3,688
308 Sadashivgad Salara 1971 (MAHARASHTRA)
22.79 7,861 4,120 3,741
309 Shupiyau Anantnag 1911 2,114 +li2 +5.77
1,161 953 VAMMU & KASHMIR) 1921 2,23~ 1,223 1,013
1931 2,217 -19 , -0.85 1,187 1,030 1941 4,359 +2,142 +96.62 2,346 2,013 1951 5,182 +823 + 18.88 2,787 2,395 1961 T.A. 5.44 6,005 +823 + 15.88 3,228 2,777 1971 N.A. 5.44 7,836 + 1,831 +30.49 4,224 3,612
310 Bhum Osmanabad 1951 4,562 +9ij +20.oi
2,399 2,163 (MAHARASHTRA) 1961 M. 41.00 5,475 2,846 2,629
)971 M. 4[,00 7,836 +2,361 +43.12 4,028 3,808
311 Vadia Amreli 1951 5,875 +14.77
2,863 3,012 (GUJARAT) 1961 M. 0.78 6,743 +8'68 3,477 3,266
1971 V.P. 15.22 7,831 +1,088 +16.14 4,025 3,806
312 ChDtila Surendranalla r 1951 4,793 +1,667 +34.78
2,389 2,404 (GUJARAT) I 1961 M. 11.91 6,460 3,342 3,118
1971 V.P. 28.16 7,824 +1,364 +21. It 4,006 3,81g
313 Nawa Nagaur 1901 5,641l +i-i +ojo
3,001 2,639 (RAJASTHAN) 1911 5,657 2,963 2,694
1921 4,824 -B33 -14.73 2,576 2,248 1931 5,997 +1,173 +24.32 3,123 2,874 1941 5,73S -259 --4.32 2,950 2,788 1951 .6,521 +783 +13.65 ' 3,323 3,198 1961 M. 34.47 8,097 +1,576 +24.17 4,243 3,854 1971 M. 32.45 7,82'1 -273 -3.37 4,052 3.772
31-1 RGl/ND/73
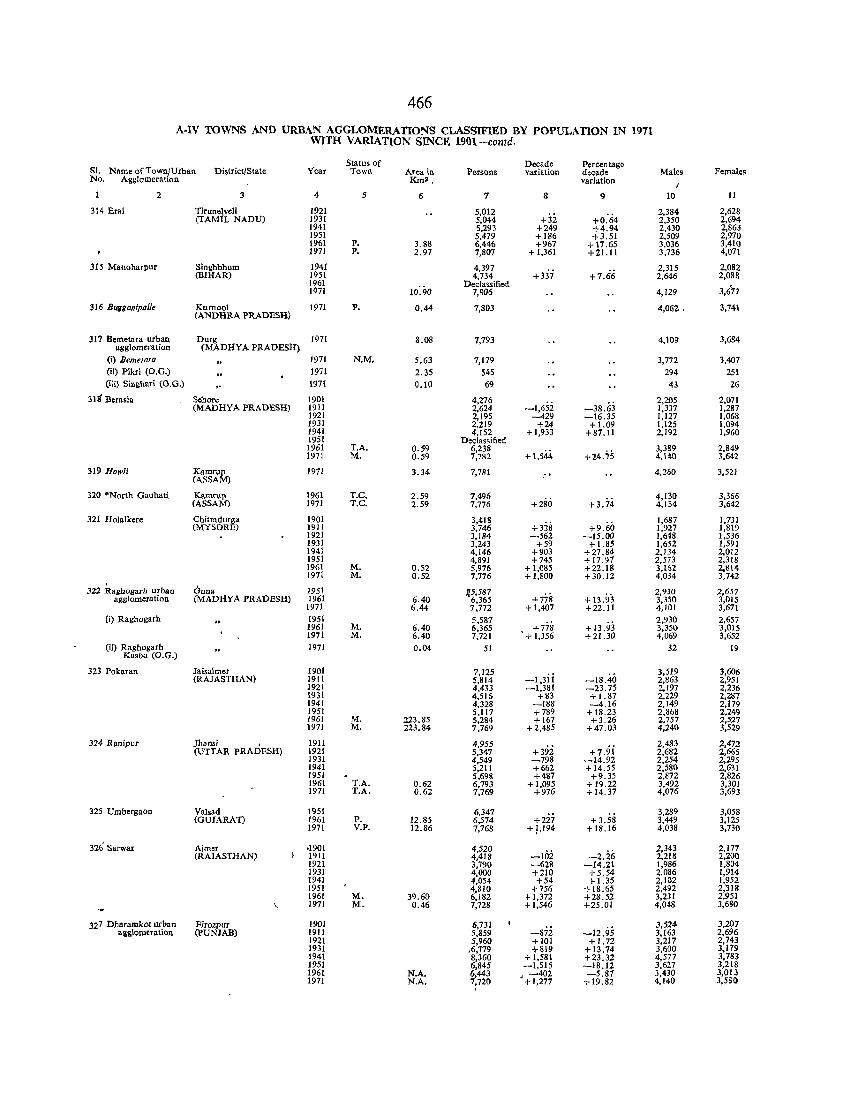
466
A-IV TOWNS AND URBAN AGGLOMERATIONS CLASSIFIED BY POPULATION IN 1971 WITI:{ VARlA.TlON SINCE 19G1-contd.
SI. Name ofTownjUrban No. Agglomeration
District/State Year
2
314 Bral
315 Manoharpur
316 BUZflanipa//e
317 Bemetara urban agglomeration
(i) Bernelara (ii) Pikri (0.0.)
(iii) Singhari (0.0.)
31s' Berasia
319 How/i
320 ·North Oauhat!
.121 Holalkere
322 Raghogarb urban agglomeration
(i) Raghogarh
(ii) Raghogarh Kasba (0.0.)
323 Pokaran
324 Ranipur
325 Umbergaon
37.6' Sarwar
327 D.haramkOl ur.ban allglomeratlon
Tirunelveli (TAM1L NADD)
Singhbhum (BIHAR)
4
1921 1931 1941 1951 1961 1971
1941 1951 1961 1971
Kurnool 1971 (ANDHRA PRADESH)
Durg 1971 (MADHYA PRADESH)
Sehore (MADHYA PRADESH)
Ramrup (ASSAM)
Kamrull (ASSAM)
Chitradurga (MYSORE)
Guna (MADHYA PRADESH)
Jaisalmer (RAJASTHAN)
]hansi , (UTTAR PRADESH)
Va1sad (GUJARAT)
Ajmer (RAJASTHAN)
Firozpur (PUNJAB)
1971 1971 1971
1901 1911 1921 1931 1941 1951 1961 1971
1971
1961 1971
1901 19!1 1921 1931 1941 1951 1961 1971
1951 1961 1971 1951 1961 1971 1971
1901 1911 1921 1931 1941 1951 1961 1971
1911 1921 1931 1941 1951 1961 1971
1951 1961 1971
'1901 1911 1921 1931 1941 1951 1961 1971
1901 1911 1921 1931 1941 1951 1961 1971
Status of Town
P. P.
P.
5
N.M.
T.A. M.
T.C. T.C.
M. M.
M. M.
M. M.
T.A. T.A.
P. V.P.
M. M.
Area in Km2 •
6
3.88 2.97
10:90
0.44
8.08
5.63 2.35 0.10
0.59 0.59
3.34
2.59 2.59
0.52 0.52
6.40 6.44
6.40 6.40
0.04
223.85 223.84
0.62 0.62
12.85 12.86
39.60 0.46
N.A. N.A.
Persons
7
5,012 5,044 5,293 5,479 6,446 7,807
4,397 4,734
Declassified 7,806
7,803
7,793
7,179 545 69
4,276 2,624 2,195 2,219 4,152
Declassified 6,238 7,782
7,781
7,496 1,776
3,418 3,746 3,184 3,243 4,146 4,891 5,976 7,776
IIS,587 6,365 7,772 5,587 6,365 7,721
51
7,125 5,814 4,433 4,516 4,328 5,117 5,284 7,769
4,955 5,347 4,549 5,211 5,698 6,793 7,769
6,341 6,574 7,768
4,520 4,418 3,790 4,000 4,054 4.810 6,182 7,728
6.731 5,859 5,960
/6,779 8,360 6,845 6,443 7.720 ,
Decade variation
8
+32 +249 +186 +967
+1,361
-1,65i -429
+24 +1,933
+ 1.544
+328 -562
+59 +903 +745
+ 1,085 +1,800
+778 + 1,407
+778 + 1,356
-1,3ii -1,381
+83 -188 +789 +167
+2,485
+392 -798 +662 +487
+ 1,095 +976
+227 +p94
-10i ---628 +210 +54
+756 + 1,372 + 1,546
-872 +101 +819
+ 1,581 -1,515
, +l,~~~
Percentage decade variation
9
+0:64 +4.94 +3.51
+17.65 +21.11
+7.66
-38.63 -16.35 + 1.09
+87.11
+2~.7S
+3.74
+9.60 -15.00
+1.85 +21.84 + 17.91 +22.18 +30.12
+ 13.93 +22.11
+ 13.93 + 21.30
-18.40 -23.75 +1.87 _4.16 + 18.23 +3.26
+47.03
+7.9i -14.92 + 14.55
+9.35 + 19.22 +14.37
+3.58 +18.16
-2.26 -14.21
+5.54 +1.35
+ 18.65 +28.52 +25.01
-12.95 +1.72
+13.74 +23.32 -18.12 -5.81
+19.82
Males
I
10
2,384 2,350 2,430 2.509 3,036 3,736
2,315 2,646
4,129
4,062.
4,109
3,772 294
43
2,205 1,337 1,127 1,125 2,192
3,389 4.140
4,260
4,130 4.134
1,687 1.927 1,648 1,652 2,134 2,573 3.162 4,034
2,930 3,350 4,101 2,930 3,350 4,069
32
3,519 2,863 2,197 2,229 2,149 2,86& 2,757 4,240
2,483 2,682 2,254 2.580 2,872 3.492 4,076
3,289 3,449 4,038
2,343 2,218 1,986 2,086 2,102 2,492 3,231 4,048
3,524 3,163 3,217 3,600 4,577 3,627 3.430 4.140
Females
11
2,628 2,694 2,863 2,970 3,410 4,071
2,082 2,088
306'77
3,741
3,684
3,407 251
26
2,071 1.287 1,068 1,094 1,960
2,849 3,642
3,521
3,366 3,642
1,731 1,819 1,536 1,591 2,012 2,318 2,814 3.742
2,657 3,015 3,671 2,657 3,015 3,652
19
3,606 2,951 2,236 2.287 2,179 2,249 2,527 3.529
2.472 2,665 2,295 2,631 2,826 3,301 3,693
3,058 3,125 3,730
2,177 2,200 1,804 1,914 1,952 2,318 2,951 3,680
3.207 2,696 2.743 3,179 3.783 3.218 3,013 J,SS()
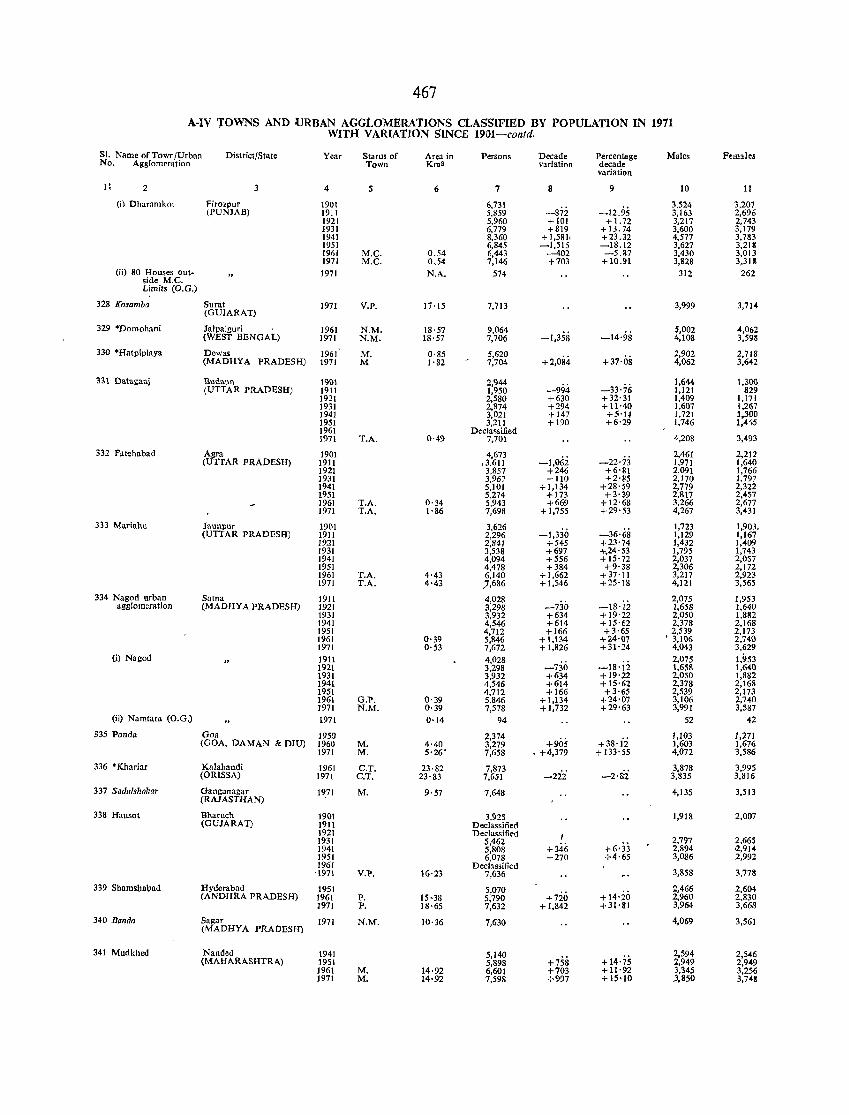
467
A-IV rOWNS AND URBAN AGGLOMERATIONS CLASSIFIED BY POPULATION IN 1971 WITH VARIATION SINCE 1901-contd.
SI. Name of Town/Urban District/State Year Status of Area in Persons Decade Percentage Males Females No. Agglomeration Town Km2 variation decade
variation
It 2 3 4 5 6 7 8 9 10 II
(i) Dharamkot Firozpur 1901 6,731 -87i -12.95
3,524 3,207 (PUNJAB) 1911 5,859 3,163 2,696
1921 5,960 +101 +1.72 3,217 2,743 1931 6,779 +819 + 13.74 3,600 3,179 1941 8,360 + 1,581, +23.32 4,577 3,783 1951 6,845 -1,515 -18.12 3,627 3,211 1961 M.e. 0.54 6,443 -402 -5.B7 3,430 3,013 1971 M.e. 0.54 7,146 +703 + 10.91 3,828 3,311
(ii) 80 Houses out-side M.e.
1971 N.A. 574 312 262
Limits (O.G.)
328 Kosamba Sural (GUJARAT)
1971 V.P. 17'15 7,713 3,999 3,714
329 *Domohani Jalpaiguri 1961 N.M. 18,57 9,064 -1,358 -14'98
5,002 4,062 (WEST BENGAL) 1971 N.M. 18·57 7,706 4,108 3,593
330 °Hatpiplaya Dewas 1961 M, 0·S5 5,620 +2,084 +31'08
2,902 2,718 (MADHYA PRADESH] 1971 M 1·82 7,704 4,062 3,642
:1:11 Datagani Budaun 19()\ 2,944 -994 -33'76
1,644 1,300, (UTTAR PRADESH) 1911 1,950 1,121 829
1921 2,580 +630 +32'31 1,409 1,171 1931 2,874 +294 + 11'40 1,607 1,267 1941 3,021 +147 +5'U 1,721 1,300 1951 3,211 +190 +6'29 1,746 1.4~5 1961 Declassified 1971 T.A. 0·49 7,701 4,208 3,493
332 Fatehabad Agra 1901 4,673 -1,062 -22·,:i
2,461 2,212 (UTTAR PRADESH) 1911 ,3,611 1,971 1,640
1921 3,857 +246 +6'81 2,091 1,766 1931 3,967 +110 +2'85 2,170 1,797 1941 5,101 +1,134 +28'59 2,779 2,322 1951 5,274 +173 +3'39 2,817 2,457 1961 T.A. 0'34 5,943 +669 + 12'68 3,266 2,677 1971 T.A. 1'86 7,698 + 1,755 +29'53 4,267 3,431
333 Mariahu Jaunpur 1901 3,626 -I,3:i6 -36'68
1,723 1,903. (UTTAR PRADESH) 1911 2,296 1,129 1,167
1921 2,841 +545 +23'74 1,432 1,409 1931 3,538 +697 +.24'53 1,795 1,743 1941 4,094 +556 + 15'72 2,037 2,057 1951 4,478 +384 +9'38 2,306 2,172 1961 T.A. 4·43 6,140 + 1,662 +37'11 3,217 2,923 1971 T.A. 4'43 ),686 +1,546 +25'\8 4,121 3,565
334 Nagod urban Satna 1911 4,028 -7jO -18·ii
2,075 1,953 agglomeration (MADHYA PRADESH) 1921 3,298 1,658 1,640
1931 3,932 +634 +19'22 2,050 1,882 1941 4,546 +614 + 15'62 2,378 2,168 1951 4,712 +166 +3'65 2,539 2,173 1961 0'39 5,846 +1,134 +24'07 ' 3,106 2,740 1971 0'53 7,672 + 1,826 +31'24 4,043 3,629
(i) Nagod 1911 4,028 -736 -ls·ii
2,075 1,1}53 1921 3,298 1,658 1,640 1931 3,932 +634 +19'22 2,050 1,882 1941 4,546 +614 +15'62 2,378 2,168 1951 4,712 +166 +3'65 2,539 2,173 1961 G.P. 0'39 5,846 +1,134 +24·\)7 3,106 2,740 1971 N.M. 0'39 7,578 + 1,732 +29'63 3,991 3,587
(ii) Namtum (O.G.) 1971 0'14 94 52 42
335 Ponda Goa 1950 2,374 +905 +38, 12 1,103 1,271
(GOA, DAMAN & DIU) 1960 M. 4·40 3,279 1,603 1,676 1971 M. 5'26' 7,658 • +4,379 + 133'55 4,072 3,586
336 'Khariar Kalahandi 1961 C.T. 23·82 7,873 -222' -2·s·i
3,878 3,995 (ORISSA) 1971 C.T. 23'83 7,651 3,835 3,816
337 Sndll/.lta/,ar Ganganagar 1~71 M. 9'57 7,648 4,135 3,513 (RAJASTHAN)
338 Hansot Bharuch 1901 3,925 1,918 2,007 (GUJARAT) 1911 Declassified
1921 Declassified I 1931 5,462 2,797 2,665 1941 5,808 +346 +6'33 2,894 ,2,91" 1951 6,078 +270 +4'65 3,086 2,992 1961 Declassified
3,858 '1971 V.l'. 16·23 7,636 3,718
339 Shamshabad Hyderabad 1951 5,070 +726 + 14'20
2,466 2,604 (ANDHRA PRADESH) 1961 P. 15-38 5,790 2,960 2,830
1971 P. 18·65 7,632 + 1,842 +31'81 3,964 3,668
340 Banda Sagar 1971 N.M. 10·36 7,630 4,069 3,561 (MADHYA PRADESH)
341 Mudkhed Nanded 1941 5,140 +758 + 14';5
2,594 2,546 (MAHARASHTRA) 1951 5,898 2,949 2,949
1961 M. 14·92 6,601 +703 + 11'92 3,345 3,256 1971 M. 14·92 7,598 +997 +IS'10 .3,850 3,748
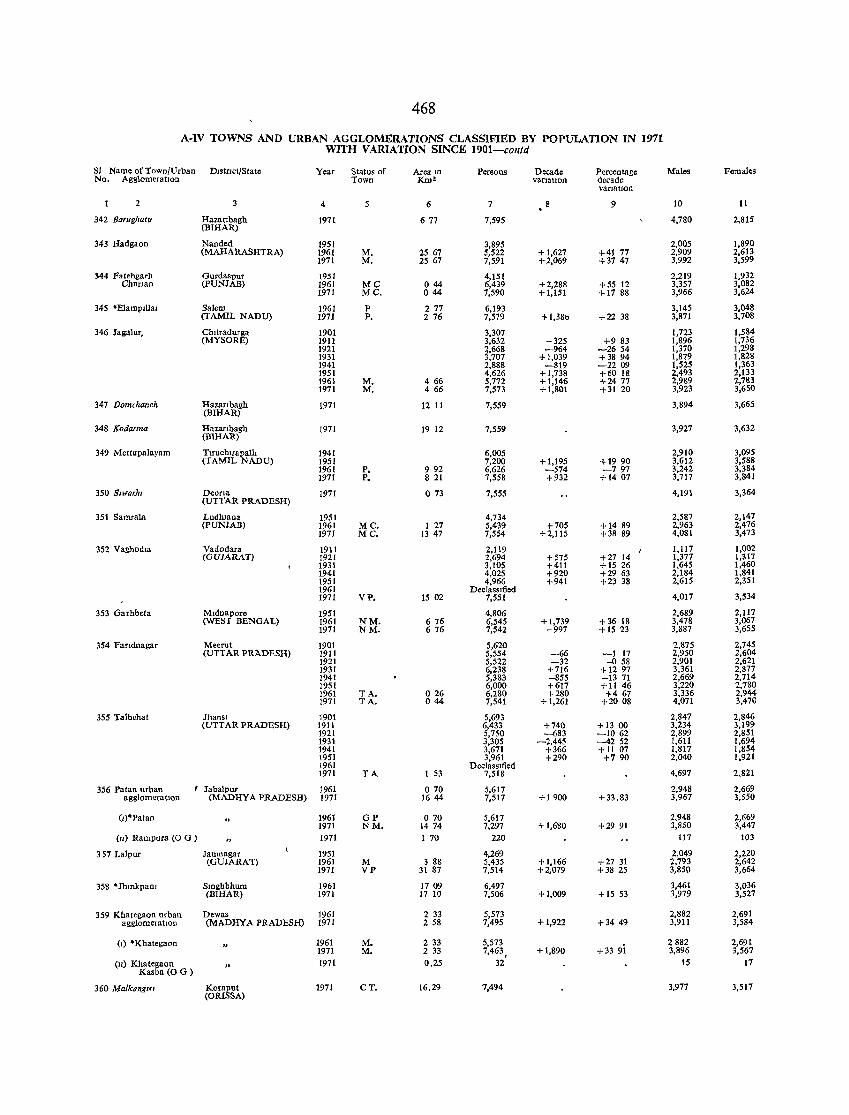
468
A-IV TOWNS AND URBAN AGGLOMERATIONS CLASSIFIED BY POPULATION IN 1971 WITH VARIATION SINCE 1901-contd
SI Name of Town/Urban DIstCict/State Year Status of Area m Persons Decade Percentage Males Females No. AgglomeratJon Town Km! vanatton decade
vanatIon
2 3 4 5 6 7 9 10 11
342 Barughutu Haza(lbagh (BIHAR)
197t 677 7,595 4,780 2,815
343 IIadgaon Nanded 1951 3,895 2,005 1,890 (MAHARASHTRA) 1961 M. 25 67 5,522 +1,627 +41 77 2,909 2,613
1971 M. 25 67 7,591 +2,069 +3747 3,992 3,599
344 Fatehgarh Gurdaspur 1951 4,151 2.219 1,932 Churlan (PUNJAB) 1961 MC 044 6,439 +2,288 +55 12 3,357 3,082
1971 MC. 044 7,590 +1,151 + 17 88 3,966 3,624
345 'ElamplUal Salem 1961 P 277 6,193 3,145 3,048 (TAMIL NADU) 1971 P. 276 7,579 +1,380 +22 38 3,871 3,708
346 Jagalur, Chltradurga 1901 3,307 1,723 1,584 (MYSORE) 1911 3,632 +325 +9 83 1,896 1,736
1921 }668 -964 -2654 1,370 1,298 1931 ,707 +1,039 +3894 1,879 1,828 1941 2,888 -819 -2209 1,525 1,363 1951 4,626 +1,738 +6018 2,493 2,133 \961 M. 466 5,772 +\,146 +2477 2,989 2,783 \971 M. 4 66 7,573 +1.801 +31 20 3,923 3,650
347 Damchanch Hazanbagh (BIHAR)
1971 12 II 7,559 3,894 3,665
348 Kadarma Hazanbagh (BIHAR)
1971 19 12 7,559 3,927 3,632
349 Mettupalayam TlTuchlTapalh 1941 6,005 2,910 3,095 (TAMIL NADU) 1951 7,200 +1,195 +19 90 3,612 3,588
1961 P. 992 6.626 -574 -797 3,242 3,384 1971 P. 8 21 7,558 +932 + 1407 3.717 3,841
350 S""orhl Deana 1971 (UTTAR PRADESH)
073 7,555 4,191 3,364
351 Samrala Ludhlana 1951 4,734 2,587 2,147 (PUNJAB) 1961 MC. 1 27 5,439 +705 +1489 2,963 2,476
1971 MC. 13 47 7,554 +2,115 +38 89 4,081 3,473
352 Vaghodlll Vadodara 1911 2,119 1,117 1,002 (GUJARATJ 1921 2,694 +575 +27 14 1,377 1,317
1931 3,105 +411 +1526 1,645 1,460 1941 4,025 +920 +29 63 2,184 1,841 1951 4,966 +941 +23 38 2,615 2,351 1961 Declassdied 1971 VP. 15 02 7,551 4,017 3,534
353 Garhbeta Mldnapore 1951 4,806 2,689 2,117 (WEST BENGAL) 1961 NM. 676 6,545 +1,739 +36 18 3,478 3.067
1971 NM. 676 7,542 +997 + 15 23 3,887 3,655
354 Fandnagar Meerut 1901 5,620 2,875 2,745 (UTTAR PRADESH) 1911 5,554 -66 -1 17 2,950 2,604
1921 5.522 -32 -0 58 2,901 2,621 1931 6,238 +716 + 12 97 3,361 2,877 1941 5,383 -855 -1371 2,669 2,714 1951 6,000 +617 +11 46 3,220 2,780 1961 TA. 026 6.280 +280 +467 3.336 2.944 1971 TA. 044 7,541 +1,261 +2008 4,071 3,470
355 Talbehat Jhansl 1901 5,693 2,847 2,846 (UTTAR PRADESH) 1911 6,433 +740 +1300 3,234 3,199
1921 5,750 -683 -1062 2,899 2,851 1931 3,305 -2.445 --42 52 1,611 1,694 1941 3,671 +366 +11 07 1,817 1,854 1951 3,961 +290 +'7 90 2,040 1,921 1961 DeclassIfied 1971 TA 1 53 7,518 4,697 2,821
356 Patan urban ( Jabalpnr 1961 070 5,617 2,948 2,669 agglomeratlon (MADHYA PRADESH) 1971 1644 7,517 +1900 +33.83 3,967 3,550
(1)"Patan 1961 GP 070 5,617 2,948 2,069 1971 NM. 14 74 7,297 +1,680 +2991 3,8$0 3,447
(11) Rampura (0 G ) 1971 1 70 220 117 103
357 Lalpur Jamnagar 1951 4,269 2,049 2,220 {GUJARAT} 1961 M 3 88 5,435 +1,166 +2731 2,793 2,642
1971 VP 31 87 7,514 +2,079 +3825 3,850 3,664
358 "Jhmkpanl Smghbhum 1961 1709 6,497 3,461 3,036 (BIHAR) 1971 17 10 7,506 +1,009 + 15 53 3,979 3,527
359 Khategaon urban Dewas 1961 233 5,573 2,882 2,691 agglomeratIOn (MADHYA PRADESH) 1971 258 7,495 +1,922 +3449 3,911 3,584
(I) "Khategaon 1961 M. 2 33 5,573 2882 2,691 1971 M. 2 33 7,463, + 1,890 +3391 3,896 3,567
{1I} Khategaon 1971 0.25 32 IS 17 Kasba (0 G)
360 Malkangm Koraput 1971 CT. 16.29 7,494 3,977 3,S17 (ORISSA)
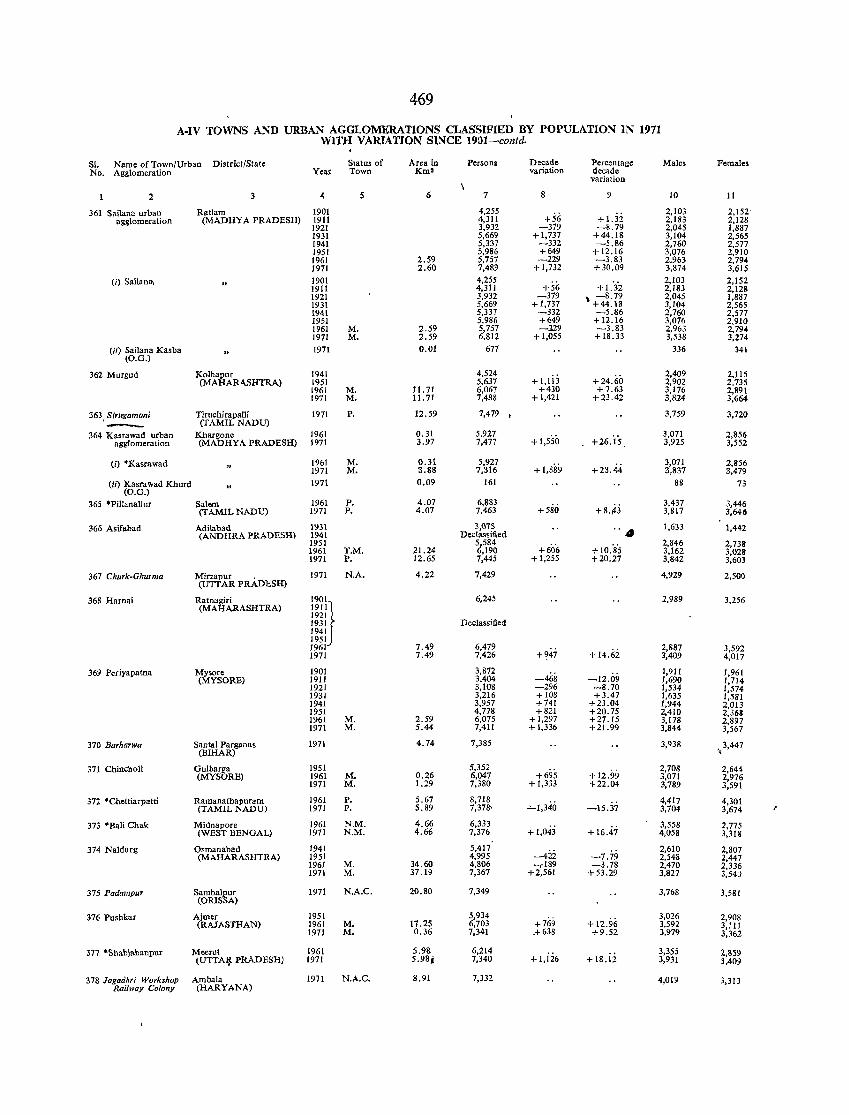
469
A-IV TOWNS AND URBAN AGGLOMERATIONS CLASSIFIED BY POPULATION IN 1971 WITH VARIATION SINCE 1901-contd.
SI. Name of Town/Urban District/State Status of Area in Persons Decade Percentage Males Females No. Agglomeration Year Town Km3 variation decade
variation
2 3 4 5 6 7 8 9 10 11
361 Sailana urban Ratlam 1901 4,255 +1.32
2,103 2,152 agglomeration (MADHY A PRADESH) 1911 4,311 +56 2,183 2,128
1921 3,932 -379 -8.79 2,045 1,887 1931 5,669 +1,737 +44.18 3,104 2,565 1941 5,337 -332 -5.86 2,760 2,577 1951 5,986 +649 +12.16 3,076 2,910 1961 2.59 5,757 -229 -3.83 2,963 2,791, 1971 2.60 7,489 +1,732 +30.09 3,874 3,615
(i) SaiIan", 1901 4,255 +56 + 1.'3'2
2,103 2,IS2 1911 4,311 2,183 2,128 1921 3,932 -379 \+4U~ 2,045 1,887 1931 5,669 + 1,737 3,104 2,565 1941 5,337 -332 -5.86 2,760 2,577 1951 5,986 +649 +12.16 3,076 2,910 1961 M. 2.59 5,757 -l29 -3.83 2,963 2,791, 1971 M. 2.59 6.812 + 1,055 + 18.33 3,538 3,274
(ii) Sailana Kasba (O.G.)
1971 0.01 677 336 341
362 Murgud Kolhapur 1941 4,524 + l,ti3 +24.60
2,409 2,115 (MAHARASHTRA) 1951 5,637 2,902 2,735
1961 M. 11. 71 6,067 +430 +7.63 3,176 2,891 1971 M. 11.71 7,488 + 1,421 +23.42 3,824 3,664
363, Sirugamani Tiruchirapalli 1971 P. 12.59 7,479 • 3,759 3,720 - (TAMIL NADU)
364 Kasrawad urban Khargone 1961 0.31 5,927 +1,550 +26.is
3,071 2,856 agglomeration (MADHYA PRADESH) 1971 3.97 7,477 3,925 3,552
(i) °Kasrawad 1961 M. 0.31 5,927 + 1,389 +23.44
3,071 2,856 1971 M. 3.88 7,316 3,837 3,479
(ii) Kasrawad Khurd (O.G.)
1971 0.09 161 88 73
365 *PillanaJlur Salem 1961 P. 4.07 6,883 +8.~3
3,437 3,446 (TAMIL NADU) 1971 P. 4.07 7,463 +580 3,817 3,646
366 Asifabad Adilabad 1931 3,075 "4 1,633 1,442
(ANDHRA PRADESH) 1941 Declassified 1951 5,584
+ 10.ii5 2,846 2,738
1961 T.M. 21.24 6,190 +606 3,162 3,028 1971 P. 12.65 7,445 +1,255 +20.27 3,842 3,603
367 Churk·Ghurma Mirzapur . 1971 N.A. 4.22 7,429 4,929 2,500 (UTTAR PRADESH)
368 Harnai Ratnagiri
"'J 6,245 2,989 3,256
(MAHARASHTRA) 1911 1921 1931 Declassified 1941 1951 1961 7.49 6,479
+947 +14.62 2,887 3,592
1971 7.49 7,426 3,409 4,017
369 Periya patna Mysore 1901 3,872 -468 -12.09
1,911 1,961 (MYSORE) 1911 3.404 1,690 1,714
1921 3,108 -296 -8.70 1,534 1,574 1931 3,216 +108 +3.47 1,635 1,581 1941 3,957 +741 +23.04 1,944 2,013 1951 4,778 +821 +20.75 2,410 2,363 1961 M. 2.59 6,075 +1,297 +27.15 3,178 2,897 1971 M, 5.44 7,411 +1,336 +21.99 3,844 3,567
370 Barharwa Santal Parganas 1971 4.74 7,385 3,938 3,447 (BIHAR) "
371 Cbincholi ~~~SbRE) 1951 5,352 +695 +12.99
2,708 2,644 1961 M. 0.26 6,047 3,071 2,976 1971 M. 1.29 7,380 + 1,333 +22.04 3,789 3,591
372 'Chettiarpatti Ramanathapuram 1961 P. 5.67 8,718 ..:...1,340 -15.37
4,417 4,301 (TAMILNADU) 1971 P. 5.89 7,378· 3,704 3,674
373 "Bali Chak Midnapore 1961 N.M. 4.66 6,333 + 1,043 + 16.47
3,558 2,175 (WEST BENGAL) 1971 N.M. 4.66 7,376 4,058 3,318
374 Naldurg Osmanabad 1941 5,417 2,610 2,807 (MAHARASHTRA) 1951 4,995 -422 -7.79 2,548 2,447
1961 M. 34.60 4,806 -,-189 -3.78 2,470 2,336 1971 M. 37.19 7,367 +2,561 + 53 .29 3,827 3,54~
375 Padampur Sambalpur 1971 N.A.C. 20.80 7,349 3,768 3,581 (ORISSA)
376 Pushkar Ajmer 1951 5,934 +769 +12.96
3,026 2,908 (RAJASTHAN) 1961 M. 17.25 6,703 3,592 3,111
1971 M. 0.36 7,341 .+638 +9.52 3,979 3,362
377 *Shahjabanpur Meerut 1961 5.98 6,214 +1,ii6 +18.ii
3,355 2,859 (UTTA~ PRADESH) 1971 5.98j 7,340 3,931 3,409
378 Jagadhri Workshop Ambala 1971 N.A.C. 8.91 7,332 4,019 3,313 Railway Colony (HARYANA)
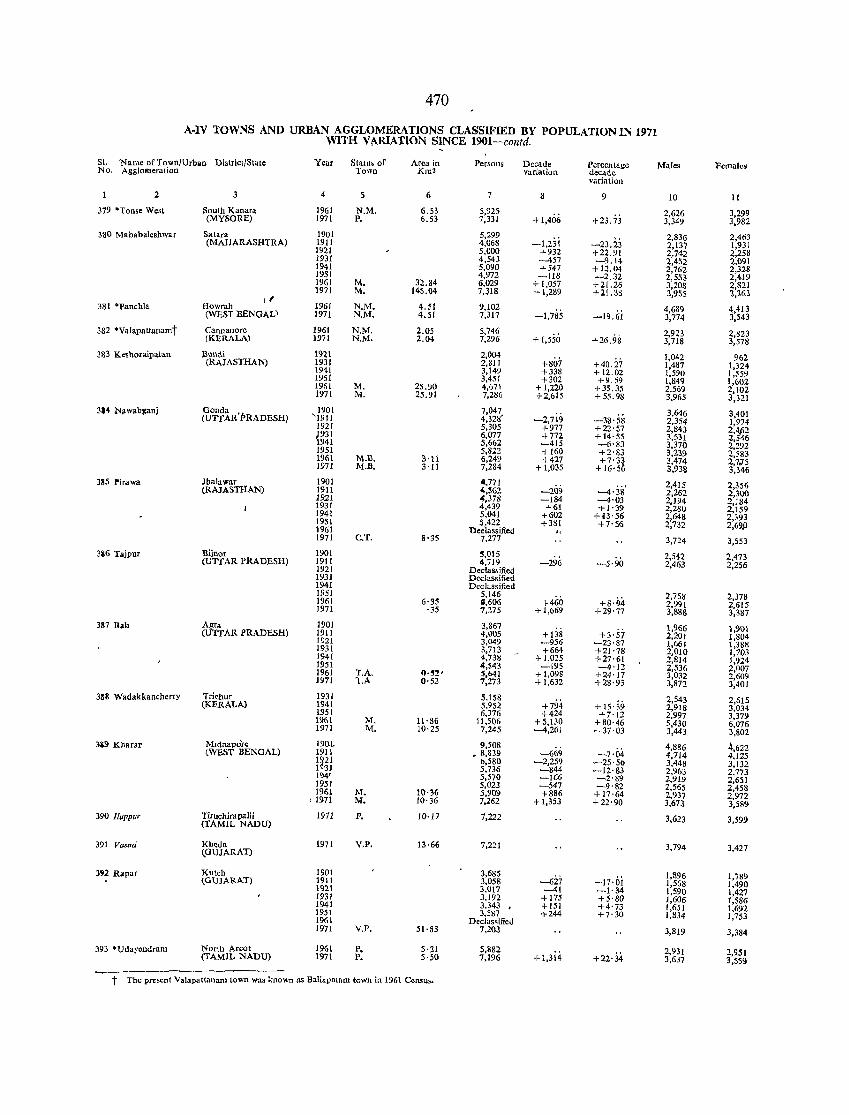
470
A·IV TOWNS AND URBAN AGGLOMERATIONS CLASSIFIED BY POPULATION IN 1971 WITH Vj\RIATlON SINCE 1901-contd.
S1. Name of Town/Urban District/State Year Statu. of Area in Persons Decade Percentage Males Females No. Agglomeration Town Kmz variation decade variation
2 3 4 5 6 7 8 9 10 11
379 "Tonse West South Kanara 1961 N.M. 6.53 5,925 +1,406 +23.7.i
2,626 3,299 (MYSORE) 1971 P. 6.53 7,331 3,349 3,982
380 Mahabaleshwar Sa tara 1901 5,299 -I,23i -23.23
2,836 2,463 (MAHARASHTRA) 1911 4,068 2,137 1,931
1921 5,000 +932 +22.91 2,742 2,258 1931 4,543 -457 -9.14 2,452 2,091 1941 5,090 +547 +12.04 2,762 2,328 1951 4,972 -118 -2.32 2,553 2,419 1961 M. 32.84 6,029 + 1,057 +21.26 3,208 2,821 1971 M. 145.04 7,318 + 1,289 +21.38 3,955 >,363
I' 1951 N.M. 4.51 9,102 4,413 381 'Panchla HowralJ -1,785 -19.6i
4,689 (WEST BENGAL' 1971 N.M, 4.51 7,317 3,774 3,543
382 "Valapattanamt Cannanore 1961 N.M. 2.05 5,746 +26.98
2,923 2,823 (KERALA) 1971 N.M. 2.04 7,296 +1,550 3,718 3,578
383 Keshoraipatan Bundi 1921 2,004 +4o.i:'
1,042 962 (RAJASTHAN) 1931 2,811 +807 1,487 1,324 1941 3.149 +338 + 12.02 1,590 1,559 1951 3,451 +302 +9.59 1,849 1,602 1961 M. 25.90 4,671 +1,220 +35.35 2,569 2,102 1971 M. 25.91 7,28G +2,615 + 55.98 3,965 3,321 314 NjlWabganj Gonda • 1901 7,047
-38'5S 3,646 3,401 (UTTAR PRADESH) '1911 4,32~' -2,719 2,354 1,974 1921 5,305 +977 +22'57 2,843 2'M2 {931 6,077 +772 + 14· 55 3,531 2, 46 941 5,662 -415 -6'83 3,370 2,292 1951 5,822 +160 +2'83 3,239 2,583 1961 M.ll. 3'11 6,249 +427 +7-31 3,474 2,7;15 1971 M.B. 3'11 7,284 + 1,035 +16'5 3,938 3,346
385 l'irawa Jbalawar 1901 4,771 -209 -4'38'
2,415 2,356 (RAJASTHAN) 1911 4,~62 2,262 2,300 1921 "',378 -184 -4'03 2,194 2,184 1931 4,439 +61 +1'39 2,280 2,159 1941 5,041 +602 +J3'56 2648 2,393 1951 5,422 +381 +7'56 2:732 2,69,P 1961 Ueclassified 'I 1971 C.T. 8'35 7,277 3,724 3,553
3i6 Tajpur Bijnor 1901 5,015 2,542 2,473 (UTTAR PRADESH) 1911 4.719 -296 -5'90 2,463 2,256 1921 Declas.ificd 1931 Declassified 1941 Declassified 1951 5,146
+460 +8'94 2,768 2,378 1961 6'35 11,606 2,991 2,615 1971 '35 7,275 + 1,669 +29'77 3,888 3,387
387 Bah Agra 1901 3,867 1,966 1,9m (UTTAR PRADESH) 1911 4,005 +138 +3'57 2,201 1,804 1921 3,049 -956 -23'87 1,661 1,388 1931 3,713 +664 +21'78 2,010 1,703 1941 <1,738 +1,025 +27'61 2,814 1,924 1951 4,543 -195 -4'12 2,536 2.007 1961 T.A. O'~2' 5,641 + 1,098 +24'17 3,032 2,609 1971 T.A 0·52 7,273 + 1,632 +28'93 3,872 3,401 3S11 Wadakkancherry Trichur 1931 5,158 2,543 2,615 (KERALA) 1941 5,952 +794 + 15·39 2,918 3,034 1951 6,376 +424 +7'12 2,997 3,379 1961 M. !l'S6 11,506 +5,130 +80'46 5,430 6,076 1971 M. 10'25 7,245 -4,26J -37'03 3,443 3,802
3i9 Kharar Mldnapore 190.1. 9,508 -7'04
4,886 4,622 (WEST BENGAL) 1911 • 8,839 -669 4,714 4.125 la21 b,580 -2,259 -25'5() 3,448 3,132 1 91 5,736 -844 -12'83 2,9&3 2,773 194' 5,570 -166 -2'89 2,919 2,651 1951 5,023 -547 -9'82 2,565 2.458 1961 M. 10'~6 5,909 +886 + 17·64 2,937 2,972 ,1971 M. 10'36 7,262 + 1,353 +22'90 3,673 3,589 390 lluppur Tiruchira palli 197J P. 10·17 7,222 3,623 3,599 (TAMIL NADU)
391 Vaslld Kboda 1971 V.P, 13·66 7,221 3,794 3,427 (._GUJARAT)
3'2 Rapar Kutch 1901 3,685 -62:' -17·iJi
1,896 1,789 (GUJARAT) 1911 3,058 1,568 1,490 1921 3,017 -41 -1'34 1,590 1,427 1931 3,192 +175 +5'8Q 1,606 1,586 1941 3,343 , +151 +4'73 1,651 1,692 1951 3,587 +244 +7'30 1,834 1,753 1961 Declas<ified 1971 V.P. 51·83 7,203 3,819 3,384
393 'Udaycndram North Areot 1961 p. 5·21 5,882 + 1,3i<i +22'34
2,931 2,951 (TAMIL NADU) 1971 P. 5·50 7,196 3,637 3,559
~ The pn:sent Valapattanam town was known US Ba1iapatam town in 1961 Census.
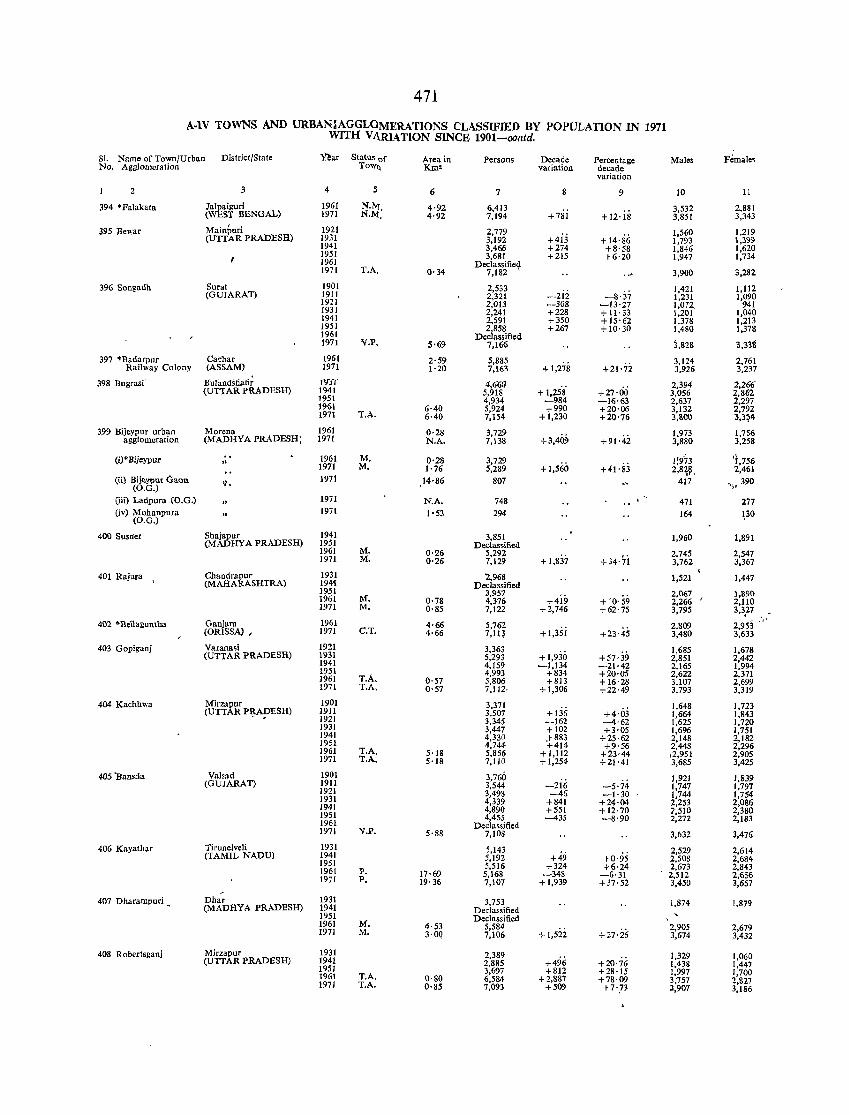
471
A·IV TOWNS AND URBANrAGGLOMERATIONS CLASSIFIED BY POPULATION IN 1971 WITH Vt\RlATION SINCE 1901-<JOntd.
SI. Name of Town/Urban District/State ~ar Status of Area in Persons Decade Percentage Males Female< No. Agglomeration TOWll Kill! variation decade
variaHon
3 4 S 6 7 8 9 10 Il
394 • Falakata Jalpaiguri 1961 ~:ki: 4·92 6,413 +7si +12·is
3,532 2,881 (WEST BENGAL) 1971 4'92 7,194 3,851 3,343
395 Bewar Mainpuri 1921 2,779 +4i:i
1,560 1,219 (UTTAR PRADESH) 1931 3,192 + 14'86 1,793 1,399
1941 3,466 +274 +8'58 1,846 1,620 1951 3,681 +215 +6'20 1,947 1,734 1961 Declassified 1971 T.A. 0·34 7,182 " 3,900 3,282
396 Songadh Sura! 1901 2,533 -2ii
1,421 1,112 (GUJARAT) 191I 2,321 -8'37 1,231 1,090
1921 2,013 -308 -13'27 1,072, 941 1931 2,241 +228 + 11· 33 1,201 1,040 \941 2,591 +350 +15'62 1,378 1,213 1951 2,858 +267 +10'30 1,480 1,378 1961 Declassified 1971 "l.p. 5·69 7,166 3,828 3,33t
397 *Badarpur Cachar 1961 2'59 5,885 + 1,278 +21'7i
3,124 2,761 Railway Colony (ASSAM) 1971 1'20 7,163 3,926 3,237
3911 Bugrasf lfuJandstiafi; IYS( 4,660 +1,25'8
2,394 2,266 (UTTAR PRADESH) 1941 5,918 +27·00 3,056 2,862
1951 4,934 -984 -16·63 2,637 2,297 1961 6·40 5,924 +990 +20'06 3,132 2,792 1971 T.A. 6·40 7,154 +1,230 +20'76 3,800 3,3~4
399 Bijeypur urban Morena 1961 0·28 3,729 +3,409
1,973 1,756 agglomeration (MADHYA PRADESH) 1971 N.A. 7,138 +91·42 3,880 3,258
(i)"Bijeypur " 1961 M. 0·28 3,729 1:973 '1,756 1971 M. 1·76 5,289 +1,560 +41'83 2,8~~. 2,461
(ii) Bijeypur (Jaon '1. 1971 14·86 807 417 "j.390 (D.G.)
(iii) Ladpura (O.G.) " 1971 N.A. 748 471 277
(iv) Mohanpura 1971 1'53 294 164 1,30 (D.G.)
400 SUSlle! Shajapur 1941 3,851 1,960 1,891 (MADHYA PRADESH) 1951 Declassified
1961 M. 0·26 5,292 2,745 2,547 1971 M. 0·26 7,129 + 1,837 +34'7i 3,762 3,367
401 Rajura Chandrapur 1931 '2,968 1,521 1,447 , (MAHARASHTRA) 194~ Declassified 1931 3,957
Hi9 2,067 1,890
1961 M. 0·78 4,376 + 10'59 2,266 ,
2,110 1971 M. 0·85 7,122 +2,746 +62'75 3,795 3,327 _
1961 ~ " .#,.
402 *Be\1aguntba Ganjam 4·66 5,762 +I,3Si
2,809 2,953 (ORISSA) I 1971 C.T. 4·66 7,11~ +23·45 3,480 3,633
403 Gopiganj Varana')i 1921 3,363 1,685 1,678 (UTTAR PRADESH) 1931 5,293 +1,930 +57'39 2,851 2,442
1941 4,159 -1,134 -21·42 2,165 1,994 1951
T.A. 4,993 +834 +20·05 2,622 2,371
1961 0'57 5,806 +813 +16'28 3,107 2,699 1971 T.A, 0·57 7,112· +1,306 +22'49 3,793 3,319
404 Kachhwa Mirzapur 1901 3,371 1,648 1,723 (UTTAR PIt~ESH) 1911 3,507 +136 +4.<ij 1,664 1,843
1921 3,345 -162 -4·62 1,625 1,720 1931 3,447 +102 +3·05 1,696 l,7S1 1941 4,330 ,+883 +25'62 2,148 2,182 1951 4,744 +414 +9'56 2,448 2,296 1961 T.A. 5·18 5,856 + 1,112 +23'44 \2,951 2,905 1971 T.A. 5·18 7,110 +1,254 +21'41 3,685 3,425
405 'Bansda VaJsad 1901 3,760 1,921 1,839 (GUJARAT) 1911 3,544 -216 -5·74 1,747 1,797 1921 3,498 -46 -1·30 1,744 1,754 1931 4,339 +841 +24·04 2,253 2,086 1941 4,890 +551 +12·70 2,510 2,380 1951 4,455 -435 -8'90 2,272 2,183 1961 Declassified
1971 V.P. 5·88 7,108 3,632 3,476
406 Kayathar Tirunelveli 1931 5,143 2,529 2,614 (TAMIL NADD) 1941 5,192 +49 +0·95 2,508 2,684 1951 5,516 +324 +6·24 2,673 2,843 1961 P. 17·69 5,168 -348 -6·31 2,512 2,656 1971 P. 19'36 7,107 +1,939 +37·52 3,450 3,657
407 Dharampuri " Dhar 1931 3,753 1,874 1,879 (MADRY A PRADESH) 1941 Declassified 1951 Declassified , 1961 M. 4·53 5,584 2,905 2,679 1971 M. 3·0Q 7,106 + 1,522 +27·26 3,674 3,432
408 Robertsganj Mirzapur 1931 2,389 1,329 1,060 (UIT AR PRADESH) 1941 2,885 +496 +20·76 1,438 1,447 1951 3,697 +812 +28·15 J,997 1,700 1961 T.A. 0·80 6,584 +2,887 +78·09 3,757 2,1127 1971 T.A. 0·85 7,093 +509 +7'73 3,907 3,186
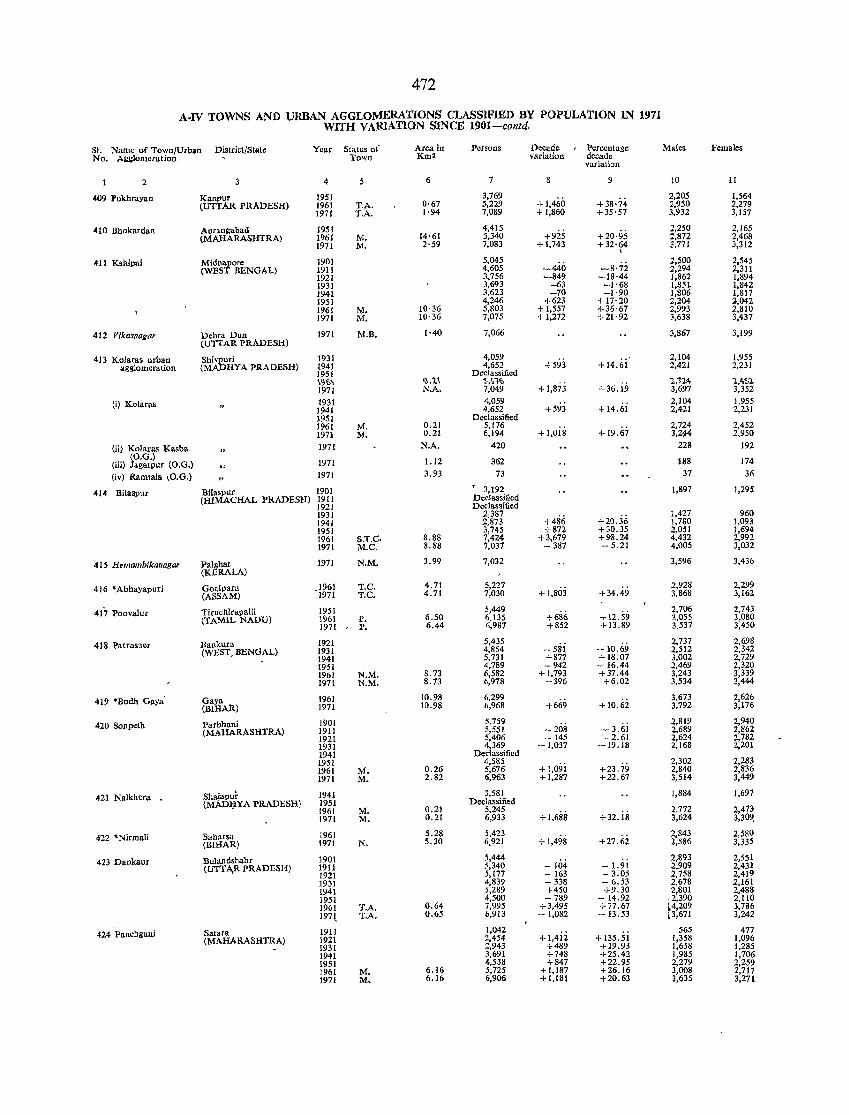
472
A.IV TOWNS AND URBAN AGGLO:r.1ERATIONS CLASSIFIED BY POPULATION IN 1971 WITH VARIATION SINCE 1901-contd.
51. Name of Town/Urban District/State Year Status of Area in Persons Decade Percentage Males Females No. Agglomeration Town Km3 variation decade
variation
2 4 6 7 9 10 11
409 Pukhrayan Kanrur 1951 3.769 + 38·74
2.205 1.564 (UTTAR PRADESH) 1961 T.A. 0·67 5.229 +1.460 2.950 2,279
1971 T.A. 1'94 7,089 + 1,860 +35'57 3,932 3.157
410 Bhokardan Aurangabad 1951 4.415 +20·95
2.250 2,165 (MAHARASHTRA) 1961 M. 14·61 5,340 +925 2,872 2.468
1971 M. 2'59 7,083 +1.743 + 32'64 3,771 3,312 I
411 Kshipai Midnapore 1901 5.045 2.500 2,545 (WEST BENGAL) 1911 4.605 -440 -8·72 2,294 2.311
1921 3,756 -849 -18'44 1,862 1,894 1931 3.693 -63 -1'68 1,851 1,842 1941 3.623 -70 -1·90 1.806 1,817 1951 4,246 +623 +17'20 2.204 2-.042 1961 M. 10'36 5.803 + 1.557 +36'67 2,993 2.810 1971 M. 10'36 7.075 +1,272 +21·92 3.638 3,437
412 Vikasnagar Dehra Dun 1971 M.B. 1·40 7,066 3.867 3.199 (UTTAR PRADESH)
413 Kolaras urban Shivpuri 1931 4.059 +593 +14.6i
2.104 1,955 aggjomeration (MADHYA PRADESH) 1941 4.652 2.421 2,231
1951 Declassified \%\ ~.1,1, ~.n""
+1.873 +36. i9 1,.11 ... 1. ... ~1,
1971 N.A. 7.049 3.697 3.352
(i) Kolaras " 1931 4.059
+593 2.104 1,955
1941 4,652 +14.61 2,421 2.231 1951 Declassified 1961 M. 0.21 5,176 2.724 2.452 1971 M. 0.21 6.194 +1.018 + 19.67 3.U4 2,950
(ii) Kolaras Kasba 1971 N.A. 420 228 192 (O.G.)
1971 1.12 362 (iii) Jagatpur (O.G.) 188 174
(iv) Ramlala \O.G.) 1971 3.93 73 37 36
0414 Bilaspur Bilaspur 1901 3,192 1.897 1,295 (HIMACHAL PRADESH) 1911 Dcoclassified
1921 Declassified 1931 2,387
+486 +20.36 1.427 960
1941 2,873 1.780 1.093 1951 3.745 +872 +30.35 2,051 1.694 1961 S.T.C. &.88 7,424 +3,679 +98.24 4,432 2,992 1971 M.C. 8.88 7.037 - 387 -5.21 4.005 3.032
415 Hemambikanagar Palghat 1971 N.M. 3.99 7,032 3,596 3.436 (KERALA)
416 • Abhayapuri Goalpara .1961 T.C. 4.71 5.227 +1,803 +34.49
2.928 2,299 (ASSAM) 1971 T.C. 4.71 7.030 3,868 3.162
,417 Poovalur Tiruchirapalli 1951 5.449 +686 + 12.59
2,706 2.743 (TAMIL NADU) 1961 1'. 6.50 ~.135 3,055 3.080
1971 P. 6.44 6.987 +852 +13.&9 3.537 3.450
418 Patrasler Bankura 1921 5.435 2.737 2,698 (WEST, BENGAL) 1931 4,854 - 581 -10.69 2.512 2.342
1941 5.731 +877 +18.07 3,002 2,729 1951 4.789 -942 -16.44 2.469 2.320 1961 N.M. 8.73 6,582 +1,793 +37.44 3.243 3.339 1971 N.M. S.73 6.978 +396 +6.02 3.534 3.444
419 'Bodh Gaya' Gaya 1961 10.98 6.299 +669
3.673 2.626 (BIHAR) 1971 10.98 6.968 +10.62 3.792 3.176
420 Sonpeth Parbhani 1901 5,759 -208
2,819 2.940 (MAHARASHTRA) 1911 5.551 -3.61 2.689 2,862
1921 5.406 -145 -2.61 2,624 2.782 1931 4,369 -1,037 -19.18 2,168 2.201 1941 Declassified 1951 4,585
+1,09i +23.79 2,302 2.283
1961 M. 0.26 5.676 2,840 2,836 1971 M. 2.82 6.963 +1,287 +22.67 3,514 3,449
421 Nalkhera Shajapu~ 1941 3.581 1,884 1.697 (MADI;iYA PRADESH) 1951 Declassified
1961 M. 0.21 5.245 +1.688
2,772 2.473 1971 M. 0.21 6,933 +32.18 3,624 3.309.
422 *Nirmali Saharsa 1961 5.28 5,423 +1.498 +27.62
2,843 2.580 (BIHAR) 1971 N. 5.30 6,921 3,586 3.335
423 Dankaur Bulandshahr 1901 5,444 - 104
2,893 2.551 (UTTA,R PRADESH) 1911 5.340 - 1.91 2,909 2.431
1921 5.177 - 163 - 3.05 2,758 2.419 1931 4,839 - 338 - 6.53 2,678 2.161 1941 5,289 +450 +9.30 2,801 2,488 1951 4.500 -789 - 14.92 l2,390 2,110 1961 T.A. 0.64 7.995 +3.495 +77.67 4,209 3.786 197t T.A. 0.65 6.913 - 1.082 - 13.53 13,671 3,242
424 ~Panchgani Salara 1911 1.042 +1.4ii
565 477 (MAHARASHTRA) 1921 2.454 + 135.51 1,358 1,096
1931 Z,943 +489 +19.93 1,658 1.285 1941 3.691 +748 +25.42 1,985 1,706 1951 4.538 +847 +22.95 2,279 2.259 1961 M. 6.16 5.725 +1,187 +26.16 3,008 2.717 1971 M. 6.16 6,906 +1,181 +20.63 3,635 3,271
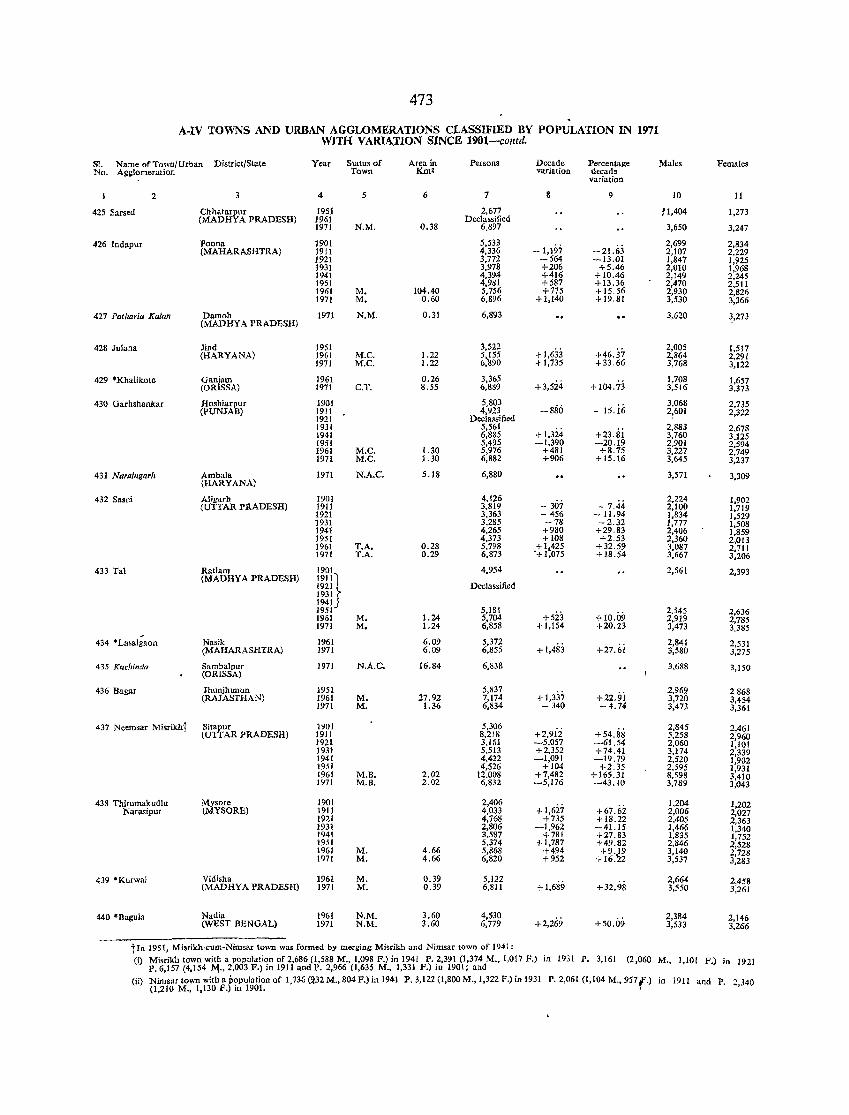
473
A-IV TOWNS AND URBAN AGGWMERATIONS CLASSIFIED BY POPULATION IN 1971 WITH VARIA:rlON SINCE 1901-contd.
Sf. Name of Towo/Urban District/Slate Year Stalus of Area in Persons Decade Percentage Males Females No. Ag~lomeration Town Km2 variation decade
variation
2 3 4 5 6 7 8 9 10 11
425 Sarsed Chhatarpur 1951 2,677 11,404 1,273 (MADHYA PRADESH) 1961 Declassified
1971 N.M. 0.38 6.897 3,650 3,247
426 Indapur Poona 1901 5,533 - 1,197 - 21.6.3
2,699 2,834 (MAHARASHTRA) 1911 4,336 2,107 2,229
1921 3,772 -564 -13.01 1,847 1,925 1931 3,978 +206 +5.46 2,010 1,968 1941 4,394 +416 + 10.46 2,149 2,245 1951 4,981 +587 +13.36 2,470 2,511 1961 M. 104.40 5,756 +775 +15.56 2,930 2,826 1971 M. 0.60 6,896 +1,140 +19,81 3,530 3,366
427 Patharia Kalan Damoh 1971 N.M. (MADHYA PRADESH)
0.31 6,893 3,620 3,273
428 JuJana lind 1951 3,522 +1,633 +46.37
2,005 1,517 (HARYANA) 1961 M.e. 1.22 5,155 2,864 2,291
1971 M.e. 1.22 6,'890 +1,735 +33.66 3,768 3,122
429 'Khalikole Gaujam 1961 0.26 3,365 +3,5i4
1,708 1,657 (ORISSA) 1971 C.T. 8.55 6,889 +104.73 3,516 3,373
430 Garhshankar Hoshiarpur 1901 5,803 -880 - 15, ii;
3,068 2,735 (PUNJAB) 1911 4,923 2~601 2,322
1921 Declassified 1931 5,561
+1,324 +23,gi 2,883 2,678
1941 6,885 3,760 3.125 1951 5,495 -1,390 -20,19 2,901 2,594 1961 M.e. 1.30 5,976 +481 +8,75 3,227 2,749 1971 M.C. 1.30 6,882 +906 + 15.16 3,645 3,237
431 Naraingarh Ambala 1971 N.A.C. 5.18 6,880 3,571 3,309 (HARYANA)
432 Sasni Aligarb 1901 4,126 -307 - 7,44
2,224 1,902 (UTTAR PRADESH) 1911 3,819 2,100 1,719
1921 3,363 - 456 - 11.94 1,834 1,529 1931 3,285 -78 -2.32 1,777 1,508 1941 4,265 +980 +29,83 2,406 1,859 1951 4,373 +108 +2,53 2,360 2,013 1961 T.A. 0.28 5,798 +1,425 +32,59 3,087 2,711 1971 T.A. 0.29 6,873 "+1,075 + 18.54 3,667 3,206
433 Tal Ratlam 1901 4,954 2,561 2,393 (MADHYA PRADESH) 1911)
ml~ Declassified
1941) 5,181 2.545 1951
+523 +10,09 2,636 1961 M. 1.24 5,704 2,919 2,785 1971 M. 1.24 6,858 + 1,154 +20.23 3,473 3.385
434 °La;algaon Nasik 1961 6.09 5,372 + 1,483 +27.6i
2,841 2,531 (MAHARASHTRA) 1971 6.09 6,855 3,580 3,275
435 Kuchinda Sambalpur 1971 N.A.C. 16.84 6,838 3,688 3,150 (ORISSA)
436 Bagar Jhunjhunun 1951 5,837 + 1,337 +z2.cji
2,969 2868 (RAJASTHAN) 1961 M. 27.92 7,174 3,720 3,454
1971 M. 1.36 6,834 - 340 -4.74 3,473 3,361
437 Neemsar Misrikht Sitapur 1901 5,306 +2,9ii +54.88
2,845 2,461 (UTTAR PRADESH) 1911 8,218 5,258 2,960
1921 3,161 -5,057 -61.54 2,060 1,101 1931 5,513 +2,352 +74,41 3,174 2,339 1941 4,422 -1,091 -19,79 2,520 1,902 1951 4,526 +104 +2.35 2,595 1,931 1961 M.B. 2.02 12.008 +7,482 +165.31 8,598 3.410 1971 M.B. 2.02 6,832 -5,176 -43.10 3,789 3,043
438 Thirumakudlu Mysore 1901 2,406 + 1,627 +67.62
1,204 1,202 Narasipur (MYSORE) 1911 4,033 2,006 2,027
1921 4,768 +135 +18.22 2,405 2,363 1931 2,806 -1,962 -41.15 1,466 1,340 1941 3,581 +781 +27.83 1,835 1,752 1951 5,374 +1,787 +49.82 2,846 2,528 1961 M. 4.66 5,868 +494 +9.19 3,140 2,728 1971 M. 4.66 6,820 +952 + 16.~2 3,537 3,283
439 'Kurwai Vidisha 1961 M. 0.39 5,122 +1,689 +32.98
2,664 2,458 (MADHYA PRADESH) 1971 M. 0.39 6,811 3,550 3,261
440 "Bagula Nadia 1961 N.M. 3.60 4,530 +2,Z69 +50.09
2,384 2,146 (WEST BENGAL) 1971 N.M. 3.60 6,779 3,533 3,266
tIn 1951, Misrikh-cum-Nimsar town was formed by merging Misrikh and NiUlSar town of 1941: (i) Misrikh town with a population of 2,686 (1,588 M., 1,098 F.) in 1941 P. 2,391 (1,374 M., 1,017 F.) in
P. 6,157 (4,154 lI<l., 2,003 F.) in 1911 and P. 2,966 (1,635 M., 1,331 F.) in 1901; and 1931 P. 3,161 (2,060 M., 1,101 P.) in 1921
(ii) Nimsar town with a p,?pu1ation of 1,736 (~32 M., 804 F.) in 1941 P. 3,122 (1,800 M., 1,322 F.) in 1931 P. 2,061 (1,104 M., 957 f) in 1911 and P. 2,340 (1,210 M., 1,130 P.) lU 1901.

474
A-IV TOWNS AND URBAN AGGLOMERATIONS CLASSIFIED BY' POPULATION IN 1971 WITH VARlATION SINCE 1901~contd.
SI. Name of Town/Urban District/State No. Agglomeration
r 2
441 Nikol " 3
Ahmadabad (GUJARAT)
Year Status' of Town
4
1971
5
V.P.
Jhabua 1961 t M. (MADHYA PRADESH) 1971 M.'
443 Bamb"a
444'Mairwa
445 Ku/gaoll
446 Peraiyur
447 Revdanda
1148 'Talala
449 AlanS,;,di
450 Dudhani
451 KothapalU Haveli
452 'Chandbali
45~ Ajjampur
454 'Muri
455 'Jaleswar
Ganjain !.
(ORJSS~)
Saran (BIHAR)
Thana.· (MAHARASHTRA)
Madurai (TAMIL NADU)
Kolaba (MAHARASHTRA) , ,
Junaga<th (GUJARAT)
I 01 "1 ~ ~
Tiruchirapalli (TAMIL NADU)
ShoJapur (MAa,A¥1¥ITRA)
"Karimnagar (ANDHRA PRADESH)
Balasore (ORISSA)
ChikmagaJur (MYSORE)
Ranelri (BIHAR)
BaJasore (ORISSA)
456 Bhawanigarh urban Sangrur. agglomeration. tpUNJ.<\B).
"~'f I
(i) Bha wanigarh
(li) Jhuggi Basti Outside M.C. Limits (O.G~
457 J'araclip
458 Nakhotrana ,
Cult.ck' (ORISSA)
Kutch (GUJARAT)
1971 N.A.C.
1971 N.
01971
1951 1961 P. 1971 P.
1901
1911} "1921 1931 1941 1951 1961 1971
1961 M.' 1971 V.P.
1931 1941 1951 1961 P. 1971 P.
1901 1911 1921 1931
-.1941 1951 1961 M.,
)971 M,
1971 r " P.
1961 • 1971
'l~n 1921 1931 1941 1951 1961 1971
1961 1971
1961 1971
1951 1961
1971
1951 1961 1971
1971
1971
1971
./
C,i',
M. M.
N.A.C
M.C. M.C.
C.T.
V.P.
459 Pasoll Shah dol 1971 N.M. (MADHY~, PRADESH)
460 Bhikangaon urban J:(hargone 1961 agglomeration (M~HYA P~ESH) 197)
(i) -Bhikangaon 1961 1971
M. M.
~reain Km2
6
10.20
0.39 0.39
2.59
3.63
7.77 10 .. 45
12.98 12.98
0.39 9.80
3.11 3.10
," •. P 26 •. 29 0.10
16.06
J1.50 6.11
0.52 0.29
4.07 5.49
23.57 12.95
, N.A. N.A.
3.89 2.59
N.A. f,
23.31
24.£8
15,54
1. 79 3.96
I. 79 1.79
Persons
7
6,785
5,071 6,771
6,771
6,166
, 6,758 i'
Decade variation
8
+1,100
4,983 5,993 + 1,0io ~,744 +751
3,660
Deehissified
5,987 6,240 6,743 •
h
4~03 6,/42,
~'m I Dedassified
5,304 I' 6,728
3,313 3,507 3,462 3,924
'4,682 '61.03 6,423 6,726
6,719
9,406 6',717
2,164 Declassified'
,.2,352 I 3,255 3,716 4,817 5,675 ~,716
4,654 6,712,
10,202 6,711
4,253 5,437 6,706
4,253 5,437 6,260 446
6,699
6,691
4,350 6,6&2
4,350 6,399
.. '
+253 +503
+586
+1,424
" +194 -45
+462 +'758
+1',421 +320 +303
\
+903 +461
+1,101 +858
+1,041
+2,058
-3,49i
+ 1,184 +1,269
+ I,iS4 +823
Percentage decade variation
9
+33.52 I
+20.27 ! 'r 12.53
.,.
+4.23 +8.06
+53. ii
+5,86 -1.28
+ 13.34 +19.32 +30.35 +5.24 +.~. ?2
-28.59
.. I.
+44.22
, -34.22
+27.84 +23.34,
+.27.84 +15.14.
.. '
+53.6i
II
Mates
10
3,758
2,598 3,5'18
3,429 '
3,671
3,600
2,506 3,012 ~,429
1,993
3,011 ~.072 3,346
2,295 3,435
1,155 1,471
2,706 3,43&
1,755 1,792 1,782 2,040 2,"366 3,118 3,306 3,437
3,326
5,449 3,673
1,01,6
1,223 1,700 1,860 2,424 2,929 3,423
2,595 13,608
5,777 3,473
2,361 2,933 3,539
2,361 2,933 3,310
229
4,579
3,211
3,810
2,334 3,492
2,334 3,346
Females
11
3,027
.2,473 3,253
3,342
3,095
3,158
2.477 2,981 3,315
1,667
2,976 3,168 3.307
2,108 3,307
1,218 1,488
, 2,598" 3,290
1,558 1,715 1,680 1,884 2,316 2,985 3,117 3,289
3,393
3,957 3,044
1,088
1,129 1,555 1,856 2,393' 2,746 3,293
2,059 3,104
4,425 3,238
1,892 2,504 3,167
1,892 2,504 2,950
217
2,126
3,428
2,881
2,016 3,190
2,016 3,053
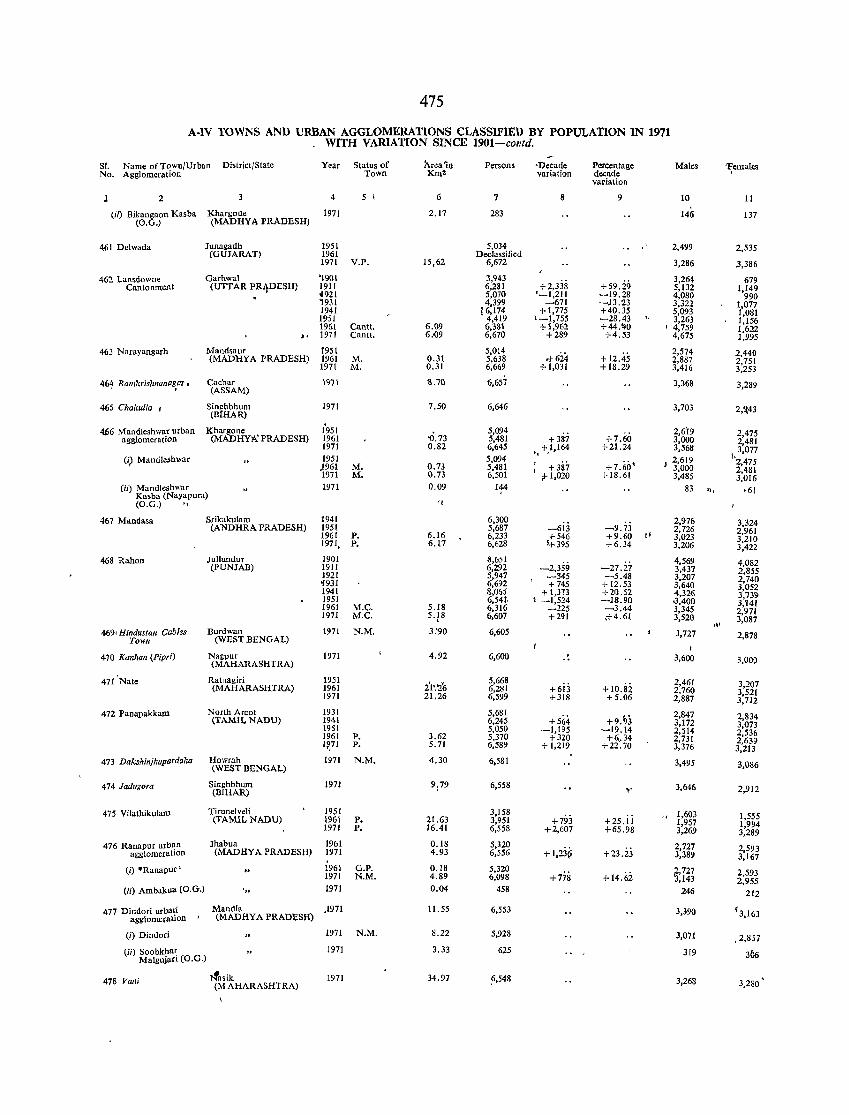
475
A·IV TOWNS AND URBAN AGGLOMERATIONS CLASSIFIED BY POPULATION IN 1971 WITH VARlATION SINCE 1901-contd.
SI. Name of Town/Urban District/State Year Status of Area 'in Persons 'Decade Percentage Males ~ema1es No. Agglomeration Town Km2 variation decade
variation
2 3 4 5 \ 6 7 8 9 10 11
(ii) Ilikangaon Kasba Khargone 1971 2.17 283 146 137 (O.G.) (MADHYA PRADESH)
4.61 Delwada Junagadh 1951 5,034 2,499 2,535 (GUJARAT) 1961 Declassified
1971 V.P. 15,62 6,672 3,286 ,3,386
462 Lansdowne Garhwal '1901 3,943 +2,338 +59.29
3,264 679 Cantonment (UTTAR PR4DESH) 1911 6,281 5,132 1,149
d921 5,070 '-1,211 -19.28 4,080 990 1931 4,399 -671 -B.23 3,322 1,077 1941 r6,174 + 1,775 +40.35 5,093 1,081 1951 . 4,419 1-1,755 -28.43 3,263 1,156 1961 Cantt. 6.09 6,3S1 +1,962 +44.'40 , 4,759 1,622
I' 1971 Cantt. 6.(}9 6,670 +289 +4.53 4,675 1,995
463 Narayangarh Mandsaur 1951 5,014 ,.J-624 +12.45
2,574 2,440 (MADHYA PRADESH) 1961 M. 0.31 5,638 2,887 2,751
1971 M. 0.31 6,669 + 1,031 + 18.29 3.416 3,253
46~ Ramkris}Jnunl1~ar Ii Cachar 1911 (ASSAM)
\1.10 6,657 3,368 3,289
465 Chal<ulia , Singhbhum 1971 (BIHAR)
7.50 6,646 3,703 2,~43
%6 Mandleshwar urban Khargone 1951 .0.73
5,094 +387 +7.60
2,6)9 2,475 agglomeratiOn (MADHY~ PRADESH) 1961 5,481 3,000 2,481
1971 0.82 6,645 + 1,164 +21.24 3,568 3,077 5,094 '. '
102,475 (i) Mandleshwar 1951 +387 +7.60'
k 2,619
{~~l M. 0.73 5,481 3.000 2,481 M. 0.73 6,501 t l ,020 +18.61 3,485 3,016
(ii) Mandleshwar 1971 0.09 Kasba (Nayapura)
1'14 83 ", ·61
(O.G.) " 'I
467 Mandasa Srikakulam 1941 6,300 -6ij -9.73
2,976 3,324 (ANDHRA PRADESH) 1951 5,687 2,726 2,961 1961 P. 6.16 6,233 +546 +9.60 !l 3,023 3,210 1971, P. 6.17 6,628 4395 +6.34 3,206 3,422
468 Rahon Jullundur 1901 8,651 -2,359 -27.27
4,569 4,082 (PUNJAB) 1911 6,292 3,437 2,855 1921 5,947 -345 -5.48 3,207 2,740 ~931 6,692 +745 + 12.53 3,640 3,052 1941 8,065 +1,373 +2Q.52 4,326 3,/39 1951 6,541, \ -1,524 -18.90 .:1,400 3,141 1961 M.e. 5.18 6,316 -225 -3.44 3,345 2,971 1971 M.C. 5.1 8 6,607 +291 .+4.6! 3,520 3,087 ,I'
469' Hindustan Cables Burdwun 1971 N.M. 3.'90 6,605 3,727 2,878 Town (WEST BENGAL) ,
470 Kunhan CPipri) Nagpur 1971 4.92 6,600 . 3,600 3,001) (MAHARASHTRA)
471 'Nate Ratnagiri 1951 2'1'.'2(;
5,668 + 10.8i
2,461 3,207 (MAHARASHTRA) 1961 6,281 +613 2,760 3.521 1971 21.26 6,599 +318 +5.06 2,887 3,712
472 Panupakkal11 North Arcot 1931 5,681 +9.~j
2,847 2,834 {TAMIL NADU} 1941 6,245 +564 3,172 3,073 1951 5,050 -1,195 -19.14 2,514 2,536 1961 P. 3.62 5,370 +320 +6,.34 2,731 2,639 1~71 P. 5.71 6,589 +1,219 +22.70 3,376 3,213
473 Dakshinjlzapardaha Howrah 1971 N.M. 4.30 6,581 3,495 3,086 (WEST BENGAL)
474 Jadl/gora Singhbhum 1971 9:79 6,558 3,646 2,912 (BlHAR) ,.
475 Yiiathikulant Tirunelveli 1951 3,158 " 1,603 1,555 (TAMIL NADU) 1961 P. 21.63 3,951 +793 +25.ii 1,957 1,994 1971 P. 16.41 6,558 +2,607 +65.98 3,269 3,289
476 Ranapur urb~n Jhabua 1961 0.18 5,320 + 1,2j~
2,727 2,593 agglomeratIon (MADHYA PRADESH) 1971 4.93 6,556 +23.ij 3,389 3,167 , (i) ·Ranapur' 1961 G.P. 0.18 5,320
+778 5,727 2,593 1971 N.M. 4.89 6,098 + 14.6i ,143 2,955
(ii) Ambakua (O.G.) '" 1971 0.04 458 246 212
477 Dindori urbaIj Mandla )971 II. 55 6,553 3,390 '3,163 agglomeratIon I (MADHYA PRADESH)
(i) Dindori 1971 N.M. 8.22 5,928 3,071 .2,857
(ii) Soobkhar 1971 3.33 625 319 306 Malgujllri CO.G.)
478 Valli ~asik 1971 34.97 ?,548 3,268 3,280 ,
CM AHARASHTRA)
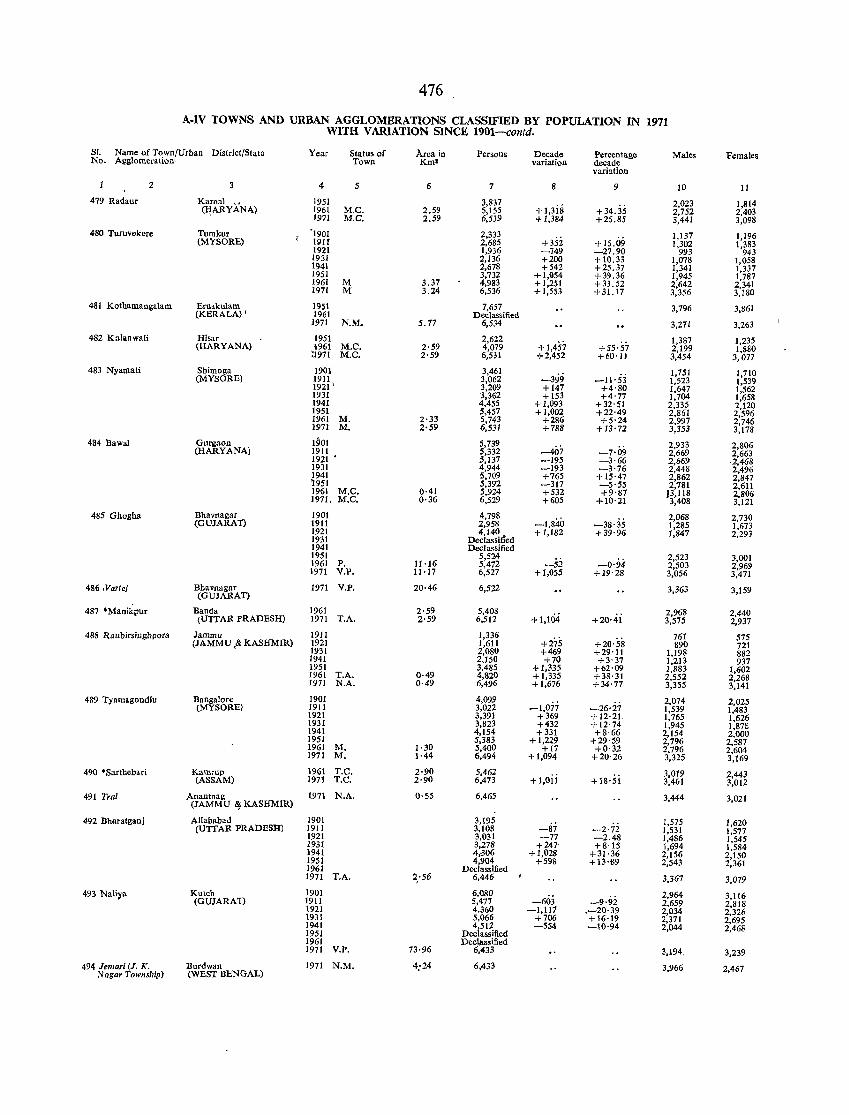
476
A-IV TOWNS AND URBAN AGGLOMERATIONS CLASSIFIED BY POPULATION IN 1971 WITH VARIATION SINCE 1901-contd.
Sf. Name of Town/Urban District/State Year Status of Area in Persons Decade Percentage Males Females No. Agglomeration' Town Km l variation decade variation
2 3 4 5 6 7 8 9 10 11 479 Radaur Kamal 1951 3,837
+1,3is + 34.35 2,023 1,814 ~ARYANA) 1961 M.C. 2.59 5,155 2,752 2,403
1971 M.e. 2.59 6,539 +1,384 +26.85 3,441 3,098
480 Turuvekere Tumkur '1901 2,333 +352 + 15.09
1,137 1,196 (MYSORE) 11IIf 2,685 1,302 1,383
1921 1,936 -749 -27.90 993 943 1931 2,136 +200 + 10.33 1,078 1,058 1941 2,678 +542 +25.37 1,341 1,337 1951 3,732 +1,054 +39.36 1,945 1,787 1961 M 3.37 4,983 +1,251 +33.52 2,642 2,341 1971 M 3.24 6,536 + 1,553 +31.17 3,356 3,180
481 Kothamangalam Ernakulam 1951 7,657 3,796 3,861 (KERALA) , 1961 Declassified 1971 N.M. 5.77 6,534 3,271 3,263
482 Kalanwali Hisar 1951 2,622 +1,457 +55'57
1,387 1,235 (HARYANA) -1961 M.C. 2·59 4,079 2,199 1,880
:1971 M.e. 2·59 6,531 +2,452 +60'11 3,454 3,077
483 Nyamati Shimoga 1901 3,461 -399 1,751 1,710
(MYSORE) 1911 3,062 -11'53 1,523 1,539 1921 \ 3,209 +147 +4'80 1,647 1,562 1931 3,362 + 153 +4'77 1,704 1,658 1941 4,455 +1,093 +32'51 2,335 2,120 1951 5,457 +1,002 +22'49 2,861 2,596 1961 M. 2·33 5,743 +286 +5'24 2,997 2,746 1971 M. 2·59 6,531 +788 +13'72 3,353 3,[78
484 BawaJ Gurgaon 1901 5,739 -407
2,933 2,806 (HARYANA) 1911 5,332 -7·09 2,669 2,663 1921 • 5,137 -195 -3,66 2,669 ·2,468
1931 4,944 -193 -3'76 2,448 2,496 1941 5,709 +765 +15'47 2,862 2,847 ~951 5,392 -317 -5'55 2,781 2,611 1961 M.C. 0·41 5,924 +532 +9'87 13,118 2,806 1971, M.C. 0·36 6,529 +605 +10'21 3,408 3,121
485 Ghogha Bhavnagar 1901 4,798 -1,840 -38·35
2,068 2,730 (GUJARAT) 1911 2,958 1,285 1,673
1921 4,140 + 1,182 +39·96 1,847 2,293 1931 Declassified 1941 Declassified 1951 5,524
-52 2,523 3,001 1961 P. 11·16 5,472 -0'94 2,503 2,969 1971 V.P. 11·17 6,527 +1,055 + 19'28 3,056 3,471
486,Vaylej Bhavnagar (GUJARAT)
1971 V.P. 20·46 6,522 3,363 3,159
487 ·Manikpur Banda 1961 2·59 5,408 + I,Hi4 +20·.ii
2,968 2,440 (UTTAR PRADESH) 1971 T.A. 2·59 6,51Z 3,575 2,937
488 Ranbirsinghpora Jammu 1911 1,336 +20'58
761 575 (JAMMU ,& KASHMIR) 1921 1,611 +275 890 721
1931 2,080 +469 +29'11 1.198 882 1941 2,150 +70 +3'37 1,213 937 1951 3,485 +1,335 +62'09 1,883 1,602 1961 T.A. 0·49 4,820 + 1,335 +38·31 2,552 2,268 1971 N.A. 0·49 6,496 +1,676 +34'77 3,355 3,141
489 Tyamagondlu Bangalore 1901 4,099 -1,071
2,074 2,025 (MYSORE) 1911 3,022 -26,27 1,539 1,483
1921 3,391 +369 +12·21. 1,765 1,626 1931 3,823 +432 + 12·74 1,945 1,87£ 1941 4,154 +331 +8·66 2,154 2,000 1951 5,383 +1,229 +29'59 2,796 2,587 1961 M. 1'30 5,400 +17 +0·32 2.796 2,604 1971 M. 1·44 6,494 +1,094 +20'26 3,325 3,169
490 ·Sarthebari Kamrup 1961 T.C. 2·90 5,462 +l,oii
3,019 2,443 (ASSAM) 1971 T.C. 2·90 6,473 +18'51 3,461 3,012
491 Tral Anantnag (JAMMU lj: KASHMIR)
1971 N.A. 0·55 6,465 3,444 3,021
492 Bharatganj Allahahad 1901 3,195 -87 1,575 1,620
(UTTAR PRADESH) 19JJ 3,108 -2·72 1,531 1,577 1921 3,031 -77 -2.48 1,486 1,545 1931 3,278 +241- +8·15 1,694 1,584 1941 4,.306 +1,028 +31·36 2,156 2,150 1951 4,904 +598 +13·69 2,543 2,361 1961 Declassified 1971 T.A. 2:56 6,446 3,367 3,079
493 Nali)'a Kutch 1901 6,080 -60:i -9'9i
2,964 3,116 (GUJARA1) 1911 5,477 2,659 2,818 1921 4,360 -1,117 .-20·39 2,034 2,326
1931 5,066 +706 +16·19 2,371 2,695 1941 4,512 -554 -10·94 2,044 2,468 1951 Declassified 1961 Declassified 1971 V.P. 73'96 6,433 3,194. 3,239
494 Jel1l(lri (J. K. Burdwan 1971 N.M. 4:24 6,433 3,966 2,467 Nagar Township) (WEST BENGAL)
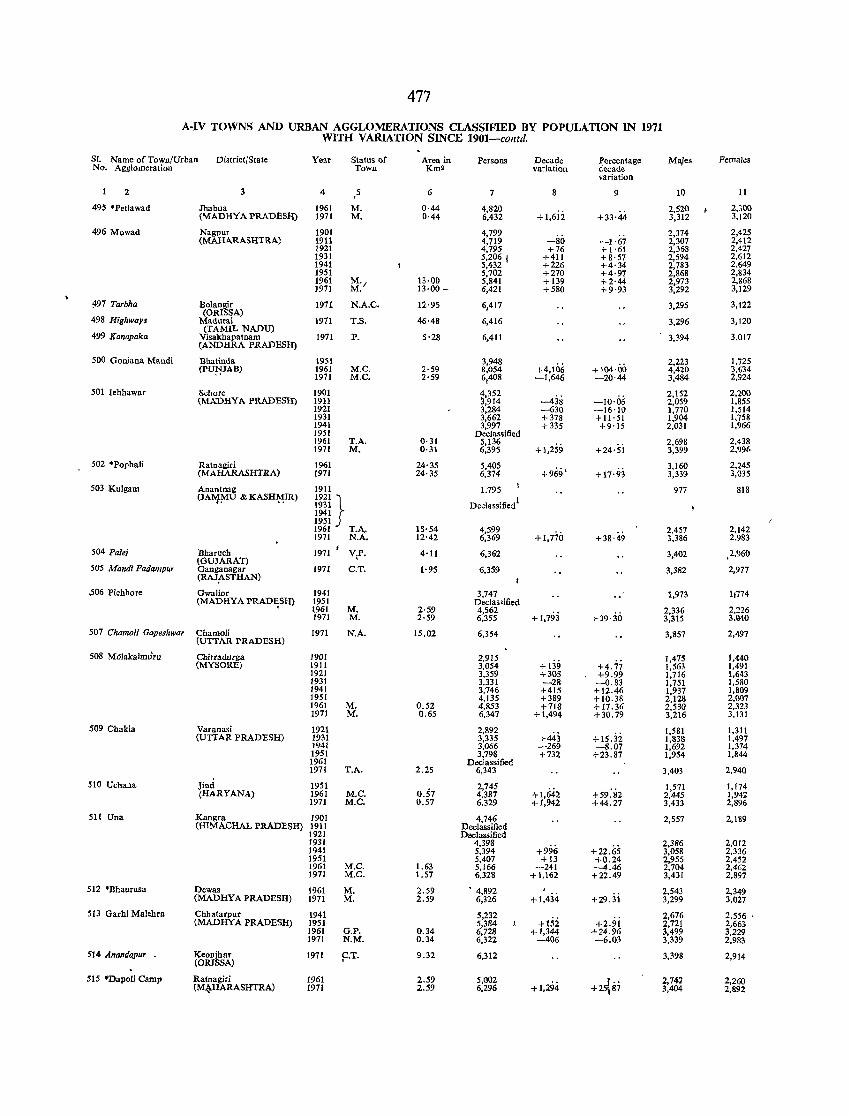
477
A·IV TOWNS AND URBAN AGGLOMERATIONS CLASSIFIED BY POPULATION IN 1971 WITH VARIATION SINCE 1901-contd.
S1. Name of Town/Urban District{State Year Status of Area in Persons Decade Percentage MaJes Females No. Agglomeration Town Km2 variation decade
variation
2 3 4 5 . 6 7 8 9 10 11
495 .Petlawad Jhabua 1961 M. 0·44 4,820 +I,6ii +33·44
2,$20 2,300 (MADHYA PRADESli) 1971 M. 0·44 6,432 3,312 3,120
496 Mowad Nagpur 1901 4,799 -1·67
2,374 2,425 (MAHARASHTRA) 1911 4,719 -80 2,307 2,412
1921 4,795 +76 +1'61 2,368 2,427 1931 5,206 I +411 +8'57 2,594 2,612 1941 5,432 +226 +4·34 2,783 2,649 1951 5,702 +270 +4·97 2,868 2,834 1961 M' I 13·00 5,841 +139 +2·44 2,973 2,868 1971 M. 13·00 - 6,421 +580 +9·93 3,292 3,129
497 Tarbha llolangir 1971 N.A.C. 12·95 61417 3,295 3,122
(ORISSA) 498 Highways Madurai 1971 T.S. 46·48 6,416 3,296 3,120
499 Kanapaka (TAMIL NADU)
3,017 Visakhapatnam 1971 P. 5'28 6,411 3,394 (ANDHRA PRADESli)
500 Goniana Mandi Bhatinda 1951 3,948 +4,106 +104·00
2,223 1,725 (PUNJAB) 1961 M.e. 2·59 8,054 4,420 3,634
1971 M.C. 2'59 6,408 -1,646 -20·44 3,484 2,924
501 lehhawar Sehore 1901 4,352 -431i -10·06
2,152 2,200 (MADHYA PRADESl!) 1911 3,914 2,059 1,855
1921 3,284 -630 -16'10 1,770 1,514 1931 3,662 +378 +11·51 1,904 1,758 1941 3,997 +335 +9'15 2,031 1,966 1951 Declas.ified 1961 T.A. 0·31 5,136
+1,259 +24·si 2,698 2,438
1971 M. 0·31 6,395 3,399 2,996
502 .Pophali Ratnagiri 1961 24·35 5,405 +969' + 17'93
3,160 2,245 (MAHARASHTRA) 1971 24·35 6,374 3,339 3,035
503 Kulgam Anantnag 1911 1.795 977 818 (JA~!V1U & KASH¥IR) 1921l
Dedassifiedl 1931 1941 1951 j
15'54 4,599 2,142 1961 T.<\. +1,770 +38·49
2,457 1971 N.A. 12·42 6,369 3,386 2.983
504 Pale; Bharuch 1971 V,P. 4'11 6,362 3,402 ,2,960 (GUJARAT)
505 Mana; Paaampu, Ganganagar 1971 C.T. 1'95 6,359 3,382 2,977 (RAJ;\-STHAN)
S06 Pichhore Gwalior 1941 3,747 1,973 11774 (MADRY A PRAD~SlI) 1951 Declas,jfied
1961 M. 2·59 4,562 2,336 2,226 1971 M. 2·59 6,355 + 1,793 + 39·30 3,315 3.040
507 Chamoli Gopeshwar Chamoli 1971 N.A. 15.02 6,354 3,857 2,497 (UTTAR PRADESH)
508 M61akalmu'ru Cbitradurga 1901 2,915 + 139 +4.77
1,475 1,440 (MYSORE) 1911 3,054 1,563 1,491
1921 3,359 +305 +9.99 1,716 1,643 1931 3,331 -28 -0.83 1,751 1,580 1941 3,146 +415 +12.46 1,937 1,809 1951 4,135 +389 +10.38 2,128 2,007 1961 M. 0.52 4,853 +718 +17.36 2,530 2,323 1971 M. 0.65 6,347 +1,494 +30.79 3,216 3,131
509 Chakia Varanasi 1921 2,892 +443 +15.32
1,581 1,311 (UTTAR PRADESH) 1931 3,335 1,838 1,497
1941 3,066 -269 -8.07 1,692 1,374 1951 3,798 +732 +23.87 1,954 1,844 1961 Declassified 1971 T.A. 2.25 6,343 3,403 2,940
510 Uehaua Jiud 1951 0.57
2,745 +1,642
1,571 1,174 (HARYANA) 1961 M.C. 4,387 +59.82 2,445 1,942
1971 M.C. 0.57 6,329 +1,942 +44.27 3,433 2,896
511 Una Kangra 1901 4,746 2,557 2,189 (HIMACHAL PRADESH) 1911 Declassified
1921 Declassified 1931 4,398
+996 2,386 2,012
1941 5,394 +22.65 3,058 2,336 1951 5,407 +13 +0.24 2,955 2,452 1961 M.e. 1.63 5,166 -241 -4.46 2,704 2,462 1971 M.e. 1.57 6,328 + 1,162 +22.49 3,431 2,897
512 'Bhaurasa Dewas 1961 M. 2.59 • 4,892 +1,434 +29.3i
2,543 2,349 (MADHYA PRADESH) 1971 M. 2.59 6,326 3,299 3,027
513 Garhi Malchra Chhatarpur 1941 5,232 +152 +2.9i
2,676 2,556 , (MADHYA PRADESH) 1951 5,384 2,721 2,663
1961 G.P. 0.34 6,728 +1,344 +24.96 3,499 3,229 1971 N.M. 0.34 6,322 -406 -6.03 3,339 2,983
514 Anandapur Keonjhar 1971 9·T• 9.32 6,312 3,398 2,914 (ORISSA)
51S .Dapoli Camp Ratnagiri 1961 2.59 5,002 +1,294 +2~li7 2,74. 2,260
(M~RASHTRA) 1971 2.59 6,296 3,404 2,892
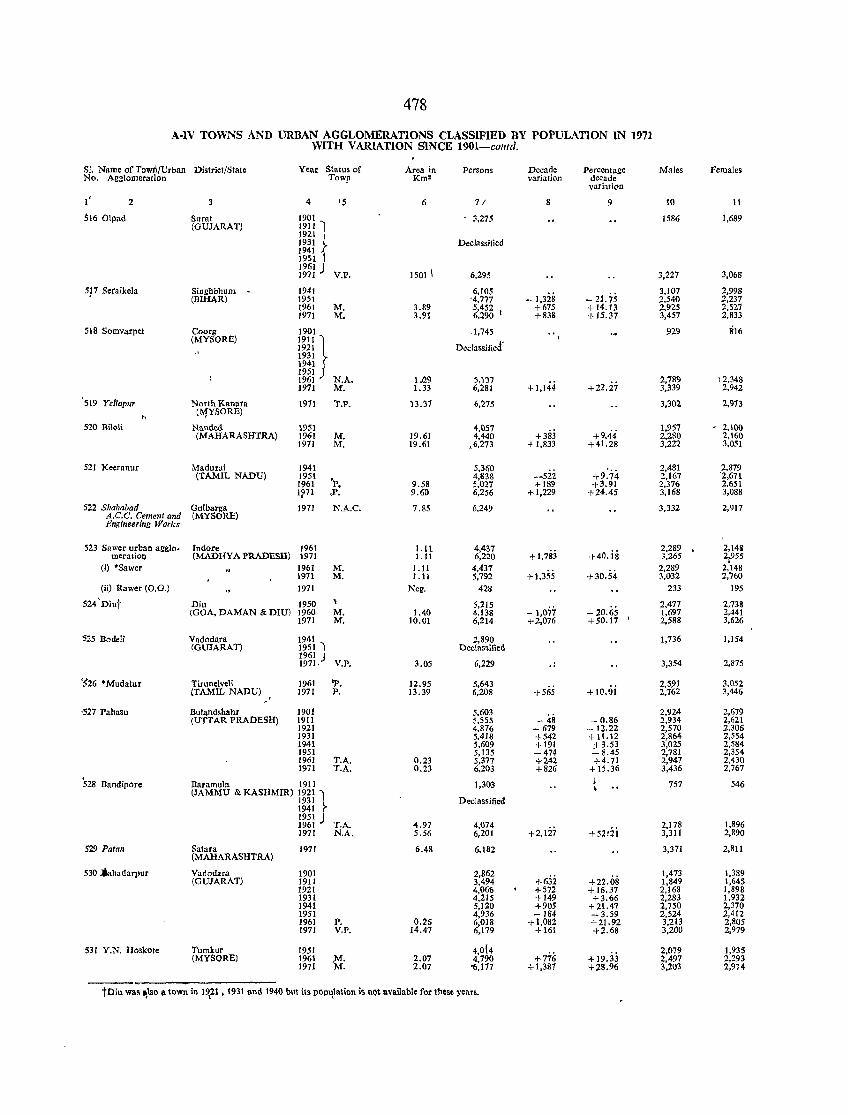
478
A-1V TOWNS AND URBAN AGGLOMERATIONS CLASSIFIED BY POPULATION IN 1971 WITH V ARlATION SINCE 1901-CO/ltd.
SI. Name of Tawil/Urban District/State Year Status of Area in Persons Decade Percentage Males Females No. Agglomeration Tow.fl Km 2 varjation decade
variation
l' 2 4 IS 6 71 8 9 10 11
5160lpad Surat 1901 1 3,275 1586 1,689 (GUJARATJ 1911
1921 1931 } Declassified 1941 ! )951 1961 J
V.P. 1501 I 6,295 3,227 3,068 1971
SF Setaikela Siogbbhum - 1941 6,105 - 1,32S - 21. 75
3.107 2,998 (BIHAR) 1951 '4,777 2.540 2,237
1961 M. 3.89 5,452 t +675 +14.13 2,925 2,521 1971 M. 3.91 6,290 +838 + 15.37 3,457 2,833
sis Somvarpet Coorg 1901 .1,745 929 816 (MYSORE)
1911 1 Declassified' 1921 1931 1941 1951 )
N.A. 1.129 5,137 2,789 ; 2,348 1961 +1,144 +22.27 1971 M. 1.33 6,281 3,339 2.942
'519 Ye/lapur North Kanuta \971 '1'.1'. 13.37 6,275 3,302 2,973
h (~YSOREJ
520 Biloli Nande(\ 1951 4,057 +3Sj +9.44
1,957 - 2.1M (MAHARASHTRA) 1961 M. 19.61 4,440 2,280 2,160
1971 M. 19.61 .6,273 + 1,833 +41.28 3,222 3,051
521 Keeranur Madurai 1941 5,360 +9:74-
2,481 2,879 (TAMIL NADU) 1951
'po 4,838 -522 2,167 '2,671
1961 9.58 5,027 +189 +3.91 2,376 2.651 1?71 .P. 9.60 6,256 +1,229 +24.45 3,168 3,088
522 Shahabad Gulbarga 1971 N.A.C. 7.85 6,249 3,332 2,917 A.C.C. Cement and (MYSORE) Engineering Works
523 Sawer urban aggIo. Indore 1961 Lit 4,437 +1,783 +40. is 2,289 2,14S
meratioQ (MADlIY A PRADESH) 1971 1.11 6,220 3,265 2,955 (i) 'Sawer 1961 M. 1.11 4,437
+1,355 +30.54 2.289 2:148
1971 M. 1.11 5,792 3,032 2,760 (ii) Rawer (O.G.) 1971 Neg. 428 233 195
524'Diut Diu 1950 ,
5,215 2,477 2-73& (GOA, DAMAN & DIU) 1960 M. 1.40 4.138 - 1,0;; - 20.65
I 1,697 2.441
1971 M. 10.01 6.214 +2,076 +50.17 2,588 3,626
525 Bodell Vadodara 1941 2,890 1,736 1,154 (GUJARAT) 1951 "I Declassified
ml J V.P. 3.05 6,229 .. 3,354 2,875
~26 "Mudalur Tirunelveli 1961 'P. 12.95 5,643 +565
2.591 3.052 (TAMIL NADU) 1971 P. 13.39 6,208 + 10.01 2,762 3,446 .
~
'527 Pabnsu Bulandshahr 1901 5,603 - 48
2.924 2,679 (UTTAR PRADESH) 1911 5,555 - 0.86 2,934 2,621
1921 4,876 - 679 -12.22 2,570 2.306 1931 5,418 +542 + 11.12 2,864 2,554 1941 5,609 +191 ;!-3.53 3,025 2,584 1951 5,135 -474 -8.45 2,781 2,354 1961 T.A. 0.23 5,377 +242 +4.71 2,947 2.430 1971 T.A. 0.23 6,203 +826 + 15.36 3,436 2,767
528 Bandipore Baramula 19J1 1,303 757 546 (JAMMU & KASHMIR) 1921 ')
Declassified 1m r 1951 J
T.A. 4.97 4,074 2,178 1,896 1961 +2,1:27 + 52r2i 1971 N.A. 5.56 6,201 3,311 2,890
529 Patan Satara 1971 6.48 6,182 3,371 2,811 (MAHARASllTRA)
530 .jru,adarpur Vadodara 1901 2,862 +22.08
1,473 1,389 (GUJARAT) 19J1 3,494 +632 1,849 1,645
1921 4,066 +572 +16.37 2.168 1,898 1931 4,215 +149 +3.66 2,283 1,932 1941 5,120 +905 +21.47 2,750 2,370 1951 4,936 -184 -3.59 2,524 2,412 1961 P. 0.26 6,OJ8 + 1,082 +21.92 3,213 2,805 1971 V.P. 14.47 6,179 +161 +2.68 3,200 2,979
531 Y.N. Hoskote Tumkur 1951 4,014 +776 + 19.33
2,079 1,935 (MYSORE) 1961 ,M. 2.07 4,790 2,497 2.293
1971 M. 2.07 '6,177 +1,381 +;28.96 3,203 2,914
tDiu was 1\150 a town in 1~21 • 1931 and 1940 bm its pOPl.\lalion is not IIvailable for these years.
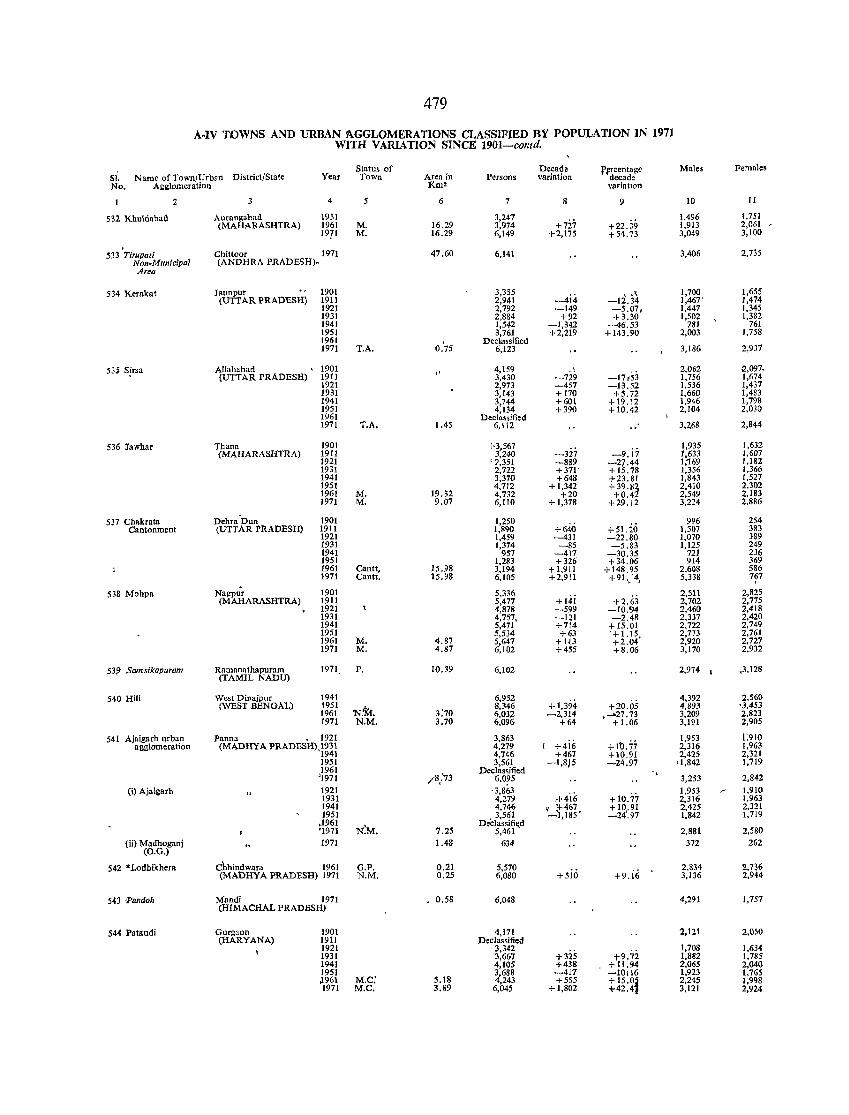
479
A-IV TOWNS AND URBAN 'l\GGLOMERATlONS CLASSIFIED BY POPULATION IN 1971 WITH V ARlATION SINCE 1901-contd.
si. Name of Town/Urban District/State Status of
Year Town No. Agglomeration
2
532 Khuldabad
533 'Tirupati Non-Municipal Area
534 Kerakat
536 !awhar
537 Chakrata Cantonment
538 Mohpa
53)} Samsikapuram
540 Hili
541 Ajaigarh urban agglomeration
(i) Ajaigath
(ii) Madhoganj (O.G.)
542 *Lodhikhera
543 Pandoh
544 Pataudi
Aurangabad (MAHA.RASHTRA)
4
1951 1961 1971
Chiltoor 1971 (ANDHRA PRADESH)-
Jaunpur t· (UTTAR PRADESH)
Allahabad (UTTAR PRADESH)
Thana (MAHARASHTRA)
Dehra'Dun (UTTAR PRADESH)
Nagpnr (MAHARASHTRA)
Ramanathapuram (fAMIL NADU)
West Dinajpur (WEST BENGAL)
1901 1911 1921 1931 1941 1951 1961 1971
1901 1911 1921 1931 1941 1951 1961 1971
1901 1911 1921 1931 1941 1951 1961 1971
1901 1911 1921 1931 1941 1951 1961 1971
1901 1911 1921 1931 1941 1951 1961 1971
1971
1941 1951 1961 1971
Panna , 1921 (MADHYA PRADESH),~m
1951
jl~n 1921 1931 1941 1951
,1961 '1971 1971
Chhindwara 1961 (MADHYA PRADESH) 1971
Mandi 1971 (HIMACHAL PRADESH)
Gurgaon (HARYANA)
1901 1911 1921 1931 1941 1951
5
M. M.
T.A.
T.A.
M. M:.
Cantt, Cant!.
M. M.
P.
N.'M. N.M.
G.P. N.M.
,1961 M.C: 1971 M.C.
Area in Km2
6
16.29 16.29
47.60
I'
1.45
19.32 9.07
15.98 15.98
4.87 4.87
10.39
7.25 1.48
0.21 0.25
0.58
5.18 3.89
Persons
7
3,247 3,974 6,149
6,141
3,355 2,941 2.792 2,884 1,542 3,761
Declassified 6,123
4,159 3,430 2,973 3,143 3,744 4,134
Declassified 6,1l2
:'3,567 3,240
, 1,351 2,722 3,370 4,712 4,732 6,llO
1,250 1,890 1,459 1,374
957 1,283 3,194 6,105
5,336 5,477 4,878 4,757, 5.471 5,534 5,647 6,102
6,102
6,952 8,346 6,032 6,096
3,863 4,279 4,746 3,561
Declas<ified 6.095
'3,863 4,279 4,746 3.561
Declassifi~d 5,461
634
5,570 6,080
6,048
4,171 Declassified
3,342 3,667 4,105 3,688 4,243
6,045
Decade variation
8
+7i; +2,175
-4i.i -149
+92 -1,342 +2,219
-7i9 -457 +170 +60\ +390
-327 -889 +371' +648
+1,342 +20
+ 1,378
+640 -431 -85
-417 +326
+1,911 +2,911
+141 -599 -121 +714 +63
+113 +455
+1.394 -2,314
+64
I +416 +467
-1,815
rt-4iiJ " ;+-467 -1,185'
+5io
+325 +438 -417 +555
+ 1,802
l',ercentage decade variatIon
9
+22.39 + 54.73
, .< -12.34 -5.07, +3.30
-46.53 + 143.90
-17153 -13.52 +5.72
+ \9.12 +10.42
-9.17 -27.44 +15.78 +23.81 +39.87. +0.42'
+29.12
+51.20 -22.80 -5.83
-30.35 +34.06
+148.95 +91.)4,
+2.63 -10.'94 -2.48 + 15.01 '+1.15, +2.04 +8.06
+20.05 ...... 27.73
+1.06
+ 1'0.77 +10.91 -24.97
+ 10.77 +10.91 -24'.97
+9.ili
i-9.'i2 + 11.94 -10116 + 15.0~ .... 42.41
Males
10
1,496 1.913 3,049
3,406
1,700 1,467' 1,447 1,502
781 2,003
3,186
2,062 1,756 1,536 1,660 1,946 2,104
3,2.68
1,935 1,633 1;169 1,356 1,843 2,410 2,549 3,224
996 1,507 1,070 1,125
721 914
2,608 5,338
2,511 .2,702 2,460 2,337 2,722 2,773 2,920 3.170
2,974 I
4,392 4,893 3,209 3,191
1,953 2,316 2,425
,1,842
3,253 1,953 2,316 2,425 1,842
2,881 372
2,834 3,136
4,291
2,121
1,708 1.882 2,065 1,923 2,245 3,121
Females
II
1,751 2,061 / 3,100
2,735
1,655 1,474 1,345 1,382
761 1.758
2,937
12,097. 1,674 1,437 1,483 1,798 2,030
2,844
1,632 1,607 1,182 1,366 1,527 2,302 2,183 2,886
254 383 389 249 236 369 586 7F
2,825 2,775 2.418 2,420 2,749 2,761 2,727 2,932
,3,128
2,560 '3,453 2,823 2,905
1~910 1.963 2,321 1,719
2,842 1,910 1,963 2,321 1.719
2,580 262
2.,7~6 2,944
1,757
2,050
1,634 1,785 2,040 1,765 1,998 2,924
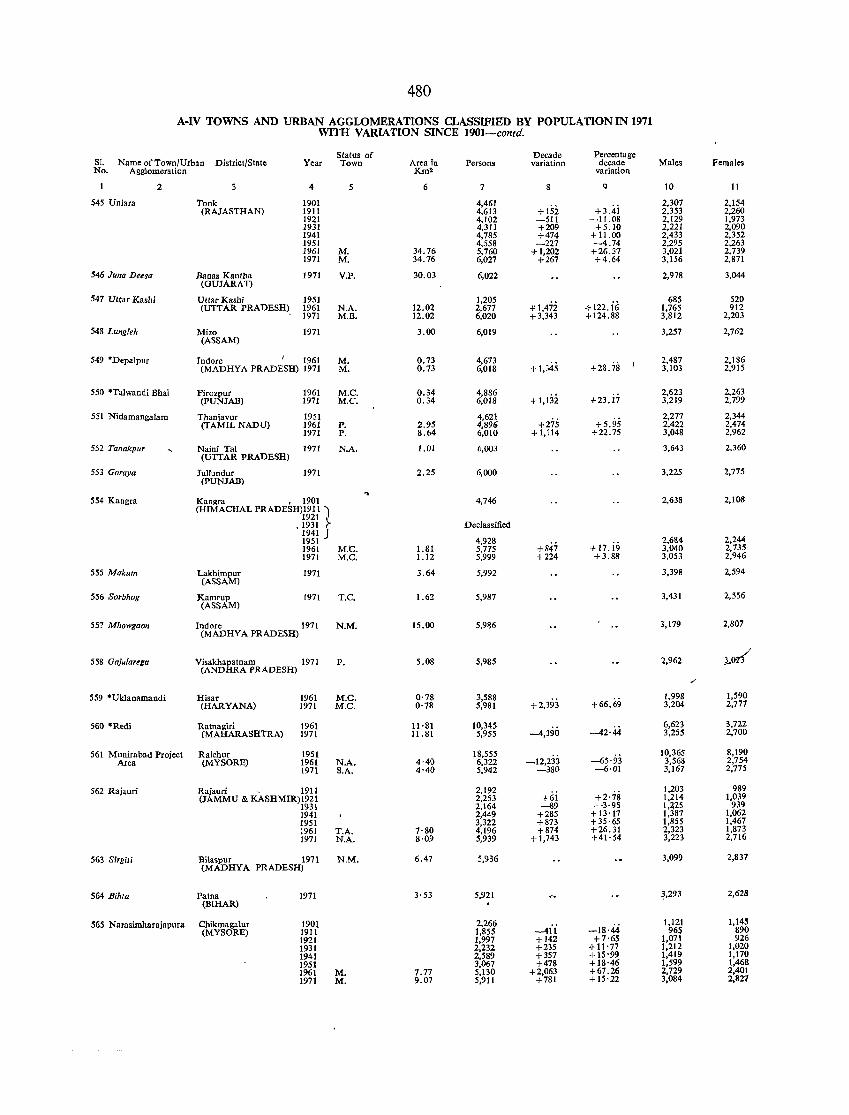
480
A-IV TOWNS AND URBAN AGGLOMERATIONS CLASSIFIED BY POPULATION IN 1971 WITH VARIATION SINCE 1901-contd.
SI. Status of Decade Percentage
Name of Town/Urban District/State Year Town Area in Persons variation deeaae Males Females No. Agglomeration Km2 variation
2 4 5 6 7 I) 10 II
545 Uniara Tonk 1901 4,461 +3.4i
2,307 2,154 (RAJASTHAN) 1911 4.613 +152 2,353 2,260
1921 4,102 -511 -11.08 2.129 1,973 1931 4,311 +209 +5.10 2,221 2,090 1941 4,785 +474 + 11.00 2,433 2,352 1951 4,558 -227 -4.74 2,295 2,263 1961 M. 34.76 5,760 +1,202 +26.37 3,021 2,739 1971 M. 34.76 6,027 +267 +4.64 3,156 2,871
546 Juna Deesa Banas Kantha 1971 V.P. 30.03 6,022 2,978 3,044 (GUJARAT)
547 Uttar Kash; Uttar Kash; 1951 1,205 -1'1,472 +122. iii
685 520 (UTTAR PRADESH). 1961 N.A. 12.02 2,677 1,765 912
1971 M.B. 12.02 6,020 +3,343 +124.88 3,812 2,203
548 Lungleh Mizo 1971 3.00 6,019 3,257 2,762 (ASSAM)
549 *Depalpur Indore 1961 M. 0.73 4,673 + 1,345 +28.78
2,487 2,186 (MADHYA PRADESH) 1971 M. 0.73 6,018 3,103 2,915
550 *Talwandi Bhai Firozpur 1961 M.C. 0.34 4,886 +1,13i +23.ii
2,623 2,263 (PUNJAB) 1971 M.e. 0.34 6,018 3,219 2,799
551 Nidamangalam Thanjavur 1951 4,621 +275 +5.9.5
2,277 2,344 (TAMIL NADU) 1961 P. 2.95 4,89' 2,422 2,474
1971 P. 8.64 6,010 +1,114 +22.75 3,048 2,962
552 Tanakpur Nain; Tal 1971 N.A. 1.01 6,003 3,643 2,360 (UTTAR PRADESH)
551 Goraya Jullundur 1971 2.25 6,000 3,225 2,775 (PUNJAB)
554 Kangra Kangra , 1901 4,746 2,638 2,108 (HIMACHAL PRADESH)mi ')
.1931 }- Declassified 1941 J
4,928 2,684 2,244 1951 +847 +17. i9 1961 M.e. 1.81 5,775 3,040 2,735
1971 M.e. 1.12 5,999 +224 +3.88 3,053 2,946
555 Makum Lakhimpur 1971 3.64 5.992 3,39B 2,594 (ASSAM)
556 Sorbhog Kamrup (ASSAM)
1971 T.C. 1.62 5,987 3,431 2,556
557 Mhowgaon Indore (MADHYA PRADESH)
1971 N.M. 15.00 5,9~6 3,179 2,807
558 Gaju/a"ga Visakhapatnam 1971 P. 5.08 5,985 2,962 J.oz{ (ANDHRA PRADESH)
,-
559 *Uklanamandi Hisar 1961 M.e. 0·78 3,588 +2,393 +66.69
1,998 1,590 (HARYANA) 1971 M.e. 0'78 5,981 3,204 2,777
560 ·Redi Ratnagiri 1961 11·81 10,345 -4,390 -42'44
6,623 3,722 (MAHARASHTRA) 1971 11.81 5,955 3,255 2,700
561 Munirabad Proiect Raichur 1951 18,555 -65·93
10,365 8,190 Area (MYSORE) 1961 N.A. 4·40 6,322 -12,233 3,568 2,754
1971 S.A. 4·40 5,942 -380 -6·01 3,167 2,775
562 Rajauri Rajauri , 1911 2,192 +2'78
1,203 989 (JAMMU & KASHMIR)~~~~ 2,253 +61 1,214 1,039
2,164 -89 -3,95 1,425 939 1941 2,449 +285 + 13'17 1,387 1,062 1951 3,322 +873 +35·65 1,855 1,467 1961 T.A. 7·80 4,196 +874 +26.31 2,323 1,873 1971 N.A. 8·09 5,939 + 1,743 +41·54 3,223 2,716
563 Sirgit; llilaspur 1971 N.M. 6.47 5,936 3,099 2,831 (MADHYA PRADESH)
564 Bihta Patna 1971 3·53 5,921 ~,293 2,628 (BIHAR)
565 Narasinaharajapura Chikmaga!ur 1901 2,266 -18·44
1,121 1,145 (MYSORE) 1911 1,855 -411 965 890
1921 1,997 +142 +7·65 1,071 926 1931 2,232 +235 + 11·77 1,212 1,020 1941 2,589 +357 + 15'99 1,419 1,170 1951 3,067 +478 +18'46 1,599 1,468 1961 M. 7.77 5,130 +2,063 +67.26 2,729 2,401 1971 M. 9.07 5,911 +781 +15'22 3,084 2,821
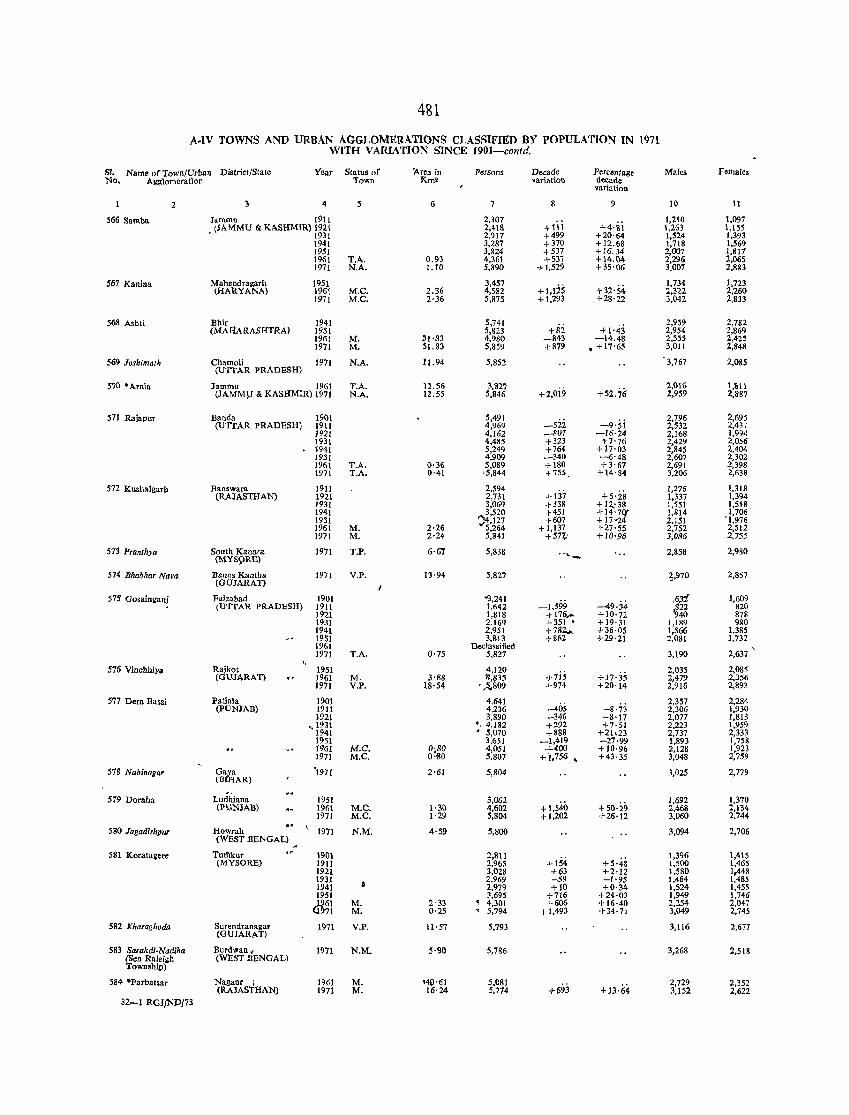
481
A.IV TOWNS AND URBAN AGGLOMERATIONS CLASSIFIED BY POPULATION IN 1971 WITH VARIATION SINCE 1901-contd.
SI. Name of Town/Urban District/State No. Agglomeration
Year Status of Town
2
566 Samba
561 Kaninn
56S Ashti
569 Joshimath
57D "Arnia
571 Rajapur
572 KWlhalgarh
573 Pranthya
574 Bhabhar Nava
57S Gosainganj
576 Vinchhiya
577 Dera Bassi
578 Nabinagar
519 Doraba
580 JagadishplIr
SSI Koratagere
5S2 Kharaghoda
S83 Sarakdi-Nadiha (Sell Raleigb Township)
584 'Parbatsar
32-1 RGJjND/73
3 4
Jammu 1911 (JAMMU & KASHMIR) 1921
• 1931 1941 1951 1961 1971
Mahendragarh 1951 (HARYANA) 1961
Bbir (MAFlARASffTRA)
Cbamoli (UTTAR PRADESm
1971
1941 19S( 1961 1971
1971
T.A. N.A.
M.C. M.C.
M. M.
N.A.
Jammu 1961 T.A. (JAMMV & KASHMIR) 1971 N.A.
Banda (UTTAR PRADESH)
Banswara (RAJASTHAN)
Soutb Kanara (MYS9RE)
Banas Kantha CGUJARAn
Faizabad (UTT All. PRADESH)
Rajko! (GUJARAT)
Patia1a (PUNJAB)
Gaya (BtRAR)
'" Ludhiana (PUNJAB)
Howrah (WEST BENGAL)
Tufllkur (MYSORE)
Surendranagar (GUJARAn
Burdwan" (W:EST BENGAL)
Nagaur l (RAJASTHAN)
1901 1911 19Z1 1931
• 1941 19S1 1961 1971
1911 1921 1931 1941 1951 1961 1971
1971
1971
1901 1911 1921 1931 1941 1951 1961 1971
1951 1961 1971
1901 1911 1921
.,1931 1941 1951 1961 1971
'1971
1951 1961 1971
1971
1901 1911 1921 1931 1941 1951 1961
<.t~71
T.A. T.A.
M. M.
T.P.
V.P.
T.A.
M. V.P.
M.C. M.C.
M.e. M.C.
N.M.
M. M.
1971 V.P.
1971 N.M.
1961 1971
M. M.
J\.rea in Km'
6
0.93 1.10
2.36 2·36
SI'83 51.S3
11.94
12.5& 12.55
0·36 0·41
2·26 2·24
6·67
13·94
0·75
3·88 IS'54
g~g
2·61
1·3D 1·29
4·59
2·33 0·25
11'57
5·90
'40'61 16'24
Persons
7
2,307 2,41& 2,917 3,287 3,824 4,361 5,890
3,457 4.582 5,875
5,741 5,823 4,980 5,859
5,852
3,821 5,846
5,491 4,969 4,162 4,485 5,249 4,909 5,089 '5,844
2,594 2,731 3,069 3,520
')4,127 5,264 5,841
5,838
5,827
"3,241 1,642 1,818 2,169 2,951 3,813
Declassified 5,827
4,120 11,835
• ,S,.S09
4,641 4,236 3,890 '< 4,182
• 5,070 3,651 4,051 5,807
5,804
3,Q62 4,602 5,804
5,800
2,811 2,965 3,028 2,969 2,979 3,695
~ 4,301 • 5,794
5,793
5,786
5,081 5,774
De.oade variation
8
+111 +499 +370 +537 +537
+1,529
+I,J25 +1,293
+82 _843 +879
+2,oi9
_522 _807 +323 +764 _340 +180 +755.
+137 +338 +451 +607
+1,137 +577.1
-1,599 +176 .... +351 ' +782..+862
+715 +974
-405 -346 +292 +888
_1,419 +400
+ 1,756 ..
+1,540 +1,202
+154 +63 -59 +10
+716 +606
+1,493
Percentage decade variation
9
+4·si +20'64 +12.68 +16.34 +14.04 +35'06
+32'54-+28'22
+ 1'43 -14.48
• + 17'65
+52.76
-9·!;i -16'24
+7'76 +17'03 -6'48 +3'67
+14'84
+5'28 +12.;38 +14'7(}' +17 .. 24 +27'55 +10'96
-49·34 +10·72 +19'31 +36'05 +29'21
+J7'35 +20'14
-8·73 -8'17 +7·51
+21.23 -27·99 +10·96 +43·35
+50·29 +26·12
+5'48 +2·12 -1'95 +0·34
+24·03 +16·40 +34·71
+13·64
Males
10
1,210 1,263 1,524 1,718 2,007 2,296 3,007
1,734 2,322 3,042
2,959 2,954 2,555 3,011
3,767
2,016 2,959
2,796 2,532 2,168 2,429 2,845 2,607 2,691 3,206
1,276 1,337 1,551 1,814 2,151 2,752 3,DS6
2,858
~,970
,g '9~~
1,189 1,566 2,081
3,190
2,035 2,479 2,916
2,357 2,306 2,077 2,223 2,737 1,893 2,128 3,048
3,025
1,692 2,468 3,060
3,094
1,396 1,500 1,580 1,484 1,524 1,949 2,254 3,049
3,116
3,268
2,729 3,152
II
1,097 1,155 1,393 1,569 1,811 2,065 2,8g3
1,723 2,260 2,833
2,782 2,869 2,425 2,848
l,OS5
1,1511 2,887
2,695 2,43, 1,994 2,056 2,404 2,302 2,398 2,638
1,318 1,394 1,518 1,706'
'1.976 2,512 2,755
2,980
2,857
1,609 820 878 980
1,385 1.732
2,637
2,085 2,356 2,893
2,2S4 1,930 1,813 1,959 2,333 1,758 1,923 2,759
2,779
1,370 2,134 2.744
2,706
1,415 1,465 1.,448 1,485 1,455 1,746 2,047 2,745
2,677
2,518
2,352 2,622
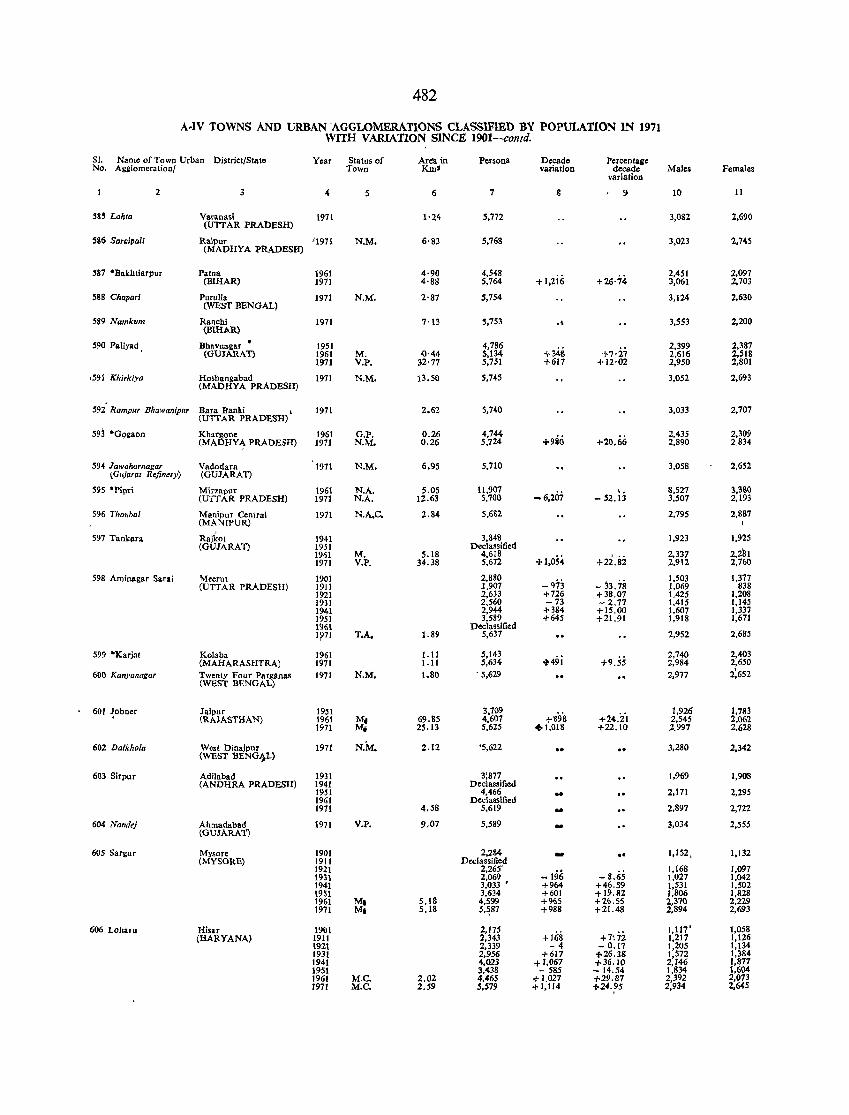
482
A·IV TOWNS AND URBAN"AGGLOMERATlONS CLASSlFlEI> BY POPULATION IN 1971 WITH VARIATION SINCE 1901--collld.
SI. Name of Town Urban District/State Year Status of Are'a in Persons Decade Percentage No. Agglomeration/ Town KmS variation decade Males Females
variation
2 3 4 5 6 7 g ~ 10 11
58~ Lohta Varanasi 1971 (UTr AR PRADESH)
1'24 5,772 3,082 2,690
586 SarQipa/i Raipur 11911 N.M, (MADRY A PRADESH)
6'83 5,768 3,023 2,745
587 'Dakhtiarpur Patna 1961 4'90 4,548 +I,zii; +26'74
2,451 2,091 (BIHAR) 1971 4'88 5,764 3,061 2,703
588 Chapar; PuruHa 1971 N.M. (WEST BENGAL)
2'87 5,754 3,124 2,630
589 Namkum Ranchi 1971 7'13 (BIHAR)
5,753 .. 3,553 2.200
590 PaHyad, Bhavnagar 1951 4,786 +348 +7'27
2,399 2,387 (GUJARAT) 1961 M. (l·44 5,134 2,616 2,518
1971 V.P. 32'77 5,751 +617 +12'02 2,950 2,801
,591 Khirkiya Hoshangabad 1971 N.M. 13.50 5,745 3,052 2,693 (MADHYA PRADESH)
592 Rampur Bhawanipur Bara Danki , 1971 2.62 5,740 3,033 2,707 (UTTAR PRADESH)
593 *G9l:aOn Khargone 1961 G.P. 0.26 4,744 +9aO +20.66
2,435 2,309 (MADHY~ PRADESH) 1971 N.M. 0.26 5,724 2,890 2.834
594 J awaharnagar Vadodara 1971 N.M, 6.95 5,710 3,058 2,652 \Gujarat Rtfinery) (GUJARAT)
595 ·Pillri Mirzapur 1961 N.A. 5.05 11,907 .. 6,207 " 8,527 3,380
(UTTAR PRADESH) 1971 N.A. 12.63 5,700 - 52.13 3,507 2,193
596 Thollbal Manipur Central 1911 N.A.C. 2.84 5,682 2,795 2,881 (MANrpUR)
597 Taru:ara Rajkol 194-1 3,848 1,923 1,925 (GUIARAT) 1951 Declassified
2,2~1 1961 M. S.18 4,618 +1,054 +2:U2
2,337 1971 V.P. 34.38 5,672 2,912 2,760
598 Aminagar Sarli Meerut 1901 2,880 - 973 - 33.78
1,503 1,377 (UTTAR PRADESH) 1911 1,907 1,069 838
1921 2,633 +726 +38.07 1,425 1,208 1931 2,560 -73 - 2.77 1.415 1,145 1941 2,944 +384 +15.00 1.607 1,337 1951 3,589 +645 +21.91 1,918 1,671 1961 Declassified 1?71 T.A. 1.89 5,637 t,952 2,685
599 ·Karjat Kolaba 1961 1.11 5,143 +49i +9.55
2,740 2,403 (MAHARASHTRA) 1971 1.11 5,634 2,984 2.650
600 Kanyanagar Twenty Four Parganas (WEST BENGAL)
1971 N.M. 1.80 . 5,629 2,977 2:652
601 ~obner Jaipur 1951 3,709 +898 +24.21
1,926 1,783 (RAlASTHAN) 1961 M. 69.85 4.607 2,545 2,062
1971 M. 25.13 5,625 +1,018 +22.10 :2.997 2,628
602 Dalkhola West Dinajpur 1971 N.M. (WEST BENG4L)
2.12 '5,622 .. 3,280 2,342
603 Sirpur Adilabad 1931 3:877 1,969 1,908 (ANDHRA PRADESH) 1941 Declassified
1951 4,466 .. 2,171 2,295 1961 Declassified 1971 4.58 5,619 ... 2,897 2,722
604 Nandtj Ahmadabad 1971 V.P. 9.07 5,589 .. 3,034 2,555 (GUJARAT)
605 Sargur Mysore 1901 2,284 .. .. 1,152, 1,132 (MYSORE) 1911 Declassified
1921 2,265' -196 - 8.65
1,168 1,097 1931 2,069 1,027 1,042 1941 3,033 • +964 +46.59 1,531 1,502 1951 3,634 +601 +19.82 1,806 1,828 1961 :Me 5.18 4,599 +965 +26.55 2,370 2,229 1971 :Me S.18 5,~87 +988 +21.48 2,894 2,693
606 Lohuu IIi.lr 1901 2,175 +168 +7~7i
1,117' 1,058 (HARYANA) 1911 2,343 1,217 1,126
1921 2,339 -4 - 0.17 1,205 1,134 1931 2,956 +617 +25.38 1,572 1,384 1941 4,023 +1,067 +36.10 2,146 1,877 1951 3,438 - 585 -14.54 1,834 1,604 1961 M.e. 2.02 4,465 +1,027 +29.87 2,392 2,073 1971 M.e. 2.59 5,579 +1,114 +24.?5 2,934 2,645
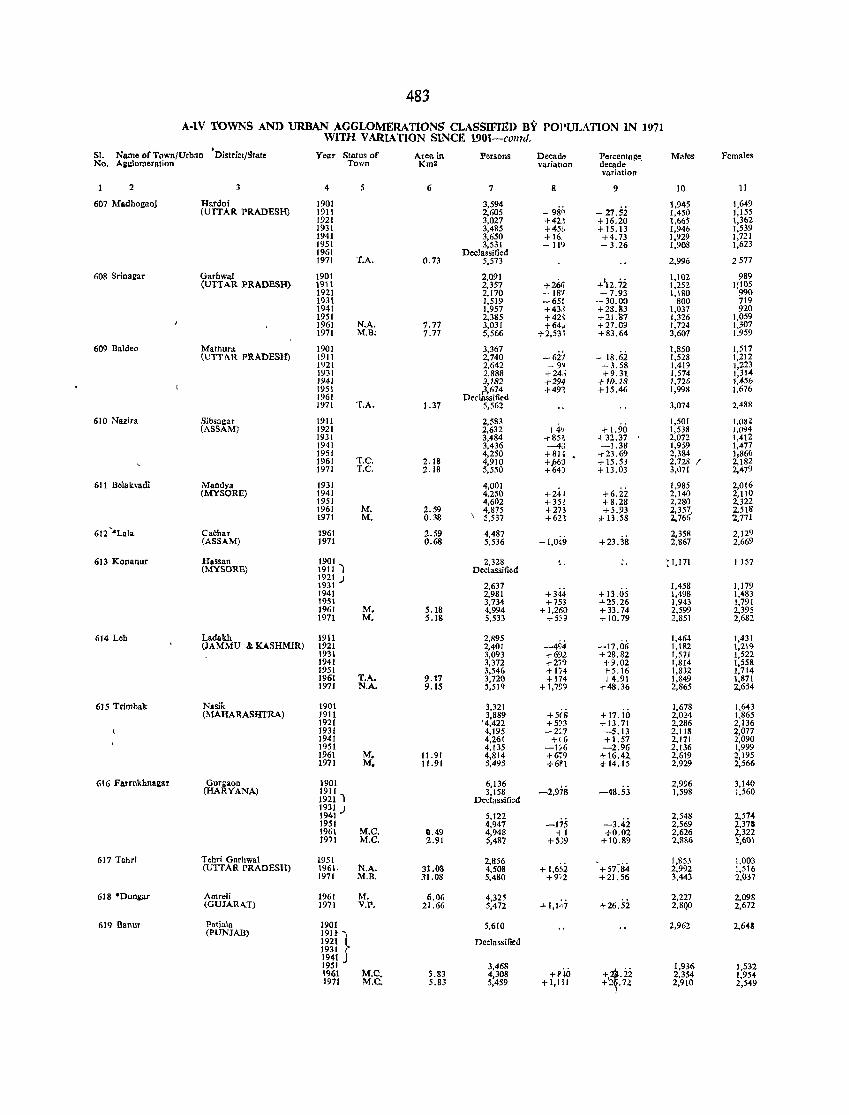
483
A·lV TOWNS AND URBAN AGGLOMERATIONS CLASSIFIED BY POI'UJ .. ATION IN 1971 WITH VARIA TlON SINCE 1901-col11d . .
Females Sl. Name of Town/Urb~n District/State Year Status of Area in Persons Decade Percentage. Males No. AlIlllorneration Town Km2 variat]on decade
variation
2 4 6 7 8 9 10 11
607 Madhognnj Hardoi 1901 3,594 - 98<\ - 27.52
1,945 1,649 (UTTAR PRADESH) 1911 2,605 1,450 1,155
1921 3,027 + 42.! +16.20 1,665 1,362 1931 3,485 + 45t, + 15.13 1,946 1,539 1941 3,650 +16. +4.73 1,929 1,721 1951 3,531 -111) - 3.26 1,908 1,623 1961 Decl a,sified 1971 T.A. 0.73 5,573 2,996 2577
608 Srinagar Garhwru 1901 2,091 +26r, +'12.72
1,102 989 (UTTAR PRADESH) 1911 2,357 1,252 lr~ 1921 2,170 - 18'1 -7.93 1,180
1931 1,519 -65: - 30.00 800 719 1941 1,957 +43,j +28.ll3 1,037 920 1951 2,385 +42~ +21.87 1,326 1,059 1961 N.A. 1.77 3,031 +64~ +27.09 1,724 1,307 1971 M.B; 1.77 5,566 +2,53; +83.64 3,607 1,959
609 Baldeo Mathura 1901 3,367 -627 - 18.i;i
1,850 1,517 (UTTA.R PRADESH) 1911 2,740 1,528 1,212
1921 2,642 - 9~ - 3.58 1,419 1,223 1931 2,888 +24,; +9.31 1,574 1,314 1941 3,182 +294 +10.28 1,726 1,456 1951 ,3,674 +49'. +15.46 1,998 1,676 1961 Declassified 1971 T.A. 1.31 5,562 3,074 2,488
610 Nazira Sibsagar 1911 2,583 + 1.90
1,501 1.082 (ASSAM) 1921 2,632 +41.,1 1,538 1,094
1931 3,484 +85~ +32.37 2,072 1,412 1941 3.436 -4;] -1.38 1,959 1,477 1951 4,250 +8U +23.69 2,384 1}866 1961 T.e. 2.18 4,910 +!i60 +15.53 2,728 / 2,182 1971 T.C. 2.18 5,550 +64) + 13.03 3,07! 2,479
611 Belakvadi Mandya 1931 4,001 +24) +6.ii
1,985 2,016 (MYSORE) 1941 4,250 2,140 2,110
1951 4,602 +35! +8.28 2,280 2,322 1961 M. 2.59 4,875 +273 +5.93 2,357, 2,518 1971 M. 0.38 \ 5,537 +62! ;;I- 13.58 2,766 2,771
612 '-Lal" Cachar 1961 2.59 4,487 + 1,049 +23.38
2,358 2,129 (ASSAM) 1971 0.68 5,536 2,867 2,669
613 Konanur Hassan 1901 2,328 . .. ; !,l71 I 157 (MYSORB) 1911 ') Declassified
m~) 2,637 +344 + 13.05
1,458 1,179 1941 2,981 1,498 1,483 1951 3,734 +753 +25.26 1,943 1,791 1961 M. 5.18 4,994 + 1,260 +33.74 2,599 2,395 1971 M. 5.18 5,533 +5,} +10.79 2,851 2,682
614 Lob Ladakh 1911 2,895 -494
1,464 1,431 (JAMMU &. KASHMIR) 1921 2,401 -17.01i 1,182 1,219
1931 3,093 +691 +28.82 1,571 1,522 1941 3,372 +2')9 +9.02 1,814 1,558 1951 3,546 + 1i4 +5.16 1,832 1,714 1961 T.A. 9.17 3,720 +174 +4.91 1,849 1,871 1971 N.A. 9.15 5,519 + 1,799 +48.36 2,865 2,654
615 TriOlbak Nasik 1901 3.321 1,678 1,643 (MAHARASHTRA) 1911 3,889 +5(8 +17.10 2,024 1,865
1921 '4,422 +5~3 +13.71 2,286 2,136 1931 4,195 -2:7 -5.13 2,11S 2,077 1941 4,261 +!6 +1.57 2,171 2,090 1951 4,135 -1~6 -2.96 2,136 1,999 1961 M. 11.91 4,814 +679 + 16.42. 2,619 2,195 1971 M. 11.91 5,495 +6P1 i- 14. 15 2,929 2,566
616 Farrnkhnlliar Gurg:1on 1901 6,136 -2,978 -48.53
2,996 3,140 (HARYANA) 1911 3,158 1,598 1,560
1921 1 Declassified
~~l~ J 5,122 -175
2,548 2,57-4 J951 4,947 -3.42 2,569 2,373 1961 M.e. '.49 4,948 ~ 1 +0.02 2,626 2,322 t971 M.e, 2.91 5,487 +5;9 + 10. 89 2,886 2.601
617 Tehri Tehri Garhwal 1951 2,856 + 1,6;2 +57:84
1,853 1,003 (UTTAR PRADE.SH) 1961. N.A. 31.08 4,508 2,992 1,516
1971 M.B. 31.08 5,480 +9"'2 +21.56 3,443 2,037
618 ·Dun&ar AOlreli 1961 M. 6.06 4,325 +1,147 + 26,Si
2.227 2,098 (GUJARAT) 1971 V.P. 21.66 5,472 2,8QO 2,672
619 Banur Patinla 1901 5,610 2,962 2,641 (PUNJAB) 1911' 1 1921 Declassified
1931 1941 J
3,468 1,936 1,532 1951 Hio 1961 M.e. 5.83 4,308 +~.22 2,354 1,954
1971 M.e, 5.83 5,459 +1,151 +'2.72 2,910 2,549
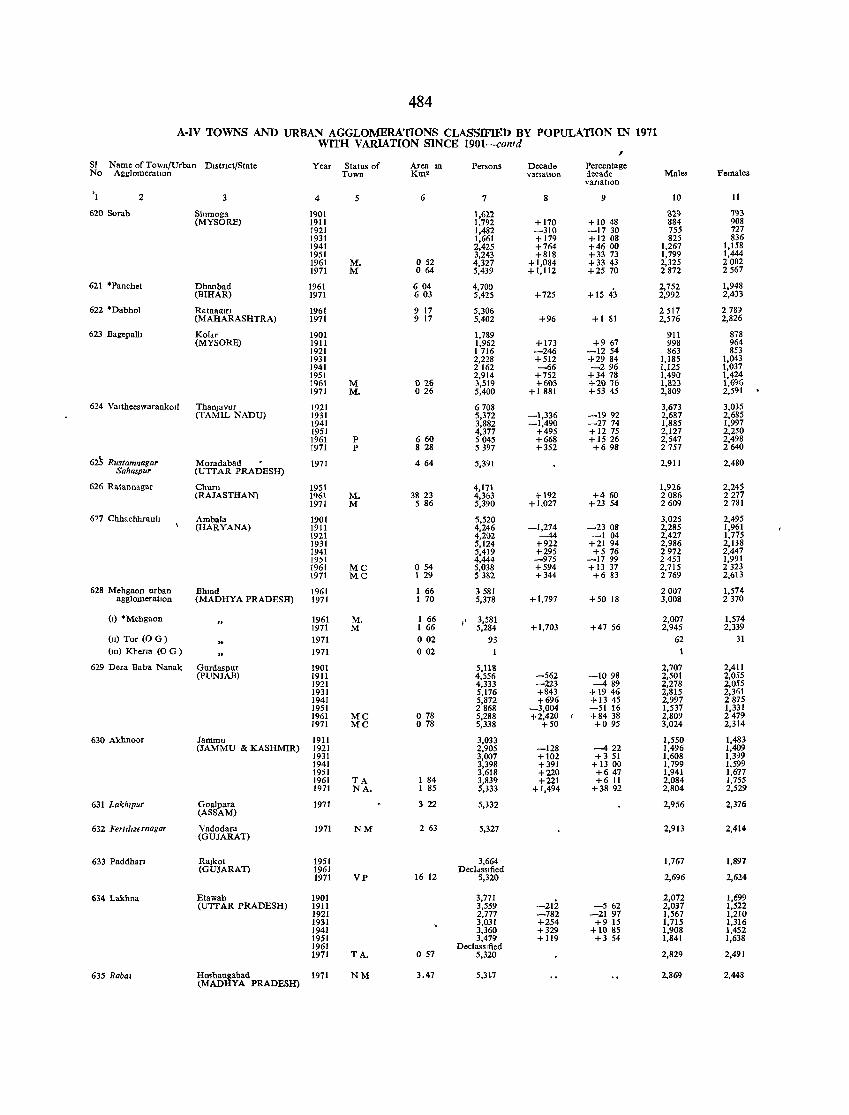
484
A-IV TOWNS AND URBAN AGGLOMERATIONS CLASSIFlElJ BY POPULATION IN 1971 WITH VARIATION SINCE 1901--contd ,
SI Name of Town/Urban DIstrIct/State Year Status of Area III Persons Decade Percentage No AgglomeratIOn Town Km" vartatiOn decade Males Females
vaT1atlOn
'I 2 3 4 5 6 7 8 9 10 11
620 Sorab Shlmoga 1901 1,622 829 793 (MYSORE) 1911 1,792 +170 + 1048 884 908
1921 1,482 -310 -1730 755 727 1931 1,661 + 179 +1208 825 836 1941 2,425 +764 +4600 1,267 1,158 1951 3,243 +818 +33 73 1,799 1,444 1961 M. 052 4,327 +1,084 +33 43 2,325 2002 1971 M 064 5,439 +1,112 +25 70 2872 2567
621 *Panchet Dbanbad 1961 604 4,700 +15 43
2,752 1,948 (BIHAR) 1971 603 5,425 +725 2,992 2,433
622 *Dabhol Ratnaqm 1961 9 17 5,306 2517 2 78~ (MAHARASHTRA) 1971 9 17 5,402 +96 +181 2,576 2,826
623 Bagepall! Kol~r 1901 1,789 911 878 (MYSORE) 1911 1,962 +173 +967 998 964
1921 1716 -246 -1254 863 853 1931 2,228 +512 +2984 1,185 1,043 1941 2162 -66 -296 1,125 1,037 1951 2,914 +752 +3478 1,490 1,424 1961 M I) 26 3,519 +605 +2076 1,823 1,6% 1971 M. 026 5,400 +1881 +53 45 2,809 2,591
624 Vallheeswarankod ThanJavur 1921 6708 3,673 3,035 (TAMIL NADU) 1931 5,372 -1,336 -1992 2,687 2,685
1941 3,882 -1,490 -2774 1,885 1,997 1951 4,377 +495 +1275 2,127 2,250 1961 P 660 5045 +668 +1526 2,547 2,498 1971 P 8 28 5397 +352 +698 2757 2640
625 Rustamnagar Moradabad 1971 464 5,391 2,911 2,480 Sahaspur (UTTAR PRADESH)
626 Ratannagar Chum 1951 4,171 1,926 2,245 (RAJASTHAN) 1961 M. 3823 4,363 +192 +460 2086 2277
1971 M 5 86 5,390 +1,027 +23 54 2609 2781
6'7 Chhachhrauh Ambala 1901 5.520 3,025 2,495 (HARYANA) 1911 4,246 -1,274 -2308 2,285 1,961
1921 4,202 -44 -104 2,427 1,775 1931 5,124 +922 +21 94 2,986 2,138 1941 5,419 +295 +5 76 2972 2,447 1951 4,444 -975 -1799 2453 1,991 1961 MC 054 5,038 +594 +13 37 2,715 2323 1971 MC 1 29 5382 +344 +6 83 2769 2,613
628 Mehgaon urban Bhmd 1961 1 66 3581 2007 1,574 agglomeratIon (MADHYA PRADESH) 1971 I 70 5,378 +1,797 +50 18 3,008 2370
(I) *Mehgaon 1961 M. 1 66 .' 3,581 2,007 1,574 1971 M 1 66 5,284 +1,703 +47 56 2,945 2,339
(n) Tor (0 G) 1971 002 93 62 31 (m) Khena (0 G ) 1971 002 1
629 Dera Baba Nanak Gurdaspur 1901 5,118 2,707 2,411 (pUNJAB) 1911 4,556 -562 -1098 2,501 2,055
1921 4,333 -223 -489 2,278 2,055 1931 5,176 +843 + 1946 2,815 2,361 1941 5,872 +696 +13 45 2,997 2875 1951 2868 -3,004 -5116 1,537 1,331 1961 Me 078 5,288 +2,420 +8438 2,809 2479 1971 MC 078 5,338 +50 +095 3,024 2,314
630 Akbnoor Jammu 1911 3,033 1,550 1,483 (JAMMU & KASHMIR) 1921 2,905 -128 -422 1,496 1,409
1931 3,007 +102 +351 1,608 1,399 1941 3,398 +391 + 13 00 1,799 1,599 1951 3,618 +220 +647 1,941 1,677 1961 TA 1 84 3,839 +221 +6 11 2,084 1,755 1971 NA. 1 85 5,333 +1,494 +3892 2,804 2,529
631 Lakh,pur GoaJpara (ASSAM)
1971 322 5,332 2,956 2,376
632 Fertllm rnagar Vadodara 1971 NM (GUJARAT)
2 63 5,327 2,913 2,414
633 PaddbarJ Rajkot 1951 3,664 1,767 1,897 (GUJARAT) 1961 Decldssllied
1971 VP 16 12 5,320 2,696 2,624
6341.akhna Etawah 1901 3,771 -21i
2,072 1,699 (UTI AR PRADESH) 1911 3,559 -562 2,037 1,522
1921 2,777 -782 -2197 1,567 1,210 1931 3,031 +254 +915 1,715 1,316 1941 3,360 +329 +1085 1,908 1,452 1951 3,479 +119 +3 54 1,841 1,638 1961 Declassl1ied 1971 TA. 057 5,320 2.829 2,491
635 Bahal Hoshangabad lMADHYA PRADESH)
1971 NM 3.47 5,317 2,869 2,448
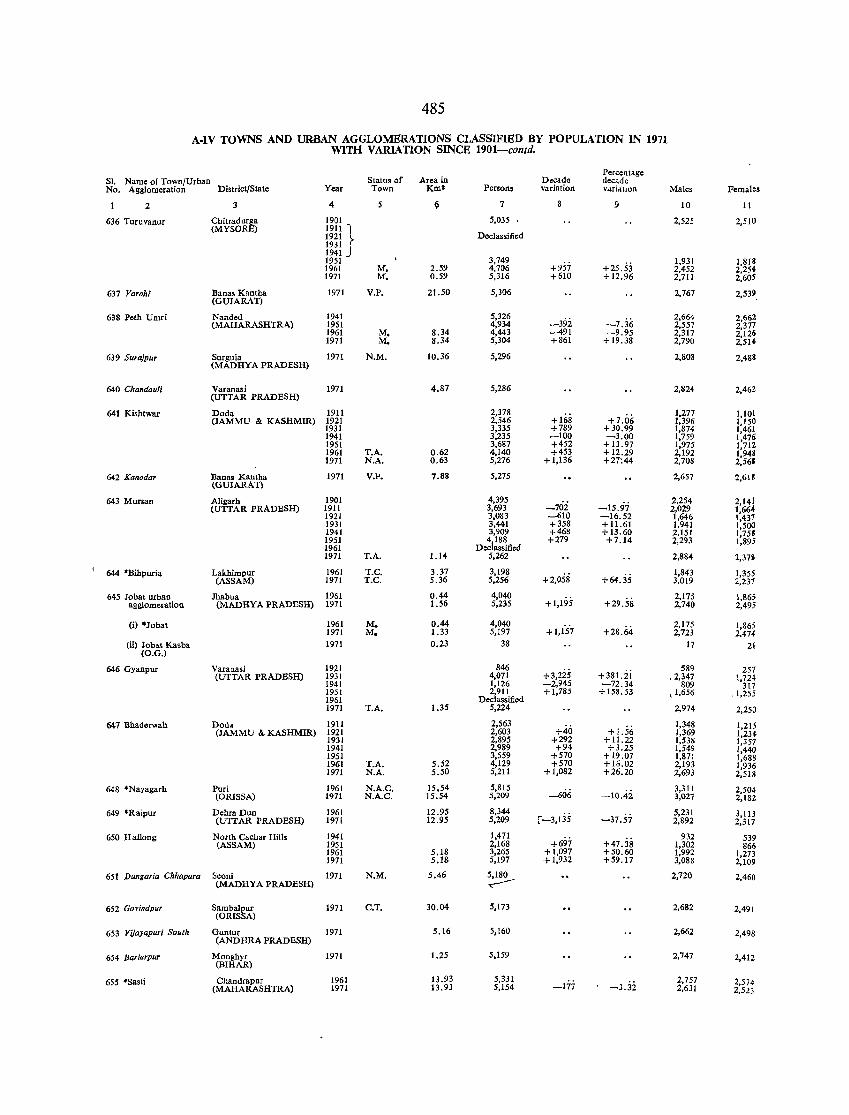
485
A.IV TOWNS AND URBAN AGGLOMERATIONS CLASSIFIED BY POPULATlON IN 1971 WITH VARIATlON SINCE 1901-contd.
Statu. of Area in Percentage
Sl. Name of Town/Urban Decade decade No. Agglomeration District/State Year Town Ktns Persons variation Yd.rid.tlOu Males Females
2 3 4 ~ 7 9 10 11
636 Turuvanur Chitradurga 1901 5,035 2,525 2,510 (MYSORE) 1911 ")
Declassified 1921 ~
~m J 1951 3,749
+957 +25.53 1,931 1,818
1961 M. 2.59 4,706 2,452 2,254 1971 M. 0.59 5,316 +610 + 12.96 2,711 2,605
637 Varahi Banas Kantha 1971 V.P. 21.50 5,306 2,767 2,539 (GUIARAT)
638 Peth Umri Nanded 1941 5,326 -39i -7.36
2,664 2,662 (MAHARASHTRA) 1951 4,934 2,557 2,377
1961 M. 8.34 4,443 --491 -9.95 2,317 2,126 1971 M. 8.34 5,304 +861 +19.38 2,790 2,514
639 Surajpur Surguia (MADHYA PRADESH)
1971 N.M. 10.36 5,296 2,808 2,48S
640 Chandauli Varanasi 1971 4.87 5,286 2,824 2,462 (UTTAR PRADESH)
641 Kishtwar Doda 1911 2,378 +168 +7.06
1,277 1,101 (JAMMU & KASHMIR) 1921 2,546 1,396 1,150
1931 3,335 +789 +30.99 1,874 1,461 1941 3,235 -100 -3.00 1,759 1,476 1951 3,687 +452 + 13.97 1,975 1,712 1961 T.A. 0.62 4,140 +453 +12.29 2,192 1,94a 1971 N.A. 0.i)3 5,276 +1,136 +2~44 2,708 2,565
642 Kanodar Bana. Kantha 1971 V.P. 7.88 5,275 2,657 2.61& (GUJARAT)
643 Mursan Aligarh 1901 4,395 -7oi -15.97
2,254 2,141 CUTI'AR PRADESH) 1911 3,693 2,029 1,664
1921 3,083 -610 -16.52 1,646 1,431 1931 3,441 +358 +11.61 1,941 1,500 1941 3,909 +468 +13.60 2,151 1,753 1951 4,188 +279 +7.14 2,293 1,895 1961 Declassified 1971 T.A. 1.14 5,262 2,884 2,3711
644 oBihpuria Lakhimpur 1961 T.C. 3.37 3,198 +2,058 +64.35
1,843 1,355 (ASSAM) 1971 T.C. 5.36 5,256 3,019 2,231
645 Jobal urban Jhabua 1961 0.44 4,040 +1,195 +29.58
2,175 1,865 agglomeration (MADHYA PRADESH) 1971 1.56 5,235 2,740 2,495
(i) -Jobal 1961 M. 0.44 4,040 +IJS'7 +28.64
2,175 1,865 1971 M. 1.33 5,197 2,723 2.474
(ii) Jobat Kasba 1971 0.23 38 17 21 (O.G.)
646 Gyanpur Varanasi 1921 846 +3,225 +381.ii
589 257 (UTTAR PRADESH) 1931 4,071 ,2,347 1,724
1941 1,126 -2,945 -72.34 809 317 1951 2,911 +1,785 +158.53 ,1,656 ,1,255 1961 Declassified 1971 T.A. 1.35 5,224 2,974 2,250
647 Bhaderwah Dod. 1911 2,563 +40 + 1.56
1,348 1,215 (JAMMU & KASHMIR) 1921 2,603 1,369 1,234
1931 2,895 +292 + 11.22 1,538 1,351 1941 2,989 +94 +3.25 1,549 [,440 1951 3,559 +570 + 19.07 1,87J 1,688 1961 T.A. 5.52 4,129 +570 +16.02 2,193 1,936 1971 N.A. 5.50 5,211 +1,082 +26.20 2,693 2,518
648 °Nayagarh Puri 1961 N.A.C. 15.54 5,815 -10.42
3,31J 2,504 (ORISSA) 1971 N.A.C. 15.54 5,209 -606 3,027 2,182
649 *Raipur DehraDun 1961 12.95 8,344 [-3,135 -37.57
5,231 3,113 (UTTAR PRADESH) 1971 12.95 5,209 2,892 2,317
650 Haflong North Cachar Hill. 1941 1,471 +697 +47,38
932 539 (ASSAM) 1951 2,168 1,302 866
1961 5.18 3,265 +1,097 +50.60 1,992 1,273 1971 5.18 5,197 +1,932 +59.17 3,088 2,109
651 Dungaria Chhapara Seoni 1971 N.M. 5.46 5,180 2,720 2,460 (MADHYA PRADESH) ..--
652 GOI';ndpur Sambalpur (ORISSA)
1971 C.T. 30.04 5,173 2,682 2,491
653 Vijayapuri South Guntur 1971 5.16 5,160 2,662 2,498 (ANDHRA PRADESH)
654 Barlarpur Monghyr (BIHAR)
1971 1.25 5,159 2,747 2,412
655 'Sasti Chandrapur 1961 13.93 5,331 -177 -3.3i
2,757 2,574 (MAHARASHl'RA) 1971 13.93 5,154 2,631 2,523
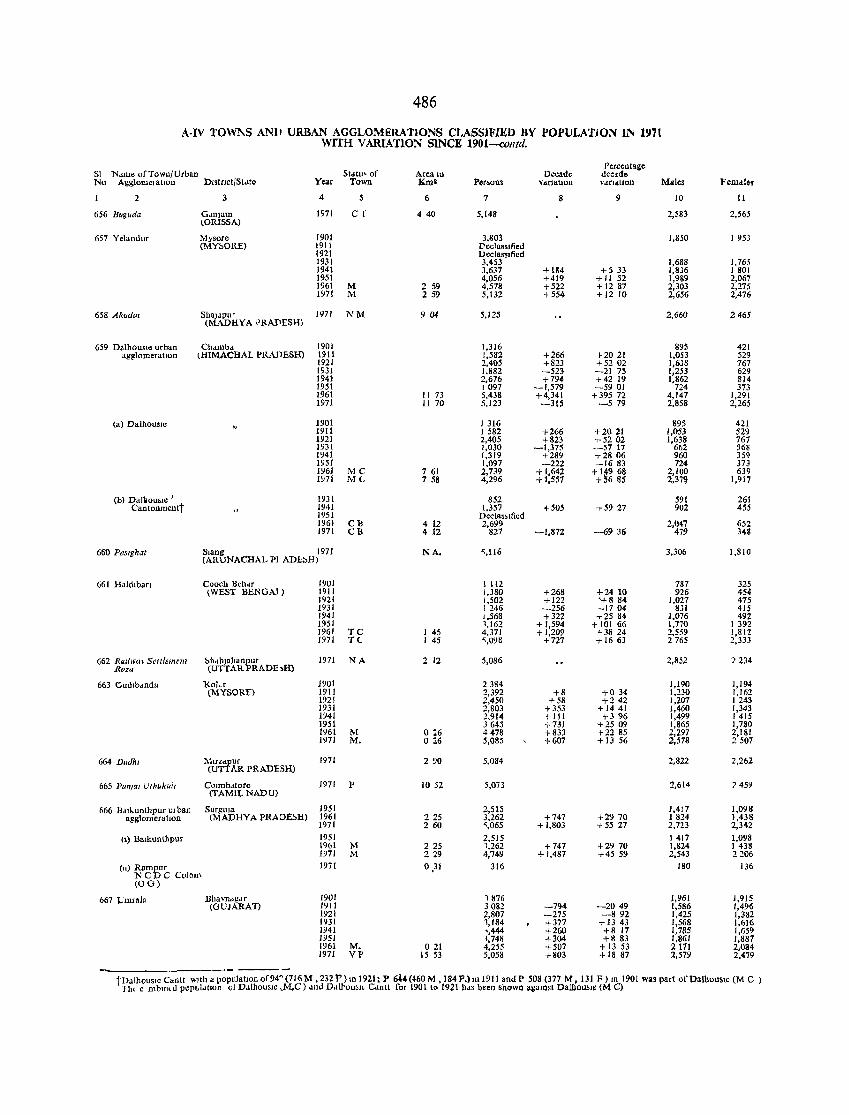
486
A·IV TOWr--S ANII URBAN AGGLOMERATIONS CLASSIFIED BY POPULATION JlI.i 1971 WITH VARIATlON SINCE 1901--<:olltd.
Ndrue of Town/Urban StdtU' of Percentage
SI Area 10 Decade decade No AggiomelatlOn Dl'tnct/Sldte Year Town Kml Persons VAriation vdrt4tlon Males Feru.de!
2 3 4 6 7 8 9 10 11
656 Buguda G.Ul)Um tORISSA)
1971 C r 4 40 5.148 2,583 2,565
657 Yelundur Mysore 1901 3,803 1,850 1 953 (MY:>ORE) 1911 DeclasSIfied
1921 DeclasSIfied 1931 3,453 1,688 1.765 1941 3,631 + 184 +533 1,836 1801 1951 4,056 +419 + 1152 1,989 2,067 1961 M 2 59 4,578 +522 +1287 2,303 2,275 1971 M 259 5,132 +554 +1210 2,656 2,476
658 Akod," ShalJPur 1971 NM 904 5,125 2,660 2465 (MADHYA PRADESH)
659 D~lhousle urban Chdmb" 1901 1,316 895 421 agg1omerallon lHIMACHAL PRADESH) 1911 1,582 +266 +2021 1,053 529
1921 2,405 +823 +5202 1,638 767 1931 1,882 -523 -2173 1,253 629 1941 2,676 +794 +4219 1,862 814 1951 1097 -1,579 -5901 724 373 1961 II 73 5,438 +4,341 +395 72 4,147 1,291 1971 11 70 5,123 -315 -579 2,858 2,265
(al DalhOUSIe 1901 J 316 895 421 1911 1582 +266 +2021 1,053 529 1921 2,405 +823 +5202 1,638 767 1931 J,030 -1,375 -5717 662 368 1941 1,319 +289 ,-2806 960 359 1951 1,097 -222 -1683 724 373 1961 MC 7 61 2,739 +1,642 +.;~~ g~ 2,100 639 1971 ML 7 58 4,296 + 1,557 2,37~ 1,917
(b) Dal~ousle I t 1931 852 591 261 Cantonment 1941 1.357 +505 .,..5927 902 455
1951 Decla."fied 1961 ell 4 12 2,699 2,047 652 1971 CB 412 827 -1,372 -6936 479 348
660 PtlslglzJ/ SIang 197J (ARUNACHAL PI AD.b~H)
NA, ~,116 3,306 1,810
661 Haldlban Cooch Behar 1901 1 112 787 325 {WEST BENGAl) 1911 1,380 +268 +2410 926 454
1921 1,502 +122 <+884 1,027 475 1931 1246 -256 -J7 04 831 415 1941 1.$68 +322 .,..2584 1,076 492 1951 1,162 +1,594 + 10! 66 1,770 1 392 196! TC 1 45 4.371 +1,209 '-3824 2,559 1,812 1971 T(' 1 45 ~,098 +727 .,.. 1663 2765 2,333
662 R",lwU} Settlement ~hdhJahanpur 1971 NA 2 12 5,086 2,852 2234 Roztl (UTTAR PRADE ,H)
663 IJudlbdndu 1<o1.r 1901 2384 1,190 1,194 (MYSORE) 1911 2,392 +8 +034 1,230 1,162
1921 2,450 +58 +242 1,207 1243 1931 2,803 +353 +1441 1,460 1,343 1941 2,914 + III +396 1,499 1415 1951 3645 +731 +2509 1,865 1,780 1961 M 026 4478 +833 t-2285 2,297 2,181 1971 M. 026 5,085 +607 +1356 2,578 2507
664 Dmllu :;"1Ir'1."r J971 (UT AR PRADESH)
290 5,084 2,822 2,262
665 Punpi Ulhukuh COImbd(ore 1971 P (TAMIL NADU)
1052 5,073 2,61 4 7459
666 B.lIl.unthpur UI ban Surgula 1951 2,515 1,417 1,098 agslomeratlOn (MADHYA PRADE~H) 1961 225 3,262 +747 +2970 1824 1,438
1971 260 \065 +1,803 +5527 2,723 2,342
(1) Balkunthpur 1951 2,515 1417 1,098 1961 M 225 1,262 +747 +2970 1,824 1 438 1971 M 229 4,749 + 1,487 +45 59 2.543 2206
(n) Rampur 1971 0,31 316 180 136 N CDC Colon' (OG)
667 JJmrala Dbavndgdr 1901 1 H76 J,961 1,915 (GUJARAT) 1911 3082 -794 -2049 1,586 1,496
1921 2,807 -275 -892 1,425 1,382 1931 1,184 +377 +13 43 1,568 1,616 1941 ',444 +2GO +8 17 1,785 1,659 1951 1,748 +304 +8 83 1.861 1,887 1961 M. 021 4,255 +507 + 13 53 2171 2,034 1971 VP 15 53 5,058 +803 +18 87 2.579 2,479
-----tDalhouslc Cantl WIth a populallOn 0[94~ (716 M ,232 F) lD 1921; P 6-\4 (460 M • 184 F.) ml91l and P 508 (377 M, 131 F) III 1901 was part of Daihoosle (M C )
J h, c rubw,,1 pop"I.Jt<on 01 D.ll.bouslc J\f,C) dnd Ddil'OU'lc Cantl for 1901 to In! hdS been snown agalOst Da~ousle (M C)
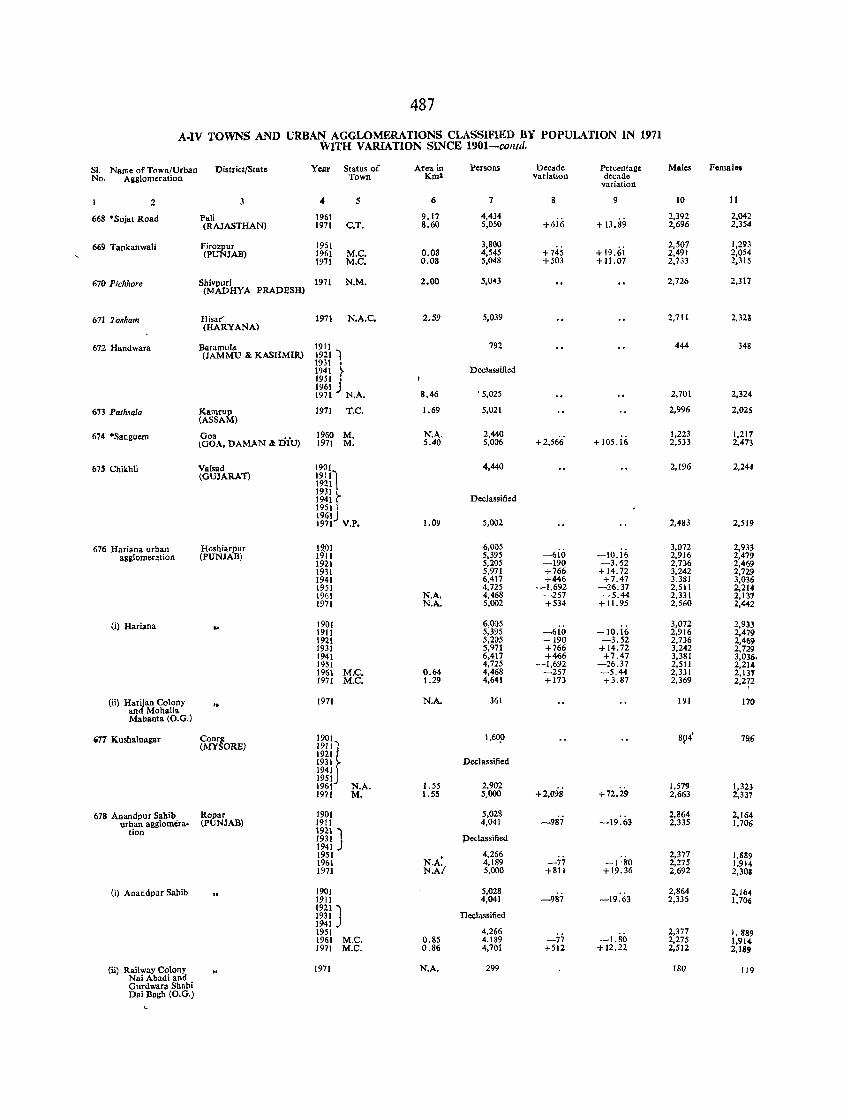
487
A-IV TOWNS AND URBAN AGGLOMERATIONS CLASSIFIED BY POPULATION IN 1971 WITH VARIATION SINCE 1901-contd.
SI. Name of Town/Urban District/State Year Status of Area in Persons Decade Percentage Males Fornal" No. Allglomeration Town KIna variation decade
variation
2 <4 5 6 7 9 10 11
668 'Sojat Road Pali 1961 9.17 4.434 +6ii; + 13.89
2.392 2,042 (RAJASTHAN) 1971 C,T. S.60 5,050 2,696 2,354
669 Tankanwali Firozpur 1951 3,SOO +19.i;i
2,507 1,293 (PUNJAB) 1961 M.C. 0.08 4,545 +745 2,491 2,054
1971 M.e. 0.08 5,048 +503 +11.07 2,733 2,315
670 Plchhore Shivpuri 1971 N.M. 2.00 5,043 2,726 2,317 (MADHYA PRADESH)
671 To.rllam Hisat' (HARYANA)
1971 N.A.C. 2.59 5,039 2,711 2.32~
672 Handwara Baramula 1911 792 444 348 (JAMMU &. KASHMIR.) 1921 ')
1931 , 1941 ~ Declassified 1951 , 1961 J
8.46 . 5,025 2,701 1971 N.A. 2,324
673 Pathsala KalOrup (ASSAM)
1971 T.C. 1.69 5,021 2,996 2,02S
674 ·Sanguem Goa t'f; 1960 M. N.A. 2,440 +2,566' + I05.i6
1,223 1,217 (GOA,OAMAN &: DIU) 1971 M. 5.40 5,006 2,533 2,473
67S Chikhli Val,ad 1901 4,440 2,196 2,244 (GUJARAT) 19111 1921
1931 r 1941 Declassified 1951 1961J
1.09 5,002 1971 V.P. 2,483 2,5a
676 Hariana urban Hoshiarpur 1,(01 6,005 -6io
3,072 2,933 agglomeration (PUNJAB) 1911 5,395 -10.16 2,916 2,479
1921 5,205 -190 -3.52 2,736 2,469 1931 5,971 +766 +14.72 3,242 2,729 1941 6,417 +446 +7.47 3.381 3,036 1951 4,725 -1,692 -26.37 2,511 2,214 1%1 N.A. 4,468 -257 -5.44 2,331 2,137 1971 N.A. 5,002 +534 + II. 95 2,560 2,442
(i) Hariana 1901 6,005 _6io -10.i6
3,072 2,933 1911 5,395 2.916 2,479 1921 5,205 -190 -3.52 2,736 2,469 1931 5,971 +766 +14.72 3,242 2,729 1941 6,417 +466 +7.47 3,381 3,036. 1951 4,725 -1.692 -26.37 2,511 2,214 1961 M.C. 0.64 4,468 -257 -5.44 2,331 2,131 1971 M.e. 1.29 4,641 +173 +3.87 2,369 2,2?2
(ii) Harijan Colony 1971 N.A. 361 IYl 170 and Mohalla Mahaota (O.G.)
677 Kushalnagar coor~ 1901 1,6op SP4' 7Q6 (MY ORE) 1911~ 1921
1931 Declassified 1941J 1951 1961 N.A. 1.55 2,902
+2,098 +72.29 1.579 1,323
1971 M. 1.55 5,000 2,663 2,337
678 Anandpur Sahib Ropar 1901 5,028 -987
2,864 2,164 urban agglomera. (PUNJAB) 1911 4,041 -19.63 2,335 1,706
tion 1921,) 1931 ) peclassified 1941 1951
N.A: 4,266
-1:80 2,377 1,889
1961 4,189 -77 2,275 1,914 1971 N.AI 5,000 +811 + 19.36 2,692 2,303
(i) Anaodpur Sahib 1901 5,028 -987 -19:63
2,864 2,164 1911 4,041 2,335 1,706 1921 ") 1931 ) Declassified 1941 1951 4,266
-77 2,377 1,889
1951 M.e. 0.85 4,189 -1.80 2,275 1,914 1971 M.e. 0.S6 4,701 +512 +12.22 2,512 2,189
(ii) Railway Colony 1971 N.A. 299 180 119 Nai Abadi and Gurdwara Shahi Oai Bash (O.G.)
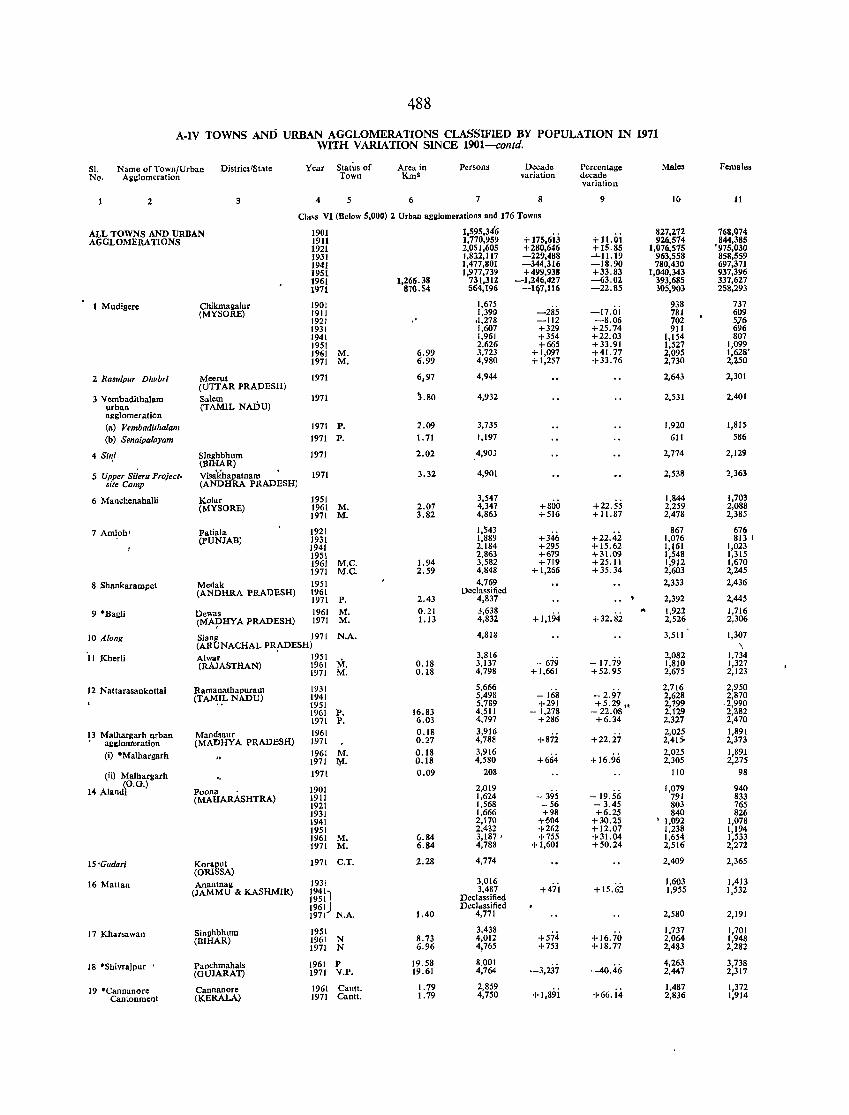
488
A-IV TOWNS AND URBAN AGGLOMERATIONS CLASSIFIED BY POPULATION IN 1971 WITH VARIATION SINCE 1901-contd.
SI. Name of Town/Urban District/State Year Status of Area in Persons Decade Percentage Males Feluale. No. Agslomeration Town Ktu2 variation decade
variation
2 3 4 6 7 8 9 10· 11
CIa.s VI (BeJow 5,000) 2 Urban agglomerations and 176 Towns
ALL TOWNS AND URBAN 1901 1,595,346 + 175,6ij +l1.oi
827,272 768,074 AGGLOMERATIONS 1911 1,770,959 926,514 844,385
1921 2,051,605 +280,646 +15.85 1,076,515 '975,030 1931 1,8l2,117 -229,488 -'-11.19 963,558 858,559 1941 1,477,801 -344,316 -18.90 780,430 697,371 1951 1,977,739 +499,938 +33.83 1,040,343 937,396 1961 1,266.38 731,312 -1,246,427 -63.02 393,685 337,627 1971 870.54 564,f96 -1~7,U6 -22.85 ~05,903 258,293
1 Mudigere Chikmaaalur 1901 1,675 -285
938 737 (MYSORE) 1911 1,390 -17.01 781 609
1921 .' .1,278 -112 -8.06 702 5;16 1931 1,607 +329 +25.74 911 696 1941 1,961 +354 +22.03 1,154 807 1951 2,626 +665 +33.91 1,527 1,099 1961 M. 6,99 3,723 +1,097 +41. 77 2,095 1,628' 1971 M. 6.99 4,980 +1,257 '1-33.76 2,730 2,250
2 Rasulpur Dhubri Meerut 1971 6,97 4,944 2,643 2,301 (UTTAR PRADESH)
3 Vembadithalam Salem 1971 ~.80 4,932 2,531 2,401 urban (TAMIL NADU) agglomeration
(a) Vemhadilhalam 1971 P. 2.09 3,735 1,920 1,815
(b) Senaipalayam 1971 P. 1. 71 1,197 611 586
4 Sin,i Singhbhum 1971 2.02 4,903 2,774 2,129 (BIHAR)
5 Upper Sileru Project- Visakhapatnam 1971 3.32 4,901 2,538 2,363 sile Camp (ANDHRA PRADESH)
6 Manch~nahal1i Kolar 1951 3,547 +22.55
1,844 1,703 (MYSORE) 1961 M. 2.07 4,347 +800 2,259 2,088
1971 M. 3.82 4,863 +516 + 11.87 2,478 2,385
7 Amloh l PaHala 1921 1,543 Hi6 +22,42
867 676 (PUNJAB) 1931 1,889 1,076 813 I
1941 2,184 +295 +15.62 1,161 1,023 1951 2,863 +679 +31.09 1,548 1,315 1961 M.C. 1.94 3,582 +719 +25.11 1,912 1,670 1971 M.C. 2,59 4,848 + 1,266 +35.34 2,603 2,245
8 Shaukarampet Medak 1951 4,769 2,333 2,436 (ANDHRA PRADESH) 1961 Declassified
1971 P. 2.43 4,837 2,392 2,445
9 'Bagli Dewas 1961 M. 0.21 3,638 +1,194 +32.82
.. 1,922 1,716 CMApHYA PRADESH) 1971 M. 1.13 4,832 2,526 2,306
10 Along Siang 1971 N.A. 4,818 3,511 1,307
'11 r<herli (ARUNACHAL. P¥DESH) \ Alwar 1951
M. 3,816 2,082 ]'734
(RAJASTHAN) 1961 0.18 3,137 - 679 - 17.79 1,810 1,327 1971 M. 0.18 4,798 +1,661 +52,95 2,675 2,123
12 Nattarasankottai Ramanathapurrun 1931 5,666 -2.97
2,716 2,950 (TA~I.L NADU) 1941 5,498 - 168 2,628 2,870
1951 5,789 +291 -+A.:Z?S"
2,799 .2,990 1961 P. 16,83 4,511 - 1,278 2,129 2,382 1971 P. 6.03 4,797 +286 +6.34 2,327 2,470
13 Maihargarh urban Mandsaur 1961 0.18 3,916 + 22.ii
2,025 1,891 • a&&loD1eration (MADHYA PRADESH) 1971 0.27 4,788 +872 2,415' 2,373
(i) 'Malhargarh 1961 M. 0.18 3,916 +664 +16.96
2,025 1,891 1971 ¥. 0.18 4,580 2,305 2,275
(ii) Ma1hargarh 1971 0.09 208 110 98 (O.G.)
1901 2,019 14 A1andi Poona 1,079 940 (MAHARASHTRA) 1911 1,624 - 395 -19.56 791 833
1921 1,568 - 56 - 3.45 803 765 1931 1,666 +98 +6.25 840 826 1941 2,170 +-504 +30.25 I 1.092 1,078 1951 2,432 +262 +12.07 1,238 1,194 1961 M. 6.84 3,187' +755 + 31.04 1,654 1,533 1971 M. 6.84 4,788 +1,601 +50.24 2,516 2,272
15'Gt/dari Koraput (ORISSA)
1971 C.T. 2.28 4,774 2,409 2,365
16 Mattan Anantnag 1931 3,016 +15.62
1,603 1,413 (JAMMU & KASHMIR) l~~l)
3,487 +471 1,955 1,532 Declassified
1961) Declassified 1971 N.A. 1.40 4,771 2,580 2,191
17 Kharsawau Singhbhum 1951 3,438 + 16.70
1,737 1,701 (BIHAR) 1961 N 8,73 4,012 +574 2,064 1,948
1971 N 6.96 4,765 +753 +18.77 2,483 2,282
18 ·Shivrajpur ' Panchmahals 1961 P 19.58 8.001 -3,237
4,263 3,738 (GUJARAT) 1971 V.P. 19.61 4,764 -40.46 2,447 2,317
19 ·Canuanore Cannanore 1961 Cantt. 1.79 2,859 +1,89i
1,487 1,372 Cantonment (KERALA) 1971 Cantt. 1.79 4,750 +66.14 2,836 1,914
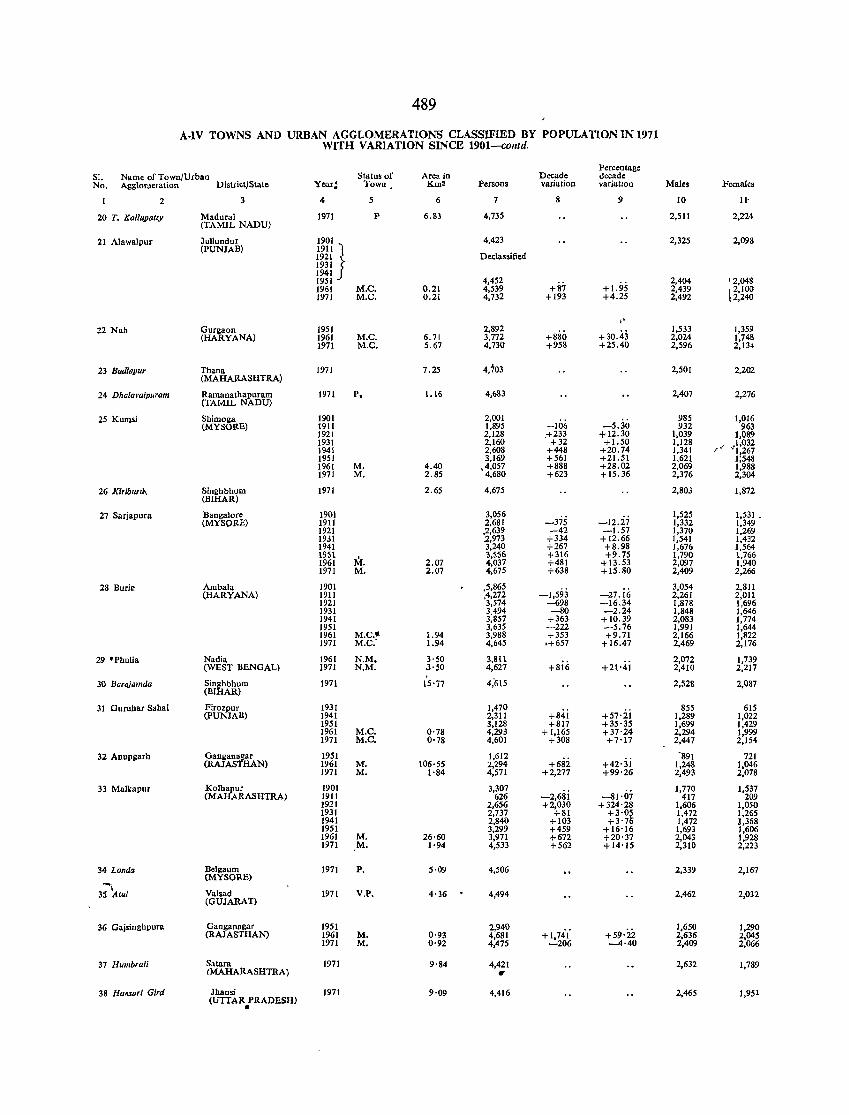
489
A.IV TOWNS AND URBAN AGGLOMERATIONS CLASSIFIED BY POPULATION IN 1971 WITH VARiATION SINCE 1901-contd.
Percentage S1. Name of Town/Urban Status of Area in Decade decade No. Agglomeration Distd~tJState Year! Town Km2 Persons vafiation variatJon Males Females
2 3 4 5 6 7 8 9 10 11'
20 T. Kallupatty Madurai 1971 P 6.83 4,735 2,511 2,224 (TAMIL NADU)
21 Alawalpur Jullundur 1901 4,423 2,325 2,098 (PUNJAB) 1911 1
Declassified 1921 J 1931 1941 1951 4,452
+8; +I.95 2,404 , 2,048
1961 M.e. 0.21 4,539 2,439 ~ 2,100 1971 M.e. 0.21 4,732 +193 +4.25 2,492 2,240
" 22 Nuh Gurgaon 1951 2,892 +30.43
1,533 1,359 (HARYANA) 1961 M.e. 6.71 3,772 +880 2,024 1,748
1971 M.C. 5.67 4,73() +958 +25.40 2,596 2,134
23 Bad/apu, Thana 1971 (MAHARASHTRA)
7.25 4,703 2,501 2,202
24 Dhalavaipuram Ramanathapuram 1971 p. 1.16 4,683 2,407 2,276 (TAMIL NADU)
25 Kumsi Shimoga 1901 2,001 985 1,016 (MYSORE) 1911 1,895 -106 -5.30 932 963
1921 2,128 .+233 +12.30 1,039 1,089 1931 2,160 +32 +1.50 1,128 ,1,032 1941 2,608 +448 +20.74 1,341 /,,,, '1,267 1951 3,169 +561 +21.51 1,621 1;548 1961 M. 4.40 ,4,057 +888 +28.02 2,069 1,988 1971 M. 2.85 4,680 +623 +15.36 2,376 2,304
26 Kirib"r~ Singhbhum 1971 2.65 4,675 2,803 1,872 (BIHAR)
27 Sarjapura Bangalore 1901 3,056 -375
1,525 1,531 • (MYSpRE) 1911 2,681 -12.27 1,332 1,349
1921 .2,639 -42 -1.57 1,370 1,269 1931 2,973 +334 +12.66 1,541 1,432 1941 3,240 +267 +8.98 1,676 1,564 1951 M. 3,556 +316 +9.75 1,790 1,766 1961 2.07 4,037 +481 +13.53 2,097 1,940 1971 M. 2.07 4,675 +638 +15.80 2,409 2,266
28 Burie Ambala 1901 .5,865 -1,593 -27.ii;
3,054 2,811 (HARYANA) 1911 ,4,272 2,261 2,011
1921 3,574 -698 -16.34 1,878 1,696 1931 3.494 -80 -2.24 1,848 1,646 1941 3,857 +363 +10.39 2,083 1,774 1951 3,635 -222 -5.76 1,991 1,644 1961 M.e." 1.94 3,988 +353 +9.71 2,166 1,822 1971 M.C: 1.94 4,645 .+657 +16.47 2,469 2,176
29 ·Phulia Nadia 1961 N.M. 3'50 3,811 2,072 1,739 (WEST BENGAL) 1971 N.M. 3'50 4,627 +816 +21'41 2,410 2,217
30 Barqjamda Singhbhum 1971 (BIHAR)
15'77 4,615 2,528 2,087
31 Gurubar Sabai Firozpur 1931 1,470 +84i
855 615 (PUNJAB) 1941 2,311 +57'21 1,289 1,022
1951 3,128 +817 +35·35 1,699 1,429 1961 M.e. 0'78 4,293 +1,165 +37'24 2,294 1,999 1971 M.e. 0'78 4,601 +308 +7'17 2,447 2,154
32 Anupgarh Ganganagar 1951 1,612 +682 +42'3i
'891 721 (RAJASTHAN) 1961 M. 106'55 2,294 1,248 1,046
1971 M. 1'84 4,571 +2,277 +99'26 2,493 2,078
33 Ma1kapur Kolbapur 1901 3,307 -2,6Si -81·07
1,770 1,537 (MAHARASHTRA) 1911 626 417 209
1921 2,656 +2,030 +324'28 1,606 1,050 1931 2,737 +81 +3'0~ 1,472 1,265 1941 2,840 +103 +3'7 1,472 1,368 1951 3,299 +459 + 16'16 1,693 1,606 1961 M. 26·60 3,971 +672 +20'37 2,043 1,928 1971 ,M. 1·94 4,533 +562 +14'15 2,310 2,223
34 Londa Belgaum (MYSORE)
1971 P. 5·09 4,506 2,339 2,167
3-;-'.4.lul Valsad (GUJARAT)
1971 V.P. 4·36 4,494 2,462 2,032
36 Gajsinghpura Ganganagar 1951 2,940 +1,74( +59'22
1,650 1,290 (RAJASTHAN) 1961 M. 0'93 4,681 2,636 2,045
1971 M. 0'92 4,475 -206 --4·40 2,409 2,066
37 Rumbrali Satara 1971 9'84 4,421 2,632 1,789 (MAHARASHTRA) •
38 Ra.sari Gird Jhansi 1971 9'09 4,416 2,465 1,951 (UTTAR PRADESH)
•
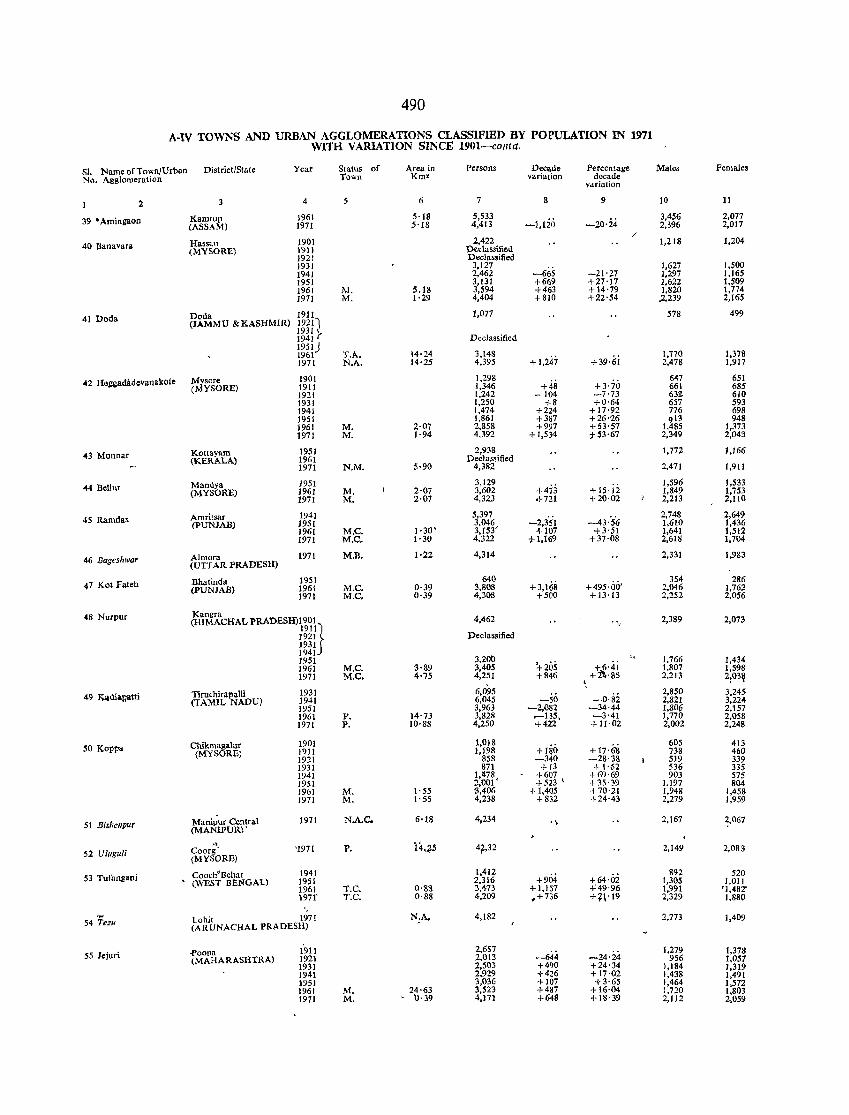
490
A.IV TOWNS AND URBAN AGGLOMERATIONS CLASSIFIED BY POPULATION IN 1971 WITH VARIATION SINCE 1901-coJ1ta.
SI. Name of Town/Urban District/State Year Status of Area in Persons Decade Percentage Males Females No. Agglomeration Town Km2 variation decade
vdriation
2 3 4 5 6 7 8 9 10 11
39 • Amingaoo Kamrup 1961 5·18 5,533 -l,rio -20'24
3,456 2,077 (ASSAM) 1971 5'18 4,413 2,396 2,017
2,422 ,I
40 Banaval'a Hassan 1901 1,218 1,204 (MYSORE) 191) Declassified
192] Declassified 1931 3,127
-665 1,627 1,500
1941 2,462 -21'27 1,297 1,165 1951 3,131 +669 +27·17 1,622 1,509 1961 1\1. S.18 3,594 +463 +14'79 1,820 1,774 1911 M. 1·29 4,404 +810 +22'54 ,2,239 2,165
41 Doda Doda 1911 1,077 578 499 (JAMMU & KASHMIR) 192 II
~~~l ~ Declassified 19SIj
T.A. 14'24 3.148 1961 +1,247 +39·i;j
1,770 1,37& 1971 N.". 14·25 4,395 2,478 1,917
42 Heggadildevanakote Mysore 1901 1,298 +48
647 651 (MYSORE) 1911 1,346 +3'70 661 685
1921 1,242 -104 -7·73 632 610 1931 1,250 +8 +0·64 651 593 1941 1,474 +224 + 17·92 776 698 1951 1,861 +387 +26'26 913 948 1961 M. 2·07 2,858 +997 +53'57 1,485 1,373 1971 M. 1·94 4,392 + 1,534 t 53 '67 2,349 2,043
43 Munna! Kottayam 1951 2,938 1,772 1,166 (KERALA) 1961 Declas~ified
1971 N.M. 5·90 4,382 2,471 1,911
44 Bellur Mandya 1951 3,129 Hij
1,596 1,533 (MYSORE) 1961 M. 2·07 3,602 +15'12 1,849 1,753
1971 M. 2·07 4,32.3 <1-721 +20·02 2,213 2,110
45 Ramdas AmrilSar 1941 5,397 -2,3S'1 -43:5'6
2,748 2,649 (pUNJAB) 1951 3,046 1,6LO 1,436
1961 M.e. 1·30' 3,153' +107 +3·51 1,641 1,512 1971 M.C. 1'30 4.322 -;1-1,169 +37·08 2,618 1,704
46 BageshlVor AlU10ra (UTTAR PRADESH)
1971 M.B. 1·22 4,314 2,331 1,983
47 Kot Fateh Bhatinda 1951 640 +3,168 +495'00-
354 286 (PUNJAB) 1961 M.C. 0·39 3,808 2,046 1,762
1971 M.C. 0·39 4,308 +500 +13·13 2,252 2.056
48 Nurpur Kangra 4,462 (HIMACHAL PRADESH)11~~ln .. , 2,389 2,073
1921J Declassified
1931 1941 '. 1951 3,200 1,766 1,434 1961 M.C. 3·89 3,405 +205 ~'4i 1,801 1,598 1971 M.C. 4'75 4,251 +846 + '85 2,213 2:03~
49 Kadiapa.tti Tiruchiraflalli 1931 6,095 -so 2,850 3,245 (TAMIL NADU) 1941 6,045 -0'82 2,821 3,224
1951 3,963 -2,082 -34·44 1,80p 2,157 1961 P. 14·73 3,828 ~135. -3'41 1,770 2,058 1971 P. 10·88 4,250 +422 +11·02 2,002 2,248
50 Koppa Chikmagalur 1901 1,018 +150 + 17·(;8
605 413 (MY SORE) 1911 1,198 738 460
1921 858 -340 -28'38 5J9 339 1931 871 + 13 +1'~2 536 335 1941 1,478 +607 +69·69 903 575 1951 2,001' +523 I +35'39 1.197 804 1901 M. 1'55 ~,406 + 1,405 +70'21 1,948 1,458 1971 M. 1'55 4,238 +832 +24'43 2,279 1,959
SI Bishenpur Manipur Central (MANlPUR) ,
1971 NA.C. 6·18 4,234 .~ 2,161 ~,067
,. '1971 P. 14.~5 4t ,32 2,149
52 Uluguli Coorg' 2,083 (MYSORE)
53 Tufanganj Cooch'Behar 1941 1,412 +904 +64·oi
892 520 . (WEST BENGAL) 1951 2,316 1,305 1,011 1961 T.C. 0·88 3,4n +1,157 +49'96 1,991 '1,482" 1971' T.C. 0·88 4,209 .+736 +f\' 19 2,329 1,880
54 Tezu Lohit 1971 N;A. 4,182 2,773 1,409 (ARUNACHAL PRADESH)
55 Jeiud .pooua 1911 2,657 -24·i4
1,279 1,378 (MAHARASHTRA) 1921 2,013 -644 956 1,057
1931 2,503 +490 +24'34 1,184 1,319 1941 2.929 +426 +17·02 1,438 1,491 1951 3,036 +107 +3'65 1,464 1,572 1961 M. 24·63 3,523 +487 +16·04 1,720 1,803 1971 M, - U'39 4,171 +648 + 18'39 2,112 2,059
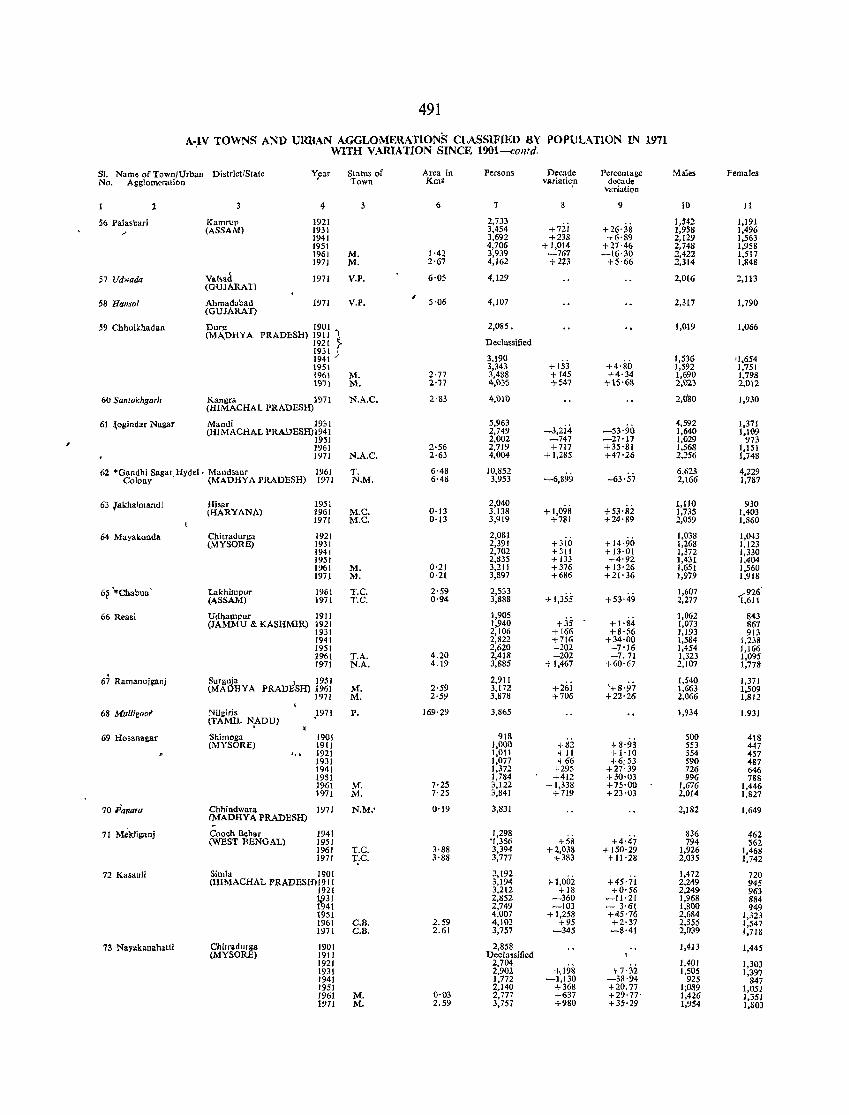
491
A";lV TOWNS AND URBAN AGGLOMERATIONS CLASSIFIED BY POPULATION IN 1971 WITH VARIATION SINCE 1901---contd.
SI. Name of Town/Urban District/State Y~ear Status of Area in Persons Decade Percentage Males Females No. Agglomeration Town Km2 variati~n decade
variation
2 ~ 6 7 9 10 Jl
56 Palasbari Kamr"p 1921 2,733 +7ii +26'38
1,542 1,191 (ASSAM) 1931 3,454 1,958 1,496
1941 3,692 +238 +6'89 2,129 1,563 1951 4,706 + 1,014 +27'46 2,748 1,958 1961 M. 1·42 3,939 -761 -16·30 2,422 1,517 1971 M. 2·67 4,162 +223 +5·66 2,314 1,848
57 Udwada Valsad 1971 V.P. 6·05 4,129 2,016 2,113 (GUJARAT)
58 Hansol Ahmadabad 1971 V.P. 5'06 4,107 2,317 1,790 (GUJARAT)
59 Chhuikhadan Dur!! 1901 2,085. 1,019 1,066 (M)\DHYA PRADESH) 1911 '\
1921 ~ Declassified
~m) 3,\90 +153 +4'80
1,536 '1,654 1951 3,343 1,592 1,751 1961 M. 2·77 3,488 + 145 +4·34 1,690 1,798 1971 M. 2·'j') 4,1>:15 +547 +15'68 2,1)23 2,012
60 Santokhgarh Kangra 1971 N.A.C, (HIMACHAL PRADESH)
2'83 4,010 2,0'80 1,930
61 ~ogindar Nugar Mandi 1931 5,963 -3,2i4 -53·90
4,592 1,371 (HIMACHAL PRADESH)1941 2,749 1,640 1,109
1951 2,002 -747 -27'17 1,029 973 )961 2·56 2,719 +717 +35·81 1,568 1,151 1971 N.A,C. 2'63 4,004 + 1,285 +47·26 2,256 1,748
62 ·Gandhi Sagar, Hydel· Mandsaur 1961 T. 6·48 10,852 -6,899 -63·57
6,623 4,229 Colony (MADHYA PRADESH) 1971 N.M, 6'4~ 3,953 2,166 1,787
63 jakha1mandi Hisar 1951 2,040 +1,098 +53'8i
1,110 930 (HARYANA) 1961 M.C. 0'13 3,138 1,735 1,403
1971 M.C. 0·13 3,919 +781 +24'89 2,059 1,860
64 Mayakonda Cbitradurga 1921 2,081 + 14·90
1,038 1,043 (MYSORE) 1931 2,391 +310 1,268 1,123
1941 2,702 +311 + 13·01 1,372 1,330 1951 2,835 + 133 +4'92 1,431 1.404 1961 M. 0·21 3,21 I +376 + 13·26 1,651 1,560 1971 M. 0'2! 3,897 +686 +21·36 1,979 1,918
6~ "'Chabua ,
Lakhimpur 1961 T.C. 2'59 2,533 1,607 926' (ASSAM) 1971 T.C. 0·94 3,888 + 1,355 +53·49 2,277 1,611
66 Reasi Udhampur 1911 1,905 +35- +1·84
1,062 843 (JAMMU &. KASHMIR) 1921 1,940 1,073 867
1931 2,106 + 166 +8'56 1,193 913 1941 2,822 +716 +34'00 1,584 1,238 1951 2,620 -202 -7'16 1,454 1,166 1961 T.A. 4.20 2,418 -202 -7.71 1,323 1,095 1971 N.A. 4.19 3,885 + 1,467 +60·67 2,107 1,778
67 Ramanujganj Surguja 1951 2,911 +26i '+8'97
1,540 1,371 (MADHYA PRADiSH) 1961 M. 2·59 3,172 1,663 1,509
1971 M. 2'59 3,878 +706 +22·26 2,066 1,812
68 Mul/igoQf Nilgiris (TAMIL NfDU)
1971 P. 169'29 3,865 1,934 1,931
69 Hosanagar Shimoga 1901 918 +8'93
500 418 (MYSORE) 1911 1,000 +82 553 447
'" 1921 1,011 +11 +1'10 554 457 1931 1,077 +66 +6:53 590 487 1941 1,372 +295 +27·39 726 646 1951 1,784 +412 + 30·03 996 788 1961 M. 7·25 3,122 + 1,338 +75·00 1,676 1,446 1971 M. 7·25 3,841 +719 +23·03 2,014 1,827
70 P'fl/lara Chhindwara 1971 N.M.' (MADHYA PRADESH)
0'19 3,831 2,182 1,649
71 Mekliganj Cooch Behar 1941 1,298 +4'47
836 462 (WEST BENGAL) 1951 '1,356 +58 794 562
1961 T.C. 3'88 3,394 +2,038 +150·29 1,926 1,468 1971 T;C. 3'88 3,777 +383 + 11'28 2,035 1,742
72 Kasauli Simla 1901 2,192 +1,002 +45'7i
1,472 720 (HIMACHAL PRAPESHll911 3,194 2.249 945
1921 3,212 +18 +0·56 2,249 963 i§31 2,852 -360 -11·21 1,968 884
41 2,749 -103 - 3-6~ 1,800 949 1951 4,007 + 1,258 +45'7 2,684 1,323 1961 C.B. 2.59 4,102 +95 +2·37 2,535 1,547 1971 C.B. 2.61 3,757 -345 -$'41 2,039 1,718
73 Nayakanahatti Chitraduraa 1901 2,858 1,413 1,445 (MYSORE) 1911 Dec lassified
1921 2,704 ';'198 +7·32 ~:~~ 1,303
1931 2,902 1,397 1941 1,772 -1,130 -38'94 925 847 1951 2,140 +368 +20.77 1;089 1,051 1961 M. 0'03 2,777 +637 +29·77 . 1,426 1,351 1971 M. 2.59 3,757 +980 +35·29 1,954 1,803
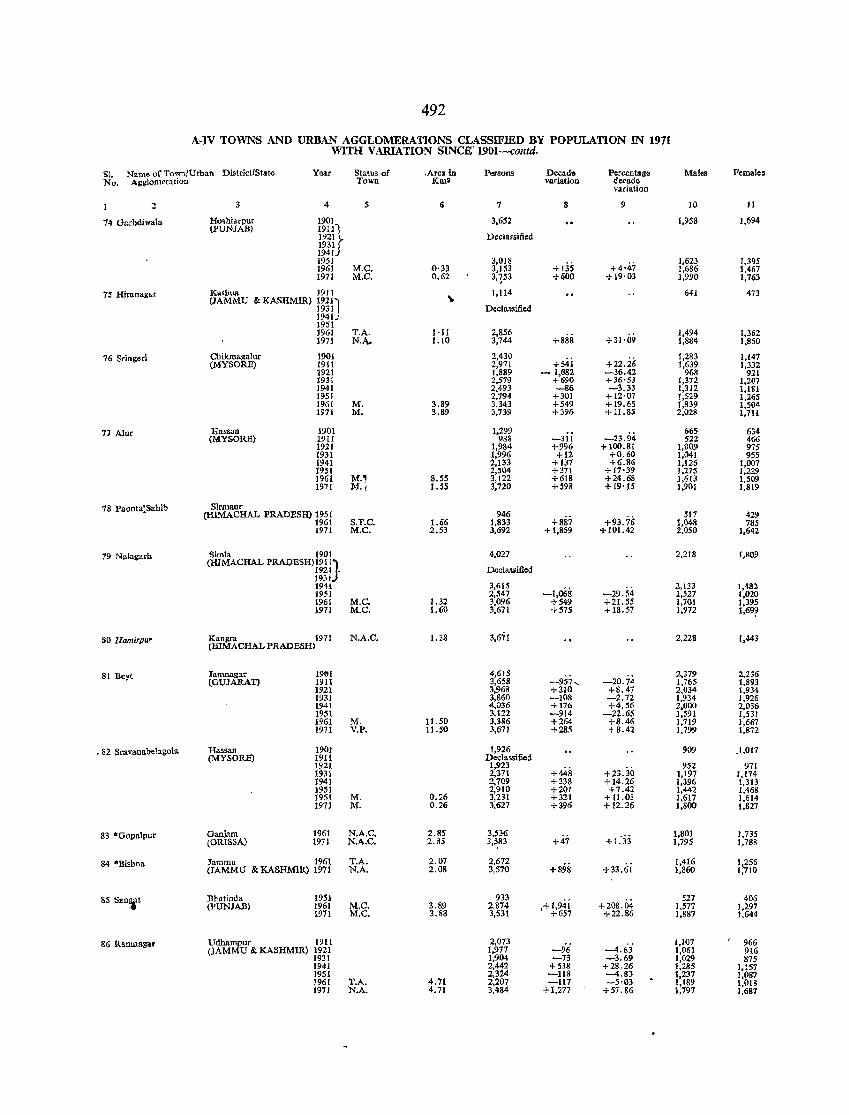
492
A·IV TOWNS AND URBAN AGGLOMERATIONS CLASSIFIED BY POPULATION IN 1971 WITH VARIATION SINCE' 1901---contd.
St. Name of Town/Urban District/State Year Status of .Area in Persons Decade Percentage Mal •• Females No. Agglomeration Town Km3 variation de<'ade
variation
2 3 4 S (; 7 8 9 10 11
14 Garhdiwala Hoshiarpur 1901 3,652 1,958 1,694 (PUNJAB) 191n
Inl ~ Decla.sified
mlJ 1951 3,018
+135 +4'47 1,623 1,395
1961 M.C. 0<)3 3,153 1.686 1,467 1971 M.C. 0.62 3,:53 +600 +19·03 1,990 1,763
7S Hiranagar Kathua 1911 \<
1,114 641 473 (JAMMU &KASHMlR) 1921J
1931 Declassified 1941 1951 1961 T.A. HI 2,856
+31·09 1,494 1,362
1971 N.A,. 1.10 3,744 +888 1,884 1,860
76 Scingeri Chikmaga!ur 1901 2,430 +22.26
1,283 1,147 (MYSORE) 19I1 2,971 +541 1,639 1,332
1921 1,889 - 1,082 -36.42 968 921 1931 2,519 +690 +36'53 1,312 1,207 1941 2,493 ......s6 -3.33 1,312 1,181 1951 2,794 +301 +12·01 1.529 1,265 1961 M. 3.89 3,343 +549 +19.65 1,839 1,504 1971 M. 3.89 3,739 +396 +11.85 2,028 1,711
77 Alur Hassau 1901 1,299 -23.94
665 634 (MYSORE) 1911 988 -311 522 466
1921 1,984 +996 +100.81 1,009 975 1931 1,996 +12 +0.60 1,041 955 1941 2,133 +137 +6.86 1,126 1,007 195'1 2,5'04 +371 +17·39 1,275 1,229 1961 M., 8.55 3,122 +618 +24.68 1,613 1,509 1971 M.I 1.55 3,720 +5911 + 19'15 1,901 1,819
78 Paonta:Sahib Sirmaur (HIMACHAL PRADESH) 1951 946 517 429
1961 S.T.C. 1.66 1,833 +887 +93.76 1,048 785 1971 M.C. 2.53 3.692 +1,859 + 101.42 2,050 1,642
79 Nalagarh Simla 1901 4,027 2,218 1,809 (HIMACHAL PRADESH)1911)
1921 . Declassified 1931 1941 3,61S
-1,068 2,133 1,432
1951 2,547 -29.54 1,527 1,020 1961 M.C. 1.32 3,096 +549 +21.55 1,7QI 1,395 1971 M.C. 1.60 3,671 +515 + 18.57 1,972 1,69?
80 Hamirpur Kangra 1971 (HIMACHALPRADESm
N.A.C. 1.38 3,671 2,228 1.443
81 Beyt Jamnagar 19tH 4,615 -957" -20.74
2,379 2,236 (GUJARAT) 1911 3,658 1,76S 1,893
1921 3,968 +310 +8.47 2,034 1,934 193J 3,860 -108 -2.72 1,934 1,926 1941 4,036 +176 +4.56 2,000 2,036 1951 3,122 -914 -22.65 1,591 1,531 1961 M. 11.50 3,386 +264 +8.46 1,719 1,667 1971 V.P. 11.50 3,671 +285 +8.42 1,799 1.872
• 82 Sral'anabelagola Hassan 1901 1,926 909 .1,017 (MYSORE) 1911 Declassified
1921 1,923 +23.30
952 971 1931 2,371 +448 1,197 1,174 1941 2,709 +338 +14.26 1,396 1,313 1951 2,910 +201 +7.42 1,442 1,468 1961 M. 0.26 3,231 +321 + 11.03 1,617 1,614 1971 M. 0.26 3.627 +396 + 12.26 1,800 1,827
83 *Gopalpur Ganjam 1961 N.A.C. 2.85 3,536 +,H +1:33
1,801 1,735 (ORISSA) 1971 N.A.C. 2.85 3,~83 1,795 1,788
84 *Bi,bna Jammn 1961 T.A. 2.07 2,672 +898 +33.6i
1,416 1~56 (JAMMU & KASHMIR) 1971 N.A. 2.08 3,570 1,860 I, 10
8S San,t Bhatinda 1951 933 ,+1,941 +208.04
527 406 (PUNJAB) 1961 M.C, 3.89 2,874 1,577 1,297
1971 M.C. 3.88 3,531 +657 +22.86 1,887 1,644
86 Ramnagar Udhampur 191[ 2,073 -4.63
1,107 966 (JAMMU & KASHMIR) 1921 1,977 -96 1,061 916
1931 1,904 -73 -3.69 1,029 875 1941 2,442 +538 +28.26 1,285 1,151 1951 2,324 -118 -4.83 1,237 1,087 1961 T.A. 4.71 2,207 -117 -5,03 1,189 1,018 ]971 N.A. 4.71 3,484 +1,277 + 57.86 1,797 1,681
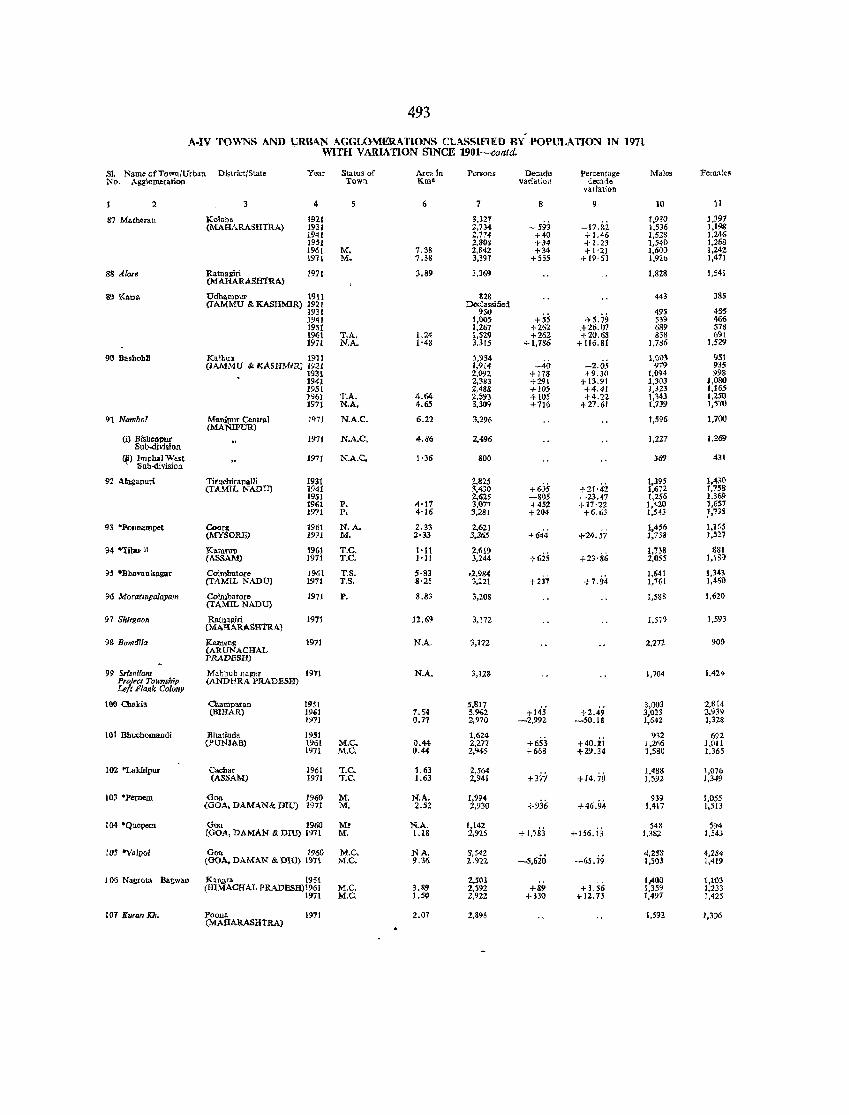
493
A·IV TOWNS AND URBAN AGGLO~ERATlONS CLASSlflED BY POPULATION IN 1971 WITH VARIATION SINCE 19t11-contd.
51. Name ofTown/U,b.n District/State Year Statu. of Area in Persons Decade Percentage Male. Fem.1.les No. Agglomeration Town. Km' variation decade
variation
2 3 4 6 7 8 10 11
81 Math.ran Kolab. 1911 3,127 -593
1,930 1,391 (MAHARASHTRA) 1931 2,734 -17.82 1,536 1.198
1941 2,774 +4() + 1.46 1,528 ],246 19S1 2,308 +34 + 1.23 1,540 1,268 1961 M. 7.38 2,842 +34 +1'21 1,600 1,242 1911 M. 1.38 3,397 +555 + [9'S3 1,920 1,471
88 AI",. Ratnagiri 1971 (MAHARASHTRA)
3.89 J.369 1,828 1,541
S~ Kana Udhampur 1911 1l2S 443 3SS (JAMMU & KASHMIR) 1921 Declassified
1931 950 +55 +5.79
495 455 1941 1,005 539 466 1951 1,267 +262 {~g:g~ 689 578 1961 T.A, 1.24 1,529 +262 838 6!}) 1971 N.A. 1·48 3.315 +1,786 + 116.81 1,786 1,529
9() Bashoh11 Kathua 1911 1,954 -4G 1,1l0l 951 (JAMMU .Ii: KASHMIR) 1921 1,914 -2.05 979 935
1931 2,!J92 + 178 +9,30 1,094 998 1941 2,383 +291 +13.91 1,303 3,080 1951 2,488 + lOS +4.41 1,323 1,I6S 1961 T.A. 4.64 2,593 + lOS +4.22 1,3U 1,25(1 1971 N.A. 4.6~ 3,309 +716 +27.61 l,n9 1,~70
91 Nambol Manipur Central 1971 N.A.C. 6.22 3,296 1,596 1,700 (MANlPUR)
(i) Bishcnpur Sub-division
1911 N.A.C.. 4.86 2,496 1,227 1.269
~) ~~E~~~~t 1971 N.A.C, 1'36 800 369 431
92 Alagalluri Tirudtirapalli 1931 2,825 +605 +21'42
1.395 1,43() (TAMIL NAnD) 1941 3,430 1,672 1.758
1951 2,625 -805 _2:l.47 1,256 1.369 1961 P. 4'11 J,()77 +452 + 17'22 1,420 ],657 1971 P. 4·16 3,281 +204 +6.63 1.543 !,?JS
93 'Ponoampct Coorg 1961 N.A. 2.33 2,621 +24.57
1,45(> 1.165 (MYSORE) 1971 M. 2'33 3,26:5 +644 1,738 1,521
~~ $lilio,ll Kamrup 1961 T.e. t'll 2,619 HiS +23'86
1,738 881 (ASSAM) 1971 T.e. I'll 3,244 2,055 1.18~
95 ·Bhavanisagar Colmbatore 1961 T.S. S'83 .2,984 +237 +7.94
1,641 1,l43 (TAMIL NADD) 1971 T.S. 8·25 3,221 1,761 1,460
96 Morarlupaloyam Colmbator. 1971 P. (TAMIL NADU)
8.83 3,208 1,588 1,620
91 Shirga~n Ratnagiri {MMIARA.SHTRA}
1971 12.69 3,ln 1.57~ 1,5'13
9& Bom<li/a KaJlleng 1911 (ARUNACHAL
N.A. 3,172 2,272 900
PRADESH)
99 Srisal,,,,,, Mahbub nagar 1911 N.A. 3,128 [,704 1,424 Prl?}l!ct To wnshfp (ANDHRA PRADESH) Left Flank Colony
100 Chalda Champaran 1951 5,817 Hii +2.49
3,003 2,814-(BIHAR) 1961 1.64 5,962 3,023 2.'H9
1971 0.17 2,970 -2,992 -50.1S 1,642 1,328
101 BbuchoJ1landi lI!tatinda 1~51 1,624 +653 Ho-ij
932 692 (PUNJAB) 1961 M.e. 0.44 2,271 1,266 l,OIl
1971 M.e. 0.44 2,945 + 658 +Z9.3,f 1,580 1,365
102 'Lakhipur C.cbar 1961 T.e. 1. 63 2,564 +377 +14.70
1,488 1,076 (ASSAM) 1971 T.C. 1.63 2,941 J,592 1,349
103 "Perncill G<>a 1960 M. N.A. {,994 +936 +46.94
939 1,05S (GOA, DAMAN& DIU) 1971 M. 2 .. U 2,nO 1,417 1,513
1M ·Quepem Goa 1960 Mr N.A. 1,142 +1,783 +156.ii
548 594 [GOA, DAMAN & DIU) 1971 M. 1.18 2,925 1,382 1,543
!O5 ·V.lpoi Goa 1960 M.C. NA. 8,542 -5,6io -65.19
4,258 4,284 (GOA, DAMAN & DIU) 1'l71 M.e. 9.'\'i 2.922 1,503 1,419
106 Nagrota Bagwl>n Kan,gra 1951 2,503 1,400 1,103 (HIMACHAL PRADESH)!961 M.C. 3.89 2,Sn +89 +3.56 1,359 1,233
1971 M.C. 1.50 2,922 +330 +12.73 1,497 l,425
I07 Kuran Kh, Poona 1971 2.07 2,898 1,592 1,306 (MAlIARASHTRA)
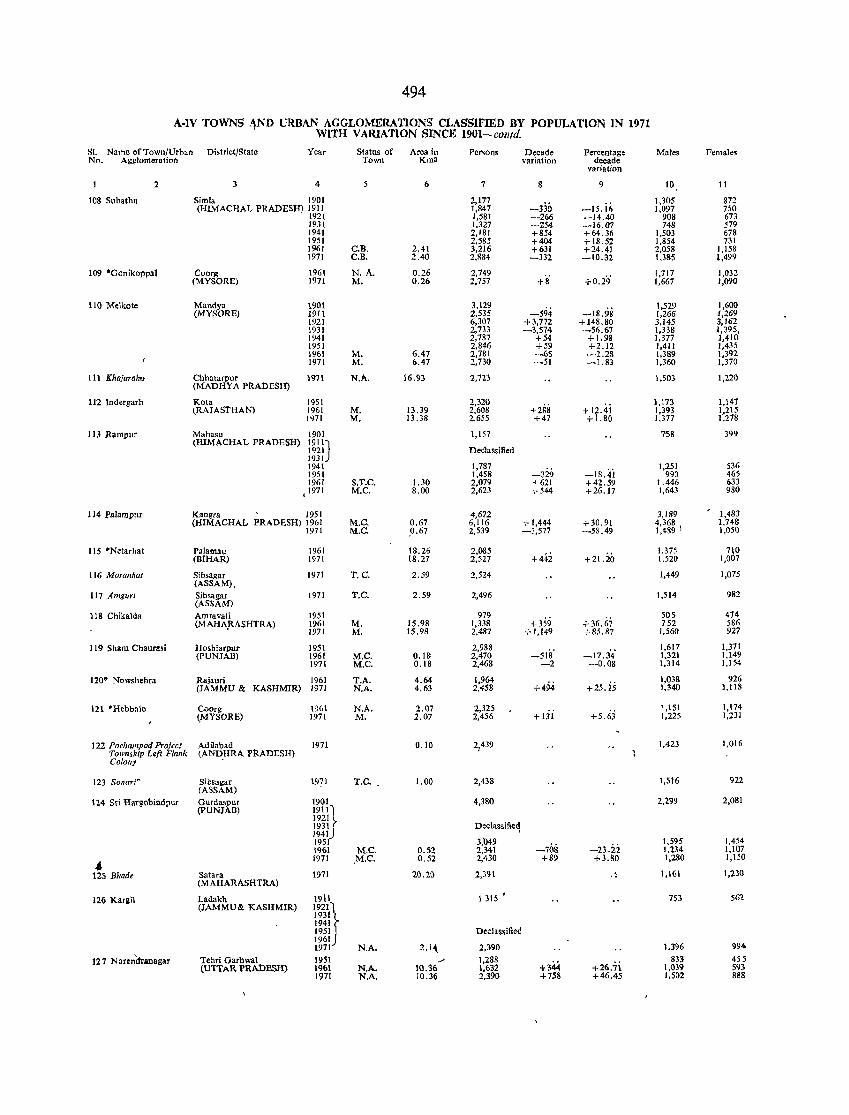
494
A-IV TOWNS AND URBAN AGGLOMERATIONS CLASSIFIED BY POPULATlON IN 1971 , WITH VARIATION SINCE 1901- COli/d.
51. Name of Town/Urban DistrictjState Year Status of Area in Per.ons Decade Percentage Males Female. No. Agglomeration Town KmB variation decade
variation
2 3 4 6 7 8 9 10 11
108 Sl1bathl1 Simla 1901 2,177 ~3jO -15.iii
1,305 872 (HIMACHAL PRADESH) 191 I 1,847 1,097 750
1921 1,581 -266 -14.40 908 673 1931 1.327 -254 -16.07 748 579 1941 2,181 +854 +64.36 1,503 678 1951 2,585 +404 +18.52 1,854 731 1961 C.B. 2.41 3,216 +631 +24.41 2,058 1,158 1971 C.B. 2.40 2,R84 -332 -10.32 1,385 1,499
109 ·Gonikoppal Coorg 1961 N. A, 0.26 2,749 +ii +0.29'
1,717 1,032 (MYSORE) 1971 M. 0.26 2,757 1,667 1,090
110 Melkote Mandyu 1901 3,\29 -18.98
1,529 1,600 (MY50RE) 1911 2,535 -594 1,266 1,269
1921 6,307 +3,772 +148.80 3,145 3,162 1931 2,733 -3,574 -56.67 1,338 1,395, 1941 2,787 +54 + 1.98 1,377 1,410 1951 2,846 +59 +2.12 1,411 1,435 1961 M. 6.47 2,781 -65 -2.28 1,389 1,392 1971 M. 6.47 2,730 -51 -1.83 1,360 1,370
111 Khajuraho Chhatarpur (MADHYA PRADESH)
1971 N.A. 16.93 2,723 1,503 1,220
112 Jndergarh Kota 1951 2,320 +288 + 1y.4i
1,173 1,147 (RAJASTHAN) 1961 M, 13.39 2,608 1,393 1,215
1971 M, 13.38 2.655 +47 + .80 1,371 1,278
113 Rampl1r Mahasu 1901 1,157 758 399 (HIMACHAL PRADESH) 1911,
Declassified l~~lJ 1941 1,787
-329 -18.4i 1,251 536
1951 1,458 993 465 1961 S.T.C. 1. 30 2,079 +621 +42.59 1.446 633
jl971 M.C. 8.00 2,623 +544 +26.17 1,643 980
114 Palampur Kangra 1951 4,672 3,189 1,483 (HIMACHAL PRADESH) 1961 M.C. 0.67 6,116 + 1,444 +30.91 4,368 I 1,748
1971 M.C. .0. 67 2,539 -3,577 -58.49 1,439 1,050
115 'Netarhat Palamau 1961 18.26 2,085 +442 +2!.iO
1,375 7\0 (BIHAR) 1971 18.27 2,527 1,520 1,007
116 Moranhat Sibsagar (ASSAM),
1971 T.C. 2.59 2,524 1,449 1,075
117 Amguri Sibsagar 1971 T.C. 2.59 2,496 1,514 982 (ASSAM)
118 Chikalda Amravati 1951 979 +359 +36.67
505 474 (M AHA,RASHTRA) 1961 M. 15.98 1,338 752 586
1971 M. 15.98 2,487 + 1,149 +85.87 1,560 927
119 Sham Chaurasi Hoshiarpur 1951 2,988 -SIS' -17.34'
1,617 1,371 (PUNJAB) 1961 M.C. 0.18 2,470 1,321 1,149
1971 M.C. 0.18 2,468 -2 -0.08 1,314 1,154
120· Nowshehra Rajauri 1961 T.A. 4,64 1,964 +494 +25.is
1,038 926 (JAMMU & KASHMIR) 1971 N.A. 4.63 2,458 1,340 1,118
121 'Hebba\e Coorg \961 N.A. 2.07 2,325 +5.63
1,151 1,174 (MYSORE) 1971 M. 2.07 2,456 + 131 1,225 1,231
122 pochwnpacf Project Adilabad 1971 0.10 21439 1,423 \,016 Township Left Flank (AND_HRA PRADESH) Colony
123 Sonar/" Sibs,gar 1971 T.C. 1.00 2,438 1,516 922 (ASSAM)
124 Sri Hargobindpur Gurdaspur 1901 4,380 2,299 2,081 (PUNJAB) 19111
1921 ~ 1931) Dec\assifie~ 1941 1951 3,049
-708 -23.ii 1,595 1,454
1961 M.e. 0.52 2,341 1,234 1,107
.4 1971 M.C, 0.52 2,430 +89 +3.80 1,280 1,150
125 Bhade Sat.ra 1971 20.20 2,3,} I .. 1,161 1,230 (MAHARASHTRA)
126 Kargil Ladakh 1911 1315 • 753 561 (JAMMU & KASHMIR) 192q
1931
J 1941 1951 Declassified 1961 1971 N.A. 2.1-4, 2,390 1.396 994
127 Narendranagar Tehri Garhwa\ 1951 ,_.> 1,288 +344 +26.7i
833 455 (UTTAR PRADESH) 1961 N,A, 10.36 1,632 1,039 5g3
1971 N.A. 10.36 2,391) +758 +46,45 1,502 888
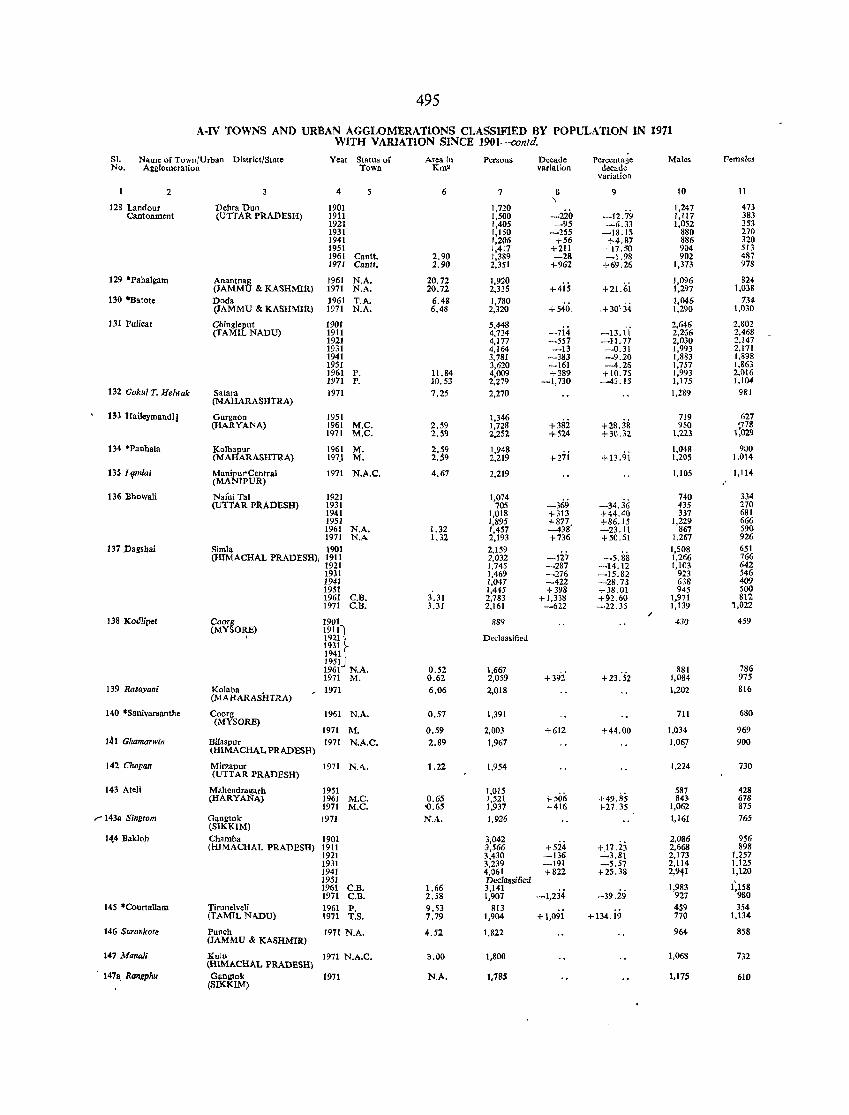
495
A-IV TOWNS AND URBAN AGGLOMERATIONS CLASSIFlED BY POPULATION IN 1911 WITH VARIATION SINCE 1901--conld.
S1. Name of Town/Urban District/State Year Status of Area in Persons Decade Percentage Male. Females No. Agglomeration Town Km2 variation decade
variation
2 4 6 7 8 9 10 11 \
128 Landour Dehra Dun 1901 1,720 -220
1,247 473 Cantonment (UTIAR pnADESH) 1911 1,500 -12.79 1,117 383
1921 1,405 -95 -6.33 1,052 353 1931 1,150 -255 -18.15 880 270 1941 1,206 +56 +4.87 886 320 1951 1,417 +211 + 17.50 904 513 1961 Cantt. 2.90 1,389 -2& -1.98 902 487 1971 Cantt. 2.90 2,351 +962 +69.26 1,373 978
129 ·Pohalgam Anantnag 1961 N.A. 20.72 1,920 His +21.6i
1,096 824 (JAMMU & KASHMIR) 1971 N.A. 20.72 2,335 1,297 1,038
130 "Batot. Dada 1961 T.A. 6.48 1,780 +540. .+30"34
1,046 734 (JAMMU & KASHMIR) 1971 N.A. 6.48 2,320 1,290 1.030
131 Pulica! Chingleput 1901 5,448 -13. ii
2,646 2,802 (TAMIL NAnD) 1911 4,734 -714 2,266 2,468
1921 4,177 -557 -11. 77 2,0)0 2,147 1931 4,164 -13 -0.31 1,993 2,171 1941 3,781 -383 -9.20 1,883 1,898 1951 3,620 -161 -4.26 1,757 1,863 1961 P. 11.84 4,009 +389 + 10.75 1,993 2.016 1971 P. 10.53 2,279 -1,730 -43. IS 1,175 1,104
132 Gokul T. 11 elwak Satara 1971 7.25 2,270 1.289 981 (MAHARASHTRA)
133 HaUeymandij Gurgaon 1951 1,346 +3si +28.38
719 627 (HARYANA) 1961 M.C. 2.59 1,728 950 '778
1971 M.C. 2.59 2,252 +524 + 30.32 1.223 1:029
134 ·Paohala Kolhapur 1961 M. 2.59 1,948 +27i +13.9i
1,048 900 (MAHARASHTRA) 197J M, 2.59 2,219 1,205 1.014
135 Ltplllai Mani~ur'Central 1971 N.A.C. 4.61 2,219 1,105 1,114 (MA IPUR)
136 Bhowali Nalni Tal 1921 1,074 -369 -34.36
740 334 (UTTAR PRADESH) 1931 705 435 270
1941 1,018 +313 +44.40 337 681 1951 1,895 +877 +86.15 1,229 666 1961 N.A, 1.32 1,457 -438' -23.11 867 590 1971 N.A 1.32 2,193 +736 +50.51 1,267 926
137 Dagshai Simla 1901 2,159 -5.88
1,508 651 (HIMACHAL PRADESH), 1911 2,032 -127 1,266 766
1921 1,745 -287 -14.12 1,103 642 1931 1,469 -276 -15.82 923 546 1941 1,047 -422 -28.73 638 409 1951 1,445 +398 +38.01 945 500 1961 C.B. 3.31 2,783 +1,338 +92.60 1,971 812 1971 C.B. 3.31 2,161 -622 -·22.35 1,139 1,022
/ 138 Kodlipet Coorg 1901 889 430 459
(MYSO~) 191t1 Declassified 1921',
1931 )-1941 1951J
0.52 1,667 881 786 1961 N.A. +392' +23:52 1971 M. 0.62 2,059 1,084 975
139 Rasayani Kolaba (MAHARASHTRA)
, 1971 6.06 2,018 1,202 816
140 .Sanivarsanthe Coorg 1961 N.A. 0.57 1,391 711 680 (MYSORE)
1971 M. 0,59 2,003 +612 +44.00 1.034 969 141 Ghamarwin Bilaspur 1971 N.A.C. 2.89 1,961 1,067 900
(HIMACHAL PRADESH)
142 Chopa" Mirzapur 1971 N.A, 1.22 1,954 1,224 730 (UTTAR PRADESH)
143 Ateli Mahendragarh 1951 1,015 +506 +49.85
587 428 (HARYANA) 196J M.C. 0.65 1,521 84} 678
1971 M.C. ~.65 1,937 +416 +27.35 1,062 875 "... 143" Singtom Gangtok 1971 N.A. 1,926 1,161 765
(SIKKlM) l-t4 Bakloh Chamba 1901 3,042
+5i,j + 17 jj 2,086 956
(HIMACHAL PRADESH) 1911 3,566 2,668 898 1921 3,430 -136 ":"3.81 2,173 1,257 1931 3,239 -191 -5.57 2.114 1,I2S 1941 4,061 +822 +25.38 2,941 1,120 1951 Declassified
1:158 1961 C.B. 1.66 3,141 -1,234 -39.29
1,983 1971 C.B. 2.58 1,907 927 980
145 ·CourtaUam Tirun.lveli 1961 p, 9.53 813 +I,09i
459 354 (TAMIL NAnD) 1971 T.S. 7.79 1,904 + 134.19 770 1.\34
146 Surankote Punch 1971 N.A. 4.52 1,822 964 858 (JAMMU & KASHMIR)
147 ManaJi Kulu (HIMACHAL PRADESH)
1971 N.A,C. 3.00 1,800 1,068 732
• 14711. Rangphu Gangtok 1971 N.A, 1,785 1.17S 610 (SIKKIM)
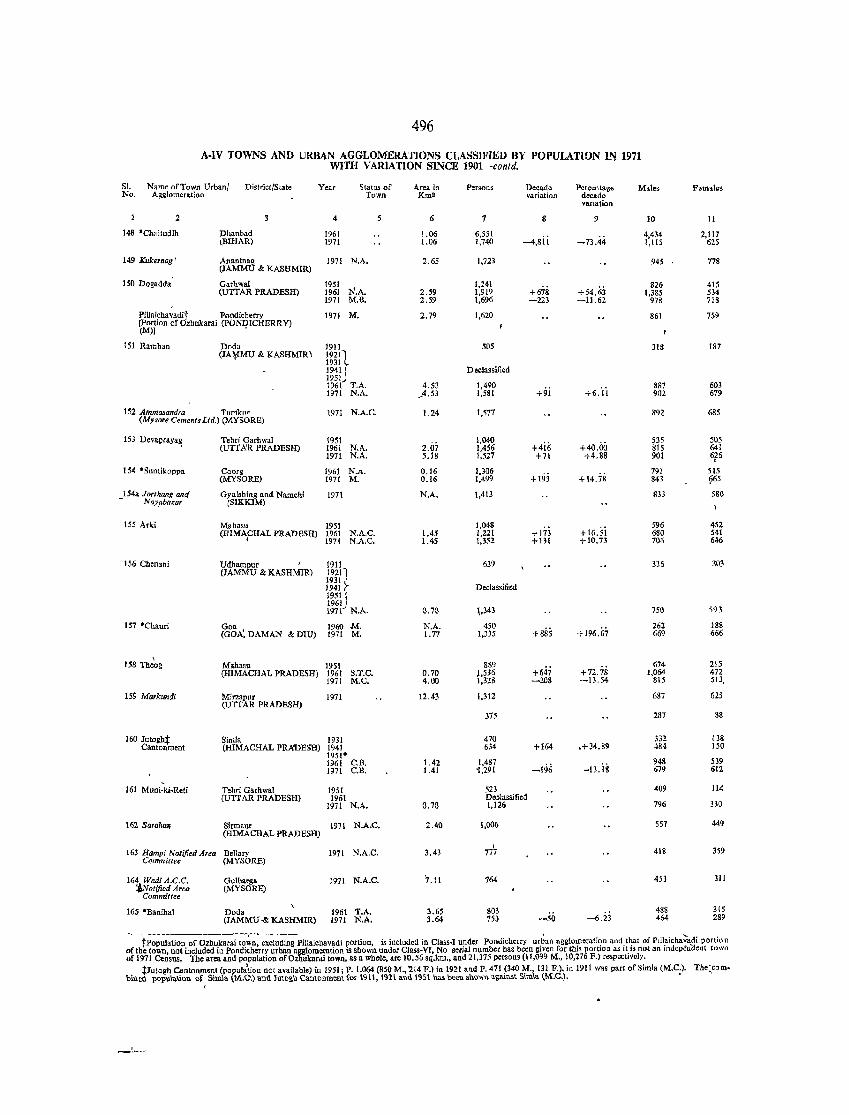
496
A-IV TOWNS AND URBAN AGGLOMERATIONS CLASSIFIED BY POPULATlON IN 1971 WiTH VARIATION SINCE 1901-contd.
SI. Name of Town Urban/ District/State Year Stat", or ~rea in Persons Dee.de Percentage Males Females No. Agglomeration Town Km' variatiol1 decade
vanation
2 4 6 1 9 10 11
148 'Cha i tudih Dhanbad 1961 1.06 6,551 4,434 2,117 tBIHAR) 1971 1.06 1,740 -4,Sii -73.44 l,llS 625
149 Kukernag' An.ntnas 1971 N.A. 2.65 1,723 945 778 (JAMMU & KASHMIR)
150 Dogadda Garhwal 1951 1,241 826 415 (UTTAR PRADESH) 1961 N.A. 2.59 1,919 +678 +54.63 1,385 534
1971 M.B. 2.59 1,696 -223 -11.62 978 718
PiUaichavadit Pondicherry 1971 M. 2.79 1,620 861 759 [Portion of Ozhokarai (PONDICHERRy] (M)] ,
IS! R.mban Doda 1911 505 318 187 (JA¥MU & KASHMIR) 19211
1931 T Declassified 1m)
1961 T.A. 4.53 1,490 +6.ii
887 603 197t N.A. ~4.53 1,581 +91 902 619
152 Ammasandra Tunikuf' 1971 N.A.C. 1.24 1,517 892 685 (Mysore Cements Ltd.) (MYSORE)
153 Devapraya~ Tehri Garhwal 1951 2.07
1,040 +4 iii +40.00
535 50S (UTTA'R PRADESH) 1961 N.A. 1,456 815 641
1971 N.A. 5.18 1,527 +71 +4.88 901 6t6
154 'Suntikoppa Coorg 1961 N.A. 0.16 1,306 + 193
791 515 (MYSORE) 1971 M. 0.16 1,499 +14.7& 843 ~65
154. Jorthang and Gyalshing and Namchi 1971 N.A. 1,413 833 SSG - NOy'abazar (SIKKlM)
ISS Arki Mahasu 1951 1,048 596 452 (HIMAFHAL PRADESH) 1961 N.A.C. 1,45 1,221 +173 +16.5i 680 541
1971 N.A.C. 1.45 1,352 +131 +10.73 706 646
156 Chenani Udhampur 1911 639 336 303 (JAMMU & KASHMIR) 19211
Im~ Declassified 1951j 1961 1911 N.A. 0.70 \,343 7S() SQ3
157 'Chauri Goa 1960 oM. N.A. 450 +885 + 196.67
262 ISS (GOA: DAMAN & DIU) 1971 M. I. 71 1,335 669 666
\ 158 Theog Mohasu 1951 889 674 21S
(HIMACHAL PRADESH) 1961 S.T.C. 0.70 ),536 +647 +72.78 1,064 472 1911 M.e. 4.00 1,328 -208 -13.54 815 513.
159 Markwlili Min.pur (UTTAR PRADESH)
1971 12.43 1,312 687 625
375 287 88
1601utoghf Simla 1931 470 332 138 Cantonment (HIMACHAL PRA'DESH) 1941 634 +164 .+34.89 484 150
1951' 1961 C.B. 1.42 1,487
-196 -B.is 948 539
1971 C.B. 1.41 1,291 679 612
, 161 Muni·ki·Reti Tehri Garhwal 1951 523 409 114
(UT1'AR PRADESH) 1961 D.~lassified 1971 N.A. 0.70 1,126 196 330
162 Saraha", Sirmaur 1911 N.A.C. 2.40 1,006 557 449 (HIMACHAL PRADESH)
163 [{amp; Notified Area Boilary I
418 359 1971 N.A.C. 3.43 777 Committee (MYSORE)
164 Wadi A.C.C. Gulbarga 1971 N.A.C. '7.11 764 453 311 :!Notified Area (MYSORE)
Committee
165 *Banihal Doda \
1961 T.A. 3.65 8()3 488 315 (JAMMU -& KASHMIR) 1971 N.A, 3.64 7SJ -50 -6.23 464 289
tPopulation of Ozhokarai town, excluding Pillaichavadi portion, is inCluded in Class·I under Pondicherry urban agglomeration and that of Plllaicha:;"di portion of the town, not included in Pondicherry urhan agglomeration is shown under Class·V£, No serial number has been given for this portion as it i. nat an indepenaent town of 1971 Census. The area and population ofOzhukarai town, as a whole, are 10.56 sq.km., and 21,375 persons (11,099 M., 10,216 F.) respectively.
tJutogh Cantonment (pol'ula'tion not available) in 1951; P. 1,064 (850 M~ '214 P.) in 1921 and P. 471 (340 M., 131 P.), in 1911 lVas part of Simla (M.C.). biDed popll1allon or 5imla \M,O.) and lutogn Cantonment fo[ 19H, 1921 and 1951 h",. ""en shown ag\\'n.t Simi .. (M.e.). •
The~com ..
I
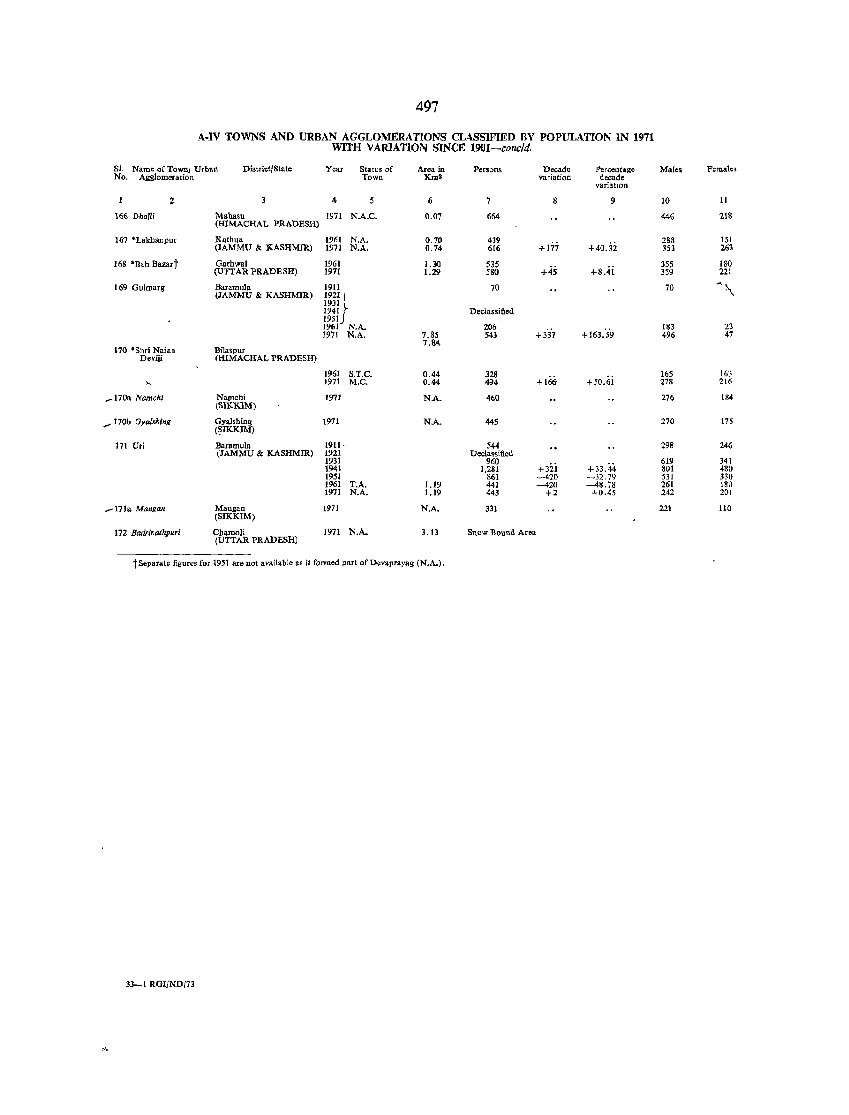
497
A-IV TOWNS AND URBAN AGGLOMERATIONS CLASSIFIED BY POPULATION lN 1971 WITH VARIATION SINCE 1901-concld.
SI. Name of TownJ Urban District/State Year Status of Area in Persons Decade Percentage Male. Females No. Agglomeration Town Km' variation decade
variation
2 3 4 6 7 9 10 11
166 Dhalli Mabasu 1971 N.A.C. 0.01 664 446 218 (HIMACHAL PRADESH)
167 'Lakllanpur Kathua 1961 M.A. 0.70 439 +177 +4oji 2&8 151
(JAMMU & KASHMIR) 1971 N.A. 0.74 616 353 263
168 'Bah Baurt Garbwal 1961 1.30 535 +45 +8 • .ji
355 180 (U'ITAR PRADESH) 1971 1.29 580 359 221
169 Gulmarg Baramula 1911 7{) 70 "'~ (JAMMU & KASHMIR) 1921
1 1931
j 1941 Declassified 195J 1961 N.A. 206
+337 + 163:59 183 23
1971 N.A. 7.85 543 496 47 7.84
17{) 'SbriNaina Bi1aspur Deviji (HIMACHAL PRADESH)
1961 S.T.C. 0.44 328 165 163
" 1971 M.e. 0.44 494 +166 +50.61 278 21(i
,....170a Namchi Namchi (SIK.KIM)
1971 NA. 4()() 276 184
...... 1701> GyaJshing Gyalshing 1971 N.A. 445 270 175 (~JKKlM)
171 Uri Baramula 1911- 544 298 246 (JAMMU & KASHMIR) 1921 Declassifi~
193J 960 +3zi +33.44-
619 341 1941 1,281 801 480 1951 861 -420 -32.79 531 330 1961 T.A. 1.19 441 -420 -48.78 261 180 1971 N.A. 1.19 443 +2 +0.45 242 201
_Ina Mangan Mangan 1971 N.A. 331 221 110 (SIK.KIM)
172 Badrinalhpur; Chamoli 1971 'N.A. 3.13 Snow Bound Area (UTTAR PRADESH)
tSeparate figures for 1951 are not available as it formed part ofDevaprayag (N.A.).
33-1 RGI/ND/73

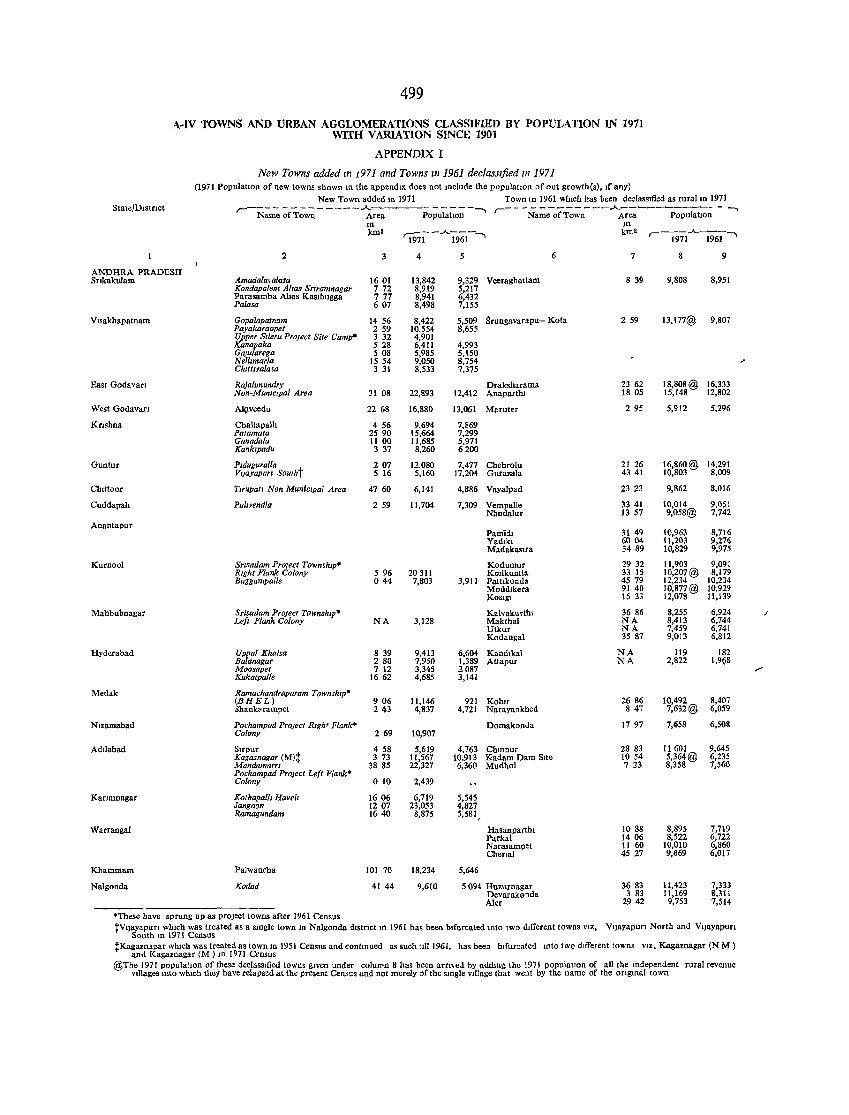
499
A-IV TOWNS AND URBAN AGGLOMERATIONS CLASSIFIED BY POPULATION IN 1971 WITH V ARlATION SINCE 1901
APPENDIX I
New Towns added m 1971 and Towns m 1961 declassified 1111971 (1971 PopulatIon of new towns shown in the appendIx does not Include the populatIOn of out growth(s), If any)
New Town added in 1971 Town In 1961 whIch has been dedassIfied as rural 10 1971 State/Dlstnct ~-----------"",-,
Name of Town Area ----- ......
Populahon r------------- A ------------ --,
Name of Town Area Population In m kID2 '1971-.A.1%i-' km2
r--197i.A. 1961"
2 3 4 5 6 7 9
ANDHRA PRADESH Srlkakulam Amadala. alasa 1601 13,842 9,329 Veeraghattam 839 9,808 8,951
Kondapalem Al,as Snramnagar 772 8,919 5,217 Parasamba Altas Kaslbugga 777 8,941 6,432 Pa/asa 607 8,498 7,155
Vlsakhapalnam Gopalapatnam 1456 8,422 5,509 Srungavarapu- Kola 259 13,177@ 9,807 Payakaraopel 259 10,554 8,655 Upper Slleru Project Site Camp· 3 32 4,901 Kanapaka 528 6,411 4,993 Gajularega 508 5,985 5,150 Nel/lmarla 1554 9,050 8,754 Chlltlvalasa 3 31 8,533 7,375
East Godavari RaJahmundry Draksharama 2362 18,808@ 16,333 Non-MUniCIpal Area 31 08 22,893 12,412 Anaparthl 1805 15,148 12,802
West Godavari A19veedu 2268 16,880 13,061 Milruter 295 5,912 5,296
Knshna Cballapalh 456 9,694 7,869 Patamata 2590 15,664 7,299 Gunadala 11 00 11,685 5,971 Kanklpadu 337 8,260 6200
Guntur Plduguralla 207 12,080 7,477 Chebrolu 21 26 16,860@ 14,291 Vljayapurz Southt 5 16 5,160 17,204 Gurazala 4341 10,803 8,009
Chlttoor Tzrupatl Non MuniCIpal Area 4760 6,141 4,886 Vayalpad 2323 9,862 8,016
Cuddapah Pullvendla 259 11,704 7,309 Vempalle 33 41 10,014 9,051 Nhndalur 1357 9,058@ 7,742
Anantapur Pami,h 31 49 10,963 8,716 Yarukl 6004 11,203 9,276 Madakasna 3489 10,829 9,975
Kurnool STlsaltam Pro/eel TownshIp. Kodumur 2932 11,903 9,091 RIghi Plank Colony 596 20311 Kollkuntla 33 15 lO,207@ 8,179 Buggampal/e 044 7,803 3,911 Patttkonda 4579 12,234 10,234
Moddlkera 91 40 10,877@ 10,929 ,KOSlgt 1533 12,078 11,139
Mahbubnagar Sri'OJlam Project Townsh,p' Kalvakurthl 36 86 8,255 6,924 Left Flank Colony NA 3,128 Makthal NA 8,413 6,744
Utkur NA 7,459 6,741 Kodangal 35 87 9,013 6,812
Hyderabad Uppal Khalsa 8 39 9,413 6,604 Kandlkal NA 119 182 Balanagar 280 7,950 1,389 Attapur NA 2,822 1,9(>8 Moosapet 7 12 3,345 2087 ,.., Kukatpalle 1662 4,685 3,141
Medak Ramachandrapllram Townsh,p' (BHEL) 906 11,146 921 Kohtr 2686 10,492 8,407 3hAnknampet 243 4,837 4,721 Narayankhed 847 7,632@ 6,059
Nlzamabad Pochampad Project RIght Flank" Domakonda 1797 7,658 6,508 Colony 269 10,907
Adtlabad Slrpur 458 5,619 4,763 Chmnur 28 83 11 601 9,645 Kagcunagar (M)t 373 11,567 10,913 Kadam Dam SIte 1054 5,364@ 6,235 Mandamarrz 3885 22,327 6,360 Mudhol 723 8,358 7,560 Pochampad Project [eft Flank· Colony 010 2,439
Karunnagar Kothapalll Havell 1606 6,719 5,545 Jangaon 1207 23,053 4,827 Ramagundam 1640 8,875 5,581,
Warrangal Hasanparthl 1088 8,895 7,719 Parka! 1406 8,522 6,722 Narasampet II 60 10,010 6,860 Cberlal 4527 9,669 6,017
Khammam Palwancha 101 70 18,234 5,646
Nalgonda Kodad 41 44 9,610 5 094 Huzurnagar 36 83 11,423 7,333 Devarakonda 3 83 11,169 8,311 Aler 2942 9,753 7,514
'These have sprung up as project towns after 1961 Census tVIJayapufl whIch was treated as a smgle town ID Nalgonda dls(nct m 1961 has been bIfurcated mID two dIfferent towns VIZ, V'JayapuCl North and VIJayapuCl
South ID 1971 Census tKagaznagar whIch was treated as town In 1951 Census and contmued
and Kagaznagar (M) m 1971 Census as such 111l1961, has been bIfurcated mto two different town, VIZ. Kagaznagar (N M )
@The 1971 populatIOn of these declassIfied towns glven under coluron 8 has been armed by addmg the 1971 populallon of all tbe mdependent rural revenue VIllages mto wluch they have relapsed at the present Census and not merely of the slDgle vtllage that went by tbe name of the ongmal (own
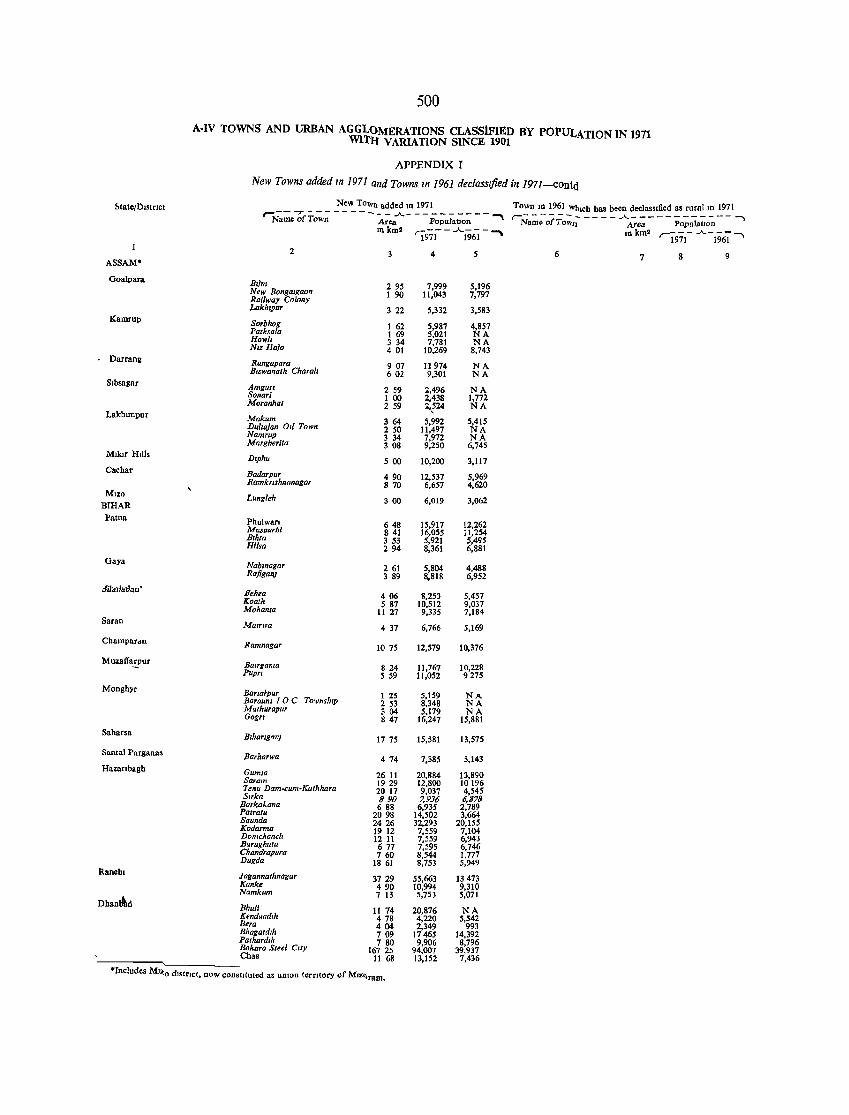
!>taleID,strlct
ASSAM·
Goalpara
Kamrup
Darrang
Slbsagar
Lakhllupur
Mllor HIlls
Cachar
M,zo
BIHAR Palna
Gaya
Saran
Cbampardn
Monghyr
Sabarsa
Santal Parganas
Hazarlbagb
Ran.hl
500
A·IV TOWNS AND URBAN AGGLOMERATIONS CLASSiFIED BY POPULATION IN 1971 WITH VARIATION SINCE 1901
APPENDIX I
New Towns added In 1971 and Towns In 1961 declassIfied in 1971--contd
New Towll added In 1971 Town 1D 1961 Wh,cb bas been declassIfied as rural 10 1971 ~----;- - -- - - ---- -..)\...- ----- ----~ r-_- - - - -- - -- - - .A.--- ---------., Name of Town Area PopuiatJon Namo ofTo"'n Area Populalwn
Inkm' '1971- - ..A..i"961 - ..... 1D km2 '1971- .A.-1961'
2 4 5 6 7 8 9
BIJm 295 7,999 5,196 New Bongalgaon 1 90 11,043 7,797 Railway Colony Lakh,pur 322 5,332 3,583
Sorbhog 1 62 5,987 4,857 Pathsala I 69 5,021 NA Howll 3 34 7,781 NA NIZ RaJo 401 10,269 8,743
Rangapara 907 11974 NA Blswanath Charall 602 9,301 NA
AmguTl 259 2,496 NA Sonarl 100 2,438 1,772 Moranhat 259 2,:24 NA
Makum 364 5,992 5,415 Dullajan Oil Town 250 11,497 NA Namrup 334 7,972 NA Margherlta 308 9,250 6,745
Dlphu 500 10,200 3,117
Badarpur 490 12,537 5,969 RamkTlshnonagor 870 6,657 4,620
Lungleh 300 6,019 3,062
Phulwan 648 15,917 12,262 MllSourJIi 841 16,055 1l,254 Blhta 3 53 5,921 5,495 Hllsa 294 8,361 6,881
Nabtnagar 261 5,804 4,488 RaftgafIJ 3 89 8.818 6,952
Beneo 406 8,253 5,457 Kaalh 5 87 10,512 9,037 Mohama 11 27 9,335 7,184
Mazrwa 4 37 6,766 5,169
Ramnagar 1075 12,579 10,376
Barrgama 824 11,767 10,228 PUPTI 5 59 11,052 9275
BaTlarpur I 25 5,159 NA Baraum 10 C TownshIp 2 53 8,348 NA Mathurapur 304 5,179 NA Gogr! 847 16,247 15,881
B,hartgal1l 177S 15,581 13,575
Barharwa 474 7,385 5,143
Gumla 26 11 20,884 13,890 Saram 1929 12,800 10196 1 enu Dam-cunz-Kathhara 20 17 9,037 4,545 SITka B JJO 7.JJ36 4878
Barkaf..ana 688 6,935 2,789 Patratu 2098 14,502 3,664 Saunda 2426 32,293 20,155 Kodarnza 19 12 7,559 7,104 Domcnanch 12 11 7,559 6,943 Barughulu 677 7,595 6,746 Chanrirapura 760 8,544 1,777 Dugda 18 61 8,753 5,949
Jagannathnagar 3729 55,663 13473 Kanke 490 10,994 9,310 Namkum 7 13 5,753 5,071
Bhull 11 74 20,876 NA Kenduadllt 478 4,220 5,542 BeTa 404 2,349 993 Bhagatdlh 709 17465 14,392 Pathardlh 780 9,906 8,796 Bokara Steel C,ty 16725 94,007 39,937 Chas 1168 13,152 7,436
*Includes MJ~o dIstrict" now conshtuted as unIon terrJtory of Mlz()ram.
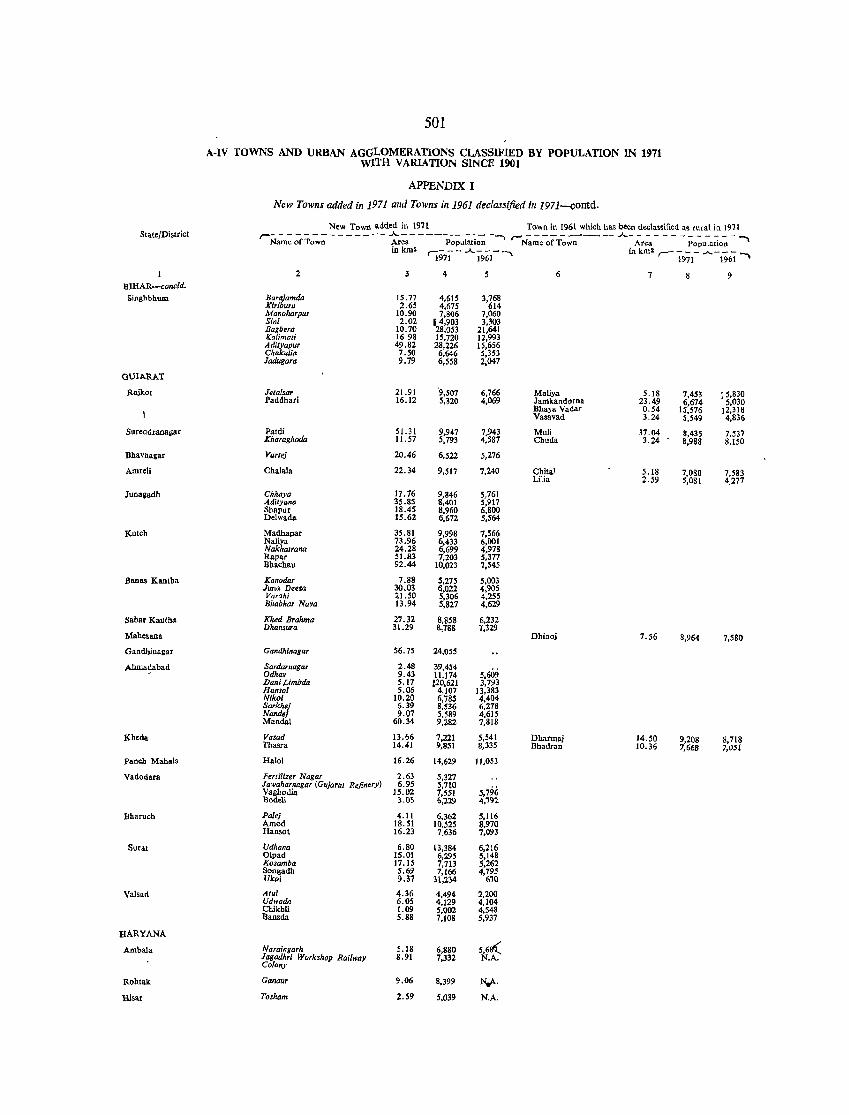
501
A-IV TOWNS AND URBAN AGGLOMERATIONS CLASSIFIED BY POPULATION IN 1971 WlTH V ARlATION SINCE 1901
APPENDIX I
New Towns added in 1971 and Towns in 1961 declassified in 1971-contd.
New Town added in 1971 Town in 1961 wllich has been declassified as rural io. 1971 State/District r-- - - ---- _____ --..A.o-----____ -, r- -----____ .A._ - - - - - - - - - - --
Name of Town Area PopuLation Name of Town Area PopulatioD ~ in km2 .-:- - - .A..- - - , in km' ,--- - - _ .A.- __
1971 1961 1971 1961 "'"
2 4 6 7 8 9 BIHAR-cone/d.
5inghbhwn Barajamda 15.77 4,615 3,m Kiriburu 2.65 4,675 Manoharpur 10.90 7,806 1,060 Sini 2.02 14,903 3,303 Hagbera 10.70 28,053 21,641 Kalimati 16.98 15,720 12,993 Adityapur 49.82 28,226 15,656 Chakulia 7.50 6,646 5,353 Jadugora 9.79 6,558 2,047
GUIAI.tAT
Rajkot Je/al.ar 21.91 '9,507 6,766 Maliya 5.18 7,453 ; 5,830 Paddhari 16.12 5,320 4,069 Jamkandc>rna 23.49 6,674 5,030
Bhaya Vadar 0.54 15,576 12,318 Vasavad 3.24 5.549 4.836
Surendranagar Paldi 51.31 9.947 7.943 Mu1i 31.04 8.435 1,537 Kharaghoda 11.57 5,793 4,587 Chuda 3.24 .
8,988 8,150
Bhavnagar VaT/ej 20.46 6,522 5,276
Amreli Chalala 22.34 9,517 7,240 Chita! 5.18 7.080 7,583 Lilia 2.59 5,031 4.271
Junagadh Chhoya 17.76 9,846 5,761 Adityana 35.85 8,401 5,917 Shapur 18.45 8,960 6,800 Delwada 15.62 6,672 5,564
Kutch Madhapar 35.81 9,998 7,566 Naliya 73.96 6,433 6,001 Nakhalrana 24.28 6,699 4,978 Rapar 51.83 7,203 5,317 Bh.chau 92.44 10,023 7,545
Banas Kantha Kanodar 7.88 5,275 5,003 JUlIa Deesil 30.03 6,022 4,905 Varahi 21.50 5,306 4,255 Bhabhar N ava 13.94 5,827 4,629
Sabar Kantha Khed Brahma 27.32 8,858 6,232 Dhan.ura 31.29 8,788 7,329
Mahesana Dhinoj 7.56 8,964 7,S80
Gandhinagar Gondhlnagar 56.75 24,055
Ahmadabad Sardarnagar 2.48 39,454 5,609 Odhav 9.43 11,174
Danl Llmbda 5.17 :20,621 3,793 Hansol 5.06 4,107 13,383 Niko/ 10.20 6,785 4,404 SorkheJ 6.39 8,536 6,218 Nondej 9.07 5,589 4,615 Mandai 60.34 9,282 7,818
Kheda Va.ad 13.66 7,221 5,541 Dharmaj 14.50 9,203 8,718 Thasra 14.41 9.851 8,335 Bhadran 10.36 7,668 7,OS1
Panch Mahals Halol 16.26 14,629 11,053
Vadodara Fertilizer Nagar 2.63 5,327 Jawaharnagor (Gujaral Refinery) 6.95 5,710
5,796 Vagho4ia 15.02 7,551 Bodeli 3.05 6,'129 4,792
Bharuch Palej 4.11 6,362 5,116 Amod 18.51 10,525 8,970 Hanset 16.23 7.636 7,093
Sural Udhana 6.30 13,384 6,216 Olpad 15.01 6,295 5,148 Kosamba 17.15 7,713 5,262 Songadh 5.69 7,166 4,795 Ukai 9.17 3l,234 670
Val.ad Atul 4.36 4,494 2,200 Ud.vado 6.05 4,129 4,104 Chikhli 1.09 5,002 4,548 Bansda 5.88 7,108 5,937
HARYANA
Ambala Naraingarh 5.18 6,880 5,6B( Jagadhri Workshop Railway 8.91 7,332 N.A. Colony
Rohtak Ganaur 9.06 8,399 rv--. Hisar Tosham 2.59 5,039 N.A.
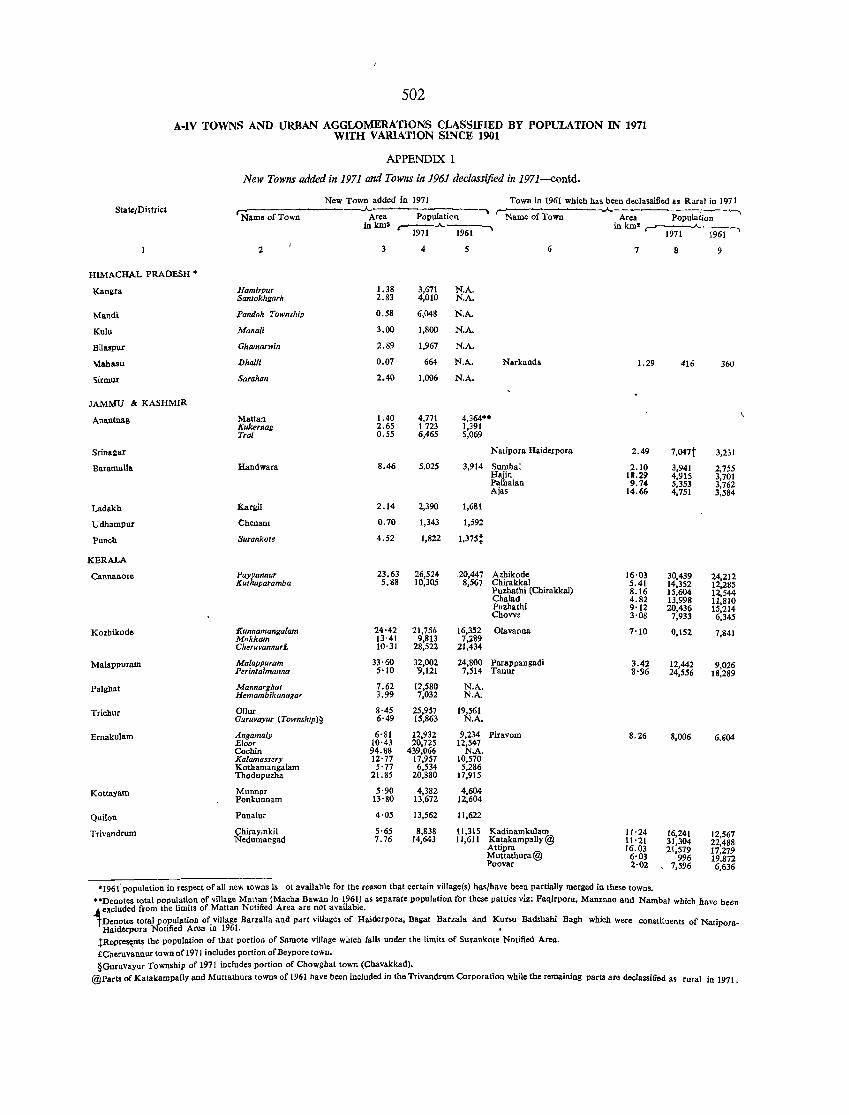
502
A-IV TOWNS AND URBAN AGGLOMERATIONS CLASSIFIED BY POPULATION IN 1971 WITH VARIATION SINCE 1901
APPENDIX I
New Towns added in 1971 and Towns in 1961 declassified in J97J--contd.
New Town added in 1971 Town in 1961 which has been declassified as Rural in 1971 Sta tel District
HIMACHAL PRADESH •
Kangra
Mandi
Kulu
Bilaspur
\1abasu
Sirmur
JAMMU & KASHMIR
Anantnag
Srinal:ar
Baramulla
Ladakh
Udhampur
Punch
KERALA
Cannanore
Kozhikode
Malappuram
Pa1ghat
Trichur
Ernakulam
Kottayam
Quilon
Trivandrum
Name of Town
2
Hamirpur Sanlokhgarh
Pandoh Township
Manali
Ghamarwin
Dhalll
Sarahan
Mattan Kukernag Tral
Handwara
KariPI
Chenaru
Surankote
Payyannur Kuthuparamba
oJ{unnamangalam Mnkkam Cheruvannur£
Malappuram Perintalmanna
Mannarghat Hemambikanagar
OJJur Guruvayur (Townshlp)~
Angamaly Eloor Cochin Kalamassery Kothamangalam Thodupuzha
Munnar Ponkunnam
Punalur
Chirayinkil Nedumangad
..A- , ..A.. Area Populati-;;;---' Area Population Name of Town
in kma '"1971.A. "l961' inkm' ---..A.. __ r- 1971 1961 '
3 4 5 6 7 8 9
1.38 3,671 N.A. 2.83 4,010 N.A.
0.58 6,048 N.A.
3.00 1,800 N.A.
2.89 1,967 N.A.
0.07 664 N.A. Narkanda 1.29 416 360
2.40 1,006 N.A.
1.40 4,771 4,364·· 2.65 1723 1,391 0.55 6,465 5,069
Natipora Haid"fpora 2.49 7,047t 3,231
8.46 5,025 3,914 Sumbal 2.10 3,941 2,755 Hajin 18.29 4,915 3,701 Palhalan 9.74 5,353 3,762 Ajas 14.66 4,751 3,584
2.14 2,390 1,681
0.70 1,343 1,592
4.52 1,822 1,315t
23.63 26,524 .20,447 Azhikode 16·03 30,439 24,212 5.88 10,305 8,567 Chirakkal 5.41 14,352 12,285
Puzhathi (Chirakkal) 8.16 15,604 12,544 Chalad 4.82 13,998 11,810 Puzhathi 9'12 20,436 15,214 Chovva 3'08 7,933 6,345
24·42 21,756 16,352 Olavanna 7'10 0,152 7,841 13·41 9,813 7,289 10·31 28,522 21,434
33·60 32,002 24,800 Parappangadi 3.42 12,442 9,026 5'10 "9,121 7,514 Tanur 8'96 24,556 18,289
7.62 12,580 N.A. 3.99 7,032 N.A.
8'45 25,957 19,561 6'49 15,863 N.A.
6'81 12,932 9,234 Piravom 8.26 8,006 6,tli04 10'43 20,725 12,547 94.88 439,066 N.A. 12'77 17,957 10,570 5'77 6,534 5,286
2[,85 20,880 17,915
5'90 4,382 4,604 13'80 13,672 12,604
4'05 13,562 11,622
5'65 8,838 11,315 Kadinamkulam 11'24 16,241 12,561 7.76 14,643 11,611 Katakampally@ 11'21 31,304 22,488 Attipra 16.03 21,579 17,279 Muttathura @ 6'03 996 19,812 Poovar 2'02 7,596 6,636
'196( population in respect of all new towns is ot available for the r,,"son that certain village(s) has/have been partially merged in these towns.
"Denotes total popul!'ti?n of village Matl!,n (Macha Baw"n in ~961) as separate population for these patties viz: Faqirpora, Manznao and Nambal which have been .l excluded from the hnuts of Mattan NotJfied Area are not available. tDenotes total population of village Barzalla and Pdct village. of Haiderpora, Bagat Barzala and Kursu I3adshahi Bagh which were constituents of Natipora-
Haiderpora Notified Area in 1961. tRepres~ts the population of that portion of Samote village which falls under the limits of Surankote Notified Area.
£Cheruvannur town of 1971 includes portion of Bey pore town. §Guruvayur Township of 1971 includes portion of Chowghat town (Chavakkad).
@Parts of Katakampally and Muttathura towns of 1961 have been included in the Trivandrwn Corporation while the remaining parts are declassified a. rural in 1971.
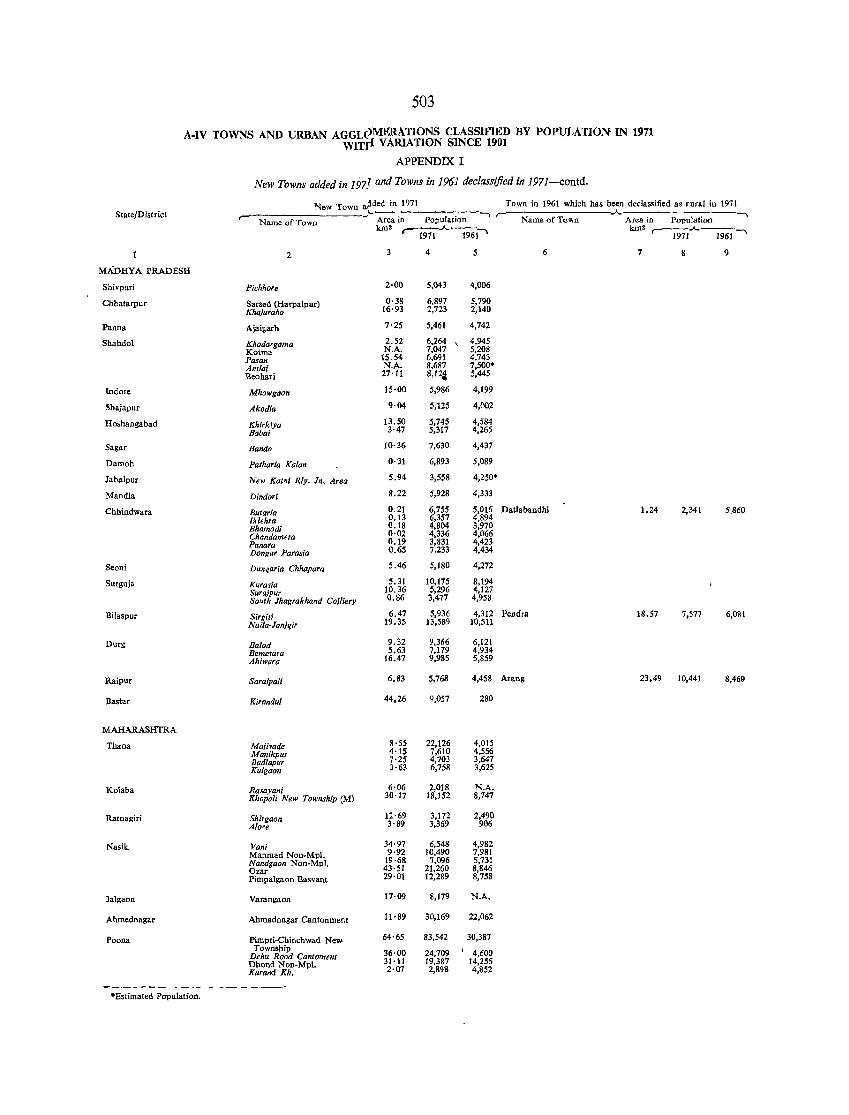
503
A-IV TOWNS AND URBAN AGGLC)MERATIONS CLASSIFIED BY POPULATION IN 1971 WlTJI VARlATlON SINCE 1901 .
APPENDIX I
New Towns added in 1971 and Towns in 1961 declassified in 197J-coutd.
State/District New Town a~ded in 1971 Town in 1961 which has been declassified as rural in 1971
.J- Area in ---, r- -"- ---Name of Town Population Name of Town Area in Population
km2 r-'!m-"-J%j> km2~_"__--1971 1961'
2- 3 4 5 6 7 8 9
MADHYA PRADESH
Shivpuri Pichhore 2·00 5,043 4,006
Chhatarpur Sarsed (Harpalpur) 0·38 6,897 5,790 Khqjuraho 16·93 2,723 2,140
Panna A.jaigarh 7·25 5,461 4,742
Shahdol Khodargama 2.52 6,264 \ 4,945 Kotrna N.A. 7,047 5,208 Pasan IS.54 6,691 4,743 Amlai N.A. 8,687 7,500· Beohari 27'11 8,12~ 5,445
Indore Mhowgaon 15·00 5,986 4,[99
5hajapur Akodia 9·04 5,125 4,002
Hoohangabad Khirkiya 13.50 5,745 4,584 Babai 3·47 5,317 ~,265
Sagar Bando 10·36 7,630 4,437
Damoh Patharia Kalan 0·31 6,893 5,089
Jabalpur New Kat"i Rly. In. Area 5.94 3,558 4,250*
Mandla Dindori 8.22 5,928 4,333
Chbindwara RUlaria 0.21 6,755 5,016 Datlabandhi 1.24 2,341 5.860 lklehra 0.13 6,357 4,894 Bhamodi 0.18 4,804 3,970 Ch4llllameta 0·02 4,336 4,066 Panara 0.19 3,831 4,423 Dongar Parasia 0.65 7.233 4,434
Seoni Dun~arja Chhapara 5.46 5,180 4,272
Surguja Kura'Jia 5.31 10,175 8,194 Surajpur 10.36 5,296 4,127 South JhagTakhand Colliery 0.86 3,417 4,958
Bilaspur SiTgiti 6.47 5,936 4,312 Pendra 18.51 1,571 6,081 Naila.Janjf(ir 19.35 13,589 10,511
Durg Balod 9.32 9,366 6,121 Remetara 5.63 7,179 4,934 AhiwaTa 16.47 9,985 5,859
Raipur Saraipali 6.83 5,768 4,458 Arang 23.49 10,441 8,469
Bastar KiTandul 44.26 0,057 280
MAHARASHTRA
Thana Majivade 8·55 22,126 4,015 ManikpliT 4·15 7,610 4,556 BadlapuT 7·25 4,703 3,647 Kuigaon 3·63 6,758 3,625
Kolaba Rasayani 6·06 2,018 N.A. Khopoli New Towns/zip (M) 30·17 18,152 8,147
Ratnagid ShiTgaon 12·69 3,172 2,490 Alore 3·89 3,369 906
Nasik Van; 34·97 6,548 4,982 Manmad Non-Mpi. 9·92 10,490 7,981 Nandgaon Non-Mpl. 19·68 7,096 5,731 Ozar 43·51 21,260 8,846 Pimp"igaon Basvant 29·01 12,289 8,758
Jalgabn Varangaou 17·09 8,179 N.A.
Ahmednagar Ahmadnagar Cantonment 11·89 30,169 22,062
Poona Pimpri-Chinchwad New 64'65 83,542 30,387 Township 36·00 24,709 I 4,600 Dehu Road Cantomenl
Dhond Non·Mpi. 31·11 19,387 14,256 Klirand Kh. 2·07 2,898 4,852
-----·Estimated Population.
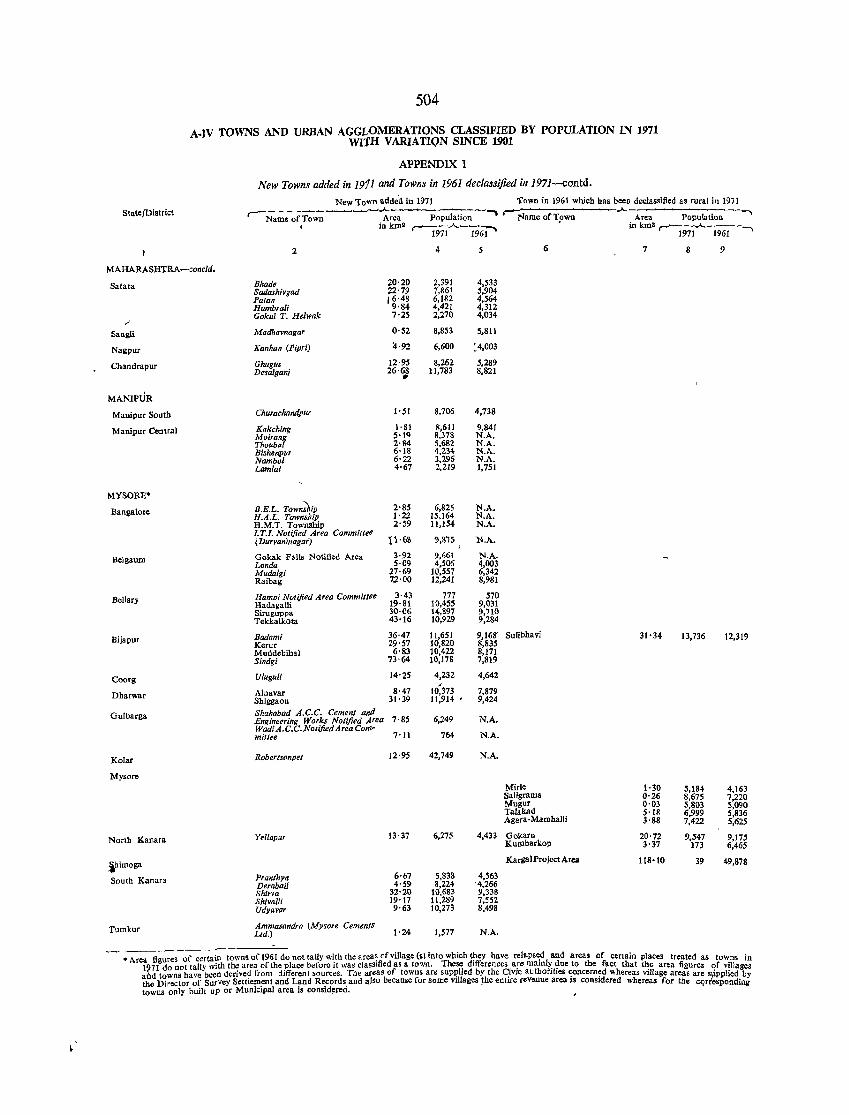
504
A.IV TOWNS AND URBAN AGGLOMERATIONS CLASSIFIED BY POPULATION IN 1971 WItH VARIATION SINCE 1901
APPENDIX 1
New Towns added in 1911 and Towns in 1961 declassified in 1971-contd.
New Town added in 1971 'fown in 1961 which has been declassified as rural in 1971 State/District ,-- --- .A.
"""'\ "---l"ame ofT,?wn .A.
Name of Town Area population Area Population -,
, in km2 ~.A.~ in km2 ~.A. ___ -,
1971 1961
2 4 5 6 7 8 9
MAHARASHTRA-concld.
Satara Bhade 20,20 2,391 4,533 Sadashivgad 22'79 7,861 5,904 Patan 16'48 6,182 4,564 HumbraU 9·84 4,421 4,312 Gokul T. He/wak 7'25 2,270 4,034
-' Sangli Madhavnagar 0,52 8,853 5,811
Nagpur Kanhan (Pipri) ~·92 6,600 : 4,003
Chandrapur Ghugus 12·95 8,262 5,289 Desaigal!i 26·68 11,783 8,821 ..
MANIPUR
Manipur South Churachandpur 1'51 8,706 4,738
Manipur Central Kakching 1·81 8,611 9,841
~'::~b~' 5'19 8,378 N.A. 2·84 5,682 N.A.
Bishenpur 6'18 4,234 N.A. Nambo/ 6'22 3,296 N.A. Lam/ai 4'67 2,219 1,751
MYSORE*
Bangalore B.E.L. Tawnihip 2'85 6,825 N.A. H.A.L. Township 1'22 15,164 N.A. H.M.T. Township 2'59 11,154 N.A. J.T.J. Notified Area Commillee
1Hi'O ( Durvaninagar) ~;i\')S N.h. I
Belgaum Gokak Fall. Notified Area 3·92 9,661 N.A. Londa 5·09 4,506 4,003 MUdalgi 27·69 10,557 6,342 Raibag 72·00 12,241 8,981
BeIlary HamlJi Notified Area Committee 3·43 777 570 Hadagalli 19·81 10,455 9,031 Siruguppa 30·06 14,897 9,710 TekkalkOta 43'16 10,929 9,284
Bijapur Badami 36·47 11,651 9,168 Sulibhavi 31'34 13,736 12,319 Kerur 29'57 10,820 8,835 Muddebihal 6'83 10,422 8,171 Sindgi 73'64 10,178 7,819
Coorg Ulugu/i 14'25 4,232 4,642
Dbarwar Alnavar 8'47 10:373 7,879 Sbiggaon 31'39 11,914 • 9,424
Gulbarga Shahabad A.C.C. Cement alia Engineering Works Notified Area 7,85 6,249 N.A. WadiA.C.C.NotifiedAreaColfl-mittee 7'11 764 N.A.
Kolar RobertsMpet 12·95 42,749 N.A.
Mysore Mirle 1·30 5,184 4,163 Saligrama 0·26 8,675 7,220 Mugur 0·03 5,803 5,090 Talakad 5·18 6,999 5,836 Agata-MambaUi 3'88 7,422 5,625
North Kanara Yellapur 13·37 6,275 4,433 Gokarn 20'72 9,547 9,175 KUOlbarkop 3'37 173 6,465
lbimoga KargalPro/ectArea 118'10 39 49,878
South Kanara Pranthya 6·67 5,838 4,563 DerOOail 4·59 8,224 '4,266 Shirva 32'20 10,683 9,338 Shivnlli 19'17 11,289 7,552 Udyavar 9'63 10,273 8,498
Tumkur Ammasandra (Mysore Cements 1'24 1,577 N.A. Ltd.)
• A.rea figures of certa\" towns of 1961 do not tally w~th the area~ of village (sl into which t!'ey have relap~ and areas of certain places treated as towns in 1971 do not tally wJth th~ area of the .place before It was classified as a town. Thes~ differences. are maInly' ~ue to the fact that the area figures of villages and towns have been denved from different sourceS. The areas of towns are sUPl?hed by the C:IVlC authonl1es ~oncern~d whereas village areas are sllPplied by the Director o~ Survey Settle!D~nt and L!,nd Re,cords and also because for some villages lhe enure revenue area IS conSidered whereas for tbe c<{rtesponding towns only bwlt up or MuniCIpal area IS conSld~red. ,
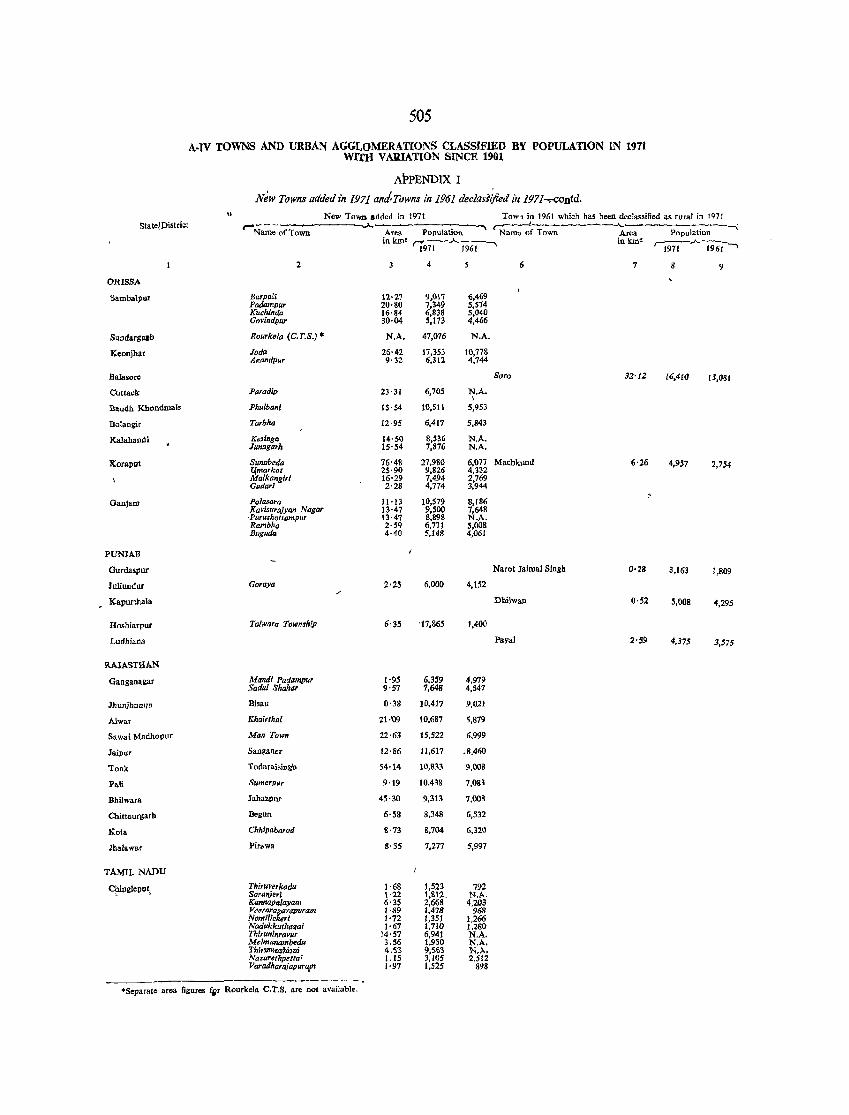
505
A.IV TOWNS AND URBAN AGGLOMERATIONS CLASSIFIED BY POPULATION IN 1911 WITH VAaIATlON SINCE 1901
AFPENDIX I
New Towns added'in 1971 and-Towns in 1961 declassl;red if! 1971,.contd. Ii New Town added in ]971 Town ip 1961 which has been declassJfied as rural in 197:
State/District .;... ""'-~--- ... -; Name of Town Area Population Name of Town Area Population
in kIDa ~.A.i961---" in kma 'l97l.A.1%I-' 2 4 6 7 8 9
ORISSA
Sambalpllf Barp"li 12·27 9,Ol7 6,469 Padampur 20'80 7,349 5,574 Kuchinda 16·84 6,838 5,040 Govlndpur 30·04 5,113 4,466
Sundu!l@b Rourkela (C.T.S.) • N.A. 47,016 N.A.
Keonjhar Jod" 26·42 17,353 10,778 Anandpur 9·32 6,312 4,744
BaTasorc Soro 32-12 16,4l0 13,081
Cutlack Paradip 23'31 6,705 N.A. \
Baudh Khondnlals Phulbanl 15·54 10,511 5,953
Bo!angir TarMa 12·95 6,411 5,843
Ka!ahandi Ke;singc 14-50 8,536 N.A. Junaga,h 15'54 7,816 N.A.
KoraPlIt 8zmabeda 76'48 27,980 6,077 Macbkjllld 6·26 4,957 2,754 l:{markot 25·90 9,826 4,332 Malkallgiri 16'29 7,494 2,769 Gudarl 2'28 4,774 3,944
Ganjam Polasara 11-13 10,579 8,186 Kav;surajyan Nagar 13·47 9,500 7,648 'Purushottompur 13·47 8,898 N.A. Rambha 2·59 6,771 5,008 Bugud4 4·40 :5,148 4,061
PUNJAB
Ourdaspur NarDI 1aimal Singh 0'28 3,163 1,809
Iullundur Goraya 2·25 6,000 4,152
Kapurthala DhlIwan 0'S2 5,008 4,295
Hoshiarpur Taiwara Township 6'35 '17,865 1,400
Ludbiana PayaJ 2-59 4,375 3,575
RAJASTHAN
Oanganagar Mandl Padampur 1·95 6,359 4,979 Sadul Shahar 9'57 1,648 4,547
Jhunjbunqn Bisau 0·38 10,417 9,021
Alw", Khairthal 2H19 10,687 5,879
Sawa; Madhopur Man Town 22·63 15,522 6,999
Jaipur Sanganer 12·86 11,617 .8.460
Tonk Todara;>;ullb 54·14 10,833 9,008
Pali Sumerpur 9·19 10,438 7,083
Bhilwara Jahazpur 45·30 9,313 7.008
Chittaurgarh Begun 6'58 8,348 6,532
Kola Chhipabarod 8·73 8,704 6,320
Ihalawar Pirllwa 8·35 7,277 5,997
TAMIL NADU
cp.ingleput, Thiruverkadu 1·68 1,523 792 SoroJljeri 1-22 1,81:2. N ..... Kannapalayam 6'35 2,668 4,2lJ3 t~:m~I::rpuram 1'89 1,478 968
1·72 1,351 1,266 NadukkuthCll1ai 1-67 1,710 1.280 Thirunlnravur 14·57 6,941 N.A. Melmanambedu 3.56 1,950 N.A. Thi''''l»lUmsm <\..s'3 9,%3 N.h. Nazarethpetta{ 1.15 3,105 2.512 Varadharajapura,m 1'97 1.525 898
-_----.Separate area figures Fir Rourkela C.T.S. arc not available.
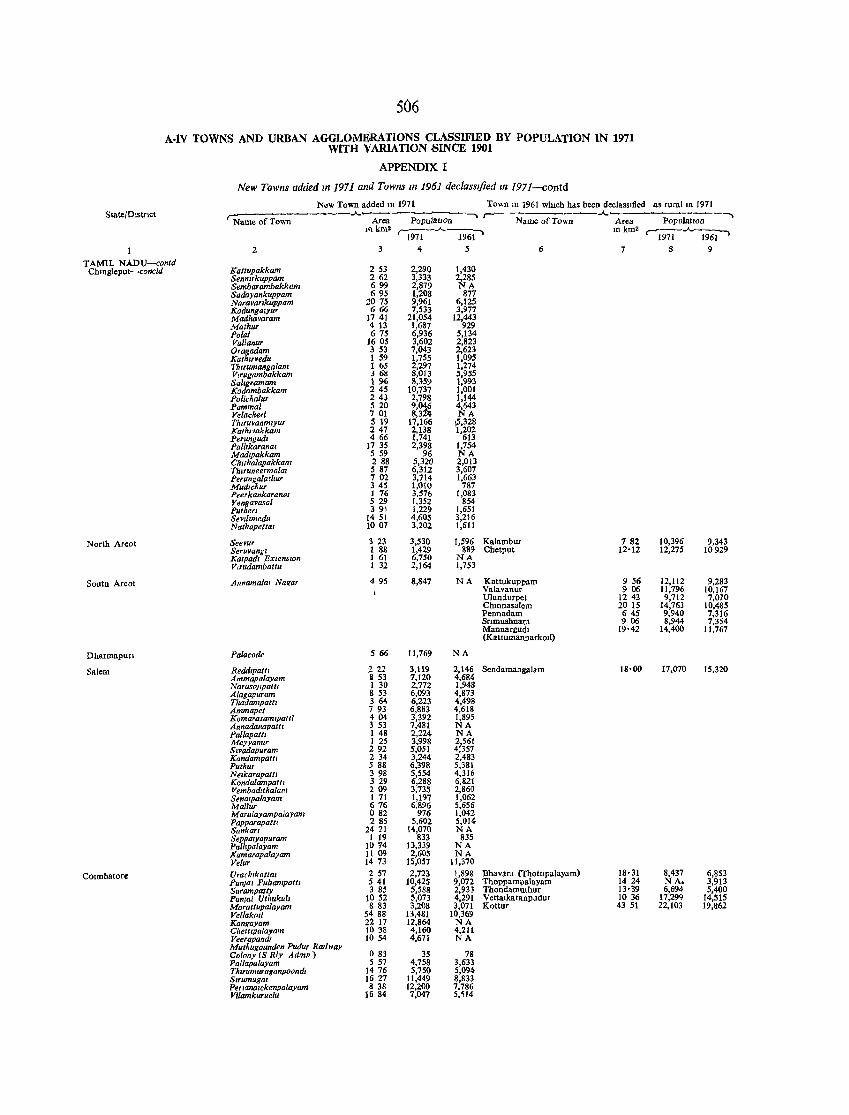
506
A·IV TOWNS AND URBAN AGGLOMERATIONS CLASSIFlED BY POPULATION IN 1971 WITH VARIATION SINCE 1901
APPENDIX I
New Towns added In 1971 and Towns In 1961 declassified In 1971--"Contd
New Town added m 1971 Town m 1961 wlnch has been declasSlfied as rural m 1971 State/D,stnct .A. --. .A. --.
Name of Town Area PopulatJon Name of Town Area PopulatIOn lAkm2 'im-.A.i%i' mkm2
r-'J971~6i' 2 4 5 6 7 8 9
TAMIL NADU-eontd Chmgleput-concld Kattupakkam 253 2,290 1,430
Senmrkuppom 262 3,333 2,285 Sembarambakkam 699 2,879 NA Sadayankuppam 695 1,208 877 Natavankuppam 2075 9,961 6,125 Kodunga,yur 666 7,533 3,977 Madhavaram 1741 21,054 12,443 Mathur 413 1,687 929 Polal 67S 6,936 5,134 Vallanur 16 05 3,602 2,823
~~~G:'~du 353 7,043 2,623 1 59 1,755 1,095
Thuumalfgalam 165 2,297 1,274 V"ugambakkam 3 68 8,013 5,955 Sal,gramam 196 8,359 1,993 Kodambakkam 245 10,737 1,001 Polichalur 243 2,798 1,144 Pammal 520 9'm 4,643 Velacheri 7 01 8,3 NA Thlfuvanmlyur 5 19 17,166 p,328 Koth,vakkam 247 2,138 1,202 Perungud, 466 1,741 613 Palilkarana. 17 35 2,398 1,754 Mad.pakkam 5 59 96 NA ChIfhalapakkam 288 5,320 2,013 ThJruneermalaz 587 6,312 3,607 Perungalathur 702 3,714 1,663 Mud,ehur 3 45 1,010 787 Peerkankaranal 1 76 3,576 1,083
~~~G:,~asQl 529 1,352 854 391 1,229 1,651
Sevlltmedu 1451 4,605 3,216 Nothapettal 1007 3,202 1,611
North Areot Seevur 3 23 3,530 1,596 Kalambur 782 10,396 9,343 Seruvangl 1 88 1,429 889 Chetput 12'12 12,275 10929 Katpad, ExtenSIOn 1 61 6,750 NA Vtrlldamballu 1 32 2,164 1,753
South Areot Annama/m Nartar 495 8,847 NA Kattukuppam 956 12,112 9,283 Valavanur 906 11,796 10,167 Uluncturpet 1243 9,712 7,070 Chmnasalem 20 15 14,763 10,485 Pennadam 645 9,940 7,316 Snmushnam 906 8,944 7,354 Mannargudl 19·42 14,400 11,767 (Kattumannarkotl)
DharlllapuCl Palacode 566 11,769 NA
Salem ReMlpattl :1. 22 3,119 2,146 Sendamangalam 18'00 17,070 15,320 Ammapalayom S 53 7,120 4,684 NaraSOjlpattl I 30 2,772 1,948 Alagapuram 8 53 6,093 4,873 Thadompattl 364 6,223 4,498 Ammapet 793 6,883 4,618 Komarasamlpattl 404 3,392 1,895 Annadanapatll 3 53 7,481 NA Pallapattl 1 48 2,224 NA Meyyanur J 25 3,998 2,561 S,vadapuram 292 5,051 4,357 Kandampattl 234 3,244 2,483 Pathur 5 88 6,398 5,381 Nelkarapattl 3 98 5,554 4,316 KtJndaiampaltl 329 6,288 6,821 Vemhadzthalam 209 3,735 2,860 Stnalpalayam 171 1,197 1,062 Mallur I) 76 6,896 5,656 Marulayampalayam 082 976 1,042 Papparapaltl 285 5,602 5,014 Sanka" 2421 14,070 NA Seppatyapuram I 19 833 835 Paillpalayam 1014 13,339 NA Kumarapalayom 1109 2,605 NA Velur 14 73 15,057 11,370
COlmbatore Uraclllkotta. 257 2,723 1,898 Bha vam (Thotllpalayam) 18·31 8,437 6,853 Pun}al Puhampattl S 41 10,425 9,072 Thoppampalayam 1424 NA. 3,913 Surampatty 3 85 5,588 2,933 Thondawuthur 13·39 6,694 5,400 Pun/ai Uthukull 1052 5,073 4,:1.91 Vettalkaranpudur 1036 17,299 14,515 Motatlupalayam 883 3,208 3,071 Kottur 4351 22,103 19,862 Vellakntl 54 88 13,481 10,369 Kangayam 22 17 12,864 NA Cilempalayam 1038 4,160 4,211 Veerapandl 10 S4 4,671 NA Muthugounden Pudu, Ra.lway
o 83 Colony (S Rly Admn) 35 78 Pallapalayam 5 57 4,758 3,633 Thltumuruganpoond, 1476 5,750 5,094 Srrumugal 16 27 11,449 8,833 PertanalCkenpalayam 8 38 12,200 7.786 Vilamkuruchl 16 84 7,047 5.~14
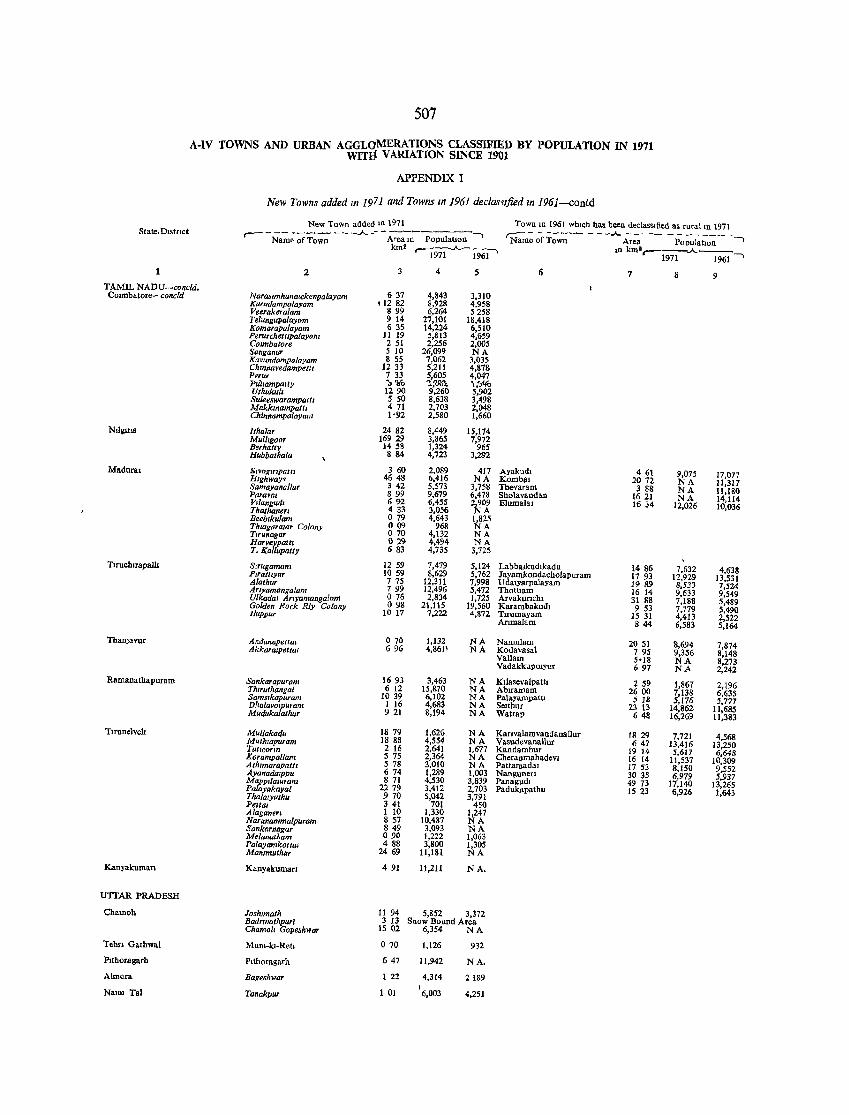
507
A-IV TOWNS AND URBAN AGGLOMERATIONS CLASSIFmD BY POPULATION IN 1971 WIT£( VARIATION SINCE 1901
APPENDIX I
New Towns added In 1971 and Towns In 1961 declasf//ied In 196}-contd
New Town add.,.} In 1971 Town In 1961 whIch has been declasSIfied as tural In 1971 Stater DlStnct ,-----------.A.--- , "Na"m~ ;r i';-w-;;- - - -.A- A"r; -_ - Po;;';"-;;- -, Name of Town Area In PopulaUon
km> r----.A.- - - 10 km" ,----.A. ___ 1971 1961' 1971 1961 '
2 4 5 I) 7 8 9 TAMIL NADU-concld. COlmbatore- concld Nara;.mhanarckenpalayarn 637 4.843 3,310
Kurudampalayom ,12 82 8,928 4,958 Veerakeralam 899 6.264 5258 Telungupalayom 9 14- 27,101 18,418 Komarapalayam 635 14,224 6.510 Perurchettrpalayam 11 19 5.813 4,659 COl11fbatore 251 2,256 2,005 Sanganur 5 10 26.099 NA Kavundampolayam 8 55 7,062 3,035 Chmltavedampell. 12 33 5,211 4,878 Ptrur 7 33 ~,60~ 4.047 Pu~.ampatty 'b'M> .i.%O.l. 11,~fiflJ
Uthakul. 1290 9.260 5,902 Suleeswarampatt. 550 8,638 3,498 Makkmampatt. 471 2,703 2,048 ChlnltDmPalayam 1'92 2,580 1,660
Nllgms lthaTa, 24 82 8.449 15,174 Mulltgoor 16929 3,865 7.972 Berhattv 14 58 1.324 965 HubbathaTa 884 4.723 3.292
Madural &1~agITlpattl 3 60 2,089 417 Ayakudl 4 61 9,075 17,077 H.ghway. 4648 6.416 NA Komb$l 2072 NA 11,317 Samayunallur 342 5,573 3,758 Thevaram 3 88 NA 11,180 Parava. 899 9,679 6,478 Sholavandan 1621 NA 14,114 Vllangud, 692 6,455 2,909 Elumalal 1634 12,026 10,036 Thathane" 4 33 3,056 NA Beeb.kulam 079 4,643 1,825 ThragaraJar Colony 009 968 NA Ttrunagar 070 4.132 NA Harveypalt< 029 4,494 NA T. Kallupatty 683 4,735 3,725
Tlruchtrapalh Strugaman, 1259 7,479 5,124 Labbatkudlkadu 1486 7,632 4,638 Plflltt.yur 1059 8,629 5,762 Jayamkondacholapuram 1793 12,929 13,531 Alathur 775 12,311 7,998 UdalYarpalayam 1989 8,533 7,524 Arryamangalam 799 12,496 5,472 ThottJam 16 14 9.633 9,549 Ulkadn. Arryamangaiam 076 2,834 1,725 Arvakunchl 31 88 7,188 5,489 Golden Rock Rly Colony 098 21,115 19,560 Karambakudl 9 53 7,779 5,490 [/uppur 10 17 7,222 4,872 Tuumayam 15 31 4,413 2,522 ArlllUllam 844 6,583 5,164
ThanJavur AndanapettUl 070 1,132 NA Nanmlam 2051 8,694 7,874 Akkara.pettal 696 4,8611 NA Kodavasal 79S 9.356 8.148 Vallam 5'18 NA 8,273 VadakkupolYur 697 NA 2,242 Ramanatbapuram Sankarapuram 16 93 3,463 NA Ktlasevalpatb 259 1,867 2.196 Thlruthangal 6 12 15.870 NA Ablramam 2600 7,138 6,635 Samslkapuram 1039 6,102 NA PalayampatU 5 18 5,176 5,777 Dhalav0'fauram 1 16 4,683 NA SelthU( 23 13 14,862 11,685 Muduka atkar 921 8,194 NA Watrap 648 16,269 11,383
Tlrnnelveh Mullakadu 1879 1,626 NA KanvalamvandanaUur 1829 7,721 4,568 MUlhlapuram 18 88 4,554 NA VasudevanaUur 647 13,416 13,250 Tutlcorzn 2 16 2.641 1,677 Kandambur 1914 5,617 6.648 Korampallam 5 75 2,364 NA Cheranmllbadevl 16 14 11,537 10,309 Athlma,apam 578 3,010 NA Pattamadal 17 53 8,150 9,552 Ayal10dmppu 674 1,289 1,003 Nangunen 30 35 6,979 5,937 MapP'[OJuram 871 4.530 3,839 Panaguw 49 73 17,140 13,265 Palayakayal 2279 3,412 2,703 Padukapatbu 15 23 6,926 1,643 ThalaIyUlhu 970 5.042 3,791 Pella. 341 701 450 Alal/ane" 1 10 1,330 1,247 Naranammalpuram 857 10.487 NA Sankarnaga, 849 3,093 NA Melanatham 090 1,222 1,063 Palayamkoltat 488 3,800 1,305 Mammuthar 2469 11.181 NA
Kanyakuman Kanyakumarl 491 11,211 NA.
UTTAR PRADESH
Chamoh Joshtmath 11 94 5,852 3,372 Badrrnalhpu,i 3 13 Snow Bound Area Chamolt Gopeshwa, 1502 6.354 NA
Tehn Gathwal MUDl-kt-ReU 070 1,126 932
PIthoragarh PIthoragarh 647 11,942 NA.
Almora Bageshwar 1 22 4,314 2189
Naml Tal Tanakpur 1 01 16,003 4.251
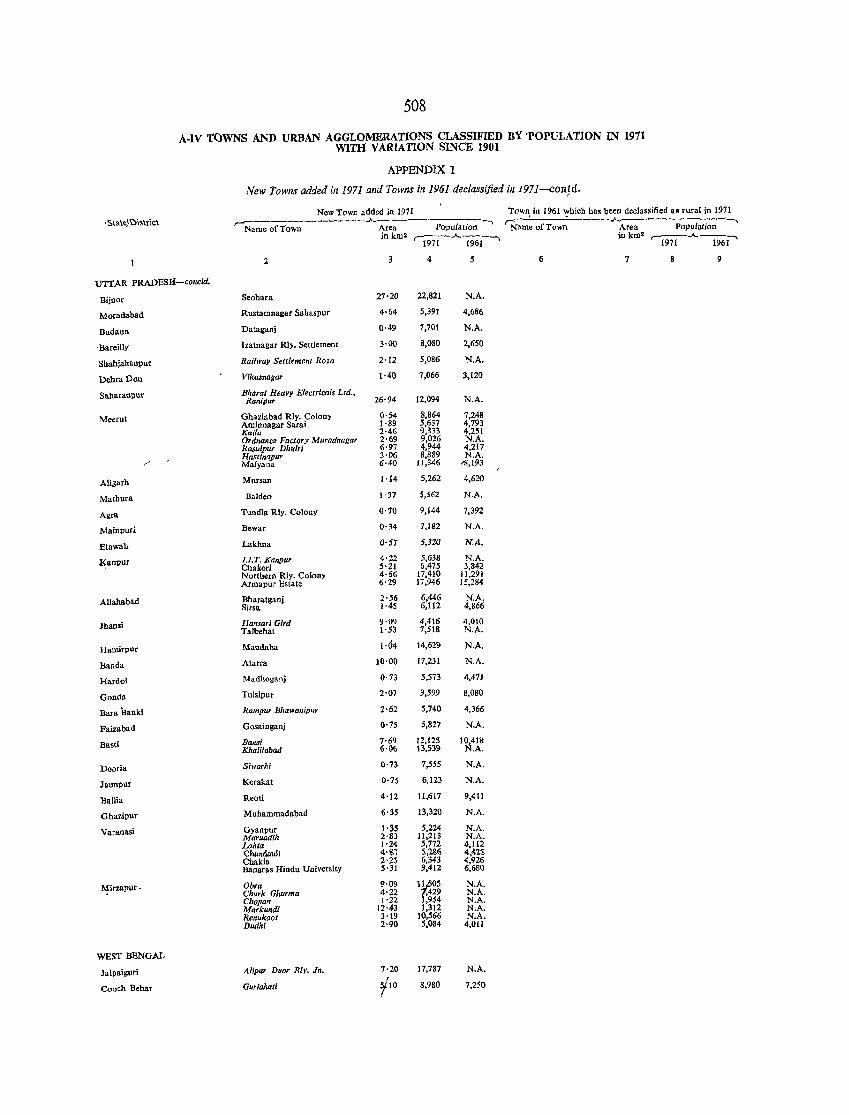
• Sta\eJDi3\t\c\
508
A-IV T()WNS AND URBAN AGGLOMERATIONS CLASSIFIED BY'POPULATION IN 1971 WITH VARIATION SINCE 1901
APPENDIX 1
New Towns added in 1971 and Towns in 1961 declassified in 1971--con!d.
Now Town added in 1971 TOwn in 1961 which has been declassified as rural in 1971 J....-------- ~:-.----J....-----------"'Name of Town Area Population ---- Name of Town Area Population -,
inkm2 r~.A.l%l-""" inkm2 ~.A.--1971 1961'
2 3 4 5 6 7 8 9
UTTAR PRADESH-concid.
Bijoor Seohara 27·20 22,821 N.A.
Moradabad Rustamnagar Sahaspur 4·64 5,391 4,686
Budaun Dataganj 0·49 7,701 N.A.
. Bareilly hatDagar Rly. Settlement 3·00 8,080 2,650
Shahjahanpur Railway Selllement Roza 2·12 5,086 N.A.
DehraDun Vika3nagar 1·40 7,066 3,120
Saharanpllf Bharat Heavy Electricals LId., 12,094 Ranipur 26·94 N.A.
Meerut Ghaziabad Rly. Colony 0·54 8,864 7,248 Aminnagar Sarai 1·89 5,637 4,793 Kaifa 2·46 9,333 4,251 Ordnance Faclory Muradnagar 2·69 9,026 N.A. Rasulpur DhHiri 6·97 4,944 4,217
,.- Hastinapu" 3·06 8,889 N.A. Malyana 6·40 11,346 -il,193
Aligarh Mursan 1·14 5,262 4,620
Mathura Baldeo 1·37 5,562 N.A.
Agra Tundl. Rly. Colony 0·10 9,144 7,392
Mainpuri Dewar 0·34 7,182 N.A.
Btawah Lakhna (l'S7 5,3Z(l N.A.
R;anpur 1.1. T. Konpur 4·22 5,638 N.A. Chakeri 5·21 6,475 3,842 Northern Rly. Colony 4·66 17,410 11,291 Armapur Estate 6'29 17,946 15,284
Allahabad Bharatganj 2·56 6,446 N.A. Sirsa 1·45 6,112 4,866
Jhansi Hansari Gird 9·09 4,416 4,010 Talbehat 1·53 7,518 N.A.
Hamirpur Maudaha 1·04 14,629 N.A.
Banda Atarra 10·00 17,231 N.A.
Hardoi Madhogani 0·73 5,573 4,471
Gonda Tulsipur 2·0') 9,599 8,080
Bara Bank; Rampur Bhawan;pur 2·62 5,740 4,366
Paizabad Gosainganj 0·75 5,827 N.A.
Basd Bans; 7·69 12,125 10,418 Khalilabad 6'06 13,539 N.A.
Deoria Siwarhi 0·73 7,555 N.A.
Jaunpur Kerakat 0·75 6,123 N.A.
Ballia Reoli 4'12 11,617 9,411
Gbazipur Muhammadabad 6·35 13,320 N.A.
Varanasi Gyanpur 1·;lS 5,224 N.A. Maruadih 2'S3 11,213 N.A. Loh/a 1·24 5,772 4,112 Chnllooull <1,·(1,1 5,2%1;'; 4,42S Chakia 2'25 6,343 4,926 Banaras Hindu University 5'31 9,412 6,680
Mirzapur- Obra 9·09 1~05 N.A. Churk Ghur11la 4'22 ,429 N.A. Chopan j'22 1,954 N.A. Markandi 12·43 1,312 N.A. Renukoot 3'19 10,566 N.A. Dudhi 2·90 5,084 4,01l
WEST BENGAL
Jalpaiguri Alipur Duor Rlv. In. 7·20 17,787 N.A.
Coooh Behar Gariahati 5/10 8,980 7,250 I
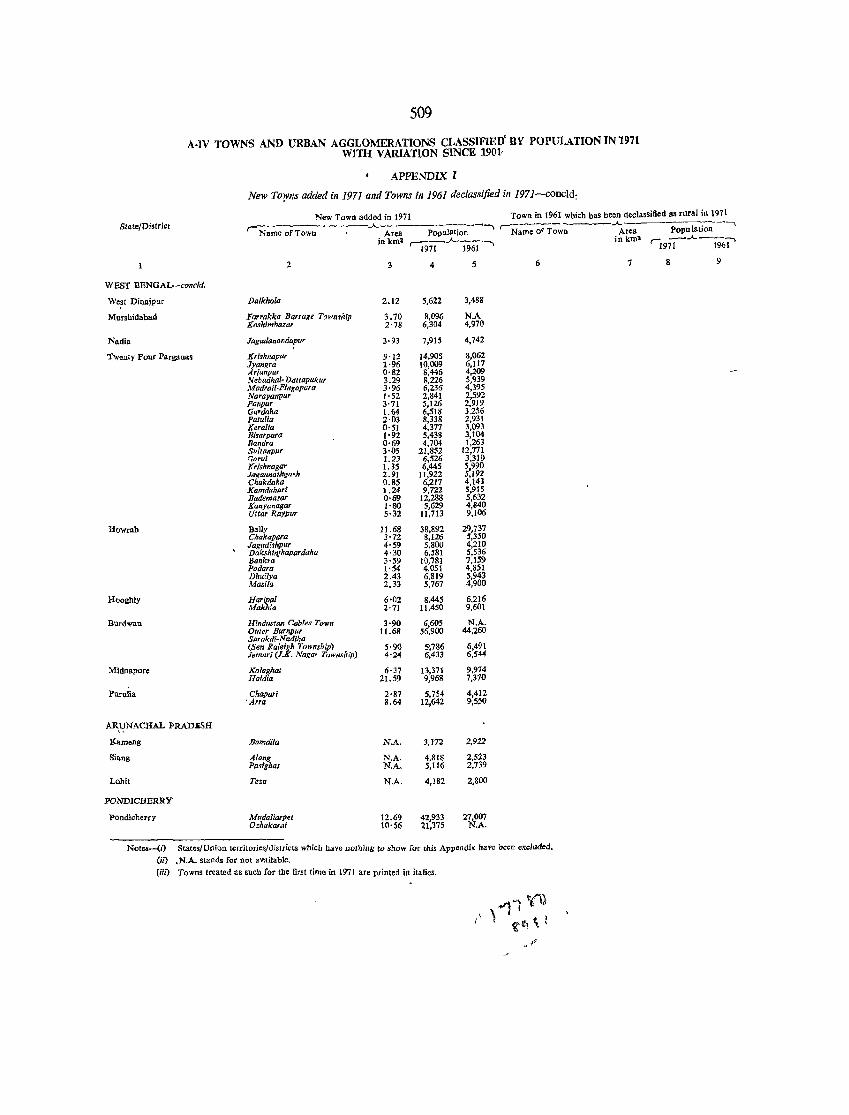
509
A.IV TOWNS AND URBAN AGGLOMERATIONS CLASSIFlED' BY POPULATIONlN1971 WITH V ARlATlON SINCE 190J,
APPENDIX I
New Totyns added in 1971 and Towns in 1961 declassified in 1971-concld:
New Town added in 1971 Town in 1961 wbich bas been declassified as rural in 1971
State/District 'Name of Town
..A..------------, , _____ -----.A-Area population Name of Town Area
in km2 r--"j9n--'-l%l' inkm2
2 3 4 5 6 7
WEST BENGAl-concld.
We~t Dinajpur Dalkhola 2.12 5,622 3,488
Mursbidabad Farrakka Barrage Township 3.70 R,096 N.A Kruhimbazar 2·78 6,304 4,970
Nadia Jagadanondapur 3·93 7,915 4,742
Twenty Four Parganas Krishnapur 9·12 14,905 8,062 Jyangra 1·96 10,009 6,117 Ar;unpur 0'82 8,446 4,209 N ebadhai· Dattapukur 3.29 B,226 5,939 Madrai{·Fingapara 3·96 6,236 4,395 Narayanpur 1·52 2,841 2,592 Panpur 3'71 5,17.6 2,919 Gurdaha 1.64 6,518 3.256 Patulia 2·03 8,338 2,931 Keratia 0'51 4,377 3,093 Blsarpara 1'92 5,438 3,104 Randra 0·69 4,704 1,263 Sultonpur 3·05 21,852 12,771 Garul 1.23 6,526 3,310 }{rishnagar 1. 35 6,445 5,990 Jagannathgm·h 2.91 11,922 5,192 C'akdaha 0.85 6,217 4,141 Kamdnhari 1.24 9,722 5,915 Bademasor 0·69 12,288 5,632 Kanyanagar 1·80 5,629 4,840 Uttar RaYPlir 5·32 11,713 9,106
Howrah Bally )1.68 38,892 29,737 Chakapara 3·72 8,126 5,350 Jagadishpur 4·59 5,800 4,210 Dakshi,yhapardaha 4·30 6,581 5,536 Bank,a 3'59 10,781 7,159 Podara 1'54 4,051 4,851 Dhuilya 2.43 6,819 5,943 Masila 2,33 5,767 4,900
Hooghly Haripal 6'02 8,445 6,216 Makhla 2·71 11,450 9,601
Burdwan Hindusfan Cable. Town 3'90 6,605 N.A. Outer Burllpur H.68 56,900 44,260 Sarakdi-Nadlha (Sen Raleigh Township) 5·90 5',786 6,491 Jemari (J.K. Naga, Township) 4·24 6,433 6,544
Midnapore Kolaghal 6·37 13,371 9,974 Haldla 21.59 9,968 7,310
Pnruiia Chapar! 2·87 5,754 4,412 'Arra 8.64 12,642 9,550
AR,t!NACHAL ]>RADliSH
Kameng Somdlla N.A. 3,172 2,922
Siang Along N.A. 4,818 2,5:23 Pasighal N.A. 5,116 2,739
Lobi! Tezu N.A. 4,182 2,800
PONDICHERRY
pondichcrry Mudaliarpet 12.69 42,933 27,007 Ozhukarai 10'56 21,375 N.A.
Not",,·-{O (ii)
(iii)
States/Union territories/districts which have nothing to show for this Appendix bave heen excluded,
,N.A. stands for not available.
Towns treated as such for tbe first time in 1971 are printed in italics.
population ..
'1971"""-1961'
9
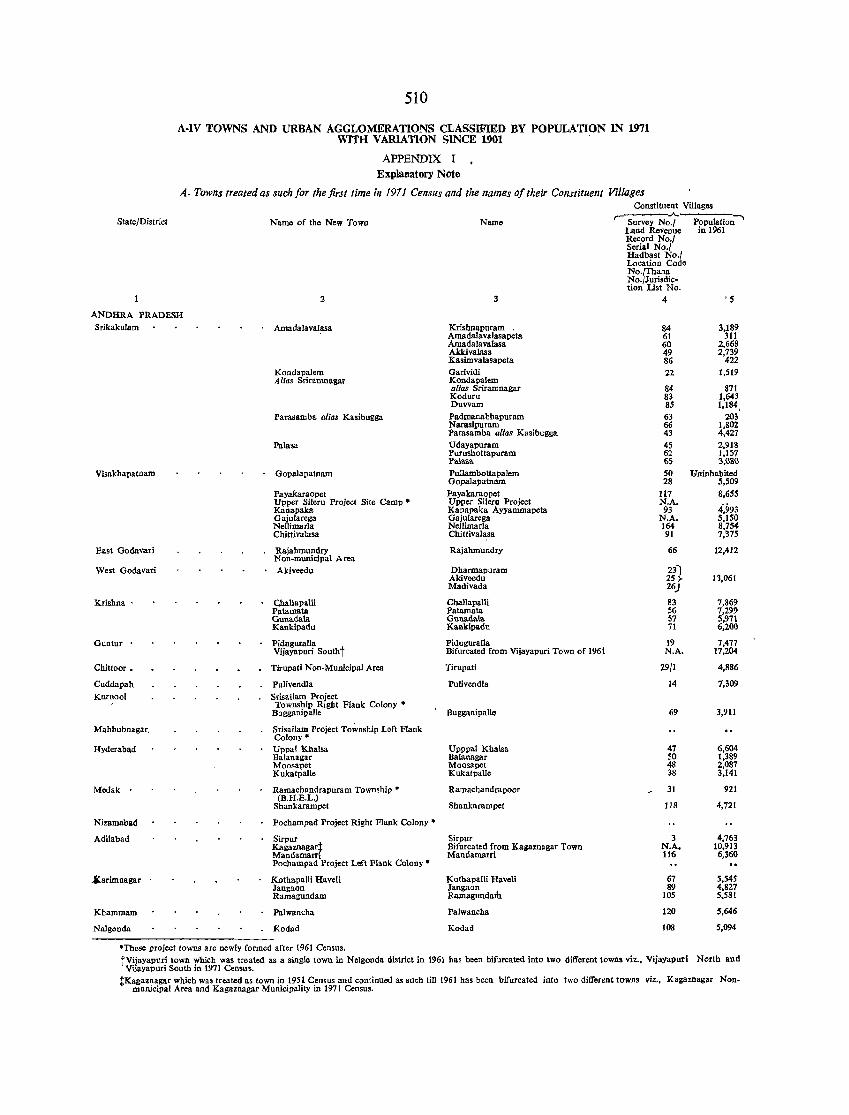
510
A-IV TOWNS AND URBAN AGGLOMERATIONS CLASSIFIED BY POPULATION IN 1971 WITH VARIATION SINCE 1901
APPENDIX I Explanatory Note
A. Towns treated as such for the first time in 1971 Census and the names of their Constituent Villages Constituent Villages
State/District
ANDHRA PRADESH Srikakulam
Visakhapatllam
East Godavari
West Goda varl
Krishna'
Guntur .
Chittoor.
Cuddapah Kumool
Name of the New Town
2
Amadalavalasa
Kondapalem A lias Sriramnagar
Parasamba alias Kasibugga
Palasa
Gopalapatnam
Payakaraopet Upper Sileru Project Site Camp • Kanapaka Gajularega Nellilllarla Chittivalasa
Rajahmundry Non-municipal Area Akiveedu
Challapalli Patamata GUlladaJa Kaukipadu
Piduguralla Vijayapuri Southt
Tirupati Non-Municipal Area
PuIivendIa SrisaHam Project
Name
3
Krishnapuram . Amadala va!asapeta Amadalavalasa AkkivaJasa Kasimvalasapeta Garividi Kondapalem alias Sriramnagar Koduru Duvvam
Padmanabhapuram Narasipuram Parasamba alias Kasihugga Udayapuram Purushottapuram l'alasa PulJambottapalcm Gopalapatnam
Payakaraopet Upper Sileru Project Kanapaka Ayyammapeta Gajulatega Nellimarla Chittivalasa
Rajahmundry
Dharmapuram Akiveedu Madivada
ChaUapalli l'atamata Gunada\a Kankipadu
PiduguraUa Bifurcated from Vijayapuri Town of 1961
Tirupati
Pulivendla
Township Right Flank Colony * Bugganipalle • Buggaoipalle
Mahbubnagar.
Hyderahad
Medak .
Nizamabad
Adilabad
~arimnagar .
Khammam
Nalgonda
Srisailam Project To';'nship Left Flank Colony * Uppal Khalsa Balanagar Moosapet Kukatpalle
Ramachandrapuram Township • (B.H.E.L.)
Shankarampet
Pochampad Project Right Flank Colony •
Sirpur Kagaznagart Mandamarri Pochampad Project Left Flank Colony * KothapatIi Haveli Jangaon Ramagundam
Palwancha
Kodad
'These project towns are newly formed after 1961 Census.
Upppal Khalsa BaJanagar Moosapet Kukatpalle
Ramacbandrapoor
Shankarampet
Sirpur Bifurcated from Kallaznagar Town Mandamarri
Kothapalli Haveli Jangaon Ramagundam
Palwancha
Kodad
r- .A. Survey No.,
Land Revenue Population-'
in 1961 Record No.1 Serial No./ Hadhast No~ Location Co e No./Thana No./Jurisdic-tion List No.
4 '5
84 3,189 61 311 60 2,668 49 2,739 86 422
22 1,519
84 871 83 1,643 85 1,184, 63 203 66 1,802 43 4,427
45 2,918 62 1,157 65 3,IlSIl SO Uninhabited 28 5,509
117 8,655 N.A.
4,993 93 N.A. 5,150 164 8,754 91 7,375
66 12,412
2fl 25 ;. 11,061 26)
83 7,869 56 7,299 57 5,971 71 6,200
19 7,477 N.A. 17,204
29/1 4,886
14 7,309
69 3,911
47 6,604 50 1,389 48 2,087 38 3,141
31 921
118 4,721
3 4,763 N.A. 10,913 116 6,360
67 5,545 89 4,827
105 5,581
120 5,646
108 5,094
tVijayapuri town which was treated as a single town in Nelgonda district in 1961 has been bifurcated into two different towns viz., Vijayapuri North and Vijayap uri South in 1971 Censu s.
tKagaznagar which was treated as town in 1951 Census and continued as such till 196 I has been bifurcated into two different towns viz., Kagaznagar Non_ municipal Area and Kagaznagar Municipality in 1971 Census.
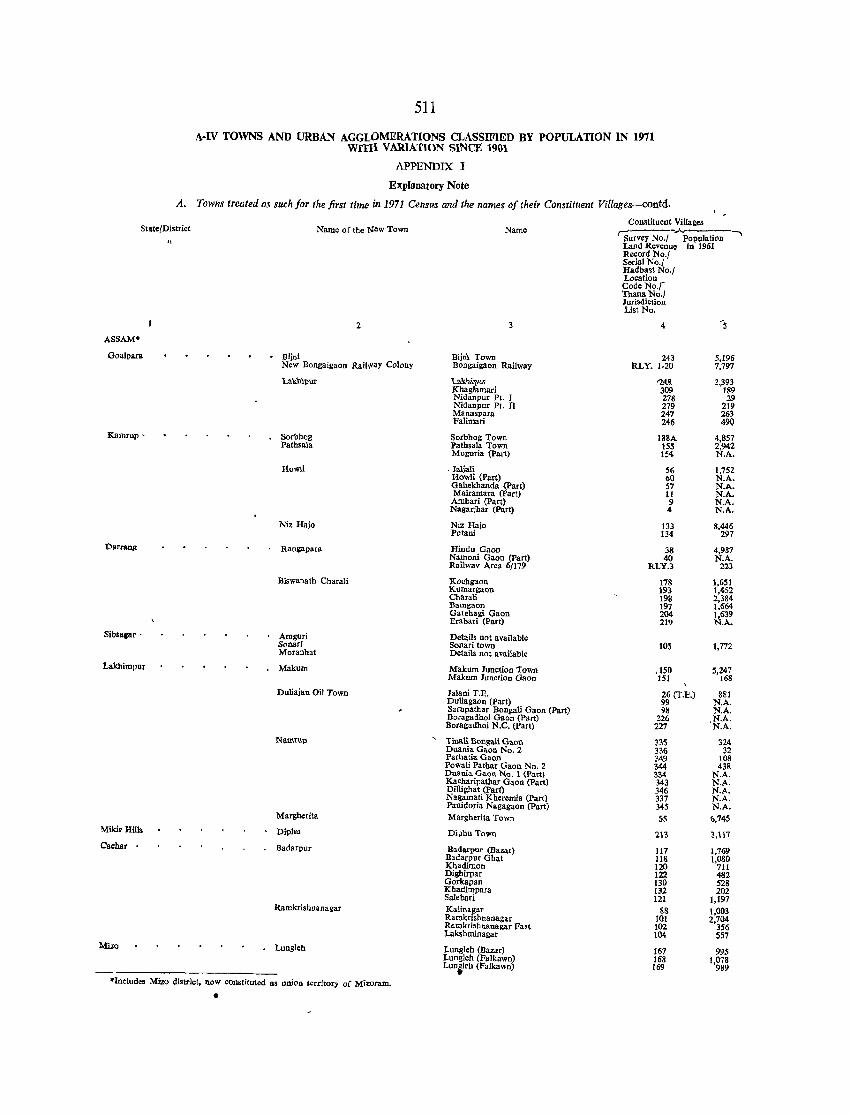
511
A-IV TOWNS AND URBAN AGGLOMERATIONS CLASSIFIED BY POPULATION IN 1971 wmI VARIATION SINCE 1%1
APPENDIX I
Explanatory Note
A. Towns treated as such for the first time in 1971 Census and the names of their Constituent VilTages-contd.
Statc{District ,\
ASSAM·
Goalpara
Kallrup'
Darrang
Sibsagar'
Lakhimpur
Mikir Hills
Cachar •
Mizo
Name of the :New Town
2
Bijni New Bongaigaon RaiJI"ay Colony
Lak'nit>ur
Sorbhog Pathsala
Howli
Niz Hajo
Rangapara
Biswanath Charali
Amguri Sonari Moranhat
Makum
Duliajan Oil Town
NI).Il\<Up
Marghetita
Diphu
lladarpur
Ramkrishnanagar
• LungJeh
"lnclud ... Mi<l:o district, nOW constituted as uniOn territory of Mizoram •
•
Name
Biim. Town Bongaigaon Railway
~"'" KhagJamari Nidanpur Pt. I Nidanpur Pt. II Manaspara Falimari
Sorbhog Town Pathsala Town Muguria (part)
. JaljaJi Howli (Part) Gahekhanda (Part) Mairamara (Part)
Ambari (Part) NagarJbar (Part)
Niz Haio Pctani
Hindu Gaon Namoni Gaon (part) Railwav Area 6)179
Kochgaon Kutnargaon Cb~rali Batngaon Garehagi Gaon Erabari (part)
Details not available Sonari town Details not available
Makum Junction Town Makum Junction GaOn
JaJani T.E. Dullagaon (part) Sarupathar Bongali Gaon (part) Boragadhoi Gaon (Part) Baragadboi N.C. (part)
, TiDali Bongali Gaon Duania Gaon No.2 Parbati .. Gaon Powali Pathar Gaon No.2 Duama Gao" No.1 (Part, Kacharipathar Gaon (Part) DiUighat (Part) Nagamali Kheremia (Part) Panidori. Nagagaon (Part) Margherita Town
DiJ)hn Town
Badarpur (Bazar) Badarpur Ghat Khadlmon Dighirpar Gorkapan Khadimpara Salebari Kalinagar Ramkrishnanagar Rarnkrishnanagar Past Lakshminagar
Lungleh (Bazar) Lungleh (Falkawn) Luoileb (Falkawn)
Constituent Villages
rsurvey No.1 ""p'-o-p-u-Ja-ti-o-n-' Land Revenue in 1961 Record No.! Serial No.1 Hadbast No.1 Location Code No_'-Thana No./ Jurisdiction List No.
4
243 RLY. 1·20
''2.4& 309 278 279 247 246
18SA 155 154
56 <>0 57 11 9 4
133 134
38 40
RLY.3
178 193 198 197 204 219
lOS
.150 151
26 (T.E.) 99 98
226 227
335 336 349 344 334 343 346 337 345
55
213
117 118 120 122 130 132 121
88 101 102 104
167 168 169
5,196 7,797
2,393 189 29
219 263 49Q
4,857 2,942 N.A.
1.752 N.A. N.A. N.A. N.A. N.A.
8,446 297
4,987 N.A.
223
1,651 1,452 2,384 1,664 1,639 N.A.
1,772
5,247 168
881 N.A. N.A.
,N.A. N.A.
324 32
108 438
N.A. N.A. N.A. N.A. N.A.
6,745
'3,B7
1,769 J,080
711 482 528 202
1,197 1,003 2.704
356 557
995
l.g~~
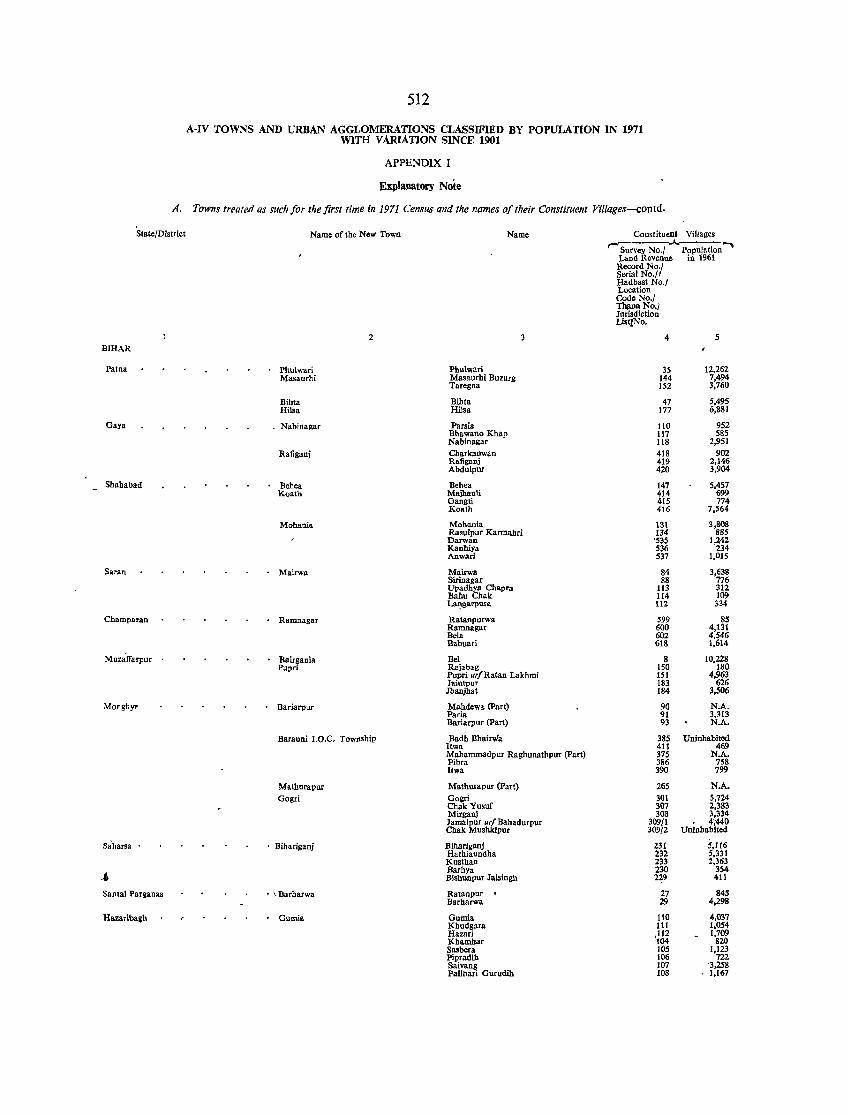
512
A-IV TOWNS AND URBAN AGGLOMERATIONS CLASSIFIED BY POPULATION IN 1971 WITH VARIATION SINCE 1901
APPENDIX I
Explanatory Note
A. Towns treated as such for the first time in 1971 Census and the names of their Constituent Villages-contd.
State/District
BIHAR
Patna
Gaya
Shababad
Saran
Champaran
M uz~irarpur
Monghyr
Santal Parganas
Hazariba~h
Name orthe New Town
Phulwari Masaurhi
Bihta Hilsa
Nabinagar
Rafiganj
Bebea Koath
Mohania
· Mairwa
· Ramnagar
Bairgania Pupri
• Bariarpur
2
Barauni I.O.C. Township
Mathurapur Gogri
• Bibariganj
• \ Barharwa
• Gumis
Name
Pbulwari Masallrhi Buzurg Taregoa
Bibta Hilsa
Parsia Bhawano Khap Nabinagar Charkanwan Rallganj Abdulpur
Behea Majhauti Gangli Koath
Mohania Rasulpur Karmahri Darwan Kanhiya Anwari
Mairwa Sirinagar Upadhya Chapra Bahu Chak ~garpura
Ratanpurwa Ramnagar Bela Babuari
Bel Rajabag Pupri uri Ratan Lakhrni Jaintpur Jbanjhat
Mabdewa (part) Paria Bariarpur (part)
Badh Bhair"'a ltwa Mahammadpur Raghunathpur (part) Pibra Itwa
Mathurapur (part) Gogri ChakYusuf Mirganj lamalpur urI Babadurpur Chak Musbkipur
Bihariganj Hathiaundba Kuslban Barbya Bishunpur Jal.ingb
Ratanpur Barharwa
Gumia Khudgara Hazari Kbamhar Sasbera Pipradib Saivang Palibari Gurudlh
Constituent
r- Survey No./ Land Revenue Record No., Serial No./I Hadbast No./ Location CadeNo./ Th;lna No., Jurisdiction ListlNo.
4
35 144 152
47 177
110 117 118 418 419 420
147 114
15 416
131 134 '535 536 537
84 88
113 114 112
599 600 602 618
8 150 151 183 184
90 91 93
385 411 375 386 390
265 301 307 308
309/1 309/2
231 232 233 230 229
27 29
110 111 ,112 104 lOS 106 107 108
Villages
Population in 1961
-.,.
S
12,262 7,494 3,760
5,495 6,881
952 585
2,951 902
2,146 3,904
5,457 699 774
7,564
3,808 885
1,242 234
1,015
3,638 776 312 109 334
85 4,131 4,546 1,614
10,228 180
4,963 626
3,506
N.A. 3,313 N.A.
Uninhabited 469
N.A. 758 799
N.A. 5,724 2,383 3,334 4;440
Uninhabited
5,116 5,331 2,363
354 411
845 4,298
4,037 1,054 1,709
820 1,123
722 -3,258 1,167
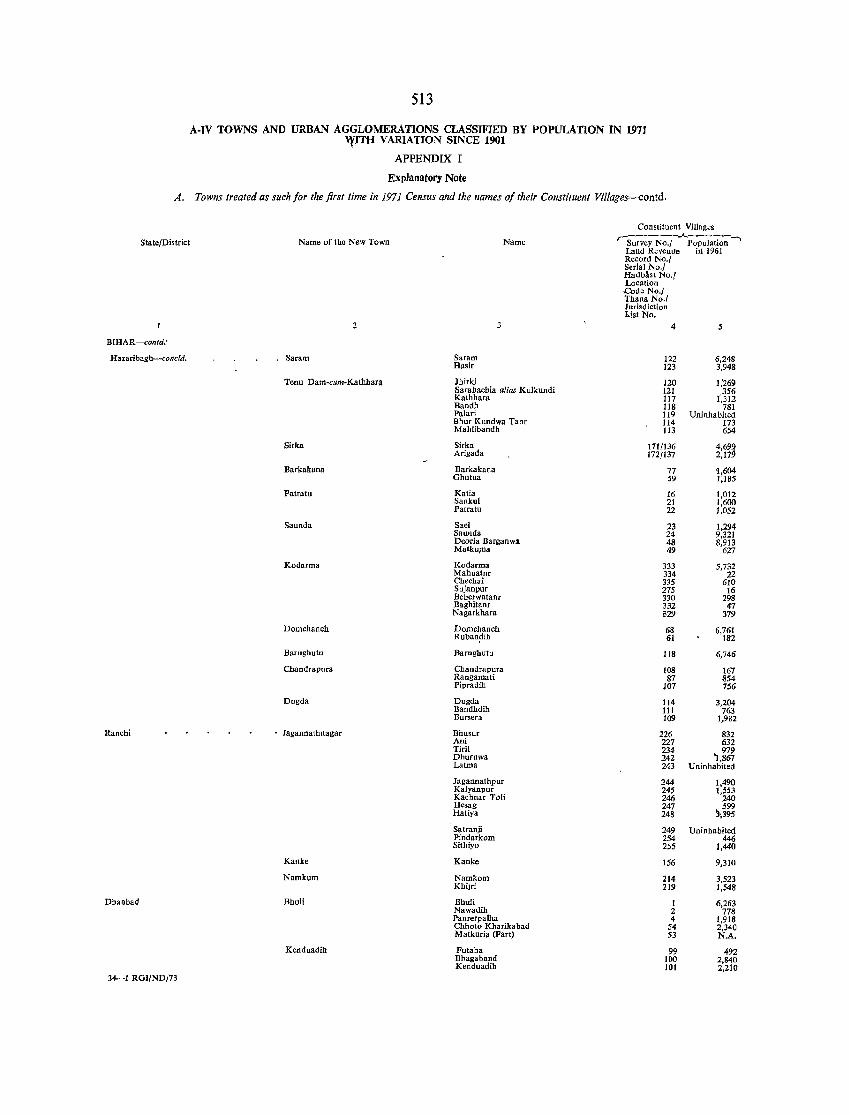
513
A-IV TOWNS AND URBAN AGGLOMERATIONS CLASSIFIED BY POPULATION IN 1971 'fITH VARIATION SINCE 1901
APPENDIX I
Explanatory Note
A. Towns treated as such for the first time in 1971 Census and the names of their Constituent Villages-contd.
State/District
BIHAR-conld:
Hazaribagh-concld.
Ranchi
Dhanbad
34--1 ROI/ND/73
Name of the New Town
Saram
Tenu Dam-cum-Kathbaq
Sirka
Barkakana
Patralu
Saunda
Kodarma
Domchanch
Barugbulu
Chandrapura
Dugda
. Jagannatbnagar
Kanke
Namkum
Bhuli
Kenduadih
Saram Hasir
Jhirki
Name
Sarahachia alias Kulkundi Kathhara Bandh Palari Bhur Kundwa Tanr Malilibandh
Sirka Arigada
Barkakana Ghlltua
Katia Sankul Patratu
Sael SallDda Deoria Barganwa Matkupla
Kodarma Mahuatnr Chechai Sujanpur Beherwatanr Baghilanr Nagarkhara
Domchanch Rubanpih
Barughulu
Chandrapura Rangamati Pipradih
Dugda Bandhdih Bursera
Bhusur Ani Tiril Dhuruwa Latma
Jagannathpur Kalyanpur Kachnar Toli Hesag Hatiya
I Satranji Pindarkom Silbiyo
Kanke
Namkom KhiJri
Bhuli Nawadih Panrerpalha Chhoto Kharikabad Matkuria (Part)
Futaha Bhagaband Kenduadih
Constituent Villages r- .A..----_..,
Survey No./ Population Land Revenue it1 1961 Record No., Serial No.1 HadbhtNo.{ Location Code No./ Thana No./ Jurisdiction 1.ist No.
4 5
122 6,248 123 3,948
120 1;269 121 d~~ 117 118 781 119 Uninhabited 114 173 Jl3 654
171/136 4,69~ 172/137 2,17
77 i604 59 1;185
16 1,012 21 1,600 22 1,052
23 1,294 24 9,321 48 8,913 49 627
333 5,732 334 22 335 610 275 16 330 298 332 47 B29 379
68 6,761 61 182
118 6,746
108 167 87 854
107 756
114 3,204 III 763 109 1,982
226 832 227 632 234 979 242 '1,867 243 Uninhabited
244 1,490 245 1,553 246 240 247 599 248 ),395
249 Uninhabited 254 446 255 1,440
156 9,310
214 3,523 219 1,548
1 6,263 2 778 4 1,918
54 2,340 53 N.A.
99 492 100 2,840 101 2,210
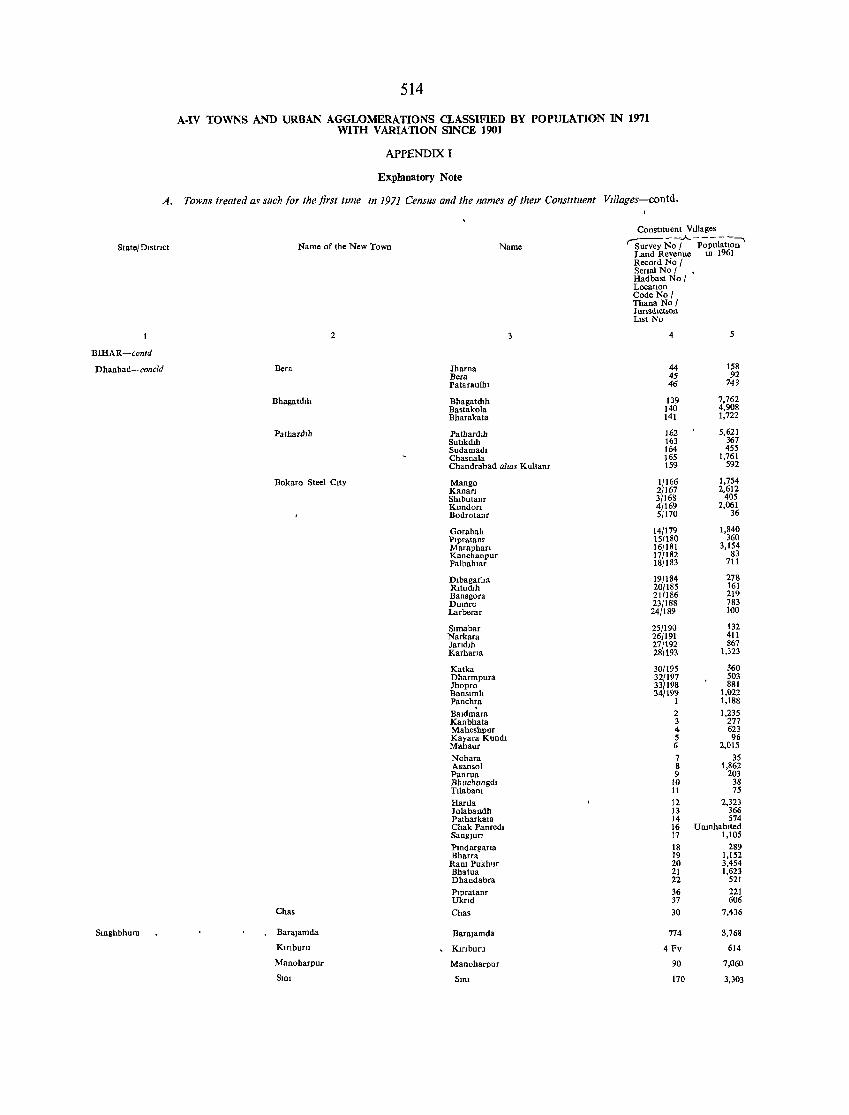
514
A-IV TOWNS AND URBAN AGGLOMERATIONS CLASSIFIED BY POPULATION IN 1971 WITH VARIATION SINCE 1901
APPENDIX I
Explanatory Note
A. Towns treated as such for the first time In 1971 Census and the names of their COllSfltuenl Villages-{:ontd.
State} DIstrIct
BIHAR-conld
Dhanbad-concld
Smghbhum
Name of the New Town
2
Bera
Bhagatdlh
Pathardlh
Bokaro SIee1 City
Chas
Barajamda
Klrlburu
Manoharpur
SIn!
Jharna Bera Pataraulbl
Bhagatdlh Bastako1a Bharakata
Palhardlh Subkdlh Sudamad. Ch_snal_
Name
Chandrabad alIas Kultam
Mango Kanan Shlbutanr Kundofl Bodrolanr
GorabalI Plpratanr Maraphan Kanchanpur Palbahlar
Dlbagarha RltUlbh Bansgora Dumro Larberar
Sunabar Narkara Jandlh Karhana
Katka Dharmpura Jhopro Banslmll Panchra
Baldmara Kanbhata Maheshpur Kayara Kundl Mahaur Nohara Asansol Panrua Bhuchungdl TIIabam Hanla lolabandh Patharkata Chak Panredl SangjUfl
Pmdargarla Bharra
Ram Pukhur Bhatua Dhandabra Plpratanr Uknd
Chas
Barajamda
.. Ktnburu
Manoharpur
Sml
ConstItuent VIllages r::--- - -.A. - - - - -""""\
Survey No 1 Population Land Revenue In 1961 Record No 1 Senal Nol Hadbast Nol LocatlOn Code No } Thana No 1 J uflsdlctlon List No
4 5
44 158 45 92 46 743
139 7,762 140 4,908 141 1,722
162 5,621 163 367 164 455 165 1,761 159 592
1/166 1,754 2/167 2,612 3/168 405 4/169 2,061 5}170 36
14/179 1,840 151180 360 161181 3,154 17/182 83 181183 711
19/184 278 20/185 161 21/186 219 23/188 783 24/189 100
25/190 132 26/191 411 27/192 867 28/193 1,323
30/195 360 32/197 503 33/198 881 34/199 1,022
I 1,188
2 1,235 3 277 4 623 5 96 6 2,015
7 35 8 1,862 9 203
10 38 11 75
12 2,323 13 366 14 574 16 Umnhablted 17 1,105
18 289 19 1,152 20 3,454 21 1,623 22 521
36 221 37 606
30 7,436
774 3,768
4 Fv 614
90 7,060
170 3,303
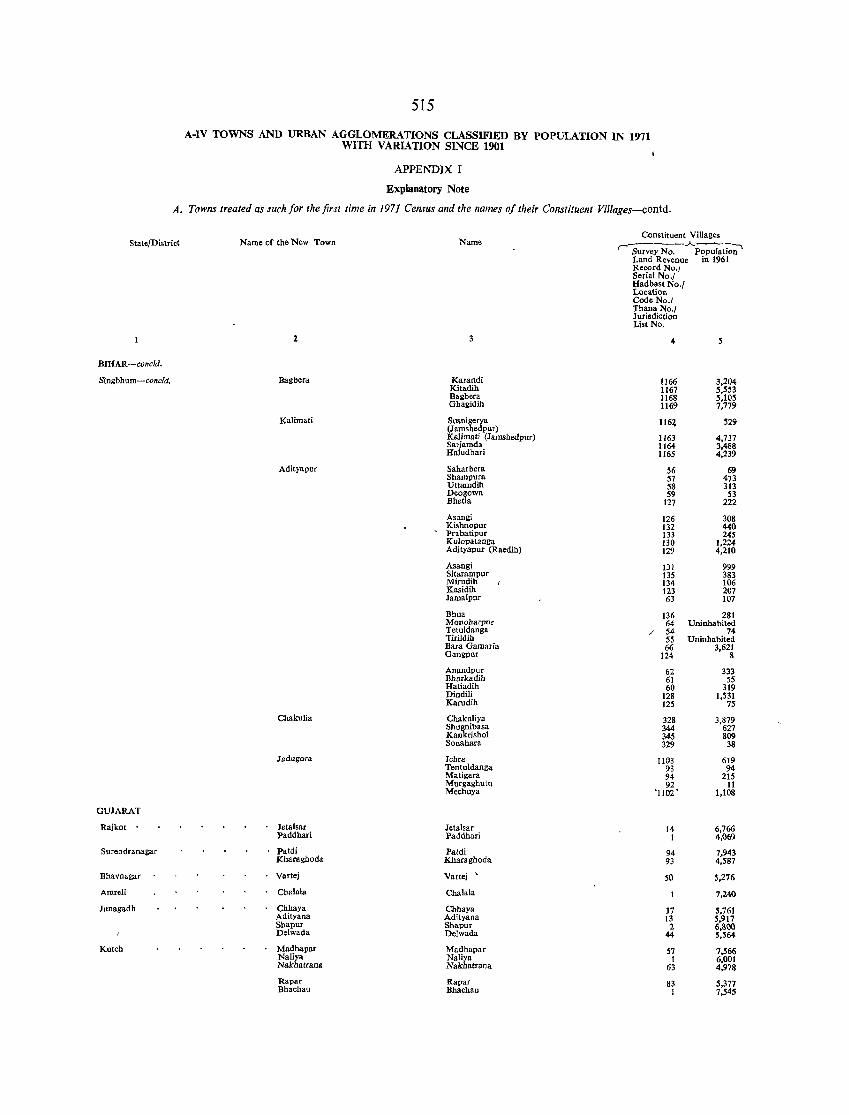
515
A-IV TOWNS AND URBAN AGGLOMERATIONS CLASSIFIED BY POPULATION IN 1971 WITH VARIATION SINCE 1901
APPENDIX I
Explanatory Note
A. Towns treated as such for the first time in 1971 Census and the names of their Constituent Villages-contd.
State/District Name of the New Town
2
BIHAR-concld.
Singbhum-concld. Bagbem
Kalimati
Adityapur
Chakulia
Jadugora
GUJARAT
Rajkot Jetalsar Paddhari
Surendranagar Patdi Kbamghoda
Bhavnagar Vartej
Amreli Chalala
Junagadh Chhaya Adityana Shapur De!wada
Kutch Madhapar Nallya Nakhatrana
Rapar Bhachau
Name
Karandi Kitadih Bagbera Ghagidih
Susnigerya (Jamshedpur) KaJimati (Jamshedpur) Satjamda Haludbari
Saharbera Shampura Uttamdih Deogown Bhetia
Asangi Kishnopur
- Prabatipur Kulopatanga Adityapur (Raedih)
Asangi Sitammpur Mirudih Kasidih Jamalpur
Bhua Monoharpur Tetuldanga Tirildih Bara Gamaria Gangpur
Anandpur Bhurkadih Hatiadih Dindill Karudih
Chakullya Shugnibasa Kankrishol Sonahara
Iehra Tentuldanga Matigara Murgaghutu Mechuya
Jeta!sar Paddhari
Paldi Kbaraghoda
Vartej ,
Chala!a
Chhaya Adityana Shapur Delwada
Madhapar Nallya Nakhatrana
Rapar Bhachau
Constituent Villages -----.A.-~-,
,- Survey No. Population Land Revenue in 1961 Record No., Serial No.! Hadbast No.1 Location Code No.1 Thana No., Jurisdiction List No.
.o!
l!66 3,204 1167 5,553 1168 5,IOS 1169 7,779
1164 529
1163 4,737 1164 3,488 1165 4,239
56 69 57 473 58 313 59 53
127 222
126 308 132 440 133 245 130 1,224 129 4,210
131 999 135 383 134 106 123 207 63 107
136 281 64 Uninhabited
/ 54 74 55 Uninhabited 66 3,621
124 8
62 333 61 55 60 319
128 1,531 125 75
328 3,879 344 627 345 809 329 38
1103 619 93 94 94 215 92 11
'1102 • 1,108
14 6,766 I 4,069
94 7,943 93 4,587
50 5,276
7,240
17 5,761 13 5,917 2 6,800
44 5,564
57 7,566 1 6,001
63 4,978
83 5,377 I 7,545
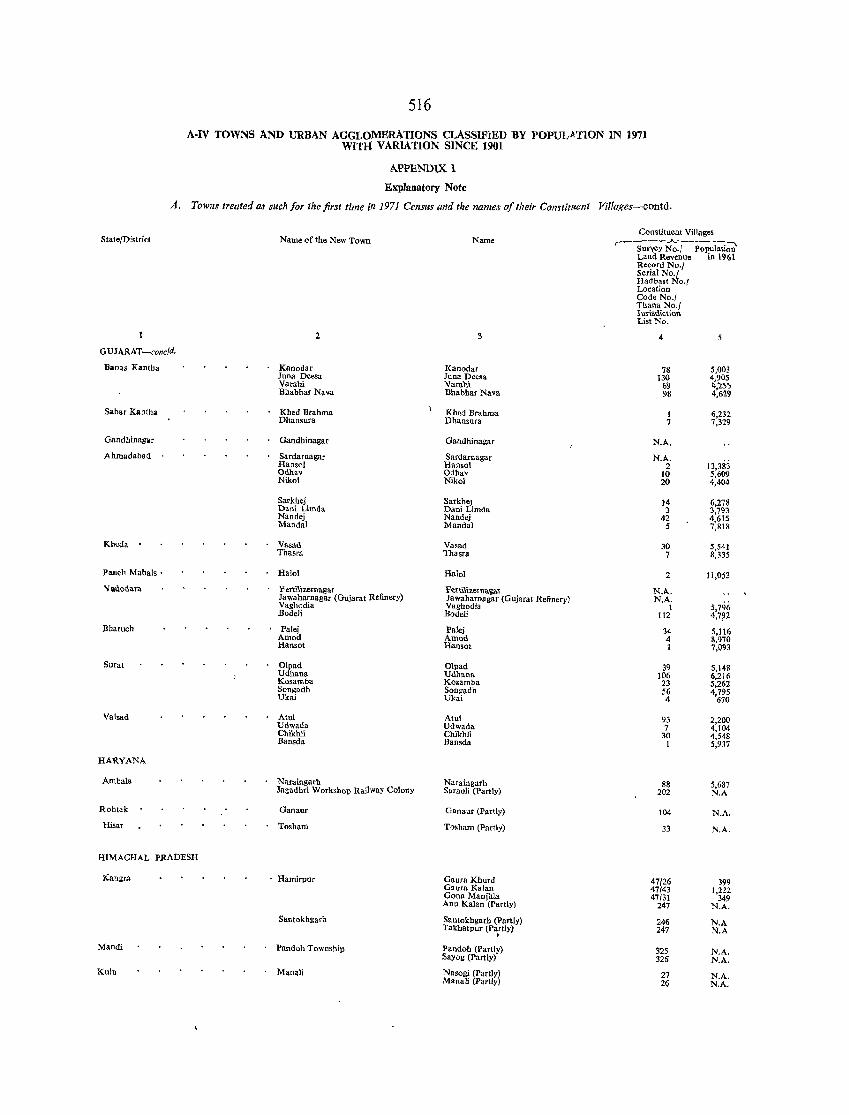
516
A·IV TOWNS AND URBAN AGGLOMERATIONS CLASSIFlED BY POPULATION IN 1971 WITH VARIATION SINCE 1901
APPENDIX 1
Explanatory Note
A. Towns treated as such/or the first time in ]971 Census and the names o/their ConstitlWnt Villages-contd.
State/District
OUJARAT -concld.
Banas Kantha
Sabar Kantha
Oandhinagar
Ahmadabad
Kheda
Panch Mahals .
'\Iauodala
Bll.rueh
Sura!
Val.ad
HAltYANA
Ambala
Rohtak
Hisar
HIMACHAL pRADESH
Kangra
Mandi
Knlu
Name of the New Town
2
Kanodar Juna Deesa Varahi Bhabhar Nava
Khed Brahma Dhansura
Gandhinagar
Sardarnagar Hansol Odhav Nikol
Sarkhej Dani Limda Nandej MandaI
Vasad Thasra
Halol
'l'ert1llzernagar Jawaharnagar (Gujarat Refinery) Vaghodia Bodeli
Palej Amod Hansot
OIpad Udhana Kosamba Songadh Ukai
Atul Udwada Chikhli Bansda
Naraingarh Jagadhri Workshop RailWay Colony
Ganaur
Tosham
. Hamirpnr
Santokhgarh
Pandoh Township
Manali
Name
Kanodar Juna Deesa Varahi Bhabhar Nava
Khed Brahma Dhansura
Gandhinagar
Sardarnagar Hansol Odhav Nikol
Sarkhe) Dani Limda Nandej MandaI
Va sad Thasra
Halol
I'ert\\\zerna'l,ar Jawaharnagar (Gujarat Refinery) Vaghodia Bodeli
Pale] Amod Hansot
Olpad Udhana Ko,amba Songadh Ukai
Atul Udwada Chlkhli Bansda
Naramgarh Sarauli (partly)
Gaoaur (Partly)
Tosham (Partly)
Gaura Khurd Os-ura Kalan Gona Manjh!a Anu Kalan (Partly)
Samokhgarh (Partly) Takhalpur (Partly) . Pandoh (partly) SaYDg (partly)
Nasog] (partly) Manali (Partly)
Constituent Villages
~;;NoTPoPUI;;ti;,;' Land Revenue in 1961 Record No./ Serial No.1 Hadbast No.1 Location Code No.1 Thana N0.1 I "risdiction List No.
4
78 5,003 130 4,905
69 4,2;; 98 4,629
1 6,232 7 7,329
N.A.
N.A. 13,383 2
10 5,609 20 4,404
14 6,278 3 3,793
42 4,615 5 7,818
30 5,541 7 8,335
2 11,053
N."-. N.A.
5,796 1 112 4,7~2
34 5,116 4 8,970
7,093
39 5,148 106 6,216 23 5,262 56 4,795 4 670
93 2,200 7 4,104
30 4,548 1 5,937
88 5,687 202 N.A
104 N.A.
33 N.A.
47126 399 47143 1,222 47/31 349
247 N.A.
246 N.A 247 N.A
325 N.A. 326 N.A.
27 N.A. 26 N.A.
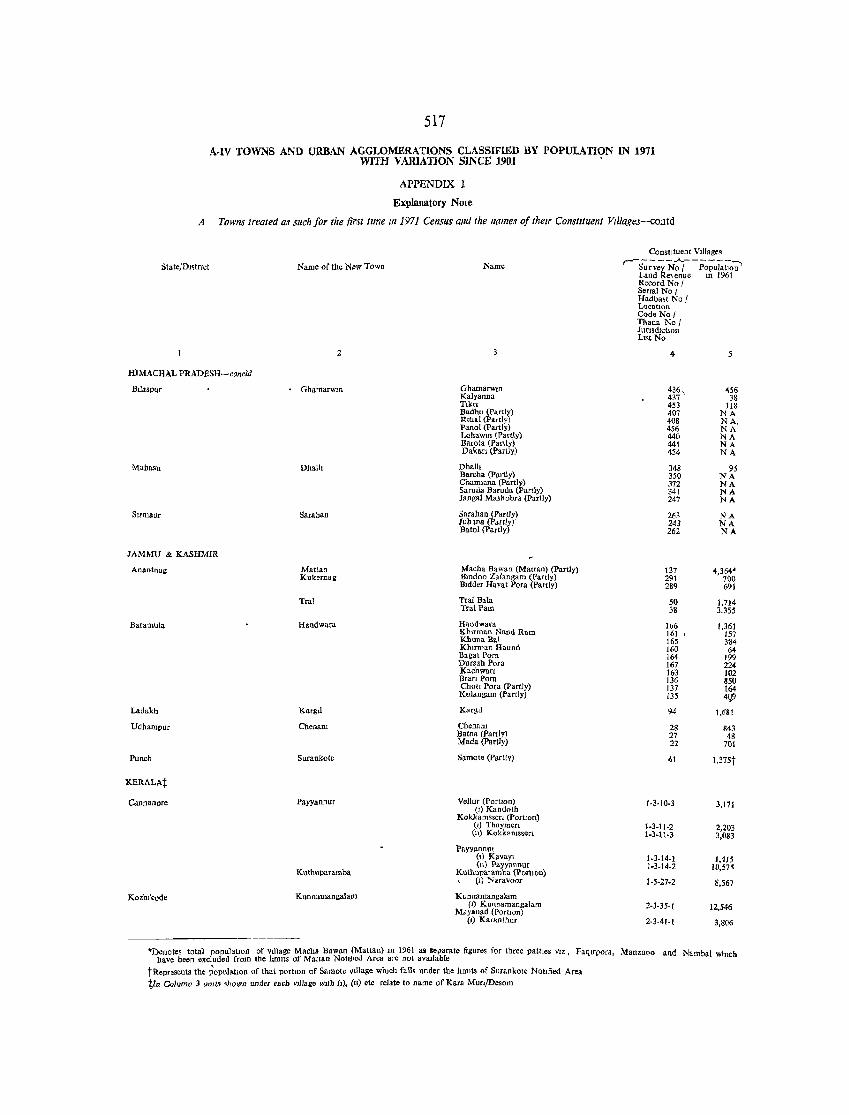
517
A·IV TOWNS AND URBAN AGGLOMERATIONS CLASSIFIED BY POPULATION IN 1971 WITH VARlAT10N SlNCE 1901 '
APPENDIX I
Explanatory Note
A Towns treated as such for the first lime In 1971 Census and the names of their Constituent Villages-contd
BlMACHAL l'RADESH-concld
Btlaspur
Mahasu
Sumaur
JAMMU & KASHMIR
Anantnag
BaramQla
Ladakh
Udhampur
Punch
KERALAt
Cannanore
Kozhlkode
Name of the New Town
• Ghamarwm
DhallI
Sarahan
Mattan Kukernag
Tral
Handwara
Kargu
Chenaru
Sllrankole
Payyannur
Kllthllparamoo.
Kllnnamangalajll
Name
ObamarWlll Kalyanna Tlkn Badhu (Partly) Ritla! (partly) Panol (partly) Lohawm (Partly) Barota (Partly) Dakar! (Partly)
Dballl Bareha (Partly) Charman. (partly) SarUlla Baruil. (Partly) Jangal Mashobra (partly)
Sarahan (Partly) Iuh loa (Partly) Batol (Partly)
Macha Bawan (Matt.n) (Partly) Bmdoa Zalangam (partly) BIdder Hayat Pora (Partly)
Tral Bala Tral Pam
Handwara Klurman Nand Ram KhunaBal Khuman Haund Bagat Pora Dur8sh Pora Kachwan Bran Para Chatl Pora (Partly) Kulangam (Partly)
Kargll
ChonaID Batna (Partly) Mada (partly)
Samote (Partly)
Vellur (PortJon) (I) Kandoth
Kokkantssen (PortlOn) (I) Thaymen (ll) KQkkEru ... r1
Payyannm (I) KavaYI (11) Payyannur
Kulhuparamba (porllon) (1) Nar.voor
Kunnamanga1am (J) K.unnamangalam
Mayanad (PortIOn) (,) Karanlhur
ConstItuent V,lIages
r-S-;;;;'; N-:r -Po;ulaUo~ Land RO\enue lU 1961 Record No ( Senal No I Hadbast No f LocatIon Code No f Thana No f J unsdlctlOn LlSt No
4
436, 456 437 38 453 118 407 NA 408 NA. 456 NA 440 NA 441 NA 454 NA
348 95 350 NA 372 NA 341 NA 247 NA
263 NA 243 NA 262 NA
137 ~,364' 291 700 289 691
50 1,714 38 3,355
106 1,361 161 I 157 165 384 160 64 164 199 167 22<1 163 102 136 850 137 164 135 4Q9
94 1,681
28 843 27 48 22 701
41 I ,31St
1-3-10-3 3,171
1-3-11-2 2,203 1·3·11·3 3,083
1·3.14·1 1,415 1·3·14·2 1O,57~
1·5·27-2 8,567
2·3·35·1 12,546
2-3-41·1 3,806
OI)enotes total populauon of village Macha Bawan (Mattan) 10 1961 as •• "arate figures for three patlIes VIZ, FaqlTpora, Manzaoo and Nambal whIch have been excluded from the !unitS of MaUan NotlPcd Area are not avollable
tn.epresents the populatlon of that portIOn of Samol. village whIch falls under the hmlts of Suraokote N otJfied Area
trn C<Jlumn 3 uallS shown uniler ."eb v,Dage Mtb (1), (u) etc relate to name of Kara Mur,fDesom
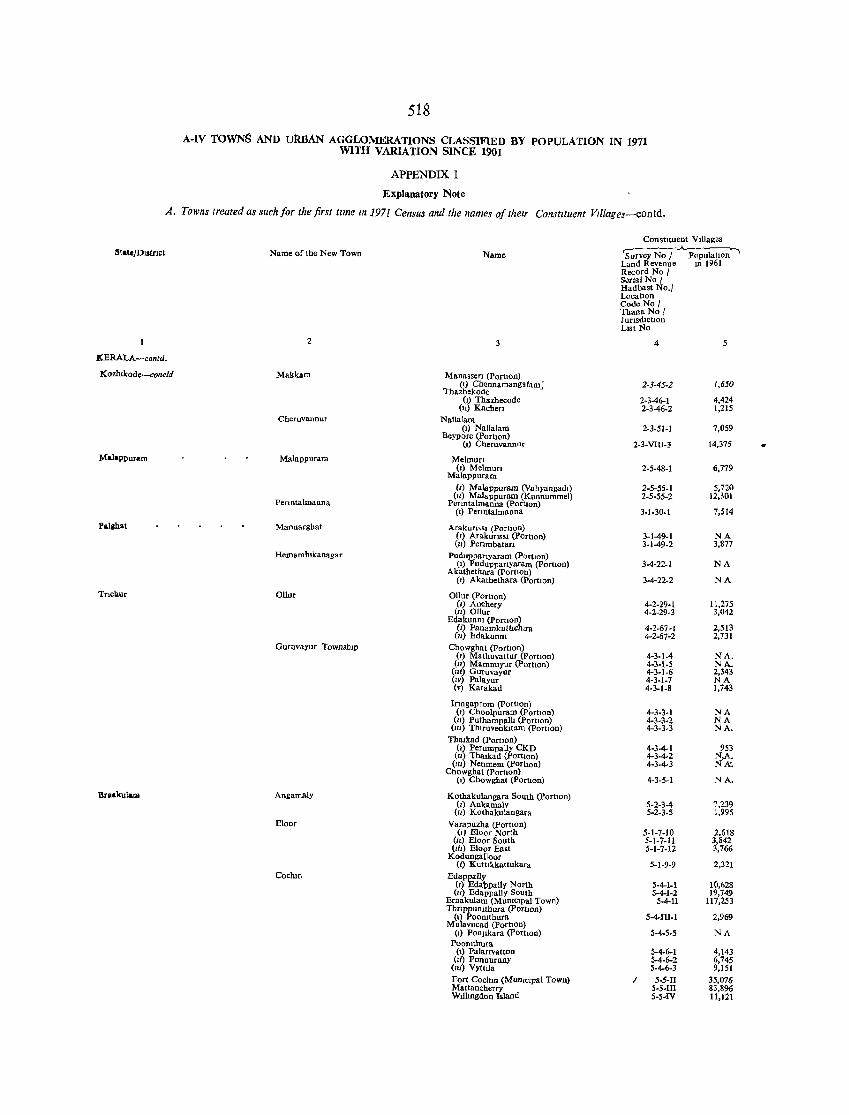
518
A-IV TOWNS AND URBAN AGGLOMERATIONS CLASSIFIED BY POPULATION IN 1911 WITH VARIATION SINCE 1901
APPENDIX I
Explanatory Note
A. Towns treated as such for the first flme In 1971 Census and the names of their ConstItuent VIllages-contd.
State/DI.tnct
KERALA-contd.
Kozhlkode-concld
Malapl>un~m
Paillhat
Tncb.ur
Jl,raakulatll
Name of the New Town
2
Makkam
Cheruvallnur
Malappuram
Perllltalmanna
Mannarghat
Hemamh,kanagar
Ollor
Guruvayur Townsh,p
Angarnaly
Eloor
Cochm
Naill.
Manassen (PortIOn) (I) Chennamangalam 1
Thazhekode (I) Thazhecode
(11) Kachen Nallalam
(I) NaUalam Beypore (Porllon)
(I) Cheruvannur
Melmufl (I) Melmun
Malappuram
(I) Maiappurarn (Vahyangadl) (II) Malappuram (Kunnummel)
Penntalmanna (porllon) (I) Penntalmanna
Arakuf1\SI (PortlOn) (I) ArakurlSsl (portIOn) (II) Penmbatan
Pudupparlyaram (Porbon) (I) Puduppanyaram (portlOn)
Akathethara (PortIOn) (I) Akathethara (PortIOn)
Ollur (portIOn) (I) Anchery (II) OUur
Edakunnl (PortIOn) (I) PanamkutllcbU-a (II) Edakunru
Cbowghat (portIOn) (I) Mathuvattur (Porlton) (II) Mammlyor (PortIOn)
(IIi) Guruvayur (,v) Palaynr (v) Karakad
Inngaprom (portIon) (,) Choolpuram (PortIOn)
(II) Puthampalh (Portion) (Ill) Thlruvenk.tam (PortIOn)
Thalkad (PortlDn) (,) perumpa~ CKD
(II) Thalkad ortlon) (III) Nenmem (porllon)
Chowghat (PortIOn) (1) Chowghat (porlton)
Kotbakulangara South (portIon) (I) Ankamaly
(II) Kothakulangara
Varapuzha (portion) (I) Eloor North
(IL) Eloor South (IiI) E100r Eait
Kodungalloor (I) Kuttlkkattukara
Edappally (I) EdatJpally North (II) Edappally South
Ernakulam (Mumclpal Town) Thr'PPullltbura (portzon)
(I) Poomthura Mulavucad (portIon)
(I) PonJlkara (portIOn) Poomthura
(I) Palanvatton (Ii) Ponnurnny
(IIi) Vyttrla
Fort Cochm (MlIIlJClpal Town) Mattancherry W.lhngdon Island
ConstItuent VIllages ,-----.A. , Survey No I PopulatIOn
Land Revenue 1U 1961 Record No I Serial No I Hadbast No.1 LocatIon Code No I Thana No I J urlsdlctlOn LIst No
4 5
2-3-45·;2 1,650
2-3-46-1 4,424 2-3-46·2 1,21S
2-3-51-1 7,059
2-3-VIlI-3 14,375
2-S-48-1 6,779
2-S-55-1 5,720 2-5-55-2 12,301
3-1-30-1 7,S14
3-1-49-1 NA 3-1-49-2 3,877
3-4-22-1 NA
3-4-22-2 NA
4-2-29-1 11,275 4-2-29-3 3,042
4-2-67-1 2,513 4-2-67-2 2,731
4-3-1-4 NA. 4-3-1-5 NA. 4-3-1-6 2,343 4-3-1-7 NA 4-3-1·8 1,743
4-3-3-1 NA 4-3-3-2 NA 4-3-3-3 NA.
4-3-4-1 953 4-3-4-2 N,A. 4-3-4·3 Nk.
4-3-5-1 NA.
5-2-3-4 7,239 5-2-3-5 1,99S
5-1-7-10 2.618 5-1-7-11 3,842 5-1-7-12 3,766
5-1-9-9 2,321
S-4-I-l 10,628 S-4-1-2 19,749
5-4-II 117,253
5-4-IlI-l 2.969
5-4-5-5 NA
5-4-6-1 4,143 5-4-6-2 6,745 5-4-6-3 9.1S1
I 5-S-JI 35,076 5-s-1II 83,896 5-5-IV 11,121
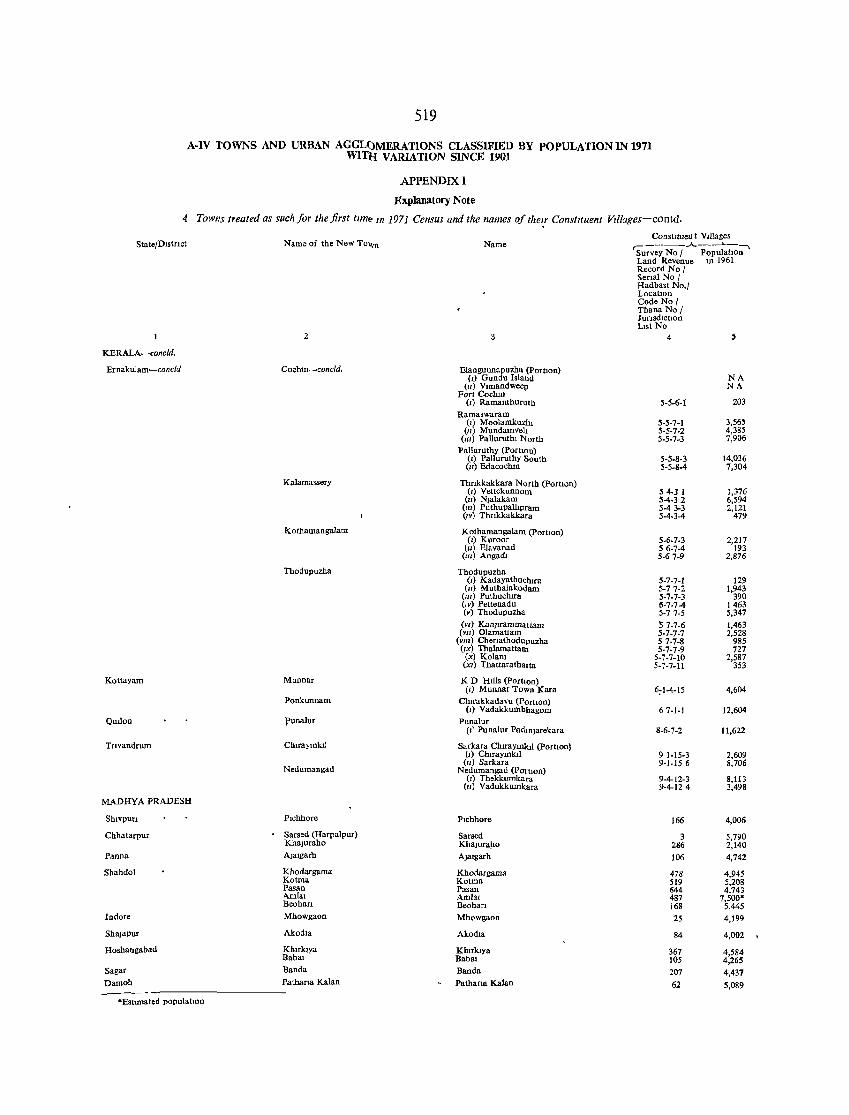
519
A-IV TOWNS AND URBAN AGGL()MERATIONS CLASSIFIED BY POPULATION IN 1971 WITl-I VARlATION SINCE 1901
APPENDIX I
Explanatory Note
4 Towns treated as such Jor the first time In 1971 Census and the names oj tllelr COllsfltuent Villages-conld,
State/DIStrIct
KERALA-concld,
Ernakulam-concld
Kottayam
QUllon
Tnvandrum
MADHYA PRADESH
Sluvpun
Chhatarpur
Panna
Shahdol
Indore
Shajapur
Hosbangabad
Sagar
Damoh
*Esttmated populatIon
Name of the New T01>;n
2
Cochtn-concld,
Kalamassery
Kothamangalam
Thodupuzha
Mannar
Ponkunnam
runalur
Cluraymkll
Nedumangad
P,chhore
Sarsed (Harpalpur) Khajuraho
AJalgarb
Khodargama Kotrna Pasan Amla, Beohan
Mhowgaon
Akodla
Khlrktya Babal
Banda
Pathana Kalan
Name
3
Elangunnapuzha (Porlton) (,) Gundu Island
(ll) V,mandweep ForI Cochm
(,) Ramanthurnth
Ramaswaram (,) Moolamknzh,
(II) Mundamvelt (Ill) Palluruthl North
Palluruthy (portIon) (,) Palluruthy South (ll) Edacochm
Thnkkakkara North (PortIOn) (,) Vettekunnom
(ll) N)alakam (Ill) Puthupalhpram (,v) Thnkkakkara
Kothamangalam (porlton) (,) Kureor
(ll) Ela vanad (m) Angad.
Thodupuzha (,) Kadayathuch,ra
(II) Muthalakodam (Ill) Puthuclura (IV) Pettenadu (v) Thodupuzha
(VI) KaojlCammattam (Vll) Olamattam
(vm) Chenathodupuzha ('x) Thalarnattalll
(x) Kolam (xl) Thattarathatta
K D Hills (PortIon) (,) Munnar Town Kara
ChIrakkadavu (Porhon) (,) Vadakkumbhagom
Punalur (,1 Punalur PadJnjarekara
Sarkara ChIraymk,1 (portlOn) (1) Cluraymkll
(ll) Sarkara Nedumangad (PortlOn)
(,) Thekkumkara (II) Vadukkumkara
Plchhore
Sarsed Khajur<!_ho
Ajalgarh
Khodargama Kotma Pasan Amlal Beohan
Mhowgaon
Akodla
Khlfklya Bab",
Banda
Pathana Kalan
ConstItuen t VIllages
'Su~;; No I -"- po~~;' Land Revenue 10 1961 Record No / Senal No / Hadbast No,/ LocatlOn Code No / Thana No / JUrISdiction LIst No
4 S
NA NA
5-5-6-1 203
5-5-7-1 3,56' 5-5-7-2 4,385 5-5-7-3 7,906
5-5-8-3 14,036 5-5-8-4 7,304
54·31 1,376 5-4·32 6,594 5-43-3 2,121 5-4-3-4 479
5-6·7-3 2,217 56-7-4 193 5·67-9 2,876
5-7-7-1 129 5-77·2 1,943 5-7-7-3 390 6·7-7-4 1463 5-77-5 5,347
~ 7·7-6 1,463 5·7-7-7 2,528 57·7-8 985 5-7-7-9 727
5-7-7-10 2,587 5·7-7-11 353
6,1-4-15 4,604
67-1-1 12,604
8-6-7-2 11,622
91-15-3 2,609 9-1-156 8,706
9-4-12-3 8,113 9-4-124 3,498
166 4,006
3 5,790 286 2,140
106 4,742
478 4,945 519 5,208 644 4,743 487 7,500· 168 5,445
25 4,199
84 4,002
367 4,584 105 4,265 207 4,437
62 5,089
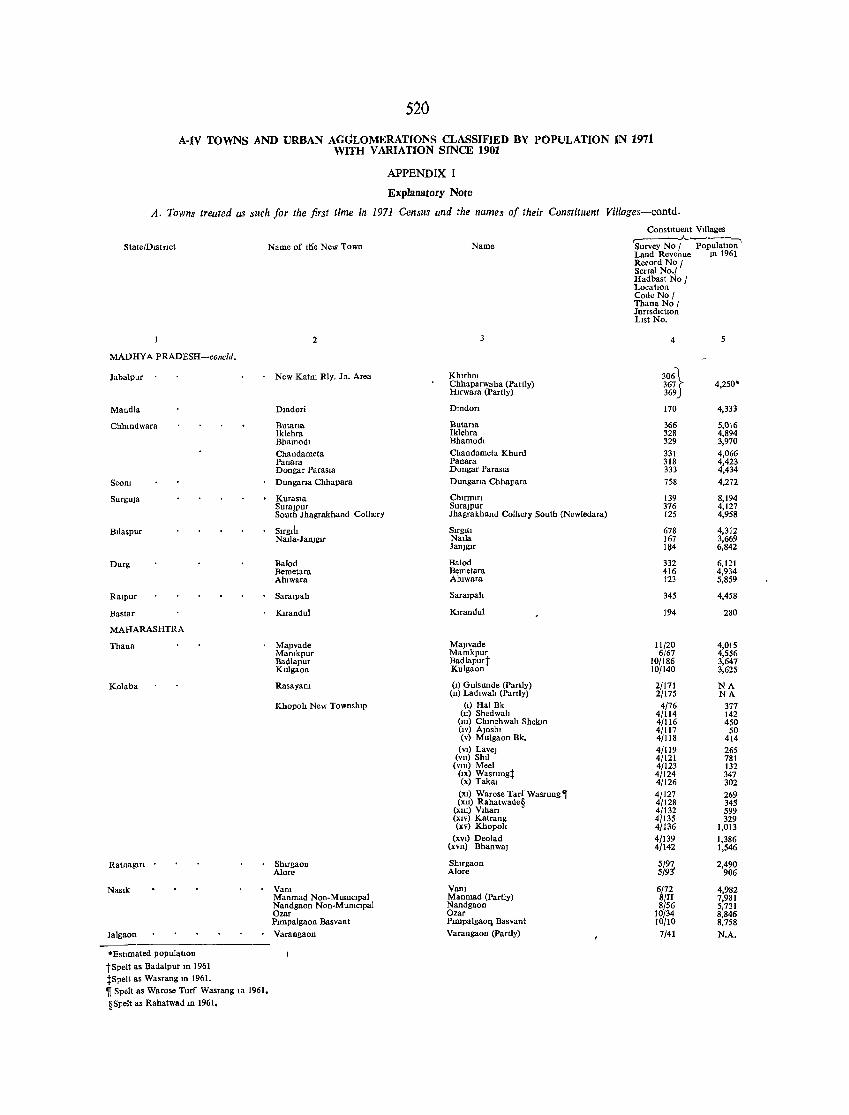
520
A-IV TOWNS AND URBAN AGGLOMERATIONS CLASSIFIED BY POPULATION IN 1971 WITH VARIATION SINCE 1901
APPENDIX I
Explanatory Note
A. Towns treated as such for the first time in 1971 Census and the names of their Constituent Villages-contd.
Slate/DIslnct Name of tlfe New Town
2
MADHYA PRADESH-concld.
Jaba1pur . New Katm Rly. In. Area
Mandla
Chbmdwara
Seom
Surguja
Buaspur
Durg
Ralpur
Bastar
MAHARASHTRA
Thana
Kalaba
RatnaglIl
Naslk
Jalgaon
• Esumated populatlOn
tSpelt as Badalpur 10 1961 tSpelt as Wasrang m 1961. "if Spelt as Warose Turf Wasrang lU 1961.
§Spelt as Rabatwad m 1961.
Dmdori
Bulana lklebra Bhamodl Chandameta Panara Dongar Parasla Dungana Chhapara
Kurasla Surajpur South Jhagrakhand Colhery
Slrglt. Nalla·JanJgrr
Balod Bernetara Ablwara
Saralpah
Klfandul
MajlVade Mamkpur Badlapur Kulgaon
Rasayam
Khopoh New TownshIp
Shlfgaon Alore
Vam Manmad Non-Murnclpal Nandgaon Non.Mumclpal Ozar Pnnpalgaon Basvant
Varangaon
Name
Khrrhrn Chbaparwaha (Partly) Hlrwara (partly)
Dmdon
Butana Iklehra Bharnodl
Chandamela Khurd Panara Dongar Parasill
Dungana Chhapara
Clurrnm SuraJPur Jhagrakhand CollIery South (Newledara)
Sirgitl Nalla Janjglr
Balod Bernetara Ahlwara
Saralpah
Ktrandul
MajlVade Mamkpur Badlapurt Kulgaon
(1) Gulsunde (Partly) (n) Ladlwah (Partly)
(I) HalBk (n) Shedwah
(m) Chmchwall Shekm (IV) Ajoshl (v) Mulgaon Bk.
(VI) Lavej (vn) Shll
(Vlll) Meel (IX) Wasrungt (x) Takal
(XI) Warose Tarf Wasrung"if (xn) Rahatwade§
(xm) Vlhan (XIV) Katrang (xv) Khopoh
(XVI) Deolad (XVll) BhanwaJ
Shlfgaon AI are
Vam Manmad (Partly) Nandgaon Ozar Plrnpalgaoq B.svanl Varangaon (Partly)
Consl1lnent Villages ....A-~----~
Survey No / PopulatlOn Land Revenue III 1961 Record No / SeIlal No~ Hadbast 0/ Location CadeNo / Thana No I JurIsdIctIon LISt No.
4
3061 367 r 4,250' 369J
170 4,333
366 5,016 328 4,894 329 3,970
331 4,066 318 4,423 333 4,434
758 4,272
139 8,194 376 4,127 125 4,958
678 4,312 167 3,669 IS4 6,842
332 6,121 416 4,934 123 5,859
345 4,458
194 280
11/20 4,015 6/67 4,556
10/186 3,647 10/140 3,625
2/171 NA 2/175 NA
4/76 377 4/114 142 4/116 450 4/117 50 4/118 414 4/119 265 4/121 781 4/[23 132 4/124 347 4/126 302 4/127 269 4/128 345 4/132 599 4/135 329 4/136 1,013 4/l39 1,386 4/142 1,546
5/97 2,490 5/9:5 906
6/72 4,982 8/II 7,981 8/56 5,731
10/34 8,846 10/10 8,758 7/41 N.A .
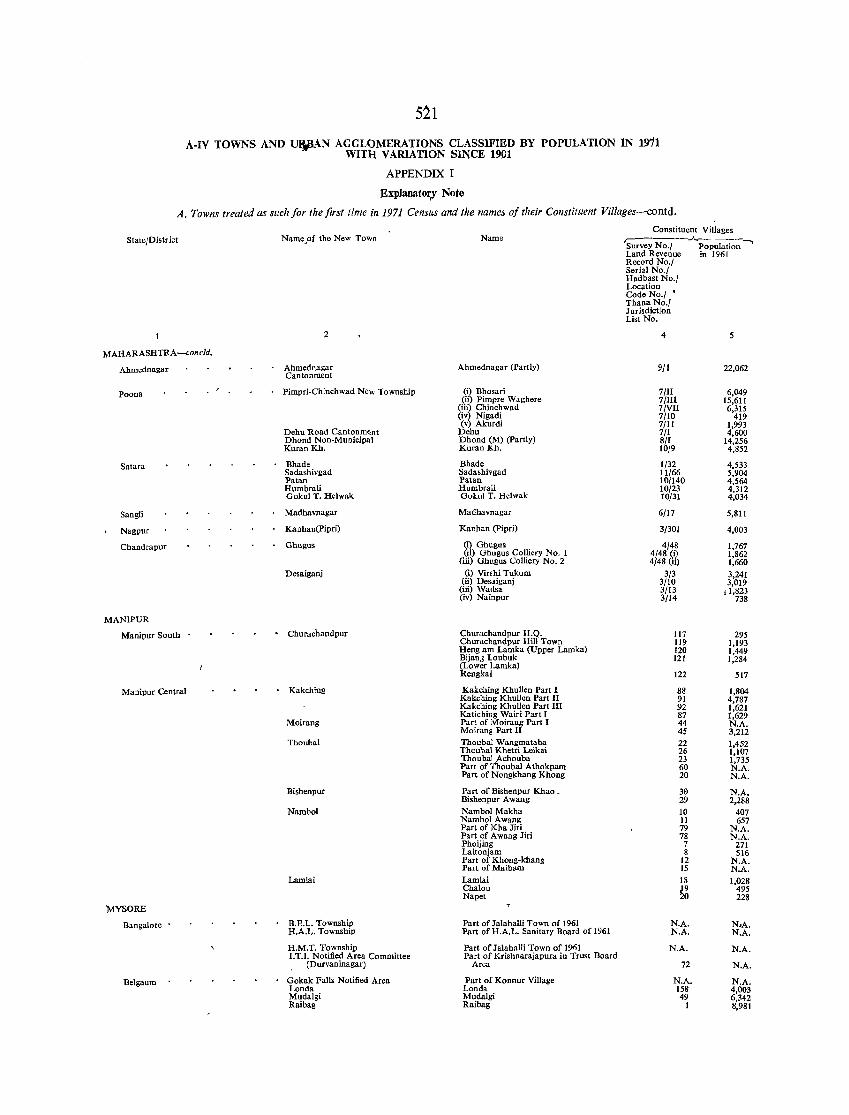
521
A-IV TOWNS AND U¥AN AGGLOMERATIONS CLASSlFIED BY POPULATION IN 1911 WITH VARIATION SlN'CE 19,01
APPENDIX I
ExpIanator,Y Note
A. Towns treated as such for the first time in 1971 Census and the names of their Constituent Vi/lages-contd.
Constituent Villages Name_of the New Town Name StateJDistrict ,---------.A.------
Survey No., Population '""I Land Revenue in 1961 Record No.1 Serial No.1 Hadbast No.J Location Code No.1 • Thana No.1 Jurisdiction List No.
2 4 5
MAHARASHTRA-concld.
Abmednagar Ahmednagar Cantonment
Ahmednagar (Partly) 9/1 22.062
Poona Pimpri-Chinchwad New Township (i) Bhosari 7/II 6,049 (ii) Pimpre Waghere 7/III 15,611
(iii) Chinchwad 7/VII 6,315 (iv) Nigadi 7/10 419 (v) Akurdi 7/11 1,993
Dehu Road Cantonm~nt Dehu 7/1 4,600 Dhond Non-Municipal Dhond (M) (partly) 8/1 14,256 Kuran Kh. Kuran Kh. 10/9 4,852
Salara Bhade Bhade 1/32 4,533 Sadashivgad Sada.hivgad 11/66 5,904 Patan Patan 101140 4,564 Humbrali Humbrali 10/23 4,312 Gokul T. Helwak Gokul T. Helwak 10/31 4,034
SangJi Madhavnagar Madhavnagar 6/17 5,811
Nagpur Kanhan(Pipri) Kanhan (pipri) 3/301 4,003
Chandrapur Ghugus (i) Ghcgns 4/48 1,767 (ii) Ghugus Colliery No.1 4/48 (i) 1,862
(iii) Ghugus Colliery No.2 4/48 (ii) 1,660 Desaiganj (i) Vinhi Tukum 3/3 3,241
(ii) Desaiganj 3/10 3,019 (iii) Wallsa 3/13 ,1,823 (iv) Nainpur 3/14 738
MANJPUR
Mani1?ur South Churachandpur Churachandpur H.Q. 117 295 Churacband1?ur Hill Town 119 1,193 Heng.am Lamka (Upper Lamka) 120 1,449 BijanJ loubuk 121 1,284 (Lower Lamka) Rengkai 122 517
Manipur Central Kakching Kakching Khullen Part I 88 1,804 Kakcbing Khullen Part II 91 4,787 Kakcbing Khullen Part III 92 1,621 Katiching Wairi Part I 87 1,629
Moirang Part of M oirang Part I 44 N.A. Moirang Part II 45 3,212
Thoubal Thoubal Wangmataba 22 1,452 Thou'oal Khetri Leikai 26 1,107 ThoubaJrtchouba 23 1,735 Part of" oubal Athokpam 60 N.A. Part of Nongkhang Khong 20 N.A.
Bishenpur Part of Bishenpur Khao , 30 N.A. Bishenpur Awang 29 2,288
Nambol Nambol Makha 10 407 Nambol Awang 11 657 Part of Kha Jiri 79 N.A. Part of Awang Jiri 78 N.A. Phoijing 7 271 Laitonjam 8 516 Part of Khong-khang 12 N.A. Part of Maibam 15 N.A.
Lamlai Lamlai 18 1,028 Chalou ~g 495 Napet 228
MYSORE
Bangalore B.E.L. Township Part of Jalahalli Town of 1961 N.A. N,A. H.A.L. Township Part of H.A.L. Sanitary Board of 1961 N.A. N.A.
H.M,T. Township Part of JalahaIJi Town of 1961 N,A. N.A. I.T.I. Notified Area Committee Part of Krishnarajapura in Trust Board
(Durvaninagar) Area 72 N.A.
Belgaum Gokak Falls Notified Area Part of Konnur Village N.A. N.A. Londa Londa 158 4,003 Mudalgi Mudalgi 49 6,342 Raibag Raibag 1 8,981
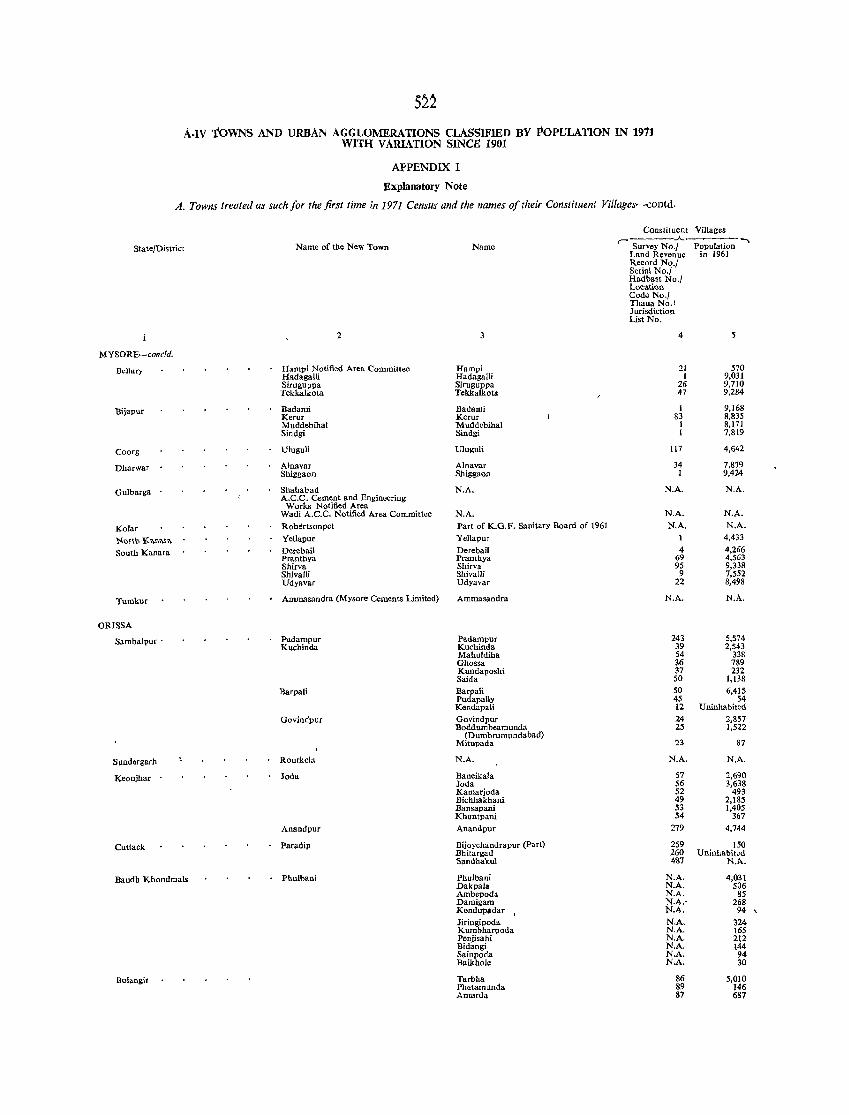
521 A-IV TOWNS AND URBAN AGGLOMERATIONS CLASSlFillD BY POPULATION IN 191J
WITH VARIATION SINCE 1901
APPENDIX I
Explanatory Note
A. Towns treated as such for the first time in 1971 Census and the names of their Constituent Villages-contd.
Constituent ( ..A..
Slate/District Name of the New Town Name Survey No., Land Reven ue Record No.1 Serial No.1 Hadbast No.1 Location Code No.1 Thana No.1 Jurisdiction List No.
2 4
MYSORE-concld.
Bellary Hampi Notified Area Committee Hampi 21 Hadagalli Hadagalli I Siruguppa Siruguppa 26 Tekkalkota Tekkalkota 47
Bijapur Badami Badami 1 Kerur Kerur 83 Muddebihal 'Muddebihal I Sindgi Sindg; I
Coorg Uluguli Uiuguli 117
Dharwar Alnavar Alnavar 34 Shiggaon Shiggaon 1
Gulbarga Shahabad N.A. N.A. A.C.C. Cement and Engineering
Works Notified Area Wadi A.C.C. Notified Area Committee N.A. N.A.
Kolar Robertsonpet Part of K.G.F. Sanitary Board of 1961 N.A.
N<>!tb K",,,,,,'''' YeUapur YeUapur
South Kanara Derebail Derebail 4 Pranthya Pranthya 69 Shirva Shirva 95 Shivalli Shivalli 9 Udyavar Udyavar 22
Tumkur Ammasandra (Mysore Cements Limited) Ammasandra N.A.
ORISSA
Sambalpur' Padampur Padampur 243 Kuchinda Kuchinda 39
Mahuldiha 54 Ghossa 36 Kundaposhi 37 Saida 50
BarpaIi Barpali 50 Pudapally 45 Kendapali 12
Govindpur Govindpur 24 Boddumbeamunda 25
(Dumbrumundabad) Mitupada 23
Sundorgarh Rourkela N.A. N.A.
Keonjhar Joda Baneikala 57 Joda 56 Kamarjoda 52 Bichhakhani 49 Bansapani 53 Khuntpani 54
Anandpur Anandpur 279
Cuttack Paradip Bijoychandrapur (Part) 259 Bhitargad 260 Sandhakul 437
Baudh KhondmaIs Phulbani Phulbani N.A. Dakpala N.A. Ambepoda N.A. Damigam N.A." Kendupadar N.A.
Jiringipoda N.A. Kumbharpoda N.A. Penjisahi N.A. Bidangi N.A. Sainpoda N.A. Baikhole N.A.
Bolangir Tarbha 86 Phatamunda 89 Antarda 87
Villages
Population --in 1961
S
570 9,031 9,710 9,284
9,168 8,835 8,171 7,819
4,642
7,879 9,424
N.A.
N.A.
N.A. 4,433
4,266 4,563 9,338 7,552 8,498
N.A.
5,574 2,543
338 789 232
1,138
6,415 54
Uninhabited 2,857 1,522
87
N.A.
2,690 3,638
493 2,185 1,405
367
4,744
150 Uninhabited
N.A.
4,031 506
85 268
94 \
324 165 212 144 94 30
5,010 146 687
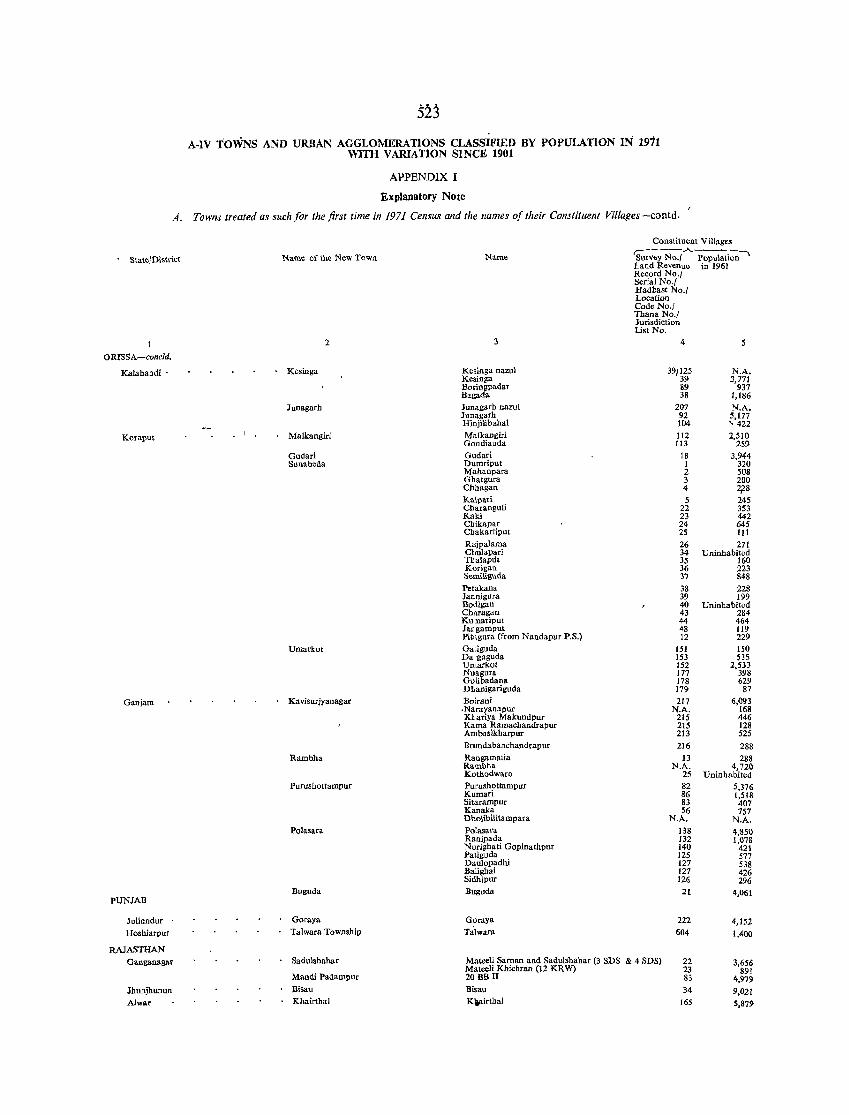
A-IV TOWNS AND URBAN AGGLOMERATIONS CLASsiFIED BY POPULATION IN 1911 WITH VARIATION SINCE 1901
APPENDIX I
Explanatory Note
A. Towns treated as such for the first time in 1971 Census and the names of their Constituent Villages -contd. I
State/District
ORISSA-concld.
Kalabandi •
Koraput • I •
Ganjam
PUNJAB
Julhmdur Hoshiarpur
RAJASTHAN Ganganagar
Jhunjhunun
Alwar
Name of ihe New Town
2
Kesinga
Junagarh
Malkangiri
Gudari Sunabeda
Uroarkot
](a visurjyanagar
Rambha
Purushottampur
Polasara
Buguda
Goraya Ta)wara Township
Sadulshahar
Mandi Padarnpur
Bisau Khairthal
Constituent Villages
Name e ---.A.-__ _ Survey No., Population' Land Revenue in 1961 Record No., Serial No.1
3
Kesinga nazul Kesinga Boringpadar Bagada Junagarh nazul Junagarh Hinjilibahal Malkangiri Gondiauda
Gudari Durnriput Mahanpara Ghatgura Chhagan Ka\pad Charanguli Kaki Chikapar Cbakarliput
Rajpalama ChulaNri Tbalapdt Korigan Semili&uda Petakana Jannigura Botligan Charagan Kunariput Jatgarnput Pitagura (from Nandapur P.S.) Ga:iguda Da'gaguda Unlarkot Nuagura Guubadana Dhanigariguda Boirani .Narayanapur KJ: adya Makundpur Kama Ramachandrapur Ambasikharpur
Brundabanchandrapur Rangamatia Rambha Kothodwaro Purushottampur Kumari Sitarampur Kanaka Dholibilitampara Potasara Ranipada Nurighati Gopinathpur Patiguda Dau)opadhl Balighai Sidhipur Buguda
Hadbast No.1 Location Code No., Thana No.1 Jurisdiction List No.
4
39{125 39 89 38
207 92 104
112 113
18 I 2 3 4
5 22 23 24 25
26 34 35 36 37
38 39 40 43 44 48 12
lSI 153 152 177 178 179
217 N.A.
215 215 213
216
13 N.A.
2S
82 86 83 56
N.A.
138 132 140 125 127 127 126
21
Goraya 222
Talwara 604
Mateeli Saman and Sadulshahar (3 SDS & 4 SDS) 22 Mateeli Khichran (12 KRW) 23 WMll U Bisau 34 K\airthal 165
N.A. 3,771
937 1,186
N.A. ~,177
" 422 2,510
259
3,944 320 508 200 2,28 245 3S3 442 645 111
271 Uninbabited
160 223 848
228 199
Uninhabited 284 464 119 229 150 535
2,533 398 629
87
6,093 168 446 128 525
288
288 4,720
Uninhabited 5,376 I,SIS 407 757
N.A. 4,851) 1,078
421 577 538 426 296
4,061
4,152
1,400
3,656 891
4,979
9,021
5,S7?
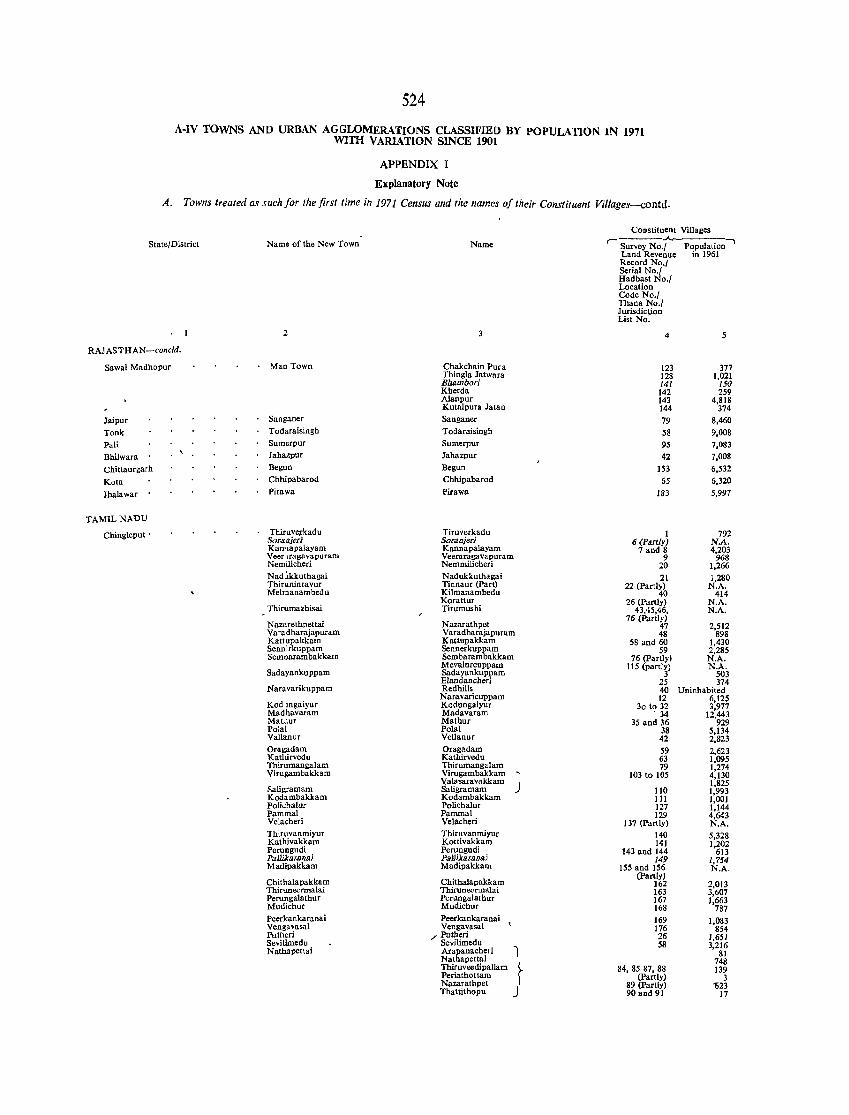
524
A-IV TOWNS AND URBAN AGGLOMERATIONS CLASSIFIED BY POPULATION lN 1971 WITH VARIATlON SINCE 1901
APPENDIX I
Explanatory Note
A. Towns treated as such for the first time in 1971 Census and the names of their Constituent Villages-contd.
Constituent Villages
State/District
RAJASTHAN-concld.
Sawai Madhopur
Jaipur Tonk Pali Bhilwara Chittaurgarh
Kota lbalawar
TAMILNADU
Chingleput .
Name of the New Town
2
Man Town
Sanganer Todaraisingh Sumerpur
Jahazpur Begun Chhipabarod Pirawa
Thiruve;rkadu Sora.ajeri Kan'lapalayam Veer \ragavapuram Nemilicheri Nad:UCkuthagai Thiruninravur Melmanambedu
Thirumazhisai
Nazarethpettai Varadharajapuram Kattupakkam Sennirkuppam Semoarambakkam
Sadayankuppam
Naravarikuppam
Kod lngaiyur Madhavaram Mat..mr Polal Vallanur Oragadam Kathirvedu Thirumangalam Virugambakkam
Saligramam Kodambakkam Pali..:haJur Pam mal Velacheri Thiruvanmiyur Kathivakkam Perungudi Pallikaranai Madipakkam
Chithalapakkam Thiruneennalai PerungaJathur Mudichur Peerkaukaranai Vengavasal Putheri Sevilimedu Nathapettai
Name
Chakchain Pur a ThingJa Jatwara BlI&miJari Kherda Alanpur Kutalpura Jatan Sanganer T odaraisingh Sumerpur
Jahazpur Begun Chhipabarod Pirawa
Tiruverkadu Soralljeri Kannapalayam Veeraragavapuram Nernmilicheri Nadukkuthagai Tinnaur (Part) Kilmanambedu Korattur Tirumushi
Nazarathpet Varadharajapuram Kattupakkam Sennerkuppam Sembarambakkam MevaJurcuppam Sadayankuppam Elandancheri Redhills Naravaricuppam Kodungaiyur Madavaram Mathur PoJal Vellanur Oragadam Kathirvedu Thirumangalam Virugambakkam , \:'alasaravakkam JI Saligramam Kodambakkam Polichalur Parnmal VeJacheri Thiruvanmiyur Kottivakkam Perungudi PaHikaranai Madipakkam
ChitbaJapakkam Tbiruneermalai Perungalathur Mudicbur Peerkankaranai VengavasaJ
.; Putheri Sevilimedu Arapanacheri I Nathapettai Thiruveedipallam I, Periathottam r Nazarathpet Thattithopu J
,- Survey No., Land Revenue
Population" in 1961
Record No., Serial No./ Hadbast No./ Location Code No.' Thana No./ JurisdicJ,ion List No.
4 5
123 377 128 1,021 141 IS() 142 259 143 4,818 144 374
79 8,460
58 9,008
95 7,083
42 7,008
153 6,532
65 6,320
183 5,997
1 792 6 (Partly) N.A.
7 and 8 4,203 9 968
20 1,266
21 1,280 22 (partl~) N.A.
40 414 26 (partly) N.A.
43,45,46, N.A. 76 (PartJy)
47 2,512 48 898
58 and 60 1,430 59 2,285
76 (partly) N.A. 115 (partJ~) N.A.
503 25 374 40 Uninhabited 12 6,125
30 to 32 3,977 . 34 12,443
35 and 36 929 38 5,134 42 2,823 59 2,623 63 1,095 79 1,274
103 to 105 4,130 1,825
110 1,993 III 1,001 127 1,144 129 4,643
137 (partly) N.A. 140 5,328 141 1,202
143 and 144 613 149 1,754
155 and 156 N.A. (Partly)
162 2,013 163 3,607 167 1,663 168 787 169 1,083 176 854 26 1,651 58 3,216
81 748
84,85 87, 88 139 (partly) 3
89 (partly) '623 90 and 91 17
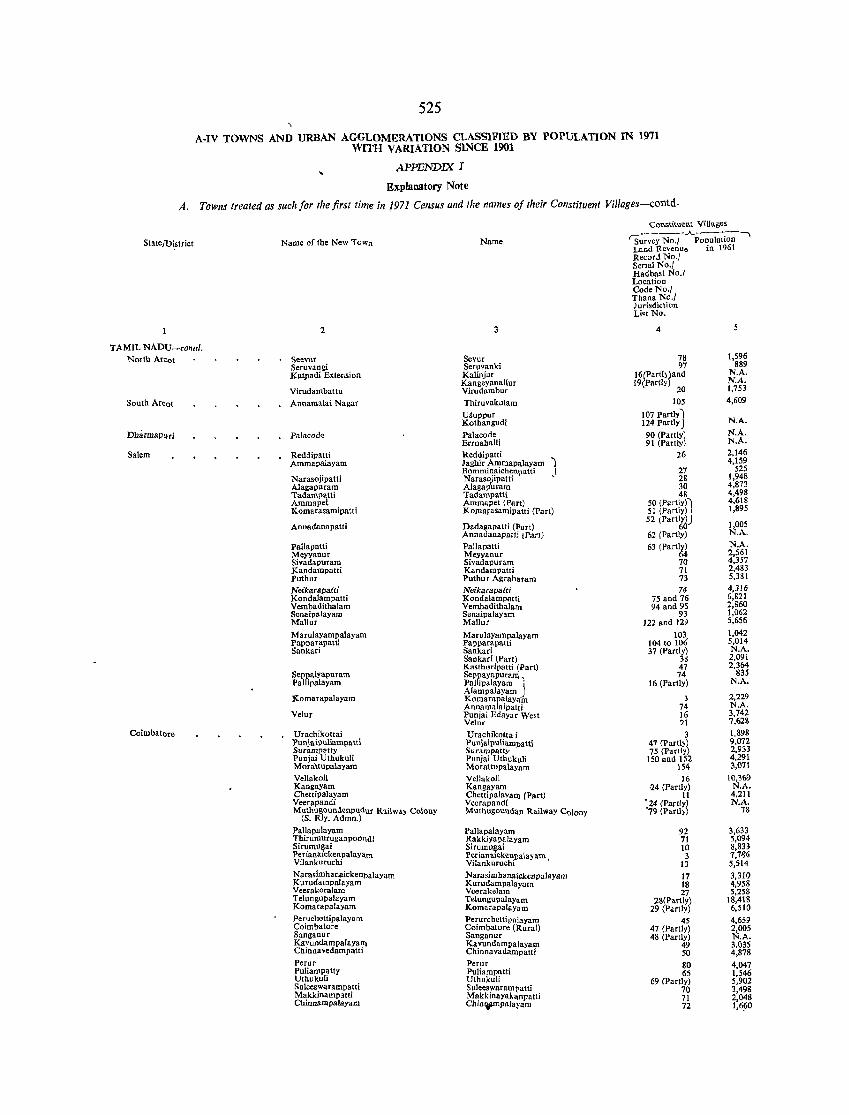
525
A-IV TOWNS AND URBAN AGGLOMERATIONS CLASSIFlED BY POPULATION IN 1971 WITH VARIATION SINCE 1901
APPENDIX J
Explanatory Note
A. Towns treated as such/or the first time in 1971 Census and the names oj their Constituent Villages-contd.
Con,tit""nt Villages
StateJDistrict Name of the New Town Name
____ ...A-___ ,
'survey No.! Population Land Re.enoe in 1961 Recod No.! SeTlal No.1 Hadba.~t No.1 Location Code No.! Thana No.! Jurisdiction Li.t No.
2 3 4
TAMIL NADU-conrd. North Areo!
South Areol
Dlll'rmapori
Salem
Coimbatore
Seevur Seruvangi Katpadi Extension
Virudambattu
Annamalai Nagar
Palacode
Reddipatti Ammapalayam
Narasojipatti Alagapuram Tadampl\).\i Ammapei Komarasamipatti
Annadanapatti
Pallapatti Meyyanur Sivadapuram Kandampatti Puthur Ne{karapatt{ Kondalampatti Vembadithalam Senaipalayam Mallnr
M arulayampalayam Papparapatti Sankari
Seppaiyapuram Pallipalayam
Komarapalayam
Velur
Urachikottai Punjaipuliampatti Surampatty Punjai Uthukuli Monittupalayam Vellakoil Kangayam Chettipalayam Veerapandi Muthugoundenpudur R.,.ilwlY Colony
(S. Rly. Admn.)
Pallapalayam ThirumuruganpcOlldi Sirumugai Perianaickenpalaya.m Vilankuruchi
N arasimha naickenbalayam Kurudampalayam Veerakeralam Telungupalayam Komarapalayam Peruchettipalayam Coimbatore Sanganur Kavundampalayam Chinnavedampatti
Perur Puliampatty Uthukuli Suleeswarampatti Makkinamp.tti Chinnampalayam
Sevur Seruvanki Kalinjur Kangeyanallur Virudambur
Thiru vakulam Usuppur Kothangudi
Palacode Erenahalli ReddipaW Jaghir Ammapalayam J RQmminaichenpatti \ NarasoJipatti ' A1agap'uram Tad.mp.lt; Ammapet (Part) Komarasamipatti (Part)
Dadagapatti (Part) Annadanapalli lPart) Pallapatti Meyyanur Sivadapuram Kandampatti Puthur Agrabaram NeikarapaUi Kondalampatti Vemhadithalalll Senaipaiayam Mallur
Marulayampalayam Papparapatti Sankari Saokari (Part) Kasthuripatti (Part) Seppayapuram Pallipalayarn 1 Alampalayam J Komaropalayam Annam.laipatti Punjai Edayar West Velur
Urachikotta i Punjaipuliampatti Surampatty Punjai Uthukuli Moratlupalayam Vellakoil Kang.yam Chettipalavam (Part) Veerapandi Muthugoundan Railway Colony
Pallapalayam Rakkiyapa layam Sirumugai
~~f!~~~:il>alay.m , Nara,imhanaickenpalayam Kurudampalayam Veerakelam Telungupalayam KomarapalaYam Perurchettipalayam Coimbatore (Rural) Sanganur Kavundampalayam Chinnavadampatti Perur Puliampatti Uthukuli Suleeswaraml'atti Makkinayahnpatti Chimpmpalayaru
78 1,596 97 889
16(Partl) )and N.A. 19(Par(ly) 20 N.A.
1,753
105 4,609
107 PartlYI N.A. 124 Partlyj
90 g:artly] N.A. 91 Partly) N.A.
26 2,146 4,159
27 525 28 1,948 30 4,873 48 4,498
50 (Partlyll 4,618 51 (Partly) I 1,895
52 (PartZriJ 1,005 62 (Partly) N.A.
63 (Partly) N.A. 64 2,561 70 4,357 71 2,483 73 5,381
74 4,316 75 and 76 6,821 94 and 95 2,860
93 1,062 J22 and 129 5,656
104 to \~~ 1,042 5,014
37 (Partly) N.A. 38 2,091 47 2,364 74 835
16 (Partly) N.A.
3 2,229 74 N.A. 16 3,742 21 7.628
3 1,898 47 (Partly) 9,072 75 (Partly) 2,933
150 and 152 4,291 154 3,071
16 10,369 14 (Partly) N.A.
II 4.211 -.24 (Partly) N.A. 79 (Partly) 78
92 3,633 71 5,094 10 8,833 3 7,7€6
13 5,514
17 3,310 18 4,958 27 5,258
28(Partly) 18,418 29 (Partly) 6,510
45 4,659 47 (Partly) 2,005 48 (Partly) N.A.
49 3,035 50 4,878
80 4,047 65 1,546
69 (Partly) 5,902 70 3,498 71 2,048 72 1,6!iO
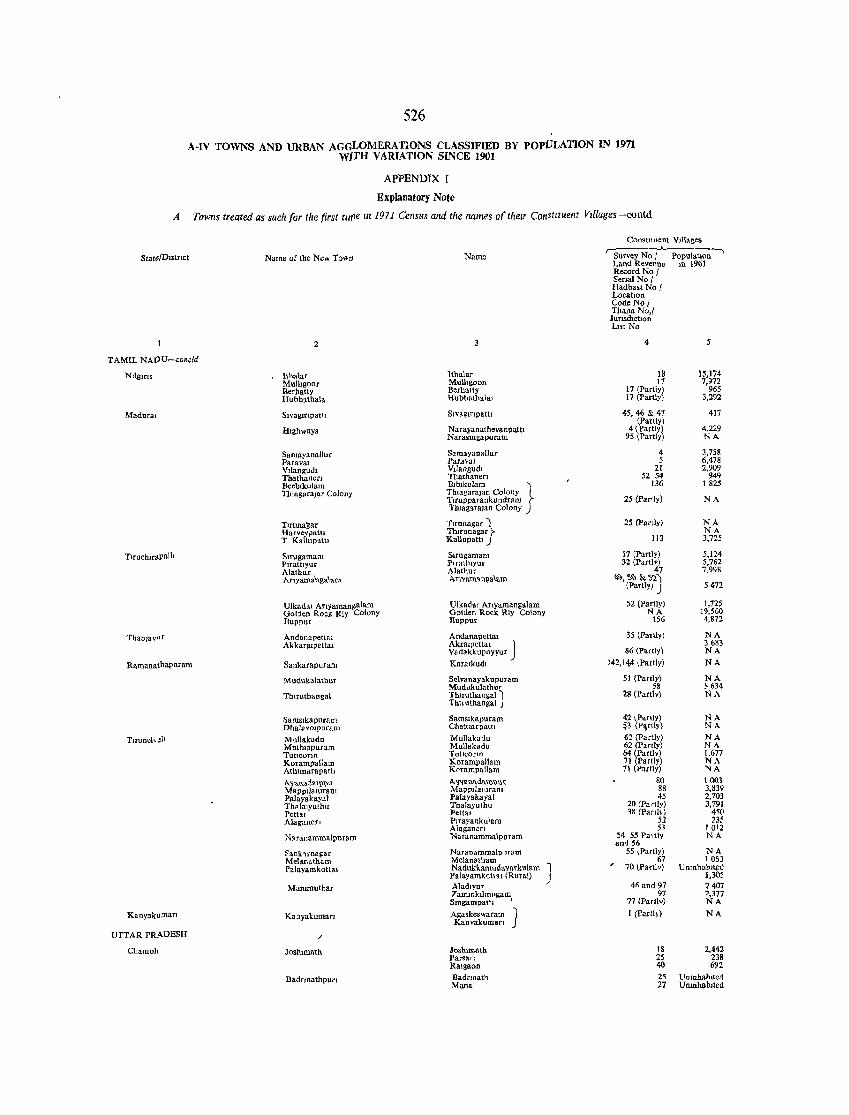
526
A.IV TOWNS AND URBAN AGGLOMERATIONS CLASSIFIED BY POPULATION IN J971 wITH VARIATION SINCE 1901
APPENDIX I
Explanatory Note
A Towns treated as such for the first tllf!e In 1971 Census and the names of theIr Constltuent Villages -contd
Constituent Villages
StatdDlstnct Name Name of the New Town r: ..A.. . .,
Survey No I Papulahon Land Revenue III 1961 Record No I Sen.INol Hadbast No I LocatIOn CodeNol Thana No,l
JunsmctlOn LIst No
4
TAMIL NAOU-conC/d
Nllglrls. llhal.r lth.lar Mulhgoor Mulhgoon Berhatty Berhatty Hubbatnala Hubb.th.lat
18 15,174 17 7,972
17 (Partly) 965 17 (Partly) 3,292
Madural SlvaglClpattl Slvaglnpattl
HIghways Narayanathevanpattl Narasmgapuram
45.46 & 47 417 (Partly)
4 (Partly) 4,229 95 (Partly) NA
Samayaoallur Samayanallur Paraval Pardv31 Vllangudl V,langudl Thathanert Thathanen Beebtkulam Blblklllam } ThmgaraJar Colony ThlagaraJan Colony
Tlfupparankundram ThtagarOJan Colony
4 3,758 5 6,478
21 2,909 52 54 94q
136 1825
25 (parly) NA
Tltunagar Ttrun.gar I Harveypatt1 Tlmun.gar )0-T Kallupatll Kallupattl)
25 (Partly) NA NA
113 3,725
Tltuchltllpalh Slrugamaru Slrugamam Plratttyur Plrathlyur Alathur Alatbur Any.mangalaro 1\.nyam~nga'am
17 (Partly) 5,124 32 (Partlv) 5,762
47 7,998 "">,:>~ 1< 'j':l.j
(Partly) ) 5472
Ulkadat Arty.man~alam Ulk.dat Artyamangalam Golien Rock Rly Colony Golden Rock Rly Colony lluppur lluppur
52 (Partly) 1,725 NA 19,560
156 4,872
ThanJ3VlJT
R.manalhapuram
Andanapettal Andanapettal AkkaralpettaJ Akralpettal ")
Vadakkupoyyur J Sanka, apuram Karalkudl
35 (Partly) NA 3683
86 (Partly) NA 142,144 (Partly) NA
Mudukalathur Selvanayakupuram Mudukulathur
Thlruthangal Tluruthangal I Thlruthangal J
51 (Partly) NA 58 ;634
28 (Partly) NA
Samslkapuram Samslkapuram DhalavOlpuram ChettIaCpath
42 (Partly) NA p (PVt1y) NA
Tuunel ... eh Mullakadu Mullakadu Muth1apuram Mullakadu Tutlcorm Tutl'conn Korampallam Korampal1am Athlmarapatll K('rampal1am
62 (Partly) NA 62 (Partly) N-\ 64 (Partly) 1,677 71 (Partly) NA 71 (Parlly) "I A
.... ~a'll.a:la\!lpu "-TI.",.da\\I\)ut MaPPtl"lUram MappIlalUraOl Palayakayal Palayakayal Th.latyuthu Thalayuthu PettaI Petta) Alaganer l Plfayankulam
AI.ganert Nnanammalpuram Naranarnmalpuram
81l \ Olll 88 3,839 45 2,703
20 (Pa'tly) 3,791 38 (Partl,) 450
52 235 53 1012
54 55 Pa1t1y NA and 56
~anktrnagar Naranammalp Jram Melanatham Melanatham Palayamkotta. Nadukkamudayark~lam J Palayamk(ltl~t (Rural)
Mammuthar AladlVur 7ammlalmugam Stngampat4 J '
55 ,Partly) NA 67 1063
70 (Partlv) Unmhabll:l!d 1,305
4~ and 97 2407 97 ',377
77 (Partlv) NA
Kanyakuman Kanyakuman Agaskeswaram ] Kaovakuman 1 (Parll)) NA
UTTAR PRADESH /
CbamolJ Joshlmath Joshtmath ParSan
18 2,442 25 238
Ralgaon 40 69Z
Badnnathpun Badrmath Mana
25 Unmhablted 27 Unmhablted
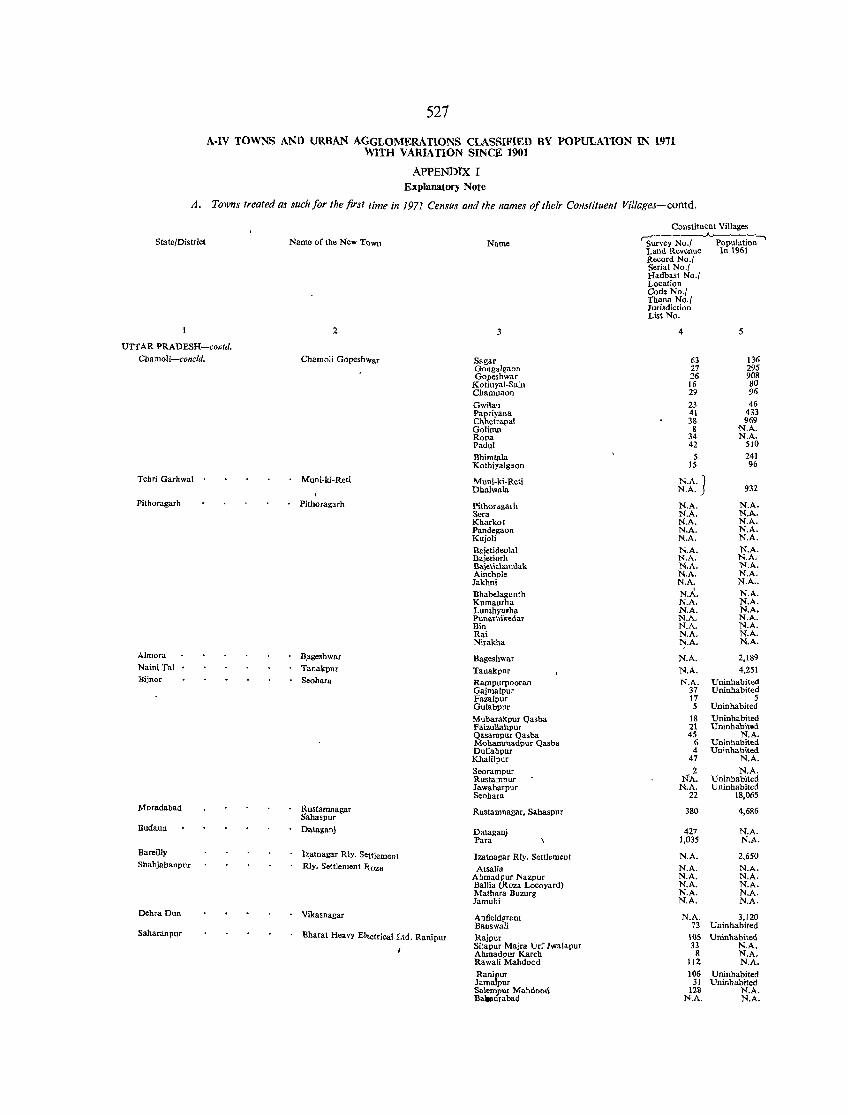
527
A-IV TOWNS AND URBAN AGGLOMERATlONS CLASSIFIED BY POPULATION IN 1971 WITH VARIATION SINCE 1901
APPENDIX I Explanatory Note
A. Towns treated as such for the first time in 1971 CenslIs and the names of their Constituent Villages-contd.
State/District
UTTAR PRADESH-colitd. Chamoli-concld.
Tehri Garhwal
Pithoragarh
Almora Naini Tal Bijnor
Moradabad
Budauu
Bareilly Shahjahanpur
DehraDtln
Saharanpur
Name of the New Town
2
Chamoli Gopesh'\'ar
Muni-ki-Reti
Pithoragarh
B.ageshwar Tanakpur Seohara
Rustarnnagar Sahaspur Dataganj
Iz.atnagar Rly. Settlement Rly. Settlement Itoza
Vikasnagar
Bharat Heavy EI~trical Ltd. Ranipur
I
Name
Sagar Gongalgaon Gopeshwar
Kotiuyal-Sain Chamnaon
Gwilau Papriyana Chhetrapal Golimn Ropa Padul Bhimtala Kothiyalgaon
Muni-ki-Reti Dhalwala
Pithoragarh Sera Kharkot Pandegaon Kujoli Baietideolal Bajetiorh Bajetichand"k Ainchole Jakhni Bhabelagunth Kumaurha Lunthyufha Punarhikedar Bin Rai Nirakha
Bageshwar Tanakpur Rampurpooran Gajmalpur Fazalpur Gulabpur Mubarakpur Qasba Faizullahpur Qasampur Qasba Mohammadpur Qasba Dullahpur Khalilpur Seorampur Rustampur Jawaharpur Seohara
Rustamnagar, Sahaspur
Dataganj Para
lzatnagar Rly. Settlement Atsalia
Ahmadpur Nazpur Ballia (Roza Locoyard) Mathara Buzurg Jamuhi
Anfieldgrant Banswali Rajpur Sitapur Majra Urf Jwalapur Ahmadpur Karch Rawali Mahdood Ranipur JamaJpur Salempur Mahdood Ba¥drabad
Constituent Villages
rgurvey No.1 ..A.. POPulati~-' Land Revenue In 1961 Record No.1 Serial No.1 Hadbast No.1 Location Cod. No.1 Thana No.1 Jurisdiction List No.
4 5
63 136 27 295 26 908
16 80 29 96
23 46 41 433 38 969 8 N.A.
34 N.A. 42 510
5 241 15 96
N.A.] N.A. 932
N.A. N.A. N.A. N.A. N.A. NA. N.A. N.A. N.A. N.A. N.A. N.A. N.A. N.A. N.A. N.A. N.A. N.A. N.A. N.A ..
N.A. N.A. N.A. N.A. N.A. N.A. N.A. N.A. N.A. N.A. N.A. N.A. N.A. N.A.
N.A. 2,189
N.A. 4,251
N.A. Uninhabited 37 Uninhabited 17 5 5 Uninhabited
18 Uninhabited 21 Uninhabited 4S N.A.
6 Uninhabited 4 Uninhabited
47 N.A. 2 N.A.
NA. Uninhabited N.A. Uninhabited
22 18,065
380 4,686
427 N.A. 1,035 N.A.
N.A. 2,650
N.A. N.A. N.A. N.A. N.A. N.A. N.A. N.A. N.A. N.A.
N.A. 3,120 73 Uninhabited
I()S Uninhabited 33 N.A.
8 N.A. III N.A. 106 Uninhabited
31 Uninhabited 128 N.A.
N.A. N.A.
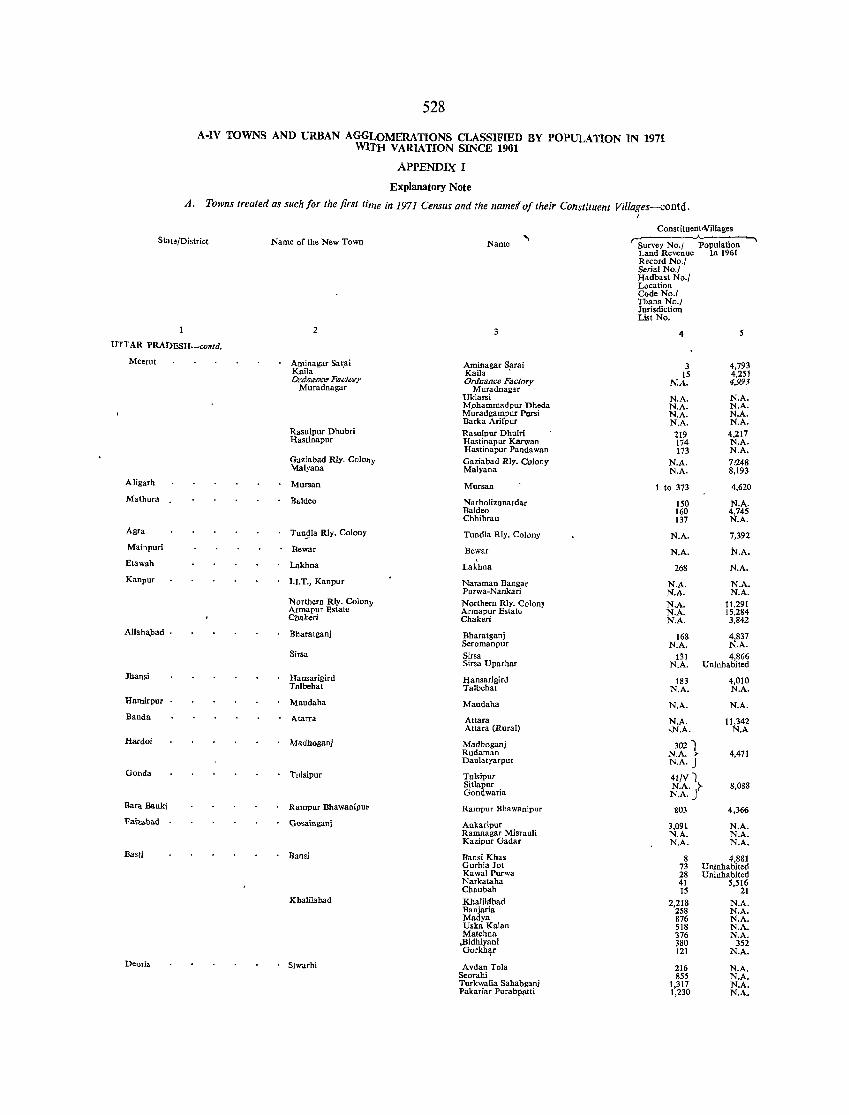
528
A-IV TOWNS AND URBAN AGGLOMERATIONS CLASSIFffiD BY POPULATION IN 1971 WITH VARIATION SINCE 1901
APPENDIX I
Explanatory Note
A. Towns treated as such for the first time in 1971 Census and the name! of their Constituent Villages-contd.
Constituent-vtllages
State/District Name of the New Town Name " r-: .A. Survey No.1 Population
UTTAR PRAbESH-contd.
Meerut
Aligarh
Mathura
Agra
Mainpuri
Etawah
Kanpur
Allaha,):>3d .
Jhansi
Halllirpur
Banda
Hardoi
Gonda
Bara Banki
Fai:tabad .
llasti
Deoril
2
Aminagar Sar,ai Kaila Ord03oa:' F3ctorJ'
Muradnagar
Rasulpnr Dhubri Hastinapur
Gaziabad Rly. CoIOll), Malyana
Mursan
Baldeo
Tun;lla Rly. Colony
Bewar
Lakhna
I.I.T., Kanpur
Northern Rly. Colon;. Armapur Estate Chakeri
Bharatganj
Sirsa
lIansarigird Talbehat
Maudaha
AtaITa
Madhoganj
· Tulsipnr
Rampur llhawaniput
Cosainganj
• Bansi
Khalilabad
· Siwarhi
3
Aminagar Sarai Kaila • Ordnance Factory
Muradnagar Uklarsi Mohammadpur Dheda Muradgampur Pursi llarka Arifpur
Rasulpur Dhulri Hastinapur Karwan Hastina pur Panda wan Gaziabad Rly. Colony Malyana
Mursan
Narholizunardar llaldeo Chhibrau
Tundla Rly. Colony
Bewar
Lakhna
Naraman Bangar Purwa-Nankari
Northern Rly. Colony Armapur Estate Chakeri
Bharatganj Seromanpur
Sirsa Sirsa Uparhar
IJansarigird 'talbehat
Maudaha
Attara Attara (Rural)
Madhoganj Rudaman Daulatyarpur
Tulsipur Sitlapur Gondwaria
Rampur Bhawanipur
Ankaripur Ramnagar Misrauli Kazipur Gadar
Bansi Khas Gurhia Jot Kawai Purwa Narkataha Chaubah
Khalilotbad Banjaria Madya UskaKalan Matehna
,Bidhiyani Gorkh'tr
Avdan Tola Seorahi Turkwalia Sahabganj Pakariar Purabpstti
Land Revenue In 1961 Record No.1 Serial No.1 Hadbast No.1 Location Code No./ Thana NO.1 Jurisdiction List No.
4
3 4,793 15 4,251
N.A. 4,993
N.A. N.A. N.A. N.A. N.A. N.A. N.A. N.A.
219 4,217 174 N.A. 173 N.A.
N.A. 7:248 N.A. 8,193
to 373 4,620
150 N.A. 160 4,745 137 N.A.
N.A. 7,392
N.A. kA.
268 N.A.
N.A. N.A. NA. N.A.
N.A. 11,291 N.A. 15,284 N.A. 3,842
168 4,837 N.A. N.A.
1~1 4,866 N.A. Uninhabited
183 4,010 N.A. N.A.
N.A. N.A.
N.A. 11,342 -N.A. N.A
302 , N.A. > N.A. J
4,471
41/vi N.A. ~ N.A.J
8,088
803 4,366
3,091 N.A. N.A. N.A. N.A. N.A.
8 4,881 73 Uninhabited 28 Uninhabited 41 5,516 15 21
2.218 N.A. 258 N.A. 876 N.A. 518 N.A. 376 N.A. 380 352 121 N.A.
216 N.A. 855 N.A.
1,317 N.A. 1,230 N.A.
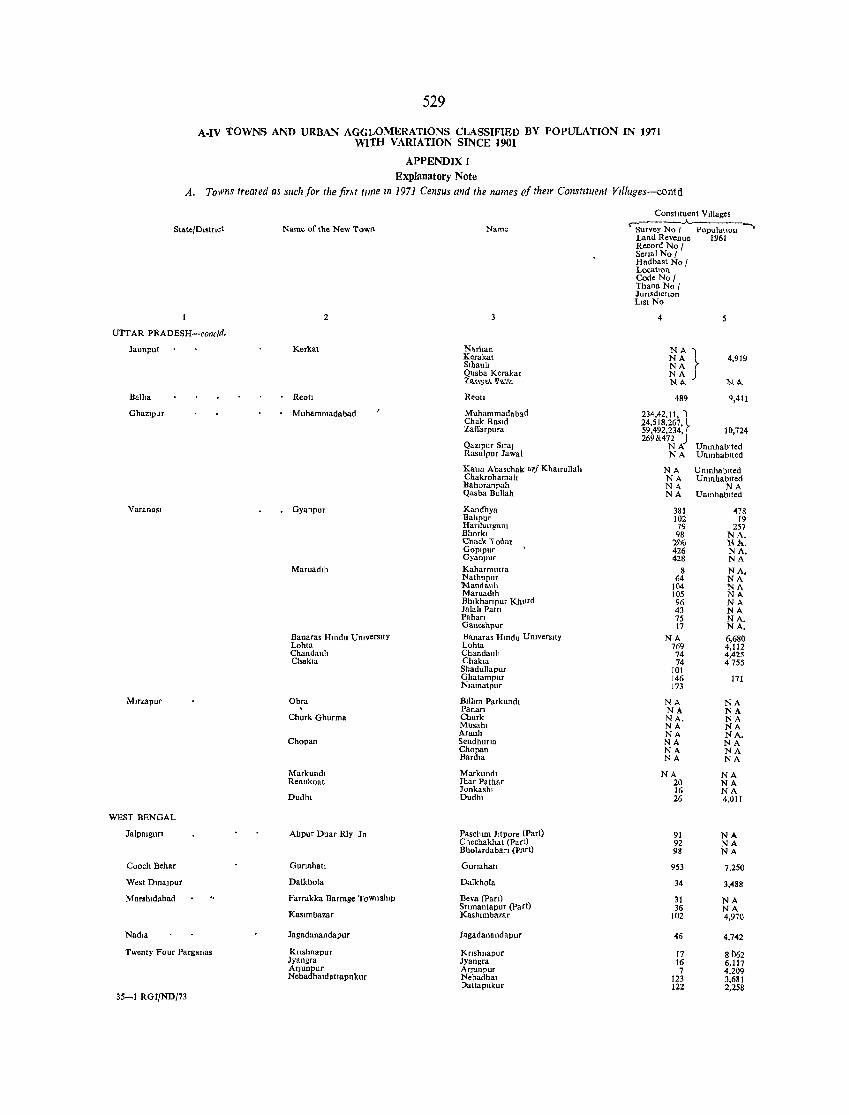
529
A.IV TOWNS AND URBAN AGGI.OMERATlONS CLASSIFIED BY POPULATION IN 1971 wr:rH VARIATION SINCE 1901
APPENDIX I Explanatory Note
A. Towns treated as such for the fir~t II/tie In 1971 Census and the names of thelT Constituent Vlliages-contd
State/D.strlct
UTTAR PRADESH-cone/d.
Jaunpur
Ballla
GhazlpJr
VanmaSI
Mlrzapur
WEST BENGAL
Jalpatgun
Cooch Behar
West DmaJPur
M urshldabad
Nadia
Twenty Four Parganas
35-1 Rat/NO!73
Name of the New Tow,'
2
Kerkat
Reot!
Muhammadabad
• Gyanpur
Maruadth
Banaras HlOdu UnIVerSity Lohta Chandauh Chuk ..
Obra
Churk Ghurma
Chopan
Markundl Renukoat
Dudht
Altpur Duar Rly J n
Gurtahatt
Dalkhola
Farrakka Barrage Townshtp
KaSimbazar
J.gadanandapur
Krlshnapur Jyangra ArJunpur Nebadha.dattapukur
Name
N~rhan Kerakat Slhauh Qusba Kerakat 1..R..t;_1,'J~.,t .. T]!lt~tT~
Reoll
Muhammadabad Cbak Rasld Zaffarpura
Qazlpur SlTaJ Rasulpur Jawal
Katla Abaschak urI Khalrullah Chakrohamalt Bahoranpah Qasba Bullah
Kandhya Baltpur HanhargaoJ Bhorkl CnaeR 106al Gop.pur Gyanpur
Kaharmutta Nathupur Mandauh Maruadlh Bhtkhanpur Khurd Jalah Patti Pahan Ganeshpur Banaras Hmdu Umvers1ty Lohla Chandallh Chak .. Shadullapur Ghalampur Nlamatpur
Btlllm Parkundt Panan Churk Musahl Araul. Sendhuna Chopan Bard ..
Markundl Ihar Pathar Jonkashl Dudh.
Pasch.m JJtpore (Part) Chechakhat (Part) Bhol.lrdaban (Pllrt)
Gunahall
Dalkhola
Beva (part) Snmantapur (part) Kashtmbazar
Jagadanandapur
Krtshnapur Jyangr. ArJunpur Nebadhal Dattapukur
ConstItuent Vtllages
<"Survey No fA PopulatIOn --. Land Revenue 1961 Record No / Sertal No / Hadbast No / LocatIon Code No / Thana No / Junsdlchon LtstNo
4
NA ")
~! r 4,919
NA J N"- N!\'
489 Q,411
234.42.11'1 24,518.267, 59,492.234, 10,724 269&472 J
Unmhablted Nt\: NA Untnh.blted
NA UninhabIted NA Unmhabtted N<\ NA NA Unmhablled
381 478 102 19 79 257 98 NA.
1.% N1o.. 426 NA. 428 NA
8 NA. 64 NA
104 NA 105 NA 96 NA 43 NA 7S NA. 17 NA.
NA 6,680 769 4.112 74 4,425 74 4755
101 146 171 173
NA NA NA NA NA. NA NA NA NA NA. NA NA NA NA NA NA
NA NA 20 NA 16 NA 26 4,011
91 NA 92 NA 9g NA
953 7.250
34 3,482
31 NA 36 NA
102 4,970
46 4,742
17 8062 16 6,117 7 4,209
123 3,681 122 2,258
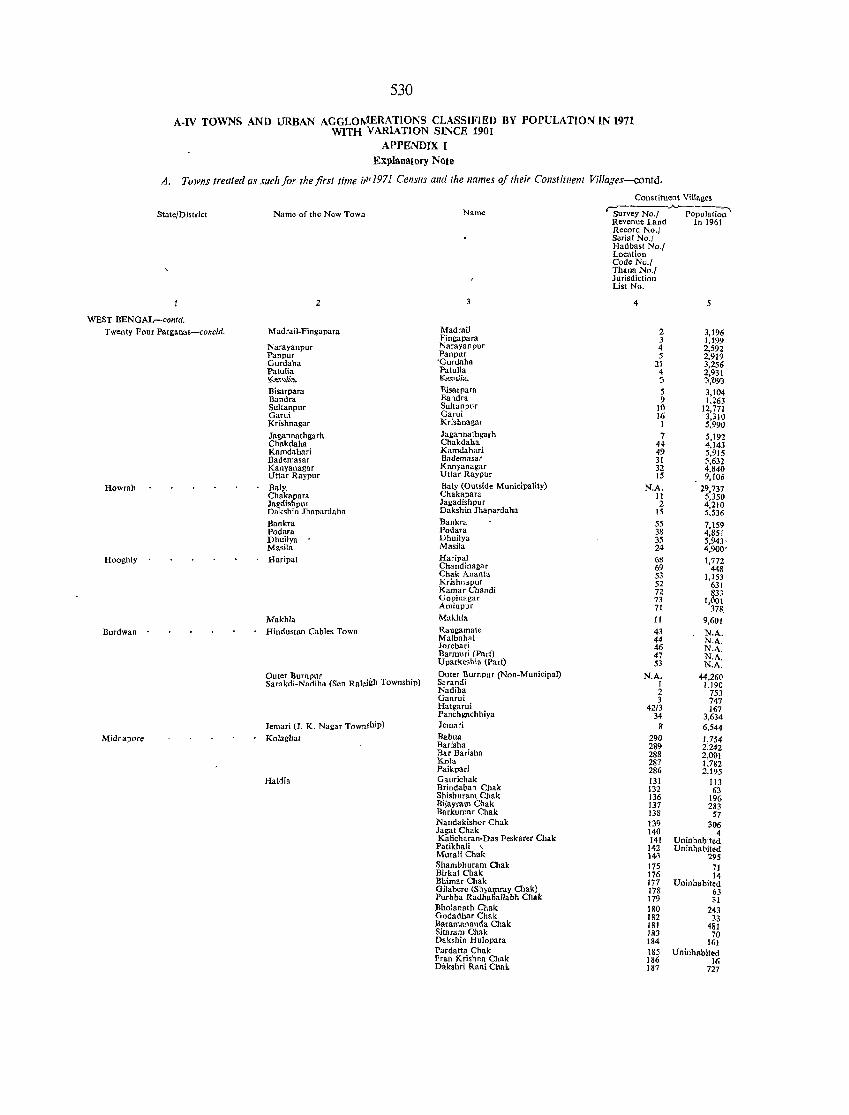
530
A.IV TOWNS AND URBAN AGGLOl\fERATlONS CLASSIFIED BY POPULATION IN 1971 WITH VARlATION SINCE 1901
APPENDIX r Explanatory Note
A. Towns treated as such for the first time itl '1971 Census alld the names of their Constituent Villages-contd.
Constituent Villages
State/District
WEST BENGAL-contd.
Twenty Four Parlolanas-concld.
Howrah
Hooghly
Burdwan
Midnapore
Name of the New Town
2
Madrail-Fingapara
Narayanpur Pan pur Gurdaha Patulia K,,-,.,,~' ... Bisarpara Bandra Sultanpur Garui Krishnagar
Jagannathgarh Chakdaha Kamdahari Bademasar Kanyanagar Uttar Raypur
Baly, Chakapara Jagdishpu, Dakshin Jhapardaha
Bankra Podara Dhuilya Masila Haripal
Makhla
Hindustan Cables Town
Outer Burnpur . Sarakdi-Nadiha (Sen Raleigh Township)
Jemari (J. K. Nagar Town,hip)
Kolagbat
Haldi.
Name
Madrail Fingnpara Narayanpur Panpu, 'Gurdaha Patulia f{l".,fnUa..
Bisarpara Bandr. Sultnnpur Garui Krishnagar
Jagannathgarh Chakdaha Kamdahari Bademas., Kanyanagar Uttar Raypur
Baly (Outside Municipality) Chakapara Jagadishpur Dakshin Jhapardaha Bankra PodaTa Dhuilya Masila Haripal Chandinagar Chak Ananta Krishnapur Kamar Chandi Gopinagar Aminpur
Makhla
Rangamate Malbahal Jorebari Barmuri (Part) Uparkeshia (Part)
Outer Burnpur (Non-Municipal) Sarandi Nadiha Ganrui Hatgarui Pancbgachhiya Jemari Babua Barisha Bar Barisha Kola Paikpari Gaurichak Brindaban Chak Shishuram Chak Bijayram Chak Barkumar Chak Nandakishor Chak Jaga! Chak Kalicharan-Das Peskarer Chak Patikhali \ Murali Chak Shambhuram Chak Birka! Chak Bhimar Chak Gilabere (Shya)llray Chak) Purbba Radhaoallabh Chak Bholanath Chak Godadhar Chak Baramananda Chak Sitaram Chak Dakshin Hulopara Pardatta Chak Pran Krishna Chak DAkshri Rani Chak
'survey No.1 J....----,
Population Revenue Land In 1961 Record No.1 Serial No.1 Hadbast No.1 Location Code No.1 Thana No.1 Jurisdiction List No.
4
2 3,196 3 1,199 4 2,592 5 2,919
21 3,256 4 2,931 :J j,1Pi'J 5 3,104 9 1.~63
10 12, 71 16 3,310
1 5,990 7 5,192
44 4.143 49 5,915 31 5,632 32 4.840 15 9,106
N.A. 29,737 11 5,350 2 4,210
15 5,536 55 7,159 38 4,851 35 5,943' 24 4,900' 68 1,772 69 448 53 1,153 52 631 72 ~33 73 1,001 71 378. 11 9,601 43 N.A. 44 N.A. 46 N.A. 47 N.A. 53 N.A.
N.A. 44,260 1 1,190 2 753 3 747
42/3 167 34 3,634
8 6,544 290 1,754 289 2,242 288 2,001 287 1,782 286 2,195 131 113 132 63 136 196 137 283 138 57 139 306 140 4 141 Uninhabited
142 Uninhabited 14>3 295 175 71 176 14 177 Uninhabited 178 63 179 31 180 243 182 33 181 481 183 70 184 161 185 Uninhabited 186 16 187 727
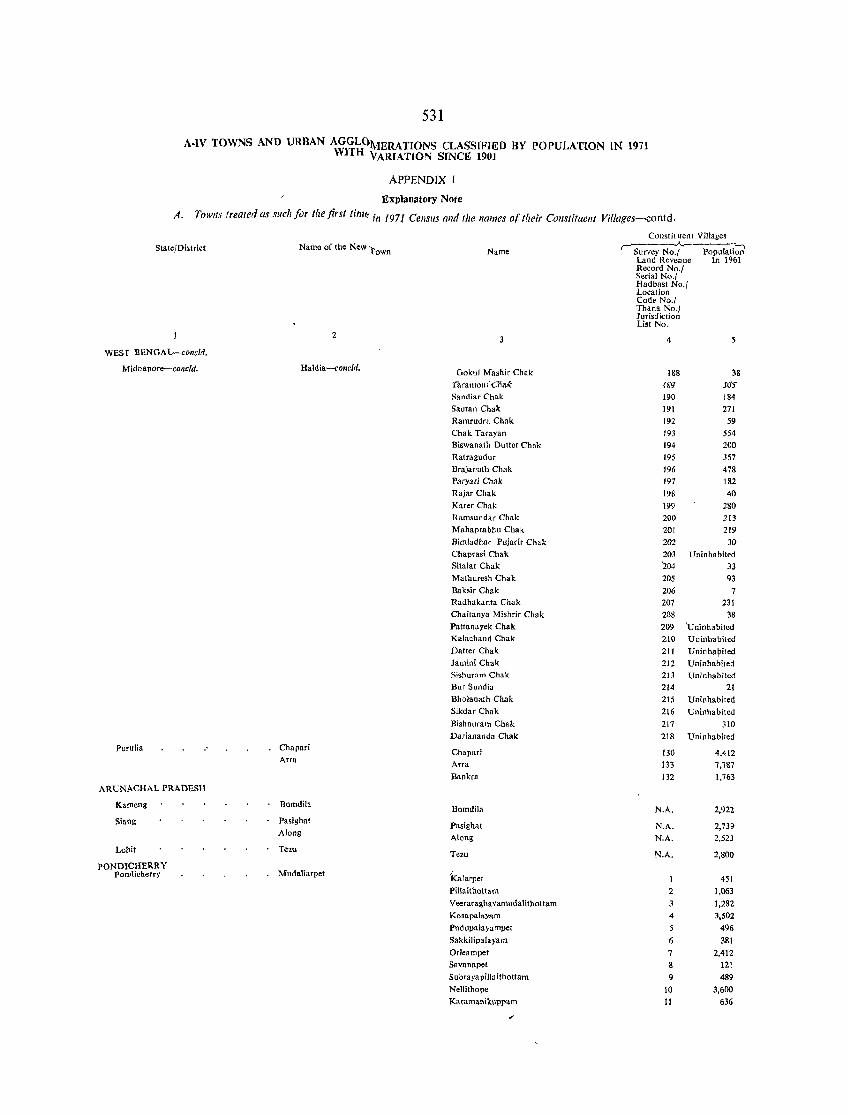
531
A·IV TOWNS AND URBAN AGGLOMERATIONS CLASSIFIED BY POPULATlON IN 1971 WITH" ARIATLON SINCE 1901
APPENDIX r Explanatory Note
A. Towns treated as such for the first time in 1971 Censlls alld the names of their COllstituent Villages-contd.
State/ District
WEsr BENGAL-concld.
Midnapore-concld.
Purulia
ARUNACHAL PRADESH
'Kameng
Siang
Lobit
PONDICHERRY Pondicherry
Name of the New fown
2
Haldia-concld.
Chapari
Arr.
Bomdila
Pasighat
Along
Tezu
Mudaliarpet
Name
Ookul Mashir Chak
Taramon'-Cna~ Sandiar Chak
Sautan Chak
Ramrudr. Chak
Chak Tarayan
Biswanatll Dutter Chak Ratragudur
Brajanath Chak Paryar; Chak
Rajar Chak
Karer Chak
Ramsundar Chak
Mahaprabllu Cbak
Bimladhar Pujarir Chak
Chaprasi Chak Sit.lar Chak
Mathuregh Chak
Baksir Chak Radhakanta Chak
Chaitanya Mishrir Chak
Pallanayek Chak
Kalachand Chak
Datter Chak
Jamini Chak Sishuram Chak
Bur Sundia
Bholanath Chak
Sikdar Chak
Bishnurarn Chak
Dariananda Chak
Chapari
Arm
Bankr.
Bomdila
Pasighat Along
Tezu
/ Kalarpet
Pillaithottam
Veeraraghavamudalithottam
Kosapala)'am
Pudupalayampet
Sakkilipalayam
Orleampet
Savanapet
Suhrayapillaithottam
Nellithope
Karamanikuppam
Constit uent Villages
r- Survey No.1 Populaii';:;;;-Land Revenue In 1961 Record No.1 Serial No.1 Hadbast No.1 Location Code No.' Thana No.' Jurisdiction List No.
4
188 38 (f;q 1(]S
190 184
191 271
192 59
193 554
194 200
195 357
196 478 197 182
198 40
199 280
200 213
201 219
202 30
203 Uninbabited '204 33
205 93
206 7 207 231 2()S 38
209 'Uninhabited
210 Uninhabited
211 Uninha\>ited 212 Uninhabited
213 Uninhabited
214 21
215 Uninhabited
216 Uninhabited
217 31()
218 Uninhabited
130 4.412 133 7,787
132 1,763
N.A, 2,922
N.A. 2,739 N.A. 2,523
N.A. 2,800
I 451
2 1,063
1,282
4 3,502
5 496
6 381 7 2,412
8 121
9 489
10 3,600
II 636
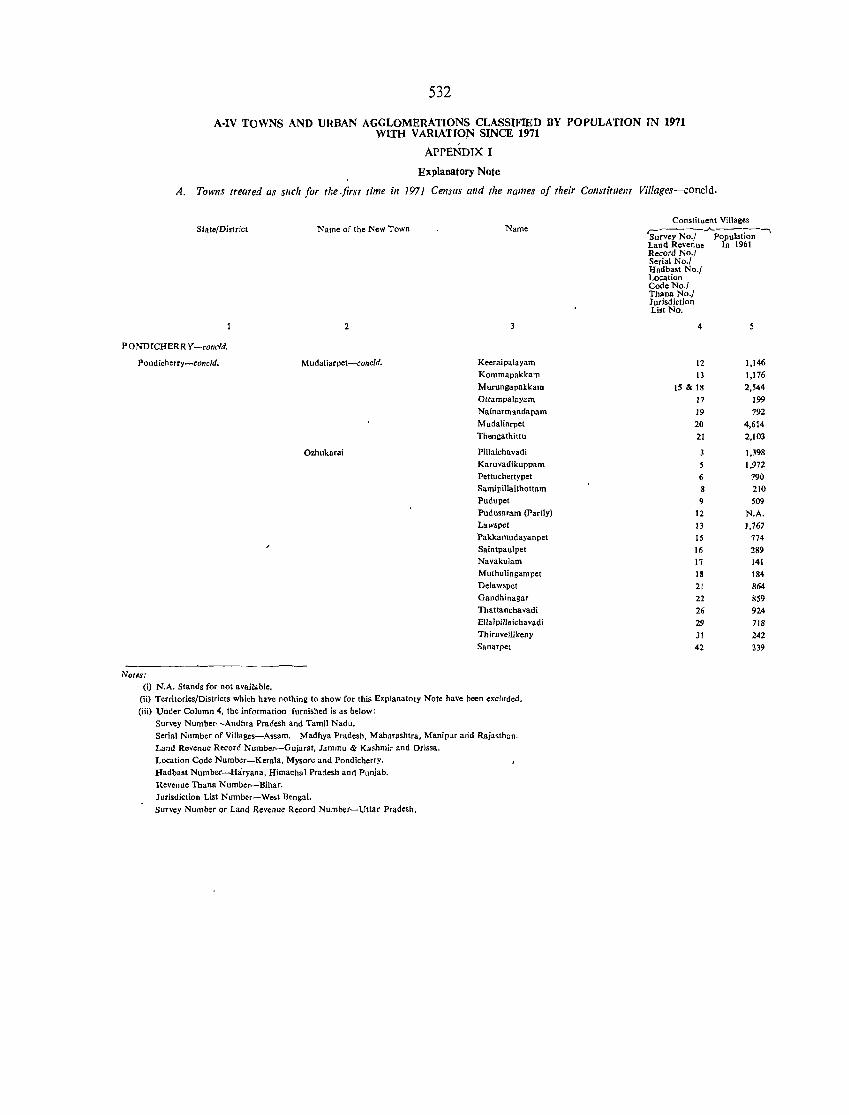
532
A·IV TOWNS AND URBAN AGGLOMERATIONS CLASSIFffiO BY POPULATION TN 1971 WITH VARIATION SINCE 1971
, APPENDIX I
Explanatory Note
A. Towns treated as such for the ·first time in 1971 Census and the names of their Constiftlellt Villages-conc1d.
St.te/District
P ONDfCIfERR Y-collcld.
Pondicherry-collcld.
Not .. : (i) N.A. Stands for not available.
Name of the New Town
2
Mudaliarpet-concld.
Ozhukarai
Name
Keeraipalayam
Kommapakkam Murungapakkam
Ottampal.yam
Nainarmandapam Mudaliarpet
Thengathittu
Pi11aichavadi
Karuvadikuppam Pettuchettypet Samipillaithottam Pudupet Pudusaram (partly) Lawspet Pakkamudayanpet
Saintpaulpet Navakulam Muthulingampet Del.wspe! Gandhinagar Thattanchavadi
Ellaipillaichavadi Thiruvellikeny San.rpet
(ii) Territories/Districts which ha're nothing to show for this Explanatory Note have been excluded.
(iii) Under Column 4, the information furnished is as helow: Survey Nurnber-Andhra Pradesh and Tamil Nadu. Serial Number of Villages-Assam, Madhya Pradesh, Maharashtra, Manipur arid Rajasthan.
Land Revenue Record Number-GujaTal, Jammu & Kashmir and Orissa. Location Code Number-Kerala, Mysore and Pondicherry. Hadbast Number-Haryana, Himachal Pradesh and Punjab.
Revenue Thana Number-Bihar. Jurisdiction List Number-West nengal.
Survey Number or Lan<! Revenue Record Number-Uttar PradeSh.
Constituent Villages c------"------. Survey No., Population Land Revenue In 1961 Record N0.1 Serial No./ Hadbast No./ Location Code No.! Thana No., Jurisdiction List No.
4
12 1,146
1J 1,176
15 & 18 2,544
17 199
19 792
20 4,614
21 2,103
1,398
1,972 6 790 8 210
9 509 12 N.A. 13 1,767
15 774 16 289 17 141
18 184 21 864 22 859 26 924
29 718
31 242 42 339
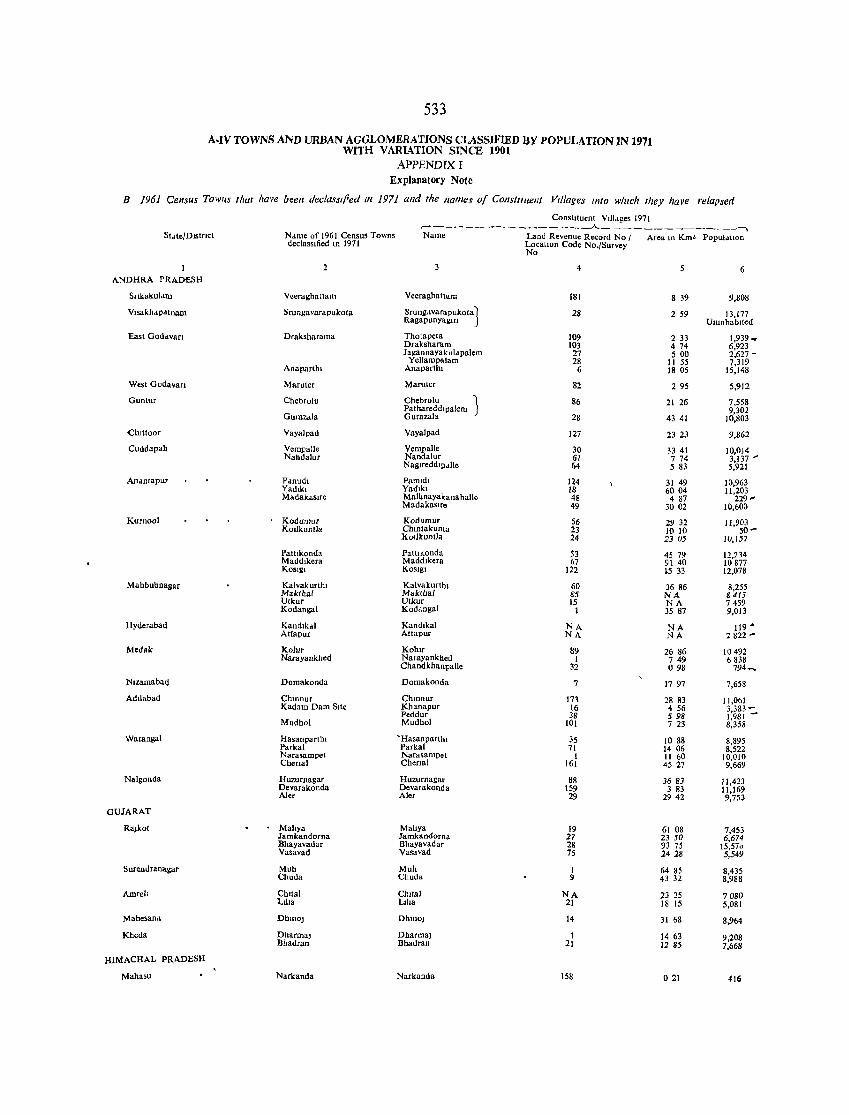
533
A.IV TOWNS AND URBAN AGGLOMERATIONS CLASSIFIED BY POPULATION IN 1971 WITH VARIATION SINCE 1901
APPENDIX I Explanatory Note
B 1961 Census TOIVIIS tllur f,ave been declasslfed III 1971 afld the names of COllstlll/ent VIllages Into wlllch they have relapsed
Constituent Villages 1971
ANDHRA PRADESH
Snkakul.llll
Vlsakhapatnam
East God<lvan
West Godavan
Guntur
Chlttoor
Cuddapah
Ananlapur
Kurnool
Mahbubnagar
Hyderabad
Medak
Nlzamabad
Adllabad
Warangal
Nalgonda
GUJARAT
Sureudran'lgar
Annell
Mahosana
Kbeda
HIMACHAL PRADESH
Mabaso
Name of 1961 CensuS Towns declassified In 1971
2
Veeraghallam
Srungavarapukota
Draksbarama
Anaparthl
Maruter
Chebrolu
Guraula
Vayalpad
Vempalle Nandalur
Pdnudl Yadlkl Madakaslfe
Kodumur Koukontla
Pattlkonda Maddlkera KOSIgl
Kalvakurtbl Makrltal Utkuf Kodangal
Kandlkal Atlapur
Kohlf Narayankhed
Domakonda
Chmnur Kadam Dam SIte
Mudhol
Hasanparlhl Parkal Narasampet Chenal
Huzurnagar Devarakonda Aler
Mallya Jamkandorna Bhayavadar Vasavad
Muh Chuda
Chlt.1 LIlia
Dhmo)
Dbarma) Bhadran
Narkanda
,----- -- - _______ .A. _____________ -.
Name Land Revenue Record No I Area III Kml Popul.1tton Location Code No./Survey No
3
Veeragbattum
srungdvarapukota} RagapunYagm
Tbotapeta Draksharam Jagannayakulapalem
Yellampulam Anapartbl
Maruter
Cbebrolu } Pathareddlpalem Gurazala
Vayalpad
Vempalle Nandalur Naglfeddlpdlle
Pamldl Yadlkl Malhnayakanahalle MadakaSife
Kodumur Chmtakunta KOllkuDlla
Patllkonda Maddlkera KOSlgI
Kalvakurtht Maktbal Utkur Koddngal
Kaudlkal Allapur
Kohlf Narayankhed Chandkhaupalle
Domakonda
Chmnur Kbanapur Peddur Mudhol
-Hasanpartbl Parkal Narasampet Chenal
Huzurnagar Devarakonda Aler
Mallya lamkandorna Bhayavadar Vasavad
Mub Chuda
Chltal Llha
Dhmo)
Dharma) Bbadran
Narkauda
4
181
28
109 103
27 28
6
82
86
28
127
30 61 64
124 18 48 49
56 23 24
53 67
122
60 85 15
I
NA NA
89 I
32
7
171 16 38
101
35 71
1 161
88 159 29
19 27 28 75
I 9
NA 21
14
1 21
ISS
g 39
2 S9
2 33 4 74 500
II 55 18 05
295
21 26
4341
2323
33 41 7 74 5 83
31 49 6004 487
30 02
29 32 ]0 10 2305
45 79 91 40 is 33
36 86 NA NA 35 87
NA NA
26 86 749 098
17 97
28 83 456 598 7 23
10 88 14 06 11 60 4527
36 83 3 83
2942
61 08 23 50 93 75 2428
64 85 43 32
2325 18 15
31 68
14 63 1285
021
6
9.808
13.177 Ulllohablted
1,939 .. 6,923 2.627 -7,319
15,148
5,912
7,558 9,302
10,803
9.862
IO,OJ4 3,137 .. 5,921
10,963 11,203
229 ... 10,600
ll,903 50-
10,157
12.234 10877 12,078
8,255 8413 7459 9,013
119" 2822 -
10492 6838
794_
7,658
11,001 3,383-1.981 -8.358
8,895 8,522
10,010 9,669
11,423 11.169 9,753
7,453 6,674
15,570 5,549
8,435 8,988
7080 5,081
8,964
9,208 7,668
416
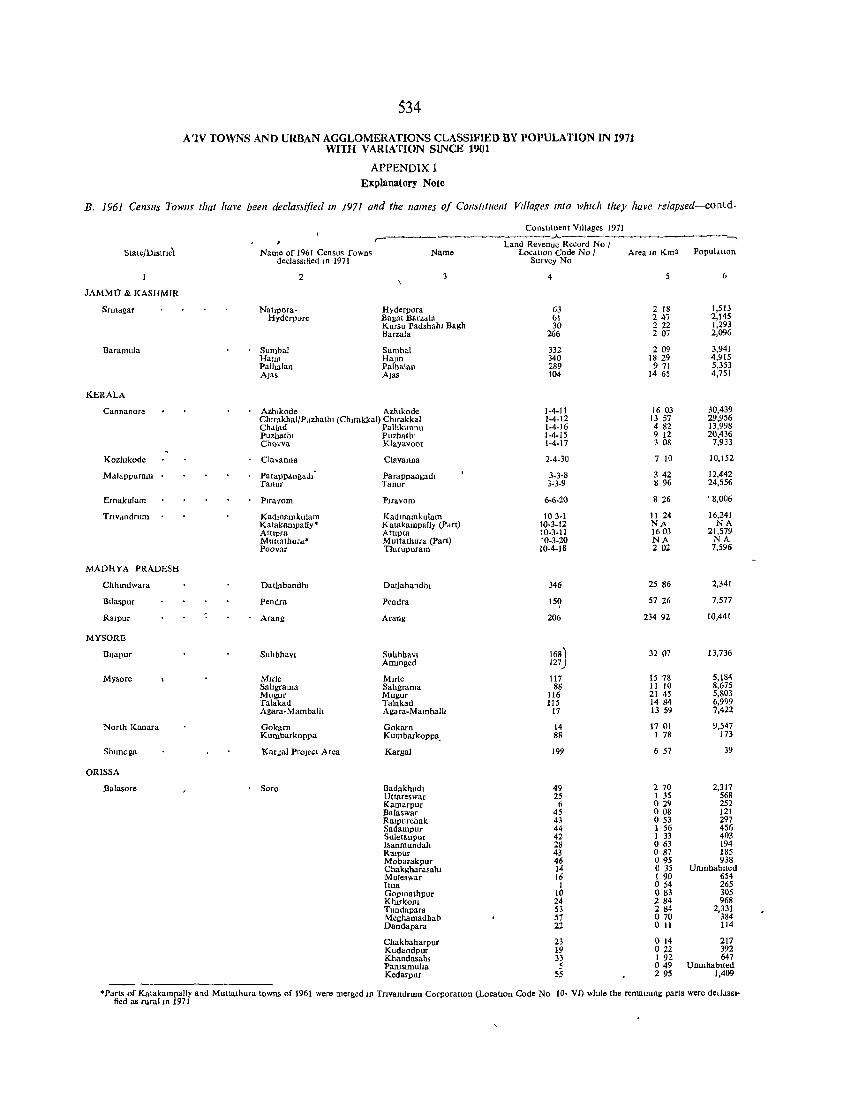
534
A'IV TOWNS AND URBAN AGGLOMERATIONS CLASSIFIED BY POPULATION IN 1971 WITH VARIATION SINCE 1901
APPENDIX I Explanatory Note
B. 1961 Censlls Towns tlrat have been declasJijied lfl 1971 and the flames of COilstlll/etll Villages mfo wludz they have relapsed-contd.
Conshtuent VIlldges 1971 r- ,A. ,
Land Revenue Record No j State/DIstrIct Name of 1961 Census Towns Name LocdtJOn Code No j Area In Km' Populdtlon
declaSSIfied m 1971 Survey No
2 4 6
JAMMO & KASHMIR
Srmagar Nallpora- Hyderpora 63 2 18 1,513 Hyderpore Bagat Barzala 61 247 2,145
Kursu Padshahl Bagh 30 222 1,293 Barmla 266 207 2,096
Baramula Sumbal Sumbal 33Z 209 3,941 Ha;m Ba;m 340 1829 4,915 Palhalan Pathalan 289 971 5,353 A;as A;as 104 1465 4,751
KERALA
Cannanore Azhlkode Azhikode 1-4-11 16 03 30,439 Clurakha1jPuzhathi (Chlrakkal) Chlrakka1 1-4-12 J3 57 29,956 Chdlad Palllkunnu 1-4-16 482 13,998 Puzhathl Puzhathl 1-4-15 9 12 20,436 Chovva Klayavoor 1-4-17 308 7,933
Kozhlkode Clavanna Clavanna 2-4-30 7 10 10,152
Mdlappuram ParaPlhlngadl - Parappangadl 3-3-8 342 12,442 Tanur Tanur 3-3-9 896 24,556
Ernakulam Plravom PJravom 6-6-20 826 • 8,006
Tnvdndrum KadlOamkulam Kadmamkulam 103·1 II 24 16,241 Katakampally' Katakampally (Pdft) 10-3-12 NA NA Attlpra Attlpra 10-3-11 1603 21,579 Muttathur,,' M uttathura (Part) 10-3-20 NA NA Poovar Thlrupuram 10-4-18 202 7,596
MADHYA PRADESH
Chhlndwara D.tlabandhl Datlabandhl 346 2586 2,341
Bllaspur Pendra Pendr. 15~ 5726 7,577
Ralpur Arang Arang 206 23492 10,441
MYSORE
BIJapur Sultbhavl Suhbhavl 168J 3207 13,736 Ammged 127
Mysore MlrJ. Mlrle 117 15 78 5,184 Sahgrama Sahgrama 88 II 10 8,675 Mugur Mugur 116 21 45 5,803 Talakad Tal.kad 115 1484 6,999 Agara-Mambalh Agara-Mambalh 17 13 j9 7,422
North Kanara Gokarn Gokarn 14 17 01 9,547 Kumbarkoppa Kumbarkoppa. 88 1 78 173
Shlmoga Kargal PrOject Area Kargal 199 6 S7 39
ORISSA
Balasore Soro Badakhudl 49 270 2,317 Uttareswar 2S 1 35 568 Kamarpur 6 029 252 Balaswar 45 008 121 Ralpurehak 43 o S3 297 Sadampur 44 1 56 456 Suletanpm 42 1 33 403 Isanmundah 28 o 63 194 Raipllr 43 087 185 Mobarakpur 46 095 938 Chakgharasahl 14 035 Unmhablted Muleswar 16 I 90 654 Itu. 1 054 265 Gopmathpur 10 o 83 305 KJurkom 24 284 968 Tuadapara 53 284 2,331 Meghamadh.b 51 070 384 Dandapara 21 o 11 114
Chakbaharpur 23 o 14 217 Kudandpur 19 022 392 Khandasahi 33 I 92 647 Paruslmuha S 049 Umnhabited Kedarpur 55 295 1,409
----'Parts of Katakampally alld Muttathura towns of 1961 were merged In Tflvandrum CorporatIOn (LocatlOD Code No 10- Vn whd. the remammg parts were deddssl-
Iled as rural m 1971
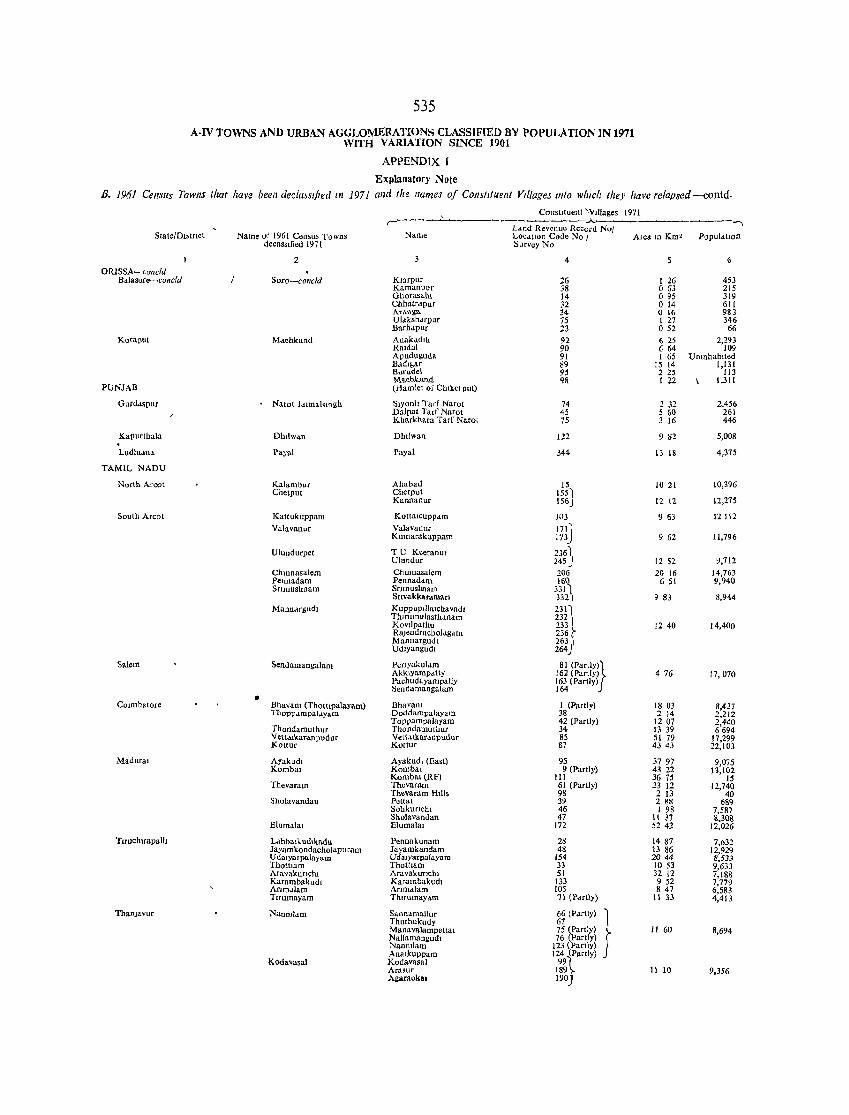
535 A-IV TOWNS AND URBAN AGGLOlVIERATIONS CLASSIFIED BY POPULATION IN 1971
WITH VARIATION SINCE 1901
APPEND£X [
Explanatory Note
B. 1961 Census Towns that have been decla;slfted III 1971 and the names of Constituent Villages mto IV/UCIt they have relapsed -contd.
ConstItuent "VlIlages 1971 r- A -.
L~nd Revenue ReCord Nol State/Dl,tnct Naille 01 1961 Cen,us Towns Name Locdtlon Code No / Alea m Km' Populdtlon
decasslfied 197 I Survey No
2 4 6 ORISSA- wllcld
Balasorc-concld SOfo-co1lcld Klarpur 26 I 26 453 Kamanpur 38 063 215 Ghorasahl J4 095 319 Chhatrapur 32 o 14 611 ArAnga 34 o 16 983 UI"kshdrpur 75 I 27 346 Barhapur 23 052 66
Korallut Mdchkund Anakadlh 92 6 25 2,293 Raldal 90 664 J09 Apuduguda 91 I 65 Umnhablted Badl!"ar 89 15 14 1,131 Burudel 95 2 25 113 M.v..bkJ!.lJJi q& 1 Z2 1,311
PUNJAB (Hamlet of Chlketput)
Gurddspur Natal Jalmalsmgh S,yonlt Tarf Narot 14 232 2,456 Dalpat Tarf Narot 45 5 60 261 Kharkhara Tarf Narot 75 3 16 446
Kapurthala Dhllwan Dhllwan 122 982 5,008
Ludhldna Payal Payal 344 13 18 4,375
TAMIL NADU
North Areot Kalambur AIl"bad J5 1021 10,396 Chelput Chetput 155,
Kannanur 156J 12 12 12,275
South Areol Kattukuppam KoltalcUPPdm 303 9 63 12112
Valavanur Valavanur 171J Kumarakllpp.am 173 9 62 11,796
UlundurpcI T U Keeranur 2361 Ulundllr 245 J 12 52 9,712
Chmnasalem ChwnasaJem 206 20 J6 14,763 Pennadam Pennadam 160 6 51 9,940 Snmushnam Srimushnam 331~
Snvakkaramart 332 9 83 8,944 Mannargudl Kuppupdlalehavadl 231")
Thlrumulasthdnam 232 1 KovIlpathu 233 \ 1240 14,400
Ra)endracholdgdUl 236 Mannargudl 263 UdJyangudl 264J
Salem Sendamangalam Penyakuldm 81 (Partly)) Akklyampdlty 162 (partly)} 476 17,070 Pachudayampally 163 (Partly) Sendamangalam 164
• COlmbatore llhavam (Thottlpalayam) BhavaOl 1 (Partly) 18 03 8,437 ThoppampaldYalll Doddampalayam 38 2 14 2,212
Toppampalayam 42 (Partly) 12 07 2,440 Thondamulhur Thondamuthur 34 13 39 6694 Vetldlkaranpuollr Vett.ukaranpudur 85 51 79 17,299 Koltur Kottur 81 43 43 22,103
Madura, Ayaklldl Ayakudl (East) 95 37 97 9,075 Kombat Kombal 9 (Partly) 4322 13,102
Kombal(RF) 111 36 75 15 Thevaram Thevaram 61 (Partly) 23 12 12,740
Thevaram HIlls 98 213 40 Sholavaudan Pettal 39 288 689
SohkurIch, 46 1 98 7,587 Sholavandan 47 11 31 8,308
Elum.lal Elumalal 172 5242 12,026
TlfllChtrapalh Labba,l.udlkadu Pennakunam 28 1487 7,632 Jayamkondacholapuram Jayamkandam 48 13 86 12,929 Udalyarpalayam Udalyarpalayam 154 2044 8,533 Thottmm ThottJam 33 1053 9,633 Aravakunchl Aravakuflch, 51 32 12 7,188 Karambakudl Kararnbakudl 133 952 7,779 Artmdlam Anmalam 105 847 6,583 Tlfwnayam TI:urumay~m 71 tPdrtl)} Il 33 4,413
ThaDJavur Nann.ldm Sannamallur 66 (PMtly) 1 Thuthukudy 61 Manavalampettal 75 (Partly)
f II 60 8,694
Nallamangudl 76 (Partly) NannJlam 123 (Partly) Analkuppam lZ4Kart1Y)
Kodavasal Kodavasal 99 Arasur 189 II 10 9,356 Agaraokal 190J
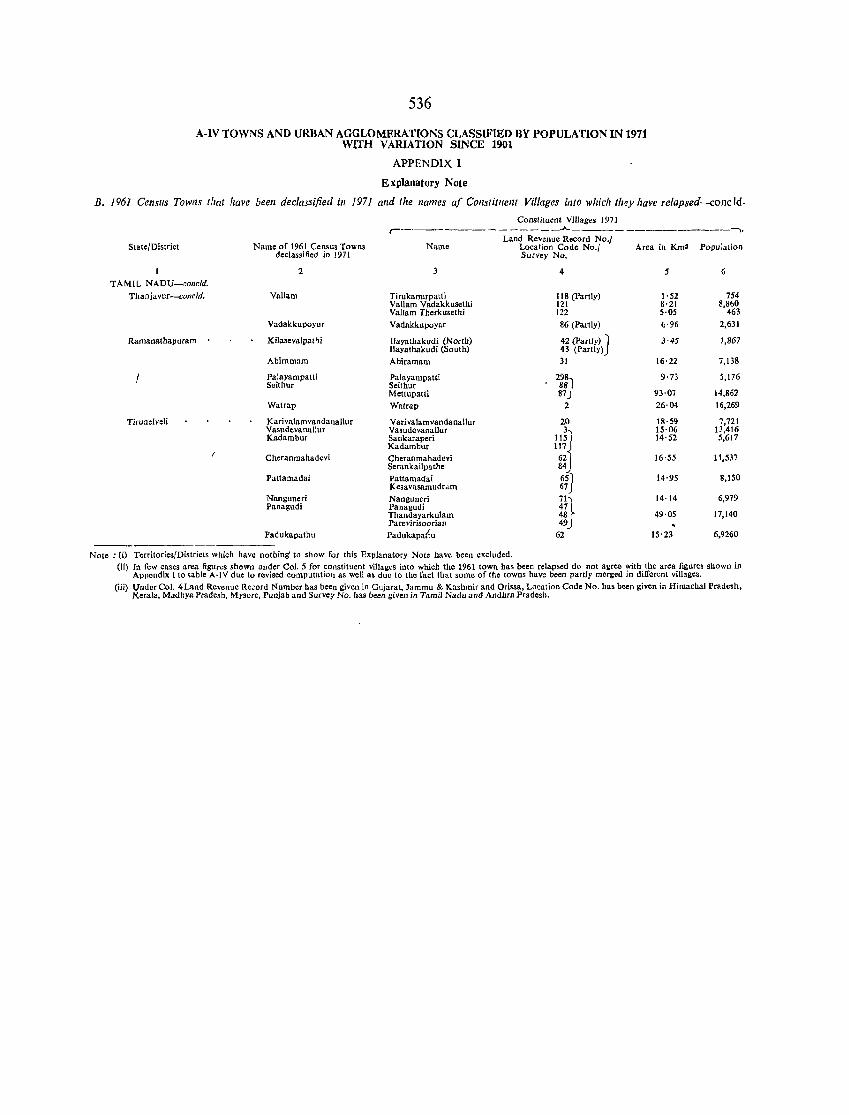
536
A-IV TOWNS AND URBAN AGGLOMERATIONS CLASSIFIED BY POPULATION IN 1971 WITH VARIATION SINCE 1901
APPENDIX I
Explanatory Note
B. 1961 Censlls Towns (bat have been declassified in 1971 and the names af COlls/illlem Villages inlO which they have relapsed---{;oncld.
Constituent Villages 1971 ,-_______________ --A-_______________ --,.
State/District Name of 1961 Census Towns Name declassified in 1 97 1
Land Reyenue R.cord No./ Location Code No./ Survey No.
Area in Kma Population
2 4 5 6 TAMIL NADU-concld.
Thanja vur -concld. Vallam Tirukanurpatti 118 (partly) 1·52 754 Vallam Vadakkusethi 121 8·21 8,860 Vailam Therkusethi 122 5·05 463
Vadakkupoyur Vadakkupoyar 86 (Partly) 6·96 2,631
Ramanathapuram Kilasevalpathi Uayathakudi (North) 42 (partly) ] 3·45 ),867 Jlayathakudi (South) 43 (Partly)
Abiramam Abiramam 31 16'22 7,138
j Palayampatti Palayampatti 2Z3i 9'73 5,176 Seithur Seithur
Mettupalti 87) 93·07 14,862 Watrap Watrap 2 26·04 16,269
TirunelveU Karivalamyandanallur Vari valamvandanallur 20 18·59 7,721 VasudevanalJur Vasudevanallur 3 15·06 13,416 Kadambur Sankaraperi 115 J 14'52 5,617
Kadambur 117 Cheranmahadcvi Cheranmahadevi 62 J 16'55 11,537
Serankailpathe 84 Pattamadai Paltamadai 65] 14·95 8,150
Kesavasamudrdffi 67 Nanguneri Nanguneri
7}
14'14 6,979 Panagudi Panagudi 47
Thandayarkulam 48 49·05 17,140 Parevirisoorian 49
Padukapathu Padukapat'tu 62 15·23 6,9260
Note: (0 Territories/Districts which have nothing' to show for this Explanatory Note have been excluded. Cii) In few cases area figures shown under Col. 5 for constituent villages into which the 1961 town has been relapsed do not agree with the area figures shown in
Appendix Ito table A,IV due to revised computation as well as due 10 the fact that some of the towns have been partly merged in different villages. (iii) Under Col. 4 Land Revenue Reoord Number has been given in Qujarat, Jammu & Kashmir and Orissa, Location Code No. has been given in Himachal Pradesh,
Ker.la, Madhya Pradesh, My.ore, Punjab and Survey No. has been given in Tamil Nadu and Andllra Pradesh.
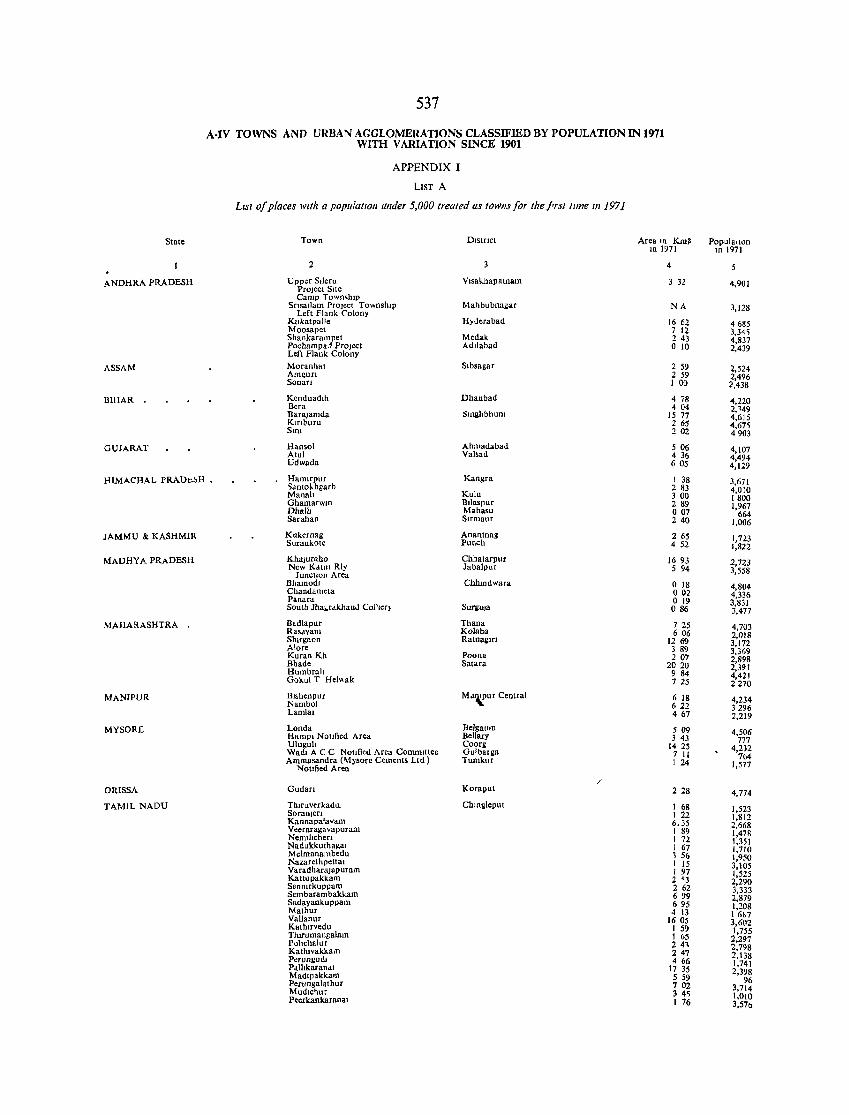
State
ANDHRA PRADESH
ASSAM
BIHAR .
GUIARAT
537
A-IV TOWNS AND URBAN AGGLOMERATIONS CLASSIFIED BY POPULATION IN 1971 WITH VARIATION SINCE 1901
APPENDIX I
LIST A
LISt of places With a popular/oill/flder 5,000 treated as towns for the frsf/llne m1971
Town Dlstnct
2
Upper Slleru Vlsakhapatnam Project SIte Camp Town,hlp
SnsaIlam Project TownshIp Mahbubnagar Left Flank Colony
Kukatvalle Hyderabad Moosapet Shankarampet Medak Pochampaj PrOject Adllabad Left Flank Colony Moranhat Slbsagar Am~un Senan
Konduadlb Dhanbad Bora Raralamda Smghbhum Klflburu SlnI
Hansol Ahmadabad Atul Valsad Udwada
Area In Km~ In 1971
4
3 32
NA
16 62 7 12 243 o 10
2 59 2 59 I 00
4 78 404
15 77 265 202
506 4 36 605
HIMACHAL PRAD",~H • Hamlrpur Kangra I 38 ~Jnto~hgarh
JAMMU & KASHMIR
MADHYA PRADESH
MAHARASHTRA •
MANIPUR
MYSORJ:
ORISSA
TAMIL NADU
Manalt GhamarwlO Dball, Sarahan
Kukernag Surankote
KhaJuraho New K"tm Rly
JunctIon Area Shamod, Chandameta Panara South Jhabrdkhand Col'ler~
Badlapur Rasayam SIurgaon Alore Kuran Kh Shade Humbrah Gokul T Hel"ak
RI~benpur Nambol Lamlal
Londa Hampl NotIfied Area Ulugull Wad, A C C NotIfied Area Committee Ammasandra (1\1ysore Cements Ltd)
Noufied Area
Gudan
Thlruverkadll, Soran)en Kannapa1avam Veeraragavapuram Nellultchen Nadukkuthalo\al Melmanambedu Nazareth pett a, Varadharajapuram Kattupakkam SenOlrkuppam Sembarambakkam Sadayankuppam Mathur Vallanur Kathlrvedu Truruman!!alam Pohchalur Katlllvakkaon Perungudl P.tllikarandl Madlpakkarn Perungalathur Mudlchur Peerkankaranal
Kulu 2 83 3 00
Btlaspur 2 89 Mahasu 007 Sirmaur 240
Anantnag 2 65 Punch 4 52
Chhatarpur 16 93 Jabalpur 5 94
Chhmdwara o 18 002 o 19
Surgu)a 086
Thana 7 25 Kolaba 606 Ratnagm 1269
3 89 Poona 207 Satara 2020
9 84 7 2S
M .. ~ur Central 6 18 622 4 67
Selgaulll 509 Bellary 3 43 Coorg 1425 GulbaIga 7 II Tumkur I 24
/ Koraput 228
Chlusleput I 68 1 22 6.35 I 89 172 J 67 'l 56 I 15 1 97 2 ~3 262 699 6 95 4 13
1605 I 59 I 65 2 4' 247 4 66
17 35 5 59 702 3 4~ I 76
Popul'llon In 1971
4,901
3,128
4685 3,34; 4,837 2,439
2,524 2,496 1,438
4,220 2,149 4,615 4,67; 4903
4,107 4,494 4,129
3,671 4,010 1800 1,967
664 1,006
1,723 1,822
2,723 3,558
4,804 4,336 3,831 3,477
4,703 2,()18 3,172 3,3(,9 2,898 2,391 4,421 2270
4,234 3296 2,219
4,506 777
4,232 764
1,577
4,774
1,523 1,812 2,668 1,47& 1,351 1,710 1,950 3,105 1,525 2,290 3,333 2,879 1,208 161>7 3,602 1,755 2,297 2,798 2,138 1,741 2,398
96 3,714 1,010 3,570
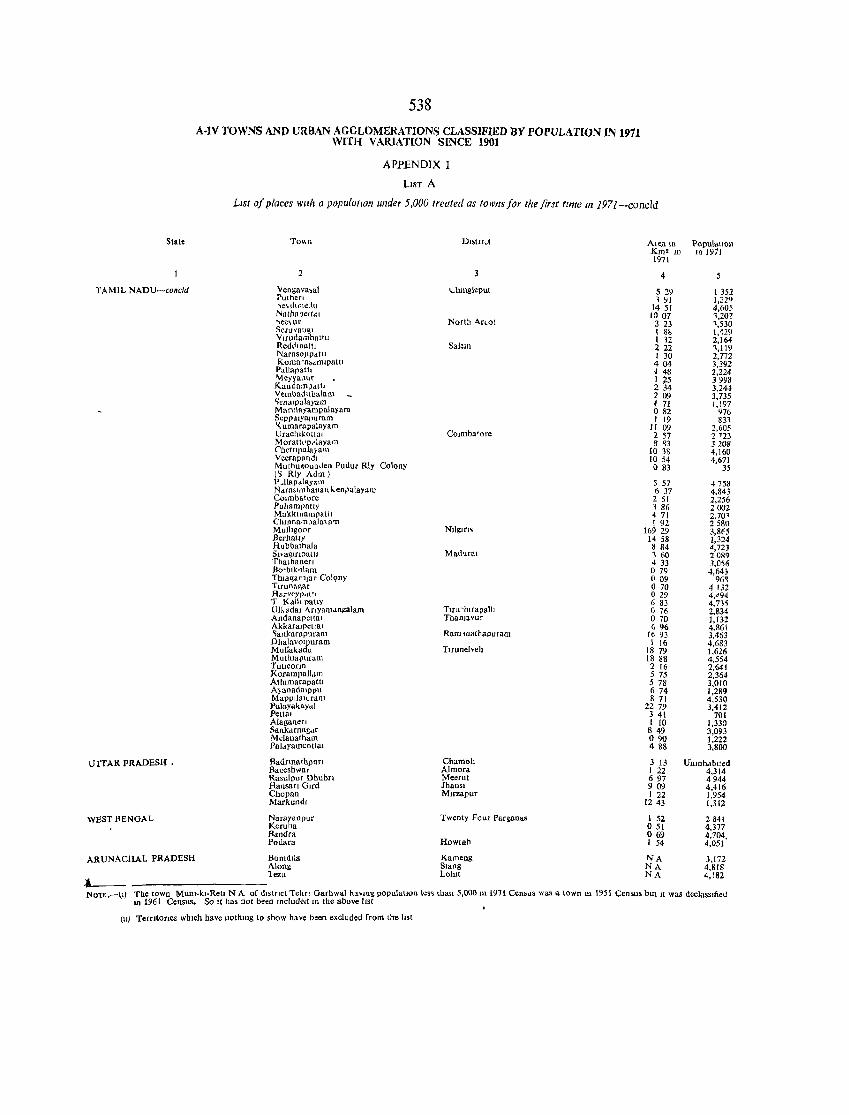
538 A·IV TOWNS AND URBAN AGGLOMERATIONS CLASSIFIED BY POPULATlON IN 1971
WITH V ARlATION SINCE 1901
APPENDIX I
LIST A
LIst of places with a pOpll{C/flon ullder 5,000 treated as fowflS for the /irst tlllte III 1971-concld
State
TAMIL NADU-concld
UTTAR PRADESH.
WEST BENGAL
ARUNACHAL PRADESH
~ -----------------
2
Vengava,aJ Puthen ~e\lhl11e\'u Natha,ettdl ~ee\ur
Seruvall~l Vtrudambattu ReddLpattl NarasoJlpatll Komara~d.lmpattl Pallapath 'Jeyy,mur Kandampdlt. VembadLlbalam 'ienalp.l,yam Marulayampalayarn SepPJ,lyalJuram t< umarapalayam Urachlkotti,ll Morath.lpr'layam Chettlpalayam Veerapandl Muthu.ounJen Pudu. Rly Colony ('> Rly Adm) P .llapalayam Nd.ra::'Jmhanalf..ken,.:'lalayarn ConnbatQre Pu]mmpatty MakklOampattl Chlnnampala\ a'll Mulhgo(1r Berhatty Hubbathala SnagIfJDUltl Thalhanen Be-blk"lam Thla~arlJar ColQny Ttruna~ar H arveypolt t I T Kalil natty Ulk ada! "'f1yam,m~aJ.m AndanapcttaL Akkaralpetlal '5ankarapurarn Dhalavolpuram Mullakadu Mutluapuram Tutlconn KorampaU.>m Athlmarapattl A) anadalppu MapptialUram Palayakay .. l Pettal Alaganen Sankdrnag,lf Melanatham Paldyamcottal
Badnnathpun Bageshwar Rasulpur Dhubn Hansan GIrd Chopan Markundl
Narayanpur Kerulla Bandra Podara
BomdIla Along lezu
<vhmgleput
North II,.rlot
Salem
COlmb:f,tore
Ma<hral
THu'huapalil ThaDJaVur
Ramioathapuram
THunelvelI
Chamoh Almora Meerut Jhansl M,rzapur
Twenty Four Parganas
Howtah
Kameng Slang Lohlt
Area tn Km2w 1971
4
5 29 1 91
1451 1007
3 23 I 81> 112 222 1 30 404 i 48 } ;15 234 }09 I 71 082 I 19
11 09 2 57 8 ~3
1038 10 54 083
5 57 6 37 2 51 1 86 471 1 92
169 29 1458 8 84 3 60 oJ. 33 o 79 009 o 70 o 29 6 83 o 76 o 70 696
16 93 I 16
18 79 18 88 2 16 5 75 5 78 674 87[
2279 3 41 I 10 849 090 488
3 13 I 22 697 909 I 22
1243
1 52 051 069 1 54
"'fA NA NA
POpul"llon 10 1971
1351 1,229 4,605 1,201 \530 1,429 2,164 '1,119 2,772 3,392 2,224 3998 3,244 3,735 1,197
976 833
2,605 2 7 23 3208 4,160 4,671
35
4753 4,843 2,256 2002 2,701 2580 3,8f5 1,324 d,723 2089 3,0'i6 4,643 96~
4132 4,'94 4,7Vi 2,834 1.132 4,861 3,453 4,683 1,626 4,554 2,641 2,364 3,010 1,289 4,530 3,412
701 1,330 3,093 1,222 3,800
UnInhdblted 4,314 4944 4,416 1,954 1,312
2841 4,377 4,704, 4,051
3,172 4,818 4,182
NOTE.-~I) The town MUnI·kI·RetI N A of dIStrict Tehrl Garhwal havHtIl populalloll l.s. thau 5,000 III 1971 Cen.us was a lown 1I1 1951 Census but It was declassified lD 1961 Census. So It has Dot been Included lLl the above lJst •
(II) Terutones which have nothlllg to show have been excluded from tire lIst
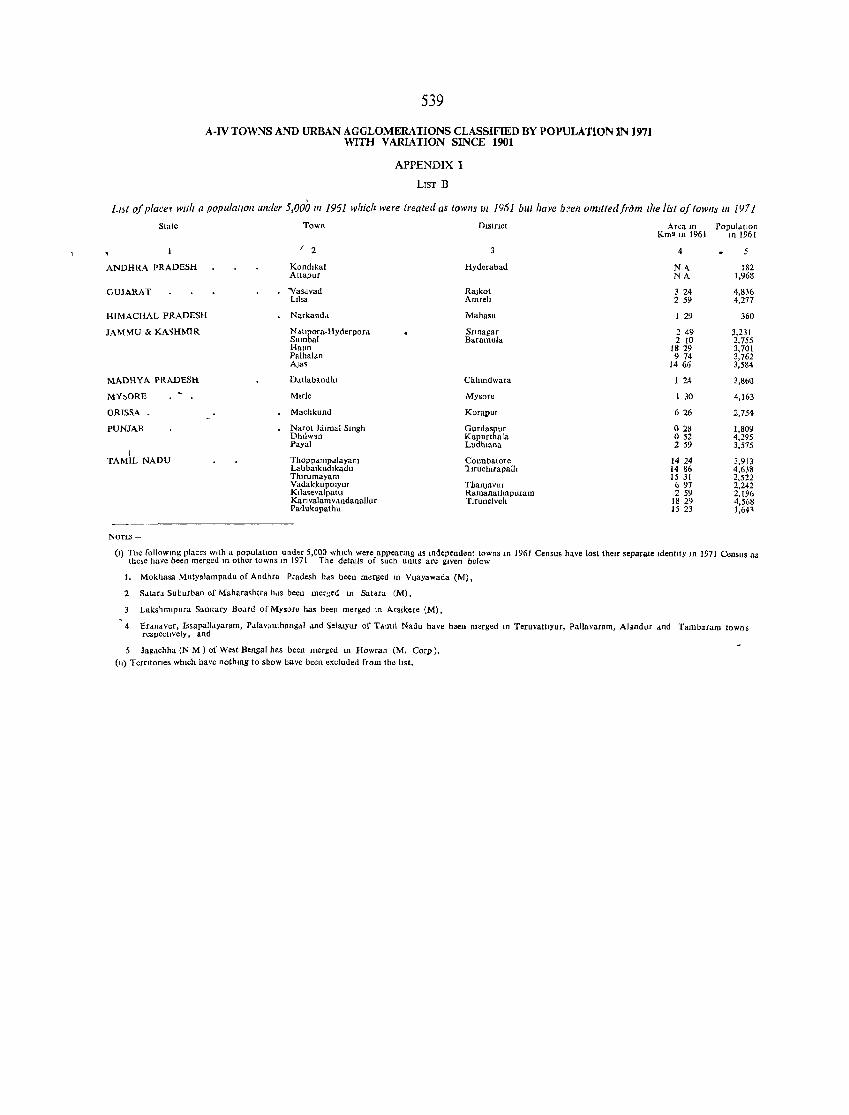
539
A-IV TOWNS AND URBAN AGGLOMERATIONS CLASSIFIED BY POPULATION IN 1971 WITH VARIATION SINCE 1901
APPENDIX I
LIST B
L/~t 0/ place~ wall {l poplilaflollllnder 5,000 III 1961 w!tich were treated as towns III /961 but !tave b~ell OImtfed/rom the list 0/ (OWIlS III 1971
State Town Dlstnct Area In POpUldtion Km'lll 1961 10 1961
/ 2 4
ANDHRA PRADESH Kondlkal Hyderabad N4 182 Attapur NA 1,968
GUJARAT "Vas.wad Rajkot 324 4,836 Lilta Amreh 2 59 4,277
HIMACHAL PRADESH Narkandd Mahasu I 29 360
JAMMU & KA~HMIR N.tlpora·Hyderpord SrlOagar 2 49 3,231 Sumbal Baramula 2 10 2,755 HaJIll 1829 3,701 Palhal~n 9 74 3,762 Aja, 1466 3,584
MADHYA PRADESH Ddtlabandtu Cnhmdwara 124 3,86()
MY",ORE Mtrle Mysore I 3() 4,163
ORISSA. Machkund Koraput 626 2,754
PUNJAB Narol JalmaI SlUgh Gurdaspur 028 1,809 Dhtlw~n Kapurthala 052 4,295 Payal Ludh.ana 2 59 3,575
I TAMIL NADU Thoppdl1lp.tlayam Co.mbatore 14 24 3,913
Labbatkudlkadu 11ruchltapaIh 14 86 4,638 Thlfumayam 15 31 2,522 VadakkupOlYur ThanjllvlIr 697 2,242 Kilasevalpatll Ramanathapuram 2 59 2,196 Kaflvalamvdndanallur Tlrunelvell 1829 4,568 Pa<iuk~pathu 15 23 1,641
NOTES -
(I) Tne followmg places With a populatIon under 5,000 whIch were appeanng dS mdependent towns In 1961 Census have lost their separate Identity In 1971 Census as Ihe,. have been merged 10 other towns 10 197 [ The details of such umts are given below
I. Mokhasa Mulyalampadu of Andhea Pradesh h"s been merged 10 V'jayawada (M),
2 Sdtara Suburban of Maharashtra h,\s been merged In Satdra (M).
Lnks,mll1ura SaOltary Board of Mysore has been merged 10 Arslkere (M),
4 Er.navur, Issapall"yaram, Pdlava11lhangdl dnd Selalyur of Tam.1 Nadu have been m.rged In Teruvattlyur, Pallavaram, AI.ndur dnd Tambaram lowns respectively, and
5 Jagdchha (N M ) of West Bengal has been merged In Howrah (M. Corp).
(11) Terfltofles which have nothlOg to show have been excluded from the hst.
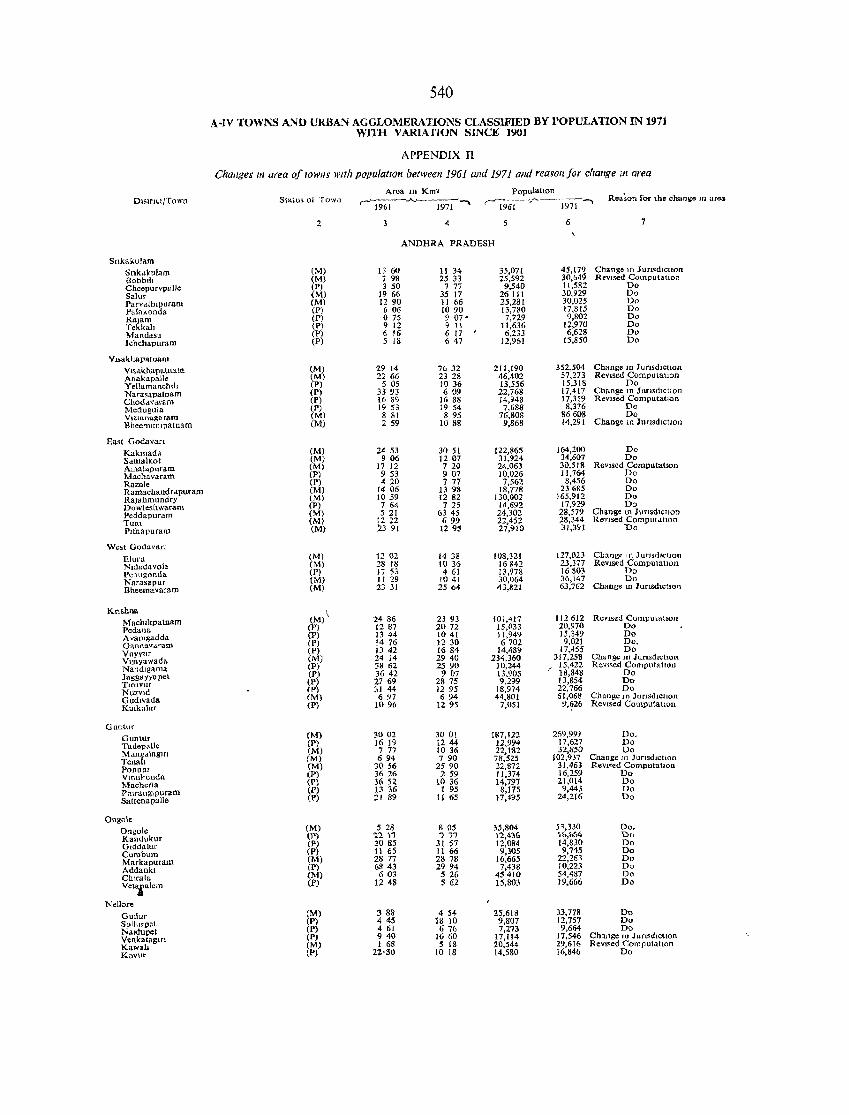
540
A.IV TOWNS AND URBAJ.~ AGGLOMERATIONS CLASSIFIED BY POPULATION IN 1911 WITH VARIATION SINCE 1901
APPENDIX II
(,flanges 1/1 area of IOWlls wllh populatIOn between 1961 alld 1971 alld reason for cllallge //I area
Area lD Km' populatIOn Re-a;on fol' the change III area DistrICt/Town Sl(;\.lu~ ol Town '-1%'--"- ~ r-~-~~I-" 1971
2 4 5 6 7
ANDHRA PRADESH
Snkakulam
Snk"kulam (M) 13 60 II 34 35,071 45,179 Change HI: JUrIswctlon
Bobblll (M) 798 25 33 25,592 30,04<1 RevIsed Cotnputatron ChcepurvpaUc (p) 3 50 777 9.540 11.582 Do Salur (M) 19 66 35 17 26 III 30,929 Do Parvdthlpuram (M) 1290 II 66 25,281 30,Cl25 Do Palakonda (P) 6 06 1090 13,780 17.815 Do Rajam (P) o 75 9 07· 7,729 9,801 Do Tekkah (P) 9 12 9 11 11.636 12,970 Do Mandasa (P) 6 16 6 17 6.233 6.628 Do Ichchapuram (P) 5 [8 647 12,961 15,850 Do
VlSakhapatnam V" .... khapa.tnam (M) 29 14 7632 211,190 >52,504 Change In "1 unSdlctIon Anakapalle eM) 22 66 2328 46,402 57.273 ReVised Computation YeUamanchlh (Pl 5 05 1036 13,556 15,318 Do Narasa-patnam (P) 33 93 609 22.768 17,417 Change ill J umd,Ctlon Chodavaram (P) 16 89 1688 14,948 17,319 RevJsed ComputatIon
Medugula (P) 19 53 19 54 7,688 8,376 Do Vlz1anagaram (M) 8 81 895 76,808 86608 Do Bl1eemtItllpatnam (M) 2 59 1088 9,868 14,291 Change m JUrISdIctIOn
East Godavari Kakmada (M) 2453 3051 122,865 164,200 Do Sdma1kol (M) 906 1207 31,924 34,607 Do Amalapuram (M) 17 12 720 24,063 30,518 Revlsed Computation M.achavaram CP) 953 907 10,026 11,764 Do Ramie (P) 420 777 7,562 8,456 Do Ramachandrdpuram (M) 1406 1398 18,778 23685 Do Rajahmundry (M) 1059 1282 130,002 165,912 Do Dowleshwaram (P) 764 7 25 14,692 [7,929 Do Peddapuram (M) 521 6345 24,302 28,579 Change In Iunsdictlon
Tum (M) 1222 699 22.452 28,344 ReVised ComputdtlOn Plthapuram (M) iJ 91 1295 27,910 31,391 Do
Wc:,t GodavarI
E1uru (M) 12 02 14 38 108,321 127,023 Change J n J UrJsd1ctwn
Nldndavole (M) 28 18 1036 16842 23,377 ReVised ComputatIOn Penugonda (P) 17 53 461 13,978 16803 Do Narasapur (M) II 29 1041 30,064 36,147 Do
Bheemavaram (M) 2331 2504 43,821 63,762 Change LO 1 unsdlchon
Knshna (M)\ Machillpalnam 2486 23 93 101,417 112 612 ReVIsed CompulatlOII
Pcd"na (P) 1287 2072 15,033 20,970 Do Avamgadda (P) 1344 1041 11,949 15.349 Do Gannavc1ram (P) 1476 12 30 6702 9,021 Do,
Vuyyur (P) 1342 1684 14,489 17,455 Do
VIJ.yawada (M) 24 14 2940 234,360 317,258 Change 10 JurLsdlchon
Nandlgama (P) 3862 2S 90 10,244 / 15.422 Revl",ed ComputatIOn
Jaggayyapet (P) 3642 907 13,905 18,848 Do
TlCuvur (P) 2769 2875 9,299 13,854 Do
NUZVld (P) 31 44 1295 18,974 22,766 Do
Gudlvada (M) 697 694 44,801 61,068 Change In JU(JsdlChon
Kmkalur (P) 1096 1295 7.051 9,y26 ReVISed ComputatIon
Guntur Guntur (M) 3002 3001 187,122 259.991 DQ.
Tadepalle (P) 1619 1244 12,994 17,627 Do M.d.ngalaglIJ. (M) 777 1036 22,182 32,850 Do
Tenall (M) 694 790 78,525 102,937 Change In JunsdlctlOll
PonouI (M) 3056 2590 22,872 31,463 RevICed Computatlon
Vmuycnda (P) 16 26 259 11.374 16,259 Do Macherla (1') 36 52 10 36 14,797 21,014 Do Phlranglpuram (P) 13 36 1 95 8,175 9,443 Do
Sattenapalle (P) 11 89 11 65 17,495 24,216 Do
Ongole Ongole (M) 528 805 35,804- 51,330 Do. Kaodukur (1') 22 Yl
') " \2,4,6 ~6,6S" Do
Glddalur (P) 2085 31 57 12.084 14,830 Do Cumbum (P) 11 65 Jl 66 9,305 9,745 Do Markapuram (M) 28 77 2~ 78 16,665 22,261 Do
Addaokl (P) 6843 2994 7,438 10,223 Do Ctllrala (M) 603 526 45410 54.487 Do
Vet.alem (P) 1248 S 62 15,803 19,666 Do
Nellore Guour (M) 388 4 54 25,618 33,778 Do S"Uurpot (P) 445 18 10 9,807 12,757 Do N, .. dupel (P) 4 61 676 7,273 9.664 Do Venkatagm (P) 940 1660 17,114 17,546 Change 10 Junsdlctlon KawaI! (M) 1 68 5 18 20,544 29,616 ReVised Computahon Kovur (P) 22'30 10 18 14,580 16,840 Do
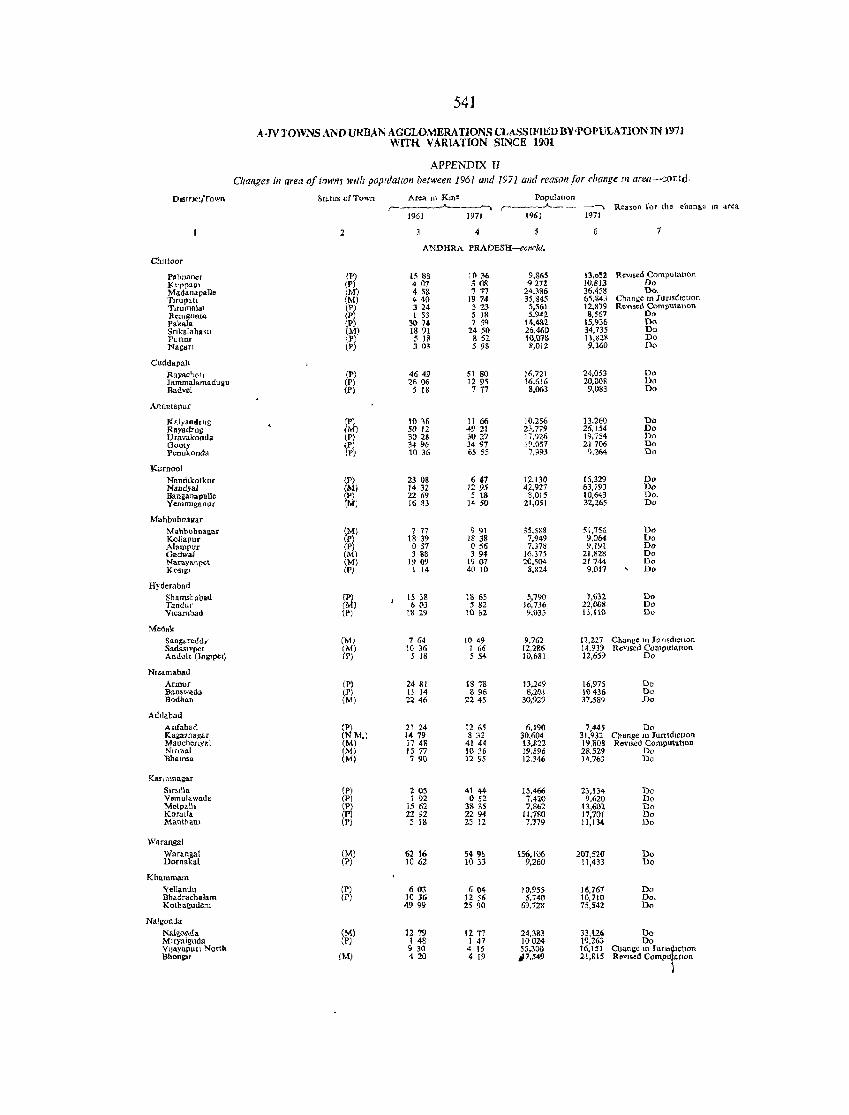
541
A-JVTOWNSANDURBAN AGGLOMERATIONS CLASSIFIEDBY'POPULATlONINl 971 WITH VARIATION SINCE 1901
APPENDIX II Changes in area of fowns lVllh popllla/iOn be/ween 1961 and 1971 and reason for change //1 areu-c()ntd·
O"tnct/Town St~tus of Town Area m Kln' 1'ol',"al1On r----___.I...---. r-----~-----. Reason fOT the eh~nge In area 1961 1971 1961 1971
2 4
ANDHRA PRADESlI-concld.
ChmaoT
PaJmaner (1') 15 88 1(1 :% 9,865 13,,,S2 Rewsed Computar,on Kuppom (P) 4 07 308 ')272 10.813 Do Madan_pall. 1M) 4 S8 777 24,:\35 36,458 Do. TIru~atl (M) 440 1974 35,845 65,843 Change In JunsdrctlOn Tlrumalal \P? 3 24 323 5,561 12,879 Rev\,s<:.d Ccrnpu1aHon Renlgunta. (1' 1 53 5 18 5,942 8,567 0" Pakala (1') 3() 'l' 2 59 14,481 15,936 Do S"kalah.'" (M) 18 91 2450 26,460 34,735 Do Puttu< \1') 5 ]8 852 lOmE 11,828 Do NagaTl (P) 3 03 5 98 8,m2 9,360 Do
Cuddapah
Rayachoh (1') 4649 51 80 16,721 24,053 Do Iammalarnaduau (P) 2606 12 95 16,616 20.008 Do Badvel (P) 5 18 7 77 &,063 9,083 Do
Anantaflur
Kalyandrug (P) 10 ~6 !l 66 10,256 13.260 Do Rayadrug (M) 50 12 4921 23.779 26,154 Do Uravakonda (P) 30 28 3027 170926 W,7S4 Do Gooey ,Pi 34 % 34 97 19.()51 21706 Do Penukonaa (l') 1036 65 5S 7,993 9,264 Do
Kl.Irnool NandIlwtkur (P) 23 08 647 12,1)0 16,329 Do Nandyal (M) 14 32 1295 42,927 63,193 Do Banganapalle (P) 2269 5 18 8,015 10,643 Do. Yemmlganur (M) 16 83 14 SO 21,051 32,265 Do
MahbubnagaT Mahbubnagar (M) 777 9 91 35,588 51.756 Do Kollapur (P) 18 39 18 38 7,949 9.064 Da Alampur (P) 057 056 7,378 9,191 Do Oadwa/ (M) 3 88 3 94 16,375 21,828 Do N'araya.npet (M) 19 09 1907 20,504 21144 Do KoslgJ iP) 1 14 40 10 8.824 9,017 Do
Hyderabad
Shamshabad ttl 15 ,8 13 65 5,790 7,632 Do Ta"duf ( ) 603 582 16,736 22,008 Do Vlcarab.1t (1') 18 29 1082 9,03:' 13,\10 Do
Medok Sangareddy (M) 764 IIH9 9,762 17,227 Change 10 JUrIsdlctJon Sadaslvpet (M) 1036 1 66 12.286 14,939 ReVIsed Computauon Arrdolc (JoS1pet) (1') 5 18 554 10,681 12,659 Do
NlZamabad Armur (P) 24 81 18 78 13.249 16,975 Do Banswada (P) IJ 14 896 8,201 Hl436 Do Bodh"" (M) 2246 2245 30,929 37.589 .00
Ad,labad
Asuabad (P) 21 24 12 65 6.190 7,44~ Do Kaga.nagar (NM.) 1479 8 32 30.604 31,932 Change In Junsdlworl Manchenyal (M) 17 48 41 44 13,812 19,808 ReVIsed Compu\allon N.rmal (M) 15 77 10 36 19,596 28,529 Do Bbamsa (M) 790 12 95 12,346 14,763 Do
Ka'f"m\oagar Slr~I1ht (P) 205 41 44 15,466 23,04 Do Vcrnulawada (P) 192 o 52 7.420 9,620 Do Metpalh (1') 15 62 3& 35 1,862 13,6()1 Do Koratla (P) 2292 2294 11,780 17,7DI Do Manthant (P) 5 18 2S 12 7,779 11,134 Do
Warangal Warangal (M) 62 16 54 9S iS6,I06 201,S2(), Do Dornakal (P) 1062 1033 9,260 11,433 Do
Kbammam Ydlandu (P) 603 604 10,955 J6,761 Do Bbadracbalam (P) 1036 1256 5,740 10,710 Do. Kotbagudem 49 99 25 90 69.728 75,542 Do
Nalgonda
Nalgond" (M) 1279 1277 24,3&3 33,12<; 00 Mrryalguda (1') 148 1 47 !()O24 19,263 Do Vlj"_vapu[\ North 9' 30 4 15 55,300 16,151 Change In fu.r.tiJ~lctlOn Bhonglf (M) 42() 4 19 tP,549 21,815 R •• ".d Compu allon
I
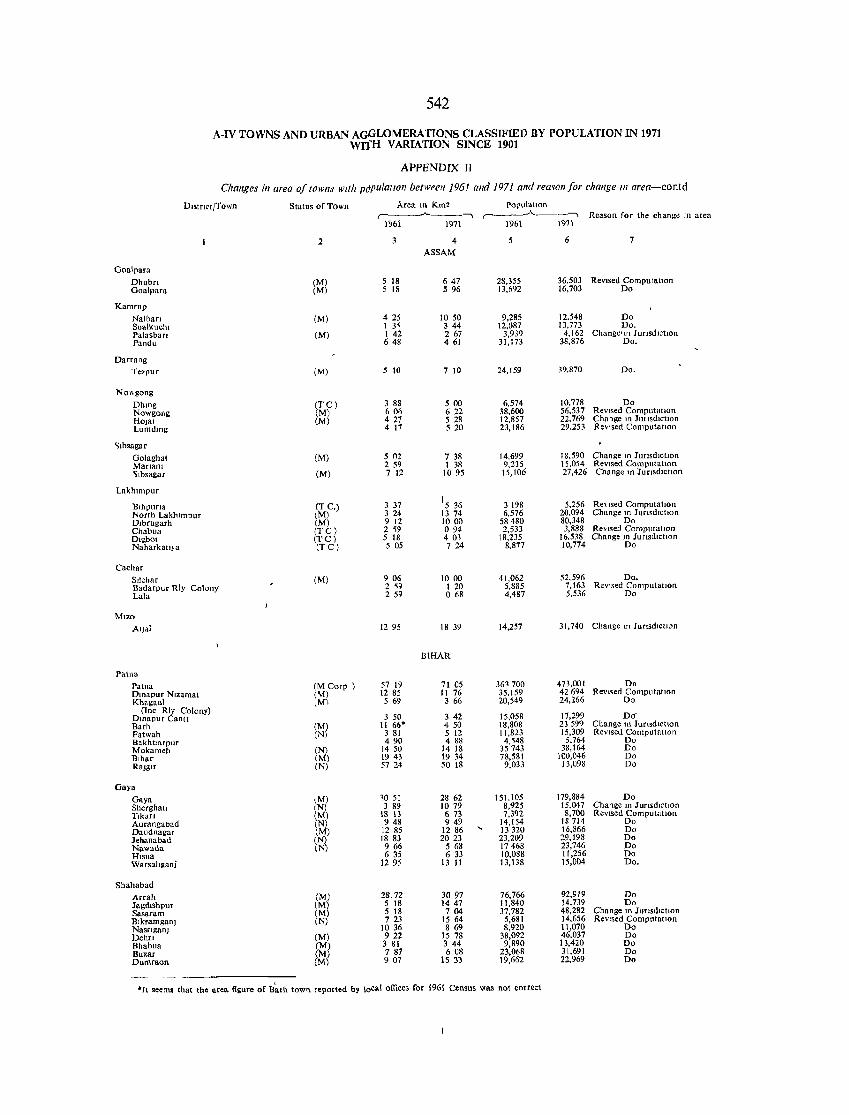
542
A-IV TOWNS AND URBAN AGGLOMERATIONS CLASSIFIED BY POPULATION IN 1971 WrfH VARIATION SINCE 1901
APPENDIX II
Changes ill area of fowns wah papulation betweell J96! and J97 J and remon for change 111 area-contd
DIStrIct/Town Status of Town Area tn Km2 POI',daIlOn r------~-----~ ,-------"-----, Reason for the change In area
1961 1971 1961 1971
2 3 4 5 6 7
ASSAM
Goalpara
DhubrI (M) 5 18 647 28,355 36,503 ReVIsed ComputatIOn Goalpara (M) 5 18 596 13,692 16,703 Do
Kamrup NalbarI (M) 42S 1050 9,285 12,548 Do Sualkuc1u 1 3~ 344 12,087 13,773 Do. Palasban (M) I 42 2 67 3,939 4,162 Change'ln JUrisdIction Pandu 648 461 31,173 38,876 Do.
Darrang Te7~lUf" (M) 5 10 7 10 24,159 39.870 Do.
No\\gong
Dhmg (TC) 3 88 500 6,574 10,778 Do Nowgong (M) 606 622 38,600 56,537 ReVised ComputatIOn HOjal (M) 427 528 12,857 22,769 Change m JUrISdiction Lumdmg 4 17 520 23,186 29.253 ReVised Computation
~Ibsagar
Golaghat (M) 502 7 38 14,699 18.590 Change In JUrISd,ct,on Mariam 2 59 1 38 9.235 15.054 ReVised Computation ~Ibsagal (M) 7 12 10 95 15,106 27.426 Change m Junsd,ctIon
Lakhlmpur
Blhpurla (T C.) 3 37 15 36 3198 5,256 Re\ Ised ComputatJon North Laklllmpur lM) 3 24 1374 6.576 20.094 Change m JUrisdictIOn Dlbrugarh (M) 9 12 1000 58480 80,348 Do Chabua (TC) 2 59 094 2.533 3,888 RevISed ComputatIOn DlgbOl (l'C) 5 18 403 18,235 16.538 Change m J unsdlctiOn Naharkatl}a (TC) 505 7 24 8,877 10,774 Do
Cachar Sdchar (M) 906 1000 41,062 52.596 00_ Badarpur Rly Colony 2';9 1 20 5,885 7,163 ReVised ComputatIOn Lala 259 o 68 4,487 5,536 Do
MIZO
Alj"l 12 95 18 39 14.257 31,740 Change tn J unsdlctl0n
BIHAR
Patna Patna (MCorp) 57 19 71 05 361700 473,001 Do Dlnapur Nlzamat (\1) 12 85 11 76 35.159 42694 ReVised ComputatIOn Khagaul eM) 569 3 66 20,549 24.266 Do
(Tnc Rly Colony) 3 50 17,299 Dm.pur Cantt 342 15.058 Dcf
Barh (M) 11 66" 450 18.808 23599 Change In Junsdectlon Fatwah (N) 3 81 5 12 11.823 15,309 ReVised ComputatIOn Bakhtlarpur 49O 488 4,548 5,764 Do Mokameh (t2 1450 14 18 35743 38.164 Do Bihar ( ) 1943 1934 78,581 100,046 Do RajSlr (N) 57 24 50 18 9,033 13.098 Do
Gaya Gaya \M) 10 51 28 62 151,105 179,884 Do Sherghatl (N) 3 89 1079 8,925 15.047 Change m JUrISdlctlon
Tlkan (M) 18 13 673 7.392 8,700 Revlsed Computatlon Aurangaoad (N) 948 949 14,154 18714 Do Daudnagar 1M) 12 85 1286 13320 16,866 Do Iehanabad (N) 18 83 20 23 23,209 29,198 Do Nawada (N) 966 5 68 17468 23,746 Do Hisua 6 35 6 33 10,088 11,256 Do Warsahgan,i 1295 13 11 13,138 15,004 Do.
Shahabad Arrah (M) 28.72 3097 76,766 92.919 Do Jagdlshpur (M) 5 18 1447 11.840 14.739 Do Sasaram (M) 5 18 704 37,782 48,282 Change m Junsdlctlon Blkramganj (N) 723 1564 5,681 14,656 ReVIsed Computation Nasrlganj 1036 869 8,920 11,070 Do Dehn eM) 922 15 78 38,092 46,037 Do Bhabua (M) 3 81 3 44 9,890 13,420 Do Buxar (M) 7 87 608 23,068 31,691 Do DUO'lrROn (M) 907 15 33 19,662 22,969 Do
'It seems that tho area figure of B;",h town reported by local offices for 1961 Census was not correct
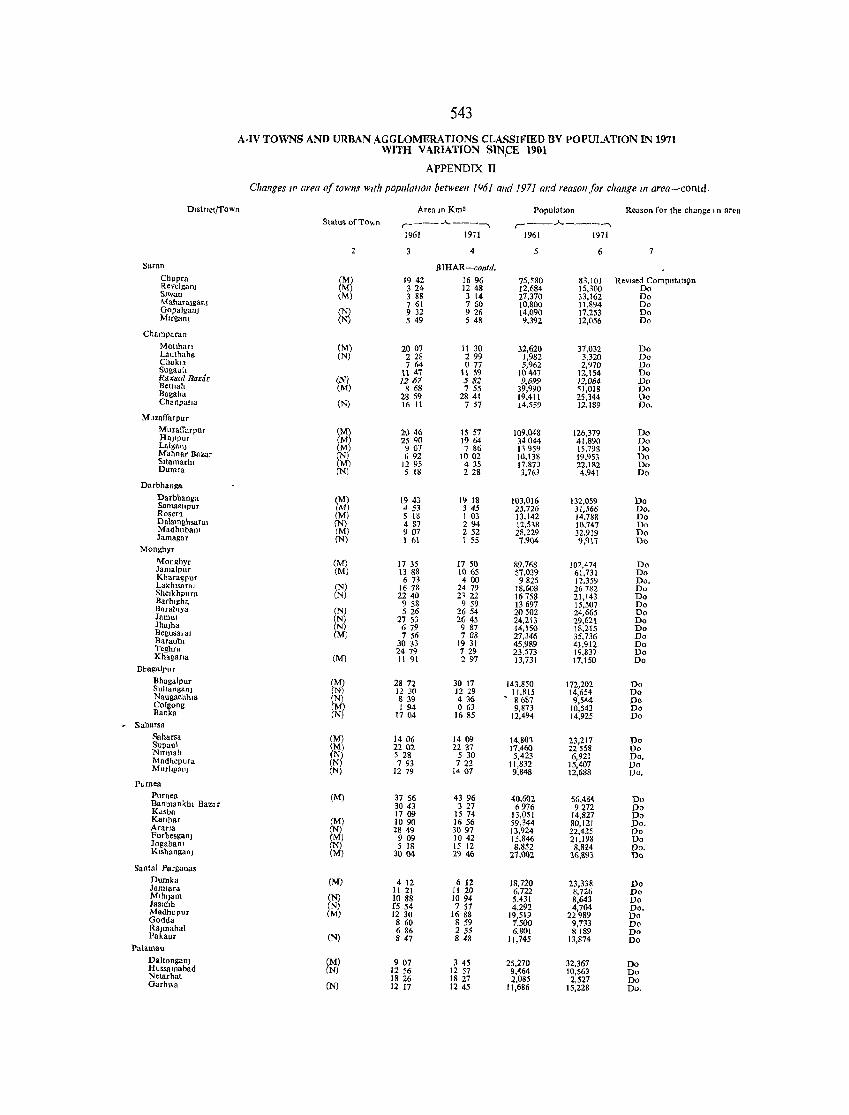
543
A·IV TOWNS AND URBAN AGGLOMERATIONS CLASSIFIED BY POPULATION IN 1971 WITH V ARIATION SI~,CE 1901
APPENDIX II
Changes II' area of towns Wlfh popillatlon between 1(J61 and 1971 and reason for change In area-contd,
Dlstrtct/fown Area 10 Km' Population Reason for tbe change I n area
Status ofTa"n r---...A-----., r- ---'------'" 1961 1971 1961 1971
3 4 5 6
Saran BIHAR-contd, Chapra (M? 1942 16 96 15,580 83,101 ReVISed Coml'ntatl9n RevelganJ (M 324 1248 12,684 15,300 Do Siwan \M) 3 88 3 14 27,370 33,162 Do Mahara]san] 761 760 10,800 11,894 Do GopalganJ (N) 9 32 9 26 14,090 17,253 Do Mlfsan] (N) 549 5 48 9,392 12,056 Do
Champaran
MatIhall (M) 2007 11 30 32,620 37,032 Do Lauthahlt (N) 2 28 299 1,982 3,320 Do Ch.k .. 764 077 5,962 2,970 Do Sugaull \l 47 11 59 10447 12,154 Do R<lx<l,,1 Bazar (;>;'1 1267 582 9,699 12.0M DD BettIah (M) 8 68 7 55 39,990 '1,018 Do Bagaha 28 59 28 41 19,411 25,344 Do Chanpatla (N) 16 11 7 57 14,559 12,189 Do,
Mllzaffarpnr
Muzafl"aTpnT (M) 2() 46 15 57 109,Q48 126,379 Do HaJlpur (M) 25 90 1964 34044 41,890 Do LalganJ (M) \)07 7 86 11959 15,798 Do M ahnar Bazar (N) 692 1002 10,138 19,953 Do SItamarhl (M) 12 95 4 35 17,87) 22,182 Do Dumra (N) 5 18 228 3.763 4,941 Do
Darbhanga
Darbhanga (M) 1943 1918 !()3,O16 132,059 Do Samastlpur (M) 453 J 45 25,726 31,566 Do. Roser~ (M) 5 18 1 03 )3,142 14.788 Do Dahmghsaral (N) 487 294 12,538 10,747 Do MadhnbaOi (M) 907 252 28,229 32,919 Do Jamagar (N) 1 61 1 SS 7,9()4 9,911 Do
Monghyr
I\{onghyr (M) 17 35 17 50 89,768 102,474 Do Jam.1pur (M) 13 88 1065 57,039 61,731 Do Kharagpur 6 73 400 9825 12.359 Do. Lakh1.saral (N) 16 78 2479 18,608 26782 Do Shelkhpura (N) 2240 21 22 16758 21,143 Do Barblgha 958 9 59 13697 15,507 Do BarahIya (N) 526 26 54 20502 24,665 Do JamU1 (N) 27 53 26 45 24,213 29,621 Do Iha]ha (N) 679 9 87 14,150 18,215 Do Begusal1\l (M) 756 708 27,346 35,736 Do Baraulll 30 33 19 31 45,989 41,912 Do Tcghra 2479 729 23,573 19,837 Do KhagaTia (M) 11 91 297 13,731 17,150 Do Bhagalpur
Bhagalpur (M) 2872 30 17 143,850 172,202 Do Sultanganl (N) 1230 12 29 11.815 14,654 Do Naugachhla tN ) 8 39 436 ' 8687 9,544 On ~~~~~ng M) 1 94 o 63 9.873 10,543 Do
(N) 1704 16 85 12.494 14,925 Dn - Sabarsa
Sahars. (M) 1406 1409 14,801 23,217 Dn Supanl (M) 2202 22 37 17,460 22558 Do Nlrmall (N) 5 28 5 30 5,423 6,921 Do. Madhepura (N) 7 93 7 22 11,832 15,407 Do MurllganJ (N) 1279 1407 9,848 12,688 Do. Purnea
Purnea (M) 37 56 43 96 40,602 56,484 Do Banmankhl Bazar 30 43 3 27 6976 9272 Do Kdsba 1709 IS 74 13.051 14,827 Do Katlhar (M) 1090 1656 59,344 80,121 Do. Arana (N) 28 49 3097 13,924 22,425 Do Forbesgan] (M) 909 1042 15,846 21,198 Do Jogabam (N) 5 18 15 12 8,852 8,824 Do. KlShangan) (M) 3004 2946 27,002 36,S'H Do
Santal Parganas Dnmka (M) 4 12 6 12 18,720 23,338 Do Jamt"ra 1! 21 11 20 6,722 8.726 Do MlhlJam (N) 10 88 1094 5,431 8,643 Do Jasldlh (N) (5 54 7 57 4,292 4,704 Do. Madhupur (M) 12 30 16 88 19,519 22989 Do Godda 8 60 8 59 7.500 9,733 Do RaJmahal 6 86 2 55 6,801 8189 Do Pakaur (N) 8 47 8 48 11,745 13,874 Do
Palamau Daltongan] (M) 907 3 45 25,270 32,367 Do Hussamabad (N) 1256 12 57 9,464 10,563 Do Netarhat 18 26 18 27 2.085 2,527 Do Garbwa (N) 12 17 12 45 11,686 15,228 Do,
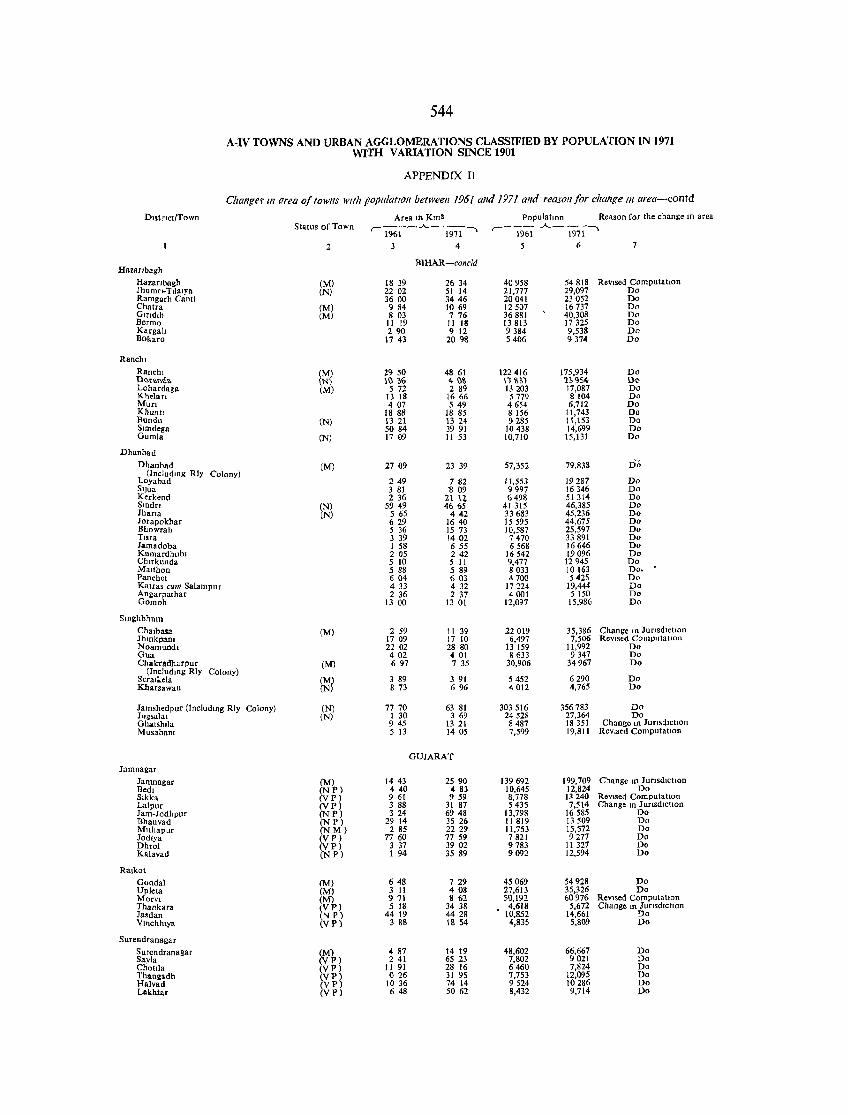
544
A-IV TOWNS AND URBAN AGGLOMERATIONS CLASSIFIED BY POPULATION IN 1971 wrrH VARIATION SINCE 1901
APPENDIX II
Changer In area of tOWtlS walt populatlolt betweell 1961 atld 1971 alld reasol/ for change 111 area-contd
DISt rlet/Town Area In Km2 Populalton Reason for the change In area Status of Town , 1961-.A.-m1"""\ ,----.A.----"""\
1961 1971
2 3 4 5 (\ 7
BIHAR-conc1d HazarJbagh
Hazarlbagh (M) 18 39 26 34 40958 54818 RevISed ComputatIOn Jhumfl-T,la,ya (N) 2202 51 14 21,777 29,097 Do Ramgarh Cant! 3600 3446 20041 23052 Do Chatra (M) 984 1069 12507 16737 Do Gmdlh (M) 8 03 776 36881 40,308 Do Bermo 11 19 II 18 13813 17325 Do Kargah 290 9 12 9384 9,538 Do Bokaro 1743 2098 5406 9374 Do
Ranchl
Ranchl (M) 2950 48 61 122416 175,934 Do U",'I''''.<'..,. IN) II} % 4 I}'/, \11'.:', 'l:. <:154 ll<} Lohardaga (M) 572 289 13203 17,087 Do Khelan 13 18 1666 5779 8104 Do MUfl 407 549 4654 6,712 Do Khuntl 1888 1885 8156 11,743 Do Bundu (N) 13 21 13 24 9285 11,153 Do Slmdega 50 84 39 91 10438 14,699 Do Gumla (N) 17 09 11 53 10,710 15,131 Do
Dhanbad
Dhanbad (M) 2709 23 39 57,352 79,838 Do (Including Rly Colony)
LOyabad 249 7 82 11,553 19287 Do S'lua 3 81 1l 09 9997 16346 Do Kerkend 2 36 21 1~ 6498 51314 Do Sllldfl (N) 5949 46 65 41315 46,385 Do JharJa (N) 5 65 442 33683 45,236 Do Jorapokhar 629 1640 15595 44,675 Do Bhowrah 5 36 1573 10,587 25,597 Do T1sra 3 39 1402 7470 33891 Do Jamadoba I 58 655 6568 16646 Do Kumardhubl 205 242 16542 19096 Do Chlfkunda 5 10 5 II 9,477 12945 Do Malthon 5 88 5 89 8033 10163 Do. Panchet 604 603 4700 5425 Do Katras cum Salampur 4 33 432 17224 19,444 Do Angarpathar 2 36 2 37 4001 5150 Do Gomoh 13 00 130\ 12,097 15,986 Do
Smghbhum
Ch3lbasa (M) 2 59 11 39 22019 35,386 Change tn Junsd,ctlOn Jhmkpam 1709 17 10 6,497 7,506 ReVised Computaholl Noamundl 2202 2880 13 159 11,992 Do Gua 402 401 8633 9347 Do Chakradbarpur (Mj 697 735 30,906 34967 Do
(Including Rly Colony) Serall..ela (My 3 89 391 5452 6290 Do Kharsawan (N 873 696 4012 4,765 Do
Jamshedpur (Including Rly Colony) (N) 77 70 63 81 303516 356783 Do Jug-salal (N) 1 30 3 69 24528 27,364 Do Ghatshda 945 1321 8487 18351 Change lfi JunsdlctJon Musabam 5 13 1405 7,599 19,811 ReVised ComputatIon
GUJARAT
Jamnagar
Jamnagar (M) 14 43 25 90 139692 199,709 Change In J unsdlChon Bedl (NP) 440 483 10,645 12,824 Do Slkka (VP) 961 959 8,778 13240 RC\Tlsed Computatlon Lalpur (VP) 3 88 31 87 5435 7,514 Change In JUrISdIctIOn Jam-Jodhpur (NP) 324 6948 13,798 16585 Do llhanvad (NP) 29 14 35 26 1 1819 13509 Do Mllhapur (NM) 2 85 2229 11,753 15,572 Do Jodlya (V P) 7760 7759 7821 9277 Do Dhrol (VP) 3 37 3902 9783 11327 Do Kalavad (N P) 194 35 89 9092 12,594 Do
Ra]kot
Gondal (M) 648 729 45069 54928 Do Up leta (M) 3 11 408 27,613 35,326 Do Morvl (M) 971 8 62 50,192 60n6 Rev1%ed ComputatIOn Thankar. (VP) 5 18 3438 4,618 5,672 Change III JUrISdIctIOn Ja.dan (N P) 44 19 44 28 10,852 14,661 Do Vmchh,ya (VP) 3 88 18 54 4,835 5,809 Do
Surendranagar
Surendranagar (M) " 87 14 19 48,602 66,667 Do Sayla (VP) 241 6523 7,802 9021 Do Chotlla (VP) 11 91 28 16 6460 7,824 Do Tha.ngadh (VP) 026 31 95 7,753 12,095 Do Halvad (VP) 10 36 74 14 9524 10286 Do Lakhlu (VP) 648 5062 8,432 9,714 Do
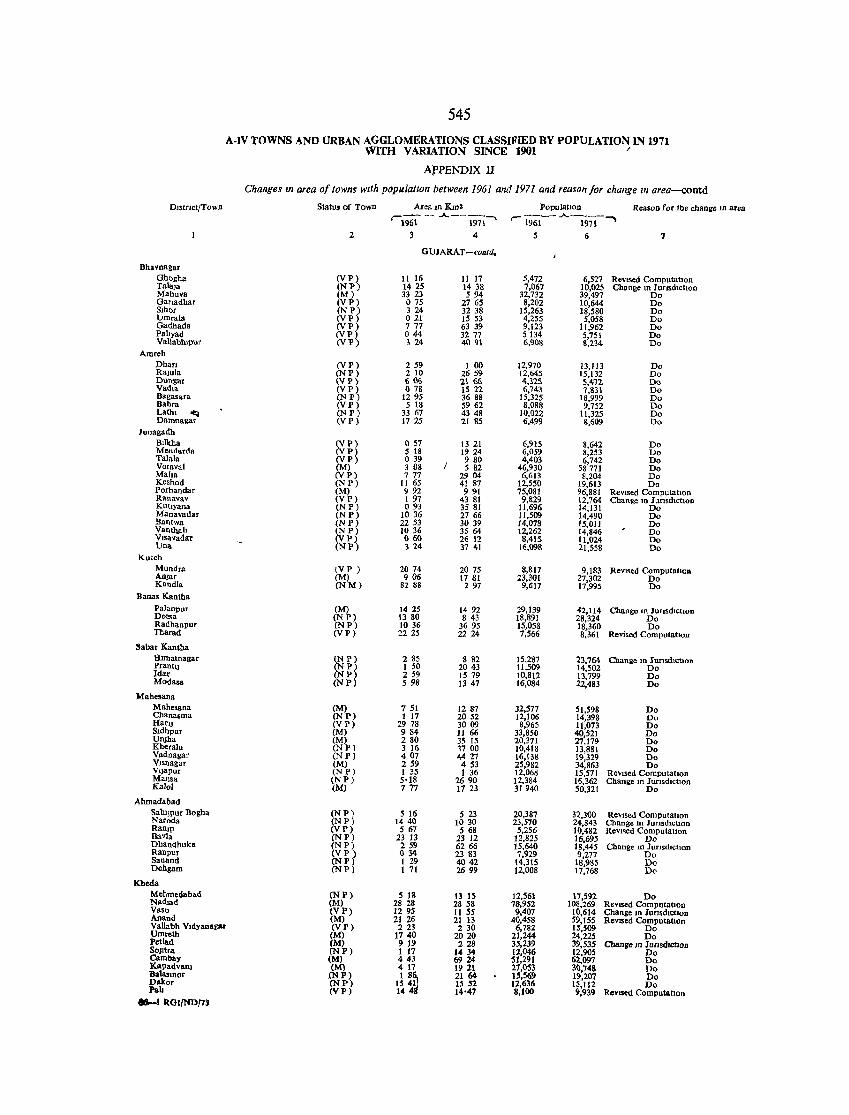
545
A·IV TOWNS AND URBAN AGGLOMERATIONS CLASSIFIED BY POPULATION IN 1971 WITH VARIATION SINCE 1901 /
ApPENDIX II
Changes In area 0/ towns wI,h populatIOn between 1961 and 1971 and reason for change In area-contd
OlstTlct/ToWIl Status of Town AreamKm' PopulatIon Reason for tbe cbange m area r-i961-- .A.--197i-- ('""1961-- .A.197i- ......
2 3 4 5 6 7
GUJARAT -contd.
BhavD2gar Gbogba NP) II 16 1117 5,472 6,527 ReVISed Computallon Talala (NI') 14 25 1438 7,067 10,Q25 Cbange 10 JunsdlctlOn Mahuva (M) 33 23 594 32,732 39,497 Do Gartadbar (VP) 075 2765 8,202 10,644 Do Slhor (NP) 324 32 38 15,263 18,580 Do umrala (VP) 021 15 53 4,255 5,058 Do Gadhada NP) 777 6339 9,123 11,962 Do Pahyad {VP) 044 3277 5134 5,751 Do Vallabhlpur {VI' ) 324 4091 6,908 8,234 Do
Amrel1 Oblln (VP) 259 100 12,970 13,113 Do RajU1a (NP) 2 10 2659 12,645 15,132 Do Dungat {V P) 6% 2166 4,325 5,412 Do Va<ha (VP) () 78 15 II 6,743 7,831 Do Bagasara (NP) 1295 36 88 15,325 18,999 Do Babra (VP) 5 18 5962 8,088 9,752 Do Lathl <t',j (NP) 3367 4348 10,022 11,325 Do Damnagar {VP} 1725 21 85 6,499 &,609 00
Junagadb Bilkha {VP) 057 13 21 6,915 8,642 Do Mendarda {VP) 5 18 1924 6,059 8,253 Do Talala (VP) 039 980 4,403 6,742 Do Veraval (M) 3 88 582 46,930 58771 Do MalIa (VP) 777 2904 6,613 8,204 Do Keshod (NP) 11 65 41 87 12,550 19,613 Do Porbandar (M) 992 991 75,081 96,881 ReVised ComputatlOn Ranavav (VP) 197 4381 9,829 12,764 Change 10 J unsdlCllon KutIyana (NP) 093 3581 11,696 14,131 Do Manavadar (NP) 1036 2766 11,509 14,490 Do Bantwa {NP~ 22 S3 3039 14,078 15,011 Do Vantlulh (NP 1036 3564 12,262 14,846 Do VIsavad" (VP) 060 26 12 8,41S 1J,024 Do Una (NP) 324 3741 16,098 21,558 Do
Kutch Mundra (VP) 2074 2075 8,817 9,183 ReVIsed Computallon Anlar (M) 906 1781 23,301 27,302 Do Kandla (NM) 82 88 297 9,617 17,995 Do
Banas Kantha Palanpur (M) 1425 1492 29,139 42,114 Change In 1 unsdlcbon Deesa (NP) 1380 843 18,891 28,324 Do Radhanpur (NP) 1036 36 95 15,058 18,360 Do Tharad {VP) 2225 2224 7,566 8,361 Revised Computallon
Sabar Kantha Hlmatnagar (NP) 285 882 15,287 23,764 Change 10 Jun.mclloD PralltIJ (NP) I 50 2043 11,509 14,502 Do Jdar (NP~ 259 1579 10,812 13,799 Do Modasa (NP 598 1347 16,084 22,483 Do
Mahesana Mahesana (M) 751 1287 32,577 51,598 Do Cbanasma (NP) I 17 2052 12,106 14,398 Do HarJJ (VP) 2978 3009 8,965 11,073 Do Sldbpur (M) 984 11 66 33,850 40,521 Do UnJha (M) 280 35 15 20,371 27,179 Do Kheralu (NP) 3 16 ,700 10,418 13,881 Do Vadnagar (NI') 407 44 27 16,138 19,329 Do Vlsnagar (M) 259 453 25,982 34,863 Do Vllapur (NP) 1 35 1 36 12,068 15,571 ReVIsed ComputalIon Mansa (NP) S'18 2690 12,384 16,362 Change 10 Junsdlctlon Kalol (M) 777 1723 31940 50,321 Do
Ahmadabad SahllPur Bogha (NI') 5 16 5 23 20,387 32,300 ReVIsed ComputatIon Naroda (NP) 1440 1030 23,570 24,843 Change In JUrISdIctIon Ranlp {VP) 567 568 5,256 10,482 ReVl';ed Computallon BavJa (NPl 23 J3 23 12 12,825 16,695 Do Dhandhuka FvP) 259 6266 15,640 18,445 Change m JunsdlciIon Ranllur P) 034 2383 7,929 9,277 Do Sanand (NPl 1 29 4042 14,315 18,985 Do Debgam (NP) 1 71 2699 12,008 17,768 Do
Kbeda Mehmedabad (NP) 5 18 13 15 12,561 11,592 Do NadIad (M) 28 28 2858 78,952 108,269 ReVISed ComputatIon Vaso (VP) 129S II 55 9,407 10,614 Change 10 JUrIsdIctIon Anand (M) 21 26 21 13 40,458 59,155 ReVIsed Computallon Vallabh Vldyanagar {VP) 223 230 6,782 1~,509 Do Urnteth (M) 1740 2020 21,244 24,225 Do Pctlad (M) 9 J9 228 35,239 39,535 Cbange m Junswcbon SOJltra (NP) I 17 14 34 12,046 12,905 Do cambay (M) 443 6924 51,291 62,097 Do Kapadvan) (M) 417 1921 27,053 30,748 Do BalaslDor (NP) 1 86 2164 15,569 19,207 Do Dakor (NP) IS~ 15 52 12,636 IS,1I2 Do Pab (VP) 14 14·47 8,100 9,939 RevISed ComputanoJ\
16-1 ttOlfND/11
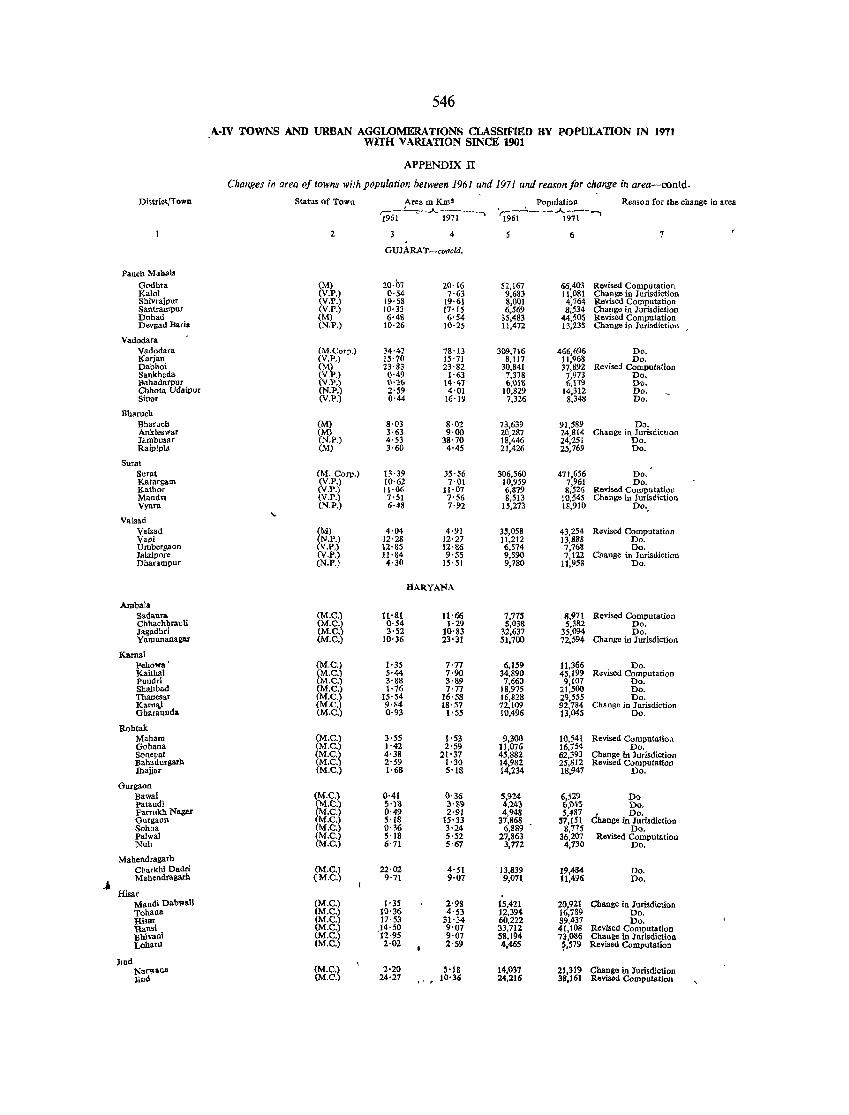
Distriet/iown
Panch Mab81.
Godhra Kalol Shivrajpur Santrampuf Dohad Devgad Bada
Vadodara Vadodafa Karjan Oabhoi Sankheda l!ahadafpur Cbhota Udaipur SillDr
Bharuch Bharucb Ankleswar JambusA' Rajpipla
Surat Surat Katargam Kathor MandVl Vyara
Valsad VaIsad Vapi Umbergaon Jalalporc DharaIOl>ut
Aruba!a SlIdanra Chhachbrauli Jagadhri ¥amunanapr
Kamal Pehowa ' Kaithal PundTi Shahbad Thanesar
~h~~~unda Rohtak
Maham Gobana Sonepat Babadurgarh Jhajjar
Gurgaon Bawal Pataudi Farmkh Nagar Gurg.oll Sohna Palwa1 Nub
Mahendragarh Charkhi Dadri Mahendragarh
Hisar Mandl Dabwall Tohana !lisar !lansi llhivani Loharu
Jmd lSannna lind
546
A-IV TOWNS AND URBAN AGGLOMERATIONS CLASSIFIED BY POPULATION IN 1m WITH VARiATION SINCE 1901
APPENDIX II
Changes in area oj towns with population between 1961 and 1971 and reason for change in area-contd.
StatuI of Town
2
(M) (V.P.) (v.l'.) (V.P.) (M) (N.P.)
(M.Corp.) (V.P.) (M) (v.P.) {V.P.) (N.P.) (V.P.)
(M) (M) (N.P.) (M)
(M. Corp.) (V.P.) (V.P.) (V.P.) (N.P.)
(M) (N.P.) (v.P.) (V.P.) eN.p.)
(M.e.) (M.C.) (M.C.) (M.C.)
(M.C.) (M.C.) (M.e.) (M.C.) (M.C.) (M.C.) (M_C.)
(M.e.) (M.C.) (M.C.! (M.e. (M.e.
(M.C.) (M.e.) (M.C.) (M.e.) (M.C.) (M.e.) (M.C.)
(M.e.) (M.C.)
(M.e.) (M.C.) (M.C.) (M.C.) (M.e.) (M.e.)
(M.e.) (M.e.)
Area In Kmt 'i961-' -,-.A. 197i--'
4
GUJARA 'l' -cofield.
20·()7 0'54
19'58 10·33 6·48
10·26
~4'42 15·70 23 ·83 0·49 1)'26 2·59 0·44
8·03 3·63 4'53 3·60
13·39 10'62 11·06 7'51 6·48
4·04 12'28 12'85 1l'84 4·30
H·St 0·54 3'52
10·36
1'35 5·44 3·88 1·76
15·54 9·84 0·93
3'55 1·42 4·38 2'59 1'68
0·41 5·18 0·49 S·18 0·36 5·18 6'71
22·02 9·71
1'35 10'36 17'53 14'51) 12·95 2·02
2·20 24·27
20·16 7·63
19'61 17'15 6'54
10'25
78·13 1S'71 23'82
1·63 14'41 4'01
16'19
8·02 9·00
38·70 4·45
3-5'56 7'01
11-07 7'56 7·92
4·91 12'27 12-86 9'55
15'51
HARYANA
It·66 1'29
10'83 23-31
7'77 1-90 3-89 7'77
16'58 18·57
I-55
1'53 2'59
21'37 1'30 5'18
0·36 3''8~ 2'91
15' 33 3·24 5-52 5'67
4'51 9'07
2'98 4'53
31'34 9'07 9'07 2'59
5·13 10·36
PopulatioJ] ~~-.....!..-__ J.- __ ......
1961 1971
Reason for tbe change in area
52,167 9,683 8,001 6,569
35,483 11,472
309,716 8,117
30,841 7,378 6,\)111
10,829 7,326
73,639 20,287 18,446 21,426
306,560 10,959 6,879 8,513
15,273
35,058 11,212 6,574 9,590 9,780
1,77S 5,038
32,637 51,700
6,159 34,890 7,660
18,975 16,828 72,109 10,496
9,300 11,076 45,882 14,982 14,234
5,924 4,24j 4,948
37,868 6,889
27,863 3,712
13,839 9,071
. 15,421 12,394 60,222 33,712 S8,194 4,465
14,037 24.216
6
66,403 Revised Computation 11,081 Change in Jurisdiction 4,764 Revised Computation 8,;34 Change in Jurisdiction
44,506 Revised Computation 13.~3S Change in Jurisdiction
466,696 11,968 37,892
7,973 6,119
14,312 8,348
91,589 24,814 24,:251 25,16')
471,656 7,961 8,526
10,545 18,910
43,254 13,888 7,768 7,122
11,958
Do. Do.
Revised Computation Do. Do. Do. Do.
Do. Change in Jurisdictton
Do. Do.
Do. Do.
Revised Computation Change in Jurisdiction
DO."
Revised Computation Do. Do.
Change in Jurisdiction Do.
8,971 Revised Computation 5,382 Do.
35,094 Do. 72,594 Change in Jurisdiction
11,366 45,199 9,107
21,500 29,555 92,784 13,045
IO,S41 16,154 62,393 2S,812 18,947
6,529 6.1)45 5,487
57,151 8,775
36,207 4,730
19,484 11,496
20,921 16,789 S9,437 41,108 73,0&6 ?S79
Do. Revised Computation
Do. Do. Do.
Change in Jurisdiction Do.
Revised Compntatio.l Do.
Change in Jurisdiction Revised Computation
Do.
Do Do.
, Do. Change in JurisdictioD
Do. Revised Compntation
Do.
Do. Do.
Change in Jurisdiction Do. Do.
Revised Computation Change in Jurisdicti()B Revised Computation
21,319 Change in Jurisdiction 38,161 Revised Computation
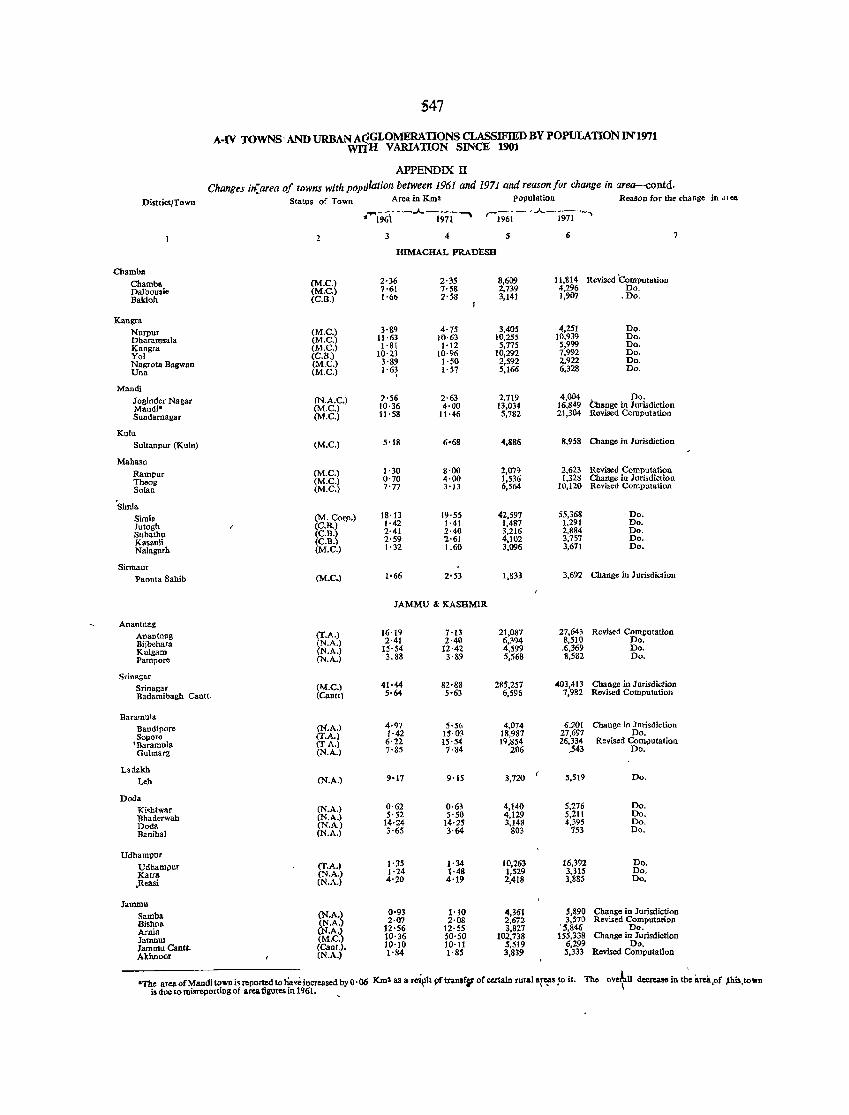
S47
A-IV TOWNS- AND URBAN Ac<GLOMERATIONS CLASSIFIED BY POPULATION 1N'1971 wn'H VARIATION SlNCE 1901
APPENDIX II
Changes i,(area of towns with population between 1961 and 1971 and reason for change in are~ntd. District/Town Status of Town AreainKm2 Population Reason for the rhange in die&.
• ..... 196't ---"-"I97i-~ ,-1961-- ........ -1971-.
2 3 4 5 6
HIMACHAL PRADESH
Chamba
Chamba (M,e.) 2·36 2·35 8,609 11,814 Revised 'computation Dalhousie (M.C,) 7·61 7·58 2,739 4,296 Do.
Bakloh (C.B.) 1·66 2'58 3,141 1,907 .Do.
Kangra Nurpur (M.C.) 3'89 4·75 3,405 4,251 Do. Dbaramsala (M.C.) 11·63 10·63 10,255 10.939 Do.
Kangra (M.C.) 1·81 1·12 5,775 5,999 Do.
Yol (C.B.) 10'23 10·96 10,292 7,992 Do.
Nagrota Bagwan (M.C.) 3'89 1·50 2,592 2,922 Do.
Una (M.C.) 1'6~ 1'57 5,166 6,328 Do.
Mandl
Joginder Nagar fN.A.C.) "56 2·63 2,719 4,004 a. Do. Mandl" (M,C'l 10·36 4·00 13,034 16,849 ange in J urlsdiction
Sundaroagar (M.C. 11·58 11·46 5,782 21,304 Revised Computation
Kulu
SultanpUf (Kulu) (M.C.) 5'18 6·68 4,886 8,958 Change in Iurisdiction
Mahasu
Rampur (M.C.) 1·30 8·00 2,079 2,623 Revised Computation Theog (M.C.) 0'70 4·00 1,536 1,328 Change in Jurisdiction
Solan (M.C.) 7'77 3'13 6,564 10,120 Revbed Computation
'Simla
Simla (M. Corp.) lS'13 19'55 42,597 55,368 Do.
Jutogh (C. B.) 1·42 1·41 1,487 1.291 Do.
Subathu (C.B.) 2·41 2·40 3,216 2,884 Do.
Kasauli (C.B.) 2'59 2·61 4,102 3,75'1 Do.
Nalagarh (M.e.) 1'32 1.60 3,096 3,671 Do.
Sirmaur PaonIa Sahib (M.C.) 1·66 2'53 1,833 3,692 Change in Jurisdiction
JAMMU &; KASHMIR
Anantnag Anantnag mA
.) 16'19 7·13 21,087 27,643 Re\%ed Computation
Bijbehara . A.) 2·41 2·40 6,394 8,510 Do •
Kulgam .A.) IS'54 12·42 4,599 .6,369 Do,
Pampore ~.A.) 3.88 3·89 5,568 8,582 Do.
Srin2.&ar
Srinagar (M.C.) 41·44 82'88 285,257 403,413 Change in Jurisdiction Badamibagh Cantt. (Cantt) 5·64 5·63 6,596 7,982 Revised Computation
Baramula Bandipore eN.A.) 4·97 5·56 4,074 6.201 Change in Jurisdiction
Sopora (T.A.) 1·42 15·03 18,987 27,6'17 Do.
"Baramula (T A.) 6·22 15'54 19,854 26,334 Revised Com!)utation
Gulmarg eN.A.) 7·85 7·84 206 ..543 Do.
L.dakh Leh (N.A.) 9-11 9'15 3,720 S,S!9 Do.
Doda Ki<htwar eN.A.) 0·62 0·61 4,140 5,276 Do.
Bbaderwah eN.A.~ 5·52 5'50 4,129 5,211 Do.
Doda (N.A 14'24 14·25 3,148 •• 395 Do.
Banihal (N.A.) 3'65 3·64 803 753 Do.
Udhampur
Udhampur (T.A.) 1·35 1·34 10,263 16,392 Do.
Katta (N.A.) 1·24 1·48 1,529 3,31S Do.
,Reasi (N.A.) 4'20 4'19 2,418 3,885 Do.
Jammu Samba (N,A,~ 0'93 1'10 4,361 5,890 Change in Jurisdiction
Bishna (N.A. 2·07 2·08 2,672 3,570 Revised Computation
Arnia (N.A.) 12·56 12·55 3,821 '5,846 Do.
Jammu (M.C,) 10·36 50'50 102,738 155,338 Change in Jurisdiction
Jammu Cantt. (Cant.). 10·10 10·11 S,519 6,299 Do.
Akhnoor (N.A.) 1'84 t·85 3,839 5,333 Revised Computation
"The area ofMandi town iueported to have increased by o· 06 Kms as a reil"t pftransfi1 of certain rural areas to it. The is due to misreporting of area figures in 1961. , \. ,
ovehU decrease in th~ 'area of ,this to .. n \ ..
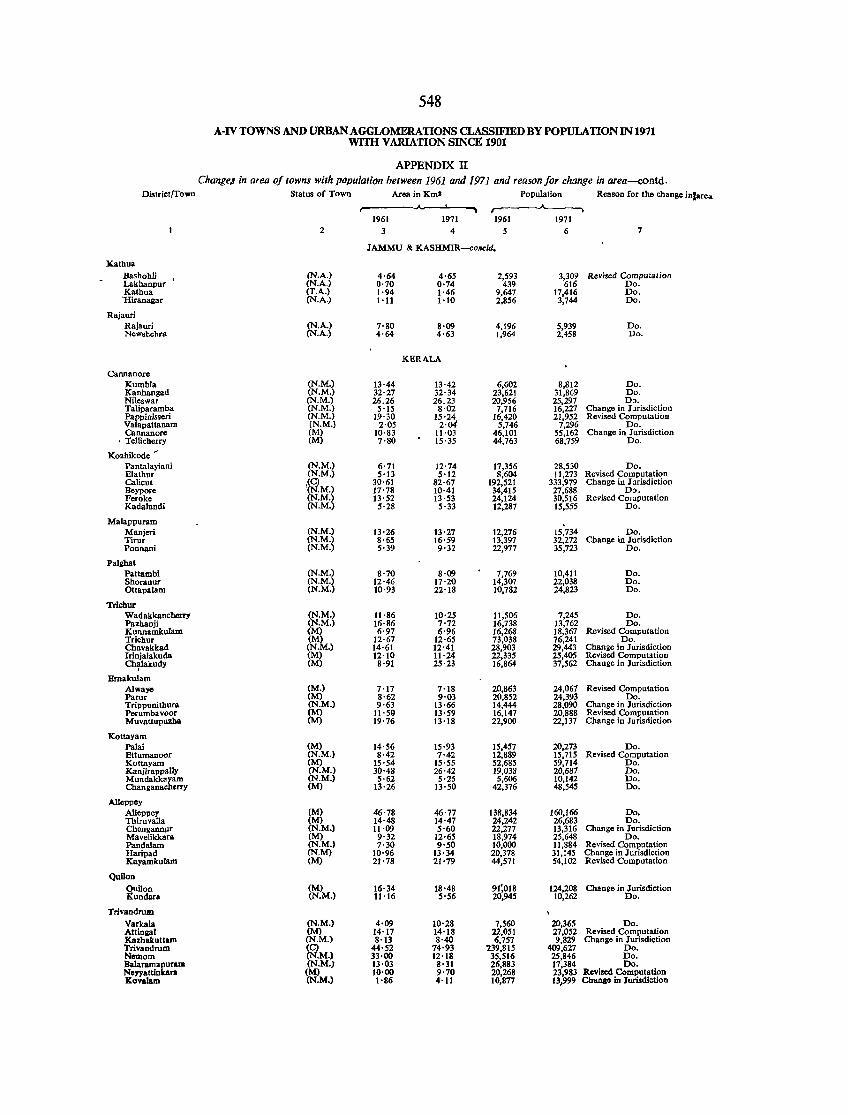
548
A-IV TOWNS AND URBAN AGGLOMERATIONS CLASSIFIED BY POPULATION IN 1971 WITH VARIATION SINCE 1901
APPENDIX II ChallgeJ in area of towns with population between 1961 and 1971 and reason for change in area-contd.
District/Town Status of ToWll AreainKmI Population Reason for the change iniarea. ..A. .., r-----_''_____.
1961 1971 1961 1971 2 3 4 6 7
1AMMU & KASHMlR-concld.
:Kathua Bashohli (N.A.) 4·64 4'65 2,593 3,309 Revised Computation Lakhanpur (N.A.) 0'70 0·74 439 616 Do. Kathua (T.A.) 1·94 1 ·46 9,647 17,416 Do. 'Hiranagar (N.A.) 1·11 1'10 2,856 3,744 Do.
Rajauri Rajauri (N.A.) 7·80 8·09 4.196 5,939 Do. Newshehra (N.A.) 4·64 4·63 1,964 2.458 Do.
KER4.LA
Cannanore Kumbla (N.M.) 13·44 13·42 6,602 8,812 Do. Kanhangad (N.M.) 32·27 32·34 23,621 31,869 Do. Nileswar (N.M.) 26.26 26.23 20,956 25,297 Do. Taliparamba (N.M.) 5'15 8·02 7,716 16,227 Change in Jurisdiction Pappinisseri (N.M.) 19·30 15'24 16,420 21,952 Revised Computation Valapattanam (N.M.) 2·05 2·04 5,746 7,296 Do. Cannanore (M) 10·83 ll·03 46,101 55,162 Change in Jurisdiction
I TelUcherry (M) 7'80 15'35 44,763 68,759 Do.
Kozhikode ~
Pantalayiani (N.M.) 6'71 12·74 17,356 28,530 Do. Elathur (N.M.) 5'13 5·12 8,604 11.273 Revised Computation Calicut ,(C) 30·61 82·67 192,521 333,979 Change in Jurisdiction Beypore (N.M.) 17·78 10·41 34,415 27,688 Do. Feroke (N.M.) 13'52 13·53 24.124 30,516 Revised Computation Kada1undi (N.M.) 5·28 5·33 12,287 15,555 Do.
Malappuram Manjeri (N.M.) 13·26 13·27 12,276 15,734 Do. Tirur (N.M.) 8'65 16'59 13,391 32,272 Change in Jurisdiction Ponnani (N.M.) 5'39 9'32 22,977 35,723 Do.
Palghat Pattambi (N.M.) 8'70 8·09 7,769 10,411 Do. Shoranur (N.M.) 12·46 17'20 14,307 22,038 Do. Ottapa1am (N.M.) 10'93 22·18 10,782 24,823 Do.
Trichur Wadakkancherry (N.M.) 11·86 10·25 11,506 7,245 Do. Pazhanji (N.M.) 16'86 7'72 16,738 13,762 Do. Kunnamkulam (M) 6·97 6·96 16,268 18,367 Revised Computation Trichur (M) 12'67 12·65 73,038 76,241 Do. Chavakkad (N.M.) 14·61 12'41 28,903 29,443 Change in Jurisdiction lrinja1akuda (M) 12'10 11·24 22,335 25,405 Revised Computation ~lakudy (M) 8·91 25'23 15,864 37,562 Change in Jurisdiction
Ernakulam Alwayc (M.) 7'17 7'18 20,863 24,067 Revised Computation Parur (M) 8·62 9·03 20,852 24,393 Do. Trippunithura (N.M.) 9·63 13·66 14,444 28,090 Change in Jurisdiction Perumbavoor (M) 11'59 13'59 16,147 20,888 Revised Computation Muvattupuzha (M) 19'76 13·18 22,900 22,137 Change in Jurisdiction
Kottayam Palai (M) 14·56 15'93 15,457 20,273 Do. Ettumanoor (N.M.) 8·42 7·42 12,889 15,715 Revised Computation Kottayam (M) 15'54 15'55 52,685 59,714 Do. Kanjirappally (N.M.) 30'48 26·42 19,038 20,687 Do. Mundakkayam (N.M.) 5·62 5'25 5,606 10,142 Do. Changanacherry (M) 13·26 13'50 42,376 48,545 Do.
Alleppey Alleppey (M) 46·78 46·77 138,834 160,166 Do, Thiruvalla (M) 14·48 14·47 24,242 26,683 Do. Chengannur (N.M.) 11·09 5'60 22,277 13,316 Change in JurisdictioD Mavelikkara (M) 9·32 12·65 18,974 25,648 Do. Pandalam (N.M.) 7'30 9'50 10,000 11,884 Revised Computation Haripad (N.M) 10·96 13·34 20,378 31,145 Change in Jurisdiction Kayamkulam (M) 21'78 21'79 44,571 54,102 Revised Computation
Quilon Quilon (M) 16·34 18·48 91~018 124,208 Change in Jurisdiction Kundara (N.M.) ll'16 5·56 20,945 10,262 Do.
Trivandrum Varkala (N.M.) 4·09 10'28 7,560 20,365 Do. Attingal (M) 14'17 14'18 22,051 27,052 Revised Computation Kazhakuttam (N.M.) 8·13 8·40 6,757 9,829 Change in Jurisdiction Trivandrum (C) 44'52 74·93 '239,815 409,627 Do. Nemom (N.M.) 33·00 12'18 35,516 25,846 Do. Balaramapurara (N.M.) 13·03 8·31 26,883 17,384 Do. Noyyattinicara (M) 10·00 9'70 20,268 23,983 Revised Computation Kovalam (N.M.) 1·86 4·11 10,877 13,999 Change in Jurisdiction
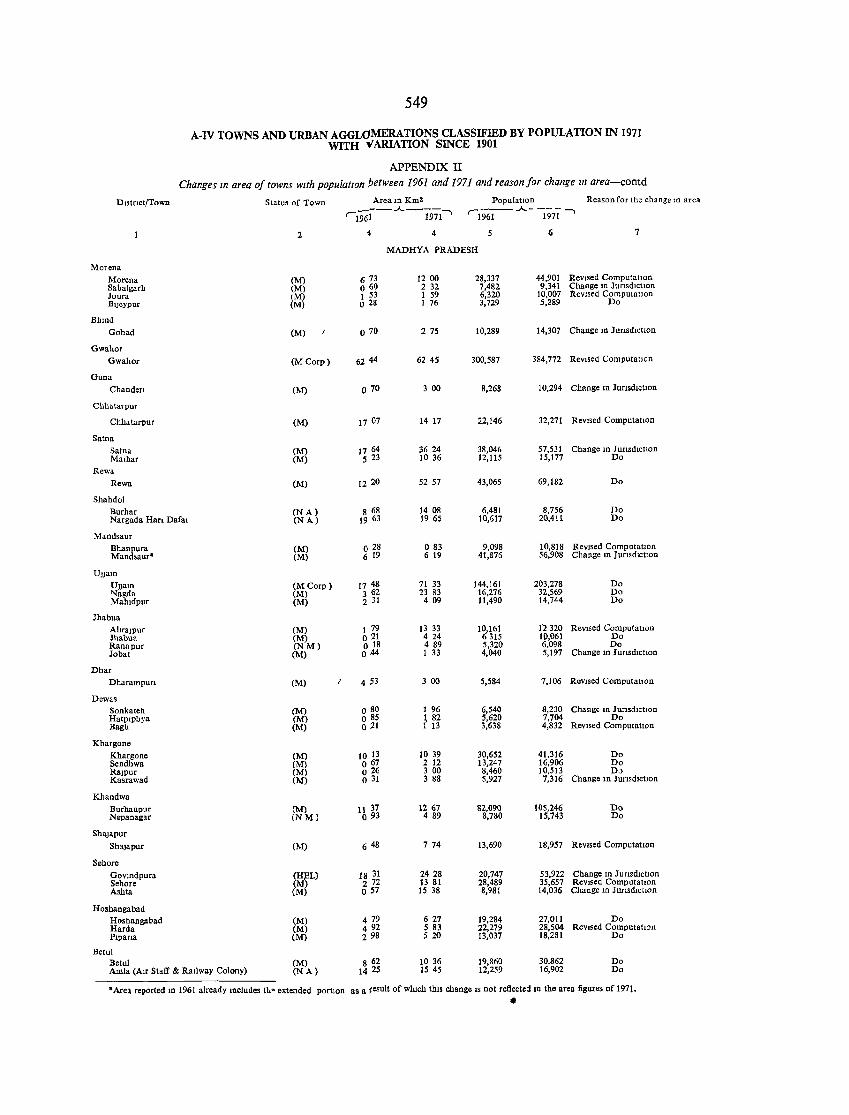
549
A.IV TOWNS AND URBAN AGGLOMERATIONS CLASSIFIED BY POPULATION IN 1971 WITH V ARlATION SINCE 1901
APPENDIX IT Changes In area of towns with populatIOn !Jetween 1961 and 1971 and reason for change In area-contd
DI,tnct/Town Status of Town Aream Km2 PopulatIon Reason for the change 10 area _--.A.---- 'i9"6-1-- ';""-1971"""'" '1961 1971"""'"
2 4 5 6 7
MADHYA PRADESH
Morena Morena (M) 6 73 1200 28,337 44,901 RevIsed ComputatlOn Sabalgarh (M) 0 60 232 7,482 9,341 Change In Junsdlc(1on loura (M) 1 53 1 59 6,320 10,007 ReVised ComputatIOn DIleypur (M) 0 28 1 76 3,729 5,289 Do
Bhmd Gohad (M) 0 70 27S 10,289 14,307 Change 111 JunsdlctIOn
Gwaltor Gwahor (MCorp) 62 44 624S 300,587 384,772 ReViSed Computation
Guna Cb.nden (M) 0 70 3 00 8,268 10,294 Change In JUrlsdlc(lon
Chhatarpur
Chhatarpm (M) 17 07 14 17 22,146 32,271 ReVIsed ComputatIOn
Satn. Satna (M) 17 64 3624 38,046 57,531 Change In Junsdlc(lon Malb.r (M) S 23 10 36 12,115 15,177 Do
Rewa Rewa (M) 12 20 5257 43,065 69,182 Do
Shahdol Burhar (N A) 8 68 1408 6,481 8,756 Do Nargada Han Dafa. (N A) 19 63 19 65 10,617 20,411 Do
Mandsaur Bhanpura (M) 0 28 o 83 9,098 10,818 ReVIsed Comput.llon Mandsaur* (M) 6 19 6 19 41,876 56,908 Change ill Junsdlcllon
U,Jam Unam (M Corp) 17 48 71 33 144,161 203,278 Do "lagda (M) 3 62 23 83 16,276 32,569 Do Malndpur (M) 2 31 409 11,490 14,744 Do
Jhabua
Ahr"Pur (M) 1 79 13 33 10,161 1:2320 ReVIsed ComputatIOn Jhabua (M) 0 21 424 6315 10,061 Do Ranapur (NM) o 18 489 5,320 6,098 Do Jobat (M) 0 44 1 33 4,040 5,197 Change In J unsdlctlon
Dhar Dbarampun (M) 4 ;3 300 5,584 7,106 ReVIsed Computation
Dewas Sonk.teb (M) 0 80 I 96 6,540 8,230 Change In JUrIsdictIOn Hatplphya (M) 0 85 ~ 82 5,620 7,704 Do Bagh (M) 021 1 13 3,638 4,832 ReVIsed ComputatIOn
Khargone Khargone (M) 10 13 10 39 30,652 41,316 Do Sendhwa (M) 0 67 2 12 13,247 16,906 Do RaJPur (M) 0 26 300 8,460 10,513 DJ Kasrawad (M) 0 31 3 88 5,927 7,316 Change In JUrISdictIon
Khandwa Burhanpur (M) II 37 1267 82,090 105,246 Do Nepanagar (NM) 0 93 489 8,780 15,743 Do
ShaJapur
ShaJapur (M) 6 48 774 13,690 18,957 ReVIsed Computation
Seboro Govmdpura (H)3L) 18 31 2428 20,747 53,922 Cbange m Junsdlctton Sebore (M) 272 13 81 28,489 35,657 ReVIsed ComputatIOn Ashta (M) 0 57 15 38 8,981 14,036 Change In J uflsmctlOn
Hoshangabad Hoshangai>ad (M) 4 79 627 19,284 27,011 Do Harda (M) 4 92 5 83 22,279 28,504 ReVIsed Computallon Plpana (M) 2 98 520 13,037 18,281 Do
Betu! BetuJ (M) 8 62 10 36 19,860 30,862 Do Ami. (AIr Staff & RaIlway Colony) (N A) 14 2S 15 45 12,259 16,902 Do
·Area reported In 1961 already lUcludes tt.· extended portIOn as a (esult of winch tblS change IS not reflected m the area figures of 1971.
•
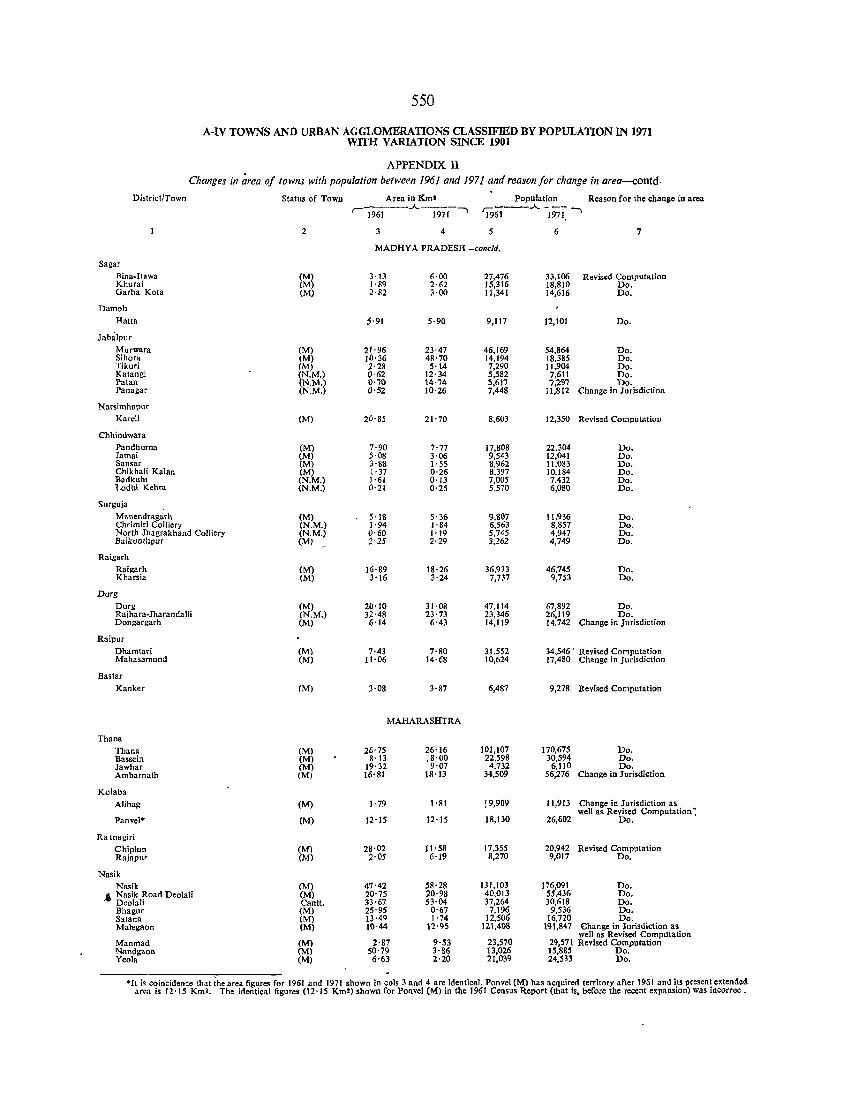
550
A-IV TOWNS AND URBAN AGGLOMERATIONS CLASSIFIED BY POPULATION IN 1971 WITH VARIATION SINCE 1901
APPENDIX 11 Changes in area of towns with population between 1961 and 1971 and reason for change in area-contd·
District/Town Status of Town Area in }{rna Population Reason for the change in area
'1%i"'"--"-I9'7I-' ----"----'l961 1971, '
2 4 5 6 7
MADHYA PRADESH -coneld.
Sagar Rina .. Itawa (M) 3·13 6·00 27,476 33,106 Revised Computation Khura; (M) 1·89 2·62 15,316 18,810 Do. Garha Kota (M) 2·82 3·00 11,341 14,616 Do.
Damoh
Hatta S'91 5·90 9,117 12,101 Do.
Jabalpur Murwara (M) 21·96 23·47 46,169 54,864 Do. Sihora (M) 10'36 48'70 14,194 18,385 Do. Tikuri (M) ~'28 5'lA 7,290 11,904 Do. Katangi (N.M.) 0'62 12'34 5,582 7,611 Do. Patan (N.M.) 0'70 14·74 5,617 7,?;'97 Do. Panagar (N.M.) 0'52 10'26 7,448 1I,812 Change in Jurisdiction
Narsimhapur KareIi (M) 20'S5 21·70 8,603 12,350 Revised Computation
Chhindwara Pandhurna (M) 7·90 7·77 17,808 22,304 Do. Jamai (M) ,·08 3·06 9,543 12,041 Do. Sausar (M) 3'88 1·55 8,962 11,083 Do. Chikhali Kalan (M) 1'37 0'26 8,397 10,184 Do. Badkuhl (N.M.) 1·61 0'13 7,005 7,432 Do. Lodhi Kehra (N.M.) 0'21 0'25 5,570 6,080 Do.
Surguja Manendragarh (M) 5'18 5·36 9,807 11,936 Do. Chrimiri Colliery (N.M.) 1·94 1'84 6,563 8,857 Do. North Jhagrakhand Colliery (N.M.) 0·60 1'19 5,745 4,947 Do. Baikunth"ur (M) 2'25 2·29 3,262 4,749 Do.
Raigarh
Raigarh (M) 16'89 18·26 36,933 46,745 Do. Kharsia (M) 3'16 3·24 7,737 9,753 Do.
Durg Durg (M) 20'10 31·08 47,114 67,892 Do. Rajhara-Jharandalli (N.M.) 32·48 23·73 23,346 26,119 Do. Dongargarh (M) 6'14 6·43 14,119 14,742 Change in Jurisdiction
Raipur
Dhamtari (M) 1·43 7·S0 31,552 34,546' Revised Computation Mahasamund (M) 11·06 14'68 10,624 17,480 Change in J urisdictioo
Bastar
Kanker (M) 3·08 3·87 6,487 9,278 Revised Computation
MAHARASHTRA
Thana Thana (M) 26'75 26·16 101,107 170,675 Do. Bassein (M) 8'13 .8·00 22,598 30,594 Do. Jawhar (M) 19·32 9·07 4,732 6,110 Do. Ambarnath (M) 16·81 18·13 34,509 56,276 Change in Jurisdiction
Kolaba Alibag (M) 1·79 1'81 19,909 11,913 Change in Jurisdiction as
Panv.l· 12·15 18,130 26,602 well as Revised Computation ~
(M) 12'15 Do.
Ra tnagiri
Chiplun (M) 28·02 11'58 17,355 20,942 Revised Computation Rajapur (M) 2·05 6'19 8,270 9,017 Do.
Nasik Nasik (M) 47'42 58·28 131,103 176,091 Do.
-' Nasik Road Deolali (M) 20'75 20·98 40,013 55,436 Do. Deolali Cantl. 33·67 53·04 37,264 30,618 Do. Bhagur (M) 25·95 0'67 7,196 9,536 Do. Satan a (M) 13'4Q 1'74 12,50':: 16,720 Do. Malegaon (M) 10·44 12·95 121,408 191,847 Change in Jurisdiction a.
9·53 23,570 well as Revised Computation
Manmad (M) 2'S7 29,571 Revised Computation Nandgaon (M) 50·79 3'86 13,026 15,885 Do. Yeola (M) 6'63 2·20 21,039 24,533 Do.
"Il is coinciden~e that the area figures for 1961 and 1971 shown in cols 3 and 4 are identical. Ponvel (M) has acquired territory after 1<;)51 and its presentextende.i aron is 12'15 Km2. The identical figures (12'15 Km2) shown for Ponve1 eM) in the 1961 Census Report (that is, before the recent expansion) was incorrec .
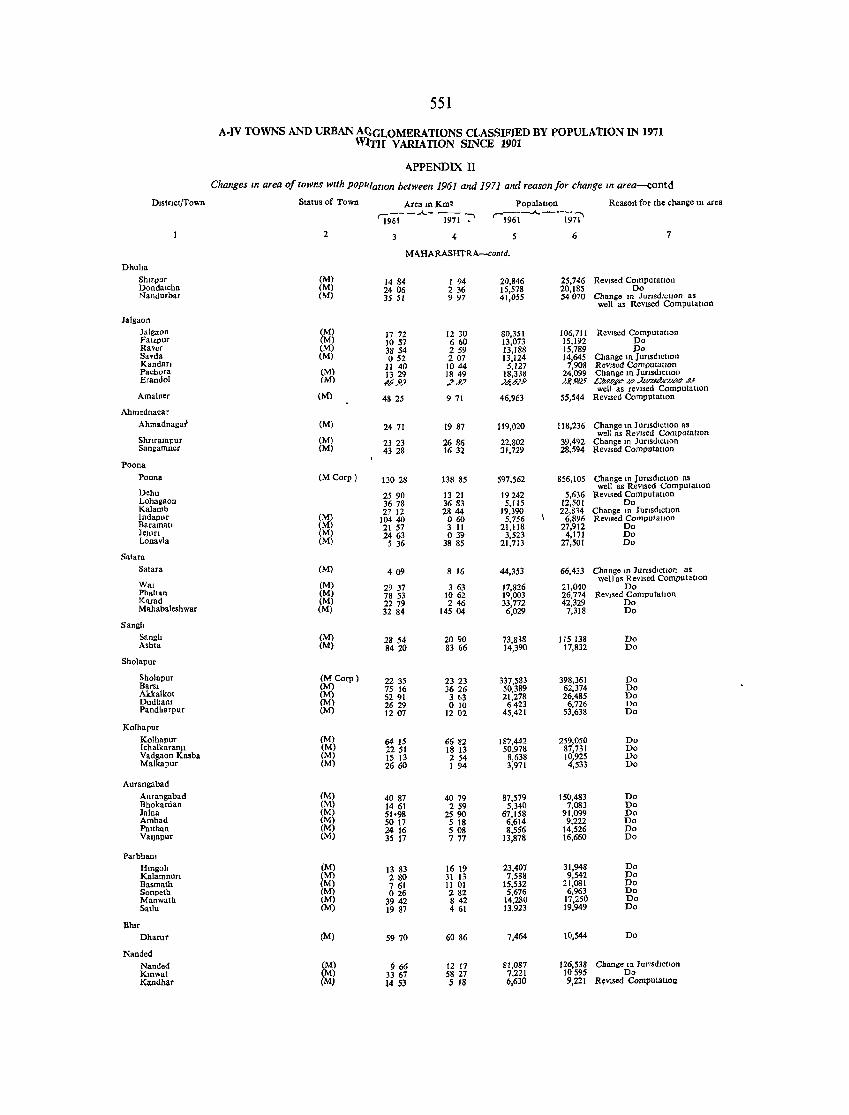
551
A·IV TOWNS AND URBAN A({GLOMERATIONS CLASSIFIED BY POPULATION IN 1971 WlTH V ARlATION SINCE 1901
A.PPENDIX II
Changes In area o/towns with POPlllat/on between 1961 and 1971 and reason/or change In area-contd
DistrIct/Town Status of Town AreamKm2 PopulatIon Reasod for the change tn Mea
'196i- -.A.- 197i -:-- r-OO-.A. --197i' 2 4 6 7
MAHARASHTRA-contd.
Dhulta Shtrpur (M) 1484 I 94 20,846 25,746 ReVIsed ComputatIon Dondalcha (M) 2406 236 15,578 20,185 00 Nandurbar (M) 35 51 997 41,055 54070 Change In J uClsdJctlOn as
well as RevISed Computauon
Jolgaon Jalgaon (M) 1772 1230 SO,3S[ 106,711 ReVised ComputatIon Falzpur (M) 1057 660 13,073 15,[92 Do Raver (M) 38 54 259 13,188 15,789 Do Savda (M) 052 207 13,124 14,645 Change In Junsdlctlon Kandan 11 40 1044 5,127 7,908 ReVised Computatton Pachora (M) 1329 1849 18,338 24,099 Change In J uflsdlCtlOn Erandol 1M) #Y'} ,?,?? 14#IY 1Y,J>.I).)' CA.PP,ff&" -'P J ... .r.uO.lc/""'P .us
well as reVised Computauon Amalner (M) 48 25 971 46,963 55,544 ReVIsed Computallon
Ahmednaoar Ahrn.dnaga~ (M) 2471 1987 119,020 118,236 Change In Junsdlctlon as
well as ReVIsed Computation Shrtrampur (M) 23 23 2686 22,802 39,492 Change 10 Iunsd,ctlOn Sangamner eM) 4328 1632 21,729 28,594 ReVIsed ComputatIon
Poona Poona (MCorp) 13028 138 85 597,562 856,105 Change 10 JUClsdlctlon as
well as ReVIsed Computation Dehu 2590 1321 19242 5,636 ReVIsed Computation Lohagaon 36 78 3683 5,115 12,501 Do Kalamb 27 12 2844 19,390 22,834 Change In Jurisdiction Indapur (M) 104 40 060 5,756 6,896 Revlsed ComputatJon Baramah (M) 21 57 3 II 21,118 27,912 Do JeJun (M) 2463 039 3,523 4,171 Do Lonavla (M) 5 36 38 85 21,713 27,501 Do
Satam.
Satara (M) 409 8 16 44,353 66,433 Change In JUrISdictIOn as well as ReVised ComputatIOn
Wal (M) 2937 363 17,826 21,040 Do Phaltan (M) 78 53 1062 19,003 26,774 ReVIsed ComputatIon Karad (M) 2279 246 33,772 42,329 Do MahabaIeshwar (M) 32 84 14504 6,029 7,318 Do
Sangh Sangh (M) 2854 2090 73,838 115138 Do Ashta (M) 8420 83 66 14,390 17,832 Do
ShoIapur
Sholapur (M Corp) 2235 2323 337,583 398,361 Do Bam (M) 75 16 3626 50,389 62,374 Do Akkalkot (M) 5291 3 63 21,278 26,485 Do Dudham (M) 2629 o 10 6423 6,726 Do Pandharpur (M) 1207 1202 45,421 53,638 Do
KoIhapur Kolhapur (M) 64 15 6682 187,442 259,050 Do [chalkaran)1 (M) 2251 18 13 50,978 87,731 Do Vadgaon Kasba (M) 15 13 254 8,638 10,925 Do Malkapur (M) 2660 1 94 3,971 4,533 Do
Aurangabad Aurangabad (M) 4087 4079 87,579 15(),483 Do Bhokardan (M) 1461 259 5,340 7,083 Do Jalna (M) 51·98 2590 67,1S8 91,099 Do Ambad (M) 5017 5 18 6,614 9,222 Do Palthan (M) 24 16 508 8,556 14,526 Do Val)apur (M) 35 17 777 13,878 16,660 Do
ParbhaDl
Hmgob (M) 13 83 16 19 23,407 31,948 Do Kalamnun (M) 280 31 13 7,588 9,542 Do Basmath (M) 761 II 01 15,532 21,081 Do Sonpeth (M) 026 282 5,676 6,963 Do Manwath (M) 3942 842 14,280 17,250 Do Sallu (M) 1987 461 13,923 19,949 Do
Blur Dharur (M) 5970 6086 7,464 10,544 Do
Nonded Nanded (M) 966 12 17 81,087 126,538 Change In JUrlSdlctlOn Km"at (M) 33 67 5827 7,221 10595 Do Kandhar (M) 14 ~3 5 18 (>,630 9,221 RevlS~d Computatloa
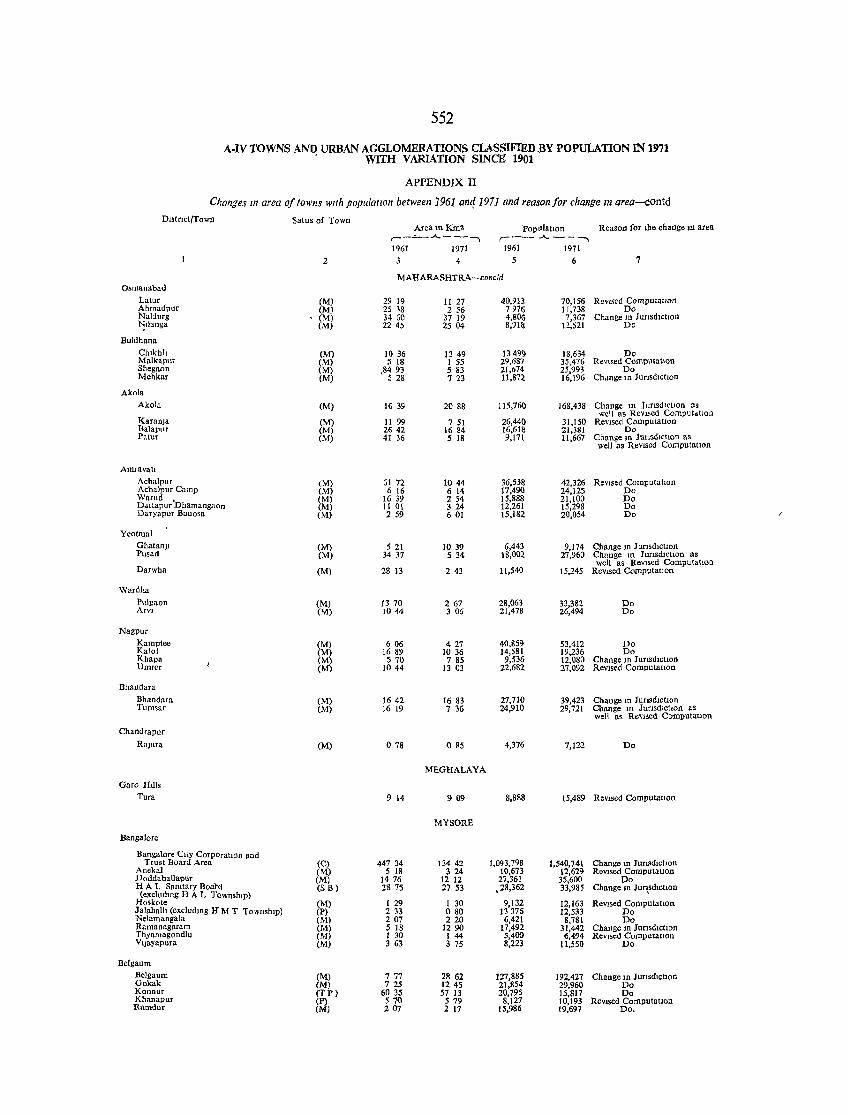
552
A-N TOWNS AND URBAN AGGLOMERATIONS CLASSIFIED.BY POPULATION IN 1971 , WITH VARIATION SINCE 1901
APPENDIX II
Changes 111 area of towns With populatIOn between i961 an11971 and reason for change III area-contd DlS!nct/TowJl
Osmanabad
Latur Ahmadpur Naldurg r-:llanga
Buldhana
Chlkhh Malkapur Shegaon Mehkar
Akola
Akola
Karan]a Balapur Patur
AmravatI Achalpur Achalpur Camp Warud , Dattapur Dhamangaon Daryapur Banosa
Yeotma) Ghatan]l Pusad
Darwha
Wardha
Pulgaon ArVI
Nagpur
Kamptee Kalol Khapa Umrer
Bhandara
Bhandara Tumsar
Chandrapur
Ralura
Oaro Hllis Tura
Bansalore
Bangalore CIty CorpOratlOn and Trust Board Area
Aneka1 Doddaballapur HAL Samlary BoahJ (excludmg HAL T()wnsh,p)
Hoskote Jalahalh (excludmg H M T TownshIp) Nelamangala Ramanagaram Thyamagondlu V'jayapura
Belgaum
Belsaum Gokak Konnur Khanapur Rnmdur
Satus of Town
2
(M) (M) (M) eM)
(M) (M) (M) eM)
(M)
(M) eM) (M)
(M) eM) (M) (M) (M)
(M) eM)
eM)
(M) (M)
(M) (M) (M) (M)
eM) eM)
(M)
(C) (M) (M) (S B)
(M) (P) (M) (M) (M) (M)
(M) (M) (TP) (P) (M)
AreamKm' Popl1latlon Reason for lhe change In area ;- _-,-_.A. ----. ,~- .A. - ---.
1961 1971 1961 1971
3 4 5 6 7
MAHARASHTRA-concld
29 19 25 ~8 3460 2245
1036 5 18
,84 93 5 28
163<}
11 9<} 2642 41 36
61 72 6 16
16 39 11 01 2 59
521 34 37
28 13
1370 1044
606 1689 570
1044
1642 16 19
078
9 14
447 34 5 18
1476 28 75
1 29 233 207 5 18 1 30 363
777 725
6035 570 207
II 27 256
37 19 2504
13 49 I 55 5 83 723
2088
7 51 16 84 5 18
1044 6 14 254 324 601
1039 5 34
243
267 3 06
427 1036
7 85 13 03
1683 7 36
085
MEOHALAYA
909
MYSORB
13442 324
12 12 27 53
I 30 080 220
1290 144 375
2862 1245 57 13 579 217
40,9B 7975 4,806 8,9111
1349<) 29,687 21,074 !l,8n
115,760
26,440 16,61& 9,171
36,538 17,490 15,888 12,261 15,182,
6,443 18,002,
11,540
28,063 21,478
40,859 14,581
9,536 22,682
27,710 24,910
4,376
8,888
1,093,798 10,673 27,361
.28,362
9,132 ]3 376 6,421
17,492 5,400 8,223
127,885 21,854 20,795
8,127 15,986
70,156 ReVIsed ComputatJOIl 11,738 Do 7,367 Change 10 J uflsdlclIon
12,521 Do
18,634 Do 35,476 ReVIsed Computallon 25,993 Do 16,196 Chdngeln JunsdIchon
168,438
31,150 21,381 11,667
42,326 24,125 21,100 15,298 20,054
Change In JurISdICtIon as wel! as ReVISed ComputdtlOn
ReVIsed CompuIauon Do
Change In JUtlSdlctlOn as well as ReVISed ComputatIon
ReVIsed ComputatIOn Do Do Do Do
9,174 Change III JUrlsdlchon 27,960 Change III Junsdlchon as
well as ReVIsed Computatloll 15,245 ReVIsed ComputatIon
33,382 26,494
Do Do
53,412 Do 19.236 Do 12,080 Change 10 J unsd,chon 27,092 ReVIsed Computatron
39,423 Change In 1urlsdICtlon 29,721 Change m JunsdlctlOn as
well as ReVIsed ComputatlOn
7,122 Do
15,489 ReVIsed ComputatIon
1,540,741 12,629 35,600 33,985
12,163 12,533 8,781
31,442 6,494
11,550
192,427 29,960 15,817 10,193 19,691
Change m JurIsdIction ReVISed ComputatIon
Do Change III lur\"dlChOJl
ReVIsed Computatlon Do Do
Change III JUnsdIctIOJl ReVIsed Coroputallon
Do
Chamge 10 Junsdlctlon Do Do
ReVISed ComputatIOn Do.
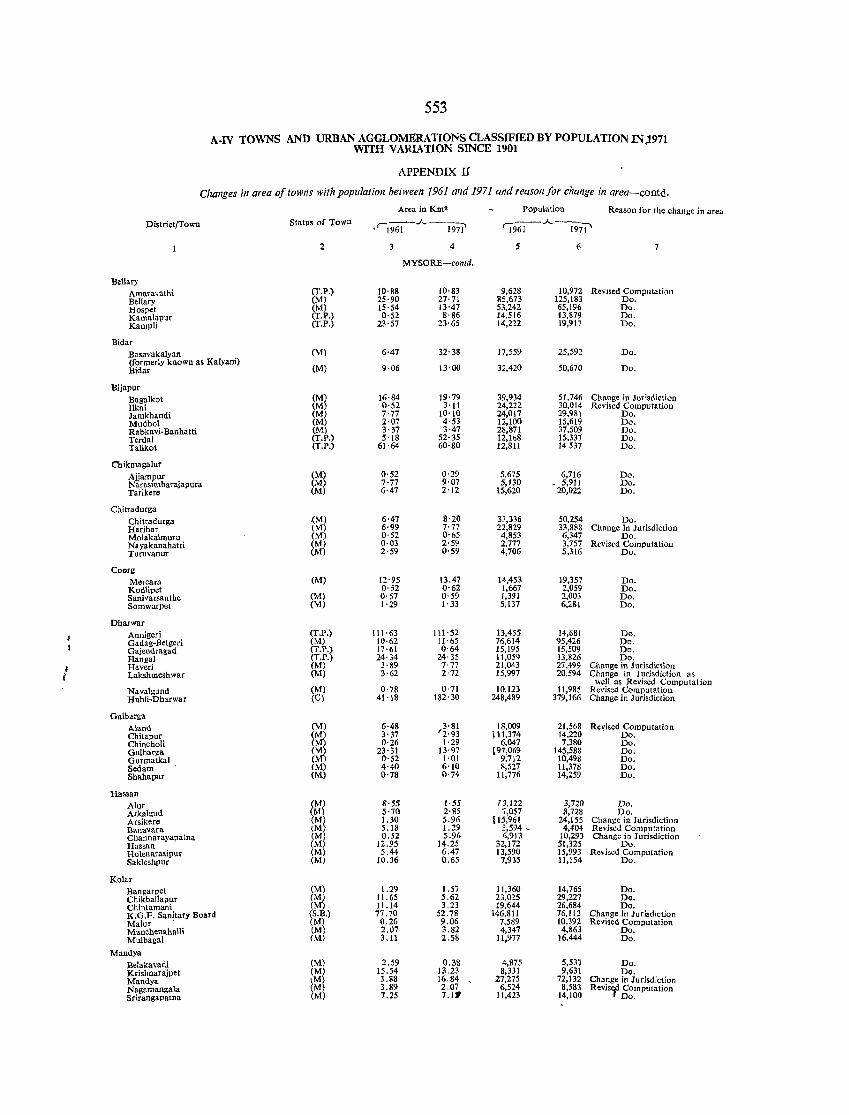
553
A.IV TOWNS AND URBAN AGGLOMERATlONS CLASSIFIED BY POPULATION IN 1971 WITH VARIATION SINCE 1901 '
APPENDIX II
Changes in area of towns with population between 1961 and 1971 and reasoll for change ill area-contd.
Area in Km" Population Reason for the change in area
District/Town Status of Town "i961-.)~ --1-97i' '1961--..A.. "-"I971'
2 4 5 6 7
MYSORE-contd.
Bellary Amaravathi (T.P.) 10'88 10'83 9,628 10,972 RevIsed Computation Bellary (M) 25·90 27'71 85,673 125,183 Do. Hospet (M) 15·54 13·47 53,242 65,196 Do. Kamalapur (T.P.) 0'52 8'86 14,516 <13,879 Do. Kampli (T.P.) 23'57 23'65 14,222 19,917 Do.
Bidar Basavakalyan (M) 6·47 32·38 17,559 25,592 Do. (formerly known as Kalyani)
(M) 9·06 13·00 32,420 50,670 Bidar Do.
Bijapur Bagalkot (M) 16·84 19·79 39,934 51,746 Change in Jllrisdiotion I1kal (M) 0·52 3'11 24,222 30,014 Revised Computation Jamkhandi (M) 7'77 10'10 24,017 29,981 Do. Mudhol (M) 2·07 4·53 12,100 15,619 Do. Rabkavi-Banhatti (M) 3'37 3·47 28,871 37,509 Do. Terdal (T.P.) 5'18 52'35 12,168 15,337 Do. Talikot (T.P.) 61·64 60'80 12,811 14537 Do.
Chikmagalur Ajjampur (M) 0'52 0·29 5,675 6,716 Do. NaraSlmharajapura (M) 7·77 9'07 5,130 5,911 Do. Tarikere (M) 6·47 2'12 15,620 20,022 Do.
Chitradurga Chitradurga (M) 6·47 8'20 33,336 50,254 Do. Harihar (M) 6'99 7·77 22,829 33,8~8 Change in Jurisdiction Molakalmuru (M) 0·52 0'05 4,853 6,347 Do. N. yakanahatti (M) 0·03 2'59 2,777 3,757 Revised Computation Turuvanur (M) 2·59 0'59 4,706 5,316 Do.
Coorg Mercara (M) 12·95 13.47 14,453 19,357 Do. Kodlipet 0·52 0·62 1,667 2,059 Do. Sanivarsanthe (M) 0'57 0'59 1,391 2,003 Do. Somwarpet (M) 1'29 l' 33 5,137 6,281 Do.
Dharwar Annigeri (T.P.) 111'63 111·52 13,455 14,681 Do. Gadag-Betseri (M) 10'62 II'OS 76,614 95,426 Do. Gaiendragad (T.P.) 17·61 0·64 15,195 15,509 Do. Hangal (T.P.) 24·34 24'35 11,059 13,826 Do.
I Haveri (M) 3'89 7·77 21.043 27,499 Change in Jurisdiction Lakshmeshwar (M) 3·62 2·72 15,997 20,594 Change in Jurisdiction as
Navalgund (M) 0'78 0'71 10,123 II ,985 well as Revised Computation
Revised Computation Hubli-Dharwar (C) 41'18 182'30 248,489 379,166 Change in J uri,diction
Gulbarga Aland (M) 6·48 3·81 18,009 21,568 Reyised Computation Chitapur (M) 3'37 '2'93 \11,374 14,220 Do. Chincholi (M) 0'26 1·29 6,047 7,380 Do. Gulbarga (M) 23·31 13·97 (97,O69 145,588 Do. Gurmatkal (M) 0-·52 1'01 9,712 10,498 Do. Sedam (M) 4·40 6'10 8,527 11,378 Do. Shahapur (M) 0'78 0'74 11,776 14,259 Do.
Hassan Alur (M) 8'55 1·55 13,122 3,720 Do. Arkal~ud (M) 5·70 2·85 7,057 8,728 Do. Arsikere (M) 1.30 5.96 [15,961 24,155 Change in Jurisdiction Banavara tM) 5.J8 1. 29 3,594 ~ 4,404 Revised Computation Channarayapatna (M) 0.52 5.96 6,913 10,293 Change in Jurisdiction Hassan (M) 12.95 14.25 32,172 51,325 Do. Holetlarasipur (M) 5.44 6.47 13,590 15,993 Revised Computation Sakleshpur (M) 10.36 0.65 7,935 11,154 Do.
Kolar Bangarpet (M) 1.29 1.57 11,360 14,765 Do. Chikbailapur (M) 11.65 5.62 23,025 29,227 Do. Chintamani (M) 11.14 3.23 19,644 26,684 Do. KG.F. Sanitary Board (S.B.) 77.70 52.78 146,811 76,112 Change in Jurisdiction Malur (M) 0.26 9.06 7,589 10,392 Revised Computation Manchenahalli (M) 2.07 3.82 4,347 4,863 Do. Mulbagal (M) 3.11 2.58 11,977 16,444 Do.
Mandya Belakavadi (M) 2.59 0.38 4,875 5,537 Do. Krishnarajpet (M) 15.54 J3.23 8,331 9,631 Do. Mandya 1M} 3.88 16.84 27,275 72,132 Change in Jurisdiction Nagamangala (M) 3.89 2.07 6,524 8,583 Revisr Computation Srirangapatna (M) 7.25 7.1. 11,423 14,100 Do.
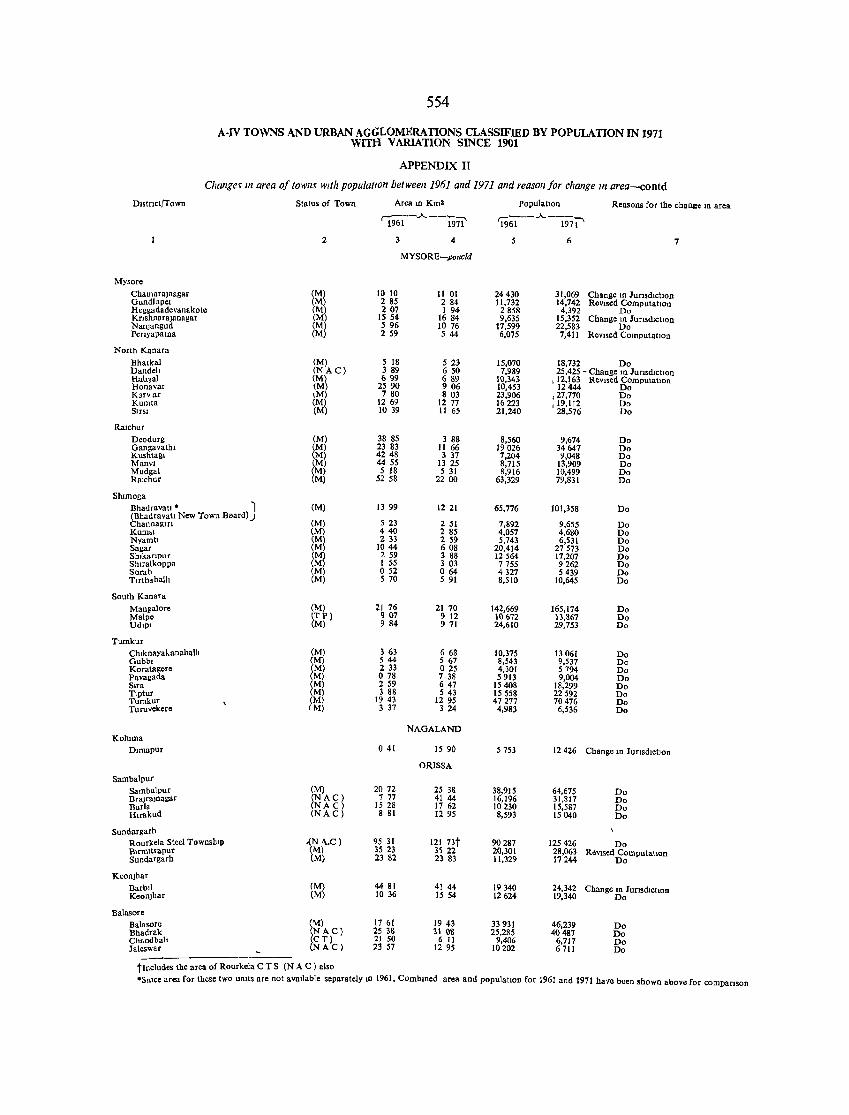
554
A-IV TOWNS AND URBAN AGGLOMERATIONS CLASSIFIED BY POPULATION IN 1971 WITH VARIATlON SINCE 1901
APPENDIX II
Change~ III area 0/ towns With population betweell1961 and 1971 alld reason/or change III area--contd
DIStrict/Town Status of Town Aream Km' PopulatIon Reasons for the change m area
'l%l--'- --1971' 'i9~-'-1971' 2 3 4 6 7
MYSORE-_poncld
Mysore Chamarajnagar (M) 10 10 11 01 24430 31,069 Change In JUrISdlChon Gundlupet (M) 2 85 284 11,732 14,742 ReVIsed Computahon Heggadadevanakote (M) 207 I 94 2858 4,392 Do Krtshnarajanagar (M) 1554 1684 9,635 15,352 Change m JUrIsructlon Nan)angud (M? 596 1076 17,599 22,583 Do Penyapatna (M 2 59 544 6,075 7,411 Rev15ed ComputatIOn
North Kanara Bhatkal (M) 5 18 523 15,070 18,732 Do Dandell (NAC) 389 650 7,989 25,425 - Change m Jnnsdlchon Ralwal (M) G 99 689 10,343 ,12,163 ReViSed Computation Honavat (M 2590 906 10,453 12444 Do KJryar \M? 780 803 23,906 ,27,770 Do Kumta (M 1269 1277 16223 ,19,112 Do SlCSI (M) 1039 11 65 21,240 28,576 Do
Ralchur Dcodurg (M) 38 85 3 88 8,560 9,674 Do Gangavathl (M) 23 83 11 66 19026 34647 Do Kushtagl (M) 4248 3 37 7,204 9,048 Do Manv! eM) 44 55 1325 8,715 13,909 Do Mudgal (M) 5 18 5 31 8,916 10,499 Do Ralchur (M) 52 58 2200 63,329 79,831 Do
Shlmoga
BhadravaU • I (M) 13 99 1221 65,776 101,358 Do (Bhadravatl New Town Board»)
(M) 5 23 251 7,892 9,655 Do Channaglfl Kum,1 (M) 440 285 4,057 4,680 Do Nvamtl (M) 233 259 5,743 6,531 Do Sagar (M) 1044 608 20,414 27573 Do Shtkarlpur (M? 259 3 88 12 S64 17,207 Do Shltalkoppa (M 1 55 303 7755 9262 Do Sorab (M) 052 064 4327 5439 Do Tltthahalh (M) 5 70 591 8,510 10,645 Do
South Kanara Mangalor. (M) 21 76 21 70 142,669 165,174 Do Malpe (TP) 907 9 12 10672 13,867 Do Udipi (M) 984 971 24.610 29,753 Do
Tumkur ChlknayakanahallJ (M) 3 63 6 68 10,375 13 061 Do Gubbl (M) 544 5 67 8,543 9,537 Do Koratagere (M) 2 33 o 2S 4,301 5794 Do Pavagada (Ml 078 7 38 5913 9,004 Do Slra (M 259 647 15408 18,299 Do T,ptur (M) 3 88 5 43 15 558 22592 Do Tumkur (M) 1943 12 95 47277 70476 Do Turuvekere 1M) 3 37 3 24 4,983 6,536 Do
NAGALAND Kohllna
Dlmapur 041 15 90 5753 12426 Change In JUTlsd,ctlon
ORISSA
Sambalpur Sambalpur (M) 2072 25 38 38,915 64,675 Do BraJra}nagar iNACl 7 77 41 44 16,196 31,817 Do Burla NAC 15 28 17 62 10230 15,587 Do Hltakud (NAC) 8 81 1295 8,593 15040 Do
Sundargarh Rourkela Steel TownshIp .(N <\.C) 95 31 121 73t 90287 125426 Do Blrm1t,apur (M) 35 23 3~ 22 20,301 28,063 ReVised ComputatIon Sundargarh (M) 2382 2383 11.329 17244 Do
Keonjhar Barbll (M) 44 81 41 44 19340 24,342 Change In I unsd,ctlon Keon)har (M) 10 36 15 54 12624 19,340 Do
Balasore Balasore S1) 1761 1943 33931 46,239 Do Bhadrak AC) 25 38 31 08 25,285 40487 Do Chandbah (CT) 21 50 6 11 9,406 6,717 Do Ialeswar (NAC) 23 57 12 95 10 202 6711 Do
tlncludes the area of Rourkela C T S (N A C ) also 'Smce area for these two umts are not avaJlable separately In 1961, Combmed area and population for 1961 and 1971 have been shown above for companson
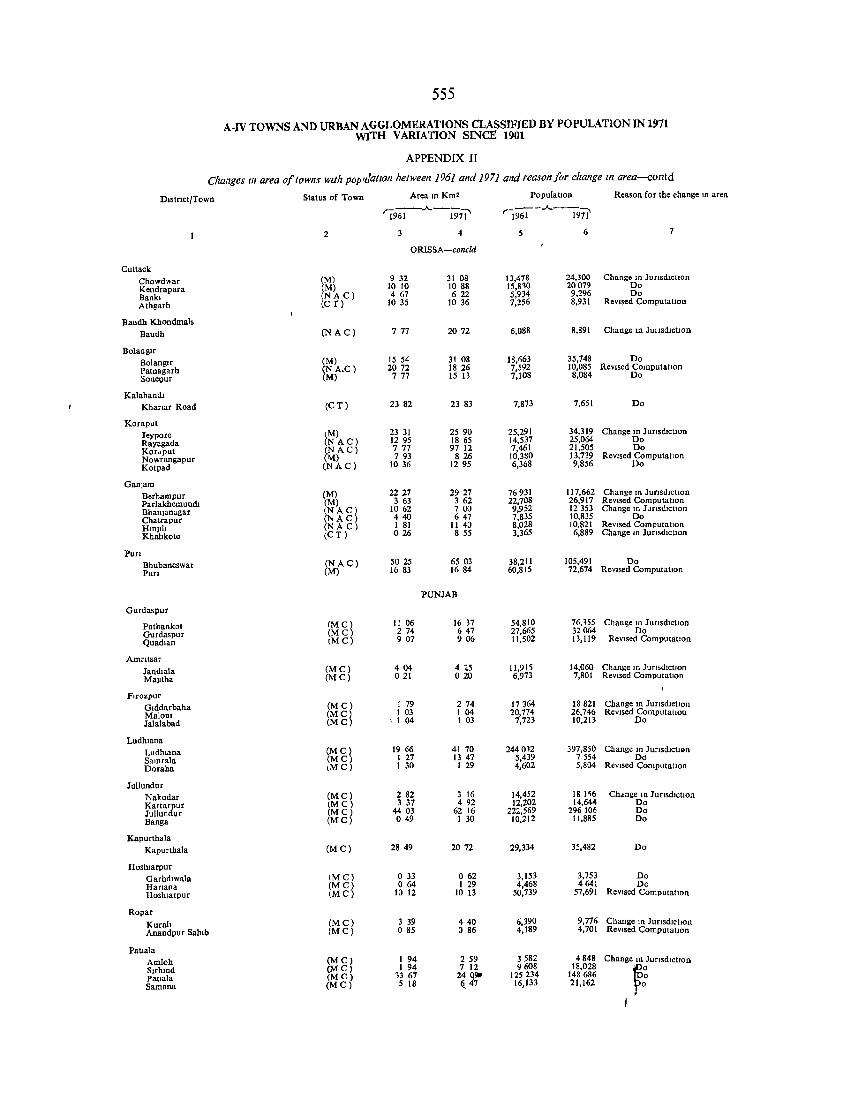
555
A-IV TOWNS AND URBAN AGGLOMERATIONS CLASSIFIIW BY POPULATION IN 1971 WJTH VARIATION SINCE 1901
APPENDIX II
C/langes 1Il area of towns Wtllt pop'llatton between 1961 and 1971 and reason for change m area-colltd
DlstnctjTown Status of Town Area m Km' Population Reason for the change ID area
'l~..A..-i9ii' 'i%i-..A..--191l'
2 4 6 7
ORISSA-concld
Cuttack
Chowd"ar (M) 932 31 08 13,478 24,300 Change 10 JUrJsdlcUon
Kendrapara (M) 10 10 1088 15,810 20079 Do
Banlo [NA C) 467 622 5,934 9,296 Do Athgarh CT) 10 35 10 36 7,2S6 8,931 ReVISed Computation
Baudh Khondmals Baudh (N AC) 777 2072 6,088 8,891 Change In JU11sdictlol}
BolangIr Bolanglr (M) 1554 31 08 18,663 35,748 Do Patnagarh ~NA.C) 2072 1826 7,592 10,085 ReVised ComputatIon
SoneQur M) 777 15 13 7,108 8,084 Do
Kalahandi Khanar Road (CT) 2382 23 83 7,873 7,651 Do
Koraput Jeypore ~M) 23 31 2590 25,291 34,319 Change m Juftsd,ctJon Rayagada N AC) 1295 1865 14,537 25,064 Do Kordput (N AC) 777 97 12 7,461 21,505 Do Nowrangapur (1\1) 793 826 10,380 13,739 ReVIsed Computatlon Kotpad (NAC) 10 36 1295 6,368 9,856 Do
Ganjam Berhampur (M) 2227 2927 76931 117,662 Change In J uflsdlctlon Parlakhemundi (M) 363 362 22,708 26,917 ReVised Computation Bhanjanagar lNAC\
1062 700 9,952 12353 Change III JurIsdIctIon
Chatrapur (1'<AC 440 647 7,835 10,835 Do Htnjlh (NAC I 81 11 40 8,028 10,821 ReVIsed Computation Khahkote (CT) 026 8 55 3,365 6,889 Change ID J uflsdlctlOn
Pun Bhubaneswar (NAC) 5025 65 03 38,211 105,491 Do Purl (M) 16 83 1684 60,815 72,674 ReVIsed Computation
PUNJAB
Gurdaspur
Pathankot (MC) II 06 16 37 54,810 76, '55 Change In JuftsdlctlOn Gurdaspur (MCl 274 647 27,665 32064 Do Quadlan lMC 907 906 11,502 13,119 ReVised ComputatIOn
Amntsar landlala (MC) 404 425 11,91S 14,060 Change 1n JUrISdIctIOn
MaJltha (MC) 021 020 6,973 7,801 ReVIsed Computal1on
Ftrozpur
Glddarbaha (MC) 1 79 274 17364 18821 Change In JUrIsdictIOn Malonl (MC~ I 03 104 20,774 26,746 ReVised Computatlou lalalabad (MC I I 04 I 03 7,723 10,213 Do
Ludluana Ludhlana (MC~ 19 66 41 70 244012 397,850 Change In Junsdictlgn Samrala (MC I 27 1347 5,439 7554 O<l
Doraha \MC) I 30 1 29 4,602 5,804 ReVIsed Computation
lnllundur Nakodar (MC) 282 3 16 14,452 181'16 Ch.mge In luftsdlctlon Kartarpur (MC) 3 37 492 12,202 14,644 Do lullundur i~g~
44 03 62 16 222,S69 296106 Do Banga 049 1 30 10,212 11,885 Do
Kapurthala Kapurthala (MC) 2849 2072 29,334 35,482 Do
Hosluarpur Garhdnvala (MC) o 33 062 3,153 3,753 Do Hanana (MC) 064 1 29 4,468 4641 Do Hoshlarpur (MC) 10 12 10 13 50,739 57,691 ReVised ComputatIOn
Ropar
Kurah (MC) 3 39 440 6,390 9,776 Change tn Junsdlctlon Anandpur Salub (MC) o 85 o 86 4,189 4,701 ReVised ComputatIOn
Pabala Amloh (MC) 1 94 259 3 S82 4848 Change m JUflsdlctJol} Slfhmd (MC) 1 94 7 12 9608 18,028 fJ Pallala (Me) 13 67 24 cg- 125234 148686
Samana (MC) 5 18 ~4 16,133 21,162 ,
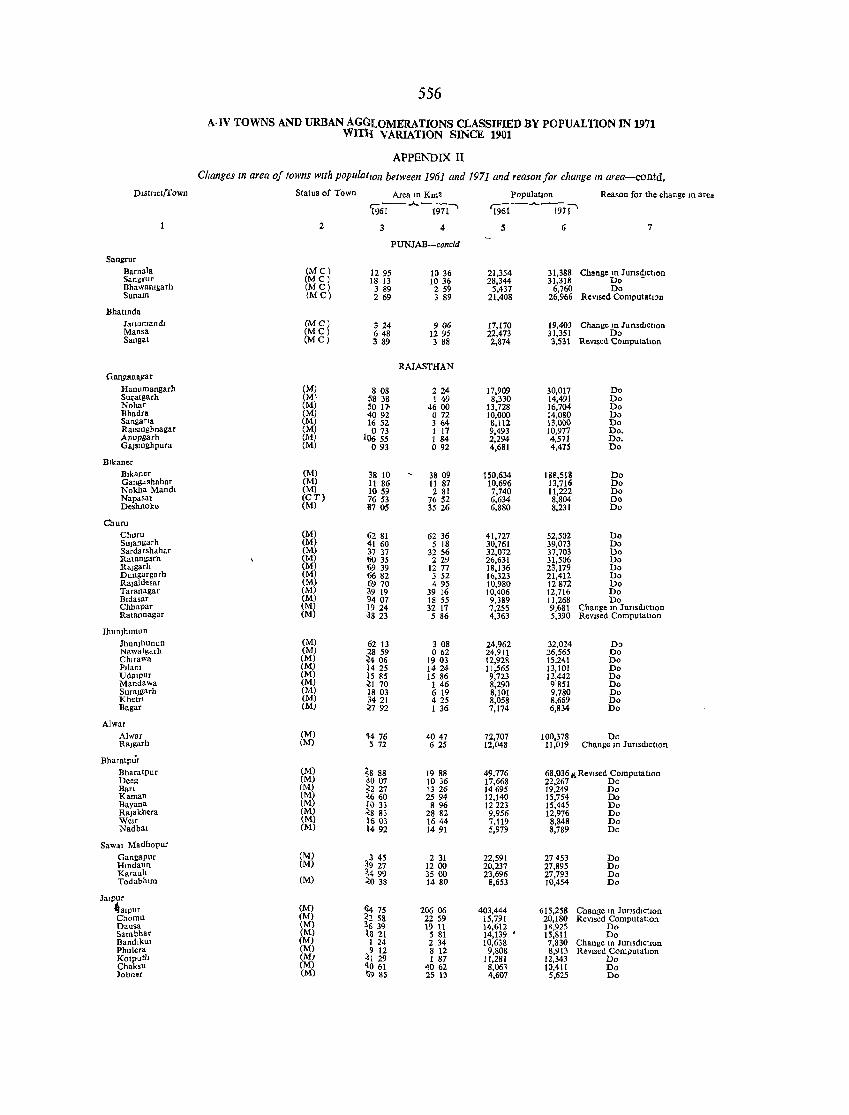
556
A·IV TOWNS AND URBAN AGGLOMERATIONS CLASSlFillD BY POPUALTION IN 1971 WITII VARIATION SINCE 1901
APPENDIX II
Changes In area of fowns with populatIOn between 1961 and 1971 and reason for change In area-contd,
DIstrIct/Town Status of Town Area ID Km2 PopulatIOn Reason for the change III .rea
'196-{-- ..A.. 197t .... 'i96i-..A..i971' 2 3 4 S 6 7
PUNJAB-concld
Sangrur Barnal. (Me) 1295 1036 21,354 31,388 Change III ]unsi!JctJon Sangrur (MC) 18 13 10 3~ 28,344 31,318 Do Bhawamgarh (MC) 389 25 5,431 6,760 Do Sunam (MC) 269 3 89 21,408 26,966 ReVIsed Computahon
Bhatmda JaItumandI (MC) 324 906 17,170 19,403 Change In lurlS(ilcllon Mans. (MC) 648 12 95 22,473 31,351 Do Sanga! (MC) 389 3 88 2,874 3,531 ReViSed Computation
RAJASTHAN Gaeyanl\l!ar
Hanumangarh (M) 808 224 17,909 30,017 Do Su,atgarh (M' 58 38 1 49 8,330 14,491 Do Nohar (M) 50 11< 4600 13,728 16,704 Do Bhadra (M) 4092 072 10,000 14,080 Do Sangarla (M) 16 52 364 8,112 13,000 Do RalSlnghnagar (M) 1 073 1 17 9,493 10,977 Do. Anupgarh (M) 06 55 1 84 2,294 4,571 Do. Gajsmghpura (M) 093 092 4,681 4,415 Do
Blkaner
Blkaner (M) 38 10 38 09 150,634 188,518 Do Galls"shahar (M) 11 86 11 81 10,696 13,716 Do Nokha Mandl (M) 1059 281 7,740 11,222 Do Napasar (CT) 7653 76 52 6,634 8,804 Do Deshnoke (M) 8705 35 26 6,880 8,231 Do
Churu Churu (M) 6281 62 36 41,727 52,502 Do SUjangarh (M) 41 60 5 18 30,761 39,073 Do Sardarshahar (M) 37 37 3256 32,072 37,703 Do Ratangarh (M) 60 35 229 26,631 31,506 Do Rajgarh (M) 6939 12 77 18,136 23,179 Do Dungargarh (M) 66 82 3 52 16,323 21,412 Do RaJaldesar (M) 6970 495 10,980 12872 Do Taranagar (M) 39 19 39 16 10,406 12,716 Do Bldasar (M) 9407 18 55 9,389 11.268 Do Cbbapar (M) 19 24 32 17 7,255 9,681 Change ill JUrIsdIction Ratannagar (M) 38 23 586 4,363 5,390 ReVISed ComputatIOn
JhunJhunun Jhumhunun (M) 62 13 3 08 24,962 32,024 Do Nawalgdrh (M) 28 59 062 24,911 26,565 Do Chlrawa (M) ~4 06 1903 12,928 15,241 Do Pllam (M) 1425 1424 11,565 13,101 Do UdaIpur (M) 15 85 1586 9,723 12,442 Do Mandawa (M) ~1 70 1 46 8,290 9851 Do Surajsarh (M) 1803 6 19 8,101 9,780 Do Khetri (M) 3421 425 8,058 8,669 Do Bagar (M) ~7 92 1 36 7,174 6,834 Do
Alwar Alwar (M) 1476 4047 72,707 100,378 Do Raj8.rh (M) 5 72 625 12,048 11,019 Change In JUrISdIctIon
Bharatpur Bharatpur (M) <8 88 1988 49,776 68,036AReVised Computalion Deeg (M) ~O 07 1036 17,668 22,267 Do Barl (M) ~2 27 1326 14695 19,249 Do Kaman (M) 660 2594 12,140 15,754 Do Bayana (M) 10 33 896 12223 15,445 Do Rajakhera (M) <8 83 28 82 9,956 12,976 Do WeIr (M) \603 1644 7,119 8,848 Do Nadbal (M) 1492 1491 5,979 8,789 Do
Sawal Madhopur Gangapur (M) 33 45 231 22,591 27453 Do Hmdaun (M) ~9 27 1200 20,237 27,895 Do Karauh
(M) 499 3500 23,696 27,793 Do
Todabhlm <038 1480 8,653 10,454 Do
Jalpur 4alPur (M) 11475 20606 403,444 615,258 Change 10 Junsdlc\Jon Chomu (M) <2 58 2259 15,791 20,180 ReVised ComputatIOn Dausa (M) 36 39 19 11 14,612 18,925 Do Sambhar (M) la 21 581 14,139 • 15,811 Do Bandlkul (M) I 24 2 34 10,638 7,830 Change In JUrISdlc\Jon Phulera (M) l12 8 12 9,808 8,913 Revlsed Com,mtatlOn Kotputl1 (M) 1 29 1 87 11,281 12,343 Do Chaksu (M) '1061 4062 8,06, 10,411 Do Jobnet (M) ~9 85 25 13 4,607 5,625 Do
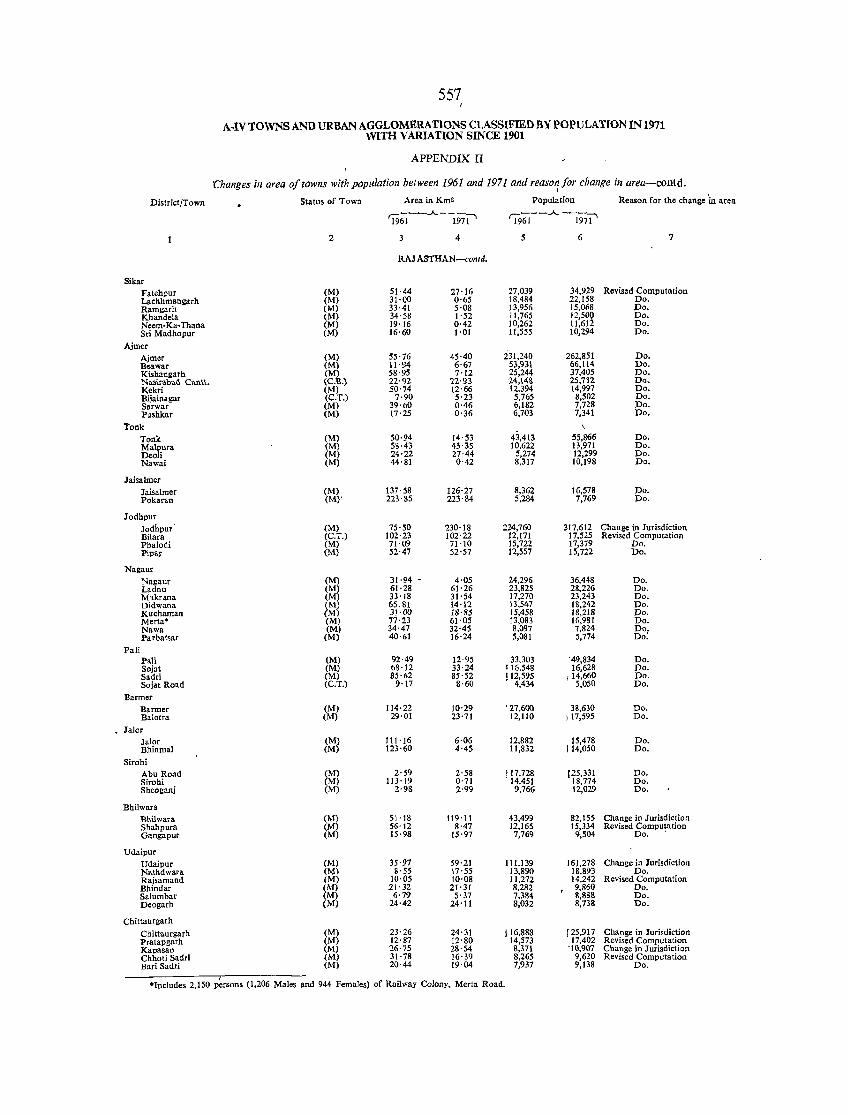
557 I
A-IV TOWNS AND URBAN AGGLOMERATlONS CLASSIFIED BY POPULATION IN 1971 WITH VARIATION SINCE 1901
APPENDIX II
Changes in area a/towns with population between 1961 and 1971 and reaso~/or change in area-contd.
District/Town Status of Town Area in Km2 Population Reason for the change 'in area
'i96-1--A -1971' 'l96i--.A. 197l"
2 3 4 5 6 7
RAJ ASTHAN-contd.
Sikar Fatehpur (M) 51·44 27'16 27,039 34,929 Revised Computation Lachhmanll'1rh (M) 31·00 0'05 18,484 22,158 Do. Ramgarh (M) 33·41 5'08 13,956 15,068 Do. Khandela (M) 34·58 1'52 11,765 12,50g Do. Neem-Ka-Thana (M) 19'16 0·42 10,262 11,61 Do. Sri Madhopur (M) 16'60 1'01 11,555 10,294 Do.
Ajmer Ajmer (M) 55·76 45·40 231,240 262,851 Do. Beawar (M) 11'94 6'67 53,931 66,114 Do. Kishangarh (M) 58·95 7·12 25,244 37,405 Do. NusiTubad Cantt. (C.B.) 21·Q2 22·91 24,\4% 2S,?32 Do_ Kekri (M) 50·74 12·66 12,394 14,997 Do. Bijainagar (C.T.) 7·90 5'23 5,765 8,502 Do. Sarwar (M) 39'00 0·46 6,182 7,728 Do. Pushkar (M) 17'25 0'36 6,703 7,341 Do.
Tonk \
Tonk (M) 50·94 14'53 43,413 ~5,866 Do.
i:i:~liura (M) 58·43 45·35 10,622 13,971 Do. (M) 24'22 27·44 5,274 12,299 Do.
Nawai (M) 44·81 0'42 8,317 10!198 Do.
Jaisaimer Jaisalmer (M) 137'58 126'27 8,362 16,578 Do. Pokaran (M)' 223·85 223·84 5,284 7,769 Do.
Jodhpur Jodhpur (M) 75'50 230'18 224,760 317,612 Change in Jurisdiction Bilara (C.T.) 102'23 102'22 12,171 17,525 Revised Computation Phalodi (M) 71·09 71'10 15,722 17,379 Do. Pipa, (M) 52·47 52'57 12,557 15,722 Do.
Nagaur Nagaur (M) 31·94 - 4·05 24,296 36,448 Do. Ladnu (M) 61'28 61'26 23,825 28,226 Do. M~kr .. na (M) 33'18 31'54 17,270 23,243 Do. Didwana {M) 65.81 14'12 13,547 18,242 Do. Kucharnan (M) 31-00 18'85 15,458 18,218 Do. Merta'" (M) 77·23 61·05 13,083 16,981 Do. Nawa (M) 34·47 32'45 8,097 7,824 Do. Parbatsar (M) 40·61 16·24 5,081 5,774 Do:
Pali Pali (M) 92·49 12·95 33,303 '49,834 Do. Sojat (M) 68·12 33'24 E 16,548 16,628 Do. Sadri (M) 85·62 85'52 112,595 1 14,660 Do. Sojat Road (C.T.) 9'17 8·60 4,434 5,050 Do.
Barrner Barrner (M) 114·22 10·29 • 27,600 38,630 Do. Balotra (M) 29·01 23'71 12,110 117,595 Do.
Jalor lalor (M) 111'16 6·06 12,882 15,478 Do. Bhinmal (M) 123·60 4·45 11,832 i 14,050 Do.
Sirohi Abu Road (M) 2·59 2'58 t1 7,728 [25,331 Do. Sirohi (M) 113·19 0'71 14,451 18,774 Do. Sheog.nj (M) 2·98 2·99 9,766 12,029 Do.
Bhilwara Bhilwara (M) 51'18 119'11 43,499 82,155 Change in Jurisdiction Shahpura (M) 56'12 8·47 12,165 15,334 Revised Computation Gangapur (M) 15·98 15·97 7,769 9,504 Do. .
Udaipur Udaipur (M) 35·97 59·21 111,139 161,278 Change in Jurisdiction Nathdwara (M) 8·55 17'55 13,890 18,893 Do. Rajsamand (M) 10·05 10·08 11,272 14,242 Revised Computation Bhindar (M) 21'32 21·31 8,282 9,860 Do. Salumbar (M) 6·79 5·37 7,384 8,888 Do. Deogarh (M) 24·42 24'11 8,032 8,738 Do.
Chittaurgarh
Chittaurgarh (M) 23·26 24·31 116,888 [25,917 Change in Jurisdiction Pratapgarh (M) 12·87 12'80 14,573 17,402 Revised Computation Kapasan (M) 26'75 28'54 8,371 '10,907 Change in Jurisdiction Chhoti Sadri (M) 31·78 16·39 8,265 9,620 Revised Computation Bari Sadri (M) 20·44 19·04 7,937 9,138 Do .
• Includes 2,150 persons (1,206 Males and 944 Females) of Railway Colony, Merta Road.
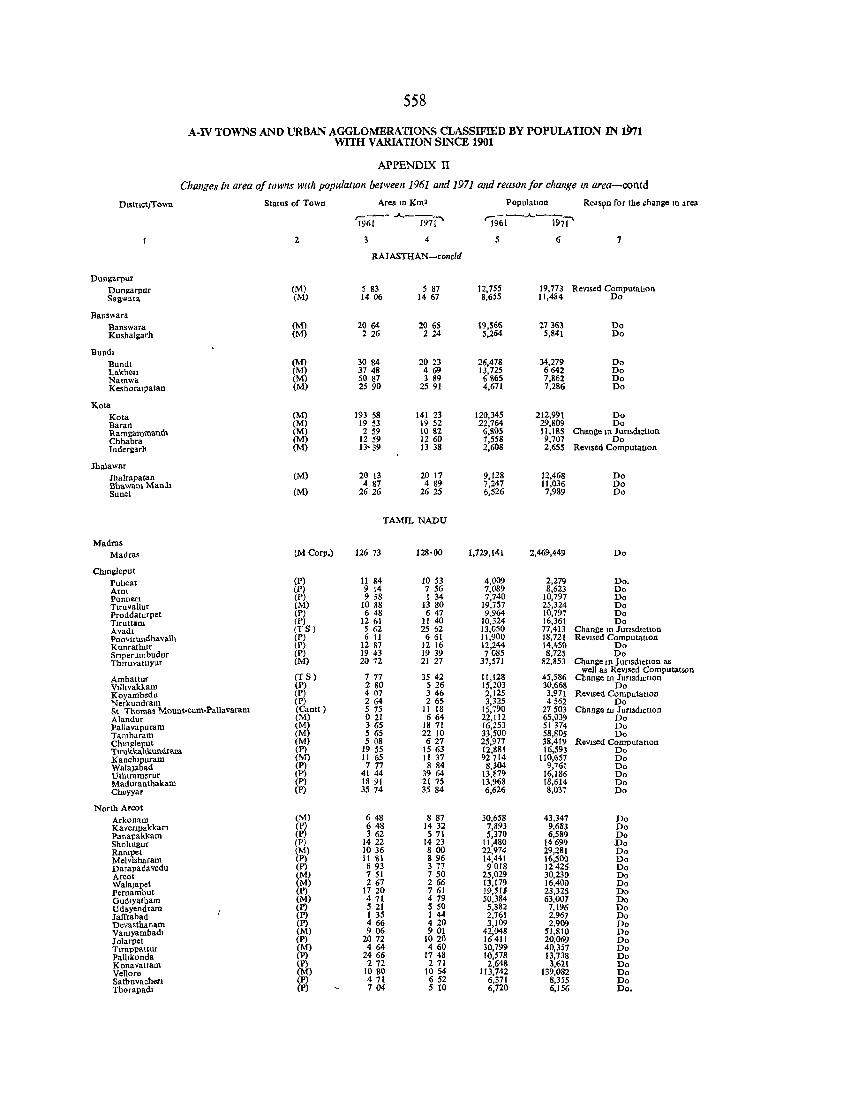
558
A-IV TOWNS AND URBAN AGGLOMERATIONS CLASSIFIED BY POPULATION IN 1971 WITH VARIATION SINCE 1901
APPENDIX II
Changes in area of towns with papulation between 1961 and 1971 and reason for challge III area-contd
DIstnct/Town Status of Town Area In Km3 PopulatIOn Reaspn for the change In area
'i961--..A..-mi' '1961-..A..----mT' 2 4 5 6 7
RAJ ASTHAN-conc1d
Dungarpur Dungarpur (M) 5 83 5 87 12,755 19,773 ReVIsed ComputatIon Sagwara (M) 1406 1467 8,655 11,484 Do
Banswara Banswara (M) 2064 2065 19,566 27363 Do Kushalgarh (M) 2 26 224 5,264 5,841 Do
Bundl Bundl (M) 3084 2023 26,478 34,279 Do Lakhen (M) 37 48 469 13,725 6642 Do Namwa (M) 50 87 3 89 6 S65 7,862 Do Keshoralpatan (M) 2S 90 2591 4,671 7,286 Do
Kota Kota (M) 193 58 141 23 120,345 212,991 Do Baran (M) 19 53 1952 22,764 29,809 Do Ramgan)roandl (M) 259 1082 6,805 lI,18S Change III J unsd,ctlon Chhabra (M) 1259 1260 7,558 9,707 Do Indergarh (M) 13'39 13 38 2,608 2,655 ReVIsed Computauon
Jhalawar Jhalrapatan (M) 20 13 20 17 9,128 12,468 Do Bhawam Mandl 4 87 489 7,247 11,036 Do Sunel (M) 2626 2625 6,526 7,989 Do
TAMIL NADU
Madras Madras (M Corp.) 126 73 128'00 1,729,141 2,469,449 Do
Chtngleput Puhcat (P) 11 84 to 53 4,009 2,279 Do. Arnl (P) 9 14 7 56 7,089 8,623 Do Ponnen (P) 9 58 I 34 7,740 10,797 Do Ttruvallur (M) 10 88 13 80 19,757 25,324 Do Proddaturpet (P) 648 647 9,964 10,797 Do Tlruttaru (P) 12 61 II 40 10,324 16,361 Do Avadl (TS) 5 62 25 62 13,050 77,413 Change tn J uflsd,ctlon Poovlfundha valli (P) 6 11 661 11,900 18,721 ReVIsed Computauon Kunrathur (P) 12 87 12 16 12,244 14,<1-50 Do Snperumbudur (P) 1943 19 39 7085 8,725 Do Thlfuvaltlyur (M) 2072 21 27 37,571 82,853 Change 10 J unsdlctlon as
(TS) 7 77 3542 11,128 45,586 well as ReVIsed ComputatIon
Ambattur Change 10 JUflsd,ctJon VIIltvakkam (P) 2 80 526 15,203 30,668 Do Koyambcdu (P) 407 346 2,125 3,971 ReVised Computatlon Nerkundram (P) 2 64 265 3,325 4562 Do St Thomas Mount-eum·Pallavaram (Cant!) 5 15 II 18 15,790 27503 Change In J uflsdlcUon Alandur (M) 021 664 22,112 65,039 Do Pallavapuram (M) 365 1871 16,253 51314 Do Tambaram (M) 5 65 22 10 33,500 58,805 Do Chmgleput (M) 5 08 627 25,977 38,419 ReVIsed Computallon Tirukkahkundram (P) 1955 1563 JNn 16,593 Do Kanchlpuram (M) 11 65 11 37 tlO,657 Do Wala)abad (P) 7 77 8 84 8,304 9,761 Do Uthlramerur (P) 41 44 3964 13,879 16.186 Do Maduranthakam (P) 18 91 21 75 13,968 18,614 Do Cheyyar (P) 35 14 3584 6,626 8,037 Do
North Areat Arkonam (M) 648 8 87 30,658 43,347 Do Kavenpakkam (P) 648 1432 7,893 9,683 Do Panapakkam (P) 362 S 71 5,370 6,589 Do Shohngur (P) 1422 1423 11,480 14699 Do Raru~t (M) 1036 800 22,974 29,281 Do Melvlsharam (P) II 81 896 14,441 16,500 Do Darapadavedu (P) 893 377 9018 12425 Do Areot (M) 751 750 25,029 30,230 Do Wala)apet (M) 267 266 13,179 16,400 Do Pernambut (P) 1720 761 19,51$ 23,325 Do Gudlyatbam (M) 471 479 50,384 63,007 Do Udayendrarn (P) 521 S 50 5,882 7,196 Do Jaffrabad (P) 1 35 1 44 2,761 2,967 Do Devasthanam (P) 466 420 3,109 2,909 Do Vamyambadl (M) 906 901 42,048 51,810 Do Jolarpet (P) 2072 1020 16411 20,069 Do Tlruppat\ur (M) 464 460 30,799 40,357 Do Palhkonda (P) 2466 1748 10,578 13,738 Do Konavattam (P) 272 271 2,648 3,621 Do Vellore (M) 1080 10 54 113,742 139,082 Do Satbuvachen (P) 471 652 6,371 8,355 Do Thorapadl (P) 704 5 10 6,720 6,156 Do.
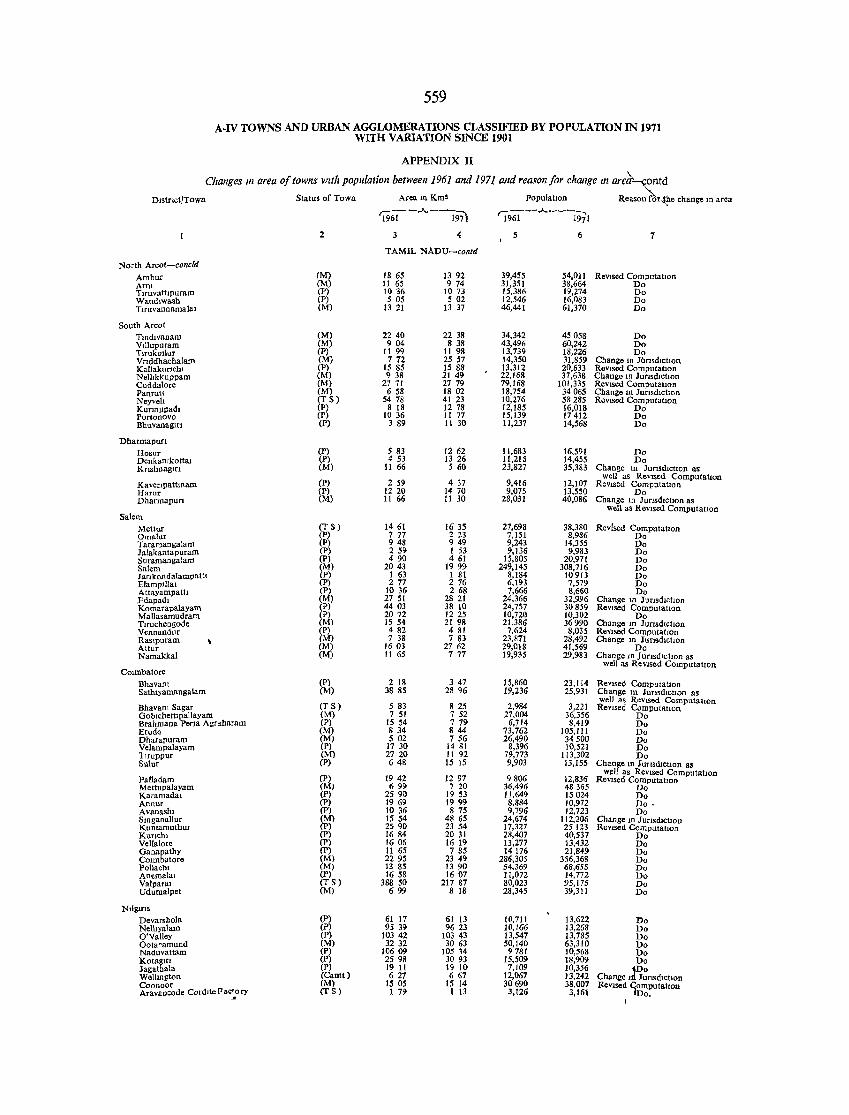
559
A-IV TOWNS AND URBAN AGGLOMERATIONS CLASSIFIED BY POPULATION IN 1971 WITH VARIATION SINCE 1901
APPENDIX II
Changes III area of towns With population between 196] and 1971 and reason for change III are}-~td Dlstflct/Town Status of Town Area In Km~ Population Reason for 4"he change 10 area
'i961--"---1m '1961--"---1971
2 3 4 5 6 7
TAMIL NADU-contd
North Arcot-concld Ambur (M) 18 65 1392 39,455 54,011 ReVIsed ComputatIOn Arm (M) 11 65 974 31,351 38,664 Do Tuuvattlpuram (P) 1036 1073 15,386 19,274 Do Wandlwash (P) 5 05 S 02 12,546 16,083 Do Tlruvannamalal (M) 13 21 13 37 46,441 61,370 Do
South Arcot Tmdlvanam (M) 2240 2238 34,342 45058 Do Villupuram (M) 904 838 43,496 60,242 Do TlTuko!lur (P) 11 99 11 98 13,739 18,226 Do Vrlddha.chalarn (M) 772 25 57 14,350 31,859 Change 10 JUnsdlchon KalJakur,ehl (P) 15 85 1588 13,312 20,633 ReVIsed Computation Nelltkkuppam (M) 9 38 21 49 22,168 37,638 Change in JUflSdICtlOn Cuddalore (M) 27 71 27 79 79,168 101,335 Revlsed Computation PanruU (M) 6 58 1802 18,754 34065 Change In Junsdlctlon Neyveh (T S) 54 78 41 23 10,276 58285 ReVised Computation KurlnJlPadl (P) 8 18 1278 12,185 16,018 Do Portonovo (P) 1036 11 77 15,139 17412 Do Bhuvanagm (P) 389 11 30 11,237 14,568 Do
Dharmapun Hosur (P) 5 83 1262 11,683 16,591 Do Denkarukottru (P) 4 53 1326 It,21S 14,455 Do Knshnagm (M) 11 66 560 23,827 35,383 Change In JUrISdictIOn as
(P) 259 4 37 9,416 12,107 well as ReVIsed Computation
Kavenpattmaro ReVIsed ComputatIOn Harllr (P) 12 20 1470 9,075 13,550 Do Dharmapun (M) 11 66 11 30 28,031 40,086 Change m Junsdlclion as
Salem well as RevlSed Computation
Mettur (T S) 14 61 16 35 27,698 38,380 Revised ComputatIOn Omalur (P) 777 223 7,151 8,986 Do Taramangalam (P) 948 949 9,243 14,355 Do Jalakantapuram (P) 259 1 53 9,136 9,983 Do Suramangalam (P) 490 4 61 15,805 20,971 Do Salem (M) 2043 1999 249,145 308,716 Do lankondaiampat(l (P) 1 63 1 81 8,184 10913 Do ElamplUal (P) 2 77 2 76 6,193 7,579 Do Attayampatli (P) 1036 2 68 7,666 8,660 Do Edapadl (M) 27 51 2821 24,366 32,996 Change In Junsd,ctlOn Komarapalayam (P) 4403 38 10 24,757 30859 ReVIsed ComputatIOn Mallasamudram (P) 2072 1225 10,720 )0,302 Do TIruchengode (M) 1554 21 98 21,386 36990 Change In JunsdlctlOn Vennandur (P) 482 481 7,624 8,035 ReVised ComputatIOn Raslpuram (M) 738 783 23,871 28,492 Change In Junsd,ctlOn Attur (M) 1603 2762 29,018 41,569 Do Namakkal (M) 11 65 777 19,935 29,983 Change III JunsdlctlOn as
Counbatore well as ReVised ComputalIon
Bhavam (P) 2 18 3 47 15,860 23,114 Revlsed Computallon Sathlyamangalam (M) 388S 28 96 19,236 25,931 Change In Junsdlchon as
Bha vam Sagar (T S) 5 83 8 25 2,984 3,221 wen as ReVised ComputatIon ReVised ComputatIOn
GoblchettJpallayarn (M) 7 51 7 52 27,004 36,356 Do Brahmana Perla Agraharam (P) 15 54 7 79 6,714 8,419 Do Erode (M) 834 844 73,762 105,111 Do Dharapuram (M) 502 756 26,490 34500 Do Velampalayam (P) 17 30 1481 8,396 10,521 Do T,ruppur (M) 27 20 1192 79,773 113,302 Do Sulur (P) 648 15 IS 9,903 13,155 Change m JUrlSdlctIOn as
Palladam (P) 1942 1297 9806 12,836 w~ll as ReVised Computahon
ReVised ComputatIOn Mettupalayam (M) 699 720 36,496 48365 Do Karamadal (P) 2590 19 53 11,649 15024 Do Annur (P) 1969 1999 8,884 10,972 Do· Avanaslu (P) 1036 875 9,796 12,723 Do Smganallur (M) 1554 48 65 24,674 112,206 Change m JUrISdiction KUDtamutbur (P) 2590 23 54 17,327 25123 ReVIsed ComputatlOn Kunchl (P) 1684 20 31 28,407 40,537 Do Vellalore (P) 1606 16 19 13,277 13,432 Do Ganapathy (P) 11 65 785 14176 21,849 Do COimbatore (M) 2295 2349 286,305 356,368 Do Pollacbl (M) J3 85 1390 54,369 68,655 Do Antmalal (P) 1658 1607 11,072 14,772 Do Valparal (T S) 38850 21787 80,023 95,175 Do Udumalpet (M) 699 8 18 28,345 39,311 Do
Nligms Devarshola (P) 61 17 61 13 10,711 13,622 Do Nelhya1am (P) 9S 39 9623 10,166 13,268 Do O'Valley (P) 103 42 103 43 13,547 13,785 Do Ootaramund (M) 32 32 30 63 50,140 63,310 Do Naduvattam (P) 10609 105 14 9781 10,568 Do Kotaglfl (P) 2S 98 3093 15,509 18,909 Do Jagathala (P) 19 11 1910 7,109 10,356 JDo Wellmgton (Cantt) 627 667 12,067 13,242 Change I Junsdlctlon Coonoor (M) 1505 15 14 30690 38,007 ReVised qomputatton Aravancode CordlteE'ae:ory (TS) 1 79 1 13 3,126 3,161 Do.
I
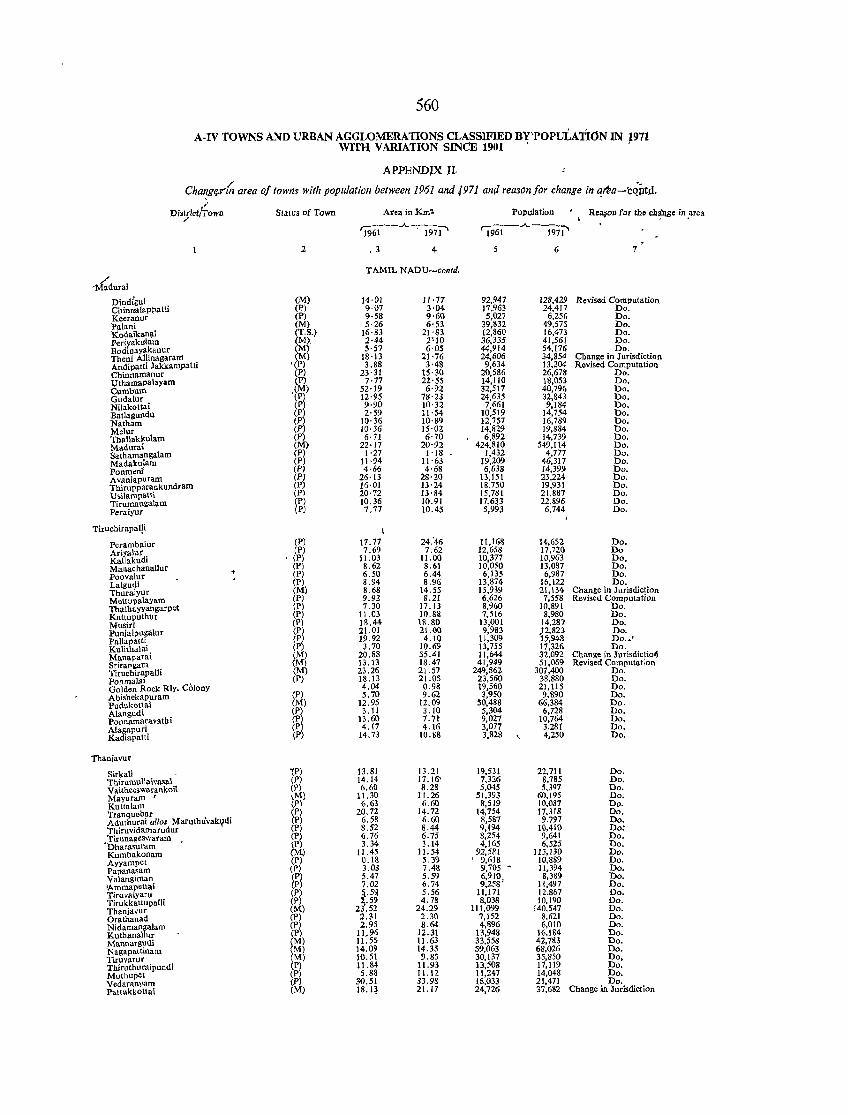
560
A·IV TOWNS AND URBAN AGGLOMERATIONS CLASSlFIED BY'"POPuLATION IN 1971 WITH VARIATION SINCE 1901
APPENDJX II.
Cha~g~~ area 0/ towns with population between ]96] and 197] and reason/or change in '!n-a-cQiltrl. ,., Dis;Jic£/Town Status of Town AreainKm~ Population Re~oll for the ch~ilge in .area
'J961--"--, -1971' 'l9~-"--1971' 2 . 3 4 5 6 7
TAMIL NADU-contd.
4durai
Dind{gu! (M) 14,01 11,77 92,947 128,429 Revised Computation Chinnalappatti (P) 9,07 3,04 17,963 24,417 Do, Keeranur (P) 9·58 9,60 5,027 6,256 Do. Palani (M) 5·26 6·53 39,832 49,575 Do. I{odaikan~1 (T.S.) 16,83 21'83 12,860 16,473 Do. Periyakulam (M), 2·44 2'10 36,335 41,56[ Do. Bodinayakanur (M) 5·57 6,05 44,914 54,176 Do. Theni AUinagaram (M) 18·13 21·76 24,606 34,854 Change in Jurisdiction Andipatti Jakkampatti '(P) 3.88 3'48 9,634 13,204 Revi;ed Computation Chinnamanur (P) 23·31 15·30 20,586 26,678 Do. Uthamapalayam (P) 7·77 22'55 14,[10 18,053 Do. Cumbum (M) 52·19 6·92 32,517 40,796 Do. Gudalur '(P) 12·95 78'23 24,635 32,843 Do. Nilakottai (P) 9·90 10'32 7,661 9,184 Do. BatIagundu (Pl 2·59 11·54 10,519 14,754 Do. Natham (P) 10·36 10'89 12,757 16,789 Do. Melur (Pl 10·36 15·02 14,829 19,884 Do. ThaUaklmlam (Pl 6·71 6·70 , 6,892 14,739 Do. Madurai (M) 22·17 20·92 424,810 549,114 Do. Sathamangalam (Pl 1·27 1'18 1,432 4,777 Do. Madakulam (P) 11·94 11·63 19,209 46,317 Do. Ponmonl (P) 4·66 4·68 6,638 14,399 Do. A vaniapuram (P) 26·13 28·20 13,151 23,224 Do. 'Ihirupparaukundram (Pl 16·01 13'24 18,750 19.931 Do. U.i1ampatti (Pl 20·72 13'84 15,781 21.887 Do. Tirumangalam (Pl 10.36 10.91 17,63,3 22,896 Do. Peraiyur (P) 7.77 10.45 5,993 6,744 Do.
Tiruchirapal!i I
Peramba\ur (P) 17.77 24:46 11,168 14,652 Do. Ariyalur (P) 7,69 7.62 12,658 17,720 Do Kallakudi (P) 11.03 11.00 10,377 10,963 Do, Manachanallur (P) 8.62 8.61 10,050 13,087 Do. Poovalur (P) 6.50 6.44 6,135 6,987 Do. Lalgudi (P) 8.94 8,96 13,874 16,122 Do. Thuraiyur (M) 8.68 14.55 15,939 21,134 Change in J llrisdiction Mettupalayam (P~ 9,92 8,21 6,626 7,558 Revised Computation Thathayyangarpet (P 7.30 17.13 8,960 10,891 Do. Kattuputhnr (P) 11.03 10.88 7,516 8,980 Do. Musiri (P) 18.44 18,80 13,001 14,287 Do. Punjaipugalur (P) 21.01 21.00 9,983 )2,823 Do. Pallapatti (Pl 19.92 4.10 11,309 1",948 Do .• ' Kulithalai (P) 3.70 10.69 13,755 17,326 Do. Manaparal (MI 20.88 55.41 11,644 32,092 Change in J urisdictioll Srirarogam (M 13.13 18,47 41,949 51,069 Revised Computat;on Tiruchirapalli ~~ 23.26 21.57 249,862 307,400 Do. Poam.llli , 18.13 21.05 23,560 38,880 Do. Golden Rock Rly. Colony 4.04 0.98 19,560 21,115 Do. Abishekapnram (P) 5.70 9.62 3,950 9,890 Do. Pudukottai (M) 12.95 12.09 -SO,488 66,384 Do. Alangudi (P) 3.11 3.10 5,304 6,728 Do. Ponnamarllvathi (P) 13.60 7.71 9,027 10,764 Do. Alagapuri (Pl 4.17 4,16 3,077 3.281 Do. Kadiapatti (P) 14.73 10.88 3,828 " 4,250 Do,
Thanjavur
Sirkali ,,(P) 13.81 13,21 19,531 22,711 Do. 'Ihirumullaivasa1 (P) 14.14 17.16' 7,326 8,785 Do. Vaitheeswarankoil (Pl 6.60 8.28 5,045 5,3Q7 Do. Mayuram t 1M ) 11. 30 11.26 51,393 60,195 Do. Kutta[aT11 (P\ 6.63 6,60 8,519 10.087 Do. Tranquebar S:l 20.72 14.72 14,754 17,318 Do. Aduthurai alios Maruthuvakydi 6.58 6.60 8,587 9.797 Do. 'Ihiruvidamarudur (P) 8.52 8.44 9,194 1(),410 Do: Tirunageswaram (P) 6.76 6.75 8,254 9,641 Do.
'Dharasuram (P) 3.34 3.14 4,165 6,525 Do. Kumbakonam (M.) !l.45 11.54 92,581 113,130 Do. Ayyampet (P) 0.18 5.39 9,618 10,889 Do. Papanasam (Pl 3.03 7.48 9,705 ~ 11,394 Do. Valangiman (P) 5.47 5.59 6,910, 8,389 Do. 'Ammapettai (P) 7,02 6.74 9,258 11,497 Do. Tiruvaiyaru (Pl 5..5\! 5.56 11,171 12.867 Do. TirukkattupaUi (P)
2Ui 4.78 8,038 10,190 Do.
Thanjavur (M) 24.29 111,099 140,547 Do. Orathanad (P) 2.31 2,3(l 7,152 8,621 Do. Nidamanglllam (P) 2,95 8.64 4,896 6,010 Do. Kutbanallur (P) 11,96 12.31 13,948 16,184 Do. MannargUlli (M) 11.55 11.63 33,558 42,783 Do. Nagapattinam (M) 14.09 14.35 59,063 68,026 Do. Tiruvarur (M) 10.51 9.85 30,137 35,850 Do, Thiruthuraipundi (P) 11.84 11.93 13,508 17,119 Do. Muthupet (P) 5,88 11.12 11,247 14,048 Do. Vedarau\'am (Pl 30.51 33.98 18,033 21,471 Do. Pattukkottai (M) 18.Q 21.17 24,726 37,682 Change in Jurisdiction
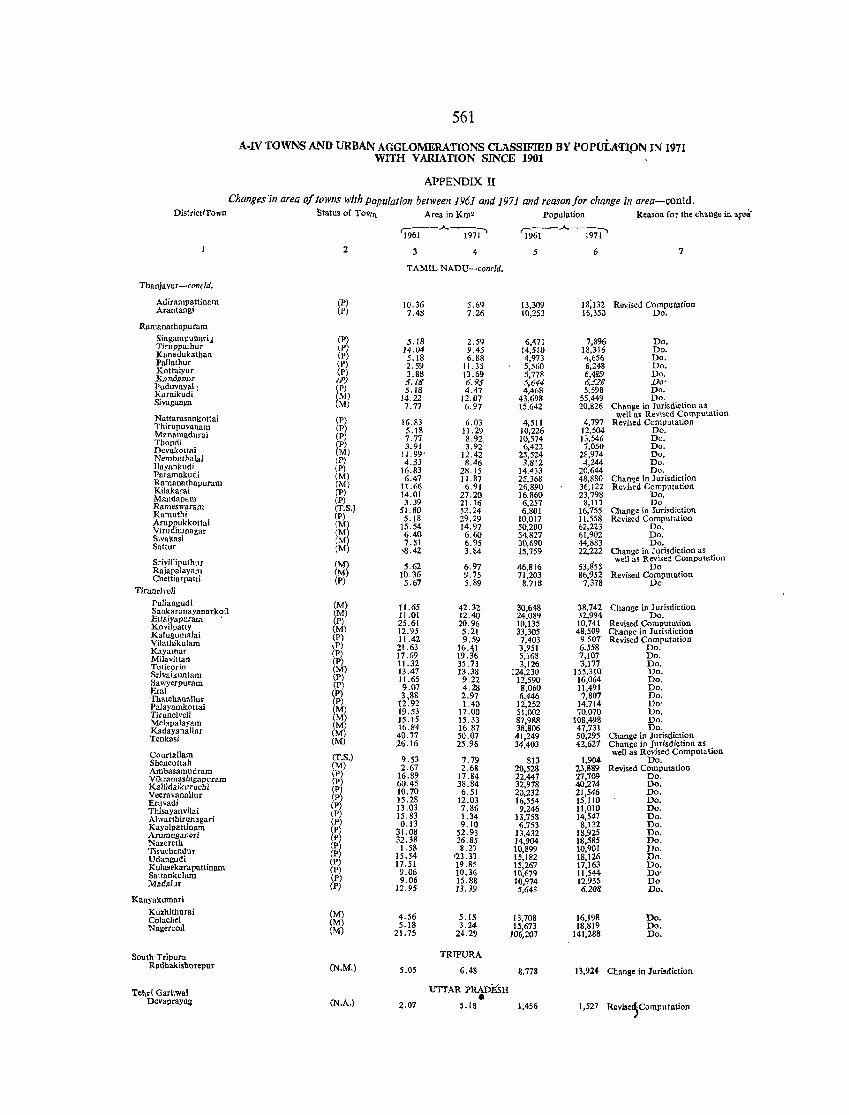
561
A·N TOWNS AND URBAN AGGLOMERATIONS CLASSIFIED BY POpuiA<rr.ON IN 1971 WITH VARIATION SINCE 1901
APPENDIX II
Changesrn area of towns with Population between 1961 and 1971 and reason/or change ill area-contd. District/rown Statu. of Town Area inKm' Population Reason for the change in "tea-
'i961-.A..-ml' '196i-.A..-m1' 2 3 4 5 6 7
TAMIL NADU-concld.
Thanjavur-condd.
Adirampattinam (P) 10.36 5.69 13,309 18;132 Revised Computation Arantangi (P) 7.48 7.26 10,253 16,350 Do.
Ramanathapuram Singampunarij (P) 5.18 2.59 6,471 7,896 Do. Tiruppathur (P) 14.04 9.45 14,510 18,316 Do. Kanadukathan (P) 5.18 6.88 4,973 4,656 Do. Pallathur (P) 2.59 11. 3S 5,560 6,248 Do. Kottaiyur (P) 3.88 13.69 5,778 6,4l!9 Do. X:mtlllm»)' ,1'; 5.18 6.95 5,644 6,528 Do' PuduvaYal: (P) 5.18 4.47 4,468 5,598 Do. Karaikudi (:.1) 14.22 12.07 43,698 55,449 Do. Sivaganga (M) 7.77 6.97 15,642 20,826 Change in Jurisdiction as
well as Revised Computation Nattarasankottai (P) 16.83 6.03 4,511 4,797 Revi;ed Computation Thirupuvanam (P) 5.18 11.29 10,226 12,504 Do. Manamadurai (P) 7.77 8.92 10,574 13,546 Do. Thondi [P) 3.91 3.9z' 6,4Z2 7,050 Do. Dcvakottai M) 11.99' 12.42 25,524 28,974 Do, Nembuthalai (P) 4.53 8.46 3,812 4,244 Do. llayankudi (P) 16.83 28.15 14,433 20,644 Do. Paramakudi (M) 6.47 11. 87 25,368 48,880 Chan"e in Jurisdiction Ramanathapuram eM) 11.66 6.91 26,890 36,122 Revbed Computation Kilakarai (P) 14.01 27.20 16.860 23,798 Do, Mandapam (P) 3.39 21.16 6,257 8,117 Do Rameswaram (T.S.) 51.80 52.24 6,801 16,755 Change in Jurisdiction Kamuthi (P) 5.18 29.29 10,017 11,558 Revised Computation Aruppukkottai (M) 15.54 14.97 50,200 62,223 Do. Virudhunagar (M) 6.40 6.60 54,827 61,902 Do. Sivakasi (:\f) 7.51 6.95 30,690 44,883 Do. Sattur (M) 'S.42 3.84 15,759 22,222 Change in Jurisdiction as
53,s'S5 well as Revised Computation Srivillipulhur (M) 5.62 6.97 46,816 Do Rajapalayam (M) 10.36 9.75 71,203 86,952 Revised Computation Chettiarpatti (P) 5.67 5.89 8,718 7,378 Do
Tirunelveli Puliangudi (M) 11.65 42.32 30,648 38,742 Change in Jurisdiction Sankaranayanarkoil (M) 11.01 12.40 24,089 32,994 Do. Ettaiyapt!ram (P) 25.61 20.95 10,135 10,741 Revised Computation Kovilpatty (M) 12.95 5.21 33,305 48,509 Chan Fe in Jurisdiction Kalugumalai (P) 11.42 9.59 7,403 9507 Revised Computation Vilalhiku!am iP) 21.63 16.~1 3,951 6.558 Do. Kayathar .P) 17.69 19. 6 5,168 7,107 Do. Mj)avitta~ (P) 11.32 35.73 3,126 3,111 Do. Tuticorin (M) 13.47 13.38 124,230 155.310 Do. Srivaikuntam (P) 11.65 9.22 12,590 16,064 Do. Sawyerpuram (P) 9.07 4.28 8,060 11,491 Do. Eral (P) 3,88 2.97 6,446 7,807 Do. Thatchanallur (P) 12.92 1.40 12,252 14.714 Do' Palayamkottai (M) 19.53 17.00 51,002 70,070 Do. Tirunelveli (M) 15.15 15.33 87,988 108,49& Do. Melapalayam (M) 16.84 16.87 38,806 47,731 Do. KadayanaUur (M) 40.77 50.07 41,249 50,295 Change in Jurisdiction Tenkasi (M) 26.16 25.96 34,403 42,627 Change in Jurisdiction as
weU as Revised Computation Courtallam (T.S.) 9.53 7.79 813 1,904 Do. Shencottah (M) 2.67 2,68 20,528 23,889 Revised Computation Ambasamudram (P) 16.89 17.84 22,447 27,709 Do. Vikramasingapuram (P) 60.45 38.84 32,978 40,274 Do. Kallidaikurucbi (P) 10.70 6.51 20,232 21,546 Do. VeeravanaUur (P) 15.28 12.03 16,554 15.110 Do. Eruvadi (P) 13.03 7.86 9,246 11,010 Do. Thisayanvilai (P? 15.83 1.34 13,758 14,547 Do. Alwarthirunagari (P 0.13 9.10 6,753 8,132 Do. Kayalpattinam (P 31.08 52.93 13,432 18,925 Do. Arumuganeri (Pi 32.38 26.85 14,904 18,585 Do. Nazereth (P 1.58 8.27 10,899 10,901 Do. Tiruchendur (P) 15.54 >23.37 15,182 18,126 Do. Udangudi (P) 17.51 19.85 15,267 17,163 Do. Kulasekarapattinam (P) 9.06 10,36 10,679 11,544 Do' Sattankulam (P) 9.06 15.88 10,974 12,935 Do Madalur (P) 12.95 13.39 5,643 6,208 Do.
Kanyakumari
Kuzhithurai (M) 4.56 5.IS 13,708 16,198 Do. Colachel (M~ 5.18 3.24 15,673 18,819 Do. Nagercoil (M 21.75 24.29 106,207 141,288 Do.
South Tripura TRIPURA Radhakishorepur (N.M.) 5.05 6.48 8,778 13,924 Change in Jurisdiction
Tehri Garhwal UTTAR PRADESH • Devapray~ (N.A.) 2.07 5.IS 1,456 1,527 Revise1computation
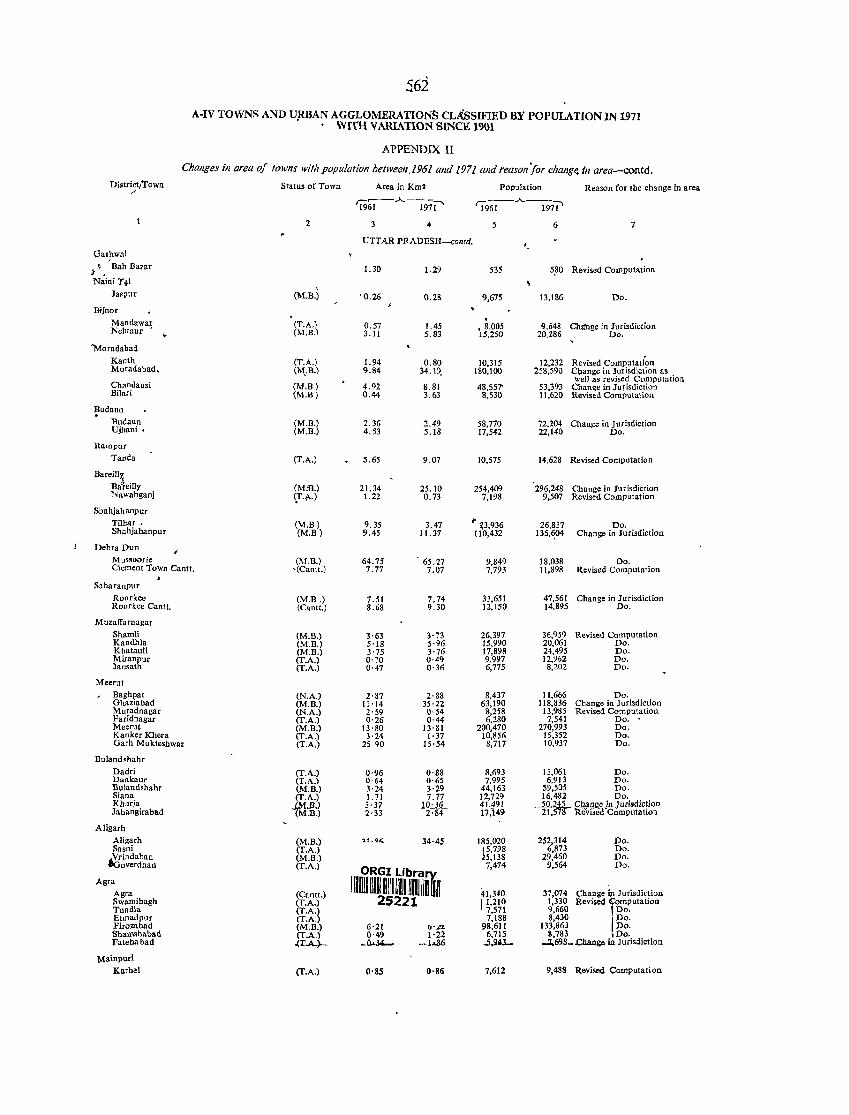
562
A-IV TOWNS AND UJlliAN AGGLOMERATIONS CLAssIFIED BY POPULATION IN 1971 , WITH VARIATION SINCE 1901
APPENDIX II
Changes in area 0/ towns witiz population between.l961 and 1971 and reason/or change. fll area-contd.
District/rown Status of Town "
Area in Km2 Population Reason for tbe change in area
'i9~.A.---m-i' 'l9~.A.~il\ 3 4 5 6 7
UTTAR PRADESH-contd. • paI~wnl
t ' .. ~ Bah Bazar 1.30 1.29 535 5.80 Revised Computation NliiainJ .
J •• pur (M.B.) '0.26 0.28 9,675 13,186 Do.
BiInor
Mandawa~ (T.A.) .
Chunge in Jurisdiction 0.57 1.45 ,8,005 9.648 Nehtaur '"
(M.B.\ 3.11 5.83 15,250 20.286 Do.
"Moradabad
Kaoth (T.A.) 1.94 0.80 10,315 12,232 Revised Computati~n Moradabad. (M,.B.) 9.84 34.19, ISO,IOD 258,590 Cl).ange in Jurisdiction as .
weJl as revised Computahon Chandausi (M.B) 4.92 8.81 48,557' 53,393 Change in Jurisdiction Bilari (M.B) 0.44 3.63 8,53() 1l,62() Revised Computation
Budaun . Buoaun (M.B.) 2.36 2.49 58,770 72,204 Change in Jurisdiction Ujhani. (M.B.) 4,53 5.18 17,542 22,140 Do.
Ramput
Taada (T.A.) 5.65 9.07 10,575 14.628 Revised Computation
Bareilly, Ba4eilly (M:S.) 21.34 25.10 254,409 296,248 Change in Jurisdiction Nawabgani <.T.,\,.) 1.22 0.73 7,198 9,507 Revised Computation
Shahjahanpur
Tilhar • (M.B) 9.35 3.47 ... ~3,936 26,837 Do. Shahjahanpur (M.B) 9.45 11.37 110,432 135A04 Change in Jurisdiction
Dehra Dun Mussoorie (M.B.) 64.75 65.27 9,849 18,038 Do. Clement Town Cantt. -(Cantt.) 7.77 7.07 7,793 11,898 Revised Computation
Saharanpur
Roorkee (M.B.) 7.51 7.74 33,651 47,561 Change in Jurisdiction Roorkee Cantt. (Cantt.) 8.68 9.30 12,150 14,895 Do.
Muzaffarnagar Shamli (M.B.) 3,63 3·73 26,397 36,959 Revised Computation Kandhla (M.B.) 5'18 5·96 15,990 20,061 Do. Khatauli (M.B.) 3'75 3·76 17,898 24,495 Do. Miranpur (T.A.) 0'70 0·49 9,997 12,962 Do. Jansath (T.A.) 0·47 0·36 6,775 8,202 Do.
Meerut Baghpat (N.A.) 2·87 2·88 8,437 11,666 Do. Ghaziabad (M.B.) 11'14 35·22 63,190 118,836 Change in Jurisdiction Muradnagar (N.A.) 2'59 0·54 8,258 13,985 Revised Computation Faridnagar (T.A.) 0'26 0·44 6,280 7,541 Do. Meerut (M.B.) 13·80 13·81 200,470 270,993 Do. Kaoker Khera (T.A.) 3·24 1,37 10,856 15,352 Do, Garh Mukteshwar (T.A.) 25 90 15·54 8,117 10,937 Do.
Buland shahr Dadri (T.A.) 0·96 0·88 l!,693 13,061 Do. Dankaur (T.A.) 0·64 0·65 7,995 6,913 Do, Bulandshahr (M.B.) 3·24 3·29 44,163 59,505 Do. Siaoa (T.A.) 1. 71 7.77 12,729 16,482 Do. Khurja ~M.B.) 3·37 10~lQ_ 41,491 .2Q,l45 Chao~o J uri.diction Jahangirabad M.ll.) 2·33 2·84 17,149 . 21,srg- ReVISe Computation
Aligarh Aligarh (M.B.) '11 _. QJ;_ 34·4$ 185,020 252,314 Do. Sasni (T.A.) l5,798 6,873 Do. ~indaban (M.B.) 5,138 29,460 Do,
overdhan (T.A.)
I ~ruli'~1 ~~ilmilMfl 7,474 9,564 Do.
Agra Agra (Canlt.) 41,340 37,074 c>=~ , 'w"'""," Swamibagb (T.A.) 25221 11•210 1,330 Revised omputation Tundla (T.A.) 7,571 9,660 Do, Etmadpur (T.A.) 7,188 8,430 Do. Firozabad (M.B.) 6'21 0''''' 98,611 133,863 Do. Shamshabad (T.A.) 0'4<) 1'22 6,715 8,783 ,Do. Fatebabad .(:r.A..)- _0...J4- -Wti ..5,93- -l.698_~ia Jurisdiction
Mainpuri Karhal (T.A.) O'8S 0·86 7,612 9.488 Revised Computation
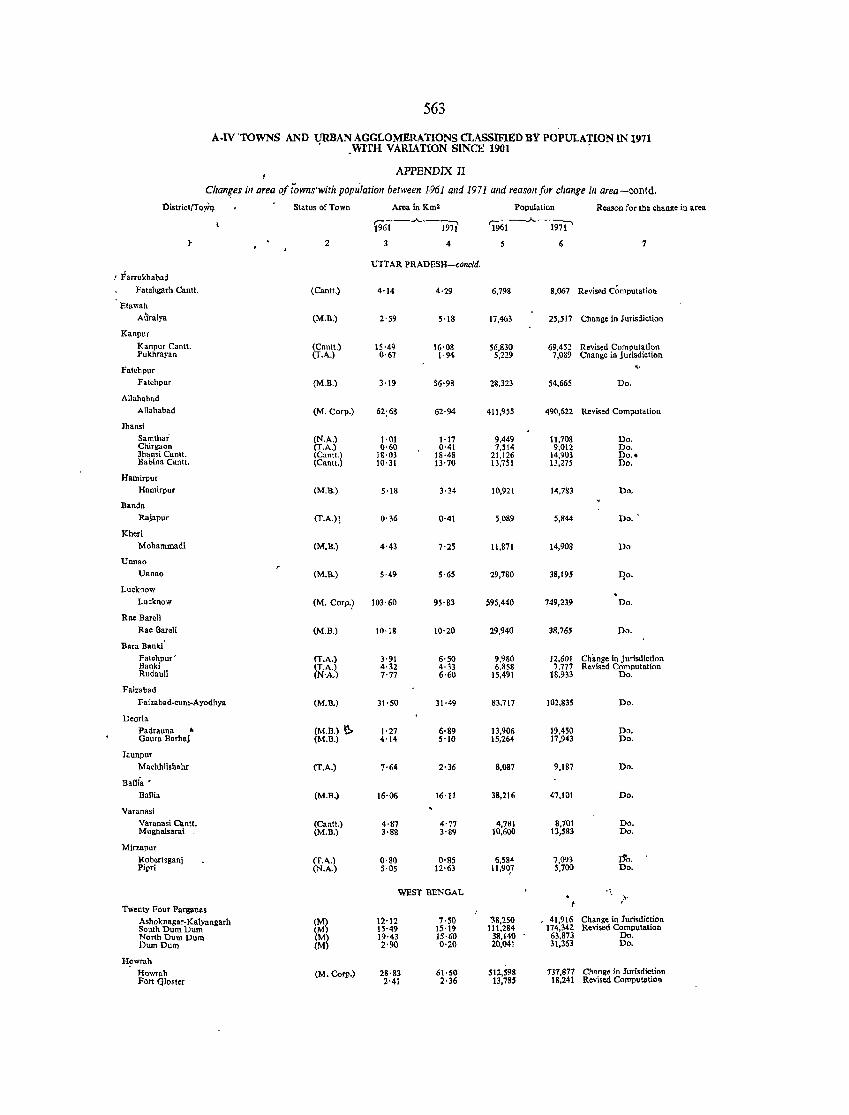
563
A·IV'TOWNS AND lJRBAN AGGLOMERATIONS CLASSIFlED BY POPULATION IN 1971 WITH VARIATION SINCE 1901
APPENDIX II
Cltan~es ill area of iowns'with popu'ration between [,961 and 1971 and reason fur change in area-~ontd, District/TQ~ Status of Town Area in Km2 Population Reason for the change in area
196-1---"--i91i' 'i9~A197l' 1- 2 4 S 6 7
UTTAR PRADESH-concld.
! Farrukhabad
Fatehgarh Canlt. (Cantt.) 4'14 4·29 6,798 8,067 Revised Computation
Etawah Aliraiya (M.B.) 2'59 5' 18 11,463 25,517 Change in Jurisdiction
Kanpur
Kanpur Cantt. (Cantt.) 15·49 16·08 56.830 69.452 Revised Computation Pukhrayan (TA) 0·67 1'94 5.229 7,089 Change in ] urisdiction
Falehpur Fatchpur (M.B.) 3·19 S6'98 28,323 54.665 Do.
Allahabad Allahabad (M. Corp.) 62;68 62·94 411,955 490,622 Rovised Computation
lhansi Sarnthai (N.A.) 1·01 1·17 9,449 11.708 Do. Chirgaon ('LA.) ()'60 0·41 7,514 9,012 Do, lbansi Canlt. (Cantl.) 18·03 18·48 21.126 14.903 Do .• Babina Cantt. (Cantt.) 10·31 13·70 13,751 13,275 Do.
Hamirpur Hamirpur (M.B.) 5·18 3·34 10,921 14.783 Do.
Banda Rajapur (T.A.)j 0'36 0'41 5,089 5,844 Do.
lCh.ri Mohammadi (M.B,) 4·43 7'25 11,871 14,908 Do
Unnao Unnao (M.B.) 5'49 5'65 29,780 38,195 :qo.
Lucknow Lu:know (M. Cor".) 103'60 95'83 595,440 749,239 Do.
Rae BareH Rae Bareli (M.B.) 10·18 10'20 29,940 38.765 Do.
Bara Banki Fatehpur' (T.A,) 3·91 6·50 9,980 12,601 ChilO!!e in Jurisdiction Banki (T.A.) 4·32 4·33 6,858 1,777 Revised Computation Rudauli (N·A.) 7'77 6·60 15,491 18,933 Do.
Faizabad
Fa;z.b.d.cum·Ayodhya (M.B.) 31·50 31·49 83.717 102,835 Do.
Deoria Padrauna • (M.B.) ~ 1'27 6·89 13,906 19,450 Do. Gaura Barhaj (M.B.) 4'14 5·10 15,264 17,943 Do.
launpur Machhlisbahr (T.A.) 7·64 2·36 8,087 9,187 Do.
Bam;' , Ballia (M.B.) 16·0& 16'11 38,216 47,101 Do.
Varanasi Varanasi Cantt. (Cantt.) 4'87 4'77 4,781 8,701 Do. M ugh.l,arai (M.B.) 3·88 3'89 10,600 13,583 Do.
Mirzapur Robert,ganj (T.A.) 0·80 0'85 6,584 7,093 110. Pipri (N.A.) 5·05 12'63 11,90,7 5,700 Do.
WEST BENGAL .~
,'" Twenty Four Parganas
Ashoknagar.Kalyangarh (M) 12·12 7'50 "38,250 41,916 Change in Jurisdiction South Dum Dum (M) 15'49 15·19 111,284 174,342 Revised Computation North Dum Dum (M) 19·43 15·60 38,140 63.873 Do. DumDum (M) 2·90 0·20 20,041 31,363 Do.
Howrah Howrah (M. Corp.) 28·83 61·50 512,598 131,817 Chana" in lurisdiction Fort Qloster 2'41 2·36 13,785 18,241 Revised Computation
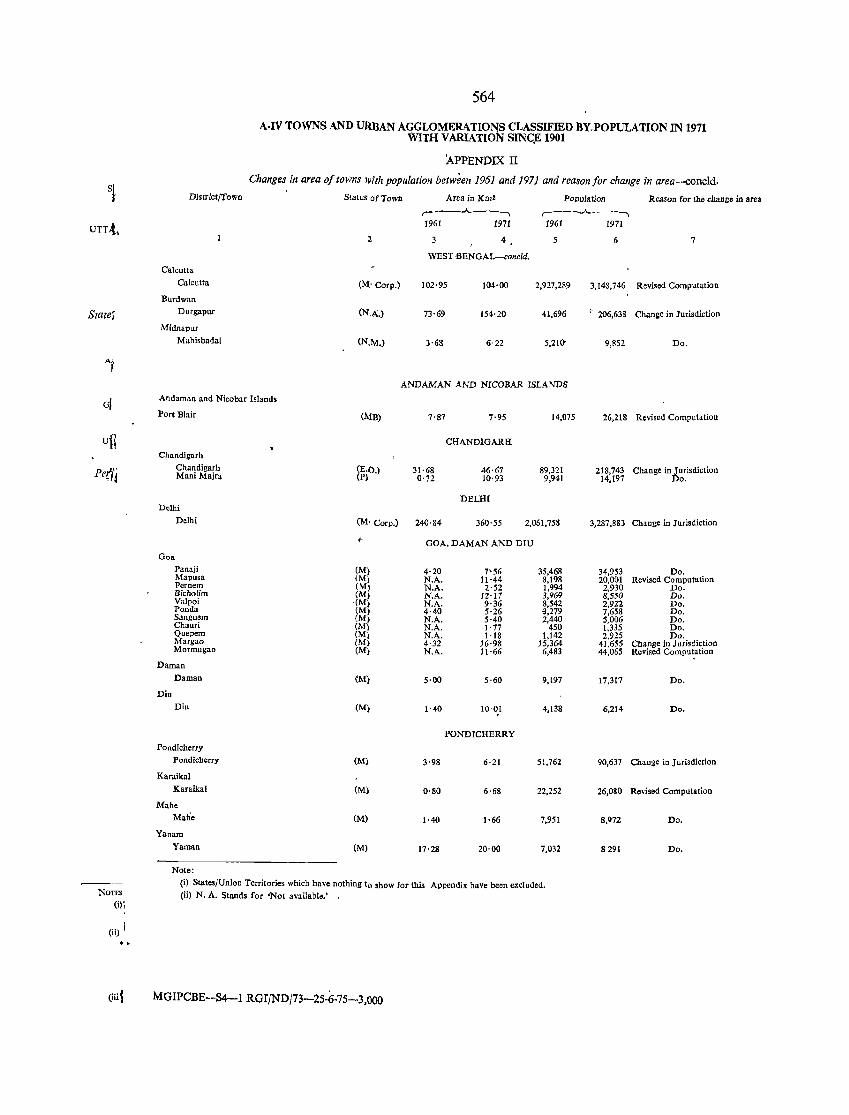
S!
UTT.t
State;
i
oj
U~
Pef{j
NOTES
(i),
(ii) I ..
District/Town
Calculla Calcutta
Burdwan Durgapur
Midnapur Mahishadal
564
A-IV TOWNS AND URBAN AGGLOMERATIONS CLASSIFIED BY.POPULATION IN 1971 WITH VARIATION SINC.E 1901
APPENDIX IT
Changes in area of towns With population between 1961 and 1971 and reason for change in area-conc1d.
Status of Town Area in Km2 PoPulation Reason for the change in area ,----.A..--..... ,---"---, 1961 1971 1961 1971
2 4 5 6 7
WEST 'BENGAL-cone/d.
(M:' Corp.) 102·95 104·00 2,927;289 3,143,746 Revised Computation
(N.A'.) 73·69 154'20 41,696 .' 206,638 Change in Jurisdiction
(N.M.) 3·68 6·22 5,210' 9,852 Do.
ANDAMAN AND NrCOBAR ISLANDS
Andaman and Nicobar Islands
Port Blair (MB) 7'87 7·95 14,075
CHANDIGARH
Chandigarh Chandigarh (E.O.) 31·68 46·67 89,321 ManiMajra (P) 0'72 10·93 9,941
DELHI Delhi
Delhi (M' Corp.) 240·84 360·55 2,061,758
,. GOA, DAMAN AND DIU
Goa
Panaji (M) 4·20 7'56 35,468 Mapusa (M) N.A. 11·44 8,198 Pernem CM) N.A. 2·52 1,994 Bicholim (M) N.A. 12'17 3,969 Valpoi '(M) N.A. 9·36 8,542 Ponda CM) 4·40 5'26 3,279 Sanguem (M) N.A. 5'40 2,440 Chauri (M) N.A. 1·77 450 Quepem (M) N.A.. 1·18 1,142 Margao (M) 4·32 J6·98 J5,364 Mormugao eM) N.A. H·66 6,483
Daman Daman (M) 5·00 5·60 9,197
Diu Diu (M) 1·40 10·01 4,138
t
PONDICHERRY
Pondicherry Pondicberry (M) 3'98 6'21 51,762
Karaika1 Karaikal (M) 0·80 6·68 22,252
Mabe Mab'e (M) 1·40 1·66 7,951
Yanam Yaman (M) 17'28 20·00 7,032
Note:
(i) States/Union Territories which have nothing to !how for this Appendix have been excluded. (ii) N. A. Stands for 'Not available.' •
26,218 Revised Computation
218,743 Change in Jurisdiction 14,197 Do.
3,287,883 Change in Jurisdiction
34,953 Do. 20,001 Revised Computation 2.930 Do. 8,550 Do. 2.922 Do. 7,658 Do. 5,006 Do. 1.335 Do. 2,925 Do.
41,655 Change in Jurisdiction 44,065 Revised Computation
17,317 Do.
6,214 Do.
90,637 Change in Jurisdiction
26,080 Revised Computation
8,972 Do.
8291 Do.
(iiij MGIPCBE--S4-1 RGIjNDj73-2S-6-7S-3,OOO