General Economic Tables, Part II-B (i), Series-4, Bihar
142
CENSUS OF INDIA 1971 SERIES 4 BIHAR PART II-B (i) GENERAL ECONOMIC TABLES (B-I.PART A AND B-II) B. L. DAS OF THE INVIAN ADMINISTRATiVE 'SERVICE Director of Census Operations, Bihar
-
Upload
khangminh22 -
Category
Documents
-
view
1 -
download
0
Transcript of General Economic Tables, Part II-B (i), Series-4, Bihar
CENSUS OF INDIA 1971
SERIES 4
BIHAR
PART II-B (i)
GENERAL ECONOMIC TABLES
(B-I.PART A AND B-II)
B. L. DAS
OF THE INVIAN ADMINISTRATiVE 'SERVICE
Director of Census Operations, Bihar
PART I-A
PART J-B
PART I-C
PART Jl-A
PART II-A • Supplement
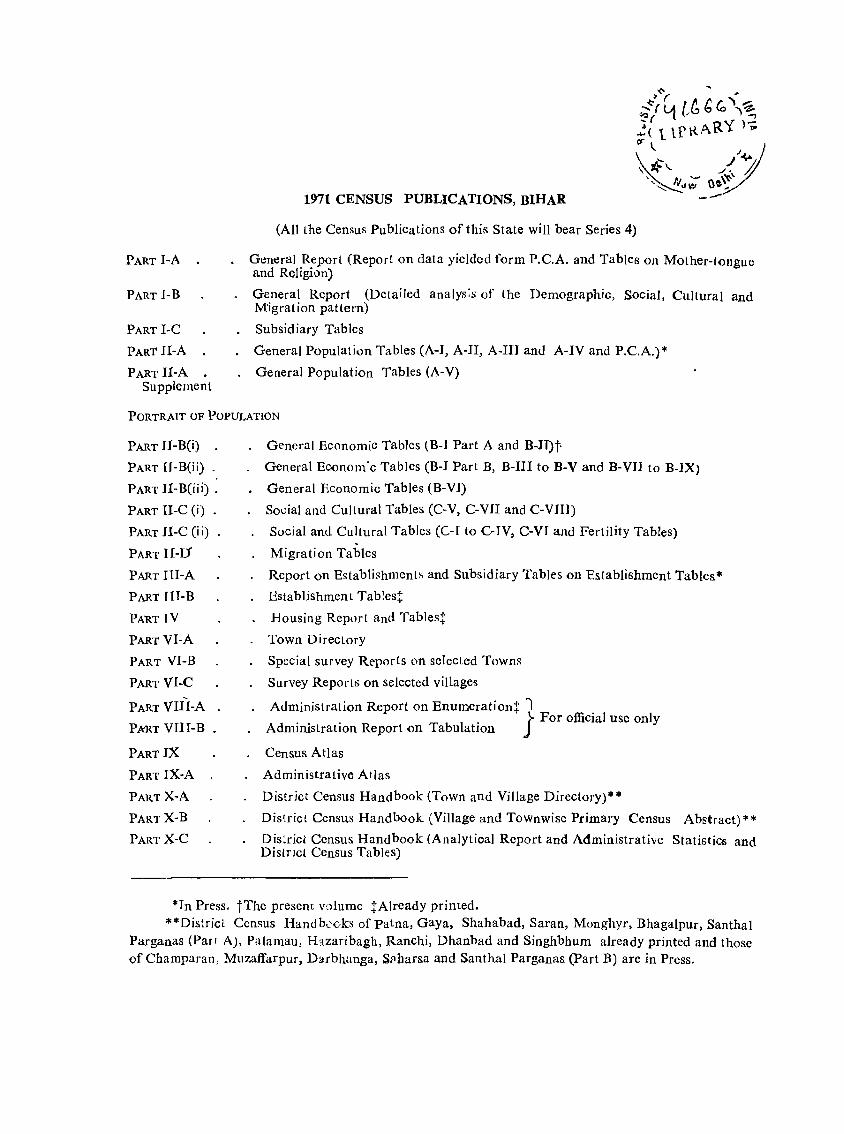
1971 CENSUS PUBLICATIONS, BIHAR
(All the Census Publications of this State will bear Series 4)
General Report (Report on data yielded form P.C.A. and Tables on Mother-tongue and Religion)
General Report (Detailed analys;s of the Demographic, Social, Cultural and Migration pattern)
Subsidiary Tables
General Population Tables (A-I, A-II, A-III and A-IV and P.C.A.)*
General Population Tables (A-V)
PORTRAIT OF POPULATION
PART II-B(i)
PART II-B(ii)
PART II-BCiii) .
PART II-C (i) .
PART H-C (ii)
PART H-D'
PART TlI-A
PART rn-B PART IV
PART VI-A
PART VI-B
PART VI-C ,
PART VIII-A
PA'RT VUI-B
PART IX
PART IX-A
PART X-A
PART X-B
PART X-C
General Economic Tables (B-1 Part A and B-II)t·
General Econom'c Tables (B-1 Part B, B-II1 to B-V and B-VII to B-IX)
General Economic Tables (B-Vl)
Social and Cultural Tables (C-V, C-VII and C-VIII)
Social and Cultural Tables (C-r to C-TV, c-vr and Fertility Tables)
Migration Tables
Report on Establishment~ and Subsidiary Tables on Establishment Tables*
Establishment Tab!es!
Housing Report and Tables!
Town Directory
Special survey Reports on selected Towns
Survey Reports on selected villages
Administration Report on Enumeration! I j For official use only
Administration Report on Tabulation
Census Atlas
Administrative Atlas
District Census Handbook (Town and Village Directory) * *
District Census Handbook (Village and Townwise Primary Census Abstract) * * Dis~ricl Census Handbook (Analytical Report and Administrative Statistics and Distnct CenSus Tables)
*Tn Press. tThe presenr volume !Already printed. **District Census Handbuoks of Patna, Gaya, Shahabad, Saran, Monghyr, Bhagalpur, Santhal
Parganas (ParI A), Palamau, H~zaribagh, Ranchi, Dhanbad and Singhbhum already printed and those of Champa ran, Muzaffarpur, Darbhanga, Sflbarsa and Santhal Parganas (Part B) are in Press.
PREFACE.
INTRODUCTORY N OTB
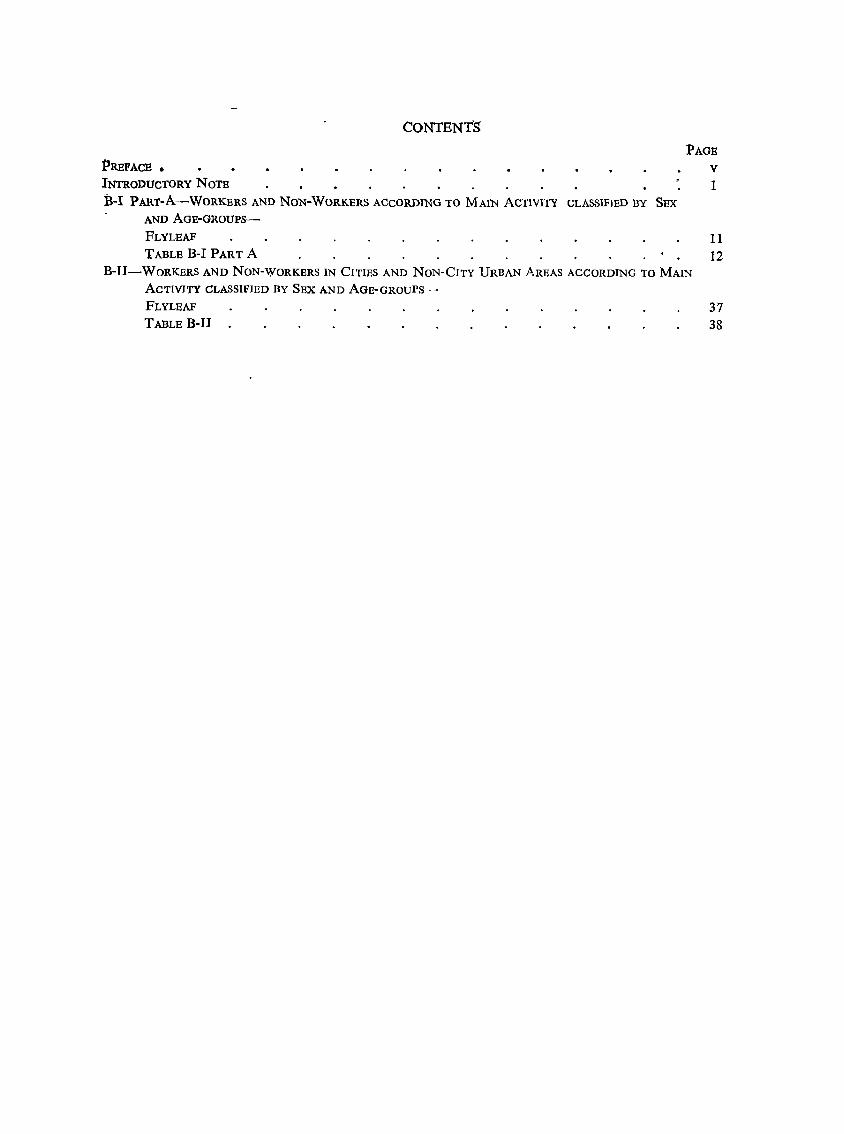
CONTENTS'
B-1 PART-A-WORKERS AND NON~WORKERS ACCORDING TO MAIN ACTIVITY CLASSIFIED BY SEX
AND AGB~GROUPS-
FLYLEAF
TABLE B-1 PART A
PAGB
V
1
11 12
B-II-WORKERS AND NON-WORKBRS IN CITIES AND NON-CITY URBAN AREAS ACCORDING TO MAIN
ACTIVITY CLASSIFIED BY SEX AND AGE-GROUPS
FLYLEAF
TABLE B-U
37 38

Page no· 1
6 11 12 13
14 15 16
17 18 19
21 25
26 27
29
30 31 32 33
38
40 42 44
45
46 47 48
51 53
54
55
57 62 63
64 66
67
68
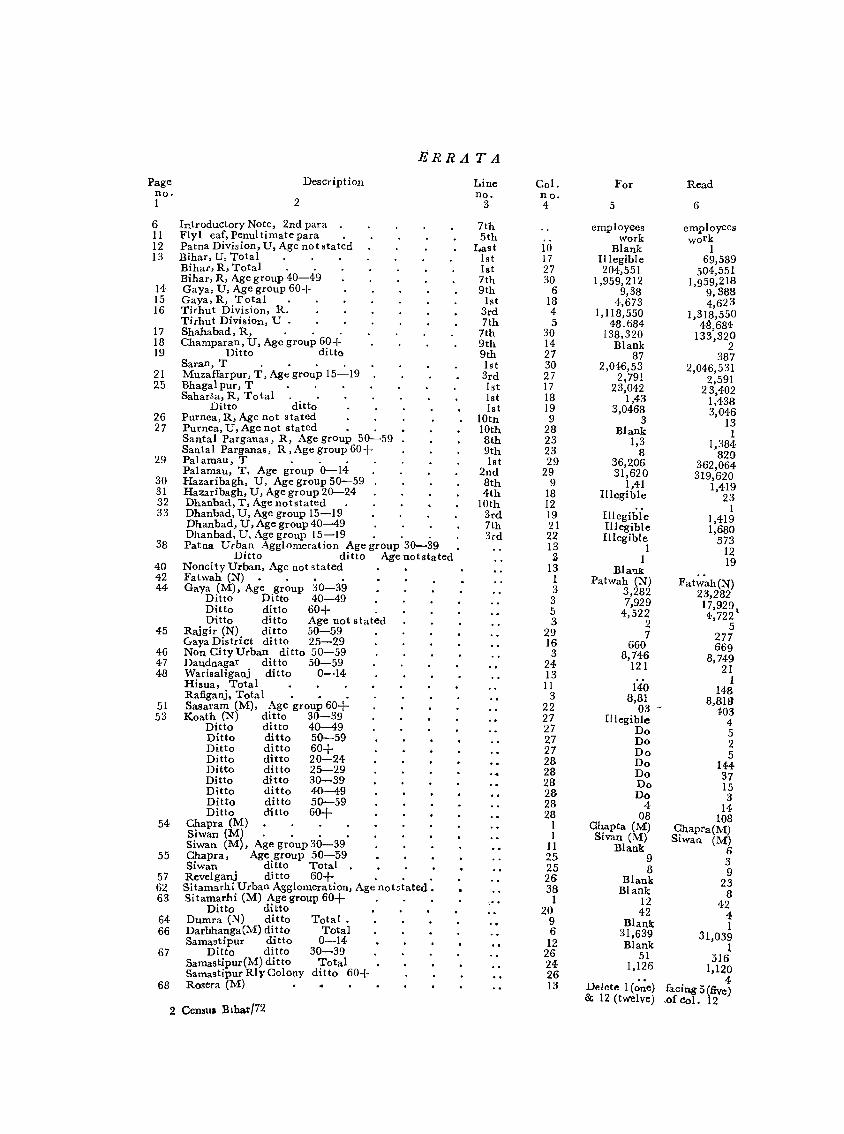
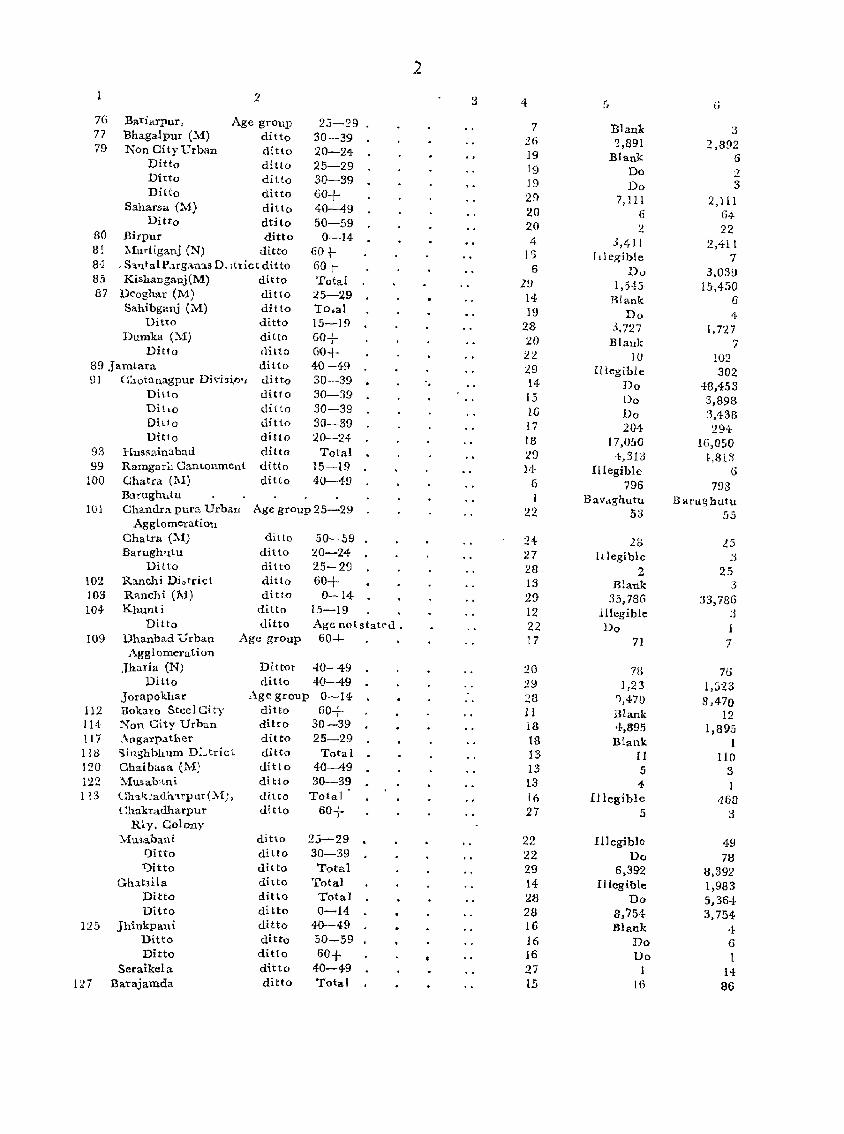
ERRA T A
Description
2
Introductory Note, 2nd para . Flyl eaf,Penultimatepara . Patna Division, U, Age not stated Bihar, U, Total Bihar, R, Total Bihar, R, Age group 40-49 Gaya, U, Age group 60+ Gaya, R, Total . Tirhut Division, R. Tirhut Division, U .
"Shahabad, R, . . . Champaran, U, Age group 60+
Ditto ditto Saran, T . • . . Muzaffarpur, T, Age group 15-19 Bhaga1pur, T Saharsa, R, Total
Ditto ditto Purnea, R, Age not stated Purnea, U, Age not stated . Santal Parganas, R, Age group 50-59 Santal Parganas, R, Age group 60+ Palamau, T .., Palamau, T, Age group 0-14 Hazaribagh, U, Age group 50-59 Hazaribagh, U, Age group 20-24-Dhanbad, T, Age not stated Dhanbad, U, Age group 15-19 Dhanbad, U, Age group 40-49 • Dhanbad, U, Age group 15-19 . . . Patna Urban Agglomeration Age group 30-39
Ditto ditto Age notstated Noncity Urban, Age not stated Fatwah eN). . • . Gaya (M), Age group 30-39
Ditto Ditto 40-49 Ditto ditto 60+ Ditto ditto Age not stated
Rajgir (N) ditto 50-59 Gaya District ditto 25-29 Non City Urban ditto 50-59 Daudnagar ditto 50-59 Warisaligaoj ditto 0-14 Hisua, Total • • • Rafiganj, Total • • . Sasaram eM), Age group 60+ Koath (N) ditto 30-39
Ditto ditto 40-49 Ditto ditto 50-59 Ditto ditto 60+ Ditto ditto 20-24-Ditto ditto 25-29 Ditto ditto 30-39 Ditto ditto 40-49 Ditto ditto 50-59 Ditto ditto 60+
Chapra (M). . . Siwan (M) . . . • Siwan (M), Age group 30-39 Chapra, Age group 50-59 Siwan ditto Total. • Revelganj ditto 60+ '" Sitamarhi Urban Agglomeration, Age notstated. Sitamarhi (M) Age group 60+
Ditto ditto Dumra (N) ditto Total. Darbhanga(M) ditto Total Samastipur ditto 0-14
Ditto ditto 30-39 Samastipur(M) ditto Total SamastipurRlyColony ditto 60+ Rosera (M)
Line no.
3
7th 5th
Last 1st 1st 7th 9th
1st 3rd 7th
7th 9th 9th Ist 3rd 1st lst lst
10th 10th 8th 9th lst
2nd 8th 4th
10th 3ed 7th 3rd
,"
2 Census Blhar{72
Col. no. 4
10 17 27 30
6 18 4 5
30 14 27 30 27 17 18 19 9
28 23 23 29
29 9
18 12 19 21 22 13
:3 13 1 3 3 5 3
29 16 3
24-13 11
3 22 27 27 27 27 28 28 28 28 28 28
1 I
11 25 25 26 38 1
20 9 6
12 26 24 26 13
For
5
employees work
Blank Illegible 204,551
1,959,212 9,38
4,673 1,118,550
48.684 138,320
Blank 87
2,046,53 2,791
23,042 1,43
3,0468 3
Blank 1,3
8 36,206 31,620
1,41 Illegible
Illegibie Illegible Illegible
1 I
Bla'lK Patwah eN)
3,282 7,929
4,522 2 7
660 8,746
121
140 8,81
03 -Illegible
Do Do Do Do Do Do Do
4 08
Chapta eM) Sivan (M)
Blank 9 8
Blank Blank
12 42
Blank: 31,639 Blank
51 1,126
Delete 1 (;~e) & 12 (twelve)
Read
6
employees work
I 69,589
504,551 1,959,218
9,388 4,623
1,318,550 411,684
133,320 2
387 2,046,531
2,591 23,402
1,438 3,046
13 1
1,384 820
362,064 319,620
1,419 23
I 1,419 1,680
573 12 19
Fatwah(N) 23,282 17,929, 4,722
5 277 669
8,749 21
1 148
8,811J 403
4 5 2 5
IH 37 15 3
14 108
Chapra(M) Siwan (M)
6 3 9
23 8
42 4: 1
31,039 1
516 1,120
4 facing 5 (five) ,of col. 12
2
:2 :3 4 r-., (j
76 Bariarpur , Age group 2;:;-29 7 Blank :) 77 Bhagalpur (M) ditto 30-39 26 '2,891 2,892 79 Non OitY'Grban ditto 20-24 19 Blank 6 Ditto ditto 25-29 19 Do 2 Ditto ditto 30-39 19 Do 3 Ditto ditto 60+ 29 7, III 2, III Saharsa (M) diHo 40-49 20 6 G4 Ditto dtito 50-59 20 2 22 80 Birpur ditto 0-14 4 3,111 2,411 B! 1furl iganj (:-{) ditto 60 t- ]S fdegible 7 84 - Sl'ltal Pargan:u Ddtrict ditto 60 J 6 Do 3,03~
83 Kishanganj(M) ditto Total Z!J 1,5<!''j l5,450 87 Deoghar (M) uitto 25-29 14 Blank G
Sahibganj (:vI) ditto TOLa1 19 Do 4 Ditto ditto 15-19 28 3,727 1,7'1.7
Dumka (:,\1) ditto 60+ 20 Blank 7 Ditto IIi 11 Q GO+ 22 10 102
89 Jamtara ditto 40-49 ::!9 Illegible 302 !)l C~lotanagpur Divj~~I)'L ditto 30-39 . 14 Do 48,453 Ditto ditto 30-39 15 Do 3,898 Ditto ditto 30-39 1G Do 3,438 Diuo ditto 30-39 17 201- 294 Ditto ditto 20--24- 13 17,050 1G,050
93 Hussainabad ditto Total 29 4,313 ~,8 I:i 99 Ramgar;l Cant.onment ditto 15-19 14 Illegible G
100 Uhatra (!\I) ditto 40-4!) 6 796 793 B:uughutu Bavdghutu BOIrughutu
101 Uhandra pura Urball Age group 25-29 22 53 55 Agglomeration
Chatra {Ai) dltto 50-59 24- 21:> LS Barugh'ltu ditto :.!O-Z4 '27 It legible ;;
Ditto ditto 25-29 28 2 25 102 Ranchi Diotrict ditto 60+ 13 Blank 3 103 Ranchi (M) ditto 0-14 29 33,786 33,786 104 Khunti ditto 15-19 12 Illegible :1
Ditto ditto Age not stat".d . 22 Do 1 109 Dhanbad Urban Age group
Agg I omerat i 011
60+ 17 71 7
Jharia (N) Dittot 40-49 20 7S 76 Ditto ditto 40-49 29 1,23 1,:)23
Jorapokhar Age group 0-14 28 '),470 8,470 112 Hokaro Steel City ditto GO+ 11 Blank 12 114 ~on City Urban ditto 30-39 18 '~JS95 1,895 117 .\ngarpather ditto 25-29 18 Blank 1 lW ~illshbhum D:~tricl. ditto Total 13 II 110 120 Chaibasa {M; ditto 40-49 13 5 3 122 Alu~abani ditto 30--39 13 of 1 1 ~ 3 Uhg,l{:adhTrpurC.\{; , tiitto Total 16 Illegible 468
Chukradharpur di tto 60+ 27 5 3 Rly. Colony
Mu>,abani ditto 23-29 . 22 Illegible 49 Ditto diLto 30-39 22 Do 78 1)itto ditto Total 29 6,392 8,392
Gh:tt3ila ditto Total 14 Illegible 1,983 Ditto ditto Total 28 Do 5,364 Ditto ditto 0-14 28 8,754 3,754-
125 Jhinkpall i ditto 40-49 16 Blank 4· Ditto ditto 50-59 , 16 Do {) Ditto ditto 60+ 16 Do 1
Seraikela ditto 40-49 27 1 14 lV Barajamda ditto Total 15 lG 86
PREFACE
This volume contains the two Economic Tables prepared on full count. Other Econ oniie Tables prepared on samp.le basis (10 per cent f~r rural areas and 20 per cent for urban areas) will be presented in separate volumes. Each table is preceded by a Flyleaf which explains the scope, content and presentation of the table. The census terms used in tables have been explained in the Introductory Note and Flyleaves.
Table B-I Part A has been presented for the State, its 4 Divisions and 17 Districts as existing at the time of 1971 Census. Similarly, Table B-Il has been presented for the urban areas of the State, its 4 Divisions and 17 Districts as existing at the time of 1971 Census, and Cities, City Urban Agglomerations, Non-City urban areas, Town Urban Agglomerations and Towns falling in them.
While comparing the participation rates of 1971 Census with those of the previous census the changes in the definition of worker should be taken note of. According to the definition of worker adopted in 1961 Census, if a person helped in tht'? family economic activity even part-time he was treated as a worker. Thus a person who was engaged primarily in household duties or a boy or a girl who Was primarily a student helped in the economic activity of the family in spare time was treated as a worker in 1961.
At the 1971 C~nsus a p::rson has been categorised as a worker or non-worker on the basis of the main activity returned by him. Only such persons as were primarily engaged III some economic activity as full-time workers have been treated as workers. For details a reference may be made to the Instructions for filling in question 16 (main activity')_of Individual Slip reproduced in the Introductory Note. -
I am thankful to Shree U. P. Shrivastava, Deputy Director of Census Operations of my office for his assistance in preparation and printing of this volume. Among others associated with the preparation and printing of this volume mention may be made of the work done by Shree J;{. • .8. Singh, Investigator, Sarvashree T. N. Verma, Kanhaiya Lal, Maheshwar Prasad, P. N. Sinha, Tabulation Officers and Shree Sheo Prasad, Printing Inspector. It is almost impossible to express in words my deep Indebtedness to Shree A. Chandra Sekhar, Registrar General and Census Commissioner of India for his guidance and inspiration in all stages of work. I am also grateful to Shree K. K. Chakravorty, AssIstant Registrar General and Shree S. C. Srivastava, Assistant Central Tabulation Officer and their staff for scrutiny of our tables and theIr useful suggestions. My thanks are also due to Shree S. R. Sethi, Manager, Government of India Press, Nasik for the care taken in printing this volume.
PATNA: April 24, 1974
B. L.DAS Director of Census Operations,
Bihar

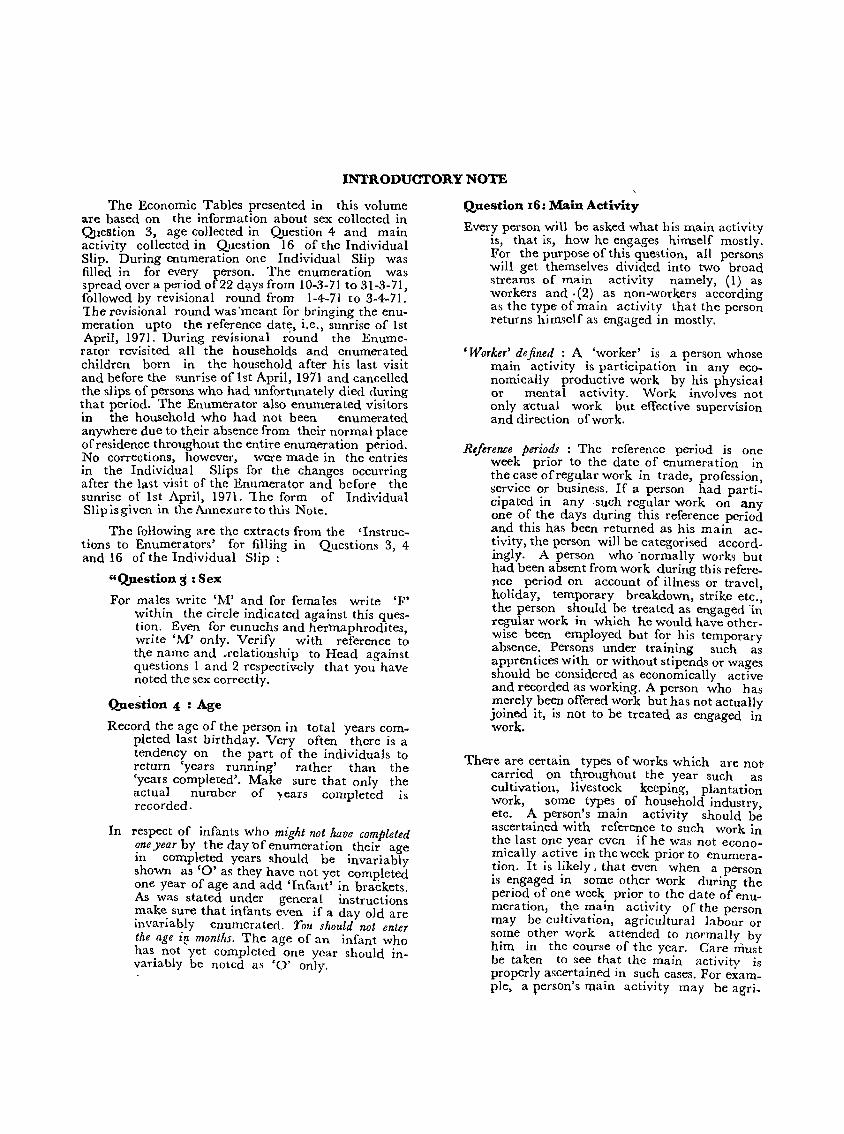
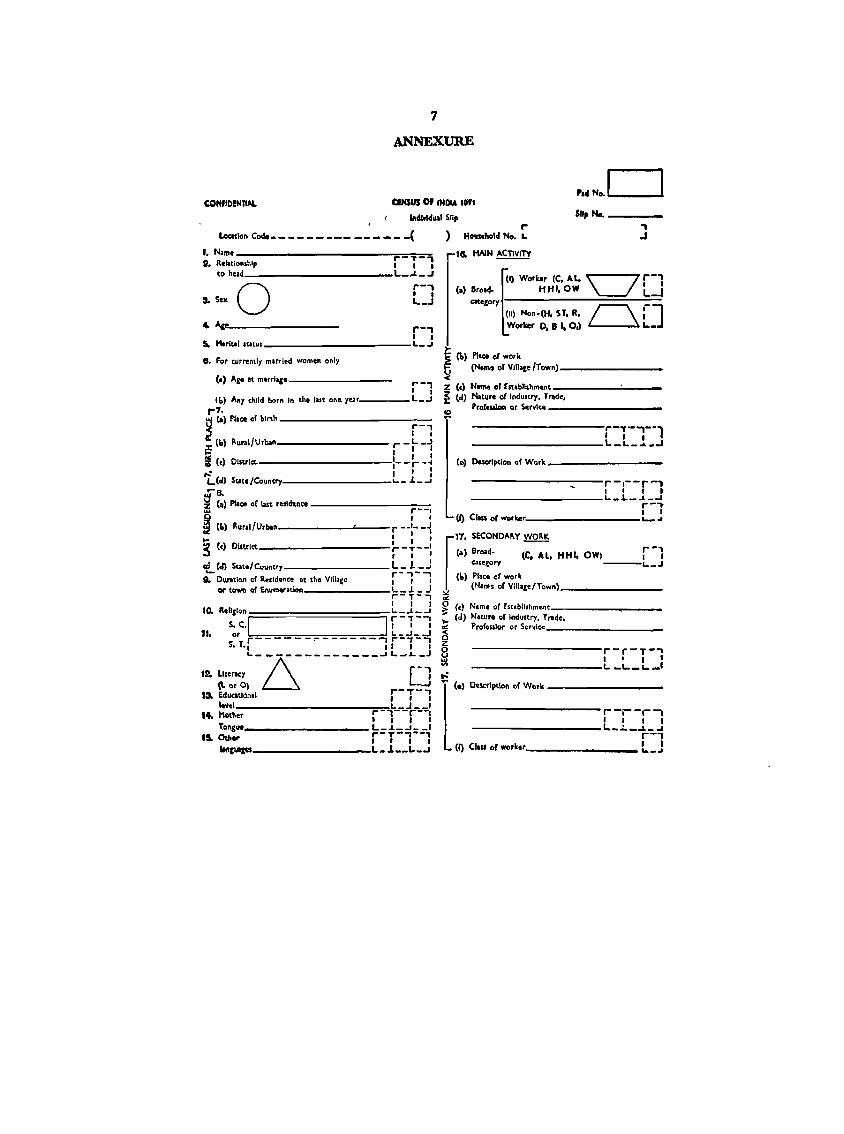
INTRODUCTORY NOTE
The Economic Tables presented in this volu~e are based on the informat!on abou~ sex collected ~n Question 3, age ~ollected 1!1 QuestIOn 4 and. ?Iam activity collected In q_uestIOn 16. of the In~lVldual Slip. During enumeratIOn one Individual ~hp was filled in for every person. The enumeratIOn was spread over a period of22 d~ys from 10-3-71 to 31-3-71, followed by revisional round from 1-~-7! to 3-4-71. The rcvisional round was 'meant for brmgmg the enumeration upto the reference dat~, i.e., sunrise of 1st April, 1971. During revisional round the Enumerator revisited all the households and ~numera~e~ children born in the household after hIs last VISit and before the sunrise of 1st April, 1971 an~ cancel!ed the slips of persons who had unfortunately dIed ~u.rmg that period. The Enumerator also enumerated VISItors in the household who had not been enumerated anywhere due to their absence ~rom their n~rmal p~ace of residence throughout the entire enum~atlOn perl~d. No corrections, however, were made III the ent~les in the Individual Slips for the changes occurnng after the la'>t visit of the Enumerator and before the sunrise of 1st April, 1971. 'The form of Individual Slip is given in the Annexure to this Note.
The foHowing are the extracts from the 'Instructions to Enumerators' for filling in Questions 3, 4 and 16 of the Individual Slip:
"Question:3 : Sex
For males write 'M' and for females write 'F' within the circle indicated against this question. Even for eunuchs and hermaphrodites, write 'M' only. Verify with reference to the name and .relationship to Head against questions 1 and 2 respectively that you have noted the sex correctly.
Q.ue~tion 4 : Age
Record the age of the person in total years c?mpIe ted last birthday. Very often there IS a tendency on the part of the individuals to return 'years running' rather than the 'years completed'. Make sure that only the actual number of years completed is recorded.
In respect of infants who might not have completed one year by the day "Of enumeration their age in completed years should be invariably shown as '0' as they have not yet completed one year of age and add 'Infant' in brackets. As was stated under general instructions make sure that infants even if a day old are invariably enumerated. You should not enter the age it! months. The age of an infant w~o has not yet completed one year should mvariably be noted as '0' only.
Question 16: Main Activity
Every person will be asked what hi~ main activity is that is how he engages hImself mostly. F~r the p~rpose of this question, all persons will get themselve3 divided into two broad streams of main activity namely, (1) as workers and· (2) as non-workers according as the type of main activity that the person returns him,>elf as engaged 1U mostly.
'Worker'defined : A 'worker' is a person whose main activity is participation in any economically productive work by his physical or mental activity. Work involves not only actual work but effective supervision and direction of work.
Reference periods : The reference period ,is o~e week prior to the date of enumeratIOn m the case of regular work in trade, profession, service or business. If a person had participated in any ·such regular work on any one of the days during this reference period and this has been returned as his main activity, the person will be categorised accord. ingly. A person who ·normally works but had been absent from work during this reference period on account of illness or travel, holiday, temporary breakdown, strike etc., the person should be treated as engaged -in regular work in which he would have otherwise been employed but for his temporary absence. Persons under training such as apprentices with or without stipends or wages should be considered as economically active and recorded as working. A person who has merely been offered work but has not actually joined it, is not to be treated as engaged in work.
There are certain types of works which are notcarried on t~roughout the year such as cultivation, livestock keeping, plantation work, some types of household industry, etc. A person's main activity should be ascertained with reference to such work in the last one year even if he was not economica 11y active in the week prior to enumeration. It is likely, that even when a person is engaged in some other work during the period of one week. prior,t!? the date of enumeration, the mam actIVIty of the person may be cultivation, agricultural labour or some other work attended to normally by him in the Course of the year. Care must be taken to see that the main activity is properly ascertained in such cases. For example, a person's main activity may be agri.
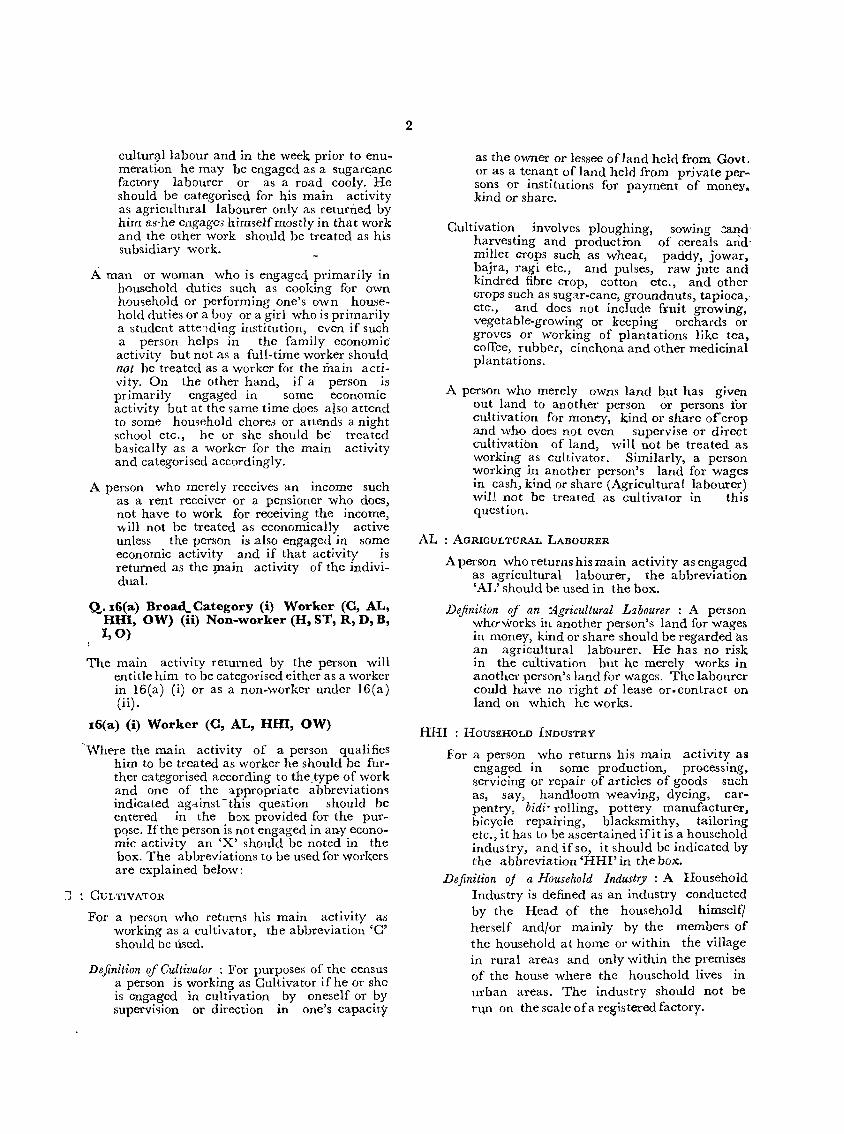
cultur<Jllabour and in the week prior to enumeration he may be engaged as a sugarcane factory labourer or as a road cooly. He should be categorised for his main activity as agricultural labourer only as returned by him as-he eagage3 himself mostly in that work and the other work should be treated as his subsidiary work.
A man or woman who is engaged primarily in household duties such as cooking for own household or performing one's own household duties or a boy or a girl who is primarily a student atte'1ding institution, even if such a person helps in the family economic activity but not as a full-time worker should not be treated as a worker for the main activity. On the other hand, if a person .is primarily engaged in . some economIC activity but at the same time does also attend to some homehold chore.3 or attends a night school etc., he or she should be· treated basically as a worker for the main activity and categorised accordingly.
A person who merely receives an income such as a rent receiver or a pensioner who does, not have to work for receiving the income, ",ill not be treated as economically active unless the person is also engaged in some economic activity and if that activity is returned as the !'lain activity of the individual.
Q. x6(a) Broad.. Category (i) Worker (C, AL, RHI, OW) (ii) Non-worker (H, S'I', R, D, B, 1,0)
The main activity retumed by the person will entitle him to be categorised either as a worker in 16(a) (i) or as a non-worker under 16(a) (ii) .
16(a) (i) Worker (C, AL, HHI, OW)
'Where the main activity of a person qualifies him to be treated as worker he should be further categorised according to the.type of work and one of the appropriate abbreviation<; indicated ag-'l.insC this question should be entered in the box provided for the purpqse. If the person is not engaged in any.economic activity an 'X' should be noted III the box. The abbreviations to be used for workers are explained below:
CULTIVATOR
For a person who re~urns his main a~ti,:ity, a~ working as a cultIvator, the abbrevIatlon C should be used.
De finition of Cultivator : For purposes of the census J a person is working as Cultivator if he or she
is engaged in cultivation by oneself or ?y supervi'lion or direction in one's capacIty
2
as the owner or lessee ofland held from Govt. or as a tenant of land held from private per~ sons or institutions for payment of moneYA kind or share.
Cultivation involves ploughing, sowing :::a:qd' harvesting and product ron of cereals andmillet crops such as wheat, paddy, jowar, bajra, ragi etc., and pulses, raw jute and kindred fibre crop, cotton etc., and other crops such as sugar-cane, groundnuts, tapioca,. etc., and does not include f:tuit growing, vegetable-growing or keeping orchards or groves or working of plantations like tea, coffee, rubber, cinchona and other medicinal plantations.
A person who merely owns land but has given out land to another perSon or persons for cultivation for money, kind or share ofcrop and who does not even supervise or direct cultivatibn of land, will not be treated as working as cultivator. Similarly, a person working in another person's land for wages in cash, kind or share (Agricultural labourer) will not be treated as cultivator in this question.
AL ; AGRICULTURAL LABOURER
A person who returns his main activity as en~a&,ed as agricultural labourer, the abbreVIatIOn 'AL' should be used in the box.
Definition of an :Agricultural Labourer : A person whO'works in another person's land for wages in money, kind or share should be regarded as an agricultural lab'ourer. He has no risk in the cultivation but he merely works in another person's land for wages. The labourer could have no right Df lease or-contract on land on which he works.
HHI : HOUSEHOLD INDUSTR Y
For a person who returns his I?ain activit~ as engaged in some productIOn, processmg, servicing or repair of articles of goods such as, say, handloom weaving, dyeing, carpentry, bidi- rolling, pottery. manufa~tu~er, bicycle repairing, biacksmithy, taIlOrIng etc. it has to be ascertained ifit is a household ind~stry, and ifso, it should be indicated by the abbreviation 'HH!' in the box.
Definition oj a Household Industry : A Household Industry is defined as an industry conducted by the Head of the household himself! herself and/or mainly by the members of the household at home or within the village in rural areas and only within the premises of the house where the household lives in urban areas. The industry should not be rl\n on the scale ofa re~istered factory_
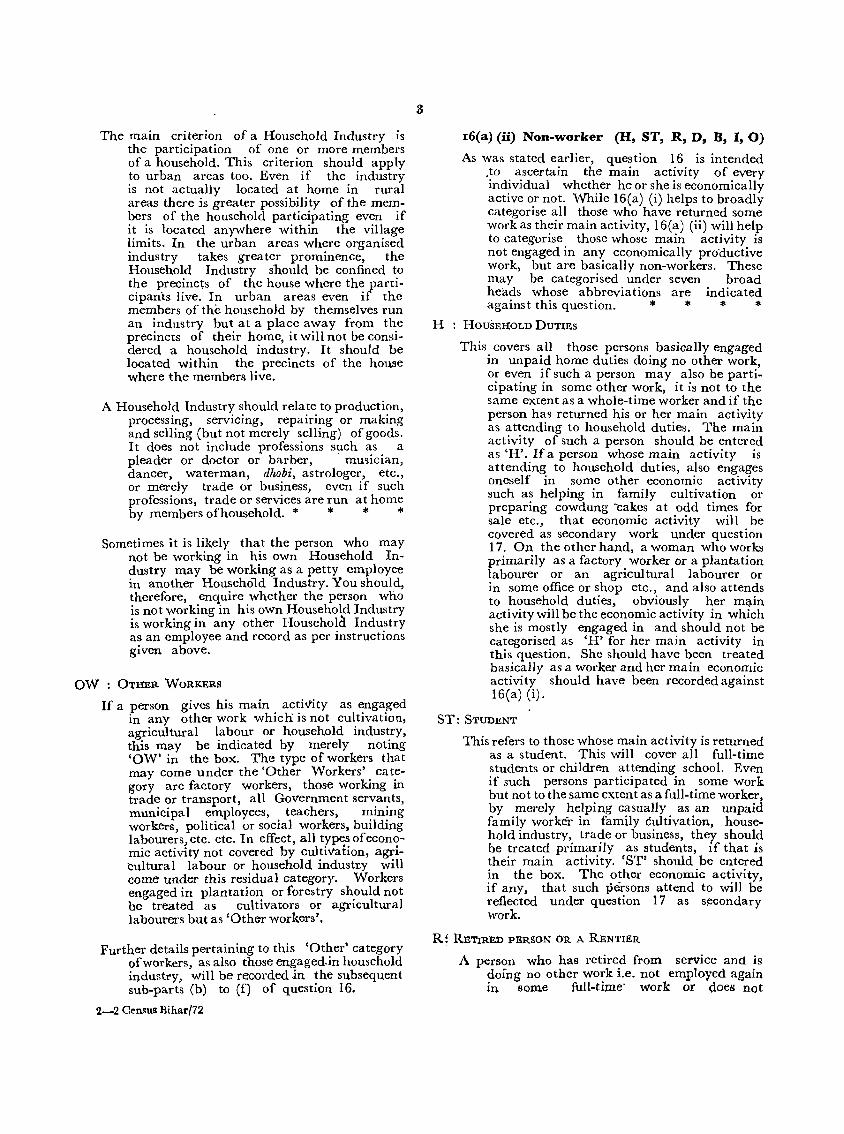
The main criterion of a Household Industry is the participation of one or more members of a household. This criterion should apply ~o urban areas too. Even if the industry IS not actually located at home in rural areas there is greater possibility of the mem~e~s of the household participating even if 1~ 1.S located anywhere within the village hm1ts. In the urban areas where organised industry takes greater prominence, the Household Industry should be confined to the precincts of the house where the panicipani:s live. In urban areas even if the members of the household by themselves run an industry but at a place away from the precincts of their home, it will not be considered a household industry. It should be located within the precincts of the house where the members live.
A Household Industry should relate to production, processing, servicing, repairing or making and selling (but not merely selling) of goods. It does not include professions such as a pleader or doctor or barber, . musician, dancer, waterman, dhabi, astrologer, etc., or merely trade or business, even if such professions, trade or services are run at home by members of household. * * * *
Sometimes it is likely that the person who may not be working in his own Household Industry may be wor.king as a petty employee in another Household Industry. You should, therefore, enquire whether the person who is not working in his own Household Industry is working in any other Household Industry as an employee and record as per instructions given above.
OW : OTl!ER WORKERS
If a person gives his main acti"ity as engaged in any other work which: is not cultivation, agricultural labour or household industry, this may be indicated by merely noting 'OW' in the box. The type of workers that may come under the 'Other Workers' category are factory workers, those working in trade or transport, all Government servants, municipal employees, teachers, mining workers, political or social workers, building labourers, etc. etc. In effect, all typesofeconomic activity not covered by cultivation, agribultural labour or household industr,y will come under this residual category. Workers engaged in plantation or forestry should not be treated as cultivators or agricultural labourers but as 'Other workers'.
Further details pertaining to this 'Other' category of workers, as also those engaged.in household iI}dustry, will be recorded .in the subsequent sub-parts (b) to (f) of question 16.
2-2 Census Bihar/72
r6(a) (ii) Non-worker (H, ST, R, D, B, 1,0)
As was stated earlier, question 16 is intended .~o . ~scertain the main activity of every md~vldual whet~er he or she is economically actIve ~r not. WhIle 16(a) (i) helps to broadly categorIse all those who have returned some work as th~ir main activity, 16(a) (ii) will help to categOflse those whose main activity is not engaged in any economically pr<>ductive work, but are basically non-workers. These may be categorised under seven broad heads whose abbreviations are indicated against this question. * * * *
H HouimltOLD DUTIES
This. covers all those persons basically engaged m unpaid home duties doing no other work o~ ev~n ~f such a person may also be parti: c1patmg III some other work, it is not to the same extent as a whole-time worker and if the person has returned his or her main activity as attending to household duties. The main activity of such a person should be entered as 'H'. If a person whose main activity is attendin~ to household duties, also engages oneself III some other economic activity such as helping in family cultivation or preparing cowdung -cakes at odd times for sale etc., that economic activity will be covered as secondary work under question 17. On the other hand, a woman who works primarily as a factory worker or a plantation labourer or an agricultural labourer or in some office or shop etc., and also attends to household duties, obviously her mqin activity will be the economic activity in which she is mostly engaged in and should not be categorised as 'H' for her main activity in this question. She should have been treated basically as a worker and her main economic activity should have been recorded against 16(a) (i).
ST: STUDENT
This refers to those whose main activity is returned as a student. This will cover all full-time students or children attending school. Even if such persons participated in some work but not to the same extent as a full-time worker by merely helping casually as an unpaid family worker in family cultivation, household industry, trade or business, they should be treated primarily as students, if that is their main activity. 'ST' should be entered in the box. The other economic activity, if any, that such persons attend to will be reflected under question 17 as s~condary work.
R! RETIRED PBRSON OR A RENTIER
A person who has retired from service and is ~olng no other wo:k i.e. not employed again Ul some full-tIme" work or does not
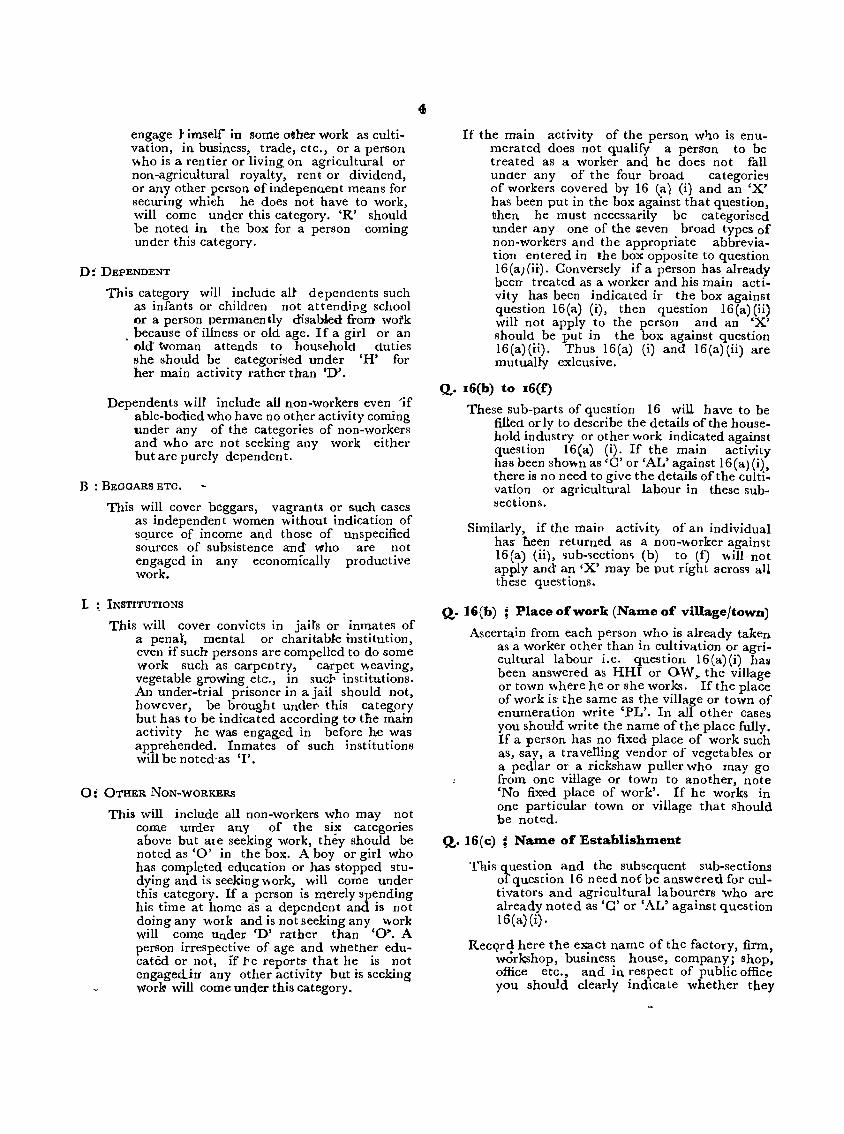
engage ~ imself' in some other work as cultivation, in business, trade, etc., or a person ""ho is a rentier or living, on agricultural or non-agricultural royalty, rent or dividend, or any other pel'son of indepenuent means for securing which he does not have to work, will come under this category. 'R' should be noted in the box for a person coming under this category.
D:' DEPENDENT
This category will include aU dependents such as infants or children not attendipg school or a person permanently disabled frOl'l.1' work
. because of illness or old age. If a girl or an old' 'tvoman attends to household duties she should be eategorised under 'H' for her main activity rather than 'D'.
Dependents ""ill include aU non-workers even 'if able-bodied who have no other activity coming under any of the categories of non-workers and ""ho are not seeking any work either but are purely dependent.
B : BEGGARS ETC.
This will co"er beggars, vagrants or such cases as independent women ""ithout indication of so_urce of income and those of unspecified sources of subsistence and who are not engaged in any economically productive work.
I. INSTITUTIONS
This will cover convicts in jails or inmates of a: penal, mental or charitable institution, even if such persons are compelled to do some work such as carpentry, carpet ""eaving, vegetable growing etc., in suc}> institutions. An under-trial prisoner in a jail should not, however, be brought under- this categ.ory but has to be indicated according to tIle main activity he was engaged in before he was apprehended. Inmates of such institutions will be noted'as '1'.
0: OTHER NON-WORKERS
This will include all non-workers who may not come under any of the six categories above but ale seeking work, they should be noted as '0' in the box. A boy or girl who has completed education or has stopped studying and is seeking ""ork, ""ill come under this category. If a person is merely spending his time at home as a dependent and is not doing any ""ork and is not seeking any ..... ork will come under 'D' rather than '0", A person irrespective of age and whether educated or not, if re reports- that he is not engagedJrr any other activity but is seeking work wm come under this category.
4
If the main activity of the person w~o is enumerated does not qualify a person to be treated as a worker and he does not fall under any of the four broad categorie':! of workers covered by 16 (a) (i) and an 'X' has been put in the box against that question, then he must necessarily be categorised under anyone of the seven broad types of non-workers and the appropriate abbreviation entered in the box opposite to question l6(a)(ii). Conversely if a person has already be err treated as a worker and his main activity has been indicated ir the box against question l6(a) (i), then question l6(a) (ii) will not apply to the person and an 'X' should be put in the box against question l6(a)(ii). Thus l6(a) (i) and l6(a)(ii) are mutually exlcusive.
Q.. 16(b) to 16(£)
These sub-parts of question 16 will have to be filled orly to describe the details of the household industry or other work indicated against question 16(a) (i). If the main activity has been shov.n as 'C' or 'AL' against l6(a)(i) there is no need to give the details of the culti: vation or agricultural labour in these subsections.
Similarly, if the maip activity of an individual has' been returned as a non-""orker agaimt 16(a) (ii), .,ub-~ectiom (b) to (f) ""ill not apply and an 'X' may be put right acros'! all these questions.
Q.. IG(b) ; Place of work (Name of village/town)
Ascertain from each person who is already taken as a worker other than in cultivation or agricultural labour i.e. question l6(a)(i) hali been answered as HHI or OW,. the village or town ""here he or she works. If the place of work is the same as the village or town of enumeration write 'PL'. In all other Cases you should wri te the name of the place fully. If a person has no fixed place of work such as, say, a travelling vendor of vegetables or a pedlar or a rickshaw puller who may go from one village or town to another, note 'No fixed place of work'. If he works in one particular town or village that should be noted.
Q.. 16(c) ; Name of Establishment
This quesdon and the subsequent sub-sections of question 16 need nof be answered for cultivators and agricultural labourers who are already noted as 'C' or 'AL' against question 16(a) (i).
RecQrd here the exact name of the factory, firm, wOrkshop, business house, company; shop, office etc., and in respect of public office you should clearly indicate whether they
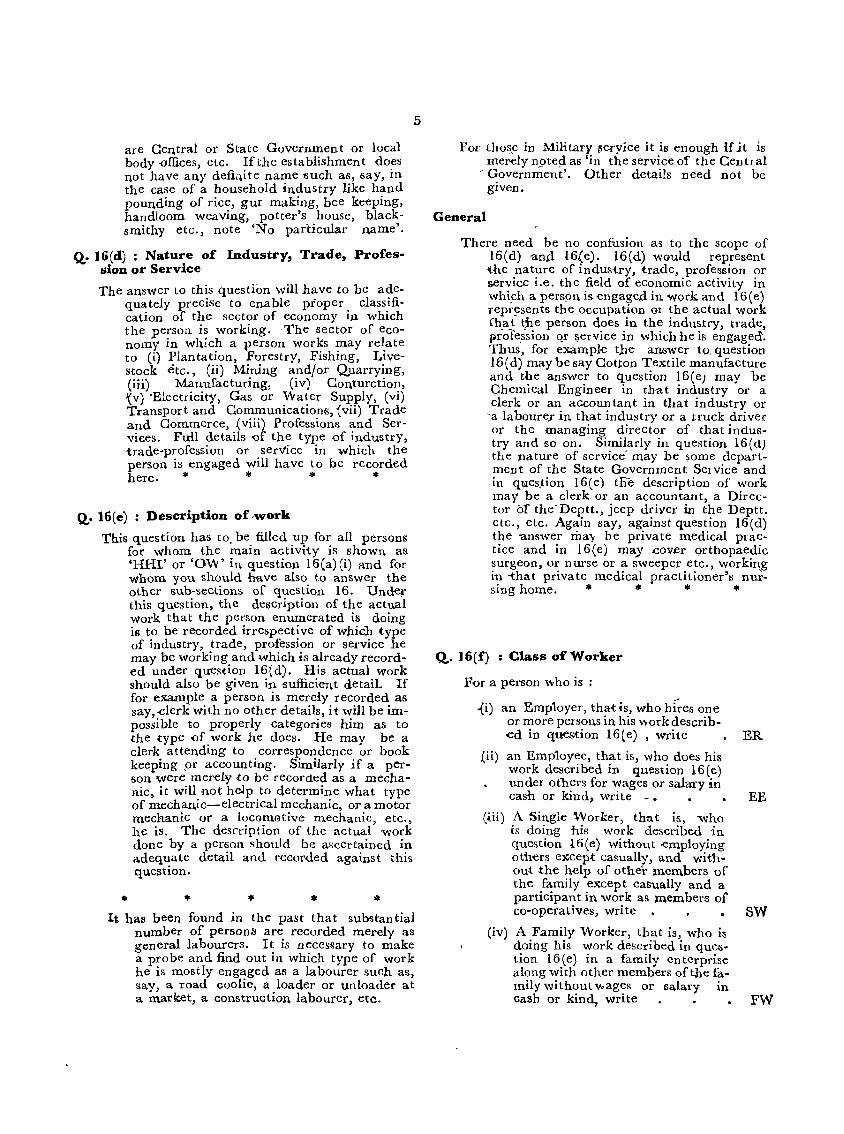
are Central or State Government or local body -offices, etc. If the establishment does not have any defi{\,ite name 'Such as, say, in the case of a household industry like hand pounding of rice, gur making, bee keeping, handloom weaving, potter's house, blacksmithy etc., note <No particular name'.
Q.o J6(dj : Nature of Industry, Trade, Profession or Service
The answer to this question wlll have to be adequately precise to enable pioper classification of the sector of economy in which the person is working. 'The sector of economy in which a person works may relate to (i) Plantation, Forestry, Fishing, Livestock etc., (ii) Mining and/or Quarrying, (iii) Manufacturing, (iv) Conturction, I(v) "Electricity, Gas or 'Water Supply, (vi) Transport and Communications, ~vii) Trade and Commerce, {viii) Professions and Services. FuH details 'Of the type .of industry, trade-profession or serVice in which the person is engaged will have to be recorded here. * * * *
Q.o 16(e) : Description of 'Work
This question has to. be filled up for all persons for whom the main activity is shown as 'HHI' or 'O'W' in question l6(a)(i) and for whom you should have also to answer the other sub-s(tctions of question 16. Under this question, the description of the actual work that the person enumerated is doing is to be recorded irrespective of whicb type of industry, trade, profession or service he may be working and which is already recorded under question 16{d). His actual work should also be given in sufficient detail. If for exa.mple a person is merely recorded as say, ..clerk wi th no other details, it will be impossible to properly categories him as to the .type of work he does. He may be a clerk attending to correspondence or book keeping 9r accounting. Similarly if a person were merely'(:o be recorded as a mechanic, it will not help to determine wha't type of mechanic-electrical mechanic, or a motor mechanic or" a 10comGtive mechanic, etc., he is. The description of the actual work done by a person should be ascertained in adequate detail and recorded against this question.
* *
5
It has been found in the past that substantial number of persons are recorded merely as general labourers. It is necessary to make a probe and find out in which type of work he is mostly engaged all a labourer such as, say, a road coolie, a loader or unloader at a market, a con.struction labourer. etc.
FOl" thos.e in Military JlCi"yice it is enough if it is merely n,.9te!i as 'in the service of the Cen tr al
- Government'. Other details need not be given.
General
There need be no confusion as to the scope of 16(d) ansi 16{e). 16(d) would represent the nature of industry, trade, profession or service i.e. the field of economic activity in whi..ch a perspn is engaged in work and 16(e) repr~sents the occupation 01 the actual work fb_a.t t;he person does in the industry, trade, profe.ssioll Q. ser'lTice 5n which he is engaged. Thus, for example the answer to. question 1,6 ( d) may be say Cotton Textile manufacture and the answer to question 16(e) may be Chemical Engineer in that industry or a clerk or an accountant in that industry or
'a labourer in that industry or a truck driver or the managing director of that industry and so on. Similarly in question 16(d) the nature of service- may be some department of the State Government Service and in q1:les,tion 16(e) tFie description of work may be a clerk or an accountant, a Director iJ.f the"Deptt" jeep driver in the Deptt. etc., etc. Again say, against question 16(d) the answer may be private medical practice and in 16(e) may .cov.er orthopaedic surgeon, or nurse or a sweeper etc., working in -that private medical practitioner's nu~-sing home. ... ... * ...
Q.. 16(f) : Class of Worker
For a person 'Who is :
{i) an Emp1oyer, that IS, who hires one or more persons in his ,",ork described in question 16(e) , write
{ii) an Employee, that is, who does his work described in question 16(e) under others for wages or salary in
ER
cash or kind, write - 0 EE
(iii) A Single Worker, that is, who is doing his work described in question l6(e) without empioying others except casually, and without the help of other meIl\bers of the family except casually and a participant in work as :members of co-operatives, write SW
(iv) A Family 'Worker, that is, who is doing his work described in question 16(e) in a family enterprise along with other members of the family without Vvages or salary in cash or kind, write • FW
For a person for whom an 'X' is put in questions 16(d) and 16(e) putan 'X' in this question also.
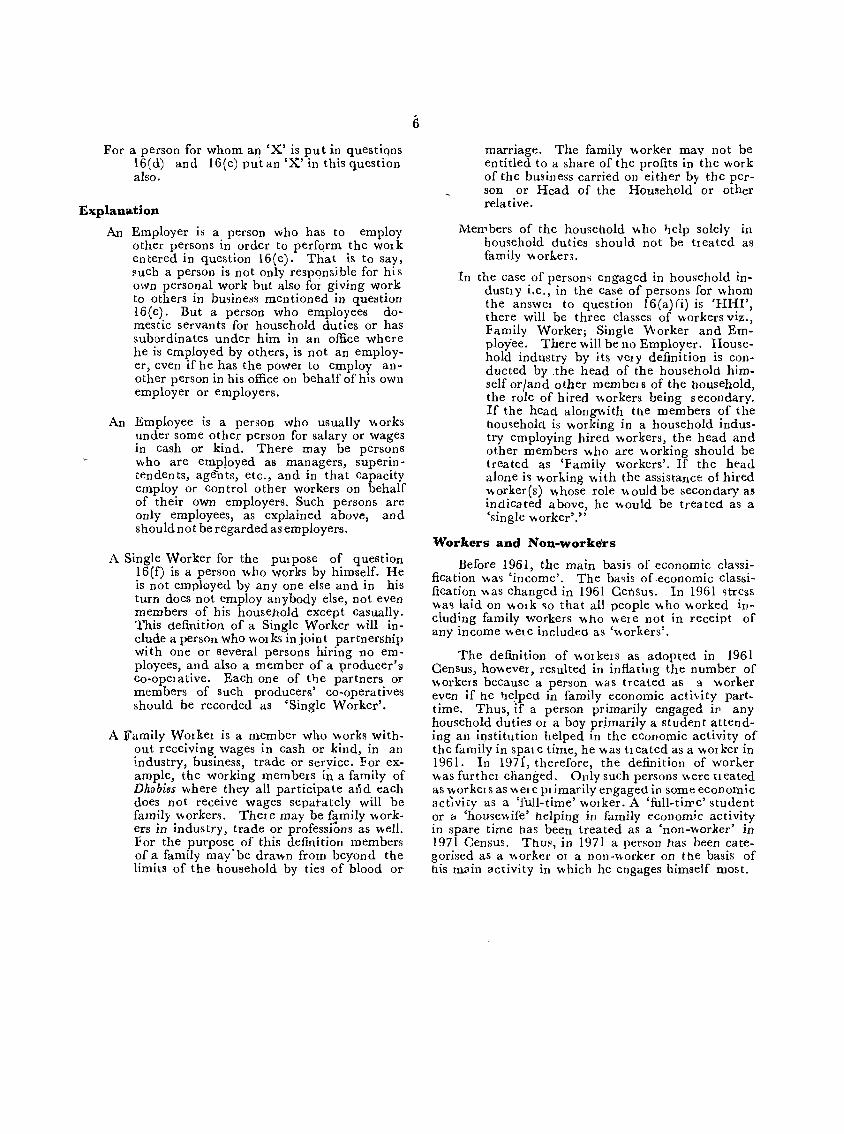
Explanation
An Employer is a person who has to employ other persons in order to perform the work entered in question l6(e). That is to say, such a person is not only responsible for his own personal work but also for giving work to others in business mentioned in question 16( e). But a person who employees domestic servants for household duties or has subordinates under him in an office where he is employed by others, is not an employer, even if he has the power to employ another person in his office on behalf of his own employer or employers.
An Employee is a person who usually '\\-orks under some other person for salary or wages in cash or kind. There may be persons who are emptoyed as managers, superintendents, agents, etc., and in that capacity employ or control other workers on behalf of their OWn employers. Such persons are only employees, as explained above, and should not be regarded as employers.
A Single Worker for the purpose of question 16(f) is a person who works by himself. He is not employed by anyone else and in his turn does not employ anybody else, not even members of his household except casually. This definition of a Single Worker '\\-ill include a person who '\\-olks injoint partnership with one or several persons hiring no employees, and also a member of a producer's co-opelative. Each one of tlJe partners or mem bers of such producers' co-operatives should be recorded as 'Single Worker'.
A Family Worker is a member who '\\-orks without receiving wages in oash or kind, in an industry, business, trade or seryice. For example, the working members in a family of Dhobies '\\-here they all participate and each does not receive wages sepatately will be family '\\-orkers. The1 e may be family '\\-orkers in indus try, trade or professions as '\\-ell. For the purpose of this definition members of a family may'be dra'\\-n from beyond the limits of the household by ties of blood or'
marriage. The family ,\\-orker may not be entitled to a share of the profits in the work of the business carried on either by the person or Head of the Homehold or other relative.
MeIPbers of the household '\\-ho ~elp solely III
household duties should not be treated as family '\\-or1..en.
In the case of persons engaged in household industry i.e., in the Case of persons for '\\-hom the anSwel to question 16(a) (i) is 'HHI', there will be three classes of '\\- or kers viz., Family Worker; Single V\rorker and Employee. There '\\-ill be no Employer. Household industry by its vel y definition is conducted by .the head of the household himself or/and other members of the household, the role of hired '\\-orkers being secondary. If the head along'\\-ith the members of the homehold is '\\-orking in a household industry employing hired '\\-orkers, the head and other members '\\-ho are '\\-orking should be treated as 'Family workers'. If the head alone is \\-orking ,\\-jth the assistance of hired '\\-orker(s) '\\-hose role \\-ould be secondary all indicated above, he '\\-ould be treated as a 'single ,\\-orker'."
Workers and Non-workers
Before 1961, the main basis of economic cla~sjfication '\\-a~ 'income'. The basis of .economic classification \\-as changed in 1961 CeflSm. In 1961 stress '\\-as laid on '\\-Olk <;0 that all people '\\-ho '\\-orked including family workers '\\-ho '\\-el e not in receipt of any income '\\-ele included as 'V\orkers'.
The definition of \\-olkels as adopted in 1961 Census, ho,\\-evel, resulted in inflating the number of '\\-orkers because a person '\\-as treated as a '\\-orker even if he t:le.lped in family economic activity parttime. Thus, if a person primarily engaged il" any household duties or a boy primarily a student attending an institution helped in the economic activity of the family in spm e time, he '\\-as tt eated as a '\\-01 ker in 1961. In 197f, therefore, the definition of worker '\\-as further changed. Only such persons \\-ere heated as '\\-or kel s as '\\-el e pI imarily ellgaged ill some economic act~vity as a 'iull-time' '\\-Olker. A 'full-tiIPe'student or 1:1 'houseV\ife' helping in family economic activity in spare time has been treated as a 'non-,\\-orker' in 1971 Census. ThUS, in 1971 a person has been categorised as a \\-orker 01 a non-V\orker on the basis of his main activity in '\\-hich he engages himself most.
7
ANNEXURE
',dNO.D CONflDftlnAL. CENSUS 0' INDIA 10"
I individual Slip r
Householcl No. L
$11'1'10. ___ _
, .J
LoatlonCode ______________ -( )
t. Name _____________ -:==""" II. Relation,hlp r-1-1 co h •• d _____________ '-_..L_.J
o 4.~~-------------
,...-, I I '-_J
roo, So H,rlul Stllus _____________ LJ o. For tur .. ntly married warne. only
C.) A,e at marrl.'. ________ _ r-, I I
II.) A.y child born In the lISt on& yur ____ L_.J
1'7· :'l la) Pllce of birth ____________ _
< r-, I! I I :a: (I.) (l.unljUrban _________ r - L._J I-' I I I I Ic) OISUIc:t. ____________ :' __ :-_~
,..: I I : L(tl) Suce/o,untry ... _ J. _-' r-e. g C.) Place of latt rollcknce _______ --:= __
r- , ~ I I ~ eL) lI.unl!Urban ______ -'-_____ I __ J
, I I
; () : I I ;;) c Olmlct r-"1"--1 I I I t. ed) S .. 'o/O'oot,y _________ L _ LJ
t. Ou.ratlon of Resldenc. It the Viii,," f -i-l or to_ of Enu"",ot"" L _ J. _ J
r-T-' to. Religion L_l_ J
16. t1AIN~
~I) Wo,br IC, AL. '\___/ roo,
M Broa4- HHI, OW LJ Cltegory
u) Non-CHo ST, R, 0 :-] Worlrer D, B I, OJ 1.-
~ (10) PlICO cI wo,k t; CNlmo of Viii". /Tcwn) - _______ _
< Z (e) Nome of £st.bll.hmcM _____ ....;'--__ _
~ Cd) Nature of Indu ... ),. rnod., :e Profudoft or S.rvl"" ----------
""-T-'--, I I I ___________ L_L_ ... _oJ
ee) Oacrlptlon of Work _________ _
----------r-I--r-' _ ___________ L_l_LJ r--.
(I) CIISI of work.er'--_________ L. J
r17. SECONDARY WORK
(a) Bro.d- (C. AL, HHI, OW) roo" c ... gory ---LJ
(I.) Plac. of wo'~ ><! (Noms of VIII.ge/Town) ________ _
~ ;:; (cl N,me of Fstabll'hme"t ______ .-__ _
I I r-,--,
S.C. "I I I ~
SO'T r - - -.., l:--:.-=}-=--=l z~ 11.
Id) Natur. 01 Industry. Trod •• Prof.Sllar or Service _________ _
•• , II I I '- _____________ -'L._.L_J 8 -----------,--,--T-'
Dill 1,,1
12. Literacy [J --_________ 1.. -'-_ .... _1
13. t:t~nll r-T- "I t:
l' (.1 Oosc,lptlOl\ of We.k
.. ~.l ' I I I .. Mothor r-,L--_.lr ..... -::; r-'-I--.
Ton,,,. L_!_L _: I , , I fS. Other r-T-T-1 '--~-1--:..~
1tJI,1lIIIU L_J __ L_.J (f) "." cfwo,ker _________ L .. J

TABLE B-1 PART A
WORKERS AND NON-WORKERS ACCORDING TO MAIN ACTIVITY
CLASSIFIED BY SEX AND AGE-GROUPS

II
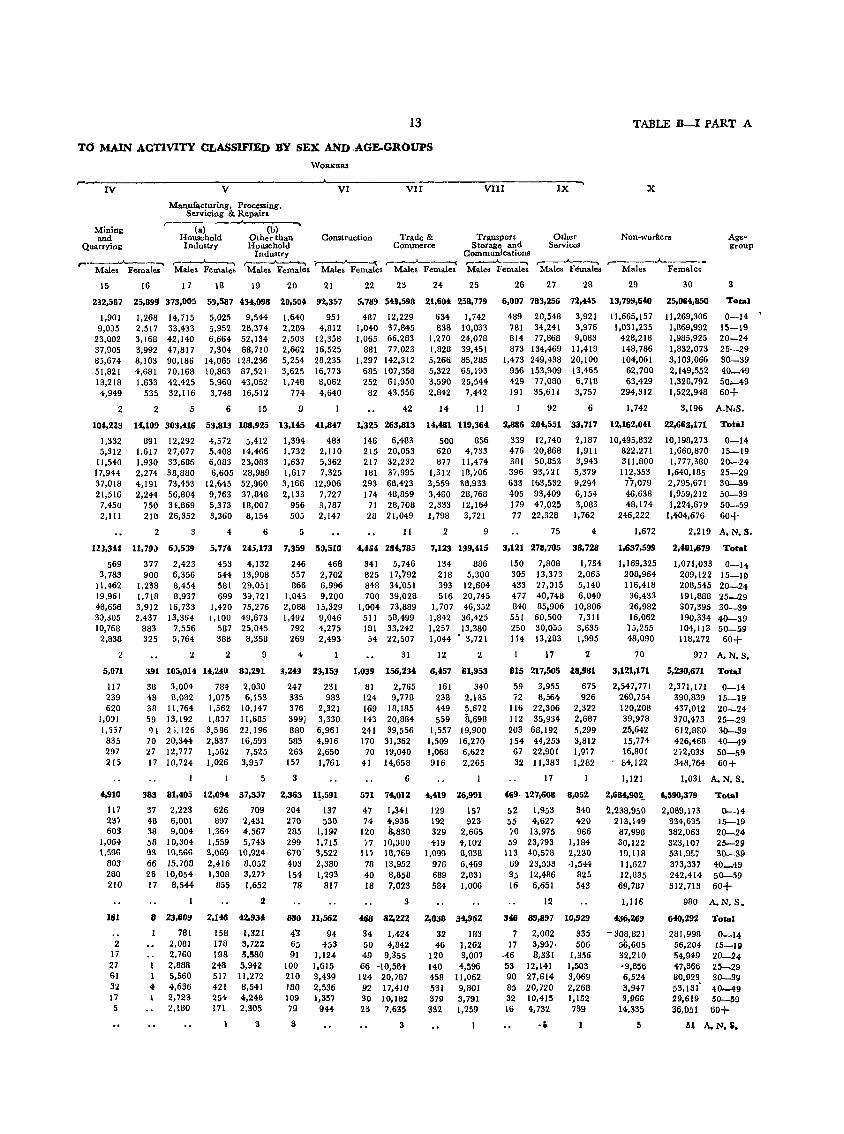
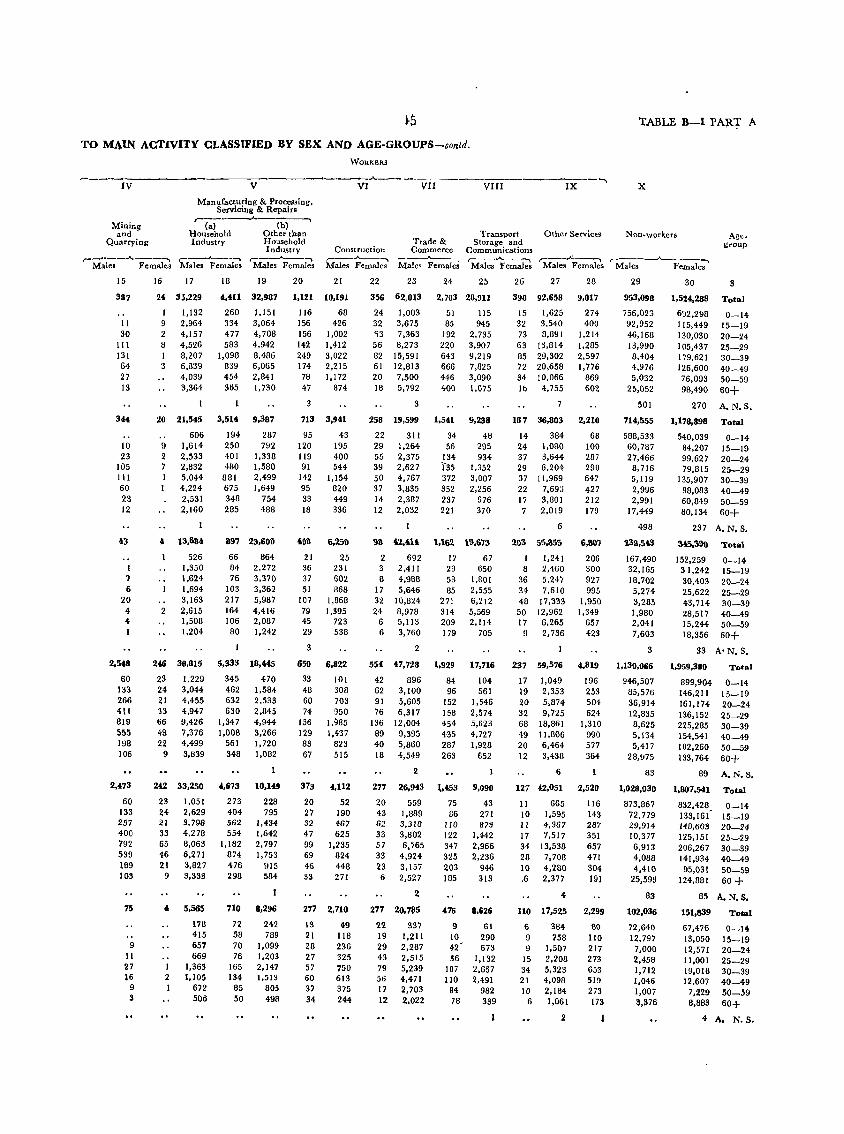
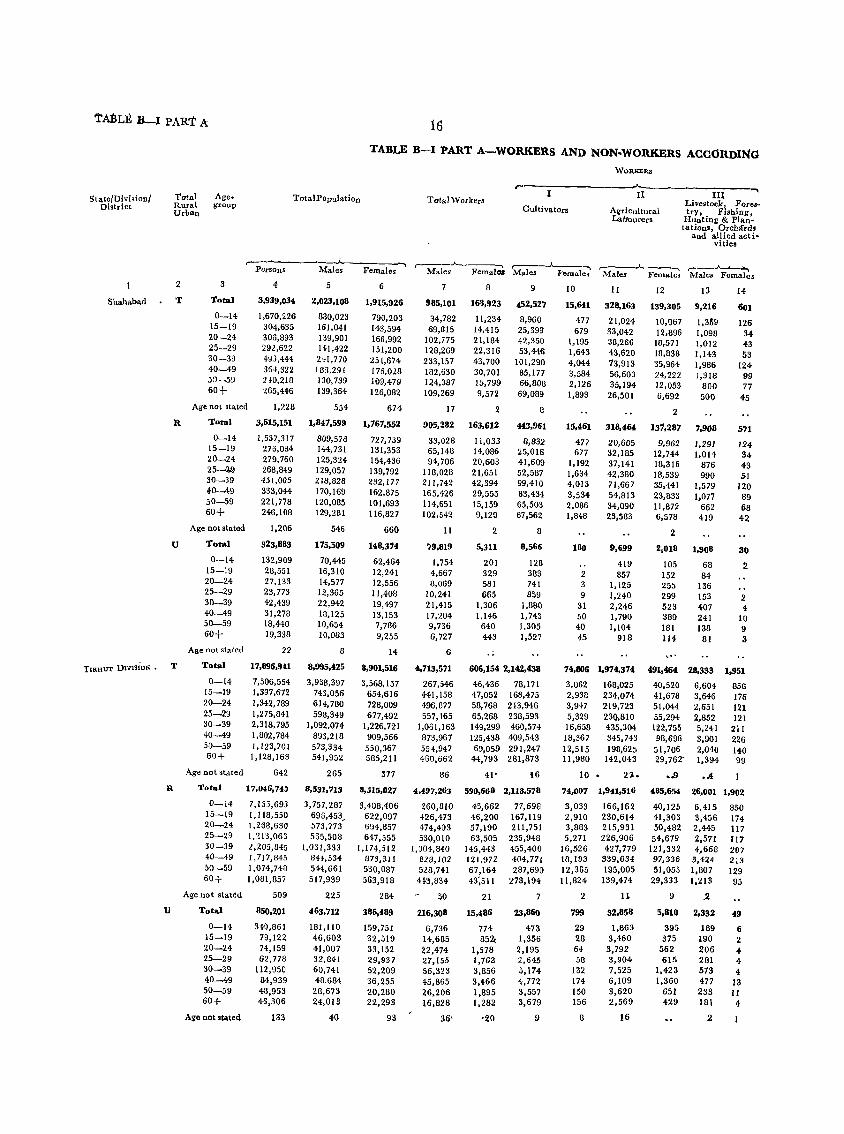
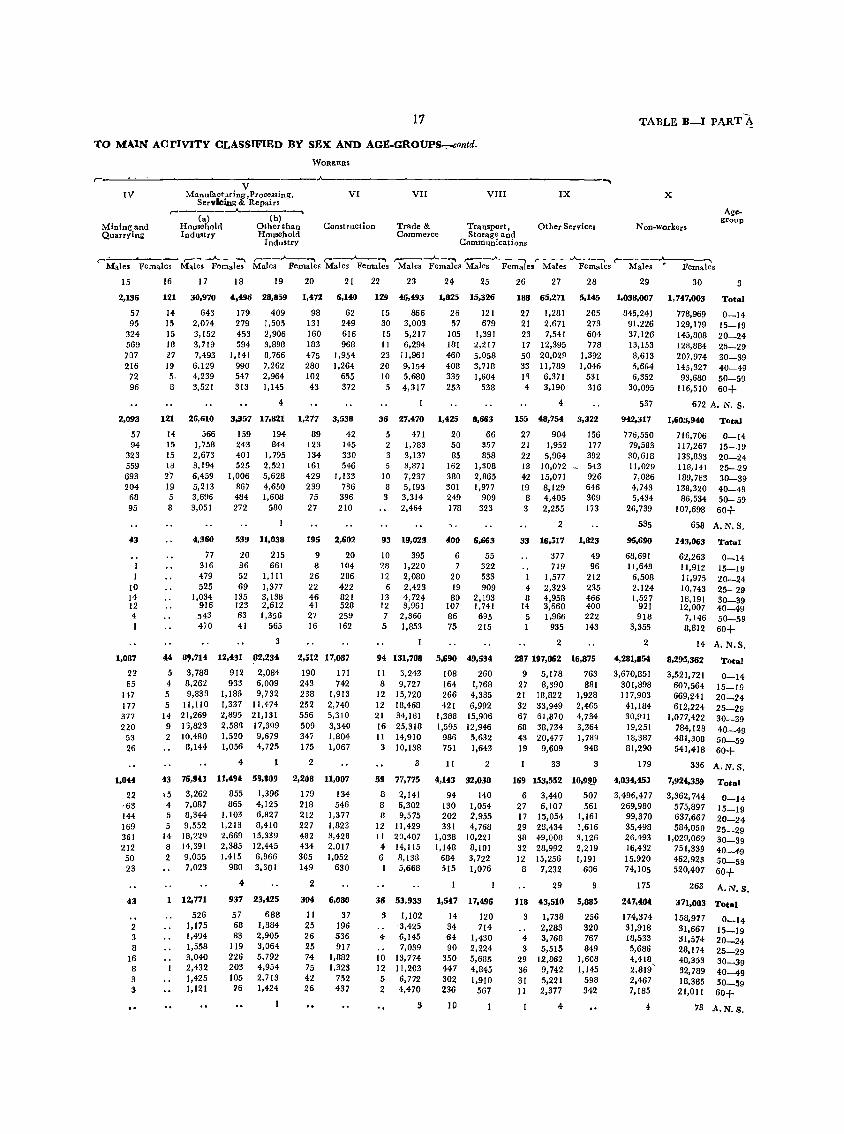
TABLE B-l PART A-WORKEttS AND NON-WORKERS ACCORDlNG TO MAIN ACTIVITY CLASSIFIEl> BY SEX AND AGE-GROlJPS
FLYLEAF
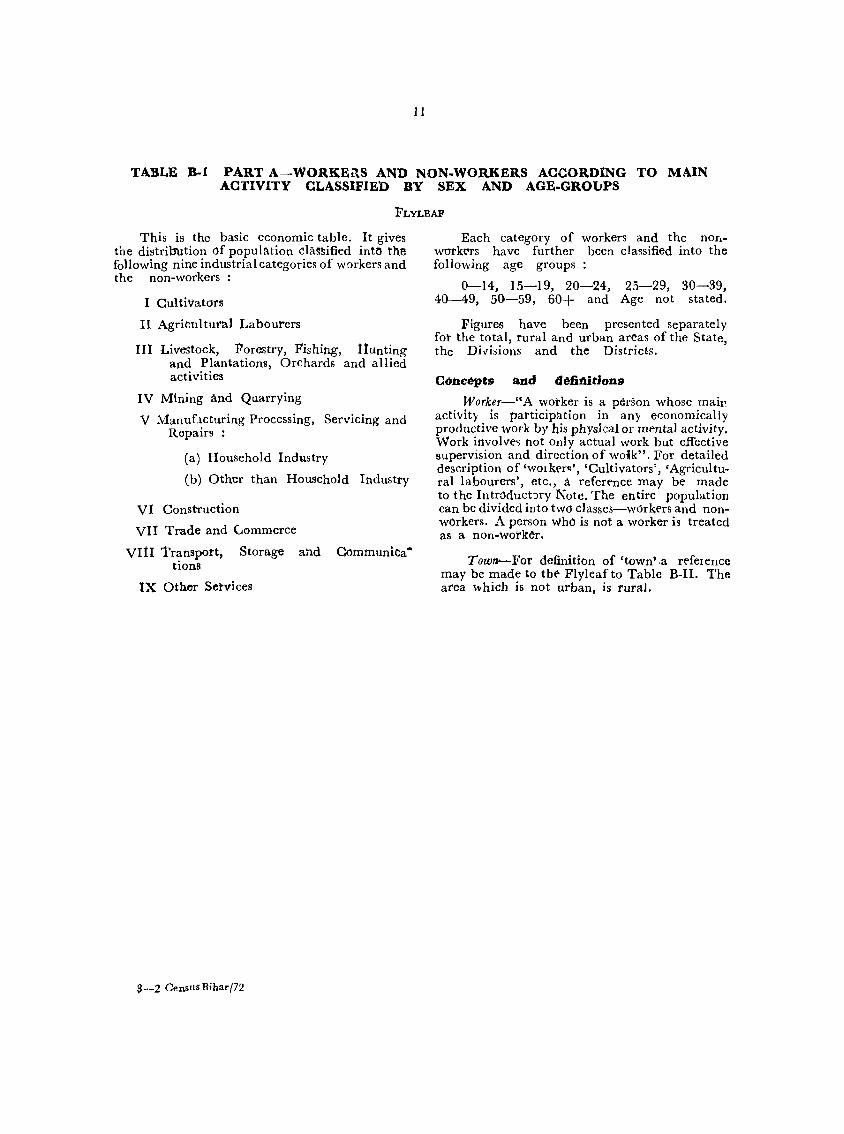
This is the basic economic table. It gives the distribution of population clas'!lified into the following nine industrial categories of workers and the non-workers:
I Cultivatot~
II Agricultural Labourers
III Livestock, Forestry, Fishing, Hunting and Plantations, Orchards and allied activities
IV Mining and Quarrying
V Manuf.lcturing Processing, Servicing and Repairs:
(a) Household Industry
(b) Other than Household Industry
VI Construction
VII Trade and (,ommerce
VItI Transport, Storage and Communications
IX Other Setvices
S--2 CenSUS Bihar/72
Each category of workers and the nor.workers have further been classified into the following age groups:
0-14, 15-19, 20-24, 25-29, 30-39, 40-49, 50-59, 60+ and Age not stated.
Figures have been presented separately fot the total, rural and urban areas of the State, the Di"i"ions and the Districts.
Cc)ilC~pts and d~fitiitions
Worker-"A wotker is a person whose main activity is participation in any et::onomically productive work by his physical or mental activity. Work involve~ not only actual work but effective supervision and direction of wolk". For detailed description of 'wolker~', 'Cultivators', 'Agricultural labourers', etc., a reference may be made to the IntroductJry Note. The entire population can be divided into two classes-workers and nonworkers. A person who is not a worker is treated as a hon-worker.
Town ........ For definition of 'town' ,a refeIence may be made to tht' Flyleaf to Table B-II. The area ""hieh is not urban, is rura1.
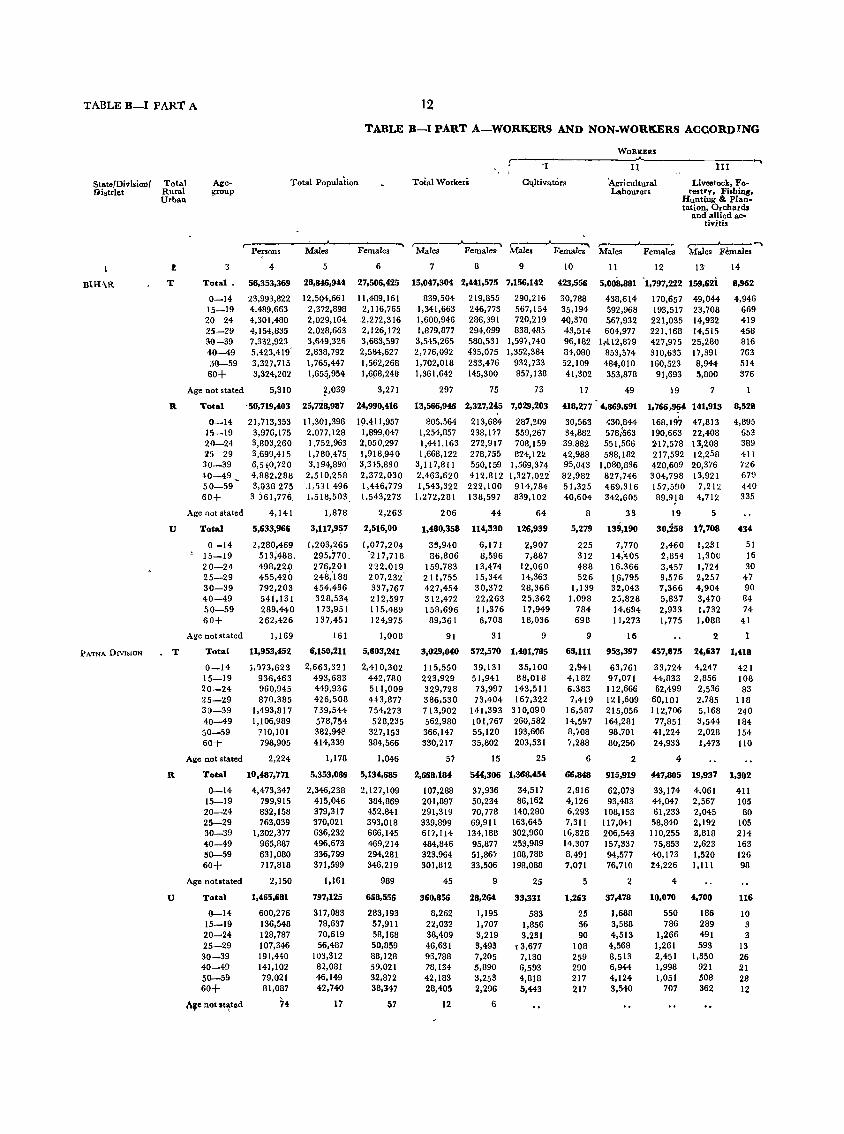
TABLE B-1 PART A
St&te{Divl.ionl 9i.trl.:t
Total Rural Urban
Agegroup
Total Population
12
TABLE B-1 PART A-WORKERS AND NON.WORKERS ACCORD1.NG
Total Workers
WORKERS
r-----'l--------------l-l~----------~l-l-I----~
C~ltivators .Agricultural Labourers
Livestock, Forestry. Fishing,
Hunting & Plantation, Orchards
and allied ae-tivids
rp-e-r-.o-n-.--~~~~eA.----~F~e-m-a~le-s~ r Males
!
BIH\R T
R
u
PATNA DIVISION • T
R
u
3
Total.
0-14 15-19 20 24 25-29 30-39 'l0-49 50-59 60+
Age not stated
Tot.al
0-14 15-19 7,0-24 2:' 29 30-39 40-49 50-59 60+
Age not stated
Total
0-14 1 15-19
20-24 25-29 30-39 40-49 50-59 60+
Age not 'tated
Total
0-14 15-19 20-24 25-29 30-39 40-49 50-59 60-t-
Age not stated
Total
0-14 15-19 20-24 25-29 30-39 40-49 ~0-59
60+
Age not stated
Total
0-14 15-19 20-24 25-29 30-39 40-49 50-59 60+
hie not It~tod
4
56,353,369
23,993,822 4,489,663 4,301,480 4,154,835 7,332,923 5,423,419' 3,327,715 3,324,202
5,310
5
28,846,944
12,504,661 2,372,898 2,029,164, 2,028,663 3,649,326 2,838,792 1,765,447 1,65~,954
~,039
6
27,506,425
11,489,161 2,116,765 2,272,316 2,126,172 3,683,597 2,584,627 1,562,268 J,6!58,248
3,271
7
15,047,304
839,504 1,341,663 1,600,946 1,879,877 3,545,265 2,776,092 I, 702,018 1,361,642
297
8 9
2,441,575 7,156,142
219,855 246,773 286,391 294,099 580,531 435,075 233,476 145,300
75
290,216 567,154 720,219 838,485
1,59i.740 1,352,384
932,733 857,138
73
10
423,556
30,788 35,194 40,370 43,514 96,182 84,080 52,109 41,302
17
II 12 13'
5,008,881 '1,797,222 159,62i
438,6\4 592,968 567,932 604,977
If112,8i9 853,574 484,010 353,878
49
170,657 193,517 221,035 221,168 427,9'5 310,635 160,523
91,693
19
49.044 23,708 14,932 14,515 25,2.80 17.391 8,944 5,800
7
14
8,962
4,946 669 419 458 816 763 514 376
·50,719,403 25,728,987 24,990,416 13,566,946 2,327,245 7,029,203 418,277 4,869,691 1,766,964 141,913 8,528
21,713,353 3,976,175 3,803,260 3,699,415 6, st,O,72 0 4,882,28!l 3,038 275
3, )61,776,
4,141
5,633,966
2,280,469 513;488. 498,nO 455,42.0 792,203 541,131 289,440 262,426
1,169
11,953,452
;,n3,623 936,463 960,945 870,385
1,4,93,817 1,106,989
710,101 798,905
2,224
10,487,771
4.473,347 799,915 832,158 763,039
1,302,377 965,887 631,080 717,818
2,150
1,465,681
600,276 136,548 128,787 107,346 191,440 141,102 79,021 81,087
74
11,301,396 2,077,128 1,752,963 1,780,475 3,194,890'
2,510,258 .1,,) I 496 1,518,503.
1,878
10,411,957 1,899,047 2,050,297 1.918,940 3,345,830 2,372,030 1.446;779 1,543;273
2,263
3,117,957 2,516,00
1,203,265 295,770, 276,201 248;188 454,436 328,534 173,951 137,451
161
1,077,204 -217,718 222,019 207,232' 337,767 212,597 115,489 124,975
1,008
6,150,211 5,803,241
2,663,321 493,683 449,936 426,508 739,544 578,754 382,941.'1 414,339
1,178
5,353,086
2,346,238 415,046 379,317 370.021 636,232 496,673 336,799 371,599
1,161
797,125
317,083 78,637 70,619 56,487
103,312 82,081 46,149 42,740
17
2,410,302 442,780 511,009 443,877 754,273 528,235
327,153 384,566
1,046
5,134,685
2,127,109 384,869 452,841 393,018 666,145 469,214 294,281 346,219
989
668,556
283,193 57.911 58,168 50,859 88,128 59,021 32,872 38,347
57
S05,564 1,254,857 1,441,163 1,668,122
3,117,811 2,463,620 1,543,322
1.272,281
206
213,684 238,177 272,917 278,755 550.159 412,812 222,100 138,597
44
287,31l\) 559,267 708,159 fl24,12l
1,569,374 1,327,022'
914,784 839,102
64
1,480,358 114,330 126,939
3S,940 86,806
159,783 211,755 427,454 312,472 158,696 89,361
91
6.171 8,596
13,474 15,344 30,372 22,263 11,376 6,703
31
2,907 7,887
12,060 14,363 28,366 25,362 17.949 18,036
9
3,029,040 572,570 1,401,785
115,550 223,929 329,728 386,530 713,902 562,980 366,147 330,217
57
2,668,184
107,288 201,897 291,319 339,899 6D,I14 484,846 323,964 301,812
45
360,856
8,262 22,032 38,409 46,631 95,788 78,134 42,183 28,405
12
39,131 51,941 73,997 73,404
141,393 101.767 55,120 35,802
15
544,306
37,936 50,234 70,778 69,911
134.188 95,877 51,86i 33,506
9
28,264
1,195 1,707 3,219 3,493 7,205 5,890 3,253 2,296
6
35,100 88,018 143,511 167,322
310,090 260,582 193,606 203,531
25
1,368,454
34,517 86,162
140,280 163,645 302,960 253,989 188,788 198,088
25
33,331
583 1,856 3,231
t3,677 7,130 6,593 4,818 5,443
30,563 34,882 39,882 42,988 95,043 82,982 51,325 40,604
8
430,844 578,:S63 551,566 51l8, 182
1,080,836 827,746 469,316 342,605
33
5,279 139,190
225 312 488 526
1,139 1,098
784 698
9
7,770 14;405 16,366 16,795 32,043 25,828 14,694 11,273
16
168,197 190,663 217,578 217,592 420,609 304,798 157,590 89,9~8
19
47,813 22,408 13,208 12,258 20.376 13,921
7,212 4,712
5
30,258 17,708
2,460 2,854 3,457 3,576 7,366 5,837 2,933 1,775
1,221 1,!lOC 1,724 2,257 4,904 3,470 1,732 1,088
2
4,895 653 389 411 726 679 440 335
434
51 16 30
47 90 84 74
41
68,111 953,397 457,875 24,637 1,418
2,941 4,182 6,383 7,419
16,587 14,5!17 8,'108 7,288
6
66,848
2,916 4,126 6,293 7,311
16,328 14,307 8,491 7,071
5
1,263
25 56 90
108 259 290 217 217
63,761 97,071 112,666 121,609 215,056 164,281 98.701 80,250
2
915,919
62,073 93,483
108,153 117,041 206,543 157,337 94,577 76,710
2
37,478
1,688 3,588 4,513
4,568 8,513 6,944 4,124 3.540
33,724 44,833 62,199
60,101 112,706 77,851 41,224 24,933
4
4.247 2,856 2,536 2,785 5,168 3,544 2,028 1,473
447,805 19,937
33,174 4,061 44,047 2,567 61,233 2,045 58,840 2,192 II 0,255 3,818
75,853 2,623 40,173 1,520 %4,226 I, 1I1
4
10,070 4,700
550 786
1,266 1,261 2,451 1,998 1,051
707
186 289 491 593
1,350 921 508 362
421 108 83
118 240 184 154 110
1,302
411 105
80 105 214 163 126 98
116
10 3 3
13 26 21 28 12
13
TO MAIN ACTIVITY CLASSIFIED BY SEX AND .AGE-GROUPS
WORKERS
r---I~V----------------~V---------------A--V~I--------~V=17I----'----~V=I7I~I------~I=X~~
Mining and
Quarrying
Manufacturing, Processing, Servicing & Repairs
(a) Household Industry
(b) ~ Other than Household
Industry
Construction Trade & Commerce
Transport Other Services
,...-----'-'---- -Males Females
,....-__.-~"' Males Females
r-~ ;-~~ ,-___"__---... Male. Females Males Females Males Females
Storage and Communications ..... ---'---.. Males Females
,....----"----, Males Females
15
232,557
1,901 9,035
23.002 37,905 8:;,674 51,821 13,218 4,949
2
104,223
1,332 5,312
11,540 17,914 37,018 21,516
7,450 2,111
IZ3,3U
569 3,783
11,462 19.961 48,656 30,305 10,768
2,838
2
5,071
117 239 620
I,O!)1 1 ,'~57
835 297 215
4,910
117 23, 603
1,064-1,596
803 280 210
161
2 17 27 61 32 17 5
16 17
25,89!1 373,005
1,268 14,715 2,517 33,433 3,168 42,140 3,992 47,817 8,103 90,186 4,681 70,168 1,633 42,425
535 32,116
18
59,587
5,025 5,952 6.664 7,304
14,065 10,863 5,960 3,748
19
9,544 28,374 52,194 68,710
128,236 87,521 43,052 16,512
20
1,640 2,289 2,503 2,662 5,254 3,625 1,748
774
21
951 4,812
12,358 16,525 28,235 16,773 8,062 4,640
2 5 6 15 .9
14,109 303,416 53,813 188,925 13,145 41,847
891 1,617 1,930 2,274 4,191 2,244
750 210
2
12,292 27,077 33,686 3B,880 73,453 56,804 31,869 26,352
3
ll,79J 6),539
377 2,423 900 6,356
1,238 8,454 1,718 8,937 3,912 16,733 2,437 13,364
883 7,556 325 5,764
2
4,572 5,408 6,083 6,605
12,645 9,763 5,373 3,360
4
5,412 14,466 23,083 28,989 52,960 37,848 18,007 8,154
6
5,714 245,173
453 4,132 544 13,908 581 29,051 699 39,721
1,420 75,276 1,100 49,673
587 25,045 388 8,358
2 9
3.'11 10:;,014 14,2iO 8J,291
2,030 6,153
10,147 11,685 22,196 16,593
311 3,004 784 48 8,082 1,075 38 11,764 1,562 59 13,192 1,837 9f 2;,126 3,586 70 20,344 2,837 27 12,777 1,562 7,525
3,957 17 10,724 1,026
5
383 81,405 12,094 37,357
37 2,223 48 6,001 38 9,004 58 10,304 93 19,566 66 15,708 26 10,054 17 8,544
8 23,609
781 2,081 2,760 2,888
I 5,560 4 4,636
2,723 2,180
626 897
1,364 1,559 3,069 2,416 1,308
855
709 2,431 4,567 5,743
10,924 8,052 3,277 1,652
2
2,146 42,934
158 1,321 178 3,722 19B 5,5BO 2t8 5,942 517 11,272 421 8,541 254 4,248 171 2,305
:3
1,394 1,732 1,637 1,617 3,166 2,133
956 505
5
7,359
246 557 866
1,045 2,088 1,492
792 269
4
3,2i3
247 335 376 3991 8BO 583 263
157
3
2,363
204 270 2B5 299 670' 403 154
78
48~
2,110 5,362 7,325
12,906 7,727 3,787 2,147
53,510
468 2,702 6,996 9,200
15,329 9,046 4,275 2,493
23,153
231 983
2,321 3,330 6,961 4,916 2,650 1,761·
Q,591
137 530
1,197 1,715 3,522 2,380 1,293
817
880 11,562
43 94 65 453 91 1,124
100 1,615 210 3,439 180 2,536 109 1,357 79 944
:3
22 23 24 25
5,7119- 548,598 21,604 258,779
487 12,229 1,040 37,M5 1,065 66,283
881 77,023 1,297 142,312
685 107,358 252 61,950
82 43,556
42
1;325 263,813
146 6,483 215 20,053 217 32,232 181 3,,995 293 68,423 174 48,859
71 28,708 28 21,049
11
4,454 284,785
341 5,746 825 17,792 848 34;051 700 39,028
1,004 73,889 511 5!l,499 III I 33,242 54 22,507
1,039
81 124 169 143 241 170 70
41
31
156,234
2,765 9,778
18,185 20,884 39,556
31,362 19,040 14,658
6
571 74,012
47 1.341 74 +,936
120 &,830 17 10,300
11"1 1(1,769 78 13,952 40 8,658 18 7,023
3
468 82,222
34 1,424 50 4-,642 49 9,355 66 -10,584-124 20,'67 92 17,410 SO 10,162 23 7,635
3
634 838
1,270 1,828 5,266 5,322 3,590 2,842
14
1,742 10,033 24,078 39,451 85,285 65,193 25,544 7,442
11
14,481 119,364
500 856 620 4,733 877 11,474-
1,312 18,/06 3,559 3B,933 3,480 28,768 2,333 12,164 1,798 3,721
2 9
7,123 139,ilS
134 886 218 5,300 393 12,604 516 20,745
1,707 46,352 I,M2 36,425 1,257 13,380 1,044 • 3,721
12 2
6,457 61,953
161 340 238 2,185 449 5,672 559 8,698
1,557 19,900 1,509 16,270 1,068 6,622 916 2,265
4,419
129 192 329 419
1,099 978 689 584
26,991
157 923
2,665 4,102 8,B38 6,469 2,831 1,006
2,038 34,962
32 183 46 1,262
120 3,007 140 4-,596 458 11,062 531 9,801 379 3,791 332 1,259
1
26 27 28
6,007 783,256 72,445
489 20,548 781 34,241 814 77,868 873 134,469
1,473 249,438 956 153,909 429 77,080 191 35,611
3,921 3,976 9,083
11,419 20,100 13,465 6,718 3,757
92 6
2,886 20i,551 '33,717
339 12,740 2,187 476 20,868 1,911 381 50,853 3,943 396 93,/21 5,379 633 Ib3,532 9,294 405 93,409 6,154 179 47,025 3,083 77 22,328 1,762
75 4
3,121 278,705
150 7,808 305 13,373 433 27,015 477 40,74.8 840 85,906
551 60,500 250 30,055 114 13,283
17
38,728
1,734 2,065 5,140 6,040
10,806 7,311 3,635 1,995
'2
815 217,505 18,981
59 3,955 675 72 8,564 926
116 22,306 2,322 112 35,934 2,687 203 68,192 5,299 154 44,253 3,612 67 22,901 1,9~7
32 11,383 1,282
17
469. 127,608
52 1,953 55 4,627 ,0 13,975 59 23,793
113 40,578 69 23,533 35 12,486 16 6,651
12
8,052
840 420 966
1,164 2,230 ,1,544-
825 543
346 89,897 10,929
7 2,002 335 17 3,937· 506
-46 8,331 1,356 53 12,141 1,503 90 27,614 3,069 85 20,720 2,268 32 10,415 1,152 16 4,732 739
••
TABLE B-1 PART A
x
Non-workers Agegroup
,.... ___ .A--__ _
Males Females
29
13,799,6<10
11,665,157 1,031,235
428,218 148,786 104,061 62,700 63,429
294,312
1,742
12,162,041
10,495,832 822,271 311,800 112,353
7''1.079 46,638 48,174
246,222
1,672
1,637,599
1,169,325 208,964 116,418
36,433 26,982 16,062
15,255 48,090
70
3,121,171
2,547,771 269,754 120,208 39,978 25,642 15,774 16,801 84,122
1,121
2,6B4,90~
~,238,950 213,149
87,998 30,122 19,IIB 11,8Z7 12,835 69,787
1,116
436,269
- 308,821 56,605 32,210 -9,656 6,524 3,947 3,966
14,335
5
30
25,064,850
11,269,306 1,869,992 1,985,925 1,832,073 3,103,066 2,149,552 1,328,792 1,522,948
3,196
22,663,171
10,198,273 1,660,870 1,777,380
1,640,185 2,795,671 1,959.212 1,224,679
1,404.676
2,219
2,401,679
1,071,033 209,122 208,545 191,888 307.395 190,334 104,113 118,272
977
5,230,671
2,371,171 390,839 437,012 370,473 612,880 426,466 2i2,033 348,764
3
Total
0-14 15-19 20-24 25-29 30-39 40_49 50 ...... 49 60+
A.N;S.
Total
0-14 15-19 20-24 25-29 30-39 50-39 50-59 60+
A.N.S.
Total
0-14 15-19 20-24 25-29 30-39 40-39 50-59 60+
A.N.S.
Total
0-14 15-19 20-24 25-29 30-39 40-49 50-59 60+
1,031
&'590,379
2,089,173 334,635 382,063 323,107 531.95' 373,337 242,414 312,713
A.N. S.
990
Total
0--14 15-19 20-24· 2:5-29 30-39
40_49 50-59 60+
A.N. s. GiO,292 Total
281,998 0-14 56,204 15-111 54,949 20-24 47,366 2:1-29 80,923 30-39 53,131' 40-49 29,619 50-59 36,051 60+
51 A. N. S.
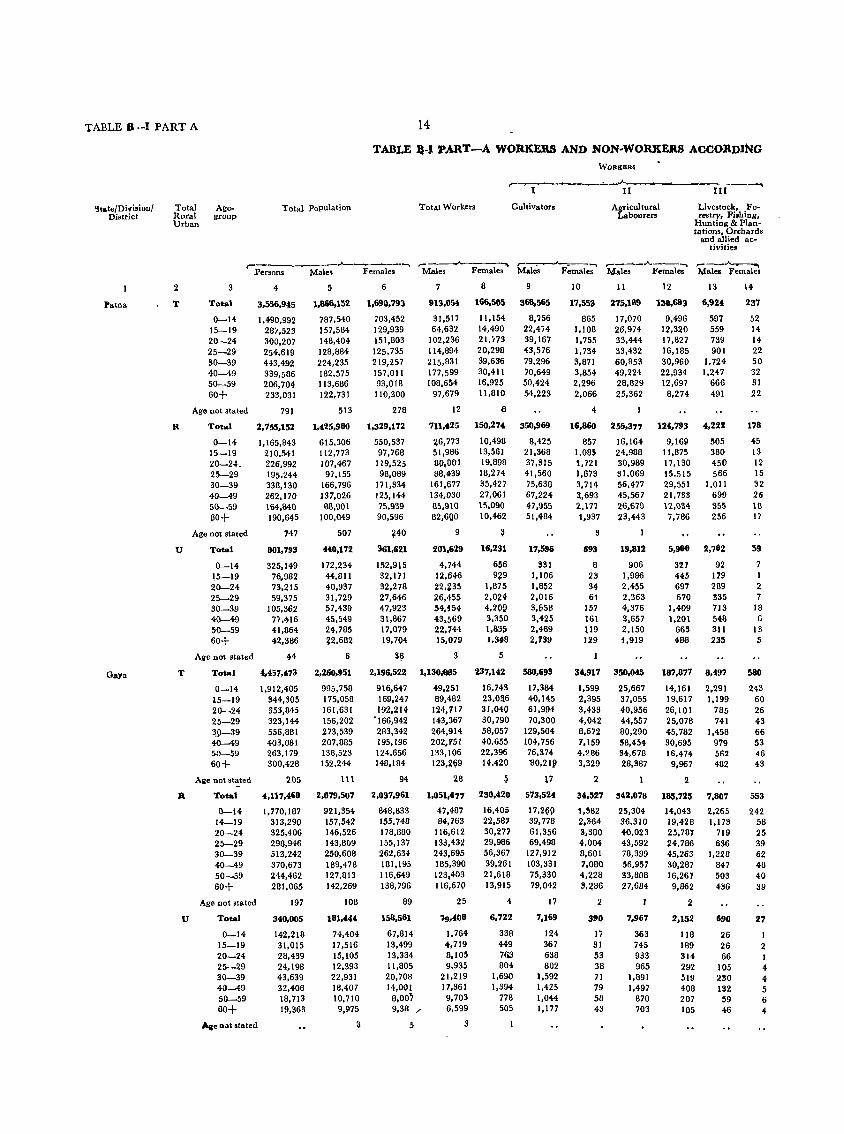
TABLE B --I PART A 14
TABLE lH PART-A WOlilKERS AND NON-WORKERS ACCORDING
WORICBRS
r- . J- .... 1 II III
'3late/Di.·l,ion/ Total Age- Total population Total Worker. Cultivators Agricultural Livestock, Fa-District Rural group Labourers restry, Fishing,
Urban Huntmg & Plan-tation., Orchards
and allied ac-tivities
r-Females
...... ,-Female;" ,-~ ....... ,---.,.11..--..... .....--_,,___ .....
.Persons Males Males Males Females Male. females Males Females
2 4 5 6 7 8 10 11 12 13 14
Patna T Total 3.556,945 1.866,152 1.691).793 913.054 166.505 368.5i5 17.553 275.189 130,693 6,924 237
0-14 1.490.992 787,540 703.452 31,517 11.154 8.256 865 17.070 9.496 597 52 15-19 28~,523 157,584 129,939 64.632 14,490 22,474 I,IOB 26,974 12,320 559 J4 20-24 300,207 148.404 151.803 102,236 21,;73 39,167 1,755 33,444 17,827 739 14
25-29 254.619 128.884 125.735 114,894 20,298 43,576 1.734 33.432 16.105 901 22
30-39 H3.492 224.235 219,251 215,831 39,636 79,296 3,871 60,853 30,960 1,724 50 40-49 339.586 182.575 157.011 177.599 30,411 70,649 3,854 49,224 22.934 1.247 32
50-59 206.704 113.686 93.018 108.654 16.925 50.424 2,296 28,829 12.697 666 31
60+ 233.031 122.731 110,300 97,679 11,810 54,223 2,066 25.362 8.274 491 22
Age pot stated 791 513 278 12 8 4
R Total 2,755,152 1,425,980 1,329,172 711,425 150,274 350,969 16,860 255,377 124,793 4,222 178
0-14 1,165.843 615.306 550,537 ~6,773 10.498 8,425 857 16,164 9,169 505 45 15-19 210.541 112.773 97.768 51,986 13,561 21,368 1,085 24,988 11,875 380 13
20-24_ 226,992 107,467 119,525 80,001 19,898 37,315 t,721 30.989 17.130 450 12
25-29 195.244 97,155 98.089 68.439 18,274 41,560 1.673 31.069 15.515 566 15
30-39 338,130 166.796 171,334 161,677 35.427 75,638 3.714 56,477 29,551 1.011 32
40-49 262,170 137,026 125,144 134,030 27,061 67.224 3,693 45,567 21.733 699 26 50-59 164,840 88,901 75.939 85.910 15,090 47.955 2.177 26,679 12,034 355 18 60+ 190,645 100,049 90,596 82,6QO 10,462 51,484 1,937 23,443 7,786 256 17
Age not stated 747 507 ~40 9 ~ '3
U Total 801,793 440,172 361,621 201,629 16,231 17,596 693 19,812 5,980 2,702 59
0-14 325.149 112.234 152,915 4,744 656 331 8 906 327 92 15-19 76,982 44.811 32,111 12,646 9~9 1,106 23 1.986 445 179 I
20-24 73,215 40.937 32.278 22,t!35 1,875 1,852 34 2.455 697 289 2 25-29 59,375 31.729 27,646 26,455 2.024 2,016 61 2.363 670 335 7 30-39 105,362 57.439 47,923 54,i54 4,209 3.558 157 4.376 1,409 713 18 40-49 n,416 45.549 31,867 4:3,569 3,350 3,425 161 3,657 1.201 548 G 50-59 41,864 24.785 17,079 22,744 1,83:; 2,469 119 2,150 663 311 13
60+ 42,386 Z2,682 19.704 15,079 1,348 2.739 129 i,919 488 23' 5
Age not stated 44 6 S~ '3 .5
GAl'a T Total 4.«5M73 2,~0,951 2,196,522 1,130,iI85 237,142 580,693 34.917 350,045 187,877 8.497 580
0-14 1.912.405 995,758 916,647 49,251 16,743 17,384 1,599 25,667 14,161 2,291 243 15-19 344,305 175,058 169,247 89.482 23,086 40,145 2,395 37,055 19,617 1,199 60 20-24 353,845 161.631 192,214 124,117 31,04Q 61,994 3,433 40,956 26,101 785 26 25-29 323,144 156,202 ·166,942 143,367 30,790 70,300 4,042 404,557 25,078 741 43 ~9-39 556,881 273,539 283,342 264,914 58,057 129,504 8,672 80,290 45,782 1.458 66 40-49 403,081 207,885 195,196 202,151 40.655 104.756 1,159 58,454 30,695 979 53 50-59 263.179 138.523 124,656 133.106 22.396 76.374 4.286 34.678 16,474 562 46 60+ 300.428 152.244 148.184 123,2(l9 14,420 '!lO.ZIl! 3,329 28,387 9.967 482 43
Aile not st~ted 205 III 94 28 ~ 17 2 2
R Total 4,117,468 2,079,507 2,037,961 1,051,477 230,420 573,524 34,527 3112,078 185,725 7,807 553
0-14 1,770,187 921,354 848.833 47,487 16.405 17,2(lO 1,582 25,304 14,043 2,265 242 14-19 313,290 157,542 155.748 84,763 22,58' 39.778 2.364 36,310 19,428 1,173 58 20-24 325.406 146.526 178.880 116,612 30,277 61,356 3,380 40,023 25,787 719 25 25-29 298.946 143.809 155,137 133,432 29,986 69.498 4.004 43,592 24,786 636 39 30-39 513,242 250,608 262,634 243,695 56,367 127,912 8,601 78,399 45,263 1,228 62 40-49 370.673 189.478 181,195 185,390 39,261 103,331 7,080 56,957 30.287 847 48 50-59 244,462 127.813 116,649 123,403 21,618 75,330 4.228 33,808 16,267 503 40 60+ 281.065 142,269 138.796 116,670 13,915 79.042 :q86 27,684 9,862 436 39
Age not stated 197 108 89 25 4 17 2 2
U Total 340,005 181,444 158,561 '19,408 6,722 7.169 3!lO 7.961 2,152 690 27
0-14 142,218 74,404 67,814 1,764 338 124 17 363 118 26 I 15-19 31.015 17,516 13.499 4,719 449 367 31 745 189 26 2 20-24 28,439 15.105 13,334 8,105 7&3 638 53 933 314 66 I 25-29 24,198 12,393 11,805 9,935 804 802 38 965 292 105 4-30-39 43,639 22.931 20.708 21,219 1,690 1,592 71 1.891 519 230 4 40-49 32.408 18.407 14,001 17,361 1,394 1,425 79 1,497 408 132 5 50-59 18,713 10.710 8,007 9,703 778 1,044 58 870 207 59 6 80+ 19,363 9.1175 9,3R ,- 6.599 505 1,177 43 703 105 46 4
Ale Dol' stated a 5 3
TO M4,IN ACTIVITY CLASSIFIED BY SEX AND AGE-GROUPS-contd.
IV
Mining and
Quarrying
WORKERS ___ ..A--__
V
Manufacturing & Processing, Servicing & Repairs
r-(';)--..A---~""",, Household Other than Industry Household
Industry
VI I'll
Tlade & Commerce
VIII
l'ransport
IX
Other Services
r--"---..A.---~ ,..---"---""""\ r---J.--~ Male. Females M.les Females Males Female,
Construction ,----"---... Males Females
,.... ----..A.----.. •
Males Females
Storage and Communications ,.----..... - ... Males Females
r---"--..., Males Females
15
387
II 30
111 131 64 27 13
10 23
105 III 60 23 12
43
I 7 6
20 4 4 I
2,548
60 133 266 411 819 5&5 19B 106
2 •• 73
60 133 257 400 792 539 189 103
75
9 II 27 16
9 3
16 17
24 33,229
I 1,132 9 2,964 2 4,157 o 4,526 I 8,207 3 6,B39
4,039 3,364
20 21,5.5
606 9 1,614 2 2,533 7 2,832 I 5,044
4,224 2.531 2,160
4 13,684
2
246
23 24 21 33 66 48 22
9
526 1,350 1,624 1.694 3,163 2,615 1,508 1,204
38,815
1,229 3,044 4,455 4,947 9,426 7,376 4,499 3,B39
242 33,250
23 1,051 24 2,629 21 3,798 33 4,278 65 8,063 46 6,271 21 3,827
9 3,333
"
1 2
5,565
118 415 657 669
1,363 1,105
612 506
18
.,411
260 334 477 503
1,098 839 454 365
1
19
32,987
1,151 3,064 4,708 4,942 8,486 6,065 2,841 1,730
3,51. 9,387
194 287 250 792 401 1,338 480 1,580
081 2,499 675 1,649 340 754 285 488
66 64 76
103 217 164 106 80
5,333
345 462 632 630
1.347 1,008
561 348
4,673
273 404 562 554
1,182 874 476 298
710
72 58 70 76
165 134
85 50
864 2,272 3,370 3,362 5,987 4,416 2,087 1,242
18,445
470 1,584 2.533 2,845 4,944 3.266 1,720 1,082
10,149
228 795
1,434 1,642 2,797 1,753
915 584
8,296
242 789
1,099 1,203 2.147 1.513
805 490
20
1,121
116 156 156 142 249 174 78 47
21
10,191
68 426
1,002 1,412 3,022 2,215 1,172
874
713 3,941
95 43 120 195 119 400 91 544
142 1,154 95 820 33 449 18 336
21 36 37 51
107 79 45 29
3
650
33 48 60 74
156 129 83 67
373
20 27 32 47 99 69 46 33
25 231 602 868
I,B68 1.395
723 538
6,822
101 308 703 950
1,985 1,437
823 515
4,112
52 190 467 625
1,235 624 448 271
277 2,710
13 49 21 118 28 236 27 325 57 750 60 613 37 3i5 34 244
22 23
356 62,013
24 1.003 32 3,675 ~3 7,363 56 8,273 02 15.591 61 12.813 20 7,500 18 5,792
3
258 19.599
22 311 29 1,264 55 2,375 39 2,627 50 4,767 37 3,835 14 2,387 12 2,032
93 !l'l,Uil
2 692 3 2,411 8 4,988
17 5,646 32 10,824 24 8,978
6 5,113 6 3.760
2
554 47,728
42 896 62 3,100 91 5,605 76 6,317
136 12,004 89 9,395 40 5,860 18 4,549
277
20 43 62 33 57 33 23 6
2
26,943
559 1,889 3,31B 3,802 6.'i65
4,924 3,157 2,527
2
277 20,7115
22 337 19 1.211 29 2,287 43 2,515 79 5,239 56 4,471 17 2.703 12 2.022
24 25
2,703 28,911
51 115 85 945
192 2,735 220 3,907 643 9,219 666 7,825 446 3,090 400 1,075
1,541 9,238
34 48 56 295
134 934 135 1,352 372 3,007 352 2,256 237 976 221 370
1,162. 19,673
D 29 5B 85
271 314 209 179
1,929
84 96
152 15S 454 435 287 263
\,453
75 86
110 122 347 325 203 185
67 650
I,BOI 2,555 6,212 5,569 2.114
705
17.716
104 561
1,546 2,574 5,623 4,727 1,928
652
9,098
43 271 873
1,442 2,966 2.236
946 313
476 8,626
9 61 10 290 42' 673 36 1,132
107 2,657 110 2.491
84 982 78 339
26 27
390' 92,658
15 1,625 32 3,540 73 8.891 63 13,814 85 29.302 72 20.658 34 10,066 Ib 4,755
187 36,803
14 24 37 29
384 I,OBO 3,644 6,204
37 11,969 22 7.69:3
3,001 2.019
17 7
I 8
36 34
6
1.241 2,460 5,24, 7,610
48 17,333 50 12.962 17 6,265
9 2,736
237 59,576
17 1,049 19 2,353 20 5,674 32 9,725 68 18,861 49 11,806 20 6,464 12 3,438
6
127 '2,051
II 665 10 1.595 II +,367 17 7,517 34 13,538 28 7.708 10 4,280 ,6 2.377
4
110' 17,525
6 384 9 758 9 1.507
15 2,208 34 5,323 21 4,098 10 2.IS4
6 1,061
2
28
9,817
274 400
1,214 1,285 2,597 1.776
869 602
2,210
68 100 287 290 647 427 212 179
6,SO'
206 300 927 995
1.950 1,349
657 423
4,819
196 253 504 624
1,310 990 577 364
2,520'
116 143 287 351 657 471 304 191
2,299
80 110 217 273 653 519 273 173
'!:ABLE B-1 PARr A
X
Non ... workers Agegroup
,.-------'-----, Males Females
29
953,898
756.023 92,952 46,168 13,990 8.404 4,976 5,032
25,052
501
714,555
588,533 60,7'07 27,466
8,716 5,119 2,996 2,991
17,449
498
233,543
167,490 32,165 IB,702 5,274 3,285 1,980 2,041 7,603
3
1,138,066
946.507 ~5,576
36,914 12,835 8,625 5,134 5,417
28,\175
83
1,028,830
873,867 72,779 29.914 10,377 6,913 4,088 4.410
25,599
83
102,036
72,640 12.797
7,000 2,458 1,712 1,046 1,007 3,376
30
1,524,288
692,298 115,449 130,030 105,437 179,621 126,600 76,093 98,490
270
1,178,898
540,039 84,207 99,627 79,815
135,907 98,083 60,849 80.134
3
Total
0-14 15-19 20-24 25-29 30-39 40-49 50-59 60+
A.N.S.
Total
0-14 15-19 20-24 25-29 30-39 40-49 50-59 60+
237 A. N, S.
36,391) Total
152.259 31,242 30,403 25,622 43,714 28.517 15,244 18,356
33
1,959.380
899.904 146,211 161,174 136,152 225,285 154,541 102,260 133,764
0-14 15-19 20-24 25-29 30-39 40-49 50-59 60+
A·N. s. Tot .. l
0-14 15-19 20-24 25-29 30-39 40-49 50-59 60+
B9 A. N. S.
1,807,541
832,428 133,16I' 148,603 125,151 206,267 141,934 95,031
124,881
Total
0-14 15-19 20-24 25-29 30-39 40-49 50-59 60+
85 A. N. S.
151,839
67,476 13,050 12.571 lI,OOI 19,018 12,607
7,229 8,883
Total
0-14 15-19 20-24 25-29 30-39 40-49 50-59 60+
4 A. N.S.
1'A:BL~ .B-1 PART A 16
TABLE B-1 PART A-WORKERS AND NON-WORKERS ACCORDING
WORKBl\S
,... ""' Total Age. TotalPopulation II III State(Dlvi,ionl Total Wocker. Livestock, Fore, .. District Rural group Cultivators Agricultural try, Fishing, Urban
Labourers Hunting & Plan· tations, Orchard.
and allied actio vities
";'__----, .-___ .J.-_ __ -. .--_.A.......-...., r----'----. ,....
r--~"'" Persons Males Females Males Females Males Females Males Females Males Females 2 3 4 5 6 8 9 10 II 12 13 14
Shahabad T Total 3,939,034 2,023,108 1,915,926 985,101 163,923 452,527 15,641 328,163 139,305 9,216 Gol 0-14 1,670,226 880,023 790,203 34,782 11,234 8,960 477 21,024 10,067 1,369 126 15-19 304,635 161,041 143,594 69,815 14,415 25,399 679 33,042 12,896 1,098 34 20-24 305,893 139,901 166,992 102,775 21,184 42,350 1,195 38,266 10,571 1,012 43 25-29 292,622 141,422 151,200 128,269 22,316 53,446 1,643 43,620 18,838 1,143 53 30-39 4~3,444 241,770 251,674 233,157 43.700 101.290 4,044 13,913 35.964 1,986 124 40-49 364,322 183,29. 176,028 Hl2,630 30.701 85,177 3,584 56,603 24,222 1,318 99
5~-59 HO,218 130,739 109,479 124,387 15,799 66,808 2,126 35,194 12.053 800 77 60+ 265,446 139.364 126,082 1()9.269 9.572 69,089 1,893 26,501 6.692 500 45 Age not stated 1,228 554 674 17 2 B 2
II Total 3,615,151 1,841,599 1,161,552 9l)5,282 163,612 443,961 15,461 318,464 131,287 7,908 511 0-14: 1,537.311 809,578 727,739 33.028 II.033 8,832 477 20,605 9,962 1,291 124 15-19 276,084 144,731 131,353 65,148 14,086 25,016 677 32,185 12,744 1,014 34 20-24 279,760 125.324 154,436 94.706 20.603 41,609 1.192 37.141 18.316 816 43 25~W 268.849 129,057 139,792 118.028 21.651 52.587 1,634 42.380 18,539 990 51 30-39 451,005 218,828 232,177 211.742 42,394- 99,410 4,013 71,667 35,441 1.579 120 4,0-49 333,044 170,169 162,875 165,426 29,555 83,434 3,534 54,813 23,833 1,077 89 50-59 221.778 120,085 101,693 114,651 15.159 65.503 2,086 34,090 11,872 662 68 60+ 246.108 129.281 116.827 102.542 9.129 67,562 1.848 25.583 6,578 419 42
Age not stated 1.206 546 660 11 2 8 2 U Total 323,883 115,509 148.374 ')'9,819 5,311 8,566 180 9,699 2,018 1.308 30
0-14 132.909 70.445 62,464 1.754 201 128 419 105 68 2 15-19 28.551 16.310 12,241 4.667 329 383 2 857 152 84 20-24 27,133 14,577 12,556 3,069 581 741 3 1.125 255 136 25-29 23.7'13 12.365 11,408 10.241 665 859 9 1.240 299 153 2 30-39 42.439 22,942 19,497 21,415 1.306 1,880 31 2,246 523 407 4 40-49 31.278 18,125 13,153 17.204 1,146 1,743 50 1.790 389 241 10 50-59 18,440 10.654 7.786 9.736 640 1,305 40 1,104 181 138 9 60+ 19.338 10.083 9.255 6.727 443 1.527 4-5 918 114- 81 3
Age not stated 22 8 14 6 "
TIRHUT DIVISION • T Total 11,896,941 8,995,425 8.901.516 4,713,571 606,154 2,142,438 74,806 1,974,314 491,(64 28,333 1,951 0-14 1.506,554 3,938.397 3.568,157 267,546 46,436 78.171 3,062 168,025 40,520 6,604 856
15-19 1,397.672 743.056 654,616 441,158 47.052 168.475 2.938 234,074 41.678 3.646 176 20-24 1,342,789 614,780 728,009 496,877 58,768 213,946 3,947 219,723 51,044 2,651 121 25-29 1,275,841 598,349 677,492 557.165 65.268 238.593 5,329 230,810 55,294 2,852 121 30-39 2.318.795 1,092,074 1.226.721 1,061,163 149,299 460.574 16,658 435.304 122.755 5,241 211 40-49 1,802.784 893,218 909.566 873.967 125.438 409.543 18.367 345.743 98.696 3,901 226 50-59 1,123,701 573.334 550.367 554.947 69,059 291,247 12,515 198,625 51.706 2,040 140 60+ 1.128,163 541.952 585,211 450,662 44,793 281,873 11.980 142.043 29,762- 1,394 99
Age not stated 642 265 377 86 41" i6 10 • 2~. .JJ ..4:
R Total 17,016,740 8,531,713 8.515,027 4,497,263 590,668 2,118,578 74,007 l,9ft,516 485,654 26,001 1,902 0-14 7,133,693 3,757,287 3,408,406 260,810 45.662 77,698 3,033 166.162 40,125 6,415 850
15-19 1,118,550 696,453, 622,097 426,473 46.200 167,119 2.910 230.614 41,303 3,456 174 20-24 1.268,630 573.773 694.857 474-.403 57.190 211,751 3.883 215,931 50.482 2,445 1I7 25-29 1,213,063 555,508 647,555 530,010 63,505 235,948 5,271 226,906 54,679 2,511 117 30-39 l,205.845 1,031,333 1,174,512 1,001.840 145.443 455.400 16.526 427,779 121,332 4,668 207 40_49 1,717,845 844,534 873,311 BlB.102 121,972 404.771 18,193 339.634 97.336 3,424 213 50-59 1,074.748 544,661 530.087 528.741 67.164 287,690 12,365 195,005 51.055 1,807 129 60+ 1,081,857 517.939 553,918 443.834 43;511 278,194 11.824 139,474 29,333 1,213 95
Age no t stated 509 225 284 50 21 7 2 11 9 .2
u Total 850,201 463,712 386,489 216,308 15,486 23,8Go 799 32,858 5,810 2,332 49
0-14 3~O,861 181,110 159,751 6,736 774 473 29 1.863 395 189 6 15-19 79,122 46,603 32.519 14,685 85~ 1,356 28 3.460 315 190 2 20-24 74,159 41.007 33,152 22,474 1,578 2.195 64 3.792 562 206 4 25-29 62,778 32,841 29.937 27,155 1.763 2,645 58 3,904 615 281 4 30-39 112.950 60,741 52.209 56.323 3.856 5.174 132 7,525 1.423 573 4 40-49 84.939 48.684 36,255 45.865 3,466 4.772 174 6.109 1.360 477 13 50-59 48,953 28.673 20,280 26.206 1,895 3,557 150 3,620 651 233 11 60+ 46.306 24.013 22.293 16,826 1,282 3,679 156 2,569 429 181 4
Age not stated 133 40 93 36' ·:to 9 8 16 2
17
TO MAIN ACrIVlTY CLASSIFIED BY SEX: AND AGE.GROUPS...,-contd.
~'----~~--~~----------------
IV
Mining and Quarrying
V Manufacturing, Processing,
ServlCiug & Repairs ~ ___ - ___ .A. ____ ~
(a) (b) Household Other than Industry Household
Industry
~----------------------------------------------. VI'
Construction
VII
Trade & Commerce
VIII IX
Transport, Other Services Storage and
Communicati ons
TABLE B-1 PART ~
X
N on-workers
Agegroup
~_,_____.,_--- r---.A-..-, r---'----.... r--'----.... ~-_..A......-"'"""\ '---'''''''__"-I (" -..A..-_"""",, r-----"--- ........ Male. Females Males Females Males Females Males Females Males Females Males Females Males Females Males - Females
15
2,136
57 95
324 569 707 216
72 96
2,093
57 94
323 559 693 204
68 95
43
1 1
10 14 12 4 1
1,081
22 65
117 177 377 220
53 26
1,044
22 ·63 144 169 361 212 50 23
43
2 3 8
16 8 3 :I
16 17 18 19 20 21 22 23 24 25
121 30,970 4,496 28,859 1,472 6,140 129 46,493 1,825 15,326
14 15 15 10 27 19 5, 8
643 2,074 3,152 3,719 7,493 6,129 4,239 3,521
179 279 453 594
1,141 990 547 313
409 1,505 2,906 3,898 8,766 7,262 2,964 1,145
4
98 131 160 183 475 280 102 43
62 249 616 968
1,954 1,264
655 372
121 26,610 3,957 17,821 1,277 3,538
14 15 15 18 27 19 5 8
566 1,758 2,673 3,194 6,459 5,213 3,696 3,051
4,360
77 316 479 525
1,034 916 543 470
44 8,,714
5 3,788 4 8,262 5 9,838 5 11,110
14 21,269 9 13,823 2 10,480
8,144
159 243 401 525
1,006 867 484 272
194 844
1,795 2,521 5,628 4,650 1,608
580
539 11,038
20 36 52 69
135 123 63 41
12,431
912 933
1,186 1,337 2,895 2,588 1,520 1,056
4
215 661
1,111 1,377 3,138 2,612 1,356
565
82,234
2,084 6,009 9,732
11,474 21,131 17,399 9,679 4,725
43 76,943 11,494 53,809
\5 3,262 855 1,396 4 7,087 865 4,125 5 8,344 1,103 6,827 5 9,552 1,218 8,410
14 18,229 2,669 15,339 8 14,391 2,385 12,445 2 9,055 1,415 6,966
7,023 980 3,301
12,771
526 1,175 1,494 1,558 3,040 2,432 1,425 1,121
4
937 23,425
57 688 68 1,884 83 2,905
119 3,064 226 5,792 203 4,954 105 2,713 76 ),424
89 123 134 161 429 239 75 27
42 145 330 546
1,133 736
396 210
195 2,602
9 8
26 22 46 41 27 16
20 104 286 422 821 528 259 162
2,512 17,087
190 171 243 742 238 1,913 252 2,740 556 5,310 509 3,340 347 1,804 175 1,067
2
2,208 11,007
179 134 218 546 212 1,377 227 1,823 482 3,428 434 2,017 305 1,052 149 630
2
304
11 25 26 25 74 75 42 26
6,080
37 196 536 917
1,882 1,323
752 437
15 866 30 3,003 15 5,217 11 6,294 23 11,961 20 9,154 10 5,680
5 4,317
26 57
105 181 460 408 335 253
121 679
1,391 2,217 5,058 3,718 1,604
538
36 27,470 1,425 8,663
5 2 3
10 8 3
471 1,/83 3,137 3,871 7,237 5,193 3,314 2,464
93 19,023
10 395 28 1,220 12 2,080
6 2,423 13 4,724 12 3,961 7 2,366 5 1,853
94 131,708
11 3,243 8 9,727
12 15,720 12 18,468 21 34,181 16 25,318 II 14,910 3 10,138
3
58 77,775
8 2,141 B 6,302 B 9,575
12 11,429 11 20,407 4 14,115 6 8,133 1 5,668
36 53,933
3 1,102 '3,425
4 6,145 7,039
10 13,774 12 11,203 5 6,772 2 4,470
3
20 50 85
162 380 301 249 178
66 357 858
1,308 2,865 1,977
909 323
400 6,663
6 7
20 19 80
107 86 75
55 322 533 909,
2,193 1,741 695 215
5,690 49,534
108 260 164 1,768 266 4,335 421 6,992
1,388 15,906 1,595 12,946
986 5,632 751 1,643
11 2
4,143
94 130 202 331
1,038 1,148
684 515
32,038
140 1,054 2,955 4,768
10,221 8,101 3,722 1,076
1,547 11,496
14 120 34 714 64 1,430 90 2,224
350 5,685 447 4,845 302 1,910 236 567
10 1
26 27 28 29 30 3
188 65,271 5,145 1,038,007 1,747,003 Total
27 1,281 21 2,671 23 7,541 17 12,395 50 20,029 33 11,789 1~ 6,371 4 3,190
4
205 273 604 778
1,392 1,046
531 316
155 48,754 3,322
27 904 21 1,952 22 5,964 13 10,072_ 42 15,071
156 177 392 543 926 646 309 173
19 8,129 8 4,405 3 2,255
2
33 16,517 1,823
4 8
14 5 1
377 719
1,577 2,323 4,958 3,660 1,966
935
2
287 197,062
9 5,178 27 8,390 21 18,822 32 33,949 67 61,870 68 38,734 43 20,477 19 9,609
33
49 96
212 235 466 400 222 143
16,875
763 881
1,928 2,465 4,734 3,364 1,789
948
3
169 153,552 10,99_Q
6 3,440 507 27 6,107 561 17 15,054 1,161 29 28,434 1,616 38 49,00B 3,126 32 28,992 2,219 12 15,256 1,191
8 7,232 606
29
118 43,510
3 1,738 2,283
4 3,768 3 5,515
29 12,862 36 9,742 31 5,221 11 2,377
4
5,885
256 320 767 849
1,608 1,145
598 342
845,241 91,226 37,126 13,153 8,613 5,664 6,352
30,095
537
778,969 129,179 145,806 128,884 2M,974 145,327 93,680
116,510
0-14 15-19 20-24 25-29 30-39 40-49 50-59 60+
672 A, N, S,
942,317 1,603,940 Total
776,550 79,583 30,618 11,029 7,086 4,743 5,434
26,739
535
95,690
68,691 11,643
6,508 2,124 1,527
921 918
3,356
2
4,281,854
3,670,851 301,898 117,903
41,184 30,911 19,251 18,387 81,290
179
4,034,450
3,496,477 269,980
99,370 35,498 26,493 16,432 15,920 74,105
175
247,404
174,374 31,918 18,533 5,686 4,418 2,819' 2,467 7,185
4-
716,706 117,267 133,833 118,141 189,783 138,320 86,534
107,698
0-14 15-19 20-24 25-29 30-39 40-49 50-59 60+
658 A,N, S.
143,063 Total
62,263 11,912 11,975 10,743 18,191 12,007
7,146 8,812
0-14 15-19 20-24 25-29 30-39 40-49 50-59 60+
14 A,N.S.
8,295,362
3,521,721 607,564 669,241 612,224
1,077,422 784,128 481,303 541,418
Total
0-14 15-19 20-24 25-29 30-39 40-49 50-59 60+
336 A,N. S,
7,924,359
3,362,744 575,897 637,667 584,050
1,029,069 751,339 462,923 520,407
Total
0-14 15-19 20-24 25-29 30-39 40-49 50-59 60+
263 A.N, S,
371,003
158,977 31,667 31,5H 28,174 48,353 32,789 18,385 21,011
Total
0-14 15-19 20-24 25-29 30-39 40-49 50-59 60+
73 A.N. S.
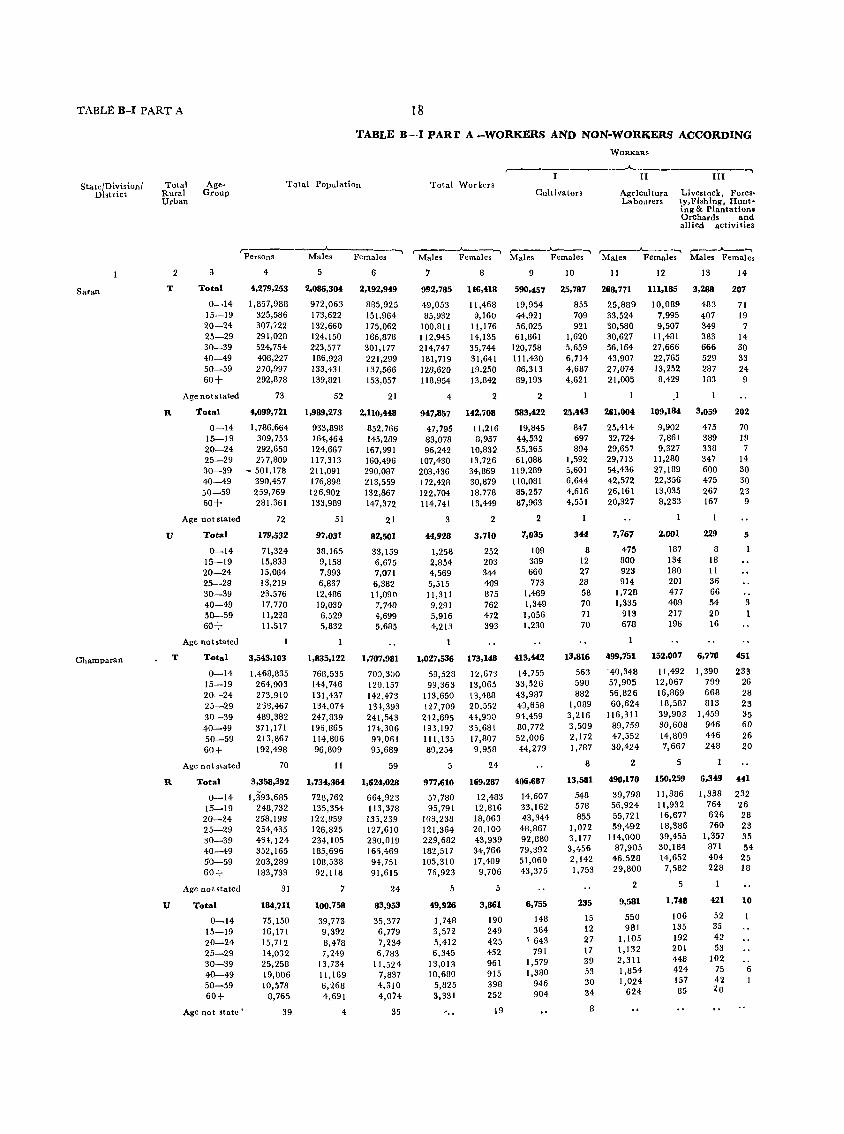
TABLE B-1 PART A 18
TABLE B--I PARr A -WORKERS AND NON-WORKERS ACCORDING
WORKERS
,-~ "'I-I ------IU-....... State/Division/ Total Age- Total Population Total Workers
District Rural Group Cultivators Agrlcul tura Livestock, Fores .. Urban Labourers ty,Fishlng, Hunt-
ing & Plantations Orchards and allied activities
,.... -"-----..... ,.... ___ .A.--_ ....... ,-__ .A..-__ -.. ,-___ .A--..... ,----"---. PersOns Males Females Males Females Males Females Male. Females Males Females
2 3 4 5 6 7 8 9 10 11 12 13 14
Saran T To.tal 4,279.253 2.086.304 2.192.949 992.785 U6.418 590.457 25.787 268.771 111.185 3.288 207
0-14 1,857,988 972,063 885,925 49,053 11,468 19,954 855 25,889 10,089 483 71 15-19 325,586 173,622 151,964 85,932 9,160 44,921 709 33,524 7,995 407 19 20-24 307,122 132,660 175,062 100,811 11,176 56,025 921 30,580 9,507 349 7 25-29 291,028 124,150 166,878 112,945 14,135 61,861 1,620 30,627 11,481 383 14 30-39 524,754 223,577 301,177 214,747 35,744 120,758 5,659 56,164 27,666 666 30 40-49 408,227 186,928 221,299 181,719 31.641 111,430 6,714 43,907 22,765 529 53 50-59 270,997 133,431 137,566 128,620 19,250 86,313 4,687 27,074 13,252 287 24 60+ 292,878 139,821 153,057 118,954 13,842 89,193 4,621 21,005 8,429 183 9
Age not stated 73 52 21 4 2 2 1
R 1'otal 0&,099.721 1.989.273 2.110.448 947.857 142.708 583.422 25.4'13 261.004 109.184 3.059 202
0-14 1,786,664 933,898 852,766 47,795 11,216 19,845 847 25,414 9,902 475 70 15-19 309,753 164,464 145,289 83,078 8,957 44,532 697 32,724 7,861 389 19 20-24 292,658 124,667 167,991 96,242 10,832 55,365 894 29,657 9,327 338 7 25-29 217,809 117,313 160,496 107,430 13,726 61,088 1,592 29,713 11.280 347 14 30-39 - 501,178 211,091 290,087 203,436 34,869 119,289 5,601 54,436 27,189 600 30 40-49 390,457 176,898 213,559 172,428 30,879 110,081 6,644 42,572 22,356 475 30 50-59 259,769 126,902 132,B67 122,704 18,778 85,257 4,616 26,161 13,035 267 23 60+ 281,361 133,989 147,372 114,741 13,449 87,963 4,551 20,327 8,233 167 9
Age not stated 72 51 21 3 2 2 1
U Total 179.532 9?'o31 82,501 44,928 3.710 7.035 344 7.767 2,001 229 5
0-14 71,324 38,165 33,159 1,258 252 109 8 475 187 8 I
15-19 15,833 9,158 6,675 2,854 203 389 12 600 134 16 20-24 15,064 7,993 7,071 4,569 344 660 27 923 180 II
25-29 13,219 6,837 6,382 5,515 409 773 28 914 201 36 30-39 23,576 12,486 11,090 11,311 875 1,469 58 1,728 477 66
40-49 17,710 10,030 7,740 9,291 762 1,349 70 1,335 409 54 3
50-59 11,228 6,529 4,699 5,916 472 1,056 71 913 217 20 1 60+ 11,517 5,832 5,685 4,213 393 1,230 70 678 196 16
Age not stated
Champaran T Total 3,543.103 1.835.122 1.707,981 1.027.536 173.148 413.442 13.816 499.751 l52.007 6.770 451
0-14 1,468,835 768,535 70J,300 59,528 1l(,673 14,755 563 ·40,348 11,492 1,390 233
15-19 264,903 144,746 120,157 99,363 13,065 33,526 590 57,905 12,067 799 26
20-24 273,910 131,437 142,473 113,650 13,488 43,987 882 56,826 16,869 668 28
25-29 23g,467 134,074 134,393 127,709 20,552 43,658 1,089 60,624 18,587 813 23
30-39 489,382 247,839 241,543 242,695 H,9JO 91,459 3,216 116,311 39,903 1,459 35
40-49 371,171 196,865 174,306 193,197 35,681 80,772 3,509 89,759 30,608 946 60
50-59 213,857 114,806 93,061 111,135 17,807 52,006 2,172 47,552 14,809 446 26
60+ 192,498 96,809 95,689 80,254 9,958 44,279 1,787 30,424 7,667 248 20
Age not stated 70 11 59 5 24 8 2 5
R Total 3.358.392 1,734.364 1.624.028 977.610 169.287 406.687 13,581 490.170 150.259 6.349 441
0-14 1,393,685 728,762 664,923 57,780 12,483 14,607 548 39,798 11,386 1,338 232
15-19 248,732 135,354 113,378 95,791 12,816 33,162 578 56,924 11,932 764 26
20-24 258,198 J 22,959 133,239 103,238 18,063 43,344 855 55,721 16,677 626 28
25-29 254,435 126,825 127,610 121,364 20,100 48,867 1,072 59,492 18,386 760 23
30-39 454,124 234,105 230,019 229,682 43,939 92,880 3,177 114,000 39,455 1,357 35
40-49 352,165 185,696 166,469 182,517 34,766 79,392 3,456 87.905 30,184 871 54
50-59 203,289 108,538 94,751 105,310 17,409 51,060 2,142 46,528 14,652 404 25
60+ 183,733 92,118 91,615 76,923 9,706 43,375 1,753 29,800 7,582 228 18
Age no t stated 31 24 5 5 2 5
U Total 184.?11 100,758 83.953 49,926 3.861 6.755 235 9,581 1.748 421 10
0-14 75,150 39,773 35,377 1,748 190 148 15 550 106 52
15-19 16,171 9,392 6,779 3,572 249 364 12 981 135 35
20-24 15,712 8,478 7,234 5,412 425 ' 643 27 1,105 192 42
25-29 14,032 7,249 6,783 6,345 452 791 17 1,132 201 53
30-39 25,258 13,734 11,524 13,013 961 1,579 39 2,311 448 102
40-49 19,006 11,169 7,837 10,680 915 1,380 53 1,854 424 75 6
50-59 10,578 6,268 4,310 5,825 398 946 30 1,024 157 42
60+ 8,765 4.691 4,074 3,331 252 904 34 624 85 20
Age not state' 39 4 35 ' .. 19 8

19 TABLE B·I PART:A.
TO MAIN ACTIVITY CLASSIFIED BY SEX AND AGE-GROUPS~contd.
,.... IV
Mininq and
Quarrying
V' Manufacturing, Processing,
Servicing & Repairs ,... _____ .A.. _____ '-,
Ca) (b) Hou,ehold Other than
I ndustry House hold Industry
WORKERS
VI
Construction
""'-,-----VII
Trade & Commerce
VIII
Transport, Storage and
Communications
IX
Other Services
X
N on~workcrs
Age. group
,... __ .A.-__ -, ,..._~ ,--..A----, r---..A----, ,-__ ..A-....... ,-__ ,.A-_...-.,. r---.A.--~ ,-----...........___ ....... Males Fem~les Males Females Males Females Males Females Males Females Males Females Males Females Males Females
15
428
6 19 56 74
149 90 24 10
412
6 17 56 71
142 87 24
9
16
2
3 7 3
257
8 31
36 39 80 53
7 3
253
8 31 36 38 79 52 6 3
4
1 1 1
16 17
9 16,651
649 1,410
3 1,718 1 1,976 3 3,832
3,178 2,109 1,779
18 19
3,380 24,4119
218 413 182 1,465 259 2,783 314 3,524 817 6,493 761 5,194 475 3,021 334 1,516
20
1,108
68 64 72
104 264 263 186 87
21
3,325
28 127 359 525
1,061 656 363 206
9 14,104 3,137 2~,027 1,050 2,337
3 I 3 1
551 -1,188 1,428 1,677 3,275 2,685 1,772 1,528
2,547
98 222 290 299 557 493 337 251
201 168 235 284 757 722 458 312
331 1,174 2,298 2,928 5,397 4,233 2,441 1,225
223 4,382
17 14 24 30 60 39 17 22
82 291 485 596
1,096 961 580 291
2B 16,895 2,439 17,284
4 6gz 3 I ,672 2 2,069 3 2,186 9 4,171 5 3,121 2 1,859
1,125
28 13,803
4 550 3 1,340 2 1,691 3 1,762 9 3.410 5 2,570 2 1,556
924
3,092
142 332 378 424 761 551 303 201
178 479 152 1,260
287 1,964 291 2,236 564 4,219 495 4,099 284 2,181 188 846
2,273
171 138 269 267 529 457 266 176
11,317
298 852
1,275 1,549 2.804 2,619 1,387
533
166 5,967
7 181 14 408 18 689 24 687 35 1.415 38 1,480 IS 794 12 313
65 63 65 96
256 244 177
84
58
3 I 7 8 8
19 9
405
35 61 35 42 91 74 47
20
326
32 54 30 38 65 58 35 14
79
3 7 5 4
26 16
12 6
21 100 271 367 765 431 248 134
988
7 27 88
158 296 225 115 72
4615
58 219 625 915
1,528 763 337
170
3,178
51 177 500 647
1,018 473 210 102
1,437
7 42
125 268 510 290 127 68
22 23
26 28,923
7 665 2,004 3,508 4,008 7,267 5,426 3,519 2,526
6 2 4 2 I 4
21 17,680
6 457 6 1,336 2 2,218 4 2,593 1 4,494
3,145 2 2,009
1,428
5 11,243
208 668
1 1 2
1,290 1,415 2,773 2,281 1,510 1,098
24
929
11 23 42 59
222 265 177 130
25
12,295
49 376
1,016 1,791 4,045 3,184 1,451
383
739 9,252
10 18 35 47
186 223 132
88
27 266 782
1,393 3,056 2,370 1,079
279
190 3,043
I 5 7
12 36 42 45 42
22 110 234 398 989 814 372 104
20 24,918 1,096 7,321
1 644 1 2,020 2 3,196 3 3,704 7 6,454 5 4,771 1 2,594
1,535
11 54 20 328 53 754 88 1,104
267 2,349 346 1,822 173 728 128 182
10
12 13,972
384 1,250 1,847
3 2,230 G 3,689
2,502
720
9 13
37 70
1QO 209 112 80
4,038
26 175
443 666
1,295 940 397 96
8
2
1 5
1,263 807
10,946 376
260 2 770 7
1,349 16 1,474 18 2,765 77 2,21>9 137 1.331 61
728 48 ,IJI
'. "I7l'1 10
3,283
28 153 311 438
1,054 882 ~31
86
26 27
64 44,238
917 1,679
5 4,417 12 8,176 17 14,312 17 8,125 10 4,459
3 2,153
28
3,743
148 162 358 526
1,064 821 435 229
'29
1,093,519
923,010 87,690 31,849 1l,205 8,830 5,209 4,811
20,867
48
30
2.046,53
874.457 142,804 163,886 152,743 265,433 189,658 118,316 139,215
Tota
o. -14 15-19 20-24 25-29 30-39 40-49 50-59 60+
46 36,560 2,877 1,041,416
19 A. N.S.
1,967,740 Total
668 1,352
4 3,829 12 7,253 14 ll,982 11 6,349
18
4 3,446 1 1,681
3 6 6 2
7,678
249 327 588 923
2,330 1,776 1,013
472
114 125 260 396 832 648 331 171
866
34 37 98
130 232 173 104 58
28 36,283 2,858
2 1,100 1 1,693
3,525 4 6,430 8 11,665 7 7,091
3 3,425 2 1,442
15
4 6 3
2
27,843
720 1,116
2,755 5,353 9,150 5,193 2,499 1,055
2
13 8,«0
380 487 770
1,077 2 2,515 4 1,898 3 926 2 67
154 144 330 422 800
572 290 146
1,632
99 70
165 234 467 340 174 83
1,226
55 74
165 188 333 232 116 63
886,103 81,386 28,425 9,883 7,655 4,470 4,198
19,248
48
52,103
36,907 6,304 3,424 1,322 1,175
739 613
1,619
841,550 136,332 157,159 146,770 255,218 182,680 114,089 133,923
19
0-14 15-19 20-24 25--29 30-39 40_49 50-59 60+
A.N.S.
78,791 Total
32,907 6,472 6,727 5,973
10,215 6,978 4,227 5,292
0-14 15-19 20-24 25-29 30-39 40-49 50-59 60+
A.N.S.
807,586 i,534,633 Totai
709,007 45,383 17,787 6,365 5,144 3,66B 3,671
16,555
6
756,754
,670,982 39,563 14,721
5,461 4,423 3,179 3,228
15,195
2
50,832
38,025 5,820 3,066
'904 "721 489 H3
1,360
4-
687,627 107,092 123,985 113,841 196,643 138,625 81,254 85,731
35
1,454,741
652,440 100,562 117,176 107,510 186,080 131,703 77,342 81,909
19
0-11 15-19 20-24 25-29 30-39 40-49 50-59 60+
A.N.S,
Total
0-14 15-19 20-24 25-29 30--39 40-49 50-59 60+
A.N S.
80,092 Total
35,187 0-14 6,530 15-19 6,609 20-24 6,331 25-29
10.563 SO 39 6,922 40-49 3,912 50-59 3,622 "":60+
16 .\.N. S,
4--2 CensUS Bihar/72
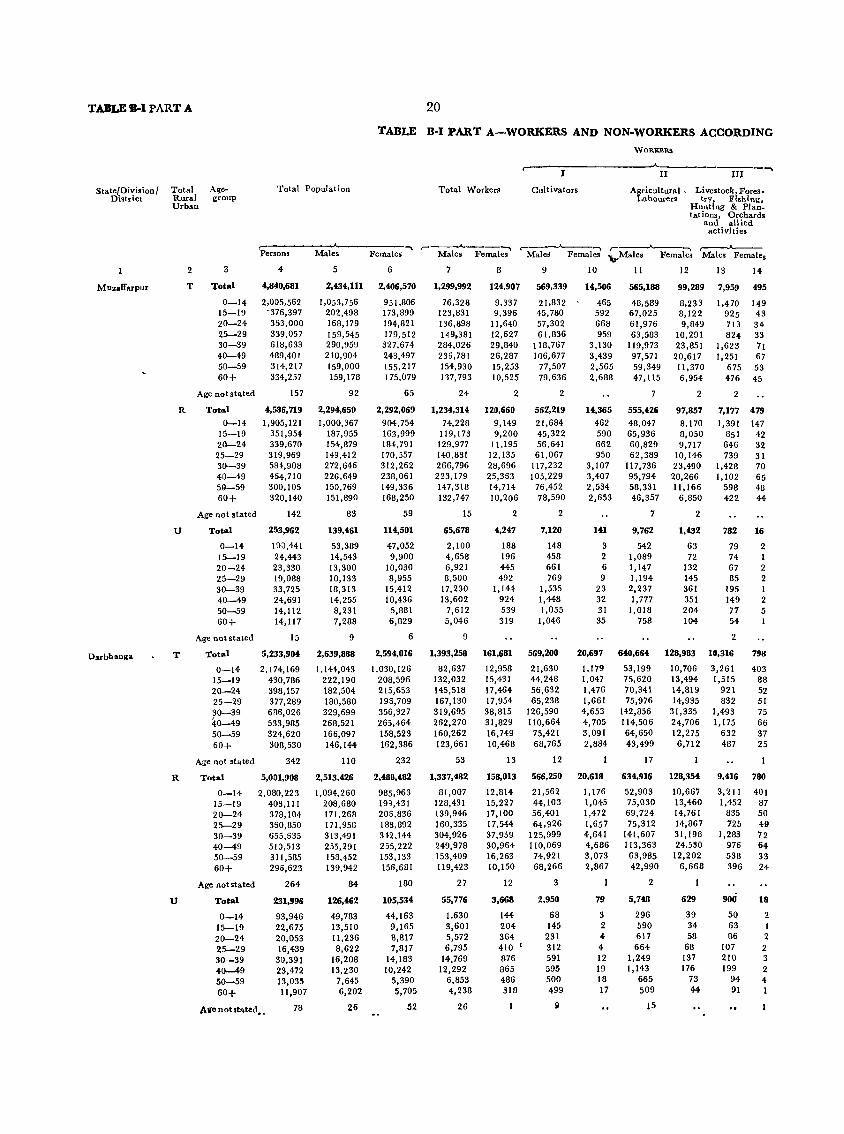
TABLED-I PART A 20
TABLE B-1 PART A-WORKERS AND NON-WORKERS ACCORDING
WORKERS
r-II III
......
State/Division/ Total Age .. Total Population Total Workers Cultivators Agricultural. Livestock, Fores-District Rural group Labourers try, Fishing,
Urban Hunting & Plan_ tations, Orchards
and allied activities
r------'--- ..... ,----'------.. ,..---.....___ ..... ,---..A. __ ..... ,--Jo--__
Persons Males Females Males Females Males Females ",Males Females Males Females
2 3 4 5 6 7 8 9 10 11 12 13 14
Muzaffarpur T Total 4,840,681 2,434,111 2,406,570 1,299,992 124,907 569,339 14,506 565,188 99,289 7,959 495
0-14 2,005,562 1,053,756 951.806 76,328 9,337 21,832 465 48,589 8,233 1,470 149 15-19 -376,397 202,498 173,899 123,831 9,396 45,780 592 67,025 8,122 925 43 20-24 353,000 168,179 194,821 136,898 11,640 57,302 668 61,976 9,849 713 34 25-29 339,057 159,545 179,512 149,381 12,627 61,836 959 63,583 10,291 824 33 30-39 618,633 290,959 327.674 284,026 29,840 118,767 3,130 119,973 23,851 1,623 71 40-49 489.401 HO,904 243,497 236,781 26,287 1()6,677 3,439 97,571 20,617 1,251 67 50-59 314,217 159,000 155,217 154,930 15,253 77,507 2,565 59,349 11,370 675 53 60+ 334,257 159,178 175,079 117,793 10,525 79,636 2,688 47,115 6,954 476 45
Age not stated 157 92 65 24 2 2 7 2 2
R Total 4,586,719 2,294,650 2,292,069 1,234,314 120,660 562,219 14,365 555,426 97,857 7,177 479
0-14 1,905,121 1,000,367 904,754 74,228 9,149 21,684 462 48,047 8,170 1,391 147 15-19 351,954 187,955 163,999 119,173 9,200 45,322 590 65,936 8,050 851 42 20-24 339,670 154,879 18~, 791 129,977 11,195 56,641 662 60,829 9,717 646 32 25-29 319,969 149,412 170,557 140,881 12,135 61,067 950 62,389 10,146 739 31 30-39 584,908 272,646 312,262 266,796 28,696 117,232 3,107 117,736 23,490 1,428 70 40-49 464,710 226,649 238,061 223,179 25,363 105,229 3,407 95,794 20,266 1,102 65 59-59 300,105 150,769 149,336 147,318 14,714 76,452 2,534 58,331 11,166 598 48 60+ 320,140 151,890 168,250 132,747 10,206 78,590 2,653 46,357 6,850 422 44
Age not stated 142 83 59 15 2 2 7 2
U Total 253,962 139,461 114,501 65,678 4,247 7,120 141 9,762 1,432 782 16
0-14 I()G,441 53,389 47,052 2,100 188 148 3 542 63 79 2 15-19 24,443 14,543 9,900 4,658 196 458 2 1,089 72 74 I 20-24 23,330 13,300 10,030 6,921 445 661 6 1,147 132 67 2 25-29 19,088 10,133 8,955 8,500 492 769 9 1,194 145 85 2 30-39 33,725 18,313 15,412 17,230 1,144 1,535 23 2,237 361 195 I 40-49 24,691 14,255 10,436 13,602 924 1,448 32 1,777 351 149 2 50-59 14,112 8,231 5,881 7,612 539 1,055 31 1,018 204 77 5 60+ 14,117 7,288 6,829 5,046 319 1,046 35 758 104 54
Age not stated 15 9 6 9 2
Darbbanga T Total 5,233,904 2,639,888 2,594,016 1,393,258 161,681 569,200 20,697 640,664 128,983 10,316 798
0-14 2,174,169 1,144,043 1,030,126 82,637 12,958 21,630 1.179 53,199 10,706 3,261 403 15-19 430,786 222,190 208,596 132,032 15,431 44,248 1,047 75,620 13,494 1,515 88 20-24 398,157 182,504 215,653 145,518 17,464 56,632 1,476 70,341 14,819 921 52 25-29 377,289 180,580 193,709 167,130 17,954 65,238 1,661 75,976 14,935 832 51 30-39 686,026 329,699 356,327 319,695 38,815 126,590 4,653 142,856 31,335 1,493 75 40-49 533,985 268,521 26;,464 262,270 31,829 110,664 4,705 114,506 24,706 1,175 66 50-59 324,620 166,097 158,523 160,262 16,749 75,421 3,091 64,650 12,275 632 37 60+ 308,530 146,144- 162,386 123,661 10,468 68,765 2,884 43,499 6,712 487 25
Age not stated 342 110 232 53 13 12 17
R Total 5,001,908 2,513,426 2,488,482 1,337,482 158,013 566,250 20,618 634,916 128,354 9,416 780
0-14 2,080,223 1,094,260 985,963 81,007 12,814 21,562 1,176 52,903 10,667 3,211 401 15-19 408,111 208,680 199,431 128,431 15,227 44,103 1,045 75,030 13,460 1,452 87 20-24 378,104 171,268 206,836 139,946 17,100 56,401 1,472 69,724 14,761 835 50 25-29 360,850 171,958 188,092 1GO,335 17,544 64,926 1,657 75,312 14,867 725 49 30-39 655,635 313,491 342,144 304,926 37,939 125,999 4,641 141,607 31,198 1,283 72 40-49 510,513 255,291 255,222 249,978 30,964 110,069 4,686 113,363 24.530 976 64 50-59 311,585 158,452 153,133 153,409 16,263 74,921 3,073 63,985 12,202 538 33 60+ 296,623 139,942 156,601 119,423 10,150 68,266 2,867 42,990 6,668 396 24
Age not stated 264 04 180 27 12 3 2
U Total 231,996 126,462 105,534 55,776 3,668 2,950 79 5,748 629 900 18
0-14 93,946 49,783 44,163 1.630 144 68 3 296 39 50 2 15-19 22,675 13,510 9,165 3,601 204 145 2 590 34 63 I 20-24 20,053 11,236 8,817 5,572 364 231 4 617 58 86 2
25-29 16,439 8,622 7,817 6,795 410 ( 312 4 664 68 107 2 30-39 30,391 16,208 14,183 14,769 876 591 12 1,249 137 210 3
40-49 23,472 13,230 10,242 12,292 865 595 19 1,143 176 199 2 50-59 13,035 7,645 5,390 6,853 486 500 18 665 73 94 4
60+ 11,907 6,202 5,705 4,238 318 499 17 509 44 91 I
Ale not stated •• 78 26 52 26 II 15
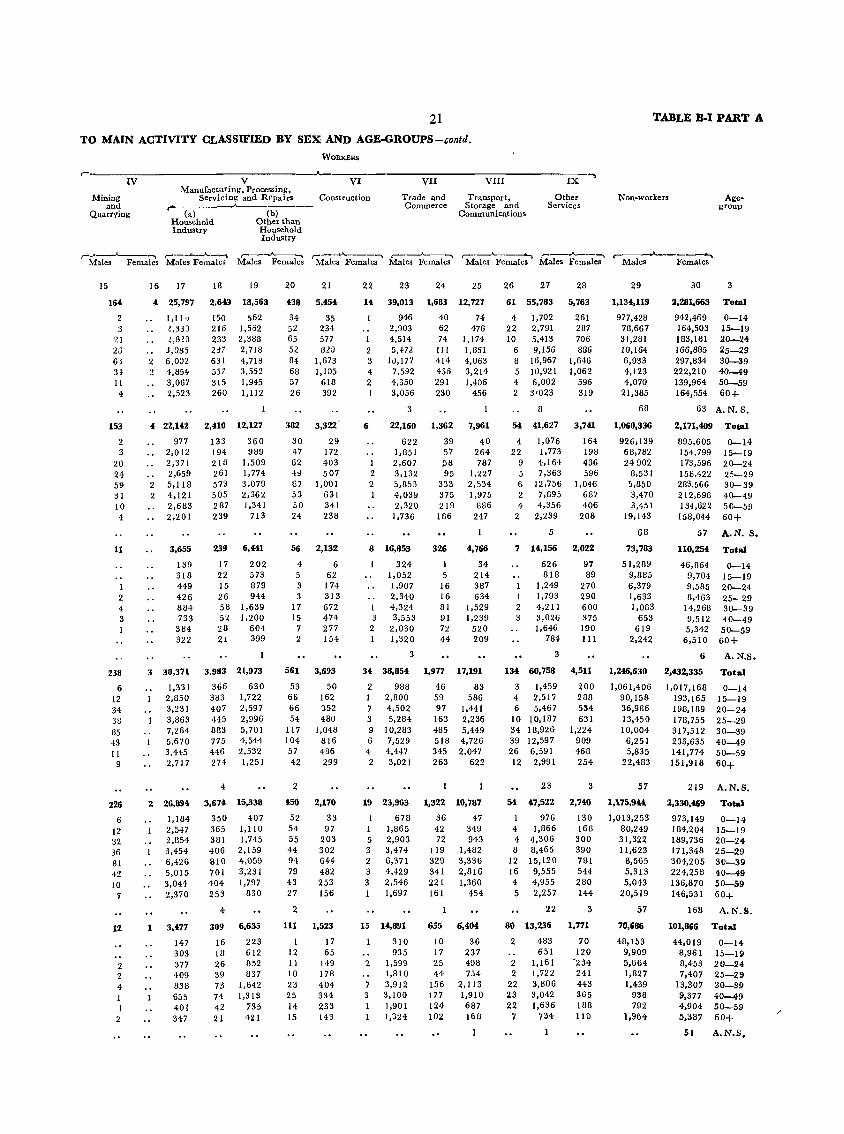
21
TO MAIN ACTIVITY CLASSIFIED BY SEX AND AGE·GROUPS-~ontd.
WORKERS
~.----------------------------------~ IV
Mining and
Quarrying
V VI Manufacturing, Processing,
Servicing and Repairs Construction r" (al .A---~ __
Household Other than Industry Household
Industry
.----------------------------------. VII VIII IX
Trade and Transport, Commerce Storage and
Communications
Other Services
TABLE B.I PART A
Non·workers Agegroup
,,-._._---"---....... ,-__ .__,,;,,__..A,.._-\ ,-----'----, ,----oA.-"l r-____.A...-........ r--J...---......... I ___ .A..---~ r---.A..----.... Males Females Males Females Males Females Males Females Males Females Males Females Males Females Males Females
15
164
2
21 25 63 3! 11 4
153
2 3
20 24 59 31 10 4
11
I 2 4 3
238
6 12 34 38 85 43 II
9
226
6 12 32 36 81 42 10
7
12
2 2 4
I 2
16 17
4 25,797
1,110 l,33) l,8!O 3,085
2 6,002 2 4,854
3,067 2,523
18
2,64~
150 216 233 237 631 537 315 260
19
18,568
562 1,562 2,388 2,718 4,718 3,552 1,945 1,112
"2Z,142 2,410 12,127
2 2
977 2,012 2,371 2,659 5,118 4,121 2,683 2,201
3,655
139 318 449 426 884 733
384 322
3 30,371
1,331 2,850 3,231 3,863 7,264 5,670 3,445 2,717
2 26,894
1,184 2,547 2,854 3,454 6,426 5,015 3,044 2,370
1 3,477
147 303 377 409 838 655 401 347
133 194 218 261 573 505 287 239
360 989
1,509 1,774 3,079 2,362 1,341
713
239 6,441
17 22 15 26 58 52 28 21
3,983
366 383 407 445 883 775 446 274
4
3,674
350 365 381 406 810 701 404 253
4
202 573 879 944
1,639 1,200
604 399
21,973
630 1,722 2,597 2,996 5,701 4,544 2,532 1,251
15,338
407 1,110 1,745
2,159 4,059 3,231 1,797
830
309 6,635
16 18 26 39 73 74 42 21
223 612 852 B37
1,642 1,313
735 421
20
438
34 52 65 52 B4 68 57 26
21
5,454
35 234 577 8~O
1,673 1,105
618 392
382 3,322
30 47 62 4:1 67 53 50 24
29 172 403 507
1,001 631 341 238
56 2,132
4 5 3 3
17 15
7 2
561
53 66 66 54
117 104 57 42
2
451)
52 54 55 44 94 79 43 27
2
6 62 174 313 672 474 277 154
3,693
50 162 352 480
1,048 816 436 299
2,170
33 97
203 302 644 482 253 156
111 1,523
1 12 11 10 23 25 14 15
17 65
149 17B 404 334 233 143
22
14
2 3 4 2
23
39,013
946 2,903 4,514 5,472
1il,l77 7,592 4,350 3,056
3
24
1,688
40 62 74 III 414 436 291 230
25
12,727
74 478
1,174 1,861 4,063 3,214 1,406
456
6 22,160 1,362 7,961
1 2 2
622 1,851 2,607 3,132 5,853 4,03!! 2,320
1,736
8 16,853
I 3
2
324 1,052 1,907 2,340 4,324 3,553
2,030 1,320
3
34 38,854
2 98B 1 2,800 7 4,502 3 5,284 9 10,283 6 7,529 4 4,447 2 3,021
19 23,963
678 1,865
5 2,903 3 3,474 2 6,371 3 4,429 3 2,546
1,697
15 14,891
310 935
2
7 3 I 1
1,599 I,B10 3,912 3,100 1,901 1,324
39 57 li8 95
333 375 219
186
326
5 16 16 81 91 72 44
40 264 787
1,227 2,534 1,975
886 247
4,766
34 214 387 634
1,529 1,239
520 209
1,977 17,191
46 83 59 586 97 1,441
163 2,236 4B5 5,449 518 4,726 345 2,047 263 622
1,322 10,787
36 47 42 349 72 943
119 1,482 329 3,336 341 2,816 221 1,360 161 454
655 6,404
10 17 25 44
156 177 124 102
36 237 498 754
2,113 1,910 687 168
26 27
61 55,783
4 1,702 22 2,791 10 5,413
6 9,156 8 16,967 5 10,921 4 6,002 2 3'023
8
28
5,763
261 287 706 886
1,646 1,062
596 319
54 41,627 3,741
4 22
9 5 6 2 4
2
1,076 1,773 4,164 7,363
12,756 7,895 4,356
2,239
5
164 198 436 596
1,046 687 406
208
7 14,156 2,022
1 I 2 3
626 818
1,249 1,793 4,211 3,026 1,646
784
3
134 60,758
3 1,459 4 2,517 6 5,467
10 10,IB7 34 18,926 39 12,597 26 6,591 12 2,991
23
54 47,522
976 4 1,866 4 4,306 8 8,465
12 15,120 16 9,555 4 4,955 5 2,257
22
97 89
270 290 600 375 190 III
4,511
200 288 534 631
1,224 909 468 254
3
2,740
130 168
300 390 781 544 280 144
3
80 13,236 1,771
2
2 2
22 23 22
7
483 651
1,161 1,722 3,806 3,042 1,636
734
I
70 120
'234 241 443 365 188 110
29
1,134,119
977,428 7B,667 31,281 10,164 6,933 4,123 4,070
21,385
68
1,060,336
926.139 68,782 24902
8,531 5,850 3,470 3,451
19,143
68
73,783
51,289 9,885 6,379 1,633 1,083
653 619
2,242
1,246,630
1,061,406 90,158 36,9B6 13,450 10,004
6,251 5,835
22,483
57
1,175,944
1,013,253 80,249 31,322 11,623
B,565 5,313 5,043
20,519
57
70,686
48,153 9,909 5,664 1,827 1,439
938 792
1,964
30
2,281,663
942,469 164,503 183,181 166,B85 297,834 222,210 139,964 164,554
63
3
Total
0-14 15-19 20--24 25-29 30-39 40--49 50-59 60+
A.N.S.
2,171,409 Total
895,605 154,799 173,596 158,422 2B3,566 212,698 134,622 158,044
0-14 15~19
20-24 25-29 30-39 40-49 50-59 60+
57 A.N. S.
110,254 Total
46,864 9,704 9,585 8,463
14,268 9,512 5,342 6,510
6
2,432,335
1,017,168 193,165 198,189 178,755 317,512 233,635 141,774 151,918
0-14 15-19 20-24 25-29 30-39 40-49 50-59 60+
A.N.S.
Total
0-14 15-19 20-24 25-29 30-39 40--49 50-59 60+
219 A.N.S.
2,330,469
973,149 184,204 189,736 171,348 304,205 224,258 136,870 146,531
168
Total
0-14 15-19 20-24 25-29 30-39 40-49 50-59 60+
A.N.S.
101,866 Total
44,019 8,961 8,453 7,407
13,307 9,377 4,904 5,387
51
0-14 15-19 20-24 25-29 30-39 40-49 50-59 60+
A.N.S,
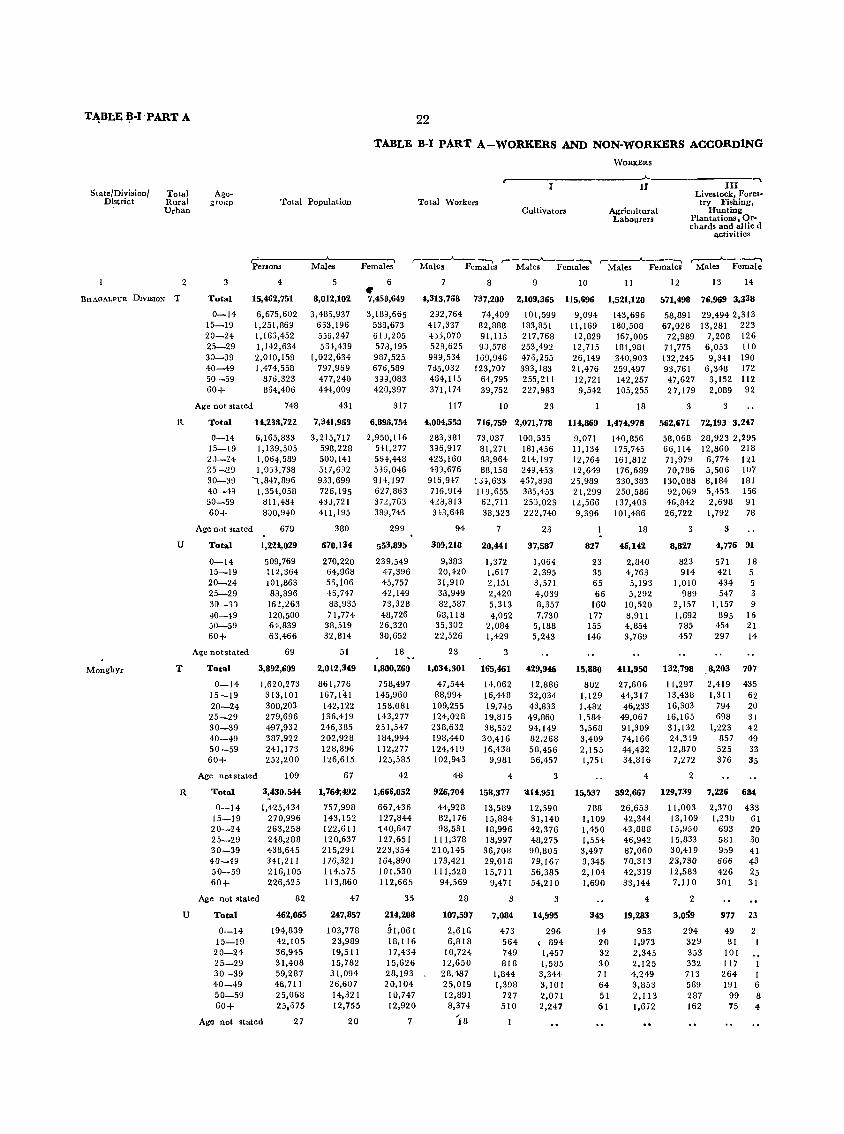
State/Division/ District
Total Rural Urban
2
BHAGALPUR DIVISION T
u
Monghyr T
R
u
22
TABLE B-1 PART A-WORKERS AND NON-WORKERS ACCORDING
Agegroup Total Population Total Workers
r---------------I
Cultivators
WORKERS
Agricultural Labourers
------..... III
Livestock, Forestry Fishing,
Hunting Plantations, Or-chards and allie d
activities
,...,. ___ --.J~ _____ ..... r-------"---'""""\ ,-----A. ___ ....... r- _.---..A-___ .. ,---.A.~
Perlons Males Females Males Females Males Females Males Females Males Female
3
Total
0-14 15-19 20-24 25-29 30-39 40-49 50-59 60+
4
15,462,751
6,675,602 1,251,869 1,163,452 1,142,634 2,010,159 1,474,558
876,323 854,406
Age not stated 748
5 6 • 8,012,102 7,4SB,64,9
3,483,937 653,196 555,247 55l,439
1,022,63<1: 797,969 477,240 444,009
431
3,189,665 539,673 61 J,205 578,195 987,525 676,589 333,083 420,397
317
7 8 9 10 11 12 13 14
4,313,7&8 737,2BO 2,109,365 115,696 1,521,120 :'71,498 76,969 3,338
292,764 417,337 4}',070 523,625 999,534 7a5,032 454,115 371,174
117
74,409 82,888 91,115 90,578
169,946 123,707
64,795 39,752
10
101,599 183,851 217,768 253,492 476,255 393,183 255,211 227,983
23
9,094 11,169 12,829 12,715 26,149 21,476 12,721 9,542
143,696 180,508
167,005 181,981 340,903 259,497 142,257 105,255
18
58,891 67,028
72,989 71,775 132,245 93,761 47,627 27,179
3
29,494 2,313 13,281 223
7,208 126 6,053 110 9,341 190
6,348 172 3,132 112 2,089 92
Total 14,238,722 7,341,963 6,895,75'& 4,034,550 716,759 2,071,778 114,8&9 1,474,978 562,671 72,193 3,247
0-14 15-19 2J-24 25-29 30-39 40-49 50-59 60+
6,165,833 1,139,505 1,064,589 1,053,738
',847,896 1,354,058
811,484 830,940
Age n,)t stated 679
Total
0-14 15-19 20-24 25-29 30-11 40-19 50-59 60+
Age not stated
Total
0-14 15-19 20-24 25-29 30-39 40-49 50-59 60+
Age not statod
1,22*,029
509,769 112,364 101,863 83,896
16!,263 120,500 6~,839
63,466
69
3,892,6B9
1,620,273 313,101 300,203 279,696 497,932 387,922 241,173 252,200
109
3,215,717 598,228 500,141 517,632 933,699 726,195 433,721 411,195
380
670,134
270,220 64,968 55,106 -15,747 88,935 71,774
38,519 32,814
51
2,012,349
861,776 167,141 142,122 135,419 246,385 202,928 128,896 126,615
67
2,950,116 541,277 55!,448 535,046 91+,197 627,863 372,763 389,745
299
553,89[>
239,549 47,396 45,757 42,149 73,328 48,726 26,320 30,652
18
1,880,260
758,497 145,960 158,081 143,277 251,547 184,994 112,277 125,585
42
Total 3,430,5« 1,764;492 1,666,052
0-14 15-19 20-24 25-29 30-39 40-49 50-59 60+
Age not stated
Total
0--14 15-19 20-24 25-29 30-39 40-49 50-59 60+
1,425,434 270,996 263,258 248,288 4·38,645 341,211 216,105 226,525
82
462,065
194,839 42,105 36,945 31,408 59,287 46,711 25,068 25,675
Age not stated 27
757,998 143,152 122,61 I 120,637 215,291 176,321 114.575 113,860
47
247,857
103,778 23,989 19,511 15,782 31,094 26,607 14,321 12,755
20
667,436 127,844
'140,647 127,651 223,354 164,890 101,530 112,665
35
214,208
91,061 18,116 17,434 15,626 28,193 20,104 10,747 12,920
7
283,381 396,917 423,160 433,676 916,947 716,914 423,813 3.8,648
94
339,218
9,383 20,420 31,910 38,949 82,587 68,118 35,302 22,526
23
1,034,301
47,544 88,994 109,255 124,028 238,632 198,440 124,419 102,943
46
73,037 81,271 83,964 88,158
1H,633 119,655
62,711 38,323
7
20,«1
1,372 1,617 2,151 2,420 5,313 4,052
2,084 1,429
3
165,461
14,062 16,448 19,745 19,815 38,552
30,416 16,438
9,981
4
100,535 181,456 214,197 249,453 457,898 385,453 253,023 222,740
23
37,587
1,064 2,395 3,571 4,039 8,357 7,730
5,188 5,243
429,946
12,886 32,034 43,833 49,860 94,149 82,268 58,456 56,457
3
926,704 1511,377 '414,951
44,928 82,176 98,531
111,378 210,145 173,421 111,528
94,569
28
107,591
2,616 6,818
10,724 12,650 28,487 25,019 12,891 8,374
/18
13,589 15,884 18,996 18,997
36,708 29,018 15,711
9,471
3
7,084
473 564 749 818
1,844 1,398
727 510
12,590 31,140 42,376 48,275 90,805 79,167 56,385 54,210
3
14,995
296 , 894 1,457 1,585 3,344 3,101 2,071 2,247
9,071 11,134 12,764 12,649 25,989 21,299 12,566 9,396
140,856 175,745 161,812 176,689 330,383 250,586 137,403 101,486
18
827 46,142
23 2,840 35 4,763 65 5,193 66 5,292
160 10,520 177 8,911 155 4,854 146 3,769
15,880
802 1,129 1,482 1,584 3,568 3,409 2,155 1,751
411,950
27,606 44,317 46,233
49,067 91,309 74,166 44,432 34,816
4
58,068 66,114 71,979 70,786
130,088 92,069 46,842 26,722
3
8,827
823 914
1,010 989
2,157 1,692 785 457
132,798
11,297 13,438 16,303 16,165 31,132 24,319 12,870 7,272
2
28,923 2,295 12,860 218
6,774 121 5,506 1U7 8,184 181 5,453 156 2,698 91 1,792 78
3
4,776 91
571 18 421 5 434 5 547 3
1,157 9 895 15
454 21 297 14
.8,203
2,419 1,311
794 698
1,223 857
525 376
707
435 62 20 31 42 49 33 35
15,:'37 392,667 129,739 7,226 684
788 1,109 1,450 1,554 3,497 3,345 2,104 1,690
343
14 20 32 30 71 64 51 61
26,653 42,344 43,888 46,942 87,060 70,313 42,319 33,144
4
19,283
953 1,973 2,345 2,125 4,249 3,853 2,113 1,672
11,003 13,109 15,950 15,833 30,419 23,730 12,583 7,110
2
3,0~9
294 329 353 332 713 589 287 162
2,370 433 1,230 61
693 20 581 30 959 41 666 43 426 25 301 31
977 23
49 2 81
101 117 264 1 191 6
99 8 75 4
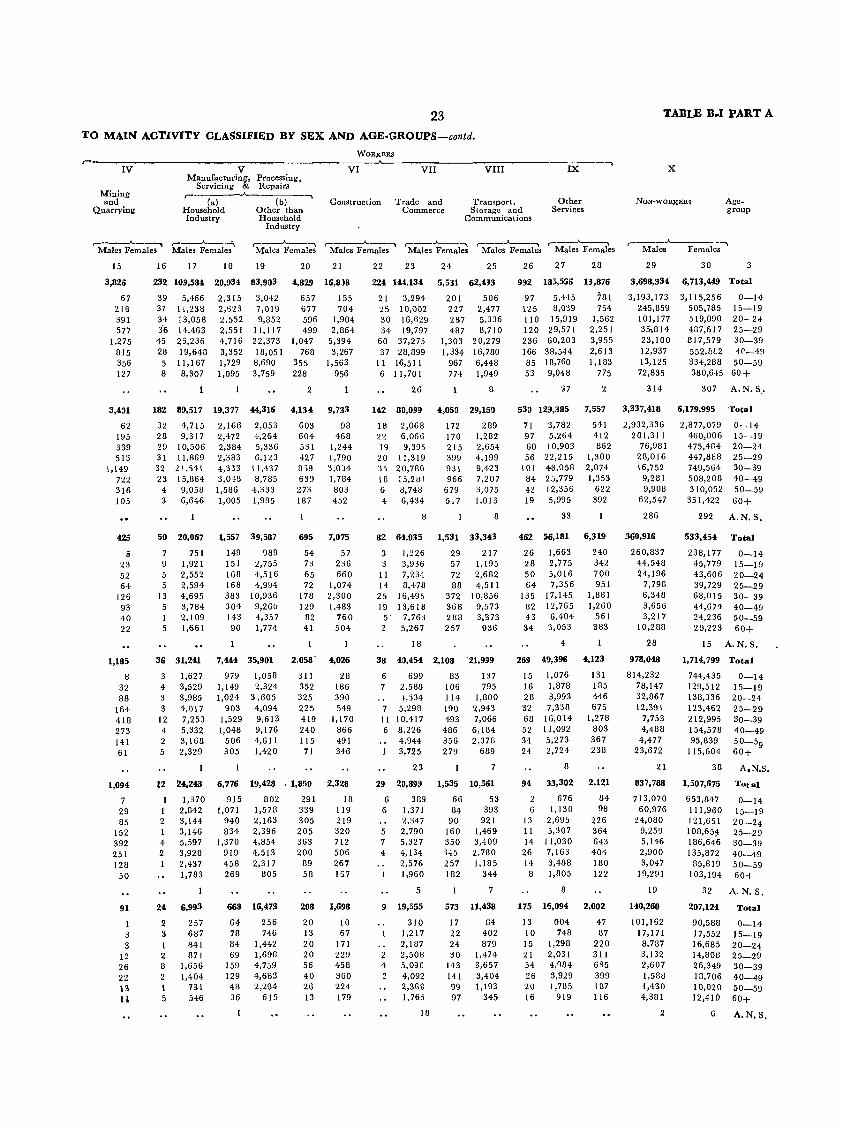
23 TO MAIN ACTIVITY CLASSIFIED BY SEX ANn AGE-GROUPS-contd.
WORKERS
.--------------------------------~ IV V VI VII
Mining and
Quarrying
Manufacturing, Processing, Servicing & Repairs
,-. _____ .A.--. ______ '"">
(a) (b) Household Other than Industry Household
Industry
Construction Trade and Uommerce
VIII
Transport. Storage and
Communications
._-------,. IX
Other Services
TABLE B.I PART A
X
NON-WORKERS Age. group
,-____ ..A. __ .....,. r---A.._ . .....:." r---..A.--,""> ,-__ --A._-. r---""""__-" r---..A.----. ,-_..A._....... ,-___ ...A-______ '""> Males Females Males Females Males Females Males Females Males Females Males Females Males Females Males Females
15
3,826
67 21B 391 577
1,275 815 356 127
3,401
62 195 339 513
1,149 722 316 105
425
S 23 52 64
126 93 40 22
1,185
8 32 88
164 418 273 141 61
1,094
7 29 85
152 392 251 128
50
91
1 3 3
12 26 22 \3
1"
16 17 18 19
232 109,584 20,934 83,903
3,042 7,019 9,852
39 5,466 37 11,238 34 13,058 3'6 14,463 45 23,236 2B 19,648 5 11,167 8 8,307
182 89,517
32 4,715 28 9,317 29 10,506 31 11,869 32 21,541 23 15,864
4 9,058 3 6,646
2,315 2,623 2,552 2,551 4,716 3,352 1,729 1,095
19,377
2,166 2,472 2,384 2,383 4,'333 3,Ot8 1,586 1,005
11,117 22,373 18,051 8,690 3,759
44,316
2,053 +,264 5,336 6,123
11,437 8,785
4,333 1,985
50 20,067 1,557 39,587
7 9 5 5
13 5
5
751 1,921 2,552 2,594 4,695 3,784 2,109 1,661
149 989 151 2,755 168 4,516 168 4,994 383 10,936 304 9,2G6 143 4,357 90 1,774
36 31,241 7,444 35,901
3 4 3 3
12 4 2 5
1,627 3,529 3,985 4,017 7,253 5,332 3,168 2,329
12 l!4,248
1 1,370 1 2,842 2 3,144 I 3,146 4 5,597 2 3,928
24
2 3 1 2 8 2 \ 5
2,437 1,783
6,993
257 687 841 871
1,656 1,404
7iB 546
979 1,149 1,024
903 1,529 1,048
506 305
1,058 2,324
3,605 4,094 9,613 9,176 4,611 1,420
6,776 19,428
915 1,071
940 834
1,370 919 458 269
668
64 78 84 69
159 129 4B 36
802 1,578 2,163 2,396 4,854 4,513 2,317
805
16,473
256 746
1,442 1,698 4,759 4,663 2,294
615
20
4,829
657 677 596 499
1,047 768
355 228
2
4,134
603 604 531 427 839 639 273 187
21
16,8l8
155 704
1,904 2,864
5,394 3,267
1,563 956
9,733
98 468
1,244 1,790 3,0')4 1,784 803 452
695 7,075
54 73 65 72
178 129
82 41
57 236 660
1,074 2,300 1,483
760 504
2,058' 4,026
311 352 325 225 419 240 115 71
,1,8511
291 339 305 205 363 200
89 58
208
20 13 20 20 56 40 26 13
28 186 390 549
1,170 866 491 346
2,328
18 119 219 320 712 506 267 167
1,698
10 67
17 I 229 458 360 224 179
22 23
224 144,134
21 3,294 25 10,002 30 16,629 34 19,797
60 37,275 37 28,899
11 16,51 I 6 11,701
26
142 80,099
18 2,068 22 6,066 19 9,395 20 11,319 3; 20,71\0 18 15,2UI 6 8,748 4 6,434
8
24
5,581
201 227 287 487
1,303 1,334
967 774
4,050
172 170 215 399 931 966
679 517
25
62,4~3
506 2,477 5,336 8,710
20,279 16,780 6,448 1,949
8
29,150
289 1,282 2,654 4,199 9,423 7,207 3,075 1,013
8
82 64,035 1,531 33,343
1,226 3,936
11 7,234 14 8,478 25 16,495 19 13,618 5' 7,763 2 5,267
18
29 217 57 1,195 72 2,682 88 4,511
372 10,856 368 9,573 288 3,373 257 936
38 4D,454 2,108 '21,999
6 699 2,588 1,534
5,298 1 I 10,417 6 8,226
4,944 3,725
23
29 20,899
6 389 6 1,371
2,347 5 2,790 7 5,327 4 4,134
2,576 1,960
5
9 19,555
310 1,217 2,187
2 2,508 4 5,090 2 4,092
2,368 1,765
IS
83 106 114 190 493
48G 356 279
1,535
66 84
90 160 350 345 257 182
137 795
1,800 2,943 7,066 6,184 2,378
689
10,561
53 393
921 1,469 3,409 2,780 I, 185
344
7
573 11,438
17 84 22 402 24 879 30 1,474
143 3,657 141 3,404 99 1,193 97 345
26 27
992 185,555
97 5,445 125 8,039 110 15,919 120 29,571 236 60,203 166 38,544 85 18,760 53 9,048
37
533 129,385
71 3,782 97 5,264 60 10,903 56 22,215
101 4c3,058 84 25,779 42 12,356 19 5,995
33
28
13,876
781 754
1,562 2,251 3,955 2,613 1,183
775
2
7,557
541 412 862
1,300 2,074 1,353
622 392
462 56,181 6,319
26 1,663 28 2,775 50 5,016 64 7,356
135 17,145 82 12,765 43 6,404 34 3,053
4
240 342 700 951
1,881 1,260
561 383
269 49,396 4,123
15 1,076 16 1,878 28 3,993 32 7,338 68 16,014 52 11,092 34 5,273 24 2,724
8
94 33,302
2 676 6 1,130
13 2,695 11 5,307 14 11,030
26 7,163 14 3,488 8 1,805
8
175 16,094
13 004 10 748 15 1,298 21 2,031 54 4,Q84 26 3,929 20 1,785 16 919
131 185 446 675
1,278 803 367 238
2,121
84 98
226 364 643 404 180 122
2,002
47 87
220 311 635 399 187 116
29
3,698,334
3,193,173 245,859 101,177 35-,814 23,100 12,937 13,125 72,835
314
3,337,418
2,932,336 201,311
76,981 28,016 16,752
9,281 9,908
62,547
286
360,916
260,837 44,548 24,196
7,798 6,348 3,656 3,217
10,288
28
978,048
814,232 78,147 32,867 12,391
7,753 4,488 4,477
23,672
21
837,788
713,070 60,976
24,080 9,259 5,146 2,900 3,047
19,291
19
140,260
101,162 17,171 8,787 3,132 2,607 1,588 1,430 4,381
2
30
6,713,449
3,115,256 505,785 519,090 487,617 817,579 552,8[2 334,288 380,645
307
6,179,995
2,877,079 460,006 475,484 447,888 749,564 508,208 310,052
351,422
3
Total
0-14 15-19 20-24 25-29 30-39 4C_49
50-59 60+
A.N.S .•
Total
0-14 15- -19 20-24 25-29 30-39 40-49 50-59 60+
292 A.N. S.
533,454 Total
238,177 45,779 43,606 39,729 68,015 44,674 24,236 29,223
0-14 15-19 20-24 25-29 30- ·39 40-49 50-59 60+
15 A.N.S.
1,714,799 Total
744,435 129,512 138,336 123,462 212,995 154,578 95,839
115,604
38
1,507,675
653,347 111,960 121,651 108,65:4 186,646 135,872
85,819 103,194
32
207,124
90,588 17,552 16,685 14,808 26,349 18,706 10,020 12,410
6
0-14 15-19 20--24 25-29 30-39 40-49 50-59 60+
A.N.S.
Total
0-14 15--19 20-24 25-29 30-39 40-49 50-59 60+
A.N.S.
Total
0-14 15-19 20-24 25-29 30-39 40-49 50-59 60+
A.N.S.
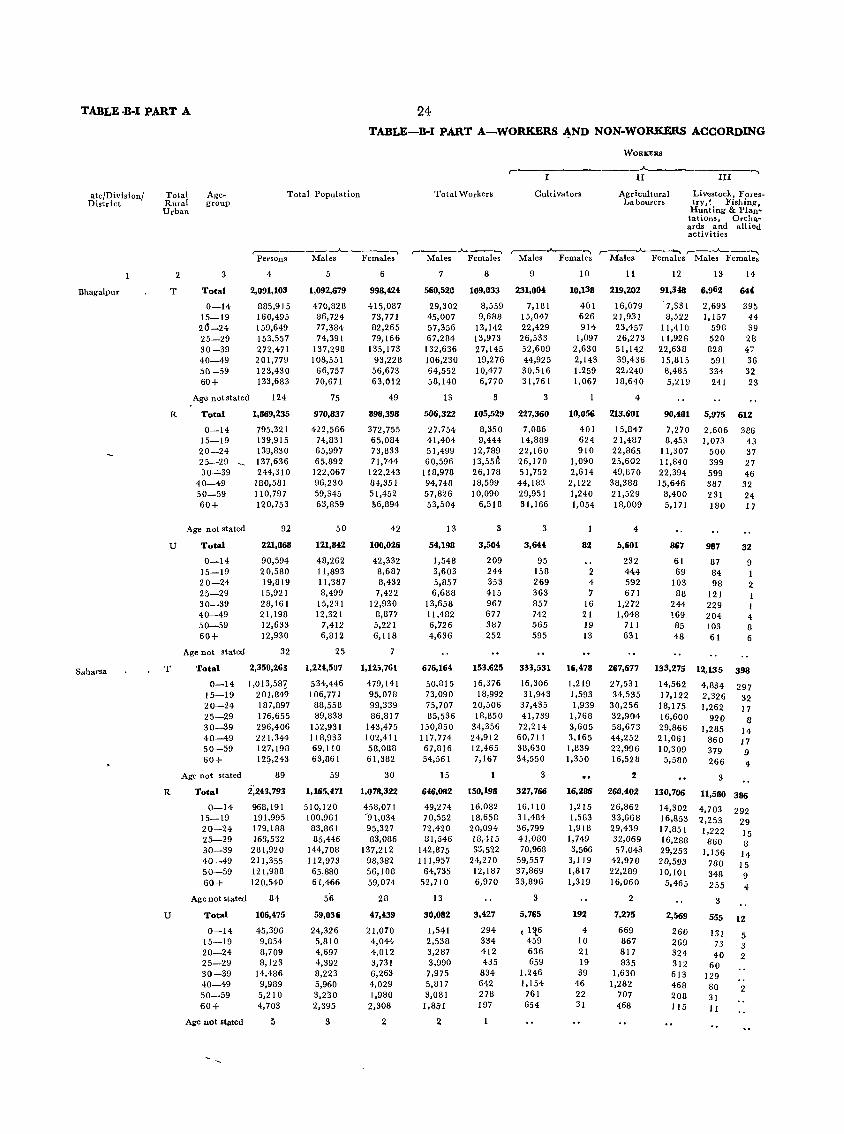
TABLE ·B-I PART A
ate/Division/ District
Bhagalpur
Total Age-Rural group Urban
2
T
3
Total
0-14 15-19 2(1-24 25-29 30-39 40--49 50-59 60+
Total Population
24 TABLE-B-I PART A-WORKERS ~ND NON-WORKERS ACCORDING
Total Workers Cultivators
WORKERS .A.~ _________ -..
II III
Agricultural Livestock, Fores~ Labourers try J ~ Fishing."
Hunting & Plan" tat ions, Oreha" ards and allied activities
,-_______ .A.--___ ...... ,-___ oA---...... ,-__ .A---...... r--""--....., r--.A.---....., Persons Males Females Males Females Males Females Males Females Males Females
4
2,091,103
885,915 160,495 159,649 153,557 272,471 201,779 123,430 133,683
5
1,092,679
470,828 86,724 77,384 74,391
137,298 IOS,551
66,757 70,671
6
998,424
415,087 73,771 82,265 79,166
135,173 93,228 56,673 63,012
7 8 9
560,520 109,033 231,004
29,302 45,007 57,356 67,284
132,636 106,230 64,552 58,140
8,559 9,688
13,142 13,973 27,145 19,276 10,477 6,770
7,181 15,047 22,429 26,533 52,609 44,925 30,516 31,761
10 11
10,138 219,202
401 626 914
1,097 2,630 2,143 1,259 1,067
16,079 21,931 23,457 26,273 51,142 39,436 22,240 18,640
12 13
91,348 6,962
·7,331 8,522
11,410 11,928
22,638 15,815 8,485 5,219
2,693 1,157
598 520 828 591 334 241
14
644
395 44 39 28 47 36 32 23
Age not stated 124 75
970,837
422,566 74,831
49
898,398
372,755 65,084 73,833 71,744
122,243 84,351 51,452 S6,894
13 3
105,529
8,350 9,444
12,789 13,558 26,178 18,599 10,090
3 4
R
U
Saharsa T
R
u
Total
0-14 15-19 20-24 25-29 30·...:.39
40-49 50-59 60+
Age not stated
Total
0-14 15-19 20-24 25-29 30-39 40-49 50-59 60+
Age not stated
Total
0-14 15-19 20-24 25-29 30-39 40-49 50-59 60+
Age not stated
Total
0-14 15-19 20-24 25-29 30-39 40-49 50-59 60+
Age not stated
Total
0-14 15-19 20-24 25-29 30-39 40-49 50-59 60+
Age not stated
1,869,235
795,321 139,915 139,830 137,636 244,310
180,581 110,797 120,753
92
221,868
90,594 20,580 19,819 15,921 28,161 21,198 12,633 12,930
32
2,350,266
1,013,582 201,849 187,897 176,655 296,406 221,344 127,198 12~,243
89
2:243,793
968,191 191,995 179,188 168,532
281,920 211,355 121,988 120,540
84
106,475
45,396 9,854 8,709 8,123
14,486 9,989 5,210 4,703
5
65,997 65,892
122,067 96,230 59,345 63,859
50
121,842
48,262 11,893 11,387 8,499
15,231 12,321
7,412 6,812
25
1,224,507
534,446 106,771
88,558 89,838
152,931 118,933 69,110 63,861
59
1,165,471
510,120 100,961
83,861 85,446
144,708 112,973 65,880 61,466
56 59,036
24,326 5,810 4,697 4,392 8,223 5,960 3,230 2,395
3
42
100,026
42,332 8,687 8,432
7,422 12,930
8,877 5,221 6,118
7
1,125,761
479,141 95,078 99,339 86,817
143,475 102,411 58,088 61,382
30
1,078,322
458,071 -91,034 95,327 83,086
137,212 98,382 56,108 59,074
28
47,439
21,070 4,044 4,012 3,731 6,263 4,029 1,980 2,308
2
506,322
27,754 41,404 51,499 60,596
118,978 94,748 57,826 53,504
13
54,198
1,548 3,603 5,857 6,688
13,658 11,482 6,726 4,636
6,518
3
3,504
209 244 353 415 967 677 387 252
227,360
7,086 14,889 22,160 26,170 51,752 44,183 29,951 31,166
3
3,644
95 158 269 363 857 742 565 595
10,056
401 624 910
1,090 2,614 2,122 1,240 1,054
82
2 4 7
16 21 19 13
213,601
15,847 21,487 22,865 25,602 49,870
38,388 21,529 18,009
4
3,601
232 444 592 671
1,272 1,048
711 631
90,481
7,270 8,453
11,307 11,840 22,394 15,646
8,400 5,171
867
61 69
103 88
244 !69 85 48
5,975 612
2,606 3e6 1,073 43
500 37 399 27 599 46 387 32 231 24 18D 17
987
87 84 98
121 229 204 ID3 61
32
9 1 2
I 4 8 6
676,164
50,815 73,090 75,707 85,536
153,625 333,531 16,478 267,677 133,275 12,135 398
150,850 117,774 67,816 54,561
15
16,376 18,992
20,506 18,850
34,356 24,912 12,465 7,167
646,082 150,198
49,274 70,552 72,420 81,546
142,875 111,957
64,735 52,710
13
30,082
1,541 2,538 3,287 3,990 7,975 5,817 3,081
1,8111
2
16,082 13,658 20,094 18,415 3:},522
24,27D 12,187 6,970
3,427
294 334 412 435
834 642 278 197
16,306 31,943
37,435 41,739
72,214 60,711 38,630 34,550
3
327,766
16,110 31,484 36,799 41,080 70,968
59,557 37,869 33,896
3
5,765
( 1!1_6 459 636 659
1,246 1,154 761 654
1,219 1,593 1,939
1,768 3,605 3,165 1,839 1,350
27,531 34,535
30,256 32,904 58,673 44,252 22,996 16,528
2
14,562 17,122 18,175 16,600 29,866 21,061 10,309
5,580
4,834 297 2,326 32 1,262 17
920 8 1,285 14
860 17 379 9 266 4
3
16,286 260,402 130,706 11,580 386
1,215 1,583 1,918 1,749 3,566
3,119 1,817 1,319
192
4 10 21 19 39
46 22 31
26,862 33,668 29,439 32,069 57,043
42,970 22,289 16,060
2
7,275
669 867 817 835
1,630 1,282
707 468
14,302 16,853 17,851 16,288 29,253 20,593 10,101
5,465
4,703 2,253 1,222
860 1,156
780 348 255
3
292 29 15 8
14 15 9 4
2,569 555 12
260 131 5 269 73 3 324 4D 2 312 60 613 129 468 80 2 208 31 115 II
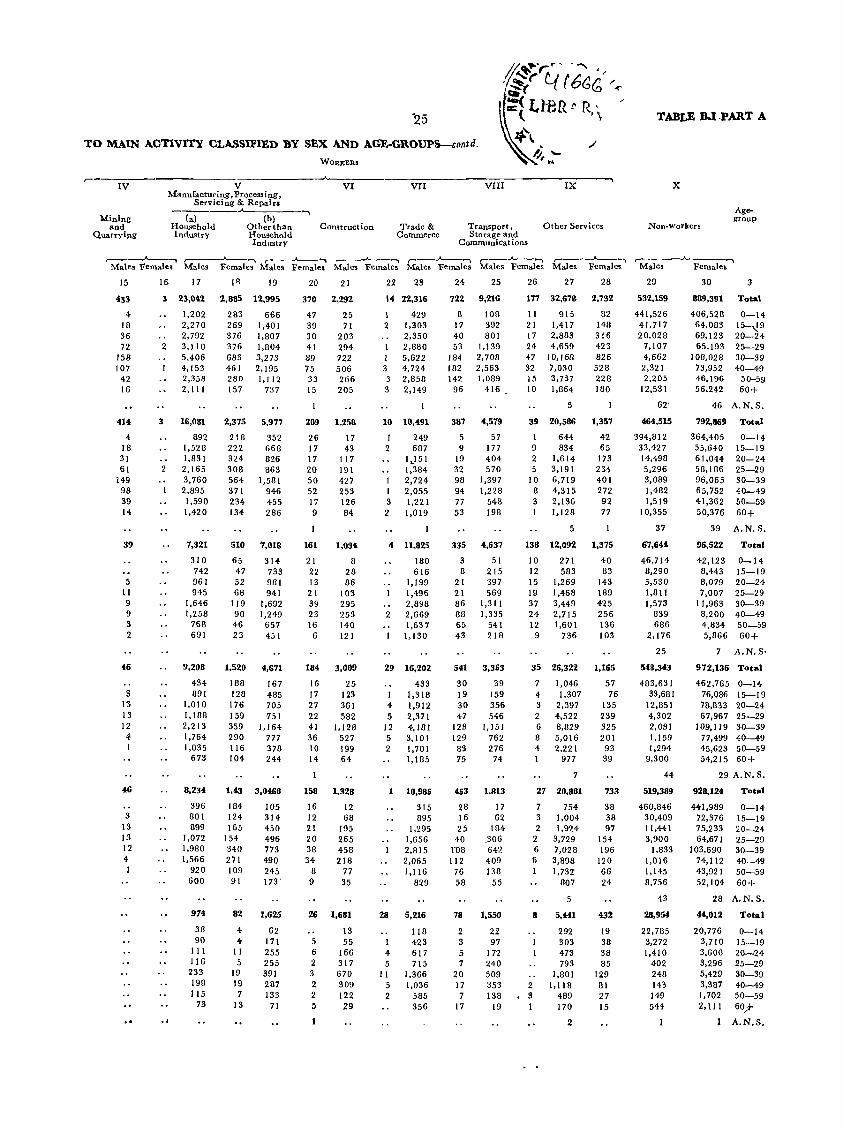
TO MAIN ACTIVITY CLASSlPlED BY SEX AND ACE-GROUPS--contd.
~"'---I-V------------------V-------------~---V~I---------v-r-I----------V-I~Ir~------~IX
Mining and
Quarrying
Manufactur i ng, process i ng , Servici ng & Repairs
(a) Household Industry
(b) Other than Household Industry
Construction Trade & Commerce
Transport, Storage and
Communications
Other Services
TABLE B-I·PART A.
x
Non-workers
Agegroup
,---.A---, r--..A..---"\ ,-___ .A---.... ~ __ ....A---_~ r---.A.-.-....., ~ __ ..A.. __ "'"""' r----.A.-.-....., ,-----....___...., Males Females Males Females Males Females Males Females Males Females Males Females Males Females Males Females
15
453
4-18 36 72
158 107
42 16
414
4 18 31 61
149 98 39 14
39
5 11 9 9 3 2
46
3 13 13 12
4 1
46
3 13 13 12 4 1
16 17 19
1 23,042 2,885 12,995
2
1,202 2,270 2,792 3,110 5,406 4,153 2,358 2,111
3 16,081
2
..
892 1,528 1,831 2,165 3,760 2,895 1,590 1,420
7,321
310 742 961 945
1,646 1,258
768 691
9,208
434 891
1,010 1,188 2,213 1,764 1,035
673
8,234
396 801 899
1,072 1,980 1,566
920 600
974
38 90 III 116 233 198 115
73
283 269 376 376 683 461 280 157
666 1,401 1,807 1,804 3,273 2')95 1,112
737
2,375 5,977
218 222 324 308 564 371 234 134
510
65 47 52 68
119 90 46 23
352 668 826 863
1,581 946 455 286
7,01&
314 733 981 941
1,692 1,249 657 451
1,520 4,671
188 167 128 485 176 705 159 ·751 359 1,164 290 777 116 378 104 244
1,43
184 124 165
154 340 271 109 91
82
4 4
11 5
19 19 7
13
3,0468
105 314 450 496 773 490 245 173'
1,625
62 171 255 255 391 287 133
71
20 21
370 2,292
47 39 30 41 89 75 33 15
25 71
203 294 722 506 266 205
209 1,258
26 17 17 20 50 52 17 9
161
21 22 13 21 39 23 16 6
17 43
117 191 427 253 126 84
1,034
8 28 86
103 295 253 140 12 I
184 3,009
16 25 17 123 27 361 22 582 41 1,128 36 527 10 199 14 64
158
16 12 21 20 38 34
8 9
1,328
12 68
195 265 458 218
77 35
26 1,681
13 5 6 2 3 2 2 5
55 166 317 670 309 122 29
22 23
14 2.2.,316
1 2
3 3
429 1,303 2,350 2,880 5,622 4,724 2,858 2,149
10 10,4.91
1 2
1 3 2
249 687
1 • ..l51 1,384 2,724 2,055 1,221 1,019
4 11,825
180 616
1,199 1,496 2,898
2 2,669 1,637 1,130
29 16,202
433 1,318
4 1,912 5 2,371
12 4,181 5 3,101 2 1,701
1,185
10,986
315 895
1,295 1,656 2,815 2,065 1,116
829
28 5,216
4 5
II 5 2
118 423 617 715
1,366 1,036
585 356
24 25
722 9,2.16
8 17 40 53
184-182 142
96
108 392 801
1,139 2,708 2,563 1,089
416
387 4,579
5 9
19 32 98 94 77 53
335
3 8
2 I 21 86 88 65 43
57 177 404 570
1,397 1,228
548 198
4,637
51 215 397 569
1,311 1,335
541 218
541 3,363
30 39 19 159 30 356 47 546
12B 1,151 129 762 83 276 75 74
463
28 16 25
40 r08 112
76 58
78
2 3 5 7
20 17 7
17
1,813
17 62
184 ,306 642 409 138
55
1,550
22 97
172 240 509 353 138
19
26 27 28
117 32,678 2,732
11 21 17 24 47 32 15 10
915 1,417 2,883 4,659
10,168 7,030 3,737 1,864
5
82 148 316 423 826 528 228 180
39 20,586 1,357
I 9 2 5
10 8 3
644 834
1,614 3,191 6,719 4,315 2,136 1,128
5
138 12,092
10 271 12 583 15 1,269 19 1,468 37 3,449 24 2,715 12 1,601
9 736
42 65
173 234 401 272 92 77
1,375
40 83
143 189 425 256 136 103
35 26,322 1,165
7 1,046 4 1,307 3 2,397 2 4,522 6 8,829 8 5,016 4 2,221
977
7
27 20,881
7 754 3 1,004 2 1,924
2 3,729 6 7,028 6 3,898
2. 3 1
8
1,732 807
5
5,441
292 303 473 793
1,801 1,118
489 170
2
57 76
135 239 325 201 93 39
733
38 38 97
154 196
120 66 24
432
19 38 38 85
129 81 27 15
29
532.,159
441,526 41,717 20,028
7,107 4,662 2,321 2,205
12,531
62'
464,515
394,812 33,427 14,498 5,296 3,089 1,482 1,519
10,355
37
67,644
46,714 8,290 5,530 1,811 1,573
839 686
2,176
25
548,343
483,631 33,681
12,851 4,302 2,081 1,159 1,294
9,300
44
519,389
460,846 30,409 11,441 3,900
1,833 1,016 1,145 8,756
43
28,954
22,785 3,272 1,410
402 248 143 149 544
30 3
889,391 Total
406,528 64,083 69,123 65,193
108,028 73,952 46,196 56.242
0-14 15--.!9 20-24 25-29 30-39 40-49
50-59 60+
46 A.N.S.
792,869 Total
364,405 55,640 61,044-58.186 96,065 65,752 41,362 50,376
39
96,522
42,123 8,443 8,079 7,007
11,963 8,200 4,834 5,866
7
0-14 15-19 20-24 25-29 30-39 40-49 50-59 60+
A.N.S.
Total
0-14 15-19 20-24 25-29 30-39 40-49 50-59 60+
A.N.S·
972,136 Total
462,765 0-14 76,086 15-19 78.833 20-24 67.967 25-29
109,119 30-39 77,499 40-49 45,623 50-59 54,215 60+
29 A.N. S.
928,124
441,989 72,376 75,233 64,671
103,690 74,112 43,921 52,104
Total
0-14 15-19 20-24 25-29 30-39 40-49 50-59 60+
28 A.N.S.
44,012 Total
20,776 3,710 3,600 3,296 5,429 3,387 1,702 2,111
0-14 15-19 20-H 25-29 30-39 40-49 50-59 60)-
A.N.S,
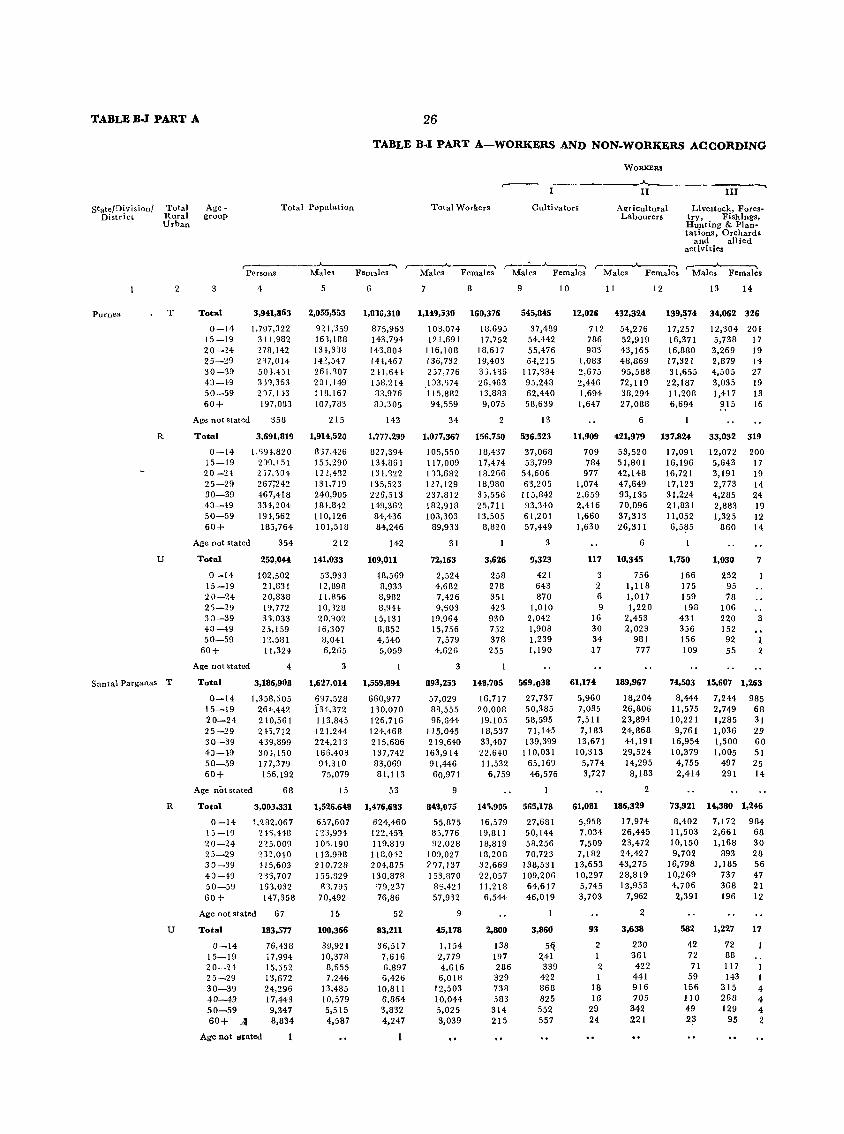
TABLE B.J PART A 26
state/Division/ District
Purnea
Total Rural Urban
2
T
R
u
San tal Parganas T
R
u
Age -group
Total Population
TABLE B.I PART A-WORKERS AND NON·WORKERS ACCORDING
Total Workers Cultivators
WORKERS
.... ,-----II
Agri cultural Labourers
III
Livestock, Fores .. try, Fishings, Hunting & Plantations, Orchards
and allied activities
,-______ .J<-____ ~ t"---...A....---~ r----..A..---'-\ r~--""'____...., ,----"---...., PersonS Males Females Males Females Males Females Males Females Males Females
3
Total
0-14 15-19 20-14 25-29 30-39 4:1-}9 50-59 60+
Age not stated
Total
0-14 15-19 20-24 25-29 30-39 4:1-49 50-59 60+
Age not stated
Total
0-14 15-19 20-24 25-29 3:1-39 4G-49 50-59
60+
Age not stated
Total
0-14 15-19 20-24 25-29 30-39 4J-49 50-59 60+
4
3,941,863
1,797,322 311,982 'U8,142 2~7,OI4
503.451 3;1,353 217.113 197,083
358
3,691,819
!,S9},S20 230,151 2 ;7.304 267;242 467,418 334,204 19},562 183,764
354
250,044
102,502 21,831 20,838 19,772 35,033 23.159 12,581 11,324
4
3,186,90S
1,358,505 264,442 240,561 2}3,712 439,899 301,150 177,379 156,192
Age not stated 68
Total
0-14 15-19 20-24 25-29 30-39 40-49 50-59 60+
3,003,331
1,282,067 24'),418 n5,009 232,010 }15,603 2 Q5, 707 153,032 147,358
Age not stated 67
Total
0-14 15-19 20-24 25-29 30-39 40-49 50-59 60+ ,-1
183,577
76,438 ;7,994 15,552 13,672 24,296 17,443 9,347 8,834
Age not stated
5
2,055,553
921,359 163,188 IH,338 142,547 261,Q07 201,149 IIB.167 107,783
215
1,914,520
837,426 153,290 122,432 131,719 240,905 181,842 110,126 101,518
212
141,033
53,933 12,898 II,B56 10,12B 20,902 16,307
8,041 6,265
3
1,627,014
697,528 134,372 113,845 121,244 224,213 165,408 94,310 75,079
15
1,526,648
657,607 123,9H 10'),190 113,998 210,728 155,829
81,795 70,492
15
100,366
39,921 10,378
8,655 7,246
13,485 10,579 5,515 4,587
6
1,835,310
875,963 143,794 143,804 141,467 211,641 158,214 83,976 8),305
143
1,777,299
827,394 134,861 131,322 135,523 226,513 149,362 84,436 84,246
142
109,011
48,569 8,933 8,982 8,944
15,131 8,852 4,540 5,059
1,559,894
660,977 130,070 126,716 124,468 215,686 137,742 83,069 81,113
53
1,476,683
624,460 122,45'4 119,819 118,042 204,875 130,878 l79,237 76,86
52
83,211
36,517 7,616 6,897 6,426
10,811 6,864 3,832 4,247
7
1,149,530
108,074 121,691
116,108 136,732 237,776
IJ3,S74 115,882 94,559
34
1,077,367
105,550 117,009 113,682 127.129 237,812 182,918 103,303
89,933
31
72,163
2,524 4,682 7,426 9,603
19,964 15,756
7,579 4,626
3
893,253
57,029 89,555 96,644
115,045 219,640
163,914 91,446 60,971
9
848,075
55,875 85,776 92,028
109,027 2~7,137
153,B70 86,421 57,932
9
45,178
1,154 2,779 4,616 6,018
12,503 10,044 5,025 3,039
8
16D,376
18,695 17,752
18,617 19,403 33,1% 26,463 13,883 9,075
2
156,750
18,437 17,474 18,266 18,980 33,556 25,711 13,505
8,820
3,626
258 278 351 423 930 752 378 255
1411,705
16,717 20,008 19,105 18,537 33,407 22,640 11,532
6,759
14'j,9D5
16,579 19,811 18,819 18,208 32,669 22,057 11,218 6,544
2,800
138 197 286 329 738 583 314 215
9
545,845
37,4B9 54,442 55,476 64,215
117,984 93,248 62,440 58,639
13
536,523
37,068 53,799
54,606 63,205
115,842 93,340 61,201 57,449
3
9,323
421 643 870
1,010 2,042 1,908 1,239 1,190
569,038
27,737 50,385 58,595 71,145
139,399 110,031
65,169 46,576
565,178
27,681 50,144 58,256 70,723
138,531 109,206 64,617 46,019
3,860
5q 2,41 339
422 868 825 552 557
10
12,026
712 786 983
1,083 2,675 2,446 1,694 1,647
11,909
709 784 977
1,074 2,659 2,416 1,660 1,630
II
432,324
54,276 52,919 43,165 48,869 95,588 72,119 38,294 27,088
6
421,979
53,520 51,801 42,148 47,649 93,135 70,096 37,313 26,311
6
117 10,345
3 2 6 9
16 30 34 17
61,174
5,960 7,035 7,511 7,183
13,671 10,313
5,774 3,727
61,081
5,958 7,034 7,509 7,182
13,653 10,297 5,745 3,703
93
2 I 2 1
18 16
29 24
756 1,118 1,017 1,220
2,453 2,023
981 777
189,967
18,204 26,806 23,894 24,868 44,191 29,524 14,295 8,183
2
186,329
17,974 26,445 23,472 24,427 43,275 28,819 13,953
7,962
2
3,638
230 361 422 441 916 705
342 221
12
139,~74
17,257 16,371 16,880 17,321 31,655
22,187 11,208 6,694
137,824
17,091 16,196 16,721 17,123 31,224 21,831 11,052 6,5~5
1,750
166 175 159 198
431 356 156 J09
74,503
8,444 11,575 10,221 9,761
16,954 10,379
4,755 2,414
73,921
8,402 11,503 10,150 9,702
16,798 10,269 4,706 2,391
13 \4
34,062 326
12,304 201 5,738 17 3,269 19 2,879 14 4,505 27 3,035 19 1,417 13
915 16
33,032 319
12,072 200 5,643 17 3,191 19 2,773 14 4,285 24 2,883 19 1,325 12
860 14
1,030
232 95 78
106 220 152 92 55
7
3
1 2
15,607 1,263
7,244 985 2,749 68 1,285 31 1,036 29 1,500 60 1,005 51
497 25 291 14
14,380
7,172 2,661 1,168
893 1,185
737 368 196
1,246
984 68 30 28 56 47 21 12
582 1,227 17
42 72 72 88 71 117
59 143 156 315 4 110 268 4 49 129 4 2~ 95 2
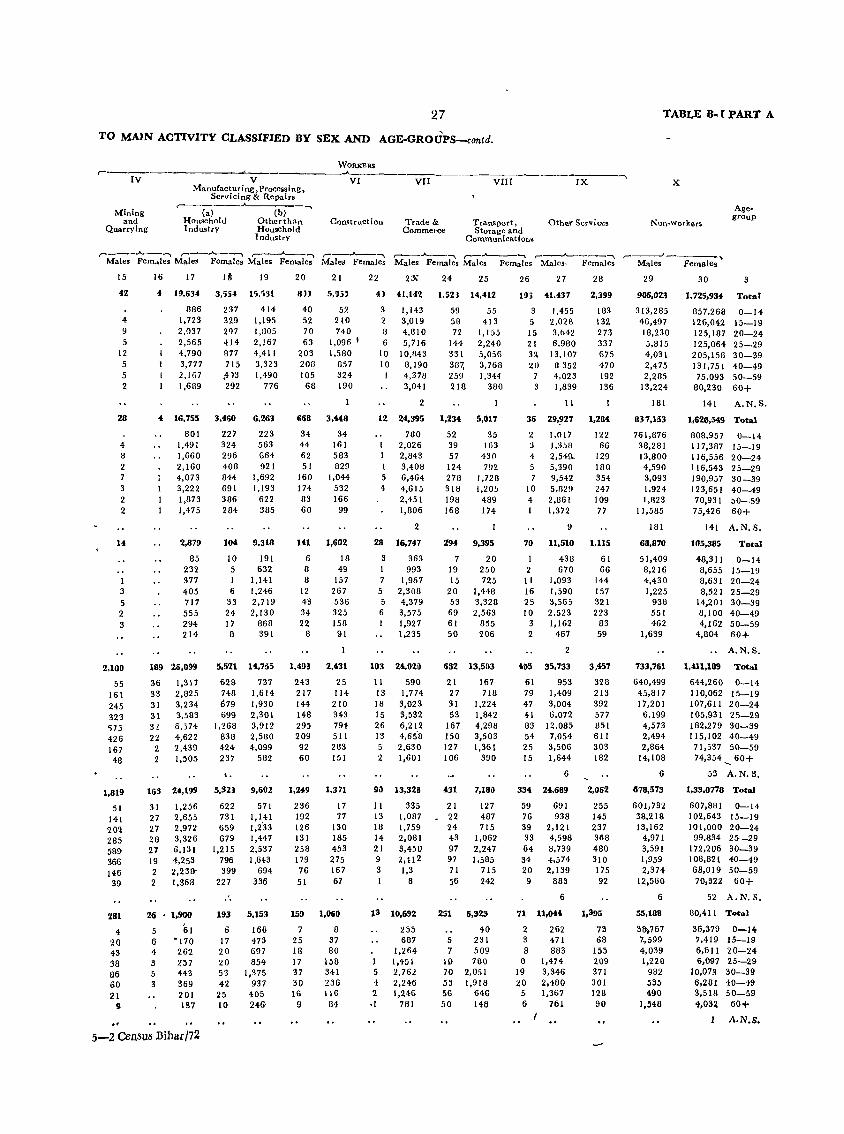
'27
TO MAIN ACTIVITY CLASSIFIED BY SEX AND AGE-GROUPS-contd.
,---IV
Mining and
Quarrying
V Manufacturing, Processing,
Scrvi ci ng & Repai rS
Ca} Household Industry
(b) Other than Household Industry
WORKERS
VI
Construction
vn
Trade & Commerce
VIn IX
Transport, Other Services Storage and
Communicatior)s
TABLE B- [ PART A
X
Non·workers
Agegroup
r---,.A......-.-'"""\ r---.."----....... r---""___""'\ r---'--""'\ r--.A----.... r--"""----~ r--..A--.--....., r---J _____ , Males Females Males Females Males Females Males Females Males Females Males F·emales Males· Females Males Females
15
42
4 9 5
12 5 5 2
28
4 8
'2 7 3 '2 2
14
1 3
5 2 3
2,100
55 161 245 323 '>73 426 167 48
16 17 IA 19
4 19,614 3,5$4 1~,'>31
886 1,723 2,037 2,565 4,790 3,777 2,167 1,689
237 414 329 1,195 297 1,!l05 414 2,167 877 4,411 715 3,'323
,4)3 1,490 292 776
4 16,755 3,460 6,263
801 1,491 1,660 2,160 4,073 3,222 1,873 1,475
2,879
85 232 377 405 717 555 294 214
189 26,099
36 1,317 33 2,825 31 3,234 31 3.583 'l! 6,;74 22 4,622
'2 2,439 2 1,'05
227 324 296 408 844 691 386 284
104
10 5 1 6
33 24 17 8
5,571
628 748 679 699
1,268 838 424 237
223 563 664 921
1,692 1,193
622 385
9,318
191 632
1.141 1,246 2,719 2.130
068 391
14,755
737 1.614 1,930 2,301 3.912 2.580 4,099
582
20 21
8)) 5,0:;)
40 52 52 210 70 740 63 1,096'
203 1,580 200 057 105 324
68 190
668 3,448
34 44 62 51
160 174 83 60
HI
6 8 8
12 43 34 22
8
1,408
U3 217 144 148 295 209 92 60
34 161 583 029
1,044 532 166
99
1,602
18 49
157 267 536 325 158
91
2,431
25 114 210 343 794 511 283 151
1,819
51 141 '20'2 285 58~
366 146
163 U,199 5,328 9.602 1,249 1,371
39
281
4 20 43 38 86 60 21
9
31 1.256 27 2.655 27 2.972 28 3.326 '27 6,131 19 4.253 2 2,239-2 1.369
26 1,900
5 61 6 "170 4 262 3 Z57 5 443 3 369
201 137
5-2 Census :Bihar/72
622 731 659 679
1.215 796 399
227
571 1,141 1.2"33 1,447 2.537 1,643
694 336
193 5.153
6 166 17 473 20 697 20 854 53 1,375 42 937
25 405 10 246'
236 192 126 131 258 179 76 51
17 77
130 165 453 275 167 67
159 1,060
8 25 37 18 80 17 158 37 341 30 236 16 116
9 64
22 24 25
4) 41,142 1,521 14,412
3 1.143 2 3,019 o 4,810 6 5,716
10 10,ll43 10 8,190
4,378 3,041
2
59 55 58 413 72 1,155
144 2,240 331 5,056 387, 3,768 259 1,344 218 360
12 24,395 1,234 5.017
1 1 5 4
28
3 1 7
5 5 6
780 2,026 2.843 3,408 6,464 4,615 2,451 1,806
2
l6,747
363 993
1.967 2,308 4.379 3,575 1,927 1,235
183 24,Il2B
11 590 13 1,774 18 3.023 15 3,532 26 6,212 13 4,65·8 5 2.630 2 1,601
91) 13,328
II 13 18 14 21 9 3
335 1.087 1,759 2,081 3.450 2.H2 1.3
8
13 10,692
255 687
1.264 1,451
5 2.762 4 2.246 2 1,246 ,I 781
52 39 57 124 276 318 198 168
294
7 19 15
20 53 69 61 50
6112
21 27 31 53
167 150 127 106
35 1G3
430 7!12
1,726 1,20~
489 174
9,395
20 250 725
1,448 3.328 2.563
855 206
13,583
167 718
1.224 1,842 4,298 3,503 1.361
390
431 7,18B
21 _ 22
24 43 97 97 71 56
127 487 715
1,062 2,247 1.585
715 242
251 6,323
40 5 231 7 509
1P 780 70 2,051 53 1.918 56 646 50 148
26 27
18; 41.437
1,455 5 2,028 15 3,042 21 6,980 33 13.107 ~o 8 352 7 4.023 3 1.839
11
28
2,399
103 132 273 337 675 470 192 136
36 29,?27 1,284
2
4 5 7
10 4
70
2 11 16 25 10
3 2
4115
61 79 47 41 83 54 25 15
1.017 1.358 2,519.. 5,390 9.542 5.829 2.861 1.372
9
11.510
438 670
1.093 1.590 3.565 2.523 1,162
467
2
35,733
953 1,409 3,004 6.072
12.085 7.054 3.506 1,644
6
334 24,689
59 691 76 938 39 2,121 33 4.598 64 8.739 34 ·h574 20 2.139
9 883
6
122 66
129 180 354 247 109 77
1,115
61 66
144 157 321 223
83 59
3,457
328 213 392 577 851 611 303 182
2.062
255 145 237 368 480 310 175 92
71 11,044 1,395
2 262 73 3 471 68 8 883 155
a 1,474 209 19 3.346 371 20 2,480 301
5 1,367 128 6 761 90
29
908,023
313,285 46.497 18.230 5,815 4,031 2.475 2.285
13.224
181
8H,153
761,876 38,281 13.800 4.590 3,093 1.924 1.Sl23
11,585
181
68.870
51,409 8.216 4.430 1.225
9S8 551 462
1,639
733.761
640,499 45.817 17,201
6.199 4,573 2,494 2,864
14,108
U
678,573
601,732 38,218 13,162
4,971 3.591 1,959 2,374
12,560
6
55,188
38)767 7 .• 599 4,039 1,228
982 535 490
1,!)48
30 3
1,725,934 Total
857,268 0-14 126,042 15-19 125.187 20-24 125,064 25-29 205,158 30_39 131,751 40-49 75,093 50-59
80,230 60+
141 A.N.S.
1,620,549 Total
808,957 117,387 116,556 116,543 190,957 123,651 70,931 75,426
0-14 15-19 20-24 25-29 30-39 40-49 ~0-59
60+
141 A.N.S.
105,385
48,311 8,655 8,631 8,521
14,201 8,100 4,162
4,804
1,411,189
644,260 110,062 107,611 105,931 182,279 115,102 71,537 74,354
Total
0-14 15-19 20-24 25-29 30-39 40-49 50-59 60+
A.N.S.
Total
0-14 15-19 20-24 25-29 30-39 40-49 50-59 60+
53 A.N.S.
1,33,0778 Total
607,881 0-14 102,643 15-19 101,000 20-24
99,834 25-29 172,206 30-39 108.821 40-49 68,019 50-59 70,322 60+
52 A.N.S.
00,411 Total
36,379 7,419 6,611 6,097
10,073
0-14 15-19 20-24 25-29 30-39
6,261 40-49 3,516 50-59 i,03a 60i-
A.N.S,
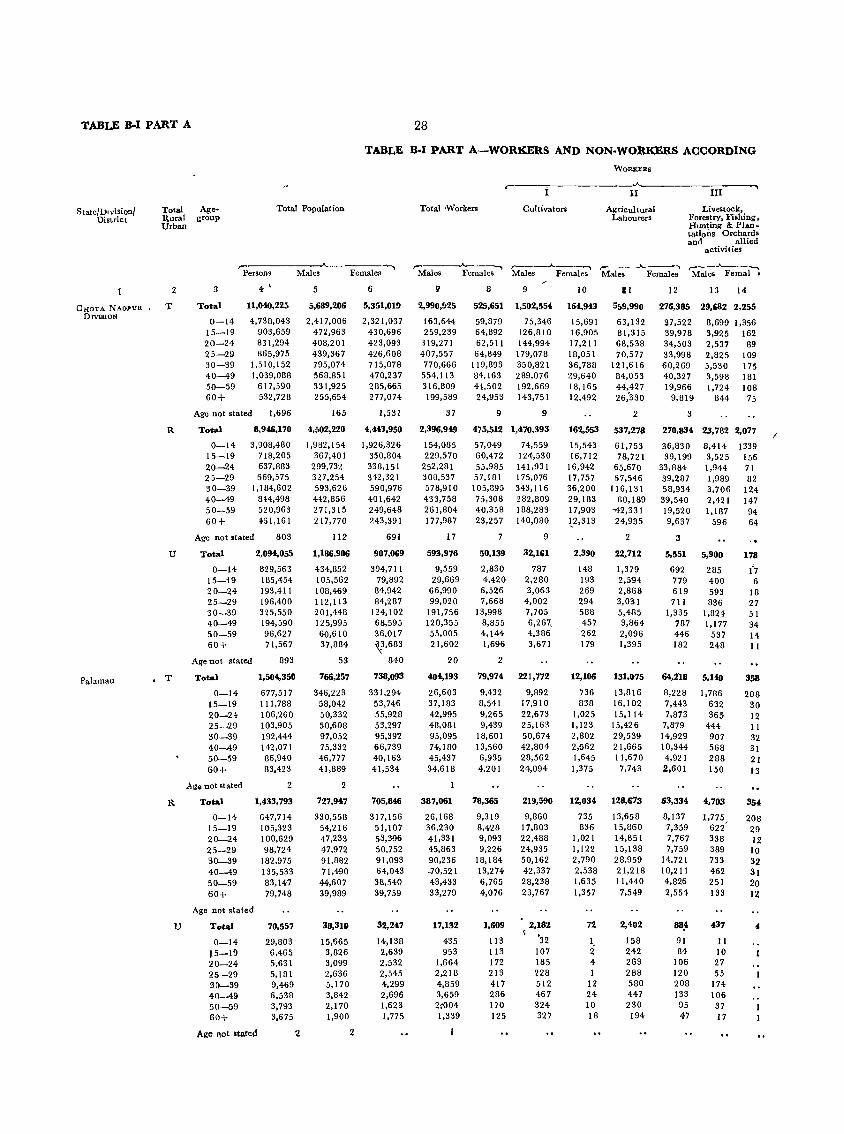
TABLE B·I PART A 28
State/UlVision/ District
CHOTA NAOPUR DIVISION
Palamau
Total Age~ural group Urban
Total Population
TABLE B·I PART A-WORKEltS AND NON·WORKEltS ACCORDING
Total ·Workers
WORKERS
r------I~---------------I;_'------------l-II----~
Cultivators Agdcultural Labourers
Livestock, Forestry, Fishing, Hunting & Plantations Orchards and allied
activities
r------------'-- -......, r-__.A".---~ ,------"---") r----.A..___.., r--.A-~ Persons Males Females Males Females Males Females Males Females Males Fernal •
2
T
R
U
• T
R
u
3
Total
0-14 15-19 20-24 25-29 30-39 40-49 50-59 60+
4: '
11,040,225
4,738,043 903,659 831,294 865,975
1,510,152 1,039,088
617,590 532,728
Age not stated 1,696
5
5,689,206
2,417,006 472,963 408,201 439,367 795,074 568,851 331,925 255,654
165
Total 8,946,170 4,:'02,220
0-14 15-19 20-24 25-29 30-39 40-49 50-39 60+
3,908,480 718,205 637,883 669,575
I, 184,602 844,498 520,963 451,161
Age not stated 803
Total
0-14 15--19 20-24 25-29 30-39 40-49 50-59 60+
Aile not stated
Total
0--14 15--19 20-H 25--29 30-39 40-49 50-59 60+
A ge not stated
Total
0--14 15-19 20-24 25-29 30-39 40-49 50-59 60+
Age not stated
Total
0-14 .5-19 ~0-24
25-29 30-39 40--49 50-59 60+
2,094,055
829,563 185,454 193,411 196,400 325,550 194,590 96,627 71,567
893
1,504,350
677,517 111,788 106,260 103,905 192,444 142,071 86,940 83,423
2
1,433,793
G47,714 105,323 100,629 98,724
182,975 135,533 83,147 79,748
70,557
29,803 6,465 5,631 5,181 9,469 6,538 3,793 3,675
Age not stated
1,982,154 367,40 I
299,732 327,254 593,626 442,856 271,315 217,770
112
1,186,986
434,852 105,562 108,469 112,113 201,448 125,995 60,610 37,884
53
766,257
346,223 58,042 50,332 50,608 97,052 75,332 46,777 41,889
2
727,947
330,558 54,216 47,233 47,972 91,882 71,490
44,607 39,989
38,310
15,665 3,826 3,099 2,636 5,170 3,842 2,170 1,900
2
6
5,351,019
2,321,037 430,696 423,093 426,608 715,078 470,237 285,665 277,074
1,531
4,443,950
1,926,326 350,804 338,151 342,321 590,976 401,642 249,648 243,391
691
907,069
394,711 79,892
84,942 84,287
124,102 68,595 36,017 'i{,683
840
738,093
331,294 53,746 55,928 53,297 95,392 66,739 40,163 41,534
705,846
317,156 51,107 53,396 50,752 91,093 64,043 38,540 39,759
32,2U
14,138 2,639 2,532 2,545 4,299 2,696 1,623 1,775
'1
2,990,!l25
163,644 259,239
319,271 407,557 770,666 554,113 316,809 199,589
37
8
525,651
59,879 64,892 62,511 64,849
119,893 84,163 H,502 24,953
9
9
1,502,554.
75,346 126,810 144,994 179,078 350,821 289,076 192,669 143,751
9
2,396,949 475,512 1,470,393
154,085 229,570
252,281 308,537 578,910 433,758 261,804 177,987
17
593,976
9,559 29,669 66,990 99,020
191,756 120,355 55,005 21,602
20
404,193
26,603 37,183 42,995 48,081 95,095 74,180 45,437 34,618
387,061
26,168 36,230 41,331 45,863 90,236 -70,521 43,433 33,279
17,132
435 953
1,664 2,218 4,859 3,659 2:004 1,339
57,049 60,472 55,985 57,181 105,895 73,308 40,358 23,257
7
50,139
2,830 4,420
6,526 7,668
13,998 8,855 4,144 1,696
2
74,559 124,530 141,931 175,076 343,116 282,809 188,283 140,080
9
32,161
787 2,280 3,063
4,002 7,705 6,267, 4,386 3,671
79.974 221 ,772
9,432 8,541 9,265 9,439
18,601 13,560 6,935 4,201
78,365
9,319 8,428 9,093 9,226
18,184 13,274 6,765 4,076
9,892 17,910 22,673 25,163 50,674 42,804 28,562 24,094
219,590
9,860 17,803 22,488 24,935 50,162 42,337 28,238 23,767
1,609 2,182 I •
113 32 113 107 172 185 213 228 417 512 286 467 170 324 125 327
10
164,943
15,691 16,905 17,211 18,051 36,788 29,640 18,165 12,492
11
559,990
63,132 81,315 68,538 70,577
121,616 84,053 44,427 26;330
2
162,553 537,278
15,543 16,712
16,942 17,757 36,200 29,183 17,903 t2,313
2,390
148 193 269 294 588 457 262 179
61,753 78,721
65,670 67,546
116,131 80,189
--42,331 24,935
2
22,712
1,379 2,594 2,868 3,031 5,485 3,864 2,096 1,395
12,106 131,075
736 838
1,025 1,123 2,802 2,-562 1,645 1,375
12,034
735 836
1,021 1,122 2,790 2,538 1,635 1,357
72
1, 2 4 1
12 24 10 18
13,816 16,102 15,114
15,426 29,539 21,665 11,670
7,743
128,673
13,658 15,860 14,851 15,138 28,959 21,218 11,440 7,549
2,402
158 242 263 288 580 447 230 194
12 13 14
276,385 29,682 2,255
27,522 39,978 34,503 33,998 60,269 40,327 19,966
9,819
3
8,699 3,925 2,537 2,825 5,530 3,598 1,724
844
1,356 162
89 109 175 181 108
75
210,834 23,782 2,071
36,830 39,199
33,884 39,287 58,934 39,540 19,520 9,637
3
5,551
692 779 619 711
1,335 787 446 182
8,414 1339 3,525 156 1,944 71 1,989 82 3,706 124 2,421 147 1,187 94
596 64
5,900
285 400 593 836
1,824 1,177
537 248
178
1'7 6
18 27 51 34 14 11
64,218 5,140 358
208 30 12 II 32 31 21 13
8,228 7,443 7,873
7,879 14,929 10,344 4,921 2,601
63,334
8,137 7,359 7,767 7,759
14,721 10,211 4,826 2,554
88;'
91 84
106 120 208 133 95 47
1,786 632 365
444 907 568 288 150
4,703
1,775 622' 338 389 733 462 251 133
437
11 10 27 55
174 106 37 17
354.
208 29 12 10 32 31 20 12
4
I
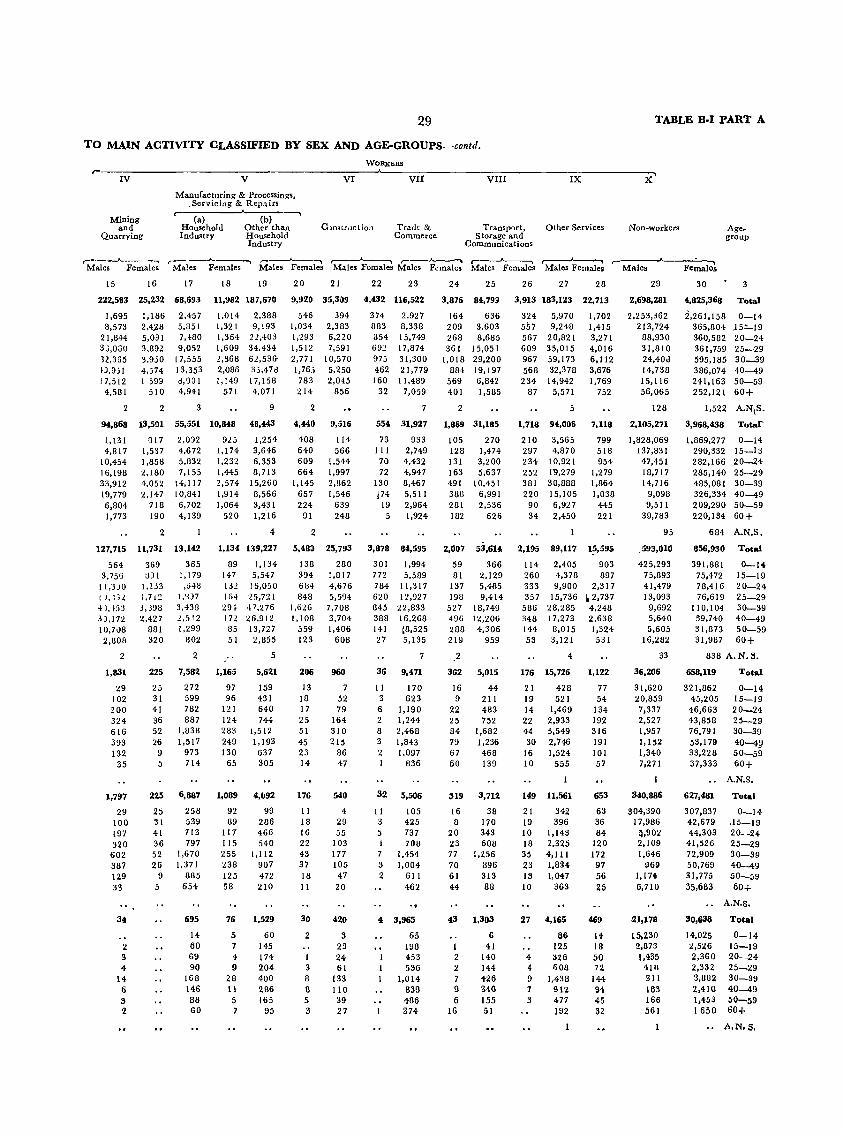
29 TABLE B·I PART A
TO MAIN ACTIVITY CLASSIFIED BY SEX AND AGE-GROUPS- -contd.
WORJ<ERS
~---rv~-----------------V~--------------V~I---A----~V=I~I----------V~I=II~---------I-X-----------X~
Mining and
Quarrying
Manufacturing & Processings, ~SerlJ'icing & Repairs
,..---.-A..-_-.."
(a) (b) Household Other than Industry Household
Industry
Clnstrllction Trade & Commerce
Transport, Other Services Storage and
Communications
Non-workers Age. group
r-·----"-- ~ ,..-- __ J.-__ -. ,-_-A..--"'\ r--.A..--~ r--A.--~ r-~ ~ ,..-----__ "--_--'_"\ Males Females Males Females Males Females Males Females Males F<males Males Females Ma1es Females Males
15 16 17 18 19 20 21 22 23
2:12,583 25,232 68,693 11,982 187,670 9,920 35,309 4,432 116,522
1,695 8,573
21,844 3';,060 3l,355 D,9jl 17,512
4,581
2
I, 186 2,4,;uJ 5,031 3,892 3,930 4,574 I 599
510
2
2,457 5,851 7,480 9,052
17,555 13,353 d,OO I 4,941
3
1,014 1,321 1,364 1,609 2,868 2,086 1,149
571
2,388 9,193
22,403 34.434 02,53& 35,47d 17,158 4,071
9
546 1,034 1,293 1,512 2,771 1,76j 783 214
2
394 2,383 6,220 7,591
10,570 5,250 2,045
856
374 883 354 69~
975 462 160
32
2,927 8,338 15,749 17,874 31,300 21,779
11,489 7,059
7
24 25 26 27 28
3,876 84,799 3,913 183,123 22,713
164 209 268 361
1,018 884
569 401
2
636 3,603 8,685
15,051 29,200 19,197 6,842 1,585
324 557 567 609 967 568 234
87
5,970 9,248
20,821 35,015 59,173 32,378
14,942 5,571
5
1,702 1,415 3,271 4,016 6,112 3,676 1,769
752
Females
29 30 3
2,698,281 4,825,368 Total
2,253,362 213,724
88,930 31,810 24,40,) 14,738 15,116 56,065
128
2,261,158 365,804 360,582 361,759 595,185 386,074 241,163 252,121
1,522
0-14 15"-19 20-24 25-29 30-39 40-49 50-59 60+
A.N\S.
94,868 13,5111 55,551 10,848 48,443 4,440 9,516 554 31,927 1,869 31,185 1,718 94,006 7,118 2,105,271 3,968,438 Totar
1,131 4,817
10,454 16,198 33,912 19,779 6,804 1,773
317 1,537 1,858 2,180 4,052 2,147
718 190
2
2.092 4,672 5,832 7,155
14,117 10,841 6,702 4,139
127,715 11,731 13,142
564 3,756
11,3)0 1 J, liL 4 I, ~53 3J,I72 10,708 2,80&
2
1,831
29 102 200 324 616 393 132
35
1,797
29 100 197 320 602 387 129 33
3t
2 !I 4
14 6 3 2
369 :J)I
1,133 I. 712 J,J98 2.427
881 320
225
25 !II 41 36 52 26
9
"
365 1,179 ,tH8
1,'1)7 3,433 2.512 1.299
802
2
7,582
272 599 782 887
1,83B 1,517
973 714
225 6,887
25 258 31 539 41 713 36 797 52 1,670 20 I,HI
9 885 5 654
695
14 60 69 90
IG8 146 88 60
925 1,174 1,232 1,445 2,574 1,914 1,064
520
1,254 3,646 6,353 8,713
15,260 8,566 3,431 1,216
4
408 640 609 664
1,145 657 224
91
2
114 566
1,544 1,997 2,862 1,546
639 248
73 III 70 72
130 .74
19 5
933 2,749 4,432 4,947 8,467 5,511 2,964 1,924
105 128 131 163 491 388 281 182
270 1,474 3,200 5,637
10,451 6,991 2,536
626
210 297 234 252 381 220
90 34
3,565 4,870
10,921 1"9,279 30,888 15,105 6,927 2,450
799 518 954
1,279 1,864 1,038
445 221
1,134: 139,221 5,4110 25,793 3,878 84,595 2,007 53,614 2,195 89,117 1;;,593
89 1,134 147 5,547 132 16,050 164 '25,721 291 'P,276 172 26,912 B5 13,727 51 2,855
5
1,165 5,621
97 159 96 431
121 640 124 744 283 1,512 249 I, 193 130 637
65 305
1,089
92 89
117 115 255 238 125 58
76
5 7 4 9
28 11 5 7
4,.,92
99 286 466 540
1,112 907 472 210
1,529
60 145 174 204 400 286 165
95
138 394 6B4 848
1,626 1,108
559 123
206
13 18 17 25 51 45 23 14
176
11 18 16 22 43 37 18 11
30
2
I 3 8 8 5 3
280 1,817 4,676 5,594
7,708 3,704 1,406
608
960
7 52 79
164 310 215
86 47
540
4 29 55
103 177 105 47 20
420
3 23 24 61
133 110 39 27
301 772 784 620 845 388 141 27
1,994 5,589
11,317 12,927
22,833 16,268 ~8,525
5,135
7
36 9,471
11 170 3 623 6 1,190 2 1,244 8 2,468 3 1,843 2 1,097
836
32 5,506
11 105 3 425 5 737 1 706 7 1,454 3 1,004 2 Gil
462
t 3,965
65 198 453 536
1,014 839 486 374
59 366 81 2,129
137 5,485 198 9,414
527 18,749 496 12,206 288 4,306 219 959
2
362 5,015
16 44 9 211
22 483 25 752 84 1,682 7f) 1,236 67 468 60 139
319 3,712
16 38 8 170
20 343 23 001l 77 1,256 70 896 61 313 44 88
I 2 2 7 9 6
1G
1,303
G 41
140 144 426 34<l 155 51
114 2,405 260 4,378 333 9,900 357 15,736
586 28,285 348 17,273 144 8,015 53 3,121
4
176 15,726
21 428 19 521 14 1,469 22 2,933 44 5,549 30 2,746
16 1,524 10 555
14:9 11,561
21 342 19 396 10 1,143 18 2,325 35 4,111 23 1,834 13 1,04:7 10 363
27
4 4 ~
7 3
4,165
86 125 326 lioa
1,438 912 477 192
1
903 897
2,317 p,737 4,248 2,638 1,324 531
1,122
77 54
134 192 316 191 101 57
653
63 36 64
120 172 97 56 25
469
li' 18 50 72.
144 91 45 32
1,828,069 137,831
47,451 18,717 14,716
9,098 9,511
39,783
95
_593,010
425,293 75,893 41,479 13,093
9,692 5,640 5,605
16,282
33
36,206
31,620 20,859 7,337 2,527 1,957 1,152 1,340 7,271
340,886
304,390 17,986 ~,902
2,109 1,646
969 1,1" 6,710
21,178
15,230 2,873 1,435
4111 311 183 166 561
1,869,277 290,332 282,166 285,140 485,081 326,334 209,290 220,134
684
0-14 15-13 20-24 25-29 30-39 40--49 50-59 60+
A.N.S.
856,930 T Deal
391,881 75,472 78,416 76,619
110,104 59,740 31,873 31,9B7
0-1' 15-19 20-24 25-29 30-39 40-49 50-59 60+
838 A.N.S.
658,119
321,862 45,205 46,603 43,858 76,791 53,179 33,228 37,333
627,481
307,837 42,679 44,303
41,526 72,909 50,769 31,775 35,6B3
30,6:18
14,025 2,526 2,360 2,332 3,882 2,410 1,453 1650
Toeal
0-14 15-19 20-24 25-29 30-39 40-49 50-59 60+
A.N.S.
Total
0-14 .15-19 20--U 25-29 30-39 40-49 50-59 60+
A.N.s.
Total
0-14 15-19 20--24 25-29 30-39 40-49 50-59 60+
A.N.S.

TABLE B-lC PART A 30
St.te! Di vision! District
fla:ftari bagh
Ranchi
TABLE B-1 PART A-WORKERS AND NON·WORKERS ACCORDING
~---------------
Total Age. Total Population Total Workers Cultivators Rural ~rn\1p Urban
WORKERS A________________~
II III
Agr i cui tural Labourers
Livestock I Fores· try I Fish lng,
Hunting Plan· tatlons Orchards and allied actio
vities
r--L-------""" ,-------...___._."""' ~--.....--~ r----...A...---"""" Persons Males Females Males Females Males Females Males Females
2
T
R
U
T
R
u
3
Total
4 5 6
3,02~,214 1,5~,193 51,494,021
0-14 15-19 20-24 25-29 30-39 40-49 50-59 60+
1,349.167 242,627 216,821 225,053 405.309 275,536 161,033 144,545
Age not stated 123
687,359 123,571 102,395 107,832 205,181 146,322 84,388 69,094
51
661,808 119,056 114,426 117,221 '200,128 129,214 76,645 75,451
72
Total 2,631,435 1,310,112 1,321,323
0-14 15-1'9 20-24
25-29 30-39 40-49 50-59 60+
i.184,021 210,724 185,338 191,612 345,340
1239,647 143,719 130,928
Age not stated 106
Total
0-14 15-19 20-24 25-29 30-39 40-49 50-59 60+
Age not stated
388,779
165,146 31,903 31,483 33,441 59,969 35,889 17,314 13,617
17
600,792 105,632 85,824 89,679
168,830 123,336 73,845 62,137
37
216,081
86,567 17,939 16,571 18,153 36,351 22,986 10,543 6,957
14
Total 2,611,U5 1,323,3113
0-14 15-19 20-24 25-29 30-39 40-49 50-59 60+
1, [30,630 213,658 190,064 198,583 337,991 245.974 157,957 135,730
Age not stateJ 858
Total
0-14 15-19 20-24 25-29 a0-39 40-49 50-59 .60+
2,254,518
983,693 179,770 154,023 165,203 288.365 217,351 142,862 122,428
Age not stated 23
Tatal
0-14 15-19 20-24 25-29 30-39 40-49 50-59 , 611+
Age not stated
356,927
146,937 33.888 35,241 33,380 49,626 28,623 15,095 13,302
835
570,853 1(1.680 90,244 99,538
172,569 129.590 83,328
'65.463
38
1,126.653
4H,170 92,861 71,259 80,983
142,662 112,012
74,424 59,255
23
196,650
76,683 l8,819 18,985 18,551 29.907 17,578 8,904 7,208
15
583.229 105.092 99.514
101.933 176,510 116,311 69,874 68,791
69
172,698
78.579 13,964 14,912 15.288 23,618 12,903 6,771 6,660
3
1,288,142
559,77i 101.978 99,820 99,045
165,422 116,384
74,629 70,267
820
1,127,865
489,523 86,909 131,564-84,216 145,703 105,339
68,438 64,173
160,277
70,254 15,069 16,256 14,829 19.719 11,045
6,191 6,094
820
7 8 9
7,78,619 118,818 438,q56
44,449 74.540 84,618
100.586 198.492 142,186 80,171 53.560
117 6n,650
42.486 69,320 74,048 84,673
164,005 120,240
70,692 49,182
4
103,909
1,963 5.220
10,570 15,913 34,487 21,946 9,479 4,378
13
11,331 13,086 13,715 15,263 30,507 20,398 9,617 4.894
7.
22,929 42,900 45,496 51,864
102,388 81,270 52,022 39,986
110,582 UB,472
10,981 12,585 12,882 14,070 27,751 18,731
8,951 4,626
5
8,236
350 501 833
1,193 2,756 1,667 666 268
2
22.647 42,023 44.483 50,606 99,983 79,379 50,603 28,747
10,384
282 877
1,013 1,258 ~,405
1,891 1,41 1,239
... 700,035 131,204 446,433
49,645 61,921 68.946 92,203
167,380 126.436 80,238 53,262
4
612,936
48,093 57,500 59,764 76.692 139,447 110,021
72,380 49,038
87,099
1,552 4,421 9,182
15,511 27,933 f6,415
7,856 4,224
3
20,376 17,007 15,639 14,988 25,924 19,305 11,129 6,8%
'123,121
19,777 16,318 14.470 13,732 23,868 i7,953 10,466 6,537
8083
599 689
1,169 1.256 2,056 1,352
663 :&
28,47S 36,120 39,545 52,025
100,966 86,233 60,246 42,820
440,923
28,361 35,797 39,103
51,366 99,641 85,123 59,408 42,104
5,510
117 323 442 639
1,325 1110 838 716
10 I I
39,675 140,598
2.939 3.956 4,262 4,855
10.260 7,297 3.744 2,362
15.235 20,082 17,013 17,045
30,663 21,591 11,900
7.069
38,869 135,137
2.895 3,893
4,164 4,747
10,042 7.129 3,671
2,328
806
44 63 98
lOll 211l 168 73 34
62,666
8.475 6,962 6,767 6,617
12,594 10,425 6,402 4,424
62,402
8,446 6,93B 6,743 6,589
12,551 10,368 6,373 4,391
264-
29 24 24 28 43 57 29 30
14,875 19,429
16,320 16,364
29,452 20,676 11,324 6,697
5,461
360 653 693 6111
1.211 915 576 372
102,022
16,428 17,099 12,482 12,313 19,180 12,915 7,242 4,363.
97,635
16,172 16,618 11,964 11,777 18,127 12,127 .. 6,780 4.070
4,387
256 481 518 536
1,053 788 462 293
12 13 14
61,504 8.076 667
6.858 7,7~ 7,543 7,873
14,978 9,932 4,594 2,007
2
2,732 997 568 684
1,495 960 403 237
451 35 14 28 29 51 37 22
60,704 6,8'11 651
6,781 7.611 7,468 7.787
14,742 9,803 4.524 1,986
2
2,670 448 937 35 444 12 527 27·
1,098 29 707 43 304 36
184 21
.'. 800 1,205 16
3 77 106 75 86 236 129
70 21
62 60
124 157 397 253
99 53
2
8 I
S2,802 5,233' 497
10,247 8,542 6,703 5,950 9,,>77 6,496. 3.~29
1,858
51,569
10.086 11,349 6.562 5,789 9,195 6,322 3,446 1,820
1,295 593 480 531
1,047 742 363 182
3,835
1,248 517 359 340
603 428 220 120
1,233 1,398
161 193 141 161 282 174 83 38
47 76
121 191 444 314 ,143
62
325 42 24 27 24 25 II 19
462
318 41 20 21 15 22
9 16
35
7
4 6 9 3 2 3
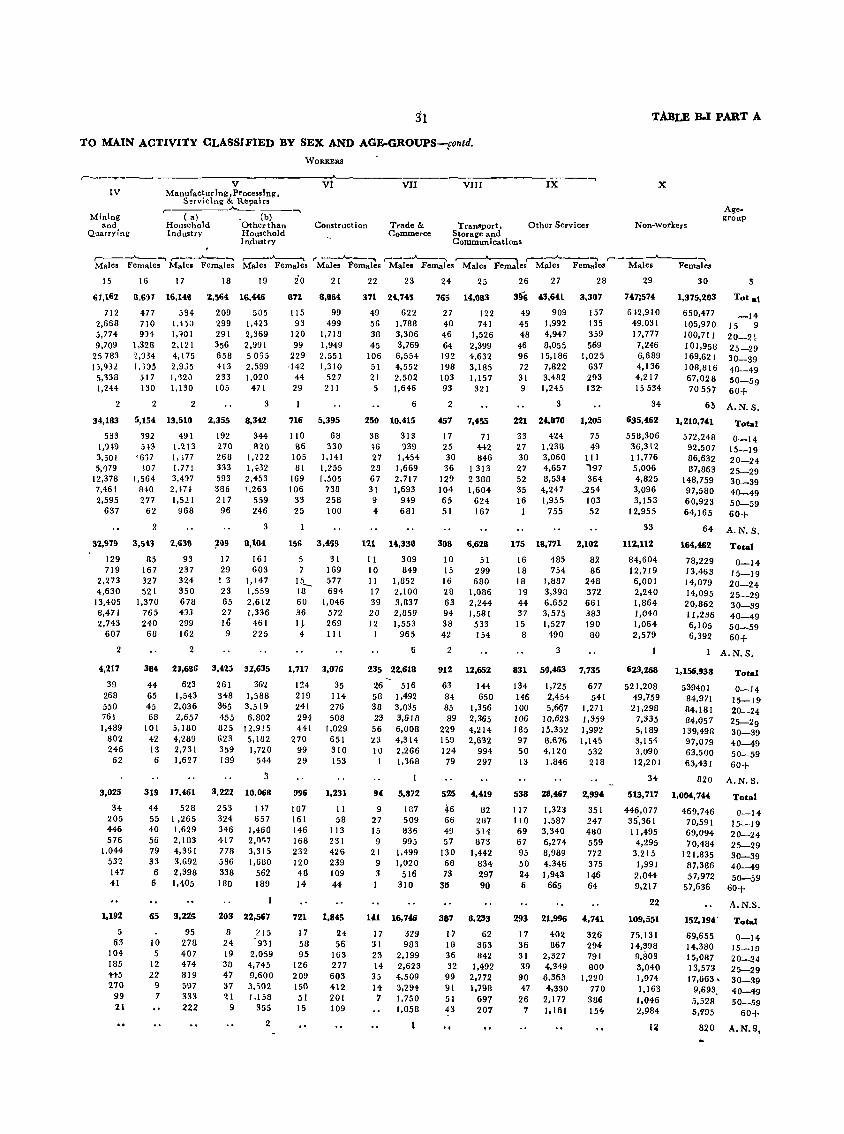
31
TO MAIN ACTIVITY CLASSIFIED BY SEX AND AGE-GROUPS-fontd.
WORKERS
,....---·~-'---------V-------V-!l------V-:::I:-:'I------V=II-:I-
IV
Mining and
Quarrying
Manufactur ing, ProcessIng, S~rvicing & Repairs
,------'-._----...... r- (a) . (b) Household Other than Industry Household
Industry
Construction Trade & Commerce
Transport. Storage and Communications
._----..... IX
Other Services
TABLE B-1 PART A
X
Non-workers
Agegroup
r---""'___"'"""\ 1"--~-~ r- "'"""' r __ J-.-"""", r---..A-..-"""", r---~"""" ,...... .__-..... Male. Females Males Females Males Females Males Females Males Females Males Females Males Females Males Females
15
67,162
712 2,658 5,774 9,709
25783 13,932 5,338 1,244
2
16 17
8,6H 16,146
477 594 710 1.nG 9)4 1,-'01
1,328 2,121 2,~J4 4, t 75 I, >:)5 2,955
H7 1,'12J 130 1,130
2 2
18 19
2,564 16,«6
209 505 299 1,423 291 2,369 356 2,991 658 5055 413 2,599 233 1,020 105 471
3
34,183 5,154 13,510 2,355 8,342
593 1,949 3,501 5,079
12,378 7,461 2,595
637
3'2,979
129 719
2,273 4,630
13,405 8,471 2,743
607
2
4,217
39 268 550 761 1,489
802 246 62
3,025
34 205 446 576
1,044 532 147 41
1,192
5 63
104 185 445 270
99 21
392 H3
'6)7 107
1,564 840 277
62
2
491 1,213 1. i77 t ,771 3,497 2,4H 1,521
968
3,5iS 2,63B
85 93 167 237 327 324 521 350
1,370 678 765 4JJ 240 299 68 162
384
44 65 45 68
101 42 13 6
2
2~,6BG
623 1,543 2,036 2,657
5,180 4,289 2,731 1,627
319 17,461
44 528 55 I ,265 40 1,629 56 2,103 79 4,361 33 3,692
6 2,398 6 1,405
65 3,225
10 5
12 22
9 7
95 278 407 474 819 597 333 222
192 344 270 820 258 1,222 333 1,432 593 2,453 386 1,263 217 559 96 246
:Z{)9 8,104
17 161 29 603 ~ 3 1,147 23 1,559 65 2,612 27 1,336 I~ 461 9 225
3,423 32,635
261 362 348 1,588 365 3,519 455 6,802 825 12,915 623 5,1U2 359 1,720 1!l9 544
3
3,222 10,068
253 IH 324 657 346 1,460 417 2.',,,7 778 3,315 586 1,61l0 338 562 180 189
203 22,567
8 24 19 38 47 37 ~I
9
215 931
2,059 4,745 9,600 3,'i02 J .158
355
2
io 871
115 93
120 99
229 ,142
44 29
21
8,aS4
99 499
1.718 1,949 2,551 1,310
527 211
716 5,395
110 86
105 81
169 106
33 25
68 330
1,141 1,255 1,505
738 258 100
15S 3,4S9
5 31 7 169
15_ 577 18 694 60 1,046 36 572 I), 269 4 III
1,717
124 219 241 294 441
270 99 29
996
107 161 146 168 232 120 48 J4
3,076
35 114 276 508
1,029 651 310 153
1,231
II 58
113 231 426 239 109 44
721 1,845
17 58 95
126 209 150 51 15
24 56
163 277 603 412 201 109
22 23
371 24,7<15
49 622 56 1,788 38 3,306 45 3,769
106 6,554 51 4,552 21 2,502 5 1,646
6
250 10,415
38 313 46 939 27 1,454 28 1,669 67 2,717 31 1,693 9 949 4 681
121 14,330
11 309 10 849 II 1,852 17 2,100 39 3,837 20 2,859 12 1,553
I 965
6
235 22,618
26 516 58 1,492 38 3,035 23 3,618 56 6,008 :'(3 4,314 10 2,266
1 1,368
94
9 27 15
9 21
9 3
5,872
187 509 836 995
1.499 1,020
516 310
141 16,746
17 31 23 14
35 14 7
329 983
2,199 2,623 4,509 3,294 1,750 1,058
24 25
765 U,083
27 122 40 741 46 1,526 64 2,399 192 4,632 198 3,185 103 1,157 93 321
2
457 7,455
17 71 25 442 30 846 36 1313
129 2388 104 1,604 65 624 51 167
308
10 IS 16 28 63 94 38 42
2
6,628
51 299 680
1,086 2,244 1,581
533 154
911 12,652
63 144 84 650 85 1,356 89 2,365
229 4,214 159 2,632 124 994
79 297
525
46 66 49 57
130 68 73
311
4,419
82 287 514 873
1,442 834 291 90
387 8,233
17 18 36 32 99 91 51 43
. ,
62 363 842
1,492 2,772 1,79B
697 207 ..
26 27
396 43,6il
49 909 45 1,992 48 4,947
46 8,055 96 15,186 72 7.822 31 3,482 9 1,245
3
28
3,307
157 135 359 569
1,025 637 293 132-
221 24,870 1,105
33 424 27 1,238 30 3,060 27 4,657 52 8,534 35 4,247 16 1,955
1 755
75 49
III 1~7 364
..254 103 52
175 18,771 2,102
16 485 82 18 754 86 18 1,887 248 19 3,398 372 44 6,652 661 37 3,575 383 15 1,527 190
8 490 80
831
134 146 100 106 185 97 50 13
3
50,463
1,725 2,454 5,6f)7
10,623 15,352 8,676 4,120 1.846
538 28,467
117 1,323 110 1,587 69 3,340 67 6,274 95 8,989 50 4,346 24 1,943 6 665
7,735
677 541
1,271 1,359 1,992 1,145
532 218
2,994
351 247 480 559 772 375 146 64
293 21,996 4,741
17 36 31 39 90 47
26 7
402 867
2.327 4,349 6,363 4,330
2.177 1,161
326 294 791 800
1,220 710 386 154
29
747;574
6}2,910 49.031 17,777
7,246 6,689 4.136 4,217 15534
34
30
1,375,103
650,477 105,970 100,711 101,958 169,621 108.816 67,028 70557
3
Tot at
_14 15 9 20--21 25-29 30--39 40-49 50-59 60+
65 A.N.S.
635,462 1,210,741 Total
0-14 15-19 20-24 25-29 30-39 40-49 50-59 60+
558,306 36,312 11,776 5,006 4,825 3,096 3,153
12,955
33
112,112
84,604 12,719 6.001 2,240 1.864 1,040 1,064 2,579
623,268
521,208 49,759 21,298
7,335 5,189 3,154 3,090 12,201
34
513,717
446,077 35',361 11,495
4,295 3,215 1,991
2,044 9,217
22
109,5:;1
75,131 14,398 9.803 3,040 1,974 1,163 I,Oi6 2,984
12
572,248 92,507 86,632 87,863
148,759 97,580 60,923 64,165
64 A.N. S.
164,461
78,229 13,463 14,079 14.095 20,862 11,236 6,105 6,392
1,156,938
539401 84,971 84,181 84,057
139,498 97,079 63,500 63,431
Total
0-14 15-19 20-24 25-29 30-39 40-49 50-59 60+
A.N.S.
Total
0-14 15-19 20-24 25-29 30-39 40-49 50-59 60+
820 A.N. S.
1,004,744
469,746 70,591 69,094 70,484
121,835 87,386 57,972
57,636
Total
0-14 15-19 20-24 25-29 30-39 40-49 50-59
60+
A.N.S.
152,194' Total
69,655 14,380 15,087 13,573 17,663.
9,693. 5,528 5,'195
820
0-14 15-19 20-24 25-29 30-39 i0-49 50-59
60+
A.N.S,
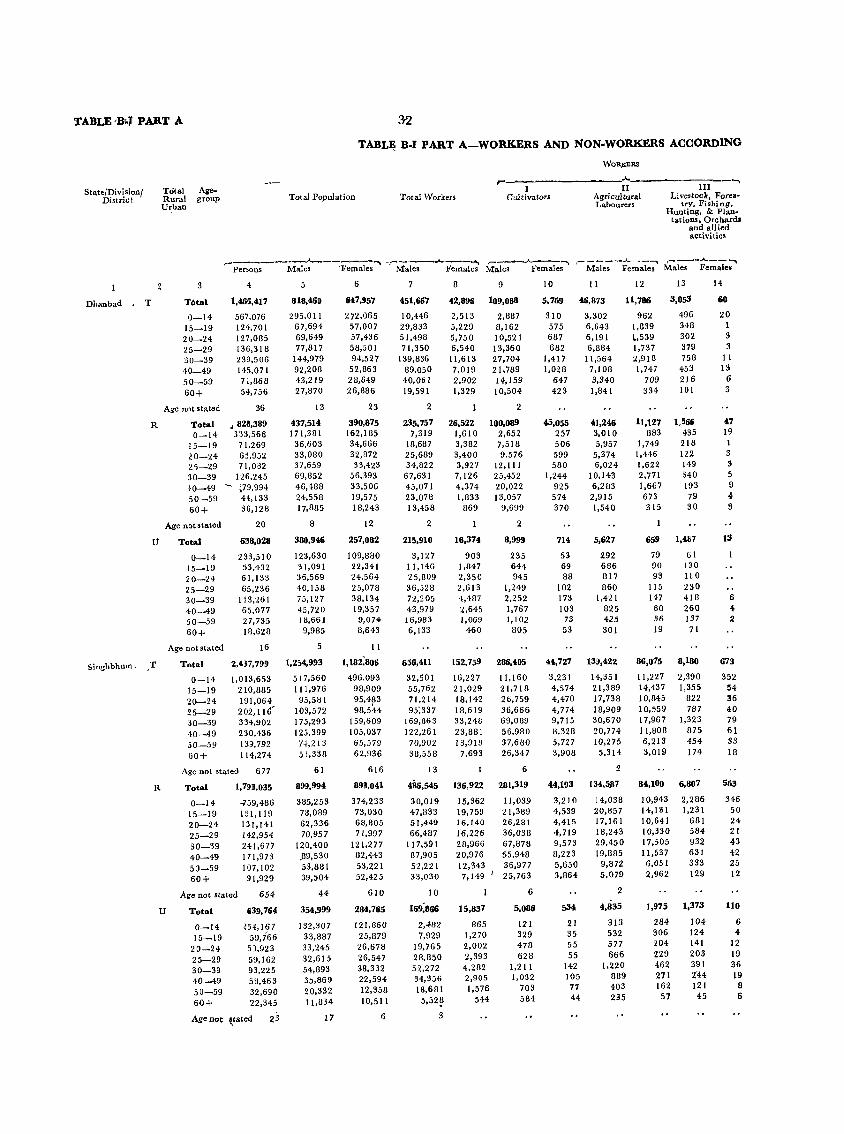
TABLE'B"J PART A
State/Division/ District
Total AlI"Rural group Urban
Total Population
32
TABU; B-1 PART A-WORKERS AND NON-WORKERS ACCORDING
Total Workers
WORJ<ERS
,-------------~----~~-------, III I Cultivators
II Agricultural Labourers
Li vestock, Fates .. try, Fishing.
Hunting, & Plantations, Orchards
aud allied activitie~
r--------..A.. ....... ----.--~ -r----,......____"'""'I r---""""'_-""""\ ,-- ____ ..A.. ._'"""'\ r----.A.--~ Persons Males 'Females Males Females Males Females Males Females Male, Females
Dhanbad • T TOtal
0-14 15-19 20-24 25-29 30-39 40-49 50-59 60+
Age not stated
R Total 0-14
15-19 20-24 2~-l9
30-39 40-49 50-59 60+
Age not stated
U Total
0-14 15-19 20-24 25-29 30-39 40-49 50-59 60+
4
1,46.,417
567,076 124,701 127,085 136,318 230,506 145,071 71,868 54,756
36
.828,389 333,566
71,269 65,952 71,032
126,245 ;79,994 44,133 36,128
20
638,028
233,510 53,432 61,133 65,236
113,261 65,077 27,735 18,628
Singhbhum, ,T
Age not stated
Total
16
2,417,799
1,013,653 210,885 191,064 202,1 Hr 334,902 230,436 139,792 114,274
R
U
0-14 15-19 20-24 25-29 30-39 40-49 50-59 60+
Age not .tated 677
Total
0-14 15-19 20-24 25-29 30-39 40-49 50-59 60+
1,793,035
.... 59,486 151,119 131,141 142,954 241,677 171,973 107,102 91,929
Age not stated
Total
654
639,764
0-14 15-19 20-24 25-29 30-39 40-49 50-59 6{)+
?54,167 59,i66 5),923 59,162 93,225 58,463 32,690 22,345
Age not ~tated 23
5
818,460
295,011 67,694 69,649 77,817
144,979 92,208 43,219 27,870
13
437,514 171,381
36,603 33,080 37,659 69,852 46,488 24,558 17,885
8
380,946
123,630 31,091 36,569 40,158 75,127 45,720 18,661 9,985
5
1,2:'4,993
517,560 111,976
95,581 103,572 175,293 125,399
74,213 51,338
61
899,994
385,253 73,089 62,336 70,957
120,400 ,89,530 53,881 39,504
44
354,999
132,307 33,887 33,245 32,615 54,893 35,869 20,332 11,834
17
6
647,957
272,065 57,007 57,436 58,501 94,527
52,863 28,649 26,886
23
390,875 162,185 34,666 32,872 33,423
56,393 33,506 19,575 18,243
12
257,082
109,880 22,341 24,564 25,078 38,134 19,357
9,074 8,643
11
1,182;806
496,093 98,909 95,483 98.544
159,609 105,037 65,579 62,936
616
898,041
374,233 73,030 68,805 71,997
121,277 82,443 53,22 I 52,425
610
284,765
121,860 25,879 26,678 26,547 38,332 22,594 12,358 10,511
6
451,667
10,446 29,833 51,498 71,350
139,836 89,050 40,061 19,591
2
235,757 7,319
18,687 25,689 34,822
67,631 45,071 23,078 13,458
2
215,910
3,127 11,146 25,809 36,528 72,205 43,979 16,983 6,133
656,411
32,501 55,762 71,214 95;337
169,863 122,261
70,902 38,558
13
8 9
42,896 109,088
2,513 5,229 5,750 6,540
11,613 7,019 2,902 1,329
26,522 1,610 3,382 3,400 3,927 7,126 4,374 1,833
869
16,374
903 1,047 2,350 2,613 4,487 l,645 1,069
460
152,759
16,227 21,029 18,142 18,619 33,240 23,881 13,919
7,693
2,887 8,162 10,521 13,360 27,704 21,789 14,159 10,504
2
100,089 2,652 7,518 9,576
12,111 25,452 20,022 13,057
9,699
2
8,999
235 644 945
1,249 2,252 1,767 1,102
805
286,405
11,160 21,718 26,759 36,666 69,089 56,980 37,680 26,347
6
486,545 136,922 281,319
30,019 47,833 51,449 66,487
117,591 87,905 52,221 33,030
10
169;866
2,482 7,929
19,765 28,850 52,272 34,356 18,681 5,52~
3
15,362 19,759 16,140 16,226 28,966 20,976 12,343 7,149 I
15,837
865 1,270 2,002 2,393 4,282 2,905 1,576
544
11,039 21,389 26,281 36,038 67,878 55,948 36,977 25,763
6
5,086
121 329 478 628
1,211 1.032
703 584
10 11
5,769 46,873
12
11,786
13
3,0:;3
496 348 302 379 758
453 216 101
310 575 687 682
1,417 1,028
647 423
45,055 257 506 599 580
1,244 925 574 370
714
53 69 88
102 173 103
73 53
4i,727
3.231 4,574 4,470 4,774 9,715 H,328 5,727 3,908
3,302 6,643 6,191 6,884
11,564 7,108 3,340 1,841
41,246 3,010 5,957
5,374 6,024
10,143 6,283 2,915 1,540
5,627
292 686 817 860
1,421 825 425 301
139,422
14,351 21,389 17,738 18,909 30,670 20,774 10,275
5,314
2
"",193 134,5117
3,210 4,539 4,415 4,719 9,573 8,223 5,650 3,864
534
21 35 55 55
142 105 77 44
14,038 20,857 17,161 18,243 29,450 19,885
9,872 5,079
2
4,835
313 532 577 666
1,220 8B9 403 235
962 1,839 ~,539
1,737 2,918 1,747
709 334
11,127 883
1,749 1,446 1,622 2,771 1,667 673 315
659
79 90 93
115 147
80 36 19
86,075
11,227 14,437 10,845 10,559 17,967 11,808 6,213 3,019
1,566 435 218 122 149 340 193 79 30
1,467
61 130 )LO
230 418 260 137 71
8,180
2,390 1,355
822 787
1,323 875 454 174
84,100 6,807
10,943 14,131 10.641 10,330 17,505 11,537 6,051 2,962
2,286 1,231
681 584 932 631 333 129
1,975 1,373
284 306 204 229 462 271 162
57
104 124 141 203 391 2'44 121 45
14
60
20 1 3 3
11 13
6 3
47 19 I 3 3 5 9 4-3
13
6 4 2
673
352 :H 36 40 79 61 33 18
563
346 50 24 21 43 42 25 12
110
6 4-
12 19 36 19
8 6
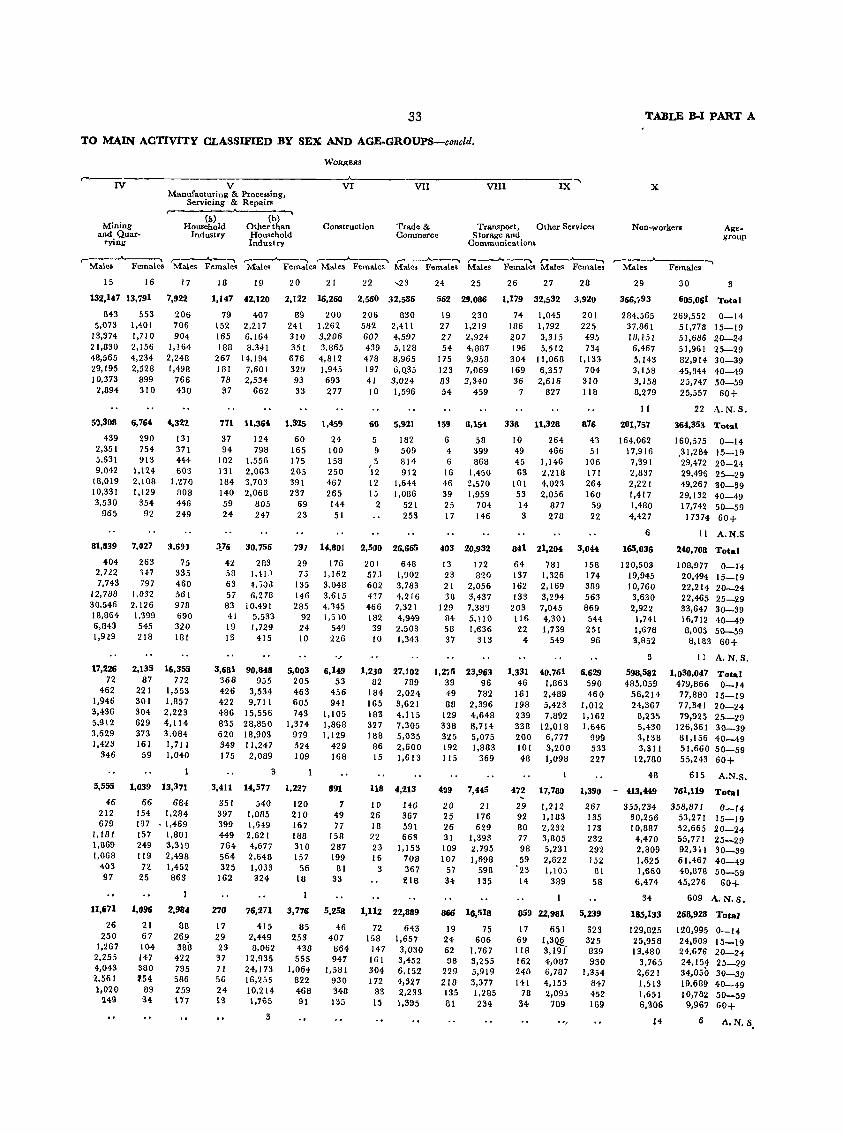
33
TO MAIN ACTIVITY CLASSIFIED BY SEX AND AGE.GROUPS-concld.
WOJl,l(ERS
~----rv------------------V------------------~V~I-----------V~II~------~V~II~I--------~I~X~~ Manufacturing & Processing,
Mining and Quar
rying
Servicing & Repair!!
(a) Household
Industry
(b) Other than Household Industry
Construction Trade & Commerce
Transport, Other Services Storage and
Communications
TABLE B·I PART A
x
Non-workers Agegroup
~--......__-.. r----A..---... r----,.A.....-~ r--A---.. ,-_.A--~ ,..-.A-___ -.. ~_.A-----... r-Males Females Males Females Male. Females Males Females Males Female. Male. Females Males Females Males
-..
IS
132,1.7
843 5,073
13,374 21,830 48,565 29,195 10,373
2,894
16
13,191
553 1,401 1,110 2,156 4,234 2,528
899 310
17
7.922
206 706 904
1,164 2,248 1,498
766 430
51).308 6, 76~ 4.,322
439 2,351 5,631 9,042
18,019 10,331 3,530
965
81,839
404 2.722 7,743
12,788 30,546 18,864 6,343 l,n9
17,226 72
462 1,946 3,436 5,912 3,629 1,423
346
5,555
46 212 679
1,181 1,869 1,068
403 97
11,671
26 250
1,267 2,255 4,043 2,561 1,020
249
290 754 913
1,124 2,108 1,129
354 92
7,027
263 'it7 797
1.032 2,126 1,399 545 218
2,135 87
221 301 304 629 373 161 59
131 371 444 603
1,270 808 446 249
3,6~J
75 335 460 561 978 690 320 181
16,355 772
1,553 1,857 2,223 4,114 3,084 1,711 1,040
1,039 13,371
66 684 154 1,284 197 • 1,469 157 1,801 249 3,319 119 2,498 72 1,452
25 863
1,096
21 67 11)4 147 380 ~54
89 '34
1
2,984
88 269 388
422 795 586 259 177
18 19 20 21
1.147 42,120 2,122 16,260
79 407 89 200 152 2,217 241 1,262 165 6,164 310 3,206 188 8,341 351 3,865
267 14,194 676 4,812 181 7,601 329 1,945 78 2,534 93 693 37 662 33 277
771 11,364. 1,325 1,459
37 124 94 798
102 1,556 131 2,063 184 3,703 140 2,068 59 805 24 247
l!_76 30,755
42 283 58 1,11) 63 4,:;Od 57 6,278 83 10,491 41 5,533 19 1,729 13 415
3,681 36B 426 422 486 835 620 349 175
3.411
351 397 399 449 764 564 325
162
270
17 29 23 37 71 56 24 1'3
90,848 955
3,534 9,711
15,556 28,850 18,903 11,247 2,089
3
14,577
540 1,085 1,549 2,621 4,677 2,64B 1,033 324
76,271
415 2,449 0,062
12,935 24,173 16,255 10,214 1,765
3
60 165 175 205 391 237
69 23
24 100 158 250 467 265 144 51
791 14,801
29 176 73 1.162
135 3,048 146 3.615 285 4,145
92 1.5)0 24 549 10 226
5,003 205 463 605 743
1,374 979 524 109
1,227
120 210 167 18B 310 157
56 18
3,776
85 253
436 555
1,064 822 468 91
6,149 53
456 941
1,105 1,868 1,129
429 168
891
7 49 77
158 287 199
81 33
5,258
46 407
864 947
1,581 930 348 135
2,560 32,586
206 830 582 2,411 607 4,597 439 5,128 478 8,965 197 6,0.35 41 3,024 10 1,596
611 5,921
5 9 5
112
12 15
2
182 509 814 912
1,644 1.086
521 253
2,500 26,663
201 648 573 1,902 602 3,783 417 4,216 466 7,321 lB2 4,949 39 2,503 10 1,343
1,230 82
184 165 183 327 188
86 15
118
10 26 18 22 23 16
3
1,112
72 158
147 161 304 172
83 15
27,102 789
2,024 3,621 4,115 7,305 5,035 2,600 1,613
4,213
146 367 591 663
1,153 708 367 218
22,889
643 1,657 3,030 3,452 6,152 4,327 2,233 1,395
24
562
19 27 27 54
175 123 83 54
25
29,086
230 1,219 2,924 4,887 9,958 7,069 2,340
459
26
1,179
74 186 207 196 304 169 36
7
27
32,532
1,045 1,792 3,315 5,512
11,068 6,357 2,616
827
28
3,920
201 225 495 734
1,133 704
310 118
159 8,154 338 11,328 876
43 51
106 171 264 160
6 58 4 399 6 868
16 1,450 46 2,570 39 1,959 25 704 17 146
403 20,932
13 172 23 820 21 2,056 38 3,437
129 7,389 84 5,110 58 1,636 37 313
1,2i5 39 49 88
129 338 325 192 115
409
20 25 26 31 109 107
57 34
866
19 24 62 98
229 218 135 81
23,963 96
782 2,396 4,648 8,714 5,075 1,883
369
7,U5
21 176 629
1,393 2,795 1,698
598 135
16,518
75 606
I, 767 3,255 5,919 3,377 1,285 234
10 264 49 466 45 1,146 63 2,218
101 4,023 53 2,056 14 877 3 278
59 22
841 21,204 3,044
64 781 158 137 1,326 174 162 2,169 389 133 ~294 563
203 7,045 869 116 4,301 544 22 1,739 251
4 549 96
1,331 46
161 196 239 338 200 101 48
472
29 92 80 77 98 59
'23
14
40,761 1,863 2,489 5,423 7,892
12,018 6,777 3,200 1 .. 096
17,780
1,212 1,183 2,232 3,805 5,231 2,622 1,105
389
859 22,981
17 651 69 1,3Qt lIB 3,191 162 4,067 240 6,787 141 4,155
78 2,095 34 709
6,629 590 460
1,012 1,162 1,646
999 533 227
1,390
267 135 173 232 292 152
81 58
5,239
323 325 839 930
1,354 847 452 169
29
366,i93
284,565 37,861 18,151 6,467 5,143 3,158 3,158 8,279
11
201,757
164,062 17,916
7,391 2,837 2,221 1,417 1,480 4,427
6
165,036
120,503 19,945 10,760 3,630 2,922
1,741 1,618 3,852
Female.
30 3
605,061 Tota 1
269,552 51,778 51,686 51,961 82,914 45,844 25,747 25,557
22
0--14 15--19 20--24 25--29 30-39 40--49 50--59 60+
A.N.S.
3M,353 Total
160,575 0-14 .31,284 15-19 29,472 20-24 29,496 25--29 49,267 30-39 29,132 40-49 17,742 50-59 17314 60+
11 A.N.S
240,708 Total
108,977 0-1"4 20,494 15--19 22,214 20--24 22,465 25-29 33,647 30--39 16,712 40--49 6,005 50-59 8,183 60+
5 11 A.N.S.
598,582 485,059
56,214 24,367
0,235 5,430 3,138 3,311
12,780
48
- 413,449
355,234 30,256 10,887
4,470 2,809 1,625 1,660
6,474
34
185.133
129,825 25,958 13,480
3,765 2,621 1,513 1,651 6,306
14
1,030,047 Total 479,866 0-14 77,880 15--19 77,341 20--24 79,925 25--29
126,361 30-39 81,156 40--49 51,660 50--59 55,243 60+
615 A.N.S.
761,119
358,871 53,271 32,665 55,771 92,311 61,467 40,078 45,276
Total
6-14 15-19 20-24 25-29 30-39 40-49 50-59 60+
609 A. N. S,
268,926 TotaJ
120,995 24,609 24,676 24,154 34,050 19,689 10,762
9,967
6
0-14 15-19 20-24 25--29 30--39 40-49 50-59 60+
A,N.S,

6-2 CenSUs Bibar/72
TABLE B .. II
WORKERS AND NON-WORKERS IN CITIES AND NON-CITY URBAN AREAS ACCORDING TO MAIN ACTIVITY CLASSIFIED BY SEX
AND AGE-GROUPS

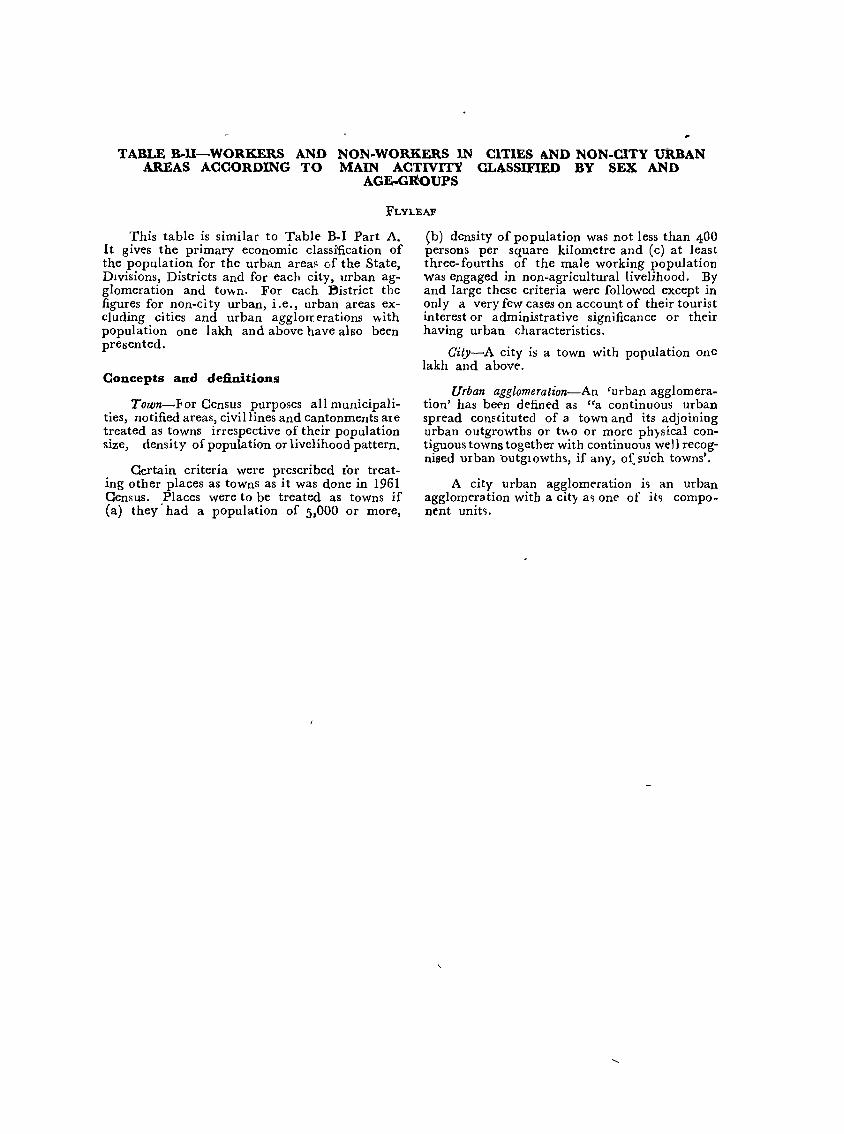
TABLE B-lI-WORKERS AND NON-WORKERS IN CITIES AND NON-CITY URBAN AREAS ACCORDING TO MAIN ACTIVITY CLASSIFIED BY SEX AND
AGE.GROUPS
FLYl.EAP
This table is similar to Table B-1 Part A. It gives the primary economic classification of the population for the urban area~ of the State, DIvisions, Districts and for each city, urban agglomeration and tOVvn. For each ~istrict the figures for non-city urban, i.e., urban areas excluding cities and urban agglorrerations Vvith population one lakh and above have also been presented.
Concepts and definitions
Town-For Census purposes all municipalities, notified areas, civil lines and cantonments are treated as towns irrespective of their population size, density of population or livelihood pattern.
Certain criteria were prescribed tor treating other places as towns as it was done in 1961 Census. Places were to be treated as towns if (a) they' had a population of 5,000 or more,
(b) density of population was not less than 400 persons per square kilometre and (c) at least three-fourths of the male working population was engaged in non-agricultural livelihood. By and large these criteria were followed except in only a very few cases on account of their tourist interest or administrative significance or their having urban characteristics.
City-A city is a town with population one lakh and above.
Urban agglomeration-An 'urban agglomeration' has bet'n defined as "a continuous urban spread constituted of a town and its adjoining urban outgrowths or tVvo or more physical contiguous towns together with continuous well recognised urban -outglOwths, if any, o( such towns'.
A city urban agglomeration i~ an urban agglomeration with a cit'}' a~ one of its component unit~.
,
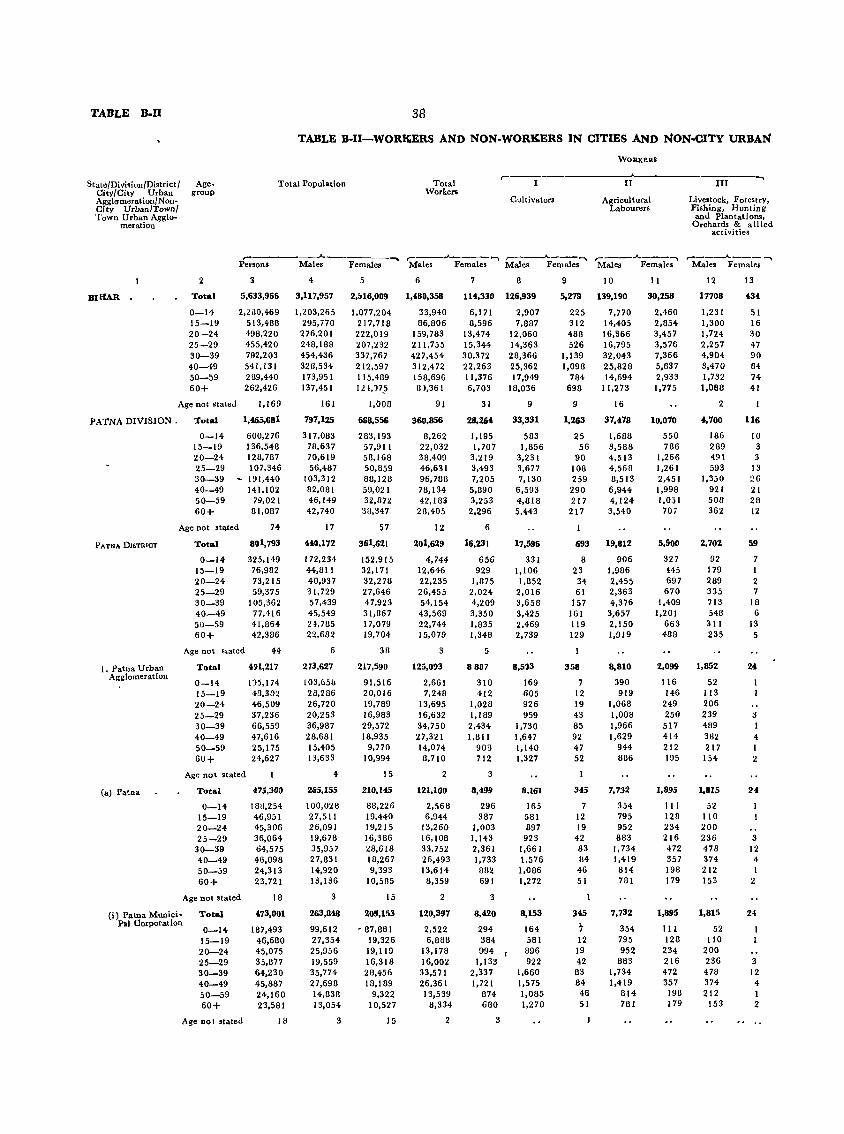
TABLE B.n 38
TABLE B-II-WORKERS AND NON-WORKERS IN CITIES AND NON-CITY URBAN
State/Division/District/ Age. City/City Urban group Agglomeration/Non-City Urban/Town/ Town Urban Agglo-
meration
Total Population Total Workers
Cultivators
WORKP."s
II
Agricul tural Labourers
III
Livestock, Forestry, Fishing, Hunting and Plantations,
Orchards & allied activities
,-_______ ..... _____ ... ,-__ .,k.--_""",, ,---..A. __ .... ,-__ A ___ ",,"",\ ,-_--.A. ___ ........ Persons Male. Female. Males Females Males Females Males Female. Males Female.
2 4 5
BIHAR Total 5,633,966 3,117,957 2,516,009
0-14 15-19 20-24 25-29 30-39 40--49 50-59 60+
Age not stated
2,280,469 513,488 498,220 455,420 792,203 541,131 2B9,440 262,426
PATNA DIVISION. Total
1,169
1,W,681
600,276 136,548 128,787 107,346
PATNA DISTRICT
I. Patna Urban Agglomeration
(a) Patna
0-14 15-19 20-24 25-29 30-39 40-49 50-59 60+
- 191,440 141,102
79,021 81,087
Age not stated
Total
0-14 15-19 20-24 25-29 30-39 40-49 50-59 60+
Age not stated
Total
0-14 15-19 20-24 25-29 30-39 40-49 50-59 60+
Age not .tated
Total
0-14 15-19 20-24 25-29 30-39 40-49 50-59 60+
Age not stated
74
801,793
325,149 76,982 73,215 59,375
105,362 77,416 41,864 42,386
44
Ul,217
n5,174 43,302 46,509 37,236 66,559 47,616 25,175 24,627
475,301)
18B,254 46,951 45,306 36,064 64,575 46,098 24,313 23,721
(i) Patna Munici. Pal Corporation
Total
0-14 15-19 20-24 25-29 30-39 40-49 50-59 60+
18
473,001
187,493 46,680 45,075 35,877 64,230 45,887 24,160 23,581
Age no I stated 18
1,203,265 295,770 276,201 248,188 454,436 328,534 173,951 137,451
161
797,125
317,083 78,637 70,619 56,487
103,312 82,081 46,149 42,740
17
440,172
172,234 44,811 40,937 31,729 57,439 45,549 24,785 22,682
6
213,627
103,&5b 28,286 26,720 20,253 36,987 28,681 15,405 13,633
4
2&5,155
100,028 27,511 26,091 19,678 35,957 27,831 14,920 13,136
3
263,848
99,612 27,354 25,956 19,559 35,774 27,698 14,830 13,054
3
1,077,204 217,718 222,019 207,232 337,767 212,597 115,489 Ill,H,5
1,008
668,556
283,193 57,911 58,168 50,859 88,128 59,021 32,872 31l,347
57
361,621
152,915 32,171 32,278 27,646 47,923 31,867 17,079 19,704
38
217,59~
91,516 20,016 19,789 16,983 29,572 18,935
9,770 10,994
15
210,145
88,226 19,440 19,215 16,386 28,618 18,267 9,393
10,585
15
209,153
• 87,881 19,326 19,119 16,318 28,456 18,189
9,322 10,527
15
6
1,480,358
33,940 86,806
159,783 211,755 427,454 312,472 158,696 B),361
91
360,856
8,262 22,032 38,409 46,631 96,788 78,134 42,163 26,405
12
201,629
4,744 12,646 22,235 26,455 54,154 43,569 22,744 15,079
3
125,093
2,661 7.248
13,695 16,632 34,750 27,321 14,074 8,710
2
121,100
2,568 6,944
13,260 16,108 33,752 26,493 13,614
8,359
2
120,397
2,522 6,888
13,178 16,002 33,571 26,361 13,539
8,334
2
7 8
114,330 126,939
6,171 8,596
13,474 15,344 30,372 22,263 11,376 6,703
31
28,264
1,195 1,707
3,219 3,493 7,205 5,090 3,253 2,296
6
16,231
656 929
1,875 2,024 4,209 3,350 1.835 1,348
5
8807
310 412
1,028 1,189
2,434 1,811
908 712
3
8,499
296 387
1,003 1,143 2,361 1,733 882 691
3
8,420
294 384 994
1,133 2,337 1,721
874 660
3
2,907 7,887
12.060 14,353 28.366 25,362 17,949
18,036
9
33,331
583 1,856
3,231 3,677 7,130
6,593 4,018 5,443
17,596
331 1,106 1,852 2,016 3,650 3,425 2,469 2,739
8,51)3
169 605 926 959
1,730 1,647 1,140 1,327
8,161
165 581 897
923 1,661 1,576 1,086 1,272
8,153
164 581 896 922
1,660 1,575 1,085 1,270
9 10
5,279 139,190
225 312 488 526
1,139 1,098
764 698
9
1,263
25 56
90 108 259 290 217
217
693
8 23
34 61
157 161 119 129
358
7 12 19 43 85 92 47 52
345
12 19 42 83 84 46 51
345
7 12 19 42 83 84 46 51
7,770 14,405 16,366 16,795 32,043 25,828 14,694
11,273
16
37,478
1,688 3,588 4,513 4,568 8,513
6,944 4,124 3,540
19,812
906 1,986 2,455 2,363 4,376
3,657 2,150 1,919
8,810
390 919
1,068 1,008 1,966 1,629
944 B06
7,732
354 795 952 883
1,734 1,419
814 701
7,732
354 795 952
883 1,734 1,419
814 701
11
30,258
2,460 2,854 3,457 3,576 7,366 5,637 2,933 1,775
10,070
550 786
1,266 1,261 2,451 1,998 I,O.H 70;
5,!iOO
327 H5 697 670
1,409 1,201
663 488
12
17708
1,231 1,300 1,724 2,257 4,904 3,470 1,732 I,OB8
2
4.'100
186 289 491 593
1,350 921 508 362
2,702
92 179 289 335 713 548 311 235
2,099 1,852
116 52 146 113
249 206 250 239 517 489 414 382 212 217 195 154
1,895
111 128 234 216 472 357 198 179
1,895
111 128
234 216 472 357
198 179
1,815
52 110 200 236 478 374 212 153
1,815
52 110
200 236 478 374 212
153
13
434
51 16 30 47 90 64 74 41
116
10 3 3
13 ~6
21 28 12
59
1 2 7
18 6
13 5
3 1 4 1 2
3 12 4 1
2
24
3 12 4 1 2
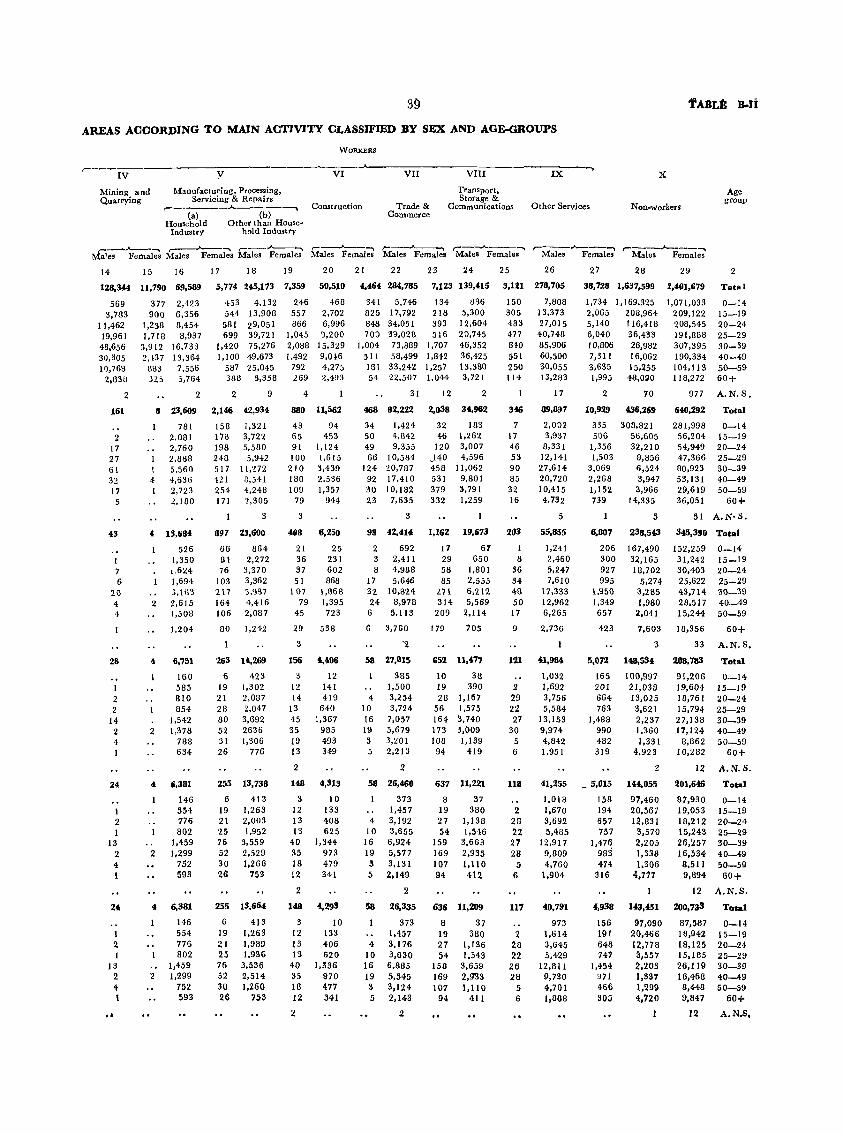
AREAS ACCORDING TO MAIN ACTIVITY CLASSIFIED BY SEX AND AGE-GROUPS
WORKERS
IV ------------y------------------v~I~~----~V==II~----~V~I=I~I----------I=X~--·~
Mining and Quarrying
!\!anufacturiug, Processing, Servicing & Repairs
r------"--------.. Construction Ca) Cb)
Household Other than House-Industry hold Industry
Trade & Commerce
Transport, Storage &
Communications Other Services Non·workers
,_-A---"""", ,-___ -"--..... ,-----"---....... ,.......--"---... ,-___,.____,. r--..A---... ,.----"---..... r----J.----"""'" Males Females Males Females Males Females Males Females Males Females Males Females Males Females Males Females
14 15 16
128,344 11,790 69,589
569 3,783
11,462 19,961 48,656 30,305 10,768
2,838
317 900
1,238 1,718
3,912 2,137
BS3 J45
2,123 6,356 8,454 8,937
16,733 13,364 7,556 5,764
2 2
161 8 23,609
2 17 27 61
7BI 2,081 2,760 2,B8B 5,560
32 4 4,636 17 2,723 5 2,IBO
17 18
5,774 245,173
-153 4,132 544 13,908
581 29,051 699 39,721
1,420 75,276 1,100 49,673
587 25,045 388 8,358
2 9
2,146 42,934
158 1,321 17B 3,722 198 5,580 248 5,9 .. 2 517 11,272 421 8,541 254 4,248 171 2,305
19
7,359
246 557 866
1,045 2,088 1,492
792 269
4
880
43 65 91 100
210 180 109
79
20
50,510
468 2,702 6,996 9,200
15,329 9,0.6 4,275 2.493
11,562
94 453
1,124 1.615 3,439 2,536 1,357
944
21 22
,,464 284,785
341 5,746 825 17,792 848 34,051 700 39,028
1,004 73,889 511 58,499 lSI 33,242 54 22,507
31
468 82,222
34 1,424 50 4,842 49 9,355 66 10,584
124 20,787 92 17,410 30 10,182 23 7,635
23
7,123 139,415
134 21B 393 516
1,707 1,842 1,257 1,044
12
2,038
32 46
120 _140 458 531 379 332
u86 5,300
12,604 20,745 46,352 36,425 13,380 3,721
2
3',912
183 1,262 3,007 4,596
11,062 9,B01 3,791 1.259
25 26
3,121 278,705
150 7,808 305 13.373 433 27,015 477 40,748 8~0 85,906 551 60,500 250 30,055 114 13,283
17
346 89,897
7 2,002 17 3,937 46 8,331 53 12,141 90 27,614 85 20,720 32 10,415 16 4,732
27 2B
38,728 1,637,599
1,734 2.065 5,140 6.040 10,806 7,311 3,635 1,995
2
10,929
335 506
1,356 1,503
3.069 2,268 1,152 739
1,169,325 208,964 116,418 36,433 26,982 16,062 15,255
48,0110
70
436.269
308,821 56,605 32,210
9,856 6,524 3,947
:),966 14,335
29
2,401,679
1,071,033 209,122 208,545 191,888 307,395 190,334 104,113 118,272
977
640,292
281,998 56,204 54,949 47,366 80,923 53,131 29,619 36,051
Age group
2
Total
0-14 15-19 20-24 25-29 30-39 40-49 50-59 60+
A.N.S.
Total
0-14 15-19 20-24 25-29 30-39 40--49 50-59
60+
3 3 3 5 5
238,543
167,490 32,165 18,702
51 A,N'S,
43
7 6
20 4 4
26
I 2 2
14 2 4
24
1 2 1
13 2 4 1
24
1 2 1
13 2 4 t ..
2
4
2
4
2
4
2
13,6114
526 1,350
1.6 24 1,69,} 3,163 2,615 1,508
1,204
6,751
160 585 810 854
1,542 1,378
78B 634
6,381
146 554 776 802
1,459 1,299
752 593
6,381
146 554 776 802
1,459 1,299
752 593
897 23,600
66 864 Bt 2,272 76 3,370
103 3,362 211 5,937 164 4,416 106 2,087
ao 1,242
263 14,269
6 423 19 1,302 21 2,087 28 2,017 00 3,692 52 2636 31 1,306 26 776
255 13,738
6 413 19 1,263 21 2,003 25 1,952 76 3,559 52 2,529 30 1,266 26 753
255 13,664.
6 413 19 1.263 21 1.989 25 1,936 76 3,536 52 2,514 30 1,260 26 753
4.08 6,250
21 25 36 231 37 602 51 868
1 ()7 1,668 79 1,395
45 723
29 538
3
156 4.406
3 12 12 141 14 419
13 640 45 1,367 35 985 19 493 13 349
2
148 4,313
3 10 12 133 13 408 13 625
40 1,344 35 973 18 479 12 341
2
148
3 12 13 13
40 35 18 12
2
4,293
10 133 406 620
1,336 970 477 341
98 42,4014.
2 692 3 2,411 8 4,988
17 5,646 32 10,824 24 8,978 6 5,113
6 3,760
'2
58 27,015
385 1,500
4 3,254 10 3,724 16 7,057 19 5,679 3 3,~01
5 2,213
2
58 26,460
373 1,457
4 3,192 10 3,655
16 6,924 19 5,577
'3 3,131 5 2,149
58
4 10 16 19
'3 5
2
26,335
373 1,457 3,176 3,630 6,895 5,545 3,124 2,143
2
1,162 19,&73
17 67 29 650 58 1,801 85 2,555
:1.71 6,212 314 5,569
209 2,114
179 705
652 11,477
10 38 19 390 28 1,167
56 1,575 164 3,740 173 3,009 108 1,139 94 419
637 11,221
8 37 19 380 27 1,138 54 1,546
159 3,663 169 2,935 107 1,110 94 412
636 n,209
8 37 19 380 27 1,136 54 1,543
158 3.659 169 2,!1'33 107 1,110
94 411
203
8 36 34 48 50 17
9
121
2 29 22 27
30 5 6
118
2 23 22 27 28
5 6
117
2 26 22 26 28
5 El
55,855
1,241 2,460 5,247 7,610
17,333 12,962 6,265
2,736
41,984
1,032 1,692 3,756 5,584
13,153 9,974 4,842 1,951
41,255
1,018 1,670 3,692 5,485
12,917 9,809 4.760
1,904
40,791
973 1,614 3,645 5,429
12.811 9,730 4,701 1,866
6,807
206 300 927 995
1,950 1,349 657
423
5.072
165 201 664 763
1,488 990 482 319
_ 5,015
158 194 657 757
1,476 983 474
316
4,938
156 191 648 747
1,454 971 466 305
_~.274
3,285 1,980
2,041
7,603
3
1411,534
100.997 21,038 13.025 3,621 2,237 1,360 1,331
4,923
2
144,055
97,460 20,567 12,831
3,570 2,205 1,338 1,306
4,717
1
143,451
97,090 20,466 12,778 3,557 2,203 1,337 1,299 4,720
1
345,390
152,259 31,242 30,403 25,622 43,714 28,517 15,244
18,356
33
208,783
91,206 19,604 18,761 15,794 27,138 17,124
8,862 10,282
12
201,646
87.930 19,053 18,212 15,243 26,257 16,534: 8,511 9,894
12
200,73'
87,587 18,942 18,125 15,185 26,119 16,<t68 8,448 9,847
12
Total
0-14 15-19 20-24 25-29 30-39 40-49 50-59
60+
A.N.S.
Tot"l
0-14 15-19 20-24 25-29 30-39 40-49 50-59
60+
A.N.S.
Total
0-14 15-19 20-24 25-29 30-39 40--49 50--59 60+
A.N.S.
Total
0-14 15-19 20-24 25-29 30-39 40-49 50-59
60+
A.N.S,
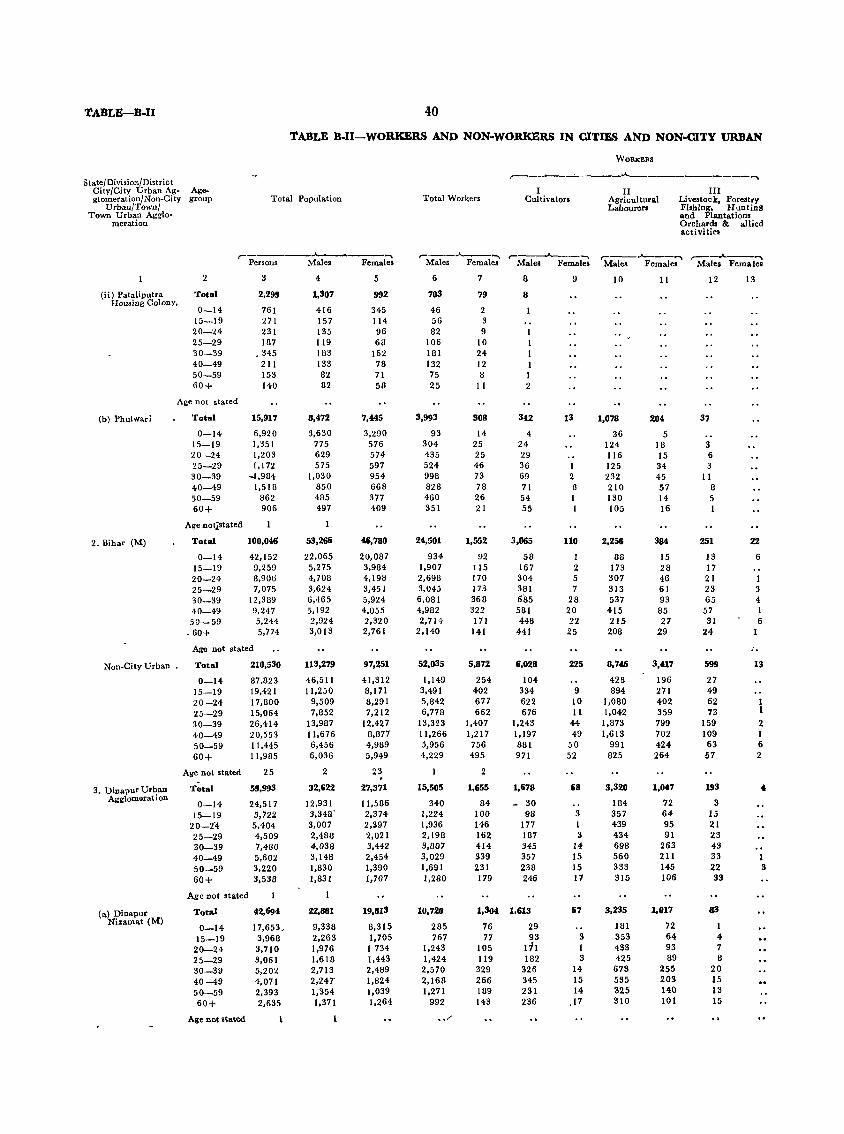
TABLE-B..II 40
TABLE B-II-WORKERS AND NON-WORKERS IN CITIES AND NON-CITY URBAN
WORKE.RS
State/ Divisioa/District
.-_~_. ____ J.. ____________ ~
City/City Urban Ag- Age. I II III glomeration/Non-City group Total Population Total Workers Cultivators Agricul tural Livestock, Forestry
Urban/Town/ Labourers Fishing, Huntin8 Town Urban Agglo- and Plantations
meration Orchards & allied activitiel
.- ..... ,----"---..... r-_....____ .... r---...___-..... r---.A--~ Persons Males Females Males Females Males Females Males Females Males Females
2 3 4 5 6 7 6 9 10 11 12 13
(ii) Pataliputra Total 2.299 1,307 992 703 79 8 Housing Colony,
0-14 761 416 345 46 2 15-19 271 157 114 56 3 20-24 231 135 96 82 9 25-29 187 119 68 106 10 30-39 .345 183 162 181 24 40-49 211 133 78 132 12 1 50-59 153 62 71 75 8 1 60+ 140 62 56 25 11 2
Age not stated
(b) l'hu1wari Total 15.917 8.472 7.445 3.993 308 342 13 1.078 204 37
0-14 6,920 3,630 3,290 93 14 4 36 5 15-19 1,351 775 576 304 25 24 124 18 3 20-24 1.203 629 574 435 25 29 116 15 6 25-29 1,172 575 597 524 46 36 1 125 34 3 30-39 -1.984 1,030 954 998 73 69 2 232 45 11 40-49 1,518 850 668 628 78 71 8 210 57 6 50-59 862 485 377 460 26 54 1 130 14 5 60+ 906 497 409 351 21 55 1 105 16 1
Age not~stated
2. Bihar (M) Total 100,046 53.266 46,780 24,501 1,552 3,065 110 2,256 384 251 22
0-14 42.152 22,065 20,087 934 92 58 1 88 15 13 6 15-19 9,259 5,275 3,984 1.907 115 167 2 173 28 17 20-24 8,906 4,708 4,198 2,698 170 304 5 307 46 21 25-29 7,075 3,624 3,451 3,045 173 381 7 313 61 23 3 30-39 12,389 6,465 5,924 6,081 368 685 28 537 93 65 4 40-49 9,247 5,192 4,055 4,982 322 581 20 415 85 57 1 50-59 5,244 2.924 2,320 2,714 171 448 22 215 27 31 6 .60+ 5,774 3,013 2,761 2.140 141 441 25 208 29 24 1
Age not stated ,.
Non-City Urban Total 210,530 113,279 97,251 52,035 5,872 6,028 225 8,746 3,417 599 13
0-14 87.823 46,511 41,312 1,149 254 104 428 196 27 15-19 19.421 11.250 8.171 3,491 402 334 9 894 271 49 20-24 17,800 9.509 8,291 5.842 677 622 10 1,080 402 62 25-29 15,064 7,852 7,212 6.778 662 676 11 1.042 359 73 30-39 26.414 13,967 12,427 13.323 1,407 1,243 44 1,873 799 159 2 40-49 20.553 11,676 8.877 11,266 1,217 1.197 49 1.613 702 109 1 50-59 11,445 6,456 4.989 5,956 756 881 50 991 424 63 6
60+ 11.965 6.036 5,949 4,229 495 971 52 625 264 57 2
Age nol stated 25 2 23 2
3. Dinapur Urban Total 59.993 32,622 27,371 15,505 1,655 1,678 68 3,320 1,047 193 4. Agg10m@ration
0-14 24.517 12.931 11.586 340 84 - 30 104 72 3
15-19 5,722 3,348' 2,374 1,224 100 96 3 357 64 15
20-2'4 5.404 3.007 2,397 1,936 146 177 1 439 95 21 25-29 4,509 2.480 2,021 2,198 162, 187 3 434 91 23 30-39 7,480 4.036 3.442 3,807 414 345 14 696 263 43
40-49 5.602 3,148 2,454 3,029 339 357 15 560 211 33 1 50-59 3.220 1,830 1,390 1,691 2,31 238 15 333 145 22 3
60+ 3,538 1,831 r,707 1,280 179 246 17 315 106 33
Age not stated
(a) Dinapur Total 42.694 22,881 19,813 10,720 1,304 1,613 67 3,235 1,017 83 Nizamat (M)
0-14 17.653, 9.338 8,315 285 76 29 181 72 1
15-19 3.968 2,263 1,705 767 77 93 3 353 64 4
20-24 3,710 1,976 1734 1.243 105 t71 1 433 93 7
25-29 3.061 1.618 1,443 1,424 119 182 3 425 89 8
30-39 5,202 2,713 2.489 2.570 329 326 14 673 255 20
40-49 4.071 2.247 1,824 2,168 266 345 15 535 203 15
50-59 2,393 1,354 1,039 1,271 189 231 14 325 140 13
60+ 2,635 1.371 1,264 992 143 236 ,17 310 101 15
Age not stated .. /
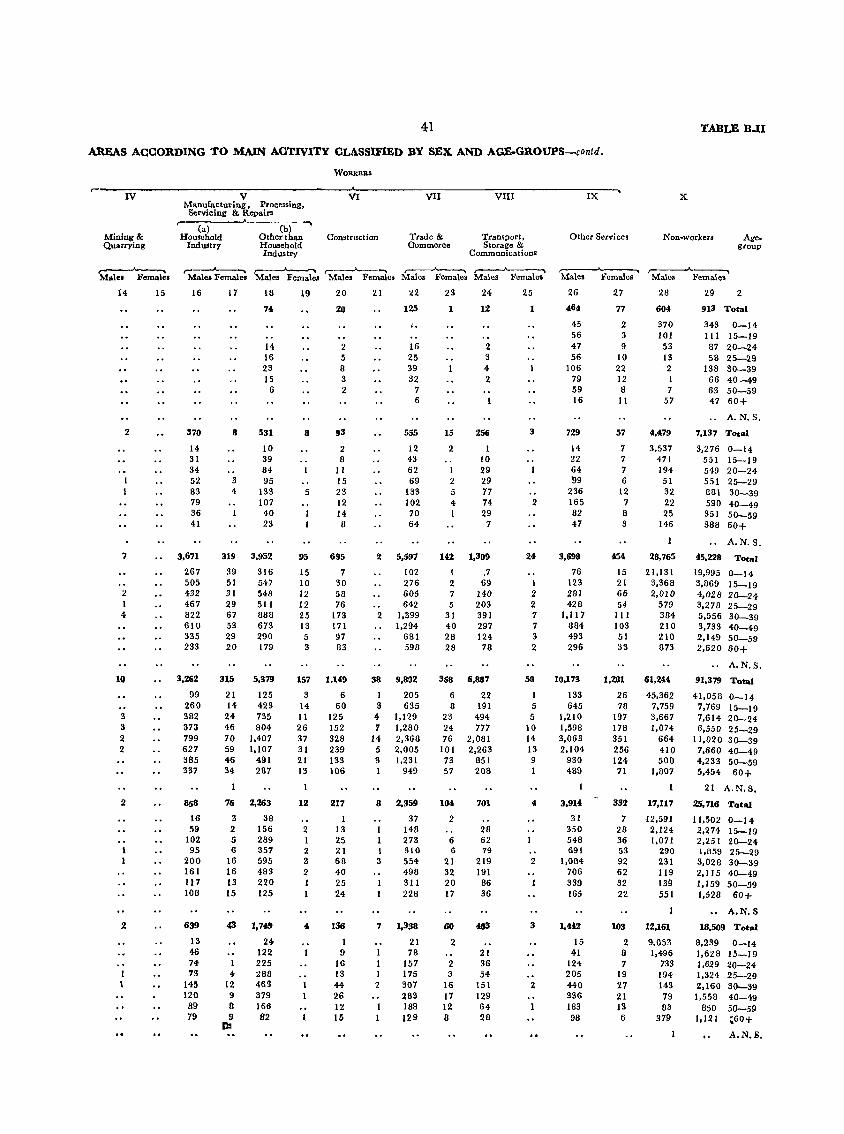
41 TABLE B • .u
AREAS ACCORDING TO MAIN ACTIVITY CLASSIFIED BY SEX AND AGE-GROUPS-contd.
WORKERS
r- ...... IV V VI VII VIII IX X
Manufacturing, Processing, Servicing 8< Repairs
r-(a) (b)
Milling 8< Household Other than Construction Trade 8< Transport, Other Services Non-workers Age. Quarrying Industry Household Commerce Storage 8< group
Industry Communications
Mal.. Female. ,...---'--...... Males Female.
r-Females 'Males Fem';!e. Males ~
Male. Females r--..A----"\ Males Females
r----"--..... Males Female.
r---'---....... Males Females
14 15 16 17 18 19 20 21 22 23 24 25 26 27 28 29 2
7. 20 125 1 12 1 464 77 60. 913 Total
t. 45 2 370 343 0-14 56 3 101 111 15-19
14 2 16 2 47 9 53 87 20-24 16 5 25 3 56 10 13 5B 25-29 23 8 39 4 106 22 2 138 30-39 15 3 32 2 79 12 I 66 40-49 6 2 7 59 8 7 63 50-59
6 16 11 57 47 60+
A.N.S.
2 370 8 531 8 93 555 15 256 3 729 57 4,479 7,137 Total
14- 10 2 12 2 14 7 3,537 3,276 0-14 31 39 8 43 10 22 7 471 551 15-19 34 84 11 62 I 29 64 7 194 549 20-24 52 3 95 15 69 2 29 '99 6 51 551 25-29 B3 4 133 5 23 133 5 77 236 12 32 BBI 30-39 79 107 12 102 4 74 2 165 7 22 590 40-49 36 40 14 70 1 29 82 8 25 35J 50-59 4J 23 8 64 7 47 3 146 388 60+
A.N.s.
7 3.671 319 3.952 95 695 2 5.597 142 1.309 24 3.698 454 28.765 45.228 Total
267 39 316 15 7 102 I .7 76 15 21,131 19,995 0-14 505 51 547 10 30 276 2 69 1 123 21 3.368 3,869 15-19
2 432 3J 548 J2 58 605 7 140 2 28J 66 2.0JO 4,028 20-24 1 467 29 511 12 76 642 5 203 2 428 54 579 3,278 25-29 4 822 67 888 25 173 2 1.399 31 391 7 1,117 111 384 5,556 30-39
610 53 673 13 171 1,294 40 297 7 884 103 210 3,733 40-49 335 29 290 5 97 681 28 124 :3 49:3 51 210 2,149 50-59 233 20 179 3 83 598 28 78 2 296 33 873 2,620 60+
A.N.S.
10 3.262 315 5,379 157 1,14.9 38 9,8D2 368 6,887 58 10,173 1,261 61,244 91,379 Total
99 21 125 3 6 I 205 6 22 1 133 26 45.362 41,058 0-14 260 14 423 14 60 3 635 8 191 5 645 78 7,759 7,769 15-19
3 382 24 735 11 125 4 1,129 23 494 5 1,210 197 3,667 7,614 20-24 '3 373 46 804 26 152 7 1,280 24 777 10 1.598 178 1,074 6,550 25-29 2 799 70 1,407 37 328 14 2,368 76 2,081 14 3,063 351 664 I J.020 30-39 2 627 59 1.107 3J 239 5 2,005 101 2.263 13 2,104 256 410 7,660 40-49
385 46 491 21 133 '3 1,231 73 851 9 930 124 500 4,233 50-59 337 34 287 13 106 1 949 57 'lOB 1 489 71 1.807 5.454 60+
21 A.N.S.
2 858 76 2,263 12 217 8 2,359 104 701 • 3,914 332 17.117 25,716 Total
16 3 38 1 37 2 31 7 -l2.59J 11,502 0-J4 59 2 156 2 13 1 148 28 350 28 2,124 2.274 15-19
102 5 289 1 25 1 273 6 62 548 36 1,071 2,251 20-24 95 6 357 2 21 1 310 6 79 691 53 290 1,859 25-29
200 16 595 ::I 68 3 554 21 219 2 1,084 92 231 3,028 30-39 161 16 483 2 40 498 32 191 706 62 119 2,115 40-49 117 13 220 1 25 311 20 86 339 32 139 1,159 50-59 108 15 125 1 24 228 17 36 165 22 551 1.528 60+
A.N.S
2 639 4:J 1.7<&9 4 136 7 1,338 60 <l83 3 1,4042 103 12,161 18.509 TotAl
13 24 1 21 2 15 2 9,053 8,239 0-14 46 122 9 78 21 41 8 1,496 1,628 J5-19 74 1 225 16 1 157 2 36 124 7 733 1,629 20-24
1 73 4- :za8 13 1 175 3 54 205 19 194 1,324 25-29 1 145 12 463 44 2 307 16 151 2 440 '17 143 2,160 30-39
120 9 379 26 283 17 129 336 21 19 1.559 40-49 89 B 166 12 1 189 12 64 183 )3 83 650 50-59 79 9 82
III 15 ) 129 6 28 96 I) 379 1.121 .60;-
A.N.S.
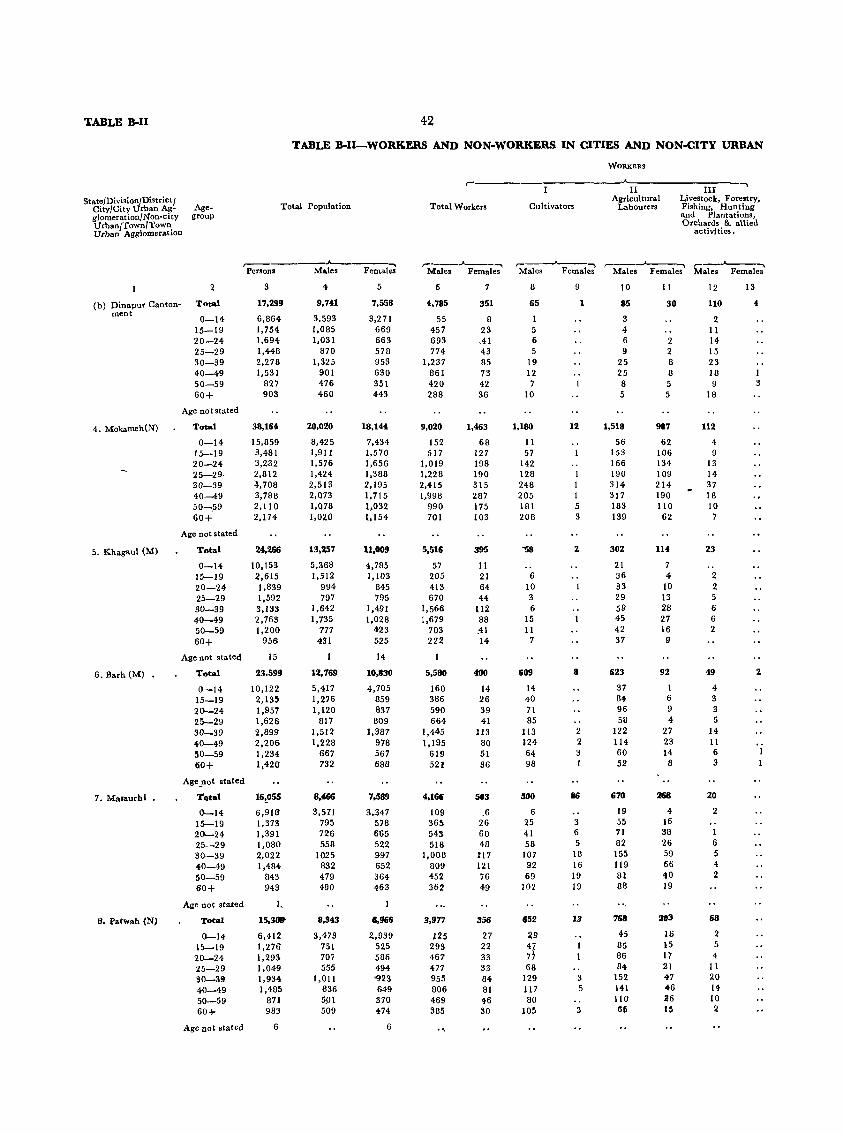
TABLE B.lI 42
TABLE B·II-WORKERS AND NON·WORKERS IN CITIES AND NON-CITY URBAN
WORKERS
t"" II III
......
State/Divisi0{'j,District/ Total Population Total Workers Cultivators
Agricultural Livestock, Forestry, City/City rban Ag- Age- Labourers Fishing, Hunting glomeration/Non-city group and Plantations, Urban/Town/Town Orcbards & allied Urban Agglomeration activities.
r------....__---~ ,.---.....____, ,-__ ..A-----...... ,---'---...... r- ...... Persons Male. Female. Males Females Male. Females Males Females Males Females
2 3 4 5 6 7 8 9 10 II 12 13
(b) Dinapur Canton- Total 17,299 9,741 7,558 4.785 351 65 1 85 30 110 4 ment
0-14 6,864 3,593 3,271 55 8 3 2 15-19 1,754 1,085 669 457 23 5 4 11 20-24 1,694 1,031 663 693 .4 I 6 6 2 14 25-29 1,448 870 578 774 43 5 9 2 15 30-39 2,278 1,325 953 1,237 85 19 25 8 23 40-49 1,531 901 630 861 73 12 25 8 18 I 50-59 827 476 351 420 42 7 8 5 9 3 60+ 903 460 443 288 36 10 5 5 18
Age not stated
4. Mokameh(N) Total 38,164 20,020 18,144 9,020 1,463 1,180 12 1,518 987 112
0-14 15,859 8,425 7,434 152 68 II 56 62 4 15-19 3,481 1,91 I 1,570 517 127 57 153 106 9 20-24 3,232 1,576 1,656 1,019 198 142 166 134 13 25-29· 2,812 1,424 1,388 1,228 190 128 190 109 14 30-39 ~,708 2,513 2,195 2,415 315 248 314 214 37 40-49 3,788 2,073 1,715 1,99B 2B7 205 1 317 190 1B 50-,59 2,110 1,07B 1,032 990 175 1BI 5 1B3 110 10 60+ 2,174 1,020 1,154 701 103 208 3 139 62 7
Age not stated
5. Khagau1 (M) Total 24,26& 13,257 11,009 5,51& 395 -S8 2 302 114 23
0-14 10,153 5,368 4,785 57 11 21 7 15-19 2,615 1,512 1,103 205 21 6 36 4 2 20-24 1,839 994 845 413 64 10 33 10 2 25-29 1,592 797 795 670 4:4: 3 29 13 5 30-39 3,133 1,642 1,491 1,566 112 6 59 28 6 40-49 2,763 1,735 1,028 1,679 88 15 45 27 6 50-59 1,200 777 423 703 .41 11 42 16 2
60+ 956 431 525 222 14 7 37 9
Age not stated 15 14
6. Barh (M) Total 23.599 12,769 10,830 5,580 400 609 8 623 92 49 2
0-14 10,122 5,417 4,70'5 160 14 14 37 I 4 15-19 2,135 1,276 859 386 26 40' 84 6 3 20~24 1,957 1,120 837 590 39 71 96 9 3
25-29 1,626 817 80'9 664 41 85 58 4 5
30-39 2,899 1,512 1,387 1,445 H3 113 2 122 27 14 40-49 2,206 1,228 978 1,195 80 124 2 114 23 11 50-59 1,234 667 567 619 51 64 3 60 14 6
60'+ 1,420 7'32 688 52! 36 98 1 52 8 3
Age _not stated
7. M"saurhl • Total 16~055 8.466 7.589 4,1~ 503 500 86 670 2Ci8 20
0.-14 6,918 3,571 3,347 10'9 .6 6 19 4 2 15-19 1,373 795 578 365 26 25 3 55 16
20.-24 1,391 726 665 543 60 41 6 71 38 1
25-29 1,080' 558 522 518 48 58 5 82 26 6
30-39 2,022 1025 997 1,008 117 10'7 18 155 59 5
40'-49 1,484 1132 652 80'9 121 92 16 119 66 4
50-59 843 479 364 452 76 69 19 81 40 2
60+ 943 480 463 362 49 102 19 88 19
Age not stated 1.
B. Patwah (N) Total 15,3. 8,343 1,966 3,977 356 652 13 768 llf)3 68
<l-14 6,412 3,473 2.,939 125 27 29 45 16 2 15-19 1,276 751 525 293 22 iI 85 15 5
20'-24 1,293 707 586 467 33 86 17 4
25-29 1,049 555 494 477 33 68 84 21 II 30-39 1,934 I,OIl '923 955 84 129 3 152 47 20'
40-49 1,485 836 649 806 81 117 5 141 46 14
50-59 871 5j)1 370' 469 46 80 110 116 10
60+ 983 50'9 474 385 30 105 3 G5 15 2.
Age not stated 6 6
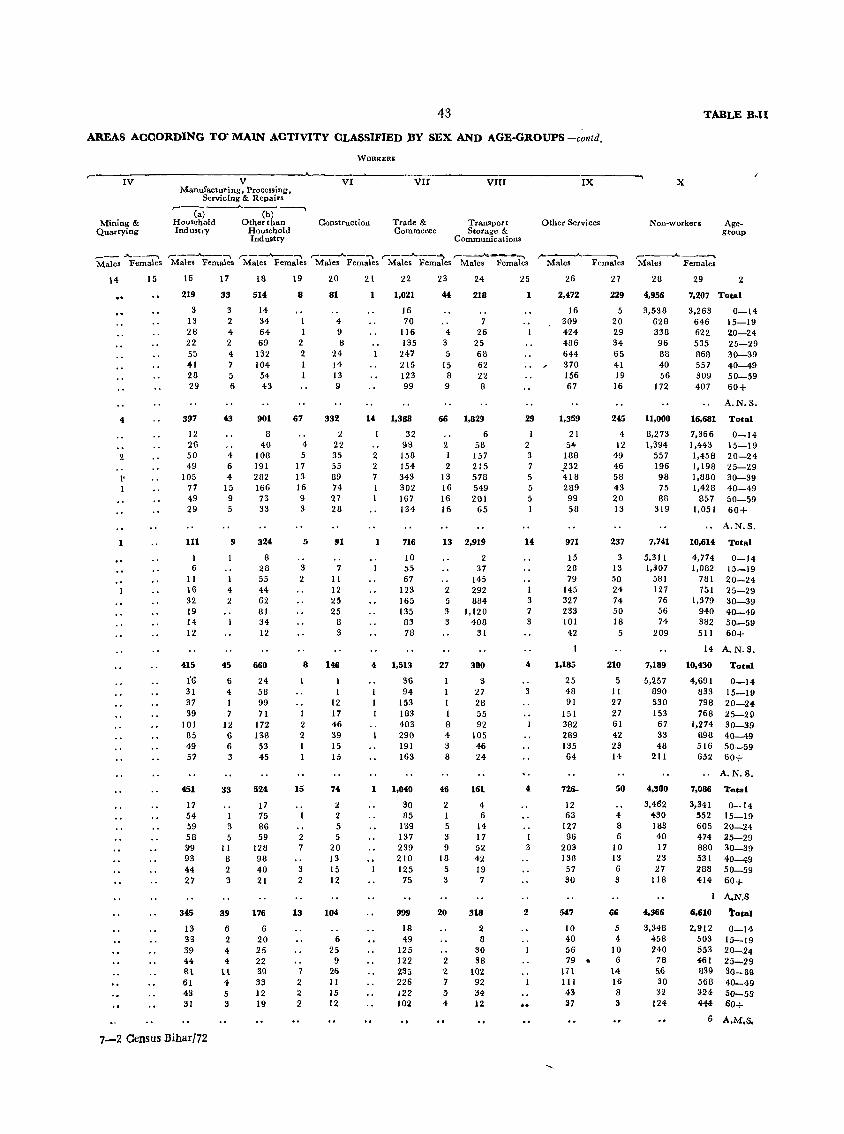
43
AREAS ACCORDING TO- MAIN ACTIVITY CLASSIFIED .BY SEX AND AGE-GROUPS-contd.
~-----I-V----------------~V~----~
Manufacturing, Processing, Servicing & Repairs
Mining & Quarrying
~,-~----~-----------,~ Ca) Cb)
Household Other than Ind ustry Household
Industry
WORKERS
VI
Construction
VII
Trade & Commerce
VIn
Transport Storage &
Communications
IX
Other Services
X
Non-workers
TABLE B-II
Ageg<oup
_--- ,.A... ___ ~ ,-_-..A... __ ......_ r----A.--., ,--.A.. __ ~ ,-__ A __ ~ ,-------"'c;_'""""'11 t"'------..A..--~ ,..-------"-_ __.....,
Males Females Males Females Males Females Males Females Males Females Males Females Males Females Males Females
14 15
2
l'
1
16
219
3 13 28 22 55 41 28 29
397
12 26 50 49
105 77 49 29
111
1 6
11 16 32 19 14 12
415
1"6 31 37 39
101 85 49 57
451
17 54 59 58 99 93 44 27
345
13 33 39 44 81 61 43 31
7-2 Census Bihar/72
17
33
3 2 4 2 4 7 5 6
43
4 6 4
15 9 5
9
4 2
45
6 4 1 7
12 6 6 3
33
3 5
11 8 2 3
39
6 2 4 4 Il 4 5 3
18
514
14 34 64 69
132 104 54 43
901
8 40
108 191 282 166 73 33
324
8 28 55 44 62 81 34 12
660
24 58 99 71
172 138 53 45
524
17 75 86 59
128 98 40 21
176
6 20 25 22 39 33 12 19
19
8
1 1
2 2
67
4 5
17 13 16 9 3
5
3 2
8
1 2 2 1
15
2 7
3 2
13
7 2 2 2
20
81
4 9 8
24 14 13 9
332
2 22 35 55 89 74 27 28
91
7 11 12 25 25
8 3
146
1 1
12 17 46 39 15 15
74
2 2 5 5
20 13 15 12
104
6 25
9 26 11 15 12
21
2 2 7
1
4
1
22
1,021
16 70
LL6 135
247 215 123 99
1,388
32 98 158 154 343 302 167 134
716
10 55 67
123 165 135
83 78
1,513
36 94
153 183 403 290 191 163
1,040
30 85
139 137 239 210 125 75
999
18 49
125 122 2,35 226 122 102
23
44
4 3 5
15 8 9
66
2 I 2
13 16 16 16
24
218
7 26
25 68 62 22 8
1,829
6 58 157 215 578 549 201
65
13 2,919
2
2. 5 3 3
27
1 1 1 8 4 3 8
46
2 I 5 3 9
18 5 3
20
2 Z 7 ;)
4
37 145 292 884
1,120 408
31
380
3 27 28 55 92
105 46 24
161
4 6
14 17 52 42 19 7
:U8
2. 8
30 38
10Z 92 34 12
25
1
29
1 2 3 7 5 5 5 I
3 7 3
4
3
3
2
••
26
2,472
16 309 424 486 644 370 156 67
1,359
21 54
188 _232 418 289 99 58
971
15 28 79
145 327 233 101
42
1,185
25 48 91
151 382 289 135 64
72S-
12 63
127 96
203 138 57 30
547
10 40 56 79 ..
171 111 43 37
27
229
5 20 29 34 65 41 19 16
245
4 12
49 46 58 43 20 13
237
3 13 50 24 74 50 18
5
210
5 11 27 27 61 42 23 14
50
4 8 6
10 13 6 3
66
5 4
10 6
14 16 8 S
28
4,956
3,538 628 338 96 88 40 56
172
11,000
8,273 1,394
557 196 98 75 88
319
7,741
5,311 1,307
581 127 76 56 74
209
7,189
5,257 890 530 153
67 33 48
211
',300
3,462 430 183 40 17 23 27
118
4,966
3,348 458 240
78 56 30 ~2
124
29 2
7,207 Total
3,263 646 622 535 868 557 309 407
16,681
7,366 1,443 1,456 1,198 1,880 1,428
857 1,051
0--14 15--19 20--24 25--29 30--39 40--49 50--59 60+
A.N.S.
Total
0--14 15--19 20--24 25--29 30--39 40--49 50--59 60+
A.N.S.
10,614 Total
4,774 1,082
781 751
1,379 940 382 511
0--14 15-19 20--24 25-29 30--39 40--49 50-59 60+
14 A. N.S.
10,430
4,691 833 798 768
1,274 898 516 652
7.086
3,341 552 605 474 880 531 288 414
6,610
2,912 503 553 461 839 568 324 444
Total
0-14 15--19 20-24 25-29 30--39 40--49 50--59 60+
A.N.S.
Toea I
0-.14 15--19 20--24 25--29 30--39 40-49 50--59 60+
A.N.S
total
0--14 15-19 20-24 25-29 So-all 40_49 50-59 60+
6 A.l'4.S.
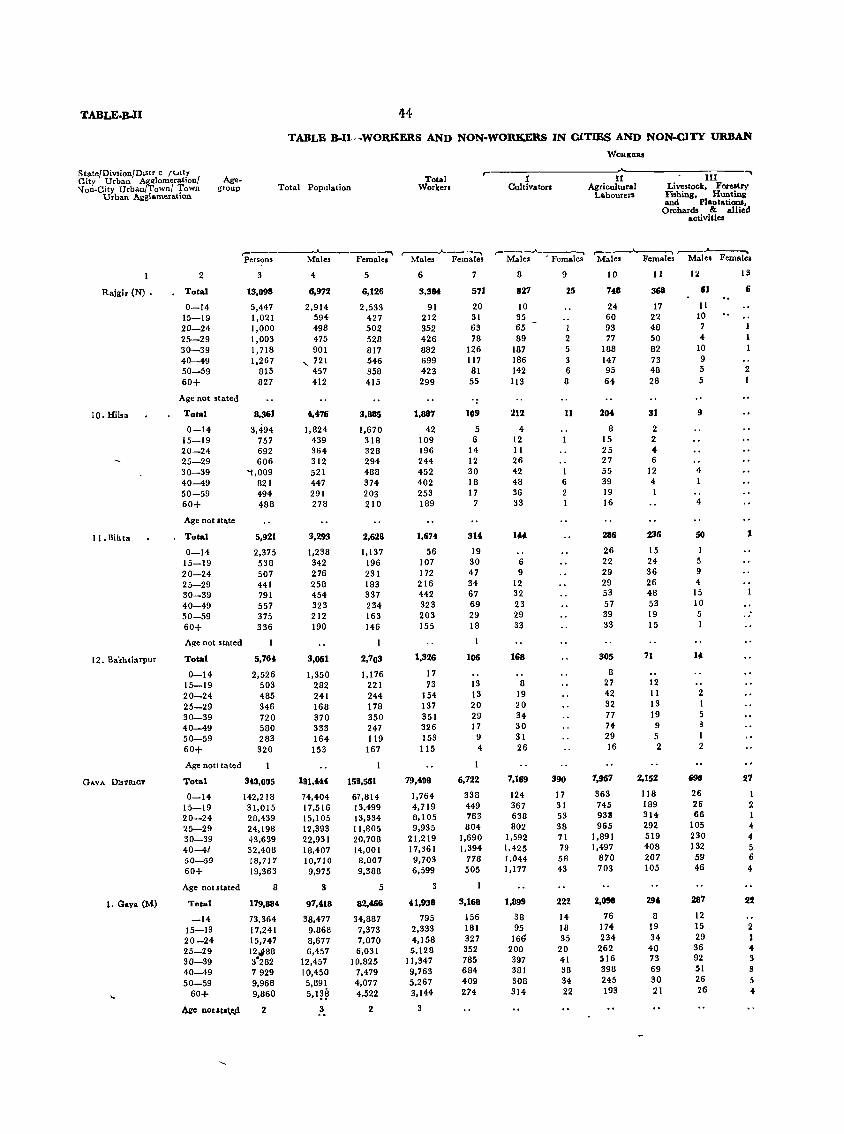
TABLE·B..II 44
TABLE B.I1-WORKERS AND NON-WORKERS IN CiTIES AND NON·ClTY URBAN
WORKERS
State/Divsion/D!Str c ft.-Ity r-City Urban Agglomeration/ Age- Total I II III
.... "on-City Urban/Town/ Town group Total Population Worketl Cultivatotl Agricul tural Livestock, Forestry
Urban Agglomeration Laboure" Fishing, Hunting and PlantatiOllll,
Orchards & allied activities
,- ,----.,..""----""""\ ,----'----...... Male.
------, ,-Fema~ ,- Males
...... Persons Females Male. Females Male. ' Female. Males Female.
2 3 4 5 6 7 8 9 10 11 12 13
Rajgir (N) • Total 13,098 6,972 6,126 3,384 571 827 25 748 368 61 6
0-14 5,447 2,914 2,533 91 20 10 24 17 11 15-19 1,021 594 427 212 31 35 60 22 10
20-24 1,000 498 502 352 63 65 1 93 48 7
25-29 1,003 475 528 426 78 89 2 77 50 4
30-39 1,718 901 817 882 126 187 5 188 82 10
40-49 1,267 .... 721 546 699 117 186 :I 147 73 9
50-59 815 457 358 423 81 142 6 95 48 5 2
60+ 827 412 415 299 55 113 8 64 28 5 I
Aile not .tated
10. Hilsa Total 8,361 ,,476 3,885 1,887 109 212 11 204 31 9
0-14 3,494 1,824 1,670 42 5 4 8 2 15-19 757 439 318 109 6 12 15 2 20--24 692 364 328 196 14 II 25 4 25-29 606 312 294 244 12 26 27 6 30-39 "1,009 521 488 452 30 42 1 55 12 4
40-49 821 447 374 402 18 48 6 39 4 I 50-59 494 291 203 253 17 36 2 19 1
60+ 488 278 210 189 7 33 16 4
Age not .t~te
II. Bint .. Total 5,921 3,293 2,628 1,674 314 144 286 236 50 1
0-14 2,375 1,238 1,137 56 19 26 15 I
15-19 538 342 196 107 30 6 22 24 5
20-24 507 276 231 172 47 9 29 36 9
25-29 441 258 183 216 34 12 29 26 4
30-39 791 454 337 442 67 32 53 48 15
40-49 557 323 234 323 69 23 57 53 10
50-59 375 212 163 203 29 29 39 19 5 .. 60+ 336 190 146 155 18 33 33 15 I
Age not stated
12. Bakhtiarpur Total 5,764 3,061 2,703 1,326 106 168 305 71 14
0-14 2,526 1,350 1,176 17 8
15-19 503 282 221 73 13 8 27 12
20-24 485 241 244 154 13 19 42 11 2
25-29 346 168 178 137 20 20 32 13 1
30-39 720 370 350 351 29 34 77 19 5
40-49 580 333 247 326 17 30 7+ 9 S
50-59 283 164 119 153 9 31 29 5 I
60+ 320 153 167 115 4 26 16 2 2
Age not! t .. ted
GAYA DIsTRIOT Total 340,005 181,4U 158,561 79,408 6,722 7,169 390 1,967 2,152 690 21
0-14 142,218 74,404 67,814 1,764 338 124 17 363 118 26 1
15-19 31,015 17,516 13,499 4,719 449 367 31 745 189 26 2 20-24 28,439 15,105 13,334 8,105 763 638 53 98S 314 66 1
25-29 24,198 12,393 11,805 9,935 804 802 38 965 292 lOS 4
30-39 43,639 22,931 20,708 21,219 1,690 1,592 71 1,891 519 230 4
40-41 32,408 18,407 14,001 17,361 1,394 1,425 79 1,497 408 132 5
50-59 18,717 10,710 8,007 9,703 778 1,044 58 870 207 59 6
60+ 19,363 9,975 9,388 6,599 505 1,177 43 703 105 46 4
Age nol stated 8 S 5
I. Gaya (M) Total 179,884 97,418 82,466 U,938 3,168 1,899 222 2,O!NI 29' 281 22
-14 73,364 38,477 34,887 795 156 38 14 76 8 12
15-19 17,241 9.868 7,373 2,333 181 95 18 174 19 15 2
20-24 15,747 8,677 7,070 4,158 327 16t1 35 234 34 29 1 25-29 12.188 6,457 6,031 5,128 352 200 20 262 40 36 4
30-39 3'282 12,457 10,825 11,347 785 397 41 516 73 92 3
40-49 7929 10,450 7,479 9,763 684 381 38 398 69 51 5
50-59 9,968 5,891 4,077 5,267 409 308 34 245 30 26 5
60+ 9,860 5,1~~ 4,522 3,144 274 314 22 193 21 26 4
~ noutal,e,.d 2 .3. 2 3
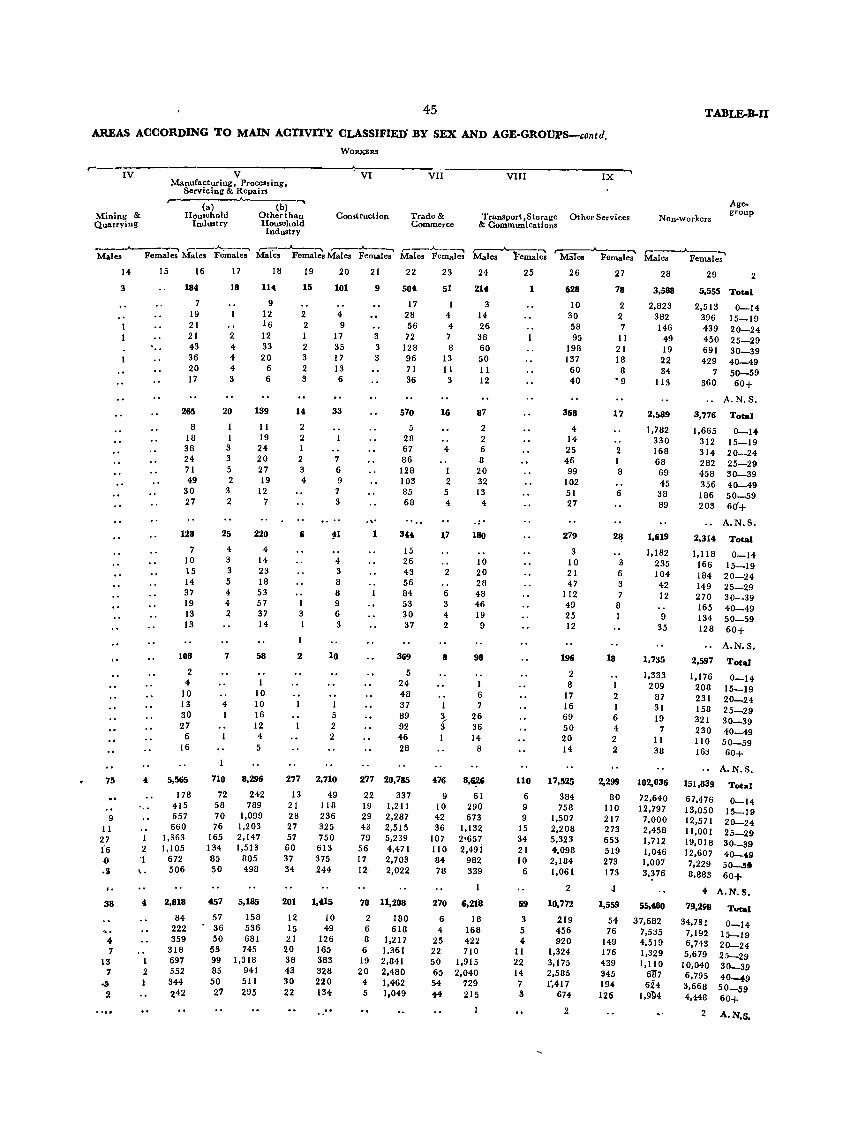
45
AREAS ACCORDING TO MAIN ACTIVITY CLASSIFIED BY SEX AND AGE-GROUPS-contd.
WORKERS
r------I~V----------------~V~----------------~~V~I~------~V~II~--------~V~I~I~I------------~I~X~-
Manufacturing, Processing J
Servicing & Repairs
Mining & Quarrying
r----(a-)----.A.------(-b )-""'
Household Otherthan Industry Household
Industry
Construction Trade & Commerce
Transport J Storage & Communications
Other Services
TABLE-B-n
Non~workers
AgegroUp
----"-----...._, ... ---..A..:--~ ,---'""'---,._, ,----~,._, r--.A..---,._, ,--.A.____ ,---....___..... r-----.A--...... Males Females Males Females Ma(es Females Males Females Males Females Males 1>emale8 MiiTes temales Males Females
75
9 11 27 16 l}
.s
38
4 7
13 7
·a 2
14
3
1 2
"1 ~ .
1 2
15 16
184
7 19 21 21 43 36 20 17
265
8 18 38 24 71 49
30 27
128
7 10 15 14 37 19 13 13
108
2 4
10 13 30 27
6 16
5,565
178 415 657 660
1,363 1,105
672 506
2,818
84 222 359
318 697 552 344 242
17
18
18
114
2 4 4 4 3
20
1 3 3 5 2
3 2
25
4 3 3 5 4 4 2
7
4 1
710
72 58 70 76
165 134 85 50
9 12 16 12 33 20
6 6
139
11 19 24 20 27 19
12 7
220
4 14 23 18 53 57 37 14
58
1 10 10 16 12 4 5
8,296
242 789
1,099 1,203 2,147 1,513
805 498
5,185
158 536 681 745
457
57 36 50
53 99 85 50 27
1,318 941 511 295
19
15
20
101
2 2 1 2 3 2 3
14
2 2 1 2 3 4
6
3
2
277
13 21 28 27 57 60 37 34
201
12 15 21
20 38 43 30 22
4 9
17 35 17 13 6
33
7 6 9
7 3
~1
4 3 8 8 9 6 3
10
1 5 2 2
2,710
49 118 236 325 750 613 375 244
1,415
10 49
126 165 383 328 220 134
21
9
3 3 3
1
22
504
17 28 56 72
128 96 71 36
570
5 20 67 86 128 103 85 68
344
15 26 43 56 84 53 30 37
369
5 24 48 37 89 92 46 28
277 20,785
22 337 19 1,211 29 2,287 43 2,515 79 5,239
56 4,471 17 2,703 12- 2,022
70 11,208
2 180 6 618 8 1,217 6 1,361 19 2,841 20 2,480
4 1,462 5 1,049
23
51
4 4 7 8
13 II 3
16
4
1 2
5 4
17
2
6 3 4 2
8
~ 3 I
476
9 10 42 36
107 110 84 70
270
6 4
25 22 50 65 54 4i
24
214
3 14 26 38 60 50 11 12
87
2 2 6 8
20 32 13
4
. :. 180
10 20 28 48 46 19 9
98
1 6 7
26 36 14
8
8,~
61 290 673
1,132 2'657 2,49i
982 339
6,2111
18 168 422 710
1,915 2,040
729 215
1
25
1
110
6 9 9
15 34 21 10
6
69
3 5 4
11 22 14 7 !I
26
628
10 30 58 95
198 137 60 40
368
4 14 25 46 99
102 51 27
279
3 10 21 47
112 49 25 12
196
2 8
17 16 69 50 20 14
17,525
384 758
1,507 2,208 5,323 4,098 2,184 1,061
2
10.772
219 456 920
1.324 3,175 2,585 1',417
671
2
27
78
2 2 7
11 21 18
8 • 9
17
2 1 8
6
28
18
3 6 3 7
8 1
1 2 1 6 4 2 2
2,299
80 110 217 273 653 519 273 173
J
1,559
54 76
149 176 439 345 194 126
28
3,588
2,823 382 146
49 19 22 34
113
2,&89
1,782 330 168 68 69 45
38 89
1,619
1,182 235 104 42 12
9 35
1,735
1.333 209
87 31 19
7 11 38
102,036
72,640 12,797 7,000 2,458 1,712 1,046 1,007 3,376
55,480
37.682 7,535 4,519 1,329 1,110
6117 624
1.9114
29 2
5,555 Total
2,513 396 439 450 691 429
0-14 15-19 20-24 25-29 30-39 40-49 50-59 7
360
3,776
1,665 312 314 282 458 356 186 203
60+
A.N.S.
Total
0-14 15-19 20-24 25-29 30-39 40-49 50-59 60'+
A.N.S •
2,314 Total
1,118 166 184 149 270 165 134 128
2,597
1,176 208 231 158 321 230 110 163
151,839
67,476 13,050 12,571 11,001 19,018 12.607 7,229 8,883
0-14 15-19 20-24 25-29 30-39 40-49 50-59 60+
A.N.S.
Total
0-14 15-19 20-24 25-29 30-39 40--49 50-59 60+
A.N.S.
Total
0-14 15-19 20-24 25-29 30-39 40-.9 50-... 60+
"' A.N.S.
79,298
34,73! 7,192 6,743 5,679
10,040 6,795 3,668 4,448
2
Total
0-14 15-19 20-24 25-29 30-39 40-49 50-59 60+
A.N.S.
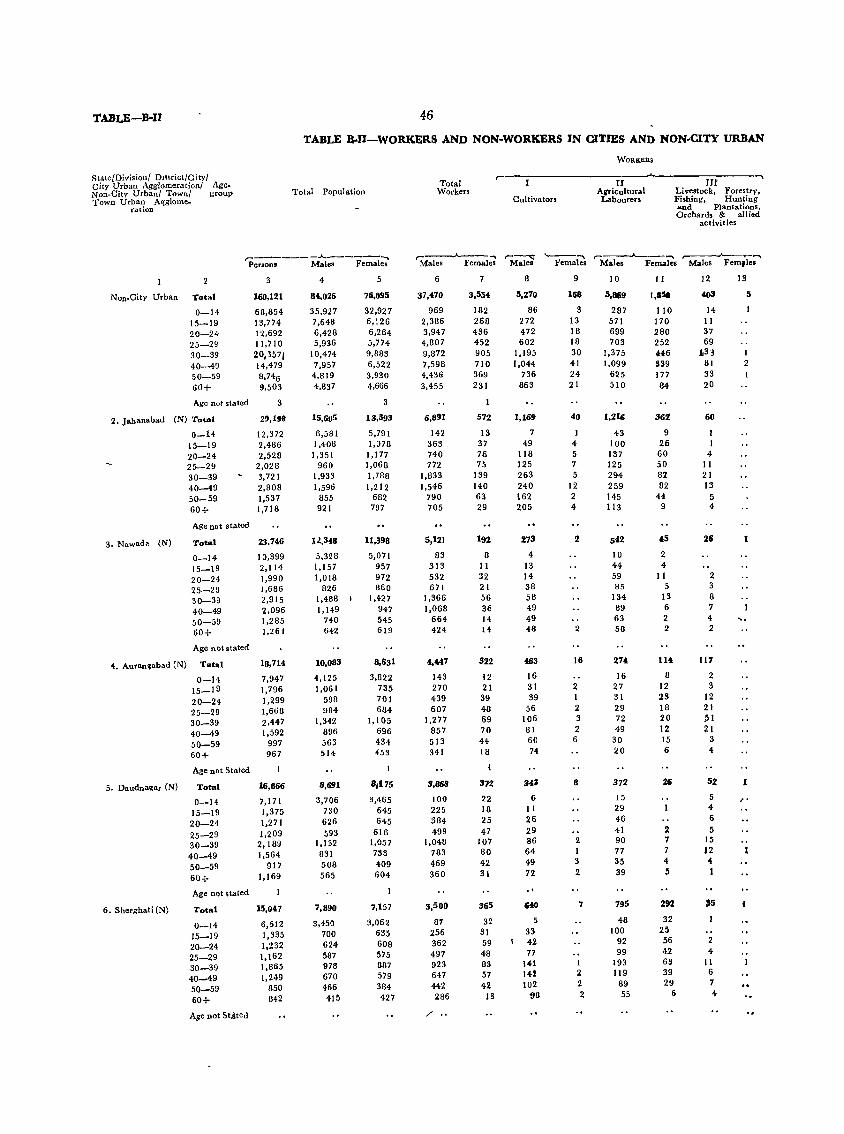
I'ABLE-B-II 46
TABLE Bon-WORKERS AND NON-WORKERS IN CITIES AND NON-CITY URBAN
State/Division! DJstrict/Ci ty/ City Urban Agglomerationl AgeNon-City Urban! Town/ group Town Urban A~glorne-
ration
Total Population
,-_____ -..A.-----...... Persons Males Females
2
Non_City Urban Total
0-14 15-19 20-24 25-29 30-39 40-49 50-59 60+
Age not stated
2. Jabanabad (N) Total
0_14 15-19 20-24 25-29 30-39 40-49 50-59 60+
3. Nowado (N)
Age not stated
Total
0-14 15-19 20-24 25-29 30-39 40-49 50-59 60+
Age not stated
4. Aurangabad eN) Tatal
0-14 15_19 20-24 25-29 30-39 40-49 50-59 60+
Age not Stated
3
160,121
68,854 13,774 12,692 11.710 20,357j 14,479 8,746 9,503
3
29,198
12,372 2,486 2,528
2,028 3,721 2,808 1,537 1,718
23,746
10,399 2,114 1,990 1,686 2,915 2,096 1,285 1,261
7,947 1,796 1,299 1,6ti8 2,447 1,592
997 967
5. Daudnagar (N) Total 16,866
6. Shergbati eN)
0-14 15-19 20-24 25-29 30-39 40-49 50-59 60+
Age not stated
Total
0-14 15-19 20-24 25-29 30-39 40-49 50-59 60+
Age Dot Stated
7,171 1,375 1,271 1,209 2,189 1,564
917 1,169
15,047
6,512 1,335 1,232 1,162 1,865 1,249
850 642
4
84,026
35,927 7,648 6,428 5,9~6
10,474 7,957 4,819 4,837
15,605
6,581 1,408 1,351
960 1,933 1,596
855 921
U,348
5,328 1,157 1,0iB
826 1,488 1,149
HO 642
10,083
4,125 1,061
598 984
1,342 896 563 514
8,691
3,706 730 626 593
1,132 831 508 565
7,890
3,450 700 624 587 978 670 466 415
5
76,095
32,927 6,126 6,264 5,774 9,883 6,522 3,930 4,666
3
13,593
5,791 1,078
1,177 1,068 1,788 1,212
682 797
11,398
5,071 957 972 860
1,427 947 545 619
8,631
3,822 735 701 684
1,105 696 434 453
1
8,175
3,465 645 645
616 1,057 733 409 604
7,157
3,062 635 60B 575 807 579 384 427
Total Workers
WORKER!
~I~------------r=I----~------~II~I------~
Cultivators Aericultural Livestock, Forestry,
Labourers Fishing, Hunting and Plantations. Orchards &: alliod
activities
,-__ .J---~ ,.-~ ._~ ,--_-'-__ ....., .....,
Males Females Males Females Males Ferna1e. Males Fern,le.
6
37,470
969 2,386 3,947 4,807 9,U72 7,598 4,436 3,455
6,891
142 363 740 772
1,833 1,546
790 705
5,121
83 313 532 671
1,366 1,068
664 424
4,447
143 270 439 607
1,277 857 513 341
3,868
100 225 384 499
1,048 783 469 360
3,500
87 256 362 497 923 647 442 286
/' ..
3,554
182 268 436 452 905 710 369 231
572
13 37 76 75
139 140 63 29
192
8 11 32 21 56 36 14-14
322
12 21 39 48 69 70 44 18
312
22 18 25 47
107 80 42 31
365
32 31 59 48 83 57 42
13
8
5,270
86 272 472 602
1,195 1,044
736 863
1,169
7 49
118 125 263 240 162 205
273
4 13 14 38 58 49 49 48
463
16 31 39
56 106 81 60 74
34' 6
11 26 29 86 64 49 72
640
5 33 42 77
141 142 102
98
9
168
3 13 18 18 30 41 24 21
40
4 5 7 5
12 2 4
2
2
16
2 1 2 3 2
6
8
2 I 3 2
7
1 2 2 2
10
5,869
287 571 699 703
1,375 )'099
625 510
1,216
43 100 137 125 294 259 145 113
542
10 44 59 85
134 89 63 58
274
16 27 31 29 72 49
30 20
372
15 29 46 41 90 77 35 39
795
48 100
92 99
193 119
89 55
II
1,851
110 170 280 252 ~'6 339 177 84
362
9 26 60 50 82 82
44 9
,S
2 4
11 5
13 6 2 2
11!
8 12 23 18 20 12 15 6
2 7 7 4 5
292
32 25 56 42 63 39 29
6
12
403
14 II 37 69
),33 81 33 20
60
I I
4 II 21 13
5 4
26
2 3 8 7 4 2
117
2 3
12 21 ,H 21
3 4-
52 5 4-6 5
15 12 4 I
J5
2 4
11 6 7 4
13
5
I 2
1
,"
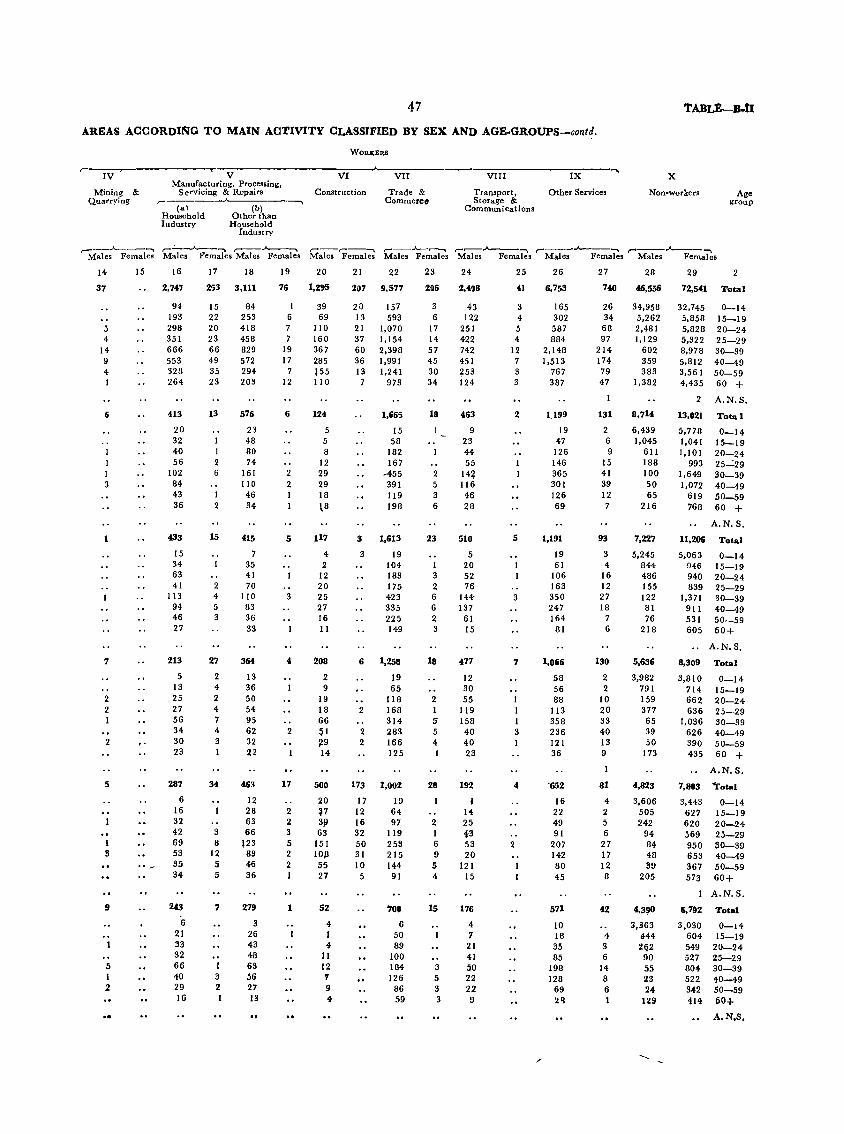
47
AREAS ACCORDING TO MAIN ACTIVITY CLASSIFIED BY SEX AND AGE.GROUPS-contd.
WORXI!RS
~---I-V~------------'--~-V-------------------V-I----A---V-I-I-------
Mining & Quarrying
Manufacturing, Processing, Servicing & Repairs
,--------'---------.. (al (b)
Household Other than Industry Household
Industry
Construction Trade & Commereo
VIII
Transport, Storage &
Communications
IX
Other Services
TABIJ:--B.tI
X
Non-workers Age group
r---~A--- ........ ,-;_-.J--",",", ,---'---, ,---,-----, ,..---.A.--r--........ ,....r--.A.--~ r----"------, ,....---"----, Males Females Males Females Males Females Males Females Males Females Males Females Males Females Males Females
14
37
5 4
14 9 4 1
6
3
1
7
2 2 1
2
5
1 3
9
5 1 2
15 16
2,747
94 193 298 351 666 553 328 264
413
20 32 40 56
102 84 43 36
433
15 34 63 41
113 94 46 27
213
5 13 25 27 56 34 30 23
287
6 16 32 42 69 53 35 34
243
6 21 33 32 66 40 29 16
17
253
15 22 20 23 66 49 35 23
13
I 2 6
I 2
15
2 4 5 3
27
2 4 2 4 7 4 3 I
3 8
12 5 5
7
3 2
18
3,111
84 253 418 458 829 572 294 203
576
23 48 80 74
161 110 46 34
415
7 35 41 70
110 83 36 33
364
13 36 50 54 95 62 32 22
463
12 28 63 66
123 89 46 36
279
3 26 43 48 63 56 27 13
19
76
1 6 7 7
19 17
7 12
6
2 2 1 1
5
3
2
17
2 2 3 5 2 2 I
1
20
1,%95
39 69
110 160 367 285 155 110
124
5 5 8
12 29 29 18
t8
117
4 2
12 20 25 27 16 11
208
2 9
19 16 66 !II ~9 14
500
20 F 311 63
151 1011 5'5 27
52
4 1 4
11 12 7 9 4
21
207
20 13 21 37 60 36 13 7
3
3
6
2
2 2
173
17 12 16 32 50 31 10
5
22
9,577
157 593
1,070 1,154 2,396 1,991 1,241
973
1,665
15 58
182 167
-455 391 119 196
1,613
19 104 163 175 423 335 225 149
1,258
19 65
116 166 314 283 166 125
1,002
19 64 97
119 253 215 144 91
700
6 50 89
100 184 126
86 59
23
206
3 6
17 14 57 45 30 34
18
2 5 3 6
23
I 3 2 6 6 2 3
18
2 I 5' 5 4
28
2 1 6 9 5 4
15
3 5 3 3
24
2,408
43 122
251 422 742 451 ~53 124
463
9 23 44 55 14~ 116 46 28
510
5 20 52 76
144-1~7
61 15
4." 12 30 55
119 158 iO 40 23
192
I H 25 i3 53 20
I'll 15
176
4 7 21 41 50 22 22 9
25
41
3 4 5 4
12 7 3 3
2
5
3
7
1 1 I 3
4
2
"
26
6,753
165 302 587 884
2,148 1,513
767 387
1,199
19 47 126 146 365 301 126 69
1,191
19 61
106 163 350 247 164
81
1,066
58 56 88
113 358 236 12 I 36
'652
16 22 49 91
207 142 80 45
571
10 18 35 85
198 128
69 2q
27
740
26 34 68 97
214 174 79 47
131
2 6 9
15 41 39 12 7
93
3 4
16 12 27 18
7 6
130
2 2
10 20 33 40 13 9
81
4 2 5 6
27 17 12 8
4 3 6
14 8 6 I
28
46,556
34,958 5,262 2,481 1,129
602 359 363
1,382
8,714
6,439 1,045
611 186 100 50 65
216
7,227
5.245 844 486 155 122 81 76
218
5,636
3,982 79 I 159 377 65 39 50
173
4,823
3,606 505 242
94 84 48 39
205
'-3(10
3,363 jJ,44
21,12 90 55 23 24
129
29
72,541
32,745 5,858 5,826 5,322 8,978 5,812 3,56 ) 4,435
2
13,021
5,778 1.041 1,101
993 1,649 1,072
619 768
11,206
5,063 946 940 839
1,371 911 531 605
8,309
3,810 714 662 636
1,036 626 390 435
7,803
3,443 627 620 569 950 653 367 573
1
6,792
3,030 604 549 527 804 522 342 41i
2
T'Otal
0-14 15-19 20-24 25-29 30-39 40-19 50-59 60 + A.N.S.
Total
0-14 15-19 20-24 25"":'29 30-39 40-49 50-59 60 +
A.N.S.
Total
0-)4 15-19 20-24-25-29 30-39 40-49 50-59 60+
A.N.S.
Total
0-14 15-19 20-24 25-29 30-39 40-49 50-59 60 +
A.N.S.
'Total
0-14 15-19 20-24 25-29 30-39 40-49 50-59 60+
A.N.S.
Total
0-14 15-19 20-24 25-29 30-39 iO-49 50-59 60+
A.N,S,
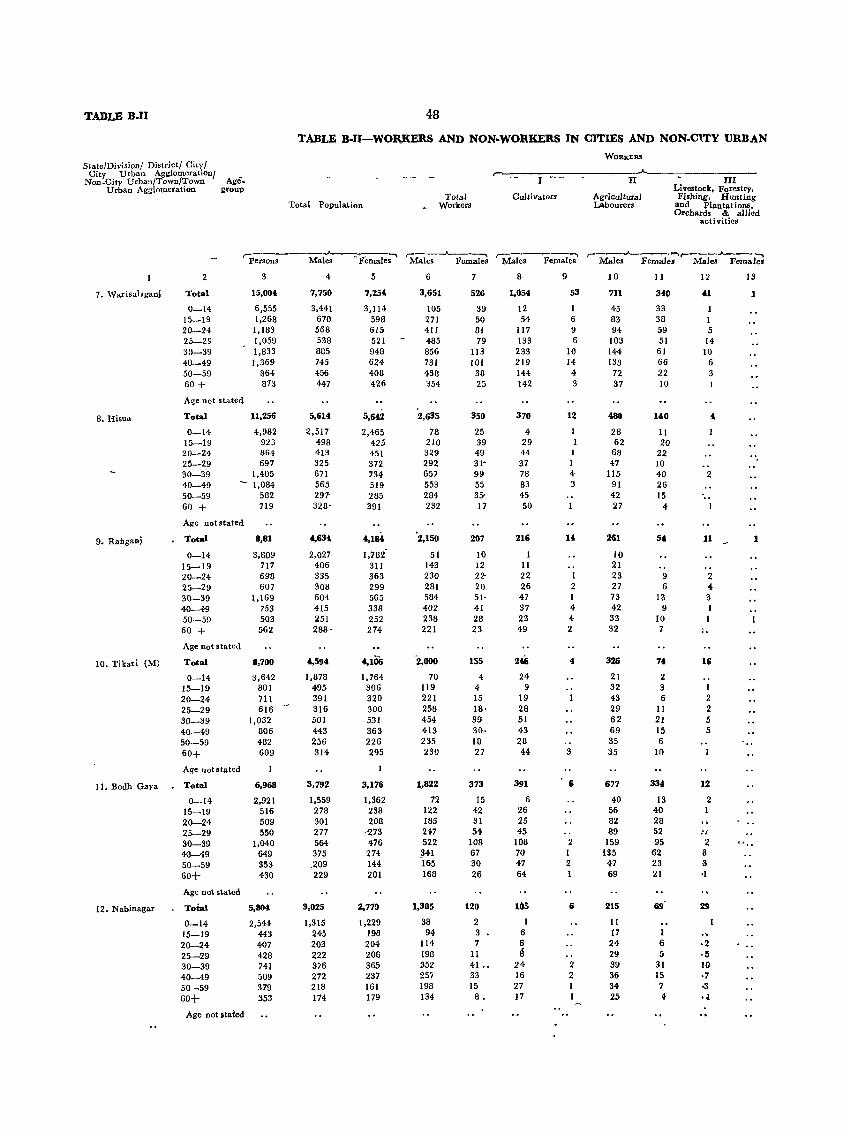
TABLE B.II 48
TABLE B-I1-WORKERS AND NON·WORKEltS IN CITIES AND NON.C\TY URBAN
WORKERS State/Division/ District/ City/
City Urban Agglomeration! Age.
r- I -_ , Non-Citl: Urban!Town!l'own II III
Ur an Agglomeration group Livestock, Forestry, Total Cultivators Agricul tural Fishing, Hunting
Total Population ~ Workers Labourers and plantation ••
Orchards &. allied activities
'-Persons Males ~Female~ r-..J.-.--..... Males Females (""'Male. Fern"I;'
r---A----~r---~--~ Males Female. Males Females
2 3 4 5 6 7 8 9 10 II 12 13
7. Warisaligani Total 15,OM, 7,750 7,Z5' 3,651 5Z6 1,054 53 711 3'0 'I 1
0-14 6,555 3,441 3,114 105 39 12 1 45 33 15-19 1,268 670 598 271 50 54 6 83 38 I 20-24 1,183 568 615 411 81 117 9 94 59 5 25-29 1,059 538 521 485 79 133 6 103 51 14 30-39 1,833 885 948 856 113 233 10 144 61 10 40-49 1,369 745 624 731 101 219 14 133 66 6 50-59 864 456 408 438 38 144 4 72 22 3 60 + 873 447 426 354 25 142 3 37 10
Age not stated
8. Hisua Total 11,256 5,614 5,642 2,635 350 370 12 480 140 4
0-14 4,982 2,517 2,465 78 25 4 1 28 11 15--19 923 498 425 210 39 29 1 62 20 20-24 864 413 451 329 49 44 1 68 22 25-29 697 325 372 292 31' 37 1 47 10 30-39 1,405 671 734 657 9~ 78 4 115 40 2 40-49 1,084 565 519 553 55 83 3 91 26 50-59 582 297' 285 284 35- 45 42 15 .. 60 + 719 328' 391 232 17 50 27 4
Age not stated
9_ Rahga.pj Total 8,81 ',634 4,184 2,150 207 216 14 261 S, 11 1
0-14 3,809 2,027 1,78£ 51 10 10 15-19 717 406 311 143 12 11 21 20-24 698 335 363 230 22' 22 I 23 9 2 25-29 607 308 299 281 20 26 2 27 6 4 30-39 1,169 604 565 584 51, 47 1 73 13 3 40-49 753 415 338 402 41 37 4 42 9 1 50-59 503 251 252 238 28 23 4 33 10 1 60 + 562 288 ' 274 221 23 49 2 32 7 .. Age not stated
10. Tikari (M) Total 8,700 4,594 4,106 '2,000 155 2~ 4 326 7f 16
0-14 3,642 1,878 1.764 70 4 24 21 2 15-19 801 495 306 119 4 9 32 3 I
20-24 711 391 320 221 15 19 43 6 2 25-29 616 316 300 258 18· 28 29 11 2 30-39 1,032 501 531 454 39 51 62 21 5 40-49 806 443 363 413 30· 43 69 15 5 50-59 482 256 226 235 18 28 35 6 60+ 609 314 295 230 27 44 3 35 10
Age not stated
II. Bodh Gaya Total 6,968 3,792 3,176 1,822 313 391 6 677 33' 12
0-14 .2,921 1,559 l,g62 72 15 6 40 13 2 15-19 516 278 238 122 42 26 56 40 I
20-24 509 301 208 185 31 25 82 28 iI
25--29 550 277 -273 247 54 45 89 52 fI
30-39 1,040 564 476 522 108 108 2 159 95 2 40-49 649 375 274 341 67 70 1 135 62 8
50-59 353 .209 144 165 30 47 2 47 23 8
60+ 430 229 201 168 26 64 1 69 21 ·1
Age not stated
12. Nabinagar Total 5,804 3,025 2,779 1,385 120 lOS 6 215 69 29
0-14 2,544 1,315 1,229 38 2 I 11 15-19 443 245 198 94 3 6 17 1 20-24 407 203 204 114 7 6 24 6 ·2 25-29 428 222 206 198 11 S 29 5 ·5 30-39 741 376 365 352 41 •• 24 2 39 31 lO
40-49 509 272 237 25'i 33 16 2 36 15 ·7 50-59 379 218 161 198 15 27 1 34 7 ·3 60+ 353 174 179 134 8. J7 I 25 4 ·l
Age not stated
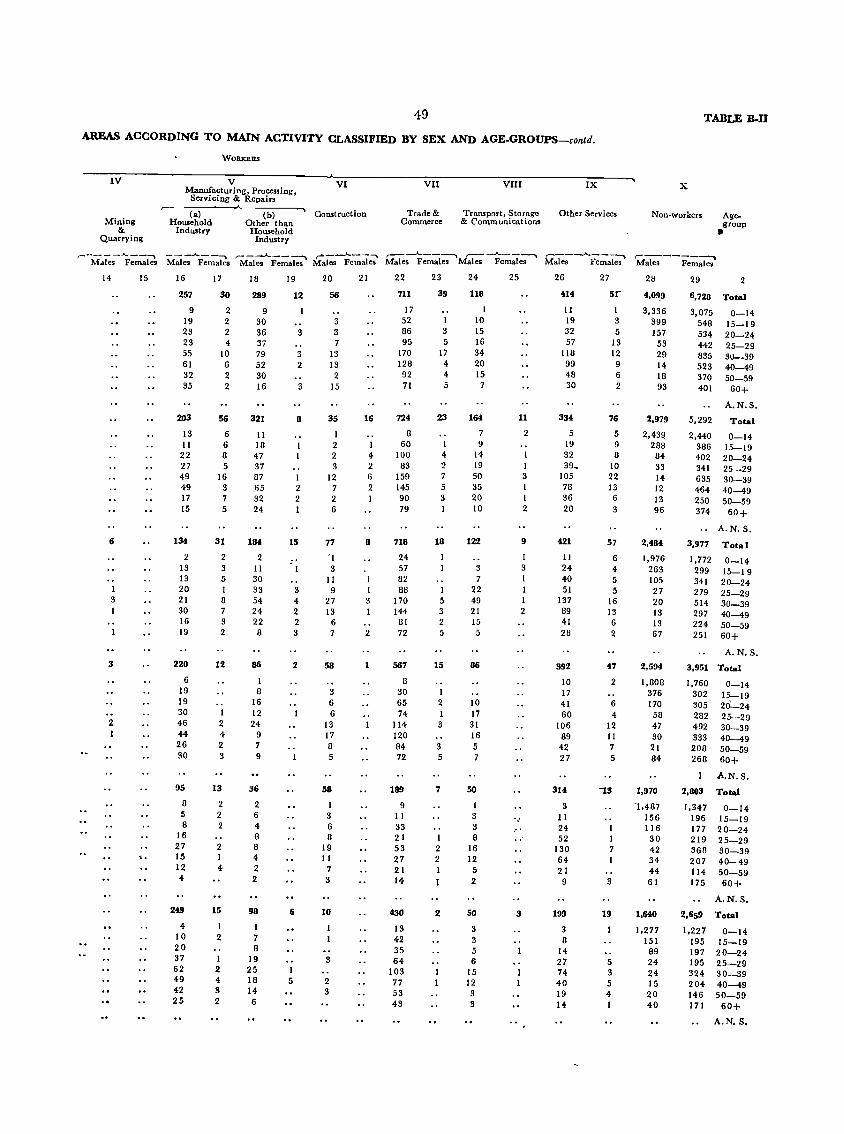
49
AREAS ACCORDING TO MAIN ACTIVITY CLASSIFIED BY SEX AND AGE-GROUPS-contd.
IV
Mining &
Quarrying
WORXERS
V Manufacturing, Processing,
Servicing & Repairs
(al Household
Industry
(bl Other than
Household Industry
VI
Construction
VII
Trade & Commerce
VIII
Transport, Storage & Communications
IX
Other Services
TABLE B-I1
X
Non·workers Age-group
• ,-•• ___ .A.. __ .......,. ___ ..A. __ .......,. r------'-----; ~-....__..A..-_~ r---A...--~ r---A ---....... r----.A...--~ ,-_____ _,
M .. les Females Males Females Males Females Males Females Males Females Males Females Males Females Males Female.
14
6
3 1
3
2 1
15 16
257
9 19 23 23 55 61 32 35
203
13 11 22 27 49 49 17 15
134
2 13 13 20 21 30 16 19
220
6 19 19 30 46 44 26 30
95
8 5 8
16 27 15 12 4
249
4 10 20 37 62 49 42 25
17
30
2 2 2 4
10 6 2 2
56
6 6 8 5
16 3 7 5
31
2 3 5
8 7 3 2
12
1 2 4 2 3
13
2 2 2
2 1 4
15
1 2
1 2 4 3 2
18
289
9 30 36 37 79 52 30 16
321
11 18 47 37 87 65 32 24
1M
2 II 30 33 54 24 22 8
86
1 8
16 12 24
9 7 9
36
2 6 4 8 8 4 2 2
98
I 7 8
19 25 18 14 6
19
12
3
3 2
3
8
I 2 2 1
15
3 4 2 2 3
2
6
1 5
20
56
3 3 7
13 13
2 15
35
1 2 2 3
12 7 2 6
77
'1 3
11 9
27 13
6
58
3 6 6
13 17 8 5
58
1 3 6 8
19 11
7 3
10
3
2 3
21
16
1 4 2 6 2 1
8
3 1
2
1
22
711
17 52 86 95
170 128 92 71
724
8 60
100 83
159 145 90 79
718
24 57 82 88
170 144
81 72
567
8 30 65 74
114 120 84 72
189
9 11 33 21 53 27 21 14
430
13 42 35 64
103 77 53 43
23
39
1 3 5
17 4 4 5
23
I 4 2 7 5 3
18
I 5 3 2 5
15
I 2 1 3
3 5
7
1 2 2 I
t
2
24
118
10 15 16 34 20 15
7
164
7 9
14 19 50 35 20 10
122
3 7
22 49 21 15 5
86
10 17 31 16 5 7
50
I 3 3 8
16 12 5 2
50
3 3 5 6
15 12 3 3
25
11
2
I 3
1 2
9
1 3
1 I 2
3
26
tit
11 19 32 57
118 99 48 30
33t
5 19 32 39.
105 78 36 20
421
11 24 40 51
137 89 41 28
392
10 17 41 60
106 89 42 27
314
3 II 24 52
130 64 21 9
199
3 8
14 27 74 40 19 14
27
51-
I 3 5
13 12 9 6 2
76
5 9 8
10 22 13 6 3
57
6 4 5 5
16 13 6 2
t7
2
6 4
12 II 7 5
13
I 7
3
19
5 3 5 4 I
28
4,O!i9
3,336 399 157
53 29 14 18 93
2,979
2,43~
288 84 33 14 12 13 96
2,48t
1,976 263 105 27 20 13 13 67
2,594
1,808 376 170 58 47 30 21 84
1,970
-1,487 156 116 30 42 34 44 61
1,640
1,277 151 89 24 24 15 20 40
29
6,728
3,075 548 534 442 835 523 370 401
5,292
2,440 386 402 341 635 464 250 374
3,977
1,772 299 341 279 514 297 224 251
2
Total
0-14 15-19 20-24 25-29 30-39 40-49 50-59
60+
A.N.S.
Total
0-14 15--19 20--24 25-29 30-39 40-49 50-59 60+
A.N.S.
Total
0-14 15-19 20-24 25-29 30-39 40-49 50-59 60+
A.N.S.
3,951 Total
1,760 302 305 282 492 333 208 268
0-14 15--19 20'--24 25--29 30-39 40--49 50-59 60+
A.N.S.
2,803 Total
1,347 196 177 219 368 207 114 175
0-14 15-19 20-24 25-29 30-39 40-49 50-59 60+
A.N.S.
2.659 Total
1,227 195 197 195 324 204 146 171
0-14 15-19 20-24 25-29 30-39 40-49 50-59 60+
A.N. s.
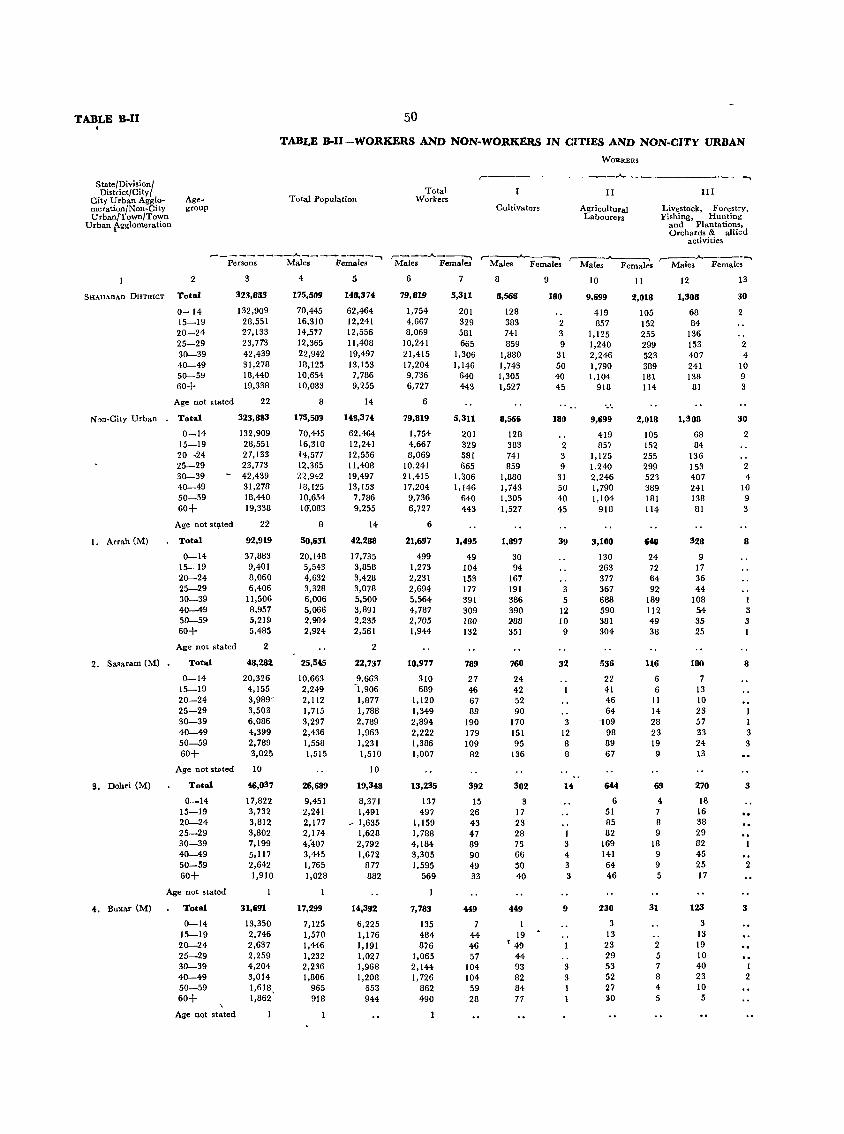
TABLE B.II
State/Division/ District/City/
City Urban Agglo- Age-meration/Non-City group Urban/Town/Town
Urban 4'-gglomeration
50
TABLE B·I1-WORKERS AND NON-WORKERS IN CITIES AND NON·CITY URBAN
Total Population Total
Workers Cultivators
WORKERS
II
Agricultural Labourers
._------...., III
Livestock, Forestry, Fishing, Hunting
and Plantations, Orchards & allied
activities ,.- _________ ..A.. __________ ...... ,..-___ A-_-. ,- ....." ,--_A-_-.. ,-__ oA. _____ ~
Persons Males Females Males Females Males Females Males Females Males Females
SHABABAD DISTRICT
Non-City Urban
1. Arrah (M)
2
Total
0-14 15-19 20-24 25-29 30-39 40-49 50--59 60+
Age not stated
Total
3
323,8113
132,909 28,551 27,133 23,773 42,439 31,278 18,440 19,338
22
323,883
132,909 28,551 27,133 23,773
0-14 15-19 20-24 25-29 30-39 40-49 50-59 60+
- 42,439
Age not st(lted
Total
0-14 15-19 20-24 25-29 30-39 40-49 50-59 60+
31,278 18,440 19,338
22
92,919
37,883 9,401 8,060 6,406
11,506 8,957 5,219 5,485
2. Sasaram (M) •
Age not stated
Total
2
48,282
3. Dehri (M)
4. Buxar (M)
0-14 15-19 20-24 25-29 30-39 40-49 50-59 60+
Age not sto.ted
Total
0-14 15-19 20-24 25-29 30-39 40-49 50-59 60+
Age not stated
Total
0-14 15-19 20-24 25-29 30-39 40-49 50-59 60+
\
Age not stated
20,326 4,155 3,989' 3,503 6,086 4,399 2,789 3,025
10
46,037
17,822 3,732 3,812 3,802 7,199 5,117 2,642 1,910
:n,691
13,350 2,746 2,637 2,259 4,204 3,014 1,618 1,862'
4
175,509
70,445 16,310 14,517 12,365 22,942 18,125 10,654 10,083
8
175,509
70,445 16,310 11,577 12,365 22,942 18,125 10,654 HI,OB3
8
50,631
20,148 5,,543 4,632 3,328 6,006 5,066 2,984 2,924
25,545
10,663 2,249 2,112 1,715 3,297 2,436 1,558 1,515
26,689
9,451 2,241 2,177 2,174 4;407 3,445 1,765 1,028
17,299
7,125 1,570 1,446 1,232 2,236 1,806
965 918
5
148,374
62,464 12,241 12,556 11,408 19,497 13,153 7,786 9,255
14
143,374
62,464 12,241 12,556 11,408 19,497 13,153
7,786 9,255
14
42,288
17,735 3,858 3,428 3,078 5,500 3,891 2,235 2,561
2
22,737
9,663 ~1,906
1,877 1,788 2,789 1,963 1,231 1,510
10
19,348
8,371 1,491
~ 1,635 1,628 2,792 1,672
877 882
14,392
6,225 1,176 1,191 1,027 1,968 1,208
653 944
6
79,819
1,754 4,667 8,069
10,241 21,415 17,204 9,736 6,727
6
79,819
1,754 4,667 8,069
10,241 21,415 17,204
9,736 6,727
6
21,697
499 1,273 2,231 2,694 5,564 4,787 2,705 1,944
10,977
310 689
1,120 1,349 2,894 2,222 1,386 1,007
13,235
137 497
1,159 1,788 4,184 3,305 1,595
569
7,783
135 484 876
1,065 2,144 1,726
862 490
7
5,311
201 329 581 665
1,306 1,146
640 443
5,311
201 329 581 665
1,306 1,146
640 443
1,495
49 104 153 177 391 309 180 132
789
27 46 67 89
190 179 109
82
392
15 26 43 47 89 90 49 33
449
44 46 57
104 104 59 28
8
8,566
128 383 741 859
1,880 1,743 1,305 1,527
8,566
128 383 741 859
1,880 1,743 1,305 1,527
1,897
30 94
167 191 386 390 288 351
760
24 42 52 90
170 151 95
136
302
3 17 23 28 75 66 50 40
449
1 19
{ 49 44 93 82 84 77
9
180
2 3 9
31 50 40 45
1811
2 3 9
31 50 40 45
39
3 5
12 10 9
32
3 12 8 8
14
1 3 4 3 3
9
3 3
10
9,699
419 857
1,125 1,240 2,246 1,790 1,104
918
9,699
419 857
1,125 1,240 2,246 1,790 1,104
918
3,100
130 263 377 367 688 590 381 304
536
22 41 46 64
109 98 89 67
644
6 51 85 82
169 141 64 46
230
3 13 23 29 53 52 27 gO
II
2,018
105 152 255 299 523 389 181 114
2,018
105 152 255 299 523 389 181 114
640
24 72 64 92
189 112 49 38
116
6 6
11 14 28 23 19 9
69
4 7 8 9
18 9 9 5
31
2 5 7 8 4 5
12
1,308
68 84
136 153 407 241 138
81
1,308
68 84
136 153 407 241 138 81
328
9 17 36 44
108 54 35 25
180
13 10 23 57 33 24 13
270
18 16 38 29 82 45 25 17
123 3
13 19 10 40 23 10 5
13
30
2 4
10 9 3
30
2
2 4
10 9 3
8
I 3 3 1
8
1 1 3 3
3
2
3
I 2
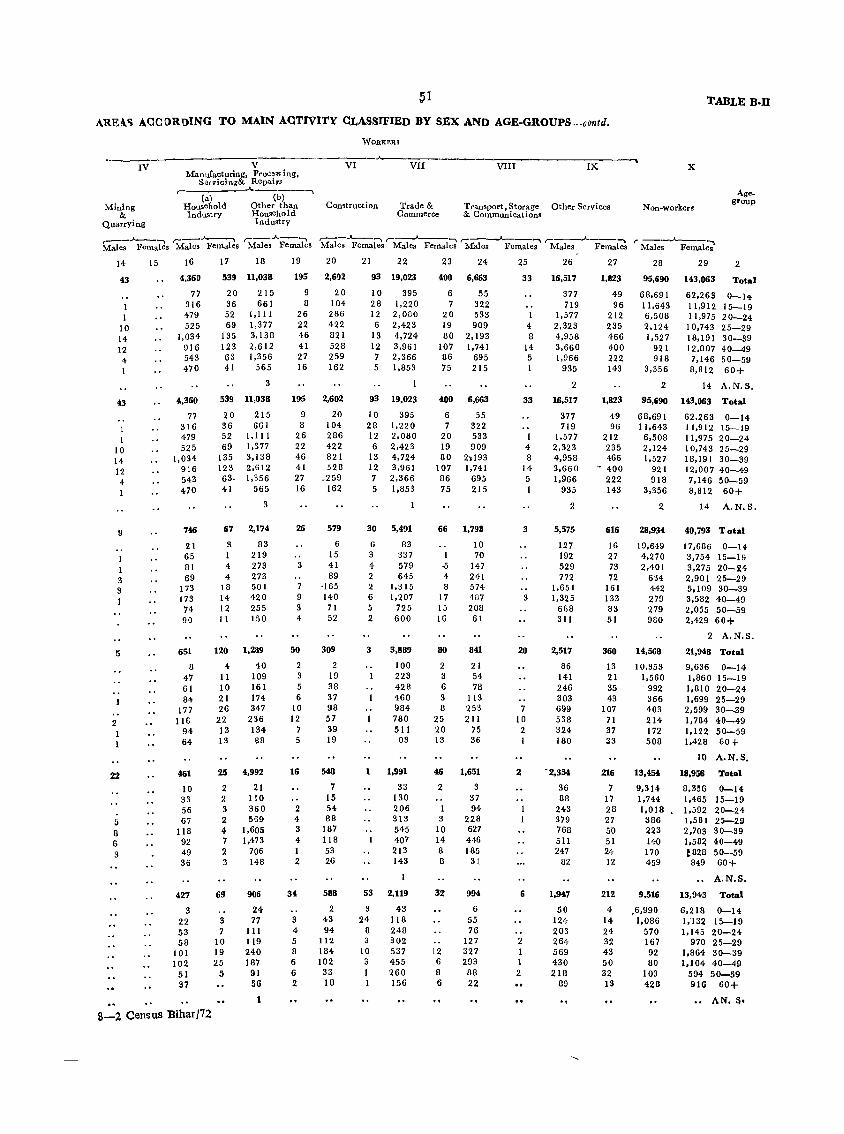
:51 TABLE B-D
ARE"'') ACCORulNG TO MAIN ACTIVITY CLASSIFIED BY SEX AND AGE-GROUPS-contd'.
WORKERS
V VI Manufacturing, ProC~~~ ing,
Servicing& Repairs
VII VIII IX X
,----~ ...... -----....., Mining
r- Cal (b) Household Other than Construction Industry Household
Trade & Commerce
Transport, Storage Other Services & CommWlications
Non-workers
Age_ group
& Quarrying Industry
14
43
1 1
10 14 12
4 1
1 1
10 14 12 4 1
9
1 3 3 1
5
2
22
5 8 6 3
15 16
4,360
77 316 479 525
1,034 916 543 470
4,360
77 316 479 525
1,034 916 543 470
17 18
539 11,038
20 215 36 661 52 1,111 69 1,377
135 3,138 123 2,612 63 1,356 41 565
3
539 11,038
20 215 36 661 52 1,111 69 1,377
135 3,138 123 2,612 63. 1,356 41 565
3
746 67 2,174
21 3 83 65 1 219 81 4 273 69 4 273
173 18 501 173 14 420 74 12 255 90 11 150
651 120 1,289
8 47 61 84
177 116
94 64
461
10 33 56 67
118 92 49 36
427
3 22 53 58
101 102
51 37
4 11 10 21 26
22 13 13
25
2 2 3 2 4 7 2 3
69
3 7
10 19 25
5
40 109 161 174 347
236 134 88
4,992
21 110 360 569
1,605 1,473
706 148
906
24 77
III 119 240 187 91 56
1
8-2 CensuS Bihar/72
19 20
195 2,602
9 8
26 22 46 41 27 16
195
9 8
26 22 46 41 27 16
20 104 286 422 821 528 259 162
2,602
20 104 286 422 821 528
_259 162
26 579
6 15 41 89
7 ·165 9 140 3 71 4 52
50 309
2 3 5 6
10 12
7 5
16
2 4 3 4 1 2
34
3 4 5 8 6 6 2
2 19 38 37 98 57 39 19
548
7 15 54 88
187 118 53 26
588
2 43 94
112 184 102 33 18
21 22
93 19,023
10 395 28 1,220 12 2.080 6 2,423
13 4,724 12 3,961 7 2,366 5 1,853
93 19,023
10 395 28 1,220 12 2,080 6 2,423
13 4,724 12 3,961 7 2,366 5 1,853
30 5,491
6 83 3 337 4 579 2 645 2 1,315 6 1,207 5 725 2 600
3 3,889
100 223 428 460 984 780 511 03
1,991
33 130 206 313 545 407 213 143
53 2,119
3 43 24 118
8 248 3 302
10 537 3 455 I 260 1 156
23 24
400 6,653
6 55 7 322
20 533 19 909 80 2,193
107 1,741 86 695 75 215
400 6,663
6 55 7 322
20 533 19 909 80 2,193
107 1,741 86 695 75 215
66 1,798
10 70
" 147 4 241 8 574
17 487 15 208 16 61
80 841
2 3 6 3 8
25 20 13
46
2
1 3
10 14 8 8
32
12 6 8 6
21 54 78
113 253 211
75 36
1,651
3 37 94
228 627 446 185
31
994
6 55 76
127 327 293 88 22
25
33
4 8
14 5
33
1 4 8
14 5 1
3
3
20
7 10 2
2
6
2 1 1 2
26
16,517
377 719
1,577 2.323 4,958 3,660 1,966
935
2
16,517
377 719
1,577 2,323 4,958 3,660 1,966
935
2
5,575
127 192 529 772
1,651 1,325
668 311
2,517
86 141 246 303 699 538 324 180
-2,354
36 88
243 379 768 511 247
82
1,947
50 124 203 264 569 430 218
89
27 28 29 2 1,823 95,690 143,063 Total
49 68,691 96 11,643
212 6,508 235 2,124 466 1,527 400 921 222 918 143 3,356
1,823
49 96
212 235 466
~ 400
222 143
2
95,690
68,691 11,643 6,508 2,124 1,527
921 918
3,356
2
616 28,934
16 19,649 27 4,270 73 2,401 72 634
161 442 133 279 83 279 51 980
360 14,568
13 21 35 43
107 71 37 33
216
7 17 28 27 50 51 24 12
10,353 1,560
992 366 403 214 172 508
13,454
9,314 1,744 1,018
386 223 140 170 459
212 9,516
4 ,6,990 14 1,086 24 570 32 167 43 92 50 80 32 103 13 428
62,263 0-14 11,912 15-19 11,975 20-24
10,743 25-29 18,191 30-39 12,007 40-49 7,146 50-59 8,812 60+
14 A.N.S.
143,063 Total
62,263 0-14 11,912 15-19 11,975 20-24 10,743 25-29 18,191 30-39 12,007 40-49 7,146 50-59 8,812 60+
14 A.N.S.
40,793 Total
17,686 0-14, 3,754 15-19 3,275 20-24 2.901 25-29 5,109 30-39 3,582 40-49 2,055 50-59 2,429 60+
2 A.N.S.
21,948 Total
9.636 0-14 1,860 15-19 1,810 20-24 1,699 25-29 2,599 30-39 1,784 40-49 1,122 50-59 1.428 60+
10 A.N.S.
18,956
8,356 1,465 1,592 1,581 2.703 1,58~
~828 849
Total
0-14 15-19 20-24 25-29 30-39 40-49 50-59 60+
A.N.S.
13,943 Total
6.218 0-14 1,'132 15-19 1,145 20-24
970 25-29 1,864 30-39 1,104 40-49
594 50-59 916 60+
•• AN. is.
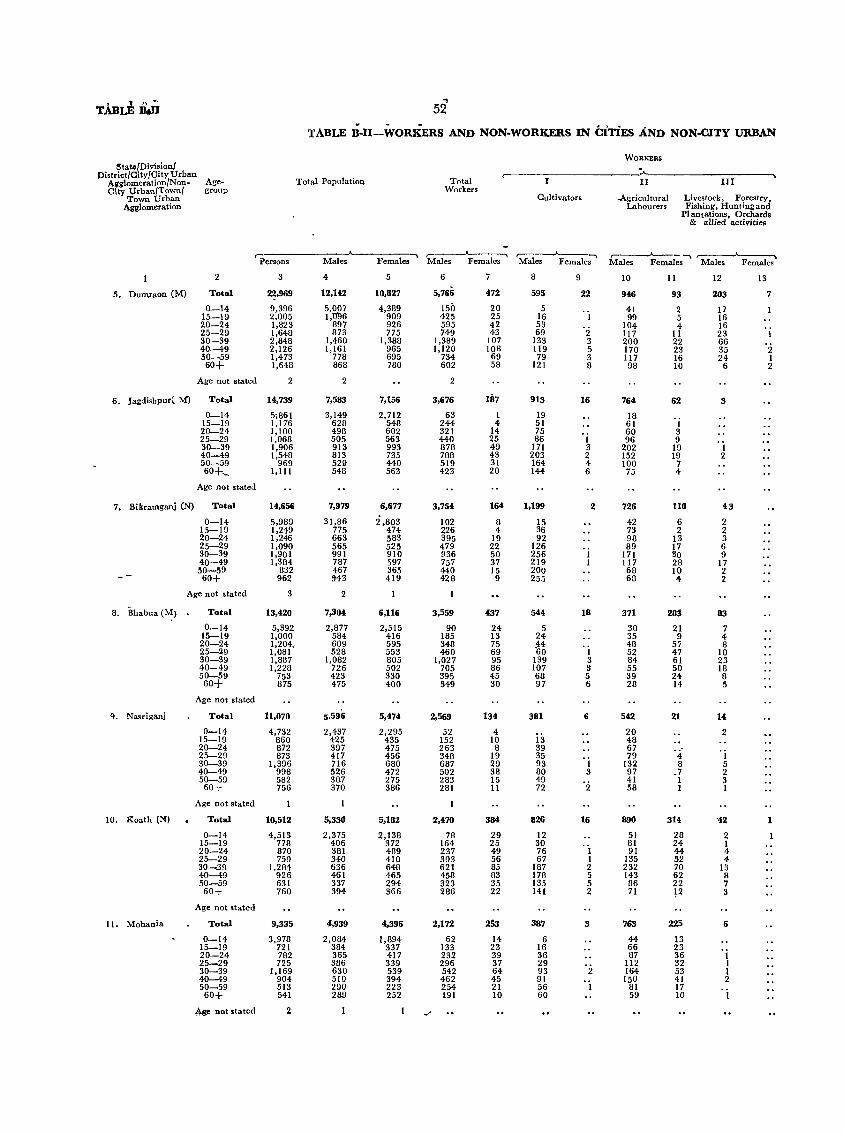
TABLE ii.ii 52 TABLE n.U-WORKERs AND NON·WORKERS IN CiTiES AND NON·CITY URBAN
WORKERS !ltatefDivision/
District/City/City Urban Total Population Total
r- ...., Aa'&:lomeration/Non. Age. II III City Urban/Town/ group Workers
Town Urban Cultivators -Agricultural Livestock, Forestry, Agglomeration Labourers Fishing, Huntingand
PI antations, Orchards & allied activities
r----'-----"'"""\ .- ...., r---------"--...., r----.A..-- ~ r-----..A..-","""\ Persons Males Females Males Females Males Females Males Females Males Females
2 3 4 5 6 8 9 10 II 12 13
5. Dumraon (M) Total 22,969 12,142 10,827 5,766 472 595 22 9t6 93 203 7
0-14 9,396 5,007 4,389 150 20 5 41 2 17 15-19 2,005 1,'0'96 909 125 25 16 1 99 5 16 20-24 1,823 897 926 595 42 53 104 4 16 25-29 1,648 873 775 749 43 69 2 117 11 23 I 30-39 2,848 1,460 1,388 1,389 107 133 3 200 22 66 '2 40-49 2,126 1,161 965 1,120 lOR 119 5 170 23 35 50-59 1,473 778 695 734 69 79 3 117 16 24 1 60+ 1,648 868 780 602 58 121 8 98 10 6 2
Age not stated 2 2 2
6. Jagdishpur( M) Total 14,739 7,583 7,156 3,676 187 913 16 764 62 3
0-14 5;861 3,149 2,712 63 1 19 18 . i 15-19 1,176 628 548 244 4 51 61 20-24 1,100 498 602 321 14 75 60 3 25-29 1,068 505 563 440 25 86 1 96 9 30-39 1,906 913 993 878 49 171 3 202 19 1 40-49 1,548 813 735 788 43 203 2 152 19 2 50-59 969 5211 440 519 31 164 4 100 7 60+_ 1,I11 548 563 423 20 144 6 75 4
Age not stated
7. Bikramgani (N) Total 14,656 7,979 6,677 3,764 164 1,199 2 726 110 43
0-14 5,989 31,86 i,803 102 8 15 42 6 2 15-19 1,249 775 474 226 4 36 73 2 2 20-24 1,246 663 583 395 19 92 98 13 3 25-29 1,090 565 525 479 22 126 89 17 6 30-39 1,901 991 910 936 50 256 171 30 9 40-49 1,384 787 597 757 37 219 117 28 17 50-59 832 467 365 440 15 200 68 10 2 60+ 962 5'43 419 428 9 255 68 4 2
Age not stated 3 2
8. Bhabua eM) Total 13,420 7,304 6,116 3,559 437 544 18 371 28j 83
0-14 5,392 2,877 2,515 90 24 5 30 21 7 15-19 1,000 584 416 185 13 24 35 9 4 20-24 1,204< 609 595 348 75 ~~ 48 57 8 25-29 1,081 528 553 460 69 1 52 47 10 30-39 1,887 1,082 805 1,027 95 139 3 84 61 23 40-49 1,228 726 502 705 86 107 3 55 50 18 50-59 753 423 330 395 45 68 5 39 24 8 60+ 875 475 400 349 30 97 6 28 14 5
Age not stated
9. Nasriganj Total 11,070 5.596 5,474 2,569 134 381 6 542 21 14
0-14 4,732 2,437 2,295 52 4 is
20 2 15-19 860 425 435 152 10 48 20-24 872 397 475 263 8 39 67 25-29 873 417 456 348 19 35 79 4 1 30-39 1,396 716 680 687 29 93 1 132 8 5 40-49 998 526 472 502 38 80 3 97 .7 2 50-59 582 307 275 283 15 49 41 1 3 60+ 756 370 386 281 II 72 2 58 1 1
Age not stated
10. Koath eN) Total 10,512 5,330 5,182 2,470 384 826 16 890 314 '42 1
0-14 4,513 2,375 2,138 78 29 12 51 28 2 15-19 778 406 372 164 25 30 81 24 1 20-24 870 381 489 237 49 76 1 91 44 4 25-29 750 340 410 303 56 67 1 135 52 4 30.....,39 1,284 636 648 621 85 187 2 232 70 13 40-49 926 461 465 458 83 178 5 143 62 8 50-59 631 337 294 323 35 135 5 86 22 7 60+ 760 394 366 286 22 141 2 71 !2 3
Age not stated
It. Mohania Total 9,335 4,939 4,396 2,172 2~3 387 3 763 225 6
0-14 3,978 2,084 1,894 62 14 6 44 13 15-19 721 384 337 133 23 16 66 23 20-24 782 365 417 232 39 36 87 36 1 25-29 725 386 339 296 37 29 112 32 1 30-39 1,169 630 539 542 64 93 2 164 53 1 40-49 904 510 394 462 45 91 150 41 2 50-59 513 290 223 254 21 56 81 17 . i 60+ 541 289 252 191 10 60 59 10
!\.ge not stated 2 1 1 ""
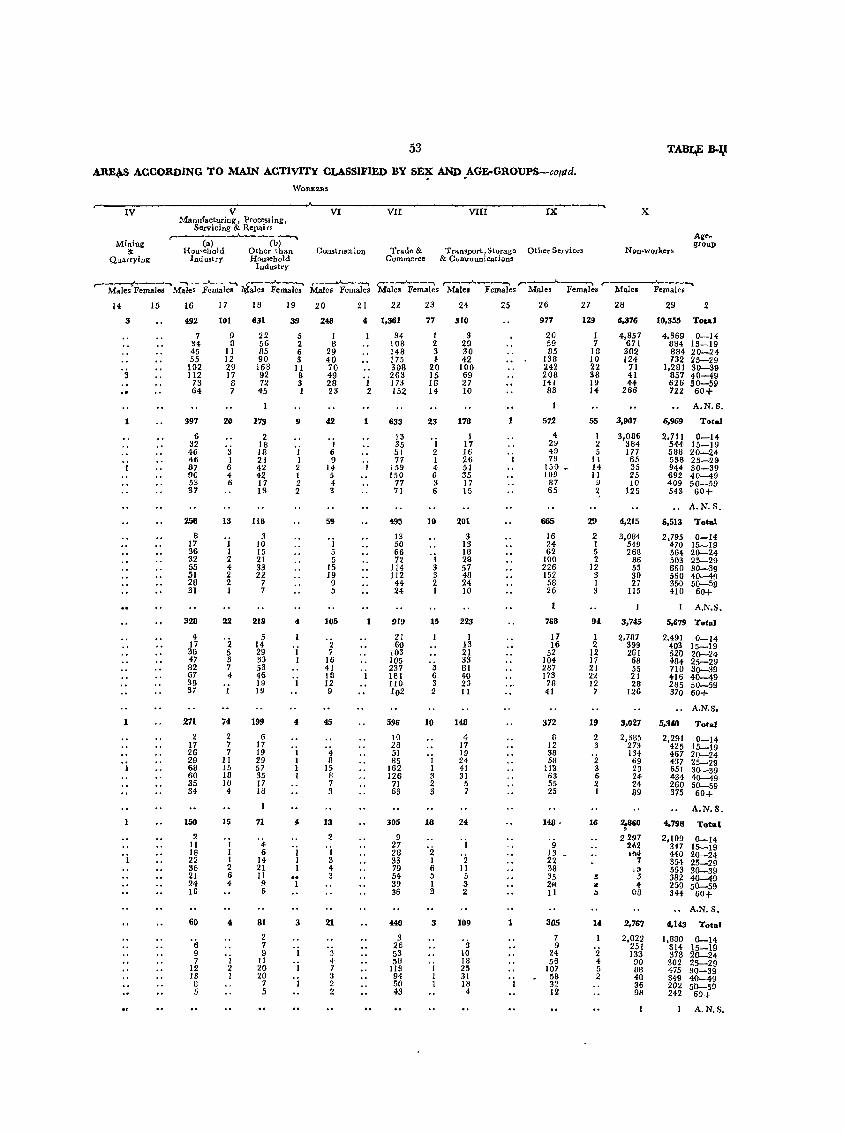
53 TABQ; B-:Q
AREAS ACCORDING TO MAIN ACTIVITY CLASSIFIED BY SEX AND AGE·GROUPS-co/ltd. , . . WORKED.S
r-' -"" IV V VI VII VIn IX X Manufacturing, Processing,
Servicing & Repair.
Mining r-
(a) (b) Aie•
COllstructlon Trauc & Transport, Storago Other Services Non .. workers group
&: Hou,ehold Other than Quarrying Industry H()u,ehold Commorce & Communication:!!
Indu,try
r-.---t-~-..... ~ ,....---->---., ~ .... r-~----..J.--~ .,.....----'----"""\ ,-----.A.~ r-Fem~ Males Females Males Female. ¥ales Female. Males Females Males Females Male. Females Males Females Males
14 15 16 17 18 19 20 21 22 23 24 25 26 27 28 29 2
3 492 101 631 39 248 " 1,361 77 310 977 129 6,376 10,355 Total
7 9 22 5 I 34 I 3 20 1 4,857 4.369 0-14 34 0 56 2 B 108 2 29 59 7 671 8B4 15-19 45 II 85 6 29 148 3 30 8~ [8 302 884 20-24 55 12 90 3 40 [ 75 l 42 [38 10 [24 732 25-29
·s 102 29 16B 1[ 70 308 20 100 242 22 71 1,281 30-39 112 17 92 8 49 263 15 69 208 38 41 857 40-49
73 8 72 3 28 I 173 18 27 141 19 4+ 626 50-59 64 7 45 I 23 2 152 14- 10 83 14 266 722 60+
A.N.S.
397 20 173 9 42 633 23 178 572 55 3.907 6,969 Total
6 2 13 1 4 [ 3,086 2,711 0-14 32 18 I 35 I 17 2V 2 384 544 15-19 46 3 18 I 6 51 2 16 49 5 177 588 20-24 46 I 21 I 9 77 I 26 I 7~ II 65 538 25-29 67 6 42 2 14 159 4 51 150 _ J4 35 944 30-39 90 4 42 1 5 150 6 35 109 II 25 692 40-49 53 6 17 2 4 77 3 17 87 y 10 409 50-59 37 13 2 3 71 6 15 65 ~ 125 543 60+
A.N.S.
258 13 11B 59 495 10 201 Ci65 29 ",215 6,513 Total
8 . j 3 13 3 16 2 3,084 2,795 0-14 17 10 1 50 13 24 I 549 470 15-19 36 1 15 5 66 'i IS 62 5 268 564 20-24 32 2 21 5 72 28 100 2 86 503 25-29 55 4 33 15 114 3 57 226 12 55 860 30-39 51 2 22 19 112 3 48 152 3 30 560 40-49 28 2 1 9 44 2 24 58 I 27 350 50-59 31 I 7 5 24 I 10 26 3 115 410 60+
A.N.S.
328 22 2Ul <I 105 919 15 223 768 9' 3,7£5 5,679 Total
4 '2 5 21 I 17 I 2.7B1 2.491 0-14 11 14 'j 2 60 13 16 2 399 403 15-19 36 5 29 7 103 21 52 12 261 520 20-24 47 3 33 I 16 105 '3 33 104 17 68 484 25-29 82 7 53 41 231 81 281 21 55 710 30-39 67 4 46 18 I 181 6 40 173 22 21 416 40-49 3S 19 I 12 110 3 23 78 12 28 285 5U-59 37 I 19 9 102 2 II 41 7 126 370 60+
A.N.S.
271 74 199 4 45 596 10 148 372 19 3,027 5,340 Total
2 2 6 10 4 B 2 2,385 2,291 0-14 17 7 17 . i '4 28 17 12 3 273 425 15-19 26 7 19 51 19 38 '2 1st 467 20-24
'j 29 II 29 1 B 85 I 24 58 69 437 25-29 68 15 57 1 15 162 1 41 11"3 3 29 651 30-39 60 18 35 I 8 126 3 31 63 6 24 434 40-49 35 10 17 7 71 2 5 55 2 24 260 50-59 34 4 18 3 63 3 7 25 I 89 375 60+
A.N.S.
150 15 71 " 13 305 18 24 148· 16 2,860 4.798 Total , 2 -4 2 9 'j 2297 2,109 0-14
11 1 'j 27 '2 9 24,2 347 15-19 'j 18 1 6 28 '2
13 _ 1M 440 20-24 22 I 14 3 33 I 22 1 354 25-29 36 2 21 4 79 6 II 38 J,D 563 30-39 21 6 II .. 3 54 5 5 35 l! 5 382 40-49 24 4 9 I 39 1 3 2<1 ., 4 259 50-59 16 6 36 3 2 II :> 1)8 344 60+
A.N.S.
60 " 81 3 21 440 3 109 1 305 14 2,767 4,143 Total
'(; 2 3 '3 7 2,022 1,880 0-14 7 26 9 251 314 15-19
9 9 3 53 10 24 2 133 378 20-24 7 I II 4 58 18 56 4 90 302 25-29 12 2 20 7 liS I 25 107 5 88 475 30-39
13 I 20 'j 3 94 I 31 58 2 48 849 40-49 U 7 2 50 1 18 32 36 202 50-59 5 5 2 43 4 12 98 242 60+
A.N.S.
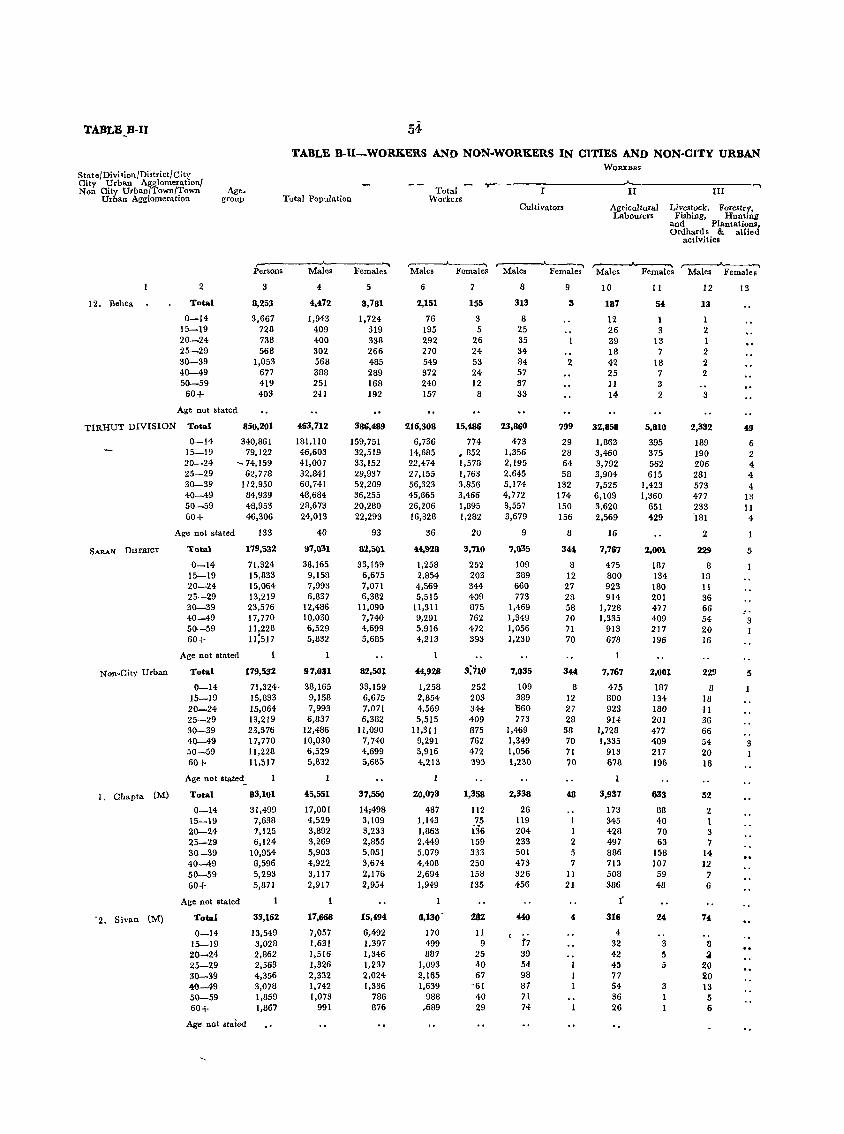
TABLE_B-n 54
TABLE B-I1-WORKERS AND NON-WORKERS IN CITIES AND NON-OJTY URBAN WORl"''''
StatelDivisionlDi.trictlCity City Urban A1glomeration/
Age_ Total ,.....
r III .....
Non CitJi Urban Town/Town II Ur an Agglomeration group Total Population Workers
Cultivators Agricultural Livestock, Forestry, Labourers Fishing, Hunting
and Plantations, Ordhards & allied
activities
,--~ ,---->----~ ,...--"---..... ,...--"---..... Persons Males Females Males Females Males Females Males Females Males Females
2 3 4 5 6 8 9 10 11 12 13
12. Behea Total 8,253 4,472 3,781 2,151 155 313 3 187 54 13
0-14 3,667 1,943 1,724 76 3 8 12 1 1 15-19 728 409 319 195 5 25 26 3 2 20-24 738 400 338 292 26 35 39 13 1 25-29 568 302 266 270 24 34 18 7 2 30-39 1,053 568 485 549 53 84 2 42 18 2 40-49 677 388 289 312 24 57 25 7 2 50-59 419 251 168 240 12 37 11 3 60+ 403 241 192 157 8 33 14 2 3
Age not stated
TIRHUT DIVISION Total 850,201 463,712 386,489 216,308 15,486 23,860 799 32,858 5,810 2,332 49
0-14 340,861 181,110 159,751 6,736 774 473 29 1,863 395 189 6 15-19 79,122 46,603 32,519 14,685 .852 1,356 28 3,460 375 190 2 20-24 -74,159 41,007 33,152 22,474 1,578 2,195 64 3,792 562 206 4 25-29 62,778 32,841 29,937 27,[55 1,763 2,645 58 3,904 615 281 4 30-39 112,950 60,741 52,209 56,323 3,856 5,174 132 7,525 1,423 573 4 40-49 84,939 48,684 36,255 45,865 3,466 4,772 174 6,109 1,360 477 13 50-59 48,953 28,673 20,280 26,206 1,895 3,557 150 3,620 651 233 11 60+ 46,306 24,013 22,293 16,828 1,282 3,679 156 2,569 429 -181 4
Age not stated 133 40 93 36 20 9 8 16 2
SARAN DISTRICT Total 179,532 97,031 82,501 *4,928 3,710 7,035 344 7,767 2,001 229 5
0-14 71,324 38,165 33,159 1,258 252 109 8 475 187 8 15-19 15,833 9,158 6,675 2,854 203 389 12 800 134 18 20-24 15,064 7,993 7,071 4,569 344 660 27 923 180 II 25-29 13,219 6,837 6,382 5,515 409 773 28 914 201 36 30-39 23,576 12,486 I1,090 11,311 875 1,469 58 1,728 4'17 66 40-49 17,770 10,030 7,740 9,291 762 1,349 -70 1,335 409 54 3 50-59 11,228 6,529 4,699 5,916 472 1,056 7I 913 211 20 I 60+ 11;517 5,832 5,685 4,213 393 1,230 70 678 196 16
Age Dot atated
Non-City Urban Total 179,532 97,031 82,501 44,928 3;110 7,035 344 7,767 2,001 229 5
0-14 71,324- 38,165 33,159 1,258 252 109 8 475 187 8 15-19 15,833 9,158 6,675 2,854 203 389 12 800 134 18 20-24 15,064 7,993 7,071 4,569 344 '660 27 923 180 II 25-29 13,219 6,837 6,382 5,515 409 773 28 914 201 36 30-39 23,576 12,486 11,090 11,311 875 1,469 58 1,728 477 66 40-49 17,770 10,030 7,740 9,291 762 1,349 70 1,335 409 54 3 50-59 11,228 6,529 4,699 5,916 472 1,056 71 913 217 20 I 60+ 11,517 5,832 ;',685 4,213 393 1,230 70 678 196 16
Age Dot stated_ I
1. Chapta (M) Total 83,101 45,551 37,550 20,073 1,358 2,338 48 3,937 633 52
0-14 31,499 17,001 14;498 487 1I2 26 173 88 2 15-19 7,638 4,529 3,109 1,143 75 119 I 345 40 1 20-24 7,125 3,892 3,233 1,863 iS6 204 1 428 70 3 25-29 6,124 3,269 2,855 2,449 159 233 2 497 63 7 30-39 10,954 5,903 5,051 5,079 333 501 5 886 158 14 40-49 8,596 4,922 3,674 4,408 250 473 7 713 107 12 50-59 5,293 3,117 2,176 2,694 158 326 l! 508 59 7 60+ 5,871 2,917 2,954 1,949 135 456 21 386 48 6
Age not stated r '2. Sivan (M) Total 33,162 17,668 15,409<1 8,13()- 282 440 4 316 24 74
0-14 13,549 7,057 6,492 170 11 4 15-19 3,028 1,631 1,397 499 9 t7 32 3 8 20--24 2,862 1,516 1,346 887 25 39 42 5 .lI 25-29 2,563 1,326 1,237 1,093 40 54 4~ 5 20 30-g9 4,356 2,332 2,024 2,165 67 98 77 ~O 40-49 3,078 1,742 1,336 1,639 -61 87 54 3 13 50-59 1,859 1,073 786 988 40 71 36 1 5 60+ 1,867 991 876 ,689 29 74 26 6
Age Dot stated
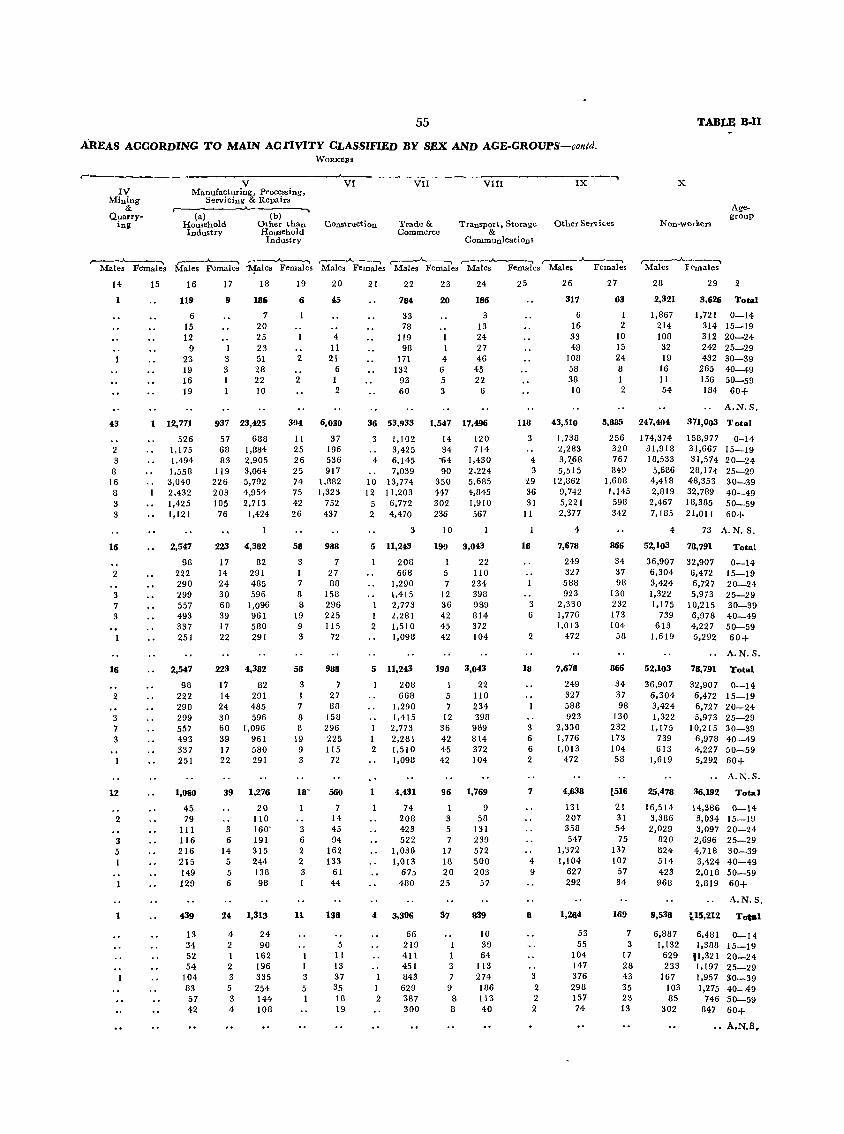
55
AREAS ACCORDING TO MAIN AC rIVlTY CLASSIFIED BY SEX AND AGE-GROUPS-contd. WORKSl"
r----------------------------v---------------~V~I----------V-I-I---------V--II-I------------~IX~---~
IV Min.tg
Quarrying
Manufacturing, Processing, Servicing & Repairs r .A-______ ......
Ca) (b) Household Other than Construction Industry Household
Industry
Trade & Commerce
Transport, Storage &
Communications
Other Serv ices
TABLE B-Il
x
Non-workers
Agegroup
r-"--""'---'"'"""'\ r- -.. ,.-----'--...... .--""--...... .----......__.., ,---....... ---~ f'--........ ---~ ,-__ oA._._ ...... Males Females Males Females 1'1ales Females Males Females Males Females Males Females Males Females Males Females
14
1
43
2 3
3 16 3 3 3
16
2
3 7 3
16
2
3 7 3
2
3 5 1
1
15 16
119
6 15 12
9 23 19 16 19
12,771
526 1,175 1,494 1,558 3,040 2,432 1,425 1,121
2,547
98 222 290 299 557 493 337 251
2,547
98 222 290 299 557 493 337 251
1,060
45 79
III 116 216 215 149 129
439
13 34 52 54
104 83 57 42
17
9
1 3 3 1 1
18
186
7 20 25 23 51 28 22 10
937 23,425
57 68 83
119 226 203 105 76
6B8 1,884 2,905 3,064 5,792 4,954 2,713
1,424
223 4,382
17 14 24 30 60 39 17 22
223
17 14 24 30 60 39 17 22
39
3 6
14 5 5 6
82 291 485 596
1,096 961 580 291
4,332
82 291 485 596
1,096 961 580 291
1,276
20 110 160-191 315 244 138 98
24 1,313
4 2 I 2 3 5 3 4
24 90
162 196 335 254 144 108
19
6
2
2
20
45
4 11 21
6 1 2
304 6,080
11 25 26 25 74 75 42 26
58
3 I 7 8 8
19 9 3
58
3 I 7 8 8
19 9 3
3 6 2 2 3 1
11
1 1 3 5 1
37 196 536 917
1,382 1,323
752 437
988
7 27 88
153 296 225 115
72
988
7 27 83
153 296 225 115
72
560
7 14 45 94
162 133
61 44
138
5 11 13 37 35 18 19
21 22
784
33 78
119 98
171 132
93 60
23
20
4 6 5 3
24
186
3 13 24 27 46
45 22
6
36 53,933 1,547 17,496
3 1,102 3,425
4 6,145 7,039
10 13,774 12 11,203
5 6,772 2 4,470
3
5 11,243
203 668
1,290
I 2
1,415 2,773 2,281 1,510 1,09B
5 11,243
20B 668
1,290 1,415
2,773 I 2,281 2 1,510
. ' 1,093
4,431
74 203 423 522
1,036 1,013
675 480
4 3,306
1 2
66 219 411 451 843 629 387 300
14 34
"64 90
350 447 302 236
10
120 714
1,430 2,224 5,685 4,845 1,910 567
190 3,043
5 7
12 36 42 45 42
190
5 7
12 36 42 45 42
96
3 5 7
17 18 20
25
37
I 1 3 7
9 8 8
22 JlO 234 398 989 814 372 104
3,043
22 110 234 398
989 814 372 104
1,769
9 58
131 239 572 500 203
57
839
10 39 64
Jl3 274 186 113 40
lI8
3
4 3
29 36 31 II
18
3 6
2
18
3 6 6 2
7
4 9
8
3 2 2 2
26
311
6 16 33 48
108 58 38 10
43,510
1,738 2,283 3,7.§8 5,515
12,862 9,74'2 5,221 2,377
4
'1,678
249 327 588 923
2,330 1,776 1,013
472
7,678
249 327 588 923
2,330 1,776 1,013
472
4,638
131 207 358 547
1,372 1,104
627 292
1,264
53 55
104 147 376 29B 157 74
27
63
I 2
10 15 24 8 1 2
28
2,321
1,867 214 108 32 19
16 II 54
29 2
3,626 Total
1,721 314 312 242 432
265 156 184
0-14 15-19 20-24 25-29 30-39 40-49 50-59 60+
A.N.S.
3,885 247,404 371,003 Total
256 320 767 849
1,603 1,145 598 342
866
34 37 93
130 232 173 104
53
866
34 37 98
130 232 173 104 58
[516
21 31 54 75
137 107
57 34
169
7 3
17 28 43 35 23 13
174,374 31,918 18,533
5,686 4,418 2,819
2,467 7,185
158,977 31,667 31,574 28,174 48,353 32,789 18,385 21,011
0-14 15-19 20-24 25-29 30-39 40-49 50-59 60+
4 73 A.N. S.
52,103 78,791
36,907 6,304 3,424 1,322 1,175
739 613
1,619
52,103
36,907 6,304 3,424 1,322 1,175
739 613
1,619
25,478
16,514 3,386 2,029
820 824 514 423 968
32,907 6,472 6,727 5,973
10,215 6,978 4,227 5,292
78,791
32,907 6,472 6,727 5,973
10,215 6,978 4,227 5,292
36,192
14,386 3,034 3,097
2,G96 4,718 3,424 2,018 2,819
Total
0-14 15-19 20-24 25-29 30-39 40-49 50-59 60+
A.N.S.
Total
0-14 15-19 20-24 25-29 30-39 40-49 50-59 60+
A.N.S .
Total
0-14 15-19 20-24 25-29 30-39 40-49 50-59 60+
A.N.S.
9,538 t15,212 To .. l
6,887 1,132
629 233
167 103 85
302
6,481 0-14 1,388 15-19
11,321 20-24 1,197 25-29 1,957 30-39 1,275 40-49
746 50-59 847 60+
•• A.N.S.
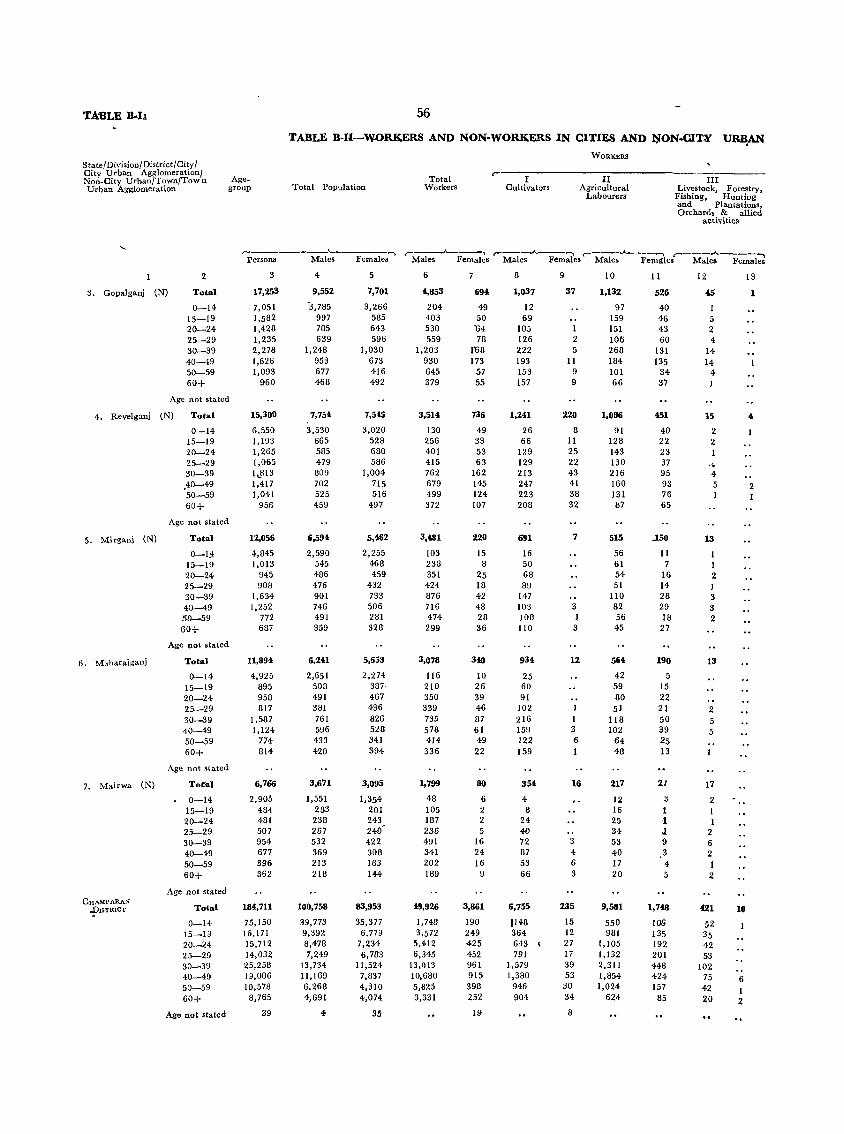
T.tBLE B-b
State/ Division/ District/City/ City Urban Agl,llomerationl Non-City Urban/Town/Tow n Urban Agglomeration
Agegroup
2
~. Gopalganj (N) Total
0-14 15-19 20-24 25-29 30-39 40-49 50-59 60+
Age not stated
4. Reveiganj (N) Total
5. Mirgan.i (N)
7. Mairwa (N)
GHAMPARAN .DlSTRICT
0-14 15-19 20-24 25-29 30-39 .40-49 50-59 60+
Age not stated
Total
0-14 15-19 20-24 25-29 30-39 40-49 50-59 60+
Age not stated
Total
0-14 15-19 20-24 25-29 30-39 40--49 50-59 60+
Age not stated
To£al
0-14 15-19 20-24 25-29 30-39 40--49 50-59 60+
Age not stated
Total
0-14 15-19 20-24 25-29 30-39 40-49 50-59 60+
Age not stated
3
17,253
7,051 1,582 1,428 1,235 2,278 1,626 1,093
960
15,300
6,550 1,193 1,265 1,065 IJ113 1,417 1,041
956
12,056
4,845 1,013
945 90B
1,634 1,252
772 687
11,894
4,925 895 958 817
1,587 1,124
774 814
6,766
2,905 484 481 507 954 677 396 362
184,711
75,150 10,171 15,712 14,032 25,258 19,006 10,578
8,765
39
56
TABLE B-I1-WORKERS AND NON-WORKERS IN CITIES AND ~ON-CIT.¥ U~AN
Total Population
4
9,552
-3,785 997 785 639
1,248 953 677 468
7,7S4
3,530 665 585 479 B09 702 525 459
6,594
2,590 545 486 476 901 746 491 359
6,241
2,651 508 491 381 761 596 433 420
3,671
1,551 283
238 267 532 369 213 218
100,758
39,773 9,392 8,478 7,249
13,734 11,169 6,268 4,691
4
5
7,701
3,266 585 643 596
1,030 673 416 492
7,545
3,020 528 680 586
1,004 715 516
497
5,452
2,255 468 459
432 733 506 281 328
5,653
2,274 387-467 436 826 528 341 394
,3,095
1,354 201 243 240-
422 308 183 144
83,953
35,377 6,779
7,234 6,783
11,524 7,837 4,310 4,074
35
Total Workers
6
4,853
204 403 530 559
1,203 930 645 379
3,514
130 256 401 415 762 679 499 372
3,481
103 238 351 424 876 716 474 299
3,078
116 210 350 339 73~
578 414 336
1,799
48 105 187 236 491 341 202 189
49,926
1,748 3,572
5,412 6,345
13,013 10,680 5,825 3,331
694
49 50
'64 78
1"8 173
57 55
736
49 33 53 63
162 145 124 107
220
15 8
25 18 42 48 28 36
340
10 26 39 46 87 61 49 22
80
6 2 2 5
16 24 16
9
3,861
190 249 425 452 961 915 398 252
19
WORKBRS
~-----I----------~I~I----------------I-I-I--------
Cultivators Agricultural Livestock, Forestry, Labourers Fishing, Hunting
8
1,037
12 69
105 126 222 193 153 157
1,241
26 66
129 129 213 247 223 208
691
16 50 68 89
147 103 108 110
934
25 60 91
102 216 159 122 159
354
4 8
24 40 72 87 53 66
6,755
1148 364 643 I
791 1,579 1,380
946 904
9
37
1 2 5
11 9 9
220
8 11 25 22 43 41 38 32
7
3 1 3
12
1 3 6 1
16
3 4 6 3
235
15 12 27 17 39 53 30 34
8
10
1,132
97 159 151 106 268 184 101 66
1,086
91 128 143 130 216 160 131 b7
515
56 61 54 51
110 82 56 45
564
42 59 80
51 1I8 102
64 48
217
J2 16 25 34 53 40 17 20
9,581
550 981
1,105 1,132 2,311 1,854 1,024
624
11
526
40 46 43 60
131 135
34 37
451
40 22 23 37 95 93 76 65
,.150
11 7
16 14 28 29 J8 27
190
5 15 22 2J 50 39 25 13
21
a 1 1 <1 9
.3 4 5
1,748
106 135 192 201 448 424 157
85
and Plantations, Orchards & allied
activities
12
45
5 2 4
14 14
4 1
15
2 2
." 4 5
13
1 I 2 J 3 3 2
13
2 5 5
17
2 1 1
2 6 2 I ~
421
52 3!) 42 53
102 75 42 20
10
6 1 2
13
1
2 1
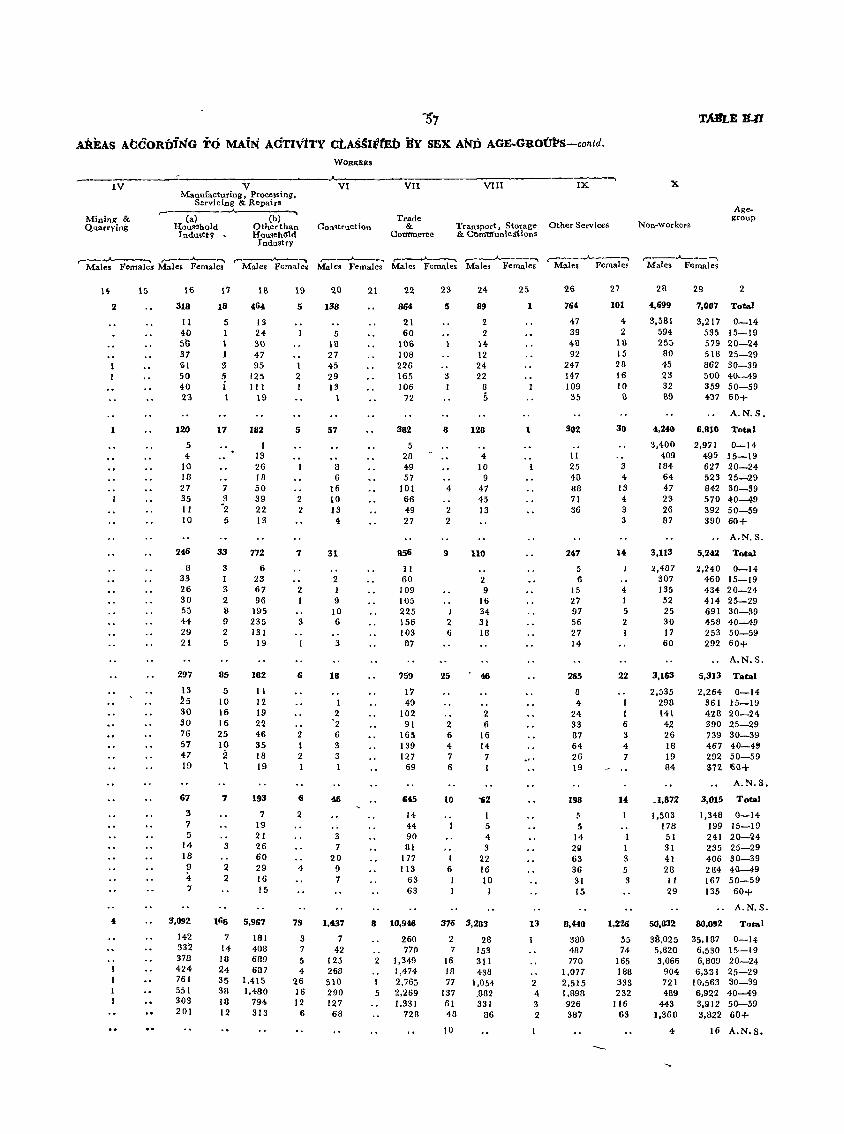
"57
AREAS ACCORDiNG TO MAiN AQTIVITY CLAS§IFfEb BY SEX AND AGE-GBOUPS-contd.
IV
Mining & Qilarrying
V Manufacturing, Proce3sing,
Servicing & Repairs ~----(a-)----·~------(-b-)-~
Household Other than Industt? Hou.eh~Id
Industry
WORKERS
VI
Con~truct ion
VII
Trade &
Contrneree
VIn
Transport, Storage & Ctlm"Trfunlc.rllons
IX
Other Services
X
Non .. workers
TMfLE lUI
Agegroup
r--__.A"......--......." ,....--........._...... r-----..Ao-....... ,-__ .A--__ ~---~ ,---__ .A-___ ~ r--..A.--"""'\ r---..A-.--_-...... Males Females Males Females Males Female. Males Females Male. Female. Males Females Male. Female, Males Females
\4 \5
2
1
\6
318
11 40 56 37 61 50 40 23
120
5 4-
10 10 27 35 II 10
246
8 33 26 30 55 44 29 21
297
13 ~5 30 30 76 57 47 19
67
3 7 5
14 18 9 4 7
3,092
142 332 378 424 761 551 303 201
\7
18
5 1 1 1 3
~ 1 \
17
33
3 1 3 2 8 9 2 5
85
5 10 16 16 25 10 2 'I
7
3
2 2
\8
464
13 24 31\ 47 95
125 III
19
182
I 13 26 18 50 39 22 13
772
6 23 67 96
195 235 131
19
182
11 12 19 22 46 35 18 19
193
7 19 21 26 60 29 16 15
166 5,967
7 101 14 408 18 689 24 6117 35 1,415 38 1,400 18 794 12 313
1.9
5
I 2
5
2 2
7
2 I
3
6
2 1 2 1
6
2
4
79
3 7 5 4
26 16 12
6
20
138
5 \8 27 45 29 13
I
57
8 6
16 10 13 4
31
2 I 9
10 6
3
18
I 2 2 6 3 3
46
3 7
20 9 7
1,437
7 42
125 26B 5\0 290 127 68
21 22
864
21 60
11\6 108 226 165 106
72
382
5 28 49 57
101 66 49 27
856
11 60 109 11\5 225 156 103 S7
759
17 49
102 91
165 139 127
69
645
14 44 90 81
177 113
63 63
8 10,946
260 770
2 1,349 1,474 2,765
5 2,269 1,331
728
23
5
3
8
4
2 2
9
I 2 6
25
2 6 4 7 6
10
I 6
24
89
2 2
14 12 24 22
8 5
128
4 10
9 47 45 13
110
2 9
16 34 31 18
2 6
16 14
7
5 4 3
22 16 10
1
:)76 3,283
2 28 7 153
16 311 III 438 77 1,054
137 .882 61 331 48 86
10
25
1
1
13
2 4 3 2
1
26
764
47 39 48 92
247 147 109
35
302
11 25 48 as 71 36
247
5 6
15 27 97 56 27 14
265
8 4
24-33 87 64 26 19
198
!\ 5
14 2Q 63 36 31 15
8,440
380 487 770
1,077 2,515 1,898 926 387
27
101
4 2
18 15 28 16 10
8
30
3 4
13 4 3 3
14
4 1 5 2 1
22
1 1 6 3 4 7
1 3 5 3
1,226
55 74
165 188 333 232
116 63
28
4,699
3,581 594 255 80 45 23 32 89
4,240
3,400 409
184 64 47 23 26 87
3,113
2,487 307 135 52 25 30 17 60
3,163
2,535 298 141 42 26 18 19 84
_1,872
1,503 178 51 31 41 28 11 29
50,832
311,025 5,820 3,066
904 721 489
443 1,360
4-
29
7,007
3,217 535 579 518 862 500 359 437
2
Total
0-14 15-19 20-24 25-29 30-39 40-49 50-59 60+
A.N.S.
6,810 Total
2,971 495 627 523 842 570 392 390
5,242
2,240 460 434 414 691 458 253 292
5,313
2.264 361 428 390 739 467 292 372
3,015
1,348 199 241 235 4-06 284 167 135
0-14 15-19 20-24 25-29 30-39 40-49 50-59 60+
A.N.S.
Total
0-14 15-19 20-24 25-29 30-39 40-49 50-59 60+
A.N.S.
Tatal
0-14 15-19 20-24-25-29 30-39 40-4~
50-59 M+
A.N.S.
Total
0-14 15-19 20-24 25-29 30-39 40-49 50-59 60+
A.N.S.
80,092 Total
35,107 0-14 6,530 15-19 6,809 20-24 6,331 25-29
10,563 30_39 6,922 40-49 3,912 50-59 3,822 60+
16 A.N.S.
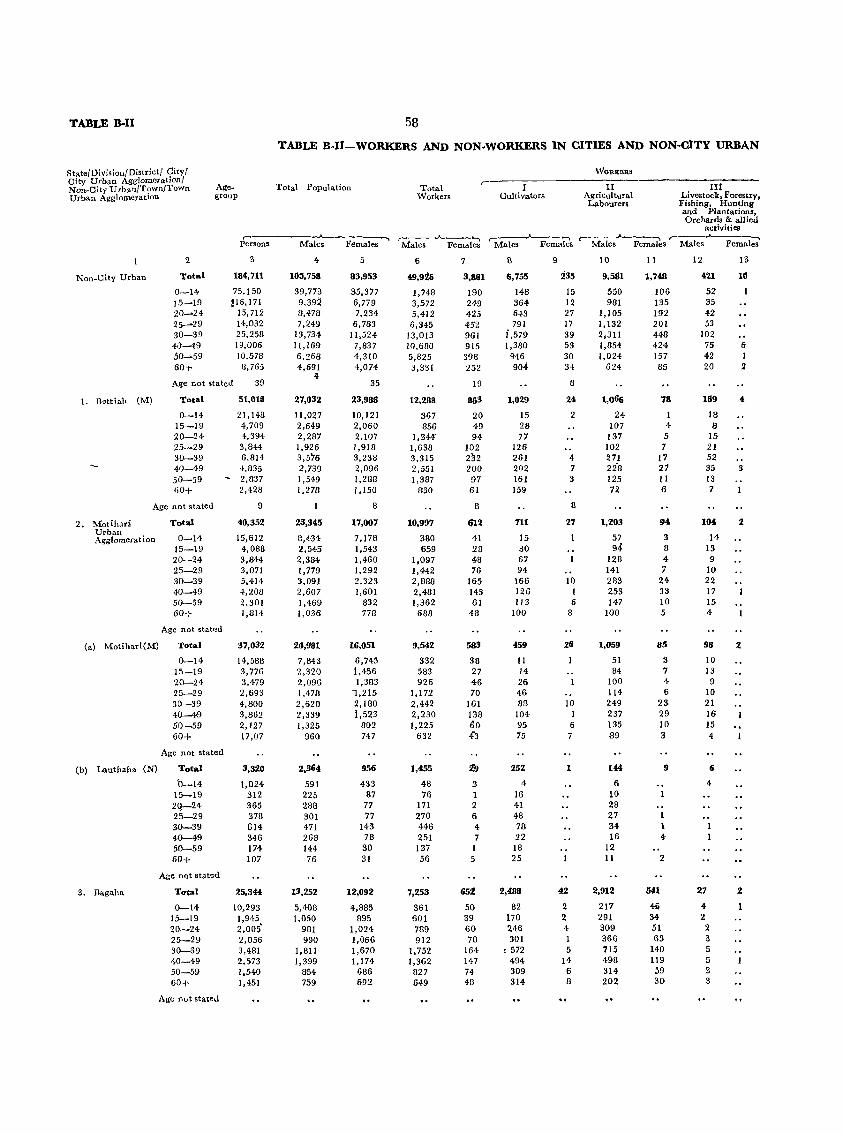
TABLE B·I1 58
TABLE B-I1-WORKERS AND NON.WORKERS IN CITIES AND NON·CITY URBAN
State/Oivisiou/District/ City! WORKERS City Urban Agglomerationl
Age- Total Population ,
r II III Non-City Urban!T?wn!Town Total Urban AgglomeratlOn group Workers Cultivators Agricultural Livestock, Forestry,
Labourers Fishing, Hunting and Plantations, Orchards & allied
activities r-
F~m~ , __ J..--_,"""" ,----"-----. r-~~ ,-__ .A.--....,
Persons Males Males Females Males Females Males Females Males Females
2 :I 4 5 6 7 II 9 10 II 12 1:1
Non-City Urban Total 184,711 101),758 83,953 49,9i& 3,861 6,755 235 9,581 1,748 421 10
0-14 75.150 39,773 35,377 1,748 190 148 15 550 106 52 1 15~19 !16.171 9.392 6,779 3,572 249 364 12 981 135 35 20~24 15,712 8,478 7,234 5,412 425 643 27 1,105 192 42 25~29 14.032 7,249 6.783 6,3+5 452 791 17 1,132 201 53 SO-39 25,258 13,734 11,524 13,013 961 i,579 39 2,311 448 102 40-49 19,006 11.169 7,837 10,680 915 1,380 53 1,854 424 75 6 50~59 10.578 6.268 4,3(0 5,825 398 946 30 1,024 157 42 I 60+ 8.765 4,691 4,074 3,331 252 904 34 624 85 20 2
4 Age not stated 39 35 19 8
1. Bettiah (M) Total 51,018 27,032 23,986 12,288 8&3 1,029 24 1,066 78 169 " 0-14 21.148 11,027 10,121 367 20 15 2 24 18 15-19 4,709 2,649 2,060 856 49 28 107 4 8 20-24 4,394 2,287 2,107 1,344' 94 77 137 5 15 25-29 3.844- 1,926 1,918 1,638 102 126 102 7 21 30-39 6.814 3,576 3,238 3.315 232 261 4 271 17 52 40-49 4.835 2,739 2,096 2,551 200 202 7 ZiB 21 35 3 50-59 - 2,B37 1,549 1,2BB 1,3B7 97 161 3 125 II 13 00+ 2.428 1,278 1,150 830 61 159 72 6 7
Age not stated 9 8 8 8
2. Motihari Total "0,352 23,3"5 17,007 10,997 612 711 27 1,203 94 104 2 Urban
15,612 Agglomeration 0-14 8,434 7,171l 380 41 15 1 57 3 14 15-19 4,088 2,545 1,543 659 28 30 94 8 13 20-24 3,844 2,3B4 1,460 1,097 48 67 128 4 9 25-29 3,071 1,779 1,292 1,442 76 94 141 7 10 30-39 5,414 3,091 2,323 2,888 165 166 10 283 24 22 40-49 4,208 2,607 1.601 2,4Bl 145 125 1 253 33 17 50-59 2,301 1,469 832 1,362 61 1I3 6 147 10 15 60+ 1,814 1,036 778 68B 4B 100 B 100 5 4
Age not stated
(a) Motihari(M) Total 37,032 20,981 16,051 9,5-12 583 "5' 26 1,059 85 98 2
0-14 14,588 7,843 6,745 332 38 11 51 3 10 15-19 3,776 2.320 1,456 583 27 14 84 7 13 20-24- 3,479 2,096 1,383 926 46 26 100 4 9 25-29 2,693 1,478 ',215 1,172 70 46 114 6 10 30-39 4,800 2,620 2,180 2,442 161 88 10 249 23 21 40-49 3,862 2,339 1,523 2,230 138 104 1 237 29 16 50-59 2,127 1.325 802 1,225 60 95 6 135 10 15
60+ 17,07 960 747 632 43 75 7 89 3 4
Age not stated
(b) Lauthaha (N) Total 3,320 2.364 956 1,"55 :$ 252 1 101" 9 6
'0-14 1,024 591 433 48 3 4 6 4 15-19 312 225 87 76 1 16 10 2q~24 365 288 77 171 2 41 28 25-29 378 301 77 270 6 48 27 30-39 614 471 143 446 4 78 34 40-49 346 268 78 251 7 22 16 4-50-59 174 144 30 137 18 12 60+ 107 76 31 56 5 25 II 2
Age not stated
3. Bagaha Total 25,344 13,252 12,092 7,253 652 2,488 42 2,912 541 27 2
0-14 10,293 5,408 4,885 361 50 82 2 217 411 4 15-19 1,945 1,050 895 601 39 170 2 291 34 2 20-24 2,005' 981 1,024 789 60 246 4 309 51 2 25-29 2,056 990 1,066 912 70 301 1 366 63 3 30-39 3,481 1,8I1 1,670 1,752 164 ,572 5 715 140 5 40-49 2.573 1,399 1,174 1,362 147 494 14 498 119 5 50-59 1,540 854 686 827 74 309 6 314 59 3
60+ 1,451 759 692 649 48 314 8 202 30 3
Age not stated
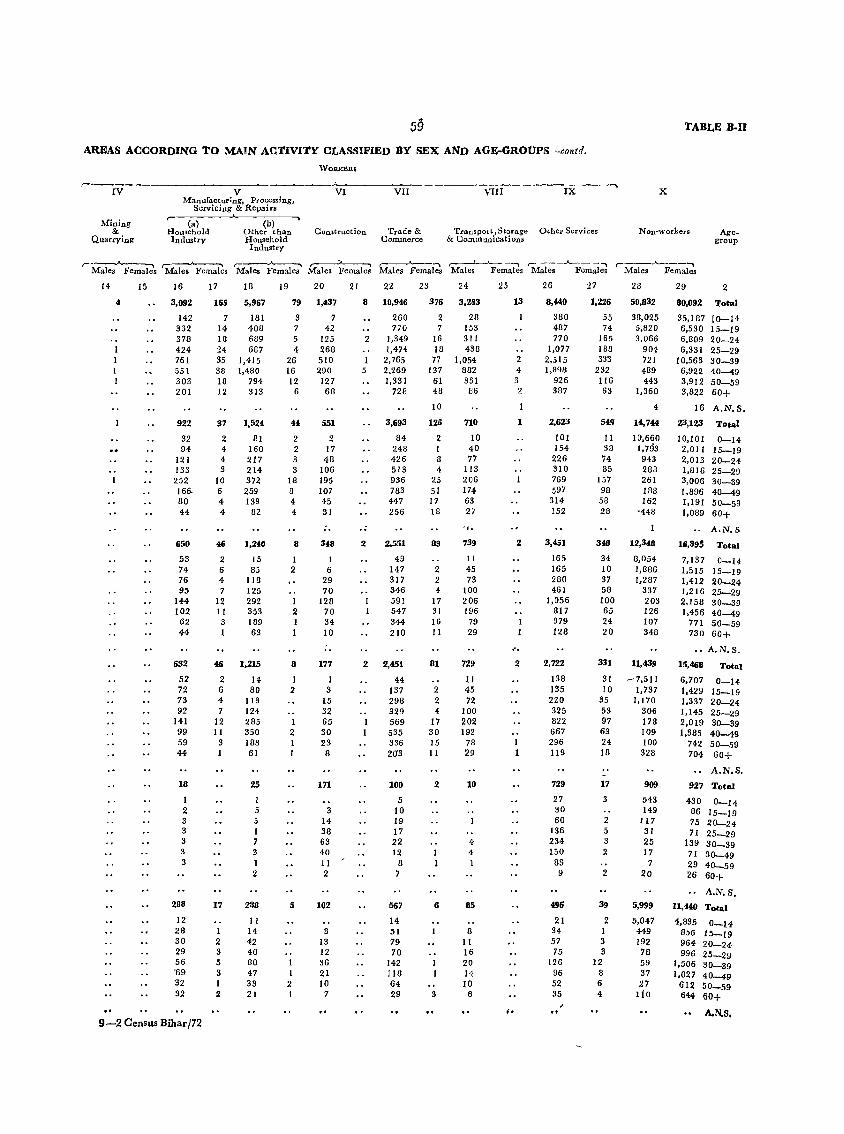
59 AREAS ACCORDING TO MAIN ACTIVITY CLASSIFIED BY SEX AND AGE-GROUPS ~contr!.
,..... IV
Mining &
Quarrying
V Manufa.cturing, Processing,
Servicing & Repairs
r- (a) (b) Ilo l"eho1d Other than Industry Household
Industry
WORKE,..
VI VII
Construction Trade & Commerce
VIII IX
Transport ,Storage Other Services & Commuuications
TABLE B·lI
X
Non-workers Age. group
,--___.,...__---., r- -.. r------...A..----...." ,..--.:...___ ......... r-_'_______~ ,--'__'________--, r--~.A.----., r--~.A..---""'"" Males Females Males Females Males Females Males Female, Males Females Males Females Males Females Males Females
15
" 16
3,092
142 332 378 424 761 551 303 201
922
32 94
121 133 252 166-80 44
650
53 74 76 95
144 102
62 44
632
52 72 73 92
141 99 59 44
18
1 2 3 3 3 3 3
288
12 28 30 29 56 139 32 32
9-2 Census Bihar/72
17 18
165 5,967
7 181 14 408 18 689 24 687 35 1,415 38 1,480 18 794 12 313
37
2 4 4 S
10 6 4 4
46
2 6 4 7
12 II
3 1
1,524
81 160 217 214 372 259 139
112
1,240
15 85
118 125 292 353 189 63
46 1.215
2 6 4 7
12 11
3
17
1 2 3 5 3 1 2
14 80
113 124 285 350 188 61
25
I 5 5 I 7 3 1 2
288
11 14 42 40 80 47 33 21
19
79
3 7 5 4
26 16 12
6
44
2 2 3 3
18 8 4 4
8
1 2
1 2 1 1
8
I 2
1 2 1 1
5
I I
2 I
20
1,437
7 42
125 268 510 290 127 68
551
2 17 48
106 195 107 45 31
346
I 6
29 70
128 70 34 10
177
1 3
15 32 65 30 23 II
171
3 14 38 63 40 11 2
102
3 13 12 36 21 10
7
21
8
2
5
2
22 23
10,946 376
260 2 770 7
1,349 16 1,474 1B
2,765 77 2,269 137 1,331 61
728 48
3,693
84 248 426 513 936 783 447 256
2,551
49 147 317 346 591 547 344 210
10
126
2 I 8 4
25 51 17 18
83
2 2 4
17 31 16 11
2 2,451 81
1 1
44 137 298 329 569 535 336 20'3
100
5 10 19 17 22 12
B 7
567
14 51 79 70
142 118 64 29
2 2 4
17 30 IS 11
2
1 1
6
3
24
3,283
28 153 311 43B
1,054 882 331 86
710
10 40 77
113 206 174 63 27
739
II 45 73
100 206 196
79 29
729
11 45 72
100 202 192
78 29
10
4 4 1
85
8 11 16 20 14 10
6
25
t.
13
2 4
3 2
1
2
2
26
8,440
3BO 4B7 770
1,077 2,515 1,898
926 387
2,623
101 154
226 310 769 597
314 152
3,451
165 165 2BO 461
1,056 817 379 128
2,722
138 135 220 325 B22 667 296 119
729
27 30 60
136 234 150
B3 9
496
21 34 57 75
126 96 52 35
, ..
27
1,226
55 74
165 18B 333
232 116 63
549
11 38 74 85
157 98 58 28
348
34 10 37 58 100 65 24 20
331
31 10
35 53 97 63 24 18
17
2 5 3 2
2
39
2 I 3 3
12 8 6 4
2B
50,832
38,025 5,820 3,066
904 721 489 443
1,360
4
14,744
10,660 l,ni3 943 288 261 188 162
·448
12,348
8,054 1,886 1,287
337 203 126 107 34B
11.439
-7,511 1,737
1,170 306 178 109 100
328
909
543 149
117 31 25 17 7
20
5,999
5,047 449 192 78 59 37 27
1io
29 2
80,092 Total
35,187 (0-14 6,530 15-19 6,899 20-24 6,331 25-29
10,563 30-39 6,922 40-49 3,912 50-59 3,822 60+
16 A.N. S.
23,123
10,101 2,011 2,013 1,816 3,006 1,896 1,191 1,089
Total
0-14 15-19 20-24 25-29 30-39 40-49 50-59 60+
A.N.S
16,39~ Total
7,137 1,515 1,412 1,216 2,158 1,456
771 730
0-14 15_19 20-24 25-29 30-39 40-49 50-59 60+
.• A.N.S.
15,468 Total
6,707 1,429 1,337 1,145 2,019 1,385
742 704
0-14 15-19 20-24 25-29 30-39 40-49 50-59 60+
A.N.S.
927 Total
430 0-14 86 15-19 75 20-24 71 25-29
139 30-39 71 30-49 29 40-59 26 60+
A.N.S.
11,440 Total
4,835 0-14 856 15-19 964 20-24 996 25-29
1,506 30-39 1,027 40-49
612 50_59 644 60+
A.N.S.

TABLE B_1 6Q
TABLE B-II-·-WORKERS AND NON-WORKERS IN C1TIES AND NON·CI TY URBAN
WORKERS
State/Division/District/Cityf Age_ TOlal
,.... II.A-----m----, CilY Urban Agglomeration!
Non-City Urban/Tow;>/Town group Town Population Workers Urban Agglomeratlon Cultivators Agricultural Livestock, Forestry,
Labourers Fishing, Hunting & Plantations"
Orchards & allied activities
.A..----r-~ ,. __ .A--"'_ r"
;persons Males Females Males Females ,.----.A.--....., Males Females
,.--_'______' Males Females
r----'---~ Males Females
2 3 4 5 6 7 8 9 10 II 12 13
4. Narkatiaganj Total 16,041 9,080 6,961 4,967 235 304 5 817 141 33 1
0-14- 6,577 3,509 3,068 159 5 I 58 I 6 15-19 1,264 766 498 332 lJ 12 109 5 2 20-24 1,234 650 584 523 31 26 liZ 22 2 25-29 1,213 642 571 603 21 39 103 13 8 30-39 2,406 1,369 1,037 1,347 60 YO I 177 39 5 40-49 1,888 1,284 604 1,267 74 73 I 140 46 3 50-59 860 546 314 525 20 42 78 10 3 60+ 596 314- 282 211 15 41 3 40 5 4-
Age not stated 3 3
i. Ramnaiar Total 12,579 6,830 5,749 3,573 640 415 109 1,132 450 31 1
0-14 5,095 2,690 2,405 116 51 9 10 71 40 3 15-19 963 509 454 245 71 21 10 109 58 3 20-24 991 499 492 375 7g 41 21 131 54 1 25-29 988 486 502 435 82' 46 16 127 56 4 30-39 1,874 1,067 807 1,005 158 110 18 303 118 8 40-49 -1,414 846 568 799 126 ' 97 17 242 84 5 50-59 715 446 269 405 45 45 9 107 26 6 60+ 539 287 252 193 28 46 8 42 14
Age not stated
•• Chanp .. ti .. (N) Total 12,189 6,517 5,672 3,338 311 848 10 632 208 18
0-14 5,012 2,681 2,331 101 9 20 27 6 3 15-19 948 550 398 263 It' 52 65 14 2 20-24 946 492 454 372 41 92 76 32 3 25-29 874 411 463 381 39 97 84 32 2 30-39 1,668 869 799 829 73 186 I 140 55 2 40-49 1,332 732 600 710 75 180 2 138 45 6 50-59 168 452 316 431 38 120 3 62 12 60+ 639 330 309 251 21 101 4 40 12
Age not stated 2 2 . 7.5ullauli Total 12,15~ 6,494 5,660 3,272 303 620 14 1,149 203 31
0-14 5,210 2.7!l8 2,422 147 9 5 69 8 3 15-19 964 559 405 313 15 41 142 10 4 20-24 898 462 436 352 25 66 134 22 9
25-29 861 431 430 383 29 54 135 ·22 4 30-39 1,559 B06 753 774 62 140 255 4B 4 40-49 1,300 696 G04 671 92 136 8 216 57 4 50-59 721 419 302 393 45 97 3 113 25 2 60+ 631 333 29B 239 16 81 2 85 11 1
Age not stated 10 10 10
3. R .. ""ul Bazar (N) TDtal 12,064 6,566 5,498 3,468 221 314 4 626 33 6
0-14 4,969 2,605 2,364 101 2 I 25 2 1
15-19 1,005 599 406 269 20 10 63 2 I 20-24 1,144 575 569 477 "47 28 71 2 I 25-29 912 466 446 445 ""31 31 69 I I 30-39 1,670 938 732 908 "41 69 154 7 2 40-49 1,154 682 472 663 51> 64 3 131 13 50-59 647 398 249 370 17 52 73 4 60+ 550 300 250 235 13 59 40 2
Age not state'! 13 3 10
9. Chaltia Total 2,970 1,642 1,328 770 24 26 44 2
0-14 1,234 631 603 16 3 2
15-19 285 165 120 34 3 I
20-24 256 ilia 108 83 ,'S 7 25-29 213 118 95 106 '2 5 30-39 372 i07 165 195 "6 5 13 2 40_49 302 184 118 176 6 8 8
.50-59 189 135 54 125 I 7 5
60+ 117 54 63 35 2 3 S
loge not stated 2 2
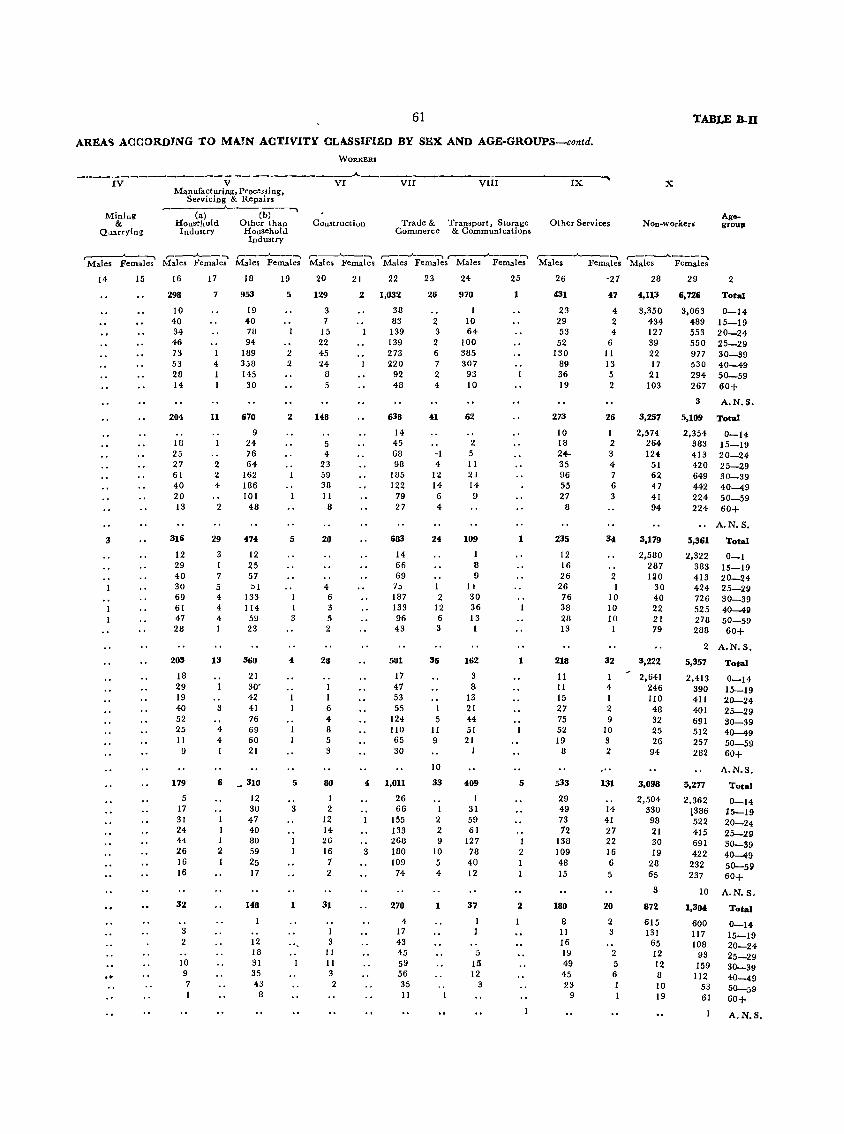
61
AREA'i ACCORDING TO MAJN ACTIVITY CLASSIFIED BY SEX AND AGE-GROUPS-contd.
WORKERS _. __________________________ A.
N V ~
~{ining &
Q,J:lrrylng
Manufacturin.g, Peoce.Bing, Servicing & Repairs
Ca) Household Industry
Cb) Other than Household Industry
Coustruction
VII VIII
Trade & Transport, Storage Commerce & Communications
IX
Other Services
TABLE B-D
X
N on~workerl Age_ grou,
,-__ ..........___~ ,-_ _.___,_ ~ ,--__ _,.___._. ,-___.__........ ,-__ J-_..., ,.... ___ ..A---_..., , __ ~ __ "'""" ,.-___ ....... ___ -, Males Females Males Females Males Females Males :Females Males Females Males Females Males Females Males Females
15
3
.,
16
298
10 40 34 46 73 53 28 14
204
18 25 27 61 40 20 13
316
12 29 40 30 69 61 41 28
203
18 29 19 40 52 25 II
9
179
5 17 31 24 44 26 16 16
32
3 2
10 9 7
17
7
4 1
11
2 2 4
2
29
3 1 1 5 4 4 4 I
3
4 4 1
18
953
19 40 711 94
189 358 145 30
670
9 21 76 64
162 186 101
48
474
12 25 51 51
133 114 59 23
360
21 30' 42 41 76 69 60 21
6 _ 310
12 30 47 40
1 80 2 59
25 11
148
12 18 31 35 43
8
19
5
2 2
2
5
3
4
5
3
1
",
20
129
3 7
15 22 45 24
8 5
148
5 4
23 59 38 II
8
20
4 6 3 5 2
28
I I 6 4 8 5 3
80
1 2
12 14 26 16 7 2
31
I 3
11 II 3 2
21 22
2 1,032
38 83 139 139 273 220
92 48
638
14 45 68 98
1U5 122
79 21
683
14 66 69
75 187 133 96 43
501
11 47 53 55
124 110 65 30
4 1,011
26 66
155 133 260
3 180 109 74
210
4 17 43 45 59 56 35 II
23
26
2 3 2 6 7 2 4
41
-I 4
12 14 6 4
24
1 2
12 6 3
5 11 9
10
33
1 2 2 9
10 5 4
1
24
970
I 10 64
100 385 307
93 10
62
2 5 11 21 14 9
109
1 8 9
11 30 36 13
162
3 8
13 21 44 51 21
1
409
1 31 59 61
127 78 40 12
37
1 I
5 15 12
3
25
1
1
5
1 2 1
2
26
431
23 29 53
52 130
89 36 19
273
10 18 24-35 96 55 27
8
235
12 16 26
26 76 38 28 13
218
11 11 15 27 75 52 19
8
533
29 49 73 12
138 109 48 15
180
8 11 16 19 49 45 23
9
-27
47
4 2 4
6 11 13 5 2
25
1 2 3 4 7 6 3
34
2 1
10 10 10 1
32
1 4 1 2 9
10 3 2
131
14 41 27 22 16 6 5
20
2 3
2 5 6
28
4,113
3,350 434 127 39 22 17
21 103
3,257
2,574 264 124
51 62 47 41 94
3,179
2,580 287 120
30 40 22 21 79
3,222
2,641 246 110 48 32 25 26
94
3,098
2,504 330 98 21 30 19
28 65
29
6,726
3,063 489 553 550 977 530 294 267
2
Total
0-14 15-19 20-24 25-29 30-39 40-49 50-59 60+
3 A.N.S.
5,109 Total
2,354 0-14 383 15-19 413 20-24 420 25-29 649 30-39 442 40-49 224 50-59 224 60+
A.N.S.
5,361 Total
2,322 0-1 383 15-19 413 20-24 424 25-29 726 30-39 525 40-411 218 50-59 288 60+
2 A.N.S.
5,357
2,413 390 411 401 691 512 257 282
5,277
2.362 L386 522 415 691 422
232 237
Total
0-14 15-19 20-24 25-29 30-39 40-49 50-59 60+
A.N.S.
Total
0-14 J5-19 20-24 25-29 30-39 40-49 50-59 60+
3 10 A.N. S.
872
615 131
65 12 12 8 10 19
1,304
600 117 108
93 159
112 53 61
Total
0-14 15-19 20-24 25-29 30-39 40-49 50-59 60+
A.N.S.
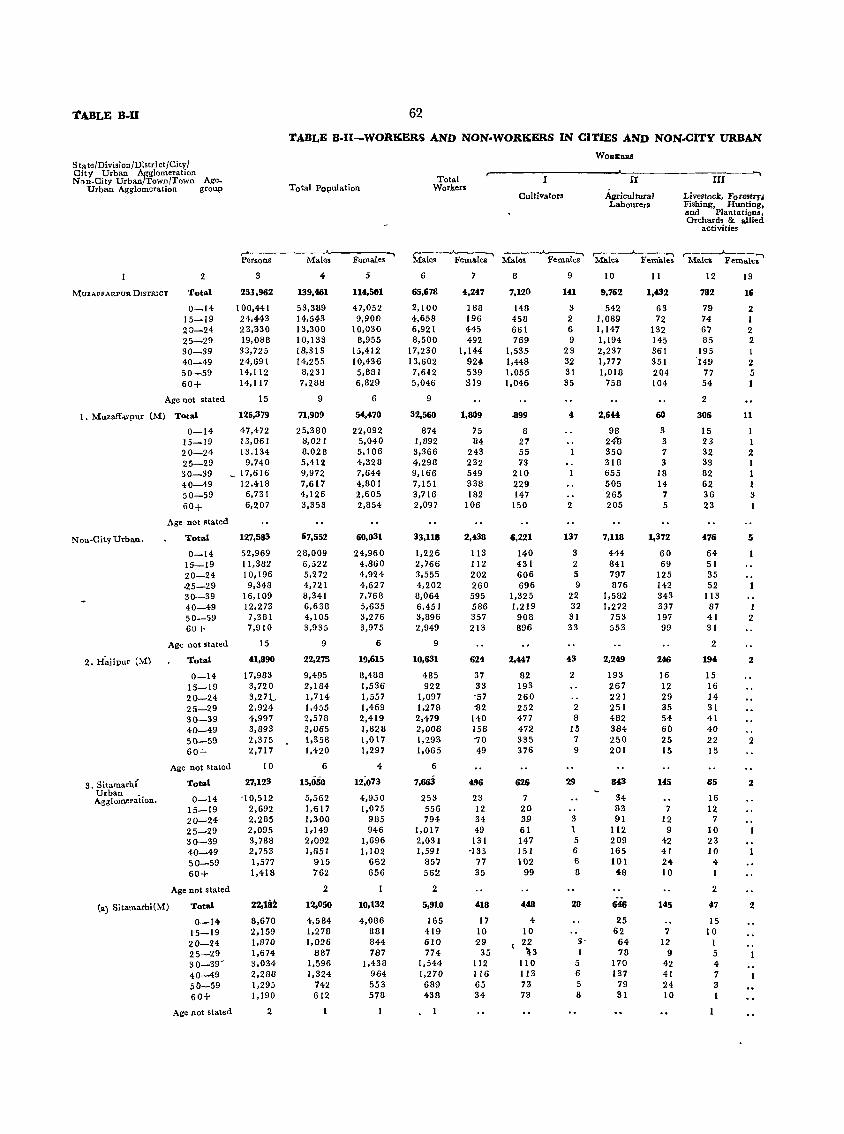
'tABLE B-U 62
TABLE B-II-WORKERS AND NON-WORKERS IN CITIES AND NON-CITY URBAN
WOBEERS State/Di"ision/District/City/ City Urban Agglomeration
Total r-
I II III Non-City Urban/Town/Town Age_ Urban Agglomeration group Total Population Workers
Cultivators Agricultural Livestock. Forestry, Labourers Fishing. Hunting.
and Plantations, Orchard. & allied
activities
r'" ---"- -. ,--____.________, ~--"------, ,--__ ..A.-----, ,-__ J.-__ ---,
Persons Males Females Males Females Males Females Male. Fern"l ... Males Females
2 S 4 5 6 7 8 9 10 11 12 13
MazAFFARPUIl DISTRICT Total 253.962 139.461 114.501 65.678 4.247 7.120 141 9,762 1.432 782 16
0_14 100,441 53.389 47.052 2,100 188 148 3 542 63 79 2 15-19 24.443 14,543 9,900 4.658 196 458 2 1,089 72 74 1 :;:::1-24 23.330 13.300 10,030 6,921 445 661 6 1.147 132 67 2 25-29 19,088 10.133 8,955 8,500 492 769 9 1.194 145 85 2 30-39 33,725 18,313 15,412 17,230 1,144 1,535 23 2,237 361 195 1 40-49 24,691 14,255 10,436 13,602 924 1,448 32 i,77' 351 149 2 50-59 14,112 8,231 5,881 7,6'12 539 1,055 31 1,018 204 77 5 60+ 14,117 7,288 6,829 5,046 319 1,046 35 758 104 54 1
Age not stated 15 9 6 9 2
1. Muzaff~rpur (M) Total 12&,379 71,909 54,470 32,560 1,809 .899 4 2.6" 60 306 11
0-14 47,472 25,380 22,092 874 75 8 98 3 15 1 15-19 13,061 8,021 5,040 1,892 "84 27 248 3 23 1 20-24 13,134 8,028 5,106 3,366 243 55 350 7 32 2 25-29 9,740 5,412 4,328 4.298 232 73 318 3 33 30-39 _ 17,616 9,972 7,644 9,166 549 210 655 18 82 40-49 12,418 7,617 4,801 7,151 338 229 505 14 62 50-59 6,731 4,126 2,605 3,716 182 147 265 7 36 3
60+ 6,207 3,353 2,854 2,097 106 150 2 205 5 23 1
Age not stated
Non-City Urban. Total 127,583 67,552 60,031 33,118 2,<1,38 6.221 137 7,118 1.372 476 5
0-14 52,969 28,009 24,960 1,226 113 140 3 444 60 64 15-19 11,382 6,522 4,860 2,766 112 431 2 841 69 51 20-24 10,196 5,272 4,924 3,555 202 606 5 797 125 35 ·25-29 9,348 4,721 4,627 4,202 260 696 9 876 142 52 30-39 16,109 8,341 7,768 8,064 595 1,325 22 1,582 343 113 40-49 12,273 6,638 5,635 6.451 586 1,219 32 1,272 337 87 I 50-59 7,381 4,105 3.276 3,896 357 908 31 753 197 41 2 60+ 7,910 3,935 3,975 2,949 213 896 33 553 99 31
Age not stated 15 9 6 9 2
2. H;'jipur (M) Total 41,890 22,275 19,615 10,631 624 2,"7 43 2,249 246 19;1 2
0-14 17,983 9,495 8,488 485 37 82 2 193 16 15 15-[9 3,720 2,184 1,536 922 33 193 267 [2 16 20-24 3,27 !_ 1,714 1,557 1,097 ·57 260 221 29 14 25-29 2,924 1,455 1,469 1,278 132 252 2 251 35 31 30-39 4,997 2,578 2,419 2,479 140 477 8 482 54 41 40-49 3,893 2,065 1,828 2,006 156 472 15 384 60 40 50-59 2,375 \,358 1,017 1,293 -'10 335 7 250 25 22 2 60+ 2,717 1,420 1,297 1,065 49 376 9 201 15 15
Age not stated 10 6 4 6
3. Sitamarhl Total 27,123 15,050 12;073 7,663 496 626 29 843 145 85 2 Urban _.
0-14 -10,512 5,562 4,950 253 23 7 34 16 Agglomeratlon. 15-19 2,692 1,617 1,075 556 [2 20 83 7 12 20-24 2,285 1,300 985 794 34 39 3 91 12 7 25-29 2,095 1,149 946 1,017 49 61 1 112 9 10 30-39 3,788 2.092 1,696 2,031 131 147 5 209 42 23 40-49 2,753 1,651 1,102 1,591 -135 151 6 165 41 10 50-59 1,577 915 662 857 77 102 6 101 24 4
60+ 1,418 762 656 562 35 99 8 48 10 1
Age not stated 2 2 2
(a) Sitamarhi(M) Total 22,182 12,050 10,132 5,910 ;l18 ;l48 28 646 145 47 2
0-14 8,670 4,584 4,086 165 17 4 25 15 15-19 2,159 1.278 881 419 10 10 62 7 10 20-24 1,870 1,026 844 610 29 22 3· 64 12 I 25-29 1,674 887 787 774 35 ~3 1 78 9 5 30-39' 3,034 1,596 1,438 1,544 112 110 5 170 42 4 40-49 2,288 1,324- 964 1,270 116 113 6 137 41 7 50-59 1,295 742 553 689 65 73 5 79 24 3 60+ 1,190 612 578 438 34 73 8 31 10 1
Age not stated 2
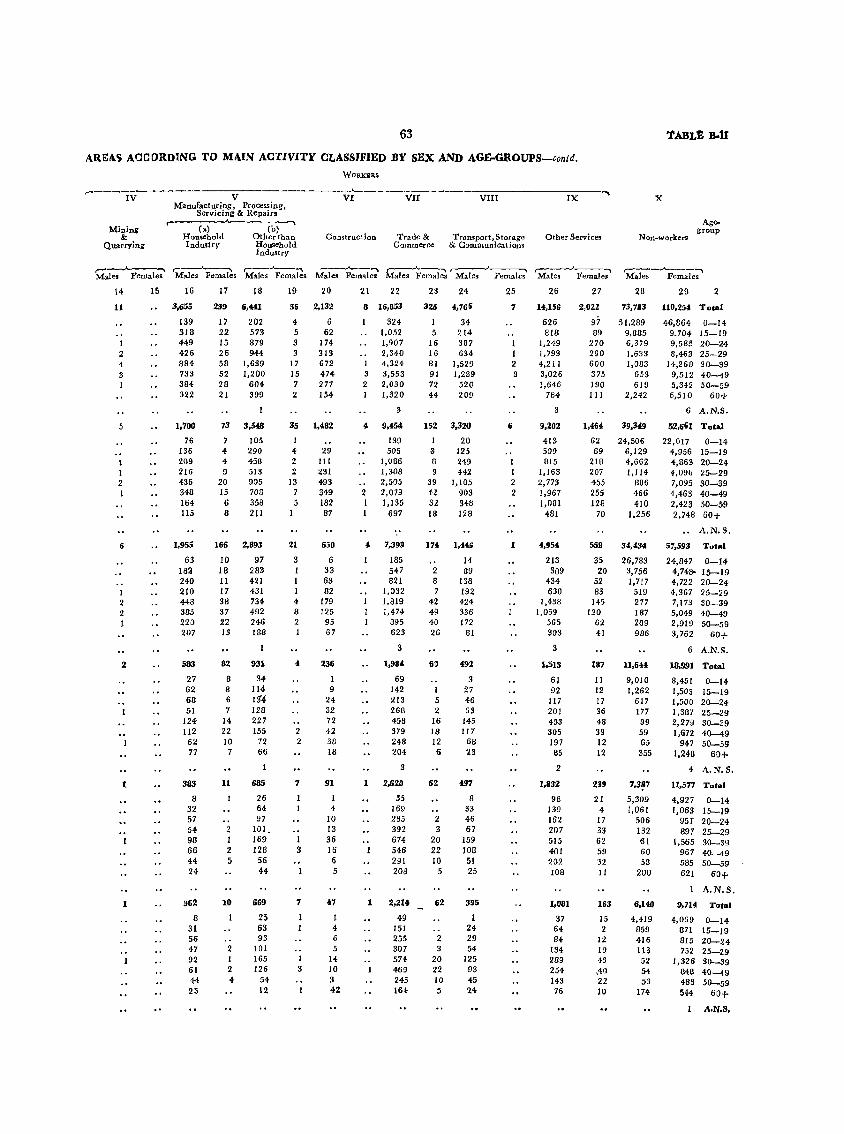
63
ARE,\t; ACCORD1NG TO MAIN AOTIVITY CLASSJFIED BY SEX AND AGE-GROUPS-contd.
IV
Minilli &
Quarryioll:
..----'--..... Males Females
14
11
2 4 3 I
5
I 2 I
6
I 2 2 1
2
1
1
15
WORKsas
V Manufacturing, Processing,
Servicing & Repairs
'------~V~I~------~V=II~--------~V=I~II~--------~I=X~--~
r'---------~----------~ (a) (b) Household Other than COD.!iltructioD. Trade &
Commerce Transport, Storage
& Communications Industry Household Industry
Males Femaks
16 17
,----'---Male, Females
18 19
Males
20
3,655
139 318 449 426 884 733 384 322
239 6,"1 S6 2,132
1,700
76 136 209 216 436 348 164 115
1,955
63 182 240 210 448 385 220 207
583
27 62 68 51
124 lI2
62 77
383
8 32 57 54 98 66 44 24
362
8 31 56 47 92 61 44 23
17 22 15 26 58 52 28 21
73
7 4 4 9
20 15
6 8
202 573 879 944
1,639 1,200
604 399
3,548
105 290 456 513 905 708 358 211
166 2,893
10 18 11 17 38 31 22 13
81
8 8 6
H 22 10
7
11
2 1 2 5
10
2 1 2 4
97 283 421 431 734 492 246 188
931
34 114 1!f4 128 227 155
72 66
685
26 64 97
101. 169 128
56 44
669
25 63 93
101 165 126
54 12
4 5 3 3
17 15 7 2
35
I 4 2 2
13 7 5
1
21
3 1 1 1 4 8 2
4
2 2
7
7
I 3
6 62
174 313 672 474 277 154
1,482
29 III 231 493 349 182 87
650
6 33 63 82
119 125 95 67
136
9 24 32 72 42 38 18
91
I 4
10 13 36 16 6 5
47
1 4 6 5
14 10 3 42
21 22
8 16,853
2 1
2 1 1
324 1,052 1,907 2,340 4,324 3,553 2,030 1,320
3
9,45£
139 505
1,066 1,308 2,505 2,079 1,135
697
" 7,399
1
185 547 821
1,032 1,819 1,474
895 623
3
1,934
69 142 213 268 458 379 248 204
S
2,620
55 169 285 392 674 546 291 208
2,214
49 151 255 307 574 469 245 164
23 24
326 4,166
34 5 214
16 387 16 634 81 1,529 91 1,239 72 520 44 209
152 3,320
20 a 125 3 249 9 442
39 1,105 42 903 32 348 18 128
17<& 1,"6
2 8 7
42 49 40 26
61)
5 2
16 18 12 6
62
2 3
20 22 10
5
62
2 3
20 22 10 5
14 89
138 192 424 336 172
81
492
3 27 46 63
145 111
63 23
497
6 33 46 61
159 108 51 25
395
1 24 29 54
125 93 45 24
Femal~ 25
7
1 1 2 3
6
I 2 2
1
Other Services
,---,..,____.." Males Females
26
a,us 626 818
1,249 1,793 4,211 3,026 1,646
784
3
9,202
413 509 615
1,163 2,773 1,967 1,081
481
4,954
213 309
434 630
1,438 1,059
565 303
1,513
61 92
117 201 453 305 191 65
2
1,832
98 139 162 207 515 401 202 108
1,081
37 64 84
134 289 254 143 76
27
2,022
97 89
270 290 600 375 190 111
1,464
62 69
218 207 455 255 128
70
558
35 20
52 83
145 120
62 41
187
11 12 17 36 48 39 12 12
239
21 4
17 33 62 59 32 11
163
15 2
12 19 43 ,40 22 10
x
Non-workers
Agegroup
,----....... ----, Males Females
28 29 2
73,783 110,25<& Total
51,289 9,885 6,379 1,633 1,083
653 619
2,242
39,349
24,506 6,129 4,662 J,I14
806 466 410
1.256
34,43'
26,783 3,756 1,717
519 277 187 209 986
11,644
9,010 1,262
617 177 99 59 65
355
7,3~7
5,309 1,061
506 J32 61 60 58
200
6,140
4,419 859 416 113 52 54 53
174
46,864 0-14 9.704 15-19 9,585 20-24 8,463 25-29
14,268 30-39 9,512 40---49 5,342 50-59 6,510 60+
6 A.N.S.
52,661 Total
22,017 0-14 4,956 15-19 4,863 20-24 4,096 25-29 7,095 30-39 4,463 40-49 2,423 50-59 2.748 60+
A.N.S.
57,593 Total
24.847 0-14 4,748- 15-19 4,722 20-24 4,367 25-29 7,173 30-39 5,049 40-49 2,919 50-59 3,762 60+
6 A.N.S.
18,991 Total
8,451 0-14 1.503 15-19 1,500 20-24 1,387 25-29 2,279 30-39 1,672 40-49
947 50-59 1,248 60+
4 A.N.S.
11,577 Total
4,927 0-14 1,063 15-19
95f 20-24 897 25-29
1,565 30-39 967 40-49 585 50-59 621 60+
A.N.S.
9,714 Total
4,069 0-14 871 15-19 815 20-24 752 25-29
1,326 30-39 348 40---49 488 50-59 544 60+
A.N.S.
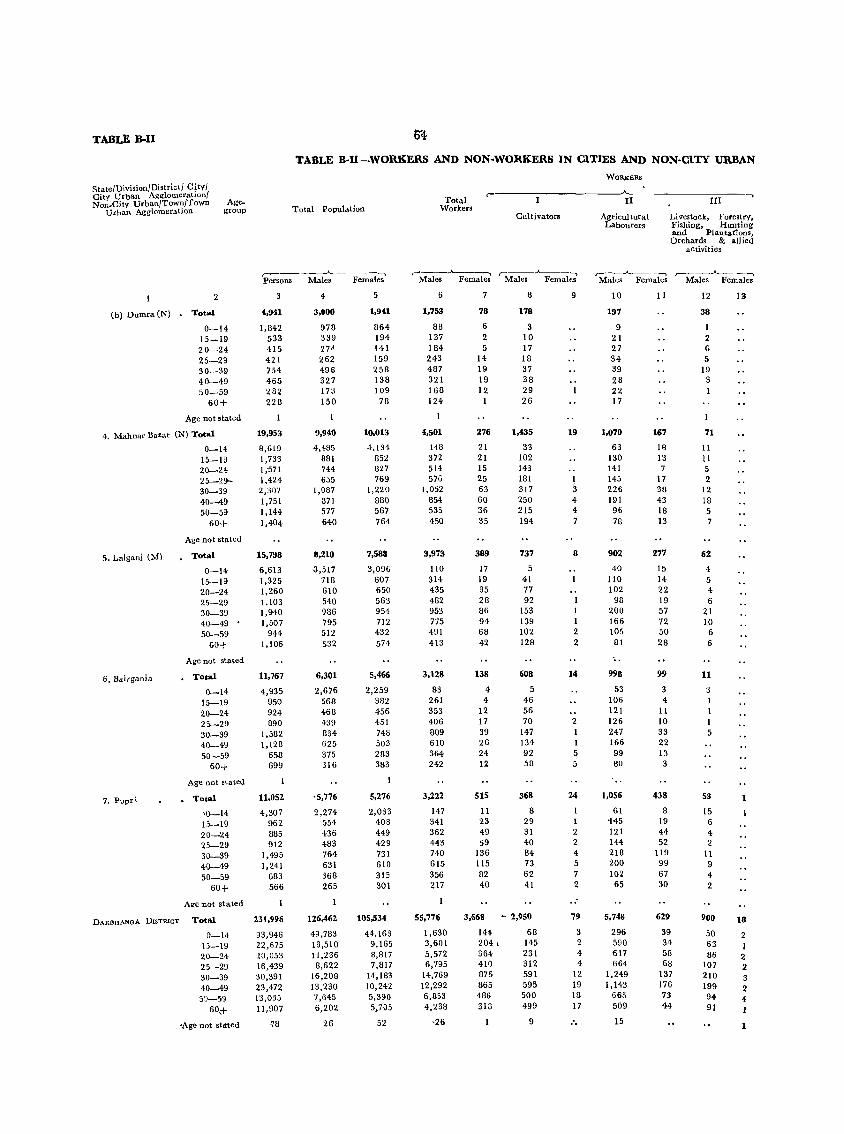
TABL:t B·II
State/Di'lision/District/ City/ City Urban AgglomeratlOnl Non-City Urban/Town/Town
Urban Agglomeration Age
group
(b) Dumra (N)
2
Total
0-14 15-19 20-24 25-29 30-39 40-49 50-59
60+
Age not stated
4. Mahnar Bazar (N) Total
0-14 15-19 20-24 25-29-30-39 40--49 50-59
5. Lalganj (M)
6. Bairgania
7. Pupri
DARnnANGA DISTRICT
60+
Age not stated
Total
0-14 15-19 20-24 25-29 30-39 40-49 50-59
GO+
Age not stated
Total
0-14 15-19 20-24 25-29 30-39 40-49 50-59
60+
Age not staled
Total
'0-14 15-19 20-24 25-29 30-39 40--49 50-59
60+
Age not stated
Total
0_14 15-19 20-24 25-29 30-39 40--49 53-59
60,+
'Age not st!!ted
04
TABLE B·II-WORKERS AND NON·WORKERS IN CITIES AND NON·CITY URBAN
Total Population
,-------'-----.. Persons Males Females
3
~,941
I,B42 533 415 421 754 465 2B2 228
19,953
B,619 1,733 1;571 1,424 2,307 1,751 1,144 1,404
15,798
6,613 1,325 1,260 1.103 1,940 1,507
944 1,106
11,767
4,935 950 924 890
1,582 1,128
658 699
11.052
4,307 962 BB5 912
1.495 1,241
6B3 566
231,996
93,946 22,675 20,053 16,439 30,391 23,472 13,035 11,907
'18
4
3,000
97B 339 274 262 496 327 173 150
9,940
4,185 881 744 655
1,087 371 577 640
8,210
-3,517 71B 610 540 9B6 795 512 532
6,301
2,676 568 468 439 334 625 375 316
-5,776
2,274 554 436 483 764 631 36B 265
126,462
49.7B3 13,510 11,236 B,622
16,208 13,230 7,645 6,202
26
5
1,94.1
864 194 141 159 258 13B 109 78
10.013
4,134 B52 827 769
1,220 8BO 567 764
7,588
3,096 607 650 563 954 712 432 574
5,466
2,259 382 456 451 748 503 2B3 383
5,276
2,033 408 449 429 731 610 315 301
105,534
44,163 9,165 8,B17 7,B17
14,183 10,242 5,390 5,705
52
WORJ<;ERS
Total Workers
~------~----'---------~I7I-------------I~II~--'~
Cultivators
r----"'---......., ,... ___ .A--_-, Males Females Males Females
6
1,753
BS 137 184 243 487 321 168 124
4,501
148 372 514 576
1,052 854 535 450
3,973
110 314 435 4B2 953 775 491 413
3,128
83 261 353 406 809 610 364 242
3,222
147 341 362 443 740 615 356 217
55,776
1.630 3,601 5,572 6,795
14,769 12,292 6,B53 4,238
'26
7
78
6 2 5
14 19 19 12
1
276
21 21 15 25 63 60 36 35
389
17 19 35 28 86 94 68 42
138
4 4
12 17 39 26 24 12
515
11 23 49 59
136 115 B2 40
3,668
144 204 I
364 410 876 B65 4B6 31B
8
178
3 10 17 IB 37 38 29 26
1,435
33 102 143 181 317 250 215 194
737
5 41 77 92
153 139 102 128
608
5 46 56 70
147 134 92 58
368
8 29 31 40 84 73 62 41
- 2,')50
68 145 231 312 591 595 500 499
9
9
19
1 3 4 4 7
8
1 1 2 2
14
2 1 1 5 5
24
1 2 2 4 5 7 2
79
3 2 4 4
12 19 18 17
Agricultural Labourers
Livestock, Forestry. Fishing, Hunting and PlantaCions, Orchards & all ied
activities
Males ~l~ r- Males Femal;?
10
197
9 21 27 34 39 28 22 17
1,070
63 130 141 145 226 191 96 78
902
40 110 102
98 200 166 105 81
998
53 106 121 126 247 166 99 80
1,056
61 N5 121 144 218 200 102 65
5,748
296 590 617 664
1,249 1,143
665 509
15
11
167
18 13 7
17 38 43 18 13
277
15 14 22 19 57 72 50 28
99
3 4
11 10 33 22 13 3
438
8 19 44 52
119 99 67 30
629
39 34 58 68
137 176 73 44
12
38
1 2 6 5
19 3
71
11 11 5 2
12 IB 5 7
62
4 5 4 6
21 10
6 6
11
3
1 5
53
15 6 4 2
11 9 4 2
900
50 63 86
107 210 199 9+ 91
13
18
2 I 2 2 3 2 4 1
1
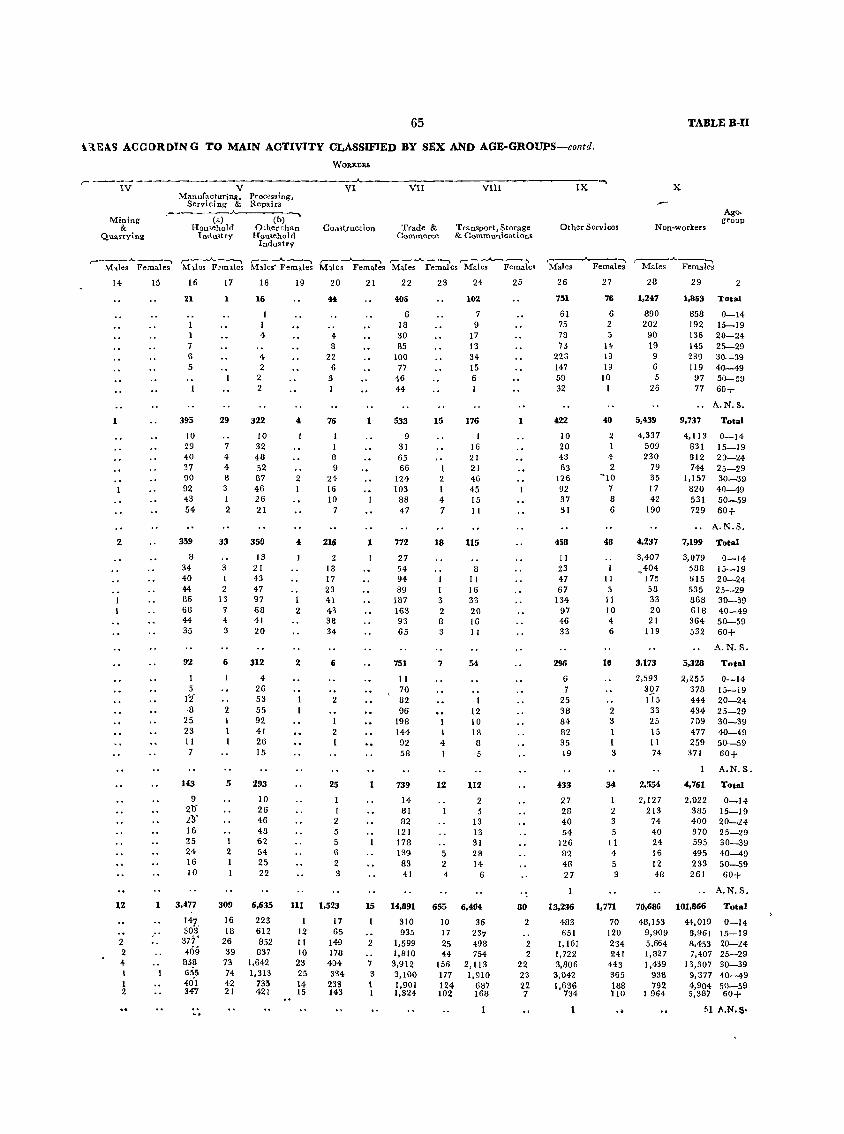
65
\'{EA.S ACCORDING TO MAIN ACTIVITY CLASSIFIED BY SEX AND AGE-GROUPS-contd,
,--IV
Mining &
Quarrying
V Manufacturing.
Servicing &
(a) Hou<ehold
IndU'ltry
Processing. Repairs
(b) ..... Other than
Househ<>ld Industry
WORKERS
VI
COLl,'lt_ruction
VII
Trade & Commerce
VIII
Transport, Storage & Communications
IX
Other Services
TABLE B-I1
X
Non-workers
Agegroup
,-____ .A... __ --. r--__"___~ r--.A----, ,.-__ ...A...-----~ ,...... __ .A. __ ....... r---.,JI,..,-~ ,-----------...., ,.---..... --..... M'lles Females ~hles F"mlles Mlles' Fem,les Males Females Males Females Males Females Males Females Males Females
14
1
2
12
2 2
04,
15
1
16
21
1 1 7 6 5
395
[0 29 40 37 90 92 43 54
359
8 34 40 44 86 68 44 35
92
I 5
(2" ,8
25 23 II 7
143
9 2'tf i!1 16 25 24 16 10
3,477
147 303' 377' 409 838 655 40'1 347
17
1
29
7 4 4 8 3 1 2
33
3 1 2
13 7 4 3
6
2 1 1 1
5
I 2 I
309
16 16
26 39
73 74 42 21
18
16
I I 4
4 2
2 2
322
10 32 48 52 87 46 26 21
350
13 21 43 47 97 68 41 20
312
4 26 53 55 92 41 26 15
293
10 26 46 48 62 54 25 22
6,635
223 612 852 837
1,642 1,313
735 421
19
4
2 I
4
2
2
111
12 II 10
23 25 14 15
20
44
4 8
22 6
3 I
76
8 9
24 16 10
7
216
2 18 17 23 41 43 38 34
6
2
I 2 1
25
I 2 5 5 6 2 3
1,523
17 65
149 178
404 334
233 143
21
1
1
1
15
2
7 3 I 1
22
406
6 18 30 B5
100 77
46 44
533
9 31 65 66
124 103 66 47
772
27 54 94 B9
187 163 93 65
751
II 70 62 96
198 144 92 58
739
14 61 62
121 178 139 83 41
14,891
310 935
1,599 1,810 3,912 3,100 1,901 1,324
23
15
1 2 1 4 7
18
I 3 2 6 3
7
1 4
12
5 2 4
24
102
9 17 13 34 15 6
176
I 16 21 21 46 45 15 II
115
6 11 16 33 20 16 II
54
I 12 10 18 8 5
112
2 5
13 13 31 28 14
6
655 6,4(J4
10 36 17 237 25 498 H 754
156 2,113 177 1,910 124 6B7 102 168
25
80
2
2 2
22 23 22 7
26
751
61 75 78 73
223 147 59 32
422
10 20 43 63
126 92 37 31
458
II 23 47 67
134 97 46 33
296
6 7
25 38 84 82 35 19
433
27 28 40 54
126 82 48 27
13,236
463 651
1,161 1,722 3,606 3,042 1,636
734
27
76
6 2 5
14 19 19
10 I
40
2 I 4 2
-10 7 8 6
48
11 5 II 10 4 6
10
2 3 I 1 3
34
I 2 3 5
11 4 5 3
1,771
70 120 234 241
443 365 ISB 110 ..
28
1,247
890 202
90 19 9 6 5
26
5,439
4,337 509 230
79 35 17 42
190
4,237
3,407 ~404
175 58 33 20 21
119
3,173
2,593 3Q7 115
33 25 15 11 74
2,554
2,127 213
74 40 24 16 12 48
70,686
48,153 9,909 5,664 1,827 1,439
938 792
1964
29
1,863 Total
858 0-14 192 15-19 136 20-24 145 25-29 239 30-39 119 40-49
97 50-59 77 60+
9,737
4,113 831 812 744
1,157 820 531 729
A,N,S,
Total
0-14 15-19 20-24 25-29 30-39 40-49 50-59 60+
A,N,S.
7,199 Total
3,079 566 615 535 668 618 364 532
5,328
2,255 376 444 434 709 477 259
371
4,761
2,022 365 400 370 595 495 233 261
0-14 15-19 20-24 25-29 30-39 40-49 50-59 60+
A,N,S.
Total
0-14 15-19 20-24 25-29 30-39 40-49 50-59 60+
A.N,S.
Total
0-14 15-19 20-24 25-29 30-39 40-49 50-59 60+
A,N,S,
101,866 Total
44,019 0-14 8,961 15-19 6,453 20-24 7,407 25-29
13,307 30-39 9,377 40-49 4,904 50-59 5,387 60+
51 A.N.s·
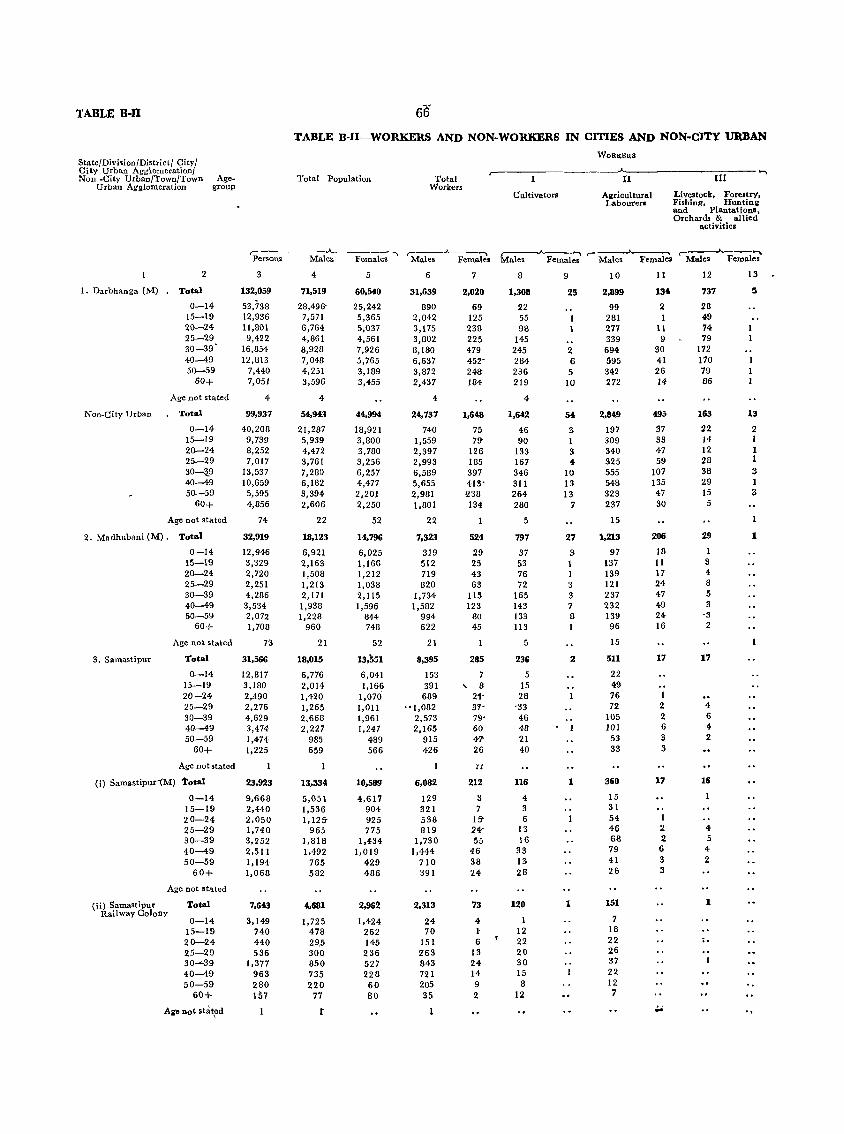
TABLE B-II 673 TABLE B-H-WORKERS AND NON-WORKERS IN CITIES AND NON-CITY URBAN
WORKERS State/Divi.ion/District/ City/ City Urban Agglomeration/ -, Non -City Urban/Town/Town Age- Total Population Total
,--II III
Urban Agglomeration group Workers Cultivators Agricultural Livestock. Forestry.
Labourers Fishing, Hunting and Plantations, Orchards & allied
activities
,- .A.--__ '" ,----'---....., Persons Males Females Males Female.
,----"----, ,-- ---"---...,. ,--__ J.-__ ......
Males Females Males Female. Males Females
2 3 4 5 6 7 8 9 10 II 12 13
1. Darbhanga (M) Total 132,059 71,519 60,540 31,639 2,020 1,308 2S 2,899 134 737 5
0-14 53,738 28,496- 25,242 890 69 22 99 2 28 15-19 12,936 7,571 5,365 2,042 125 55 281 1 49 20-24 11,801 6,764 5,037 3,175 238 98 277 11 74 25-29 9,422 4,861 4,561 3,802 225 145 339 9 79 30-39 16,854 8,928 7,926 8,180 479 245 2 694 30 112 40-49 12,813 7,048 5,765 6,637 452- 284 6 595 41 110 50-59 7,440 4,251 3,189 3,872 248 236 5 342 26 19
60+ 7,051 3,596 3,455 2,437 184 219 10 272 14 86
Age not stated 4 4 4 4
Non-City Urban Total 99,937 54,943 44,994 24,737 1,648 1,642 54 2,849 t95 163 13
0-14 40,208 21,287 18,921 740 75 46 3 197 37 22 2 15-19 9,739 5,939 3,800 1,559 79- 90 I 309 33 14 I 20-24 8,252 4,472 3,780 2,397 126 133 3 340 47 12 I 25-29 7,017 3,761 3,256 2,993 185 167 4 325 59 28 1
30-~g 13,537 7,280 6,257 6,589 397 346 10 555 107 38 3 40-49 10,659 6,182 4,477 5,655 413' 311 13 548 135 29 1 50-59 5,595 3,394 2,201 2,981 £38 264 13 323 47 15 3
60+ 4,856 2,606 2,250 1,801 134 280 7 237 30 5
Age not stated 74 22 52 22 5 15
2. Madhubani (M) _ Total 32,919 18,123 14,796 7,323 524 797 27 1,213 206 29 1
0-14 12,946 6,921 6,025 319 29 37 3 97 18 1 15-19 3,329 2,163 1,166 512 25 53 1 137 11 3 20-24 2,720 1,508 1,212 719 43 76 1 139 17 4
25-29 2,251 1,213 1,038 820 63 72 3 121 24 8 30-39 4,286 2,171 2,115 1,734 !l5 165 3 237 47 5 40-49 3,534 1,938 1,596 1,582 123 143 7 232 49 3 50-59 2,072 1,228 844 994 80 133 8 139 24 -3
60+ 1,708 960 748 622 45 113 96 16 2
Age not stated 73 21 52 21 5 15
3. Samastipur Total 31,566 18,015 13,551 8,395 285 236 2 511 17 17
0-14 12,817 6,776 6,041 153 7 5 22 15-19 3,180 2,014 1,166 391 , 8 15 49 20-24 2,490 1,420 1,070' 689 21- 28 76 I 25-29 2,276 1,265 1,011 "1,082 31- -33 72 2 4 30-39 4,629 2,668 1,961 2,573 79' 46 105 2 6
40-49 3,474 2,227 1,247 2,165 60 48 101 6 4
50-59 1,474 985 489 915 4t7' 21 53 3 2 60+ 1,225 659 566 426 26 40 33 3
Age not stated .. (i) SamastipuriM) 'total 23,923 13,334 10,589 6,082 212 116 1 360 17 16
0-14 9,668 5,051 4,617 129 3 4 15
15-19 2,440 1,536 904 321 7 3 31
20-24 2,050 1,125- 925 538 15- 6 54 1
25-29 1,740 965 775 819 24- 13 46 2 4
30-39 3,252 1,818 1,434 1,730 55 16 68 2 5
40-49 2,511 1,492 1,019 1,444 46 33 79 6 4
50-59 1,194 765 429 710 38 13 41 3 2
60+ 1,068 582 486 391 24 28 26 3
Age not stated
(H) Samastipur Total 7,643 4,681 2,962 2,313 73 120 1 151 1 Railway Colony
0-14 3,149 24 4 1 7 1,725 1,424 15-19 740 478 262 70 1 12 18
20-24 440 29.5 145 151 6 22 22 ., 25-29 536 300 236 263 13 20 26
30-"-39 1,377 850 527 843 24 30 37
40-49 963 735 228 721 14 15 22
50-59 280 220 60 205 9 8 12
60+ 1$7 77 80 35 2 12 7
Aile not stat~d r ..
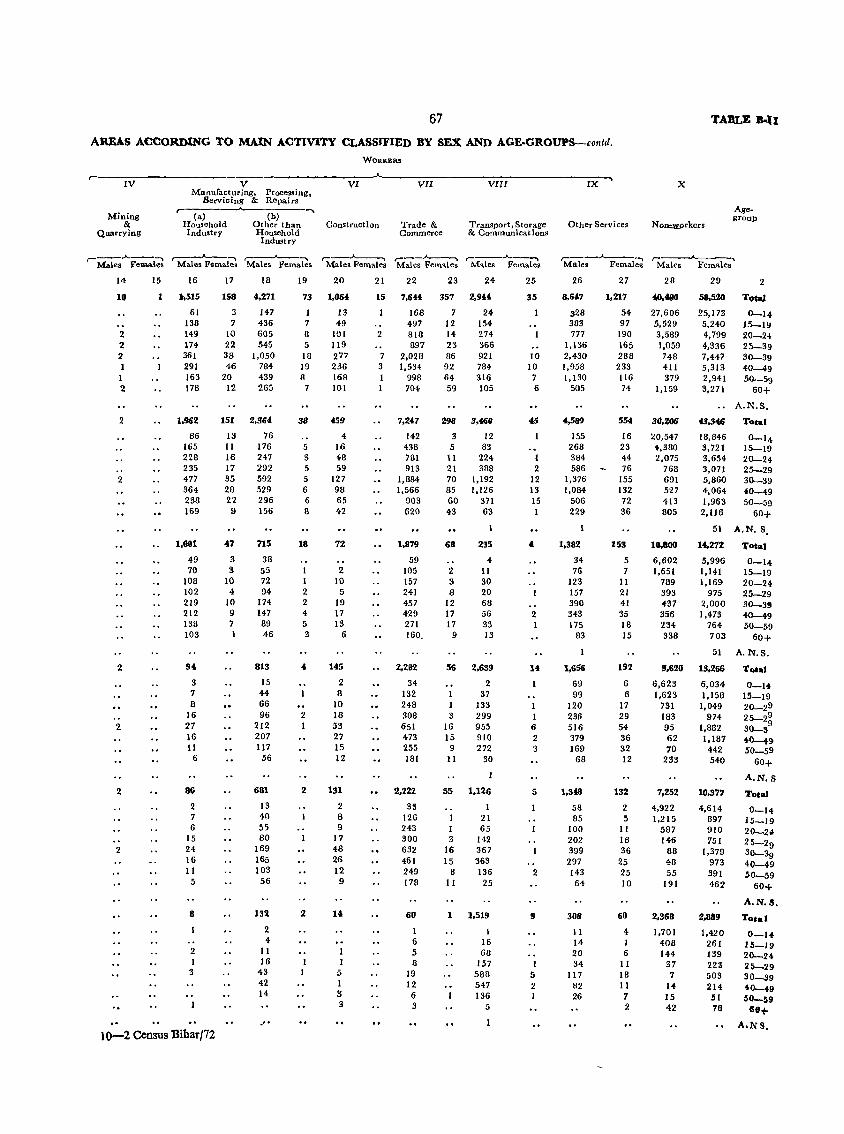
67
AREAS ACCORDING TO MAIN ACTIVITY CLASSJFlED BY SEX AND AGE-GROUPS-contd.
WORKERS
~-----rv------------------v~--------------~V~I~~------V=I~I--------~V~I7II~----------~I=X~~ Manufacturing, Proceuing,
Servicing & Repairs
Mining &
Quarrying
r--------~----------~ (a) (b)
Household Other than Industry Household
Industry
Construction Trade & Commerce
Transport J Storage & Communications
Other Services
x
No=orkers
AgegrOUp
,.... _____ .A. __ ~ r---.A-~ r-_"'____~ ,---""""__, ,---....___.., ;-------'--.,
Males Females Males Female. Males Females Males Females Males Females Males FemaLes r----A----~ ~----~~ Males Females Males Females
14
10
2 2 2 1 1 2
2
2
2
2
2
15 16
1.515
61 138 149 174 361 291 163 178
l.!Ui2
86 165 228 235 477 364 238 169
1.001
49 70
108 102 219 212 138 103
94
3 7 8
16 27 16 11
6
86
2 7 6
15 24 16 II
5
8
2 I
3
10-2 Census Bibar/72
17
158
3 7
10 22 38 46
20 12
151
13 11 16 17 35 28 22 9
47
3 3
10 4
10 9 7 I
18
4.271
147 436 605 545
1,050 784 439 265
2,364
76 176 247 292 592 529 296 156
715
38 55 72 94
174 147 89 46
813
15 44 66 96
212 207 117
56
681
13 40 55 80
169 165 103 56
132
2 4
11 16
43 42 14
. "
19
73
I 7 8 5
18 19 8
7
38
5 3 5 5 6 6 8
18
I I 2 2 4 5 3
2 I
2
2
20
1.064
13 49
101 119 277 236 168 101
69
4 16 48 59
127 98 65 42
72
2 10 5
19 17 13
6
H5
2 8
10 18 53 27 15 12
131
2 8 9
17 48 26 12
9
5 1 3 3
21
15
2
7 3 I I
22
7,644
168 497 818 897
2,028 1,534
998 704
7,247
142 438 781 913
1,884 1,566
903 620
1,879
59 105 157 241 457 429 271 160.
2,2112
34 132 248 308 651 473 255 181
2,222
33 126 243 300 632 461 249 178
60
1 6 5 8
19 12 6 3
23
357
7 12 14 23 86 92 64 59
298
3 5 1I 21 70 85 60 43
68
2 3 8
12 17 17
9
24
2,944
24 154 274 366 921 784 316 105
3,460
12 83
224 388
1,192 1,126
371 63
235
4 11 30 20 68 56 33 13
56 2,639
2 37
133 3 299
16 955 15 910
9 272 11 SO
55 1,126
I 21
1 65 3 142
16 367 15 363
8 136 11 25
1 1,519
I 16 68
157 588 547 136
5
25
35
10 10 7 6
t 2
12 13 15
«
2 I
I 6 2 3
5
2
9
1 5 2 1
26
8,6'7
328 383 777
1,136 2,430 1,958 1,130
505
4,589
155 268 384 586
1,376 1,084
506 229
1,382
34 76
123 157 390 343 175
83
1,656
69 99
120 236 516 379 169
68
1,348
58 85
100 202 399 297 143
64
308
11 14 20 34
117 112 26
27
1,217
54 97
190 165 288 233 116 74
554
16 23 44 76
155 132 72 36
153
5 7
11 21 41 35 18 15
192
6 6
17 29 54 36 32 12
132
2 5
II 18 36
25 25 10
60
4 1 6 II 18 11 7 2
28
4Al.4eO 27,606 5,529 3,589 1,059 748 411 379
1,159
:lO,547 -f,380 2,075
768 691 527 413 805
10,800
6,602 1,651
789 393 +37 356 234 338
9,620
6,623 1,623
731 183 95 62 70
233
7,252
4,922 1,215
587 146
88 48 55
191
2,368
1,701 408 144
37 7 If 15 42
29
58,520
25,173 5,240 4,799 4,336 7,447 5.313 2,941 3,271
43~
18,846 3,721 3,654 3,071 5,860 4,064 1,963 2,116
51
14,272
5,996 1,141 1,169
975 2,000 1,473
764 703
2
TqtaJ
0-14 15-1!! 20-24 25-39 30-39 40--49 50-59
60+
A.N.S.
Total
0-14 15-19 20-24 25-29 30-39 40-49 50-59
60+
A.N. S.
'tOtal
0-14 15-19 20-24 25-29 30-3~ 40-49 50-59
60+
51 A. N.S.
13,266
6,034 1,158
1,049 974
1,882 1,187
442 540
10,377
4,614 897 910 751
1,379 973 391 462
2,889
1,420 261 139 223 503 214 51 18
Total
0-14 15-19 20_29
25-2~ 30-3 40-49 50-59
60+
A.N.S
Tota)
0-14 15-19 20-24 25-29 30-39 40-49 50-59
60+
A.N.8.
Total
O-If 15-19 20-24 25-29 30-39 40-49 50-59 8.~
A.NS •
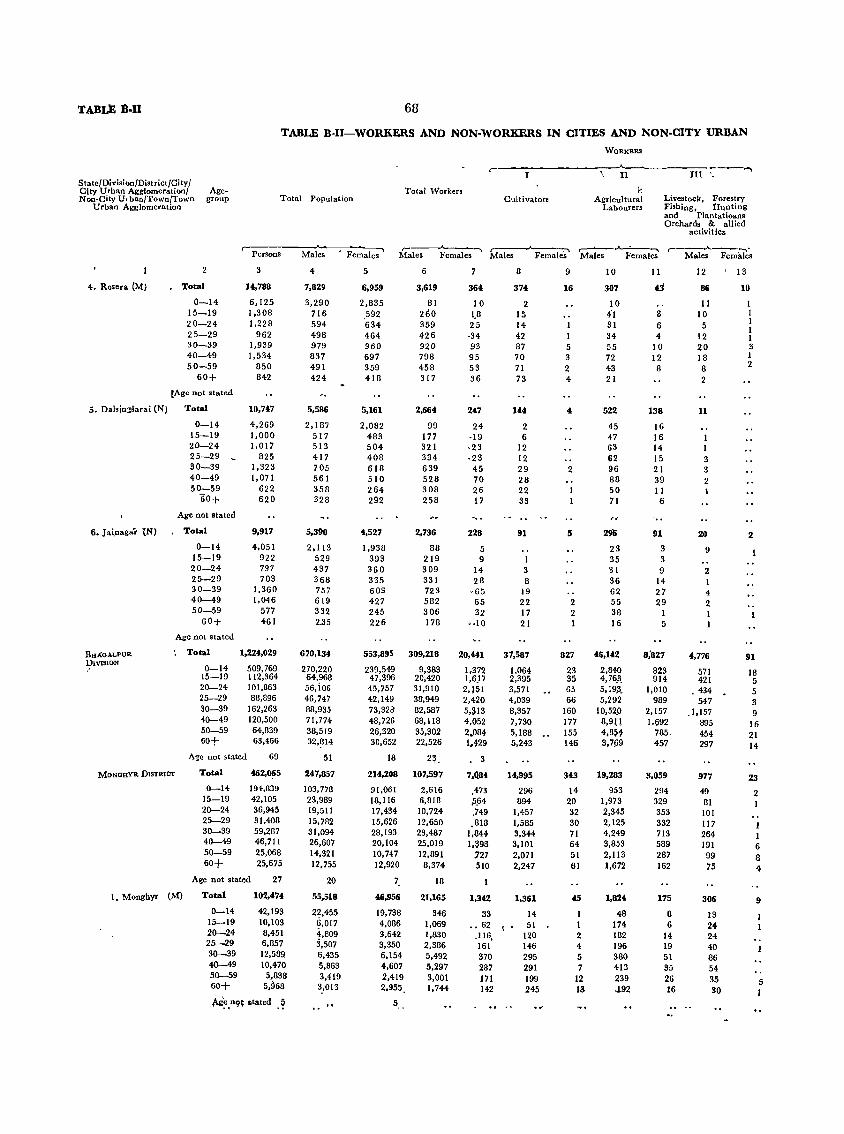
TAB~ B-II 68
TABLE B-I1-WORKERS AND NON-WORKERS IN CITIES AND NON-CITY URBAN
WORKERli
r-\ 11 III ;---"'"
State/Di~ision/District/CitYI Age- Total Workers <: City Urban Agglomeration/
Non-CityU.ban/Town/Town group Total Population Cultivators Agricultural Livestock, Forestry Urban Agglomeration Labourers Fishing, Hunting
and Plantatioans Orchards & allied
activities
Persons Males . Female. r----'-------..
Male. Females r---oA.--.,.... Males Female.
r-----.,A...-.:..-"'""" Males Females
r---.A---..-Males Females
3 4 5 6 7 8 9 10 11 12 , 13
4. Rosera (M) Total 14,788 7,829 6,959 3,619 364 374 16 307 t:J 86 10
0-14 6,125 3,290 2,835 81 10 2 10 11 I 15-19 1,308 716 ,592 260 1.8 15 4'1 S 10 I 20-24 1,228 594 634 359 25 14 31 6 5 I
1 25-29 962 498 464 426 ·34 42 34 4 12 I 30-39 1,939 979 960 920 93 87 5 55 10 20 3 40-49 1,534 837 697 798 95 70 3 72 12 18 I 50-59 850 491 359 458 53 71 2 43 8 8 2
60+ 842 424 418 317 36 73 4 21 2 IAge not stated
5. Da1sinISarai (N) 'total 10,747 5,586 5,161 2,664 247 144 4 522 138 11
0-14 4,269 2,187 2,082 99 24 2 45 16 15-19 1,000 517 483 177 -19 6 47 16 I 20-24 1,017 513 504 321 ·23 12 63 14 1 25-29 - 825 417 408 334 ·23 12 62 IS 3 30-39 1,323 705 618 639 45 29 2 96 21 3 40-49 1,071 561 510 528 70 28 88 39 2 50-59 622 358 264 308 26 22 50 II
60+ 620 328 292 258 17 33 71 6
Age not stated
6. Jai,nagar {N) Total 9,917 5,390 4,527 2,736 228 91 5 291> 91 20 2 0-14 4,051 2,113 1,938 88 5 23 3 9
15-19 922 529 393 219 9 I 35 3 20-24 797 437 360 309 14 3 31 9 2 25-29 703 368 335 331 28 8 36 14 30-39 1,360 757 603 723 ·65 19 62 27 4 40-49 1,046 619 427 582 65 22 2 55 29 2 50-59 577 332 245 306 32 17 2 38 1
60+ 461 2.35 226 178 ··10 21 1 16 5
Age not stated
BH,(oALPUR Total 1,224,029 670,134 553,895 309,218 20,441 31,587 827 46,142 8;827 4,776 91 UIVlSlON
0-14 509,769 270,220 239,549 9,383 1,372 1,064 23 2,840 823 571 18 15-19 112,364 64,968 47,396 20,420 1,6)7 2,395 35 4,76.3. 914 421 5 20-24 101,863 56,iOG 45,757 31,910 2,151 3,571 65 5,19.3. 1,010 .434 5 25-29 88,896 46,747 42,149 38,949 2,420 4,039 66 5,292 989 547 3 30-39 162,263 88,935 73,328 82,587 5,~13 8,357 160 10,52.0 2,157 .1,157 9 40-49 120,500 71,774 48,726 68,118 4,052 7,730 177 8,911 1.692 895 16 50-59 64,839 38,519 26,320 35,302 2.084 5,188 155 4,8;;t 785. 454 21 60+ 63,466 32,~14 30,652 22,526 l.t29 5,243 146 3,7!i9 457 297 14
Age not stated 69 51 18 23, 3
;MONGHYR DISTRICT Total 462,065 247,857 214,208 107,597 7.Q84 14,995 343 19,283 3,059 977 23 0-14 194,839 103,778 91,061 2,616 .473 296 14 953 294 49 2
15-19 42,105 23,989 18,116 6,818 ,'i.64 894 20 1,973 329 81 1 20-24 36,945 19,511 17,434 10,724 .749 1,457 32 2,345 353 101 25-29 31,408 15,782 15,626 12,650 _B18 1,585 30 2,125 332 117 30-39 59,287 31,094 28,193 28,487 1,644 3,344 71 4,249 713 264 1 40-49 46,711 26,607 20,104 25,019 1,398 3,101 64 3,853 589 191 6 50-59 25,068 14,321 10,747 12,891 727 2,071 51 2,113 287 99 8 60+ 25,675 12,755 12,920 8,374 510 2,247 61 1,672 162 75 4
Age not stated 27 20 7, 18
I. Mongbyr (M) Total 102,4.74 55,518 46,956 21,165 1.342 1,361 45 1,824 175 306 9 0-14 42,193 22,455 19,738 346 33 14 I 48 8 13
15-19 10,103 6,017 4,OB~ 1,069 •• 62 I' 51 1 174 6 24 20-24 8,451 4,809 3,642 1,830 .116, 120 2 182 14 24 25-29 6,857 3,507 3,350 2,386 161 146 4 196 19 40 30-39 12,509 6,435 6,154 5,492 370 295 5 380 51 86 40-49 10,470 5,863 4,607 5,297 287 291 7 413 35 54 50-59 5,838 3,419 2,419 3,001 171 199 12 239 26 35 5 60+ 5,968 3,013 2,955 1,744 142 245 13 ,192 16 SO 1 Ai~.D9~ stated .? 5,.
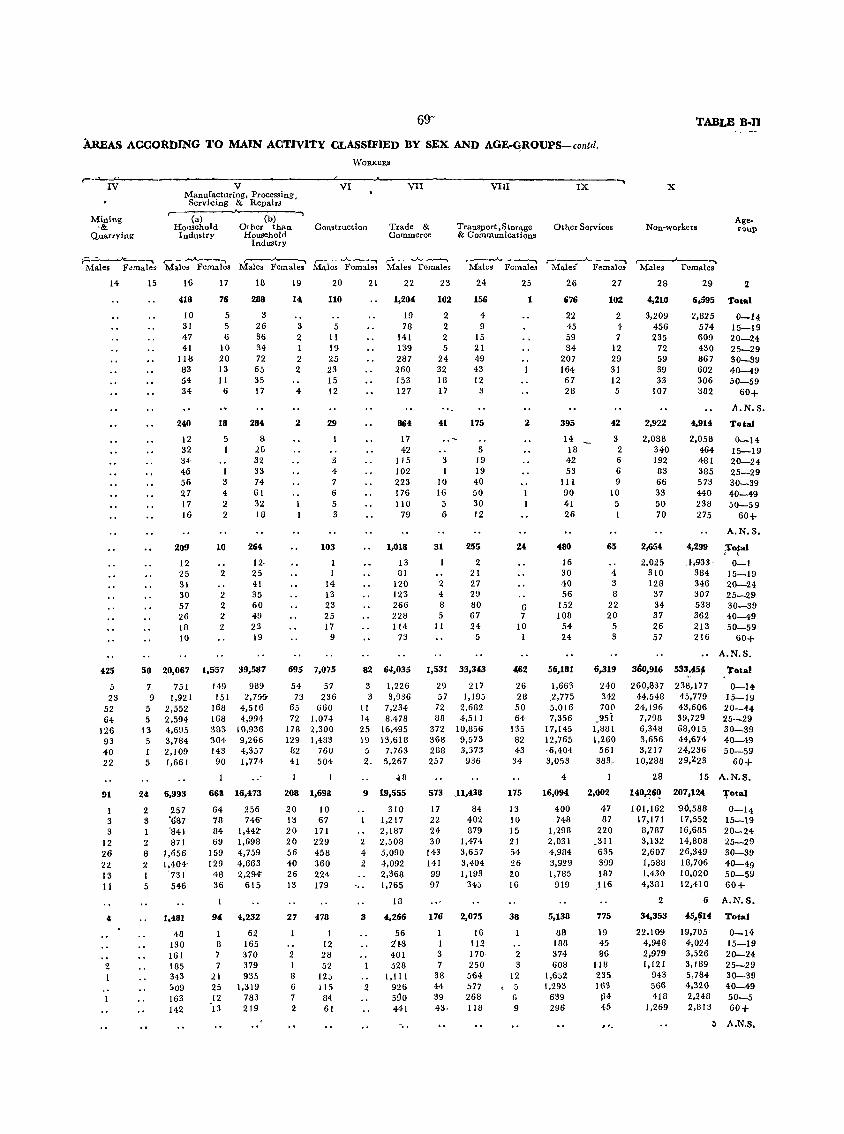
69~
AREAS ACCo:kblNG '1'0 MAIN ACTIVITY CLASSIFIED BY SEX AND AGE-{!ROUPS-contd.
WORKERS
~~'-I~V~------------------V----------------4-V-I----~----7V=I7I----------~V~II=I--·---------=IX=-----~
Manufacturing, Processing Servicing & Repairs'
Mining .&
Quarrying
(a) Household Industry
(0) Other than Household
Industry
Construction Trade & Commerce
Transport, Storage &; Communications
Other Services
TABLE B·IJ
x
Non-workers Ager1)Up
F-="---'::--, r---wA...--~ r---,......___~ r----.A.-:-., "":" __ .A..-...-., ,-__ ...A.--_~ r--"'___..., ,----'--..... Males Fomales Male, Females Males Females Males Fem,le. Males Females Males Females Males Females Males Females
14
425
5 23
52 64
126 93 40 22
91
1 3 3
12 26 22 13 11
2
15 16
4t8
10 31 47 41
118 63 54 34
240
12 32 34 46 56 27 17 16
209
12 25 31 30 57 26 16 10
50 20,067
7 751 9 1,921
5 2,552 5 2,594
13 4,695 5 3,784 I 2,109 5 1,661
24
2 3 1 2 6 2 1 5
6,993
'-57 'u87 '841 871
1,656 1,404' "731 546
1,481
48 130 161 185 343 &09 163 142
17
76
5 5 6
10 20 13 11
6
18
5 1
1 3 4 2 2
10
2
2 2 2 7.
18
288
3 26 36 34 72 65 35 17
284
8 26 32 33 74 61 32 16
264
12· 25 41 35 60 49 23 19
1,557 39,587
149 989 151 2,755-
166 4,516 168 4,994 383 10,936 304 9,266 143 4,357 90 1,774
66B
64 78 84 69
159 129 48 36
94
8 7 7
21 25 12
'13
16,473
256 746'
1,442" 1,698 4,759 4,663 2,294"
615
4,232
62 165 370 379 935
1,319 783 219
19
14
3 2 1 2 2
4
2
20
110
5 11 19 25 23 15 12
29
3 4 7 6 :; 3
103
I 1
14 13 23 25 17
9
695 7,075
54 57 73 236
65 660 72 1,074
178 2,300 129 1,483
82 760 41 504
208
20 13 20 20 56 40 26 13
27
2 1 8 6 7 2
1,698
10 67
171 229 458 360 224 179
478
1 12 28 52
125 115 84 61
21 22
1,204
19 78
141 139 287 260 153 127
864
17 42
115 102 223 176 110
79
1.018
13 81
120 123 266 226 114
73
82 64,035
3 1,226 3 3,936
11 7,234 14 8,476 25 16,495 19 13,618 5 7,763 2. 5,267
9
2 4 2
' ..
3
2
.18
19.555
310 1,217 2,187 2,508 5,090 4,092 2,366 1,765
18
4.266
56 2'~3 401 528
1,111 926 5~0 441
23
102
2 2 2 5
24 32 18 17
3 1
10 16 5 6
31
2 4 8 5
11
1.531
29 57
72 88
372 368 288 257
573
17 22 24 30
143 141 99 97
24
156
4 9
15 21 49 43 12
3
175
5 19 19 40 50 30 12
255
2 21 27 29 80 67 24
5
33,343
217 1,195
2,682 4,511
10,856 9,573 3,373
936
"11.438
84 402 879
1,474 3,657 3,404 1,193
345
176 2,075
1 16 I 112 $ 170, 7 250
38 564 44 577 39 268 43· 118
25
1
2
24
6 7
10 1
462
26 28 50 64
135 82 43
34
175
13 10 15 21 54 26 Zo 16
38
2 3
12 , 5
6 9
26
676
22 45 59 84
207 164 67 28
395
14 18 42 53
III 90 41 26
480
16 30 40 56
152 108
54 24
56,181
1,663 ,2,775 5,016 7,356
17,145 12,765 '6,404 3,053
4
16,094
400 748
1,298 2,031 4,984 3,929 1,785
919
5,138
88 188 374 608
1,652 1,293
639 296
21
102
2 4 7
12 29 31 12 5
42
3 2 6 6 9
10 :; 1
65
4 3 8
22 20
5 3
6,319
240 342 70(1
,95 i 1,881 1,260
561 383.
2.002
47 87
220 ,311 635 399 167
,116
775
19 45 !l6
116 235 16'3 Jl4 45
, ....
28
4,210
3,209 456 235
72 59 39 33
107
2,922
2,088 340 192 83 66 33 50 70
2,654
2,025 310 128 37 34 37 26 57
360,916
260,837 44,548 24,196
7,798 6,348 3,656 3,217
10,288
28
140,26~
101,162 17,171 8,787 3,132 2,607 1,588 1,430 4,381
2
34,353
22.109 4,948 2,979 1,121
943 566 418
1,269
29 2
6,595 Total
2,825 574 609 430 867 602 306 382
4,914
2,058 464 481 385 573 440 238 275
4.299
,1,933· 384 346 307 538 362 213 216
533~45~
238,177 45,779 43,606 39,729 68,015, 44,674 24,236 29,223
0-14 15-19 20-24 25-29 30-39 40-49 50-59
60+
A.N.S.
Total
0-14 15-19 20-24 25-29 30-39 40-49 50-59
60+
A.N.S.
.Total ; ,
0-1 15-19 20-24 25-29 30-39 40-49 50-59
60+
A.N.S.
'rllta! "
0-1+ 15-19 20-44 25-29 30-39 40-49 50-59
60+
15 A.N.S.
207.1:z4
-gO,588 17,552 16,685 14,808 26,349 18,706 10,020 12,410
Total
0-14 15-19 20-24 25-29 30-39 40-49 50-59 60+
6 A.N.S.
45.~14
19,705 4,024 3,526 3,189 5,784 4,320 2,248 2,813
Total
0-14 15-19 20-24 25-29 30-39 40-49 50-5 60+
:; A.N.S.
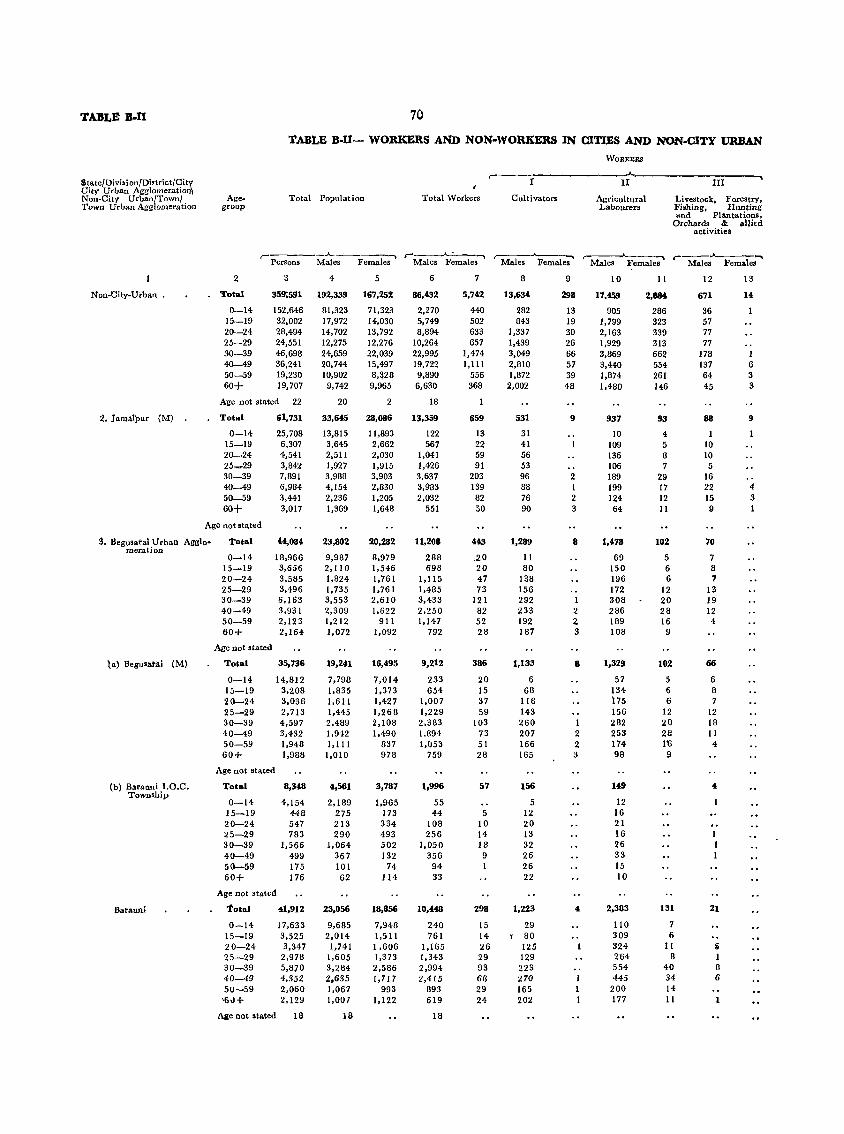
TABLE- B.Il 70
TABLE B·U- WORKERS AND NON·WORKERS IN CITIES AND NON-CITY URBAN
WORKERS
State/Divi.ion/Diotrict/City r IX III ...
City Urban Agglomeration\ ,
Non-City Urban/Town/ Age- Total Population Total Workers Cultivators Agricultural Livestock, Forestry, Town Urban Agglomeration group Labourers Fishing. Hunting
and Plantations, Orchard. & allied
activities
,- r--..A---:---. ,.----_"_____..., Female;-'
.-Female;'
,.... Females"" Persons Males Males Females Males Females Male. Males
2 3 4 5 6 7 8 9 10 11 12 13
Non-Oity-Urban • Total 359;591 192,339 167.25! 86.432 5.742 13.634 298 17.459 2,1184 671 14
0-14 152.646 81,323 71,323 2,270 440 282 13 905 286 36 15--19 32.002 17,972 14,030 5,749 502 843 19 1.799 323 57 20--24 28,494 14,702 13,792 8.894 633 1,337 30 2,163 339 77 25-29 24,551 12,275 12,276 10,264 657 1.439 26 1,929 313 77 30-39 46,698 24,659 22,039 22,995 1,474 3,049 66 3,869 662 178 I 40--49 36.241 20,744 15,497 19,722 1,111 2,810 57 3,440 554 137 6 50-59 19,230 10,902 8,~28 9,890 556 1,872 39 1,874 261 64 3 60+ 19,707 9,742 9,965 6,630 368 2,002 48 1,480 146 45 3
Age -IIot stated 22 20 2 18
:.1_ ]am"lpur (M) Total 61,731 33,645 28,086 13.359 659 531 9 937 93 88 9
0--14 25,708 13,815 11,893 122 13 31 10 4 I 15-19 6,307 3,645 2,662 567 22 41 109 5 10 20-24 4,541 2,511 2,030 1,041 59 56 136 8 10 25_29 3,842 1.927 1,915 1,426 91 53 106 7 5 30-39 7,891 3,988 3.903 3,637 203 96 2 189 29 16 40-49 6,984 4,154 2,830 3.983 139 88 1 199 17 22 4 50--59 3,441 2.236 1,205 2,032 82 76 2 124 12 15 3 60+ 3,017 1,369 1,648 551 50 90 3 64 11 9 1
Age not stated
~. Begusai'ai Urban Agglo' 'total (4,084 23,802 20,282 11,208 443 1,289 8 1,478 1112 70 meration
0-14 18,966 9,987 8.979 288 .20 11 69 5 7 15-19 3,656 2,110 1.546 698 20 80 150 6 8 20-24 3.585 1.824 1.761 l,ll5 47 138 196 6 7 25-29 3.496 1.735 1.761 1.485 73 156 172 12 13 30-39 6.163 3.553 2.610 3.433 121 292 1 308 20 19 40-49 3.931 2.309 1.622 2.250 82 233 2 286 28 12 50-59 2.123 1.212 911 1.147 52 192 2 189 16 4 60+ 2,164 1.072 1,092 792 28 187 3 108 9
Age not stated
tal BeguSAt4i (M) Tolal 35,736 19,241 16,495 9,212 386 1,133 8 1,329 102 66
0-14 14,812 7,798 7,014 233 20 6 57 5 6 15-19 3,208 1,835 1,373 654 15 68 134 6 8 ~0-24 3,038 1,611 1,427 1.007 37 118 175 6 7 25-29 2,713 1,445 1,268 1,229 59 143 156 12 12 30-39 4,597 2,489 2,108 2,383 103 260 1 282 20 18 40--49 3,432 1,942 1.490 1.894 73 207 2 253 28 II 50-59 1,948 1,111 837 1,053 51 166 2 174 1'6 4 60+ 1,988 1,010 978 759 28 165 :I 98 9
Age not stated
(b) Barallni 1.0.C. Total 8,348 4,561 3,787 1,996 57 156 149 4 Township
0-14 4.154 2.189 1,965 5 12 55 15-19 448 275 173 44 5 12 16 20-24 547 213 334 108 10 20 21 25-29 783 290 493 256 14 13 16 I 30-39 1,566 1,064 502 1,050 18 32 26 1 40-49 499 367 132 356 9 26 33 1 50-59 175 101 74 94 1 26 15 60+ 176 62 114- 33 22 10
Age not stated
Baraun; 'total 41,912 23,056 18,856 10,448 298 1,223 4 2,383 131 21
0--14 17,633 9,685 7,948 240 15 29 110 7 15-19 3,525 2.014 1.511 761 14 t 80 309 6 20-24 3,347 1,741 1.606 1,165 26 125 324 11 li 25-29 2.978 1.605 1,373 1,343 29 129 204 8 1 30-39 5.870 3,284 2.586 2,994 93 223 554 40 8 40-49 4,352 2.635 1.717 2.415 68 270 I 445 34 6 50-59 2.060 1.067 993 893 29 165 1 200 14 '6J+ 2.129 1.007 1,122 619 21 202 1 177 11
Ale not stated 18 18 18
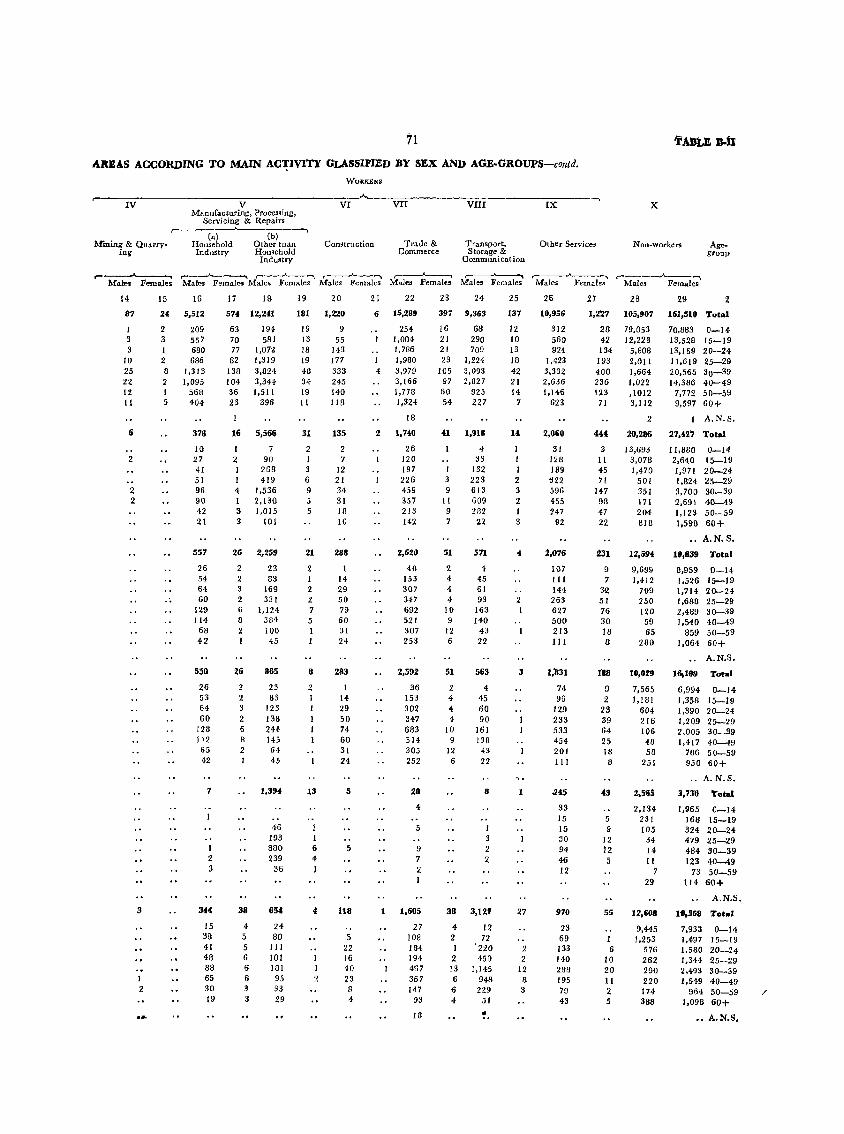
7i
AKEAS ACCORD1NG TO MAIN AC~JVlTY GLASSIFIED BY SEX AND AGE·GROUPS-contd.
.-----'----IV V Manufacturing, Processing,
Servicing & Repairs r-------"------......
(a) (b) Mining & Quarry- Household Other tJ1ao
iOIl Industry Household Industry
WORKERS
VI ~~V=II~-------~V=I=II-------I~X~-
Construction Trade & Commerce
Transport, Other Services Storage &
Communication
x
Non-workers Agegroup
'----'--"-l r---J--~ r--.A....--..... ,-__ ...A--_-" r---"---, r---""____'" ,---........__-~ r---.....__ ...... Males Females Males Females Males Females Mal'es Females l~ales Females Males Females Males Females Males Females
14
87
3 10 25 22 12 II
6
2
2 2
3
I 2
15
24
2 3 I
2 8 2 I 5
16
5,512
209 557 6BO 686
1,313 1.095
568 404
378
10 27 41 51 96 90 42 21
557
26 54 64 60
129 114 6a 42
550
26 53 64 60
128 112 65 42
7
I 2 3
au 15 S8 41 48 88 65 30 19
17 18
574 12,241
63 194-70 581 77 1,072 62 1,319
138 3,824 104 3,344 36 1,511 23 396
1
16 5,566
1 7 2 90 1 268 I 419 4 1,536 I 2,130 3 1,015 3 101
26 2,259
2 2 3 2 6 8 2 I
2&
2 2 3 2 6 8 2
38
4-5 5 6 6 6 3 3
23 83
169 331
1,124 384 100 45
865
23 83
123 138 214 145 64 45
1,394
46 193 880 239
36
654
24 80 III 101 181 95 33 29
19
181
19 13 18 19 48 34 19 II
31
2 I 3 6 9 5 5
21
1 2 2 7 5
8
2 I
13
1 1 6 4 I
I 2
20
1,220
9 55
143 177 333 245 140 118
135
2 7
12 21 34 31 18 10
288
14 29 50 79 60 31 24
283
1 14 29 50 74 60 31 24
5
5
1I8
5 22 16 40 23 8 4
21
6
1 4
22
15,289
254 1,004 1,786 1,980 3.979 3,166 1,778 1,324
18
2 1,740
26 120 197 226 459 357 213 142
2,620
40 153 307 347 692 521 307 253
2,592
36 153 302 347 683 514 305 252
28
4
5
9 7 2 1
I.G05
27 lOB 184 194 4fi7 367 1-17
93
18
23
397
16 21 21 23
105 97 60 54
24
9,363
68 290 709
1,224 3.093 2,827
925 227
41 1,918
4 33
132 223
9 613 11 609 9 282 7 22
51
2 4 4 4
10 9
12 6
51
2 4 4 4
10 9
12 6
571
4 45 61 93
163 140
43 22
563
4 45 60 90
161 138
43 22
8
I .'3 2 2
38 3,121
4 12 2 72 1 '220 2 450 13 1.145 6 948 6 229 4 51
!.
25
137
12 10 13 18 42 21 14
7
1 1 2 3 2 I 3
2 1
3
27
2 2
12 8 3
26
10,956
312 580 924
1,423 3.332 2,636 1,146
623
2,060
31 128 189
-522 596 455 247
92
:t,076
107 III 144 263 627 500 213 111
1.'1131
74 96
129 233 533 454 201 111
.245
33 15 15 30 94 46 12
970
23 69 133 140 2aa 195 79 43
27
1,2'27
28 42 134
193 400 236 123 71
"" 3 II 45 71
147 93 47 22
lIS1
9 7
32 51 76 30 18 8
IllS
9 2
23 39 64 25 18
8
43
5 9
12 12 5
55
I 6
10 20 11 2 5
23
105,907
79,053 12,223
5.80B 2,011 1,664 1,022 ,1012 3,112
2
20,286
13,693 3,078 1,470
501 351 171 204 818
12,594
9,699 1,412
709 250 120 59 65
280
10,1129
7,565 1,181
604 216 106 48 58
251
2,565
2.134 231 105
34 14 11
7 29
12,608
9.445 1,253
576 262 290 220 174 388
29
161,510
70,883 13.528 13,159 11,619 20,565 14,386
7,772 9,597
2
Tutal
0-14 15-19 20-24 25-29 30-39 40-49 50-59 60+
A.N.S.
27,427 Total
11,880 0-14 2.640 15-19 1,971 20-24 1,824 25-29 3,700 30-39 2,691 40-49 1,123 50-59 1,598 60+
.. A.N.S.
n,lIa9 Total
8,959 1,526 1,714 1,688 2,489 1.540
859 1,064
0-14 15-19 20-24 25-29 30-39 40-49 50-59 60+
A.N.S.
16,109 Total
6,994 0-14 1,358 15-19 1,390 20-24 1,209 25-29 2.005 30-39 1,417 40-49
786 50-59 950 60+
" A.N.S.
3,730 Total
1,965 0-14 168 15-19 324 20-24 479 25-29 484 30-39 123 40-49
73 50-59 114 60+
A.N.S.
111.558 Total
7.933 0-14 1,497 15-19 1.580 20-24 1.344 25-29 2,493 30-39 1,649 40-49
964 50-59 1,096 60+
•• A.N.S.
/
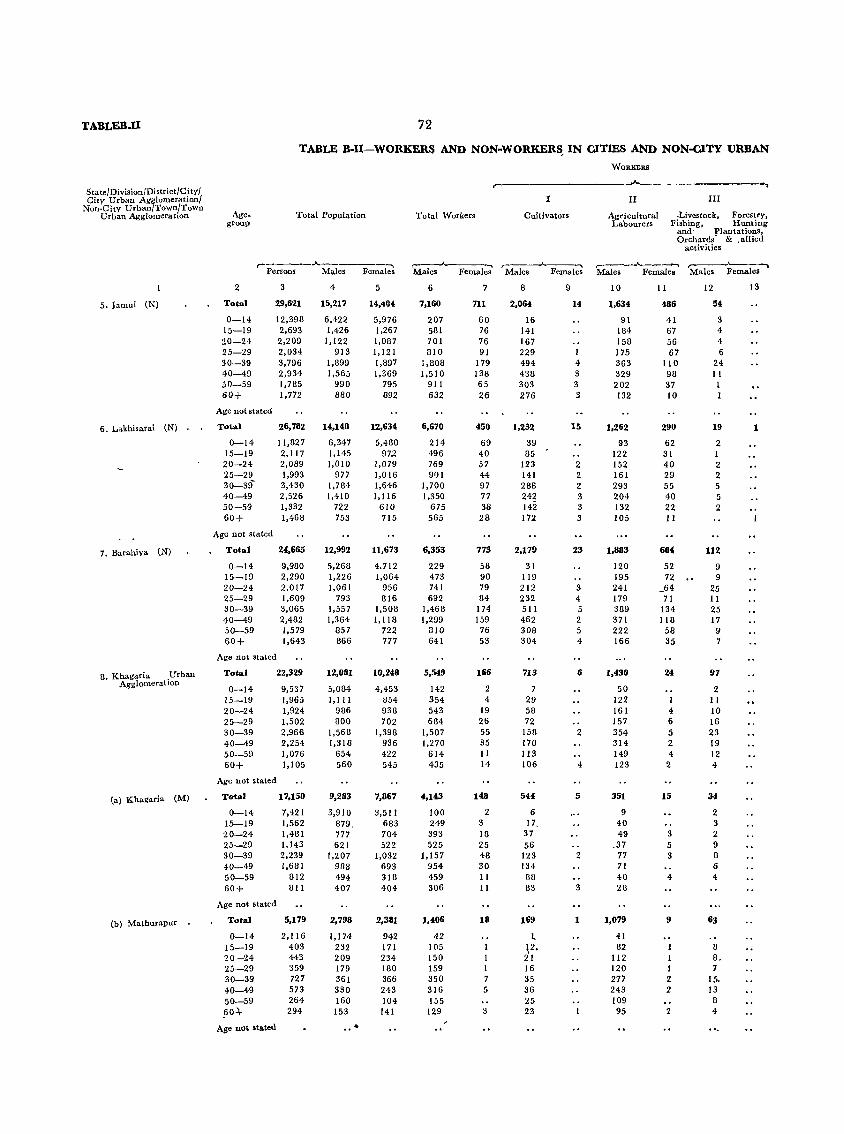
TABLEB-II 72
TABLE B-I1-WORKERS AND NON·WORKER~ IN CITIES AND NON-CITY URBAN
WORKERS
S ta tel Division/District/ City/ .- ~
City Urban Agglomeration! r II III Non-City Urban/Town/Town
Age. Total Population -Livestock, Forestry, Urban Agglomeration Total Workers Cultivators Agr i cuI tural group Labourers Fishing, Hunting
and" Plantations, Orchards' &. allied
activities
,--------"---------, Persons Males Females
r---.A.---..... Males Females
r---.A---..... Males Females
r---.A.--~ Males Females
,...__,___ ... Males Females
2 3 4 5 6 7 8 9 10 II 12 13
5. Jamui (N) Total 29,621 15,217 14,404 7,160 711 2,064 14 1,634 486 54
0-14 12,398 6.422 5,976 207 60 16 91 41 3 15-19 2,693 1,426 1,267 581 76 141 184 67 4 20-24 2,209 1,122 1,087 701 76 167 158 56 4 25-29 2,034 913 1,121 810 91 229 I J 75 67 6 30-39 3,796 1,899 1,897 1,808 179 494 4 363 110 24 40-49 2,934 1,565 1,369 1,510 138 438 3 329 98 II 50-59 1,785 990 795 911 65 303 3 202 37 1 60+ 1,772 880 892 632 26 276 3 132 10 I
Age not stated
6. Lakhisarai (N) Total 26,782 14,148 12,634 6,670 450 1,232 15 1,262 290 19 1
0-14 11,827 6,347 5,480 214 69 39 93 62 2 15-19 2,117 1,145 972 496 40 85 122 31 I 20-24 2,089 1,010 1,079 769 57 123 2 152 40 2 25-29 1,993 977 1,016 9f)! 44 141 2 161 29 2 30-39- 3,430 1,784 1,646 1,700 97 288 2 293 55 5 40-49 2,526 1,410 1,116 1,350 77 242 3 204 40 5 50-59 1,332 722 610 675 38 142 3 132 22 2 60+ 1,468 753 715 565 28 172 3 105 11
Age not stated
7. Barahiya (N) Total 24,665 12,992 11,673 6,353 773 2,179 23 1,883 604 112
0-14 9,980 5,268 4.712 229 58 31 120 52 9 15-19 2,290 1,226 1,064 473 90 119 195 72 9 20-24 2,017 1,061 956 741 79 212 3 241 _64 25 25-29 1,609 793 816 692 84 232 4 179 71 II 30-39 3,065 1,557 1,508 1,468 174 511 5 389 134 25 40-49 2,482 1,364 1,118 1,299 159 462 2 371 118 17 50-59 1,579 857 722 810 76 308 5 222 58 9 60+ 1,643 866 777 641 53 304 4 166 35 7
Age not stated
B. Khagaria .Urban Total 22,329 12,081 10,248 5,549 166 713 6 1,430 24 97 AgglomeratIOn
0-14 9,537 5,084 4,453 142 2 7 50 2 15-19 1,965 1,111 854 354 4 29 122 1 11 20-24 1,924 986 938 543 19 58 161 4 10 25-29 1,502 BOO 702 684 26 72 157 6 16 30-39 2,966 1,568 1,398 1,507 55 158 2 354 5 23 40-49 2,254 1,318 936 1,270 35 170 314 2 19 50-59 1,076 654 422 614 II 113 149 4 12 60+ 1,105 560 545 435 14 106 4 123 2 4
Age not stated
(a) Khagaria (M) Total 17,150 9,283 7,867 4,143 148 544 5 351 15 34
0-14 7,421 3,910 3,511 100 2 6 9 2 15-19 1,562 879. 683 249 3 17. 40 3 20-24 1,481 777 704 393 18 37 49 3 2 25-29 1,143 621 522 525 25 56 .37 5 9 30-39 2,239 1,207 1,032 1,157 48 123 2 77 3 8 40-49 1,681 988 693 954 30 134 71 6 50-59 812 494 318 459 II 88 40 4 4 60+ 811 407 404 306 11 83 3 28
Age not stated
(b) Mathurapur Total 5,179 2,798 2,381 1,406 18 169 1,079 9 63
0-14 2,116 1,174 942 42 l 41 15-19 403 232 171 lOS \2. 82 1 8 20-24 443 209 234 150 21 112 I 8< 25-29 359 179 180 159 1 16 120 1 7 30-39 727 361 366 350 7 35 277 2 15< 40-49 573 330 243 316 5 36 243 2 13 50-59 264 160 104 155 25 109 8
.604- 294 153 141 129 3 23 95 2 4
Age not stated ..

'13
A~E~S ACCORDING TO MAIN ACT,VITY CLASSIFIED BY S:f,:~ AND AGE-GROUPS-contd.
WORKERS
r:~-~'-l-V------------------V----------~---~ VII '----v-I-r-r----------r-x--------,
Mining &
Quarrying
Manufacturing, Processing, Servicing & Repairs
,------.... ----------, (a)
Household Industry
(b) Other than Household.
Industry ,--~~ r-_"'_"""__~ ,---...__-, M~es Females Males Females Males Female~
14
13
I 2 4 2 4
5
2 I
2
1
1
15 16
804
39 94
101 103 165 155
88 _p9
721
18 52 103 100 157 154
71 66
389
15 36 48 55 85 72 51 27
232
8 16 22 36 60 49 31 10
223
8 15 21 34 59 47 29 10
9
1 1 2 I 2 2
17
106
15 8
15 17 23 15
B 5
23
I 1 3 3 4 6 3 2
28
2 3 4 2 5 7 3 2
21
6
9 6
20
6
8 6
Ii!
300
15 23 42 32 80 61 23 24
436
7 37 57
68 132 87 35 13
170
7 18 15 21 42 30 23 14
429
13 32 57 56
122 79 48 22
420
13 32 54 54
121 77 47 22
9
3 2 1 2 1
19
1
6
2 2
14
1 3 2 I 4 2
1
1
Construction Trade & Transport, Storage Commerce & Communications
,..--.A----, ,-_.A.----, ,-__ ~....__.__" Males Females Males Females Males Females
20
90
3 14 9
26 23 II 4
116
I 9
12 18 30 25 9
12
74
3 5
15 2
17 12 13 7
78
3 10 17 23 13
5 6
72
1 3 9
15 21 13 5 5
6
1 2 2
21 22
J, 1,042
1
16 80 125 131 251 197 152 90
1,585
29 119 196
240 398 322 166 115
681
12 56
103 94
137 123
87 69
1,401
25 92
141 178 36'9 322 157 117
1,373
25 90
139 174 362 316 154 113
28
2 2 4 7 6 3 4
23
33
15 7 9 1
62
2 4 5 4
19 17 3 8
31
1 7 3
4 11
I 4
21
3 8 8
2
17
3 6 6
2
4
2 2
24
283
4 12 20 38 95 74 32 8
568
8 33 55 75
184 121 61 31
184
4 11 24 25 62 37 16 5
328
3 II 39 46
124 75 22 8
305
3 11 38 41
118 70 17
7
23
5 6 5 5 1
25
1
8
3 I
2
2
Other Services
,---"----, Males Females
_26
876
23 '40 69 85
306 220
95 38
726
17 38 68 96
211 189 56 51
679
28 24 58 73
199 174 81 42
840
33 38 45
106 274 229 76
,39
820 _
33 38 44
105 268 220
74 38
20
1 I 6 9 2
27
69
4
5 6
24 15
8 7
44
3 2 6 6
13 8
4 2
71
2 5 3 5
21 19 8 8
91
2 • .3 8
17 31 18 6 6
88
2 3 8
17 29 17 6 6
3
2 I
TABLE B-ll
x
Non~Workers Agegroup
,--__ .A.---, Males Females
28'
8,057
6,215 845 421 103
91 55 79
248
7,478
6,133 649 241
76 84 60 47
188
6,639
5,039 753 320 .1 0 1
89 65 47
225
6,532
4,942 757 443 116 61 48 40
125
5,140
3,810 630 384
96 50 34 35
101
1,392
1,132 127 59 20 11 14 5
24
29- 2
13,693 Totlll
5,916 0-14 1,191 15-19 1,011 20-24 1,030 25-29 1,718 30-39 1,231 40-49
730 50-59 866 60+
A.N.S.
12,184 Total
5,411 0-14 932 15-19
1,022 20_24 972 25-29
1,549 30-39 1,039 40-49 572 50-59 687 60+
.. A.N.S.
"10,900' Total
4,654 0_14 974 15-19 877 20-24
732 25-29 1,334 30-39
959 40-49 646 50-59 724 60+
A.N.S.
10,082 Total
4,451 0_14 850 15_19 919 20-24 676 25-29
1,343 30_39 901 40_49 411 50-59 531 60+
7,719
3,509 680 686 497 984 663 307 393
A.N.S.
Total
0-14 15-19 20-24 25-29 30_39 40_49 50_59 60+
.. A.N.S.
2,363 Total
942 0-14 170 15-19 233 20-24 179 25-29 359 30-39 238 40-49 104 50-59 138 60+
A.N.S.
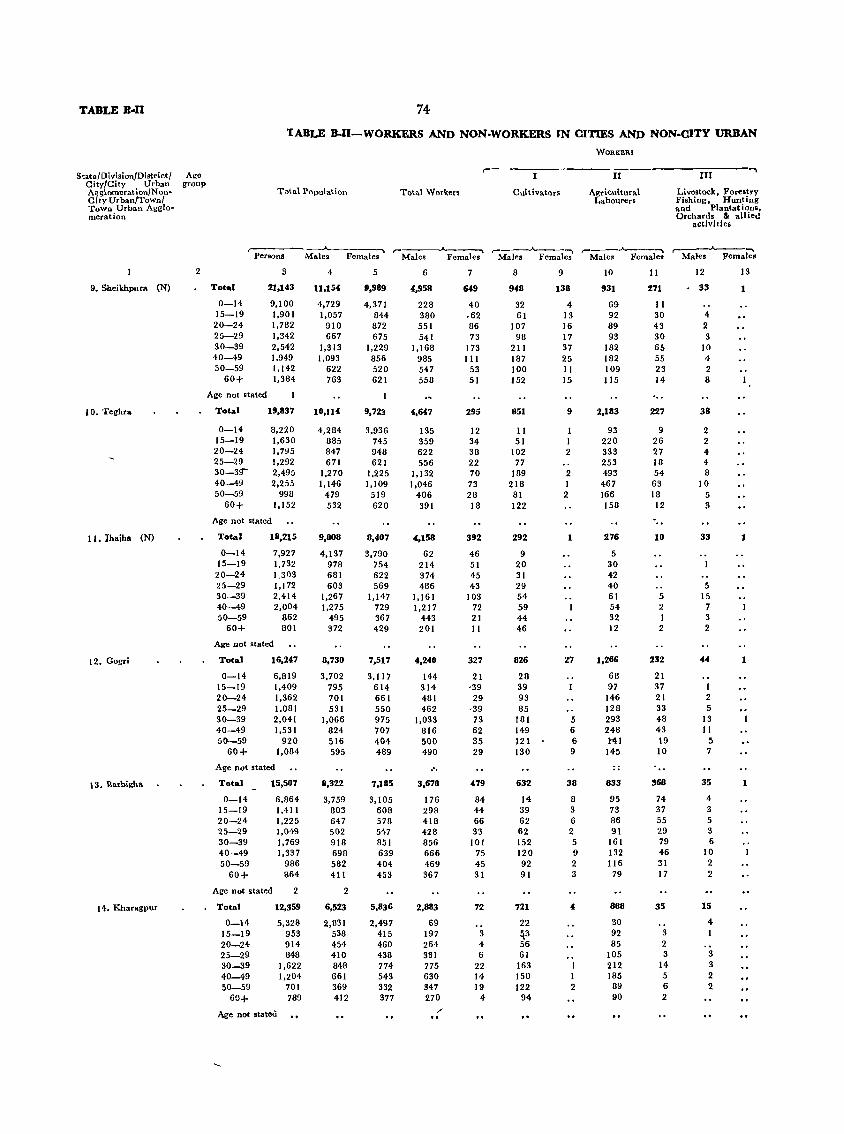
TABLE B-II 74-
TABLE B.II-WORKERS AND NON·WORKERS IN CITIES AND NON·CITY URBAN
WORKERS
,-- ..... State/ Oi vis ion/District / Age II III
City/City Urban group Total Population A~glomeration/Non- Total Workers Cultivators Agricultural Livestock, Forestry
City Urban/Town/ Labourers Fishing, Hunting Town Urban Agglo- and Plantat i ono, meration Orchards 3< allied
activities
,..-_--..A.-_ ....... r"----'-------. ...... ...... r" Female? r"Male. Persons Males Females Males Males Females Males Female. Females
2 3 4 5 6 7 8 9 10 11 12 13
9. Sheikhpura (N) Total 21,143 11,154 9,989 4,958 &49 948 138 931 271 33 1
0-14 9.100 4,729 4,371 228 40 32 4 69 11 15-19 1,901 1,057 844 380 .62 61 13 92 30 4 20-24 1,782 910 872 551 86 107 16 89 43 2 25-29 1,342 667 675 541 73 98 17 93 30 3 30-39 2,542 1,313 1,229 1,168 173 211 37 182 65 10 40-49 1.949 1,093 856 985 III 187 25 182 55 4 50-59 1,142 622 520 547 53 100 11 109 23 2
60+ 1,384 763 621 558 51 152 15 115 14 8
Age not stated '"
10. Teghra Total 1',837 10,114 9,723 4,647 295 851 9 2,183 227 38
0-14 8,220 4,284 3,936 135 12 11 1 93 9 2 15-19 1,630 885 745 359 34 51 1 220 26 2 20-24 1,795 847 948 622 38 102 2 333 27 4 25-29 1,292 671 621 556 22 77 253 18 4 30-3!!"' 2,495 1,270 1,225 1,132 70 189 2 493 54 8 40--49 2,255 1,146 1,109 1,046 73 218 1 467 63 10 50-59 998 479 519 406 28 81 2 166 18 5
60+ 1,152 532 620 391 18 122 158 12 3
Age not stated
11. lbaiha (N) Total 18,215 9,808 8,407 4,158 392 292 276 10 33 1
0-14 7,927 4,137 3,790 62 46 9 5 15-19 1,732 978 754 214 51 20 30 20-24 1,303 681 622 374 45 31 42 25-29 1,172 603 569 486 43 29 40 5 30-39 2,414 1,267 1,147 1,161 103 54 61 5 15 40-49 2,004 1,275 729 1,217 72 59 54 2 7 50--59 862 495 367 443 21 44 32 1 3
60+ 801 372 429 201 11 46 12 2 2
Age not stated
12. Gogri Total 16,247 8,730 7,517 4,240 327 826 27 1,266 232 44 1
0-14 6,819 3,702 3,117 144 21 28 68 21 15-19 1,409 795 614 314 -39 39 97 37 1 20-24 1,362 701 661 481 29 93 146 21 2 25-29 1,081 531 550 462 ·39 85 128 33 5 30-39 2,041 1,066 975 1,033 73 181 5 293 48 13 40-49 1,531 824 707 816 62 149 6 248 43 11 50-59 920 516 404 500 35 121 6 M1 19 !i
60+ 1,084 595 489 490 29 130 9 145 10 7
Age not stated ,', .. 13, Earbigha Total 15,507 8,322 7,185 3,678 .79 632 38 833 368 35 1
0-14 6,864 3,759 3,105 176 84 14 8 95 74 4 15-19 1,411 803 608 298 44 39 3 73 37 3 20-24 1,225 647 578 418 66 62 6 86 55 5 25-29 1,049 502 547 428 33 62 2 91 29 3 30-39 1,769 918 851 856 101 152 5 161 79 6 40-49 1,337 698 639 666 75 120 9 132 46 10 50-59 986 582 404 469 45 92 2 116 31 2
60+ 864 411 453 367 31 91 3 79 17 2
Age not stated 2 2
14, Kharagpur Total 12,359 6,523 5,836 2,883 72 721 « 888 35 15
0-14 5,328 2,831 2,497 69 22 SO 4 15-19 953 538 415 197 3 !P 92 3 1 20-24 914 454 460 264 4 56 85 2 25-29 848 410 438 331 6 61 105 3 3 30-39 1,622 848 774 775 22 163 212 14 3 40-49 1,204 661 543 630 14 150 1 185 5 2 50-59 701 369 332 347 19 122 2 89 6 2
60+ 789 412 377 270 4 94 90 2
Age not stated / ..
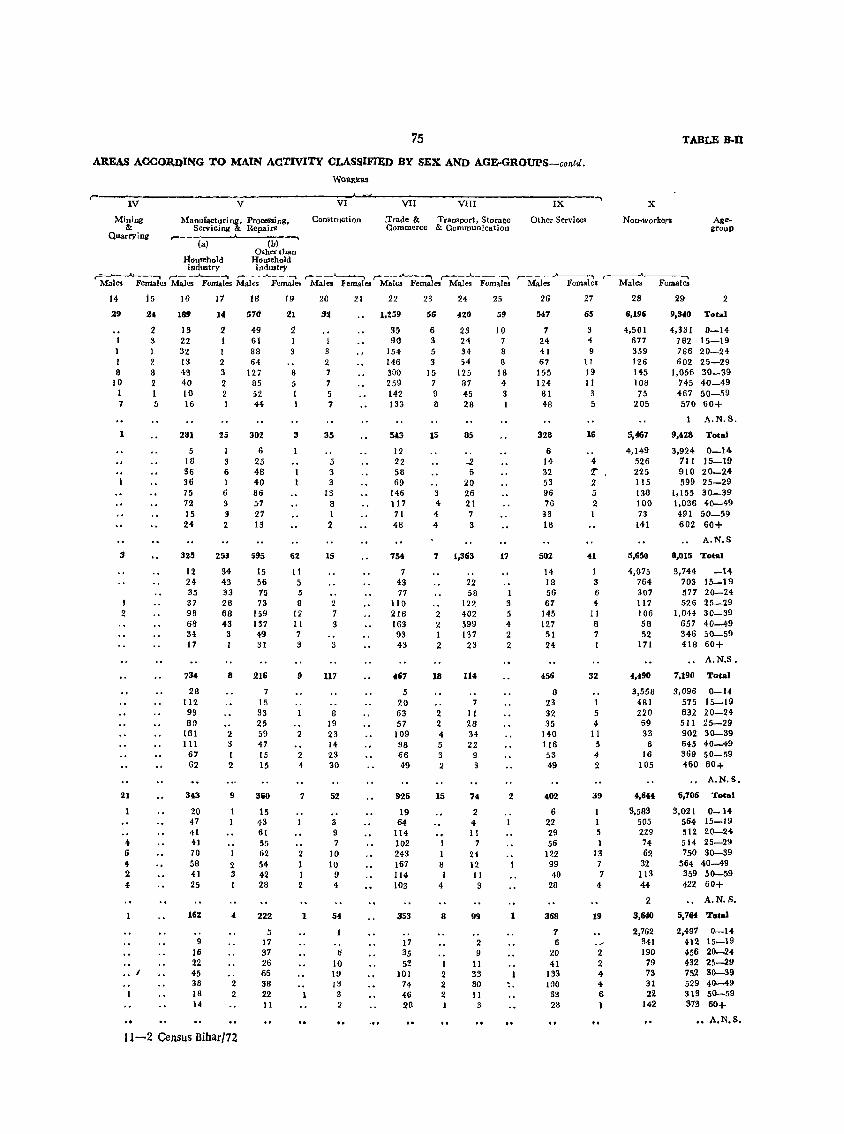
75 TABLE :a-n AR.EAS AOCOR.DING TO MAIN ACTIVITY CLASSIFJED BY SEX AND AGE-GROUPS-contd.
r-----l-v-----------------v--~------------cV~I~~~--~VI~I--------V-I-II-------------I-X------~ x Mining
& Quarrying
l\{anul'acturing, Processing, Servicing & Repairs
(a) (b) Othertllan
ltou!lehold HOU!lehold industry industry
Construction .Trade & Transport, Storage Commerce & Communication
r" Ma-I-........... ~F-ema-le5 ~~~s Males Females r-MaJes Females r-~~esr-~-F-e-m-ale's
14
29
1 1 1 6
10 I 7
1
J 2
4-S 4 2 4
•• J
15
2~
2 3 1 2 S :2 1 5
16
189
13 22 32 13 43 40 10 16
281
5 18 36 36 75 12 15 24
325
12 24-35 37 96 68 34-17
73~
28 liZ 93 80
181 III
67 62
343
20 47 41 41 70 58 41 25
162
9 16 22 45 38 18 14
17
14
2 I
2 3 2 2
2S
I 3 6 I 6 3 9 2
253
34 43 33 28 68 43 3
8
2 3 I 2
9
I
2 3 1
4
2 2
11--2 Census Bihar/72
III
57fl
49 61 88 64
127 85 52 44
302
6 25 48 40 86 51 27 13
595
15 56 75 13
159 137 49 31
2Iti
15 33 25 59 47 15 15
360
15 43 61 55 62 54 42 28
222
5 17 37 26 66 38 22 11
19
21
!I j
8 5 1 1
3
62
11 5 5 8
12 11 7 3
9
2
2 4
7
2 1 I 2
1
20
:JZ
3 2 7 7 5 7
5 3 3
13 8 1 2
15
2 1 3
3
117
o 19 23 14 23 30
52
3 9 7
10 10
9 4
54
~
10 ]9 )3
3 2
21 22
1,259
35 90
154 146 300 259 142 133
543
12 22 56 69
146 117 71 48
754
7 43 77
110 218 163 93 43
467
5 20 63 57 109 98 66 49
926
19 64
114 102 243 167 1I4 103
353
17 35 52
101 74 46 28
23
56
6 3 5 3
15 7 9 8
15
3 4 4 4
24
420
23 24-34 54
125 87 45 28
85
-.2 6
20 26 21 7 3
7 1,363
2 2 1 2
18
2 2 4 5 3 2
15
I 8 1
4
8
1 2 2 2
22 58
122 402 599 137 23
ll~
7 11 26 34 22
9 3
74
2 4 II
7 24 12 11 3
99
2 9
11 33 30 11
3
25
59
10
8 8
18 4 3
17
1 3 5 4 2 2
2
1
Other Services Non-worker1 AgegroUP
.-__ .A---...., • __ -'-___ .....
Males Females Mal.. Females
26
547
7 24 41 67
155 IH
81 48
328
6 14 32 53 96 76
33 18
502
14 18 56 67
145 127 51 24
45fi
6 23 32 35
140 116 53 49
402
6 22 29 56
122 99 40 28
368
7 6
20 41
133 100
33 28
27
65
3
" 9 11 19 11
3 5
1&
4 '["
2 5 2
41
1 3 6 4-
11 6 7
32
1 5 4 II
5 4 2
39
1 1 5 1
13 7 7
4
19
2 2 4 4-6 I ..
28
6,19&
4,501 677 359 126 145 108 75
205
5,467
4,149 526 225 115 136 100 73
141
5,650
4,075 764 307 117 106 58 52
171
4,.90
3,558 481 220 69 33 B
16 105
4,644
3,563 505 229 74-62
32 113 44
2
3,640
2,762 341 190
79 73 31 22
142
, .
29 2
9,'40 Total
4,3S1 0-14 782 15-19 186 20-24 602 25-29
1,056 30_39 745 40_49 467 50-59 570 60+
A.N.S.
9,'28 Total
3,924 0_10\ 711 15-19 910 20-24 599 25-29
1,155 30_39 1,036 40-49 491 50-59 602 60+
A.N.S
8,015 Total
3,744 703 577 526
1,044 657 346 41B
-14 15-19 20-24 25-29 30-39 40-49 50-59 60+
A.N.S.
7,190 Total
3,096 0-14 575 15-19 632 20-24 511 25-29 902 30-39 645 40_49 369 50-59 460 60+
A.N.S.
6,706 Total
3,021 0-14 564 15-19 512 20-24 514 25-29 750 30-39
564 40-49 359 50-59 422 60+
A.N.S.
5,764 Total
2,497 412 456 432 752 529 31S 373
0-14 15-19 20-24 25-29 30-39 40-49 50-59 60+
•• A.N.S.
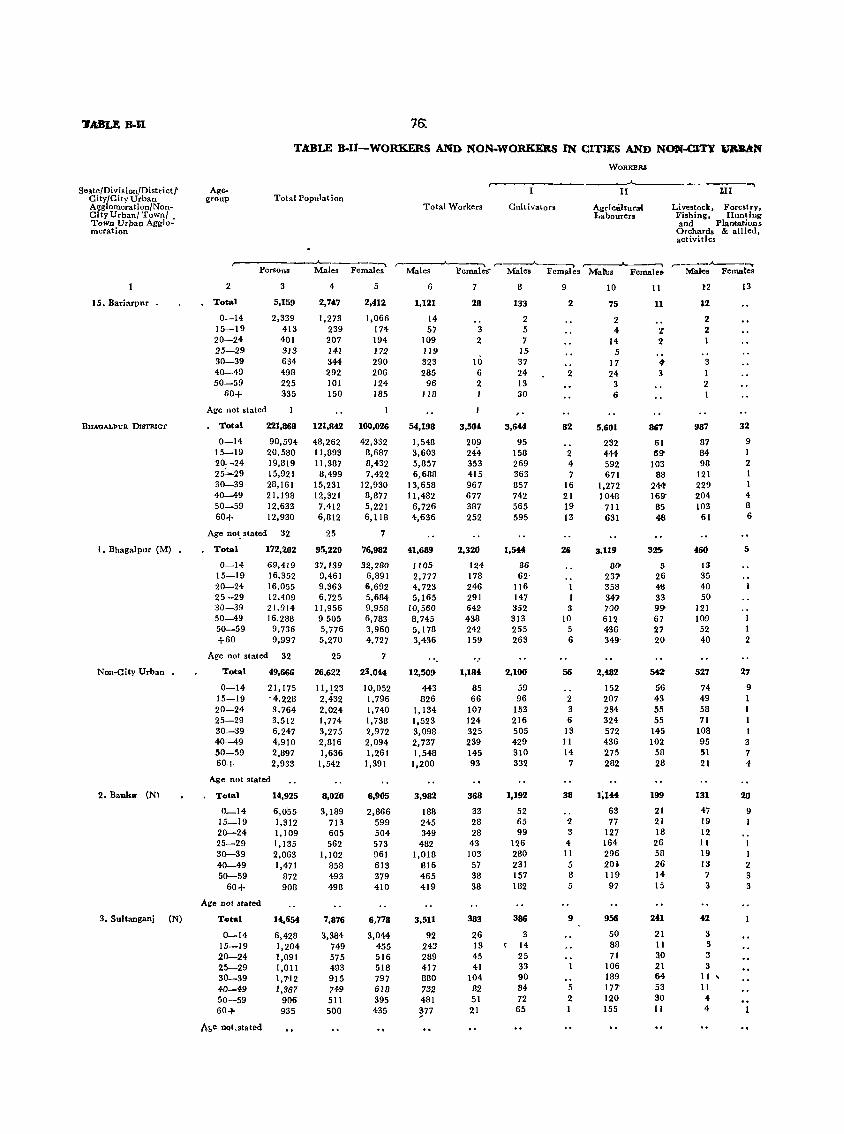
Se.tefDivisioll/Districtt CityfCityUrban A~glomeration/NonCityUrbanfTownf. Town Urpan Agglomeration
15. BaTiarpur
BHA'OALPUR DtSTlUcT
I. Bhagalpur (M)
Non-City Urban .
2. BankS' (N\
3. Sultanganj (N)
TA:BLE B-I1-WORKERS ANI) NON-WORKEltS IN CITIES AND NON-ClTY l1DAN
Agegroup Total Population
r----¥-er-s-on-s----~'e-s--F-e-ma--Ic?
2
Total
0-14 15-19 20-24 25-29 30-39 40-49 50-59
60+
3
5,159
2,339 413 401 313 634 498 225 335
Age not stated
Total
0-14 15-19 20-24 25:""29 30-39 40-49 50-59 60+
221,868
90.594 20,580 19,819 15,921 28,161 21,198 12,633 12,930
Age not, stated 32
Total
0-14 15-19 20-24 25-29 30-39 50-49 50-59 +60
172,202
69,419 16,352 16,055 12.409 21.914 16,288
9,736 9,997
Age not stated 32
Total
0-14 15-19 20-24 25-29 30-39 40-49 50-59 60+
49,666
21,175 -4,228 3,764 3,512 6,247 4,910 2,897 2,933
Age not stated
Tutal
0_14 15_19 20~24
25-29 30-39 40-49 50-59
60+
Age DO! stated
Total
0-14 15-19 20-24 25-29 30-39 M-49 50-59 60-!,-
A&e not,stated
14,925
6,055 1,312 1,109 1,135 2,063 1,471
872 908
14,654
6,428 1,204 1,091 1,011 1,7'12 1,367
906 935
4
2,747
1,273 239 207 HI 344 292 101 150
121,842
48,262 11,893 11,387 8,499
15,231 12,321 7,412 6,812
25
95,220
37,139 9,461 9,363 6,725
11,956 9505 5,776 5,270
25
26,622
11,123 2,432 2,024 1,774 3,275 2,816 1,636
1,542
8,020
3,189 713 605 562
1,102 858 493 498
7,876
3,384 749 575 493 915 749 511 500
5
2,412
1,066 174 194 J 72 290 206 124 185
100,026
42,332 8,687 8,432 7,422
12,930 8,877 5,221 6,118
7
76,982
82,280 6,891 6,692 5,684 9,958 6,783 3,960 4,727
7
23,044
10,052 1,796 1,740 1,738 2,972 2,094 1,261
1,391
6,905
2,866 599 504 573 961 613 379 410
6,778
3,044 455 516 518 797 618 395 435
WORKBRS
r-----~--------------I-I~--------------II~I---~
Total Workers Cultivators Agricultura{ Labourers
Livestock, Forestry, Fishing, Hunting and Plantations Orchard. & allied, activities
,--_,..,____"""""\ r-____.A".......-,. Males Females' Male. Females .Malic.
r---.A,--..... Femalc& Mak. Female.
6
1,121
14 57
109 J19 323 285
96 lI8
54,198
1,548 3,603 5,857 6,688
13,658 11,482
6,726 4,636
41,689
1105 2,777 4,723 5,165
10,560 8,745 5,178 3,436
12,509'
443 826
1,134 1,523 3,098 2,737 1,548
1,200
3,982
188 245 349 482
1,018 816 465 419
3,511
92 243 289 417 880 732 481
~77
7
28
3 2
10 6 2
3,504
209 244 353 415 967 677 387 252
2,320
124 178 246 291 642 438 242 159
1,184
85 66
107 124 325 239 145 93
368
33 28 28 43 103 57 38 38
383
26 13 45 41
104 82 51 21
8
133
2 5 7
15 37 24 13 30
3,644
95 150 269 363 857 742 565 595
1,544
36 62
116 147 352 313 255 263
2,100
59 96
153 216 505 429 310 332
1,192
52 65 99
126 280 231 157 182
386
3 14 25 33 90 84 72 65
9
2
2
82
2 4 7
16 21 19 13
3 10
5 6
56
2 3 6
13 II 14
7
38
2 3
4 II
5 8 5
9
5 2 1
10
75
2 4
14 5
17 24
3 6
5,601
232 444 592 671
1,272 1048
711 631
3,119
O{} 231 358 347 700 612 436 349-
2,482
152 207 234 324 572 436 275 282
1;144
63 77
127 164 296 20} 119 97
956
50 88 71
106 189 177' 120 155
11
11
Z 2
4-3
867
61 69'
103 88
24t 16!)" 85 46
35
5 26 4S 33 99-67 27 20
~
56 43 55 55
145 102
58 28
199
21 21 18 26 58 26 14 15
241
21 II !l0 21 64 53 30 II
!2
12
2 2 1
3 I 2 1
987
87 84 98
121 229 204 103 61
460
13 35 40 50
121 109 52 40
527
74 49 58 71
108 95 51 21
131
47 19 12 11 19 13 7 3
f2
3 3 :I 3 II, II 4 4
13
32
9 I 2 1 I 4 8 6
5
1 2
27
9
I 3 7 4
20
9
I 2 3 3
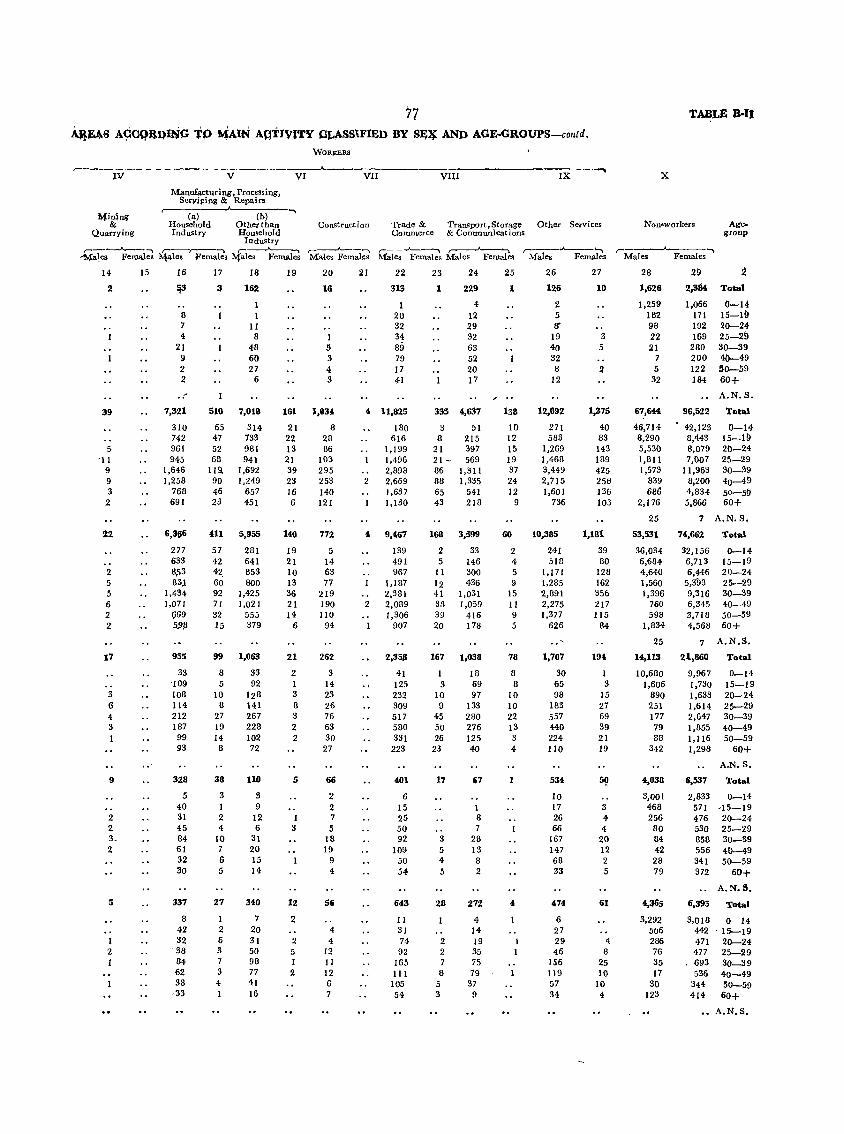
'77 AJl.t:A6 A¢~J!.l}uiG if) t4AUol A~tJVJTY QJ,.ASS1FIED BY SJ<;~ AND AGE-GROUPS-contd.
WORj<ERS
r-----------------------------------------~-------------------------------N V ~ W
Manufacturing, Processing, Seryjping & Repairs
VIII IX~
t,1in'jng &
Quarrying
r---(~ ..... Household Other than Construction Trade & Transport, Storage Other Services Industry Household Commerce & Communications
Industry ,.-___ .A...--, r----,---~ ,.-----'----.
-14a\es Females "4ales Female • .J){ales Females ,----A----....... r-~ r-~ ,.---.......__...., Males Femal~s Males Females Males Females Males Females
14
2
39
5 '11
9 9 3
2
2 5 5 6 2 2
17
3 6 4 3
9
2 2 3. 2
5
I 2 I
15 16
l!3
B 7 4
21 9 2 2
7,321
310 742 961 945
1,646 1,258
768 691
6,366
277 633 8,53 83.1
1,434 1,071
969 5.913
955
33 '109 108 114 212 187 99 93
328
5 40 31 45 84 61 32 30
337
8 42 32
'S8 84 62 36
·33
17
3
18
162
1 1
1I 8
48 60 27
6
510 7,018
65 314 47 733 52 981 68 941
119. 1,692 90 1,249 46 657 23 451
411
57 42 4~ 60 92 71 32 15
99
8 5
10 8
27 19 14 8
38
3 1 2 4
10 7 6 5
27
I 2 6 3 7 3 4 I
5,955
281 641 853 800
1,425 1,021
555 379
1,063
33 92
128 141 267 228 102 72
110
3 9
12 6
31 20 15 14
340
7 20 31 50 98 77 41 16
19 20
16
I 5 3 4 3
161 1,034
21 8 22 28 13 86 21 103 39 295 23 253 16 140 6 121
140
19 21 10 13 36 21 14
6
21
2 I 3 8 3 2 2
5
J 3
12
2
2 5 1 2
77'1.
5 14 63 77
219 190 110
94
262
3 14 23 26 76 63 30
27
66
2 2 7 5
18 19
9 4
56
4 4
12 II 12 6 7
21 22
313
1 20 32 34 89 79 17 41
4 11,825
180 616
1,199 1,496 2,898
2 2,669
2
1,637 1,130
9,467
139 491 967
1.187 2,381 2,089 1,306
907
2,35j1
41 125 232 309 517 580 331
223
401
6 15 25 50 92
109 50 54
643
II 31 74 92
165 III 105 54
23
1
24
229
4 12 29 32 63 52 20 17
335 4,637
3 51 8 215
21 397 21 - 569 86 1,311 88 1,335 65 541 43 218
168
2 5
11 12 41 3t1 39 20
167
1 3
10 9
45 50 26
23
17
3 5 4 5
28
2 2 7 8
5 3
3,599
33 146 300 436
1,031 1,059
416 178
1,038
18 69 97
133 280 276 125 40
67
1 8 7
28 13 8 2
272
4 14 19 35 75 79
37 9
25
1
138
10 12 15 19 37 24 12
9
60
2 4 5 9
15 II 9 5
78
8 8
10 10 22 13 3 4
1
1 1
26
126
2 5 8'
19 40 32 8
12
12,092
271 583
1,269 1,468 3,449 2,715 1,601
736
10,385
241 518
1,171 1,285 2,891 2,275 1,377
626
1,707
30 65 98
183 557 440 224 110
534
10 17 26 66
167 147 68 33
474
6 27 29 46
156 119 57 34
27
10
3 5
:I
1,375
40 83 143 189 425 256 136 103
1,181
39 80
128 162 350 217 1I5
84
194
I 3
15 27 69 39 21 19
3 4 4
20 12 2 5
61
4 8
25 10
10 4
TABLE ~ll
x
Non-workers Agegroup
r-~ ..... Males Females
28
1,626
1,259 162 98 22 21
7 5
32
67,644
46,714 8,290 5,530 1,811 1.573
839 686
2,176
25
53,531
36,034 6,684 4,640 1,560 1,396
760 598
1,834
29 2 2,S84 Total
1,066 171 192 169
280 200 122 184
96,522
42,123 8,443 8,079 7,007
11,963 8,200 4,834 5.866
0-14 15-19 20--24 25--29 30--39 40-49 50--59 60+
A.N.S.
'rotal
0--14 15-111 20-24 25--29 30 __ 39 40--49 50--5§ 60+
7 A.N.S.
74,662
32,156 6,713 6,446
5,3"93 9,316 6,345 3,718 4,568
Total
0--14 15--19 20-24 25--29 30--39 40-49 50--59 60+
25 7 A.N.S.
14,113
10,680 1,606
890 251 177 79 88
342
4,038
3,001 468 256 80 84 42 28 79
4,365
3,292 !i(j6 286 76 35 17
30 123
21,860
9,967 1,730 1,633 1,614 2,647 1,855 1,116 1,298
6,537
2,833 571 476 530 858 556 341 372
Total
0_14 15-19 20-24 25-29 30--39 40--49 50--59
60+
A.N.S.
Total
0-14 -15-19 20--24 25--29 30-39 40--49 50-59
60+
A.N.S.
6,395 Total
3,018 0 14 442 '15--19 471 20--24
477 25-29 693 30--39 536 40-49
344 50--59 414 60+
A.N.S.
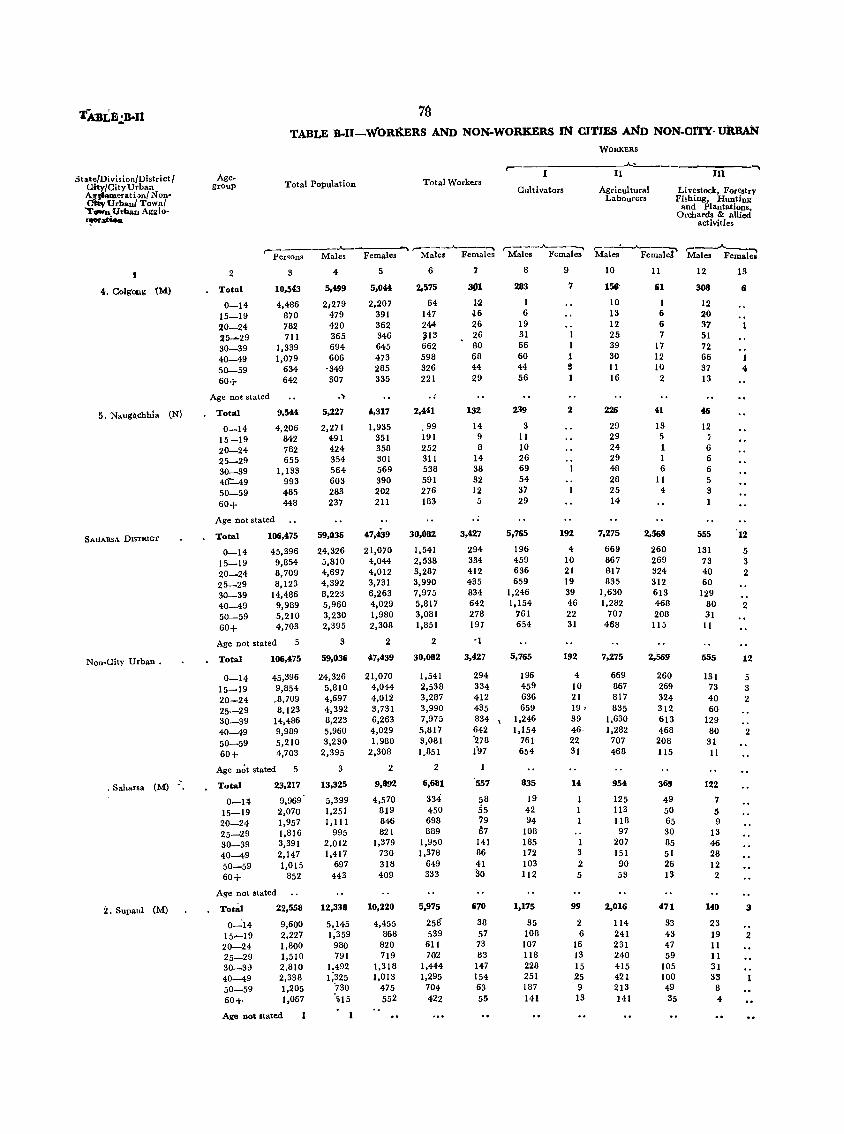
TABLE.:,B-Il 7~
TABLE B.IJ~WORKERS AND NON-WORKERS IN CITIES AND NON.cI'rY-11lmAN WORKERS
r-----~ ...... StatelDivi,ionjDistrictj Age- I II III
City/City Urban group Total Population Total Workers
~raeratbn/Non-Cultivators Agricultural Livestock, Forestry
Urban/ Town/ Labourers Fishing, Hunting
"T_ Uri>a" Agglo- and Plantations,
~adeo. Orchards & allied
activities
,..~ ______ .A-_ ~ __ -...A.. ___ ...... ,-___ A------, r--~--""
,-____.A.. ___ ......
Per'OnS Males Females Male. Females Males Females Males Female! Males Females
t 2 3 4 5 6 7 8 9 10 11 12 13
4. Colgong ~M) Total 10,543 5,499 5,044 2,575 31)1 283 7 156- 61 308 6
0-14 4,486 2.279 2,207 64 1-2 1 10 I 12
15-19 870 479 391 147 i6 6 13 6 20 20-24 782 420 362 2M- 26 19 12 6 37
25~29 711 365 346 ~13 26 31 I 25 7 51
30-39 1,339 694 645 662 80 66 1 39 17 72 40-49 1,079 606 473 598 68 60 1 30 12 66 I 50-59 634 -349 285 326 44 44 S 11 10 37 .. 60+ 642 307 335 221 29 56 16 2 13
Age not stated .') .. 5. Naugilchhia (N) Total 9,544 5,227 ',317 2,4,11 132 239 2 226 41 46
0-14 4,206 2,271 1,935 99 14 3 29 13 12
15-19 842 491 351 191 9 11 29 5
20-24 782 424 358 252 8 10 24 I 6
25-29 655 354 301 311 14 26 29 I 6
30-39 1,133 564 569 538 38 69 48 6 6
40"::...49 993 603 390 591 32 54 28 11 5
50-59 485 283 202 276 12 37 25 4 3
60+ 448 237 211 183 5 29 14 1
Age not stated .. SAllARSA DISTRICT Total 106,475 59,036 47,439 30,082 3,427 5,765 192 7,275 2,569 555 12
0-14 45,396 24,326 21,070 1,541 294 196 4 669 260 131 5 15-19 9,854 5,810 4,044 2,538 334 459 10 867 269 73 3
20-24 8,709 4,697 4,012 3,287 412 636 21 817 324 40 2 25-29 8,123 4,392 3,731 3,990 435 659 19 835 312 60
30-39 14,486 8,223 6,263 7,975 834 1,246 39 1,630 613 129 40-49 9,989 5,960 4,029 5,817 642 1,154 46 1,282 468 80 2 50-59 5,210 3,230 1,980 3,081 278 761 22 707 208 31
60+ 4,703 2,395 2,308 1,851 191 654 31 468 115 11
Age not stated 5 3 2 2 -1
Non-City Urban. Total 106,475 59,036 47,439 30,082 3,427 5,765 192 7,275 2,569 555 12
0-14 45,396 24,326 21,070 1,541 294 196 4 669 260 131 5 15-19 9,854 5,810 4,044 2,538 334 459 10 867 269 73 3 20-24 ,8,709 4,697 4,012 3,287 412 636 21 817 324 40 2 25-29 8,123 4,392 3,731 3,990 435 659 19, 835 312 60 30-39 14,486 8,223 6,263 7,975 834 \ 1,246 39 1,630 613 129 40-49 9,989 5,960 4,029 5,817 642 1,154 46 1,282 468 80 2 50-59 5,210 3,230 1.980 3,081 '278 761 22 707 208 31
60+ 4,703 2,395 2,308 1.851 197 654 31 468 115 II
Age not stated 5 3 2 2
, Saharsa (M) _' Total 23,217 13,325 9,892 6,681 557 835 14 954 369 122
0-14 9,969 5,399 4,570 334 58 19 I 125 49 7
15-19 2,070 1,251 819 450 55 42 1 113 50 5 20-24 1,957 1,111 846 698 '9 94 1 118 65 9 25-29 1,816 995 821 889 67 108 97 30 13 30-39 3,391 2,012 1,379 1,950 141 185 1 207 85 46 40-49 2,147 1,417 730 1,378 86 172 3 151 51 28 50-59 1,015 697 318 649 41 103 2 90 26 12 60+ 852 443 409 333 30 112 5 53 13 2
Age not stated
2. Supau1 (M) Total 22,558 12,338 10,220 5,975 670 1,175 99 2,016 471 1«0 3
0"":14 9,600 5,145 4,455 258 38 35 2 114 33 23 15~19 2,227 1;359 868 539 57 108 6 241 43 19 2 20-24 1,800 980 820 611 73 107 16 231 47 II 25-29 1,510 791 719 702 83 118 13 240 59 11 30-3il 2,810 1.492 1,318 1,444 147 228 15 415 105 31 40-49 2,338 1;325 1,013 1,295 154 251 25 421 100 33 50-59 1,205 -730 475 704 63 187 9 213 49 8
60+ 1,067 \i15 552 422 55 141 13 141 35 4
Age Dot stated 1
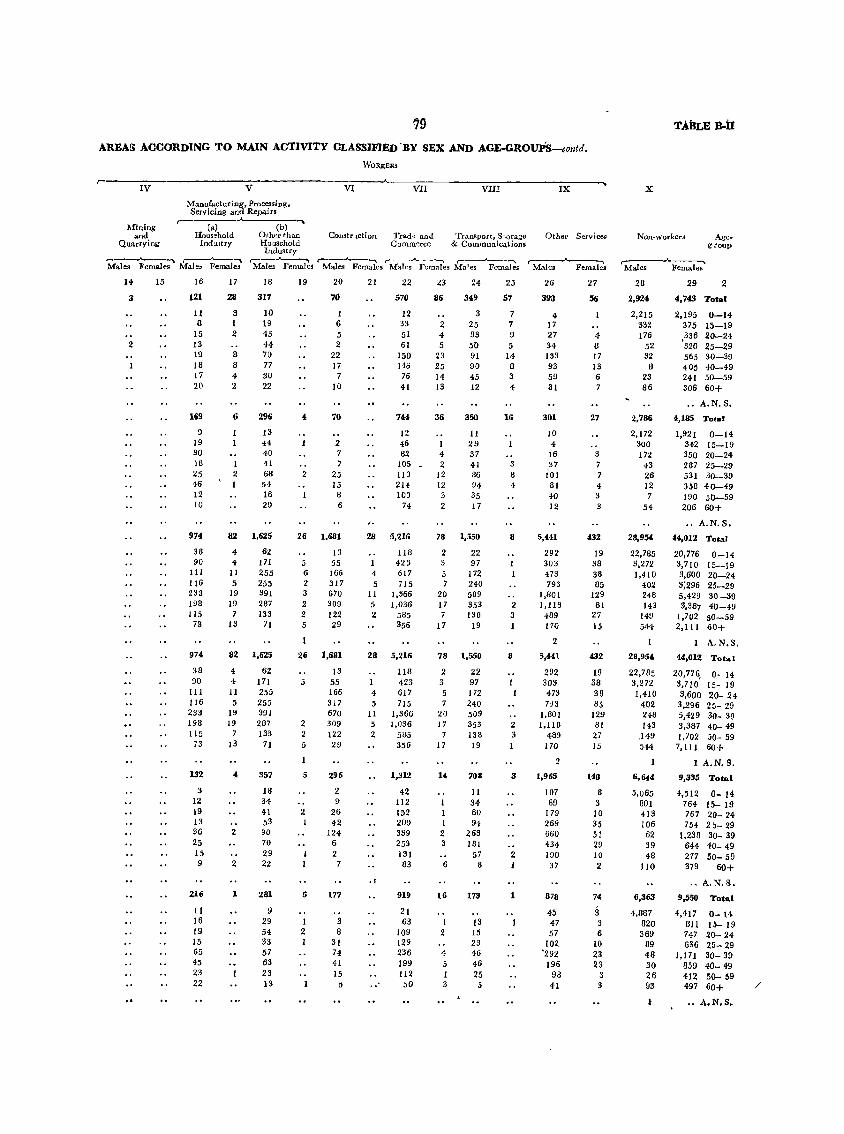
79 AREA[; ACOORDING TO MAIN ACTIVITY CLASSIFIED 'BY SEX AND AGE.GROUPS-contd.
~'------I-V--------------~V~------------~V=I~--~----V~I-I---------V=II=I--------~IX=----~
Mining and
Quarrying
Manufacturing, Processing, Servicing and Repairs
(a) Household
Indu.try
(b) Other than Construction Trade and Transport, Storage Other ServiceS! HOllSChold Commerce & Communications Industry
,---"'---~ ~-""'"\ Males Females l\{ale~ Females
r--""'__...., ,---.... -..... r" __ ,.A...-........ f----..A..-...., r-----..A..--...., Males Females Males Females Males Females Males Females Males Females
14
3
2
15 16
121
11 8
15 13 19 18 17 20
169
9 19 30 18 25 46 12 10
914
38 90
III 116 233 198 115
73
914
38 90
111 116 233 196 115
73
132
3 12 19 13 36 25 15 9
216
11 16 19 15 65 45 23 22
17
211
3 1 2
8 8 4 2
6
I 2
16
311
10 19 45 44 70 77 30 22
296
13 44 40 41 68 54 16 20
82 1,625
4 4
11 5
19 19 7
13
62 171 255 255 391 287 133
71
82 1,625
4 4 11 5
19 19
7 13
4
2
2
1
62 171 255 255 391 207 133
71
357
16 34 41 53 90 70 29 22
281
9 29 54 33 57 63 23 13
19
4
2
20
7()
1 6 5 2
22 17
7 10
70
2 7 7
25 15
8 6
26 1,681
5 6 2 3
2 2 5
13 55 166 317 670 309 122 29
26 1,681
5
2 2 5
5
2
I 1
5
I 2 1
13 55 166 317 670 309 122 29
296
2 9
26 42
124 6
2 7
177
3 8
31 74 41 15
5
21 22
570
12 33 51 61
150 146 76 4!
7'" 12 46 82
105 110 214 100
74
28 5,216
118 423 617 715
4 5
11 5 2
1,366 1,036
28 5,216
lI6 423
4 617 5 715
11 1,366 5 1,036 2 585
. ,
355
1,312
42 112 152 200 339 253 131 83
919
21 63
109 129 236 199 112 50
23
86
4 5
23 25 14 13
36
I 4 2
12 12 3 2
24
349
3 25 33 50 91 90 45 12
3511
11 29 37 41 86 94 35 17
78 1,550
2 3
5 7
20 17 7
17
22 97
172 240 509 353 138
19
78 1,550
2 3 5 7
20 17
7 17
I 2 3
6
16
I 2
4 5 1 3
22 97 172 240 509 353 138 19
708
11 34 60 94
263 181
57 8
173
13 15 23 46 46 25 5
25
51
7 7 9 5
14 6 3 4
16
3
6 4
8
2 3 1
8
2 3
3
2
1
26
398
4 17 27 34 133 93 59 31
301
10 4
16 37
iOl 81 40 12
5,441
292 303 473 793
1,801 1,118
489 170
2
5,"1
292 303 473 7"3
1,601 1,118
489 170
2
1,965
107 89
179 269 660 434 190 37
878
45 47 57
102 '292
196 98 41
27
56
4 8 17 13 6 7
27
3 7
4 3
432
19 38 38 85
129 61
27 15
432
19 as 36 85
129 81
27 15
148
8 3 10 35 51 29 10 2
74
3 3 6
10 23 23
3 3
TABLE n-it
x
Non~workcrs Age-group
r--.A.----..... Males Females
28
2,924
2,215 332 176
52 32 6
23 66
2,786
2,172 300 172
43 26 12 7
54
28,954
22,785 3,272 1,410
402 248 143
149 544
28,954
22,785 3,272 1,410
402 248 !f3
.149 544
6,644
5,065 801 413 106
62 39 48
110
6,363
4,887 820 369
89 48 30 26 93
29 2
4,743 Total
2,195 0-14 375 15-19 336 20-24
'320 25-29 565 30-39 405 40-49 241 50-59 306 60+
•• A.N.S.
4,185 Total
1,921 0-14 342 15-19 350 20-24 287 25-29 531 30-39 358 40-49 190 50-59 206 60+
•• A.N.S.
44,012 Tot .. 1
20,776 3,710 3,600 3:296 5,429 3,387
1,702 2,111
0-14 15-19 20-24 25-29 30-39 40-49 50-59 60+
A.N.S.
44,012 Tota I
20,776, 0- 14 3,710 15- 19 3,600 20- 24 3,296 25- 29 5,429 30- 39 3,387 40- 49 1,702 50- 59
7,111 60+
1 A.N. S.
9,3S5 Total
4,512 0- 14 764 15- 19 767 20- 24 754 23- 29
1,238 30- 39 644 40- 49 277 50- 59 379 60+
.• A.N.S .
9,550 Total
4,417 611 747 636
1,171 859 412 497
0- 14 15- 19 20- 24 25- 29 30- 39 40- 49 50- 59 60+
•• A.N.S.
/
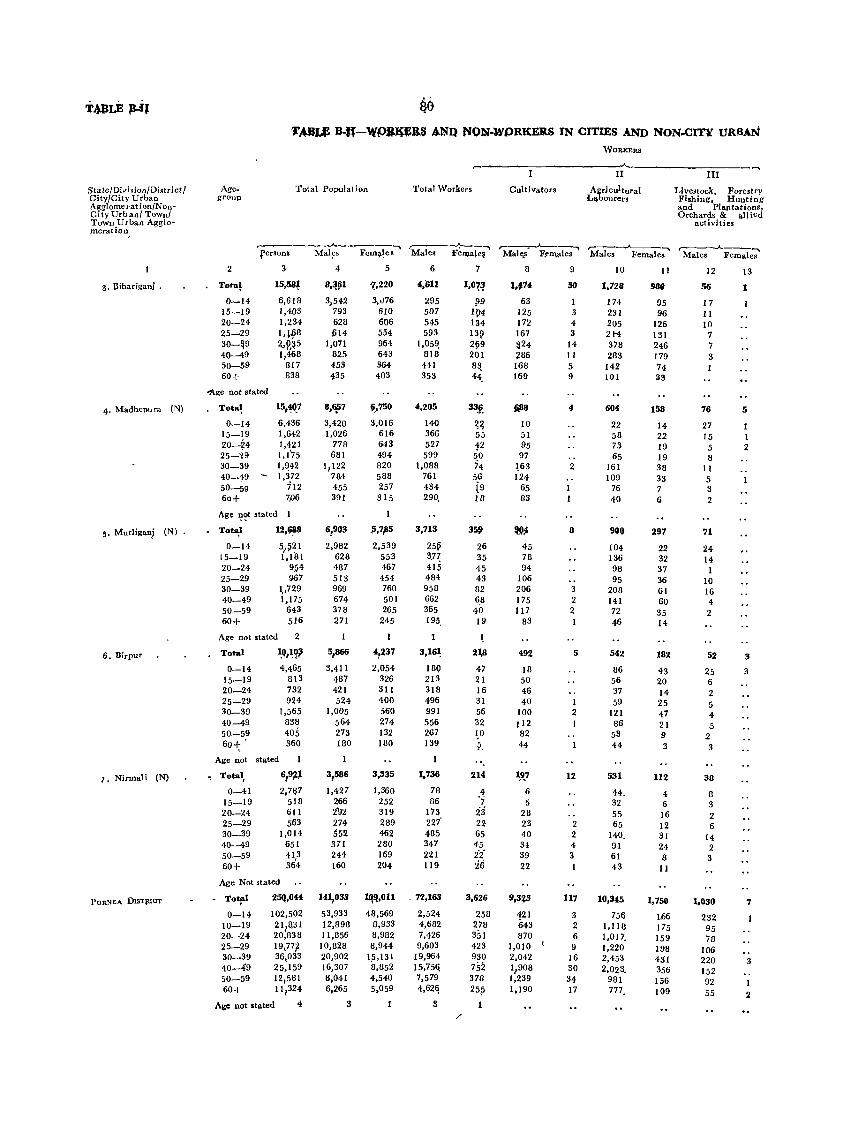
TULE JI.iJ M 'J'ABW B·n-WP.BlWB.3 .6.NQ NOlN·WDRKERS IN CITmS AND NON.CITY URBAN
WORKERS
II III
State/Di,;,ion/District/ Age- Total Population Total Workers Cultivators AgrIcultural Livestock, Forestry Cily/City Urban group L~bourers Fishing, Hunting Agglomeration!Non- and Plantations, CityUrban! Town! Orchards & allied Town Urban Agglo- activities meration)
--'-------., r---~---. .---.--"---., .---........A.--. r---.... ----. fersons Mal~s F"m~\es Males FeIl).ale~ Mal~s F~Ill.l\les Males Females Males Females
2 3 4 5 6 7 8 9 10 II 12 13
3. j3iharigan j . Total 15,58, 8,=t~1 1,220 4,611 I,O?~ 1.174 50 1,728 980 56 I
0-14 6,618 3,542 3,"'76 295 l}9 63 174 95 17 15-19 1,403 793 610 507 1{l4 125 3 231 96 II 20-24 1,234 628 606 545 134 172 4 205 126 10 25-29 1,lf8 .614 554 593 13~ 167 3 2M 131 7 30-~9 2.p'~5 1,071 964 1,05~ 2~9 324 14 378 246 7 40-49 1,468 825 643 818 201 ~86 II 283 179 3 50-59 817 453 364 441 8~ 168 5 142 74 60+ 838 t 35 403 353 44, 169 9 101 a3
"l\ge not stated
4. MadheDII fa (N) Tota~ 15,~.7 8,¥7 ~,750 4,205 3~~ i88 4 604 158 76 5
0-14 6,436 3,420 3,016 140 ~~ 10 22 14 27 1 15-19 1,642 1,026 616 366 55 51 58 22 IS I 20-24 1,421 778 643 527 12 95 73 19 5 2 25-'i9 1,1'75 681 494 599 50 97 65 19 8 30-39 1,~42 1,122 820 1,088, 74 ~63 2 161 38 11 40-49 1,372 784 588 761 56 124 109 33 5 50-59 712 455 257 434 ~9 65 76 7 3 60+ 7p6 391 315 290, 18 83 40 6 2
Age '!c:>t stated
5. Murliganj (N) • - Tot~l 12,!i!l8 6,903 1'>,7115 3,713 3S? 'll,lJ 8 900 297 71
0-14 5J~~1 2,982 2,539 25\) 26 45 104 22 24 15-19 1,181 628 553 37~ 35 78 136 32 14 20-24 9,14 487 467 415 45 94 98 37 I 25-29 967 513 454 484 43 106 95 36 10 30-39 \.129 969 760 958 82 206 3 208 61 16 40-49 1,175 674 501 662 6,8 175 2 141 60 4 50-59 643 378 265 365 40 117 2 72 35 2 60+ 516 271 245 195, 19 83 46 14
Age not stated 2 ~
6. Dirpur Total ~OA~iJ 5,866 4,237 3,16~ 2\8 492 5 542 182 52 3
0-14 4,465 3,411 2,054 IBQ 47 18 86 43 25 3 15-19 813 487 326 213 21 50 56 20 6 20-24 732 421 311 318 16 46 37 14 2 25-29 924 524 400 496 31 40 1 59 25 5 30-39 1,565 1,005 560 991 56 100 2 121 41 4 40-49 838 564 214 556 32 Il2 86 21 ,5 50-59 405 273 132 267 ~O 82 53 9 2 60"': 360 180 180 139 ~. 44 44 3 3
Age not stated I -1. Nirma1i (N) ~ Total, 6,9'1-~ 31586 3,335 1,736 214 ~9,7 12 531 112 38
0-41 2,71F 1,421 1,360 78 4 6 44. 4 8 15-19 518 266 252 86 'j 5 32 6 3 20-24 611 2'92 319 173 23 28 55 16 2 25-29 563 274 289 227' 22 23 2 65 12 6 30-39 1,014 552 462 485 65 40 2 140. 31 14 40-49 651 311 280 347 45 34 4 91 24 2 50-59 41,3 244 169 221 2'z' 39 3 61 8 3 60+ 364 160 204 119 26 22 43 11
Age Not stated
l'URNEA DIST~lCT - Total 2511,044 14~O33 lII!1,Oll , 72,163 , 3,626 9,3~3 117 10,345 1,750 1,030 7 0-14 102,502 53,933 48,569 2,524 258 421 3 756 1.66 232
10-19 21/8)11 12,898 8,933 4,682 278 643 2 1,118 175 95 20-24 20,838 11,856 8,982 7,426 351 870 6 1,017. 159 78 25-29 19,77'f. 10,828 8,944 9,603 423 1,010 I 9 1,220 198 106 30-39 36,033 20,902 1,5,131 19,964 930 2,042 16 2,453 431 220 3 40-49 25,159 16,307 8,852 15,75(i 752 1, 908 30 2,023. 356 152 50-59 12,581 8,041 4,540 1,579 378 1,239 34 981 156 92 1 60+ 11,324 6,265 5,059 4,62G 25;; 1,190 17 777 109 55 2
Age not stated 4 3 3
/'
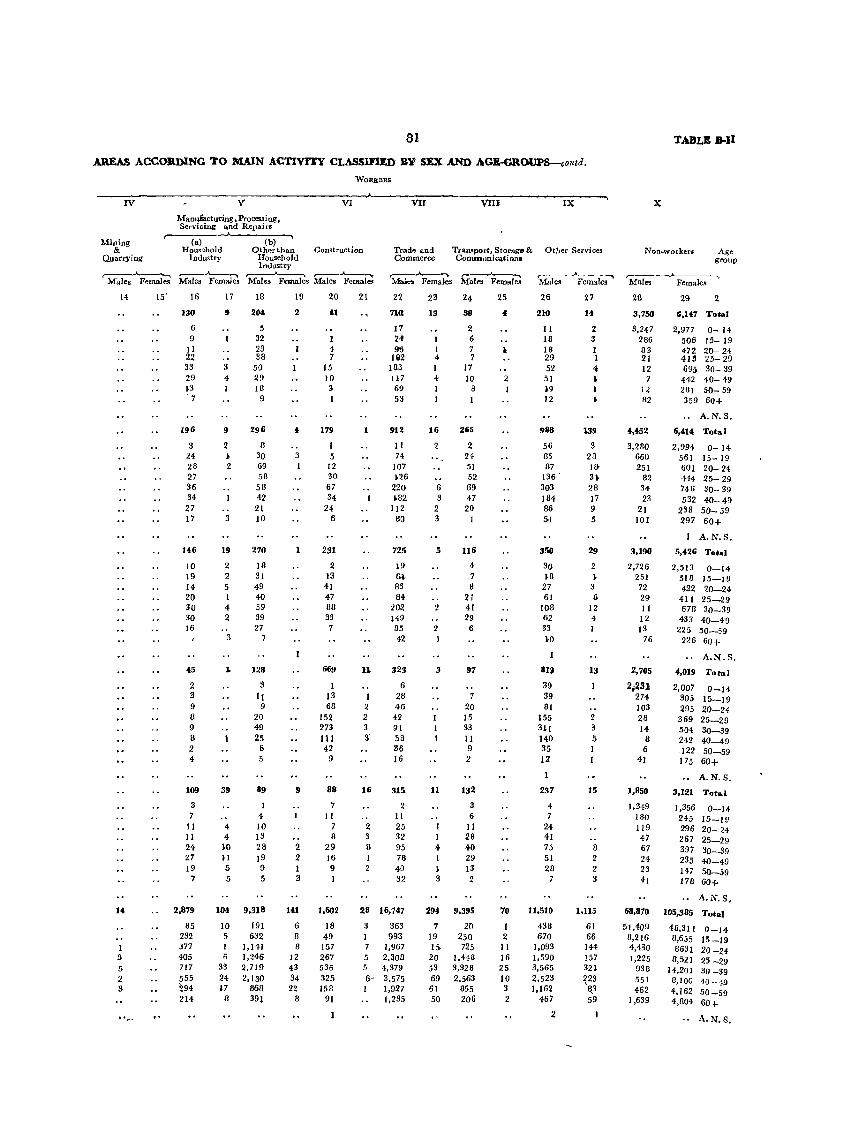
81
AREAS ACCOl\DlNG TO MAIN ACTIVITY CLASSIFIED BY SEX AND AGB-GROUPS-conta.
IV
Mining &
Quarrying
V
Manufacturing, Processing, Servicing ~nd Repahs
,----"----...... (a) (b)
Household Other than Industry Household
Industry
WORKERS
VI VII VIII IX
Construction Trade and Transport, Storage & Other Services Commerce Communications
,..-__ .A.-_....., ~-.A.--.-., ,..--~ ,..--~
Males Females Males Females Male~ Females Males Females M:Ue& ~ks Males Females .Males Females'-\
14
1 3 5 2 3
. .... ~
15' 16
130
6 9
11 22 33 29 }3
·7
196
3 24 28 27 36 34 27 17
}46
10 19 14 20 30 30 16
45
2 3 9 8 9 8 2 4
109
3 7
11 11 24 27 19
7
2,879
85 232 377 405 717 555 294 214
17
!t
3 4
9
2 ~ 2
3
19
2 2 5 I 4 2
3
J,
39
4 4 ~O }I
5 5
18
204
5 32 23 38
50 29 18
9
296
Il 30 69 58 58 42
21 10
270
18 31 49 40 59 39 27
7
128
3
11 9
20 49 25
6 5
89
4 10 13 28
19 9 5
104 9,318
10 191 5 632 I 1,141 6 1,246
33 2,719 24 2,130 17 868
8 391
19
2
3 1
1
9
2 2 1 3
141
6 8 8
12 43 34 22
8
20
tll
4 7
15 10 3
I
179
5 12 30 67 34
24 6
231
2 13 41 47 88 33
7
669
I 13 68
152 273 III 42
9
88
7 II
7 8
29 16 9
1,6()2
18 49 157 267 536 325 158
91
21
11
I 2 2 3 3·
16
2 3 8
22
na 17 2-t 9'5
192 ISS Il7 69 53
912
11 74
107 U6
22(} ~82
1J2 80
725
}9 &t 83 84
202 149 85 42
323
6 28 45
42 91 53 36 16
31S.
2 11 25 32 95 78 40 32
2B 16,747
3 363 1 993 7 1,967 5 2,308 5 4,379 6- 3,575
1,927 1,235
23
13
1 I 4 I 0}
1
16
2
6 3
2 3
5
2
2 I
3
I I 1
11
I 4 I ~ 3
24
58
2 6 7 7
17 10
8
265
2 24 51 52 69 47 20
1
116
4 , 8
21 41 29
6
97
7 20 15 33 11 9 2
132
3 6
11 28 40 29 13 2
29. 9,395
7 20 19 250 15, 725 20 1,448 53 3,328 69 2,563 61 855 50 206
25 ..
2
70
1 2 II 16 25 10 3 2
26
210
11 18 18 29 52
51 ~9
12
988
56 85 87
136 . 303 184 86 !>1
350
30 }S
27 61
W8 62 33 ~O
au 39 39 81
155 3lJ 140 35 12
237
4 7
24 41 75 51 28
7
11,510
438 670
1,093 1,590 3,565 2,523 1,162
467
2
27
If
2 3 r I 4
• 1 ~
139
3 28 1& 3} 28 17 9 5
29
2
• 3 6
12 4
13
2 3
5 1 I
15
8 2 2 3
1,115
61 66 144 157 32l 223 '1!.3 59
TABLE 11-11
X
Non~wo[kers Age group
rMales
28
3,750
3,247 286 83 21 12
1.1 82
4,452
3,280 660 251
82 34 23
21 101
3,190
2,726 251 72 29 11 12 13
76
2,705
2;2Sl 274 103 28 14
8 6
41
1,850
),349 180 119 47 67 24 23 41
68,870
51,409 8,216 4,430 1,225
938 551 462
1,639
Females
29 2
6,147 Total
2,977 0- 14 506 15- 19 472 20- 24 415 25-29 695 30- 39 442 40- 49 281 50- 59 359 60+
" A.N.S.
6,tl14 Total
2,994 0- 14 561 15- 19 601 20-24 444 25-29 746 30- 39 532 40- 49
238 50- 59 297 60+
I A.N.S.
5,«26 Total
2,513 0-14 518 15-19 422 20-24
411 25--29 678 30-39
433 40-49 225 50-59
226 60+
4,019
2,007 305 295 369 504 242 122
175
A.N.S.
Total
0-14 15-19 20-24 25-29 30-39 40-49 50-59 60+
" A.N.S.
3,121 Total
1,356 0-14 245 15-19 296 20-24 267 25-29 397 30-39 235 40-49 147 50-59 178 60+
.• A.N.S.
105,385 Total
48,311 0-14 a,655 15-19 8631 20 -24
8,52 I 2.5 -29 14,201 30 -39 8,100 40 -49 4,162 50-59 4,804 60+
A.N.S .
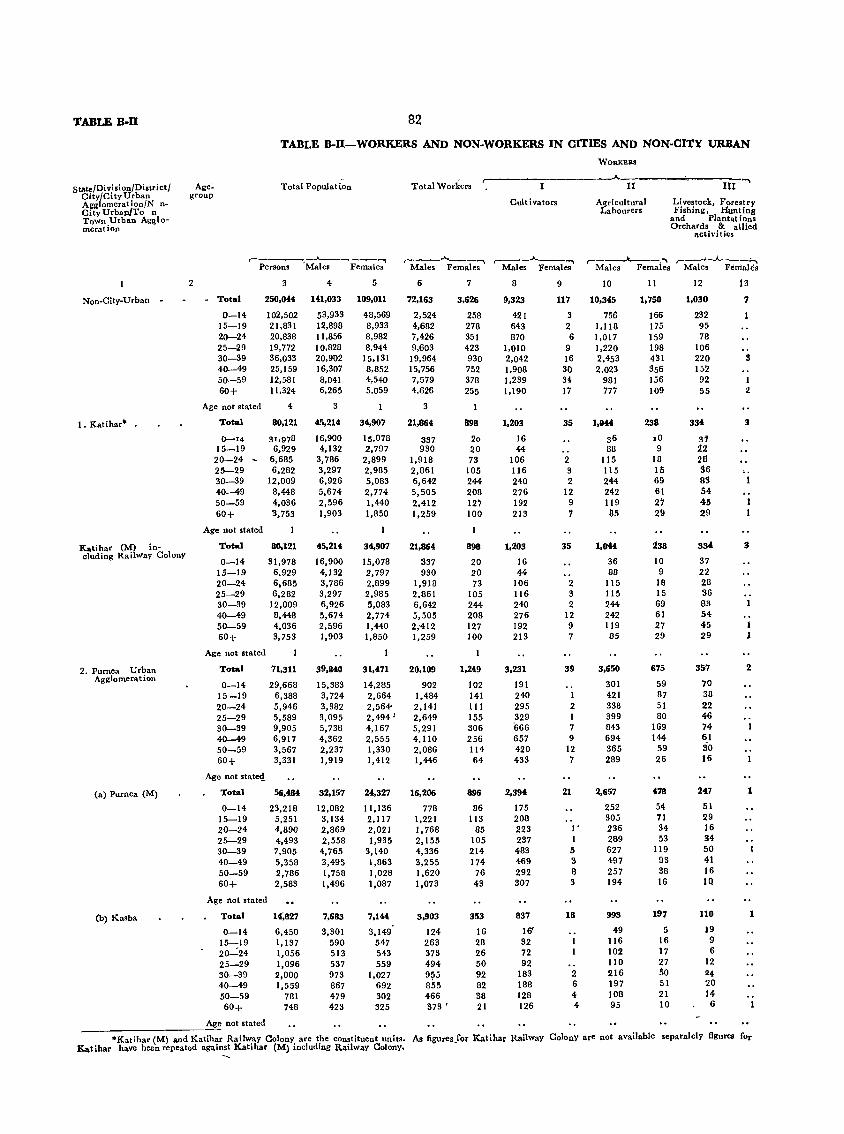
TABLE B-II 82
TABLE B-II-WORKERS AND NON-WORKERS IN CITIES AND NON-CITY URBAN
WORKBlI.8
... state/Division/District/ Age~ Total Population Total Workers II III ....
City/City Urban group Cult i vator. Agricultural Livestock. Forestry Agglomcration/N n-
CityUrban/To n Labourers Fishing, Hunting Town Urban Agglo- and Plantat ions meration Orchards & alJicd
activities
,-____ ,_J.--___ .......
PersOnS Males Females r----'-_, - ....
Males Females r----....... ----,
Males Females ,-__ ....k....-__ ,,",,
Males Females ,..-__ .;._..A.. __ ....,
Males Females
2 3 4 5 6 8 9 10 11 12 13
Non-City-Urban - - Total 250,044 141,033 109,011 72,163 3,626 9,323 117 10,345 1,750 1,030 7
0-14 102,502 53,933 48,569 2,524 258 421 3 756 166 232 15-19 21,831 12,89B 8,933 4,682 278 643 2 1,118 175 95 20-24 20,838 11,856 8,982 7,426 351 870 6 1,017 159 78 25-29 19,772 10,828 8,944 9,603 423 1,010 9 1,220 198 106 30-39 36,033 20,902 ·15,131 19,964 930 2,042 16 2,453 431 220 :I 40-49 25,159 16,307 8,852 15,756 752 1,908 30 2,023 356 152 50-59 12,581 8,041 4,540 7,579 378 1,239 34 981 156 92 1 60+ 11,324 6,265 5,059 4,626 255 1,190 17 777 109 55 2
Age not stated 4 3 3
I. Katihar" Total 80,121 45,214 34,907 21,864 898 1,203 35 1.044 2311 334 :J
0-14 31,978 16,900 15,078 337 20 16 36 10 31 15-19 6,929 4,132 2,797 930 20 44 88 9 22 20-24 - 6,685 3,786 2,899 1,918 73 106 2 115 18 28 25-29 6,282 3,297 2,985 2,861 105 116 3 115 15 36 30-39 12,009 6,926 5,083 6,642 244 240 2 244 69 83 40-49 8,448 5,674 2,774 5,505 20B 276 12 242 61 54 50-59 4,036 2,596 1,440 2,412 127 192 9 119 27 45 60+ 3,753 1,903 1,850 1,259 100 213 1 115 29 29
Age not stated
Katihar (M) in- Total 80,121 45,214 34,907 21,864 898 1,203 35 1,H4 238 33. 3 eluding Railway Colony
0-14 31,978 16,900 15,078 337 20 16 36 10 37 15-19 6.929 4,132 2.797 930 20 44 88 9 22 20-24 6.685 3,786 2.899 1,918 73 106 2 115 18 28 25-29 6,282 3,297 2.985 2,861 105 116 3 115 15 36 30-39 12,009 6,926 5,083 6,642 244 240 2 244 69 83 40--49 8.448 5,674 2,774 5,505 208 276 12 242 61 54 50-59 4.036 2,596 1.440 2;412 127 192 9 119 27 45 60+ 3,753 1,903 1,850 1,259 100 213 7 85 29 29
Age not stated
2. Purnea Urban Total 71,311 39,840 31,471 20,109 1,249 3,231 39 3,650 675 357 2 Agglomeration
0-14 29,668 15,383 14,285 902 102 191 301 59 70 15-19 6,388 3,724 2,664 1,484 141 240 I 421 87 38
20-24 5,946 3,382 2,564- 2,141 III 295 2 338 51 22 25-29 5,589 3,095 2,494 J 2,649 155 329 1 399 80 46 30-39 9,905 5,738 4,167 5.291 306 ·666 7 843 169 74 40--49 6,917 4,362 2,555 4,110 256 657 9 694 144 61
50-59 3,567 2,237 1,330 2,086 114 420 12 365 59 SO 60+ 3,331 1,919 1,412 1,446 64 433 7 289 26 16
Age not state<!.
(a) Purnea (M) Total 56,484 32,157 24,327 16,206 896 2,394 21 2,657 478 247 1
0-14 23.218 12,082 11,136 778 86 175 252 54 51
15-19 5,251 3,134 2,117 1,221 113 208 305 71 29 20-24 4,890 2.869 2,021 1,768 85 223 I' 236 34 16
25-29 4,493 2,558 1,935 2,155 105 237 1 289 53 34
30-39 7,905 4,765 3,140 4,336 214 483 5 627 119 50
40-49 5,358 3.495 1.863 3,255 174 469 3 497 93 41
50-59 2,786 1,758 1,028 1,620 76 292 8 257 38 16
60+ 2,583 1,496 1,087 1,073 43 307 3 194 16 lQ
Age not stated
(b) Kasba Total 14;827 7,683 7,144 3,903 353 837 18 993 197 110 1
0-14 6,450 3,301 3,149 124 16 16' 49 5 19
15-19 1,137 590 547 263 28 32 116 16 9
20""::24 1,056 513 543 373 26 72 102 17 6
25-29 1,096 537 559 494 50 92 110 27 12
30-39 2,000 973 1,027 9~5 92 183 2 216 50 114
40-49 1,559 867 692 855 82 188 6 197 51 20
50-59 7B1 479 302 466 38 128 4 108 21 14
60+ 748 423 325 373 ' 21 126 4 95 10 6
Age not stated
*Katihar (M) and Katihar Railway Colony are the constituent units. A. figuresJor Katihar Railway Colony are not available separalely figures for ICatibar have been repeated against Katihar (M) including Railway Colony.
-..
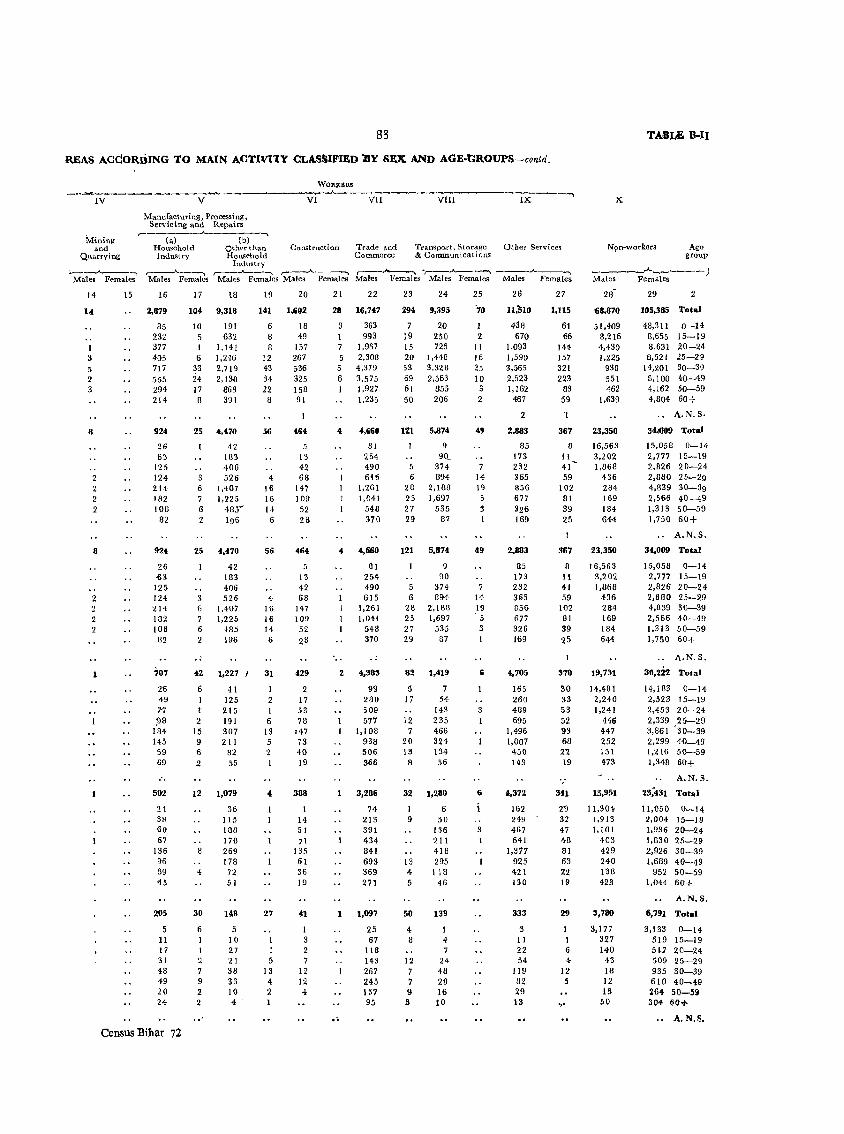
83
REAS AcdORDING TO MMN AC'rIVI1Y CLASSIFIED bY SEX AND AGE-GROUPS-coned.
IV
M-ining and
Quarrying
'o.----.,A..-l
Ma1es Females
14
14
5 2 3
8
2 2 2
8
1
15
WOR}{l.RS
,------------~ V VI VII
Manufacturing, Processing, Servicing and Repairs
(a) HQusehold Industry
(b) Oth<:'r than Constructton Household
Industry
Trade and Commerce
VIII IX
Transport) Storage Other Services. & Communications
,---.A--"l ,-J..--~ ,------.A.-----. Males Females Males Females Males Females
,--__ .....____, ',--_"__~ ,--__ .A.. __ -,
Males Females Males Females Males Females
16
2,879
85 232 377 405 717 555 294 214
924
26 63
125 124 214 182 lOB
82
924
26 ·63 125 124 214 IB2 108
82
;07
26 49 n
:98 184 145 59 69
502
21 38 60 67
136 96 39 <15
205
5 11 17 31 18 19 20 24
17 18
104 9,318
10
6 33 24 17 8
191 632
1,141 1,246 2,719 2,130
868 391
25 4.470
6 7 6 2
42 183 406 526
1,407 1.225 485~
196
25 4,470
6 7 6 2
42 183 406 526
1,407 1.225
485 196
42 1,227
6 1 l' 2
15 9 6
2
41 125 215 191 307 211
82 55
12 1,079
4
30
6 I I 2 7 9 2 2
36 115 188 170 269 178 72 51
148
5 10 27 21 38 33 10 4
19
6 B
12 43 34 22 8
56
4 16 16 14
6
56
4 16 16 14 6
31
2 1 6
13 5 2
4
27
1 1 5
13 4 2
20
18 49
157 267 536 325 158 91
4&4
5 13 42 68
147 109 52 28
464
5 13 42 68
147 109 52
28
429
17 53 78
.47 73 40 19
388
1 14 51 71
135 61 36 19
f1
1 3
12 12
oj,
21 22
28 16,747
5 6
4
363 993
1,967 2,308
4,379 3,575 1,927 1.235
4,660
81 254 490 6.5
1,2G1 1,041
548 370
4 4,660
81 254 49() 615
1.261 1,041
548 370
2 4,383
99 280 509 577
1,108 938 506 366
1 3,286
. '
74 213 391 434 841 693 369 271
1,097
25 67
118 143 267 245 137 95
23 24
294 9,395
7 19 15 20 53 69 61 50
20 250 725
1,448 3,328 2,563
855 206
121 5,874
5 6
28 25 27 29
9 90_
374 894
2.188 1.697
535 87
121 5,874
o 90
374 894
5 6
28 25 27 29
2,188 1,697
535 87
82 1,419
5 17
12 7
20 13
8
7 54
143 235 466 324 134 56
32 1,280
1 9
13 4 5
50
4 8
12 7 7 9 3
6 50
136 211 418 295 118
46
139
I 4
24 48 29 16 10
25
'70
1 2
11 16 25 10
3 2
49
14 19 5 3 1
19
7 14 19 , 5
3
6
3
1
6
26
11.1;10
43S 670
1,093 1,590 3.565 2,523 l, 162
467
2.1183
85 173 232 365 856 677 326 169
2,883
85 173 232 365 856 677 326 169
4,705
165 260 489 695
1.496 1,007
450 143
4,372
162 249 467 641
1,377 925 421 130
333
:I 11 22 54
119 82 29 13
27
1,115
61 66
144 ]57 321 223
83 59
367
8 11 41 59
102 81 39 25
367
8 It 41 59
102 81 39 25
:'70
30 33 53 52 93 68 n 19
341
2~
32 47 4B BI 63 22 19
29
1 6 4
12 5
Census Bihar 72
TABLE B-II
X
N9n-workers Age group
___ ___.A.~_--- )
Males Females
28-
68,870
51,409 8,216 4,430 1,225
938 551 462
1,639
23,350
16,563 3,202 1,868
436 284 169 184 644
23,350
16,563 3,202 1,868
436 284 169 184 644
19,731
14,481 2,240 1,241
446 447 252 151 473
15,951
11,304 ],913 1,101
403 429 240 138 423
3,780
3,177 327 140
43 18 12 13
50
29 2
105,385 Total
48,311 8,655 8,631 8,521
14,201 8.100 4,162 4,804
o -14 15-19 20-24 25-29 30~39
40-49 50~59
60+
.• A.N.S.
3M109 Total
15,058 2,777 2,826 2,880 4,839 2,566 1.313 1,750
0-14 15-19 20-24 25-29 30-39 40-49 50-59 60+
., A.N.S.
34,009 Total
15,058 2,777 2,826 2,880 4,839 2,566 1,313 1,750
0-14 15-19 20-24 25-29 30-39 40-49 50-59 60+
.. A.N.S.
30,222 Total
14,18g 0-14 2.523 15-19 2,453 20-24 2,339 25-29 3,861 30-39 2,299 40_49 1,216 50-59 1.348 60+
A.N.S.
23;431 Total
11,050 0-14 ~,004 15-19 1,936 20-24 1,830 25-29 2,926 30-39 1,689 40-49
952 50-59 1,014 60+
A.N.S.
6,791 Total
3,133 0-14 519 15-19 51-1 20-24 509 25-29 935 30-39 610 40-49 264 50-~9 300f 60+
.. A.N.S •
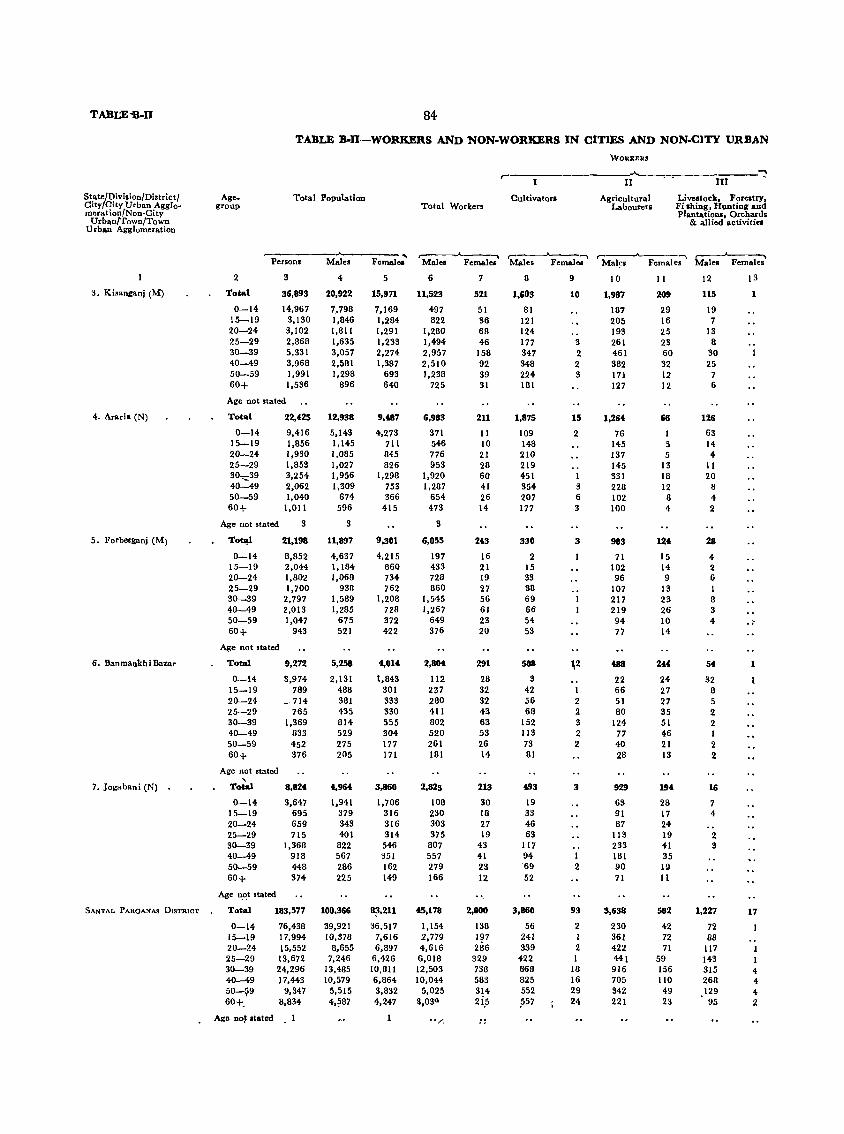
TABI;E-B-U 84
TABLE B-I1-WORKERS AND NON·WORKERS IN CITIES AND NON.C1TY URBAN
WOlU<ERS
~ ,-I II III
State/Division/District/ Age. Total Population Cultivator. Agricultural Livestock, Forestry, City!CityUrban Agglo- group Total Workers Labourers Fi .hing, Hunting and meration/Non-City PlantatioOl, Orchards
Urban/Town/Town & allied activities Urban Agglomeration
,------..A.-~ ,----"----. ,----""---. ,-Males Females" Females Persons Males Females Males Females Ma1~. Females Males
2 3 4 5 6 7 8 9 10 11 12 13
3. Kisanganj (M) Total 36,893 20,922 15,971 11,523 521 1,603 10 1,987 209 U5 1
0-14 14,967 7,798 7,169 497 51 81 187 29 19 15-19 3,130 1,846 1,284 822 36 121 205 16 7 20-24 3,102 1,611 1,291 1,260 68 124 193 25 13 25-29 2,868 1,635 1,233 1,494 46 177 3 261 23 8 30-39 5,331 3,057 2,274 2,957 158 347 2 461 60 30 40-49 3,968 2,581 1,387 2,510 92 348 2 982 32 25 50-59 1,991 1,298 693 1,238 39 224 3 171 12 7 60+ 1,536 896 640 725 31 181 127 12 6
Age not stated
4. Araria (N) Total 22,;125 12,938 9,;187 6,983 211 1,875 15 1,26;1 66 126
0-14 9,416 5,143 4,273 371 11 109 2 76 1 63 15-19 1,856 1,145 711 546 10 148 145 5 14 20-24 1,930 1,085 845 776 21 210 137 5 4 25-29 1,853 1,027 826 953 28 219 145 13 11 30-:::39 3,254 1,956 1,298 1,920 60 451 1 331 18 20 40-49 2,062 1,309 753 1,287 41 354 3 228 12 8 50-59 1,040 674 366 654 26 207 6 102 8 4 60+ 1,011 596 415 473 14 177 3 100 4 2
Age not stated 3 3 3
5. Forbcsganj eM) To~l 21,198 11,897 9,301 6,055 2;13 330 3 983 12;1 28
0-14 8,852 4,637 4,215 197 16 2 71 15 4 15-19 2,044 1,184 860 433 21 15 102 14 2 20-24 1,802 1,068 734 728 19 33 96 9 6 25-29 1,700 938 762 860 27 98 107 13 1 30-39 2,797 1,589 1,206 1,545 56 69 217 23 8 40-49 2,013 1,285 728 1,267 61 66 219 26 3 50-59 1,047 675 372 649 23 54 94 10 4 .. 60+ 943 521 422 376 20 53 77 14
Age not stated
6. BanmankhiBazar Total 9,272 5,258 4,01;1 2,8M 291 588 \2 ;lB8 2;1;1 5;1 1
0-14 3,974 2,131 1,843 112 28 3 22 24 32 15-19 769 486 301 237 32 42 1 66 27 8 20-24 _714 381 333 280 32 56 2 51 27 5 25-29 765 435 330 411 43 68 2 80 35 2 30-39 1,369 814 555 802 63 152 3 124 51 2 40-49 833 529 304 520 53 113 2 77 46 1 50-59 452 275 177 261 26 73 2 40 21 2 60+ 376 205 171 181 14 81 26 13 2
Age not stated , 7. Jogabani eN) Total 8,82;1 ;1,96;1 3,8fi0 2,825 213 ;193 3 929 194 16
0-14 3,647 1,941 1,706 108 30 19 63 26 7 15-19 695 379 316 230 18 33 91 17 4 20-24 659 343 316 303 27 46 87 24 25-29 715 401 314 375 19 63 113 19 2 30-39 1,368 822 546 607 43 117 233 41 3 40-49 918 567 351 557 41 94 1 181 35 50-59 448 286 162 279 23 ·69 2 90 19 60+ 374 225 149 166 12 52 71 11
Age ~'!t stated .. SANTAL PAROANAS D(STRICT Total 183,577 100,366 8~,211 ts,178 2,800 3,860 93 3,638 582 1,227 17
0-14 76,438 39,921 36,517 1,154 138 56 2 230 42 72 15-19 17,994 10,378 7,616 2,779 197 241 1 361 72 88 20-24 15,552 8,655 6,897 4,616 286 339 2 422 71 117 25-29 13,672 7,246 6,426 6,018 329 422 1 441 59 143 1 30-39 24,296 13,465 10,611 12,503 736 866 18 916 156 315 4 40-49 17,443 10,579 6,864 IO,OH 583 825 16 705 110 268 4 50-~9 9,347 5,515 3,832 5,025 314 552 29 342 49 129 4 60+. 8,834 4,?87 4,247 9,030 2(5 .557 24 221 23 95 2
Age no~ .tated 1 "/. ..

85
AREAS ACC(,)RDING TO MAIN AOTIVITY CLASSIFIED DY SEX AND AGE-GROUPS-contd.
WORKERS
--~--I-V------------------V-----------------V--I---A-----V-I-I----------V-I-I-I---------I-X-------~
Mining &
Quarrying
Manufacturing Processing J
Servicing & Repairs ,...---------~--------~ (a) (b)
Household . Other than Industry House-hold
Industry
Construction Trade & Commerce
Transport, Storage Other Services & Communications
x
Non-workers
TABLED.II
AgegrOup
,.----'------.. Males Female.
r-'--"'-____ Males Females Mai-e-s ~~ ~M~ M~ :M-al-e-s-'-P-ema-I-e • ..., M;;les Females Males Females ~
14
2
281
4 '20 43 38 '86 60 it 9
2
15
26
~ 6 4 3 5 3
16
448
17 38 78 53
102 97 50 13
201
3 22 25 35 46 27 24 19
291
6 27 35 42 80 55 31 15
222
5 23 31 40 61 34 18 10
86
2 10 6
13 30 15
4 6
1,900
61 170 262 257 443 369 201 137
17
24
2 3
7 6 3 3
7
4 1
5
1
193
6 17 20 20 53 42 25 10
18
1,3611
43 118 202 176 356 282 126
65
451
20 45 63 67
121 86 27 22
880
25 82
132 132 239 155 84 31
245
7 25 30 53 67 39 14 10
677
13 54 93
101 222 132 50 12
5,153
166 473 697 854
1,375 937 405 246
19
35
4 5 5
10 8 3
10
2 3 2 2
3 I
5
I I 2
159
7 25 18 17 37 30 16
9
20
231
5 8
20 SO 66 55 29 18
267
2 6
21 59
107 49 13
9
117
3 2
15 15 33 24 14 11
70
3 6
13 29 9 6 3
4 7 6 4 3
1,060
8 37 80' 158 341 236 116 84
2,.'
3 1
22
3,174
74 180 404 440 765 706 386 219
17 1,589
3 1 7 3
3
1
51 96
211 254 ,*34 281 170 92
2,064
40 119 259 303 538 439 228 138
634
15 45 69 85
205 126 57 32
243
3 19 25 34 68 44 32 18
13 10,692
255 687
1,264 1 1,451 5 2,762 4 2,246 2 1,246
781
8
7 10 10
8
23
I 1 I
7 7 3 3
15
1 1 3 3 5
5
1 1 2
5
3
24
1,053
62 ,97
155 364 267
76 32
219
7 -22 31 70 62 19 8
468
4 25 51 77
117 126
49 19
4 5
21 38 40 23
3
228
8 33 35 85 47 19
1
251 6,323
40 5 231 7 509
10 780 70 2,051 53 1,918 56 646 50 148
25
5
2
3
3
1 1
6
2 2
71
2 3 8 8
19 20 5 6
26
1.542
71 83
148 194 465 348 169 64
989
47 63 83
132 339 192
87 44
.2
893
42 59
101 1'45 243 180
91 32
369
27 21 27 49
124 81 28 12
. , 129
1 II 13 10 42 38 11 3
11,044
262 471 883
1,474 3,346 2,480 1,367
761
27
190
16 10 SO 20 65 33 8 8
70
5 2 8
-8
26 12
7 2
91
6 8
13 27 26
7 4
23
4 3 5 7 2
4
I I
1,395
73 68
155 209 371 301 128 90
28
9,399
7,301 1,024
531 141 100
71 60
171
5,955
4,772 599 309
74 36 22 20
123
5,842
4,440 751
340 78 44 18 26
145
2,454
2,019 251 101 24 12 9
14 24
29
15,45
7,118 1,248 1,223 1,187 2,116 1,295
654 609
2
Total'
0-14 15-19 20-24 25-29 30-311 40-49 50-b9 60+
A.N.S.
9,276 Total
4,262 701 824 798
1,238 712 340 401
9,058
4,199 839 715 735
1,152 667 349 402
3,'123
1,815 269 301 287 492 251 151 157
0-14 15-19 20-24 25-29 30-39 40-49 50-59 60+
A.N.S,
Total
0-14 15-19 20-24 25-29 30-39 40-49 50-59 60+
A.N.S.
Total
0-14 15-19 20-24 25-29 30-39 40-49 50-59 60+
A.N.S •
2,139 3,647 Total
1,833 149 40 26 15 10
7 59
55,188
36,767 7,599 4,039 1,228
982 535 490
1,548
1,676 298 289 295 503 310 139
137-
0-14 15-19 20-24 25-29 30-39 40-49 50-59
60+
A.N.S.
80,411 Total
36,379 7,419 6,611 6,097
10,073 6,281 3,518 4,032
0-14 15-19 20-24 25-29 30-39 40-49 50-59 60+
A.N.S
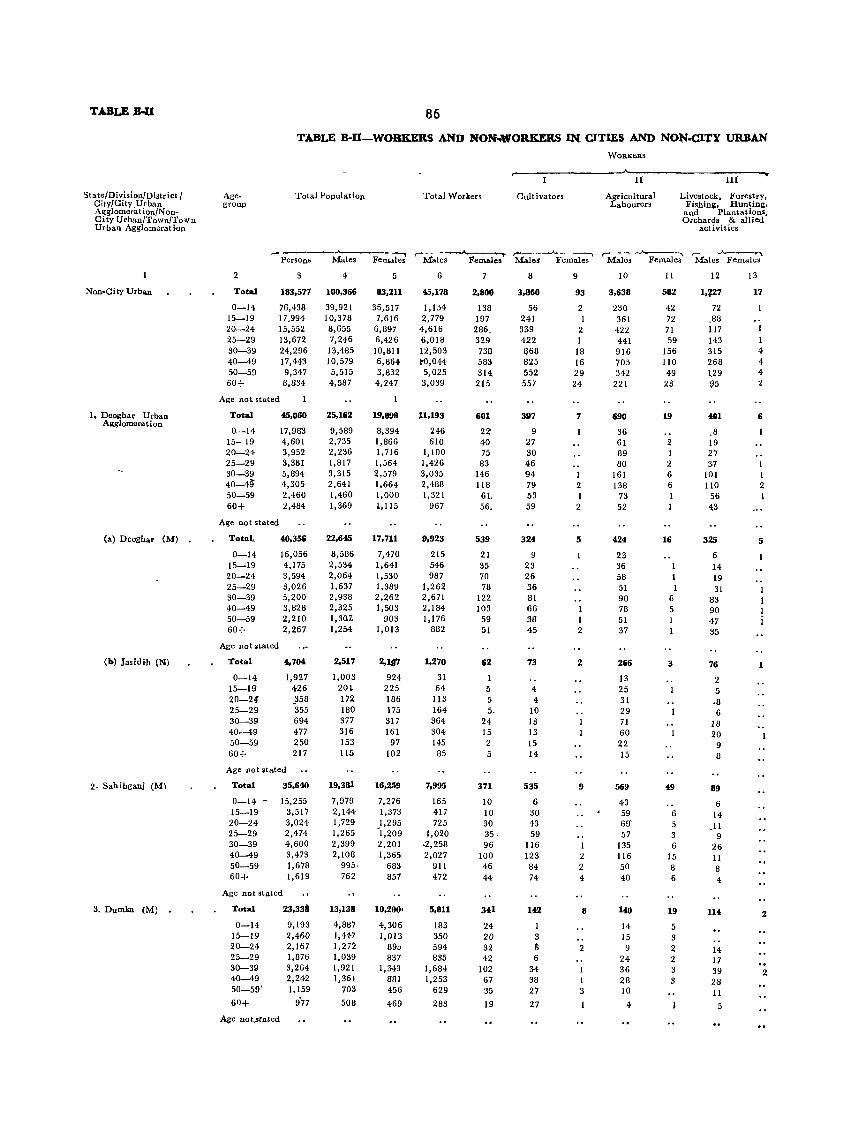
TABLE B-II
State/Division/District / CitY/City Urban Agglomerat ion/N onCity Urban/Town/ToRn Urban Agglomeration
Non-City Urban
I. Deoghar Urban Agglomeration
(al Deoghar (M) •
(b) lasidih (N)
2. Sahibgani (M)
3. Dumka (M)
86
TABLE S-D-WOBKERS AND NONo.WORKJmS IN- CITIES AND NON-CITY URBAN
Agegroup
Total Population
2
Total
0-14 15-19 20-24 25-29 30-39 40-49 50-59 60+
,PerSOnS
183.577
76,438 17.994-15,552 13,672 24,296 17,443 9,347 8,834
Age not. stated
Total
0-14 15- 19 20-24 25-29 30-39 40-49" 50-59 60+
Age not stated
TotaL
0-14 15-19 20~24
25-29 30-39 40-49 50-59 60+
Age not ,tated
Total
0-14 15-19 20-24 25-29 30-39 40-49 50-59 60+
45,060
17,983 4,601 3,952 3,381 5,894 4,305 2,460 2,484
40.35i
16,056 4,175 3,594 3,026 5,200 3,828 2,210 2,267
4.704
1,927 426 _358 355 694 477 250 217
Age not stated
Total
0-14 -15-19 20-24 25-29 30-39 40-49 50-59 60+
35.640
15,255 3,517 3.024 2,474 4,600 3,473 1,678 1,619
Age not stated
Total
0-14 15-19 20-24 25-29 30-39 40-49 50-5!J'
60+
23,3311
9,193 2,460 2,167 1,876 3.264 2,242 1,159
9'77
Males
4
100,366
39,921 10,378 8,655 7,246
13,485 10,579 5,515 4,587
25,162
9,589 2,735 2,236 1,817 3,315 2,641 1,460 1,369
22,64.5
8,586 2,534 2,064 1,637 2,938 2,325 1,30.7-1,254
2,517
1,003 201 172 180 377 316 153 11.5
19.381
7,979 2,144 1,729 1,265 2,399 2,108
995· 762
13,138
4,887 1,4-47 1,272 1,039 1,921 1,361
703
508
Fernal;;;'
5
83,211
36,517 7,616
6,897 6,426 10,811 6,864 3,832 4,247
19.898
8,394 1,866 1,716 1,564 2,579 1,664 1,000 1,115
17,711
7.470 1,641 1,530 1,389 2,262 1,503
903 1,013
2,1117
924-225 186 175 317 161
97 102
16,259
7,276 1,373 1,295 -1,209 2,201 1,365
683 857
10,200'
4,306 1,013 89~
837 1,343
881 456
469
Total Workers
Males
6
45.178
1,154 2,779
4,616 6,018 12,503 1'0,044 5,025 3,039
11,193
246 610
1,100 1,426 3,035 2,488 1,321
967
9,923
215 546 987
1,262 2,671 2,184 1,176
882
1,270
31 64
113 164 364 304 145
85
7,995
165 4-17 725
1,020 -2,258 2,027
911 472
5,811
183 350 594 835
1,684 1,253
629
283
Females
2,800
138 197
286. 329 738 583 314
215
601
22" 40 75 83
146 118 6L 56.
539
21 35 70 78
122 103
59 51
62
5 5 5,
24 15 2 5
371
10 10 30 35· 96
100 46 44
341
24 20 32 42
102 67 35
19
WORKERS
r-----------------·~-I-I------------~I=II~---w
Cultivators Agricultural Labourers
Livestock, ForestrY, Fishing, Hunting,
and Plantations, Orchards & allied
activities
~~ r---A---~ r ~ Male. Females Males Females Males Females
8
3,860
56 241 339 422 868 825 552 557
397
9 27 30 46 94 79 53 59
324
9 23 26 36 81 66 38 45
73
4 4-
10 13 13 15 14
535
6 30 4-3 59
116 123 84 74
142
I 3 I> 6
34 38 27
27
9
93
2 1
2 1
18 16 29 24
7
1 2 1 2
5
I 2
2
9
1 2 2 4
8
2
1 3
10
3,638
230 361
4-22 441 916 705 342
221
690
36 61 89 80
161 138
73 52
424
23 36 58 51 90 78 51 37
266
13 25 31 29 71 60 22 15
569
43 59 69' .17
135 116 50 40
140
14 15 9
24 36 28 10
4
11
582
42 72 71 59
156 110 49
23
19
2 I 2 6 6
16
1 1 I
6 5
3
49
6 5 3 6
15 8 6
19
5 3 2 2 3 3
12
1.~27
72 .88 117 143 315 268 129 95
401
,8 19 27 37
101 110
56 43
325
6 14 19 31
83 90 47 35
76
2 5 ·8 6
18 20
9 8
89
6 14
,Ii 9
26 II 8 4
114
14 17 39 28 II
5
13
17
4 4 4 2
6
I 2
5
1
2
2
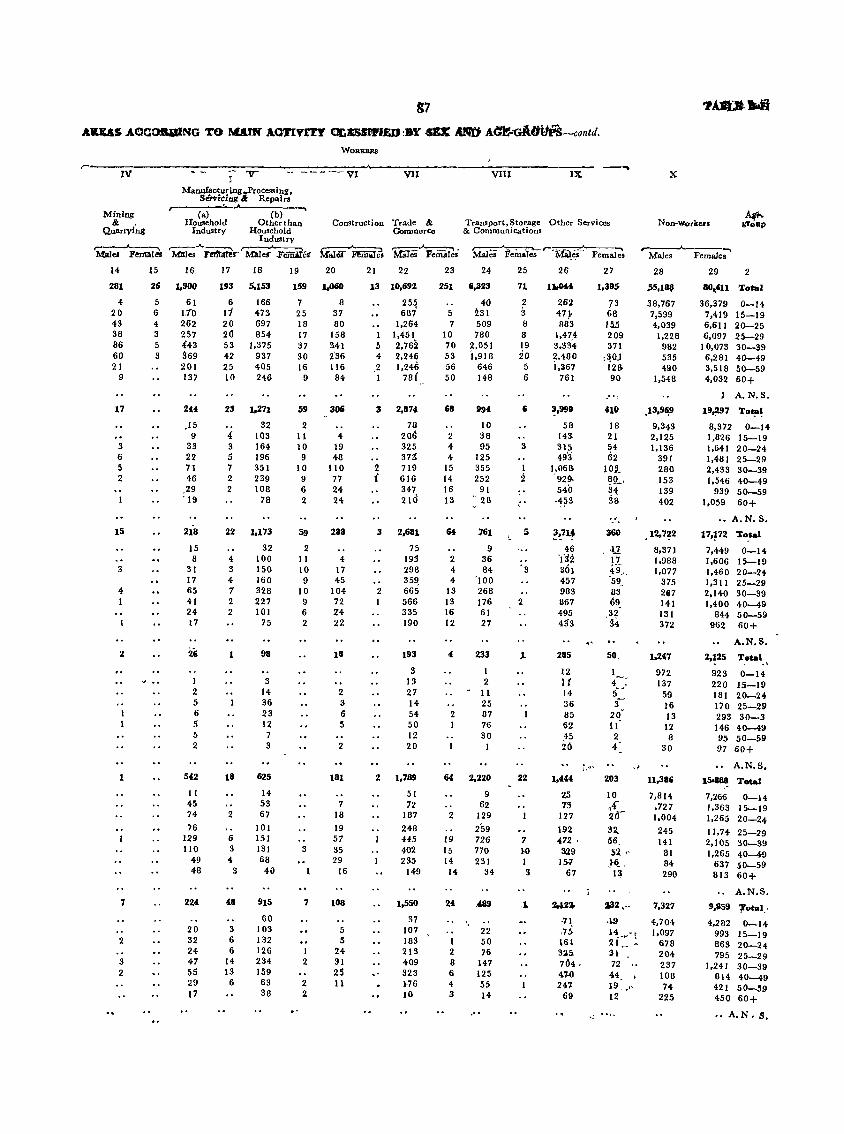
g7
AltUS .,AQCO:BIiIENG TO l\UUf AOTlVnY 4CC.msPPIED :.1' .-x AN'tf A~GiIWPS-contd. WORJU!lI8
~-----.----------------~~----------~~=-~----~~--------~~--------~~ IV 1- V VI VII VIII IX X
Mining &:. •
Quarrying
14
281
4 20 43 38 86 60 21
9
17
3 6 5 2
15
3
4
2
1
7
2
3 2
Manufacturing ~Ptocessing, Slt<ticing« Repai rs
,- (a) (b) --Household Otherthao Construction Trade &:.
Industry Household Industry
15 16.
26 1,900
5 6 4 3 5 3
61 1.10 262 257 443 $69 201 137
2U
)5 9
33 22 71 46
,29 '19
218
15 8
3t 17 65 41 24 17
1 2 5 6 5 5 2
542
II 45 74
76 129 110
49 48
224
20 32 24 47 55 29 17
17 18
193 5,153
6 11 20 20 53 42 25 10
166 473 697 854
1,375 937 405 246
23 1,271
32 -4 103 3 164 5 196 7 351 2 239 2 108
78
22 1,173
32 4 100 3 150 4 160 1 328 2 227 2 101
1
18
2
6 3 4
3
48
3 6 6
14 13 6
75
98
3 14 36 23 12 7 3
625
14 53 67
101 151 131 68 40
915
60 103 132 126 234 159 63 38
19 20
159 l,OliO
7 25 18 17 37 30 16
9
59
2 11 10 9
10 9 6 2
59
2 11 10 9
10 9 6 2
3
7
1 2
2 2
8 37 80
158 :HI 2'36 116
84
306
4 19 48
tiD 77 24 24
288
4 17 45
104 72 Z4 22
2 3 6 5
2
181
7 18
19 57 35 29
16
108
5 5
24 31 25 11
CommerCe
21 22
13 10.692
255 687'
1,264 1 5 4
.2 1
1,451 2,762 2,246 1,246
781
3 2,81'
78 206 325 371
2 719 { 616
347 210
3 2,681
75 199 29B 35~
2 665 566 335 190
193
3 13 27 14-54 50 12 20
2 1,789
51 72
187
248 445 402 235
149
1,550
37 107 183 213 409 323 )c16 10
Transport, Storage Other Services & Communications
Non-Work.,...
23 24
251 &,.323
40 5 7
10 70 53 56 50
231 509 780
2,051 i,918
646 148
68 99'
10 2 38 4 95 4 125
15 355 14 252 16 91 13 '·28
2 4 4
13 13 16 12
761
9 36 84
'100 268 176 61 27
of 233
I 2
" 11 25
2 87 1 76
30
64 2.220
2
19 15 14 14
1 2 8 6 4 3
",
9 62
129
2'59 726 710 231
,"
34
22 50 76
147 125 55 14
25
71
2 3 8 8 19 20
5 6
3
I 2
3
2
1.
22
7 ~O
1 3
,-._----"----..... Males Females
26
11,04.4
262 4H 883
1.47,4 3,334 2,480 i.1I67
761
~.999
58 143 31,~ 493
1,06& ·92!).
540 ·453
~!71~ 46
'(32 301 457 983 1167 495 433
27
1,395
73 68 15.5 209 371
,!lOJ 12& 90
410
18 21 54 62
10S_ ~Q.., 34 3S
J60
,U I.t :l9, .. 59_ 83 ~9.
,3? 34
28
j;5.111t1
38,767 7,599 4,039 1,228
982 535 490
1,548
.13.9~9
9,343 2,125 1,136
391 280 153 139 402
12,7~2
8,371 1,988 1,077
375 267 141 131 372
285 50. 1.247
12 I 972 It {-: 137 14 ;;. 59 36 3- 16 85 20· 13 62 11' 12 45 2 8 26 4' 30
1,4oft
25 19
127
192 472 '
3:19 15¥
67
2,l2~
,71 .7S 161 315 704. 4.W 247-
69
203
10 .,of 20-n 56 li2·
.}-q_ , 13
:132.-.1.9
1~~-! 21 H. 72 .. 44. , 19 __ "
12
11,386
7,814 ,727 1,004
245 141
81 84 290
7,327
4,704 1,097
678 204 237 108 74
225
29 2
80,.411 T .. tal
36,379 7,419 6,611 6,097
1 0,073 6,281 3,518 4,032
0-14 15-19 20-25 25-29 30-39 40-49 50-59 60+
I A.N.S.
19,297 To~~
8,372 1,826 1,641 1,481 2,433 1,546
939 1,059
0-14 15-19 20-24 25-29 30-39 40-49 50-59 60+
" A.N.S.
17,p2 Total
7,449 0-14 1,606 15-19 1,460 20-24 1,311 25-29 2,140 30-39 1,400 40-49
844 50-59 962 60+
A.N.S.
2,125 Total
923 0-14 220 15-19 181 20-24 170 25-29 293 30-3 146 40-49 95 50-59 97 60+
•• A.N.S.
1511188 Total
7.266 1,363 1,265
11,74 2,105 1,265
637 813
9,859
4,282 993 863 795
1,241 814 421 450
0-14 15-19 20-24
25-29 30-39 40-49 50-59 60+
A.N.S.
1otal ..
0-14 15-19 20-24 25-29 30-39 40-49 50-59 60+
•• A.N. S.
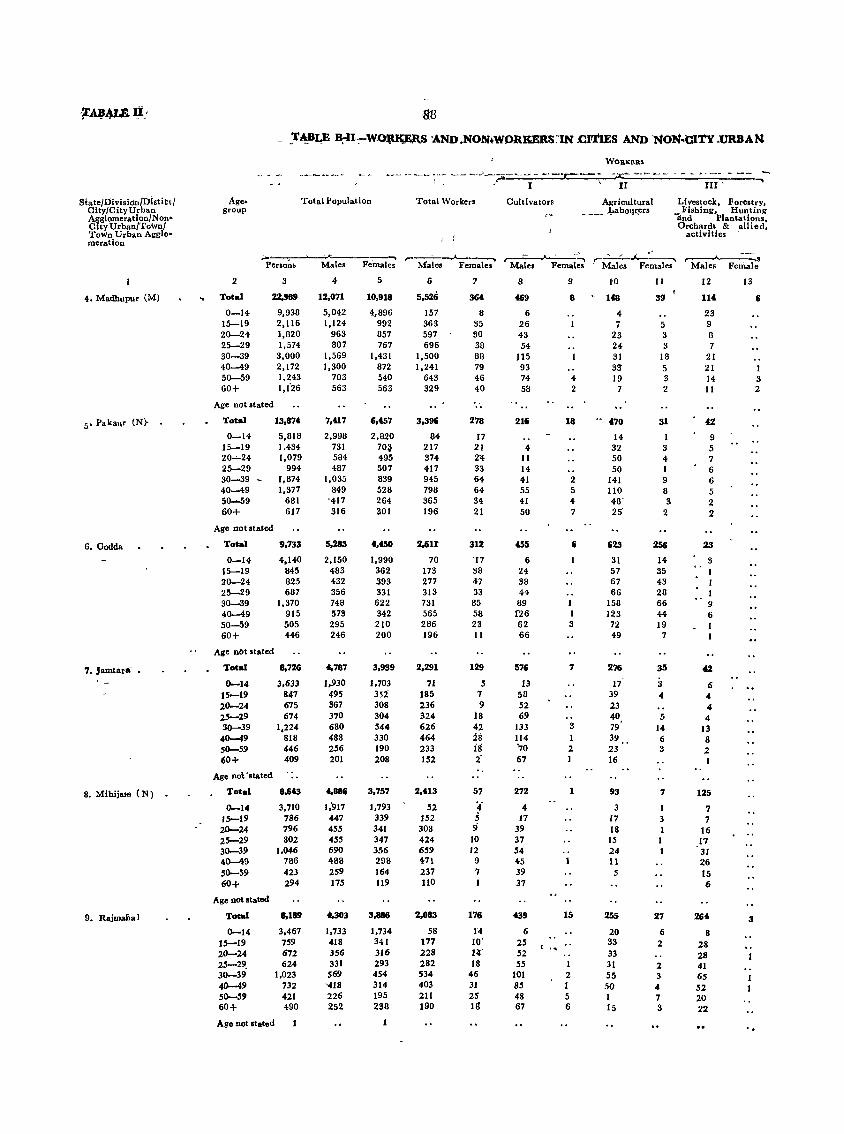
·;r~4IA~: ·88
_ ~T~~E ~I-:-W~ 'AND.NON+WORKERS~IN .Cl'.tIEs AND NoN .. ortY.URBAN
WOR,KBRS ~~---..._- ~--- -_h ;--- ~--"--;:o;---- - ---'r=-'--~ '"':x:;.--- ---- -~ -. - - ...... _ ... --- -,
, , . I \ II III' .....
Siate/DivisiOIl/nistitt/ Age- Total Population Total Workers Cultivators Agricultural Livestock. Forestry. Clty/CityUrban group ____ .:{.abollr_ers Fishing, Hunting Agglomeratlon/Non- '7ind Plantations, CltyUrbaD,/Town/ Orchards & all i e d. ToWn Urban Agglo> activities . meration
;;-.- . ...._ Fernal:
,---' __ ..A---,", ..... ,--,_,_.;....._:::__""" -.9 Perso~!t Males Males Females Males Females . Males Females Males Female
2 3 4- 5 6 8 9 i-O 11 12 13
4. Madhupur (M) .. Total 22>989 12.071 10,918 5,526 364 469 8 ~ 148 39 114 6
0-14 9,936 5,042 4,696 157 6 6 4 23 15-19 2.116 1,124 992 363 35 26 7 5 9 20--24 1,820 963 657 597 80 43 23 3 6 25-29 1,574 807 767 696 38 54 24 3 7 30-39 3,000 1,569 1,431 1,500 88 J15 31 18 21 40-49 2,172 1,300 872 1,241 79 93 33 5 21 50--59 1,243 703 540 643 46 74 4 19 3 14 3 60+ 1,f26 563 563 329 40 58 2 7 2 11 2
Age not stated
5' Pakaur (N) Total 13,87t 7,417 6,~7 3,396 278 216 18 470 31 42
0-14 5,618 2,998 2,620 84 17 14 I 9 15-19 1,434 731 70a 217 21 4 32 3 5 20-=-24 1,079 584 495 374 Z4 11 50 4 7 25-29 994 467 507 417 33 14 50 I 6 30-39 - 1,874 1,035 839 945 64 41 2 141 9 6 40-49 1,377 849 526 798 64 55 5 110 8 5 50-59 681 -417 264 365 34 41 4 48' S 2 60+ 617 316 301 196 21 50 7 25' 2 2
Age not stated
6. Godda Total 9,733 5,283 .. t50 2,6n 312 ~5 6 623 256 23
0-14 4,140 2,150 1,990 70 '17 6 31 14 3 15-19 845 483 362 173 38 H 57 35 I 20--24 625 432 393 277 47 38 67 43 I 25-29 687 356 331 313 33 44 66 28 I 30--39 1,370 748 622 731 65 89 I 156 66 9 40-49 915 573 342 565 58 f26 1 123 44 6 50-59 505 295 210 266 23 62 3 72 19 I 60+ 446 246 200 196 11 66 49 7 1
Age nOt .tated
7. J arntara' Totar 8,726 ',787 3,939 2,291 129 576 7 276 35 42
0-14 3,633 1,930 1,703 71 5 13 17 3 6 15-19 847 495 352 185 7 58 39 4 4 20-24 675 367 308 236 9 52 23 4 25-29 674 370 304 324 18 69 40 5 4 30-39 1,224 680 544 626 42 133 3 79 14 13 40-49 818 488 330 464 28 114 39 6 8 50-59 446 256 190 233 is 70 2 23 3 2 60+ 409 201 208 152 2 67 I 16 I
Age no~ 'stated
8, Mlhij"", (N) Total 8,643 4,886 3,757 2,413 57 272 1 93 7 125
0-14 3,710 1,'917 1,793 52 4' 4 3 1 7 15-19 786 447 339 152 5 17 17 3 7 20-24 796 455 341 308 <j 39 18 1 16 25-29 802 455 347 424 10 37 15 I 17 30-39 1,046 690 356 659 12 54 24 1 31 40-49 786 488 298 471 9 45 11 26 50--59 423 259 164 237 7 39 5 15 60+ 294 175 119 110 37 6
Age not stated
9. Ra,imafial Total 8,189 "303 3,886 2,083 176 439 15 255 27 264 3
0-14 3,467 1,733 1.734 58 1'4 6 20 6 8 15-19 759 418 341 177 10" 25 33 2 28 20-24 672 356 316 228 1~- 52 33 28 25-29, 624 331 293 282 18 55 31 2 41 30-39 1,023 569 454 534 46 101 2 55 3 65 40-49 732 '418 314 403 31 85 1 50 4 52 50-59 421 226 195 211 25 48 5 1 7 20 60+ 490 252 238 190 II! 67 6 15 3 22
Age not stated "
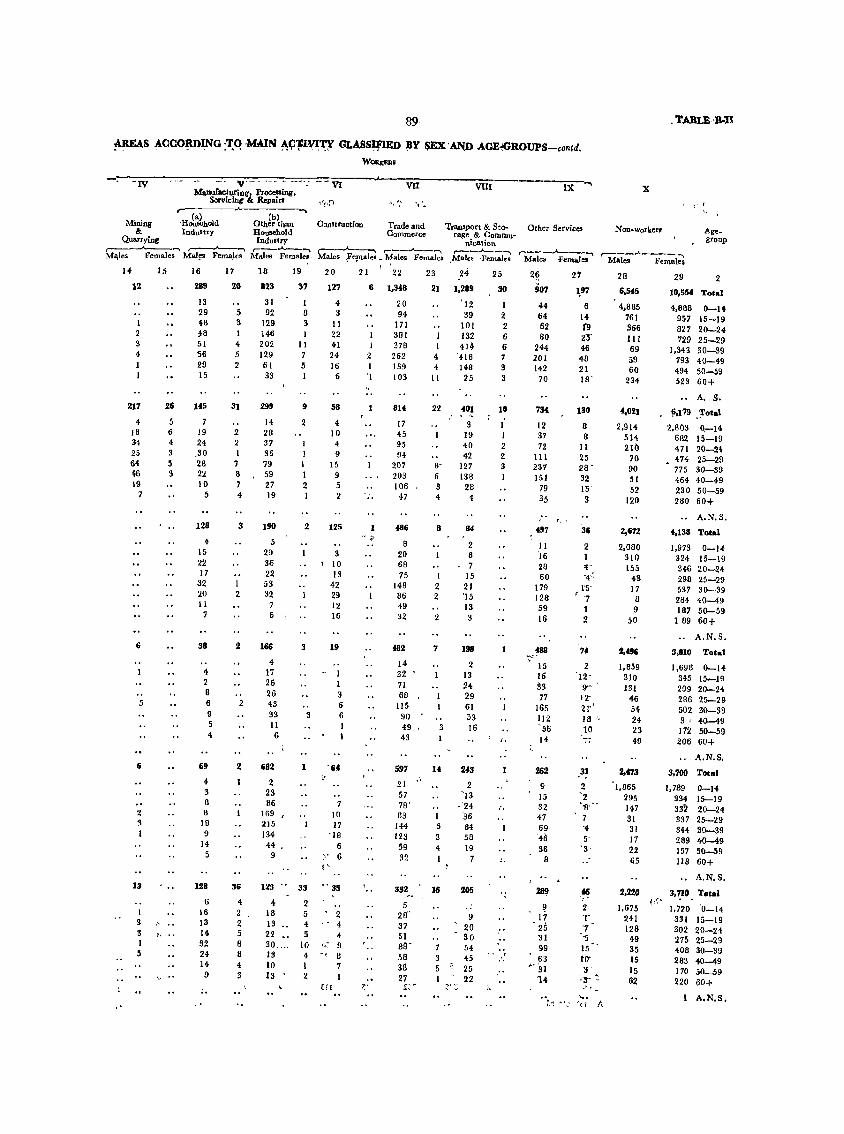
~RE-lS -lCCORD~NG:~Q MAIN A(l'F1VJ;'ry GJ.US~flED BY SEX'~ -lGE.,GROUPS-cQntd. WOlIxBRS
-~'~-~W~~~~--~-~V~--=,~,7'~-~-~~-~-~~~--~~--~~~[~------7,~~I~(--MauuCacturingl Processing.
Servicing « Repairs
r--(-)-----~-----(b-)--~~
----IX-....
Mining 'Hou~hold Other than &. Industry Household
Construction Trade and Commerce
Transport & Sto· Other Service. rage & Commu-Quarrying Industry nication ,------'---""""\ ~~~ r--~'"'
Mllies Females MaI~. FemaJes Males Female., ,-__ J.--_""", r--"""_-"'-I
Males 1Fe~les _ M-ales Females r--.A.-._....... r--""--...,
,Males ·Pemales, Males -Females
I+ 15
12
I 2 3 4 I
217
4 18 34 25 64 46 19
7
6
5
6
2 :3 I
I 3 3 I 5
26
5 6 4 3 5 3
.h ••
.~. ..
16 17 18
289 20 823
13 31 29 5 92 48 3 129 1:8 146 51 4 202 56 5 129 29 2 61 15 33
145
7 19 24 .30 28 22 10
5
128
4 15 22 17
32 20 II
7
38
4 2 8 6 9 5 4
6!1
4 3 8 8
IS 9
14 5
31 299
14 2 28 2 37 1 36 7 79 8 59 7 27 4 19
3
I 2
2
2
2
I
190
5 29 36 22 53 32
7 6 !
166
4 17 26 26 43 33 II 6
682
2 23 86
169 J
215 134 44.
9
19 20
31 127
1 4 8 3 3 11 I 22
II 41 7 24 5 16 I 6
9
2
I 1 1 2 I
58
4 10 4 9
15 9 5 2
2 125
3
3 , 10
13 42 29 12 16
19
- 1 1 3 6
3 6
10 17
'18 6
~_. 6
121 36
4 2 2 5 8 8 4 3
123" 33 .. 35
6 16 13 14 32 24 14 9
4 18 5 13 4 22 5 30,... 10 13 4 10 I 13 2
2 4 4
'" 9 8 7 1
21 22 23 24 6 1,348
20 94
171 381
1 378
21 1,289
'12 39
101 1 132 1 414
2 262 4 '418 I 139 4 148 ') 103 II 25
~.
814
17 45 95 94
207 203 106
47
486
8 20 68 75
148 86 49 32
482
I4 32 71 68
115 90 49 43
22 401
3 19 40 42
8- 127 6 138 3 28 4 '4
8
1 2 2
7
3
84
2 8
, 7 15
21 '15 13 3
198
2 13 24 29 61 53 16
591 It 243
2 '13
,'24 '36 84 58 19
21 ~'. 57 78' 83
144 5 123 3 59 4 32 1
332
5 28" 37 51 as' 58 38 27 &~ ...
16 205
9 20 So
, 54 3 45 5 25 I 22
25
30
I 2 2 6 6 7 3 3
10
I 1 2 2 3
:.
." :.'
,\
2~
901
44 64 62 80
244 201 142
70
73"
12 37 72
III 237 151
79 35
497 ~
11 '16
26 60
179 128 59 16
15 16 Ss 71
165 112 '56
262
9 15 32 47 69 46 36
8
289
9 17
- 25 :il 99 63
.. ' '31
14
~. 1
27
1,97
6 14 f9 25-46 48 21 18'
130
8 8
II 25 28' 32 15' 3
36
2 I 'I' '4'~
1'5-'7 1 2
7.
2 '12' !r
'12' 2r" 18 '. 10
S' '3-
2 T '7
-'5
15 to" 3-
~3'" :: .. , ....
x
Non-workers
. TA8LE·'P·l1
• t' r
Age. group
r---.A.-___ -..
Males ~·emale.
28
6,545
4.885 761 366 111 69 59 60
234
".021
2.914 514 210
70 90 51 52
12()
2,612
2.080 310 155
43 11 8 9
50
2.t96
1.859 310 131
46 54 24 23 49
2,.73
'1.865 295 147 31 31 11 22 ~5
2.220
1.675 241 128
49 35 15 15 62
29 2
lO,5M Total
4,888 0-14 957 15-19 827 20-24 729 25-29
1.343 30-39 793 40-49 494 50-59 523 60+
A. S.
~,179 "Total
2.803 Q-14 682 15-19 471 20-24 474 25-29 775 30-39 464 40-49 230 50-59 280 60+
A.N.S,
4,138 Total
1.973 0-14 324 15-19 346 20-24-298 25-29 537 30-39 284 40-49 187 50-59
189 60+
.. A.N.S.
3,810 Total
1,698 0-14 345 15-19 299 20-24 286 25-29 502 30-39 3' 40-49 172 50-59 206 60+
A.N.S.
3.700 Total
1.789 334 332 337 344 289 157 118
0-14 15-19 20-24 25-29 30-39 40-49 50-59 60+
A.N.S •
:J.no Total ~l>
1.720 '0-14 331 15-19 302 20-24 275 25-29 408 30-39 283 40-49 170 50-59 220 60+
1 A.N.S.

"I'DLE'g.1J. 9n
TAIIl.'E B41-WOlUOms AND MoM.Woitms iN CITIES ANt> NONoCl'n' 'URBAN
WORKERS
t"'""'~- ::--- -~ - - ... ----. - :-...-:-' ----.--1.:,-:- -~. '-- --n - - 7(":'::__--~=-=--":';;';"-'~-,I , IU'
St.te/Di.hion/District Age- Total Population Total Workers Cultivators Agricultural Livestock, Forestry, City/CityUrban group ,.. - Laboilrers Fishing, Hunting, A~glomeration/Non" and Plantations, Ci If U rban/T o:;:{. Orchards & allied Town Urban Agg o· activities meration
b ,... Female-='
,- ,-~~ ,--'------. ,... __ ,A. __ -.
Persons Males Males Female, Males Fe'Vales ¥ales Females, Males Females
3 4 5 6 7, 8 9 10 II 12 13
, 10 Barharwa Tot.r 7,385 3,938 3,447 1,859 171 .359 Ii 374 100 13
0-14 3~301 1,696 ' 1.605 68 11 S 48 12 2 15-19 629 354 275 135 11 27 41, 9 1 20.:-24 542 261 281 177 16 25 41 12 1 25-29 SS6 319 267 281 19 38 54 12 4 30-39 1,001 S59 442 ,31 57 91 6 96 30 4 4D-49 6;:!3 )53 270 334 29 67 2 57 19 1 50-59 331 ,201 130 189 19 54 5 24 S 60+ 3'72 195 177 144 3 52 13
Age not stated
bHOTANA'GPUR DrvJ: Total 2,09',055 1,18G,986 907.0G9 593.97~ 50.139 32.1Gl 2.390 22.712 5.551 5.900 178 ." SlON
0-14 829,563 434.,852 394.711 9.559 2,830 787 148 1,379 692 285 17 15..,.19 185,454 105,562 79,892 29,669 4,420 2,280 193 2,594 779 400 6 20-24 193,411 IO~,469 84,942 66.990 6,526 3.063 269 2,868 619 593 18 25-29 196,400 112,113 84.287 99.020 7.668 4.002 294 3.031 711 836 27 30-39 325.5S0 201)448 124,102 191,756 13,998 7.705 588 5.485 1.335 t,824 51 40-49 194,590 125.995 ,68.595 : 120,355 8.855 6.267 457 3,864 787 t.177 34 50-59- 96.627 60.610 36.017 55.005 4.144 4.386 262 2,096 446 537 14 60+ 71.567 37.884 33.683 21.602 1.696 3,671 179 1,395 182 248 11
Age not stat~d 893 53 840 20 • 2
~ALAMAU DISTRICT Total 70.557 38.310 32.247 17.132 1.609 2,182 72 2.402 884 437 4
0-14 29,803 15.665 14,138 43.5, 113 32 158 91 11 15-19 <;,465 3.826 2,639 953 113 107 2 242 .84 10 20-24 :;,631 3,099 2,532 1.664 172 185 4 263 106 27 25-;1.9 $.I~1 2,li36 2,545 2.21S 213 228 1 288 120 '55 30-39 9,469 ~.170 4.299 4.859 417 512 12 580 208 174 40-49 6;538 3.842 2.696 3.659 236 467 24 447 133 106 50-59 3,793 2.170 1.623 2.004 170 324, 10 230 95 37 1 60.j. 3.675 1.900 1,775 1.339 125 327 18 194 47 17 1
Age not stated 2 2 1" ,
NOIl-CityUrban Total 70.,557 38.310 32.247 17,13~ 1,609 2.182 12 2,402 884 437 4 ,J: f:! 0-14 29.~03 15,665 14.138 435 113 32 158 91 11
15-19 6,,465 3,826 2,639 953 113 107 2 242 114 10 20-24 S~31 3.099 2.532 1,664 172 185 4 263 t06 27 25-29 5,181 2.636 2,545 2.218 213 228 1 288 120 55 30-.39 9,469 5,170 4.299 4.859 417 512 12 580 208 174 40-49 6.538 3.842 2.696 3.659. 286 467 24 447 133 106 50-59 3,793 2,170 1,623 2.1JOlJ' 170 , 324 10 230 95 37
60+ 3.675 1.900 1,775 1,339 125 327 18 194 47 17
Age not sta ted 2 2 1. <, ~
" 1. D.lt~ngan.i(N) Total 32.367 17,695 14,672 7,66~ 362 315 2 134 t1 226 1
0-41 13,7°8 ~.911 ,6,297 13t 8 2 2
15-19 l,228 1,898 1.330 3411 It 12 8 2 20-24 2,730 1,544 '1,186 691 40 '22 10 16 25-29 2.387 1.234 1,153 1,025 54 SO 10 2 27 30-.39 4.398 2.405 1,993 2.261 1U 77 38 4 85 40-49 3,104 1.845 1.259 1.75@ 74 68 36 57 50-59 1,747 1.047 700 950 37 44 21 4 26
60+ 1,564 810 754 511 27 40 11 1 11
Age nO,t stated f'
2" Garhwa (N) Total 1~.22B 8,191 7,037 3,BS3 367 642 20 503 160 95 2
0-14 6,525 3,392 3.133 98 24 14 19 16 5 15-19 1.353 858 495 274' 19 50 48 13 4
20T"24 1 ;Ul 598 :' 513 428 2ll 56 56 17 4 25-29 1,026 527 499 - 475, 38 SO ( '. 39 '12 15
30rl9 1,974 1,044 930 1003 111 125 3 118 SO 34 4(}.,-49 1,425 844 581 81() p6 "136 6 131 2'3 23 SO-59 ,837 456 381 433- 3.$
" 98 2 48 17 5
60+ 977 472 50S 362 45 113 9 44 12, S
Asenot stated' ." ," '. ".
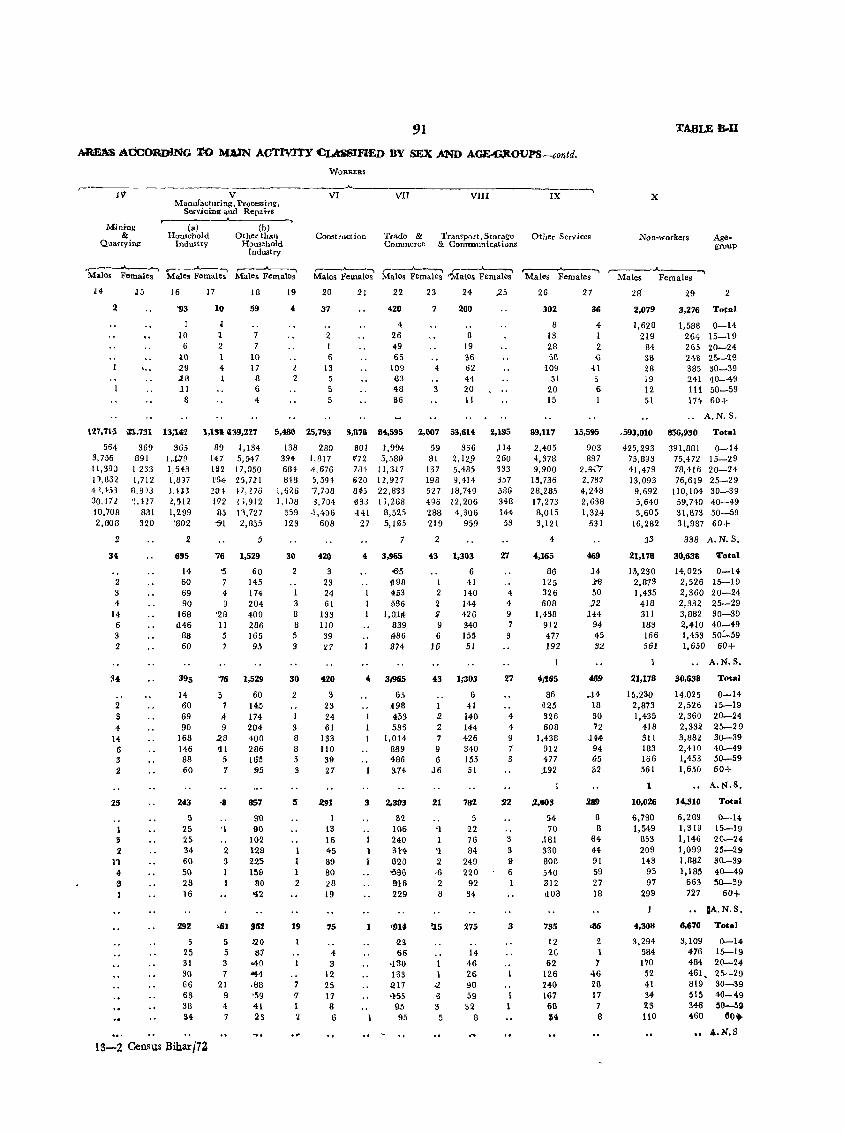
91
ABE1\'S ACCORDING l'() MAIN ACTIVITY C~FlED BY SEX AND A,GE-G,l{OUPS-contd.
,------iV----· V
Manufacturing, Processing, Servicing and Repai'rs
r-------A--------,~ Mining
& QIlarrying
(a) Household
Industry
(b) Other than
Household Industry
WORKERS
VIII VI VII '----,~,
IX
Construction Trade & Transport, Storage Other Servjces Commerce & COIlllDunications
X
TABLE IMI
Agegroup
-r--"-~ ~--~ r---'---. r--........___~ ~~-'"""'Io ,.--""'---~ ,----..A----....., r----.... --~ Mo.les Females M .. les Females Males Females Males Females Males Females· ''Maies Females Males Females Males Females
J5
' ..
16
"93
10 6
10 29 Jo8 Jl
8
17
10
i 1 2
4 1
18
59
7 10 17
8 6 4
127,715 \t1,731 13,U2 1,lnil3!1,1'Z7
564 3,756 1I,39J 19,852 4 1,433 30,17l 10,708 2,90B
2
34
2 3 4
14 6 3 2
34
'2 3 4
14 6 3 2
25
S 2
11 4 8 1
369 891
1 233 1,712
ll.3lJ '!,127
831 320
365 1,J..79 1,548 I,Bl7 J, ill !,512 1,299 'B02
2
695
14 60 69 90
168 d46
88 60
395
14 60 69 90
168 146 88 60
243
5 25 25 34 60 50 28 16
292
5 25 31 30 66 63 38 54
13-2 Census Bihar/72
99 1,134 147 5,547 IS2 17,050 1'54 25,721 20 I fl,27o 1'72 Z ;,912 85 13,727
"5'1 2,855
5
76 1,529
'5 7 4 9
'28 II 5
'16
5 7 A 9
.28 al
5
'I
2 3 I I
>.lil
5 5 3 7
21 9 4 7
60 145 174 204 400 286 165 95
1,529
60 14.5 174 204 400 286 165
!I.5
857
30 90
102 129 22'5 lllil
80 '42
1152
:20 37
<40 "44 ,88 -59 41 23
19
4
2 2
20
37
2
6 13 5 5 5
21 22
420
4 26 49 65
109 08S 48 S6
23
7
4
3
24
200
8 19 % 62 44 20 11
5,480 25,793 S,878 84,595 2,007 53,614 2,195
138 394 68i 8i8
1,626 1.138
559 123
30
2
3 8 8 5 :I
30
2
3 8 8 5 3
1 1 1 2
19
7 q 1 2
280 1,817 4,676 5,591 7,7J8 3,704 .I,4~6
608
420
3 23 24 61
133 110 39 27
"20
3 23 24 61
133 110 39 27
.l!91
1 13 16 45 89 80 28 19
75
4 3
12 25 17 8 6
SOl 1,994 '172 5,589 781 11,3.17 620 12,927 845 22,833 69B 1),268 -141 8,525
27 5,IB5
4 3,965
065 ~98 453 5B6
3
1 1
1,0;1* 839 ~86
374
3t965
65 JI98 453 536
1,014 839 486 3.74
2,393
32 106 240 31'4 620 o!>S6 &16 229
59 356 81 2,129
137 5,485 198 9,414 527 18,749 496 12,206 2BB 4,306 219 959
2
"3 1,303
6 I 2 2 fl 9 6
16
43
1 .2 2 7 9 6
J6
21
':l .2 ,6
2 B
!I5
1 1
1J. 6 3
41 140 144 426 340 153 51
1;303
6 41
140 144 426 340 155 51
782
5 22 76 84
249 220
92 34
275
14 46 26 90 59 32
8
)14 260 333 357 586 348 144 53
27
4 4 9 7
27
4 4 9 7 3
22
3 3 9 6
3
1 1
26
302
8 13 28 58
-l09 51
20 15
89,117
2,405 4,378 9,900
13,736 28,285 17,273 8,015 3,121
4
4,165
86 125 326 608
1,438 912 477 192
4;165
86 '125 326 608
1,438 912 477
192
,2,,'103
54 70
,181 330 B08 540 812 JI08
735
12 26 62
126 240 167 68 $4
27
as 4 1 2
-6 H 5 6
15,595
903 B97
2,s·fi 2,737 4,248 2,638 1,324
531
469
14 .Hl 50
J2 144
94 45 82
469
_H 18 50 72
144 94 65 82
289
8 8
64 44 91 59 27 18
2 1 7
46 28 17 7 8
2S
2,079
1,628 219
84 38 28 19 12 51
29
3,276
1,588 264 265 24B 385 241 III 174
2
Total
0-14 15-19 20~24
25--29 30-39 40-49 50-59 60+
A.N,S,
.593,010 856,930 Total
425,293 75,893 41,479 13,093
9,692 5,640 5,605
16,282
33
21,178
15,230 2,973 1,435
41B 311 183 166 561
21,178
15,230 2,873 1,435
418 311 183 166 561
1
10,026
6,780 1,549
853 209 143
95 97
299
4,308
3,294 584 170
52 41 34 23 110
391,881 75,472 78,416 76,619
IIO,104 59,740 31,873 31,987
0-14 15-29 20-24 25-29 30-39 40-49 50-59 60+
838 A,N. S,
30,638 "'otal
14,025 0-14 2,526 15-19 2,360 20-24 2,332 25-29 3,882 30-39 2,410 40-+9 1,453 50':"'59 1,650 60+
.' A,N.S.
30,638
14,025 2,526 2,360 2,332 3,8B2 2,410 1,453 1,650
14,310
6,289 1,319 1,146 1,099 1,882 1,185
663 727
6,670
3,109 476 484 461, 819 515 346 460
Total
0-14 15-19 20-24 25-29 30-39 40-49 50-59 60+
A.N.S.
Total
0-14 15-19 20-24 25-29 30-39 40-49 50---59
60+
;A,N.S.
Total
0-14 15-19 20-24 25-29 30-39 40-49 50-59
ClO"
4..N.S
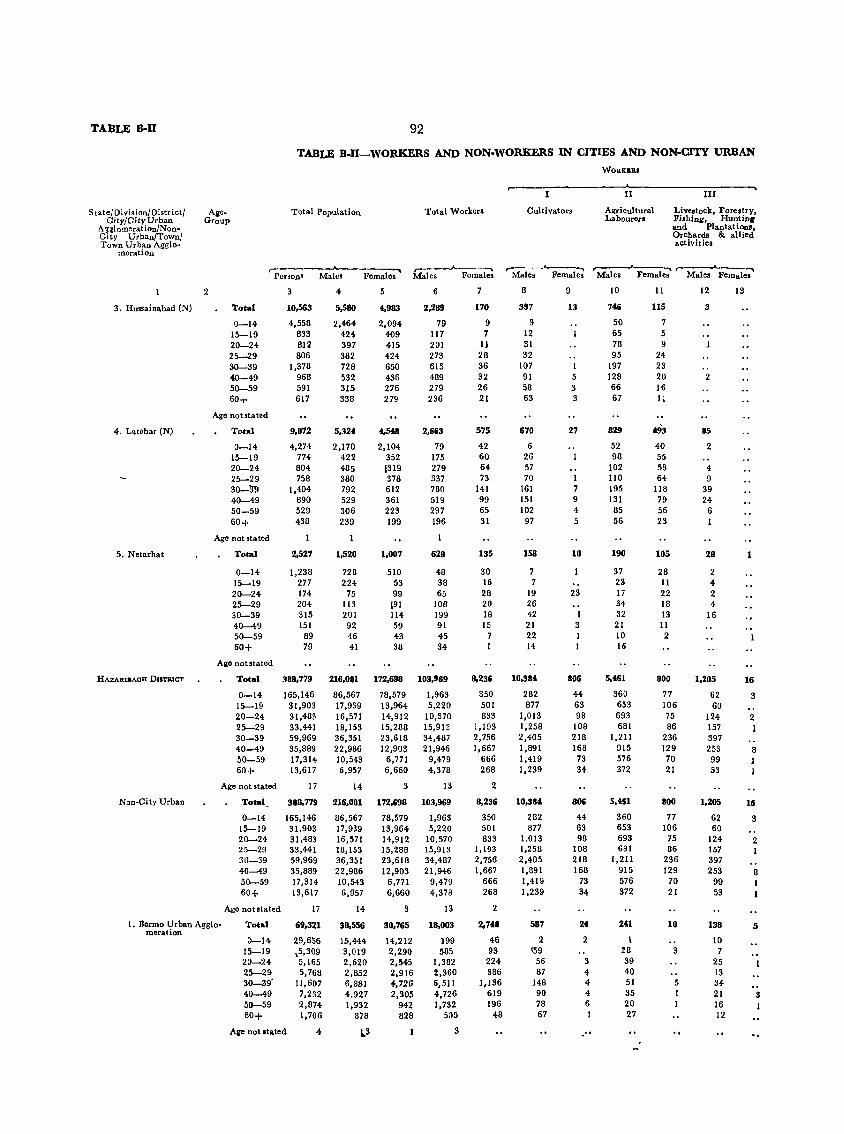
TABLE B-II 92
TABLE B..JI-WORKERS AND NON-WORKERS IN CITIES AND NON-CITY URBAN WORltlllU
,-I II
...... III
State/Division/District/ Alle- Total Population Total Workers Cultivators Agricultural Live8tock, Forestry, City/City Urban Group Labourer. Fi,hing, Huntine
A nlomeration/N on- and Planlat ions, Cily Urban/Town/ OrChard. & allied Town Urban Agglo- activities
meration
,-Female;'
,...---"---...... "'-Mal •• Femal~ Male. Femal;' r- Mal •• PersonS Male. Males Female. Females
4 5 6 7 8 9 10 II 12 13
3. Hussainabad (N) Total 10,563 5,580 4,983 2,289 170 397 13 746 115 3
0-14 4,558 2,464 2,094 79 9 !I 50 7 15-19 833 424 409 117 7 12 65 5 20-24 812 397 415 201 IJ 31 78 9 25-29 806 382 424 273 28 32 95 24 30-39 1,378 728 650 615 36 107 197 23 40-49 968 532 436 489 32 91 5 128 20 2 50-59 591 315 276 279 26 58 3 66 16 6O-r 617 338 279 236 21 63 3 67 II
Age nolstated
4, Latehar (N) Total 9,812 5,324 4,548 2,663 575 610 Z7 829 f93 85
0-14 4,274 2,170 2,104 79 42 6 52 40 2 15-19 774 422 352 175 60 26 98 55 20-24 804 485 !319 279 64 57 102 58 4 25-29 758 380 378 337 73 70 I 110 64 9 30-~ 1,404 792 612 780 141 161 7 195 liS 39 40-49 890 529 361 519 99 151 9 131 79 24-50-59 529 306 223 297 65 102 4 85 56 6 60+ 438 239 199 196 31 97 5 56 23
Age not stated
5. Netarhat Total 2,527 1,520 1,007 628 135 158 10 190 105 28 1
0-14 1,238 728 510 48 30 7 37 28 2 15-19 277 224 53 38 16 2:' 11 4 20-24 174 75 99 65 28 19 23 17 22 2 25-29 204 IJ3 191 108 20 26 34 18 4 30-39 315 201 114 199 18 42 I 32 13 16 40-49 151 92 59 91 15 21 3 21 IJ 50-59 89 46 43 45 7 22 10 2 60+ 79 41 38 34 14 16
Age not stated
HJ\.ZARIBAOH DISTJUCT Total 388,719 216,081 172,698 103,969 8,236 10,384 806 5,461 800 1,205 16
0-14 165,146 86,567 78,579 1,963 350 2S2 44 360 77 62 3 15-19 31,903 17,939 13,964 5,220 501 877 63 653 106 60 20-24 31,483 16,571 14,912 10,570 833 1,013 98 693 75 124 2 25-29 33,441 18,153 15,288 15,913 1,193 1,258 108 681 86 157 1 30-39 59,969 36,351 23,618 34,487 2,756 2,405 218 1,211 236 397 40-49 35,869 22,986 12,903 21,946 1,667 1,891 168 915 129 253 8 50-59 17,314 10,543 6,771 9,479 666 1,419 73 576 70 99 1 60+ 13,617 6,957 6,660 4,378 268 1,239 34 372 21 53
Age not stated 17 14 3 13 2
Non-Ci ty Urban Total - 388,779 216,081 172,698 103,969 8,236 10,384 BOG 5,4S1 800 1,205 16
0-14 165,146 86,567 76,579 1,963 350 282 44 360 77 62 3 15-19 31,903 17,939 13,964 5,220 501 877 63 653 106 60 20-24 31,483 16,~71 14,912 10,570 833 1.013 98 693 75 124 2 25-29 33,441 13,153 15,288 15,913 1,193 1,258 108 681 86 157 30-39 59,969 36,351 23,618 34,487 2,756 2,405 218 1,211 236 397 40-49 35,889 22,986 12,903 21,946 1,667 1,891 168 915 129 253 8 50-59 17,314 10,543 6,771 9,479 666 1,419 73 576 70 99 60+ 13,617 6,957 6,660 4,378 268 1,239 34 372 21 53
Age not stated 17 14 3 13 2
I. Bermo Urban Agglo-meration
Total 69,321 38,556 30,765 18,003 2,748 587 24 2U 10 138 5
0-14 29,656 15,444 14,212 199 46 2 2 1 10 15-19 ,5,309 3,019 2,290 585 93 (59 %8 3 7 20-24 5,165 2,620 2,545 1,382 224 56 3 39 25 25-29 5,768 2,852 2,916 %,360 386 87 4 40 13 30-fl9' 11,607 6,881 4-,726 6,51J 1,136 148 4 51 5 34-40-49 7,232 4,927 2,305 4,726 619 90 4 35 21 3 50-59 2,874 1,932 942 1,732 196 78 6 20 16 60+ 1,706 878 828 505 48 67 27 12
All" not stated 4 ~3 3 ..
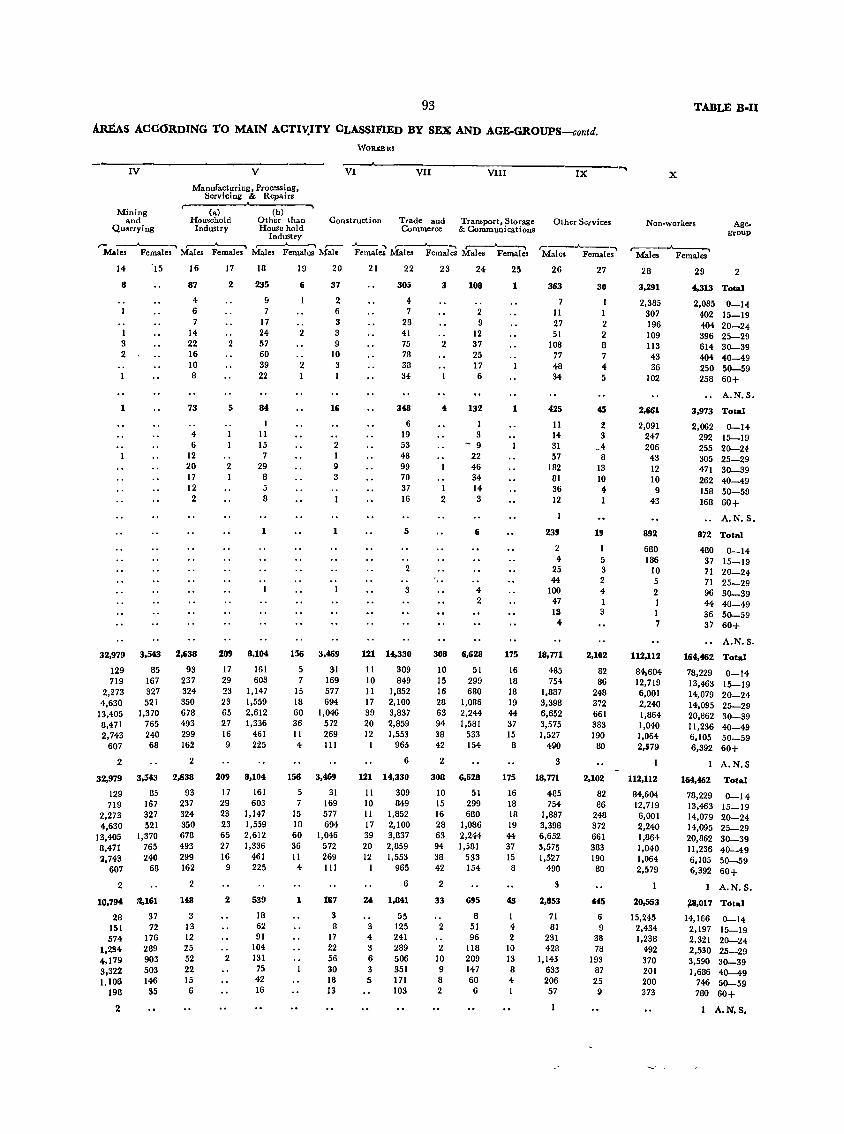
93
AREAs ACCORDING TO MAIN ACTl~ITY CLASSIFIED BY SEX AND AGE-GROUPS-contd.
IV
Mining and
Quarrying
V
Manufacturing, Processing, Servicing & Repairs
r'--------~--------~ (a) (b)
Household Other than Industry House hold
Industry
WORKERS
VI VII VIII
Construction Trade and Transport, Storage Commerce & Communications
r----""'---......, ,--"---'"""\ r- ,-- ""'-- "'\ r---'---. r---'----Male. Females Males Females Males Females Mal. Females Males Females Males Female,
14
8
1 3 2
1
15 16
117
4 6 7
14 22 16 10 8
73
4 6
12 20 17 12 2
32,979 3,543 2,638
129 719
2,273 4,630
13,405 8,471 2,743
607
2
32,979
129 719
2,273 4,630
13,405 8,471 :l,743
607
2
10,79'
28 151 574
1,234 4,179 3,322 1.101>
198
2
85 11>7 327 521
1,370 765 240 68
3,543
85 167 327 521
1,370 765 240
68
1t161
37 72
176 289 903 503 146 35
93 237 324 350 678 493 299 162
2
2,638
93 237 324 350 678 493 299 162
2
I'll
3 13 12 25 52 22 15 6
17
2
5
2
18
235
9 7
17 24 r,7 60 39 22
II(
I 11 15 7
29 8 5 8
1
209 8,104
17 29 23 23 65 27 16 9
209
17 29 23 23 65 27 16
9
2
2
161 603
1,147 1,559 2,612 1,336
461 225
8,104
161 603
1,147 1,559 2,612 1,336
461 225
539
18 62 91
104 131 75 42 16
19
6
2
2
20
37
2 6 3 3 9
10 3 1
16
2 I 9 3
1
156 3,469
5 7
15 18 60 36 II 4
156
5 7
15 18 60 36 11
4
1
31 169 577 694
1,046 572 269 III
3,469
31 169 577 694
1,046 572 269 III
167
S 8
17 22 56 30 18 13
21 22
305
4 7
28 41 75 78 38 34
348
6 19 53 48 99 70 37 16
5
2
3
121 14,330
11 10 11 17 39 20 12
121
11 10 11 17 39 20 12
1
24
3 4 3 6 3 5
309 849
1,852 2,100 3,837 2,859 1,553
965
6
14,330
309 849
1,852 2,100 3,837 2,859 1,553
965
6
1,841
55 125 241 289 506 351 171 103
23
3
2
I 2
24
108
2 9
12 37 25 17 6
132
1 3
- 9 22 46 34 14 3
6
4 2
308 6,628
10 15 16 28 63 94 38 42
2
308
10 15 16 28 63 94 38 42
2
33
2
2 10 9 8 2
51 299 680
1,086 2,244 1,581
533 154
6,628
51 299 680
1,086 2,244 1,581
533 154
695
8 51 96
118 209 147 60 6
25
1
1
175
16 18 18 19 44 37 15 8
175
16 18 18 19 44 37 15
8
43
1 4 2
10 13 8 4 I
IX
Other Services
r---""__-. Males Females
26
3&3
7 11 27 51
108 77 48 34
425
11 14 31 57
182 81 36 12
23g
2 4
25 44
100 47 13
4
18,771
485 754
1,887 3,398 6,652 3,575 1,527
4g0
3
18,771
485 754
1,887 3,398 6,652 3,575 1,527
490
2,853
71 81
231 428
1,145 633 206 57
27
30
1 1 2 2 8 7 4 5
45
2 3
_4 8
13 10 4 1
19
5 3 2 4 1 3
2,102
82 86
248 372 661 383 190 80
2,102
82 86
248 372 661 383 190 80
«5
6 9
38 78
193 87 25 9
TABLE B-I1
X
Non-workers Age. group
r---""__"'" Males Females
28
3,291
2,385 307 196 109 113 43 36
102
2,661
2,091 247 206
43 12 10 9
43
89:l
680 186
10 5 2 1 1 7
112,112
84,604 12,719 6,001 2,240 1,864 1,040 1,064 2,579
112,112
84,604 12,719 6,001 2,240 1,864 1,040 1,064 2,579
20,553
15,245 2,434 1,238
492 370 201 200 373
29 2
4,313 Total
2,085 0-14 402 15-19 404 20-24 396 25-29 614 30-39 404 40-49 250 50-59 258 60+
A.N.S.
3,973 Total
2,062 292 255 305 471 262 158 168
0-14 15-19 20-24 25-29 30-39 40-49 50-59 60+
A.N.S.
872 Total
480 0-14 37 15-19 71 20-24 71 25-29 96 30-39 44 40-49 36 50-59 37 60+
A.N.S.
164,462 Total
78,229 13,463 14,079 14,095 20,862 11,236 6,105 6,392
164,462
78,229 13,463 14,079 14,095 20,862 11,236 6,105 6,392
:zs,017
14,166 2,197 2,321 2,530 3,590 1,686
746 780
0-14 15-19 20-24 25-29 30-39 40-49 50-59 60+
A.N.S
Total
0-14 15-19 20-24 25-29 30-39 40-49 50-59 60+
A.N.S.
TOtal
0-14 15-19 20-24 25-29 30-39 40-49 50-59 60+
1 A.N.S.
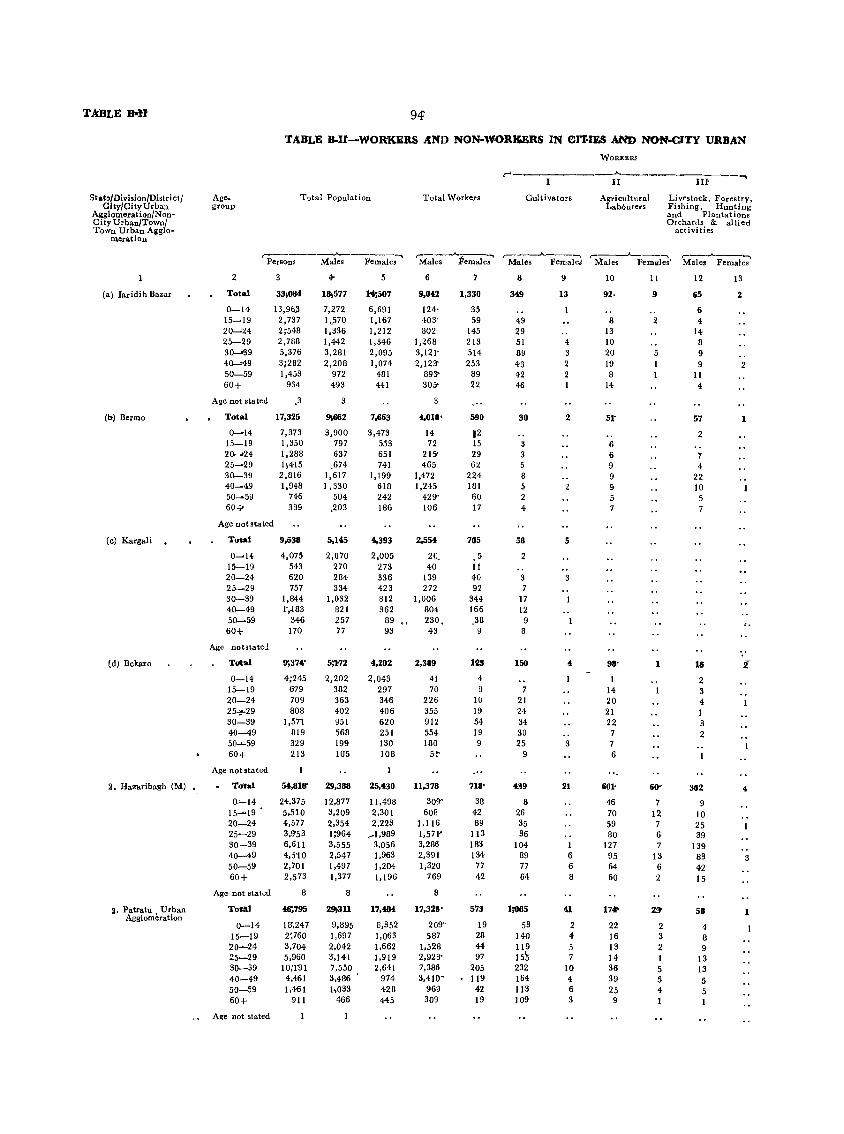
TABLE n-n
State/Dlvision/District/ City/City Urban
Agglomerat ion/N onC! ty Urban/Town/ Town Urban Agglo-
meration
Cal laridih Bazar
(b) Berroo
(0) Kargali
(d) Bokaro
2. HaZllribagh (M)
3. Patratu. Urban Agglomeration
Agegroup
94'
TABLE B-U~WORKERS AND NON·WORKERS IN err,ms AND NON-CITY URBAN
Total Population Total Workers Cultivators
WORKER'
.A-
Il
Agricultural Labourers
In
Livestock, Forestry, Fishing, Hunting and Plantations Orchards & allied
activities
, ________ .A..-____ -... r---__,.A..---""""'I ,-___ ,.A.. __ --, ,-___ ..A..-__ --, ,.....--.A.-__ --,
PersonS Males Female. Males Females Males Females Males Ferna:le" Male, Females
2
Total
0-14 15-19 20~24
25-29 30~9
40-"49 50-59 60+
Age not stated
Total
0~14
15-19 20..j24 25~29
30-39 40-49 50~59
60-l'
Age not stated
Total
0~14
15-19 20-24 25-29 30-39 40-49 50-59 60+
Age not,tated
Totlol
0-14 15-19 20-24 257"29 30-39 40-49 50~59
60+
Age not stated
Total
0"-14 15 ..... 19 20-24 25~29
30-39 40-49 50-59 60+
Age not stated
Totill
0-14 15-19 20~24
2~-29 30-39 40-49 50-59 60+
Age not stated
331084
13,96.3 2,737 2;548 2,788 5,376 3;282 1,453
934
,3
17,325
7,373 1,350 1,288 11415
2,816 1,948
746 389
9,538
4,075 543 620 757
1,844 1',483
346 170
9;374'
4;245 679 709 .a08
1,571 819 329 213
5'1,818'
24,375 5,510 4,577 3,9'53 6,611 4,5'10 2,701 2,573
8
~795
13;247 ~760
3,704 5,960
10,'['91 4,461 1,4ul
911
~
181577
7,272 1,570 1,336 1,442 3,281 2,208
972 493
3
91662
3,900 797 637
.674 1,617 1,330
504 .203
5,145
2,070 270 284 334
1,032 821 257 77
5;1'12
2,202 382 363 402 951 568 199 W5
29,388
12,877 3,209 2,354 1;964 3,555 2,547 1,497 1,377
8
2!P1311
9,895 1,697 2,042 3,141 7,550 3,486 h033
466
5
1:+,507
6,691 1,167 1,212 1,346 2,095 1,074
481 441
7,663
3,473 553 651 741
1,199 618 242 186
4,393
2.005 273 336 423 812 362
89 93
4,202
2,043 297 346 406 620 251 130 108
25,430
11,498 2,301 2,223
_1,989 3,056 1,963 1,204 1,196
17.484
8,352 1,063 1,662 1,919 2,641
974 428 445
6
9.042
124, 403-802
1,268 3,121' 2,123"
89~'
305'
4,018'
14 72
215' 465
1,472 1,245
429' 106
2,554
20. 40
139 272
1,006 804 230. 43
2,389
41 70
226 355 912 554 180 5t
11.378
309" 608
1.116 1,571' 3,286 2,391 1,320
769
8
17,325'
209' 587
1,528 2,928' 7,386 3,410'
969 309
7
1,330
35 59
145 213 514 253
89 22
590
12 15 29 62
224 181 60 17
705
.5 II 40 92
344 166 .38
lU
4 8
10 19 54 19 9
718'
38 42 89
113 183 134
77 42
573
19 28 44 97
205 119
42 19
8
349
49 29 51 89 43 42 46
30
3 3 5 8 5 2 4
58
2
3 7
17 12
9 8
150
7 21 24 34 30 25
9
439
8 26 35 36
104 89 77 64
1;0115
53 140 119 155 232 164 113 109
9
13
4 3 2 2 I
2
5
3
21
1 6 6 8
41
2 4 5 7
10 4 6 3
10
92·
8 13 10 20 19 8
14
6 6 9 9 9 5 7
98'
14 20 21 22 7 7 6
601-
46 70 59 80
127 95 64 60
17~
22 16 13 14 36 39 25 9
II
9
2
5
1
60'
7 12 7 6 7
13 6 2
~
2 3 2 I 5 5 4
12
65
6 4
14 8 9 9
11 4
57
2
4 22 10
5 7
16
2 3 4 I 3 2
352
9 10 25 39
139 83 42 15
58
4 o 9
13 13 5 5 1
13
2
2
1
4
3
1
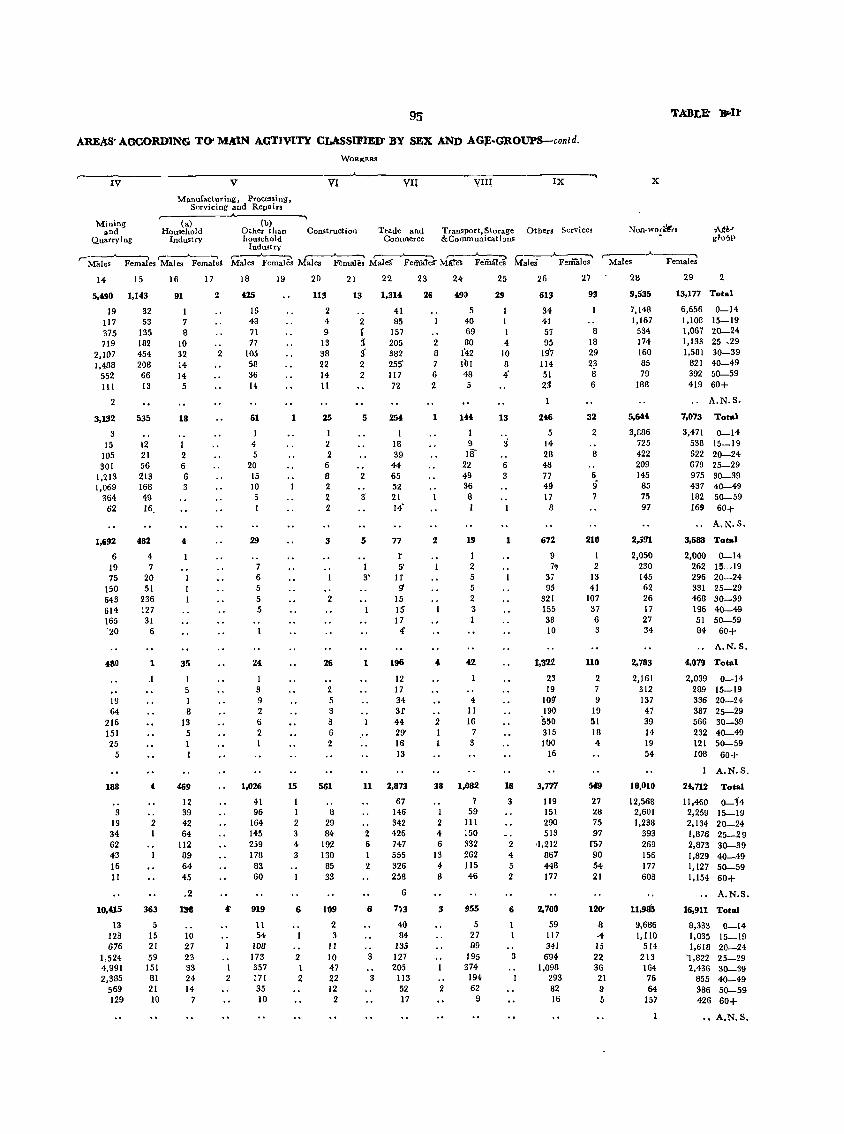
AREAS'" AOCORDIN& TO'MkIN ACTIVITY CLASSIFIED' BY SEX AND AGJ:·GROUPS-contd.
IV v Manufacturing, Processing,
Servicing and Repairs ~ __________ .A-__________ ~
WORKERS
.~~--------------~-------------------~ VI~ vm IX
Mining and
Quarrying
(a) (b) Household Other than Construction Trade and
Commerce Transport, Storage Others Services &Communications
14 15
5,490 1,143
19 il7 375 719
2,107 1,488
552 III
2
3,132
3 15
105 301
1,213 1,069
364 62
1,692
6 19 75
150 643 614 165 '20
480
19 64
216 151 25
5
188
3 19 34 62 43 16 II
10,<llS
13 128 676
1,524 4.991 2,385
569 129
32 53
135 182 454 208 66 13
535
12 21 56 213 168 49 16.
482
4 7
20 51
236 127 31
6
1
.1
4
2
363
5 15 21 59
151 81 21 10
Industry household Industry
16
91
1 7 B
10 32 14 14 5
18
1 2 6 6
4
35
I 5
8 13
5 1 1
469
12 39 42 64
112 89 64 45
,2
llMI
10 27 23 33 24 14
7
17
2
2
18
US
16 48 71 77
105 58 36 14
61
4 5
20 15 10 5 I
29
7 6 5 5 5
24
1 3 9 2 6 2
1,026
41 96
164 145 259 178 83 60
919
11 54
108 173 357 171 35 10
19
1
15
1 1 2 3 4 3
6
2 1 2
20
113
2 4 9
13 38 22 14 II
25
1 2 2
6 8 2 2 2
3
2
26
2 5 3 8 6 2
561
8 29 84
192 130 85 33
Ill9
2 3
II 10 47 22 12
2
21
13
2 f j
:f 2 2
5
2
5
1 3'
1
22
1,314
41 85
157 205 382 255' 117 72
254
18 39
44 65 52 21 14'
77
r 5'
11' rJ
15 IS 17
4'
196
12 17 34 31' 44 29' 16 13
11 2,873
2 6 1 2
6
3
3
67 146 342 426 747 555 326 258
6
7i3
40 84
135 127 205
113 52 17
23
26
2 8 7 6 2
1
"
2 1 1
24
493
5 40 69 80
1'42 Ill! 48 5
144
1 9 18
22 49 36 8 I
19
1 2 5 5 2 3 1
4 11 16
7 3
38 1,002
1 2 4 6
13 4 8
2
7 59
III 150 332 262 115 46
955
5 27 89
195 374
194 62
9
25
29
1 1 4
10 8 4'
13
6 3
1
16
3
2 4 5 2
6
1 1
3
26
613
34 41 57 95
19'1 114 51 21
246
5 14 28 48 77 49 17
B
672
9 7~
37 95
321 155 38 10
t,S21
23 19
109 190 550 315 100
16
3,777
119 151 290 513
,1,212 867 448 177
2,700
59 117 341 594
1,098 293 82 16
27
93
8 18 29 23 Ii 6
32
2
8
6 9 7
210
1 2
13 41
107 37 6 3
110
2 7 9
19 51 18 4
549
27 28 75 97
57 90 54 21
12&
8 -4 15 22 36 21 9 5
X
Non.worlMrs
28
9,535
7,148 1,167
534 174 160 85 79
18B
5,644
3,8B6 725 422 209 145
B5 75 97
2,591
2,050 230 145 62 26 17 27 34
2,783
2,161 312 137
47 39 14 19 54
18,010
12,568 2,601 1,238
393 269 156 177 608
11,985 9,686 1,110
514 213 164 76 64
157
Females
29 2
13,177 Total
6,656 I,IOB 1,067 1,133 1,581
821 392 419
0-14 15-19 20-24 25-29 30-39 40-49 50-59 60+
A.N.S.
7,073
3,471 538 622 679 975 437 182 169
Total
0-14 15_19 20-24 25-29 30-39 40-49 50-59 60+
A.N.S.
3,688 Total
2,000 262 296 331 468 196
0_14 15-19 20-24 25-29 30-39 40-49
51 50-5g 84 60+
A.N.S.
4,079 Total
2,039 0-14 2B9 15-19 336 20-24 387 25-29 566 30-39 232 40-49 121 50-59 108 60+
I A.N.S.
24,712 Total
11,460 0-14 2,259 15-19 2,134 20-24 1,876 25-29 2,873 30-39 1,829 40-49 1,127 50-59 1,154 60+
A.N.S.
16,911 Total
8,333 1,035 1,618
1,822 2,436
855 386 426
0-14 15_19 20-24 25-29 30-39 40-49 50-59 60+
.. A.N.S.
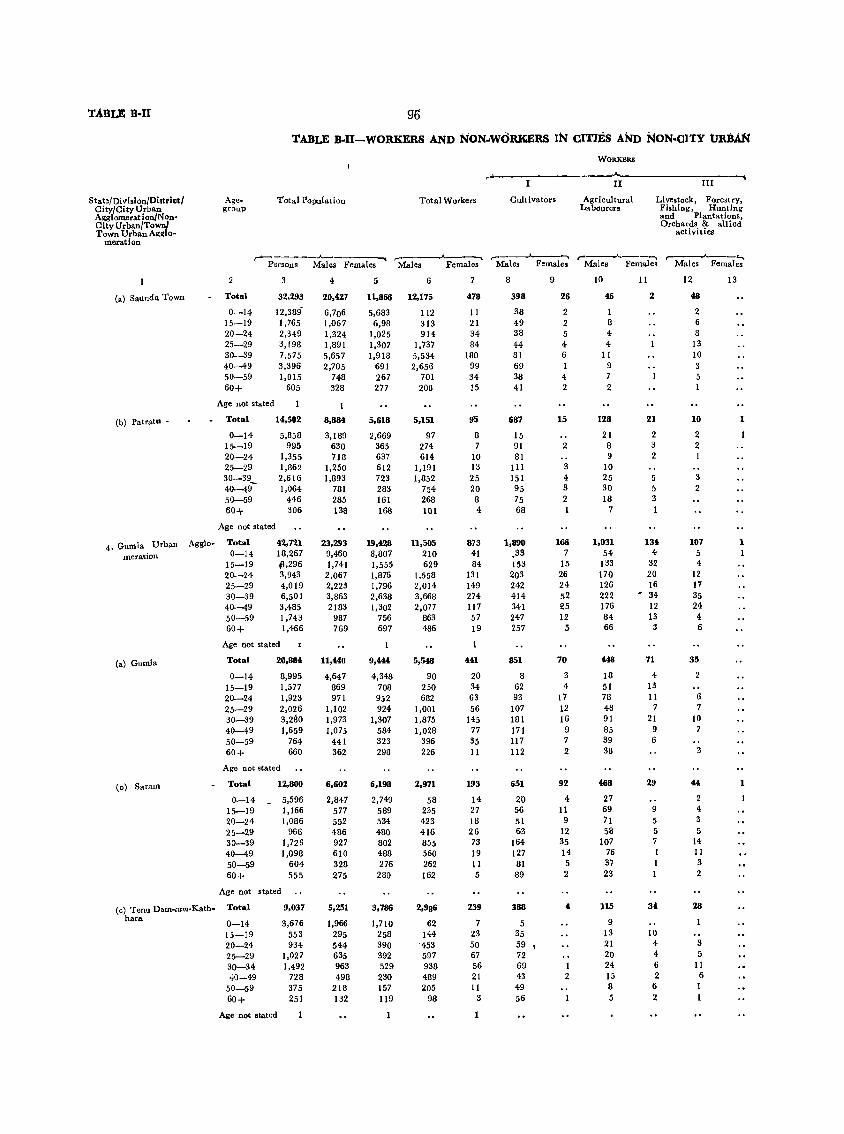
TABLE B·II 96
TABLE B·I1-WORKERS AND NON"WdRKERS IN CITIES AND NON.dITY tJRB~
WORKBRS
~ ..... II III
State/Dlvision/Distrlctl Age- 1'ota ll'opLilation Total Workers Cultivators Agricultural Livestock, Forestry, City/City Urban group Labourers Fishing, Hunting Agglomeration/Non- and Plantations, City Urban/Town/ Orchards & allied Town Urban Agglo- activities
meration ,..-.-__ -..A....--____ .....
r"----"---...... ...... r---..A..--...... ,.... __ .A-_~
Persons Males Females Male. Females r"Males Female. Males Females Males Females
2 3 4 5 6 8 9 10 II 12 13
(a) Saunda Town Total 32,293 20,\&27 11,866 12,175 478 398 26 46 2 48
0-14 12,389- 6,706 5,683 112 11 38 2 1 2 15-19 1,765 1,067 6,98 313 21 49 2 8 6 20-24 2,349 1,324 1,025 914 34 38 5 4 8 25-29 3,198 1,891 1,307 1,737 84 44 4 4 13 30-39 7,575 5,657 1,918 5,534 180 81 6 II 10 40-49 3,396 2,705 691 2,656 99 69 9 50-59 1,015 748 267 701 34 38 4 7 5 60+ 605 328 277 208 15 41 2 2 I
Age not stated
(b) Patrat .. - Total 14,502 8,884 5,618 5,151 95 687 15 128 21 10 1
0-14 5,858 3,189 2,669 97 8 15 21 2 2 15-19 995 630 365 274 7 91 2 8 3 2 20-24 1,355 718 637 614 10 81 9 2 25-29 1,862 1,250 612 1,191 13 III 3 10 30-39 2,616 1,893 723 1,852 25 151 4 25 5 3 40-49- 1,064 781 283 754 20 95 3 30 5 2 50-59 446 285 161 268 8 75 2 18 3
60+ 306 138 168 101 4 68 7 1
Age not stated
4. Gumia Urhan Agglo- Total 42,721 23,293 19,428 11,505 873 1,890 166 1,031 13' 107 1
meration 0-14 18,267 9,460 8,807 210 41 .33 7 54 4 5 15-19 1I,296 1,741 1,555 629 84 153 15 133 32 4 20-24 3,943 2,067 1,876 1,558 131 203 26 170 20 12 25-29 4,019 2,223 1,796 2,014 149 242 24 126 16 17 30-39 6,501 3,863 2,638 3,668 274 414 52 222 • 34 35 40-49 3,485 2183 1,302 2,077 117 341 25 176 12 24 50-59 1,743 987 756 863 57 247 12 84 13 4 60+ 1,466 769 697 486 19 257 5 66 3 6
Age not stated
(a) Gumia Total 20,884 11,440 9,4« 5,548 «1 851 70 4!l8 71 35
0-14 8,995 4,647 4,348 90 20 8 3 18 4 2 15-19 1,577 869 708 250 34 62 4 51 13
20-24 1,923 971 952 682 63 93 17 78 11 6
25-29 2,026 1,102 924 1,001 56 107 12 48 7 7
30-39 3,280 1,973 1,307 1,875 145 181 16 91 21 10 40-49 1,659 1,075 584 1,028 77 171 9 85 9 7
50-59 764 441 323 396 35 117 7 39 6
60+ 660 362 298 226 II 112 2 38 3
Age not stated
(b) Saram Total 12,800 6,602 6,198 2,971 193 651 92 468 29 4' 1
0-14 - 5,596 2,847 2,749 58 14 20 4 27 2 15-19 1,166 577 589 235 27 56 11 69 9 4
20-24 1,086 552 534 423 18 51 9 71 5 3
25-29 966 486 480 416 26 63 12 58 5 5 30-39 1,729 927 802 855 73 164 35 107 7 14 40-49 1,098 610 488 560 19 127 14 76 1 11
50-59 604 328 276 262 11 81 5 37 1 3
60+ 555 275 280 162 5 89 2 23 1 2
Age not stated
(c) Tenu Dam-,um-Kath. Total 9,037 5,251 3,786 2,986 239 388 4 115 34 28 hara
0-14 3,676 1,966 1,710 62 9 5 15-19 553 295 258 144 23 35 13 10
20-24 934 544 390 -453 50 59 I 21 4 3
25-29 1,027 635 392 597 67 72 20 4 5
30-34 1,492 963 529 938 56 69 1 24 6 11 40-49 728 498 230 489 21 43 2 15 2 6
50-59 375 218 157 205 11 49 8 (I
60+ 251 132 119 98 3 56 5 2
Age not stated 1
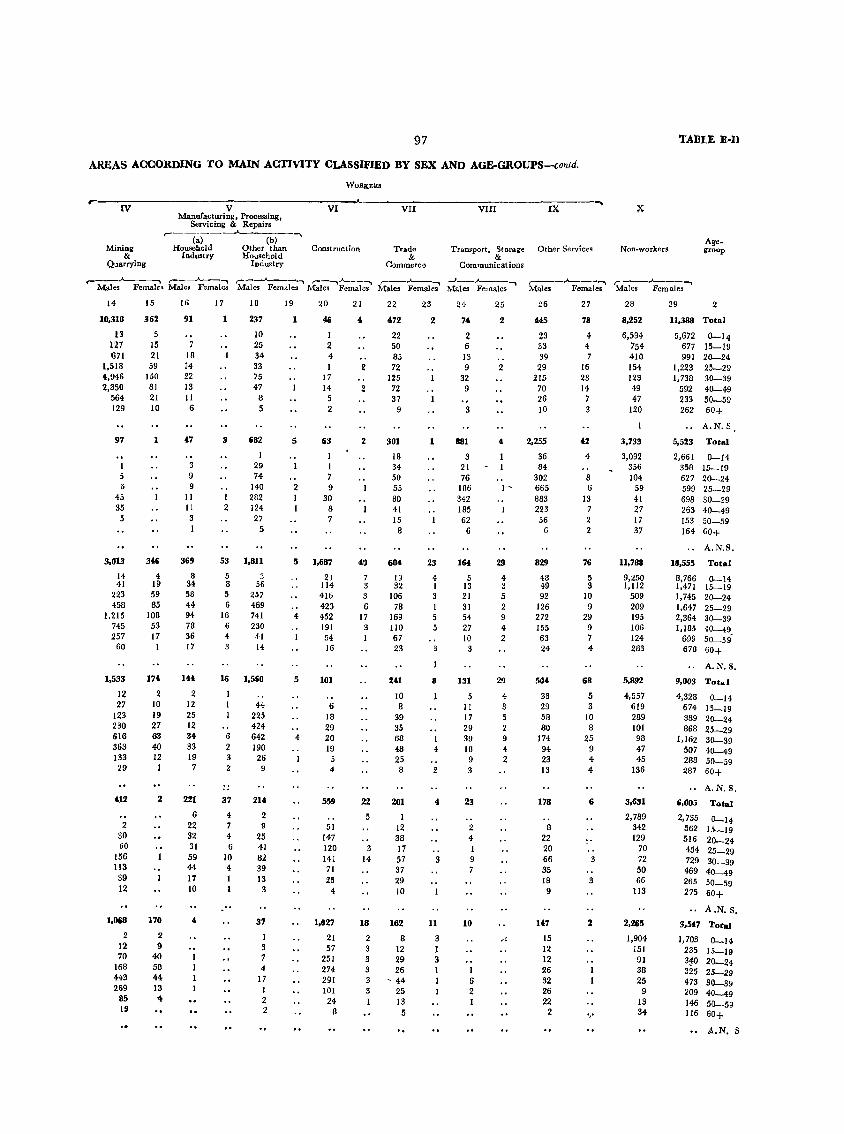
97
AREAS ACCORDING "CO MAIN ACTIVITY CLASSIFIED BY SEX AND AGE-GROUPS-contd.
,-'----------------------
Mining &
Quarrying
V Manufacturing. Processing,
Servicing &. Repairs ,--------~---------~
(a) (b) Household Other than
Industry Household Industry
VI
Construction
VII
Trade .I<
Commerce
VIU
Transport, ~torage
Communications
IX
Other Services Non-workers
TAllIE E.}}
Agegroup
<""---~ ,--""'---,,",", r---..A.---~ r---,~~ ,-_..A..-........ -' __ ..A---"""""I ,---01---........ r-..A.-,.--~ Males Females Males Females Males Females Males Females Males Females :rvtales Females Males Females Males Females
14
10,318
13 127 671
1,518 4,946 2,350
564 129
97
1 5 B
45 35 5
3,013
14 41
223 458
1,215 745 257
60
1,533
12 27
123 230 616 363 133 29
412
2 30 60
156 113
39 12
1,068
2 12 70
168 443 269
85 19
15
362
5 15 21 59
150 81 21 10
1
3~
4 19 59 85
108 53 17
I
174.
2 10 19 27 63 40 12 1
2
170
2 9
40 58 44 13 '4
16
91
7 18 14 22 13 11 6
f7
3 9 9
11 II 3 I
369
a 34 58 44 94 78 36 17
144
12 25 12 34 33 19 7
221
6 22 32 31 59 44 17 10
4
17
1
18
237
10 25 34 33 75 47
8 5
3 682
I 29 74
140 I 282 2 124
27 5
53 1,811
5 3 8 56 5 257 6 469
16 741 6 230 4 4J
16
6 2 3 2
37
4
4 6
10 4 1 1
14
1,560
44 225 424 642 190
26 9
2It 2 9
25 41 82 39 13
3
31
1 3 7 4
17 I 2 2
19 20
~
I 2 4 1
17 14
5 2
5 63
2 9 1 30 1 8
7
5 1,687
21 114 416 423
4 452
5
4
191 54 16
101
6 18 29 20 19
4
559
51 147 120 141 71 25
4
1,027
21 57
251 274 291 101 24
8
21
4
2
2
2
40
7 3 3 6
17 3 1
22
5
3 14
22
472
22 50 85 72
125 72 37
9
301
18 34 50 55 80 41 15 8
604
19 32
106 78
169 110 67 23
241
10 8
39 35 68 48 25 8
201
1 12 38 17 57 37 29 10
18 162
2 8 3 12 3 29 3 26 3 ' 44
25 13 5
23
2
24
74
2 6
13 9
32 9
3
1 881
3 21 76
186 342 185 62
6
23 164
4 5 1 13 3 21 I 31 5 54 5 27
10 3 3
8
I 4
4
3
11
3 1 3
131
5 11 17 29 39 18
9 3
23
2 4 1 9 7
10
I 6 2 1
25
2
2
26
us 23 33 39
29 215
70 26 10
4 2,255
36 84
302 I' 665
883 223 56
6
29 829
4 48 3 49 5 92 2 126 9 272 4 ISS 2 63
29
4 3 5 2 9 4 2
24
504
33 29 58 80
174 94 23 13
178
o 22 20 66 35 18 9
l!l7
15 12 12 26 32 26 22
2
27
78
4 4 7
16 23 14
7 3
42
4
8 6
13 7 2 2
76
5 3
JO 9
29 9 7 4
68
5 3
10 8
25 9 4 4
6
3
2
','
28
8,252
6,594 754 410 154 123 49 47
120
3,733
3,092 356 104
59 41 27 17 37
ll,788
9,250 1,112
509 209 195 106 124 283
5,892
4,557 619 289 101 98 47 45
136
3,631
2,789 342 129
70 72 50 66
113
2,265
1,904 151 91 38 25
9 13 34
29 2
11,388 Total
5,672 0-14 677 15-19 991 20--24
1,223 25-29 1,738 30-39
592 40-49 233 50-59 262 60+
A.N.S
5,523 Total
2,661 0-14 358 15-19 627 20-24 599 25-29 698 30-39 263 40-49 153 50-59 164 60+
A.N.S.
18,555 Total
8,766 0-14 1,471 15-19 1,745 20-24 1,647 25-29 2,364 30-39 1,185 40-49
699 50-59' 678 60+
.. A.N.S.
g,003
4,328 674 889 868
1,162 507 288 287
Total
0-14 15-19 20-24 25-29 30-39 40-49 50-59 60+
A.N.S.
6,005 Total
2,735 562 516 454 729 469 265 275
0-14 15-19 20-24 25-29 30-39 40-49 50-59 60+
A.N.S.
:J,547 Total
1,703 0-14 235 15-19 3~O 20-24 325 25-29 473 30-39 209 40-49 146 50-59 116 60+
A.N. S
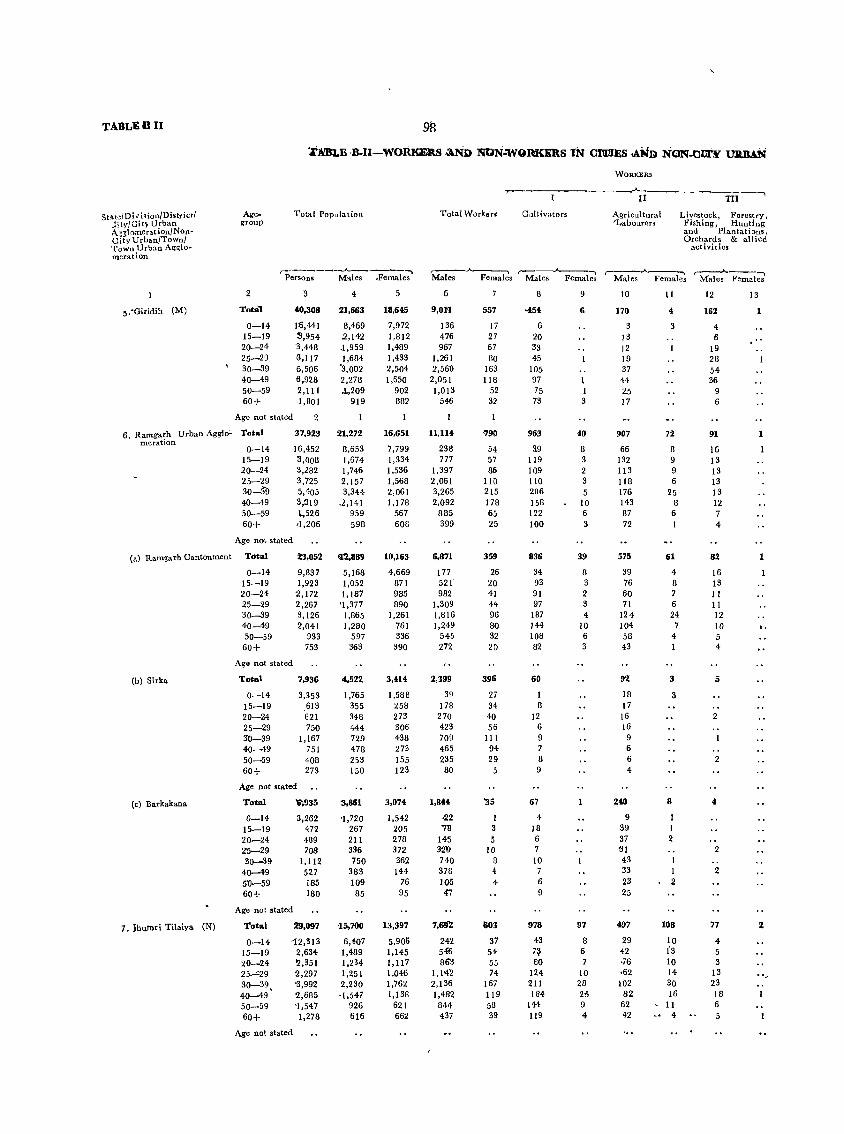
TABLEBII 98
T1I!BLE ,B.II-WO:RK'.El1lS ;AND l'mN'.:wQRKERS TN ClUES .AND NON.oliN' lJ'llBAN
WORKERS
'r" II TIl
-,
State/Division/District! Age- Total Population Total Workor< Cultivators Agricultural Livestock, Forestry, Jity!Cit} Urban group 'La.bourers Fishing, Hunting A "''''lomeration/Non~ and Plantations, City Urban!Town/ Orchards & allied Tow" U rb,n Agglo- activities meratlon
,-------........_-----... r----'-----, ,----.....___...., ,--.A.---. ,-__ .A.. ___ -.
Persons Males .Females Males Fem.ales Males Females Males Females Males Females
2 :3 4 5 6 8 9 10 11 12 13
5,'Giridih (M) Total '0,308 21,663 18,645 9,Otl 557 0454 6 170 4 162
0-14 IS,441 8,469 7,972 136 17 6 3 4 15-19 S,954 2,142 1,812 476 27 20 13 6 20-24 3,448 ,1,959 1,489 967 67 33 12 19 25-29 8.117 1,684 1,433 ]'261 80 45 19 28 30-39 6,506 '3,002 2,504 2,560 163 105 37 54 40-49 8,928 2,278 1,650 2,051 118 97 1 44 36 50-59 2,111 .l,209 902 1,013 52 75 1 25 9 60+ 1,801 919 882 546 32 73 3 17 6
Age not stated 2
6, Ramgarh Urban AggloC Total 37,923 21,272 16,651 11,114 790 963 40 907 72 91 meration
0-14 16,452 8,653 7,799 238 54 3.9 8 66 8 16 15-19 3,008 1,674 1,334 777 57 119 3 132 9 13 20-24 3,282 1,746 1,536 1,397 86 109 2 113 9 13 25-29 3,725 2,157 1,568 2,061 110 110 3 118 6 13 30-39 5,405 3,344 2,061 3,265 215 206 5 176 25 13 40-49 3;319 .2,141 1,178 2,092 178 158 10 143 8 12 50-59 l,526 959 567 885 65 122 6 87 6 7 60+ '1,206 598 608 399 25 100 3 72 4
Age not stated
(a) Ramgarh Cantonment Tdtal 23,052 q~,8R9 10,163 6,871 359 836 39 575 61 82 1
0-14 9,837 5,168 4,669 177 26 34 8 39 4 16 15-19 1,923 1,052 871 521 20 93 3 76 8 13 20-24 2,172 1,187 985 982 41 91 2 60 7 II 25-29 2,267 '1,377 890 1,309 44 97 3 71 6 11 30-39 3,126 1,865 1,261 1,816 96 187 4 124 24 12 40-49 2,041 1.280 761 1,249 80 144 10 104 7 10 50-59 933 597 336 545 32 108 6 58 4 5 60+ 753 363 390 272 20 82 3 43 1 4
Ago not stated
(b) Sirka Total 7,936 4.522 3,414 2,399 396 60 92 3 5
0-14 3,353 1,765 1,588 39 27 1 18 3 15-19 613 355 258 178 34 8 17 20-24 621 348 273 270 40 12 16 2 25-29 750 444 306 423 56 6 16 3'0-39 1,167 729 438 709 111 9 9 40-49 751 478 273 465 94 7 6 50-59 408 253 155 235 29 8 6 2 60+ 273 150 123 80 5 9 4
Age not stated
(c) Barkakana Total "".935 ~.861 3.074 1.R*, '35 67 240 8 4
0-14 3,262 '1,720 1,542 -22 I 4 9 1 15-19 472 267 205 78 3 18 39 1 20-24 489 211 278 14'5 5 6 37 2 25-29 708 336 372 32~ 10 7 ~1 2 30--39 1,112 750 362 740 8 10 43
40-49 527 383 144 378 4 7 33 I 2
50-59 165 109 76 105 4 6 23 2
60+ 180 85 95 47 9 25
Age not stated
7, Jhulnri Tilaiya (N) Total 29.097 '15,700 13.397 7,6!r.Z 503 978 97 497 108 77 2
0-14 12,313 6,407 5,906 242 37 43 8 29 10 4 15-19 2,634 1,489 1,145 54'6 54 7~ 6 42 13 5 20-24 2,351 1,234 1,117 8~3 55 80 ,76 10 3 2';"'::29 ~,297 1,251 1,046 1,14'2 74 124 10 ,62 14 13 . " 30-39, '3,992 2,230 1,762 2,136 167 211 28 102 30 23
40-49 2,685 -1,547 1,138 1,482 119 184 25 82 16 18
50-59 '1,547 926 621 844 58 144 9 62 11 6
60+ 1,278 616 662 437 39 119 4 42 4 5
Age not stated
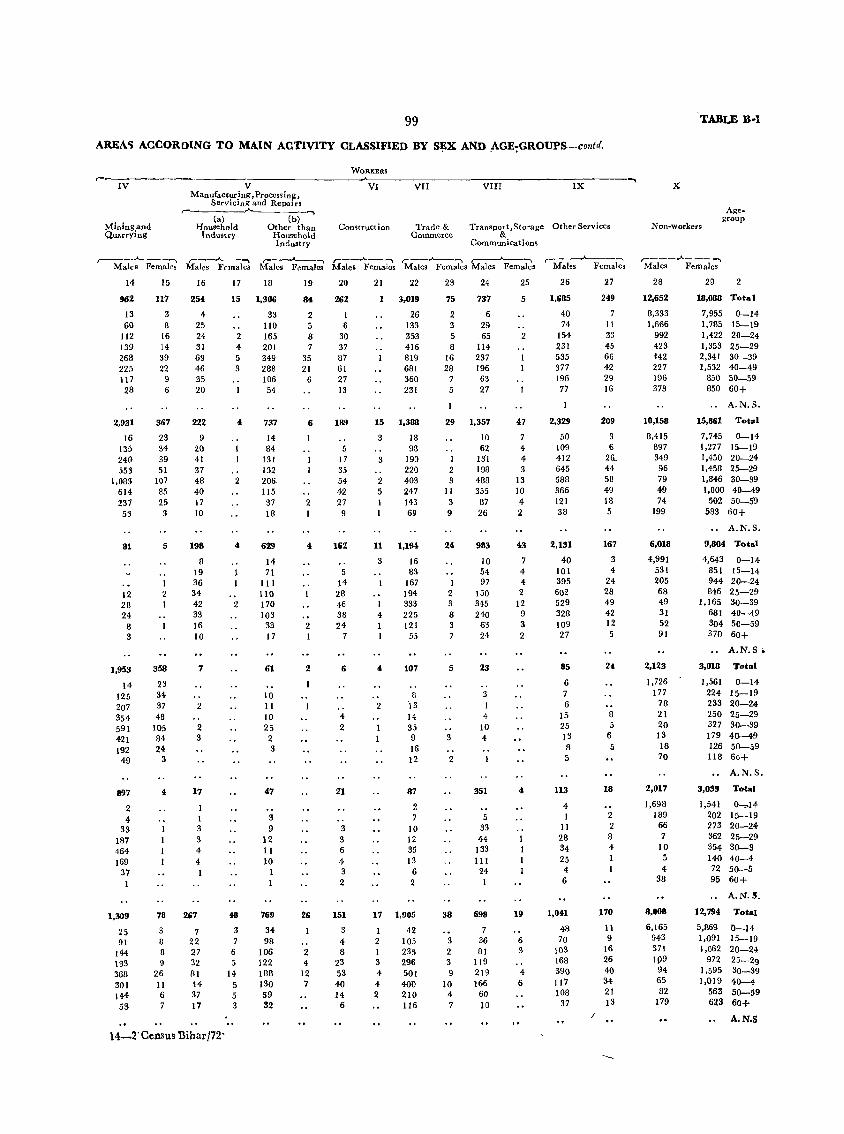
99
AREAS ACCORoING TO MAIN ACTIVITY CLASSIFIED BY S~X AND .AGE~GROUPS-contd.
WORKERS
~"~IV~------'------------V------------------~~V-I------V--II----------V-I-II--------'
Manufacturing, Processing, Servicing and Repairs
l\tiningand Quarrying
~ ________ ,A~ _______ ....,
(a) Household
Industry
(b) Other than
Household Industry
Construct ion Trade & Commerce
Transpo&t, Storage
Communications
IX
Other Serv ices
TABLE BoI
X
Non .. workers
Agegroup
~ ___ .A----. r---.A.....---,\ r--~",",", ,-__ ..A._-, r _.A-----, ,_.A-----, ,---"""'__~~ r---..A.- -..., Males Females Males Females Males Females Males Females Males Females Males Females Males Females Males Females
14
962
13 60
112 139 268 225 117 28
2,931
16 13:' 240 553
1,083 614-237 53
81
12 28 24
S 3
1,953
14 125 207 354 591 421 192 49
897
2 4
33 187 464 169
37
1,309
25 91
144 IS3 368 301 144 53
15
117
3 8
16 14 39 22
9 6
367
23 34 39 51
107 85 25 3
5
1 2 1
358
23 34 37 48
105 84 24
3
4
78
8 8 9
26 11 6 7
16
254
4 25 24 31 69 46 35 20
222
9 20 41 37 48 40 17 10
198
8 19 36 34 42 33 16 10
7
2
2 3
17
1 3 3 4 4 1
267
7 22 27 32 81 14 37 17
14-2' Census Bihar/72'
17 18
15 1,306
33 110
2 165 4 201 5 349 3 288
4
2
2
48
3 7
6 5
14 5 5 3
106 54
7..,.7
14 B4
131 132 206 115 37 18
629
14 71
III 110 170 103
33 17
61
10 11 10 25 2 3
47
3 9
12 11 10
1 1
769
34 98
106 122 188 130 59 32
19
84
2 5 8 7
35 21
6
6
2 I
4
2
2
26
2 4
12 7
20
262
I 6
30 37 87 61 27 13
189
5 17 35 54 42 27
9
162
5 14 28 46 38 24
7
6
4 2
21
3 3 6 4 3 2
151
3 4 8
23 53 40 14
6
21 22
3,019
26 133 353 416 819 681 360 231
15 1,388
3 18 98
3 190 220
2 403 5 247
143 69
11 1,19~
3 16 83
167 194 333
4 225 1 121 1 55
4
2
107
8 i3 14 35 9 16 12
87
2 7
10 12 35 13
6 2
17 1,905
1 2 1 3 4 4 2
42 105 235 296 501 400 210 116
23
75
2 3 5 8
16 28
7 5
24
737
6 29 65
114 237 196 63 27
29 1,357
1 2 3
11 3 9
24
1 2 3 8 3 7
5
3
2
38
3 2 3 9
10 4 7
10 62
13'1 198 488 355 87 26
983
10 54 97
150 345 240
63 24
23
4 10 4
351
5 33 44
133 111
24 I
698
7 36 81
119 219 166
60 10
25
5
2
47
7 4 4 3
13 10 4 2
43
7 4 4 2
12 9 3 2
4
19
6 3
4 6
26
1,685
40 74
154 231 535 377 196 77
2,329
50 109 412 645 588 366 121 38
2,131
40 101 395 602 529 328 109 27
85
6 7 6
15 25 13 8 5
113
4
11 28 34 25 4 6
1,041
48 70
103 168 390 117 108 37
;'
27
249
7 11 33 45 66 42 29 16
209
3 6
26.. 44 58 49 18 5
167
3 4
24 28 49 42 12 5
24
8 5
6 5
18
2 2 8 4 1
170
11 9
16 26 40 34 21 13
28
12,652
8,333 1,666
992 423 442 227 196 373
10,158
8,415 897 349 96 79 49 74
199
6,018
4,991 531 205 68 49 31 52 91
2,123
1,726 177
78 21 20 13 18 70
2,017
1,698 189
66 7
10 5 4
38
8,008
6,165 943 371
109 94 65 82
179
29 2
18,088 Tota 1
7,955 0-14 1,785 15-19 1,422 20-24 1,353 25-29 2,341 30-39 1,532 40-49
850 50-59 850 60+
A.N.S.
15,861 Total
7,745 0-14 1,277 15-Hl 1,450 20-24 1,458 25-29 1,846 30-39 1,000 40-49
502 50-59 583 60+
.. A.N.S.
9,804 Total
4,643 851 944 846
1,165 681 304 370
0-14 15-14 20-24 25-29 30-39 40-49 50-59 60+
A.N.S.
3,018 Total
1,561 224 233 250 327 179 126 118
0-14 15-19 20-24 25-29 30-39 4()-49 50-59 60+
A.N.S.
3,039 Total
1,541 0-=J4. 202 15-19 273 20-24 362 25-29 354 30-3 140 40-4 72 50-5 95 60+
.. A.N.S.
12,794 Total
5,869 1,091 1,062
972 1.595 1,019
563 623
0-14 15-19 20-24 25-29 30-39 40-4 50-59 60+
A.N.S
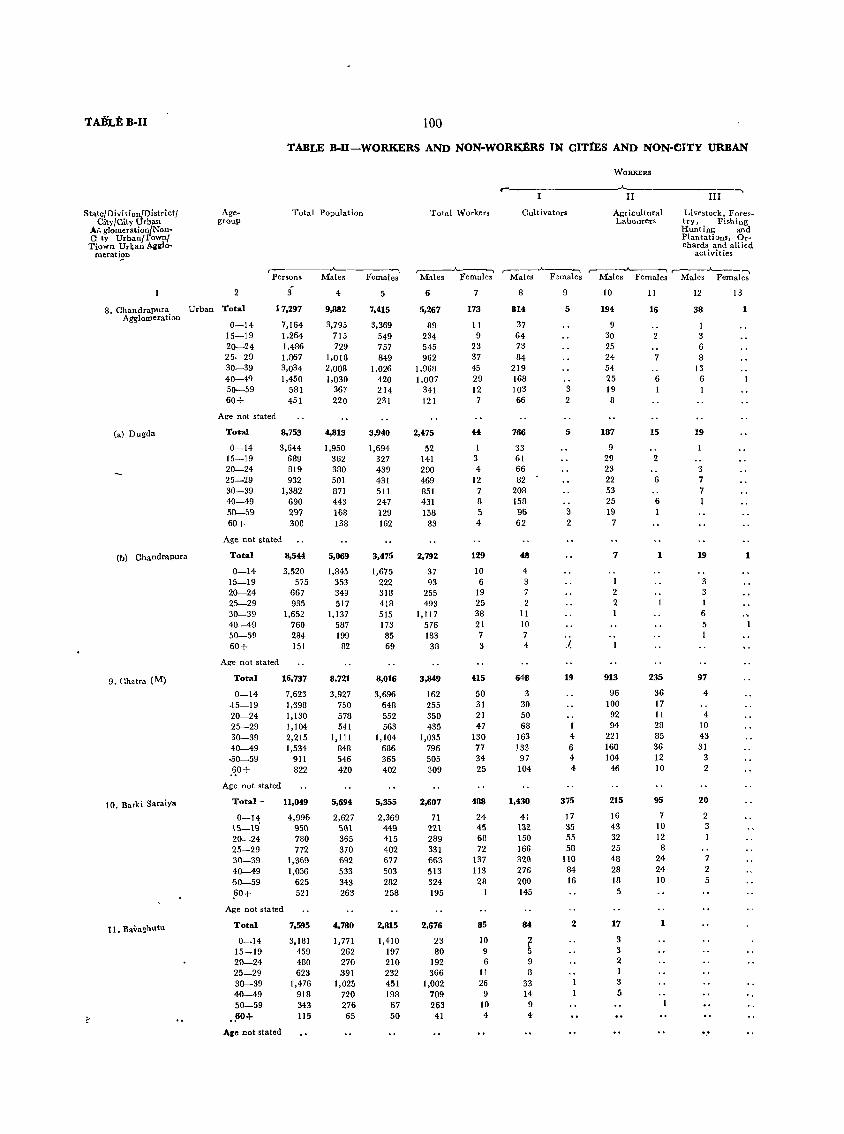
State/ Divi ,i onJDistrict / City/City Urban
Ai: glomeration/Nona ty Urbanrrown/ Tiown U, lan '\111110-
meratiolll
8. Chandrapura Agglomeration
Ca) Dugda
(b) Ghandrapura
9. Chalra eM)
10. Bark; Saraiya
t 1. Bavaghutu
100
TABLE B-I1-WORKERS AND NON-WORKERS TN CITiES AND NON-CITY URBAN
Agegroup
Total Poplliation Total Workers
WORKERS
r-----------------~·------------
Cultivators
II
Agricultural Labourers
III
Livestock, Forctltry, Fishing Hunting and Plantations, Or .. chards and aUied
activities
r------.A-------.~ ,---"""__---... r---.A----~ ,-----..A.----~ ,------,.).. ___ -. Persons Males Females Males females Males Females Males Females Males Females
2
Urban Total
0-14 15-19 20-24 25-29 30-39 40-49 50-59 60+
i 17,297
7,164 1,264 1,486 1,867 3,034 1,450
581 451
Age not stated
Total
0-14 15-19 20-24 25-29 30-39 40-49 50-59 60+
8,753
3,644 689 B19 932
1,382 690 297 300
Age not stated
Total
0-14 15-19 20-24 25-29 30-39 40-49 50-59 60+
Age not stated
Total
0-14 .15-19 20-24 25-29 30-39 40-49
.... 0-59
.~O+
Age not stated
Total -
0-14 1;'-19' 20-24 25-29 30-39 40-49 50-59 .60+
8,544
3,520 575
667 935
1,652 760 284 151
16,737
7,623 1.398 1,130 1,104 2,215 1,534
911 822
11,049
4,996 950 780 772
1,369 1,036
625 521
Age not stated
Total 7,595
3,181 459 480 623
0-·14 15-19 20-24 25-29 30-39 40-49 50-59
,,60+
Aie Dot stated
1,476 918 343 115
4
9,882
3,795 715 729
1,018 2,008 1,030
367 220
4,813
1,950 362 380 501 871 443 168 138
5,069
1,845 353 349 517
1,137 587 199
82
8,721
3,927 750 578 541
1,111 848 546 420
5,694
2,627 ;'01 365 370 692 533 343 263
4,780
1,771 262 270 .391
1,025 720 276 65
5
7,415
3,369 549 757 849
1,026 420 214 231
3,940
1,694 327 439 431 511 247 129 162
3,475
1,675 222 3IB 418 515 173
85 69
8,016
3,696 648 552 563
1,104 686 365 402
5,355
2,369 449 415 402 677 503 282 258
2,815
1,410 197 210 232 451 198 67 50
6
5,267
89 234 545 962
1,968 1,007
341 121
2,475
52 141 290 469 851 431 158
83
2,792
37 93
255 493
1,117 576 183
38
3,849
162 255 350 435
1,035 796 505 309
2,607
71 221 289 331 663 513 324 195
2,676
23 80
192 366
1,002 709 263 41
7
173
11 9
23 37 45 29 12
7
3 4
12 7 8 :; 4
129
10 6
19 25 38 21 7 3
415
50 31 21 47
130 77 34 25
488
24 45 68 72
137 113 28
85
10 9 6
11 26
9 10 4
8
814
37 64 73 84
219 168 103 66
766
33 61 66 82
208 158 96 62
48
4 3 7 2
II 10 7 4
648
3 30 50 68
163 133 97 104
1,430
41 132. 150 166 320 276 200 145
~ 9 8
33 14 9 ..
9
5
3 2
5
3 2
.1,
19
1 4 6 4 4
375
17 35 55 58
110 84 16
2
10
194
9 30 25 24 54 25 19 8
187
9 29 23 22 53 25 19
7
7
1 2 2
913
96 100
92 94
221 160 104
46
215
16 43 32 25 48 28 18
5
17
3 3 2 1 3 5
II
16
7
6
15
2
6
6 1
1
235
36 17 11 28 85 36 12 10
95
7 10 12 8
24 24 10
1
12
38
1 3 6 8
13 6
19
3 7 7 1
19
3 3 I 6 5 1
97
4
4 10 43 31
3 2
20
2 3
7 2 5
13
1
1
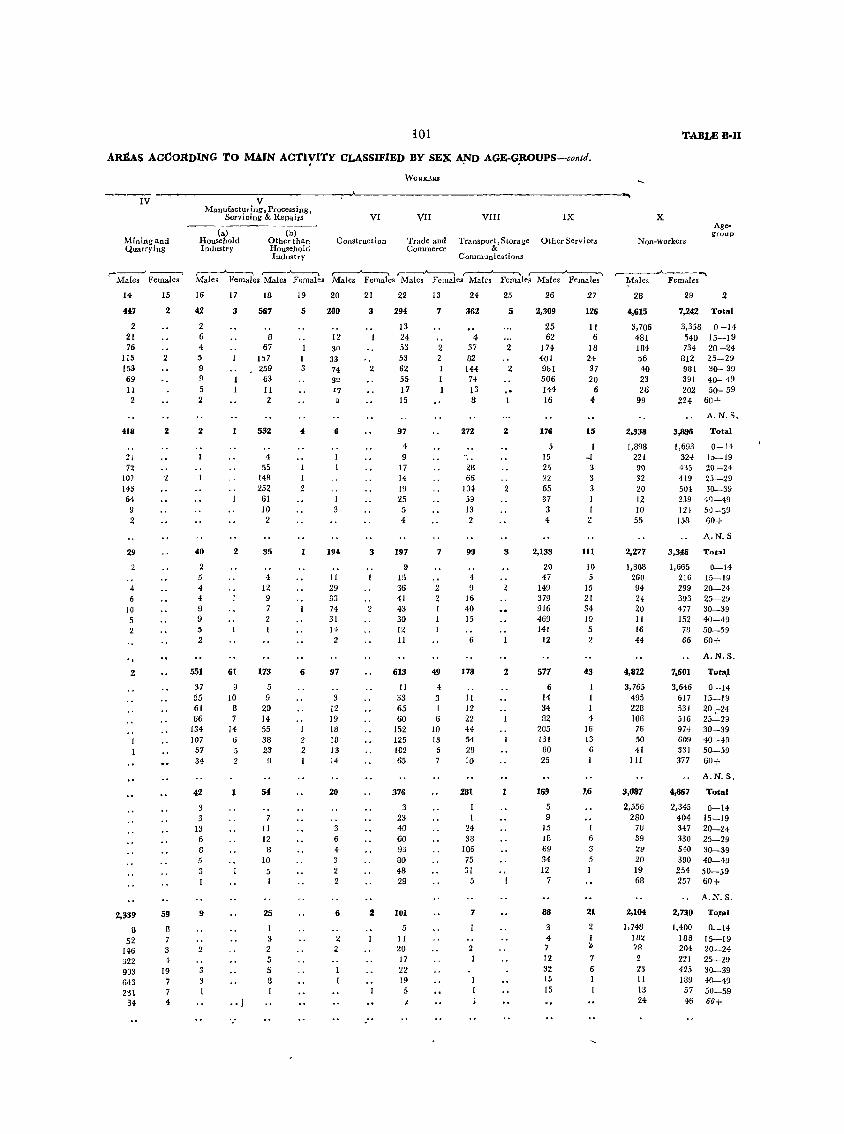
l01 TABLE B·Il
AREAS AcdoRDING TO MAIN ACTlYITY CLASSIFIED BY SEX AJ'lD AGE-G~UPS-contd.
WGRKERS
------I-V -·----------------V·-----------~A------------------· ------------------------~
Mining and Quarrying
Manufacturing J Processing, Servicing & Repairs
(,,) Household Industry
(b) Other than Household Industry
VI
Construction
VII
Trade and Commerce
VIII
TransporA:' Storage
Communications
IX
Other Services
X
Non-Workers
Agegroup
,------' ----, ,--...A---, ,.--.-..A.----~ ~l ,--_~ r------~ ,---.....____, ,---__ ,A ____ '"'
Males Females Males Females Males Females Males Females Males Females Males Females Males Females Males Females
14
447
2 21 76
III 153 69 II 2
418
21 72
10)
143 64
9
2
29
4 6
10
"
2
2,339
S 52
146 322 903 643 231
34
IS
2
2
59
8 7 3 4
19 7 7 4
16
42
2 6 4 5 9 9 5 2
2
40
5 4 4 9 9 5 2
551
37 55 61 66
134 107
57 34
42
3 3
13 6 8 5
9
2
3 3
17
3
2
61
9 10
8 7
14 6 5 2
1
•• J
16
567
8 67
157 259
63 II 2
532
4 55
148 252
61 10 2
35
4 12 9 7 2 I
173
5 9
20 14 55 38 23
9
54
7 11 12
8 10
5 I
25
3 2 5 5 8
19
5
I 3
I 2
6
I 2 2 1
20
200
12 30
33 74 32 17
6
11 29 33 74 31 14 2
97
3 12 19 18 18 13 14
20
3 6 4 3
2 2
6
2 2
21
3
2
3
22
294
13 24 53 53 62 55 17 15
97
4 9
17 14 19 25 5 4
197
9 15 36 41 43 30 12 11
613
11 33 65 60
152 125 102 65
376
3 23 40 60 93 80 48 29
101
5 II 20 17 22 19 5
13
7
2 2 I I
I
7
2 2
49
4
3 1 6
10 13
5 7
24
362
4 37 82 144 74 13 8
272
2B 66
104 59 13 2
9U
4 9
16 40 15
6
178
II 12 22 44 54 28 10
281
24 38
106 75 31
5
7
2 I
25
5
2
2
2
2
3
2
2
26
2,309
25 62
174 401 D81 506 144 16
176
5 15 25 22 65 37 3 4
2,133
20 47
149 379 916 469 141
12
577
6 14 34 82
205 131 80 25
169
5 9
Jj
18 69 34 12
7
88
3 4 7 12 32 15 15
27
126
II 6
18 24 37 20
6 ..
15
-1 3 3 3
111
10 5
15 21 34 1D 5 2
43
1 I I 4
16 13 6 I
!6
1 6
5
21
2 I D
7 6 I I
28
4,615
3,706 481 184 56 40 23 26
99
2,338
1,898 221 90 32 20 12 10
55
2,277
1,808 260 94 24 20 II 16 44
4,87~
3,765 495 228 106 76 50 41
III
3,087
2,556 280
76 39 Zli 20 19 68
2,104
1,748 IU~ 7R
2 23 11 13 24
29
7,242
3,358 540 734
812 981 391 202
224
Total
0-14 15-19 20·-24 25-29 30- 39 40- 49 50- 59
60+
A.N.S.
3,896 Total
1,693 0-14 324 15-19 435 20-24 419 25-29 501 30-39 239 4~-49
12 ~ 5-J-59 158 60+
A.N.S
3,31&6 Total
1,665 0-14 216 15-19 299 20-24 393 25-29 477 30-39 152 40-49 78 50-59 66 60+
7,601
3,646 617 531 516 974 609 331 377
A.N.S.
Tota,l
0-14 15-19 20-;-24 25-29 30-39 40-49 50-59 60+
A.N. s. 4,867 Total
2,345 0-14 404 15-19 347 20-24 330 25-29 540 30-39 390 40-49
254 50-59 257 60+
2,73,0
1,400 188 204 221 425 139 57 46
A.N.S.
:ro~al
0-14 15-19 20-24 25-29 30-39 40-49 50-59 60+
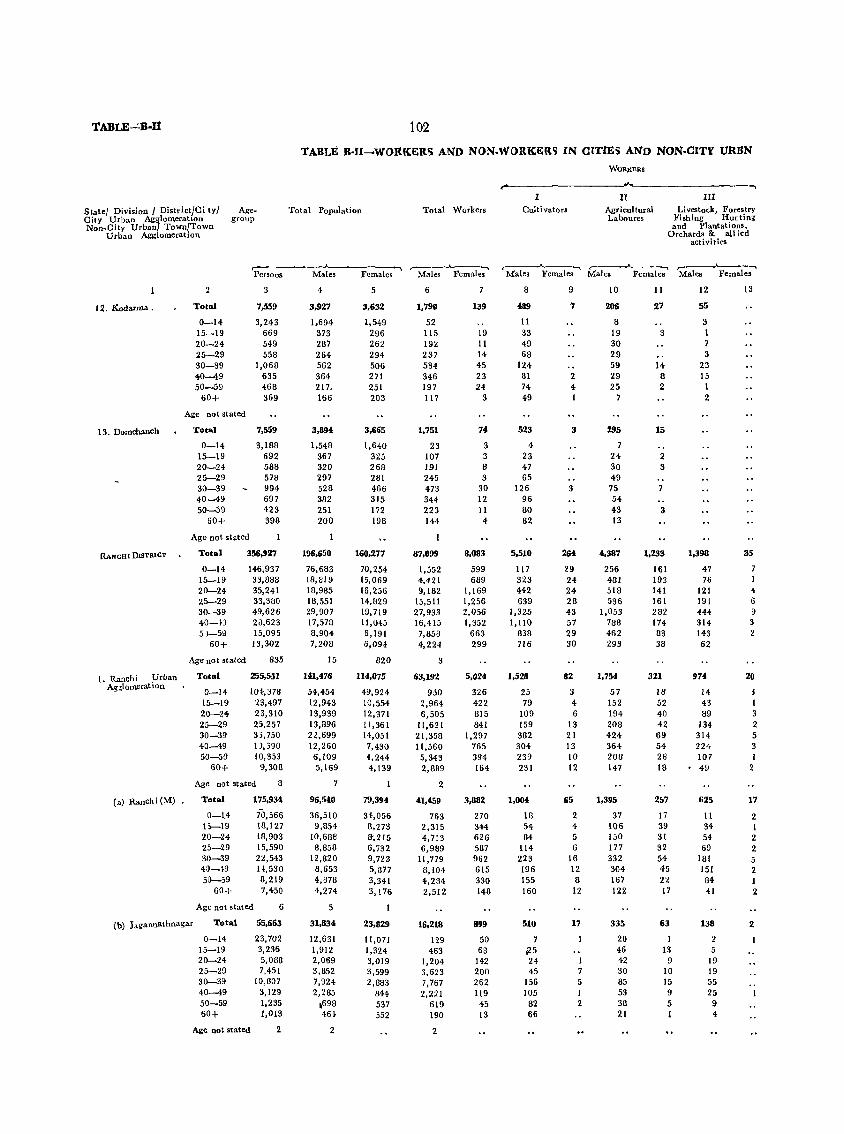
102
TABLE B-JI~WOltKERS AND NON.WORKER5 IN CITIES AND NON-CITY tJRBN
State/ Division I District/Ci ty/ Age-City Urban Agglomeration group Non-City Urbani Town/Town
Urban Agglomeration
Total Population
~.--------~----------~ Persons Males Females
1:1. Kodarma.
13. Domchanch
RAN cHI DISTRICT
1. Ranchi Urban Ag~\omerat ion
Total
0-14 15-19 20-24 25-29 30-39 40-49 50-59
60+
Age Dot stated
Total
0-14 15-19 20-24 25-29 30-39 40-49 50-59
60+
7,559
3,243 669 549 558
1,068 635 468 369
7,559
3,188 692 588 578 994 697 423 398
Age not stated
Total
0-14 15-19 20-24 25-29 30-39 40-D 5J-59
60+
Age not stated
Total
0-14 15-19 20-24 25-29 30-39 40-49 50-59
60+
356,927
146,937 33,888 35,241 33,380 49,626 20,623 15,095 13,302
835
255,551
104,378 23,497 26,310 25,257 3),750 1),390 10,353
9,308
Age Dot stated 8
(a) Ranchi (M). Total 175,93f.
70,566 18,127 18,903 15,590 22,543 B,530 8,219 7,450
(b) Jagannathnagar
0-1.4 15-19 20-24 25-29 30-39 4J-49 50-59
60+
Age Dot stated
Total
0-14 15-19 20-24 25-29 30-39 40-49 50-59 60+
Age Dot stated
6
55,663
23,702 3,236 5,08B 7,451
10,807 3,129 1,235 1,013
2
4
3,9:t7
1,694 373 287 264 562 364 217. 166
3,894
1,548 367 320 297 528 382 251 200
196,650
76.683 18.819 18,985 18,551 29,907 17,578 8,904 7,208
15
141,476
54,454 12.943 13,939 13,896 2l,699 12,260 6,109 5,169
96,540
36,510 9,854
10,688 8,858
12,820 8,653 4,878 4,274
5
31,834
12,631 1.912 2,069 3,852 7,924 2,285
,698 46~
2
5
3,632
1,549 296 262 294 506 271 251 203
3,665
1,640 325 268 281 466 315 172 198
160,211
70,254 15,069 16,256 14,829 19,719 11.045 6,191 6,094
820
114,075
49,924 10,554 12,371 11,361 14,051 7,430 4,244 4.139
19,394
34,056 8,273 8;215 6,732 9.723 5,877 3,341 3.176
23,829
11.071 1,324 3,019 3,599 2,883
844 537 552
Total Workers
WORJ{ERS
r--------------------~-------------------~ I
Cu1tivators II III
Agricultural Livestock, Forestry Laboures Fishing Hunting
and Plantations, Orchards & all ied
activities
,.----'--c:-'-.... r-~'""""'\ .--.A---~ r- ~ Males Females Males Females Males Females Males Females
6
1,790
52 115 192 237 534 346 197 117
1,751
23 107 191 245 473 344 223 144
87,099
1,552 4,421 9,182
15,511 27,933 16.415 7,858 4,224
3
63,192
950 2,964 6,505
11,621 21,358 11,560 5,343 2,889
2
41,459
763 2,315 4,713 6,989
11,779 8,104 4,284 2,512
16,218
129 463
1,204 3,623 7,767 2,221
619 190
2
139
19 II 14 45 23
..24 3
74.
3 3 8 3
30 12 11 4
8,083
599 689
1,169 1,256 2,056 1,352
663 299
5,024
326 422 815 841
1,297 765 394 164
3,882
270 344 626 587 962 615 330 148
899
50 68
142 200 262 119
45 13
8
489
11 33 49 68
124 81 74 49
523
4 23 47 65
126 96 80 82
5,510
117 323 442 639
1,325 1,110
838 716
1,528
25 79
109 159 382 304 239 231
1,004
18 54 84
114 223 196 155 160
510
7 i25 24 45
156 105
82 66
9
7
2 4
3
3
26f.
29 24 24 28 43 57 29 30
82
3 4 6
13 21 13 10 12
65
2 4 5 6
16 12 8
12
11
5 1 2
10
206
8 19 30 29 59 29 25
7
295
7 24 30 49
75 54 43 13
4.,387
256 481 518 536
1,053 788 462 293
1,754
57 152 194 208 424 364 208 147
1,395
37 106 150 177 332 304 167 122
335
20 46 42 30 85 53 38 21
11
27
3
14 8 2
15
2 3
3
1,233
161 193 141 161 282 174 83 38
321
18 52 40 42 69 54 28 18
257
17 39 31 32 54 45 22 17
63
I 13
9 10 15 9 5 1
12
55
3 1 7 3
23 15 1 2
1,398
47 76
121 191 444 314 143 62
974.
14 43 89
134 314 224 107 49
625
II 34 54 69
181 151 84 41
138
2 5
19 19 55 25 9 4
13
35
4 6 9 3 2
20
3 1 3 2 5 3 1
2
17
2 1 2 2 5 2 1 2
2
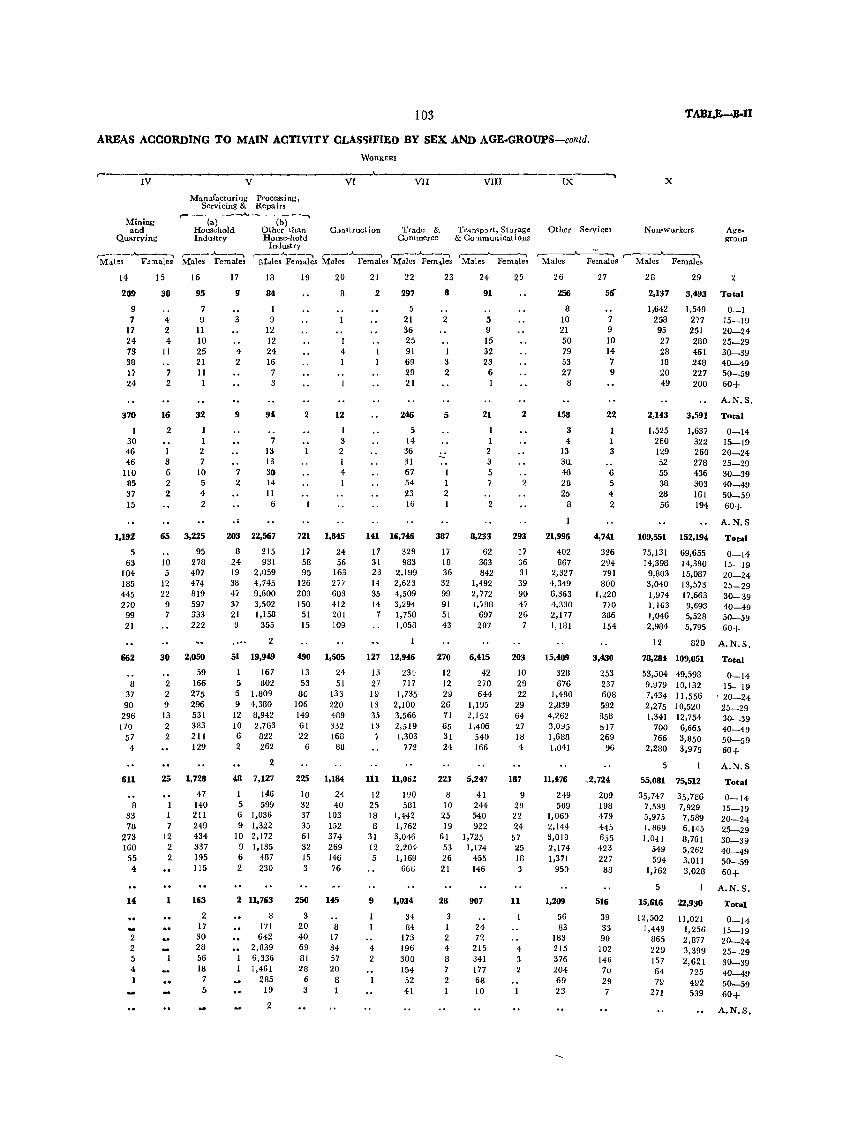
103
AREAS ACCORDING TO MAIN ACTIVITY CLAS')IFIED BY SEX AND AGE-GROUPS-contd.
r---IV
Mining and
Quarrying
,-_·_-......... ---1 Males Fenales
14
209
9 7
17 24 73 38 Ii 24
370
30 46 46
110 85 37 15
1,192
5 63
104 185 445 270 99 21
15
30
4 2 4 II
7 2
16
2
I 3 6 2 2
65
10 5
12 22
9 7
V
Manufacturing processing, Servicing & Repairs
VI
WORKERS
VII VIII
r-'----(a-)----~-----(-b)---~ Household Other than C"nstruct ion Trade & Tra:1~p[)rt, Storage Industry House-hold Commerce & Communications
,-__ ..A.-__ ~
Males Female,
16
95
7 !I
II 10 25 21 11 I
32
1 2 7
10 5 4 2
3,225
95 278 407 474 819 597 333 222
17
g
4 2
9
2
., 203
8 24 19 3a 47 3' 21 9
.....
Industry ~--~--~ r--~--~ ~--~I r--~-~
!'y.I41es Females Males Females Males Females Males Females
18
84
9 12 12 24 16 7 3
94
7 13 13 30 14 II
6
22,567
215 931
2,059 4,745 9,600 3,502 1,158
355
2
19
2
721
17 58 95
126 209 150 51 15
20
8
4
12
3 2 I ..
1,845
24 56
163 2ii 603 412 201 109
21
2
22
297
5 21 36 25 91 69 29 21
246
5 14 36 31 67 54 23 16
141 16,746
17 329 31 983 23 2,199 14 2,623 35 4,509 14 3,294
7 1,750 1,058
23
8
2
I 3 2
5
I 2
387
17 18 36 32 99 91 51 43
24
91
5 9 15 32 23
6 1
21
I 2 3 5
2
8,233
62 363 842
1,492 2,772 l,i98
697 207
25
2
2
293
17 36 31 39 90 47 26 7
662 30 2,050 51 19,949 490 1,505 127 12,946 270
12 12 29 26 71 65 31 24
6,415
42 270 644
203
10 29 22
29 64 27 18 4
8 37 90 2~6
170 57 4
611
8 33 7u
273 160
55 4
2 2 5 4 1
2 2 9 13 2 2
25
1 1 7
12 2 2
1
59 166 275 296 531 383 211 129
1,728
47 140 211 249 434 337 195 115
163
2 17 30 28 56 18
7 5
I 167 5 802 6 1,809 9 1,380
12 8,942 10 2,763 6 822 2 262
2
48 7,127
146 5 599 6 1,036 !I 1,322
10 2,172 9 1,135 6 487 2 230
2 11,763
8 171 642
2,839 6,336 1,461
285 19
2
13 53
80 106 149 61 22
6
225
10 32 37 35 61 32 15 3
250
3 20 40 69 81 28
6 3
24 51
133 220 489 332 168
88
1,184
24 40
103 152 374 269 146 76
145
8 17 34 57 20
8
13 27 19 13 35 J3
111
12 25 18 8
31 12 5
9
4 2
234 717
1,735 2,100 3,566 2,519 1,303
772
11,06Z
190 581
1,442 1,762 3,046 2,204 1,169
66ij
1,034
34 84
173 196 300 154
52 41
223
8 10
25 19
61 53 26 21
28
3 1 2 4 8 7 2
1,195 2,152 1,406
540 166
5,247
41 244 540 922
1,725 1,174
455 146
907
24 72
215 341 177 68 10
187
9 29 22 24
57 25 18 3
11
4
-------. IX
Other Services
X
Non .. workers Agegroup
r---~ r~--~ Males Females Males Fernal es
26
256
8 10 21 50 79 53 27
8
158
3 4
13 3(l 46 28 25
8
ZI,996
402 867
2,327 4,349 6,363 4,330 2,177 1,181
15,409
328 676
1,480 2,839 4,262 3,O!)5 1,688 1,041
11,476
249 509
1,060 2,144 3,019 2,174 1,311
950
1,209
56 83
183 215 376 204 69 23
27
56"
7 9 10 14 7 9
22
1 1 3
6 5 .. 2
4,741
326 294 791
800 1,220
7)0
386 154
3,430
253 237 608 592 858 517 269
96
_2,724
209 198 479 445 6j5 423 227 88
516
39 33 90 102 146 70 29 7
28 29
2,137 3,493 Total
1,642 258 95 27 28 18 20 49
2,143
1,525 260 129 52 55 38 28 56
109,551
75,131 14,398
9,803 3,040 1,974 1,163 1,046 2,984
12
1,549
2" 251 280 461 248 227 200
0-1 15-19 20-24 25-29 30-39 40-49 50-59 60+
A.N.S.
3,591 Total
1,637 322 260 278 436 303 161 194
152,194
69,655 14,380 15,087 13,!>73 17,663 9,693 5,528 5,795
820
0-14 15---19 20-24 25-29 30-39 40-49 50_59 60+
A.N.S
Total
0-14 15-19 20-24 25-29 30-39 40-49 50-5~
60+
A.N.S .
78,28!l 109,051 Total
53,504 9,979 7,434 2,275 1,341
700 766
2,280
5
55,081
35,747 7,539 5,975 1,869 1,04]
549 594
1,"162
5
15,616
12,502 1,449
865 229 157 64 79
271
49,598 10,132 II ,556 10,520 12,754 6,665 3,850 3,975
75,512
35,786 7,929 7,589 6,145 8,761 5,262 3,011 3,028
22,930
11,021 1,256 2,877 3,399 2,621
725 492 539
0-14 15--19
. 20-24 25-29 30-39 40-49 50-59 60+
A.N.S
Total
0-14 15-19 20-24 25-29 30-39 40-49 50-59 60+
A.N.S.
Total
0-14 15-19 20-24 25-29 30-39 40-49 50-59 60+
A.N.S.
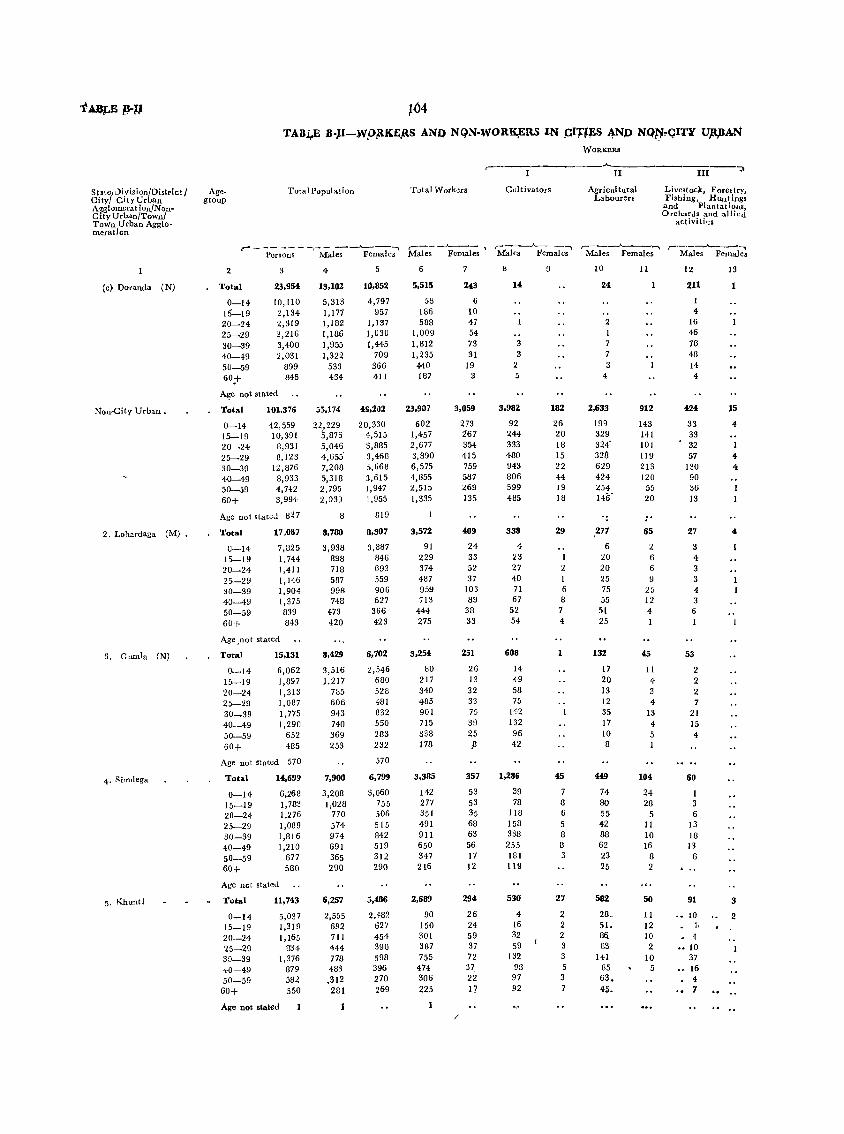
1M TA3.I,.E B.}I-'w,O,RKE,RS AND NQN·WORK,ERS IN prn~S 4N,o NQ;tjM;:Il';r" U,R,llAN'
WORKERS ________ A, ____________ ,
II III
Stitej Di .ision/District / Age-City/ City Urban group
Total Population Total Workers Cultivators Agricultural Labourers
Livestock, Forestry, Fishing, Huntins:s and Plantations, OrcharJs and allied
A~glomerationfNon" CityUrban/Town/ Town Urban Agglo-meration
(c} Doranda (N)
Non-City Urban.
2. Lohardaga eM).
3. Gumla (N)
4. Rimdega
5. Khunti
activiti'!s
r- _ - - - - - -,_ - __ .A.. _____ -... r-'-- ---'---.. , __ .A. __ -, ,-___ --A--"""'"' ,---__ -.A.-__ -"
Persons Males Females Males Females Males Females Males Females Males Females
2
Total
0-14 15:-19 20-24 25-29 30-39 40-49 50-59 60;+
23,954
10,110 2,134 2,319 2,216 3,400 2,031
899 845
A!;" not stated
Total
0-14 15-19 20-24 25-29 30-39 40---49 50-59 60+
101,376
42,559 10,391
8,931 8,123
12,876 8,933 4,742 3,994
Age no t stateJ 827
Total
0-14 15-19 20-24 25-29 30-39 40-49 50-59 60+
17,087
7,825 1,744 1,4II 1,146 1,904 1,375 839 843
Age .not stated
Total
0-14 15-19 20-24 25-29 30_39 40-49 50-59 60+
15,131
6,062 1,897 1,313 1,087 1,775 1,290
652 485
Age not gtated 570
Total
0-14 15-19 20-24 25-29 30-39 40-49 50-59 60+
14,699
6,268 1,783 1,276 1,089 1,816 1,210
677 580
Age not stated
Total
0-14 15-19 20-24 25-29 30-39 40-49 50-59 60+
11,743
5,037 1,319 1,165
834 1,376
879 582 550
Age not stated
4
13,101
5,313 1,177 1,182 1,186 1,955 1,322
533 434
55,174
22,229 5,876 5,046 4,655' 7,208 5,318 2,795 2,039
8
8,780
3,938 898 718 587 99R 748
473 420
8,.29
3,516 1,217
785 606 943 740 369 253
7,900
3,208 1,028
770 574 974 691 365 290
6,257
2,555 692 711 444 778 483
,312 281
10,852
4,797 957
1,137 1,030 1,445
709 366 411
45,202
20,330 4,515 3,885 3,468 5,G68 3,615 1,947 1,955
819
8,307
3,887 846 693 559 90G 627
366 423
6,702
2,546 680 528 481 832 550 283 232
570
6,799
3,060 755 506 515 842 519 312 290
5,486
2,482 627 454 390 598 396 270 269
6
5,515
5~
186 588
1,009 1,812 1,235 440 187
23,907
602 1,457 2,677 3,890 6,575 4,855 ~,515
1,335
3,572
91 229 374 487 959 713
444 275
3,254
80 217 340 485 901 715 338 178
3,385
142 277 351 491 911 650 347 216
2,689
90 150 301 387 755
474 306 225
243
6 10 4; 54 73 31
19 3
3,059
273 267 354 415 759 587 269 135
/
409
24 33 52 37
103 89
38 33
251
26 13 32 33 75 39 25 .8
357
53 53 35 68 63 56 17 12
294
26 24 59 37 72 37. 22
Ii
8
14
3 3
2 5
3,982
92 244 333 480 943 806 599 485
338
4 23 27 40 71 67
52 54
608
14 49 58 75
142 132 96 42
1,286
39 78
1I8 158 338 255 181 119
530
4 16 32 59
132 98 97 92
9
182
26 ~o
18 15 22 44 19 18
29
2 I 6 8 7 4
1
45
8 6
5 8 8 3
27
2 2 2 3 3 5
3 7
10
24
2 I 7 7 3
4
2,633
199 3~9
324' 328 629 424 254 146'
,277
6 20 20 25 75 55 51 25
132
17 20 13 12 35 17 IO 8
449
74 80 55 42 88 62 23 25
582
28_
51. 8fi 83
141 85 63. 45.
11
912
143 141 101 1I9 213 120
55 20
65
2 6 6 U
25 12 4
45
II 4 3 4
13 4 5 I
104
24 28
5 II 10 16
8 2
50
11 12 10 2
10 5
12
211
1 4
16 46 78 48 14 4
424
33 33 32 57
130 90 36 13
27
3 4 3 3 4 3 6
53
2 2 2 7
21 15 4
60
6 )3
18 13
6
91
•• JO ~ I
• 4 •• 10
37 16 4 7
13
15
4
4 4
4
" 2
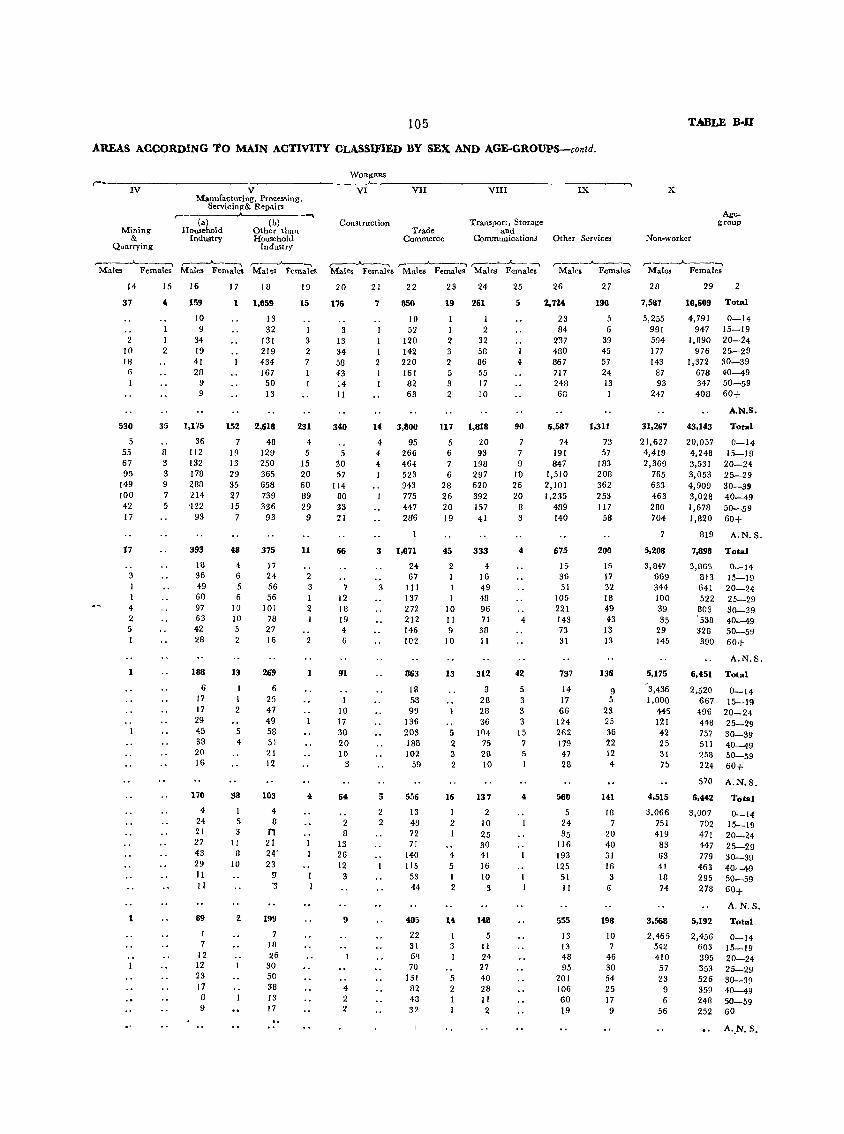
105
AREAS ACCORDING TO MAIN ACTIVITY OLASSIFIED BY SEX AND AGE-GROUPS-contd,
tv
Mining &
Quarrying
V Manufacturing, Proces'I,ing,
Servicing& Repairs ~---(a-)----_A-----(b-)----~
Household Other than Industry Household
Industry
WORI<ERS
VI
Construction
VII
Trade Commerce
VIII
Transport, Storage and
Communications
IX
Other Services
TABLE B·I1
X
Non-worker
Age. group
~----"-----, ~_..A--_-... ,--_ _"______-, ~_-"---., r-..A.----~ r--_""_..J.-_-"'I ,-___ .A.. ___ ""-\ r----.A-----, Male. Females Male. Females Mal,s Females Male,; Females Males Females Males Females Males Females Malos Females
14
37
2 !O III
(j
530
5 55 67 95
149 100 42 17
17
3
4 2 5 I
1
15
4
I 2
35
8 3 3 9 7 5
16
159
10 9
34 19 41 28
9 9
1,1'/5
36 112 132 178 283 214 '122
93
393
18 36 49 60 97 63 42 28
188
6 17 17 29 45 38 20 16
170
4 24 21 27 43 29 II II
89
12 12 23 17 8 9
J 7
1
152
7 19 13 29 35 27 15 7
48
4 6 5 6
ID 10 5 2
13
I I 2
5 4
38
5
11 8
10
2
1fl
1,059
13 32
131 219 434 167 50 13
2,618
48 129 250 365 658 739 336 93
375
17 24 56 56
101 78 27 16
269
6 25 47 49 58 51 21 12
103
4 8
n 21 24' 2S
g
'3
199
7 18 26
30 50 38 13 17
19
15
I 3 2
231
4 5
15 20 60 89 29
9
11
2 3 I 2
2
4
1 I
20
176
3 13 34 58 43 14 II
34.0
5 30 57
114 80 33 21
66
7 12 18 19 4 G
91
10 17 30 20 10
3
64
2 8
13 26 12 3
9
4 2 2
21
7
I I I 2 1
Ii
4 4 4
3
3
5
2 2
22
850
10 52
120 I4~
220 161 82 63
3,800
95 266 464 523 943 775 447 28'6
1,071
24 67
III 137 272 212 146 102
863
18 58 99
136 203 188 102
59
55G
13 48 72 71
140 115
53 44
485
22 31 68 70
131 112 48 32
23
19
I 1 2 3 2 5 3 2
117
5 6 7 6
28 26 20 19
45
2
10 II 9
10
13
5 2 3 2
16
I 2
4 5 I 2
14
3
1
5 2
24
261
I 2
32 58 86 55 17 10
1,818
20 93
198 297 620 392 157 41
333
4 16 49 48 96 71 38 II
312
3 2B 28 36
104 75 28 10
137
2 10 25 30 41 16 10
3
H8
5 11 24 27 40 28 II 2
25
5
4
90
7 7
10 26 20
8 3
4
42
5 3 3 3
15 7 5 1
26
2,724
23 84
237 480 867 717 248 68
6,587
74 191 847
1,510 2,101 1,235
489 140
675
15 36 51
105 221 143 73 31
737
14 17 66
124 262 179 47 28
560
5 24 35
116 193 125
51 II
555
13 13 48 95
201 106 60 19
27
190
5 6
39 45 57 24 13
1,311
73 57
183 208 362 253 117
58
200
15 17 32 18 49 43
13 13
136
9 5
23 25 36 22 12 4
141
18 7
20 40 31 16 3
6
198
10 7
46 30 54 25 17 9
28
7,587
5,255 991 594 177 143
87 93
247
31,267
21,627 4,419 2,369
765 633 463 280 704
5,208
3,047 669 344 100 39 35
29 145
5,175
'3,436 1,000
445 121 42 25 31 7!J
4,515
3,066 751 419
83 63 41 18 74
3,568
2,465 542 410 57 23
9 6
56
29
10,609
4,791 947
1,090 976
1,372 678 347 408
43,143
20,057 4,248 3,531 3,053 4,909 3,028 1,678 1,820
2
Total
0-14 15-19 20-24 25--29 30-39 40--49 50-59 60+
A,N,S.
Total
0-14 15-19 20-24 25--29 30-39 40-49 50-59 60+
B19 A.N.S.
7,898
3,863 813 641 522 803 '538 328 390
6,451
2,520 667 496 443 757 511 258 224
Total
0-14 15-19 20-24 25-29 30-39 40-49 50-59 60+
A.N.S.
Total
0-14 15--19
20-24 25-29 30-39 40-49 50-59 60+
570 A.N.S.
6,442 Total
3,007 702 471 447 779 463 295 278
5,192
2,456 603 395 353 526 359 2411 252
0-14 15-19 20-24 25--29 30--39 40--49 50-59 60+
A.N.S.
Total
0-14 15-19 20-24 25-29 30--39 40-49 50-59 60
A._N.S.
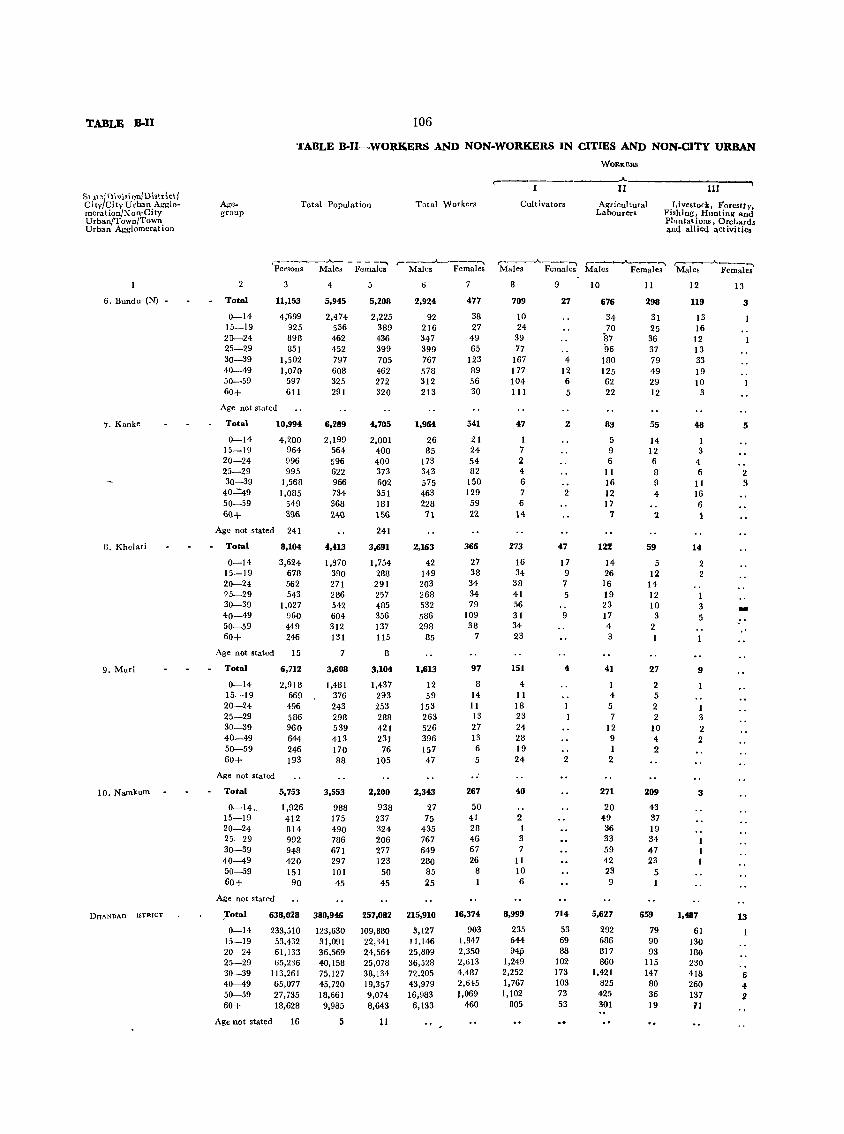
TABLE 8-11
5t ,t'll)ivi,\onl Districtl City/City Urban Agglomeration/Non-City Urban/Town/Town. Urban AgglomeratlOn
6. Bundu (N)
7. Kanke
8. Khelari
9. Muri
10. Namkum
DnANUAO ISTRICT
106
TABLE B-I1-WORKERS AND NON-WORKERS IN CITIES AND NON.CITY URBAN
Agegroup
Total Population Total Workers
WORKeRS
----~--i'l------IIJ
Cultivators Agricultural Labourers
Livestock, Forestry Fishing, Hunting and Plantations, Orchards "nd allied activities
,-_____ ..A.._ - - - -""""'II r----J.,..-----~"'_\ r------"-----~ r-~--""'----~ ,-----"---_...., Persons Males Females Males Females Males Females Males Females Males Females
Total
0-14 15-19 20-24 25-29 30-39 40-49 50-59 60+
3
11,153
4;699 925 898 851
1,502 1,070
597 611
Age not stated
Total
0-14 15-19 20-24 25-29 30-39 40~9
50-59 6()+
10,994
4,200 964 996 995
1,568 1,085
549 3<)6
Age not stated 241
Total
0-14 15-19 20-24 75-29 30-39 40-49 50-59 60+
Age not stated
Total
0-14 15-19 20-24 25-29 30-39 40-49 50-59 60+
Age not stated
Total
0-14_ 15-19 20-24 25-29 30-39 40-49 50-59 60+
Age not stated
8,104
3,624 678 562 543
1,027 960 449 246
15
6,712
2,918 669 496 586 960 644 246 193
5,753
1,926 412 814 992 948 420 151 90
4
5,945
2,474 536 462 452 797 608 325 291
6,289
2,199 564 596 622 966 734 368 2.4()
4,413
1,870 390 271 286 542 604 312 131
7
3,608
1,481 376 243 298 539 413 170 88
3,553
988 175 490 786 671 297 101 45
638,028 380,946
0-14 15-19 20-24 25-29 30-39 40-49 50-59 60+
233,510 53,432 61,133 65,236
113,261 65,077 27,735 18,628
Age not stated 16
123,630 31,091 36,569 40,158 75,127 45,720 18,661 9,985
:i
5
5,208
2,225 389 436 399 705 462 272 320
4,705
2,001 400 400 373 602 351 181 156
241
3,691
1,754 288 291 257 485 356 137 115
8
3,104
1,437 293 253 288 421 231 76
105
2,200
938 237 324 206 277 123
50 45
6
2,924
92 216 347 399 767 578 312 213
1,964
26 85
173 343 575 463 228 71
2,163
42 149 203 268 532 586 298
85
1,613
12 59
153 263 526 396 157 47
2,343
27 75
435 767 649 280
85 25
257,082 215,910
109,880 22,341 24,564 25,078 38,134 19,357 9,074 8,643
II
3,127 11,146 25,809 36,528 72,205 43,979 16,983
6,133
477
38 27
49 65
123 89 56 30
541
21 24 54 82
150 129 59 2.2.
366
27 38 34 34 79
109 38
7
97
8 14 11 13 27 13 6 5
267
50 41 28 46 67 26
8
16,374
903 1,847 2,350 2,613 4,487 2,615 1,069
460
709
10 24
39 77
167 177 104 III
47
1 7 2 4 6 7 6
14
273
16 34
38 41 56 31 34 23
151
4 11 18 23 24 28 19 24
40
2 1 3 7
11 10 6
8,999
235 644 94p
1,249 2,252 1,767 1,102
805
9
27
4 12 6 5
2
2
47
17 9 7 5
9
4
2
714
53 69 88
102 173 103 73 53
10
676
34 70
il7 96 180 125 62 22
83
5 9 6
11 16 12 17
7
122
14 26
16 19 23 17 4 3
41
1 4 5 7
12 9 I
2
271
20 49 36 33 59 42 23 9
5,627
292 686 817 860
1,421 825 425 301
11
298
31 25 36 37 79 49 29 12
55
14 12 6 8 9 4
59
5 12
14 12 10
3 2
27
2 5 2 2
10 4 2
209
43 37 19 34 47 23
5 1
659
79 90 93
115 147 80 36 19
12
119
13 16
12 13 33 19 10
3
48
1 3
4 Ii
11 16 6 1
14
2 2
1 3 5
9
I 3 2 2
3
1.487
61 130 180 230 418 260 137 71
13
3
5
2 3
-
13
6 4
2
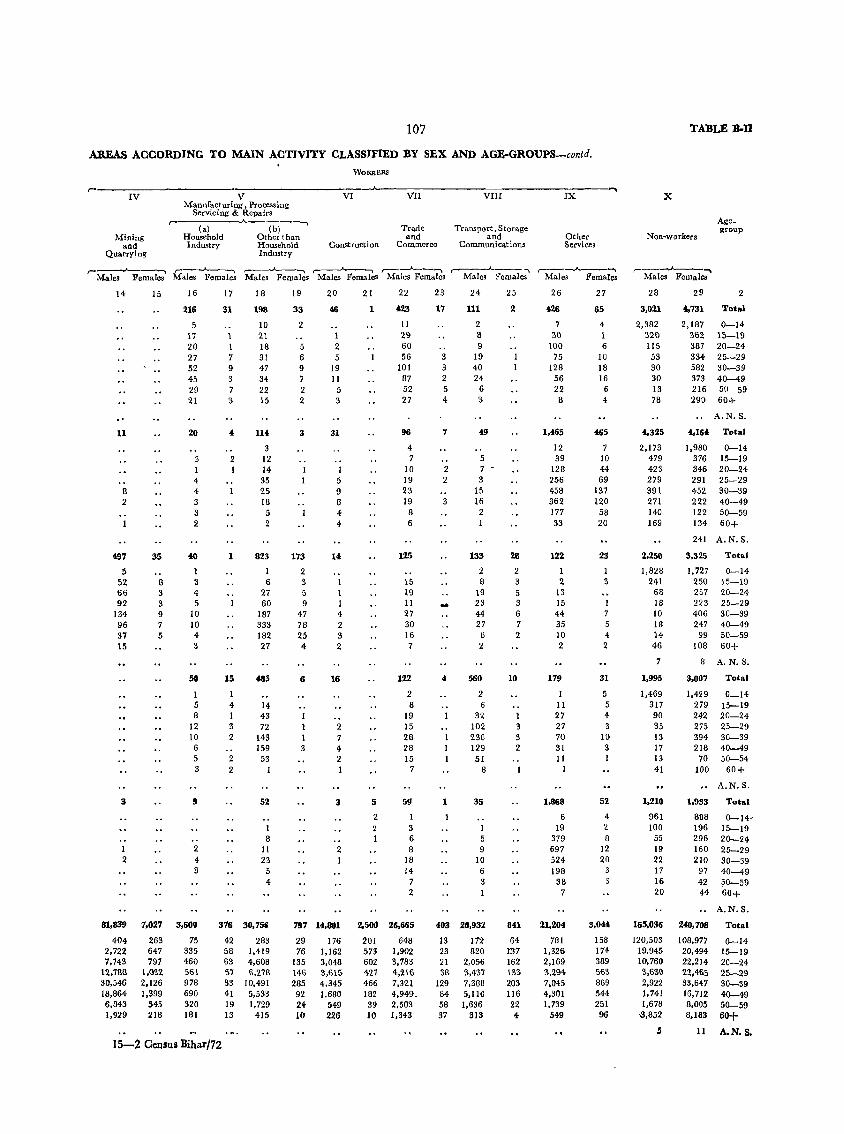
107
AREAS ACCORDING TO MAIN ACTIVITY CLASSJFIED BY SEX AND AGE-GROUPS-contd.
WORKER'
r------rv------------------v-----------------v-r--~----~v~rr-----------v-r-I-r-----------IX------~ Manufacturing, Processing
Servicing & Repairs r----------~--------~
(a) (b) Household Other than Mining
and Quarrying
Industry Household Construction
Trade and
Commerce
Transport) Storage and
Communications
14
11
8 2
497
5 52 66 92
134 96 37 15
3
I 2
15
35
6 3 3 9 7 5
16
216
5 17 20 27 52 45 29 21
20
3 1 4 4 3 3 2
40
1 3 4 5
10 10 4
50
I 5 8
12 10 6 5 3
9
2 4 3
L7
31
1 1 7 9 3 7 3
4
2 I
1
15
1 4 I 3 2
2 2
Industry
18
198
10 21 18 31 47 34 22 15
114.
3 12 14 35 25 18
5 2
823
1 6
27 60
187 333 182 27
485
14 43 72
143 159
53 1
52
1 8
Jl 23
5 4
L9
33
2
5 6 9
2 2
3
1 1
173
2 3 5 9
47 78 25 4
6
3
20
46
I 2 5
19 11
5 3
31
5 9 8 4 4
1 I 4 2 3 2
16
2 7 4 2 1
3
2
81.839 7.027
263 647 797
3,600 376 30,756 797 14,801
29 176 404 2,722 7,743
12,768 30,546 18,864 6,843 1,929
1,002 2,126 1,399
545 218
75 335 460 56l 978 690 320 181
15-2 Census Bjhar/72
42 283 58 1,419 63 4,608 57 6,278 83 10,491 41 5,533 19 1,729 13 415
76 1,162 135 3,048 146 3,615 285 4,345 92 1,680 24 549 10 226
21
1
5
2 2 1
22
423
L1 29 60 56
101 87 52 27
96
4 7
10 19 23 19
8 6
125
15 19 11 27 30 16 7
122
2 8
19 15 28 28 15
7
59
1 3 6 8
IS 14
7 2
2,501) 26,665
201 648 575 1,902 602 3,783 421 4,216 466 7,321 182 4,949_
39 2,503 10 1,343
23
17
3 2 5 4
7
2 2
3
-4
1
24
111
2 8 9
19 40 24
6 3
49
5 7 -3
15 16 2
133
2 8
19 23 44 27
8 2
560
2 6
32 102 230 129 51
8
35
5 9
10 6 3
403 20,932
13 172 23 820 21 2,056 38 3,437
129 7,388 84 5,110 58 1,636 37 313
25
2
28
2 3 5 3 6 7 2
10
1 3 3 2
841
64 r37 162 133 203 116 22 4
Other Services:
26
426
7 '30
100 75
128 56 22 8
1,465
12 39
128 256 458 362 177 33
122
1 2
13 15 44 35 10 2
179
Jl 27 27 70 31 11
1
1,868
6 19
379 697 524 198
38 7
21,204
781 1,326 2,169 3,294 7,045 4,301 1,739
549
27
65
4 1 6
10 18 16
6 4
465
7 10 44-69
137 120 58 20
23
I 3
1 7 5 4 2
31
5 4 3
10 3
52
4 2 8
12 20
3 '3
3,044
158 174 389 563 869 544 251 96
TABLE B-IJ
x
Non-workers
Age_ group
28
3,021
2,382 320 LIS 53 30 30 13 78
4,325
2,173 479 423 279 391 271 140 169
2,250
1,828 241
611 18 10 18 14 46
7
1,995
1,469 317 90 35 13 17 13 41
1,210
961 100
55 19 22 17 16 20
165,036
120,503 19,945 10,760 3,630 2,922 1,741 1,678
>3,852
29
4,731
2,187 362 387 334 582 373 216 290
2
Total
0-14 15-19 20-24 25-29 30-39 40-49 50 59 60+
.. A.N.S.
4,164
1,980 376 346 291 452 222 122 134
Total
0-14 15-19 20-24 25-29 30-39 40-49 50-59 60+
241 A.N. S.
3,325
1,727 250 257 223 406 247
99 108
3,007
1,429 279 242 275 394 218
70 100
1.933
Total
0-14 15-19 20-24 25-29 30-39 40-49 50-59 60+
A.N.S.
Total
0_14 15-19 20-24 25-29 30-39 40-49 50-54 60+
A.N.S.
Total
888 0-14-196 15-19 296 20-24 160 25-29 210 30-39
97 40-49 42 ;;0-59 44 60+
.. A.N.S.
240,708
108.977 20,494 22,2J4 22,465 33,647 16,7J2 8,005 8,183
Total
0--14 15-19 20-24 25-29 30-39 40-49 50-59 60+
5 11 A.N. S.
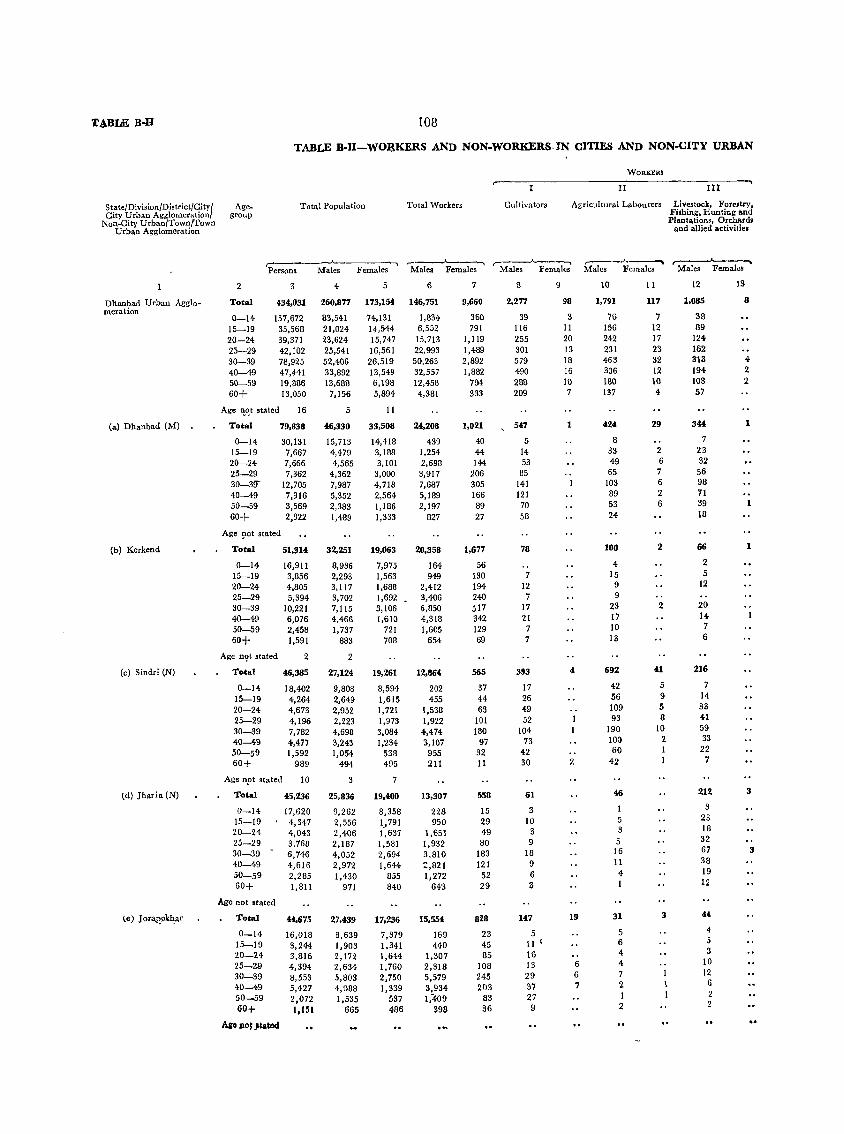
T~BLE B-Il 108
TABLE B·II-WOIlKERS AND NON·WORKERS· IN CITIES AND NON·CITY URBAN
WORKERS
r-II III
.....
State/Division/District/City! Age- Total Population Total Workers Cultivators Agricultural Labourers Livestock, Fore.ltry City Urban Agglomeration group Fishing, Hunting and
Non-City Urban/Townrrown Plantations, Orchard. Urban Agglomeration and allied activities
r" --'-- r----'----, ,.....--"---..... ,--.>.-~ ,....---~ ..... Persons Males Females Males Females Males Females Males Females Males Females
2. 4 5 6 7 8 9 10 11 12 13
Dhanbad Urban Agglo- Total 434,031 260,877 173,154 146,751 9,660 2,277 98 1,791 117 1,085 8 meration
0-14 157,672 83,541 74,131 1,834 360 39 3 76 7 38 15-19 35,568 21,024 14,544 6,552 791 116 II 156 12 89 20-24 39,371 23,624 15,747 15,713 1,119 255 20 242 17 124 25-29 42,102 25,541 16,561 22,993 1,489 301 13 231 23 162 30-39 78,925 52,406 26,519 50,263 2,892 579 18 463 32 313 4
40-49 47,441 33,892 13,549 32,557 1,882 490 16 306 12 194 2
50--59 19,886 13,688 6,198 12,458 794 288 10 180 10 108 2
60+ 13,050 7,156 5,894 4,381 333 209 7 137 4 57
Age ~~t stated 16 5 11
(a) Dhanbad (M) Total 79,838 46,330 33,508 24,208 1,021 547 1 424 29 344 1
0-14 30,131 15,713 14,418 439 40 5 8 7
15-19 7,667 4,479 3,188 1,254 44 14 33 2. 23
20--24 7,666 4,565 3,101 2,698 144 53 49 6 32
25-29 7,362 4,362 3,000 3,917 206 85 65 7 56 30-3g- 12,705 7,987 4,718 7,687 305 141 103 6 98
40-49 7,916 5,352 2,564 5,189 166 121 89 2 11
50-59 3,569 2,383 1,186 2,197 89 70 53 6 39
60+ 2,822 1,489 1,333 827 27 58 24- 18
Age ~ot stated
(b) Kerkend Total 51,314 32,251 19,063 20,3511 1,677 78 100 2 66 1
0-14 16,911 8,936 7,975 164 56 4 2
15-19 3,856 2,293 1,563 949 130 7 15 5
20-24 4,805 3,117 1,688 2,412 194 12 9 12
25-29 5,394 3,702 1,692 3,406 240 7 9 30-39 10,221 7,115 3,106 6,a50 517 17 23 2 20
40-49 6,076 4,466 1,610 4,318 342 21 17 14
50-59 2,458 1,737 721 1,605 129 7 10 7
60+ 1,591 883 708 654 69 7 13 6
Age n<;>t stated 2 2
(c) Sindri (N) Total 46,385 27,124 19,261 12,864 565 393 4 692 41 216
0-14 18,402 9,808 8,594 202 37 17 42 5 7
15-19 4,264 2,649 1,615 455 44 2.6 56 9 14
20-24 4,673 2,952 1,721 1,538 63 49 109 5 33
25-29 4,196 2,223 1,973 1,922 101 52 93 8 41
30-39 7,782 4,698 3,084 4,474 180 104 190 10 59
40-49 4,477 3,243 1,234 3,107 97 73 100 2 33
50-59 1,592 1,054 538 955 32 42 60 1 22
60+ 989 494 495 211 11 30 2 42 1 7
Age npt stated 10 3
(d) Jhari a (N) Total 45,236 25,836 19,400 13,307 558 61 46 2IZ 3
0-14 17,620 9,262 8,358 228 15 3 3
15-19 4,347 2,556 1>791 950 29 10 5 23
20-24 4,043 2,406 1,637 1,651 49 3 3 18
25-29 3,768 2,187 1,581 1,932 80 9 5 32
30-39 - 6,746 4,052 2,694 3,810 183 18 16 67 3
40-49 4,616 2,972 1,644 ::,821 121 9 11 38
50-59 2,285 1,430 855 1,272 52 6 4 19
60+ 1,811 971 840 643 29 3 1 12
Age not stated
l e) J ol"<lp'pk~ar Total 44,675 27,439 17,236 15,554 828 147 19 31 3 44
0-14 16,018 8,639 7,379 169 23 5 5 4
15-19 3,244 1,903 1.341 440 45 111 6 5
20-24 3,816 2,172 1,644 1,307 85 16 4 3
25-W 4,394 2,634 1,760 2,318 108 13 6 4 10
30-39 8,553 5,803 2,750 5,579 245 29 6 7 12
40-49 5,427 4,088 1,339 3,934 203 37 7 2 6
50-59 2,072 1,535 537 1,409 83 27 1
60+ 1,151 665 486 398 36 9 2
Aa'o 110' ,Iated
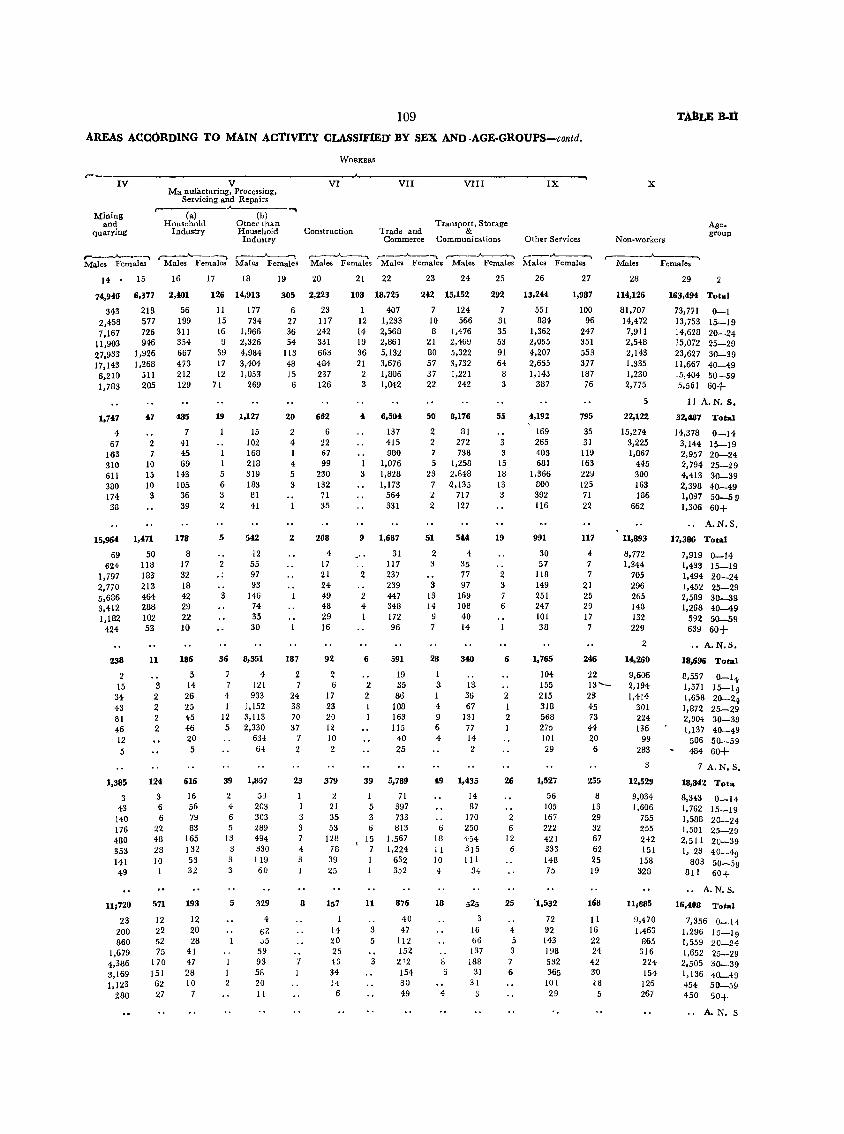
109
AREAS A<lCORDING TO MAIN ACTIVITY CLASSIFIED BY SEX AND ·AGE·GROUPS-contd.
WORKERS __________________________________________ A-_____________________________________ ,~
IV V VI VII VIII IX
Mining and
quarying
Ma Dufacturing, Processing, Servicing and Repairs
,------:------""-------...... (a) (b)
Household Otner than Industry Household
Industry Construction Trade and
Commerce
Transport, Storage &
Communications Other Services
X
Non-workers
Age_ gronp
r-_.A--__ -._. r----"---...... r----..A-----~ ,--...A-...--....... ,-__ ...,A___.... ,---__ .A--_","""\ ,-.A--_"""",, ,-------'----....... Males Females Males Females Males Females Males Fema.les Males Females Males Females Males Females l\1a.les Females
14" 15 16
74,940 6,377 2,401
343 2,458 7,167
11,903 27,933 17,143 6,210
218 56 577 199 726 311 946 354
1,926 667 1,268 473
511 212 1,783 205 129
1,747
4 67
163 310 611 380 174 38
47
2 7
10 15 10
3
15,964 1,471
69 50 624 118
1,797 183 2,770 213 5,686 464 3,412 288 1,182 102
424 53
238
2 15 34 43 81 46 12 5
1,385
3 43
140 176 480 353 141 49
11;720
23 200 860
1,679 4,386 3,169 1,123
280
11
3 2 2 2 2
124
3 6 6
22 48 28 10
571
12 22 52 75
170 151 62 27
!l85
7 41 45 69
143 105 36 39
173
8 17 32 18 42 29 22 10
186
5 14
26 25 45 46 20 5
616
16 56 7~
83 165 132 53 32
193
12 20 28
41 47 28 10
7
17 18
126 14,913
11 177 15 734 16 1,966
9 2,326 39 4,984 17 3,404 12 1,053
71 269
19
5 6 3 2
5
2
3
1,127
15 102 168 218 319 183 81 41
542
12 55 97 93
146 74 35 30
36 8,351
7 4 7 121 4 933 I 1,152
12 3,113 5 2,330
634 61
39 1,857
2 4 6 5
13 3 3 3
5
59
203 303 289 494 330 119 60
329
4
61: 05
59 93 58 20 II
19 20
305 2,223
6 23 27 117 36 242 54 331
113 663 48 484 15 237 6 126
20
2 4 I 4 5 3
2
187
2 7
24 38 70 37
7 2
23
I I 3 3 7 4 3
8
662
6 22 67 99
230 132 11 35
208
4 17 21 24 49 48 29 16
92
2 6
17 23 20 12 10 2
379
2 21 35 53
128 78 39 25
157
14 20 25 43 34 14
6
21 22
108 18,725
I 407 12 1,233 14 2,568 19 2,861 36 5,132 21 3,676
2 1,806 3 1,042
I 3
6,504
137 415 980
1,076 1,828 1,173
564 331
9 1,687
31 117
2 237 239
2 447 4 348 I 172
6
2 2 I I
96
591
19 35
813 108 163 115
40 25
39 5,789
5 3 6
15 7 I
11
3 5
3
71 397 733 813
1,567 1,224
632 352
876
40 47
112 152
212 154 80 j:9
23 24
242 15,152
7 124 10 566 8 1,476
21 2,469 80 5,322 57 3,732 37 1,221 22 242
50
2 2 7 5
23 7 2 2
51
2 3
3 13 14
9 7
28
I 3 I 4 9 6 4
8,176
81 272 738
1,258 2,848 <2,135
717 127
5"
4 35 77 97
169 J08 40 J4
340
13 36 67
131 77 14 2
49 1,435
6 18 II 10 4
18
8 6
4
14 87
170 250 454 315 III
34
525
16 66 137 188
31 31
3
25
292
7 31 35 53 91 64
8 3
55
3 3
15 18 13 3
19
2 3
6
6
2 I 2
26
2 6
12 6
25
4 5 3
7 6
26
13,244
551 884
1,362 2,055 4,207 2,655 1,143
387
4,192
169 265 403 681
1,366 800 392 116
991
30 57
118 149 251 247 101 38
1,765
104 155 215 318 568 275 101 29
1,527
56 105 167 222 421 333 148 75
1,532
72 92 143 198 532 365
101 29
27
1,987
100 96
247 351 553 377 187 76
795
35 31 119 163 229 125 71 22
117
4 7 7
21 25 29 17 7
246
22 13-23 45 73 44 20 6
255
H 13 29 32 67 62 25 19
168
II 16 22 24 42 31)
<6 5
28
114,126
81,707 14,472 7,911 2,548 2,143 1,335 1,230 2,775
29 2
163,494 Total
73,771 13,753 14,628 15,072 23,627 11,667 .5,404 5,561
0-1 15-19 20-24 25-29 30-39 40-49 50-59 60+
5 llA.N.S.
22,122
15,274 3,225 1,867
445 300 163 186
662
11,893
8,772 1,344
705 296 265 146 132 229
32,487
14,378 3,144 2,957 2,794 4,413 2,398 1,097 1,306
Total
0-14 15-19 20-24 25-29 30-39 40-49 50-59 60+
A.N.S.
17,386 Total
7,919 0-14 1,433 15-19 1,494 20-24 1,452 25-29 2,589 30-39 1,268 40-49
592 50-59 639 60+
2 .. A.N.S.
14,260
9,606 2,194 1,414
301 224 136
99 283
3
12,529
9,034 1,606
755 255 242 151 158
328
11;885
9,470 1,463
865 316 224 154 126 267
18,696 Total
8,557 0-14 1,571 15-19 1,658 20-24 1,872 25-29 2,904 30-39 1,137 40-49
506 50-59 484 60+
7 A.N. S.
18,842 Tota
8,343 1,762 1,588 1,501 2,511 I, 23
803 811
0-14 15-19 20-24 25-29 20-39 40-49 50-59 60+
.. A.N.S.
16,408 Total
7,356 0-14 1,296 15-19 1,559 20-24 1,652 ~5-29 2,505 30-39 1,136 40-49 454 50-59 450 50+
A.N. S
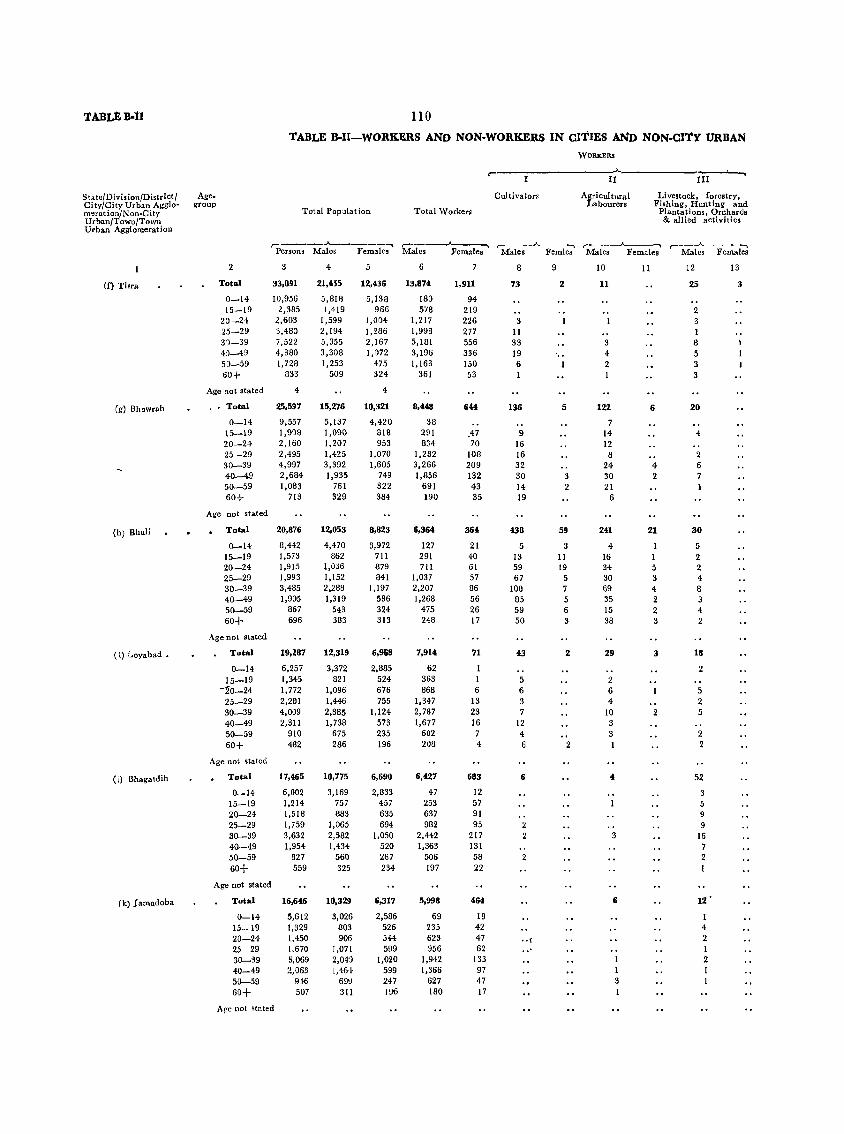
TABLEB-l1 110
TABLE B-II-WORK.ERS AND NON-WORKERS IN CITIES AND NON-CITY URBAN
WORKERS
r-II ~ ....
State/Divi.ion/District/ Age- Cultivators Agricultural Livestock, forestry, Ci ty/City Urban Agglo- group Labourers Fishing, Hunting and meration/Non-City Total Population Total Worker. Plantations, Orchards Urban/Town/Town & allied activities Urban Agglomeration
,- _,.__----~ ,- ,---'--.. ,---_,.______, r---"---~ Persons Males Female. Males Females Males Fernles Males Females Males Females
2 4 5 6 8 9 10 11 12 13
(f) Tisra Total 33,891 21,455 12,436 13,874 1,911 73 2 11 25 3
0-14 10,956 5,818 5,138 180 94 15-19 2,385 1,419 966 5'/8 219 2
20-24 2,603 1,599 1,004 1,217 226 3 3 25-29 3,480 2,194 1,286 1,998 277 11 31-39 7,522 5,355 2,167 5,181 556 33 8 4'}-49 4,380 3,308 1,072 3,196 336 19 .. 4 5 50-59 1,728 1,253 475 1,163 150 6 2 3 60+ 833 509 324 361 53 1 I 3
Age not stated 4 4
(g) Uhowrah ' Total 25,597 15,276 10,321 8,448 644 136 5 122 6 20
0-14 9,557 5,137 4,420 38 7 15-19 1,908 1,090 818 291 47 9 14 4 20-24 2,160 1,207 953 834 70 16 12 25-29 2,495 1,425 1,070 1,282 108 16 8 2 30-39 4,997 3,392 1,605 3,266 209 32 24 4 6 40-49 2,684 1,935 749 1,856 132 30 3 30 2 7 50-59 1,083 761 322 691 43 14 2 21 I 60+ 713 329 384 190 35 19 6
Age not .t .. ted
(h) Bhali Total 20,876 12,053 8,823 6,364 364 438 59 241 21 30
0-14 8,442 4,470 3,972 127 21 5 4 5 15-19 1,573 862 711 291 40 13 II 16 2 20-24 1,915 1,036 879 711 61 59 19 34 5 2 25-29 1,993 1,152 841 1,037 57 67 5 30 3 4 30-39 3,485 2.288 1,197 2,207 86 100 7 69 4 8 40-49 1,905 1,319 586 1,268 56 85 5 35 2 3 50-59 867 543 324 475 26 59 6 15 2 4 60+ 696 383 313 248 17 50 3 38 3 2
Age not stated
0) Loy.bad • Total 19,287 12,319 6,908 7,914 71 43 2 29 3 18
0-14 6,257 3,372 2,885 62 1 2 15-19 1,345 821 524 363 I 5 2
'"10-24 1,772 1,096 676 868 6 6 6 5 25-29 2,21H 1,446 755 1,347 13 3 4 2 30-39 4,009 2,885 1,124 2,787 23 7 10 2 40-49 2,311 1,738 573 1,677 16 12 3 50-59 910 675 235 602 7 4 3 2 60+ 482 286 196 208 4 6 2 I 2
Age not stated
(i) Bhagatdih Total 17,465 10,775 6,690 6,427 683 6 4 52
0-14 6,002 3,169 2,833 47 12 15-19 1,214 757 457 253 57 5 20-24 1,518 883 635 637 91 9 25-29 1,759 1,065 694 982 95 9 30-39 3,632 2,582 1,050 2,442 217 3 16 40-49 1,954 1,434 520 1,363 131 7 50-59 827 560 267 506 58 2 2 60+ 559 325 234 197 22 1
Age not stated
(k) J arnadoba Total 16,646 10,329 6,317 5,998 464 6 12 •
0-14 5,612 3,026 2,586 69 19 1 I.s- 19 1,329 803 526 235 42 4 20-24 1,450 906 544 623 47 .. ( 2 25 29 1,670 l,07t 599 956 62 " 1 30-39 g,069 2,049 1,020 1,942 133 2 40-49 2,063 1,46·l 599 1,366 97 I 50-59 ~H6 69" 247 627 47 3 60+ 507 311 1% 180 17 1
Are Dot stated
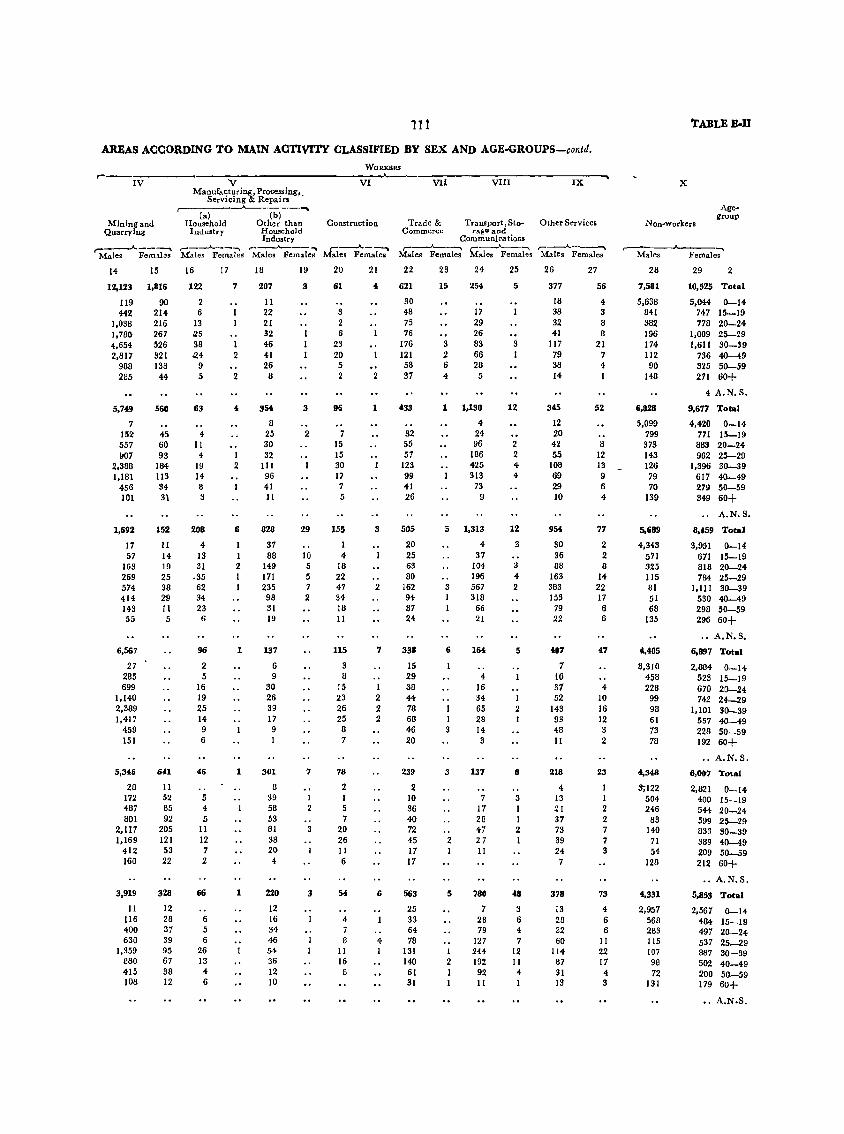
111
AREAS ACCORDING TO MAIN ACTIVITY CLASSIFIED BY SEX AND AGE-GROUPS-conld.
WORKERS
Iv--------------~·V---------------------V~I~~------V~II~----~V~I~I~I----------I=x=--'~
Manufacturing, Processing. Servicing & Repairs .
Mining and Quarrying
r'-------~----~ (a) (b)
Household Other than Industry Household
Industry
Construction
r---A--~ ~ __ A __ ~ r--A---~ r--A--, Males Females .Males Females Males Females Males Females
14 15 16 17 18
12,123 1,816 122 7 207
119 90 2 II 442 214 6 22
1,038 216 13 21 1,78G 267.:l5 32 4,654 526 38 I 46 2,817 321 .24 2 41
988 136 9 26 285 44 5 2 8
5,7~
7 152 557 !l07
2,388 1,181
456 101
1,692
17 57
163 269 574 414 143 55
6,567
27 285 699
1,140 2,389 1,417
459 151
5,346
28 172 487 801
2,117 1,169
412 160
3,919
II 116 400 630
1.359 880 415 108
560
45 60 93
184 113 34 3\
152
11 14 19 25 38 29 II 5
641
11 52 85 92
205 121 53 22
328
12 28 37 39 95 67 38 12
63
4 II
4 19 14 8 3
20B
4 13 31
.35 62 34 23 6
96
2 5
16 19 25 14 9 6
46
5 4 5
II 12 7 2
66
6 5 6
26 13 4 6
4
I 2
6
I 2 I
1
1
1
354
8 25 SO 32
111 96 41 11
B28
37 88
149 171 235 98 31 19
137
6 9
30 26 39 17 9 1
301
B 39 58 53 81 38 20 4
220
12 16 34 46 54 36 12 10
19
3
3
2
29
10 5 5 7 2
7
3
20
61
3 2 6
23 20
5 2
96
7 15 15 30 17 7 5
155
I 4
18 22 47 34 18 II
115
3 8
15 23 26 25 8 7
78
2 I 5 7
20 26 II 6
54
4 7 8
II 16 8
21
4
2
3
2
7
1 2 2 2
6
4
Trade & Transport, Slo- Other Services Commerce rage and
Communications ..---"'--""""'1 (""""----'--, r---A.. .. -~
Males Females Male, Females Males Female.
22
621
30 48 75 76
176 121 58 37
32 55 57
123 99 41 26
505
20 25 63 80
162 94-37 24-
338
15 29 38 44 78 68 46 20
239
2 10 36 40 72 45 17 17
563
25 33 64 78
131 140 61 31
23
15
3 2 6 4
24
254
17 29 26 83 66 28
5
1 1,130
4 24 96
186 425 313
73 !J
5 1,313
4 37
104 196
3 567 I 318
6
I 3
3
2
5
1 2 1 1
66 21
164
4-16 34 65 28 14 3
137
7 17 28 47 27 11
780
7 28 79
127 244 192 92 II
25
5
3 I
12
2 2 4-4
12
3
3 4 2
5
I 2
8
3 1 I 2 1
48
3 6 4 7
12 11 4 I
26
377
18 38 32 41
117 79 38 14
36
12 20 42 55
108 69 29 10
954
30 36 88
163 383 153
79 22
407
7 '16 37 52
143 93 48 11
218
4 13 21 37 73 39 24 7
378
13 28 32 60
114 87 31 13
27
56
4 3 8 8
21 7 4 I
52
8 12 13 9 6 4
77
2 2 8
14 22 17 6 6
47
4 10 16 12 3 2
I 2 2 7 7 3
73
4 6 6
II 22 17 4 3
TABLEB·D
x
Non .. workers
Agegroup
,.---__ A--.....,
Males Females
28
7,581
5,638 841 382 196 174 112 90
148
6,828
5,099 799 373 143 126 79 70
139
5,689
4,343 571 325 115 81 51 68
135
4,405
3,310 458 228
99 98 61 73 78
4,348
3;122 504 246
83 140
71 54
128
4,331
2,957 568 283 115 107 98 72
131
29 2
10,525 Total
5,044 0-14 747 15-19 778 20-24
1,009 2!>-29 1,611 30-39
736 40-49 325 50-59 271 60+
4 A.N.S.
9,677 Total
4,420 0-14-771 15-19 883 20-24-962 25-29
1,396 30-39 617 40-49 279 50-59 349 60+
A.N.S.
8,459 Total
3,951 0-14 671 15-19 818 20-24 784 2!>-29
1,111 30-39 530 40-49 298 50-59 296 60+
•• A.N.S,
6,897
2,884 523 670 742
1,101 557 228 192
Total
0-14 15-19 21>-24 24-29 30-39 40-49 50-59 60+
•. A.N.S.
6,007 Total
2,821 400 544 599 833 389 209 212
0-14 15-19 20-24 25-29 30-39 40-49 50-59 60+
•. A.N.S.
5,853 Total
2,567 0-14 484 15-19 497 20-24 537 25-29 887 30-39 502 40-49 200 50-59 179 60+
" A.N.S.
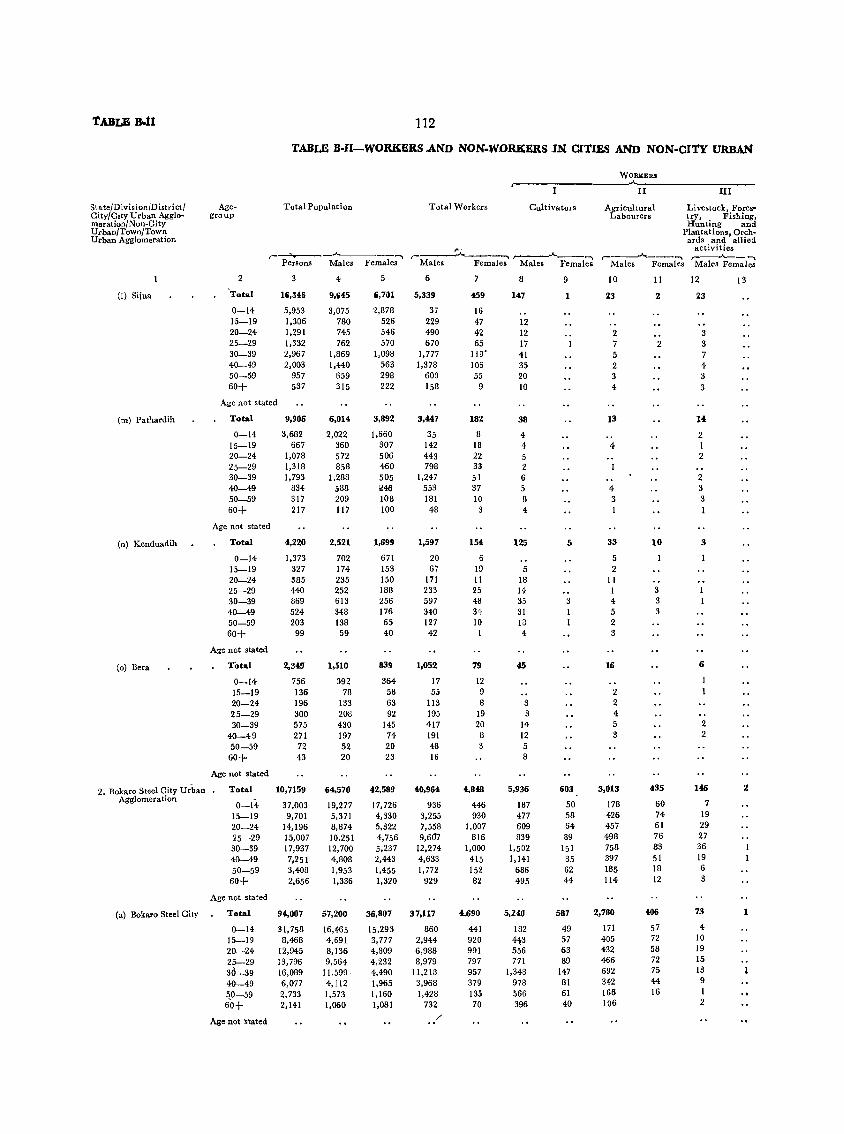
'tABLE :o..tl 112
TABLE B·II-WORKERS .AND NON-WDRKERS IN CITIES AND NON·CITY URBAN
WORKERS r-
_...._____ II III
State/Division/District/ Age- Total Population Total Workers Cultivators Agricultural Livestock, Fores-City/CIty Urban Agglo- group Labourers try, Fishing, moration/Non-City Hunting and Urban/Town/Town Plantations,Orch .. Urban Agglomeration ard. and allied
"". activities r--~--""'___-- ......
,-___ .A.. ___ -, ,-__ .A.. __ -, ,-___ .A.. ___ -, ,----'---,
PersonS Males Females Males Females Males Females Males Females Male. Females
2 4 5 6 7 8 9 10 11 12 13
(I) Sijua Total 16,345 9,645 6,701 5,339 459 147 1 23 2 23
0-14 5,953 3,075 2,878 37 16 15-19 1,306 780 526 229 47 12 20-24 1,291 745 546 490 42 12 2 3 25-29 1,332 762 570 670 65 17 7 2 3 30-39 2,967 1,869 1,098 1,777 119' 41 5 7 40-49 2,003 1,440 563 1,378 106 35 2 4 50-59 957 659 298 600 55 20 3 3 60+ 537 315 222 158 9 10 4 3
Age not stated
(m) Pathardih Total 9,906 6,014 3,892 3,447 182 38 13 H
0-14 3,682 2,022 1,660 35 4 2 15-19 667 360 307 142 18 4 4 1 20-24 1,078 572 506 443 22 5 2 25-29 1,318 858 460 798 33 2 30-39 1,793 1,288 505 1,247 51 6 2 40-49 834 588 lI46 553 37 5 4 3 50-59 317 209 108 181 10 B 3 3 60+ 217 1I7 100 48 3 4 1 1
Age not stated
(n) Kenduadih Total 4,220 2,521 1,699 1,597 154 125 5 33 10 3
0-14 1,373 702 671 20 6 5 15-19 327 174 153 67 19 5 2 20-24 385 235 150 171 11 18 11 25-29 440 252 188 233 25 14 1 3 30-39 869 613 256 597 48 35 3 4 3 40-49 524 348 176 340 34 31 I 5 3 50-59 203 138 65 127 10 18 1 2 60+ 99 59 40 42 I 4 3
Age not stated
(0) Bera Total 2,349 1,510 839 1,052 79 '" 16 6
0-14 756 392 364 17 12 15-19 136 78 58 55 9 2 20-24 196 133 63 lIS 8 3 2 25-29 300 208 92 195 19 3 4 30-39 575 430 145 417 20 14 5 2
40-49 271 197 74 191 8 12 3 2 50-59 72 52 20 48 3 5 60+ 43 20 23 16 8
Age not stated
2. Bokaro Steel City Urban Total 10,7159 64,570 42,589 40,964 4,848 5,936 603 3,013 435 146 2 Agglomeration
0-14 37,003 19,277 17,726 936 446 187 50 178 60 7
15-19 9,701 5,371 4,330 3,255 930 477 58 426 74 19
20-24 14,196 8,874 5,322 7,558 1,007 609 64 457 61 29
25-29 15,007 10,251 4,756 9,6<l7 816 839 89 498 76 27
30-39 17,937 12,700 5,237 12,274 1,000 1,502 151 758 83 36
40--49 7,251 4,808 2,443 4,633 415 1,141 85 397 51 19
50-59 3,408 1,953 1,455 1,772 152 686 62 l1l5 18 6
60+ 2,656 1,336 1,320 929 82 495 44 114 12 3
Age not stated
(a) Bokaro Steel City Total 94,007 57,200 36,807 37,117 4,690 5,240 587 2,780 406 73 1
Q.-14 31,758 16,465 15,293 860 441 182 49 171 57 4
15-19 8,468 4,691 3,777 2,944 920 4'ts 57 405 72 10
20-24 12,945 8,136 4,309 6,988 991 556 63 432 58 19
25--29 13,796 9,564 4,232 3,979 797 771 89 466 72 15
36-39 16,089 11,599. 4,490 11,218 957 1,348 147 692 75 13
40-49 6,077 4,112 1,965 3,968 379 973 81 342 44 9
.'i_0-59 2,733 1,573 1,160 1,428 135 566 61 166 16 1
60+ 2,141 1,060 1,081 732 70 396 40 106 2
Age not 5tated ;"

113
AREAS ACCORDING TO MAIN ACTIVITY CLASSIFIED BY SEX AND AGE.GROUPS-contd.
,-----IV
Mining & Quarrying
WOIlKERS _______ .A.
V VI VII Manufactuing, Processing,
Servicing & Repairs ,-____ J--___ ~
IIo~:~hold Othe;~~an Industry IIousehold Trade &
Industry Construction Commerce
VIII
Transport, Storago &
Communications
IX
Other Services
TABLED-II
X
Non .. workers Age_ group
,-__ --.A.--. ,--..A.._-, ,-__ .A.--. ,-_...A.-...... ,-- ........ ,------....'--...... r--~ Males Female. Males Females Males Females Males Females Males Females Males Females Males Females Males Females
14
4,134
11 134 334 499
1,474 1,134
464 84
2,160
3 59
275 532 850 328 102 11
1,289
10 51
123 191 512 281 97 24
907
9 41 97
176 312 162 42
8
195
6 18 26 34 66 30 11 4
172
6 18 24 33 53 27
S 3
• w
15
370
11 38 34 53 98 83 45 8
87
2 11 9
15 26 19 4 1
120
4 15 8
21 35 28 8 I
79
12 9 8
19 20
8 3
6
6
4
16
95
9 18 12 26 17 8 5
35
1 2 1
15 5 3 2
12
0"
2 1 5 3
"'540
10 69 77
112 140
78 39 15
361
5 47 55 78 97 47 25
7
17
2
2
18
99
7 20 14 25 18 II 4
53"
16 67
137 218
78 12 6
16
2 1 2 4 6 1
11
2 6
226 10,392
31 58 40 426 44 2,111 45 3,154 39 3,612 17 849 5 149 5 33
220 9,746
31 43 40 365 44 1,965 45 3,023 38 3,431 14 772
3 124 !l 23
19
1
9
1 1 3
3
10
1 7
20
115
4 14 15 22 38 14 8
46
1 6 5
10 13 5 3 3
4
1
21
13
3 5 5
1
.1 I 1
1
22
318
13 25 44 49 78 54 33 22
198
(" 14 32 38 46 35 19 10
52
3 g.
9 17 6 6 2
11
3" 4 2 2
23" n,189 2,372 "'301
172 418 770 833
15 148 200 25 1,026 561 58 2,775 583 50 3,217 403 64 3,563 424 1,167
577 256 108
18 1,118 157 2 258 37 2 84 7
228 12,076
15 146 24 1,022 56 2,760 48 3,206 63 3,528 18 1,088
2 248 2 78
2,372 3,120
200 149 561 301 583 556 403 625 424 860 157 400 37 158
7 7).
23
7
3
4
2
2
2
24
113
2 7
17 21 33 22 8 3
207
4 19 29 37 57 40 14 7
26
2 4 9 5 2 3
8
1 2 5
97 1,523
6 34 13 129
7 275 10 361 34 487 15 169 5 50 7 18
59
6 12 5 7
22 6
1,342
29 115 252 329 425 139 41 12
25
2t
8 3
7 5
t7
1 5 8
10 00
13 9 1
t82
56 102 124 67 90 36 6 1
t80
56 101 124 67 89 36
6
26
272
11 31 26 33 66 54 36 15
202
17 18 26 34 40 50 14 3
37
2 2 5 6
II 5
5
• 7
6 8 7 6
14 6
2,729
136 247 429 532 943 25~
132 55
2,207
125 218 369 433 771 166
91 34
27
39
5
5 3 9 9 8
33
4 2 3.. 6 7 8 2 1
6
2 3
391
27 56 66 76
110 35 17 4
331
26 52 58 66 94 23
9 3
28
.,306
3,038 551 255
92 92 62 59 157
2,567
1,987 218 129 60 41 35 28 69
924
682 107 64 19 16 8
11 17
458
315 23 20 13 13
6 4 4
23,606
18,341 2,116 1,316
644 426 175 181 407
20,083
15,605 1,747 1,148
585 381 144 145 328
29 2
6,242 Total
2,862 0-14 479 15-19 504 20-24 505 25-29 979 30-39 457 40--49 243 50-59 213 60+
.• A.N.S.
3,710 Total
1,652 289 484 427 454 209
98 97
0-14 15-19 20-24 25-29 30-39 40-49 50-59 60+
A.N.S.
1,5.&5 Total
665 0-14 134 15-19 139 20-24 163 25-29 208 30-39 142 40-49 55 50-59 39 60+
.. A.N.S •
760 Total
352 0-14 49 15-19 55 20-24 73 25-29
125 30-~9 66 40-49 17 50-59 23 60+
A.N.S.
37,741 Total
17,280 3,400 4,315 3,940 4,237 2,028 1,303 1,238
0-14 15-HI 20-24 25-29 30-39 40-49 50-59 60+
.• A.N.S.
32,117 Total
14,852 0-14 2,857 15-19 3,818 20-24 3,435 25-29 3,533 30-39 1,5B6 40-49 1,025 50-59 1,011 60+
.. A.N.S •
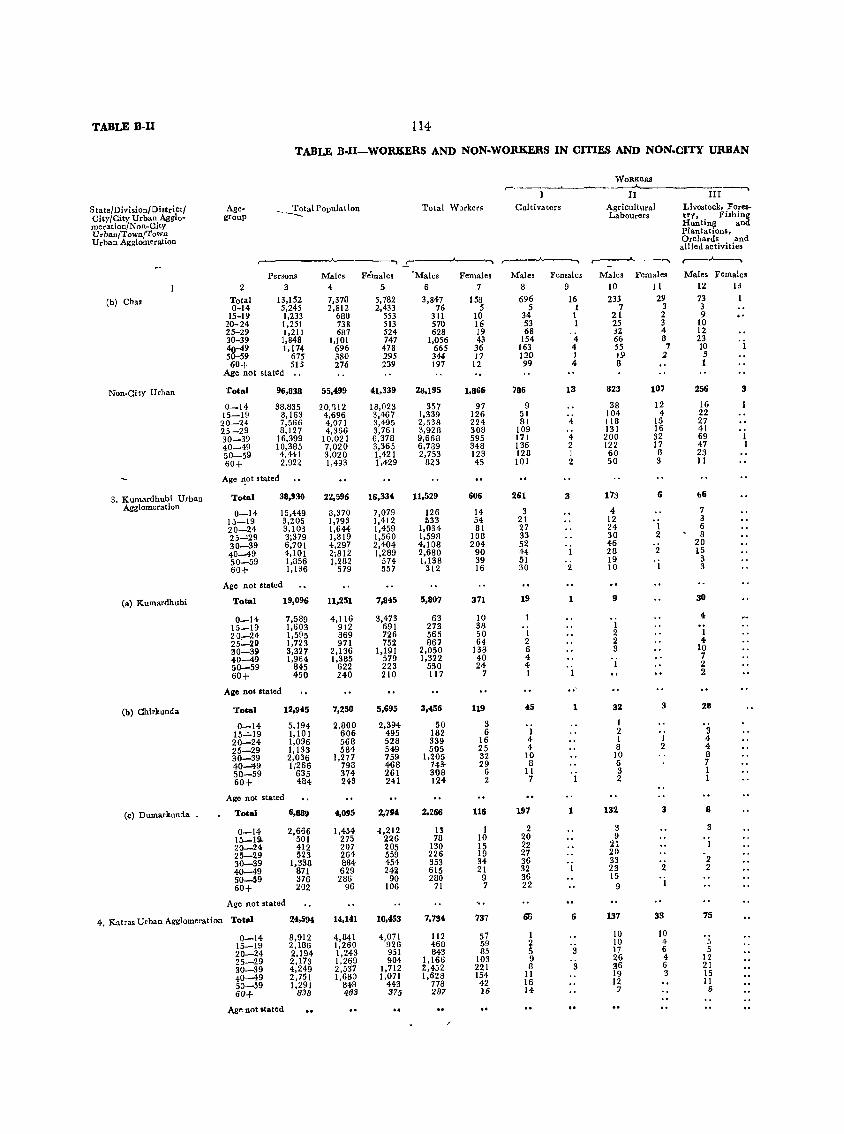
TABLE B-II 114
TABLE B·I1-WORKERS AND NON·WORKERS IN CITIES AND NON.CITY URBAN
WoRKEllS ,------__
I II III
State/Di vision/ District/ Age- _ ~tal Population Total Workers Cultivators Agricultural Livestock, Fore .. City/City Urban Agglo- group Labourers try, Fishing meration/Non-City Hunting and Urban/Town/Town Plantations, Urban Agglomeration Orchards and
allied activities
,----"-----..... ..!:'---.A. __ -. ,-__.,.,,___ __ .----"---, ,..--J---.....
Persons Males Females 'Males Females Males Females Males Females Males Females
2 3 4 5 6 8 9 10 II 12 13
(b) Cha. Total 13,152 7,370 5,782 3,847 158 696 16 233 29 73 I 0-14 5,245 2,812 2,433 76 5 5 t 7 3 3
15-19 1,233 680 553 311 10 34 1 21 2 9 20-24 1,251 738 513 570 16 53 1 25 3 10 25-29 1,211 687 524 628 19 68 '4 32 4 12 30-39 1,848 1,101 747 1,056 43 154 66 8 23
o i 40-49 1,174 696 478 665 36 163 4 55 7 10 50-59 675 380 295 344 17 120 1 19 2 5 60+ 515 276 239 197 12 99 4 8 1
Age not stated .. Non-City Urban Total 96,838 55,499 41,339 28,195 1,866 786 13 823 107 256 3
0-14 38,835 20,312 18,023 357 97 9 38 12 16 15-19 8,163 4,696 3,467 1,339 126 51 104 4 22 20-24 7,566 4,071 3,495 2,538 224 81 4 118 15 27 25-29 8,127 4,366 3,761 3,928 308 109 131 16 41 30-39 16,399 10,021 6,378 9,668 595 171 4 200 32 69 1 40--49 10,385 7,020 3,365 6.789 348 136 2 122 17 47 1 50-59 4,441 3,020 1,421 2,753 123 128 1 60 8 23 60+ 2,922 1,493 1,429 823 45 101 2 50 3 11
Age ,,-at stated
3, Kumardhubi Urban Total 38,930 22,596 16,334 11,529 606 261 3 173 6 fl6
Agglomeration 0-14 15,449 8,370 7,079 126 14 3 4 7
15-19 3,205 1,793 1,412 1133 54 21 12 3 20-24 3,103 1,644 1,459 1,034 81 27 24 1 6 25~29 3;379 1,819 1,560 1,598 108 33 30 2 8 30-39 6,701 4,297 2,404 4,108 204 52 46 20 40-49 4,101 2;812 1,289 2,680 90 44 28 2 16 50-59 1,856 1,282 574 1,138 39 51 19 3 60+ 1,136 579 557 312 16 30 10 1 3
Age not .tated
<al Kumardhubi Total 19,096 11,251 7,845 5,807 371 19 1 9 30
0-14 7,589 4,116 3,473 63 10 4
15-19 1,603 912 691 273 38 1 20-24 1,595 869 726 565 50 1 2 1 25:__2g 1,723 971 752 867 64 2 2 4 30-39 3,327 2,136 1,191 2,050 138 6 3 10 40--49 1,964 1,385 579 1,322 40 4 7 50-59 845 622 223 550 24 4 1 2
60+ 450 240 210 117 7 1 2
Aile not otated .. (bl Chirkunda Total 12.9'5 7,250 5,695 3,456 119 45 1 32 3 28
0-14 5,194 2,800 2,394 50 3 1 15-'-19 1,101 606 495 182 6 1 2 3 20-24 1,096 568 528 339 16 4 I I 4
25-29 1,133 584 549 505 25 4 8 2 4
30-39 2,036 1,271 759 1,205 32 10 10 8
40-'19 1;266 798 468 743- 29 8 -5 7
50-59 635 374 261 308 6 11 3 1
60+ 484 243 241 124 2 7 2 I
Age not stated
(c) Dumarkunda 0 Total 6,889 4,095 2,79' 2,266 116 197 1 132 3 8
0-14 2,666 1,454 cI,212 13 1 2 3 3
15-1~ 501 275 226 78 10 20 9 20-24 412 207 205 130 15 22 21 1 25-29 523 264 559 226 19 27 20
30-39 1,338 884 454 853 34 36 OJ 33 2
40-49 871 629 242 615 21 32 23 2 2
50-59 376 286 90 280 9 36 15 'i 60+ 202 96 106 71 7 22 9
Age not stated
4, Katra. Urban Agglomeration Total 24,594 14,141 10,453 7,734 737 65 6 137 33 75
0-14 8,912 4,841 4,071 112 57 1 10 10
15-19 2,186 1,260 926 468 59 ~ 10 4 5
20-24 2,194 1,243 951 843 85 3 17 6 5
25-29 2,173 1,2~9 904 1,166 103 9 26 4 12
30-39 4,249 2,5 7 1,712 2,452 221 8 3 36 6 21
40--49 2,751 1,680 1,071 1,628 154 11 19 3 15
50-59 1,291 848 443 778 42 16 12 11
6Q+ 838 463 375 287 16 H 7 6
Age not .tated
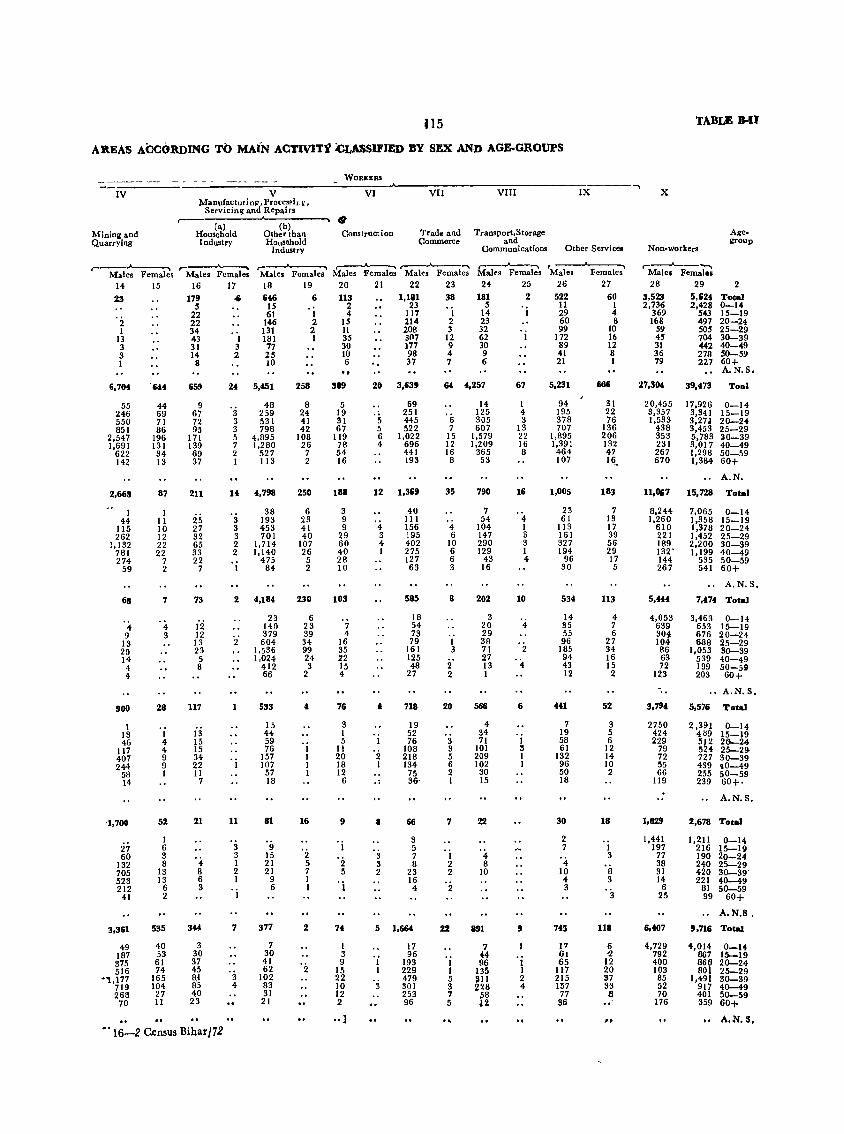
U5
AREAS AOOOl\DING TO MAiN ACTIVITY Q.A'SSIlJED BY SEX AND AGE-GROUPS
-~-.~-- ---IV
Mining and Quarrying
r---,.A...-..... Males Female.
14 15
23
2 1
13 3 3 I
6.704
55 246 550 851
2.547 1.691
622 142
2.668
1 44
115 262
1,132 781 274
59
68
4 9
13 20 14 4 4
900
I 13 46
117 407 244
58 14
'1.700
27 60
132 705 523 212
41
3.361
49 187 375 516
-'.177 719 268
70
'644
44 69 71 86
196 131 34 13
87
1 11 10 12 22 22
7 2
7
4 3
28
1 4 4 9 9 1
52
1 6 3 8
13 13
I) 2
535
40 53 61 74
165 104 27 II
WORKERS
V Manufacturing JProces~jr.r,
Servicing and Repairs
VI VII VIII
, _____ .A. ____ .......
llous~~old Oth~~{han Construction Trade and Commerce
Transport,Storage and
Communications I ndustry Household
Industry
r----.A.-_ Males Females Males Female? M"'a-l-es__'F-e-m-al~ Mal.. Femal: Males Female's
16 17 18 19 20 21 22 23 24 25
179 -4i S
22 22
~~ "I 31 3 14 2 8
646 15 61
146 131 181 77 2S 10
659 24 5.451
9 67 72 9~
171 139 69 37
%11
25 27 32 65 33 22
7
73
Ii 12 ]3 23 5 8
117
13 15 15 34 22 11
7
21
, 4 8 6 3
344
3 30 37 45 8,~ 85 40 23
3 3 3 5 7 2 I
3 3 3 2 2
I
48 259 531 798
4,895 1,280
527 113
4.798
38 193 453 701
1,714 1,140
475 84
2 4.184
2
1
11
3 3 I 2 I
I
7
3 4
23 140 379 604
1,536 1,024
412 66
533
15 44 59 76
157 107 57 18
81
'9 15 21 21
9 6
377
7 30 41 62
102 83 31 21
6
'i
258
2 2 1
8 24 41 42
108 26 7 2
250
6 23 41 40
107 26
5 2
230
6 23 39 34 99 24 3
2
16
'2 5 7 I 1
2
'2
113 2 4
15 11 35 30 10 6
389
5 19 31 67
119 78 54 16
188
3 9 9
29 60 40 28 10
103
7 4
16 35 22 15 4
76
3 I 5
11 20 18 12
6
9
I
'2 5
I
74
I 3 9
15 22 10 12 2
,.J
1.181 38 181 2
1~~ 'i I~ 'i 214 2 23 208 3 32 307 12 62 177 9 30 98 4 9
'. 37 7 6
20 3.63' 64 4.257
5 5 6 4
12
4 3 4 I
2 I
3 3 2
69 251 445 522
1,022 696 441 193
1.369
40 III 156 195 402 275 127 63
585
18 54 73 79
161 125 48
27
718
19 52 76
108 218 134
75 3&
66
3 5 7 8
23 16 4
5 1.664
I I
'3
17 96
193 229 479 301 253 96
'6 7
15 12 16 8
35
4 6
10 6 6 3
8
I 3
2 2
20
3 3 5 6 2 I
7
1 2 2
'2
22
I I 5 3 7 5
14 125 305 607
1,579 1,209
365 53
790
7 54
104 147 290 129
43 16
202
3 20 29 38 71 27 13 I
566
4 34 71
101 209 102
30 15
22
'4 8
10
891
7 H 96
135 ~11 228
58 ~2
67
I 4 3
13 22 16 8
16
4 1 3 3 1 4
10
4
2
'4
6
1 3 I 1
9
'j 1 2 4
·'16-2 Census Biharj72
IX
Other Services , __ ..A-__ ~
Male. 26
522 11 29 60 99
172 89 41 21
5.231
94 195 378 707
1,895 1,391 464 107
1,005
23 61
113 161 327 194
96 30
534
14 35 55 96
185 94 43 12
441
7 19 58 61
132 96 50 18
30
2 7
4 10 4 3
70&5
17 61 65
117 U5 157 77 36
Female. 27
60 I 4 8
10 16 12 8 1
866
31 22 76
136 206 132 41 16.
183
7 13 17 39 56 29 17 5
113
4 7 6
27 34 16 15 2
52
3 5 6
12 14 10 2
18
I 3
8 3
'3
118
6 -2 12 20 37 33 .8
TABLE B-Il
x
Non-workers
r- ....., Males Females 28 29
3,523 5,624 2,736 2.428
369 S43 168 497
S9 50S 4S 704 31 442 36 278 79 227
Age. group
2 T<>ta1 0-14 15-19 20-24 25-29 30-39 40-49 SO-S9 60+ A,N,S.
27.304
20.455 3.357 1.533
39,473 Toal
438 353 .231 267 670
11,067
8.244 1,260
610 221 189 132" 144 267
5.444
4,053 639 30f 104 86 63 72
123
3.794
2750 424 229
79 72 55 66
119
1.82!1
1.441 197
77 38 31 14
6 25
4.729 792 400 103 85 52 70
176
"
17.926 3.341 3.27J 3.453 5.783 3.017 1.298 1.384
15,728
7,065 1.358 1,378 1,452 2.200 1.199
535 541
0-14 15-19 20-24 25-29 30-39 40-49 50-59 60+
A,N,
Total
0-14 15-19 20-24 25-29 30-39 40-49 50-59 60+
A,N,S.
7,474 Total
3.463 653 676 688
1.053 539 199 203
5.571i
2.391 4a9 5,2 524 727 439 255 239
0-14 15-19 20~24 25-29 30-39 40-49 50-59 60+
A,N,S.
Tot.d
0-14 15-19 26-24 25-2"" 30-39 ~0-49 50-59 60+,
A.N,S,
2.678 Total
1.211 216 190 240 420 :221
81 99
0-14 15-111 20-24 25-29 30-39' 40-49 SO-59
60+
A,N,S,
9,716 Totlol
4.014 867 S6(l 801
1.491 917 401 359
0-14 15-19 20-24 25-29 30-39 40-49 50-59 60+
A.N.S,
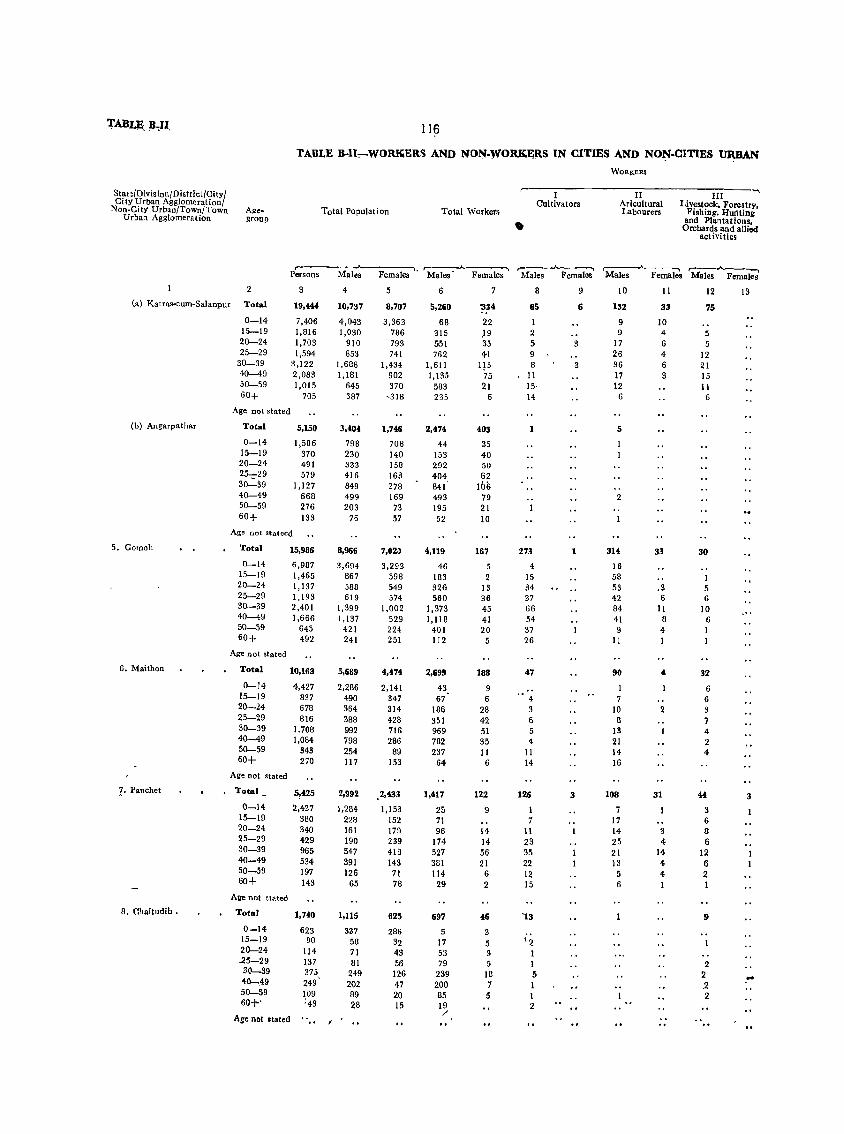
'J,'ABL;E, B,lI. 116
TABLE B.Il,-WOR&ER~ AND NO~·WOltK~.RS IN CITIES AND NO~.CITIES ~
WORl<ERS
Stat./Division/District/City/ I II III ""' City Urban Agglomeration/ Cultivators Aricultural Livestock. Forestry. Non-City Urban/Town/Town Age- Total Population Total Workers Labourers Fishing, Hunting
Urbatl Agglomeration group • and Plantations. Orchards and alliod
activities
r--------'----"""'"\ ,-_--.A.. ,-------'--, Males Females
,---.A. __ --,
Persons Males Females' Males' Females Males Females Males Females
2 3 4 6 7 8 9 10 11 12 13 Ca) Katras-cum-Salanpur Total 19,4~ 10,737 8,707 5,260 '334 65 6 132 33 75
0-14 7.406 4.043 3,363 68 22 I 9 10 15-19 1.816 1,030 786 315 .19 2 9 4 5 20-24 1,703 910 793 551 35 5 3 17 6 5 25-29 1,594 853 741 762 41 9 26 4 12
30-39 3,122 1,688 1,434 1,611 ,,5 8 3 36 6 21 40-49 2,083 1,181 902 1,135 75 11 17 3 15 50-59 1,015 645 370 583 21 15· 12 11 60+ 705 387 ,318 235 6 14 6 6
Age not stated
(b) Angarpathar Total 5.150 3,404 1.746 2,474 403 1 5
0-14 1,506 798 708 44 35 15-19 370 230 140 153 40 20-24 491 333 158 292 50 25-29 579 416 163 404 62 30":39 1,127 849 278 841 106 40-49 668 499 169 493 79 2 50-59 276 203 73 195 21 60+ 133 76 57 52 10
Age not stateed
5. Gomoh Total 15,986 8,966 7.02D 4,119 167 273 1 314 33 30 0-14 6,987 3,694 3,293 46 5 4 16
15-19 1,465 867 598 183 2 15 58 1 20-24 1,137 588 549 326 13 34 53 .3 5 25-29 1,193 619 574 560 36 37 42 6 6 30-39 2,401 1,399 1,002 1.373 45 66 84 11 10 40-49 1,666 1,137 529 1,118 41 54 41 8 6 50-59 645 421 224 401 20 37 9 4 60+ 492 241 251 112 5 26 II
Age not stated
6. Maithon Total 10,163 5,689 4,.74 2.699 188 47 90 4 32 0-14 4,427 2,286 2,141 43 9 1 6
15-19 837 490 347 67 6 4 7 6 20-24 678 364 314 186 28 3 10 2 3 25-29 816 388 428 351 42 6 8 7 30-39 1.708 992 716 969 51 5 13 4 40-49 1,084 798 286 782 35 4 21 2 50-59 343 254 89 237 11 11 14 4 60+ 270 117 153 64 6 14 16
Age not stated
,7.. Panchet Total 5~425 2,992 ,2,433 1,417 122 126 3 108 31 44 3 0-14 2,437 1,284 1,153 25 9 1 7 3
15-19 380 228 152 71 7 17 6 20-24 340 161 179 96 14 11 14 3 8 25-29 429 190 239 174 14 23 25 4 6 30-39 965 547 418 527 56 35 21 14 12 40-49 534 391 143 381 21 22 13 4 6 50-59 197 126 71 114 6 12 5 4 2 60+ 143 65 78 29 2 15 6 I 1
Aile not 'tated
8. Chaitudih • Total 1,740 1,115 625 697 46 '13 9 0-14 623 337 286 5 3 15-19 90 58 32 17 5 (2 20-24 114 71 43 53 3 I .25-29 137 81 56 79 5 I 2 gO-39 375, 249 126 239 18 5 2 40-.49 249 202 47 200 7 1 .2 50-59 109 89 20 85 5 I 2 60+- ;43 28 15 19 2
/ Age not stated .. ..
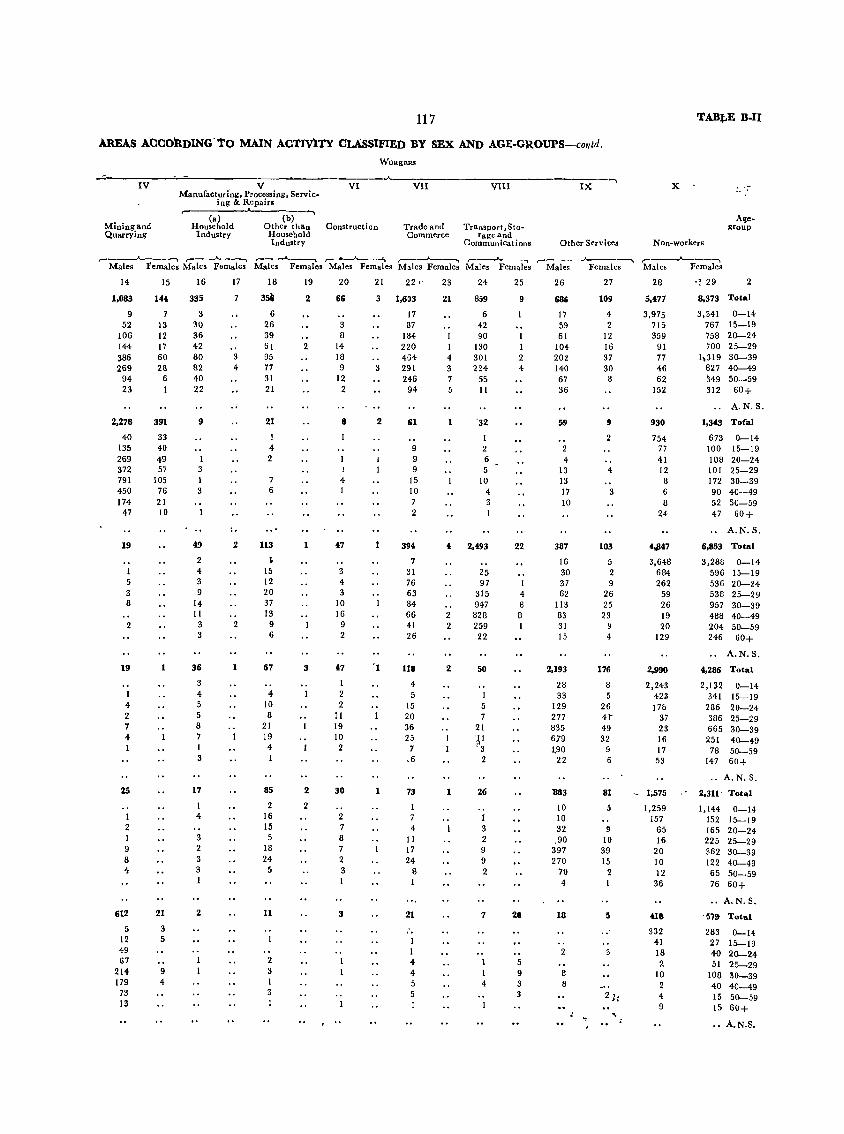
117
AREAS ACCORDING'TO MAIN ACTIvlTY CLASSIFIED BY SEX AND AGE-GROUPS-contd.
WORKERS
-------------"-"=---------------_.---------------~-----------------IV . V VI VII VIII
Mining and Quarrying
Manufacturing, Processing, Servic-ing &: Repairs
r---------~--------~ (a) (b) Household Other than Construction
Industry Household Industry
Trade and Transport,Sto-Commerce rage and
Communications
--------., IX
Other Services
TAB:t-E B-1I
X
Non .. workers
, ,., '
r-___"_~ ,--~ ,-----"-~ ,---.,.0....----.. r--~-....." ,- ,----'----~ r----"----., Males Females Males Females Males Females Males Females Males Females Males Females Males Females Males Females
14
1,083
9 52
106 144 386 269
94 23
2,278
40 135 269 372 791 450 174
47
19
5 3 8
2
19
4 2 7 4
1 2
9 8 4
612
5 12 49 67
214 179
73 13
15
14,1
13 12 17 60 28
6
391
33 40 49 57
105 76 21 10
21
3 5
9 4
16
335
3 30 36 42 80 82 40 22
9
1 3 1 3
19
2 4 3 9
14 II
3
36
3 4 5 5 8 7
3
17
1 4
3 2 3 3
2
17
7
4
..
:.
2
18
356 6
26 39 61 95 77 31 21
21
4 2
7 6
113
1· 15 12 20 37 13
9 6
67
4 10 8
21 19 4 1
85
2 16 15 5
18 24
5
11
2 3 I 3
19
2
2
3
2
2
20
66
3 8
14 18 9
12 2
8
I
4 I
3 4 3
10 16
9 2
47
1 2 2
11 19 10 2
30
2 7 8 7 2 3.
3
21 22,'
3 1,603
17 87
184 220 464
3 291
2
1
246 94
61
9 9 9
15 10 7 2
394
7 31 76 63 84 66 41 26
118
4 5
15 20 36 25
7 .6
73
4 11 17 24
8 1
21
I 1 4 4 5 5
23
21
4 3 7 5
24
859
6 42 90
130 301 224
55 11
2 6 5
10 4 3
4 2,193
2 2
2
25 97
315 947 828 259 22
50
I 5
21 ',p " 3
2
26
1 3 2 9 9 2
7
4
25
9
1 2 4
22
4 8 8 1
20
5 9 3 3
26
68&
17 59 61
104 202 140 67 36
59
4 13 13 17 10
387
16 30 37 62
113 83 31 15
2,193
28 33
129 277 835 679 1.90
22
1183
10 10 32 ,90
397 270
70 4
18
2
8 8
27
109
4 2
12 16 37 30 8
9
4
3
103
5 2 9
26 25 23
9 4
176
a 5
26 4l' 49 3.2
9
81
9 10 39 15
2
.. " .
28
5.477
3,975 715 359
91 77 46 62
152
930
754 17 41 12 8 6 8
24
4J147
3,648 684 262
59 26 19 20
129
2,990
2,243 423 170
37 23 16 17 53
1,575
1,259 157
65 16
20 10 12
36
418
332 41 18 ?
10 2 4 9
'1 29 2
8,373 Total
3,341 0-14 767 15-19 758 20-24 700 25-29
h319 30-39 827 40-49 349 50-59 312 60+
A.N.S .
1,343 Tofa1
673 0-14 100 15-19 108 20-24 101 25-29 172 30-39 90 40-49 52 50-59 47 60+
A.N.S.
6,853 Total
3,288 0-14 596 15-19 536 20-24 538 25-29 957 30-39 488 40-49 204 50-59 246 60+
.. A.N.S.
4,286 Total
2,132 0-14 341 15-19
286 20-24 386 25-29 665 30-39
251 40-49 78 50-59
147 60+
.. A.N.S.
2,311' Total
1,144 0-14 152 15-19 165 20-24 225 25-29 362 30-39 122 40-49 65 50-59 76 60+
.. A.N.S.
'579- Total
283 0-14 27 15-19 40 20-24 51 25-29
108 30-39 40 40-49 15 50-59 15 60+
.. A.N.S.
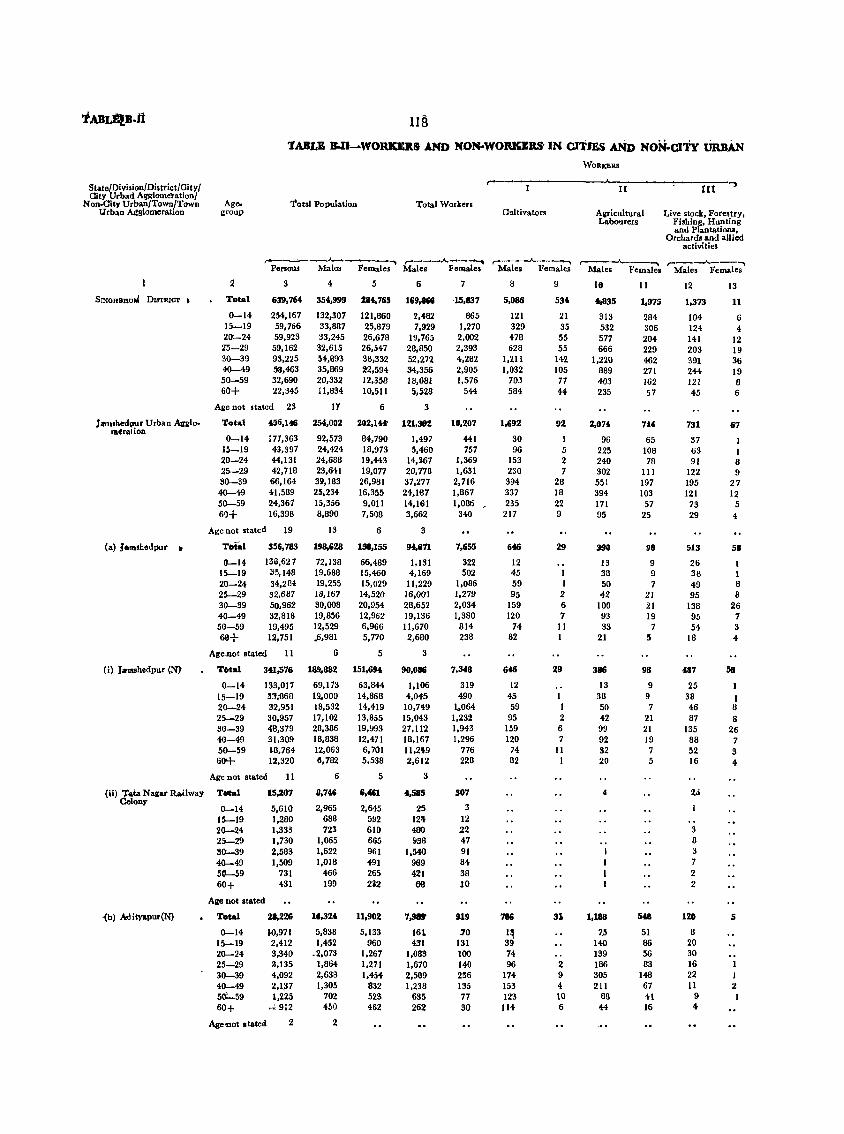
T ABL8!.B.1i lIB 1ABU B-I1 ...... WORKEllS' AND NON-WORKERS'IN CITIES AND NON·Cl'fY URBAN
WORKERS
State{Divi.ion{District{CitV{ II [11 ..,
Oity Urbad Agy,I(J[Jlel'ation{ Total Population NOD-City Urban Towo{Town Age- Total Worker.
lJ rban Agglomeration group Cultivators Allricu1tura1 Live stock, Forestry, Labonrers Fishing, Hunting
and PlantatiOOJl, Orchards and allied
activities ,. _____ --...A..-___ ~ ,-_. __ .A..------.
,----'---, ,..---"--....., ,..---'---..... Persons Males Female, Males Females Males FemaleB Males Female. Males Females
2 3 4 5 6 7 8 9 10 11 12 13
SINOH_HUIA DISTRICT Total 639,764 35',999 284,765 169,_ ,15,837 5,086 53& .,035 1,975 1,373 11
0-14 254,167 132,307 121,860 2,482 865 121 21 313 284 104 6 15-19 59,166 33,881 25,879 7,929 1,210 329 35 532 306 124 4 20-24 59,923 33,245 26,618 19,765 2,002 478 55 577 204 141 12 75-29 59,162 32,615 26,547 28,850 2,393 628 55 666 229 203 19 30-39 93,225 54,893 38,332 52,272 4,282 1,211 142 1,220 462 391 36 40-49 58,463 35,869 22,594 34,356 2,905 1,032 105 889 271 244 19 50-59 32,690 20,332 12,358 18,661 1,576 703 77 403 162 121 8 60+ 22,345 11,834 10,511 5,528 544 584 44 235 57 45 6
Age not stated 23 IT 6 3
J.,u.hlfdpur Urban Agg1o-meralioD
Total ~6,146 254,002 202,Ut' 121,3t2 11,207 1,692 92 2,074 7U 731 67
0-14 177,363 92,573 84,790 1,497 441 30 1 96 65 37 I 15-19 43,397 24,424 18,973 5,460 751 96 5 225 108 63 1 20-24 44,131 24,688 19,443 14,367 1,369 153 2 240 78 91 8 25-29 42,718 23,641 19,077 20,778 1,631 230 7 302 111 122 9 30-39 66,164 39,183 26,981 37,277 2,716 394 28 551 197 195 27 40-49 41,589 25,234 16,355 24,187 1,867 337 18 394 103 121 12 50-59 24,367 15,356 9,011 14,161 1,086 / 235 22 171 57 73 5 6()+ 16,398 8,890 7,5()8 3,662 340 217 9 95 25 29 4
Age not stated 19 13 6 3
(a) laauhedput • Total 35&,783 198,628 158,155 94,&71 7,655 646 29 390 98 513 58
(J_14 ISill,627 72,138 66,489 1.131 322 12 13 9 26 I 15-19 35,148 19,688 15,460 4,169 502 45 1 38 9 38 1 20-24 34,284 19,255 15,029 11,229 1,086 59 1 50 7 49 8 25-29 32.687 18,167 14,520 16,001 1,279 95 2 42 21 95 8 30-39 50,962 30,008 20,954 28,652 2,034 159 6 100 21 138 26 40-49 32,818 19,856 12,962 19,136 1,380 120 7 93 19 95 7 50-59 19,495 12,529 6,966 11,670 814 74 11 33 7 54 3 60+ 12,751 .6,981 5,770 2,680 238 82 1 21 .5 18 4
Age.not stated 11 6 5 3
(i) J",aubedpur (N] T6t1l1 34l,576 189,88Z 151,694 90,011& 7,348 646 29 386 98 481 58
0-14 133,017 69,173 63,844 1,106 319 12 13 9 25 15-19 !:I,1l68 19,000 14,868 4,M5 490 45 1 38 9 38 , 20-24 32,951 18,532 14,419 10,749 1.064 59 I 50 7 46 8 25-29 30,957 17.,102 13,855 15,043 1,232 95 2 42 21 87 8 30-39 48,379 28,386 19,993 27,11'2 1,943 159 6 99 21 135 26 40-49 31,309 18,838 12,471 18,167 1,296 120 7 92 19 88 7 50-59 Ul,764 12,063 6,701 11,2'9 776 74 11 32 7 52 3 600t- 12,320 6,782 5,538 2,612 228 82 20 5 16 4
Age not stated 11 6 5 3
(Ii) '):.ta Nall'ar Railway T_l 15,207 8,746 6,461 4,585 307 4 2'> Colony
0-14 5,610 2,965 2,645 25 3 15-19 1,280 688 592 12' 12 20-24 1,333 723 610 480 22 3 25-29 1,730 1,065 665 958 47 8 30-39 2,583 1,622 961 1,540 91 :$
40-49 1,509 1,018 491 989 84 7 50-59 731 466 265 421 38 2 60+ 431 199 2i2 68 10 2
Age not stated
·(b) Mityapur(N) Total 21,226 1,,324 11,902 7,9. 919 786 31 1,188 548 120 5
0-14 lO,971 5,838 5,133 161 :10 1~ 7Jj 51 8 15-19 2,412 1,452 960 431 131 39 140 86 20 20-24 3,340 .2,073 1,267 1,083 100 74 139 56 30 25-29 3,135 1,864 1,271 1,670 140 96 2 186 83 16 30-39 4,092 2,638 1,454 2,509 2S6 174 9 305 148 22 1 40-49 2,~37 1,305 832 1,238 135 153 4 211 67 11 2 50:-59 1,225 702 523 635 71 123 10 8S 41 9 I 60+ .~ 912 450 462 262 30 114 6 44 16 4
Age'l1ot I tatem 2 2
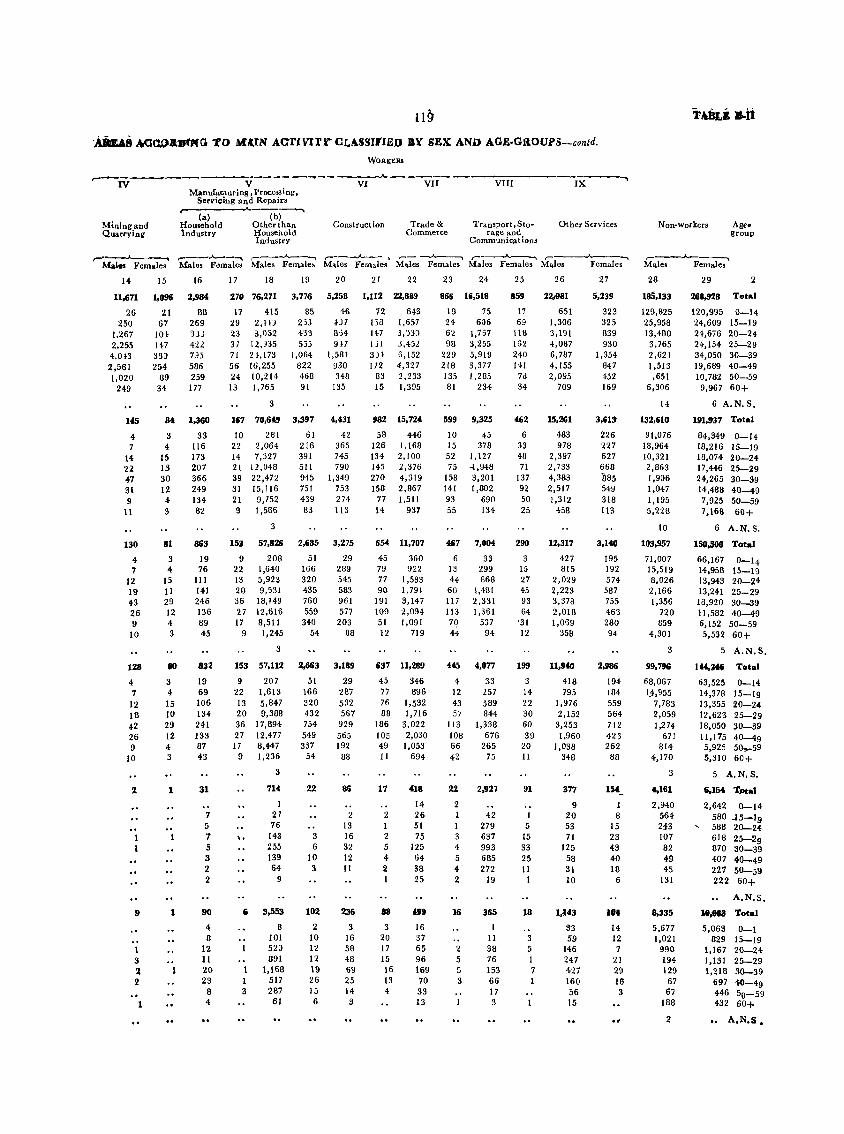
119 -.Ai£Aj Ml®ll'JJfl!(G TO &fUN ACTIVIr~ CLASSIFIED BY SEX: AND AG,E.G.ROUPS-contd.
IV
Mining and Quarrying
WORKERS
'-------------v-I--~-------V-I-I----------V-I-I·I-----------I-X------~ V
Manufacturing, Processing, Servicing and Repairs r-----.A.----..... (a) (b)
Household Other than Industry Household
Industry
Construct ion Trade & Commerce
Transport, Storage and
Communications
Other Services Non-workers Agegroup
,...- ....., ,---.......___" .- ,---_A_ ) r--~ r-- r----""---, ,-___ -..A.. ___ .....
Males Females Males Females Males Female. M.les Females Males Females Males Females Males Females Males Females
J4
110671
26 250
1,267 2,255 4-,On 2,561 (,020
249
145
4 7
14 22 47 31 9
11
130
4 7
12 19 43 26 9
10
128
4 7
12 18 42 26 9
10
9
1 3 :I 2
15
1,096
21 67
IO}
147 38J 254
89 34
84
3 4
15 13 30 12 4 :;
81
3 4
15 11 29 12 4 3
80
3 4 15 10 29 12 4 3
1
1
16
2,984
88 269 333 422 73j
586 259 177
1,360
33 116 173 207 366 249 IH 82
863
19 76
III 141 246 136 89 45
a32
19 69 106 134 241 133 87 43
31
7 5 7 5 3 2 2
90
4 8
12 11 20 23
8 4
17 18
278 76,271
17 415 29 2,IU 23 3,052 37 12,935 71 21,173 56 16,255 24 10,214
13 1,765
3
li7 70,649
10 281 22 2,064 14 7,327 21 12,048 39 22,472 31 15,116 21 9,752 9 1,586
3
153 57,826
9 208 22 1,640 13 5,923 20 9,531 36 18,149 27 12,616 17 8,51 I
9 1,245
3
153 57,112
9 207 22 1,61:> 13 5,841 20 9,388 36 17,894 27 12,477 17 8,447
9 1,236
, .
3
714
I 27 76
143 255 139 64
9
ti 3,553
8 101 520 891
1,168 1 517 3 287
61
19
3,776
85 2H 433 5jj
1,064 822 468 91
3,397
61 216 391 511 945 751 439 83
20
5,258
46 ~J7
8-34 917
1,581 930 348
135
4,431
42 365 745 790
1,349 753 274 113
2,685 3,275
51 29 166 269 320 545 435 583 760 961 559 577
340 203 54 88
2,663
51 166 320 432 754 549 337
54
22
3 6
10 3
102
2 10 12 12 19 26 15 6
3,189
29 287 532 567 929 565 192
88
86
2 13 16 32 12 11
236
3 16 58 48 69 25 14 3
21 22
1,112 22,8119
72 643 Ij8 1,657 147 3,')30 Ijl 3,452 3H 6,152 172 4,327
83 2,233 15 1,395
982 15,724
58 446 126 1,168 134 2,100 145 2,376 270 4,319 158 2,867
77 1,511 14 937
654 11,707
45 360 79 922 77 1,583 90 1,791
191 3,147 109 2,094 51 1,091 12 719
637 11,289
45 346 77 896 76 1,532 88 1,716
186 3,022 105 2,030 49 1,053 II 694
17
2 I 2 5 4 2 1
88
3 20 17 15 16 13 4
418
14 26 51 75
125 64 38 25
'ft 16 37 65 96 169 70 33 13
23 24
866 Ii,518
19 75 24 6J6 62 1,767 98 3,255
229 5,919 218 3,377 135 1,285 81 234
599 9,325
10 45 15 378 52 1,127 75 -4,948
158 3,201 141 1,802 93 690 55 134
467 7,004
33 13 299 H 868 60 1,481 117 2,331 113 1,361 7Q 537 H 94
445
4 12 43 57
113 108 66 42
22
2 1 I 3 4 5 4 2
16
2 5
3
4,077
33 257 589 844
1,338 676
265 75
2,927
42 279 637 993 685 272
19
365
II 38 76 153 66 17 3
25
859
17 69
118 152 240 141
7d 34
462
6 33 48 71
137 92 50 25
290
15 27 45 93 64
-31 12
199
3 14 22 30 60 39
20 II
91
5 15 33 25 11
1
18
3 5 I 7 I
26
22j981
651 1,306 3,191 4,087 6,787 4,155 2,095
709
15,261
483 978
2,397 2,733 4,383 2,517 1,312
458
12,317
427 815
2,029 2,223 3,378 2,018 1,069
358
11,940
418 795
1,976 2,152
3,253 1,960
1,038 348
377
9 20 53 71
125 58 31 10
1,1.&3
33 59
146 247 427 160 56 15
27
5,239
323 325 839 930
1,354 847 452 169
3.'1"
226 227 627 668 885 549 318 113
3,140
195 192 574 587 755 463 280 94
2,986
194 184 559 564 712 423 262 88
154_
1 8
15 23 43 40 18
6
101
14 12 7
21 29 IB 3
28
185,133
129,825 25,958 13,480 3,765 2,621 1,513 ,651
6,306
14
132,610
91,016 18,964 10,321 2,863 1,906 1,047 1,195 5,228
10
103,957
71,007 15,519 8,026 2,166 1,356
720 859
4,301
3
99,7911
68,067 lj-,955
7,783 2,059 1,274
671 814
4,170
3
4,161
2,940 564 21-3 107 82 49 45
131
8,335
5,577 1,021
990 194 129 67 67
188
29 2
268,928 Total
120,995 0-14 24,609 15-19 24,676 20-24 24,154 25-29 34,050 30-39 19,689 40-49 10,782 50-59
9,967 60+
6 A.N.S.
191,'37 Total
84,349 0-14 18,216 15-19 18,074 20-24 17,446 25-29 24,265 30-39 14,488 40-49 7,925 50-59 7,168 60+
6 A.N.S.
15O.soo Total
66,167 0-14 14,958 15-19 13,943 20-24 13,241 25-29 18,920 30-39 11,582 40-49 6,152 50-59 5,532 60+
5 A.N.S.
1"-3"
63,525 14,378 13,355 12,623 18,050 11,175 5,925 5,310
Total
0-14 15-19 20-24 25-29 30-39 40-49 5~59 60+
5 A.N.S.
5.154 Tpt.l
2,642 0-14 580 -15-19 588 20-24 618 25-29 870 30-39 407 40-49 227 50-59 222 60+
A.N.S.
1t,fIU Total
5,063 0-1 829 15-19
1,167 20-24 1,131 25-29 1,218 30-39
697 40-49 446 50-59 432 60+
2 ., A.N.S.
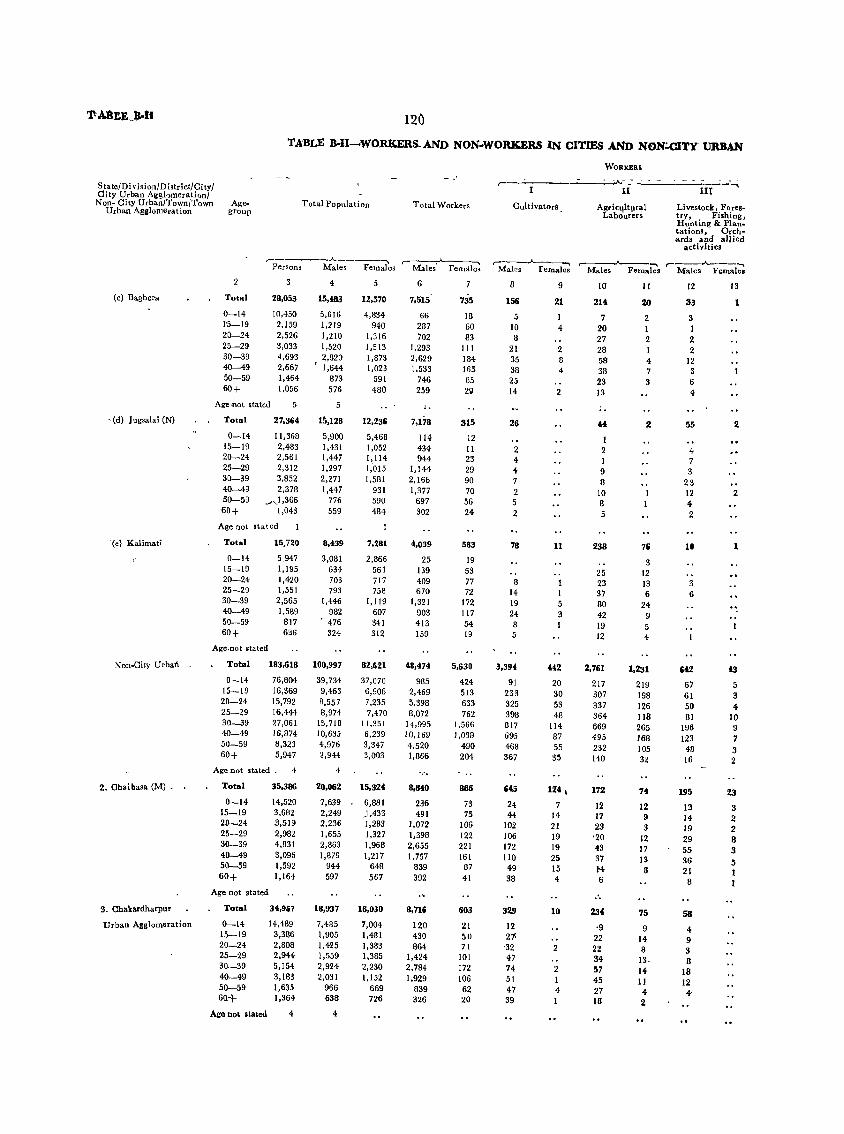
1'1-A8:tE Jl·l:I 120
TABLE B·U---<WORKER!tAND NON-lVORJQ:RS IN CITIES AND NON!CITY URBAN
State! D i vision/D istrict/Ci ty/ City Urban Aggbmerati()n/ Non- City Urban/Town/Town Age-
Urban Agglomeration group Total Population Total Workers Cultivators
WORJ(I!RS
II
Agricultural Labo'ur'mj
III
Livestock, Fores .. try, Fishing, Hunting & Plan_ tations, Orch .. ards and alii ed
activities
,-------"------, r---~"""""I ,----_.A. __ """""I r--.A----",\ r-' _'_.A. ___ ~ Persons Males Females Males Females Males Females Males Females Males Females
(c) Bagbera
'(d) Jug,alai (N)
'(ej Kalimati
Non-City Urbafl .
2, Chaibasa (M), .
3. Chakardharpur
lJrban Agglomeration
2
Total
0-14 1'5-19 20-24 25-29 30-39 40-49 50-59 60+
3
28,053
10,450 2,159 2,526 3,033 4,693 2,667 1,464 1,056
Age not stated 5
Total
0-14 15-19 20-24 25-29 30-39 40-49 50-59 60+
27.364
11,368 2,483 2,561 2,312 3,852 2,378
"",,1,366 1,043
Age not stated
Total
0-14 15-19 20-24 25-29 30-39 40-49 50-59 60+
Age.not 'tatelt
15,720
5,947 1,195 1,420 1,551 2,565 1,589
817 636
4
15,483
5.616 1.219 1,210 1,520 2,820 1,644
873 576
5
15,128
5,900 1,431 1,447 1,297 2,271 1,447
776 559
8,439
3,081 634 703 793
1,446 982 476 324
Total
0-14 15-19 20-24 25-29 30-39 40-49 50-59 60+
183,618 100,997
76,804 16,369 15,792 16,444 27.061 16,874 8,323 5,947
39,734 9,463 8,557 8,974
15,710 10,635 4,976 2,944
Age not stated. 4 4
Total
0-14 15-19 20-24 25-29 30-39 40-49 50-59 60+
Age not stated
Total
0-14 15-19 20-24 25-29 30-39 40-49 50-59 60+
Age Ilot stated
35,386
14,520 3,682 .3,519 2,982 4,B31 3,096 1,592 1,164
34,967
14,489 3,386 2,B08 2,944 5,154 3,183 1,635 1,364
4
20,062
7,639 2,249 2,236 1,655 2,863 1,879
944 597
18,937
7,485 1,905 1,425 1,559 2,924 2,031
966 638
4
5
12,570
4,834 940
1,316 1,513 1,873 1,023
591 480
12,236
5,468 1,052 1,114 1;015 1,581
931 590 484
7,281
2,866 561 717 758
1,119 607 341 312
82,621
37,070 6,906 7,235 7,470
11,351 6,239 3,347 3,003
15,324
6,881 ),433 1,283 1,327 1,968 1,217
648 567
16,030
7,004 1,4Bl 1,383 1,3B5 2,230 1,152
669 726
6
7,515'
66 287 702
1,293 2,629 1,533
746 259
7,178
114 434 944
1,144 2,166 1,377
697 302
~,039
25 139 409 670
1,321 903 413 159
48,474
985 2,469 5,398 8,072
14,995 10,169 4,520 1,866
8,840
236 491
1,072 1,398 2,655 1,757
839 392
8,'11&
120 430 864
1,424 2,784 1,929
839 326
735
18 60 83
III 184 165 85 29
315
12 11 23 29 90 70 56 24
583
19 53 77 72
172 117 54 19
5,630
424 513 633 762
1,566 1,038
490 204
886
73 75
106 122 221 161 87 41
603
21 50 71
101 172 106 62 20
B
156
5 10 8
21 35 38 25 14
26
2 4 4 7 2 5 2
78
8 14 19 24 8 5
3,394
91 233 325 398 817 695 46B 367
645
24 44
102 106 172 110 49 38
329
12 21
'32 47 74 51 47 39
9
21
1 4
2 8 4
2
11
1 I 5 3 1
442
20 30 53 48
114 87 55 35
124 I
7 14 21 19 19 25 15 4
10
2
2 1 4 I
10
214
7 20 27 28 58 38 23 13
2 1 9 8
10 8 5
238
25 23 37 80 42 19 12
2,761
217 307 337 364 669 495 232 140
172
12 17 23 '20 43 37 )'4
6
234
-9 22 22 34 57 45 27 18
JI
20
2 '1 2 1 4 7 3
2
1 1
76
3 12 13 6
24 9 5 4
1,231
219 198 126 Jl8 265 168 105 32
7.
12 9 3
12 17 J3 8
75
9 14 8
13. H 11
4 2
12
33
3 I 2 2
12 3 6 4
55
4 7 3
23 12 4 2
10
3 6
642
67 61 50 81
196 123 48 16
195
13 14 19 29 55 36 21 8
58
4 9 3 8
18 12 4
13
2
2
1
IS
5 3 4
10 9 ., 3 2
23
3 2 2 8 3 5 I I
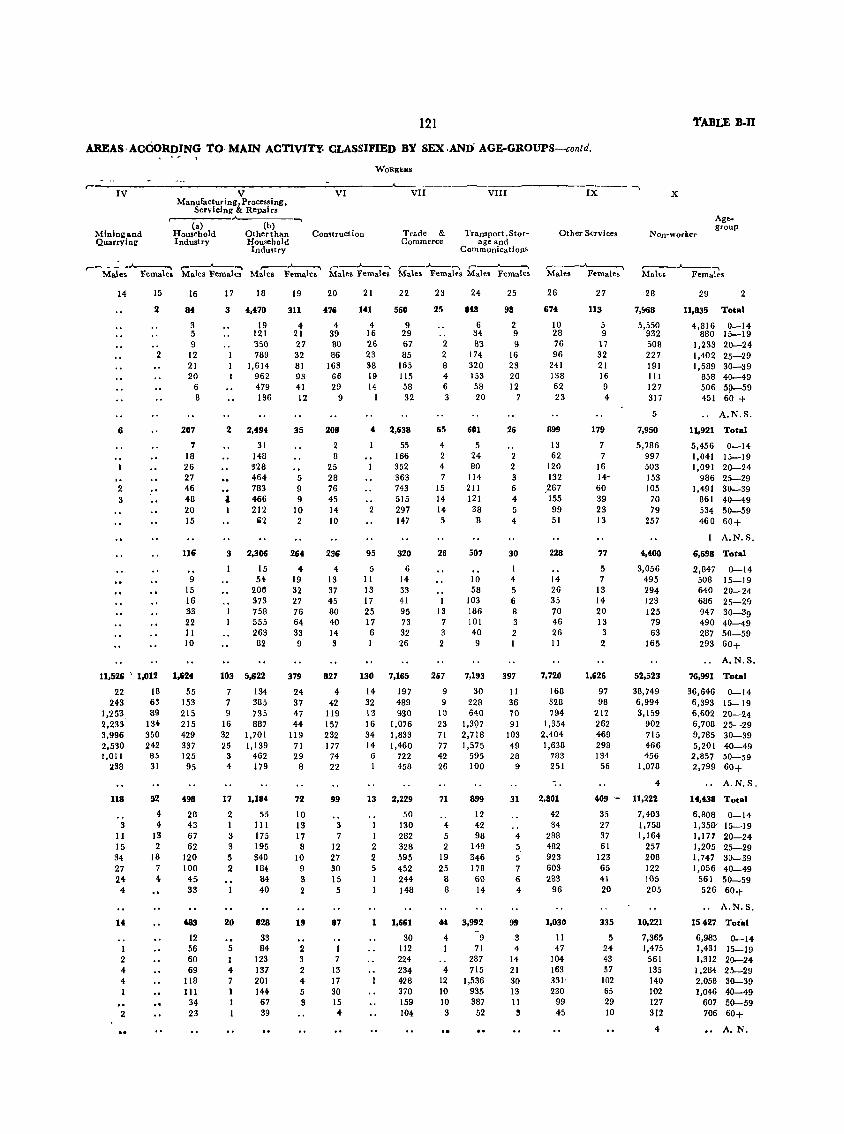
121
AREAS· ACCoRDJNG TO MAIN ACTIVITY- CLASSIFIED BY SEX .AND AGE-GROUPS-conld.
WORKERS
~----I-V------------------V------------~-V-I------~~~V=I~I--------~V=I~I~I-------------IX
Manufacturing, Processing,
Miningand Quarrying
Servicing lit Repairs r---------.~---------~
(a) (b) Household Otherthan Industry Household
Industry
Construction Trade & Commerce
Transport ,Stor .. age and
Communications
Other Services
- --. X
TABLE B-II
Age. group
,.... ___ ._...A..--., r- ~ r--..A..---...., ,.-_.A---, ,--_.A----. ,--_.A--.... r---~.... r----.A--....
Males Femalea Males Females Males Females Males Females Males Females Males Females Males Females Males Females
14
6
2 3
15
:I
2
11,526 ' 1,012
22 18 243 63
1,253. 89 2,233 134 3,996 350 2,530 242 1,011 85
238 31
UI
3 11 15 34 27 24
4
1 2 4 4 1
2
52
4 4
J3 2
18 7 4
16
84
3 5 9 12 21 20
6 8
207
7 18 26 27 46 48 20 15
116
9 15 16 33 22 11 10
1,&24
55 153 215 215 429 337 125 95
498
28 43 67 62
120 100 45 33
483
12 56 60 69
118 111
34 23
17 18 19 20 21 22
3 4,470 311 47& 141 560
19 4 4 4 9 121 21 39 16 29 350 27 80 26 67 789 32 86 23 85
1,614 81 163 38 165 962 93 66 19 115 479 41 29 14 58 136 12 9 1 32
2 2,494
I 1
31 148 328 464 783 466 212
1i2
3 2,306
15 54
20e 373 758 555 263 82
103 5,622
7 134 7 385 9 7S5
16 887 32 1,701 25 1,139
3 462 4 179
17 1,184
2 55 1 III 3 175 3 195 5 340 2 184
20
5 1 4 7
84 40
128
33 84
123 137 201 144
67 39
35
5 9 9
10 2
264
4 19 32 27 76 64 33 9
379
24 37 47 44
119 71 29
8
72
10 13 17 8
10 9 3 2
19
2 3 2 4 5 3
208
8 25 28 76 45 14 10
236
4 13 37 45 80 40 14 3
827
4 42
119 157 232 177
74 22
99
3 7
12 27 30 15 5
87
1 7
13 17 30 15 4
4 2,638
2
95
5 11 13 17 25 17 6
130
14 32 13 16 34 14
6 1
55 166 352 363 743 515 297 147
320
6 14 33 41 95 73 32 26
7,1&5
197 489 930
1,076 1,833 1,460
722 458
13 2,229
50 130
I 282 2 328 2 595 5 452 1 244 1 148
1,661
30 112 224 234 428 370 159 104
23 24
25 848
6 34
2 83 2 174 8 320 4 153 6 58 3 20
65
4 2 4 7
15 14 14
26
1 13
7 3 2
267
9 9
10 23 71 77 42 26
71
4 5 2
19 25
8 8
601
5 24 80
114 211 121 38 B
507
10 58
103 186 101 40 9
7,193
30 228 640
1,397 2,718 1,575
595 100
899
12 42 98
149 346 178 60 14
44 3,992
4 9 1 71
287 4 715
12 1,536 10 935 10 387 3 52
25
98
2 9 9
16 23 20 12
7
26
2 2 3 6 4 5 4
30
4 5 6 8 3 2
397
11 36 70 91
103 49 28
9
26
674
10 28 76 96
241 138 62 23
899
13 62
120 132
,267 155 99 51
228
14 26 35 70 46 26 11
7,720
168 328 794
1,354 2,404 1,638
783 251
31 2,801
42 84
4 288 5, 482 5 923 7 603 6 283 4 96
99
3 4
14 21 30 13 11 3
1,030
11 47
104 163 331: 230
99 45
27
113
5 9
17 32 21 16 9 4
28
7,!168
5,550 932 508 227 191 111 127 317
29
11,835 Total
4,816 0-14 880 15-19
1,233 20-24 1,402 25-29 1,689 30-39
858 40--49 506 50--59 451 60 +
5 .. A.N,S.
179
7 7
16 14~
60 39 23 13
77
5 7
13 14 20 13
3 2
1,626
97 98
212 262 469 298 134
56
7,950
5,786 997 503 153 105
70 79
257
4,400
3,056 495 294 123 125
79 63
165
52,523
38,749 6,994 3,159
902 715 466 456
1,078
4
409 - 11,222
35 7,403 27 1,758 37 1,164 61 257
123 208 65 122 41 105 20 205
335
5 24 43 57
102 65 29 10
10,221
7,365 1,475
561 135 140 102 127 312
11,921 Total
5,456 1,041 1,091
986 1,491
861 534 460
0-14 15-19 20-24 25-29 30-39 40-49 50-59 60+
A.N.S.
6,&98 Total
2,847 508 640 686 947 490 287 293
0-14 15-19 20-24 25-2 fJ
30-39 40-49 50-59 60+
A.N.S.
76,991 Total
36,646 0-14 6,393 15-19 6,602 20-24 6,708 25-29 9,785 30-39 5,201 40-49 2,857 50-59 2,799 60+
A.N.S.
14,438 Total
6,808 0-14 1,358' 15-19 1,177 20-24 1,205 25-29 1,747 30-39 1,056 40-49
561 50-59 526 60+
.. A.N.S.
15427 Total
6,983 0-14 1,431 15-19 1,312 20-24 1,284 25-29 2,058 30-39 1,046 40--49
607 50--59 706 60+
4 .. A. N.

TA.IL! .. II 122
'fA8LE B·n~wORK~f1S "\ND ,NON·WORKf:RS IN ~ITI~ AND ~TY .~
WORKERS
r---------- .A.
""' 1"" --- -- - - ---U"-- .-. iff
it \te/Oi vision/District/C i ty/ Livestock, Fares. City U.rban Agglomeration!
Age. Total Population try,. Fishing.
Non.City Urban/Town/Town Total Workers CultivaUlts· Agr lcuttltl'lll .• Hunting & Plan. Urban Agglomeration roup Labourers tations.. Orch-
ard. and allied activities
, Persons Females"""
,..-----'---..., ,..----......___....., r----"-- ..... ,...-.....__--Males Males Females Males Females Males l'emales Maler Females
4 5 6 7 8 9 10 11 12 13
(i) Chakardharpur (M) • Total 22,709 12,303 10,tOG 5,'95 356 329 10 233 75 54
0-14 9,555 4,981 4,574 99 16 12 9 9 3 15-19 2,204 1,281 923 358 38 27 22 14 9 20-24 1,895 1,014 881 617 48 32 21 8 2 25-29 1,871 994 877 889 55 47 34 13 7 30-39 3,048 1,699 1,349 1,591 80 74 2 57 14 17 40-49 1,995 1,216 779 1,145 61 51 I 45 II 12 50-59 1,101 603 498 509 42 47 4 27 4 4 60+ 1,040 515 525 287 16 39 I 18 2
Age not stated
(Ii) C1W<ardharpur Rail. Total 12,258 6,634 5,624 3,221 2n 4 waVe.lony
0-14 4,934 2,504 2,430 21 5 15-19 1,182 624 558 72 12 20-24 913 411 502 247 23 25-2!l. 1,073 565 508 535 46 30-39 2,106 1,225 881 1,193 92 40-49 1,188 815 373 784 45 .. 50-59 534 363 171 330 20 .. 60+ 324 123 201 39 4
Age not stated 4 4
4. Mu.abani Total 19.111 11.025 8.786 5.560 394 239 19 288 131' 38 Ii
0-14 8,499 4,415 4,084 86 24 18 7 14 15-19 1,539 854 685 247 32 14 35 14 9 20-24 1,866 1,036 830 776 33 21 49 12 3 25-29 1,869 1,006 863 921 48 26 35 12 3 30-39 2.921 1,755 1,166 1,703 98 58 71 34 9 « 40-49 1,780 1,179 601 1,152 94 56 42 30 3 50-59 849 535 314 490 39 43 5 21 17 60+ 488 245 243 185 26 21 5 17 10
Age not Slated
5. G~at.il Total 18.351 9,853 8.68 «,489 U3 3U 11 374 83 42 2
0-14 7,730 3,943 3,787 75 33 30 13 6 15-19 1,244 1.011 733 275 18 20 47 5 3 20-24 1,575 851 724 541 41 20 1 42 6 4
25-29 1,473 820 653 723 49 43 2 57 8 3 30-39 2,328 1,224 1,104 1,127 116 83 1 94 28 13
40-49 1,741 989 752 918 108 77 3 58 9 9
50-59 1,075 670 405 615 60 57 3 39 11 2 60+ 685 345 340 215 18 41 7 S 2
Age not stated
6, Noamundi , Total 11.992 6,1i37 50355 3,41>9 617 241 29 1111 31 27 :I
0-14 4,899 2,539 2,360 56 22 5 2 2
15-19 1,016 585 431 195 80 12 5 27 II 1
20-24 1,073 555 518 422 102 14 2 33 4 3
25-29 1,239 707 532 662 80 27 23 « 4
30-39 1,928 1,133 795 1,102 161 66 6 43 « 10
40-49 1,152 736 416 712 119 72 5 28 2 « 50-59 423 249 174 235 42 29 7 15 3 3
60+ 262 133 129 75 11 16 3 10 1 2
Age not stated.
7, Gua Tatal 9.347 «.981 4.366 2,278 399 6 "22
0-14 4,172 2,111 2,061 5 6 15-19 642 353 289 47 20 'r 20-24 !i95 256 339 138 23 25-29 838 362 476 302 56 1
30-39 1,582 900 682 862 150 2 ',' II
40-49 996 659 337 640 96 7
50-59 "357 244 113 228 37 3
60+ 165 96 69 56 11 /j. Aie not stated ..
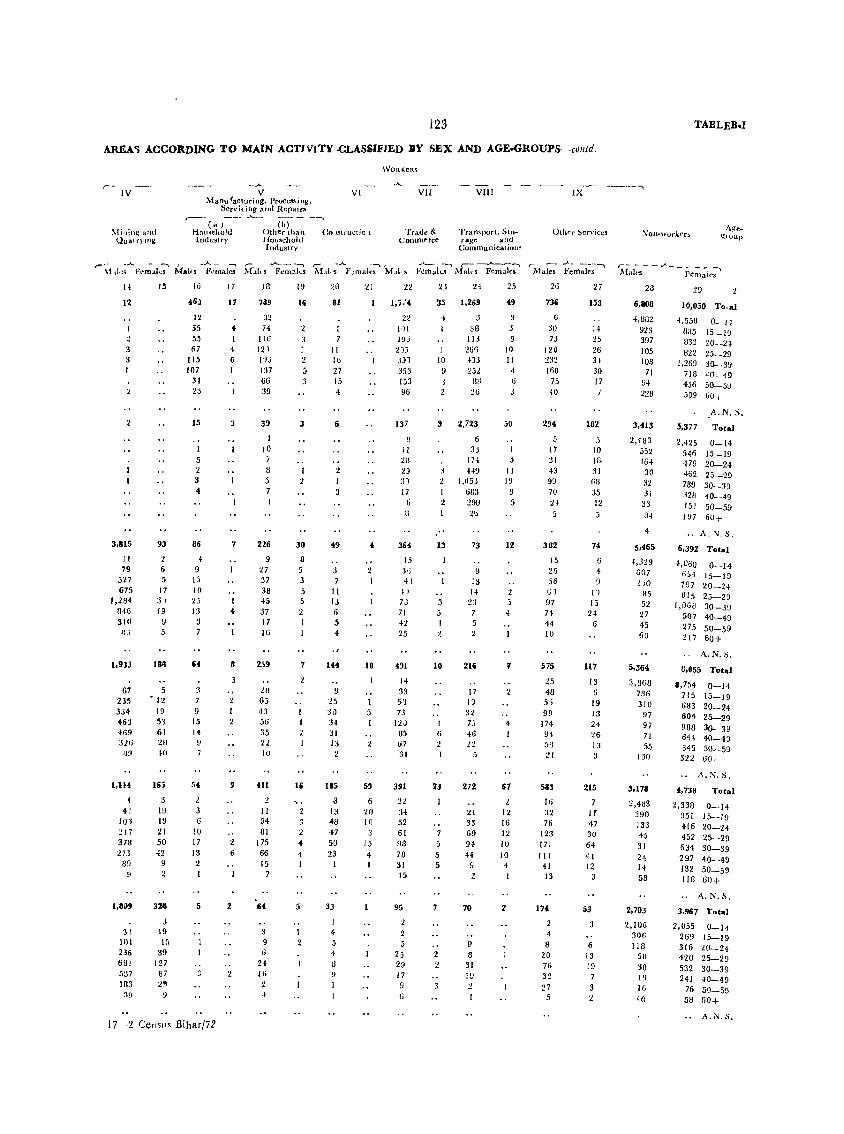
123
AREA') ACCORDING TO MAIN ACT'VITY -CLASSIFIED BY SEX AND AGE.GROUPS· -coil/d.
IV
~finill~ and QUCllrYlog
__ ,A...
V VI Manu facturing. Processing.
Servicing amI Repairs r---
(a) HOll'iehokl Illdustry
(bj-- ---, Other thall Co lSlruclio 1 Hou~chold Industry
\VOR.IO!RS
VII
Trauc & Commerce
VIII IX
Trarupurl, Sto- Olh("r .scrvicc~ ra,Re • al~d
(Jommu OlcatlOlJ:;
'rABLEBJ
--~-,
,--- -"""'- - "'l I _..A.._""""\,- -j,_---~,- _..A.... -"'II ,,,---~ ,_·_.,....____l r __ . .A. ---... ,----..A-- ___ l \ill.;,., Females Mails F.:malcs ~r~ll s Fcm:.llcs l\.Lll.,s F ;malcs M ... &I, s FI!Ihalt.s ~{alcs Fema)rs Males Fc.malr-s l\ICllcs Pemales
[j
12
3 3
I
3,115
II 79
527 675
1,284 U4fi 310
1,91J
1.5
93
2 6
17 3 ) 19
9 5
67 5 235 • 12 334 IU 463 5'l 469 61 :llIj 2U
U!I ~(1
1,114
4 41
103 217 378 273
89
1,8~9
3! III 1 236 6UI 5~7
IIl3 39
165
3 19 19 21 50 42
9
321
3 19 1;)
39 127 87 2~
!J
16
t6J
12
55 55 67
115 107
34 2:3
15
5 2 3 4
86
4
9 Ij
10 2j 13
:J 7
:l 7 9
15 14
54
2 3 fi
10 17 13
2
5
17 -2 (_;CnsHs Bihar/72
17
17
4 I 4 G I
J
7
..
II
9
6
2
:t! 74
1I(j
12 ) JIJJ
137 66 39
3~
I 10 7
n 5 7
216
9 27 37 38 45 37 17 16
259
~u
6j
43 56 35 a IU
.It
2 II 54 81
175 66 15
7
9 6
24 16
2
19
16
3 I 2 5 3
3
I ~
30
8 5 3
2 1
16
2 3 ~
4
5
1 2
20
81
11 16 27 15 4
6
49
3 7
11 13 6 5 4
144
9 25 30 34 31 13
2
185
3 13 40 47
50 23
1
33
I 4 5 4 8
21
4
2 I
10
5
59
20 10 3
15
4 1
12
1,5,'4
22 1,)( 19j
2'lj 3J1 353 153 96
137
U II 2~
2J :1)
17
364
1.1 3,)
4) f)
7J 71 42 25
491
14 33 51 7.1
12J 85 67 31
391
22 H 52 61 98 78 31 15
95
2
25 29 17 9 (j
21
!IS 1,269
f
1
10 9
I 2
:1 36
113 2G~
+JJ 252
IlII 26
9 2,723
6 3J
IH :1 H9 2 1,05J
1 68:1 2 290 I 2()
13
3 5
10
6
2
23
7
5 5 5
2 2
73
9 13
23 7 5
216
17 19 32 7j
46 22
272
21 33 69 94 44
9
70
9 8
31 19 2
25
49
3
3
9
10 II
4 (j
:l
50
II 19
9
4 1
67
12 16 12 IU 10 4
2
26
736
30 73
120 1:,t~
160 75 40
294
5 17 31 H 99 70 21
J82
15 26 56 oj 97 H 44 IU
575
48 5 ; 99
174 94 58 21
58l
If) 32 76
123 171 III
41 13
17i
4
8 20 76 32 27
5
27
153
14 25 26 H 30 17
182
3 10 II> 31
GB 35 It .)
74
G 4 9
1') Ij
24 G
117
13
6 19 13 24 26 13
215
7 H 47 30 64 41 12
53
6 13 19 7 3 2
28
6,1108
-1,832
923 397 105 108
71 94 :na
3,413
2,'183 552 164 30 32 31
33 81
29
10,050 To, al
4,558 0- H 885 15-IU 833 10--Z.} 822 25--29
1,269 30- -39 718 40- 49 456 50-5~ 509 GO J-
.A.N. S.
5,377 Total
2,425 0-14 546 15_19 479 20-24 462 25-29 789 30-S9 328 40--49 151 50-59 IU7 60i-
4 .. A . .\!, S.
5,465
4,329 G07 liO
85 52 27 45 60
5,364
3,868 736 310
97 97 71 55
130
3,178
~,483
390 133 45 31 24 14 58
2,703
2,106 306 118
50 38 19 16
40
6,392 Total
4,060 0--14 6,,3 15-19 797 20-24 815 25-20
1,068 30-39 507 40-49 275 50-59 217 60+
.. A.N.S.
8,055 Total
8,754 0-14 715 15-19
683 20-24 604 25-29 988 30- 39 5H 40-43 345 50-59
O2Z 60-
.. A.N.S.
4,738
2,338 351 416 452 634 297
132 110
Total
0-14 15-19 20-24 25--29 30-39 40- -49 50-59 60+
.. A.N.S.
3,967 Total
2,055 269 316 420 532 241
76 58
0-14 15-19 20-24 25-29 30-39 40-49 50-59 r.0+
A.N,S.
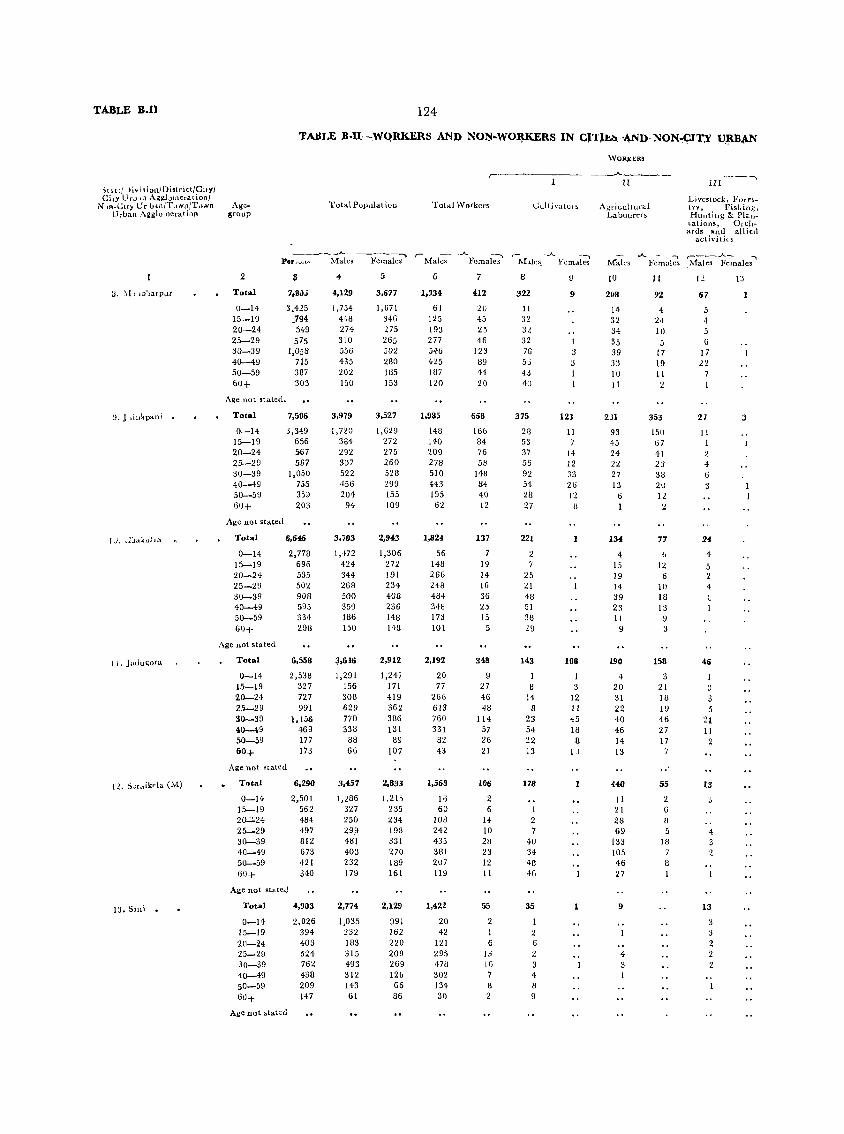
TABLE B_ll 124
TABLE .B-ll--.WQRKERS AND NON-WO}l.KERS IN CrlJt.::t. '.I\.ND NON~<;:IT~ U).tB~N
)tll:} )ivisionJDislril't/CitYI City UJ'J ul AggbmerationJ
NJn ... L!lt) UrlHn/Town/T..,wn Age-Urban A~glu neration IJroup
Total PUj)~latiuu Total Workers Gultivatun.
__ --__ ..A-~ ____ ~ r- __ ..A- -~.- ~-A.. ~~
l'er ~,",~l'> Males Females Males Females ~I..11cs. Fcm-tles
:..I. J liukpani •
I J . .JJakul JA
11. Jauugoru
13. Siui •
2
Total
0-14 15-19 20-24 25-29 30-39 40-49 50-59 60+
"BJ~
3,425 _794 549 575
1,058 715 387 303
Age not stated.
Total
0-14 15-19 20-24 25-29 30-39 40-49 50-59 60+
Age not stateu
Total
0-14 15-19 20-2'1 25-29 30-39 40-49 50-59 6U+
Age not stated
Total
0-14 15-19 20-24 25-29 30-39 40-49 ;\0-59 60+
7,506
3,349 656 367 567
1,050 755 35:1 203
6,646
2,778 696 535 502 900 595 334 298
6,558
2,538 327 727 991
1,156 469 177 173
Age not stalCu
Total 6,290
0-14 15-19 20':::'24 25-29 30-39 40-49 50-59 60+
Age not statcJ
Total
0-14 15-19 2Q-24 25-29 30-39 40-49 50-59 6u+
Age no t staled
2,501 562 484 497 812 673 421 340
4,903
2,026 394 403 524 762 438 209 147
4
4,129
1,754 443 274 310 556 435 202 150
3,979
1,720 384 292 307 522 456 204
94
3,703
1,472 424 344 268 500 359 186 15U
3,616
1,291 156 308 629 770 33H
88 66
3,457
1,286 327 250 29,9 4HI 403 232 179
2,774
1,035 232 183 315 493 312 143 61
5
3,677
I,G71 346 275 265 502 280 185 153
3,527
1,629 272 275 260 528 299 155 109
2,943
1,306 272 191 234 408 236 148 148
2,912
1,247 171 419 362 386 131
89 107
2,833
[,215 235 234 198 331 270 189 161
2,129
991 162 220 209 269 12b 66 86
6
1,~34
61 125 193 277 546 425 lU7 120
1,935
148 140 209 278 510 443 195 62
1,824
56 148 266 248 484 348 173 101
2,192
20 77
266 613 760 331
82 43
1,568
16 60
108 242 435 381 2U7 119
1,422
20 42
121 295 478 302 134 30
412
2U 45 2~
46 123 89 44 20
668
166 84 76 58
148 84 40 12
137
19 14 16 36 25 15
5
348
9 27 46 48
114 57 26 21
106
6 14 10 28 23 12 11
55
6 I~
16 7 8 2
B
322
II 32 32 32 7G 56 43 40
375
28 53 37 56 n 54 28 27
221
2
25 21 48 51 38 29
143
8 14
8 23 54 22 13
178
1 2 7
40 34 48 4G
35
I 2 6 2
4 8 9
9
9
1 3 3
121
II 7
14 12 33 26 12
8
1
108
3 12 11 45 18
8 1 J
1
WORKERS
---"------II
AgriGultural Labourers
----..., III
Livestock. Furt·~try, Fisl,ing, Huutiug &. Pl&:'Jllations, Orchards anu all j nl
acciviti( s
.A. - .. r----.A-- ""'""I Males Females .l\tales Females
10
208
14 32 34 35 39 33 10 11
2Jl
93 45 24 22 27 13
6 I
134
4 15 19 14 39 23 11
9
190
4 20 31 22 40 46 14 13
{40
11 21 28 69
133 105 46 27
9
4
II
92
4 24 10 5
17 19 11 2
353
151) 67 41 2~
38 2U 12
" ti 12
6 10 18 13 ~
:I
158
21 18 IV 46 27 17
55
2 6 8 5
18 7 8 1
12
67
G 17 n
27
11 1
4 6 3
24
4
5 2 4
46
~
21 11 2
13
4 3 2
13
3 3 2 2
IJ
3
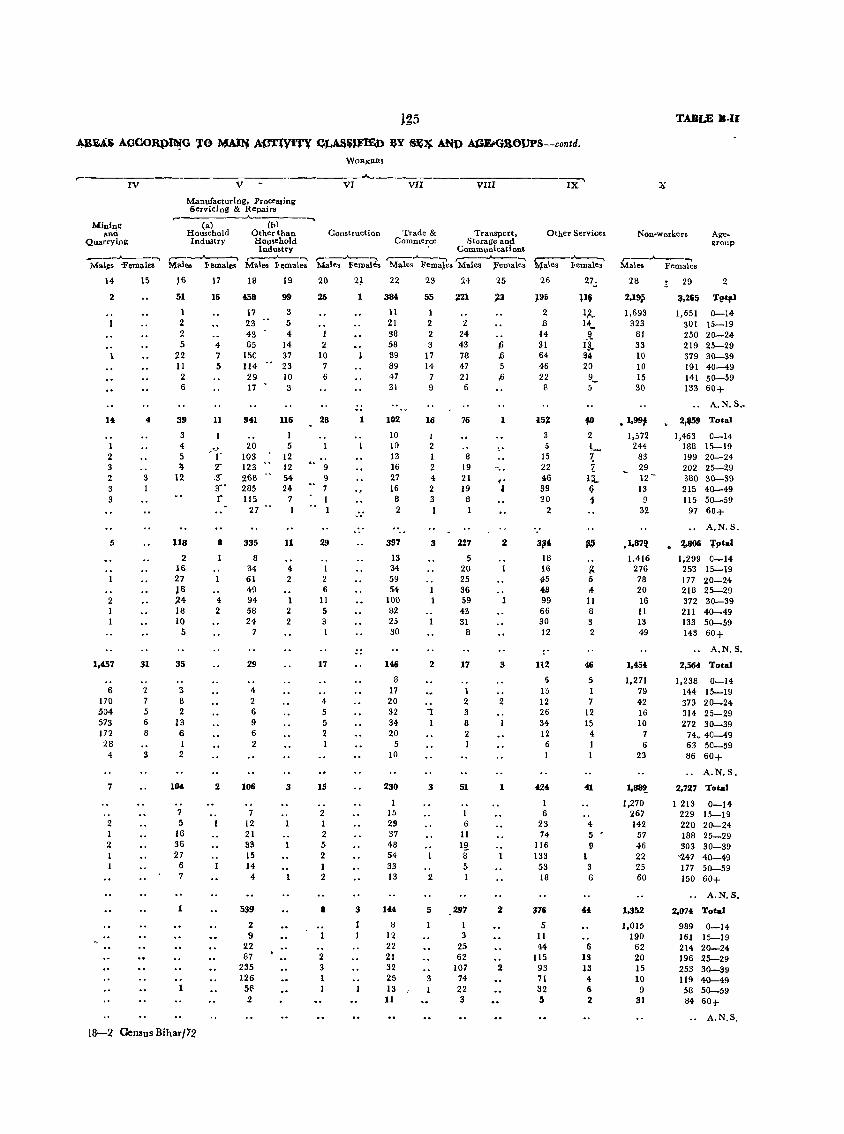
WOR)<I!R,
r-------- ,-----"--IV
Mining ana
Quarrying
_--.A---",,"",
Mal,es 'Females
14
2
1 2 3 2 3 3
.5
2
1,457
6 170 .504 573 172 28
4
7
2 1 2 1
15
3 I
31
2 7 5 6 8
3
V
Manufacturing, Proct"slIing Servicing & Repairs
r---------~-------~ (bl (a) Household Industry
r---..A-.----,. Males Females
)6
51
1 2 2 5
22 II 2 6
39
3 4 5 \
12
118
2 16 27 J6 ;24 18 10
S
35
::I 8 2
13 6 1 2
104
7 5
16 36 27
6 7
1
17
16
4 7 5
11
8
4 2
2
Other than Household Industry
,-----"'----." Males Females
18
458
17 23 43 65
150 114 29 17
941
20 103 123 268 285 115
27
335
8 34 61 49 94 58 24
7
29
4 2 6 9 6 2
106
7 12 21 33 15 14 4
539
2 9
22 87
235 126
51:' 2
19
99
3 5 4
14 37 23 10 3
116
I 5
12 12 54 24
7 1
11
4 2
1 2 2
3
18-2 Census Biharf72
VI VII VIII
Construction Trade & ComnJ,.erce
Transport, Storage and
Communications ,-_.A---..., r--""'__-~ r---.J-~ Males Females Males Fern,.,e. Males ;Females
20
26
1 2
10 7 6
28
9 9 7 I 1
29
1 2 6
11 5 3 I
17
4 5 .5 2 I
15
2 1 2 5 2 1 2
8
2 3 1 1
2,1
1
1
·r
3
1 1
22
38.
11 21 38 58 89 89 47 31
102
10 10 13 16 27 16
8 2
397
13 34 59 54
100 82 25 30
U6
8 17 20 32 34 20
5 10
230
1 15 29 37 48 54 33 13
144
8 12 22 21 32 25 13 11
23
55
1 2 2 3
17 14
7 9
16
1
2 1 2 4 2 3
3
2
,
3
2
5
3 1
24
;Z21
2 24 43 78 47 21 6
76
8 19 21 19
8
227
.5 20 25 36 59 43 31
8
17
1 2 3 8 2.
51
1 6
11
1~ 8 5
297
I 3
25 62
107 74 22 3
25
~3
1
,. J
2
3
2
1
2
2
IX
Other Services
r---"----, t4ales l<emale.
26
J9i
2 B
14 31 64 46 22 8
t5~
5 15 22 46 39 20
2
3l1t
18 16 4-5 4B 99 66 30 12
112
l)
15 12 26 34 12 6 1
t24
I 6
23 74
116 133 53 18
376
5 11 44
115 93 71 32 5
~ /)
Ii 11 8 3 2
46
5 1 7
12 15
4 I
41
4 5 9
1 3 6
6 13 13
4-6 2
TAJlL£ .-11
Non .. workers Agegroup
,---....____..., Male. Females
28
2,19?
1,693 323
81 33 10 10 15 30
• 1,991
1,572 244
83 29 12 -13
9 32
.1,87~
1,416 276 78 20 16 11 13 49
1,45.
1,271 79 42 16 10
7 6
23
1,~
1,270 267 142
57 46 22 25 60
1,352
1,015 190 62 20 15 10 9
31
29
3,265
1,651 SOl 250 219 379 191 141 133
2
1t>t1'1 0-14
15-19 20-24-25--29 30-39 40-49 50-59 60+
A.N.S .•
2,1159 Total
1,463 188 199 202 3S0 215 115
97
0-14 15--19 20-24 25--29 30-39 40-49 50-59 60+
A.N.S .
• ~ rptal
1,299 0-14 253 15--19 177 20-24 218 25--29 372 30-39 211 40-49 133 50-59 143 60+
.. A.N.S.
2,564 Total
1,238 0-14 144 15-19 373 20-24 314 25-29 272 30-39 74,40-49 63 50-59 86 60+
A.N.S.
2,727 Total
I 213 229 220 188 303
'247 177 150
0-14 15--19 20-24 25-29 30-39 40-49 50-59 60+
A,N.S.
2,07. Total
989 0-14 16J 15--19 214 20-24 196 25--29 253 30-39 119 40-49 58 50-59 84 60+
•. A,N,S,
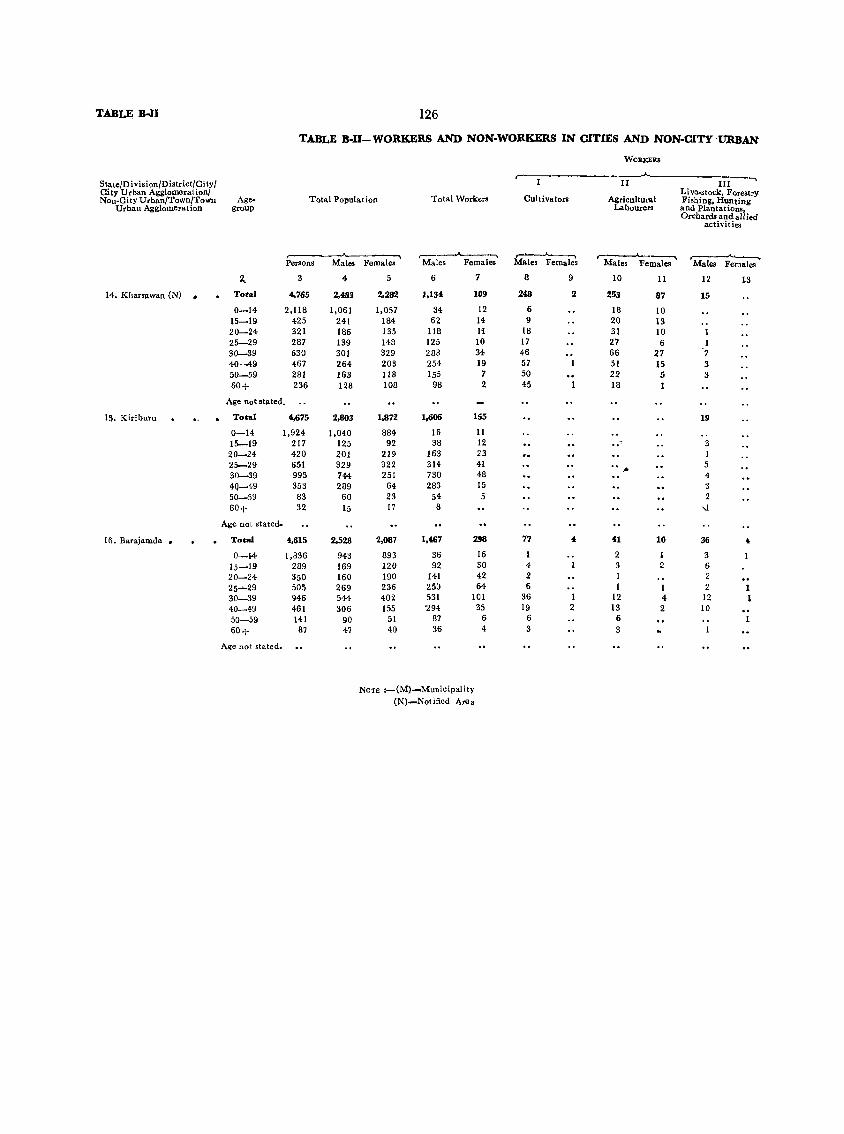
TABLE B-II 126
TABLE B-U- WORKERS AND NON-WORKERS IN CITIES AND NON-CITY -URBAN"
WORKERS
-"-State/Division/District/CityJ II III
...... City Urban Agglomeration/
Total Population Total Worke ... Cultivators Agricultural Live-stock, ForestrY
Non-City Urban/Town/Town Age- Fishing, Hunting Urban Agglomeration group Labourers and Plantations,
Orchards and allied activities
,- ...... ,- ,-~~ ,--------'---..... ,-Persons Males Females Males Females Males Females Males Females Males Females
2. 3 4 5 6 7 8 9 10 11 12 13
14. Kharsawan (N) Total 4,765 2,483 2.282 1,134 109 248 2 253 87 15
0-14 2,118 1,061 1,057 34 12 6 18 10 15-19 425 241 184 62 14 9 20 13 20-24 321 186 135 118 Ii 18 31 10 1 25-29 287 139 148 125 10 17 27 6 1 30-39 630 301 329 288 34 46 66 27 7 40-49 467 264 203 254 19 57 51 15 3 50-59 281 163 lIB 155 7 50 22 5 3 60+ 236 128 108 98 2 45 18
Age not stated.
15. Kiriburu Total 4,675 2.803 1.872 1.606 155 19
0-14 1,924 1,040 884 16 11 15-19 217 125 92 38 12 3 20-24 420 201 219 163 23 I 25-29 651 329 322 314 41 5 30-39 995 744 251 730 48
.. 4
4Q-49 353 289 64 283 15 3 50-59 8:1 60 23 54 5 2 60+ 32 15 17 8 ~
Age not stated.
16. Barajamda • Total 4,615 2,528 2,087 1.467 298 77 4 41 10 36 " 0-14 1,836 943 893 36 16 2 1 3
15-19 289 169 120 92 SO 4 3 \I 6 20-24 350 160 190 141 42 2 2 25~29 505 269 236 250 64 6 1 1 2 1 30-39 946 544 402 531 101 36 I 12 4 12 1 40-49 461 306 155 '294 35 19 2 13 2 10 50-59 141 90 51 87 6 6 6
60+ 87 47 40 36 4 3 3
Age not stated.
NOTE :-(M)_Municipality
(N)_Notified Area
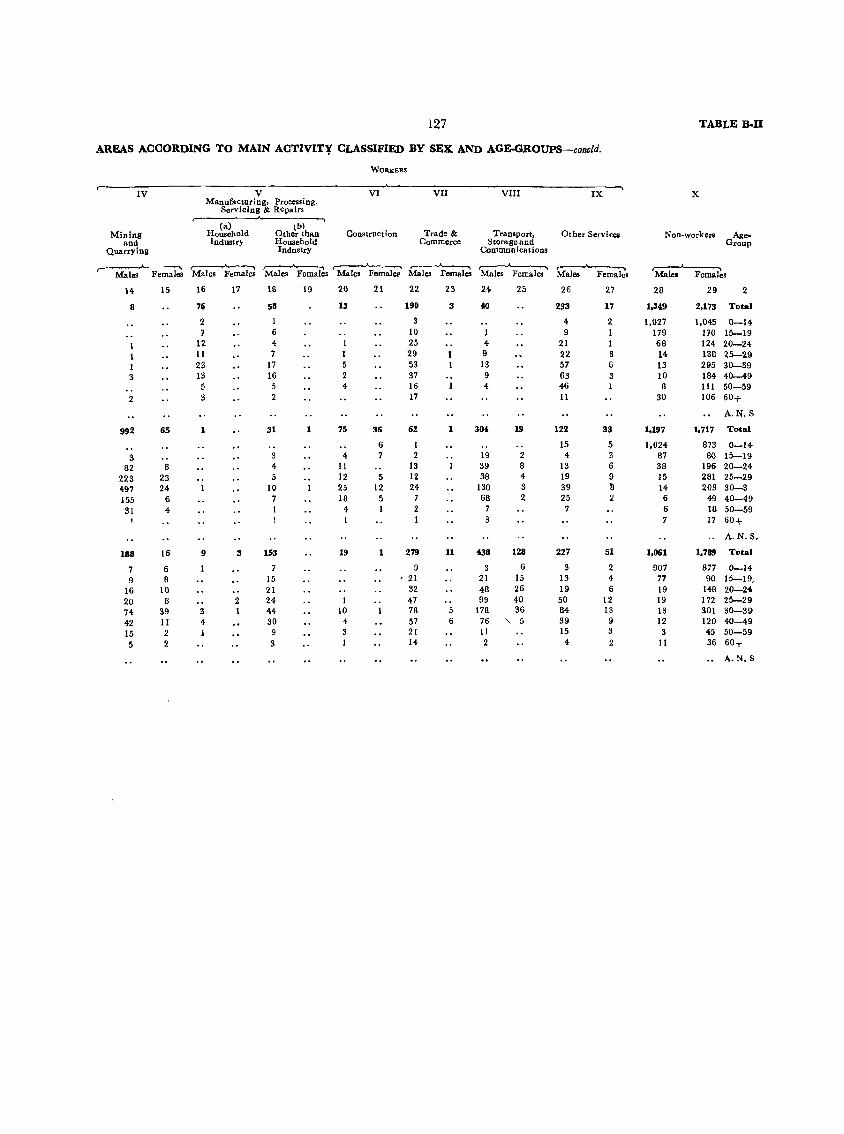
127 TABLE :8-11
AREAS ACOORDING TO MAIN ACTIVITY CLASSIFIED BY SEX AND AGE-GltOuPS-condd.
WORKER.
,-- ---, IV V VI VII VIII IX X
Manufacturing, Processing, Servicing & Repairs
,- ..., (a) lbl
Trade & Transport, Mining Household Other than Construction Other Services Non-workers Age-and Industr} Household Commerce Storage and Group
Quarrying Industry COOlmunications
,--~ ,- r----"------. r--.A.--.~ ,..._____..____.. ,...----A-----. Males Female. Male. Females Males Females Males Females Males Females Males Females Males Females Males Females
14 15 16 17 16 19 20 21 22 23 24 25 26 27 28 29 2
8 76 58 13 190 3 40 233 17 1,349 2,173 Total
2. 1 3 4 2 1,027 1,045 0-14 7 6 10 1 9 1 179 170 15-19
1 12 4- 1 25 4 21 1 68 124 20-24
1 11 7 1 29 9 22 3 14 138 25-29
1 23 17 53 13 57 6 13 295 30-39 3 13 16 37 9 63 3 10 184 40-49
5 5 4 16 4 46 8 III 50-59
2 3 2 17 11 30 106 60+
A.N.S
992 65 :n 1 75 36 62 1 30. 19 122 33 1,197 1,717 Total
6 1 15 5 1,024 873 0-14-
3 4 7 2 19 2 4 3 87 80 15-19 82 8 4 11 13 39 8 13 6 38 196 20-24
223 23 5 12 5 12 38 4 19 9 15 281 25-29
~97 24 10 25 12 24 130 3 39 11 14 203 30-3 155 6 7 18 5 7 68 2 25 6 49 40-49
31 4 1 4 1 2 7 7 6 18 50-59 1 1 1 3 7 17 60+
A.N.S.
188 16 9 3 153 19 1 279 11 438 128 227 51 1,061 1,789 Total
6 9 3 6 3 2 907 877 0-14 9 8 15 ' 21 21 15 13 4 77 90 15-19,
16 10 21 32 48 26 19 6 19 148 20-24
20 8 2 24 I 47 99 40 50 12 19 172 25-29 74- 39 3 1 44 10 78 5 178 36 84 13 13 301 30-39 42 11 4- 30 4 57 6 76 "- 5 39 9 12 120 40-49
15 2 9 3 21 11 15 3 3 45 50-59
5 2 3 14 2 4 2 11 36 60+
A.N. S

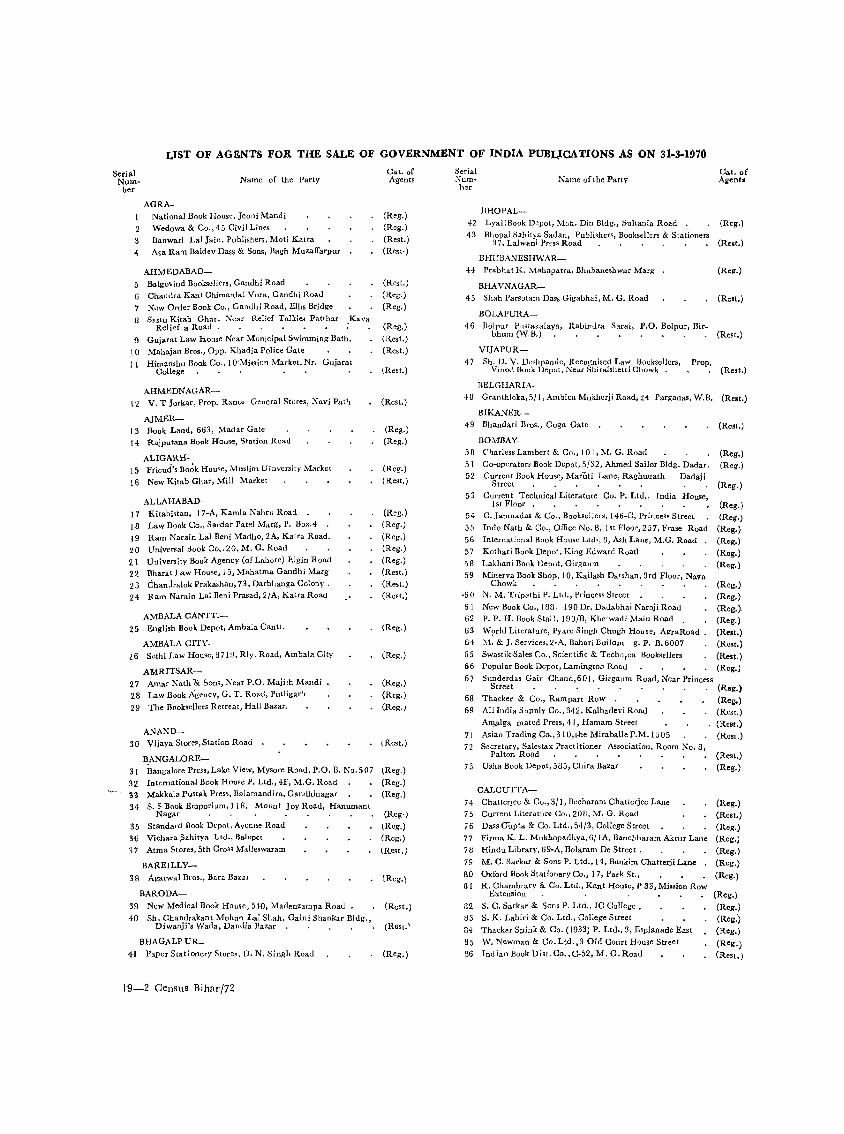
LIST OF AGENTS FOR THE SALE OF GOVERNMENT OF INDIA PUBL,lCATJONS AS ON 31-3-1970
Serial Num ..
ber Name of the Party
AGRA-Nationa.l Book House, Jeoni Mandi Wedowa & Co.,45 Civil Lines
Banwari Lal Jain, Publishers, Moti Katra 4 Asa Ram Baldev Dass & Sons, Bagh MuzalIarpur
AIIMEDABAD-5 Ba.lgo,ind Booksellers, Gandhi Road
6 Chanura Kant Chimanlal Vora, Gandhi Roau N.,w Order Book Co., Gandhi Road, Ellis Bridge
S?stu Kitab Ghar, ~ear Relief Talkies Patthar 4Kava Relief a Road •
9 Gujarat Law DonSe Near Municipal Swimming Bath. 1.0 Mahajan Bros., Opp. Khadia Police Gate
11 Himanshu Rook Co., I O"Mission Market, NT. Gujarat College
AHMEDNAGAR-l2 V~ T Jarkar, Prop. Rarna General Stores, Navi Path
hJMER-13 Book Land, 663, Madar Gate 14 Rajputana Book House, Station RoaJ
ALIGARH-t 5 Friend's Bo~k House, Muslim Uinvel'sity Market
16 New Kitab Ghar, Mill Market
ALLAHABAD-17 Kitabistan, 17-A, Kamla Nahru Road
18 Law Book Co., Sardar Patel Marg, P. Box.4
19 Ram Narain Lal Beni Madho, 2A, Katra Road. 20 Universal Book Co .. 20, M. G. Road
2 I University Book Agency (of Lahore) E,lgin Road 22 Bharat Law House, 15, Mahatma Gandhi Marg 23 Chanjralok Prakashan, 73, Darbhanga Colony.
24 Ram Narain Lal Beni Prasad, 2/A, Katra Road
AMBALA CANTT.-25 English Book Depot, Ambala Cantt.
AMBALA CITY-<6 Sethi Law House, 8719, Rly. Road, Ambala City
AMRITSAR--27 Amar Nath '& Sons, Near P.O. Majhh Mandi 28 LawB'ook Agency, G. T. Road, Putligarh
29 The Booksellers Retreat, Hall Bazar.
ANAND-30 Vijaya Stores,Station Road
BANGALORE-
31 Bangalore Press,Lakc View, Mysore Road, P.O. B.1':0.507
32 International Book House P. Ltd., 4F, M.G. Road
3$ Makkala Pustak Pres'), Balamanuira. Ganrthinagar
34 S. S Book Emporium, 118, Mount joy Road, Hanumant Nagar
35 Standard Book Depot~ Avenue Road
36 Vichara .sahitya Ltd., Balep<:t
37 Atma Stores, 5th Cros-: Malleswaram
BAREILLY-
38 Agarwal Bros., Bara Baz.,H
BARODA-
Cat. of Agents
(Reg.) (Reg.)
(Rest.) (Rest.)
(Rest.) (Reg,)
(Reg.)
(Reg.)
(Rest.)
(Rest.)
\Rest.)
(Rest.)
(Reg.)
(Reg.)
(Reg.)
(Rest.)
(Reg.)
(Reg.)
(Reg.)
(Reg.)
(Reg.)
(Rest.)
(Rest.)
(Rest.)
(Reg.)
(Reg.)
(Reg.)
(Reg.)
(Reg.)
\Rest.)
(Reg.)
(Reg.)
(Reg.)
(Reg.)
(Reg.)
(Reg.)
(Rest.)
(Reg.)
39 New Medical Book House, 510, Madenzampa Road (Rest.)
40 Sh. Chandrakant Moh." l.al Shah, Gaini Shankar Bldg., Diwanji's Wada, Dam.lia Bazar (Rest.'
BHAGALPUR_
41 Paper Stationery Stores, D. N. Singh Road (Reg.)
19-2 Censlls Bihar/72
Serial Number
llHOPAL-
Name of the Party Cat. of Agent.
42 Lyal JBook Depot, Moh. Din Bldg., Sultania Road (Reg.)
43 Bhopal Sahitya Sadan, Publishers, Booksellers & Stationers 37. Lalwani Press Road (Rest.)
llHUBANESHWAR-
44 Prabhat K. Mahapatra, Bhubancshwar Marg (Reg.)
BHAVNAGAR-
45 Shah Parsotam Dass Gigabhai, M. G. Road (Rest.)
BOLAPURA-
46 Bolpur Pustakalaya, Rabinura Sarai, P.O. Bolpur, Bir_ bhum (W.B.) (Rest.)
VIJAPUR~
47 Sh. D. V. Dcshpande, Recognised Law Booksellers, Prop. Viuoll Buok Depot, Near Shiralshetti Chowk . (Rest.)
BELGHARIA-
48 Granthloka, 5/1, Ambica Mukherji Road, 24 Parganas, W.B. (Rest.)
BIKA:-<'ER--
49 Bhandari Bros., Goga Gate
BOMBAY.
50 CqarlessLambert & Co., 101,]\f. G. Road
51 Co-operators Book Depot, 5/32, Ahmed Sailor Bldg. Dadar.
52 Current Book House, Maruti Lane, Raghunath Dadaji Street . . . . . . .
53 Current Technical Literature Co. P. Ltd., India House, 1st Floor.
54 C. }amnadas & Co .. Booksellers, 146-C. Princess Street
55 Indo Nath & Co., Office No.8, 1 st Floor, 257, Frase Road 56 International Book House Ltd·, 9, Ash Lane, M.G. Road
57 Kothari Book Depot, King Edward Road
.5 8 Lakhani Book Depot. Girgallm
59 ~Iinerva Book Shop, 10, KaiIash Darshan, 3rd Floor. Nava Chowk
·60 N. M. Tripathi P. Ltd., Princess Street
6 I New Book Co., 188- -190 Dr. Dauabhai Naroji Road 62 P. P. H. Book Stall, 190/B, Khetwadi Main Road .
63 W9rld l.iterature, Pyare Singh Chugh House, AgraRoad 64 1\1. & J. Services, 2-A, Bahari Builom g. P. B.6007
65 Swastik,sales Co., Scientific & Techo:ca Booksellers
66 Popular Book Depot, LamingtoD Road
6 7 ~underdas Gain Chand, 6 0 I, Girgaum Road, Near Princess Street
68 Thacker & Co., Rampart Row . 69 All India Supply Co., 342, Kalbadevi Road
Am)1lga mated Press, 41, Hamam Street
71 Asian Trading Co., 31 O,the Miraballe P.M. 1505
72 Secretary. Sales tax. Practitioner Association, Room No.8. Pal ton Road
73 Usha !look Depot, 585, Chira Bazar
CALCUTTA-
74 Chatterjee & Co., 3} I, Beeharam Chatterjee Lane
75 Current Literature Co., 208, M. G. Road
76 Dass erupta & Co. Ltd., 54/3, College Street
77 Firma. K. L. Mukhopadhya, 6/ 1 A, Banchharam Akrur Lane
78 Hindu Library, 69-A, Bolaram De Street.
79 M. O. Sarkar & Sons P. Ltd .• 14, Bankim Chatterji Lane
80 Oxford Book Stationery Co., 17, Park St.,
31 R. Chambrary & Co. Ltd., Kant House, P 33, Mission Row Extension
82 S. C. Sarkar & Sons P. Ltd., IC College.
83 S. K. l.ahiri & Co. Ltd., College Street
84 Thacker Spink & Co. (1933) P. Ltd., 3, Esplanade East
85 W. Newman & Co. Ltd. ,3 Old Court House Street
86 Indian Book Dist. Co., C·52, M. a.Road
(Rest.)
(Reg.)
(Rell'.)
(Reg.)
(Reg.)
(Reg.)
(Reg.)
(Reg.)
(Reg.)
(Reg.)
(Reg.)
(Reg.)
(Reg.).
(Reg.)
(Rest.) (Rest.)
(Rest.)
(Reg.)
(Reg.)
(Reg.) (Rest.)
(Rest.)
(Rest.)
(Rest.)
(Reg.)
(Reg.)
(Rest.)
(Reg.)
(Reg.)
(Reg.)
(Reg.)
(Reg.)
(Reg.)
(Reg.)
(Reg.)
(Reg.)
(Reg.)
(Rest.)
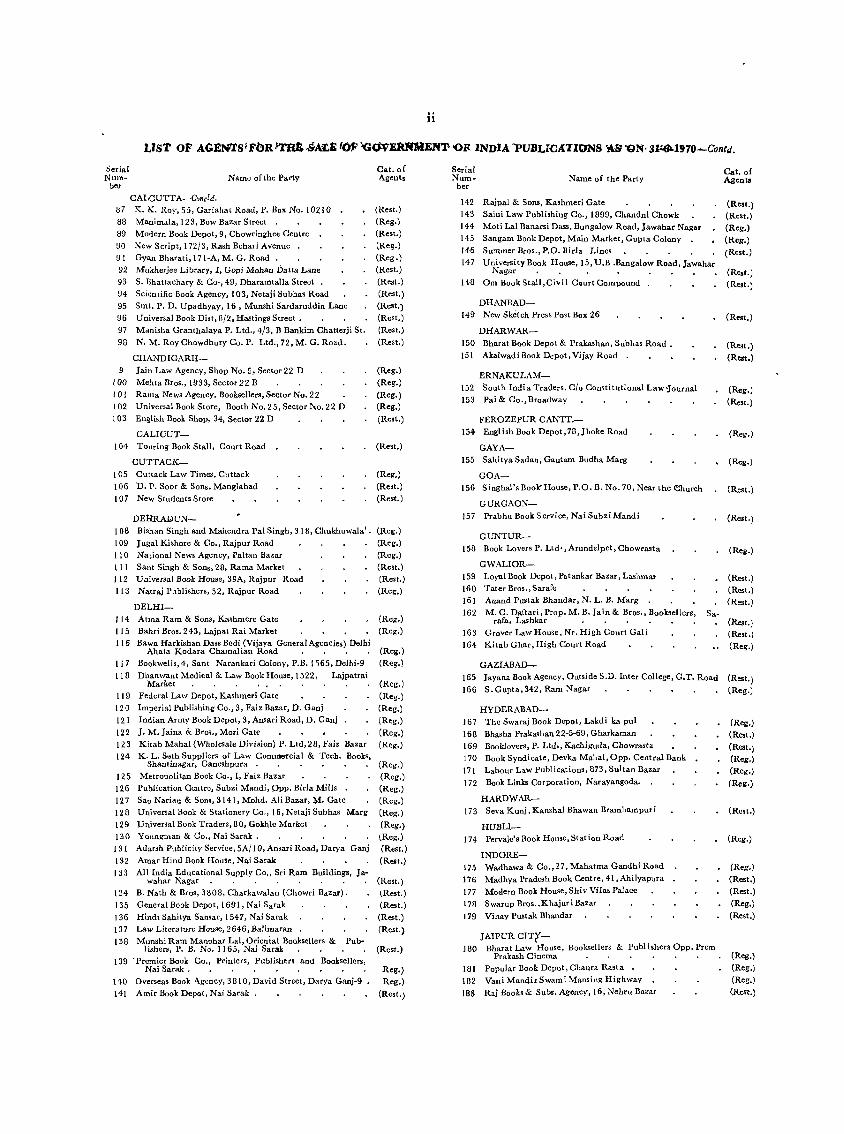
Serial Nurn- Name of the Party
ber
CALCUTTA-Coneld. 1$7 K. K. Roy, 55, Gariahat Road, P. Box No.1 021 0
88 Manimala, 123, Bow Bazar Street
89 Modern Book Depot, 9, Chowringhee Centre
90 New Script, 172/3, Rash Behad Avenue
91 Gyan Bharati, 171-A, M. G. Road
92 Mukherjee Library, r, Gopi Mohan Datta Lane 93 S. Bhattachary & Co·, 49, Dharamtalla Street 94 Scientific Book Agency, 103, Netaji Subhas Road
95 Smt. P. D. Upadhyay, 16, Munshi Sardaruddin Lane
96 Universal Book Dist, 8/2, Hastings Street.
97 Manisha Granthalaya P. Ltd., 4/3. B Bankim Chatterji St.
98 N. M. Roy Chowdhury Co. P. Ltd., 72.M. G. Road.
CHANDIGARH--Jain Law Agency, Shop No.5, Sector 22 D
100 Mehta Bros., 1933, Sector 22 B
101 Rama News Agency. Booksellers, Sector No.2 2
102 Universal Book Store, Booth No. 25. Sector No. 22 D 103 English Book Shop, 34, Sector 22 D
CALIOUT-
104 Touring Book Stall. Court Road
CUTTACK-
105 Cuttack Law Times, Cuttack
106 'D. P. Soar & Sons, Manglabad
107 New Students Store
DEHRALlUN-
108 Bisnan Singh and Mahendra Pal Singh, 318, Chukhuwala'.
109 Jugal Kishore & Co., Rajpur Road
11O National News Agency, Paltan Bazar
III Sant Singh & Sons, 28, Rama Market
112 U.n,iversnl Book House, 39A, Rajpur Road
113 Natraj Pl1blishers, 52, Rajpur Road
DELHI-
114 Atma Ram & Sons, Kashmere Gate 115 Bahd Bros. 243, Lajpat Rai Market
116 Bawa Harkishan Dass Bedi (Vijaya General Agencies) Delhi Ahata Kodara Chamalian Road . . . .
117 Bookwells, 4, Sant Narankari Colony, P.B. 1565, Delhi-9
118 Dhanwant Medical & Law Book House, 1522, Lajpatrai Market
119 Federal Law Depot, Kashmed Gate
12 ° Imperial Publishing Co., 3, Faiz Bazar, D. Ganj 121 Indian Army Book Depot, 3, Ansari Road, D. Ganj
122 J. M. Jaina & Bros., Mori Gate 123 Kitab Mahal (Wholesale Division) P. Ltd,2B, Fai. Bazar 124 K. L. Seth Suppliers of Law Commercial & Te"h. Books,
Shantinagar, Ganeshpura .
125 Metropolitan Book Co., I, Faiz Bazar
126 Publication Centre, Subzi Mandi, Opp. Birla Mills
127 Sao Narian & Sons, 3141, Mohd. Ali Bazar,~. Gate 128 Universal Book & Stationery Co" 16, Netaji Subhas Marg
129 Universal Book Traders,80, Gokhle Market
130 Youngman & Co., Nai Sarak . 131 Adarsh Publicity Service, 5A/l 0, Ansari Road, Darya Ganj
132 Amar Hind Book House, Nai Sarak 133 All India Educational Supply Co., Sri Ram Buildings, Ja-
wahar Nagar
134 B. Nath & Bros, 3308, Charkawalan (Chowri Bazar).
135 General Book Depot, 1691, Nai Sarak
136 Hind. Sahitya Sansar, 1547, Nai Sarak 137 Law Literature House, 2646, BaHmaran 138 Munshi Ram Manohar Lal, Orienial Booksellers & Pub
lishers, P. B. No. 1165, Nai Sarak 139 'Premier Book Co., Printers, Publishers and Booksellers,
Nai Sarak •
140 Overseas Book Agency, 381 0, David Street, Darya Ganj-9 .
141 Amir Book Dep&t, Nai Sarak .
Cat. of Agent.
(Rest.) (Reg.)
(Rest.) (Reg.)
(Reg.)
(Rest.)
(Rest.)
(Rest.)
(Rest.)
(Rest.)
(Rest.)
(Rest.)
(Reg.)
(Reg.)
(Reg.) (Reg.)
(Rest.)
(Rest.)
(Reg.)
(Rest.) (Rest.)
(Reg.) (Reg.)
(Reg.) (Rest.) (Rest.)
(Reg.)
(Reg.)
(Reg.)
(Reg.)
(Reg.)
(Reg.)
(Reg.)
(Reg.)
(Reg.)
(Reg.)
(Reg.)
(Reg.)
(Reg.)
(Reg.) (Reg.)
(Reg.)
(Reg.)
lReg.) (Rest.)
(Rest.)
(Rest.)
\Rest.) (Rest.)
(Rest.)
(Rest.)
(Rest.)
Reg.)
Reg.)
(Rest.)
.' n
Serial Num- Name of the Party
ber
142 Rajpal & Sons, Kashmeri Gate 143 Saini Law Publishing Co., 1899, Chandni Chowk 144 Moti Lal Banarsi Dass, Bungalow Road, Jawahar Nagar 145 Sangam Book Depot, Main Market, Gupta Colony
146 Summer Bros., P.O. Birla Lines 147 University Book House, 15, U.B .Bangalow Road,Jawahar
Nagar . . . • . • . .
148 Om Book Stall,Civil Court Compound
DHANBAD-
149 New Sketch Press PostBox 26
DHARWAR-
150 Bharat Book Depot & Prakashan, Subhas Road.
151 AkalwadiBook DePot, Vijay Road
ERNAKULAM-
152 South India Traders, C/o Constitutional Law~ournal 153 Pai& Co.,Broadway
FEROZEPUR CANTT.-154 English Book Depot, 78, Jhoke Road
GAYA-155 Sahitya Sadan, Gautam Budha Marg
GOA-156 Singhal's Book' House, P.O. B. No. 70, Near the ehurch
GURGAON-157 Prabhu Book Service, Nai Subzi Mandi
GUNTUR-
158 Book Lovers P. Ltd·, Arundelpet, Chowrasta
GWALIOR-159 Loyal Book Depot, Patankar Bazar, Lashmar
160 Tater Bros., Sarafe 161 Anand Pustak Bhandar, N. L. B. Marg
162 M. C. Daftari, Prop. M. B. Jain & Bros., Boc>ksellers, rafa, Lashkar
163 Grover Law House, Nr. High Court Gali
164 Kitab Ghar, High Court Road
GAZIABAD-
Sa-
Cat. of Agents
(Rest.) (Rest.) (Reg.)
(Reg.)
(Rest.)
(Rest.)
(Rest.)
(Rest.)
(Rest.)
(Rest.)
(Reg.)
(Rest.)
(Reg.)
(Reg.)
(Rest.)
(Rest.)
(Reg.)
(Rest.) (Rest.)
(Rest.)
(Rest.) (Re,t.)
(Reg.)
165 Jayana Book Agency, Outside S.D. Inter Coliege, G.T. Road (Rest.)
166 S. Gupta, 342, Ram Nagar (Reg.)
HYDERABAD-167 The Swaraj Book Depot, Lakdi ka pul
168 Bhasha Prakashan 22-5-69, Gharkaman
169 Booklovers, P. Ltd" Kachiguda, Chowrasta
170 Book Syndicate, Devka Mahal,Opp. Central Bank 171 Labour L~w Pllblications, 873, Sultan Bazar
172 Book Links Corporation, Narayangoda.
HARDWAR-173 Seva Kunj, Kanshal Bhawan Bramhampuri
HUBLI-174 Pervaje's Book House, Station Road
INDORE-175 Wadhawa & Co.,27, Mahatma Gandhi Road
176 Madhya Pradesh Book Centre, 41 ,Ahilyapllra
177 Moaern Book House, Shiv Vilas Palace
17fl Swarup Bros. ,Khajuri Bazar
179 VinaY Pustak Bhandar
JAIPUR. CIT('-180 Bharat Law House, Booksellers & Publishers Opp. Prem
Prakash Cinema lSI Popular Book Depot, Chaura Rasta
182 Vani MandirSwami Mansing Highway
183 Raj Books & Sub •. Agency, 16, Nehru Bazar
(Reg.) (Rest.)
(Rest.) (Reg.) (Reg.)
(Reg.)
(Rest.)
(Reg.)
(Reg.)
(Rest.) (Rest.)
(Reg.)
(Rest.)
(Reg.)
(Reg.)
(Reg.)
(Rest.)
LIST OF AGENTS FOR THE SALE OF GOVERNMENT OF INDIA PUBLICATIONS AS ON 31.3~1970-Contd.
Serial Number
JAMSHEDPUR-
Name of the Party
184 Atm.r Kitab Ghar, Diagonal Road, P. B. No. 78 185 Gupta Stores, Dhatktdith 186 Sanya1 Bros. Booksellers & New, A~ents, 26, Main Road
JAMNAGAR-187 Swadeshi Vastu Bhand.r, Ratanabai Masid Road
JODHPUR-188 Chopra Bros. ,Tripoli a Bazar 189 Dwark. Da. Rathi, Wholesale Books and News Agents 190 Kltab Ghar, Sojati Gate 191 Rajasthan Law House, High Court Road
JABALPUR-192 Modern Book House,286,Jawahargani 193 Popular Book House, Nr. Omti P. O.
TULLUNDER CITY-194 . Jain General House, Bazar Bansanwala
195 Hazoori.ua Bros., MaiHiran Gate . 196 University Publishers, Railway Road
JHUNJHUNU (RAJ)-197 Shashi Kumar Sharat Chandra
KANPUR-198 Adv4ni & Co., P. BOll'lOO,The Mall
199 Sahitya Niketan, Shar.dhanand Park
200 Univers.IBookStall,The Mall
KAPSAN-201 Parkashan Prasaran,l;90,Nandhar Niwas, Azad Marg
KOLHAPUR-202 M.harashtra Granth Bhandar, Mahadwar Road
KUMTA-203 S. V. Kamat,Booksellers & Stationer. (S. Kanara)
LUCKNOW-204 B.lkrishna Book Co. Ltd., Hazratgsnj 205 British Book Depot ,84, Hazratganj 2{16 Eastern Book Co., 34, Lalbagh Road 2()7 Ram Advani HaZratganj, P. B. 154 208 Universal Publishers (P) Ltli., Hazratganj
209 Acquarium Supply Co.,219, Fababad Road 210 Civil & Military Educational Stores,106/B, Sadar Bazar.
LUDHIANA-211 Lyall Book Depot, Chaura Bazar 212 MohindraBros.,Katchori Road I
21.1 Nanda Stationery Bhandar, Pust,ak Bazar 2 J4 The Pharmacy News, Pindi St.
MADURAI-21'5- . Qriental Book House, 258, West Masi St. 216 Vivekananda Fress l 48, West MasiStreet.
MATHURA-217 Rath & Co., Tilohi Bldg., Bengal; Ghat
MADRAS-218 Account Test Institute, P.O. 760, Egmore 219 C. Subbiah Chetty, 62, Big Street, Triplicanc 220 K. Krishnamurty, Post Box 384 221 P. Vardhachary & Co.,8, LioghiChetty Street
222 C.Sitaroman & Co.,33, Royauettach High Road 22S M. Sachechalam & Co., 14, Bankuram CbettyStreet • 224 Madras Book Agency
%25 Nav Bharat Agencies 18, Andiappa St.,Sadhana Sadan 226 The Rex Trading Co. P.lI. 5049,31 &: 32 James St .. 227 Mohan Pathippagam &: Book Depot,S, Pyecrafh Tripli
cance 228 Naresh Co., 3, Dr. Rangachari Road, Mylapore
229 Reliance Trading Co., 70/IO,Shambu Dos St ••
Cat. of Agents
(Reg.) (Reg.)
(Rest.)
(Reg.)
(Reg.) (Reg.) (Reg.)
(Rest.)
(Reg.) (Rest.)
(Reg.)
(Rest.) (Rest.)
(Rest.)
(Reg.) (Reg.)
(Reg.)
(Reg.)
(Rest.)
(Reg.)
(Reg.)
(Reg.) (Reg.) (Reg.)
(Reg.)
(Rest.) (Rest.)
(Reg.)
(Rest.)
(Rest.) (Rest.)
(Reg.) (Reg.)
(Rest.)
(Reg.) (Reg.) (Reg.) (Reg.)
(Reg.)
(Rest.) (Rest.) (Rest.) (Rest.)
(Rest.) (ROSh) (Reg.)
Serial Num
ber
MANGALORE-
Name of the Party
230 U. R. SMneye Sons, Car Street, P. Box 128 231 K. 1Ihoga'Rao &: Co. Kodial Bail
MEERUT-
232 Loya JBo~k Depot, Chhipi Tank
233 Prakash Educational Stores, Subhash Bazar
MUZAFFARNAGAR~ 234 B. S.Jain & Co., 71, Abupura
235 Cargya & Co., 1"39, G. New Market
MUZAFFARPUR_
236 Scientific ~ Ed~catio .. nal Supply Syndicate
MYSORE-
237 H. Vankataramiah & Sons, Krishnaragendra Circle 238 People Book House, Opp.lagan Mohan Palace. 239 Geeta Book House, New State Circle 240 Indian Mercantile Corpn., Ramvilas
M&"IDSAUR_
241 Nahta Bros., Booksellers & Stationers
MUSSOURI-
242 Hind Traders, N. A. A. Centre, Dich Road
NAGPUR_
243 Western Book Depot, Residency Road
244 The Executive Secretary, Mineral Industry Association, Mineral House, Near All India Radio Square , :
NILGIRIS_
245 Mary Martin Booksellers, Kotagiris, l\{adras.States
NAINITAL-
246 Consal Book Depot,Bara Bazar
NADIAD-
247 R. S. Desai, Station Road
NEW DELHI-
248 Amri t Book Co., Connaught Circus 249 Aopki Du'l:an, 5/5777, Dev NIlg,r •
259 Bhawani & Sons, 8 F, Connaught Place 251
252 253 254
255 256 257
258
259 260
261 262 263
Central News Agency, 23/90, Connaught Circus
English Book Stores, 7-L, Connaught Circus, P. B. No. 928 lain Book Agency, 0/9, Prem House, Connaught Place Iayana Book Depot, P. B. 2505, Karol Bagh
Luxmi Book Store, 72, lanpath, P. O. Box 553 Mehrs Bros.,50-G, Kalkaji,New Delhi-19
Navyul Traders, Desh Bandhu Gupta Road, Dev Nagar New Book Depot, Latest Books, Periodicals Sty.P. B. No. 96,
Conn.ught Place . • • . _ • •
Oxford Book & Statonery Co.,ScindiaHouse . Peoples P"blisJdng Hou.e (P) Ltd., Rani lhansi Road
Ram Krishna & Sons (of Lahore), 16/B, Connaught Place • R. K. Publishers, 23, Beadonpura, Karol Bagb • Sharma Bro •. , 17, New Market, Moti Nagar
264 TheSecretary,IndianMet.Society,Lodi Road 265 Suneja Book Centre, 24/90, Connaught Gircus .
266 United Book Agency, 31, Municipal Market, Connaught Circus . . . . . .
267
268 269
Hindi Book House, 82, ]anpath
LakshmiBook Depot,57, Rang-arpura, Karol Bagh
Cat. of Agent~
(Reg.) (Rest.)
(Reg.)
(Reg.)
(Reg.)
(Rest.)
(Rest.)
(Reg.) (Reg.) (Reg.) (Rest.)
(Rest.)
(Rest.)
(Reg.)
(Rest.)
(Rest.)
(Reg.)
(Rest.)
(Reg.)
(Reg.)
(Rei.) (Reg.) (Reg.)
(Reg.) (Reg.) (Reg.)
(Reg.) (Reg.)
(Reg.) (Reg.) (Reg.) (Reg.)
(Reg.)
(Reg.) (Reg.) (Reg.)
(Reg.) (Reg.) (Rest.)
270 271
N. C. Kau,,!,hal & Co., 40, Model Basti, P. O. Karol 1Iagh, New D.lhl-5 . • . . • • • • (Rest.)
Ravindra Book Agency, 4D/50,Double Storey, Lajpat Nagar (Reg.) Sant Ram Booksellers, 16,New Municipal Market, Lodi
Colony . • • • • • • • 272 Subhas B,ook Depot, Shop No. Ill, Central Market,
vas-purt
(Rest.) Srinj·
(Rest.) 273 The Seey. Federation of Association of Small rndustryof
India, 23.B/2, Rohtak Road (Rest.)
iv,
Llsr OF AGENTS FOR THE_SALE OF GOVERN~:E;N't 0)' INDJA PUijL!CATIONS AS ON 31-3-197O-Contd.
Serial Num
ber
NEW DELHI-Coneld.
Name of the Party
274 Globe Publications, C-33, Nizamudin East
275 Standard Booksellers, Stationers, Palam Enclave '. 276 Scientific Instruments Stores, A-355, New Rajender Nagar 277 Shyam Pustak Bhandar, 3819, Arya Samaj Road
PATIALA-278 Jajn& Co.,17,ShahNashlnBazar.
PATNA-279 Lllxmi Trading Co., Padri KiHaveli 280 J. N. P. Agarwal & Co., PadriKi Haveli 281 MotiLal Banarsi Dass & Co., Bankipur 282 Today & Tomorrow, Ashok Rajpath
POONA-283 Deccan Book Stall, Deccan Gymkhana 284 Impniat Book Depot, 266, M. G. Road 285 Sarswat, 67, Patel Flats 2, Bombay-Poona Road
International Book Service, Deccan Gymkhana
Cat. of Agents
(Reot.) (Rest.) (Rest.) (Rest.)
(Reg.)
(Reg.)
(Reg.)
(Reg.) (Rest.)
(Reg.) (Reg.) (Rest.) (Reg.) 286
287 Raka Book Agency, 01'1'. Natu's Chawl, Near Appa Balwant Chowk •• ••• '. (Reg.)
288 Secy., Bharati Itihasa Samshodhan Maudi r 1321, Sarlashiv Path . • • • • • • • • (Rest.)
PONDICHERRY -289 Honesty Book House, 9, Rue Dupl ix
PUDKKOTTAI-290 Meeoakashi Pattippagam, 4142 East Main St.
291 Sh. P. Swaptinathan Shivam & Co., East Main Road
RAJKOT-292 Mohan Lal Dossabhai Shah, Booksellers & Subs. & Advt.
Agent
RAIPUR-293 Pustak Pratisthan, Sati Bazaar
RANCHI-294 Crown Bo\)k Depot, Upper Bazar
REWARI-295 Tika Ram Sing Lal
SAUGAR-296 Yadw B"k Stall ,Publishers & Booksellers
SECUNDERABAD-297 Hiodustan Diary Publishers, Market Street
SIVAKASI-298 Ganesh Stores, South Car Street
SIMLA-299 Minerva Boot< Shop, The Mall
"
(Rest.)
(Rest.)
(Rest.)
(Reg.)
(Rest.)
(Reg.)
(Rest.)
Rest.}
(Rest.)
(Rest.)
(Rest.)
Serial Number
SURAT-
Name of the Party Cat. of Agents
300 Shd Gajanan Pustakalaya, Tower Road (Reg.) 301 Gujarat Subs. Agency Jawahar Lat Nehru Marg, Athwa
Lines • • (Rest.)
TUTICORIN-302 Shri K. 'Thiagarajan, 51,French Chapai Road (Rest.)
'l'RICHINOPOL Y-
303 S. Krishnaswamy & Co., 35, Subhash Chandra Bose Road (Rest.)
TRIPURA-304 G. R. Dutta & Co., Scientific Equipments Suppliers.
TRIVANDRUM-305 International Book Depot, Main Road 306 Reddiar Press & Book Depot, P. B. No.4
TEZPUR-
(Rest.).
(Reg.) (Rest.)
307 Jyoti Prakashan Bhawan, 'Tezpur, Assam • • (Rest.)
UDAIPUR-308 Book Centre, Maharana Bhopal College, Consumer,
Co-Op. Society Ltd. •• . (Rest.} 309 Ashutosh & Co., Station Road, Opp. University of Udai-
pur • (Rest.)
UJJAIN-310 RamiBros.,41, Mallipura
VARANASI-311 The Manager, Banaras Hindu University Book Depot
312 Chowkhamba Sanskrit Series Office, Gopal Mandir Lane, P. B.No. 8. • • • •
313 Kohinoor Stores, University Road, Lanka 314 ViswavidyaJaya Prakashan, K 40/18, Bhairo Nath Marg 315 Globe Book Centre, P.O. Hindus University
VIZEGAPA'1:AM-316 Gupta Bros., Vizia Building. 317 The Secretary, Andhra University General Co_Op. Stores
VELLORE-318 A. Venkatasubban, Law Booksellers
WARDHA-319 Swarajeya Bhanaar, Rathi Market •
FOR LOCAL SALE
(Rest.)
(Reg.)
(Reg.) (Reg.). (Reg.) (Rest.)
(Reg.) (Rest.).
(Reg.)
(Rec.)
Govt. of India Kitab Mahal, J anpath, Opp. India Coffee House, New Delh' Phone No. 44561. •
Govt. of India Boo&" Dep.ot, 8, Hastings Street, Calcutta, Phone No. 23-3813.
High Commissione for India in London, India House, London, W.C.2.
S & R AGENTS AS ON 31-3-72
I. The Asstt. Director, Extension Centre, Bhuli Road, Dhanbad.
2. The Asstt. Director, Extension Centre, Santnagar, Hydrabad·I8. 3. The Asstt. Director, Govt. ofIndia, S. 1. S. 1. Ministry ofC & I Exten
sion Centre, Kapileshwar Road, Belgaum. 4. The Asstt. Director, Extension Centre, Krish.na DisH. (A. 1.) 5. The Asstt. Drrector, Footwear, Extension Centre, Polo Ground No.1,
Jodhpur. 6. The Asstt. Director, Industrial Extension Centre, Nadiad (Guj.)
7. The Development Commissioner, Small Scale Industries, Udyog Bhawan, New Delhi.
8. The Dy. Director, Incharge, S. 1. S. 1. C/o Chief Civil Admn., Goa.. Panjim.
9. The. Director, Govt. Press, Hyderabad. 10. The Director, Indian Bureau of Mines, Govt. of India, Ministry of
Steel, Mines & Fuel, Nagpur.
II. The Director, S. 1. S. I. Industrial Extension Centre, Udhana-Surat.
12. The Employment Officer, Employment Exchange, Dhar, Madhya Pradesh.
13. The Employment Officer, Employment Exchange, Gopal Bhavan Morena.
14. The Employment Officer,EmploymentExchange, Jhabua. 15. The Head Clerk, Govt.Book Depot,Ahmedabad. 16. The Head Clerk, Photozincographic Press, 5 Finance Road, Poona.
17. The Officer.in.Charge, Assam, Govt.B. D.,ShOlong.
18. The O. I/O., Extension Centre, Club Road, Muzzaffarpur.
19. The O. I/C.,Extension Centre, Industrial Estate, Kokar, Rauchi.
20. The O. IIC., State Information Centre, Hyderabad. 21. The O. IIC.,S. I. S. 1. Extension Centre, MaIda.
22. The O. IIC., S. 1. S. I., Habra, Tabaluria, 24, Parganas.
23. The O. r/C., University Employment Bureau, Lucknow.
24. The O. I/C., s. I. S. I. Ch.rontanning Extension Centre ,Tangra 33/1, North Topsia Road, Calcutta-46.
25. The O. IIC.,S. I. S. 1. Exten.ion Centre (Footwear), Calcutta. 26. The O. IIC., S. I. S. 1., Model Carpentry Workshop, Puyali Nagar,
P.O. Burnipur, 24 Parganas.
27. Publication Division,SalesDepot,North Block,New Delhi. 28. The Press Officer, Orissa Sectt. Cuttack.
29. The Registrar of Compauies, Andhra Bank Bldg., 6, Linghi CbIllty Street, P. B. 1530, Madras.
30. The Registrar of Companies, Assam, Mauipur and Tripura, Shill",,!!.
31. Th.e Registrar of Companies, Bihar, Jamal Road, Patna.l.
32. The Registrar of Companies, 162, Brigade Road, Bangalor ••
33. The Registrar of Companies, Everest, 100 Marine Drive, Bombay.
34. Th.e Registrar of Companies, Gujarat State Samachar Bldg, Ahlllle-dab ad.
35. The Registrar of Companies, Gwalior (M.P.)
36. The Registrar of (Jompanies ,H. No. 3.5·837, Hyder Guda,Hyderabad.
'37. Th.. Registrar of CompanIes, Keta a, 70, Feet Road, Ernakulam. 38. The Registrar of Companies, M. G. Road, West Cotto Bldg., P. B.
334, Kanpur.
39. Th.e Registrar of Companies, Narayani Bldg. Braboume Road, Cal cutta-I.
40. The Registrar of Companies,Orissa,CuttackCh.andi,Cuttack. ...... h _The Registrar;of Companies, Pondicherry.
42. Th.e Ref!i.strar of Companies, Puniab & Himachal PrMesh Link Road,JullundurCity. '
43. Th.e Registrar of Companies, Rajasthau, Ajmer Sh Kumta Prasad House, 1st Floor'C'Sch.eme,AshokMarg. Jaipur: • ,
44. The Registrar of Companies, Sunligh.t Insurance Buildiug, Aimeri gate Extension, New Delhi.
45. The Registrar of Trade Unions, Kanpur.
46. Soochua Sahita Depot, (Srate Book Depot), Lucknow.
47. Supdt. Bhupendra State Press, Patiala.
48. Supdt. Govt. Press & Book Depot, Nagpur.
49. Supdt. Govt. Press, Mount Road, Madras.
50. Supdt. Govt. State, Stores and Pub •. P. O. Gulzarbarh, Patna,-7.
51 Supdt. Govt. Printing & Stationery Depot, Rajasthan, Jaipur City.
52 Supdt. Govt. Printing and Stationery, Rajkot.
v
53. Sopdt. Govt. Printing and Stationery, Punjab, Chandigarh.
54. Supdt. Govt. State Emporium, V. P. Rewa. 55. Dy. Controller,Printing & Stationery Office, Himachal Pradesh, Siltlla.
S(}. Supdt. Printing and Stationery, Allahabad, Uttar Pradesh. 57. Supdt. Printing and Stationery, Madh.ya Yradesh, Gwalior.
58. Supdt. Printing and Stationery, Charni Road, Bombay.
59. Supdt. State Govt. Press, Ehopal.
60. The Asstt. Director, Publicity & Information, Vidhan Sandha, Bangalore-I.
61. Supdt. Govt. Press, Trivandrum.
62 Asstt. Information Officer, Press Iuformation Bureau, InformatioD Centre, Srina gar.
63. Chief Controller ofImports & Exports, Panjim, Goa. 64. Employment Officer, Employment Exchange (Near Bus Stop) Sidh
(M.P.) 65. The Director, Regional Meteorological Centre, Alipur, CalcuttA.
*36. The Asstt. Director,Stat-e !nformation Centre,Hubli. 67. The Director 0 !Supplie. and Disposal, Deptt. of Supply, IO,Mount
Road, Madras-2. 68 Director General of Supplies and Disposals, N. I. C. Bldg., New Delhi.
69. The Controller o£Imports & Exports, Rajkot.
79. The Inspector, Dock Safety, MIL & E Madras Harbour, Madras-I. 71. The Inspecting Asstt. Commissioner of Income Tax, Kerala, Er.na
kulam. 72. The Under Secretary, Rajya Sabha Sectt., Parliament House, New
Delhi.
73. Controller ofImpor" & Exports, 7, Portland Park, Visakhapatnam.
74. The Senior Inspector, Dock Safety, Botwalla Ch.ambers, Sir, P. M. Road, Bombay.
75. Controller ofImDorts & Exports, 1. B. H·P. Pondicherry.
76. Dy. Direct" lIncharge, S. I. S. I., Sah.akar Bhavan, Trik.. B'l!icba, Rajkot.
77. The Publicity and Liaison Officer, Forest Research Institute, & Colleges, Near Forest, P. O. Dehradun.
78. The Asstt. Controller of Imports and Exports, Govt. of India, Mini. stry of Commerce, New Kandla.
79. The Dy. Director General (S. D.) 6, Esplanade East, Calcutta.
80. Th.e Director, Govt. ofIndia, S. I. S. 1. Ministry 0 fI &. S, Industrial Areas·B, Ludhiana
81. The Govt. Epigraphi. tfor India.
82. The Asstt. Director, Incharge, S. I. S. I. Extension Centre, Varanasi.
83. The Director of Supplies, Swarup Nagar, Kanpur.
84. The Asstt. Director (Admn.) Office ofth.e Dte. of Supplies & Disposal Bombay.
85. Th.e Chief Controller of Imports & Exports, Ministry of Internationa Trade, Madras.
86. 87. 88. 89.
90.
91.
92. 93. 94.
95.
96.
97.
98.
99.
100.
101.
The Dy. Collector of Customs, Custom House; V isakhapatnam. The Principal Officer, Merantile Marine Department, Calcutta. Th.e Director,S. 1.5. 1. Karan Nagar, Srinagar.
The Director,I/C, S. I. S. 1.,107, Iudustrial Estate,Kanpur.
The Director of .Inspection, New Marine Lines,Bombay-l.
The Dy.ChiefControlierofImporJs & Exports, T. D. Road, Ernakulam_
Th.e Asslt. Director,Govt. Stationery & Book nopa t,Aura l<;a The Asstl.DirectorI/C, S.LS. 1. Club Road, Hubli. The Employment Officer, Talcher.
The Director ofInspectiol'1, Dte. G & S, Dispooa1.I, Gan~sh Chandr a Avenue, Calcutta. The Collector of Customs, New Custom House, Bombay,
The Controller of Import' & Exports, Bangalore.
The Admn. Officer, Tariff Commissioner, 101, Ql>een's R_d, Bombay. The Commissioner of Income Tax, Patiala. The Director, Ministry of I & Supply, (Deptt. of Industry), Cutlack.
~~~n'?'Y' Director or Publi. Relations, State Information Centre.
102. The Officer-in-Charge, State Information Cenl .. , Madras. 103. The Asstt.Director,S.LS.L M.1.Road,Jaipur. 104. The Collector of Customs, Madras.
105. National Jiuilding Org., Nirman Bhavan, Ne ... Delhi.
106. Th.e Controller of Communication, Bombay Region, Bomba 107. The Karnatak UniversiW, Dharwar.
lOB. 10) •
1l0.
Ill. 112.
The Sardar Patel Umversity, VaUabh Vidyanagar. The Principal Publications Officer Sending Commission for Scientific
& Tech., Terminology, U.G.C., Building, New Delhi. The Ollicer-in-Charge, Information Centre, Swai Ram Singh
Road, Jaipur. The Director General of Civil Aviation, New Delhi.
Controller of Aerodromes, Delhi.
vi
113. Controller of Aerodromes, Calcuta. 114. Controller of Aerodromes, Bombay.
115. Controller of Aerodromes, Madras. 116. 117.
lIB.
The Registrar, Punjab Agrl. University, Ludhiana. The Land & Development Officer, M. of Health, Family Planning
W. H. & U. D., Nirman Bhavan, New Delhi. Acting Secretary Official Language (Leg.) Commission, Ministry
of Law, Bhagwan Dass Road, New Delhi.
1. Registrar General, India2/A, MansinghRoad,NewDelhi-lI. 2. The Director of Census Operations, Andhra Pradesh, Khusro Manzi!
Hyderabad-4. 3. The Director of Census Operations, Assam, Bomfyle Road, Shillong-I, 4. The Director of Census Operations, Bihar, Boring Canal Road, Patna,l; 5. The Director of Census Operations, Gujarat, EllisBridge, Ahmedabad.'" 6. The Director of Census Operations, Haryana, Kothi No.1 Sector 10-A
Chandigarh . 7. The Director of Census Operations, HimachaIPradesh,Boswel,SimJa-5. 8. The Director of Census Operations, Jammu & Kashmir, 19, Karan
Nagar, Srinagar. 9. The Director of CenSUS Operations, Kerala, Kowdiat. Avenue, Road.
Trivandrum-3. - . 11}. The Director of Census Operations, Madhya Pradesh, Civil Lin ••
Bhopal-2 (M.P.) _ II. The Director of Census Operations, Maharashtra, Spro t Road, Bam·
b:.y-l (BR).
GrPN- S4-2 census Bibar{72- -7-3-75-500
12. The Director of Census Operations, Manipur, Imphal. 13. The Director of Census Operations, Meghalaya Nangri Hills, Shil.
long-3. 14. TheDirectorof Census Operations, Mysore Basappa Cross Road.
Shanti Nagar, Bangalore-l. IS. The Director of Census Operations, Nagaland, Kohima. 16. The Director of Census Operations, Orissa, Chandni Chouk,
Cuttack-l.
17. The Director of Census Operations, Punjab, No. 72, Sector-5, Chandigarh.
18. The Director of Census Operations, Rajasthan, Rambag Palace, Jaipur.
19. The Director of Census Operations, Tamil Nadu 10, Poes Garden, Madras-86.
20. The Director of Census Operations, Tripura, Durga Bari West Compound, Agartala.
21. The Director of Census Operations, Uttar Pradesh, 6-Park Road, Lucknow.
22. The Director of Census Operations, West Bengal, 20 British India Street, Calcutta-I.
23. The Director of Census Operations, Andaman and Nic9bar Islands, Port Blair.
24. The Director of Census Operations, ArunachalPradesh, Laithumkhrah, ShiIlong.
25. The Director of Census Operations, Chandigarh, Kothi No. 1012, Sector, 8-C, Chandigarh.
26. The Director of Census Operations, Dadra and Nagar Haveli, PAnaji. 27. The Director of Census Operations, Dellii-2, UnderHill Road, Delhi.6. 28. The Director of Census Operations, Goa, Daman & Diu, Dt. A. Borkar
Road, Panaji. 29. The Director of Census Operations, L. M. & A. IsI"nd., Kavaratt;' 30 The Director of Census Operations, POlldicherry: Madras.