Housing Report and Tables, Part IV-A , Series-6, Haryana
226
CENSUS OF INDIA 1971 SERIES 6 PART IV-A HOUSING REPORT AND TABLES HARYANA 1. E. N. CHAUHAN OF THE INDIAN ADMINISTRATIVE SERVICE Director of Census Operations Haryana
-
Upload
khangminh22 -
Category
Documents
-
view
2 -
download
0
Transcript of Housing Report and Tables, Part IV-A , Series-6, Haryana
CENSUS OF INDIA 1971
SERIES 6
PART IV-A
HOUSING REPORT AND TABLES
HARYANA
1. E. N. CHAUHAN
OF THE INDIAN ADMINISTRATIVE SERVICE
Director of Census Operations Haryana
o 3 1
29
29
7 5
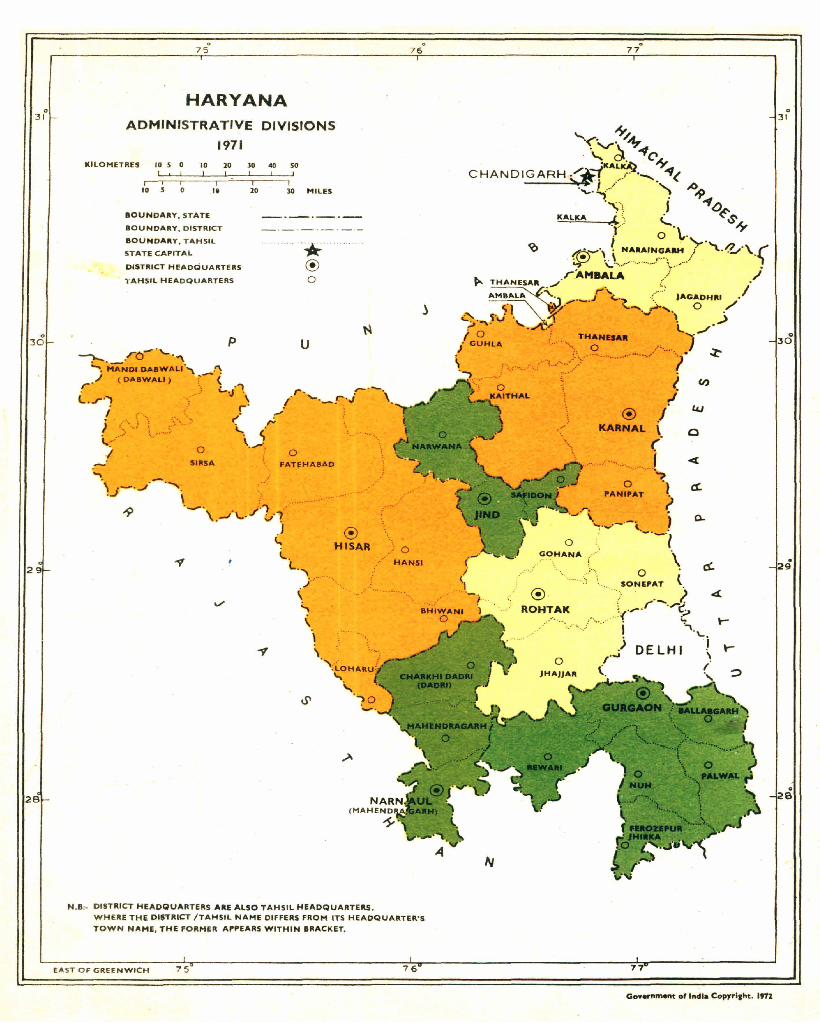
HARYANA ADMINISTRATIVE DIVISIONS
1971
KILO METRES 10 5 0 10 10 30 40 50
10 5 . 11
80UNDARY. STATE
BOUNDARY. OISTRICT
BOUNDARY. T AHSil
STATE CAPITAL
DISTRICT HEAOQUARTERS
"AHSIL HEADQUARTERS
p -"\..... .rc- '-.',,\ . ..__ .
..... MANDl 0A8WALI !'\
10 30 MilES
u
r ' '/ ( DABWALI )
L .• r''')
~- < , . """,", r .., '_ '--. ';" 4, " '- ._f' . ..j \
I j ~, \..:," ./ -
o SIRSA
r ' ~ (" /" "-. ~
\ ._ '. o
FATfHABAD
..,
'-. . L ,""I
; \.
"" " \
'\
..... .
(!) HISAR
' '\ L·· ' .>H •• RlI
N ,B:· DISTRICT HEADQUART ERS ARE ALSO TAHSIL HEADQUARTERS .
o 7 6
o HANSI
WHE RE THE DISTRICT / TAHSIL NAME DIFFERS FROM ITS HEADQUARTER'S
TOWN NAME. THE FORMER A"PEARS WITHIN BRACKET,
EA ST O F G REE NWIC H 75 7 6
o 31
o 30
® KARNAL c
@ ROHTAK
o "" . SONE"AT l.
. f"-"'/ ;. ,"_ ' t',;.. .... . ( ~
o
I "'-.) i r
".,j DElH I \ \. f
IV
77
Go .... nm ... t of India Copyrl.ht. 1f71
CENSUS OF INDIA 1971
A-CENTRAL GOVERNMENT PUBLICATIONS
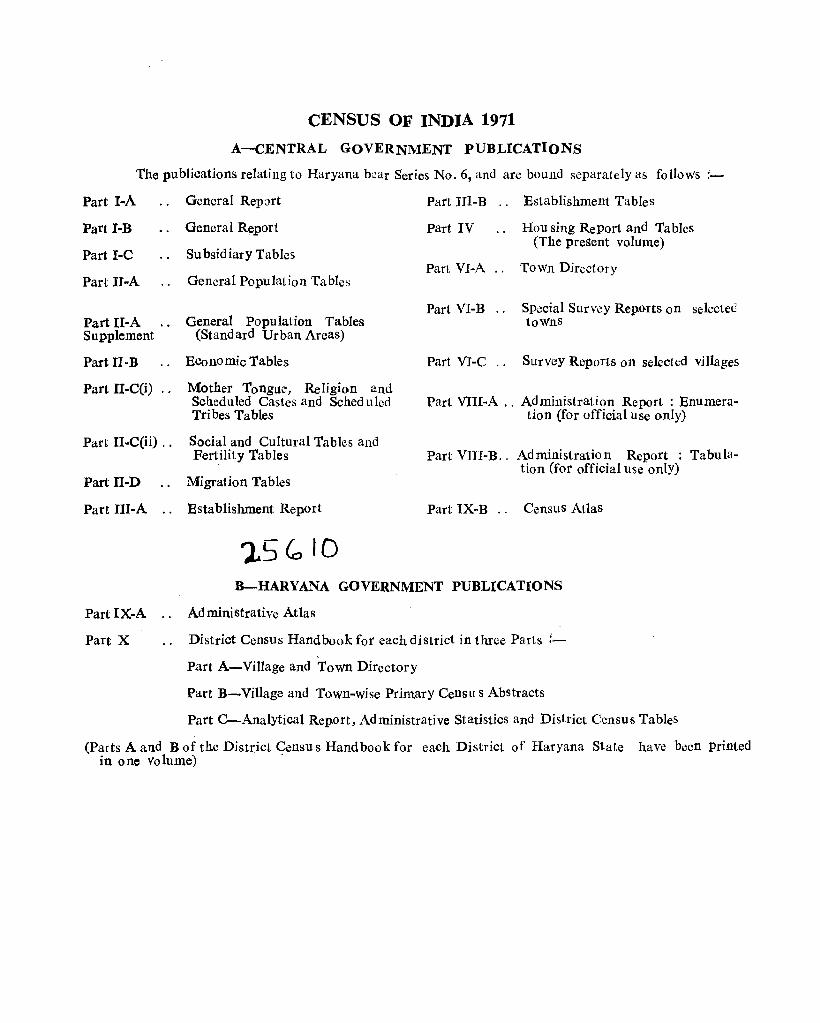
The publications relating to Haryana b~ar Series No.6, and are bound separately as follows :-
Part I-A
Part I-B
Part I-C
Part II-A
Part II-A Supplement
Part JI-B
Part II-CO)
Part II-C(ii) ..
PartII-D
Part lII-A
Part IX-A
Part X
General Rep::lrt
General Report
Su bsid iary Tables
General PopulaLion Tables
General Population Tables (Standard Urban Areas)
Economic Tables
Mother Tongue, Religion and Scheduled Castes and Scheduled Tribes Tables
Social and Cultural Tables and Fertility Tables
Migration Tables
Establishment Report
'lS Co 10
Part JII-B .. Establishment Tables
Part IV Hou sing Report and Tables (The present volume)
Part VI-A .. TOWn Directory
Pari VI-B Sp.::cial Survey Reports on selected toWnS
Part VJ-C .. Survey Reports on selected villages
Pari VIII-A .. Administration Report: Enumeration (for official use only)
Part VlII-B .. Administration Report : Tabulation (for official use only)
Part IX-B .. Census Atlas
B-HARYANA GOVERNMENT PUBLICATIONS
Administrative Atlas
District Census Handbook for each district in three Parts :-
Part A-Village and Town Directory
Part B-Village and Town-wise Primary Censu s Abstracts
Part C-Analytical Report, Administrative Statistics and District Census Tables
(Parts A and B of the District Censu s Handbook for each District of Haryana State have been printed in one Volume)
PREFACE
CHAPTER I
CHAPTER II
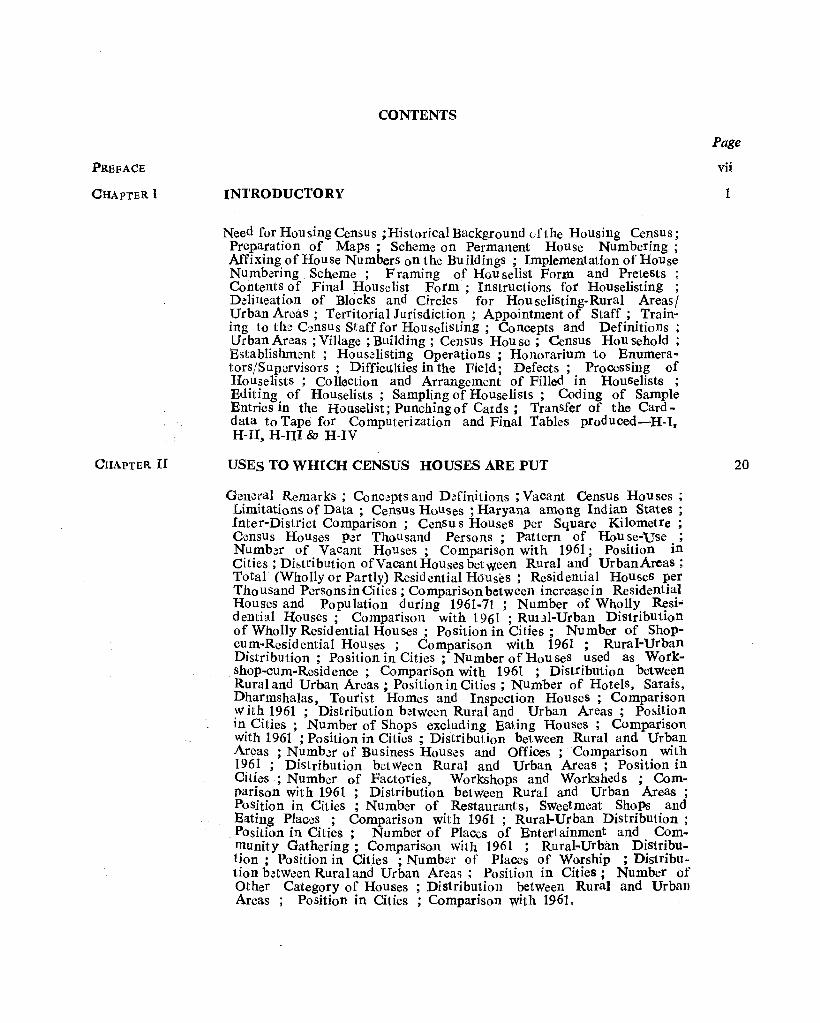
CONTENTS
INTRODUCTORY
Need for Housing Census ; Historical Background of the Housing Census; Preparation of Maps; Scheme on Permanent House Numbering; Affixing of House Numbers on the Buildings; Implementation of House Numb.::ring . Scheme; Framing of Hou selist Form and PreteSts ; Contents of Final Houselist Form; Instructions for Houselisting ; DelilJ.eation of Blocks and Circles for Hou selisting-Rural Areas! Urban Areas; Territorial Jurisdiction; Appointment of Staff; Training to the Census Staff for Houselisting; Concepts and Definitions; Urban Areas; Village; Building; Census Hou se; Census Hou sehold ; ESl:ablishment ; Houselisting Operations ; Honorarium to Enumerators/Supervisors; DifficUlties in the Field; Defects; Processing of Houselists ; Collection and Arrangement of Filled in Houselists ; Editing of Houselists ; Sampling of Houselists; Coding of Sample Entries in the Houselist; Punching of Cards; Transfer of the Carddata to Tape for Computerization and Final Tables produced-H-I, H-II, H-JII &. H-IV
USES TO WHICH CENSUS HOUSES ARE PUT
Gcncl'al Remarks; Concepts and D.::finitions ; Vacant Census Houses; Limitations of Data; Ce)1SUs Houses; Haryana among Indian States; Inter-Distl'ict Comparison; Censu s HouseS per Square Kilometre; Census Houses per Thousand Persons; pattern of House-Use ; Number of Vacant Houses; Comparison with 1961; position in Cities; Distribution of Vacant Houses betw,een Rural and UrbanAreas; Total (Wholly or Partly) Residential Houses; Residential Houses per Thousand Persons in Cities ; Comparison between increasein Residential Houses and Population dudng 1961-71 ; Number of Wholly Residential Houses; Comparison with 1961 ; RULlI-Urban Distribution of Wholly Residential Houses; position in Cities; Number of Shopcum-Resid ential Houses; Comparison with 1961 ; Rural-Urban Distribution ; Position in Cities ; Number of Hon seS used as Workshop-cum-Residence; Comparison with 1961 ; Distribution between Rural and Urban Areas; Position in Cities; Number of HotelS, Sarais, Dharmshalas, Tourist Homes and Inspection Houses; Comparison with 1961 ; Distribution between Rural and Urban Areas; pObition in. Cilies ; Number of Shops excluding Eating Houses; Comparison Wlth 1961 ; Position in Cities; Distribution between Rural and Urban Areas ; Number of Business Houses and Offices ; Comparison with 1961 ; Distribution bet Ween Rural and Urban Areas ; Position in Cities; Number of Fac.tories, Workshops and Worksheds ; Comparison with 1961 ; Distribution between Rural and Urban Areas; POSition in Cities ; Number of Restaurants, SWeetmeat ShoPs and Eating Places ; Comparison with 1961 ; Rural-Urban Distribution;
. Position in Cities; Number of Places of Entertainment and Community Gathering; Comparison with 1961 ; Rural-Urban Distribution ; Position in Cities ; Number of Places of Worship ; Distribution b"twcen Rural and Urban Areas; Position in Cities; Number of Other Category of Houses ; Distribution between Rural and Urban Areas ; Position in Cities ; Comparison with 1961.
Page
vii
1
20
CHAPTER IV
CHAPTER V
ANNEXURES
ANNEXURE I
ANNEXURE II
ANNE'CURE UI
ANNEXURE IV
ANNEXURE V
ANNEXURE VI
ANNEXURE VII
ANNEXURE VIII
ANNEXURE IX
ANNEXURE X
ANNEXURE Xl
ANNEXURE XII
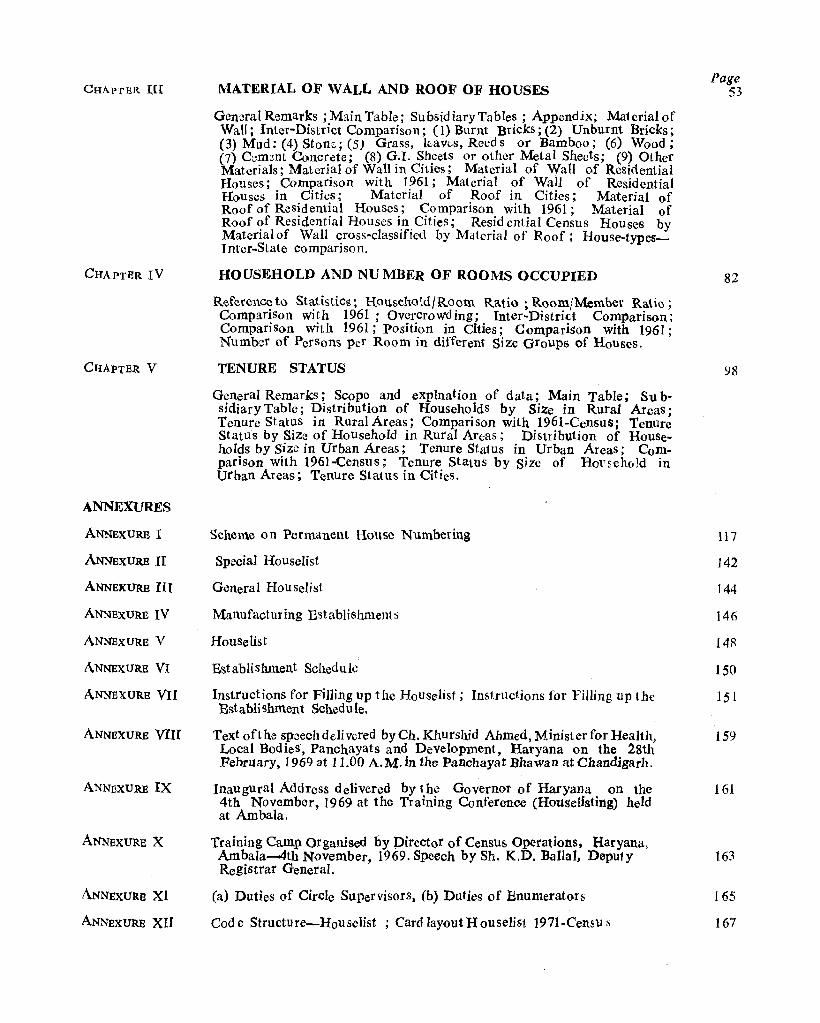
MATERIAL OF WALL AND ROOF OF HOUSES
General Remarks; Main Table; SubsidiaryTables ; Appendix; Material of Wall; Inter-District Comparison; (1) Burnt Bricks; (2) Unburnt Bricks; (3) Mud: (4) Stone,; (5) Grass, kav<.s, Reed s or Bamboo; (6) Wood; (7) Cemmt Concrete; (8) G.I. Sheets or other Metal Sheets; (9) Other Materials; Material of Wall in Cities; Material of Wall of Residential Houses; Comparison with 1961; Material of Wall of Residential Houses in Cities; Material of Roof in Cities; Material of Roof of Residential Houses; Comparison with 1961; Material of Roof ?f Residential Houses i.n. Cities; Res!d ential Census Houses by Materlalof Wall ~ross-cIasSlflect by Matenal of Roof; House-typesInter-State comparIson.
HOUSEHOLD AND NUMBER OF ROOMS OCCUPIED
R~ferellcet() Statislics; Household/Room Ratio; Room/Member Ra\io; Comparison with 1961; Overcrowding; Inter-District Comparison; CompariSon with 1961; Position in Cities; Comparison with 1961; Numb~r of Persons per Room in different Size oroUps of Houses.
TENURE STATUS
General Remarks; Scope and explnation of data; Main Table; Su bsidiary Table; Distribution of Households by Size in Rural Areas; Tenure Status in Rural Areas; Comparison with 1961-Census; Tenure Status by Size of Household in Rural Areas; Distribution of HouseholdS by Size in Urban Areas; Tenure Status in Urban Areas; Comparison with 1961-Census; Tenure Status by size of HOl'sehold in urban Areas; Tenure Status in CitieS,
Scheme 0 n Permanent House Numbering
Special HouseIis1
General Houselist
Manufacturing Establishments
Houselist
Establishment Schedule
Instructions for Filling up the Houselist; Instructions for Filling up the Establishment Schedule.
Text oft he speech deli vered by Cb. Khurshid Ahmed, Minist er for Health, Local BodieS, Panchayats and Development, Haryana on the 28th February, 1969 at 11.00 A.M.ln the Panchayat Dhawan atChandigarll.
Inaugural Address delivered by the Governor of Haryana on the 4th November, 1969 at the Training Conference (Houselisting) held at Ambala.
Training Camp Organised by pirector of Census Operations, Haryana, Ambala--4th November, 1969. Speech by Sh. K.D. Ballal, Deputy Registrar General.
(a) Duties of Circle SUPervisors, (b) Duties of Enumerators
Cod e Structure-Rou selist ; Card layout H o1.1seHst 1971-Censu s
Page 53
82
98
117
142
144
146
148
150
151
159
161
163
165
167
AN_II;EXURE XUI
ANNEXURE XIV
ANNEXURE XV
ANNEX URE XVI
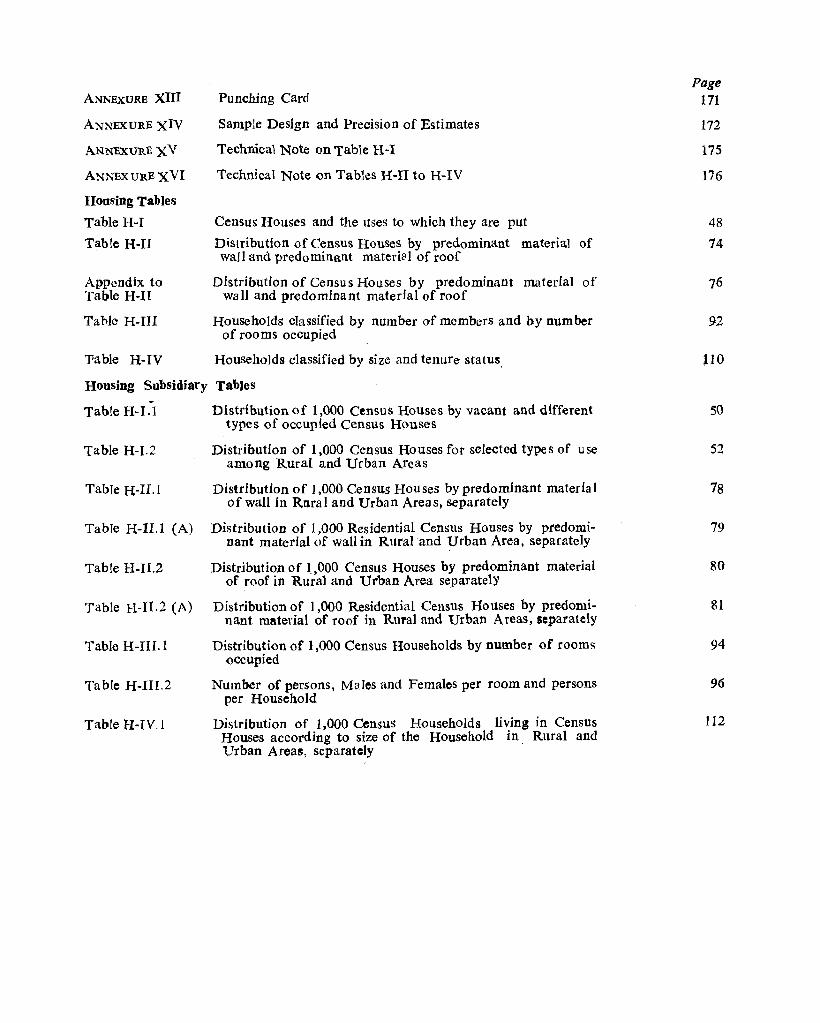
Housing Tables
Table H-I
Table H-II
Appendix to Table H-II
Table H-III
Table H-IV
Punching Card
Sample Design and Precision of Estimates
Technical Note on Table H-I
Technical Note on Tables H-II to H-IV
Census Houses and the useS to Which they are put
Distribution of Census Houses by predominant material of wall and predominant materi1Jl of roof
DIstribution of Census Houses by predominant material of wall and predominant material of roof
Households classified by number of members and by number of rooms occupied
Households classified by size and tenure status.
Housing Subsidiary Tables
Table H-I.l
Table H-I.2
Table H-ILI
Table H-II.1 (A)
Table H-II.2
Table H-II.2 (A)
Table H-III. I
Table H-III.2
Table H-IV.l
Distribution of 1,000 Census Houses by vacant and different types of occupied Census Houses
Distribution of 1,000 Census Houses for selected types of use among Rural and Urban Areas
Distribution of 1,000 Census Hou ses by predominant materia I of wall in Rural and Urban Areas, separately
Distribution of 1,000 Residential Census Houses by predominant material of wall in Rural and Urban Area, separately
Distribution of 1.,000 Census Houses by predominant material of roof in Rural and Urban Area separately
Distribution of 1,000 Residential Census Houses by predominant material of roof ill Rural and Urban Areas, separately
Distribution of 1,000 Census Households by number of rooms occupied
Number of persons, MaJes and Females per room and persons per Household
Distribution of 1,000 CensuS Households living in Census Houses according to size of the Household in Rural and Urban Areas, separately
Page 171
172
175
176
48
14
76
92
110
50
52
78
79
80
81
94
96
112
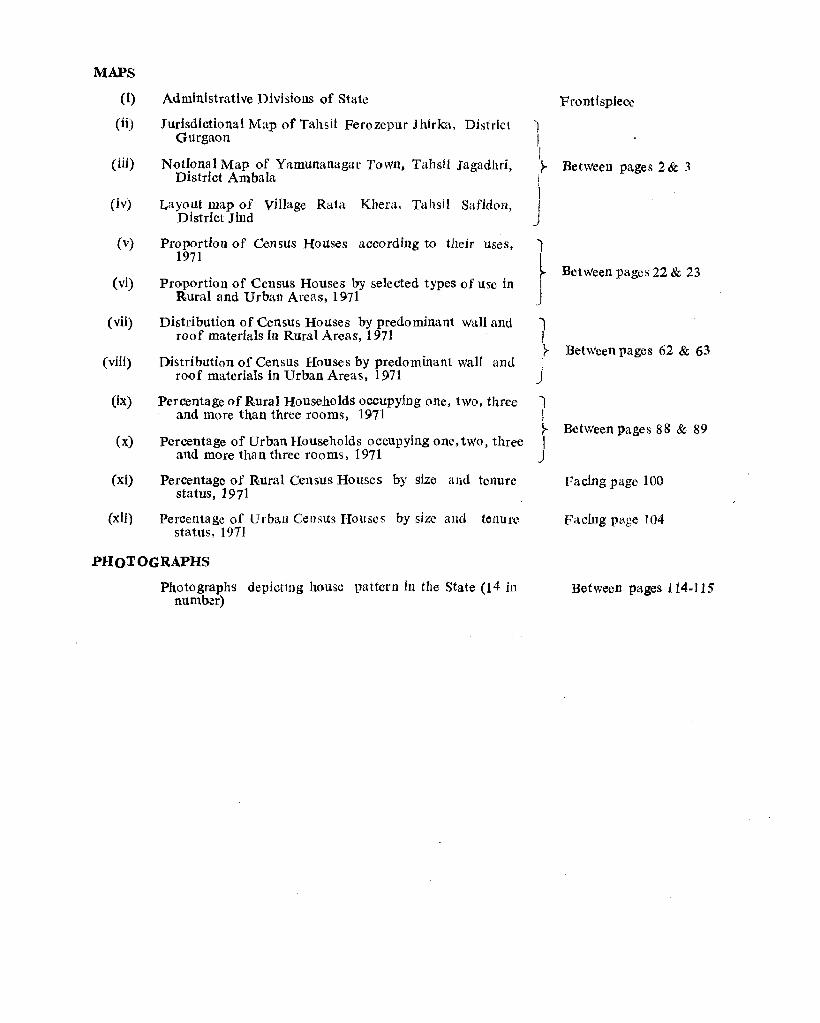
MAPS
(1)
(H)
(HI)
(iv)
(v)
(vi)
(vii)
(vHf)
(IX)
ex)
(xi)
(xU)
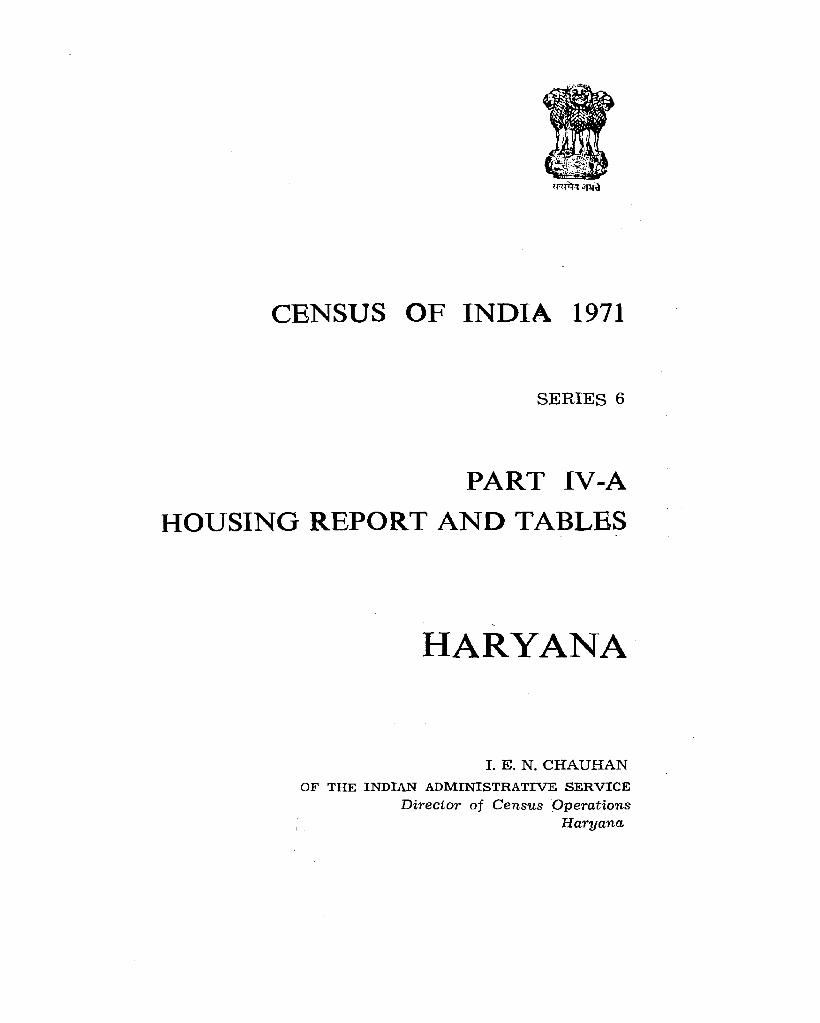
Administrative Divisions of State
Jurisdictional Map of Tahsil Ferozepur Jhtrka, District Gurgaoll
Notional Ma.p of Yamunanaga.r Town, Tahsil Jagadhri, District Ambala
Layout IUap of vllIage Rata Khera. Tahsll Safidon, District Jind
Proportion of Census Houses according to their Uses, 1971
Proportion of Census Houses by selected types of Use in Rural and Urban Areas, 1971
Distribution of Census Houses by predominant \vall and roof materials in Rural Areas, 1971
Distribution of Census Houses by predominant wall and roof materials in Urban Areas, 1971
Percentage of Rural Households occupying one, two, three and more than three rooIUS, 1971
Percentage of Urban Households occupying one, two, three and more than three rooms, 1971
Percentage of Rural Census Houses by size and tenure status, 1971
Percentage of Urban Census Houses by size and tenure statns, 1911
PHOTOGRAPHS
Photographs depicting house pattern in the State (14 in number)
') I
Frontispiece
I~ Between pages 2 & 3 i
I j I t Between pages 22 & 23
t ,;.. Between pages 62 & 63 I
J 1 I ~ Between pages 88 & 89 I J
Facing page 100
Facing page 104
Between pages 114-115
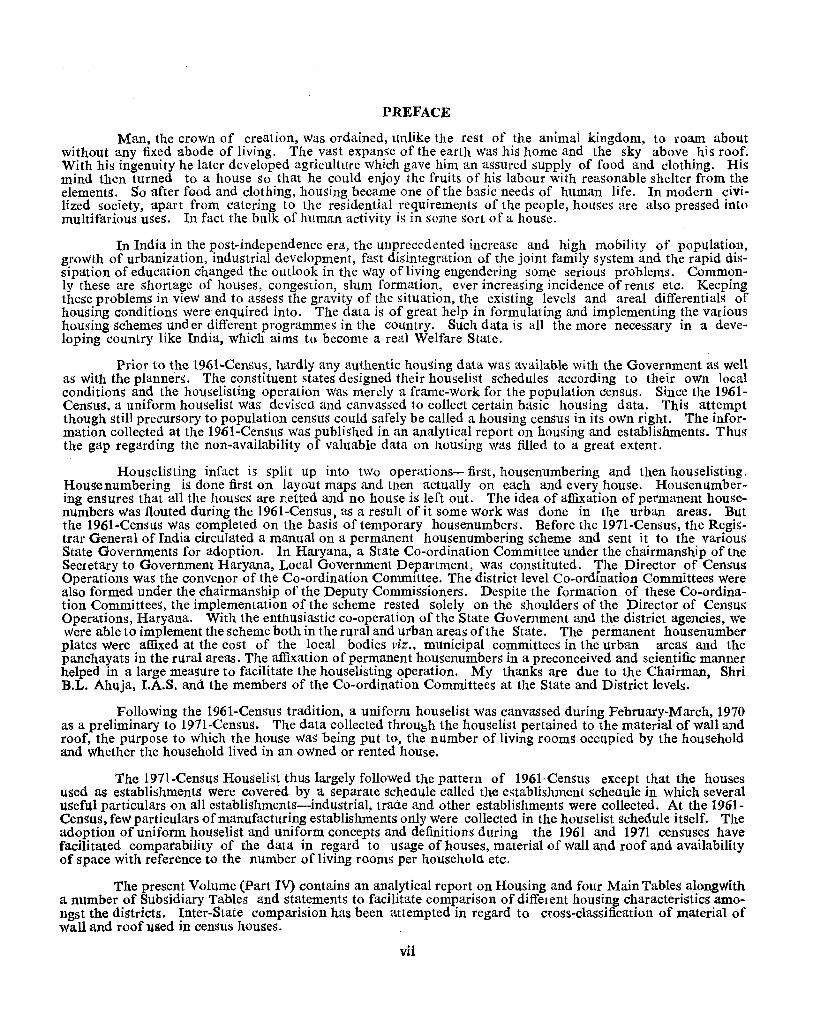
PREFACE
Man, the croWn of creation, Was ordained, unlike the rest of the animal kingdom, to roam about without any fixed abode of living. The vast expanse of the earth was his home and the sky above his roof. With his ingenuity he later developed agriculture which gave him an aSSUred supply of food and clothing. His mind then turned to a house so that he could enjoy the fruits of his labour with reasonable shelter frolD. the elements. So after food and clothing, housing became one of the basic needs of human life. In modern civilized society, apart from catering to the residential requirements of the people, houses are also pressed into multifarious uses. In fact the bulk of hUman activity is in some Sort of a hOUSe.
In India in the post-independence era, the unprecedented increase and high mobility of population, growth of urbanization, industrial development, fast disintegration of the joint family system and the rapid dissipation of education changed the outlook in the way of living engendering some serious problems. Commonly these are shortage of houses, congestion, slum formation, ever increasing incidence of rentS etc. Keeping these problems in view and to aSSeSS the gravity of the situation, the existing levels and areal differentialS of housing conditions were enquired into. The data is of great help in formulating and implementing the various housing schemes und er different programmes in the country. Such data is all the more necessary in a developing country like India, Which aims to become a real Welfare State.
Prior to the 1961-Census, hardly any authentic housing data was available with the Government as well as with the planners. The constituent states designed their houselist schedules according to their own local conditions and the houselisting operation was merdy a frame-work for the population census. Since the 1961-Census. a uniform houselist was devised and canvassed to collect certain basic housing data. This attempt though still precursory to population census could safely be called a housing census in its oWn right. The information collected at the 1961-Census was published in an analytical report on housing and establishments. Thus the gap regarding the non-availability of valuable data on housing was filled to a great extent.
Houselisting infact is split up into two operations-first, housenumbering and then houselisting. Housenumbering is done first on layout maps and then actually on each and every house. Housenumbering ensures that all the houses are netted and no house is left out. The idea of affixation of permanent housenumbers was flouted during the 1961-Census, as a result of it Some work was done in the urban areas. But the 1961-Census was completed on the basis of temporary housenumbers. Before the 1971-Census, the Registrar General of India circulated a manual on a permanent housenumbering scheme and sent it to the various State Governments for adoption. In Hal'yana, a State Co-ordination Committee under the chairmanShip of tIle Secletary to Government Haryana, Local Government Department, was constituted. The Director of Census Operations was the convenor of the Co-ordination Committee. The district level Co-ordination Committees Were also formed under the chairmanship of the Deputy Commissioners. Despite the formation of these Co-ordination Committees, the implementation of the scheme rested solely on the Shoulders of the Director of Census Operations, Haryana. With the enthusiastic co-operation of the State Government and the district agencies, We Were able to implement the scheme both in the rural and urban areas of the State. The permanent housenumber plates Were affixed at the cost of the local bodies viz., municipal committees in the urban areas and the panchayats in the rural areas. The affixation of permanent housenumbers in a preconceived and scientific manner helped in a large measure to facilitate the houselisting operation. My thanks are due to the Chairman, Shri B.L. Ahuja, I.A.S. and the members of the Co-ordination Committees at the State and District levels.
FollOWing the 1961-CensuS tradition, a uniform houselist Was canvassed during Februaty-March, 1970 as a preliminary to 1971-Census. The data collected throu6h the houselist pertained to the material of wall and roof, the purpose to Which the house Was being put to, the number of living roomS occupied by the household and Whether the household lived in an owned or rented house.
The 1971-Census Houselist thus largely followed the pattern of 1961-CenSus except that the houses used as establishments were covered by a separate scheaule called the establishment scheaule in which several useful particulars on all establiShments-industrial, traae and other establishments were collected. At the 1961-Census, feW particulars of manufacturing establishments only Were collected in the houselist schedule itSelf. The adoption of uniform houselist and uniform concepts and definitions during the 1961 and 1971 cenSuses have facilitated compatability of the data in regard to usage of houses, material of wall and roof and availability of space with reference to the number of living rooms per househola etc.
The present Volume (Part IV) contains an analytical report on Housing and four Main Tables alongwith a number of Subsidiary Tables and statements to facilitate comparison of diffelent housing characteristics amongst the districts. Inter-State comparision has been attempted in regard to cross-classification of material of wall and roof used in cenSus houses.
vii
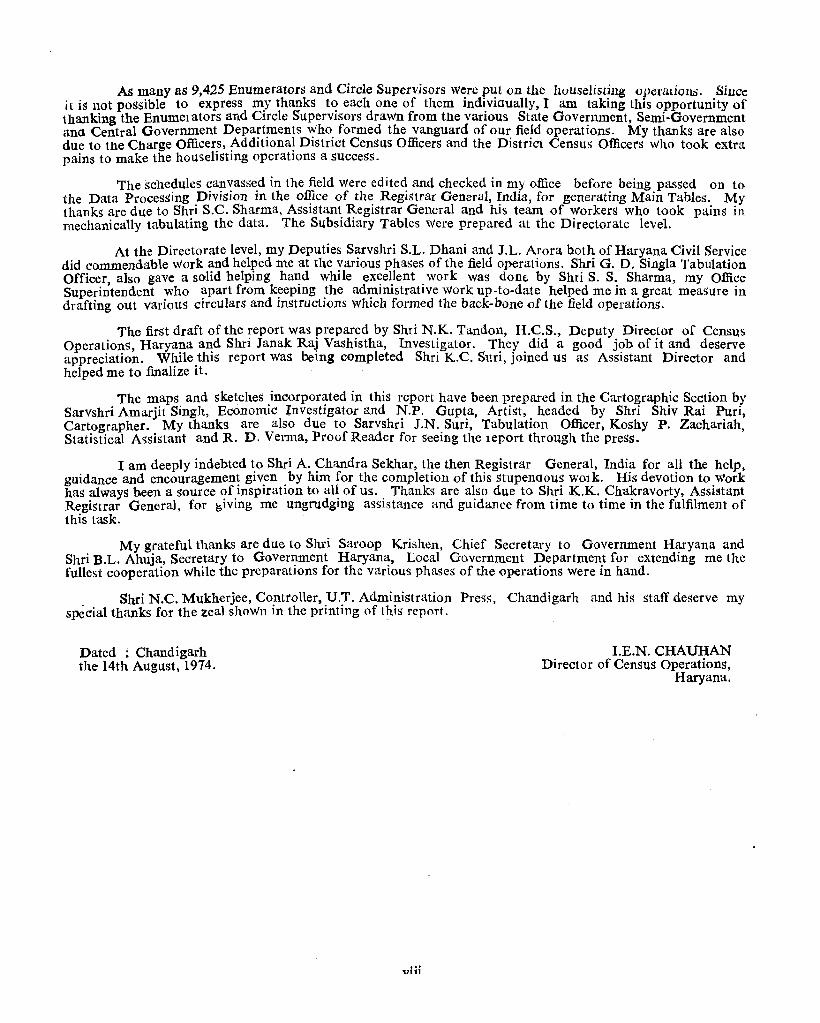
As many as 9,425 Enumerators and Circle Supervisors were put on the houselisting operations. Since il is not possible to express my thanks t~ each one of them indi.viaually, I am taking this o.pportunity of thanking the Enumelators and CIrcle SuperVIsors drawn from the varIOUS State Government, SemI-Government ana Central Government Departments who formed the vanguard of our field operations. My thanks are also due to the Charge Officer~, f\dditiona~ District CenSuS Officers and the District Censlls Officers who took extra pains to make the housebstlllg operatIOns a SucceSs.
The schedules canvassed in the field Were edited and checked in my office before being passed on to the Data Processing Division in the office of the Registrar General, India, for generating Main Tables. My thanks are due to Shri S.C. Sharma, Assistant Registrar General and his team of workers who took pains in mechanically tabulating the data. The Subsidiary Tables were prepared at the Directorate level.
At the Directorate level, my Deputies Sarvshri S.L. Dhani and J.L. Arora both of Haryana Civil Service did commendable work and helped me at the various phases of the field operations. Shri G. D. Singla Tabulation Officer, also gave a solid helping ha~d while ex~e~lent. work was done. by Shri S. S: Sharma, my Office Superintendent ?"ho ~part from k~epIng .the adI?1lmstratlve work up-to-date helped me In a. great measure in drafting out varIOUS CIrculars and IllstnlctIOns whIch formed the back-bone of the field operatIOns.
The first draft of the report was prepared by Shri N.K. Tandon, H.C.S., Deputy Director of Census Operations Haryana and Shri Janak Raj Vashistha, Investigator. They did a good job of it and deserve appreciatio~. While this report was being completed Shri K.C. Snri, joined us as Assistant Director and helped me to finalize it.
The maps and sketches incorporated in this report have been prepared in the Cartographic Section by Sarvshri Amarjit Singh, Economic Investigator and N.P. Gupta, Artist, headed by Shri Shiv Rai Puri, Cartographer. My thanks are also due to Sarvshr i J.N .. Suri, Tabulation Officer, Koshy P. Zachariah, Statistical Assistant and R. D. Verma, Proof Reader for seemg the leport through the preSs.
I am deeply indebted to Shri A. Chandra Sekhar, the then Registrar General, India for all the help. guidance and encouragement given by him for the completion of this stupenaous WOlk. His devotion to Work has always been a source ?f_inspiration to al~ of us .. Thanks are a~so due to Sh~i K.K. ~ha~ravorty, Assistant Registrar General, for !;IVmg me ungrudglllg assIstance and gUidance from time to tIme m the fulfilment of this task.
My grateful thanks are due to Shri Saroop Krishen. Chief Secretary to Government H~ryal1a and Shri B.L. Ahuja, Secretary to Government Haryana, Local Government Department for extendlng me the fullest cooperation while the preparations for the various phases of the operations were in hand.
Shri N.C. Mukherjee, Controller, U.T. Administration Pres:::, Chandigarh and his staff deserve my special thanks for the zeal shown in the printing of this report.
Dated : Chandigarh the 14th August, 1914.
.. ' vlll
I.E.N. CHAUHAN Director of Census Operations,
Haryana .
CHAPTER 1
INTRODUCTORY
Need for Housing Census
I . The Housing Census or collection, compilation and processing of statistical data concerning houses has a two fold purpose. Firstly, it is a means to an end viz, the population count. It serves as an inventory for the Census Enumerators enabling them to undertake subsequently the enumeration work. The main aim of the population count is to provide to the State a fairly accurate assessment of the population of the country and with this end in view, it has to be ensured that no one is missed or counted twice, or to use census termiJ?ology, that there is no omission or duplication in the count as far as possible. The houselist prepared at the time of the Housing Census serves as a frame work for the purposes of achieving this objective and for ensuring complete coverage of the area and the population living therein. The Housing Census provides just this basis by dividing the territory into suitable strata and blocks as will be seen subsequently in this volume. The houselist, in conjunction with the layout maps, provides a base for the Census functionaries in the enumeration blocks. It .also serves as a guide for future surveys and sampling by scholars and specialists.
2. Secondly, the Housing Census is essential in the larger interests of the citizens of the State. Housing is one of the universally accepted needs of the people besides food and clothing. Collection of the data regarding the number of houses, ~heir typ~s, the different uses to which they are put, matenal used 111 the construction of such houses, their size and the tenure characteristics reflect the availability and further requirements of the houses in the State. The data regarding slums also brings to light the unhygienic conditions in those areas. Every national Government also strives to provide shelter to its people but before any such plan can be formulated, it is essential that the Government should have an idea about present availability and the future requirements. Haryana came into being with effect from the 1st November, 1966, after the erstwhile Punjab State was re-organised and is still in the early stages of development. With rapid industrialization and the consequent influx of the population into the urban areas from the rural areas the housing problem in urban areas is apt to become all the more accute. Congestion ofpopulatio~ in such areas i~ naturally ~n the increase. The Housmg Census prOVides the baSIC data to the State for the purposes of solving the problem of shortage of houses, and the consequent removal of congestion, specially in slum areas. In the Five Year 'Plans separate allocation is made for housing and this State has already started the 'Low-Income Group Housing' and the 'Middle-Income. Group Housing' schemes. The Housing Census prOVides the necessary data for formulating these schemes. In other words, the' Housing Census plays a pivotal role in shaping the housing programmes of the State.
Historical Background of the Housing Census
3. The numbering of houses and their listing has always been a preceding exercise for actual enumeration but the uniform concept of the Census House and the uniform houselist was framed as late as 1961. In the Censuses prior to 1951 the definition of a Census House differed from State to State and from Census to Census. The Superintendents of Census Operations were allowed to frame definition of houses "To suit the circumstances of the different parts of their charge and the chief aim was administrative, namely, to show the enumerator what buildings he had to visit." The detailed particulars about the material used, accommodation available etc. were not collected at that time. The first such attempt was made in the 1871-Census series in the then Madras Presidency when the data on the distribution of houses according to terraced, tiled and thatched houses and the distribution of population amongst these types of houses was collected. In the erstwhile composite Punjab, the definition of a Census House also varied during these Censuses. In 1881, a house was defined as comprising all buildings possessing a common courtyard. In 1891, it comprised buildings located within a common enclosure or having a common courtyard excepting lanes and semi-public spaces in towns as well as outlying huts and shelters. This definition was widened in 1901 and the house included any place which happened to be occupied on the reference date of actual Census, selection being left to Local Census Officers. Subsequently, during 1911, 1921 and 1931, the house in the rural areas was defined as a structure occupied by one commensal family with its resident dependents such as widows and servants. The houses where one or more persons were found sleeping on the night of the final enumeration were also listed irrespective of the fact whether such houses were detached or not. In towns, however, the structures intended for the exclusive residence of one or more commensal families were treated as houses. Separate rooms or set of rooms in Hotels and Sarais were treated as separate houses. So much so that the shops, schools and other institutions where someone was found sleeping during the night of enumera.tion were also considered as houses. In the year 1941, a House was defined as a dwelling place of a commensal family. This was, subsequently, changed in 1951 where it was defined as a dwelling with a separate entrance. Inspite of varying concepts two common features are discernible in all Censuses up to 1951. Firstly, only residential houses were recorded and secondly, other houses were recorded if someone was found sleeping therein on the prescribed date. During the 1961-Census a uniform definition of a Cen. sus House was adopted and it was defined as structure or a part of structure inhabited or vacant or a dwelling or a shop-cum-dwelling or a place of business, workshOp, school etc. with a separate 'entrance. If a
building had a number of flats or blocks which had separate entrances and were independent of each other, these were considered as separate Census Houses.
4. The structures where no one was found sleeping on the night of actual enumeration, were excluded in the Censuses up to 1951. These structures, however, came within the ambit of a Census House from 1961 onwards. The definition adopted at the 197J-Census was almost the same.
Preparation of Maps
5. To ensure complete coverage, and to make the population count as accurate as possible, it is essential to have suitable maps for the administrative units and to further divide these units into convenient blocks of an optimum size before starting the actual houselisting/enumeration. For this purpose, the maps have to be brought up-to-date and in some cases to be drawn afresh. Jurisdictional, notional and layout maps were prepared as detailed here-in-after :-
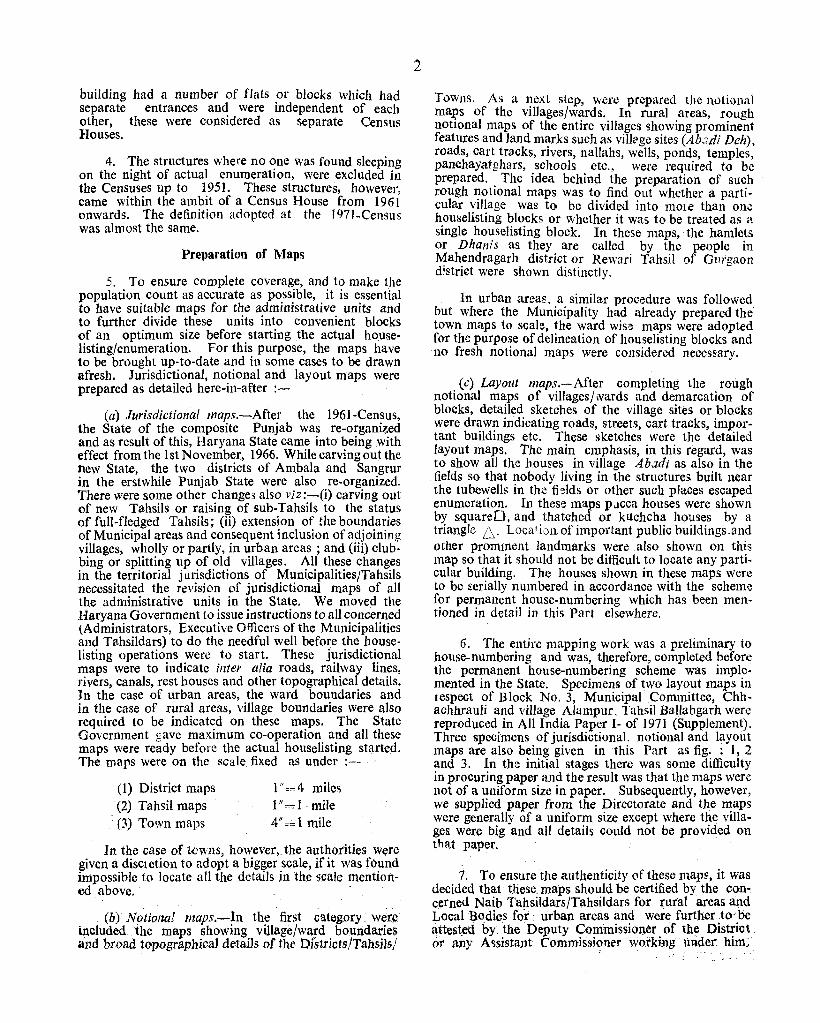
(a) Jurisdictional maps.-After the 1961-Census, the State of the composite Punjab was re-organized and as result of this, Haryana State came into being with effect from the 1st November, 1966. While carving out the new State, the two districts of Ambala and Sangrur in the erstwhile Punjab State were also re-organized. There were some other change, also l'iz:-(i) carving out of new Tahsils or raising of sub-Tahsils to the status of full-fledged Tahsils; (ii) extension of the boundaries of Municipal areas and consequent inclusion of adjoining villages, wholly or partly, in urban areas; and (iii) clubbing or splitting up of old villages. All these changes in the territorial jurisdictions of MunicipalitiesjTahsils necessitated the revision of jurisdictional maps of all the administrative units in the State. We moved the Haryana Government to issue instructions to all concerned (Administrators, Executive Officers of the Municipalities and Tahsildars) to do the needful well before the houselisting operations were to start. These jurisdictional maps were to indicate inter alia roads, railway lines, rivers, canals, rest houses and other topographical details. In the case of urban areas, the ward boundaries and in the case of rural areas, village boundaries were also required to be indicated on these maps. The State Government "ave maximum co-operation and all these maps were ready before the actual houselisting started. The maps were on the scale fixed as under :-
(1) District maps (2) Tahsil maps (3) Town maps
1"=4 miles 1"=1 mile 4" = 1 mile
In the case of towllS, however, the authorities were given a discretion to adopt a bigger scale, if it was found impossible to locate all the details iIi the scale mentioned above.
-(b) Notional maps.-In the first category were
included the maps showing village/ward boundaries and broad topographical detai1s of the DfstrictslTa.hsiJsj
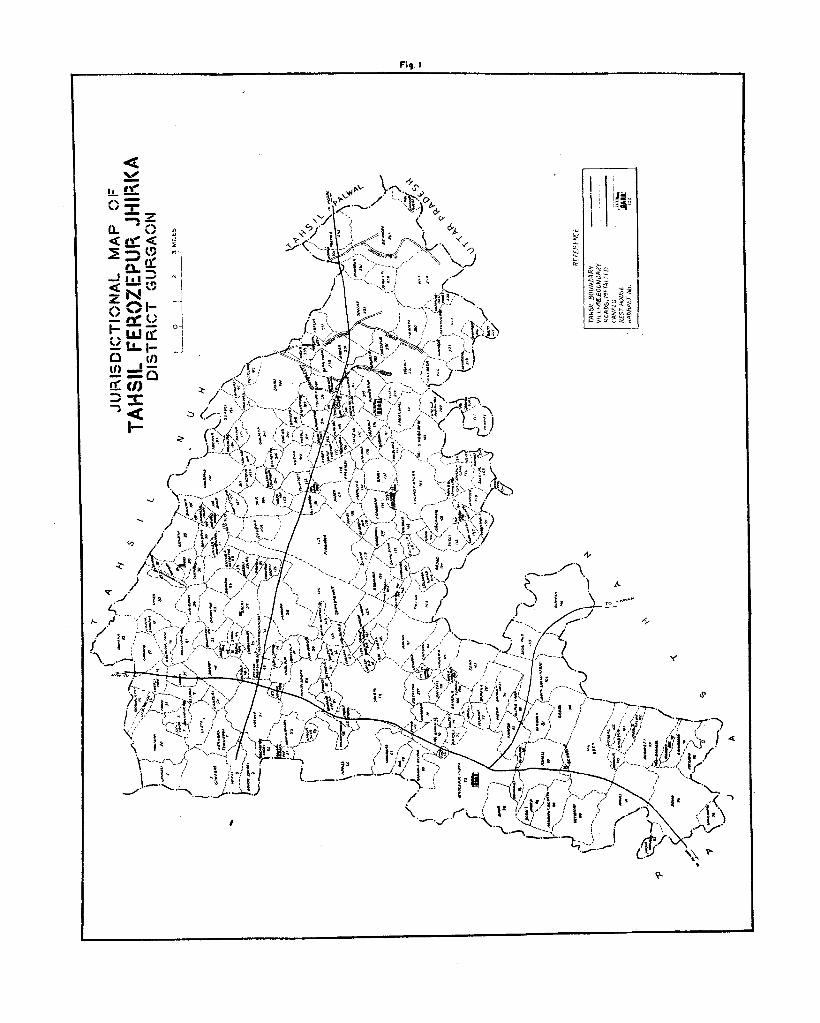
Towns. As a next stop, were prepared the notional maps of the villages/wards. In rural areas, rough notional maps of the entire villages showing prominent features and Jand marks such as vi1l~ge sites (Ab:;di Deh), roads, cart tracks, rivers, nallahs, wells, ponds, temples, panchayatghars, schools etc., were required to be prepared. The idea behind the preparation of such rough notional maps was to find out whether a particular village was to be divided into more than one houselisting blocks or whether it was to be treated as a single house listing block. In these maps, the hamlets or Dhanis as they are called by the people in Mahendragarh district or Rewari Tahsil of Gurgaon district were shown distinctly.
In urban areas, a similar procedure was followed but wher~ the Municipality had already prepared the' town maps to scale. the ward wis~ maps were adopted for the purpose of delineation of houselisting blocks and 110 fresh notional maps were considered necessary.
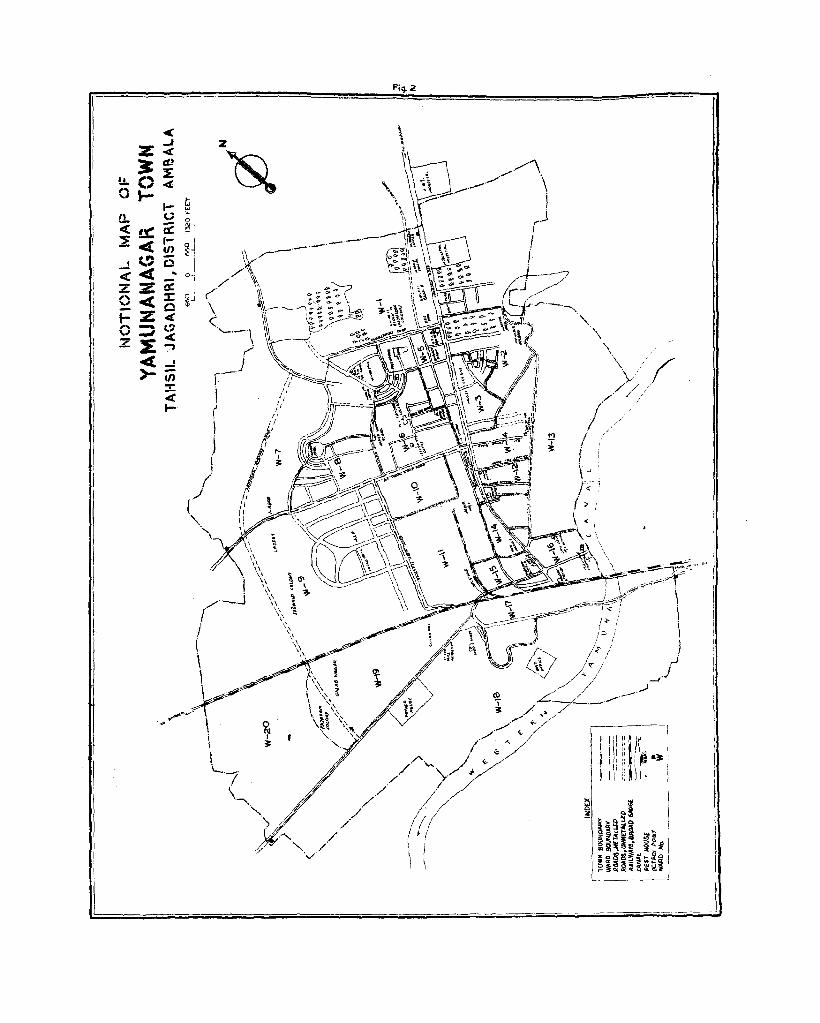
(c) Layout maps.-After completing the rough notional maps of villages/ \Yards and demarcation of blocks, detailed sketches of the village sites or blocks were drawn indicating roads, streets, cart traCks, important buildings etc. These sketches were the detailed layout maps. Tbe main emphasis, in this regard, was to show all the houses in village Abadi as also in the fields so that nobody living in the structures built near the tubewells in the fi';!lds or other such places escaped enumeration. In these maps pLlcca houses were shown by squareD, and thatched or kUchcha houses by a triangle 6. Location. of important public buildings.and other prominent landmarks were also shown on this map so that it should not be difficult to locate any particular building, The houses shown in these maps were to be serially numbered in accordance with the scheme for permanent house-numbering which has been mentioned in detail in this part elsewhere.
6. The entire mapping work was a preliminary to house-numbering and was, therefore, completed before the permanent house-numbering scheme was impl~. mented in the State. Specimens of two layout maps m respect of Block No.3, Municipal Committee, Chhachhrauli and village Alampur. Tahsil Ballabgarh were reproduced in All India Paper 1- of 1971 (Supplement), Three specimens of jurisdictionaL notional and layout maps are also being given ill this Part as fig. : 1, 2 and 3. In the initial stages there was some difficulty in procuring paper and the result was that the maps were 110t of a uniform size in paper. Subsequently, however, we supplied paper from the Directorate and the maps were generally of a uniform size except where the villages were big and all details could not be provided on that paper,
. 7. To ensure the authenticity of these mape, it was decided that these maps should be certified by the Concerned Naib TahsiJdarsjTahsildars for rural areas and Local B.odies for' urban areas and were further to"be attested by the Deputy Commissioner of the Dis~ict or any Assistant Commissioner workmg nnder hlln~
" _,,, 11--_ ..... _ ~, .J. .."
..,~~ 111 u.. "'_ « a:: ~ ~.1 -~\".., 2:-,!(
a...:::) N~ ..1 I. I '1'\ I ~N'" _j
" ''''''1- ! " ", , ... I , .. ,,, .. , °1 1- !jj n' , 0 .. 1 _ _j " _ (/) - 1-(/)=0 n' (I) ~x 1«
1-
FiCJ·1
I

PiCJ.2
,..J
,-' j
._.J
.. '

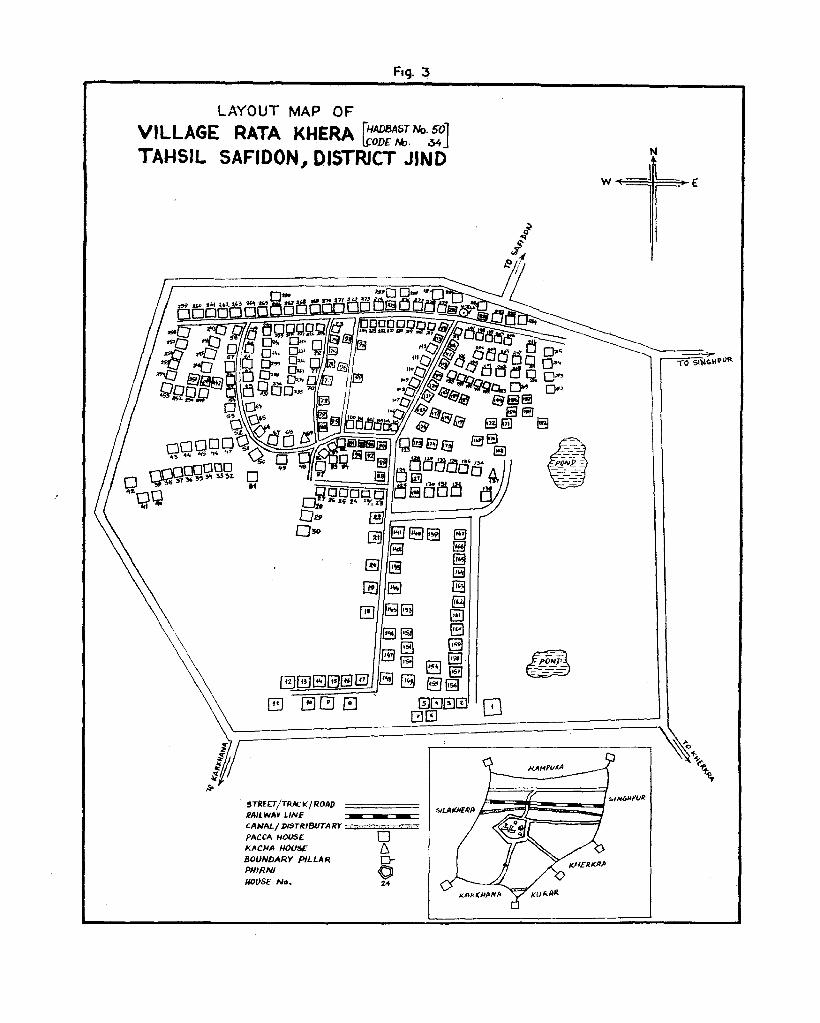
FIg. :3
LAYOUT MAP OF VILLAGE RATA KHERA rHADBAST No. 501
. ~ODE ,..,. .y, J TAHSIL SAFIDON, DISTRICT JIND
5TR££T /TRA(;K/ ROil/) ~~==~ RAILWAY UNE _ _ _
CAI>IAt./ /)ISTR'FJUTARY
PACCA HOIJSC 0 I<ACHA HOUSE £::, BOUNDARY PILLAR 0-PHIRNJ 0 /IOVSE No. 24
ga '@
N
w _jL E
li

Scheme on Permanent House Numbering
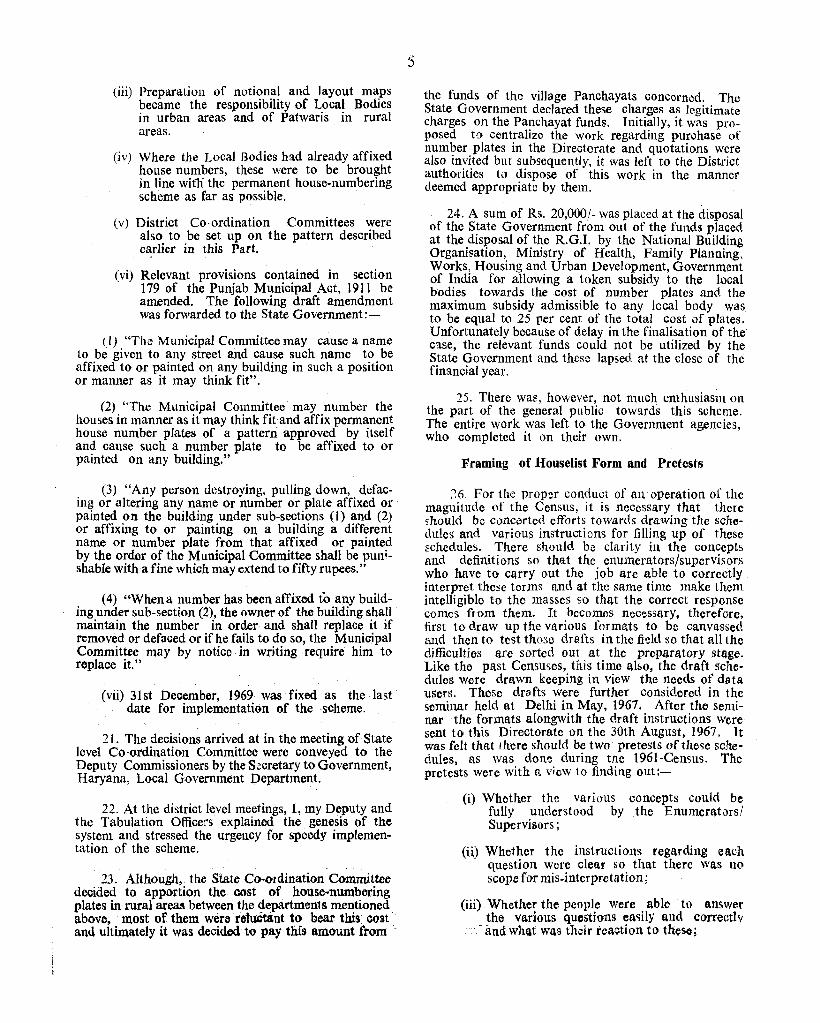
8. A good house-numbering system not only serves as a basis for the pOl'ulatir''l count but it facilitates all th,~ plans. surveys and schemes form~lated by a welfare State which are essential for the be,D.I. ~t .of the citizens. In any modern system of governmeht it is essential that every person be easily located in his house for purposes of providing services such as post and telegraph, family planning, elections and so on. It is also desirable that outsiders, on entry into the town/village should be able 10 locate any particular house and the individual in it by simple reference to the layout map. A good housenumbering system is, therefore, a dire necessity both from the point of view of an individual as well as that of administration. A uniform scheme for house-numbering was, therefore, prepared for the entire country. It also mad~ provision for maintaining the numbering effectively and continuously. This was with a view to achieving the maximum amount of standardization.
. 9. Even before the present scheme came into vogue,
the Census Department. Punjab had earlier taken up this que~tjon of numbering of houses with the State Government in March, 1960 and the latter had issu~d instructions to various authoritks for implementing thl! scheme. The expend.iture involved. had been declared a fit charge on the funds of Municipal Committees. However, as Census work had to be finished within the scheduled time, the organization could not wait for the work to be completed. The State Government, took certain decisions in this context at a conference in September, 1962 and thereafter ismed further instructions to the Executive Officers of the Municipal Committees. Some progress . towards this end had been achieved when the scheme was circulated.
J O. After the detailed Jayout mapf of villages/wards had been prepared it was decided to number the houses serially in accordance with one of the three formulae detailed below :-
(i) SiNg Ie-series house-numberillg.-'-This system of house-numbering, wherein the houses falling in a particular village were to be numbered in one serial order for the entire viflage, was recommended for small villages where the number of houses did not exceed 125 and where the village was not divided into separate, independent and mfficiently apart hamlets or DTzanis.
. (ii) Block house-numbering system.-Tbe larger villages having more than 125 houses and divided into separate viable blocks were required to be numbered under this system. Here large villages were to be broken up into convenient blocks and every block was to be seyjally numbered separately. While indicating the house numbers in these blocks, the block number~ and the house numbere were both required to be given. The description 2-109, therefore, represented house No. 109 in block No.2.
(iii) Locality/ward/stre(:fs house-numbering system.-Th's system was recommended for large town~ having dis~inct localities or wards ... Each ward was to be given
a separate Code No. and within the ward, all the houses in those streets were to be allotted numbers. In this system, the h:mse number was made up of three component numbers viZ. (a) ward Nc. (b) road or street number and (c) house No. For example house No. 2-4-49 meant house No. 49 situated in street No.4 falling in ward No. 2 of the town.
II. The above methvds were embodied in the permanent house-numbering scheme. The actual numbering, how;::ver, was left to the local functionaries to be done in any logical fashion. Where any housenumbering system existed prior to this and was working satisfactorily, no denova numbering was envisaged. As a result of this, in Haryana also, all these three systems prevailed. For instance, singlc-series house-numbering system was in vogue in small villages, Mahendragarh and Ganaur towns, block numbering system in larger villages and most of the towns while locality/ward I street numbering system prevailed in Narwana and Fatehabad. By and large, the Muntcipal Committees adopted the system as wat: prevalent prior to the implementation of this scheme for the purpose of assessment and realisation of property tax, hous~ tax and other such purposes.
Affixing of House Numbers on the Buildings
12. After the numbering had be~n done on the layout sketches in respect of all the buildings whether residential, non-residential, occupied or un-occupied, temples. office buildings, shops, huts, jhuggies or khokhas, numbers had to be marked in the centre of the lintel of the front door or on the front door or next to it on the wall. In the case of a hut the numbcr was to be affixed on any suitable beam, pillar, or flat part or failing this on a wooden plate hung by a wire or rope from any suitable place in the hut. All old numbers, if any, were to be obliterated. Only international numerals were to be used. Where, however, the locality/ward/street numbering system was adopted. it was further decided that at the beginning and end of each street a wooden or metal plate was to be affixed indicating the number and name of the Etreet and the ward number in the manner indicated below:-
Street No. I -----Temple Street Ward No. 4
13. It was also envisaged that there would be a periodical check up of the houses and those which may have sprung up during the intervening period should be given a number separated by an oblique. For instance, a new house falling between house Nos. 5 and 6 would be allotted house No. 5/1. This would be specifically distinguishable from the Census House No. as the latter would be described within brackets such as 5(1), 5(2) etc.
14. The system of giving new numbers was tried by the Census Organization, at the \!ime of the post enumeration check conducted during April, 1971, and the survey for the purposes of comparability of response to economic questions canvassed both at
1961 and 1971 Censuses conducted in Haryana during December, 1971/January, 1972. It proved useful.
15. On the organization side, at State level, a Coordination Committee was constituted with the Director as the convener. The Secretary to Government, Haryana, Local Bodies was the Chairman and the other members of this Committee were:-
(1) The Excise and Taxation Commissioner, Haryana.
(2) Chief Electoral Officer, Haryana.
(3) Director, Postal Services, Punjab Circle.
(4) Deputy Secretary, Revenue, Haryana.
(5) Director, Urban Local Bodies, Haryana.
(6) Director, Panchayats, Haryana.
(7) Director, Civil Defence, Haryana.
(8) Under Secretary, Food and Suppli0s, Haryana.
(9) Executive Officer, Cantonment Board, Ambala Cantt.
16. At were made scheme:
district level, the following officers responsible for the execution of the
Deputy Commissioner of the district assisted by;-
(i) Sub-Divisional Officers (Civil)
(ii) Tahsildars
(iii) District Pood and Supplies Officer
(iv) District Development and Panchayat Officer
(v) Secretary /Executi ve Officer I Administrator of Municipalities
(vi) Excise and Taxation Officer
(vii) Chief Medical Officer
(viii) Representative:of Electricity Department
(ix) Representative of P & T Department
(x) Secretary, Zila Parishad
17. In urban areas, the initial responsibility was that of the Secretary/Executive Officer of the Municipal Committees/Cantonment Board while in rural areas, that of yjllage Panchayats.
18. "The circular containing the in~:tructiQJ1S 011.tM. scheme is reproduced as A.n~e:lfllre I'e -: _ :
4
Implementation of House Numbering Scheme
19. In April, 1967, the Additional Registrar General, India took up the ma.tter regarding implementation of the permanent h6'use-numbedng scheme with the Chief Secretary to Government, Haryana, Chandigarh. This Directorate also took up the matter with the State Government on the 20th January, 1968 detailing the major steps required to be taken in the implementation of the scheme. The State Government then issued instructions to all concerned with this subject. The Co-ordination Committee at the State level was constituted by the Haryana Government on the 1st of June, 1968. The Deputy Director of Military Lands and Cantonments and Economic and Statistical Adviser to Government Haryana were also brought on to the Cominittee and the first meeting was fixed for the 3rd of July, 1968 but as the Map Officer, office of the Registrar General, India was not in a position -to attend the meeting on that day, the meeting was postponed to the 12th of July, 1968. In this meeting, it was basically agreed that every house in the State should be allotted only one number but no decision with regard to the cost of affixing of number plates could be taken. It was further decided that this· Directorate would be the executing agency and would provide the necessary leadership. Before the second meeting was fixed, the position already existing in the State was ascertained by my office and it transpired that out of 62 urban local bodies at that time, 34 had already provided permanent house-numbering plates, 5 more were in the process of doing this and 19 had only a temporary system. The remaining four local bodies had not taken any decision in this regard. In rural areas, the scheme was to be implemented from scratch.
20. The Committee again met on the 19th November, 1968 and took the following decisions:-
(i) The cost of affixing permanent housenumbering pI t tes would be borne by the Municipal Committee.
(ii) In the rural areas, the cost of affixing the plates was to be borne by the following departments of the State/Central Govern· ment :-
(a) Electiolis ;
(b) Panchayats ;
(c) F.ood and Supplies
Cd) Planning;
(e) P.W.D. Electricity;
(f) P.W.D. Public Health
(g) Excise and Taxation
(h) Health ; and
'.', .. _._ (if C~n-su~ .I)jrect?rate.
(iii) Preparation of notional and layout maps . became the responsibility of Local Bodies
in urban areas and of Patwaris in rural areas.
(iv) Where the Local Bodies had already affixed house numbers, these were to be brought in line witu the permanent house-numbering scheme as far as possible.
(v) District Co-ordination Committees were also to be set up on the pattern described earlier in this Part.
(vi) Relevant provisions contained in section 179 of the Punjab Municipal Act, 1911 be amended. The following draft amendment was forwarded to the State Government:-
(1) "The Municipal Committee may cause a name to be given to any street and cause such name to. be affixed to or painted on any building in such a positIon or manner as it may think fit".
(2) "The Municipal Committee may number the houses in manner as it may think fit and affix permanent house number plates of a pattern approved by itself and cause such a number plate to be affixed to or painted on any building."
(3) "AllY person destroying, pulling down, defacing or altering any name or number or plate affixed or painted on the building under sub-sections (l) and (2) or affixing to or painting on a building a different name or number plate from that affixed or painted by the order of the Municipal Committee shall be punishable with a fine which may extend to fifty rupees."
(4) "Whena number has been affixed to any building under sub-section (2), the owner of the building s.ha~l maintain the number in order and shall replace it If removed or defaced or if he fails to do so, the Municipal Committee may by notice in writing require him to replace it."
(vii) 31st December, 1969 was fixed as the last date for implementation of the scheme.
21. The decisions arrived at in the meeting of State level Co·ordination Committee were conveyed to the Deputy Commissioners by the Secretary to Government, Haryana, Local Government Department.
22. At the district level meetings, I, my Deputy and the Tabulation Officers explained the genesis of the system and stressed the urgency for speedy implementation of the scheme.
23. Although, the State Co-ordination Committee decided to apportion the cost of house-num~ering plates in·rural areas betw~e~ the ~epartments me~tlOned. above. most of them were retU'Ctant to bear this cost. and ultimately it was decided to pay this amount from .
5
the funds of the village Panchayats concerned. The State Government declared these charges as legitimate charges on the Panchayat funds. Initially, it was proposed t·:) centralize the work regarding purchase of number plates in the Directorate and quotations were also invited but subsequently, it was left to the District authorities til disPo.se of this work in the manner d.eemed appropriate by them.
24. A sum of Rs. 20,000/- was placed at the disposal of the State Government from out of the funds placed at the disposal of the R.G.I. by the National Building Organisation, Ministry of Health, Family Planning, Works, Housing and Urban Development, Gove1'l1meilt of India for allowing a token subsidy to the local bodies towards the cost of number plates and the maximum subsidy admissible to any Ie cal body was to be equaJ to 25 per cent of the total cost of plates. Unfortunately because of delay in the finalisation of the case, the relevant funds could not be utilized by the State Government and these lapsed at the close of the financial year.
25. There wa~, however, not much enthusiasm on the part of the general public towards this scheme. The entire work was left to the Government agencies, who completed it on their own.
Framing of Houselist Form and Pretests
~(j. For the propzr conduct of an operation of the magnitude of the Census, it is necessary. that there ,hould be concerted efforts towards draw!l1g the schedules and various instructions for fillin.g up of these schedules. There Should be clarity in the concepts and definitions so that the enumerators/supervisors who have to carry out the job are able to. correctly interpret these terms and at the same time make them intelligible to the masses so tha.t the correct response comes fr om them. It becomes necessary, therefore, first to draw up the va.rious formats to be canvassed and then to test those drafts in the fi~ld so that all the difficulties arc sorted out at the preparatory stage. Like the past Censuses, this time £1,1&0, the draft Schedules Were drawn keeping i.n view the needs of data. USers. These drBfts were further considered in the seminar held at Delhi in May, 1967. After the seminar the formats alongwith the draft instructions Were sent to this Directorate on the 30th August, 1967. It was felt that there should be two pretests of tho<;c schedules, as was done during t.ne 1961-Cemus. The pretests were with a viow to finding out:-
(i) Whether the various concepts could be fully understood by the Enumerators! Supervisors;
(U) Whether the instructions regarding each question were clear so that there was 110 scope for mis-interpretation;
(iii) Whethe~ the peopl.e were . able to answer the vanous questIOns eac;Ily and correctly
. - and whtlt was their tCl\ction to theso;
(iv) Whe~her the space provided for recording the lllfoflna.tioll against each question in schedules was a.dequate ; and
(v) Whcthc~ the fonnats were suitable.
. 27. The first draft schedule provided a few more partIculars. It was proposed to canvass twv Houselist Schedules l'iZ. 0) General HouseUst and (ii) Special Househ!)t. The former wes to be canvassed in all area~ other than sample areas while the latter was reqU1r~d to be canvassed. in sample areas. These h.ousebsts, among ~ther thlllgS, contemplated collectIon of d~ta regardlllg the age of the hvuse, material of floor ~n the .house, drinking water supply, electri~lty available III the house, whether there was a privy III the ~ouse Or not, totallivillg area (in sq. metres), rent paid for the house and type of fuel used ill the house: The information concerning the manufacturing establIshments was sought to be collected through a separate schedule.
28. In Haryalla, during the first pretest, these schedules were canvassed in four rural and. two urban blocks in November/December, 1967. These sehed~les Were canvassed by ill} predecessor through the DJrectorate staff as some new concepts and ideas were involved and it WaS not considered safe to depend on the field agency so far as-theSe Were concerned. ,
29. The results achieved in the first pretest were considered in the conference held ill Nirman. Bhawan, New Delhi from the 23rd January, 1968 to the 27th· January, 1968 and certain suggestions Were made. The schedules also underwent some changes as a re.sult of discussions of the Registrar General, India WIth experts and data USers. It was decided to canvass only one houselist. Some of the questions included in the special houselist initially Were brought in the revised form. These were the age of the house, whether it was wholly or partly an establishment, whether the household belonged to Scheduled Caste or Scheduled Tribe and whether it cultivated land. The scope of establishments was widened so as to include all establishments and not merelv manufactur-ing establishments.· " .
30. Thereafter, these schedules and the draft instructiolls were got translated into Hindi and ultimately canvassed in the second protest. In our State, the second pretest was conducted in the following 13 blocks:-
Urban Areas
(i) 4 Blocks Nos. 43- 46 of Ward VII of K.anwl town.
(ii) 4 Blocks Nos. 59- 62 of Ward IX of R(}ht~k town.
Rural Areas
(0 Rahna H.B. No. 95 in Tnh~,i1 Null,
.. (ii) J~.ajpurit H.B.. NO: i07 in Tahsil Hansi.
Tahsil (iii) Majra ,Khurd H. B. NO. 63 in Mahendragarh.
(iv) Pindara HoB. No. 72 ill Tahsil Jind.
~ v) Kha.n Ahmadpur H.B. No. 144 in Tahsil Ambala .
31. The Secretary to Government Haryana, Local GOVernment Department was approached to issue instructions to all heads of departments to (i) give full cooperation to the CensuS Organisation; (ii) appoint suitable staff to wmk as Enumerators/Supervisors in the pretest; and (iii) to see that th'O staff· put on duty was not allowed leave during the period of pretest. The HarY8.na Government readily accepted our suggestions and issued suitable instructions to the field sta.ff. The Enumerators for the pretest were· drawn from the teachers because ultimately the work was to bo attencl.cd to by them. Supervjsory staff was, however, from higher ranks. In the ca<;e of urban areas Executive Officers of the Municipal Committees cOll~crncd were the Supervisors while for the rural areas, this work was nssigne(\ to' tho Naib Tahsilcl.ars.
32. On the 28th Februar), 1969 and the 1st March, 1969, a training seminar wac; organized. The in0ugura[ session was presided over by Shri Khursbic1, Ahmed, the then Minister for Health, Local Government and Development. HaryanQ. He being inchal'ge of the Local Bodies Department, the entire machinery became conscious of the importance of Census work. The Ref.sistrar General, Tndia was kind enough to preside over the deliberations. The Secretary Local Bo.dies Department also attended that function. This seminar was attended to by the District Development and Panchayat Officers (who Were ex-officio Additional District Census Officers),. Enumerators/s-upervisors connected with the pretest. The Deputy Commissioners, Rohtak and Kamal Were also invited to participate in the discussions but because of their pre-occupatiolls, they could not come. The Registrar General, India impressed upon all the functi{}11aries the i>l!lJortance of the work. .A copy of. the speech of, Hon'ble Minister is rep! oduced as Annexure VIII.
33. Shri G.P. Sharma, Research Officer, office of the Registrar . GeJ1e~al, In~ia, New ~lhj q,i1ated on the subject of house numQerillg an4 prep:.\fa,tion of notional lUapS .. ·In addition, the technique of filling up the houselist schedules as well. as the various concepts we.re drilled into the minds of the participants. Sub3equeiltly, the headquarters staff was deputed to remain present white the District Census Officers imparted further training to the staff.
34. The Registrar General of India also wrote to all the State Governments 011 the 25th February, 1969 about the Second pretest.
35, All these steps went a. 101l.gway ill involving the licld _officers and other State Government officers and in . _mentally preparing them for conducting the f>tupendous task nhearl. Thei became conscious of thcimpm1Wlce or the job with the result that We . could .0
finalize it . smoothly &nd cflicjent1y~
36. While the Second pretest was going Oil in the field, the Regi: trar General, India/Deputy Registrar General, Were kind enough to visit some of the blocks in Haryana. 1, myself and my deputy also went round. We also sent headquarter's staff to different blocks with a view 10 ensuring the proper conduct of the pretest.
37. The Second pretest was carried out from 15t11 March. 1969 to 2nd April, 1969 and When it was over, t calkd a conference on the 19th April, 1969 ill which the Deputy Commissioners Rohtak and Karnal and other District Census Officers Were present. Shri K.D. Ballal,-Deputy Registrar General, (Census) also participated in the deliberations. We discussed the outcome. of the two pretests and gave suggestions for improvement in the fonnats/instructions.
38. The matter then came up for consideratioll before the conference of Directors but sub3equelltly, decisions Were taken after full discussion by the R.G.I. with the Planning Commission. on the 24th May, 1969. This meeting was presided OVer by the Deputy Chairman Dr. D.R. Gadgil and as a result of this some important changes were carried out in the hou5el;st and
. the final form was devised.
39. The collection of data in regard to the age of the house, material of floor, amenitie~ available, privy etc. was dropped.
40. Copies of formats u~ed at rretests. are given in . Annexures II, HI & IV.
Contents of Final HOl1selist Form
41. After two pretests and deliberations of the Directors, Census Operations, a final form for t~e houselist was devised and a copy of the same IS given in Annexure V. It was sought to include in this, information regarding the particulars of t~e buildings, Census Houses (Cols. 2 and 3), materIal used for the construction of walls/roofs of the Census Houses (Cols. 4 and 5), purpose for which the house is used i.e. whether it is used as residence, shop, shop-cum-residence, business, factory, worksh~p, workshop-cum-residence, school, bank, commercIal house, office, hospital, hotel etc. or vacant (Col. 6), whether used wholly or partly for an establishment (Col. 7), if used as residence, particulars of the household (Cols. 8 and 9), whether the household belongs to S. C./S. T. (Col. 10), nO .. ?f living rooms in the house (Col. 11), whether It IS a rented house or an owned one (Col. 12), no. of persons residing therein (Cols. 13-15), whether the household cultivates land (Col. 16). In the remarks (Col: 17), the reasons were to be mentioned if the entry In Col. 6 was "Vacant."
42. The houselist form used in 1971 was slightly different from that used in 1961. The essential data relating to inciustrial establishments, w?rkshops and faeptories, i.e. the name - pf the, establIshment, a~erage 'number ,of persons e1Pploye~ per day ~nd the ~nd of ppwer alld.fuel used for machme% v:as Included mthe houselist at the 1961-Census but III 1971 a 'separate
7
schedule known as "Establishment Schedule" was canvassed. A copy of this proforma is given in Annexure VI.
43. The data regarding establishments which was interpreted alongwith other information in 1961-Census in the Housing Report is being dealt with separatelY'in the 'Report on Establishments'in Part III.
Instructions for HOllselisting
44. Instructions to the Enumerators/Supervisors for filling up the entries in the Houselist and Establishment Schedules were contained in an "Instruction Booklet" issued by the office of the Registrar General. The relevant extracts are reproduced in Annexure VII. The entire State was divided into urban and rural areas and location codes were allotted to all the areas. In the case of an urban area, the code consisted of the number for the District/Town/Ward while the code for rural area was made up of District, Tahsil and Village. In addition, there were special charges and reserved forest charges. Strictly military areas were excluded as the houselisting was not required to be done in them.
45 At State level, a Circular was issued. It contained instructions to the charge officers regarding distribution of houselist forms, other material connected with houselisting, training to the staff employed in connection therewith, and other instructions regarding the matters to be looked into at various levels.
Delineation of Blocks and Circles for Houselisting
46 For the purposes of houselisting, the State was divided into the following types of charges :---
(1) Rural Charges
(2) Urban Charges
(3) Reserved Fore'st Charges
(4) Special charges
Comprising all the viI· lages in a Tahsil excluding towns, forest areas and special charge.
J'Vfunicipal/Committeej cantonment, Notified Area Committee excluding special charge.
Comprising Ambala Forest Division (Reserv
ed forest areas of Kalesar and Morni Hills).
: (i) Hindustan Machine Tools, Pinjore (ii) Bhupindra Cement works, Surajpur (iii) Medical College, Rohtak and (iv) . Railway Colony, lind,
41. fhe number of charges under (i), (ii) and (iv) wet:e. 32,64 and 4, respectively. These charges were further divided into Supervisors' circles and Enumerators' blocks. While carving out the blocks, pains were taken to ensure that the village and ward boundaries were not cutting across as it was basically wrong to do so, since the data had to be presented village/wardwise.
48. As houselisting was concerned more with houses than individuals, the basis for carving out the blocks was houses rather than population and with the help of notional/layout maps of villages/wards prepared for the permanent house-numbering scheme and the norm of 250-300 houses, the blocks were requir~d to be carved out afresh. In some cases, the charge officers were allowed even to go upto 350 houses. The charge officers were made responsible for ensuring that the carving out of blocks was done strictly in accordance with the instructions. The procedure followed for achievement of this objective was as below:-
Rural Areas
49. Villages where the total number of houses was less than 350 were treated as single blocks and entrusted to separate enumerators. Smaller villages, which on account of geographical contiguity could be clubbed together were entrusted to the same enumerator but such officials were clearly told that the houselists for each of these blocks would have to be prepared separately. In no case was a complete village clubbed with a part of another village to form one enumerator's block. Big villages were distributed into viable blocks keeping in view the norm described above but here also geographical compactness was the foremost consideration.
Urban Areas
50. The Municipalities had their ward-wise layout maps and with the help of these, the blocks were carved out exactly in the same fashion as in the case of rural areas but it was also ensured that boundaries of the enumerator's blocks in these areas were well-defined so as to obviate the chances of overlapping.
5]. The reserved forest charge in Ambala District was already divided into ranges and each range was considered as a separate enumerator's block. In special charges, however, the procedure as adopted in urban areas was enforced.
It was further decided that all the Rural Charge Officers and the Urban Charge Officers should meet and decide about the boundaries of their respective charges so that there should be no overlapping or omission of allY area.
52. One Supervisory Circle was imposed on five enumerators' blocks. The distribution of blocks was entered ill the charge registers prescribed for the purpose which inter alia provided for the full identification particulars of the blocks and the names of Enumerators and Supervisors responsible for houselisting in these areas.
8
53. Having done so, the blocks and circles were numbered off in one series separately in their respective . charges.
54. The pyramid of territorial jurisdiction of each houselisting enumerator was as under :-
rUrban
I I ,
Ward/Sector / Locality or
Mohalla , Enumerator's
Block
Territorial Jurisdiction
State I
District I
Rural (Tahsils, all areas except urban and reserve forest
area) I
Village , ,
Enumerator's Block
.-- ----., Forest Division I I I
Forest Ranges I I
Enumerator's Block
55. There was some confusion with regard to the numbering of houselisting blocks. Although under the instructions, these blocks were required to be numbered in one series within an operational unit (charge), some Charge Officers gave numbers as 'A' 'B' which subsequently presented difficulty as these alphabets could not be punched on the cards in the Data Pro;;essing Division, office of ! he Registrar General, India. The numbering had in su~ cases to be redone.
56. The total number of houselisting blocks and supervisory ,circles was as under ;.-
Blocks
Circles
Total
Rural
Urban
10,591
9,071
},520
Total 1,579
Rural 1,270
Urban 30:)
Appointment of Staff
57. Deputy Commissioners were notified to act as District Census Officers of their respective districts. Since these officers were expected to be heavily pre-occupied with their normal heavy duties the District Development and Panchayat . Officers were designated as Additional District Census Officers and made directly responsible for Census work. Below them came the Charge Officers. In the case of rural areas, the Tlihsildars concerned· \'Vere declared Charge Officers
and Naib Tahsildars (Muhal) as Assistant Charge Officers. In respect of urban areas, the Executive OfficersjS ecretaries! Administrators were declared Charge Officers of the municipality concerned. Below the Charge Officers were the Supervisors who were responsible for 4-5 Fnumerator!>' blocks and at the lowest rung were the Enumerators. Where the villages were small, more than one village was entrusted to one Enu-merator. -
58. In the selection of Enumerators/Supervisors, the Di~trict Census Officers were given a free hand. This staff was largely drawn from the Revenue Patwaris, School Teachers, Village Level workers and other staff employed in the State Government departments. The District Census Officers were asked to draw up their inventories of the available staff keeping in view their place of residence so that the Census work, which was \:ssentially to he done outside office hours, could be
9
done conveniently and in time. Senior officials amongst this staff were to act as Supervisors and juniors as Enumerators. The State Government, on our initiative issued instructions to all concerned to allow the deployment of this staff and to stress on them the need for maximum co-operation towards completion of this stupendous task.
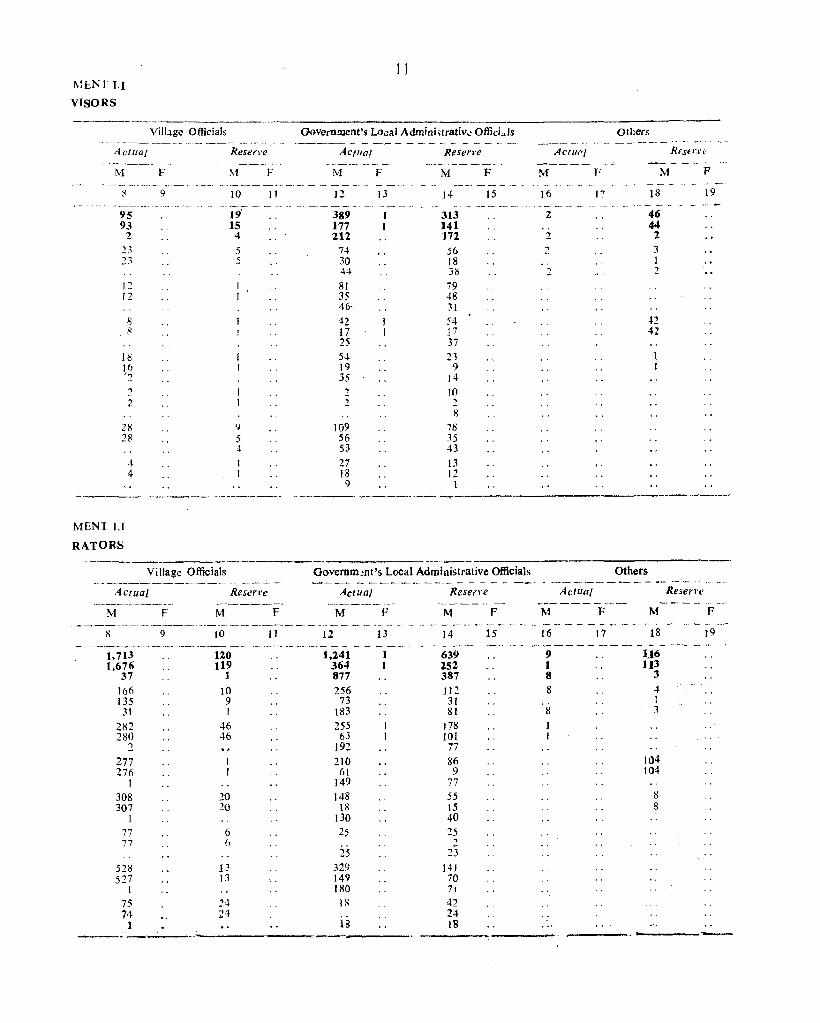
59. The appointments of staff for houselisting were made under the provisions of Indian Census Act and powers were delegated by the State Government to the Director of Census Operations, Deputy Commissioners, District Development and Panchayat Officers and Sub-Divisional Officers (Civil) to make appointments. The letters which were issued on printed forms were accompanied by relevant extracts from the Census Act so as to avoid any default. Particulars of the personnel engaged for this work are furnished in the statements given on next pages.
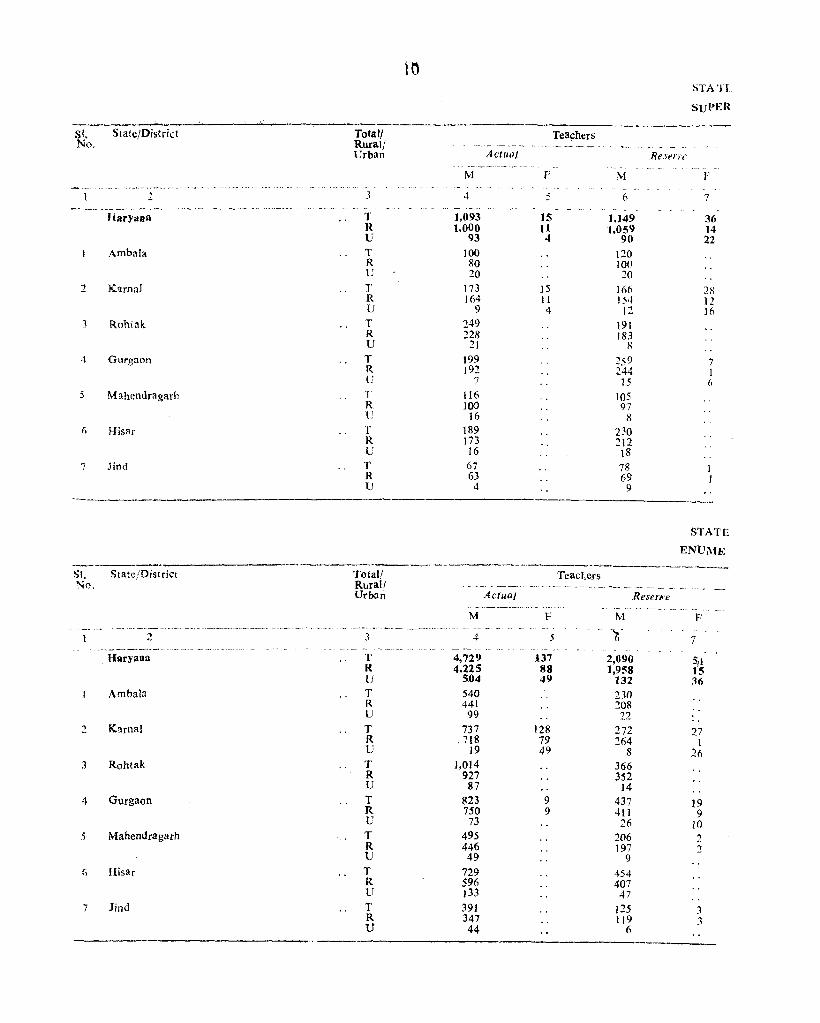
tn
Sl. State/District Totall No, Rural/
Urban
-~ ... ~.,. .. _"_ ... -- _, .-.. ~ 3 ,j.
~----~.-,
____ •• _._0 __ .•.• __ - -- - -- .-Haryana T
R U
Ambala T R U
2 K'lrnaJ T R U
3 Rohiak T R U
4 Gurgaon T R U
5 Mahendragarh T R U
6 Hisar T R U
7 Jind T R lJ
------_._----_--- ---~-.~-
sr. State/District Total/ No, Rural!
Urban
__ • __ •• -_'0 0 ~ •• _. - •• -~- ....
2 3
T R U
Ambala l' R U
:2 Kumal T R U
3 Rohtak l' R U
4 Gurgaon T R U
5 ~ahendragarh l' R U
() Hisar T R U
7 Jind T R U
Teachers ·_._r_ ~_ .. __ - -_- -_ .... - .. _ -- .
Actual -_. - -- -- -.- -- ~
M l'
4 5 - - -- ,-- -'_-1,093 15 1,000 II
93 4 100 80 20
173 }S 164 11
9 4 249 228
21 199 192
7
116 100
16 189 173 16 67 63
4
-------TcacI.ers
M
6
1.149 1,059
90 120 100 20
166 154
12
191 183
R
259 244
15 105 97
8 230 212 18 78 69
9
Resl'fl'l'
STATL
SUI>EI~
F
7
36 14 22
2S 12 16
7 I 6
STATE
ENUME --_,_-~---
.. _.---_._. _.o" •.• _,, ___ ._ .• . _. -_ ~- - _. - - •...
Actual Resn"d'e .-----~--.. -- ---.- . __ , __ .. -
M F M F
4 5 -'6' 7
4,729 137 2,090 5/1 4,225 88 1,958 15
504 49 132 .36 540 230 441 208 99 22 . ,
737 128 272 27 ,718 79 264 I
19 49 8 26 1,014 366
927 352 87 14
823 9 437 19 750 9 411 9 73 26 10
495 206 2 446 197 :! 49 9
729 454 596 407 133 47 391 125 :'1 347 119 3 44 6
MENT J.I
VISORS
11
Vilbgc Officials Government's Local Adm;ni;;trativ~ Offici"Js Others
A Clllll!
M
95 93
2 'P --, 23
12 12
8 ?i
18 16 '2
2 2
28 28
MENT U
RATORS
4 4
F
9
Reserve
10
19 15 4 5 5
'}
:; 4
F
II
Village Officials
Actual Reserre
M F M F
9 10 11 ,,-~ '_'_"_-- -- -_ .. __ . ___ .. .... ------_. -----_.-
1,713 120 1,676 119
37 1
166 10 135 9
31 I
282 46 280 46
2 277 276
1 308 20 307 20
I 77 6 77 6
528 13 527 13
I 75 14 N 24
1 --
Actllal
M F ~--.~--
12 13 __ ._--_._ 389 1 177 1 212
74 30 44 81 35 46-42 17 25 54 19 35 2 2
109 56 53 27 18
9
Reserve
M F
J4 15
313 141 172 56 18 38 79 48 31 54 t7 37 23
9 14 10 2 8
78 35 43 13 12
1
_----- -- -~---.-~ ._---- -
M
16
2
2
2
AC!IIf'/
F
17
M
18
46 44 1 3 1 2
42 42
F
19
--------,.~--~---
Oovemm:nt's Local Administrative Officials Others
Actual Reserve Actuol Resent'
M M F M F M
12 13 14 15 16 17 18 19 _.--_--- _._--_, .. _____ • ___ o_o_
_o __________ .~ ___
1,241 1 639 9 1,16 364 1 252 1 113 877 387 8 3
256 112 8 4 73 31 I
l
183 81 8 3
255 178 I 63 101 I
192 77 210 86 104
61 9 104 149 77
148 55 8 18 15 8
130 40 25 25 ., 25 23
329 14J 149 70 180 71
IH 42 24
18 18 ----
60. To provide assistance to the Charge Officers District Census Officers. temporary clerical posts. as detailed below, were also sanctioned :~
Tahsildars One L.D.C. each
District Census Officers One Assistant, Onc L.D.C. and One Peon each
61. This staff was paid dues at the rates applicable to the State Government employees of identical grades but the expenditure involved was debitcd to the Census Organisation.
62. The pyramid of housclisting hierarchy was as under :-
Director of Census Operations I
District Census Officer I ,..._------_._- .'- --------,
Urban Rural Forests Charge Officer Charge Officer (Divisional (Administrator/ (Tahsildar/Naib- Forest Officers Executive Officer/ Tahsildar for for Reserved Secretary of . Tahsils/Sub- forest Divi-Municipal Tahsils excIud- sions) Committees or ing Reserved Cantonment forests and Boards) Municipal
I towns) I I
Circle Supervisor Circle Supervisor (controlling 4 or 5 (controlling 4 or Enumerators' 5 Enumerators'
Blocks) Blocks) I I
Enumerators Enumerators
I I I I I
Circle Super-visor
,I I
Enumerators
Training to the Census Staff for liouseJi5ting
63. After the work relating to delineation of housclisting blocks and deployment of staff for carrying out the job in those blocks was completed, the next t.ask was to train the staff connected with this operatIon. This was no simple matter. The essence of Census is accuracy and completeness and this Objective could be achieved only if the entire machinery from the Directorate personnel down to the lowest level of enumerators was thoroughly and properly trained. It was essential to drive home to all concerned the different concepts adopted during this operation so that they were firstly able to understand these concepts with clarity and precision and secondl) to elicit proper replies to tIle questions adopted. Even a minor mistake or doubt about the concepts on the part of cnumeral0ra could cumulatively assume large proportions. It was, therefore, stressed upon the District Census Officers tha.t the entire staff should be trained properly and perfectly.
64. To slart with, training was imparted to the Directorate staff by the Registr&r General. Sub
- sequently Additional District Census Officers. were called to Chandigarh on 9th/10th October, 1969
12
and imtructiol1s were imparted to lhem with the help of printed charts. All pa.rticipants were called upon to explain the methodology. At the third stage, a traini,lg conferenc~ was convened. [It Ambala from the 4th Novemb::;r, 1969 to the Cth NovemrcT. 1969 and was inaugurated. by 1 he Governor of Hr.rYLllw.. The participUil,1 s of this training conference were the Commissilln~r Ambala Division, District CCl15US Officers except Rohtak, Additional District Census Officers, Sub-Area Commander. Ambala, LA.S.! H.C.S. Officers working as ~dmil1istr.e.tors of the Municipalities, all Charge Officcr,s of Ambala and the Commander, HarY8,na Armed Police. The genesis of hou~elisting wa.s explained and all the instructions issued ill connection with this operation Were imparted to a.ll the delegates to the conference. The Deputy Registrar General was kinrl. enougH to address the delegates effectively. The :.peeches of 1.he Governor and the n.R.G. are reproduced in the Annexures IX ana X. The idea behind the conference was to impress upon them the importance of adequate training to the fiel(l. staff which was ultimately the vanguard of the whole operation. Thereafter training was imparted to the Tahsildars who were functioning as Charge Officers for rural areas and to other urban charge Officers incharge of Municipalities, Cantonment and Notified Area Committees. These Charge Officers were, in turn, required to train the Supervisors/Enumerators employed under them particularly with regard to the following points:-
(i) Object of Census, Houselisting operations, its importance and key role played by the Enumerators in this national task.
(ii) Important provisions of the Census Act and the responsibilities of the Enumerators and Supervisors.
(A gist of various duties of Enumerators / Supcrvisor~ in conncction with h()u~cliRt ing was supplied to all the officiah for their ready reference. Thesc guidelincs nrc also reproduced in Annexure XI).
(iii) To familiarize the!11selve~ with the houscnumbering system prevailing ill their areas and acquaint themselves with the location codcs assigncd to each. charge/block.
(.iv) To know the detailed instructiolls regarding the filling up of Houseljst and tIle EstabliShment Schedules.
(v) Preparation of det(l.iled layout ske tches and assigning house numbers to the newly co,nstructed houses.
(vi) Urgency about the completion of the . various stages of 110uselisting operations
within the time schedule already framed.
65. The Charge Officers were directed to hold atlea~t three rounds of training for the Enumerators/SupervIsors employed under them. It was further required that
all the officials should be called upon to go through the instructions before attending these classes and further to fill in the houselist and establishment schedules as a practical exercise. The Charge Officers were also n~quired to ensure that there was no deoficicncy so far as the training was concerned and to weed out the officials .whom they qid not think to be properly trained as untralllcd personnel were a dead loss. An attendance and form register was 'prescribed indicating whether or not any particular Enumerator/Supervisor had received the requisite number of trainings.
COnCC)lts and Definitiors
66. The definitions of various terms used at the time of houselisting are as under :-
67. Pucca House.-It is difficult to precisely define the terms Pucca house and Kachc ha house. TIle categorisation of these two types of structures was' made simply to facilitate identification. A Pcccu house was treated as one which had its wall~ and roof made of the following material :-
68. Wall material.-Burnt bricks, Stones (duly packed with lime or cement), Cement Concrete or l limber etc.
69. Roof material.-Tiles, G alvanised CorJ'ugated Iron Sheets, Asbestos Cement Sheets, Reinforced Brick Concrete, Reinforced Cement Concrete, Timber etc.
70. Kachcha House.-Where, the wall and/or roof of house were made up of any material other than that used in plicca structure, it was considered as a ka c1IC{1Ct
construction. The material used in constructing kac!lc{w houses was unburnt bricks, bamboos, mud, grass, reeds, thatched structurc etc.
{lrban Areas
71. 1 he following areas were considered as Urban areas f"O far as the Census was concerned :-
(a) all places with .a Municipality, cantonment Board or a Notified Area Committee.
(b) all other places which satisfied the following criteria :-
(i) a minimum population of 5,000.
(ij) atleast 75 per cent of the male working population was non-agricultural;
(iii) a density of population of atleast 386 per sq. km. (i.e., 1,000 per sq. mile).
71.. The Directors of Census Operations were allowed discretion in this respect, which was to be exercised in consultation "ith the State Government but so far as Haryana is concerned no other areas except those mentioned at (a) above were treated as urban areas.
13
Village
73. The definition of a 'village' .ldopted in Haryana for Census purposes corresponds to the one contained in the Puniab Land Revenue Act. 1887. Under that Act a village is called a Revenue Estate or Mau::a for which a ;-eparate record of rights is maintained or which has been separately assessed to Land Revenue or would have been so assessed if the land revenue had not been realized or compounded or redeemed or which the State Government had otherwise declared as an 'Estate'. This definition had been adopted for Census· purposes ever since 1901. The village is, therefore, not merely the Abedi J)~,II but refers to the entire area coming within the estate.
Building
74. A 'building' is generally a single structure but wmetimes it is made up of more than one component units, which are used or ilTe likely to be used as residences or establishments such as shops, workshops, factories etc. A series of different buildings joined with one another by common walls on either side and looking like a continuous structure would practically be treated as independent of one another and each portion of this continuous structure would be assigned separate building number, while if a building comprises of more than one structures combined by a common courtyard, common verandah or stair-case, the entire structure shall be treated and numbered as one unit.
Census House
75. A 'Census House' i~ a building or part of a building having a separate main entrance from the road or common courtyard or stair-case etc. used or recognized as a separate unit. It may be inhabited or vacant. It may be used for a residential or non-residential purpose or both. If a building has a number of flats or blocks which are independent of one another having separate entrances of their own from the road or a common stair-case or a common courtyard leading to a main gate, those will be considered as separate Census Houses. If within a large enclosed area, there are separate buildings, then each such building will be one or more separate Census Houses. If all the structures within an enclosed compound were together treated as one building then each structure with a separate entrance would be treated as a separate Census House.
Census Household
76. A 'Household' is a group of persons who commonly live together and would take their meals fro111 a common kitchen unless the exigencies of work prevented any of them from doing so. There may be 'onemember household', 'two-member household' or 'multimember household'. For Census purposes each one of these types is regarded as a "Household". Again, there may be a household of persons related by blood or household of unrelated persons. The latter are Boarding Houses, Hostels, Residential Hotels, Orphanages, Rescue Homes, Ashrams etc. These are called "Institutional Households."
E!!tabJishll1cnt
77. An 'Establishment' is a place where goods are produced or manufactured not solely for domestic consnmption or where servicing and/or repairing is done such as factory, workshop or household jndustr" or servicing and/or repair workshop or a place wherc retail or wholesale business is carried on or commercial services are rendered or an office, public or private or a place of entertainment or where educational, religious, social or entertainment services are rendered. It is necessary that in all these places one or more per~ons should be actually working. Thus an establishment would cover manufacturing, trade and other establishments where people work.
7'6. Therc was some confusion with regard to the difference between a building and a Census House. In cities/towns, one often comes across a structure having a main verandah and different rooms used by different persons but having common baths and latrines. These separate units were to be treated as separate Census Houses and not as one Census House notwithstanding the provision of common baths/latrines. As a natural corollary, this definition may not sometimes reflect the lack of housing adequately.
HOuselisting Operations
79. Having appointed the staff on the basis of blocks the programme for houselisting operations was framed as per details below :-
Operatioll Date
(i) Completion of Training programme.
20th January or latest by the 25th January, 1970.
(ii) Distribution of Houselist forms, Establishment Schedules etc. to the Supervisors and Enumerators.
Between 20th and
(iii) Special meetings of Circle Supervisors by the Charge Officers to impart Jast
25th January, 1970.
Between 27th and 30th January, 1970.
minute instructions and to ensure that the required number of forms/ schedules were available with each Enumerator.
(iv) Survey of blocks, marking of their boundaries, bringing up-to-date the house numbers and preparation of layout maps by the enumerators according to the Instructions booklet.
1st to 3rd February, 1970.
14
(v) Report by the Supervisors to 4th February, 1970 the Charge Officers that each at the latest Enumerator had completed the work at item No. (iv) above.
(vi) Canvassing the schedules by the Enumerators.
4th to 25th February, 1970.
(vii) Preparation of duplicate copies of Houselist and Establishment Schedules by the Enumerators.
26th to 28th February, 1970.
(viii) Preparation of Houselist I st to 3 I'd March, 1970. Abstracts by the Enumerators and passing on the record to the Charge Officers through their Supervisors.
(ix) (a) Preparation of Houselist 3rd to 7th March, Abstracts by the Charge 1970. Officers and (b) Transmission of the records to the District Headquarters.
Ix) Despatch of records by the gtll to 15th March, District Census Officers. J 970.
80. The time schedule had to be altered slightly because of the State-wide agitation on the question of transfer of Chandigarh to Punjab. T he operations in the field had to be continued up to the 10th March, 1970 instead of the 28th February, 1970 and the records were to be despatched by the District Census Officers liP to the 25th March, 1970. 1_'here wa~, howev~r, no other hinderance in the completIon of thIS operatIOn.
Honorarium to Enumerators/Supervisors
8J. Prior to the 1951-Census, no remuneration was, paid for the houselisting work entrusted to the staff under the State Government. At the time of 1951-Census, however, a small remuneration was paid by the Central Government by way of scriptory charges to the staff. During the 1961-Census, an honorarium was paid to the staff for houselisting!enumeration and this honorarium included the enumerators' expenses for attending the training clas~es. The hono~arium was, further increased during thIS Census. WhIle the staff employed was allowed regular ~r.A. for attend!ng t~e training classes at the rates apphca.ble to them.m thelr own departments, they were paid honoranu~. at the rate of Rs. 15/- each for the househstm.g operations. The amount ~n,:olved on .account of this honorarium for the househstmg operatlons only works out to Rs. 244,175.38 and the district-wise expenditure came to :-
Slate,l District
A mount of honorarium paid for houselisting to
Supervisors Enumerators (RS.) (Rs.)
Total Rs.
-------~ ------2------3 --------4---
Haryana 23,925·00 220,250'38 244,175' 38 Ambala 2,985' 00 28,008'13 30,993'13 Kamal 4,215·00 41,786' 26 46,001-26 Rohtak 4,500·00 40,512'58 45,012·58 Gurgaon 4,065'00 41,565'75 45,630,75 Mahendragarh 1,800·00 13,449'91 15,249,91 Risar 4,890·00 40,418· 57 45,308' 57 Jind 1,470,00 14,509'18 15,979,18
15
82. Even at this rate the total amount of honorarium including that paid during actual enumeration which the Exchequer had to pay comes to Rs. 4 crores, the strength of Enumerators/Supervisors in India being about one million. It would thus be evident that it was not possible to pay anything more than tbis token honorarium. This is, as a matter of fact. not are· mUneration for performing this gigantic task but only a token in recognition of almost honorary services rendered by the staff in completing this job.
S3. In addition, the Additional District Census Officers and Charge Officers were allowed honorarium at the following rates:-
(1) Additional District Census Officers I
(2) Charge Officers (Rural)
(3) Charge Officers (Urban)(n) towns having a population
of more than 50,000 (b) towns having a population
of less than 50,000
(4) Charge Officers (for Special Charges)
Rs. 150/- each.
Rs. 75/- each
Rs. 75- each
Rs.37.50 each
Rs.37.50 each
The total expenditure involved on this account district·wise was;-
State/District Total Additional Charge District Officers Census Officers
(Rs.) (Rs.) (Rs.)
2 3 4 -------... ~-.----.- _". __ . ._._ ----- --,
Haryana 6,187' SO 900 5,287'50
Ambalu 787'50 150 637·50
Karnal 1,012'50 1'iO 862·50
Rohtak 525·00 Nil 525·00
Gurgaon 1,762'50 150 1,612'50
Mahendragarh 412' 50 150 262·50
Hisar 1,087'50 150 937·50
lind 600·00 150 450·00
Difficulties in the Field
84. I would, now, like to dilate upon some of the difficulties which we faced in the completion of the houselisting operations :-
(i) The District Development and Panchayat Officers who were nominated as ex-officio Additional District Census Officers were mainly occupied with
other duties assigncd to them in the districts with the result that they. could hardly find much time to properly plan and effectlVely supervise the operations in the field. Although, there was some response from the district authorities to our requests for relieving them from their additional jobs, yet tbe whole-time attention of thcse officers during the operation could not be procured. During the first ten days of February, 1970 there was a wide spread agitation in Haryana on the award given by the Prime Minister of India on the Chandigarh issue and as such the District Development and Panchayat Officers were mainly occupied with the law and order situation during these days.
(,ii) Nowadays, when the country-side of Haryana is almost everywhere linked with the main roads, mobility of the Inspecting Officers can go a long way towards ensuring the smooth and efficient functioning of the Census Officials in the field. Despite our efforts to get jeeps provided to the District Development and Panchayat Officers through the State Government, no tangible results could be achieved. It was left, then, to the District Development and Panchayat Officers tq arrange their own transport through their Block Development Officers but this, too, was not easy as a block jeep could not move outside the blocks and most jeeps seemed not to be in proper working order.
(iii) 'We requested the State Government to freeze the transfers of the officials deputed for houselisting operations, but cases are not lacking wherein the transfers were affected even after the officials had received the training. This naturally upset the programme to some extent as alternative arrangements had to be made keeping in view the place of residence of tbe Enumerators/Supervisors so appointed.
(iv) In Haryana, prior to the houselisting operatiops, as a general policy, the State Government transferred the teachers from their previous places of posting so as to ensure that they were away from their home tahsil:; etc. but in the majority of cases these officials did not shift their residences permanently to the new places of posting and this necessitated their covering good distances daily. Their appointments as Census Enumerators/Supervisors had been made on the assumption that they were residing at the places of their new postings and this affected their work adversely.
Defects
85. Despite extensive training of the Enumerators and Supervisors spread over three rounds and periodical checking by the Headquarters staff while the operations were on, we cannot categorically say that the houselists were free from defects.
86. There WaS confusion with regard to the concepts of "Census House", ·'Va.cant House," '"In'ititutional Household" etc. Although efforts Were made by the Hupervisors and the Headquarters staff to remOVe the doubts of the Enumerators, many mistakes were subsequently discovered. The common errors noticed were :-
(i) According to the definition of building for the purposes of Census, u structure which is used or is
likely to be usell. for rcsidenc~ or cSlablisJ~met~t only has to be llumbcrecl., but dunn.g thz checkIng It was found that numbers had been allotted eVen to structures wIlien had four walls but J1 0 roof and COllld not thus be 1Ised for any purpose.
(ii) In some cases, in Columns 4 and 5 of the l1omelist. material of wall and roof was merely shown as Kachcha and Pucer, and no dctG ils wefe given.
(iii) In filling Colum~l ~ .there WaS .a~ain some COl~fusion between the dcfmltlOn of ceJlmg and roof. Some of the Enumerators mentioned the material of the ceiling instead of roof. Aga.in, i.u the case where the roof was covered by mud plaster. cement plaster o~ lime plaster expo:;ed to the sky, the Enumerators mentIOned the material as mud, cement or lime whereas this material was only a cOVer for the predominant material of the roof which infact con~tituted its fabric.
(iv) Classification of Establishment into three categories viz. (i) manufacturing (ij) trading and (iii) others also presented (l.ifficulties and the enumerator could not prop;Jrly differentia.tc between "factories" and "workshops".
tv) Where a house was vacant the rea~on wao. required to be given in col. no. 17 of the houselist, but in a number of cases these reaSOl1'> were not forth-coming.
(vi) Vacant shop" ill some cases Were shown as '·Establishments".
(vii) In column no. 10 of the houselist, the llame of the particular scheduled caste to which the head of tbe household belonged was to be mentioned whereas in some cases the word "S.C." was only written by the enumerator~.
87. By and large, however, the quality of data cllllcctcd hy the enumerators was good.
Processing of Housclists
88. The collection and compilation of housing data was different from that collected in the 1961-Census in two wayS. Firstly, during the 1961-Censu5, information regarding establishments (restricted ~o manufacturi~g establishments only) was collected m the Housellst itself while in the present Census, a separate 'Establishment Schedule' was canvassed. Secondly, the data collected during the 1961-Ceuslls Was compiled through the following tables :-
E- I Showing the Census Houses and the uses to which they Were put.
E-I [ Census Households classified by tenure status.
B-TII Census Houses used as workshops and factories classified by industry, power used and size of employment.
[6
E-l V Distribution of Census Houses used wholly or partly llS dwellings bv wall und roof material. -
E-V Households classified by numb.::r of members and number ofroo111s occupied.
89. In the tabulation plan for the 197] -Census, the da.ta regarding establishments was separated and 'E' series tables generated. This data has been interpreted compr~hemively in II sep:J.rEl.t~ .Report (Part III). Here III thIS volume, the remallllng data previously covered by the other four tables is being included in almo3t the same form excepting that instead of Census Houses used wh.olly or partly as dwc11inCts by wall and roof material as inclucl.:;d in B·IV at dS6] ·Censlls all the Cemus Houses have been included now. Further Table E-I at the 1961-Census was on 100 per cent ba~is, the data included in the corresponding table is bell1g presented now 011 a. 20 p(:r cellt sample basis.
90. Speed is the essence of Census work if da.ta is to be ofrenl use to n developing country. For the first time in the history of our Census recour~e was made to th~ use of computors in t?e 1971-Census. As ll. pa.rt of thIS programme. the housll1g data was abo tabulated by an /\utomatic Data Processing Sy;;tem. For this pUrP?3e, it wa.s necessary to cod~ ~ll the entries appearmg III the schedules after devlslIlg a foolproof code structure and then to punch all these code~ on cards and subsequently to transfer these L'ants on to magnetic tape. A note regarding the outline for establishing the coding and punching cells was discu"sed at the training conference of the Directors Census Operatioll', held at Daljeeling in September, 1969 and latcr on short duration training courses were arranged by the office of the Regi~trar General India wherein the Deputy Directors and Tabulatiol~ Officers from all the State~ were trailJed Coding and Punching GelI~ werc established in most of the States but in Haryana, no such cell wa.s created and the functitll1S assigned to it Were cntrusted to the Data Processing Division in the office of the Recristrar Gcnerel lncli,a at Delhi. "',
9 I: The main steps in the processing of the househst and prepanng of the input for housing tabulation on the Computor are given below :-
(1) Collection and arrangement of the filled in Houselists.
(2) Editing of the Houselists.
(3) Sampling of the Houselists.
(4) Coding of Sample entries in the Houselists
(5) Punching of Cards for the coded entries.
(6) Trall~fer of Cards to the magnetic tapes WIth the help of a.n electronic Computor.
92. In Haryana, items at No.1 and 2 were looked after at the Hcadquarters of tht.: Directorate whilc the remaining items were dealt with in the rata Pro. cessing r ivision as no separate Coding and Punching Cell was establjsh<.;d here. The main points and the procedure followed are given below in some hroad outlines:-
Collection and Arrangement of Filled in Houselists
93. Mter the completion oftlle opera.tions, every enumera10r was requited to hand over the following records to his Charge Officer :-.
(i) Houselist
(ii) Establishment Schedule
(iii) Houselist Abstract
2 copies
2 copies
2 copies
94. The entire record of all the enumerators' blocks faIling within the jurisdiction of the Charge Officer was collected and arranged separately in the serial order of the location code. Out of this records, one copy of t11e Houselist, two copies of the Establishment Schedule and one copy of the Houselist Abstract, were sent to the following offices :-
95. Office of Director of Census Operations at Chandigc,rh : -All the Urbr.n Charges in the State and Rural Charges of Ambala and Karnal districts.
96. Office of Deputy Director of Census Operations at Rohtak :-All the Rural Charges of Ruhta:k, Gurgaon; Ma.hendragarh, Hisar and Jind districts.
97. The remaining records were retained by the respective Charge Officers for use by them in carving out the blocks for actual enumeration.
Editing of Houselists
98. Although, during tho houselisting operations, comprehensive training counes were hdd for the Enumerators/Supervisors and they were also given notes regarding the items to be checked and taken care of. yet the likelihood of incorrect and inconsistent entries creeping in could not be overruled. In the case of manual processing and tabulation of data, there are many chances, eVen a.t an advanced stage of tabulation to remove these inaccuracies and inconsistencies, but in the Automatic Data Processing System, once any incorrect entry is punched on the card, it will go on, with the result that the ultimate figures will be far from accurate and a single mistake may lea4.to cumulativo effects. It was, therefore, essential that thy initial Opunl.tioll (b0fore the data was taken on the" cards for computerization) Was unc!.ertclken carefully lo emurc that the dJ.ta. was faultless ~nd no omission or inaccuracy renwincd in the returns or sch~dule"S,' . If could also ha.ppen that a number of entries m!l.Y he omitted.
17
To make up for thi::; some information was supplied. This was called "imputation". The work relating to the editing of housdists was . distributed amongst Tabulation Officers, Statistical Assistants and Computors so as to emllre a greeter amount of accuracy.
99. Since housing data was required to be tabulated 011 a 20 per cent sample basis the total editing of Eouselists was not necessary, but as the Establishment Schedule'; were to be processed on cent-per-cent basis, and the entries embodied in columns 1, 2, 3, 6 and 7 were interconnected with the establishment data, it became necessary to edit atleast some particulars of the entries relating to establishments. The editing -was, therefore, divided into two stages viz., (a) pre-sampling edit and (b) Post-sampling edit. The particulars regarding Building/Census House, whether these were being used as establishments and the particulars of the heads of households contained in columns 1, 2, 3, 6, 7, 8 and 9 were, therefore, scrutinized .on a cent-per-cent basis at the first stage i.e., before the 20 per cent sample was drawn. During the second stage i.e., after the sample had been drawn, data regarding the detail of material used for the construction of walls/roofs, tenure status of the household, size of the household etc. contained in columns 4, 5, 10, 11, 12, 13, 14, 15 and 16 was edited.
100. Detailed instructions regarding editing of houselists and imputation, if any, to be made, were circulated by the office of the Registrar General, india. An example of such an imputation is given below. SUppl9sing there was a case wherein an entry existed in the Establishment Schedule, while the corresponding entry in the I:f.ouselist was missing, the relevant entries in the H ouselist were made as under:- •
Col. 1. Next number of the line was given at the end of the block.
Cols. 2-3. Same number as existing in Col. 2 of the Establishment Schedule.
Cols. 4-5. Entries occurring in the Houselist for the preceding house number to the one recorded in Col. 2 of the Establishment Schedule.
Col. 6 As per Col. 6 of the Establishment Schedule.
Col. 7 Yes. Col. 8-17. Nil.
101. Similarly, at the time of Post-sampling edit, imputations as explained below were made.
102. If an entry against Cols.4-5 was merely KachTu: or Pucca, specific material which was COJij' monly found to have been used in the relevant block was added. Similarly, if there w.: c .(,n omission of the number of persons in a ho .sehold, entry was made on the basis of 'person rOOlll' ratio of 1961 Census (i.e. three persons per room). Ir ca"e ent y regarding rental status was missed, it was provid;d as 'R' and if the enumerator had omitted to glY\! a reply to Col 16. it was decided to add 'If es' if the houselist related to rural areas and 'No' if the Houselis\. was for an urban area.
sampling of House)ists
1 OJ. Ma.ximum am )unt of care was nece;sary to ensure accurate sampling of entries in the Houselist, The sampling was done on a sin~le continuous order for each of the operational units which were as under :-
(i) Tahsil for rural areas (ii) City (iii) Non-city urban area of a district
104. As a first step towards this direction all. the Cel'lsus Houses within a block were numbered serially along the line dividing columns 2 and 3 of the Houselist and subsequently with the help of Random Star~ number (which was different for each operational unit) and the control chart. every fifth Census House was ticked with a red pencil.
105 There were certain built-in checks also for the purpose of ensuring that the sample selection had gone of quite correctly as for example it was ensured that unit digit of the feriaI No. of the house selected was either the starting number or that number plus 5. Similarly at the end of the sampling process for a particular block, it was ensured that :-
(Expected No. 'I [Last selected SI. No., ~ of Sample ~ was equal ~ -First selected SL »-LHouses J to L No, + 1 J
5 106. In addition, sampling supervisors were also
required to check the work of samp~ers on day-io-day basis so as to reduce the chances of maccurate sampling.
Coding of Sample Entries in the Houselist
101. Mechanical processing of data requires all the entries in the schedules to be assigned some codes. A code has been defined as a "Brief title composed of either letters or numbers, used to identify an item of data and express its relationship to other _items of th~ same or similar nature". The purpose behmd codmg lS
to enable the presentation of data in a meaningful and useable manner. The coding system should be capable of providing space for additional entries; exact, so that every item is correctly represented by the code ; understandable, for both encoding and decoding; should, by itself, indicate some of the characteristics of the items and finally capable of bringing in anticipated data. It would thus be seen that framing of code structure needs a lot of pre-thinking and a thorough knowledge of the items to be covered. There are different systems for assigning code numbers and the code structure adopted for the entries in the Houselist is appended as Annexure XU .. The digit system was adopted.
18
108. After editing of entries in the Houselist the records were sent to the Data Processing Division of the Registrar General's office as no Coding and Punchi~g Cell was in position in Haryana. The relevant .entnes . against the Sample Census Houses were codt:d tn that -. office according to the code' structure. Theteafter a
cel1t-per-cent checking was done in respect of the codes as otherwise, incorrect results would have followed. Completion of this item of work made the material ready for mechanical processing.
Plwcbing of Cards
IO J. A standard dze card was prescribed tor this purpose. It had minute specifications and was verticall>" divided into 80 columns and horizontally into ten POSItions from 0-9. A specimen of the card is given in Annexure XIII. The data which had already been translated into codes was transferred on to this card by means of holes through a Punch Machine. By making holes in specified position. the Computor could transcribe the data in a pre-determined manner. As soon as the punching was completed, the cards were passed through Veri'lers which were fixed with plunges and with the help of these instruments, it could be checked whether the perforation had been done properly. If not, necessary corrections could be made at that st, ge.
Transfer of the Card-data to Tape for Computerization
110. After the cards had been punched and verified the data was passed on for computerisation and by arranging and re-arranging the cards systematically. t,he data was analysed from different angles. The entIre job concerning sampling. coding etc. was done by the Registrar General's office.
Final Tables Produced
Ill. The data collected during the 1971·Censlls was tabulated and presented in four Tables H-I to H-IV. All these Tables are based on a 20 per cent Sample of Census Houses. While these Tables have been discussed in detail in Chapters U to V of this Part their purview, in brief, is given as under :--
H-I-CelfSlIs Houses mid the I/Ses to whic11 IluY (Ire pur.
112. In this Table figures have been compiled district-wise (both Rural and Urban) regarding the total number of \. :ensus houses, houses lying vacant and houses used as (i) Resid~nce, (ii~ Shop-cutD-residence, (iii) W orkshop-cum-resIdence mcIudmg househo.ld industry (iv) Hotels, sarais, dharmshalas, tOUflSt houses ~nd inspection houses, (v) Shops excluding eating houses (vi) Business houses and offi~~s' (vii) Factories, workshops and worksheds (Vlll) Restaurants, sweetmeat shops and eating places (ix) Places of entertainments and community gathering (panchayatghar) excluding places of worship, (x) Places of worship (e.g. temple, church, mosque, gurudwara etc.) and (xi) others.
H-II-Distribution of Census Houses by pre·dominant material of wall and predominant material of roof~
i 113. This Table also gives information district-wise and is cross classified by predominant material of wall
such as grass, leaves, reeds or bamboo, mud, un burnt bricks, wood, burnt bricks, OJ. sheets, stone, cement concrete etc., and also by predominant material' of roof such as grass, leaves, reeds, thatch, tiles, slates, corrugated iron sheets, asbestos cement sheets. brick and lime, stones, RBCjRCC etc. This Table is accompanied by an Appendix wherein the predominant material of wall is cross-classified by predominant material of roof in respect of residential Census Houses. Figures have also been compared with the figures for other States in India.
H-III-Households classified by number of members and by number of rooms occupied. '
114. This Table gives figures relating to households occupying one room. 2. 3, 4 and 5 rooms and
19
with unspecified number of rooms as also the number of members involved. The district -wise figures have also been tabuiated.
H-IV-Households classified by size and tenure status
115. Information about the size of households i.e. the members of the households and the tenure ~tatus i.e. whether the household is occupying the house in the capacity of an owner or a tenant is embodied in this Table Besides the district-wise, fig. ;res. the data has also been sp:it up into rural and urban.
116. In addition to this, subsidiary tables to the main tables detailed above have been generated. These have been discussed in detail in relevant chapters in this Part.
CHAPTER 11 USES TO WHICH CENSUS HOUSES ARE PUT
General Remarks A Census House may be used for a variety of pur
poses, e.g., as a residence, shop-cum-residence, business house, factory. workshop, workshop-cum· residence, school, bank, commercial house, office, ho~pitaI, hotel etc., or it may be vacant. Broadly speaklilg, Census Houses can be grouped into two distinct broad types, namely residential and non-residential. In other words, 'they may be used for human habitation or for some other purpose. One may also come across a combination of both types when a Census ? ouse is used for the dual purpose of habitation and business, profctision. calling or pursuit, to provide a means of livelihood for the household. Instances of shop-cum-residence or a workshop-eum-residence become meaningful in this context. where a Census House is partly used as a resi, dence and partly as a shop or workshop. Since residential housing is a social need. first priority goes to dwellings, especially in the villages .. In towns ~he~e more than three-fourths of the workmg populatIOn IS
engaged in non-agricultural economic activities, a fairly large number of Census Houses may be devoted to nonresidential uses such as for shop, workshop, factory. office, bank, school, temple etc. The proportion of non-residential houses used for some kinds of economic activities generally reflects the relative economic advancement in spheres of trade and commerce. industry, official business, banking etc. Similarly, the number of the Census Houses used as places of entertainments like cinema houses, theatres, clubs, panchayatghars for community gathering etc., and places of worship such as temples, churches, mosques and gurudwaras, may throw light on the extent of sodal and religious activities, respectively available in a particular area. Census Houses may also be found vacant for a temporary period or permanently for a variety of reasons. The preponderance of vacant Census P'ouses in a place may indicate the extent of mobility of population residing there and also the availability of additional accommodation. The relatively high or low proportions of particular uses to which the Census Houses are put in any region may be governed by various economic, soc'al and other functional characteristics of the area which can further be attributed to some historical, political or natural backgrounds. A detailed study of the extent and variety of uses of the Census Houses and the factors and forces responsible for the predominance of certain types of houses in some areas may be of special interest both to the public at large and to economists, social scientists, research workers, scholars and planners in general.
Concepts and Definitions
2. It would be quite appropriate to explain here in a 1ittle detail the various concepts and definitions re· lating to the uses of Census Houses for proper understanding of the subject.
(i) Residellce.-A residence is a Census House which is used wholly for human habitation.
(ii) Shop.-A shop is a place where articles are bought and/or sold for cash or for credit.
20
(iii) SIz0p-cwll-residence.-A shop-cum· residence is a Census House used for the combined purposes of residence and running a shop.
(iv) Workshop,-A wor~shop is ~~ place where. ~ny kind of production, processl11g. repaIrIng or servlcmg goes on or where goods and articles are mude and sold, but is not large enough to be a factory. It is not necessary that some machinery should exist. Even a place where some household industry sllch as say hand-100m weaving, biri-rolling, baskets, broom-sticks, paper kites, toys making, tailoring etc. is carried on has been treated as a workshop.
(v) Factory.~A factory is a large. workshop which is registered under the Indian Factones Act. A workshop merely licenced by the Municipal or any. other authority or registered for any other purpose was not rccorded as a factory unless it was registered under the Indian Factories Act.
(vi) Workshop-culJ1-resi dellce.-W orkshop-cun~-res!, dence is a factory, workshop or workshed which IS
also used as a residence.
(vii) Otlzers.-(a) Office, business l~ouse~ bank, etc. (Business house is that where transactIOns II1 money Or other articles take place).
(b) Hospital, dispensary, health centre, doctor's clinic, etc.
(c) School and other educational institution.
(d) Hotel, sarai, dharmshala, tourist house, ins· pection house. ~tc.
(e) Restaurant. sweetmeat shop and eating place. (A sweetmeat shop where sweetmeat is being made and
~old was recorded as a workshop).
(f) Place of entertainment such as cinema house, theatre. community·gathering (panc/za)'otghar) etc.
(g) Place of worship e.g., temple, church, mosque, gurudwara, etc.
(h) Institution such as orphanage, rescue home, jail, reformatory, children home, etc.
(i) Cattle-shed, garage, godown, laundry, petrol. pump, passenger shelter, etc.
Vacant Census Houses
3. If no person lived in a Census House at the time of enumeration and it was not being used for any of the purposes llsted above, then it was shown as vacant. If the Census House was locked because the occupants had gone on a journey or pilgrimage, then it was not treated as vacant but the use to which it was put was recorded.
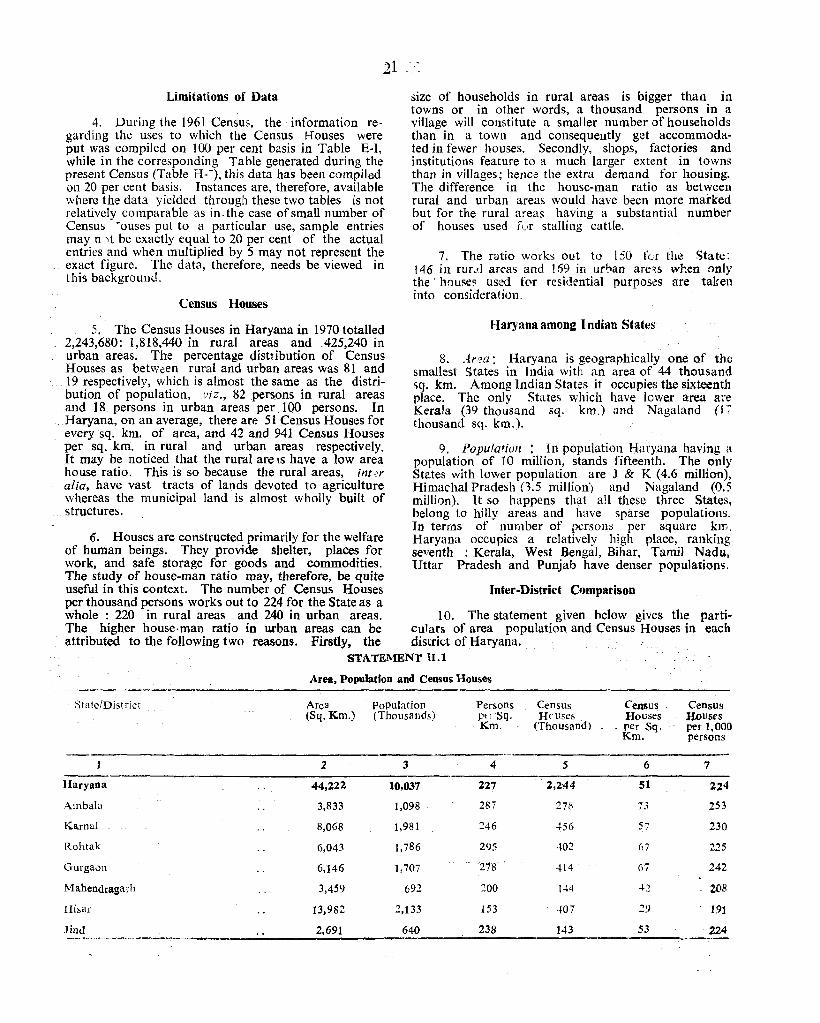
21
Limitations of Data
4. During the 1961 Census, the· information regarding the uses to which the Census Houses were put was compiled on 100 per cent basis in Table E-l, while in the corresponding Table generated during the present Census (Table H --:), this data has been compiled on 20 per cent basis. Instances are, therefore, available where the data yielded through these two tables is not relatively comparable as in. the case of small number of Census Touses put to a particular use, sample entries may n ~t be exactly equal to 20 per cent of the actual entries and when multiplied by 5 may not represent the exact figure. The data, therefore, needs be viewed in this background.
Census Houses
5. The Census Houses in Haryana in 1970 totalled 2,243,680: 1,818,440 in rural areas and .425,240 in urban areas. The percentage distribution of Census Houses as between rural and urban areas was 81 and 19 respectively, which is almost the same as the distribution of population, l'iz., 82 persons in rural areas
. and 18 persons in urban areas per 100 persons. In . Haryana, on an average, there are 51 Census Houses for
every sq. km. of area, and 42 and 941 Census Houses per sq. km. in rural and urban areas respectively. It may be noticed that the rural are tS have a low area house ratio. This is so because the rural areas, int?r alia, have vast tracts of lands devoted to agriculture whereas the municipal land is almost wholly built of
. structures.
6. Houses are constructed primarily for the welfare of human beings. They provide shelter, places for work, and safe storage for goods and commodities. The study of house-man ratio may, therefore, be quite useful in this context. The number of Census Houses per thousand persons works out to 224 for the State as a
size of households in rural areas is bigger than in towns or in other words, a thousand persons in a village will constitute a smaller number of households than in a town and consequently get accommodated in fewer houses. Secondly, shops, factories and institutions feature to a much larger extent in towns than in villages; hence the extra demand for housing. The difference in the house-man ratio as between rural and urban areas would have been more marked but for the rural areas having a substantial number of houses used rur stalling cattle.
7. The ratio works out to 150 fcc the State: 146 in rULd areas and 169 in url:lan are'1S when only the' hOUSC!l used f0r residential purposes are taken into consideration.
Haryana among I ndian States
8. Arqil: Haryana is geographically one of the smallest States in india with an area of 44 thousand sq. km. Among Indian States it occupies the sixteenth place. The only State~ which have lower area are Kerala (39 thousand sq. km.) and Nagaland (17 thousand sq. km.).
9. Population : In population Iiaryana baving a population of 10 million, stands fifteenth. The only States with lower population are J & K (4.6 million), Himachal Pradesh n.5 million) and Nagaland (0.5 million). It so happens that all these three States, belong to hilly areas and have sparse populations . In terms of number of persons per square km. Haryana occupies a relatively high place, ranking seventh : Kerala, West Bengal, Bihar, Tamil Nadu, Uttar Pradesh and Punjab have denser populations.
Inter-District Comparison
whole : 220 in rural areas and 240 in urban areas. 10. The statement given helow gives the pal'ti-The higher house-man ratio in urban areas can be culars of area population and Census Houses in each
. attributed to the following two reasons. Firstly, the district of Haryana.
State/District
Haryana
Ambala
Karnal
Rohtak
GurgaOll
Mahendragarh
Hisar
Jind
STATEMENT n.1
Area, Population and Census Houses
Area population Persons (Sq. Km.) (Thousands) prj Sq.
Km.
2 3 4
44,222 10,037 227
3,833 1,098 287
8,068 1,981 246
6,043 1,786 295 _ ..
6,146 1,707 278
3,459 692 200
13,982 2,133 153
2,691 640 238
Census ('emus :Census Heuses Houses ]louses
(Thousand) . per .Sq. per 1,000 Km. persons
5 6 7
2,244 51 2.24
27Ci 73 253
456 57 230
402 h7 225
414 67 242
144 42 208
407 29 191
143 53 224
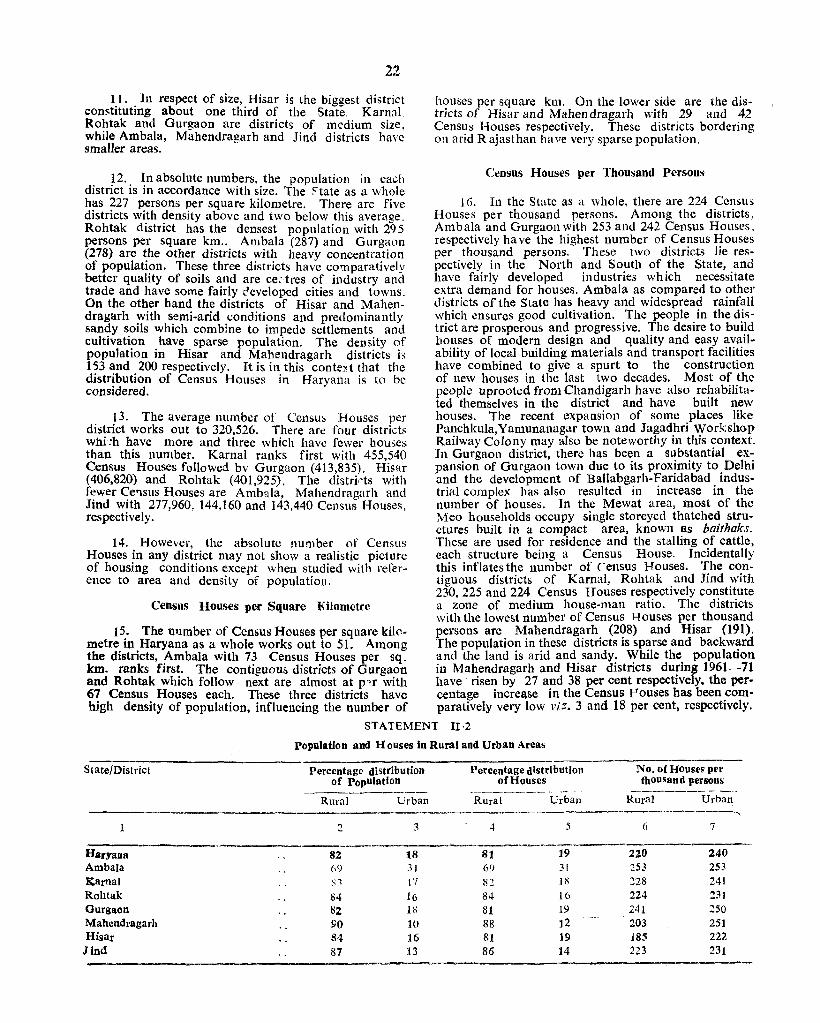
22
11 . In respect of size, Hisar is the biggest district constituting about one third of the State. Kamal Rohtak and Gurgaon are districts of medium size, while Ambala, Mahendragarh and .lind districts have smaller areas.
. p.. ~n absolute num~ers, the population in each dIstnct IS 111 accordance WIth si7e. The ~tate as a whole has 227 persons per square kilometre. There are five districts wi~h ~ensity above and two below this average. Rohtak dlstnct has the densest population with 295 persons per square km.. Ambala (287) and Gurgaon (278) are the other districts with heavy concentration of populati?n. The~e three districts have comparatively better quahty of soIls and are ce; tres of industry and trade and have some fairly ceveloped cities and towns. On the other hand the districts of Hisar and Mahendragarh with semi-arid conditions and predominantly sandy soils which combine to impede settlements and cultivati~n . have. sparse population. The density of populatIOn In Hlsar and Mahendragarh districts is ] 53 and 200 respectively. It is in this context that the distribution of Census Houses in Harvana is to he considered. •
. ,13. The average number of Censu~ Houses per dlstnct works out to 320,526. There are [our di<;tricts will:h have more and three which have fewer houses than this number. Kamal ranks first with 455,540 Census Houses followed bv Gurgaon (413,835). Hisar (406,820) and Rohtak (401,925). The distrirts with fewer Ce'lsus Houses are Ambala, Mahendragarh and Jind with 277,960, 144,160 and 143,440 Census Houses, res pectiveI y.
14. However, the absolute number of Census Houses in any district may not show a realistic picture of housing conditions except when studied with refer .. ence to area and density of population.
Census Houses per Square Kilometre
houses pel' square km. On the lower side are the districts of Risar and Mahendragarh with 29 and 42 Census Houses respectively. These districts bordering on arid Rajasthan have very sparse population.
Census Houses per Thousand Persons
16. In the State as a whole, there are 224 Census Houses per thousand persons. Among the districts. Ambala and Gurgaon with 253 and 242 Census HOllses, respectively ha ve the highest number of Census Houses per thousand persons. These two districts lie respectively in the North and South of the State, and have fairly developed industries which necessitate extra demand for houses. Ambala as compared to other districts of the State has heavy and widespread rainfall which ensures good cultivation. The people in the district are prosperous and progressive. The desire to build houses of modern design and quality and easy availability of local building materials and transport facilities have combined to give a spurt to the construction of new houses in the last two decades. Most of the people uprooted from Chandigarh have also rehabilitated themselves in the district and have built new houses. The recent expansion of some places like Panchkula,Yamunanagar town and Jagadhri Workshop Railway Colony may also be noteworthy in this context. In Gurgaon district, there has been a substantial expansion of Gurgaon town due to its proximity to Delhi and the development of Ballabgarh-Faridabad industrial complex has also resulted in increase in the number of houses. In the Mewat area, most of the Meo households occupy single storeyed thatched structures built in a compact area, known as hoithoh. These are used for residence and the stalling of cattle, each structure being a Census House. Incidentally this inflates the number of Census Houses. The contiguous districts of Kamal, Rohtak and Jind with 230, 225 and 224 Census Houses respectively constitute a zone of medium house-man ratio. The districts with the lowest number of Census I-{ouses per thousand
15. The lll Jmber of Census Houses per square kilo- persons are Mahendragarh (208) and Risar (191). metre in Haryana as a whole works out to 51. A.mong The population in these districts is sparse and backward the districts, Ambala with 73 Census Houses per sq. and the land is arid and sandy. While the population km. ranks first. The contiguous districts of Gurgaon in Mahendragarh and Hisar districts during 1961-71 and Rohtak which follow next are almost at pqr with have risen by 27 and 38 per cent respectively. the per-67 Census Houses each. These three districts have centage increase in the Census Vouses has been com-high density of population, influencing the number of paratively very low viZ. 3 and 18 per cent, respectively.
State/District
"aryana Ambala Kamal Rohtak Gurgaon Mahendragarh Hisar Jind
STATEMENT II·2
population and H oQses in Rural and Urban Areas
Percentage distribution Percentage distribution No. ofHOuse~ per of population of Houses thousand persons
~----------- --_------- ~ --- ._------- ----.-Rural Urban Rural Urban RUral Urban
~ ~ 4 5 6 7
-82 18 81 19 220 2;40 69 31 69 31 253 253 ~~ , " ]7 ~l li'\ 228 241
114 16 84 16 224 :31 82 It:: 81 19 241 250 ~O 10 88 12 203 251
84 16 81 19 185 222 87 13 86 14 223 231
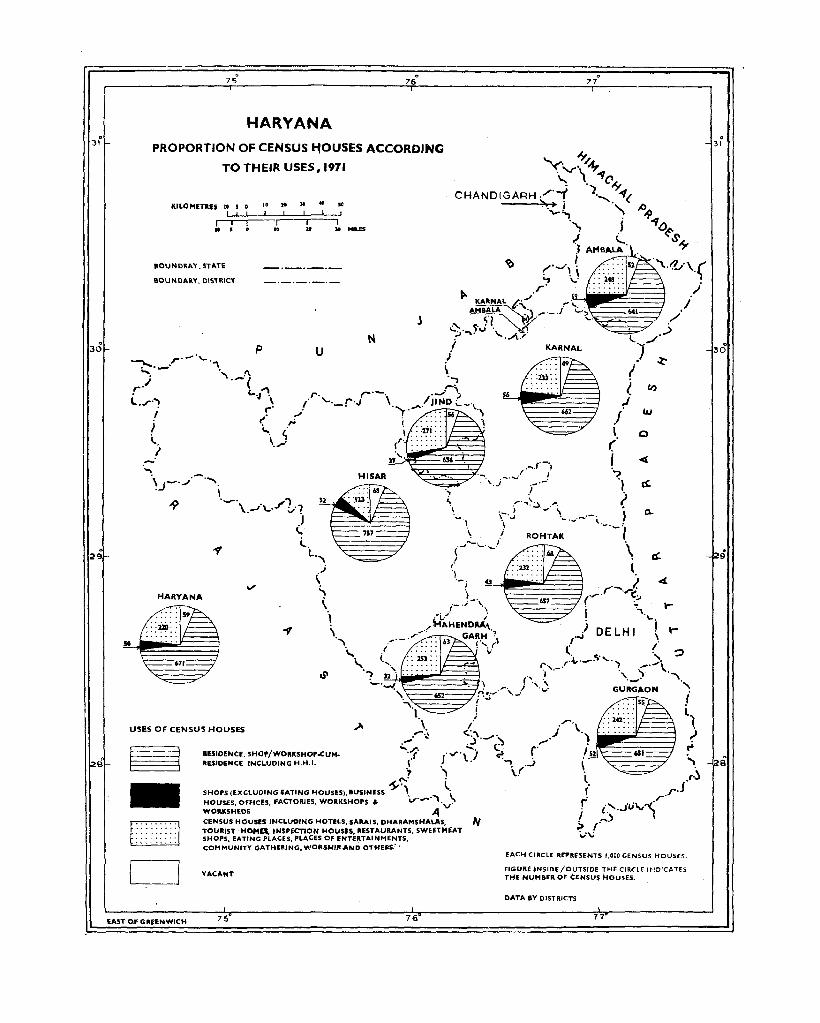
. 31
29
28
HARYANA
PROPORTION OF CENSUS I10USES ACCORDING
TO THEIR USES, 1971
KILOMETftES " • • ,. .. ••
" . ,. ,. MILES
80UNDRAY. STATE
80UNDARY. DISTRICT
HARYANA
</ " \
"
\" 50
..,
USES OF CENSUS HOUSES
EAST OF GRI'ENWICH
RESIDENCE. SHOP/WORKSHOP.c;UM. RESIDENCE INCLUDING H.H.1.
VAC"NT
75
'" " ."")
76
''1..'Z/\{
./ .I
./
EACI-f CIRCLE RFPRfSENTS I,OCO CENSUS HOUSES.
FIG(JRt: JNSIOE/OUTS~OE THI: CIRCLE ,,,_!D!CATES THE NUMa.ER OF tENSU$ HOUSES.
DATA BY DISTRICTS
77
. 31
o 30

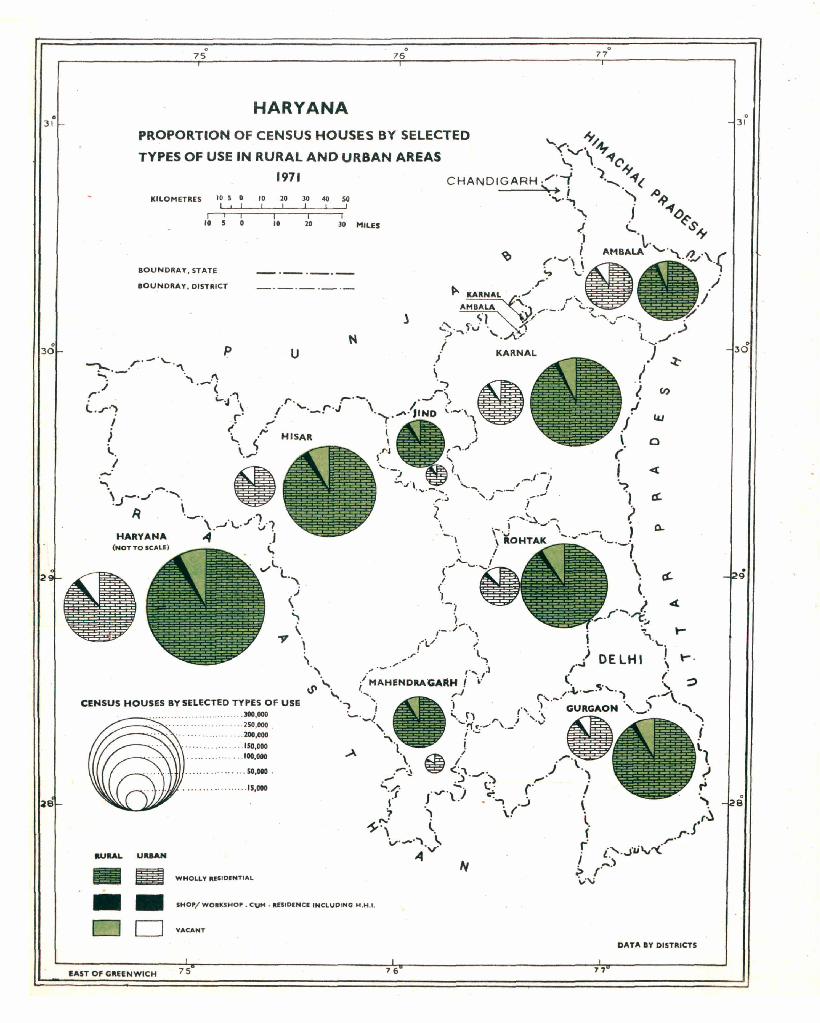
o 31
. 30
. 7 5
HARYANA PROPORTION OF CENSUS HOUSES BY SELECTED
TYPES OF USE IN RURAL AND URBAN AREAS
1971
KilOMETRES 10 S 0 10 20
10 5 10
BOUNDRAY, STAH
BOUNDRAY , DISTRICT
CENSUS HOUSES BY SELECTED TYPES OF USE
UUAN
. . ... 300,000 ... 250,000
.. . . 100,COO
. . . • .• .. •.. •. .. . . • . ISO,COO . .. .. 100,000
• ••. • .• .• . .• . . . .. SO,COO •
• •• . . • , .• , .•... .. . 1 S,COO
WHOLLY RESIDENTIAL
10 40 SO
10 10 MilES
• SHOP/ WOIilKSHOP _ C\IM . IlESID£ NCE INCLuprNc ... . t U .
D 0 VACANT
EAST OF GRUNWICH 7 5 76
. 77
. 31
o
. B
DATA BY DISTRICTS
77

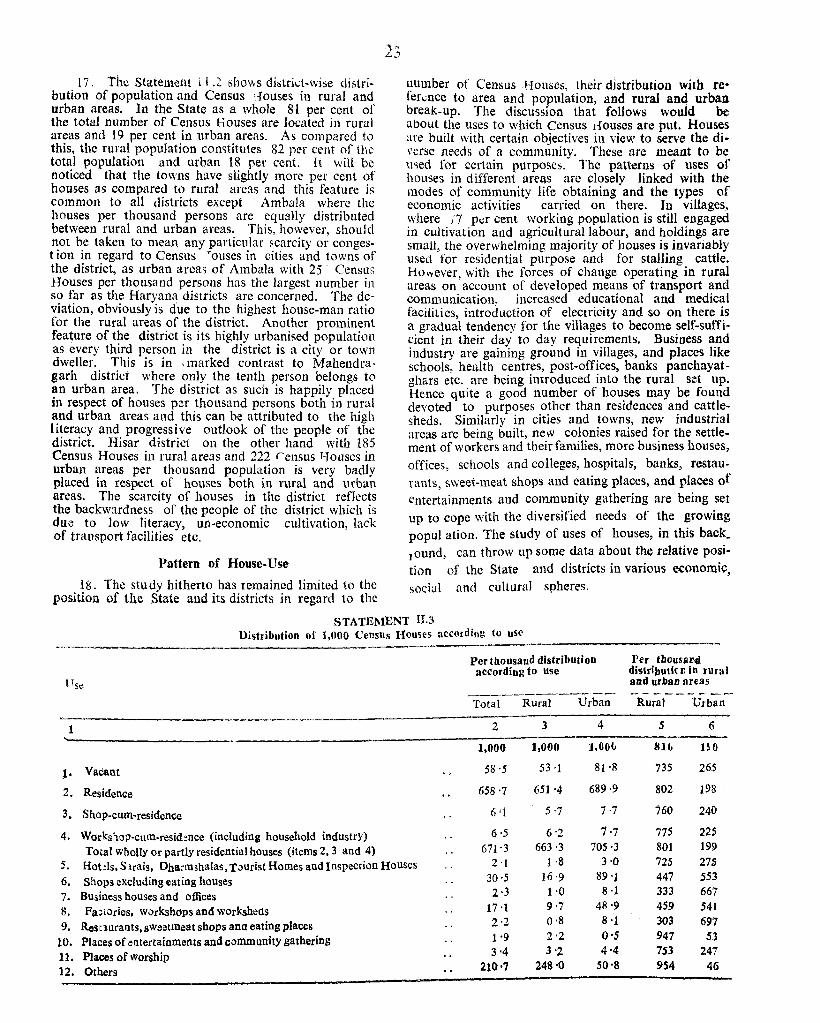
17. The Statell1(:llt i I .2 bhows district-wise distribution of population and Census Houses in rural and urban areas. In the State as a whole 81 per cent or the total number of Census Houses are located in rural areas and 19 per cent in urban areas. As compared to this, the rural population constitutes 82 per cent of the total population and urban 18 per cent. It will be noticed that the towns have slightly more per cent of houses as compared to rural areas and this feature is common to all districts except Arnbala where the houses per thousand persons are equally distributed between rural and urban areas. This, however, should 110t be taken to mean any particular Fcarcity or congest ion in regard to Census Touses in cities and towns of the district, as urban areas of Ambala with 25 Census Houses per thousand persons has the largest number in so far as the Haryana districts are concerned. The deviation, obviously is due to the highest house-man ratio for the rural areas of the district. Another prominent feature of the district is its highly urbanised population as every third person in the district is a city or town dweller. This is in ,marked contrast to Mahendragarh district where only the tenth person belongs to an urban area. The district as such is happily placed in respect of houses per thousand persons both in rural and urban areas and this can be attributed to the high literacy and progressive outlook of the people of the district. Hisar district on the other hand with 185 Census Houses in rural areas and 222 rensus T-fouses in urban areas per thousand popUlation is very badly placed in respect of houses both in rural and urban areas. The scarcity of houses in the district reflects the backwardness of the people of the district which is due to low literacy, un-economic cultivation, lack of transport facilities etc.
l'attern of House-Use
18. The study hitherto has remained limited to the position of the State and its districts in regard to the
nllmber of Census Houses, their distribution with re:. fer",nce to area and population, and rural and urban break-up. The discussion that follows would be about the uses to which Census tfouses are put. Houses are built with certain objectives in view to serve the di· verse needs of a community_ These are meant to be ll~ed for certain purposes. The patterns of uses of houses in different areas are closely linked with the modes of community life obtaining -and the types of economic activities carried on there. In villages, where 17 pcr cent working population is still ~ngaged in cultivation and agricultural labour, and holdmgs are small, the overwhelming majority of houses is invariably used for residential purpose and for stalling cattle. However with the forces of change operating in rural areas on' account of developed means of transport and communication. increased educational and medical facilities introduction of electricity and so on there is a gradu~l tendency for the villa~es to become ~elf-suffi. cient in their dav to day reqUIrements. BuslDess and industry are gaining ground in villages, and places like schools health centres, post-offices, banks panchayatghars etc. are being introduced into the rural set up. Hence quite a good number of houses may be found devoted to purposes other than residences a':1d catt~esheds. Similarly in cities and towns, new mdustnal areas are being built, new colonies raised for the settlement of workers and their families, more business houses, offices schools and colleges, hospitals, banks, restaurants ~weei-meat shops and eating places, and places of enter~ainl11ents and community gathering are being set up to cope with the diversified needs of the growing popul ation. The study of uses of houses, in this back_ found, can throw up some data about the relative posi. tion of the State and districts in various economic, social and cultural spheres.
STATEMENT 11.3 Distribution of 1,000 Census Houses according to usc
Per thousand distribution Per tbouSlll1G according to use distributit n in rural
Use aDd urban areas -------_.....-_---_... ~-------,._
Total Rural Urban Rural Urban
1 2 3 4 5 6
1.000 1,000 I,COb 8Ib no
l· Vacant 58 '5 53 '1 81 '8 735 265
2. Residence 658-7 651 '4 689·9 802 198
3, Shop-currl-residence 6 ·1 5 '7 7·7 760 240
4. Works'lop-cum-resid!nce (including household industrY) 0·5 6-2 1'7 775 225
Total wholly or partly residential houses (items 2.3 and 4) 671'3 663 '3 705·3 801 199
5. Hot!!s. Slrais, Dha~m3halas, TJurist Homes and Inspection Houses 2 '1 1 ·8 3'0 725 275
6. Shops excluding eating houses 30 ·5 16'9 89 '1 447 .553 2-3 1 '0 8 ·1 333 667 7. Bu,iness houses and offices
9·7 48'9 459 541 Fa;tories. workshops and worksheos 17'1 8. 2·2 0·8 8 '1 303 697 9. RcSllurants. sweetmeat shops ana eating places 1'9 2'2 0'5 947 53 10. Places of entertainments and community gathering 3'4 3'2 4'4 753 247 11. Places of worship
210'7 248'0 50'8 954 46 12. Others
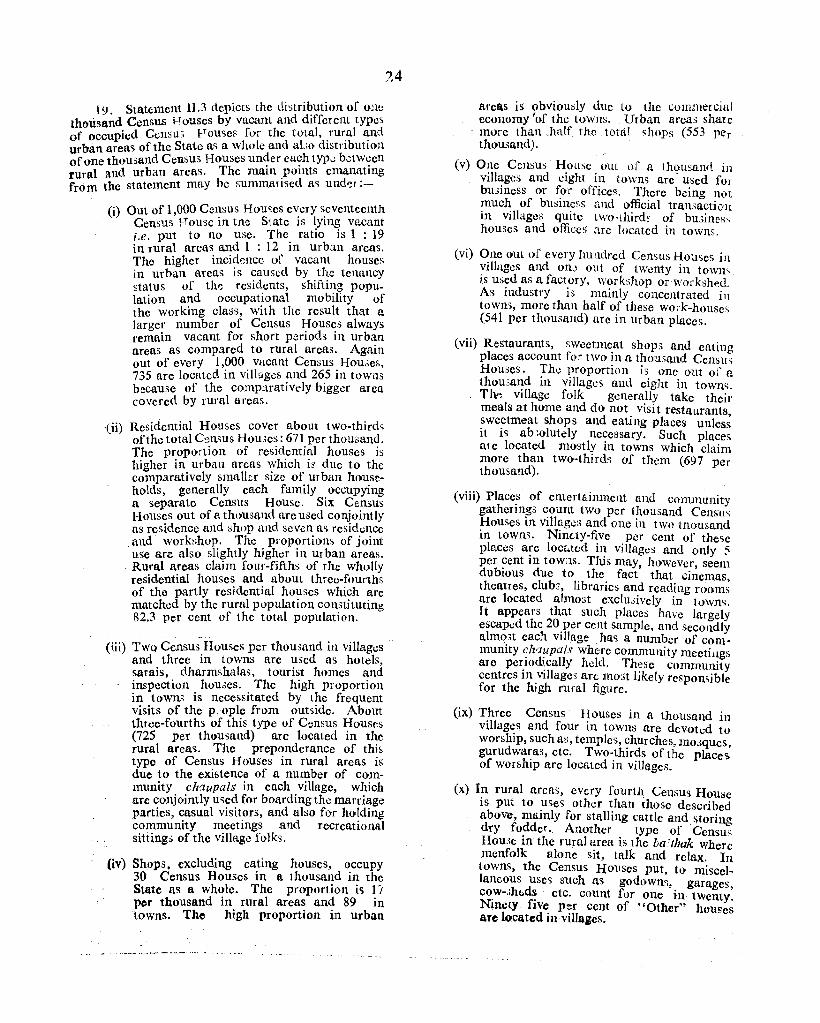
19 StatelUent 11.3 depicts the distribution of Oll!;
thousa~d Census Houses by vacant and different type::. f ··d CC115U5 F ouses for the total, rural and
o boccuPlacc of the State as a wlwle and aLo distribution ur an are , . d h . b' . . of one thousand Census Houses un. er ca? type; vtw~en rural and urban areas. The mam .polllts elllim~tmg from the statement may be summaTlsed as Und(!I.--
(i) Out of 1,000 Census Homes ev_cry s.eventeenth Census [Touse in tnc State IS l'ym~ vacant i.e. put to no use. The. ratIO IS 1 : 19 in rural areas and 1 : 12 1U urban areas. The higher incidence of vacant houses in urban areas is caused by the tenancy ~tatus of thl! residents, shifting population and occupational mobility of the working class, with the result that a larger number of Census ,!ous,:s always remain vacant for short penods 111 urban areas as compared to rural areas. Again out of eVery 1,000 vacant Census Houdes, 735 are located in villages and 265 in towns because of the compMatively bigger area covered by rural areas.
(ii) Residential Houses cOVer about two-thirds of the total C~)n'>us Hou3e~: 671. per thousan~. The proportion of re8Id.entl~I houses IS
higher in urban areas ,:,hlch IS due to the comparatively smaller sIze of urban households generally each family occupying n separate Census HOUse. Six <?c!lsus Houses out of a thousand are used con~omtly as residence and shop and SeVen as rcsldt,;nce and workshop. The proportions of joint usc are also slightly higher ill Ur ban areas. Rural areas claim four-fifths of the wholly residential houses and about three-fourths of tho partly residential houses which are matched by the rural popUlation constituting 82.3 per cent of the total popUlation.
(iii) Two Census-Houses per thousand in villages and three in towns are used as hotels, sarais dharmshalas, tourist homes and inspection. houdes. . The high proportion in towns IS nece"sltated by the frequent visits of the p ople from outside. About three-fourths of this type of Census Housf's (725 per thou~and) arc located in the rural areas. The preponderance of thj~ type of Census Houses in rural areas is due to the existence of a number of community chaupals in each .village, w~ich are conjointly u~ed for boardlllg the marnagc parties, casual visit.ors, and also for ho~ding community meetmgs and recreatIOnal sittings of the village folks.
(iv) Shops, excluding ca~ing houses, ~ccupy . 30 Census Houses 1U a thousand m the
State as a whole. The proportion is 17 per thousand in rural areas and 89 in towns. The high proportion in urban
24
(v)
areaS is obviou~ly due to the commercial economy fof the tOWIlS_ Urban areas share more than half the totn1 shops (553 per thousand).
One Census House oul of a thousand in villages and eight in towns are - used for bu.;iness or for offices. There being not much of busine,;s and official transaction in villages quite l Wo-third~ of bUJines, houses and offices nrc located in towns.
(vi) One out of every hU'ldred Census Hou5es in vilIL~ges and 0110 out of twenty in town' is used as a factory, worhhop or worksheet As industry is muinly concentrated iII towIH, more than half of these work-houses (541 per thousand) nre in urban places.
(vii) Restaurants, sweetmeat shop:; and eating places account for two in a thousll.ud Census Houses. The proportion is one out of a thoU3a.nd in villages and eight in town~. Th~ village folk generally take their meals at home and do not visi t restaurants, sweetmeat shops and eating places unless it is ab.;olutcly necessary. Such places ate located mostly in towns which claim more than two-thirds of them (697 per thousand).
(viii) PlaceS of entertejmnellt and community gathering;:; count two per thousa.nd Census Houses in viIlage~, and OIle in two tnousand in towns. NinGty-five per cent of these places are loc"led in villages and only 5 per cent in towas. This may, however, seem dubious due to the fact that cinemas, theatres, club3, libraries and reacting rooms are located abn03t exclusively in town". It appears that such places have largely escaped the 20 per cent sample, and secondly alm03t each village has a number of community ch'1upals where community meeti1!gs are periodically held. These community centres in villages arc m03t likely respomible for the high rural figure.
(ix) Three Census HOUses in a thousand in villages and four in towns are devoh;d to worship, such as, temples, churches, m03ques, gurudwaras, etc. Two-thirds of the places of worship arc located in viIlages_
(x) In rural areas, eVery fourtn Census House is put to USeS other than those described above, mainly for stll.IIing cattle and !)toring dry fodder. Another type of 'Census Hou;>c in the rural urea is the ba ·thak where menfolk alone sit, talk and relax. In towns, the Census HOUses put, to miscellaneous Uses such as godown,>, garages, cow-.;h<;.ds etc. count for one in twenty. Ninety five per cent of "Other" houses are located in villages.
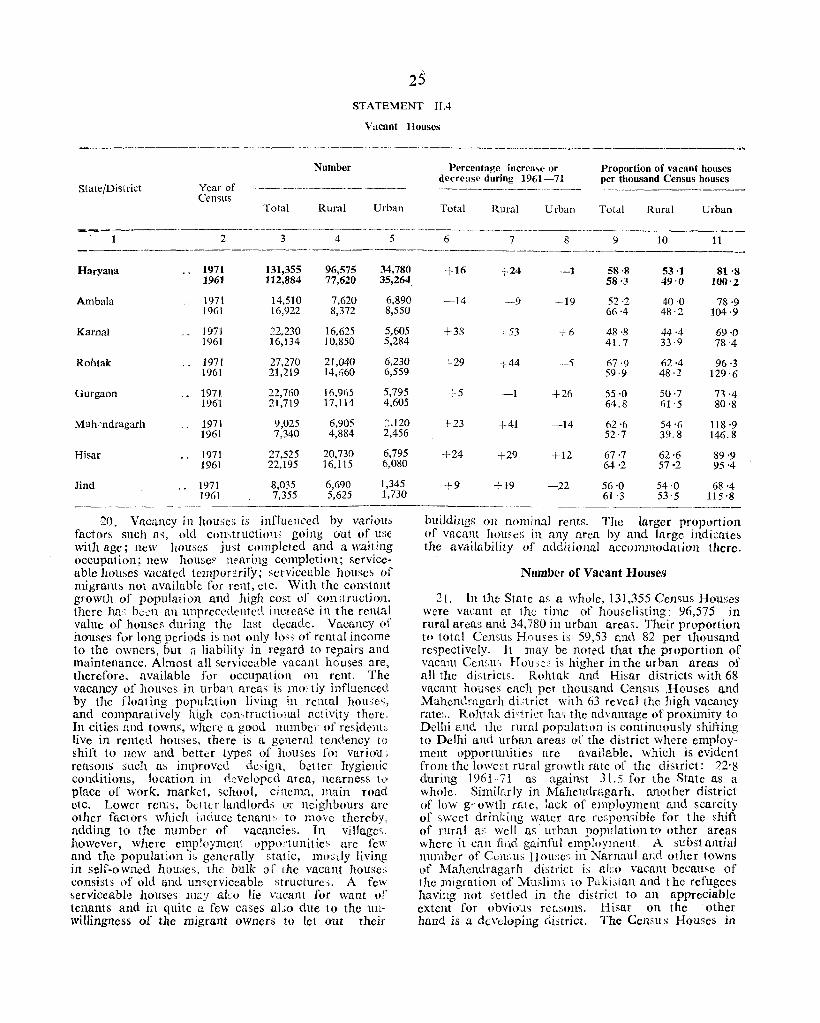
STATEMENT II.4
V .. cant Houses
State/District Year of Census
Total
Number
Rural Urban
Pprccntage increase or dcneas(' during 1961-71
Total Rural Urban
Proportion of vacant houses per thousand Census houses
----------
Total Rural Urban
-.~~--.---~~--------,-,- '-,._ .--.-~--~---------~-.---.----~~-~-----~-~------.-
2 3 4 5 6 7 8 9 10 11 ---------------~------ --------~-~-----------~----~.--
Haryana 1971 131,355 96.575 34,780 1961 112,884 77,620 35,264
Ambala 1971 14,510 7,620 6,890 1961 16,922 8,372 8,550
Kamal 197J ~;2,230 16,625 5,605 1961 16,134 10,850 5,284
Rohtak 1971 27,270 21,040 6,230 1961 21,219 14,660 6,559
Gurgaon 1971 22,760 16,965 5,795 1961 21,719 17,114 4,605
Mah 'ndragarh 1971 9,025 6,905 :,120 1961 7,340 4,884 2,456
Hisar 1971 27,525 20,730 6,795 1961 22,195 16,115 6,miO
Jind 1971 8,035 6,690 1,345 1961 7,355 5,625 1,730
-----------------20. Vacancy in houses is influenced by various
factors such U" old coJl';tluctioH:' going out of usc with age; llew houses just completed and a waiting occupation; neW house~ nearing complotion; serviceable 110uses vacated tcmpor2rily; scrviccuble houses of migrants not available for rent, etC. With the constant growth of popUlation .and high cost of con ;lructioll. there h[1." b'::::l1 an unpr('ccc1.ellted inclcase in the rental value of houses during the last decade. Vacancy of houses for long periods is not only loss of rental income to the owners, but a liability in regard to repairs and maintenance. Almost all serviceable vacant houses are, therefore. available 1',)1' occupation on rent. The vacancy of houses in urban arcas is mo. tty influcnced by the floating population living in rental hOlb('S, and comparatively high con<,tructional nctivity there, In cities nnd towns, where II good numbc;- or resident;, liVe in rented houses, there is a geneml tendency to shift to neW and better types of houses for variou, reasonS such as improved design. b.:tter hygienic conditions, location in developed area, nearness to place of work, market, school, cinema, main road etc. Lower rents, hc1tu landlords or neighbours arc other factors which iilducc tenant~, to move thereby, adding to the number of vacancies. In village'., however, where emp\)ymcnt oppo,tunitie'; arc fc'x and the population 'is generally static, mosdy living in self-owned hou;>es. the bulk 'Jf Ihe vacant houSef; consists of old and umcrviccablc structures. A few serviceable houses l1U;Y aLo lie VJ.cant for want of tenants and in quite a few caSes also due to the unwillingness of the migrant owners to let out their
+16 +24 ---1 58·8 53·1 81'8 58'3 49'0 100'2
-14 -9 ~19 52·2 40·0 78'9 66·4 48-2 104·9
+38 ,,53 +6 48 . .8 44·4 69·0 41.7 33-9 78 4
-29 +44 -5 67'9 62·4 96·3 59·9 48·2 129'6
+5 -1 +26 55·0 50·7 73 ·4 64.8 61'5 80'8
t23 +41 -14 62'6 54'6 118 ·9 52·7 39.8 146.8
+24 +29 +12 67·7 62'6 89'9 64·2 57·2 95·4
+9 +19 -22 56·0 54'0 68'4 61 ·3 53'5 115'8
buildings Oll nominal rents. The larger proportion of vacant home!; in any area hy Hnd large indicates tIle availabllity of additional accommodation there.
Number of Vacant Houses
21. In the State as a whole, 131,355 Census Houses Were vacant Ht the time of houselisting: 96,575 in rural areas and 34,780 in urban areas. Their proportion to total Census House~ is 59,53 r.nd 82 per thousand respectively. It may be noted that the proportion of vacant Ccmu:; H OUS~2 is higher in the ur ban areas of all the districts. Rohtak and Hi,ar districts with 68 vacan.t hOllses each per thomand Census .Houses and Mahcnd"ugarh di"trict with 63 reveal the l1igh vacancy rate',. ROn.Hlk di':triet hac; the advantage of proximity to Delhi and the rural population is continuously shifting to Delhi and urban areas of the district where employment oppofmnities nrc available, which is evident from the lowcst rural growth rate of the district: 22'S during 1961-71 as against 31.5 for the State as a whole. Similr,rly in Mahenclragarh, another district of low g" owth rrdc, lack of employment and scarcity of sweet drinking water are re:;ponsible for the shift of rum 1 a:-; Well as urban population to other areas where it can find gainful employment A subst antiai number of C..;nslls House, in Narnnul and other towns of Mallcndragarh district i:; a1:;o vacant because of the migration of Muslim3 to p(lki~tan and t he refugees having not settled in the district to an appreciable extent for obvious re[.sons. Hisar on the other hand is a dc;\'doping district. The Censu s Houses in
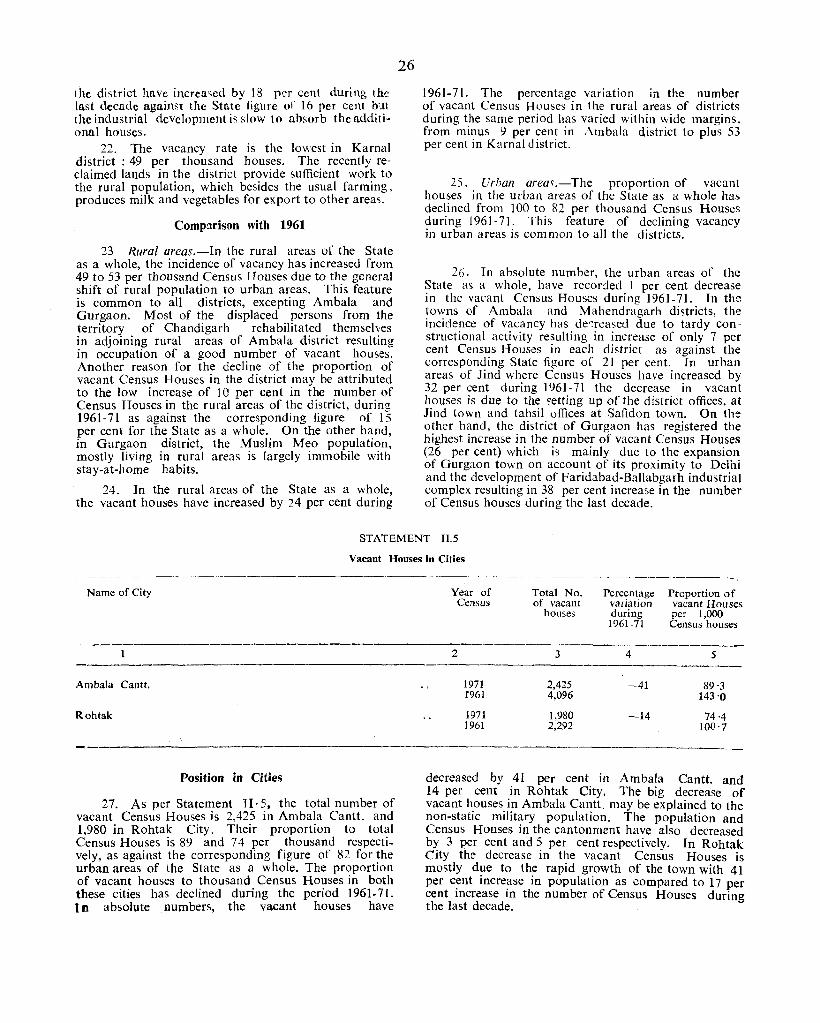
the district have incrca<;cd by 18 per cent dUring, the last decade against the State figure of 16 per cent but the industrial development is slow to absorb the n.dditionnl houses.
22. The vacancy rate is the lowest in Kamal district : 49 per thousand houses. The recently reclaimed lands in the district provide sufficient work to the rural population, which besides the usual farming, produces milk and vegetables for export to other area~.
Comparison with 1961
23 Rural areas.-In the rural areas of the State as a whole, the incidence of vacancy has increased from 49 to 53 per thousand Census Houses due to the general shift of rural population to urban areas. This feature is common to all districts, excepting Ambala and Gurgaon. Most of the displaced persons from the territory of Chandigarh rehabilitated themselves in adjoining rural areas of Ambala district resulting in occupation of a good number of vacant houses. Another reason for the decline of the proportion of vacant Census Houses in the district may be attributed to the low increase of 10 per cent in the number of Census Houses in the rural areas of the district, during 1961-71 as against the corresponding figure of 15 per cent for the State as a whole. On the other hand, in Gurgaon district, the Muslim Mea population, mostly living in rural areas is largely immobile with stay-at-home habits.
24. In the rural areas of the State as a whole, the vacant houses have increased by 24 per cent during
26 1961-71. The percentage variation in the number of vacant Census Houses in the rural areas of districts during the same period has varied within wide margins, from minus 9 per cent in Ambala district to plus 53 per cent in Karnal district.
25. Urban areas.-The proportion of vacant houses in the urban areas of the State as a whole has declined from 100 to 82 per thousand Census Houses during 1961-71. This feature of declining vacancy in urban areas is common to all the districts.
26. In absolute number, the urban areas of the State as a whole, have recorded 1 per cent decrease in the va, ant Census Houses during 1961-71. In the towns of Ambala and Mahendragarh districts, the incidence of vacancy has de~reased due to tardy constructional activity resulting in increase of only 7 per cent Census Houses in each district as against the corresponding State figure of 2 I per cent. In urhan areas of lind where Census Houses have increased by 32 per cent during 1961-71 the decrease in vacant houses is due to the setting up of the district offices, at lind town and tahsil offices at Safidon town. On the other hand, the district of Gurgaon has registered the highest increase in the number of vacant Census Houses (26 per cent) which is mainly due to the expansion of Gurgaon town on account of its proximity to Deihi and the development of Faridabad-Ballabgarh industrial complex resulting in 38 per cent increase in the number of Census houses during the last decade.
STATEMENT 11.5
Vacant Houses in Cities
Name of City
Ambala Cantt.
Rohtak
Position in Cities
27. As per Statement TI· 5, the total number of vacant Census Houses is 2,425 in Ambala Cant!. and 1,980 in Rohtak City. Their proportion to total Census Houses is 89 and 74 per thousand respectively, as against the corresponding figure of 82 for the urban areas of the State as a whole. The proportion of vacant houses to thousand Census Houses in both these cities has declined during the period 1961-71. I n absolute numbers, the vacant houses have
Year of Census
2
1971 f961
1971 1961
Total No. of vacant
hOllses
3
2,425 4,096
1,980 2,292
Percentage variation during
1961-71
4
-41
-14
Proportion of vacant Houses per 1,000 Census houses
5
89·3 143'0
74·4 100'7
decreased by 41 per cent in Ambala Cantt. and 14 per cent in Rohtak City. The big decrease of vacant houses in Ambala Cantt. may be explained to the non-static military population. The population and Census Houses in the cantonment have also decreased b~ 3 rer cent and ~ per cent respectively. In Rohtak CIty the decrease 111 the vacant Census Houses is mostly due to the rapid growth of the town with 41 per c~nt incre~se in population as compared to 17 per cent Increase 111 the number of Census Houses during the last decade.
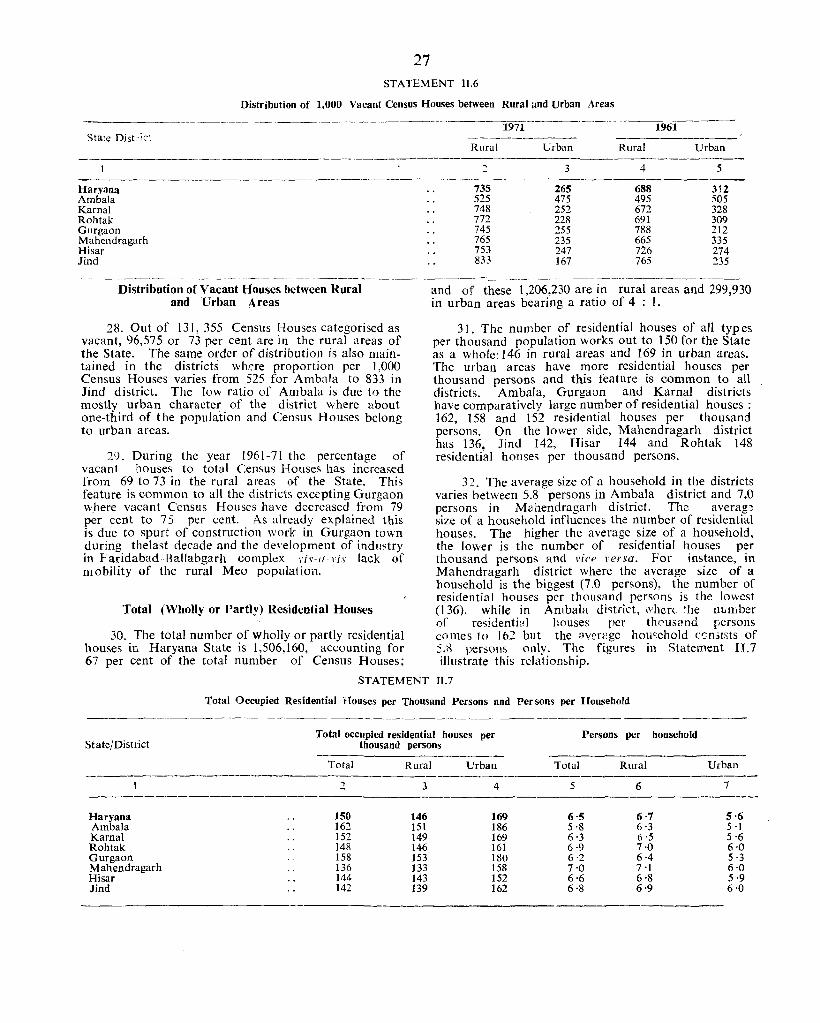
27 STATEMENT 1I.6
Distribution of 1,000 Vacant Census Houses between Rural und Urban Areas
1961 ." ~----~~-------~--i9'ir---------·
State Dist;ict Rural Urban Rural Urban
::! 3 4 5 -------~-----------
Haryana 735 265 688 312 Ambala 525 475 495 505 Kamal 748 252 672 328 Rohtak 772 228 691 309 Gurgaon 745 255 788 212 Mahendragarh 765 235 665 335 Hisar 753 247 726 274 lind 833 167 765 235
---~------- ------~ -~---~----.-~-------------~
Distribution of Vacant Houses between Rural and Urban Areas
28. Out of 131,355 Census Houses categorised as vacant, 96,575 or 73 per cent are in the rural areas of the State. The same order of distribution is also maintained in the districts whf.'re proportion per 1,000 Census Houses varies from 525 for Ambala to 833 in Jind district. The low ratio of Ambala is due to the mostly urban character of the district where about one-third of the population and Census Houses belong to urban areas.
29 _ During the year 1961-71 the percentage of vacant houses to total Census Houses has increased from 69 to 73 in the rural areas of the State. This feature is cornman to all the districts excepting Gurgaon where vacant Census Houses have decreased from 79 per cent to 75 per cent. As already explained this is due to spurt of construction work in Gurgaon town during thelast decade and the development of industry in F aridabad-Ballabgarh complex ris-a lis lack of mobility of the rural Mea populatioi1.
Total (Wholly or Partly) Residential Houses
30. The total number of wholly or partly residential houses in Haryana State is 1,506,160, accounting for 67 per cent of the total number of Census Houses;
and of these 1,206,230 are in rural areas and 299,930 in urban areas bearing a ratio of 4 : 1.
31. The number of residential houses of all typ es per thousand population works out to 150 for the State as a whole: 146 in rural areas and 169 in urban areas. The urban areas have more residential houses per thousand persons and this feature is common to all districts. Ambala, Gurgaon and Karnal districts have comparatively large number of residential houses: 162, 158 and 152 residential houses per thousand persons. On the lower side, Mahendragarh district has 136, Jind 142, Risar 144 and Rohtak 148 residential hOllses per thousand persons.
32. The average size of a household in the districts varies between 5.8 persons in Ambala district and 7.0 persons in Mahendragarh district. The averag~ size of a household influences the number of residential houses. The higher the average size of a household, the lower is the number of residential houses per thousand persons and vice versa. For instance, in Mahendragarh district where the average size of a household is the biggest (7.0 persons), the number of residential houses per thousand persons is the lowest (136). while in Ambala district, when ~lJe llLdI,ber of residenti3l houses per thousand persons comes to J (12 but the ;lVf.'f('ge hou,ehold cr:n~lsts of 5.~ persons only. The figures in Statement lJ.7 illustrate this rdation:,hip.
STATEMENT II.7
St ate/District
Haryana Ambala Kamal Rohtak Gurgaon Mahendragarh Hisar Jind
Total Occupied Residential Houses per Thousand Persons and Per sons per Household
Total occupied residential houses per Persons per household thousand persons
Total Rural Urban Total Rural
2 3 4 5 6
150 146 169 6·5 6·7 162 151 186 5·8 6-3 152 149 169 6·3 6'5 148 146 161 6·9 7·0 158 153 180 6-2 6·4 136 133 158 7'0 7 '1 144 143 152 6·6 6·8 142 139 162 6·8 6'9
Urban
7
5·6 5 '1 5·6 6·0 5·3 6'0 5·9 6'0
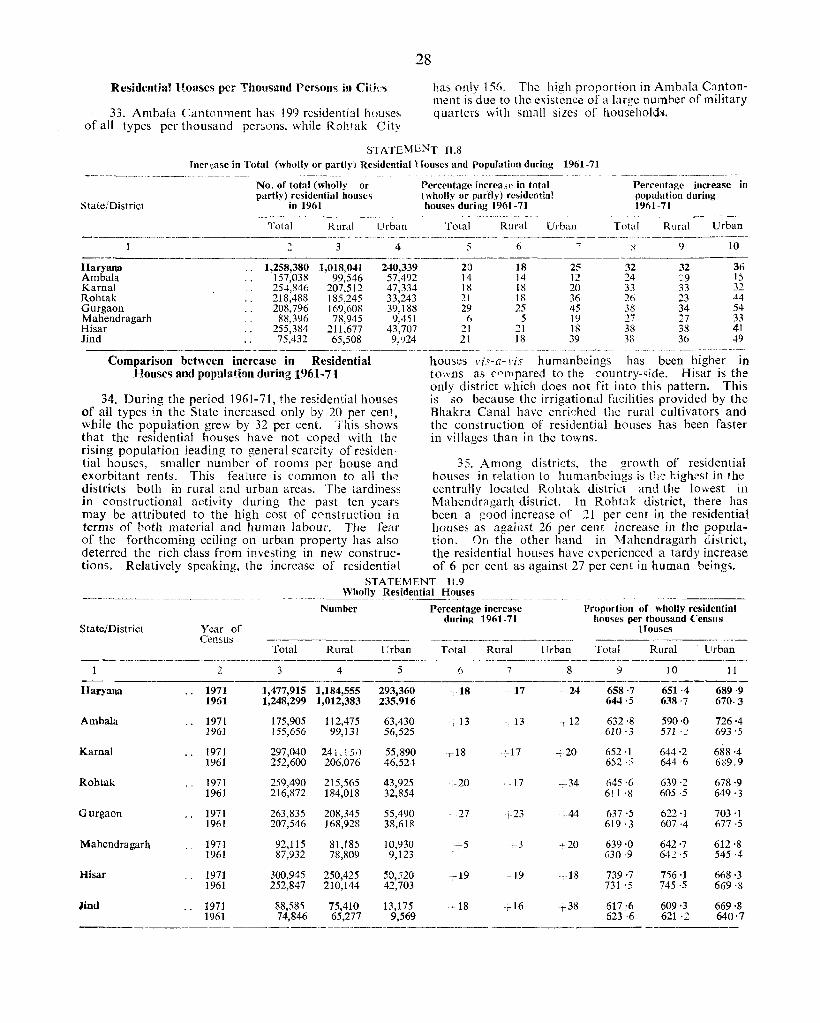
28
Rcsidentia! Houses per Thousand Persons in Citk'i
33. Ambala Cantonment has 199 residential house:; of all types per thousand persons. while Roh1ak City
ha~ only 156. The high proportion in Ambala Cantonment is due to the existence of a large numher of military quarters with sma!! sizes of househokh.
STATEMENT 11.8 fncrzase in Total (wholly or partly) Residential Houses and population during 1961-71
Stale/District
Haryana Ambala Kamal Rohtak Gurgaon Mahendragarh Hisar Jind
No. of total (wholly or partly) residential houses
in 1961
Total Rural
3
1,258,380 1,018,041 157,038 99,546 254,846 207,512 218,488 185,245 208,796 169,608
88,396 78,945 255,384 211,677 75,432 65,508
Urban
4
240,339 57,492 47,334 33,243 39,188 9,451
43,707 9,')24
Percpntage increa;;c in total (wholly or partly) residential houses during 1961-71
Total Rural Urhan
5 6 7
20 18 25 14 14 12 18 18 20 21 18 36 29 25 45
(, 5 19 21 21 18 21 18 39
Percentage increase in population during 1961-71
Total Rural Urban
9 10
32 32 36 24 .9 15 33 33 32 ].6 23 44 38 34 54 "., 27 33 38 38 41 38 36 49
-----_._------ -.---------~---- --.. ~---. - -- - .~- --_.- _ ... , ---- ----~--.--. - .-------,,-
Comparison between increase in Residential House .. and population during 1961-71
34. During the period 1961-71, the residential houses of all types in the State increased only by 20 per cent. while the population grew by 32 per cent. This shows that the residential houses have not coped with the' rising population leading to general scarcity of residen·
houses l'i<:-a- \'is humanbeings has been higher in towns as ("'nopared to the country-,ide, Hisar is the only district which does not fit into this pattern. This is so because the irrigational facilities provided by the Bhakra Canal have enrir:hed the rural cultivators and the construction of residential houses has been faster in villages than in the towns.
tial houses, smaller number of rooms per house and 35. Among distrids, the growth of residential exorbitant rents. This feature is common to all th.: houses in f':Oiation to humanbciilgs is the r.igh,~st in the districts both in rural ami urban areas. The tardiness centrally located Rohlak district and the lowest in in constructional activity during the past ten years Mahendragarh district. In Rohtak district, there has may be attributed to the high cost of construction in been a g00d increase of 21 per cent in the residential terms of 1:-oth material and human labour. The feitr houses as against 26 per cent increase in the popula-of the forthcoming ceiling on urban property has also tion, On the other hand in ~.1ahendragarh district, deterred the rich class from investing in new construc- the residential houses have experienced a tardy increase tions. Relatively speaking, the increase of residential of 6 per ccnt as against 27 per cent in human beings.
State/District Year of Census
:: Haryana 1971
1961
Arnbala 1971 1961
Karoal 1971 1961
Rohtak 1971 1961
Gurgaon 1971 1961
Mahendragarh 1971 1961
Hisar 1971 1961
lind 1971 1961
STATEMENT II.9 ________ ~}~o_lly __ Residential _ _I_io_llses
Number Percentage increase during 1961-71
Froportion of wholly residential hou~es per thousand Censlls
Houses --~--~-".-----------~- ~_~~~~~-,~-----~~.-~- ~--.~---
Total Rural Urban Total Rural Urban Total Rural Urban --------"~----------
4 5 (i 7 8 9 10 11 --- --_._-----------
1,477,915 1,184,555 293,360 ~18 17 -,-24 658·7 651 ·4 689·9 1,248,299 1,012,383 235,916 644 ·5 638'7 670·3
175,905 112,475 63,430 ,13 13 'r 12 632·8 590·0 726·4 155,656 99,131 56,525 610 ·3 571 '2 693'5
297,040 241,150 55,890 1'18 j-17 -;.20 652 ·1 644·2 688·4 252,600 206,076 46,52.~ 652 ,5 644 6 609.9
259,490 215,565 43,925 --'-20 +17 +34 645·6 639·2 678·9 216,872 184,018 32,854 611 ·8 605 ·5 649 ·3
263,S35 208,345 55,490 -27 ~f-23 ,44 637 ·5 622 ·1 703 '1 207,546 168,928 38,618 619·3 607 ·4 677 ·5
92,115 81,185 10,930 c..5 ,_ 3 ·,·20 639·0 642·7 612·8 87,932 78,809 9,123 630,9 642·5 545·4
300,945 250,425 SO,S20 -19 -19 -;-18 739·7 756 ·1 668'3 252,847 210,144 42,703 731 '5- 745 ·5 669'8
88,585 75,410 13,175 -.,.18 r16 -r38 617·6 609'3 669'8 74,846 65,277 9,569 623 ·6 621 .2- 640·7
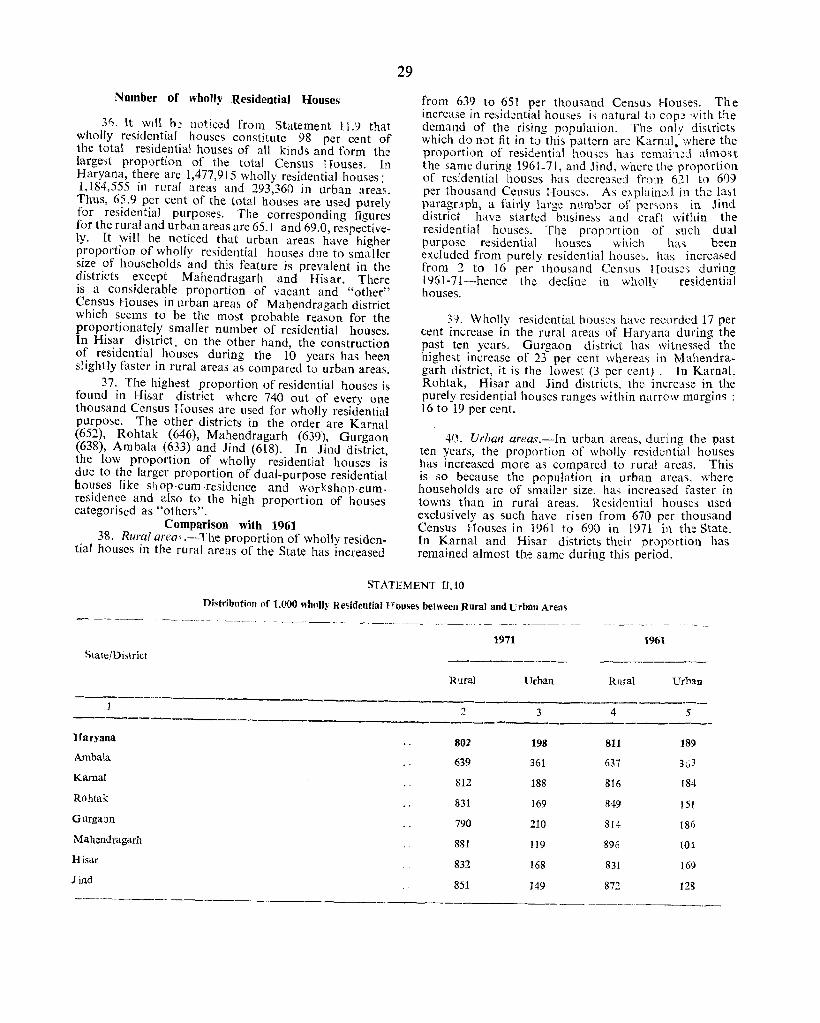
Number of wholly Residential Houses
31'). It will b~ noticed from Statement 11.9 that wholly residential houses constitute 98 per cent of the total residential houses of all kinds and form the largest proportion of the total Census Houses. In Haryana, there are 1,477,9J 5 wholly residential houses: 1,184,555 in rural areas and 293,360 in urban areas. Thus, 65.9 per cent of the total houses are used purely for residential purposes. The corresponding figures for the rural and urban areas are 65.1 and 69.0, respectively. It will be noticed that urban areas have higher proportion of wholly residential houses due to smaller size of households and this feature is prevalent in the districts except Mahendragarh and Hisar. There is a considerable proportion of vacant and "other" Census Houses in urban areas of Mahendragarh district which seems to be the most probable reason for the proportionately smaller number of residential houses. In Hisar district, on the other hand, the construction of residential houses during the 10 years has been slightly faster in rural areas as compared to urban areas.
37. The highest proportion of residential houses is found in Hisar district where 740 out of everyone thousand Census Houses are used for wholly residential purpose. The other districts in the order are Karnal (652), Rohtak (646), Mahendragarh (639), Gurgaou (638), Ambala (633) and Jind (618). In Jind district, the low proportion of wholly residential houses is due to the larger proportion of dual-purpose residential houses like sl! op-cum .residence and workshop-cumresidence and also to the high proportion of houses categorised as "others".
Comparison with 1961 38. Rural areal .--The proportion of wholly residen
tial houses in the rural areas of the State has increased
29
from 639 to 651 per thousand Censu~ Houses. Th e increase in residential houses is natural to cop:! with the demand of the rising population. The only districts which do not fit in to this pattern ar.': KHll1l. where the proportion of residential houses na:; remai'ld alm~)St the same during 1961-71, and Jind, where the proportion of residential houses has decreased from 621 to 609 per thousand Census Houses. As explained in the la~t paragraph, a fairly large number of persons in Jind district have started business and craft within the residential houses. The prop:)ftion of such dual purpose residential houses which ha'> been excluded from purely residential houses, has increa~ed from 2 to 16 per thousand Cen\us Houses .dun?g 1961-71-hence the decline in wholly reSidential houses.
39. Whollv residentiaL houses have recorded 17 per cent increase in the rural areas of Haryana during the past ten years. Gurgaon district has witnessed the highest increase of 23 per cent whereas in Mahendragarh district, it is the lowest (3 per cent). In Kamal, Rohtak, Hisar and Jind districts, the increase in the purely residential houses ranges within narrow margins: 16 to 19 per cent.
-w. Urhan areas.-In urban areas, during the past ten years, the proportion of wholly residcntial houses has increased more as compared to rural areas. This is so because the population in urban areas, \vhcre households are of smaller size, has increased faster in towns than in rural areas. Residential houses used exclusively as such have ri sen from 670 per thousand Census Houses in 1961 to 690 in 1971 in the State. In Kamal and Hisar districts their proportion has remained almost the same during this period.
STATEMENT IUO
Distribution of 1,000 wholly Residential Houses bet\\een Rural and Urban Areas
1971 1961
StateIDi~\rict
Rural Urban Rural Urban
2 3 4 5
Haryana 801 198 811 189 Ambala 639 361 637 3G3 Kamal 812 188 816 184
Rohtak 831 169 849 151 Gurgaan 790 210 814 186 Mahendragarh 881 119 896 10+ Hisar 832 168 831 169 Jind 851 149 872 128 _---_._-_. __ ----
--_---
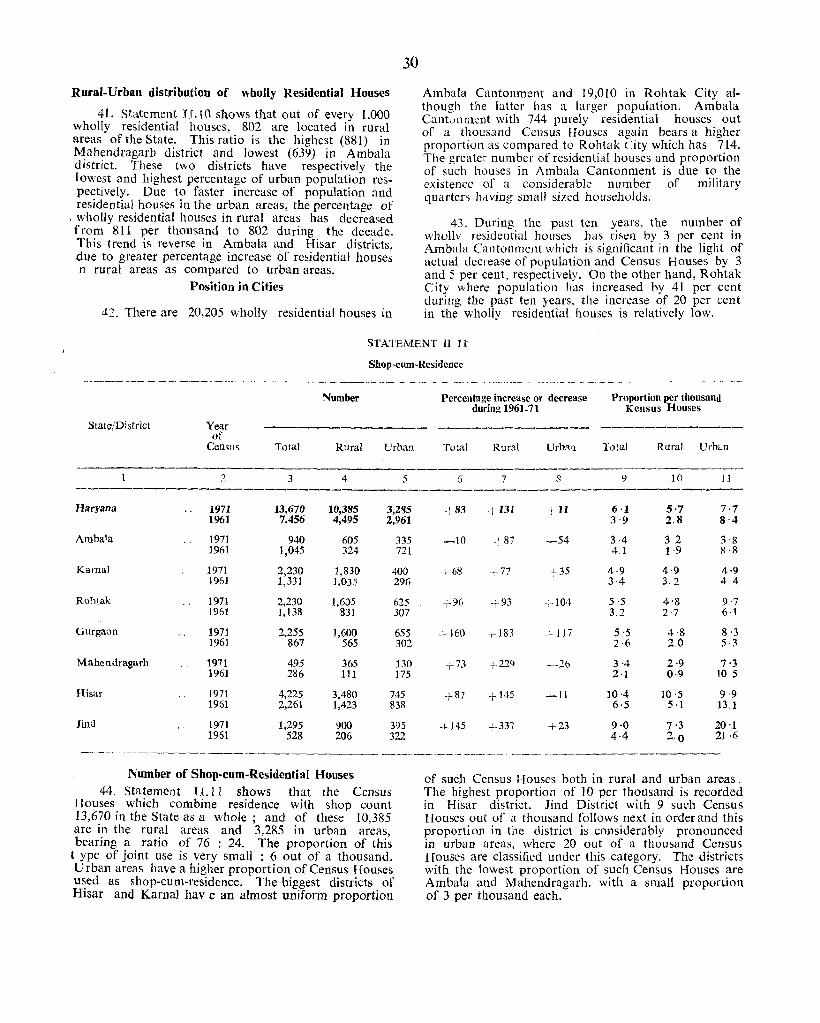
Rural-Urban distribution of wholly Residential Houses
41. Statement H.lO shows that out of every 1,000 wholly residential houses, 802 are located in rural areas of the State. This ratio is the highest (881) in Mahendragarh district and lowest (639) in Ambala district. These two districts have respectively the lowest and highest percentage of urban population respectively. Due to faster increase of popUlation and residential houses in the urban areas, the percentage of
. wholly residential houses in rural areas has decreased from 811 per thousand to 802 during the decade. This trend is reverse in Ambala and Hisar districts. due to greater percentage increase of residential houses n rural areas as compared to urban areas.
Position in Cities
42. There are 20,205 wholly residential houses in
30
Ambala Cantonment and 19,010 in Rohtak City although the latter has a larger population. Ambala Cant~nmcnt with 744 purely residential houses out of a thousand Census Houses again bears a higher proportion as compared to Rohtak City which has 714. The greater number of residential houses and proportion of such houses in Ambala Cantonment is due to the existence of a considerable number of military quarters having small sized households.
43. During the past ten years, the number of whollv residential houses has rist:n by 3 per cent in Ambala Cantonment which is significant in the light of actual decrease of population and Census Houses by 3 and 5 per cent, respectively. On the other hand, Rohtak City where popUlation has increased by 41 per cent during the past ten years, the increase of 20 per cent in the wholly residential houses is relatively low.
STATEMENT II H
Shop-cum-Rcsidencc
Number Percentage increase or decrease during 1961-71
Proportion per thousand Kensus Houses
State/District Year ------------- -------------- ------------
Haryana
Ambala
Karnal
Rohtak
Gurgaon
Mahendragarh
Hisar
Jind
of Cen~us
2
1971 1961
1971 1961
1971 1961
1971 1961
1971 1961
1971 1961
1971 1961
1971 1961
Total
3
13,670 7,456
940 1,045
2,230 1,331
2,230 J,138
2,255 867
495 286
4,225 2,261
1,295 528
Rural
4
10,385 4,495
605 324
1,830 1,035
1,605 831
1,600 565
365 111
3,480 1,423
900 206
Number of Shop-cum-Residential Houses
Urban
5
3,285 2,961
335 721
400 296
625 307
655 302
130 175
745 838
395 322
44. Statement 11.11 shows that the Census Houses which combine residence with shop count 13,670 in the State as a whole; and of these 10,385 are in the rural areas and 3,285 in urban areas, bearing a ratio of 76 : 24. The proportion of this
type of joint use is very small : 6 out of a thousand. Urban areas have a higher proportion of Census Houses used as shop-cum-residence. The biggest districts of Hisar and Karnal have an almost uniform proportion
Total Rur2.l Urban
G 7 8
+83 +131
-10 -54
-j 68 + 77 +35
+96 +93
+ 160 + I J 7
+73 -; 229 -26
+145 -11
+145 +337 +23
Total Rural UrbC:ll
-----------~
9
6·1 3'9
3·4 4.1
4 9 34
5·5 3.2
3·4 2·1
10·4 6·5
9·0 4-4
10
5·7 2.8
32 1 ·9
4·9 3.2
4'8 2·7
4·8 2.0
2·9 0·9
10·5 5·1
7·3 2·0
11
7·7 8·4
3·g 8·8
4·9 4 4
9·7 6·1
8·3 5·3
7·3 10 5
9·9 13.1
20 ·1 21 ·6
of such Census Houses both in rural and urban areas. The highest proportion of 10 per thousand is recorded in Hisar district. lind District with 9 such Census Houses out of a thousand follows next in order and this proportion in the district is considerably pronounced in urban arcas, where 20 out of a thousand Census Houses are classified under this category. The districts with the lowest proportion of such Census Houses are Ambala and Mahendragarh. with a small proportion of 3 per thousand each.
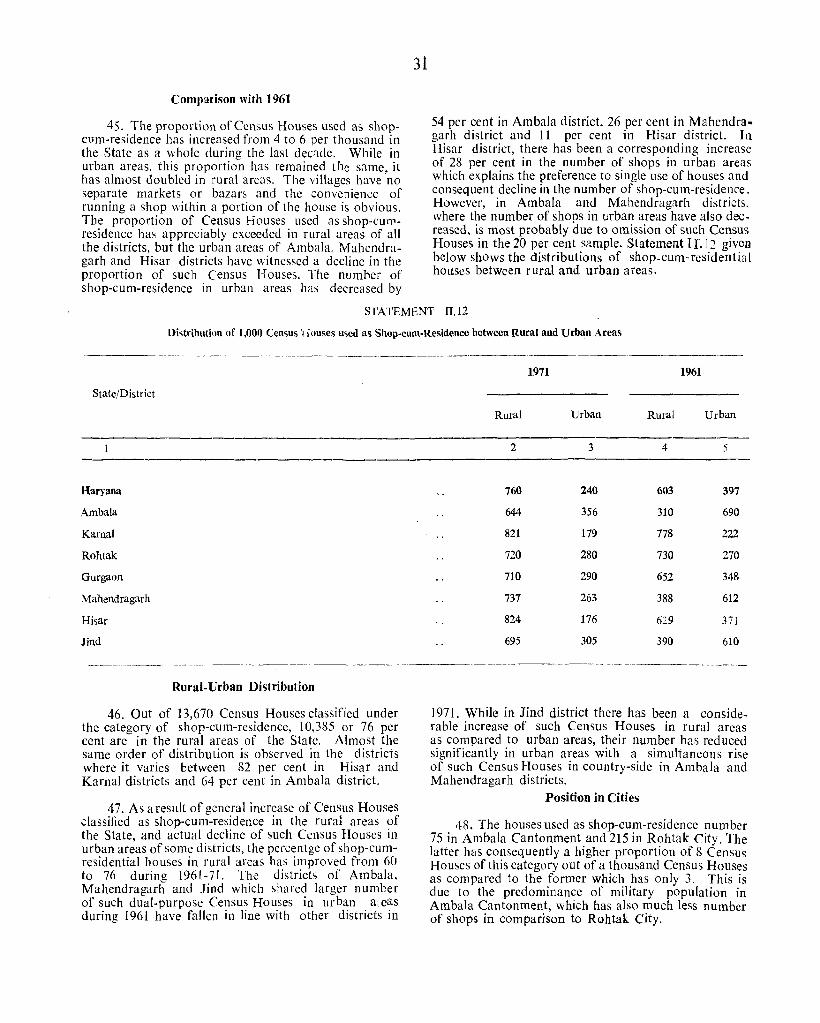
Comparison with 1961
45. The proportion of Census Houses used as shopc11m-residence has increased from 4 to (> per thousand in the State as a whole during the last dWlde. While in urban areas, this proportion has remained the S::l.mc, it has almost doubled in rural areas. The villages have no separate markets or bazcns and the convenience of running a shop vvithin a portion of the house is obvious. The proportion of Census Houses used as shop-culT'residence ha" appreciably exceeded in rural areas of aU the districts, but the urban areas of Ambala .. Mahendragarh and Hisar districts have witnessed a decline in the proportion of such Census Houses. The number of shop-cum-residence in urban areas has decreased by
31
54 per cent in Ambala district, 26 per cent in Mahendragarh district and 11 per cent in Hisar district. In Hisar district, there has been a corresponding increase of 28 per cent in the number of shops in urban arcas which explains the preference to single use of houses and consequent decline in the number of shop-cum-residenre. However, in Ambala and Mahendragarh districts. where the number of shops in urban areas have also decreased, is most probably due to omission of such Census Houses in the 20 per cent !'ample. Statement T r. I 2 given below shows the distributions of shop-cum-residential houses between rural and urban areas.
STATEMENT n.12
Uistribution of 1,000 Census 'j {ouses used as Shop-cum-Residence between Rural and Urban Areas
State/District
Haryana
Ambala
Kamal
Rohtak
Gurgaon
Mahendragarh
Hisar
Jind
-----~_-----_-
Rural-Urban Distribution
46. Out of 13,670 Census Houses classified under the category of shop-cum-residence, 10,385 or 76 per cent are in the rural areas of the State. Almost the same order of distribution is observed in the districts where it varies between 82 per cent in Hisar and Karnal districts and 64 per cent in Ambala district.
47. As a result of general increase of CenSus Houses classified as shop-cum-residence in the rural areas of the State, and actual decline of such Census Houses in urban areas of some districts, the percentge of shop-cumresidential houses in rural areas has improved from 60 to 76 during 1961-71. The districts of Ambala, Mahendragarh and lind which shared larger number of such dual-purpose Census Houses in urban a~cas during 1961 have fallen in line with other districts in
Rural
2
760
644
821
720
710
737
824
695
1971
Urban
3
240
356
179
280
290
263
176
305
1961
Rural Urban
4 5
603 397
310 690
778 222
730 270
652 348
388 612
629 371
390 610
1971. While in lind district there has been a considerable increase of such Census Houses in rural areas as compared to urban areas, their number has reduced significantly in urban areas with a simultaneous rise of such Census Houses in country-side in Ambala and Mahendragarh districts.
Position in Cities
48. The houses used as shop-cum-residence number 75 in Ambala Cantonment and 215 in Rohtak City. The latter has consequently a higher proportion of 8 Census Houses of this category out of a thousand Census Houses as compared to the former which has only 3. This is due to the predominance of military popUlation in Ambala Cantonment, which has also much less number of shops in comparison to Rohtak City.
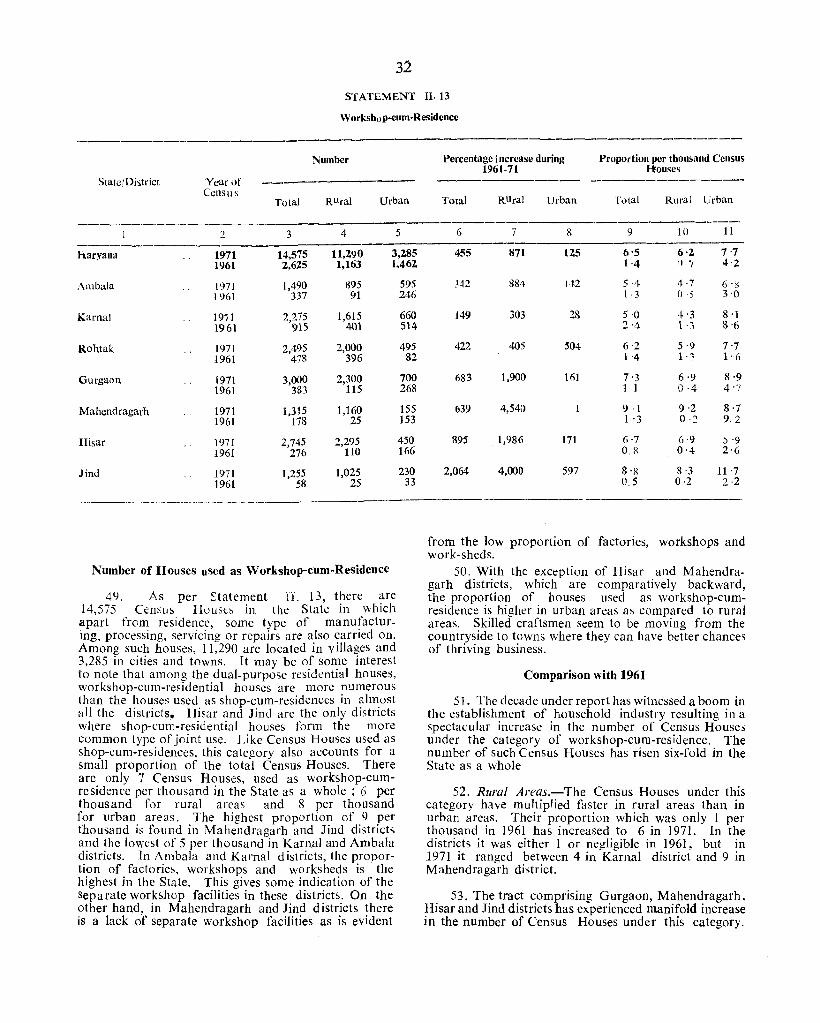
32
STATEMENT II. 13
Worksho p-cum-Residencc
Number
State/District Year of Census
Urban Total RUral
-) 3 4 5 ---------_. haryalla 1971 14,575 11,290 3,285
1961 2,6Z5 1,163 1,462
Ambala 1971 1,490 895 1961 337 91
Kamal 19i 1 2,275 1,615 1961 915 401
Rohtak 1971 2,495 2,000 1961 418 396
Gurgaon 1971 3,000 2,300 1961 383 115
Mahendragarh 1971 1,315 1,160 1961 118 25
Hisar 1971 2,745 2,295 1961 276 110
Jind 1971 1,255 1,025 1961 58 25
.-------- ---~--
Number of Houses used as Workshop-cum-Residence
49. As per ~tatement iOi'. 13, there are 14,575 Census Houses ill. the State in which apart from residence, some type of manufacturing, processing, servicing or repairs are also carned OIl.
Among such houses, 11,290 arc located in villages and 3,285 in cities and towns. It may be of some interest to note that among the dual-purpose residential houses, workshop-cum-residential houses are more numerous than the houses used as shop-cum-residences in ~l~ost all the districts. Hisar and Jind are the only dIstrIcts where shop-emil-residential houses form the more common type of joint use. Like Census Houses used as shop-cum-residences, this category also accounts for a small proportion of the total Census Houses. There are only 7 Census Houses, used as workshop-cumresidence per thousand in the State as a whole; 6 per thousand for rural areas and 8 per thousand for urban areas. The highest proportion of 9 per thousand is found in Mahendragarh and Jind districts and the lowest of 5 per thousand in Karnal and Ambala districts. In Arnbala and Karnal districts, the proportion of factories, workshops and worksheds is the highest in the State. This gives some indication of the separate workshop facilities in these districts. On the other hand, in Mahendragarh and lind districts there is a lack of separate workshop facilities as is evident
595 246
660 514
495 82
700 268
155 153
450 166
230 33
Percentage increase during Proportion per thousand Census 1961-71 Houses
------------ -------------Total RUral Urban Total Rural Urban
6 7 8 9 10 11
455 871 125 6'5 6·2 7'7 1-4 II 7 4'2
342 884 1·+2 5-4 4·7 6 oK I -3 0·5 3'0
149 303 28 5·0 4 '3 8'1 2'4 1 -3 g-6
422 40S 504 6·2 5 '9 7'7 1 -4 1- , 1-6
683 1,900 161 7'3 6·9 8'9 I t 0·4 4'7
639 4,54ll 9 ·1 9·2 8'7 1 . 3 0-2 9. 2
895 1,986 171 6·7 6-9 :, -9 0.8 0-4 2'6
2,064 4,000 597 g'8 8·3 11'7 0.5 0·2 2·2
from the low proportion of factories, workshops and work-sheds.
50. With the exception of Hisar and Mahendragarh districts, which are comparatively backward, the proportion of houses used as workshop-cumresidence is higher in urban areas as compared to rural areas. Skilled craftsmen seem to be moving from the countryside to towns where they can have better chances of thriving business.
Comparison with 1961
51. The decade under report has witnessed a boom in the establishment of household industry resulting in a spectacular increase in the number of Census Houses under the category of workshop-cum-residence. The number of such Census Houses has risen six-fold in the State as a whole
52. Rural Areas.-The Census Houses under this category have multiplied faster in rural areas than in urban areas. Their proportion which was only 1 per thousand in 1961 has increased to 6 in 1971. In the districts it was either 1 or negligible in 1961, but in 1971 it ranged between 4 in Karnal district and 9 in Mahendragarh district.
53. The tract comprising Gurgaon, Mahendragarh, Hisar and lind districts has experienced manifold increase in the number of Census Houses under this category.
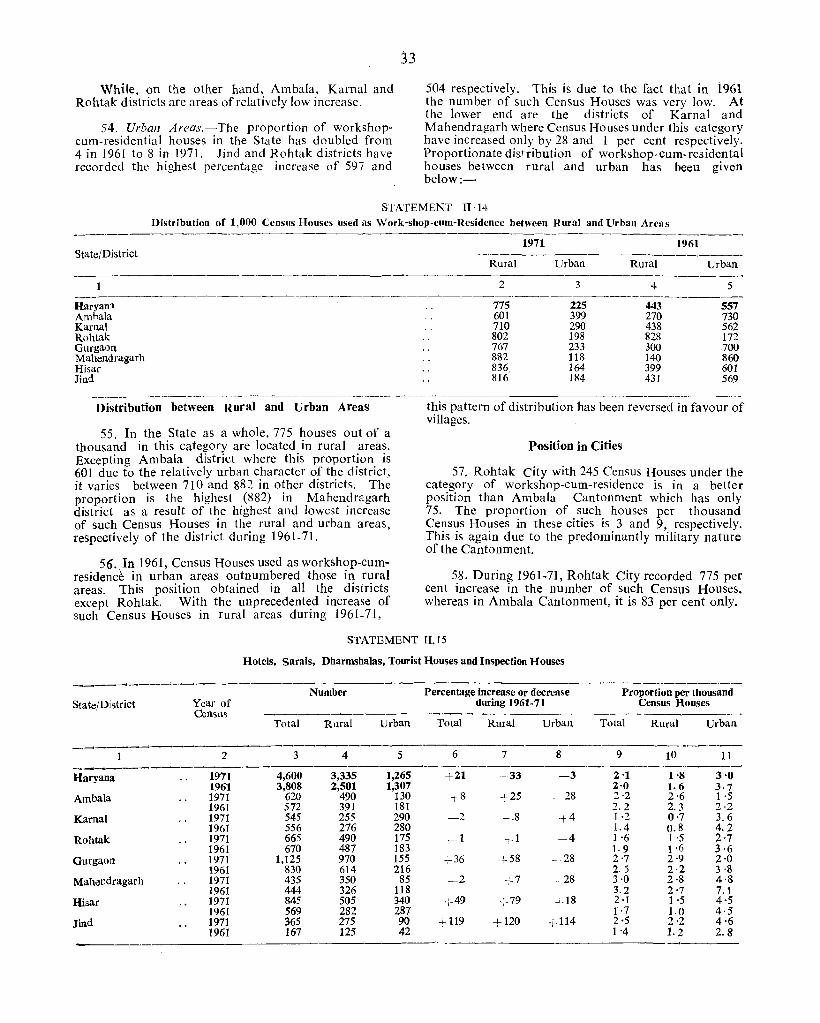
While, on the other hand, Ambala, Kamal and Rohtak districts are areas of relatively low increase.
54. Urban Areas.--The proportion of workshopcum-residential houses in the Statc has doubled from 4 in 1961 to 8 in 1971. lind and Rohtak districts have recorded the highest percentage increase of 597 and
33
504 respectively. This is due to the fact that in i961 the number of such Census Houses was very low. At the lower end are the districts of Kamal and Mahendragarh where Census Houses under this category have increased only by 28 and 1 per cent respectively. Proportionate disl ribution of workshop-cum-residental homes between rural and urban has been given below:-
STATEMENT I1·14 Distribution of 1,000 Censns Houses used as Work-shop-cum-Residence between Rural and Urban Areas
State/District
Haryana Amhala Kamal Rohtak Gurgaon Mahendragarh Hisar Jind
Distribution between Rural and Urban Areas
55. In the State as a whole, 775 houses out of a thousand in this category are located in rural areas. Excepting Ambala district where this proportion is 601 due to the relatively urban character of the district, it varies between 710 and 882 in other districts. The proportion is the highest (882) in Mahendragarh district as a result of the highest and lowest increase of such Census Houses in the rural and urban areas. respectively of the district during 1961-71. .
56. In 1961, Census Houses used as workshop-cumresidenc~ in urban areas outnumbered those in rural areas. This position obtained in all the districts except Rohtak. With the unprecedented increase of such Census Houses in rural areas during 1961_71,
1971 1961
Rural Urban Rural Urban
2 3 4 5
775 225 443 557 601 399 270 730 710 290 438 562 802 198 828 172 767 233 300 700 882 118 140 860 836. 164 399 601 816 184 431 569
this pattern of distribution has been reversed in favour of villages.
Position in Cities
57. Rohtak City with 245 Census Houses under the category of workshop-cum-residence is in a better position than Ambala Cantonment which has only 75. The proportion of such houses per thousand Census Houses in these cities is 3 and 9, respectively. This is again due to the predominantly military nature of the Cantonment.
58. During 1961-71, Rohtak City recorded 775 per cent increase in the number of such Census Houses, whereas in Ambala Cantonment, it is 83 per cent only.
STATEMENT IU5
Hotels, Sarais, Dharmshalas, Tourist Houses and Inspection Houses
--------_ Number Percentage increase or decrease Proportion per thousand
State/District Year of during 1961-71 Census Houses Census _----------------
Total Rural Urban Total Rural Urban Total Rural Urban
---------- ---_-:2 3 4 5 6 7 8 9 10 11
llaryana 1971 4,600 3,335 1,265 +21 +33 -3 2'1 1'8 3'0 1961 3,808 2,501 1,307 2'0 1.6 3·7
Ambala 1971 620 490 130 ,8 +25 - 28 2·2 2·6 1 ·5 1961 572 391 181 2.2 2.3 2·2
Karnal 1971 545 255 290 -2 -8 +4 1 ·2 0·7 3.6 1961 556 276 280 1.4 0.8 4.2
Rohtak 1971 665 490 175 -1 +1 -4 1 '6 1 ·5 2'7 1961 670 487 183 1·9 1 ·6 3·6
Gurgaon 1971 1,125 970 155 +36 +58 - 28 2'7 2·9 2·0 1961 830 614 216 2. 5 2·2 3·8
Mahecdragarh 1971 435 350 85 --2 +7 -28 3·0 2·8 4·8 1961 444 326 118 3.2 2'7 7.1
Hisar 1971 845 505 340 +49 +79 T18 2 ·1 1 ·5 4·5 1961 569 282 287 1·7 1.0 4·5
Jind 1971 365 275 90 +119 +120 +114 2·5 2·2 4·6 1961 167 125 42 1 '4 1.2 2.8
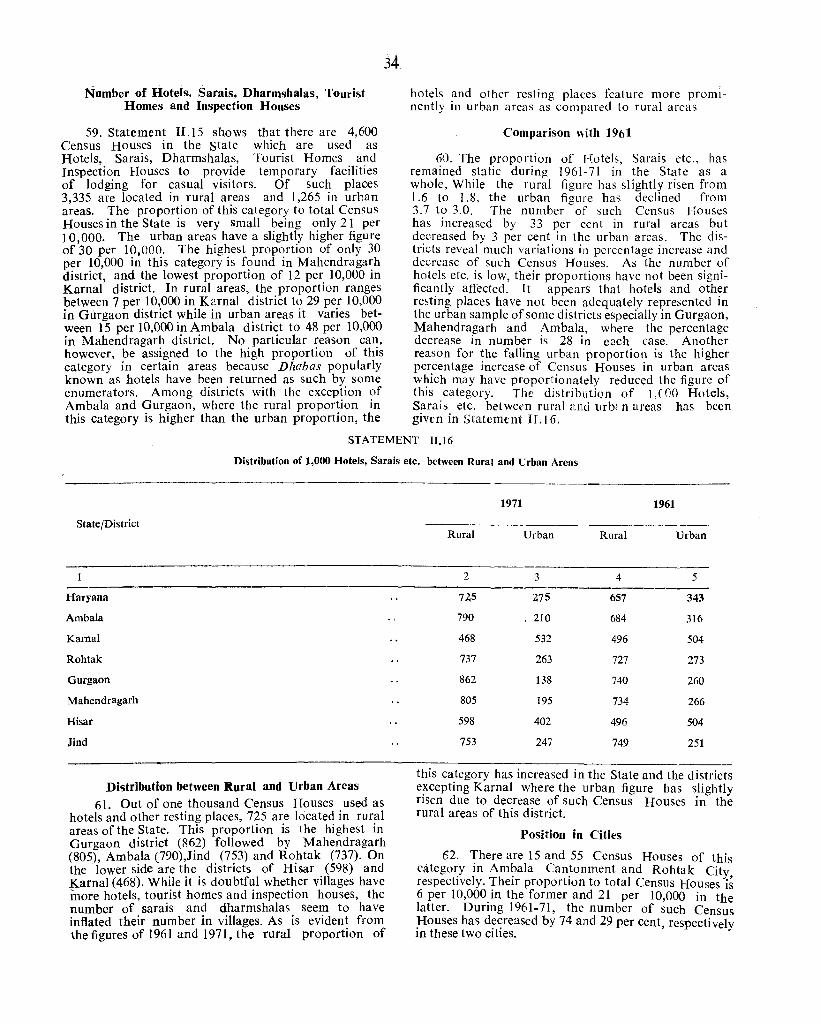
Number of Hotels, Sarais, Dharmshalas, Tourist Homes and Inspection Houses
59. Statement II,15 shows that there are 4,600 Census Houses in the state which are used as Hotels, Sarais, Dharmshalas, Tourist Homes and Inspection Houses to provide temporary facilities of lodging for casual visitors. Of such places 3,335 are located in rural areas and 1,265 in urban areas. The proportion of this category to total Census Houses in the State is very small being only 21 per 10 000. The urban areas have a slightly higher figure of'30 per 10,000. The highest proportion of only 30 per 10,000 in this category is found in Mahendragarh district, and the lowest proportion of 12 per 10,000 in Karnal district. In rural areas, the proportion ranges between 7 per 10,000 in K2.rnal district to 29 per 10,000 in Gurgaon district while in urban areas it varies between 15 per 10,000 in Ambala district to 48 per 10,000 in Mahendragarh district. No particular reason can, however, be assigned to the high proportion of this category in certain areas because Dlzabas popularly known as hotels have been returned as such by some enumerators. Among districts with the exception of Ambala and Gurgaon, where the rural proportion in this category is higher than the urban proportion, the
34
hotels and other resting places feature more prominently in urban areas as compared to rural areas
Comparison with 1961
60. The proportion of t-fotels, Sarais etc., has remained static during 1961-71 in the State as a whole, While the rural figure has slightly risen from 1.6 to 1.8, the urban figure has declined from 3.7 to 3,0. The number of such Census Houses has increased by 33 per cent in rural areas but decreased by 3 per cent in the urban areas. The districts reveal much variations in percentage increase and decrease of such Census Houses. As the number of hotels etc. is low, their proportions have not been significantly affected. It appears that hotels and other resting places have not been adequately represented in the urban sample of some districts especially in Gurgaon, Mahendragarh and Ambala, where the percentage decrease in number is 28 in each case. Another reason for the falling urban proportion is the higher percentage increase of Census Houses in urban areas which may have proportionately reduced the figure of this category. The distribution of I,COO Hotels, Sarais etc. bet wern rural and urbi n areas has been given in Statement IT.16.
STATEMENT II.16
Distribution of 1,000 Hotels, Sarais etc. between Rural and Urban Areas
State/District
Haryana
Ambala
Kamal
Rohtak
Gurgaon
Mahcndragarh
Hisar
Jind
Distribution between Kural and Urban Areas 61. Out of one thousand Census Houses used as
hotels and other resting places, 725 are located in rural areas of the State. This proportion is the highest in Gurgaon district (862) followed by Mahendragarh (805), Ambala (790),Jind (753) and Rohtak (737). On the lower side are the districts of Hisar (598) and Karnal (468). While it is doubtful whether villages have more hotels, tourist homes and inspection houses, the number of sara is and dharmshalas seem to have inflated their number in villages. As is evident from the figures of 1961 and 1971, the rural proportion of
1971 1961
Rural Urban Rural Urban
2 3 4 5
745 '1.75 657 343
790 210 684 316
468 532 496 504
737 263 727 273
862 138 740 260
805 195 734 266
598 402 496 504
753 247 749 251
this category has increased in the State and the districts e~cepting Karnal where the urban figure has slightly rIsen due to decrease of such Census Houses in the rural areas of this district.
Position in Cities
62, There are 15 and 55 Census Houses of this category in Ambala Cantonment and Rohtak City respectively. Their proportion to total Census Houses i~ 6 per 10,000 in the former and 21 per 10,000 in the latter. During 1961-71, the number of such Census ;Houses has d~~reased by 74 and 29 per cent, respectively III these two cItIes.
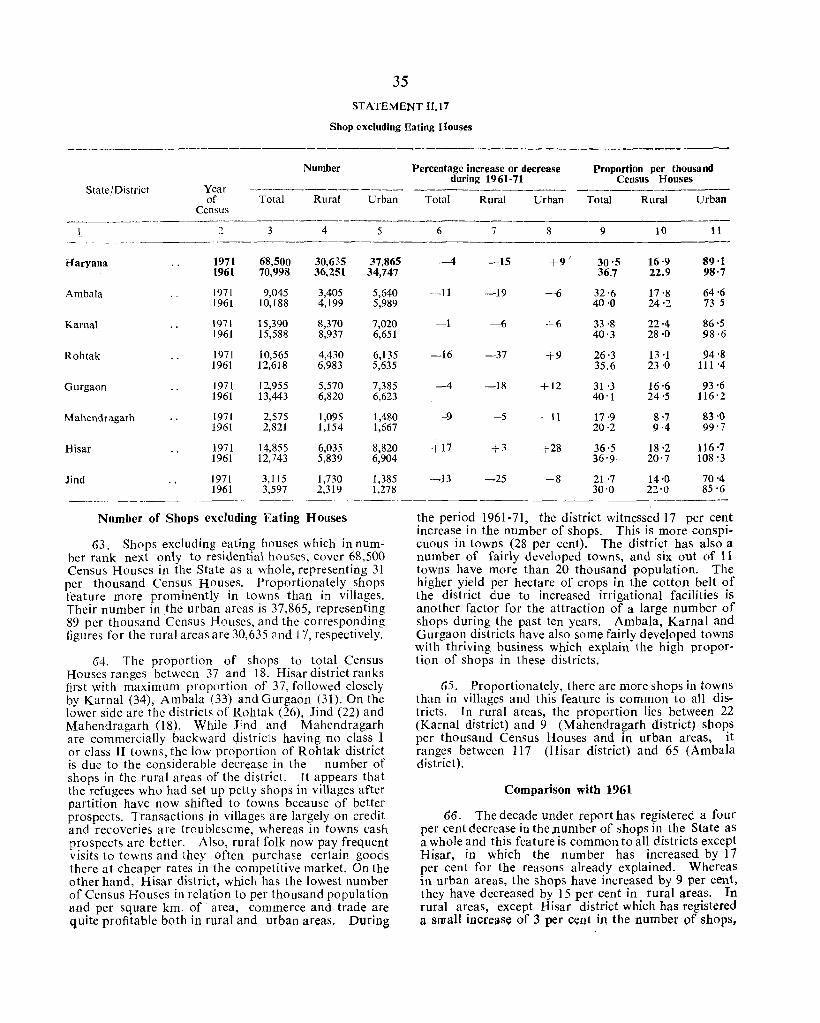
35
STATEMENT II.17
Shop excluding Eating Houses
Number
State/District Year of Total Rural Urban
Census -----,
I 2- 3 4 5 -_---
H'aryana 197. 1961
68,500 30,635 37,865 70,998 36,251 34,747
Ambala 1971 9,045 3,405 5,640 1961 10,188 4,199 5,989
Karnal 1971 15,390 8,370 7,020 1961 15,588 8,937 6,651
Rohtak 1971 10,565 4,430 6,135 1961 12,618 6,983 5,635
Gurgaon 1971 1961
12,955 5,570 7,385 13,443 6,820 6,623
Mahendragarh 1971 1961
2,575 1,095 1,480 2,821 1,154 1,667
Hisar 1971 14,855 6,035 8,820 1961 12,743 5,839 6,904
lind 1971 3,115 1,730 1,385 1961 3,597 2,319 1,278
---~--- _--- ---------_-------___ -Number of Shops excluding Eating Houses
63. Shops excluding eating houses which in number rank next only to residential hom,es, cover 68,500 Census Houses in the State as a whole, representing 31 per thousand Census Houses. Proportionately shops feature more prominently in towns than in villages. Their number in the urban areas is 37,865, representing 89 per thousand Census Houses, and thc corresponding figures for the Tural areas are 30,635 and 1 'i. respectively.
64. Thc proportion of shops to total Census Houses ranges betwccn 37 and 18. Hisar district ranks first with maximum proportion of 37, followed closely by Karnal (34), Ambala (33) and Gurgaon (31). On the lower side are the districts of Rohtak (26), lind (22) and Mahendragarh (18). While lind and Mahendragarh are commercially backward districts having no class I or class II towns, the low proportion of Rohtak district is due to the considerable decrease in the number of shops in the rural areas of the district. It appears that the refugees who had set up petty shops in villages after partition have now shifted to towns because of better prospects. Transactions in villages are largely on credit and recoveries are troublesome, whereas in towns cash prospects are better. Also, rural folk now pay frequent visits to towns and they often purchase certain goods there at cheaper rates in the competitive market. On the other hand, Hisar district, which has the lowest number of Census Houses in relation to per thousand population and per square km. of area, commerce and trade are quite profitable both in rural and urban areas. During
Percentage increase or decrease during 1961-71
Total Rural Urban
6 7 8
-4 -15 +9'
-11 -19 -6
-1 -6 -\6
-16 -37 +9
-4 -18 +12
-9 -5 -11
+17 +3 +28
-13 -25 +8
Proportion per thousand Census Houses
Total Rural Urban
9 10 11
30·5 16'9 89·1 36.7 22.9 98'7
32'6 17'8 64'6 40'0 24'2 73 5
33·8 22·4 86·5 40'3 28·0 98·6
26·3 13 ·1 94'8 35.6 23 ·0 111 '4
31 '3 16 '6 93'6 40'1 24'5 116'2
17·9 8 ·7 83'0 20·2 9·4 99'7
36'5 18 ·2 116 '7 36'9 20'7 108 '3
21 ·7 14'0 70'4 30·0 22'0 85'6
the period 1961-71, the district witnessed 17 per cent increase in the number of shops. This is more conspicuous in towns (28 per cent). The district has also a number of fairly developed towns, and six out of 11 towns have more than 20 thousand population. The higher yield per hectare of crops in the cotton belt of the district due to increased irrigational facilities is another factor for the attraction of a large number of shops during the past ten years. Ambala, Karnal and Gurgaon districts have also some fairly developed towns with thriving business which explain the high proportion of shops in these districts.
65. Proportionately, there are more shops in towns than in villages and this feature is common to all districts. In rural areas, the proportion lies between 22 (Karnal district) and 9 (Mahendragarh district) shops per thousand Census Houses and in urban areas, it ranges between 117 (Hisar district) and 65 (Ambala district).
Comparison with 1961
66. The decade under report has registered a four per cent decrease in the)1umber of shops in the State as a whole and this feature is common to all districts except Hisar, in which the number has increased by 17 per cent for the reasons already explained. Whereas in urban areas, the shops have increased by 9 per cent, they have decreased by 15 per cent in rural areas. In rural areas, except Hisar district which has registered a swall increase of 3 per cent in the number of shops,
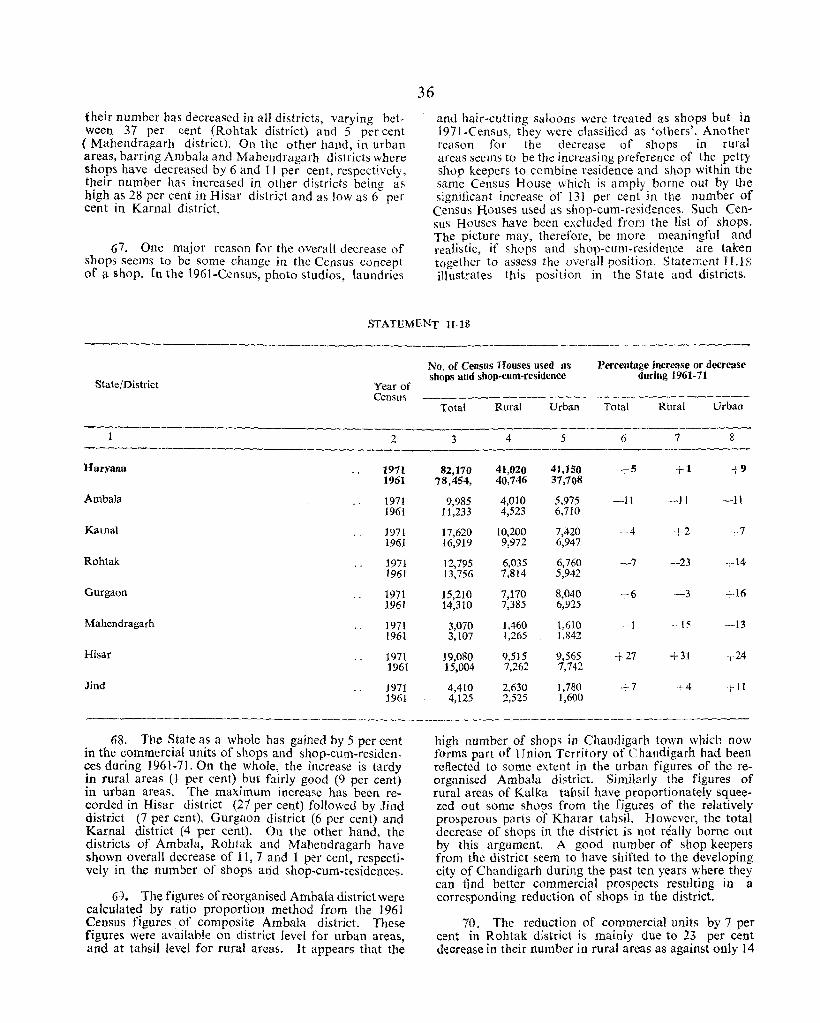
their number has decreased in all districts, varying between 37 per cent (Rohtak district) and 5 per cent
(Mahendragarh district). On the other hand, in urban areas, barring Ambala and Mahendragarh districts where shops have decrea~ed by 6 and 11 per cent, respectively, theIr number has Increased in other districts being as high as 28 per cent in Hisar district and as low as 6 per cent in Karnal district.
67. One major reason for the overall decrease of shops seems to be some change in the Census concept of a shop. In the 1961-Census, photo studios, laundries
36
and hair-cutting saloons were treated as shops but in 197I-Census, they were classified as 'others'. Another reason for the decrease of shops in rural areas seems to be the increasing preference of the petty shop keepers to combine residence and shop within the same Census House which is amply borne out by the significant increase of 131 per cent in the number of
Census Houses used as shop-cum-resjd~nces. Such Census Houses have been excluded from the list of shops. The picture may, therefore, be more meaningful and realistic, if shops and shop-cum-residence are taken together to assess the overall position. Statement 11.18 illustrates this position in the State and districts.
STATEMENT II·IS
State/District
ltaryana
AmbaJa
Karnal
Rohtak
Gurgaon
Mahendragarh
Hisar
Jind
Year of Census
2
1971 1961
1971 1961
1971 1961
1971 1961
1971 1961
1971 1961
1971 1961
1971 1961
68. The State as a whole has gained by 5 per cent in the commercial units of shops and shop-cum-residen, ces during 1961-71. On the whole, the increase is tardy in rural areas (1 per cent) but fairly good (9 per cent) in urban areas, The maximum increase has been recorded in Hisar district (21 per cent) followed by Jind district (7 per cent), Gurgaon district (6 per cent) and Kamal district (4 per cent). On the other hand, the districts of Ambala, Rohtak and Mahendragarh have shown overall decrease of 11, 7 and I per cent, respectively in the number of shops and shop-cum-residences.
6·~. The figures of reorganised Ambala district were calculated by ratio proportion method from the 1961 Census figures of composite Ambala district. These figures were available on district level for urban areas, and at tahsil level for rural areas. It appears that the
No. of Census Houses used as shops and shop-cum-residence
Total Rural Urban
3 4 5
82,170 41,020 41,150 78.454, 40,746 37,708
9,985 4,010 5.975 11,233 4,523 6,710
17,620 JO,200 7,420 16,919 9,972 6,947
12,795 6,035 6,760 13,756 7,814 5,942
15,210 7,170 8,040 14,310 7,385 6,925
3,070 1,460 1,610 3,107 1,265 1,842
19,080 9.515 9,565 15,004 7,262 7,742
4,410 2,630 J,780 4,125 2,525 1,600
Percentage increase or decrease during 1961-71
Total Rllral Urban
6 7 8
+5 +1 +9
-II -11 -11
14 +2 ,7
-7 -23 7. 14
-;.·6 -3 ..,_.16
-- 1 <; -13
+27 +31 -;-24
+7 -" 4 ,11
high number of shop, in Chandigarh town which now fOrms part of Union Territory of Chandigarh had been refl.ected to some extent in the urban figures of the reorganised Ambala district. Similarly the figures of rural areas of Kalka tahsil have proportionately squeezed out some shops from the figures of the relatively prosperous parts of Kharar tahsil. However, the total decrease of shops in the district is not really borne out by this argument. A good number of shop keepers from the di-strict seem to have shifted to the developing city of Chandigarh during the past ten years where they can find better commercial prospects resulting in a corresponding reduction of shops in the district.
70. The reduction of commercial units by 7 per cent in Rohtak district is mainly due to 23 per cent decrease in their number in rural areas as against only 14
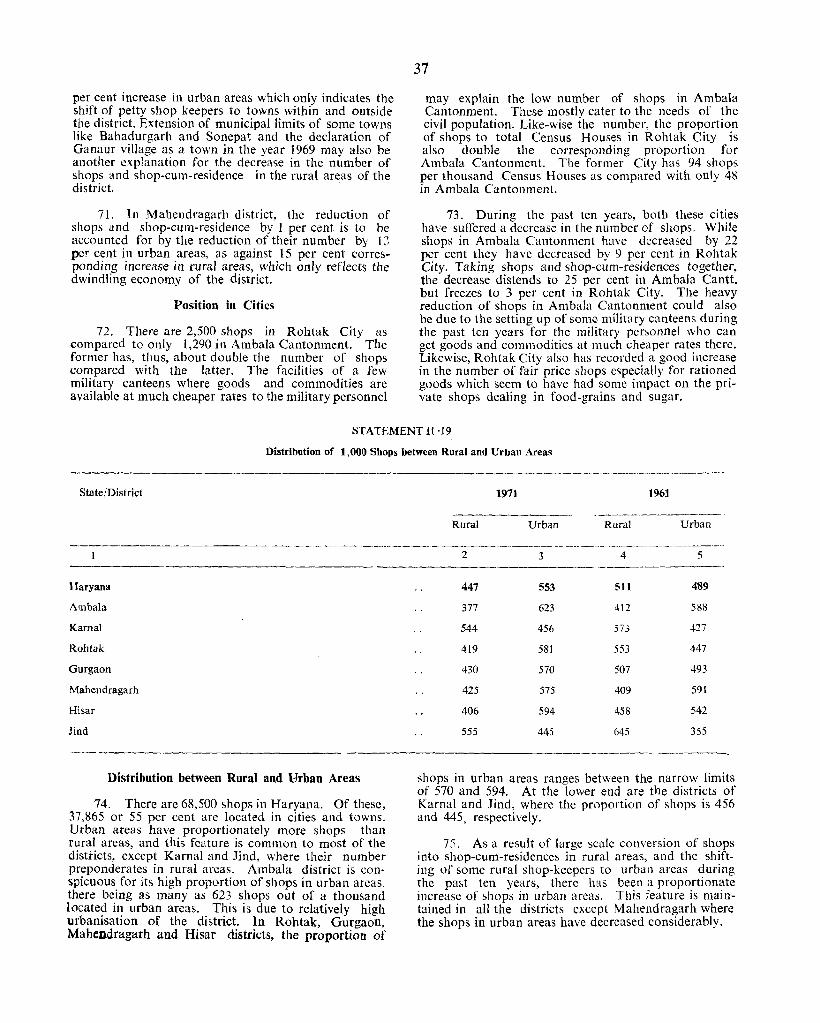
per cent increase in urban areas which only indicates the shift of petty shop keepers to towns within and outside the district. Extension of municipal limits of some towns like Bahadurgarh and Sonepat and the declaration of Ganaur village as a town in the year 1969 may also be another explanation for the decrease in the number of shops and shop-cum-residence in the rural areas of the district.
71. In Mahendragarh district, the reduction of shops and shop-cum-residence by 1 per cent is to be accounted for by the reduction of their number by l,j pe!" cent in urban areas, as against 15 per cent corresponding increase in rural areas, which only reflects the dwindling economy of the district.
Position in Cities
72. There are 2,500 shops in Rohtak City as compared to only 1,290 in Ambala Cantonment. The former has, thus, about double the number of shops compared with the latter. The facilities of a few military canteens where goods and commodities are available at much cheaper rates to the military personnel
37
may explain the low number of shops in Ambala Cantonment. These mostly cater to the needs of the civil population. Like-wise the number, the proportion of shops to total Census Houses in Rohtak City is also double the corresponding proportion for Ambala Cantonment. The former City has 94 shops per thousand Census Houses as compared with only 48 in Ambala Cantonment.
73. During the past ten years, both these cities have suffered a decrease in the number of shops. While shops in Ambala Cantonment have decreased by 22 per cent they have decreased by 9 per cent in Rohtak City. Taking shops and shop-cum-residences together, the decrease distends to 25 per cent in Ambala Cantt. but freezes to 3 per cent in Rohtak City. The heavy reduction of shops in Ambala Cantonment could also be due to the setting up of some military canteens during the past ten years for thc military personnel who can get goods and commodities at much cheaper rates there. Likewise, Rohtak City also has recorded a good increase in the number of fair price shops especially for rationed goods which seem to have had some impact on the private shops dealing in food-grains and sugar.
STATEMENT 11·19
Distribution of 1,000 Shops between Rural and Urban Areas
State/District
Haryana
Ambala
Kamal
Rohtak
Gurgaon
Mahendragarh
Hisar
Jind
Distribution between Rural and Urban Areas
74. There are 68,500 shops in Haryana. Of these, 37,865 or 55 per cent are located in cities and towns. Urban areas have proportionately more shops than rural areas, and this feature is common to most of the districts, except Kamal and Jind, where their number preponderates in rural areas. Ambala district is conspicuous for its high proportion of shops in urban areas. there being as many as 623 shops out of a thousand located in urban areas. This is due to relatively high urbanisation of the district. In Rohtak, Gurgaon, Mahendragarh and Hisar districts, the proportion of
1971 1961
Rural Urban Rural Urban
2 3 4 5 -------------
447 553 511 489
377 623 412 588
544 456 573 .r'~ ~I
419 581 553 447
430 570 507 493
425 575 409 591
406 594 458 542
555 445 645 355
'--~-
shops in urban areas ranges between the narrow limits of 570 and 594. At the lower end are the districts of Kamal and lind, where the proportion of shops is 456 and 445, respectively.
1",. As a result of large scale conversion of shops into shop-cum-residences in rural areas, and the shifting of some rural shop-keepers to urban areas during the past ten years, there has been a proportionate increase of shops in urban areas. This feature is maintained in all the districts except Mahendragarh where the shops in urban areas have decreased considerably,
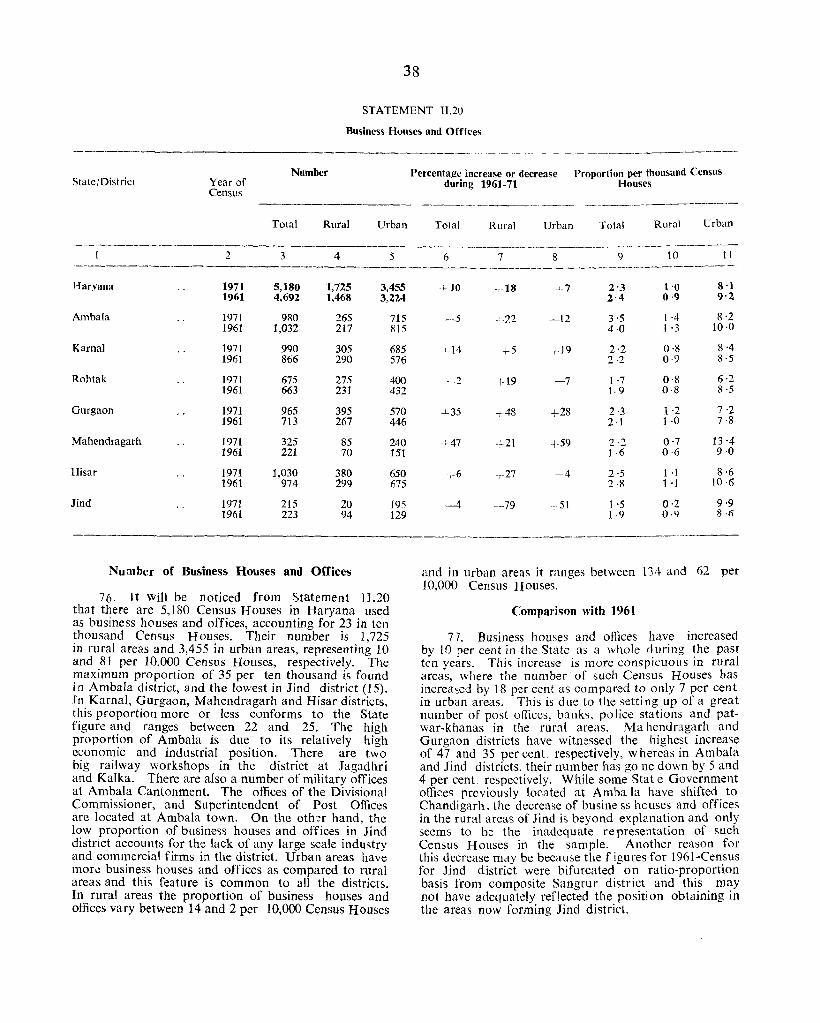
38
STATEMENT n.20
Business Houses and Offices
------ ---------------.-----.-~------------
Number Percentage increase or decrease Proportion per thousand Census State/District Year of during 1961-71 Houses
Census ----~~-
Total Rural Urban Total Rural Urban Total Rural Urban
~--.. -.--.---.-~--~~-. --- - ------------2 3 4 5 6 7 8 9 10 11
~-~--------~----______ • ____ ~~ ____________ ......._ _____ ~_~ _______ ~ __ M~ _________
Haryana 1971 5,180 1,77.5 3,455 1961 4,692 1,468 3,224
Ambala 1971 980 265 1961 1,032 217
Kamal 1971 990 305 1961 866 290
Rohtak 1971 675 275 1961 663 231
Gurgaon 1971 965 395 1961 713 267
Mahendragarh 1971 325 85 1961 221 70
Hisar 1971 1,030 380 1961 974 299
Jind 1971 215 20 1961 223 94
Number of Business Houses and Offices
76. 1 t will be noticed from Statement II .20 that there are 5,180 Census Houses in Haryana used as business houses and offices, accounting for 23 in ten thousand Cen!5us Houses. Their number is 1,725 in rural areas and 3,455 in urban areas, representing] 0 and 8] per 10,000 Census Houses, respectively. The maximum proportion of 35 per ten thousand is found in Ambala district, and the lowest in Jind district (l5). In Karnal, Gurgaon, Mahendragarh and Risar districts, this proportion more or less conforms to the State figure and ranges between 22 and 25. The high proportion of Ambala is due to its relatively high economic and industrial position. There are two big railway workshops in the district at Jagadhri and Kalka. There are also a number of military offices at Ambala Cantonment. The offices of the Divisional Commissioner, and Superintendent of Post Offices are located at Ambala town. On the oth~r hand, the low proportion of business houses and offices in Jind district accounts for the lack of any large scale industry and commercial firms in the district. Urban areas have mor.: business houses and offices as compared to rural areas and this feature is common to all the districts. In rural areas the proportion of business houses and offices vary between 14 and 2 per 10,000 Census Houses
715 815
685 576
400 432
570 446
240 151
650 675
195 129
t 10 i 18 -~-7 2'3 1'0 8·1 2·4 0·9 9,2
-5 122 -12 3·5 [·4 8·2 4·0 1 ·3 10·0
+14 +5 ,;-19 2·2 0·8 8'4 2·2 0·9 8'5
-+-2 +19 -7 1 ·7 0·8 6·2 1.9 0·8 8·5
+35 +48 +28 2·3 1 ·2 7 ·2 2·1 1 ·0 7·8
+47 +21 +59 2·2 0·7 13'4 1 ·6 0·6 9-0
+6 +27 -4 2·5 1 ·1 8·6 2·8 l·J [0·6
-4 --79 L51 1 ·5 0·2 9·9 1 ·9 0·9 8·6
and in urban areas it ranges between 134 and 62 per 10,000 Census Houses.
Compari~on with 1961
77. Business houses and offices have increased by to per cent in the State as a whole during the past ten years. This increase is more conspicuous in rural areas, where the number of such Census Houses has increased by 18 per cent as compared to only 7 per cent in urban areas. This is due to the setting up of a great number of post offices, banks, police stations and patwar-khanas in the rural areas. Ma hendragarh and Gurgaon districts have witnessed the highest increase of 47 and 35 per cent, respectively, whereas in Ambala and Jind districts. their number has go ne down by 5 and 4 per cent. respectively. While some Stat e Government offices previously located at Amba la have shifted to Chandigarh, the decrease of busine ss houses and offices in the rural areas of Jind is beyond explanation and only seems to be the inadequate representation of sueh Census Houses in the sample. Another reason for this decrease may be because the figures for 1961-Cen.sus for Jind district were bifurcated on ratio-proportIOn basis from composite Sangrur district and this may not have adequately reflected the position obtaining in the areas now forming Jind district.
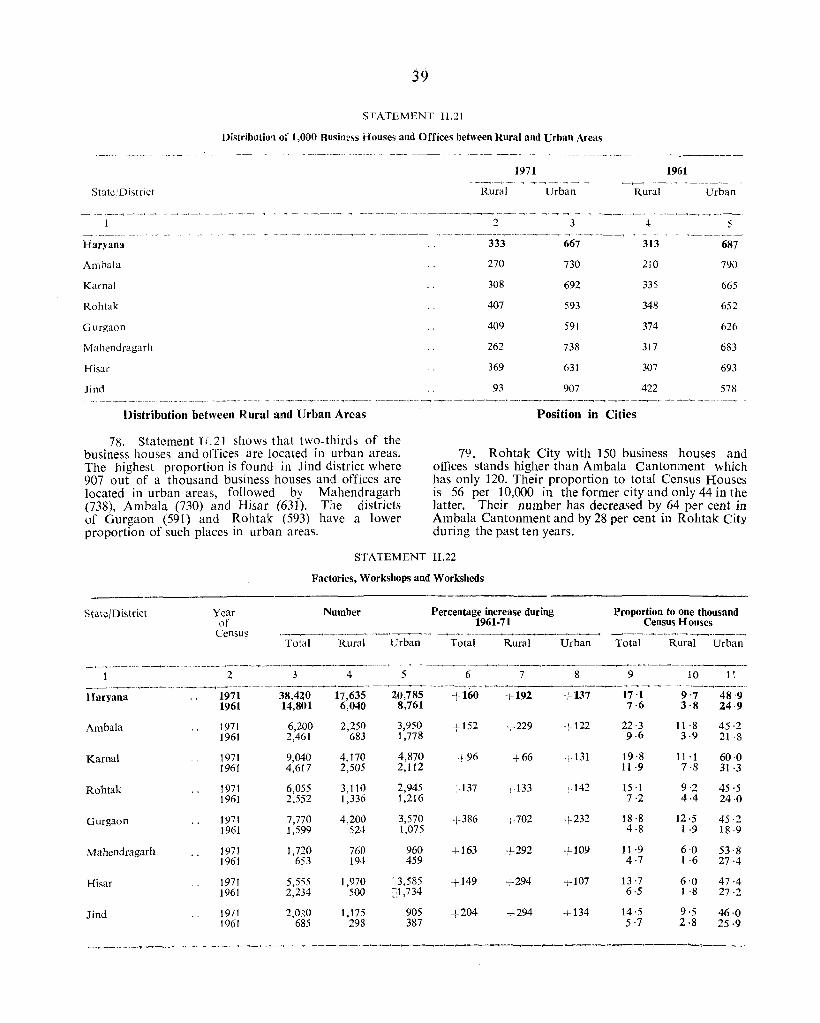
39
STATEMENT 1l.21
Distribution of 1,000 Business H'ouses and Offices between Rural and Urban Areas
Snll',District
Haryall\l
Ambala
Kamal
Rohtak
Gurgaon
Mahendragarh
Hisar
Jind
Distribution between Rural and Urban Areas
78. Statement n.2l shows that two. thirds of the business houses and offices are located in urban areas. The highest proportion is found in Jind district where 907 out of a thousand business houses and offices are located in urban areas, followed by Mahendragarh (738), Ambala (730) and Hisar (631). The districts of Gurgaon (591) and Rohtak (593) have a lower proportion of such places in urban areas.
1971 1961
Rural Urban Rural Urban
2 3 4 5 , --.-<; -~.~. ~'-~--_"-~---_____'_"'-----~______'---;~---"1---~'~_'_~_-' ___ ---<_ ~---
333 667 313 687
270 730 210 790
308 692 335 665
407 593 348 652
409 591 374 626
262 738 317 683
369 631 307 693
93 907 422 578
Position in Cities
79. Rohtak City with 150 business houses and offices stands higher than Ambala Cantonment which has only 120. Their proportion to total Census Houses is 56 per 10,000 in the former city and only 44 in the latter. Their number has decreased by 64 per cent in Ambala Cantonment and by 28 per cent in Rohtak City during the past ten years.
STATEMENT 1I.22
State/District
-_,___...___,___,---.~ .___,, __ - ... - -
-~..______,___.,-....,~- .~ ... __,--...,-.
Haryana
Ambala
Karnal
Rohtak
Gurgaon
Mahendragarh
Hisar
Jind
Year of
Census Total
Factories, Workshops and W orksheds
Nutnber
Rural Urban
Percentage increase during 1961-71
Total Rural Urban
Proportion to one thousand Census Houses
Total Rural Urban
- ..... _---- -~--~---",,____'___"'-"~"""--'__'___"----'-~._-'-'__' ---~__,.-____,__,........__..--------.,-~-....--.,-__,-___.,____.,______,-.-..--,...__,.---~----...~-..-~-~~
2 3 4 5 6 7 8 9 10 II ... ___ ...,-___,___,-----.-.-....,----~.---------,----,--,---,-~---,.....-,----,---~-------.___:__'------.--~-~--~---...,.------.____,_____,>- ...... '-~----__, _ ___1___., ___
1971 38,420 17,635 20,785 +160 +192 +137 17·1 9'7 48 '9 1961 14,801 6,040 8,761 7·6 3·8 24·9
1971 6,200 2,250 3,950 +152 +229 +122 22·3 11 ·8 45·2 1961 2,461 683 1,778 9·6 3·9 21 ·8
1971 9,040 4,170 4,870 +96 +66 -+-131 19·8 11 ·1 60·0 1961 4,617 2,505 2,112 11 ·9 7·8 31 ·3
1971 6,055 3,110 2,945 -C· 137 +133 ·;-142 15 ·1 9·2 45·5 1961 2,552 1,336 1,216 7·2 4·4 24·0
1971 7,770 4,200 3,570 +386 +702 +232 18·8 J2·5 45·2 1961 1,599 524 1,075 4·8 1 ·9 18·9
1971 1,720 760 960 +163 +292 +109 II ·9 6·0 53·8 1961 653 194 459 4·7 1 ·6 27·4
1971 5,555 1,970 . 3,585 +149 +294 +107 13·7 6'0 47·4 1961 2,234 500 C1,734 6·5 1 ·8 27·2
1971 2,0.,0 1,175 905 +204 +294 +134 14 ·5 9·5 46,0 1961 685 298 387 5·7 2·8 25·9
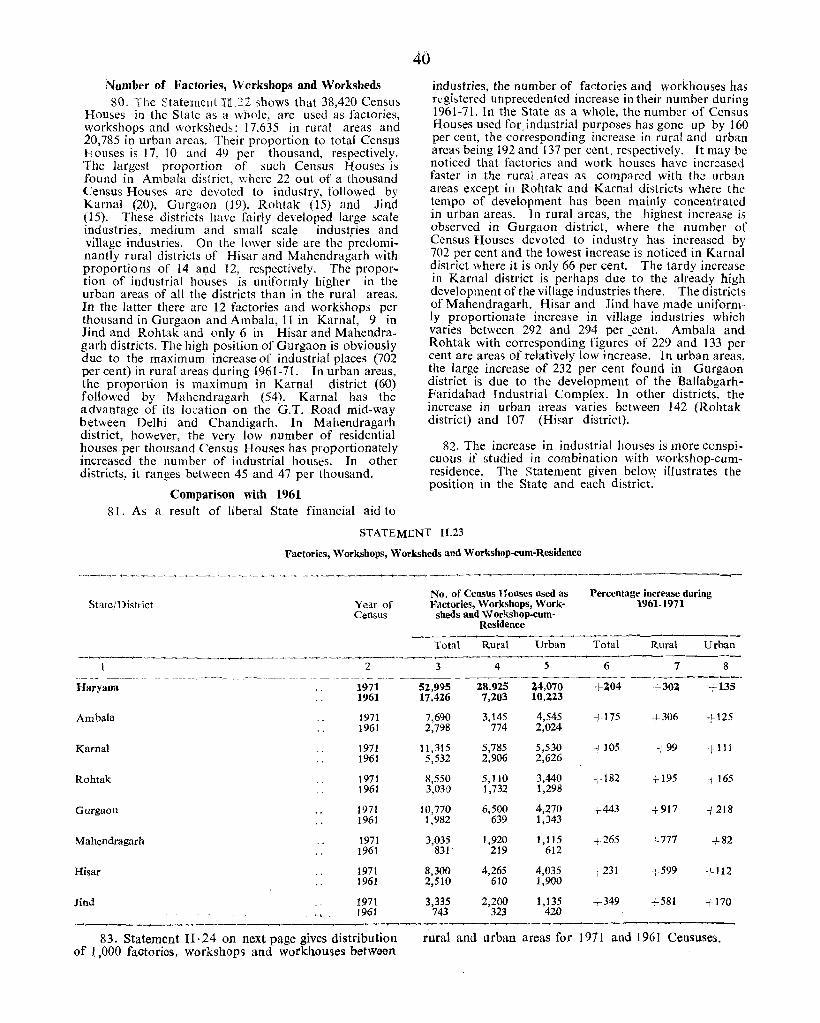
Number of :Factories, Worksbops and Worksbeds 80. The Statemelli H.22 shows that 38,420 Census
Houses in the State as a whole, are used as factories, workshops and worksheds: 17,635 in rural areas and 20,785 in urban areas. Their proportion to total Census houses is 17, 10 and 49 per thousand, respectively. The largest proportion of such Census Houses is found in Ambala district, where 22 out of a thousand Census Houses are devoif.!d to industry, followed by Kamal (20), Gurgaon (19), Rohtak (15) and Jind (15). These districts have fairly developed large scale industries, medium and small scale industries and village industries. On the lower side are the predominantly rural districts of Hisar and Mahendragarh with ~roportions of 14 and 12, respectively. The proportion of industrial houses is uniformly higher in the urban areas of all the districts than in the rural areas. In the latter there are 12 factories and workshops per thousand in Gurgaon and Ambala, 11 in Karnal, 9 in Jind and Rohtak and only 6 in Hisar and Mahendra. garh districts. The high position of Gurgaon is obviously due to the maximum increase of industrial places (702 per cent) in rural areas during 1961-71. In urban areas, the proportion is maximum in Karnal district (60) followed by Mahcndragarh (54). Karnal has the advantage of its location on the G.T. Road mid~way between Delhi and Chandigarh. In Mahendragarh district, however, the very low number of residential ~ouses per thousand Census Houses has proportionately mcreased the number of industrial houses. In other districts, it ranges between 45 and 47 per thousand.
Comparison with 1961 81. As a result of liberal State financial aid to
40 industries, the number of factories and workhouses has registered unprecedented increase in their number during 1961-71. In the State as a whole, the number of Census Houses used for,industrial purposes has gone up by 160 per cent, the corresponding increase in rural and urban areas being 192 and 137 per cent. respectively. rt may be noticed that factories and work houses have increased faster in the rural. areas as compared with the urban areas except in Rohtak and Karnal districts where the tempo of development has been mainly concentrated in urban areas. J n rural areas, the highest increase is observed in Gurgaon district, where the number of Census Houses devoted to industry has increased by 702 per cent and the lowest increase is noticed in Karnal district where it is only 66 per cent. The tardy increase in Kamal district is perhaps due to the already high development of the village industries there. The districts of Mahendragarh, Hisar and Jind have made uniform· ly proportionate increase in village industries which varies between 292 and 294 per ~cent. Ambala and Rohtak with corresponding figures of 229 and 133 per cent are areas of relatively low increase. In urban areas, the large increase of 232 per cent found in Gurgaon district is due to the development of the BallabgarhFaridabad Industrial Complex. In other districts, the increase in urban areas varies between 142 (Rohtak district) and 107 (Hisar district).
82. The increase in industrial houses is more conspicuous if studied in combination with workshop-cumresidence. The Statement given below illustrates the position in the State and each district:
STATEMENT II.23
Factories, Workshops, Worksheds and Workshop-cnm-Residence
No. of Census Houses used as Percentage increase during State/District Year of Factories, Workshops, Work- 1961-1971
Census sheds and Workshop-cum-Residence
~.-------~
Total Rural Urban Total Rural Urban --....,____,--~----,~-"'----...,___.,~--~--~ ,,__..,.____..,-- --~----~-------
2 3 4 5 6 7 8 - -_-- ----------- .,---_--------- - -- ---- ---- --- ----~--~---~ ---------MarYana 1971 52,995 28,925 24,070 +204 +302 +135
1961 17,416 7,203 10,223
Ambala 1971 7,690 3,145 4,545 +175 +306 +125 1961 2,798 774 2,024
Karnal 1971 11,315 5,785 5,530 -! 105 -! 99 +111 1961 5,532 2,906 2,626
Rohtak 1971 8,550 5, ItO 3,440 -,182 +195 +165 1961 3,030 1,732 1,298
Gurgaoll 1971 10,770 6,500 4,270 +443 +917 +218 1961 1,982 639 1,343
Mahendragarh 1971 3,035 1,920 J ,115 +265 +777 +82 1961 831 219 612
Hisar 1971 8,300 4,265 4,035 +231 +599 +112 1961 2,510 610 1,900
Jind 1971 3,335 2,200 1,135 -+-349 +581 +170 1961 743 323 420
-~ ---... ------~
83. Statement II ·24 on next page gives distribution of 1,000 factories, workshops and workhouses between
rural and urban areas for 1971 and 1961 Censuses.
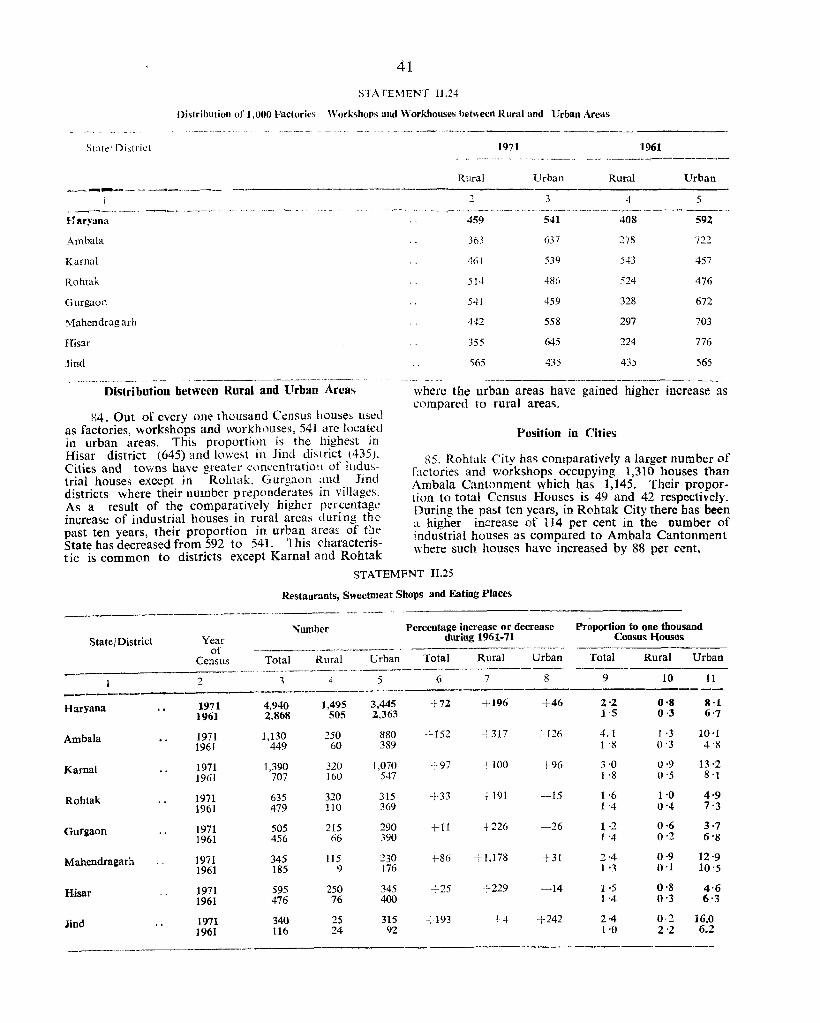
41
STATEMENT II .24
Distribution of J ,000 Facl()rk~ Workshops and Workhouses he!l\een Rural and Urban Areas
State District
HlIryuna
Ambala
Karnal
Rohtak
Gurgaon
Mahendrag arh
Hisar
Jim!
Distribution between Rural and Urban Areas
H4. Out of everyone thousand Census houses used as factories, workshops and workhou~es, 541 aTe located in urban areas. This proportion IS the lllghe"t m Hisar district (645) and lowe~t in Jind district (435). Cities and towns have greater concentration of industrial houses except in Rohtak, G urgaon :lIld. Jwd districts where their number preponderates HI VIllages. As a result of the comparatively higher per.:entage increase of industrial houses in rural areas during the past ten vears their proportion in urban areas of the State has decr~ased from 592 to 54l. This characteristic is common to districts except Karnal and Rohtak
Rural
2
459
363
461
514
541
442
355
565
1971 -.----.. - -------
1961
Urban Rural Urban ,
4 5 .)
. --"~------<-----'---' 541 408 592
637 278 722
539 543 457
486 524 476
459 328 672
558 297 703
645 224 776
435 435 565
where the urban areas have gained higher increase as compared to rural areas.
Position in Cities
tl5. Rohtak City has comparatively a larger number of ractories and workshops occupying 1,310 houses than Ambala Cantonment which has 1,145. Their proportion to total Census Houses is 49 and 42 respectively. During the past ten years, in Rohtak ~ity there bas bee~ a higher increase of ll4 per cent m the number ot industrial houses as compared to Ambala Cantonment where such houses have increased by 88 per cent.
STATEMENT II.25
Restaurants, Sweetmeat Shops and Eating Places
---------------------- -~ ~......_~~ ~----. Number Percentage increase or decrease Proportion to one thousand
State/District Year during 1961-71 Census Houses or --.--~---" -.-~----~-~'
Urban Total Rural Urban Census Total Rural Urban Total Rural . --.----,,,.,,~ .. ",.,-- _._ ,~-------~--
2 3 4 5 6 7 8 9 10 II -----
1971 4,940 1,495 3,445 +72 -H96 +46 Z'2 0·8 8·1 Haryana 1961 ~,868 505 1,363 1·5 0·3 6'7
1971 1,130 250 880 +152 +317 : 126 4.1 1 ·3 10'1 Ambala 1961 449 60 389 1'8 0'] 4'8
1971 1,390 320 1,070 ! 97 +100 +96 3 ·0 0·9 13'2 Kamal 1961 707 160 547 1·8 0'5 8 '1
1971 635 320 315 +33 +191 -15 1 '6 1'0 4'9 Rohtak 1961 479 no 369 1-4 0'4 7'3
1971 505 215 290 +11 +226 -26 1 ·2 0·6 3'7 Gurgaon 1961 456 66 390 1 '4 0'2 6'S
1971 345 115 230 +-86 +1,178 +31 2·4 0·9 12'9 Mahendragarh 1961 185 9 176 1 '1 0·1 10'5
1971 595 250 345 -'-25 +229 -14 1 '5 0'8 4'6 Hisar 1961 476 76 400 1 '4 0'3 6'3
1971 340 2S 315 +193 \4 +242 2·4 0·2 16.0 lind 1961 116 24 92 1'0 2'2 6.2

Number of Restaurants, Sweetmeat Shops and Eating Places
86. The number of Census Houses devoted to this category of houses in the State is 4,940 : 1, 95 in rural areas and 3,445 in urban areas, and in terms of 10,000 Census Houses, they count 22, 8 and 81, respectively. Among the districts, the proportion of houses in this category is the highest in Ambala district with 41 per 10,000 houses and lowest in Gurgaon with only 12. The relatively high position of Ambala accounts for the maximum proportion of restaurants etc. in villagcs where they number 13 per 10,000 houses, matched by a fairly good proportion in towns: 101 per 10,000 houses. The relatively low position of Gurgaoll district is explained by the low proportion of this category of Census Houses in towns, which is 37 per 10,000 houses only. Jind district has the largest proportion of 160 per 10,000 in towns and the lowest proportion of 2 per 10,000 in villages. The proportion of restaurants etc. is uniformly higher in towns of all the districts than the corresponding proportion in villages.
Comparison with 1961
87. The State as a whole has recorded a fairly oood increase of 72 per cent in the number of restaur~nts s\veetmeat shops and eating places. The increase i~ much faster in rural areas as comp'ned with urban areas' 190 and 46 per cent, respectively. This pattern i~
42
common to all the distrids except lind. The district of lind as a whole has experienced the 'hi"hest increase of 193 per cent, where their number has J~ultiplied three times during 1961-71, follO\ved by Ambnla_ Kamal and Mahendragarh district" with])2 97 [ind SG per ccnt. respectively.
88. It may be notic<:d that the increase in Jintl district has remained almost confined to urban areas alld is the 111[l',imum ('242 per cent) amoncrst the districts. lind was formed into a new district after reorganisat ion of the composi Ie: punjab in 1966 and Safidon, one of the towns, was raised to the status of a tahsil w hicb resulted in high traffic in these towns. Gurgaon district on the other hand has witnes~ed the lowest increase of 11 per cent. Restaurants etc., have increased by 226 per cent in the rural areas of this district, while the urban areas suffered a decrease of 26 per cent in their number. Hisar ancl Rohtak districts with increase of 25 and 33 per cent respectively as a whole are other districts of low increas~ due to the reduction of restaurants etc. in towns. As a result of the constantly increasing traffic in towns, it is unlikely that the number of restaurants etc. could decrease in the urban areas of Gurgaon, Hisar and ~oht~k distri~ts. T~le only explanation to be given 1ll tlus case IS the ll1adequate representation of this category of ho uses in the sample. The distribution one thousand Census House us\:d under this category in the rural and urban areas has been given in the statement given below:-
STAT[:MENT 1I.26
Distribution of 1,000 CCnSll'i House~ lISed <IS Rc,!aman:,. Sweetm"", She,P'> alld Eating PlaCt!s hetween Rllral allt\ Urban "re'h
1971 1961
State IDistriCl
:! .) 4· 5 ~---------.....-.~----.... ---. --_._---------------- ----"'------.....,_.~ --------..."''''''._,_ ........ _ =---..
Haryanll
Ambnla
K:trnal
Gurgaon
Mahcndragm'h
HisaI
Jind
Rural-Urban Distribution
8'9. In the State, 697 out of a thousand restaurants, sweetmeat shops and eating places are located in urban lUeas. The proportion is the highest in Jind (926), followed by Ambala (779) and Kamal (770). The districts of Rohtak (496), Gurgaon (574), Hisar (580) and Mahendragarh (667) have a low proportion of such CenS\lS HOllses in mban areas. The proportion of
3(B 697 17fi 844
211 77') 131 Xi)(,
230 770 2:Y, 7H
SOl ·WI, :no 770
426 5N 1-1-5 :-i55
333 667 49 951
420 5:-:0 160 840
74 926 207 793 ... -.-.--~-.. _. . .... --"_. __ .,._-
restaurants etc. is uniformly higher in urban areas of all the districts, except Rohtak. This is due to decrease in the number in urban areas. As a result of the high increase of Census Houses in this category in villages during the past ten years their proportion has correspondingly decreased in towns except for Jind district where the number has increased significantly in urbal~ areas for the reasons explained earlier.
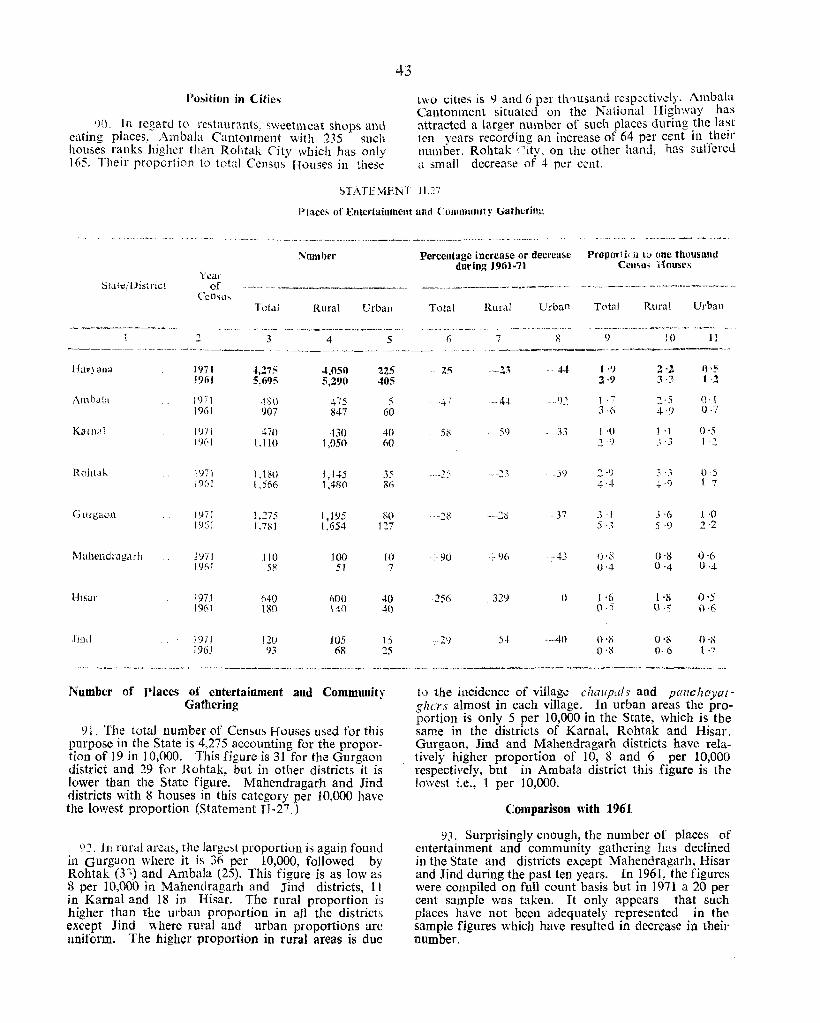
I'o~ition in Cities
9D, In regard to restaurants_ SWl!etml.!at shops and eating places. Ambala Cantonment with 235 such houses n~llks highe.r than Rohtak City which has only 165. Theil' proportIon to total Census Houses in these
43
two cities is ') and 6 per tlnusand respectively. Ambala Cantonment situated on the National Higll',vay has attracted a larger number of such places during the last len vears recording an increase of 64 per cent in their lllllnber, Rohtak ('ity, on the other hand, has suffc:red a small decrease of 4 per cent,
STATEMENT 11.27
I'lace, of Entertainment and C omlllllllil y (lathering
Siatt)!Districi Year
of CCnSlh
Total
3
:\'llmJWI'
Rural Urban
4 5 ~--~---------- --- ----------~-~---.~~'---.~--.---~, -~-.--~.-~---.-.- .
l-iaO,)!1'l 1')71 -+,Z7" .t,050 22§i 19111 5.695 5,290 ",OS
Ame"ta t 971 .\go 475 ." 1961 907 847 60
K:mwl 1'l71 470 430 40 I ()(·I 1.110 1,050 fiO
Rohta!... 1971 1 ,I~O I. i-+5 35 ;9(,1 1.566 1.4:>;0 R6
(iurgaQn 1971 1.275 1,1')5 ~O 1% I 1,781 1,654 127
IV! ahendragar h 1':171 110 100 10 1961 58 51 7
Hisar 1971 640 600 40 1%1 180 HD 4{)
.1md Wi! 120 105 15 1961 9J 68 25
Percentage increase or decrease ProporliCll to one thousand during 1961-71 CClISIl!; House~
Total Rural Urban Total Rural Urban
7 8 10 JJ
-zs --Z-' .. U I,f) 2'2 (I.:; 2·9 3·3 l'Z
-1-~ -- 4+ 92 1 . , 2·5 o 1 3 ·6 4·9 0·7
51' 59 33 I .() 1 ., o·~ ::; ") -' ·3
, .0
.. "-25 " -_J 59 2,·9 3 ',1 0-5 4·4 -+·9 1 7
--2::< -·-20 ·37 .) .[ .1·6 1 ,0 5 .~ 5 ·9 2·2
'-90 ',,96 ·B U'S 0'8 0'6 0'-1- 0'4 0'4
·256 329 0 J ·6 L'8 0·5 n·s \) ''i \.I.t)
-,-29 5-1 ·~40 0·1) 0'8 (1'1'
0'8 I). 6 1 ·7
<~'~~~~--'~--- -.---~,-~--~---~-'- . --------,--~-,~~~ ___ ~< __ ~._~2~_~· . .--...,~ __ ~" .'" __ ._~~~. '~, .
Number of Places of' entertainment and Community Gathering
91, The total number of Census H l)USeS used for this purpose in the State is 4,275 accounting for the proportion of 19 in 10,000. This figure is 31 for the Gurgaon district and 29 for Rohtak. but in other districts it is lower than the State figure. Mahendragarh and Jind districts with 8 houses in this category per 10,000 have the lowest proportion (Statement TT-27.)
9':, In rural arcas, the largl;;~t proportion is again found in Gurgaon where it is 36 per 10,000, followed by Rohtak (3~) and Ambala (25). This figure is as low as g per 10,000 in Mahendragarh and Jind districts, 11 in Kamal and 18 in Hisar. The rural proportion is higher than the urban proportion in all the districts except Jind where rural and urban proportions are uniform. The higher proportion in rural areas is due
to the incidence of village chal/pall' and pallclwyatgllCTs almost in each village. In urban areas the proportion is only 5 per 10,000 in the State, which is the same in the districts of Karnal. Rohtak and Hisar, Gurgaon, Jind and Mahendragarh districts have relatively higher proportion of 10, 8 and 6 per 10,000 respectively, but in Ambala district this figure is the lowest Le., 1 per 10,000.
Comparison witb 1961
<.) J, Surprisingly enough, the number of place~ of entertainment and community gathering has declined in the State and districts ex.cept Mahendragarh, Hisar and Jind during the past ten years. In 1961, the figures were compiled on full count basis but in 1971 a 20 per cent sample was taken. It only appears that such places have not bcen adequately represented in the sample figures which have resulted in decrease in their number,
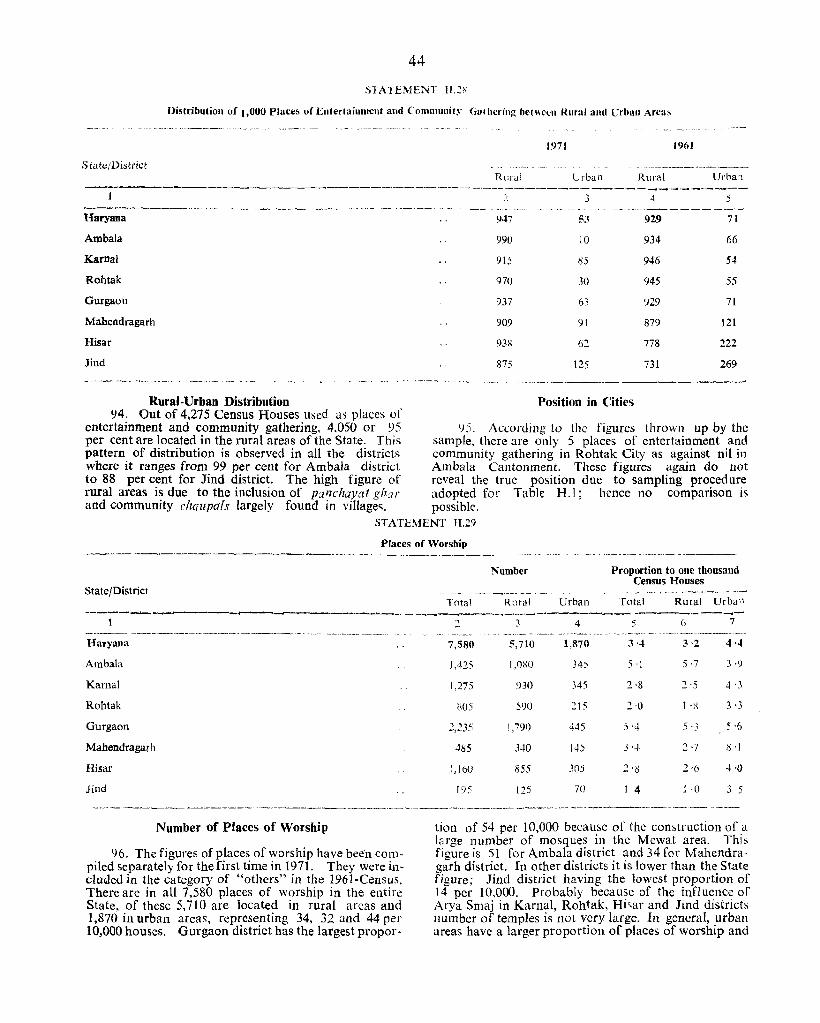
44
STATEMENT H.2~
Distribution of 1.000 Places of Entertainment and Community Ga. hering beH\ccn .Rural and erhan Arca~
1971 1961
S tat<.)!Di~tl'ict Rural U rball Rural Urba'1
.-----------~---~--~----------~~---------~~----------
Haryana
Arnhala
KarnaJ
Rohtak
Gurgaon
Mahendragarh
Hisar
Jind
Rural-Urban Distribution l)4. Out of 4,275 Census Houses used as places 0['
-,
947
991)
915
970
937
909
938
875
3 4 5 .. -- -- --~------~~--
!'3 929 71
)0 934 66
85 946 54
30 945 55
I)~ 929 71
91 879 121
62 778 222
125 731 269
Position in Cities
entertainment and community gathering, 4,050 or 95 9). Acwrding to the figures thrown up by the per cent are located in the rural areas of the State. This sample, there are only 5 places of entertainment and pattern of distribution is observed in all the districts community gathering in Rohtak City as against nil in where it ranges from 99 per cent for Ambala district Ambala Cantonment. These figures again do not to 88 per cent for Jind district. The high figure of reveal the true position due to sampling procedure rural areas is due to the inclusion of panchayat gil" J' adopted for Table H.J; hence no comparison is and community dIal/pals largely found in villages. possible.
STATEMENT II.29
Places of Worship
Number
State/District Total Rural Urban
Proportion to one thousand Census Houses
Total Rural Urba 11 --------- ,,_, - --.. ___ -_ - --------~-
Haryanu
Ambala
Kamal
Rohtak
Gurgaon
Mahendragarh
Hisar
lind
Number of Places of Worship
96. The figures of places of worship have bee'n compiled separately for the first time in 1971. They were included in the category of "others" in the 1961-Census. There are in all 7,580 places of worship in the entire State, of these 5,710 are located in rural arcas and 1,870 ill urban areas, representing 34, 32. and 44 per 10,000 houses. Gurgaon district has the largest propor·
2 3 4 5 6 7 --- -- --~--"~-----
_. ~-.--- ~----------~---- ---.--.,-,-.~-~~~-- ---~- ,---
7,580 5,71() 1,870 3·4 3'2 4·4
1,425 1,0gO 345 5 ·1 5 ·7 3·')
1,275 930 345 2·g 2'5 4'3
005 590 215 l'll 1 ·X 3·3
2,235 1,790 445 5'4- 5'3 5·6
485 3·10 145 3 '4 2·7 ::;.1
1,160 855 305 2'S 2'6 4'0
195 125 70 1 4 1 ·0 3 5
tion of 54 per 10,000 because of the construction of a large number of mosques in the Mewat area. This
. figure is 51 for Ambala district and 34 for Mahendra" garh district. In other districts it is lower than the State figure; lind district having the lowest proportion of 14 per 10,000. Probably because of the influence of Arya Smaj in Kamal, Rohtak, Hi,ar and lind districts number of temples is not vcry large. In general, urban areas have a larger proportion of places of worShip and

this feature is common to all the districts except Amhala where their proportion is higher in rural areas. In rural arcas. the maximum proportion is observed in Ambala district; 57 per 10,000, folIowed by Gurgaon (53). In KarnaL Mahendragarh and Hisar districts. the rural proportion ranges between narrow limits of 27 and 25; but Rohtak (18) and .lind (10) have very
45
low proportion of holy places in rural areas. In urban areas as a whole, 44 houses in 10,000 are used for worship. In Mahendragarh and Gurgaon districts, the corresponding figures are 81 and 56, respectively. but in other districts, these vary between 43 for Kamal district and 33 for Rohtak district.
ST ATEMENT Il.30
Distribution of 1,000 Places of Worship between Rural and Urban Areas
State/District
!laryana
Ambala
Kamal
Rohtak
Gurgaon
Mahendragarh
Hisar
Jind
Rural
2
753
758
7:")
733
801
701
737
641
1971
Urban
3 ---- ~.
447
:~42
271
'167
199
299
263
359
------.----------------.--~ --_ ... __ .. -----------._--- ---------------_ ...... __ --_
Distribution between Rural and Urban Areas
97. Out of 7,580 houses devoted to worShip, 5,710 or 753 per 1,000 are located in the rural areas of the State. This proportion is the highest in Gurgaon district where it is 801 per 1,000 and lowest in Jind district where this figurc is 641 only. In other districts, the proportion of temples, mosques and churches revolves round the State figure and varies between 756 and 701.
Position in Cities
98. Ambala Cantonment has double the nllmber of temples, churches, mosques, gurudwaras etc. as compared with Rohtak City; the number being 120 and 60, respectively. In terms of 1,000 Census Houses, their proportion is 4 in Ambala Cantonment and only 2 in Rohtak City.
STATEMENT lUI
Stale/ District
Harl'ana
Ambala
Kamal
Rohtak
Mahendraga r h
Hisar
Jind
Other Census Houseti
------------------ ---------------------------Number Proportion t~ one thousand Census Houses
.~~~~- ....... Total Rural Urban Total Rural Urban
----------,---~-----------
2 3 4 5 6 7
471,670 451,050 21,620 210'7 248·0 50'8
65,235 60,825 4,410 234'7 319 '0 50·5
102,665 98,355 4,310 225 '4 262'7 53 ·1
89,860 86,655 3,205 223·6 257'0 49'5
95,155 91,365 3,790 229·9 172'8 4g.0
35,215 33,865 1,350 244·3 268 ·0 75 ·7
46,700 43,695 3,005 114 ·8 131 ·9 39·7
37,840 36,290 1,550 263 ·R 293 -2 78 '8
_._----------------------------------------------
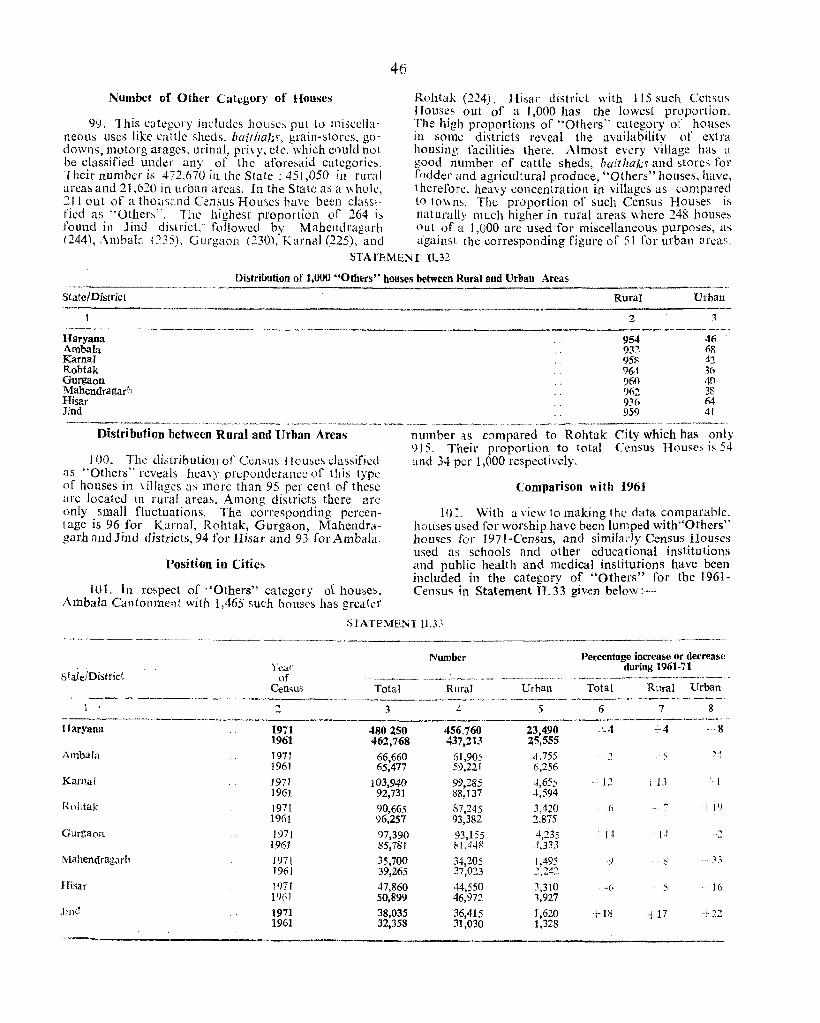
46
Number of Other Category of Houses Rohtak (224). Hiliar district with 115 such CensLis Houses out of a J ,000 has the lowest proportion.
99. This category includes hOLlses pUl to miseella~ The high proportions of "Others" category of houses neous llses like cattlc sheds, baitlwl;~, graill-stores, go' in some districts reveal the availability of extra downs, Il1otorg aragcs, urinal, pri\y, etc. which could n01 housing facilities there. Almost ever)' Village has a bc classified under any of tbc aforesaid c.ttegories. good number of cattle sheds, baithak~ and stores for Their numbcr is 472,670 in thc Stale; 451,050 in. rural fodder and agricultural produce, "Others" houses, have, areas and 21,620 in urban areas. In the State as a whole, therefore, heavy concentration in villages as compared 211 out of a thousand Census HOUSes have been cIassi- to towns. The proportion of such Census Houses i5 fjed as "Other~". The highest proportion of 264 is naturally much higher in rural areas where 248 housc:-, found in lind di~lrict: followed b:v Mahendragarh out of a 1,000 are used for miscellaneous purposes, as (244), AmbaLt (235). Gurgaon (2301, Kamal (225), and ,Igains! the corresponding figure of Sl for urban areas.
STATEMENT Il,32
Distribution of 1,000 "Others" houses between Rural aud Urban Areas -~--~.-- -------------------------~-.-,-----
Slate/District Rural Urban
2 3 -.---~-------.--------.-.-.. -- .---.--.---------------.. ,~---Haryana AmbaJa Kamal Rohtak Gurgaon Ma.hendragarh Hisar Jind
Distribution bctwe(.~n Rural and Urban Areas
100. The distributioll or Ccn~Lls Houses dassificd as "Others" reveals heavy preponderance of tbis type of houses in \ illages as more than 95 per cent of these arc located in rural areas. Among districts there arc only small fluctuations. The corresponding percentage is 96 for Kamal, Rohtak, Gurgaon, Mahendragarh and Jind districts, 94 for Hisar and 93 [or Ambala.
Position in Cities
101. In respect of "Others" category ot houses, Ambala Cantonment wiih 1,465 such houses has greater
954 93~ 95:>: 964 960 962 936 959
46 tiR ;j:;
3fi 40 3g 64 41
number as compared to Rohtak Citv which has only 915, Their proportion to total CCIlsus Hou!'e~ is 54 and 34 per 1,000 respectively.
Comparison with 1961
lO~. With a view to making tbe data comparable. hOLlses used for worship have been lumped with "Others" houses for 1971-Census, and similarly Census Houses used as schools and other educational institutions and public health and medical institutions have been included in the category of "Others" for the 1961-Census in Statement TT. 33 given betow :~--
S IAIEMENI 11.3.'
Sf ate/District
1
Yt~dl of
Census
::! --------_ .. _--_._,,_ ....... _----,,----_ .... ------I faryana 1971
1961 AmbaJa 1971
1961
Kamal 1971 1961
Rpl,tak 1971 1961
Gurgaon 1971 1961
Mahendragarh 1971 1961
Hisar 1971 1%1
.lind 1971 1961
Number
Total Rural Urban
3 4 5 ~---.----------
480150 456.760 23,490 462,768 437,213 25,555
66,660 61,905 4,755 65,477 59,221 6,256
103,940 99,285 -1,655 92,731 88,137 4,594
90,665 87,245 3,420 96,257 93,382 2,875
97,390 93,155 4,235 85,781 81,44g 1,333
35,700 34,205 1,495 39,265 37,023 2,242
47,860 44,550 .\310 50,899 46,972 3,927
38,035 36,415 1,620 32,358 31,030 1,328
Percentage increase or decreas(' dOl'iug 1961-71
Total Rural Urban
6
.:-4
:-2 ; 5 '):1.
. 12 j> 13 >·'1
- (i
It 14 2
'>
-6 --5 16
+l~
103. The Ccnsus Housc~ Llsl'd for other purp()se~ have increased by 4 per cent in the State as a whole. Due to a grcatcr demand for houses for the specified categories in urban areas, their number has decreased by R per cent in towns. The distrids of .lind. GUl'g:lOI1.
47
Kamal and Ambala reveal an increase or such Censll, Houses during the past ten years, while Hisar, Mahendragarh and Rohtak have witnessed a decn.'asl' in their numher.

Slate,' DiStrict/ Cit\'
TotaJ Rural Orban
-_ _.' ___ """",~,,·""~ •• d· _,~._.~_ •• ~ ._~ •
2
Haryana Total
Rural
Urban
Ambala Total
Rural
Urban
Kamal Total
Rural
Urban
Rohtak Total
Rural
Urban
GUrg(lon Total
Rural
Urban
Mabendragarh Total
Rural
Urban
Hisar Total
Rural
Urban
Jind Total
RUral
Urban
Ambala cauU. (City) ., Urban (Ambala District)
Rohtak (City) (Rohtak District)
Urban
48
Total number
of CenslIs HOllses
TABLE H-I .. CENSUS HOUSES AN D TI-iE:
Census Houses vacant at the time of HOll!;elisting Residence
Oeeupied Censu~
ShoP-culIlresidence
Workshopcum-residence inCluding Household industry
. ,-~--.--..•. "--~-"""'_-~ -'~----'-'---' .~---- ~~-.~. ---~~.-.-------------- -----3 4 5 6 7
n ___ ~.~n~~. ___ ••••• ___ "_ ~_. ___ -~_._._~_~~ .. __ ~ __ _ ~~_ .. _·_.w
2,243,680 131,355 1,477,915 13,670 14,575
1,818,440 96,575 1,184,555 10,385 11,290
425,240 34,780 293,360 3,285 '\.185
177,960 14,510 175,905 940 1,490
190,635 7,620 112,475 605 895
87,325 6,890 63,430 335 59'
455,540 22,230 297,040 2,230 2,275
374,355 16,625 241,150 1,830 1,615
81,185 5,605 55,890 400 660
401,925 27,270 259,490 2,230 2,495
337,225 21,040 215,565 1,605 2,000
64,700 6,230 43,925 625 495
413,835 22,700 263,835 2,255 3,000
334,910 16,965 208,345 1,600 2,300
78,925 5,795 55,490 655 700
144,160 9,025 92,115 495 1,315
126,325 6,905 81,185 365 1,160
17,835 2,120 10,930 130 155
406,820 27,525 300,945 4,225 2,745
331,220 20,730 250,425 3,480 2,295
15,600 6,795 50,520 745 450
143,440 8,035 88,585 1,295 1,255
123,170 6,690 75,410 900 1,025
19,670 1,345 13,175 395 230
27,170 2,425 20,205 75 75
26,610 1,980 19,010 215 245
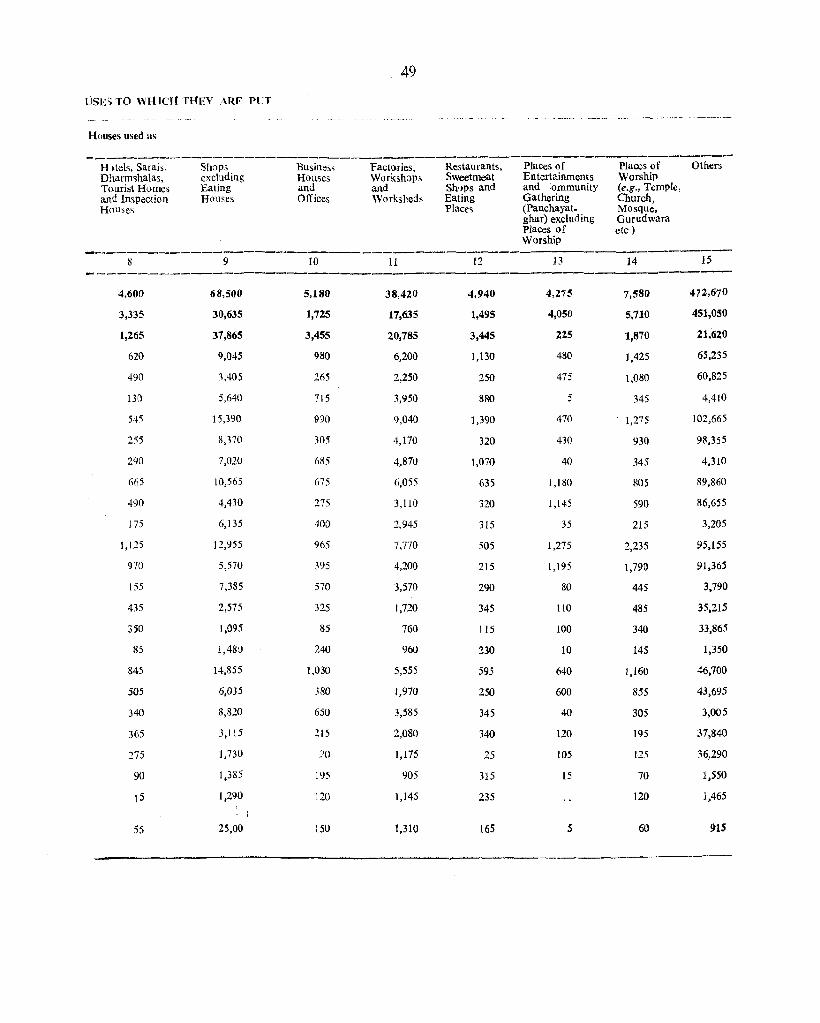
49
USE~ TO WI-llCH THEY ARE Pl'T
--~---.------ --_ .. _-----------------
H(.uses med as
H ltels, Sarais, Shap3 Busines, Factories, Restaurants, Places of Places of Others Dharm<;halas, excluding Houses Workshops Sweetmeat Entertainments Worship Tourist Homes Eating and and Sh,>ps and and ,ommunity (e.g., Temple, and InSP<)ction Honses Offices Worksheds Eating Gathering Church, Houses Place, (Panchayat- Mosque,
ghar) excluding Gurudwara Places of Worship
etc)
8 9 10 11 12 13 14 15 ---------------------------------------------------
4,600 68,500 5,180 38,4Z0 4,940 4,Z75 7,580 472,670
3,335 30,635 1,725 17,635 1,495 4,050 5,710 451,050
1,265 37,865 3,455 20,785 3,445 225 1,870 21.620
620 9,045 980 6,200 1,130 480 1,425 65,235
490 3,405 205 2,250 250 475 1,080 60,825
130 5,640 715 3,950 880 5 345 4,410
545 15,390 9)0 9,040 1,390 470 1,275 102,665
255 8,370 305 4,170 320 430 930 98,35 5
290 7,010 (,85 4,870 1,070 40 345 4,310
665 10,565 675 (',055 635 1,180 80S 89,860
490 4,430 275 3,110 320 1,145 590 86,655
175 6,135 400 2,945 315 35 215 3,205
1,125 12,955 965 7,770 505 1,275 2,235 95,155
970 5,570 395 4,200 215 1,195 1,790 91,365
155 7,385 570 3,570 290 80 445 3,790
435 2,575 325 1,720 345 110 485 35,215
350 1,095 85 760 115 100 340 33,865
85 1,48'J 240 960 230 10 145 1,350
845 14,855 1,030 5,555 595 640 1,160 46,700
505 6,035 380 1,970 250 600 855 43,695
340 8,820 650 3,585 345 40 305 3,005
365 3,115 215 2,080 340 120 195 37,840
275 1,730 70 1,175 25 105 125 36,290
90 1,385 195 905 315 15 70 1,550
15 1,290 120 1,145 235 120 1,465
55 25,00 [50 1,310 165 .5 60 915
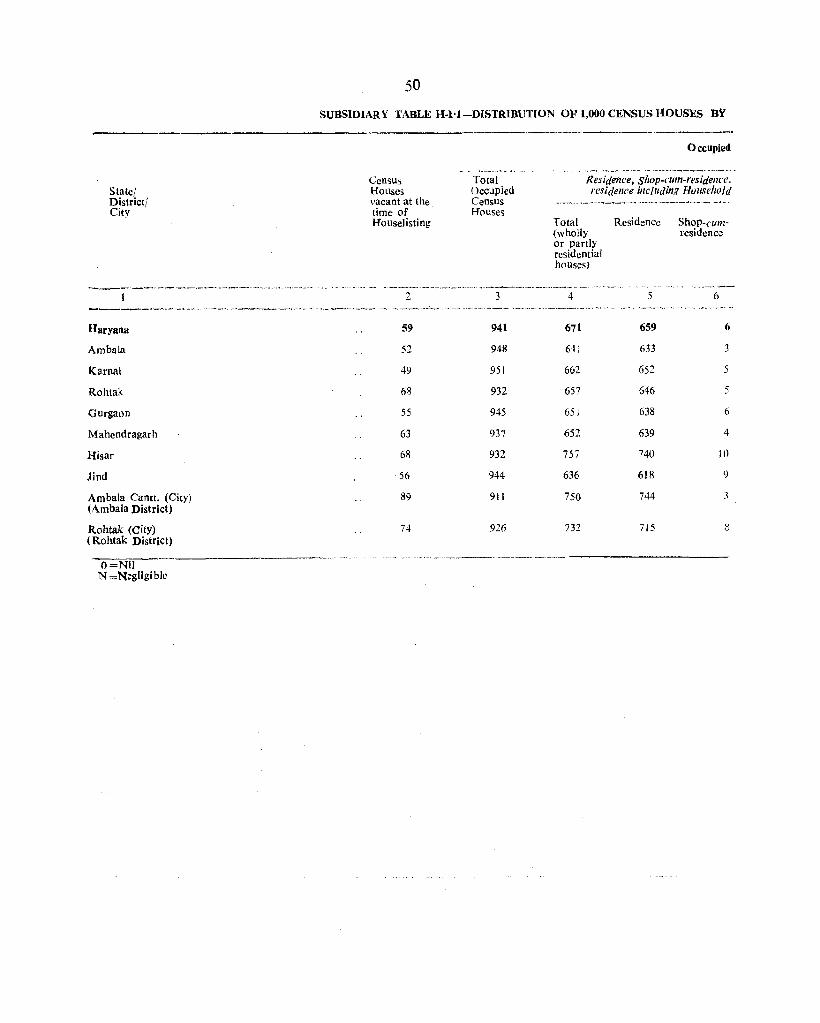
State! District/ City
Haryana
Ambala
Karnal
Rohtak
Glirgaon
Mahendragarh
Hisar
.lind
Ambala Cantt. (City) (Ambala District)
Rohtak (City) (Rohtak District)
O=NiJ N =Negllgiblc
SO
SUBSIDIARY TABLE H.B-DlSTRIBUTION OF 1,000 CENSUS HOUSES BY
Census Houses vacant at the time of HOliseJisting
Total Occupied Census Houses
Occupied
Residence, Shop. cum-residence, residellce illcluding HousehOld
Total Residence ShoP'cllm-(wholly residence or partly residential houses)
.. -,_~~-- --_-_. __ .-- ~ .... ----.-.-.---------... -- .~ .,-~--.... -..,. ~-- - -'". ,- .-~-.~---~ 3 4 5 6 ..
-."--.. ~---- -.-~ -, -- .. -_ .. _-----_-- .. _ __. - .~--- --
59 941 671 659 6
52 948 641 633 3
49 951 662 652 5
68 932 657 646 5
55 945 651 638 6
63 937 652 639 4
68 932 757 740 10
-56 944 636 618 9
89 911 750 744 3
74 926 732 715 8
.. --- ------ ._--_.,,-----
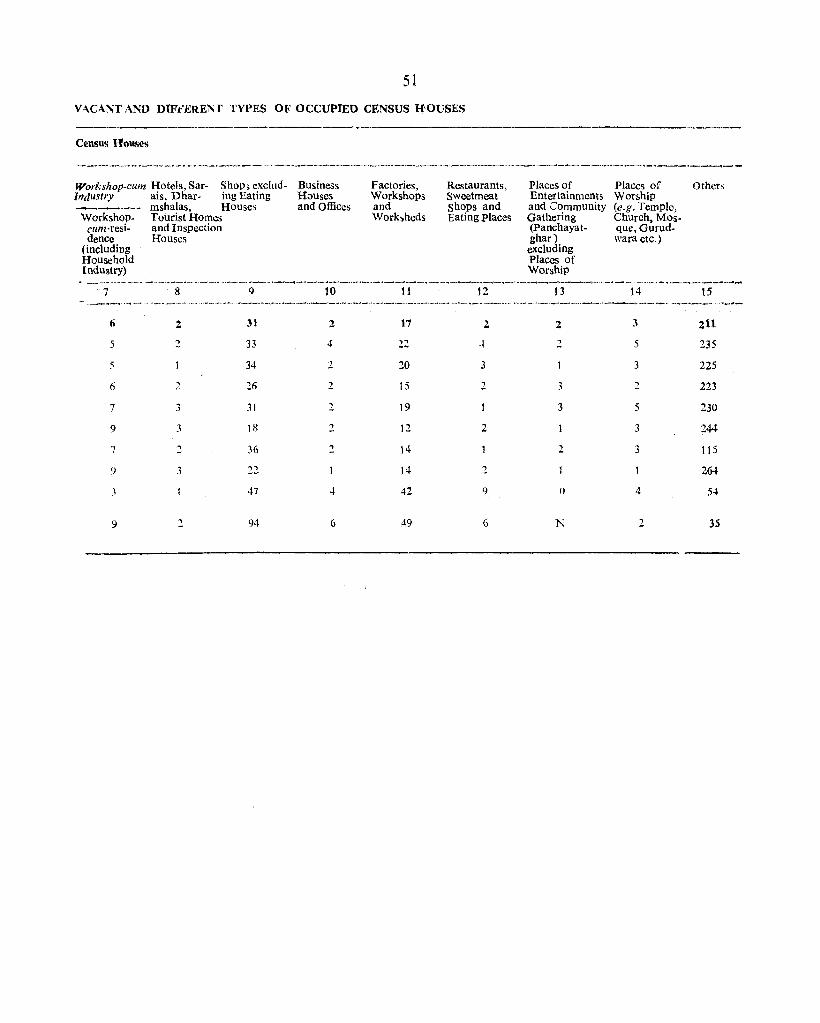
51
VACANT AND DlF~'ERENr TYPES 01<' OCCUPIED CENSUS H'OUSES
Census Houses
Workshop-cUll! Hotels, Sar- Shop, exclud. Illdustry ais, Dhar· ing Eating --.~---- mshalas, Houses Workshop. Tourist Homes
cum·resi- and Inspection dence Houses
(including Household Industry)
7
6
5
5
6
7
9
7
3
9
8
2
2
2
3
3
2
3
9
31
33
34
211
31
18
36
22
47
94
Business Houses and Offices
10
2
4
2
2
2
2
2
4
6
Factories, Workshops and Worksheds
11
17
22
20
15
19
12
14
14
42
49
Restaurants, Sweetmeat Shops and Eating Places
12
2
-t
3
2
2
2
')
6
------------
Places of Entertainments and Community Gathering (Panchayat. ghar) excluding Places of Worship
13
1
2
3
3
2
0
N
Places of Worship (e.g. Temple, Church, Mosque, Gurud. wara etc.)
14
3
5
3
2
5
3
3
4
2
Others
15
211
235
225
223
230
244
115
264
54
35
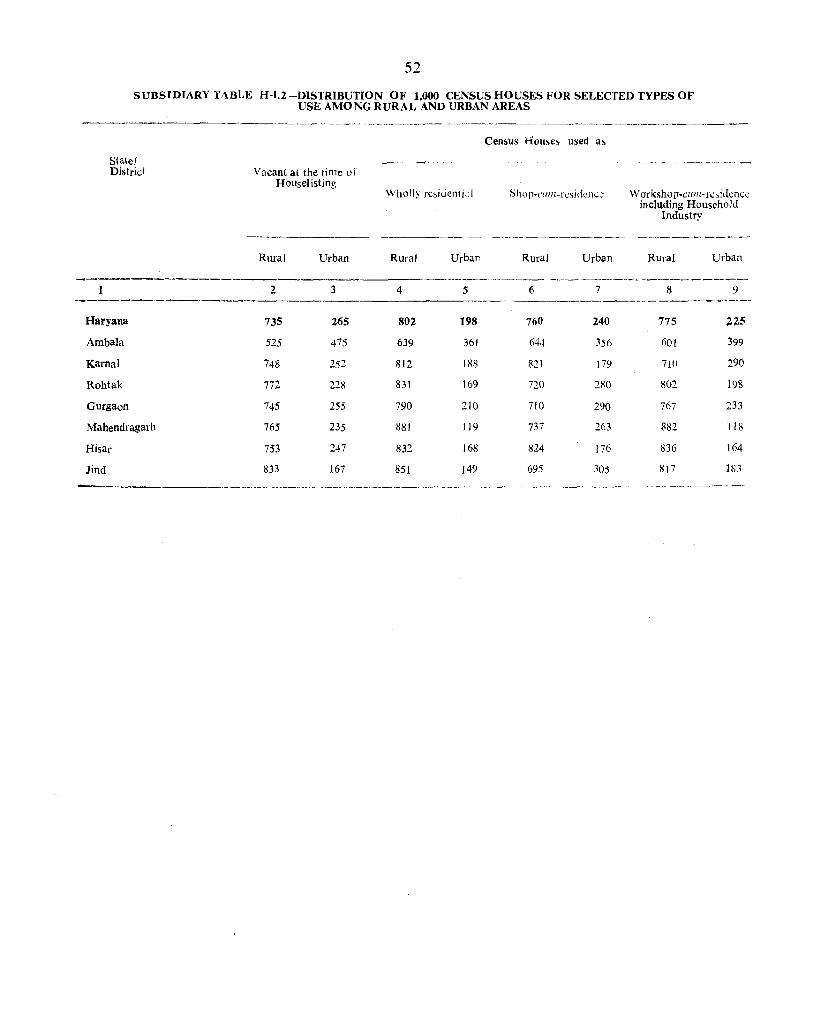
52
S UBSIDJARY TABLE H-U -DISTRIBUTION OF 1,000 CENSUS HOUSES FOR SELECTED TYPES OF USE AMONG RURAL AND URBAN AREAS
1
State! District
._-_ .. -._-_ ..... __ .. _ ...•. - .. _--_._-- ... -_. __ ..... _ .... _--------_._-------
Vacant at the time of Housel isting
Rural Urban
2 3
Census Houses used as
Wholly resiucnti,: 1 SJ10p-cl//ll-r~sidc!lc Workshop-wlIl- n;sidcnt:<;
Rural Urban Rural
4 5 6
Urban
including Household Industry
Rural Urban
.~---~~----------
7 8 9 ~----------.--------------- .. --.-----.---------~----
Haryana 735 265 802 198 760 240 775 225
AmbaJa 525 475 639 361 644 356 60! 399
Karnal 748 252 812 188 821 179 710 290
Rohtak 772 228 831 169 720 280 802 198
Gurgaon 745 255 790 210 710 290 767 233
Mahendragarh 765 235 IHll 119 737 263 882 118
Hisar 753 247 832 168 824 176 836 164
Jind 833 167 851 149 695 305 817 183
--- --.----~--~--~--".~----- .. ---------- --- -_._- ---.-.-.-~---,,---.-.----
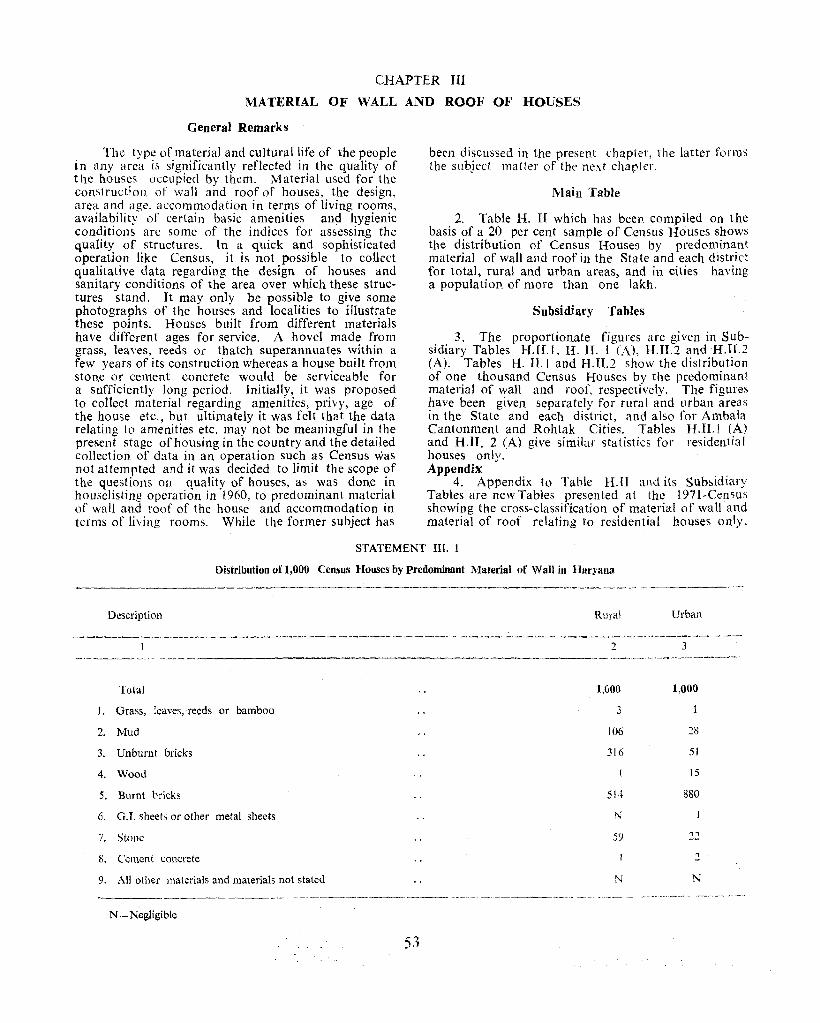
CHAPTER III
MATERIAL OF WALL AND ROOF OF HOUSES
General Remarks
The type of material and cultural life of the people in any area is significantly reflected in the quality of the houses occupied by them. Material used for the construct;ol1. of wall and roof of houses, the design, area and age. accommodation in terms of living rooms, availability of certain basic amenities and hygienic conditions are some of the indices for assessing the quality of structures. In a quick and sophisticated operation like Census, it is not possible to collect qualitative data regarding the design of houses and sanitary conditions of the area over which these structures stand. It may only be possible to give some photographs of the houses and localities to illustrate these points. Houses built from different materials have different ages for service. A hovel made from grass, leaves, reeds Of thatch superannuates within a few years of its construction whereas a house built from stone or cement concrete would be serviceable for a sufficiently long period. Initially, it was proposed to collect material regarding amenities, privy, age of the house etc., but ultimately it was felt that the data relating to amenities etc. may not be meaningful in the present stage of housing in the country and the detailed collection. of data in an operation such as Census waS not attempted and it was decided to limit the scope of the questions on quality of houses, as was done in houselisting operation in 1960, to predominant material of wall and roof of the house and accommodation in terms of living rooms. While the former subject has
been discussed in the present chapter, the latter forms the subject matter of the next chapter.
Main Table
2. Table H. II which has been compiled on the basis of a 20 per cent sample of Census Houses shows the distribution of Census Houses by predominant material of wall and roof in the State and each district for total, rural and urban areas, and ill cities having a population of more than one lakh.
Subsidiary Tables
3. The proportionate figures are given in Sub· sidiary Tables H.ILI, H. II. I (A), H.II.2 and H.II.2 (A). Tables H. 1].1 and H.ll.2 show the distribution of one thousand Census Houses by the predominant material of wall and roof, respectively. The figures have been given separately for rural and urban areas in the State and each district, and also for Ambala Cantonment and Rohtak Cities. Tables H.ll.l (A) and H.II. 2 (A) give similar statistics for residential houses only. Appendix
4. Appendix to Table H.II and its Sub~idiary Tables are new Tables presented at the 1971·Census showing the cross-classification of material of wall and materia! of roof relating to residential houses only.
STATEMENT Ill. 1
Distribution of 1,000 Census Houses by Predominant Material of Wall in Haryana
Description Rural Urban
3
Tolal I,GOO 1,000
1. Grass, !eaves, reeds or bamboo 3 1
2. Mud 106 28
3. Unbumt bricks 316 51
4. Wood 15
5. Burnt bricks 514 880
6. GJ. sheets or other metal sheets N
7. Stone 59 " 8. Cement concrete 2
9. All other materials and materials not stated N N
---_._-----------------__ ._-------- ---- - - --- ----- ---._ ---<-- - -_.- ---~-.-- _._.-
N .~ Negligible

Material of Wall
5. Proportional distribution of Census Houses by predominant material of wall is given in statement 11£.1 for the rural and urban areas of Haryana State. Burnt bricks have been used in walls in most of the cases both in rural m:d urban areas, the proportion in villages being 514 per 1,000 Census Houses and that in towns 880. These high figures undoubtedly indicate relatively much better housing conditions in Haryana and the growing prosperity of its people. Unburnt bricks are most common after burnt bricks both in rural and urban sectors of the State accounting for the walls of 316 and 51 per 1,000, Census Houses, respectively. Mud ranks third among wall material again both in country-side and towns; 106 houses per 1,000 in rural areas and 28 in urban areas are having walls of this material. The higher proportion of houses with walls made of unburnt bricks which is three times the proportion of mud walls in villages, and double the proportion of mud walls in towns signifies the general preference for more shapely houses although these may involve a little more labour and cost. Stone occupies the fourth place among wall materials in rural as well as in urban areas but its use is confined to the semi-montainous districts of Ambala and Mahendragarh. In the State. the proportion of stone walled houses is 59 per 1,000 in villages and 22 per 1,000 in towns. Cement concrete claims the walls of 1 per 1,000 houses in villages and 2 in towns. Wood accounts for the walls of 1 per 1,000 houses in rural areas and 15 in urban areas. The relatively higher proportion of houses having wooden walls in towns is due to the construction of wooden stalls (Khokhas) by petty shop-keepers like cycle-repairers, beverage-sellers, cigarette and betel-sellers and lawyers' stalls in courts etc. Three out of a thousand houses in rural areas and I in urban areas have walls made of grass, leaves, reeds or bamboo. The use of G.I. sheets or other metal sheets is negligible in villages while hardly 1 per IOelQ Census Houses in towns have walls of this material. To summarise, burnt bricks are predominantly used in the walls of houses in rural and urban areas. Houses having walls made of unburnt bricks and mud though not as numerous are considerable in number. The use of stone as wall material is confined to the districts where it is found while other materials do not call for any comments.
Inter-District Comparison
6. Proportionate distribution of different materials of walls of houses presents some interesting variations among districts depending on the general features, such as local availability of construction material, climatic conditions, amount of rainfall, cropping pattern, soil geology etc., and economic level of the people. The statistics with regard to the usage of material of walls of Census Houses in rural and urban areas of each district are given in Table H.n and Subsidiary Table H.lt L These materials are discussed below in accordance with the number of tbe houses in which they have been used.
(1) Burnt Bricks
7. Burnt brick is the predominant material used for the construction of walls of houses as 51.4 per cent of the rural houses and 88.0 per cent of the urban houses have walls of burnt bricks.
8. Among the rural areas of the districts, the use of burnt bricks as material of wall is the maximum in the centrally located districts of Jind, Rohtak and Kamal, where the percentage of such houses is 82.3, 66.3 and 63.9, respectively. This is in marked contrast to the semi-montane districts of Ambala, Gurgaon and Mahendragarh where the corresponding figures are 30.5, 32.2 and 44.5, respectively. Hisar is another district of lower percentage i.e. 44.8 per cent houses having walls made of burnt bricks.
9. The use of burnt bricks in the construction of walls of houses is considerably pronounced in towns. The highest proportions of such houses in urban areas are again found in the central districts of Jind, Rohtak and Kamal where 94.3, 93.5 and 91.9 per cent houses, respectively have walls of this material, and the lowest proportions are observed in the semi-hilly districts of Gurgaon and Mahendragarh accounting for 78.2 and 65.9 per cent houses, respectively of this type. The only deviation from the rural pattern is evidenced in the higher percentage of these houses in the districts of Ambala (90.7) and Hisar (89.7). It would thus be more appropriate and correct lo say that houses in Raryana have walls of burnt bricks which is a healthy sign for the growing prosperity and well-being of the people of this State.
(2) Unburnt Bricks
10. Next to burnt bricks, unburnt bricks i.e. mud moulded into bricks and dried in the sun is the most common material of wall construction. These bricks are laid with mud. mortar and when dry are plastered over with a mixture of mud and cowdung. Walls of unburnt bricks are more popular in villages than in towns. As many as 31.6 per cent houses in villages and 5.1 per cent houses in towns have walls of this material.
11. The use of un burnt bricks is substantial in the predominantly sandy districts of Hisar and Mahendragarh where respectively 52.3 and 31.3 per cent ('f the rural houses and 8.0 and 6.6 per cent of the urban houses have walls made of sun dried bricks. Risar district is conspicuous for its scanty rainfall. The percentage of houses with walls made of unburnt bricks is the lowest for Jind district: 15.4 for rural areas and 2.4 for urban areas. In this district, the use of burnt bricks is common both in villages and towns. In the remaining districts of Ambala, Kamal, Rohtak and Gurgaon, the extent of use of sun dried. bricks is more or less the same ; between 26 and 30 per cent of the houses in villages and between 4 and 5 per cent of houses in towns have walls of this material. The prop0l1ionately greater use of unburnt bricks as compared to mud in construction of walls is in itself a
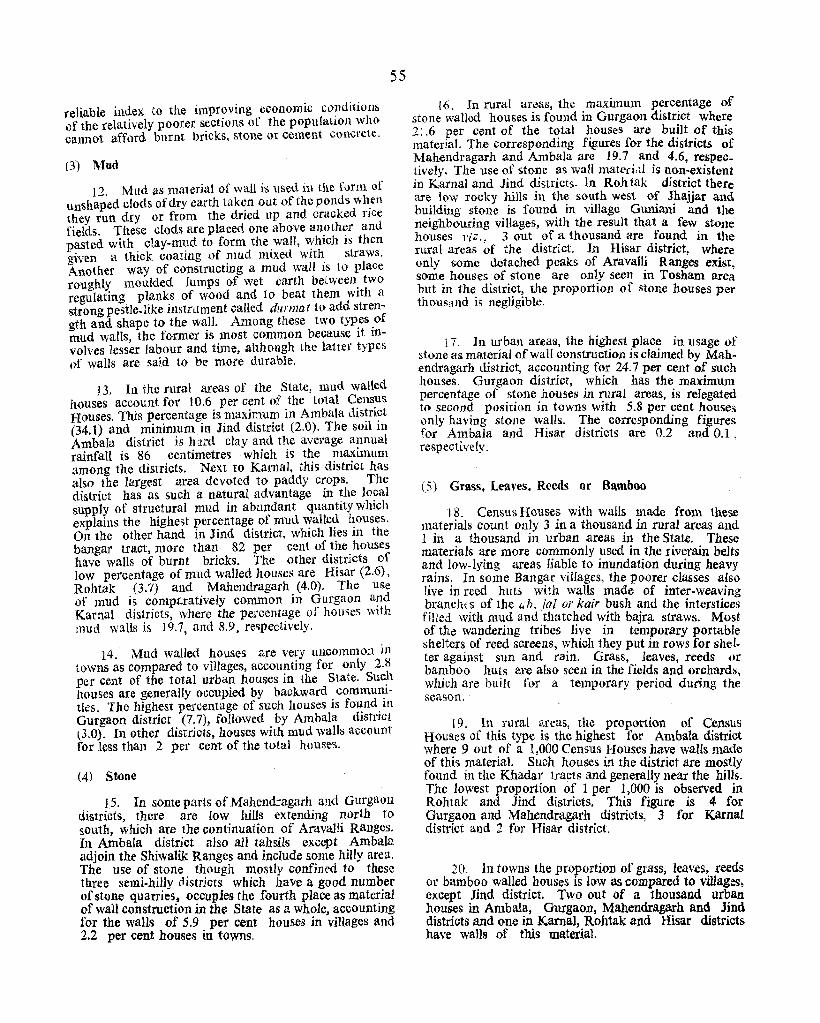
reliable index to the improving economic conditions of the relatively poorer sections of the population who cannot afford burnt bricks, stone or cement concrete.
(3) Mud
J 2. Mud as material of wall is used in the form of unshaped clods of dry earth taken out of the ponds when they run dry or from the dried up and cracked rice fields. These cLods are placed one above another and pasted with clay-mud to form the wall, which is then given a thick coating of mud mixed with straws. Another way of constructing a mud wall is to place roughly moulded lumps of wet earth between two regulating planks of wood and to beat them with a strong pestle-like instrument called durmat to add. strength and shape to the wall. Among these two types of mud walls, the former is most common because it involves lesser labour and time, although the latter types of walls are said to be more durable.
55
13, In the rural areas of the State, mud walled houses account for 10.6 per cent of the total Census Houses. This pe1'centage is maximum in Ambala district (34.1) and minimum in Jind district (2.0). The soil in Ambala district is hard clay and the average annual rainfall is 86 centimetres which is the maximum among the districts. Next to Kamal, this district has also the largest area devoted to paddy crops. The district has as such a natural advantage in the local supply of structural mud in abundant quantity which explains the highest percentage of mud walled houses. On the other hand in Jind district, which lies in the bangar tract, more than 82 per cent of the houses have walls of bUrnt bricks. The other districts of low percentage of mud walled houses are Risar (2.6), Rohtak (3.7) and Mahendragarh (4.0). The USe
of mud is comparatively common in Gurgaon and Karnal districts, where the percentage of houses with mud v,lalls is 19.7, and 8.9, respectively.
14. Mud walled houses are very Ullcommon in towns as compared to vilIages, accounting for only 2.8 per cent of the total urban houses in the State. Such houses are generally occupied by backward communities. The highest percentage of such houses is found in Gurgaon district (7.7), followed by Ambala district (3.0). In other districts, houses with mud walls account for less than 2 per cent of the total houses.
(4) Stone
. ! 5. In some parts of Mahendragarh and Gurgaoll dlstrIcts, ~here are low hills extending north to south, WhlCh are the continuation of AravaJli Ranges. In . ~mbala ~ist~jct also all tahsils except AmbaJa adJom the Shlwalik Ranges and include some hilly area. The use of stone though mostly confined to these three semi-hi~ly district~ which have a good number of stone quarrIes., o~cUPJes the fourth place as material of wall construction lD the State as a whole, accounting for the walls of 5.9 per cent houses in villages and 2.2 per cent houses in towns.
16. In rural areas, the maximulll percentage of stone walled houses is found in Gurgaon district where 21.6 per cent of the total houses are built of this material. The corresponding figures for the districts of ~a.hendragarh and Ambala are 19.7 and 4.6, respec~J.vely. The use o.f stol?c ~s wall mated,:l is non-existent m Karnal and Jmd dlstncts. In Roh 1ak district there are low rocky hills in the south" west of Jhajjar and building stone is found in village Guniani a.nd the neighbouring villages, with the result that a few stone houses viz., 3 out .o.f a thousand are found in the rural areas of the district. In Hisar district, where only some detached peaks of Aravalli Ranges exist som~ houses. of .stone are only seen in Tosham are~ but 111 the dIstnct, the proportion of stone houses per thous'lud is negligible.
17. In urban areas, the highest place in usage of stone as material of wall construction is claimed by Mahendragarh district, accounting for 24.7 per cent of such houses. Gurgaon district, which has the maximum percentage of st(}ne houses in nltal areas is relegated to secon~ position in towns with 5.8 pe~ cent house5 only havmg stone walls. The corresponding figures for AJ?1bala and Hisar districts are 0.2 and 0.1 . respectLVcly.
(5) Grass, Leaves, Reeds or Bamboo
18. Census Houses with walls made from these m~terials count on!y 3 in a thousand in rural areas and 1 111 ~ thousand III urban areas in the State. These matenals are more commonly used in the riverain belts an.d low-lying areas liable to inundation during heavy r~lJns: In some Bang~r viilages, the poorer classes also lIve In reed huts w~th walls made of inter-weaving ~ranch(~ of the "b. JaJ OJ' kair bush and the interstices filled WIth mud and thatched with bajra straws. Most of the wandering tribes live in temporary portable shelters. of reed screens, \~hich they put in rows for shelter agalllst sun and ram. Grass, leaves, reeds or ba~boo hu~s ar~ also seen in the fields and orchards, WhICh are bUIlt tvf a temporary period during the season.
19. In rural areas, the proportion of Census Houses of this type is the highest for Ambala district wher~ 9 out .of a 1,000 Census Houses have walls made ?f thIS ?1atenal. Such houses in the district are mostly found III the Khada~ tracts and generally near the hills. The lowest proportlon of 1 per 1,000 is observed in Rohtak and Jind districts. This figure is 4 for Gurgaon and Mahendragarh districts 3 for Karnal district and 2 for Hisar district. '
20. In towns the proportion of grass, leaves, reeds 01' bamboo walled houses 1S low as compared to villages except Jind district. Two out of a thousand urb~ h~us;cs in Ambal~, Gurgaon, Mahendragarh and Jind distrIcts and one III Kamal, Rohtak and Hisar districts have walls of this material.

«(,) Wood
21. In Haryana State, one Census House in a thousand in rural ar¢as and fifteen in towns have wood walls. It may be noticed that wood as a material of wall is not popular in villages, but is a little more common in towns. These houses are generalJy wooden stalls installed by petty shop-keepers like fruit-sellers, beverage makers, cigarette, an<:1 betel-sellers, barben, cycle-repairers etc., and lawyers in courts and have not the remotest resemblance to wood houses of the hilly areas.
22. In rural areas of districts, the proportion of such houses is invariably 1 per 1,000. In towns, however, there are wide variations among districts in regard to the usage of wood as material of wall. The maximum proportion of 37 per 1,000 is found in Gurgaon district, followed by Mahendragal'h 18, Karnal 14 and Jind 13. Ambala, Rohtak and Risar districts have low proportions of 7,8 and 1(', respectively. No reasons, however, can be assigned to high o-r low use of wood in the districts. Tn gener 1, the greater u~e of wood as material of wall reflects the relath'ely poorer economic condiri ons of the trading class of the towns of a district.
(7) Cement Concrete
. 27. In Haryana, cement is produced. by two factones one at Surajpur in Ambala district and the other at Charkhi Dadri in Mahendragarh district. Census Hou~es with walls ?f cement concrete account for only one 111 a thousand In rural areas and 2 in towns of the State. In r~lfal areas, the maximum proportion of 4 per 1,000 IS found in Ambala district, 1 per 1,000 in Karnal, Rohtak and Jind districts, while its use is negligible in Gurgaon, Mahendragarh and Hisar distri~ts. The high figure of rural Ambala may be explamed to the good number of cement concrete buildings at Pi~ore constructed by the Hindustan Machine Tools Factory. In regard to urban areas Jind records the highest proportion of 6 rer tho~sand, closely follow~d .by ~ohtak .(5) and Ambala (4). Mahendragarh dlstnct IS conspIcuoUS for not having a single Census House with cement concrete wall. The districts of Hisar where 2 out of a thousand houses and Karnal and Gurgaon where lout of a thousand houses have walls of cement concrete represent areas of low use of thiB material.
(8) G. I. Sheets or other Metal Sheets
. 24. In a State like Haryana which is characterised by extreme climate. the use of galvanised iron sheets or
56
other metal sheets as material of wall construction is very rare, since they freely transmit heat and cold. For the most part these structures are meant for stores or sheds. The villages of Jind district rarely have houses with walls of metal sheets, while the rural areas of other districts have oniy a negligible proportion of such houses. In towns, two out of a thousand Census Houses in lind district and one in Ambala district have walls of this material, but in the remaining five districts their use is again insignificant.
(9) Other Materials
25. The materials discussed above cover 100 per cent of the houses. All other materials and those not ~tated are insignificant and not worth mentioning both m respect of rural and urban areas of thc districts.
Material of Wall in Cities
2G. As many as 93 per cent houses in Rohtak City and 90 per cent houses in Arnhala Cantonment have walls made of burnt bricks. The rest of the material is used in smaller quantities. The use of unburnt bricks. burnt bricks and cement concrete is relatively higher. in Rohtak City. On the other hand in Ambala Cantonment houses having walls of grass, leaves, reeds or bamboo; mud; wood; GJ sheets or other metal sheets and other materials outnumber those in Rohtak City.
Material of Wall of Residential Houses
27. Subsidiary Table H.ll.l (A) shows distribution of 1,000 residential Census Houses by predominant wall material in the State and each district for rural and urban areas, separately. Since residential house5 provide :t place for rest and recreation to the humanbeings, their qual ity in terms of materials used is aU the more important and meaningful. The material used in the constructi on of walls of residential houses has been grouped in three categories viz., (i) those which are liable to superannuation within a few years of service i.e. grass, leaves, reeds or bamboo, mud, unburnt bricks and wood (ii) durable materials of more permanent nature, i.e., burnt bricks, G.I. sheets or other metal sheets, stone and cement concrete; and (iii) all other materials and materials not stated. In Census terminology, the walls made of the first category of materials may be described as Kachcha walls, while tho se built of the second category of materials as Pucca walls.
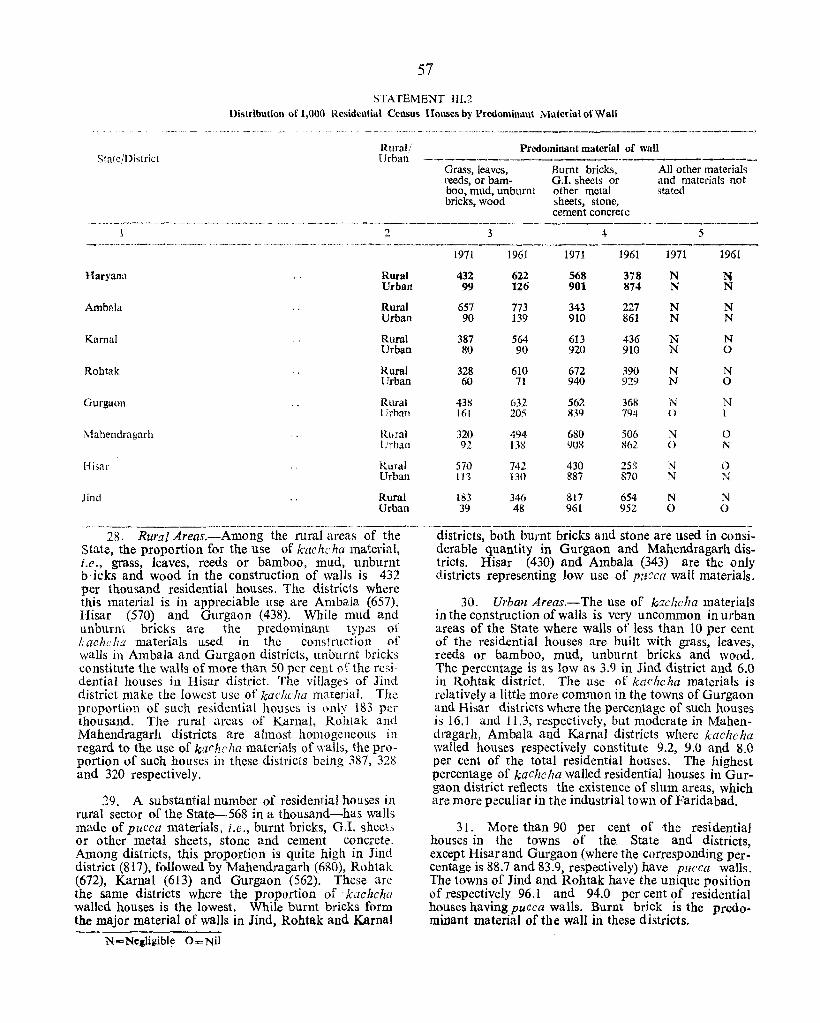
57
STATEMENT 1IL2 1)istributioll of 1,000 Residential Census HOllses by Predominant Material of Wall
State/District Rural! Urban
2
Predominant material of wall
Grass, leaves, reeds, or bamboo, mud, unburnt bricks, wood
3
Burnt bricks. G.!. sheets or other metal sheets, stone, cement concrete
4-
All other materials and materials not stated
._--_._--S
_.-_ ... -.-~¥-~,~...--~-,~.--~ .. ~-~~-............ -~ .~.---.. ,-~ ._---- - .-~~.-~ "--~~' ~~~"~-~~-.-.-..--- -.. _----_----_.
Haryann Rural Urban
Arnbala Rural Urban
Karnal Rural Urban
Robtak Rural Urban
Gurgaon Rural l Irban
l'.tahendragarh Ihlral Urban
Hisar Rural Urban
Jind Rural Urban
-----.. --.--.. ---------~--.. ---28. Rural Areas.-Among the mral areas of the
State, the proportion for the use of k:ac he ha material, i.e., grass, leaves, reeds or bamboo, mud, unburnt b icks and wood in the constmction of walls is 432 per thousand residential houses. The districts where this material is in appreciable use are Ambala (657), Hisar (570) and Gurgaon (438). While mud and unburl1l. bricks are the predominant typ.::s or kachclw materials used in the construction or walls in Ambala and Gurgaon districts, unburnt bricks constitute the walls of more than 50 per cent of the residential houses in Hisar district. The villages of Jind district make the lowest use of kac1zcha material. The proportion of such residential houses is unly 183 per thousand. The rural areas of Ka rna 1 , Rohtak and Mahendragarh districts are almost homogeneous in regard to the use of kachc ha materials of walls, the proportion of such houses in these districts being 387, 328 and 320 respectively.
~9. A substantial number of residential houses ill rural sector of the Statc-568 in a thousand-has walls made of pucca materials. i.e., burnt bricks, OJ. sheeb or other metal sheets, stone and cement concrete. Among districts, this proportion is quite high in Jind district (817), followed by Mahendragarh (680), Rohtak (672), Kamal (613) and Gurgaon (562). These are the same districts where the proportion of, kachcha walled houses is the lowest. While burnt bricks form the major material of walls in Jind, Rohtak and Karnal
N-Ne,ligible O=Nil
1971 1961 1971 1961 1971 1961
432 622 568 378 N N 99 126 901 874 N N
657 773 343 227 N N 90 139 910 861 N N
387 564 613 436 N N 80 90 920 910 N 0
328 610 672 390 N N 60 71 940 929 N 0
4311 632 562 368 N N 161 205 839 794 l) t
320 494 680 506 N 0 92 13g 908 862 0 N
570 742 430 258 N 0 113 130 887 870 N N
183 346 817 654 N N 39 48 961 952 0 0
'-'-'--------------~------:----
districts, both burnt bricks and stone are used in consi-derable quantity in Gurgaon and Mahendragarh districts. Hisar (430) and Ambala (343) are the only districts representing low use of pl!CCa wall materials.
30. Urban Areas.-The use of k·7chelza materials in the constmction of walls is very uncommon in urban areas of the State where walls of less than 10 per cent of the residential houses are built with grass, leaves, reeds or bamboo, mud, unburnt bricks and wood. The percentage is as low as 3.9 in Jind district and 6.0 in Rohtak district. The use of kacheha materials is relatively a little more common in the towns of Gurgaon and Risar districts where the percentage of such houses is 16.1 and 11.3, respectively, but moderate in Mahendragarh, Ambala and Karnal districts where kachr lut walled houses respectively constitute 9.2, 9.0 and 8.0 per cent of the total residential houses. The highest percentage of kachc Ita walled residential houses in Gurgaon district reflects the existence of slum areas, which are more peculiar in the industrial town of Faridabad.
31. More than 90 per cent of the residential houses in the towns of the State and districts, except Hisar and Gurgaon (where the corresponding percentage is 88.7 and 83.9, respectively) have pl/eea walls. The towns of Jind and Rohtak have the unique position of respectively 96.1 and 94.0 per cent of residential houses having pucca walls. Burnt brick is the predominant material of the wall in these districts.

Comparison with 1961
32. As is well borne out by the statistics relating to the categorisation of walls of residential houses for the 1971 and 1961 Censuses, the decade under report has witnessed a perceptible increase in the use of lJU 'ca materials both in the rural and urban areas of the State. The State prnjJottion of TJU 'C./ walled horses fox the rural areas has imp.·oved from 378 per 1,000 in 1961 to 568 in 1971. The corresponding fig'lre for the urban areas of the State has increased from 874 pel' 1,000 in 1961 to 901 in 1971. It may be noticed that the ptt}?ortional increase ill the use of pu~ca materials is much more
58
marked in villages than in towns, Among districts, the proportional increase is relatively high in the rural areas of Rohtak and Gurgaoll and in urban areas of Ambala, Mahenctragarh and Gurgaon.
Material of Wall of Residential Houses ill Cities
33, AboClt 90 per cent of the residential houses in Rohtak City and Am )ala Cantonm~nt have walls nnd.! of pu"ca materials. Rl)atak City with 928 O:lt of a J ,ODO resid~ntial hO:lses in this category is superior to Ambala Cantonment where the corresponding figure is 892, The cOtre.>pmKiing proportions in these two cities in 1961 were 913 and 873, respectively.
:\HTERIAL OF ROOF'
STA.TEMENT IH'3
Distribution of 1,000 Census Houses by Predominant Material of ROof in Haryana
O~scription Rural Urban
2 3
Total 1,000 1,000
Grass, L~'lns, R~~ds, Thatch, \\rood, Mud, unburnt bricks 01' Bamboo 765 431
2 Tiles, Slate, Shingle
3 Corrugated iron, zinc or other Met,,] sheet,
4 A;bes'o5 c~ment sheet~
5 Bricks and Lime
6 Stone
1 C0ncrete R.B.C./R.C.C.
8 All other materials and matuials net stal(C
34. Statement III. 3 shows the distribution of 1,000 Census Houses by predominant material of roof in the rural and urban areas of the State. More than three· fourths of the rural Cens.us Houses in the State -·765 per 1,000 have roofs made of ,;;a.;/lcha materials i.e., grass, leaves, reeds, thatch, wood, mud, unburnt bricks or bamboo. In the urban areas as a whole no material of roof is predominant, though grass, leaves etc., again occupy the foremost place in the cunstruction of roofs in urban houses. Taking the combined figur.;: of the towns of the State, 431 in a thousand Census Houses have roofs made of this material. Burnt bricks and lime are most common next to grass, leaves, etc., in villages but are relegated to third place in towns. As many as 106 out of every 1,000 Census Houses in the country-side and 137 in towns have roofs made of bricks and lime. Concrete ruof:> rank third in rural areas but claim second place in urban areas, accounting for 56 and 251 per thuusand Census Houses, respectively. Tiles, slate, shingle apPl'opriate fourth place as material of roof both in rural and urban areas, claiming respectively 38 and 117 Census Houses in a thousand. Stone accounts for the roufs uf 28 out of a 1,000 Census Houses in the rural sec\.or of the State and 33 in its urban sec-
38 117
3 22
2 8
[06 137
2R 33
56 25t
2
tor. CorflLgated iron, zinc or other metal sheets cover the roofs of only 3 Censils Houses in a thousand in villages while their proportion in urban areas, which is 22 p~r 1,000, is relatively higher. Asbestos Cement sheets account for a very small p;oportioll of Census Hoascs both in rural and urban areas which is 2 per 1,000 Comus douses in rural areas and 8 in u"'ban areas. The P{opol'tion of Census HO:lses having roofs made up of the rest of material and material not stated is on ly 2 in a 1,000 Census houses in villages and one in towns. To sum up, f,.ac/tcha materials particularly thatch and mud are predominantly used in the construction of roofs in rural areas but pucca materials are most commonly favoured in urban areas.
35. Grass, Leaves, Re.:ds etc.-It may be noticed that grass, reeds, thatch, wood, mud and bamboo are the predominant roofing materials in the rural areas of the State while leaves and uuburnt bricks are not being in use in this part of the country. Census Houses with roofs made from these materials account for as many as 765 in a thousand in the rural areas and 431 in urban areas of Haryana. These figures, however. seem to be some-what inflated because of general misunderstanding

regarding the concept or roof. According to instructions issued by the Census Commissioner of India, the predominant material of roof refers to "the material out of which most of the oukr roofs, exposed to the weather and not the ceiling is made. If the roofis mainly wade of bricks, stone etc., and has mud plaster, cement plaster or lime plaster exposed to the sky, the material of roof in such case will not be "mud", "cement" or "lime". respectively but it will be "bricks", "stone" etc. which constitute the fabric of the roof." It is a general practice in Haryana to spread earth on the roofs made of bricks, stone or even cement concrete to lessen the harmful effects of burning heat and some of the enumerators wrongly recorded "mud" as the predominant material of roof in such cases because it was exposed to the sky. Clear cut instructions issued and clarifications made by this Directorate and on-the-spol checking by the supervisMY staff have minimised such errors to a considerable extent but the data being presented under this sub-head has, therefore, its limitations and has to be viewed in this background.
36. Thatched and mud roofs are of several kinds. Sloping roofs are generally made of reeds and long grass such as kaalls, baasa, sarI' and patera or stalks of bajra and wheat plants; their use depending on the local availability of these articles and local tastes. For constructing such a sloping roof commonly called chhap· par, reeds and long grass are arranged in rows and fixed tightly on a rectangular frame made of bamboo. Such roofs either slope otT to one side of the room or to both sides from the ridge. In the latter case, two chhappars of equal dimensions are fastened together on a beam placed across the two walls making the width of the room. In order to make the roof leak-proof and fire-proof and to give it the necessary weight so that it is not blown off by strong winds, a two inch thick coa-
• ting of mud is sometimes given.
31. In the case of a flat roof, a strong beam (shaihteer) of saa! wood is placed on the side walls, and is supported in the centre by a big log of wood called thamma resting on the ground. In big rooms, two or more such beams are placed breadthwise. Then rafters (karian) of saa! or sain wood are pIacl'd on the r.1'am about six inches apart. On these rafters, small bits of wood of the size 8"x3 x r locally called karanjas or thinly sawn long pieces of wood called phatfian which are generally the waste of sawn timber and now more comml)nly used are arranged close to one another. R~eds, long grass or grainless sheaves of bajra, jowar or wheat plants or leafy parts of sugarcane sticks are then neatly spread over them and given about one inch coating of mud (gaar). The top is covered by dry earth to a thickness of 4 to 6 inches and beaten with wooden thaapis. The final dressing to the top of the roof is given with a mixture of mud, straw and cow dung. Another variation in the case of houses belonging to poor persons is that an unhewn t,runk of wood is substituted for beam and fat branches of wood replace rafters. Without making use of karanjas or phatli, reeds and long grass are directly arranged on them, Wood of saal, cheel, keekal', sheesham, kair, neem, jaal, faanti, aam, iamoa is used as timber.
59
38. 111 the rural areas, house with roofs of any of the types mentioned above range between 797 and 854 per thousand in districts other than Gurgaon (604) and Mahendragarh (453). In these two districts, the fewer houses with thatch etc. are matched by a larger number of those having roofs of brick and lime, and stone.
39. In towns, this material in the construction of roofs is predominantly used in Rohtak, Karnal and Hisar districts only, where the proportion of houses having roof of such material is respectively 587, 579, and 532 per thousand. In lind district, where the proportion of such houses is 418 per thousand, this roofing material, though not predominant, is used in a considerable quantity. In the sub-montane districts of Ambala (309), Gurgaon (261) and Mahendragarh (115), where more permanent roofing materials like bricks, tiles, stone and concrete are favoured. the use of thatch etc. is much low.
40. Bricks and Lime.-Next to grass, leaves, reeds etc. bricks with lime is the principal roofing material in the rural areas of Haryana State. Out of a' thousand Census Fouses in the villages of the State, 106 have roofs made of brick and lime. There are considerable variations in the distribution of such houses among districts. Mahendragarh district with 275 rural houses ill a thousand, having roofs made of bricks and lime stands first in this respect and Ambala last with only 26 houses in this category. Tn Mahendragarh district, where majority of the rural houses have walls made of burnt bricks or stone and lime-stone is available in consider~ able quantity, the use of brick and lime as roofing material is quite obvious. The district is also inadequately wooded and deficient in thatching materials. On the other hand, the use of bricks and lime in the construction of roofs is warranted in the villages of Ambala district where walls of the houses are overwhelmingly made of mud and adobe. The district has also s )me area under forests which abounds in wood, reeds and long grass explaining the high incidence of thatched and mud roofed houses there. Gurgaon (151), lind (138) and Rohtak (100) are the other distri;ts where bricks and lime as roofing material are relatively more common in the rural areas, but the districts of Hisar (91) and Kamal (57) represent areas of their low use.
41. The use of bricks and lime as roofing material is a little more common in towns as compared to villages. This feature is observed in all the districts except Gurgaon. The deviation in Gurgaon district is attributed partly to the high use of bricks and lime in the countryside of the district, where among districts it is only lower to Mahendragarh and partly to the higher preference given to concrete roofs in the towns of the district, especially in the developing industrial town of Faridabad. The maximum proportion of urban houses having roofs made of bricks and lime is found in lind district, where 340 in a thousand Census Houses have roofs of this material closely followed by Mahendragarh district (318). The highest proportion of brick and lime roofed houses in the towns of Jind district is balanced by the lowest proportion of houses with con· crete roofs. In Mahendragarh district, however, the
use of concrete as roofing material of urban houses i~ the maximum among districts and the high proportion of bricks and lime only explains the better quality of houses there. The districts of Karnal (72), Gurgaon (103) and Ambala (123) have relatively low proportions of urban houses in this category. In Ambala and Karnal districts, the low use of brieks and lime Illay again be explained by the higher use of concrcte as WOntH! material of urban house~ but in Kamal district \\her~ concrete roofs are also rarely seen, the low proportion of bricks and lime roofed homes indicates the relatively unsatisfactory living conditions in the district. The districts of Hisar (152) and Rohtak (49) however, represent areas of relatively higher use of bricks and lime as roofing material.
42. Concrete.-Census Houses having concrete roofs account for 56 in a thousand in villages and 251 in towns of the State. Concrete roofs are very uncommon in the rural areas of districts except the semi-hilly districts of Mahcndragarh and Gurgaon where 151 and 125 Census E ouses respectively in a thousand have roofs made of this material. In other districts the proportion of rural houses in this category is low and varies between 46 and 12 per thousand.
43. In urban areas also, the highest proportion of concrete roofed houses is again returned by Mahendragarh district (426~ followed by Gurgaon (329), Ambala (309) and Hlsar (249). In Mahendragarh district, where lime, stone and concrete are available in abundant quantity, an overwhelming majority of the houses has roofs made of lime and concrete or lime and stone pieces which explains the high proportion of such Census Houses in this district, whereas in other districts, the concrete roofs arc generally of the type or R.C.C. or R.B.C. In the districts of Karnal (170), Rohtak (166) and Jind (152) the proportion of urban houses having concrete roofs is more or less uniform. The high lIse of concrete in the urban areas of all the districts indicates its growing popUlarity as rOOfing material.
4~. Tifes, Slate, Sfting!c.--Shingle is used nowhere in the State as a roofing material, while the use of slate is confined to some parts of the sub-montane districts of Gurgaon and Mahendragarh, where slate stone is found. Tile roofs, however, feature prominently in the northern districts of Ambala and Kamal where respectively, 106 and 75 Census Houses per 1,000 il; rural areas and 210 and 165 Census Houses per 1,000 in urban areas have roofs made of tile. The soil of these districts which is mostly clay is highly suitable for the manufacturing of tiles. These districts are also areas of relatively high rainfall. In other districts, their use as roofing material is low and ranges between 47 and 4 per 1,000 in rural areas and between 117 and 14 per 1,000 in urban arcas.
45. Stone.--Stone roofs are found only in the submontane districts of Gurgaon and Mahendragarh. Out of a thousand Census Houses, 106 in rural areas and 121 in urban areas of Gurgaon district have roofs made of stone. The corresponding figures for Mahendra~ garh district are 71 and 104, respectively. In other
60
districts, the usc of stone as roofing material is either low or practically non-existent.
46. Corrugated irol1, zinc or o/{I(;" lIl"taf she.cts.Mctal sheets are a little more popular as matenal of roof than as material of \\all. The proportion of hOllses with roofs built of corrugated iron, zinc or other metal sheets per thousand i~, howcver. low. They arc generally used to form the roofs of stores _and sl~cds. Ccnsus Houses \\ ith metal roofs account tor 3 III ,\ thousJnd in rural areas and 22 in urban areas. Thc maximum proportion of such Census Houses is observed in the industrial districts of Ambala and Gurgaon. Seven out of a thousand Census Houses in villages and 30 in towns of Ambala district have metal roofs. The corresponding figures for Gurgaon district are ~ an.d 46, respectively. In other districts the proportIon IS less than 3 per thousand in rural areas and between 20 and 8 per 1,000 in urban areas.
47. Asbestos cement sheets.-Among roofing ma~ teriaIs, the use of asbestos cement sheets is the lowest both in rural and urban areas of the State. Out of a thousand Census Houses, only 2 in rural areas and 8 in, urban areas of the State claim to have roofs made of this material.
48. Census Houses with roofs built of a"bestos cement sheets are practically unknown in the rural areas of Kamal, Mahendragarh and Hisar districts, \'lhile their proportion is hardly 1 in a thousand in the country-side of Ambala and Jind districts. The maximum proportion of only 6 per J ,000 in rural areas is observed in Rohtak district, followed by Gurgaon (3).
-'19. Among urban areas, the use of asbesto& (cment sheets for roofing is relatively more popular in the industrial districts of GUflraon and Ambala, where resnectivelv 21 and 17 Census -Houses in a thousand fal! in 'this category. In the rest of the districts urban houses with roof" of asbestos cement sheets count less than 5 1n a thousand.
50. Otlter At atcria/s .-All other roofing l11ateriab and materials for which information was not available in the HOllselist have been grouped in this category. Such Census Houses count only 2 in a thousand in villages and 1 in towns of the State. Census Home!; witb such roofs feature prominently only in the rural areas of Ambala district (13 pcr 1,000), where these are mostly in the shape of tented houses.
Material of Roof in Cities 5 [. In Rohtak City, 523 out of a 1,000 Census,
Houses have k 7e lzr ha roofs made of grass, reeds, thatch wood, mud or bamboo. The corresponding figure for Ambala Cantonment is only 377, showing comparativeJy better housing conditions in this city. In regard to plicca materials of roofing, Census Houses with roofs made of corrugated iron, zinc or other metal sheets. asbestos cement sheets and concrete feature more prominently in Ambala Cantonment. The use of bricks and lime and stone for constructing house roofs is, however, higher in Rohtak City as compared to ~ Anibala Cantonment.
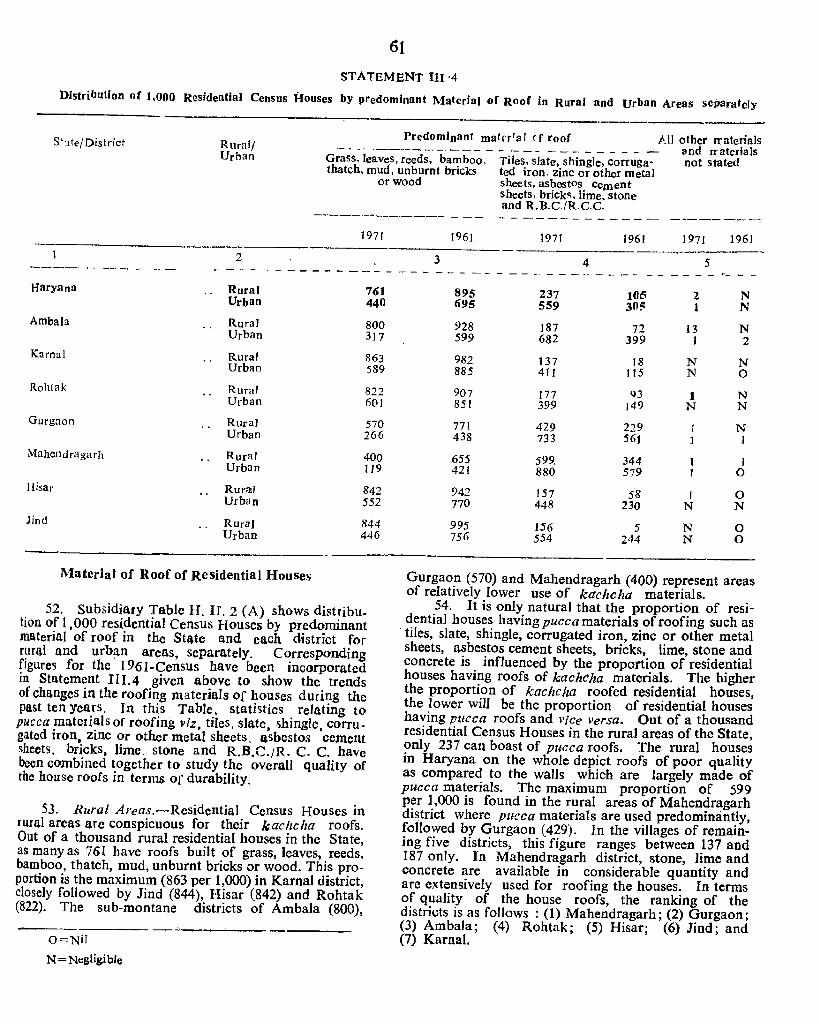
01
STATEMENT In'4
Distributfon of 1.000 Residential Census Houses by predominant Material of Roof in Rural and Urban Areas separately
Predominan1 matnral (f roof All other rratcrials S'"ltejDistrict Rural/ Urban .---------- - - --- --~ - - - - - - and rratcrials
Grass. leaves. reeds, bamboo, Tiles. slate, shingle. corruga- not stated thatch, mud. unburnt bricks ted iron. zinc or other metal
or wood sheets, asbestos cement sheets, bricks, lime. stone and R.B.C./R.C.C.
---_--"-------- - - - - - - - - - - - - - - - - - --_,,- ----:
1971 1961 1971 1961 1971 1961
2 3 4 5 - - .- - - - -.. - - - - -.___ - - - - - - - - - - - - - -, - - - ~- - - - - - - - - - -Haryana Rural 761
Urban 440
Ambala Rural 800 Urban 317
Kamal Rural 863 Urban 589
Rohtak Rural 822 Urban 601
GUrg:lOn Rural 570 Urban 266
Mahendragarh Rural 400 Urban 119
Hisar Rural 842 Urban 552
Jind RUral 844 Urban 446
Material of Roof of Residential Houses
52. Subsidiary Table H. II. 2 (A) shows distribution of J ,000 residential Census Houses by predominant material of roof in the Stq,te and each district for rurq,l and urban areas, separately. Corresponding figure') for the' 196 I -Census have been incorporated in Statement II 1.4 given above to show the trends of changes in the roofing materials of houses during the past ten Years. In this Table, statistics relating to pllcca m'ltetialsof roofing viz, tiles, slate, shingle, corru. gated iron. zinc Or other metal sheets, asbestos cement sheets. bricks, lime. stone and R.B.C./R. C. C. have been combined together to study the overall quality of the house roofs in terms Of durability.
53. Rural Areas.-Residential Census Houses in rural areas are conspicuous for their kaclzclza roofs. Out of a thousand rural residential houses in the State, as many as 761 have roofs built of grass, leaves, reeds, bamboo thatch, mud, unburnt bricks or wood. This proportion i~ the maximum (863 per 1,000) in Karnal district, closely followed by Jind (844), Hisar (842) and Rohtak (822). The sub-montane districts of Ambala (800),
O=Nil
N = Nt:gligi bJe
895 237 695 559
928 187 599 682
982 137 885 411
907 177 851 399
771 429 438 733
655 599, 421 880
942 157 770 448
995 156 756 554
105 30~
72 399
18 115
93 149
229 561
344 579
58 230
5 244
2 1
13 I
N N
1 N
I 1
I N
N N
N N
N 2
N o N N
N 1
J o o N
o o
Gurgaon (570) and Mahendragarh (400) represent areas of relatively lower use of kachcha materials.
54. It is only natural that the proportion of residential houses havingpuccamaterials of roofing such as
. tiles, slate, shingle, corrugated iron, zinc or other metal sheets, asbestos cement sheets, bricks, lime, stone and concrete is influenced by the proportion of residential houses having roofs of kacMha materials. The higher the proportion of kachclza roofed residential houses, the lower wiIJ be the proportion of residential houses having pucca roofs and vice versa. Out of a thousand residential Census Houses in the rural areas of the State, only 237 can boast of pltcca roofs. The rural hou~es in Haryana on the whole depict roofs of poor quahty as compared to the walls which are largely made of pucca materials. The maximum proportion of 599 per 1,000 is found in the rural areas of Mahen~ragarh district where pucca materials are used predommantly. followed by Gurgaon (429). In the villages of remaining five districts, this figure ranges between 137 and 187 only. Tn Mahendragarh district, stone, lime and concrete are available in considerable quantity and are extensively used for roofing the houses. In terms of quality of the house roofs, the ranking of the districts is as follows : (1) Mahendragarh; (2) Gurgaon; (3) Ambala; (4) Rohtak; (5) Hisar; (6) Jind; and (7) Kamal.
55. Urban Areas. -The position of urban residential houses in relation to roofing materials is much better when compared to rural houses. Taking the combined fjgure of the urban areas of the State as a whole, only 440 out of a thousand residential houses have {cachcha roofs. Kachcha materials for roofing are, however, in predominant use in the towns of Rohtak (601 per 1,000). Karnal (589 per 1,000) and Risar (552 per 1,000) districts. The semi-montane districts of Mahendra~ garh (119), Gurgaon (266) and Ambala (317) represent areas where kachcha materials for roofing in towns are used in the least quantity. Jind (446) is another district, where in urban areas residential houses with kachcha roofs are relatively unpopular.
56. In the towns of Raryana State, out of a thousand residential houses, 559 show pucca roofs. This figure is as high as 880 for Mahendragarh district, followed by Gurgaon (733), Ambala (682) and Jind (554). In Rohtak, Karnal and Hisar districts, the proportion of urban residential houses having plIcca roofs varies between narrow limits of 448 and 399 per 1,000. In urban areas, the ranking of the districts in terms of quality of roofs of residential houses is as follows : (1) Mahendragarh; (2) Gurgaon; (3) Ambala; (4) Jind; (5) Hisar; (6) Karnal and (7) Rohtak.
Comparison with 1961
57. Proportionate figures of the roof material of residential houses for the years 1961 and 1971 unmistakably show the process of rapid replacement of kachcfta roofs with pucca ones both in rural and urban areas of all the districts of the State. In the rural areas of the State as a whole, the proportion of pucca roofed residential houses has more than doubled since 1961. It has improved from 105 per 1,000 in 1961 to 237 in 1971. The corresponding figure for the urban areas of the State has increased from 305 per 1,000 in 1961 to 559 per 1,000 in 1971. It may be noticed that except Gurgaon district the proportionate increase in the use of pucca materials of roofing is relatively much more marked in towns than in villages. Among districts the proportional increase is relatively high in the rural areas of Mahendragarh, Gurgaon and Jind districts and in the urban areas of Jind, Mahendragarh and Karnal districts.
Material of Roof of Residential Houses in Cities
58. In Ambala Cantonment, 610 out of a thousand residential Census Houses have pucca roofs. This figure is only 440 for Rohtak City, showing relatively much poor quality of roofs.
Residential Census Houses by Material of Wall cross-classified by Material f)f Roof
59. In the preceding paragraphs, an attempt has been made to study the type of Census Houses and resi· dential Census Houses by predomimmt materials of wall
62
and roof separately. Appendix to Table H-II is a new Table generated at the 1971-Census and shows the absolute figures of residential Census Houses by material of wall cross-classified by material of roof in the total, rural and urban areas of the State and each district and also for Ambala Cantonment and Rohtak Cities. This will help to reflect more realistically the quality of house construction in the State and its regions. Subsidiary Table which is based on the Appendix to Table R-II, furnishes the distribution of 1,000 residential Census Houses cross-classified by material of wall and material of roof. The materials used in the construction of walls and roofs of residential houses have been grouped together in three broad categories viz., (i) those which are liable to superannuation within a few years of service, i e., grass, leaves, reeds, bamboo, thatch, mud, unburnt bricks and wood as materials of wall and roof, (ii) durable materials of more permanent nature, i.e., burnt bricks, G.I. sheets or other metal sheets, stone and cement as material of wall and tiles, slate, shingle, corrugated iron, zinc or other metal sheets, asbestos cement sheets, bricks, lime, stone and R.B.C./R.C.C. as roofing matprials and (iii) all other materials and materials not stated. In common parlance, the walls and roofs made of the first category of materials are described kaehlCha and of the second category as ptlcca. The cross-classification of materials of wan and roof furnishes nine types of residential houses which are discussed below.
60. Purely Kl.4chcha Houses.--Residential Census Houses made of kac he ha walls and kar he ha roofs account for a little more than one-third(35.4 per cent) of the total stock of residential Census Houses in the State. This type of house construction is most familiar in Hisar and Ambala districts where the proportion is 47.5 and 43.7 per cent, respectively, which reflects relatively unsatisfactory living conditions there. Gurgaon (37.0 per cent) is another district where the proportion of this type of houses is higher than the corresponding State figure. The lowest proportion is noticed in Jind district where it is 15.5 per cent only. In this district, houses with pucca walls and kac he rza roofs are found predominantly. In Karnal (32.0 per cent), Rohtak, (27.8 per cent) and Mahendragarh (27.1 per cent), the proportion in villages is less intense.
61. In rural areas of the State, purely kachcha houses constitute 42 1 per cent of the residential houses. Ambala district records the maximum proportion where nearly two-thirds (64.5 per cent) of the rural residential houses belong to this type. Next come Hisar (54.9 per cent) and Gurgaon (43.3 percent) districts. That the proportion of purely kae he ha houses is exceedingly high in the rural areas of these three districts is a substantial evidence for the poor housing conditions in the villages there. Houses with kacheha walls and roofs not only render living conditions unsatisfactory, but also involve recurring expenditure and time for their maintenance and repair. The lowest proportion of this type of houses in villages is registered in Jind district where it is only 17.8 per cent. In the rural areas of Karnal(37.8 per cent), Rohtak (32.4 per'cent) and Mahendragarh(29.6 per cent) districts, the proportion of such houses is moderate.
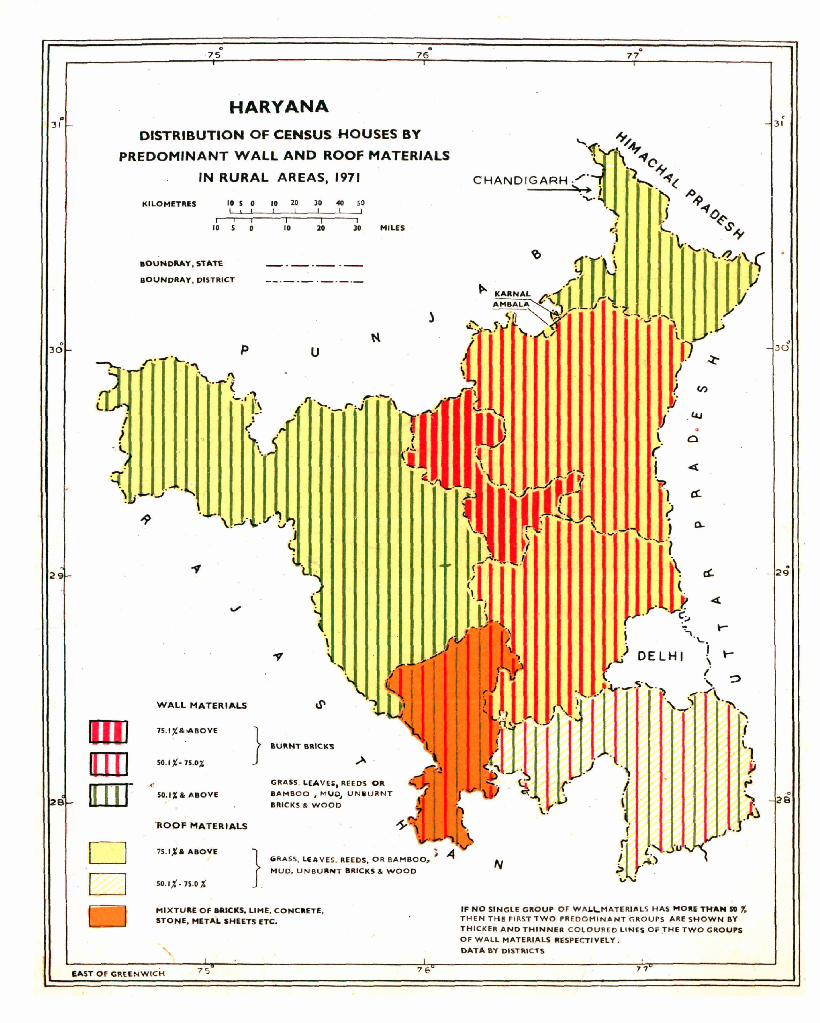
• 31
29 ·
e
c o 75 76
HARYANA
DISTRIBUTION OF CENSUS .HOUSES BY
PREDOMINANT WALL AND ROOF MATERIALS
IN RURAL AREAS, 1971
lIlII rnr
KILOMETRES 10 5 0 10 10 30 40 50
10 5
B()UNDIl.AT. STATE
BOUNDRAy • .,ISTIUCT
p
WALL MATERIALS
15. I.%& .... BOVE
50. 1 t, 75.0%
.' 50.1,." ABOVE
1I0PF MATERIALS
75 . 1%1 ABOVE
50. 1,% .75.01.
o 10 10 30 MILES
} BURNT BIIICK~
GRASS . LEAVES, REEDS 011
BAMBOO. MVD, UNIIU~NT
BRICKS & WOPD
MIXTURE OF dICKS. LIME, CONCRETE,
STONE. METAL SHEETS ETC,
EAST OF GRUNWICH 75
.7'
CHANDIGARH _/' ...... ~ i ...,.,
.• .,;J- "' ;).
\.
I) .~ I
. (41
o
.... I "'~
.) DELHI t t
(" ::>
" \' "i'\. ~
l 1,.1
~ r 1
IF NO SINGLE GROUI' OF WAJ. .... MATERIAL5 HAS MOllE TH'AN SO r. TH EN TH E FIRST TWO PRE DOMINANT r.ROUPS ARE SHOWN BY TH ICKER AND THINNER CO~OUREO LINES OF .THE TWO GROUPS OF WALL MATERIALS· ·trESPECTIVEl Y. DATA BY DISTRIC'1'S
77
< 31
' 0
2B


· 3 1
2
e
c o 75 76
HARYANA DISTRIBUTION OF CENSUS HOUSES BY
PREDOMINANT WALL AND ROOF MATERIALS
IN ORBAN AREAS, 1971
m [Ill
D D
KILOMETRES 1150" 103040 50
10 5 ' 0
IIOU N DRAY. STAn
IIOUNDIIAY. DISTRICT
p
WALL MATERIALS
75 . .I~& AIIOVE
SO.I % - n .o%,
10 10 )0 MILES
u
h
~. ~~:
L
\ ,.
ROOF MATERIALS-
flfl' -S- ',
v """'_· . G:lASS. LEAVES, REEDS 011 BAMBOO, .4 V
MUD, UNBURNT IIRICKS & WOOD SO. lt-75.0%
MIX TURE OF BRICKS, LlHE. CONCRETE, STONE, METAL SHEETS ETC.
EA ST O F GREENWICH 75 76
./,J
, .,." ..
~
1 ~ ~ (I)
-w
\ 0 v «
lJ , . .-. 1 : I[~~ ~4
~ "
~.
t-
.-( ';'" ~;..
i ~. \.. ) DELHI j
.:;;a , \
( / _, ... ~,--... - ~. -.~.
::>
,
DATA BY DISTRICTS
77
< 31
tf 0
30
t
~ ,~
[\ 0
29

62. Purely kachrha houses are relatively few in towns, constituting 8.6 per cent of the total urban residential houses in the State. The districts returning higher corresponding figures are Gurgaon (13.6 per cent) and Hisar (10.8 per cent) only. In Gurgaon, the relatively high urban proportion of k :(rJl~ he houses is brought about by the existence of slum areas, especially in the industrial town of Faridabad. In Rohtak (5.8 per cent) and lind (3. I per cent), the proportion of such houses in towns is very low but in Mahendragarh (8.0 per cent), Karnal (7.1 per cent) and Ambala (7.0 per cent). it is moderate.
63. Semi-Pucca Houses.-o-There nre two types of res idential houses in this division viz., (i) houses with plteca walls but kac/lcha roofs, (ii) houses with kaehcha walls but pucca roofs. The former type of houses is the predominant form of semi-plteca houses in Haryana State.
64. Houses with Pucca walls and Kachcha roofs.Like purely belt ~ ha houses, this type accounts for another one-third (34.3 per cent) of the total residential houses in the State. Among districts, Jind outstrips with 62.8 per cent and is followed by Rohtak (50.7 per cent). Karnal (49.2 per cent) and Hisar (31.9 per cent). The districts of Ambala (1S.8 per cent), Gurgaon (13.6 per cent) and Mahendragarh (9.6 per cent) are areas of relatively low proportion of such houses.
65. In rural areas, the proportion of this type of houses is more or less similar to total areas. The rural proportion of the State is 34.0 per cent. The districts returning higher proportion are again Jind (66.6 per cent), Rohtak (49.9 per cent) and Karnal (48.5 per cent). Other districts in descending order of proportion are Hisar (29.3 per cent), Ambala (15.5 per cent), Gurgaon (13.7 per cent) and Mahendragarh (l0.4 per cent). In the former three districts, as seen in the preceding paragraphs, houses are overwhelmingly made of kachcha walls and k2che ha roofs but in Mahendragarh district, they are largely built of pllcca walls and plicea roofs.
66. In urban areas also, this type of houses accounts for considerable proportion of 35.5 per cent in the State. In the towns of Rohtak (54.3 per cent) and Kamal (51.8 per cent) districts, they form the predominant type of residential houses and in Hisar (44.4 per cent) and lind (41.5 per cent) districts, their proportion is substantial. In Ambala (24.7 per cent), Gurgaon (13.0 per cent) and Mahendragarh (3.9 per cent). this proportion is relatively low.
67. Houses with Kachcha walls and Fucca roo!\\This type of houses is very uncommon in the State. accounting for only 1.1 per cent of the total residential houses. The rural proportion of the State conforms to the total proportion but urban areas furnish a slightly higher proportion of 1.3 per cent. As kcc1lcha walls cannot withstand the heavy weight of pucca roofs, the roofs in this type of houses are mostly made of Khaprail or light metal sheets like tin.
6S. In rural areas, this house-type is relatively more common in Mahendragarh (2.3 per cent) and Hisar (2.1 per cent) districts. In other districts the proportion
6.3
varies between (1.2 per cent) and (0.5 per cent) only which shows unpopularity of such type of houses.
69. In urban areas, the districts where this type of houses are relatively more are Gurgaon (2.4 per cent) and Ambala (2.0 per cent). In othel districts, their percentage varies between 1.2 and 0.2 only.
10. Purely Pucca House ''.-Residential houses with )'lIC!;a walls and pueca roofs account for 29.0 per cent of the total residential houses in the State. The corres~ ponding proportion for rural and urban areas is 22.7 per cent and 54.6 per cent, respectively. It is obvious that the prop0rtion of pucea houses is much more pronounced in towns than in villages in all the districts of the State. In total areas, Mahendragarh district with 61.1 per cent such houses leads all other districts and is followed with a lag by Gurgaon (48.4 per cent) and Ambala (35.2 per cent). It may be noticed that all these three districts have sub-montane character with abundant supply of structural stone and lime, and the latter two districts are centres of industry and trade In the remaining four districts, the proportion of pucc~ houses is much below the State figure : vi:. Rohtak and Jind (21.1 per cent each), Hisar (I8.7 per cent), and Karnal (1S.0 per cent). .
71. In rural areas, pltcca houses are most commonly seen in the sub-montane districts of Mahendragarh (57.6 per cent) and Gurgaon (42.4 per cent), only. In other districts, their proportion varies between 17.6 per cent and 12.8 per cent only; the lowest proportion being returned by Karnal district.
72. In urban areas, pl/cca houses form predominant proportion in Mahendragarh (86.8 per cent), 9urgaon (70.9 per cent), Ambala (62.2 per cent) and JInd (54.5 per cent) districts. In the remaining three districts, their proportion is lower than the State average of 54.6 per cent. The percentage is 44.3 in Hisar, 40.1 in Karnal and 39.7 in Rohtak.
73. The remaining five types of residential houses riz, (i) kachclw walls and other roofs, (ii) pueca walls and other roofs, (iii) other walls and kaelzcha roofs, (iv) other \'valls and pucca roofs and (v) other walls and other roofs are insignificant, returning negligible proportion and need no discussion.
House-types-Intcr-State comparison 74. The comparison of patterns of house construc
tion between HarY:llla and various States and Union Territories of India presents some interesting features. St,'.tement lln.5 shows distribution of residential Censlls l-l.(Juses in the StaH; and Union Territories by material uf wall cross-classified by material of roof. Out of the nille types of residential houses, only four, namely (i) !l\)uses with kaehcha walls and kachch." ro~f~. Oi) house~; with k (Ie !zelia walls and pucca roois, (~ll) houses with pueea walls and kachcha roofs, and (IV) houses with PUCC(l walls and pllcea roofs arc more i 1l1portant accountir.g together for 99 per cent of the total residential houses of the country as a Whole. The remaining five types viZ, (i) houses withkachcha walls and other roofs, (ii) houses with pucca walls

and other roofs, (iii) houses with other walls and kachclw roofs, (Iv) -houses with other ,valls an,l pucca roofs and (v) houses with other wans and other roofs bear insignificant proportions in the- country as a whole as ~yeU as in individual States and Union Territories and hence need no comparison.
75. Houses -with Kachcha walls and Kac/lcllC( roofs.Houses with walls made of grass, leaves, reeds, bamboo, mud, unburnt bricks or wood and roofs of grass leaves, leeds, b"mbOl..', tbatch, mud, unburnt brick~ or wood are included in this type. In Haryana a5 a whole, 35.4 per cent of the total residen.tial houses are entirely kachcha structures us against the corresponding figure of37.4'pe~ c..:nt for .India as a whole. which shows that the illcldence of th15 type of houses in Haryana is slightly lesser than the country's average. Among the 21 States, Haryana .ranks. fifteenth in this respect showing that two-thIrds ot the total States have higher proportion of kachcha houses as compared to Haryana and viewing from this angle, the State compares favourably in the housing conditions. The States having more than 50 per cent houses built of entirely kachcha materials are Tripura (91.3%), Manipur C::6.9%), Assam (80_2~~), Nagaland (78.5%), Orissa (70.6%),. Meghalaya ~66.4%), Andhra Pradesh (51.5%), Taml] Nadu (51.4/~), and Keraia (50.9%). Forming eastern and south-eastern portion of the country, tbese States are areas of heavy rainfall caused by the monsoon current arriving from the Bay of Bengal and are subject to other vagaries of nature and hence the investment in building pucca houses is perhaps considered a luxury there. The other States returning higher proportion of this type of houses are West Bengal (41.5%), Jammu and Kashmir (44.6%), Uttar Pradesh (42.9%), and Punjab (39.4%). The only six States with lesser proportion of kachclw houses than Haryana arc Mysore (25.3%), Rajastban (24.9%), Maharashtra (14.7%), Himachal Pradesh (I4.4/~), ~l&<lhyu Pradesh (3.3~~), and Gujarat (5.4%). Among the eight Union Territories, Arunachal Pradesh (84.6~~), Pondicherry (62,7~~), Andaman and Nicobar Islands (56.0%), and Dadra and Nagar Haveli (51·2%), furni.sh higher proportion of k{lchcha houses but Goa, Daman and Diu (l2.f%), Delhi (6.5~~), Chandigarh (6.2~,~) and Laccadive, Minicoy and Amindivi Islands (4.4~~) ha,e markedly lower proportion as compel fed to the State of Haryana.
76. Tn rural areas, the incidence of purely karhclza houses is 42.1 per cent in Haryana, as against the Corresponding mean figure of 43.6 per cent for India, placing it on the fourteenth position among the States. The State of Bihar, which had a slightly higher proportion of purely ka:chcha houses than Haryana in the total areas. registers lower proportion in the rural areas. The position of Haryana I'is-a-vis other States is almost the same in rural areas as in total areas in this respect, with the difference that rural proportions are higher for kachcha houses as compared to total arells_ The States having more than 50 per cent of the rural residenti.al houses in this type are Tripura (93.5~)J Manipur (90.7%), Nagaland (84.4%), Assam (84.1%), Meghalaya (76.1%). Orissa
64
(74.3~~), West Bengal (61.6~~), Tamil Nadu (60.7':,;). And~ril PradeSh (55.9%), and Kcrala (53.6%), again formtng the eastern and south-eastern portion of the country. Other States fllrnishin~ higher conespondin~ proportion than Haryan';- are Jammu and KashmIr (49.7%), Punjab (49.5%), and Uttar Pradesh (48.3~), forming the north and nOTth-eastern portion ~f IndIa. The seven Sta~es returnIng lesser proportJon of kachcha houses 10 fural areas are Bihar (41.6%), Mysore (29.4%), Rajasthan (28.7%), Mabarasbtra (19.:'%), Himl1chal PradeSh (l5.4~~), Madhya Pradesh (9.5%), al1d Gujarat (6.8%). Among the Union Territories, Arunachal Prade~h (86.7%), Pondicherry (71.6%), Andaman & Nicobar Islands (66.5%) and Dadra and Nagar Haveli (51.2%) have again higher rural proportion of kachcha houses than Haryana while Chandigarh (27.0%). Goa, I?aman and Diu (13.9%), Delhi (8,7%) and La~cadlve, ~inicoy and Amindivi . Islands (4.4%), re?lster relatively lower correspondlllg proportion of this house-type.
. 77 .. In urban areas, the proportion ofkac/Jcha houses IS consIderably low as compared to rural areas because pacca materials are llsed to a considerable extent ill building houses in ci~ies and towns, Only R. () ~,;, of tilt: total urban bouses In Haryanu ,H"t' entirdv kach'(:!w structures as against the c(,rresponding' figure of 12.7% for the urban areas of Inetia. again placiuO' the State on the fourteentll position- among'" tho;; States. There are only two States viZ. Manipnr and Tripura (59.1 % each) where the kaC'hcha ilOuses account for more than 50 per cent of the total urb:m hOllses in urban areas. Other States reporting higher proportion of hachcha houses in urban areas than Haryana are Assam (40.6%), Kerala (35.1%), Orissa (33.2%), Andhra Pradesh (30.6%), Tamil Nadu (26.7%), Nagaland (24.4%), Jammu and Kashmir (17.3%) Mysore (12.2%), Bihilr (10.1~~), Uttar Prad:sh (8.9%) and Punjab (8.8%). The seven States claiming lesser proportion of kaclicira urban houses are Meghalaya (8,5%), Rajasthan (7.6/~). West Bengal (6.3%), Maharashtra (4.5%), Himachal PradeSh (3.4%), Gujarat (2.0%) and Madhya Pradesh (I.8o,"~) Among the Union Territories, Dadra and Nagar Haveli and Laccadive, Minicov and Amindivi 1slands have no urban areas. The '1jnion Territories of Pondicherry (48.1 ~~), Arunachal Pradesh (41.0~~ I and Andaman & Nicobar Islands (20_7~,~) record higher urban propo~tion of kat hi' ha houses. as compared to Haryana, whde Goa, Daman & Dm (7.8%), Delhi (6.3%) and Chandigarh (3.8°~) have lesser rural proportion of this house-type. ' .
78. Houses with Kachcha walls alld Pucca roofsThe residential houses having walls made of grass, leaves, reeds or bamboo, mud, unburnt bricks Or wood and roofs of tiles, slate, shingJe, corrugated iron, zinc or other metal sheets, asbestos cement sheets, brick, lime, stone, R.B.C. or R.C.C. are very uncommon in Haryana. because the kachcha walls for the greater part made from tbe sandy soil, are not able to bear the weight of heavy pucca roofll_ Due to
extreme climate. metal sheets arc also 110t suited ror marinO" since they transmit to the room heat and cold of the ~vcather. 'Although structural slate is availablc to some quantity, its use as roofing material i3 limited in the State. Haryana ranb last among the States in the proportion 0[' this type of houses, accounting for only J.l ~~ of the total resi~cntial hou~es o~ this type as against the corresponding pro:portl,?tl ot 26.8~,~ for Tndia as a whole. The States navll1g higher proportion than the country's average are Madhya Pradesh (67.3/~), G'Jjarat (43.4/~). Bihar (41.9~~), Himachal Pradesh (31.1/~), Maharashtra (29.3~)~), and Uttar Pradesh (27.0/~). The only States somewhat resembling Haryana in this aspect are Jammu and Kashmir (2.8/~) and Punjab (1.7%). Amo?-g the. Union Territories, those having lower propor~lOn 01 this pattern of houses tha~l Haryana are. P.oI?dlcherry (0.7%) Laccadive, Minlcoy and AmllldlVl Islan~s (0.4%), and Chandigarh (0.1%). The Union. TerrI: tories returning considerably higher proportlon ot such houses than Harvana are Goa, Daman & Diu (56.8~,~). Dadra and' Nagar. Haveli (4.l0~)<;) and J\ndaman & Nicohar Isbnds ()9.R~):)).
79. In rural are~!s too, houses oj' this type constitute 1.1 ~:, of the total houses ,IS in total areas, as ag.ainst the corresponding figure of 19.() ~{, for rural IndIa. The State ranks last among the States ll1 the rural proportion of houses or this category. Tht: States having higher rural proportion than .the eorres·· ponding all-India rural figure are agam Madhya Pradesh (73.8 %) and Gujarat (54.9 %) :vhere th~se constitute predominant house type and Bihar (44.3 ~), Maharashtra (33.3 %), Himachal Pradesh. (32.8 ~~), Rajasthan (30.5%) and Uttar Pradesh (29.6.~,o). Among the Union Territories, Goa, I' aman & DIU (60.5 ~~), Dadra & Nagar Haveli (43.0'lc;) and AnJa~an &. Nicobar Islands return considerable proportlOl) oj
this house-type in rural areas, whereas in the rcm~ining Union Territories, the correspondmg proportlOlI is low ri=. Arunachal Pradesh (5.0(:~), Delhi (0.8~~), Pondicherry (0.7 %), Laccadive, Minicoy & Amindiv; 1slands (0.4 ~J and Chandigarh (OJ 10)'
80. In urban areas, Haryana has again a very JO\\
place in the proportion of houses of this type, with on~y 1.3 per cent of the total urban houses belongll1g to tl1tS type as against the corresponding figure of J 5.6 ~.~ for India. The only State returning lower corres· ponding proportion than Haryana is Punjab (0'7 %). There are ten States which have higher urban proportion than the country's average in this category and ten below this mean. The leading States are Meghalaya (77.6 %), Madhya Pradesh (32' 7 /~), Ma?ipur (30.5%), Nagaland (29.7%), Assam (28.0~/~), Tnpura (23.3 %), Bihar (22.9 %), Mysore (21.9 %), Maharas~tra (20.4%) and West Bengal (19.0%). Ar_nong the unlO!1 Territories, the urban proportion of thIS house-type IS
significant in Andaman & Nicobar Islands. (75.4 /9) and Goa, Daman & Diu (~2.9%). Th~ Ul1lon Terntories of Chandigarh (1.0 (0) and Pondlcherry (0.7 %) return lower correspondlOg proportion than Haryana.
65
81. HOllses Wilh Pucca walls and Kacllclza roofs.Residential hOLlses with wall materials of burnt hricks, OJ. sheets or other metal sheets, stone 01' cement and roofing materials of grass, leaves, reecis, thatch, bamboo, mud, ullburnt bricks or wood form this house type. Among States, Haryana figures prominent in this house-type accounting for 34.3 ~~ of the total houses in this category as against the corresponding figure of 7.8 ~~ for India. The only State listing higher proportion than Haryana in this respect is Jammu and Kashmir, where this proportion is 39.7 %. Other States recording higher proportion than the country's average are Mysore (25.4 %), Punjab (21.1 %), Andhra Pradesh (15.7 %), Himachal Pradesh (14.4 %), Maharashtra (13.4 %) and Kerala (ILl %). This proportion is less than one per cent in Assam (0.9 %), Meghalaya (0.6 %), Madhya Pradesh (0.6 %), West Bengal (0.5 %), Bihar (0.5 %), Manipur (0.2 %), Nagaland (0.2 %) and Tripura (0.2 %). Among Union Territories, Pondicherry has higher corresponding proportion than Haryana, accounting for 56.5 /~ of the total houses in this category. The Union Terri· tories of Chandigarh (13.3/~) and Delhi (10.5%) have higher proportion than the country's mean figure but these proportions are lower than the corresponding proportion in Haryana State.
S2. In rural areas too, Haryan<l occupies the second place, accounting for 34.0 ~.~ or the total rural houses as against the corresponding figure of 7.9:10 for India; Jammu and Kashmir State being at the top with 42.3 ~~ of the rural houses falling in this category. The States having lower rural proportion than Haryana but higher than the country's mean figure are again Mysore (28.8 %), Punjab (20.2 ~Io), Andhra Pradesh (16.9 %), Maharashtra (16.3 %), Himachal Pradesh (14.7 %) and Kerala (11.6 %). The States having less than 1.0 per cent rural houses in this category are Assam (0.9 %), Meghalaya (0.6 %), Bihar (0.5 %) ,Gujarat (0.5 ~<J Madhya Pradesh (0.5 ~~), West Bengal (0.4 %), Manipur (0.2 ~~), Nagaland (0.2 ~,;» and Tripura (0.1 /~). Among the Union Territories, Laccadive, Minicoy & Amindivi Islands (56.5~~), Chandigarh (47.4 %) and Delhi (35.1 %) return higher rural proportion of this house· type than Haryana State. The union Territory of Dadra & Nagar Haveli is conspicuous for the absence of this house-type while in Goa, Daman & Diu, this proportion is as low as 0.3 /~.
83. In urban areas, Haryana ranks foremost among the States in the proportion of this house-type, accounting for 35.5 % of the urban houses in this category ; the corresponding figure for India being 7.6 % only. The States returning higher proportion of this type in urban areas than the country's average but lower than the proportion in Haryana are Jammu and Kashmir (25.8 %), Punjab (23.7 %), Uttar Pradesh (15.7%), Mysore (14.6%), Himachal Pradesh (11.1%), Andhra Pradesh (10.3 %) and Kerala (8.3 %). The States returning low urban proportion are Assam (0.9 %), Bihar (0.7%), Meghalaya (0.7%), Tripura (0.7 %), West Bengal (0.6 %), Nagaland (0.5 %) and Manipur (0.2 %). Among the Union Territories, this
proportion is 9.4% in Chandigarh, 8.1 ~Il in Dadra & Nagar Haveli and 6.4 % in Pondicherry but it is as low as 0.8 % in Laccadive, Minicoy and Amindivi Islands, 0.5 % in Goa, Daman & Diu and 0.1 % in Arunachal Pradesh.
R4. Houses with Plicea warls and PUCCtl I'oojs.-Houses of this type are built of entirely pucca materials with burnt bricks, G.!. sheets or other metal sheets, stone or cement as the wall material and tiles, slate, shingle, corrugated iron, zinc or other metal sheets, asbestos cement sheets, brick, lime, stone, RB.C. or R.C.C. as roofing material. The extent of pucca houses indicates the relative prosperity or otherwise of a State. In Haryana State as a whole, 29.0% of the total houses are of the above description as against the all-India figure of 27.9 % showing that the State has better housing standards than the average standard prevailing in the country. Haryana stands seventh among the Indian States in this context and comparing from this angle, the State enjoys preeminent place. The six States having higher proportion of this house-type than Haryana are Gujarat (49.5 %), Rajasthan (44.1 %), Maharashtra (42.2 %), Himachal Pradesh (40.1 %), Punjab (37.7 %) and Tamil Nadu (32.4 %). The States where this proportion is less than 10.0 % are Orissa (9.2 %), Assam (8.9 %), Nagaland (7.1 %), Meghalaya (7.1 ~~), Tripura (2.4%) and Manipur 0.9 %). Among Union Territories, Chandigarh (80.2 %), Delhi (79.8 %), Laccadive, Minicoy and Amindivi Islands (38.6%), Goa, Daman & Diu. (30.2%) and Pondicherry (30.0%) bave higber
66
corresponding proportion than Haryalla State. In Arunachal Pradesh (6.5 %), Dadra & Nagar Haveli (5.8 %) and Andaman & Nicobar Islands (2.9 %), this proportion is considerably low.
85. In rural areas, Haryana ranks eighth among the Slates in this respect, accounting for 22.7 % of the total rural houses belonging to this type, as against the corresponding figure of 18.9 % for India. The States returning higher rural proportion than Haryana are Gujarat (37.6 %), Himachal Pradesh (37.1 %), Rajasthan (36.0%), Maharashtra (31.0 /6), Punjab (28.2 %) Kerala (25.1 %) and Tamil Nadu (23.0 %). Among Union Territories, Delhi (54.6 ~~), Laccadive, Minicoy & Amindivi Islands (38.6 %), Chandigarh (25.3%) and Goa, Daman & Diu ,2\3%) return higher rural proportion of this house-type than Haryana State.
86. In urban areas, Haryana occupies the central place with ten States having higher proportion of pucca houses and ten having lower proportion of this type of houses. The pucco houses account for 54.6 % of the total urban houses in Haryana, as against the corresponding figure of 63.8 % for India. The States claiming higher urban proportion of such houses than Haryalla are Rajasthan (80.2 ?Io), Gujarat (78.9 %), West Bengal (74.0 %), Himachal Pradesh (71.6 %), Maharashtra (67.1 %), Punjab (66.6%), Bihar (66.3 %), Uttar Pradesh C2.5%), Madhya Pradesh (64.l %) and Tamil Nadu (57.3 %) Among the Union Territories, only Chandigarh (86.5 %) and Delhi (82.3 %) have higher corresponding proportion than the Haryana State.
STATEMENT TIl. 5
Distribution of Residential Census Houses in the States an i U.lil)] Territories by Maierial of Wall Cross-classified hy Material of Roof
_----_._- -------------------_._-- ----------------_._---
S ta te/District! Cit y
India
Total! RUra11 Urban
2
Total
RUral
Urban
.... ~--.~~-----.. _ -=-.~-=--~~
Total ~o.of Census Houses
3
93,0(;5,288
74,465,1()~
18,540,186
Predominant Material of Wall
I Grass, leaves reeds or bamboo, mud, ul.burnt bricks, wood
II Burnt bricks, G. I. sheets 01' other metal sheets, store, cement
III All other materials ami materials not stated
4
1 II III
J II III
I II III
Predominant Material of Roof
Grass, leaves, Tiles, slate, All other reeds or bamboo, shingle, materials thatch, mud, c rrugated and unburnt bricks iron. zinc or materials 01 wood other metal not stated
sheets. asbestos eemeIt sheets, brick, lime, stene and R.B.C.!R.C.C.
5 6 7
34,776,292 24,911,823 35,649 7,277.625 25,912,542 33,22(1
11,899 ~0,256 25,982
32,42V83 22,022,947 17,281 5,8'i4,831 14,075,1.51 15,581
10,366 10,676 15,786
2,353,909 1.,888,876 18.368 1,402,;94 11,8;;.7,291 17,6~9
1,533 9,580 10,196
---~--~- ---,------.----~----.-.--,-, .
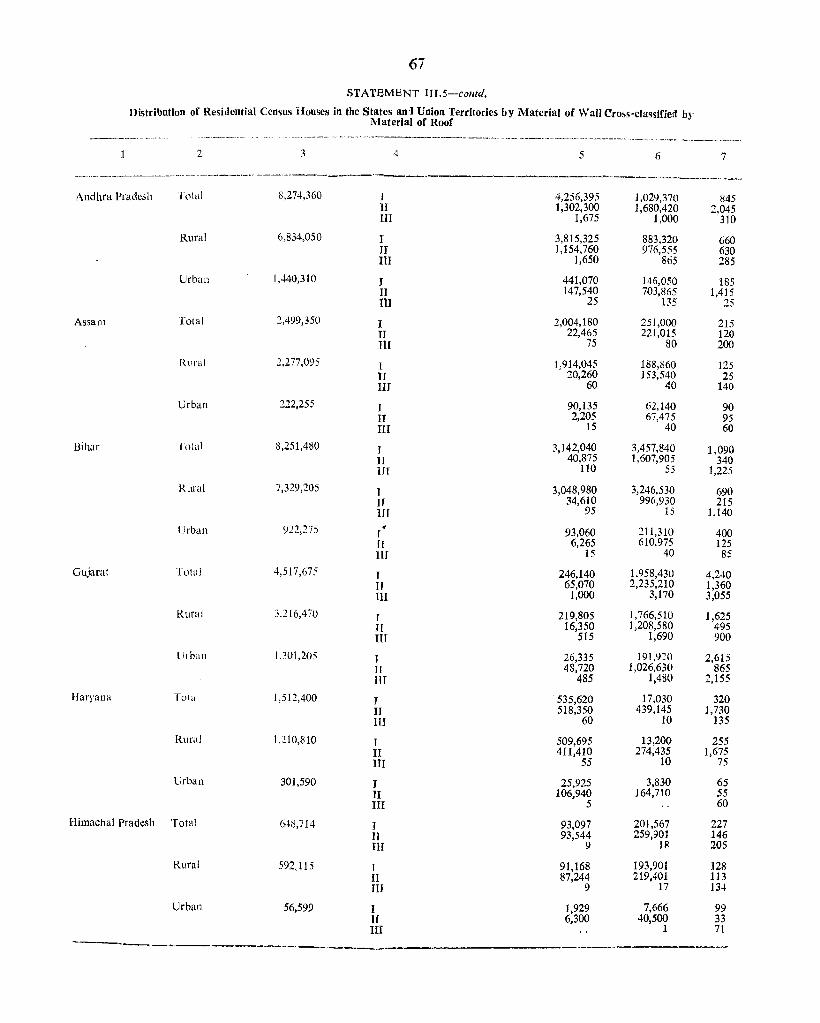
67
STATEMENT III.5-comd.
Distribution of Residential Census Houses in the States ani Union Territories by Material of Wall Cross-classified by Material of Roof
----_. __ .. .,.--.-.---, .. ~ -- ---~.-.~- " ... ,. ~~ ----~~-=-----.- -~-,--~.~-~-~-,----.-. ------~ _T~'.~_ .. ___ ~_. ~_"_~~~._ .• ___
2 3 4 5 6 7
--~-~,-~--~~--~~----.~-~-'--.--- .. ,~~--~.-~ ~- ~ .. ------~--------------------=--~-~~~~---~~-~--~ .. y .........
Andhra Pradesh Tl)tal l:i,274,360 J 4,256,395 1,029,370 845 II 1,302,300 1,680,420 2,045 HI 1,675 1,000 310
Rural 6.834,050 I 3,815,325 883,320 660 II 1,154,760 976,555 630 III 1,650 865 285
Urban 1,440,310 J 441,070 146,050 185 II 147,540 703,865 1,415 III 25 135 25
Assam Total 2,499,350 I 2,004,180 251,000 215 II 22,465 221,015 120 m 75 80 200
Rural 2,277,095 l 1,914,045 188,1)60 125 II 20,260 153,540 25 llJ 60 40 140
Urban 222,255 J 90,135 62,140 90 II 2,205 67,475 95 III 15 40 60
Bihar Total 8,251,480 J 3,142,040 3,457,840 1,090 ]I 40,875 1,607,905 340 Ilr 110 55 1,225
Rural 7,329,205 J 3,048,980 3,246,530 690 H 34,610 996,930 215 III 95 15 1.140
Urban 922,275 . 93,060 211,310 400 r
II 6,265 610,975 125 I1f 15 40 85
Gujarat Total 4,517,675 T 246,140 1.958,430 4,240 11 65,070 2,235,210 1,360 III 1,000 3,170 3,055
Rural 3.216,470 I 219,805 1,766,510 1,625 II 16,350 1,208,580 495 III 515 1,690 900
Urban 1,301,205 T 26,335 191,9~O 2,615 II 48,720 1,026,630 865 IU 485 1,480 2,155
Haryana Tota 1,512,400 T 535,620 17,030 320 II 518,350 439,145 1,730 III 60 10 135
Ruml 1,210,1)10 J 509,695 13,200 255 II 411,410 274,435 1,675 III 55 10 75
Urban 301,590 I 25,925 3,830 65 II 106,940 164,710 55 III 5 60
Himachal Pradesh Total 64~,714 I 93,097 201,567 227 II 93,544 259,901 146 III 9 IB 205
Rural 592,115 1 91,168 193,901 128 II 87,244 219,401 113 III 9 17 134
Urban 56,599 J 1,929 7,666 99 II 6,300 40,500 33 III 1 71
,~
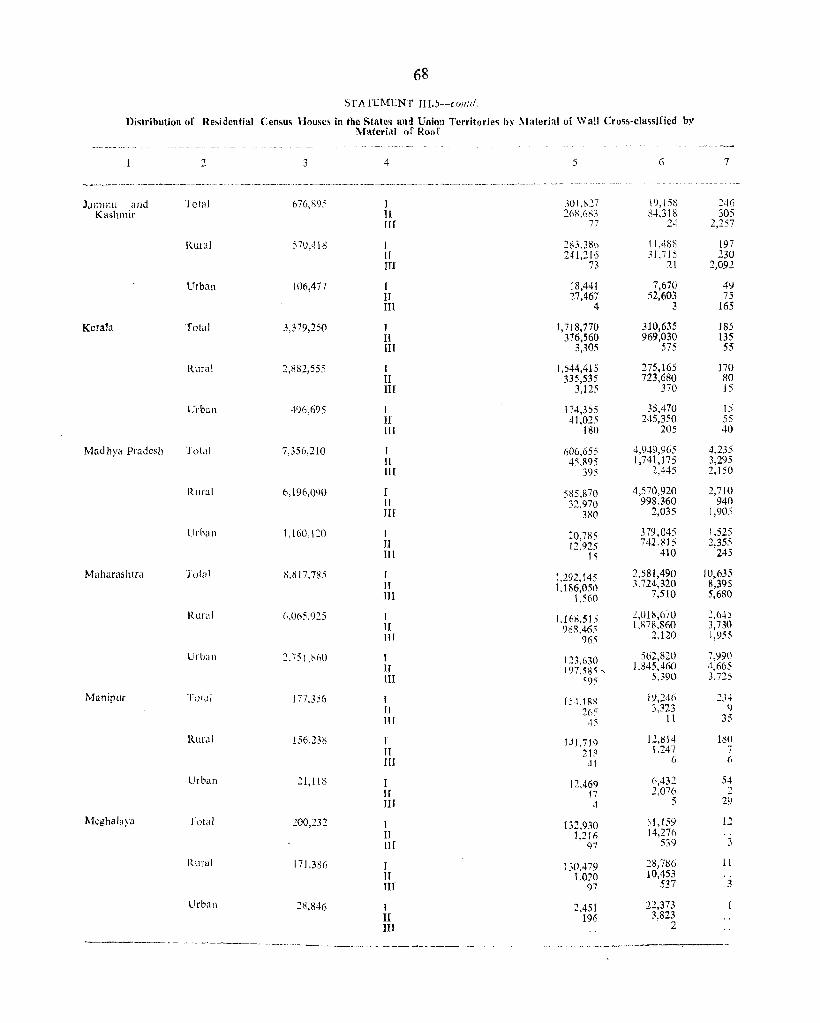
68
STA l'EMLNT nI.5-(Jilld
Distribution of Residential Census HJUSCS ill the State~ an d Union Territories b\' :\laterial of Wall Cross-classified :\Iaterial of Roof .
by
---- ------ -._
2 4 5 (, 7
-~.--.-'--'-.. ---~~~,...-_. -- .. _-_._---_._- "-- -------- -.~"--------.----- ~----"---- ---- ._- •.. _ - .-_.--._--
Jammu and lotal 676,S95 I 30J .~27 19,158 246 Kashmir 11 2(,g.6K3 1\.:\.318 305
1If 77 24 2,257
Rural 570,;118 J 2~3,3l'Sb 11,48:-) 197 If 241,216 31.715 230 III 73 21 2,092
Urban 106,477 I 18,441 7,670 4') II 27,467 52,603 75 III 4 3 165
Keraln Total 3,379,250 1 1.718,770 310,635 185 Il 376,560 969,030 135 III 3,30:;- 575 55
Rural 2,881,555 I 1,544,415 275,165 170 II 335,535 723,6RO 80 III 3,125 370 15
Urbilll -196,695 I 174,355 35,470 15 II 41.025 245,350 55 III 180 205 40
Madhya Pradesh Total 7,356,210 1 606,655 4,949,965 4,235 11 45,895 1,741,175 3,295 IU 395 2,445 2,150
Rural 6,196,090 I 585.870 4,570,920 2,710 11 32,970 998,360 940 III 31<0 2,035 1,905
Urban 1,160,120 I 20.785 379,045 1,525 J1 12.925 742.815 2,355 III 15 410 245
Maharashtra Total S,817,785 [ 1.292.!45 2.581,490 10,635 IT 1.186,050 3,724,320 8,395 1II 1,560 7,510 5,680
Rur,d h,06\925 1 1.168.515 2,U1I:;,670 2.6-+5 II 988,465 I,R78,g60 3,730 III %~ 2.120 1,955
U, b,lll 2, /51 ,S60 T 113,630 562,820 7,990 II 191.5~' , 1,845,460 4,665 1lI 59" 5,390 3,725
Manipur TolClI 177.356 I 1)4,ISg 19,241> 234 U :!65 3,323 9 IT[ 45 II 35
Rur.t1 156,238 1 1~1.7J9 12,tl14 180 11 :!IR 1.247 7 m 41 6 (J
Urban 21,118 1 12,469 6,432 54 If 41 2,07(1 : III 4 5 29
Meghalilya Totdl 200,232 I 132.930 51,159 12 II 1,~16 14,276 HI 97 519 3
Rural 171.386 r 130,479 28,71)6 11
11 1,020 10,453 ' . lIT 97 537 3
Urban 28,846 I 2,451 22,373 II 196 3,823 JII 2
,-----~- - ----~ ---- ---~,.- ----~.-~~- - ,--- -,--_-- "_- .-~

69
STATEMENT II 1,5-comd,
Distribution of Residential Census Houses in the State~ and UnlOll Territories by Material of Wall Cross-classified by Material of Roof
---_._- - - - ---------- _"_--__ .. -._ -_. __ . --------_-----_ .. _- ._--_._--
2 3 4 5 6 7
-_---_---------_ .. _--
Mysorc Total 4,799,105 I 1,212,270 1,187,000 710 IT 1,218,295 1,173,730 4,435 III 580 1,590 495
Rural 3,653,720 J 1,072,365 935,870 490 II 1,051,620 589,395 2,400 IJI 550 665 365
Urban 1,145,385 I 139,905 251,130 220 II 166,675 584,335 2,035 III 30 925 130
Nagaland Iotal 103,747 I 81,434 14,722 3 II 189 7,392 ,. m 1 1 5
Rural 93,459 I 78,921 11,664 3 II 138 2,727 .. III 1 1 -I
Urb~n 10,238 I 2,513 3,058 II 51 4,665 ., III 1
Orissa Total 3,g70,390 1 2,731,745 638,440 1,165 II 137,800 357,075 330 III 1,515 1,420 900
Rur~1 3,519,730 I 2,615,185 587,085 1,020 II 117,295 195,760 225 III ],475 965 720
lIrha n 350,660 I 116,560 51,355 145 n 20,505 161,315 105 III 40 455 180
Punjab To(al 2,205,765 I 869,665 37,795 335 II 464,565 831,445 425 III 120 15 1,400
R1If~1 1,658,620 1 R21,820 34,080 270 II 334,995 466,910 255 III 95 10 185
Urban 547,145 J 47,845 3,715 65 II 129,570 364,535 170 III 25 5 1,215
Rajasthan Total 4,427,835 I 1,100,300 1,166,700 950 II 205,400 1,950,495 2,385 III 120 135 1,350
l{ural 3,617,820 I 1,038,655 1,103,365 ll25 II 170,720 1,301,135 1,735 III 105 10 1,270
Urban 810,015 J 61,645 63,335 125 II 34,680 649,360 650 III 15 125 80
Tamil Nadu Total 8,025,780 I 4,120,695 1,114,360 685 II 186,015 2,602,735 200 III 30 775 285
Rur<ll 5,824,570 I 3,532,985 838,735 495 II 109,020 1,342,255 135 III 15 735 195
Urban 2,201,210 J 587,710 275,625 190 II 76,995 1,260,480 65 III 15 40 90
~---~---,--------~-- -_-_..,.._-.--- ---.--
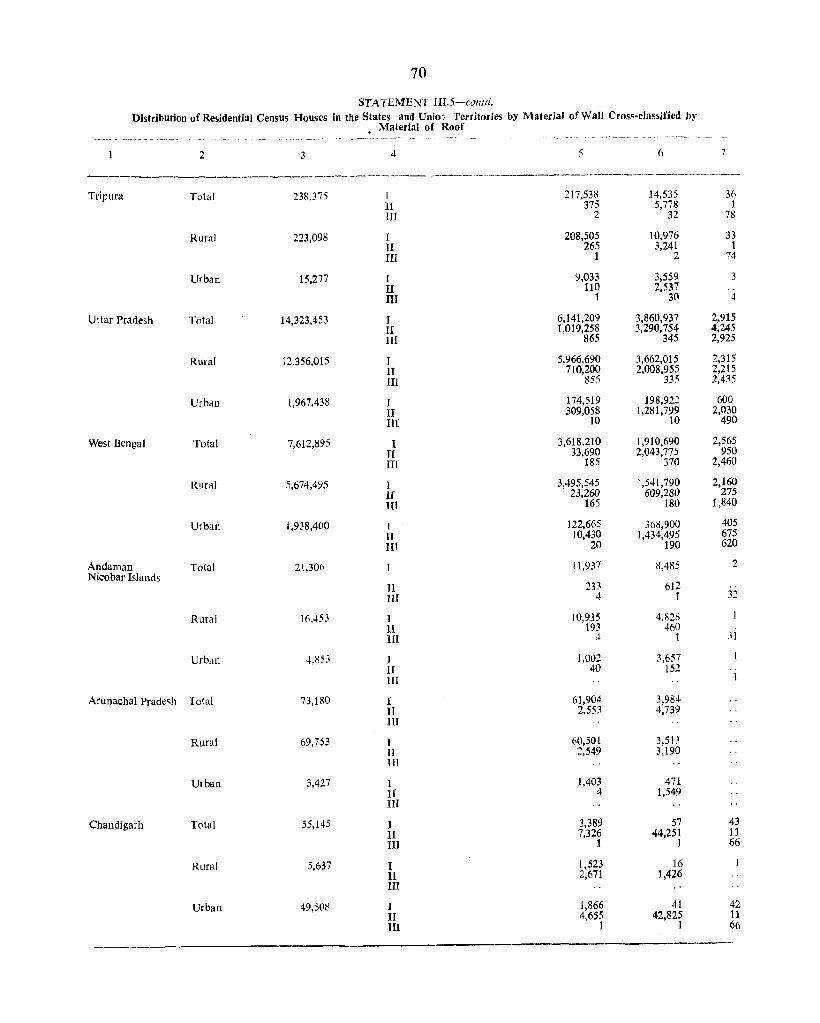
70
STATEMENT IIL5-colltd. Distribution of Residential Census Houses in the States and Unio'F Territories by Material of Wall Cross-classified by
Material of Roof ---- .- ~ --- ._ - __ -_- -- - - -- _-
2 3 4 5 6 7
'_.---~ ___ • ___ .• _' __ ~ ___ ·.U'_~_' _____ ' , __ ~ ____ ~_. __ .~ •• ~ ____ ,~~~. ___
Tripura Total 238,375 r 217,538 14,535 36 l[ 375 5,778 1 III 2 32 78
Rural 223,098 I 208,505 10.976 33 II 265 3,241 1 III 1 " 74 ..
Urban 15,277 I ':),033 3,559 3 II 110 2,537 m 1 30 4
Uttar Pradesh Total 14,323,453 J 6,141,209 3,860,937 2,915 II 1,019,258 3,290,754 4,245 III 865 345 2,925
Rural 12,356,015 T 5,966,690 3,662,015 2,315 II 710,200 2,008,955 2,215 III 855 335 2,435
Urban 1,967,438 I 174,519 198,922 600 II 309,058 1,281,799 2,030 III 10 to 490
West Bengal Total 7,612,895 1 3,618.210 1,910,690 2,565 Jl 33,690 2,043,775 950 HI 185 370 2,460
Rural 5,674,495 I 3,495,545 J ,541,790 2,160 II 23,260 609,280 275 III 165 180 1,840
Urban 1,938,400 I 122,665 36::1,900 405 lJ 10,430 1,434,495 675 III 20 190 620
Andaman Total 21,306 11,937 8,485 2 Nicobar Islands
II 233 612 0'
HI 4 1 32
Rural 16,453 J 10,935 4,828 1l 193 46() III 4 1 31
Urban 4,853 J 1,002 :',657 II 40 152 0'
m 1
Arunachal Prade~h Total 73,180 1 61,904 3,984 II 2,553 4,739 HI
Rural 69,753 1 60,501 3,513 11 2,549 3,190 III
Urban 3,427 I 1,403 471 II 4 1,549 III
Chandigarh Total 55,145 I 3,389 57 43 II 7,326 44,251 11 III 1 I 66
Rural 5,637 I 1,523 16 Ii 2,671 1,426 m
Urban 49,508 I 1,866 41 42 II 4,655 42,825 11 III 1 1 66
------
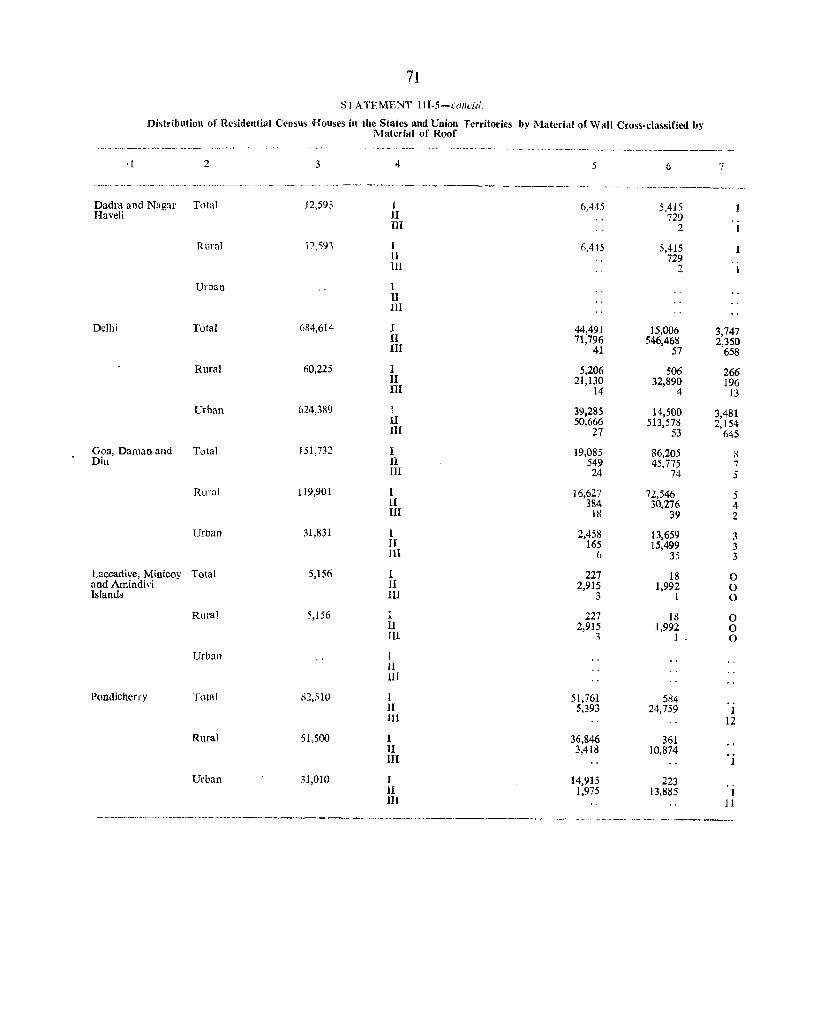
71
STATEMENT lI1-5-uJ/lc/d.
Distribution of Residential Census HOUSES in the States and Union Territories by Material of Wall Cross-classified by Material of Roof
. -.. -~-- _. -.. ..-~ --~.--.--~--~ .. ,_, _"_ --_- _ .. _ .. --.--.-... ~ .. ~ -.. --~--.--,---.--.. ~------ ._-
'I 2 3 4 5 6 7
_-_-,_.---. -.--.--.. -.-~.~-. ...._....,---~~~--~--~~.----.~--~.~~.-----~-.
Dadra and Nagar T0tal 12,593 1 6,445 5,415 Haveli II 729
III 2
RuraJ 12.593 I (',445 5,415 11 729 III 2 I
Urban 1 II III
Delhi Total 684,614 I 44,491 15,006 3,747 II 71,796 546,468 2,350 III 41 57 658
Rural 60,225 I 5,206 506 266 II 21,130 32,890 196 III 14 4 13
Urban 624,389 I 39,285 14,500 3,481 II 50,666 513,578 2,154 III 27 53 645
G?a, Daman and Total 151,732 I 19,085 86,205 S DIU II 549 45,775 7
III 24 74 5
Rural 119,901 1 16,627 72,546 5 11 384 ~O,276 4 I1I 18 39 2
Urban 31,831 1 2,458 13,659 3 II 165 15,499 3 IU 6 35 3
Laccadive, Minicoy Total 5,156 1 227 18 0 and Amindid II 2,915 1,992 0 Islands III 3 1 0
Rl1I'al 5,156 1 227 18 0 11 2,915 1,992 0 m :\ 1 0
Urban [
11 ur
Pondichcrry Total 82,510 1 51,761 584 j[ 5,393 24,759 1 1IL 12
Rural 51,500 I 36,846 361 II 3,418 10,874
'i 1I1
Urban 31,010 I 14,915 223 11 1,975 13,885 I HI 11
~ _____ .. _~r'_"--~~_~ _____ ~_~ _____ ~ ________________ , ___ ~ ______ ,. __ -~---~~---".-


13
TABLE H·I1 DISTRIBUTION OF CENSUS HOUSES
BY PREDOMINA~T MATERIAL OF WALl .. AND PREDOMINANT MATERIAL OF ROOF
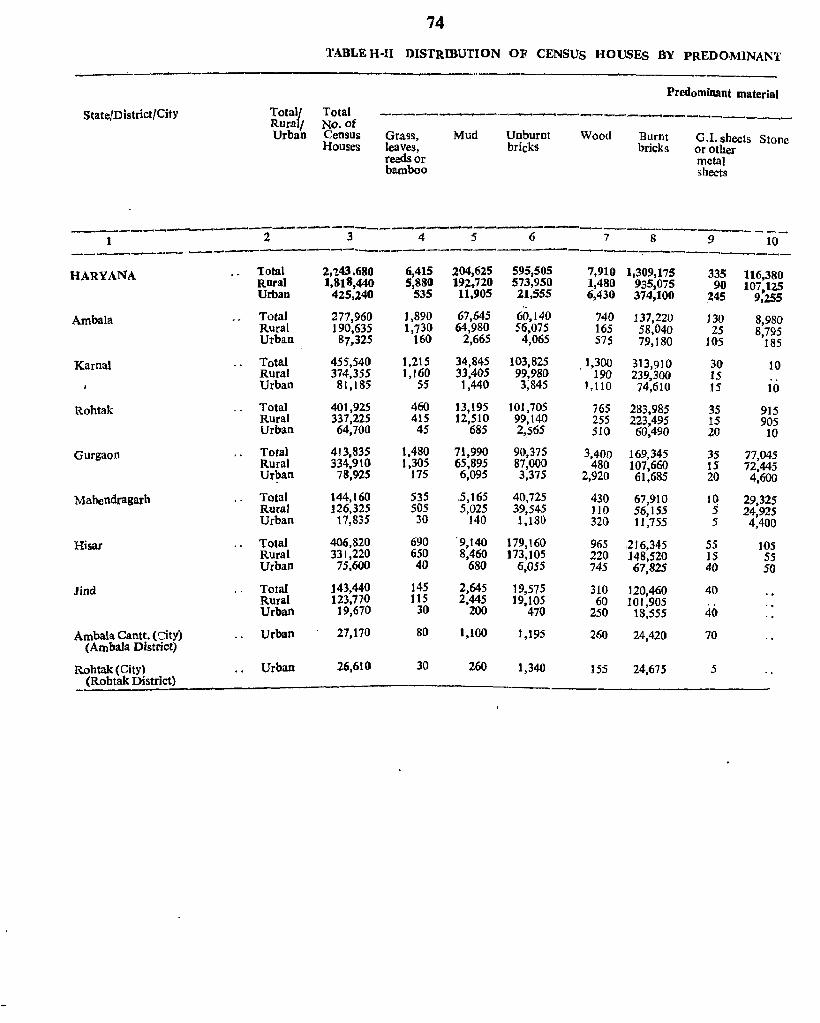
State/District{City
-----1
Total! Rural/ Urban
74
TABLE H·II DISTRmUTION OF CENSUS HOUSES BY PREDOMINANT
Total No. of Census Houses
Predominant material
--__.", _ _., _ _.._,,__._...,_..,,_,._-.--__..----------...,.-,--...----Grass, leaves, reeds or bamboo
Mud Unburnt bricks
Wood Burnt bricks
G.!. shei:ts Stone or other metal sheets
-----z------3-----4----5----6---~--7--~8-- ---_ 9 10 -------_......-_----------------------------_,,_.._,-------------._--
HARYAN'A Total 2,t43.680 6,415 204,625 595,505 7,910 1,309,175 335 116,380 Rural 1,818,440 5,880 192.720 573,950 1,480 935,075 90 107.125 Urban 425,240 535 11,905 21,555 6,430 374,100 ~45 9,255
Ambala Total 277,960 1,890 67,645 60,140 740 137,220 130 8,980 Rural 190,635 1,730 64,980 56,075 165 58,040 25 8,795 Urban 87,325 160 2,665 4,065 575 79,180 105 185
Karnal Total 455,540 1,215 34,845 103,825 .1,300 313,910 30 10 Rural 374,355 1,160 33,405 99,980 190 239,300 15 Urban 81,185 55 1,440 3;845 , ,110 74,610 15 10
Rohtak Total 401,925 460 13,195 101,705 765 283,985 35 915 Rural 337,225 415 12,510 99,140 255 223,495 15 905 Urban 64,700 45 685 2,565 510 60,490 20 10
Gurgaon Total 413,835 1.480 71,990 90,375 3,400 169,345 35 77,045 Rural 334,910 1,305 65,895 87,000 480 107,660 IS 72,445 Urban 78,925 175 6,095 3,375 2,920 61,685 20 4,600
Mabendragarh Total 144,160 535 .5,165 40,725 430 67,910 IQ 29,325 Rural 126,325 505 5,025 39,545 ]10 56,155 5 24,925 Urban 17,835 30 140 1,180 320 11,755 5 4,400
Hisar Total 406,820 690 '9,140 179,160 965 .216,345 55 105 Rural 331,220 650 8,460 173,105 220 148,520 15 SS Urban 75,6(1() 40 680 6,055 745 67,825 40 50
Jind Total 143,440 145 2,645 19,575 310 120,460 40 Rural 123,770 115 2,445 19,105 60 101,905 Urban 19,670 30 200 470 250 18,555 40
Ambala Cantt. (Sity) Urban 27,170 80 1,100 1,195 260 24,420 70 (All1bala District)
Rohtak (City) Urban 26,610 30 (Robtak District)
260 1,340 ]55 24,675 5

75
MATERIAL OF WALL AND PREDOMINANT MATERIAL OF ROOF
of Wall Predominant material of roof
----------.. - ---... '------_--, -------------..,.--Cement All other Grass, leaves, Tiles, Corruga .. Asbestos Brick and Stone Concrete, All other concrete materials reeds. slate, te? iron, cement lime R.B.C./ materials
and thatch, shingle zmcor sheets R.C.C. and materials wood, other materials not stated mud, metal not stated
unburnt sheets bricks or bamboo
~.-----11 12 13 14 15 16 11 18 19 20
~--- _ _.,---------,.-----""I___..,_------2,970 365 1,573,765 119,395 14,050 7,340 250,570 64,925 209,515 4,120 1,890 230 1,390,105 69,735 4,805 3,740 19;Z,345 50,805 102,655 3,650 1,080 135 183,060 49,660 9,245 3,600 58,225 14,120 106,860 470
1,140 75 118,915 38,580 3,955 1,730 15,740 780 35,155 2,505 800 25 151,890 20,205 1,325 255 4,995 175 8,815 2,315 340 50 27,025 18,375 2,630 1,415 10,745 5 26,940 130
300 105 366,635 41,575 1,360 185 27,105 130 18,J20 430 235 70 319,625 28,190 390 105 21,250 95 4,355 345 65 35 47,010 13,385 970 80 5,855 35 13,765 85
795 70 315,260 10,295 910 2,005 43,220 4,730 25,335 170 440 50 277,295 5,840 355 1,970 33,600 3,455 14,590 120 355 20 37,965 4,455 555 35 9,620 1,275 10,745 50
140 25 222,805 10,660 5,695 2,790 58,775 44,940 67,115 455 90 20 202,125 1,460 2,030 1,125 50,640 35,360 41,745 325 50 5 20,580 9,200 3,665 1,665 8,135 9,580 25,970 130 40 20 59,220 6,150 595 60 40,365 10,885 26,720 165 40 15 57,170 5,895 235 35 34,690 9,035 19,125 140 5 2,050 255 360 25 5,675 1,850 1,595 25
300 60 318,880 9,800 1,190 465 41,590 3,290 31,280 325 150 45 278,670 7,180 445 165 30,080 1,960 J2,430 290 150 15 40,210 2,620 745 300 11,510 ] ,330 18,850 35
255 to 112,050 2,335 345 105 23,115 110 4,590 70 135 5 103,830 965 25 85 17,090 125 1,595 55 120 5 8,220 1,310 320 20 6,685 45 2,995 15
25 20 10,235 2,400 995 1,320 1,545 10,655 20
130 15 13,920 3,335 180 10 3,885 235 5,010 35
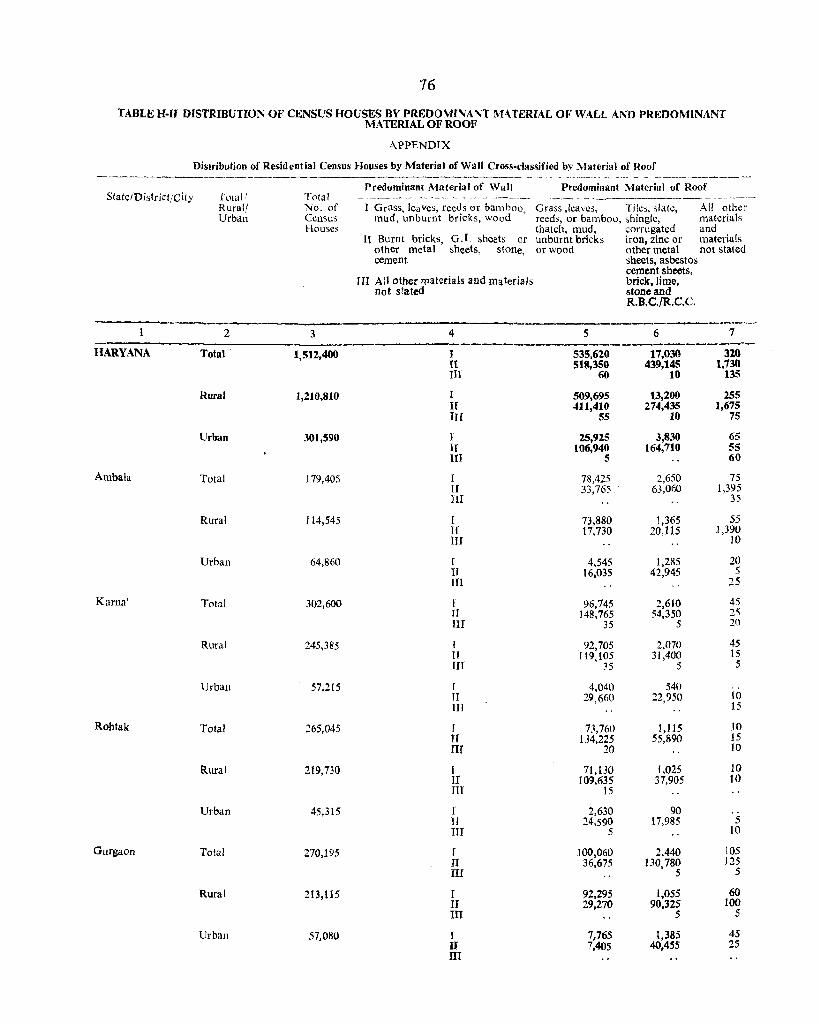
76
TABLE H·ll DISTRIBUTION OF CENSUS HOUSES BY PREDOMINANT MATERlAL OF WALL AND PREDOMINANT MATERIAL OF ROOF
APPENDIX
Distribution of Residential Census Houses by Material of Wall Cross·c1assified by Material of Roof ----.- ._- ,.~ .-.--------.--~--- -----~----~-
Predominant Material of Wall Predominant Material of Roof State/District/City Total' Total -----~- .. - --.~____.,--, --.. _- -.- --_-__ .. -- -- - ~ ----.~-----------~.---
Rural! No. of I Grass. leaves, reeds or bamboo Grass ,leaves, Tiles, slate, All other Urban Census mud, unburnt bricks, wood ' reeds, or bamboo, shingle, materials
Houses thatch, mud, I.:orrugated and l[ Burnt bricks, G.I. sheets or unburnt bricks iron, zinc or materials
other metal sheets, stone, or wood other metal not stated cement sheets, asbestos
cement sheets, III All other materials and materiaJs brick, lime,
not stated stone and R.B.C./R.C.c.
1 2 3 4 5 6 7
HARYANA Total ~ 1,512,400 I 535,620 17,030 320 II 518,350 439,145 1,730 III 60 10 135
Rural 1,210,810 I 509,695 13,200 255 If 411,410 274,435 1,675 nr 55 10 7S
Urban 301,590 I 25,925 3,830 65 If 106,940 164,710 55 III 5 60
Ambala. Total 179,405 I 78,425 2,650 75 II 33,765 63,060 1,395 1lI 35
Rural 114,545 r 73,880 1,365 55 II 17,730 20.115 1,390 IJJ 10
Urban 64,860 r 4,545 1,285 20 II 16,035 42,945 5 III 25
Kamal Tot31 302,600 I 96,745 2,610 45 H 148,765 54,350 25 III 35 5 20
Rural 245,385 I 92,705 2,070 45 II 119,105 31,400 15 £If 35 5 5
Urban 57,215 T 4,040 540 IT 29,660 22,950 JO III 15
Rohtak Total 265,045 r 73,760 1,115 10 If 134,225 55,890 15 IIf 20 10
Rural 219,730 r 71,130 1.025 10 II 109.635 31,905 10 m 15
Urban 45,315 r 2,630 90 If 24,590 11,985 5 III 5 10
Gurgaon Total 270,195 I 100,060 2,440 105 II 36,675 130,780 125 m 5 5
Rural 213,115 T 92,295 1,055 60 II 29,270 90,325 100 m 5 5
Urball 57,080 I 7,765 1,385 45 II 7,405 40,455 25 ill
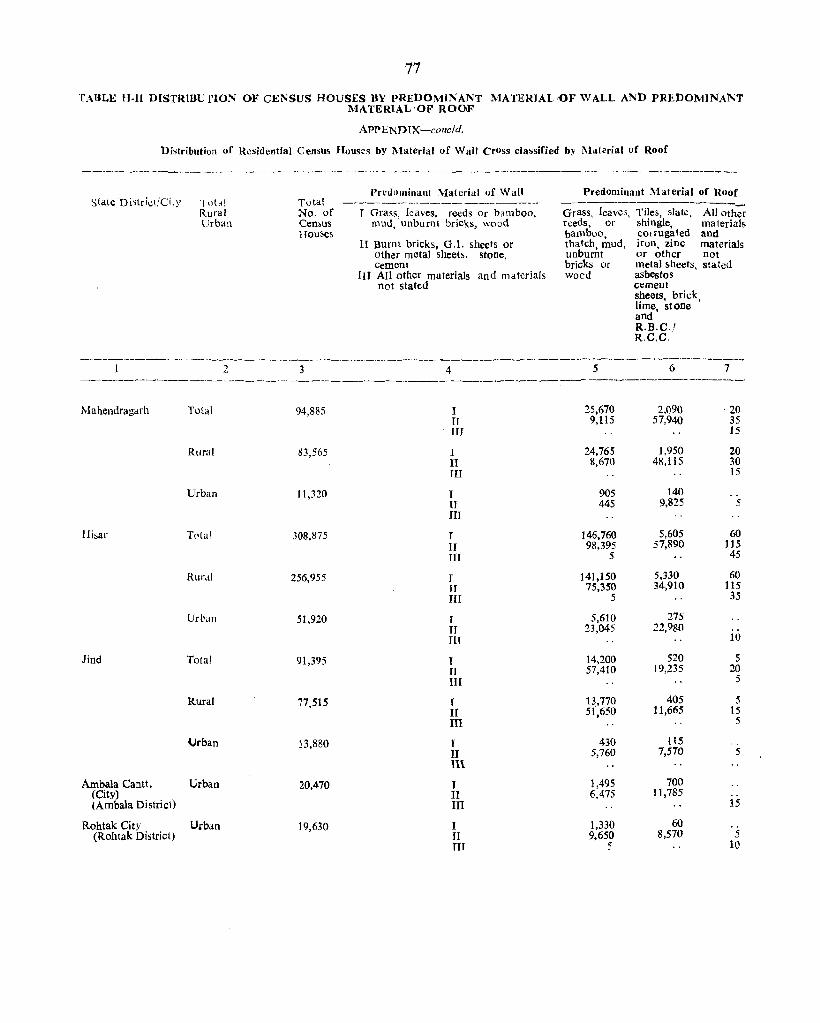
77
TABLE H·1l DISTRIBUTION OF CENSUS HOUSES BY PREDOMINANT MATERJAL 'OF WALL AND PR.hDOMINAl'I;T MATERIAL 'OF ROOF
APPENDTX-collc/d.
Distribution of Residential Census Houses by Material of Wall Cross-classified by Mat~rial of Roof
stale Dhlri.,;tjCily
Mahendragarh
Hisar
Jind
rotai Rural Urban
2
Total
Rural
Urban
Rural
Urban
Total
Rural
Urban
Ambala Cant!. Urban (City) (Ambala District)
Rohtak City Urban (Rohtak District)
Total No. of Cen,us Houses
3
94,885
83,565
11,320
308,875
256,955
51,920
91,395
77,515
13,880
20,470
19,630
['rcdominant :\latcrial of Wall
I Grass, leaves, reeds or bamboo, mud, unburnt bricks, wood
II Burnt bricks, G.1. sheets or other metal sheets, stone, cement
III AU other materials and materials not stated
4
I TI III
I II III
J U III
T U III
T IT III
I IT III
T If III
I II III
I II Il\
I II III
I II III
Predominant :\1aterial of Hoof
G~~~leave:;~Tiles~slatc All oth; reeds, or shingle, 'materials bamboo, corrugated and thatch, mud, iron, zinc materials unburnt or other not bricks or metal sheets, stated woed asbestos
5
25,670 9,115
24,765 8,670
905 445
146,760 98,395
5
141,150 75,350
5
5,610 23,045
14,200 57,410
13,770 51,650
430 5,760
1,495 6,475
1,330 9,650
5
cement sheets, brick lime, stone ' and R.B.C./ R,C.C,
6
2,090 57,940
1,950 48,115
140 9,825
5,605 57,890
5,330 34,910
275 22,980
520 19,235
405 11,665
115 7,570
700 11,785
60 8,570
7
20 35 15
20 30 15
5
60 115 45
60 115 35
10
5 20
5
5 15
5
5
15
5 10
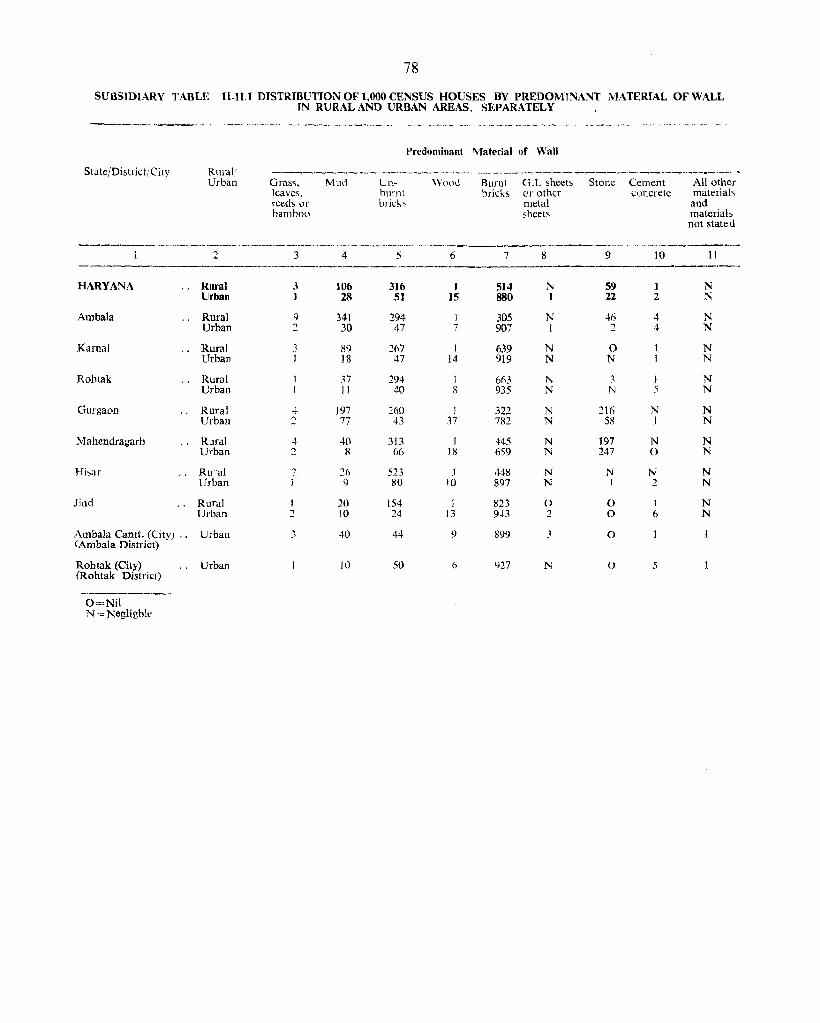
78
SUBSlDIARY TABLE H-Il.1 DISTRIBUTION OF 1,000 CENSUS HOUSES BY PREDOMINANT MATERIAL OF WALL IN RURAL AND URBAN AREAS, SEPARATELY
S(~tc/DistrictICilY
HARYANA
Ambala
Kamal
Rohtak
Gurgaon
Mahendragarh
Hi,ar
lind
Ambala Cantt. (City) .. (Ambala District)
Rohtak (City) (Rohtak District)
O=Nil N=Negligbk
Predominant '\Iaterial or Wall
Rural Urban Grass, Mud
leaves, reeds or bamboo
Unburnt brick,
Wool!
------~-. ~---.-~-~~-~~----~~~----.~----
2 3 4 5 6
Rural 3 106 316 J Urban I 28 51 15
Rural 9 341 294 I Urban .2 30 47 7
Rural .1 89 267 1 Urban I 18 47 14
Rural .~7 294 1 Urban 11 40 8
Rural -+ 197 260 1 Urban .2 77 43 37
Rural -l 40 313 1 Urban .2 8 66 18
RwaJ 26 523 .1 Urban <) 80 )0
Rural 20 154 1 Urban :; 10 24 13
Urban 3 40 44- <)
Urban 10 50 6
Burnt GJ. sheets Stone Cement bricks Of other concrete
metal sheets
All other materials and material~ not stated
~--~-~--.----p,-
7 8 9 10 11 ._-----514 :'\ 59 J N 880 1 22 2 N
305 N 46 4 N 907 I :; ..1- N
639 N 0 N 919 N N N
663 N ~ 1 N 935 N N 5 N
322 N 216 N N 782 N 58 I N
445 N 197 N N 659 N 247 0 N
448 N N N N 897 N I 2 N
823 () 0 J N 9.+3 2 0 6 N
899 3 0
927 N 0 5
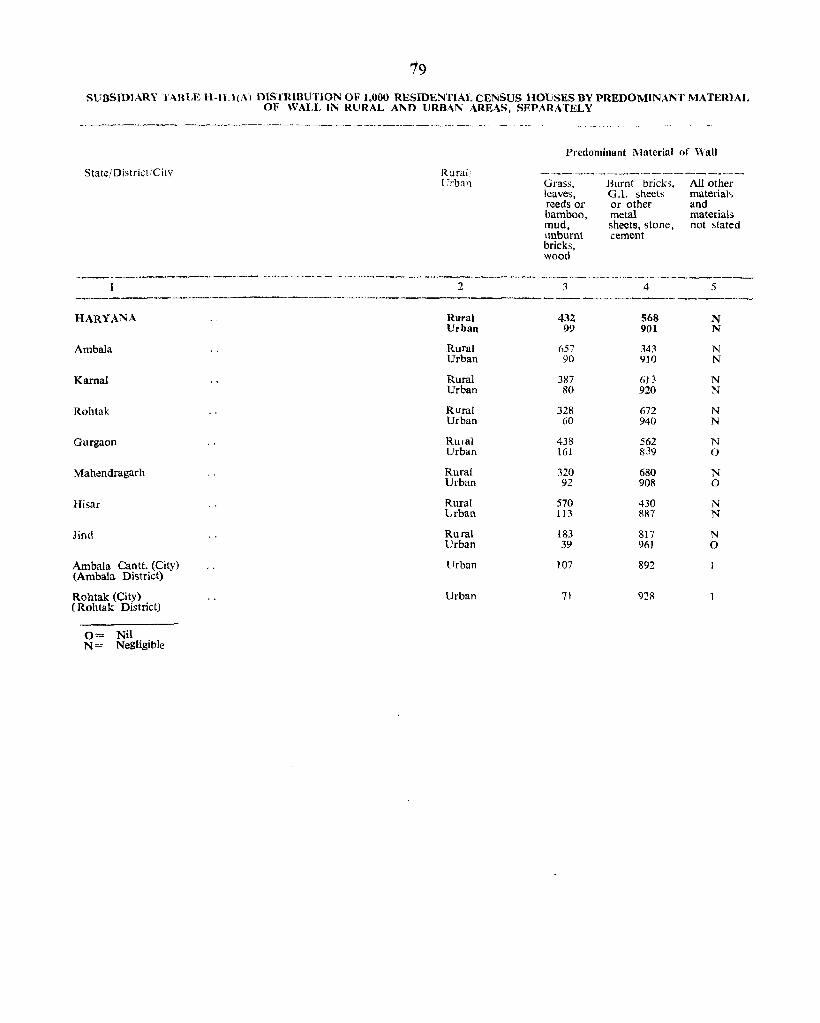
79
SUBSIDIARY TABLE H·lT.l(A) mSTRInUTION Ol' 1,O()l) RESIDE:-.lTIALCENSUS HOUSES BY PREDOMINANT MATERIAL OF WALL IN RURAL AND URBAN AREAS, SEPARATELY
State(DistrictiCity
1
HARYANA
Ambala
Karoal
Rohtak
Gurgaon
Mahendragarh
Hi~ar
Jind
Ambala Cantt. (City) (Ambala District)
Rohtak (City) (Rohtak District)
0= Nil N= Negligible
Rural' Urban
2
Rural Urban
Rural Urban
Rural Urban
Rural Urban
Rural Urban
Rural Urban
Rural Urban
Rural Urban
Urban
Urban
Predominant Matet'ial of Wall
Grass, leaves, reeds or bamboo, mud. unbumt bricks, wood
3
434 99
657 90
387 80
328 60
438 161
:120 92
570 113
183 39
107
71
Hurnt bricks, 0,1. sheets or other metal sheets. stone, cement
4
568 901
343 910
613 920
672 940
562 839
680 908
430 887
817 961
892
92R
All other materials and materials not stated
5
N N
N N
N N
N N
N 0
N 0
N N
N 0
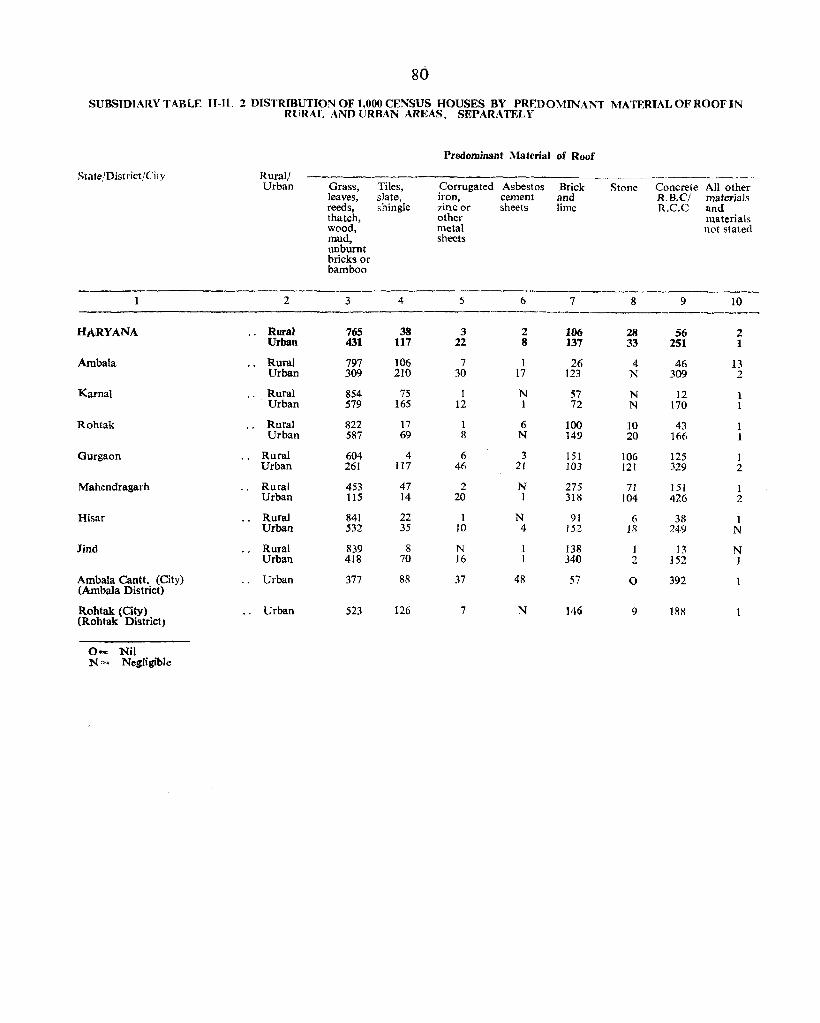
80
SUBSIDIARY TABLE H-II. 2 DISTRIBUTION OF 1,000 CENSUS HOUSES BY PREDOMINANT MATERIAL OF ROOF IN RURAL AND VRRAN AREAS, SEPARATELY
Predominant Material of Roof
State/District/City Rural/ Urban Grass, Tiles, Corrugated Asbestos Brick Stone Concrete All other
leaves, slate, iron, cement and R,B.Cj materials reeds, shingle zinc or sheets lime R,C.C and thatch, other materials wood, metal not slated mud, sheets unburnt bricks or bamboo
2 3 4 5 6 7 8 9 10
HARYANA RuraJ 765 38 3 2 106 28 56 2 Urban 431 117 22 8 137 33 2S1 1
Ambala Rural 797 106 7 1 26 4 46 13 Urban 309 210 30 17 123 N 309 2
Karnal ., Rural 854 7S 1 N 57 N 12 1 Urban 579 165 12 1 72 N 170 1
Rohtak Rural 822 17 1 6 100 10 43 1 Urban 587 69 8 N 149 20 166 1
Gurgaon Rural 604 4 6 3 151 106 125 1 Urban 261 117 46 21 103 121 329 2
Mahendragarh Rural 453 47 2 N 275 71 151 1 Urban 115 14 20 1 3Ill 104 426 2
Hisar Rural 841 22 1 N 91 (i 38 1 Urban 532 35 10 4 152 18 249 N
Jind Rural 839 8 N 138 J 13 N Urban 418 70 16 340 2 152 1
Ambala Cantt. (City) Urban 377 88 37 4R 57 0 392 (Ambala District)
Rohtak (City) Urban 523 126 7 N ]46 9 188 (Rohtak District)
0- Nil N= Negligible
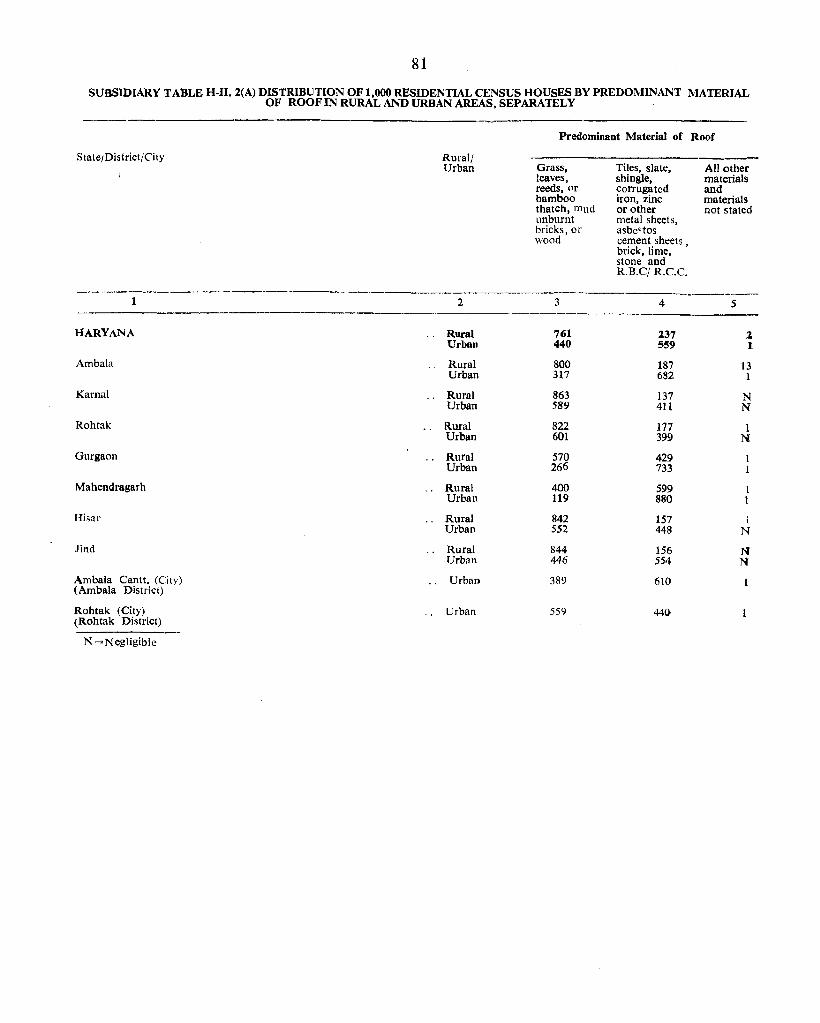
81
SUBSIDIARY TABLE H-II. 2(A) DISTRIBUTION OF 1,000 RESIDENTIAL CENSUS HOUSES BY PREDOMINANT MATERIAL OF ROOF IN RURAL AND URBAN AREAS, SEPARATELY
State/District/City
I-JARYANA
Ambala
Kamal
Rohtak
Gurgaon
Mahendragarh
Hi,ar
Jind
Ambala Cantt. (City) (Ambala District)
Rohtak (City) (Rohtak District)
N =Negligible
· .
· .
· .
· .
-Rural/ Urban
2
Rural Urban
Rural Urban
Rural Urban
Rural Urban
Rural Urban
Rural Urban
Rural Urban
Rural Urban
Urban
Urban
Predominant Material of Roof
Grass, Tiles, slate, All other leaves, shingle, materials reeds, or corrugated and bamboo iron, zinc materials thatch, 111 u d or other not stated unburnt metal sheets, bricks, or asbe<tos wood cement sheets,
brick, lime, stone and R.B.Cf R.C.C.
-----3 4 5
761 237 1 440 559 1
800 187 13 317 682 1
863 137 N 589 411 N
822 177 1 601 399 1'1
570 429 1 266 733 1
400 599 1 119 880 1
842 157 1 552 448 N
844 156 N 446 554 N
389 610
559 440
82 CHAPTBRIV
HOUSEHOLD AND NUMBER OF ROOMS OCCUPIED
fn this Chapter, 1 would be dealing with the classification of househ Ids according to the number of members and by number of rooms occupied. The data regarding this hav~ been compiled in Table H-III, which provides for distribution of households by different number of rooms and number of members. These households have been divided in groups occupy. ing I, 2, 3,4 and 5 and more rooms. In the 1961-Census, this information was compiled in Table E-V and the only difference at the 197LCensus is that presently the data have been compiled up to district level ~hereas at the 1961-Census. it was available up to tahsll level also.
?. According to the concepts adopted at the 1971-Census for the: purposes of this Table, a household was defined as a group of persons living. together and having their meals from a common kItchen unl.ess the exigencies of work prevented anyone from domg so. The room for this purpose was to have four walls with a door-way and a roof overhead and wa~ to ~e wide and long enough for a person to sleep m i.e. It should have a length of not less than 2 metres .and a breadth of atl:ast I i metres and be 2 metres in heIght. An enclosed room, however, which was used in co.mman for sleeping, sitting, dining, storing and cookmg etc., was to be regarded as a room. An uner .clo~ed verandah, kitchen, store, garage, cattle.shed, latrme and room in which a household industry such as It handloom was located, which was not norma Y usable for living or sleeping etc. was excluded from the definition of a room for this purpose. The enumerators deputed for houselisting were specifically instruCted for correctly recording the number of living roomS available with the Census households. They were told that in case there was only one household in a Census House, the counting of rooms would not be difficult, but if a Census House accommodated a number of households, the number of rooms occupied by each household had to be entered against the name of each head of household. In cases, where a room was occupied by more than one household or they shared more than one room, the number of
rooms were to be given together against a bracket as common to such households. In the case of conical shaped huts or tents in which human beings resided, and improvised accommodation was available, due to non-availa bility of four walls, the definition of room \Vas not strictly applicable, but still these huts or tents were to be construed as rooms for our purposes.
3. No attempt was made to collect the floor area of the rooms in occupation of the households as it was not possible to collect this data through temporary, honorary and non-technical census functionaries and as su~h an exact estimate of congestion is not reflected in t~IS data. A room may be barely of the minimum dimensions mentioned above and the household occupying it may have 3-4 members, while on the other hand, in rural areas of this State, there may be big rooms having capacity to accommodate 8-10 persons but still being counted as one room for our purpose. There the congestion may not be so aCLte as in the fe·rmer case. The data thus being processed ha\e its limitations and may be viewed in this context.
4. From the Table H-III, two Subsidiary Tables H-III.l and H-III.2 have been generated. The former Table gives the distribution of 1.000 Census Households in different groups of 1, 2, 3, 4 and 5 and more rooms respectively. The second Subsidiary Table gives the number of persons per room, and number of persons per household by size of Census Houses. The data available are being discussed in subsequent para. graphs.
Reference to Statistics
5. Table H-1I1 gives the absolute figures regarding the total number of households in the State/districts, number of members involved in these households and distribution of these members according to the number of rooms occupied by them. Comparative position of the totals of the two Censuses is up}:cnded hereafter.
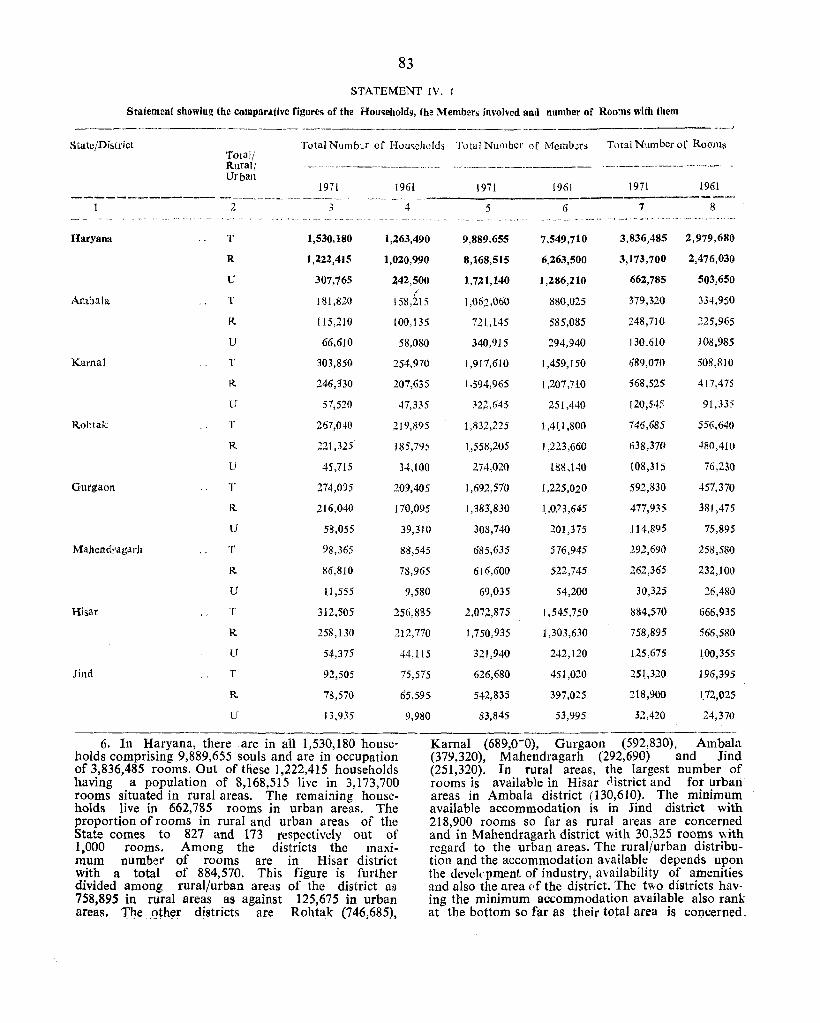
83
STATEMENT IV.
Statement showing the comparative figures of the Hou~eholds, the Members involved and number of Ro()'us with them
-----_.- -----_._-----_._-------------_. State/Dislrict Total Ntll11b~r of Households Total NUl1lber of Memb~rs Total N'Jmber of Roams
Total; Rural! - _. ~~- .. _-----_._--_.-- _- .... _- _. __ •• o _____ • __ ~ ••• _________ . -..... ~-.-. --~~ .-~,,- ,~"- .~- "-'-~-'
Urban 1971 1961 1971 1961 1971 1961
------------ - ---_----_._. --- -~ .. ----2 3 4 5 6 7 8
---. _ .. - .. -. - ,
Haryana T 1,530,180 1,263,490 9,889,655 7,549,710 3.836,485 2,979,680
R 1.222,415 1,020,990 8,168,515 6,263,500 3,173,700 2,476,030
U 307,765 242,500 1,7Z1,140 1,286,210 662,785 503,650
Amba1a T 181,820 Iss,ils 1,06;2,060 880,025 379,320 334,950
R 115,210 100,135 721, 145 585,085 248,710 225,965
U 66,610 58,080 340,915 294,940 J 30.610 108,985
Kamal T 303,850 254,970 1,911,610 1,459,150 689,070 508,810
R 246,330 207,635 1.594,965 1,207,710 568,525 417,475
U 57,520 47,335 ~22,645 251,440 120,545 91,335
R.ohtak T 267,O~O 219,895 1,832,225 1 AU ,800 746,685 556,640
R :!21,325 185,795 1,558,205 1,223,660 638,370 480,41{l
U 45,715 34'(00 274,020 1(o\\!,140 t08,315 76,230
Gurgaon T 274,095 20';),405 1,692,510 1,225,020 592,830 457,370
R 216,040 170,095 1,383,830 1.,0;2 3 ,645 477,935 381,475
V 58,055 39,310 308,740 201,375 114,895 75,895
Mahendragar)l T 98,365 88,545 685,635 576,945 292,690 258,580
R 86,8JO 73,965 616,600 522,745 262,365 :m,100
l! 11 ,555 9,580 69,035 54,200 30,325 26,480
Hisat T 312,505 256,885 2,012,875 1,545,750 884,570 666,935
R 258,130 212,110 1,750,935 1,303,630 758,895 566,580
LJ 54,375 44,115 32J,940 242,120 125,675 100,355
Jind T 92,505 75,575 626,680 451,020 2S~,320 J96,395
R 78,570 65,595 542,835 397,025 218,900 1.72,025
U 13,935 9,980 83,845 53,995 32,420 24,370
6. In Haryana, there are in all 1,530,180 households comprising 9,889,655 souls and are in occupation of 3,836,485 rooms. Out of these 1,222,415 households having a population of 8,168,515 live in 3,173,700 rooms situated in rural areas. The remaining households live in 662,785 rooms in urban areas. The proportion of rooms in rural and urban areas of the State comes to 827 and 173 respectively out of 1,000 rooms. Among the districts the maximum number of rooms are in Risar district with a total of 884,570. This figure is further divided among rural/urban areas of the district as 758,895 in rural areas as against 125,675 in urban areas. The _Qther districts are Rohtak (746,685),
Kamal (689,0-0), Gurgaon (592,830). Ambala (379,320), Mahendragarh (292,690) and Jind (251,320), In rural areas, the largest number of rooms is available in Risar r1istrict and for urban areas in Ambala district (130,610), The minimum available accommodation is in Jind district with 218,900 rooms so far as rural areas are concerned and in Mahendragarh district with 30,325 rooms ..... ith regard to the urban areas. The rural/urban distribution and the accommodation available depends upon the devekpment of industry, availability of amenities and also the area (,f the district. The two districts having the minimum accommodation available also rank at the bottom so far as their total area is concerned,
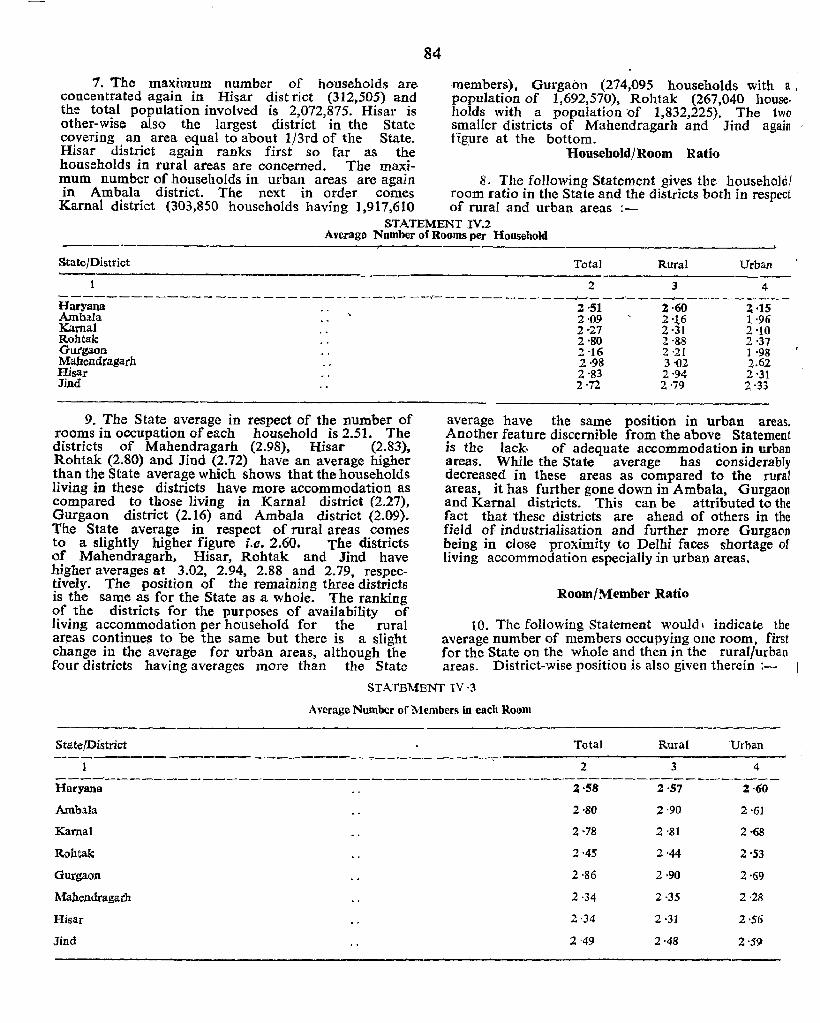
7. The maximum number of households are concentrated again in Risar district (312,505) and the total population involved is 2,072,875. Hisar is other-wise also the largest district in the State covering an area equal to about 1/3rd of the State. Hisar district again ranks first so far as the households in rural areas are concerned. The maxi-
84
members), Gurgabn (274,095 hou.seholds with a, population of 1,692,570). Rohtak (267,040 house· holds with a population ()f 1,832,225). The two smaller districts of Mahendragarh and Jind again figure at the bottom.
Household/Room Ratio
mum number of households in urban areas are again 8. The following Statement gives the household! in Ambala district. The next in order comes room ratio in the State and the districts both in respect Karnal district (303,850 households having 1,917,610 of rural and urban areas ,-
STATEMENT IV.2 Averago Number of Rooms per Household
State/District Total Rural Urban
2 3 4 ------------ - -'_- - ------- - --_"- __"_I/--- ________ _....; __ _ __.o" ___ --.l ______ _____ _
Haryana Amoala Karnal R.obtak GUl'gaon Mabendi'agal'h EisaI' Jind
9, The State average in respect of the number of rooms in occupation of each household is 2.51. The districts of Mahendragarh (2.98), Hisar (2.83), Rohtak (2.80) and Jind (2.72) have an average higher than the State average which shows that the households living in these districts have more accommodation as compared to those living in Karnal district (2.27), Gurgaon district (2.16) and Ambala district (2.09), The State average in respect of rural areas comes to a slightly higher figure i.e. 2.60. The districts of Mahendragarh, Hisar, Rohtak and Jind have higher averages at 3.02. 2.94, 2.88 and 2.79, respectively. The position of the remaining three districts is the same as for the State as a whole. The ranking of the districts for the purposes of availability of living accommodation per household for the rural ar~as continues to be the same but there is a slight change in the average for urban areas, although the four districts having averages more than the State
2'S1 2;·60 ~·lS 2'09 2'1.6 1'96 2'21 2 -31 2 '10 2'80 2'88 2-37 2 '16 2 -21 1 ·98 2·98 3 '02 2.62 2'83 2'94 2-31 2'72 2·79 2-33
average have the same position in urban areas. Another feature discernible from the above Statement is the lack of adequate accommodation in urban areas. While the State average has considerably decreased in these areas as compared to the rural areas, it has further gone down in Ambala. Gurgaon and Kamal districts. This can be attributed to the fact that 'these districts are ahead of others in the field of industrialisation and further more Gurgaon being in close proximity to Delhi faces shortage of living accommodation especially in urban areas.
Room/Member Ratio
10. The following Statement would, indicate tbe average number of members occupying one room, first for the State on the whole and then in the rural/urban areas. District-wise position is also given therein :-
STATEMENT IV·3
Average Number of Members in each Roum
State/District Total Rural Urban ---------~---------------~-----
2 3 4
Ambala 2'80 2'90 2 '61
Kamal 2 -78 2 '81 2 ·68
R.ohtak 2·45 2·44 2 '53
Gurgaon 2·86 2 ,90 2'69
Mahendragarh 2·34 2·35 2·28
Hisar 2 ·34 2 ·31 2'56
Jind 2'49 2'48 2'59
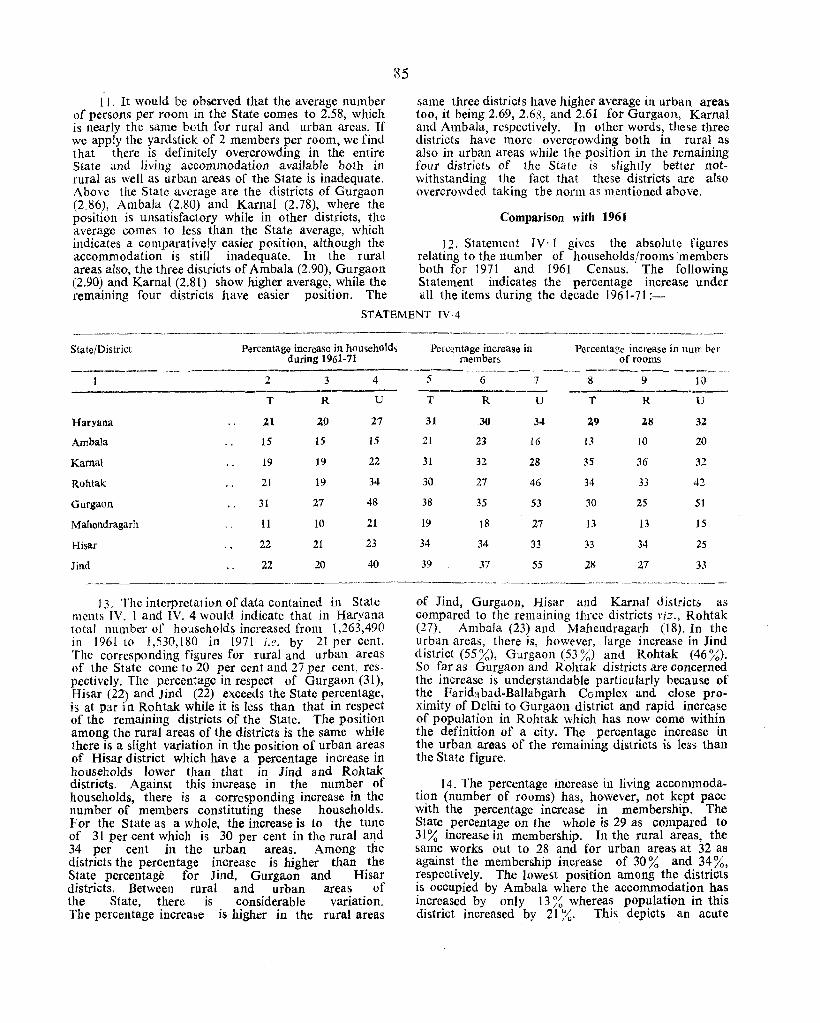
11. It would be observed that the average number of persons per room in the State comes to 2.58, which is nearly the same both for rural and urban areas. If we apply the yardstick of 2 members per room, we find that there is definitely overcrowding in the entire State and living accommodation available both in rural as well as urban areas of the State is inadequate. Above the State average are the districts of Gurgaon (2.86), Ambala (2.80) and Kamal (2.78), where the position is unsatisfactory while in other districts, the average comes to less than the State average, which indicates a comparatively easier position, although the accommodation is still inadequate. In the rural areas also, the three districts of Ambala (2.90), Gurgaon (2.90) and Kamal (2.81) show higher average, while the remaining four districts have easier position. The
85
same three districts have higher average in urban areas too, it being 2.69, 2.68, and 2.61 for Gurgaon, Karnal and Ambala, respectively. In other words, these three districts have more overcrowding both in rural as also in urban areas while the position in the remaining four districts of the State is slightly better notwithstanding the fact that these districts are also overcrowded taking the norm as mentioned above.
Comparison with 1961
12. Statement IV· 1 gives the absolute figures relating to the number of households/rooms 'members both for 1971 and 1961 Census. The following Statement indicates the percentage increase under all the items during the decade 1961-71 :-
STATEMENT IY·4
State/District
Haryana
Ambala
Kamal
Rohtak
Gurgaon
Mahendragarh
Hisar
Jind
.----~ ..
Percentage increase in household~ during 1961-71
2 3 4
T R U
II lO 21
15 15 15
19 19 22
21 19 34
31 27 48
11 10 21
22 21 23
22 20 40
13. The interpretation of data contained in State lllcnts IV. I and IV. 4 would indicate that in Haryana total number of households increased from 1,263,490 in 1961 to 1,530,180 in 1971 i.e. by 21 per cent. The corrc~ponding figures for rural and urban areas of the State come to 20 per cent and 27 per cent. respectively. The percentage in respect of Gurgaon (31), Hisar (22) and Jind (22) exceeds the State percentage, is at par in Rohtak while it is less than that in respect of the remaining districts of the State. The position among the rural areas of the districts is the same while there is a slight variation in the position of urban areas of Hisar district which have a percentage increase in households lower than that in Jind and Rohtak districts. Against this increase in the number of households, there is a corresponding increase in the number of members constituting these households. For the State as a whole, the increase is 10 the tune of 31 per cent which is 30 per cent in the rural and 34 per cent in the urban areas. Among the districts the percentage increase is higher than the State percentage for Jind, Gurgaon and Hisar districts. Between rural and urban areas of the State, there is considerable variation. The percentage increase is higher in the rural areas
.----.~- .-~--.--~---~-.-.-~----~~-
Percentage increase in Percentage increase in num bel' members of rooms
------ - _- ---.~- _- -----~- --~~-----__ ._-- - .
5 6 7 8 9 II) -------- _----T R U T R U
31 30 34 19 28 32
21 23 16 Ll to 20
31 32 28 35 36 32
30. 27 46 34 33 42
38 35 53 30 25 51
19 18 27 13 13 15
34 34 33 33 34 25
39 37 55 28 27 33
of Jind, Gurgaoll, Hisar and Karnal districts as compared to the remaining three districts riz., Rohtak (27). Ambala (23) and. Mahcndragarh (18). In the urban areas, there is, however, large increase in Jind district (55%), Gurgaon (53%) and Rohtak (46%). So far as Gurgaoll and Rohtak districts are concerned the increase is understandable particularly because of the Faridlbad.-Ballabgarh Complex and close proximity of Delhi to Gurgaon district and rapid increase of population in Rohtak which has now come within the definition of a city. The percentage increase in the urban areas of the remaining districts is less than the State figure.
14. The percentage increase in living accommodation (number of rooms) has, however, not kept pace with the percentage increase in membership. The State percentage on the whole is 29 as compared to 31% increase in membership. In the rural areas, the same works out to 28 and for urban areas at 32 as against the membership increase of 30 % and 34 %, respectively. The lowest position among the districts is occupied by Ambala where the accommodation has increased by only 13 % whereas population in this district increased by 21 ~{ This depicts an acute
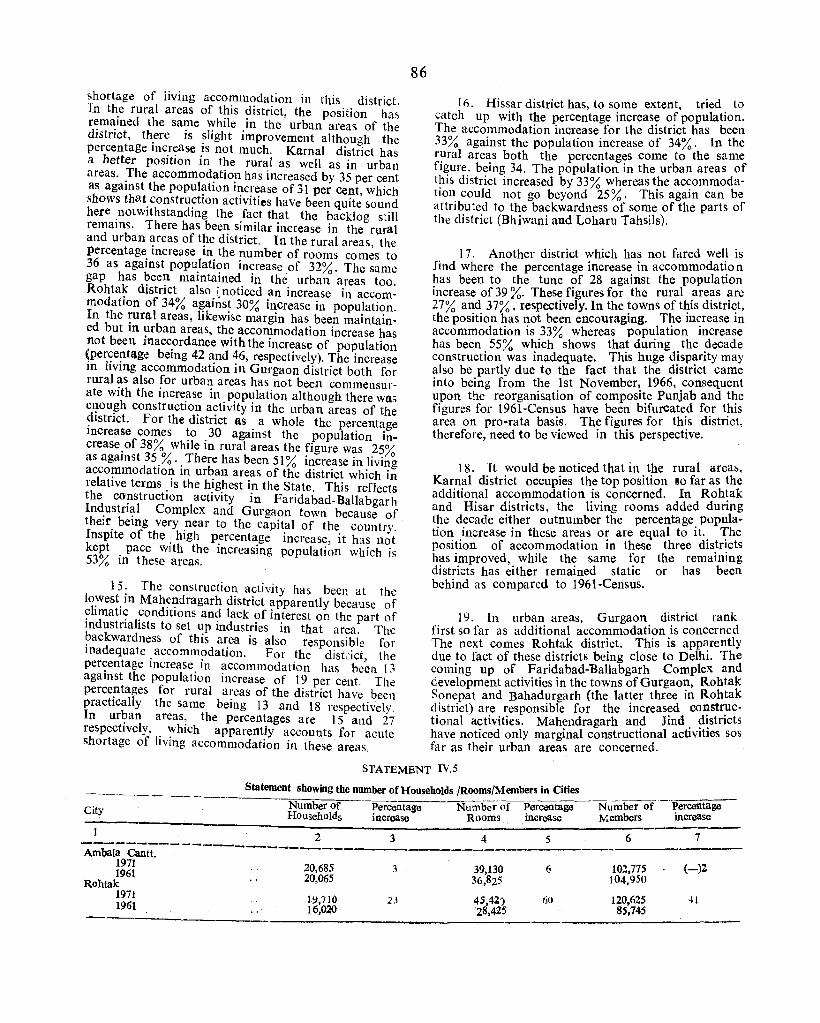
shortage of living accommodation in this district. In the rural areas of this district, the position has remained the same while in the urban areas of the district, th.ere is ~light improvement although the percentage lUcrease IS not much. Kamal district has a better position in the rural as well as in urban areas. :rhe accommod~ti0!l has increased by 35 per cent as agaInst the populatIOn Increase of 31 per cent, which shows that construction activities have been quite sound here .notwithstanding the fact that the backlog still remaIllS. There has been similar increase in the rural and urban areas of the district. In the rural areas the percentage increase in the number of rooms com~s to 36 as against population increase of 32%. The same gap has been maintained in the urbano areas too. Rohtak district also; noticed an increase in accommodation of 34% against 30% increase in population. In the !ural areas, likewise margin has been maintained but III urban areas, the accommodation increase has not been inacc.ordance with the incr~ase of population <per~e!1tago;! beIng 42 ~nd ~6, respectIvely). The increase III hVIUg accommodatIon In Gurgaon district both for rural as also for urban areas has not been commensurate with the increase in population although there wa; e~ough construction activity in the urban areas of the ~IStrict. For the district as a whole the percentage Increase comes to 30 against the popUlation increase.of 38% While in rural areas the figure was 25% as agaInst 35.% .. There has been 51% increase in living accommodation In urban areas of the district which in relative terms. is the highest in the State. This reflects the constructIon activity in Faridabad-Ballabgarh Indystril.d Complex and Gurgaon town because of thelr. belllg very .near to the capital of the country. Insplte of the hIgh percentage increase, it has 110t kept pace with the increasing papUlation which is 53% in these areas.
15: The constructio~ activity has been at the lo:west. III Mah~l?-dragarh district ~pparently because of ?hmatl~ ~ondltlons an? lack of lllterest on the part of II1dustnahsts to set up llldustries in that area. The ~ackwardness of this a~ea is also responsible for madequate accommodatIOn. For the district the percentage increase in accommodation has be~1l 13 against the population increase of 19 per cent. The percentages for rural areas of the district have been practically the same being 13 and 18 respectively. In urban areas, the percentages are 15 and 27 respectively, which apparently accounts for acute shortage of living accommodation in these areas.
86
16. Hissar district has, to some extent, tried to catch up with the percentage increase of popUlation. The accommodation increase for the district has been 33% against the population increase of 34%. In the rural areas both the percentages come to the same figure, being 34. The population in the urban areas of this district increased by 33% whereas the accommodation could not go beyond 25%. This again can be attributed to the backwardness of some of the parts of the district (Bhiwani and Loharu Tahsils).
17. Another district which has not fared well is Jind where the percentage increase in accommodation has been to the tune of 28 against the population increase of 39 %. These figures for the rural areas are 27% and 37%, respectively. In the ~owns of t~is distri~t, the position has ~ot been encouragIng. T~e lll~rease In accommodation IS 33% whereas populatIOn lUcrease has been 55% whiCh shows tha~ during . the .decade construction was inadequate. ThIS huge dispanty may also be partly due to the fact that the district came into being from the 1st November, 1966, consequent upon the reorganisation of composi~e Punjab and t~e figures for 1961-Census have been blfurcate.d f~r t~lS area on pro-rata basis. The figures for thIS dIstnct, therefore, need to be viewed in this perspective.
18. It would be noticed that in the rural areas, Karnal district occupies the top position 110 far as the additional accommodation is concerned. In Rohtak and Hisar districts, the living rooms added during the decade either outnumber the percentage popula~ tion increase in these areas or are equal to it. The position of accommodation in these three dis~r~cts has improved, while the same ~or the remallllUg districts has either remained statIc or has been behind as compared to 1961-Census.
19. In urban areas, Gurgaon district rank first so far as additional accommodation is concerned The next comes Rohtak district. This is apparently due to fact of these districts being close to Delhi. The coming up of Faridabad-BaUabgarh Complex and development activities in the towns of Gurgaon, Rohtak Sonepat and Bahadurgarh (the lat~er three in Rohtak district) are responsible for the Increas~d coJ?-str.uctional activities. Mahendragarh an~ Jllld. ~~stncts have noticed only marginal constructIonal actIvIties sos far as their urban areas are concerned.
STATEMENT IV.5
----_. __ ._-_. Statement showing the number of HousehOlds /Rooms/Members in Cities ~.
··Percentage Number of Percentage Number of Percentage Number of City Households increase Rooms increase M.embers increase
2 3 4 A;;ili~i;-c;;---------------~-----------
5 6 7
1971 20,685 3 39,130 6 102,775 (-)2 1961 20,065 36,8,25 ]04.950 Rohtak 1971 19,710 23 45,42) 60 120,625 41 1961 16,020 28,425 85,745
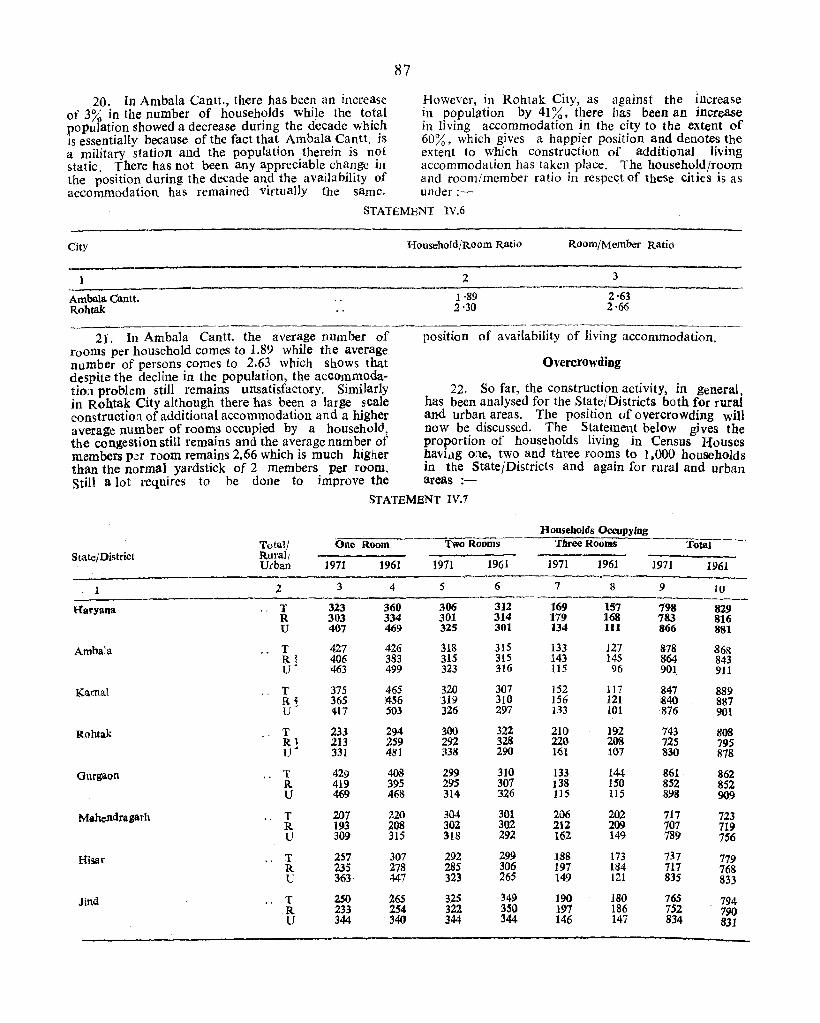
87
20. In Ambala Cantt., there has been an increase However, in Rohtak City, as against the increase of 3% in the number of households while the total in population by 41%, there bas been an increase population showed a decrease during the decade which in living accommodation in the city to the extent of is essentially because of the fact that Ambala Cantt. is 60%, which gives a happier position and denotes the a military station and the population therein is not extent to which construction of additional living static. There has not been any appreciable change in accommodation has taken place. The household/room the position during the decade and the availability of and room/member ratio in respect of theSe cities is as accommodation has remained virtually the same. under;-
City
1
Ambala. Cantt. Rohtak
STATEMENT IV.6
Household/Room Ratio
2
1,89 2'30
Room/Member Ratio
3
2,63 2'66
21. In Ambala Cantt. the average number of position of availability of living accommodation. rooms per household comeS to 1.89 while the average number of persons comes to 2.63 which shows that Overcrowding despite the decline in the population, the accommoda-tio., problem still remains unsatisfactory. Similarly 22. So far, the construction activity, in general in Rohtak City although there has been a large scale has been analysed for the State/Districts both for rurai constructio::1 of additional accommodation and a hlgher and urban areas. The position of overcrowding will average number of rooms occupied by a household, now be discussed. The Statement below gjves the the congestion still remains and the average nllmber of proportion of households living in Census Houses members p.!r room remains 2.66 which is much higher havL.lg O:1e, two and three rooms to 1.000 households than the normal yardstick of 2 members per room. in the State/Districts and again for rural and urban Still a lot requires to be done to improve the areas :-
State/District
1
Haeyana
Ambala
Kamal
RQhtak
GurgaQn
Mahendragarh
Hisar
Jind
Total/ R.urall Urban
" T R U
.. T RI v·
.. T R, u·
.. T R.l U~
T R U
.. T R. U
.. T R. U
.. T R. U
STATEMENT IV.1
One Room
1971 1961
3
323 303 407
427 406 463
375 365 417
233 213 331
429 419 469
207 193 309
257 235 363
250 233 344
4
360 334 469
426 383 499
465 n56 503
294 259 481
408 395 468
220 208 315
307 278 447
165 254
, 340
Two Rooms
1971 1961
5
306 301 325
318 315 323
320 319 326
300 292 338
299 295 314
304 302 318
292 285 323
325 322 344
6
312 314 301
315 315 3:16
307 310 297
322 328 290
310 307 326
301 302 292
299 306 265
349 350 344
Households Occupying Three Rooms
1971 1961
7
169 179 134
133 143 115
152 156 133
210 22Q 161
133 138 115
206 212 162
188 197 149
190 197 146
8
157 168 111
127 145 96
117 121 101
192 208 107
144 150 115
202 209 149
173 t84 121
180 186 147
1971
9
798 783 866
878 864 901
847 840 876
143 725 830
861 852 898
717 707 789
737 717 835
765 752 834
Total
1961
10
829 816 881
868 843 911
889 887 901
808 795 878
862 852 909
723 719 756
779 768 833
794 790 831

23. As was mentioned earlier, the data was collected in terms of number of living rooms and no attempt was made to collect data regarding area etc. In the absence of the latter data, the exact position of congestion cannot be worked out but an attempt is being made through the data given in Statement IV.7 above, to arrive at some conclusions. For this purpose, it has been assumed that the smaller the number of rooms with the household, the lesser would be scope for privacy. It has, therefore, been felt that only those households can be considered as residing in comfortable conditions which are !n occupation of 4 rooms and above. Consequently, 10 the above table, the proportion of households with 1, 2 and 3 rooms have been segregated. Out of these, households occupying 1 or 2 rooms would be considered as residing in extremely congested conditions.
24. From the data, it would be noticed that in Haryana, 798 households out of 1,000 are residing in extremely congested/moderately congested conditions, which accounts for 4/5th of the total households. Out of these, 629 households are living in tenements having only 1 or 2 rooms, which is again very high and accounts for 63 per cent of the households. As between rural! urban areas of the State, it would be observed that 783 households in rural areas and 866 in urban areas fall under this category. The number is comparatively high in the cities/towns of the State. As many as 604 households in rural areas and 732 in urban areas are again in occupation of 1 or 2 rooms. Generally, it can be said that the congestion in urban areas of the State is comparatively more than in the rural areas.
Inter-District Comparison
25. Among the districts, the position is in no way better. In Ambala district, 878 households live in the tenements having I, 2 and 3 rooms and out of this number, first two types accommodate 745 households. The figure of households falling in this category for Ambala district is higher than the proportion for the State indicating thereby that this district is highly oVercrowded. Again in the rural areas of the district 864 households are in occupation of these three types while for urban areas the figure is still higher, being 901. The first two types of tenements cover 721 and 786 households, in rural and urban areas, respectively. In other words, the households in urban areas of Ambala district are living in extremely congested conditions. This can be attributed to the coming up of new industries.
26. The position in Karnal district, although slightly better than that of Ambala, cannot still be considered as satisfactory. The number of households having 1 to 3 rooms is 847 for the district, 840 for the rural areas and 876 for the urban areas. The figures for households occupying land 2 rooms are 695 for the district, 684 for rural areas and 743 for urban areas. The position in rural areas of the district is comparatively easier than that in the urban areas, but a huge majori·· ty of households is still reSiding in small houses with little privacy.
88
27. Rohtak district is still better placed in this regard. The total number of households living in 1, 2 and 3 room tenements is 743 against which the rural figure is 725 and the urban figure 830. Here also, the position in urban areas is unsatisfactory. The households living in hOUses having 1 or 2 rooms each have a proportion of 533 for the district, 505 for rural areas and 669 in urban areas. The proportion for rural areas depicts a healthy trend indicating that People prefer to live in bigger houses having amenities etc.
28. Like Ambala district, Gurgaon is another district with a huge concentration of households in houses with few rooms. The proportion of households living in 1,2 and 3 rooms comes to 861 whereas it is 878 in the case of Ambala. The corresponding proportion for the rural/urban areas comeS to 852 and 898, respectively. Out of these households, those occupying I or 2 rooms number 728, 714 and 783 m the total, rural and urban areas, respectively. The position in rural areas is comparatively easier than that in the urban areas. These households can also be said to be living inextremely congested conditions.
. 29. In Mahendragarh district, the total population of households in occupation of tenements having I, 2 and 3 rooms comes to 717 which is the lowest ill the State. Similarly, the figures for rural/urban areas viz. 707 and 789 are also the lowest as compared to those of other such areas of the State. This can be attributed to the fact that Mahendragarh being a backward district, a tendency is apparent to have one room just abutting within another room so as to ensure privacy. Consequently, the number of households living in smaller units is less than that in other districts. The corresponding figures for 1 or 2 room tenements are 511, 495 and 627, respectively for the district/rural/ urban areas. The figures in urban areas are comparatively higher.
30. The proportionate figure for such households for Hisar district as a whole is 737, while the same for rural/urban areas is 717 and 835, respectively. Out of these households, 549 in the district, 520 in rural areas and 686 in urban areas are thosc which are living in I or 2 room tenements. The position in this district is almost comparable with Rohtak district where the proportionate figures are 743, 725 and 830, respectively for the district/rural/urban areas.
31. Regarding lind district, it would be noticed !hat the proportionate figure for the households falling In this category is 765 for the district while the same for the rural/urban areas is 752 and 834, respectively. The corresponding figure for households living in 1 or 2 room tenements comes to 575, 555 and 688, respectively for the district/rural/urban areas. Again there is correspondingly higher figure for the urban areas as compared to the rural areas of the district.
32. From the above discussion, it would be noticed that among the districts, so far as the households living in congested conditions, are concerned, the position of Ambala and Gurgaon is unsatisfactory. This is again due to the effect of industrialisation which results in occupation of smaller tenements by the work~rs due to
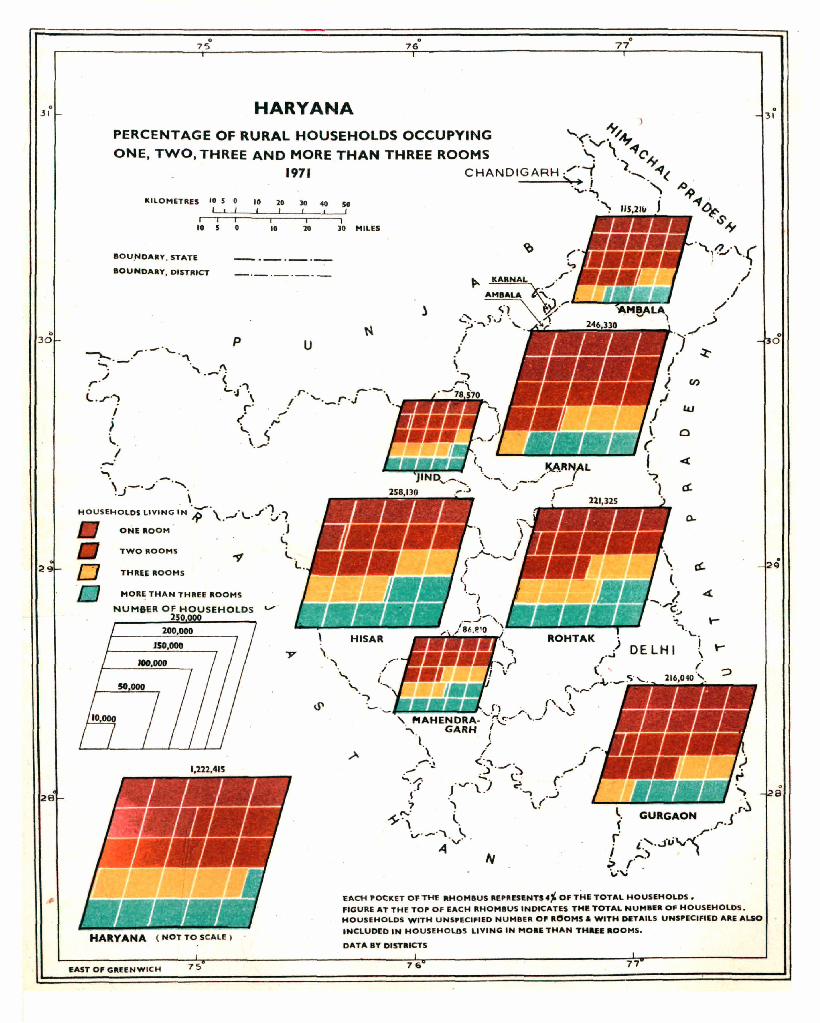
o 3 1
28
o 7 S
. 77
HARYANA ~ )
PERCENTAGE OF RURAL HOUSEHOLDS OCCUPYING ..... ·<V. /..., ONE, TWO, THREE AND MORE THAN THREE ROOMS \ \ "f"-sr
KI LOM ET RJ;S 10 5 0
10 5 0
BOU)'IDARY , STATE
BOUNDARY, DISTRICT
..... -\ .-,..J' ' ''"', ,J \
p
10 20
10
1971 CHANDI G ARH (,.-( ) ........... "f( '.~ , "
..... "l ... 30 40 so . ~ I
10 30 MILES
u
a
HOUSEHO LDS LIV IN G I'N '~·\ . _'· \.. . J' ·1/? ONE ROOM J
l,
o £J
TWO ROOMS
THREE ROOM S
HORE THAN THRE E ROOMS
NUMBER OF HOUSEHOLDS 250000
200.000
J50.ooo
.,000
HARYANA ( NOT TO SCALE )
EAST OF GREENWI C H 75
.~
~.~ GURGAON J'
r ' ,r '
i.'· ..:s·U "'''<l ! ,,..) tJ ·
" ACM " OC1(£T OF T HE RHOMIIUS RE"RESENTS4~ OF Tin TOTAL HOUSEHOLDS.
FIGURE AT THE TOP O F EACH RHOM8US INDICATES THE TOTAL NUM8ER OF HOUSEHOLDS . HOUSEHOLDS WITH UNSPECIFIED NUMB~R OF ROOMS. WITH DETAILS UNSPECIFIED ARE ALSO
INCLUDED IN HOUSEHOLDS LIVING IN MORE THAN THREE ROOMS.
DAT A BY DISTRICTS
7& 77
o o
o
a

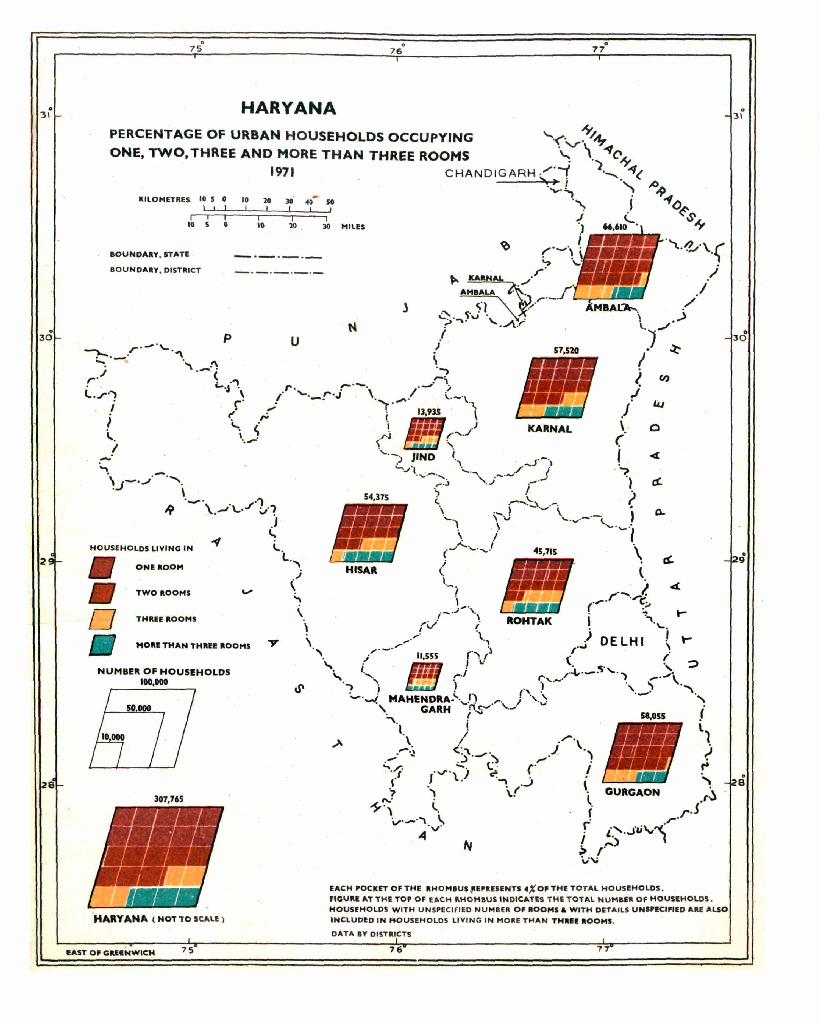
o 31
2
e
. 75 o
7 6
HARYANA
KilOMETRES. 10 5 0 10 10 30' 4')- SO
10 5 o 10 30 MILES
aOVNDAIIY, STATE
BOUNOAIIY,DISTIlICT
.)
o
HOVSEHOLDS LIVING IN
" ONE RO,OM
TWOIIOOMS
o THREE 11001015
MOllE THAN THilliE' aOOMS
NUMBER OF HOUSEHOLDS IDO,OOO
'HARYANA (HOT10SCALE )
E"ST OF GRUNWIc:N 75
EACH POCKET OF THE IIHOM8US-I'EPIIESENTS 4;(OF THE TOTAL HOUSEHOLDS . 'tGU"E AT THE TOP OF EACH I\HOMIIUS INDICA.TES T HE TOTA.L NUMIIIII OF HOUSEHOLDS . HOUSEHOLDS WITH UNSPECIFIED NUMBER OF ROOHS .. WITH DETAILS UNSPICIPIED AilE ALSO INCLVDED IN fl>OUSEHOLDS LIVING IN MOItE THAN THIIIIIIOOHS.
DATA BY DISTRICTS
76 77
o 31
. 9

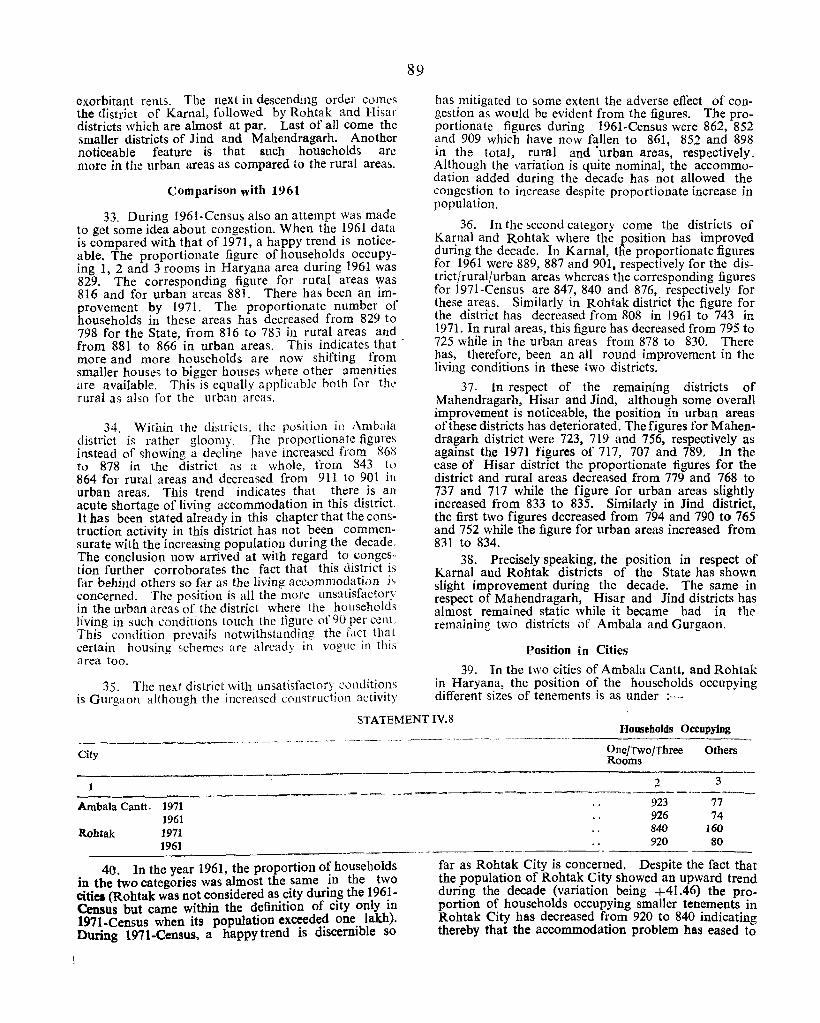
exorbitant rents. The next in descending order comes the district of Kamal, followed by Rohtak and Hisar districts which are almost at par. Last of all come the smaller districts of Jind and Mahendragarh. Another noticeable feature is that Iluch households are more in the urban areas as compared to the rural areas.
Comparison with 1961
33. During 1961-Census also an attempt was made to get some idea about congestion. When the 1961 data is compared with that of 1971, a happy trend is noticeable. The proportionate figure of households occupying 1, 2 and 3 rooms in Haryana area during 1961 was 829. The corresponding figure for rural areas was 816 and for urban areas 881. There has been an improvement by 1971. The proportionate number of households in these areas has decreased from 829 to 798 for the State, from 816 to 783 in rural areas and from 881 to 866 in urban areas. This indicates that -more and more households are now shifting from smaller houses to bigger houses where other amenities are available. This is equally applicable hath for the rural as also for the urban areas.
34. Within the districts, the pOSIlHHl in Ambala district is rather gloomy. The proportionate figures instead of showing a decline have increased from 868 to 878 in the district as a whole, from 843 ro 864 for rural areas and decreased from 911 to 901 in urban areas. This trend indicates that there is an acute shortage of living accommodation in this district. It has been stated already in this chapter that the construction activity in this district has not been commensurate with the increasing population during the decade. The conclusion now arrived at with regard to congestion further corroborates the fact that this district is far behind others so far as the living accommodation is concerned. The position is all the more unsatisfactory in the urban areas of the district where the households living in such conditions touch the tigure of 90 per cent. This condition prevails notwithstanding the ract that certain housing schemes are already in vogue in this area too.
35. The next district with unsatisfactory conditions is Gurgaon although the increa'Sed construction activity
89
has mitigated to some extent the adverse effect of congestion as would be evident from the figures. The proportionate figures during 1961-Census were 862, 852 and 909 which have now fallen to 861, 852 and 898 in the total, rural and ·urban areas, respectively. Although the variation is quite nominal, the accommodation added during the decade has not allowed the congestion to increase despite proportionate increase in population.
36. In the second category come the districts of Ka~nal and Rohtak where the position has improved dUrIng the decade. In Kamal, the proportionate figures fO.r 1961 were 889, 887 and 901, respectively for the distrIct/rural/urban areas whereas the corresponding figures for 1971-Census are 847, 840 and 876, respectively for these ~re~s. Similarly in Rohtak district the figure for the dIstrIct has decreased from 808 in 1961 to 743 in 1971. In rural areas, this figure has decreased from 795 to 725 while in the urban areas from 878 to 830. There has, therefore, been an all round improvement in the living conditions in these two districts.
37. In respect of the remaining districts of Mahendragarh, Hisar and Jind, although some overall improvement is noticeable, the position in urban areas of these districts has deteriorated. The figures for Mahendragarh district were 723, 719 and 756, respectively as against the 1971 figures of 717, 707 and 789. In the case of Hisar district the proportionate figures for the district and rural areas decreased from 779 and 768 to 737 and 717 while the figure for urban areas slightly increased from 833 to 835. Similarly in Jind district, the first two figures decreased from 794 and 790 to 765 and 752 while the figure for urban areas increased from 831 to 834.
38. Precisely speaking, the position in respect of Kamal and Rohtak districts of the State has shown slight improvement during the decade. The same in respect of Mahendragarh, Hisar and Jind districts has almost remained static while it became bad in the remaining two districts of Amhala and Gurgaon.
Position in Cities
39. In the two cities of Ambala Cantt. and Rohtak in Haryana, the position of the households occupying different sizes of tenements is as under :-
STATEMENT IV.8
City
Households Occupying
One/Two/Three Rooms
Others
;2 3 ______ - ______ --__ ------'-- __ • _ •• ________ • __ m __________________ _
Ambala Cantt. 1971 1961
Rohtak 1971 1961
923 926 840 920
77 74
160 80
----------- -----_._--------_. . 40. In the year 1961, the proportion o~households In the two categories was almost the same III the two cities (Rohtak was not considered as. c:ity durin.g the 196~Census but came within the defimtJon of cIty only III
1971-Census when its population exceeded one lakh). During 1971-Census, a happy trend is discernible so
far as Rohtak City is concerned. Despite the fact that the population of Rohtak City showed an upward trend during the decade (variation being +41.46) the proportion of households occupying smaller tenements in Rohtak City has decreased from 920 to 840 indicating thereby that the accommodation problem has eased to
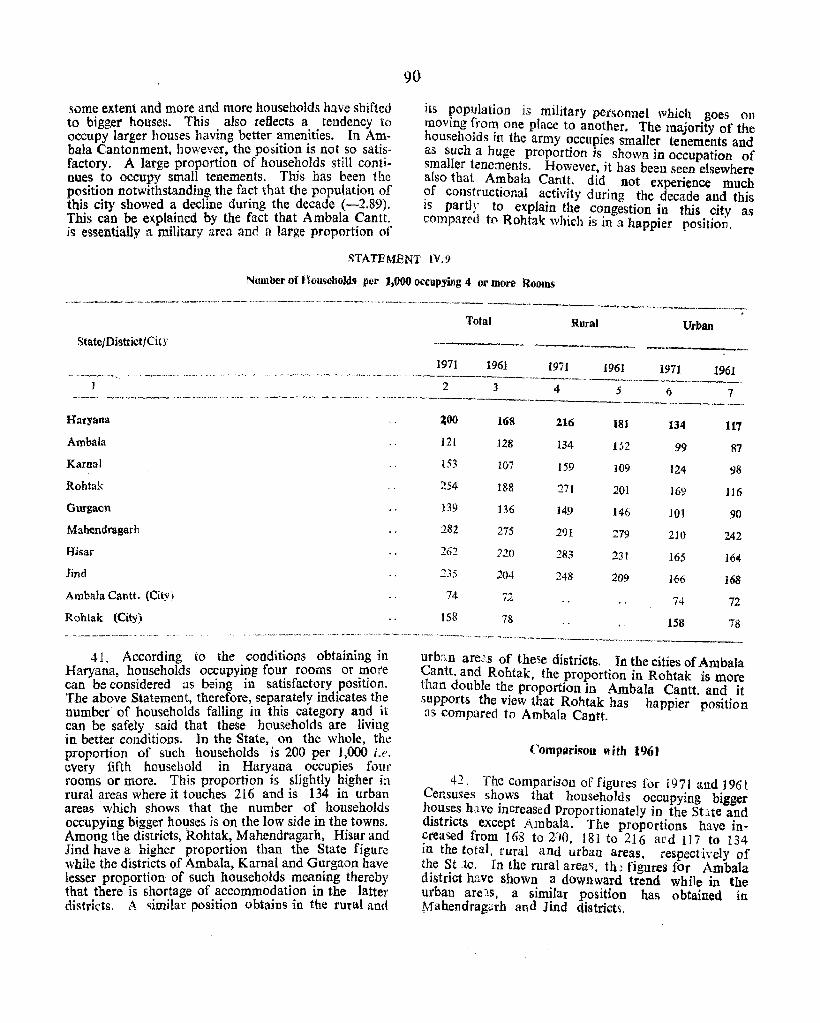
some extent and more and more households have shifted to bigger houses. This also reflects a tendency to occupy larger houses having better .a~en~ties. In A~bala Cantonment. however, the posItIOn IS not so satIsfactory. A large proportion of households still continues to occupy small tenements. This has bee.n the position notwithstanding the fact that the populatIon of this city showed a decline during the decade (-2.89). This can be explained by the fact that Ambala Cantt. ic; essentially a military area and n large proportion of
90
its population is military personnel which goes on movmg from one place to another. The majority of the households in the army occupies smaller tenements and as such a huge proportion is shown in occupation of smaller tenements. However, it has been seen elsewhere also that AJ?bala Ca,:t~. did not experience much ?f constructIOnal a~tlvlty during the decade and this IS partly to explaIn the congestion in this city as compared to Rohtak which is in a happier position.
STATEMENT IV.!>
Nnmber of 1 t()uscbolds per 1,000 occupying 4 or more Rooms
State/District/City
Haryana
Ambala
Kamal
Rohtak
Gurgaon
Mahendragarh
Hisar
lind
Ambala Cantt. (City)
Rohtak (City)
41. According to the conditions obtaining in Haryana households occupying four rooms or more can -be c~nsidered as being in satisfactory position. The above Statement, therefore, separately indicates the number of households falling in this category and it can be safely said that these households are living in better conditions. In the State, on the whole, the proportion of such households is 200 per 1,000 i.e. every fifth household in Haryana occupies fOllf rooms or more. This proportion is slightly higher in rural areas where it touches 216 and is 134 in urban areas which shows that the number of households occupying bigger houses is on the low side in th~ towns. Among the districts, Rohtak~ Mahendragarh, HISa! and Jind have a higher proportlon than the State figure while the districts of Ambala, Karnal and Gurgaon have lesser proportion of such households meaning thereby that there is shortage of accommodation in the latter districts, A similar position obtains in the rural and
Total Rural Urban
-- _-----1971 1961 1971 1961 1971 1961
---~-----~~- --~--- --~--.-----. ----2 3 4 5 (j 7
'--'--... ~ ----~-.
~oo
J21
U3
254
139
282
162
235
74
IS8
168
128
107
188
136
275
220
204
72
78
216 181
134 152
159 109
271 201
149 146
291 279
283 231
248 209
134 117
99 87
124 98
169 116
10] 90
210 242
165 164
Hi6 168
74 72
138 78
urb:ln are~s of the~e districts. In the cities of AmbaJa Cantt. and Rohtak. the proportion in Rohtak is more than double the proportion in Ambala Cantt. and it supports the view that Rohtak has happier position flS compared to Amhala Cantt. .
Comparison ~'ith 1961
42. The comparison of figures for 1971 and 1961 Censuses shows that households occupying bigger h~)Us~s h:wo increased Proportionately in the Stlte and dlstncts except Ambala. The proportions have increased from 168 to 2.)0, 181 to 216 ar'd 117 to 134 in the total, rural and urban areas, respectively of the S t :te. In the rural area'l, th ~ figures fOr Ambala district have shown a downward trend while in the urban are1S, a similar position has obtained in MahendragJrh and Jind districts.
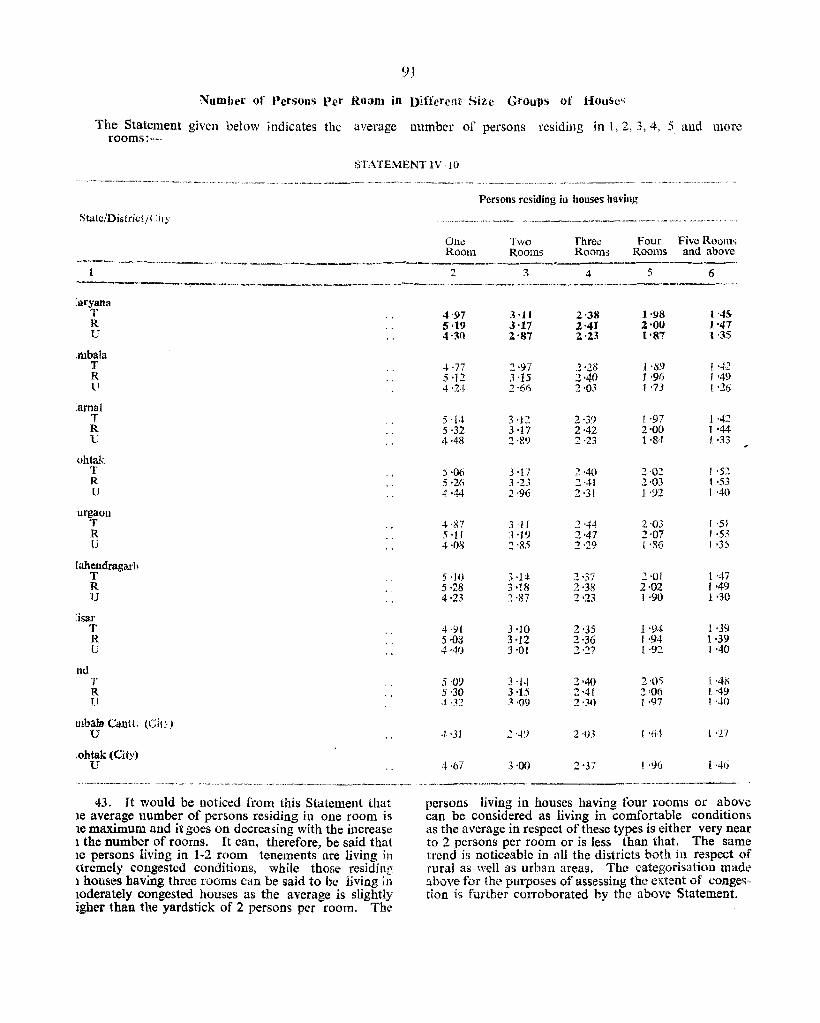
91
Number of Persons Per Roam in Different Size Grou'ps of Houses
The Statement given below indicates the average number of persons residing in 1, 2, 3, 4, 5 and more rooms:--
STATEMENT IV·JO
Sta!c/Distrjl.!t/<:il y
[aryana T R U
,rnbala T R U
:arnaJ T R U
ohtak T R U
'urgaoll T R U
!ahendragarh T R U
lisar T R U
nd T R lJ
rnbala Cantt. (City) U
~ohtak (City) U
._. ---~---"~-'-------' --... -~- ..... _.-" ~ ,, ___ ._. c~_~_ .. _.~ .... '~-~~"""'-"""'-"---~ -~.---------
43. rt would be noticed from tllls Statement that le average number of persons residing in one room is Ie maximum and it goes on decreasing with the increase 1 the number of rooms, It can, therefore, be said that 1e persons living in 1-2 room tenements are living in ttremely congested conditions. while those residing 1 houses having three rooms can be said to be living in loderately congested houses as the average is slightly igber than the yardstick of 2 persons per room. The
Persons residing in houses havillg
--
One Room
4-97 5,19 4·30
J, ·77 5 ·12 -1·24·
5,14 5·32 4·48
5·06 5·26 .:1·44
4,87 5 ·11 4,08
5 ·10 5,28 4·23
4'91 5'OS 4·40
5 '09 5·30 !':lC!
'['31
4'67
Two Rooms
3·11 3'17 ~'87
2 ·97 3 '.15 2'66
3'J2 3'17 2·89
3 ·17 3 ·23 2'96
_HI ., '19 2'85
.'\ ·1.:1-3,18 ~'87
3 '10 3 '12 3'01
3·j": 3 '15 3'()9
,2 '4~1
3 '00
~.~.--~-~--~
Three Rooms
2'38 2'41 2,'U
';'28 2·40 2'03
2·39 2·42 2,23
2·40 2,41 2'3!
.1 '4.J 2'47 2'29
2·37 2'38 2'23
2'35 2'36 2'27
2'40 2'41 2 ·~O
2'03
2'37
Four Five ROOll1~ Rooms and above
1'98 1.'43 1'00 l'47 1'87 l'35
I '1)9 I. 'J,2 1 '96 I. '49 1 '73 I '26
t '97 1 ·42 2'00 1'44 1,84- ! ·33
2,02 I '52 2·03 t ,53 1'92 I ·40
2 ,03 ! '51 2'07 1'53 [ '86 1'35
2 'Oi 1 '47 2'02 j ,49 1 '90 1 ·30
1 '94 1 '39 I '94 1'39 1 ·92 1 '40
2'05 [,48 ~'O6 l. '49 1 ·97 f 'clO
( '(il- I '27
(.9rJ l'46
---persons living in houses having foul' rooms or above can be considered as living in comfortable conditions as the average in respect of these types is either very near to 2 persons per room or is less than that, The same {rend is noticeable in all the districts both in respect of rural as well as urban areas. The categorisation made: above for the purposes of assessing the extent of conges, tion is further corroborated by the above Statement.
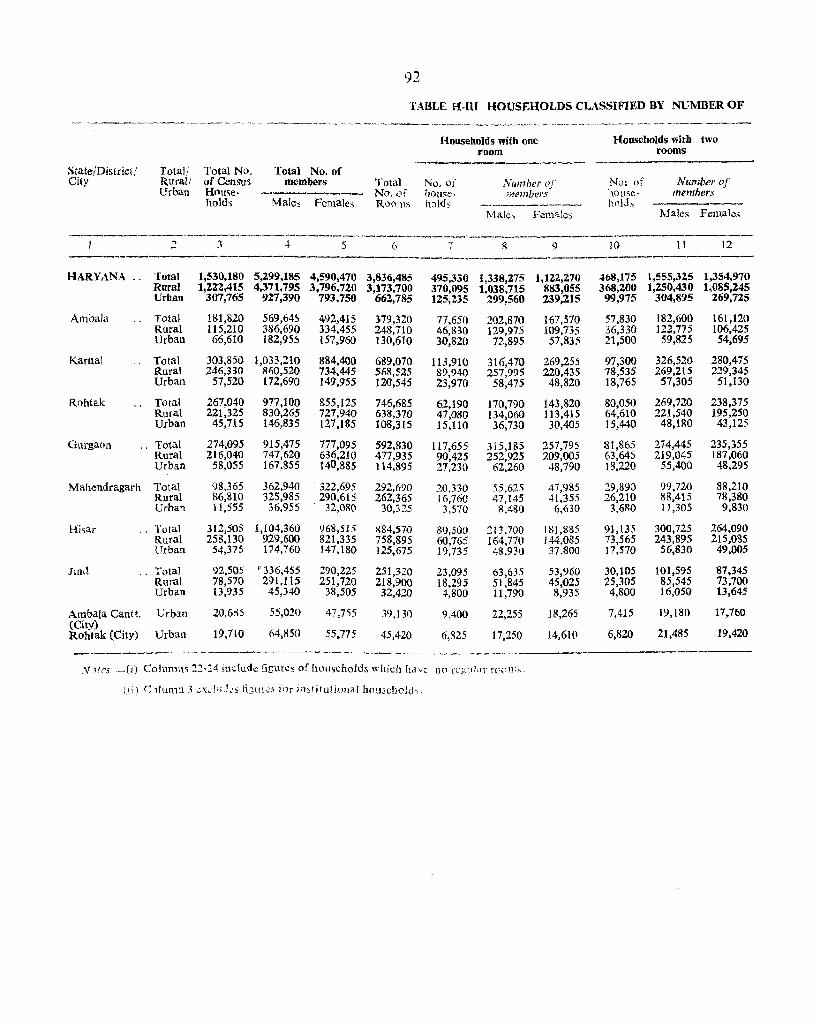
92
TABLE II-Ill HOUSEHOLDS CLASSIFIED BY NUMBER OF
--..... --~~------~,~-~--~--------~~~"--~----- - -~-------- --~----~--~~~------
Households with one ltousebolds with two room rooms
-------------State/District / Total.' Total No. Total No. of City Rurali of Censll~ members Total No. of Number or N\)~ of Number of
Urban Home- No. of hou;;e- members house- members holds Mabi Females Rooms holt!'; -------~-
hold,; Males Females Males Females
__________ ~ _________ ~~~2 __ ._~ ______ •• ____ ~_,_.._._-~ ___________ ._-----------
J 3 4 5 6 7 8 9 J() 11 12 -------------------------------~--------,,--..--.------------
HARYANA .. Total 1,530,180 5,299,185 4,590,470 3,836,485 495,330 1,338,275 1,12.2,270 468,175 1,555,325 1,354,970 Rural 1,222,415 4,371,795 3.796.720 3,173,700 370,095 1,038,715 883,055 368,200 1,250,430 1,085,245 Urban 307,765 927,390 793,750 662,785 lZ5,235 299,560 239,215 99,975 304,895 269.725
Ambala , . Total 181,820 569,645 492,415 379,320 71,65() 202,870 167,570 57,830 182,600 161,120 Rural 115,210 386,690 334,455 248,710 46,830 129,975 109,735 36,330 122,775 106,425 Urban 66,610 182,955 157.960 130,610 30,820 72,895 57,835 21,500 59,825 54,695
Karnal Total 303,850 1,033,210 884,400 689,070 113,910 316,470 269,255 97,300 326,520 280,475 Rural 246,330 860,520 734,445 568,525 89,940 257,995 220,435 78,535 269,215 229,345 Urban 57,520 172,690 149,955 120,545 23,970 58,475 48,820 18,765 57,305 51,130
Rohtak , , Total 267,040 977,100 855,125 746,685 62,190 170,790 143,820 80,050 269,720 238,375 Rural 221,325 830,265 727,940 638,370 47,080 134,060 113,415 64,610 221,540 195,250 Urban 45,715 146,835 127,185 108,315 15,110 36,730 30,405 15,440 48,180 43,125
Gurgaon " Total 274,095 915,475 777,095 592,830 117,655 315,185 257,795 81,865 274,445 235,355 Rural 216,040 747,620 636,210 477,935 90,425 252,925 209,005 63,645 219,045 187,060 Urban 58,055 167,855 140,885 114,895 27,230 62,260 48,790 18,220 55,400 48,295
Mahendragarh Total 98,365 362,940 322,695 292,690 20,330 55,615 47,985 29,890 99,720 88,210 Rural 86,810 325,985 - 290,615 262,365 16,760 47,145 41,355 26,210 88,415 78,380 Urban 11,555 36,955 32,080 30,:;25 3,570 8.480 6,630 3,680 11,305 9,830
Hisar ., Total 312,505 1,104,360 968,515 884,570 80,500 113,700 181,885 91,135 300,725 264,090 Rural 258,130 929,600 821,335 758,895 60,765 164,770 144,085 73,565 243,895 215,085 Urban 54,375 174,760 147.180 125,675 19,735 48,930 37,800 17,570 56,830 49,005
lind ., Total 92,505 c336,455 290,225 251,320 23,095 63,635 53,960 30,105 101,595 87,345 Rural 78,570 291,115 251,720 218,900 18,295 51,845 45,025 25,305 85,545 73,700 Urba.n 13,935 45,340 38,505 32,420 4,800 11,790 8,935 4,800 16,050 13,645
Ambala Cantt. Urban 20,635 55,020 47,755 39,130 9,400 22,255 18,265 7,415 19,180 17,760 (City) Rohtak (City) Urban 19,710 64,850 55.775 45,420 6,825 17,250 14,610 6,820 21,485 19,420
iV}tcS· -(0 Columns :~·14 include figures of households which ha 'e nn n:~l.dar rf,Q'_H:,),
(ii) C:1lunn _; n~lld~s fi;m", for llbtitutioll'll how,ehol(l:"
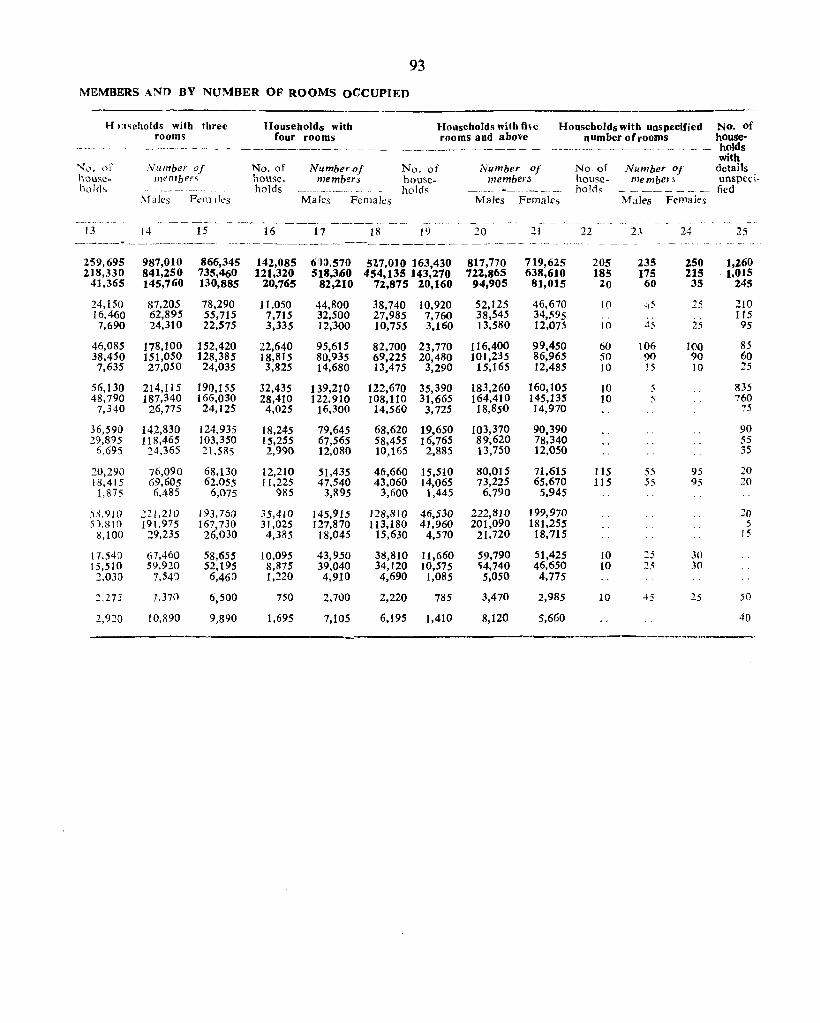
93
MEMBERS ASD BY NUMBER OF ROOMS OCCUPIED
H !:"cholds with three Households with Households with five Householdswith unspecified No. of rooms rour rooms rooms and above number ofroo-rns house--_. __ - - -- ._- - ----~---- --- -- - -- - ~.-.----~ - -- _-- - - ---_ .. -------~- -_. -- _._ .- holds
with Nv. oi~ Vlllltber of No. of Number of No. of Number of No. of Number of details house- melllben house. members house- members hotlse- memben unspcci-hold~ - "_ - - --- --. holds ---.--- - --- holds ------------------- -. holds - --- -- -- - -- - fled
1\1 ales Fen1:lks Maks Females Males Females Males Femaks
- ------ - ---- ---- -- _._ ----------_----_. _ _ -_- .. _ - _. -. 13 14 15 16 17 18 19 20 21 22 23 24 25
~~--.---.- ... -.-~~----- ---~. . -~ _--- _._._--------_._ --. ----.--.---~- _.- ---.--- "_ -_- ---,_- ._- . _--- -- -- .
259,695 987,010 866,345 142,085 6):),570 527,010 163,430 817,770 719,625 205 235 250 1,260 218,330 841,250 735,460 121,320 518,360 454,135 143,270 722,865 638,610 185 175 215 1,015
41,365 145,760 130,885 20,765 82,210 72,87S 20,160 94,905 81,015 20 60 35 245
24,150 87,205 78,290 1 t .050 44,800 38,740 10,920 52,125 46,670 10 45 2~ 210 16,460 62,895 55,715 7,715 32,500 27,985 7,760 38,545 34,~95 .. 115 7,690 24,310 22,575 3,335 12,300 10,755 3,160 13,580 12,075 10 45 25 95
46,085 178,100 152,420 22,640 95,615 82,700 23,770 116,400 99,450 60 106 100 85 38,450 151,050 128,385 18,815 80,935 69,225 20,480 101,235 86,965 50 90 90 60 7,635 27,050 24,035 3,825 14,680 13,475 3,290 15,165 12,485 10 15 10 25
56,130 214,1l5 190,155 32,435 139,210 122,670 35,390 183,260 160,105 10 .5 835 48,790 187,340 166,030 28,410 122,910 108,110 31,665 164,410 145,135 10 5 760
7,340 26,775 24,125 4,025 16,300 14,560 3,725 18,850 14,970 75
36,59D 142,830 124,935 18,245 79,645 68,620 19,650 103,370 90,390 90 29,895 118,465 103,350 15,255 67,565 58,455 16,765 89,620 78,340 55
6,695 24,365 21,585 2,990 12,080 10,165 2,885 13,750 12,050 35
20,290 76,090 68,130 12,210 51,435 46,660 15,510 80,015 71,615 lI5 55 95 20 1H,415 69,605 62,055 11,225 47,540 43,060 14,065 73,225 65,670 115 55 95 20 1,875 6,485 6,075 985 3,895 3,600 1,445 6,790 5,945
5:),910 221,210 193.760 35,410 145,915 128,810 46,530 222,810 199,970 20 5 ).810 191.975 167,730 3[,025 127,870 113,180 41,960 201,090 181,255 5
UOO 29,235 26,030 4,385 18,045 15,630 4,570 21,720 18,715 15
17,540 67,460 58,655 10,095 43,950 38,810 11,660 59,790 51,425 10 ~5 30 15,510 59,920 52,195 8.875 39,040 34,120 10,575 <;4,740 46,650 10 25 .1(1 2,030 7,54') 6,46D 1,220 4,910 4,690 1,085 5,050 4,775
2.275 7.370 6,500 750 2,700 2,220 785 3,470 2,985 10 45 25 50
l,nO 10,890 9,890 1,695 7,105 6,195 1,410 8,120 5,660 40
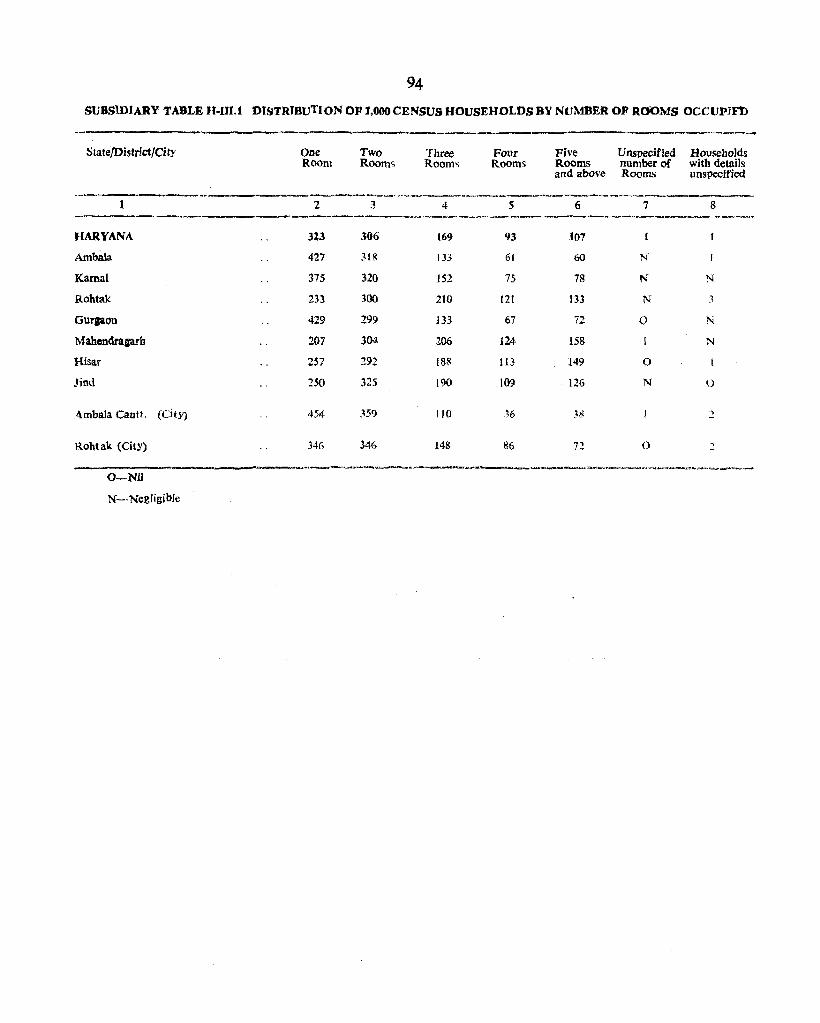
94
SUBSIDIARY TABLE H-lJl.t DISTRIBUTION OF ],000 CENSUS HOUSEHOLDS BY NUMBER OF ROOMS OCCUPJF'b
State/District/Ci ty
1
HARYANA
Ambala
Kama!
Rohtak
Gurgaon
Mahendragarb
Hisar
Jind
Ambala Calltt. (City)
Rohtak (City)
O-Nil
N-· Negligible
One Room
2
313
427
375
233
429
207
257
250
454
346
Two Rooms
Three Rooms
._~. ___ ._,_ .... m
3 4 -_ ...... __ ._-_ .. 306 169
31ii 133
320 152
300 2tO
299 133
304 206
29.: 188
325 190
359 110
346 148
Four Rooms
5
93
6J
75
121
67
124-
113
109
36
86
Five Rooms and above
6
107
60
78
133
72
158
149
126
38
n
V nspecified number of Rooms
7
N
N
N
o
o
N
o
Households with details unspecified
8
N
.1
o
SUBSIDIARY TABLE H-III.2 NUMBER OF PERSONS, MALES AND FEMALES
PER ROOM AND PERSONS PER HOUSEHOLD
95
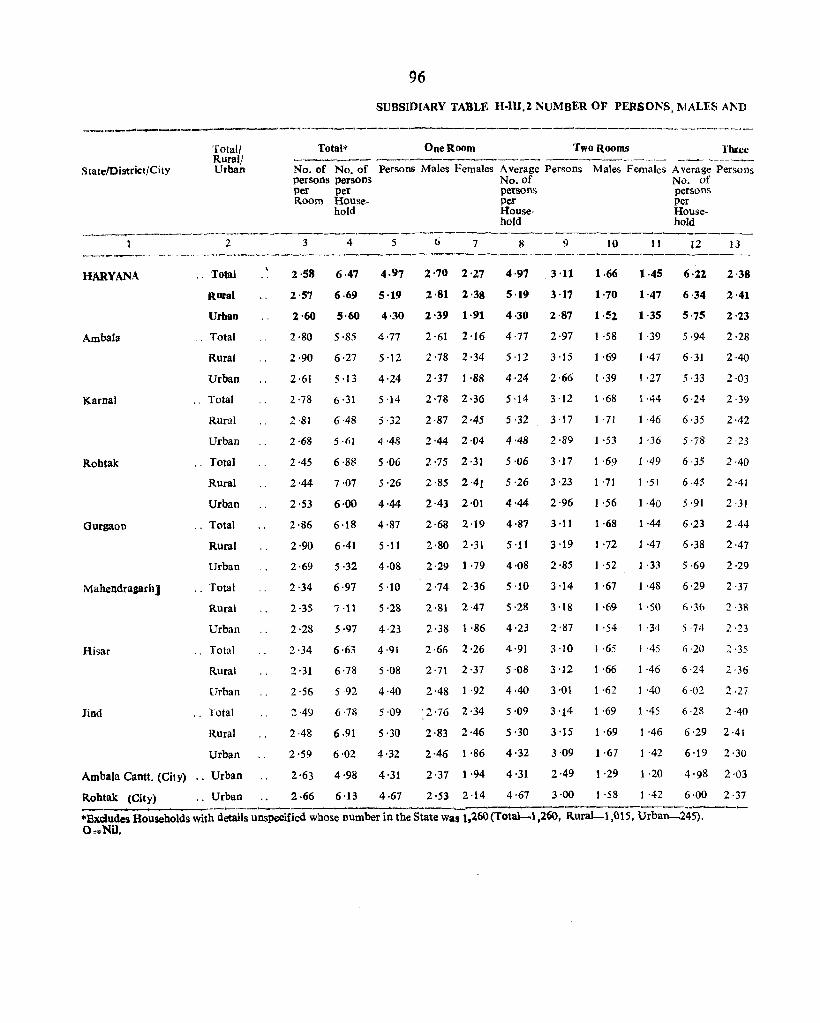
96
SUBSIDIARY TABLE H-1II.2 NUMBER OF PERSONS, MALES Al\D
-..... -~-_...-----"'------_.--~-------__,---------------------~------_----.._--
StatetDistrict/Chy
Total/ RuraJj Urban
Total'"
No. of No. of persons persons per per Room House-
hold
One Room Two Rooms Three
Persons Males Females Average Persons No. of persons per House-hold
Males Females Average Persons No. of persons per House-hold
,~-----_,_.<---------------__,------...--------'-_,_,-...".,.._,--~-------------~--
"ARYAN:\.
Ambala
Karnal
Robtak
Qurgaon
Mahendragarh 1
Hisar
lind
Ambala Cantt. (City)
Rohtak (City)
2 3 4 5 6 7 8 9 10 11 12 13
,. Total
Rural
Urban
.. Total
Rural
Urban
.. Total
Rural
Urban
., Total
Rural
Urban
.. Total
Rural
Urban
" Total
Rural
Urban
Total
Rural
Urban
" Total
Rural
Urban
Urban
.. Urban
2·58 6·47 4·97 2'70 2'27 4·97
2·57 6·69 5'19 2·81 2·38 5·19
3·11
3·17
2·87
2·97
2'60 5·60
2·80
2'90
2·61
2 '78
2 ·81
2·68
2·45
5·85
6·27
5·13
6·31
6 -48
5·61
6·88
2·44 7·07
2·53 6·00
2·86 6·18
2·90
2·69
2·34
6·41
5·32
6·97
2·35 7·11
2·28
2·34
2·31
2·56
2·49
2 -48
2'59
5·97
6·63
6·78
5·92
6·78
6·91
6·02
2·63 4·98
2·66 6·13
4·30 2'39 1·91 4·30
4·77
5 '12
4·24
5 '14
5·32
4·48
5·06
5·26
4·44
4·87
5 ·11
4·08
5 ·10
5·28
4·23
4·91
5-{l8
4·40
2'61 2·16 4·77
2'782'34
2·37 1·88
2'78 2·36
2·87 2·45
5 ·12
4·24
5 -14
5·32
2 ·44 2 '04 4 ·48
5 '06
3'15
2·66
3 '12
3 ·17
2·89
3 ·17 2 ·75 2 ·31
2·85 2·41
2·43 2·01
5 ·26 3 ·23
4·44 2·96
2·68 2·19 4·87
2·80 2'31 5 ·11
2 ·29 1 '79 4 '08
2'74 2·36 5'10
2 ·81 2·47 5·28
2 ·38 1 ·86 4 ·23
2·66 2·26 4·91
2 ·71 2 ·37 5 '08
2 ·48 1 ·92 4 ·40
5·09 '2'76 2·34 5 '09
5'30
3 ·11
3'19
2·85
3 ·14
3 ·18
2·87
3 '10
3 ·12
3·01
3 '14
3 '15
3 ·09
2·49
3·00
5'30
4'32
4'31
4·67
2·83 2·46
2·46 1·86 4·32
2·37 1·94 4·31
2'53 2·14 4·67
1·66
1·70
1 ·58
1 ·69
1 ·39
1 ·68
1 ·71
1 '53
1 ·69
1 '71
1 ·56
1 ·68
1 ·72
1 ·52
1 ·67
1 ·69
1'54
1·65
1 ·66
1 ·62
1 ·69
1 ·69
1 ·67
1 ·29
1 ·58
1·45 6·12 2·38
1·47 6·34 2·41
1·35 5'75 2·23
2·28
2·40
2·03
2·39
2·42
2·23
2·40
2·41
2·31
2·44
2·47
2·29
2·37
1 ·39
1 ·47
1·27
1 -44
1 ·46
1 ·36
1 ·49
5·94
6'31
5·33
6·24
6·35
5'78
6·35
1'51 6 ·45
1 ·40 5 ·91
1·44
1 ·47
1 ·33
1 ·48
1 ·50
1·34
1·45
1 ·46
1 ·40
1 ·45
I -46
1 -42
t ·20
I -42
6·23
6·38
5 ·69
6·29
6·36 2·38
5·74
6·20
6·24
6·02
6·28
2·23
2·35
2 ·36
2·27
2 -40
6·29 2·41
6·192'30
4'98 2·03
6·00 2 ·37
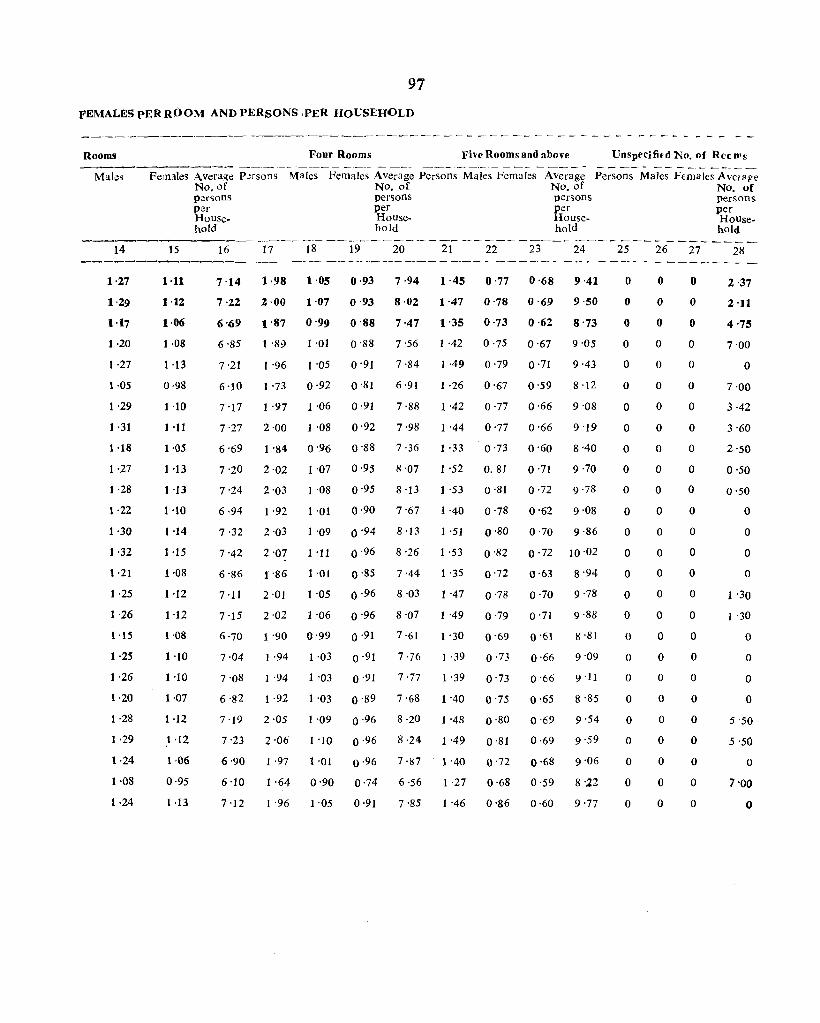
97
FEMALES PER ROOM AND PERSONS {PER HOUSEHOLD
Rooms
Males
14
1,27
1'29
1·17
1 ·20
1 ·27
1 ·05
1 ·29
1 ·31
1 ·18
1 ·27
1 ·28
1·22
1 ·30
1·32
1·21
1 ·25
1 ·26
1'15
1 ·25
1 ·26
1·20
1 ·28
1 ·29
1·24
1 ·08
1 ·24
Four Rooms Five Rooms and above Unspecifi£d No. of ReeD's
Fern3les Average p.!rsons No. of
Males Females AVerage Persons Males Females No, of
Average Persons Males FemaJes Avel2 ge No. of No, or
15
1·11
1·12
1·06
1 ·08
1-13
0·98
1 ·10
1 ,11
1·05
1-13
1 '13
1 ,10
1 ,14
1 ·15
1 ·08
1 ,12
1-12
1'08
1 ,10
1,10
1 ·07
1 ·12
1 '12
1,06
0·95
1 ·13
P:!fSOnS persons persons per Household
per House-
per House-hold hold
16
7'141,981·050·937,941·450'770'689'41
7 '22 2 ·00 1 '07 0 ·93 8 ·02 1'47 0 '78 0 '6,9 9 ·50
6 '09 1 '87 0 '99 0 '88 7 '47 1 '35 0 '73 0 ·62 8 '73
6'85 1 '89 1 '01 0'S8 7 ·56 1 '42 0'75 0'67 9'05
7'21 1 '96 1 '05 0'91 7'84 1 ·49 0'79 0·71 9 '43
6'10 1 '73 0·92 0'81 6·91 1 ·26 0'67 0'59 8'12
7'171·971'060·917'881'420'770'669'08
7'272'001'080'927'981'440'77 0'66 9'19
6'69 1'84 0'96 0'88 7'36 1,33 0'73 0'60 8'40
7 '20 2 '02 1 '07 0 ·95 8 '07 1 '52 0.81 0 '71 9 ·70
7'24 2'03 1 ·08 0'95 8'13 1 ·53 0'81 0·72 9'78
6·94 1 ·92 1 '01 0·90 7'67 1 '40 0'78 0'62 9'08
7.322'031'09 0'948'131'510'800'709'86
7 '42 2 '07 1 -11 0 ·96 8 '26 1 '53 0 '82 0·72 10 ·02
6 '86 1 '86 1 '01 0 ·85 7 '44 1 '35 0'72 0 ·63 8 '94
7'11 2'01 1 '05 0 ·96 8 '03 1 '47 0'78 0 '70 9'78
7'152'021'060'968'071'490'790'71 9'88
6-70 1 '90 0'99 0 ·91 7'61 1'30 0'69 0'61 8 '81
7 ·04 1 ·94 1 '03 0 ·91 7 -76 1 ·39 0 ·73 0 ·66 9 '09
7'08 1 ·94 1 '03 0'91 7'77 1'39 0'73 0 '66 9.11
6 -82 1 -92 1 '03 0 '89 7 '68 1 '40 0 '75 0 ·65 8 '85
7'192'051'09 0.968'20 1'480'800'699'54
7 '23 2 '06 1 '10 0 ·96 8 ·24 1 ,49 0 '81 0 ·69 9 '59
6 ·90 1 ·97 1 -01 0 ·96 7 '87 1 '40 0'72 0 '68 9 '06
6'10 1·640'900·746'561·270'680'598'22
7'121'96 1'05 0'917'851'460'860-609'77
o o
o o o o
o o o o
o
o o o o
o o
o
o
o
o o
o
o
o o
o o o o o
o
o
o
o o o
o o
o
o
o
o o
o
o
o o
o
o
o o
o o
o o
o
o
o o
o
o o
o o
o o
o
o
o o o
o
o
o o
o o
persons per HOUsehold
2·37
2 '11
4'75
7'00
o 7 -00
3·42
3-60
2'50
0,50
0'50
o o
o o
1 -30
1 '30
o
o
o o
5'50
5'50
o 7'00
o
CHAPTER V
TENURE STATUS
General Remarks
Tenure status of households has significant bearing in areas characterised by economic and cultural growth. In villages, where the economy is predominantly agrarian and opportunities of gainful employment are lacking to attract migrants from outside, there is a heavy preponderance of households living in their own houses. The bulk of residents in rural areas are permanent dwellers living there for generations occupying the same ancestral houses. For the construction of new houses, there are vast tracts of land available in the countryside. The land value is comparatively much lower in villages than in towns. There are no prescribed standards of design. The constructional materials used largely depend on the convenience and tastes of the individual house-owners, local availability and the funds available. The labour charges there are practically negligible due to the universal practice of utilizing reciprocal labour from amongst the community members. The lower castes owning no land may be allotted free plots from the village common land. The Government may also provide financial aid for the construction of houses every year to some deserving persons. It, therefore, follows that most of the households in villages live in their own houses, whether these are big buildings or small thatched huts. However, due to the spread of educational and medical facilities, introduction of electricity and canal irrigation and increased developmental activities in the rural areas, some households of school teachers, medical personnel and persons employed in different development activities, irrigation projects, electricity board, revenue department etc. may be found living in rented houses. Some big landlords construct farm houses for the use of their tenants and attached agricultural labourers which they provide free of rent. Such households are there only for a temporary period so long as their employment or service conditions require them to stay there. There may also be some industrial estates or other urban agglomerations falling outside the municipal limits of the towns and a good portion of the floating population working within the towns or in the industrial estates or other similar establishments immediately outside the municipal boundaries may be residing in the rented houses in the adjoining villages to avoid high rents obtaining in big towns and cities. These factors, though difficult to pinpoint, may individually or severally account for the district variations in the proportion of households living in rented houses in the rural areas.
2. The position, however, is much different in towns, especially in those areas where industry and business are fairly developed. Such places usually have more amenities and attract persons in search of jobs, com~ mercial opportunities or education. A substantial
98
size of the urban population, thus, consists of migrants coming and going. The proportion of households living in rented houses there is, therefore, considerable. The price of house-sites is heavy in towns and expenses involved in purchasing constructional material and hiring labour add to the cost, it is not within the means of every person to build a house of his own. Generally speaking, the higher the economic and cultural development of an area, the higher the inflow of migrants and consequently number of households living in rented ~ouses increases. On the other hand, a low proportIon of households living in rented houses indicates economic stagnation in the area.
Scope and explanation of data
3. The term 'household' has been defined as a group of persons who commonly live together and would take their meals from a common kitchen unless the exigencies of work prevented any of them from doing so. This definition covers two types of households : (1) households purely or mostly of related persons and (2) institutional households of unrelated persons such as boarding houses, hostels, residential hotels, orphanages, rescue homes, ashrams, chummeries, etc. For the purposes of presenting data pertaining to tenure status of households, institutional households have been excluded, and the figures in Table H-IV have been compiled in respect of households of solely or mostly related persons living in wholly or partly residential houses. Such households can be further divided into two categories in respect of the houses they live in : (I) households living in their own houses and not paying anything to anybody in the form of rent and (2) households living in rented or rent free houses which are owned by persons other than the members of the household. This classification of owned and rented houses may require further explanation. A household living in a flat or a house taken on ownership basis on payment of instalment was deemed to be living in its own house, notwithstanding that all instalments had not been paid. Similarly, temporary houses constructed by the households from their own funds, on the land taken on lease or encroached on or in the case of wooden stalls installed by the households themselves on municipal land for which no rent was paid and the households were entitled to remove the material or debris after a specified period or under certain conditions were also included under the scope of owned houses. Taking it to the logical conclusion it can be said that only those houses were to be considered as owned houses for which the household had full and absolute right of addition, alteration or disposal either as an individual or as a co-partner. The enumerators were, however, instructed not to verify
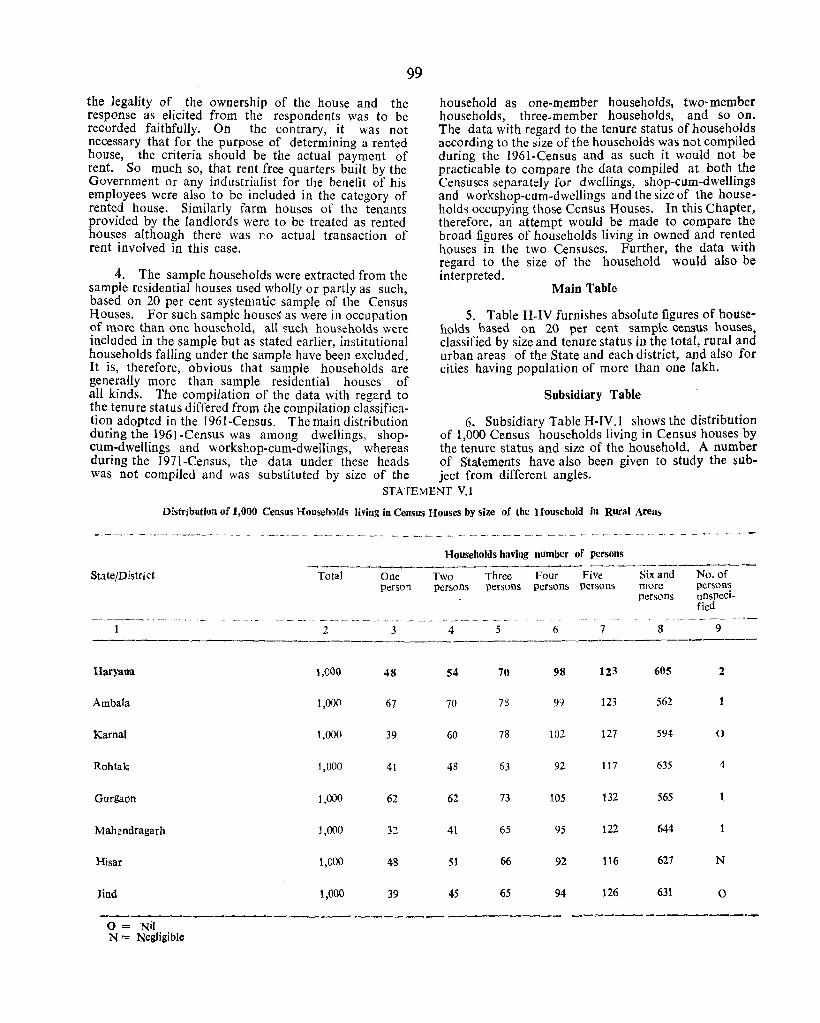
99
the legality of the ownership of the house and the response as elicited from the respondents was to be recorded faithfully. On the contrary, it was not necessary that for the purpose of determining a rented house, the criteria should be the actual payment of rent. So much so, that rent free quarters built by the Government or any industrialist for the benefit of his employees were also to be included in the category of rented house. Similarly farm houses of the tenants provided by the landlords were to be treated as rented houses although there was no actual transaction of rent involved in this case.
household as one-member households, two-member households, three-member households, and so on. The data with regard to the tenure status of households according to the size of the households was not compiled during the 1961-Census and as such it would not be practicable to compare the data compiled at both the Censuses separately for dwellings, shop-cum-dwellings and workshop-cum-dwellings and the size of the households occupying those Census Houses. In this Chapter, therefore, an attempt would be made to compare the broad figures of households living in owned and rented houses in the two Censuses. Further, the data with regard to the size of the household would also be interpreted.
Main Table
5. Table H-IV furnishes absolute figures of households based on 20 per cent sample census houses, classified by size and tenure status in the total, rural and urban areas of the State and each district, and also for cities having population of more than one lakh.
Subsidiary Table
4. The sample households were extracted from the sample residential houses used wholly or partly as such, based on 20 per cent systematic sample of the Census Houses. For such sample houses as were in occupation of more than one household, aU such households were included in the sample but as stated earlier, institutional households falling under the sample have been excluded. It is, therefore, obvious that sample households are generally more than sample residential houses of all kinds. The compilation of the data with regard to the tenure status differed from the compilation classifica-tion adopted in the 1961-Census. The main distribution 6. Subsidiary Table H-IV.! shows the distribution during the 1961-Census was among dwellings, shop- of 1,000 Census households living in Census houses by cum-dwellings and workshop-cum-dwellings, whereas the tenure status and size of the household. A number during the 1971-Census, the data under these heads of Statements have also been given to study the sub-was not compiled and was substituted by size of the ject from different angles.
STATEMENT V.l
Distribution of 1,000 Census Households living in Census Houses by size of the HQusehold in Rural Areas
- - --- - -~- -- - - - - - - ~- - - - -- -_- - -- - - -- -- - - - -- - - - - -- - -- - - - - - ._ .- -Households having number of persons ------------------------___.... ____ ---------_ .... _------ "'-
State/District Total One Two Three Four Five Six and No. of Person persons persons Persons persons more persons
persons unspeci-fied
---------~-- -_-_--- - -- - -- - - - ~ - - - --~ - - - - -- - - - _- - -_u _____ •
6_
2 3 4 5 6 7 8 9 --------------
Haryana 1,COO 48 54 70 98 123 605 2
Ambala 1,000 67 70 78 99 123 562
Kamal 1,000 39 60 78 102 127 594 0
Rohtak: 1,000 41 48 63 92 117 635 4
Gurgaon 1,000 62 62 73 105 132 565
Mahendragarh 1,000 32 41 65 95 122 644
Hisar 1,000 48 51 66 92 116 627 N
Jind 1,000 39 45 65 94 126 631 0
---------.-~ ,- --~-----------... _
0= Nil N= Negligible
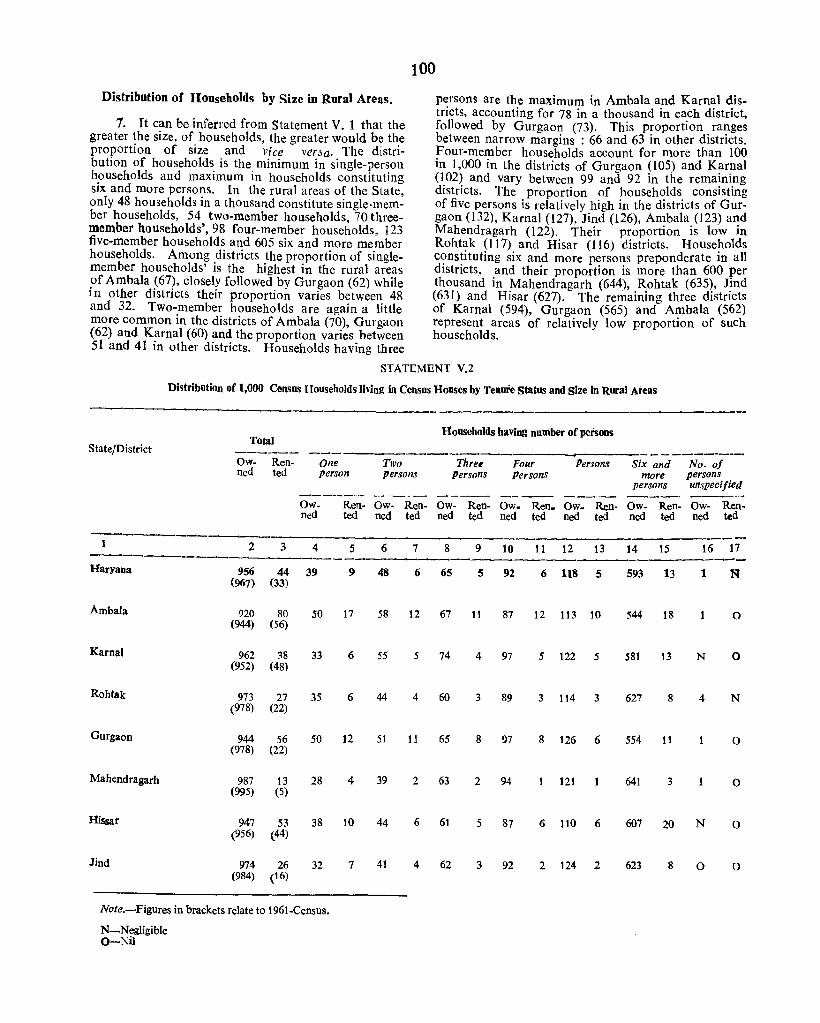
Distribution of Households by Size in Rural Areas.
1. It can be inferred from Statement V. 1 that the greater the size, of households, the greater would be the proportion of size and vice '1er sa. The distribution of households is the minimum in single-person households and maximum in households constituting six and more persons. In the rural areas of the State, only 48 households in a thousand constitute single.member households, 54 two-member households, 70 threemember households', 98 four-member households, 123 five-member households and 605 six and more member households. Among districts the proportion of single. member households' is the highest in the rural areas of Ambala (67), closely followed by Gurgaon (62) while in other districts their proportion varies between 48 and 32. Two-member households are again a little more common in the districts of Ambala (70), Gurgaon (62) and Kamal (60) and the proportion varies between 51 and 41 in other districts. Households having three
100
persons are the maximum in Ambala and Karnal districts, accounting for 78 in a thousand in each district, followed by Gurgaon (73). This proportion ranges between narrow margins : 66 and 63 in other districts. Four-member households account for more than 100 in 1,000 in the districts of Gurgaon (l05) and Karnal (102) and vary between 99 and 92 in the remaining districts. The proportion of households consisting of five persons is relatively high in the districts of Gurgaon (132), Karnal (127), Jind (126), Ambala (123) and Mahendragarh (122). Their proportion is low in Rohtak (117) and Hisar (116) districts. Households constituting six and more persons preponderate in all districts, and their proportion is more than 600 per thousand in Mahendragarh (644), Rohtak (635), Jind (631) and Hisar (627). The remaining three districts of Karnal (594), Gurgaon (565) and Ambala (562) represent areas of relatively low proportion of such households.
STATEMENT V.2
State/District
Haryana
Ambala
Karnal
Rohtak
Gurgaon
Mahendragarh
Hissar
Jind
Distribution of 1,000 Census Households Jiving in Census Houses by Tenure status and Size in Rural Meas
Total
Ow- Ren-ned ted
2 3
One person
Two persons
Households baving number of persons
Three Persons
Four Persons
Persons Six and No. of more persons
persons unspecified ------ --- --- --_- ---- --- ----Ow- Ren- Ow. Ren- Ow- Ren- Ow- Ren. Ow. Ren- Ow- Ren- Ow- Ren-ned ted ned ted ned ted ned ted ned ted ned ted ned ted
4 5 6 7 8 9 10 11 12 13 14 15 16 17
956 44 39 9 48 6 65 5 92 6 118 5 593 13 1 (967) (33)
920 80 (944) (56)
962 ~8 (952) (48)
973 27 (978) (22)
944 56 (978) (22)
987 13 (995) (5)
947 53 (956) (44)
974 26 (984) (16)
50 17
33 6
35 6
50 12
28 4
38 10
32 7
58 12 67 11 81 12 113 10
55 5 74 4 97 5 122 5
44 4 60 3 89 3 114 3
51 11 65 8 97 8 126 6
39 2 63 2 94 121
44 6 61 5 87 6 110 6
41 4 62 3 92 2 124 2
544 18 o
581 13 N o
627 8 4 N
554 11 o
641 3 o
607 20 N o
623 8 o o
Note.-Figures in brackets relate to 1961-Census.
N-NegJigible Q-Ni)
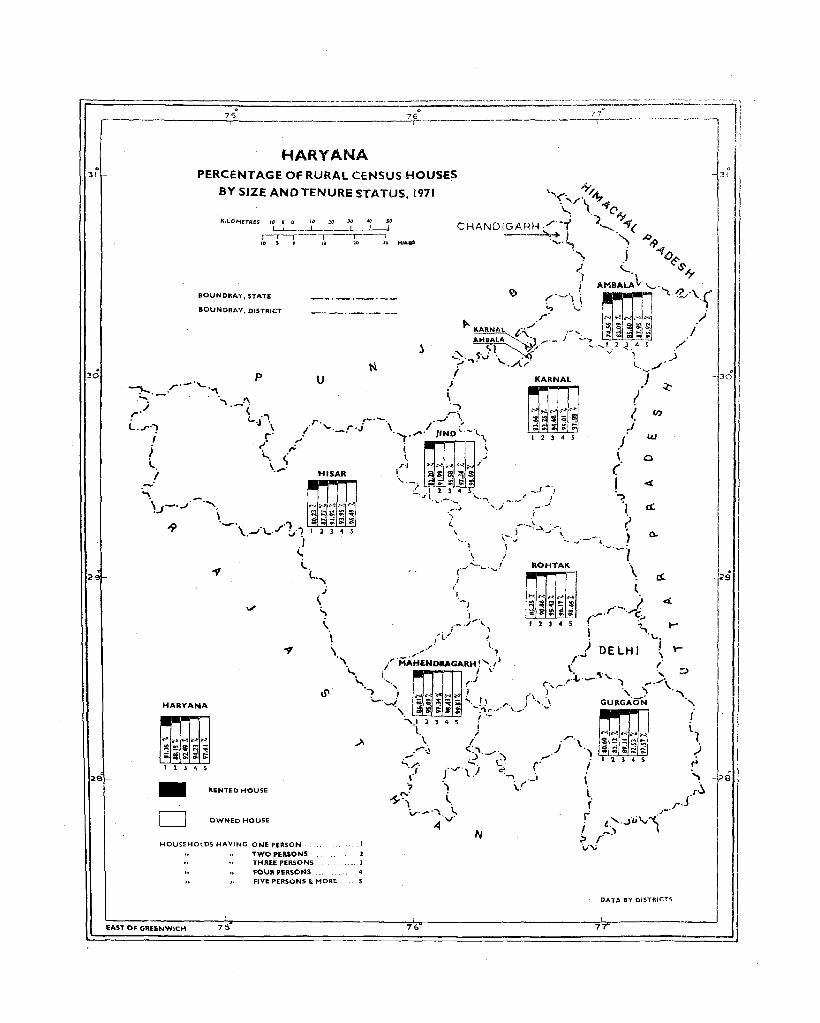
75° 760
/7
I.-------__,'::.....__---H-A-R-Y--A-N-A---'T--'-------------r----
3t" - PERCENTAGE OF RURAL CENSUS HOUSES
29
BY SIZE AND TENURE STATUS, 1971
N.JLOMf'TRfS to- 5 a Iq 10 JO 40 .50 L..._j__J_,_j____L_,_i-_ _j ,. .
BOUNDRAY. STATE
80UNCRAY. DISTRICT
HARYANA
~~~~N
~~e::l::; ;;.b!t;: 1 1 3 4 S -D
RENTED HOUSE
OWNEO HOUSE
HOUSEHOLDS HAVING ONE PERSON·
.. .. TWO PEI\SONS, THREE PERSONS .. FOUR PERSONS, FIVE PERSONS & MORE ..
,.
",I
" ",3
-, ,.
o ,- ,j i
«
t I
I ~~~_-----------~~------__ ------------------~~r_--------------------------~D~ArT-A-B-Y-D_lS_T_ft_iC_T __ S _____j :j EAST OF GRE£NWICH 75 76 7 T I

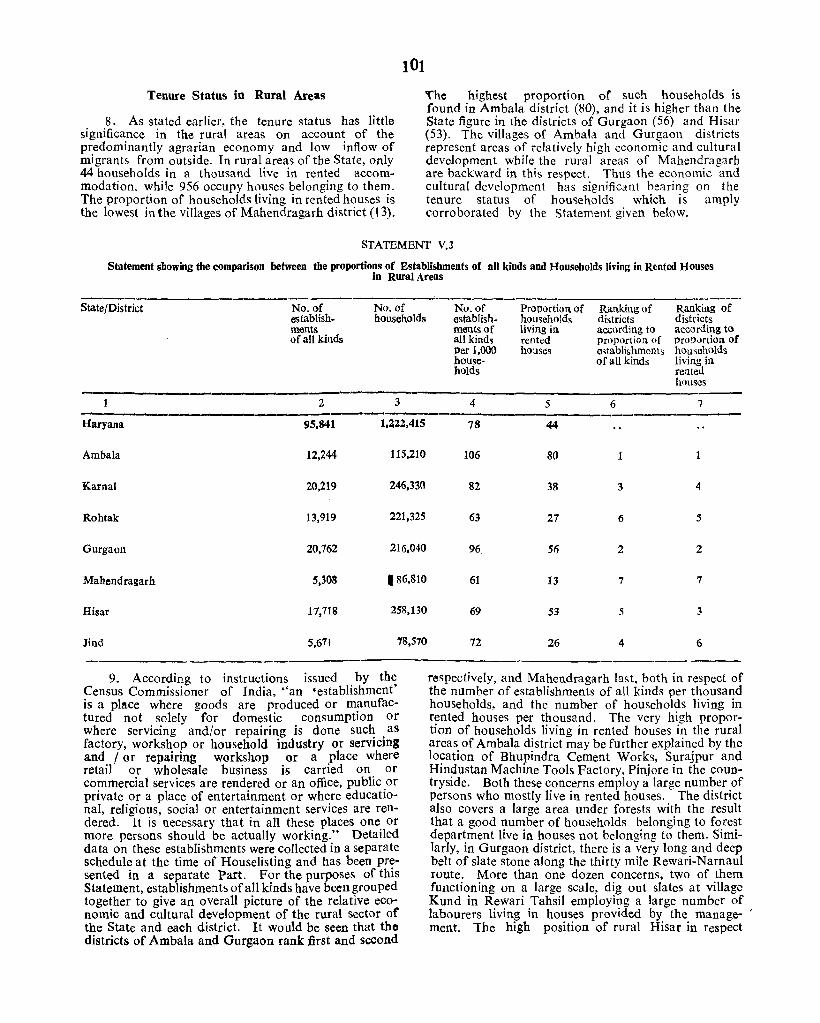
101
Tenure Status in Rural Areas
8. As stated earlier, the tenure status has little significance in the rural areas on account of the predominantly agrarian economy and low inflow of migrants from outside. In rural areas of the State, only 44 households in a thousand live in rented accommodation, while 956 occupy houses belonging to them. The proportion of households living in rented houses is the lowest in the villages of Mahendragarh district (13).
The highest proportion of' such households is found in Ambala district (80), and it is higher than the State figure in the districts of Gurgaon (56) and Hisar (53). The villages of Ambala and Gurgaon districts represent areas of relatively high economic and cultural development while the rural areas of Mahendragarh are backward in this respect. Thus the economic and cultural development has significant bearing on the tenure status of households which is amply corroborated by the Statement given below.
STATEMENT V.3
Statement showing the comparison between the proportions of Establishments of all kinds and Households living in Rented Houses in Rural Areas
State/District
Haryana
Ambala
Karnal
Rohtak
Gurgaon
Mahendragarh
Hisar
Jind
No. of establishments of all kinds
2
95,841
12,244
20,219
13,919
20,762
5,308
17,718
5,671
No. of households
3
l,lll,415
115,210
246,330
221,325
216,040
186,810
25B,130
18,570
9. According to instructions issued by the Census Commissioner of India, "an 'establishment' is a place where goods are produced or manufactured not solely for domestic consumption or where servicing and/or repairing is done suc~ . as factory, workshop or household industry or servlcmg and I or repairing workshop or a place where retail or wholesale business is carried on or commercial services are rendered or an office, public or private or a place of entertainment or where educational, religious, social or entertainment services are rendered. It is necessary that in all these places one or more persons should be actually working." Detailed data on these establishments were collected in a separate schedule at the time of Houselisting and has been presented in a separate Part. For the purposes of this Statement, establishments of all kinds have been grouped together to give an overall picture of the relative eConomic and cultural development of the rural sector of the State and each district. It would be seen that the districts of Ambala and Gurgaon rank first and second
No. of establishmentsof all kinds Per 1,000 households
4
78
106
82
63
96
61
69
72
Proportion of househOlds living in rented hl)uses
5
44
80
38
27
56
13
53
26
Ranking of districts according to proportion of establishments of aU kinds
6
3
6
2
7
5
4
Ranking of districts according to pro\)Jrtion of households living in rented houses
7
4
5
2
7
3
6
respectively, and Mahendragarh last, both in respect of the number of establishments of all kinds per thousand households, and the number of households living in rented houses per thousand. The very high proportion of households living in rented houses in the rural areas of Ambala district may be further explained by the location of Bhupindra Cement Works, Surajpur and Hindustan Machine Tools Factory, Pinjore in the countryside. Both these concerns employ a large number of Persons who mostly live in rented houses. The district also covers a large area under forests with the result that a good number of households belonging to forest department live in houses not belonging to them. Similarly, in Gurgaon district, there is a very long and deep belt of slate stone along the thirty mile Rewari-Narnaul route. More than one dozen concerns, two of them functioning on a large scale, dig out slates at village Kund in Rewari Tahsil employing a large number of labourers living in houses provided by the manage- ' ment. The high position of rural Hisar in respect
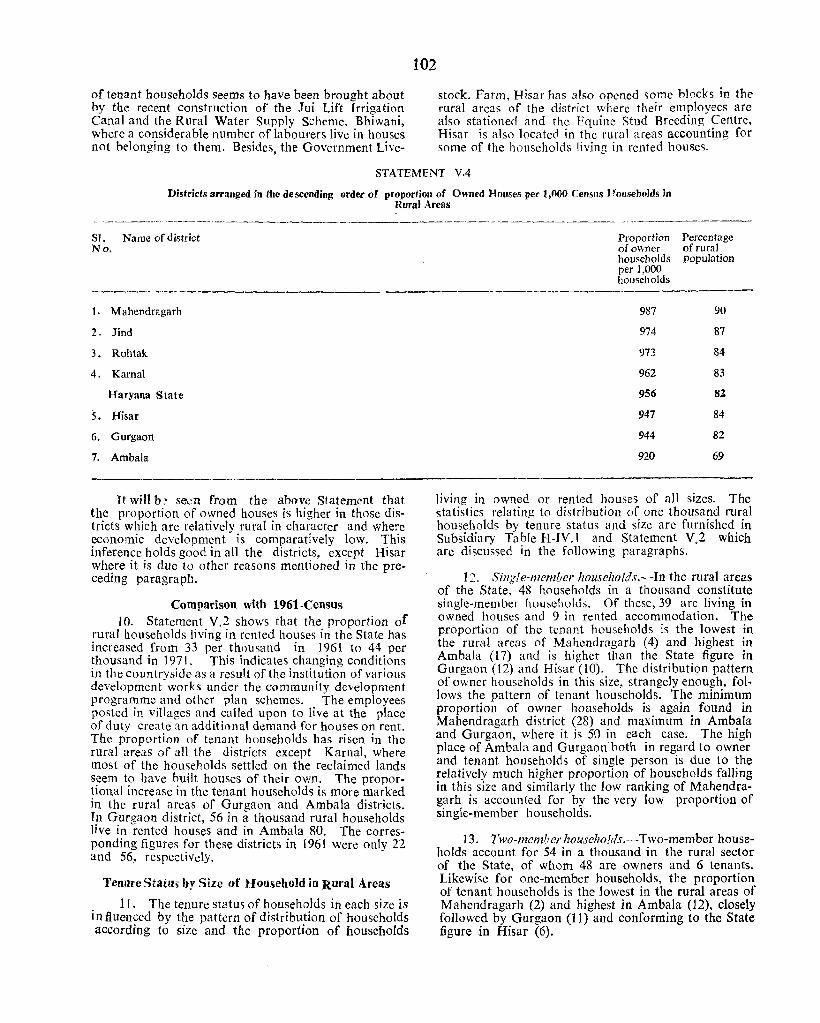
of tenant households Seems to have been brought about by the recent construction of the .lui Lift Irrigation Canal and the Rural Water Supply Scheme, Bhiwani, where a considerable number of labourers live in houses not belonging 10 them. Besides, the Government Live-
102
stock. Farm, Hisar has also opened some blocks in the rural areas of the district where their employees are also stationed and the Equine Stud Breeding Centre, Hisar is also located in the rural areas accounting for some of the households living in rented houses.
STATEMENT VA
Districts arranged in the descending order of proportion of Owned Houses per 1,000 CenslIs Households in Rural Areas
SI. Name of district No.
1. Mahendragarh
2. Jind
3. Rohtak
4. Kamal
Haryana State
5. Hisar
6. Gurgaon
7. Ambala
It will b ~ seen from the above Statement that the proportion of owned houses is higher in those districts which are relatively rural in character and where ~conomic development is comparatively low. This IUference holds good in all the districts, except Hisar where it is due to other reasons mentioned in the pre· ceding paragraph.
Comparison with 1961-Census 10. Statement V.2 shows that the proportion of
rural households living in rented houses in the State has increased from 33 per thousand in 1961 to 44 per !housand in 1971. This indicates changing conditions III the countryside as a result of the institution of various development works under the community deVelopment programme and other plan schemes. The employees posted in villages and called upon to live at the place of duty create an additional demand for houses on rent. The proportion of tenant households has risen in the rural areas of all the districts except Karnal, where mo&t of the households settled on the reclaimed lands s~em t? have ~uilt houses of their own. The propor· tionallI1crease In the tenant households is more marked in the rural areas of Gurgaon and Ambala districts. In Gurgaon district, 56 in a thousand rural households live in rented houses and in Ambala 80. The corres· ponding figures for these districts in 1961 were only 22 and 56, respectively.
TenureStattH by Size of Household in Rural Areas
. 1 I. The tenure status of households in each size is InflUenced by the pattern of distribution of households according to size and the proportion of households
Proportion of owner households per 1,000 households
Percentage of rural population
987 90
974 87
973 84
962 83
956 8Z
947 84
944 82
920 69
living in owned or rented houses of all sizes. The statistics relating to distribution of one thousand rural households by tenure status and size are furnished in Subsidiary Table H-IV.1 and Statement V.2 which are discussed in the following paragraphs.
12. Single-member households.-In the rural areas of the State, 48 households in a thousand constitute single-member households. Of these, 39 are living in owned houses and 9 in rented accommodation. The proportion of the tenant households is the lowest in the rural areas of Mahendragarh (4) and highest in Ambala (17) and is higher than the State figure in Gurgaon (12) and Hisar (10). The distribution pattern of owner households in this size, strangely enough, follows the pattern of tenant households. The minimum proportion of owner households is again found in Mahendragarh district (28) and maximum in Ambala and Gurgaon, where it is 50 in each case. The high place of Ambala and Gurgaon both in regard to owner and tenant households of single person is due to the relatively much higher proportion of households falling in this size and similarly the low ranking of Mahendragarh is accounted for by the very low proportion of single-member households.
13. Two-member households.-Two-member households account for 54 in a thousand in the rural sector of the State, of whom 48 are owners and 6 tenants. Likewise for one·member households, the proportion of tenant households is the lowest in the rural areas of Mahendragarh (2) and highest in Ambala (12), closely followed by Gurgaon (11) and conforming to the State figure in Hisar (6).
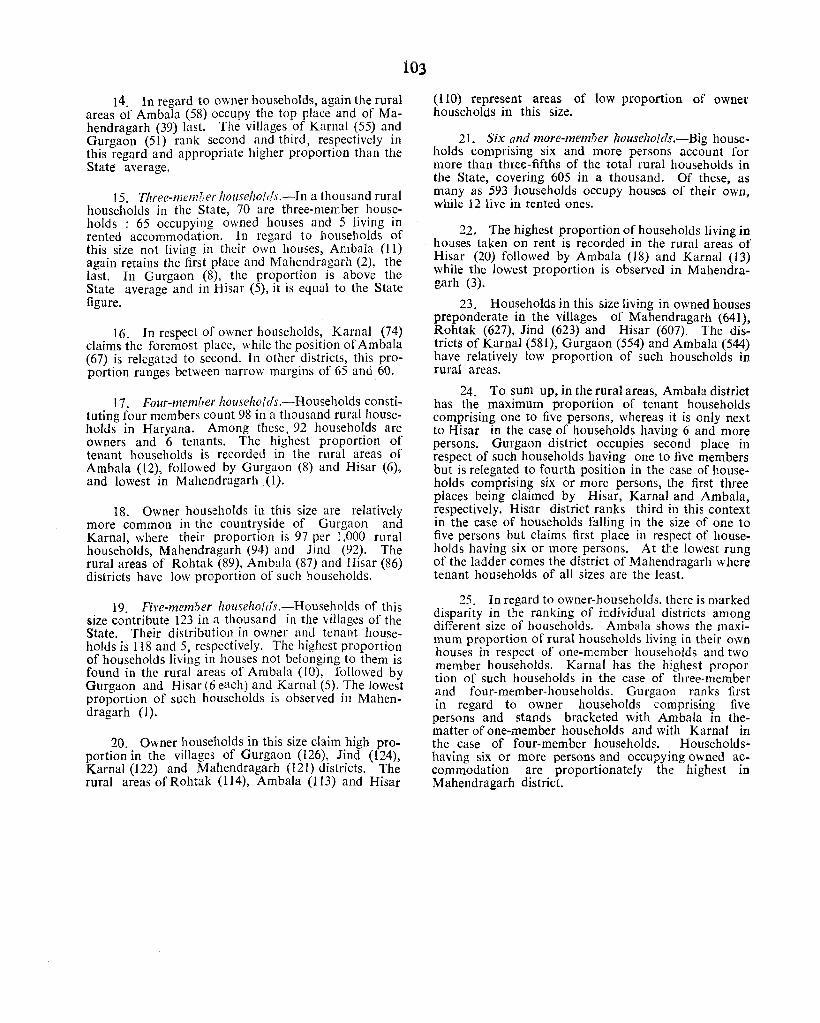
14. In regard to owner households, again the rural areas of Ambala (58) occupy the top place and of Mahendragarh (39) last. The villages of Kamal (55) and Gurgaon (51) rank second and third, respectively in this regard and appropriate higher proportion than the State average.
15. Three-memher houseJlOlds.-In a thousand rural households in the State, 70 are three-member households : 65 occupying owned houses and 5 living in rented accommodation. In regard to households of this size not living in their own houses, Ambala (II) again retains the first place and Mahendragarh (2), the last. In Gurgaon (8), the proportion is above the State average and in Hisar (5), it is equal to the State figure.
16. In respect of owner households, Karnal (74) claims the foremost place, while the position of Ambala (67) is relegated to second. I n other districts, this proportion ranges between narrow margins of 65 and 60.
17. Four-member households.-Households constituting four members count 98 in a thousand rural households in Haryana. Among these, 92 households are owners and 6 tenants. The highest proportion of tenant households is recorded in the rural areas of Ambala (12), followed by Gurgaon (8) and Hisar (6), and lowest in Mahendragarh (1).
18. Owner households in this size are relatively more common in the countryside of Gurgaon and Kamal, where their proportion is 97 per 1,000 rural households, Mahendragarh (94) and Jind (92). The rural areas of Rohtak (89), Ambala (87) and Hisar (86) districts have low proportion of such households.
19. Five-member households.-Households of this size contribute 123 in a thousand in the villages of the State. Their distribution in owner and tenant households is 118 and 5, respectively. The highest proportion of households living in houses not belonging to them is found in the rural areas of Ambala (10), followed by Gurgaon and Hisar (6 each) and Karnal (5). The lowest proportion of such households is observed in Mahendragarh (1).
20. Owner households in this size claim high proportion in the villages of Gurgaon (126), Jind (124), Kamal (122) and Mahendragarh (121) districts. The rural areas of Rohtak (114), Ambala (1l3) and Hisar
103
(110) represent areas of low proportion of owner households in this size.
21. Six and more-member households.-Big households compri~ing six and more per~ons account for more than three-fifths of the total rural households in the State, covering 605 in a thousand. Of these, as many as 593 households occupy houses of their own, while 12 live in rented ones.
22. The highest proportion of households living in houses taken on rent is recorded in the rural areas of Hisar (20) followed by Ambala (18) and Kamal (13) while the lowest proportion is observed in Mahendragarh (3).
23. Households in this size living in owned houses preponderate in the villages of Mahendragarh (641), Rohtak (627), Jind (623) and Hisar (607). The districts of Kamal (581), Gurgaon (554) and Ambala (544) have relatively low proportion of such households in rural areas.
24. To sum up, in the rural areas, AmbaJa district has the maximum proportion of tenant households comprising one to five persons, whereas it is only next to Hisar in the case of households having 6 and more persons. Gurgaon district occupies second place in respect of such households having one to five members but is relegated to fourth position in the case of households comprising six or more persons, the first three places being claimed by Hisar, Karnal and Ambala, respectively. Hisar district ranks third in this context in the case of households falling in the size of one to five persons but claims first place in respect of households having six or more persons. At the lowest rung of the ladder comes the district of Mahendragarh where tenant households of all sizes are the least.
25. In regard to owner-households, there is marked disparity in the ranking of individual districts among different size of households. Ambala shows the maximum proportion of rural households living in their own houses in respect of one-member households and two member households. Karnal has the highest propor tion of such households in the case of three"member and four-member-households. Gurgaon ranks first in regard to owner households comprising five persons and stands bracketed with Ambala in thematter of one-member households and with Kamal in the case of four-member households. Householdshaving six or more persons and occupying owned accommodation are proportionately the highest in Mahendragarh district.
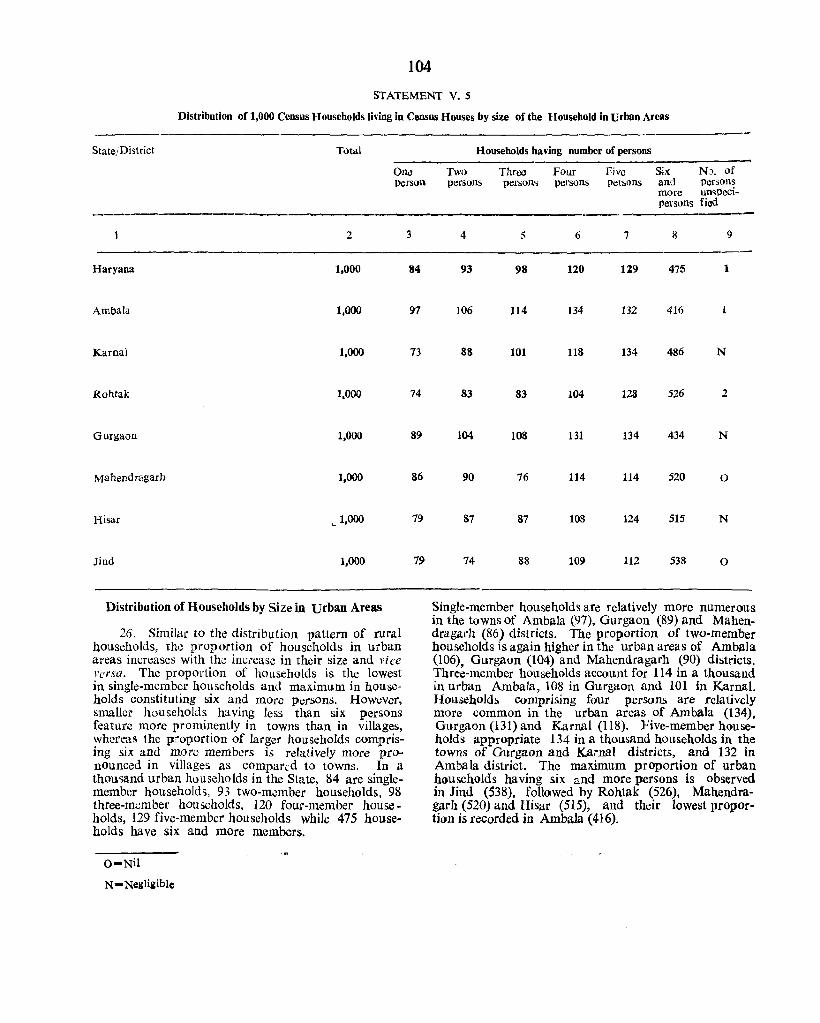
104
STATEMENT V. 5
Distribution of 1,000 Census Households living in Census Houses by size of the Household in urban Areas
State/District Total
One Person
2
Haryana 1,000
Ambala 1,000
Karnal 1,000
Rohtak 1,000
Gurgaon 1,000
Mahendragarh 1,000
Hisar L 1,000
Jind 1,000
Distribution of Households by Size in urban Areas
26. Similar to the distribution pattern of rural households, th.:: proportion of households in urban areas increases with the increase in their size and vice Versa. The proportion of households is the lowest in single-member households and maximum in households constituting six and more persons. However, smaller households having less than six persons feature more prominently in towns than in villages, whereas the proportion of larger households comprIsing six and more members is relatively more pronounced in villages as compar.:d to towns. In a thousand urban households in the State, 84 are singlemember households, 93 two-member households, 98 three-member households, 120 four-member households, 129 five-member households while 475 households have six and more members.
O-Nil
N""Negliiiblc
3
84
97
73
74
89
86
79
79
Households having number of persons
Two persons
4
93
106
88
83
104
90
87
74
Three persons
5
98
114
101
83
108
76
87
88
Four persons
6
120
134
118
104
131
114
108
109
Five persons
7
129
132
134
128
134
114
124
112
Six NJ. of and persons more unspeci-persons fied
8 9
475 1
416 1
486 N
526 2
434 N
520 0
515 N
538 0
Single-member households are relatively more numerous in the towns of Ambala (97), Gurgaon (89) and Mahendragarh (86) districts. The proportion of two-member households is again higher in the urban areas of Ambala (106) Gurgaon (104) and Mahendragarh (90) districts. Thre~-member households account for 114 in a thousand in urban Ambala, 108 in Gurgaon and 101 in Kamal. Households comprising four persons are relatively more common in the urban areas of Ambala (134), Gurgaon (131) and Kamal (118). Five-member households appropriate 134 in a thousand households in the towns of Gurgaon and Karnal districts, and 132 in Ambala district. The maximum proportion of urban households having six and more persons is observed in Jind (538), followed by Rohtak (526), Mahendragarh (520) and Risar (515), and their lowest proportion is recorded in Ambala (416).
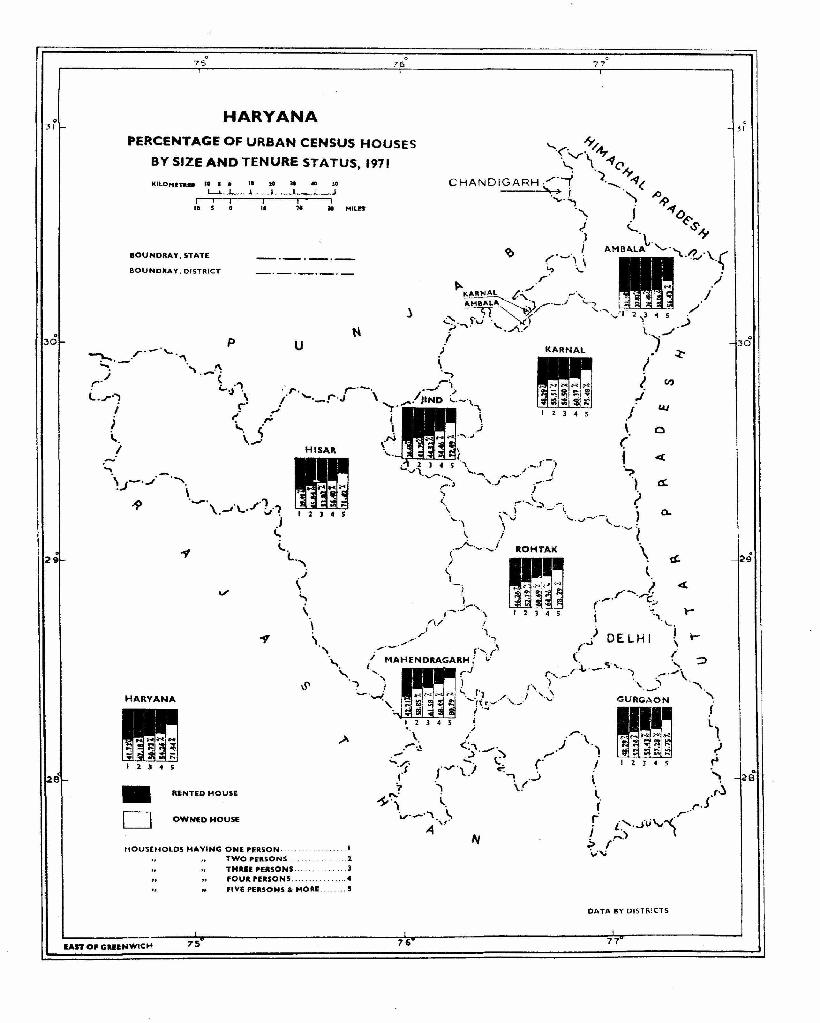
o 31
2
e
o 75 76
HARYANA PERCENTAGE OF URBAN CENSUS HOUSES
BY SIZE AND TENURE STATUS. 1971
I( ILOMII!TItU .0 I 0
,. 5
IIOUNDRAY, STATE
BOUNDRAY, DISTRICT
.,
HARYANA
p
-D RENTED HOUSE
OWNED HOUSE
.. ]I
I.
u
.,
HOUSEHOLDS HAVING ONE PERSON .. · TWO PERSONS THREE PER.SONS .. FOUR PERSONS ........ .
FIVE PERSONS" MORE ..
lAST OF GRE&NWICH 75
50
II HILEI'
1 ... 3
...5
76
77
o 31
. 30
o
.. 26
DATA BY DISTRICTS
77

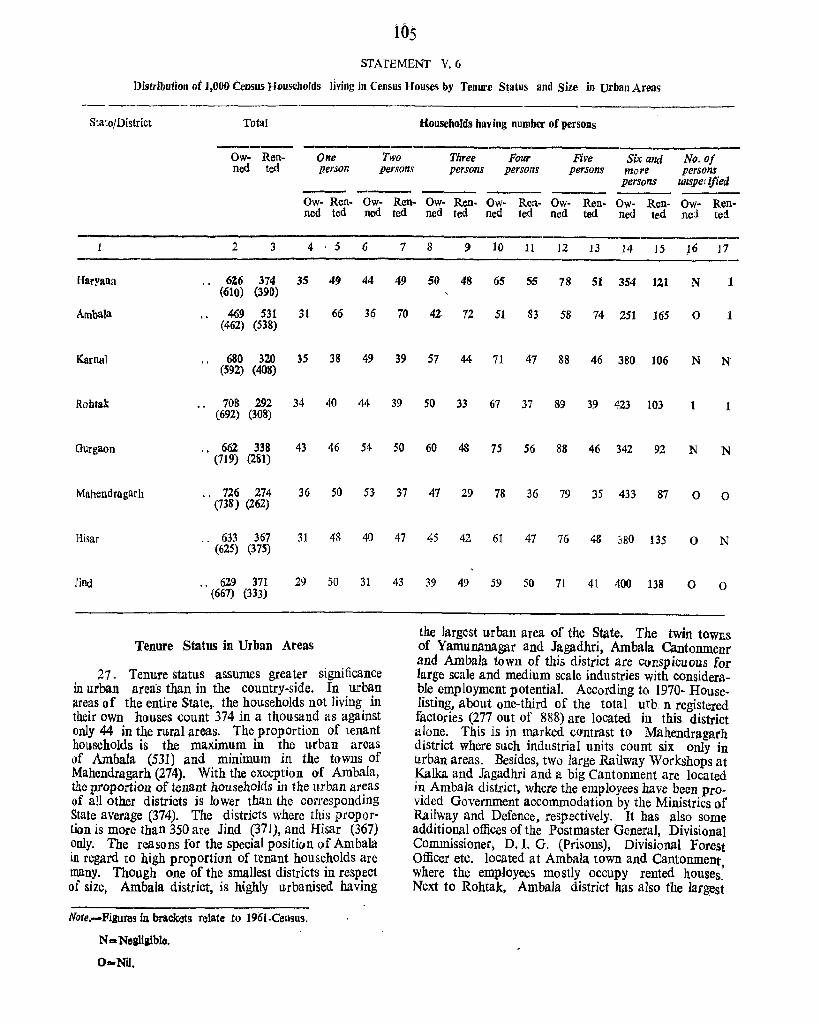
105
STATEMENT V.6
Distribution of 1,000 Census Households living in Census Houses by Tenure Status and Size in urban Areas
State/District Total Households having number of persons
Ow- Renned ted
One persoll
Two persons
Three Four Five Six and No. of persons persons persons more persons
persons unspe( ified
Ow- Ren- Ow- Ren- Ow- Ren- Ow- Ren- Ow- Ren- Ow- Ren- Ow- Ren-ned ted ned ted ned ted ned ted ned ted ned ted ned ted
2 3 4 ·56 7 8 9 10 11 12 13 14 15 J6 17
Haryana 6Z6 374 3S 49 44 49 50 48 65 55 78 51 354 lZI N 1 (610) (390)
Ambala 469 531 31 66 36 70 42 72 51 83 58 74 251 165 0 1 (462) (538)
Karnal 680 320 35 38 49 39 57 44 71 47 88 46 380 106 N N (592) (408)
Robtak 708 292 34 40 44 39 50 33 67 37 89 39 423 103 1 1 (692) (308)
OUrgaon . . 662 338 43 46 54 SO 60 48 7S 56 88 46 342 92 N N (719) (281)
Mahendrag:lrh .. 726 274 36 SO 53 37 47 29 78 36 79 35 433 87 0 0 (738) (262)
Hisar .. 633 367 31 48 40 47 45 42 61 47 76 48 JSO 135 0 N (625) (375)
Jind . . 629 371 29 50 31 43 39 49 59 50 71 41 400 138 0 0 (667) (333)
Tenure Status in Urban Areas
27. Tenure status assumes greater significance in urban areas than in the country-side. In urban areas of the entire State, the households not living in their own houses count 374 in a thousand as against only 44 in the rural areas. The proportion of tenant households is the maximum in the urban areas of Ambala (531) and minimum in the towns of Mahendragarh (274). With the exception OIf Ambala, the proportion of tenant households in the urban ar~as of all other districts is lower than the cortespondmg State average (374). The districts where this proportion is more than 350 are lind (371), and Risar (367) only. The reasons for the special positian of Ambala in regard to high proportion of tenant households are many. Though one of the smallest districts in respect of size, Ambala district, is highly urbanised having
NOfe.-Figuros in brackots relate .to 1961-Census.
N =: Neallaible.
O-NiI.
the largest urban area of the State. The twin towns of Yamunanagar and Jagadhri, Ambala Cantonmenr and Ambala town of this district are conspicuous for large scale and medium scale industries with considerable employment potential. According to 1970- Houselisting, about Qne-third of the total urb. n registered factories (277 Qut of 888) are located in this district alone. This is in marked contrast to Mahendragarh district where su.ch industrial units count six only in urban areas. Besides, two large Railway Workshops at Kalka and Jagadhri and a big Cantonment arc located in Ambala district, where the employees have been provided Government accommodation by the Ministries of Railway and Defence, respectively. It has also some additional offices of the Postmaster General, Divisional COmmissiQner, D.1. G. (Prisons), Divisional Forest Officer etc. located at Ambala town and Cantonment where the employees mostly occupy rented houses: Next to Rohtak, Ambala district has also the lar&Cst
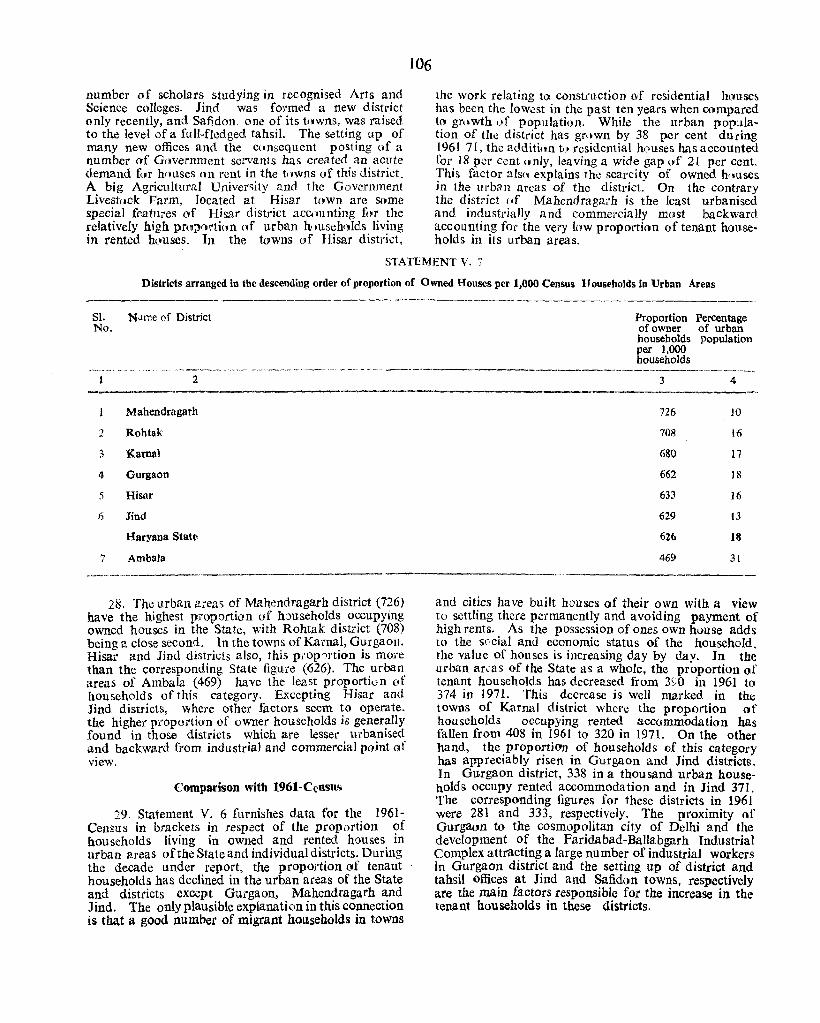
number of scholars studying in recognised Arts and Science colleges. Jind was formed a new district only recently, and Safidon. one of its towns, was raised to the level of a full-fledged. tahsil. The setting up of many new offices and the c(lnsequent posting of a number of Gl,vernment servants has created an acute demand fi,r houses on rent in the t"wns of this district. A big Agricultural University and. the Government Livestock Farm, located at Hisar town are some special features of Hisar disttict aCC<lunting fi,r the relatively high pru:i,)ortiun of urban h'lUseh,dds living in rented houses. In the towns of Hisar distdcL
106
the work relating to constlUction of residential houses has been the lOwest in the past ten years when compared to grt)wth l)f population. While the urban popula~ tion of the distl'ict has gr<lwn by 38 per cent during 1961 71, the additiun tl' residenlial houses has accounted for 18 per cent only, leaving a wide gap uf 21 per cent. This factor als(l explains the scarcity of owned h,mses in the urban areas of the district. On the contrary the district (.f Mahendragath is the least urbanised and industrially and commetcially most backward accounting for the vel'Y low proportion of tenant households in its urban areas.
STATEMENT V. 7
Districts arranged In the descending order of proportion of Owned Houses per 1,000 Census Households in Urban Areas
Sl. N..lme of District No.
2
Mahendragarh
2 Rohtak
3 Kamal
4 Gurgaon
5 Hisar
6 Jind
Haryana Stat...,
7 Ambala
2~. The urban areas of Mahendragarh district (726) have the highest proportion ()If households occupying owned houses in the State, with Rohtak district (708) being a close second. In the towns of Kamal, Gurgaon, Hisar and Jind districts also, this ptop"'ftion is more than the corresponding State figure (626). The urban areas of Ambala (469) have the least proportion of households of this category. Excepting Hisar and Jind districts, where other factors seem to operate, the higher proportion of owner households is generally found in those districts which are lesset' urbanised and backward from industrial and commercial point of view.
Comparison with 1961-Census
29. Statement V. 6 furnishes data for the 1961-Census in brackets in respect of the prop0r'tion of households living in owned and rented. houses in urban areas of the State and individual districts. During the decade under report, the proportion of tenant households has declined in the urban areas of the State and distdcts except GUl"gaon, Mahendragarh and Jind. The only plausible explanation in this connection is that a good number of migrant hOLlseholds in towns
Proportion Percentage of owner of urban households population per 1.000 households
3
726
708
680
662
633
629
626
469
4
10
16
17
18
16
13
18
31
and cities have built houses of their own with a view to settling there permanently and avoiding payment of high rents. As the possession of ones own house adds to the se,cial and economic status of the household. the value of houses is increasing day by day. In the urban ar(us of the State as a whole, the proportion of tenant households has decreased from 3~O ill 1961 to 374 in 1971. This decrease is well marked in the towns of Karnal district where the proportion of households occupying rented accommodation has fallen from 408 in 1961 to 320 in 1971. On the other hand, the proportion of households of this category has appreciably risen in Gurgaon and Jind districts. In Gurgaon district, 338 in a thousand urban hOUseholds occupy rented accommodation and in lind 371. The corresponding figures for these districts in 1961 were 281 and 333, respectively. The proximity of Gurgaon to the cosmopolitan city of Delhi and the development of the Faridabad-Ballabgarh Industrial Complex attracting a large number of industrial workers in Gurgaon district and the setting up of district and tahsil offices at Jind and Safidon towns, respectively are the main factors responsible for the increase in the tenant households in these districts.
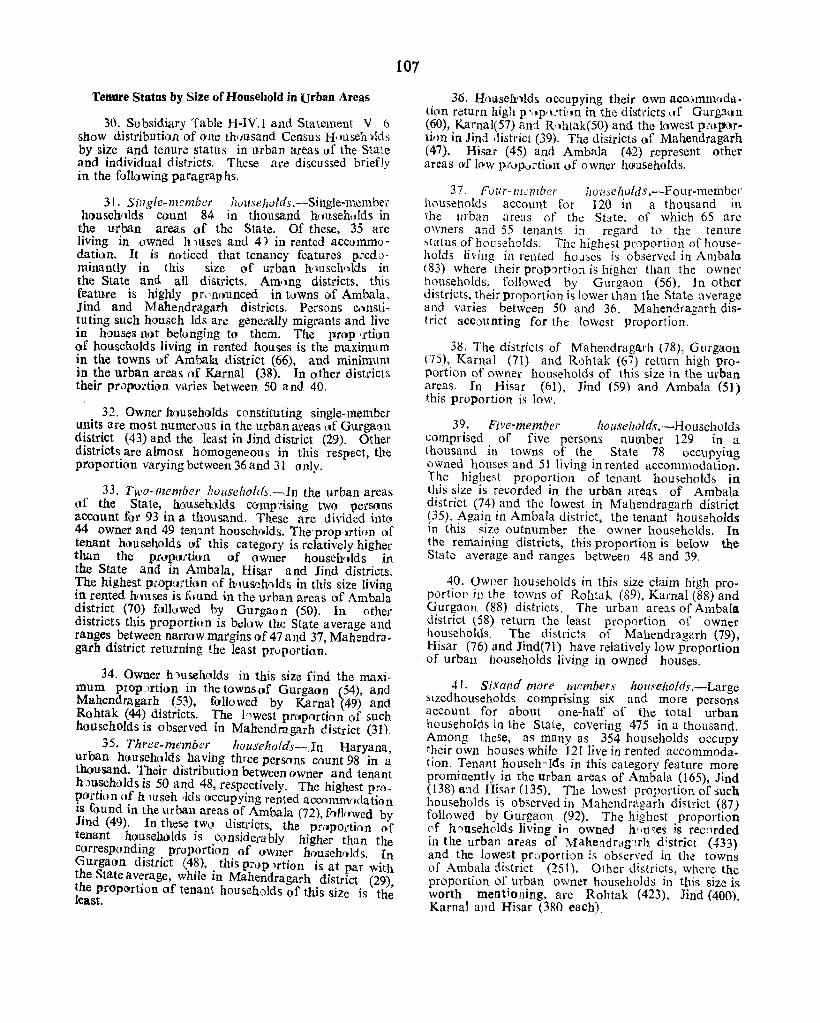
Tenure Status by Size of Household in urban Areas
30. Subsid.iary Table H-IY.l and Statement V, 6 show distribution of one th'lusand Census H mseh;)lds by size and tenure status in urban areas uf the State and individual districts, These are discussed briefly in the following paragrap hs.
31. Single-member {zollse/iolds.-Single-membe,' househrllds count 84 in thousand h(mseh'llds in
the urban areas of the State. Of these, 35 are living in owned h mses and 4) in rented accommodatiun. It is noticed that tenancy features pl'edo' minantly in this size of urban h'mscll'dds in the State and all distdcts. Amlng districts, this feature is highly pr"nounced in tuwns of Ambala. Jind and Mahendragarh districts. Persons C(lnstituting such househ Ids are genel'uIIy migrants and live in houses not belunging to them. The prop 'rtion of households living in rented houses is the maximum in the towns of Ambala district (66), and minimum in the urban areas of K.arnal (38). In other d.istrict& their propottion vades between 50 and 40,
32. Owner households constituting single-member units are most nUffier0US in the urban areas (If Gurgaoll district (43) and the least in Jind district (29). Other districts are almost homogeneous in this respect, the proportion varying between 36 and 31 only.
33. Two-member IlVuselzolds.-In the urban areas of the State, hClUsehcdds compdsing two pel'sons account fol' 93 in a thousand. These are divided into 44 owner and 49 ten'lnt households. The'prop,artion of tenant households of this category is relatively higher than the pruptJl'tion of owner househ,dds in the State and in Ambala, Hisar and Jind districts .. The highest p;op(J;:'tion of h'JUsch()lds in this size living in rented h'mses is found in the urban areas of Ambala district (70) followed by Gurgaon (50). In (lthel" districts this proportion is bel()w the State average and ranges between narrow margins of 47 and 37, Mahendragarh district returning the least pruportion.
34. Owner h')useholds in this size find the maximum prop )rtion in the tOlwnsof Gurgaon (54), and Mahendragarh (53), fullowed by Kamal (49) and Rohtak (44~ districts. The hwest pmportion of such households IS observed in Mahendragarh district (31).
35. Three-membel: 110 useholds-, In Haryana, urban households ha vlllg three perS<lns count 98 in a thousand. Their distribution between owner and tenant h:)U~eholds is 50 and 48, respectively. The highest proportion (If h luseh ,Ids occupying rented accomrn()0.ation l~ found. In the urban areas ?f ~mbala (72), frdhwed by Jlnd (49). In these ~W(l dIS~l'Icts, the prl)portillin of tenant h()~seholds IS .cunslderably higher than the correspandI~g . proportion of owner hlluseh(}lds. In Gurgaon (iIstnct (48), this prop lrtioll is at par with the State av~rage, while in Mahendragarh district (29) the proportton OIf tenant households of this size is th~ least.
107
36. Househ'llds occupying their own acoomlll(jdati(ln return high p', Ipthoti, III in the districts lIf Gurgaon (60), Karnal(57) ani R'lhtak(50) and the lowest p:"p'----.rtion in Jind district (39). The districts of Mahendragarh (47), Hisar (45) and Ambala (42) represent other areas of low pl\lpvrtion of owner hOluseholds.
37. Fullr-twmbcr hOl!seholds .-Four-member households account for 120 in a thousand in the urban areas of the State. of which 6S arc owners and 55 tenants in regard to the tenure status of househ~lds. The highest proportion of households living in rellLed houses is observed in Ambala (83) where their proportion is higher than the owner households, followed by Gurgaon (56). In other districts, their proportion is lower than the State average and varies between 50 and 36. Mahendragarh district acc0unting for the lowest proportion,
38. The districts of Mahendragarh (78), Gurgaotl (75), Kamal (71) and Rohtak (67) return high proportion of owner households of this size in the urban areas. In Hisar (61), Jind (59) and Ambala (51) this proportion is low,
39. Five-member hotlseholds.-Households comprised of five persons number 129 in a lhousand ill towns of the State 78 occupying owned houses and 51 living in rented accommDdation. The highest proportion of tenant households in this size is recorded in. the urban areas of Ambala district (74) and the lowest in Mahendragarh district (35). Again in Ambala district, the tenant households in this size outnumber the owner households. In the remaining districts, this proportion is below the State average and ranges between 48 and 39,
40. Owner households in this size claim high proportion in the towns of Rohtak (89), Kamal (88) and Gurgaon (88) districts. The urban areas of Ambala district (58) return the least proportion of owner households. The districts of Mahendragarh (79), Hisar (76) and Jind(7l) have relatively low proportion of urban households living in owned houses.
41. Sixand more members IlOtlSe!zoldl'.-Large sizedhouseholds comprising six and more persons account for about one-half of the total urban households in the State, covering 475 in a thousand. Among these, as many as 354 households occupy their own houses while 121 live in rented accommodation. Tenant househ r Ids in this category feature more prominently in the urban areas of Ambala (165), Jind (138) and Hisar (135). The lowest proportion of such households is observed in Mahendragarh district (87) followed by Gurgaol1 (92). The highest proportion of h ')useholds living in owned h('u~es is recorded in the urban areas of Mahendrag'~rh d;strict (433) and the lowest proportion is observed in the towns of Ambala district (251). Other districts, where the proportion of urban owner households in this size is worth mentioning, are Rohtak (423), Jind (400), Kamal and Risar (380 each).
.t~. To conclude, in urban areas, tenancy features prominentiy in small ~i,leJ li<}u:iellOld~ whik' the pro· portion (\fh,]usehuld~ li\·ing in o\\'ll\,:d hemsl's is ,ignjCicant in the: cas:: of lancer lJ<)U,dlO[(h. Singk-l11cmbcr households livin.0, in bn'll~e\ l1()l hd(\l1gi 11g to them ,)utnurnber the owner hous,~IJ(1!ds in a\1 dislrids while the reverse (;ondiliPl) oi)laim in tJ1c C,l~': nf lww;eholds haying six and more per,ot1s. Tlll' urban areas of Amhala district have higher proportion of tenant households as compared to owner households in tlle size of two persons, thrc: pe1'sons, four per~ons and five persons. III lind disLril.:t, the llrban househ'Jlds Jiving 1n rented hou~eo outnumber those occupying their own accommodation ill the size of tv;o persons aud three persons and in Hi:,;u distrid in the size of two persons. The high or low proportions of tenant and owner households In varlo-us sizes of the household, do not l~ad to an ea:;.y explanation 01' definite conchl-
101:1
~j\)m. However, the relative position of district~ in each size provides useful information which has been att':mpLxi [11 this chaptel-.
Tenure Status ill Cities
4,- III a tllOus;wJ Ccnsu~ Household." 704 in A1JlbaJa Cantonment and 310 in Rohtak City live ill rented accommodation. The proportion of tcnant hou~eholds in both these cities is higher than the corresponding urban proporticll of their respective districts. ThCi special position of Ambala Cantonment in regard to tenancy is obvious and needs no explanation. On ac\:ount of the large disparity between the proportion of hvo cities, AmbaJa Cantonment has invariably :l higher proportion of tenant households in all sizes of households When compared to Rohtak City.
109
TABLE H-IV
HOUSEHOLDS CLASSIFIED BY SIZE AND TENURE STATUS
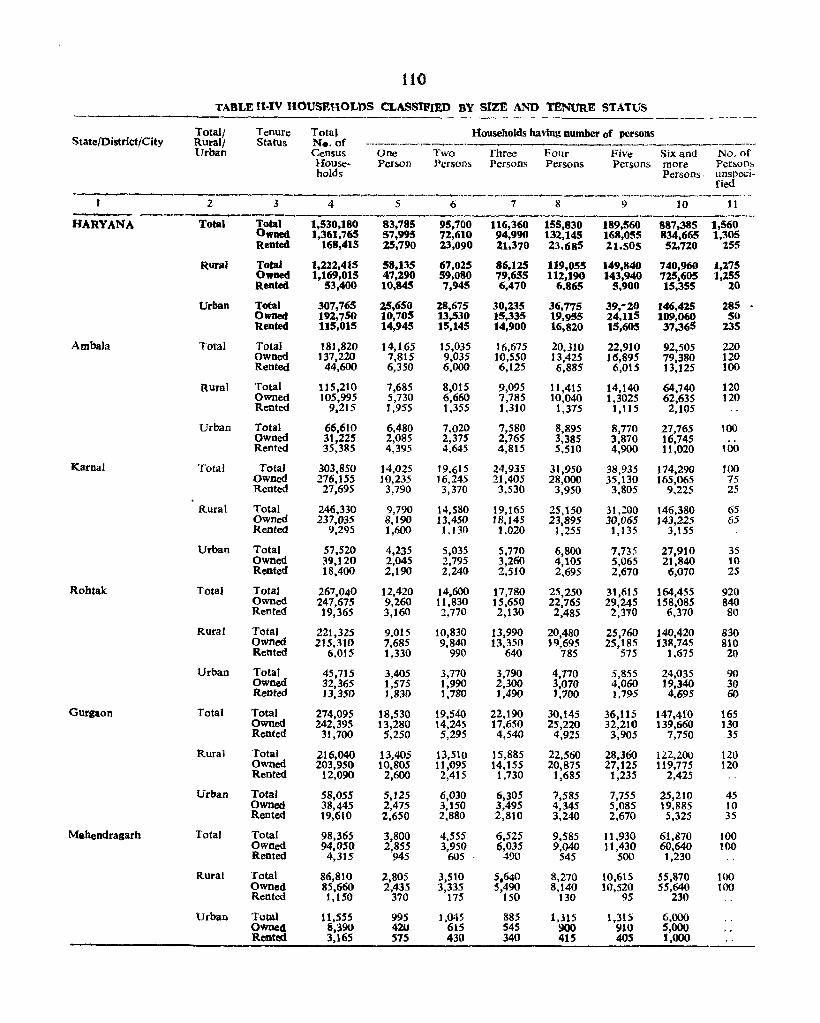
110
TABLE 1t·IV HOUSEHOLDS CLASSIFIED BY SIZE AND TENURE STATUS
Totall Tenure Total Households having number of persons StatcfDistrict/City Rurall Status N •. of --.___,~,--~.-.--...---,
._, __ ~,_,_~_J
Urban Census One Two Three Four Five Six and No. of House- Person Persons Persons Persons Persons more Persons holds Persons unspeci-
fied ~-·'~·--'-~--'''''''~·--''''~-'-'~-''''--'--'---."_-~I_---'''''____''-~'--·'·~.
2 3 4 5 6 7 8 9 10 11
HARYANA Total Total 1,530,180 83,785 95,700 116,360 155,830 189,560 887,385 1,560 Owned 1,361,765 57,995 72,610 94,990 13Z,14S 168,055 834,665 1,305 Reated 168,415 :ZS,790 13,090 ZI,370 23,685 21.505 51,nO 255
Rural Tota' 1,222,415 58,135 67,025 86,1.25 119,055 149,840 740,960 1,275 0,,_ 1,169,015 47,290 59,080 79,655 112,190 143,940 725,605 1,255 Rented 53,400 10,845 7,945 6,470 6,865 5,900 15,355 20
Urban Total 307,765 ZS.650 28,675 30,235 36,775 39,~20 146.425 285 Owned 192,750 10,705 13,530 15,335 19,955 24,115 109,060 SO Reated 115,015 14,945 15,145 14,900 16,820 15,605 37,365 235
Ambala Total Total 181,820 14,165 15,035 16,675 20,310 22,910 92,505 220 Owned 137,220 7,815 9,035 10,550 13,425 16,895 79,380 120 Rented 44,600 6,350 6,000 6,125 6,885 6,015 13,125 100
Rural Total 115,210 7,685 8,015 9,095 11,415 14,140 64,740 120 Owned 105,995 5,730 6,660 7,785 10,040 1,3025 62,635 120 Rented 9,215 1,955 1,355 1,310 1,315 1,115 2,105
urban Total 66,610 6,480 7,020 7,580 8,895 8,770 27,765 100 Owned 31,225 2,085 2,375 2,765 3,385 3,870 16,745 Rented 35,385 4,395 4,645 4,815 5,510 4,900 11,020 100
Karnal Total Total 303,850 14,025 19,615 24,935 31,950 38,935 174,290 tOO Owned 276,155 10,235 16,245 21,405 28,000 35,130 165,065 75 Rented 27,695 3,790 3,370 3,530 3,950 3,805 9,225 25
Rural Total 246,330 9,790 14,580 19,165 25,150 31,200 146,380 65 Owned 237,035 8,190 13,450 18,145 23,895 30,065 143.225 65 Rented 9,295 1,600 ',130 1,020 1,255 1,135 3,155
Urban Total 57,520 4,235 5,035 5.770 6,800 7,735 27,910 35 Owned 39,120 2,045 2,795 3,260 4,105 5,065 21,840 10 Rented 18,400 2.190 2,240 2,510 2,695 2,670 6.070 25
Robtak: Total Total 267,040 12,420 14,600 17,780 25,250 31,615 164,455 920 Owned 247,675 9,260 11,830 15,650 22,765 29,245 158,085 840 Rented 19,365 3,160 2,770 2,130 2,485 2,310 6.370 80
Rural Total 221,325 9,015 10,830 13,990 20,480 25,760 140,420 830 Owned 215,310 7,685 9,840 13,350 19,695 25,185 138,745 810 Rented 6.015 1.330 990 640 785 575 1.675 20
Urban Total 45,715 3,405 3,770 3,790 4,770 5,855 24,035 90 Owned 32,365 1,575 1,990 2,300 3,070 4,060 19,]40 30 Rented 13,350 1,830 1,180 1,490 1,100 1,795 4,695 60
Gurgaon Total Total 274,095 18,530 19,540 22,190 30,145 36,115 147,410 165 Owned 242,395 13,280 14,245 17,650 25,220 32.210 139,660 130 Rented 31,700 5,250 5,295 4,540 4,925 3,905 7,750 35
Rural Total 216,040 13,405 13,510 15,885 22,560 28,360 122,200 120 Owned 203,950 10,805 11,095 14,155 20,875 27,125 119,775 120 Rented 12,090 2,600 2,415 1,730 1,685 1,235 2,425
Urban Total 58,055 5,125 6,030 6,305 7,585 7,755 25,210 45 Owned 38,445 2,475 3,150 3,495 4,345 5,085 19,885 10 Rented 19,610 2,650 2,880 2,810 3,240 2,670 5,325 35
Mahendragarh Total Total 98,365 3,800 4,555 6,525 9,585 1 t ,930 61,870 100 Owned 94,050 2,855 3,950 6,035 9,040 11,430 60,640 100 Rented 4,315 945 605 490 545 500 1,230
Rural Total 86,810 2,805 3,510 5,640 8,270 10,615 55,870 100 Owned 85,660 2,435 3,335 5,490 8,140 10,520 55,640 100 Rented 1,150 370 175 ISO 130 95 230
Urban Total 11,555 995 1,045 885 1.315 t,315 6,000 Owned 8,390 420 615 545 900 910 5,000 Rented 3,165 57S 430 340 415 405 1,000
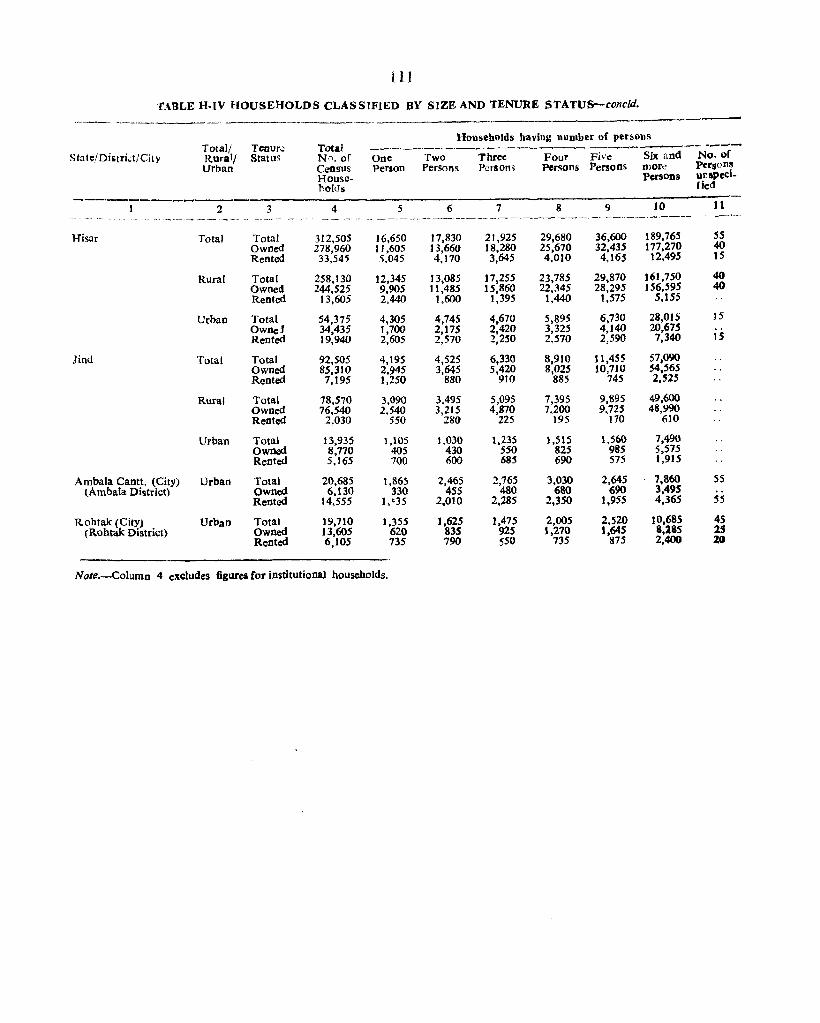
III
TABLE H-IV HOUSEHOLDS CLASSIFIED BY SIZE AND TENURE STATUS-conc/d •
.. --. Households having number of per~ons
Total/ Tenur.! Total ~-""""-'--'-----" -----State/Diiari.:t/City Rural/ StatuS Nn. of One Two Three Four Fh'e Six and No. of
Urban Census Person PerSOns PerSOn'> Persons Persons more Person~
House- Persons Ut1 lpecl -
holds fied
Z 3 4 5 6 7 8 9 10 11 _-_ .. ~ -- -- - _._ ._,,- -.' -- -- . __ -- ._ --- - ~ -- --~. --_. ~-'----~-' ~-.---~---------- -~-.---.-~---~-..__"
Hisar Total Total 312,505 16,650 17,830 21,925 29,680 36,600 189,765 55 Owned 278,960 11,605 13,660 18,280 25,670 32,435 177,270 40 Rented 33,545 5,045 4,170 3,645 4,010 4,165 12,495 15
Rural Total 258,130 12,345 13,085 17,255 23,785 29,870 161,750 40 Owned 244,525 9,905 11,485 15,860 22,345 28,295 156,595 40 Rented 13,605 2,440 1,600 1,395 1,440 1,575 5,155
Urban Total 54,375 4,305 4,745 4,670 5,895 6,730 28,015 )5 Ownef 34,435 .1,700 2,175 2,420 3,325 4,140 20,675 Rented 19,940 2,605 2,570 2,250 2,570 2,590 7,340 IS
lind Tota! Total 92,505 4,195 4,525 6,330 8,910 11,455 57,090 Owned 85,310 2,945 3,645 5,420 8,025 10,710 54,565 Rented 7,J95 1,250 880 910 885 745 2,525
Rural Total 78,570 3,090 3,495 5,095 1,395 9,895 49,600 Owned 76,540 2,540 3,215 4,870 7,200 9,725 48,990 Rented 2,030 550 280 225 195 170 610
Urban Total 13,935 },105 1,030 1,235 1,515 1,:;60 7,490 Owned 8,770 405 430 550 825 985 5,575 Rented 5,165 700 600 685 690 575 1,915
Ambala Cantt. (City) Urban Total 20,685 1,865 2,465 2,765 3,030 2,645 7,860 55 tAmbala District) owned 6,130 330 455 480 680 690 3,495
Rented 14.555 1,~35 2,010 2,285 2,350 1,955 4,365 55
Rohtak (CitY) Urban Total 19,710 1,355 1,625 1,475 2.005 2,520 10,685 45 (Rohtak: District) Owned 13,605 620 835 925 1,270 1,645 8,285 25
Rented 6.105 735 790 550 735 875 2,400 20
Note.~Column 4 excludes figures Cor institutional househOlds.
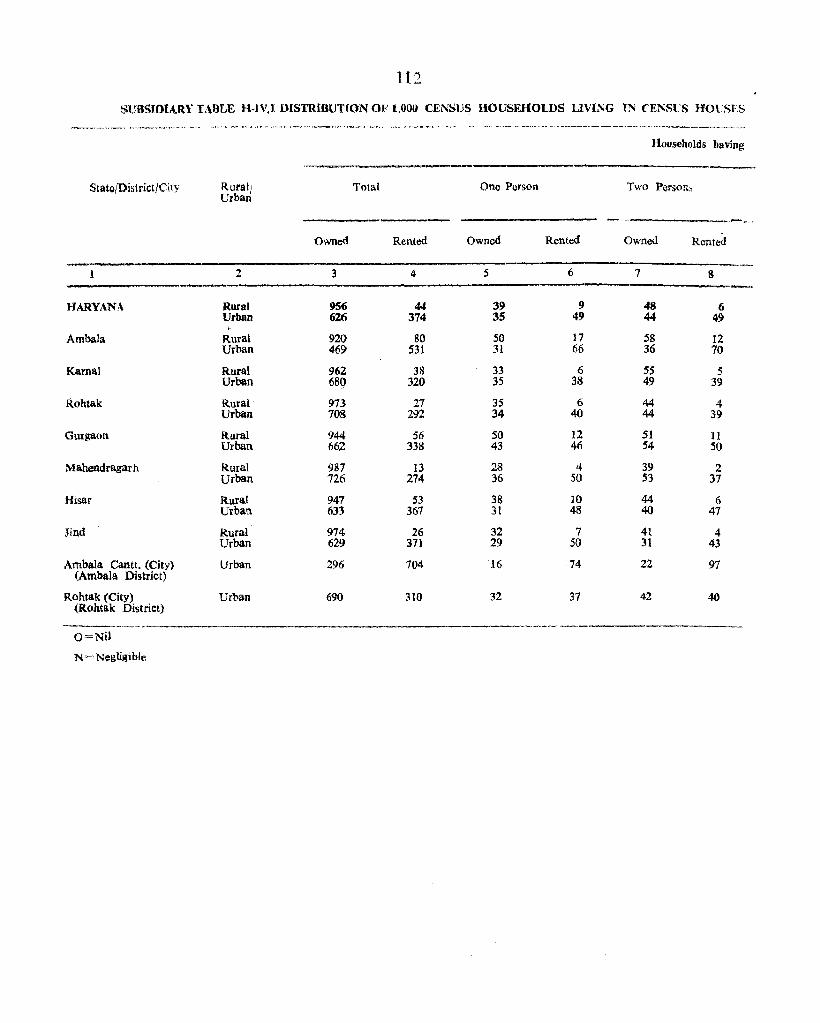
112
SUBSIDIARY TABLE H..lV.l DISTRIBUTiON OF' 1,000 CENSUS HOUSEHOLDS LIVING IN CEl"SrS HOl"SES
StateiDistrictjCi.ty
1
HARYANA
Ambala
Kamal
Rohtak
Gurgaon
Mabendragar h
Hisar
Jind
Ambala Cantt. (City) (Ambala District)
Rohtak (City) (Rohtak Distriet)
O=Nil
N=Negiigible
Rural; Urban
2
Rural Urban
Rural Urban
Rural Urban
Rural Urban
Rural Urban
Rural Urban
Rural Urban
Rural Urban
Urban
Urban
Total
---Owned Rented
3 4
956 44 6Z6 374
920 80 469 531
962 38 680 320
973 27 708 292
944 56 662 338
987 13 726 274
947 53 633 367
974 26 629 371
296 704
(j90 310
Households having
----------.--------.----------One Person Two Porsons
Owned Rented Owned Rented
5 6 7 8
39 9 48 6 35 49 44 49
SO 17 58 12 31 66 36 70
33 6 55 5 35 38 49 39
35 6 44 4 34 40 44 39
50 12 51 11 43 46 54 50
28 4 39 2 36 50 53 37
38 10 44 6 31 48 40 47
32 7 41 4 29 50 31 43
16 74 22 97
32 37 42 40
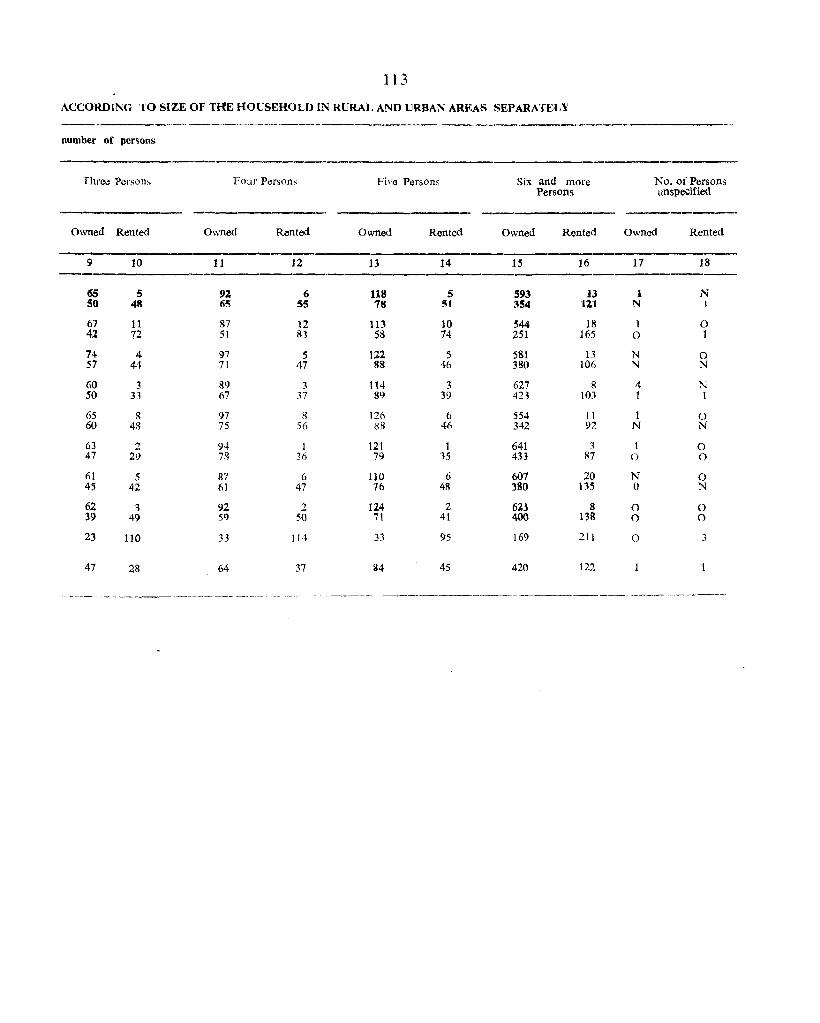
113
ACCORDING TO SIZE OF THE HOUSEHOLD IN RURAL AND URBAN AREAS SEPARATELY
----, number of persons
Three Persons Foul' Persons Fil'e Persons Six and more No. of Persons Persons unspecifie<.\
Owned Rented Owned Rented Owned Rented Owned Rented Owned Rented
9 10 11 12 13 14 15 16 17 18
65 5 92 6 118 5 593 13 1 N SO 48 65 55 78 51 354 111 N I
67 11 87 12 113 10 544 18 1 0 42 72 51 83 58 74 251 165 0 1
7·~ 4 97 5 122 5 581 13 N 0 57 44 71 47 88 46 380 106 N N
60 3 89 3 114 3 627 8 4 N 50 33 67 37 89 39 423 103 I I
65 S 97 S 121) 6 554 II 1 0 60 48 75 56 88 40 342 92 N N
63 2 94 I 121 1 641 3 1 0 47 29 73 36 79 ,5 433 S7 0 0
61 5 87 (, 110 (I 607 20 N 0 45 42 61 47 76 48 380 135 0 N
62 3 92 2 124 2 623 8 0 0 39 49 59 50 7! 41 400 138 0 0
23 110 33 114 33 95 169 211 0 3
47 28 64 37 84 45 420 122
.~---~~~~~-.--.~---- --- --- ------- --<--~~- --~- .. --

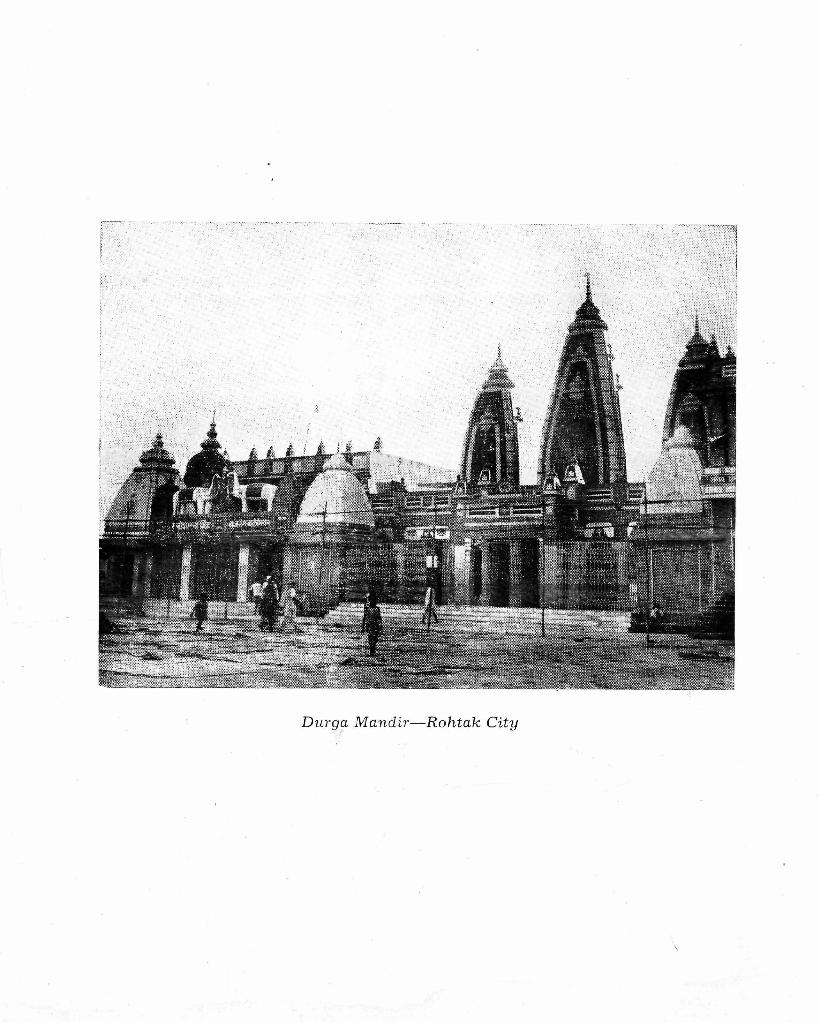
Durga Mandir-Rohtak City
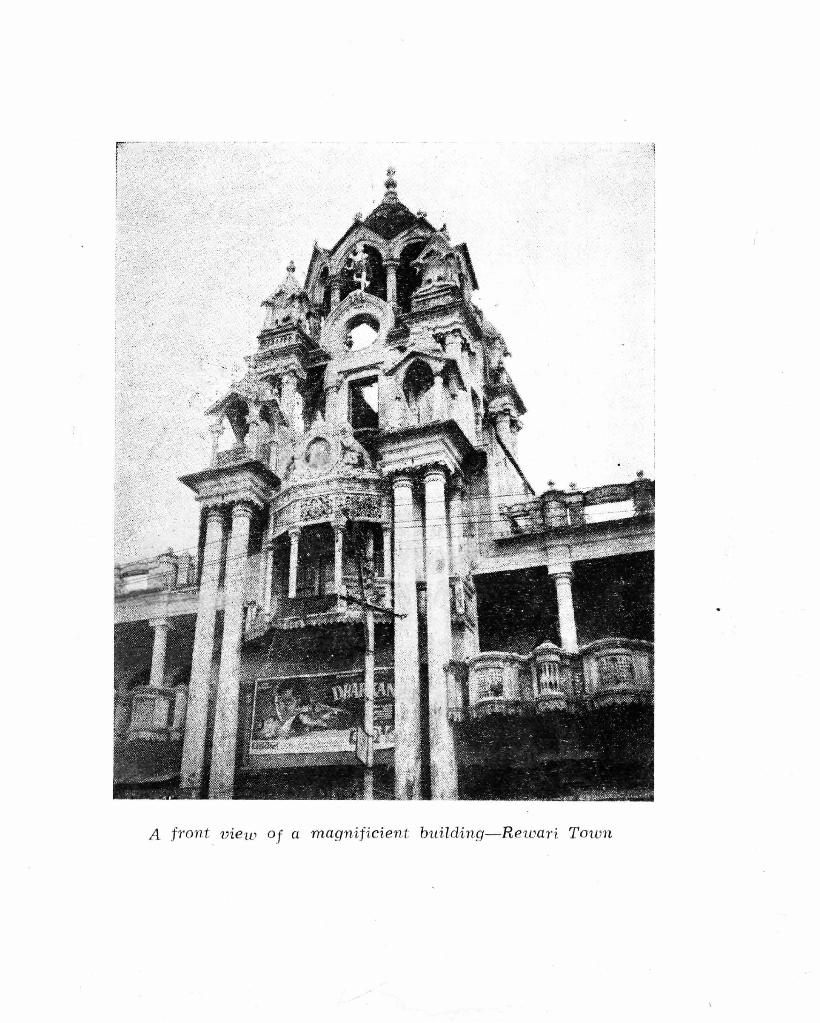
A f'wnt view of a magnificient building- Rewa'I''i Town
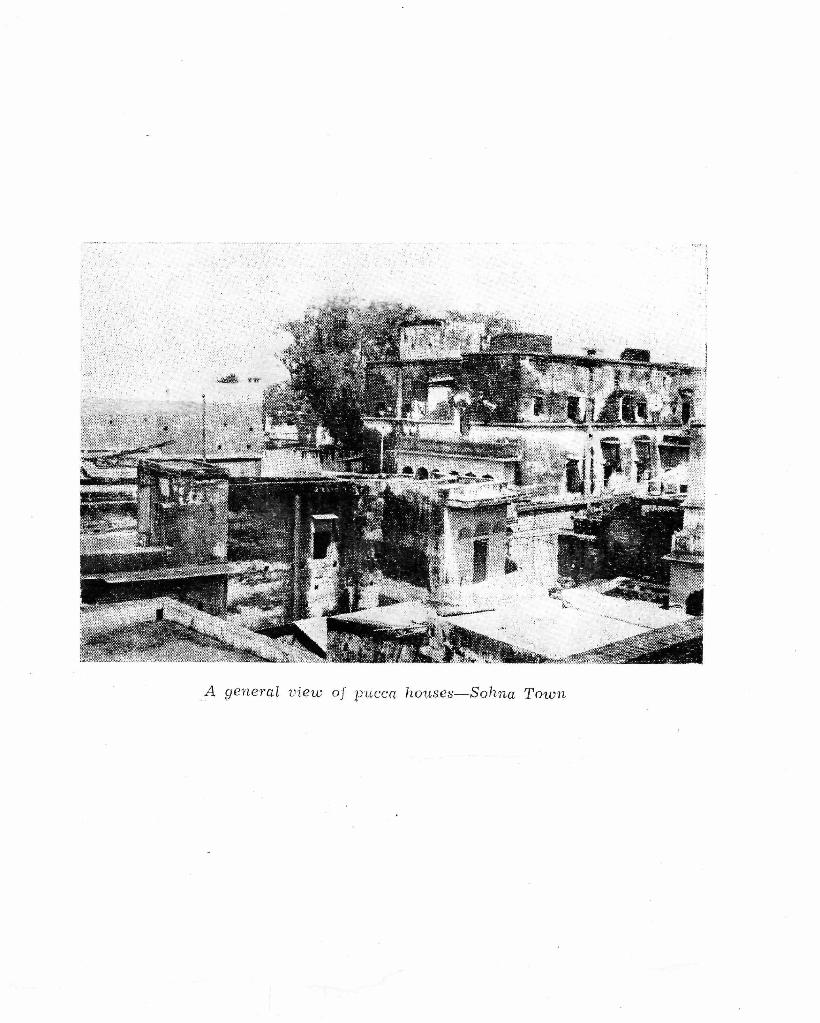
A general vil?'W of pucca hottses-Sohna Town

LaLa Chuhi Mal-ki-Chhatri-Nid~ Town. The building is nwde of red stone and bears stamp oj M1islim architecture
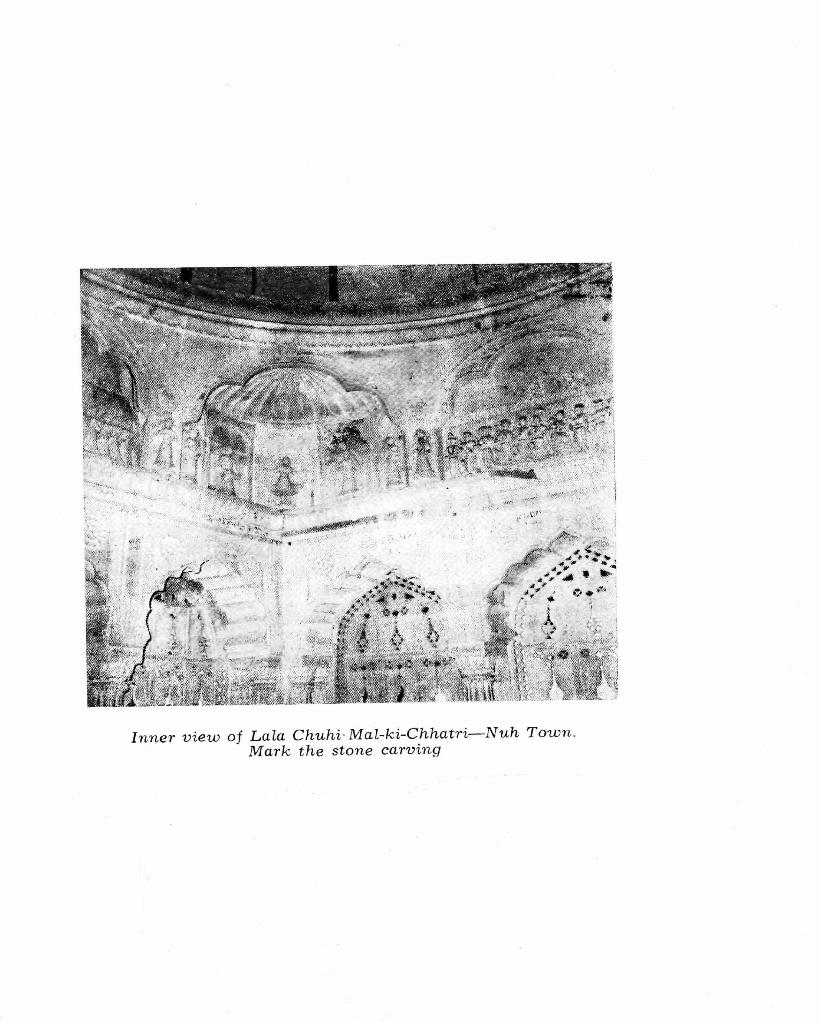
Inner view of Lala Chuhi · Mal-ki-Chhatri-Nuh Town . Mark the stone carving
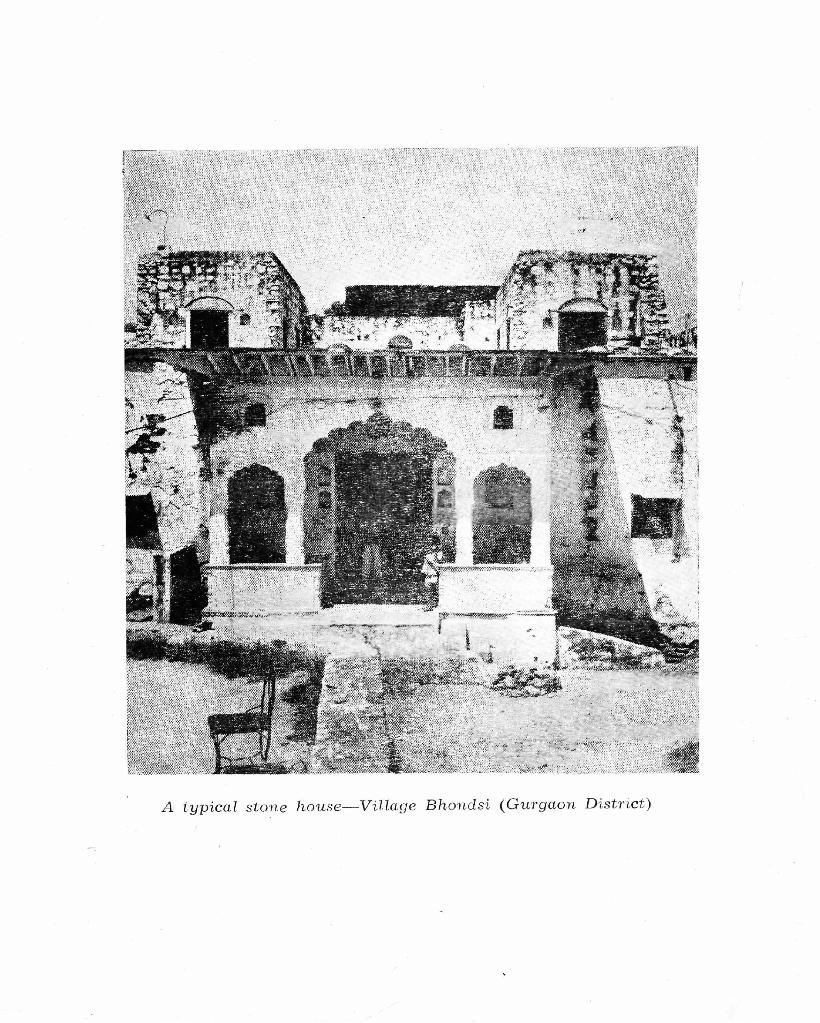
A typical stone house-Village Bhondsi (Gurgaon District)
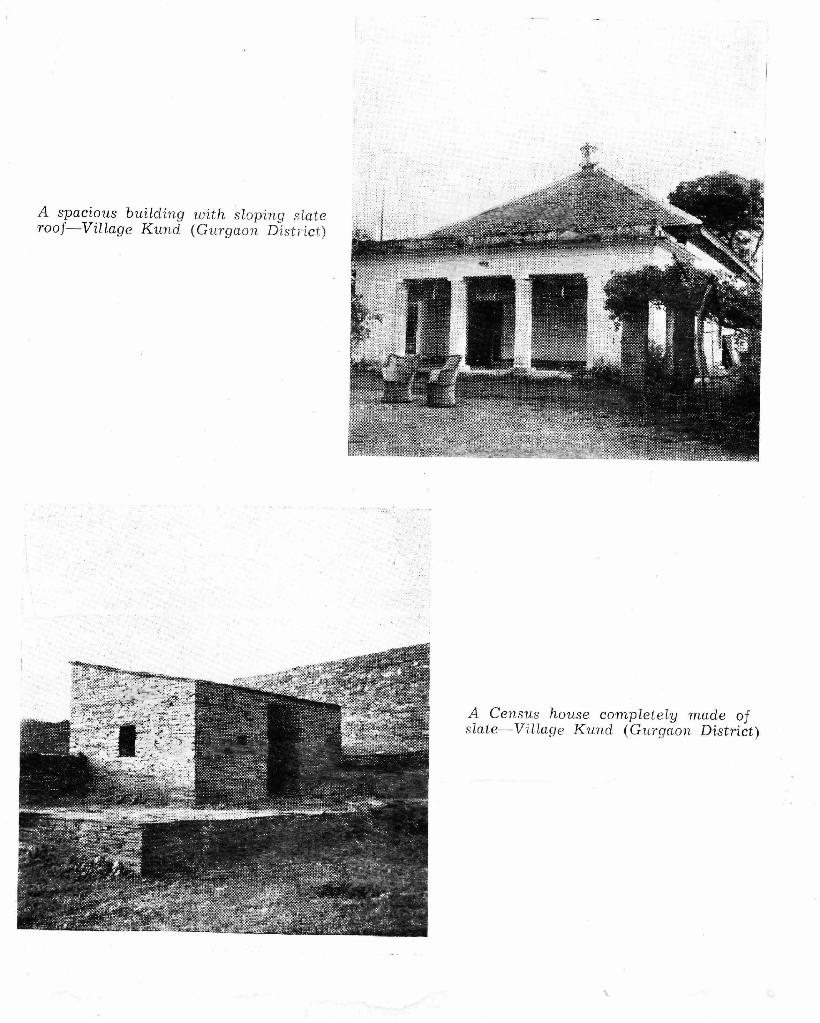
A spacious building with sloping slate roof-Village Kund (Gurgaon District)
A Census house completely made of slate-Village Kund (Gurgaon District)
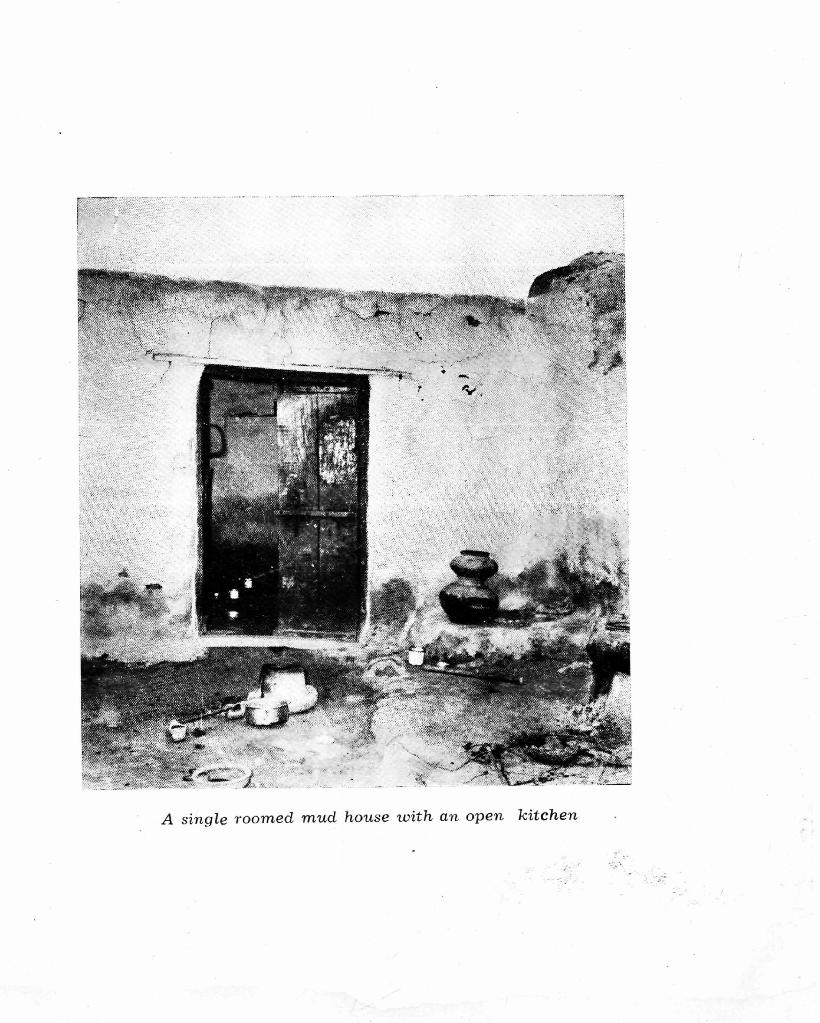
A single roomed mud house with an open kitchen
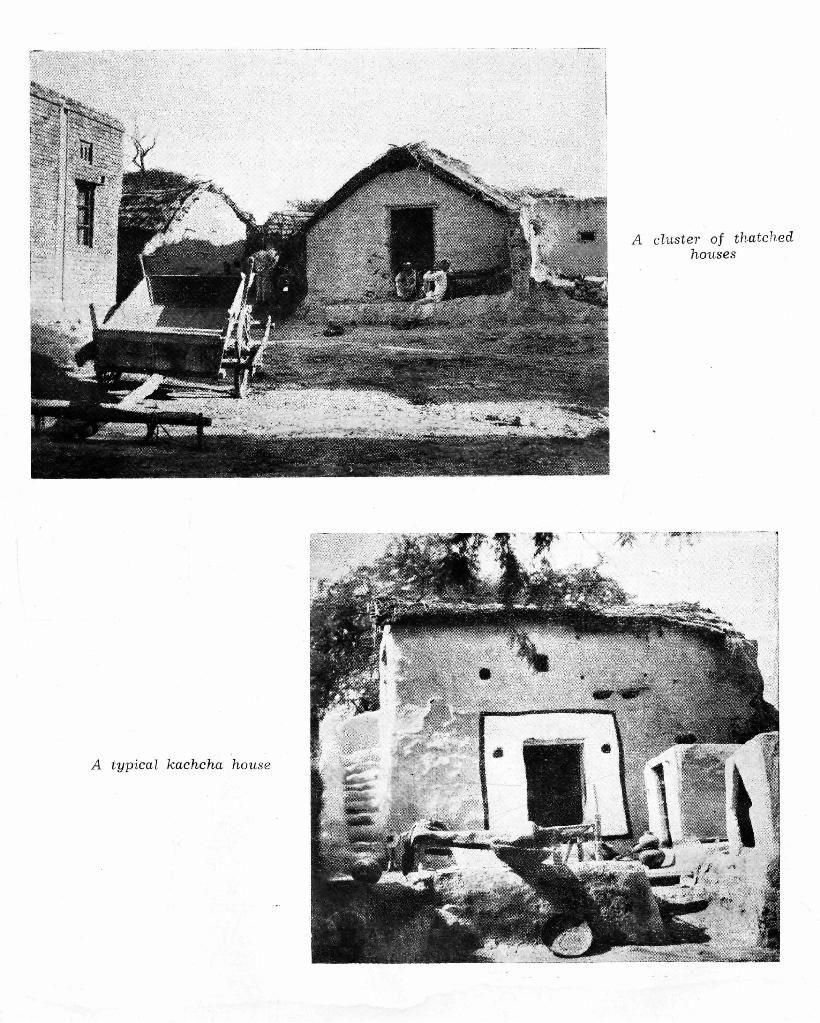
A typicaL kachcha house
A cluste1' of thatched houses
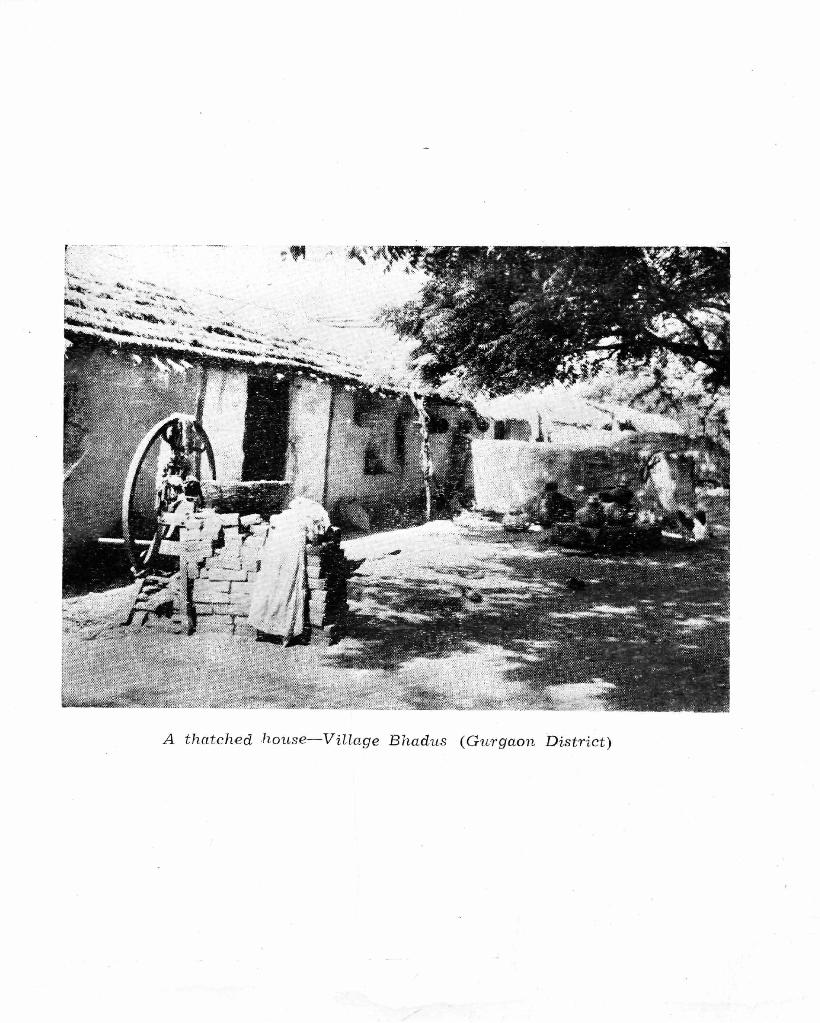
A thatched house-Village Bhadus (Gu rgaon District)
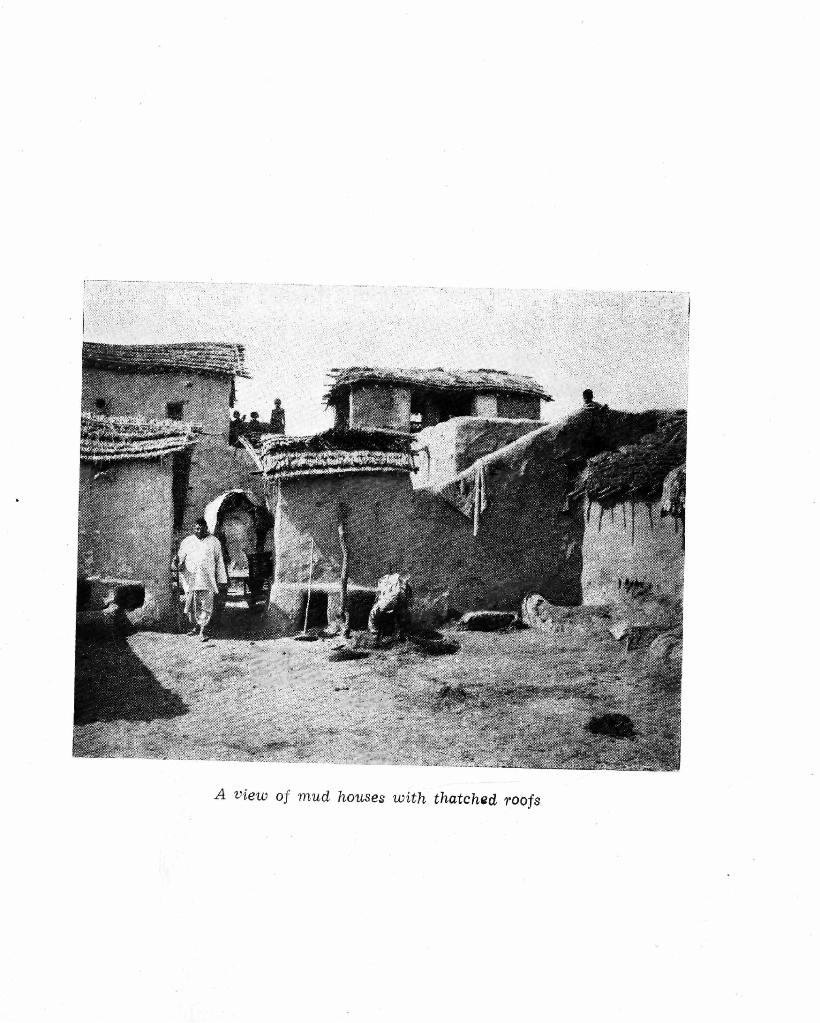
A view of mud houses with thatchQd roofs
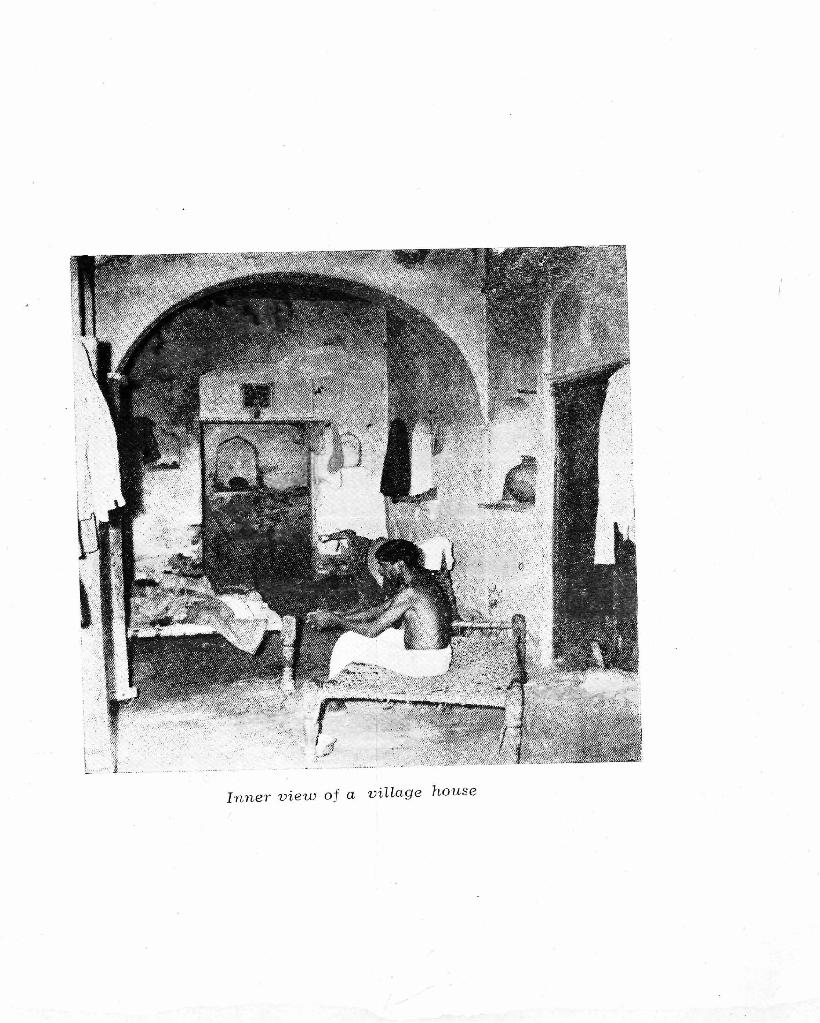
Inner view of a vilLage house
ANNEXURES
115
-I

111
ANNEXURE
SCHEME 0:"11: PERMANENT HOUSE NUMBERING Manual of Instructions
CHAPTER I
INTRODUCTION
Objedives
The objective of the house numbering scheme is to have a uniform system of house numbering throughout the country and to maintain it effectively and continuously so that it can serve all purposes, official as well as non-official, requiring the location of the citizen at his household or the location of a house. The advantage of having such a permanent scheme of house numbering is obvious and it is in the interest of person~ living in the houses as well as of the local authorities and the Government to maintain the house numbers. Day after day the need for locating every house and household is increasingly felt stich as for purposes of providing postal and telegraphic services, health and family planning programmes. socio-economic surveys, preparation of electoral rolls, housing and population censuses and so on. A good house numbering system will serve the needs of the public, the local authorities, all Government Departments and all other agencies who have to deal with the location and identification of the house or household. This is one of the basic needs of proper administration and it is unfortunate that in most areas, except on the eve of the census taking when some temporary house numbering is done, no permanent system of house numbering prevails. It should be the objective of a good house numbering s,"h~me that even an absolute stranger on entering a village or town should be able to easily locate a required building or house"with the help of an intelligible system ofhollse numbering. It is also important that there should be no duplication or multiplication of hOllse numbers as it sometimes happens when different agencies paint different house numbers on houses to suit their needs; only one good and permanent system should be able to serve the purposes of all. It is now proposed to achieve thi~"
Purpo~ of the Manual
There are considerable variations in regard to practices in house numbering prevailing in the various States where some system of house numbering exists. Some variations may be due to local conditions and the others may be due to the absence of a co-ordinating agency. The need is to have as far as possible a uniform system of house numbering throughout the country with complete coverage and least variations between the States. The Manual is a step towards achieving the maximum amount of standardization essential to meet these needs. If there is a satisfactory system of permanent house numbering already in existence such as in large cities or other urban units. they need not be completely upset but as far as possible be brought in line with the instructions in this Manual. The Manual provides an outline and brief discussions of most of the details which should be considered by the State Government.:; for implementing the house numhering scheme in their States.
CHAPTER II
AGENCY A~D UNITS FOR HOUSE NUMBERING
State LCl'cl
[t, is desirable that the system of hou~e numbering should be given effect to in each State under the direction of the State Government at the Secretariat level. The General Administration Department of the State Government dealing with Elections, Census, etc. or the Local Administration and Panchayati Raj Department appears to be the most suitable Secretariat Department to co-ordinate the work and get the work done by tbe District Officers.
The State Government maybe assisted by a committee of executives made up of the Diret.;tor of Municipalities Director of Panchayats, Chief Electoral Officer, the Superintendent of Census Operations and a representative of the Posts and Telegraphs"Department. The Superintendent of Census Operations can be the couvenor of the Committee.
District Level
At the district level the District Collector may be entrusted with the responsibility of giving effect to the system of house numbering. He is considered most suitable as he, as the Chief Administrative Officer of the district, is generally put in charge of important operations like elections and census and is likely to be most interested in introducing a satisfactory system of permanent house numbering which are so very essential for the above operations, apart from the various other extremely useful purposes that the house numbering will serve. The District Collector will of course use the agency of the Panchayat Department, the Municipal authorities, the Revenue authorities and others in getting through the work.
118
The following authorities may be made responsible fot' house numbering at the kl\\n and viHage level.
Town and Village {,evel
Urban Areas.-The Commissioners of City Corporations. the Commissioners or Executive Officers of Municipalities, the Executive Officers of Cantonment Boards, the / .dministrative authorities of project townships etc., the Executive Officers of the Urban Panchayats, or any other authorities as the State Government may decide will be responsible for the introduction and maintenance of a permanent !;ystem of house numbering in their respective areas.
Rural Areas.-The Executive Officer of the Panchayat, if any. the village Headman or Patwari or any other authority as the District Collector may decide.
"Area Units under tbe bouse numbering scbeme
Urban Areas.-The area falling within the defined limits of a Municipal Corporation, Municipal Town, Cantonment, Urban Panchayat or any other Urban unit will be the unit for working out a house numbering plan for the Urban unit.
Rural Areas. -·In the rural areas, the revenue village which has a definite surveyed boundary or the village Panchayat if its jurisdiction is conterminous with a revenue village, or a cluster of houses with district identity bearing a distinct name as in Tribal habitations in the midst of forests etc. will form the units under the house numbering scheme. It is, ho\\ever, observed that in some States as in Madras, village Panchayat is taken as a unit for house numbering even if it is made up of more than one revenue village or part of a revenue village but treating the portions of the Panchayat covering each revenue village as separate blocks for the purpose of house numbering. There is no objection to continuing this system. As the jurisdictions of Panchayats are likely to change often on various considerations such as population size, political considerations etc., it is desirable to have a more permanent unit viZ., the Revenue village as a permanent house numbering unit. The State Governments may consider the possibility of constituting the village Panchayats in such a way that each Panchayat covers one or more whole revenue villages and avoid portions of revenue villages falling in different Panchayats. This may be convenient from the point of various aspects of administration.
Units for bouse Dumbering
All structures or parts of structures having separate access from a road or ~OlIlmon courtyard, staircase etc. and which are normally recognised as separate units for ali practical purposes, whether used as dwellings or nondwellings should each bear a distinct house number. When a cluster of structures form one unit as for example, a main building, out-houses and garage within a compound which has a main entrance, then one common number may be given to this cluster but with sub-numbers to each separate unit of this cluster. Similarly in rural areas also where a main living hut, a grain storing shed and a cattle shed are separate structures but all together form one cluster they should be given one main house number with each individual structures bearing sub-numbers. But if within a large compound a number of independent housing or other building units exist as for example, a number of housing units of a railway colony within a compound or a factory building and separate living quarters within a compound etc., each should bear distinct house number. At the compound gate the house numbers faIling within the compound could perhaps be exhibited. The mode of numbering the houses and how they should be marked etc. will be explained in a subsequent chapter of this Manual.
CHAPTER In
PREPARATION OF A GOOD PLAN OF HOUSE NUMBERING AND HOUSELlSTING
General.-The ideal aimed at is that a stranger on entering a village or towll, if he has to locate any area or a house should be able to approach the Panchayatghar or the Municipal Office and at once be guided by a large plan of the village or to~n exhibited on a wall in which the entire layout of the village or town is given with the prominent land marks, streets, etc. and the position of each house with its number indicated. One would need hardly any other guide than this to locate any house in the village or town. The house numbering plan should be the pride of the Panchayat or the Municipality. On each house or building the actual house number corresponding to the one given on the map should have been prominently painted or an embossed house numbering plate affixed. How we should set about this and the principles to be followed in house numbering will be explained presently.
Ncming (!l Streets.-It will greatly facilitate location of house numbers if every road and street in every town and village is given a definite name. In several towns, the streets, though not all, are generally named. There-
>II Note.-Particular care should be taken of areas lying adjacent to the demarcated limits of Urban units which often times look like a part of the Urban units but actually lie outside their boundary and should be properly induded in the Rural units within whose limits such areas lie.
119
Ire a number 110t yet named. It will be desirable as a preliminary step to get all the roads and streets in every village and town properly named. Often times the roads and streets are named after historical personages, national leaders and even local personalities. There can be no objection to this. But where a controversy is likely to arise it is desirable to name a road or street by some permanent feature of the place such as say, Sivam temple street. Rail way station road, Stadium road, Mosque street, etc. etc. The Municipalities and Panchayats should be persuaded to get all the roads and streets properly named.
Preparation of notional maps
Rural Areas.-The first step to be taken befor~ the actual affixing of house numbers on d.oors is to prepare a rough notional ma.p of the entire village and decide on whether the village should be sub divided. into blocks and if so how ? Normally a small village of less than 125 houses need net be sub-divided into blocks. But if a village has one or more hamlets, irrespective of the size, it is d.esirable to divide the area of the village into blocks so that each hamlet with the adjoining area is recognised. as a separate block of a village. It is imp()rtant that the dividing lines between one block and another should be clearly demarcated. Such dividing lines, besides following some natural boundaries wherever possible should also be indicated. by the survey numbers that fall on either side of the dividing line in cad strally surveyed villages. A notional map showing the general topographical details of a whole revenue village particularly if a survey map is already available with the village revenue officials will grea tly help. This notional map should indicate the prominent features and land marks such as the village site, roacis, cart tracks, hills, rivers, nallahs, etc. A model of a notional map is given in figure 1. Clear demarcation lines of blocks are important so that any structure coming anywhere within the bound.aries of a particular block is covered by a specific block without giving scope for any doubt. It may be desirable to define at the foot of the map the boundaries of each block clearly.
Having thw; prepared the village map, tllen each block of the village as demarcated on the village map should be taken up for a detailed sketching of the layout. In this detailed sketch the emphasis is mainly on the layout of the houses in the village site. The sketch should show all the roads, streets and cart tracks. The names of the streets should. be shown on these sketches. All topographical details, im:;>ortant features and public buildings should be prominently shown. Then every single building or house should be located on this sketch. It will be an advantage if the pucca houses are shown say by a square and the th~\tched houses by a triangle. When once the location of every building and house is fixed on the plan it will be a simple matter to decide on a convenient method of numbering the houses in one series following certain principles. No hard and fast rule can be laid as to the direction in which the house numbers should run, i.e., left to right or in a clock-wise order or north-east to south-west and so on. Much depends on the layout. So long as some convenient and intelligible order is followed it should be all right. The numbers allotted to each house should be marked on the sketch and with the help of arrow marks at intervals, the direction in which the house numbers run should be indicated. This is particularly important when streets cut across one another and the house numbering series along a street get il1terrupt~d. It will be of advantage if the numbers are roughly marked in pencil on this sketch and. later verified with the actual state of things on ground to see if the order of numbering indicated on the sketch would be convenient or if any slight changes are needed for after all the sketch is only a rough one and the actual state of buildings on grouild may suggest a more intelligible order of numbering at some places. It may also help easy identification if the name of the owner or occupier or the purpose for which a house is used is also indicated on the layout sketch at some key points and here and there in the middle of a series also, particularly when there are clusters of houses. Whenever odd houses are found strewn about within the area of fields, etc., it will be necessary to indicate the survey number in which such isolated houses are located. A few principles to be observed in house numbering will be explained in subsequent portions of this Manual.
Where villages are not cadastrally surveyed and the village boundaries 110t fixed by survey, it is essential that the limits of each village are defined by some permanent features so that it may be known that any house falling in any such areas may be reckoned along with a particular village. In the forest area it may be desirable to take each Forest Range Officer's jurisdiction. map it and locate all the clusters of habitations having distinct names, each of which would be treated as a separate village for the purpose of house numbering. Since it is likely that some of the tribal habitations may change their location now and then, it is necessary to define the location of a habitation area with reference to any known permanent feature such as a hill stream, a range of hills, road and so on.
Urban Al'eas.-The preparation of notional maps and the house numbering sketches in urban areas should essentially follow the same procedure as in the rural areas excepting that in most urban units the draughtsman of the municipal administration might have already prepared town maps perhaps even to scale and these may come extremely useful. It has been found from experience th:1.t tht~ boundaries of towns are often times loosely defined and not properly demarcated giving rise to several doubts regarding the areas lying on the outskirts of towns. It is important that the map should very clearly indicate the boundaries by means of definite survey numbers and also other permanent features. Sometimes one side of a road falls within the town limits and the other side excluded along the outer boundaries of towns. All these should be carefully verified on ground before the maps are certified.
The system to be followed in the division of towns into convenient locations/wards, blocks or streets for the purpose of house numbering will be explained. later. But what is essential is that very detailed plans showing the location of every building or house along every road and street in each ward, locality or block of a town should be clearly
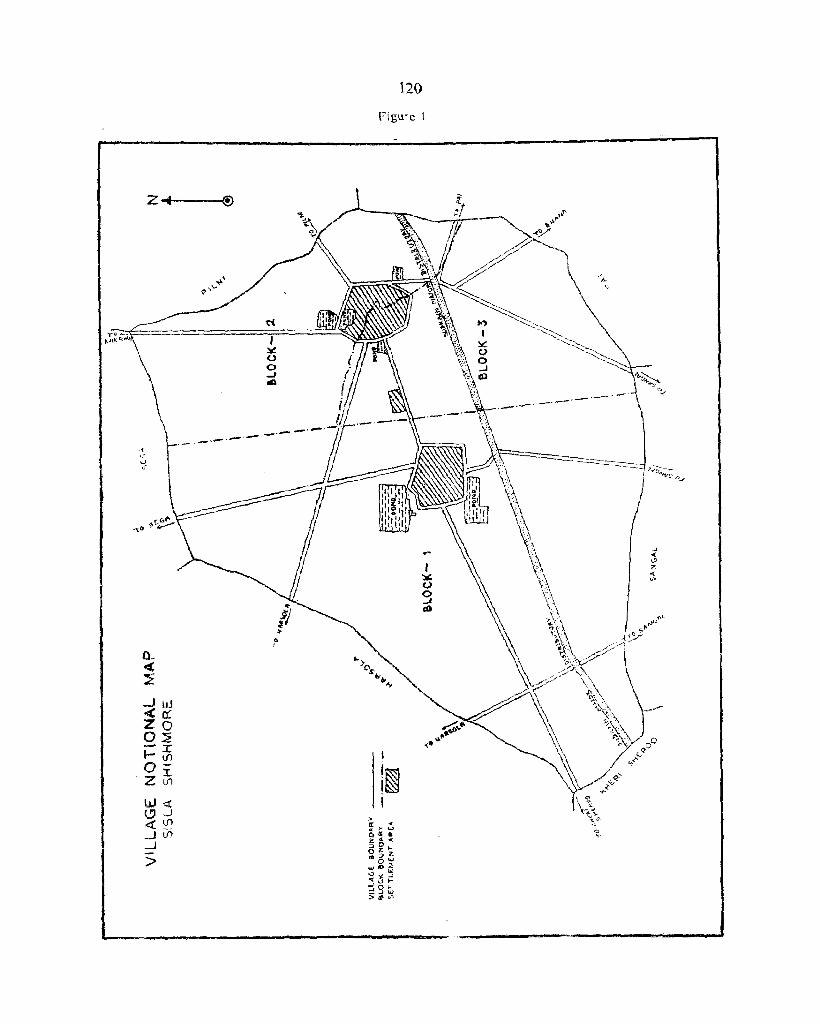
• I
120
Figure
I
I~ I
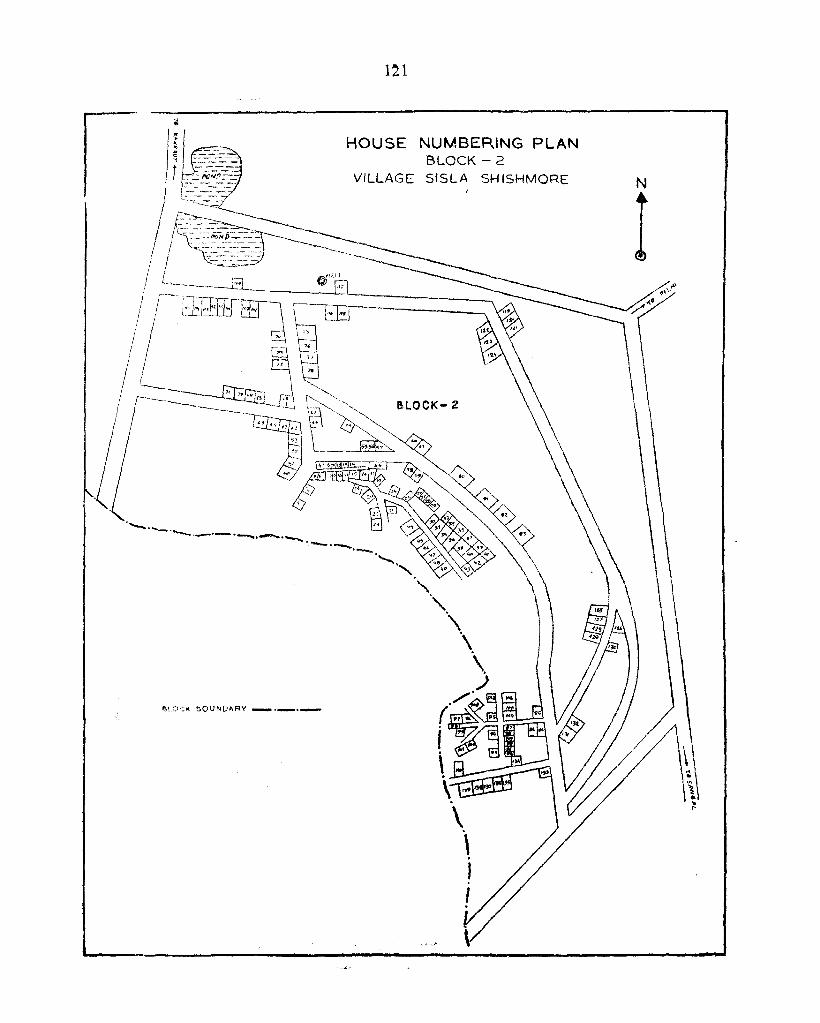
~LOCK COVNDARY __ • __ _
121
HOUSE NUMBERING PLAN BLOCK - 2
VILLAGE SfSLA SHISHMORE N
r
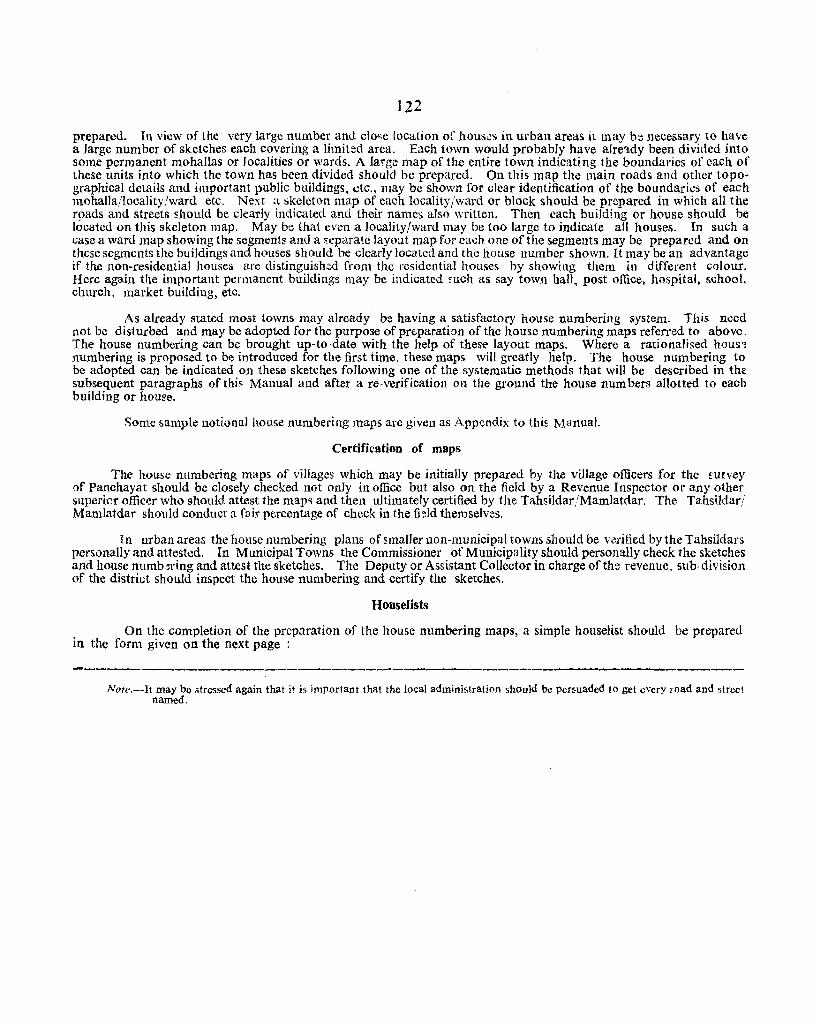
122
prepared. In view of the very large number and c1o<;e location of houses in urban areas it may be necessary to have a large number of sketches each covering a limited area. Each town would probably have alre~dy been divided into some permanent mohaJlas or localities or wards. A large map of the entire town indicating the boundaries of each of these units into which the town has been divided should be prepared. On this map the main roads and other topographical details and important public buildings, etc., may be shown for clear identification of the boundaries of each mohalla/locality/ward etc. Next a skeleton map of each locality/ward or block should be prepared in which all the r9ads and streets 8hould be clearly indicated and their names also written, Then each building or house should be located on this skeleton map. May be that even a locality/ward may be too large to indicate all houses, In such a case a ward map showing the segments and a sepa.rate layout map for each one orthe segments may be prepared and on these segments the buildings and houses should be clearly located and the house number shown. It may be an advantage if the non-residential houses are distinguish.ed from the residential houses by showing them in different colour. Here again the important permanent buildings may be indicated mch as say town hall, post office, hospital, schooL church, market building, etc.
As already stated most towns may already be having a satisfactory house numbering system, This need not be disturbed and may be adopted for the purpose of pr('paration of the house numbering maps refen'cd to above. The house numbering can be brought up-to-date with the help of these layout maps. Where a rationalised hom.'! numbering is proposed to be introduced for the first time, these maps will greatly help. The house numbering to be adopted can be indicated on these sketches following one of the systematic methods that will be described in thl;: subsequent paragraphs of this Manual and after a re-verification on the ground the house num bel'S allotted to each building or houEe.
Some sample notional house numbering maps are given as .A.ppendix to this Manual.
Certification of maps
The house numbering maps of villages which may be initially prepared by the village officers for the wrvey of Panchayat should be closely checked not only in office but also on the field by a Revenue Inspector or any other superior officer who should attest the maps and then ultimately certified by the Tahsildar/Mamlatdar. The Tahsildarj Mamlatdar should conduct a fair percentage of check in the fbld themselves.
I11 urban areas the house numbering plans of smaller non-municipal towns should be verified by the Tahsildars personally and attested. In Municipal Towns the Commissioner of Municipality should personally check the sketches and house numb~ring and attest the sketches. The Deputy or Assistant Collector in charge of the revenue, sub-division of the district should inspect the house numbering and certify the sketches.
HooseJists
On the completion of the preparation of the house numbering maps, a simple houselist should be prepared. in the form given on the next page :
-------------------------------------------Note.-It may be stressed again that it is important that the local administration should be Persuaded to get cycry road and street
named.
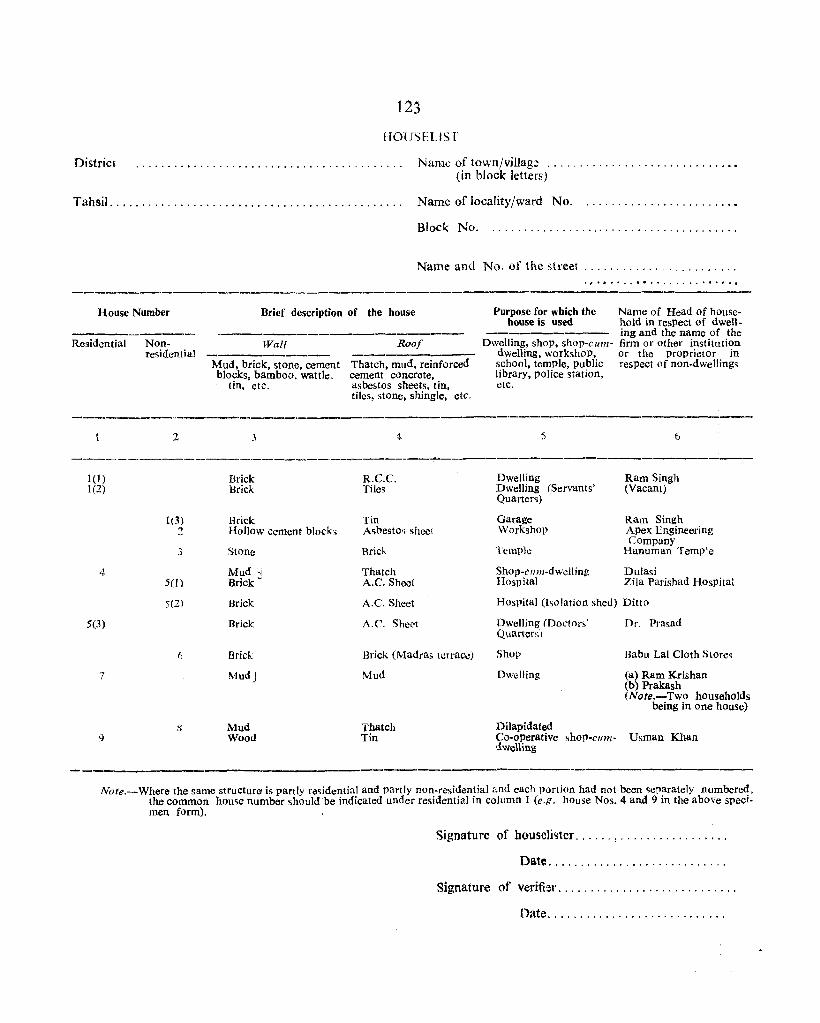
District
123
ITOlJSFLTST
Name of town/village ............................•• (in block letter!')
Tahsil ............................................. . Name of locality/ward No.
House Number
Residential Nonresidential
Block No.
Name and No. of the ,,{reel
Brief description of the house
Wall
Mud, brick, stone, cement blocks, bamboo, wattle.
tin, etc.
Roof
Thatch, mud, reinforced cement concrete, asbestos sheets, tin, tiles, stone. shingle. etC.
.........................
Purpose for which the Name of Head of house-house is used hold in resPect of dwell-
----------- ing and the name of the Dwelling, shop, shop-cum- firm or other institution
dwelling, workshop, or the proprietor in school, temple, public respect of non-dwelling~ library, pOlice station, etc.
------_ .. _------_._---2 5
-----------------------~---------...___--------------------------
1 (1) Brick R.C.C. Dwelling Ram Singh 1(2) Brick Tiles DWelling (Servants' (Vacant)
Quarters)
1(3) Brick Tin Garage Ram Singh 2 Hollow cement block<; Asbesto'l sheet Workshop APex Engineering
3 Stone Brick Temple \,ompuny
Hanuman Temple
4 Mud'i Thatch Shop-cllm-dwelling Dulasi 5(1) Brick -. A.C. Shoot Hospital Zila Parishad HOspital
5(2) Brick A.C. Sheet Hospital (Isolation shed) Ditto
5(3) Brick A.C. Sheet Dwelling (Doctors' Dr. Prasad Quarters)
(, Brick. Brick (Madras terrace) Shop Babu Lal Cloth Store"
7 MudJ Mud Dwelling (a) Ram Krishan (b) Prakash (Nole.-Two households
being in one house)
8 Mud Thatcl1 Dilapidated l) Wood Tin Co-operative
dwellin.g shop-cum- Usman Khan
-----------------Note.-Where the same structure is partly re~ideJ1tial and partly non-residential and each portion had not been separately numbered,
the common house number should be indicated under residential in column I (e.g. house Nos. 4 and 9 in the above specimen form).
Signature of houselister ...... ! ••..•••••••.•••••
Date ........................... .
Signature of verifi~r ........................... .
Date ........................... .
124
1n the above fo,rm some sample entries are also made for guidance. The houselist serves a ve ry useful purpose to enable the identification of houses and also to rebuild the house number even if the house numbers were to be missing. Such a houselist will also be extremflly useful in the conduct of any surveys apart from its utility for the Municipal and Panchayat Administration. This houselist should be brought up.to-date annually when the ~~use llumbers are also checked and brought up-to-date. The houselist can be prepared by any employee of the MUnlClpa! or Panchayat office in Urban areas and by the village officers or by Panchayat Secretary in rural areas. A cent per cent verification should be done by a higher official and ultimately certified by the Municipal Commissioner or Tahsildar as the case may be.
Copies of house numbering plans and houselists to be prepared
When once the house numbering plans are finalised and houselists are prepared, six copies should be taken and they should be preserved with the following authorities:-
Rliral.-Village Karnam/Patwari: one copy; Panchayat Office: !lvo cories ; Tahsildar: one copy: State Census Office : one copy; Office of the Director of Panchayats : one copy.
Urban.-Municipal or Panchayat Office: three copies ; Revenue Sub-divisional Ofllcc : one copy ; State Census Office: one copy; Office of the Director of Municipal Administration: one copy.
Standard size of the maps
To facili~te the house numbering sketches to be conveniently bound say for a Tahsil or a District, as a whole, it will be necessary to prepare these maps on a standard size of fairly thick paper--probably drawing paper of size 30" X 28" which is generally available in the market.
It is best that the State Government arranges to issue the paper needed of standard size to all villages and tOWllS through the Collectors of Districts.
Enlarged maps to be exhibited
Besides the preparation of the house numbering sketches and houselists as indicated above, these should be exhibited on the wall of the Panchayat or Municipal Office on a large sized map indicating the layout of the entire village or town showing the topographical details, the division of the area into blocks, the layout of streets and the location of every house and the number allotted to it. In the municipal towns obviously it wilt not be possible to exhibit the detailed sketches showing the house numbering of every locality at the Central Ofike on a large scale. If there are Ward Offices, these can be exhibited in those offices, while in the Central Office the general map of the town showing the important topographical details and the demarcations of the wards should be exhibited.
It will not be possible to lay down the standard size of these large scale maps. Much depends Oil the availability of the wall space in tbe Panchayatghar or the Municipal Office. A good large mlp of the entire village or town showing boldly the layout of the houses in the village/town should do pride to the office and should be exhibited prominently in the office concerned which can be a good guide for any administrator, s chola r or visitor.
CHAPTER IV
SYSTEMS OF HOUSE NUMBERING
Soon after the skeleton layout maps are prepared and before allotting house numbers it should be considered what would be the most convenient system of house numbering that can be introduced as a permanent measun: where a systematic house numbering does not already exist. The sketches referred to in the foregoing paragraphs provide the frame work. If a convenient system of house numbering is decided upon it is easy to allot the house numbers to each of the houses on the sketches and then later get these painted on the houses and the houselist prepared. The job is then completed.
The following are the systems of house numbering recommended:
Rural Areas
Small Vi/lages.-In rural areas if a village is small say, with a maximum of 125 houses or less and it is not made up of separate hamlets, all the houses of the village can be numbered off in one series in some orderly manne!' such as say, following a clockwise order if it is a cluster of houses or continuously along a street from one end to oth. end on one side and then cross over and continue the numbering on the other side of the street till reaching the poin' opposite to where the numbering started. The house numbering series can run on to cover the other streets or other elusters in one continuous order.
1'25
Large Villagl's.-In large villages 01' where a village has one or more separate hamlets then it is desirable to break up the village into convenient blocks each block having ab:)ut 100 houses or slightly 111 Jr~ or Ie",. Wherever there are separate hamlets, irrespectiw, of the number of houses in the hamlet, it is desirable to treat each hamlet as a separate block. The blocks so formed should be numbered off in a convenient order. clock-\visc or anticlock-wise or from left to right or from north to south, depending on the demarcation of the blocks. It is desirable that the first block starts with the main village. Withill each block all the houses will be numbered in one continuous series. The house numbers to be allotted to each house \vill bear the block number followed by a hyphen and then the house number as 1-29, or 2-46, etc.
It is quite likely that some very large villages may have well laid out streets and clearly distinguishable localities or wards. In such cases, the locality-street-house numbering system as in urban areas can be adopted. This system will be explained under urban areas.
Urban Areas In urban areas two systems of house numbering have been found to be convenient (I) Block-House Numbering
System and (2) LocalityfWard-Street-House Numbering System. (1) Block-house numbering system.-This is the same as indicated for large villages in rural areas. The
town will be divided into convenient blocks. each block consisting of a group of adjoining streets or other compact local area with well-defined boundaries. Each block rnav have about 100 to 125 houses. First of all. each block so formed will be allotted a block number_ Then in each block the hcuses are numbered in a logical way, each house Ill.mber being indicated by block number and the house number. Thus a number bearing 2·30 would mean tha t it is a house with number 30 in block number 2 of the town.
This system of block-house numbering will be adequate in the smaller towns though there is no objection if they followed the liystem that will be explained in the next paragraph.
(2) Locality/ward-' ,,·eel·house rlimbel'il1[Z 'ystell1.-This system is found to be by far the most suitable in all large towns usually divided into well established mohallas or localities or wards bearing distinct local names and covered by roads, streets, lanes and bye-lanes. Each one of the localities will be demarcated and will be allotted a code number. Within each locality. each road and a street will also be allotted separate serial numbers. Along each road or street the houses are numbered off in one series. Thus, a house number under this system will be illade up of a code indicating the locality number, the street number and the house number. Thus a number like 2-4-99 would mean house No. 99 in street No.4 of locality No.2. But in order to obviate the need for painting the entire code of three numbers on each door it is suggested that at the end of each road and street a prominent metal plate, cement block or wooden board be fixed on which the locality number and the street numbers are marked along with the name of the street. Much confusion can be saved if every road and every street is properly named. Each house in that street or lane will be painted with only the serial number of the house that falls in that street or lane.
It is likely some times that a large main road such as say, Mount Road in Madras, may pass right through the city cutting i.1cross a number of localities. In such contingencies, a large road can by itself be treated as one locality bearing a locality number and since there will be only one road it can bear number 1 for street number and the buildings can be numbered off continuously right alol1~ the entire road. But it may also be possible that some smaller roads bearing a common name, may be cutting through more than one locality and it may create some confusion if the house 'lumbers along this road in each locality are given separate series of numbers in which case one may find the same number being painted on the houses falling in the two different localities on the same road though the code numbers of1he locality and the street might have been in<iicated ()n sepa'ate boards i'1 each locality. In such cases, there is no objection if the houses are continuously numbered from one end to the other end of the street by one continuous series even if it passes through more than one locality but at every end of the street falling within each locality, the locality number and the street number and the name of the street should be given.
Wherever possible the town administrations should be encouraged to put up the house numbering sketches mounted on posts as one often comes across in several colonies in Delhi. These sketches should show the layout of the houses and the numbers, all the streets and all topographical details such as parks and other public buildLgs, etc.
In some cities, instead of a locality the electoral ward of the city or town may have been taken as the major unit into which the city or town is divided. There can be no ob_iection to this so long as these are well recognised units with definite boundaries and are likely to be fairly permanent. Where a ward-street-house numbering system has been adopted, if there were any changes in the ward boundaries at any subsequent stage it is important to ensure that any new streets added to, or existing streets deleted from a ward is properly numberej and the correct ward number also indicated in streets affected by such changes. Since the street is the unit for the house number ~eries the actual house numbers on the doors of houses are not likely to get affected if an entire street or lane is transferred from one ward to another. But if on the door of each house the entire code of ward and street number had been painted, then obviously these require to be altered whenever changes in the boundaries of wards affect them.
Where there are no streets but a cluster of houses exist as probablY in a slum area of a town, such a slum area C3U be allotted a street number series and all the houses within that cluster numbered off in some logical
order or if such cluster close to any other road or street the houses in the cluster can be numbered in the series Ilong with the houses in that street, thus, treating this duster as belonging to that adjoining street.
CHAPTER V
MODE OF AFFIXING HOUS}: NUMBERS
All houses to be numbered
It is important not to leave out any house from numbering. All existing buildings whether residential or non-reEidential whether occupied or un-occupied, including temples, churches, mosques, shop~, office huJdings, etc. are to be numbered. Hou~cs with Ecparate main entrances and built for use as separate dwdlings should bel nllmbered, as separate houses though they form part of the fame building or be situated in the same compound b')longing to the same owner and irrespective of the number of families actu<lJJy in occupation. Even the huts used or likely '0 be used for residential or non-residential purposes should be numbered. Where a new colony has sprung up, it should be treated as part of an existing block or treated as a new block. A railway colony should also be numbered in the same way as in the "ase of a new colony. Reserve forest areas should be treated as a part of village or panchayat. Areas under the control of military authorities may be numbered in consultation with the military authorities. In this regard, care should be taken to see that the numbers given by the authorities concerned are not interfered with but it should be ensured that the1"e should be no ambiguity in two ~ets of numbers. It is desirable to see that as far as possible the local numbers given by authorities such as the Railways, P.W.D., etc., in certain colonies of their own are made to fit into the general hou~e numbering scheme without having to give another number. For example, if in a city the buildings in a railway colony had already been numbered in a series by the Railway authorities, such colony need only be recognized as a ~epatate locality or block of the town and the h.:mse number~ already given by the Railway authorities fitted into the general houEe numbering scheme. Supposing they had given a single number for a cluster of buildings in a compound, for the purpose of the house numbering scheme sub-number.;; can be allotted to each building.
In the rural areas, it is the responsibility of the Village Officers or the Panchayat authorities as the Collector may decide to ensure that all the structures within the limits of their village have been invariably allotted a house number whereas in urban areas the responsibility for houso numbering lies on the local civic authol'ities concerned. Affixing of permanent house-numbering plate~ should be encouraged. But thc numbering should strictly conform to the house numbering plan and should not be left to the discretion of some contractors who are known to fix house number plates indiscriminately. It is, therefore, eEsential that a basic detail of the house numbering plan rhould be drawn up in each village and town which should be duly approved by higher authorities on the lines already indicated before the actual affixing of the numbers 011 houses starts. This chapter of the Manual gives some guidance as to how the numbers should be actually marked.
Place where house number is to be affixed
The best plal_;e to mark the house number is the centre of the lintel of the front door of the house or the number may be marked on the front door itrelf or next to it on the wall. Where there is no durable door worth the name. as for instance, in some huts, a small portion of the wall near the entrance to the house should be white washed, if this has not been done by the owner and the number marked on the white washed portion. In case of huts which have neither doors nor walls for there may be constructions where a sloping thatched roof itself reaches the ground without wall.:. the number may be marked on any suitable beam, pillar 01' flat part in the house or failing all this on a small metal plate (preferably zinc) or wooden board which can be hung by a wire or rope from the roof of the dwelling at or as near to the entrance as possible and aCknowledgement of the receipt of the number plate or board should be obtained from the person residing ill the dwelling. It may not be practicable with the existing resources to affix house number plates ;n all the houses immediately in the villages. Therefore, this may be made voluntary on the part of Panchayats. But house numbers should be ms.rkcd by using some cheap material as gem, tar or chullam. Since the houses are generally white wasbed on festival occasions the~e numbers are likely to be obliterated. While the villagers may be educated to have t11e£e numbers repainted neatly, it should be the responsibility of the Panchayat to ensure that annually all the house numbers are repainted and kept intact. Small embossed house numbering plates ale found to be cheap and convenient and even if covered by colour-wash dUling festivals the numbers would bc distinguishable. In rural areas, where durable hous~ numbering plates cannot be ;lffixed on all the house~ immediately, house number plates should be affixed at least to certain pelmanent structures in the village like plIcca houses located at strategic points, school buildings, hospital buildings, temples, etc. to start with. In fuch cases the Pan~hayat may take up the supply of embossed home numbering plates for the entire village in a staggered faFhion during the coune of say, 2 to 3 years. In the selection of places on the houses for making the numbers, uniformity of location is ideal but where deviations can not be avoided, they should be subjected again to some uniformity. Thi!' would facilitate location of numbers without any effort. Wherevcl fresh numbering is done, all the old numbers, if any, should be completely obliterated.
126
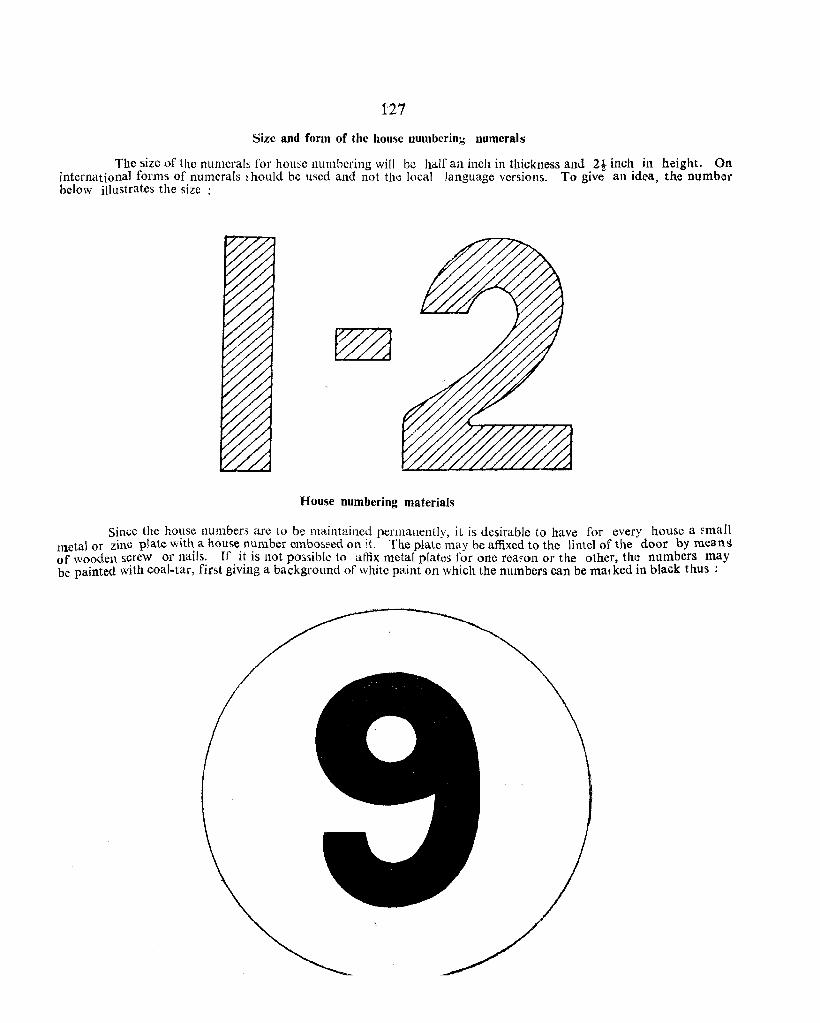
127
Size and form of the house lIumbering numerals
The size of the numerals for home llumbering will be half an ineh in thickness and 2i inch in height. On international forms of numerals fhould be used and not th'~ local language versions. To give an idea, the numbel" below illustrates the size :
House numbering materials
Since the house numbers are to be maintained permanently, it is desirable to have for every house a ~mall metal or zinc plate with a house number embos~ed on;t. The plate may be affixed to the lintel of the door by means of wooden screw or nails. If it is not p05~ihle to affix metal plates for one rea<on or the other, the numbers may be painted with coal-tar, first giving a background of white p8.int on which the numbers can be mal ked in black thus:
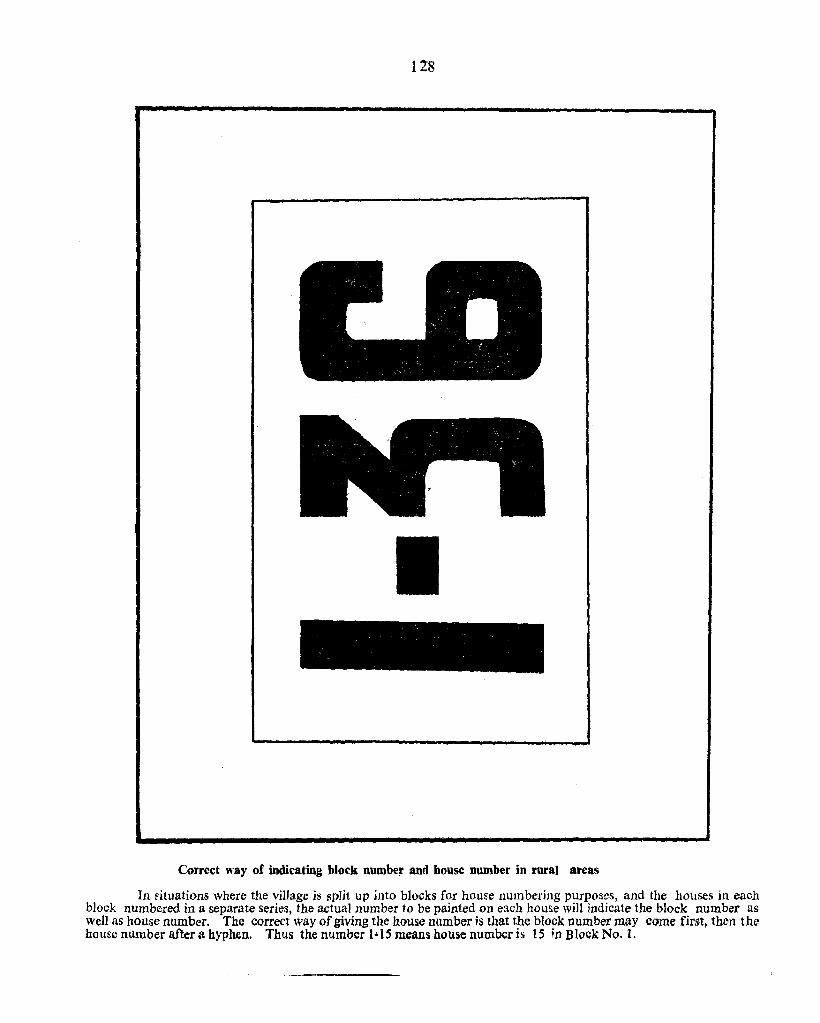
128
Correct way of indicating block number and house number in rural areas
In Eituations where the village is split up into blocks for house numbering purposes, and the houses in each block numbered in a separate series, the actual number to be painted on each house will indicate the block number as well as house number. The correct way of giving the house number is that the block number may come first, then the house number after a hyphen. Thus the number 1 .. 15 means house number is 15 in BIQck No.1.
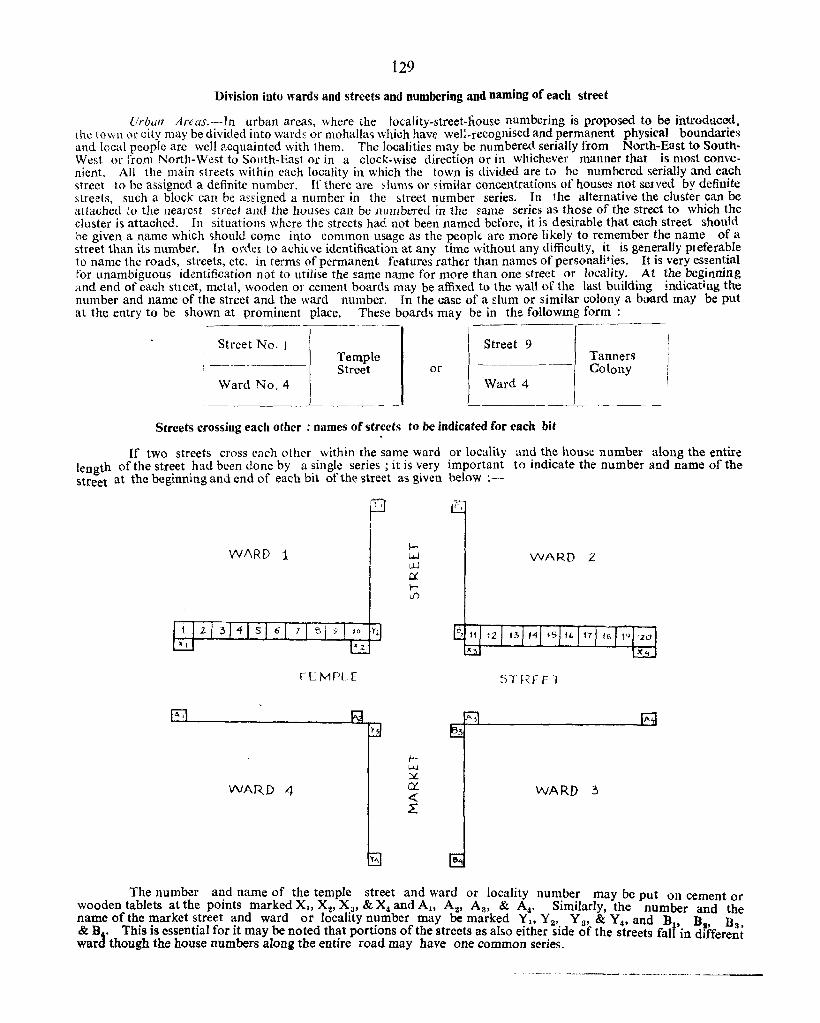
129
Division into wards and streets and numbering and naming of each street
UrbUIl ANas.-In urban areas, where the locality-street-l1.ouse numbering is proposed to be introduced, the town or city may be divided into wards or mohalla'i which have- wcl:-recognised and permanent physiC'aJ boundaries and local people are well acquainted with them. The localities may be numbered serially from North-East to SouthWest or from North-West to South-East or in a clock-wise direction or in whichever manner that is most convenient. All the main streets within eaeh locality in which the town is divided are to be numbered serially and each street to be assigned a definite number. If there arc ~lums or ~imi(ar concentrations of houses not served by definite streets, such a block can be as~igned a number in the street number series. In !he alternative the cluster can be attached to the nearest street and the houses can be numbered in the same series as those of the street to which the cluster is attached. In situations where the streets had not been named before, it is desirable that each street should be given a name which should come into common usage as the pcoplt are more likely to remember the name of a street than its number. In order to achi( ve identification at any time without any difficulty, it is generally pleferable to name the roads, streets, etc. in terms of permanent features ratht:.r than names of personalities. It is very essential for unambiguous identification not to utilise the same n!l.me for more than one street or locality. At the beginning and end of each sheet, metal, wooden or cement boards may be affixed to the wall of the last building indicating the number and name of the street and the ward number. In the case of a slum or similar colony a board may be put at the entry to be shown at prominent place. These boards may be in the followmg form:
Street No. I
Ward No.4
Temple Street
Street 9
or Ward 4
Streets crossing each other : names of streets to be indicated for each bit
Tanners Colony
If two streets cross each other within the same ward or locality and the house number along the entire length of the street had been done by a single series; it is very important to indicate the number and name of the street at the beginning and end of each bit of the street as given below :-
P I
WARD 1 WARD 2
TEMPLE STRE E T
,,-, A
y
WARD 4 WARD :3
The number a~d name of the temple street and ward or locality nu~ber may be put on cement or wooden tablets at the pomts marked X" X z, X.a, & X4 and A" A2, Aa, & A,. SImilarly, the number and the name of the market street and ward or localIty number may be marked Y" Y 2' Y 3' & Y 4 and B B B & B.. This is essential for it may be noted that portions of the streets as also either side of the streets falt'in drffere~t ward though the house numbers along the entire road may have one common series.
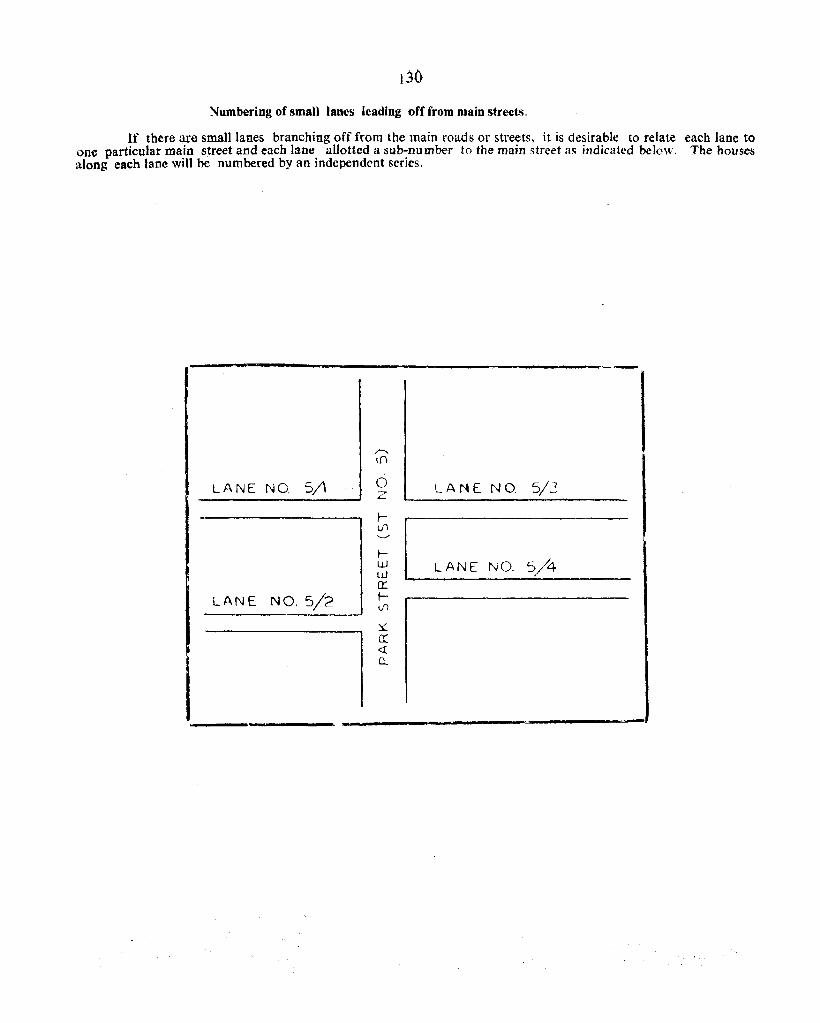
130
Numbering of small lanes leading off from main street. ...
if there are small lanes branching off from the main roads or streets, it is desirable to relate each lane to one particular main street and each lane allotted a sub-number to the main street as indicated below. The houses along each lane will be numbered by an independent series.
LANE NO 51'
LANE NO. 5/2
o z r t/) '-./
tW W Ct:. lt./)
~
0:: <1: Q
LA liE NO 5/3
LANE NO. ~/4
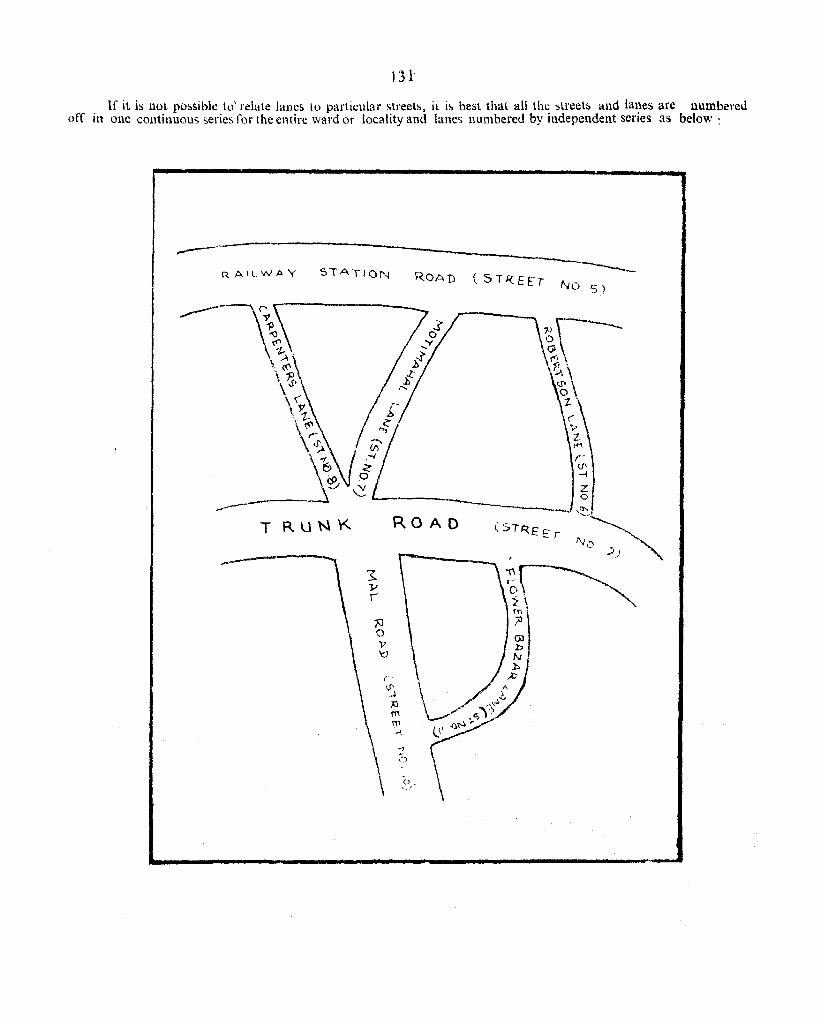
131
. If it is 110t possible to' relate Janes to particular streets, it is best that all the streets and lanes are l1umbered off III one continuous series for the entire ward or locality and lanes numbered by independent series as below:
...----~-.-----------RAILWAY S"TAT10N ROAD
T RUN\<' ROAD _-1J 0 V 'd
,-IS' "l 10 rn iii ...;
\ 1 ()
\ \ O. "'./
( STR.Etr --No 5)
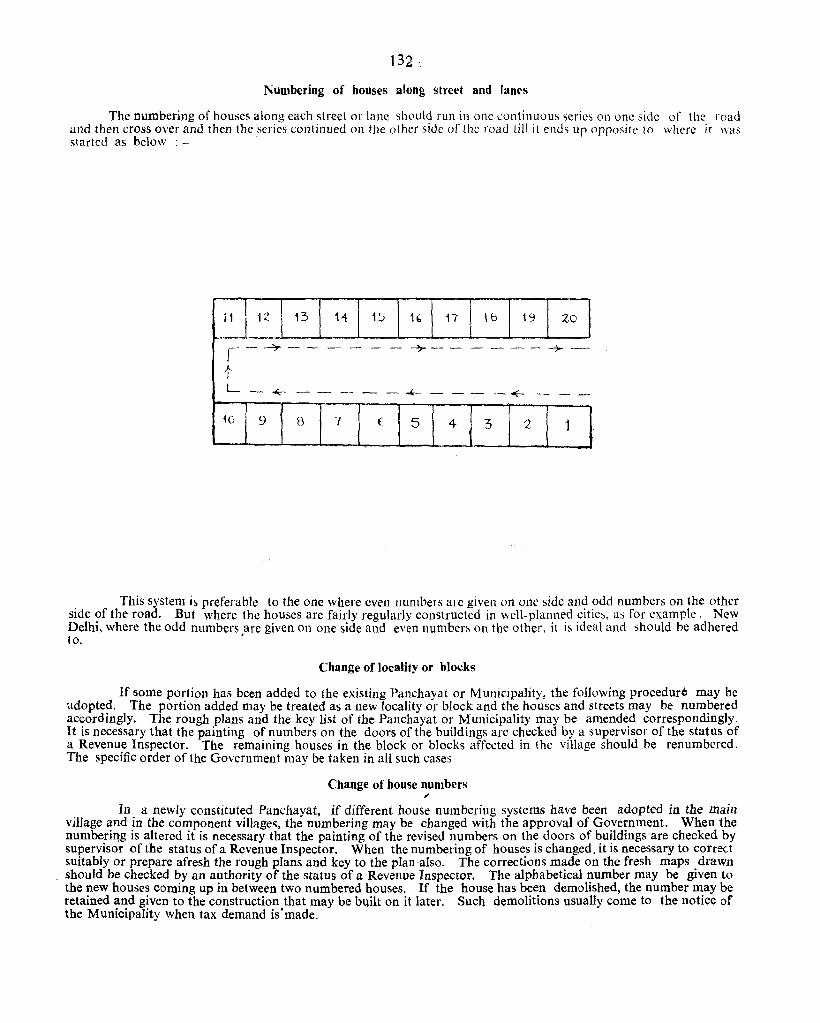
Numbering of houses aloo& street and Jam's
The numbering of houses along each street or lane should run in one continuous series all aile side of the road and then cross over and then the series continued on the other side of the road til! it ends ur 0prosite 10 where it was started as below :-
~-
_:_J~_ I 13 H 15 H. 17 It> 1'1 ZO
r--'T- - - - - - _".. - - - --- -?- -1" I .__ - "'-_ -- - -- - - -'- - -- -~ .-_ - -
H! 9 8 7 ( 5 4 '3 2 1
This system is preferable to the one where even numbers are gIven on one side and odd numbers on the other side of the road. But where the houses are fairly regularly constructed in well-planned cities. as for example, New Delhi, where the odd numbers are given on one side and even numbers on the other, it is ideal and should be adhered to. .
Change of locality or blocks
If some portion has been added to the existing Panchayat or Municipality, the following procedure may be adopted. The portion added may be treated as a new locality Or block and the houses and streets may be numbered accordingly. The rough plans and the key list of the Panchayat or Municipality lllay be amended correspondingly. It is necessary that the painting of numbers on the doors of the buildings are checked by a supervisor of the status of a Revenue Inspector. The remaining houses in the block or blocks affected in the village should be renumbered. The specific order of the Government may be taken in all such cases
Change of house numbers "
In a newly constituted Panchayat, if different house numbering systems have been adopted in the main village and in the component villages, the numbering may be changed with the approval of Government. When the numberi~g is altered it is necessary that the painting of the revised numbers on the doors of buildings are checked by supervisor of the status of a Revenue Inspector. When the numbering of houses is changed, it is necessary to correct suitably or prepare afresh the rough plans and key to the plan also. The corrections made on the fresh maps drawn should be checked by an authority of the status of a Revenue Inspector. The alphabetical number may be given to the new houses coming up in between two numbered houses. If the house has been demolished, the number may be retained and given to the construction that may be built on it later. Such demolitions usually come to the notice of the Municipality when tax demand is'made.
13"3
CHAPTER VI
MAINTENANCE OF HOUSE NUMBERS
It is important that house numbers should be well-maintained on a permanellt basis both in rural and urban arcas. The responsibility for maintenance rests with the Panchayat in the rural and executive authorities in the urban areas. It is the responsibility of these authorities to see that every building or hut has been numbered in accordance with the instnlctions whether situated in a Municipality, Township, Panchayat, Estate or settlement in the forest. New constructions should be assigned house-number immediately after they have come into being. The numbers to be allotted should fit into the general system of house numbering. Whenever new constructions come up in between two houses already bearing house numbers, the new houses should be allotted sub-numbers by adding an alphabet to the lower of the two existing house numbers between which the new constructions have come up. Supposing two new houses are constructed between two buildings bearing any house numbers 4 and 5, the new constructions will be numbered as 4-A and 4-B. If another new house comes up between house No. 4-A and 4-B, it can be numbered 4-A-l. If a new house should come up between house No.4 and 4-A it can be numbered as 4-1. If on the other hand the new constructions come up at the very end of the street where the last number of the existing series of house numbers terminate, then the new houses will be allotted numbers in continuation of the series. Thus the house numbering can be brought up-to-date periodically. If a large number of constructions come up anew as when a new colony springs up then it will be desirable to treat it as a separate street, block or locality and the houses in that new colony given a separate series of numbers. The new locality, block or street numbers, as the case may be, can be allotted an alphabetical appendage to the adjoining locality, block or street. After a few years if the entire face of an area is changed by a series of new constructions demanding a complete revision of the old house numbering system, then it will be advantageous to completely revise and introduce a fresh system of house numbering obliterating all old numbers.
Whenever new constructions come up and fresh house numbers arc allotted GIrt' should be taken 1.0 ensure that the house numbering sketch and the houselist are also brought up-to·dale.
Annual Verificatioll of HOUSe Numbers
Certificate
The house numbering shall be verified annually. It will be brought up-to.date and a certificate will be furnishd in the prescribed prOfOl"lna given Oil t be next pa.ge :-.-
136
CHAPTER VB
CONCLUSION
A good system of permanent house numbering is a direly felt need both from the point of view of the citizen as well as that of administration. Spasmodic efforts had been made in the past in some areas which have yielded v,-:rious measures of success. The country has entered a phase of planned and scientific development. In all plans, In aU surveys, in elections and in all schemes of social and economic uplift it is necessary to locate the household and the individual for whose welfare alone the country is striving. One feels frustrated by the lack of system which makes it difficult even to identify a house correctly. Often times the authorities in ch~r$e of ~ach surveyor scheme keep on affixing their own identification numbers on the doors thus completely dlsfIgur-109 the walls or doors of houses apart from the utter confusion this leads to. Hence the need for a good, sound and permanent scheme of house numbering. In the ultimate analysis the introduction and maintenance of housenumbering may not involve much cost. What is needed is a little effort, the determination and willingness to work out good scheme of house numbering. Can anybody deny that a good large plan of a village o.r town in the office of the P~nchayat or Municipality is an absolute necessity for good administration as it w~ll h~lp to present an overall pIcture of the entire unit in all its aspects? It is hoped this Manual will give some gUldellnes to all tho~e charged with the responsibility to work out and introduce immediately a satisfactory system of housenumbenng .
. The !nstr~ctio~s in. this Manual are by no means comprehensive and cannot possibly be expected to meet the varJ:lllg SituatIOns In different parts of the country. It is hoped that the State Governments wlth the help of the adVisory committee will be able to resolve severa) local difficulties in consonance with the general scheme of things spelt out in this Manual. If any matter of major policy are involved they may kindly be referred to the Registrar General's Office which will try to render whatever service that it can.
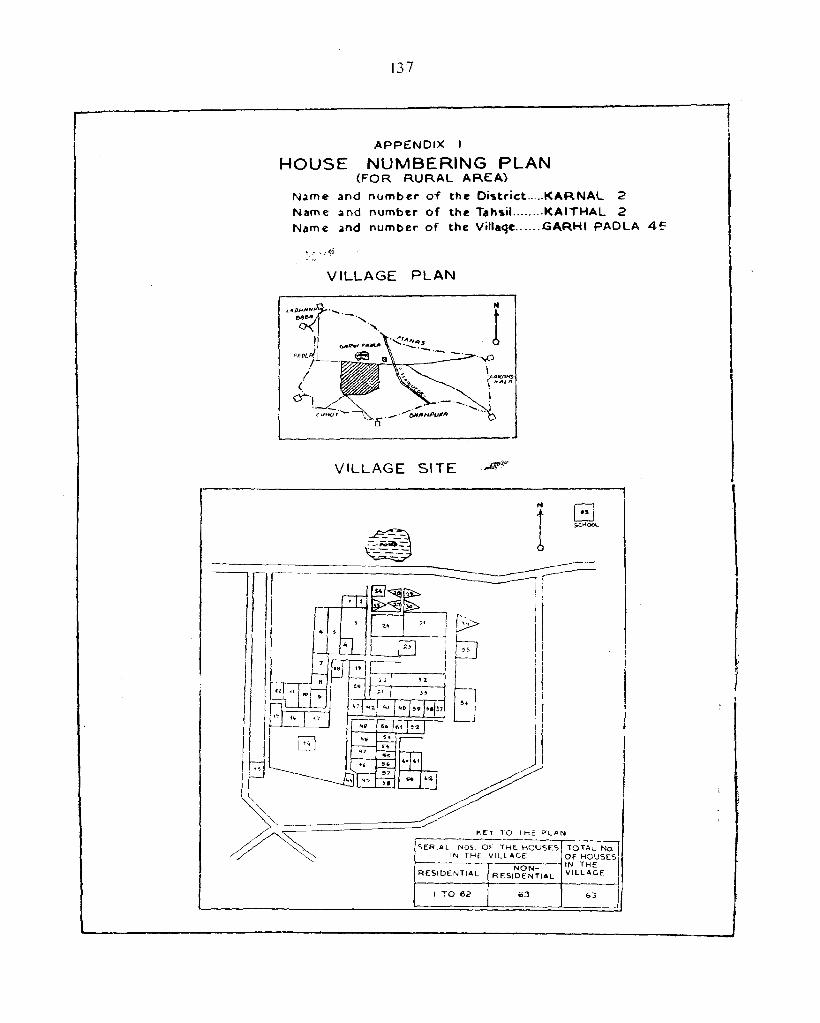
137
APPENDIX
HOUSE NUMBERING PLAN (FOR RURAL AREA)
N.1me and number of the Oistrict.. ... KARNAL 2 Name .and number of the Tahsil ........ KAITHAL 2 Name .and number of the Villaqe ...... .GARHI PAOLA 4~
VILLAGE PLAN
VILLAGE SITE ...t#'~
Of
1
I
I I,
I "
~\' "'~'.~========:::.- "ET TO 'He PLAN '~" "R'", '0' 0' '" "0"'" 'Om"" , IN THE VILLAGE Of HOUSES NON- IN THE
RESIDENTIAL RESIDENTIAL VILLAGE
I TO 62 63 63
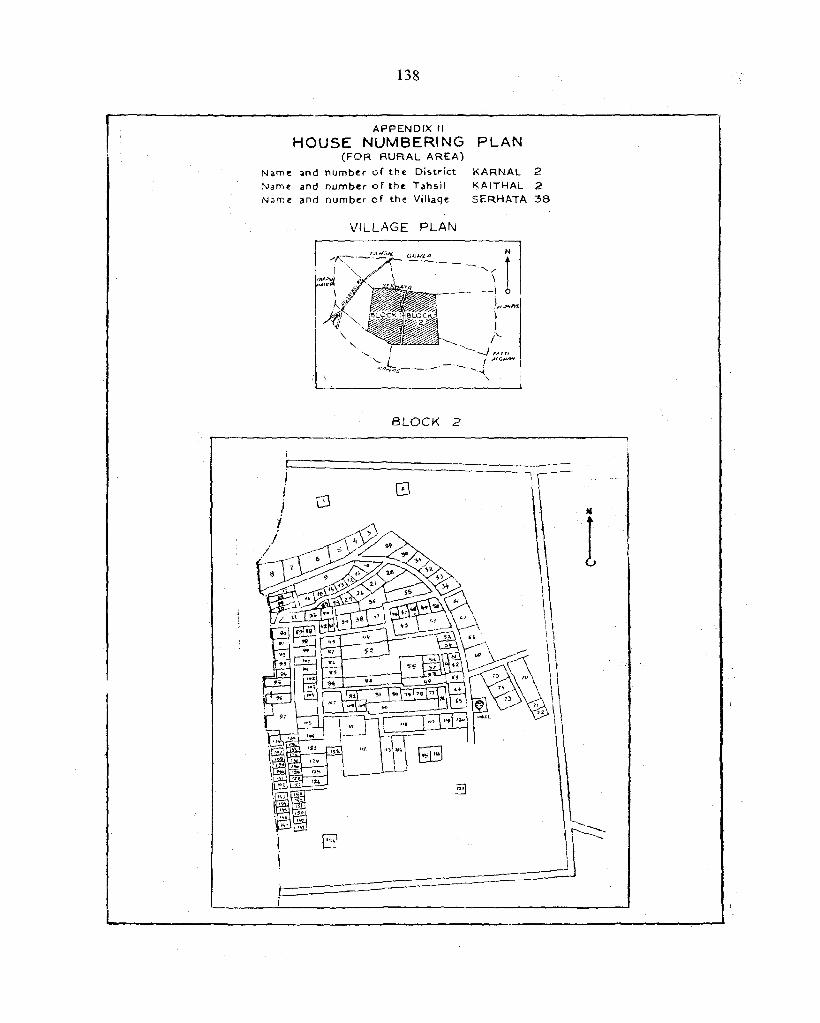
Name Name Name
138
APPENDIX II
HOUSE NUMBERING PLAN
.nd
and and
(FOR RURAL AREA)
number of the Di",trict
number of the Tahsil
number of the Villa<jt
VILLAGE PLAN
KARNAL KAITHAL
SERHATA
N
1
,flf.rl
r "'~G"'''*''' -...-.~.
"
BLOCK 2
2
2 38
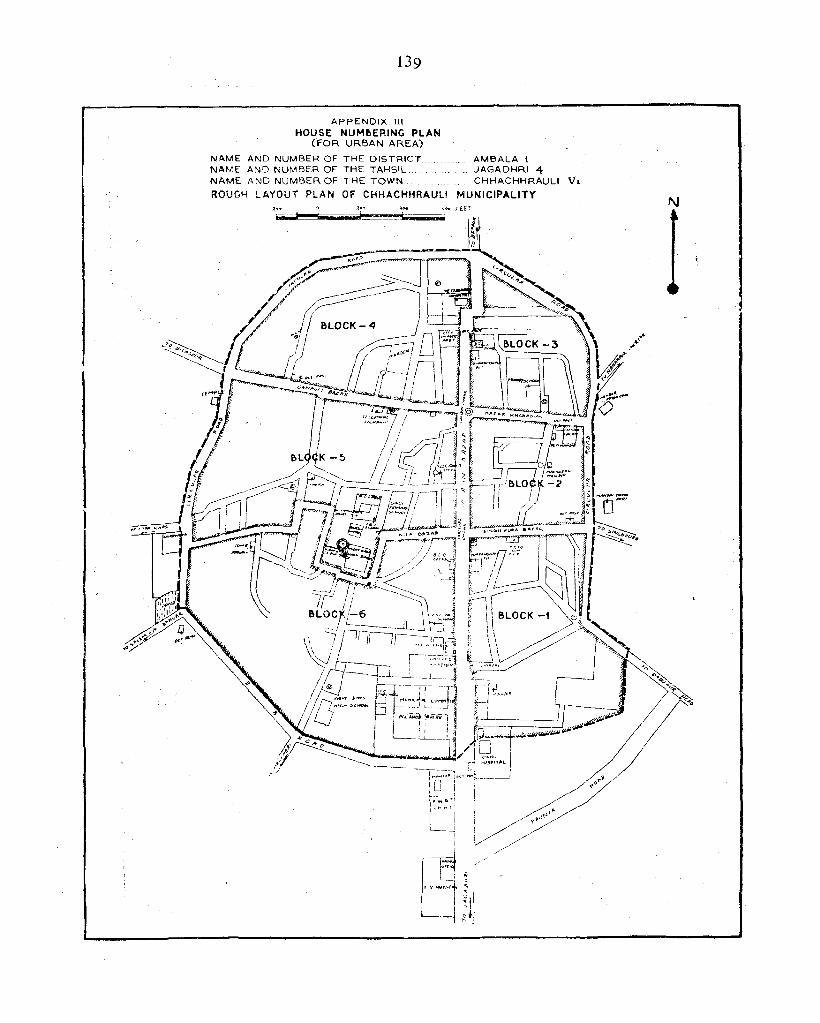
APPENDIX III HOUSE NUMBERING PLAN
(FOR URBAN AREA)
NAME AND NUMBER OF THE DISTRICT... AMBALA 1 NAME AND NUMBER OF THE TAHS!L... JAGADHRI 4 NAME AND NUMBER OF THE TOWN. CHHACHHRAUU VL
ROUG\-; LAYOUT PLAN OF CHHACHHRAUU MUNICIPALITY
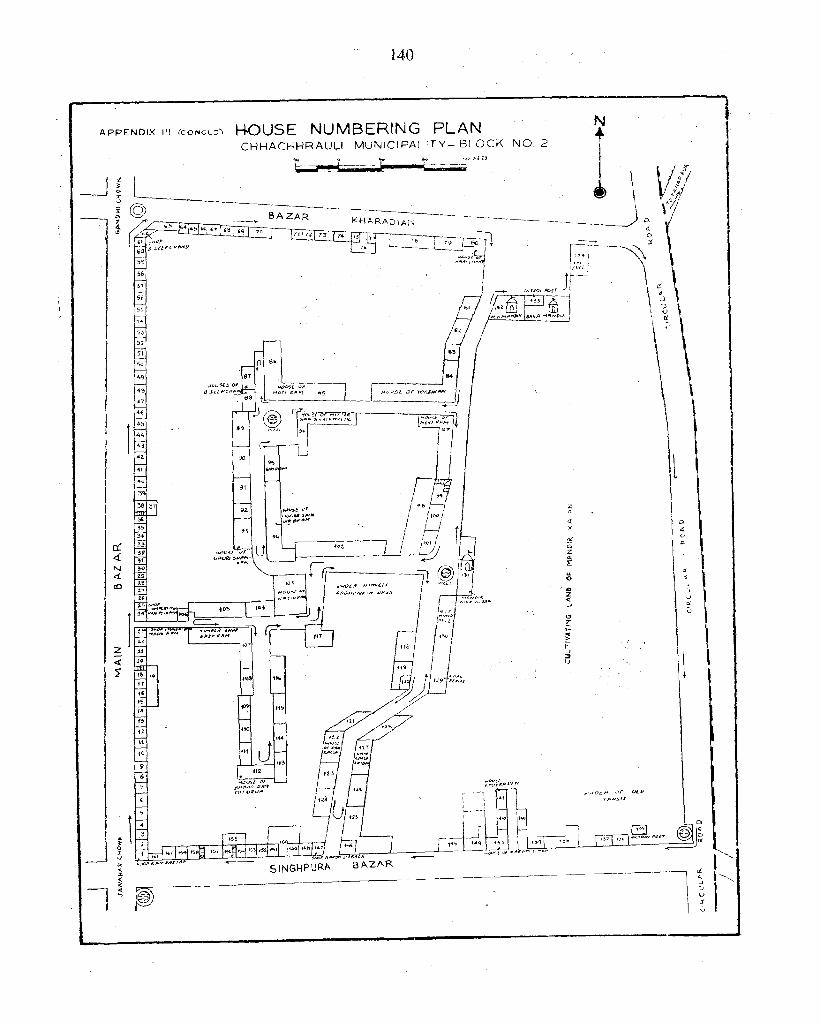
140
APPENDIX III (CONCLD', H-OUSE NUMBERING PLAN CHHAr::HHRAULI MUNICIPALlTY~ BLOCK NO.2
'" I ~---~ i ,=- ----:.t Fl-ll
~~~~~~~=.---L 7, 79.B{ .... <~, I
r-~;:':'+~~~
z « 2
~ , " '" ... '"
l!~ SINGHPURA
" () .. z < -'
N
1 \ ) "
\/,f oil
fll
r{ . .J
, ';:l l <.) • 0'
\ \l 1
1
\
\ I C\
I ..: 0
"
"
\ " J u 0' u
~
141
ANNEXURES II, III AND IV

142
ANNEXURE
CENSUS OF
SPECIAL
(ForSampJe
(Schedule
Name of District ... ' ...... , .............. ,"',',.,"', ... ""'.,.,.,",.,"',.,," ,.,"",., ,(Code No,), "',',.,.,,., " ..
Name of Island/Taluk/Tahsil/Thana/Anchal. , .. , . '" , ... ,." .... " .... ",., ... ,' .... ' ....... ' ,(Code No.) .. , .. , ... , , .. , . , "
----,.----~---- ---',---Descrl'ptlon of Census Drinking Water
House Supply
Line Building Census Age of Use to which If vacant, Irs any ~e of '-Ma:-I~:- -:ate- s:::: Distan:-No. No. House the house the censU& give reasons production, . rial of rial of rial of if not
(Municipal No. in years house is put 'processing or wall roof floor within Local servicing done? the house Authority " (If yes, the or Census details to be ~J ~~
t 2 3 4 5 6 7 8 9 10 I 11 12
-------__ • -------- _-.... - ____ __. -------- __"'-.- ---- ___ - ---.... ---0 ...... __ ..-..-__
1 .......... ..
2 i .......... .. , ......... ,., ,1, ... " .. ....... ·1·········
3 .......... ..
4 ........... .
5 .......... ..
6 .......... .. • ••••••••••• 1 ••••••••••••••
7 ........... ..
8 ........... . ..,'., .... 1 .... ",., ... . ........ \ ... . . ....•. '! •.......
9 .......... ..
o ........... . • •••• y • ••••••• , •••••• ' •• ,' •• ,',.,. I' , ' , , , . , .. , . , ,
2 ........... .
3 ........... .
41 .......... ..
5 .......... ..
6 ........... .
7 .......... ..
.. ...... \ ............... . ........ .......... ........... .
8 ........... . ' .................................. 1 ...................... 1 ....... .
9/ ........... . o .......... .. ...... .. : : :::::::::::: : J:: J: ....... .
Signature of Enumerator .. , . , . , . , ... , , .... , ... , . , , , ....... " . , Date ..................... '.
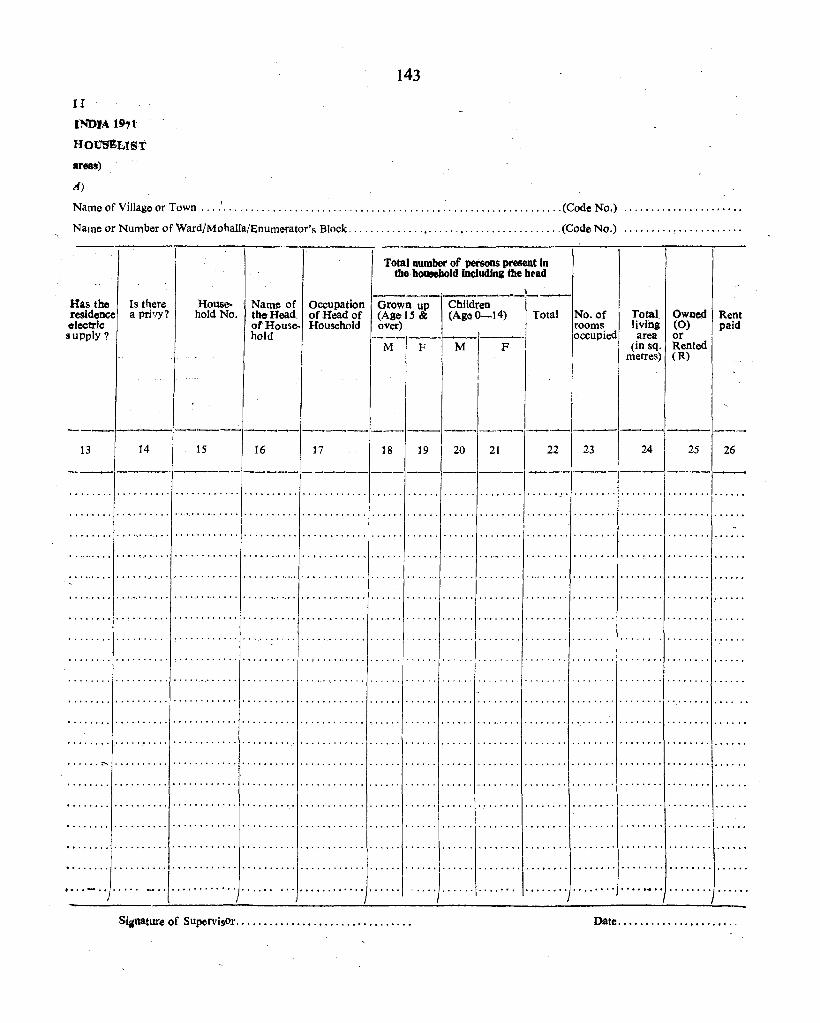
II
INDJA 1971
HoUSELlst
areas)
A)
143
Name of Village or Town ... : .............................................................. (Code No.)
Name or Number of Ward/Mohalla/Enumerator's Block ............. '.' .... '.' ................. (Code No.)
Has tbe residence olectric supply?
Is there a privy?
House- Nall1l) or Occupation hold No. the Head. of Head of
of House- Household hold
Total number of persons present in the bousehold.includlng the bead
--~--~----Grown up Children (Age 1 ~ & (Age 0-14) Total No. of over) rooms
1:1---;-......-r----p· 0","";'"
Total living area
(in sq. metres)
Owned (0) . or Rented (R)
Rent paid
---._ --------~ --__.._ ------------ "_--__ -~~-~-__ - ~,--~J----J---~
13 14 15 16 17 18 19 20 21 22 23 24 25 26
----------------- ------ -------------_--- ----~I---I---I--
............ 1 ....................... .
.... ....... . ...... , .............. " ................... , ..... . ........ I ........
::·:-·r:::·~: 1·:::.·.· ••••••. : .••• ···::.: •• :·f·: ••• :j: •••• : •• : •.••..••. :: " ......... _ .. Signature of SupervisOr .............•.................. Date ..............•.......
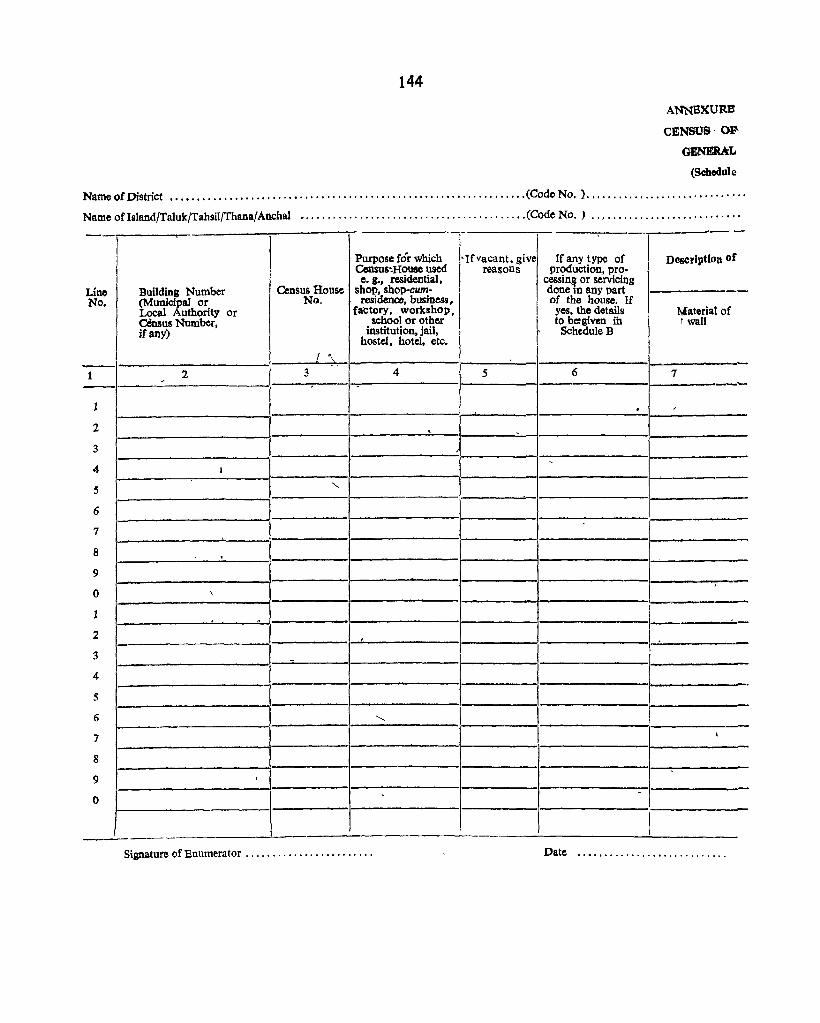
144
ANNEXURB
CENSUS o.p.
GENERAL
(Schedule
Name QfDistrict ••.•...................•.......................................... (Code No. } ...........................•.•
Name ofIsland/Taluk/TahsiljThana/Anchal .......................................... (Code No. J ....•...•...••.•.••.••.•.•••
Line No.
1
2
3
4
5
6
1
8
9
o 1
2
3
4
5
6
7
8
9
o
I
I
. _-Purpose for which . If vacant. give CensUS·.HOuse used reasons e. g., residential,
Building Number Census House shop, shop-cum-(Municif,al or No. residence, business, Local uthority or factory. workshop. census Number, school or other if any) institution, jail,
hostel, hotel, etc.
, f '\ , .. 2 3 4 5
~
-
I
"-
,
,
\
,
-
'-
,
Signature of Enumerator ....................... .
-
If any type of I Description of production, pro- I
ceasing or servicing done in any part -of the house. If
yes, the details to be:g!ven ih
¥aterialof wall
ScheduleB
6 .1 -. ,
-
,
. I
I
P-== I
,
-
I Date ........................... .
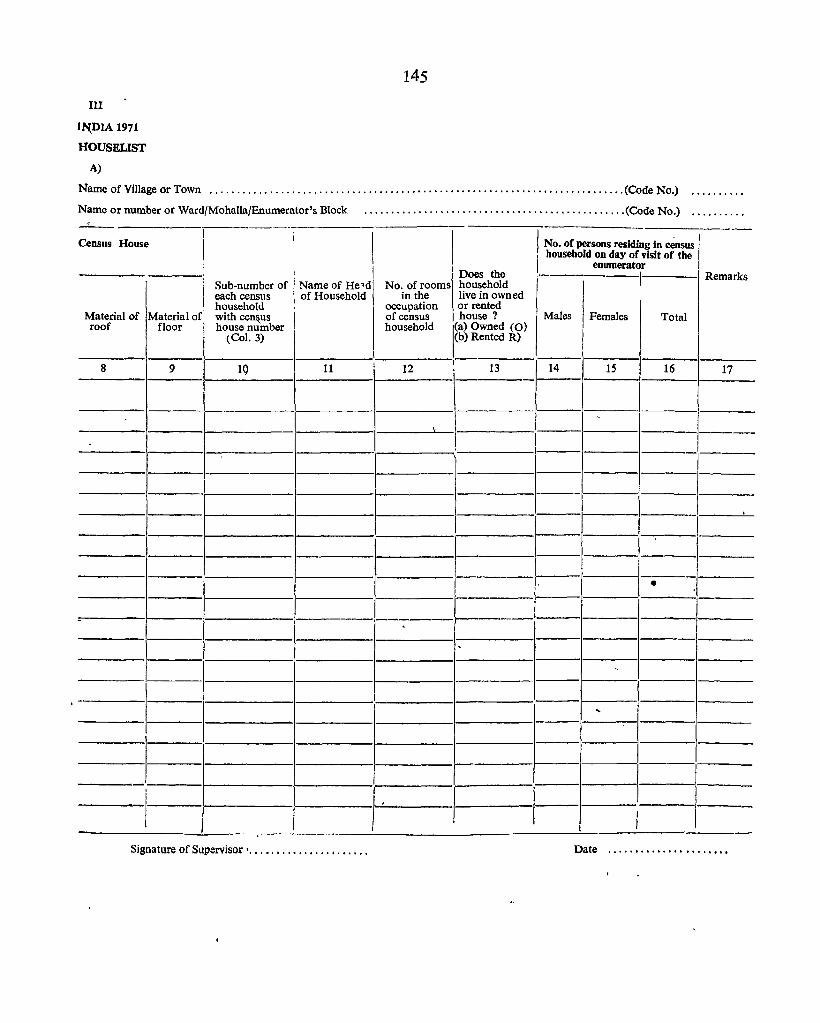
III
I~DIA 1971
HOUSELIST
A)
145
Name of Village or Town ............................................................................ (Code No.)
Name or number or Ward/Mohalia/Enumerator's Block ................................................ (Code No.)
Census House
Sub-number of I Name of He'd each census I of Household household
Material of Material of with cenilus roof floor house number
(Col. 3)
8 9 lQ 11
.
I
I
-
I
I Signature of Supervisor' ..................... .
I Does the No. of rooms household
I No. of persons residing In c~nsus I ' household on day of visit of the I enumerator ,------1---1 Remarks
in the live in owned
! Males occupation or rented
I of census house? Females Total household I(a) Owned (0)
(b) Rented R) I
I I 12
I 13 14 15 16 , 17
,
I ----I ----_
,
I I I I I -------
•
'---=---E- I -
I I ...
I I
I I 1 ' I I
Date ......... , ........... .
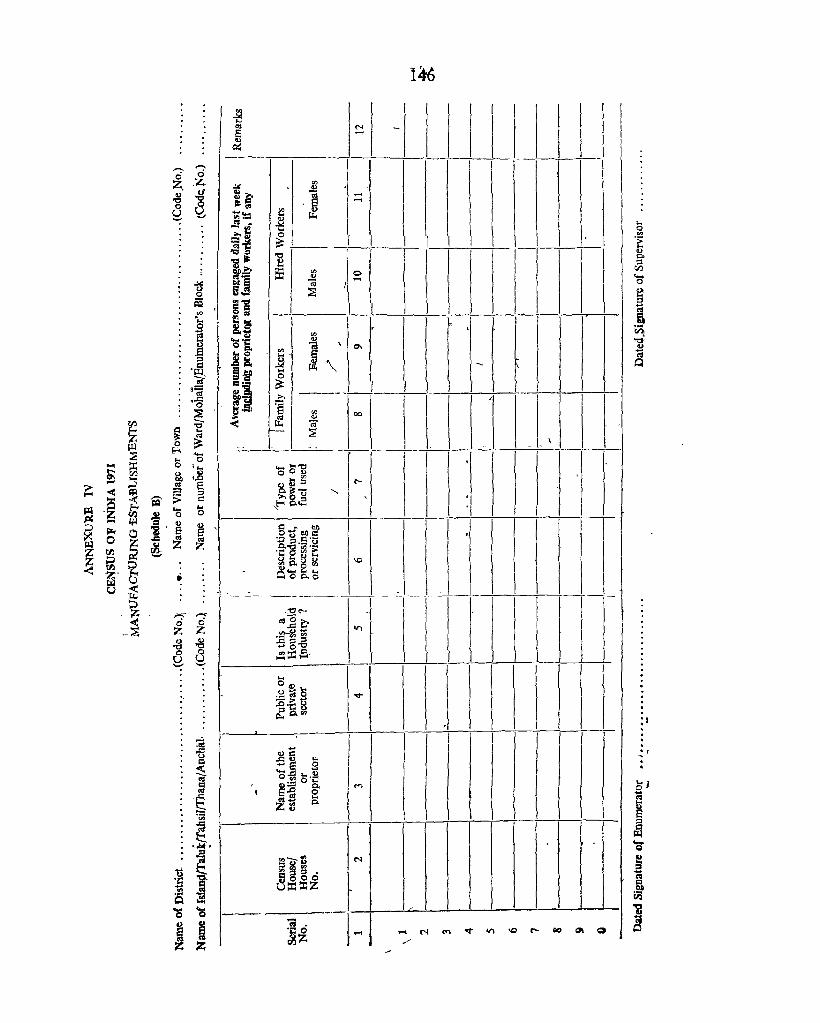
__ I_JI
00
-r -----+--I --'--,-!---'-: ---!--"--!-'------_
I I !
~- ~
~ ~
§ ~
:1 · · · .,
· ·
ANNE:XURES V AND VI
147
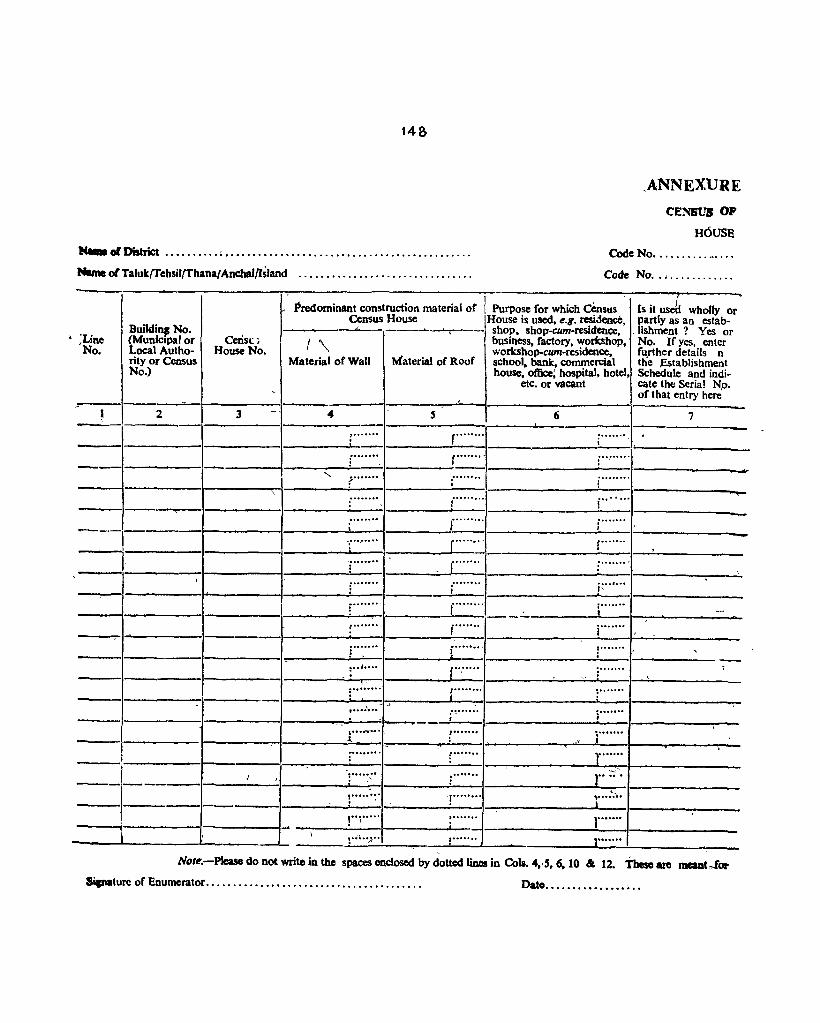
14&
,.ANNEXURE
C'E!\'SUS OP
H6uSE
..... of District ••••..•.• 01 ••••••••••••••••••••••••••••••••••••••••••••• Code No .......... ~ ... .
Name or Talukrrehsil/Thanal Anc:haI{lsland .....•.•.....••................. Code No •. , ........... .
r r ..... _, _'_on malod,l or I ""- r ... wbkh a..." Is it us~ wholly or
Census House House is used, e.g. residence, partly as an estab-
I Bw1dilll No. -- ~~-- shop, shop-cum-residence, .lishment ? Yes or
:Line (Municipal or Cens!; .. I \ business, factory, workshop, No. If yes, enter No. Local Autho- House No.
Material of Roof workshop-cum-residencc, fu;ther details n
rity or Census Material or Wall school, bank, commercial the ;Establishment No.) house, office; hospital, hotel, Schedule and indi-
etc. or vacant cate the Serial N.o. , of that entry here --
! 2 3 -, 4 5 6 7 --
~ -: .......
I ........ i .. ······· . , - - "- ........ . .
i··· .. · .. .-
r .. ·· .. · i .. ·· .. , ........ r .. ·· .. · i······· I I -. --I ., ......... [ ...... , r·······
I ,
, ........ r··· .. · . ......... : ,
I , ,. ....... j: ..•••• I
........ r····· .. r .. · .. · ---: ....... r······ ; ....... I ........ { ........ ! ....... , , . .
: •• J •••• ( .. : ..... . ....... ; , , >' ......... [ ........ : .......
I ..... ' ... ~ "
; ....... , , -_ , ; ••.• 11---.· l······· j ....... ..l .'f.
I -_ ........ f······· 1 .... · .. , -1---- / .......... : ....... r~' , : '
- '-! ...... ~ . ·l········ , ....... " i
"·1 .. · .. , ....... r· .. ··· \ \ ! .. ~ .. ) .. : ....... } ....... -
NOle;-Plcase do not write in the spaces enclosed by dotted lines in Cots. 4, >', 6. 10 &: 12. Tbeso arc meant-for
Sitnature of Enumerator ....•..•.....••..•.•••...•.....•.....•.. Date ......•••••••.• ~ .•
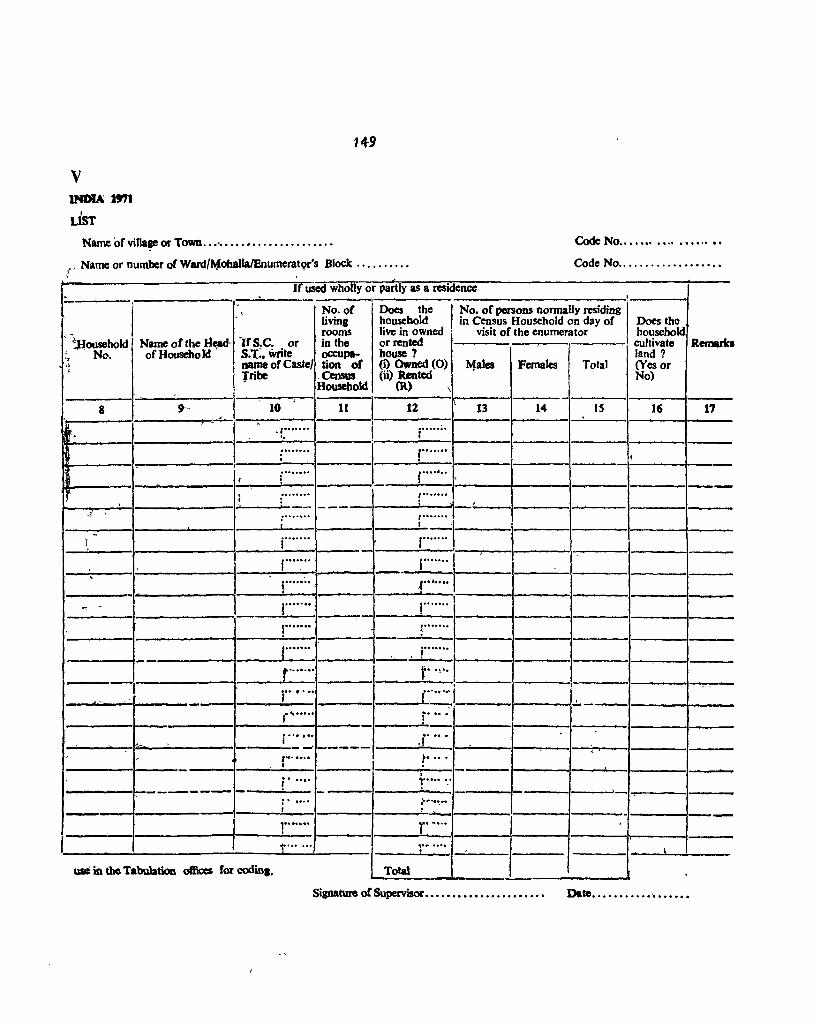
14-9
;
LIST
COOe No ..................... .
CodeNo ............••••.•.
f If uSed wbolly or partly as a residence , _______ ',_--:..' _______ 11 __________ • __________
1 ____ 1
living household in Census Household on day of Does the I . No. of Does tbe I No. of persons normally residing
" rooms live in owned' visit of the enumerator household , ~ousehold I Name of the 1j1i8cf. 'lfS,C: . or in the or rented "I cultivate Remarb :, No. of Household S.1;;., WJ1te oecupa- bouse? land?
.' ., I name of Castel tion of (i) Owned (0) Males Females Total (Yes or • Tribe Census (ii) Ilented No)
Household (R) \
~----__ i---------~T_.4.-I---~,------I----I1---1'-----12------~--1-3---I---1-4--i
10 9-8
,r .... ••· '.
IS 16 17
:....... r·· ..... , ~------I~------------:,-----~---I-------·I-----~---I-------I-------I--------I------~-----,i······· f······· "----------I-----------,~~--~---·,-------~-·--~~--,------·!--------,--------,·------,-----
I ,....... I 1----,"'-,.,....;..' -I--------I, ..... -,_jo.-.. '.-.. ·-.. - ----l---.J-:.-.. -......... 1--' ------1-""---1-----·1---
i ! I ---\-,"---I-----~~~~----~.--.-.I-------1----~f···-··~···, Ii····
I--~,~-I------~!I~-----!-----~-----
f ...... • r ...... I~ ____ I---I---,---,I--I--~:-----I----------------~-----~~---I------~---· ,- I {....... r··· .. · ----------I------------·l-----~~--I~----I----~---I-------il-------I-------I-------I------I ....... I
j ........
f' ., .. , C .. ···j
--;0.
)"' .... 1-....... 10'-...-.-1--------1---.:--1------1------'-r· ... ---
1" ....... I--------I----,--------·I-----~---~------I·----~ .r ... I'" , •. ---...... ~_·r .. -~----I-,---- ..... ------I---....... -·I-..:.---t· ... . I"· ••.•
I---------I----------~----~I----II------I----~---I 1····· ... 1 _____ 1-------___ ..:.1_' -"_" _ ---I--_.;:__-II----: ....... ~. '" ....... , _________ ; ___________ ~-----~f~--I------I-___ --~ ...._
I 1
, -
§ -
I ,1----1--. t· ~ ... ,
1 _______ ~--___ -------li----~l""-···-··,--___ I----~ __ -I------1----_+----~~-----.I----
t .. · ." LTOtal r' .... _. __ ..!-___ . ____ -' use in the Tabulation oftK:es for codinl.
Signature or Supervisor.. . • • •• • • •• • • • • • • • • • • • Date •..•••••••••••••••
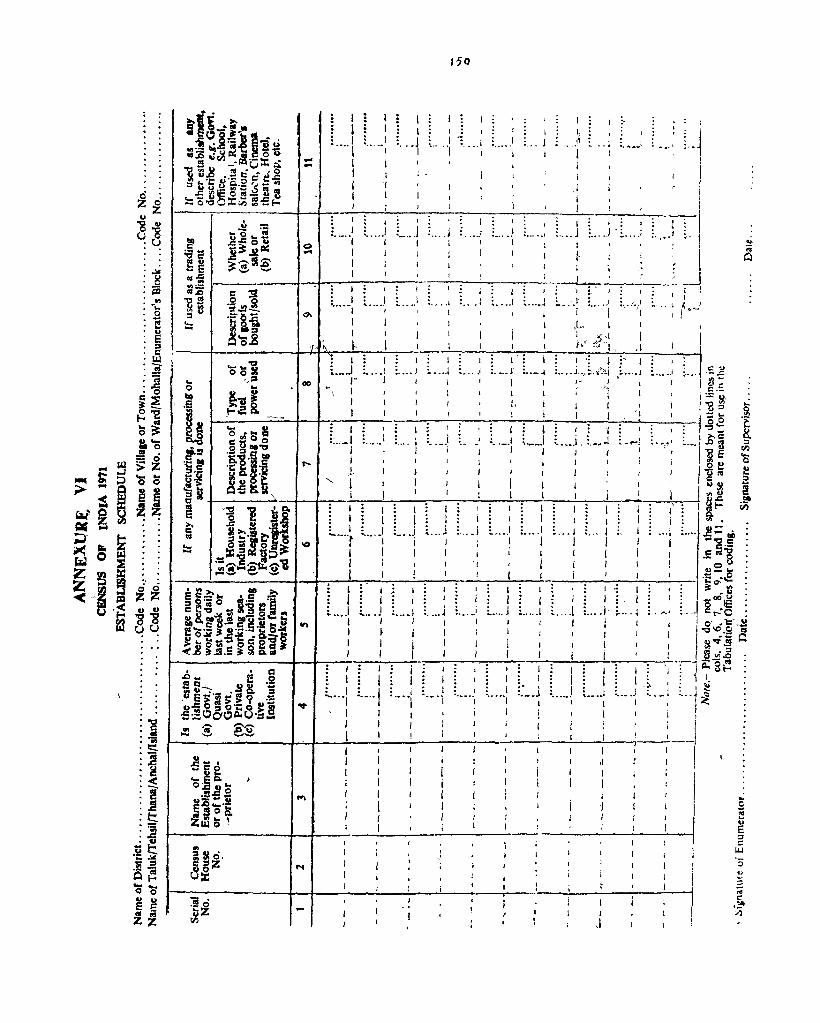
" . o ci zz <) 0
'g'8 L!U
--I I
.... \ I I ,
: I : I •••.•• 1
150
I . I , I
.. ~ ...... : -: ... ~ I -_ ... I
I .. j
1
I
j ! I
•• J
I
:
--: :-j I I
.: i ' j • ':: : ; i : : ::::: I j
f~ t!i! ~ --'-j; 1 L.; '1 -; --: - i '-f ' r ; . _.: -I ~~ " _;_! __ :...I ____ .....:_! _ ....... J~~.....,._'._,. __ :._.,._. __ .~ ~, (rJA c ~ J I I I.; I I I:, l J I I
J
I 1 i .~.:a~ 0\ •••••.. : L ... ~ i : .... ; •... : ~ .... : ~ ...• : :. .... : : ..... ; :,.".,.; '. ',' 1'·'" ~ .~ l"l 'I, I I L. I I ,
l ____ ~ __ Q-~-j------~I~,~~·~~~,~~I~~~~~:~~~~~!~~:~--;-:,'~,-?_·~:w,~~.~\ ____ I __ ~! '! I , 1 1 I 1 I ,,;!." J ,
'0 ~.1 00 L_.~_ ..... ; : .... ; ~ .... : ~ .... : :····1 : .. -~ : .... ~.:.:.<'),: ~ .... : ..... ; 0'" =2 ~ ..., * I' , , I I I I I '''j I I I j .~, .~ ~-g ~ 'I I I ' I, II' I , ,'I I 1 "G ~ ~ L-~.~--~--~-==-=-~~~~--~I~---I~---'~--'~---'~--;_!~--;__~~I~-~I~~~~ __ '~_ = 5
Q ... U I'. I I I I ': I I , .g,:: g o~"a' ' .... , I>'C
~-: g ~':.g L .. al ...... : .... j . ---1 L -; :"-'l '--: : ..... ~. : .... ; : .~; : .. 'i :"li ~ .~ ! :g_.g li! r-- I ; , I I ; I 1 ,f I .2 ~ g:g ~ &('5 J.. j " I I I , I I g '" ~ t Q~ & • "i I : : : ! I I I' : I J : ~ c~l-------~'--J--~---.~--_IL· ~--~--~~~~~~~--~I~-L'~-----~'--~f ~F
; .~~] .it :!;!. t L .. .l : ... i ~ .... ; : ... ,: ... i .... J .. ) .. .1 ..... I;~cti ~!::·;t'H ICI ... •• .. f ...... , :-"i 1 ; I I I I I I c'_ .. ~.g12 i:!~ I I I I I ii' ( I I .S <Us ':;:'iO'.s~,,"'U''8 I i I I '1 , I I I I ! .,~ ...
____ -l~~~~ ___ ~~_~ __ ~~ ... ~~--~1~~.~1~--~'~---1~.-~!~--~1~--~1~--~1~--~'~ __ ~I~ ___ '~ __ I'E~~ • "'» .. ~ I I .. I I , I I I. I I ~ .rl
~~~S .. iie~.. I: l:: I : ••. _: :. .... 1 L. ... l ... 1 1....: ~.:.! .~: .. ~.Ig:~ . ~8.~8.i!g~'::b on L.··I , .... , · .. ··i : .... ~ ! I I j • 1 I 10
, .1:-,2
i~~ ~~~'d'~il : ~ j : : ; : : : : : I ~~~ ~ -<..8 it.!!.5 iI! ~ IS... I I I I I I I i I • I J S3 vi.5
I--..:....:--------t-..J--:-....;.I:..-::---j;_,:---i;-';---,-::---,~.:---,~~--J:-::---J~;---!.., ~--, -:---:':"1 -:- I ~ 8 ~ ~ .. e .~ . I I 1 I I. I I I I I 1 . . i~~·iii~.~ _ :. .... : ··-1 .... , ... j : ...... ; ::_.~ .. -.: L ... : L .. : ._; "i~ u.c:O~O·CO~1!! ~ , , I I
~~~~::_:~~=-~_O~~~~~·_=_-__ -J __ ..J-___ :~I ____ ,~: ___ ~: ____ :~; ___ ;~: ____ :-' --~;~--i~:---,:~i---;r:---:~!.---I ... ~e i I I I I I I i I : ( '0.11: g. .. I j I ! i ' , iii , :3~g .... I I I 1 , I
~li'::.!! : I j I I • , j ",soa I ( It! Zi!i ~ , I I I j I
I I
J
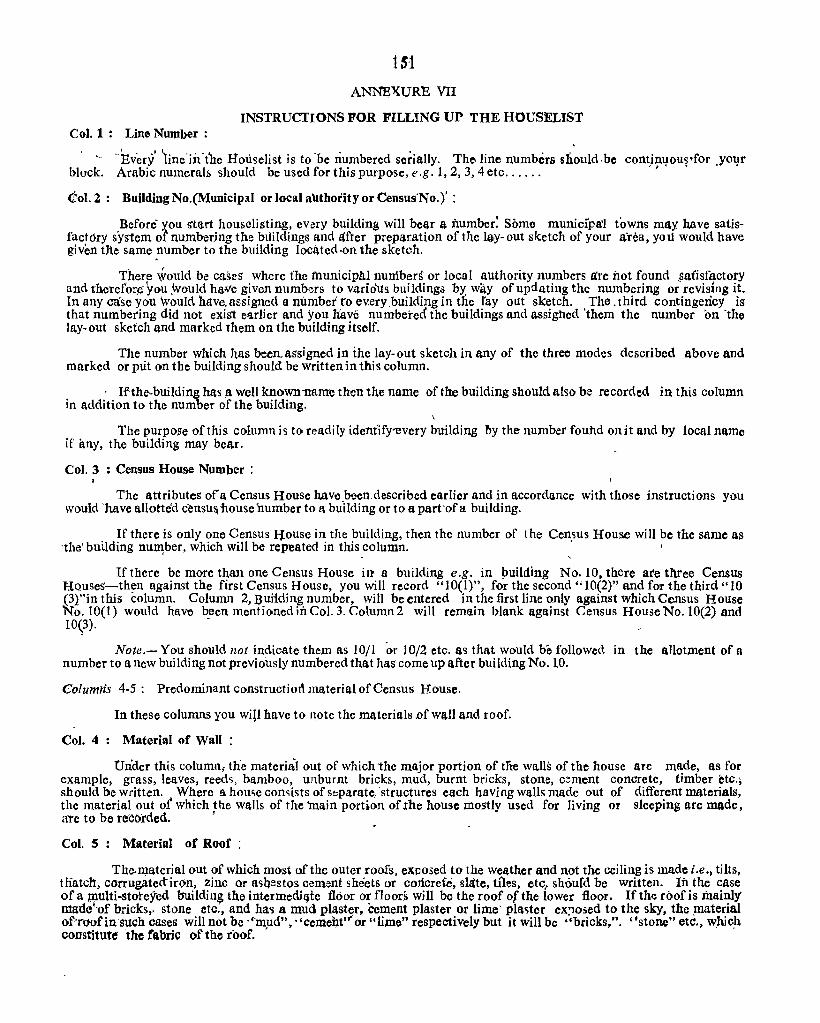
15t ANNEXURE VII
INSTRUCTIONS FOR FILLING UP THE HOUSELIST Col. 1: Line Number :
. ~, "Every' 1ine'in'tlte Houselist is to 'be numbered serially. The-line numbers should.be continuous'for your block. Arabic numerals should be used for this purpose, e.g. 1,2,3,4 etc. . .. . . 'I' • ••
<tol. 2: Building No.(Municipal orlocal authority or Census'No.)' :
Before" )!Ou start houselisting, every building will be-6r a number: Some munidpa'l towns may' have satisfact6ry system of numbering the buildi.ngs and aftcr prcparation of the lay-out sketch of your area, you would have given t11e same number to the building located·on the sketch.
There would be caseS where tne 1Dunicipalnunfbers or local authority numbers £ire hot found $a.iisfactory and therefor,eyou ,would have given numbers fo va.riolis. buildings by way of updating the numbering or rcvising it. In any case you would have. assigned a number to every building in the fay out sketch. The. third contingency is that numbel'ing did not exist ef1rlier and you have numbered the buildings and assiglled 'them the number on 'the lay-out sketch and marked them on the building itself.
The number which has been. assigned in the lay-out skctch in any of the three modes described above and marked or put on the building should be written in this column.
. Ifthe.building has ,a well known-name then the name of the building should also be recorded in this column in addition to the number of the building.
\
The purpose of this column is to readily identlfy-every bUilding by the number fouhd onit and by local name if any, the building may bear.
Col. 3 : Census House Number:
The attributes of'a Census House have been described earlier and in accordance with those instructions you would 'have allottc'd censu~ house 'number to l\ building or to a part'of a building.
If there is only one Census Itouse in the building, then the number of the Comus House will be the same as 'tIHI'building nu~ber, which will be repeated in this column. "
If there be more than one Census House ill' it building e.g. ill Imilding No. 10, there are three Census Hquses-th~n against the first Census House, you will record "10(1)", for the second "10(2)" and for the third "10 (3}"in this column. Column 2, 'ijuiiding number, will be entered in the first line only against which Census House No. 10(1) would have ~een mentioned iil Col. 3. Column 2 will remain blank against Census House No. 10(2) and 10\3).
Note.- You should not indicate them as 10/1 or 10/2 etc. as that would be followed in the allotment of a number to a new building not previously numbered that has come up Mtcr building No. 10.
€olumris 4-5: Predominant constructiot\ material of Census House.
In these columns you wi!! have to note the materials .of wall and roof.
Col. 4: Material of Wall :
Dnder this column, the matcrial out of which 1he major portion of tne walls of the house are made, as for example, grass, leaves, reeds, bamboo, unburnt bricks, mud, burnt bricks, stone, c::ment concrete, timber etc.; should be written. Where a home consists of sr:;parate, 'structures each having walls made out of different materials, the material out of which the walls of the "'roain portion of ,the house mostly used for living or sleeping Rre IIlAde, are to be reco:rded. f
Col. 5: Material of Roof :
Thc.ll).aterialout of which most of the outer roofs. exposed to the weather and not the ceiling is made i.e., tilts, tliatch, corrugatedir6n, Zinc or a~Qestos cement sheets or concrefe, slate, tiles, etc, shourd be written. Ih the case of a Plulti-storey-ed building the intermediEJtc floor or floors will be the roof of the lower floor. If the roof is mainly' ll1ade"of bricks" stone etc;, and has a mud plaster. ccment plaster or lime' pla~ter ex,05ed to the sky, the ,material of'roofin such caseS will not be "'m~d", . 'cement'" or "lime" respectively but it will be "bricks.". "stone" etc., whic}:l cOIJStitut~ the fabric of the roof.
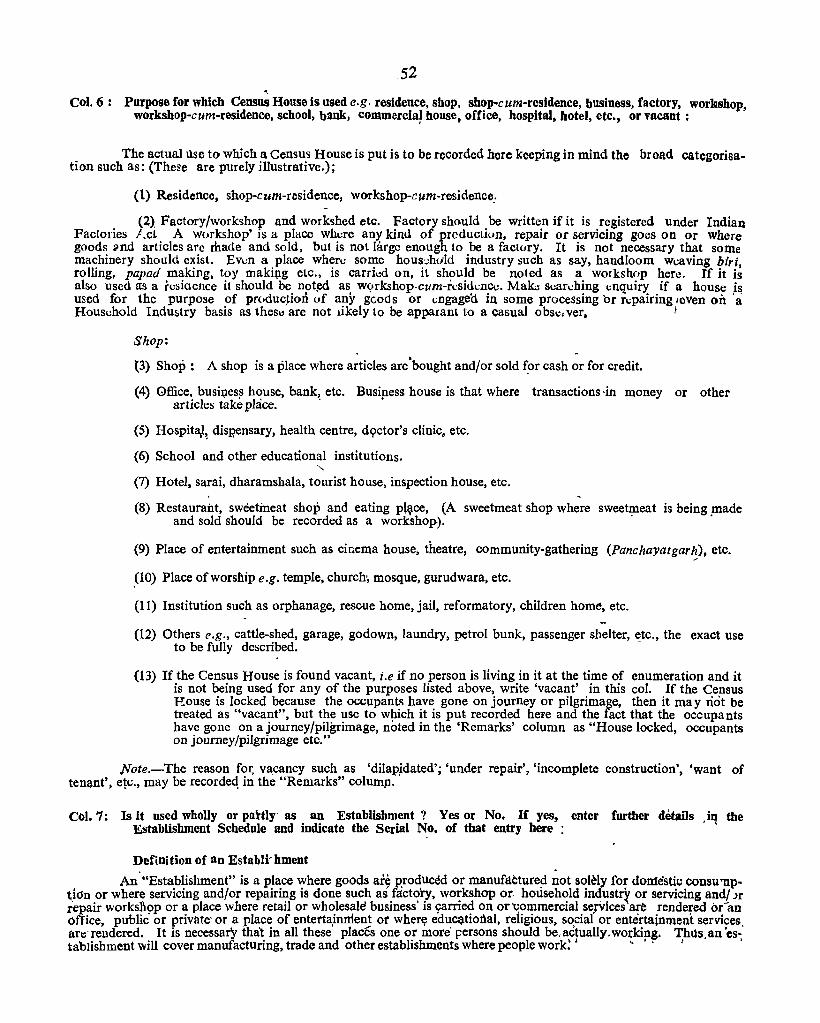
52
Co). 6: Purpose for which Census House is used e.g. residence, shop, shop-cum-residence, business, factory. wor]Gshop, workshop-cum-residence, school, bank, commercia~ house, office, hospital, hotel, etc., or vacant :
The actual use to which a Census House is put is to be recorded here keeping in mind the broad categorisation such as: (These are purely illustrative.);
(1) Residence, shop-cum-residence, workshop-cum-residence:
(2) Factory/workshop and workshed etc. Factory should be written if it is registered under Indian Factories I.c! A workshop' is a place where any kind of prcducLion, repair or servicing goes on or where goods 2nd articles are made and sold, but is not large cnough to be a factory. It is not necessary that some machinery should exist. EVlin a place when; some hous'..:huld industry such as say, hand loom weaving biri, rolling, papad making, toy maki{1g etc., is carril:d on, it should be noted as a workshop here. If it is also used lIS a rcsiaence it should be not~d as wyrkshop-cum-r,-·sidcnCc. Malw sl.:arching I.:nquiry if a house is used for the purpose of pr(lduc~iorl. of any gcods or I.:ngagea in some processing 'or repairing leven on 'a: Housl.:hold Industry basis as thesl: are not likely to be apparant to a casual obscLver. I
Shop:
(3) Shop: A shop is a place where articles are 'bought and/or sold ~or cash or for credit.
(4) Office, busil;less house, bank, etc. Business house is that where transactions -in money or other articles take pl~ice. . .
(5) Hospita,l~ dispensary, health centre, d9ctor'S clinic, etc.
(6) School and other educational institutions. "-
(7) Hotel, sarai, dharamshala, tourist house, inspection house, etc.
(8) Restaurant, sweetmeat shop and eating plq,ce, (A sweetmeat shop where sweet~eat is being .made and sold should be recorded as a workshop).
(9) Place of entertainment such as cinema house, theatre, community-gathering (Panchayatgar~), etc.
(10) Place of worship e.g. temple, church; mosque, gurudwara, etc.
(11) Institution such as orphanage, rescue home, jail, reformatory, children home, etc.
(12) Others e.g., cattle-shed, garage, godown, laundry, petrol bunk, passenger shelter, ~tc., the exact use to be fully described.
(13) If the Census lJouse is found vacant, i.e if no person is living in it at the time of enumeration and it is not being used for any of the purposes listed above, write 'vacant' in this col. If the Census House is locked because the occupants have gone on journey or pilgrimage, then it may riot be treated as "vacant", but the use to which it is put recorded hele and the fact that the occupants have gone on a journey/pilgrimage, noted in the 'Remarks' column as "House locked, occupants on journey/pilgrimage etc."
Note.-The reason for. vacancy such as 'dilapjdated'; 'under repair', 'incomplete construction', 'want of tenant', etc., may be recordeq in the "Remarks" colum]].
Col. 7: Is it used wholly or partly' as an Establishment? Yes or No. IT yes, enter further details .ut the Establishment Schedule and indicate tbe Serial No. of that entry bere :
Definition of an Establi' hment
An'''Establishment'' is a place where goods are p'roduced or Ihanufactured not sol~ly for domestic consu'nptid'n or where servicing and/or repairing is done such as factory, workshop or. household industtt or servicing andl Jr repair works~9P or ~ place where retail or wh~lesale business' is s:arri~ on or'-:~>I~mercial.se.rVices ~e .rendered o(an office pUblIC or pnvlltc' or a place of entertll;Inttient or wher~ edu~tIonal, religIOUS, SOCIal or entertaInment serVIces, afe're~dcred. It is necessary that in all these places one or more persons should be,actually.working. Thlls.an'establishment will cover manufacturing, trade and other establishments where people work: I '" ',! I
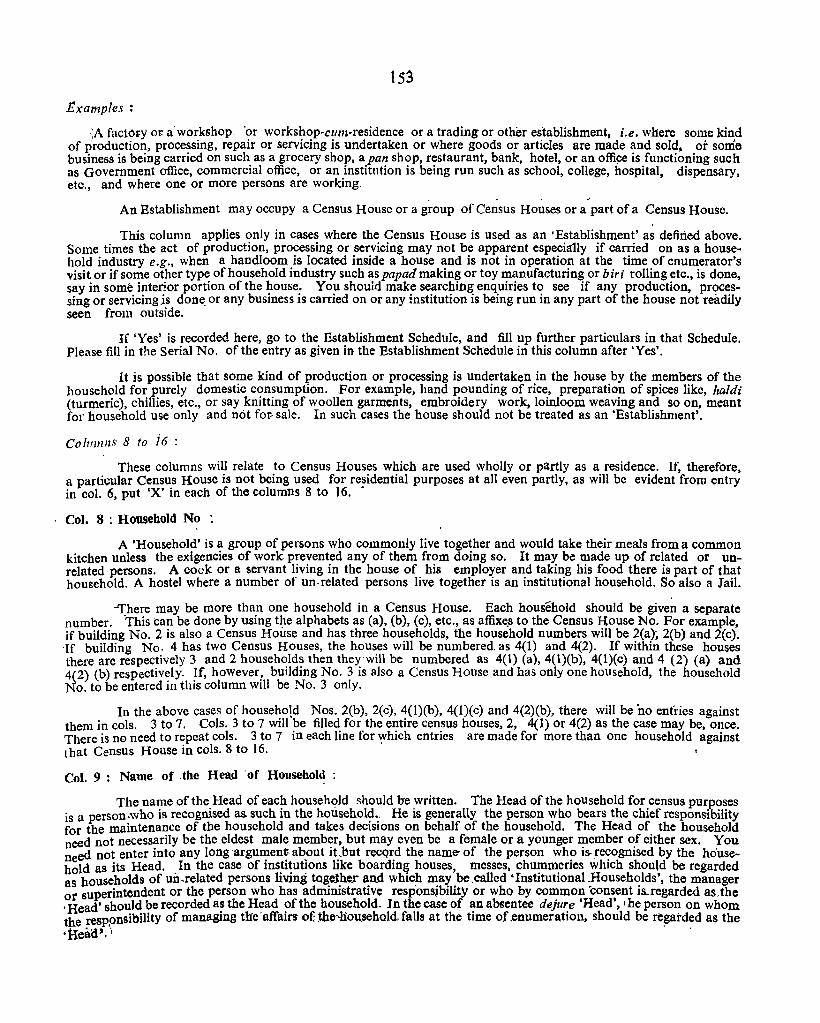
153
Examples:
:A factory 0); a'workshop 'or workshop-cum-residence or a trading or other establishment, i.e. where some kind of production, processing, repair or servicing is undertaken or where goods or articles are made and sold. ot some business is being carried on such as a grocery shop, a pan shop, restaurant, bank, hotel, or an offi~e is functioning such as Government office, commercial office, or an institution is being run such as school, college, hospital, dispensary, etc., and where one or more persons are working.
. .' .;
An Establishment may occupy a Census House or a group of Census Houses or a part of a Census House.
This column applies only in cases where the Census House is used as an 'Establishment' as defined above. Some times the act of production, processing or servicing may not be apparent especially if carried on as a household industry e.g., when a handloom is located inside a house and is not in operation at the time of enumerator's visit or if some other type of household industry such as papad making or toy manufacturing or b jri rolling etc., is done. say in some interior portion of the house. You shouid make searching enquiries to see if any production, processing or servicing.is done. or any business is carried on or any institution is being run in any part of the house not readily seen from outside.
If 'Yes' is recorded here, go to the Establishment Schedule, and fill up further particulars in that Schedule. Please fill in the Serial No. of the entry as given in the Establishment Schedule in this column after 'Yes'.
It is possible that some kind of production or processing is undertaken in the house by the members of the household for purely domestic consumption. .For example, hand pounding of rice, preparation of spices like, haldi (turmeric), chillies, etc., or say knitting of woollen garments, embroidery work, loinloom weaving and so on, meant for household use only and not fo~ sale. In such cases the house should not be treated as an 'Establishment'.
Columns 8 to i6 :
These columns will relate to Census Houses which are used wholly or partly as a residence. If, therefore, a particular Census House is not being used for residential purposes at all even partly, as will be evident from entry in col. 6, put 'X' in each of the columns 8 to 16. .
Col. 8 : Household No :
A 'Household' is a group of persons who commonly live together and would take their meals from a common kitchen unless the exigencies of work prevented any of them from doing so. It may be made up of related or unrelated persons. A cook or a servant living in the house of his employer and taking his food there is part of that household. A. hostel where a number of un· related persons live together is an institutional household. So also a Jail.
-'There may be more than one household in a Census House. Each household should be given a separate number. This can be done by using tl1e alphabets as (a), (b), (c), etc., as affix~s to the Census House No. For example, if building No.2 is also a Census House and has three hou.seholds, the household numbers will be ~(a!, 2(b) and 2(c). 'If building No.4 has two Census Houses, the houses will be numbered. as 4(1) and 4(2). If wIthm these houses there are respectively 3 and 2 households then they will be numbered as 4(1) (a), 4(l)(b), 4(1)(c) and 4 (2) (a) and 4(2) (b) respectively. If, however, building No.3 is also a Census House and has only one household, the household No. to be entered in this column will be No.3 only.
In the above cases of household Nos. 2(b), 2(c) , 4(1)(b), 4(1)(c) and 4(2)(b), there will be no entries against them in cols. 3 to 7. Cols. 3 to 7 will be filled for the entire census houses, 2, 4(1) or 4(2) as the case may be, once. There is no need to repeat cols. 3 to 7 in each line for ~hich entries are made for more than one household against that Census House in cols. 8 to 16.
Col. 9: Name of .the Head 'of Househol~ :
The name of the Head of each househ91d should b'e written. The Head of the household for census purposes is a person.who is recognised as, such in the househol?; He is generally the person who bears the chief responsibility for the maintenance of the household and takes deCISIons on behalf of the household. The Head of the household need not necessarily be the eldest male member, but may even be a female or a younger member of either sex. You need not enter into any long ·argument about it ,but recQrd the name- of the person who is. !ecognised by the heuseM
hold as its Head. In the case of institutIons like boarding houses, messes, chummeries which should be regarded as households of uihrelated persons living tageJher and which may be.called 'InstitutionaLHouseholds', the manager or superintendent or the person who has administrative resp·onsibility or who by common consent is...regarded as.thc 'Head' should be recorded a~ the ~~ad ?fthe hou~ehold. In the case of ~n absentee deju~e 'Head', ,he person on whom the resp.onsihility of managIng the affaIrs of: thO'}iousehold. falls at the tIme of .enumeratIon, should be re~atded as the 'Head'.i .
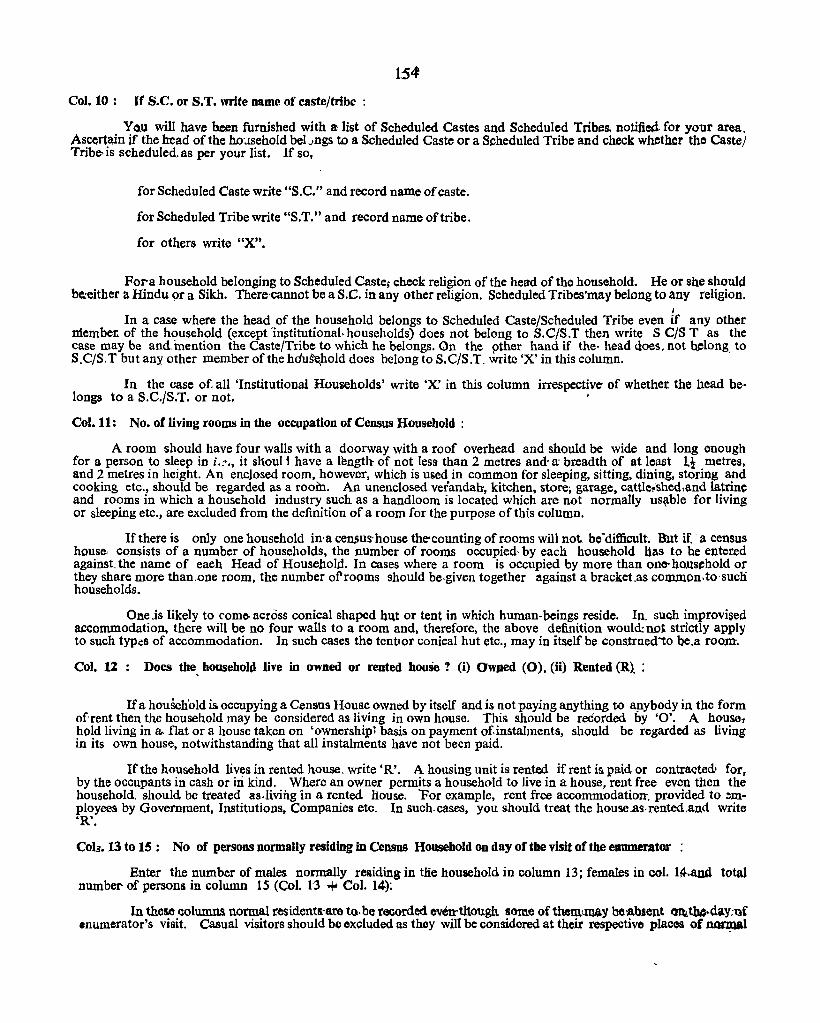
1:54
Col. to : If S.C. or S.T. write Dame of caste/tribe:
You will have been furnished with & list of Scheduled Castes and Scheduled Tribes. notified for your area. Ascertain if the head of the ho·.lsehold bel Jngs to a Scheduled Caste or a Scheduled Tribe and check whether the Castel Tribc> is scheduled. as per your list. If so,
for Scheduled Caste write "S.C." and record name of caste.
for Scheduled Tribe write "S.T." and record name of tribe.
for others write "XIt.
Fora household belonging to Scheduled Caste; check religion of the head of the household. He or she should be:either a Hindu 9r a Sikh. There'cannot be a S.C. in any other religion. Scheduled Tribes'may belong to any religion.
I
In a case where the head of the household belongs to Scheduled Caste/Scheduled Tribe even if any other membet. of the household (except 'institutional. households) does not belong to S.C/S.T then write S CIS T as the case may be and. inention the Caste/Tribe to which he belongs. On the other hand if the· head does, not belong" to S.C/S.T but any other member of the hdu~hold does belong to S.C/S.T. write 'X' in this column.
In the case of. all 'Institutional Households' write 'X' in this column irrespective- of whether the head be~ longs to a S.C./S.T. or not.
Col. 11: No. of living rooms in the occupation of Census Household :
A room should have four walls with a doorway with a roof overhead and should be wide and long enough for a person to sleep in i.:,., it shaul i have a length of not less than 2 metres and' a: breadth of at least 11 metres, and 2 metres in height. An enclosed room, however, which is lliJed in common for sleeping, sitting, dining, storing and cooking etc., should be regarded as a room. An unenclosed verandah, kitchen, store, garage, cattle~shedland latrine and rooms in which a household industry such as a handloom is located which are not normally us~ble for living or sleeping etc., are excluded from the definition of a room for the purpose of this column.
If there is only one household in'a census-house the-counting of rooms will not. be-difficult. But if. -a census house, cqnsists of a number of households, the number of rooms occupied· by each household bas to be entered against the name of each Head of Household. In cases where a room is occupied by more than one- household Of they share more than.one room, the number of'rooms should be.given together against a bracket.as cb.llllllon.to·sucn households.
One,is likely to come. across conical shaped h-qt or tent in which human-beings reside. In, such improvised accommodatioJ]., there will be nO four walls to a room and, therefore, the above definition would: not strictly apply to such types of accommodation. In such cases the tentfor conical hut etc., may in itself be construed'to be,a roo.m.
Col. 12: Does the, household live in owned or rented houSe? (i) Owped (0), (ii) Rented (R). :
If a household is occupying a Census House owned by itsclf and is not paying anything to apybody in the form of rent then the household may be considered as living in own house. This should be recorded by '0'. A house, hold living in a.. flat or a house taken on 'ownershipl basis on payment of instalments, should be regarded as living in its own house, notwithstanding that all instalments have not been paid.
If the household lives in rented house. write 'R'. A housing unit is rented if rent is. paid or contracted· for, by the occupants in cash or in kind. Where an owner permits a household to live in a house, rent free even then the household. should be treated as,living'in a rented 11ouse. 'For example, rent free accommodation. provided to employees by Government, Institutions, Companies etc. In such. cases, you should treat the housells·rented.and write ·R'.
Cob. 13 to 15: No of persons normally residing in Census Housebold on day of the visit of tbe enumerator :
Enter the number of males normally residing in tlie household in column 13; females in col. 1~..and total number- of persons in column IS (Col. 1'3 ". Col. 14-);
In these columns normal residents-a.re to· be recorded even' though some of tMmUll&Y bo:a.bJent tm.tl\c·t!ay.llf enumerator's visit. Casual visitors should be excluded as they will be considered at their respective places of n~
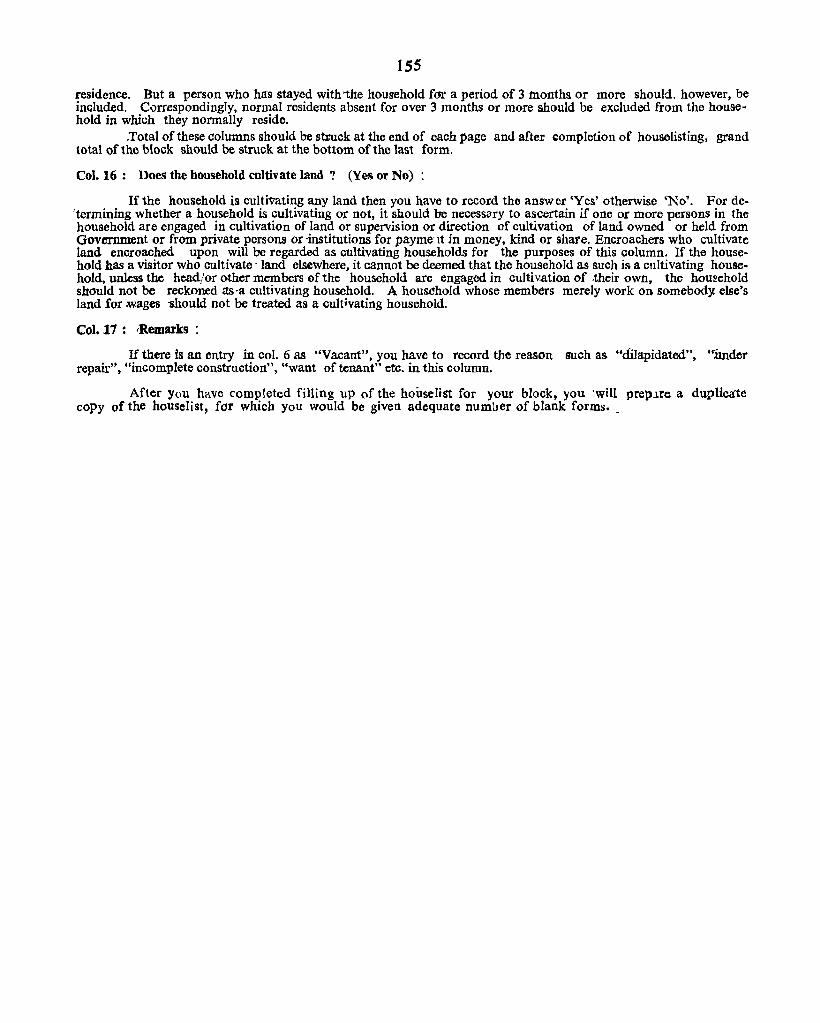
155
residence. But a person who has stayed with'the houS'ehold for a period of 3 tnonths or more should. however, be in~luded. Correspondingly, normal residents absent for over 3 months or more should be excluded from the household in which they normally reside .
. Total of these columns should be struck at the end of each page and after ~ompletion of houselisting, grand total of the block should be struck at the bottom of the last form.
Col. 16: Does the household cultivate land? (Yes or No) :
If the household is cultivating any land then you have to record the answer 'Yes' otherwise 'No'. For de'termining whether a household is cultivating or not, it should be necessary to ascertain if one or more persons in the household are engaged in cultivation of land or supervision or direction of cultivation of land owned or held from Government or from private persons or-institutions for paymelt in money, kind or share. Encroachers who cultivate land encroached upon will be regarded as cultivating households for the purposes of this column. If the household has a visitor who cultivate' land elsewhere, it cannot be deemed that the household as such is a cultivating household, unless the head/or other members of the household are engaged in cultiy,ation of .their owl1, the hou~ehold should not be reckoned as·a cultivating household. A household whose members merely work on somebod)( else's land for ;wages 'Should not be treated as a cultivating household.
CoL 17: 'Remarks :
If there is an entry in col. 6 as "Vacant", you have to record the reason such as ··dilapidated", ".under repair", "incomplete construction", "want of tenant" etc. in this column.
After you have completed filling up of the houselist for your block, you 'will prep.l.re a dUDlica1:e copy of the hOllselist, for which you would be given adequate numlJer of blank forms •.
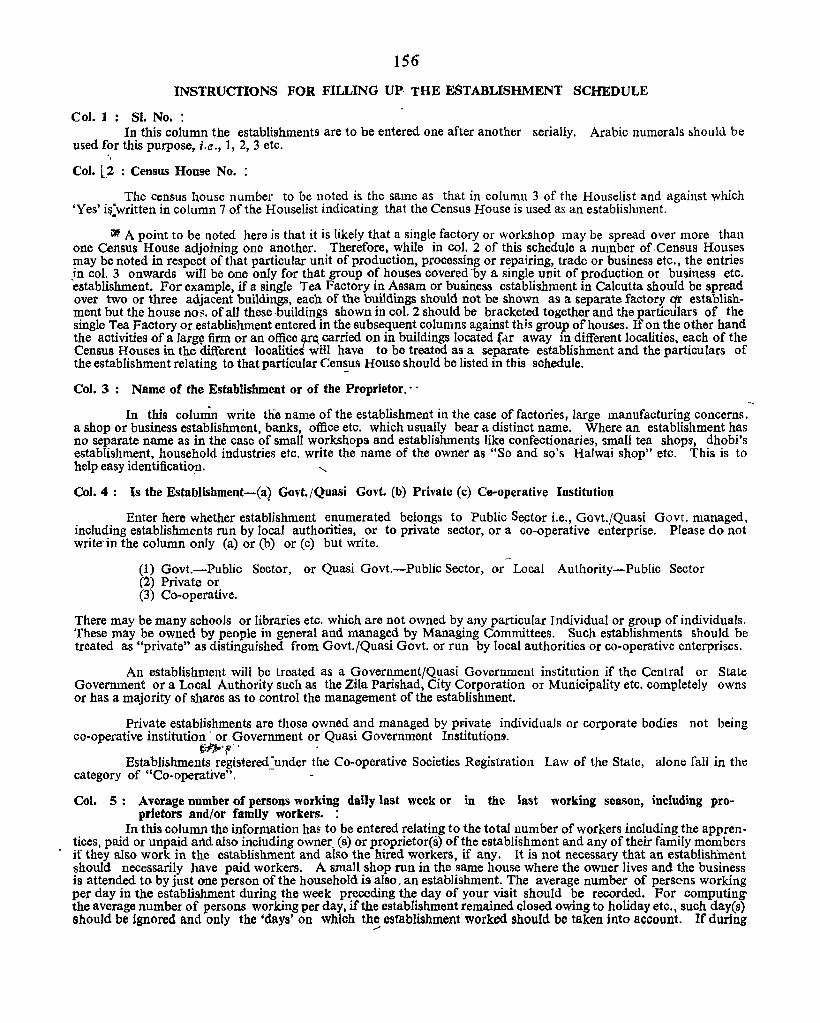
156
INSTRUCTIONS FOR FILLING UP· THE ESTABLISHMENT SCHEDULE
Col. 1: SI. No. : In this column the establishments are to be entered one after another serially. Arabic numerals should be
used for this purpose, i.(!., 1, 2, 3 etc.
Col. L2 : Census House No. :
The Census house number to be noted is the same as that in column 3 of the Houselist and against which 'Yes' i(written in column 7 of the Houselist indicating that the Census House is used as an establishment.
i.if A point to be noted here is that it is likely that a single factory or workshop may be spread over more than one Census House adjoining one another. Therefore. while in col. 2 of this schedu.le a number of·Census Houses may be noted in respect of that particular unit of production, processing or repairing, trade or business etc., the entries }n col. 3 onwards will be one only for that group of houses covered 'by a single unit of production or business etc. establishment. For example, if a single Tea Factory in Assam or business establishment in Calcutta should be spread over two or three adjacent buildings, each of the buildings should not be shown as a separate factory ~ establishment but the house nos. of aU these -buildings shown in col. 2 should be bracketed together and the partiCUlars of the single Tea Factory or establishment entered in the subsequent columns against this group of houses. If on the other hand the activities of a larg~ firm or an office ~e. carried on in buildings located {dr away in different localities, each of the Census Houses in the different localities wHl have to be treated as a separate establishment and the particulars of the establishment relating to that particular Cen~us House should be listed in this schedule.
Col. 3: Name of the Establishment or of the Proprietor."
In this column write tlic name of the establishment in the case of factories, large manufacturing concerns. a shop or business establishment, banks, office etc. which usually bear a distinct name. Where an establishment has no separate name as in the case of small workshops and establishments like confectionaries, small tea shops, dhobi's establishment, household industries etc. write the name of the owner as "So and so's Halwai shop" etc. This is to help easy identificati~n. '-.
Col. 4: Is the Establishment-Ca) Govt./Quasi Govt. (b) Private (c) Co·operative Institution
Enter here whether establishment enumerated belongs to Public Septor Le., Govt./Quasi Govt. managed, including establishments run by local authorities, or to private sector, or a co-operative enterprise. Please do not write-in the column only (a) or (b) or (c) but write.
-(1) Govt.-Public Sector, or Quasi Govt.-Public Sector, or Local Authority-Public Sector (2) Private or (3) Co-operative.
There may be many schools or libraries etc. which are not owned by any particular Individual or group of individuals. These may be owned by people in general and managed by Managing Committees. Such establishments should be treated as "private" as distinguished from Govt./Quasi Govt. or run by local authorities or co-operative enterprises.
An establishment will be treated as a Government/Quasi Government institution if the Central or State Government or a Local Authority such as the Zila Parishad, City Corporation or Municipality etc. completely owns or has a majority of shares as to control the management of the establishment.
Private establishments are those owned and managed by pFivate individuals or corporate bodies not being co-operative institution' or Government or Quasi Government Institutions.
t1i)l',- . . Establishments registered -under the Co-operative Societies Registration Law of the State, alone fall in the
category of "Co-operative". _. -
Col. 5 : Average number of persons working daily last week or in the last working season, including proprietors and/or family workers. :
In this column the information has to be entered relating to the total num ber of workers including the apprentices' paid or unpaid and also including owner. (s) or proprietor(s) of the establishment and any of their family members if they also work in the establishment and also the hired workers, if any. It is not necessary that an establishment should necessarily have paid workers. A small shop run in the same house where the owner lives and the business is attended to by just one person of the household is also, an establishment. The average number of persc-ns working per day in the establishment during the week preceding the day of your visit should be recorded. For computing the average number of persons working per day. if the establishment remained closed owing to holiday etc., such day(s) should be ignored and only the 'days' on which the esfablishment worked should be taken into account. If during
..-'
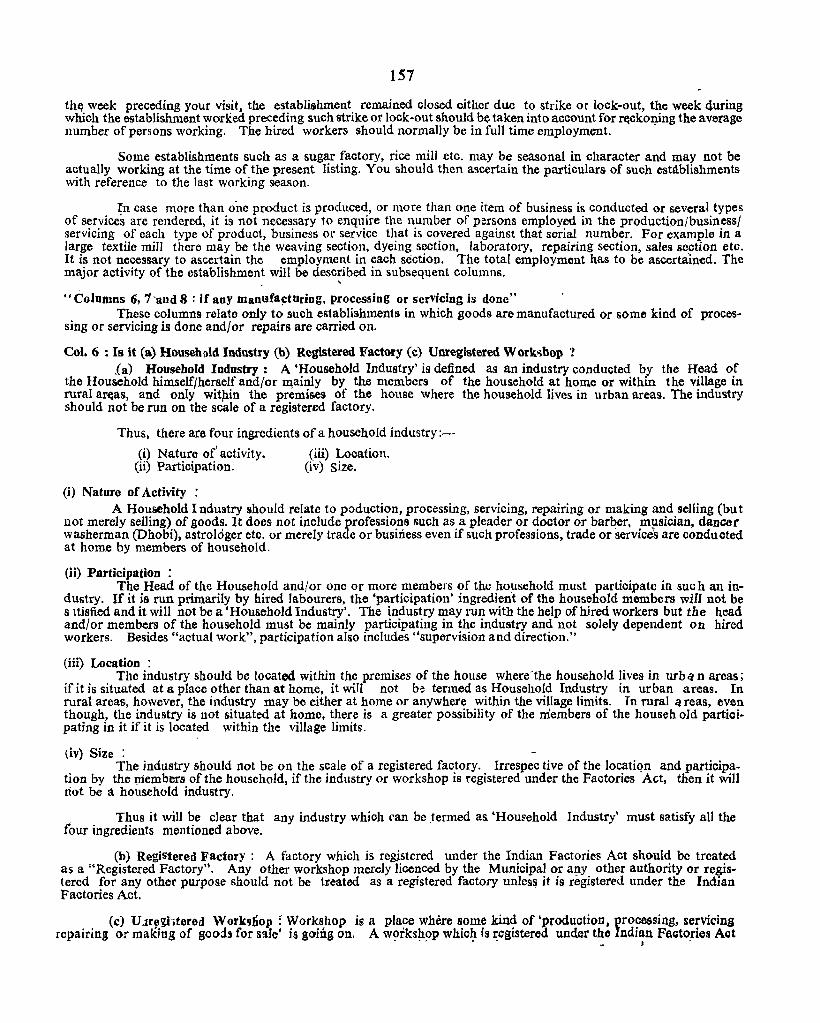
157
thq week preceding your visit, the establishment remained closed either due to strike or lock-out, the week <luring which the establishment worKed preceding such strike or lock-out should be taken into account for r(jcko:Qing the average number of persons working. The hired workers should normally be in full time employment.
Some establishments such as a sugar factory, rice mill etc. may be seasonal in character and may not be actually working at the time of the present listing. You should then ascertain the particulars of such establishments with reference to the last working season.
~n case more than one product is produced, or more than 011e item of business is conducted or several types of services are rendered, it is not necessary to enquire the number of persons employed in the production/business/ servicing of each type of product, business or service that is covered against that serial number. For example in a large textile miII there may be the weaving section, dyeing section, laboratory, repairing section, sales se,ction etc. It is not necessary to ascertain the employment in each section. The total employment has to be ascertained. The major activity of the establishment will be described in subsequent columns. ,
.. Columns 6, 1-and 8 : If any b1ant!fa~turiDg, proces5ing or servicing is done" These columns relate only to suoh establishments in which goods are manufactured or some kind of proces
sing or servicing is done and/or repairs are carried on.
Col. 6 : Is it (a) Household Industry (b) Registered Factory (c) Unregistered Workliihop ? .(a) Household Industry: A 'Household Industry' is defined as an industry conducted by the Head of
the Household himself/herself and/or lIlainly by the members of the household at home or within the village in rural art;a!I, and only witpin the premises of the house where the household lives in urban areas. The industry should not be run on the scale of a registered factory.
Thus, there are four ingredients of a household industry :-
(i) Nature of' activity. (iii) Location. (ii) Participation. (iv) Size.
(i) Nature of Activity : A Household I ndustry should relate to poduction, processing, servicing, repairing or making and selling (but
not merely selling) of goods. It does not include professions such as a pleader or doctor or barber, musician, dancer washerman (Dhobi), astrolOger etc. or merely trade or business even if such professions, trade or service~ are conducted at home by members of household.
(ii) Participation ; The Head of the Household and/or one or more members of the household must participate in sue h an in
dustry. If it is run primarily by hired labourers, the 'participation' ingredient of the household members will not be s ltisfied and it will not be a • Household Industry'. The industry may run with the help of hired workers but the head and/or members of the household must be mainly participating in the industry and not solely dependent on hired workers_ Besides "actual work", participation also includes "supervision and direction,"
(iii) Location : The industry should be located within the premises of the house where'the household lives in w"bci n areas;
if it is situated at a place other than at home, it will not be termed as Household Industry in urban areas. In rural areas, however, the industry may be either at home or anywhere within the village limits. In rural q reas, even though, the industry is not situated at home, there is a greater possibility of the members of the housch old partiCipating in it if it is located within the village limits.
(iv) Size : The industry should oot be on the scale of a registered factory. Irrespec tive of the locatiqn and participa
tion by the l;liembers of the household, if the industry or workshop is registered under the Factories Act, then it will riot be a household industry.
Thus it will be clear that any industry which ('an be .termed as. 'Household Industry' must satisfy all the four ingredients mentioned above.
(b) Registered Factory: A factory which is reg,istered under the Indian Factories Act should be treated as a "Registered Factory". Any other workshop merely licenced by the Municipal or a~y other authority or registered for any other purpose should not be treated as a registered factory unless it is registered under the Indian Factories Act.
(c) U;1roghtered Workshop: Workshop is a place where Bome kind of 'production, processing, servicin3 repairing or making of good, for s!lle' is gohlg on. A workshop whioh is registered under the Indian Faotories Aot
• . • ~. .,. J -
158"
should be treated as a registered factory and others as unregistered workshops. Workshops which are run as Household Industry-should be tre1ted as Household Tndustl'y and entered as such.
When you come across an establishmen t where some kind of manufacturing, processing or servicing etc. is done, you 'Should ascertain whether it is a Household Industry or a registered factory or a workshop 110t registered under the Factories Act and write whatever it actually is in this column. Please note that workshops .merely licenced or entered in the registers of a local authority are not to be considered as registered factories unless registered under the Indian Factories Act. All workshops other than household industries and not registered under the Jndian Factories Act should be treated as unregistered workshops even if they are merely licenced as workshops ~y the !ocal authorities. Please do not write (a) or (1)) or (c) in the column but write "Household Industry" or "RegIstered Factory" or "-Unregistered Workshop" as the case may be.
Col. 7: Description of the prodoctsr processing or servicing done :
The description of the actual work rela'jng to product, proces~ing and servicing whicll is done in the Household Indus~ry, factory or workshop that is being lie ted is to b:: recorded here, '!.g., handloom weaving lace knitting, .oil ghani etc., manufacturin& of GJ. Pipes, electroplating, motor or cycle repairing, iron foundry, paper making-or book binding, printing and dyeing, shoe making. sweet meat. making etc. If in any establishmeht more than one article is produced or more than one kind of processing or servicing or repairing is done, indicate only the m3.jor kind of products or processing or repa~in~ or servicing etc.
Col. 8: Type oUueI or power used : Enter here the description of the power or fuel used for the running of the factory. workshop (or household
industry if it is run on power or fuen. The fuels can be kerosene, soft coke, petroJ, diesel, gas, coal. wood, etc., electricity' and steam etc. are so.me of the sources of power. Some units may be run by animal power such as .oir ghani. Some may be run by.merely human energy such as carpet making pottery making etc. Enter the descnption of fuel or power used for the production, processing. servicing etc. th.lt is carried on in the establishment There may be instances where more than one fuel or power is used, ill such cases"only the fuel or power which is used in running the primary unit of the industry will be noted in this column .
....
Columns 9 and 10 are to be filled ill respect of trading establishments or establishments which'render commer-cial services only. ,
Trading or business establishments are those where some trading i.e. transactions involving sale and/or purchase of goods go ou. .
Establishments rendering commercial services are the banks, money lending firms, pawn shops, etc.
Col. '9: D~cription of goods bought/sold:
If it is a trading establishment, you should ascertain what are the goods bought and'or sold and write the description in this column. If there are more than one type of goods bought/sold by the establishment, you should give description of the main item of goods bought/sold by the estab1ishment~
In the case of establishments rendering commercial services such as in the.cas~ of Banks etc. you should write the description of the services rendered, asin the case of a bank, you should w.rite "banking services".
Col. 10 : Whether (8) Wholesale or (b) Retail :
For all trading establishments, you should ascertain in respect of the goods mentioned in column 9, whether they are sold/bought in wholesale or in retail and write as the case may be.
You may come acrdss certain'establishments wherein both types of .trade i.e. wholesale ancLretail go on. In such cases, you should ascertain in which category (i.e. wholesale or retail) the volume of trade is greater and record the category accordingly.
In the case of esta1;lishments render(ng commercial services, e.g., bank etc. please do not write any of the two categories i.e. 'wholesale' or 'retail' but put an 'X' in this col~mn.
Col. 11 : If used.as any other establishment,. describe e.g., GOvernment Office, School, Hospital, Railway Station, Barber's SaIoon, Cinema, Theatre, Hotel, Tea Shop etc.:
Two specific types of establishments have been covered in columns 6 to 10. Column 11 relates to the remaining type s of establishments not covered 'by CoiUDlllS 6 to 10. You have to describe such establishments in this column, e.g., Government offiCCy·school,.hospital,..t.ailway statio~ orphanage, rescue home, barb~r's aaloon, cinema, theatre, hotel, tea shop, lawyer's office, doctor's clinic, laundry, etc. '
ANNBXURE VIII
Text or the speech delivered hy E:h. Khurshi4 Ahmed, Minister Cor Health, Local Bollies, Panchayats and Development, lliryana on the 28th February, 1969 at 11 00 A.M. in the Panchayat Bhawan at
Chandigarh
Shri Chandra Sekhar, Ge'ntlemen,
I am very happy to be with you all today and' orr behalf of the,State Government of Hllryana, I welcome you all to this training course organised by tbe Census Organization. Those of you who are serving in my State must feel happy and privileged to get this opportunity of b~coming partners in an operation of. such a na.tionwide importance, as the Census of India is. The history of the Indian Census through the pas~ one hundred year.> seems to be one of an ever expanding hodzon and magnitude. To-day itpractically includes every branch or scholarship in the socio-economic complex of the country.
2. It is on the data which you all will collect, compile and tabulate that the future plans in the country will be formulated or modified. Jus.t think what a role you will be playing. Today Census is no longer the mere counting of individuals but the recording of their particulars as well. This at once makes the Census the single fruitful.source of aCC:l~atc info:m.ltion. No ~dminis.tration wh:ther it is comm"rcialor civic or governmental can today be succe~ful unless it h&s accurate data about the {lcople, their environment, their needs and aspirations. It is here that the C;}llSUS Org.lnization plays its unique role. It is here that your 4uty becomes a privilege.
3, Haryaua is a new State and as such it has a number of problems which we are pledged to tackle. For us, therefore, tae Census is a matter of very geeat importance. The work in the field will bo done, as us~l, by our no:mll district staff under tne guidance of tte Government of India. The prime responsibility, therefore, g~ntIem}n, rests squarely on your shoulders. Whether you arc a Patwari, or a teacher or a panch or a. D.D.P.O. or a D..:puty COilllllissioner,-you are all links in a, common chain. And like any chain its s,trength lies in its w<}akest link. So ev~ry link should be strong and efficient. I repeat-if you arc a link you have to be as strong as every link. A firm co·op.mltive effort is required and everyone of you should feel equally responsible right fro:.n now. WhJtev,;:r your stan:1ing in thz government hierarchy you should note that your performl4uce in th<) census field will be taken into account when your merit is being assessed.
4. The preliminary work of tue 1971-Censu~ has already started. Every stage is to be taken with equa.l seriousness. The scheme of permanent house numbering is a m03t useful and practical one. In the urban local bodies it is a necessity aud I would like all municipa.lities to impleffieut it full without further delay. The State Coordination Committee has already issuf'd cutain directives. Those of you who are concerned with it should see that tbese directions are complied with. In the rural areas the onus falls on tne Patwaris under the overall responsibility of the Pancbayats. I would like every D.D. & P.O. to give p~rsonal attention to this work. In anY civilised com~unity, accurate City, Town or Village maps are a prime requisite. There is no reason why maps should not be such tha.t any stranger could locate in Q, matter of minutes the street, localit~ or bouse which he wants merely by looking at a map. Th;; prep.lration of these maps Whether notional or layout is thus an urgent task to b-: t(l.ken up at once. Irutructions in reg4rd to their pleparation have, I am told, already been issued to you. Please see to them promptly and carefully.
S. So the prep.lration of maps and the numo~ring of houses are two proliminAries of the Census. A third one is now to be put on the ground. Tbis is the Second Pretest oftbe Census Sch.,dules and Questionna.ircs scheduled to take place next month. These arc to be canvai:sed in_some 13 blocks---5 rural and 8 urban-in Haryana. One village block per district has been selccted in Gurgaon, Mahendrag.lrh, Jind, Hisar and Amb.lla. Four urban blocks each h~ve boon selected in th·;, municipalities of Karnal and Rohtak. The aim of this Iretest is to test th~ concop''S, p:oc¢dure~, suitability and adoptability of the formats and quci>t!oanaires. The data you collect is through predetermined quest;ong. If these are off the mark then the whole census can go off the mark. So kindly canvass these schJdules with great carc. In ooch district the District Development and Panchayat Officer has been designated as the District Census Officer. Prim~ responsibility for ensuring that every enumerator understands what to do, rest~ therefore, on the shoulders of tbe D.D. & P.O., but I would like to make it clear that the government will hold tho;} D~puty Commissioner, as head of the distnct administration, responsible for the successful coml'letion ofth~ op"ration. He muat, therefore, ensure that all Census Officers under him know llnd do their job thoroughly. I have no doubt that they will live upto their task.
6. I would not like to take up more of your time beoa.use Ii proper ~rogramme of detailed instructions has been drawn out for you. I would urge you to pay full attention to this traming. Tho pretest may be only in

160-
13 blocks hut it is a regular mini.c<:.llSllS Imparting a ·two-way "experience. You gentlemen are the nucleus whichwill ultimately set the pattern for the whole operation. I am particularly happy to see Part IV of the Household Form which denls with Family Planning. As Health Minister, I consider such d 1.ta of the utmo~t importance ..
7. I would like to assure the Registrar General of india, Shri Chandra. Sekh~r that the Census Organization can count upon the Government of Haryana for the fullest co-operatIon in thh nationa.J task of such vital importanCe.
I wish you al~ succeSS in your delib~rations and work.
Thank y'!'u, JAI HIND
ANNEXURE IX
Inaugural Address delivered by the Governor of Haryana on the 4th November, 1969 at the Tra.inimt ConferencE! (Houselisting) held at Ambala
Gentlemen,
On behalf of the Government of Haryana I extend to you all, a hearty welcome to this Training Collference at Ambala. I am happy to have this opportunity of being with you at the start of your three dll-Y session. You gentlemen, as Census Officers, are charged with the onerous duties of conducting the next decennial Census. The Indian Census, Operation has acquired a world-wicj.e reputation. The year 1971 will complete 100 years of decennial Census in India and it will be our privilege to "celebrate" the Centenary. Indian.Census has gone on all these years regardless of political, social or economic changes. It has always functioned in the cool, clean climate of objectivity and scientific accuracy. It has gone on from strength to strength gnd is to-day the single, largest source of reliable information in the country.
2. For us 'in Haryana it will, so to speak, be the first Census. It is, therefore, all the more import.ant that the data we eoUect, be accurate and untainted by personal prejudices or predilections. Objective accuracy _is only pos-' sible if each one of you knows exactly what you have to do' and then do it properly and with dedication~ That i~ why it is so important that you receive ,and then impart adequate training. The questions which the Census enumerator has to ask are not only numerous but also a little complicated. It is no longer a question of merely counting heads and getting a few particulars. Today many more 'important data have to be colll?cted whicp will be of immense value in the formulation of the country's plans and I pro~ects. I cannot, therefore, stress too strongly upon the importance of collecting all such·d_ata accurately and in the manner."required. ,
3. The'State of Haryana has only 7 dist'ricts, but even so, it will require no less thanIO,OOO trained operatives in thc field for the Houselisting Operations scheduled to take place in February, 1970. Before the enumerators can' be trained, the Circle Supervisors, Charge Officers, the Sub-Divisional and District Census Officers have to be trained. All Deputy Commissioners in the State have been notified as District Census Officers. The re!>1>onsibility for the proper conduct of the Census Operations in their respective jurisdictions, will. rest squarely on their s.l1oulders. They will of course, be assisted by Additional District Census Officers who will normally be their District Development and Panchayat Officers. I am glad to know from the Director of Census Operations, Haryana, that he has been receiving the most encouraging co-operation and response from you all. The District Development and Panchayat Officers have so far received instructions in three State Level Conferences but the real training now lies ahead. It is needless for me to emphasise that work pertaining to the Census is as much a part of your duty as any other job you are normally required to do. In the forthcoming census as many as one million field operatives will have to function in India. Obviously ne'Y staff cannot be recruited on such a gigantic scale-particularly in 'a poor country like India. During the last 100 years, we have always depended on the normal district staff and we shall continue to do so. I have no doubt that the p.istrict staff will perform these duties cheerfully, as they did it in the past.
4. The main task of enumeration is due in 1971, but the Houselisting Operations will start in February next year. This Housing Census is of no less importance. Every single structure, building, house or establishment has to be listed. You will be using two kinds of Schedules-the Houselist and the Establishment Schedule. The various questions have been drafted with a great deal of care and thought and after prolonged discussions at all India level. You may rest assure that they are the minimum needed and-are best in forin. Once you learn the concepts and manner in which the work is to be done, your task will be fairly simple. Remember that it is to you that the actual field workers will be looking for clarifications and guidance. Any mistake you make will be multiplied and magnified and there will be no way of correcting the error. So please be very, very clear about all the instructions you receive. The Deputy Commissioner cannot afford to pass on the responsibility to his .District~Developmeni and Panchayat Officer ; nQr must the latter think that he can, ~n turn, pass on the task to the Charge Officers. Similarly, Charge Officers must not leave it to their Circle Supervisors, nor the Supervisors leave the work to the Enumerators. At all stages of the hierarchy from the Enumerator right upto the District Census Offic(fl', each must shoulder his responsibility. For this, each must be fully informed and trruned. We must next deploy our mass communications media to the fullest extent so that every citizen is made aware M the exact nature of his co-operation and duty. The Indian Census Act no doubt gives certain powers and obligations, but these should be used only where they are absolutely necessary. I am confident that with a properly trained field staff and well organised public relations campaigns, the work of the Census will go through smoothly. Since a large number of school teachers will be put in the field as Enumerators, the Education Department has to play an effective role.
j •
5. The Director of Census Operations has already explained how the State will be divided into about 10,000 rural and urban blocks. In urban areas the Chief Executive Officer of the local body wilJ serve as the Charge Officer. He will have to apply himself diligently and intelligently to the task in hand. It is not enough for him merely to pass orders, 1;1e has also to see that they are properly implemented. In Haryana we have 64 such local bodies including a
162 large Cantonment. An earlie~ programme-that of Permanent House Numbering-is expected to be completed by February, 1970. T].lis will help you in the carving out of your blocks. Please follow instructions very careful1y. If your blocks -are carelessly drawn out, you may be heading for confusiQD.
6. Census is one Operation in which guesses or rough and ready methods have no place. You must be accurate. Every operative ha~ to be ful1y trained. Training is a continuous process and is not merely a question of an odd lecture here and there.When the enumerator goes into his block for the census work he should be fully familiar with his work and therefore confideut. Charge Officers, Circle Supervisors and Enumerators will be recruited from all departments in the State. We have to raise a t~sk force of 10,000 efficient persons. The impression that Census is the responsibility of the revenue or administrative department aloqe, is quite erroneous. It is the job of ev~ry Government servant who is cal1ed upon to function as such. Th~ performance of Government servants in Census Operat ions will, as usual be.reflected in their annual cpnfidential reports. There should be no doubt about this.
7. DlJring the ,next few days here, you' lUU&! apply yourselv~s assiduously to your work as trainees. When you go back, you will have to organise a series of training camps in your districts or charges. You will have to train thousands of persons-not,as I said before,by merely lecturing to them but by actually ensuring that they have understood all important census concepts. This you will be aple to dO'only if you, yourself are clear in your ideas. [fliis training is meant to sive you just the information and guidance you need. You must :jllake full use of this \ opportunity. After this camp you willl:>e entitely on your, own; any pUstak,es you m~ke,will be your respon.sibility. So please attend this course carefully. OJU' sendceS and the administration have taken 'different kinds of work in, their stride. This Census will, I am sure, be yet another c~~nge which Sou willmee.t succe&sfully.
, S. I am ver,y much interested. in this work and would like to he infprmed periodically both by the Census Organisation as well as by the Chairman of the State Level Co-ordination Commit.tee about the progr~ss of the work.
~ I now declare the Training CQ.Dfer()nce open a.nd w.i,sh you all·success in yl)ur deliberations.
TAT llT .... TT"\
163
ANNEXV~E X
Training' Camp organised by Director of Census Operations, Haryana, Ambala-4tb November, 1969' Spee~b by Sbri K.D. Ballal, Deputy R ~gi.~trar General .
We are here to' embark upon the preliminaries f 'r sharpening our tcmls to undertake the w!)rld's largest single administrative operation which is the Census of India, 1971. We are d0eply behold .. m to your Excellency £tJr sparing a few moments of your most precious time to be amidst us in spite uf your Excellency's pressing pteoccuparions. It is our unique privilege. It is a manifestati(m of your Excellency'S "keen interest in the Census Jpenitions. We have rich tradition of taking complete censuses OIf p pulation fmm the year 1872. The census has, of cours'e, grown over this period both in quantitative and qualitative terms. 'Nhe Indian Censu's tuday is universally acknowledged as the most authentic and comprehensive source erf information about our land and the people. With the dawn (If Independence and with the ad'.ption of democrAtic system of Guvemment, impor:tall'ce of authentic data on population was enhanced. Dematcatiun of Electoral constituencies as also the size of the legislatures depended on the statistical information' regarding the size of the p' 'pulation and, its geographical distribution. Thes~ data are also invaluable for the implementatil1n of the constitutional ptovisiQns like the welfare of the socially and economicaOy backward classes. The advent of ,the Five Year Plarls added 'a new dimen:;ions to Census Operations. They ptoduce information on such a variety of the aspects of the nation's economy liktt ptlpUlation growth, its distrioution, literacy, migration, housing and so on. The planners, various governmental agencies as well as the researchers look for detailed and sophisticated data on the trends in occupational and industrial affiliations of the labour force, fertility patterns, age structure and education~llevels, etc. The census has to meet this increasing hunger for data. Lack of data can well be the most serious bottleneck in the process of planning in developing Countries. Past two censuses in the post-Independence period have thrown up minimum basic data regarding the total population, its growth, distribution,· etc. But as the economy expands, the secm 'al'inter-dependence, need for regional balance and various other complexities come in. This makes varied dema'.t;lds for more and mote data. Twin factors of larger data and higher reliability of it in explaining the various policy variables then become of critical importance. Data collection and decision maki:p.g are two inseparable and inter-dependent aspects in the prncess of planning. It is precisely because of the crucialpJJ1e it plays in indicating the possible policy variables in diverse fields that the census statistics have to meet the test of .accutacy as well as timeliness. Even the slightest doubt about its reliability or any delay in their pUblication wo.uld defeat the very purpose of the operations. I
Census operations mark a. singular endeavour in which the States and the Centre are equally c0ncerned. It is not merely the willing and whflllehearted co-operation of t4e States but it is complete identification with the purpose by the States which characterises this venture. Most of the developed cnuntries are amazed at the success of the technically sound censuseS in India not only because of the enl1rmOUS multitude (If the p, ipulation but also the inaccessibility , OIf,the areas,level OIf literacy ufthe enumeration agency and the respf):qdents and the multilingual situation in this vast country, the last being a real formidable task in taking universal and synchr,lll<lUs census with unif(,rm concepts and schedules. The secret of the success lies in the zeal and the dedicati(m with which the employees of the Centre and State Governments and local bodies put their best in carefully planning the uperatiun and exercising meticuluus care in execution of various items of training and field work according to a pre-determined time schedule throughout the country.
The 1971 Census, like its predecessor, has two distinct phases viz., (1) H 'use numbering with a view to locating the places of residence of the people so that none is left from the count and none is counted more than once, Houselisting which leads to' census O'f houses and census of establishments and (2) the Enumeration of the people which will be fyom 10th February, to 28th February 1971 with 1st March, 1971 as the reference date.
The first operation will be completed in the field frO'm Febr.uary, 1970 to May, 1970 in mO'st of the States and provide apart from the data of Housing and Establishments, will provide precise frame for carving out enumerators blO'cks fO'r the final count.
The new featutes of the 1971-Census are (i) the full count of the establishments, manufacturing, trading, commercial and all others which will yield statistics O'n the products manufactured and the kind of fuel used in the case of manqfacturing establishments, product sold in the case of trading establishments and services rendered or business transacted in other establishments and the average number of persons employed in each one of them,(ii)ascertaining fertility of currently married women during one year reference period, (iii) ascertaining migration data with reference to last date of residence, (iv) secondary work O'f the wOlrking popUlation, (v) detailed universal survey of all graduates and persons holding diplomas through a specially designed card, (vi) preparation of town directories and detailed study of two hundred towns etc. With a view to bringing further sO'phistication in our meth' Ids fO'r minimising h!lman bias and errors and for the production of statistics without loss of time and with mO'te cross classification, sampling teChnique and procedures would be employed in the tabulation O'f census data and the Housing and Establishment Schedules as well as Individual Slips of urban areas will be processed on Electrllnic ComputO'r. Adoption of these technological developments cast additional burde.n on the field workers fi,l' perfecting the input devises and rendering them free from errors at the stage of canvassing. This calls for intensive training lIf the enumeratiun agency and driving home to them the various concepts so that they are able to perfO'rm their tasks in a well informed manner.
164
It is gratifying t() note that the Haryana Government have made excellent progress in the very first step of the stupendous operation. For mQst of the villages, well delineated notional maps have been prepared show.ing streets, lanes, public buildings and permanent landmarks and also the location of every house in the village. The houses have been assigned number in a systematic manner and metal number plates bearing such number have been fixed in most of the villages. The remaining work is expected to be completed shortly. Similar action is in hand for the urban area, too. This makes for the Scheme of Permanent House-numbering. The State Government, District Officers and the local bodies worked with commend!ib1e zealttnd successfully accomplished the very basic project which is indispensable for ,the census taking. This is the foretaste of the determination of the Haryana Government to take accurate census in their area. We hav~ no doubt whatsoever, that the Haryana Government would give all facilities to their employees to be able to a~quaint tJtemselves well in their undertaking and make a success of their first census, and the ~leyenth decennial census hi the country which faUs in the centenary year of tensus taking in this, country.
1 :We are grateful to your Exceliency for the infinite trouble you tooJ< in remaining with us for ~his confer~nce and boosting OUf morale and inspiring us to take up the challenging task. We invoke your blessings for the success ,in the operation.. ..
, We .are al~ gr<j.teful to the Haryana Government,and their senior officers who have takQn so ,mu6h pain to narticipate in this Conferene. • r
165
ANNEXURE XI ,
(a) Duties of Circle Supervisor
(i) He should attend to the Training Classes and read the 'Instructions to Enumerators for filling up the Houselist and Establishment Sc.l1edule' thoroughly and remove conceptual difficulties, ifany ;
(ii) He. should establish intimate contact with the Enumerators ap?ointed . for his Circle and should note down 'their residential address ;
(iii) He should ens ute that instructioll) imparted by the Charge Officers are clearly understoQd by the Enumerators of his Circle;
(iv) He should keep the' reserve quota of the forms given to him by the Charge Officers carefully and satisfy the additional requirements of Enumerators, if any, promptly. In case he needs forms over and above the ,reserve quota with him, he should immediately contact the Charge Officer ;
(v) Before the actual Houselisting Op,eration, he should check up Enumerators' blocks to ensure that there is clear demarcation of boundaries, that buildings in each block bear either permanent or temporary numbers and census houses in each building have also been given sub-numbers by the enumerators with Gerlt, and that lay-out sketches prepared by the enumerators are accurate and all the houses are clearly plotted thereon;
(vi) He should send a report to the Charge Officer on or before the 4th February, 1970 positively that the enumerators under him have (a) brought the house numbers in'their blocks up-to-date; and (b) prepared lay-out sketches; ,
(vii) In actual Houselisting Operation, he should inspect at least 25 per cent of the Households in each block;
(viii) After the Operatbn is over, he should check up all the entries in the HouseIist and Establishment Schedules as well as the Houselist Abstract and sign them in token of having made the required checking; and
. (ix) The filled-in HOllseJist and Establishment Schedules, in duplicate, the Houselist Abstracts prepared by the enumerators and the layout maps should be tagged and packed for each block separately and then passed on to the Charge Officer.
I
(b) Duties' of Enumerators
. (i) He should attend all the training classes including the practical tiaining class and grasp all the instruc-tions contained in the Booklet thoroughly ;
(ii) He should establish intimate contact with his Circle Supervisor and note down his residential address;
(iii) He should keep the HouseHst forms, Establishment Schedules, HouseUst Abstract, etc., given to him by his Charge Officer carefully and see that no form is wasted. In case he needs extra forms he should ask for the same from his Circle Supervisor;
(iv) Before the actual Houselisting Operation, he should visit his block(s) so as to be a bsolutely familiar with his area and its extent. He should then check the building !1umbers-in case permanent number plates already exist and bring them up· to-date by giving temporary numbers with Geru to the newly sprung up buildings. In case permanent house numbers have not been given, he should give house numbers with Geru to all houses according to the instructions contained in the 'Instruction Booklet';
(v) He should ensure that every Census House is given a sub-number in case there are more than one census houses in a building;
(vi) He should prepare lay-out map(s) of his block(s) on a thick paper of 15"x14" size showing the location of each house in his block(s) alongwith house numbers given to them;
(vii) He should then start canvassing of the HOLlselist and Establishment Schedules from 4th February and complete it by 25th February. 1970 ;
166
(viii) The Houselist and Establishment Schedwes are to be filled up in Hindi as far as possible or jn English and in no other language. These should be filled up in ink neatly and legibly. Over-writings and cuttings should be avoided
(ix) He should prepare duplicate copies of the Hbuselist and Establishment Scl'ledllles from..26th to 28th February 1970 '; and
(x) Lastly he should ptepare.the HOllselist Abstract on 1st March, 1970 and pass on the whole record to his Circle Supervisor. \
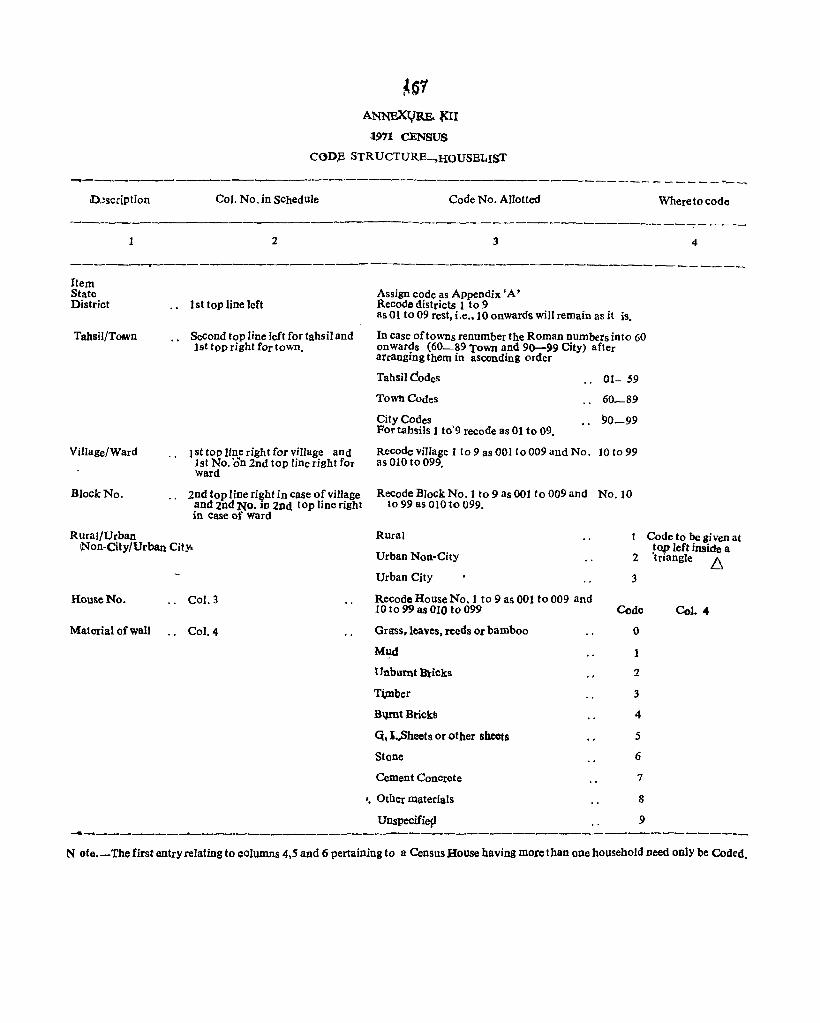
ANNEXtJRE. ~II
-1971 CENSUS
CODp STRUCTURE-.HOUSELIST
-".-------------------------------------------------- - --. - - - ----.. Col. No. in SChedule Code No. Allotted Whereto code
------------------------------------------------ ---:- - ~- .. _ 1 2 3 4
-------..------------------------Item State District
Tahsil/Tor.vn
Village/Ward
Block No.
1st top line left
Second top line left for tahsil and 1st tpp right for town.
I st top line right for village and 1st No. 'an 2nd top line right for ward
2nd top line right in case of village and 2nd NO. in 2nd top line right in Case of ward
Rural/Urban \Non-City/Urban City.
House No. Col. 3
Material of wall Col. 4
Assign code as Appendix' A ' Recode districts 1 to 9 as 01 to 09 rest, i.e .• 10 onwards will remain as it is.
In case of towns renumber the Roman numbers into 60 onwards (60-89 Town and 90-99 City) after arranging them in ascending order
Tahsil Codes 01-59
Town Codes
City Codes For tahsUs 1 to'9 recode as 01 to 09.
Recode village 1 to 9 as 001 to 009 and No. 10 to 99 as 010 to 099.
RecodeBlockNo.1 t09asOOl to 009 and No.IO to 99 as 010 to 099.
RUral
Urban Non-City
Urban City
Code to be given at top left inside a
2 'triangle .6.
Recode House No.1 to 9 as 001 to 009 and 10 to 99 as 010 to 099
Grass. leaves, reeds Or bamboo
M~d
Unburnt Bricks
T~ber
.B~tBrickll
Q, l.,Sheefs or other sheets
Stone
Cement Concrete
" Other materials
Unspecifiep
3
Code Col. 4
0
1
2
3
4
5
6
7
8
9 -_..,---------------~---------------------------------------
N ote. -The first entry relating to columns 4,5 and 6 pertaining to a Census House having more than one household need only be Coded.
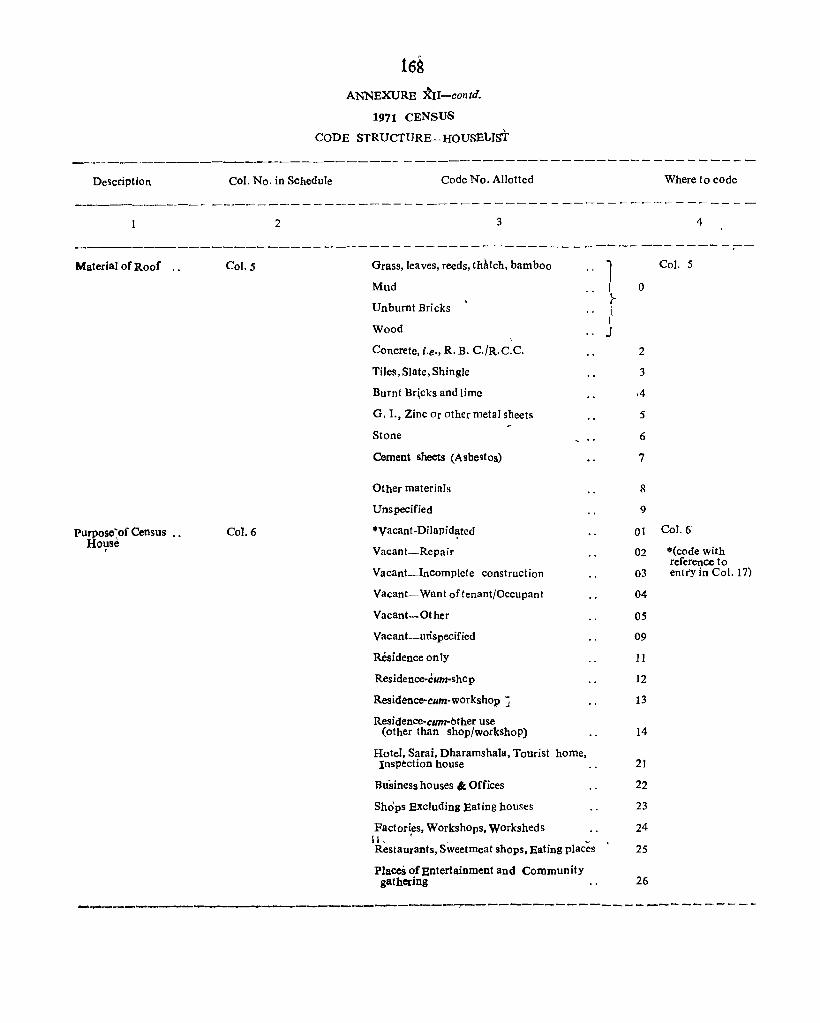
Description
16~ ANNEXURE -,tIl-canto.
1971 CENSUS
CODE STRUcrURE-HOUSELIsT
Col. No. in SChedule Code No. Allotted Where to code
------------ -------------------- ----------- - ---- ------ -------2 3 4
-----------------------------------------------------------;---Material of Roof ..
Purposcfof Census HOl!se
Col.S
Col. 6
Grass, leaves, reeds, thAtch, bamboo
Mud
Unbumt Bricks
Wood
Concrete, j.e., R. B. C./R.C.C.
Tiles, Slate, Shingle
Burnt Br\cks and lime
G. I., Zinc Or other metal sheets
Stone
Cement sheets (Asbegtos)
Other materials
Unspecified
·vacant-Dilapid~tcd
Vacant-Repair
Vacant-Incomplete construction
Vacant-Want of tenant/Occupant
Vacant-Other
Vacant-U1ispecified
Residence only
Residence-cum·shop
Residence-cum-workshop j
Residence-cum-bther use (other than shop/workshoP)
Hotel, Sarai, Dharamshala, Tourist horne, Inspection house
Business houses " Offices
Shops EXCluding Eating hOllses
Factories, Workshops, Worksheds i I . • . _
Restaurants, Sweetmeat shops, Eating places
PlaceS of Bntertainment and Community gathering
Co). 5 I o }-I I J
2
3
.4
5
6
7
8
9
01 Col. 6
02 .(code with reference to
03 entry in Col. 17)
04
05
09
11
12
13
14
21
22
23
24
25
26
-----------------------------....,--------------------------
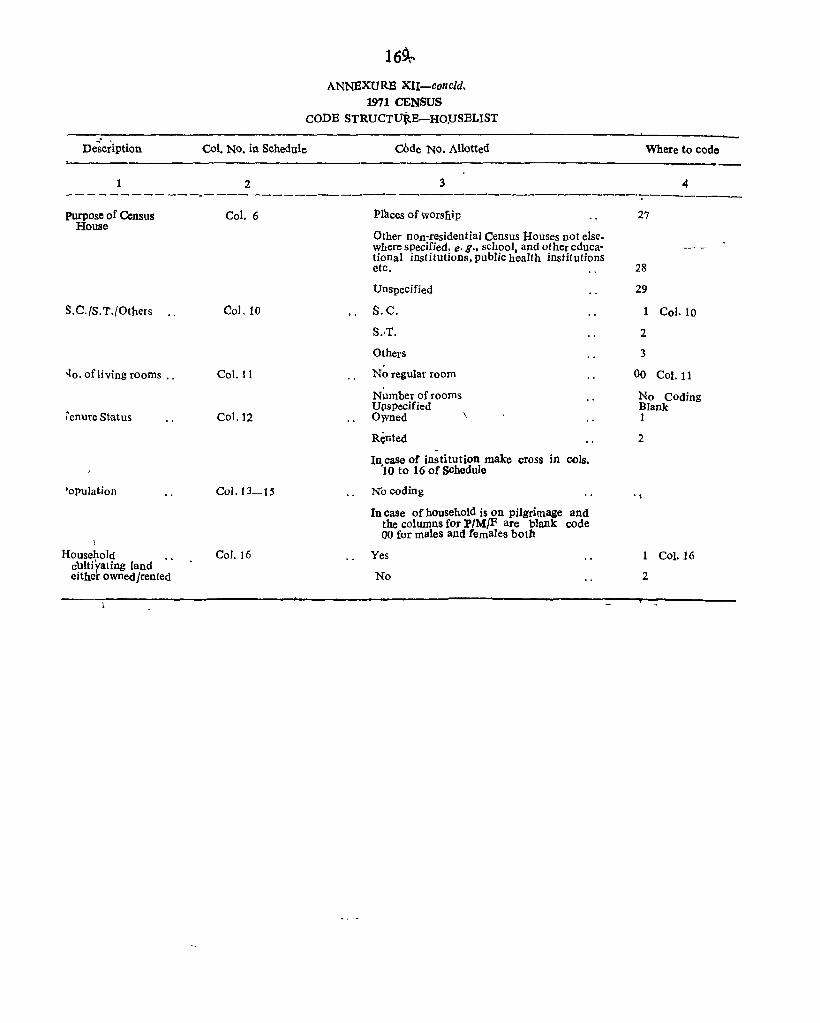
1
169,.
ANNEXURE XII-conc/d. 1971 CENSUS
CODE STRUCTUttE-HOPSELIST
Col. NO. in Schedule COde NO. Allotted
2 3
Where to code
4 - - - - - -------.. ----------------------------------------;----------purpose of Census
House
S.C. IS. T./Others
-to. of living rooms ..
renure St-atus
'opulation
1
Household .. culti rating land either owned/rented
Col. 6
Col. 10
Col. 11
Col. 12
Col. 13-15
Col. 16
Pfuces ofworsliip 27
Other non-residential Census Houses not else-where sPecified. e. g., school, and other educa-tional institutions, public health institutions ~. 3
Unspecified 29
S.C.
S.·T.
Others
No regular room
N~mber of rooms Up.specified Owned
R~lited
In case of institution make cross in C<lls. '10 to 16 of SChedule
N"o coding
In case of household is on pilgrimage and the columns for P/M/F are blank code 00 for males and females both
Yes
No
1 Col. 10
2
3
00 Col.ll
No Coding Blank 1
2
.,
Col. 16
2
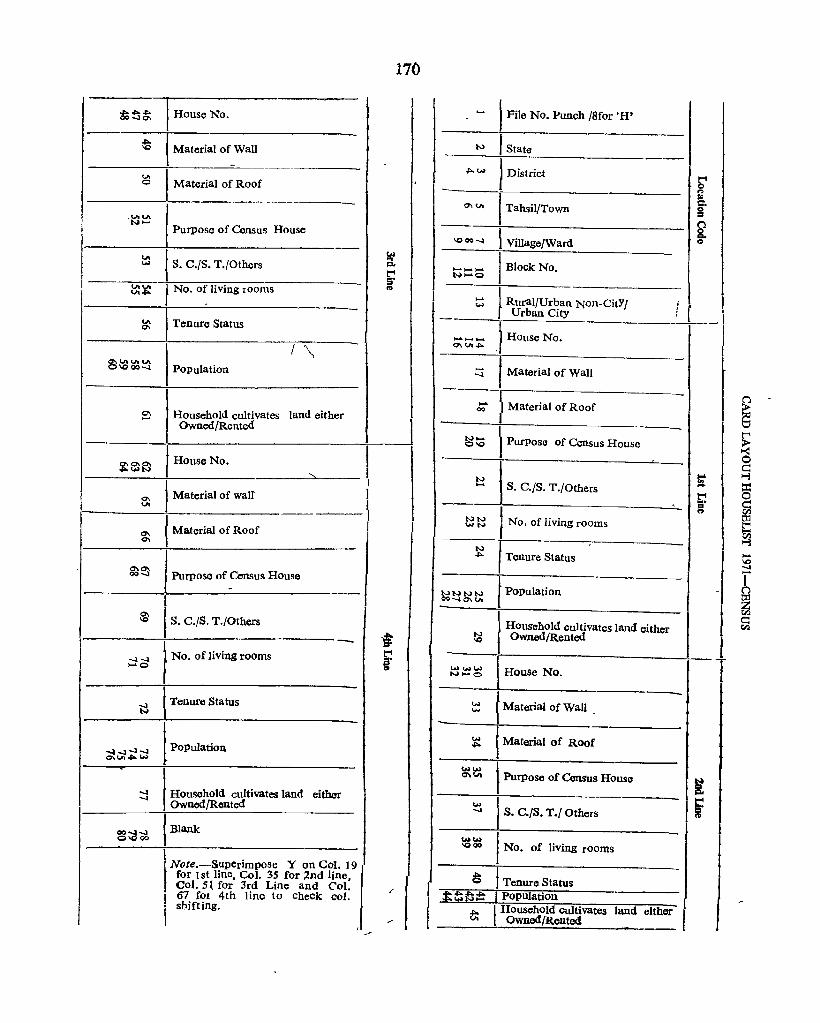
I House No.
t Material Of_wall
t Material of Roof
I Pu,"o,", of Cemu' Hou",
--~ t S. C./S. T./Others g.
~ $'
'" j No. of living rooms
V\ t Tenure Status 0\
I Population
f\ ~V\V\V\
\Qoo-..l
1 :=l I H"",,,"old col"""',,, land either
Owned/Rented
t House No. t ~$~ .' I
I
I l Material of wall' J 0\
\ V\
-~
0\ t Material of Roof 0\
0\0\ 00-..1 I Pu,"o", of ",""u' Ho~
'" s. C./S. T./Others \Q
-t ~ g
-::=a I No. of "vIng """'"
~ I Tenure Status
~-..I-..I-..I O\V\ ........
t Population
-..J Illomehold _.at" , .... either -..I Owned/Rented
I- I Blank OO~-..J O\QOO
9 I No".-Sup.,impo", Y on Ccl. I for 1st line Col. 35 for 2nd hne, Col 51 for' 3rd Line and ('o}. 67 COl' 4th line to check col. I shifting.
/
17()
I
1
I
I
I File No. Punch /Sfor 'H'
-N-, State
.-0\
......... V\.j>.
--..I
.... 00
N .... OIQ
N ...
NI'-> \NN
N .j>.
NNN -..IC7\V\
N IQ
............ N .... O
W .....
w .... ww Q\VI
1 District
I Tahsil/Town
1 Village/Ward I Block No.
I Rural/Urban Non-CitY/ f Urban City ____ ~ -J House No.
f Material of Wall
II Material of Roof I -\ Purpose of Census House
Is. C./S. T./Oth'B
, No. of living rOoms
t Tenure Status
1 Population
I Ho ...... ,. cui,.""", , .... • W", Owned/Rented
1 HOUSe No.
{ Material of Wall
~ Material of Roof
l Purpose of Census House
.... '" .... ~ CI
'"
N 8. I S. C./S. T./ Others I i-
t No. of living rooms
I Tenure Status I Population
1 Household cultivates land either I Owned/Rented
~ &: '6 Q S c:::
~ CIl ~
..... IQ -..I
r ~ c::: CIl
1
171
ANNEXURE XIII
Punching Card
0000 000 a 0 a a 0 a 0 000 000 00 0,0 0 a 0 0 00 00 a 0 a Q 0 00 0 000 a 0 a a 0 0 000 a 0 0 a I.) 0 0 a 0 0 000000 a 0 a 00 a 0 00 0 0 0 1414567 e "II) It 11.1'5 14 l5~r7lel'J20 111:2 :l'S242526 27241930 51 J13~.3 .. 35 3ot:>31!.85940 '" .2 .. 3 .... 4S,.. 47 4849 '0501,-253'4 SS 5'4 ~I 5"~')U .1~1"""'S" "7""'970711273 14 7$ 7£ 71781.30
I II I I I I I I I " I I I I J I I I I I I I I I I I I I I I I I I , I I , I I I I I I I I I , I I I J I I I I I I I , I I I I I , I I I J J , I J I I J I I
22HZ 22 l. 2. 222. 2. 2. 2 2.2. 2. 2. 2. Z 2. 2. 2. 2. 2. 2. 2. 2. 2. 2. 22. 2. 2. ~ 2. 2. 2. 2. 2. Z 2. 2. 22.2. Z Z 2. Z 2. 2 Z :2 2. 2. Z 2. 2 Z 2. Z 2 2. 2. 2. 2. 2 2. 2. 2. 2. 2. 2 2. 2. 2. 2. 2.
3,3~ 3333.3.3.3.3.3 .3.3 333 3533.3 .3 .3 33.3 3 .3 .3.3 .3 :3 3 3 3:; .3 3 3 3 .3 .5 .3 -:;.3"3 3 .3 3 3 .3 .3 3 3 .3 .3 .3.3 .3 3·3 .3.3 .3 3 3 3 .3 .3 3.3 3 3 3 3":5 ::5 .3 .3
H ..,. H 4 .. t 4- 4+ 4- .~ .... 4 «. .. H 4- 4 t " f 4 4 ~ + .. 4 t " t " + 4 t 4 4 4 t .. 4 4 4 4 .;. 4 4 4 4 .. 4 t 4 '" 4 t 4 .. 4 4 4 + 4 4 4 + 4 4- 4 4-..,. 4,4"" + 4 4
555555S5S355~SS55S55555~555S55555S555555555:;555555555555555555555555555555555555
H<;'66!; {; 6 66666 6666666 I; G 6 6 {; (; 666 66 6 6 G G S 6 6 G 6 (, 6 G 6 ('6 ., 6" 6 6 6 6 6 6 6 ,,6 G 6666., G 6 i 6 G S {) 6 ~ 6 b b 6 bof,
...... 777777777777777777717777177777777777777177777777777777 711 77177717717777777777771
88S8888see8888So88f>Sea B otlBSBBSSB 888 B e688 I) 68S 68S8 688888888 88'S88B8B8SSe_eSeS8 8888 B 8
99999999 999 '3 ~ 99 '399:) 9 9,. '" '3 9 9 9 9 9 9 "9 9 ~ 9 9 '3 '3 '3 9 9 '3 9 9 '3 '3 '3 '3 9 '3 '3 9 :I 9 '3 9 9 9 9 9 '3 '3 'l '3 '3 '3 9 9 9 9 9 9 '3 9 9 9 9 9' 9 9 I 2 l4 5' 7 6 9 10 II t1 I~ 1415 IEa'718 t91021 ;l 23 2.4 <'5 2tl7l.e.t~~~'.31. 5~ l13S ,,, 37 3~.s9 '041 ~2..e41 1-5 -« .... 7'\849 '50SI 52 5'35'"" ~S 54 51 5e 5,g,O ~l ~1 ,,\~'" 'SQ,"-11b9,910 111'1- 13-1" 15 14 77"78 19 SO
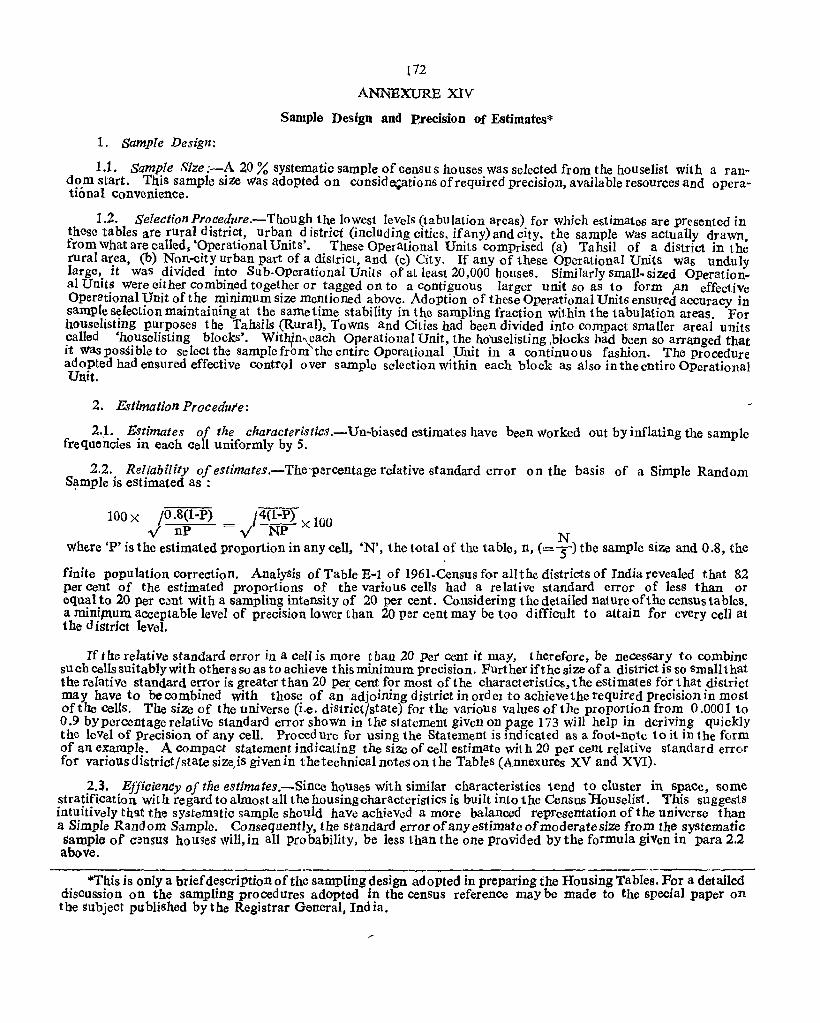
172
ANNEXURE XIV
Sample Design and Brecision of Estimates*
1. Sample Design:
1.1. Sample Size :-A 20 % systematic sample of censu s houses was selected from the houselist with a ran~ d?m start. T~is sample size was adopted on conside;ations of required precision, available resources and operational convelllence.
1.2. SelectionProcedllre.-Though the lowest leVelS (tabUlation areas) for which estimates are pr{'sented in these tables are rural district, urban district (including cities, ifany) and city, the sample Was actually drawn from What are called J 'Operational Units'. These OPerational Units comprised (a) Tahsil of a district in th~ rural area, (b) Non-city urban part of a district, and (c) City. If any of these Operational Units was unduly large, it WaS divided into Sub.Operational UniLs of at least 20,000 houses. Similarly smaIl- sized OPerational Units Were either combined together or tagged on to a contiguous larger unit so as to form an effective Operl1tional Unit of the minimum size mentioned above. Adoption of these Operational Units ensured accuracy in sample selection maintaining at the same time stability in the sampling fraction within the tabulation areas. For houselisting purposes the Tahsils (Rura!), Towns and Cities had been divided into compact smaller areal units called 'houselisting blocks'. WitNn~ach Operational Unit, the ho'uselisting ,blocks had been so arranged that it was possible to select the sample from the entire Operational :Unit in a continuous fashion. The procedUre adopted had ensured effective control over sample selection within each block as ttlso in the entire Operational Unit.
2. Estimation Procedure:
2 .. 1. Estimates of the characteristics.-Un-biased estimates have been worked out by inflating the sample frequencies in each cell uniformly by 5.
2.2. Reliability ojestimates.-The-percentage relative standard error on the basis of a Simple Random S~mple is estimated as :
100 X jO.8(1-P) _ l~l-P) 100 v nP -...; NP X
whe,re 'P' is the estimated proportion in any cell, 'N', the total of the table, n, (= ~) the sample size and 0.8, the
finite population correction. AnalySis of Ta ble E-l of 1961-Census for all the districts of India revealed that 82 per cent of the estimated proportions of the various cells had a relative standard error of less than or equal to 20 Per cent with a sampling intensity of 20 per cent. Considering the detailed nature of the census tables. a miniJllum acceptable level of precision lower than 20 per cent may be too difficult to attain for every celI at the district level.
If t h~ relative standard error in a cell is more than 20 Pet cent it may, therefore, be necessary to combine such cells suitably with others So as to achieve this minimum precision. Further if the size ofa district is so smallthat the relative standard error is greater than 20 per cent for most of the characteristics, the est.imates for that district rna y have to be combined with those of an 'adjoining district in ord el to achieve the required precision in most of the cells. The size of the universe (i.e. district/state) for the various values of the proportion from 0.0001 to 0.9 by percentage relative standard error shown in the statement giVen on page 173 will help in deriving quickly the level of Precision of any cell. Proced Ure for using the Statement is ind icated as a foot-note 1.0 it in the form of an example. A compact statement indicating the size of cell estimate with 20 per cen! r«lative standard errOl" for various district/state size,iS given in the technical notes on the Tables (Annexures XV and XVI).
2.3. EffiCiency of the estimates.-Since hOUses With similar characteristics tend to cluster in spaCe, some stratification with regard to almost aU the hOllsingcharacteris1ics is built into the Census lIouselist. This suggests intuitivdy that the system':ltic sample should have achieved a more balanced representation of the universe than a Simple Random Sample. Consequently, the standard error of any estimate of moderate sIze from th~ systematic Sample of census hou~es will, in all probability, be less than the one provided by the formula given 1ll para 2.2 above.
*This is only a brief description of the sampling design ad opted in preparing the Housing Tables. For a detailed discussion on the sampling procedures adopted in the cenSus reference may be made to the special paper on the Subject published by the Registrar General, Ind ia.
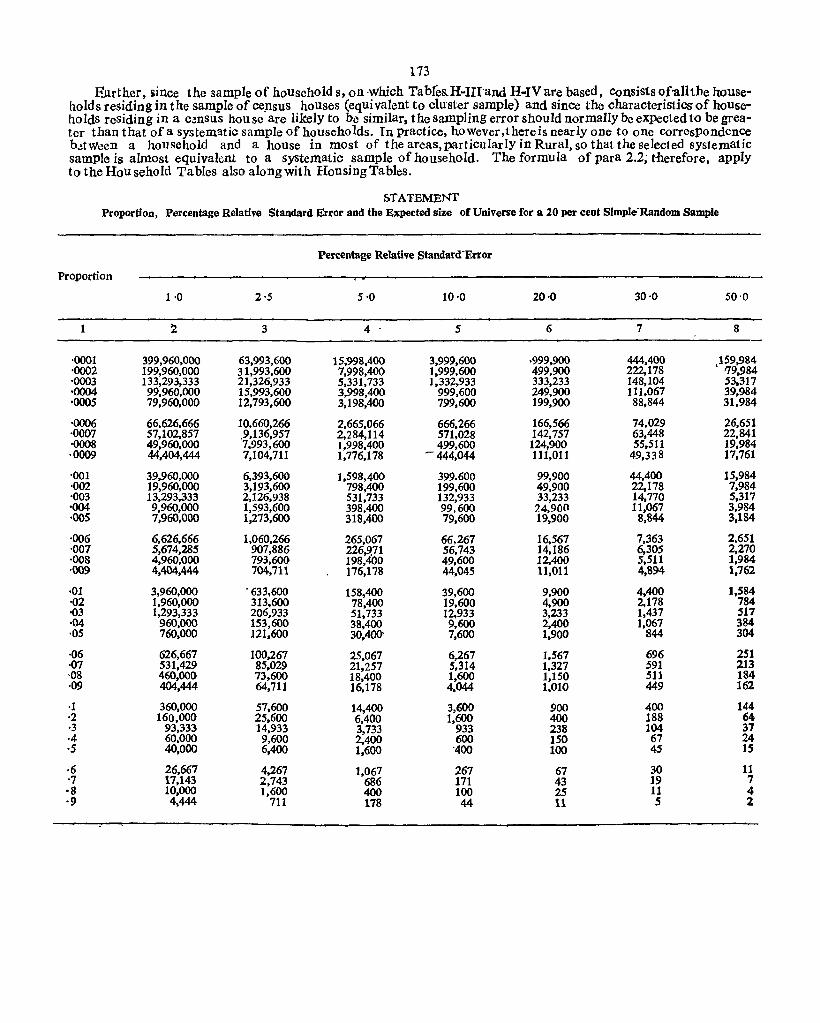
173 Rurther, iince the sample of household s, on which Tables..H~Inand H~IVare based, Consists o fall tbe lrouse~
hold s residing in the sample of CC].1sus houses (equivalent to cltrster sample) and since the characteristics of house~ holds residing in a c~nsus bouse are likely to be similar, the sampling error should normally be eXPect_ed to be grea-ter than that of a systematic sample of households. In practice, ho Wever,t here is nearly one to one correspondence b.}tWeen a household and a house in most of the areas,particularly in Rural, SO that the selected syslematic sample is almost equivalent to a systematic sample of household. The formula of para 2.2; therefore, apply to the Hou sehold Tables also along with Housing Tables.
STATEMENT Proportion, Percentage Relative Standard Error and the E~pected size of Universe for a 20 per cent Simple-Random Sample
Percentage Relative Standard "Error
Proportion
1 ·0 2'5 5·0 10-0 20-0 30'0 50'0
1 ~ 3 4 . 5 6 7 8
·0001 399,960,000 63,993,600 15,'998,400 3,999,600 .-999,900 444,400 159,984 ,0002 199,960,000 31,993,600 7,998,400 1,999,600 499,900 222,178 • '79,984 '0003 133,293,333 21,326,933 5,331,733 1,332,933 333,233 148,104 53.317 ,0004 99,960,000 15,993,600 3,998,400 999,600 249,900 111,067 39,984 '0005 79,960,000 12,793,600 3,198,400 799,600 199,900 88,844 31,984
·0006 66.626,666 10,660.266 2,665,066 666,266 166,566 74,029 26,651 ·0007 57,102,857 ,9,136,957 2,284,114 571,028 142,757 63,448 22,841 ·0008 49,960,000 7,993,600 1,998,400 499,600 124,900 55,511 19,984 ·0009 44,404,444 7,104,711 1,776,178 - 444,044 111,011 49,338 17,761
'001 39,960,000 6,393,600 1,598,400 399.600 99,900 44,400 15,984 ·002 19,960,000 3,193,600 798,400 199,600 49,900 22,178 7,984 '003 13,293,333 2,126,938 531,733 132,933 33,233 14,770 5,317 ,004 9,960,000 1,593,600 398,400 99,600 24,900 11,067 3,984 '005 7,960,000 1,273,600 318,400 79,600 19,900 8,844 3,184
·006 6,626,666 1,060,266 265,067 66.267 16,567 7,363 2,651 '007 5,674,285 907,886 226,9,71 56,743 14,186 6,305 2,270 '008 4,960,000 793,600 198,400 49,600 12,400 5,511 1,984 '009 4,404,444 704,711 176,178 44,045 11,011 4,~94 1,762
·01 3,960,000 . 633,600 158,400 39,600 9,900 4,400 1,584 ,02 1,960,000 313,600 78,400 19,600 4,900 2,178 784 ·03 1,293,333 206,933 51,733 12,933 3,233 1,437 517 ·04 960,000 153,600 38,400 9,600 2,400 1,067 384 ·05 760,000 121,600 30,400' 7,600 1,900 844 304
·06 626,667 100,267 25,067 6,267 1,567 696 251 ·07 531,429 85,029 21,257 5,314 1,327 591 213 -08 460,000 73,600 18,400 1,600 1,150 511 184 ·09 404,444 64,711 16,178 4,044 1,0lO 449 162
·1 360,000 57,600 14,400 3,600 900 400 144 ·2 160,000 25,600 6,400 1,600 400 188 64 ·3 93,333 14,933 3,733 933 238 104 37 ·4 60,000 9,600 2,400 600 150 67 24 ·5 40,000 6.400 1,600 '400 100 45 15
·6 26,667 4,267 1,067 267 67 30 11 -7 17,143 2,743 686 171 43 19 7 ,8 10,000 1,600 400 100 25 11 4 ·9 4.444 711 178 44 11 5 2
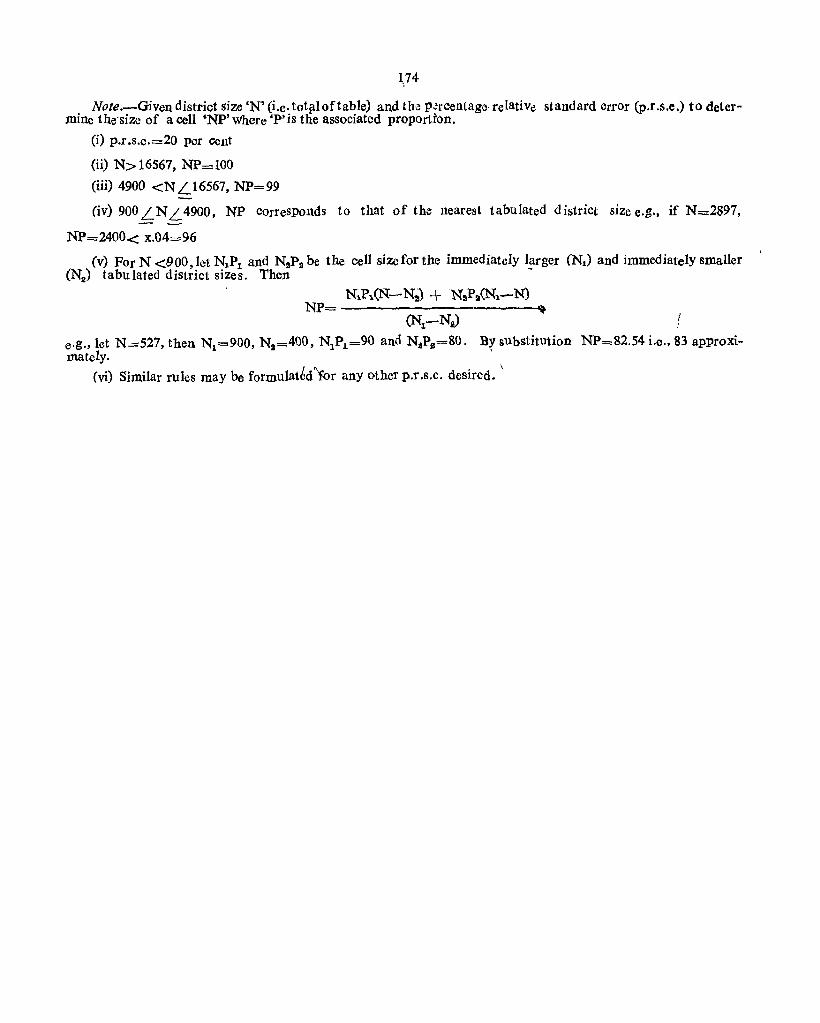
1?4
Note.-Given district size 'N' (Le. totft! oft able) and Lh~ p~rcenlage" relative standard error (p.r .s.e.) to deter-mine the"size of a cell 'NP' Where 'P'is the associated proportion.
(i) p.r.s.e.=20 per cent
(ii) N> 16567, NP=100
(iii) 4900 <N L16567, NP=99
(iv) 900 LNL 4900, NP corresponds to that of the nearest tabulated district size e.g., if N=2897,
NP=2400< x.04=96
(v) For N <900, let N1Pl and NaPa be the cel1 size for the immediately larger (N!) and immediately smaller (N2) tabulated district siZes. Then -
NP= N;.Pl.(N-N~) + Nli;P:a(Nl.-N) -...
(Nl-N.) I I
e.g., let N=527, then N1=900, N lI=400, N1P1 =90 and N;aPlI=80. By sUbstitution NP=82.54 i.e., 83 approxi-
lllately. ' (vi) Similar rules may be formulat~d'\for any other p.r .s,e. desired. \
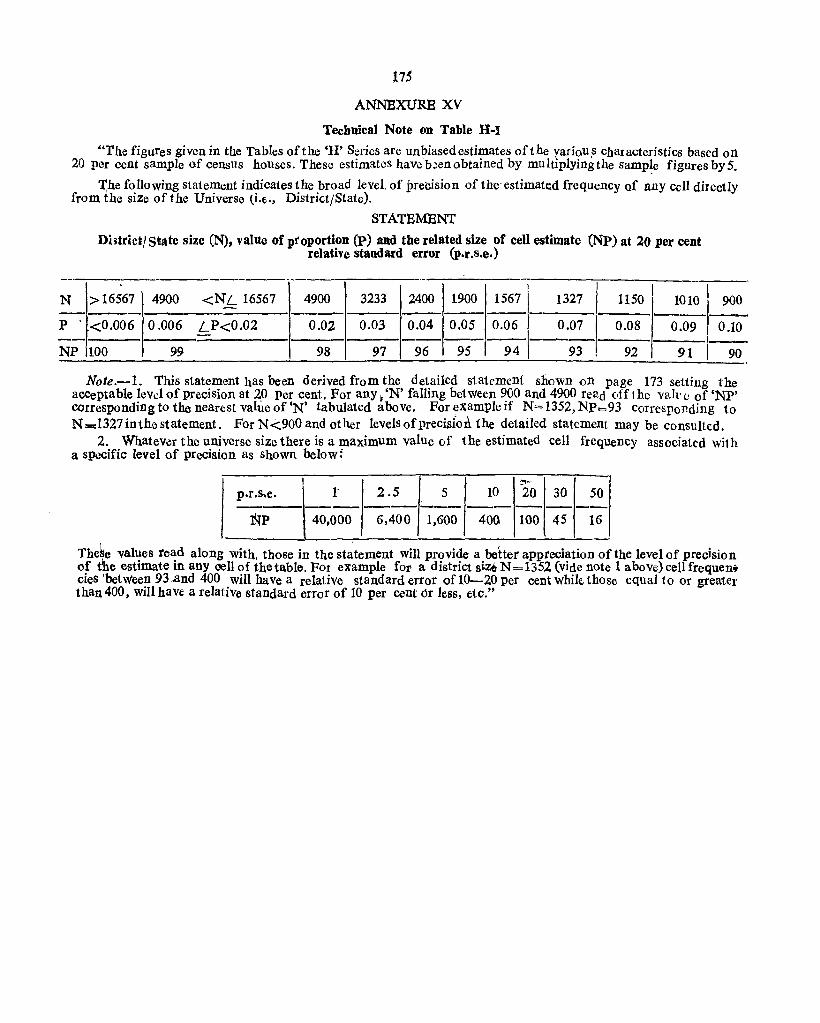
1.75
ANNEXURE XV
Technical Note on Table H-I
"The figures given in the Tables of the 'H' Series are unbiased estimates of the variou,s characteristics based on 20 per cent sample of census houses. These estimates have b;!enobtained by mulUplYingthe samp~e figures by 5.
"I:he following statement indicates the broad level. of precision of the- estimate.d frequency of any cell directly from the size of the Universe {i.e., DistrktJState).
STATEMENT
Dhtrictl state size (N), value of pl'oportion (p) and the related size of cell estimate (NP) at 20 per cent relative standard error (p.r.s.e.)
--------- ----- ---
I N >16567 4900 <NL 16567 4900 3233 2400 1900 1567 1327 1150 I 1010 I 900 - -- --I-- -P <0.006 0.006 LP<0.02 0.02 0.03 0.04 0.05 0.06 0.07 0.08 0.09 I 0.10 - '--NP 100 99 98 97 96 ----I 95 94 93 I 92 91 I 90
Note.-l. This statement has been derived from the detailed statement shown on page 173 setting the aCCeptable levd of precision at ~O Per cent. For any r 'N' falling between ~OO and 4900 read (.ff1hc v~Jl'(; of 'NP' corresponding to the nearest value of 'N' tabulated above. For example If N= 1352, Np=93 correspon.ding to N_1327inthestatement. For N<900 and other levelsofprecisiort the detailed statement may be consulted.
2. Whatever the universe size there is a maximum value of the estimated cell frequency associated wi1 h a specific level of precision as shown beloW:
!' ......
p.r.s.e. 1 2.5 5 10 20 30 50 ---------------- -_"'"_ -------
NP 40.000 6,400 1,600 400 100 45 16
The~e values read along with, those in the statement will provide a better appreciation of the level of precision of the estimate in any 0011 of the table. FOI example for a district size N =1352 (vide note 1 above;) cell frequen;. cies 'bet Ween 93 ,and 400 will have a relative standard error of 10-20 per cent while those equal to or greate!" than 400, will have a relative standard error of 10 per cent or Jess, etc."
L\~~R]~1)(vI
Tecbnic~l Note on Tables R,I1 to H-IV
"The figures given in these Tables are unbiased .estimates of the qharacteristics base<! on 20 per c,ent ~ample of censtrs h'ouses. For a brief note on the predsion oft he cell frequencies, reference is iilvifed'~to the 'technical note on Table H-I. .
As alrel:J.dy mentioned in the technical note on Table H-I, these" estimates have been obtained' by multiplying the sample figures by 5". -
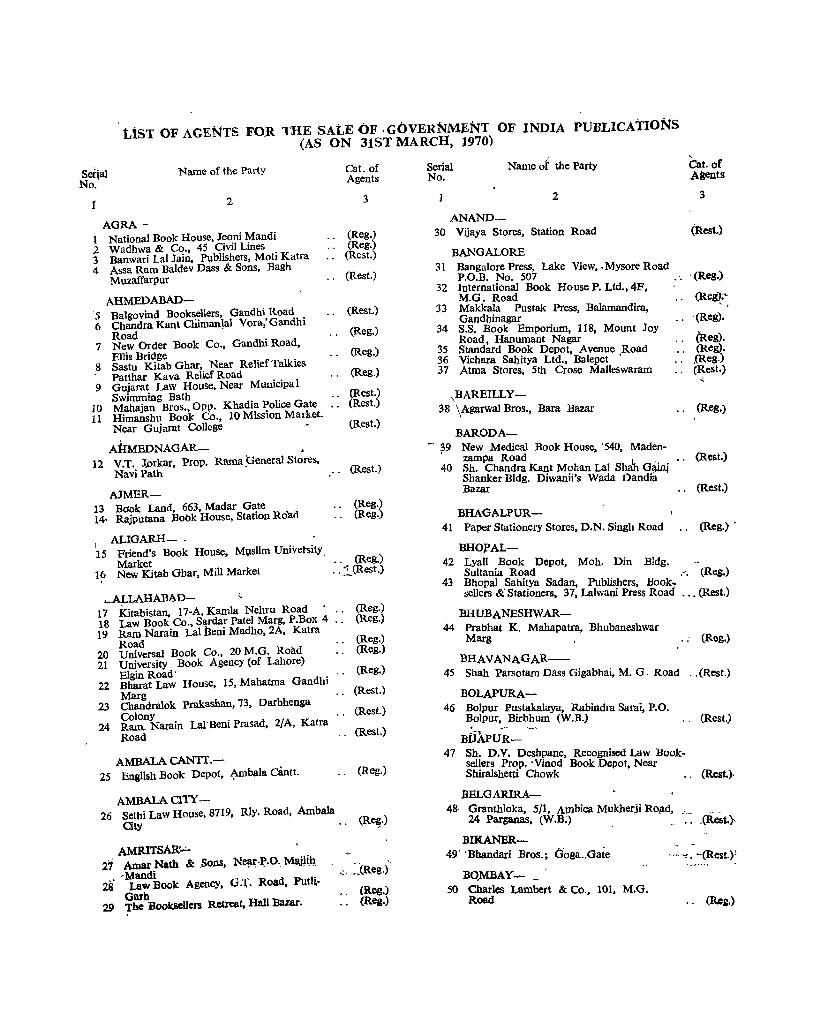
tIST OF AGENTS FOR THE SAtE OF ,GOVERNMENT OF INDIA PUBLICATIONs (AS ON 31ST MARCIl, 1970)
Name of the Party
2
AGRA-
Cat. of Agents
3
(Reg.) 1 National Book House, Jeoni Mandi 2 Wadhwa & Co., 45 Civil Lines " (Reg.) 3 Banwari Lal Jain, Publishers, Moti Katra 4 Assa Ram Baldev Dass & Sons, Bagh
Muzaffarpur
AHMEDABAD-'5 Balgovind Booksellers, Gandhi Road 6 Chandra Kant Cliimanlal Vora,'Gandhi
Road . 7 New Order Book Co., Gandhi Road,
Ellis Bridge 8 Sastu Kitab Ghar, Near Relief Talkies
Patthar Kava Relief Road 9 Gujarat Law House, Near Municipal
Swimming Bath 10 Mahajan Bros., Opp. Khadia Police Gate 11 Himanshu Book Co., 10 Mission Market,
Near Gujarat College
.A1IMEDNAGAR- , 12 V.T. Jprkar, Prop. Rama:<JeneralStores,
Navi Path
AJMER-13 Bdok Land, 663, Madar Gate 14. Rajputana Book House, Station Ro"ad
I ALIGARH-·
(Rest.)
(Rest.)
(Rest.)
(Reg.)
(Reg.)
(Reg,)
(Rest.) (Rest.)
(Rest.)
(Rest.)
(Reg.) (Reg.)
15 Friend's Book House, M\1slim Univetsity, Market ., (Reg.)
I? New Kitab Ghar, Mill Market ' ,1.(Rest.)
.....ALLAHABAD-17 lGtabistan, 17-A, Kamla Nehru Road' (Reg.) 18 Law Book Co., Sardar Patel Marg, P.Box 4 (Reg.) 19 Ram Narain Lal Beni Madho, 2A, Katra
Road (Reg.) 20 Universal Book Co., 20 M.G. Road (Reg.) 21 University Book Agency (of Lahore)
Elgin Road' (Reg.) 22 Bharat Law House, 15, Mahatma Gandhi
Marg (Rest.) 23 Chandra10k Prakashan, 73, Darbhenga
ColonY (Rest.) 24 Ram. Narain Lal'Beni Prasad, 2/A, Katra
Road (Rest.)
AMBALA CANIT.-25 English Book Depot, ~mbala aintt. ,,(Reg.)
AMBALA CITY-26 Sethi Law House, 8719, Rly. Road, Ambala
City
AMRITSAR~
(Re~.)
1'i Amar Nath & So,llS, N~J,>.O._ Ma,@l 'Mandi .;. ::(Reg.)·
28' Law Book Agency, o:r. Road, Pudi.-Garb (Reg.)
29 The Booksellers Retreat, Hall Bazar. .. (Reg.)
Serial No.
Name ot the Party
1 2
ANAND-30 Vijaya Stores, Station Road
BANGALORE 31 Bangalore Press, Lake View, .Mysore Road
P.O.B. No. 507 32 International Book House P. Ltd., 4F,
M.G. Road 33 Makkala Pustak Press, Balamandira,
Gandhinagar 34 S.S. Book Emporium, 118, Mount Joy
Road, Hanumant Nagar 35 Standard Book Depot, Avenue Road 36 Vichara Sa4itya Ltd., Balepet • 37 Atma Stores. 5th Crose Malleswaram
,BAREILLY-38 \Agarwal Bros., Bam Bazar
BARODA-- ~9 New Medical Book House. '540, Maden
zampa Road 40 Sh. Chandra Kant Mohan Lal Shah Gamj
Shanker Bldg. Diwanii's Wada Oandia Bazar
BHAGALPUR-
Cat. of Agents
3
(Rest.)
.. . (Reg.)
(Re~;"
(Reg).
(Reg). (Reg).
,(Reg,) (Rest.)
" (Reg.)
(Rest.)
(Rest.)
41 Paper Stationery Stores, D.N. Singh Road .. (Reg.,'
BH01?AL-42 Lyall. Book Depot, Moh. Din Bldg.
Sultama Road .~. (Reg.) 43 Bhopal Sahitya Sadan, Publishers, Book-
sellers &: Stationers, 37, Lalwani Press Road ..• (Rest.)
BHUBANESHWAR-44 Prabhat K. Mahapatra. Bhubaneshwar
Marg
BHAVANAGAR-
" (Reg.)
45 Shah Parsotam Dass Gigabhai, M. G. Road " (Rest.)
BOLAPURA-46 Bolpur Pustakalaya, Rabindra Sarai, P.O.
~olpur, __ Birbhum (W.B.) (Rest.)
BUAPUR-47 Sh. D.V. Deshpane, Recognised. Law Book
sellers Prop .. Vinod Book Depot Near Shiralshetti Chowk • (Rest.),
BELGARIRA-48· Granthloka, 5/1. A!l1bica Mukherji ROild,
24 Parganas, (W.B:) ' ..
BlKANER-49' 'Bhandari Bros.; Goga.,Gate
BQMBAY- _ 50 Charles Lambert & Co., 101, M.G.
Road
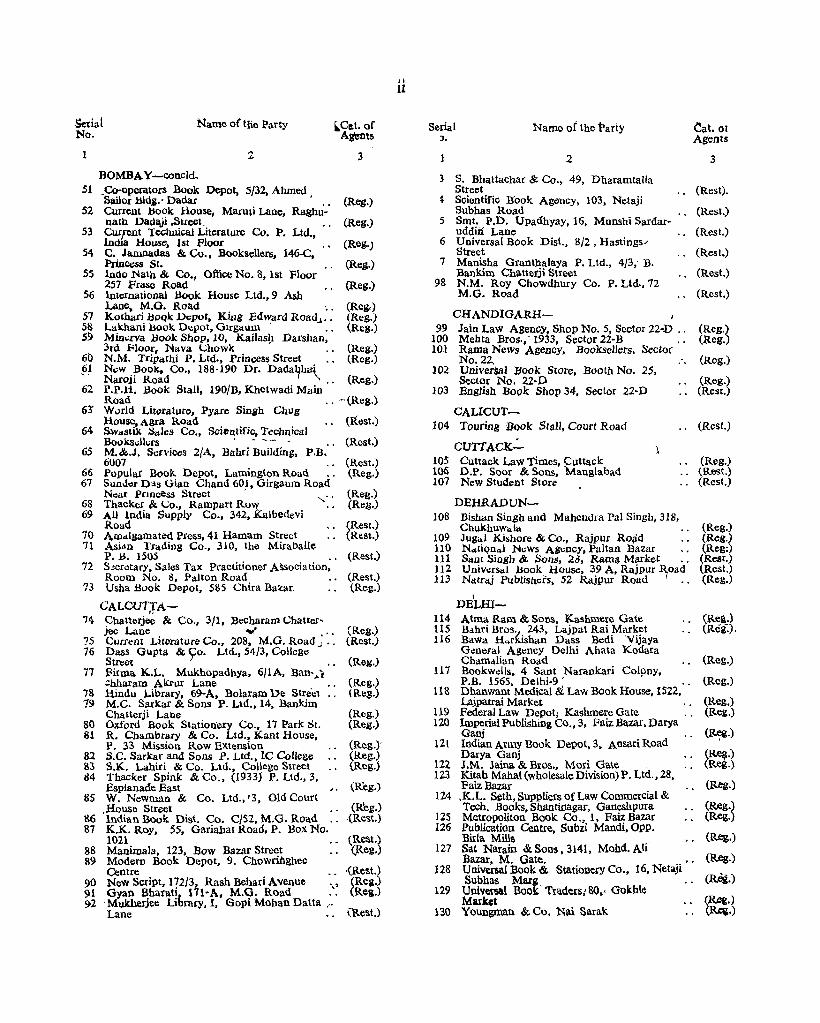
Serial No.
1
Name of the Party
z BOMBA Y-concld.
~Cat. of Ag'ents
3
.51 .Co-operators Book Depot, 5/32, Ahmed ~ Sailor »IdS.' Dadar , , (Reg.)
52 Current !look House, Maruti Laue, Raghu-nath Dadi\ii ,Street. " (Reg.)
53 Current Techuical Literature Co. p, Ltd., India House. 1st Floor
54 C. Jamnadas & Cu.. Booksellers, 146-C, PriJlcess St.
55 indo Na\h & Co., Office No.8, 1st Floor 257 Frase Road
56 International .Book House Ltd.,9 Ash Lane. M.O. Road ~.
(Reg.)
(Reg.)
(Reg.)
(Reg.,) (Reg.) (Reg.)
57 Kothari ,ljoQk 1>"pol, King Edward Road.J." 58 l.i:lkhaui ,ljook D~pot, Girgltum . .. Sl} Mintlcva Hook Shop, 10, Kai1asli Darshan,
3fd Floor, Nava Chowk' . . (Reg.) 60 N.M. Tripltchi P. Ltd., Princess Stfeet . . (Reg.) 61 N<lw BOOK. Co., 188-190 Dr. Dada~hai ,. Naroji Road " .• (Reg.) 62 P.P.H. Book Stall, 190/B, Khetwadi Main
Road . , - (Reg,) 63' W"rJd LiteratUfe. Pyare Singh Chug
.House, Agra Road 64 Swasti.lr. ::; .. le8 Co., Scientific, Technical
(Rest.)
Boo.ksdltlrs ' ., (Rest.) 65 M.&..J. S"cviccs 2/A, Bahri Building, P.B.
6007 (Rest.) 66 Popular Book. Depot, Lamington Road ., (Reg.) 67 Sun.!"r Das Gian Chand 601, Girgaum Road
N<laJ: PflncCss Street' " ... : ' (Reg.) 68 Thacker &. Co., Rampart RoV( (Reg.) 69 AU India Supply Co., 342. Kalbedevi
Road 70 Am.dgamated Press, 41 Hamam Street
(Rest.) (Rest.)
71 Asi"n Trading Co., 310, the Miraballe P . .6. 1505 ., (Rest.)
72 S:crctary, SaleS Tax Practitioner Allsociation, Room No.8, Patton Road
73 Vsha .Book Depot, 5~S Chira Bazar.
CALCUTJA-
(Rest.) (Reg.)
'14 Chatterjee &. Co., 3/1, Becharalll Chatter-jee 1..ane "'" , . {Re8.)
7S Current Literature Co., 208. M.G. R.oad .. ; '. (Rest.) 76 Dass Gupta &. yo. Ltd., 54/3, College
Street 77 FirIlla K..L. Mukhopadhya, 6/1A, Ban· ... t
::hharam AJQur Lane 18 Hindu Library, 69-A, Bolaram De Strel:l 19 M.C. Sarka! &. Sons P. Ltd., 14, Bankim
Chatterji l.ane 80 Oxford Book Stationery Co., 17 Park St. 81 R. Chambrary & Co. Ltd., Kant House,
P. 33 Mission Row Elttension 82 S.C. Sarkar and Sons P. Ltd., IC College 83 S.K. Lahiri & Co. Ltd., Colltge Street 114 Thacker Spink & Co., (1933) P. Ltd., 3,
Esplanade East 85 W. Newman & Co. Ltd.,I3, Old Court
,House Street
(Re!:!.)
(Reg.) (Reg.)
(Reg.) (Reg.)
(Reg.)' (Reg.) (Reg.)
(Reg.) (Re .. t.) 86 Indian Book. Dist. CO. CIS1, M.G. Road
87 K.K. Roy. 55, Gariahat Road, P. Box No. 1021. (R~t.)
88 Manimala, 123, Bow Bazar Street (Reg.) 89 Modern Book Depot. 9. Chowrib8hee
Centre 90 New Script, 172/3, Rash Dehari Avenue ',' 91 Gyan Bhatati i11-A. M.G. Road ..
(Rest.) (Reg.) (Reg.)
92 . Mukherjee Library, I, <:lopi Mohan Datta ." Lane (Rest.)
II
11
Serial ~.
1
Nam.e of the Party
2
3 S. Bhattachar & Co., 49, Dharamtalla Street
'" Scientific B'ook Agency, 103, Netaji Subhas Road
5 Smt. P.D. Upadhyay,16, Munshi Sardaruddin Lane
6 Universal Book Dist., 8/2, Hastings ... Street
7 Manisha Grauthalaya P. Ltd., 4/3; B. Bankim Chatterji Street
98 N.M. Roy Chowdhury Co. P. Ltd., 72 M.G. Road
CHANDlGARII- I
Cat. 01 Agents
3
(Rest),
(Rest.)
(Rest.)
(Rest.)
(Rest.)
(Rest.)
99 Jain Law AgencY, Shop No.5, Sector 22-D ,. (Reg.) 100 Mehta Bros.,' 1933, Sector 22-B ., (Reg.) 101 Rama News Agency, Booksellers, Sector
No. 22, .. (Reg.) 102 UniverSal Book Store, Booth No. 25,
Sector No. 22-P (Reg.) 103 English Book Shop 34, Sector 22-D (Rest.)
CALlCUT-104 Touring Book Stall, Court Road
CUTTACK':'" 105 Cuttack l.aw Times, Cuttack 106 D.P. Soar & Sons, Manglabad 107 New Student Store
DEHRADUN-108 Bishan Singh and Mahendra Pal Singh, 318,
Chukhuw"lct 109 Jug .. 1 Kishore & Co., Rajpur ROlid 11Q N4til?n41 N"ws AS'"ncy, Paltan Bazar III SlInt Singh &. Sons, .20, Rama Market . , 112 Uniwcsal .I:Iook liouse. 39 A, RajpuJ: ~oad 113 Natraj Publish,ds, 52 RajpuJ: Road "
j
DELHl-114 Atma Ram & Sons, Kashmere Gate lI5 Hdhri .I:Iros". 243, Lajpat Rai Market 116 Bawa H"rKishan Dass Dedi 'Vijaya
Gtlneral Ag~ncy Delhi Ahata Kodara Chamdlian Road
117 BookweUs. 4 Sant Narankari Colony, P . .B. 1565, Delhi.9; .
118 Dhanwant Medical & Law Book House, 1522, Lajpatrai Market
119 Federal Law Depot; Kashmere Gate 120 Imperial Publishing Co., 3, Faiz Bazar, Darya
Ganj 121 Indian Army Book Depot,3, Ansari Road
Darya Ganj 122 S.M. Jaina & BIOS .. Mori Gate . 123 Kitab Mahal (wholesale DiviSion) P. Ltd., 28,
FaizBazar 124 ,K.L. Seth, Suppliers of Law Commercial &
Tech. Books, Shantirlagar, Ganeshpura 12S Metropoliton Book Co., I, Faiz Bazar 126 Publication Centre, Subzi Mandi,Opp.
Birla Mills . 127 Sat Narain & Sons, 3141. Mohd. Ali
Bazar, M. Gate. 128 Universal Book & Stationery Co., 16, Netaji
Subhas Marg 129 Uciveml BooK' Traders; 80,· Gukhle
Market 130 Youngman & Co. Nai Sarak
(Rest.)
(Reg.) (Rest.) (Rest.)
(Reg.) (Reg.) (Res;) (Rest·l (Rest.) (Rc8.)
(Rea.) (Rei.).
(Reg,)
(Reg.)
(Reg.) (R.e~.)
(~,)
(Reg.) (Reg.)
(Reg.)
(~g.) (Reg.)
(Reg.)
(Reg.)
(Rig.)
(fu:&.) (~.)

Serial No.
Name of the Party
2
DELHI-coneld. Adrash Publicity Service, 5A/lO, Ansari Road Darya Ganj
Cat. of Agents
3
(Rest.) (Rest.)
131
132 133
p4 135 '136 137. 138
Amar Hind Book House, Nai Sarak All1ndia Educational Supply Co., Sri Ram Buildings, Jawahar Nagar B. Nath & Bros .• 3808, Charkawalan (Chowri Bazar)
" (Rest.)
139
140
141 142 143
144
145
146 147
J48
General Book Depot, 1691, Nai Sarak Hindi Sahltya Sansar, 1547, Nai Sarak Law Literature House, 2646, Balimaran Munshi Ram Manohar Lal, Oriental Booksellers & Publishers, P.B. No. 1165, Nai Sarak Premier Book Co., Printers, Publishers and Bookseller, Nai Sarak Oversees Book Agency,. 3810, David Street, Darya Ganj-9 Amir Book Depot, Nai Sarak Rajpal & Sons, Kashmeri Gate Saini Law Publishing Co., 1899, Chandni Chowk Mod Lal Banarsi Dass, Bangalow'Road, Jawahar Nagar . Sangam Book Depot, Main Market, Gupta Colony SUmmer Bros., P.O. Birla Lines University Book House, 15, U.B. Bangalow Road, Jawahar Nagar bm Book Stall, Civil COurt Compound
DHANBAD-149 New Sketch Press Post Box 26
DHARWAR-150 Bharat Book Depot &"Prakashan, Subhas
. J Road ~51 Akalwadi Book Depot, Vijay Road
ERNAKULAM-.-152 South India Traders, C/o Constitutional
Law Journal 153- pai & Co., Broadway
FEROZEPUR CANTT.-154 English Book Depot, 78, Ihoke Road
GAYA- . 155 Sahitya Sadan, Gifutam Budha Marg
'GOA-. ) 156 Singhal's Book House, P. O. B. No. 70
Near the Church
GURGAON-
(Rest.) (Rest.) (Rest.) (Rest.)
(Rest.)
(Reg.)
(Reg.) (Rest.) (Rest.)
(Rest.)
(Reg.)
(Reg.) (Rest.)
(Rest.) (Reg.)
(Rest.)
(Rest.) (Rest.)
(Reg.) (Rest.)
(Reg.)
(Reg.)
(Rest.)
I 157 Prabhu Book Service, Nai Subzi Mandl " (Rest.)
GUNTUR-lS8 Book Lovers P. Ltd., Arn~delpet, Chowrasta ..
GWALIOR-159 Loyal Book Depot, Patankar Bazar, Lashmar 160 Tater Bros., Sarafe 161 Anand Pustak Bhandar, M.L.B. Marg 162 M. C. Daftari, Prop. M.B. Jain & Bros.,
Booksellers, Sarafa, Lashkar 163 Grqver Law.House, . Near High Court Gall 194 Kitab Ghar, High Court Road
(Reg.)
(Rest.) (Rest.) (Rest.)
(Rest.) (Rest.) (Res.)
Serial :No.
Name of the Party
2
OHAZlABAD-165 Jayana Book: Agency, Outside S.D. Inter
College, O.T. Road 166 S. Gupta, 342, Ram Nagar
HYDERABAD- • 167 The Swaraj Book Depot, Lakdikapul 168 Bhasha Prakashan 22-5-69 Gharkaman 169 Booklovers, P. Ltd., Kachiguda Chowrasta 170 Book Syndicate, Devka Mahal, Opposite
Central Bank 171 Labour Law Publications 873, Sultan Bazar 172 Book Links Corporation, Narayanagoda
HARDWAR~ 0 173 Seva Kunj, Kanshal Bhawan Brahampuri
HUBLI-174 Pervaje's Book House, Station Roaci
/ INDORE-
175 Wadhwa & Co., 27 Mahatma Gandhi Road 176 Madhya Pradesh Book Centre, 41, Ahilya-
" pura 177 \ Modem Book House, Shiv Vilas Palace U8 SWarup Bros., Khajuri Bazar 179 Vinay Pustak Bhandar
JAIPUR CITY-180 'Bharat Law House, Booksellers & Publishers
Opp. Prem Prakash Cinema 181 Popular Book Depot. Cnaura Rasta 182 Vani Mandir Swami Mansing Highway 183 Raj Books & Subs. Agency, 16 Nehru
Bazar
JAMSHBDPUR-184 Amar Kitab Ohar, Diagonal Rd., P.B. No.
78 185 Gupta Stores, Dhatkidith 186 Saoyal Bros. Booksellers & News Agents
·26 .. Main Road
JAMNAGAR-187 Swaaeshi Vastu Bhandar, Ratnabai Masid
Road "
JODHPUR- [! 188 Chopra Bros., Tripolia Bazar 189 Dwarka Das Rathi, Whole<;ale Books and
News Agents 190 Kitab Ghar, Sojati Gate 191 Rajasthan Law House, High Court Road
,JUBBALP-UR--; 192 Modern Book House, 286, Jawa~arganj 193 Popular Book House, Near Omt) P.O.
JULLUNDUR CITY-194 Jain Genera) House, Bazar Bansanwala 195 Hazooria Bros., Mai Hiran Gate 196 University Publishers, Railway Road
JHUNJHUNU (RA.J)-197 Shashi Kumar Sharat Chandra.
KANPUR-198 Advaui & Co., P. Box 100, The Mall 199 Sahitya Niketan, Sharadhanan(J Park 200 Vniversal Book Stall, The Man
Cat. of Agents
3
. ~ (Rest.) (Reg.)
(Reg.) (Rest.) (Rest.)
(Reg.~ (Reg. (Reg.
(Rest.)
(Reg.)
(Reg.)
(Rest.) (Rest.) (Reg.) (Rest.)
(Reg.) (Reg.) (Reg:)
(Rest)
(Reg.) (Reg.)
(Reit.)
(Reg.)
(Reg.)
(Reg.) (Reg.) (Rest.)
(Reg.) (Rest.)
(Reg.) (Rest.) (Rest.)
(Rc<;t.)
(Reg.) (Rea.) (Reg.)
Serial No.
1
KAPSAN-
Name of the Party
2
Cat. of Agents
3
201 Parkashan Parasaran, 1/90, Namcthar Niwas Azad Marg (Reg.)
KOLAPUR-202 Maharashtra Granth Bhandar, Mahadwar
Road \ .. (Rest.)
KUMTA-203 S.V. Kamat, Booksellers & Stationers
(S. Kanara)
LUCKNOW..L 204' Balkrishna Book Co. Ltd., Hazrat Ganj 20S British Book Depot, 84. Hazrat G~nj 206 Eac;tern Book Co., 34, Lalbagh Road .. 207 Ram Advani Hazratganj, P.B. 154 .. 208 Universal Publishers (P) Ltd., Hazratgp~· .. 209 Acquarium Supply Co., 213, Faizabad ] ad 210 Civil & Military Educational Stores, 106 •
Sadar Bazar _
LUDHTANA-211 Lyall Book Depot Chaura Bazar 212 Mohindra Bros., Katcheri Road 213 .Nanda Stationery Bhandar, Pustak Bazar 214 The Pharmacy News, Pindi St.
MADURAI- t)
(Reg.)
(Reg.) (Reg.) (Reg.) (Reg.) (Reg.) (Rest.)
(Rest.}
(Reg.) (Rest.) (Rest.) (Rest.)
21S Oriental Book House, 258; West Masi St. .. (Reg.) ~16 ViveIcananda Press, 48, West Masi Street" ," (Reg.)
217 Rath & Co., Tilohi Building, Bengali Ghat (Rest.)
- MADRAS-218 Account Test Institute, P.O. 760, Emgora .. (Reg.)
(1<.eg.) (Reg.)
219 C. Subbiah,Chetty, 62 Big Street, Triplicance 220 K. KI\shnamurty, Post Box 384 221 P. Vardhachary & Co., 8 Linghi Chettv
Sticet, <:
222 C. Sitaraman & Co .• 33, Royapettach High Road
223 M. Sachecha!am & Co., 14 Bankurarn Chetty Street
224 1 Madras Book Agency 225 The Rex Trading Co'., P.B. 5049, 31 & 32
James Street 226 Nav Bharat Agencies 18, Andiappa Street
Sadhana Sadan . 227 Mohan Pathippagam & Bbok Depot, 3: ... Pyecrafts. Triplicance 22!S"' Narcsh Co., 3, Dr. Rangachari Ro., Myla
pore 229 Reliance Trading Co., 70/10, Shambu Das'
Street MANGALqRE-
(Reg.)
~Reg.)
(Rest.) (Rest.)
.. ·~(Rest.)
'(Rest.)
(Rest.)
(Rest.)
(Reg.)
230 U.R. Shaneye Sons, Car St~eet, P. B'ox 128 .. ! (Reg.) 231 K Bhoga Rao & Co., Kodlat Bail ' ..• (Rest.,
MEERUT-:t32, Loyal Book Depot. ,Chhipi Tank (Reg.) 233 Prakash Educational Stores, SubIiash BaZar (Reg.)
MUZAFFARNAGAR-2H B.S. Jain & Co., 71 Abupura (R('~.) 235 Gargya & Co .• 139. G, New Market .(Rest.)
: MtTZAFFERoPUR-~~~. S~ie.qtifj.c ~ ~du~ti,?nal ~upply ,rSyndi~a.t .. , ,.; (Re~t.;
iv
Serial ..No.,
MYSORE-
Name of the Party
237 H. Vankataramiah & Sons, Krishnaragendra Circle
238 People Book House, Opp. Jagan Mohan Palace
239 Geeta Book House, New State Circle 240 Indian Mercantile Corporation, Ramvilas
MANDSAUR-241 Nabta Bros., Booksellers & Stationers
MUSSOURI-242jHind Traders, N.A.A. Centre. Dick Road
I NAGPUR- I
243 Western Book Depot, Residency Road 244 The E!,e~utive ~ecretary, Mineral Industry
ASSOCIatIon, MineraI House"Near All India Radio Square
NILGIRIS-245 Mary Martin Booksellers, Kotagiris Madras
States
NAINITAL-
Cat. of Agents
3
(Reg.)
(Reg.) (Reg.) (Rest.)
(Rest.)
(Rest.)
(Reg.) )
(Rest.)
(Rest.)
246 Consa! Book Depot,.. Bara Bazar
NADIAD-" . (Reg.)
247 R. S. Desai;"'Station Ro~d NEW DELHI-
248 Amrit Book Co., Connaught Circus 249 Aapki Dukan, 5f5777, Dev Nagar 250 Bhawani & Sons, 8-F, Connaught Place 251 Central News Agency, 23/90, Connaught
Circus 252 English Book Stores, 7-L, Connaught cifcus
P.B. No. 328 ) 253 Jain Book Agency, C/9, Prem House,
Connaugbt Place 254 Jayana Book Depot, P.B. 2505, Karol Bagh 255 Luxmi Book Store, 72, Janpath P.O. Box
553 , 256 Mehra Bros., SO-G, Kalkaji, New Delhi-19 257 Navyug Traders, Desh Bandhu Gupta Road,
Dev Nagar 258 New Book Depot, Latest Books, Periodicals,
Sty. P.B. 96, Connaught Place 259 Oxford Book & Stationery Co., Scindia
(Rest.)
(Reg.) (Reg.) (Reg.)
(Reg.)
(Reg.)
(Reg.) (Reg.) -(Reg.)
(Reg.)
(Reg.) ,
(Reg.)
House ... .tReg.) 260 Peoples Publishing House (P) Ltd., Ranijhansi
Road . . ." (Reg.) '261 Ram Krishna & Sons (of Lahore) 16!B,
Connaught Place -262 R. K. Publishers, 23, Beadonpura, Karol
(Reg.)
Bagh , .. (Reg.) 263 Sharma Bros., 17, New Market, Moti Nagar.. (Reg.) 264 The SecretarY, Indian Met. Society, Lodi
Road \ 2~S Suneja Book Centre. 24/90. Connaught
C~US ~ 266 United Book Agency. 31, Municipal
Market. Connaught Circus 267 Hindi B,ook House, 82, Janpath 268 Lakshrr/i Book Depot, 57, Ragarpura.
Karol Bagh .-269 N.C. Kaunc\lal &0 Co., 40, Model Basti, P.O.
Karol Bagh, New Delhi-5 . 270 Ravindra,.Bppk Agency, 4DfSO,.Double I' StOte)', Lajpat Nasat· ",
(Reg.) , cReg.)
(Reg.) .. (Reg.)
(Rest.)
(Rest.)
Se.t:ial 1'(0.
Name of the Party
1 2
NEW DELHI-<:oncld. 271 Sant Ram BooKsellers, 16, New Municipal
Market, Lodi Colony 272 Subhas Book Depot, Shop No. 111, Central
Market, Srinivaspuri 273 The Seey., Federation of Association of
Small Industry of India, 23-B/2. Rohtak Road
274 G1obo Publications, C-33 Nizamudin East 275 Standard Booksellers, Stationers, Palam
Enclave 276 Scientific Instruments Stores. A-3SS, New
Rajender Nagar . 277 Shyam Pustak Bhandar, 3819, Arya Smaj
C Road
PATIALA-278 Jain & Co., 17 Shah Nashin Bazar
279 280 281
282
283 284 785
286
281
288
PATNA-Luxmi Trading Co., Padri Ki Haveli J.N.P. Agarwal & Co., Padri Ki Haveli Moti Lal Banarsi Dass & Co., Padri Ki Haveli Today & Tomorrow, Ashok Rajpath
POONA-])(:c:can Book Stall, Deccan Gymkhana Imperial Book Depot, 266, M.G. Road
. &t.rswat 67, Patel Flats, 2 Bombay-Poona Road International Book Service, Deccan GymKhana Raka Book Agency', Opp. Natu's Chawl, Near Appa Balwant Chowk Secy., Bharati Itihasa Samshodha1la Mandir, 1321, Sadasbiv Path
PONDICHERRY-'.289 Honesty Book House, 9 Rue Duplix
PUDUKKOTTAI-290 Meenakashi Pattippagam, 4142, East Main
Street 291 Shri P. Swaminathan Shlvanf & Co., East
Main Road
RAJKOT-292 Mohan La! Dossbhai Shah Booksellers & ~I
Subs. & Advt. Agent
RAIPUR-293 Pustak Pratisthan, Sati Bazar
RANCill-294 Crown Book Depot, Upper Bazar
REWARI-295 Tika Ram Sing La!
SAUGAR-
Cat. of Agents
3
(Rest.)
(Rest.)
(Rest.) (Rest.)
(Rest.)
(Rest.)
(Rest.)
(Reg.)
(Reg.) (Reg.)
(Reg.) (Rest.)
(Reg.) (Reg.)
(Rest.)
(Reg.)
(Reg.)
(Rest.)
(Rest.)
(Rest.)
(Rest)
(Reg.)
(Rest.)
(Reg.)
(Rest.)'
296 Yadav Book Stall, Publishers & Booksellers .. (Rest.)
SECUNDERABAD 297 Hindnstan Diary Publishers, Market Street (Rest.)
. SlVAKASI.,,--298' danesh'stores, SouthlCar Str«!t (Rest.)
Serial No.
1
SIMLA-
2
299 Minerva Book Shop, The MaIl
SURAT-,--300 Shri Gajanan Pustakalaya, Tower Road 301 Gujarat Subs. Agency, Jawali.ar La! Nehru
Marg, Athwa Lines
TUTICORIN-
302 Shri K. Thlagarajan, 51, French Chapai Road ,
TRICillNOPOLLY 303 S. Krishnaswami & Co., 35 Subbash Chandra
Bose Road ....
TRlPURA-
304 G.R. Dutta & Co., Scientific Equipments Suppliers
TRIV ANDRUM-305 International Book Depot, Main Road 306 Reddiar Press-& Book Depot, P.B. No.4
\
TEZPUR-307 Jyoti Prakashan Bbawan, Tezpur-Assam
UDAIPUR-308 Book Centre, Mabarana Bhopal College,
Consumer, Co-operative Society Ltd. 309 ' Ashutosh & Co .. Station Road, Opp.
University of Udaipur
UJJAIN-310 Rami Bros., 41, Mallipura
VARANASI-311 The Manager, Banaras Hindu University
Book Depot 312 Chowkhamba Sanskrit Saries Office, Gopal
Mandir Lane, P.B. No.8 313 Kohinoor Storc:s, University Road Lanka 314 Viswavidlyalaya Prakashan, K 40/18, Bhairo
NathMarg 315 Globe Book Centre, P.O. Hindus University
VISAKHAPATNAM-316 Gupta Bros., Vizia Builping 317 The Secretary, Andhra University General
Co., Opp. Stores
VELLORE-318 A-. Venkatasubban, Law Booksellers
WARDHA-319 Swarajeya Bhandar, Rathi Market
FOR LOCAL SALE
Cat. of ~
3
'(Reg.)
(Reg.)
(Rest.)
(Rest.)
(Rest;)
(Rest.)
(Reg.) (Rest.)
(Rest.)
(Rest.)
(Rest.)
.. (Rest.)
(Reg.)
(Reg.) (Reg.)
(Reg.) (Rest.)
(Reg.)
(Rest.)
(Reg.) \
(Reg.)
1. Government of India Kitab Mahal, Janpath, Opposite India Coffee House, New DeJhi. Phone No. 44561
2. Government of India Bpok Depot, 8, Hastings Street, Calcutta, Phone No. 2~-3813.
3. High . Commissioner for Indian in }..ondon , Inaia House,'Londoti W.C. 2
ON S. & R. ·BAS.IS
1. The Assistant Director, Extension Centre, Bhuli Road, Dhanbad.
2. The Assistant Director, Extension Centre, Santnagar, Hyderabad-18.
3. 'The Asstt. Director, Govt. of India, S,I.S.I. Ministry of C&I Extension Centre, Kapileshwar Road, Belgaum.
4. The Asstt. Director, Extension Centre, Krishna Distt. I (A.!.) ')
5. I The Asstt. Director, Footwear, Extension Ceotre, Polo Ground No.1, Jodhpur.
6. The Asstt. Director, Industrial Extension Centre, Nadiad (Gujarat).
1. The Development COmmissioner, Small-Scale InQ.ustries, Udyog Bhawan, New Delhi.
8. TheDy:Director,lncharge, S.I.S.l., C/o Chief Civil Admn., Goa, Panjim.
9. The Director, Govt.Press Hyderab~d. 10. The Director, Indian Bureau of Mines, Govt. of India,
Ministry of Steel Mines and Fuel' Nagpur. 11. The Director, S.I.S.I. Industrial Extc!ns~n Centre,
Udhna-Surat. 12. The Employment Officer, Employment Exchange,-Dhar,
Madhya Pradesh. 13. The Employment Officer, Employment Exchange, Gopal
Bhavan, Morena: __ . 14. The Employment Officer, Employment Exchange,
J1labue. 15. The Head Clerk, Govt. Book Depot, Ahmedabad. ] 6. The Head Clerk, Photozincographic Press, 5 F~nance
Road, Poona. . ...... 11. The Officer-in;.Charge, Assam, Goyt. B.D., Shillong. 18. The Officer-in-Charge, Extension Centre, Club Road,
M"uzaffarpur. 19. The Officer-in-Charge; Extension Centre, Industrial Estate
Kokar, Ranchi. 20. The Officer-in-Charge, State Information Centre,
Hyderabad. 21. The Officer-in-Charge, S.I.S.I. Extension.Centre, Maida. 22. Th~ Oli::~r-in-Charge, S.I.S.I., Habra, Tabaluria, 24
Parganas. 23. The Officer-in-Charge, University Emplo~ent Bureau,
Lucknow. 24. Officer-in-Charge, S.l.S.I. Chrontanning Extension
Centre, Tangra 33/1, North Topsia Road, Calcutta-46. 25. The Officer-in-Charge, S.I.S.I. Extension Centre
(Footwear), Calcutta-2. 26. The Officer-in-Charge, S.l.S.l., Model Ciupehtry
Workshop, Puyali Nagar, P.O. Burnipur, 24 Parganas. 21. Publication Division, Sales Depot, North Block, New
Dellli. 28. The Press Officer. Orissa Sectt., Cuttack. 29. The Registrar of Companies, Andhra Bank Building,
6, Linghi Chetty Street, P.B. 1530, Madras. 30. The Registrar of Companies, 'Assam, Manipur and
Tripura, Shillong. 31. The Rciistrar of Complwies, Bihar Journal Ro,\d,
Patna-l.. 32, The Registrar of' ,Companies, 162, Brigade Road,
Bangalore. 33. The RelPstrar of Companies, Everest, toO Marine
Drive, Bombay. 34:' The 'Registrar of COmpanies, Gujarat State s"amachar
Building, Ahmedabad: . '.' .,' . .
vi
"
35. 36.
37.
38.
39.
40.
41. 42.
43.
44.
45. 46.
47. 48.
49.
50.
51.
52.
53.
54.
55.
56.
57.
58.
59" 60.
61. 62.
63.
64 ..
65.
66.
67.
68.
ON S. & R. BASlS - eontd.
The Registrar of Companies, Gwalior (M.P.) The, Registrar M Companies, H.No. 3-5-837, Hyder Guda. Hyderabad. The Registrar of Companies, Kerala, 70, Fee! Road, Ernakulam. The Registrar of Companies, M.O. Road, West Cotto Building, P.B. 334, Kanpur. The Registrar of Companies. Narayani Building, Bracourne Road, Calcutta. The Registrar of Companies, Orissa, Cuttack Chandi, Cuttack. The Registrar of Companies, Pondicherry. / The Registrar of Companies, Punjab & Himachal Pradesh, Link ~oad, Jullundur City. The Registrar of Companies, Rajastha_q_ & Ajmer, Shri Kumta Prasad House, 1 st Floor, ·c' Scheme Ashok Marg, Jaipur. The Registrar of Companics, Sunlight Insurance Building, Ajmeri Gate Extension, New Delhi. The R'egistrar of Trade Unions, Kanpur. Soochna Sahita Depot, (State Book Depot), Lucknow. . Superintenaent, Bhupendra State Press, Patiala. Superintendent, Govemment Press and Book Depot, Nagpur. Superintendent, Government Press, Mount Road, Madras. '-. , Superintcndent
L Government State Stores and Pubs.
r.O. Gulzenbagh, Patna. Superintendent, GoVernment Printing and Stationery
Depot, Rajasthan, Jaipur City. Sup~rintendent, Government Printing and Stationery. Rajkot. Superintendent, Governm~l1t Printing and Stationery, Punjab, Chandigarh. Superintendent, Government State Emporium, V. P. Rewa. Deputy Controller, Printing and Stationery Office Himachal Pradesh, Simla. Superintenaent, Printing and Stalionery, Allahabad-, Uttar Pradesh. Superintendent, Printing and Stationery, Madhya Pradesh, Gwalior. Superintendent, Printing and Stationery, Charni Road, Bombay. Superintendent, State Government Press, Bhopal. The Assi~tant Director, Publicity and Information, Vidhan Sabha, Bangalore-l. . Superintendent, Government Press, Trivandrum. Assistant Information Officer, Press Information Bureau, Information Centre, Srinagar. Chief Controller of Import~ and Exports, 'Panjam, Goa. Employment Officer, EmpioymentJ Exchange (Near Bus Stop), Sidhi (M.P.) \ .. The Director, Regional MeteI:.ological Centre, Alipur, Calcutta. The Assistant Director, State Information Centre, Hubli. The Director of Supplies and DisJ)Osal, Department of Supply, lO~ Mount Road. Madras-l, Director General of Supplies and Disposals, N.r.C, Building, New DeIhL .,'" '. 1
oN S. &,R. BAsI5.,..-·ctmtd.
69. The Controller of Imports and Exports, Raj~ot. 70. The Inspector, Dock Safety, MIL & J? Madras
Harbour, Madras-I. 71. The Inspecting Assistant Commissioner of Income
Tax, Kela1a, T Ernakulam. 72. Tne Under Secretary, Rajya Sabha Secretariat, Patlia
,ment House, New Delhi. 73. Controller of Imports and Exports, 7, POllland Park,
Visa1chapatnam. 74. The Seniol Inspector, Dock Safety, Botwalla
Chaml:.ers Sir, P.M. Road, Bombay. 75. Controller of Imports and Exports, I.B. 14-P, Pondi
clierry. 76. Deputy Director, Incharge, S.I.S.I., Sahakar Bhavan,
Trikon Bagicha. Rajkot. 77. The Publicity and Liaision Officer, Forest Research
Institute and Colleges, Near Forest, P.O. D'hradun. 78. The Assistant Controller of Imports an$'! Exports,
Government of India, Ministry of Commerce, New Kandla.
79. The Deputy Director General (S.D.) 6, Esplanade East Calcutta.
80.
81. 82.
83. 84.
85.
90.
The Director, Government of India, S.I.S.I., Ministry of I. & S., Industtial Area-B. Ludhiana. The Government Epigraphist for India. The Assist:lnt Director, Incharge, S.1.S.1., Extension Centre, Varanasi. The Director of Supplies. Swarup Nagar, Kanpur. The A,>sis.ant Director (Admn.), Office of the Directorate of Supplies and Disposal, Bombay. The Chief Controller of Imports and Exports, Ministry of Intt:rnational Trade; Madras. The D~puty Collector of Customs, Custom House, Visakhapatnam. I
The Principal Officer, Mercantile Marine Department, Calcutta. The Director, S.l. S.l., Karan Nagar, Srinagar. The Director, Incharge, S.I.S.I., 107, Industrial Estate, Kanpur. The Director of Inspection, New Marine Lines, Bombay-I.
91. The Deputy Chief Controller of Imports and Exports, T.D. Road, Ernakulam.
92. The Assistant Director, Government Stationery and Book Depot, Aurangabad.
93. The Assistant Director Incharge, S.I.S.l., Club Road, Hubli.
94. The Employment Officer, Talcher. 95. The Director of Inspection, Dte., G & S, Disposal, 1,
Ganesh Chandra Avenue, Calcutta. 96. The Collector of Customs,New Custom House, Bombay. 97. The Controller of Imports & Exports, :Bangalore. 98. The Admn. Officer, Tariff Commissioner, 101, Queen's
Road, Bombay.
99. The Commissioner ofIncome Tax, Patiala.
100. The Director, Ministry of! & Supply, (Deptt. of Industry), Cuttack.
vH
ON S. & R. BASIS -couto.
101. T~e Deputy Director of Public Rel~tio~s, state tn£6r-mation· Centre, Patna. .
102 .. The Officer-in-Charge, State Information Centre, Madras.
103. The Asstt. Director; S.I.S.I.M.I. Road, Jaipur. 104. The Collector of Customs, Madras. 105. National Building Organisatior{', Nirman Bhavan New
Delhi. ' 106. The ContrOller of Communication, Bombay Region,
Bombay. '107. The Kamatak University, Dharwar. 108. The Sardar Patel University, Vallabh Vidyanagar. 109. The Principal Publications Officer Sending commission
for Scientific & Technical Terminology, U.G.C. Buildmg, New Delhi.
110. The Officer-in-Charge, Information Centre, Swai Ram Singh Road, Jaipur.
Ill. The Director General of Civil Aviation, New Delhi. 112. Controller of Aerodrumes Delhi. 113. Controller of Aerodrumes. Calcutta. t14. Controller of Aerodrumes, Bombay. 115. Contr~ller of Aerodrumes, Madras. . n 6.: The Registrar, Punjab Agricultural University, Ludhiana. 117. The land & Development Officer, M. of Health, Family
Planning W.H.&U.D., Nirman Bhavan, New Delhi. 118. Acting Secretary, Official Language (Leg.) Commission,
Ministry of Law, Bhagwan Dass Road, New Delhi. 119. Registrar General, India, 2/A, Mansingh Road, New
Delhi H. ~
120. The Director of Census Operations, Andhra Pradesh, Khusro Manzil, Hyderabad-4.
121. The Director of Census Operations, Assam, Bombfyle Road, Shillong-l.
122. The Director of Census Operations, Bihar, Boring Canal Road, Patna.
123. The Director of Census Operations, Gujarat, Ellis Bridge, Ahmedabad-6.
124. The Director of Census Operations, Haryana, Kothi No.1, Sector 10-A, Chandigarh.
125. The Director of Census Operations, Himachal Pradesh, Boswel, Sirr!la-5.
126. The Director of Census of Operations, Jammu & Kash. mir, 19 Karan Nagar, Srinagar.
127. The Director of Census Operations Kerala, Kowdiar Avenue Road, Trivandrum-3.
128. The Director of Census Operations, Madhya Pradesh, Civil Lines, Bhopal-2 (M.P.)
129. The Director of Census Operations, Maharashtra, Sprot Road, Bombay:1 (BR).
130. The Director of Census Operations, Manipur, Imphal. 131 . The Director of CenS\lS Operations, Meghalaya, NangO
" Hills, Shillong-3. 132. The Director of Census Operations, Mysore, Basappa
Cross Road, Shanti Nagar, Bangalore-l. 133. The Director of Census Operations, Nagaland, Kohima. 134., The Director of Census_Operations, Orissa, Chandni
Chouk, Cuttack-1.
135. The'.:: Director: of Census Operations', PUl\iab, No. 72, Sector S, C~andigarh. .
136. The Director of Census Operations, Rajasthan~ Rambag Palace, Jaipur.
137. The Director of Census Operations, Tamil Nadu, 10, Poes Garden, Madras-86.
138. The Director of Census Operations, Tripura, Durga • Bari West Comp6und, Agartala.
139. The Director of Census Operations, Uttar Pradesh, 6-Park Road, Lucknow.
140. The Director of Census 'Operations, West Bengal, 20 British Indilln Street, Calcutta-I.
141. The Director of Census Operations, Andaman and Nicobar Islands, Port Blair.
viii 6N' s. &: R. BASIS--=c()l1cld. -
142., The Director of CensuS' Operations, ArUnachal i'l:adesh, Laithumkhrah, Shillong.
143. The Director of Census Operations, Chandigarh, Kothi ~ No. 1012, Sector 8-C, Chandigarh.
144. The Director of Census Operations, Dadra and Nagar ,HaveIi, Panaji.
145. The Director of Census Operations, Delhi, 2, Under Hill Road, Delhi-6 .
146. The Director of Census Operations, Goa; Daman, and Diu, Dr. A. Borkar Road, Panaji.
147. The Director of Census Operations, L.M.&A. Islands, Kavaratti.
148. The Director of Census Operations. Pondicherry, Madras.